UNITED STATES
SECURITIES AND EXCHANGE COMMISSION
Washington, D.C. 20549
FORM N-CSR
CERTIFIED SHAREHOLDER REPORT OF REGISTERED
MANAGEMENT INVESTMENT COMPANIES
Investment Company Act file number | 811-10041 |
|
JNL Investors Series Trust |
(Exact name of registrant as specified in charter) |
|
1 Corporate Way, Lansing, Michigan | | 48951 |
(Address of principal executive offices) | | (Zip code) |
|
225 West Wacker Drive, Suite 1200, Chicago, Illinois 60606 |
(Mailing address) |
|
Steven J. Fredricks Jackson National Asset Management, LLC 225 West Wacker Drive, Suite 1200 Chicago, Illinois 60606 |
(Name and address of agent for service) |
|
Registrant’s telephone number, including area code: | (312) 338-5800 | |
|
Date of fiscal year end: | December 31 | |
|
Date of reporting period: | December 31, 2013 | |
| | | | | | | | | |
Form N-CSR is to be used by management investment companies to file reports with the Commission not later than 10 days after the transmission to stockholders of any report that is required to be transmitted to stockholders under Rule 30e-1 under the Investment Company Act of 1940 (17 CFR 270.30e-1). The Commission may use the information provided on Form N-CSR in its regulatory, disclosure review, inspection, and policymaking roles.
A registrant is required to disclose the information specified by Form N-CSR, and the Commission will make this information public. A registrant is not required to respond to the collection of information contained in Form N-CSR unless the Form displays a currently valid Office of Management and Budget (“OMB”) control number. Please direct comments concerning the accuracy of the information collection burden estimate and any suggestions for reducing the burden to Secretary, Securities and Exchange Commission, 450 Fifth Street, NW, Washington, DC 20549-0609. The OMB has reviewed this collection of information under the clearance requirements of 44 U.S.C. §3507.
Item 1. Report to Shareholders.

ANNUAL REPORT
December 31, 2013
· JNL® Investors Series Trust
This report is for the general information of qualified and non-qualified plan participants, as well as contract/policyowners of the PerspectiveSM, Perspective II®, Perspective AdvisorsSM, Perspective Advisors IISM, PerspectiveSM L Series, CuriangardSM, Perspective AdvantageSM, Perspective Focus®, Perspective Investor VUL®, Ultimate Investor® VUL, Jackson AdvisorSM VUL, Defined Strategies®, Fifth Third Perspective, Retirement Latitudes®, Perspective (New York), Perspective II (New York), Perspective Advisors II (New York), Perspective L Series (New York), Curiangard (New York), Perspective Advisors (New York), Perspective Focus (New York) and Perspective Investor VUL (New York). Not all the portfolios are available in all of the products. Jackson® is the marketing name for Jackson National Life Insurance Company® (Home Office: Lansing, Michigan) and Jackson National Life Insurance Company of New York® (Home Office: Purchase, New York).


JNL/PPM America Funds
PPM America, Inc.
Market Summary: Relative to 2012, U.S. fixed income total return was much weaker, with Treasuries and higher quality segments producing losses and lower quality credits producing mid to high single digit returns. For example, Treasuries lost -2.75% as measured by the Barclays Capital Treasury Bond Index and investment grade corporates lost -1.53%, as measured by Barclays Capital U.S. Corporate Investment Grade Index, whereas high yield bonds and bank loans gained 7.41% and 5.29%, as measured by BofA Merrill Lynch US High Yield Master II Index and S&P LSTA Index, respectively. Rising interest rates drove these differences, with higher quality bonds having less coupon and spread to offset the approximate +100 basis points ("bps") and +126 bps rise in 5- and 10-year Treasury yields that occurred, year over year.
Higher interest rates reflected the anticipation and eventual execution by the U.S. Federal Reserve ("Fed") of quantitative easing policy withdrawal. After
trading below 2% for much of the year, Fed Chairman Bernanke's tapering comments during May pushed the 10-year Treasury yield to 2.74% by early August. Treasury yields rose further as the year progressed, particularly during the last quarter, on the back of better economic data and the Fed's decision in December to reduce its asset purchase program by $10 billion a month.
While higher interest rates contributed negatively to total return, credit performance was broadly positive: high yield and investment grade corporate credit spreads tightened by 27 bps and 134 bps, respectively, during the year. Contributing trends included a credit supportive level of underlying economic growth, still reasonable corporate credit metrics and the absence of a major spike in mergers and acquisitions and leveraged buyouts. Demand also generally held up well, as evidenced by falling new issue concessions and despite predictions for a "great rotation" into equity.
JNL/PPM America Low Duration Bond Fund
Portfolio Composition*:
Non-U.S. Government Agency ABS | | | 33.3 | % | |
Financials | | | 28.3 | | |
Government Securities | | | 11.9 | | |
Energy | | | 4.3 | | |
Industrials | | | 3.2 | | |
U.S. Government Agency MBS | | | 3.2 | | |
Consumer Discretionary | | | 2.7 | | |
Health Care | | | 2.7 | | |
Telecommunication Services | | | 2.7 | | |
Consumer Staples | | | 2.4 | | |
Materials | | | 1.4 | | |
Utilities | | | 1.0 | | |
Information Technology | | | 0.4 | | |
Short Term Investments | | | 2.5 | | |
Total Investments | | | 100.0 | % | |
*Total Investments at December 31, 2013
Portfolio Manager Commentary: For the period September 16, 2013 through December 31,
2013, JNL/PPM America Low Duration Bond Fund performed in line with its benchmark by posting a return of 0.41% for Class A shares compared to 0.41% for the Barclays Capital 1-3 Year U.S. Government/Credit Index.
The investment results were positively impacted primarily by an overweight to corporate bonds and to a lesser degree overweights to asset-backed securities and commercial mortgage-backed securities. The corporate bond market, both investment grade and high yield, produced strong results. Further, the Fed's $10 billion taper announcement on December 19 did little to sway investors' demand for corporate debt. The Fund's curve exposure to the three plus part of the curve detracted from performance as the curve steepened in December post taper.
We expect the economy to continue its pattern of moderate growth in the 2 to 2.5% range over the next twelve months while inflation remains
contained. Our expectation is for modestly higher two and three year interest rates over the next twelve months, and although the Fed's taper program is now in full swing the Fed is closely monitoring employment and inflation trends. As labor market gains have been less than stellar and inflation is low, we expect short duration interest rate increases to be somewhat contained. We expect to remain overweight in corporate bonds based on positive earnings, solid corporate balance sheets and favorable valuations, i.e. attractive yield spreads. We also anticipate a meaningful allocation to asset-backed securities as valuations are attractive and collateral performance trends are stable.
Total Return | |
Since Inception | | | 0.41 | % | |
(Inception date September 16, 2013) | |
JNL/PPM America Total Return Fund
Portfolio Composition*:
Financials | | | 22.6 | % | |
U.S. Government Agency MBS | | | 17.2 | | |
Energy | | | 11.7 | | |
Non-U.S. Government Agency ABS | | | 6.5 | | |
Consumer Discretionary | | | 6.0 | | |
Materials | | | 4.4 | | |
Industrials | | | 3.8 | | |
Telecommunication Services | | | 3.2 | | |
Utilities | | | 3.1 | | |
Government Securities | | | 2.8 | | |
Health Care | | | 2.5 | | |
Consumer Staples | | | 1.9 | | |
Information Technology | | | 1.4 | | |
Short Term Investments | | | 12.9 | | |
Total Investments | | | 100.0 | % | |
*Total Investments at December 31, 2013
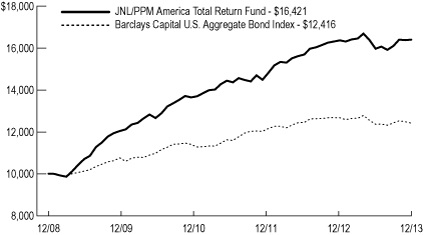
Portfolio Manager Commentary: For the year ended December 31, 2013, JNL/PPM
America Total Return Fund outperformed its benchmark by posting a return of 0.20% for Class A shares compared to -2.02% for the Barclays Capital U.S. Aggregate Bond Index. The Fund also outperformed the Lipper Intermediate Investment Grade Bond Funds Peer Group which returned -1.56%, placing it in the 7th percentile of its Lipper universe.
The investment results of the Fund were positively impacted by an overweight to corporate bonds and a corresponding underweight in Treasuries. Both the investment grade and high yield corporate bond markets performed well following a second quarter rout as a result of Fed tapering fears. Over time, the bond market has become acclimated to the prospect of less accommodative Fed policy and, therefore, the market response to the actual tapering announcement in December was relatively muted. Within the corporate bond component of the Fund, the banking and
metals/mining sectors were strong contributors to Fund performance as were high yield bonds.
We expect the economy to continue its moderate growth pattern in the 2 to 3% range in 2014. Also, we expect inflation to remain subdued, staying below the Fed's 2% target. Our expectation is for modestly higher rates over the next twelve months as the Fed continues to taper and the employment picture improves, albeit slowly. We expect to remain overweight in investment grade corporate bonds based on positive earnings, solid corporate balance sheets and favorable valuations, i.e. attractive yield spreads. Also, we expect to maintain an overweight to high yield for the same reasons as well as low projected default rates. However, valuations for high yield bonds are not quite as attractive as they have been which may lead us to pare back our allocation in the first half of 2014.
Past performance is not predictive of future performance. Investment return and principal value will fluctuate so that an investor's shares, when redeemed, may be worth more or less than their original cost. Performance numbers are net of all Fund operating expenses, but not do not reflect the deduction of insurance charges.

JNL/PPM America Funds (continued)
PPM America, Inc.
JNL/PPM America Total Return Fund
Average Annual Total Returns | |
| 1 Year | | | 0.20 | % | |
| 5 Year | | | 10.45 | | |
Since Inception | | | 10.42 | | |
(Inception date December 29, 2008) | |
Past performance is not predictive of future performance. Investment return and principal value will fluctuate so that an investor's shares, when redeemed, may be worth more or less than their original cost. Performance numbers are net of all Fund operating expenses, but not do not reflect the deduction of insurance charges.
JNL Investors Series Trust
Schedules of Investments
December 31, 2013
| | Shares/Par | | Value | |
JNL/PPM America Low Duration Bond Fund | | | | | |
NON-U.S. GOVERNMENT AGENCY ASSET-BACKED SECURITIES - 33.9% | | | | | |
AEP Texas Central Transition Funding III LLC, 1.98%, 06/01/21 | | $ | 4,000,000 | | $ | 3,929,540 | |
American Express Credit Account Master Trust | | | | | |
0.68%, 03/15/18 | | 1,000,000 | | 1,001,722 | |
0.99%, 03/15/18 | | 3,000,000 | | 3,009,036 | |
0.77%, 05/15/18 | | 5,100,000 | | 5,094,849 | |
American Express Issuance Trust II, 0.62%, 02/15/19 (a) | | 455,000 | | 451,568 | |
AmeriCredit Automobile Receivables Trust | | | | | |
2.85%, 08/08/16 | | 1,250,000 | | 1,271,061 | |
2.86%, 01/09/17 | | 1,000,000 | | 1,020,584 | |
1.78%, 03/08/17 | | 525,000 | | 530,257 | |
0.96%, 04/09/18 | | 400,000 | | 400,707 | |
1.52%, 01/08/19 | | 2,000,000 | | 1,992,862 | |
Bear Stearns Commercial Mortgage Securities Trust REMIC | | | | | |
5.58%, 04/12/38 (a) | | 585,000 | | 632,515 | |
5.44%, 03/11/39 (a) | | 1,545,000 | | 1,664,107 | |
5.45%, 12/11/40 (a) | | 1,091,000 | | 1,164,816 | |
4.67%, 06/11/41 | | 5,878,339 | | 6,113,261 | |
5.47%, 01/12/45 (a) | | 1,097,628 | | 1,216,027 | |
California Republic Auto Receivables Trust, 1.23%, 03/15/19 | | 2,880,000 | | 2,877,572 | |
Capital One Multi-Asset Execution Trust, 0.96%, 09/16/19 | | 5,000,000 | | 4,974,950 | |
CarMax Auto Owner Trust, 0.97%, 04/16/18 | | 5,860,000 | | 5,883,135 | |
CenterPoint Energy Transition Bond Co. IV LLC, 0.90%, 04/15/18 | | 6,987,150 | | 6,987,479 | |
Chase Issuance Trust | | | | | |
0.42%, 04/15/19 (a) | | 5,000,000 | | 4,939,725 | |
0.63%, 04/15/19 (a) | | 3,000,000 | | 2,960,703 | |
Citibank Credit Card Issuance Trust | | | | | |
5.50%, 03/24/17 | | 595,000 | | 625,488 | |
1.11%, 07/23/18 | | 8,000,000 | | 8,028,448 | |
Citigroup Commercial Mortgage Trust REMIC, 5.43%, 10/15/49 | | 4,000,000 | | 4,364,112 | |
Citigroup/Deutsche Bank Commercial Mortgage Trust REMIC, 5.22%, 07/15/44 (a) | | 731,000 | | 768,119 | |
CNH Equipment Trust | | | | | |
1.75%, 05/16/16 | | 484,384 | | 488,525 | |
0.99%, 11/15/18 | | 1,915,000 | | 1,891,068 | |
1.01%, 02/18/20 | | 6,625,000 | | 6,579,460 | |
COMM Mortgage Trust REMIC, 0.72%, 03/10/46 | | 1,343,809 | | 1,336,262 | |
Credit Suisse First Boston Mortgage Securities Corp. REMIC, 5.57%, 05/15/36 (a) | | 424,000 | | 437,930 | |
Discover Card Execution Note Trust | | | | | |
0.81%, 08/15/17 | | 600,000 | | 602,076 | |
1.04%, 04/15/19 | | 6,294,000 | | 6,287,693 | |
Discover Card Master Trust I, 0.42%, 09/15/16 (a) | | 1,458,000 | | 1,456,939 | |
Ford Credit Auto Owner Trust | | | | | |
2.27%, 01/15/17 | | 2,000,000 | | 2,054,592 | |
0.55%, 07/15/17 | | 4,117,000 | | 4,117,041 | |
1.54%, 03/15/19 | | 2,500,000 | | 2,482,450 | |
Ford Credit Floorplan Master Owner Trust, 1.50%, 09/15/18 | | 1,000,000 | | 1,008,816 | |
GE Equipment Midticket LLC, 0.95%, 03/22/17 | | 2,000,000 | | 2,004,410 | |
GE Equipment Small Ticket LLC, 1.39%, 07/24/20 (b) | | 2,000,000 | | 2,006,918 | |
GE Equipment Transportation LLC | | | | | |
0.50%, 11/24/15 | | 2,459,534 | | 2,458,484 | |
0.62%, 07/25/16 | | 1,780,000 | | 1,779,806 | |
1.30%, 10/25/21 | | 5,000,000 | | 4,979,135 | |
GreatAmerica Leasing Receivables Funding LLC | | | | | |
0.61%, 05/15/15 (b) | | 3,534,160 | | 3,534,150 | |
0.78%, 06/15/16 (b) | | 685,000 | | 684,980 | |
1.16%, 05/15/18 (b) | | 625,000 | | 624,731 | |
Huntington Auto Trust, 1.31%, 11/15/16 (b) | | 1,860,000 | | 1,876,565 | |
JPMorgan Chase Commercial Mortgage Securities Trust REMIC, 5.32%, 12/15/44 (a) | | 1,025,000 | | 1,089,825 | |
LB-UBS Commercial Mortgage Trust REMIC, 5.06%, 09/15/40 (a) | | 575,000 | | 601,114 | |
Mercedes-Benz Auto Receivables Trust, 0.78%, 08/15/17 | | 2,100,000 | | 2,103,841 | |
Morgan Stanley Capital I Trust REMIC, 5.65%, 06/11/42 (a) | | 4,000,000 | | 4,493,556 | |
Sierra Timeshare Receivables Funding LLC | | | | | |
3.51%, 11/20/25 (b) | | 846,485 | | 862,405 | |
3.37%, 07/20/28 (b) | | 1,111,170 | | 1,140,030 | |
Springleaf Mortgage Loan Trust REMIC, 1.87%, 09/25/57 (a) (b) | | 2,414,385 | | 2,414,151 | |
Volvo Financial Equipment LLC, 0.53%, 11/16/15 (b) | | 4,830,000 | | 4,828,044 | |
Wachovia Bank Commercial Mortgage Trust REMIC, 5.29%, 07/15/41 (a) | | 5,000,000 | | 5,073,065 | |
Westlake Automobile Receivables Trust, 1.12%, 01/15/18 (b) | | 3,630,000 | | 3,632,831 | |
Total Non-U.S. Government Agency Asset-Backed Securities (cost $147,019,189) | | | | 146,833,536 | |
| | | | | |
CORPORATE BONDS AND NOTES - 50.2% | | | | | |
| | | | | |
CONSUMER DISCRETIONARY - 2.8% | | | | | |
Dollar General Corp., 1.88%, 04/15/18 | | 3,000,000 | | 2,900,748 | |
Glencore Funding LLC, 2.50%, 01/15/19 (b) | | 1,500,000 | | 1,451,691 | |
GLP Capital LP, 4.38%, 11/01/18 (b) | | 1,037,000 | | 1,060,333 | |
Jaguar Land Rover Automotive Plc, 4.13%, 12/15/18 (b) | | 1,846,000 | | 1,857,537 | |
Macy’s Retail Holdings Inc., 7.88%, 07/15/15 (c) | | 2,000,000 | | 2,203,708 | |
MGM Resorts International, 6.63%, 07/15/15 | | 1,000,000 | | 1,072,500 | |
Toll Brothers Finance Corp., 4.00%, 12/31/18 | | 1,577,000 | | 1,604,598 | |
| | | | 12,151,115 | |
| | | | | |
CONSUMER STAPLES - 2.5% | | | | | |
Bunge Ltd. Finance Corp., 5.10%, 07/15/15 | | 3,232,000 | | 3,421,204 | |
ConAgra Foods Inc., 1.30%, 01/25/16 | | 3,000,000 | | 3,005,037 | |
Kraft Foods Group Inc., 2.25%, 06/05/17 | | 3,000,000 | | 3,036,567 | |
WM Wrigley Jr. Co. | | | | | |
1.40%, 10/21/16 (b) | | 909,000 | | 910,310 | |
2.00%, 10/20/17 (b) | | 468,000 | | 466,504 | |
| | | | 10,839,622 | |
| | | | | |
ENERGY - 4.3% | | | | | |
Anadarko Petroleum Corp., 5.95%, 09/15/16 | | 2,000,000 | | 2,227,980 | |
BP Capital Markets Plc, 3.20%, 03/11/16 | | 4,000,000 | | 4,200,076 | |
Devon Energy Corp., 1.20%, 12/15/16 | | 2,000,000 | | 1,999,006 | |
Parker Drilling Co., 9.13%, 04/01/18 | | 1,250,000 | | 1,325,000 | |
Petrobras Global Finance BV, 2.00%, 05/20/16 | | 2,000,000 | | 1,998,418 | |
Shell International Finance BV, 0.90%, 11/15/16 | | 4,500,000 | | 4,499,077 | |
Statoil ASA, 1.80%, 11/23/16 | | 2,500,000 | | 2,555,565 | |
| | | | 18,805,122 | |
| | | | | | | |
See accompanying Notes to Financial Statements.
| | Shares/Par | | Value | |
FINANCIALS - 28.8% | | | | | |
Ally Financial Inc., 2.75%, 01/30/17 | | 2,500,000 | | 2,509,375 | |
Ameriprise Financial Inc., 5.65%, 11/15/15 | | 1,391,000 | | 1,510,743 | |
Bank of America Corp., 3.63%, 03/17/16 | | 2,500,000 | | 2,630,013 | |
Bank of Montreal, 2.38%, 01/25/19 | | 5,000,000 | | 4,982,795 | |
Bank of Nova Scotia, 0.95%, 03/15/16 | | 5,000,000 | | 5,006,815 | |
Berkshire Hathaway Finance Corp, 0.95%, 08/15/16 | | 2,679,000 | | 2,690,964 | |
BNP Paribas SA, 3.60%, 02/23/16 | | 6,000,000 | | 6,316,536 | |
Branch Banking & Trust Co., 0.67%, 12/01/16 (a) | | 2,000,000 | | 2,001,682 | |
Canadian Imperial Bank of Commerce, 2.35%, 12/11/15 | | 1,360,000 | | 1,404,566 | |
Capital One Bank USA NA, 1.15%, 11/21/16 | | 2,234,000 | | 2,224,088 | |
Capital One Financial Corp., 2.15%, 03/23/15 | | 6,000,000 | | 6,099,486 | |
Citigroup Inc., 4.75%, 05/19/15 | | 4,428,000 | | 4,659,372 | |
CNH Capital LLC, 3.88%, 11/01/15 | | 3,000,000 | | 3,097,500 | |
Credit Suisse New York, 3.50%, 03/23/15 | | 6,000,000 | | 6,211,998 | |
Fifth Third Bancorp, 3.63%, 01/25/16 | | 5,000,000 | | 5,252,665 | |
Ford Motor Credit Co. LLC | | | | | |
8.70%, 10/01/14 | | 1,500,000 | | 1,587,936 | |
2.50%, 01/15/16 | | 2,000,000 | | 2,051,776 | |
1.50%, 01/17/17 | | 2,346,000 | | 2,344,761 | |
General Electric Capital Corp. | | | | | |
1.00%, 01/08/16 | | 4,000,000 | | 4,009,784 | |
2.30%, 04/27/17 | | 2,000,000 | | 2,054,988 | |
Goldman Sachs Group Inc., 5.35%, 01/15/16 | | 5,000,000 | | 5,410,585 | |
HCP Inc., 6.30%, 09/15/16 | | 1,500,000 | | 1,689,047 | |
Huntington National Bank, 1.30%, 11/20/16 | | 1,875,000 | | 1,875,143 | |
JPMorgan Chase & Co., 2.60%, 01/15/16 | | 3,000,000 | | 3,089,793 | |
Mack-Cali Realty LP, 5.13%, 01/15/15 | | 2,444,000 | | 2,545,206 | |
MBNA Corp., 5.00%, 06/15/15 | | 1,735,000 | | 1,832,738 | |
Morgan Stanley, 4.10%, 01/26/15 | | 4,000,000 | | 4,137,208 | |
Perrigo Co. Plc, 1.30%, 11/08/16 (b) | | 1,364,000 | | 1,359,170 | |
PNC Bank NA, 1.15%, 11/01/16 | | 2,727,000 | | 2,730,141 | |
Prudential Financial Inc., 3.88%, 01/14/15 | | 3,500,000 | | 3,618,177 | |
Regions Financial Corp., 5.75%, 06/15/15 | | 2,000,000 | | 2,131,048 | |
Royal Bank of Scotland Group Plc, 2.55%, 09/18/15 | | 5,000,000 | | 5,113,785 | |
Santander Holdings USA Inc., 3.00%, 09/24/15 | | 5,000,000 | | 5,163,245 | |
SLM Corp., 6.00%, 01/25/17 | | 2,000,000 | | 2,165,000 | |
Svenska Handelsbanken AB, 2.50%, 01/25/19 | | 3,676,000 | | 3,702,566 | |
Union Bank NA | | | | | |
3.00%, 06/06/16 | | 1,413,000 | | 1,477,506 | |
1.50%, 09/26/16 | | 3,019,000 | | 3,053,012 | |
Wells Fargo & Co., 1.25%, 07/20/16 | | 5,000,000 | | 5,036,750 | |
| | | | 124,777,963 | |
| | | | | |
HEALTH CARE - 2.8% | | | | | |
Express Scripts Holding Co., 2.65%, 02/15/17 | | 3,000,000 | | 3,090,957 | |
Teva Pharmaceutical Finance II BV, 3.00%, 06/15/15 | | 3,000,000 | | 3,096,105 | |
Thermo Fisher Scientific Inc., 2.40%, 02/01/19 | | 1,307,000 | | 1,294,122 | |
Ventas Realty LP, 1.55%, 09/26/16 | | 1,395,000 | | 1,404,797 | |
Zoetis Inc., 1.15%, 02/01/16 | | 3,000,000 | | 3,003,240 | |
| | | | 11,889,221 | |
| | | | | |
INDUSTRIALS - 3.3% | | | | | |
Aviation Capital Group Corp., 3.88%, 09/27/16 (b) | | 1,346,000 | | 1,390,170 | |
Bombardier Inc., 4.25%, 01/15/16 (b) | | 2,000,000 | | 2,090,000 | |
ERAC USA Finance LLC, 2.80%, 11/01/18 (b) | | 4,000,000 | | 4,040,044 | |
Microsoft Corp., 1.63%, 12/06/18 | | 4,500,000 | | 4,436,276 | |
Penske Truck Leasing Co. LP, 3.75%, 05/11/17 (b) | | 2,000,000 | | 2,103,176 | |
| | | | 14,059,666 | |
| | | | | |
INFORMATION TECHNOLOGY - 0.5% | | | | | |
Hewlett-Packard Co., 2.35%, 03/15/15 | | 2,000,000 | | 2,031,298 | |
| | | | | |
MATERIALS - 1.5% | | | | | |
Ecolab Inc., 3.00%, 12/08/16 | | 3,000,000 | | 3,142,878 | |
FMG Resources August 2006 Pty Ltd., 6.38%, 02/01/16 (b) | | 1,000,000 | | 1,035,000 | |
Yara International ASA, 5.25%, 12/15/14 (b) | | 2,000,000 | | 2,074,120 | |
| | | | 6,251,998 | |
| | | | | |
TELECOMMUNICATION SERVICES - 2.7% | | | | | |
America Movil SAB de CV, 5.75%, 01/15/15 | | 4,000,000 | | 4,188,000 | |
AT&T Inc., 0.80%, 12/01/15 | | 2,000,000 | | 1,994,940 | |
PAETEC Holding Corp., 9.88%, 12/01/18 | | 1,006,000 | | 1,124,205 | |
Verizon Communications Inc., 0.70%, 11/02/15 | | 4,500,000 | | 4,487,445 | |
| | | | 11,794,590 | |
| | | | | |
UTILITIES - 1.0% | | | | | |
MidAmerican Energy Holdings Co., 2.00%, 11/15/18 (b) | | 3,636,000 | | 3,578,130 | |
Southern Co., 2.38%, 09/15/15 | | 900,000 | | 921,050 | |
| | | | 4,499,180 | |
| | | | | |
Total Corporate Bonds and Notes (cost $216,691,627) | | | | 217,099,775 | |
| | | | | |
GOVERNMENT AND AGENCY OBLIGATIONS - 15.4% | | | | | |
| | | | | |
GOVERNMENT SECURITIES - 12.1% | | | | | |
Federal Home Loan Bank - 1.4% (d) | | | | | |
Federal Home Loan Bank, 2.00%, 09/09/16 | | 5,835,000 | | 6,030,713 | |
Federal Home Loan Mortgage Corp. - 0.6% (d) | | | | | |
Federal Home Loan Mortgage Corp., 0.88%, 10/14/16 | | 2,667,000 | | 2,675,816 | |
Federal National Mortgage Association - 0.9% (d) | | | | | |
Federal National Mortgage Association, 0.88%, 02/08/18 | | 4,000,000 | | 3,897,569 | |
U.S. Treasury Securities - 9.2% | | | | | |
U.S. Treasury Note | | | | | |
0.25%, 12/31/15 | | 2,250,000 | | 2,244,025 | |
0.50%, 06/15/16 | | 2,050,000 | | 2,047,919 | |
0.63%, 08/15/16 - 05/31/17 | | 24,683,000 | | 24,580,322 | |
0.88%, 04/30/17 | | 4,609,000 | | 4,594,598 | |
0.75%, 06/30/17 - 12/31/17 | | 6,450,000 | | 6,338,784 | |
| | | | 39,805,648 | |
| | | | | |
U.S. GOVERNMENT AGENCY MORTGAGE-BACKED SECURITIES - 3.3% | | | | | |
Federal Home Loan Mortgage Corp. - 0.5% | | | | | |
Federal Home Loan Mortgage Corp. REMIC, 3.00%, 02/15/39 | | 1,887,623 | | 1,898,664 | |
Federal National Mortgage Association - 2.8% | | | | | |
Federal National Mortgage Association | | | | | |
4.00%, 04/01/26 - 08/01/26 | | 3,682,236 | | 3,903,751 | |
3.50%, 02/15/29, TBA (e) | | 8,000,000 | | 8,344,687 | |
| | | | 12,248,438 | |
| | | | | |
Total Government and Agency Obligations
(cost $66,780,831) | | | | 66,556,797 | |
See accompanying Notes to Financial Statements.
| | Shares/Par | | Value | |
SHORT TERM INVESTMENTS - 2.5% | | | | | |
| | | | | |
Investment Companies - 2.5% | | | | | |
JNL Money Market Fund, 0.01% (f) (g) | | 10,913,042 | | 10,913,042 | |
| | | | | |
Total Short Term Investments (cost $10,913,042) | | | | 10,913,042 | |
| | | | | |
Total Investments - 102.0% (cost $441,404,689) | | | | 441,403,150 | |
Other Assets and Liabilities, Net - (2.0%) | | | | (8,496,535 | ) |
Total Net Assets - 100.0% | | | | $ | 432,906,615 | |
| | | | | | |
(a) | | Variable rate security. Rate stated was in effect as of December 31, 2013. |
(b) | | Rule 144A or Section 4(2) of the Securities Act of 1933 security which is restricted to resale to institutional investors. The Sub-Adviser deemed this security to be liquid based on procedures approved by the Trust’s Board of Trustees. As of December 31, 2013, the value of Rule 144A securities and Section 4(2) paper deemed liquid was $45,020,991. |
(c) | | The interest rate for this security is inversely affected by upgrades or downgrades to the credit rating of the issuer. |
(d) | | Securities in this category are direct debt of the agency and not collateralized by mortgages. |
(e) | | All or a portion of the investment was purchased on a delayed delivery basis. As of December 31, 2013, the total payable of investments purchased on a delayed delivery basis was $8,357,500. |
(f) | | Investment in affiliate. |
(g) | | Yield changes daily to reflect current market conditions. Rate was the quoted yield as of December 31, 2013. |
JNL/PPM America Total Return Fund | | | | | |
NON-U.S. GOVERNMENT AGENCY ASSET-BACKED SECURITIES - 7.2% | | | | | |
American Airlines Pass-Through Trust | | | | | |
5.60%, 07/15/20 (a) | | $ | 3,298,000 | | $ | 3,351,593 | |
4.95%, 01/15/23 (a) | | 1,179,000 | | 1,236,476 | |
American Express Credit Account Master Trust | | | | | |
1.22%, 04/17/17 (a) (b) | | 1,718,000 | | 1,721,680 | |
0.99%, 03/15/18 | | 477,000 | | 478,437 | |
American Tower Trust I, 3.07%, 03/15/23 (a) | | 4,246,000 | | 3,972,375 | |
AmeriCredit Automobile Receivables Trust | | | | | |
1.73%, 02/08/17 | | 1,080,000 | | 1,090,984 | |
4.26%, 02/08/17 | | 158,000 | | 164,264 | |
1.59%, 07/10/17 | | 473,000 | | 476,991 | |
1.31%, 11/08/17 | | 606,000 | | 607,844 | |
1.07%, 03/08/18 | | 905,000 | | 900,194 | |
Aventura Mall Trust REMIC, 3.74%, 12/05/32 (a) (b) | | 1,575,000 | | 1,613,095 | |
Banc of America Commercial Mortgage Trust REMIC, 5.75%, 02/10/51 (b) | | 800,000 | | 883,438 | |
Bear Stearns Commercial Mortgage Securities REMIC | | | | | |
5.74%, 09/11/42 (b) | | 500,000 | | 564,146 | |
5.69%, 06/11/50 (b) | | 300,000 | | 335,890 | |
Capital One Multi-Asset Execution Trust, 4.90%, 12/15/17 | | 2,595,000 | | 2,709,299 | |
Continental Airlines Inc. Pass-Through Trust | | | | | |
6.25%, 04/11/20 | | 719,587 | | 764,562 | |
4.15%, 04/11/24 (c) | | 1,038,791 | | 1,051,127 | |
4.00%, 10/29/24 | | 1,277,000 | | 1,270,615 | |
Countrywide Asset-Backed Certificates REMIC, 4.95%, 04/25/33 (b) | | 16,395 | | 16,412 | |
DBUBS Mortgage Trust REMIC, 3.74%, 11/10/46 (a) | | 3,130,878 | | 3,290,121 | |
Delta Air Lines Inc. Pass-Through Trust | | | | | |
6.20%, 07/02/18 | | 897 | | 1,001 | |
4.95%, 05/23/19 | | 193,567 | | 210,020 | |
Greenwich Capital Commercial Funding Corp. REMIC, 5.44%, 03/10/39 | | 139,000 | | 152,673 | |
GS Mortgage Securities Corp. Trust REMIC, 3.55%, 04/10/34 (a) | | 2,500,000 | | 2,454,575 | |
GS Mortgage Securities Trust REMIC | | | | | |
5.62%, 11/10/39 | | 702,000 | | 687,493 | |
4.95%, 01/10/45 (a) | | 847,000 | | 911,359 | |
JPMorgan Chase Commercial Mortgage Securities Trust REMIC, 5.71%, 02/12/49 (b) | | 1,860,000 | | 2,065,139 | |
Morgan Stanley Bank of America Merrill Lynch Trust REMIC, 2.86%, 11/15/45 | | 3,000,000 | | 2,816,814 | |
Morgan Stanley Capital I Trust REMIC, 5.91%, 06/11/49 (b) | | 2,750,000 | | 3,067,482 | |
Morgan Stanley Re-REMIC Trust REMIC, 5.80%, 08/12/45 (a) (b) (c) | | 1,500,000 | | 1,638,693 | |
MVW Owner Trust, 2.15%, 04/22/30 (a) | | 1,441,322 | | 1,445,837 | |
Sierra Receivables Funding Co. LLC | | | | | |
2.84%, 11/20/28 (a) | | 700,854 | | 713,648 | |
2.38%, 03/20/29 (a) | | 393,265 | | 397,175 | |
United Air Lines Pass-Through Trust, 9.75%, 01/15/17 (c) | | 65,887 | | 75,482 | |
| | | | | |
Total Non-U.S. Government Agency Asset-Backed Securities (cost $42,731,501) | | | | 43,136,934 | |
| | | | | |
CORPORATE BONDS AND NOTES - 64.8% | | | | | |
| | | | | |
CONSUMER DISCRETIONARY - 6.7% | | | | | |
A&E Television Networks LLC | | | | | |
3.11%, 08/22/19 (d) | | 1,000,000 | | 983,716 | |
3.63%, 08/22/22 (d) | | 1,000,000 | | 952,699 | |
3.78%, 08/22/24 (d) | | 1,000,000 | | 933,695 | |
Churchill Downs Inc., 5.38%, 12/15/21 (a) (c) | | 630,000 | | 641,025 | |
Delphi Corp. | | | | | |
6.13%, 05/15/21 (c) | | 185,000 | | 205,119 | |
5.00%, 02/15/23 | | 1,317,000 | | 1,354,864 | |
Dollar General Corp., 3.25%, 04/15/23 (c) | | 1,883,000 | | 1,729,317 | |
DreamWorks Animation SKG Inc., 6.88%, 08/15/20 (a) (c) | | 824,000 | | 871,380 | |
Four Seasons Hotels Limited 1st Lien Term Loan, 3.25%, 06/27/20 (b) | | 1,160,093 | | 1,162,993 | |
General Motors Co. | | | | | |
3.50%, 10/02/18 (a) | | 3,000,000 | | 3,067,500 | |
6.25%, 10/02/43 (a) | | 885,000 | | 919,294 | |
Glencore Funding LLC | | | | | |
1.40%, 05/27/16 (a) (b) | | 2,500,000 | | 2,488,302 | |
4.13%, 05/30/23 (a) (c) | | 1,906,000 | | 1,778,395 | |
GLP Capital LP | | | | | |
4.38%, 11/01/18 (a) (c) | | 277,000 | | 283,233 | |
4.88%, 11/01/20 (a) (c) | | 311,000 | | 311,000 | |
5.38%, 11/01/23 (a) | | 242,000 | | 237,765 | |
Interpublic Group of Cos. Inc., 3.75%, 02/15/23 | | 2,029,000 | | 1,896,449 | |
JC Penney Corp. Inc. Term Loan, 6.00%, 05/22/18 (b) | | 885,550 | | 865,182 | |
KB Home, 7.50%, 09/15/22 | | 409,000 | | 430,473 | |
LKQ Corp, 4.75%, 05/15/23 (a) | | 245,000 | | 227,850 | |
MGM Resorts International | | | | | |
6.75%, 10/01/20 (c) | | 1,505,000 | | 1,610,350 | |
6.63%, 12/15/21 (c) | | 865,000 | | 914,738 | |
NAI Entertainment Holdings, 5.00%, 08/01/18 (a) (c) | | 228,000 | | 235,410 | |
NBCUniversal Enterprise Inc., 5.25%, (callable at 100 beginning 03/19/21) (a) (e) | | 1,589,000 | | 1,573,110 | |
NVR Inc., 3.95%, 09/15/22 | | 3,073,000 | | 2,900,070 | |
Quebecor Media Inc., 5.75%, 01/15/23 | | 1,696,000 | | 1,640,880 | |
Schaeffler Holding Finance BV, 6.88%, 08/15/18 (a) (c) (k) | | 778,000 | | 824,680 | |
Seminole Indian Tribe of Florida, 6.54%, 10/01/20 (a) | | 950,000 | | 1,040,250 | |
| | | | | | | |
See accompanying Notes to Financial Statements.
| | Shares/Par | | Value | |
SES SA | | | | | |
3.60%, 04/04/23 (a) | | 652,000 | | 607,481 | |
5.30%, 04/04/43 (a) | | 464,000 | | 433,422 | |
Shea Homes LP, 8.63%, 05/15/19 (c) | | 627,000 | | 694,403 | |
Taylor Morrison Communities Inc. | | | | | |
7.75%, 04/15/20 (a) | | 673,000 | | 740,300 | |
7.75%, 04/15/20 (a) | | 100,000 | | 110,000 | |
TRW Automotive Inc. | | | | | |
7.25%, 03/15/17 (a) | | 100,000 | | 114,750 | |
4.50%, 03/01/21 (a) | | 867,000 | | 875,670 | |
4.45%, 12/01/23 (a) | | 825,000 | | 800,250 | |
Univision Communications Inc. Incremental Term Loan, 4.00%, 03/01/20 (b) | | 1,061,975 | | 1,065,957 | |
Wynn Las Vegas LLC, 7.75%, 08/15/20 (c) | | 2,100,000 | | 2,357,250 | |
| | | | 39,879,222 | |
| | | | | |
CONSUMER STAPLES - 2.1% | | | | | |
Altria Group Inc., 4.00%, 01/31/24 | | 1,791,000 | | 1,747,604 | |
B&G Foods Inc., 4.63%, 06/01/21 | | 714,000 | | 685,440 | |
Bunge Ltd. Finance Co., 8.50%, 06/15/19 (f) | | 100,000 | | 122,785 | |
ConAgra Foods Inc., 4.65%, 01/25/43 | | 1,267,000 | | 1,159,852 | |
Constellation Brands Inc., 4.25%, 05/01/23 | | 208,000 | | 193,960 | |
Hawk Acquisition Sub Inc., 4.25%, 10/15/20 (a) (c) | | 1,208,000 | | 1,168,740 | |
Lorillard Tobacco Co., 7.00%, 08/04/41 (c) | | 562,000 | | 609,359 | |
Mars Inc. | | | | | |
2.19%, 10/11/17 (d) | | 2,850,000 | | 2,839,925 | |
3.74%, 10/11/27 (d) | | 1,200,000 | | 1,107,920 | |
SABMiller Holdings Inc., 3.75%, 01/15/22 (a) | | 1,602,000 | | 1,605,704 | |
WM Wrigley Jr. Co., 3.38%, 10/21/20 (a) | | 1,317,000 | | 1,300,341 | |
| | | | 12,541,630 | |
| | | | | |
ENERGY - 12.6% | | | | | |
Access Midstream Partners LP, 4.88%, 05/15/23 (c) | | 1,088,000 | | 1,049,920 | |
Alpha Natural Resources Inc. | | | | | |
9.75%, 04/15/18 (c) | | 1,700,000 | | 1,802,000 | |
6.25%, 06/01/21 (c) | | 1,097,000 | | 937,935 | |
Arch Coal Inc. | | | | | |
8.00%, 01/15/19 (a) (c) | | 887,000 | | 884,782 | |
9.88%, 06/15/19 | | 2,064,000 | | 1,836,960 | |
BP Capital Markets Plc | | | | | |
3.25%, 05/06/22 | | 2,472,000 | | 2,392,466 | |
2.75%, 05/10/23 | | 2,346,000 | | 2,138,567 | |
Chesapeake Midstream Partners LP, 5.88%, 04/15/21 | | 657,000 | | 699,705 | |
Concho Resources Inc., 5.50%, 04/01/23 (c) | | 3,114,000 | | 3,207,420 | |
Continental Resources Inc., 4.50%, 04/15/23 | | 1,776,000 | | 1,800,420 | |
DCP Midstream LLC, 5.85%, 05/21/43 (a) (b) | | 2,184,000 | | 2,031,120 | |
DCP Midstream Operating LP | | | | | |
2.50%, 12/01/17 | | 2,312,000 | | 2,301,069 | |
4.95%, 04/01/22 (c) | | 1,704,000 | | 1,727,333 | |
3.88%, 03/15/23 | | 2,416,000 | | 2,221,355 | |
Ecopetrol SA, 7.38%, 09/18/43 | | 2,186,000 | | 2,369,624 | |
El Paso Pipeline Partners Operating Co. LLC | | | | | |
7.50%, 11/15/40 | | 500,000 | | 598,018 | |
4.70%, 11/01/42 | | 1,385,000 | | 1,181,617 | |
Ensco Plc, 4.70%, 03/15/21 (c) | | 1,925,000 | | 2,033,599 | |
Enterprise Products Operating LLC, 5.95%, 02/01/41 | | 700,000 | | 759,852 | |
EP Energy LLC | | | | | |
6.88%, 05/01/19 | | 1,000,000 | | 1,076,250 | |
9.38%, 05/01/20 (c) | | 650,000 | | 749,937 | |
EPE Holdings LLC, 8.13%, 12/15/17 (a) (c) (k) | | 1,057,587 | | 1,086,671 | |
Fieldwood Energy LLC 1st Lien Term Loan, 2.88%, 04/25/33 (b) | | 1,197,000 | | 1,204,314 | |
Gulfmark Offshore Inc., 6.38%, 03/15/22 | | 1,278,000 | | 1,287,585 | |
Hornbeck Offshore Services Inc., 5.00%, 03/01/21 | | 2,420,000 | | 2,371,600 | |
Kinder Morgan Energy Partners LP | | | | | |
3.45%, 02/15/23 | | 373,000 | | 345,912 | |
4.15%, 02/01/24 (c) | | 3,304,000 | | 3,191,201 | |
Kinder Morgan Inc., 5.00%, 02/15/21 (a) | | 479,000 | | 471,236 | |
Linden Term Loan B, 5.00%, 12/01/20 | | 600,000 | | 603,750 | |
MarkWest Energy Partners LP | | | | | |
5.50%, 02/15/23 | | 671,000 | | 676,033 | |
4.50%, 07/15/23 (c) | | 1,239,000 | | 1,161,562 | |
Penn Virginia Corp., 8.50%, 05/01/20 | | 850,000 | | 913,750 | |
Penn Virginia Resource Partners LP, 6.50%, 05/15/21 (a) | | 1,380,000 | | 1,428,300 | |
Petrobras Global Finance BV | | | | | |
2.00%, 05/20/16 (c) | | 2,750,000 | | 2,747,825 | |
4.38%, 05/20/23 (c) | | 1,681,000 | | 1,495,298 | |
5.63%, 05/20/43 | | 1,498,000 | | 1,219,182 | |
Petroleos Mexicanos, 2.29%, 02/15/24 | | 3,261,000 | | 3,212,453 | |
Plains Exploration & Production Co. | | | | | |
6.50%, 11/15/20 | | 2,050,000 | | 2,263,159 | |
6.88%, 02/15/23 | | 4,185,000 | | 4,666,275 | |
Regency Energy Partners LP, 4.50%, 11/01/23 | | 987,000 | | 898,170 | |
Rosneft Oil Co. via Rosneft International Finance Ltd., 4.20%, 03/06/22 (a) | | 2,200,000 | | 2,018,500 | |
Schlumberger Investment SA, 3.65%, 12/01/23 | | 2,000,000 | | 1,979,234 | |
Seadrill Ltd., 5.63%, 09/15/17 (a) (c) | | 2,376,000 | | 2,459,160 | |
Transocean Inc. | | | | | |
2.50%, 10/15/17 (c) (f) | | 1,000,000 | | 1,010,174 | |
6.38%, 12/15/21 (f) | | 1,824,000 | | 2,046,997 | |
3.80%, 10/15/22 (f) | | 505,000 | | 477,931 | |
Williams Cos. Inc., 3.70%, 01/15/23 | | 305,000 | | 265,800 | |
| | | | 75,302,021 | |
| | | | | |
FINANCIALS - 23.1% | | | | | |
AIG SunAmerica Global Financing X, 6.90%, 03/15/32 (a) | | 1,696,000 | | 2,050,878 | |
Allstate Corp., 5.75%, 08/15/53 (b) | | 1,880,000 | | 1,894,100 | |
American International Group Inc., 8.25%, 08/15/18 | | 2,350,000 | | 2,938,219 | |
American Tower Corp., 3.40%, 02/15/19 | | 1,282,000 | | 1,304,440 | |
Bank of America Corp. | | | | | |
5.20% (callable at 100 beginning 06/01/23) (e) | | 2,167,000 | | 1,906,960 | |
3.30%, 01/11/23 | | 4,425,000 | | 4,180,634 | |
4.10%, 07/24/23 | | 500,000 | | 501,313 | |
Bank of America NA, 6.10%, 06/15/17 | | 3,000,000 | | 3,381,543 | |
Barclays Bank Plc | | | | | |
7.63%, 11/21/22 (c) | | 1,279,000 | | 1,362,135 | |
7.75%, 04/10/23 (b) (c) | | 1,009,000 | | 1,094,765 | |
Barclays Plc, 8.25%, (callable at 100 beginning 12/15/18) (e) | | 2,000,000 | | 2,065,000 | |
BBVA US Senior SAU, 4.66%, 10/09/15 | | 3,000,000 | | 3,153,834 | |
BlackRock Inc., 3.38%, 06/01/22 | | 1,062,000 | | 1,048,847 | |
Chubb Corp., 6.38%, 03/29/67 (b) | | 100,000 | | 108,250 | |
Citigroup Inc. | | | | | |
4.05%, 07/30/22 | | 1,225,000 | | 1,209,567 | |
5.95% (callable at 100 beginning 01/30/23) (e) | | 2,150,000 | | 1,989,503 | |
5.90% (callable at 100 beginning 02/15/23) (e) | | 1,375,000 | | 1,285,625 | |
Cooperatieve Centrale Raiffeisen-Boerenleenbank BA | | | | | |
4.63%, 12/01/23 | | 1,000,000 | | 1,005,388 | |
5.75%, 12/01/43 | | 1,798,000 | | 1,899,511 | |
Corp. Andina de Fomento, 3.75%, 01/15/16 | | 2,500,000 | | 2,599,245 | |
Credit Mutuel - CIC Home Loan SFH, 1.50%, 11/16/17 (a) (c) | | 2,000,000 | | 1,982,400 | |
Credit Suisse AG, 6.50%, 08/08/23 (a) | | 4,711,000 | | 5,011,326 | |
See accompanying Notes to Financial Statements.
| | Shares/Par | | Value | |
Credit Suisse Group AG, 7.50%, (callable at 100 beginning 12/11/23) (a) (c) (e) | | 3,148,000 | | 3,325,075 | |
Deutsche Bank AG, 4.30%, 05/24/28 (b) | | 3,300,000 | | 2,982,999 | |
Discover Bank, 4.20%, 08/08/23 | | 2,000,000 | | 1,969,458 | |
Duke Realty LP, 8.25%, 08/15/19 | | 100,000 | | 123,750 | |
Fifth Third Bancorp, 5.10%, (callable at 100 beginning 06/30/23) (e) | | 4,236,000 | | 3,748,860 | |
Five Corners Funding Trust, 4.42%, 11/15/23 (a) (c) | | 3,895,000 | | 3,833,159 | |
FMR LLC, 4.95%, 02/01/33 (a) | | 2,137,000 | | 2,090,886 | |
Ford Motor Credit Co. LLC | | | | | |
2.38%, 01/16/18 | | 5,850,000 | | 5,905,651 | |
5.00%, 05/15/18 | | 2,748,000 | | 3,059,620 | |
General Electric Capital Corp. | | | | | |
7.13% (callable at 100 beginning 06/15/22) (e) | | 1,300,000 | | 1,452,750 | |
6.25% (callable at 100 beginning 12/15/22) (e) | | 2,444,000 | | 2,523,430 | |
3.10%, 01/09/23 | | 2,050,000 | | 1,941,860 | |
Goldman Sachs Group Inc. | | | | | |
2.38%, 01/22/18 | | 4,158,000 | | 4,171,950 | |
6.75%, 10/01/37 | | 1,000,000 | | 1,109,324 | |
Guggenheim Partners Investment Management Holdings LLC Initial Term Loan, 4.25%, 06/13/17 (b) | | 498,750 | | 502,989 | |
Hartford Financial Services Group Inc., 5.13%, 04/15/22 | | 649,000 | | 705,913 | |
ING US Inc., 5.65%, 05/15/53 (b) | | 1,136,000 | | 1,104,760 | |
International Lease Finance Corp. | | | | | |
4.88%, 04/01/15 (c) | | 1,000,000 | | 1,035,000 | |
8.63%, 01/15/22 | | 750,000 | | 885,228 | |
Invesco Finance Plc, 3.13%, 11/30/22 (c) | | 1,778,000 | | 1,642,598 | |
IPIC GMTN Ltd., 5.50%, 03/01/22 (a) | | 1,000,000 | | 1,090,000 | |
JPMorgan Chase & Co. | | | | | |
7.90% (callable at 100 beginning 04/30/18) (e) | | 5,330,000 | | 5,876,325 | |
3.25%, 09/23/22 | | 1,834,000 | | 1,754,859 | |
3.38%, 05/01/23 | | 990,000 | | 921,192 | |
Mack-Cali Realty LP, 3.15%, 05/15/23 | | 1,500,000 | | 1,299,893 | |
Macquarie Group Ltd., 7.30%, 08/01/14 (a) | | 150,000 | | 155,492 | |
MetLife Inc., 4.37%, 09/15/23 | | 1,120,000 | | 1,141,540 | |
Morgan Stanley | | | | | |
4.88%, 11/01/22 | | 2,131,000 | | 2,178,227 | |
4.10%, 05/22/23 | | 3,108,000 | | 3,003,030 | |
Murray Street Investment Trust I, 4.65%, 03/09/17 (g) | | 2,750,000 | | 2,960,422 | |
National Rural Utilities Cooperative Finance Corp., 4.75%, 04/30/43 (b) | | 3,146,000 | | 2,929,712 | |
PNC Financial Services Group Inc., 4.85%, (callable at 100 beginning 06/01/23) (e) | | 581,000 | | 520,286 | |
Prologis International Funding II, 4.88%, 02/15/20 (a) | | 2,222,000 | | 2,194,983 | |
Prudential Financial Inc., 5.20%, 03/15/44 (b) (c) | | 1,186,000 | | 1,147,455 | |
Royal Bank of Scotland Group Plc | | | | | |
6.10%, 06/10/23 (c) | | 3,370,000 | | 3,392,330 | |
6.00%, 12/19/23 | | 2,657,000 | | 2,675,918 | |
Santander Holdings USA Inc., 4.63%, 04/19/16 | | 1,550,000 | | 1,652,750 | |
Santander UK Plc, 5.00%, 11/07/23 (a) | | 1,152,000 | | 1,154,457 | |
Sparebank 1 Boligkreditt A/S, 1.75%, 11/15/19 (a) | | 1,000,000 | | 948,474 | |
Springleaf Finance Corp. Term Loan, 4.75%, 11/15/16 (b) | | 2,000,000 | | 2,021,000 | |
UBS AG, 2.25%, 03/30/17 (a) | | 1,850,000 | | 1,905,763 | |
Vesey Street Investment Trust I, 4.40%, 09/01/16 (g) | | 588,000 | | 631,299 | |
Wells Fargo & Co. | | | | | |
7.98% (callable at 100 beginning 03/15/18) (e) | | 5,657,000 | | 6,307,555 | |
3.45%, 02/13/23 | | 1,791,000 | | 1,690,602 | |
| | | | 137,642,307 | |
| | | | | |
HEALTH CARE - 2.8% | | | | | |
Capsugel SA, 7.00%, 05/15/19 (a) (k) | | 892,000 | | 908,725 | |
CFR International SpA, 5.13%, 12/06/22 (a) | | 1,026,000 | | 940,899 | |
Forest Laboratories Inc., 5.00%, 12/15/21 (a) | | 1,858,000 | | 1,864,968 | |
Hospira Inc., 5.80%, 08/12/23 | | 816,000 | | 841,629 | |
Howard Hughes Medical Institute, 3.50%, 09/01/23 | | 2,046,000 | | 2,008,605 | |
Mayo Clinic Rochester, 3.77%, 11/15/43 | | 600,000 | | 476,458 | |
Memorial Sloan-Kettering Cancer Center | | | | | |
5.00%, 07/01/42 (c) | | 997,000 | | 979,409 | |
4.13%, 07/01/52 | | 587,000 | | 480,942 | |
Merck & Co. Inc., 4.15%, 05/18/43 | | 1,520,000 | | 1,383,375 | |
Novartis Capital Corp., 2.40%, 09/21/22 | | 1,027,000 | | 940,090 | |
Pfizer Inc., 4.30%, 06/15/43 | | 1,700,000 | | 1,592,546 | |
Tenet Healthcare Corp. | | | | | |
6.00%, 10/01/20 (a) (c) | | 599,000 | | 625,206 | |
8.13%, 04/01/22 | | 786,000 | | 846,915 | |
Thermo Fisher Scientific Inc. | | | | | |
2.40%, 02/01/19 (c) | | 871,000 | | 862,418 | |
5.30%, 02/01/44 | | 314,000 | | 316,392 | |
Valeant Pharmaceuticals International Inc., 5.63%, 12/01/21 (a) | | 965,000 | | 969,825 | |
Zoetis Inc., 4.70%, 02/01/43 (c) | | 684,000 | | 637,021 | |
| | | | 16,675,423 | |
| | | | | |
INDUSTRIALS - 4.4% | | | | | |
Abengoa Finance SAU, 7.75%, 02/01/20 (a) | | 1,159,000 | | 1,193,770 | |
Aircastle Ltd., 4.63%, 12/15/18 | | 1,258,000 | | 1,267,435 | |
Algeco Scotsman Global Finance Plc, 10.75%, 10/15/19 (a) (c) | | 1,700,000 | | 1,793,500 | |
Aviation Capital Group Corp., 3.88%, 09/27/16 (a) | | 1,346,000 | | 1,390,170 | |
Bombardier Inc., 6.13%, 01/15/23 (a) | | 731,000 | | 725,517 | |
General Electric Co., 2.70%, 10/09/22 | | 1,775,000 | | 1,658,777 | |
International Lease Finance Corp. | | | | | |
6.50%, 09/01/14 (a) | | 150,000 | | 155,063 | |
2.19%, 06/15/16 (b) | | 1,750,000 | | 1,758,750 | |
6.75%, 09/01/16 (a) | | 1,100,000 | | 1,226,500 | |
7.13%, 09/01/18 (a) | | 1,000,000 | | 1,157,500 | |
4.63%, 04/15/21 | | 1,237,000 | | 1,181,335 | |
Meritor Inc., 6.75%, 06/15/21 | | 2,057,000 | | 2,098,140 | |
Penske Truck Leasing Co. LP, 4.88%, 07/11/22 (a) | | 1,634,000 | | 1,673,902 | |
Pentair Finance SA, 2.65%, 12/01/19 | | 1,310,000 | | 1,244,399 | |
Sydney Airport Finance Co. Pty Ltd., 3.90%, 03/22/23 (a) | | 2,344,000 | | 2,218,955 | |
United Continental Holdings Inc. | | | | | |
6.00%, 07/15/26 | | 2,515,000 | | 2,162,900 | |
6.00%, 07/15/28 | | 2,714,000 | | 2,286,545 | |
United Technologies Corp., 4.50%, 06/01/42 | | 948,000 | | 917,199 | |
| | | | 26,110,357 | |
| | | | | |
INFORMATION TECHNOLOGY - 1.6% | | | | | |
Fidelity National Information Services Inc., 3.50%, 04/15/23 (c) | | 2,025,000 | | 1,842,880 | |
SAP Ireland US-Financial Services Ltd. | | | | | |
2.82%, 11/15/20 (d) | | 2,485,000 | | 2,303,115 | |
3.18%, 11/15/22 (d) | | 2,485,000 | | 2,255,396 | |
ViaSat Inc., 6.88%, 06/15/20 | | 3,092,000 | | 3,269,790 | |
| | | | 9,671,181 | |
| | | | | |
MATERIALS - 4.5% | | | | | |
Agrium Inc., 4.90%, 06/01/43 (c) | | 938,000 | | 865,556 | |
See accompanying Notes to Financial Statements.
| | Shares/Par | | Value | |
Arch Western Finance LLC Term Loan, 5.75%, 05/14/18 (b) | | 987,478 | | 972,873 | |
Ashland Inc. | | | | | |
3.88%, 04/15/18 | | 1,500,000 | | 1,518,750 | |
6.88%, 05/15/43 | | 1,623,000 | | 1,533,735 | |
Barrick Gold Corp. | | | | | |
3.85%, 04/01/22 (c) | | 399,000 | | 358,844 | |
4.10%, 05/01/23 | | 2,935,000 | | 2,648,811 | |
Barrick North America Finance LLC, 5.75%, 05/01/43 | | 245,000 | | 219,619 | |
Cemex Finance LLC, 9.38%, 10/12/22 (a) | | 855,000 | | 964,013 | |
Cemex SAB de CV, 6.50%, 12/10/19 (a) | | 2,040,000 | | 2,107,320 | |
FMG Resources August 2006 Pty Ltd. | | | | | |
6.00%, 04/01/17 (a) (c) | | 500,000 | | 531,250 | |
8.25%, 11/01/19 (a) (c) | | 1,050,000 | | 1,178,625 | |
FMG Resources Pty Ltd. New Term Loan B, 4.25%, 06/30/19 (b) | | 1,876,298 | | 1,899,170 | |
Freeport-McMoRan Copper & Gold Inc. | | | | | |
3.10%, 03/15/20 | | 2,350,000 | | 2,280,605 | |
5.45%, 03/15/43 | | 1,650,000 | | 1,573,861 | |
LYB International Finance BV, 4.00%, 07/15/23 | | 1,020,000 | | 1,005,176 | |
Rain CII Carbon LLC, 8.25%, 01/15/21 (a) | | 1,000 | | 1,020 | |
Rock-Tenn Co., 3.50%, 03/01/20 | | 470,000 | | 461,787 | |
Samarco Mineracao SA, 4.13%, 11/01/22 (a) | | 1,680,000 | | 1,512,000 | |
Smurfit Kappa Acquisitions, 4.88%, 09/15/18 (a) | | 1,720,000 | | 1,784,500 | |
Verso Paper Holdings LLC, 11.75%, 01/15/19 | | 911,000 | | 965,660 | |
Xstrata Finance Canada Ltd., 4.25%, 10/25/22 (a) | | 2,642,000 | | 2,515,364 | |
| | | | 26,898,539 | |
| | | | | |
TELECOMMUNICATION SERVICES - 3.5% | | | | | |
Crown Castle Towers LLC, 4.88%, 08/15/20 (a) | | 1,450,000 | | 1,519,459 | |
Lynx II Corp., 6.38%, 04/15/23 (a) (c) | | 449,000 | | 456,857 | |
Qtel International Finance Ltd., 3.88%, 01/31/28 (a) | | 3,332,000 | | 2,832,200 | |
Sprint Corp., 7.13%, 06/15/24 (a) | | 936,000 | | 950,040 | |
Telecom Italia Capital SA, 6.18%, 06/18/14 | | 98,000 | | 100,205 | |
Telefonica Moviles Chile SA, 2.88%, 11/09/15 (a) | | 100,000 | | 101,829 | |
Verizon Communications Inc. | | | | | |
4.50%, 09/15/20 | | 2,400,000 | | 2,566,440 | |
5.15%, 09/15/23 | | 2,750,000 | | 2,948,003 | |
6.40%, 09/15/33 | | 1,756,000 | | 2,014,064 | |
6.55%, 09/15/43 | | 6,379,000 | | 7,438,412 | |
| | | | 20,927,509 | |
| | | | | |
UTILITIES - 3.5% | | | | | |
Abu Dhabi National Energy Co., 4.75%, 09/15/14 (a) | | 175,000 | | 179,095 | |
Calpine Corp., 5.88%, 01/15/24 (a) | | 120,000 | | 117,300 | |
Electricite de France SA, 5.25%, (callable at 100 beginning 01/29/23) (a) (c) (e) | | 5,320,000 | | 5,290,740 | |
Enel SpA, 8.75%, 09/24/73 (a) (b) | | 2,372,000 | | 2,579,235 | |
FirstEnergy Corp., 4.25%, 03/15/23 (f) | | 883,000 | | 821,833 | |
Monongahela Power Co., 4.10%, 04/15/24 (a) | | 1,469,000 | | 1,465,796 | |
Oncor Electric Delivery Co. LLC | | | | | |
6.80%, 09/01/18 | | 2,250,000 | | 2,643,007 | |
4.10%, 06/01/22 | | 1,679,000 | | 1,684,136 | |
5.30%, 06/01/42 | | 360,000 | | 373,022 | |
Pacific Gas & Electric Co., 3.25%, 06/15/23 (c) | | 1,505,000 | | 1,425,267 | |
PPL Capital Funding Inc., 3.40%, 06/01/23 | | 2,000,000 | | 1,857,968 | |
PPL WEM Holdings Plc, 3.90%, 05/01/16 (a) | | 200,000 | | 208,989 | |
Puget Energy Inc., 6.00%, 09/01/21 | | 1,650,000 | | 1,842,827 | |
| | | | 20,489,215 | |
| | | | | |
Total Corporate Bonds and Notes (cost $386,625,597) | | | | 386,137,404 | |
| | | | | |
GOVERNMENT AND AGENCY OBLIGATIONS - 22.4% | | | | | |
| | | | | |
GOVERNMENT SECURITIES - 3.3% | | | | | |
Municipals - 0.2% | | | | | |
Port Authority of New York & New Jersey, GO, 4.46%, 10/01/62 | | 1,490,000 | | 1,269,301 | |
U.S. Treasury Securities - 3.1% | | | | | |
U.S. Treasury Bond | | | | | |
3.75%, 08/15/41 | | 5,348,000 | | 5,192,576 | |
3.13%, 11/15/41 | | 3,735,000 | | 3,212,683 | |
U.S. Treasury Note | | | | | |
2.00%, 11/15/21 | | 1,031,000 | | 982,672 | |
2.00%, 02/15/22 (c) | | 7,641,000 | | 7,239,252 | |
1.75%, 05/15/22 | | 1,835,000 | | 1,693,934 | |
| | | | 18,321,117 | |
| | | | | |
U.S. GOVERNMENT AGENCY MORTGAGE-BACKED SECURITIES - 19.1% | | | | | |
Federal Home Loan Mortgage Corp. - 5.1% | | | | | |
Federal Home Loan Mortgage Corp. | | | | | |
3.00%, 01/15/29, TBA (h) | | 2,511,000 | | 2,557,493 | |
6.00%, 07/01/37 - 09/01/37 | | 386,165 | | 426,034 | |
5.00%, 02/01/38 - 08/01/40 | | 3,047,120 | | 3,288,782 | |
5.50%, 03/01/39 - 07/01/39 | | 987,769 | | 1,076,583 | |
4.50%, 09/01/40 - 03/01/42 | | 9,883,768 | | 10,472,994 | |
4.00%, 04/01/42 | | 4,079,057 | | 4,193,258 | |
3.50%, 06/01/42 | | 1,345,826 | | 1,337,179 | |
3.00%, 02/01/43 - 03/01/43 | | 4,529,934 | | 4,296,916 | |
4.00%, 01/15/44, TBA (h) | | 2,333,000 | | 2,395,881 | |
| | | | 30,045,120 | |
| | | | | |
Federal National Mortgage Association - 9.4% | | | | | |
Federal National Mortgage Association | | | | | |
4.00%, 04/01/26 - 12/01/43 | | 6,967,334 | | 7,277,999 | |
3.00%, 06/01/27 - 08/01/43 | | 13,121,899 | | 12,640,441 | |
2.50%, 08/01/28 | | 2,994,594 | | 2,967,163 | |
2.50%, 01/15/29, TBA (h) | | 2,615,000 | | 2,588,033 | |
3.50%, 02/15/29, TBA (h) | | 5,557,000 | | 5,796,429 | |
5.50%, 12/01/33 - 09/01/39 | | 5,706,165 | | 6,278,337 | |
5.00%, 06/01/35 | | 4,168,258 | | 4,528,027 | |
6.00%, 08/01/37 - 01/01/38 | | 669,054 | | 740,137 | |
3.50%, 01/01/42 - 04/01/43 | | 9,184,030 | | 9,136,735 | |
4.50%, 09/01/43 | | 1,069,595 | | 1,134,684 | |
4.50%, 02/15/44, TBA (h) | | 587,000 | | 620,042 | |
5.00%, 02/15/44, TBA (h) | | 2,056,000 | | 2,226,423 | |
| | | | 55,934,450 | |
| | | | | |
Government National Mortgage Association - 4.6% | | | | | |
Government National Mortgage Association | | | | | |
4.50%, 03/15/40 - 06/15/40 | | 5,128,879 | | 5,483,530 | |
5.00%, 08/20/41 | | 2,198,716 | | 2,401,707 | |
3.50%, 02/15/43 - 06/20/43 | | 7,776,206 | | 7,854,592 | |
2.50%, 05/20/43 (b) | | 3,022,004 | | 3,116,948 | |
3.00%, 05/20/43 | | 3,004,445 | | 2,908,214 | |
4.00%, 01/15/44, TBA (h) | | 5,599,000 | | 5,821,429 | |
| | | | 27,586,420 | |
| | | | | |
Total Government and Agency Obligations
(cost $137,878,335) | | | | 133,156,408 | |
| | | | | |
PREFERRED STOCKS - 2.0% | | | | | |
| | | | | |
ENERGY - 0.2% | | | | | |
NuStar Logistics LP, 7.63% | | 48,000 | | 1,222,560 | |
| | | | | |
FINANCIALS - 1.8% | | | | | |
Allstate Corp., 5.10% | | 49,000 | | 1,181,390 | |
See accompanying Notes to Financial Statements.
| | Shares/Par | | Value | |
Goldman Sachs Group Inc., 5.50%, (callable at 25 beginning 05/10/23) (e) | | 126,000 | | 2,808,540 | |
PNC Financial Services Group Inc., 6.13%, (callable at 25 beginning 05/01/22), Series P (e) | | 70,000 | | 1,767,500 | |
U.S. Bancorp, 6.00%, (callable at 25 beginning 04/15/17), Series G (c) (e) | | 44,500 | | 1,217,965 | |
Wells Fargo & Co., 5.85%, (callable at 25 beginning 09/15/23) (e) | | 146,000 | | 3,441,220 | |
| | | | 10,416,615 | |
| | | | | |
Total Preferred Stocks (cost $12,211,700) | | | | 11,639,175 | |
| | | | | |
TRUST PREFERREDS - 0.2% | | | | | |
| | | | | |
FINANCIALS - 0.2% | | | | | |
Citigroup Capital XIII, 7.88%, (callable at 25 beginning 10/30/15) | | 42,000 | | 1,144,500 | |
| | | | | |
Total Trust Preferreds (cost $1,103,830) | | | | 1,144,500 | |
| | | | | |
SHORT TERM INVESTMENTS - 14.2% | | | | | |
| | | | | |
Investment Company - 5.1% | | | | | |
JNL Money Market Fund, 0.01% (i) (j) | | 30,643,344 | | 30,643,344 | |
| | | | | |
Securities Lending Collateral - 9.1% | | | | | |
Securities Lending Cash Collateral Fund LLC, 0.22% (i) (j) | | 54,220,317 | | 54,220,317 | |
| | | | | |
Total Short Term Investments (cost $84,863,661) | | | | 84,863,661 | |
| | | | | |
Total Investments - 110.8% (cost $665,414,624) | | | | 660,078,082 | |
Other Assets and Liabilities, Net - (10.8%) | | | | (64,237,056 | ) |
Total Net Assets - 100.0% | | | | $ | 595,841,026 | |
| | | | | | |
(a) | | Rule 144A or Section 4(2) of the Securities Act of 1933 security which is restricted to resale to institutional investors. The Sub-Adviser deemed this security to be liquid based on procedures approved by the Trust’s Board of Trustees. As of December 31, 2013, the value of Rule 144A securities and Section 4(2) paper deemed liquid was $124,265,273. |
(b) | | Variable rate security. Rate stated was in effect as of December 31, 2013. |
(c) | | All or a portion of the security was on loan. |
(d) | | Security fair valued in good faith in accordance with the procedures approved by the Trust’s Board of Trustees. Good faith fair valued securities may be classified as Level 2 or Level 3 for Financial Accounting Standards Board (“FASB”) Accounting Standards Codification (“ASU”)Topic 820 “Fair Value Measurements and Disclosures” in the Notes to the Financial Statements. |
(e) | | Perpetual security. |
(f) | | The interest rate for this security is inversely affected by upgrades or downgrades to the credit rating of the issuer. |
(g) | | Security is a “step-up” bond where the coupon may increase or step up at a future date. Rate stated was the coupon as of December 31, 2013. |
(h) | | All or a portion of the investment was purchased on a delayed delivery basis. As of December 31, 2013, the total payable of investments purchased on a delayed delivery basis was $22,142,479. |
(i) | | Investment in affiliate. |
(j) | | Yield changes daily to reflect current market conditions. Rate was the quoted yield as of December 31, 2013. |
(k) | | Pay-in-kind security. The interest coupon earned by the security may be paid in cash or additional par. |
JNL Money Market Fund | | | | | |
| | | | | |
CORPORATE BONDS AND NOTES - 18.6% | | | | | |
| | | | | |
CONSUMER DISCRETIONARY - 0.2% | | | | | |
Board of Trustees of The Leland Stanford Junior University, 3.63%, 05/01/14 | | $ | 4,940,000 | | $ | 4,994,272 | |
CONSUMER STAPLES - 2.5% | | | | | |
Procter & Gamble Co., 0.16%, 02/06/14 (a) | | 35,500,000 | | 35,501,136 | |
Wal-Mart Stores Inc., 1.63%, 04/15/14 | | 25,940,000 | | 26,040,962 | |
| | | | 61,542,098 | |
| | | | | |
ENERGY - 0.2% | | | | | |
BP Capital Markets Plc, 0.84%, 03/11/14 (a) | | 6,189,000 | | 6,196,489 | |
FINANCIALS - 14.0% | | | | | |
American Honda Finance Corp. | | | | | |
0.24%, 05/20/14 (a) (b) | | 13,700,000 | | 13,700,000 | |
0.64%, 06/18/14 (a) (b) | | 18,000,000 | | 18,034,942 | |
0.26%, 07/17/14 (a) (b) | | 20,000,000 | | 20,000,000 | |
0.24%, 12/05/14 (a) | | 10,000,000 | | 10,000,000 | |
Australia & New Zealand Banking Group Ltd., 0.98%, 01/10/14 (a) (b) | | 13,100,000 | | 13,103,012 | |
Bank of New York Mellon Corp., 4.30%, 05/15/14 | | 6,996,000 | | 7,100,913 | |
Barclays Bank Plc, 1.28%, 01/13/14 (a) | | 5,825,000 | | 5,826,892 | |
BNP Paribas SA, 1.14%, 01/10/14 (a) | | 20,100,000 | | 20,102,941 | |
Caterpillar Financial Services Corp, 0.39%, 08/27/14 (a) | | 23,200,000 | | 23,227,536 | |
General Electric Capital Corp. | | | | | |
0.87%, 04/07/14 (a) | | 4,683,000 | | 4,691,298 | |
0.50%, 09/15/14 (a) | | 17,344,000 | | 17,376,544 | |
HSBC Bank Plc, 1.04%, 01/17/14 (a) (b) | | 2,705,000 | | 2,706,074 | |
JPMorgan Chase & Co., 1.04%, 01/24/14 (a) | | 29,975,000 | | 29,989,280 | |
MassMutual Global Funding II, 0.62%, 01/14/14 (a) (b) | | 23,186,000 | | 23,189,477 | |
MetLife Institutional Funding II, 1.14%, 04/04/14 (a) (b) | | 6,890,000 | | 6,907,051 | |
Metropolitan Life Global Funding I | | | | | |
0.99%, 01/10/14 (a) (b) | | 6,925,000 | | 6,926,385 | |
0.59%, 03/19/14 (a) (b) | | 35,360,000 | | 35,389,018 | |
National Rural Utilities Cooperative Finance Corp., 0.32%, 02/18/14 (a) | | 11,800,000 | | 11,800,000 | |
New York Life Global Funding | | | | | |
0.36%, 06/18/14 (a) (b) | | 3,250,000 | | 3,252,400 | |
0.24%, 07/30/14 (a) (b) | | 19,000,000 | | 19,004,632 | |
Principal Life Global Funding II, 0.40%, 09/19/14 (a) (b) | | 8,184,000 | | 8,192,608 | |
Royal Bank of Canada, 1.45%, 10/30/14 | | 4,413,000 | | 4,456,641 | |
State Street Corp. | | | | | |
0.59%, 03/07/14 (a) | | 3,000,000 | | 3,002,012 | |
4.30%, 05/30/14 | | 5,000,000 | | 5,083,607 | |
Toronto-Dominion Bank | | | | | |
0.54%, 07/14/14 (a) | | 7,000,000 | | 7,013,346 | |
1.38%, 07/14/14 | | 11,988,000 | | 12,054,170 | |
Toyota Motor Credit Corp., 0.64%, 01/17/14 (a) | | 3,450,000 | | 3,450,986 | |
U.S. Bancorp, 4.20%, 05/15/14 | | 11,209,000 | | 11,372,938 | |
| | | | 346,954,703 | |
| | | | | |
INFORMATION TECHNOLOGY - 1.7% | | | | | |
Cisco Systems Inc. | | | | | |
0.49%, 03/14/14 (a) | | 20,836,000 | | 20,849,893 | |
2.90%, 11/17/14 | | 7,352,000 | | 7,518,555 | |
International Business Machines Corp., 0.88%, 10/31/14 | | 10,000,000 | | 10,050,578 | |
Oracle Corp., 3.75%, 07/08/14 | | 3,310,000 | | 3,369,015 | |
| | | | 41,788,041 | |
| | | | | |
Total Corporate Bonds and Notes (cost $461,475,603) | | | | 461,475,603 | |
| | | | | | | |
See accompanying Notes to Financial Statements.
| | Shares/Par | | Value | |
GOVERNMENT AND AGENCY OBLIGATIONS - 21.0% | | | | | |
| | | | | |
GOVERNMENT SECURITIES - 21.0% | | | | | |
Federal Farm Credit Bank - 0.6% (c) | | | | | |
Federal Farm Credit Bank | | | | | |
0.15%, 01/17/14 | | 5,000,000 | | 4,999,952 | |
0.13%, 04/09/14 | | 10,000,000 | | 10,000,367 | |
| | | | 15,000,319 | |
| | | | | |
Federal Home Loan Bank - 9.0% (c) | | | | | |
Federal Home Loan Bank | | | | | |
0.07%, 03/17/14 | | 19,245,000 | | 19,244,198 | |
0.10%, 04/10/14 | | 27,000,000 | | 26,999,841 | |
0.14%, 04/15/14 | | 25,000,000 | | 25,002,705 | |
0.12%, 06/23/14 - 09/12/14 (a) | | 32,000,000 | | 31,999,153 | |
0.40%, 07/02/14 | | 6,000,000 | | 6,007,012 | |
0.25%, 07/25/14 | | 25,000,000 | | 25,000,000 | |
0.17%, 08/26/14 | | 38,175,000 | | 38,175,718 | |
0.13%, 10/02/14 - 11/04/14 | | 29,000,000 | | 28,991,474 | |
0.11%, 11/25/14 (a) | | 20,000,000 | | 19,996,391 | |
| | | | 221,416,492 | |
| | | | | |
Federal Home Loan Mortgage Corp. - 1.5% (c) | | | | | |
Federal Home Loan Mortgage Corp. | | | | | |
1.00%, 08/20/14 | | 10,000,000 | | 10,053,482 | |
0.75%, 11/25/14 | | 13,050,000 | | 13,116,871 | |
0.63%, 12/29/14 | | 13,000,000 | | 13,056,386 | |
| | | | 36,226,739 | |
| | | | | |
Federal National Mortgage Association - 0.7% (c) | | | | | |
Federal National Mortgage Association, 0.34%, 08/11/14 (a) | | 17,720,000 | | 17,747,526 | |
Sovereign - 2.7% | | | | | |
Export Development Canada, 0.13%, 01/12/15 (a) (b) | | 15,000,000 | | 14,998,433 | |
KFW, 0.13%, 10/30/14 (a) | | 52,400,000 | | 52,391,007 | |
| | | | 67,389,440 | |
| | | | | |
Treasury Inflation Index Securities - 5.1% | | | | | |
U.S. Treasury Inflation Indexed Note, 2.00%, 01/15/14 (d) | | 126,395,000 | | 126,352,961 | |
U.S. Treasury Securities - 1.4% | | | | | |
U.S. Treasury Note, 1.00%, 05/15/14 | | 35,000,000 | | 35,112,732 | |
| | | | | |
Total Government and Agency Obligations
(cost $519,246,209) | | | | 519,246,209 | |
| | | | | |
SHORT TERM INVESTMENTS - 60.5% | | | | | |
| | | | | |
Certificates of Deposit - 20.9% | | | | | |
Bank of Montreal | | | | | |
0.26%, 01/07/14 (a) | | 13,250,000 | | 13,250,000 | |
0.18%, 04/21/14 (a) | | 25,000,000 | | 25,000,000 | |
0.24%, 06/18/14 (a) | | 22,350,000 | | 22,350,000 | |
0.42%, 07/24/14 (a) | | 4,000,000 | | 4,004,249 | |
Bank of Nova Scotia | | | | | |
0.24%, 03/21/14 (a) | | 18,000,000 | | 18,000,000 | |
0.23%, 09/18/14 | | 19,000,000 | | 19,000,000 | |
0.23%, 10/21/14 (a) | | 22,000,000 | | 22,000,000 | |
Barclays Bank Plc, 0.19%, 03/31/14 (a) | | 22,000,000 | | 22,000,000 | |
BMO Capital Markets, 0.17%, 03/20/14 | | 7,000,000 | | 7,000,000 | |
BNP Paribas SA, 0.26%, 02/27/14 | | 20,000,000 | | 20,000,000 | |
Canadian Imperial Bank of Commerce | | | | | |
0.23%, 03/26/14 (a) | | 22,000,000 | | 22,000,000 | |
0.24%, 05/09/14 (a) | | 13,500,000 | | 13,500,000 | |
0.23%, 09/25/14 (a) | | 23,000,000 | | 23,000,000 | |
Cooperatieve Centrale Raiffeisen-Boerenleenbank BA | | | | | |
0.31%, 01/27/14 (a) | | 25,000,000 | | 25,000,000 | |
0.28%, 09/12/14 (a) | | 12,000,000 | | 12,000,000 | |
Credit Suisse | | | | | |
0.27%, 05/14/14 (a) | | 16,000,000 | | 16,000,000 | |
0.44%, 11/14/14 (a) | | 15,000,000 | | 15,000,000 | |
Deutsche Bank AG | | | | | |
0.25%, 04/30/14 (a) | | 16,000,000 | | 16,000,000 | |
0.33%, 08/04/14 (a) | | 16,000,000 | | 16,000,000 | |
Royal Bank of Canada | | | | | |
0.31%, 01/27/14 (a) | | 26,000,000 | | 26,000,000 | |
0.23%, 06/09/14 | | 22,000,000 | | 22,000,000 | |
0.28%, 06/24/14 (a) | | 11,000,000 | | 11,000,000 | |
Societe Generale SA | | | | | |
0.25%, 02/03/14 | | 14,000,000 | | 14,000,000 | |
0.36%, 03/10/14 (a) | | 14,000,000 | | 14,000,000 | |
Standard Chartered Bank | | | | | |
0.24%, 01/23/14 (a) | | 25,500,000 | | 25,500,000 | |
0.31%, 04/10/14 (a) | | 25,000,000 | | 25,000,000 | |
0.29%, 09/11/14 (a) | | 12,000,000 | | 12,000,000 | |
Svenska Handelsbanken AB, 0.25%, 02/18/14 | | 16,500,000 | | 16,500,110 | |
UBS AG, 0.19%, 03/31/14 | | 21,000,000 | | 21,000,000 | |
| | | | 518,104,359 | |
| | | | | |
Commercial Paper - 11.4% | | | | | |
BPCE SA | | | | | |
0.44%, 01/02/14 (b) | | 19,500,000 | | 19,499,762 | |
0.41%, 03/03/14 (b) | | 15,800,000 | | 15,788,889 | |
Commonwealth Bank of Australia, 0.20%, 02/24/14 (a) (b) | | 20,000,000 | | 20,000,000 | |
Fairway Finance Corp. | | | | | |
0.20%, 01/08/14 (b) | | 16,000,000 | | 15,999,378 | |
0.18%, 01/27/14 (b) | | 13,576,000 | | 13,574,333 | |
General Electric Capital Corp. | | | | | |
0.22%, 02/10/14 | | 23,700,000 | | 23,694,207 | |
0.13%, 03/12/14 | | 31,000,000 | | 30,992,164 | |
HSBC Bank Plc, 0.22%, 02/07/14 (a) | | 15,000,000 | | 15,000,000 | |
HSBC Bank USA | | | | | |
0.22%, 01/09/14 | | 18,000,000 | | 17,999,120 | |
0.22%, 03/24/14 | | 8,000,000 | | 7,995,991 | |
0.22%, 05/19/14 (b) | | 15,000,000 | | 14,987,350 | |
JPMorgan Chase & Co., 0.23%, 02/14/14 | | 22,350,000 | | 22,343,717 | |
Nordea Bank AB, 0.21%, 03/24/14 (b) | | 34,000,000 | | 33,983,737 | |
Societe Generale SA, 0.46%, 01/10/14 | | 19,700,000 | | 19,697,734 | |
Toyota Motor Credit Corp., 0.21%, 05/28/14 | | 12,000,000 | | 11,989,710 | |
| | | | 283,546,092 | |
| | | | | |
Federal Home Loan Bank - 0.8% (c) | | | | | |
Federal Home Loan Bank, 0.11%, 03/21/14 | | 20,000,000 | | 19,995,172 | |
Investment Company - 0.0% | | | | | |
JPMorgan U.S. Treasury Plus Money Market Fund, 0.00% (e) | | 30,011 | | 30,011 | |
Repurchase Agreements - 26.8% | | | | | |
Repurchase Agreement with BCL, 0.01%, (Collateralized by $39,464,600 U.S. Treasury Note, 0.75%, due 02/28/18, value $38,556,031) acquired on 12/31/13, due 01/02/14 at $37,800,021 | | $ | 37,800,000 | | 37,800,000 | |
Repurchase Agreement with BCL, 0.03%, (Collateralized by $22,509 Federal Home Loan Mortgage Corp., 2.11%, due 04/01/35, value $23,714, $5,955,383 Federal National Mortgage Association, 1.80-5.00%, due 10/01/18-09/01/43, value $6,319,532, $6,098,568 Government National Mortgage Association, 4.55%, due 11/20/62, value $6,222,358, and $18,085,300 U.S. Treasury Note, 0.25%, due 12/31/15, value $18,034,444) acquired on 12/31/13, due 01/07/14 at $30,000,175 | | 30,000,000 | | 30,000,000 | |
| | | | | | |
See accompanying Notes to Financial Statements.
| | Shares/Par | | Value | |
Repurchase Agreement with BCL, 0.03%, (Collateralized by $4,639 Federal Home Loan Mortgage Corp., 4.86%, due 07/01/38, value $4,919, $1,813,007 Government National Mortgage Association, 4.51%, due 11/20/62, value $1,863,778, $2,130,500 U.S. Treasury Note, 0.25%, due 12/31/15, value $2,124,509, and $5,841,074 Federal National Mortgage Association, 1.80-5.00%, due 10/01/18-09/01/43, value $6,206,848) acquired on 12/30/13, due 01/06/14 at $10,000,058 | | 10,000,000 | | 10,000,000 | |
Repurchase Agreement with BNP, 0.01%, (Collateralized by $21,845,841 Federal Home Loan Mortgage Corp., 3.00-6.50%, due 09/01/17-11/01/43, value $23,427,132 and $57,676,852 Federal National Mortgage Association, 2.00-6.00%, due 04/01/16-11/01/43, value $60,110,895) acquired on 12/31/13, due 01/02/14 at $81,900,046 | | 81,900,000 | | 81,900,000 | |
Repurchase Agreement with BOA, 0.01%, (Collateralized by $26,161,500 Federal Home Loan Mortgage Corp., due 12/11/25, value $16,218,037) acquired on 12/31/13, due 01/02/14 at $15,900,004 | | 15,900,000 | | 15,900,000 | |
Repurchase Agreement with BOA, 0.03%, (Collateralized by $52,060,000 Federal Home Loan Mortgage Corp., due 12/17/29, value $25,500,029) acquired on 12/27/13, due 01/03/14 at $25,000,146 | | 25,000,000 | | 25,000,000 | |
Repurchase Agreement with CSI, 0.01%, (Collateralized by $4,565,000 U.S. Treasury Note, 0.75%, due 10/31/17, value $4,491,478) acquired on 12/31/13, due 01/02/14 at $4,400,001 | | 4,400,000 | | 4,400,000 | |
Repurchase Agreement with DUB, 0.04%, (Collateralized by $22,521,200 U.S. Treasury Note, 1.75%, due 05/15/23, value $20,400,013) acquired on 12/30/13, due 01/06/14 at $20,000,156 | | 20,000,000 | | 20,000,000 | |
Repurchase Agreement with GSC, 0.04%, (Collateralized by $30,669,121 Federal National Mortgage Association, 2.50-3.50%, due 04/01/27-07/01/42, value $30,600,010) acquired on 12/31/13, due 01/07/14 at $30,000,233 | | 30,000,000 | | 30,000,000 | |
Repurchase Agreement with GSC, 0.05%, (Collateralized by $30,570,901 Federal National Mortgage Association, 3.50%, due 07/01/42, value $30,599,994) acquired on 12/27/13, due 01/03/14 at $30,000,292 | | 30,000,000 | | 30,000,000 | |
Repurchase Agreement with GSC, 0.05%, (Collateralized by $30,735,212 Federal National Mortgage Association, 2.50-3.50%, due 08/01/28-07/01/42, value $30,600,005) acquired on 12/30/13, due 01/06/14 at $30,000,292 | | 30,000,000 | | 30,000,000 | |
Repurchase Agreement with HSB, 0.02%, (Collateralized by $2,155,375 Federal National Mortgage Association, 1.62-2.46%, due 04/01/37-12/01/43, value $2,221,157 and $115,251,539 Federal Home Loan Mortgage Corp., 0.00-2.85%, due 01/01/43-12/01/43, value $115,898,202) acquired on 12/31/13, due 01/02/14 at $115,800,129 | | 115,800,000 | | 115,800,000 | |
Repurchase Agreement with RBS, 0.01%, (Collateralized by $145,585,200 U.S. Treasury Note, 0.38-1.00%, due 01/15/16-03/31/17, value $145,964,222) acquired on 12/31/13, due 01/02/14 at $143,100,080 | | 143,100,000 | | 143,100,000 | |
Repurchase Agreement with TDS, 0.01%, (Collateralized by $89,504,812 Federal National Mortgage Association, 3.00-4.00%, due 10/01/32-02/01/42, value $90,881,964) acquired on 12/31/13, due 01/02/14 at $89,100,049 | | 89,100,000 | | 89,100,000 | |
| | | | 663,000,000 | |
| | | | | |
Treasury Securities - 0.6% | | | | | |
U.S. Treasury Bill, 0.03%, 01/09/14 | | 15,000,000 | | 14,999,930 | |
| | | | | |
Total Short Term Investments (cost $1,499,675,564) | | | | 1,499,675,564 | |
| | | | | |
Total Investments - 100.1% (cost $2,480,397,376) | | | | 2,480,397,376 | |
Other Assets and Liabilities, Net - (0.1%) | | | | (2,704,760 | ) |
Total Net Assets - 100.0% | | | | $ | 2,477,692,616 | |
| | | | | | |
(a) | | Variable rate security. Rate stated was in effect as of December 31, 2013. |
(b) | | Rule 144A or Section 4(2) of the Securities Act of 1933 security which is restricted to resale to institutional investors. The Sub-Adviser deemed this security to be liquid based on procedures approved by the Trust’s Board of Trustees. As of December 31, 2013, the value of Rule 144A securities and Section 4(2) paper deemed liquid was $319,237,479. |
(c) | | Securities in this category are direct debt of the agency and not collateralized by mortgages. |
(d) | | Treasury inflation indexed note, par amount is adjusted for inflation. |
(e) | | Yield changes daily to reflect current market conditions. Rate was the quoted yield as of December 31, 2013. |
See accompanying Notes to Financial Statements.
JNL Investors Series Trust
Notes to Schedules of Investments
December 31, 2013
Abbreviations:
ABS - Asset -Backed Security
GO - General Obligation
MBS - Mortgage -Backed Security
REMIC - Real Estate Mortgage Investment Conduit
TBA -To Be Announced (Securities purchased on a delayed delivery basis)
Counterparty Abbreviations:
BCL - Barclays Capital Inc.
BNP - BNP Paribas Securities
BOA — Bancamerica Securities/Bank of America NA
CSI - Credit Suisse Securities, LLC
DUB - Deutsche Bank Alex Brown Inc.
GSC - Goldman Sachs & Co.
HSB - HSBC Securities, Inc.
RBS - Royal Bank Of Scotland
TDS — TD Securities Inc.
Schedule of Open Futures Contracts
| | Expiration | | Contracts
Long /
(Short) | | Unrealized
Appreciation /
(Depreciation) | |
JNL/PPM America Low Duration Bond Fund | | | | | | | |
U.S. Treasury Note Future, 5-Year | | March 2014 | | (261 | ) | $ | 391,835 | |
JNL/PPM America Total Return Fund | | | | | | | |
U.S. Treasury Long Bond Future, 20-Year | | March 2014 | | 20 | | $ | (42,832 | ) |
U.S. Treasury Note Future, 10-Year | | March 2014 | | (686 | ) | 1,535,176 | |
U.S. Treasury Note Future, 5-Year | | March 2014 | | (39 | ) | 55,877 | |
U.S. Treasury Ultra Long Term Bond Future, 30-Year | | March 2014 | | 32 | | (63,614 | ) |
| | | | | | $ | 1,484,607 | |
See accompanying Notes to Financial Statements.
JNL Investors Series Trust
Statements of Assets and Liabilities
December 31, 2013
| | JNL/PPM America
Low Duration
Bond Fund | | JNL/PPM America
Total Return Fund | | JNL Money
Market Fund | |
Assets | | | | | | | |
Investments - unaffiliated, at value (a) | | $ | 430,490,108 | | $ | 575,214,421 | | $ | 1,817,397,376 | |
Investments - affiliated, at value (b) | | 10,913,042 | | 84,863,661 | | — | |
Repurchase agreements (a) | | — | | — | | 663,000,000 | |
Total investments, at value (c) | | 441,403,150 | | 660,078,082 | | 2,480,397,376 | |
Cash | | 3 | | 3,834,886 | | — | |
Receivable for investments sold | | 8,392,292 | | 11,891,279 | | — | |
Receivable for fund shares sold | | 2,196 | | 505,093 | | — | |
Receivable from adviser | | — | | — | | 17,968 | |
Receivable for dividends and interest | | 2,129,932 | | 5,036,365 | | 2,268,717 | |
Receivable for variation margin | | 24,469 | | 121,563 | | — | |
Receivable for deposits with brokers | | 258,390 | | 1,009,415 | | — | |
Total assets | | 452,210,432 | | 682,476,683 | | 2,482,684,061 | |
| | | | | | | |
Liabilities | | | | | | | |
Payable for advisory fees | | 165,595 | | 253,580 | | 364,688 | |
Payable for administrative fees | | 36,798 | | 50,716 | | — | |
Payable for 12b-1 fee (Class A) | | 26,088 | | 35,939 | | — | |
Payable for investment securities purchased | | 19,050,305 | | 31,408,467 | | 4,509,591 | |
Payable for fund shares redeemed | | 22,819 | | 622,214 | | — | |
Payable for dividends | | — | | — | | 10,949 | |
Payable for trustee fees | | 932 | | 7,412 | | 69,362 | |
Payable for other expenses | | 1,280 | | 1,636 | | 36,855 | |
Payable for variation margin | | — | | 35,376 | | — | |
Payable upon return of securities loaned | | — | | 54,220,317 | | — | |
Total liabilities | | 19,303,817 | | 86,635,657 | | 4,991,445 | |
Net assets | | $ | 432,906,615 | | $ | 595,841,026 | | $ | 2,477,692,616 | |
| | | | | | | |
Net assets consist of: | | | | | | | |
Paid-in capital | | $ | 432,268,603 | | $ | 584,294,495 | | $ | 2,477,591,726 | |
Undistributed (excess of distributions over) net investment income (loss) | | 17,984 | | 17,976,409 | | 100,890 | |
Accumulated net realized gain (loss) | | 229,732 | | (2,577,944 | ) | — | |
Net unrealized appreciation (depreciation) on investments and foreign currency | | 390,296 | | (3,851,934 | ) | — | |
| | $ | 432,906,615 | | $ | 595,841,026 | | $ | 2,477,692,616 | |
| | | | | | | |
Shares outstanding (no par value), unlimited shares authorized | | 43,206,930 | | 52,434,004 | | 2,477,592,033 | |
Net asset value per share | | $ | 10.02 | | $ | 11.36 | | $ | 1.00 | |
(a) Investments - unaffiliated, at cost | | $ | 430,491,647 | | $ | 580,550,963 | | $ | 2,480,397,376 | |
(b) Investments - affiliated, at cost | | 10,913,042 | | 84,863,661 | | — | |
(c) Total investments, at cost | | $ | 441,404,689 | | $ | 665,414,624 | | $ | 2,480,397,376 | |
(b) Including value of securities on loan | | — | | 53,036,798 | | — | |
See accompanying Notes to Financial Statements.
JNL Investors Series Trust
Statements of Operations
For the Year Ended December 31, 2013
| | JNL/PPM
America Low
Duration Bond
Fund(b) | | JNL/PPM
America Total
Return Fund | | JNL Money
Market Fund | |
Investment income | | | | | | | |
Dividends(a) | | $ | 427 | | $ | 565,703 | | $ | — | |
Interest | | 1,503,383 | | 20,010,042 | | 4,829,551 | |
Securities lending (a) | | — | | 175,923 | | — | |
Total investment income | | 1,503,810 | | 20,751,668 | | 4,829,551 | |
| | | | | | | |
Expenses | | | | | | | |
Advisory fees | | 511,498 | | 2,845,509 | | 4,733,154 | |
Administrative fees | | 113,665 | | 569,098 | | — | |
12b-1 fee (Class A) | | 227,334 | | 1,138,216 | | — | |
Legal fees | | 657 | | 2,574 | | 12,884 | |
Trustee fees | | 1,245 | | 8,010 | | 38,787 | |
Other expenses | | 1,877 | | 6,354 | | 41,239 | |
Total expenses | | 856,276 | | 4,569,761 | | 4,826,064 | |
Expense waiver | | — | | — | | 236,263 | |
Net expenses | | 856,276 | | 4,569,761 | | 4,589,801 | |
Net investment income | | 647,534 | | 16,181,907 | | 239,750 | |
| | | | | | | |
Realized and unrealized gain (loss) | | | | | | | |
Net realized gain (loss) on: | | | | | | | |
Unaffiliated investments | | 484,409 | | 253,304 | | 54,126 | |
Futures contracts | | (184,526 | ) | 730,330 | | — | |
Net change in unrealized appreciation (depreciation) on: | | | | | | | |
Investments | | (1,539 | ) | (19,481,409 | ) | — | |
Futures contracts | | 391,835 | | 1,372,091 | | — | |
Net realized and unrealized gain (loss) | | 690,179 | | (17,125,684 | ) | 54,126 | |
| | | | | | | |
Net increase (decrease) in net assets from operations | | $ | 1,337,713 | | $ | (943,777 | ) | $ | 293,876 | |
(a) Dividends from affiliated investments | | $ | 427 | | $ | 179,125 | | $ | — | |
(b) Period from September 16, 2013 (commencement of operations). | | | | | |
See accompanying Notes to Financial Statements.
JNL Investors Series Trust
Statements of Changes in Net Assets
| | JNL/PPM America Low
Duration Bond Fund | | JNL/PPM America Total Return Fund | |
| | For the Period Ended
December 31, 2013(a) | | For the Year Ended
December 31, 2013 | | For the Year Ended
December 31, 2012 | |
Operations | | | | | | | |
Net investment income | | $ | 647,534 | | $ | 16,181,907 | | $ | 7,831,251 | |
Net realized gain | | 299,883 | | 983,634 | | 15,240,137 | |
Net change in unrealized appreciation (depreciation) | | 390,296 | | (18,109,318 | ) | 11,195,505 | |
Net increase (decrease) in net assets from operations | | 1,337,713 | | (943,777 | ) | 34,266,893 | |
Distributions to shareholders | | | | | | | |
From net investment income | | | | | | | |
Class A | | (824,913 | ) | (9,577,057 | ) | (36,721 | ) |
From net realized gains | | | | | | | |
Class A | | (58,593 | ) | (15,303,630 | ) | (325,682 | ) |
Total distributions to shareholders | | (883,506 | ) | (24,880,687 | ) | (362,403 | ) |
Share transactions(1) | | | | | | | |
Proceeds from the sale of shares | | | | | | | |
Class A | | 438,731,643 | | 203,653,202 | | 185,359,317 | |
Reinvestment of distributions | | | | | | | |
Class A | | 883,506 | | 24,880,687 | | 362,403 | |
Cost of shares redeemed | | | | | | | |
Class A | | (7,162,741 | ) | (94,532,291 | ) | (33,553,312 | ) |
Net increase in net assets from share transactions | | 432,452,408 | | 134,001,598 | | 152,168,408 | |
Net increase net assets | | 432,906,615 | | 108,177,134 | | 186,072,898 | |
Net assets beginning of year | | — | | 487,663,892 | | 301,590,994 | |
Net assets end of year | | $ | 432,906,615 | | $ | 595,841,026 | | $ | 487,663,892 | |
Undistributed (excess of distributions over) net investment income | | $ | 17,984 | | $ | 17,976,409 | | $ | 9,573,727 | |
(1)Share transactions | | | | | | | |
Shares sold | | | | | | | |
Class A | | 43,833,319 | | 17,128,565 | | 16,014,786 | |
Reinvestment of distributions | | | | | | | |
Class A | | 88,262 | | 2,199,884 | | 30,660 | |
Shares redeemed | | | | | | | |
Class A | | (714,651 | ) | (8,118,035 | ) | (2,950,566 | ) |
Net increase | | | | | | | |
Class A | | 43,206,930 | | 11,210,414 | | 13,094,880 | |
Purchase and sales of investment securities (excluding short-term securities): | | | | | | | |
Purchase of securities | | $ | 874,502,811 | (b) | $ | 1,049,427,291 | (c) | $ | 1,338,040,058 | (d) |
Proceeds from sales of securities | | 443,693,883 | (b) | 936,728,772 | (c) | 1,167,430,099 | (d) |
| | | | | | | | | | |
(a) Period from September 16, 2013 (commencement of operations).
(b) Amounts include $431,896,996 and $365,286,112 of purchases and sales, respectively, of U.S. Government Securities.
(c) Amounts include $492,345,725 and $525,020,112 of purchases and sales, respectively, of U.S. Government Securities.
(d) Amounts include $644,975,575 and $564,643,455 of purchases and sales, respectively, of U.S. Government Securities.
See accompanying Notes to Financial Statements.
JNL Investors Series Trust
Statements of Changes in Net Assets
| | JNL Money Market Fund | |
| | For the Year Ended
December 31, 2013 | | For the Year Ended
December 31, 2012 | |
Operations | | | | | |
Net investment income | | $ | 239,750 | | $ | 1,137,684 | |
Net realized gain | | 54,126 | | 76,236 | |
Net change in unrealized appreciation (depreciation) | | — | | — | |
Net increase in net assets from operations | | 293,876 | | 1,213,920 | |
Distributions to shareholders | | | | | |
From net investment income | | | | | |
Institutional Class | | (239,750 | ) | (1,137,684 | ) |
From net realized gains | | | | | |
Institutional Class | | — | | — | |
Total distributions to shareholders | | (239,750 | ) | (1,137,684 | ) |
Share transactions(1) | | | | | |
Proceeds from the sale of shares | | | | | |
Institutional Class | | 29,101,347,235 | | 22,391,595,564 | |
Cost of shares redeemed | | | | | |
Institutional Class | | (28,747,891,223 | ) | (22,307,991,490 | ) |
Net increase in net assets from share transactions | | 353,456,012 | | 83,604,074 | |
Net increase net assets | | 353,510,138 | | 83,680,310 | |
Net assets beginning of year | | 2,124,182,478 | | 2,040,502,168 | |
Net assets end of year | | $ | 2,477,692,616 | | $ | 2,124,182,478 | |
Undistributed (excess of distributions over) net investment income | | $ | 100,890 | | $ | (29,127 | ) |
(1)Share transactions | | | | | |
Shares sold | | | | | |
Institutional Class | | 29,101,347,235 | | 22,391,595,564 | |
Shares redeemed | | | | | |
Institutional Class | | (28,747,891,223 | ) | (22,307,991,490 | ) |
Net increase | | | | | |
Institutional Class | | 353,456,012 | | 83,604,074 | |
Purchase and sales of investment securities
(excluding short-term securities): | | | | | |
Purchase of securities | | $ | 1,641,560,671 | (a) | $ | 1,105,364,684 | (b) |
Proceeds from sales of securities | | 1,409,182,521 | (a) | 942,551,210 | (b) |
| | | | | | | |
(a) Amounts include $863,078,413 and $878,337,526 of purchases and sales, respectively, of U.S. Government Securities.
(b) Amounts include $787,858,493 and $665,447,210 of purchases and sales, respectively, of U.S. Government Securities.
See accompanying Notes to Financial Statements.
JNL Investors Series Trust
Financial Highlights
For a Share Outstanding
| | | | Increase (Decrease) from
Investment Operations(a) | | Distributions from | | | | Supplemental Data | | Ratios(b) | |
Period
Ended | | Net Asset
Value,
Beginning
of Period | | Net
Investment
Income
(Loss) | | Net Realized
& Unrealized
Gains
(Losses) | | Total from
Investment
Operations | | Net
Investment
Income | | Net Realized
Gains on
Investment
Transactions | | Net Asset
Value, End
of Period | | Total
Return(c) | | Net Assets,
End of
Period (in
thousands) | | Portfolio
Turnover (d) | | Net
Expenses to
Average Net
Assets | | Total
Expenses to
Average Net
Assets | | Net
Investment
Income
(Loss)
to Average
Net Assets | |
JNL/PPM America Low Duration Bond Fund | | | | | | | | | | | | | | | | | | | | | | | | | | | |
12/31/2013 (k) | | $ | 10.00 | | $ | 0.02 | | $ | 0.02 | | $ | 0.04 | | $ | (0.02 | ) | $ | (0.00 | )(e) | $ | 10.02 | | 0.41 | % | $ | 432,907 | | 125 | %(f) | 0.75 | % | 0.75 | % | 0.57 | % |
JNL/PPM America Total Return Fund | | | | | | | | | | | | | | | | | | | | | | | | | | | |
12/31/2013 | | 11.83 | | 0.33 | | (0.31 | ) | 0.02 | | (0.19 | ) | (0.30 | ) | 11.36 | | 0.20 | | 595,841 | | 102 | (g) | 0.80 | | 0.80 | | 2.84 | |
12/31/2012 | | 10.72 | | 0.25 | | 0.86 | | 1.11 | | (0.00 | )(e) | (0.00 | )(e) | 11.83 | | 10.44 | | 487,664 | | 229 | (g) | 0.80 | | 0.80 | | 2.15 | |
12/31/2011 (h) | | 11.73 | | 0.04 | | 0.04 | | 0.08 | | (0.49 | ) | (0.60 | ) | 10.72 | | 0.87 | | 301,591 | | 33 | (g) | 0.76 | (j) | 0.76 | (j) | 2.41 | |
10/31/2011 | | 12.38 | | 0.50 | | 0.27 | | 0.77 | | (0.54 | ) | (0.88 | ) | 11.73 | | 7.25 | | 29,476 | | 302 | (g) | 0.61 | | 0.61 | | 4.36 | |
10/31/2010 | | 11.94 | | 0.53 | | 1.09 | | 1.62 | | (0.49 | ) | (0.69 | ) | 12.38 | | 14.88 | | 27,488 | | 246 | (g) | 0.60 | | 0.60 | | 4.56 | |
10/31/2009 (i) | | 10.00 | | 0.40 | | 1.54 | | 1.94 | | — | | — | | 11.94 | | 19.40 | | 23,923 | | 476 | (g) | 0.80 | | 0.80 | | 4.39 | |
JNL Money Market Fund | | | | | | | | | | | | | | | | | | | | | | | | | | | |
12/31/2013 | | 1.00 | | 0.00 | | — | | 0.00 | (e) | (0.00 | )(e) | — | | 1.00 | | 0.01 | | 2,477,693 | | n/a | | 0.18 | | 0.19 | | 0.01 | |
12/31/2012 | | 1.00 | | 0.00 | | — | | 0.00 | (e) | (0.00 | )(e) | — | | 1.00 | | 0.05 | | 2,124,182 | | n/a | | 0.19 | | 0.19 | | 0.05 | |
12/31/2011 (h) | | 1.00 | | 0.00 | | — | | 0.00 | (e) | (0.00 | )(e) | — | | 1.00 | | 0.01 | | 2,040,502 | | n/a | | 0.19 | | 0.19 | | 0.03 | |
10/31/2011 | | 1.00 | | 0.00 | | — | | 0.00 | (e) | (0.00 | )(e) | — | | 1.00 | | 0.05 | | 1,894,400 | | n/a | | 0.19 | | 0.20 | | 0.05 | |
10/31/2010 | | 1.00 | | 0.00 | | — | | 0.00 | (e) | (0.00 | )(e) | — | | 1.00 | | 0.06 | | 1,510,322 | | n/a | | 0.20 | | 0.20 | | 0.06 | |
10/31/2009 | | 1.00 | | 0.01 | | — | | 0.01 | | (0.01 | ) | — | | 1.00 | | 0.60 | | 844,206 | | n/a | | 0.21 | | 0.21 | | 0.49 | |
| | | | | | | | | | | | | | | | | | | | | | | | | | | | | | | | | | | |
(a) | Calculated using the average shares method. |
(b) | Annualized for periods less than one year. |
(c) | Total return assumes reinvestment of all distributions for the period. Total return is not annualized for periods less than one year. |
(d) | Portfolio turnover is not annualized for periods of less than one year and excludes dollar roll transactions. |
(e) | Amount represents less than $0.005. |
(f) | Portfolio turnover including dollar roll transactions for JNL/PPM America Low Duration Bond Fund was 129% for the period ended December 31, 2013. |
(g) | Portfolio turnover including dollar roll transactions for JNL/PPM America Total Return Fund was 647% for the period ended October 31, 2009, 454% for the year ended October 31, 2010, 410% for the year ended October 31, 2011, 56% for the period ended December 31, 2011, 328% for the year ended December 31, 2012 and 168% for the year ended December 31, 2013. |
(h) | For the two months ended December 31, 2011. |
(i) | Commencement of operations for JNL/PPM America Total Return Fund was December 29, 2008. |
(j) | The JNL/PPM America Total Return Fund began charging an annual 12b-1 fee of 0.20% of average daily net assets on December 12, 2011. |
(k) | Commencement of operations for JNL/PPM America Low Duration Bond Fund was September 16, 2013. |
See accompanying Notes to Financial Statements.
JNL Investors Series Trust
Notes to Financial Statements
December 31, 2013
NOTE 1. ORGANIZATION
The JNL Investors Series Trust (“Trust”) was organized under the laws of Massachusetts, by a Declaration of Trust, dated July 28, 2000. The Trust is registered with the U.S. Securities and Exchange Commission (“SEC”) under the Investment Company Act of 1940, as amended, (“1940 Act”), and the Securities Act of 1933, as amended, (“1933 Act”) as an open-end management investment company issuing its shares in various series. Each series is known as a “Fund” (collectively, “Funds”) and represents a distinct portfolio with its own investment objectives and policies. The Trust currently consists of three (3) separate Funds, JNL/PPM America Low Duration Bond Fund and JNL/PPM America Total Return Fund, for which PPM America, Inc. serves as the Sub-Adviser, and JNL Money Market Fund, for which Wellington Management Company, LLP serves as Sub-Adviser. JNL/PPM America Low Duration Bond Fund, JNL/PPM America Total Return Fund and JNL Money Market Fund are diversified investment companies as defined in the 1940 Act.
Jackson National Asset Management, LLC (“JNAM” or “Adviser”), a wholly-owned subsidiary of Jackson National Life Insurance Company® (“Jackson”), serves as investment adviser to each of the Funds. Jackson is an indirect wholly owned subsidiary of Prudential plc, a publicly traded company incorporated in the United Kingdom. Prudential plc is not affiliated in any manner with Prudential Financial Inc., a company whose principal place of business is the United States of America. PPM America, Inc., the Sub-Adviser for JNL/PPM America Low Duration Bond Fund and JNL/PPM America Total Return Fund, is an affiliate of JNAM. At December 31, 2013, affiliated investment companies owned 100% of the outstanding capital shares of JNL/PPM America Low Duration Bond Fund, JNL/PPM America Total Return Fund and JNL Money Market Fund.
JNL/PPM America Low Duration Bond Fund and JNL/PPM America Total Return Fund presently offer one class of shares, Class A, which are available for investment to certain Funds in the JNL Series Trust, an open end management investment company advised by JNAM. JNL Money Market Fund offers an Institutional Class of shares. Institutional Class shares are not sold to retail investors but are available for investment to affiliated Funds.
JNL/PPM America Low Duration Bond Fund commenced operations on September 16, 2013.
NOTE 2. SIGNIFICANT ACCOUNTING POLICIES
The Funds are investment companies and follow accounting and reporting guidance under Financial Accounting Standards Board (“FASB”) Accounting Standards Codification (“ASC”) Topic 946, “Financial Services-Investment Companies”. The following is a summary of significant accounting policies consistently followed by the Trust in the preparation of its financial statements in conformity with U.S. generally accepted accounting principles (“GAAP”).
Security Valuation - Under the Trust’s valuation policy and procedures, the Trust’s Board of Trustees (“Board” or “Trustees”) has delegated the daily operational oversight of the securities valuation function to the JNAM Pricing Committee (“Pricing Committee”), which consists of certain officers of the Trust and JNAM management. The Pricing Committee is responsible for determining fair valuations for any security for which market quotations are not readily available. For those securities fair valued under procedures adopted by the Board, the Pricing Committee reviews and affirms the reasonableness of the fair valuation determinations after considering all relevant information that is reasonably available. The Pricing Committee’s fair valuation determinations are subject to review by the Board at its next regularly scheduled meeting covering the calendar quarter in which the fair valuation was determined. For fair valuation determinations that are deemed significant, the Board is promptly notified, in detail, of the fair valuation.
The net asset value (“NAV”) of each Fund shall be determined as of the close of trading (generally, 4:00 PM Eastern Time) on each day the New York Stock Exchange (“NYSE”) is open for trading. Debt securities are generally valued by independent pricing services approved by the Board. Pricing services utilized to value debt securities may use various pricing techniques which take into account appropriate factors such as: yield; credit quality; coupon rate; maturity; type of issue; trading characteristics; call features; credit ratings; broker quotes; and other relevant data. If pricing services are unable to provide valuations, debt securities are valued at the most recent bid quotation for a long position and ask quotation for a short position or an evaluated price, as applicable, obtained from each Fund’s Sub-Adviser, a broker/dealer or widely used quotation system. All securities in the JNL Money Market Fund, as permitted by compliance with applicable provisions of Rule 2a-7 under the 1940 Act, and other short-term securities maturing within sixty (60) days are valued at amortized cost, unless it is determined that such practice does not approximate market value. Futures contracts traded on an exchange are valued at the exchange’s settlement price which reflects fair value. If the settlement price is not available, exchange traded futures are valued at the last sales price as of the close of business on the local exchange. Stocks traded on an exchange are generally valued at the official closing price of the exchange where the security is principally traded. If there is no official closing price for the security, the security may be valued at the last quoted sale price on the exchange where the security is principally traded or final bid price in the absence of a sale. Stocks not listed on a national or foreign stock exchange may be valued at the closing bid price on the over the counter market. Investments in mutual funds are valued at the NAV per share determined as of the close of the NYSE on each valuation date. The Securities Lending Cash Collateral Fund LLC, which provides daily liquidity, is valued at the daily reported NAV of the fund, as a practical expedient, as of the close of the NYSE on each valuation date.
Market quotations may not be readily available for certain investments or it may be determined that a quotation of an investment does not represent market value. In such instances, the investment is valued as determined in good faith using procedures approved by the Board. Situations that may require an investment to be fair valued may include instances where a security is thinly traded, halted or restricted as to resale. In addition, investments may be fair valued based on the occurrence of a significant event. Significant events may be specific to a particular issuer, such as mergers, restructurings or defaults. Alternatively, significant events may affect an entire market, such as natural disasters, government action and significant changes in value of U.S. securities markets. Securities are fair valued based on observable and unobservable inputs, including the Adviser’s or Pricing Committee’s own assumptions in determining fair value of an investment. Under the procedures approved by the Board, the Adviser may rely on pricing services or other sources, including each Fund’s Sub-Adviser, to assist in determining the fair value of an investment. Factors considered to determine fair value may include the correlation with price movement of similar securities in the same or other markets; the type, cost and investment characteristics of the security; the business and financial condition of the issuer; and trading or other market data.
JNL Investors Series Trust
Notes to Financial Statements
December 31, 2013
If an investment is valued at a fair value for purposes of calculating a Fund’s NAV, the value may be different from the last quoted price for the investment depending on the source and method used to determine the value. Although there can be no assurance, in general, the fair value of the investment is the amount the owner of such investment might reasonably expect to receive in an orderly transaction between market participants upon its current sale.
Distributions to Shareholders - The amount and timing of distributions are determined in accordance with federal income tax regulations, which may differ from GAAP. JNL/PPM America Low Duration Bond Fund and JNL/PPM America Total Return Fund generally declare and pay dividends from net investment income annually, but may pay more frequently to avoid excise tax. JNL Money Market Fund declares dividends daily and pays dividends monthly. Distributions of net realized capital gains, if any, will be distributed at least annually, to the extent they exceed available capital loss carryforwards.
Security Transactions and Investment Income - Security transactions are recorded on the trade date for financial reporting purposes. Dividend income, net of applicable withholding taxes, is recorded on the ex-dividend date. Income received in lieu of dividends for securities loaned is included in dividends in the Statements of Operations. Interest income, including level-yield amortization of discounts and premiums, is accrued daily. A Fund may place a debt obligation on non-accrual status and reduce related interest income by ceasing current accruals and writing off interest receivables when the collection of all or a portion of interest has become doubtful. A debt obligation is removed from non-accrual status when the issuer resumes interest payments or when collectability of interest is reasonably assured. Realized gains and losses are determined on the specific identification basis.
Expenses - Expenses are recorded on an accrual basis. Expenses of the Trust that are directly attributable to a specific Fund are charged to that Fund. Other Trust level expenses are allocated to the Funds based on the average daily net assets of each Fund.
Guarantees and Indemnifications - In the normal course of business, the Trust may enter into contracts with service providers that contain a variety of representations which provide general indemnifications for certain liabilities. Under the Trust’s organizational documents, its officers and Trustees are indemnified against certain liabilities arising out of the performance of their duties to the Funds. Each Fund’s maximum exposure under these arrangements is unknown. However, since their commencement of operations, the Funds have not had claims or losses pursuant to these contracts and expect the risk of loss to be remote. The Funds’ maximum exposure under these arrangements is unknown since the amount of any future claims that may be made against the Funds cannot be determined and the Funds have no historical basis for predicting the likelihood of any such claims.
Use of Estimates - The preparation of financial statements in conformity with GAAP requires management to make estimates and assumptions that affect the reported amounts of assets and liabilities and disclosure of contingent assets and liabilities at the date of the financial statements and the reported amounts of increases and decreases in net assets from operations during the reporting period. Actual results could differ from those estimates.
NOTE 3. FASB ASC TOPIC 820, “FAIR VALUE MEASUREMENTS AND DISCLOSURE”
This standard establishes a single authoritative definition of fair value, sets out a framework for measuring fair value and requires additional disclosures about fair value measurements. Various inputs are used in determining the value of a Fund’s investments under FASB ASC Topic 820 guidance. The inputs are summarized into three broad categories.
Level 1 includes valuations based on quoted prices of identical securities in active markets including valuations for securities listed on a national or foreign stock exchange or investments in mutual funds and securities lending collateral, which is valued as a practical expedient at its daily reported NAV.
Level 2 includes valuations determined from significant direct or indirect observable inputs. Direct observable inputs include broker quotes, third party prices, closing prices of similar securities in active markets, closing prices for identical or similar securities in non-active markets or corporate action or reorganization entitlement values. Indirect significant observable inputs include factors such as interest rates, yield curves, prepayment speeds or credit ratings. Level 2 includes valuations for fixed income securities, broker quotes in active markets, securities subject to corporate actions or securities valued at amortized cost.
Level 3 includes valuations determined from significant unobservable inputs including the Adviser’s own assumptions in determining the fair value of the investment. Inputs used to determine the fair value of Level 3 securities include security specific inputs such as: credit quality, credit rating spreads, issuer news, trading characteristics, call features, maturity or anticipated cash flows; or industry specific inputs such as: trading activity of similar markets or securities, changes in the security’s underlying index or changes in comparable securities’ models. Level 3 valuations include securities that are priced based on single source broker quotes, where prices may be unavailable due to halted trading, restricted to resale due to market events, newly issued or investments for which reliable quotes are otherwise not available.
To assess the continuing appropriateness of security valuation, the Adviser regularly compares prior day prices with current day prices, transaction prices and alternative vendor prices. When the comparison results exceed pre-defined thresholds, the Adviser challenges the prices exceeding tolerance levels with the pricing service or broker. To verify Level 3 unobservable inputs, the Adviser uses a variety of techniques as appropriate to substantiate these valuation approaches including a regular review of key inputs and assumptions, transaction back-testing or disposition analysis and review of related market activity.
The inputs or methodology used for valuing securities are not necessarily an indication of the risk associated with investing in those securities.
JNL Investors Series Trust
Notes to Financial Statements
December 31, 2013
The following table summarizes each Fund’s investments in securities and other financial instruments as of December 31, 2013 by valuation level.
| | Assets - Securities | |
| | Level 1 | | Level 2 | | Level 3 | | Total | |
JNL/PPM America Low Duration Bond Fund | | | | | | | | | |
Non-U.S. Government Agency ABS | | $ | — | | $ | 146,833,536 | | $ | — | | $ | 146,833,536 | |
Corporate Bonds and Notes | | — | | 217,099,775 | | — | | 217,099,775 | |
Government and Agency Obligations | | — | | 66,556,797 | | — | | 66,556,797 | |
Short Term Investments | | 10,913,042 | | — | | — | | 10,913,042 | |
Fund Total | | $ | 10,913,042 | | $ | 430,490,108 | | $ | — | | $ | 441,403,150 | |
JNL/PPM America Total Return Fund | | | | | | | | | |
Non-U.S. Government Agency ABS | | $ | — | | $ | 43,136,934 | | $ | — | | $ | 43,136,934 | |
Corporate Bonds and Notes | | — | | 374,760,938 | | 11,376,466 | | 386,137,404 | |
Government and Agency Obligations | | — | | 133,156,408 | | — | | 133,156,408 | |
Preferred Stocks | | 11,639,175 | | — | | — | | 11,639,175 | |
Trust Preferreds | | 1,144,500 | | — | | — | | 1,144,500 | |
Short Term Investments | | 84,863,661 | | — | | — | | 84,863,661 | |
Fund Total | | $ | 97,647,336 | | $ | 551,054,280 | | $ | 11,376,466 | | $ | 660,078,082 | |
JNL Money Market Fund | | | | | | | | | |
Corporate Bonds and Notes | | $ | — | | $ | 461,475,603 | | $ | — | | $ | 461,475,603 | |
Government and Agency Obligations | | — | | 519,246,209 | | — | | 519,246,209 | |
Short Term Investments | | 30,011 | | 1,499,645,553 | | — | | 1,499,675,564 | |
Fund Total | | $ | 30,011 | | $ | 2,480,367,365 | | $ | — | | $ | 2,480,397,376 | |
| | Assets - Other Financial Instruments(1) | |
| | Level 1 | | Level 2 | | Level 3 | | Total | |
JNL/PPM America Low Duration Bond Fund | | | | | | | | | |
Open Futures Contracts | | $ | 391,835 | | $ | — | | $ | — | | $ | 391,835 | |
Fund Total | | $ | 391,835 | | $ | — | | $ | — | | $ | 391,835 | |
JNL/PPM America Total Return Fund | | | | | | | | | |
Open Futures Contracts | | $ | 1,591,053 | | $ | — | | $ | — | | $ | 1,591,053 | |
Fund Total | | $ | 1,591,053 | | $ | — | | $ | — | | $ | 1,591,053 | |
| | Liabilities - Other Financial Instruments(1) | |
| | Level 1 | | Level 2 | | Level 3 | | Total | |
JNL/PPM America Total Return Fund | | | | | | | | | |
Open Futures Contracts | | $ | (106,446 | ) | $ | — | | $ | — | | $ | (106,446 | ) |
Fund Total | | $ | (106,446 | ) | $ | — | | $ | — | | $ | (106,446 | ) |
(1)Investments in other financial instruments include futures contracts which are reflected at the unrealized appreciation/(depreciation) on the instrument.
The Funds recognize transfers between levels as of the beginning of the period. There were no significant transfers into or out of Level 1, 2, or 3 for the period. There were no significant Level 3 valuations for which significant unobservable valuation inputs were developed at December 31, 2013.
NOTE 4. SECURITIES INVESTMENTS, INVESTMENT RISKS AND REGULATORY MATTERS
U.S. Government Agencies or Government Sponsored Enterprises - Certain Funds may invest in U.S. government agencies or government sponsored enterprises. U.S. Government securities are obligations of, and in certain cases, guaranteed by, the U.S. government, its agencies or instrumentalities. Some U.S. Government securities, such as Treasury bills, notes and bonds, and securities guaranteed by the Government National Mortgage Association, are supported by the full faith and credit of the U.S. government; others, such as those of the Federal Home Loan Bank, are supported by the right of the issuer to borrow from the U.S. Department of the Treasury (“U.S. Treasury”); others, such as those of the Federal National Mortgage Association (“FNMA” or “Fannie Mae”), are supported by the discretionary authority of the U.S. government to purchase the agency’s obligations; and still others, such as those of the Student Loan Marketing Association, are supported only by the credit of the instrumentality. U.S. Government securities may include zero coupon securities, which do not distribute interest on a current basis and tend to be subject to greater risk than interest paying securities of similar maturities.
Government-related guarantors (i.e., guarantors that are not backed by the full faith and credit of the U.S. government) include FNMA and the Federal Home Loan Mortgage Corporation (“FHLMC” or “Freddie Mac”). FNMA purchases conventional (i.e., not insured or guaranteed by any government agency) residential mortgages from a list of approved seller/servicers, which include state and federally chartered savings and loan associations, mutual savings banks, commercial banks and credit unions and mortgage bankers. Pass-through securities issued by FNMA are guaranteed as to timely payment of principal and interest by FNMA, but are not backed by the full faith and credit of the U.S. government. FHLMC issues Participation Certificates (“PCs”), which are pass-through securities, each representing an undivided interest in a pool of residential mortgages. FHLMC guarantees the timely payment of interest and ultimate collection of principal, but PCs are not backed by the full faith and credit of the U.S. government.
FNMA and FHMLC were placed into conservatorship by the Federal Housing Finance Agency (“FHFA”). As the conservator, FHFA succeeded to all rights, titles, powers and privileges of FNMA and FHLMC and of any stockholder, officer or director of FNMA and FHLMC with respect to FNMA and FHLMC and each enterprise’s assets. In connection with the conservatorship, the U.S. Treasury entered into a Senior Preferred Stock Purchase Agreement with FNMA and FHLMC. This agreement contains various covenants that severely limit each enterprise’s operations. In exchange for
JNL Investors Series Trust
Notes to Financial Statements
December 31, 2013
entering into these agreements, the U.S. Treasury received senior preferred stock in each enterprise and warrants to purchase each enterprise’s common stock. The U.S. Treasury created a new secured lending facility, which is available to FNMA and FHLMC as a liquidity backstop and created a temporary program to purchase mortgage-backed securities issued by FNMA and FHLMC. FNMA and FHLMC are continuing to operate as going concerns while in conservatorship and each remains liable for all of its obligations, including its guaranty obligations, associated with its mortgage-backed securities.
Unregistered Securities - A Fund may own certain investment securities, which are unregistered and thus restricted to resale. These securities may also be referred to as “private placements”. Unregistered securities may be “illiquid” because there is no readily available market for sale of the securities. Where future dispositions of the securities require registration under the 1933 Act, as amended, the Funds have the right to include those securities in such registration generally without cost to the Funds. The Funds have no right to require registration of unregistered securities.
Repurchase Agreements - Certain Funds may invest in repurchase agreements. In a repurchase agreement, the Fund takes possession of an underlying debt obligation (collateral) subject to an obligation of the seller to repurchase, and the Fund to resell, the obligation at an agreed upon price and date. Earnings on collateral and compensation to the seller are based on agreed upon rates between the seller and the Fund. Interest earned on repurchase agreements is recorded as interest income to the Fund. The underlying securities used as collateral for repurchase agreements may be held in safekeeping by the Fund’s Custodian or designated sub custodians under triparty repurchase agreements or delivered to the counterparty. When a repurchase agreement is entered into, the Fund typically receives securities with a value that approximates or exceeds the repurchase price, including any accrued interest earned on the repurchase agreement. The value of such securities will be marked to market daily, and cash or additional securities will be exchanged between the parties with a frequency and in amounts prescribed in the repurchase agreement.
Securities purchased under repurchase agreements are reflected as an asset on the Statements of Assets and Liabilities. The value of repurchase agreements and collateral pledged or received by a counterparty are disclosed in the Schedules of Investments. The Fund’s net exposure to the counterparty is determined by the amount of any excess or shortfall in collateral compared to the value of the repurchase agreement. In the event of a default by the counterparty, realization of the collateral proceeds could be delayed, during which time the value of such collateral may decline.
Delayed-Delivery Securities - JNL/PPM America Low Duration Bond Fund and JNL/PPM America Total Return Fund may purchase or sell securities on a delayed-delivery basis, including To Be Announced (“TBA”) or “To Be Acquired” securities. These transactions involve a commitment by a Fund to purchase or sell securities for a predetermined price or yield, with payment and delivery taking place beyond the customary settlement period. In TBA transactions, the Fund commits to purchasing or selling securities for which all specific information is not yet known at the time of the trade, particularly the face amount and maturity date of the underlying security transactions. When delayed-delivery purchases are outstanding, a Fund is required to have sufficient cash and/or liquid securities to cover its commitments on these transactions. When purchasing a security on a delayed-delivery basis, the Fund assumes the rights of ownership of the security, including the risk of price and yield fluctuations, and considers such fluctuations when determining its NAV. A Fund may dispose of or renegotiate a delayed-delivery transaction after it is entered into, and may sell delayed-delivery securities before they are delivered, which may result in a realized gain or loss. When a Fund has sold a security on a delayed-delivery basis, the Fund does not participate in future gains or losses with respect to the security. Securities purchased on a TBA basis are not settled until they are delivered to the Fund. In connection with TBA transactions, Funds may maintain a short position related to certain securities. In connection with these transactions, the Fund owns an equal amount of the securities or holds securities convertible (or exchangeable) into an equal amount of the securities, of the same issuer, as the position held short.
Mortgage-Backed Dollar and Treasury Roll Transactions - JNL/PPM America Low Duration Bond Fund and JNL/PPM America Total Return Fund may sell mortgage-backed or treasury securities and simultaneously contract to repurchase securities at a future date at an agreed upon price. The Funds may only enter into covered rolls. A “covered roll” is a type of dollar roll for which a Fund maintains offsetting positions in cash, U.S. Government securities, or other liquid assets which mature on or before the forward repurchase settlement date of the dollar roll transaction. During the period between the sale and repurchase, a Fund forgoes interest and principal paid on the mortgage-backed securities. A Fund is compensated by the interest earned on the cash proceeds of the initial sale and from negotiated fees paid by brokers offered as an inducement to the Fund to “roll over” its purchase commitments. A Fund may dispose of “covered roll” securities after they are entered into and close these positions before their maturity, which may result in a realized gain or loss.
In a mortgage-backed or treasury securities roll transaction, if the repurchased security is determined to be similar, but not substantially the same, the transaction is accounted for as a purchase and sale. Any gains, losses and any income or fees earned are recorded to realized gain or loss. If the repurchased security is determined to be substantially the same, the transaction is accounted for as a secured borrowing, rather than as a purchase and sales transaction. Any income or fees earned are recorded to investment income and financing costs associated with the transaction are recorded to interest expense. For the year ending December 31, 2013, JNL/PPM America Low Duration Bond Fund and JNL/PPM America Total Return Fund did not transact in treasury transactions characterized as secured borrowing transactions.
Dollar roll transactions involve the risk that the market value of the securities sold by a Fund may decline below the repurchase price of those securities which the Fund is obligated to purchase or that the return earned by the Fund with the proceeds of a dollar roll may not exceed transaction costs.
Securities Lending and Securities Lending Collateral - JNL/PPM America Low Duration Bond Fund and JNL/PPM America Total Return Fund may lend securities to certain brokers, dealers or other financial institutions in order to earn additional income. The borrowers and the Funds’ securities lending agent exchange negotiated lender fees and the Fund receives a fee equal to a percentage of the net negotiated lender fees and the net income generated by the securities lending collateral held during each lending transaction. The securities lending agent is authorized to loan securities on behalf of the
JNL Investors Series Trust
Notes to Financial Statements
December 31, 2013
Funds to approved borrowers and per the securities lending agreement is required to maintain collateral at least equal to the value of the securities loaned based on the previous day’s value of the securities loaned, marked-to-market daily. Any shortfalls are adjusted the next business day. Cash collateral received from the borrower is recorded in the Statements of Assets and Liabilities as payable upon return of securities loaned and investments - affiliated, at value and cost. The value of securities on loan is disclosed under footnote (d) on the Statements of Assets and Liabilities. Although a Fund is indemnified by its securities lending agent for insufficient collateral obtained from the borrower, each Fund’s net exposure to the borrower is determined by the amount of any excess or shortfall in cash collateral received compared to the value of securities on loan. In addition, there could be a decline in the value of the collateral or in the value of the securities loaned while a Fund seeks to enforce its rights thereto and the Fund could experience subnormal levels of income or lack of access to income during that period. Each Fund also bears the risk of any deficiency in the amount of collateral available for return to a borrower due to a loss in an approved investment. Each Fund is responsible for returning the full amount of collateral received for a particular loan when the borrower returns the applicable security.
In the event of bankruptcy or other default of the borrower, a Fund could experience delays in recovering the loaned securities and incur expenses related to enforcing its rights. However, a Fund is indemnified by its securities lending agent for borrower default.
JPMorgan Chase Bank, N.A. (“JPM Chase” or “Custodian”) serves as custodian and securities lending agent to the Funds. The Funds have cash collateral invested in the Securities Lending Cash Collateral Fund LLC, a limited liability company sponsored by the Adviser. Although the Securities Lending Cash Collateral Fund LLC is not a registered fund under the 1940 Act, and is not a “money market fund”, it typically has daily liquidity and invests in high quality U.S. dollar-denominated instruments that qualify at time of purchase as “eligible securities” within the meaning of Rule 2a-7 under the 1940 Act, which governs money market funds. The Securities Lending Cash Collateral Fund LLC is only offered to JNAM affiliated funds. Short-term securities in the Securities Lending Cash Collateral Fund LLC are valued at amortized cost, unless it is determined that such practice does not approximate market value. Securities that are not valued at amortized cost are generally valued based on prices furnished by pricing services. If pricing services are unable to provide valuations, debt securities are valued at the most recent bid quotation or evaluated price, as applicable, obtained from a broker/dealer or widely used quotation system.
Market, Credit and Counterparty Risk - In the normal course of business, the Funds trade financial instruments and enter into financial transactions where the risk of potential loss exists due to changes in the market (“market risk”) or failure of the other party to a transaction to perform (“credit risk”). Similar to credit risk, the Funds may be exposed to counterparty risk, or the risk that an institution or other entity with which the Funds have unsettled or open transactions will default. Financial assets, which potentially expose the Funds to credit risk, consist principally of investments and cash due from counterparties (“counterparty risk”). The extent of the Funds’ exposure to credit and counterparty risks in respect to these financial assets is incorporated within their carrying value as recorded in the Funds’ Statements of Assets and Liabilities. For certain derivative contracts, the potential loss could exceed the value of the financial assets recorded in the financial statements.
NOTE 5. MASTER NETTING AGREEMENTS, CUSTOMER ACCOUNT AGREEMENTS AND COLLATERAL
Under various agreements, certain investment transactions require collateral to be exchanged by a Fund and a counterparty or segregated at the custodian. U.S. Treasury Bills and U.S. dollar cash are generally the preferred forms of collateral, although other forms of high quality or sovereign securities may be used. Securities held by a Fund that are used as collateral are identified as such within the Schedules of Investments.
Master Netting Agreements (“Master Agreements”) - Certain Funds are subject to various Master Agreements, which govern the terms of certain transactions and mitigate the counterparty risk associated with relevant transactions by specifying credit protection mechanisms and providing standardization that improves legal certainty. Since different types of financial transactions have different mechanics and are sometimes traded out of different legal entities of a particular counterparty organization, each type of transaction may be covered by a different Master Agreement, resulting in the need for multiple agreements with a single counterparty. A Fund may net exposure and collateralize multiple transaction types governed by the same Master Agreement with the same counterparty and may close out and net its total exposure to a counterparty in the event of a default and/or termination event with respect to all the transactions governed under a single agreement with a counterparty. Each Master Agreement defines whether the Fund is contractually able to net settle daily payments. Additionally, certain circumstances, such as laws of a particular jurisdiction or settlement of amounts due in different currencies, may prohibit or restrict the right of offset as defined in the Master Agreements.
Master Agreements also help limit credit and counterparty risk by specifying collateral posting arrangements at pre-arranged exposure levels. Under the Master Agreements, collateral is routinely transferred if the total net exposure to certain transactions (net of existing collateral) governed under the relevant master agreement with a counterparty in a given account exceeds a specified threshold depending on the counterparty and the type of Master Agreement. A Fund’s overall exposure to counterparty risk can change substantially within a short period, as it is affected by each transaction subject to the relevant Master Agreement. To the extent amounts due to a Fund from its counterparties are not fully collateralized, contractually or otherwise, the Fund bears the risk of loss from counterparty non-performance. The Funds’ Sub-Advisers attempt to limit counterparty risk by only entering into Master Agreements with counterparties which are believed to have the financial resources to honor their obligations and by monitoring the financial stability of those counterparties.
Master Repurchase Agreements and Global Master Repurchase Agreements (individually and collectively “Master Repo Agreements”) - Master Repo Agreements govern repurchase, reverse repurchase and treasury roll transactions between a Fund and select counterparties. The Master Repo Agreements maintain provisions for, among other things, initiation and confirmation, income payments and transfer, events of default, termination, and maintenance of collateral. In the event of default, the total value exposure will be offset against collateral exchanged to date, which would result in a net receivable/(payable) that would be due from/to the counterparty.
JNL Investors Series Trust
Notes to Financial Statements
December 31, 2013
Customer Account Agreements - Customer Account Agreements and related addendums govern cleared derivative transactions such as futures contracts. Futures contracts require posting an amount of cash or cash equivalents equal to a certain percentage of the contract amount known as the “initial margin” as determined by each relevant clearing agency and is segregated at a Futures Commissions Merchant (“FCM”) which is registered with the Commodity Futures Trading Commission (“CFTC”) or the applicable regulator. The Fund receives from or pays to the counterparty an amount of cash equal to the daily fluctuation in the value of the contracts. Such receipts or payments are known as the “variation margin”. In the event of default, counterparty risk is significantly reduced as creditors to the FCM do not have claim to a Fund’s assets in the segregated account.
NOTE 6. FINANCIAL DERIVATIVE INSTRUMENTS
FASB ASC Topic 815, “Derivatives and Hedging” - This standard includes the requirement for enhanced qualitative disclosures about objectives and strategies for using derivative instruments and disclosures regarding credit related contingent features in derivative instruments; as well as quantitative disclosures in the semi-annual and annual financial statements about fair value, gains and losses, and volume of activity for derivative instruments. Information about these instruments is disclosed in the context of each instrument’s primary underlying risk exposure which is categorized as credit, equity price, interest rate, and foreign currency exchange rate risk.
Futures Contracts - During the year, JNL/PPM America Low Duration Bond Fund and JNL/PPM America Total Return Fund used futures contracts to manage exposure to or hedge changes in interest rates and to replicate treasury bond positions. A futures contract is a standardized contract obligating two parties to exchange a specified asset at an agreed upon price and date. Variation margin is recorded by the Fund until the contracts are terminated at which time realized gains and losses are recognized. Futures contracts involve to varying degrees, risk of loss in excess of the variation margin recorded by the Fund. The primary risks associated with the use of futures contracts are the imperfect correlation between the change in value of the securities held by the Fund or the change in the value of an underlying entity and the prices of the futures contracts and the possibility the Fund may not be able to enter into a closing transaction because of an illiquid market. With futures, counterparty risk is reduced to the Fund since futures contracts are exchange traded and the exchange’s clearinghouse, acting as counterparty to all exchange traded futures, guarantees the futures contracts against default.
At December 31, 2013, variation margin related to futures contracts is reflected as receivable or payable for variation margin in each Fund’s Statement of Assets and Liabilities. During the year ended December 31, 2013, realized gains and change in unrealized appreciation/(depreciation) in futures contracts is reflected in each Fund’s Statement of Operations. Net exposure to a Fund for futures contracts is the variation margin receivable or payable in addition to any collateral pledged for the initial margin on the futures contracts. At December 31, 2013, the JNL/PPM America Low Duration Bond Fund and JNL/PPM America Total Return Fund had $258,390 and $1,009,415 cash pledged as collateral for futures contracts, respectively. The futures contracts outstanding as of December 31, 2013, as disclosed in the Notes to the Schedules of Investments and the amounts of realized and changes in unrealized gains and losses on futures contracts during the period as disclosed in the Statements of Operations serve as indicators of the volume of activity for each Fund. For the year ended December 31, 2013, the average monthly notional value at purchase of futures in JNL/PPM America Low Duration Bond Fund and JNL/PPM America Total Return Fund was $8,983,340 and $99,254,269, respectively.
NOTE 7. INVESTMENT ADVISORY FEES AND TRANSACTIONS WITH AFFILIATES
Advisory Fee - The Trust has an investment advisory and management agreement with JNAM, whereby JNAM provides investment management services. Each Fund pays JNAM an annual fee, accrued daily and paid monthly, based on a specified percentage of the average daily net assets of each Fund. A portion of this fee is paid by JNAM to the Sub-Advisers as compensation for their services. The JNL/PPM America Low Duration Bond Fund is obligated to pay JNAM an annual rate of 0.45% for net assets up to $500 million and 0.40% for net assets over $500 million. The JNL/PPM America Total Return Fund is obligated to pay JNAM an annual rate of 0.50% for net assets up to $1 billion and 0.45% for net assets over $1 billion. The JNL Money Market Fund is obligated to pay JNAM an annual rate of 0.20% for net assets up to $750 million and 0.18% for net assets over $750 million.
Administrative Fee - JNAM also serves as the “Administrator” to the Funds. The JNL/PPM America Low Duration Bond Fund and JNL/PPM America Total Return Fund pay JNAM an Administrative Fee at an annual rate of 0.10% of the average daily net assets of each Fund which is accrued daily and paid monthly. JNAM provides or procures most of the necessary administrative functions and services for the operations of the JNL Money Market Fund at no additional cost. In accordance with the administration agreement, JNAM is responsible for payment of the following expenses: fund accounting, shareholder reporting, shareholder servicing, certain legal, insurance, custody, audit, and tax fees. Additionally, JNAM provides transfer agency services.
Fee Waiver and Expense Reimbursements - Pursuant to a contractual expense limitation agreement, effective November 1, 2010, JNAM agreed to waive fees and reimburse expenses of the JNL Money Market Fund to the extent necessary to limit operating expenses of the Fund (excluding brokerage expense, interest, taxes and dividend, and extraordinary expenses) to an annual rate as a percentage of average daily net assets equal to or less than the Fund’s net investment income for the year. In addition, when the Fund receives income sufficient to pay a dividend, JNAM may recapture previously waived fees and reimbursed expenses from the Fund for a period of three years following the reimbursement period. During the year ended December 31, 2013, $236,263 of fees were waived under the contractual expense limitation agreement and is available for recapture. There are no fees waived under the contractual expense limitation agreement in prior years that are available for recapture.
Rule 12b-1 Fees - JNL/PPM America Low Duration Bond Fund and JNL/PPM America Total Return Fund adopted a Distribution Plan under the provisions under Rule 12b-1 under the 1940 Act for the purpose of reimbursement of certain distribution and related service expenses from the sale and distribution of each Fund’s Class A shares. Jackson National Life Distributors LLC (“JNLD”), a wholly-owned subsidiary of Jackson and an affiliate of JNAM, is the principal underwriter of the Funds, with responsibility for promoting sales of their shares. JNLD also is the principal underwriter of the variable insurance products issued by Jackson and its subsidiaries. For the JNL/PPM America Low Duration Bond Fund and JNL/PPM America Total Return Fund, the maximum annual 12b-1 fee allowed is 0.20% of the average daily net assets attributable to Class A shares. Amounts charged pursuant
JNL Investors Series Trust
Notes to Financial Statements
December 31, 2013
to the Distribution Plan are reflected as 12b-1 fees (Class A) in the Statements of Operations. Institutional Class shares of JNL Money Market Fund have no Rule 12b-1 Fees.
Deferred Compensation Plan - Effective January 1, 2007, the Funds adopted a Deferred Compensation Plan whereby disinterested Trustees may defer the receipt of all or a portion of their compensation. These deferred amounts, which remain as liabilities of the Funds, are treated as if invested and reinvested in shares of one or more affiliated funds at the discretion of the applicable Trustees. These amounts represent general, unsecured liabilities of the Funds and vary according to the total returns of the selected Funds. Prior to January 1, 2007, Trustees were able to defer the receipt of their compensation under a separate plan. Deferred amounts under this plan are credited at a fixed annual rate of return of five percent (5%). Liabilities related to deferred balances are included in payable for Trustees fees in the Statements of Assets and Liabilities. Increases or decreases related to the changes in value of deferred balances are included in Trustees fees set forth in the Statements of Operations.
Investments in Affiliates - JNL/PPM America Total Return Fund participates in securities lending and receives cash collateral, which is invested by the Custodian in the Securities Lending Cash Collateral Fund LLC, which is an affiliate of the Fund’s Adviser. JNAM serves as the Administrator for the Securities Lending Cash Collateral Fund LLC. The fair value and par value of the investment in the Securities Lending Cash Collateral Fund LLC is reported under Securities Lending Collateral in the Schedule of Investments. Income received from the Securities Lending Cash Collateral Fund LLC is aggregated with income from securities lending when received from the custodian. During the year ended December 31, 2013, JNL/PPM America Low Duration Bond Fund and JNL/PPM America Total Return Fund invested in a money market fund which is managed by the Adviser. The JNL Money Market Fund is offered as a cash management tool to the Funds and their affiliates and is not available for direct purchase by members of the public. The total value and cost of such affiliated investments is disclosed separately in the Statements of Assets and Liabilities, and the associated income and realized gain (loss) are disclosed separately in the Statements of Operations.
The following table details cash management investments in affiliates held at December 31, 2013. There was no realized gain or loss relating to transactions in these investments during the year ended December 31, 2013.
| | JNL Money Market Fund | |
Fund | | Beginning
Amortized Cost | | Ending
Amortized Cost | | Dividend
Income | |
JNL/PPM America Low Duration Bond Fund | | $ | — | | $ | 10,913,042 | | $ | 427 | |
JNL/PPM America Total Return Fund | | 21,672,331 | | 30,643,344 | | 3,202 | |
| | | | | | | | | | |
NOTE 8. BORROWING ARRANGEMENTS
Effective June 7, 2013, the Trust entered into a Syndicated Credit Agreement (“SCA”) with a group of lenders. JNL/PPM America Total Return Fund and JNL Money Market Fund participate in the SCA with other funds managed by JNAM and Curian Capital, LLC, an affiliate of JNAM, in a credit facility which is used solely to finance shareholder redemptions or for other temporary or emergency purposes. The Funds may borrow up to the lesser of $300,000,000, the amount available under the facility; the limits set for borrowing by the Funds’ prospectuses and the 1940 Act; or an amount prescribed within the SCA. Interest on borrowings is payable at the Federal Funds Rate plus the amount by which the one month London Interbank Offer Rate (“LIBOR”) exceeds the Federal Funds rate plus 1.00% on an annualized basis. The Funds pay an annual commitment fee of 0.075% of the available commitments and an annual administration fee to JPM Chase. These expenses are allocated to the participating Funds based on each Fund’s net assets as a percentage of the participating Funds’ total net assets. No amounts were borrowed under the facility during the period. The fees are included in other expenses in each Fund’s Statement of Operations.
NOTE 9. INCOME TAX MATTERS
Each Fund is a separate taxpayer for federal income tax purposes. Each Fund intends to qualify as a regulated investment company (“RIC”) and to distribute substantially all net investment income and net capital gains, if any, to its shareholders and otherwise comply with Subchapter M of the Internal Revenue Code of 1986, as amended, applicable to regulated investment companies. Therefore, no federal income tax provision is required. Under current tax law, interest, dividends and capital gains paid by the Funds are not currently taxable to shareholders when left to accumulate within a variable annuity contract or variable life insurance policies.
The following information is presented on an income tax basis. Differences between amounts for financial statements and federal income tax purposes are primarily due to timing and character differences in recognizing certain gains and losses on investment transactions. Permanent differences between financial statement and federal income tax reporting are reclassified within the capital accounts based on their federal income tax treatment. Temporary differences do not require reclassification. Permanent differences may include but are not limited to the following: expired capital loss carryforwards, paydown reclassifications, non-deductible offering costs and distribution adjustments. These reclassifications have no impact on net assets.
| | Net Increase (Decrease) | |
| | Undistributed
Net Investment
Income | | Accumulated
Net Realized
Gain (Loss) | | Paid-in Capital | |
JNL/PPM America Low Duration Bond Fund | | $ | 195,363 | | $ | (11,558 | ) | $ | (183,805 | ) |
JNL/PPM America Total Return Fund | | 1,797,832 | | (1,797,832 | ) | — | |
JNL Money Market Fund | | 130,017 | | (130,017 | ) | — | |
| | | | | | | | | | |
At December 31, 2013, the Funds did not have any capital loss carryovers for U.S. federal income tax purposes.
JNL Investors Series Trust
Notes to Financial Statements
December 31, 2013
At December 31, 2013, the Funds had no capital, currency and/or PFIC mark-to-market losses realized after October 31, 2013 (“Post-October losses”).
As of December 31, 2013, the cost of investments and the components of net unrealized appreciation/(depreciation) were as follows:
| | Tax Cost of
Investments | | Gross
Unrealized
Appreciation | | Gross
Unrealized
Depreciation | | Net Unrealized
Appreciation/
(Depreciation) | |
JNL/PPM America Low Duration Bond Fund | | $ | 441,414,718 | | $ | 808,543 | | $ | (820,111 | ) | $ | (11,568 | ) |
JNL/PPM America Total Return Fund | | 665,535,012 | | 10,858,749 | | (16,315,679 | ) | (5,456,930 | ) |
JNL Money Market Fund | | 2,480,397,376 | | — | | — | | — | |
| | | | | | | | | | | | | |
As of December 31, 2013, the components of distributable taxable earnings for U.S. federal income tax purposes were as follows:
| | Undistributed
Net Ordinary
Income* | | Undistributed
Net Long-Term
Capital Gain | | Unrealized
Gains
(Losses)** | | Capital Loss
Carryforward | |
JNL/PPM America Low Duration Bond Fund | | $ | 525,256 | | $ | 124,386 | | $ | (11,630 | ) | $ | — | |
JNL/PPM America Total Return Fund | | 17,982,413 | | 26,643 | | (6,462,525 | ) | — | |
JNL Money Market Fund | | 173,900 | | — | | (73,010 | ) | — | |
| | | | | | | | | | | | | |
* Undistributed net ordinary income consists of net taxable income derived from dividends, interest and net short-term capital gains, if any.
** Unrealized gains (losses) are adjusted for open wash sale loss deferrals and accelerated recognition of unrealized gain on certain futures contracts for federal income tax purposes.
The tax character of distributions paid during the Funds’ fiscal period ended December 31, 2013 was as follows:
| | Net Ordinary
Income* | | Long-term
Capital Gain** | |
JNL/PPM America Low Duration Bond Fund | | $ | 889,074 | | $ | — | |
JNL/PPM America Total Return Fund | | 23,379,552 | | 1,501,135 | |
JNL Money Market Fund | | 239,750 | | — | |
| | | | | | | |
* Net ordinary income consists of net taxable income derived from dividends, interest and net short-term capital gains, if any.
** The Funds designated as a long-term capital gain dividend, pursuant to the Internal Revenue code section 852(b)(3), the amount necessary to reduce earnings and profits of the Funds related to net capital gains to zero for the year ended December 31, 2013.
The tax character of distributions paid during the Funds’ fiscal year ended December 31, 2012 was as follows:
| | Net Ordinary
Income* | | Long-term
Capital Gain | |
JNL/PPM America Total Return Fund | | $ | 362,403 | | $ | — | |
JNL Money Market Fund | | 1,137,684 | | — | |
| | | | | | | |
* Net ordinary income consists of net taxable income derived from dividends, interest and net short-term capital gains, if any.
FASB ASC Topic 740 “Income Taxes” provides guidance for how uncertain tax positions should be recognized, measured, presented and disclosed in the financial statements. FASB ASC Topic 740 requires the evaluation of tax positions taken or expected to be taken in the course of preparing each Fund’s tax return to determine whether the tax positions are “more-likely-than-not” of being sustained by the applicable tax authority. Tax positions not deemed to meet the “more-likely-than-not” threshold would result in the Funds recording a tax expense in the current year. FASB ASC Topic 740 requires that management evaluate the tax positions taken in returns for 2010, 2011, 2012 and 2013, which remain subject to examination by the Internal Revenue Service and certain other jurisdictions. Management completed an evaluation of the Funds’ tax positions and based on that evaluation, determined that no provision for federal income tax was required in the Funds’ financial statements during the year ended December 31, 2013.
NOTE 10. SUBSEQUENT EVENTS
Management has evaluated subsequent events for the Funds through the date the financial statements are issued, and has concluded there are no events that require adjustments to the financial statements or disclosure in the notes.
Report of Independent Registered Public Accounting Firm
To the Shareholders and Board of Trustees
JNL Investors Series Trust:
We have audited the accompanying statements of assets and liabilities of JNL/PPM America Low Duration Bond Fund, JNL/PPM America Total Return Fund and JNL Money Market Fund (the “Funds”) (series of JNL Investors Series Trust), including the schedules of investments, as of December 31, 2013, and the related statements of operations for the year or period then ended, the statements of changes in net assets for the each of the years or periods in the two-year period then ended, and the financial highlights for each of the years or periods in the five-year period then ended. These financial statements and financial highlights are the responsibility of the Funds’ management. Our responsibility is to express an opinion on these financial statements and financial highlights based on our audits.
We conducted our audits in accordance with the standards of the Public Company Accounting Oversight Board (United States). Those standards require that we plan and perform the audit to obtain reasonable assurance about whether the financial statements and financial highlights are free of material misstatement. An audit includes examining, on a test basis, evidence supporting the amounts and disclosures in the financial statements. Our procedures included confirmation of securities owned as of December 31, 2013, by correspondence with the custodian and brokers or other appropriate auditing procedures. An audit also includes assessing the accounting principles used and significant estimates made by management, as well as evaluating the overall financial statement presentation. We believe that our audits provide a reasonable basis for our opinion.
In our opinion, the financial statements and financial highlights referred to above present fairly, in all material respects, the financial position of the Funds as of December 31, 2013, the results of their operations, changes in their net assets and the financial highlights for each of the years or periods indicated above, in conformity with U.S. generally accepted accounting principles.
/s/ KPMG LLP | |
| |
Chicago, Illinois | |
February 28, 2014 | |
JNL Investors Series Trust
Additional Disclosures (Unaudited)
December 31, 2013
Disclosure of Fund Expenses
Shareholders incur ongoing costs, which include costs for portfolio management, administrative services, Rule 12b-1 fees and other operating expenses. Operating expenses such as these are deducted from each Fund’s gross income and directly reduce the final investment return. These expenses are expressed as a percentage of the Fund’s average net assets; this percentage is known as the Fund’s expense ratio. The examples below use the expense ratio and are intended to help the investor understand the ongoing costs (in dollars) of investing in a Fund and to compare these costs with the ongoing costs of investing in other mutual funds. The examples are based on an investment of $1,000 made at the beginning of the period shown and held for the entire period.
Expenses Using Actual Fund Return. This section provides information about the actual account values and actual expenses incurred by the Fund. Use the information in this section, together with the amount invested, to estimate the expenses paid over the period. Simply divide the account value by $1,000 (for example, an $8,600 account value divided by $1,000 = 8.6), then multiply the result by the number in the first section under the heading entitled “Expenses Paid During Period” to estimate the expenses paid during this period.
Expenses Using Hypothetical 5% Return. This section provides information that can be used to compare each Fund’s costs with those of other mutual funds. It assumes that the Fund’s expense ratio for the period is unchanged and assumes an annual 5% return before expenses, which is not the Fund’s actual return. This example is useful in making comparisons because the U.S. Securities and Exchange Commission SEC requires all mutual funds to make the 5% calculation.
| | Expenses Using Actual Fund Return | | Expenses Using Hypothetical 5% Return | |
| | Beginning
Account
Value
7/01/2013 | | Ending
Account
Value
12/31/2013 | | Annualized
Expense
Ratios | | Expenses
Paid
During
Period† | | Beginning
Account
Value
7/01/2013 | | Ending
Account
Value
12/31/2013 | | Annualized
Expense
Ratios | | Expenses
Paid
During
Period†† | |
JNL/PPM America Low Duration Bond Fund * Class A | | $ | 1,000.00 | | $ | 1,004.10 | | 0.75 | % | $ | 2.20 | | $ | 1,000.00 | | $ | 1,021.43 | | 0.75 | % | $ | 3.82 | |
JNL/PPM America Total Return Fund Class A | | 1,000.00 | | 1,027.20 | | 0.80 | | 4.09 | | 1,000.00 | | 1,021.17 | | 0.80 | | 4.08 | |
JNL Money Market Fund Institutional Class | | 1,000.00 | | 1,000.00 | | 0.18 | | 0.91 | | 1,000.00 | | 1,024.30 | | 0.18 | | 0.92 | |
| | | | | | | | | | | | | | | | | | | | | | | |
* Fund has less than 6-month’s operating history. For Funds with less than 6-month’s operating history, the amounts reported under Expenses Using Hypothetical 5% Return are not comparable to the amounts reported in Expenses Using Actual Fund Return.
† For Funds with at least 6-month operating history, expenses paid during the period are equal to the annualized net expense ratio, multiplied by the average account value over the period, then multiplied by 184/365 (to reflect the most recent 6-month period). For the Fund with less than 6-month’s operating history, expenses paid during the period are equal to the annualized net expenses ratio, multiplied by the average account value over the period since inception, then multiplied by 107/365 (to reflect the period since the Fund’s inception).
†† Expenses paid during the period are equal to the annualized net expense ratio, multiplied by the average account value over the period, then multiplied by 184/365 (to reflect the most recent 6-month period).
Quarterly Portfolio Holdings
The Funds file a complete schedule of portfolio holdings with the SEC for the first and third quarters of each fiscal year on Form N-Q. The Funds’ Forms N-Q are available on the SEC’s website at www.sec.gov. The Forms N-Q may be reviewed and copied at the SEC’s Public Reference Room in Washington, DC, and information on the operation of the Public Reference Room may be obtained by calling 800-SEC-0330. It is also available upon request from the registrant by calling the Funds toll-free at 1-866-255-1935.
Proxy Voting Policies and Procedures
A description of the Policy of the Funds’ Adviser (and sub-advisers) used to vote proxies relating to the portfolio securities and information on how the Funds voted proxies relating to portfolio securities during the 12-month period ended June 30, 2013, are available (1) without charge, upon request by calling 1-800-392-2909; (2) on Jackson National Life Insurance Company’s or Jackson National Life Insurance Company of New York’s website at www.jackson.com; and (3) on the SEC’s website at www.sec.gov.
TRUSTEES AND OFFICERS OF JNL INVESTORS SERIES TRUST (“TRUST”)
NAME, ADDRESS AND (AGE) | | POSITION(S) HELD WITH TRUST
(LENGTH OF TIME SERVED) | | NUMBER OF PORTFOLIOS IN FUND COMPLEX TO
BE OVERSEEN BY TRUSTEE | |
Interested Trustee | | | | | |
Mark D. Nerud (47)(1) | | Trustee (2) | | 108 | |
1 Corporate Way | | (01/2007 to present) | | | |
Lansing, MI 48951 | | | | | |
| | President and Chief Executive Officer | | | |
| | (12/2006 to present) | | | |
PRINCIPAL OCCUPATION(S) DURING PAST 5 YEARS:
Chief Executive Officer of the Adviser (01/2010 to present); President of the Adviser (01/2007 to present); Managing Board Member of Curian Capital, LLC (01/2011 to present) and Curian Clearing LLC (01/2011 to present); Managing Board Member of the Adviser (11/2000 to 11/2003) (01/2007 to 12/2010); President and CEO of other Investment Companies advised by the Adviser (12/2006 to present); Vice President — Fund Accounting & Administration of Jackson National Life Insurance Company (01/2000 to 12/2009)
OTHER DIRECTORSHIPS HELD BY TRUSTEE DURING PAST 5 YEARS: None
Disinterested Trustees | | | | | |
Michael Bouchard (57) | | Trustee (2) | | 108 | |
1 Corporate Way | | (12/2003 to present) | | | |
Lansing, MI 48951 | | | | | |
PRINCIPAL OCCUPATION(S) DURING PAST 5 YEARS:
Sheriff, Oakland County, Michigan (01/1999 to present)
OTHER DIRECTORSHIPS HELD BY TRUSTEE DURING PAST 5 YEARS: None
Ellen Carnahan (58) | | Trustee (2) | | 108 | |
1 Corporate Way | | (12/2013 to present) | | | |
Lansing, MI 48951 | | | | | |
PRINCIPAL OCCUPATION(S) DURING PAST 5 YEARS:
Principal, Machrie Enterprises LLC (07/07 to present)
OTHER DIRECTORSHIPS HELD BY TRUSTEE DURING PAST 5 YEARS:
Director, Integrys Energy Group (05/2003 to present); Governance Committee Member and Chair, Integrys Energy Group (05/2010 to 05/2013); Finance Committee Member, Integrys Energy Group (05/2003 to 2012); Audit Committee Member, Integrys Energy Group (12/2003 to present); Environmental Committee Member, Integrys Energy Group (05/2013 to present)
William J. Crowley, Jr. (68) | | Trustee (2), (5) | | 108 | |
1 Corporate Way | | (01/2007 to present) | | | |
Lansing, MI 48951 | | | | | |
PRINCIPAL OCCUPATION(S) DURING PAST 5 YEARS:
Board Member of various corporate boards (see below) (2002 to present)
OTHER DIRECTORSHIPS HELD BY TRUSTEE DURING PAST 5 YEARS:
Director of Alpha Natural Resources (07/2009 to present); Director of Foundation Coal Holdings, Inc. (from 12/2004 until 07/2009 when the company was acquired); Director of Provident Bankshares Corporation (from 05/2003 until 05/2009 when the company was acquired)
TRUSTEES AND OFFICERS OF JNL INVESTORS SERIES TRUST (“TRUST”)
NAME, ADDRESS AND (AGE) | | POSITION(S) HELD WITH TRUST
(LENGTH OF TIME SERVED) | | NUMBER OF PORTFOLIOS IN FUND COMPLEX TO
BE OVERSEEN BY TRUSTEE | |
Disinterested Trustees | | | | | |
Dominic D’Annunzio (75) | | Trustee (2) | | 108 | |
1 Corporate Way | | (02/2002 to 12/2013)(4) | | | |
Lansing, MI 48951 | | | | | |
| | Chairman of the Board | | | |
| | (2/2004 to 12/2010) | | | |
PRINCIPAL OCCUPATION(S) DURING PAST 5 YEARS:
Acting Commissioner of Insurance for the State of Michigan (01/1990 to 05/1990) and (08/1997 to 05/1998)
OTHER DIRECTORSHIPS HELD BY TRUSTEE DURING PAST 5 YEARS: None
Michelle Engler (55) | | Chair of the Board(3) | | 108 | |
1 Corporate Way | | (01/2011 to 12/2013)(5) | | | |
Lansing, MI 48951 | | | | | |
| | Trustee (2) | | | |
| | (12/2003 to present) | | | |
PRINCIPAL OCCUPATION(S) DURING PAST 5 YEARS:
Attorney (1983 to present)
OTHER DIRECTORSHIPS HELD BY TRUSTEE DURING PAST 5 YEARS:
Director of Federal Home Loan Mortgage Corporation (2001 to 9/2008)
John Gillespie (60) | | Trustee (2) | | 108 | |
1 Corporate Way | | (12/2013 to present) | | | |
Lansing, MI 48951 | | | | | |
PRINCIPAL OCCUPATION(S) DURING PAST 5 YEARS:
Investor, Business Writer and Advisor (2006 to present); Entrepreneur-in-Residence, UCLA Office of Intellectual Property (2013 to present)
OTHER DIRECTORSHIPS HELD BY TRUSTEE DURING PAST 5 YEARS: None
James Henry, Ph.D. (75) | | Trustee (2) | | 108 | |
1 Corporate Way | | (01/2007 to 12/2013)(4) | | | |
Lansing, MI 48951 | | | | | |
PRINCIPAL OCCUPATION(S) DURING PAST 5 YEARS:
Dean Emeritus and Professor of Finance, Eli Broad College of Business and Graduate School of Management at Michigan State University (2001 to 07/2009)
OTHER DIRECTORSHIPS HELD BY TRUSTEE DURING PAST 5 YEARS: None
Richard McLellan (71) | | Trustee (2) | | 108 | |
1 Corporate Way | | (12/1994 to 12/2013) | | | |
Lansing, MI 48951 | | | | | |
PRINCIPAL OCCUPATION(S) DURING PAST 5 YEARS:
Attorney (2010 to present); Adjunct Associate Professor, Michigan State University (2008 to present); Senior Counsel, Dykema Gossett PLLC (2007 to 2009)
OTHER DIRECTORSHIPS HELD BY TRUSTEE DURING PAST 5 YEARS:
Member of the Board of Directors of ITC Holdings Corp. (11/2007 to 08/2012)
TRUSTEES AND OFFICERS OF JNL INVESTORS SERIES TRUST (“TRUST”)
NAME, ADDRESS AND (AGE) | | POSITION(S) HELD WITH TRUST
(LENGTH OF TIME SERVED) | | NUMBER OF PORTFOLIOS IN FUND COMPLEX TO
BE OVERSEEN BY TRUSTEE | |
Disinterested Trustees | | | | | |
William R. Rybak (62) | | Trustee (2) | | 108 | |
1 Corporate Way | | (01/2007 to present) | | | |
Lansing, MI 48951 | | | | | |
PRINCIPAL OCCUPATION(S) DURING PAST 5 YEARS:
Board Member of various corporate boards (see below) (2002 to present)
OTHER DIRECTORSHIPS HELD BY TRUSTEE DURING PAST 5 YEARS:
Member of the Board of Directors of Christian Brothers Investments, Inc. (2010 to present); Member of the Board of Trustees of Lewis University (10/2012 to present), Chairman of the Board of Trustees of Lewis University (1982 — 2009) and Chair Emeritus (2009 to present); Member of the Board of Directors of Howe Barnes Hoefer Arnett (2001 to 03/2011); Member of the Boards of each of the Calamos Mutual Funds (2002 to present); Member of the Board of Directors of The PrivateBancorp (2003 to present)
Edward Wood (57) | | Trustee (2) | | 108 | |
1 Corporate Way | | (12/2013 to present) | | | |
Lansing, MI 48951 | | | | | |
PRINCIPAL OCCUPATION(S) DURING PAST 5 YEARS:
Chief Operating Officer, McDonnell Investment Management, LLC (08/2010 to present); Managing Director, Morgan Stanley Investment Management (06/2010 to 01/2011); President & Principal Executive Officer of the Van Kampen Funds, Van Kampen/Morgan Stanley (12/2008 to 05/2010; Chief Administrative Officer, Van Kampen Investments (01/2008 to 05/2010); Chief Operating Officer, Van Kampen Funds Inc. (01/2008 to 05/2010)
OTHER DIRECTORSHIPS HELD BY TRUSTEE DURING PAST 5 YEARS: None
Patricia A. Woodworth (58) | | Trustee (2) | | 108 | |
1 Corporate Way | | (01/2007 to present) | | | |
Lansing, MI 48951 | | | | | |
PRINCIPAL OCCUPATION(S) DURING PAST 5 YEARS:
Vice President, Chief Financial Officer and Chief Operating Officer, The J. Paul Getty Trust (12/2007 to present)
OTHER DIRECTORSHIPS HELD BY TRUSTEE DURING PAST 5 YEARS: None
Officers | | | | | |
Danielle A. Bergandine (33) | | Anti-Money Laundering Officer | | Not Applicable | |
1 Corporate Way | | (12/2007 to present) | | | |
Lansing, MI 48951 | | | | | |
PRINCIPAL OCCUPATION(S) DURING PAST 5 YEARS:
Senior Compliance Analyst of the Adviser (6/2009 to present); Anti-Money Laundering Officer of other Investment Companies advised by Curian Capital, LLC (10/2011 to present)
Karen J. Buiter (48) | | Assistant Treasurer | | Not Applicable | |
1 Corporate Way | | (12/2008 to present) | | | |
Lansing, MI 48951 | | | | | |
PRINCIPAL OCCUPATION(S) DURING PAST 5 YEARS:
Vice President — Financial Reporting of the Adviser (07/2011 to present); Assistant Vice President — Financial Reporting of the Adviser (04/2008 to 06/2011); Assistant Treasurer of other Investment Companies advised by the Adviser (12/2008 to present); Assistant Treasurer of other Investment Companies advised by Curian Capital, LLC (11/2010 to present)
TRUSTEES AND OFFICERS OF JNL INVESTORS SERIES TRUST (“TRUST”)
NAME, ADDRESS AND (AGE) | | POSITION(S) HELD WITH TRUST
(LENGTH OF TIME SERVED) | | NUMBER OF PORTFOLIOS IN FUND COMPLEX TO
BE OVERSEEN BY TRUSTEE | |
Officers | | | | | |
Kelly L. Crosser (41) | | Assistant Secretary | | Not Applicable | |
1 Corporate Way | | (09/2007 to present) | | | |
Lansing, MI 48951 | | | | | |
PRINCIPAL OCCUPATION(S) DURING PAST 5 YEARS:
Assistant Secretary of other Investment Companies advised by the Adviser (09/2007 to present); Assistant Secretary of other Investment Companies advised by Curian Capital, LLC (11/2010 to present); Senior Compliance Analyst of Jackson National Life Insurance Company (04/2007 to 12/2013); Manager, Jackson National Life Insurance Company (12/2013 to present)
Steven J. Fredricks (43) | | Chief Compliance Officer | | Not Applicable | |
1 Corporate Way | | (01/2005 to present) | | | |
Lansing, MI 48951 | | | | | |
PRINCIPAL OCCUPATION(S) DURING PAST 5 YEARS:
Chief Compliance Officer of the Adviser and other Investment Companies advised by the Adviser (01/2005 to present); Chief Compliance Officer of other Investment Companies advised by Curian Capital, LLC (10/2011 to 05/2012)
William Harding (39) | | Vice President | | Not Applicable | |
1 Corporate Way | | (11/2012 to present) | | | |
Lansing, MI 48951 | | | | | |
PRINCIPAL OCCUPATION(S) DURING PAST 5 YEARS:
Vice President of the Adviser (10/2012 to present); Vice President of other Investment Companies advised by the Adviser (11/2012 to present); Head of Manager Research, Morningstar Associates (08/2011 to 10/2012); Director of Research, Morningstar Investment Services (01/2007 to 08/2011)
Daniel W. Koors (43) | | Vice President | | Not Applicable | |
1 Corporate Way | | (12/2006 to present) | | | |
Lansing, MI 48951 | | | | | |
PRINCIPAL OCCUPATION(S) DURING PAST 5 YEARS:
Senior Vice President of the Adviser (01/2009 to present) and Chief Operating Officer of the Adviser (04/2011 to present); Chief Financial Officer of the Adviser (01/2007 to 04/2011); Treasurer and Chief Financial Officer of the Trust (12/2006 to 11/2011); Treasurer and Chief Financial Officer (Principal Financial Officer) of other Investment Companies advised by Curian Capital, LLC (11/2010 to present); Vice President of the Adviser (01/2007 to 12/2008); Vice President of other Investment Companies advised by the Adviser (12/2006 to present); Treasurer and Chief Financial Officer of other Investment Companies advised by the Adviser (12/2006 to 11/2011)
Kristen K. Leeman (38) | | Assistant Secretary | | Not Applicable | |
1 Corporate Way | | (08/2012 to present) | | | |
Lansing, MI 48951 | | | | | |
PRINCIPAL OCCUPATION(S) DURING PAST 5 YEARS:
Assistant Secretary of other Investment Companies advised by the Adviser (06/2012 to present); Senior Paralegal of Jackson National Life Insurance Company (03/2006 to present)
TRUSTEES AND OFFICERS OF JNL INVESTORS SERIES TRUST (“TRUST”)
NAME, ADDRESS AND (AGE) | | POSITION(S) HELD WITH TRUST
(LENGTH OF TIME SERVED) | | NUMBER OF PORTFOLIOS IN FUND COMPLEX TO
BE OVERSEEN BY TRUSTEE | |
Officers | | | | | |
Gerard A. M. Oprins (54) | | Vice President (06/2012 to present) | | Not Applicable | |
1 Corporate Way | | Treasurer and Chief Financial Officer (11/2011 to present) | | | |
Lansing, MI 48951 | | | | |
PRINCIPAL OCCUPATION(S) DURING PAST 5 YEARS:
Senior Vice President and Chief Financial Officer of the Adviser (04/2011 to present); Vice President of other funds sponsored by Curian Capital, LLC that are in the same group of other investment companies advised by JNAM (03/2012 to present); Business Consultant (2009 to 03/2011)
Michael Piszczek (56) | | Vice President | | Not Applicable | |
1 Corporate Way | | (11/2007 to present) | | | |
Lansing, MI 48951 | | | | | |
PRINCIPAL OCCUPATION(S) DURING PAST 5 YEARS:
Vice President — Tax of the Adviser (07/2011 to present); Assistant Vice President — Tax of the Adviser (11/2007 to 06/2011); Vice President of other Investment Companies advised by the Adviser (11/2007 to present); Vice President of other Investment Companies advised by Curian Capital, LLC (11/2010 to present)
Susan S. Rhee (42) | | Vice President, Counsel and Secretary | | Not Applicable | |
1 Corporate Way | | (02/2004 to present) | | | |
Lansing, MI 48951 | | | | | |
PRINCIPAL OCCUPATION(S) DURING PAST 5 YEARS:
Senior Vice President and General Counsel of the Adviser (01/2010 to present); Chief Legal Officer (07/2004 to 12/2009) and Secretary (11/2000 to present) of the Adviser; Vice President, Counsel (Chief Legal Officer) and Secretary of other Investment Companies advised by Curian Capital, LLC (11/2010 to present); Vice President, Counsel, and Secretary of other Investment Companies advised by the Adviser (02/2004 to present)
(1) Mr. Nerud is an “interested person” of the Trust due to his position with Jackson National Asset Management, LLC, the Adviser.
(2) The interested and disinterested Trustees are elected to serve for an indefinite term.
(3) Beginning January 1, 2011, the Chairperson shall serve as Chairperson for no more than three consecutive years and may not be re-elected as Chairperson until at least one year has elapsed since the end of the Chairperson’s term.
(4) Trustees D’Annunzio and Henry retired from service on the Board as of December 31, 2013.
(5) Trustee Engler’s tenure as Chairperson ended as of December 31, 2013. Trustee Crowley was elected as Chairperson effective January 1, 2014.
You can obtain a copy of the current Statement of Additional Information or the most recent Annual or Semi-Annual Reports without charge, by calling 1-800-392-2909, or writing the JNL Investors Series Trust Service Center, 225 W. Wacker Drive, Suite 1200, Chicago, IL 60606.
TRUSTEES AND OFFICERS OF JNL INVESTORS SERIES TRUST (THE “TRUST”)
The interested Trustee and the Officers of the Trust (other than the Chief Compliance Officer, as described below) or the Adviser do not receive any compensation from the Trust for their services as Trustees or Officers. The following persons, who are disinterested Trustees of the Trust, and the Trust’s Chief Compliance Officer, received from the Trust the compensation amounts indicated for the services as such for the twelve-month period ended December 31, 2013:
TRUSTEE | | AGGREGATE COMPENSATION
FROM THE TRUST(1) | | PENSION OR
RETIREMENT BENEFITS
ACCRUED AS PART OF
TRUST EXPENSES | | ESTIMATED
ANNUAL BENEFITS
UPON RETIREMENT | | TOTAL COMPENSATION
FROM THE TRUST AND
FUND COMPLEX | |
Michael Bouchard | | $ | 5,429 | | $ | 0 | | $ | 0 | | $ | 190,000 | (4) |
Ellen Carnahan(11) | | $ | 623 | | $ | 0 | | $ | 0 | | $ | 21,793 | (5) |
William J. Crowley, Jr. | | $ | 6,000 | | $ | 0 | | $ | 0 | | $ | 210,000 | (6) |
Dominic D’Annunzio(12) | | $ | 5,429 | | $ | 0 | | $ | 0 | | $ | 190,000 | (7) |
Michelle Engler (3) | | $ | 6,857 | | $ | 0 | | $ | 0 | | $ | 240,000 | |
John Gillespie(11) | | $ | 623 | | $ | 0 | | $ | 0 | | $ | 21,793 | |
James Henry(12) | | $ | 5,572 | | $ | 0 | | $ | 0 | | $ | 195,000 | (8) |
Richard McLellan | | $ | 5,357 | | $ | 0 | | $ | 0 | | $ | 187,500 | |
William R. Rybak | | $ | 5,857 | | $ | 0 | | $ | 0 | | $ | 205,000 | |
Edward Wood(11) | | $ | 623 | | $ | 0 | | $ | 0 | | $ | 21,793 | (9) |
Patricia Woodworth | | $ | 5,429 | | $ | 0 | | $ | 0 | | $ | 190,000 | (10) |
Steven J. Fredricks (2) | | $ | 10,338 | | $ | 0 | | $ | 0 | | $ | 361,800 | |
(1) The fees paid to the independent Trustees are paid for combined service on the Boards of the Trust, JNL Series Trust, JNL Variable Fund LLC, and JNL Strategic Income Fund LLC (the “Fund Complex”). The fees are allocated to the Funds and affiliated investment companies on a pro-rata basis based on net assets. The total fees to all the independent Trustees are $1,672,880.
(2) Mr. Fredricks’ compensation is paid by the Funds for his duties as the Chief Compliance Officer of the Fund Complex. The expense is allocated to the Funds and affiliated investment companies on a pro-rata basis based on net assets.
(3) Ms. Engler was an ex officio member of the Governance Committee until December 31, 2013. Therefore, she did not receive any compensation as a member of the Governance Committee.
(4) Amount includes $2,375 deferred by Mr. Bouchard.
(5) Amount includes $10,897 deferred by Ms. Carnahan.
(6) Amount includes $177,488 deferred by Mr. Crowley.
(7) Amount includes $95,000 deferred by Mr. D’Annunzio.
(8) Amount includes $175,000 deferred by Mr. Henry.
(9) Amount includes $21,793 deferred by Mr. Wood.
(10) Amount includes $95,000 deferred by Ms. Woodworth.
(11) Ms. Carnahan, Mr. Gillespie and Mr. Wood were elected as independent Trustees of the Board effective December 1, 2013.
(12) Messrs. D’Annunzio and Henry retired from service from the Board of the Fund Complex effective December 31, 2013.
Item 2. Code of Ethics.
As of the end of the period covered by this report, the registrant had adopted a code of ethics, as defined in Item 2 of Form N-CSR, applicable to its principal executive officer, principal financial officer, principal accounting officer or controller, or persons performing similar functions. There were no substantive amendments or any waivers to this code of ethics during the period covered by this report. A copy of this code of ethics is filed as exhibit 12(a)(1) to this Form N-CSR.
Item 3. Audit Committee Financial Expert.
The registrant has named William J. Crowley, Jr. as an Audit Committee financial expert serving on its Audit Committee. William J. Crowley, Jr. is not an “interested person” of the Trust, as that term is defined by Section 2(a)(19) of the Investment Company Act of 1940, as amended, and is considered “independent” for purposes of this Item.
An “audit committee financial expert” is not an “expert” for any purpose, including for purposes of Section 11 of the Securities Act of 1933, as amended, as a result of being designated as an “audit committee financial expert.” Further, the designation of a person as an “audit committee financial expert” does not mean that the person has any greater duties, obligations, or liability than those imposed on the person without the “audit committee financial expert” designation. Similarly, the designation of a person as an “audit committee financial expert” does not affect the duties, obligations, or liability of any other member of the Audit Committee or Board of Trustees.
Item 4. Principal Accountant Fees and Services.
(a)-(d)
In accordance with the terms of the Trust’s Amended and Restated Administration Agreement dated December 15, 2006, for the JNL Money Market Fund, JNAM, the Fund’s administrator, was responsible for the payment of all expenses associated with the annual audit and other required services of the independent registered public accounting firm, and all expenses associated with the preparation and filing of the tax returns. Effective September 28, 2009, the Amended and Restated Administration Agreement was entered into by and between JNAM and the Trust, such that the Trust will also pay the aforementioned expenses for the JNL/PPM America Total Return Fund on a go-forward basis.
KPMG LLP (“KPMG”) was appointed by the Board of Trustees as the independent registered public accounting firm of the registrant for the fiscal years ended December 31, 2012 and December 31, 2013. The following table sets forth aggregate fees billed by KPMG for the respective period for professional services rendered to the registrant.
Fees for Services Rendered to the Registrant by KPMG
Fiscal Year | | Audit Fees | | Audit-Related Fees | | Tax Fees | | All Other Fees | |
2012 | | $ | 21,520 | | $ | 0 | | $ | 4,400 | | $ | 0 | |
2013 | | $ | 39,306 | | $ | 0 | | $ | 11,957 | | $ | 0 | |
The above Tax Fees for 2012 and 2013 are the aggregate fees billed for professional services by KPMG to the registrant for tax compliance, tax advice, and tax return review.
Fees for Services Rendered to Adviser Entities by KPMG
The following table sets forth the amount of fees that were billed by KPMG for the respective period to any entity controlling, controlled by, or under common control with the investment adviser that provided ongoing services to the registrant (“Adviser Entities”) that were directly related to the registrant’s operations and financial reporting.
Fiscal Year | | Audit-Related Fees | | Tax Fees | | All Other Fees | |
2012 | | $ | 124,084 | | $ | 14,500 | | $ | 0 | |
2013 | | $ | 128,954 | | $ | 10,000 | | $ | 0 | |
The above Audit-Related Fees are the aggregate fees billed to Adviser Entities for the performance of an internal control review pursuant to Statement on Standards for Attestation Engagements No. 16 of the registrant’s adviser and administrator and an audit of a non-registered affiliated investment company.
The above Tax Fees for 2012 and 2013 are the aggregate fees billed for professional services by KPMG to Adviser Entities for tax compliance, tax advice, and tax return review.
(e)(1) The Audit Committee is authorized to pre-approve non-audit services provided by the registrant’s auditors, if they find it appropriate in light of their fiduciary duties and in the exercise of their good faith business judgment and compatible with the auditors’ independence. The Chairman of the Audit Committee is authorized to approve audit and non-audit services for newly established Funds of the registrant on the same terms as the full Audit Committee previously had approved for the then existing Funds.
(e)(2) 0%
(f) Not applicable.
(g) As detailed in the tables above, the aggregate fees billed for all non-audit fees to the registrant and Adviser Entities for the fiscal year ended December 31, 2012, was $142,984. As detailed in the tables above, the aggregate fees billed for all non-audit fees to the registrant and Adviser Entities for the fiscal year ended December 31, 2013 was $150,911.
(h) For the fiscal years ended December 31, 2012 and December 31, 2013, the Audit Committee of the registrant’s Board of Trustees considered the provision of non-audit services that were rendered to the Adviser Entities that were not pre-approved pursuant to paragraph (c)(7)(ii) of Rule 2-01 of Regulation S-X, and concluded that such services were compatible with maintaining KPMG’s independence.
Item 5. Audit Committee of Listed Registrants.
Not applicable.
Item 6. Investments.
(a) Included as a part of the report to shareholders filed under Item 1.
(b) Not applicable.
Item 7. Disclosure of Proxy Voting Policies and Procedures for Closed-End Management Investment Companies.
Not applicable.
Item 8. Portfolio Managers of Closed-End Management Investment Companies.
Not applicable.
Item 9. Purchases of Equity Securities by Closed-End Management Investment Company and Affiliated Purchasers.
Not applicable.
Item 10. Submission of Matters to a Vote of Security Holders.
No material changes have been made.
Item 11. Controls and Procedures.
(a) The registrant maintains disclosure controls and procedures that are designed to ensure that information required to be disclosed in the registrant’s filings under the Securities Exchange Act of 1934, as amended, and the Investment Company Act of 1940, as amended, is recorded, processed, summarized, and reported within the periods specified in the rules and forms of the U.S. Securities and Exchange Commission. Such information is accumulated and communicated to the registrant’s management, including its principal executive officer and principal financial officer, as appropriate, to allow timely decisions regarding required disclosure. The registrant’s management, including the principal executive officer and the principal financial officer, recognizes that any set of controls and procedures, no matter how well designed and operated, can provide only reasonable assurance of achieving the desired control objectives.
Within ninety (90) days prior to the filing date of this report on Form N-CSR, the registrant had carried out an evaluation, under the supervision and with the participation of the registrant’s management, including the registrant’s principal executive officer and the registrant’s principal financial officer, of the effectiveness of the design and operation of the registrant’s disclosure controls and procedures. Based on such evaluation, the registrant’s principal executive officer and principal financial officer concluded that the registrant’s disclosure controls and procedures are effective.
(b) There have been no significant changes in the registrant’s internal controls over financial reporting during the registrant’s second fiscal quarter of the period covered by this report that have materially affected, or are reasonably likely to materially affect, the registrant’s internal controls over financial reporting. There have been no significant changes in the registrant’s internal controls or in other factors that could significantly affect the internal controls subsequent to the date of their evaluation in connection with the preparation of this report on Form N-CSR.
Item 12. Exhibits.
(a) | (1) Code of Ethics pursuant to Section 406 of the Sarbanes-Oxley Act of 2002 (as defined in Item 2(b) of Form N-CSR) is attached hereto. |
| (2) The certifications required by Rule 30a-2(a) under the Investment Company Act of 1940, as amended, are attached hereto. |
| (3) Not applicable. |
| |
(b) | The certification required by Rule 30a-2(b) under the Investment Company Act of 1940, as |
| amended, is attached hereto. |
SIGNATURES
Pursuant to the requirements of the Securities Exchange Act of 1934, as amended, and the Investment Company Act of 1940, as amended, the registrant has duly caused this report to be signed on its behalf by the undersigned, thereunto duly authorized.
JNL Investors Series Trust | |
| |
| |
By: | /s/ Mark D. Nerud | |
| Mark D. Nerud | |
| Principal Executive Officer | |
| |
Date: | March 6, 2014 | |
Pursuant to the requirements of the Securities Exchange Act of 1934, as amended, and the Investment Company Act of 1940, as amended, this report has been signed below by the following persons on behalf of the registrant and in the capacities and on the dates indicated.
By: | /s/ Mark D. Nerud | |
| Mark D. Nerud | |
| Principal Executive Officer | |
| | |
Date: | March 6, 2014 | |
| | |
| | |
By: | /s/ Gerard A.M. Oprins | |
| Gerard A.M. Oprins | |
| Principal Financial Officer | |
| | |
Date: | March 6, 2014 | |
EXHIBIT LIST
Exhibit 12(a)(1) | | Registrant’s Code of Ethics pursuant to Section 406 of the Sarbanes-Oxley Act of 2002. |
| | |
Exhibit 12(a)(2) | | Certification of the Principal Executive Officer required by Rule 30a-2(a) under the Investment Company Act of 1940, as amended. |
| | |
| | Certification of the Principal Financial Officer required by Rule 30a-2(a) under the Investment Company Act of 1940, as amended. |
| | |
Exhibit 12(b) | | Certification required by Rule 30a-2(b) under the Investment Company Act of 1940, as amended. |