UNITED STATES
SECURITIES AND EXCHANGE COMMISSION
Washington, DC 20549
FORM N-CSR
CERTIFIED SHAREHOLDER REPORT OF REGISTERED
MANAGEMENT INVESTMENT COMPANIES
Investment Company Act file number: 811-10041
JNL Investors Series Trust
(Exact name of registrant as specified in charter)
1 Corporate Way, Lansing, Michigan 48951
(Address of principal executive offices) (Zip code)
225 West Wacker Drive, Suite 1200, Chicago, Illinois 60606
(Mailing address)
Steven J. Fredricks
Jackson National Asset Management, LLC
225 West Wacker Drive, Suite 1200
Chicago, Illinois 60606
(Name and address of agent for service)
Registrant’s telephone number, including area code: (312) 338-5800
Date of fiscal year end: December 31
Date of reporting period: December 31, 2011
Form N-CSR is to be used by management investment companies to file reports with the Commission not later than 10 days after the transmission to stockholders of any report that is required to be transmitted to stockholders under Rule 30e-1 under the Investment Company Act of 1940 (17 CFR 270.30e-1). The Commission may use the information provided on Form N-CSR in its regulatory, disclosure review, inspection, and policymaking roles.
A registrant is required to disclose the information specified by Form N-CSR, and the Commission will make this information public. A registrant is not required to respond to the collection of information contained in Form N-CSR unless the Form displays a currently valid Office of Management and Budget (“OMB”) control number. Please direct comments concerning the accuracy of the information collection burden estimate and any suggestions for reducing the burden to Secretary, Securities and Exchange Commission, 450 Fifth Street, NW, Washington, DC 20549-0609. The OMB has reviewed this collection of information under the clearance requirements of 44 U.S.C. §3507.
Item 1. Report to Shareholders.
| | | | | | |
| | | |
| | | | Annual Report | | |
| | | | December 31, 2011 | | |
| | | |
| | | | • JNL® Investors Series Trust | | |
| | | | | | |
| | | | | | |
| | | | | | |
| | | | | | |
| | | | | | |
| | | | | | |
| | | | | | |
| | | | | | |
| | | | | | |
| | | | | | |
| | | | | | |
| | | | | | |
| | | | | | |
| | | | | | |
| | | | | | |
| | | | | | |
| | | | |

| | JNL PPM America Fund PPM America, Inc. | | |
Market Summary: The fixed income markets performed well for the two month period ended December 31, 2011. Long term interest rates declined during the period with yields on 5- and 30-year Treasuries falling by 0.13% and 0.24%, respectively. Long term interest rates declined because of continued concerns over the European debt crisis as well as the U.S. Federal Reserve’s (“Fed”) “Operation Twist.” Operation Twist entails the Fed selling $400 billion of short term Treasuries through June 2012 and using the proceeds to purchase longer maturity Treasuries.
For the period, the Barclays Capital U.S. Aggregate Bond Index returned 1.01%. Investment grade corporate bonds underperformed Treasuries
but the performance was quite choppy with weak relative performance in November but a partial recovery in December. Most of the relative performance of corporate bonds was driven by the European crisis as the crisis heated up in November but waned in December. Commercial mortgage backed securities (“CMBS”) outperformed Treasuries based on strong demand and a bottoming of the commercial real estate market while federal agency mortgage backed securities (“MBS”) returned approximately the same as Treasuries. High yield bonds underperformed investment grade bonds as the Barclays Capital High Yield Index returned 0.44% for the period.
JNL/PPM America Total Return Fund
| | |
Sector Weightings*: | | |
Financials | | 22.7% |
U.S. Government Agency MBS | | 19.3 |
Government Securities | | 7.2 |
Non-U.S. Government Agency ABS | | 6.8 |
Energy | | 6.0 |
Health Care | | 4.0 |
Materials | | 3.9 |
Consumer Discretionary | | 3.5 |
Utilities | | 2.6 |
Telecommunication Services | | 2.0 |
Industrials | | 1.0 |
Consumer Staples | | 0.9 |
Information Technology | | 0.7 |
Trust Preferred | | 0.3 |
Short Term Investments | | 19.6 |
| | |
Total Investments | | 100.0% |
| | |
* Total Investments at October 31,2011 |
Portfolio Manager Commentary: For the period from November 1, 2011 to December 31, 2011, the JNL/PPM America Total Return Fund underperformed
its benchmark by posting a return of 0.87% for Class A shares compared to 1.01% for the Barclays Capital U.S. Aggregate Bond Index.
The modest underperformance by the Fund can be attributed to the Funds operating and management expenses and also to an unfavorable sector allocation, primarily the Fund’s overweight in corporate bonds and underweight in Treasuries and federal agency MBS. Both investment grade and high yield corporate bonds underperformed higher quality bonds as the European crisis made investors risk averse. The Fund’s overweight in CMBS helped performance as CMBS was the best performing sector in the investment grade market. Finally, the Fund’s yield curve positioning hurt performance as the Fund was underweight longer term maturities
when the Fed announced “Operation Twist” and long term rates fell sharply.
We expect the economy to grow modestly during 2012 but economic growth will be choppy. Following a pattern that started at the end of the recession, there are likely to be quarters when the economy looks quite strong and other quarters where the economy looks like it may be close to another recession. This should lead to growth in the 2% range for 2012. The debt problems in Europe, uncertainty over growth in China and the U.S. presidential election are likely to result in continued market volatility. We believe inter-est rates will remain at fairly low levels based on modest economic growth, the Fed’s quantitative easing and low inflation. We expect to maintain the Fund’s current sector positioning with an overweight in both corporate bonds and CMBS. Current yields on both sectors are very attractive on a long term basis versus Treasuries and at least partially incorporate the risk of a recession. If the economy avoids a recession, the returns on both sectors could be quite strong relative to Treasuries.
JNL/PPM America Total Return Fund (Class A)
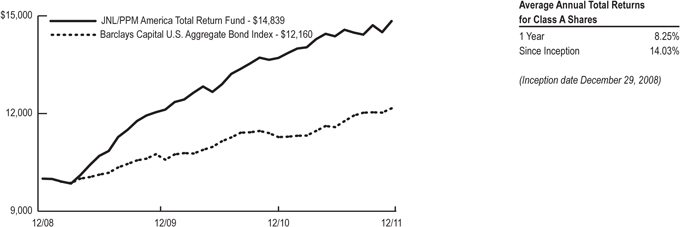
Past performance is not predictive of future performance. Investment return and principal value will fluctuate so that an investor’s shares, when redeemed, may be worth more or less than their original cost. Performance numbers are net of all Fund operating expenses.
JNL Investors Series Trust
Schedules of Investments
December 31, 2011
| | | | | | | | |
| | | Shares/Par | | | Value | |
| JNL/PPM America Total Return Fund | |
NON-U.S. GOVERNMENT AGENCY ASSET-BACKED SECURITIES - 8.0% | |
American Airlines Pass-Through Trust, 10.38%, 07/02/19 | | $ | 168,012 | | | $ | 178,513 | |
Banc of America Commercial Mortgage Inc. REMIC | | | | | | | | |
5.89%, 07/10/44 (a) | | | 3,000,000 | | | | 3,288,858 | |
5.72%, 02/10/51 (a) | | | 800,000 | | | | 875,388 | |
Bear Stearns Commercial Mortgage Securities REMIC | | | | | | | | |
5.74%, 09/11/42 (a) | | | 500,000 | | | | 575,208 | |
5.69%, 06/11/50 (a) | | | 300,000 | | | | 330,335 | |
Capital One Multi-Asset Execution Trust, 4.90%, 12/15/17 | | | 2,500,000 | | | | 2,710,027 | |
Countrywide Asset-Backed Certificates REMIC, | | | | | | | | |
4.95%, 04/25/33 (a) | | | 90,608 | | | | 89,727 | |
DBUBS Mortgage Trust REMIC, 3.74%, 11/10/46 (b) | | | 3,341,019 | | | | 3,499,260 | |
Delta Air Lines Pass-Through Trust - Class A | | | | | | | | |
6.20%, 07/02/18 | | | 1,116 | | | | 1,188 | |
4.95%, 05/23/19 | | | 238,304 | | | | 241,283 | |
Ford Credit Auto Owner Trust, 1.65%, 05/15/16 | | | 3,345,000 | | | | 3,386,702 | |
Greenwich Capital Commercial Funding Corp. REMIC, 5.44%, 03/10/39 | | | 300,000 | | | | 324,716 | |
JPMorgan Chase Commercial Mortgage Securities Corp. REMIC | | | | | | | | |
5.44%, 06/12/47 | | | 3,000,000 | | | | 3,215,436 | |
5.74%, 02/12/49 (a) | | | 250,000 | | | | 270,486 | |
LB-UBS Commercial Mortgage Trust REMIC, 5.43%, 02/15/40 | | | 300,000 | | | | 319,998 | |
Morgan Stanley Capital I REMIC, 5.88%, 06/11/49 (a) | | | 2,750,000 | | | | 3,023,149 | |
Morgan Stanley Re-REMIC Trust, 5.79%, 08/12/45 (a) (b) | | | 1,500,000 | | | | 1,681,710 | |
United Air Lines Inc., 9.75%, 01/15/17 | | | 88,934 | | | | 96,049 | |
| | | | | | | | |
Total Non-U.S. Government Agency Asset- Backed Securities
(cost $23,495,901) | | | | | | | 24,108,033 | |
| | | | | | | | |
CORPORATE BONDS AND NOTES - 55.4% | |
|
CONSUMER DISCRETIONARY - 4.1% | |
Comcast Corp., 6.40%, 03/01/40 | | | 700,000 | | | | 870,143 | |
Daimler Finance North America LLC, 3.88%, 09/15/21 (b) | | | 1,500,000 | | | | 1,507,413 | |
Delphi Corp. | | | | | | | | |
5.88%, 05/15/19 (b) | | | 800,000 | | | | 816,000 | |
6.13%, 05/15/21 (b) | | | 185,000 | | | | 190,550 | |
Meritage Homes Corp., 6.25%, 03/15/15 | | | 100,000 | | | | 98,500 | |
MGM Resorts International | | | | | | | | |
7.63%, 01/15/17 | | | 1,000,000 | | | | 952,500 | |
9.00%, 03/15/20 | | | 1,100,000 | | | | 1,218,250 | |
NAI Entertainment Holdings LLC, 8.25%, 12/15/17 (b) | | | 100,000 | | | | 105,750 | |
News America Inc., 6.15%, 02/15/41 | | | 760,000 | | | | 875,969 | |
O’Reilly Automotive Inc., 4.63%, 09/15/21 | | | 100,000 | | | | 104,852 | |
Shea Homes LP, 8.63%, 05/15/19 (b) | | | 1,127,000 | | | | 1,053,745 | |
TRW Automotive Inc., 7.25%, 03/15/17 (b) | | | 100,000 | | | | 107,000 | |
Univision Communications Inc., 7.88%, 11/01/20 (b) | | | 1,200,000 | | | | 1,218,000 | |
Virgin Media Finance Plc, 8.38%, 10/15/19 | | | 100,000 | | | | 109,750 | |
Virgin Media Secured Finance Plc, 6.50%, 01/15/18 | | | 100,000 | | | | 106,250 | |
Volvo AB, 5.95%, 04/01/15 (b) | | | 177,000 | | | | 188,003 | |
WPP Finance Co. Ltd., 4.75%, 11/21/21 (b) | | | 1,100,000 | | | | 1,091,986 | |
Wynn Las Vegas LLC, 7.75%, 08/15/20 | | | 1,600,000 | | | | 1,776,000 | |
| | | | | | | | |
| | | Shares/Par | | | Value | |
Yonkers Racing Corp, 11.38%, 07/15/16 (b) | | | 100,000 | | | | 103,000 | |
| | | | | | | | |
| | | | | | | 12,493,661 | |
CONSUMER STAPLES - 1.1% | |
Altria Group Inc., 9.95%, 11/10/38 (c) | | | 500,000 | | | | 760,491 | |
Bunge Ltd. Finance Co., 8.50%, 06/15/19 (c) | | | 100,000 | | | | 121,724 | |
Lorillard Tobacco Co. | | | | | | | | |
3.50%, 08/04/16 | | | 100,000 | | | | 101,148 | |
7.00%, 08/04/41 | | | 600,000 | | | | 630,667 | |
Reynolds Group Issuer Inc., 7.88%, 08/15/19 (b) | | | 1,500,000 | | | | 1,567,500 | |
Smithfield Foods Inc., 10.00%, 07/15/14 | | | 100,000 | | | | 116,250 | |
| | | | | | | | |
| | | | | | | 3,297,780 | |
|
ENERGY - 7.1% | |
Anadarko Petroleum Corp., 6.38%, 09/15/17 | | | 1,350,000 | | | | 1,564,831 | |
Arch Coal Inc., 7.25%, 10/01/20 | | | 1,000,000 | | | | 1,022,500 | |
BG Energy Capital Plc, 4.00%, 10/15/21 (b) | | | 2,200,000 | | | | 2,267,690 | |
BP Capital Markets Plc | | | | | | | | |
3.13%, 10/01/15 | | | 4,200,000 | | | | 4,399,177 | |
2.25%, 11/01/16 | | | 300,000 | | | | 301,913 | |
Canadian Natural Resources Ltd., 6.25%, 03/15/38 | | | 600,000 | | | | 759,038 | |
Chesapeake Oilfield Operating LLC, 6.63%, 11/15/19 (b) | | | 1,175,000 | | | | 1,222,000 | |
Dolphin Energy Ltd., 5.89%, 06/15/19 (b) | | | 172,795 | | | | 187,482 | |
El Paso Pipeline Partners Operating Co. LLC, 7.50%, 11/15/40 | | | 150,000 | | | | 174,591 | |
Energen Corp., 4.63%, 09/01/21 | | | 258,000 | | | | 256,036 | |
Ensco Plc | | | | | | | | |
3.25%, 03/15/16 | | | 300,000 | | | | 306,043 | |
4.70%, 03/15/21 | | | 1,600,000 | | | | 1,666,250 | |
Enterprise Products Operating LLC, 5.95%, 02/01/41 | | | 700,000 | | | | 784,598 | |
Nabors Industries Inc., 5.00%, 09/15/20 | | | 90,000 | | | | 91,755 | |
Petrobras International Finance Co. | | | | | | | | |
3.88%, 01/27/16 | | | 1,000,000 | | | | 1,030,211 | |
5.38%, 01/27/21 | | | 1,025,000 | | | | 1,076,866 | |
6.75%, 01/27/41 | | | 325,000 | | | | 373,468 | |
Pride International Inc., 6.88%, 08/15/20 | | | 75,000 | | | | 87,932 | |
SESI LLC, 7.13%, 12/15/21 (b) | | | 2,052,000 | | | | 2,154,600 | |
Transocean Inc. | | | | | | | | |
6.38%, 12/15/21 | | | 1,224,000 | | | | 1,300,969 | |
7.35%, 12/15/41 | | | 100,000 | | | | 111,083 | |
Weatherford International Ltd. Bermuda, 6.75%, 09/15/40 | | | 112,000 | | | | 127,050 | |
WPX Energy Inc., 6.00%, 01/15/22 (b) | | | 177,000 | | | | 181,204 | |
| | | | | | | | |
| | | | | | | 21,447,287 | |
FINANCIALS - 26.2% | | | | | | | | |
AIG SunAmerica Global Financing X, 6.90%, 03/15/32 (b) | | | 175,000 | | | | 185,352 | |
American Express Credit Corp., 2.80%, 09/19/16 | | | 3,000,000 | | | | 3,014,700 | |
American International Group Inc., 8.25%, 08/15/18 | | | 1,600,000 | | | | 1,693,602 | |
AON Corp., 8.21%, 01/01/27 | | | 100,000 | | | | 116,555 | |
Bank of America Corp. | | | | | | | | |
8.00% (callable at 100 beginning 01/30/18) (a) (d) | | | 125,000 | | | | 111,930 | |
3.75%, 07/12/16 | | | 335,000 | | | | 310,183 | |
6.50%, 08/01/16 | | | 500,000 | | | | 503,535 | |
5.63%, 10/14/16 | | | 2,150,000 | | | | 2,062,667 | |
7.63%, 06/01/19 | | | 1,400,000 | | | | 1,447,904 | |
Bank of America NA, 6.10%, 06/15/17 | | | 2,450,000 | | | | 2,305,222 | |
Berkshire Hathaway Inc., 3.75%, 08/15/21 | | | 1,000,000 | | | | 1,039,046 | |
Capital One Capital VI, 8.88%, 05/15/40 | | | 190,000 | | | | 197,199 | |
Caterpillar Financial Services Corp., 1.13%, 12/15/14 | | | 4,500,000 | | | | 4,505,593 | |
See accompanying Notes to the Financial Statements.
JNL Investors Series Trust
Schedules of Investments
December 31, 2011
| | | | | | | | |
| | | Shares/Par | | | Value | |
Chubb Corp., 6.38%, 03/29/67 (a) | | | 100,000 | | | | 98,750 | |
Citigroup Inc., 6.00%, 08/15/17 | | | 2,205,000 | | | | 2,310,756 | |
Corp. Andina de Fomento, 3.75%, 01/15/16 | | | 3,500,000 | | | | 3,553,928 | |
Credit Suisse AG | | | | | | | | |
2.60%, 05/27/16 (b) | | | 1,750,000 | | | | 1,773,431 | |
5.40%, 01/14/20 | | | 1,125,000 | | | | 1,061,061 | |
Discover Bank, 7.00%, 04/15/20 | | | 555,000 | | | | 580,679 | |
Duke Realty LP, 8.25%, 08/15/19 | | | 100,000 | | | | 117,502 | |
Ford Motor Credit Co. LLC, 5.00%, 05/15/18 | | | 3,317,000 | | | | 3,325,601 | |
FUEL Trust, 3.98%, 06/15/16 (b) | | | 2,764,000 | | | | 2,763,627 | |
General Electric Capital Corp. | | | | | | | | |
4.63%, 01/07/21 | | | 1,200,000 | | | | 1,244,942 | |
4.65%, 10/17/21 | | | 2,775,000 | | | | 2,896,176 | |
Goldman Sachs Group Inc. | | | | | | | | |
5.95%, 01/18/18 | | | 1,750,000 | | | | 1,792,387 | |
5.25%, 07/27/21 | | | 1,825,000 | | | | 1,780,361 | |
6.75%, 10/01/37 | | | 650,000 | | | | 604,833 | |
HSBC Bank Plc, 1.63%, 07/07/14 (b) | | | 2,500,000 | | | | 2,470,997 | |
HSBC Finance Corp., 6.68%, 01/15/21 | | | 100,000 | | | | 103,440 | |
HSBC Holdings Plc, 4.88%, 01/14/22 | | | 2,150,000 | | | | 2,272,320 | |
HSBC USA Inc, 9.50%, 04/15/14 | | | 145,000 | | | | 159,596 | |
Hyundai Capital America, 3.75%, 04/06/16 (b) | | | 170,000 | | | | 169,476 | |
Hyundai Capital Services Inc. | | | | | | | | |
6.00%, 05/05/15 (b) | | | 100,000 | | | | 107,305 | |
4.38%, 07/27/16 (b) | | | 200,000 | | | | 203,972 | |
4.00%, 06/08/17 (b) | | | 450,000 | | | | 445,273 | |
International Lease Finance Corp. | | | | | | | | |
6.50%, 09/01/14 (b) | | | 150,000 | | | | 153,375 | |
6.75%, 09/01/16 (b) | | | 1,100,000 | | | | 1,127,500 | |
7.13%, 09/01/18 (b) | | | 1,000,000 | | | | 1,035,000 | |
6.25%, 05/15/19 | | | 124,000 | | | | 114,550 | |
8.63%, 01/15/22 | | | 1,500,000 | | | | 1,517,411 | |
IPIC GMTN Ltd., 5.50%, 03/01/22 (b) | | | 1,000,000 | | | | 1,000,000 | |
JPMorgan Chase & Co. | | | | | | | | |
7.90% (callable at 100 beginning 04/30/18) (a) (d) | | | 100,000 | | | | 106,469 | |
3.40%, 06/24/15 | | | 3,200,000 | | | | 3,261,981 | |
5.40%, 01/06/42 | | | 1,139,000 | | | | 1,188,643 | |
JPMorgan Chase Bank NA, 5.88%, 06/13/16 | | | 1,500,000 | | | | 1,623,650 | |
Korea Development Bank, 3.88%, 05/04/17 | | | 1,756,000 | | | | 1,734,022 | |
Macquarie Group Ltd., 7.30%, 08/01/14 (b) | | | 150,000 | | | | 156,165 | |
MetLife Global Funding I Inc., 2.50%, 09/29/15 (b) | | | 3,000,000 | | | | 3,017,235 | |
MetLife Inc., 4.75%, 02/08/21 | | | 1,000,000 | | | | 1,081,793 | |
Morgan Stanley | | | | | | | | |
3.80%, 04/29/16 | | | 2,157,000 | | | | 1,987,274 | |
5.50%, 07/28/21 | | | 1,494,000 | | | | 1,381,405 | |
Nordea Bank AB, 4.88%, 05/13/21 (b) | | | 1,300,000 | | | | 1,098,770 | |
Pricoa Global Funding I, 5.30%, 09/27/13 (b) | | | 255,000 | | | | 269,679 | |
Prudential Financial Inc., 6.20%, 11/15/40 | | | 1,200,000 | | | | 1,255,686 | |
Santander Holdings USA Inc., 4.63%, 04/19/16 | | | 1,550,000 | | | | 1,488,479 | |
SLM Corp., 6.25%, 01/25/16 | | | 140,000 | | | | 136,147 | |
Springleaf Finance Corp. Term Loan, 5.50%, 05/06/17 (a) | | | 2,750,000 | | | | 2,388,485 | |
Swiss Re Solutions Holding Corp., 7.75%, 06/15/30 | | | 200,000 | | | | 250,283 | |
UBS AG, 5.88%, 07/15/16 | | | 102,000 | | | | 101,586 | |
Wachovia Bank NA, 4.88%, 02/01/15 | | | 2,190,000 | | | | 2,320,430 | |
Wells Fargo & Co. | | | | | | | | |
7.98% (callable at 100 beginning 03/15/18) (a) (d) | | | 1,200,000 | | | | 1,285,500 | |
2.63%, 12/15/16 | | | 550,000 | | | | 549,665 | |
| | | | | | | | |
| | | | | | | 78,961,084 | |
| | |
HEALTH CARE - 4.8% | | | | | | | | |
Amgen Inc., 5.65%, 06/15/42 | | | 625,000 | | | | 679,472 | |
| | | | | | | | |
| | | Shares/Par | | | Value | |
Aristotle Holding Inc. | | | | | | | | |
2.75%, 11/21/14 (b) | | | 2,400,000 | | | | 2,429,098 | |
4.75%, 11/15/21 (b) | | | 975,000 | | | | 1,008,902 | |
Baxter International Inc., 1.85%, 01/15/17 | | | 5,143,000 | | | | 5,182,971 | |
Cigna Corp., 5.38%, 02/15/42 | | | 500,000 | | | | 497,126 | |
Gilead Sciences Inc. | | | | | | | | |
4.40%, 12/01/21 | | | 1,429,000 | | | | 1,512,871 | |
5.65%, 12/01/41 | | | 650,000 | | | | 719,656 | |
HCA Inc., 6.50%, 02/15/20 | | | 2,150,000 | | | | 2,230,625 | |
Memorial Sloan-Kettering Cancer Center, 5.00%, 07/01/42 | | | 172,000 | | | | 180,314 | |
| | | | | | | | |
| | | | | | | 14,441,035 | |
| | |
INDUSTRIALS - 1.2% | | | | | | | | |
Aircastle Ltd., 9.75%, 08/01/18 (b) | | | 2,000,000 | | | | 2,085,000 | |
Bombardier Inc., 7.75%, 03/15/20 (b) | | | 1,228,000 | | | | 1,338,520 | |
Owens Corning, 9.00%, 06/15/19 | | | 100,000 | | | | 119,305 | |
| | | | | | | | |
| | | | | | | 3,542,825 | |
|
INFORMATION TECHNOLOGY - 0.9% | |
Hewlett-Packard Co., 4.65%, 12/09/21 | | | 1,300,000 | | | | 1,371,604 | |
Seagate Technology Plc, 7.00%, 11/01/21 (b) | | | 1,200,000 | | | | 1,230,000 | |
| | | | | | | | |
| | | | | | | 2,601,604 | |
| | |
MATERIALS - 4.6% | | | | | | | | |
Barrick North America Finance LLC, 4.40%, 05/30/21 | | | 1,650,000 | | | | 1,786,943 | |
Braskem Finance Ltd., 7.00%, 05/07/20 (b) | | | 200,000 | | | | 213,500 | |
Cargill Inc., 7.35%, 03/06/19 (b) | | | 100,000 | | | | 126,968 | |
Cemex SAB de CV, 9.00%, 01/11/18 (b) | | | 1,025,000 | | | | 817,437 | |
Dow Chemical Co., 4.13%, 11/15/21 | | | 191,000 | | | | 195,913 | |
Ecolab Inc., 5.50%, 12/08/41 | | | 117,000 | | | | 129,653 | |
FMG Resources August 2006 Pty Ltd., 8.25%, 11/01/19 (b) | | | 1,450,000 | | | | 1,475,375 | |
Georgia-Pacific LLC, 5.40%, 11/01/20 (b) | | | 1,900,000 | | | | 2,104,531 | |
International Paper Co., 6.00%, 11/15/41 | | | 775,000 | | | | 841,350 | |
Sealed Air Corp., 8.38%, 09/15/21 (b) | | | 1,350,000 | | | | 1,491,750 | |
Teck Resources Ltd., 10.75%, 05/15/19 | | | 3,830,000 | | | | 4,672,600 | |
| | | | | | | | |
| | | | | | | 13,856,020 | |
|
TELECOMMUNICATION SERVICES - 2.4% | |
AT&T Inc., 5.55%, 08/15/41 | | | 800,000 | | | | 941,934 | |
Crown Castle Towers LLC, 4.88%, 08/15/20 (b) | | | 1,450,000 | | | | 1,481,951 | |
France Telecom SA, 4.13%, 09/14/21 | | | 150,000 | | | | 151,211 | |
Inmarsat Finance Plc, 7.38%, 12/01/17 (b) | | | 150,000 | | | | 156,750 | |
Telecom Italia Capital SA, 6.18%, 06/18/14 | | | 150,000 | | | | 144,280 | |
Telefonica Moviles Chile SA, 2.88%, 11/09/15 (b) | | | 100,000 | | | | 98,694 | |
Verizon Communications Inc. | | | | | | | | |
2.00%, 11/01/16 | | | 4,000,000 | | | | 4,011,332 | |
3.50%, 11/01/21 | | | 190,000 | | | | 197,813 | |
| | | | | | | | |
| | | | | | | 7,183,965 | |
| | |
UTILITIES - 3.0% | | | | | | | | |
Abu Dhabi National Energy Co., 4.75%, 09/15/14 (b) | | | 175,000 | | | | 182,438 | |
AES Corp., 7.38%, 07/01/21 (b) | | | 1,300,000 | | | | 1,400,750 | |
Duquesne Light Holdings Inc., 6.40%, 09/15/20 (b) | | | 630,000 | | | | 669,924 | |
GenOn Energy Term Loan B, 6.00%, 09/20/17 (a) | | | 99,000 | | | | 98,575 | |
MidAmerican Energy Co., 6.13%, 04/01/36 | | | 939,000 | | | | 1,121,494 | |
Oglethorpe Power Corp., 5.25%, 09/01/50 | | | 104,000 | | | | 118,981 | |
Oncor Electric Delivery Co., 6.80%, 09/01/18 | | | 2,250,000 | | | | 2,736,223 | |
PPL WEM Holdings Plc | | | | | | | | |
3.90%, 05/01/16 (b) | | | 200,000 | | | | 200,481 | |
5.38%, 05/01/21 (b) | | | 1,210,000 | | | | 1,268,866 | |
See accompanying Notes to the Financial Statements.
JNL Investors Series Trust
Schedules of Investments
December 31, 2011
| | | | | | | | |
| | | Shares/Par | | | Value | |
Puget Energy Inc., 6.00%, 09/01/21 | | | 1,350,000 | | | | 1,396,872 | |
| | | | | | | | |
| | | | | | | 9,194,604 | |
| | | | | | | | |
Total Corporate Bonds and Notes (cost $165,173,549) | | | | | | | 167,019,865 | |
| | | | | | | | |
GOVERNMENT AND AGENCY
OBLIGATIONS - 31.3% | |
|
GOVERNMENT SECURITIES - 8.5% | |
Municipals - 0.0% | | | | | | | | |
Ohio State University 2008A General Receipt, 4.80%, 06/01/2111 | | | 100,000 | | | | 103,529 | |
Sovereign - 0.0% | | | | | | | | |
Republic of Poland, 5.00%, 03/23/22 | | | 100,000 | | | | 100,500 | |
U.S. Treasury Securities - 8.5% | |
U.S. Treasury Bond | | | | | | | | |
4.38%, 05/15/41 | | | 125,000 | | | | 162,871 | |
3.75%, 08/15/41 | | | 7,489,000 | | | | 8,807,768 | |
U.S. Treasury Note | | | | | | | | |
0.88%, 11/30/16 | | | 595,000 | | | | 596,813 | |
2.00%, 11/15/21 | | | 15,785,000 | | | | 15,965,044 | |
| | | | | | | | |
| | | | | | | 25,532,496 | |
|
U.S. GOVERNMENT AGENCY MORTGAGE-BACKED SECURITIES - 22.8% | |
Federal Home Loan Mortgage Corp. - 7.7% | |
Federal Home Loan Mortgage Corp. | |
4.00%, 05/01/26 - 02/01/41 | | | 1,402,126 | | | | 1,473,253 | |
3.50%, 01/15/27, TBA (e) | | | 1,044,000 | | | | 1,088,207 | |
6.00%, 09/01/37 | | | 505,072 | | | | 555,518 | |
5.00%, 03/01/38, TBA (e) | | | 3,623,399 | | | | 3,899,811 | |
5.50%, 07/01/38 | | | 487,893 | | | | 530,067 | |
5.00%, 09/01/38 - 08/01/40 | | | 1,110,181 | | | | 1,194,060 | |
4.50%, 10/01/39, TBA (e) | | | 3,941,092 | | | | 4,179,762 | |
5.50%, 01/15/41, TBA (e) | | | 4,487,000 | | | | 4,868,395 | |
3.50%, 02/15/41, TBA (e) | | | 534,000 | | | | 546,599 | |
4.00%, 02/15/41, TBA (e) | | | 2,390,000 | | | | 2,499,791 | |
6.00%, 01/15/42, TBA (e) | | | 2,086,000 | | | | 2,290,689 | |
| | | | | | | | |
| | | | | | | 23,126,152 | |
Federal National Mortgage Association - 10.0% | |
Federal National Mortgage Association | |
3.50%, 01/15/26, TBA (e) | | | 1,031,000 | | | | 1,078,039 | |
3.00%, 02/15/26, TBA (e) | | | 1,559,000 | | | | 1,605,039 | |
4.50%, 02/15/26, TBA (e) | | | 4,060,000 | | | | 4,322,631 | |
4.00%, 03/01/26 | | | 1,281,000 | | | | 1,353,021 | |
5.50%, 02/01/37 | | | 737,815 | | | | 804,936 | |
5.50%, 01/15/41, TBA (e) | | | 1,500,000 | | | | 1,633,359 | |
6.00%, 01/15/41, TBA (e) | | | 5,359,000 | | | | 5,900,762 | |
3.50%, 02/15/41, TBA (e) | | | 1,870,000 | | | | 1,917,919 | |
4.00%, 02/15/41, TBA (e) | | | 4,277,000 | | | | 4,481,494 | |
4.50%, 02/15/41, TBA (e) | | | 4,070,000 | | | | 4,321,831 | |
5.00%, 02/15/41, TBA (e) | | | 2,414,000 | | | | 2,602,594 | |
| | | | | | | | |
| | | | | | | 30,021,625 | |
Government National Mortgage Association - 5.1% | |
Government National Mortgage Association | |
5.00%, 02/01/35, TBA (e) | | | 4,738,000 | | | | 5,239,191 | |
4.00%, 01/15/41, TBA (e) | | | 3,118,000 | | | | 3,344,542 | |
4.50%, 01/15/41, TBA (e) | | | 4,313,000 | | | | 4,699,148 | |
5.50%, 01/15/41, TBA (e) | | | 679,000 | | | | 762,072 | |
4.50%, 07/15/41 | | | 1,375,000 | | | | 1,499,910 | |
| | | | | | | | |
| | | | | | | 15,544,863 | |
| | | | | | | | |
Total Government and Agency Obligations
(cost $93,791,509) | | | | | | | 94,429,165 | |
| | | | | | | | |
| | |
COMMON STOCKS - 0.0% | | | | | | | | |
| | |
FINANCIALS - 0.0% | | | | | | | | |
Citigroup Inc. | | | 1,226 | | | | 32,256 | |
| | | | | | | | |
| | |
Total Common Stocks
(cost $29,128) | | | | | | | 32,256 | |
| | | | | | | | |
| | | | | | | | |
| | | Shares/Par | | | Value | |
TRUST PREFERREDS - 0.3% | |
Citigroup Capital XIII, 7.88%, (callable at 25 beginning 10/30/15) | | | 35,000 | | | | 912,100 | |
| | | | | | | | |
Total Trust Preferreds
(cost $906,360) | | | | | | | 912,100 | |
| | | | | | | | |
SHORT TERM INVESTMENTS - 23.2% | |
Investment Company - 23.2% | |
JNL Money Market Fund, 0.02% (f) (g) | | | 69,859,053 | | | | 69,859,053 | |
| | | | | | | | |
Total Short Term Investments
(cost $69,859,053) | | | | | | | 69,859,053 | |
| | | | | | | | |
Total Investments - 118.2%
(cost $353,255,500) | | | | | | | 356,360,472 | |
Other Assets and Liabilities,
Net - (18.2%) (h) | | | | | | | (54,769,478 | ) |
| | | | | | | | |
Total Net Assets - 100.0% | | | | | | $ | 301,590,994 | |
| | | | | | | | |
| (a) | Variable rate security. Rate stated was in effect as of December 31, 2011. |
| (b) | Rule 144A or Section 4(2) liquid security. Rule 144A or Section 4(2) of the Securities Act of 1933, as amended, provides an exemption from the registration requirements for resale of this security to an institutional investor. The Sub-Adviser deemed this security to be liquid based on procedures approved by the Trust’s Board of Trustees (“Board”). As of December 31, 2011, the value of Rule 144A and Section 4(2) liquid securities was $54,900,985. |
| (c) | The interest rate for this security is inversely affected by upgrades or downgrades to the credit rating of the issuer. |
| (d) | Perpetual maturity security. Interest rate is fixed until the first call date and variable thereafter. |
| (e) | Investment purchased on a delayed delivery basis. As of December 31, 2011, the total payable of investments purchased on a delayed delivery basis was $73,388,164. |
| (f) | Investment in affiliate. |
| (g) | Yield changes daily to reflect current market conditions. Rate was the quoted yield as of December 31, 2011. |
| (h) | Cash is pledged as collateral for open futures contracts. As of December 31, 2011, total value of collateral was $493,425. |
Abbreviations:
REMIC - Real Estate Mortgage Investment Conduit
TBA - To Be Announced (Securities purchased on a delayed delivery basis)
See accompanying Notes to the Financial Statements.
JNL Investors Series Trust
Schedules of Investments
December 31, 2011
| | | | |
| JNL Money Market Fund | | | | |
| Sector Weightings: | | | | Percentage of Total
Investments |
U.S. Government Agency Mortgage-Backed Securities | | | | 11.8% |
Financials | | | | 9.8 |
Government Securities | | | | 8.0 |
Information Technology | | | | 0.3 |
Short Term Investments | | | | 70.1 |
| | | | |
Total Investments | | | | 100.0% |
| | | | |
| | | | | | | | |
| | | Shares/Par | | | Value | |
| JNL Money Market Fund | | | | | | |
|
CORPORATE BONDS AND NOTES - 10.1% | |
| | |
FINANCIALS - 9.8% | | | | | | | | |
Bank of America Corp. | | | | | | | | |
0.31%, 01/17/12 | | $ | 13,000,000 | | | $ | 13,000,000 | |
3.13%, 06/15/12 | | | 22,019,000 | | | | 22,307,485 | |
Citigroup Funding Inc., 0.68%, 03/16/12 (a) | | | 5,637,000 | | | | 5,634,323 | |
Citigroup Inc., 2.13%, 04/30/12 | | | 5,000,000 | | | | 5,031,785 | |
Commonwealth Bank of Australia, 2.40%,
01/12/12 (b) | | | 13,000,000 | | | | 13,008,468 | |
Countrywide Financial Corp., 5.80%, 06/07/12 | | | 6,000,000 | | | | 6,117,853 | |
General Electric Capital Corp. | | | | | | | | |
0.64%, 03/02/12 (a) | | | 11,000,000 | | | | 11,002,144 | |
2.00%, 09/28/12 | | | 8,906,000 | | | | 9,020,867 | |
Goldman Sachs Group Inc. | | | | | | | | |
6.60%, 01/15/12 | | | 13,429,000 | | | | 13,458,903 | |
0.62%, 02/06/12 (a) | | | 12,105,000 | | | | 12,105,026 | |
3.25%, 06/15/12 | | | 16,354,000 | | | | 16,577,804 | |
John Deere Capital Corp., 2.88%, 06/19/12 | | | 13,688,000 | | | | 13,855,751 | |
JPMorgan Chase & Co. | | | | | | | | |
4.50%, 01/15/12 | | | 5,000,000 | | | | 5,007,817 | |
2.20%, 06/15/12 | | | 11,397,000 | | | | 11,498,468 | |
State Street Corp., 2.15%, 04/30/12 | | | 6,625,000 | | | | 6,667,805 | |
Toyota Motor Credit Corp. | | | | | | | | |
0.35%, 02/02/12 (a) | | | 14,750,000 | | | | 14,750,000 | |
0.80%, 01/15/13 (a) | | | 13,800,000 | | | | 13,800,000 | |
Wells Fargo & Co., 0.51%, 01/24/12 (a) | | | 6,700,000 | | | | 6,700,379 | |
| | | | | | | | |
| | | | | | | 199,544,878 | |
|
INFORMATION TECHNOLOGY - 0.3% | |
Hewlett-Packard Co., 4.25%,
02/24/12 | | | 6,500,000 | | | | 6,536,077 | |
| | | | | | | | |
Total Corporate Bonds and Notes
(cost $206,080,955) | | | | | | | 206,080,955 | |
| | | | | | | | |
|
GOVERNMENT AND AGENCY
OBLIGATIONS - 19.8% | |
|
GOVERNMENT SECURITIES - 8.0% | |
Federal Home Loan Mortgage Corp. - 5.2% (c) | |
Federal Home Loan Mortgage Corp. | | | | | | | | |
0.35%, 07/25/12 | | | 10,000,000 | | | | 9,999,324 | |
0.17%, 09/19/12 (a) | | | 40,000,000 | | | | 39,994,214 | |
0.21%, 10/12/12 (a) | | | 41,570,000 | | | | 41,587,250 | |
4.50%, 01/15/13 | | | 13,637,000 | | | | 14,242,709 | |
| | | | | | | | |
| | | | | | | 105,823,497 | |
U.S. Treasury Securities - 2.8% | |
U.S. Treasury Note | | | | | | | | |
1.00%, 04/30/12 | | | 20,000,000 | | | | 20,052,546 | |
1.38%, 11/15/12 | | | 37,000,000 | | | | 37,384,267 | |
| | | | | | | | |
| | | | | | | 57,436,813 | |
U.S. GOVERNMENT AGENCY MORTGAGE-BACKED SECURITIES - 11.8% | |
Federal Farm Credit Bank - 1.2% | |
Federal Farm Credit Bank | | | | | | | | |
0.15%, 11/09/12 (a) | | | 15,000,000 | | | | 14,998,846 | |
0.21%, 11/26/12 (a) | | | 3,500,000 | | | | 3,501,523 | |
| | | | | | | | |
| | | Shares/Par | | | Value | |
0.13%, 12/05/12 (a) | | | 6,135,000 | | | | 6,133,274 | |
| | | | | | | | |
| | | | | | | 24,633,643 | |
Federal Home Loan Mortgage Corp. - 9.3% | |
Federal Home Loan Mortgage Corp. | | | | | | | | |
0.22%, 05/14/12 | | | 17,000,000 | | | | 17,002,635 | |
0.14%, 06/06/12 | | | 82,000,000 | | | | 81,984,822 | |
0.20%, 11/14/12 - 11/26/12 | | | 25,850,000 | | | | 25,850,695 | |
0.21%, 11/14/12 - 01/03/13 | | | 45,000,000 | | | | 45,005,072 | |
0.38%, 12/20/12 | | | 5,000,000 | | | | 5,000,000 | |
0.21%, 01/22/13 (a) | | | 15,750,000 | | | | 15,756,757 | |
| | | | | | | | |
| | | | | | | 190,599,981 | |
Federal National Mortgage Association - 1.3% | |
Federal National Mortgage Association | | | | | | | | |
0.27%, 12/03/12 (a) | | | 6,000,000 | | | | 6,005,035 | |
0.24%, 01/10/13 (a) | | | 20,000,000 | | | | 20,019,746 | |
| | | | | | | | |
| | | | | | | 26,024,781 | |
| | | | | | | | |
Total Government and Agency Obligations
(cost $404,518,715) | | | | | | | 404,518,715 | |
| | | | | | | | |
SHORT TERM INVESTMENTS - 70.0% | |
| | |
Certificates of Deposit - 14.9% | | | | | | | | |
Bank of Montreal | | | | | | | | |
0.34%, 06/13/12 | | | 14,000,000 | | | | 14,000,000 | |
0.60%, 01/04/13 (a) | | | 14,000,000 | | | | 14,000,000 | |
Bank of Nova Scotia | | | | | | | | |
0.42%, 01/25/12 (a) | | | 11,500,000 | | | | 11,500,000 | |
0.31%, 01/27/12 | | | 15,000,000 | | | | 15,000,000 | |
Barclays Bank Plc | | | | | | | | |
0.81%, 02/16/12 | | | 4,000,000 | | | | 4,000,000 | |
0.65%, 05/03/12 (a) | | | 7,500,000 | | | | 7,500,000 | |
BNP Paribas SA, 0.76%, 03/01/12 | | | 10,000,000 | | | | 10,000,000 | |
Branch Banking, 0.20%, 03/19/12 | | | 11,000,000 | | | | 11,000,000 | |
Canadian Imperial Bank of Commerce | | | | | | | | |
0.61%, 01/19/12 (a) | | | 8,000,000 | | | | 8,000,685 | |
0.37%, 04/30/12 (a) | | | 8,600,000 | | | | 8,600,000 | |
0.63%, 05/04/12 (a) | | | 15,000,000 | | | | 15,008,478 | |
0.41%, 08/09/12 (a) | | | 8,700,000 | | | | 8,700,000 | |
Citibank | | | | | | | | |
0.14%, 01/20/12 | | | 13,000,000 | | | | 13,000,000 | |
0.23%, 02/21/12 | | | 13,000,000 | | | | 13,000,000 | |
DnB NOR Bank ASA, 0.39%, 03/30/12 (a) | | | 16,000,000 | | | | 16,000,000 | |
Rabobank Nederland NV, 0.34%, 02/10/12 (a) | | | 8,000,000 | | | | 8,000,000 | |
Royal Bank of Canada | | | | | | | | |
0.30%, 02/15/12 | | | 13,000,000 | | | | 13,000,000 | |
0.35%, 03/02/12 (a) | | | 16,500,000 | | | | 16,500,000 | |
0.36%, 07/11/12 (a) | | | 8,600,000 | | | | 8,600,000 | |
Standard Chartered Bank | | | | | | | | |
0.50%, 03/02/12 | | | 17,000,000 | | | | 17,000,000 | |
0.63%, 05/08/12 | | | 10,000,000 | | | | 10,000,000 | |
Toronto-Dominion Bank NY | | | | | | | | |
0.21%, 01/03/12 | | | 20,000,000 | | | | 20,000,000 | |
0.40%, 04/27/12 | | | 7,000,000 | | | | 7,000,000 | |
0.32%, 04/30/12 | | | 12,900,000 | | | | 12,900,000 | |
UBS AG, 0.62%, 03/02/12 | | | 21,300,000 | | | | 21,300,000 | |
| | | | | | | | |
| | | | | | | 303,609,163 | |
Commercial Paper - 14.0% | | | | | | | | |
Amsterdam Funding Corp. | | | | | | | | |
0.32%, 01/10/12 | | | 12,500,000 | | | | 12,499,000 | |
0.44%, 02/06/12 (b) | | | 12,500,000 | | | | 12,494,500 | |
CAFCO LLC, 0.32%, 01/06/12 (b) | | | 28,000,000 | | | | 27,998,756 | |
Chariot Funding LLC | | | | | | | | |
0.19%, 01/25/12 (b) | | | 2,300,000 | | | | 2,299,709 | |
0.18%, 02/17/12 (b) | | | 23,000,000 | | | | 22,994,595 | |
Coca-Cola Co. | | | | | | | | |
0.17%, 02/01/12 (b) | | | 9,000,000 | | | | 8,998,682 | |
0.15%, 02/13/12 (b) | | | 10,000,000 | | | | 9,998,208 | |
0.21%, 03/01/12 (b) | | | 9,000,000 | | | | 8,996,850 | |
See accompanying Notes to the Financial Statements.
JNL Investors Series Trust
Schedules of Investments
December 31, 2011
| | | | | | | | |
| | | Shares/Par | | | Value | |
CRC Funding LLC | | | | | | | | |
0.19%, 01/18/12 | | | 12,000,000 | | | | 11,998,923 | |
0.36%, 03/08/12 | | | 13,500,000 | | | | 13,490,955 | |
Fairway Finance Corp. | | | | | | | | |
0.22%, 01/06/12 (b) | | | 3,400,000 | | | | 3,399,896 | |
0.22%, 01/12/12 (b) | | | 8,100,000 | | | | 8,099,455 | |
0.22%, 01/18/12 (b) | | | 5,300,000 | | | | 5,299,449 | |
General Electric Capital Corp., 0.23%, 02/03/12 | | | 15,500,000 | | | | 15,496,732 | |
Jupiter Securitization Corp. | | | | | | | | |
0.22%, 01/05/12 (b) | | | 13,100,000 | | | | 13,099,680 | |
0.16%, 02/21/12 (b) | | | 12,400,000 | | | | 12,397,189 | |
Market Street Funding LLC, 0.15%, 01/13/12 (b) | | | 25,300,000 | | | | 25,298,735 | |
National Rural Utilities Cooperative Finance Corp. | | | | | | | | |
0.12%, 01/17/12 | | | 8,800,000 | | | | 8,799,531 | |
0.08%, 01/19/12 | | | 9,500,000 | | �� | | 9,499,620 | |
Old Line Funding LLC, 0.22%, 01/04/12 (b) | | | 12,292,000 | | | | 12,291,775 | |
Westpac Banking Corp., 0.25%, 03/21/12 (b) | | | 12,750,000 | | | | 12,742,917 | |
Windmill Funding LLC | | | | | | | | |
0.04%, 01/04/12 (b) | | | 14,800,000 | | | | 14,799,507 | |
0.42%, 01/17/12 (b) | | | 12,500,000 | | | | 12,497,667 | |
| | | | | | | | |
| | | | | | | 285,492,331 | |
Federal National Mortgage Association - 0.4% | |
Federal National Mortgage Association, 0.03%, 01/03/12 | | | 9,500,000 | | | | 9,499,984 | |
|
Investment Company - 0.0% | |
JPMorgan Prime Money Market Fund, 0.02% (d) | | | 8,536 | | | | 8,536 | |
Repurchase Agreements - 40.7% | | | | | | | | |
Repurchase Agreement with Bank of America NA, 0.04 % (Collateralized by $102,200,106 Government National Mortgage Association, 4.50% - 6.00%, due 09/20/38 – 08/20/41, value $113,434,447 and $68,609,442 Federal National Mortgage Association, 5.00%, due 03/01/41, value $74,551,553) acquired on 12/30/11, due 01/03/12 at $184,300,819 | | $ | 184,300,000 | | | | 184,300,000 | |
Repurchase Agreement with Barclays Bank Plc, 0.01% (Collateralized by $8,204,200 U.S. Treasury Bond, 5.38%, due 02/15/31, value $11,832,082) acquired on 12/30/11, due 01/03/12 at $11,600,013 | | | 11,600,000 | | | | 11,600,000 | |
Repurchase Agreement with Credit Suisse International, 0.23% (Collateralized by $32,575,752 Federal National Mortgage Association, 4.50% - 6.00%, due 09/01/18 - 07/01/39, value $35,702,342) acquired on 12/30/11, due 01/18/12 at $35,004,249 (e) | | | 35,000,000 | | | | 35,000,000 | |
Repurchase Agreement with Deutsche Bank AG, 0.05% (Collateralized by $58,701,674 Federal National Mortgage Association, 5.00% - 6.00%, due 04/01/38 – 01/01/39, value $64,354,051) acquired on 12/29/11, due 01/05/12 at $63,000,613 | | | 63,000,000 | | | | 63,000,000 | |
Repurchase Agreement with Deutsche Bank AG, 0.06% (Collateralized by $129,299,294 Federal National Mortgage Association, 7.00%, due 08/01/38 – 10/01/38, value $147,798,000) acquired on 12/30/11, due 01/03/12 at $144,900,966 | | | 144,900,000 | | | | 144,900,000 | |
| | | | | | | | |
| | | Shares/Par | | | Value | |
Repurchase Agreement with Goldman Sachs and Co., 0.09% (Collateralized by $60,229,948 Government National Mortgage Association, 4.00% - 5.50%, due 10/15/39 - 11/20/41, value $66,300,001) acquired on 12/28/11, due 01/04/12 at $65,001,138 | | | 65,000,000 | | | | 65,000,000 | |
Repurchase Agreement with Goldman Sachs and Co., 0.09% (Collateralized by $69,637,337 Government National Mortgage Association, 4.50% - 6.50%, due 09/15/32 – 12/20/41, value $79,560,000) acquired on 12/29/11, due 01/05/12 at $78,001,365 | | | 78,000,000 | | | | 78,000,000 | |
Repurchase Agreement with Goldman Sachs and Co., 0.10% (Collateralized by $43,908,737 Government National Mortgage Association, 4.00% - 6.50%, due 01/15/33 - 09/15/41, value $48,960,630) acquired on 12/27/11, due 01/03/12 at $48,000,933 | | | 48,000,000 | | | | 48,000,000 | |
Repurchase Agreement with Goldman Sachs and Co., 0.21% (Collateralized by $4,507,882 Government National Mortgage Association, 5.50%, due 04/20/35 - 01/15/37, value $5,100,001) acquired on 12/02/11, due 01/05/12 at $5,000,992 | | | 5,000,000 | | | | 5,000,000 | |
Repurchase Agreement with Goldman Sachs and Co., 0.22% (Collateralized by $36,354,588 Government National Mortgage Association, 4.00% - 6.00%, due 01/15/33 - 11/15/41, value $40,800,000) acquired on 11/28/11, due 01/03/12 at $40,008,800 | | | 40,000,000 | | | | 40,000,000 | |
Repurchase Agreement with HSBC Bank NA, 0.00% (Collateralized by $51,312,800 U.S. Treasury Bond, 4.50% - 5.50%, due 08/15/28 - 08/15/39, value $72,421,559) acquired on 12/30/11, due 01/03/12 at $71,000,000 | | | 71,000,000 | | | | 71,000,000 | |
Repurchase Agreement with HSBC Bank NA, 0.04% (Collateralized by $33,340,000 U.S. Treasury Bond, 6.25%, due 05/15/20, value $51,715,896) acquired on 12/30/11, due 01/03/12 at $50,700,225 | | | 50,700,000 | | | | 50,700,000 | |
Repurchase Agreement with UBS AG, 0.04% (Collateralized by $33,321,409 Federal National Mortgage Association, 4.00%, due 12/1/41, value $35,118,816) acquired on 12/30/11, due 01/03/12 at $33,400,148 | | | 33,400,000 | | | | 33,400,000 | |
| | | | | | | | |
| | | | | | | 829,900,000 | |
| | | | | | | | |
| | |
Total Short Term Investments
(cost $1,428,510,014) | | | | | | | 1,428,510,014 | |
| | | | | | | | |
| | |
Total Investments - 99.9%
(cost $2,039,109,684) | | | | | | | 2,039,109,684 | |
Other Assets and Liabilities,
Net - 0.1% | | | | | | | 1,392,484 | |
| | | | | | | | |
Total Net Assets - 100.0% | | | | | | $ | 2,040,502,168 | |
| | | | | | | | |
| (a) | Variable rate security. Rate stated was in effect as of December 31, 2011. |
| (b) | Rule 144A or Section 4(2) liquid security. Rule 144A or Section 4(2) of the Securities Act of 1933, as amended, provides an exemption from the registration requirements for resale of this security to an institutional investor. The Sub-Adviser deemed this security to be liquid based on procedures approved by the Trust’s Board of Trustees (“Board”). As of December 31, 2011, the value of Rule 144A and Section 4(2) liquid securities was $226,716,038. |
| (c) | Securities in this category are direct debt of the agency and not collateralized by mortgages. |
| (d) | Yield changes daily to reflect current market conditions. Rate was the quoted yield as of December 31, 2011. |
| (e) | Restricted security. Restricted as to public resale. Restricted security or Rule 144A or Section 4(2) of the Securities Act of 1933, as amended, provides an exemption from the registration requirements for resale of the security to an institutional investor. See Restricted Securities Note in the Notes to Schedules of Investments. |
See accompanying Notes to the Financial Statements.
JNL Investors Series Trust
Notes to Schedules of Investments
December 31, 2011
Financial Accounting Standards Board (“FASB”) Accounting Standards Codification (“ASC”) Topic 820, “Fair Value Measurements and Disclosure” - This standard establishes a single authoritative definition of fair value, sets out a framework for measuring fair value and requires additional disclosures about fair value measurements. Various inputs are used in determining the value of a Fund’s investments under FASB ASC Topic 820 guidance. The inputs are summarized into three broad categories. Level 1 includes valuations based on quoted prices of identical securities in active markets including valuations for securities listed on a national or foreign stock exchange or investments in mutual funds. Level 2 includes valuations for which all significant inputs are observable, either directly or indirectly. Direct observable inputs include broker quotes, closing prices of similar securities in active markets, closing prices for identical or similar securities in non-active markets or corporate action or reorganization entitlement values. Indirect significant observable inputs include factors such as interest rates, yield curves, prepayment speeds or credit ratings. Level 2 includes valuations for fixed income securities priced by pricing services, broker quotes in active markets, securities subject to corporate actions or securities valued at amortized cost. Level 3 includes valuations based on inputs that are unobservable and significant to the fair value measurement including Jackson National Asset Management, LLC’s (“Adviser”) own assumptions in determining the fair value of the investment. Inputs used to determine the fair value of Level 3 securities include security specific inputs such as: credit quality, credit rating spreads, issuer news, trading characteristics, call features or maturity; or industry specific inputs such as: trading activity of similar markets or securities or changes in the security’s underlying index or comparable securities’ models. Level 3 valuations include securities that are priced based on single source broker quotes, where prices may be unavailable due to halted trading, restricted to resale due to market events, newly issued securities or securities for which reliable quotes are otherwise not available. There were no significant transfers between Level 1 and Level 2 during the period. There were no significant transfers into or out of Level 3 during the period. The inputs or methodology used for valuing securities are not necessarily an indication of the risk associated with investing in those securities. See Note 2 in the Notes to the Financial Statements for security valuation accounting policies.
The following table summarizes each Fund’s investments in securities and other financial instruments as of December 31, 2011 by valuation level.
| | | | | | | | | | | | | | | | |
| | | Assets as of December 31, 2011 by Level: Assets - Securities | |
| | | Level 1 | | | Level 2 | | | Level 3 | | | Total | |
JNL/PPM America Total Return Fund | | | | | | | | | | | | | | | | |
Non-U.S. Government Agency Asset-Backed Securities | | $ | — | | | $ | 24,108,033 | | | $ | — | | | $ | 24,108,033 | |
Corporate Bonds and Notes | | | — | | | | 167,019,865 | | | | — | | | | 167,019,865 | |
Government and Agency Obligations | | | — | | | | 94,429,165 | | | | — | | | | 94,429,165 | |
Common Stocks | | | 32,256 | | | | — | | | | — | | | | 32,256 | |
Trust Preferreds | | | 912,100 | | | | — | | | | — | | | | 912,100 | |
Short Term Investments | | | 69,859,053 | | | | — | | | | — | | | | 69,859,053 | |
Fund Total | | $ | 70,803,409 | | | $ | 285,557,063 | | | $ | — | | | $ | 356,360,472 | |
| | | | |
JNL Money Market Fund | | | | | | | | | | | | | | | | |
Corporate Bonds and Notes | | $ | — | | | $ | 206,080,955 | | | $ | — | | | $ | 206,080,955 | |
Government and Agency Obligations | | | — | | | | 404,518,715 | | | | — | | | | 404,518,715 | |
Short Term Investments | | | 8,536 | | | | 1,428,501,478 | | | | — | | | | 1,428,510,014 | |
Fund Total | | $ | 8,536 | | | $ | 2,039,101,148 | | | $ | — | | | $ | 2,039,109,684 | |
| | | | | | | | | | | | | | | | | | | | | | | | | | | | | | | | |
| | | Assets - Other Financial Instruments1 | | | Liabilities - Other Financial Instruments1 | |
| | | Level 1 | | | Level 2 | | | Level 3 | | | Total | | | Level 1 | | | Level 2 | | | Level 3 | | | Total | |
JNL/PPM America Total Return Fund | | | | | | | | | | | | | | | | | | | | | | | | | | | | | | | | |
Open Future Contracts | | $ | – | | | $ | – | | | $ | – | | | $ | – | | | $ | (43,093 | ) | | $ | – | | | $ | – | | | $ | (43,093 | ) |
1Investments in other financial instruments include futures contracts which are reflected at the unrealized appreciation/(depreciation) on the instrument.
Restricted Securities – Restricted securities are often purchased in private placement transactions and cannot be sold without prior registration unless the sale is pursuant to an exemption under the Securities Exchange Act of 1933, as amended. The following table details restricted securities that have been deemed illiquid, held at December 31, 2011.
| | | | | | | | | | | | | | | | |
| | | Initial
Acquisition
Date | | | Cost | | | Ending
Value | | | Percent of
Net
Assets | |
JNL Money Market Fund | | | | | | | | | | | | | | | | |
Repurchase Agreement with Credit Suisse International, 0.23% (Collateralized by $32,575,752 Federal National Mortgage Association, 4.50% - 6.00%, due 09/01/18 - 07/01/39, value $35,702,342) acquired on 12/30/11, due 01/18/12 at $35,004,249 | | | 11/17/2011 | | | $ | 35,000,000 | | | $ | 35,000,000 | | | | 1.7 | % |
| | | | | | | | | | | | | | | | |
See accompanying Notes to the Financial Statements.
JNL Investors Series Trust
Notes to Schedules of Investments
December 31, 2011
|
Schedule of Open Futures Contracts |
| | | | | | | | | | | | |
| | | Expiration | | | Contracts
(Short) | | | Unrealized
(Depreciation) | |
| |
JNL/PPM America Total Return Fund | | | | | |
| | | |
U.S. Treasury Bond Future, 20-Year | | | March 2012 | | | | (15) | | | $ | (4,802 | ) |
U.S. Treasury Note Future, 5-Year | | | March 2012 | | | | (165) | | | | (25,324 | ) |
U.S. Treasury Note Future, 10-Year | | | March 2012 | | | | (85) | | | | (9,271 | ) |
Ultra Long Term U.S. Treasury Bond Future, 30-Year | | | March 2012 | | | | (6) | | | | (3,696) | |
| | | | | | | | | | | | |
| | | | | | | | | | $ | (43,093 | ) |
See accompanying Notes to the Financial Statements.
JNL Investors Series Trust
Statements of Assets and Liabilities
December 31, 2011
| | | | | | | | |
| | | JNL/PPM
America Total
Return Fund | | | JNL Money
Market Fund | |
Assets | | | | | | | | |
Investments - unaffiliated,
at value (a) | | $ | 286,501,419 | | | $ | 1,209,209,684 | |
Investments - affiliated,
at value (b) | | | 69,859,053 | | | | – | |
Repurchase agreements (a) | | | – | | | | 829,900,000 | |
| | | | | | | | |
Total investments,
at value (c) | | | 356,360,472 | | | | 2,039,109,684 | |
Receivable for investments sold | | | 21,633,974 | | | | – | |
Receivable for fund shares sold | | | 280 | | | | – | |
Receivable for dividends and interest | | | 2,402,739 | | | | 1,848,297 | |
Receivable for deposits with brokers | | | 493,425 | | | | – | |
Other assets | | | 76 | | | | – | |
| | | | | | | | |
Total assets | | | 380,890,966 | | | | 2,040,957,981 | |
| | | | | | | | |
| | |
Liabilities | | | | | | | | |
Cash overdraft | | | 63,661 | | | | – | |
Payable for advisory fees | | | 75,231 | | | | 299,966 | |
Payable for dividends | | | – | | | | 48,550 | |
Payable for
administrative fees | | | 15,046 | | | | – | |
Payable for 12b-1 fee (Class A) | | | 28,166 | | | | – | |
Payable for investment securities purchased | | | 79,061,597 | | | | – | |
Payable for fund shares redeemed | | | 993 | | | | – | |
Payable for trustee fees | | | 689 | | | | 32,116 | |
Payable for variation margin | | | 54,407 | | | | – | |
Payable for other expenses | | | 182 | | | | 75,181 | |
| | | | | | | | |
Total liabilities | | | 79,299,972 | | | | 455,813 | |
| | | | | | | | |
Net assets | | $ | 301,590,994 | | | $ | 2,040,502,168 | |
| | | | | | | | |
| | |
Net assets consist of: | | | | | | | | |
Paid-in capital | | $ | 298,124,489 | | | $ | 2,040,531,640 | |
Undistributed (excess of distributions over) net investment income | | | 36,030 | | | | (29,127 | ) |
Accumulated net realized gain (loss) | | | 368,596 | | | | (345 | ) |
Net unrealized appreciation on investments and foreign currency | | | 3,061,879 | | | | – | |
| | | | | | | | |
| | $ | 301,590,994 | | | $ | 2,040,502,168 | |
| | | | | | | | |
Shares outstanding (no par value), unlimited shares authorized | | | 28,128,710 | | | | 2,040,531,947 | |
Net asset value per share | | $ | 10.72 | | | $ | 1.00 | |
| | | | | | | | |
| | |
(a) Investments - unaffiliated, at cost | | $ | 283,396,447 | | | $ | 2,039,109,684 | |
(b) Investments - affiliated, at cost | | | 69,859,053 | | | | – | |
| | | | | | | | |
(c) Total investments, at cost | | $ | 353,255,500 | | | $ | 2,039,109,684 | |
| | | | | | | | |
See accompanying Notes to the Financial Statements.
JNL Investors Series Trust
Statements of Operations
| | | | | | | | | | | | | | | | |
| | | JNL/PPM America Total Return Fund | | | JNL Money Market Fund | |
| | | For the two months ended
December 31, 2011 | | | For the year ended
October 31, 2011 | | | For the two months ended
December 31, 2011 | | | For the year ended
October 31, 2011 | |
Investment income | | | | | | | | | | | | | | | | |
Dividends(a) | | $ | 4,796 | | | $ | 21,386 | | | $ | 18 | | | $ | 51 | |
Interest | | | 548,844 | | | | 1,388,263 | | | | 662,635 | | | | 3,978,673 | |
| | | | | | | | | | | | | | | | |
Total investment income | | | 553,640 | | | | 1,409,649 | | | | 662,653 | | | | 3,978,724 | |
| | | | | | | | | | | | | | | | |
| | | | |
Expenses | | | | | | | | | | | | | | | | |
Advisory fees | | | 87,281 | | | | 141,814 | | | | 569,633 | | | | 3,107,707 | |
Administrative fees | | | 17,456 | | | | 28,362 | | | | – | | | | – | |
12b-1 fee (Class A) | | | 28,166 | | | | — | | | | – | | | | – | |
Legal fees | | | 35 | | | | 195 | | | | 2,252 | | | | 9,458 | |
Trustee fees | | | 102 | | | | 581 | | | | 6,529 | | | | 29,019 | |
Other expenses | | | 100 | | | | 1,800 | | | | 5,652 | | | | 81,860 | |
| | | | | | | | | | | | | | | | |
Total expenses | | | 133,140 | | | | 172,752 | | | | 584,066 | | | | 3,228,044 | |
| | | | | | | | | | | | | | | | |
Expense waiver | | | – | | | | – | | | | – | | | | (25,081 | ) |
| | | | | | | | | | | | | | | | |
Net expenses | | | 133,140 | | | | 172,752 | | | | 584,066 | | | | 3,202,963 | |
| | | | | | | | | | | | | | | | |
Net investment income | | | 420,500 | | | | 1,236,897 | | | | 78,587 | | | | 775,761 | |
| | | | | | | | | | | | | | | | |
| | | | |
Realized and unrealized gain (loss) | | | | | | | | | | | | | | | | |
Net realized gain (loss) on: | | | | | | | | | | | | | | | | |
Unaffiliated investments | | | 391,797 | | | | 1,539,689 | | | | (345 | ) | | | 51,766 | |
Futures contracts | | | 773 | | | | (47,965 | ) | | | – | | | | – | |
Net change in unrealized appreciation (depreciation) on: | | | | | | | | | | | | | | | | |
Investments | | | 1,734,301 | | | | (788,288 | ) | | | – | | | | – | |
Futures contracts | | | (49,563 | ) | | | 47,907 | | | | – | | | | – | |
| | | | | | | | | | | | | | | | |
Net realized and unrealized gain | | | 2,077,308 | | | | 751,343 | | | | (345 | ) | | | 51,766 | |
| | | | | | | | | | | | | | | | |
Net increase in net assets from operations | | $ | 2,497,808 | | | $ | 1,988,240 | | | $ | 78,242 | | | $ | 827,527 | |
| | | | | | | | | | | | | | | | |
(a) Dividends from affiliated investments | | $ | 4,784 | | | $ | 1,564 | | | $ | – | | | $ | – | |
See accompanying Notes to the Financial Statements.
JNL Investors Series Trust
Statements of Changes in Net Assets
| | | | | | | | | | | | |
| | | JNL/PPM America Total Return Fund | |
| | | For the two months ended
December 31, 2011 | | | For the year ended
October 31, 2011 | | | For the year ended
October 31, 2010 | |
Operations | | | | | | | | | | | | |
Net investment income | | $ | 420,500 | | | $ | 1,236,897 | | | $ | 1,164,571 | |
Net realized gain | | | 392,570 | | | | 1,491,724 | | | | 2,036,182 | |
Net change in unrealized appreciation (depreciation) | | | 1,684,738 | | | | (740,381 | ) | | | 364,230 | |
| | | | | | | | | | | | |
Net increase in net assets from operations | | | 2,497,808 | | | | 1,988,240 | | | | 3,564,983 | |
| | | | | | | | | | | | |
| | | |
Distributions to shareholders | | | | | | | | | | | | |
From net investment income | | | | | | | | | | | | |
Class A | | | (1,472,069 | ) | | | (1,191,029 | ) | | | (982,782 | ) |
From net realized gains | | | | | | | | | | | | |
Class A | | | (1,518,271 | ) | | | (1,964,107 | ) | | | (1,379,433 | ) |
| | | | | | | | | | | | |
Total distributions to shareholders | | | (2,990,340 | ) | | | (3,155,136 | ) | | | (2,362,215 | ) |
| | | | | | | | | | | | |
| | | |
Share transactions1 | | | | | | | | | | | | |
Proceeds from the sale of shares | | | | | | | | | | | | |
Class A | | | 299,111,113 | | | | – | | | | – | |
Reinvestment of distributions | | | | | | | | | | | | |
Class A | | | 2,990,340 | | | | 3,155,136 | | | | 2,362,215 | |
Cost of shares redeemed | | | | | | | | | | | | |
Class A | | | (29,494,315 | ) | | | – | | | | – | |
| | | | | | | | | | | | |
Net increase in net assets from share transactions | | | 272,607,138 | | | | 3,155,136 | | | | 2,632,215 | |
| | | | | | | | | | | | |
| | | |
Net increase net assets | | | 272,114,606 | | | | 1,988,240 | | | | 3,564,983 | |
| | | | | | | | | | | | |
Net assets beginning of period | | | 29,476,388 | | | | 27,488,148 | | | | 23,923,165 | |
| | | | | | | | | | | | |
Net assets end of period | | $ | 301,590,994 | | | $ | 29,476,388 | | | $ | 27,488,148 | |
| | | | | | | | | | | | |
Undistributed net investment income | | $ | 36,030 | | | $ | 1,074,996 | | | $ | 988,110 | |
| | | | | | | | | | | | |
| | | |
1Share transactions | | | | | | | | | | | | |
Shares sold | | | | | | | | | | | | |
Class A | | | 28,115,962 | | | | – | | | | – | |
Reinvestment of distributions | | | | | | | | | | | | |
Class A | | | 281,907 | | | | 292,956 | | | | 216,320 | |
Shares redeemed | | | | | | | | | | | | |
Class A | | | (2,782,423 | ) | | | – | | | | – | |
| | | | | | | | | | | | |
Net increase | | | | | | | | | | | | |
Class A | | | 25,615,446 | | | | 292,956 | | | | 216,320 | |
| | | | | | | | | | | | |
| | | |
Purchase and sales of investment securities (excluding short-term securities): | | | | | | | | | | | | |
Purchase of securities | | $ | 320,430,788 | (a) | | $ | 83,764,932 | (b) | | $ | 113,096,493 | (c) |
Proceeds from sales of securities | | | 64,500,522 | (a) | | | 84,010,994 | (b) | | | 112,794,003 | (c) |
| (a) | Amounts include $144,859,818 and $59,265,412 of purchases and sales, respectively, of U.S. Government Securities. |
| (b) | Amounts include $804,131 and $3,163,848 of purchases and sales, respectively, of U.S. Government Securities. |
| (c) | Amounts include $15,292,233 and $14,585,773 of purchases and sales, respectively, of U.S. Government Securities. |
See accompanying Notes to the Financial Statements.
JNL Investors Series Trust
Statements of Changes in Net Assets
| | | | | | | | | | | | |
| | | JNL Money Market Fund | |
| | | For the two months ended
December 31, 2011 | | | For the year ended
October 31, 2011 | | | For the year ended
October 31, 2010 | |
Operations | | | | | | | | | | | | |
Net investment income | | $ | 78,587 | | | $ | 775,761 | | | $ | 621,800 | |
Net realized gain | | | (345 | ) | | | 51,766 | | | | 13,443 | |
Net change in unrealized appreciation (depreciation) | | | – | | | | – | | | | – | |
| | | | | | | | | | | | |
Net increase in net assets from operations | | | 78,242 | | | | 827,527 | | | | 635,243 | |
| | | | | | | | | | | | |
| | | |
Distributions to shareholders | | | | | | | | | | | | |
From net investment income | | | | | | | | | | | | |
Institutional Class | | | (106,305 | ) | | | (775,761 | ) | | | (621,800 | ) |
From net realized gains | | | | | | | | | | | | |
Institutional Class | | | (53,457 | ) | | | (5,025 | ) | | | (40,629 | ) |
| | | | | | | | | | | | |
Total distributions to shareholders | | | (159,762 | ) | | | (780,786 | ) | | | (662,429 | ) |
| | | | | | | | | | | | |
| | | |
Share transactions1 | | | | | | | | | | | | |
Proceeds from the sale of shares | | | | | | | | | | | | |
Institutional Class | | | 3,285,833,304 | | | | 18,692,886,046 | | | | 13,736,592,238 | |
Cost of shares redeemed | | | | | | | | | | | | |
Institutional Class | | | (3,139,649,965 | ) | | | (18,308,854,731 | ) | | | (13,070,448,364 | ) |
| | | | | | | | | | | | |
Net increase in net assets from share transactions | | | 146,183,339 | | | | 384,031,315 | | | | 666,143,874 | |
| | | | | | | | | | | | |
| | | |
Net increase net assets | | | 146,101,819 | | | | 384,078,056 | | | | 666,116,688 | |
| | | | | | | | | | | | |
Net assets beginning of period | | | 1,894,400,349 | | | | 1,510,322,293 | | | | 844,205,605 | |
| | | | | | | | | | | | |
Net assets end of period | | $ | 2,040,502,168 | | | $ | 1,894,400,349 | | | $ | 1,510,322,293 | |
| | | | | | | | | | | | |
Undistributed (excess of distributions over) net investment income | | $ | (29,127 | ) | | $ | – | | | $ | – | |
| | | | | | | | | | | | |
1Share transactions | | | | | | | | | | | | |
Shares sold | | | | | | | | | | | | |
Institutional Class | | | 3,285,833,304 | | | | 18,692,886,046 | | | | 13,736,592,238 | |
Shares redeemed | | | | | | | | | | | | |
Institutional Class | | | (3,139,649,965 | ) | | | (18,308,854,731 | ) | | | (13,070,448,364 | ) |
| | | | | | | | | | | | |
Net increase | | | | | | | | | | | | |
Institutional Class | | | 146,183,339 | | | | 384,031,315 | | | | 666,143,874 | |
| | | | | | | | | | | | |
Purchase and sales of investment securities (excluding short-term securities): | | | | | | | | | | | | |
Purchase of securities | | $ | 217,652,435 | (a) | | $ | – | | | $ | – | |
Proceeds from sales of securities | | | 58,825,752 | (a) | | | – | | | | – | |
| (a) | Amounts include $189,805,215 and $13,159,410 of purchases and sales, respectively, of U.S. Government Securities. |
See accompanying Notes to the Financial Statements.
JNL Investors Series Trust
Financial Highlights
For a Share Outstanding
| | | | | | | | | | | | | | | | | | | | | | | | | | | | | | | | | | | | | | | | | | | | | | | | |
| | | | | | Increase (Decrease) from
Investment Operations (a) | | | Distributions from | | | | | | Supplemental Data | | | Ratios | |
Period Ended | | Net Asset
Value,
Beginning
of Period | | | Net
Investment
Income
(Loss) | | | Net
Realized &
Unrealized
Gains,
(Losses) | | | Total from
Investment
Operations | | | Net
Investment
Income | | | Net Realized
Gains on
Investment
Transactions | | | Net Asset
Value, End
of Period | | | Total
Return(b) | | | Net Assets,
End of Period (in
thousands) | | | Portfolio
Turnover (c) | | | Expenses to
Average Net
Assets (d) | | | Net
Investment
Income (Loss)
to Average Net
Assets (d) | |
JNL/PPM America Total Return Fund | | | | | | | | | | | | | | | | | | | | | | | | | | | | | |
12/31/2011 (i) | | $ | 11.73 | | | $ | 0.04 | | | $ | 0.04 | | | $ | 0.08 | | | $ | (0.49 | ) | | $ | (0.60 | ) | | $ | 10.72 | | | | 0.87 | % | | $ | 301,591 | | | | 33 | (e) % | | | 0.76 | % | | | 2.41 | % |
10/31/2011 | | | 12.38 | | | | 0.50 | | | | 0.27 | | | | 0.77 | | | | (0.54 | ) | | | (0.88 | ) | | | 11.73 | | | | 7.25 | | | | 29,476 | | | | 302 | (e) | | | 0.61 | | | | 4.36 | |
10/31/2010 | | | 11.94 | | | | 0.53 | | | | 1.09 | | | | 1.62 | | | | (0.49 | ) | | | (0.69 | ) | | | 12.38 | | | | 14.88 | | | | 27,488 | | | | 246 | (e) | | | 0.60 | | | | 4.56 | |
10/31/2009 (f) | | | 10.00 | | | | 0.40 | | | | 1.54 | | | | 1.94 | | | | – | | | | – | | | | 11.94 | | | | 19.40 | | | | 23,923 | | | | 476 | (e) | | | 0.80 | | | | 4.39 | |
JNL Money Market Fund | | | | | | | | | | | | | | | | | | | | | | | | | | | | | |
12/31/2011 (i) | | | 1.00 | | | | 0.00 | | | | – | | | | 0.00 | (h) | | | (0.00 | ) (h) | | | – | | | | 1.00 | | | | 0.01 | | | | 2,040,502 | | | | n/a | | | | 0.19 | | | | 0.03 | |
10/31/2011 | | | 1.00 | | | | 0.00 | | | | – | | | | 0.00 | (h) | | | (0.00 | ) (h) | | | – | | | | 1.00 | | | | 0.05 | | | | 1,894,400 | | | | n/a | | | | 0.19 | (g) | | | 0.05 | (g) |
10/31/2010 | | | 1.00 | | | | 0.00 | | | | – | | | | 0.00 | (h) | | | (0.00 | ) (h) | | | – | | | | 1.00 | | | | 0.06 | | | | 1,510,322 | | | | n/a | | | | 0.20 | | | | 0.06 | |
10/31/2009 | | | 1.00 | | | | 0.01 | | | | – | | | | 0.01 | | | | (0.01 | ) | | | – | | | | 1.00 | | | | 0.60 | | | | 844,206 | | | | n/a | | | | 0.21 | | | | 0.49 | |
10/31/2008 | | | 1.00 | | | | 0.03 | | | | – | | | | 0.03 | | | | (0.03 | ) | | | – | | | | 1.00 | | | | 3.12 | | | | 504,934 | | | | n/a | | | | 0.21 | | | | 3.14 | |
| (a) | Calculated using the average shares method. |
| (b) | Total return assumes reinvestment of all distributions for the period. Total return is not annualized for periods less than one year. |
| (c) | Portfolio turnover is not annualized for periods of less than one year and excludes dollar roll transactions. |
| (d) | Annualized for periods less than one year. |
| (e) | Portfolio turnover including dollar roll transactions for JNL/PPM America Total Return Fund was 647% for the period ended October 31, 2009, 454% for the year ended October 31, 2010, 410% for the year ended October 31, 2011 and 56% for the period ended December 31, 2011. |
| (f) | Commencement of operations for JNL/PPM America Total Return Fund was December 29, 2008. |
| (g) | The ratios of expenses to average net assets and net investment income to average net assets without the expense waiver for the JNL Money Market Fund were 0.20% and 0.05%, respectively for the year ended October 31, 2011. |
| (h) | Amount represents less than $0.005. |
| (i) | For the two months ended December 31, 2011. |
See accompanying Notes to the Financial Statements.
JNL Investors Series Trust
Notes to Financial Statements
December 31, 2011
NOTE 1. ORGANIZATION
The JNL Investors Series Trust (“Trust”) was organized under the laws of Massachusetts, by a Declaration of Trust, dated July 28, 2000. The Trust is registered with the U.S. Securities and Exchange Commission (“SEC”) under the Investment Company Act of 1940, as amended, (���1940 Act”), and the Securities Act of 1933, as amended, (“1933 Act”) as an open-end management investment company issuing its shares in various series. Each series is known as a “Fund” (collectively, “Funds”) and represents a distinct portfolio with its own investment objectives and policies. The Trust currently consists of two (2) separate Funds, the JNL/PPM America Total Return Fund, for which PPM America, Inc. serves as the Sub-Adviser, and the JNL Money Market Fund, for which Wellington Management Company, LLP serves as Sub-Adviser. The JNL/PPM America Total Return Fund and the JNL Money Market Fund are diversified investment companies as defined in the 1940 Act.
Jackson National Asset Management, LLC (“JNAM” or “Adviser”), a wholly-owned subsidiary of Jackson National Life Insurance Company (“Jackson”), serves as investment adviser to each of the Funds. The Adviser is a wholly owned subsidiary of Jackson, which is in turn a wholly owned subsidiary of Prudential plc, a publicly traded company incorporated in the United Kingdom. Prudential plc is not affiliated in any manner with Prudential Financial Inc., a company whose principal place of business is the United States of America. PPM America, Inc., the Sub-Adviser for JNL/PPM America Total Return Fund, is an affiliate of JNAM. At December 31, 2011, affiliated investment funds owned 100% of the outstanding capital shares of the JNL/PPM America Total Return Fund and the JNL Money Market Fund.
The JNL/PPM America Total Return Fund presently offers one class of shares, Class A, which are available for investment to certain Funds in the JNL Series Trust, an open end management investment company advised by JNAM. The JNL Money Market Fund offers an Institutional Class of shares. Institutional Class shares are not sold to retail investors but are available for investment to affiliated Funds.
NOTE 2. SIGNIFICANT ACCOUNTING POLICIES
The following is a summary of significant accounting policies consistently followed by the Trust in the preparation of its financial statements in conformity with accounting principles generally accepted in the United States of America (“GAAP”).
Effective November 21, 2011, the Trust’s Board of Trustees (“Board” or “Trustees”) approved changing the Trust’s fiscal and tax year end from October 31 to December 31.
Security Valuation – The net asset value (“NAV”) of each Fund shall be determined as of the close of trading (generally, 4:00 PM Eastern Time) on each day the New York Stock Exchange (“NYSE”) is open for trading. Debt securities are generally valued by independent pricing services approved by the Trust’s Board. Pricing services utilized to value debt securities may use various pricing techniques which take into account appropriate factors such as: yield; credit quality; coupon rate; maturity; type of issue; trading characteristics; call features; credit ratings; and other data, as well as broker quotes. If pricing services are unable to provide valuations, debt securities are valued at the most recent bid quotation or evaluated price, as applicable, obtained from the Fund’s Adviser, a broker/dealer or widely used quotation system. All securities in the JNL Money Market Fund, as permitted by compliance with applicable provisions of Rule 2a-7 under the 1940 Act, and other short-term securities maturing within sixty (60) days are valued at amortized cost, unless it is determined that such practice does not approximate market value. Futures contracts traded on a liquid exchange are valued at the settlement price. If the settlement price is not available, exchange traded futures are valued at the last sales price as of the close of business on the local exchange. Stocks traded on an exchange are generally valued at the official closing price of the exchange where the security is principally traded. If there is no official closing price for the security, the security may be valued at the last quoted sale price on the exchange where the security is principally traded or final bid price in the absence of a sale. Stocks not listed on a national or foreign stock exchange may be valued at the closing bid price on the over-the-counter market. Investments in mutual funds are valued at the NAV per share determined as of the close of the NYSE on each valuation date.
Market quotations may not be readily available for certain investments or it may be determined that a quotation for an investment does not represent market value. In such instances, the investment is valued as determined in good faith using procedures adopted by the Board. Situations that may require an investment to be fair valued may include instances where a security is thinly traded, halted or restricted as to resale. In addition, investments may be fair valued based on the occurrence of a significant event. Significant events may be specific to a particular issuer, such as mergers, restructurings or defaults. Alternatively, significant events may affect an entire market, such as natural disasters, government actions, and significant changes in value of U.S. securities markets. Securities are fair valued based on observable and unobservable inputs, including the Adviser’s own assumptions in determining fair value of an investment. Under the procedures adopted by the Board, the Adviser may rely on pricing services or other sources, including the Fund’s Sub-Adviser, to assist in determining the fair value of an investment. Factors considered to determine fair value may include the correlation with price movement of similar securities in the same or other markets; the type, cost and investment characteristics of the security; the business and financial condition of the issuer; and trading or other market data.
If an investment is valued at a fair value for purposes of calculating a Fund’s NAV, the value may be different from the last quoted price for the investment depending on the source and method used to determine the value. Although there can be no assurance, in general, the fair value of the investment is the amount the owner of such investment might reasonably expect to receive upon its current sale.
Please see the Notes to the Schedules of Investments, Financial Accounting Standards Board (“FASB”) Accounting Standards Codification (“ASC”) Topic 820, “Fair Value Measurements and Disclosure”, for expanded disclosure of fair value measurements.
Recent Accounting Pronouncements – In April, 2011, FASB released Accounting Standards Update (“ASU”) No. 2011-03 “Reconsideration of Effective Control for Repurchase Agreements”. ASU No. 2011-03 is intended to improve financial reporting of repurchase agreements and other agreements that
JNL Investors Series Trust
Notes to Financial Statements
December 31, 2011
both entitle and obligate a transferor to repurchase or redeem the financial assets before their maturity. The ASU eliminates the collateral maintenance provision that an entity may use to determine whether a transfer of securities in a repurchase agreement is accounted for as a sale or a secured borrowing. The ASU may cause certain dollar roll transactions that are currently accounted for as purchase and sale to be characterized as a secured borrowing transaction. The ASU is effective for the first interim or annual period beginning on or after December 15, 2011. Management is currently evaluating the impact ASU No. 2011-03 will have on the Funds’ financial statement disclosures.
In May 2011, FASB released ASU No. 2011-04 “Amendments to Achieve Common Fair Value Measurement and Disclosure Requirements in U.S. GAAP and International Financial Reporting Standards”. ASU 2011-04 further clarifies fair value measurement principles and requires additional disclosures. Effective for interim and annual periods beginning after December 15, 2011, entities will need to disclose the amounts and reasons for any transfers between Level 1 and Level 2 securities, quantitative information relating to significant observable inputs, a narrative description of the valuation process, and a narrative description of the sensitivity of the fair value measurement to changes in unobservable or Level 3 fair valuation inputs. Management is currently evaluating the impact ASU No. 2011-04 will have on the Funds’ financial statement disclosures.
Distributions to Shareholders – The amount and timing of distributions are determined in accordance with federal income tax regulations, which may differ from GAAP. The JNL/PPM America Total Return Fund generally declares and pays dividends from net investment income annually, but may pay more frequently to avoid excise tax. The JNL Money Market Fund declares dividends daily and pays dividends monthly. Distributions of net realized capital gains, if any, will be distributed at least annually, to the extent they exceed available capital loss carryforwards.
Expenses – Expenses are recorded on an accrual basis. Expenses of the Trust that are directly attributable to a specific Fund are charged to that Fund. Other Trust level expenses are allocated to the Funds based on the average daily net assets of each Fund.
Federal Income Taxes – Each Fund is a separate taxpayer for federal income tax purposes. Each Fund intends to qualify as a regulated investment company (“RIC”) and to distribute substantially all net investment income and net capital gains, if any, to its shareholders and otherwise comply with Subchapter M of the Internal Revenue Code of 1986, as amended, applicable to regulated investment companies. Therefore, no federal income tax provision is required.
Guarantees and Indemnifications – Under the Trust’s organizational documents, its Officers and Trustees are indemnified against certain liabilities arising out of the performance of their duties to the Funds. In addition, certain of the Funds’ contracts with service providers contain general indemnification clauses. The Funds’ maximum exposure under these arrangements is unknown since the amount of any future claims that may be made against the Funds cannot be determined and the Funds have no historical basis for predicting the likelihood of any such claims.
Security Transactions and Investment Income – Security transactions are recorded on the trade date for financial reporting purposes. Dividend income, net of applicable withholding taxes, is recorded on the ex-dividend date. Interest income, including level-yield amortization of discounts and premiums, is accrued daily. A Fund may place a debt obligation on non-accrual status and reduce related interest income by ceasing current accruals and writing off interest receivables when the collection of all or a portion of interest has become doubtful. A debt obligation is removed from non-accrual status when the issuer resumes interest payments or when collectability of interest is reasonably assured. Realized gains and losses are determined on the specific identification basis.
Use of Estimates – The preparation of financial statements in conformity with GAAP requires management to make estimates and assumptions that affect the reported amounts of assets and liabilities and disclosure of contingent assets and liabilities at the date of the financial statements and the reported amounts of increases and decreases in net assets from operations during the reporting period. Actual results could differ from those estimates.
NOTE 3. FINANCIAL DERIVATIVES AND OTHER SECURITIES INVESTMENTS
FASB ASC Topic 815, “Derivatives and Hedging” – This standard includes the requirement for qualitative disclosures about objectives and strategies for using derivative instruments and disclosures regarding credit related contingent features in derivative instruments; as well as requiring quantitative disclosures in the semi-annual and annual financial statements about fair value, realized and unrealized gains and losses and volume of activity for derivative instruments. Information about these instruments is disclosed in the context of each instrument’s primary underlying risk exposure which is categorized as credit, equity price, interest rate, and foreign currency exchange rate risk. The objectives, strategies and underlying risks for each instrument held by the JNL/PPM America Total Return Fund are discussed in the following paragraph.
Futures Contracts – The JNL/PPM America Total Return Fund may be subject to interest rate risk in the normal course of pursuing its investment objectives. During the period, the Fund used futures contracts to manage exposure to or hedge changes in interest rates and to replicate treasury bond positions. Upon entering into a futures contract, the Fund is required to deposit with the broker or counterparty an amount of cash or cash equivalents equal to a certain percentage of the contract amount, known as the “initial margin”. The Fund receives from or pays to the counterparty an amount of cash equal to the daily fluctuation in the value of the contracts. Such receipts or payments, known as the “variation margin”, are recorded by the Fund until the contracts are terminated at which time realized gains and losses are recognized. Futures contracts involve, to varying degrees, risk of loss in excess of the variation margin recorded by the Fund. The primary risks associated with the use of futures contracts are the imperfect correlation between the change in market value of the securities held by the Fund or the change in the market value of an underlying entity and the prices of the futures contracts and the possibility the Fund may not be able to enter into a closing transaction because of an illiquid market. With futures, there is minimal counterparty risk to the Fund since futures are exchange traded and the exchange’s clearing house, as counterparty to all exchange traded futures, guarantees the future contracts against default.
JNL Investors Series Trust
Notes to Financial Statements
December 31, 2011
At December 31, 2011, variation margin related to futures is reflected as receivable or payable for variation margin in the Statement of Assets and Liabilities. During the period ended December 31, 2011, realized gains and change in unrealized appreciation/(depreciation) in futures contracts is reflected for such investments in the Statement of Operations. The futures contracts outstanding as of December 31, 2011, as disclosed in the Notes to the Schedule of Investments and the amounts of realized and changes in unrealized gains and losses on futures contracts during the period as disclosed in the Statement of Operations serve as indicators of the volume of activity for the Fund.
U.S. Government Agencies or Government Sponsored Enterprises – Certain Funds may invest in U.S. government agencies or government sponsored enterprises. U.S. Government securities are obligations of and, in certain cases, guaranteed by, the U.S. government, its agencies or instrumentalities. Some U.S. Government securities, such as Treasury bills, notes and bonds, and securities guaranteed by the Government National Mortgage Association, are supported by the full faith and credit of the U.S. government; others, such as those of the Federal Home Loan Bank, are supported by the right of the issuer to borrow from the U.S. Department of the Treasury (“U.S. Treasury”); others, such as those of the Federal National Mortgage Association (“FNMA” or “Fannie Mae”), are supported by the discretionary authority of the U.S. government to purchase the agency’s obligations; and still others, such as those of the Student Loan Marketing Association, are supported only by the credit of the instrumentality. U.S. Government securities may include zero coupon securities, which do not distribute interest on a current basis and tend to be subject to greater risk than interest paying securities of similar maturities.
Government-related guarantors (i.e., guarantors who are not backed by the full faith and credit of the U.S. government) include FNMA and the Federal Home Loan Mortgage Corporation (“FHLMC” or “Freddie Mac”). FNMA purchases conventional (i.e., not insured or guaranteed by any government agency) residential mortgages from a list of approved seller/servicers which include state and federally chartered savings and loan associations, mutual savings banks, commercial banks and credit unions and mortgage bankers. Pass-through securities issued by FNMA are guaranteed as to timely payment of principal and interest by FNMA, but are not backed by the full faith and credit of the U.S. government. FHLMC issues Participation Certificates (“PCs”), which are pass-through securities, each representing an undivided interest in a pool of residential mortgages. FHLMC guarantees the timely payment of interest and ultimate collection of principal, but PCs are not backed by the full faith and credit of the U.S. government.
FNMA and FHMLC were placed into conservatorship by the Federal Housing Finance Agency (“FHFA”). As the conservator, FHFA succeeded to all rights, titles, powers and privileges of FNMA and FHLMC and of any stockholder, officer or director of FNMA and FHLMC with respect to FNMA and FHLMC and each enterprise’s assets. In connection with the conservatorship, the U.S. Treasury entered into a Senior Preferred Stock Purchase Agreement with FNMA and FHLMC. This agreement contains various covenants that severely limit each enterprise’s operations. In exchange for entering into these agreements, the U.S. Treasury received senior preferred stock in each enterprise and warrants to purchase each enterprise’s common stock. The U.S. Treasury created a new secured lending facility, which is available to FNMA and FHLMC as a liquidity backstop and created a temporary program to purchase mortgage-backed securities issued by FNMA and FHLMC. FNMA and FHLMC are continuing to operate as going concerns while in conservatorship and each remains liable for all of its obligations, including its guaranty obligations, associated with its mortgage-backed securities.
Unregistered Securities – A Fund may own certain investment securities, which are unregistered and thus restricted to resale. These securities may also be referred to as “private placements”. Unregistered securities may be “illiquid” because there is no readily available market for sale of the securities. Where future dispositions of the securities require registration under the 1933 Act, as amended, the Funds have the right to include those securities in such registration generally without cost to the Funds. The Funds have no right to require registration of unregistered securities.
Repurchase Agreements – A Fund may invest in repurchase agreements. A repurchase agreement involves the purchase of a security by a Fund and a simultaneous agreement by the seller, generally a bank or broker/dealer, to repurchase that security back from the Fund at a specified price and date or upon demand. The underlying securities used as collateral for all repurchase agreements are held in safekeeping at the Fund’s Custodian or designated subcustodians under triparty repurchase agreements. The market value of the collateral must be equal to or exceed at all times the total amount of the repurchase obligations, including interest. JNAM monitors that the daily market value of the collateral for the repurchase agreement is in excess of the repurchase agreement. In the event of a default by the counterparty, realization of the collateral proceeds could be delayed, during which time the value of such collateral may decline.
Delayed-Delivery Securities – The JNL/PPM America Total Return Fund may purchase or sell securities on a delayed-delivery basis, including To Be Announced (“TBA”) or “To Be Acquired” securities. These transactions involve a commitment by the Fund to purchase or sell securities for a predetermined price or yield, with payment and delivery taking place beyond the customary settlement period. In TBA transactions, the Fund commits to purchasing or selling securities for which all specific information is not yet known at the time of the trade, particularly the face amount and maturity date of the underlying security transactions. When delayed-delivery purchases are outstanding, the Fund is required to have sufficient cash and/or liquid securities to cover its commitments on these transactions. When purchasing a security on a delayed-delivery basis, the Fund assumes the rights of ownership of the security, including the risk of price and yield fluctuations, and considers such fluctuations when determining its NAV. The Fund may dispose of or renegotiate a delayed-delivery transaction after it is entered into, and may sell delayed-delivery securities before they are delivered, which may result in a capital gain or loss. When the Fund has sold a security on a delayed-delivery basis, the Fund does not participate in future gains or losses with respect to the security. Securities purchased on a TBA basis are not settled until they are delivered to the Fund. In connection with TBA transactions, the JNL/PPM America Total Return Fund may maintain a short position related to certain securities. In connection with these transactions, the Fund owns an equal amount of the securities or holds securities convertible (or exchangeable) into an equal amount of the securities, of the same issuer, as the position held short. Master Securities Forward Transaction Agreements (“Master Forward Agreements”) govern the consideration of factors surrounding the settlement of certain purchases and sales made on a delayed-delivery basis by and between the Fund and select counterparties. The Master Forward Agreements maintain provisions for, among other things, initiation and confirmation, payment and transfer, events of default, termination and maintenance of collateral.
JNL Investors Series Trust
Notes to Financial Statements
December 31, 2011
Dollar Roll Transactions – The JNL/PPM America Total Return Fund may enter into mortgage dollar rolls in which the Fund sells mortgage-backed securities for delivery in the current month and simultaneously contracts to repurchase substantially similar (same type, coupon and maturity) securities on a specified future date. During the roll period, the Fund foregoes principal and interest paid on the mortgage-backed securities. The Fund is compensated by the interest earned on the cash proceeds of the initial sale and from negotiated fees paid by brokers offered as an inducement to the Fund to “roll over” its purchase commitments. The Fund may only enter into covered rolls. A “covered roll” is a type of dollar roll for which the Fund maintains offsetting positions in cash, U.S. Government securities, or other liquid assets which mature on or before the forward repurchase settlement date of the dollar roll transaction. Dollar roll transactions involve the risk that the market value of the securities sold by the Fund may decline below the repurchase price of those similar securities which the Fund is obligated to purchase or that the return earned by the Fund with the proceeds of a dollar roll may not exceed transaction costs.
Securities Lending and Securities Lending Collateral – The JNL/PPM America Total Return Fund may lend securities to certain brokers, dealers or other financial institutions in order to earn additional income. The borrowers pay the Fund’s securities lending agent negotiated lender fees and the Fund receives a fee equal to a percentage of the negotiated lender fees and the net income generated by the securities lending collateral held during each lending transaction. The securities lending agent is authorized to loan securities on behalf of the Fund to approved borrowers and is required to maintain collateral at least equal to the value of the securities loaned based on the previous day’s market value of the securities loaned, marked-to-market daily. Any shortfalls are adjusted the next business day. In the event of bankruptcy or other default of the borrower, the Fund could experience delays in liquidating the loan collateral or recovering the loaned securities and incur expenses related to enforcing its rights. In addition, there could be a decline in the value of the collateral or in the value of the securities loaned while the Fund seeks to enforce its rights thereto and the Fund could experience subnormal levels of income or lack of access to income during that period. The Fund also bears the risk of any deficiency in the amount of collateral available for return to a borrower due to a loss in an approved investment. The JNL/PPM America Total Return Fund did not participate in the securities lending program during the period ended December 31, 2011.
Senior and Junior Loans – A Fund may invest in Senior loans or secured and unsecured subordinated loans, second lien loans and subordinated bridge loans (“Junior loans”) which are purchased or sold on a when-issued or delayed-delivery basis and may be settled a month or more after the trade date. Interest income on these loans is accrued based on the terms of the securities. Senior and Junior loans can be acquired through an agent, by assignment from another holder of the loan, or as a participation interest in another holder’s portion of the loan.
NOTE 4. INVESTMENT ADVISORY FEES AND TRANSACTIONS WITH AFFILIATES
The Trust has an investment advisory agreement with JNAM, whereby JNAM provides investment management services. Each Fund pays JNAM an annual fee, accrued daily and paid monthly, based on a specified percentage of the average daily net assets of each Fund. A portion of this fee is paid by JNAM to the Sub-Advisers as compensation for their services. The JNL/PPM America Total Return Fund is obligated to pay JNAM an annual rate of 0.50% for net assets up to $1 billion and 0.45% for net assets over $1 billion. The JNL Money Market Fund is obligated to pay JNAM an annual rate of 0.20% for net assets up to $750 million and 0.18% for net assets over $750 million.
Administrative Fee – JNAM also serves as the “Administrator” to the Funds. The JNL/PPM America Total Return Fund pays JNAM an Administrative Fee at an annual rate of 0.10% of the average daily net assets of the Fund which is accrued daily and paid monthly. JNAM provides or procures most of the necessary administrative functions and services for the operations of the JNL Money Market Fund at no additional cost. In accordance with the Administration Agreement, JNAM is responsible for payment of the following expenses: fund accounting, shareholder reporting, shareholder servicing, certain legal, insurance, custody, audit, and tax fees. Additionally, JNAM provides transfer agency services.
Fee Waiver and Expense Reimbursements – Effective November 1, 2010, the Board approved a contractual expense limitation agreement whereby JNAM agreed to waive fees and reimburse expenses of the JNL Money Market Fund to the extent necessary to limit operating expenses of the Fund (excluding brokerage expense, interest, taxes and dividend, and extraordinary expenses) to an annual rate as a percentage of average daily net assets equal to or less than the Fund’s net investment income for the year. JNAM may recover previously reimbursed expenses from the Fund for fees waived and reimbursed. During the year ended October 31, 2011 and the period ended December 31, 2011, no fees were waived under the contractual expense limitation agreement. During the year ended October 31, 2011, the Adviser voluntarily waived expenses of the Fund in the amount of $25,081. This amount is recorded as expense waiver in the Fund’s Statement of Operations. None of the voluntarily waived expenses are recoverable from the Fund by the Adviser.
Rule 12b-1 Fees – The JNL/PPM America Total Return Fund adopted a Distribution Plan under the provisions under Rule 12b-1 under the 1940 Act for the purpose of reimbursement of certain distribution and related service expenses from the sale and distribution of the Fund’s Class A shares. Jackson National Life Distributors LLC (“JNLD”), a wholly-owned subsidiary of Jackson and an affiliate of JNAM, is the principal underwriter of the Funds, with responsibility for promoting sales of their shares. JNLD also is the principal underwriter of the variable insurance products issued by Jackson and its subsidiaries. For the JNL/PPM Total Return Fund, the maximum annual 12b-1 fee allowed is 0.20% of the average daily net assets attributable to Class A shares. Effective December 12, 2011, the JNL/PPM America Total Return Fund began charging Rule 12b-1 fees. Amounts charged pursuant to the Distribution Plan are reflected as 12b-1 fees (Class A) in the Statements of Operations. Institutional Class shares of JNL Money Market Fund have no Rule 12b-1 Fees.
JNL Investors Series Trust
Notes to Financial Statements
December 31, 2011
Deferred Compensation Plan – Effective January 1, 2007, the Funds adopted a Deferred Compensation Plan whereby disinterested Trustees may defer the receipt of all or a portion of their compensation. These deferred amounts, which remain as liabilities of the Funds, shall be treated as if invested and reinvested in shares of one or more affiliated funds at the discretion of the applicable Trustee. These amounts represent general, unsecured liabilities of the Funds and vary according to the total returns of the selected Funds. Prior to January 1, 2007, Trustees were able to defer the receipt of their compensation under a separate plan. Deferred amounts under this plan are credited at a fixed annual rate of return of five percent (5%). Liabilities related to deferred balances are included in payable for trustee fees in the Statements of Assets and Liabilities. Increases or decreases related to the changes in value of deferred balances are included in trustee fees set forth in the Statements of Operations.
Investments in Affiliates – During the period ended December 31, 2011, the JNL/PPM America Total Return Fund invested in a money market fund which is managed by the Adviser. The JNL Money Market Fund is offered as a cash management tool to the JNL/PPM America Total Return Fund and its affiliates and is not available for direct purchase by members of the public. JNL/PPM America Total Return Fund’s investment in JNL Money Market Fund on October 31, 2011 and December 31, 2011 was $2,405,570 and $69,859,053, respectively. During the year ended October 31, 2011 and the period ended December 31, 2011, dividend income received from this investment was $1,564 and $4,784, respectively. There was no realized gain or loss relating to transactions in this investment for the year ended October 31, 2011 or the period ended December 31, 2011.
NOTE 5. FEDERAL INCOME TAX MATTERS
The following information is presented on an income tax basis. Differences between amounts for financial statements and federal income tax purposes are primarily due to timing and character differences in recognizing certain gains and losses on investment transactions. Permanent differences between financial statement and federal income tax reporting are reclassified within the capital accounts based on their federal income tax treatment. Temporary differences do not require reclassification.
To the extent there are differences between the amounts recognized for financial statements and federal income tax purposes that are permanent in nature, such amounts are reclassified within the capital accounts based on their federal income tax treatment. Permanent differences may include but are not limited to the following: expired capital loss carryforwards, market discount or paydown reclassifications, net operating losses, accounting treatment of notional principal contracts and distribution adjustments. The JNL/PPM America Total Return Fund had reclassifications which increased undistributed net investment income and decreased accumulated net realized gain by $12,603 for the period ended December 31, 2011. The JNL Money Market Fund had reclassifications which decreased undistributed net investment income, increased accumulated net realized gain and decreased paid in capital by $1,409, $1,716 and $307, respectively, for the period ended December 31, 2011. These reclassifications have no impact on net assets.
At December 31, 2011, the cost of investments, the components of net unrealized appreciation/(depreciation), undistributed net ordinary income and undistributed net long-term capital gains were as follows:
| | | | | | | | | | | | | | | | | | | | | | | | |
| | | Tax Cost of
Investments | | | Gross Unrealized
Appreciation | | | Gross Unrealized
Depreciation | | | Net Unrealized
Appreciation | | | Undistributed Net
Ordinary Income* | | | Undistributed Net
Long-Term
Capital Gain | |
JNL/PPM America Total Return Fund | | $ | 353,255,646 | | | $ | 3,473,563 | | | $ | (368,737 | ) | | $ | 3,104,826 | | | $ | 362,369 | | | $ | – | |
JNL Money Market Fund | | | 2,039,109,684 | | | | – | | | | – | | | | – | | | | 2,949 | | | | – | |
* Undistributed net ordinary income consists of net taxable income derived from dividends, interest and net short-term capital gains, if any.
The Regulated Investment Company Modernization Act of 2010 (“Act”) was enacted on December 22, 2010. In general, the provisions of the Act are effective for the Funds’ period ending December 31, 2011. Under the Act, a Fund is permitted to carry forward capital losses for an unlimited period. However, any losses incurred during post-enactment taxable years are required to be utilized prior to the losses incurred in pre-enactment taxable years. As a result of this ordering rule, pre-enactment capital loss carry forwards may be more likely to expire unused. Additionally, post-enactment capital losses that are carried forward will retain their character as either short-term or long-term capital losses, and will not be considered exclusively short-term as under previous law.
At December 31, 2011, the following Fund had post-enactment unused capital loss carryovers for U.S. federal income tax purposes, which may be used to offset future net realized capital gains and will be carried forward indefinitely and retain their character as follows:
| | | | | | | | |
| | | Short Term
Capital Losses | | | Long Term
Capital Losses | |
JNL Money Market Fund | | $ | 345 | | | $ | – | |
The JNL/PPM America Total Return Fund paid distributions of $2,477,913, $2,643,450 and $2,362,215 from net ordinary income which consists of net taxable income derived from dividends and interest and net short-term capital gains, if any, during the period ended December 31, 2011, and the years ended October 31, 2011 and 2010, respectively. The JNL/PPM America Total Return Fund paid distributions from long term capital gains of $512,427 and $511,686 during the period ended December 31, 2011 and the year ended October 31, 2011, respectively. The JNL Money Market Fund paid distributions of $159,762, $780,786 and $662,429 from net ordinary income which consists of net taxable income derived from dividends and interest and net short-term capital gains, if any, during the period ended December 31, 2011, and the years ended October 31, 2011 and 2010, respectively.
FASB ASC Topic 740 “Income Taxes” provides guidance for how uncertain tax positions should be recognized, measured, presented and disclosed in the financial statements. FASB ASC Topic 740 requires the evaluation of tax positions taken or expected to be taken in the course of preparing each Fund’s tax return to determine whether the tax positions are “more-likely-than-not” of being sustained by the applicable tax authority. Tax positions not deemed to
JNL Investors Series Trust
Notes to Financial Statements
December 31, 2011
meet the “more-likely-than-not” threshold would be recorded as a tax expense in the current year. FASB ASC Topic 740 requires that management evaluate the tax positions taken in returns for 2008, 2009, 2010 and 2011 which remain subject to examination, by the Internal Revenue Service. These returns are not subject to examination by any other tax jurisdictions. Management completed an evaluation of the Funds’ tax positions and based on that evaluation, determined that no provision for federal income tax was required in the Funds’ financial statements for the period ended December 31, 2011.
NOTE 6. SUBSEQUENT EVENTS
Management has evaluated subsequent events for the Funds through the date the financial statements are issued, and has concluded there are no events that require adjustments to the financial statements or disclosure in the footnotes.
Report of Independent Registered Public Accounting Firm
To the Shareholders and Board of Trustees
JNL Investors Series Trust:
We have audited the accompanying statements of assets and liabilities of JNL Money Market Fund and JNL/PPM America Total Return Fund (the “Funds”) (series of JNL Investors Series Trust), including the schedules of investments, as of December 31, 2011, and the related statements of operations for the period November 1, 2011 through December 31, 2011 and the year-ended October 31, 2011, the statements of changes in net assets for the period November 1, 2011 through December 31, 2011 and each of the years in the two year period then ended, and the financial highlights for each of the years or periods indicated herein. These financial statements and financial highlights are the responsibility of the Funds’ management. Our responsibility is to express an opinion on these financial statements and financial highlights based on our audits.
We conducted our audits in accordance with the standards of the Public Company Accounting Oversight Board (United States). Those standards require that we plan and perform the audit to obtain reasonable assurance about whether the financial statements and financial highlights are free of material misstatement. An audit includes examining, on a test basis, evidence supporting the amounts and disclosures in the financial statements. Our procedures included confirmation of securities owned as of December 31, 2011, by correspondence with the custodian and brokers or other appropriate auditing procedures. An audit also includes assessing the accounting principles used and significant estimates made by management, as well as evaluating the overall financial statement presentation. We believe that our audits provide a reasonable basis for our opinion.
In our opinion, the financial statements and financial highlights referred to above present fairly, in all material respects, the financial position of the Funds as of December 31, 2011, the results of their operations, changes in their net assets and the financial highlights for each of the years or period indicated herein, in conformity with U.S. generally accepted accounting principles.
|
/s/ KPMG LLP |
|
February 28, 2012 |
Chicago, Illinois |
JNL Investors Series Trust
Additional Disclosures (Unaudited)
December 31, 2011
Disclosure of Fund Expenses
Shareholders incur ongoing costs, which include costs for portfolio management, administrative services, 12b-1 fees and other operating expenses. Operating expenses such as these are deducted from each Fund’s gross income and directly reduce the final investment return. These expenses are expressed as a percentage of the Fund’s average net assets; this percentage is known as the Fund’s expense ratio. The examples below use the expense ratio and are intended to help the investor understand the ongoing costs (in dollars) of investing in a Fund and to compare these costs with the ongoing costs of investing in other mutual funds. The examples are based on an investment of $1,000 made at the beginning of the period shown and held for the entire period.
Expenses Using Actual Fund Return. This section provides information about the actual account values and actual expenses incurred by the Fund. Use the information in this section, together with the amount invested, to estimate the expenses paid over the period. Simply divide the account value by $1,000 (for example, an $8,600 account value divided by $1,000 = 8.6), then multiply the result by the number in the first section under the heading entitled “Expenses Paid During Period” to estimate the expenses paid during this period.
Expenses Using Hypothetical 5% Return. The information in this section can be used to compare each Fund’s costs with those of other mutual funds. It assumes that the Fund had an annual 5% return before expenses during the year, but that the expense ratio for the period is unchanged. This example is useful in making comparisons because the SEC requires all mutual funds to make the 5% calculation.
| | | | | | | | | | | | | | | | | | | | | | | | | | | | | | | | |
| | | Expenses Using Actual Fund Return | | | Expenses Using Hypothetical 5% Return | |
| | | Beginning
Account
Value
7/01/2011 | | | Ending
Account
Value
12/31/2011 | | | Annualized
Expense
Ratios | | | Expenses
Paid
During
Period | | | Beginning
Account
Value
7/01/2011 | | | Ending
Account
Value
12/31/2011 | | | Annualized
Expense
Ratios | | | Expenses
Paid
During
Period | |
JNL/PPM America Total Return Fund | | | | | | | | | | | | | | | | | | | | | | | | | | | | | | | | |
Class A | | $ | 1,000.00 | | | $ | 1,032.00 | | | | 0.71 | | | $ | 3.64 | | | $ | 1,000.00 | | | $ | 1,021.63 | | | | 0.71 | | | $ | 3.62 | |
JNL Money Market Fund | | | | | | | | | | | | | | | | | | | | | | | | | | | | | | | | |
Institutional Class | | | 1,000.00 | | | | 1,000.10 | | | | 0.19 | | | | 0.96 | | | | 1,000.00 | | | | 1,024.25 | | | | 0.19 | | | | 0.97 | |
Expenses paid during the period are equal to the annualized expense ratio, multiplied by the average account value over the period, multiplied by the number of days in the period, then divided by the number of days in the most recent 12-month period (to reflect the most recent 6-month period).
Quarterly Portfolio Holdings
The Funds file a complete schedule of portfolio holdings with the U.S. Securities and Exchange Commission (“SEC”) for the first and third quarters of each fiscal year on Form N-Q. The Funds’ Forms N-Q are available on the SEC’s website at www.sec.gov. The Forms N-Q may be reviewed and copied at the SEC’s Public Reference Room in Washington, DC, and information on the operation of the Public Reference Room may be obtained by calling 800-SEC-0330. It is also available upon request from the registrant by calling the Funds toll-free at 1-866-255-1935.
Proxy Voting Guidelines
The Funds’ Board has adopted the Proxy voting policies and procedures (“Policy”) of the Funds’ Adviser, pursuant to which the Board has delegated proxy voting responsibility to the Adviser, and pursuant to which the Adviser has delegated proxy voting responsibility to each of the Sub-Advisers. The Trust has adopted each of the Sub-Adviser’s proxy voting policies and procedures (“Procedures”).
The Policy is designed to promote accountability of the company’s management to its shareholders and to align the interests of management with those shareholders. The Sub-Advisers generally review each matter on a case-by-case basis in order to make a determination of how to vote in a manner that best serves the interests of Fund shareholders. The Sub-Advisers may abstain from voting from time to time where it determines that the costs associated with voting a proxy outweigh the benefits derived from exercising the right to vote. In addition, the Sub-Advisers will monitor situations that may result in a conflict of interest, in accordance with their Procedures. A description of the policy and the procedures used by the Funds to vote proxies relating to the portfolio securities, and information on how the Funds voted proxies relating to portfolio securities during the 12 month period ended June 30, 2011 are available (1) without charge, upon request by calling 1-866-255-1935, and (2) on the U.S. Securities and Exchange Commission’s website at www.sec.gov.
TRUSTEES AND OFFICERS THE TRUST
| | | | |
NAME, ADDRESSAND (AGE) | | POSITION(S) HELD WITH TRUST (LENGTHOF TIME SERVED) | | NUMBER OF PORTFOLIOS IN FUND COMPLEX TO BE OVERSEENBY TRUSTEEOR OFFICER |
Interested Trustee | | | | |
Mark D. Nerud (45)1 1 Corporate Way Lansing, MI 48951 | | Trustee2 (1/2007 to present) President and Chief Executive Officer (12/2006 to present) | | 106 |
PRINCIPAL OCCUPATION(S) DURING PAST 5 YEARS: |
| Chief Executive Officer of the Adviser (1/2010 to present); President of the Adviser (1/2007 to present); Managing Board Member of Curian Capital, LLC (1/2011 to present) and Curian Clearing LLC (1/2011 to present); Chief Financial Officer of the Adviser (11/2000 to 1/2007) and Managing Board Member of the Adviser (11/2000 to 11/2003) (1/2007 to 12/2010); President and CEO of other Investment Companies advised by the Adviser (12/2006 to present); Vice President – Fund Accounting & Administration of Jackson National Life Insurance Company (1/2000 to 12/2009) |
| |
OTHER DIRECTORSHIPS HELDBY TRUSTEE DURING PAST 5 YEARS: None |
Disinterested Trustees | | | | |
Michael Bouchard (55) 1 Corporate Way Lansing, MI 48951 | | Trustee2 (12/2003 to present) | | 106 |
PRINCIPAL OCCUPATION(S) DURING PAST 5 YEARS: Sheriff, Oakland County, Michigan (1/1999 to present) |
OTHER DIRECTORSHIPS HELDBY TRUSTEE DURING PAST 5 YEARS: None |
William J. Crowley, Jr. (66) 1 Corporate Way Lansing, MI 48951 | | Trustee2 (1/2007 to present) | | 106 |
| |
PRINCIPAL OCCUPATION(S) DURING PAST 5 YEARS: Managing Partner (Baltimore Office) – Arthur Andersen LLP (1995 to 2002); Board Member of various corporate boards (2002 to present) |
| |
OTHER DIRECTORSHIPS HELDBY TRUSTEE DURING PAST 5 YEARS: Director of Alpha Natural Resources (07/2009 to present); Director of Foundation Coal Holdings, Inc. (from 12/2004 until 7/2009 when the company was acquired); Director of Bio Veris Corporation (from 5/2003 until 6/2007 when the company was acquired); Director of Provident Bankshares Corporation (from 5/2003 until 5/2009 when the company was acquired) |
Dominic D’Annunzio (73) 1 Corporate Way Lansing, MI 48951 | | Trustee2 (2/2002 to present) Chairman of the Board (2/2004 to 12/2010) | | 106 |
PRINCIPAL OCCUPATION(S) DURING PAST 5 YEARS: Acting Commissioner of Insurance for the State of Michigan (1/1990 to 5/1990) and (8/1997 to 5/1998) |
OTHER DIRECTORSHIPS HELDBY TRUSTEE DURING PAST 5 YEARS: None |
Michelle Engler (53) 1 Corporate Way Lansing, MI 48951 | | Chairperson of the Board3 (1/2011 to present) Trustee2 (12/2003 to present) | | 106 |
| |
PRINCIPAL OCCUPATION(S) DURING PAST 5 YEARS: Attorney (1983 to present); First Lady of the State of Michigan (1990 to 2002) |
| |
OTHER DIRECTORSHIPS HELDBY TRUSTEE DURING PAST 5 YEARS: |
Director of Federal Home Loan Mortgage Corporation (2001 to 9/2008) |
1Mr. Nerud is an “interested person” of the Trust due to his position with Jackson National Asset Management, LLC, the Adviser.
2The interested and disinterested Trustees are elected to serve for an indefinite term.
3Beginning January 1, 2011, the Chairperson shall serve as Chairperson for no more than three consecutive years and may not be re-elected as Chairperson until at least one year has elapsed since the end of the Chairperson’s term. Chairperson Engler’s term will lapse at the end of 2013.
| | | | |
NAME, ADDRESSAND (AGE) | | POSITION(S) HELD WITH TRUST (LENGTHOF TIME SERVED) | | NUMBEROF PORTFOLIOSIN FUND COMPLEXTO BE OVERSEENBY TRUSTEEOR OFFICER |
James Henry, Ph.D. (73) 1 Corporate Way Lansing, MI 48951 | | Trustee2 (1/2007 to present) | | 106 |
PRINCIPAL OCCUPATION(S) DURING PAST 5 YEARS: | | |
| Dean Emeritus and Professor of Finance, Eli Broad College of Business and Graduate School of Management at Michigan State University (2001 to 7/2009) |
| |
OTHER DIRECTORSHIPS HELDBY TRUSTEE DURING PAST 5 YEARS: None |
Richard McLellan (69) 1 Corporate Way Lansing, MI 48951 | | Trustee2 (12/1994 to present) | | 106 |
PRINCIPAL OCCUPATION(S) DURING PAST 5 YEARS: | | |
| Attorney (2010 to present); Senior Counsel, Dykema Gossett PLLC (2007 to 2009); Member, Dykema Gossett PLLC (Law Firm) (1973 to 2007); Adjunct Associate Professor, Michigan State University (2008 to present) |
| |
OTHER DIRECTORSHIPS HELDBY TRUSTEE DURING PAST 5 YEARS: Member of the Board of Directors of ITC Holdings Corp. (11/2007 to present) |
William R. Rybak (60) 1 Corporate Way Lansing, MI 48951 | | Trustee2 (1/2007 to present) | | 106 |
PRINCIPAL OCCUPATION(S) DURING PAST 5 YEARS: Board Member of various corporate boards (see below) (2002 to present) |
| |
OTHER DIRECTORSHIPS HELDBY TRUSTEE DURING PAST 5 YEARS: Member of the Board of Directors of Christian Brothers Investments, Inc. (2010 to present); Chairman of the Board of Trustees of Lewis University (1982 – 2009) and Chair Emeritus (2009 to present); Member of the Board of Directors of Howe Barnes Hoefer Arnett (2001 to 3/2011); Member of the Boards of each of the Calamos Mutual Funds (2002 to present); Member of the Board of Directors of The PrivateBancorp (2003 to present); Chairman of the Board of Trustees of St. Coletta’s of Illinois (2004 to 2007) and Member of the Board (2000 to 2007) |
Patricia A. Woodworth (56) 1 Corporate Way Lansing, MI 48951 | | Trustee2 (1/2007 to present) | | 106 |
PRINCIPAL OCCUPATION(S) DURING PAST 5 YEARS: Vice President, Chief Financial Officer and Chief Operating Officer, The J. Paul Getty Trust (12/2007 to present); Executive Vice President for Finance and Administration, Chief Financial Officer, Art Institute of Chicago (2002 to 11/2007) |
| |
OTHER DIRECTORSHIPS HELDBY TRUSTEE DURING PAST 5 YEARS: None |
Karen J. Buiter, (46) 1 Corporate Way Lansing, MI 48951 | | Assistant Treasurer (12/2008 to present) | | Not Applicable |
PRINCIPAL OCCUPATION(S) DURING PAST 5 YEARS: |
Vice President – Financial Reporting of the Adviser (7/2011 to present); Assistant Treasurer of other investment companies advised by Curian Capital, LLC (11/2010 to present); Assistant Vice President – Fund Reporting of the Adviser (4/2008 to 6/2011); Assistant Treasurer of other Investment Companies advised by the Adviser (12/2008 to present); Treasurer of Henderson Global Funds (2/2004 to 3/2008) |
| | | | |
NAME, ADDRESSAND (AGE) | | POSITION(S) HELD WITH TRUST (LENGTHOF TIME SERVED) | | NUMBER OF PORTFOLIOS IN FUND COMPLEXTO
BE OVERSEENBY TRUSTEEOR OFFICER |
Officers | | | | |
Kelly L. Crosser (39) 1 Corporate Way Lansing, MI 48951 | | Assistant Secretary (9/2007 to present) | | Not Applicable |
PRINCIPAL OCCUPATION(S) DURING PAST 5 YEARS: | | |
Assistant Secretary of other Investment Companies advised by the Adviser (9/2007 to present); Assistant Secretary of other Investment Companies advised by Curian Capital, LLC (11/2010 to present); Senior Compliance Analyst of Jackson National Life Insurance Company (4/2007 to present); Mutual Fund Compliance Analyst of Jackson National Life Insurance Company (2/2006 to 4/2007) |
Steven J. Fredricks (41) 1 Corporate Way Lansing, MI 48951 | | Chief Compliance Officer (1/2005 to present) | | Not Applicable |
PRINCIPAL OCCUPATION(S) DURING PAST 5 YEARS: Chief Compliance Officer of the Adviser and other Investment Companies advised by the Adviser (1/2005 to present); Chief Compliance Officer of other Investment Companies advised by Curian Capital, LLC (10/2011 to present) |
Danielle A. Bergandine (31) 1 Corporate Way Lansing, MI 48951 | | Anti-Money Laundering Officer (12/2007 to present) | | Not Applicable |
PRINCIPAL OCCUPATION(S) DURING PAST 5 YEARS: Senior Compliance Analyst of the Adviser (6/2009 to present); Compliance Analyst of the Adviser (08/2006 to 6/2009); Anti-Money Laundering Officer of other Investment Companies advised by Curian Capital, LLC (10/2011 to present) |
Daniel W. Koors (41) 1 Corporate Way Lansing, MI 48951 | | Vice President (11/2011 to present) Vice President, Treasurer and Chief Financial Officer (12/2006 to 11/2011) | | Not Applicable |
PRINCIPAL OCCUPATION(S) DURING PAST 5 YEARS: Senior Vice President of the Adviser (1/2009 to present), Chief Operating Officer of the Adviser (4/2011 to present), and Chief Financial Officer of the Adviser (1/2007 to 4/2011); Treasurer and Chief Financial Officer (Principal Financial Officer) of other Investment Companies advised by Curian Capital, LLC (11/2010 to present); Vice President of the Adviser (1/2007 to 12/2008); Vice President, Treasurer and Chief Financial Officer of other Investment Companies advised by the Adviser (12/2006 to present); Assistant Vice President – Fund Administration of Jackson National Life Insurance Company (8/2006 to 1/2009) |
Gerard A. M. Oprins (52) 1 Corporate Way Lansing, MI 48951 | | Treasurer and Chief Financial Officer (Principal Financial Officer) (11/2011 to present) | | Not Applicable |
PRINCIPAL OCCUPATION(S) DURING PAST 5 YEARS: Senior Vice President and Chief Financial Officer of the Adviser (4/2011 to present); Treasurer and Chief Financial Officer of the Trust (11/2011 to present); Business Consultant (5/2009 to 3/2011); Partner, Ernst & Young LLP (10/1995 to 4/2009) |
Michael Piszczek (54) 1 Corporate Way Lansing, MI 48951 | | Vice President (11/2007 to present) | | Not Applicable |
PRINCIPAL OCCUPATION(S) DURING PAST 5 YEARS: Vice President – Tax of the Adviser (7/2011 to present); Vice President of other Investment Companies advised by the Adviser (11/2007 to present); Vice President of other Investment Companies advised by Curian Capital, LLC (11/2010 to present); Assistant Vice President – Tax of the Adviser (11/2007 to 6/2011); Assistant Vice President – Nuveen Investments (4/1999 to 8/2007); Assistant Vice President and Assistant Secretary – Nuveen Funds (4/1999 to 8/2007) |
Susan S. Rhee (40) 1 Corporate Way Lansing, MI 48951 | | Vice President, Counsel (Chief Legal Officer) and Secretary (2/2004 to present) | | Not Applicable |
PRINCIPAL OCCUPATION(S) DURING PAST 5 YEARS: Senior Vice President and General Counsel of the Adviser (1/2010 to present); Chief Legal Officer (7/2004 to 12/2009) and Secretary (11/2000 to present) of the Adviser; Vice President, Counsel (Chief Legal Officer), and Secretary of other Investment Companies advised by the Adviser (2/2004 to present); Vice President, Chief Legal Officer & Secretary of other Investment Companies advised by Curian Capital, LLC (11/2010 to present); Assistant Vice President of Jackson National Life Insurance Company (8/2003 to 12/2009); Associate General Counsel of Jackson National Life Insurance Company (7/2001 to 12/2009) |
TRUSTEESOFTHE JNL INVESTORS SERIES TRUST
The interested Trustee and the Officers of the Trust (other than the Chief Compliance Officer, as described below) or the Adviser do not receive any compensation from the Trust for their services as Trustees or Officers. The following persons, who are disinterested Trustees of the Trust, and the Trust’s Chief Compliance Officer, received from the Trust the compensation amounts indicated for the services as such for the twelve-month period ended December 31, 2011.
| | | | | | | | |
| TRUSTEE | | AGGREGATE
COMPENSATION FROM THE
TRUST1 | | PENSION OR RETIREMENT
BENEFITS ACCRUED AS
PART OF TRUST EXPENSES | | ESTIMATED ANNUAL
BENEFITS UPON
RETIREMENT | | TOTAL COMPENSATION
FROM THE TRUST AND
FUND COMPLEX |
Michael Bouchard | | $2,377 | | $0 | | $0 | | $159,0004 |
William J. Crowley, Jr. | | $2,638 | | $0 | | $0 | | $176,500 |
Dominic D’Annunzio | | $2,414 | | $0 | | $0 | | $161,5005 |
Michelle Engler3 | | $3,013 | | $0 | | $0 | | $201,500 |
James Henry | | $2,414 | | $0 | | $0 | | $161,5006 |
Richard McLellan | | $2,325 | | $0 | | $0 | | $155,500 |
William R. Rybak | | $2,602 | | $0 | | $0 | | $174,000 |
Patricia Woodworth | | $2,377 | | $0 | | $0 | | $159,0007 |
Steven J. Fredricks2 | | $4,578 | | $0 | | $0 | | $306,173 |
1 The fees paid to the independent Trustees are paid for combined meetings of all Funds in the Fund Complex. The fees are allocated to the Funds and affiliated investment companies on a pro-rata basis based on net assets. The total fees to all the independent Trustees are $1,348,500.
2 Mr. Fredricks’ compensation is paid by the Funds for his duties as the Chief Compliance Officer of the Fund Complex. The expense is allocated to the Funds and affiliated investment companies on a pro-rata basis based on net assets.
3 Ms. Engler is an ex officio (non-voting) member of the Governance Committee. Therefore, she does not receive any compensation as a member of the Governance Committee.
4 Amount includes $119 deferred by Mr. Bouchard.
5 Amount includes $1,207 deferred by Mr. D’Annunzio.
6 Amount includes $2,173 deferred by Mr. Henry.
7 Amount includes $2,377 deferred by Ms. Woodworth.
You can obtain a copy of the current Statement of Additional Information or the most recent Annual or Semi-Annual Reports without charge, or make other inquiries, by calling 1-866-255-1935, or writing the JNL Investors Series Trust Service Center, 225 W. Wacker Drive, Suite 1200, Chicago, IL 60606.
Item 2. Code of Ethics.
As of the end of the period covered by this report, the registrant had adopted a code of ethics, as defined in Item 2 of Form N-CSR, applicable to its principal executive officer, principal financial officer, principal accounting officer or controller, or persons performing similar functions. There were no substantive amendments or any waivers to this code of ethics during the period covered by this report. A copy of this code of ethics is filed as exhibit 12(a)(1) to this Form N-CSR.
Item 3. Audit Committee Financial Expert.
The registrant has named William J. Crowley, Jr. as an Audit Committee financial expert serving on its Audit Committee. William J. Crowley, Jr. is not an “interested person” of the Trust, as that term is defined by Section 2(a)(19) of the Investment Company Act of 1940, as amended, and is considered “independent” for purposes of this Item.
An “audit committee financial expert” is not an “expert” for any purpose, including for purposes of Section 11 of the Securities Act of 1933, as amended, as a result of being designated as an “audit committee financial expert.” Further, the designation of a person as an “audit committee financial expert” does not mean that the person has any greater duties, obligations, or liability than those imposed on the person without the “audit committee financial expert” designation. Similarly, the designation of a person as an “audit committee financial expert” does not affect the duties, obligations, or liability of any other member of the Audit Committee or Board of Trustees.
Item 4. Principal Accountant Fees and Services.
(a)-(d)
In accordance with the terms of the Trust’s Amended and Restated Administration Agreement dated December 15, 2006, for the JNL Money Market Fund, JNAM, the Fund’s administrator, was responsible for the payment of all expenses associated with the annual audit and other required services of the independent registered public accounting firm, and all expenses associated with the preparation and filing of the tax returns. Effective September 28, 2009, the Amended and Restated Administration Agreement was entered into by and between JNAM and the Trust, such that the Trust will also pay the aforementioned expenses for the JNL/PPM America Total Return Fund on a go-forward basis. On November 21, 2011, the registrant changed its fiscal year end from October 31 to December 31.
KPMG LLP (“KPMG”) was appointed by the Board of Trustees as the independent registered public accounting firm of the registrant for the fiscal years ended October 31, 2011 and December 31, 2011. The following table sets forth aggregate fees billed by KPMG for the respective period for professional services rendered to the registrant.
Fees for Services Rendered to the Registrant by KPMG
| | | | | | | | | | | | | | | | |
Fiscal Year | | Audit Fees | | | Audit-Related Fees | | | Tax Fees | | | All Other Fees | |
| October 31, 2011 | | $ | 20,600 | | | $ | 0 | | | $ | 4,000 | | | $ | 0 | |
| December 31, 2011 | | $ | 12,360 | | | $ | 0 | | | $ | 4,000 | | | $ | 0 | |
The above Tax Fees for October 31, 2011 and December 31, 2011 are the aggregate fees billed for professional services by KPMG to the registrant for tax compliance, tax advice, and tax return review.
Fees for Services Rendered to Adviser Entities by KPMG
The following table sets forth the amount of fees that were billed by KPMG for the respective period to any entity controlling, controlled by, or under common control with the investment adviser that provided ongoing services to the registrant (“Adviser Entities”) that were directly related to the registrant’s operations and financial reporting.
| | | | | | | | | | | | |
Fiscal Year | | Audit-Related Fees | | | Tax Fees | | | All Other Fees | |
October 31, 2011 | | $ | 53,000 | | | $ | 0 | | | $ | 0 | |
December 31, 2011 | | $ | 209 | | | $ | 0 | | | $ | 0 | |
The above Audit-Related Fees are the aggregate fees billed to Adviser Entities for the performance of an internal control review pursuant to Statement on Standards for Attestation Engagements No. 16 of the registrant’s adviser and administrator.
(e)(1) The Audit Committee is authorized to pre-approve non-audit services provided by the registrant’s auditors, if they find it appropriate in light of their fiduciary duties and in the exercise of their good faith business judgment and compatible with the auditors’ independence. The Chairman of the Audit Committee is authorized to approve audit and non-audit services for newly established Funds of the registrant on the same terms as the full Audit Committee previously had approved for the then existing Funds.
(e)(2) 0%
(f) Not applicable.
(g) As detailed in the tables above, the aggregate fees billed for all non-audit fees to the registrant and Adviser Entities for the fiscal year ended October 31, 2011, was $57,000. As detailed in the tables above, the aggregate fees billed for all non-audit fees to the registrant and Adviser Entities for the fiscal year ended December 31, 2011, was $4,209.
(h) For the fiscal years ended October 31, 2011 and December 31, 2011, the Audit Committee of the registrant’s Board of Trustees considered the provision of non-audit services that were rendered to the Adviser Entities that were not pre-approved pursuant to paragraph (c)(7)(ii) of Rule 2-01 of Regulation S-X, and concluded that such services were compatible with maintaining KPMG’s independence.
Item 5. Audit Committee of Listed Registrants.
Not applicable.
Item 6. Investments.
| (a) | Included as a part of the report to shareholders filed under Item 1. |
Item 7. Disclosure of Proxy Voting Policies and Procedures for Closed-End Management Investment Companies.
Not applicable.
Item 8. Portfolio Managers of Closed-End Management Investment Companies.
Not applicable.
Item 9. Purchases of Equity Securities by Closed-End Management Investment Company and Affiliated Purchasers.
Not applicable.
Item 10. Submission of Matters to a Vote of Security Holders.
No material changes have been made.
Item 11. Controls and Procedures.
| (a) | The registrant maintains disclosure controls and procedures that are designed to ensure that information required to be disclosed in the registrant’s filings under the Securities Exchange Act of 1934, as amended, and the Investment Company Act of 1940, as amended, is recorded, processed, summarized, and reported within the periods specified in the rules and forms of the U.S. Securities and Exchange Commission. Such information is accumulated and communicated to the registrant’s management, including its principal executive officer and principal financial officer, as appropriate, to allow timely decisions regarding required disclosure. The registrant’s management, including the principal executive officer and the principal financial officer, recognizes that any set of controls and procedures, no matter how well designed and operated, can provide only reasonable assurance of achieving the desired control objectives. |
Within ninety (90) days prior to the filing date of this report on Form N-CSR, the registrant had carried out an evaluation, under the supervision and with the participation of the registrant’s management, including the registrant’s principal executive officer and the registrant’s principal financial officer, of the effectiveness of the design and operation of the registrant’s disclosure controls and procedures. Based on such evaluation, the registrant’s principal executive officer and principal financial officer concluded that the registrant’s disclosure controls and procedures are effective.
| (b) | There have been no significant changes in the registrant’s internal controls over financial reporting during the registrant’s second fiscal quarter of the period covered by this report that have materially affected, or are reasonably likely to materially affect, the registrant’s internal controls over financial reporting. There have been no significant changes in the registrant’s internal controls or in other factors that could significantly affect the internal controls subsequent to the date of their evaluation in connection with the preparation of this report on Form N-CSR. |
Item 12. Exhibits.
| | (a) | (1) Code of Ethics pursuant to Section 406 of the Sarbanes-Oxley Act of 2002 (as defined in Item 2(b) of Form N-CSR) is attached hereto. |
(2) The certifications required by Rule 30a-2(a) under the Investment Company Act of 1940, as amended, are attached hereto.
(3) Not applicable.
| | (b) | The certification required by Rule 30a-2(b) under the Investment Company Act of 1940, as amended, is attached hereto. |
SIGNATURES
Pursuant to the requirements of the Securities Exchange Act of 1934, as amended, and the Investment Company Act of 1940, as amended, the registrant has duly caused this report to be signed on its behalf by the undersigned, thereunto duly authorized.
| | |
| JNL Investors Series Trust |
| |
| By: | | /s/ Mark D. Nerud |
| | Mark D. Nerud |
| | Principal Executive Officer |
| |
| Date: | | February 29, 2012 |
Pursuant to the requirements of the Securities Exchange Act of 1934, as amended, and the Investment Company Act of 1940, as amended, this report has been signed below by the following persons on behalf of the registrant and in the capacities and on the dates indicated.
| | |
By: | | /s/ Mark D. Nerud |
| | Mark D. Nerud |
| | Principal Executive Officer |
| |
| Date: | | February 29, 2012 |
| |
| By: | | /s/ Gerard A.M. Oprins |
| | Gerard A.M. Oprins |
| | Principal Financial Officer |
| |
| Date: | | February 29, 2012 |
EXHIBIT LIST
| | |
| Exhibit 12(a)(1) | | Registrant’s Code of Ethics pursuant to Section 406 of the Sarbanes-Oxley Act of 2002. |
| |
| Exhibit 12(a)(2) | | Certification of the Principal Executive Officer required by Rule 30a-2(a) under the Investment Company Act of 1940, as amended. |
| |
| | Certification of the Principal Financial Officer required by Rule 30a-2(a) under the Investment Company Act of 1940, as amended. |
| |
| Exhibit 12(b) | | Certification required by Rule 30a-2(b) under the Investment Company Act of 1940, as amended. |