UNITED STATES SECURITIES AND EXCHANGE COMMISSION
Washington, D.C. 20549
Form N-CSR
CERTIFIED SHAREHOLDER REPORT OF REGISTERED
MANAGEMENT INVESTMENT COMPANIES
Investment Company Act File Number: 811-10067
Eaton Vance Variable Trust
(Exact Name of registrant as Specified in Charter)
The Eaton Vance Building, 255 State Street, Boston, Massachusetts 02109
(Address of Principal Executive Offices)
Maureen A. Gemma
The Eaton Vance Building, 255 State Street, Boston, Massachusetts 02109
(Name and Address of Agent for Services)
(617) 482-8260
(registrant’s Telephone Number)
December 31
Date of Fiscal Year End
December 31, 2008
Date of Reporting Period
TABLE OF CONTENTS
Item 1. Reports to Stockholders
| A n n u a l R e p o r t D e c e m b e r 3 1 , 2 0 0 8 |
IMPORTANT NOTICES REGARDING PRIVACY,
DELIVERY OF SHAREHOLDER DOCUMENTS,
PORTFOLIO HOLDINGS, AND PROXY VOTING
Privacy. The Eaton Vance organization is committed to ensuring your financial privacy. Each of the financial institutions identified below has in effect the following policy (“Privacy Policy”) with respect to nonpublic personal information about its customers:
| | |
| | • | Only such information received from you, through application forms or otherwise, and information about your Eaton Vance fund transactions will be collected. This may include information such as name, address, social security number, tax status, account balances and transactions. |
| |
| | • | None of such information about you (or former customers) will be disclosed to anyone, except as permitted by law (which includes disclosure to employees necessary to service your account). In the normal course of servicing a customer’s account, Eaton Vance may share information with unaffiliated third parties that perform various required services such as transfer agents, custodians and broker/dealers. |
| |
| | • | Policies and procedures (including physical, electronic and procedural safeguards) are in place that are designed to protect the confidentiality of such information. |
| |
| | • | We reserve the right to change our Privacy Policy at any time upon proper notification to you. Customers may want to review our Policy periodically for changes by accessing the link on our homepage: www.eatonvance.com. |
Our pledge of privacy applies to the following entities within the Eaton Vance organization: the Eaton Vance Family of Funds, Eaton Vance Management, Eaton Vance Investment Counsel, Boston Management and Research, and Eaton Vance Distributors, Inc.
In addition, our Privacy Policy only applies to those Eaton Vance customers who are individuals and who have a direct relationship with us. If a customer’s account (i.e., fund shares) is held in the name of a third-party financial adviser/broker-dealer, it is likely that only such adviser’s privacy policies apply to the customer. This notice supersedes all previously issued privacy disclosures.
For more information about Eaton Vance’s Privacy Policy, please call 1-800-262-1122.
Delivery of Shareholder Documents. The Securities and Exchange Commission (the “SEC”) permits funds to deliver only one copy of shareholder documents, including prospectuses, proxy statements and shareholder reports, to fund investors with multiple accounts at the same residential or post office box address. This practice is often called “householding” and it helps eliminate duplicate mailings to shareholders.
Eaton Vance, or your financial adviser, may household the mailing of your documents indefinitely unless you instruct Eaton Vance, or your financial adviser, otherwise.
If you would prefer that your Eaton Vance documents not be householded, please contact Eaton Vance at 1-800-262-1122, or contact your financial adviser.
Your instructions that householding not apply to delivery of your Eaton Vance documents will be effective within 30 days of receipt by Eaton Vance or your financial adviser.
Portfolio Holdings. Each Eaton Vance Fund and its underlying Portfolio (if applicable) will file a schedule of its portfolio holdings on Form N-Q with the SEC for the first and third quarters of each fiscal year. The Form N-Q will be available on the Eaton Vance website www.eatonvance.com, by calling Eaton Vance at 1-800-262-1122 or in the EDGAR database on the SEC’s website at www.sec.gov. Form N-Q may also be reviewed and copied at the SEC’s public reference room in Washington, D.C. (call 1-800-732-0330 for information on the operation of the public reference room).
Proxy Voting. From time to time, funds are required to vote proxies related to the securities held by the funds. The Eaton Vance Funds or their underlying Portfolios (if applicable) vote proxies according to a set of policies and procedures approved by the Funds’ and Portfolios’ Boards. You may obtain a description of these policies and procedures and information on how the Funds or Portfolios voted proxies relating to portfolio securities during the most recent 12 month period ended June 30, without charge, upon request, by calling 1-800-262-1122. This description is also available on the SEC’s website at www.sec.gov.
Eaton Vance VT Floating-Rate Income Fund as of December 31, 2008
MANAGEMENT’S DISCUSSION OF FUND PERFORMANCE
Economic and Market Conditions
Scott H. Page, CFA
Co-Portfolio Manager
Craig P. Russ
Co-Portfolio Manager
Andrew N. Sveen, CFA
Co-Portfolio Manager
| • | | During the year that ended December 31, 2008, credit markets experienced unprecedented volatility. The bank loan market was no exception. The subprime crisis of 2007 expanded in 2008 to include nearly all credit instruments, which, in turn, caused the world economy to slip into recession. The year was a rollercoaster for the loan market and for the Fund. The total return for the Fund’s benchmark index, the S&P/LSTA Leveraged Loan Index (the Index), for the first nine months of the fiscal year was -8.00%; disappointing, but, given the environment, not especially bad compared to other markets. September 2008 brought a series of events that rattled markets more deeply: the bail-outs of Fannie Mae and Freddie Mac, the bankruptcy of Lehman Brothers, the rescue of American International Group, Inc., and a litany of unprecedented steps by the U.S. Treasury and Federal Reserve to stabilize the credit markets. |
| |
| • | | In the fund’s fiscal fourth quarter, the Index declined 22.94%, by far its worts quarterly showing ever. The average loan price in the Fund was approximately 64.6% of par as of December 31, 2008. Although statistics vary with respect to recovery rates of loans in default, the historical rate has been approximately 70% of par. As such, bank loan prices at year end were below levels that implied near universal default. Also at year end, less than 2% of the Fund was in default versus 3.7% for the Index. |
| |
| • | | While there is little doubt a recession would bring higher default rates, it is difficult to reconcile recent trading levels with market fundamentals. A range of credit statistics and criteria used to monitor creditworthiness suggested that overall credit quality appeared to be in line with historical patterns. Despite this, bank loans traded below historical recovery levels, implying a near 100% default rate. The most compelling explanation for the market’s depressed trading level was that there were more sellers of bank loans than buyers. Some selling was forced, especially by hedge funds and structured investment vehicles unable to meet margin requirements. Some selling was voluntary, as redemptions from mutual funds were significant throughout the year. In addition, many hard-pressed banks and investment banks that typically make markets in bank loans were hesitant to own loans, making trading more volatile. Late in the period, there were signs that many institutional and retail investors were becoming attracted to the asset class by record low loan prices. In the final weeks of December, loan prices rebounded slightly. |
Past performance is no guarantee of future results. Returns are historical and are calculated by determining the percentage change in net asset value or offering price (as applicable) with all distributions reinvested. Investment return and principal value will fluctuate so that shares, when redeemed, may be worth more or less than their original cost. Performance is for the stated time period only; due to market volatility, the Fund’s current performance may be lower or higher than the quoted return. For performance as of the most recent month end, please refer to www.eatonvance.com.
Fund shares are not insured by the FDIC and are not deposits or other obligations of, or guaranteed by, any depository institution. Shares are subject to investment risks, including possible loss of principal invested.
Management Discussion
| • | | The Fund’s investment objective is to provide a high level of current income. To do so, it invests primarily in senior floating-rate loans (“Senior Loans”), normally investing at least 80% of its net assets in income-producing floating-rate loans and other floating-rate debt securities. |
Eaton Vance VT Floating-Rate Income Fund
Total Return Performance 12/31/07 — 12/31/08
| | | | | |
At Net Asset Value1 | | | -27.17 | % |
S&P/LSTA Leveraged Loan Index2 | | | -29.10 | % |
| |
| Total Distributions per share | | $ | 0.495 | |
Distribution Rate3 | | | 7.81 | % |
SEC 30-Day Yield4 | | | 8.04 | % |
Please refer to page 3 for additional performance information.
| | |
| 1 | | There is no sales charge. Insurance-related charges are not included in the calculations of returns. Such expenses would reduce the overall returns shown. Please refer to the report for your insurance contract for performance data reflecting insurance-related charges. |
| |
| 2 | | It is not possible to invest directly in an Index. The Index’s total return does not reflect the expenses that would have been incurred if an investor individually purchased or sold the securities represented in the Index. The S&P/LSTA Leveraged Loan Index is an unmanaged loan market index. |
| |
| 3 | | The Distribution Rate is based on the Fund’s most recent monthly distribution per share (annualized) divided by the Fund’s net asset value at the end of the period. |
| |
| 4 | | The Fund’s SEC yield is calculated by dividing the net investment income per share for the 30-day period by the offering price at the end of the period and annualizing the result. |
1
Eaton Vance VT Floating-Rate Income Fund as of December 31, 2008
MANAGEMENT’S DISCUSSION OF FUND PERFORMANCE
| • | | Amid the credit crisis and recession, the Fund’s net asset value (NAV) declined 31.3% during the 12 months that ended December 31, 2008. That resulted in a total return of -27.17% for the period, which outperformed the Fund’s benchmark Index by 1.93%. The Fund entered this period more conservatively positioned than the Index and, therefore, performed better as riskier assets suffered a larger decline in market value. |
| |
| • | | The Fund distributed $0.495 per share in dividend income for the 12-month period. Because the Fund invests in floating-rate loans, the dividend declined during the period in concert with an aggressive reduction in short-term market interest rates driven by the Federal Reserve. Based on a $6.58 NAV per share as of December 31, 2008, and its most recent monthly distribution rate, the Fund had a distribution rate of 7.81%. The distribution rate increased since the last reporting period, as the Fund continued to generate consistent income, while market value of the investments has declined. |
| |
| • | | The Fund’s investments were diversified as of December 31, 2008, with 434 borrowers. The largest investment represented just 1.7% of the Fund’s total investments. The Fund was also diversified by industry, with none constituting more than 11.2% of total investments. Management believes that a diversified approach has helped the Fund mitigate risk in an increasing default environment.1 The quality of the Fund’s portfolio remained sound, with approximately 1.7% in defaulted assets as of December 31, 2008, the majority of which continued to pay current interest. This compared favorably to the Index, which reported 3.7% in defaulted assets as of December 31, 2008. |
| | |
| 1 | | Diversification does not guarantee a profit or eliminate risk of loss. |
The views expressed throughout this report are those of the portfolio managers and are current only through the end of the period of the report as stated on the cover. These views are subject to change at any time based upon market or other conditions, and the investment adviser disclaims any responsibility to update such views. These views may not be relied on as investment advice and, because investment decisions for a fund are based on many factors, may not be relied on as an indication of trading intent on behalf of any Eaton Vance fund. Portfolio information provided in the report may not be representative of the Fund’s current or future investments and may change due to active management.
Portfolio Composition
Top Ten Holdings1
By total investments
| | | | | |
| Alltel Communications | | | 1.7 | % |
| HCA, Inc. | | | 1.4 | |
| Georgia-Pacific Corp. | | | 1.2 | |
| SunGard Data Systems, Inc. | | | 1.2 | |
| Aramark Corp. | | | 1.1 | |
| Charter Communications Operating, Inc. | | | 1.1 | |
| Community Health Systems, Inc. | | | 1.1 | |
| PanAmSat Corp. | | | 1.0 | |
| Health Management Association, Inc. | | | 0.9 | |
| NRG Energy, Inc. | | | 0.9 | |
| | |
| 1 | | Reflects the Fund’s investments as of 12/31/08. Top Ten Holdings represented 11.6% of the Fund’s total investments and are shown as a percentage of the Fund’s total investments. |
Top Five Industries2
By total investments
| | | | | |
| Healthcare | | | 11.2 | % |
| Business Equipment and Services | | | 7.8 | |
| Cable and Satellite Television | | | 6.1 | |
| Chemicals and Plastics | | | 5.5 | |
| Publishing | | | 4.9 | |
| | |
| 2 | | Reflects the Fund’s investments as of 12/31/08. Industries are shown as a percentage of the Fund’s total investments. |
Credit Quality Ratings for
Total Loan Investments3
By total loan investments
| | | | | |
| Baa | | | 1.7 | % |
| Ba | | | 52.7 | |
| B | | | 38.3 | |
| Caa | | | 2.1 | |
Non-Rated4 | | | 5.2 | |
| | |
| 3 | | Credit Quality ratings are those provided by Moody’s Investors Service, Inc., a nationally recognized bond rating service, as of 12/31/08. Reflects the Fund’s total loan investments as of 12/31/08. Although the investment adviser considers ratings when making investment decisions, it performs its own credit and investment analysis and does not rely primarily on the ratings assigned by the rating services. Credit quality can change from time to time, and recently-issued credit ratings may not fully reflect the actual risks posed by a particular security or the issuer’s current financial condition. |
| |
| 4 | | Certain loans in which the Fund invests are not rated by a rating agency. In management’s opinion, such securities are comparable to loans rated by an independent rating agency in one of the categories listed above. |
2
Eaton Vance VT Floating-Rate Income Fund as of December 31, 2008
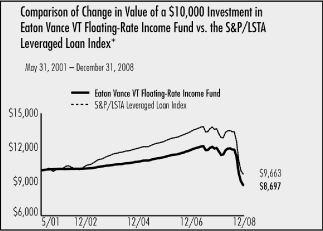
FUND PERFORMANCE
The line graph and table set forth below provide information about the Fund’s performance. The line graph compares the performance of the Fund with that of the S&P/LSTA Leveraged Loan Index, an unmanaged loan market index. The lines on the graph represent the total returns of a hypothetical investment of $10,000 in each of the Fund and the S&P/LSTA Leveraged Loan Index. The table includes the total returns of the Fund at net asset value. There is no sales charge. The performance presented below does not reflect the deduction of insurance-related sales charges or of taxes, if any, that a shareholder would pay on distributions or redemptions of Fund shares. Please refer to the report for your insurance contract for performance data reflecting insurance-related charges.
Fund Performance1
Average Annual Total Returns (at net asset value)
| | | | | |
| One Year | | | -27.17 | % |
| Five Years | | | -3.56 | |
Life of Fund† | | | -1.77 | |
| | |
| † | | Inception date: 5/2/01 |
| |
| 1 | | The Fund has no sales charge. Insurance-related charges are not included in the calculation of returns. Such expenses would reduce the overall returns shown. |
Total Annual
Operating Expenses2
| | |
| 2 | | From the Fund’s Prospectus dated 5/1/08. |
Past performance is no guarantee of future results. Returns are historical and are calculated by determining the percentage change in net asset value or offering price (as applicable) with all distributions reinvested. Investment return and principal value will fluctuate so that shares, when redeemed, may be worth more or less than their original cost. Performance is for the stated time period only; due to market volatility, the Fund’s current performance may be lower or higher than the quoted return. For performance as of the most recent month end, please refer to www.eatonvance.com.
| | |
| * | | Sources: Standard & Poors; Bloomberg, L.P.; Investment operations commenced on 5/2/01. |
The graph does not reflect the deduction of insurance-related charges or taxes that a shareholder would pay on Fund distributions or the redemption of Fund shares. It is not possible to invest directly in an Index. The Index’s total return does not reflect any commissions or expenses that would have been incurred if an investor individually purchased or sold the securities represented in the Index. Index performance is available as of month end only.
3
Eaton Vance VT Floating-Rate Income Fund as of December 31, 2008
FUND EXPENSES
Example: As a shareholder of the Fund, you incur ongoing costs, including management fees; distribution or service fees; and other Fund expenses. This Example is intended to help you understand your ongoing costs (in dollars) of investing in the Fund and to compare these costs with the ongoing costs of investing in other mutual funds. The Example is based on an investment of $1,000 invested at the beginning of the period and held for the entire period (July 1, 2008 – December 31, 2008).
Actual Expenses: The first section of the table below provides information about actual account values and actual expenses. You may use the information in this line, together with the amount you invested, to estimate the expenses that you paid over the period. Simply divide your account value by $1,000 (for example, an $8,600 account value divided by $1,000 = 8.6), then multiply the result by the number in the first line under the heading entitled “Expenses Paid During Period” to estimate the expenses you paid on your account during this period.
Hypothetical Example for Comparison Purposes: The second section of the table below provides information about hypothetical account values and hypothetical expenses based on the actual Fund expense ratio and an assumed rate of return of 5% per year (before expenses), which is not the actual return of the Fund. The hypothetical account values and expenses may not be used to estimate the actual ending account balance or expenses you paid for the period. You may use this information to compare the ongoing costs of investing in your Fund and other funds. To do so, compare this 5% hypothetical example with the 5% hypothetical examples that appear in the shareholder reports of the other funds.
Please note that the expenses shown in the table are meant to highlight your ongoing costs only and do not reflect expenses and charges which are, or may be imposed under your variable annuity contract or variable life insurance policy (“variable contracts”) (if applicable). Therefore, the second line of the table is useful in comparing ongoing costs associated with an investment in vehicles which fund benefits under variable contracts, and will not help you determine the relative total costs of owning different funds. In addition, if these expenses and charges imposed under the variable contracts were included, your costs would have been higher.
Eaton Vance VT Floating-Rate Income Fund
| | | | | | | | | | | | | | | |
| | | Beginning Account Value
| | | Ending Account Value
| | | Expenses Paid During Period*
| | | |
| | | (7/1/08) | | | (12/31/08) | | | (7/1/08 – 12/31/08) | | | |
| |
| |
Actual | | | $1,000.00 | | | | $729.60 | | | | $5.48 | | | |
| | | | | | | | | | | | | | | |
| | | | | | | | | | | | | | | |
| |
| |
| | | | | | | | | | | | | | | |
Hypothetical | | | | | | | | | | | | | | |
| (5% return per year before expenses) | | | $1,000.00 | | | | $1,018.80 | | | | $6.39 | | | |
| | | |
| | * | Expenses are equal to the Fund’s annualized expense ratio of 1.26% multiplied by the average account value over the period, multiplied by 184/366 (to reflect the one-half year period). The Example assumes that the $1,000 was invested at the net asset value per share determined at the close of business on June 30, 2008. Expenses shown do not include insurance-related charges. | |
4
Eaton Vance VT Floating-Rate Income Fund as of December 31, 2008
PORTFOLIO OF INVESTMENTS
| | | | | | | | | | | |
| Senior Floating-Rate Interests — 93.8%(1) |
Principal
| | | | | | | | |
| Amount | | | Borrower/Tranche Description | | Value | | | |
| |
| |
| |
| Aerospace and Defense — 1.8% |
| |
AWAS Capital, Inc. |
| $ | 1,691,611 | | | Term Loan, 3.25%, Maturing March 22, 2013 | | $ | 1,076,993 | | | |
Colt Defense, LLC |
| | 992,428 | | | Term Loan, 4.04%, Maturing July 9, 2014 | | | 793,942 | | | |
DAE Aviation Holdings, Inc. |
| | 287,234 | | | Term Loan, 6.28%, Maturing July 31, 2014 | | | 150,798 | | | |
| | 283,154 | | | Term Loan, 7.17%, Maturing July 31, 2014 | | | 148,656 | | | |
Evergreen International Aviation |
| | 372,547 | | | Term Loan, 9.00%, Maturing October 31, 2011 | | | 227,254 | | | |
Hawker Beechcraft Acquisition |
| | 3,469,494 | | | Term Loan, 2.79%, Maturing March 26, 2014 | | | 1,823,219 | | | |
| | 203,728 | | | Term Loan, 3.46%, Maturing March 26, 2014 | | | 107,059 | | | |
Hexcel Corp. |
| | 213,766 | | | Term Loan, 5.14%, Maturing March 1, 2012 | | | 180,633 | | | |
PGS Solutions, Inc. |
| | 1,827,339 | | | Term Loan, 4.41%, Maturing February 14, 2013 | | | 1,105,540 | | | |
TransDigm, Inc. |
| | 2,425,000 | | | Term Loan, 3.50%, Maturing June 23, 2013 | | | 1,955,762 | | | |
Vought Aircraft Industries, Inc. |
| | 1,849,291 | | | Term Loan, 2.97%, Maturing December 17, 2011 | | | 1,349,982 | | | |
| | 497,650 | | | Term Loan, 7.50%, Maturing December 22, 2011 | | | 394,388 | | | |
Wesco Aircraft Hardware Corp. |
| | 2,413,313 | | | Term Loan, 2.72%, Maturing September 29, 2013 | | | 1,846,184 | | | |
| |
| |
| | | | | | | $ | 11,160,410 | | | |
| |
| |
| |
| Air Transport — 0.6% |
| |
Delta Air Lines, Inc. |
| $ | 1,000,000 | | | Term Loan, 5.12%, Maturing April 30, 2012 | | $ | 645,500 | | | |
| | 689,500 | | | Term Loan — Second Lien, 5.15%, Maturing
April 30, 2014 | | | 350,955 | | | |
Northwest Airlines, Inc. |
| | 3,488,055 | | | DIP Loan, 3.44%, Maturing August 21, 2009 | | | 2,577,425 | | | |
| |
| |
| | | | | | | $ | 3,573,880 | | | |
| |
| |
| |
| Automotive — 3.2% |
| |
Accuride Corp. |
| $ | 4,098,258 | | | Term Loan, 5.56%, Maturing January 31, 2012 | | $ | 2,835,482 | | | |
Adesa, Inc. |
| | 3,254,186 | | | Term Loan, 3.71%, Maturing October 18, 2013 | | | 1,850,818 | | | |
Affina Group, Inc. |
| | 268,350 | | | Term Loan, 6.42%, Maturing November 30, 2011 | | | 136,858 | | | |
Allison Transmission, Inc. |
| | 1,972,089 | | | Term Loan, 4.58%, Maturing September 30, 2014 | | | 1,111,412 | | | |
Chrysler Financial |
| | 2,671,486 | | | Term Loan, 6.00%, Maturing August 1, 2014 | | | 1,404,438 | | | |
Dayco Products, LLC |
| | 1,409,398 | | | Term Loan, 6.77%, Maturing June 21, 2011 | | | 481,545 | | | |
Delphi Corp. |
| | 1,361,357 | | | DIP Loan, 0.00%, Maturing June 30, 2009(2) | | | 288,154 | | | |
| | 1,000,000 | | | DIP Loan, 9.25%, Maturing June 30, 2009 | | | 593,333 | | | |
| | 138,644 | | | DIP Loan, 9.50%, Maturing June 30, 2009 | | | 29,346 | | | |
Dollar Thrifty Automotive Group, Inc. |
| | 427,500 | | | Term Loan, 3.44%, Maturing June 15, 2014 | | | 106,875 | | | |
Federal-Mogul Corp. |
| | 1,230,675 | | | Term Loan, 3.49%, Maturing December 27, 2014 | | | 549,189 | | | |
| | 1,945,265 | | | Term Loan, 2.64%, Maturing December 27, 2015 | | | 868,074 | | | |
Ford Motor Co. |
| | 2,444,127 | | | Term Loan, 5.00%, Maturing December 15, 2013 | | | 995,982 | | | |
General Motors Corp. |
| | 5,641,260 | | | Term Loan, 5.80%, Maturing November 29, 2013 | | | 2,592,966 | | | |
Goodyear Tire & Rubber Co. |
| | 4,425,000 | | | Term Loan — Second Lien, 2.22%, Maturing
April 30, 2010 | | | 2,843,062 | | | |
Keystone Automotive Operations, Inc. |
| | 955,705 | | | Term Loan, 5.31%, Maturing January 12, 2012 | | | 394,228 | | | |
LKQ Corp. |
| | 664,617 | | | Term Loan, 3.45%, Maturing October 12, 2014 | | | 501,786 | | | |
Tenneco Automotive, Inc. |
| | 525,000 | | | Term Loan, 4.91%, Maturing March 17, 2014 | | | 330,750 | | | |
TriMas Corp. |
| | 187,500 | | | Term Loan, 4.45%, Maturing August 2, 2011 | | | 106,875 | | | |
| | 1,290,412 | | | Term Loan, 5.01%, Maturing August 2, 2013 | | | 735,535 | | | |
TRW Automotive, Inc. |
| | 911,125 | | | Term Loan, 5.21%, Maturing February 2, 2014 | | | 611,365 | | | |
United Components, Inc. |
| | 963,513 | | | Term Loan, 4.39%, Maturing June 30, 2010 | | | 669,642 | | | |
| |
| |
| | | | | | | $ | 20,037,715 | | | |
| |
| |
| |
| Beverage and Tobacco — 0.4% |
| |
Constellation Brands, Inc. |
| $ | 619,152 | | | Term Loan, 3.51%, Maturing June 5, 2013 | | $ | 549,884 | | | |
Culligan International Co. |
| | 1,793,063 | | | Term Loan, 3.30%, Maturing November 24, 2014 | | | 989,173 | | | |
Van Houtte, Inc. |
| | 868,978 | | | Term Loan, 3.96%, Maturing July 19, 2014 | | | 521,387 | | | |
| | 118,497 | | | Term Loan, 3.96%, Maturing July 19, 2014 | | | 71,098 | | | |
| |
| |
| | | | | | | $ | 2,131,542 | | | |
| |
| |
See notes to financial statements5
Eaton Vance VT Floating-Rate Income Fund as of December 31, 2008
PORTFOLIO OF INVESTMENTS CONT’D
| | | | | | | | | | | |
Principal
| | | | | | | | |
| Amount | | | Borrower/Tranche Description | | Value | | | |
| |
| |
| | | | | | | | | | | |
| Brokers, Dealers and Investment Houses — 0.1% |
| |
AmeriTrade Holding Corp. |
| $ | 728,837 | | | Term Loan, 2.38%, Maturing December 31, 2012 | | $ | 615,184 | | | |
| |
| |
| | | | | | | $ | 615,184 | | | |
| |
| |
| |
| Building and Development — 2.5% |
| |
AIMCO Properties, L.P. |
| $ | 1,225,000 | | | Term Loan, 2.94%, Maturing March 23, 2011 | | $ | 857,500 | | | |
Beacon Sales Acquisition, Inc. |
| | 1,649,317 | | | Term Loan, 5.61%, Maturing September 30, 2013 | | | 1,113,289 | | | |
Brickman Group Holdings, Inc. |
| | 1,674,220 | | | Term Loan, 3.44%, Maturing January 23, 2014 | | | 1,021,274 | | | |
Building Materials Corp. of America |
| | 784,139 | | | Term Loan, 6.63%, Maturing February 22, 2014 | | | 478,815 | | | |
Capital Automotive (REIT) |
| | 325,592 | | | Term Loan, 3.19%, Maturing December 16, 2010 | | | 134,469 | | | |
Contech Construction Products |
| | 758,101 | | | Term Loan, 3.88%, Maturing January 13, 2013 | | | 435,908 | | | |
Epco/Fantome, LLC |
| | 220,000 | | | Term Loan, 3.10%, Maturing November 23, 2010 | | | 206,800 | | | |
General Growth Properties, Inc. |
| | 348,684 | | | Term Loan, 3.08%, Maturing February 24, 2011 | | | 107,843 | | | |
LNR Property Corp. |
| | 1,980,000 | | | Term Loan, 6.69%, Maturing July 3, 2011 | | | 940,500 | | | |
Mueller Water Products, Inc. |
| | 3,879,003 | | | Term Loan, 4.47%, Maturing May 24, 2014 | | | 2,632,873 | | | |
NCI Building Systems, Inc. |
| | 187,047 | | | Term Loan, 3.59%, Maturing June 18, 2010 | | | 168,810 | | | |
Panolam Industries Holdings, Inc. |
| | 1,686,869 | | | Term Loan, 3.21%, Maturing September 30, 2012 | | | 1,096,465 | | | |
Re/Max International, Inc. |
| | 489,444 | | | Term Loan, 6.09%, Maturing December 17, 2012 | | | 345,058 | | | |
Realogy Corp. |
| | 543,242 | | | Term Loan, 3.44%, Maturing September 1, 2014 | | | 342,695 | | | |
| | 2,017,758 | | | Term Loan, 5.71%, Maturing September 1, 2014 | | | 1,272,868 | | | |
South Edge, LLC |
| | 750,000 | | | Term Loan, 0.00%, Maturing October 31, 2009(2) | | | 103,125 | | | |
Standard Pacific Corp. |
| | 450,000 | | | Term Loan, 3.90%, Maturing May 5, 2013 | | | 256,500 | | | |
TRU 2005 RE Holding Co. |
| | 4,950,000 | | | Term Loan, 4.87%, Maturing December 9, 2009 | | | 2,330,623 | | | |
Wintergames Acquisition ULC |
| | 2,314,111 | | | Term Loan, 7.97%, Maturing April 24, 2009 | | | 1,515,742 | | | |
| |
| |
| | | | | | | $ | 15,361,157 | | | |
| |
| |
| | | | | | | | | | | |
| Business Equipment and Services — 7.7% |
| |
ACCO Brands Corp. |
| $ | 1,340,476 | | | Term Loan, 7.81%, Maturing August 17, 2012 | | $ | 1,065,678 | | | |
Activant Solutions, Inc. |
| | 956,312 | | | Term Loan, 6.07%, Maturing May 1, 2013 | | | 609,649 | | | |
| | 1,420,991 | | | Term Loan, 6.88%, Maturing May 2, 2013 | | | 905,882 | | | |
Acxiom Corp. |
| | 1,230,000 | | | Term Loan, 4.94%, Maturing September 15, 2012 | | | 811,800 | | | |
Affiliated Computer Services |
| | 2,659,807 | | | Term Loan, 2.47%, Maturing March 20, 2013 | | | 2,274,135 | | | |
| | 3,369,406 | | | Term Loan, 3.32%, Maturing March 20, 2013 | | | 2,880,842 | | | |
Affinion Group, Inc. |
| | 4,223,414 | | | Term Loan, 4.65%, Maturing October 17, 2012 | | | 2,945,831 | | | |
Allied Barton Security Service |
| | 897,920 | | | Term Loan, 6.75%, Maturing February 20, 2015 | | | 776,701 | | | |
Education Management, LLC |
| | 4,228,441 | | | Term Loan, 3.25%, Maturing June 1, 2013 | | | 2,689,289 | | | |
Euronet Worldwide, Inc. |
| | 880,000 | | | Term Loan, 3.12%, Maturing April 4, 2012 | | | 717,200 | | | |
Info USA, Inc. |
| | 980,000 | | | Term Loan, 3.46%, Maturing February 14, 2012 | | | 759,500 | | | |
Information Resources, Inc. |
| | 757,279 | | | Term Loan, 3.91%, Maturing May 15, 2014 | | | 477,086 | | | |
Intergraph Corp. |
| | 1,674,762 | | | Term Loan, 4.18%, Maturing May 29, 2014 | | | 1,268,632 | | | |
| | 1,000,000 | | | Term Loan — Second Lien, 8.18%, Maturing November 29, 2014 | | | 742,500 | | | |
iPayment, Inc. |
| | 2,186,610 | | | Term Loan, 3.36%, Maturing May 10, 2013 | | | 1,443,163 | | | |
Kronos, Inc. |
| | 761,472 | | | Term Loan, 3.71%, Maturing June 11, 2014 | | | 506,379 | | | |
Language Line, Inc. |
| | 460,065 | | | Term Loan, 4.71%, Maturing June 11, 2011 | | | 365,751 | | | |
Mitchell International, Inc. |
| | 1,473,750 | | | Term Loan, 3.50%, Maturing March 28, 2014 | | | 1,090,575 | | | |
N.E.W. Holdings I, LLC |
| | 1,162,820 | | | Term Loan, 5.39%, Maturing May 22, 2014 | | | 769,399 | | | |
Protection One, Inc. |
| | 2,012,775 | | | Term Loan, 2.71%, Maturing March 31, 2012 | | | 1,368,687 | | | |
Quintiles Transnational Corp. |
| | 3,379,847 | | | Term Loan, 3.46%, Maturing March 31, 2013 | | | 2,754,575 | | | |
RiskMetrics Group Holdings, LLC |
| | 1,501,533 | | | Term Loan, 3.46%, Maturing January 11, 2014 | | | 1,302,580 | | | |
Sabre, Inc. |
| | 5,190,795 | | | Term Loan, 4.80%, Maturing September 30, 2014 | | | 2,278,759 | | | |
Safenet, Inc. |
| | 738,750 | | | Term Loan, 7.75%, Maturing April 11, 2014 | | | 376,762 | | | |
See notes to financial statements6
Eaton Vance VT Floating-Rate Income Fund as of December 31, 2008
PORTFOLIO OF INVESTMENTS CONT’D
| | | | | | | | | | | |
Principal
| | | | | | | | |
| Amount | | | Borrower/Tranche Description | | Value | | | |
| |
| |
| Business Equipment and Services (continued) |
| |
| | | | | | | | | | | |
Serena Software, Inc. |
| | 1,890,435 | | | Term Loan, 4.25%, Maturing March 10, 2013 | | | 1,219,330 | | | |
Sitel (Client Logic) |
| | 956,194 | | | Term Loan, 9.16%, Maturing January 29, 2014 | | | 573,716 | | | |
Solera Holdings, LLC |
| | 1,466,405 | | | Term Loan, 3.75%, Maturing May 15, 2014 | | | 1,055,812 | | | |
SunGard Data Systems, Inc. |
| | 9,855,021 | | | Term Loan, 4.02%, Maturing February 11, 2013 | | | 6,809,819 | | | |
| | 673,313 | | | Term Loan, 6.75%, Maturing February 28, 2014 | | | 520,976 | | | |
TDS Investor Corp. |
| | 1,367,022 | | | Term Loan, 3.07%, Maturing August 23, 2013 | | | 606,616 | | | |
| | 3,462,368 | | | Term Loan, 3.71%, Maturing August 23, 2013 | | | 1,558,066 | | | |
| | 274,294 | | | Term Loan, 6.01%, Maturing August 23, 2013 | | | 121,718 | | | |
Transaction Network Services, Inc. |
| | 368,463 | | | Term Loan, 3.88%, Maturing May 4, 2012 | | | 309,509 | | | |
URS Corp. |
| | 397,774 | | | Term Loan, 5.73%, Maturing May 15, 2013 | | | 346,063 | | | |
Valassis Communications, Inc. |
| | 1,437,493 | | | Term Loan, 3.21%, Maturing March 2, 2014 | | | 711,559 | | | |
VWR International, Inc. |
| | 1,175,000 | | | Term Loan, 2.96%, Maturing June 28, 2013 | | | 800,959 | | | |
West Corp. |
| | 3,443,762 | | | Term Loan, 3.47%, Maturing October 24, 2013 | | | 2,148,663 | | | |
| |
| |
| | | | | | | $ | 47,964,161 | | | |
| |
| |
| |
| Cable and Satellite Television — 6.0% |
| |
Atlantic Broadband Finance, LLC |
| $ | 363,696 | | | Term Loan, 3.71%, Maturing February 10, 2011 | | $ | 300,049 | | | |
Bresnan Broadband Holdings, LLC |
| | 2,700,000 | | | Term Loan, 4.58%, Maturing March 29, 2014 | | | 1,908,001 | | | |
| | 1,300,000 | | | Term Loan, 6.06%, Maturing March 29, 2014 | | | 918,667 | | | |
Cequel Communications, LLC |
| | 3,937,424 | | | Term Loan, 6.16%, Maturing November 5, 2013 | | | 2,516,262 | | | |
| | 1,000,000 | | | Term Loan — Second Lien, 7.69%, Maturing
March 31, 2015 | | | 471,667 | | | |
Charter Communications Operating, Inc. |
| | 8,350,097 | | | Term Loan, 5.06%, Maturing April 28, 2013 | | | 6,179,071 | | | |
| | 994,987 | | | Term Loan, 8.50%, Maturing March 6, 2014 | | | 793,503 | | | |
CSC Holdings, Inc. |
| | 4,728,119 | | | Term Loan, 2.95%, Maturing March 29, 2013 | | | 4,056,333 | | | |
CW Media Holdings, Inc. |
| | 444,375 | | | Term Loan, 4.71%, Maturing February 16, 2015 | | | 293,287 | | | |
DirectTV Holdings, LLC |
| | 1,789,018 | | | Term Loan, 2.90%, Maturing April 13, 2013 | | | 1,570,981 | | | |
| | 995,000 | | | Term Loan, 5.25%, Maturing April 13, 2013 | | | 890,110 | | | |
Foxco Acquisition Sub., LLC |
| | 2,069,813 | | | Term Loan, 7.25%, Maturing July 14, 2015 | | | 1,303,982 | | | |
Insight Midwest Holdings, LLC |
| | 3,712,500 | | | Term Loan, 3.91%, Maturing April 6, 2014 | | | 2,796,749 | | | |
MCC Iowa, LLC |
| | 1,000,793 | | | Term Loan, 1.95%, Maturing March 31, 2010 | | | 833,160 | | | |
Mediacom Broadband Group |
| | 1,234,899 | | | Term Loan, 2.02%, Maturing January 31, 2015 | | | 816,268 | | | |
| | 1,979,811 | | | Term Loan, 2.02%, Maturing January 31, 2015 | | | 1,308,655 | | | |
| | 1,492,500 | | | Term Loan, 6.50%, Maturing January 3, 2016 | | | 1,253,700 | | | |
Mediacom Illinois, LLC |
| | 4,220,433 | | | Term Loan, 1.95%, Maturing January 31, 2015 | | | 2,701,077 | | | |
NTL Investment Holdings, Ltd. |
| | 1,490,032 | | | Term Loan, 5.83%, Maturing March 30, 2012 | | | 1,154,775 | | | |
UPC Broadband Holding B.V. |
| | 7,500,000 | | | Term Loan, 3.18%, Maturing December 31, 2014 | | | 5,062,500 | | | |
| |
| |
| | | | | | | $ | 37,128,797 | | | |
| |
| |
| |
| Chemicals and Plastics — 5.5% |
| |
AZ Chem US, Inc. |
| $ | 929,232 | | | Term Loan, 2.46%, Maturing February 28, 2013 | | $ | 591,612 | | | |
Brenntag Holding GmbH and Co. KG |
| | 255,273 | | | Term Loan, 5.07%, Maturing December 23, 2013 | | | 186,987 | | | |
| | 2,763,182 | | | Term Loan, 5.07%, Maturing December 23, 2013 | | | 2,024,031 | | | |
| | 1,000,000 | | | Term Loan — Second Lien, 7.79%, Maturing December 23, 2015 | | | 590,000 | | | |
Celanese Holdings, LLC |
| | 6,806,022 | | | Term Loan, 5.55%, Maturing April 2, 2014 | | | 4,679,140 | | | |
Cognis GmbH |
| | 975,000 | | | Term Loan, 5.33%, Maturing September 15, 2013 | | | 588,900 | | | |
Columbian Chemicals Acquisition |
| | 1,309,601 | | | Term Loan, 4.71%, Maturing March 16, 2013 | | | 694,089 | | | |
Foamex L.P. |
| | 1,146,575 | | | Term Loan, 7.69%, Maturing February 12, 2013 | | | 381,236 | | | |
Georgia Gulf Corp. |
| | 2,089,447 | | | Term Loan, 7.41%, Maturing October 3, 2013 | | | 1,394,706 | | | |
Hexion Specialty Chemicals, Inc. |
| | 492,500 | | | Term Loan, 3.75%, Maturing May 5, 2012 | | | 179,762 | | | |
| | 493,312 | | | Term Loan, 3.75%, Maturing May 5, 2013 | | | 207,684 | | | |
| | 1,673,772 | | | Term Loan, 5.50%, Maturing May 5, 2013 | | | 702,984 | | | |
| | 2,276,759 | | | Term Loan, 6.19%, Maturing May 5, 2013 | | | 958,516 | | | |
Huish Detergents, Inc. |
| | 591,000 | | | Term Loan, 2.23%, Maturing April 26, 2014 | | | 423,550 | | | |
See notes to financial statements7
Eaton Vance VT Floating-Rate Income Fund as of December 31, 2008
PORTFOLIO OF INVESTMENTS CONT’D
| | | | | | | | | | | |
Principal
| | | | | | | | |
| Amount | | | Borrower/Tranche Description | | Value | | | |
| |
| |
| Chemicals and Plastics (continued) |
| |
| | | | | | | | | | | |
Huntsman International, LLC |
| | 3,629,268 | | | Term Loan, 2.22%, Maturing August 16, 2012 | | | 2,259,220 | | | |
INEOS Group |
| | 4,500,832 | | | Term Loan, 8.20%, Maturing December 14, 2013 | | | 1,997,244 | | | |
| | 4,500,832 | | | Term Loan, 8.70%, Maturing December 14, 2014 | | | 1,995,367 | | | |
Innophos, Inc. |
| | 1,587,681 | | | Term Loan, 3.46%, Maturing August 10, 2010 | | | 1,397,159 | | | |
Invista B.V. |
| | 194,000 | | | Term Loan, 2.96%, Maturing April 30, 2010 | | | 147,440 | | | |
| | 481,826 | | | Term Loan, 2.71%, Maturing April 29, 2011 | | | 366,187 | | | |
| | 143,757 | | | Term Loan, 2.71%, Maturing April 29, 2011 | | | 109,255 | | | |
ISP Chemco, Inc. |
| | 2,758,000 | | | Term Loan, 3.33%, Maturing June 4, 2014 | | | 1,880,038 | | | |
Kleopatra |
| | 1,175,000 | | | Term Loan, 6.82%, Maturing January 3, 2016 | | | 602,187 | | | |
Kranton Polymers, LLC |
| | 1,711,514 | | | Term Loan, 5.31%, Maturing May 12, 2013 | | | 924,217 | | | |
Lucite International Group Holdings |
| | 1,689,390 | | | Term Loan, 2.72%, Maturing July 7, 2013 | | | 1,354,328 | | | |
| | 522,473 | | | Term Loan, 2.72%, Maturing July 7, 2013 | | | 412,754 | | | |
MacDermid, Inc. |
| | 2,280,738 | | | Term Loan, 5.76%, Maturing April 12, 2014 | | | 1,471,076 | | | |
Millenium Inorganic Chemicals |
| | 786,905 | | | Term Loan, 3.71%, Maturing April 30, 2014 | | | 542,964 | | | |
Momentive Performance Material |
| | 2,123,503 | | | Term Loan, 2.75%, Maturing December 4, 2013 | | | 1,385,585 | | | |
MSCI, Inc. |
| | 990,000 | | | Term Loan, 4.70%, Maturing November 5, 2014 | | | 831,600 | | | |
Propex Fabrics, Inc. |
| | 160,455 | | | Term Loan, 7.25%, Maturing July 31, 2012(6) | | | 46,933 | | | |
Rockwood Specialties Group, Inc. |
| | 2,839,940 | | | Term Loan, 3.55%, Maturing December 10, 2012 | | | 2,305,424 | | | |
Solo Cup Co. |
| | 168,731 | | | Term Loan, 5.28%, Maturing February 27, 2011 | | | 139,203 | | | |
| |
| |
| | | | | | | $ | 33,771,378 | | | |
| |
| |
| |
| Clothing/Textiles — 0.3% |
| |
Hanesbrands, Inc. |
| $ | 1,157,902 | | | Term Loan, 5.16%, Maturing September 5, 2013 | | $ | 930,824 | | | |
The William Carter Co. |
| | 1,035,962 | | | Term Loan, 3.32%, Maturing July 14, 2012 | | | 854,669 | | | |
| |
| |
| | | | | | | $ | 1,785,493 | | | |
| |
| |
| | | | | | | | | | | |
| Conglomerates — 2.8% |
| |
Amsted Industries, Inc. |
| $ | 2,474,823 | | | Term Loan, 6.41%, Maturing October 15, 2010 | | $ | 1,522,016 | | | |
| | 463,241 | | | Term Loan, 4.14%, Maturing April 5, 2013 | | | 284,893 | | | |
Doncasters (Dunde HoldCo 4 Ltd.) |
| | 675,760 | | | Term Loan, 4.39%, Maturing July 13, 2015 | | | 452,759 | | | |
| | 675,760 | | | Term Loan, 4.89%, Maturing July 13, 2015 | | | 452,759 | | | |
GenTek, Inc. |
| | 681,846 | | | Term Loan, 5.98%, Maturing February 28, 2011 | | | 593,206 | | | |
Jarden Corp. |
| | 2,166,320 | | | Term Loan, 3.21%, Maturing January 24, 2012 | | | 1,629,073 | | | |
| | 86,700 | | | Term Loan, 3.21%, Maturing January 24, 2012 | | | 65,199 | | | |
| | 1,979,916 | | | Term Loan, 3.96%, Maturing January 24, 2012 | | | 1,546,314 | | | |
Johnson Diversey, Inc. |
| | 225,741 | | | Term Loan, 5.19%, Maturing December 16, 2010 | | | 196,395 | | | |
| | 1,990,433 | | | Term Loan, 5.19%, Maturing December 16, 2011 | | | 1,731,677 | | | |
Polymer Group, Inc. |
| | 1,451,402 | | | Term Loan, 3.38%, Maturing November 22, 2012 | | | 1,037,753 | | | |
RBS Global, Inc. |
| | 1,684,608 | | | Term Loan, 5.76%, Maturing July 19, 2013 | | | 1,221,341 | | | |
| | 2,401,639 | | | Term Loan, 5.90%, Maturing July 19, 2013 | | | 1,741,189 | | | |
RGIS Holdings, LLC |
| | 2,322,961 | | | Term Loan, 3.75%, Maturing April 30, 2014 | | | 1,193,421 | | | |
| | 116,148 | | | Term Loan, 3.96%, Maturing April 30, 2014 | | | 59,671 | | | |
The Manitowoc Company Inc. |
| | 1,150,000 | | | Term Loan, 6.50%, Maturing August 21, 2014 | | | 815,350 | | | |
US Investigations Services, Inc. |
| | 3,287,080 | | | Term Loan, 4.28%, Maturing February 21, 2015 | | | 2,391,351 | | | |
Vertrue, Inc. |
| | 567,813 | | | Term Loan, 4.46%, Maturing August 16, 2014 | | | 408,825 | | | |
| |
| |
| | | | | | | $ | 17,343,192 | | | |
| |
| |
| |
| Containers and Glass Products — 2.7% |
| |
Berry Plastics Corp. |
| $ | 3,688,078 | | | Term Loan, 3.88%, Maturing April 3, 2015 | | $ | 2,381,115 | | | |
Consolidated Container Co. |
| | 736,875 | | | Term Loan, 3.13%, Maturing March 28, 2014 | | | 386,859 | | | |
Crown Americas, Inc. |
| | 485,000 | | | Term Loan, 2.95%, Maturing November 15, 2012 | | | 426,800 | | | |
Graham Packaging Holdings Co. |
| | 6,406,005 | | | Term Loan, 5.50%, Maturing October 7, 2011 | | | 4,665,705 | | | |
See notes to financial statements8
Eaton Vance VT Floating-Rate Income Fund as of December 31, 2008
PORTFOLIO OF INVESTMENTS CONT’D
| | | | | | | | | | | |
Principal
| | | | | | | | |
| Amount | | | Borrower/Tranche Description | | Value | | | |
| |
| |
| Containers and Glass Products (continued) |
| |
| | | | | | | | | | | |
Graphic Packaging International, Inc. |
| | 5,965,465 | | | Term Loan, 5.21%, Maturing May 16, 2014 | | | 4,213,939 | | | |
| | 492,613 | | | Term Loan, 6.68%, Maturing May 16, 2014 | | | 368,228 | | | |
JSG Acquisitions |
| | 195,000 | | | Term Loan, 6.16%, Maturing December 2, 2013 | | | 119,600 | | | |
| | 195,000 | | | Term Loan, 6.41%, Maturing December 1, 2014 | | | 119,600 | | | |
Kranson Industries, Inc. |
| | 293,192 | | | Term Loan, 3.75%, Maturing July 31, 2013 | | | 227,224 | | | |
Owens-Brockway Glass Container |
| | 406,938 | | | Term Loan, 2.70%, Maturing June 14, 2013 | | | 330,128 | | | |
Pregis Corp. |
| | 1,257,750 | | | Term Loan, 2.71%, Maturing October 12, 2011 | | | 1,006,200 | | | |
Smurfit-Stone Container Corp. |
| | 240,169 | | | Term Loan, 3.44%, Maturing November 1, 2011 | | | 155,938 | | | |
| | 597,272 | | | Term Loan, 4.03%, Maturing November 1, 2011 | | | 397,186 | | | |
| | 1,483,820 | | | Term Loan, 4.07%, Maturing November 1, 2011 | | | 963,423 | | | |
| | 505,255 | | | Term Loan, 5.93%, Maturing November 1, 2011 | | | 335,995 | | | |
Tegrant Holding Corp. |
| | 982,500 | | | Term Loan, 4.21%, Maturing March 8, 2013 | | | 424,113 | | | |
| |
| |
| | | | | | | $ | 16,522,053 | | | |
| |
| |
| |
| Cosmetics/Toiletries — 0.4% |
| |
American Safety Razor Co. |
| $ | 2,166,342 | | | Term Loan, 5.50%, Maturing July 31, 2013 | | $ | 1,570,598 | | | |
Bausch & Lomb, Inc. |
| | 1,030,546 | | | Term Loan, 4.71%, Maturing April 30, 2015 | | | 706,660 | | | |
| | 260,239 | | | Term Loan, 4.71%, Maturing April 30, 2015(3) | | | 178,449 | | | |
Prestige Brands, Inc. |
| | 218,313 | | | Term Loan, 2.71%, Maturing April 7, 2011 | | | 175,742 | | | |
| |
| |
| | | | | | | $ | 2,631,449 | | | |
| |
| |
| |
| Drugs — 1.0% |
| |
Chattem, Inc. |
| $ | 630,570 | | | Term Loan, 4.54%, Maturing January 2, 2013 | | $ | 567,513 | | | |
Graceway Pharmaceuticals, LLC |
| | 1,026,562 | | | Term Loan, 4.21%, Maturing May 3, 2012 | | | 663,844 | | | |
Pharmaceutical Holdings Corp. |
| | 176,446 | | | Term Loan, 4.69%, Maturing January 30, 2012 | | | 142,921 | | | |
Royal Pharma Finance Trust |
| | 491,250 | | | Term Loan, 3.71%, Maturing April 16, 2013 | | | 437,212 | | | |
Stiefel Laboratories, Inc. |
| | 1,233,888 | | | Term Loan, 7.00%, Maturing December 28, 2013 | | | 900,739 | | | |
| | 1,613,195 | | | Term Loan, 7.00%, Maturing December 28, 2013 | | | 1,177,632 | | | |
Warner Chilcott Corp. |
| | 564,113 | | | Term Loan, 3.46%, Maturing January 18, 2012 | | | 467,368 | | | |
| | 1,826,238 | | | Term Loan, 3.46%, Maturing January 18, 2012 | | | 1,513,038 | | | |
| |
| |
| | | | | | | $ | 5,870,267 | | | |
| |
| |
| |
| Ecological Services and Equipment — 0.6% |
| |
Big Dumpster Merger Sub, Inc. |
| $ | 1,020,317 | | | Term Loan, 2.71%, Maturing February 5, 2013 | | $ | 510,159 | | | |
Casella Waste Systems, Inc. |
| | 989,714 | | | Term Loan, 3.68%, Maturing April 28, 2010 | | | 853,629 | | | |
IESI Corp. |
| | 2,000,000 | | | Term Loan, 3.63%, Maturing January 20, 2012 | | | 1,680,000 | | | |
Sensus Metering Systems, Inc. |
| | 196,435 | | | Term Loan, 4.16%, Maturing December 17, 2010 | | | 171,881 | | | |
Synagro Technologies, Inc. |
| | 738,750 | | | Term Loan, 4.24%, Maturing April 2, 2014 | | | 498,656 | | | |
Wastequip, Inc. |
| | 429,607 | | | Term Loan, 2.71%, Maturing February 5, 2013 | | | 214,804 | | | |
| |
| |
| | | | | | | $ | 3,929,129 | | | |
| |
| |
| |
| Electronics/Electrical — 2.8% |
| |
Aspect Software, Inc. |
| $ | 1,014,000 | | | Term Loan, 4.56%, Maturing July 11, 2011 | | $ | 537,420 | | | |
Baldor Electric Co. |
| | 755,377 | | | Term Loan, 3.72%, Maturing January 31, 2014 | | | 642,700 | | | |
Fairchild Semiconductor Corp. |
| | 560,625 | | | Term Loan, 2.96%, Maturing June 26, 2013 | | | 371,414 | | | |
Freescale Semiconductor, Inc. |
| | 6,314,153 | | | Term Loan, 3.93%, Maturing December 1, 2013 | | | 3,697,290 | | | |
Infor Enterprise Solutions Holdings |
| | 2,472,399 | | | Term Loan, 4.21%, Maturing July 28, 2012 | | | 1,312,431 | | | |
| | 1,446,109 | | | Term Loan, 5.21%, Maturing July 28, 2012 | | | 744,746 | | | |
| | 754,491 | | | Term Loan, 7.52%, Maturing July 28, 2012 | | | 388,563 | | | |
Network Solutions, LLC |
| | 845,439 | | | Term Loan, 3.30%, Maturing March 7, 2014 | | | 443,855 | | | |
Open Solutions, Inc. |
| | 4,146,620 | | | Term Loan, 5.96%, Maturing January 23, 2014 | | | 1,202,520 | | | |
Sensata Technologies Finance Co. |
| | 4,864,711 | | | Term Loan, 5.26%, Maturing April 27, 2013 | | | 2,505,326 | | | |
Spectrum Brands, Inc. |
| | 120,609 | | | Term Loan, 5.43%, Maturing March 30, 2013 | | | 67,541 | | | |
| | 2,349,453 | | | Term Loan, 6.57%, Maturing March 30, 2013 | | | 1,315,694 | | | |
SS&C Technologies, Inc. |
| | 1,481,068 | | | Term Loan, 3.40%, Maturing November 23, 2012 | | | 1,044,153 | | | |
See notes to financial statements9
Eaton Vance VT Floating-Rate Income Fund as of December 31, 2008
PORTFOLIO OF INVESTMENTS CONT’D
| | | | | | | | | | | |
Principal
| | | | | | | | |
| Amount | | | Borrower/Tranche Description | | Value | | | |
| |
| |
| Electronics/Electrical (continued) |
| |
| | | | | | | | | | | |
VeriFone, Inc. |
| | 1,922,674 | | | Term Loan, 3.22%, Maturing October 31, 2013 | | | 1,288,191 | | | |
Vertafore, Inc. |
| | 2,210,625 | | | Term Loan, 4.66%, Maturing January 31, 2012 | | | 1,525,331 | | | |
| |
| |
| | | | | | | $ | 17,087,175 | | | |
| |
| |
| |
| Equipment Leasing — 0.2% |
| |
The Hertz Corp. |
| $ | 379,938 | | | Term Loan, 3.28%, Maturing December 21, 2012 | | $ | 226,696 | | | |
| | 2,085,468 | | | Term Loan, 3.32%, Maturing December 21, 2012 | | | 1,244,330 | | | |
| |
| |
| | | | | | | $ | 1,471,026 | | | |
| |
| |
| |
| Farming/Agriculture — 0.2% |
| |
BF Bolthouse HoldCo, LLC |
| $ | 1,422,451 | | | Term Loan, 6.19%, Maturing December 16, 2012 | | $ | 1,066,838 | | | |
Central Garden & Pet Co. |
| | 225,085 | | | Term Loan, 1.97%, Maturing February 28, 2014 | | | 147,431 | | | |
| |
| |
| | | | | | | $ | 1,214,269 | | | |
| |
| |
| |
| Financial Intermediaries — 1.6% |
| |
Asset Acceptence Capital Corp. |
| $ | 2,022,869 | | | Term Loan, 4.24%, Maturing June 5, 2013 | | $ | 1,355,322 | | | |
Citco III, Ltd. |
| | 2,999,664 | | | Term Loan, 3.58%, Maturing June 30, 2014 | | | 1,837,294 | | | |
E.A. Viner International Co. |
| | 381,300 | | | Term Loan, 5.96%, Maturing July 31, 2013 | | | 219,247 | | | |
Grosvenor Capital Management |
| | 1,636,997 | | | Term Loan, 4.01%, Maturing December 5, 2013 | | | 867,608 | | | |
INVESTools, Inc. |
| | 1,536,000 | | | Term Loan, 3.71%, Maturing August 13, 2012 | | | 1,290,240 | | | |
LPL Holdings, Inc. |
| | 3,165,370 | | | Term Loan, 2.81%, Maturing December 18, 2014 | | | 2,279,066 | | | |
Nuveen Investments, Inc. |
| | 1,538,375 | | | Term Loan, 3.81%, Maturing June 28, 2013 | | | 609,581 | | | |
Oxford Acquisition III, Ltd. |
| | 1,805,815 | | | Term Loan, 5.58%, Maturing May 24, 2014 | | | 767,471 | | | |
RJO Holdings Corp. (RJ O’Brien) |
| | 496,231 | | | Term Loan, 4.88%, Maturing July 31, 2014(4) | | | 357,286 | | | |
| |
| |
| | | | | | | $ | 9,583,115 | | | |
| |
| |
| |
| Food Products — 2.4% |
| |
Acosta, Inc. |
| $ | 2,888,525 | | | Term Loan, 2.72%, Maturing July 28, 2013 | | $ | 1,798,107 | | | |
Advance Food Company, Inc. |
| | 19,800 | | | Term Loan, 5.52%, Maturing March 16, 2014 | | | 12,573 | | | |
| | 229,250 | | | Term Loan, 5.52%, Maturing March 16, 2014 | | | 145,574 | | | |
Advantage Sales & Marketing, Inc. |
| | 3,077,931 | | | Term Loan, 3.79%, Maturing March 29, 2013 | | | 1,946,791 | | | |
American Seafoods Group, LLC |
| | 288,289 | | | Term Loan, 5.51%, Maturing September 30, 2011 | | | 256,577 | | | |
| | 1,176,072 | | | Term Loan, 5.51%, Maturing September 30, 2012 | | | 1,005,541 | | | |
B&G Foods, Inc. |
| | 1,500,000 | | | Term Loan, 4.20%, Maturing February 23, 2013 | | | 1,237,500 | | | |
Birds Eye Foods, Inc. |
| | 732,494 | | | Term Loan, 3.21%, Maturing March 22, 2013 | | | 596,982 | | | |
Dean Foods Co. |
| | 3,441,219 | | | Term Loan, 2.95%, Maturing April 2, 2014 | | | 2,909,058 | | | |
Dole Food Company, Inc. |
| | 165,579 | | | Term Loan, 2.71%, Maturing April 12, 2013 | | | 116,389 | | | |
| | 616,900 | | | Term Loan, 4.70%, Maturing April 12, 2013 | | | 433,630 | | | |
| | 93,660 | | | Term Loan, 6.82%, Maturing April 12, 2013 | | | 65,835 | | | |
Michael Foods, Inc. |
| | 252,790 | | | Term Loan, 3.88%, Maturing November 21, 2010 | | | 223,719 | | | |
Pinnacle Foods Finance, LLC |
| | 3,078,125 | | | Term Loan, 6.12%, Maturing April 2, 2014 | | | 2,120,828 | | | |
Reddy Ice Group, Inc. |
| | 1,675,000 | | | Term Loan, 6.50%, Maturing August 9, 2012 | | | 984,062 | | | |
Wrigley Company |
| | 1,099,290 | | | Term Loan, 7.75%, Maturing October 6, 2014 | | | 1,054,403 | | | |
| |
| |
| | | | | | | $ | 14,907,569 | | | |
| |
| |
| |
| Food Service — 2.6% |
| |
AFC Enterprises, Inc. |
| $ | 755,185 | | | Term Loan, 3.75%, Maturing May 23, 2009 | | $ | 513,526 | | | |
Aramark Corp. |
| | 7,923,405 | | | Term Loan, 3.33%, Maturing January 26, 2014 | | | 6,564,050 | | | |
| | 503,242 | | | Term Loan, 4.49%, Maturing January 26, 2014 | | | 416,905 | | | |
Buffets, Inc. |
| | 739,034 | | | DIP Loan, 19.00%, Maturing July 22, 2009 | | | 720,558 | | | |
| | 417,921 | | | Term Loan, 7.71%, Maturing July 22, 2009(6) | | | 129,556 | | | |
| | 41,619 | | | Term Loan, 7.71%, Maturing July 22, 2009(6) | | | 12,902 | | | |
| | 127,070 | | | Term Loan, 10.97%, Maturing May 1, 2013 | | | 33,483 | | | |
| | 855,283 | | | Term Loan, 7.71%, Maturing November 1, 2013(6) | | | 225,367 | | | |
CBRL Group, Inc. |
| | 1,546,848 | | | Term Loan, 4.69%, Maturing April 27, 2013 | | | 933,265 | | | |
See notes to financial statements10
Eaton Vance VT Floating-Rate Income Fund as of December 31, 2008
PORTFOLIO OF INVESTMENTS CONT’D
| | | | | | | | | | | |
Principal
| | | | | | | | |
| Amount | | | Borrower/Tranche Description | | Value | | | |
| |
| |
| Food Service (continued) |
| |
| | | | | | | | | | | |
Denny’s, Inc. |
| | 123,333 | | | Term Loan, 4.15%, Maturing March 31, 2012 | | | 91,267 | | | |
| | 422,174 | | | Term Loan, 4.35%, Maturing March 31, 2012 | | | 312,409 | | | |
JRD Holdings, Inc. |
| | 3,460,156 | | | Term Loan, 4.08%, Maturing June 26, 2014 | | | 2,491,312 | | | |
NPC International, Inc. |
| | 903,914 | | | Term Loan, 4.12%, Maturing May 3, 2013 | | | 614,662 | | | |
OSI Restaurant Partners, LLC |
| | 254,791 | | | Term Loan, 4.07%, Maturing June 14, 2014 | | | 116,036 | | | |
| | 2,937,658 | | | Term Loan, 2.81%, Maturing June 14, 2014 | | | 1,337,859 | | | |
QCE Finance, LLC |
| | 1,473,633 | | | Term Loan, 3.75%, Maturing May 5, 2013 | | | 789,867 | | | |
Sagittarius Restaurants, LLC |
| | 223,739 | | | Term Loan, 9.50%, Maturing March 29, 2013 | | | 76,631 | | | |
Weight Watchers International, Inc. |
| | 980,000 | | | Term Loan, 5.69%, Maturing January 26, 2014 | | | 829,734 | | | |
| |
| |
| | | | | | | $ | 16,209,389 | | | |
| |
| |
| |
| Food/Drug Retailers — 2.2% |
| |
General Nutrition Centers, Inc. |
| $ | 2,288,025 | | | Term Loan, 4.89%, Maturing September 16, 2013 | | $ | 1,525,351 | | | |
Krispy Kreme Doughnut Corp. |
| | 339,350 | | | Term Loan, 8.92%, Maturing February 16, 2014 | | | 296,931 | | | |
Pantry, Inc. (The) |
| | 1,998,669 | | | Term Loan, 3.19%, Maturing May 15, 2014 | | | 1,244,172 | | | |
| | 575,396 | | | Term Loan, 3.19%, Maturing May 15, 2014 | | | 358,184 | | | |
Rite Aid Corp. |
| | 6,106,362 | | | Term Loan, 2.71%, Maturing June 1, 2014 | | | 3,633,286 | | | |
| | 2,932,650 | | | Term Loan, 6.00%, Maturing June 4, 2014 | | | 1,891,559 | | | |
Roundy’s Supermarkets, Inc. |
| | 4,860,034 | | | Term Loan, 4.41%, Maturing November 3, 2011 | | | 3,408,099 | | | |
Supervalu, Inc. |
| | 1,486,370 | | | Term Loan, 2.69%, Maturing June 6, 2012 | | | 1,163,550 | | | |
| |
| |
| | | | | | | $ | 13,521,132 | | | |
| |
| |
| |
| Forest Products — 1.6% |
| |
Appleton Papers, Inc. |
| $ | 886,500 | | | Term Loan, 4.53%, Maturing June 5, 2014 | | $ | 653,794 | | | |
Georgia-Pacific Corp. |
| | 2,650,417 | | | Term Loan, 3.31%, Maturing December 20, 2012 | | | 2,177,760 | | | |
| | 6,365,689 | | | Term Loan, 4.99%, Maturing December 20, 2012 | | | 5,230,477 | | | |
Newpage Corp. |
| | 1,509,750 | | | Term Loan, 5.31%, Maturing December 5, 2014 | | | 968,127 | | | |
Xerium Technologies, Inc. |
| | 1,698,844 | | | Term Loan, 6.96%, Maturing May 18, 2012 | | | 1,061,777 | | | |
| |
| |
| | | | | | | $ | 10,091,935 | | | |
| |
| |
| |
| Healthcare — 11.0% |
| |
Accellent, Inc. |
| $ | 1,464,773 | | | Term Loan, 4.70%, Maturing November 22, 2012 | | $ | 937,455 | | | |
Advanced Medical Optics, Inc. |
| | 4,659,920 | | | Term Loan, 4.38%, Maturing April 2, 2014 | | | 3,028,948 | | | |
American Medical Systems |
| | 517,189 | | | Term Loan, 2.75%, Maturing July 20, 2012 | | | 426,681 | | | |
AMN Healthcare, Inc. |
| | 852,956 | | | Term Loan, 3.21%, Maturing November 2, 2011 | | | 737,807 | | | |
AMR HoldCo, Inc. |
| | 1,289,661 | | | Term Loan, 4.18%, Maturing February 10, 2012 | | | 1,115,556 | | | |
Biomet, Inc. |
| | 2,967,462 | | | Term Loan, 4.46%, Maturing December 26, 2014 | | | 2,552,018 | | | |
Bright Horizons Family Solutions, Inc. |
| | 796,000 | | | Term Loan, 7.50%, Maturing May 15, 2015 | | | 535,973 | | | |
Cardinal Health 409, Inc. |
| | 4,681,467 | | | Term Loan, 3.71%, Maturing April 10, 2014 | | | 2,843,991 | | | |
Carestream Health, Inc. |
| | 3,746,147 | | | Term Loan, 5.42%, Maturing April 30, 2013 | | | 2,261,736 | | | |
Community Health Systems, Inc. |
| | 422,136 | | | Term Loan, 3.40%, Maturing July 25, 2014(3) | | | 330,744 | | | |
| | 8,251,857 | | | Term Loan, 4.45%, Maturing July 25, 2014 | | | 6,465,330 | | | |
Concentra, Inc. |
| | 467,875 | | | Term Loan, 3.71%, Maturing June 25, 2014 | | | 285,404 | | | |
ConMed Corp. |
| | 677,066 | | | Term Loan, 2.93%, Maturing April 13, 2013 | | | 521,341 | | | |
CRC Health Corp. |
| | 1,686,193 | | | Term Loan, 3.71%, Maturing February 6, 2013 | | | 1,025,767 | | | |
| | 764,684 | | | Term Loan, 3.71%, Maturing February 6, 2013 | | | 465,183 | | | |
DaVita, Inc. |
| | 3,056,280 | | | Term Loan, 3.30%, Maturing October 5, 2012 | | | 2,686,253 | | | |
DJO Finance, LLC |
| | 544,500 | | | Term Loan, 3.91%, Maturing May 20, 2014 | | | 386,595 | | | |
Fresenius Medical Care Holdings |
| | 1,258,291 | | | Term Loan, 2.97%, Maturing March 31, 2013 | | | 1,094,713 | | | |
Fresenius SE |
| | 324,947 | | | Term Loan, 6.75%, Maturing September 10, 2014 | | | 296,514 | | | |
| | 175,053 | | | Term Loan, 6.75%, Maturing September 10, 2014 | | | 159,736 | | | |
Hanger Orthopedic Group, Inc. |
| | 302,508 | | | Term Loan, 2.48%, Maturing May 30, 2013 | | | 242,006 | | | |
See notes to financial statements11
Eaton Vance VT Floating-Rate Income Fund as of December 31, 2008
PORTFOLIO OF INVESTMENTS CONT’D
| | | | | | | | | | | |
Principal
| | | | | | | | |
| Amount | | | Borrower/Tranche Description | | Value | | | |
| |
| |
| Healthcare (continued) |
| |
| | | | | | | | | | | |
HCA, Inc. |
| | 11,094,276 | | | Term Loan, 3.71%, Maturing November 18, 2013 | | | 8,771,412 | | | |
Health Management Association, Inc. |
| | 9,037,375 | | | Term Loan, 3.21%, Maturing February 28, 2014 | | | 5,609,625 | | | |
HealthSouth Corp. |
| | 3,764,017 | | | Term Loan, 4.70%, Maturing March 10, 2013 | | | 2,917,113 | | | |
Ikaria Acquisition, Inc. |
| | 801,897 | | | Term Loan, 5.67%, Maturing March 28, 2013 | | | 581,376 | | | |
IM U.S. Holdings, LLC |
| | 1,330,984 | | | Term Loan, 3.72%, Maturing June 26, 2014 | | | 885,105 | | | |
Invacare Corp. |
| | 960,802 | | | Term Loan, 5.02%, Maturing February 12, 2013 | | | 761,436 | | | |
inVentiv Health, Inc. |
| | 1,581,009 | | | Term Loan, 3.21%, Maturing July 6, 2014 | | | 1,260,854 | | | |
Invitrogen Corp. |
| | 2,992,500 | | | Term Loan, 5.25%, Maturing November 21, 2015 | | | 2,812,950 | | | |
LifePoint Hospitals, Inc. |
| | 1,449,394 | | | Term Loan, 3.82%, Maturing April 15, 2012 | | | 1,220,209 | | | |
MultiPlan Merger Corp. |
| | 1,819,685 | | | Term Loan, 3.00%, Maturing April 12, 2013 | | | 1,307,139 | | | |
| | 2,464,890 | | | Term Loan, 3.00%, Maturing April 12, 2013 | | | 1,770,612 | | | |
Mylan, Inc. |
| | 1,374,456 | | | Term Loan, 4.96%, Maturing October 2, 2014 | | | 1,179,741 | | | |
National Mentor Holdings, Inc. |
| | 1,198,366 | | | Term Loan, 3.46%, Maturing June 29, 2013 | | | 778,938 | | | |
| | 73,271 | | | Term Loan, 4.23%, Maturing June 29, 2013 | | | 47,626 | | | |
National Rental Institutes, Inc. |
| | 231,764 | | | Term Loan, 3.75%, Maturing March 31, 2013 | | | 139,059 | | | |
Physiotherapy Associates, Inc. |
| | 532,503 | | | Term Loan, 7.50%, Maturing June 27, 2013 | | | 312,845 | | | |
Psychiatric Solutions, Inc. |
| | 989,558 | | | Term Loan, 3.07%, Maturing May 31, 2014 | | | 783,401 | | | |
RadNet Management, Inc. |
| | 962,601 | | | Term Loan, 6.45%, Maturing November 15, 2012 | | | 721,951 | | | |
ReAble Therapeutics Finance, LLC |
| | 3,786,277 | | | Term Loan, 3.46%, Maturing November 16, 2013 | | | 2,688,257 | | | |
Renal Advantage, Inc. |
| | 753,653 | | | Term Loan, 4.50%, Maturing October 5, 2012 | | | 516,252 | | | |
Select Medical Holdings Corp. |
| | 2,755,336 | | | Term Loan, 4.15%, Maturing February 24, 2012 | | | 1,925,291 | | | |
Sunrise Medical Holdings, Inc. |
| | 442,976 | | | Term Loan, 5.54%, Maturing May 13, 2010 | | | 303,261 | | | |
TZ Merger Sub., Inc. (TriZetto) |
| | 1,221,938 | | | Term Loan, 7.50%, Maturing July 24, 2015 | | | 947,002 | | | |
Vanguard Health Holding Co., LLC |
| | 1,967,847 | | | Term Loan, 3.30%, Maturing September 23, 2011 | | | 1,618,555 | | | |
Viant Holdings, Inc. |
| | 394,000 | | | Term Loan, 3.71%, Maturing June 25, 2014 | | | 202,910 | | | |
| |
| |
| | | | | | | $ | 68,462,671 | | | |
| |
| |
| |
| Home Furnishings — 1.5% |
| |
Hunter Fan Co. |
| $ | 260,675 | | | Term Loan, 4.74%, Maturing April 16, 2014 | | $ | 146,630 | | | |
Interline Brands, Inc. |
| | 1,681,338 | | | Term Loan, 2.00%, Maturing June 23, 2013 | | | 1,080,259 | | | |
| | 1,167,319 | | | Term Loan, 2.00%, Maturing June 23, 2013 | | | 750,003 | | | |
National Bedding Co., LLC |
| | 4,465,928 | | | Term Loan, 3.75%, Maturing August 31, 2011 | | | 2,601,403 | | | |
| | 1,290,884 | | | Term Loan — Second Lien, 6.64%, Maturing August 31, 2012 | | | 617,472 | | | |
Oreck Corp. |
| | 487,310 | | | Term Loan, 4.93%, Maturing February 2, 2012(4) | | | 190,538 | | | |
Sealy Mattress Co. |
| | 1,800,000 | | | Term Loan, 6.60%, Maturing August 25, 2011 | | | 1,521,000 | | | |
| | 1,175,999 | | | Term Loan, 6.40%, Maturing August 25, 2012 | | | 931,979 | | | |
Simmons Co. |
| | 2,777,728 | | | Term Loan, 9.40%, Maturing December 19, 2011 | | | 1,506,918 | | | |
| |
| |
| | | | | | | $ | 9,346,202 | | | |
| |
| |
| |
| Industrial Equipment — 1.9% |
| |
Brand Energy and Infrastructure Services, Inc. |
| $ | 543,125 | | | Term Loan, 4.81%, Maturing February 7, 2014 | | $ | 285,141 | | | |
Bucyrus International, Inc. |
| | 493,750 | | | Term Loan, 4.66%, Maturing May 4, 2014 | | | 414,750 | | | |
CEVA Group PLC U.S. |
| | 1,748,168 | | | Term Loan, 5.03%, Maturing January 4, 2014 | | | 952,752 | | | |
| | 739,797 | | | Term Loan, 5.05%, Maturing January 4, 2014 | | | 403,189 | | | |
| | 484,835 | | | Term Loan, 6.76%, Maturing January 4, 2014 | | | 264,235 | | | |
EPD Holdings (Goodyear Engineering Products) |
| | 253,688 | | | Term Loan, 4.38%, Maturing July 13, 2014 | | | 138,894 | | | |
| | 1,773,494 | | | Term Loan, 4.38%, Maturing July 13, 2014 | | | 970,988 | | | |
Flowserve Corp. |
| | 229,041 | | | Term Loan, 2.99%, Maturing August 10, 2012 | | | 206,137 | | | |
Generac Acquisition Corp. |
| | 1,277,719 | | | Term Loan, 6.65%, Maturing November 7, 2013 | | | 729,577 | | | |
Gleason Corp. |
| | 336,936 | | | Term Loan, 4.91%, Maturing June 30, 2013 | | | 227,431 | | | |
| | 174,893 | | | Term Loan, 4.91%, Maturing June 30, 2013 | | | 118,053 | | | |
Itron, Inc. |
| | 279,433 | | | Term Loan, 3.19%, Maturing April 18, 2014 | | | 226,340 | | | |
See notes to financial statements12
Eaton Vance VT Floating-Rate Income Fund as of December 31, 2008
PORTFOLIO OF INVESTMENTS CONT’D
| | | | | | | | | | | |
Principal
| | | | | | | | |
| Amount | | | Borrower/Tranche Description | | Value | | | |
| |
| |
| Industrial Equipment (continued) |
| |
| | | | | | | | | | | |
Jason, Inc. |
| | 270,036 | | | Term Loan, 3.97%, Maturing April 30, 2010 | | | 198,477 | | | |
John Maneely Co. |
| | 2,364,910 | | | Term Loan, 7.71%, Maturing December 8, 2013 | | | 1,359,823 | | | |
Kinetek Acquisition Corp. |
| | 455,795 | | | Term Loan, 2.96%, Maturing November 10, 2013 | | | 319,057 | | | |
| | 46,773 | | | Term Loan, 2.96%, Maturing November 10, 2013 | | | 32,741 | | | |
LN Acquisitions Corp. |
| | 134,318 | | | Term Loan, 4.37%, Maturing July 11, 2014 | | | 102,082 | | | |
| | 358,182 | | | Term Loan, 4.37%, Maturing July 11, 2014 | | | 272,218 | | | |
Polypore, Inc. |
| | 4,632,718 | | | Term Loan, 3.93%, Maturing July 3, 2014 | | | 2,733,304 | | | |
Sequa Corp. |
| | 1,991,593 | | | Term Loan, 4.67%, Maturing November 30, 2014 | | | 1,131,225 | | | |
TFS Acquisition Corp. |
| | 1,197,437 | | | Term Loan, 4.96%, Maturing August 11, 2013 | | | 538,847 | | | |
| |
| |
| | | | | | | $ | 11,625,261 | | | |
| |
| |
| |
| Insurance — 1.6% |
| |
Alliant Holdings I, Inc. |
| $ | 691,250 | | | Term Loan, 4.46%, Maturing August 21, 2014 | | $ | 414,750 | | | |
AmWINS Group, Inc. |
| | 492,500 | | | Term Loan, 4.16%, Maturing June 8, 2013 | | | 290,575 | | | |
Applied Systems, Inc. |
| | 928,145 | | | Term Loan, 4.24%, Maturing September 26, 2013 | | | 719,312 | | | |
CCC Information Services Group, Inc. |
| | 781,656 | | | Term Loan, 3.72%, Maturing February 10, 2013 | | | 515,893 | | | |
Conseco, Inc. |
| | 4,412,430 | | | Term Loan, 3.83%, Maturing October 10, 2013 | | | 2,857,048 | | | |
Crawford & Company |
| | 870,357 | | | Term Loan, 3.96%, Maturing October 31, 2013 | | | 704,989 | | | |
Crump Group, Inc. |
| | 613,905 | | | Term Loan, 3.47%, Maturing August 4, 2014 | | | 386,760 | | | |
Getty Images, Inc. |
| | 2,211,094 | | | Term Loan, 8.05%, Maturing July 2, 2015 | | | 1,978,929 | | | |
Hub International Holdings, Inc. |
| | 2,075,975 | | | Term Loan, 3.96%, Maturing June 13, 2014 | | | 1,204,065 | | | |
| | 466,530 | | | Term Loan, 6.26%, Maturing June 13, 2014 | | | 270,588 | | | |
U.S.I. Holdings Corp. |
| | 1,774,234 | | | Term Loan, 4.21%, Maturing May 4, 2014 | | | 762,921 | | | |
| |
| |
| | | | | | | $ | 10,105,830 | | | |
| |
| |
| |
| Leisure Goods/Activities/ Movies — 4.8% |
| |
AMC Entertainment, Inc. |
| $ | 4,622,023 | | | Term Loan, 2.22%, Maturing January 26, 2013 | | $ | 3,378,699 | | | |
AMF Bowling Worldwide, Inc. |
| | 492,500 | | | Term Loan, 4.59%, Maturing June 8, 2013 | | | 209,313 | | | |
Bombardier Recreational Products |
| | 2,483,586 | | | Term Loan, 5.73%, Maturing June 28, 2013 | | | 1,229,375 | | | |
Carmike Cinemas, Inc. |
| | 610,280 | | | Term Loan, 5.33%, Maturing May 19, 2012 | | | 436,351 | | | |
| | 1,206,507 | | | Term Loan, 6.13%, Maturing May 19, 2012 | | | 862,652 | | | |
Cedar Fair, L.P. |
| | 3,668,545 | | | Term Loan, 3.44%, Maturing August 30, 2012 | | | 2,335,642 | | | |
Cinemark, Inc. |
| | 3,926,249 | | | Term Loan, 3.58%, Maturing October 5, 2013 | | | 2,857,748 | | | |
Dave & Buster’s, Inc. |
| | 47,813 | | | Term Loan, 4.50%, Maturing March 8, 2013 | | | 32,991 | | | |
| | 121,563 | | | Term Loan, 4.50%, Maturing March 8, 2013 | | | 83,878 | | | |
Deluxe Entertainment Services |
| | 104,273 | | | Term Loan, 3.71%, Maturing January 28, 2011 | | | 46,923 | | | |
| | 1,065,018 | | | Term Loan, 4.27%, Maturing January 28, 2011 | | | 479,258 | | | |
| | 59,055 | | | Term Loan, 6.01%, Maturing January 28, 2011 | | | 26,575 | | | |
DW Funding, LLC |
| | 627,044 | | | Term Loan, 5.93%, Maturing April 30, 2011 | | | 517,311 | | | |
Easton-Bell Sports, Inc. |
| | 1,954,792 | | | Term Loan, 5.28%, Maturing March 16, 2012 | | | 1,395,233 | | | |
Fender Musical Instruments Corp. |
| | 705,901 | | | Term Loan, 2.72%, Maturing June 9, 2014 | | | 405,893 | | | |
| | 1,399,263 | | | Term Loan, 3.71%, Maturing June 9, 2014 | | | 804,576 | | | |
Mega Blocks, Inc. |
| | 1,465,440 | | | Term Loan, 8.75%, Maturing July 26, 2012 | | | 381,015 | | | |
Metro-Goldwyn-Mayer Holdings, Inc. |
| | 2,956,507 | | | Term Loan, 4.24%, Maturing April 8, 2012 | | | 1,263,907 | | | |
| | 248,373 | | | Term Loan, 4.71%, Maturing April 8, 2012 | | | 106,180 | | | |
National CineMedia, LLC |
| | 2,400,000 | | | Term Loan, 3.75%, Maturing February 13, 2015 | | | 1,435,999 | | | |
Regal Cinemas Corp. |
| | 5,410,952 | | | Term Loan, 3.21%, Maturing November 10, 2010 | | | 3,980,058 | | | |
Revolution Studios Distribution Co., LLC |
| | 577,770 | | | Term Loan, 4.22%, Maturing December 21, 2014 | | | 352,440 | | | |
Six Flags Theme Parks, Inc. |
| | 2,068,500 | | | Term Loan, 3.68%, Maturing April 30, 2015 | | | 1,230,757 | | | |
Ticketmaster |
| | 1,525,000 | | | Term Loan, 6.64%, Maturing July 22, 2014 | | | 1,052,250 | | | |
Universal City Development Partners, Ltd. |
| | 796,080 | | | Term Loan, 6.45%, Maturing June 9, 2011 | | | 692,589 | | | |
WMG Acquisition Corp. |
| | 3,929,246 | | | Term Loan, 4.28%, Maturing February 28, 2011 | | | 3,025,519 | | | |
See notes to financial statements13
Eaton Vance VT Floating-Rate Income Fund as of December 31, 2008
PORTFOLIO OF INVESTMENTS CONT’D
| | | | | | | | | | | |
Principal
| | | | | | | | |
| Amount | | | Borrower/Tranche Description | | Value | | | |
| |
| |
| Leisure Goods/Activities/ Movies (continued) |
| |
| | | | | | | | | | | |
Zuffa, LLC |
| | 1,479,975 | | | Term Loan, 2.50%, Maturing June 20, 2016 | | | 885,518 | | | |
| | | | | | | | | | | |
| |
| |
| | | | | | | $ | 29,508,650 | | | |
| |
| |
| |
| Lodging and Casinos — 2.2% |
| |
Ameristar Casinos, Inc. |
| $ | 728,716 | | | Term Loan, 2.47%, Maturing November 10, 2012 | | $ | 442,695 | | | |
Green Valley Ranch Gaming, LLC |
| | 1,242,027 | | | Term Loan, 4.25%, Maturing February 16, 2014 | | | 537,177 | | | |
Harrah’s Operating Co. |
| | 1,985,000 | | | Term Loan, 5.84%, Maturing January 28, 2015 | | | 1,166,896 | | | |
| | 1,588,000 | | | Term Loan, 6.53%, Maturing January 28, 2015 | | | 929,863 | | | |
Herbst Gaming, Inc. |
| | 70,357 | | | Term Loan, 0.00%, Maturing December 2, 2011(2) | | | 20,052 | | | |
| | 1,699,377 | | | Term Loan, 0.00%, Maturing December 2, 2011(2) | | | 484,323 | | | |
Isle of Capri Casinos, Inc. |
| | 2,513,642 | | | Term Loan, 3.21%, Maturing November 30, 2013 | | | 1,518,239 | | | |
| | 827,985 | | | Term Loan, 3.21%, Maturing November 30, 2013 | | | 500,103 | | | |
| | 1,005,458 | | | Term Loan, 3.21%, Maturing November 30, 2013 | | | 607,296 | | | |
LodgeNet Entertainment Corp. |
| | 1,885,555 | | | Term Loan, 3.46%, Maturing April 4, 2014 | | | 744,794 | | | |
New World Gaming Partners, Ltd. |
| | 742,500 | | | Term Loan, 6.55%, Maturing June 30, 2014 | | | 330,412 | | | |
| | 150,000 | | | Term Loan, 6.55%, Maturing June 30, 2014 | | | 66,750 | | | |
Penn National Gaming, Inc. |
| | 3,104,827 | | | Term Loan, 3.56%, Maturing October 3, 2012 | | | 2,523,535 | | | |
Venetian Casino Resort/Las Vegas Sands, Inc. |
| | 910,853 | | | Term Loan, 5.52%, Maturing May 14, 2014 | | | 421,016 | | | |
| | 3,937,192 | | | Term Loan, 5.52%, Maturing May 23, 2014 | | | 1,819,857 | | | |
VML US Finance, LLC |
| | 83,333 | | | Term Loan, 6.02%, Maturing May 25, 2012 | | | 40,469 | | | |
| | 166,667 | | | Term Loan, 6.02%, Maturing May 25, 2013 | | | 80,938 | | | |
| | 900,000 | | | Term Loan, 6.02%, Maturing May 25, 2013 | | | 437,063 | | | |
Wimar OpCo, LLC |
| | 3,800,525 | | | Term Loan, 6.50%, Maturing January 3, 2012 | | | 918,461 | | | |
| |
| |
| | | | | | | $ | 13,589,939 | | | |
| |
| |
| |
| Nonferrous Metals/Minerals — 1.3% |
| |
Alpha Natural Resources, LLC |
| $ | 279,750 | | | Term Loan, 2.00%, Maturing October 26, 2012 | | $ | 240,235 | | | |
Compass Minerals Group, Inc. |
| | 2,003,328 | | | Term Loan, 3.26%, Maturing December 22, 2012 | | | 1,820,524 | | | |
Murray Energy Corp. |
| | 336,875 | | | Term Loan, 6.94%, Maturing January 28, 2010 | | | 293,081 | | | |
Noranda Aluminum Acquisition |
| | 4,774,118 | | | Term Loan, 4.24%, Maturing May 18, 2014 | | | 2,864,471 | | | |
Novelis, Inc. |
| | 454,023 | | | Term Loan, 3.46%, Maturing June 28, 2014 | | | 292,845 | | | |
| | 998,852 | | | Term Loan, 3.46%, Maturing June 28, 2014 | | | 644,259 | | | |
Oxbow Carbon and Mineral Holdings |
| | 2,435,750 | | | Term Loan, 2.84%, Maturing May 8, 2014 | | | 1,542,641 | | | |
| | 218,063 | | | Term Loan, 5.76%, Maturing May 8, 2014 | | | 138,106 | | | |
Tube City IMS Corp. |
| | 876,284 | | | Term Loan, 3.46%, Maturing January 25, 2014 | | | 284,792 | | | |
| | 108,108 | | | Term Loan, 5.76%, Maturing January 25, 2014 | | | 35,135 | | | |
| |
| |
| | | | | | | $ | 8,156,089 | | | |
| |
| |
| |
| Oil and Gas — 2.2% |
| |
Atlas Pipeline Partners, L.P. |
| $ | 1,120,000 | | | Term Loan, 2.97%, Maturing July 20, 2014 | | $ | 854,000 | | | |
Big West Oil, LLC |
| | 687,500 | | | Term Loan, 4.50%, Maturing May 1, 2014 | | | 309,375 | | | |
| | 546,875 | | | Term Loan, 4.50%, Maturing May 1, 2014 | | | 246,094 | | | |
Citgo Petroleum Corp. |
| | 440,459 | | | Term Loan, 3.27%, Maturing November 15, 2012 | | | 256,568 | | | |
Dresser, Inc. |
| | 2,426,442 | | | Term Loan, 4.41%, Maturing May 4, 2014 | | | 1,537,758 | | | |
Dynegy Holdings, Inc. |
| | 2,651,064 | | | Term Loan, 2.94%, Maturing April 2, 2013 | | | 2,008,181 | | | |
| | 147,074 | | | Term Loan, 2.94%, Maturing April 2, 2013 | | | 111,409 | | | |
Energy Transfer Equity, L.P. |
| | 900,000 | | | Term Loan, 4.14%, Maturing February 8, 2012 | | | 705,750 | | | |
Enterprise GP Holdings, L.P. |
| | 800,000 | | | Term Loan, 5.66%, Maturing October 31, 2014 | | | 664,000 | | | |
Hercules Offshore, Inc. |
| | 492,500 | | | Term Loan, 3.21%, Maturing July 6, 2013 | | | 325,050 | | | |
IFM (US) Colonial Pipeline 2, LLC |
| | 392,995 | | | Term Loan, 4.20%, Maturing February 27, 2012 | | | 314,396 | | | |
Niska Gas Storage |
| | 94,085 | | | Term Loan, 4.84%, Maturing May 13, 2011 | | | 67,976 | | | |
| | 86,017 | | | Term Loan, 4.84%, Maturing May 13, 2011 | | | 62,147 | | | |
| | 127,508 | | | Term Loan, 4.85%, Maturing May 13, 2011 | | | 92,125 | | | |
| | 843,257 | | | Term Loan, 4.85%, Maturing May 12, 2013 | | | 609,253 | | | |
Precision Drilling Corp. Tranche B-1 |
| | 2,000,000 | | | Term Loan, Maturing September 30, 2014(5) | | | 1,630,000 | | | |
See notes to financial statements14
Eaton Vance VT Floating-Rate Income Fund as of December 31, 2008
PORTFOLIO OF INVESTMENTS CONT’D
| | | | | | | | | | | |
Principal
| | | | | | | | |
| Amount | | | Borrower/Tranche Description | | Value | | | |
| |
| |
| Oil and Gas (continued) |
| |
| | | | | | | | | | | |
Targa Resources, Inc. |
| | 1,420,003 | | | Term Loan, 5.76%, Maturing October 31, 2012 | | | 903,731 | | | |
| | 2,504,009 | | | Term Loan, 5.93%, Maturing October 31, 2012 | | | 1,593,624 | | | |
Volnay Acquisition Co. |
| | 1,494,000 | | | Term Loan, 4.99%, Maturing January 12, 2014 | | | 1,193,333 | | | |
| |
| |
| | | | | | | $ | 13,484,770 | | | |
| |
| |
| | | | | | | | | | | |
| Publishing — 4.8% |
| |
American Media Operations, Inc. |
| $ | 2,021,954 | | | Term Loan, 7.56%, Maturing January 31, 2013 | | $ | 1,056,471 | | | |
Black Press US Partnership |
| | 362,457 | | | Term Loan, 4.20%, Maturing August 2, 2013 | | | 181,228 | | | |
| | 596,987 | | | Term Loan, 4.20%, Maturing August 2, 2013 | | | 298,494 | | | |
CanWest MediaWorks, Ltd. |
| | 2,080,918 | | | Term Loan, 4.20%, Maturing July 10, 2014 | | | 1,082,077 | | | |
Dex Media West, LLC |
| | 3,215,000 | | | Term Loan, 7.13%, Maturing October 24, 2014 | | | 1,406,563 | | | |
GateHouse Media Operating, Inc. |
| | 2,231,522 | | | Term Loan, 4.20%, Maturing August 28, 2014 | | | 348,117 | | | |
| | 868,478 | | | Term Loan, 4.25%, Maturing August 28, 2014 | | | 135,483 | | | |
Idearc, Inc. |
| | 10,142,862 | | | Term Loan, 3.42%, Maturing November 17, 2014 | | | 3,202,244 | | | |
Laureate Education, Inc. |
| | 540,834 | | | Term Loan, 3.75%, Maturing August 17, 2014 | | | 299,261 | | | |
| | 3,614,034 | | | Term Loan, 3.75%, Maturing August 17, 2014 | | | 1,999,764 | | | |
Local Insight Regatta Holdings, Inc. |
| | 1,343,250 | | | Term Loan, 7.75%, Maturing April 23, 2015 | | | 631,328 | | | |
MediaNews Group, Inc. |
| | 1,024,680 | | | Term Loan, 2.96%, Maturing August 25, 2010 | | | 425,242 | | | |
| | 311,374 | | | Term Loan, 2.96%, Maturing December 30, 2010 | | | 131,815 | | | |
| | 1,654,908 | | | Term Loan, 4.21%, Maturing August 2, 2013 | | | 670,238 | | | |
Merrill Communications, LLC |
| | 1,661,907 | | | Term Loan, 4.32%, Maturing February 9, 2009 | | | 1,005,454 | | | |
Nebraska Book Co., Inc. |
| | 494,923 | | | Term Loan, 6.38%, Maturing March 4, 2011 | | | 292,005 | | | |
| | 1,811,482 | | | Term Loan, 6.38%, Maturing March 4, 2011 | | | 1,068,774 | | | |
Nelson Education, Ltd. |
| | 345,625 | | | Term Loan, 3.96%, Maturing July 5, 2014 | | | 198,734 | | | |
Newspaper Holdings, Inc. |
| | 350,000 | | | Term Loan, 3.75%, Maturing July 24, 2014 | | | 192,500 | | | |
Nielsen Finance, LLC |
| | 7,630,205 | | | Term Loan, 4.24%, Maturing August 9, 2013 | | | 5,193,308 | | | |
Penton Media, Inc. |
| | 984,962 | | | Term Loan, 5.63%, Maturing February 1, 2013 | | | 392,343 | | | |
Philadelphia Newspapers, LLC |
| | 472,051 | | | Term Loan, 6.00%, Maturing June 29, 2013 | | | 106,211 | | | |
R.H. Donnelley Corp. |
| | 836,813 | | | Term Loan, 6.78%, Maturing June 30, 2010 | | | 481,167 | | | |
Reader’s Digest Association, Inc. (The) |
| | 5,067,271 | | | Term Loan, 4.08%, Maturing March 2, 2014 | | | 1,748,209 | | | |
SGS International, Inc. |
| | 194,539 | | | Term Loan, 4.13%, Maturing December 30, 2011 | | | 126,450 | | | |
| | 731,693 | | | Term Loan, 4.14%, Maturing December 30, 2011 | | | 475,600 | | | |
Source Interlink Companies, Inc. |
| | 994,962 | | | Term Loan, 5.45%, Maturing August 1, 2014 | | | 572,103 | | | |
Source Media, Inc. |
| | 638,642 | | | Term Loan, 6.46%, Maturing November 8, 2011 | | | 335,287 | | | |
Star Tribune Co. (The) |
| | 1,086,250 | | | Term Loan, 0.00%, Maturing March 5, 2014(2) | | | 221,323 | | | |
TL Acquisitions, Inc. |
| | 1,382,500 | | | Term Loan, 2.96%, Maturing July 5, 2014 | | | 908,609 | | | |
Tribune Co. |
| | 3,413,545 | | | Term Loan, 0.00%, Maturing May 17, 2009(2) | | | 962,620 | | | |
| | 1,975,025 | | | Term Loan, 0.00%, Maturing May 17, 2014(2) | | | 383,485 | | | |
Xsys, Inc. |
| | 645,050 | | | Term Loan, 6.13%, Maturing September 27, 2013 | | | 303,174 | | | |
| | 132,027 | | | Term Loan, 6.13%, Maturing September 27, 2013 | | | 62,053 | | | |
| | 638,552 | | | Term Loan, 6.13%, Maturing September 27, 2014 | | | 300,120 | | | |
| | 134,855 | | | Term Loan, 6.13%, Maturing September 27, 2014 | | | 63,382 | | | |
Yell Group, PLC |
| | 4,350,000 | | | Term Loan, 3.46%, Maturing February 10, 2013 | | | 2,544,750 | | | |
| |
| |
| | | | | | | $ | 29,805,986 | | | |
| |
| |
| |
| Radio and Television — 3.6% |
| |
Block Communications, Inc. |
| $ | 1,141,235 | | | Term Loan, 3.46%, Maturing December 22, 2011 | | $ | 930,106 | | | |
Citadel Broadcasting Corp. |
| | 5,475,000 | | | Term Loan, 2.83%, Maturing June 12, 2014 | | | 2,244,750 | | | |
CMP Susquehanna Corp. |
| | 1,408,929 | | | Term Loan, 2.97%, Maturing May 5, 2013 | | | 331,098 | | | |
Cumulus Media, Inc. |
| | 1,299,200 | | | Term Loan, 3.58%, Maturing June 11, 2014 | | | 422,240 | | | |
Discovery Communications, Inc. |
| | 2,511,750 | | | Term Loan, 3.46%, Maturing April 30, 2014 | | | 2,079,521 | | | |
Emmis Operating Co. |
| | 1,407,415 | | | Term Loan, 3.10%, Maturing November 2, 2013 | | | 598,151 | | | |
Gray Television, Inc. |
| | 1,552,736 | | | Term Loan, 4.84%, Maturing January 19, 2015 | | | 621,094 | | | |
HIT Entertainment, Inc. |
| | 1,304,350 | | | Term Loan, 4.71%, Maturing March 20, 2012 | | | 586,958 | | | |
LBI Media, Inc. |
| | 243,125 | | | Term Loan, 2.93%, Maturing March 31, 2012 | | | 121,563 | | | |
See notes to financial statements15
Eaton Vance VT Floating-Rate Income Fund as of December 31, 2008
PORTFOLIO OF INVESTMENTS CONT’D
| | | | | | | | | | | |
Principal
| | | | | | | | |
| Amount | | | Borrower/Tranche Description | | Value | | | |
| |
| |
| Radio and Television (continued) |
| |
| | | | | | | | | | | |
Live Nation Worldwide, Inc. |
| | 764,804 | | | Term Loan, 4.71%, Maturing December 21, 2013 | | | 615,668 | | | |
Local TV Finance, LLC |
| | 985,000 | | | Term Loan, 2.47%, Maturing May 7, 2013 | | | 329,975 | | | |
NEP II, Inc. |
| | 810,554 | | | Term Loan, 2.71%, Maturing February 16, 2014 | | | 567,388 | | | |
Nexstar Broadcasting, Inc. |
| | 155,321 | | | Term Loan, 3.21%, Maturing October 1, 2012 | | | 85,426 | | | |
| | 146,954 | | | Term Loan, 3.21%, Maturing October 1, 2012 | | | 80,825 | | | |
PanAmSat Corp. |
| | 2,696,687 | | | Term Loan, 6.65%, Maturing January 3, 2014 | | | 2,059,112 | | | |
| | 2,695,872 | | | Term Loan, 6.65%, Maturing January 3, 2014 | | | 2,058,490 | | | |
| | 2,695,872 | | | Term Loan, 6.65%, Maturing January 3, 2014 | | | 2,058,490 | | | |
Paxson Communications Corp. |
| | 250,000 | | | Term Loan, 8.00%, Maturing January 15, 2012 | | | 93,750 | | | |
Raycom TV Broadcasting, LLC |
| | 1,800,000 | | | Term Loan, 3.44%, Maturing June 25, 2014 | | | 1,350,000 | | | |
SFX Entertainment |
| | 113,531 | | | Term Loan, 4.28%, Maturing June 21, 2013 | | | 91,393 | | | |
Sirius Satellite Radio, Inc. |
| | 493,750 | | | Term Loan, 5.44%, Maturing December 19, 2012 | | | 271,563 | | | |
Spanish Broadcasting System, Inc. |
| | 850,716 | | | Term Loan, 3.21%, Maturing June 10, 2012 | | | 249,543 | | | |
Univision Communications, Inc. |
| | 1,885,250 | | | Term Loan — Second Lien, 2.96%, Maturing September 29, 2009 | | | 1,329,101 | | | |
| | 6,716,667 | | | Term Loan, 2.71%, Maturing September 29, 2014 | | | 2,761,296 | | | |
Young Broadcasting, Inc. |
| | 705,177 | | | Term Loan, 5.24%, Maturing November 3, 2012 | | | 261,797 | | | |
| | 523,337 | | | Term Loan, 5.24%, Maturing November 3, 2012 | | | 194,289 | | | |
| |
| |
| | | | | | | $ | 22,393,587 | | | |
| |
| |
| |
| Rail Industries — 0.3% |
| |
Kansas City Southern Railway Co. |
| $ | 1,564,899 | | | Term Loan, 4.07%, Maturing April 28, 2013 | | $ | 1,291,042 | | | |
Rail America, Inc. |
| | 57,760 | | | Term Loan, 7.88%, Maturing August 14, 2009 | | | 49,385 | | | |
| | 892,240 | | | Term Loan, 7.88%, Maturing August 13, 2010 | | | 762,865 | | | |
| |
| |
| | | | | | | $ | 2,103,292 | | | |
| |
| |
| |
| Retailers (Except Food and Drug) — 1.9% |
| |
Amscan Holdings, Inc. |
| $ | 343,875 | | | Term Loan, 3.93%, Maturing May 25, 2013 | | $ | 227,817 | | | |
Claire’s Stores, Inc. |
| | 246,250 | | | Term Loan, 3.52%, Maturing May 29, 2014 | | | 97,816 | | | |
Cumberland Farms, Inc. |
| | 1,459,645 | | | Term Loan, 2.93%, Maturing September 29, 2013 | | | 1,189,611 | | | |
Educate, Inc. |
| | 406,479 | | | Term Loan, 3.75%, Maturing June 14, 2013 | | | 245,920 | | | |
FTD, Inc. |
| | 1,275,000 | | | Term Loan, 7.14%, Maturing July 31, 2014 | | | 1,115,625 | | | |
Harbor Freight Tools USA, Inc. |
| | 608,051 | | | Term Loan, 9.75%, Maturing July 15, 2010 | | | 345,069 | | | |
Josten’s Corp. |
| | 1,718,131 | | | Term Loan, 5.17%, Maturing October 4, 2011 | | | 1,443,230 | | | |
Neiman Marcus Group, Inc. |
| | 2,083,824 | | | Term Loan, 4.19%, Maturing April 5, 2013 | | | 1,337,435 | | | |
Orbitz Worldwide, Inc. |
| | 839,375 | | | Term Loan, 4.26%, Maturing July 25, 2014 | | | 377,719 | | | |
Oriental Trading Co., Inc. |
| | 1,905,996 | | | Term Loan, 4.56%, Maturing July 31, 2013 | | | 1,081,653 | | | |
Pep Boys — Manny, Moe, & Jack, (The) |
| | 1,475,931 | | | Term Loan, 4.18%, Maturing January 27, 2011 | | | 944,596 | | | |
Rent-A-Center, Inc. |
| | 1,567,506 | | | Term Loan, 3.25%, Maturing November 15, 2012 | | | 1,316,705 | | | |
Rover Acquisition Corp. |
| | 735,000 | | | Term Loan, 4.48%, Maturing October 26, 2013 | | | 463,050 | | | |
Savers, Inc. |
| | 111,929 | | | Term Loan, 4.63%, Maturing August 11, 2012 | | | 83,947 | | | |
| | 122,449 | | | Term Loan, 4.63%, Maturing August 11, 2012 | | | 91,837 | | | |
The Yankee Candle Company, Inc. |
| | 3,218,166 | | | Term Loan, 3.40%, Maturing February 6, 2014 | | | 1,654,137 | | | |
| |
| |
| | | | | | | $ | 12,016,167 | | | |
| |
| |
| |
| Steel — 0.3% |
| |
Algoma Acquisition Corp. |
| $ | 1,801,784 | | | Term Loan, 4.42%, Maturing June 20, 2013 | | $ | 1,117,106 | | | |
Niagara Corp. |
| | 1,982,393 | | | Term Loan, 5.46%, Maturing June 29, 2014 | | | 911,901 | | | |
| |
| |
| | | | | | | $ | 2,029,007 | | | |
| |
| |
| |
| Surface Transport — 0.2% |
| |
Gainey Corp. |
| $ | 944,708 | | | Term Loan, 0.00%, Maturing April 20, 2012(2)(6) | | $ | 124,387 | | | |
Oshkosh Truck Corp. |
| | 924,404 | | | Term Loan, 3.42%, Maturing December 6, 2013 | | | 544,628 | | | |
Swift Transportation Co., Inc. |
| | 1,877,907 | | | Term Loan, 5.83%, Maturing May 10, 2014 | | | 686,777 | | | |
| |
| |
| | | | | | | $ | 1,355,792 | | | |
| |
| |
See notes to financial statements16
Eaton Vance VT Floating-Rate Income Fund as of December 31, 2008
PORTFOLIO OF INVESTMENTS CONT’D
| | | | | | | | | | | |
Principal
| | | | | | | | |
| Amount | | | Borrower/Tranche Description | | Value | | | |
| |
| |
| | | | | | | | | | | |
| Telecommunications — 4.2% |
| |
Alaska Communications Systems Holdings, Inc. |
| $ | 331,767 | | | Term Loan, 3.21%, Maturing February 1, 2012 | | $ | 260,161 | | | |
| | 1,361,488 | | | Term Loan, 3.21%, Maturing February 1, 2012 | | | 1,067,634 | | | |
Alltel Communications |
| | 3,969,862 | | | Term Loan, 4.37%, Maturing May 16, 2014 | | | 3,909,321 | | | |
| | 6,720,105 | | | Term Loan, 3.94%, Maturing May 16, 2015 | | | 6,626,655 | | | |
Asurion Corp. |
| | 4,250,000 | | | Term Loan, 5.20%, Maturing July 13, 2012 | | | 2,903,281 | | | |
Cellular South, Inc. |
| | 1,108,125 | | | Term Loan, 3.17%, Maturing May 29, 2014 | | | 947,447 | | | |
| | 375,000 | | | Term Loan, 5.26%, Maturing May 29, 2014 | | | 320,625 | | | |
Centennial Cellular Operating Co., LLC |
| | 320,833 | | | Term Loan, 3.51%, Maturing February 9, 2011 | | | 306,396 | | | |
CommScope, Inc. |
| | 4,395,049 | | | Term Loan, 3.97%, Maturing November 19, 2014 | | | 3,241,348 | | | |
Crown Castle Operating Co. |
| | 368,438 | | | Term Loan, 5.38%, Maturing January 9, 2014 | | | 254,590 | | | |
FairPoint Communications, Inc. |
| | 1,375,000 | | | Term Loan, 5.75%, Maturing March 31, 2015 | | | 876,563 | | | |
Intelsat Subsidiary Holding Co. |
| | 269,500 | | | Term Loan, 6.65%, Maturing July 3, 2013 | | | 219,104 | | | |
Iowa Telecommunications Services |
| | 1,450,000 | | | Term Loan, 3.22%, Maturing November 23, 2011 | | | 1,160,000 | | | |
IPC Systems, Inc. |
| | 1,297,295 | | | Term Loan, 3.71%, Maturing May 31, 2014 | | | 692,431 | | | |
NTelos, Inc. |
| | 1,833,959 | | | Term Loan, 2.72%, Maturing August 24, 2011 | | | 1,570,328 | | | |
Stratos Global Corp. |
| | 188,000 | | | Term Loan, 3.95%, Maturing February 13, 2012 | | | 156,510 | | | |
Telesat Canada, Inc. |
| | 1,329,146 | | | Term Loan, 6.10%, Maturing October 22, 2014 | | | 918,535 | | | |
| | 114,157 | | | Term Loan, 6.77%, Maturing October 22, 2014 | | | 78,891 | | | |
Windstream Corp. |
| | 810,414 | | | Term Loan, 6.05%, Maturing July 17, 2013 | | | 695,268 | | | |
| |
| |
| | | | | | | $ | 26,205,088 | | | |
| |
| |
| |
| Utilities — 2.8% |
| |
AEI Finance Holding, LLC |
| $ | 248,694 | | | Revolving Loan, 6.16%, Maturing March 30, 2012 | | $ | 151,704 | | | |
| | 1,947,610 | | | Term Loan, 4.46%, Maturing March 30, 2014 | | | 1,110,138 | | | |
Astoria Generating Co. |
| | 947,037 | | | Term Loan, 2.37%, Maturing February 23, 2013 | | | 778,464 | | | |
BRSP, LLC |
| | 436,534 | | | Term Loan, 5.55%, Maturing July 13, 2009 | | | 347,591 | | | |
Calpine Corp. |
| | 2,468,837 | | | DIP Loan, 4.34%, Maturing March 30, 2009 | | | 1,831,349 | | | |
Covanta Energy Corp. |
| | 1,267,273 | | | Term Loan, 3.23%, Maturing February 9, 2014 | | | 1,058,173 | | | |
| | 635,155 | | | Term Loan, 5.55%, Maturing February 9, 2014 | | | 530,354 | | | |
NRG Energy, Inc. |
| | 4,291,634 | | | Term Loan, 2.67%, Maturing June 1, 2014 | | | 3,743,378 | | | |
| | 2,113,998 | | | Term Loan, 2.96%, Maturing June 1, 2014 | | | 1,843,935 | | | |
NSG Holdings, LLC |
| | 114,488 | | | Term Loan, 3.50%, Maturing June 15, 2014 | | | 93,451 | | | |
| | 722,621 | | | Term Loan, 3.50%, Maturing June 15, 2014 | | | 589,840 | | | |
TXU Texas Competitive Electric Holdings Co., LLC |
| | 2,321,244 | | | Term Loan, 5.36%, Maturing October 10, 2014 | | | 1,620,035 | | | |
| | 3,567,400 | | | Term Loan, 5.58%, Maturing October 10, 2014 | | | 2,489,749 | | | |
USPF Holdings, LLC |
| | 923,097 | | | Term Loan, 2.95%, Maturing April 11, 2014 | | | 692,322 | | | |
Vulcan Energy Corp. |
| | 776,840 | | | Term Loan, 6.25%, Maturing July 23, 2010 | | | 644,777 | | | |
| |
| |
| | | | | | | $ | 17,525,260 | | | |
| |
| |
| | | |
| Total Senior Floating-Rate Interests | | |
| (identified cost $877,087,893) | | $ | 581,625,008 | | | |
| |
| |
| Corporate Bonds & Notes — 0.2% |
Principal
| | | | | | | | |
Amount
| | | | | | | | |
| (000’s omitted) | | | Security | | Value | | | |
| |
| |
| |
| Containers and Glass Products — 0.1% |
| |
Berry Plastics Corp., Sr. Notes, Variable Rate |
| $ | 1,000 | | | 9.503%, 2/15/15 | | $ | 695,000 | | | |
| |
| |
| | | | | | | $ | 695,000 | | | |
| |
| |
| |
| Electronics/Electrical — 0.0% |
| |
NXP BV/NXP Funding, LLC, Variable Rate |
| $ | 300 | | | 7.503%, 10/15/13 | | $ | 100,875 | | | |
| |
| |
| | | | | | | $ | 100,875 | | | |
| |
| |
| |
| Telecommunications — 0.1% |
| |
Qwest Corp., Sr. Notes, Variable Rate |
| $ | 300 | | | 5.246%, 6/15/13 | | $ | 225,000 | | | |
| |
| |
| | | | | | | $ | 225,000 | | | |
| |
| |
| | | |
| Total Corporate Bonds & Notes | | |
| (identified cost $1,548,195) | | $ | 1,020,875 | | | |
| |
| |
| | | | | | | | | | | |
See notes to financial statements17
Eaton Vance VT Floating-Rate Income Fund as of December 31, 2008
PORTFOLIO OF INVESTMENTS CONT’D
| | | | | | | | | | | | | | | | | | | |
| Short-Term Investments — 4.8% |
| Commercial Paper — 0.8% |
Principal
| | | | | | | | Maturity
| | | | | | |
| Amount | | | Borrower | | Rate | | | Date | | | Value | | | |
| |
| |
| $ | 5,000,000 | | | Societe Generale | | | 0.28 | % | | | 01/05/09 | | | $ | 4,999,845 | | | |
| |
| |
| | | | | | | | | | | |
| Total Commercial Paper | | | | | | | | | | |
| (identified cost $4,999,845) | | | | | | | | | | $ | 4,999,845 | | | |
| |
| |
| Time Deposits — 2.8% |
Principal
| | | | | | | | Maturity
| | | | | | |
| Amount | | | Borrower | | Rate | | | Date | | | Value | | | |
| |
| |
| $ | 8,617,000 | | | BNP Paribas | | | 0.01 | % | | | 01/02/09 | | | $ | 8,617,000 | | | |
| | 8,505,000 | | | Royal Bank of Canada | | | 0.03 | % | | | 01/02/09 | | | | 8,505,000 | | | |
| |
| |
| | | | | | | | | | | |
| Total Time Deposits | | | | | | | | | | |
| (identified cost $17,122,000) | | | | | | $ | 17,122,000 | | | |
| |
| |
| U.S. Government Agencies — 1.2% |
Principal
| | | | | | | | | | | | | | |
Amount
| | | | | | | | Maturity
| | | | | | |
| (000’s omitted) | | | Security | | Rate | | | Date | | | Value | | | |
| |
| |
| $ | 1,500 | | | Federal Home Loan Bank Discount Note | | | 0.20 | % | | | 01/15/09 | | | $ | 1,499,883 | | | |
| | 6,000 | | | Federal National Mortgage Association
Discount Note | | | 0.01 | % | | | 01/27/09 | | | | 5,999,957 | | | |
| |
| |
| | | | | | | | | | | |
| Total U.S. Government Agencies | | | | | | | | | | |
| (identified cost $7,499,840) | | | | | | $ | 7,499,840 | | | |
| |
| |
| | | | | | | | | | | |
| Total Short-Term Investments | | | | | | | | | | |
| (identified cost $29,621,685) | | | | | | $ | 29,621,685 | | | |
| |
| |
| | | | | | | | | | | |
| Total Investments — 98.8% | | | | | | | | | | |
| (identified cost $908,257,773) | | | | | | $ | 612,267,568 | | | |
| |
| |
| | | | | | | | | | | | | | | |
| Less Unfunded Loan Commitments — (0.1)% | | | | | | | | | | $ | (385,519 | ) | | |
| |
| |
| | | | | | | | | | | |
| Net Investments — 98.7% | | | | | | | | | | |
| (identified cost $907,872,254) | | | | | | $ | 611,882,049 | | | |
| |
| |
| | | | | | | | | | | | | | | |
Other Assets, Less
Liabilities — 1.3% | | | | | | | | | | $ | 8,035,111 | | | |
| |
| |
| | | | | | | | | | | | | | | |
| Net Assets — 100.0% | | | | | | | | | | $ | 619,917,160 | | | |
| |
| |
Industry classifications included in the Portfolio of Investments are unaudited.
DIP - Debtor in Possession
REIT - Real Estate Investment Trust
| | |
| (1) | | Senior floating-rate interests (Senior Loans) often require prepayments from excess cash flows or permit the borrowers to repay at their election. The degree to which borrowers repay, whether as a contractual requirement or at their election, cannot be predicted with accuracy. As a result, the actual remaining maturity may be substantially less than the stated maturities shown. However, Senior Loans will have an expected average life of approximately two to four years. The stated interest rate represents the weighted average interest rate of all contracts within the senior loan facility. Senior Loans typically have rates of interest which are redetermined either daily, monthly, quarterly or semi-annually by reference to a base lending rate, plus a premium. These base lending rates are primarily the London-Interbank Offered Rate (“LIBOR”), and secondarily the prime rate offered by one or more major United States banks (the “Prime Rate”) and the certificate of deposit (“CD”) rate or other base lending rates used by commercial lenders. |
| |
| (2) | | Defaulted security. Currently the issuer is in default with respect to interest payments. |
| |
| (3) | | Unfunded or partially unfunded loan commitments. See Note 1H for description. |
| |
| (4) | | Security valued at fair value using methods determined in good faith by or at the direction of the Trustees. |
| |
| (5) | | This Senior Loan will settle after December 31, 2008, at which time the interest rate will be determined. |
| |
| (6) | | Represents a payment in kind security which may pay all or a portion of interest in additional par. |
See notes to financial statements18
Eaton Vance VT Floating-Rate Income Fund as of December 31, 2008
FINANCIAL STATEMENTS
Statement of Assets and Liabilities
| | | | | | | |
| As of December 31, 2008 | | | | | |
| |
| Assets |
| |
| Investments, at value (identified cost, $907,872,254) | | $ | 611,882,049 | | | |
| Cash | | | 6,439,868 | | | |
| Receivable for investments sold | | | 201,856 | | | |
| Receivable for Fund shares sold | | | 85,988 | | | |
| Interest receivable | | | 4,087,994 | | | |
| Prepaid expenses | | | 33,538 | | | |
| |
| |
Total assets | | $ | 622,731,293 | | | |
| |
| |
| | | | | | | |
| | | | | | | |
| |
| Liabilities |
| |
| Payable for investments purchased | | $ | 1,600,000 | | | |
| Payable for Fund shares redeemed | | | 118,014 | | | |
| Dividends payable | | | 8,719 | | | |
| Payable to affiliate for investment adviser fee | | | 295,797 | | | |
| Payable to affiliate for distribution fees | | | 128,607 | | | |
| Payable to affiliate for Trustees’ fees | | | 5,920 | | | |
| Payable for shareholder servicing fees | | | 207,849 | | | |
| Accrued expenses | | | 449,227 | | | |
| |
| |
Total liabilities | | $ | 2,814,133 | | | |
| |
| |
Net Assets | | $ | 619,917,160 | | | |
| |
| |
| | | | | | | |
| | | | | | | |
| |
| Sources of Net Assets |
| |
| Paid-in capital | | $ | 918,496,045 | | | |
| Accumulated net realized loss (computed on the basis of identified cost) | | | (2,970,693 | ) | | |
| Accumulated undistributed net investment income | | | 382,013 | | | |
| Net unrealized depreciation (computed on the basis of identified cost) | | | (295,990,205 | ) | | |
| |
| |
Total | | $ | 619,917,160 | | | |
| |
| |
| | | | | | | |
| | | | | | | |
| |
| Net Asset Value, Offering Price and Redemption Price Per Share |
| |
($619,917,160 ¸ 94,197,351 shares of beneficial interest outstanding) | | |
| | | $ | 6.58 | | | |
| |
| |
Statement of Operations
| | | | | | | |
For the Year Ended
| | | | | |
| December 31, 2008 | | | | | |
| |
| Investment Income |
| |
| Interest | | $ | 51,382,296 | | | |
| |
| |
Total investment income | | $ | 51,382,296 | | | |
| |
| |
| | | | | | | |
| | | | | | | |
| |
| Expenses |
| |
| Investment adviser fee | | $ | 4,226,262 | | | |
| Shareholder servicing fees | | | 1,779,480 | | | |
| Trustees’ fees and expenses | | | 22,710 | | | |
| Distribution fees | | | 1,837,505 | | | |
| Printing and postage | | | 328,576 | | | |
| Custodian fee | | | 295,579 | | | |
| Legal and accounting services | | | 93,575 | | | |
| Transfer and dividend disbursing agent fees | | | 11,980 | | | |
| Interest expense and fees | | | 146,513 | | | |
| Miscellaneous | | | 39,759 | | | |
| |
| |
Total expenses | | $ | 8,781,939 | | | |
| |
| |
| Deduct — | | | | | | |
| Reduction of custodian fee | | $ | 17,065 | | | |
| |
| |
Total expense reductions | | $ | 17,065 | | | |
| |
| |
| | | | | | | |
Net expenses | | $ | 8,764,874 | | | |
| |
| |
| | | | | | | |
Net investment income | | $ | 42,617,422 | | | |
| |
| |
| | | | | | | |
| | | | | | | |
| |
| Realized and Unrealized Gain (Loss) |
| |
| Net realized gain (loss) — | | | | | | |
| Investment transactions (identified cost basis) | | $ | (1,575,760 | ) | | |
| |
| |
Net realized loss | | $ | (1,575,760 | ) | | |
| |
| |
| Change in unrealized appreciation (depreciation) — | | | | | | |
| Investments (identified cost basis) | | $ | (266,150,953 | ) | | |
| |
| |
| | | | | | | |
Net change in unrealized appreciation (depreciation) | | $ | (266,150,953 | ) | | |
| |
| |
| | | | | | | |
Net realized and unrealized loss | | $ | (267,726,713 | ) | | |
| |
| |
| | | | | | | |
Net decrease in net assets from operations | | $ | (225,109,291 | ) | | |
| |
| |
See notes to financial statements
19
Eaton Vance VT Floating-Rate Income Fund as of December 31, 2008
FINANCIAL STATEMENTS CONT’D
Statements of Changes in Net Assets
| | | | | | | | | | | |
| | | Year Ended
| | | Year Ended
| | | |
| Increase (Decrease) in Net Assets | | December 31, 2008 | | | December 31, 2007 | | | |
| |
| From operations — | | | | | | | | | | |
| Net investment income | | $ | 42,617,422 | | | $ | 38,496,237 | | | |
| Net realized loss from investment and foreign currency transactions | | | (1,575,760 | ) | | | (664,278 | ) | | |
| Net change in unrealized appreciation (depreciation) from investments | | | (266,150,953 | ) | | | (30,496,821 | ) | | |
| |
| |
Net increase (decrease) in net assets from operations | | $ | (225,109,291 | ) | | $ | 7,335,138 | | | |
| |
| |
| Distributions to shareholders — | | | | | | | | | | |
| From net investment income | | $ | (42,221,425 | ) | | $ | (38,505,958 | ) | | |
| Tax return of capital | | | — | | | | (22,394 | ) | | |
| |
| |
Total distributions to shareholders | | $ | (42,221,425 | ) | | $ | (38,528,352 | ) | | |
| |
| |
| Transactions in shares of beneficial interest — | | | | | | | | | | |
| Proceeds from sale of shares | | $ | 248,854,653 | | | $ | 422,766,756 | | | |
| Net asset value of shares issued to shareholders in payment of distributions declared | | | 42,107,955 | | | | 36,966,736 | | | |
| Cost of shares redeemed | | | (109,005,993 | ) | | | (169,788,221 | ) | | |
| |
| |
Net increase in net assets from Fund share transactions | | $ | 181,956,615 | | | $ | 289,945,271 | | | |
| |
| |
| | | | | | | | | | | |
Net increase (decrease) in net assets | | $ | (85,374,101 | ) | | $ | 258,752,057 | | | |
| |
| |
| | | | | | | | | | | |
| | | | | | | | | | | |
| |
| Net Assets |
| |
| At beginning of year | | $ | 705,291,261 | | | $ | 446,539,204 | | | |
| |
| |
At end of year | | $ | 619,917,160 | | | $ | 705,291,261 | | | |
| |
| |
| | | | | | | | | | | |
| | | | | | | | | | | |
| |
Accumulated undistributed
(distributions in excess of)
net investment income
included in net assets |
| |
At end of year | | $ | 382,013 | | | $ | (13,984 | ) | | |
| |
| |
See notes to financial statements
20
Eaton Vance VT Floating-Rate Income Fund as of December 31, 2008
FINANCIAL STATEMENTS CONT’D
Financial Highlights
| | | | | | | | | | | | | | | | | | | | | | | |
| | | Year Ended December 31, |
| | | |
| | | 2008 | | | 2007 | | | 2006 | | | 2005 | | | 2004 | | | |
| |
| Net asset value — Beginning of year | | $ | 9.580 | | | $ | 10.040 | | | $ | 10.080 | | | $ | 10.100 | | | $ | 10.070 | | | |
| |
| |
| | | | | | | | | | | | | | | | | | | | | | | |
| | | | | | | | | | | | | | | | | | | | | | | |
| |
| Income (loss) from operations |
| |
Net investment income(1) | | $ | 0.501 | | | $ | 0.622 | | | $ | 0.602 | | | $ | 0.406 | | | $ | 0.257 | | | |
| Net realized and unrealized gain (loss) | | | (3.006 | ) | | | (0.459 | ) | | | (0.062 | ) | | | (0.024 | ) | | | 0.026 | | | |
| |
| |
Total income (loss) from operations | | $ | (2.505 | ) | | $ | 0.163 | | | $ | 0.540 | | | $ | 0.382 | | | $ | 0.283 | | | |
| |
| |
| | | | | | | | | | | | | | | | | | | | | | | |
| | | | | | | | | | | | | | | | | | | | | | | |
| |
| Less distributions |
| |
| From net investment income | | $ | (0.495 | ) | | $ | (0.623 | ) | | $ | (0.580 | ) | | $ | (0.402 | ) | | $ | (0.253 | ) | | |
| Tax return of capital | | | — | | | | (0.000 | )(3) | | | — | | | | — | | | | — | | | |
| |
| |
Total distributions | | $ | (0.495 | ) | | $ | (0.623 | ) | | $ | (0.580 | ) | | $ | (0.402 | ) | | $ | (0.253 | ) | | |
| |
| |
| | | | | | | | | | | | | | | | | | | | | | | |
Net asset value — End of year | | $ | 6.580 | | | $ | 9.580 | | | $ | 10.040 | | | $ | 10.080 | | | $ | 10.100 | | | |
| |
| |
| | | | | | | | | | | | | | | | | | | | | | | |
Total Return(2) | | | (27.17 | )% | | | 1.62 | % | | | 5.50 | % | | | 3.86 | % | | | 2.82 | % | | |
| |
| |
| | | | | | | | | | | | | | | | | | | | | | | |
| | | | | | | | | | | | | | | | | | | | | | | |
| |
| Ratios/Supplemental Data |
| |
| Net assets, end of year (000’s omitted) | | $ | 619,917 | | | $ | 705,291 | | | $ | 446,539 | | | $ | 98,183 | | | $ | 74,984 | | | |
| Ratios (As a percentage of average daily net assets): | | | | | | | | | | | | | | | | | | | | | | |
| Expenses before custodian fee reduction | | | 1.20 | % | | | 1.14 | % | | | 1.19 | % | | | 1.27 | % | | | 1.27 | % | | |
| Expenses after custodian fee reduction | | | 1.19 | % | | | 1.12 | % | | | 1.16 | % | | | 1.25 | % | | | 1.26 | % | | |
| Net investment income | | | 5.80 | % | | | 6.30 | % | | | 6.00 | % | | | 4.03 | % | | | 2.55 | % | | |
| Portfolio Turnover | | | 16 | % | | | 45 | % | | | 38 | % | | | 60 | % | | | 61 | % | | |
| |
| |
| | |
| (1) | | Computed using average shares outstanding. |
| |
| (2) | | Returns are historical and are calculated by determining the percentage change in net asset value with all distributions reinvested. |
| |
| (3) | | Amount less than $0.001. |
See notes to financial statements
21
Eaton Vance VT Floating-Rate Income Fund as of December 31, 2008
NOTES TO FINANCIAL STATEMENT
1 Significant Accounting Policies
Eaton Vance VT Floating-Rate Income Fund (the Fund) is a diversified series of Eaton Vance Variable Trust (the Trust). The Trust is a Massachusetts business trust registered under the Investment Company Act of 1940, as amended (the 1940 Act), as an open-end management investment company. The Fund’s investment objective is to provide a high level of current income. The Fund is generally made available for purchase only to separate accounts established by participating insurance companies and qualified pension or retirement plans.
The following is a summary of significant accounting policies of the Fund. The policies are in conformity with accounting principles generally accepted in the United States of America.
A Investment Valuation — Interests in senior floating-rate loans (Senior Loans) for which reliable market quotations are readily available are valued generally at the average mean of bid and ask quotations obtained from an independent pricing service. Other Senior Loans are valued at fair value by the investment adviser under procedures approved by the Trustees. In fair valuing a Senior Loan, the investment adviser utilizes one or more of the following valuation techniques: (i) a matrix pricing approach that considers the yield on the Senior Loan relative to yields on other loan interests issued by companies of comparable credit quality; (ii) a comparison of the value of the borrower’s outstanding equity and debt to that of comparable public companies; (iii) a discounted cash flow analysis; or (iv) when the investment adviser believes it is likely that a borrower will be liquidated or sold, an analysis of the terms of such liquidation or sale. In certain cases, the investment adviser will use a combination of analytical methods to determine fair value, such as when only a portion of a borrower’s assets are likely to be sold. In conducting its assessment and analyses for purposes of determining fair value of a Senior Loan, the investment adviser will use its discretion and judgment in considering and appraising relevant factors. Fair value determinations are made by the portfolio managers of the Fund based on information available to such managers. The portfolio managers of other funds managed by the investment adviser that invest in Senior Loans may not possess the same information about a Senior Loan borrower as the portfolio managers of the Fund. At times, the fair value of a Senior Loan determined by the portfolio managers of other funds managed by the investment adviser that invest in Senior Loans may vary from the fair value of the same Senior Loan determined by the portfolio managers of the Fund. The fair value of each Senior Loan is periodically reviewed and approved by the investment adviser’s Valuation Committee and by the Trustees based upon procedures approved by the Trustees. Junior Loans are valued in the same manner as Senior Loans.
Debt obligations, including listed securities and securities for which quotations are readily available, will normally be valued on the basis of reported trades or market quotations obtained by independent pricing services, when in the services’ judgment, these prices are representative of the securities’ market values. For debt securities where market quotations are not readily available, the pricing services will use various techniques that consider factors including, but not limited to, prices or yields of securities with similar characteristics, benchmark yields, broker/dealer quotes, issuer spreads, as well as industry and economic events. Short-term debt securities with a remaining maturity of sixty days or less are valued at amortized cost, which approximates market value. If short-term debt securities are acquired with a remaining maturity of more than sixty days, they will be valued by a pricing service. Equity securities listed on a U.S. securities exchange generally are valued at the last sale price on the day of valuation or, if no sales took place on such date, at the mean between the closing bid and asked prices therefore on the exchange where such securities are principally traded. Equity securities listed on the NASDAQ Global or Global Select Market generally are valued at the NASDAQ official closing price. Unlisted or listed securities for which closing sales prices or closing quotations are not available are valued at the mean between the latest available bid and asked prices or, in the case of preferred equity securities that are not listed or traded in the over-the-counter market, by an independent pricing service. Investments for which valuations or market quotations are not readily available are valued at fair value using methods determined in good faith by or at the direction of the Trustees of the Fund considering relevant factors, data and information including the market value of freely tradable securities of the same class in the principal market on which such securities are normally traded.
B Investment Transactions — Investment transactions for financial statement purposes are accounted for on a trade date basis. Realized gains and losses on investments sold are determined on the basis of identified cost.
C Income — Interest income is recorded on the basis of interest accrued, adjusted for amortization of premium or accretion of discount. Fees associated with loan amendments are recognized immediately.
D Federal Taxes — The Fund’s policy is to comply with the provisions of the Internal Revenue Code applicable to regulated investment companies and to distribute to shareholders each year substantially all of its net investment income, and all or substantially all of its net realized capital gains. Accordingly, no provision for federal income or excise tax is necessary.
22
Eaton Vance VT Floating-Rate Income Fund as of December 31, 2008
NOTES TO FINANCIAL STATEMENT CONT’D
At December 31, 2008, the Fund, for federal income tax purposes, had a capital loss carryforward of $2,685,933 which will reduce its taxable income arising from future net realized gains on investment transactions, if any, to the extent permitted by the Internal Revenue Code, and thus will reduce the amount of distributions to shareholders, which would otherwise be necessary to relieve the Fund of any liability for federal income or excise tax. Such capital loss carryforward will expire on December 31, 2012 ($48,462), December 31, 2013 ($248,072), December 31, 2014 ($194,302), December 31, 2015 ($833,714) and December 31, 2016 ($1,361,383).
As of December 31, 2008, the Fund had no uncertain tax positions that would require financial statement recognition, de-recognition, or disclosure. Each of the Fund’s federal tax returns filed in the 3-year period ended December 31, 2008 remains subject to examination by the Internal Revenue Service.
E Expenses — The majority of expenses of the Trust are directly identifiable to an individual fund. Expenses which are not readily identifiable to a specific fund are allocated taking into consideration, among other things, the nature and type of expense and the relative size of the funds.
F Expense Reduction — State Street Bank and Trust Company (SSBT) serves as custodian of the Fund. Pursuant to the custodian agreement, SSBT receives a fee reduced by credits, which are determined based on the average daily cash balance the Fund maintains with SSBT. All credit balances, if any, used to reduce the Fund’s custodian fees are reported as a reduction of expenses in the Statement of Operations.
G Foreign Currency Translation — Investment valuations, other assets, and liabilities initially expressed in foreign currencies are translated each business day into U.S. dollars based upon current exchange rates. Purchases and sales of foreign investment securities and income and expenses denominated in foreign currencies are translated into U.S. dollars based upon currency exchange rates in effect on the respective dates of such transactions. Recognized gains or losses on investment transactions attributable to changes in foreign currency exchange rates are recorded for financial statement purposes as net realized gains and losses on investments. That portion of unrealized gains and losses on investments that results from fluctuations in foreign currency exchange rates is not separately disclosed.
H Unfunded Loan Commitments — The Fund may enter into certain credit agreements all or a portion of which may be unfunded. The Fund is obligated to fund these commitments at the borrower’s discretion. The commitments are disclosed in the accompanying Portfolio of Investments.
I Use of Estimates — The preparation of the financial statements in conformity with accounting principles generally accepted in the United States of America requires management to make estimates and assumptions that affect the reported amounts of assets and liabilities at the date of the financial statements and the reported amounts of income and expense during the reporting period. Actual results could differ from those estimates.
J Indemnifications — Under the Trust’s organizational documents, its officers and Trustees may be indemnified against certain liabilities and expenses arising out of the performance of their duties to the Fund, and shareholders are indemnified against personal liability for the obligations of the Trust. Additionally, in the normal course of business, the Fund enters into agreements with service providers that may contain indemnification clauses. The Fund’s maximum exposure under these arrangements is unknown as this would involve future claims that may be made against the Fund that have not yet occurred.
2 Distributions to Shareholders
The Fund declares dividends daily to shareholders of record at the time of declaration. Distributions are generally paid monthly. Distributions of realized capital gains (reduced by available capital loss carryforwards from prior years, if any) are made at least annually. Shareholders may reinvest income and capital gain distributions in additional shares of the Fund at the net asset value as of the reinvestment date, or if an election is made on behalf of a separate account, to receive some or all of the distributions in cash. The Fund distinguishes between distributions on a tax basis and a financial reporting basis. Accounting principles generally accepted in the United States of America require that only distributions in excess of tax basis earnings and profits be reported in the financial statements as a return of capital. Permanent differences between book and tax accounting relating to distributions are reclassified to paid-in capital. For tax purposes, distributions from short-term capital gains are considered to be from ordinary income.
The tax character of distributions declared for the years ended December 31, 2008 and December 31, 2007 was as follows:
| | | | | | | | | | | |
| | | Year Ended December 31, |
| | | 2008 | | | 2007 | | | |
| |
| Distributions declared from: | | | | | | | | | | |
| Ordinary income | | $ | 42,221,425 | | | $ | 38,505,958 | | | |
| Tax return of capital | | $ | — | | | $ | 22,394 | | | |
23
Eaton Vance VT Floating-Rate Income Fund as of December 31, 2008
NOTES TO FINANCIAL STATEMENT CONT’D
As of December 31, 2008, the components of distributable earnings (accumulated losses) and unrealized appreciation (depreciation) on a tax basis were as follows:
| | | | | | | |
| Undistributed ordinary income | | $ | 390,732 | | | |
| Capital loss carryforward | | $ | (2,685,933 | ) | | |
| Net unrealized appreciation (depreciation) | | $ | (296,274,965 | ) | | |
| Other temporary differences | | $ | (8,719 | ) | | |
The differences between components of distributable earnings (accumulated losses) on a tax basis and the amounts reflected in the Statement of Assets and Liabilities are primarily due to wash sales, premium amortization and the timing of recognizing distributions to shareholders.
3 Investment Adviser Fee and Other Transactions with Affiliates
The investment adviser fee is earned by Eaton Vance Management (EVM) as compensation for investment advisory services rendered to the Fund. The fee is computed at an annual rate of 0.575% of the Fund’s average daily net assets up to $1 billion and at reduced rates as daily net assets exceed that level, and is payable monthly. For the year ended December 31, 2008, the fee amounted to $4,226,262. EVM also serves as administrator of the Fund, but receives no compensation. Eaton Vance Distributors, Inc. (EVD), the Fund’s principal underwriter and an affiliate of EVM, received distribution fees (see Note 4).
Except for Trustees of the Fund who are not members of EVM’s organization, officers and Trustees receive remuneration for their services to the Fund out of the investment adviser fee. Certain officers and Trustees of the Fund are officers of EVM.
4 Distribution Plan
The Fund has in effect a distribution plan pursuant to Rule 12b-1 under the 1940 Act. The distribution plan provides that the Fund will pay EVD a distribution fee of 0.25% per annum of the Fund’s average daily net assets for the sale and distribution of Fund shares. Distribution fees for the year ended December 31, 2008 amounted to $1,837,505. Insurance companies receive such fees from EVD based on the value of shares held by such companies. The insurance companies through which investors hold shares of the Fund may also pay fees to third parties in connection with the sale of variable contracts and for services provided to variable contract owners. The Fund, EVM or EVD are not a party to these arrangements. Investors should consult the prospectus and statement of additional information for their variable contracts for a discussion of these payments. EVD may, at its expense, provide promotional incentives to dealers that sell variable insurance products.
5 Shareholder Servicing Plan
The Trust, on behalf of the Fund, has adopted a Shareholder Servicing Plan (“Servicing Plan”). The Servicing Plan allows the Trust to enter into shareholder servicing agreements with insurance companies, investment dealers, broker-dealers or other financial intermediaries that provide shareholder services relating to Fund shares and their shareholders, including variable contract owners or plan participants with interests in the Fund. Under the Servicing Plan, the Fund may make payments at an annual rate of up to 0.25% of the Fund’s average daily net assets attributable to its shares that are subject to shareholder servicing agreements. For the year ended December 31, 2008, shareholder servicing fees were equivalent to 0.24% per annum of the Fund’s average daily net assets and amounted to $1,779,480.
6 Purchases and Sales of Investments
Purchases and sales of investments, other than short-term obligations and including maturities and principal repayments on Senior Loans, aggregated $286,848,128 and $111,073,063, respectively, for the year ended December 31, 2008.
7 Shares of Beneficial Interest
The Fund’s Declaration of Trust permits the Trustees to issue an unlimited number of full and fractional shares of beneficial interest (without par value). Such shares may be issued in a number of different series (such as the Fund). Transactions in Fund shares were as follows:
| | | | | | | | | | | |
| | | Year Ended December 31, |
| | | 2008 | | | 2007 | | | |
| |
| Sales | | | 28,541,659 | | | | 42,552,092 | | | |
| Issued to shareholders electing to receive payments of distributions in Fund shares | | | 5,037,289 | | | | 3,759,307 | | | |
| Redemptions | | | (13,021,908 | ) | | | (17,154,153 | ) | | |
| |
| |
Net increase | | | 20,557,040 | | | | 29,157,246 | | | |
| |
| |
At December 31, 2008, separate accounts of 2 insurance companies each owned more than 10% of the Fund’s shares outstanding aggregating 89%.
24
Eaton Vance VT Floating-Rate Income Fund as of December 31, 2008
NOTES TO FINANCIAL STATEMENT CONT’D
8 Federal Income Tax Basis of Investments
The cost and unrealized appreciation (depreciation) of investments of the Fund at December 31, 2008, as determined on a federal income tax basis, were as follows:
| | | | | |
Aggregate cost | | $ | 908,157,014 | |
| |
| |
| Gross unrealized appreciation | | $ | 102,870 | |
| Gross unrealized depreciation | | | (296,377,835 | ) |
| |
| |
Net unrealized depreciation | | $ | (296,274,965 | ) |
| |
| |
9 Line of Credit
The Fund participates with other portfolios and funds managed by EVM and its affiliates in a $1 billion ($1.5 billion prior to March 24, 2008) unsecured line of credit agreement with a group of banks. Borrowings are made by the Fund solely to facilitate the handling of unusual and/or unanticipated short-term cash requirements. Interest is charged to the Fund based on its borrowings at an amount above either the Eurodollar rate or Federal Funds rate. In addition, a fee computed at an annual rate of 0.08% (0.07% prior to March 24, 2008) on the daily unused portion of the line of credit is allocated among the participating portfolios and funds at the end of each quarter. Average borrowings and the average interest rate for the year ended December 31, 2008 were $1,994,536 and 2.63%, respectively.
10 Concentration of Credit Risk
The Fund invests primarily in below investment grade floating-rate loans, which are considered speculative because of the credit risk of their issuers. Changes in economic conditions or other circumstances are more likely to reduce the capacity of issuers of these securities to make principal and interest payments. Such companies are more likely to default on their payments of interest and principal owed than issuers of investment grade bonds. An economic downturn generally leads to a higher non-payment rate, and a loan or other debt obligation may lose significant value before a default occurs. Lower rated investments also may be subject to greater price volatility than higher rated investments. Moreover, the specific collateral used to secure a loan may decline in value or become illiquid, which would adversely affect the loan’s value.
11 Fair Value Measurements
The Fund adopted Financial Accounting Standards Board Statement of Financial Accounting Standards No. 157 (FAS 157), “Fair Value Measurements”, effective January 1, 2008. FAS 157 established a three-tier hierarchy to prioritize the assumptions, referred to as inputs, used in valuation techniques to measure fair value. The three-tier hierarchy of inputs is summarized in the three broad levels listed below.
| | |
| | • | Level 1 — quoted prices in active markets for identical investments |
| | • | Level 2 — other significant observable inputs (including quoted prices for similar investments, interest rates, prepayment speeds, credit risk, etc.) |
| | • | Level 3 — significant unobservable inputs (including a fund’s own assumptions in determining the fair value of investments) |
The inputs or methodology used for valuing securities are not necessarily an indication of the risk associated with investing in those securities.
At December 31, 2008, the inputs used in valuing the Fund’s investments, which are carried at value, were as follows:
| | | | | | | | | |
| | | | | Investments in
| | | |
| | | Valuation Inputs | | Securities | | | |
| |
| Level 1 | | Quoted Prices | | $ | — | | | |
| Level 2 | | Other Significant Observable Inputs | | | 611,334,225 | | | |
| Level 3 | | Significant Unobservable Inputs | | | 547,824 | | | |
| |
| |
Total | | | | $ | 611,882,049 | | | |
| |
| |
The following is a reconciliation of Level 3 assets for which significant unobservable inputs were used to determine fair value:
| | | | | |
| | | Investments in
| |
| | | Securities | |
| | |
Balance as of December 31, 2007 | | $ | 285,584 | |
| Realized gains (losses) | | | (10 | ) |
| Change in net unrealized appreciation (depreciation) | | | (89,736 | ) |
| Net purchases (sales) | | | (6,345 | ) |
| Accrued discount (premium) | | | 1,045 | |
| Net transfers to (from) Level 3 | | | 357,286 | |
| |
| |
Balance as of December 31, 2008 | | $ | 547,824 | |
| |
| |
25
Eaton Vance VT Floating-Rate Income Fund as of December 31, 2008
REPORT OF INDEPENDENT REGISTERED PUBLIC ACCOUNTING FIRM
To the Trustees of Eaton Vance Variable Trust and
Shareholders of Eaton Vance VT Floating-Rate Income Fund:
We have audited the accompanying statement of assets and liabilities of Eaton Vance VT Floating-Rate Income Fund (the “Fund”) (one of the series constituting the Eaton Vance Variable Trust), including the portfolio of investments, as of December 31, 2008, and the related statement of operations for the year then ended, the statements of changes in net assets for each of the two years in the period then ended, and the financial highlights for each of the five years in the period then ended. These financial statements and financial highlights are the responsibility of the Fund’s management. Our responsibility is to express an opinion on these financial statements and financial highlights based on our audits.
We conducted our audits in accordance with the standards of the Public Company Accounting Oversight Board (United States). Those standards require that we plan and perform the audit to obtain reasonable assurance about whether the financial statements and financial highlights are free of material misstatement. The Fund is not required to have, nor were we engaged to perform, an audit of its internal control over financial reporting. Our audits included consideration of internal control over financial reporting as a basis for designing audit procedures that are appropriate in the circumstances, but not for the purpose of expressing an opinion on the effectiveness of the Fund’s internal control over financial reporting. Accordingly, we express no such opinion. An audit also includes examining, on a test basis, evidence supporting the amounts and disclosures in the financial statements, assessing the accounting principles used and significant estimates made by management, as well as evaluating the overall financial statement presentation. Our procedures included confirmation of securities and senior loans owned as of December 31, 2008, by correspondence with the custodian, brokers, and selling or agent banks; where replies were not received from brokers and selling or agent banks, we performed other auditing procedures. We believe that our audits provide a reasonable basis for our opinion.
In our opinion, the financial statements and financial highlights referred to above present fairly, in all material respects, the financial position of Eaton Vance VT Floating-Rate Income Fund as of December 31, 2008, the results of its operations for the year then ended, the changes in its net assets for each of the two years in the period then ended, and the financial highlights for each of the five years in the period then ended, in conformity with accounting principles generally accepted in the United States of America.
DELOITTE & TOUCHE LLP
Boston, Massachusetts
February 16, 2009
26
Eaton Vance VT Floating-Rate Income Fund
SPECIAL MEETING OF SHAREHOLDERS (Unaudited)
The Fund held a Special Meeting of Shareholders on November 14, 2008 to elect Trustees. The results of the vote were as follows:
| | | | | | | | | | | |
| | | Number of Shares |
| Nominee for Trustee | | For | | | Withheld | | | |
| |
| |
| Benjamin C. Esty | | | 88,803,949 | | | | 3,336,556 | | | |
| Thomas E. Faust Jr. | | | 88,825,733 | | | | 3,314,772 | | | |
| Allen R. Freedman | | | 88,745,208 | | | | 3,395,297 | | | |
| William H. Park | | | 88,924,910 | | | | 3,215,595 | | | |
| Ronald A. Pearlman | | | 88,693,768 | | | | 3,446,737 | | | |
| Helen Frame Peters | | | 88,674,348 | | | | 3,466,157 | | | |
| Heidi L. Steiger | | | 88,798,451 | | | | 3,342,054 | | | |
| Lynn A. Stout | | | 88,805,824 | | | | 3,334,681 | | | |
| Ralph F. Verni | | | 88,728,837 | | | | 3,411,668 | | | |
27
Eaton Vance VT Floating-Rate Income Fund
BOARD OF TRUSTEES’ ANNUAL APPROVAL OF THE INVESTMENT ADVISORY AGREEMENT
Overview of the Contract Review Process
The Investment Company Act of 1940, as amended (the “1940 Act”), provides, in substance, that each investment advisory agreement between a fund and its investment adviser will continue in effect from year to year only if its continuance is approved at least annually by the fund’s board of trustees, including by a vote of a majority of the trustees who are not “interested persons” of the fund (“Independent Trustees”), cast in person at a meeting called for the purpose of considering such approval.
At a meeting of the Boards of Trustees (each a “Board”) of the Eaton Vance group of mutual funds (the “Eaton Vance Funds”) held on April 21, 2008, the Board, including a majority of the Independent Trustees, voted to approve continuation of existing advisory and sub-advisory agreements for the Eaton Vance Funds for an additional one-year period. In voting its approval, the Board relied upon the affirmative recommendation of the Contract Review Committee of the Board (formerly the Special Committee), which is a committee comprised exclusively of Independent Trustees. Prior to making its recommendation, the Contract Review Committee reviewed information furnished for a series of meetings of the Contract Review Committee held in February, March and April 2008. Such information included, among other things, the following:
Information about Fees, Performance and Expenses
| | |
| | • | An independent report comparing the advisory and related fees paid by each fund with fees paid by comparable funds; |
| | • | An independent report comparing each fund’s total expense ratio and its components to comparable funds; |
| | • | An independent report comparing the investment performance of each fund to the investment performance of comparable funds over various time periods; |
| | • | Data regarding investment performance in comparison to relevant peer groups of funds and appropriate indices; |
| | • | Comparative information concerning fees charged by each adviser for managing other mutual funds and institutional accounts using investment strategies and techniques similar to those used in managing the fund; |
| | • | Profitability analyses for each adviser with respect to each fund; |
Information about Portfolio Management
| | |
| | • | Descriptions of the investment management services provided to each fund, including the investment strategies and processes employed, and any changes in portfolio management processes and personnel; |
| | • | Information concerning the allocation of brokerage and the benefits received by each adviser as a result of brokerage allocation, including information concerning the acquisition of research through “soft dollar” benefits received in connection with the funds’ brokerage, and the implementation of a soft dollar reimbursement program established with respect to the funds; |
| | • | Data relating to portfolio turnover rates of each fund; |
| | • | The procedures and processes used to determine the fair value of fund assets and actions taken to monitor and test the effectiveness of such procedures and processes; |
Information about each Adviser
| | |
| | • | Reports detailing the financial results and condition of each adviser; |
| | • | Descriptions of the qualifications, education and experience of the individual investment professionals whose responsibilities include portfolio management and investment research for the funds, and information relating to their compensation and responsibilities with respect to managing other mutual funds and investment accounts; |
| | • | Copies of the Codes of Ethics of each adviser and its affiliates, together with information relating to compliance with and the administration of such codes; |
| | • | Copies of or descriptions of each adviser’s proxy voting policies and procedures; |
| | • | Information concerning the resources devoted to compliance efforts undertaken by each adviser and its affiliates on behalf of the funds (including descriptions of various compliance programs) and their record of compliance with investment policies and restrictions, including policies with respect to market-timing, late trading and selective portfolio disclosure, and with policies on personal securities transactions; |
| | • | Descriptions of the business continuity and disaster recovery plans of each adviser and its affiliates; |
Other Relevant Information
| | |
| | • | Information concerning the nature, cost and character of the administrative and other non-investment management services provided by Eaton Vance Management and its affiliates; |
28
Eaton Vance VT Floating-Rate Income Fund
BOARD OF TRUSTEES’ ANNUAL APPROVAL OF THE INVESTMENT ADVISORY AGREEMENT CONT’D
| | |
| | • | Information concerning management of the relationship with the custodian, subcustodians and fund accountants by each adviser or the funds’ administrator; and |
| | • | The terms of each advisory agreement. |
In addition to the information identified above, the Contract Review Committee considered information provided from time to time by each adviser throughout the year at meetings of the Board and its committees. Over the course of the twelve-month period ended April 30, 2008, the Board met eleven times and the Contract Review Committee, the Audit Committee and the Governance Committee, each of which is a Committee comprised solely of Independent Trustees, met twelve, seven and five times, respectively. At such meetings, the Trustees received, among other things, presentations by the portfolio managers and other investment professionals of each adviser relating to the investment performance of each fund and the investment strategies used in pursuing the fund’s investment objective. The Portfolio Management Committee and the Compliance Reports and Regulatory Matters Committee are newly established and did not meet during the twelve-month period ended April 30, 2008.
For funds that invest through one or more underlying portfolios, the Board considered similar information about the portfolio(s) when considering the approval of advisory agreements. In addition, in cases where the fund’s investment adviser has engaged a sub-adviser, the Board considered similar information about the sub-adviser when considering the approval of any sub-advisory agreement.
The Contract Review Committee was assisted throughout the contract review process by Goodwin Procter LLP, legal counsel for the Independent Trustees. The members of the Contract Review Committee relied upon the advice of such counsel and their own business judgment in determining the material factors to be considered in evaluating each advisory and sub-advisory agreement and the weight to be given to each such factor. The conclusions reached with respect to each advisory and sub-advisory agreement were based on a comprehensive evaluation of all the information provided and not any single factor. Moreover, each member of the Contract Review Committee may have placed varying emphasis on particular factors in reaching conclusions with respect to each advisory and sub-advisory agreement.
Results of the Process
Based on its consideration of the foregoing, and such other information as it deemed relevant, including the factors and conclusions described below, the Contract Review Committee concluded that the continuance of the investment advisory agreement of Eaton Vance VT Floating-Rate Income Fund (the “Fund”) with Eaton Vance Management (the “Adviser”), including its fee structure, is in the interests of shareholders and, therefore, the Contract Review Committee recommended to the Board approval of the agreement. The Board accepted the recommendation of the Contract Review Committee as well as the factors considered and conclusions reached by the Contract Review Committee with respect to the agreement. Accordingly, the Board, including a majority of the Independent Trustees, voted to approve continuation of the investment advisory agreement for the Fund.
Nature, Extent and Quality of Services
In considering whether to approve the investment advisory agreement of the Fund, the Board evaluated the nature, extent and quality of services provided to the Fund by the Adviser.
The Board considered the Adviser’s management capabilities and investment process with respect to the types of investments held by the Fund, including the education, experience and number of its investment professionals and other personnel who provide portfolio management, investment research, and similar services to the Fund. The Board considered the Adviser’s experience in managing senior loan portfolios. The Board noted the experience of the Adviser’s large group of bank loan investment professionals and other personnel who provide services to the Fund, including portfolio managers and analysts. The Board also took into account the resources dedicated to portfolio management and other services, including the compensation paid to recruit and retain investment personnel, and the time and attention devoted to the Fund by senior management.
The Board also reviewed the compliance programs of the Adviser and relevant affiliates thereof. Among other matters, the Board considered compliance and reporting matters relating to personal trading by investment personnel, selective disclosure of portfolio holdings, late trading, frequent trading, portfolio valuation, business continuity and the allocation of investment opportunities. The Board also evaluated the responses of the Adviser and its affiliates to requests from regulatory authorities such as the Securities and Exchange Commission.
The Board considered shareholder and other administrative services provided or managed by Eaton Vance Management and its affiliates, including transfer agency and accounting services. The Board evaluated the benefits to shareholders of investing in a fund that is a part of a large family of funds, including the ability, in many cases, to exchange an investment among different funds without incurring additional sales charges.
29
Eaton Vance VT Floating-Rate Income Fund
BOARD OF TRUSTEES’ ANNUAL APPROVAL OF THE INVESTMENT ADVISORY AGREEMENT CONT’D
After consideration of the foregoing factors, among others, the Board concluded that the nature, extent and quality of services provided by the Adviser, taken as a whole, are appropriate and consistent with the terms of the investment advisory agreement.
Fund Performance
The Board compared the Fund’s investment performance to a relevant universe of similarly managed funds identified by an independent data provider and appropriate benchmark indices. The Board reviewed comparative performance data for the one-, three- and five-year periods ended September 30, 2007 for the Fund. The Board noted that the Fund’s performance relative to its peers is affected by management’s focus on reducing volatility. The Board concluded that the performance of the Fund was satisfactory.
Management Fees and Expenses
The Board reviewed contractual investment advisory fee rates, including any administrative fee rates, payable by the Fund (referred to collectively as “management fees”). As part of its review, the Board considered the Fund’s management fees and total expense ratio for the year ended September 30, 2007, as compared to a group of similarly managed funds selected by an independent data provider.
After reviewing the foregoing information, and in light of the nature, extent and quality of the services provided by the Adviser, the Board concluded that the management fees charged for advisory and related services and the Fund’s total expense ratio are reasonable.
Profitability
The Board reviewed the level of profits realized by the Adviser and relevant affiliates thereof in providing investment advisory and administrative services to the Fund and to all Eaton Vance Funds as a group. The Board considered the level of profits realized without regard to revenue sharing or other payments by the Adviser and its affiliates to third parties in respect of distribution services. The Board also considered other direct or indirect benefits received by the Adviser in connection with its relationship with the Fund.
The Board concluded that, in light of the foregoing factors and the nature, extent and quality of the services rendered, the profits realized by the Adviser and its affiliates are reasonable.
Economies of Scale
In reviewing management fees and profitability, the Board also considered the extent to which the Adviser and its affiliates, on the one hand, and the Fund, on the other hand, can expect to realize benefits from economies of scale as the assets of the Fund increase. The Board acknowledged the difficulty in accurately measuring the benefits resulting from the economies of scale with respect to the management of any specific fund or group of funds. The Board reviewed data summarizing the increases and decreases in the assets of the Fund and of all Eaton Vance Funds as a group over various time periods, and evaluated the extent to which the total expense ratio of the Fund and the Adviser’s profitability may have been affected by such increases or decreases. Based upon the foregoing, the Board concluded that the benefits from economies of scale are currently being shared equitably by the Adviser and the Fund. The Board also concluded that the structure of the advisory fee, which includes breakpoints at several asset levels, can be expected to cause the Adviser and its affiliates and the Fund to continue to share such benefits equitably.
30
Eaton Vance VT Floating-Rate Income Fund
MANAGEMENT AND ORGANIZATION
Fund Management. The Trustees of Eaton Vance Variable Trust (the Trust) are responsible for the overall management and supervision of the Trust’s affairs. The Trustees and officers of the Trust are listed below. Except as indicated, each individual has held the office shown or other offices in the same company for the last five years. Trustees and officers of the Trust hold indefinite terms of office. The “noninterested Trustees” consist of those Trustees who are not “interested persons” of the Trust, as that term is defined under the 1940 Act. The business address of each Trustee and officer is The Eaton Vance Building, 255 State Street, Boston, Massachusetts 02109 until March 22, 2009 and thereafter at Two International Place, Boston, Massachusetts 02110. As used below, “EVC” refers to Eaton Vance Corp., “EV” refers to Eaton Vance, Inc., “EVM” refers to Eaton Vance Management, “BMR” refers to Boston Management and Research, “EVD” refers to Eaton Vance Distributors, Inc., and “OrbiMed” refers to OrbiMed Advisors, LLC. EVC and EV are the corporate parent and trustee, respectively, of EVM and BMR. EVD is the Fund’s principal underwriter and a wholly-owned subsidiary of EVC. Each officer affiliated with Eaton Vance may hold a position with other Eaton Vance affiliates that is comparable to his or her position with EVM listed below.
| | | | | | | | | | | | | |
| | | | | Term of
| | | | Number of Portfolios
| | | |
| | | Position(s)
| | Office and
| | | | in Fund Complex
| | | |
Name and
| | with the
| | Length of
| | Principal Occupation(s)
| | Overseen By
| | | |
| Date of Birth | | Trust | | Service | | During Past Five Years | | Trustee(1) | | | Other Directorships Held |
| |
| |
| |
| Interested Trustee |
| | | | | | | | | | | | | |
Thomas E. Faust Jr.
5/31/58 | | Trustee | | Since 2007 | | Chairman, Chief Executive Officer and President of EVC, Director and President of EV, Chief Executive Officer and President of EVM and BMR, and Director of EVD. Trustee and/or Officer of 173 registered investment companies and 4 private investment companies managed by EVM or BMR. Mr. Faust is an interested person because of his positions with EVM, BMR, EVD, EVC and EV, which are affiliates of the Trust. | | | 173 | | | Director of EVC |
| |
| Noninterested Trustees |
| | | | | | | | | | | | | |
Benjamin C. Esty
1/2/63 | | Trustee | | Since 2005 | | Roy and Elizabeth Simmons Professor of Business Administration, Harvard University Graduate School of Business Administration. | | | 173 | | | None |
| | | | | | | | | | | | | |
Allen R. Freedman
4/3/40 | | Trustee | | Since 2007 | | Former Chairman (2002-2004) and a Director (1983-2004) of Systems & Computer Technology Corp. (provider of software to higher education). Formerly, a Director of Loring Ward International (fund distributor) (2005-2007). Formerly, Chairman and a Director of Indus International, Inc. (provider of enterprise management software to the power generating industry) (2005-2007). | | | 173 | | | Director of Assurant, Inc. (insurance provider) and Stonemor Partners L.P. (owner and operator of cemeteries) |
| | | | | | | | | | | | | |
William H. Park
9/19/47 | | Trustee | | Since 2003 | | Vice Chairman, Commercial Industrial Finance Corp. (specialty finance company) (since 2006). Formerly, President and Chief Executive Officer, Prizm Capital Management, LLC (investment management firm) (2002-2005). | | | 173 | | | None |
| | | | | | | | | | | | | |
Ronald A. Pearlman
7/10/40 | | Trustee | | Since 2003 | | Professor of Law, Georgetown University Law Center. | | | 173 | | | None |
| | | | | | | | | | | | | |
Helen Frame Peters
3/22/48 | | Trustee | | Since 2008 | | Professor of Finance, Carroll School of Management, Boston College. Adjunct Professor of Finance, Peking University, Beijing, China (since 2005). | | | 173 | | | Director of Federal Home Loan Bank of Boston (a bank for banks) and BJ’s Wholesale Clubs (wholesale club retailer); Trustee of SPDR Index Shares Funds and SPDR Series Trust (exchange traded funds) |
| | | | | | | | | | | | | |
Heidi L. Steiger
7/8/53 | | Trustee | | Since 2007 | | Managing Partner, Topridge Associates LLC (global wealth management firm) (since 2008); Senior Advisor (since 2008), President (2005-2008), Lowenhaupt Global Advisors, LLC (global wealth management firm). Formerly, President and Contributing Editor, Worth Magazine (2004-2005). Formerly, Executive Vice President and Global Head of Private Asset Management (and various other positions), Neuberger Berman (investment firm) (1986-2004). | | | 173 | | | Director of Nuclear Electric Insurance Ltd. (nuclear insurance provider) and Aviva USA (insurance provider) |
31
Eaton Vance VT Floating-Rate Income Fund
MANAGEMENT AND ORGANIZATION CONT’D
| | | | | | | | | | | | | |
| | | | | Term of
| | | | Number of Portfolios
| | | |
| | | Position(s)
| | Office and
| | | | in Fund Complex
| | | |
Name and
| | with the
| | Length of
| | Principal Occupation(s)
| | Overseen By
| | | |
| Date of Birth | | Trust | | Service | | During Past Five Years | | Trustee(1) | | | Other Directorships Held |
| |
| |
| Noninterested Trustees (continued) |
| | | | | | | | | | | | | |
Lynn A. Stout
9/14/57 | | Trustee | | Since 2000 | | Paul Hastings Professor of Corporate and Securities Law (since 2006) and Professor of Law (2001-2006), University of California at Los Angeles School of Law. | | | 173 | | | None |
| | | | | | | | | | | | | |
Ralph F. Verni
1/26/43 | | Chairman of
the Board
and Trustee | | Chairman of the Board since 2007 and Trustee since 2005 | | Consultant and private investor. | | | 173 | | | None |
Principal Officers who are not Trustees
| | | | | | | |
| | | | | Term of
| | |
| | | Position
| | Office and
| | |
Name and
| | with the
| | Length of
| | Principal Occupation(s)
|
| Date of Birth | | Trust | | Service | | During Past Five Years |
| |
| | | | | | | |
Duncan W. Richardson
10/26/57 | | President | | Since 2008(2) | | Executive Vice President and Chief Equity Investment Officer of EVC, EVM and BMR. Officer of 81 registered investment companies managed by EVM or BMR. |
| | | | | | | |
Samuel D. Isaly
3/12/45 | | Vice President | | Since 2000 | | Managing Partner of OrbiMed. Officer of 4 registered investment companies managed by EVM or BMR. |
| | | | | | | |
Michael R. Mach
7/15/47 | | Vice President | | Since 2006 | | Vice President of EVM and BMR. Officer of 24 registered investment companies managed by EVM or BMR. |
| | | | | | | |
Scott H. Page
11/30/59 | | Vice President | | Since 2000 | | Vice President of EVM and BMR. Officer of 11 registered investment companies managed by EVM or BMR. |
| | | | | | | |
Craig P. Russ
10/30/63 | | Vice President | | Since 2007 | | Vice President of EVM and BMR. Officer of 6 registered investment companies managed by EVM or BMR. |
| | | | | | | |
Andrew N. Sveen
3/13/61 | | Vice President | | Since 2008 | | Vice President of EVM and BMR. Officer of 4 registered investment companies managed by EVM or BMR. |
| | | | | | | |
Barbara E. Campbell
6/19/57 | | Treasurer | | Since 2005 | | Vice President of EVM and BMR. Officer of 173 registered investment companies managed by EVM or BMR. |
| | | | | | | |
Maureen A. Gemma
5/24/60 | | Secretary and
Chief Legal Officer | | Secretary since 2007 and Chief Legal Officer since 2008 | | Vice President of EVM and BMR. Officer of 173 registered investment companies managed by EVM or BMR. |
| | | | | | | |
Paul M. O’Neil
7/11/53 | | Chief Compliance Officer | | Since 2004 | | Vice President of EVM and BMR. Officer of 173 registered investment companies managed by EVM or BMR. |
| | |
| (1) | | Includes both master and feeder funds in a master-feeder structure. |
| |
| (2) | | Prior to 2008, Mr. Richardson served as a Vice President since 2000. |
The SAI for the Fund includes additional information about the Trustees and officers of the Fund and can be obtained without charge on Eaton Vance’s website at www.eatonvance.com or by calling 1-800-262-1122.
32
Investment Adviser and Administrator of
Eaton Vance VT Floating-Rate Income Fund
Eaton VanceManagement
The Eaton Vance Building
255 State Street
Boston, MA 02109
Principal Underwriter
Eaton Vance Distributors, Inc.
The Eaton Vance Building
255 State Street
Boston, MA 02109
(617) 482-8260
Custodian
State Street Bank and Trust Company
200 Clarendon Street
Boston, MA 02116
Transfer Agent
State Street Bank and Trust Company
200 Clarendon Street
Boston, MA 02116
Independent Registered Public Accounting Firm
Deloitte & Touche LLP
200 Berkeley Street
Boston, MA 02116-5022
Eaton Vance VT Floating-Rate Income Fund
The Eaton Vance Building
255 State Street
Boston, MA 02109
This report must be preceded or accompanied by a current prospectus. Before investing, investors should consider carefully the Fund’s investment objective(s), risks, and charges and expenses. The Fund’s current prospectus contains this and other information about the Fund and is available through your financial advisor. Please read the prospectus carefully before you invest or send money. For further information please call 1-800-262-1122.
| Eaton Vance investment managers EATON VANCE VT WORLDWIDE HEALTH SCIENCES FUND |
IMPORTANT NOTICES REGARDING PRIVACY,
DELIVERY OF SHAREHOLDER DOCUMENTS,
PORTFOLIO HOLDINGS, AND PROXY VOTING
Privacy. The Eaton Vance organization is committed to ensuring your financial privacy. Each of the financial institutions identified below has in effect the following policy (“Privacy Policy”) with respect to nonpublic personal information about its customers:
| | |
| | • | Only such information received from you, through application forms or otherwise, and information about your Eaton Vance fund transactions will be collected. This may include information such as name, address, social security number, tax status, account balances and transactions. |
| |
| | • | None of such information about you (or former customers) will be disclosed to anyone, except as permitted by law (which includes disclosure to employees necessary to service your account). In the normal course of servicing a customer’s account, Eaton Vance may share information with unaffiliated third parties that perform various required services such as transfer agents, custodians and broker/dealers. |
| |
| | • | Policies and procedures (including physical, electronic and procedural safeguards) are in place that are designed to protect the confidentiality of such information. |
| |
| | • | We reserve the right to change our Privacy Policy at any time upon proper notification to you. Customers may want to review our Policy periodically for changes by accessing the link on our homepage: www.eatonvance.com. |
Our pledge of privacy applies to the following entities within the Eaton Vance organization: the Eaton Vance Family of Funds, Eaton Vance Management, Eaton Vance Investment Counsel, Boston Management and Research, and Eaton Vance Distributors, Inc.
In addition, our Privacy Policy only applies to those Eaton Vance customers who are individuals and who have a direct relationship with us. If a customer’s account (i.e., fund shares) is held in the name of a third-party financial adviser/broker-dealer, it is likely that only such adviser’s privacy policies apply to the customer. This notice supersedes all previously issued privacy disclosures.
For more information about Eaton Vance’s Privacy Policy, please call 1-800-262-1122.
Delivery of Shareholder Documents. The Securities and Exchange Commission (the “SEC”) permits funds to deliver only one copy of shareholder documents, including prospectuses, proxy statements and shareholder reports, to fund investors with multiple accounts at the same residential or post office box address. This practice is often called “householding” and it helps eliminate duplicate mailings to shareholders.
Eaton Vance, or your financial adviser, may household the mailing of your documents indefinitely unless you instruct Eaton Vance, or your financial adviser, otherwise.
If you would prefer that your Eaton Vance documents not be householded, please contact Eaton Vance at 1-800-262-1122, or contact your financial adviser.
Your instructions that householding not apply to delivery of your Eaton Vance documents will be effective within 30 days of receipt by Eaton Vance or your financial adviser.
Portfolio Holdings. Each Eaton Vance Fund and its underlying Portfolio (if applicable) will file a schedule of its portfolio holdings on Form N-Q with the SEC for the first and third quarters of each fiscal year. The Form N-Q will be available on the Eaton Vance website www.eatonvance.com, by calling Eaton Vance at 1-800-262-1122 or in the EDGAR database on the SEC’s website at www.sec.gov. Form N-Q may also be reviewed and copied at the SEC’s public reference room in Washington, D.C. (call 1-800-732-0330 for information on the operation of the public reference room).
Proxy Voting. From time to time, funds are required to vote proxies related to the securities held by the funds. The Eaton Vance Funds or their underlying Portfolios (if applicable) vote proxies according to a set of policies and procedures approved by the Funds’ and Portfolios’ Boards. You may obtain a description of these policies and procedures and information on how the Funds or Portfolios voted proxies relating to portfolio securities during the most recent 12 month period ended June 30, without charge, upon request, by calling 1-800-262-1122. This description is also available on the SEC’s website at www.sec.gov.
Eaton Vance VT Worldwide Health Sciences Fund as of December 31, 2008
MANAGEMENT’S DISCUSSION OF FUND PERFORMANCE
Economic and Market Conditions
Samuel D. Isaly
Lead Portfolio Manager
Sven H. Borho, CFA
Geoffrey C. Hsu, CFA
Richard D. Klemm, Ph.D., CFA
Trevor M. Polischuk, Ph.D.
| • | | As the broader equity markets declined sharply in 2008, the healthcare sector did not decline as severely, thanks to several fundamental underpinnings of the industry: products which are generally non-discretionary consumer purchases, historically low valuations, continuing robust levels of mergers & acquisition (M&A) activity providing support for biotech companies in particular, and an unexpectedly quiet election cycle with fewer harsh words about large pharmaceutical companies than was seen in previous election years. Prior to the election, management believed the outcome of the race would not be a crucial determinant of healthcare industry fortunes in the coming years, as both candidates favored increased healthcare coverage (positive for industry) and increased government influence on drug prices (negative for industry). With the Obama administration in power, management still holds this view. |
Eaton Vance VT Worldwide Health Sciences Fund Total Return Performance 12/31/07 – 12/31/08
| | | | | |
Eaton Vance VT Worldwide Health Sciences Fund1 | | | -7.08 | % |
S&P 500 Index2 | | | -36.99 | |
MSCI World Pharmaceuticals, Biotechnology and Life Sciences Index2 | | | -15.60 | |
See page 3 for more performance information.
Past performance is no guarantee of future results. Returns are historical and are calculated by determining the percentage change in net asset value or offering price (as applicable) with all distributions reinvested. Investment return and principal value will fluctuate so that shares, when redeemed, may be worth more or less than their original cost. Performance is for the stated time period only; due to market volatility, the Fund’s current performance may be lower or higher than the quoted return. For performance as of the most recent month end, please refer to www. eatonvance.com.
Fund shares are not insured by the FDIC and are not deposits or other obligations of, or guaranteed by, any depository institution. Shares are subject to investment risks, including possible loss of principal invested.
Management Discussion
| • | | During the year ended December 31, 2008, the Fund had negative returns, primarily because of extreme pessimism in the broader stock market. The Fund outperformed the S&P 500 Index, its primary benchmark, as well as the Morgan Stanley Capital International (MSCI) World Pharmaceuticals, Biotechnology and Life Sciences Index. The primary reasons for the Fund’s outperformance were its over weighted position in large biotechnology companies, which performed well; its significant underweight in large pharmaceuticals, which performed poorly; and the fact that the Fund did not own stocks in the healthcare services sector, which had performed well prior to 2008 but experienced sharp declines during the fiscal reporting period. |
| |
| • | | M&A activity was another key driver for the Fund’s returns. During the third quarter of 2008, two of the Fund’s largest positions received acquisition offers from large pharmaceutical companies. In both cases the companies rejected the initial offers as too low. In the first case, a competitive bidder emerged and the ultimate acquisition price was significantly higher than originally expected. Management is waiting for the outcome of the second company. Overall, five significant holdings in the Fund were acquired during the year. |
| |
| • | | Management continues to emphasize U.S.-based companies in the biotechnology sector, as well as relatively modest positions in Europe and Japan. Within Europe, the Fund holds a mix of specialty and large pharmaceutical companies, while in Japan, its holdings are focused on generic drug manufacturers. |
| | |
| 1 | | There is no sales charge. Insurance-related charges are not included in the calculations of returns. Such expenses would reduce the overall returns shown. Please refer to the report for your insurance contract for performance data reflecting insurance-related charges. Absent a performance fee adjustment during the period, the return would have been lower. |
| |
| 2 | | It is not possible to invest directly in an Index. The Indices’ total returns do not reflect commissions or expenses that would have been incurred if an investor individually purchased or sold the securities represented in the Indices. The S&P 500 Index is a broad-based, unmanaged market index of common stocks commonly used as a measure of U.S. stock market performance. The MSCI World Pharmaceuticals, Biotechnology and Life Sciences Index is an unmanaged global index of common stocks in the pharmaceutical, biotechnology and life sciences industries. The Fund’s performance is compared to the performance of a domestic index and a foreign index because it invests in domestic and foreign securities. |
The views expressed throughout this report are those of the portfolio managers and are current only through the end of the period of the report as stated on the cover. These views are subject to change at any time based upon market or other conditions, and the investment adviser disclaims any responsibility to update such views. These views may not be relied on as investment advice and, because investment decisions for a fund are based on many factors, may not be relied on as an indication of trading intent on behalf of any Eaton Vance fund. Portfolio information provided in the report may not be representative of the Fund’s current or future investments and may change due to active management.
1
Eaton Vance VT Worldwide Health Sciences Fund as of December 31, 2008
FUND COMPOSITION
| | | |
| Common Stock Capitalization Distribution† | | Country Concentration of Fund† |
| By net assets | | By net assets |
| |  |
† As a percentage of the Fund’s net assets as of 12/31/08.
Top Ten Holdings*
| | | | | |
| By net assets | | | | |
| | | | | |
| Genentech, Inc. | | | 7.7 | % |
| Gilead Sciences, Inc. | | | 4.8 | |
| Bristol-Myers Squibb Co. | | | 4.7 | |
| Shionogi & Co., Ltd. | | | 4.6 | |
| Vertex Pharmaceuticals, Inc. | | | 4.5 | |
| Amgen, Inc. | | | 4.4 | |
| Novartis AG | | | 4.4 | |
| Genzyme Corp. | | | 4.4 | |
| Biogen Idec, Inc. | | | 4.3 | |
| Gen-Probe, Inc. | | | 3.6 | |
| | |
| * | | Top Ten Holdings represented 47.4% of the Fund’s net assets as of 12/31/08. Excludes cash equivalents. |
2
Eaton Vance VT Worldwide Health Sciences Fund as of December 31, 2008
FUND PERFORMANCE
The line graph and table set forth below provide information about the Fund’s performance. The line graph compares the performance of the Fund with that of the S&P 500 Index, a broad-based, unmanaged market index commonly used as a measure of U.S. stock market performance, and the Morgan Stanley Capital International (MSCI) World Pharmaceuticals, Biotechnology and Life Sciences Index, an unmanaged global index of common stocks in the pharmaceutical, biotechnology and life science industries. The lines on the graph represent the total returns of a hypothetical investment of $10,000 in each of the Fund and the S&P 500 Index and the MSCI World Pharmaceuticals, Biotechnology and Life Sciences Index. The table includes the total returns of the Fund at net asset value. There is no sales charge. The performance presented below does not reflect the deduction of insurance-related charges or of taxes, if any, that a shareholder would pay on distributions or redemptions of Fund shares. Please refer to the report for your insurance contract for performance data reflecting insurance-related charges.
Performance1
Average Annual Total Returns (at net asset value)
| | | | | |
| One Year | | | -7.08 | % |
| Five Years | | | 2.32 | |
| Life of Fund† | | | 2.26 | |
| | |
| † | | Inception Date: 5/2/01 |
| |
| 1 | | The Fund has no sales charge. Insurance-related charges are not included in the calculation of returns. Such expenses would reduce the overall returns shown. Absent a downward performance fee adjustment during certain periods, performance would have been lower. |
Total Annual Operating Expenses2
| | | | | |
| Gross Expense Ratio | | | 1.88 | % |
| Net Expense Ratio | | | 1.61 | |
| | |
| 2 | | Source: Prospectus dated 5/1/08. Total Annual Operating Expenses were 1.61% after applying the performance fee adjustment of 0.27%. For a description of the performance fee adjustment, see “Management and Organization” in the Fund’s prospectus. Absent the fee adjustment, the expenses would have been higher. |
Past performance is no guarantee of future results. Returns are historical and are calculated by determining the percentage change in net asset value or offering price (as applicable) with all distributions reinvested. Investment return and principal value will fluctuate so that shares, when redeemed, may be worth more or less than their original cost. Performance is for the stated time period only; due to market volatility, the Fund’s current performance may be lower or higher than the quoted return. For performance as of the most recent month end, please refer to www.eatonvance.com.
| | |
| * | | Source: Lipper Inc. Investment operations commenced 5/2/01. |
The graph does not reflect the deduction of insurance-related charges or taxes that a shareholder would pay on Fund distributions or the redemption of Fund shares. It is not possible to invest directly in an Index. The Indices’ total returns do not reflect any commissions or expenses that would have been incurred if an investor individually purchased or sold the securities represented in the Indices. The MSCI World Pharmaceutical, Biotechnology and Life Sciences Index reflects dividends net of any applicable foreign withholding taxes. Index performance is available as of month end only.
3
Eaton Vance VT Worldwide Health Sciences Fund as of December 31, 2008
FUND EXPENSES
Example: As a shareholder of the Fund, you incur ongoing costs, including management fees; distribution or service fees; and other Fund expenses. This Example is intended to help you understand your ongoing costs (in dollars) of investing in the Fund and to compare these costs with the ongoing costs of investing in other mutual funds. The Example is based on an investment of $1,000 invested at the beginning of the period and held for the entire period (July 1, 2008 – December 31, 2008).
Actual Expenses: The first section of the table below provides information about actual account values and actual expenses. You may use the information in this line, together with the amount you invested, to estimate the expenses that you paid over the period. Simply divide your account value by $1,000 (for example, an $8,600 account value divided by $1,000 = 8.6), then multiply the result by the number in the first line under the heading entitled “Expenses Paid During Period” to estimate the expenses you paid on your account during this period.
Hypothetical Example for Comparison Purposes: The second section of the table below provides information about hypothetical account values and hypothetical expenses based on the actual Fund expense ratio and an assumed rate of return of 5% per year (before expenses), which is not the actual return of the Fund. The hypothetical account values and expenses may not be used to estimate the actual ending account balance or expenses you paid for the period. You may use this information to compare the ongoing costs of investing in your Fund and other funds. To do so, compare this 5% hypothetical example with the 5% hypothetical examples that appear in the shareholder reports of the other funds.
Please note that the expenses shown in the table are meant to highlight your ongoing costs only and do not reflect any expenses and charges which are, or may be, imposed under your variable annuity contract or variable life insurance policy (“variable contracts”) (if applicable). Therefore, the second line of the table is useful in comparing ongoing costs associated with an investment in vehicles which fund benefits under variable contracts, and will not help you determine the relative total costs of owning different funds. In addition, if these expenses and charges imposed under the variable contracts were included, your costs would have been higher.
Eaton Vance VT Worldwide Health Sciences Fund
| | | | | | | | | | | | | | | |
| | | Beginning Account Value
| | | Ending Account Value
| | | Expenses Paid During Period*
| | | |
| | | (7/1/08) | | | (12/31/08) | | | (7/1/08 – 12/31/08) | | | |
| |
| |
Actual | | | $1,000.00 | | | | $985.60 | | | | $10.43 | ** | | |
| | | | | | | | | | | | | | | |
| | | | | | | | | | | | | | | |
| |
| |
| | | | | | | | | | | | | | | |
Hypothetical | | | | | | | | | | | | | | |
| (5% return per year before expenses) | | | $1,000.00 | | | | $1,014.60 | | | | $10.58 | ** | | |
| | | |
| | * | Expenses are equal to the Fund’s annualized expense ratio of 2.09% multiplied by the average account value over the period, multiplied by 184/366 (to reflect the one-half year period). The Example assumes that the $1,000 was invested at the net asset value per share determined at the close of business on June 30, 2008. Expenses shown do not include insurance-related charges. | |
| |
| | ** | Absent a performance fee adjustment during the period, the expenses would have been higher. | |
4
Eaton Vance VT Worldwide Health Sciences Fund as of December 31, 2008
PORTFOLIO OF INVESTMENTS
| | | | | | | | | | | | | | | |
| Common Stocks — 100.08% |
| | | | | | | | | Percentage of
| | | |
| Security | | Shares | | | Value | | | Net Assets | | | |
| |
| |
| |
| Major Capitalization - Europe — 11.21%(1) |
| |
| Alcon, Inc. | | | 2,500 | | | $ | 222,975 | | | | 1.22 | % | | |
| Merck KGaA | | | 5,300 | | | | 474,140 | | | | 2.60 | | | |
| Novartis AG | | | 16,100 | | | | 806,312 | | | | 4.42 | | | |
| Shire PLC ADR | | | 12,100 | | | | 541,838 | | | | 2.97 | | | |
| |
| |
| | | | | | | $ | 2,045,265 | | | | 11.21 | % | | |
| |
| |
| |
| Major Capitalization - Far East — 4.61%(1) |
| |
| Shionogi & Co., Ltd. | | | 32,600 | | | $ | 841,897 | | | | 4.61 | % | | |
| |
| |
| | | | | | | $ | 841,897 | | | | 4.61 | % | | |
| |
| |
| |
| Major Capitalization - North America — 47.66%(1) |
| |
| Abbott Laboratories | | | 11,400 | | | $ | 608,418 | | | | 3.33 | % | | |
Amgen, Inc.(2) | | | 14,000 | | | | 808,500 | | | | 4.43 | | | |
| Baxter International, Inc. | | | 12,100 | | | | 648,439 | | | | 3.55 | | | |
Biogen Idec, Inc.(2) | | | 16,500 | | | | 785,895 | | | | 4.31 | | | |
| Bristol-Myers Squibb Co. | | | 36,700 | | | | 853,275 | | | | 4.68 | | | |
| Covidien, Ltd. | | | 16,100 | | | | 583,464 | | | | 3.20 | | | |
Genentech, Inc.(2) | | | 17,000 | | | | 1,409,470 | | | | 7.73 | | | |
Genzyme Corp.(2) | | | 12,000 | | | | 796,440 | | | | 4.37 | | | |
Gilead Sciences, Inc.(2) | | | 17,000 | | | | 869,380 | | | | 4.76 | | | |
| Pfizer, Inc. | | | 20,000 | | | | 354,200 | | | | 1.94 | | | |
| Schering-Plough Corp. | | | 35,400 | | | | 602,862 | | | | 3.30 | | | |
| Wyeth | | | 10,000 | | | | 375,100 | | | | 2.06 | | | |
| |
| |
| | | | | | | $ | 8,695,443 | | | | 47.66 | % | | |
| |
| |
| |
| Small & Mid Capitalization - Europe — 1.81%(1) |
| |
Elan Corp. PLC ADR(2) | | | 55,000 | | | $ | 330,000 | | | | 1.81 | % | | |
| |
| |
| | | | | | | $ | 330,000 | | | | 1.81 | % | | |
| |
| |
| |
| Small & Mid Capitalization - Far East — 2.82%(1) |
| |
| Nichi-Iko Pharmaceutical Co., Ltd. | | | 6,000 | | | $ | 185,500 | | | | 1.02 | % | | |
| Sawai Pharmaceutical Co., Ltd. | | | 3,500 | | | | 173,216 | | | | 0.95 | | | |
| Towa Pharmaceutical Co., Ltd. | | | 3,500 | | | | 155,432 | | | | 0.85 | | | |
| |
| |
| | | | | | | $ | 514,148 | | | | 2.82 | % | | |
| |
| |
| |
Small & Mid Capitalization -
North America — 31.97%(1) |
| |
Align Technology, Inc.(2) | | | 28,500 | | | $ | 249,375 | | | | 1.37 | % | | |
BioMarin Pharmaceutical, Inc.(2) | | | 16,000 | | | | 284,800 | | | | 1.56 | | | |
Cubist Pharmaceuticals, Inc.(2) | | | 16,000 | | | | 386,560 | | | | 2.12 | | | |
Exelixis, Inc.(2) | | | 36,300 | | | | 182,226 | | | | 1.00 | | | |
Genomic Health, Inc.(2) | | | 13,400 | | | | 261,032 | | | | 1.43 | | | |
Gen-Probe, Inc.(2) | | | 15,500 | | | $ | 664,020 | | | | 3.64 | % | | |
InterMune, Inc.(2) | | | 13,200 | | | | 139,656 | | | | 0.76 | | | |
Masimo Corp.(2) | | | 17,000 | | | | 507,110 | | | | 2.78 | | | |
Mylan, Inc.(2) | | | 44,500 | | | | 440,105 | | | | 2.41 | | | |
NPS Pharmaceuticals, Inc.(2) | | | 34,800 | | | | 216,108 | | | | 1.18 | | | |
Onyx Pharmaceuticals, Inc.(2) | | | 18,300 | | | | 625,128 | | | | 3.43 | | | |
OSI Pharmaceuticals, Inc.(2) | | | 11,000 | | | | 429,550 | | | | 2.35 | | | |
Par Pharmaceutical Cos., Inc.(2) | | | 12,200 | | | | 163,602 | | | | 0.90 | | | |
United Therapeutics Corp.(2) | | | 7,400 | | | | 462,870 | | | | 2.54 | | | |
Vertex Pharmaceuticals, Inc.(2) | | | 27,000 | | | | 820,260 | | | | 4.50 | | | |
| |
| |
| | | | | | | $ | 5,832,402 | | | | 31.97 | % | | |
| |
| |
| | | | | | | |
| Total Common Stocks | | | | | | |
| (identified cost $17,623,766) | | $ | 18,259,155 | | | | | | | |
| |
| |
| | | | | | | |
| Total Investments | | | | | | |
| (identified cost $17,623,766) | | $ | 18,259,155 | | | | 100.08 | % | | |
| |
| |
| | | | | | | | | | | |
| Other Assets, Less Liabilities | | $ | (13,916 | ) | | | (0.08 | )% | | |
| |
| |
| | | | | | | | | | | |
| Net Assets | | $ | 18,245,239 | | | | 100.00 | % | | |
| |
| |
ADR-American Depository Receipt
| | |
| (1) | | Major Capitalization is defined as market value of $5 billion or more. Small & Mid Capitalization is defined as market value less than $5 billion. |
| |
| (2) | | Non-income producing security. |
| | | | | | | | | | | |
| Country Concentration (Unaudited) |
| | | Percentage
| | | | | | |
| Country | | of Net Assets | | | Value | | | |
| |
| |
| United States | | | 79.63 | % | | $ | 14,527,845 | | | |
| Japan | | | 7.43 | | | | 1,356,045 | | | |
| Switzerland | | | 5.64 | | | | 1,029,287 | | | |
| United Kingdom | | | 2.97 | | | | 541,838 | | | |
| Germany | | | 2.60 | | | | 474,140 | | | |
| Ireland | | | 1.81 | | | | 330,000 | | | |
| |
| |
| | | | 100.08 | % | | $ | 18,259,155 | | | |
| |
| |
See notes to financial statements5
Eaton Vance VT Worldwide Health Sciences Fund as of December 31, 2008
FINANCIAL STATEMENTS
Statement of Assets and Liabilities
| | | | | | | |
| As of December 31, 2008 | | | | | |
| |
| Assets |
| |
| Investments, at value (identified cost, $17,623,766) | | $ | 18,259,155 | | | |
| Cash | | | 8,826 | | | |
| Receivable for investments sold | | | 10,095 | | | |
| Dividends and interest receivable | | | 15,325 | | | |
| Tax reclaims receivable | | | 30,324 | | | |
| |
| |
Total assets | | $ | 18,323,725 | | | |
| |
| |
| | | | | | | |
| | | | | | | |
| |
| Liabilities |
| |
| Payable for Fund shares redeemed | | $ | 3,025 | | | |
| Payable to affiliate for investment adviser fee | | | 19,968 | | | |
| Payable to affiliate for distribution fees | | | 3,712 | | | |
| Payable to affiliate for Trustees’ fees | | | 261 | | | |
| Payable for shareholder servicing fees | | | 7,326 | | | |
| Accrued expenses | | | 44,194 | | | |
| |
| |
Total liabilities | | $ | 78,486 | | | |
| |
| |
Net Assets | | $ | 18,245,239 | | | |
| |
| |
| | | | | | | |
| | | | | | | |
| |
| Sources of Net Assets |
| |
| Paid-in capital | | $ | 16,427,271 | | | |
| Accumulated undistributed net realized gain (computed on the basis of identified cost) | | | 1,180,021 | | | |
| Net unrealized appreciation (computed on the basis of identified cost) | | | 637,947 | | | |
| |
| |
Total | | $ | 18,245,239 | | | |
| |
| |
| | | | | | | |
| | | | | | | |
| |
| Net Asset Value, Offering Price and Redemption Price Per Share |
| |
($18,245,239 ¸ 1,772,059 shares of beneficial interest outstanding) | | $ | 10.30 | | | |
| |
| |
Statement of Operations
| | | | | | | |
For the Year Ended
| | | | | |
| December 31, 2008 | | | | | |
| |
| Investment Income |
| |
| Dividends (net of foreign taxes, $13,444) | | $ | 239,229 | | | |
| Interest | | | 26,336 | | | |
| |
| |
Total investment income | | $ | 265,565 | | | |
| |
| |
| | | | | | | |
| | | | | | | |
| |
| Expenses |
| |
| Investment adviser fee | | $ | 204,144 | | | |
| Shareholder servicing fees | | | 30,533 | | | |
| Distribution fees | | | 51,061 | | | |
| Trustees’ fees and expenses | | | 823 | | | |
| Custodian fee | | | 42,019 | | | |
| Legal and accounting services | | | 38,131 | | | |
| Transfer and dividend disbursing agent fees | | | 11,979 | | | |
| Printing and postage | | | 317 | | | |
| Miscellaneous | | | 3,455 | | | |
| |
| |
Total expenses | | $ | 382,462 | | | |
| |
| |
| Deduct — | | | | | | |
| Reduction of custodian fee | | $ | 4,132 | | | |
| |
| |
Total expense reductions | | $ | 4,132 | | | |
| |
| |
| | | | | | | |
Net expenses | | $ | 378,330 | | | |
| |
| |
| | | | | | | |
Net investment loss | | $ | (112,765 | ) | | |
| |
| |
| | | | | | | |
| | | | | | | |
| |
| Realized and Unrealized Gain (Loss) |
| |
| Net realized gain (loss) — | | | | | | |
| Investment transactions (identified cost basis) | | $ | 1,351,252 | | | |
| Foreign currency transactions | | | (33,046 | ) | | |
| |
| |
Net realized gain | | $ | 1,318,206 | | | |
| |
| |
| Change in unrealized appreciation (depreciation) — | | | | | | |
| Investments (identified cost basis) | | $ | (3,095,837 | ) | | |
| Foreign currency | | | 569 | | | |
| |
| |
Net change in unrealized appreciation (depreciation) | | $ | (3,095,268 | ) | | |
| |
| |
| | | | | | | |
Net realized and unrealized loss | | $ | (1,777,062 | ) | | |
| |
| |
| | | | | | | |
Net decrease in net assets from operations | | $ | (1,889,827 | ) | | |
| |
| |
See notes to financial statements6
Eaton Vance VT Worldwide Health Sciences Fund as of December 31, 2008
FINANCIAL STATEMENTS CONT’D
Statements of Changes in Net Assets
| | | | | | | | | | | |
Increase (Decrease)
| | Year Ended
| | | Year Ended
| | | |
| in Net Assets | | December 31, 2008 | | | December 31, 2007 | | | |
| |
| |
| From operations — | | | | | | | | | | |
| Net investment loss | | $ | (112,765 | ) | | $ | (145,197 | ) | | |
| Net realized gain from investment transactions, disposal of an investment in violation of restrictions and net increase from payment by affiliate, and foreign currency transactions | | | 1,318,206 | | | | 3,031,672 | | | |
| Net change in unrealized appreciation (depreciation) from investments and foreign currency | | | (3,095,268 | ) | | | (1,360,697 | ) | | |
| |
| |
Net increase (decrease) in net assets from operations | | $ | (1,889,827 | ) | | $ | 1,525,778 | | | |
| |
| |
| Distributions to shareholders — | | | | | | | | | | |
| From net realized gain | | $ | (2,410,358 | ) | | $ | (206,765 | ) | | |
| |
| |
Total distributions to shareholders | | $ | (2,410,358 | ) | | $ | (206,765 | ) | | |
| |
| |
| Transactions in shares of beneficial interest — | | | | | | | | | | |
| Proceeds from sale of shares | | $ | 5,100,581 | | | $ | 2,021,809 | | | |
| Net asset value of shares issued to shareholders in payment of distributions declared | | | 2,410,358 | | | | 206,765 | | | |
| Cost of shares redeemed | | | (7,758,747 | ) | | | (6,610,938 | ) | | |
| |
| |
Net decrease in net assets from Fund share transactions | | $ | (247,808 | ) | | $ | (4,382,364 | ) | | |
| |
| |
| | | | | | | | | | | |
Net decrease in net assets | | $ | (4,547,993 | ) | | $ | (3,063,351 | ) | | |
| |
| |
| | | | | | | | | | | |
| | | | | | | | | | | |
| |
| Net Assets |
| |
| At beginning of year | | $ | 22,793,232 | | | $ | 25,856,583 | | | |
| |
| |
At end of year | | $ | 18,245,239 | | | $ | 22,793,232 | | | |
| |
| |
See notes to financial statements7
Eaton Vance VT Worldwide Health Sciences Fund as of December 31, 2008
FINANCIAL STATEMENTS CONT’D
Financial Highlights
| | | | | | | | | | | | | | | | | | | | | | | |
| | | Year Ended December 31, |
| | | |
| | | 2008 | | | 2007 | | | 2006 | | | 2005 | | | 2004 | | | |
| |
| Net asset value — Beginning of year | | $ | 12.660 | | | $ | 12.030 | | | $ | 12.030 | | | $ | 11.240 | | | $ | 10.580 | | | |
| |
| |
| | | | | | | | | | | | | | | | | | | | | | | |
| | | | | | | | | | | | | | | | | | | | | | | |
| |
| Income (loss) from operations |
| |
Net investment loss(1) | | $ | (0.060 | ) | | $ | (0.075 | ) | | $ | (0.077 | ) | | $ | (0.090 | ) | | $ | (0.127 | ) | | |
| Net realized and unrealized gain (loss) | | | (0.895 | ) | | | 0.808 | | | | 0.077 | | | | 0.880 | | | | 0.787 | | | |
| |
| |
Total income (loss) from operations | | $ | (0.955 | ) | | $ | 0.733 | | | $ | — | | | $ | 0.790 | | | $ | 0.660 | | | |
| |
| |
| | | | | | | | | | | | | | | | | | | | | | | |
| | | | | | | | | | | | | | | | | | | | | | | |
| |
| Less distributions |
| |
| From net realized gain | | $ | (1.405 | ) | | $ | (0.103 | ) | | $ | — | | | $ | — | | | $ | — | | | |
| |
| |
Total distributions | | $ | (1.405 | ) | | $ | (0.103 | ) | | $ | — | | | $ | — | | | $ | — | | | |
| |
| |
| | | | | | | | | | | | | | | | | | | | | | | |
Net asset value — End of year | | $ | 10.300 | | | $ | 12.660 | | | $ | 12.030 | | | $ | 12.030 | | | $ | 11.240 | | | |
| |
| |
| | | | | | | | | | | | | | | | | | | | | | | |
Total Return(2) | | | (7.08 | )% | | | 6.17 | %(4) | | | 0.00 | %(3) | | | 7.03 | % | | | 6.24 | % | | |
| |
| |
| | | | | | | | | | | | | | | | | | | | | | | |
| | | | | | | | | | | | | | | | | | | | | | | |
| |
| Ratios/Supplemental Data |
| |
| Net assets, end of year (000’s omitted) | | $ | 18,245 | | | $ | 22,793 | | | $ | 25,857 | | | $ | 28,949 | | | $ | 28,208 | | | |
| Ratios (As a percentage of average daily net assets): | | | | | | | | | | | | | | | | | | | | | | |
| Expenses before custodian fee reduction | | | 1.87 | % | | | 1.50 | %(5) | | | 1.61 | % | | | 1.72 | % | | | 1.88 | % | | |
| Expenses after custodian fee reduction | | | 1.85 | % | | | 1.50 | %(5) | | | 1.61 | % | | | 1.72 | % | | | 1.88 | % | | |
| Net investment loss | | | (0.55 | )% | | | (0.59 | )% | | | (0.65 | )% | | | (0.82 | )% | | | (1.18 | )% | | |
| Portfolio Turnover | | | 75 | % | | | 65 | % | | | 22 | % | | | 14 | % | | | 21 | % | | |
| |
| |
| | |
| (1) | | Computed using average shares outstanding. |
| |
| (2) | | Returns are historical and are calculated by determining the percentage change in net asset value with all distributions reinvested. |
| |
| (3) | | During the year ended December 31, 2006, the Fund realized a gain on the disposal of an investment security which did not meet investment guidelines. The gain was less than $0.01 per share and had no effect on total return. |
| |
| (4) | | During the year ended December 31, 2007, the investment adviser reimbursed the Fund for a net loss realized on the disposal of an investment security which did not meet investment guidelines. The loss was less than $0.01 per share and had no effect on total return. |
| |
| (5) | | The investment adviser waived a portion of its investment adviser fee (equal to less than 0.01% of average daily net assets for the year ended December 31, 2007). |
See notes to financial statements8
Eaton Vance VT Worldwide Health Sciences Fund as of December 31, 2008
NOTES TO FINANCIAL STATEMENTS
1 Significant Accounting Policies
Eaton Vance VT Worldwide Health Sciences Fund (the Fund) is a diversified series of Eaton Vance Variable Trust (the Trust). The Trust is a Massachusetts business trust registered under the Investment Company Act of 1940, as amended (the 1940 Act), as an open-end management investment company. The Fund’s investment objective is to seek long-term capital growth by investing in a worldwide and diversified portfolio of securities of health sciences companies. The Fund is generally made available for purchase only to separate accounts established by participating insurance companies and qualified pension or retirement plans.
The following is a summary of significant accounting policies of the Fund. The policies are in conformity with accounting principles generally accepted in the United States of America.
A Investment Valuation — Equity securities listed on a U.S. securities exchange generally are valued at the last sale price on the day of valuation or, if no sales took place on such date, at the mean between the closing bid and asked prices therefore on the exchange where such securities are principally traded. Equity securities listed on the NASDAQ Global or Global Select Market generally are valued at the NASDAQ official closing price. Unlisted or listed securities for which closing sales prices or closing quotations are not available are valued at the mean between the latest available bid and asked prices or, in the case of preferred equity securities that are not listed or traded in the over-the-counter market, by an independent pricing service. Short-term debt securities with a remaining maturity of sixty days or less are valued at amortized cost, which approximates market value. If short-term debt securities are acquired with a remaining maturity of more than sixty days, they will be valued by a pricing service. Foreign securities and currencies are valued in U.S. dollars, based on foreign currency exchange rate quotations supplied by an independent quotation service. The independent service uses a proprietary model to determine the exchange rate. Inputs to the model include reported trades and implied bid/ask spreads. The daily valuation of exchange-traded foreign securities generally is determined as of the close of trading on the principal exchange on which such securities trade. Events occurring after the close of trading on foreign exchanges may result in adjustments to the valuation of foreign securities to more accurately reflect their fair value as of the close of regular trading on the New York Stock Exchange. When valuing foreign equity securities that meet certain criteria, the Trustees have approved the use of a fair value service that values such securities to reflect market trading that occurs after the close of the applicable foreign markets of comparable securities or other instruments that have a strong correlation to the fair-valued securities. Investments for which valuations or market quotations are not readily available are valued at fair value using methods determined in good faith by or at the direction of the Trustees of the Fund considering relevant factors, data and information including the market value of freely tradable securities of the same class in the principal market on which such securities are normally traded.
B Investment Transactions — Investment transactions for financial statement purposes are accounted for on a trade date basis. Realized gains and losses on investments sold are determined on the basis of identified cost.
C Income — Dividend income is recorded on the ex-dividend date for dividends received in cash and/or securities. However, if the ex-dividend date has passed, certain dividends from foreign securities are recorded as the Fund is informed of the ex-dividend date. Withholding taxes on foreign dividends and capital gains have been provided for in accordance with the Fund’s understanding of the applicable countries’ tax rules and rates. Interest income is recorded on the basis of interest accrued, adjusted for amortization of premium or accretion of discount.
D Federal Taxes — The Fund’s policy is to comply with the provisions of the Internal Revenue Code applicable to regulated investment companies and to distribute to shareholders each year substantially all of its net investment income, and all or substantially all of its net realized capital gains. Accordingly, no provision for federal income or excise tax is necessary.
At December 31, 2008, the Fund had net capital losses of $329,501, attributable to security transactions incurred after October 31, 2008. These net capital losses are treated as arising on the first day of the Fund’s taxable year ending December 31, 2009.
As of December 31, 2008, the Fund had no uncertain tax positions that would require financial statement recognition, de-recognition, or disclosure. Each of the Fund’s federal tax returns filed in the 3-year period ended December 31, 2008 remains subject to examination by the Internal Revenue Service.
E Expenses — The majority of expenses of the Trust are directly identifiable to an individual fund. Expenses which are not readily identifiable to a specific fund are allocated taking into consideration, among other things, the nature and type of expense and the relative size of the funds.
F Expense Reduction — State Street Bank and Trust Company (SSBT) serves as custodian of the Fund.
9
Eaton Vance VT Worldwide Health Sciences Fund as of December 31, 2008
NOTES TO FINANCIAL STATEMENTS CONT’D
Pursuant to the custodian agreement, SSBT receives a fee reduced by credits, which are determined based on the average daily cash balance the Fund maintains with SSBT. All credit balances, if any, used to reduce the Fund’s custodian fees are reported as a reduction of expenses in the Statement of Operations.
G Foreign Currency Translation — Investment valuations, other assets, and liabilities initially expressed in foreign currencies are translated each business day into U.S. dollars based upon current exchange rates. Purchases and sales of foreign investment securities and income and expenses denominated in foreign currencies are translated into U.S. dollars based upon currency exchange rates in effect on the respective dates of such transactions. Recognized gains or losses on investment transactions attributable to changes in foreign currency exchange rates are recorded for financial statement purposes as net realized gains and losses on investments. That portion of unrealized gains and losses on investments that results from fluctuations in foreign currency exchange rates is not separately disclosed.
H Use of Estimates — The preparation of the financial statements in conformity with accounting principles generally accepted in the United States of America requires management to make estimates and assumptions that affect the reported amounts of assets and liabilities at the date of the financial statements and the reported amounts of income and expense during the reporting period. Actual results could differ from those estimates.
I Indemnifications — Under the Trust’s organizational documents, its officers and Trustees may be indemnified against certain liabilities and expenses arising out of the performance of their duties to the Fund, and shareholders are indemnified against personal liability for the obligations of the Trust. Additionally, in the normal course of business, the Fund enters into agreements with service providers that may contain indemnification clauses. The Fund’s maximum exposure under these arrangements is unknown as this would involve future claims that may be made against the Fund that have not yet occurred.
J Forward Foreign Currency Exchange Contracts — The Fund may enter into forward foreign currency exchange contracts for the purchase or sale of a specific foreign currency at a fixed price on a future date. The Fund may enter into forward contracts for hedging purposes as well as for non-hedging purposes. The forward foreign currency exchange contracts are adjusted by the daily exchange rate of the underlying currency and any gains or losses are recorded as unrealized until such time as the contracts have been closed or offset by another contract with the same broker for the same settlement date and currency. Risks may arise upon entering these contracts from the potential inability of counterparties to meet the terms of their contracts and from movements in the value of a foreign currency relative to the U.S. dollar.
2 Distributions to Shareholders
It is the present policy of the Fund to make at least one distribution annually (normally in December) of all or substantially all of its net investment income and to distribute annually all or substantially all of its net realized capital gains (reduced by available capital loss carryforwards from prior years, if any). Distributions to shareholders are recorded on the ex-dividend date. Shareholders may reinvest income and capital gain distributions in shares of the Fund at the net asset value on the ex-dividend date, or if an election is made on behalf of a separate account, to receive some or all of the distributions in cash. The Fund distinguishes between distributions on a tax basis and a financial reporting basis. Accounting principles generally accepted in the United States of America require that only distributions in excess of tax basis earnings and profits be reported in the financial statements as a return of capital. Permanent differences between book and tax accounting relating to distributions are reclassified to paid-in capital. For tax purposes, distributions from short-term capital gains are considered to be from ordinary income.
The tax character of distributions declared for the years ended December 31, 2008 and December 31, 2007 was as follows:
| | | | | | | | | | | |
| | | Year Ended December 31, |
| | | 2008 | | | 2007 | | | |
| |
| Distributions declared from: | | | | | | | | | | |
| Long-term capital gains | | $ | 2,410,358 | | | $ | 206,765 | | | |
During the year ended December 31, 2008, accumulated undistributed net realized gain was decreased by $116,306, accumulated net investment loss was decreased by $112,765, and paid-in capital was increased by $3,541 due to differences between book and tax accounting, primarily for net operating losses and foreign currency gain (loss). These reclassifications had no effect on the net assets or net asset value per share of the Fund.
As of December 31, 2008, the components of distributable earnings and unrealized appreciation (depreciation) on a tax basis were as follows:
| | | | | | | |
| Undistributed ordinary income | | $ | 406,441 | | | |
| Undistributed net realized gain | | $ | 1,117,831 | | | |
| Net unrealized appreciation | | $ | 623,197 | | | |
| Post October losses | | $ | (329,501 | ) | | |
10
Eaton Vance VT Worldwide Health Sciences Fund as of December 31, 2008
NOTES TO FINANCIAL STATEMENTS CONT’D
The differences between components of distributable earnings (accumulated losses) on a tax basis and the amounts reflected in the Statement of Assets and Liabilities are primarily due to wash sales and short-term capital gains.
3 Investment Adviser Fee and Other Transactions with Affiliates
The investment adviser fee is earned by OrbiMed Advisors, LLC (OrbiMed) as compensation for investment advisory services rendered to the Fund. The fee is computed at the annual rate of 1% of the Fund’s first $30 million in average daily net assets, 0.90% of the next $20 million in average daily net assets, 0.75% of the next $450 million in average daily net assets, and 0.70% of the next $500 million in average daily net assets, and is payable monthly. The fee rate declines for net assets of $1 billion and greater. In addition, effective May 1, 2002, OrbiMed’s fee is subject to an upward or downward performance fee adjustment of up to 0.25% of the average daily net assets of the Fund based upon the investment performance of the Fund compared to the Standard & Poor’s 500 Index over a 36-month performance period. For the year ended December 31, 2008, the investment adviser fee, net of a downward performance adjustment of $100 was equivalent to 1.00% per annum of the Fund’s average daily net assets and amounted to $204,144. Eaton Vance Management (EVM) also serves as administrator of the Fund, but receives no compensation. Eaton Vance Distributors, Inc. (EVD), the Fund’s principal underwriter and an affiliate of EVM, received distribution fees (see Note 4).
Except for Trustees of the Fund who are not members of OrbiMed’s or EVM’s organizations, officers and Trustees receive remuneration for their services to the Fund out of the investment advisor fee. Certain officers and Trustees of the Fund are officers of the above organizations.
4 Distribution Plan
The Fund has in effect a distribution plan pursuant to Rule 12b-1 under the 1940 Act. The distribution plan allows the Fund to pay EVD a distribution fee of 0.25% per annum of its average daily net assets for the sale and distribution of Fund shares. Distribution fees for the year ended December 31, 2008 amounted to $51,061. Insurance companies receive such fees from EVD based on the value of shares held by such companies. The insurance companies through which investors hold shares of the Fund may also pay fees to third parties in connection with the sale of variable contracts and for services provided to variable contract owners. The Fund, EVM or EVD are not a party to these arrangements. Investors should consult the prospectus and statement of additional information for their variable contracts for a discussion of these payments. EVD may, at its expense, provide promotional incentives to dealers that sell variable insurance products.
5 Shareholder Servicing Plan
The Trust, on behalf of the Fund, has adopted a Shareholder Servicing Plan (“Servicing Plan”). The Servicing Plan allows the Trust to enter into shareholder servicing agreements with insurance companies, investment dealers, broker dealers or other financial intermediaries that provide shareholder services relating to Fund shares and their shareholders including variable contract owners or plan participants with interests in the Fund. Under the Servicing Plan, the Fund may make payments at an annual rate of up to 0.25% of the Fund’s average daily net assets attributable to its shares that are subject to shareholder servicing agreements. For the year ended December 31, 2008, shareholder servicing fees were equivalent to 0.15% per annum of the Fund’s average daily net assets and amounted to $30,533.
6 Purchases and Sales of Investments
Purchases and sales of investments, other than short-term obligations, aggregated $14,737,060 and $16,144,131, respectively, for the year ended December 31, 2008.
7 Shares of Beneficial Interest
The Fund’s Declaration of Trust permits the Trustees to issue an unlimited number of full and fractional shares of beneficial interest (without par value). Such shares may be issued in a number of different series (such as the Fund). Transactions in Fund shares were as follows:
| | | | | | | | | | | |
| | | Year Ended December 31, |
| | | 2008 | | | 2007 | | | |
| |
| Sales | | | 461,135 | | | | 159,684 | | | |
| Issued to shareholders electing to receive payments of distributions in Fund shares | | | 243,717 | | | | 17,886 | | | |
| Redemptions | | | (733,912 | ) | | | (526,535 | ) | | |
| |
| |
Net decrease | | | (29,060 | ) | | | (348,965 | ) | | |
| |
| |
At December 31, 2008, separate accounts of two insurance companies owned 60% and 40%, respectively, of the outstanding shares of the Fund.
11
Eaton Vance VT Worldwide Health Sciences Fund as of December 31, 2008
NOTES TO FINANCIAL STATEMENTS CONT’D
8 Federal Income Tax Basis of Investments
The cost and unrealized appreciation (depreciation) of investments of the Fund at December 31, 2008, as determined on a federal income tax basis, were as follows:
| | | | | | | |
Aggregate cost | | $ | 17,638,516 | | | |
| |
| |
| Gross unrealized appreciation | | $ | 3,043,260 | | | |
| Gross unrealized depreciation | | | (2,422,621 | ) | | |
| |
| |
Net unrealized appreciation | | $ | 620,639 | | | |
| |
| |
9 Line of Credit
The Fund participates with other portfolios and funds managed by EVM and its affiliates in a $450 million unsecured line of credit agreement with a group of banks. Borrowings are made by the Fund solely to facilitate the handling of unusual and/or unanticipated short-term cash requirements. Interest is charged to the Fund based on its borrowings at an amount above either the Eurodollar rate or Federal Funds rate. In addition, a fee computed at an annual rate of 0.10% on the daily unused portion of the line of credit is allocated among the participating portfolios and funds at the end of each quarter. The Fund did not have any significant borrowings or allocated fees during the year ended December 31, 2008.
10 Risks Associated with Foreign Investments
Investing in securities issued by companies whose principal business activities are outside the United States may involve significant risks not present in domestic investments. For example, there is generally less publicly available information about foreign companies, particularly those not subject to the disclosure and reporting requirements of the U.S. securities laws. Certain foreign issuers are generally not bound by uniform accounting, auditing, and financial reporting requirements and standards of practice comparable to those applicable to domestic issuers. Investments in foreign securities also involve the risk of possible adverse changes in investment or exchange control regulations, expropriation or confiscatory taxation, limitation on the removal of funds or other assets of the Fund, political or financial instability or diplomatic and other developments which could affect such investments. Foreign stock markets, while growing in volume and sophistication, are generally not as developed as those in the United States, and securities of some foreign issuers (particularly those located in developing countries) may be less liquid and more volatile than securities of comparable U.S. companies. In general, there is less overall governmental supervision and regulation of foreign securities markets, broker-dealers and issuers than in the United States.
11 Concentration of Risk
As the Fund concentrates its investments in medical research and the health care industry, it will likely be affected by events that adversely affect that industry. The Fund has historically held fewer than 60 stocks at any one time; therefore, it is more sensitive to developments affecting particular stocks that would be a more broadly diversified fund. These developments include product obsolescence, the failure of the issuer to develop new products and the expiration of patent rights. The value of the Fund’s shares can also be impacted by regulatory activities that affect health sciences companies.
12 Fair Value Measurements
The Fund adopted Financial Accounting Standards Board Statement of Financial Accounting Standards No. 157 (FAS 157), “Fair Value Measurements”, effective January 1, 2008. FAS 157 established a three-tier hierarchy to prioritize the assumptions, referred to as inputs, used in valuation techniques to measure fair value. The three-tier hierarchy of inputs is summarized in the three broad levels listed below.
| | |
| | • | Level 1 — quoted prices in active markets for identical investments |
| | • | Level 2 — other significant observable inputs (including quoted prices for similar investments, interest rates, prepayment speeds, credit risk, etc.) |
| | • | Level 3 — significant unobservable inputs (including a fund’s own assumptions in determining the fair value of investments) |
The inputs or methodology used for valuing securities are not necessarily an indication of the risk associated with investing in those securities.
At December 31, 2008, the inputs used in valuing the Fund’s investments, which are carried at value, were as follows:
| | | | | | | | | |
| | | | | Investments in
| | | |
| | | Valuation Inputs | | Securities | | | |
| |
| Level 1 | | Quoted Prices | | $ | 15,622,658 | | | |
| Level 2 | | Other Significant Observable Inputs | | | 2,636,497 | | | |
| Level 3 | | Significant Unobservable Inputs | | | — | | | |
| |
| |
Total | | | | $ | 18,259,155 | | | |
| |
| |
The Fund held no investments or other financial instruments as of December 31, 2007 whose fair value was determined using Level 3 inputs.
12
Eaton Vance VT Worldwide Health Sciences Fund as of December 31, 2008
REPORT OF INDEPENDENT REGISTERED PUBLIC ACCOUNTING FIRM
To the Trustees of Eaton Vance Variable Trust and Shareholders of Eaton Vance VT Worldwide Health Sciences Fund:
We have audited the accompanying statement of assets and liabilities of Eaton Vance VT Worldwide Health Sciences Fund (the “Fund”) (one of the series constituting the Eaton Vance Variable Trust), including the portfolio of investments, as of December 31, 2008, the related statement of operations for the year then ended, and the statements of changes in net assets and the financial highlights for each of the two years in the period then ended. These financial statements and financial highlights are the responsibility of the Fund’s management. Our responsibility is to express an opinion on these financial statements and financial highlights based on our audits. The financial highlights for the year ended December 31, 2006, and all prior periods presented were audited by other auditors. Those auditors expressed an unqualified opinion on those financial highlights in their report dated February 16, 2007.
We conducted our audits in accordance with the standards of the Public Company Accounting Oversight Board (United States). Those standards require that we plan and perform the audit to obtain reasonable assurance about whether the financial statements and financial highlights are free of material misstatement. The Fund is not required to have, nor were we engaged to perform, an audit of its internal control over financial reporting. Our audits included consideration of internal control over financial reporting as a basis for designing audit procedures that are appropriate in the circumstances, but not for the purpose of expressing an opinion on the effectiveness of the Fund’s internal control over financial reporting. Accordingly, we express no such opinion. An audit also includes examining, on a test basis, evidence supporting the amounts and disclosures in the financial statements, assessing the accounting principles used and significant estimates made by management, as well as evaluating the overall financial statement presentation. Our procedures included confirmation of securities owned as of December 31, 2008, by correspondence with the custodian. We believe that our audits provide a reasonable basis for our opinion.
In our opinion, the financial statements and financial highlights referred to above present fairly, in all material respects, the financial position of Eaton Vance VT Worldwide Health Sciences Fund as of December 31, 2008, the results of its operations for the year then ended, and the changes in its net assets and the financial highlights for each of the two years in the period then ended, in conformity with accounting principles generally accepted in the United States of America.
DELOITTE & TOUCHE LLP
Boston, Massachusetts
February 16, 2009
13
Eaton Vance VT Worldwide Health Sciences Fund as of December 31, 2008
FEDERAL TAX INFORMATION (Unaudited)
As required by the Internal Revenue Code regulations, shareholders must be notified within 60 days of the Fund’s fiscal year end regarding the status of capital gains dividends.
Capital Gains Dividends. The Fund designates $2,413,899 as a capital gain dividend.
14
Eaton Vance VT Worldwide Health Sciences Fund
SPECIAL MEETING OF SHAREHOLDERS (Unaudited)
The Fund held a Special Meeting of Shareholders on November 14, 2008 to elect Trustees. The results of the vote were as follows:
| | | | | | | | | | | |
| | | Number of Shares | | | |
| Nominee for Trustee | | For | | | Withheld | | | |
| |
| |
| Benjamin C. Esty | | | 1,859,030 | | | | 150,913 | | | |
| Thomas E. Faust Jr. | | | 1,862,406 | | | | 147,537 | | | |
| Allen R. Freedman | | | 1,854,473 | | | | 155,469 | | | |
| William H. Park | | | 1,862,759 | | | | 147,184 | | | |
| Ronald A. Pearlman | | | 1,866,973 | | | | 142,970 | | | |
| Helen Frame Peters | | | 1,854,473 | | | | 155,469 | | | |
| Heidi L. Steiger | | | 1,858,202 | | | | 151,740 | | | |
| Lynn A. Stout | | | 1,862,759 | | | | 147,184 | | | |
| Ralph F. Verni | | | 1,862,759 | | | | 147,184 | | | |
15
Eaton Vance VT Worldwide Health Sciences Fund
BOARD OF TRUSTEES’ ANNUAL APPROVAL OF THE INVESTMENT ADVISORY AGREEMENT
Overview of the Contract Review Process
The Investment Company Act of 1940, as amended (the “1940 Act”), provides, in substance, that each investment advisory agreement between a fund and its investment adviser will continue in effect from year to year only if its continuance is approved at least annually by the fund’s board of trustees, including by a vote of a majority of the trustees who are not “interested persons” of the fund (“Independent Trustees”), cast in person at a meeting called for the purpose of considering such approval.
At a meeting of the Boards of Trustees (each a “Board”) of the Eaton Vance group of mutual funds (the “Eaton Vance Funds”) held on April 21, 2008, the Board, including a majority of the Independent Trustees, voted to approve continuation of existing advisory and sub-advisory agreements for the Eaton Vance Funds for an additional one-year period. In voting its approval, the Board relied upon the affirmative recommendation of the Contract Review Committee of the Board (formerly the Special Committee), which is a committee comprised exclusively of Independent Trustees. Prior to making its recommendation, the Contract Review Committee reviewed information furnished for a series of meetings of the Contract Review Committee held in February, March and April 2008. Such information included, among other things, the following:
Information about Fees, Performance and Expenses
| | |
| | • | An independent report comparing the advisory and related fees paid by each fund with fees paid by comparable funds; |
| | • | An independent report comparing each fund’s total expense ratio and its components to comparable funds; |
| | • | An independent report comparing the investment performance of each fund to the investment performance of comparable funds over various time periods; |
| | • | Data regarding investment performance in comparison to relevant peer groups of funds and appropriate indices; |
| | • | Comparative information concerning fees charged by each adviser for managing other mutual funds and institutional accounts using investment strategies and techniques similar to those used in managing the fund; |
| | • | Profitability analyses for each adviser with respect to each fund; |
Information about Portfolio Management
| | |
| | • | Descriptions of the investment management services provided to each fund, including the investment strategies and processes employed, and any changes in portfolio management processes and personnel; |
| | • | Information concerning the allocation of brokerage and the benefits received by each adviser as a result of brokerage allocation, including information concerning the acquisition of research through “soft dollar” benefits received in connection with the funds’ brokerage, and the implementation of a soft dollar reimbursement program established with respect to the funds; |
| | • | Data relating to portfolio turnover rates of each fund; |
| | • | The procedures and processes used to determine the fair value of fund assets and actions taken to monitor and test the effectiveness of such procedures and processes; |
Information about each Adviser
| | |
| | • | Reports detailing the financial results and condition of each adviser; |
| | • | Descriptions of the qualifications, education and experience of the individual investment professionals whose responsibilities include portfolio management and investment research for the funds, and information relating to their compensation and responsibilities with respect to managing other mutual funds and investment accounts; |
| | • | Copies of the Codes of Ethics of each adviser and its affiliates, together with information relating to compliance with and the administration of such codes; |
| | • | Copies of or descriptions of each adviser’s proxy voting policies and procedures; |
| | • | Information concerning the resources devoted to compliance efforts undertaken by each adviser and its affiliates on behalf of the funds (including descriptions of various compliance programs) and their record of compliance with investment policies and restrictions, including policies with respect to market-timing, late trading and selective portfolio disclosure, and with policies on personal securities transactions; |
| | • | Descriptions of the business continuity and disaster recovery plans of each adviser and its affiliates; |
Other Relevant Information
| | |
| | • | Information concerning the nature, cost and character of the administrative and other non-investment management services provided by Eaton Vance Management and its affiliates; |
| | • | Information concerning management of the relationship with the custodian, subcustodians and fund accountants by each adviser or the funds’ administrator; and |
| | • | The terms of each advisory agreement. |
16
Eaton Vance VT Worldwide Health Sciences Fund
BOARD OF TRUSTEES’ ANNUAL APPROVAL OF THE INVESTMENT ADVISORY AGREEMENT CONT’D
In addition to the information identified above, the Contract Review Committee considered information provided from time to time by each adviser throughout the year at meetings of the Board and its committees. Over the course of the twelve-month period ended April 30, 2008, the Board met eleven times and the Contract Review Committee, the Audit Committee and the Governance Committee, each of which is a Committee comprised solely of Independent Trustees, met twelve, seven and five times, respectively. At such meetings, the Trustees received, among other things, presentations by the portfolio managers and other investment professionals of each adviser relating to the investment performance of each fund and the investment strategies used in pursuing the fund’s investment objective. The Portfolio Management Committee and the Compliance Reports and Regulatory Matters Committee are newly established and did not meet during the twelve-month period ended April 30, 2008.
For funds that invest through one or more underlying portfolios, the Board considered similar information about the portfolio(s) when considering the approval of advisory agreements. In addition, in cases where the fund’s investment adviser has engaged a sub-adviser, the Board considered similar information about the sub-adviser when considering the approval of any sub-advisory agreement.
The Contract Review Committee was assisted throughout the contract review process by Goodwin Procter LLP, legal counsel for the Independent Trustees. The members of the Contract Review Committee relied upon the advice of such counsel and their own business judgment in determining the material factors to be considered in evaluating each advisory and sub-advisory agreement and the weight to be given to each such factor. The conclusions reached with respect to each advisory and sub-advisory agreement were based on a comprehensive evaluation of all the information provided and not any single factor. Moreover, each member of the Contract Review Committee may have placed varying emphasis on particular factors in reaching conclusions with respect to each advisory and sub-advisory agreement.
Results of the Process
Based on its consideration of the foregoing, and such other information as it deemed relevant, including the factors and conclusions described below, the Contract Review Committee concluded that the continuance of the investment advisory agreement of the Eaton Vance VT Worldwide Health Sciences Fund (the “Fund”) with OrbiMed Advisors, LLC (the “Adviser”) as well as the administrative services agreement of the Fund with Eaton Vance Management (the “Administrator”), including their fee structures, is in the interests of shareholders and, therefore, the Contract Review Committee recommended to the Board approval of the agreements. The Board accepted the recommendation of the Contract Review Committee as well as the factors considered and conclusions reached by the Contract Review Committee with respect to the agreements. Accordingly, the Board, including a majority of the Independent Trustees, voted to approve continuation of the investment advisory agreement and the administrative services agreement.
Nature, Extent and Quality of Services
In considering whether to approve the investment advisory agreement and the administrative services agreement, the Board evaluated the nature, extent and quality of services provided to the Fund by the Adviser and the Administrator.
The Board considered the Adviser’s and the Administrator’s management capabilities and investment process with respect to the types of investments held by the Fund, including the education, experience and number of its investment professionals and other personnel who provide portfolio management, investment research, and similar services to the Fund. The Board noted the Adviser’s experience in managing health sciences portfolios and the experience of the large group of professional and support staff including portfolio managers, traders and analysts who provide services under the investment advisory agreement. The Board evaluated the level of skill and expertise required to manage the Fund and concluded that the human resources available at the Adviser were appropriate to fulfill effectively its duties on behalf of the Fund. The Board also took into account the resources dedicated to portfolio management and other services, including the compensation paid to recruit and retain investment personnel, and the time and attention devoted to the Fund by senior management.
The Board also reviewed the compliance programs of the Adviser, the Administrator and their respective affiliates. Among other matters, the Board considered compliance and reporting matters relating to personal trading by investment personnel, selective disclosure of portfolio holdings, late trading, frequent trading, portfolio valuation, business continuity and the allocation of investment opportunities. The Board also evaluated the responses of the Adviser and Administrator and their affiliates to requests from regulatory authorities such as the Securities and Exchange Commission.
After consideration of the foregoing factors, among others, the Board concluded that the nature, extent and quality of services provided by the Adviser and the Administrator, taken as a whole, are appropriate and consistent with the terms of the investment advisory agreement and the administrative services agreement, respectively.
17
Eaton Vance VT Worldwide Health Sciences Fund
BOARD OF TRUSTEES’ ANNUAL APPROVAL OF THE INVESTMENT ADVISORY AGREEMENT CONT’D
Fund Performance
The Board compared the Fund’s investment performance to a relevant universe of similarly managed funds identified by an independent data provider and appropriate benchmark indices. The Board reviewed comparative performance data for the one-, three- and five-year periods ended September 30, 2007 for the Fund. The Board noted that the Fund’s performance relative to its peers was affected by the Adviser’s focus on pharmaceutical and biotechnology companies, which have in recent periods underperformed other types of health sciences companies. The Board concluded that it would be appropriate to allow additional time to evaluate the effectiveness of this investment focus in generating satisfactory long-term performance results.
Management Fees and Expenses
The Board reviewed contractual investment advisory fee rates, including any administrative fee rates, payable by the Fund (referred to collectively as “management fees”). As part of its review, the Board considered the management fees and the Fund’s total expense ratio for the year ended September 30, 2007, as compared to a group of similarly managed funds selected by an independent data provider. The Board noted that the advisory fee includes a performance-based component that is intended to align the interests of the Adviser with the interests of shareholders.
After reviewing the foregoing information, and in light of the nature, extent and quality of the services provided by the Adviser and the Administrator, the Board concluded that the management fees charged for advisory and related services and the Fund’s total expense ratio are reasonable.
Profitability
The Board reviewed the level of profits realized by the Adviser and the Administrator and their respective affiliates in providing investment advisory and administrative services to the Fund and the Fund and to all Eaton Vance Funds as a group. The Board considered the level of profits realized by the Adviser or the Administrator without regard to revenue sharing or other payments by such party in respect of distribution services. The Board also considered other direct or indirect benefits received by the Adviser or the Administrator in connection with their relationships with the Fund, including the benefits to the Adviser of research services that may be available as a result of securities transactions effected for the Fund and other investment advisory clients and the benefits to the Administrator and its affiliates of payments by the Adviser to an affiliate of the Administrator to support marketing of the Fund.
The Board concluded that, in light of the foregoing factors and the nature, extent and quality of the services rendered, the profits realized by the Adviser and the Administrator are reasonable.
Economies of Scale
In reviewing management fees and profitability, the Board also considered the extent to which the Adviser and the Administrator, on the one hand, and the Fund, on the other hand, can expect to realize benefits from economies of scale as the assets of the Fund increase. The Board acknowledged the difficulty in accurately measuring the benefits resulting from the economies of scale with respect to the management of any specific fund or group of funds. The Board reviewed data summarizing the increases and decreases in the assets of the Fund and of all Eaton Vance Funds as a group over various time periods, and evaluated the extent to which the total expense ratio of the Fund and the Adviser’s and the Administrator’s profitability may have been affected by such increases or decreases. Based upon the foregoing, the Board concluded that the benefits from economies of scale are currently being shared equitably by the Adviser and the Administrator, on the one hand, and the Fund on the other hand. The Board also concluded that the structure of the investment advisory fee, which includes breakpoints at several asset levels, can be expected to cause such benefits to continue to be shared equitably.
18
Eaton Vance VT Worldwide Health Sciences Fund
MANAGEMENT AND ORGANIZATION
Fund Management. The Trustees of Eaton Vance Variable Trust (the Trust) are responsible for the overall management and supervision of the Trust’s affairs. The Trustees and officers of the Trust are listed below. Except as indicated, each individual has held the office shown or other offices in the same company for the last five years. Trustees and officers of the Trust hold indefinite terms of office. The “noninterested Trustees” consist of those Trustees who are not “interested persons” of the Trust, as that term is defined under the 1940 Act. The business address of each Trustee and officer is The Eaton Vance Building, 255 State Street, Boston, Massachusetts 02109 until March 22, 2009 and thereafter at Two International Place, Boston, Massachusetts 02110. As used below, “EVC” refers to Eaton Vance Corp., “EV” refers to Eaton Vance, Inc., “EVM” refers to Eaton Vance Management, “BMR” refers to Boston Management and Research, “EVD” refers to Eaton Vance Distributors, Inc., and “OrbiMed” refers to OrbiMed Advisors, LLC. EVC and EV are the corporate parent and trustee, respectively, of EVM and BMR. EVD is the Fund’s principal underwriter and a wholly-owned subsidiary of EVC. Each officer affiliated with Eaton Vance may hold a position with other Eaton Vance affiliates that is comparable to his or her position with EVM listed below.
| | | | | | | | | | | | | |
| | | | | Term of
| | | | Number of Portfolios
| | | |
| | | Position(s)
| | Office and
| | | | in Fund Complex
| | | |
Name and
| | with the
| | Length of
| | Principal Occupation(s)
| | Overseen By
| | | |
| Date of Birth | | Trust | | Service | | During Past Five Years | | Trustee(1) | | | Other Directorships Held |
| |
| |
| |
| Interested Trustee |
| | | | | | | | | | | | | |
Thomas E. Faust Jr.
5/31/58 | | Trustee | | Since 2007 | | Chairman, Chief Executive Officer and President of EVC, Director and President of EV, Chief Executive Officer and President of EVM and BMR, and Director of EVD. Trustee and/or Officer of 173 registered investment companies and 4 private investment companies managed by EVM or BMR. Mr. Faust is an interested person because of his positions with EVM, BMR, EVD, EVC and EV, which are affiliates of the Trust. | | | 173 | | | Director of EVC |
| |
| Noninterested Trustees |
| | | | | | | | | | | | | |
Benjamin C. Esty
1/2/63 | | Trustee | | Since 2005 | | Roy and Elizabeth Simmons Professor of Business Administration, Harvard University Graduate School of Business Administration. | | | 173 | | | None |
| | | | | | | | | | | | | |
Allen R. Freedman
4/3/40 | | Trustee | | Since 2007 | | Former Chairman (2002-2004) and a Director (1983-2004) of Systems & Computer Technology Corp. (provider of software to higher education). Formerly, a Director of Loring Ward International (fund distributor) (2005-2007). Formerly, Chairman and a Director of Indus International, Inc. (provider of enterprise management software to the power generating industry) (2005-2007). | | | 173 | | | Director of Assurant, Inc. (insurance provider) and Stonemor Partners L.P. (owner and operator of cemeteries) |
| | | | | | | | | | | | | |
William H. Park
9/19/47 | | Trustee | | Since 2003 | | Vice Chairman, Commercial Industrial Finance Corp. (specialty finance company) (since 2006). Formerly, President and Chief Executive Officer, Prizm Capital Management, LLC (investment management firm) (2002-2005). | | | 173 | | | None |
| | | | | | | | | | | | | |
Ronald A. Pearlman
7/10/40 | | Trustee | | Since 2003 | | Professor of Law, Georgetown University Law Center. | | | 173 | | | None |
| | | | | | | | | | | | | |
Helen Frame Peters
3/22/48 | | Trustee | | Since 2008 | | Professor of Finance, Carroll School of Management, Boston College. Adjunct Professor of Finance, Peking University, Beijing, China (since 2005). | | | 173 | | | Director of Federal Home Loan Bank of Boston (a bank for banks) and BJ’s Wholesale Club (wholesale club retailer); Trustee of SPDR Index Shares Funds and SPDR Series Trust (exchange traded funds) |
| | | | | | | | | | | | | |
Heidi L. Steiger
7/8/53 | | Trustee | | Since 2007 | | Managing Partner, Topridge Associates LLC (global wealth management firm) (since 2008); Senior Advisor (since 2008), President (2005-2008), Lowenhaupt Global Advisors, LLC (global wealth management firm). Formerly, President and Contributing Editor, Worth Magazine (2004-2005). Formerly, Executive Vice President and Global Head of Private Asset Management (and various other positions), Neuberger Berman (investment firm) (1986-2004). | | | 173 | | | Director of Nuclear Electric Insurance Ltd. (nuclear insurance provider) and Aviva USA (insurance provider) |
19
Eaton Vance VT Worldwide Health Sciences Fund
MANAGEMENT AND ORGANIZATION CONT’D
| | | | | | | | | | | | | |
| | | | | Term of
| | | | Number of Portfolios
| | | |
| | | Position(s)
| | Office and
| | | | in Fund Complex
| | | |
Name and
| | with the
| | Length of
| | Principal Occupation(s)
| | Overseen By
| | | |
| Date of Birth | | Trust | | Service | | During Past Five Years | | Trustee(1) | | | Other Directorships Held |
| |
| |
| Noninterested Trustees (continued) |
| | | | | | | | | | | | | |
Lynn A. Stout
9/14/57 | | Trustee | | Since 2000 | | Paul Hastings Professor of Corporate and Securities Law (since 2006) and Professor of Law (2001- 2006), University of California at Los Angeles School of Law. | | | 173 | | | None |
| | | | | | | | | | | | | |
Ralph F. Verni
1/26/43 | | Chairman of
the Board
and Trustee | | Chairman of the Board since 2007 and Trustee since 2005 | | Consultant and private investor. | | | 173 | | | None |
Principal Officers who are not Trustees
| | | | | | | |
| | | | | Term of
| | |
| | | Position(s)
| | Office and
| | |
Name and
| | with the
| | Length of
| | Principal Occupation(s)
|
| Date of Birth | | Trust | | Service | | During Past Five Years |
| |
| | | | | | | |
Duncan W. Richardson
10/26/57 | | President | | Since 2008(2) | | Executive Vice President and Chief Equity Investment Officer of EVC, EVM and BMR. Officer of 81 registered investment companies managed by EVM or BMR. |
| | | | | | | |
Samuel D. Isaly
3/12/45 | | Vice President | | Since 2000 | | Managing Partner of OrbiMed. Officer of 4 registered investment companies managed by EVM or BMR. |
| | | | | | | |
Michael R. Mach
7/15/47 | | Vice President | | Since 2006 | | Vice President of EVM and BMR. Officer of 24 registered investment companies managed by EVM or BMR. |
| | | | | | | |
Scott H. Page
11/30/59 | | Vice President | | Since 2000 | | Vice President of EVM and BMR. Officer of 11 registered investment companies managed by EVM or BMR. |
| | | | | | | |
Craig P. Russ
10/30/63 | | Vice President | | Since 2000 | | Vice President of EVM and BMR. Officer of 6 registered investment companies managed by EVM or BMR. |
| | | | | | | |
Andrew N. Sveen
3/13/61 | | Vice President | | Since 2008 | | Vice President of EVM and BMR. Officer of 4 registered investment companies managed by EVM or BMR. |
| | | | | | | |
Barbara E. Campbell
6/19/57 | | Treasurer | | Since 2005 | | Vice President of EVM and BMR. Officer of 173 registered investment companies managed by EVM or BMR. |
| | | | | | | |
Maureen A. Gemma
5/24/60 | | Secretary and Chief Legal Officer | | Secretary since 2007 and Chief Legal Officer since 2008 | | Vice President of EVM and BMR. Officer of 173 registered investment companies managed by EVM or BMR. |
| | | | | | | |
Paul M. O’Neil
7/11/53 | | Chief
Compliance Officer | | Since 2004 | | Vice President of EVM and BMR. Officer of 173 registered investment companies managed by EVM or BMR. |
| | |
| (1) | | Includes both master and feeder funds in a master-feeder structure. |
| |
| (2) | | Prior to 2008, Mr. Richardson served as a Vice President since 2000. |
The SAI for the Fund includes additional information about the Trustees and officers of the Fund and can be obtained without charge on Eaton Vance’s website at www.eatonvance.com or by calling 1-800-262-1122.
20
Investment Adviser of Eaton Vance VT Worldwide Health Sciences Fund
OrbiMed Advisors, LLC
767 3rd Avenue
New York, NY 10017
Administrator of Eaton Vance VT Worldwide Health Sciences FundEaton Vance Management
The Eaton Vance Building
255 State Street
Boston, MA 02109
Eaton Vance Distributors, Inc.
The Eaton Vance Building
255 State Street
Boston, MA 02109
(617) 482-8260
State Street Bank and Trust Company
200 Clarendon Street
Boston, MA 02116
State Street Bank and Trust Company
200 Clarendon Street
Boston, MA 02116
Independent Registered Public Accounting FirmDeloitte & Touche LLP
200 Berkeley Street
Boston, MA 02116-5022
Eaton Vance VT Worldwide Health Sciences Fund
The Eaton Vance Building
255 State Street
Boston, MA 02109
The report is prepared for the general information of contract owners. It is authorized for distribution to prospective investors only when preceded or accompanied by a current prospectus. Before investing, investors should consider carefully the Fund’s investment objective(s), risks, and charges and expenses. The Fund’s current prospectus contains this and other information about the Fund and is available through your financial advisor. Please read the prospectus carefully before you invest or send money. For further information please call 1-800-262-1122.
| Eaton Vance Investment Managers Annual Report December 31, 2008 EATON VANCE VT LARGE-CAP VALUE FUND 2990-x-xx___VTLCVSRC |
IMPORTANT NOTICES REGARDING PRIVACY,
DELIVERY OF SHAREHOLDER DOCUMENTS,
PORTFOLIO HOLDINGS, AND PROXY VOTING
Privacy. The Eaton Vance organization is committed to ensuring your financial privacy. Each of the financial institutions identified below has in effect the following policy (“Privacy Policy”) with respect to nonpublic personal information about its customers:
| | |
| | • | Only such information received from you, through application forms or otherwise, and information about your Eaton Vance fund transactions will be collected. This may include information such as name, address, social security number, tax status, account balances and transactions. |
| |
| | • | None of such information about you (or former customers) will be disclosed to anyone, except as permitted by law (which includes disclosure to employees necessary to service your account). In the normal course of servicing a customer’s account, Eaton Vance may share information with unaffiliated third parties that perform various required services such as transfer agents, custodians and broker/dealers. |
| |
| | • | Policies and procedures (including physical, electronic and procedural safeguards) are in place that are designed to protect the confidentiality of such information. |
| |
| | • | We reserve the right to change our Privacy Policy at any time upon proper notification to you. Customers may want to review our Policy periodically for changes by accessing the link on our homepage: www.eatonvance.com. |
Our pledge of privacy applies to the following entities within the Eaton Vance organization: the Eaton Vance Family of Funds, Eaton Vance Management, Eaton Vance Investment Counsel, Boston Management and Research, and Eaton Vance Distributors, Inc.
In addition, our Privacy Policy only applies to those Eaton Vance customers who are individuals and who have a direct relationship with us. If a customer’s account (i.e., fund shares) is held in the name of a third-party financial adviser/broker-dealer, it is likely that only such adviser’s privacy policies apply to the customer. This notice supersedes all previously issued privacy disclosures.
For more information about Eaton Vance’s Privacy Policy, please call 1-800-262-1122.
Delivery of Shareholder Documents. The Securities and Exchange Commission (the “SEC”) permits funds to deliver only one copy of shareholder documents, including prospectuses, proxy statements and shareholder reports, to fund investors with multiple accounts at the same residential or post office box address. This practice is often called “householding” and it helps eliminate duplicate mailings to shareholders.
Eaton Vance, or your financial adviser, may household the mailing of your documents indefinitely unless you instruct Eaton Vance, or your financial adviser, otherwise.
If you would prefer that your Eaton Vance documents not be householded, please contact Eaton Vance at 1-800-262-1122, or contact your financial adviser.
Your instructions that householding not apply to delivery of your Eaton Vance documents will be effective within 30 days of receipt by Eaton Vance or your financial adviser.
Portfolio Holdings. Each Eaton Vance Fund and its underlying Portfolio (if applicable) will file a schedule of its portfolio holdings on Form N-Q with the SEC for the first and third quarters of each fiscal year. The Form N-Q will be available on the Eaton Vance website www.eatonvance.com, by calling Eaton Vance at 1-800-262-1122 or in the EDGAR database on the SEC’s website at www.sec.gov. Form N-Q may also be reviewed and copied at the SEC’s public reference room in Washington, D.C. (call 1-800-732-0330 for information on the operation of the public reference room).
Proxy Voting. From time to time, funds are required to vote proxies related to the securities held by the funds. The Eaton Vance Funds or their underlying Portfolios (if applicable) vote proxies according to a set of policies and procedures approved by the Funds’ and Portfolios’ Boards. You may obtain a description of these policies and procedures and information on how the Funds or Portfolios voted proxies relating to portfolio securities during the most recent 12 month period ended June 30, without charge, upon request, by calling 1-800-262-1122. This description is also available on the Securities and Exchange Commission’s website at www.sec.gov.
Eaton Vance VT Large-Cap Value Fund as of December 31, 2008
M A N A G E M E N T ’ S D I S C U S S I O N O F F U N D P E R F O R M A N C E
Michael R. Mach, CFA
Portfolio Manager
Economic and Market Conditions
| • | | Global equity markets suffered profound losses during 2008, a year that will likely go down as one of the worst in modern financial market history. The U.S. economy held up relatively well during the first half of the year, but the simultaneous bursting of the housing, credit and commodity bubbles created a global financial crisis of unforeseen levels. Equity markets collapsed during the second half of the year, as a series of catastrophic events on Wall Street induced panic and fear among market participants. Additionally, commodity prices collapsed during the second half of 2008 and after peaking at more than $145 per barrel in July, oil prices traded down to around $44 at year end. The U.S. economy was officially declared in recession during the fourth quarter as unemployment continued to rise. The Federal Reserve responded to the crises with a dramatic cut in interest rates. |
| • | | Equity markets posted double-digit declines for the year ended December 31, 2008. The S&P 500 Index suffered its worst loss since 1937, while the Dow Jones Industrials Average experienced the third-worst loss in its history. By the end of 2008, equity losses approached $7 trillion of shareholder wealth, erasing the gains of the last six years. On average, small-capitalization stocks slightly outperformed large-capitalization stocks and value-style investments fared better than growth-style investments. |
| |
| • | | Each of the 10 major sectors within the Russell 1000 Value Index (the Index), the Fund’s benchmark, posted double-digit negative returns for the year. The best-performing sectors for the Index were consumer staples and health care, while financials, information technology and materials produced the weakest sector performance. |
Past performance is no guarantee of future results. Returns are historical and are calculated by determining the percentage change in net asset value or offering price (as applicable) with all distributions reinvested. Investment return and principal value will fluctuate so that shares, when redeemed, may be worth more or less than their original cost. Performance is for the stated time period only; due to market volatility, the Fund’s current performance may be lower or higher than the quoted return. Absent an expense limitation or waiver in effect for certain periods, performance would have been lower. For performance as of the most recent month end, please refer to www.eatonvance.com.
Fund shares are not insured by the FDIC and are not deposits or other obligations of, or guaranteed by, any depository institution. Shares are subject to investment risks, including possible loss of principal invested.
Management Discussion
| • | | For the year ended December 31, 2008, the Fund outperformed the Index, primarily due to stock selection.1, 2 The Fund’s minimal exposure to many of the financial stocks that collapsed in 2008, combined with its selectivity among insurance company stocks, was the strongest contributor to the Fund’s performance relative to the Index. |
| |
| • | | Also contributing to performance was the fund’s stock selection in the industrials, information technology, and consumer discretionary sectors. Fund holdings in the energy and utilities sectors detracted the most from relative performance versus the Index. |
| |
| • | | The fund remains committed to its strategy of investing in companies that are considered to be attractive in their long-term investment prospects, are favorably priced in relation to their fundamental value, and which are likely to grow in value over time. |
The views expressed throughout this report are those of the portfolio manager and are current only through the end of the period of the report as stated on the cover. These views are subject to change at any time based upon market or other conditions, and the investment adviser disclaims any responsibility to update such views. These views may not be relied on as investment advice and, because investment decisions for a fund are based on many factors, may not be relied on as an indication of trading intent on behalf of any Eaton Vance fund. Portfolio information provided in the report may not be representative of the Fund’s current or future investments and may change due to active management.
Eaton Vance VT Large-Cap Value Fund
Total Return Performance 12/31/07 – 12/31/08
| | | | | |
Eaton Vance VT Large-Cap Value Fund1 | | | -34.96 | % |
Russell 1000 Value Index2 | | | -36.85 | |
See page 3 for more performance information.
| | |
| 1 | | There is no sales charge. Insurance-related charges are not included in the calculations of returns. Such expenses would reduce the overall returns shown. Please refer to the report for your insurance contract for performance data reflecting insurance-related charges. Absent an allocation of expenses to the investment adviser, the return would be lower. |
| |
| 2 | | It is not possible to invest directly in an Index. The Index’s total return does not reflect commissions or expenses that would have been incurred if an investor individually purchased or sold the securities represented in the Index. The Russell 1000 Value Index is a broad-based, unmanaged index of value stocks. |
1
Eaton Vance VT Large-Cap Value Fund as of December 31, 2008
F U N D C O M P O S I T I O N
Top Ten Holdings*
By net assets
| | | | | |
| AT&T, Inc. | | | 3.3 | % |
| Nestle SA | | | 3.3 | |
| Verizon Communications, Inc. | | | 3.2 | |
| Exxon Mobil Corp. | | | 3.2 | |
| Travelers Companies, Inc. (The) | | | 3.1 | |
| Johnson & Johnson | | | 3.1 | |
| Wells Fargo & Co. | | | 3.0 | |
| JPMorgan Chase & Co. | | | 3.0 | |
| Chevron Corp. | | | 3.0 | |
| United Technologies Corp. | | | 2.9 | |
| | |
| * | | Top Ten Holdings represented 31.1% of the Fund’s net assets as of 12/31/08. Excludes cash equivalents. |
Sector Weightings**
By net assets
| ** | | As a percentage of the Fund’s net assets as of 12/31/08. Excludes cash equivalents. |
2
Eaton Vance VT Large-Cap Value Fund as of December 31, 2008
F U N D P E R F O R M A N C E
The line graph and table set forth below provide information about the Fund’s performance. The line graph compares the performance of the Fund with that of the Russell 1000 Value Index, a broad-based, unmanaged index of value stocks. The lines on the graph represent the total returns of a hypothetical investment of $10,000 in each of the Fund and the Russell 1000 Value Index. The table includes the total return of the Fund at net asset value. There is no sales charge. The performance presented below does not reflect the deduction of insurance-related charges or of taxes, if any, that a shareholder would pay on distributions or redemptions of Fund shares. Please refer to the report for your insurance contract for performance data reflecting insurance-related charges.
Performance1
Average Annual Total Returns at net asset value
| | | | | |
| One Year | | | -34.96 | % |
| Life of Fund† | | | -18.93 | |
| | |
| † | | Inception Date: 3/30/07 |
| |
| 1 | | The Fund has no sales charge. Insurance-related charges are not included in the calculation of returns. Such expenses would reduce the overall returns shown. Absent an allocation of expenses to the investment adviser, the returns would be lower. |
Total Annual
Operating Expenses2
| | | | | |
| Gross Expense Ratio | | | 14.46 | % |
| Net Expense Ratio | | | 1.30 | |
| | |
| 2 | | From the Fund’s prospectus dated 5/1/08. Net expense ratio reflects a contractual expense reimbursement that continues through 4/30/09. Thereafter, the expense reimbursement may be changed or terminated, subject to Trustee approval. Without this expense reimbursement, expenses would have been higher. |
Past performance is no guarantee of future results. Returns are historical and are calculated by determining the percentage change in net asset value or offering price (as applicable) with all distributions reinvested. Investment return and principal value will fluctuate so that shares, when redeemed, may be worth more or less than their original cost. Performance is for the stated time period only; due to market volatility, the Fund’s current performance may be lower or higher than the quoted return. Absent an expense limitation or waiver in effect for certain periods, performance would have been lower. For performance as of the most recent month end, please refer to www.eatonvance.com.
| | |
| * | | Source: Lipper Inc. Investment operations commenced on 3/30/07. The graph does not reflect the deduction of insurance-related charges or taxes that a shareholder would pay on Fund distributions or the redemption of Fund shares. It is not possible to invest directly in an Index. The Index’s total return does not reflect any commissions or expenses that would have been incurred if an investor individually purchased or sold the securities represented in the Index. Index performance is available as of month end only. |
3
Eaton Vance VT Large-Cap Value Fund as of December 31, 2008
FUND EXPENSES
Example: As a shareholder of the Fund, you incur ongoing costs, including management fees; distribution or service fees; and other Fund expenses. This Example is intended to help you understand your ongoing costs (in dollars) of investing in the Fund and to compare these costs with the ongoing costs of investing in other mutual funds. The Example is based on an investment of $1,000 invested at the beginning of the period and held for the entire period (July 1, 2008 – December 31, 2008).
Actual Expenses: The first section of the table below provides information about actual account values and actual expenses. You may use the information in this line, together with the amount you invested, to estimate the expenses that you paid over the period. Simply divide your account value by $1,000 (for example, an $8,600 account value divided by $1,000 = 8.6), then multiply the result by the number in the first line under the heading entitled “Expenses Paid During Period” to estimate the expenses you paid on your account during this period.
Hypothetical Example for Comparison Purposes: The second section of the table below provides information about hypothetical account values and hypothetical expenses based on the actual Fund expense ratio and an assumed rate of return of 5% per year (before expenses), which is not the actual return of the Fund. The hypothetical account values and expenses may not be used to estimate the actual ending account balance or expenses you paid for the period. You may use this information to compare the ongoing costs of investing in your Fund and other funds. To do so, compare this 5% hypothetical example with the 5% hypothetical examples that appear in the shareholder reports of the other funds.
Please note that the expenses shown in the table are meant to highlight your ongoing costs only and do not reflect expenses and charges which are, or may be, imposed under your variable annuity contract or variable life insurance policy (“variable contracts”) (if applicable). Therefore, the second line of the table is useful in comparing ongoing costs associated with an investment in vehicles which fund benefits under variable contracts, and will not help you determine the relative total costs of owning different funds. In addition, if these expenses and charges imposed under the variable contracts were included, your costs would have been higher.
Eaton Vance VT Large-Cap Value Fund
| | | | | | | | | | | | | | | |
| | | Beginning Account Value
| | | Ending Account Value
| | | Expenses Paid During Period*
| | | |
| | | (7/1/08) | | | (12/31/08) | | | (7/1/08 – 12/31/08) | | | |
| |
| |
Actual | | | $1,000.00 | | | | $699.60 | | | | $5.55 | ** | | |
| | | | | | | | | | | | | | | |
| | | | | | | | | | | | | | | |
| |
| |
| | | | | | | | | | | | | | | |
Hypothetical | | | | | | | | | | | | | | |
| (5% return per year before expenses) | | | $1,000.00 | | | | $1,018.60 | | | | $6.60 | ** | | |
| | | |
| | * | Expenses are equal to the Fund’s annualized expense ratio of 1.30% multiplied by the average account value over the period, multiplied by 184/366 (to reflect the one-half year period). The Example assumes that $1,000 was invested at the net asset value per share determined at the close of business on June 30, 2008. Expenses shown do not include insurance-related charges. | |
| | | |
| | ** | Absent an allocation of expenses to the investment adviser, the expenses would have been higher. | |
4
Eaton Vance VT Large-Cap Value Fund as of December 31, 2008
PORTFOLIO OF INVESTMENTS
| | | | | | | | | | | |
| Common Stocks — 121.1% |
| Security | | Shares | | | Value | | | |
| |
| |
| |
| Aerospace & Defense — 7.3% |
| |
| General Dynamics Corp. | | | 5,371 | | | $ | 309,316 | | | |
| Lockheed Martin Corp. | | | 3,887 | | | | 326,819 | | | |
| United Technologies Corp. | | | 7,918 | | | | 424,405 | | | |
| |
| |
| | | | | | | $ | 1,060,540 | | | |
| |
| |
| |
| Auto Components — 0.9% |
| |
| Johnson Controls, Inc. | | | 7,454 | | | $ | 135,365 | | | |
| |
| |
| | | | | | | $ | 135,365 | | | |
| |
| |
| |
| Biotechnology — 2.7% |
| |
Amgen, Inc.(1) | | | 6,912 | | | $ | 399,168 | | | |
| |
| |
| | | | | | | $ | 399,168 | | | |
| |
| |
| |
| Capital Markets — 2.8% |
| |
| Franklin Resources, Inc. | | | 4,250 | | | $ | 271,065 | | | |
| Goldman Sachs Group, Inc. | | | 1,555 | | | | 131,226 | | | |
| |
| |
| | | | | | | $ | 402,291 | | | |
| |
| |
| |
| Chemicals — 1.3% |
| |
| Air Products and Chemicals, Inc. | | | 2,187 | | | $ | 109,940 | | | |
| Dow Chemical Co. (The) | | | 5,301 | | | | 79,992 | | | |
| |
| |
| | | | | | | $ | 189,932 | | | |
| |
| |
| |
| Commercial Banks — 5.9% |
| |
| PNC Financial Services Group, Inc. | | | 3,074 | | | $ | 150,626 | | | |
| U.S. Bancorp | | | 10,563 | | | | 264,181 | | | |
| Wells Fargo & Co. | | | 14,947 | | | | 440,638 | | | |
| |
| |
| | | | | | | $ | 855,445 | | | |
| |
| |
| |
| Commercial Services & Supplies — 1.0% |
| |
| Waste Management, Inc. | | | 4,407 | | | $ | 146,048 | | | |
| |
| |
| | | | | | | $ | 146,048 | | | |
| |
| |
| |
| Communications Equipment — 0.6% |
| |
Cisco Systems, Inc.(1) | | | 5,780 | | | $ | 94,214 | | | |
| |
| |
| | | | | | | $ | 94,214 | | | |
| |
| |
| |
| Computers & Peripherals — 5.3% |
| |
| Hewlett-Packard Co. | | | 11,179 | | | $ | 405,686 | | | |
| International Business Machines Corp. | | | 4,424 | | | | 372,324 | | | |
| |
| |
| | | | | | | $ | 778,010 | | | |
| |
| |
| |
| Diversified Financial Services — 5.0% |
| |
| Bank of America Corp. | | | 20,406 | | | $ | 287,316 | | | |
| JPMorgan Chase & Co. | | | 13,944 | | | | 439,654 | | | |
| |
| |
| | | | | | | $ | 726,970 | | | |
| |
| |
| |
| Diversified Telecommunication Services — 6.5% |
| |
| AT&T, Inc. | | | 16,851 | | | $ | 480,253 | | | |
| Verizon Communications, Inc. | | | 13,936 | | | | 472,430 | | | |
| |
| |
| | | | | | | $ | 952,683 | | | |
| |
| |
| |
| Electric Utilities — 3.8% |
| |
| Edison International | | | 8,382 | | | $ | 269,230 | | | |
| FirstEnergy Corp. | | | 5,975 | | | | 290,265 | | | |
| |
| |
| | | | | | | $ | 559,495 | | | |
| |
| |
| |
| Electrical Equipment — 0.7% |
| |
| Emerson Electric Co. | | | 2,630 | | | $ | 96,284 | | | |
| |
| |
| | | | | | | $ | 96,284 | | | |
| |
| |
| |
| Energy Equipment & Services — 1.2% |
| |
| Schlumberger, Ltd. | | | 2,205 | | | $ | 93,338 | | | |
Transocean, Ltd.(1) | | | 1,679 | | | | 79,333 | | | |
| |
| |
| | | | | | | $ | 172,671 | | | |
| |
| |
| |
| Food & Staples Retailing — 6.8% |
| |
| CVS Caremark Corp. | | | 12,548 | | | $ | 360,630 | | | |
| Kroger Co. (The) | | | 15,817 | | | | 417,727 | | | |
| Wal-Mart Stores, Inc. | | | 3,864 | | | | 216,616 | | | |
| |
| |
| | | | | | | $ | 994,973 | | | |
| |
| |
| |
| Food Products — 3.3% |
| |
| Nestle SA | | | 12,109 | | | $ | 479,494 | | | |
| |
| |
| | | | | | | $ | 479,494 | | | |
| |
| |
| |
| Health Care Equipment & Supplies — 0.7% |
| |
Boston Scientific Corp.(1) | | | 12,280 | | | $ | 95,047 | | | |
| |
| |
| | | | | | | $ | 95,047 | | | |
| |
| |
| | | | | | | | | | | |
See notes to financial statements5
Eaton Vance VT Large-Cap Value Fund as of December 31, 2008
PORTFOLIO OF INVESTMENTS CONT’D
| | | | | | | | | | | |
| Security | | Shares | | | Value | | | |
| |
| |
| Health Care Providers & Services — 1.1% |
| |
| Aetna, Inc. | | $ | 5,777 | | | $ | 164,645 | | | |
| |
| |
| | | | | | | $ | 164,645 | | | |
| |
| |
| |
| Household Products — 2.1% |
| |
| Kimberly-Clark Corp. | | | 5,698 | | | $ | 300,513 | | | |
| |
| |
| | | | | | | $ | 300,513 | | | |
| |
| |
| |
| Industrial Conglomerates — 0.8% |
| |
| General Electric Co. | | | 6,761 | | | $ | 109,528 | | | |
| |
| |
| | | | | | | $ | 109,528 | | | |
| |
| |
| |
| Insurance — 11.9% |
| |
| ACE, Ltd. | | | 5,136 | | | $ | 271,797 | | | |
| Aflac, Inc. | | | 6,119 | | | | 280,495 | | | |
| Chubb Corp. | | | 7,185 | | | | 366,435 | | | |
| MetLife, Inc. | | | 10,545 | | | | 367,599 | | | |
| Travelers Companies, Inc. (The) | | | 10,023 | | | | 453,040 | | | |
| |
| |
| | | | | | | $ | 1,739,366 | | | |
| |
| |
| |
| Life Sciences Tools & Services — 0.6% |
| |
Thermo Fisher Scientific, Inc.(1) | | | 2,634 | | | $ | 89,740 | | | |
| |
| |
| | | | | | | $ | 89,740 | | | |
| |
| |
| |
| Machinery — 2.1% |
| |
| Caterpillar, Inc. | | | 4,447 | | | $ | 198,647 | | | |
| Deere & Co. | | | 2,954 | | | | 113,197 | | | |
| |
| |
| | | | | | | $ | 311,844 | | | |
| |
| |
| |
| Media — 5.4% |
| |
| Comcast Corp., Class A | | | 19,892 | | | $ | 335,777 | | | |
| Vivendi SA | | | 7,765 | | | | 253,093 | | | |
| Walt Disney Co. | | | 8,636 | | | | 195,951 | | | |
| |
| |
| | | | | | | $ | 784,821 | | | |
| |
| |
| |
| Metals & Mining — 1.5% |
| |
| BHP Billiton, Ltd. ADR | | | 2,986 | | | $ | 128,099 | | | |
| Nucor Corp. | | | 1,932 | | | | 89,258 | | | |
| |
| |
| | | | | | | $ | 217,357 | | | |
| |
| |
| |
| Multi-Utilities — 3.0% |
| |
| PG&E Corp. | | | 2,325 | | | $ | 90,001 | | | |
| Public Service Enterprise Group, Inc. | | | 12,112 | | | | 353,307 | | | |
| |
| |
| | | | | | | $ | 443,308 | | | |
| |
| |
| |
| Oil, Gas & Consumable Fuels — 15.8% |
| |
| Anadarko Petroleum Corp. | | | 4,520 | | | $ | 174,246 | | | |
| Apache Corp. | | | 1,814 | | | | 135,197 | | | |
| Chevron Corp. | | | 5,856 | | | | 433,168 | | | |
| ConocoPhillips | | | 8,167 | | | | 423,051 | | | |
| Devon Energy Corp. | | | 1,807 | | | | 118,738 | | | |
| Exxon Mobil Corp. | | | 5,786 | | | | 461,896 | | | |
| Occidental Petroleum Corp. | | | 5,649 | | | | 338,884 | | | |
| Peabody Energy Corp. | | | 4,138 | | | | 94,140 | | | |
| XTO Energy, Inc. | | | 3,719 | | | | 131,169 | | | |
| |
| |
| | | | | | | $ | 2,310,489 | | | |
| |
| |
| |
| Pharmaceuticals — 10.1% |
| |
| Abbott Laboratories | | | 2,489 | | | $ | 132,838 | | | |
| Johnson & Johnson | | | 7,468 | | | | 446,810 | | | |
| Merck & Co., Inc. | | | 7,071 | | | | 214,958 | | | |
| Pfizer, Inc. | | | 23,256 | | | | 411,864 | | | |
| Schering-Plough Corp. | | | 15,833 | | | | 269,636 | | | |
| |
| |
| | | | | | | $ | 1,476,106 | | | |
| |
| |
| |
| Real Estate Investment Trusts (REITs) — 2.5% |
| |
| AvalonBay Communities, Inc. | | | 2,170 | | | $ | 131,459 | | | |
| Boston Properties, Inc. | | | 1,989 | | | | 109,395 | | | |
| Simon Property Group, Inc. | | | 2,261 | | | | 120,127 | | | |
| |
| |
| | | | | | | $ | 360,981 | | | |
| |
| |
| |
| Road & Rail — 2.0% |
| |
| Burlington Northern Santa Fe Corp. | | | 3,777 | | | $ | 285,957 | | | |
| |
| |
| | | | | | | $ | 285,957 | | | |
| |
| |
| |
| Specialty Retail — 3.6% |
| |
| Best Buy Co., Inc. | | | 7,437 | | | $ | 209,054 | | | |
| Staples, Inc. | | | 12,785 | | | | 229,107 | | | |
| TJX Companies, Inc. (The) | | | 4,334 | | | | 89,150 | | | |
| |
| |
| | | | | | | $ | 527,311 | | | |
| |
| |
| |
| Textiles, Apparel & Luxury Goods — 0.8% |
| |
| Nike, Inc., Class B | | | 2,142 | | | $ | 109,242 | | | |
| |
| |
| | | | | | | $ | 109,242 | | | |
| |
| |
| | | | | | | | | | | |
See notes to financial statements6
Eaton Vance VT Large-Cap Value Fund as of December 31, 2008
PORTFOLIO OF INVESTMENTS CONT’D
| | | | | | | | | | | |
| Security | | Shares | | | Value | | | |
| |
| |
| |
| Tobacco — 2.0% |
| |
| Philip Morris International, Inc. | | | 6,701 | | | $ | 291,561 | | | |
| |
| |
| | | | | | | $ | 291,561 | | | |
| |
| |
| | | |
| Total Common Stocks | | |
| (identified cost $22,113,959) | | $ | 17,661,399 | | | |
| |
| |
| | | |
| Total Investments — 121.1% | | |
| (identified cost $22,113,959) | | $ | 17,661,399 | | | |
| |
| |
| | | | | | | |
Other Assets, Less
Liabilities — (21.1)% | | $ | (3,075,997 | ) | | |
| |
| |
| | | | | | | |
| Net Assets — 100.0% | | $ | 14,585,402 | | | |
| |
| |
Industry classifications included in the Portfolio of Investments are unaudited.
ADR - American Depository Receipt
| | |
| (1) | | Non-income producing security. |
See notes to financial statements7
Eaton Vance VT Large-Cap Value Fund as of December 31, 2008
FINANCIAL STATEMENTS
Statement of Assets and Liabilities
| | | | | | | |
| As of December 31, 2008 | | | | | |
| |
| Assets |
| |
| Investments, at value (identified cost, $22,113,959) | | $ | 17,661,399 | | | |
| Cash | | | 727,059 | | | |
| Receivable from the investment adviser | | | 9,438 | | | |
| Dividends and interest receivable | | | 52,910 | | | |
| Tax reclaims receivable | | | 2,502 | | | |
| |
| |
Total assets | | $ | 18,453,308 | | | |
| |
| |
| | | | | | | |
| | | | | | | |
| |
| Liabilities |
| |
| Payable for Fund shares redeemed | | $ | 3,800,058 | | | |
| Payable to affiliate for investment adviser fee | | | 9,333 | | | |
| Payable to affiliate for distribution fees | | | 3,733 | | | |
| Payable to affiliate for Trustees’ fees | | | 300 | | | |
| Payable for shareholder servicing fees | | | 771 | | | |
| Accrued expenses | | | 53,711 | | | |
| |
| |
Total liabilities | | $ | 3,867,906 | | | |
| |
| |
Net Assets | | $ | 14,585,402 | | | |
| |
| |
| | | | | | | |
| | | | | | | |
| |
| Sources of Net Assets |
| |
| Paid-in capital | | $ | 24,209,951 | | | |
| Accumulated net realized loss (computed on the basis of identified cost) | | | (5,165,249 | ) | | |
| Accumulated distributions in excess of net investment income | | | (6,585 | ) | | |
| Net unrealized depreciation (computed on the basis of identified cost) | | | (4,452,715 | ) | | |
| |
| |
Total | | $ | 14,585,402 | | | |
| |
| |
| | | | | | | |
| | | | | | | |
| |
| Net Asset Value, Offering Price and Redemption Price Per Share |
| |
($14,585,402 ¸ 2,140,109 shares of beneficial interest outstanding) | | $ | 6.82 | | | |
| |
| |
Statement of Operations
| | | | | | | |
For the Year Ended
| | | | | |
| December 31, 2008 | | | | | |
| |
| Investment Income |
| |
| Dividends (net of foreign taxes, $3,048) | | $ | 524,853 | | | |
| Interest | | | 22,043 | | | |
| |
| |
Total investment income | | $ | 546,896 | | | |
| |
| |
| | | | | | | |
| | | | | | | |
| |
| Expenses |
| |
| Investment adviser fee | | $ | 139,074 | | | |
| Shareholder servicing fees | | | 41,813 | | | |
| Distribution fees | | | 55,629 | | | |
| Trustees’ fees and expenses | | | 902 | | | |
| Custodian fee | | | 47,476 | | | |
| Legal and accounting services | | | 44,467 | | | |
| Transfer and dividend disbursing agent fees | | | 21,505 | | | |
| Printing and postage | | | 3,290 | | | |
| Miscellaneous | | | 5,515 | | | |
| |
| |
Total expenses | | $ | 359,671 | | | |
| |
| |
| Deduct — | | | | | | |
| Allocation of expenses to the investment adviser | | $ | 70,360 | | | |
| |
| |
Total expense reductions | | $ | 70,360 | | | |
| |
| |
| | | | | | | |
Net expenses | | $ | 289,311 | | | |
| |
| |
| | | | | | | |
Net investment income | | $ | 257,585 | | | |
| |
| |
| | | | | | | |
| | | | | | | |
| |
| Realized and Unrealized Gain (Loss) |
| |
| Net realized gain (loss) — | | | | | | |
| Investment transactions (identified cost basis) | | $ | (5,145,478 | ) | | |
| Foreign currency transactions | | | 2,690 | | | |
| |
| |
Net realized loss | | $ | (5,142,788 | ) | | |
| |
| |
| Change in unrealized appreciation (depreciation) — | | | | | | |
| Investments (identified cost basis) | | $ | (4,510,297 | ) | | |
| Foreign currency | | | (158 | ) | | |
| |
| |
Net change in unrealized appreciation (depreciation) | | $ | (4,510,455 | ) | | |
| |
| |
| | | | | | | |
Net realized and unrealized loss | | $ | (9,653,243 | ) | | |
| |
| |
| | | | | | | |
Net decrease in net assets from operations | | $ | (9,395,658 | ) | | |
| |
| |
See notes to financial statements8
Eaton Vance VT Large-Cap Value Fund as of December 31, 2008
FINANCIAL STATEMENTS CONT’D
Statements of Changes in Net Assets
| | | | | | | | | | | |
Increase (Decrease)
| | Year Ended
| | | Period Ended
| | | |
| in Net Assets | | December 31, 2008 | | | December 31, 2007(1) | | | |
| |
| |
| From operations — | | | | | | | | | | |
| Net investment income | | $ | 257,585 | | | $ | 4,844 | | | |
| Net realized loss from investment and foreign currency transactions | | | (5,142,788 | ) | | | (19,458 | ) | | |
| Net change in unrealized appreciation (depreciation) from investments and foreign currency | | | (4,510,455 | ) | | | 57,740 | | | |
| |
| |
Net increase (decrease) in net assets from operations | | $ | (9,395,658 | ) | | $ | 43,126 | | | |
| |
| |
| Distributions to shareholders — | | | | | | | | | | |
| From net investment income | | $ | (272,196 | ) | | $ | — | | | |
| |
| |
Total distributions to shareholders | | $ | (272,196 | ) | | $ | — | | | |
| |
| |
| Transactions in shares of beneficial interest — | | | | | | |
| Proceeds from sale of shares | | $ | 6,868,434 | | | $ | 22,795,261 | | | |
| Cost of shares redeemed | | | (5,310,121 | ) | | | (143,444 | ) | | |
| |
| |
Net increase in net assets from Fund share transactions | | $ | 1,558,313 | | | $ | 22,651,817 | | | |
| |
| |
| | | | | | | | | | | |
Net increase (decrease) in net assets | | $ | (8,109,541 | ) | | $ | 22,694,943 | | | |
| |
| |
| | | | | | | | | | | |
| | | | | | | | | | | |
| |
| Net Assets |
| |
| At beginning of period | | $ | 22,694,943 | | | $ | — | | | |
| |
| |
At end of period | | $ | 14,585,402 | | | $ | 22,694,943 | | | |
| |
| |
| | | | | | | | | | | |
| | | | | | | | | | | |
| |
Accumulated undistributed
(distributions in excess of)
net investment income
included in net assets |
| |
At end of period | | $ | (6,585 | ) | | $ | 5,256 | | | |
| |
| |
| | |
| (1) | | For the period from the start of business, March 30, 2007, to December 31, 2007. |
See notes to financial statements9
Eaton Vance VT Large-Cap Value Fund as of December 31, 2008
FINANCIAL STATEMENTS CONT’D
Financial Highlights
| | | | | | | | | | | |
| | | Year Ended
| | | Period Ended
| | | |
| | | December 31, 2008 | | | December 31, 2007(1) | | | |
| |
| Net asset value — Beginning of period | | $ | 10.630 | | | $ | 10.000 | | | |
| |
| |
| | | | | | | | | | | |
| | | | | | | | | | | |
| |
| Income (loss) from operations |
| |
Net investment income(2) | | $ | 0.105 | | | $ | 0.072 | | | |
| Net realized and unrealized gain (loss) | | | (3.812 | ) | | | 0.558 | | | |
| |
| |
Total income (loss) from operations | | $ | (3.707 | ) | | $ | 0.630 | | | |
| |
| |
| | | | | | | | | | | |
| | | | | | | | | | | |
| |
| Less distributions |
| |
| From net investment income | | $ | (0.103 | ) | | $ | — | | | |
| |
| |
Total distributions | | $ | (0.103 | ) | | $ | — | | | |
| |
| |
| | | | | | | | | | | |
Net asset value — End of period | | $ | 6.820 | | | $ | 10.630 | | | |
| |
| |
| | | | | | | | | | | |
Total Return(3) | | | (34.96 | )% | | | 6.30 | %(6) | | |
| |
| |
| | | | | | | | | | | |
| | | | | | | | | | | |
| |
| Ratios/Supplemental Data |
| |
| Net assets, end of period (000’s omitted) | | $ | 14,585 | | | $ | 22,695 | | | |
| Ratios (As a percentage of average daily net assets): | | | | | | | | | | |
| Expenses before custodian fee reduction | | | 1.30 | %(4) | | | 1.30 | %(4)(5) | | |
| Expenses after custodian fee reduction | | | 1.30 | %(4) | | | 1.29 | %(4)(5) | | |
| Net investment income | | | 1.16 | % | | | 0.90 | %(5) | | |
| Portfolio Turnover | | | 86 | % | | | 42 | %(6) | | |
| |
| |
| | |
| (1) | | For the period from the start of business, March 30, 2007, to December 31, 2007. |
| |
| (2) | | Computed using average shares outstanding. |
| |
| (3) | | Returns are historical and are calculated by determining the percentage change in net asset value with all distributions reinvested. |
| |
| (4) | | The investment adviser subsidized certain operating expenses (equal to 0.32% and 12.96% of average daily net assets for the year ended December 31, 2008 and the period ended December 31, 2007, respectively). Absent this subsidy, total return would be lower. |
| |
| (5) | | Annualized. |
| |
| (6) | | Not annualized. |
See notes to financial statements10
Eaton Vance VT Large-Cap Value Fund as of December 31, 2008
NOTES TO FINANCIAL STATEMENTS
1 Significant Accounting Policies
Eaton Vance VT Large-Cap Value Fund (the Fund) is a diversified series of Eaton Vance Variable Trust (the Trust). The Trust is a Massachusetts business trust registered under the Investment Company Act of 1940, as amended (the 1940 Act), as an open-end management investment company. The Fund’s investment objective is to seek total return. The Fund is generally made available for purchase only to separate accounts established by participating insurance companies and qualified pension or retirement plans.
The following is a summary of significant accounting policies of the Fund. The policies are in conformity with accounting principles generally accepted in the United States of America.
A Investment Valuation — Equity securities listed on a U.S. securities exchange generally are valued at the last sale price on the day of valuation or, if no sales took place on such date, at the mean between the closing bid and asked prices therefore on the exchange where such securities are principally traded. Equity securities listed on the NASDAQ Global or Global Select Market generally are valued at the NASDAQ official closing price. Unlisted or listed securities for which closing sales prices or closing quotations are not available are valued at the mean between the latest available bid and asked prices or, in the case of preferred equity securities that are not listed or traded in the over-the-counter market, by an independent pricing service. Short-term debt securities with a remaining maturity of sixty days or less are valued at amortized cost, which approximates market value. If short-term debt securities are acquired with a remaining maturity of more than sixty days, they will be valued by a pricing service. Foreign securities and currencies are valued in U.S. dollars, based on foreign currency exchange rate quotations supplied by an independent quotation service. The independent service uses a proprietary model to determine the exchange rate. Inputs to the model include reported trades and implied bid/ask spreads. The daily valuation of exchange-traded foreign securities generally is determined as of the close of trading on the principal exchange on which such securities trade. Events occurring after the close of trading on foreign exchanges may result in adjustments to the valuation of foreign securities to more accurately reflect their fair value as of the close of regular trading on the New York Stock Exchange. When valuing foreign equity securities that meet certain criteria, the Trustees have approved the use of a fair value service that values such securities to reflect market trading that occurs after the close of the applicable foreign markets of comparable securities or other instruments that have a strong correlation to the fair-valued securities. Investments for which valuations or market quotations are not readily available are valued at fair value using methods determined in good faith by or at the direction of the Trustees of the Fund considering relevant factors, data and information including the market value of freely tradable securities of the same class in the principal market on which such securities are normally traded.
B Investment Transactions — Investment transactions for financial statement purposes are accounted for on a trade date basis. Realized gains and losses on investments sold are determined on the basis of identified cost.
C Income — Dividend income is recorded on the ex-dividend date for dividends received in cash and/or securities. However, if the ex-dividend date has passed, certain dividends from foreign securities are recorded as the Fund is informed of the ex-dividend date. Withholding taxes on foreign dividends and capital gains have been provided for in accordance with the Fund’s understanding of the applicable countries’ tax rules and rates. Interest income is recorded on the basis of interest accrued, adjusted for amortization of premium or accretion of discount.
D Federal Taxes — The Fund’s policy is to comply with the provisions of the Internal Revenue Code applicable to regulated investment companies and to distribute to shareholders each year substantially all of its net investment income, and all or substantially all of its net realized capital gains. Accordingly, no provision for federal income or excise tax is necessary. At December 31, 2008, the Fund, for federal income tax purposes, had a capital loss carryforward of $4,071,314 which will reduce its taxable income arising from future net realized gains on investment transactions, if any, to the extent permitted by the Internal Revenue Code, and thus will reduce the amount of distributions to shareholders which would otherwise be necessary to relieve the Fund of any liability for federal income or excise tax. Such capital loss carryforward will expire on December 31, 2015 ($8,964) and December 31, 2016 ($4,062,350).
Additionally, at December 31, 2008, the Fund had net capital losses of $1,014,145, attributable to security transactions incurred after October 31, 2008. These net capital losses are treated as arising on the first day of the Fund’s taxable year ending December 31, 2009.
As of December 31, 2008, the Fund had no uncertain tax positions that would require financial statement recognition, de-recognition, or disclosure. Each of the Fund’s federal tax returns filed since the start of business on March 30, 2007 to December 31, 2008 remains subject to examination by the Internal Revenue Service.
E Expenses — The majority of expenses of the Trust are directly identifiable to an individual fund. Expenses
11
Eaton Vance VT Large-Cap Value Fund as of December 31, 2008
NOTES TO FINANCIAL STATEMENTS CONT’D
which are not readily identifiable to a specific fund are allocated taking into consideration, among other things, the nature and type of expense and the relative size of the funds.
F Expense Reduction — State Street Bank and Trust Company (SSBT) serves as custodian of the Fund. Pursuant to the custodian agreement, SSBT receives a fee reduced by credits, which are determined based on the average daily cash balance the Fund maintains with SSBT. All credit balances, if any, used to reduce the Fund’s custodian fees are reported as a reduction of expenses in the Statement of Operations.
G Foreign Currency Translation — Investment valuations, other assets, and liabilities initially expressed in foreign currencies are translated each business day into U.S. dollars based upon current exchange rates. Purchases and sales of foreign investment securities and income and expenses denominated in foreign currencies are translated into U.S. dollars based upon currency exchange rates in effect on the respective dates of such transactions. Recognized gains or losses on investment transactions attributable to changes in foreign currency exchange rates are recorded for financial statement purposes as net realized gains and losses on investments. That portion of unrealized gains and losses on investments that results from fluctuations in foreign currency exchange rates is not separately disclosed.
H Use of Estimates — The preparation of the financial statements in conformity with accounting principles generally accepted in the United States of America requires management to make estimates and assumptions that affect the reported amounts of assets and liabilities at the date of the financial statements and the reported amounts of income and expense during the reporting period. Actual results could differ from those estimates.
I Indemnifications — Under the Trust’s organizational documents, its officers and Trustees may be indemnified against certain liabilities and expenses arising out of the performance of their duties to the Fund, and shareholders are indemnified against personal liability for the obligations of the Trust. Additionally, in the normal course of business, the Fund enters into agreements with service providers that may contain indemnification clauses. The Fund’s maximum exposure under these arrangements is unknown as this would involve future claims that may be made against the Fund that have not yet occurred.
2 Distributions to Shareholders
It is the present policy of the Fund to make at least one distribution annually (normally in December) of all or substantially all of its net investment income and to distribute annually all or substantially all of its net realized capital gains (reduced by available capital loss carryforwards from prior years, if any). Distributions to shareholders are recorded on the ex-dividend date. Shareholders may reinvest income and capital gain distributions in additional shares of the Fund at the net asset value as of the ex-dividend date or, if an election is made on behalf of a separate account, to receive some or all of the distributions in cash. The Fund distinguishes between distributions on a tax basis and a financial reporting basis. Accounting principles generally accepted in the United States of America require that only distributions in excess of tax basis earnings and profits be reported in the financial statements as a return of capital. Permanent differences between book and tax accounting relating to distributions are reclassified to paid-in capital. For tax purposes, distributions from short-term capital gains are considered to be from ordinary income.
The tax character of distributions declared for the year ended December 31, 2008 and the period from start of business, March 30, 2007, to December 31, 2007 was as follows:
| | | | | | | | | | | |
| | | Year Ended
| | | Period Ended
| | | |
| | | December 31, 2008 | | | December 31, 2007 | | | |
| |
| |
| Distributions declared from: | | | | | | | | | | |
| Ordinary income | | $ | 272,196 | | | | — | | | |
For the year ended December 31, 2008, accumulated net realized loss was increased by $2,591, accumulated distributions in excess of net investment income was decreased by $2,770, and paid-in capital was decreased by $179 due to differences between book and tax accounting, primarily for foreign currency gain (loss), distributions from real estate investment trusts (REITs) and non-deductible expenses. These reclassifications had no effect on the net assets or net asset value per share of the Fund.
As of December 31, 2008, the components of distributable earnings (accumulated losses) and unrealized appreciation (depreciation) on a tax basis were as follows:
| | | | | | | |
| Undistributed ordinary income | | $ | 5,415 | | | |
| Capital loss carryforward and post October losses | | $ | (5,085,459 | ) | | |
| Net unrealized depreciation | | $ | (4,544,505 | ) | | |
The differences between components of distributable earnings (accumulated losses) on a tax basis and the amounts reflected in the Statement of Assets and Liabilities are primarily due to wash sales and distributions from REITs.
12
Eaton Vance VT Large-Cap Value Fund as of December 31, 2008
NOTES TO FINANCIAL STATEMENTS CONT’D
3 Investment Adviser Fee and Other Transactions with Affiliates
The investment adviser fee is earned by Eaton Vance Management (EVM) as compensation for management and investment advisory services rendered to the Fund. The fee is computed at an annual rate of 0.625% of the Fund’s average daily net assets up to $2 billion and at reduced rates as daily net assets exceed that level, and is payable monthly. For the year ended December 31, 2008, the adviser fee amounted to $139,074. Effective May 1, 2008, EVM has agreed to reimburse the Fund’s operating expenses to the extent that they exceed 1.30% annually of the Fund’s average daily net assets. This agreement may be changed or terminated after April 30, 2009, subject to Trustee approval. Prior to May 1, 2008, EVM voluntarily reimbursed certain expenses of the Fund. Pursuant to these agreements, EVM was allocated $70,360 of the Fund’s operating expenses for the year ended December 31, 2008. EVM also serves as administrator of the Fund, but receives no compensation. Eaton Vance Distributors, Inc. (EVD), the Fund’s principal underwriter and an affiliate of EVM, received distribution fees (see Note 4).
Except for Trustees of the Fund who are not members of EVM’s organization, officers and Trustees receive remuneration for their services to the Fund out of the investment adviser fee. Certain officers and Trustees of the Fund are officers of EVM.
4 Distribution Plan
The Fund has in effect a distribution plan pursuant to Rule 12b-1 under the 1940 Act. The distribution plan provides that the Fund will pay EVD a distribution fee of 0.25% per annum of the Fund’s average daily net assets for the sale and distribution of Fund shares. Distribution fees for the year ended December 31, 2008 amounted to $55,629. Insurance companies receive such fees from EVD based on the value of shares held by such companies. The insurance companies through which investors hold shares of the Fund may also pay fees to third parties in connection with the sale of variable contracts and for services provided to variable contract owners. The Fund, EVM or EVD are not a party to these arrangements. Investors should consult the prospectus and statement of additional information for their variable contracts for a discussion of these payments. EVD may, at its expense, provide promotional incentives to dealers that sell variable insurance products.
5 Shareholder Servicing Plan
The Trust, on behalf of the Fund, has adopted a Shareholder Servicing Plan (“Servicing Plan”). The Servicing Plan allows the Trust to enter into shareholder servicing agreements with insurance companies, investment dealers, broker-dealers or other financial intermediaries that provide shareholder services relating to Fund shares and their shareholders, including variable contract owners or plan participants with interests in the Fund. Under the Servicing Plan, the Fund may make payments at an annual rate of up to 0.25% of the Fund’s average daily net assets attributable to its shares that are subject to shareholder servicing agreements. No shareholder servicing fees are levied on shares owned by EVM, its affiliates, or their respective employees or clients and may be waived under certain other limited conditions. For the year ended December 31, 2008, shareholder servicing fees were equivalent to 0.19% per annum of the Fund’s average daily net assets and amounted to $41,813.
6 Purchases and Sales of Investments
Purchases and sales of investments, other than short-term obligations, aggregated $43,760,147 and $17,399,583, respectively, for the year ended December 31, 2008.
7 Shares of Beneficial Interest
The Fund’s Declaration of Trust permits the Trustees to issue an unlimited number of full and fractional shares of beneficial interest (without par value). Such shares may be issued in a number of different series (such as the Fund). Transactions in Fund shares were as follows:
| | | | | | | | | | | |
| | | Year Ended
| | | Period Ended
| | | |
| | | December 31, 2008 | | | December 31, 2007(1) | | | |
| |
| Sales | | | 729,304 | | | | 2,148,351 | | | |
| Redemptions | | | (724,199 | ) | | | (13,347 | ) | | |
| |
| |
Net increase | | | 5,105 | | | | 2,135,004 | | | |
| |
| |
| | |
| (1) | | For the period from the start of business, March 30, 2007, to December 31, 2007. |
At December 31, 2008, EVM and a separate account of an insurance company owned 2% and 98%, respectively, of the outstanding shares of the Fund.
8 Federal Income Tax Basis of Investments
The cost and unrealized appreciation (depreciation) of investments of the Fund at December 31, 2008, as determined on a federal income tax basis, were as follows:
| | | | | | | |
Aggregate cost | | $ | 22,205,749 | | | |
| |
| |
| Gross unrealized appreciation | | $ | 171,371 | | | |
| Gross unrealized depreciation | | | (4,715,721 | ) | | |
| |
| |
Net unrealized depreciation | | $ | (4,544,350 | ) | | |
| |
| |
13
Eaton Vance VT Large-Cap Value Fund as of December 31, 2008
NOTES TO FINANCIAL STATEMENTS CONT’D
9 Line of Credit
The Fund participates with other portfolios and funds managed by EVM and its affiliates in a $450 million unsecured line of credit agreement with a group of banks. Borrowings are made by the Fund solely to facilitate the handling of unusual and/or unanticipated short-term cash requirements. Interest is charged to the Fund based on its borrowings at an amount above either the Eurodollar rate or Federal Funds rate. In addition, a fee computed at an annual rate of 0.10% on the daily unused portion of the line of credit is allocated among the participating portfolios and funds at the end of each quarter. The Fund did not have any significant borrowings or allocated fees during the year ended December 31, 2008.
10 Fair Value Measurements
The Fund adopted Financial Accounting Standards Board Statement of Financial Accounting Standards No. 157 (FAS 157), “Fair Value Measurements”, effective January 1, 2008. FAS 157 established a three-tier hierarchy to prioritize the assumptions, referred to as inputs, used in valuation techniques to measure fair value. The three-tier hierarchy of inputs is summarized in the three broad levels listed below.
| | |
| | • | Level 1 — quoted prices in active markets for identical investments |
| |
| | • | Level 2 — other significant observable inputs (including quoted prices for similar investments, interest rates, prepayment speeds, credit risk, etc.) |
| |
| | • | Level 3 — significant unobservable inputs (including a fund’s own assumptions in determining the fair value of investments) |
The inputs or methodology used for valuing securities are not necessarily an indication of the risk associated with investing in those securities.
At December 31, 2008, the inputs used in valuing the Fund’s investments, which are carried at value, were as follows:
| | | | | | | | | |
| | | | | Investments in
| | | |
| | | Valuation Inputs | | Securities | | | |
| |
| Level 1 | | Quoted Prices | | $ | 16,928,812 | | | |
| Level 2 | | Other Significant Observable Inputs | | | 732,587 | | | |
| Level 3 | | Significant Unobservable Inputs | | | — | | | |
| |
| |
Total | | | | $ | 17,661,399 | | | |
| |
| |
The Fund held no investments or other financial instruments as of December 31, 2007 whose fair value was determined using Level 3 inputs.
14
Eaton Vance VT Large-Cap Value Fund as of December 31, 2008
REPORT OF INDEPENDENT REGISTERED PUBLIC ACCOUNTING FIRM
To the Trustees of Eaton Vance Variable Trust and
Shareholders of Eaton Vance VT Large-Cap Value Fund:
We have audited the accompanying statement of assets and liabilities of Eaton Vance VT Large-Cap Value Fund (the “Fund”) (one of the series constituting the Eaton Vance Variable Trust), including the portfolio of investments, as of December 31, 2008, the related statement of operations for the year then ended, and the statements of changes in net assets and the financial highlights for the year then ended and for the period from the start of business, March 30, 2007, to December 31, 2007. These financial statements and financial highlights are the responsibility of the Fund’s management. Our responsibility is to express an opinion on these financial statements and financial highlights based on our audits.
We conducted our audits in accordance with the standards of the Public Company Accounting Oversight Board (United States). Those standards require that we plan and perform the audit to obtain reasonable assurance about whether the financial statements and financial highlights are free of material misstatement. The Fund is not required to have, nor were we engaged to perform, an audit of its internal control over financial reporting. Our audits included consideration of internal control over financial reporting as a basis for designing audit procedures that are appropriate in the circumstances, but not for the purpose of expressing an opinion on the effectiveness of the Fund’s internal control over financial reporting. Accordingly, we express no such opinion. An audit also includes examining, on a test basis, evidence supporting the amounts and disclosures in the financial statements, assessing the accounting principles used and significant estimates made by management, as well as evaluating the overall financial statement presentation. Our procedures included confirmation of securities owned as of December 31, 2008, by correspondence with the custodian.
In our opinion, the financial statements and financial highlights referred to above present fairly, in all material respects, the financial position of Eaton Vance VT Large-Cap Value Fund as of December 31, 2008, the results of its operations for the year then ended, and the changes in its net assets and the financial highlights for the year then ended and for the period from the start of business, March 30, 2007, to December 31, 2007, in conformity with accounting principles generally accepted in the United States of America.
DELOITTE & TOUCHE LLP
Boston, Massachusetts
February 16, 2009
15
Eaton Vance VT Large-Cap Value Fund as of December 31, 2008
FEDERAL TAX INFORMATION (Unaudited)
As required by the Internal Revenue Code regulations, shareholders must be notified within 60 days of the Fund’s fiscal year end regarding the status of qualified dividend income for individuals and the dividends received deduction for corporations.
Qualified Dividend Income. The Fund designates $476,204 or up to the maximum amount of such dividends allowable pursuant to the Internal Revenue Code, as qualified dividend income eligible for the reduced tax rate of 15%.
Dividends Received Deduction. Corporate shareholders are generally entitled to take the dividends received deduction on the portion of the Fund’s dividend distribution that qualifies under tax law. For the Fund’s fiscal 2008 ordinary income dividends, 100% qualifies for the corporate dividends received deduction.
16
Eaton Vance VT Large-Cap Value Fund
SPECIAL MEETING OF SHAREHOLDERS (Unaudited)
The Fund held a Special Meeting of Shareholders on November 14, 2008 to elect Trustees. The results of the vote were as follows:
| | | | | | | | | | | |
| | | Number of Shares | | | |
| Nominee for Trustee | | For | | | Withheld | | | |
| |
| |
| Benjamin C. Esty | | | 2,406,783 | | | | 189,183 | | | |
| Thomas E. Faust Jr. | | | 2,401,071 | | | | 194,895 | | | |
| Allen R. Freedman | | | 2,405,558 | | | | 190,408 | | | |
| William H. Park | | | 2,406,783 | | | | 189,183 | | | |
| Ronald A. Pearlman | | | 2,404,764 | | | | 191,202 | | | |
| Helen Frame Peters | | | 2,404,494 | | | | 191,472 | | | |
| Heidi L. Steiger | | | 2,405,232 | | | | 190,734 | | | |
| Lynn A. Stout | | | 2,406,458 | | | | 189,508 | | | |
| Ralph F. Verni | | | 2,406,783 | | | | 189,183 | | | |
17
Eaton Vance VT Large-Cap Value Fund
BOARD OF TRUSTEES’ ANNUAL APPROVAL OF THE INVESTMENT ADVISORY AGREEMENT
Overview of the Contract Review Process
The Investment Company Act of 1940, as amended (the “1940 Act”), provides, in substance, that each investment advisory agreement between a fund and its investment adviser will continue in effect from year to year only if its continuance is approved at least annually by the fund’s board of trustees, including by a vote of a majority of the trustees who are not “interested persons” of the fund (“Independent Trustees”), cast in person at a meeting called for the purpose of considering such approval.
At a meeting of the Boards of Trustees (each a “Board”) of the Eaton Vance group of mutual funds (the “Eaton Vance Funds”) held on April 21, 2008, the Board, including a majority of the Independent Trustees, voted to approve continuation of existing advisory and sub-advisory agreements for the Eaton Vance Funds for an additional one-year period. In voting its approval, the Board relied upon the affirmative recommendation of the Contract Review Committee of the Board (formerly the Special Committee), which is a committee comprised exclusively of Independent Trustees. Prior to making its recommendation, the Contract Review Committee reviewed information furnished for a series of meetings of the Contract Review Committee held in February, March and April 2008. Such information included, among other things, the following:
Information about Fees, Performance and Expenses
| | |
| | • | An independent report comparing the advisory and related fees paid by each fund with fees paid by comparable funds; |
| | • | An independent report comparing each fund’s total expense ratio and its components to comparable funds; |
| | • | An independent report comparing the investment performance of each fund to the investment performance of comparable funds over various time periods; |
| | • | Data regarding investment performance in comparison to relevant peer groups of funds and appropriate indices; |
| | • | Comparative information concerning fees charged by each adviser for managing other mutual funds and institutional accounts using investment strategies and techniques similar to those used in managing the fund; |
| | • | Profitability analyses for each adviser with respect to each fund; |
Information about Portfolio Management
| | |
| | • | Descriptions of the investment management services provided to each fund, including the investment strategies and processes employed, and any changes in portfolio management processes and personnel; |
| | • | Information concerning the allocation of brokerage and the benefits received by each adviser as a result of brokerage allocation, including information concerning the acquisition of research through “soft dollar” benefits received in connection with the funds’ brokerage, and the implementation of a soft dollar reimbursement program established with respect to the funds; |
| | • | Data relating to portfolio turnover rates of each fund; |
| | • | The procedures and processes used to determine the fair value of fund assets and actions taken to monitor and test the effectiveness of such procedures and processes; |
Information about each Adviser
| | |
| | • | Reports detailing the financial results and condition of each adviser; |
| | • | Descriptions of the qualifications, education and experience of the individual investment professionals whose responsibilities include portfolio management and investment research for the funds, and information relating to their compensation and responsibilities with respect to managing other mutual funds and investment accounts; |
| | • | Copies of the Codes of Ethics of each adviser and its affiliates, together with information relating to compliance with and the administration of such codes; |
| | • | Copies of or descriptions of each adviser’s proxy voting policies and procedures; |
| | • | Information concerning the resources devoted to compliance efforts undertaken by each adviser and its affiliates on behalf of the funds (including descriptions of various compliance programs) and their record of compliance with investment policies and restrictions, including policies with respect to market-timing, late trading and selective portfolio disclosure, and with policies on personal securities transactions; |
| | • | Descriptions of the business continuity and disaster recovery plans of each adviser and its affiliates; |
Other Relevant Information
| | |
| | • | Information concerning the nature, cost and character of the administrative and other non-investment management services provided by Eaton Vance Management and its affiliates; |
| | • | Information concerning management of the relationship with the custodian, subcustodians and fund accountants by each adviser or the funds’ administrator; and |
| | • | The terms of each advisory agreement. |
18
Eaton Vance VT Large-Cap Value Fund
BOARD OF TRUSTEES’ ANNUAL APPROVAL OF THE INVESTMENT ADVISORY AGREEMENT CONT’D
In addition to the information identified above, the Contract Review Committee considered information provided from time to time by each adviser throughout the year at meetings of the Board and its committees. Over the course of the twelve-month period ended April 30, 2008, the Board met eleven times and the Contract Review Committee, the Audit Committee and the Governance Committee, each of which is a Committee comprised solely of Independent Trustees, met twelve, seven and five times, respectively. At such meetings, the Trustees received, among other things, presentations by the portfolio managers and other investment professionals of each adviser relating to the investment performance of each fund and the investment strategies used in pursuing the fund’s investment objective. The Portfolio Management Committee and the Compliance Reports and Regulatory Matters Committee are newly established and did not meet during the twelve-month period ended April 30, 2008.
For funds that invest through one or more underlying portfolios, the Board considered similar information about the portfolio(s) when considering the approval of advisory agreements. In addition, in cases where the fund’s investment adviser has engaged a sub-adviser, the Board considered similar information about the sub-adviser when considering the approval of any sub-advisory agreement.
The Contract Review Committee was assisted throughout the contract review process by Goodwin Procter LLP, legal counsel for the Independent Trustees. The members of the Contract Review Committee relied upon the advice of such counsel and their own business judgment in determining the material factors to be considered in evaluating each advisory and sub-advisory agreement and the weight to be given to each such factor. The conclusions reached with respect to each advisory and sub-advisory agreement were based on a comprehensive evaluation of all the information provided and not any single factor. Moreover, each member of the Contract Review Committee may have placed varying emphasis on particular factors in reaching conclusions with respect to each advisory and sub-advisory agreement.
Results of the Process
Based on its consideration of the foregoing, and such other information as it deemed relevant, including the factors and conclusions described below, the Contract Review Committee concluded that the continuance of the investment advisory agreement of Eaton Vance VT Large-Cap Value Fund (the “Fund”) with Eaton Vance Management (the “Adviser”), including its fee structure, is in the interests of shareholders and, therefore, the Contract Review Committee recommended to the Board approval of the agreement. The Board accepted the recommendation of the Contract Review Committee as well as the factors considered and conclusions reached by the Contract Review Committee with respect to the agreement. Accordingly, the Board, including a majority of the Independent Trustees, voted to approve continuation of the investment advisory agreement for the Fund.
Nature, Extent and Quality of Services
In considering whether to approve the investment advisory agreement of the Fund, the Board evaluated the nature, extent and quality of services provided to the Fund by the Adviser.
The Board considered the Adviser’s management capabilities and investment process with respect to the types of investments held by the Fund, including the education, experience and number of its investment professionals and other personnel who provide portfolio management, investment research, and similar services to the Fund. The Board specifically noted the Adviser’s in-house equity research capabilities. The Board also took into account the resources dedicated to portfolio management and other services, including the compensation paid to recruit and retain investment personnel, and the time and attention devoted to the Fund by senior management.
The Board also reviewed the compliance programs of the Adviser and relevant affiliates thereof. Among other matters, the Board considered compliance and reporting matters relating to personal trading by investment personnel, selective disclosure of portfolio holdings, late trading, frequent trading, portfolio valuation, business continuity and the allocation of investment opportunities. The Board also evaluated the responses of the Adviser and its affiliates to requests from regulatory authorities such as the Securities and Exchange Commission.
The Board considered shareholder and other administrative services provided or managed by Eaton Vance Management and its affiliates, including transfer agency and accounting services. The Board evaluated the benefits to shareholders of investing in a fund that is a part of a large family of funds, including the ability, in many cases, to exchange an investment among different funds without incurring additional sales charges.
After consideration of the foregoing factors, among others, the Board concluded that the nature, extent and quality of services provided by the Adviser, taken as a whole, are appropriate and consistent with the terms of the investment advisory agreement.
19
Eaton Vance VT Large-Cap Value Fund
BOARD OF TRUSTEES’ ANNUAL APPROVAL OF THE INVESTMENT ADVISORY AGREEMENT CONT’D
Fund Performance
The Board compared the Fund’s investment performance to a relevant universe of similarly managed funds identified by an independent data provider and appropriate benchmark indices.
The Board reviewed comparative performance data for period from inception (March 2007) through September 30, 2007 for the Fund. The Board concluded that the performance of the Fund was satisfactory.
Management Fees and Expenses
The Board reviewed contractual investment advisory fee rates, including any administrative fee rates, payable by the Fund (referred to collectively as “management fees”). As part of its review, the Board considered the Fund’s management fees and total expense ratio for the period from inception through September 30, 2007, as compared to a group of similarly managed funds selected by an independent data provider. The Board considered that the Adviser had waived fees and/or paid expenses for the Fund.
After reviewing the foregoing information, and in light of the nature, extent and quality of the services provided by the Adviser, the Board concluded that the management fees charged for advisory and related services and the Fund’s total expense ratio are reasonable.
Profitability
The Board reviewed the level of profits realized by the Adviser and relevant affiliates thereof in providing investment advisory and administrative services to the Fund and to all Eaton Vance Funds as a group. The Board considered the level of profits realized without regard to revenue sharing or other payments by the Adviser and its affiliates to third parties in respect of distribution services. The Board also considered other direct or indirect benefits received by the Adviser in connection with its relationship with the Fund.
The Board concluded that, in light of the foregoing factors and the nature, extent and quality of the services rendered, the profits realized by the Adviser and its affiliates are reasonable.
Economies of Scale
In reviewing management fees and profitability, the Board also considered the extent to which the Adviser and its affiliates, on the one hand, and the Fund, on the other hand, can expect to realize benefits from economies of scale as the assets of the Fund increase. The Board acknowledged the difficulty in accurately measuring the benefits resulting from the economies of scale with respect to the management of any specific fund or group of funds. The Board reviewed data summarizing the increases and decreases in the assets of the Fund and of all Eaton Vance Funds as a group over various time periods, and evaluated the extent to which the total expense ratio of the Fund and the Adviser’s profitability may have been affected by such increases or decreases. Based upon the foregoing, the Board concluded that the benefits from economies of scale are currently being shared equitably by the Adviser and the Fund. The Board also concluded that the structure of the advisory fee, which includes breakpoints at several asset levels, can be expected to cause the Adviser and its affiliates and the Fund to continue to share such benefits equitably.
20
Eaton Vance VT Large-Cap Value Fund
MANAGEMENT AND ORGANIZATION
Fund Management. The Trustees of Eaton Vance Variable Trust (the Trust) are responsible for the overall management and supervision of the Trust’s affairs. The Trustees and officers of the Trust are listed below. Except as indicated, each individual has held the office shown or other offices in the same company for the last five years. Trustees and officers of the Trust hold indefinite terms of office. The “noninterested Trustees” consist of those Trustees who are not “interested persons” of the Trust, as that term is defined under the 1940 Act. The business address of each Trustee and officer is The Eaton Vance Building, 255 State Street, Boston, Massachusetts 02109 until March 22, 2009 and thereafter at Two International Place, Boston, Massachusetts 02110. As used below, “EVC” refers to Eaton Vance Corp., “EV” refers to Eaton Vance, Inc., “EVM” refers to Eaton Vance Management, “BMR” refers to Boston Management and Research, “EVD” refers to Eaton Vance Distributors, Inc., and “OrbiMed” refers to OrbiMed Advisors, LLC. EVC and EV are the corporate parent and trustee, respectively, of EVM and BMR. EVD is the Fund’s principal underwriter and a wholly-owned subsidiary of EVC. Each officer affiliated with Eaton Vance may hold a position with other Eaton Vance affiliates that is comparable to his or her position with EVM listed below.
| | | | | | | | | | | | | |
| | | | | Term of
| | | | Number of Portfolios
| | | |
| | | Position
| | Office and
| | | | in Fund Complex
| | | |
Name and
| | with the
| | Length of
| | Principal Occupation(s)
| | Overseen By
| | | |
| Date of Birth | | Trust | | Service | | During Past Five Years | | Trustee(1) | | | Other Directorships Held |
| |
| |
| |
| Interested Trustee |
| | | | | | | | | | | | | |
Thomas E. Faust Jr.
5/31/58 | | Trustee | | Since 2007 | | Chairman, Chief Executive Officer and President of EVC, Director and President of EV, Chief Executive Officer and President of EVM and BMR, and Director of EVD. Trustee and/or Officer of 173 registered investment companies and 4 private investment companies managed by EVM or BMR. Mr. Faust is an interested person because of his positions with EVM, BMR, EVD, EVC and EV, which are affiliates of the Trust. | | | 173 | | | Director of EVC |
| |
| Noninterested Trustees |
| | | | | | | | | | | | | |
Benjamin C. Esty
1/2/63 | | Trustee | | Since 2005 | | Roy and Elizabeth Simmons Professor of Business Administration, Harvard University Graduate School of Business Administration. | | | 173 | | | None |
| | | | | | | | | | | | | |
Allen R. Freedman
4/3/40 | | Trustee | | Since 2007 | | Former Chairman (2002-2004) and a Director (1983-2004) of Systems & Computer Technology Corp. (provider of software to higher education). Formerly, a Director of Loring Ward International (fund distributor) (2005-2007). Formerly, Chairman and a Director of Indus International, Inc. (provider of enterprise management software to the power generating industry) (2005-2007). | | | 173 | | | Director of Assurant, Inc. (insurance provider) and Stonemor Partners L.P. (owner and operator of cemeteries) |
| | | | | | | | | | | | | |
William H. Park
9/19/47 | | Trustee | | Since 2003 | | Vice Chairman, Commercial Industrial Finance Corp. (specialty finance company) (since 2006). Formerly, President and Chief Executive Officer, Prizm Capital Management, LLC (investment management firm) (2002-2005). | | | 173 | | | None |
| | | | | | | | | | | | | |
Ronald A. Pearlman
7/10/40 | | Trustee | | Since 2003 | | Professor of Law, Georgetown University Law Center. | | | 173 | | | None |
| | | | | | | | | | | | | |
Helen Frame Peters
3/22/48 | | Trustee | | Since 2008 | | Professor of Finance, Carroll School of Management, Boston College. Adjunct Professor of Finance, Peking University, Beijing, China (since 2005). | | | 173 | | | Director of Federal Home Loan Bank of Boston (a bank for banks) and BJ’s Wholesale Clubs (wholesale club retailer); Trustee of SPDR Index Shares Funds and SPDR Series Trust (exchange traded funds) |
| | | | | | | | | | | | | |
Heidi L. Steiger
7/8/53 | | Trustee | | Since 2007 | | Managing Partner, Topridge Associates LLC (global wealth management firm) (since 2008); Senior Advisor (since 2008), President (2005-2008), Lowenhaupt Global Advisors, LLC (global wealth management firm). Formerly, President and Contributing Editor, Worth Magazine (2004-2005). Formerly, Executive Vice President and Global Head of Private Asset Management (and various other positions), Neuberger Berman (investment firm) (1986-2004). | | | 173 | | | Director of Nuclear Electric Insurance Ltd. (nuclear insurance provider) and Aviva USA (insurance provider) |
21
Eaton Vance VT Large-Cap Value Fund
MANAGEMENT AND ORGANIZATION CONT’D
| | | | | | | | | | | | | |
| | | | | Term of
| | | | Number of Portfolios
| | | |
| | | Position
| | Office and
| | | | in Fund Complex
| | | |
Name and
| | with the
| | Length of
| | Principal Occupation(s)
| | Overseen By
| | | |
| Date of Birth | | Trust | | Service | | During Past Five Years | | Trustee(1) | | | Other Directorships Held |
| |
| |
| Noninterested Trustees (continued) |
| | | | | | | | | | | | | |
Lynn A. Stout
9/14/57 | | Trustee | | Since 2000 | | Paul Hastings Professor of Corporate and Securities Law (since 2006) and Professor of Law (2001-2006), University of California at Los Angeles School of Law. | | | 173 | | | None |
| | | | | | | | | | | | | |
Ralph F. Verni
1/26/43 | | Chairman of
the Board
and Trustee | | Chairman of the Board since 2007 and Trustee since 2005 | | Consultant and private investor. | | | 173 | | | None |
Principal Officers who are not Trustees
| | | | | | | |
| | | | | Term of
| | |
| | | Positions
| | Office and
| | |
Name and
| | with the
| | Length of
| | Principal Occupation(s)
|
| Date of Birth | | Trust | | Service | | During Past Five Years |
| |
| |
| | | | | | | |
Duncan W. Richardson
10/26/57 | | President | | Since 2008(2) | | Executive Vice President and Chief Equity Investment Officer of EVC, EVM and BMR. Officer of 81 registered investment companies managed by EVM or BMR. |
| | | | | | | |
Samuel D. Isaly
3/12/45 | | Vice President | | Since 2000 | | Managing Partner of OrbiMed. Officer of 4 registered investment companies managed by EVM or BMR. |
| | | | | | | |
Michael R. Mach
7/15/47 | | Vice President | | Since 2006 | | Vice President of EVM and BMR. Officer of 24 registered investment companies managed by EVM or BMR. |
| | | | | | | |
Scott H. Page
11/30/59 | | Vice President | | Since 2000 | | Vice President of EVM and BMR. Officer of 11 registered investment companies managed by EVM or BMR. |
| | | | | | | |
Craig P. Russ
10/30/63 | | Vice President | | Since 2000 | | Vice President of EVM and BMR. Officer of 6 registered investment companies managed by EVM or BMR. |
| | | | | | | |
Andrew N. Sveen
3/13/61 | | Vice President | | Since 2008 | | Vice President of EVM and BMR. Officer of 4 registered investment companies managed by EVM or BMR. |
| | | | | | | |
Barbara E. Campbell
6/19/57 | | Treasurer | | Since 2005 | | Vice President of EVM and BMR. Officer of 173 registered investment companies managed by EVM or BMR. |
| | | | | | | |
Maureen A. Gemma
5/24/60 | | Secretary and Chief Legal Officer | | Secretary since 2007 and Chief Legal Officer since 2008 | | Vice President of EVM and BMR. Officer of 173 registered investment companies managed by EVM or BMR. |
| | | | | | | |
Paul M. O’Neil
7/11/53 | | Chief Compliance Officer | | Since 2004 | | Vice President of EVM and BMR. Officer of 173 registered investment companies managed by EVM or BMR. |
| | |
| (1) | | Includes both master and feeder funds in a master-feeder structure. |
| |
| (2) | | Prior to 2008, Mr. Richardson served as a Vice President since 2000. |
The SAI for the Fund includes additional information about the Trustees and officers of the Fund and can be obtained without charge on Eaton Vance’s website at www.eatonvance.com or by calling 1-800-262-1122.
22
This Page Intentionally Left Blank
This Page Intentionally Left Blank
Investment Adviser of Eaton Vance VT Large-Cap Value Fund
Eaton Vance Management
The Eaton Vance Building
255 State Street
Boston, MA 02109
Administrator of Eaton Vance VT Large-Cap Value FundEaton Vance Management
The Eaton Vance Building
255 State Street
Boston, MA 02109
Eaton Vance Distributors, Inc.
The Eaton Vance Building
255 State Street
Boston, MA 02109
(617) 482-8260
State Street Bank and Trust Company
200 Clarendon Street
Boston, MA 02116
State Street Bank and Trust Company
200 Clarendon Street
Boston, MA 02116
Independent Registered Public Accounting FirmDeloitte & Touche LLP
200 Berkeley Street
Boston, MA 02116-5022
Eaton Vance VT Large-Cap Value FundThe Eaton Vance Building
255 State Street
Boston, MA 02109
This report must be preceded or accompanied by a current prospectus. Before investing, investors should consider carefully the Fund’s investment objective(s), risks, and charges and expenses. The Fund’s current prospectus contains this and other information about the Fund and is available through your financial advisor. Please read the prospectus carefully before you invest or send money. For further information please call 1-800-262-1122.
Item 2. Code of Ethics
The registrant has adopted a code of ethics applicable to its Principal Executive Officer, Principal Financial Officer and Principal Accounting Officer. The registrant undertakes to provide a copy of such code of ethics to any person upon request, without charge, by calling 1-800-262-1122.
Item 3. Audit Committee Financial Expert
The registrant’s Board has designated William H. Park, an independent trustee, as its audit committee financial expert. Mr. Park is a certified public accountant who is the Vice Chairman of Commercial Industrial Finance Corp (specialty finance company). Previously, he served as President and Chief Executive Officer of Prizm Capital Management, LLC (investment management firm) and as Executive Vice President and Chief Financial Officer of United Asset Management Corporation (“UAM”) (a holding company owning institutional investment management firms).
Item 4. Principal Accountant Fees and Services
(a)-(d)
The following table presents the aggregate fees billed to the registrant for the registrant’s respective fiscal years ended December 31, 2007 and December 31, 2008 by each principal accountant for professional services rendered for the audit of the registrant’s annual financial statements and fees billed for other services rendered by the principal accountant during those periods. For certain series, Pricewaterhouse Coopers was the principal accountant for the fiscal year ended 2006. For the fiscal year ended 2007, for certain Series, Pricewaterhouse Coopers was replaced by D&T.
VT Floating-Rate Fund
| | | | | | | | | |
| Fiscal Years Ended | | 12/31/2007 | | 12/31/2008 |
| |
| Audit Fees | | $ | 34,280 | | | $ | 32,525 | |
Audit-Related Fees(1) | | $ | 0 | | | $ | 0 | |
Tax Fees(2) | | $ | 6,883 | | | $ | 7,130 | |
All Other Fees(3) | | $ | 0 | | | $ | 552 | |
| | | |
| Total | | $ | 41,163 | | | $ | 40,207 | |
| | | |
VT Worldwide Health Sciences Fund
| | | | | | | | | |
| Fiscal Years Ended | | 12/31/2007 | | 12/31/2008 |
| |
| Audit Fees | | $ | 24,000 | | | $ | 27,425 | |
Audit-Related Fees(1) | | $ | 0 | | | $ | 0 | |
Tax Fees(2) | | $ | 5,800 | | | $ | 6,010 | |
All Other Fees(3) | | $ | 0 | | | $ | 0 | |
| | | |
| Total | | $ | 29,800 | | | $ | 33,435 | |
| | | |
VT Large-Cap Value Fund
| | | | | | | | | |
| Fiscal Years Ended | | 12/31/2007 | | 12/31/2008 |
| |
| Audit Fees | | $ | 31,000 | | | $ | 33,125 | |
Audit-Related Fees(1) | | $ | 0 | | | $ | 0 | |
Tax Fees(2) | | $ | 5,800 | | | $ | 8,080 | |
All Other Fees(3) | | $ | 0 | | | $ | 0 | |
| | | |
| Total | | $ | 36,800 | | | $ | 41,205 | |
| | | |
| | |
| (1) | | Audit-related fees consist of the aggregate fees billed for assurance and related services that are reasonably related to the performance of the audit of the registrant’s financial statements and are not reported under the category of audit fees. |
| |
| (2) | | Tax fees consist of the aggregate fees billed for professional services rendered by the principal accountant relating to tax compliance, tax advice, and tax planning and specifically include fees for tax return preparation and other tax related compliance/planning matters |
| |
| (3) | | All other fees consist of the aggregate fees billed for products and services provided by the registrant’s principal accountant other than audit, audit-related, and tax services. |
The Funds, comprising all of the series of the Trust, have the same fiscal year end (December 31). The following table presents the aggregate audit, audit-related, tax, and other fees billed to all of the series in the Trust by each series’ respective principal accountant of each series for the last two fiscal years of each series. For certain series, Pricewaterhouse Coopers was the principal accountant for the fiscal year ended 2006. For the fiscal year ended 2007, for certain Series, Pricewaterhouse Coopers was replaced by D&T.
| | | | | | | | | |
| Fiscal Years Ended | | 12/31/2007 | | 12/31/2008 |
| |
| | | Deloitte & Touche LLP | | Deloitte & Touche LLP |
Audit Fees | | $ | 89,280 | | | $ | 93,075 | |
Audit-Related Fees(1) | | $ | 0 | | | $ | 0 | |
Tax Fees(2) | | $ | 18,483 | | | $ | 21,220 | |
All Other Fees | | | | | | $ | 552 | |
| |
Total | | $ | 107,763 | | | $ | 114,847 | |
| | |
| (1) | | Audit-related fees consist of the aggregate fees billed for assurance and related services that are reasonable related to the performance of the audit of financial statements and are not reported under the category of audit fees. |
| |
| (2) | | Tax fees consist of the aggregate fees billed for professional services rendered by the principal accountant relating to tax compliance, tax advice, and tax planning and specifically include fees for tax return preparation. |
| |
| (3) | | All other fees consist of the aggregate fees billed for products and services provided by the principal accountant other than audit, audit-related, and tax services. |
During the Funds fiscal years ended December 31, 2007 and December 31, 2008, $35,000 and $40,000 was billed by “D&T”, the principal accountant for the Funds, for work done in connection with its Rule 17Ad-13 examination of Eaton Vance Management’s assertion that it has maintained an effective internal control; structure over the sub-transfer agent and registrar functions, such services being pre-approved in accordance with Rule 2-01(c)(7) (ii) of Regulation S-X..
(e)(1) The registrant’s audit committee has adopted policies and procedures relating to the pre-approval of services provided by the registrant’s principal accountant (the “Pre-Approval Policies”). The Pre-Approval Policies establish a framework intended to assist the audit committee in the proper discharge of its pre-approval responsibilities. As a general matter, the Pre-Approval Policies (i) specify certain types of audit, audit-related, tax, and other services determined to be pre-approved by the audit committee; and (ii) delineate specific procedures governing the mechanics of the pre-approval process, including the approval and monitoring of audit and non-audit service fees. Unless a service is specifically pre-approved under the Pre-Approval Policies, it must be separately pre-approved by the Audit Committee.
The Pre-Approval Policies and the types of audit and non-audit services pre-approved therein must be reviewed and ratified by the registrant’s audit committee at least annually. The registrant’s audit committee maintains full responsibility for the appointment, compensation, and oversight of the work of the registrant’s principal accountant.
(e)(2) No services described in paragraphs (b)-(d) above were approved by the registrant’s audit committee pursuant to the “de minimis exception” set forth in Rule 2-01 (c)(7)(i)(C) of Regulation S-X.
(f) Not applicable.
(g) The following table presents (i) the aggregate non-audit fees (i.e., fees for audit-related, tax, and other services) billed to all of the Series in the Trust by each Series’s respective principal accountant for the last two fiscal years of each Series; and (ii) the aggregate non-audit fees (i.e., fees for audit-related, tax, and other services) billed to the Eaton Vance organization by each Series’ respective principal accountant for the last two fiscal years of each Series. For the fiscal years ended 2007, for certain Series, Pricewaterhouse Coopers was replaced by D&T.
| | | | | | | | | | | | | | | | | |
| Fiscal Years Ended | | 12/31/2007 | | 12/31/2008 |
| |
| | | PricewaterhouseCoopers | | Deloitte & Touche | | PricewaterhouseCoopers | | Deloitte & Touche |
| | | LLP | | LLP | | LLP | | LLP |
Registrant(1) | | $ | 0 | | | $ | 18,483 | | | $ | 0 | | | $ | 21,772 | |
Eaton Vance(2) | | $ | 0 | | | $ | 281,446 | | | $ | 0 | | | $ | 345,473 | |
| | |
| (1) | | Includes all of the Series in the Trust. |
| |
| (2) | | The investment adviser to the Funds, as well as any of its affiliates that provide ongoing services to the Funds, are subsidiaries of Eaton Vance Corp. |
(h) The registrant’s audit committee has considered whether the provision by the registrant’s principal accountant of non-audit services to the registrant’s investment adviser and any entity controlling, controlled by, or under common control with the adviser that provides ongoing services to the registrant that were not pre-approved pursuant to Rule 2-01(c)(7)(ii) of Regulation S-X is compatible with maintaining the principal accountant’s independence.
Item 5. Audit Committee of Listed registrants
Not required in this filing.
Item 6. Schedule of Investments
Please see schedule of investments contained in the Report to Stockholders included under Item 1 of this Form N-CSR.
Item 7. Disclosure of Proxy Voting Policies and Procedures for Closed-End Management Investment Companies
Not required in this filing.
Item 8. Portfolio Managers of Closed-End Management Investment Companies
Not required in this filing.
Item 9. Purchases of Equity Securities by Closed-End Management Investment Company and Affiliated Purchasers.
Not required in this filing.
Item 10. Submission of Matters to a Vote of Security Holders.
No Material Changes.
Item 11. Controls and Procedures
(a) It is the conclusion of the registrant’s principal executive officer and principal financial officer that the effectiveness of the registrant’s current disclosure controls and procedures (such disclosure controls and procedures having been evaluated within 90 days of the date of this filing) provide reasonable assurance that the information required to be disclosed by the registrant has been recorded, processed, summarized and reported within the time period specified in the Commission’s rules and forms and that the information required to be disclosed by the registrant has been accumulated and communicated to the registrant’s principal executive officer and principal financial officer in order to allow timely decisions regarding required disclosure.
(b) There have been no changes in the registrant’s internal controls over financial reporting during the second fiscal quarter of the period covered by this report that has materially affected, or is reasonably likely to materially affect, the registrant’s internal control over financial reporting.
Item 12. Exhibits
| | | |
| (a)(1) | | Registrant’s Code of Ethics — Not applicable (please see Item 2). |
| | | |
| (a)(2)(i) | | Treasurer’s Section 302 certification. |
| | | |
| (a)(2)(ii) | | President’s Section 302 certification. |
| | | |
| (b) | | Combined Section 906 certification. |
Signatures
Pursuant to the requirements of the Securities Exchange Act of 1934 and the Investment Company Act of 1940, the registrant has duly caused this report to be signed on its behalf by the undersigned, thereunto duly authorized.
Eaton Vance Variable Trust
| | | | | |
| By: | | /s/ Duncan W. Richardson | . | |
| | | Duncan W. Richardson | | |
| | | President | | |
| | | | | |
| Date: | | February 13, 2009 | | |
Pursuant to the requirements of the Securities Exchange Act of 1934 and the Investment Company Act of 1940, this report has been signed below by the following persons on behalf of the registrant and in the capacities and on the dates indicated.
| | | | | |
| By: | | /s/ Barbara E. Campbell Barbara E. Campbell | | |
| | | Treasurer | | |
| | | | | |
| Date: | | February 13, 2009 | | |
| | | | | |
| By: | | /s/ Duncan W. Richardson | . | |
| | | Duncan W. Richardson | | |
| | | President | | |
| | | | | |
| Date: | | February 13, 2009 | | |