UNITED STATES
SECURITIES AND EXCHANGE COMMISSION
Washington, D.C. 20549
Form N-CSR
CERTIFIED SHAREHOLDER REPORT OF REGISTERED
MANAGEMENT INVESTMENT COMPANIES
Investment Company Act File Number: 811-10067
Eaton Vance Variable Trust
(Exact Name of Registrant as Specified in Charter)
Two International Place, Boston, Massachusetts 02110
(Address of Principal Executive Offices)
Maureen A. Gemma
Two International Place, Boston, Massachusetts 02110
(Name and Address of Agent for Services)
(617) 482-8260
(Registrant’s Telephone Number)
December 31
Date of Fiscal Year End
December 31, 2014
Date of Reporting Period
Item 1. Reports to Stockholders

Eaton Vance
VT Floating-Rate Income Fund
Annual Report
December 31, 2014

Commodity Futures Trading Commission Registration. Effective December 31, 2012, the Commodity Futures Trading Commission (“CFTC”) adopted certain regulatory changes that subject registered investment companies and advisers to regulation by the CFTC if a fund invests more than a prescribed level of its assets in certain CFTC-regulated instruments (including futures, certain options and swap agreements) or markets itself as providing investment exposure to such instruments. The Fund has claimed an exclusion from the definition of the term “commodity pool operator” under the Commodity Exchange Act. Accordingly, neither the Fund nor the adviser with respect to the operation of the Fund is subject to CFTC regulation. Because of its management of other strategies, the Fund’s adviser is registered with the CFTC as a commodity pool operator and a commodity trading advisor.
Fund shares are not insured by the FDIC and are not deposits or other obligations of, or guaranteed by, any depository institution. Shares are subject to investment risks, including possible loss of principal invested.
This report is prepared for the general information of contract owners. It is authorized for distribution to prospective investors only when preceded or accompanied by a current summary prospectus or prospectus. Before investing, investors should consider carefully the investment objective, risks, and charges and expenses of the Fund. This and other important information is contained in the summary prospectus and prospectus, which can be obtained from a financial advisor. Prospective investors should read the prospectus carefully before investing. For further information, please call 1-800-262-1122.
Annual Report December 31, 2014
Eaton Vance
VT Floating-Rate Income Fund
Table of Contents
| | | | |
Management’s Discussion of Fund Performance | | | 2 | |
| |
Performance | | | 3 | |
| |
Fund Profile | | | 4 | |
| |
Endnotes and Additional Disclosures | | | 5 | |
| |
Fund Expenses | | | 6 | |
| |
Financial Statements | | | 7 | |
| |
Report of Independent Registered Public Accounting Firm | | | 31 | |
| |
Federal Tax Information | | | 32 | |
| |
Management and Organization | | | 33 | |
| |
Important Notices | | | 35 | |
Eaton Vance
VT Floating-Rate Income Fund
December 31, 2014
Management’s Discussion of Fund Performance1
Economic and Market Conditions
The U.S. floating-rate loan market began the 12-month period ended December 31, 2014 on strong footing, as robust new issue supply was met by investor demand amid strong appetite for risk and a global search for yield. Aside from brief bouts of weakness in technical conditions in February and April, overall market tone was generally firm for the first seven months of the period, with total demand exceeding the supply of net new issuance by a meaningful margin.
Beginning in the second quarter, retail investor demand began to wane, turning net negative after nearly two straight years of positive demand. We believe this was in response to an unexpected declining interest rate outlook, as well an increasing number of negative headlines surrounding the asset class. Declining retail demand was more than offset by continued demand growth from institutional investors and investors in collateralized loan obligations. Sluggish technical conditions developed in the August/September timeframe, primarily due to substantial new loan supply, and deteriorated further by December due to the sharp decline in oil prices. These weaker technical conditions modestly weighed on loan prices in the final stretch of the period.
Overall, the S&P/LSTA Leveraged Loan Index2 (the Index) — a broad barometer of the loan market — returned 1.60% for the 12-month period. Returns were comprised mainly of interest income. Lower-quality loans generally outpaced their higher-quality counterparts; loans rated BB, B, CCC and D (defaulted)6 returned 1.52%, 1.43%, 6.09% and 2.30%, respectively, for the period.
On April 29, 2014, Energy Future Holdings (EFH, formerly TXU Corp.) filed for bankruptcy. The Fund did not hold a position in EFH at the time of default. EFH’s Chapter 11 bankruptcy filing caused the Index default rate to spike to 3.2% on a trailing 12-month basis as of December 31, 2014. Excluding EFH, however, the Index’s trailing 12-month default rate was a scant 0.34%, well below the market’s
10-year average of 2.6%, according to Standard & Poor’s Leveraged Commentary & Data (S&P/LCD).
Fund Performance
For the fiscal year ended December 31, 2014, Eaton Vance VT Floating-Rate Income Fund (the Fund) Initial Class shares at net asset value (NAV) had a total return of 0.57%.
By comparison, the Fund’s benchmark, the Index, returned 1.60% for the period.
During the period, the Fund maintained portfolio quality at a level consistent with management’s views on appropriate credit risk. In contrast, the Index descended in credit quality over the 12-month period, with lower-quality issuers awarded higher returns. As a result of the Fund’s historical positioning toward higher-quality credit tiers relative to the Index, the Fund’s underweighting to segments rated CCC and D (defaulted) and overweighting to loans rated BB detracted from performance relative to the Index for the year.
Among individual holdings, the Fund had underweight or no exposure to a number of high-beta7, lower-quality Index names that rallied significantly during the period, namely Cengage Learning and SuperMedia. This detracted from performance relative to the Index. Heavier-than-Index Fund holdings in Education Management, SeaDrill and Town Sports also detracted from performance relative to the Index, as these issuers underperformed the overall loan market.
On the positive side, underweight or no exposure in EFH, Ocean Rig, Templar Energy and Fieldwood Energy helped the Fund’s performance versus the Index, as these issuers trailed the overall loan market.
See Endnotes and Additional Disclosures in this report.
Past performance is no guarantee of future results. Returns are historical and are calculated by determining the percentage change in net asset value (NAV) or offering price (as applicable) with all distributions reinvested. Investment return and principal value will fluctuate so that shares, when redeemed, may be worth more or less than their original cost. Performance less than one year is cumulative. Performance is for the stated time period only; due to market volatility, the Fund’s current performance may be lower or higher than quoted. Returns are before taxes unless otherwise noted.
Eaton Vance
VT Floating-Rate Income Fund
December 31, 2014
Performance2,3
Portfolio Managers Scott H. Page, CFA, Craig P. Russ and Andrew Sveen, CFA
| | | | | | | | | | | | | | | | | | | | |
| % Average Annual Total Returns | | Class
Inception Date | | | Performance
Inception Date | | | One Year | | | Five Years | | | Ten Years | |
Initial Class at NAV | | | 05/02/2001 | | | | 05/02/2001 | | | | 0.57 | % | | | 4.63 | % | | | 3.91 | % |
ADV Class at NAV | | | 04/15/2014 | | | | 05/02/2001 | | | | 0.62 | | | | 4.64 | | | | 3.91 | |
S&P/LSTA Leveraged Loan Index | | | — | | | | — | | | | 1.60 | % | | | 5.57 | % | | | 4.90 | % |
| | | | | |
| | | | | | | | | | | | | | | | | | | | |
| % Total Annual Operating Expense Ratios4 | | | | | | | | | | | Initial
Class | | | ADV
Class | |
| | | | | | | | | | | | | | | 1.16 | % | | | 0.91 | % |
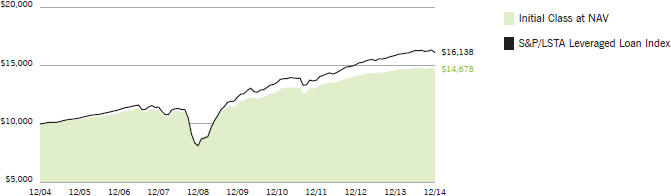
Growth of $10,000
This graph shows the change in value of a hypothetical investment of $10,000 in Initial Class of the Fund for the period indicated. For comparison, the same investment is shown in the indicated index.
| | | | | | | | | | | | | | | | |
| Growth of Investment | | Amount Invested | | | Period Beginning | | | At NAV | | | With Maximum Sales Charge | |
ADV Class | | $ | 10,000 | | | | 12/31/2004 | | | $ | 14,684 | | | | N.A. | |
See Endnotes and Additional Disclosures in this report.
Past performance is no guarantee of future results. Returns are historical and are calculated by determining the percentage change in net asset value (NAV) or offering price (as applicable) with all distributions reinvested. Investment return and principal value will fluctuate so that shares, when redeemed, may be worth more or less than their original cost. Performance less than one year is cumulative. Performance is for the stated time period only; due to market volatility, the Fund’s current performance may be lower or higher than quoted. Returns are before taxes unless otherwise noted.
Eaton Vance
VT Floating-Rate Income Fund
December 31, 2014
Fund Profile
Top 10 Issuers (% of total investments)5
| | | | |
Hilton Worldwide Finance, LLC | | | 1.2 | % |
Avago Technologies Cayman Ltd. | | | 1.1 | |
Transdigm, Inc. | | | 1.1 | |
Asurion, LLC | | | 1.1 | |
Chrysler Group, LLC | | | 1.0 | |
Michaels Stores, Inc. | | | 1.0 | |
Community Health Systems, Inc. | | | 0.9 | |
Dell, Inc. | | | 0.9 | |
Supervalu, Inc. | | | 0.9 | |
Infor (US), Inc. | | | 0.8 | |
Total | | | 10.0 | % |
Top 10 Sectors (% of total investments)5
| | | | |
Health Care | | | 10.2 | % |
Electronics/Electrical | | | 9.7 | |
Business Equipment and Services | | | 7.6 | |
Retailers (Except Food and Drug) | | | 5.5 | |
Chemicals and Plastics | | | 5.1 | |
Automotive | | | 4.6 | |
Financial Intermediaries | | | 3.8 | |
Utilities | | | 3.8 | |
Food Products | | | 3.6 | |
Lodging and Casinos | | | 3.5 | |
Total | | | 57.4 | % |
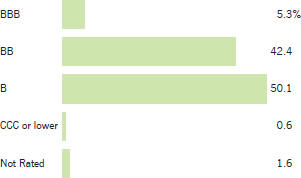
Credit Quality (% of bond and loan holdings)6
See Endnotes and Additional Disclosures in this report.
Eaton Vance
VT Floating-Rate Income Fund
December 31, 2014
Endnotes and Additional Disclosures
| 1 | The views expressed in this report are those of the portfolio manager(s) and are current only through the date stated at the top of this page. These views are subject to change at any time based upon market or other conditions, and Eaton Vance and the Fund(s) disclaim any responsibility to update such views. These views may not be relied upon as investment advice and, because investment decisions are based on many factors, may not be relied upon as an indication of trading intent on behalf of any Eaton Vance fund. This commentary may contain statements that are not historical facts, referred to as “forward looking statements”. The Fund’s actual future results may differ significantly from those stated in any forward looking statement, depending on factors such as changes in securities or financial markets or general economic conditions, the volume of sales and purchases of Fund shares, the continuation of investment advisory, administrative and service contracts, and other risks discussed from time to time in the Fund’s filings with the Securities and Exchange Commission. |
| 2 | S&P/LSTA Leveraged Loan Index is an unmanaged index of the institutional leveraged loan market. Unless otherwise stated, index returns do not reflect the effect of any applicable sales charges, commissions, expenses, taxes or leverage, as applicable. It is not possible to invest directly in an index. |
| 3 | There is no sales charge. Insurance-related charges are not included in the calculation of returns. Such expenses would reduce the overall return shown. Please refer to the report for your insurance contract for performance data reflecting insurance-related charges. |
| | Performance prior to the inception date of a class may be linked to the performance of an older class of the Fund. This linked performance is not adjusted for class expense differences. If adjusted for such differences, the performance would be different. Performance presented in the financial highlights included in the financial statements is not linked. In the performance table, the performance of ADV Class is linked to Initial Class. Performance since inception for an index, if presented, is the performance since the Fund’s or oldest share class’ inception, as applicable. |
| 4 | Source: Fund prospectus. |
| 5 | Excludes cash and cash equivalents. |
| 6 | Ratings are based on Moody’s, S&P or Fitch, as applicable. If securities are rated differently by the ratings agencies, the higher rating is applied. Ratings, which are subject to change, apply to the creditworthiness of the issuers of the underlying securities and not to the Fund or its shares. Credit ratings measure the quality of a bond based on the issuer’s creditworthiness, with ratings ranging from AAA, being the highest, to D, being the lowest based on S&P’s measures. Ratings of BBB or higher by S&P or Fitch (Baa or higher by Moody’s) are considered to be investment-grade quality. Credit ratings are based largely on the ratings agency’s analysis at the time of rating. The rating assigned to any particular security is not necessarily a reflection of the issuer’s current financial condition and does not necessarily reflect its assessment of the volatility of a security’s market value or of the liquidity of an investment in the security. Holdings designated as “Not Rated” are not rated by the national ratings agencies stated above. |
| 7 | Beta is a measure of risk that shows a fund or strategies volatility relative to that fund’s stated benchmark. A fund or strategy with a beta of 1 performed exactly like the market index; a beta less than 1 means its performance was less volatile than the index, positive or negative. |
| | Fund profile subject to change due to active management. |
Eaton Vance
VT Floating-Rate Income Fund
December 31, 2014
Fund Expenses
Example: As a Fund shareholder, you incur ongoing costs, including management fees; distribution and/or service fees; and other Fund expenses. This Example is intended to help you understand your ongoing costs (in dollars) of Fund investing and to compare these costs with the ongoing costs of investing in other mutual funds. The Example is based on an investment of $1,000 invested at the beginning of the period and held for the entire period (July 1, 2014 – December 31, 2014).
Actual Expenses: The first section of the table below provides information about actual account values and actual expenses. You may use the information in this section, together with the amount you invested, to estimate the expenses that you paid over the period. Simply divide your account value by $1,000 (for example, an $8,600 account value divided by $1,000 = 8.6), then multiply the result by the number in the first section under the heading entitled “Expenses Paid During Period” to estimate the expenses you paid on your account during this period.
Hypothetical Example for Comparison Purposes: The second section of the table below provides information about hypothetical account values and hypothetical expenses based on the actual Fund expense ratio and an assumed rate of return of 5% per year (before expenses), which is not the actual Fund return. The hypothetical account values and expenses may not be used to estimate the actual ending account balance or expenses you paid for the period. You may use this information to compare the ongoing costs of investing in your Fund and other funds. To do so, compare this 5% hypothetical example with the 5% hypothetical examples that appear in the shareholder reports of the other funds.
Please note that the expenses shown in the table are meant to highlight your ongoing costs only and do not reflect expenses and charges which are, or may be imposed under the variable annuity contract or variable life insurance policy (variable contracts) (if applicable) through which your investment in the Fund is made. Therefore, the second section of the table is useful in comparing ongoing costs associated with an investment in vehicles which fund benefits under variable contracts and to qualified pension and retirement plans, and will not help you determine the relative total costs of investing in the Fund through variable contracts. In addition, if these expenses and charges imposed under the variable contracts were included, your costs would be higher.
| | | | | | | | | | | | | | | | |
| | | Beginning
Account Value
(7/1/14) | | | Ending
Account Value
(12/31/14) | | | Expenses Paid
During Period*
(7/1/14 – 12/31/14) | | | Annualized
Expense
Ratio | |
| | | | |
| | | | | | | | | | | | | | | | |
Actual | | | | | | | | | | | | | |
Initial Class | | $ | 1,000.00 | | | $ | 992.60 | | | $ | 5.78 | | | | 1.15 | % |
ADV Class | | $ | 1,000.00 | | | $ | 992.80 | | | $ | 4.52 | | | | 0.90 | % |
| | | | | | | | | | | | | | | | | |
| | | | |
| | | | | | | | | | | | | | | | |
Hypothetical | | | | | | | | | | | | | |
(5% return per year before expenses) | | | | | | | | | | | | | |
Initial Class | | $ | 1,000.00 | | | $ | 1,019.40 | | | $ | 5.85 | | | | 1.15 | % |
ADV Class | | $ | 1,000.00 | | | $ | 1,020.70 | | | $ | 4.58 | | | | 0.90 | % |
| * | Expenses are equal to the Fund’s annualized expense ratio for the indicated Class, multiplied by the average account value over the period, multiplied by 184/365 (to reflect the one-half year period). The Example assumes that the $1,000 was invested at the net asset value per share determined at the close of business on June 30, 2014. Expenses shown do not include any insurance-related charges. |
Eaton Vance
VT Floating-Rate Income Fund
December 31, 2014
Portfolio of Investments
| | | | | | | | |
| Senior Floating-Rate Interests — 96.4%(1) | |
| | |
| | | | | | | | |
| Borrower/Tranche Description | | Principal
Amount
(000’s omitted) | | | Value | |
| | | | | | | | |
|
Aerospace and Defense — 1.9% | |
Atlantic Aviation FBO, Inc. | | | | | | | | |
Term Loan, 3.25%, Maturing June 1, 2020 | | $ | 271 | | | $ | 264,808 | |
BE Aerospace, Inc. | | | | | | | | |
Term Loan, 4.00%, Maturing December 16, 2021 | | | 750 | | | | 750,000 | |
DAE Aviation Holdings, Inc. | | | | | | | | |
Term Loan, 5.00%, Maturing November 2, 2018 | | | 336 | | | | 335,460 | |
Ducommun Incorporated | | | | | | | | |
Term Loan, 4.75%, Maturing June 28, 2017 | | | 95 | | | | 94,974 | |
IAP Worldwide Services, Inc. | | | | | | | | |
Revolving Loan, Maturing July 18, 2018(2) | | | 133 | | | | 132,540 | |
Term Loan - Second Lien, 8.00%, Maturing July 18, 2019(3) | | | 182 | | | | 145,982 | |
Silver II US Holdings, LLC | | | | | | | | |
Term Loan, 4.00%, Maturing December 13, 2019 | | | 3,207 | | | | 2,986,087 | |
Standard Aero Limited | | | | | | | | |
Term Loan, 5.00%, Maturing November 2, 2018 | | | 152 | | | | 152,073 | |
Transdigm, Inc. | | | | | | | | |
Term Loan, 3.75%, Maturing February 28, 2020 | | | 5,742 | | | | 5,653,269 | |
Term Loan, 3.75%, Maturing June 4, 2021 | | | 1,194 | | | | 1,174,299 | |
| | | | | | | | | |
| | | | | | $ | 11,689,492 | |
| | | | | | | | | |
|
Automotive — 4.5% | |
Affinia Group Intermediate Holdings, Inc. | | | | | | | | |
Term Loan, 4.75%, Maturing April 27, 2020 | | $ | 469 | | | $ | 465,706 | |
Allison Transmission, Inc. | | | | | | | | |
Term Loan, 3.75%, Maturing August 23, 2019 | | | 2,318 | | | | 2,295,136 | |
Chrysler Group, LLC | | | | | | | | |
Term Loan, 3.50%, Maturing May 24, 2017 | | | 2,754 | | | | 2,750,879 | |
Term Loan, 3.25%, Maturing December 31, 2018 | | | 3,325 | | | | 3,303,057 | |
CS Intermediate Holdco 2, LLC | | | | | | | | |
Term Loan, 4.00%, Maturing April 4, 2021 | | | 2,413 | | | | 2,387,238 | |
Dayco Products, LLC | | | | | | | | |
Term Loan, 5.25%, Maturing December 12, 2019 | | | 620 | | | | 616,823 | |
Federal-Mogul Holdings Corporation | | | | | | | | |
Term Loan, 4.75%, Maturing April 15, 2021 | | | 2,618 | | | | 2,602,892 | |
Goodyear Tire & Rubber Company (The) | | | | | | | | |
Term Loan - Second Lien, 4.75%, Maturing April 30, 2019 | | | 3,975 | | | | 3,966,056 | |
INA Beteiligungsgesellschaft GmbH | | | | | | | | |
Term Loan, 4.25%, Maturing May 15, 2020 | | | 725 | | | | 726,209 | |
MPG Holdco I, Inc. | | | | | | | | |
Term Loan, 4.25%, Maturing October 20, 2021 | | | 1,886 | | | | 1,879,325 | |
TI Group Automotive Systems, LLC | | | | | | | | |
Term Loan, 4.25%, Maturing July 2, 2021 | | | 2,264 | | | | 2,235,330 | |
| | | | | | | | |
| Borrower/Tranche Description | | Principal
Amount
(000’s omitted) | | | Value | |
| | | | | | | | |
|
Automotive (continued) | |
Tower Automotive Holdings USA, LLC | | | | | | | | |
Term Loan, 4.00%, Maturing April 23, 2020 | | $ | 2,650 | | | $ | 2,608,632 | |
Veyance Technologies, Inc. | | | | | | | | |
Term Loan, 5.25%, Maturing September 8, 2017 | | | 1,397 | | | | 1,395,773 | |
Visteon Corporation | | | | | | | | |
Term Loan, 3.50%, Maturing April 9, 2021 | | | 647 | | | | 639,878 | |
| | | | | | | | | |
| | | | | | $ | 27,872,934 | |
| | | | | | | | | |
|
Beverage and Tobacco — 0.2% | |
Flavors Holdings, Inc. | | | | | | | | |
Term Loan, 6.75%, Maturing October 3, 2020 | | $ | 568 | | | $ | 543,680 | |
Term Loan - Second Lien, 11.00%, Maturing October 3, 2021 | | | 1,000 | | | | 955,000 | |
| | | | | | | | | |
| | | | | | $ | 1,498,680 | |
| | | | | | | | | |
|
Brokerage / Securities Dealers / Investment Houses — 0.0%(4) | |
American Beacon Advisors, Inc. | | | | | | | | |
Term Loan, 4.75%, Maturing November 22, 2019 | | $ | 192 | | | $ | 189,819 | |
| | | | | | | | | |
| | | | | | $ | 189,819 | |
| | | | | | | | | |
|
Building and Development — 1.8% | |
ABC Supply Co., Inc. | | | | | | | | |
Term Loan, 3.50%, Maturing April 16, 2020 | | $ | 667 | | | $ | 647,399 | |
CPG International, Inc. | | | | | | | | |
Term Loan, 4.75%, Maturing September 30, 2020 | | | 395 | | | | 392,037 | |
Gates Global, Inc. | | | | | | | | |
Term Loan, 4.25%, Maturing July 5, 2021 | | | 973 | | | | 948,423 | |
Ply Gem Industries, Inc. | | | | | | | | |
Term Loan, 4.00%, Maturing February 1, 2021 | | | 2,487 | | | | 2,440,829 | |
Quikrete Holdings, Inc. | | | | | | | | |
Term Loan, 4.00%, Maturing September 28, 2020 | | | 591 | | | | 584,194 | |
RE/MAX International, Inc. | | | | | | | | |
Term Loan, 4.00%, Maturing July 31, 2020 | | | 1,844 | | | | 1,821,276 | |
Realogy Corporation | | | | | | | | |
Term Loan, 3.75%, Maturing March 5, 2020 | | | 3,711 | | | | 3,658,075 | |
Summit Materials Companies I, LLC | | | | | | | | |
Term Loan, 5.00%, Maturing January 30, 2019 | | | 707 | | | | 707,265 | |
WireCo WorldGroup, Inc. | | | | | | | | |
Term Loan, 6.00%, Maturing February 15, 2017 | | | 290 | | | | 291,018 | |
| | | | | | | | | |
| | | | | | $ | 11,490,516 | |
| | | | | | | | | |
| | | | |
| | 7 | | See Notes to Financial Statements. |
Eaton Vance
VT Floating-Rate Income Fund
December 31, 2014
Portfolio of Investments — continued
| | | | | | | | |
| Borrower/Tranche Description | | Principal
Amount
(000’s omitted) | | | Value | |
| | | | | | | | |
|
Business Equipment and Services — 7.5% | |
Acosta Holdco, Inc. | | | | | | | | |
Term Loan, 5.00%, Maturing September 26, 2021 | | $ | 2,500 | | | $ | 2,499,375 | |
Allied Security Holdings, LLC | | | | | | | | |
Term Loan, 4.25%, Maturing February 12, 2021 | | | 420 | | | | 413,462 | |
Altisource Solutions S.a.r.l. | | | | | | | | |
Term Loan, 4.50%, Maturing December 9, 2020 | | | 2,026 | | | | 1,580,055 | |
AVSC Holding Corp. | | | | | | | | |
Term Loan, 4.50%, Maturing January 24, 2021 | | | 273 | | | | 271,914 | |
BakerCorp International, Inc. | | | | | | | | |
Term Loan, 4.25%, Maturing February 14, 2020 | | | 1,326 | | | | 1,223,674 | |
Brickman Group Ltd., LLC | | | | | | | | |
Term Loan, 4.00%, Maturing December 18, 2020 | | | 520 | | | | 507,250 | |
Brock Holdings III, Inc. | | | | | | | | |
Term Loan, 6.00%, Maturing March 16, 2017 | | | 477 | | | | 449,576 | |
CCC Information Services, Inc. | | | | | | | | |
Term Loan, 4.00%, Maturing December 20, 2019 | | | 221 | | | | 215,029 | |
Ceridian, LLC | | | | | | | | |
Term Loan, 4.50%, Maturing September 15, 2020 | | | 2,413 | | | | 2,382,921 | |
ClientLogic Corporation | | | | | | | | |
Term Loan, 7.48%, Maturing January 30, 2017 | | | 1,132 | | | | 1,103,950 | |
Corporate Capital Trust, Inc. | | | | | | | | |
Term Loan, 4.00%, Maturing May 15, 2019 | | | 620 | | | | 612,931 | |
CPM Acquisition Corp. | | | | | | | | |
Term Loan, 6.25%, Maturing August 29, 2017 | | | 235 | | | | 235,120 | |
Crossmark Holdings, Inc. | | | | | | | | |
Term Loan, 4.50%, Maturing December 20, 2019 | | | 1,275 | | | | 1,251,030 | |
Education Management, LLC | | | | | | | | |
Term Loan, 9.25%, Maturing March 30, 2018(5) | | | 1,527 | | | | 691,005 | |
EIG Investors Corp. | | | | | | | | |
Term Loan, 5.00%, Maturing November 9, 2019 | | | 2,729 | | | | 2,718,950 | |
Emdeon Business Services, LLC | | | | | | | | |
Term Loan, 3.75%, Maturing November 2, 2018 | | | 3,683 | | | | 3,626,529 | |
Expert Global Solutions, Inc. | | | | | | | | |
Term Loan, 8.52%, Maturing April 3, 2018 | | | 313 | | | | 312,037 | |
Extreme Reach, Inc. | | | | | | | | |
Term Loan, 6.75%, Maturing February 7, 2020 | | | 467 | | | | 465,332 | |
Garda World Security Corporation | | | | | | | | |
Term Loan, 4.00%, Maturing November 6, 2020 | | | 71 | | | | 69,083 | |
Term Loan, 4.00%, Maturing November 6, 2020 | | | 276 | | | | 270,053 | |
IG Investment Holdings, LLC | | | | | | | | |
Term Loan, 5.25%, Maturing October 31, 2019 | | | 689 | | | | 687,489 | |
IMS Health Incorporated | | | | | | | | |
Term Loan, 3.50%, Maturing March 17, 2021 | | | 512 | | | | 501,774 | |
Information Resources, Inc. | | | | | | | | |
Term Loan, 4.75%, Maturing September 30, 2020 | | | 765 | | | | 764,356 | |
| | | | | | | | |
| Borrower/Tranche Description | | Principal
Amount
(000’s omitted) | | | Value | |
| | | | | | | | |
|
Business Equipment and Services (continued) | |
ION Trading Technologies S.a.r.l. | | | | | | | | |
Term Loan, 4.25%, Maturing June 10, 2021 | | $ | 794 | | | $ | 786,176 | |
KAR Auction Services, Inc. | | | | | | | | |
Term Loan, 3.50%, Maturing March 11, 2021 | | | 1,353 | | | | 1,336,802 | |
Kronos Incorporated | | | | | | | | |
Term Loan, 4.50%, Maturing October 30, 2019 | | | 1,220 | | | | 1,213,754 | |
Language Line, LLC | | | | | | | | |
Term Loan, 6.25%, Maturing June 20, 2016 | | | 977 | | | | 969,520 | |
MCS AMS Sub-Holdings, LLC | | | | | | | | |
Term Loan, 7.00%, Maturing October 15, 2019 | | | 354 | | | | 316,746 | |
Monitronics International, Inc. | | | | | | | | |
Term Loan, 4.25%, Maturing March 23, 2018 | | | 610 | | | | 604,252 | |
National CineMedia, LLC | | | | | | | | |
Term Loan, 2.92%, Maturing November 26, 2019 | | | 250 | | | | 238,542 | |
PGX Holdings, Inc. | | | | | | | | |
Term Loan, 6.25%, Maturing September 29, 2020 | | | 398 | | | | 398,991 | |
Quintiles Transnational Corp. | | | | | | | | |
Term Loan, 3.75%, Maturing June 8, 2018 | | | 2,547 | | | | 2,521,089 | |
RCS Capital Corporation | | | | | | | | |
Term Loan, 6.50%, Maturing April 29, 2019 | | | 1,472 | | | | 1,376,669 | |
Sensus USA, Inc. | | | | | | | | |
Term Loan, 4.50%, Maturing May 9, 2017 | | | 337 | | | | 330,149 | |
ServiceMaster Company | | | | | | | | |
Term Loan, 4.25%, Maturing July 1, 2021 | | | 1,571 | | | | 1,545,328 | |
SunGard Data Systems, Inc. | | | | | | | | |
Term Loan, 3.91%, Maturing February 28, 2017 | | | 424 | | | | 422,531 | |
Term Loan, 4.00%, Maturing March 8, 2020 | | | 3,203 | | | | 3,179,438 | |
TNS, Inc. | | | | | | | | |
Term Loan, 5.00%, Maturing February 14, 2020 | | | 567 | | | | 567,299 | |
TransUnion, LLC | | | | | | | | |
Term Loan, 4.00%, Maturing April 9, 2021 | | | 2,829 | | | | 2,795,035 | |
Travelport Finance (Luxembourg) S.a.r.l. | | | | | | | | |
Term Loan, 6.00%, Maturing September 2, 2021 | | | 875 | | | | 875,219 | |
U.S. Security Holdings, Inc. | | | | | | | | |
Term Loan, 6.25%, Maturing July 28, 2017 | | | 52 | | | | 51,261 | |
Term Loan, 6.25%, Maturing July 28, 2017 | | | 263 | | | | 261,871 | |
WASH Multifamily Laundry Systems, LLC | | | | | | | | |
Term Loan, 4.50%, Maturing February 21, 2019 | | | 1,481 | | | | 1,464,493 | |
West Corporation | | | | | | | | |
Term Loan, 3.25%, Maturing June 30, 2018 | | | 2,677 | | | | 2,630,090 | |
| | | | | | | | | |
| | | | | | $ | 46,738,150 | |
| | | | | | | | | |
| | | | |
| | 8 | | See Notes to Financial Statements. |
Eaton Vance
VT Floating-Rate Income Fund
December 31, 2014
Portfolio of Investments — continued
| | | | | | | | |
| Borrower/Tranche Description | | Principal
Amount
(000’s omitted) | | | Value | |
| | | | | | | | |
|
Cable and Satellite Television — 2.7% | |
Atlantic Broadband Finance, LLC | | | | | | | | |
Term Loan, 3.25%, Maturing November 30, 2019 | | $ | 815 | | | $ | 799,312 | |
Cequel Communications, LLC | | | | | | | | |
Term Loan, 3.50%, Maturing February 14, 2019 | | | 2,143 | | | | 2,115,966 | |
Charter Communications Operating, LLC | | | | | | | | |
Term Loan, 3.00%, Maturing July 1, 2020 | | | 714 | | | | 701,118 | |
Term Loan, 3.00%, Maturing January 3, 2021 | | | 1,305 | | | | 1,281,412 | |
Crown Media Holdings, Inc. | | | | | | | | |
Term Loan, 4.00%, Maturing July 14, 2018 | | | 142 | | | | 141,179 | |
CSC Holdings, Inc. | | | | | | | | |
Term Loan, 2.67%, Maturing April 17, 2020 | | | 1,065 | | | | 1,044,543 | |
MCC Iowa, LLC | | | | | | | | |
Term Loan, 3.25%, Maturing January 29, 2021 | | | 517 | | | | 499,026 | |
Term Loan, 3.75%, Maturing June 30, 2021 | | | 572 | | | | 561,159 | |
Mediacom Illinois, LLC | | | | | | | | |
Term Loan, 3.75%, Maturing June 30, 2021 | | | 324 | | | | 318,244 | |
Numericable U.S., LLC | | | | | | | | |
Term Loan, 4.50%, Maturing May 21, 2020 | | | 684 | | | | 684,173 | |
Term Loan, 4.50%, Maturing May 21, 2020 | | | 791 | | | | 790,827 | |
Sterling Entertainment Enterprises, LLC | | | | | | | | |
Term Loan, 3.17%, Maturing December 28, 2017 | | | 384 | | | | 367,450 | |
UPC Financing Partnership | | | | | | | | |
Term Loan, 3.25%, Maturing June 30, 2021 | | | 1,753 | | | | 1,718,114 | |
Virgin Media Bristol, LLC | | | | | | | | |
Term Loan, 3.50%, Maturing June 7, 2020 | | | 4,250 | | | | 4,186,250 | |
Ziggo B.V. | | | | | | | | |
Term Loan, 3.50%, Maturing January 15, 2022 | | | 363 | | | | 354,319 | |
Term Loan, 3.50%, Maturing January 15, 2022 | | | 564 | | | | 549,827 | |
Term Loan, 3.50%, Maturing January 15, 2022 | | | 598 | | | | 582,728 | |
| | | | | | | | | |
| | | | | | $ | 16,695,647 | |
| | | | | | | | | |
|
Chemicals and Plastics — 4.6% | |
Allnex (Luxembourg) & Cy S.C.A. | | | | | | | | |
Term Loan, 4.50%, Maturing October 3, 2019 | | $ | 146 | | | $ | 144,796 | |
Allnex USA, Inc. | | | | | | | | |
Term Loan, 4.50%, Maturing October 3, 2019 | | | 76 | | | | 75,128 | |
Arysta LifeScience SPC, LLC | | | | | | | | |
Term Loan, 4.50%, Maturing May 29, 2020 | | | 1,379 | | | | 1,373,251 | |
Axalta Coating Systems US Holdings, Inc. | | | | | | | | |
Term Loan, 3.75%, Maturing February 1, 2020 | | | 2,730 | | | | 2,667,272 | |
AZ Chem US, Inc. | | | | | | | | |
Term Loan, 4.50%, Maturing June 12, 2021 | | | 444 | | | | 438,498 | |
ECO Services Operations, LLC | | | | | | | | |
Term Loan, 4.75%, Maturing October 8, 2021 | | | 300 | | | | 297,000 | |
| | | | | | | | |
| Borrower/Tranche Description | | Principal
Amount
(000’s omitted) | | | Value | |
| | | | | | | | |
|
Chemicals and Plastics (continued) | |
Emerald Performance Materials, LLC | | | | | | | | |
Term Loan, 4.50%, Maturing August 1, 2021 | | $ | 374 | | | $ | 366,425 | |
Flint Group GmbH | | | | | | | | |
Term Loan, 4.75%, Maturing September 7, 2021 | | | 255 | | | | 248,404 | |
Flint Group US, LLC | | | | | | | | |
Term Loan, 4.75%, Maturing September 7, 2021 | | | 1,543 | | | | 1,502,642 | |
Gemini HDPE, LLC | | | | | | | | |
Term Loan, 4.75%, Maturing August 7, 2021 | | | 823 | | | | 796,194 | |
Huntsman International, LLC | | | | | | | | |
Term Loan, 2.71%, Maturing April 19, 2017 | | | 1,168 | | | | 1,147,188 | |
Term Loan, 3.75%, Maturing August 12, 2021 | | | 1,250 | | | | 1,232,031 | |
Ineos US Finance, LLC | | | | | | | | |
Term Loan, 3.75%, Maturing May 4, 2018 | | | 5,006 | | | | 4,872,576 | |
Kronos Worldwide, Inc. | | | | | | | | |
Term Loan, 4.75%, Maturing February 18, 2020 | | | 199 | | | | 198,252 | |
MacDermid, Inc. | | | | | | | | |
Term Loan, 4.00%, Maturing June 7, 2020 | | | 793 | | | | 779,358 | |
Minerals Technologies, Inc. | | | | | | | | |
Term Loan, 4.00%, Maturing May 9, 2021 | | | 1,224 | | | | 1,214,324 | |
Omnova Solutions, Inc. | | | | | | | | |
Term Loan, 4.25%, Maturing May 31, 2018 | | | 1,370 | | | | 1,355,987 | |
Orion Engineered Carbons GmbH | | | | | | | | |
Term Loan, 5.00%, Maturing July 25, 2021 | | | 424 | | | | 425,527 | |
OXEA Finance, LLC | | | | | | | | |
Term Loan, 4.25%, Maturing January 15, 2020 | | | 347 | | | | 332,640 | |
Term Loan - Second Lien, 8.25%, Maturing July 15, 2020 | | | 500 | | | | 478,750 | |
Polarpak, Inc. | | | | | | | | |
Term Loan, 4.50%, Maturing June 5, 2020 | | | 955 | | | | 939,625 | |
PQ Corporation | | | | | | | | |
Term Loan, 4.00%, Maturing August 7, 2017 | | | 2,035 | | | | 1,998,103 | |
Solenis International, L.P. | | | | | | | | |
Term Loan, 4.25%, Maturing July 31, 2021 | | | 224 | | | | 220,089 | |
Sonneborn Refined Products B.V. | | | | | | | | |
Term Loan, 5.50%, Maturing December 10, 2020 | | | 49 | | | | 48,872 | |
Sonneborn, LLC | | | | | | | | |
Term Loan, 5.50%, Maturing December 10, 2020 | | | 276 | | | | 276,941 | |
Tata Chemicals North America, Inc. | | | | | | | | |
Term Loan, 3.75%, Maturing August 7, 2020 | | | 739 | | | | 726,745 | |
Tronox Pigments (Netherlands) B.V. | | | | | | | | |
Term Loan, 4.00%, Maturing March 19, 2020 | | | 2,016 | | | | 1,988,142 | |
Univar, Inc. | | | | | | | | |
Term Loan, 5.00%, Maturing June 30, 2017 | | | 2,158 | | | | 2,093,813 | |
WNA Holdings, Inc. | | | | | | | | |
Term Loan, 4.50%, Maturing June 7, 2020 | | | 732 | | | | 719,870 | |
| | | | | | | | | |
| | | | | | $ | 28,958,443 | |
| | | | | | | | | |
| | | | |
| | 9 | | See Notes to Financial Statements. |
Eaton Vance
VT Floating-Rate Income Fund
December 31, 2014
Portfolio of Investments — continued
| | | | | | | | |
| Borrower/Tranche Description | | Principal
Amount
(000’s omitted) | | | Value | |
| | | | | | | | |
|
Conglomerates — 0.4% | |
RGIS Services, LLC | | | | | | | | |
Term Loan, 5.50%, Maturing October 18, 2017 | | $ | 1,573 | | | $ | 1,439,169 | |
Spectrum Brands, Inc. | | | | | | | | |
Term Loan, 3.50%, Maturing September 4, 2019 | | | 815 | | | | 807,152 | |
| | | | | | | | | |
| | | | | | $ | 2,246,321 | |
| | | | | | | | | |
|
Containers and Glass Products — 2.1% | |
Berry Plastics Holding Corporation | | | | | | | | |
Term Loan, 3.50%, Maturing February 8, 2020 | | $ | 3,124 | | | $ | 3,038,442 | |
Term Loan, 3.75%, Maturing January 6, 2021 | | | 1,989 | | | | 1,943,314 | |
Crown Americas, LLC | | | | | | | | |
Term Loan, 1.625%, Maturing October 22, 2021(6) | | | 1,075 | | | | 1,077,956 | |
Hilex Poly Co., LLC | | | | | | | | |
Term Loan, 6.00%, Maturing December 5, 2021 | | | 1,075 | | | | 1,064,250 | |
Libbey Glass, Inc. | | | | | | | | |
Term Loan, 3.75%, Maturing April 9, 2021 | | | 274 | | | | 270,205 | |
Pelican Products, Inc. | | | | | | | | |
Term Loan, 5.25%, Maturing April 10, 2020 | | | 1,641 | | | | 1,633,238 | |
Reynolds Group Holdings, Inc. | | | | | | | | |
Term Loan, 4.00%, Maturing December 1, 2018 | | | 3,617 | | | | 3,559,859 | |
TricorBraun, Inc. | | | | | | | | |
Term Loan, 4.01%, Maturing May 3, 2018 | | | 278 | | | | 274,263 | |
| | | | | | | | | |
| | | | | | $ | 12,861,527 | |
| | | | | | | | | |
|
Cosmetics / Toiletries — 0.4% | |
Prestige Brands, Inc. | | | | | | | | |
Term Loan, 4.13%, Maturing January 31, 2019 | | $ | 272 | | | $ | 272,164 | |
Term Loan, 4.50%, Maturing September 3, 2021 | | | 459 | | | | 458,793 | |
Revlon Consumer Products Corporation | | | | | | | | |
Term Loan, 4.00%, Maturing October 8, 2019 | | | 718 | | | | 707,657 | |
Sun Products Corporation (The) | | | | | | | | |
Term Loan, 5.50%, Maturing March 23, 2020 | | | 1,124 | | | | 1,051,248 | |
| | | | | | | | | |
| | | | | | $ | 2,489,862 | |
| | | | | | | | | |
|
Drugs — 2.3% | |
Alkermes, Inc. | | | | | | | | |
Term Loan, 3.50%, Maturing September 18, 2019 | | $ | 196 | | | $ | 195,010 | |
AMAG Pharmaceuticals, Inc. | | | | | | | | |
Term Loan, 7.25%, Maturing November 12, 2020 | | | 425 | | | | 422,875 | |
Auxilium Pharmaceuticals, Inc. | | | | | | | | |
Term Loan, 6.25%, Maturing April 26, 2017 | | | 297 | | | | 296,371 | |
Endo Luxembourg Finance Company I S.a r.l. | | | | | | | | |
Term Loan, 3.25%, Maturing February 28, 2021 | | | 248 | | | | 240,991 | |
| | | | | | | | |
| Borrower/Tranche Description | | Principal
Amount
(000’s omitted) | | | Value | |
| | | | | | | | |
|
Drugs (continued) | |
Ikaria, Inc. | | | | | | | | |
Term Loan, 5.00%, Maturing February 12, 2021 | | $ | 1,432 | | | $ | 1,425,885 | |
Impax Laboratories, Inc. | | | | | | | | |
Term Loan, Maturing December 2, 2020(2) | | | 575 | | | | 575,000 | |
Par Pharmaceutical Companies, Inc. | | | | | | | | |
Term Loan, 4.00%, Maturing September 30, 2019 | | | 4,813 | | | | 4,706,536 | |
Valeant Pharmaceuticals International, Inc. | | | | | | | | |
Term Loan, 3.50%, Maturing February 13, 2019 | | | 2,487 | | | | 2,467,117 | |
Term Loan, 3.50%, Maturing December 11, 2019 | | | 853 | | | | 845,865 | |
Term Loan, 3.50%, Maturing August 5, 2020 | | | 1,190 | | | | 1,180,867 | |
VWR Funding, Inc. | | | | | | | | |
Term Loan, 3.42%, Maturing April 3, 2017 | | | 2,285 | | | | 2,269,105 | |
| | | | | | | | | |
| | | | | | $ | 14,625,622 | |
| | | | | | | | | |
|
Ecological Services and Equipment — 0.7% | |
ADS Waste Holdings, Inc. | | | | | | | | |
Term Loan, 3.75%, Maturing October 9, 2019 | | $ | 4,134 | | | $ | 4,022,492 | |
EnergySolutions, LLC | | | | | | | | |
Term Loan, 6.75%, Maturing May 29, 2020 | | | 547 | | | | 547,592 | |
| | | | | | | | | |
| | | | | | $ | 4,570,084 | |
| | | | | | | | | |
|
Electronics / Electrical — 9.6% | |
Allflex Holdings III, Inc. | | | | | | | | |
Term Loan, 4.25%, Maturing July 17, 2020 | | $ | 346 | | | $ | 338,713 | |
Answers Corporation | | | | | | | | |
Term Loan, 6.25%, Maturing October 3, 2021 | | | 800 | | | | 768,000 | |
Applied Systems, Inc. | | | | | | | | |
Term Loan, 4.25%, Maturing January 25, 2021 | | | 545 | | | | 536,196 | |
Avago Technologies Cayman Ltd. | | | | | | | | |
Term Loan, 3.75%, Maturing May 6, 2021 | | | 7,065 | | | | 7,046,839 | |
Blue Coat Systems, Inc. | | | | | | | | |
Term Loan, 4.00%, Maturing May 31, 2019 | | | 1,481 | | | | 1,446,074 | |
Term Loan - Second Lien, 9.50%, Maturing June 28, 2020 | | | 450 | | | | 443,250 | |
Campaign Monitor Finance Pty Limited | | | | | | | | |
Term Loan, 6.25%, Maturing March 18, 2021 | | | 471 | | | | 465,545 | |
Carros Finance Luxembourg S.a.r.l. | | | | | | | | |
Term Loan, 4.50%, Maturing September 30, 2021 | | | 1,222 | | | | 1,211,246 | |
CommScope, Inc. | | | | | | | | |
Term Loan, 3.25%, Maturing January 14, 2018 | | | 716 | | | | 711,164 | |
CompuCom Systems, Inc. | | | | | | | | |
Term Loan, 4.25%, Maturing May 11, 2020 | | | 405 | | | | 387,471 | |
Dealertrack Technologies, Inc. | | | | | | | | |
Term Loan, 3.25%, Maturing February 28, 2021 | | | 310 | | | | 304,724 | |
| | | | |
| | 10 | | See Notes to Financial Statements. |
Eaton Vance
VT Floating-Rate Income Fund
December 31, 2014
Portfolio of Investments — continued
| | | | | | | | |
| Borrower/Tranche Description | | Principal
Amount
(000’s omitted) | | | Value | |
| | | | | | | | |
|
Electronics / Electrical (continued) | |
Dell, Inc. | | | | | | | | |
Term Loan, 4.50%, Maturing April 29, 2020 | | $ | 5,742 | | | $ | 5,734,311 | |
Eagle Parent, Inc. | | | | | | | | |
Term Loan, 4.00%, Maturing May 16, 2018 | | | 1,212 | | | | 1,198,004 | |
Entegris, Inc. | | | | | | | | |
Term Loan, 3.50%, Maturing April 30, 2021 | | | 289 | | | | 283,265 | |
Excelitas Technologies Corp. | | | | | | | | |
Term Loan, 6.00%, Maturing October 31, 2020 | | | 513 | | | | 510,374 | |
Eze Castle Software, Inc. | | | | | | | | |
Term Loan, 4.00%, Maturing April 6, 2020 | | | 321 | | | | 314,871 | |
FIDJI Luxembourg (BC4) S.a.r.l. | | | | | | | | |
Term Loan, 6.25%, Maturing December 24, 2020 | | | 481 | | | | 482,754 | |
Freescale Semiconductor, Inc. | | | | | | | | |
Term Loan, 4.25%, Maturing February 28, 2020 | | | 1,275 | | | | 1,246,430 | |
Go Daddy Operating Company, LLC | | | | | | | | |
Term Loan, 4.75%, Maturing May 13, 2021 | | | 3,227 | | | | 3,209,995 | |
GXS Group, Inc. | | | | | | | | |
Term Loan, 3.25%, Maturing January 16, 2021 | | | 594 | | | | 590,473 | |
Hyland Software, Inc. | | | | | | | | |
Term Loan, 4.75%, Maturing February 19, 2021 | | | 963 | | | | 959,242 | |
Infor (US), Inc. | | | | | | | | |
Term Loan, 3.75%, Maturing June 3, 2020 | | | 241 | | | | 233,773 | |
Term Loan, 3.75%, Maturing June 3, 2020 | | | 5,012 | | | | 4,869,720 | |
M/A-COM Technology Solutions Holdings, Inc. | | | | | | | | |
Term Loan, 4.50%, Maturing May 7, 2021 | | | 323 | | | | 323,375 | |
MA FinanceCo., LLC | | | | | | | | |
Term Loan, 4.50%, Maturing October 7, 2019 | | | 800 | | | | 767,334 | |
Term Loan, 5.25%, Maturing October 7, 2021 | | | 800 | | | | 771,334 | |
Magic Newco, LLC | | | | | | | | |
Term Loan, 5.00%, Maturing December 12, 2018 | | | 1,746 | | | | 1,739,403 | |
MH Sub I, LLC | | | | | | | | |
Term Loan, 4.00%, Maturing July 8, 2021(6) | | | 34 | | | | 33,920 | |
Term Loan, 5.00%, Maturing July 8, 2021 | | | 488 | | | | 484,750 | |
Microsemi Corporation | | | | | | | | |
Term Loan, 3.25%, Maturing February 19, 2020 | | | 577 | | | | 567,433 | |
NXP B.V. | | | | | | | | |
Term Loan, 3.25%, Maturing January 11, 2020 | | | 1,210 | | | | 1,195,071 | |
Orbotech, Inc. | | | | | | | | |
Term Loan, 5.00%, Maturing August 6, 2020 | | | 349 | | | | 346,507 | |
Renaissance Learning, Inc. | | | | | | | | |
Term Loan, 4.50%, Maturing April 9, 2021 | | | 471 | | | | 463,187 | |
Rocket Software, Inc. | | | | | | | | |
Term Loan, 5.75%, Maturing February 8, 2018 | | | 216 | | | | 214,952 | |
RP Crown Parent, LLC | | | | | | | | |
Term Loan, 6.00%, Maturing December 21, 2018 | | | 3,318 | | | | 3,087,409 | |
| | | | | | | | |
| Borrower/Tranche Description | | Principal
Amount
(000’s omitted) | | | Value | |
| | | | | | | | |
|
Electronics / Electrical (continued) | |
SGMS Escrow Corp. | | | | | | | | |
Term Loan, 6.00%, Maturing October 1, 2021 | | $ | 625 | | | $ | 617,188 | |
SGS Cayman, L.P. | | | | | | | | |
Term Loan, 6.00%, Maturing April 23, 2021 | | | 141 | | | | 140,557 | |
Shield Finance Co. S.a.r.l. | | | | | | | | |
Term Loan, 5.00%, Maturing January 29, 2021 | | | 447 | | | | 445,508 | |
Sirius Computer Solutions, Inc. | | | | | | | | |
Term Loan, 7.00%, Maturing November 30, 2018 | | | 214 | | | | 214,574 | |
SkillSoft Corporation | | | | | | | | |
Term Loan, 5.75%, Maturing April 28, 2021 | | | 1,496 | | | | 1,471,562 | |
Smart Technologies ULC | | | | | | | | |
Term Loan, 10.50%, Maturing January 31, 2018 | | | 363 | | | | 358,875 | |
Sophia, L.P. | | | | | | | | |
Term Loan, 4.00%, Maturing July 19, 2018 | | | 989 | | | | 977,687 | |
Southwire Company | | | | | | | | |
Term Loan, 3.25%, Maturing February 10, 2021 | | | 248 | | | | 239,647 | |
SunEdison Semiconductor B.V. | | | | | | | | |
Term Loan, 6.50%, Maturing May 27, 2019 | | | 547 | | | | 539,041 | |
SurveyMonkey.com, LLC | | | | | | | | |
Term Loan, 5.50%, Maturing February 5, 2019 | | | 1,260 | | | | 1,254,537 | |
Sutherland Global Services, Inc. | | | | | | | | |
Term Loan, 6.00%, Maturing April 23, 2021 | | | 607 | | | | 603,827 | |
Sybil Software, LLC | | | | | | | | |
Term Loan, 4.75%, Maturing March 20, 2020 | | | 2,069 | | | | 2,053,855 | |
Vantiv, LLC | | | | | | | | |
Term Loan, 3.75%, Maturing June 13, 2021 | | | 597 | | | | 592,985 | |
VeriFone, Inc. | | | | | | | | |
Term Loan, 3.50%, Maturing July 8, 2021 | | | 1,990 | | | | 1,966,369 | |
Vertafore, Inc. | | | | | | | | |
Term Loan, 4.25%, Maturing October 3, 2019 | | | 484 | | | | 480,018 | |
Wall Street Systems Delaware, Inc. | | | | | | | | |
Term Loan, 4.50%, Maturing April 30, 2021 | | | 2,617 | | | | 2,586,854 | |
Websense, Inc. | | | | | | | | |
Term Loan, 4.50%, Maturing June 25, 2020 | | | 443 | | | | 436,812 | |
Zebra Technologies Corporation | | | | | | | | |
Term Loan, 4.75%, Maturing October 27, 2021 | | | 1,525 | | | | 1,536,915 | |
| | | | | | | | | |
| | | | | | $ | 59,803,920 | |
| | | | | | | | | |
|
Equipment Leasing — 0.5% | |
Delos Finance S.a.r.l. | | | | | | | | |
Term Loan, 3.50%, Maturing March 6, 2021 | | $ | 1,625 | | | $ | 1,615,521 | |
Flying Fortress, Inc. | | | | | | | | |
Term Loan, 3.50%, Maturing June 30, 2017 | | | 1,458 | | | | 1,443,750 | |
| | | | | | | | | |
| | | | | | $ | 3,059,271 | |
| | | | | | | | | |
| | | | |
| | 11 | | See Notes to Financial Statements. |
Eaton Vance
VT Floating-Rate Income Fund
December 31, 2014
Portfolio of Investments — continued
| | | | | | | | |
| Borrower/Tranche Description | | Principal
Amount
(000’s omitted) | | | Value | |
| | | | | | | | |
|
Financial Intermediaries — 3.7% | |
American Capital, Ltd. | | | | | | | | |
Term Loan, 3.50%, Maturing August 22, 2017 | | $ | 297 | | | $ | 293,288 | |
Armor Holding II, LLC | | | | | | | | |
Term Loan, 5.75%, Maturing June 26, 2020 | | | 1,356 | | | | 1,349,149 | |
Citco Funding, LLC | | | | | | | | |
Term Loan, 4.25%, Maturing June 29, 2018 | | | 1,017 | | | | 1,013,636 | |
Clipper Acquisitions Corp. | | | | | | | | |
Term Loan, 3.00%, Maturing February 6, 2020 | | | 270 | | | | 259,582 | |
First Data Corporation | | | | | | | | |
Term Loan, 3.67%, Maturing March 24, 2017 | | | 500 | | | | 492,250 | |
Term Loan, 3.67%, Maturing March 23, 2018 | | | 3,455 | | | | 3,389,747 | |
Term Loan, 3.67%, Maturing September 24, 2018 | | | 1,125 | | | | 1,104,258 | |
Grosvenor Capital Management Holdings, LLP | | | | | | | | |
Term Loan, 3.75%, Maturing January 4, 2021 | | | 2,757 | | | | 2,708,949 | |
Guggenheim Partners, LLC | | | | | | | | |
Term Loan, 4.25%, Maturing July 22, 2020 | | | 867 | | | | 860,901 | |
Hamilton Lane Advisors, LLC | | | | | | | | |
Term Loan, 4.00%, Maturing February 28, 2018 | | | 263 | | | | 259,227 | |
Harbourvest Partners, LLC | | | | | | | | |
Term Loan, 3.25%, Maturing February 4, 2021 | | | 1,142 | | | | 1,106,664 | |
Home Loan Servicing Solutions Ltd. | | | | | | | | |
Term Loan, 4.50%, Maturing June 26, 2020 | | | 591 | | | | 559,234 | |
LPL Holdings, Inc. | | | | | | | | |
Term Loan, 3.25%, Maturing March 29, 2019 | | | 1,901 | | | | 1,874,564 | |
Medley, LLC | | | | | | | | |
Term Loan, 6.50%, Maturing June 15, 2019 | | | 367 | | | | 365,210 | |
MIP Delaware, LLC | | | | | | | | |
Term Loan, 4.00%, Maturing March 9, 2020 | | | 647 | | | | 642,051 | |
Moneygram International, Inc. | | | | | | | | |
Term Loan, 4.25%, Maturing March 27, 2020 | | | 221 | | | | 205,035 | |
NXT Capital, Inc. | | | | | | | | |
Term Loan, 6.25%, Maturing September 4, 2018 | | | 74 | | | | 74,807 | |
Term Loan, 6.25%, Maturing September 4, 2018 | | | 444 | | | | 446,597 | |
Ocwen Financial Corporation | | | | | | | | |
Term Loan, 5.00%, Maturing February 15, 2018 | | | 2,591 | | | | 2,440,329 | |
Starwood Property Trust, Inc. | | | | | | | | |
Term Loan, 3.50%, Maturing April 17, 2020 | | | 1,577 | | | | 1,547,779 | |
Walker & Dunlop, Inc. | | | | | | | | |
Term Loan, 5.25%, Maturing December 11, 2020 | | | 396 | | | | 395,010 | |
Walter Investment Management Corp. | | | | | | | | |
Term Loan, 4.75%, Maturing December 11, 2020 | | | 2,140 | | | | 1,936,752 | |
| | | | | | | | | |
| | | | | | $ | 23,325,019 | |
| | | | | | | | | |
| | | | | | | | |
| Borrower/Tranche Description | | Principal
Amount
(000’s omitted) | | | Value | |
| | | | | | | | |
|
Food Products — 3.5% | |
AdvancePierre Foods, Inc. | | | | | | | | |
Term Loan, 5.75%, Maturing July 10, 2017 | | $ | 2,602 | | | $ | 2,589,336 | |
Big Heart Pet Brands | | | | | | | | |
Term Loan, 3.50%, Maturing March 8, 2020 | | | 1,973 | | | | 1,898,951 | |
Charger OpCo B.V. | | | | | | | | |
Term Loan, 3.50%, Maturing July 23, 2021 | | | 1,600 | | | | 1,564,000 | |
CSM Bakery Solutions, LLC | | | | | | | | |
Term Loan, 5.00%, Maturing July 3, 2020 | | | 543 | | | | 533,623 | |
Del Monte Foods, Inc. | | | | | | | | |
Term Loan, 4.25%, Maturing February 18, 2021 | | | 945 | | | | 869,739 | |
Diamond Foods, Inc. | | | | | | | | |
Term Loan, 4.25%, Maturing August 20, 2018 | | | 1,117 | | | | 1,108,654 | |
Dole Food Company, Inc. | | | | | | | | |
Term Loan, 4.50%, Maturing November 1, 2018 | | | 703 | | | | 697,096 | |
H.J. Heinz Company | | | | | | | | |
Term Loan, 3.50%, Maturing June 5, 2020 | | | 4,746 | | | | 4,726,270 | |
High Liner Foods Incorporated | | | | | | | | |
Term Loan, 4.25%, Maturing April 24, 2021 | | | 546 | | | | 539,734 | |
JBS USA Holdings, Inc. | | | | | | | | |
Term Loan, 3.75%, Maturing May 25, 2018 | | | 2,593 | | | | 2,555,837 | |
Term Loan, 3.75%, Maturing September 18, 2020 | | | 963 | | | | 951,066 | |
NBTY, Inc. | | | | | | | | |
Term Loan, 3.50%, Maturing October 1, 2017 | | | 3,727 | | | | 3,628,895 | |
Pinnacle Foods Finance, LLC | | | | | | | | |
Term Loan, 3.00%, Maturing April 29, 2020 | | | 420 | | | | 407,936 | |
| | | | | | | | | |
| | | | | | $ | 22,071,137 | |
| | | | | | | | | |
|
Food Service — 2.3% | |
Aramark Services, Inc. | | | | | | | | |
Term Loan, 3.67%, Maturing July 26, 2016 | | $ | 48 | | | $ | 47,712 | |
Term Loan, 3.67%, Maturing July 26, 2016 | | | 216 | | | | 213,469 | |
ARG IH Corporation | | | | | | | | |
Term Loan, 4.75%, Maturing November 15, 2020 | | | 173 | | | | 172,709 | |
Buffets, Inc. | | | | | | | | |
Term Loan, 0.13%, Maturing April 22, 2015(3) | | | 83 | | | | 66,552 | |
CEC Entertainment, Inc. | | | | | | | | |
Term Loan, 4.00%, Maturing February 14, 2021 | | | 993 | | | | 969,342 | |
Darling International, Inc. | | | | | | | | |
Term Loan, 3.25%, Maturing January 6, 2021 | | | 447 | | | | 444,950 | |
Dunkin’ Brands, Inc. | | | | | | | | |
Term Loan, 3.25%, Maturing February 7, 2021 | | | 3,299 | | | | 3,228,301 | |
Landry’s, Inc. | | | | | | | | |
Term Loan, 4.00%, Maturing April 24, 2018 | | | 1,636 | | | | 1,628,312 | |
| | | | |
| | 12 | | See Notes to Financial Statements. |
Eaton Vance
VT Floating-Rate Income Fund
December 31, 2014
Portfolio of Investments — continued
| | | | | | | | |
| Borrower/Tranche Description | | Principal
Amount
(000’s omitted) | | | Value | |
| | | | | | | | |
|
Food Service (continued) | |
NPC International, Inc. | | | | | | | | |
Term Loan, 4.00%, Maturing December 28, 2018 | | $ | 1,307 | | | $ | 1,274,057 | |
OSI Restaurant Partners, LLC | | | | | | | | |
Term Loan, 3.50%, Maturing October 25, 2019 | | | 293 | | | | 289,758 | |
P.F. Chang’s China Bistro, Inc. | | | | | | | | |
Term Loan, 4.25%, Maturing July 2, 2019 | | | 191 | | | | 183,478 | |
Seminole Hard Rock Entertainment, Inc. | | | | | | | | |
Term Loan, 3.50%, Maturing May 14, 2020 | | | 148 | | | | 142,702 | |
US Foods, Inc. | | | | | | | | |
Term Loan, 4.50%, Maturing March 31, 2019 | | | 3,423 | | | | 3,407,900 | |
Weight Watchers International, Inc. | | | | | | | | |
Term Loan, 4.00%, Maturing April 2, 2020 | | | 3,242 | | | | 2,514,770 | |
| | | | | | | | | |
| | | | | | $ | 14,584,012 | |
| | | | | | | | | |
|
Food / Drug Retailers — 2.8% | |
Albertson’s Holdings, LLC | | | | | | | | |
Term Loan, 4.00%, Maturing August 25, 2019 | | $ | 1,675 | | | $ | 1,669,975 | |
Term Loan, 4.50%, Maturing August 25, 2021 | | | 675 | | | | 676,266 | |
Albertson’s, LLC | | | | | | | | |
Term Loan, 4.75%, Maturing March 21, 2019 | | | 620 | | | | 617,427 | |
General Nutrition Centers, Inc. | | | | | | | | |
Term Loan, 3.25%, Maturing March 4, 2019 | | | 2,909 | | | | 2,815,807 | |
New Albertson’s, Inc. | | | | | | | | |
Term Loan, 4.75%, Maturing June 27, 2021 | | | 4,663 | | | | 4,603,566 | |
Pantry, Inc. (The) | | | | | | | | |
Term Loan, 4.75%, Maturing August 2, 2019 | | | 220 | | | | 219,655 | |
Rite Aid Corporation | | | | | | | | |
Term Loan, 3.50%, Maturing February 21, 2020 | | | 1,256 | | | | 1,253,592 | |
Term Loan - Second Lien, 5.75%, Maturing August 21, 2020 | | | 250 | | | | 251,406 | |
Supervalu, Inc. | | | | | | | | |
Term Loan, 4.50%, Maturing March 21, 2019 | | | 5,371 | | | | 5,288,872 | |
| | | | | | | | | |
| | | | | | $ | 17,396,566 | |
| | | | | | | | | |
|
Health Care — 9.9% | |
Akorn, Inc. | | | | | | | | |
Term Loan, 4.50%, Maturing April 16, 2021 | | $ | 673 | | | $ | 669,104 | |
Alere, Inc. | | | | | | | | |
Term Loan, 4.25%, Maturing June 30, 2017 | | | 1,622 | | | | 1,612,851 | |
Alliance Healthcare Services, Inc. | | | | | | | | |
Term Loan, 4.25%, Maturing June 3, 2019 | | | 640 | | | | 633,850 | |
Amneal Pharmaceuticals, LLC | | | | | | | | |
Term Loan, 5.00%, Maturing November 1, 2019 | | | 1,070 | | | | 1,069,340 | |
Amsurg Corp. | | | | | | | | |
Term Loan, 3.75%, Maturing July 16, 2021 | | | 473 | | | | 470,853 | |
| | | | | | | | |
| Borrower/Tranche Description | | Principal
Amount
(000’s omitted) | | | Value | |
| | | | | | | | |
|
Health Care (continued) | |
Ardent Medical Services, Inc. | | | | | | | | |
Term Loan, 6.75%, Maturing July 2, 2018 | | $ | 706 | | | $ | 707,597 | |
ATI Holdings, Inc. | | | | | | | | |
Term Loan, 5.25%, Maturing December 20, 2019 | | | 221 | | | | 220,541 | |
Auris Luxembourg II S.A. | | | | | | | | |
Term Loan, Maturing December 31, 2021(2) | | | 550 | | | | 549,312 | |
Biomet, Inc. | | | | | | | | |
Term Loan, 3.67%, Maturing July 25, 2017 | | | 4,187 | | | | 4,173,890 | |
CareCore National, LLC | | | | | | | | |
Term Loan, 5.50%, Maturing March 5, 2021 | | | 324 | | | | 320,536 | |
CeramTec Acquisition Corporation | | | | | | | | |
Term Loan, 4.25%, Maturing August 30, 2020 | | | 90 | | | | 89,445 | |
CHG Healthcare Services, Inc. | | | | | | | | |
Term Loan, 4.25%, Maturing November 19, 2019 | | | 1,054 | | | | 1,044,075 | |
Community Health Systems, Inc. | | | | | | | | |
Term Loan, 4.25%, Maturing January 27, 2021 | | | 5,867 | | | | 5,862,450 | |
Convatec, Inc. | | | | | | | | |
Term Loan, 4.00%, Maturing December 22, 2016 | | | 502 | | | | 497,730 | |
CPI Buyer, LLC | | | | | | | | |
Term Loan, 5.50%, Maturing August 18, 2021 | | | 748 | | | | 736,903 | |
DaVita HealthCare Partners, Inc. | | | | | | | | |
Term Loan, 3.50%, Maturing June 24, 2021 | | | 2,090 | | | | 2,072,709 | |
DJO Finance, LLC | | | | | | | | |
Term Loan, 4.25%, Maturing September 15, 2017 | | | 1,367 | | | | 1,339,263 | |
Envision Healthcare Corporation | | | | | | | | |
Term Loan, 4.00%, Maturing May 25, 2018 | | | 2,369 | | | | 2,347,695 | |
Faenza Acquisition GmbH | | | | | | | | |
Term Loan, 4.25%, Maturing August 30, 2020 | | | 272 | | | | 269,523 | |
Term Loan, 4.25%, Maturing August 30, 2020 | | | 911 | | | | 901,648 | |
Gentiva Health Services, Inc. | | | | | | | | |
Term Loan, 6.50%, Maturing October 18, 2019 | | | 2,754 | | | | 2,757,658 | |
Grifols Worldwide Operations USA, Inc. | | | | | | | | |
Term Loan, 3.17%, Maturing February 27, 2021 | | | 3,176 | | | | 3,137,888 | |
Halyard Health, Inc. | | | | | | | | |
Term Loan, 4.00%, Maturing November 1, 2021 | | | 475 | | | | 476,113 | |
HCA, Inc. | | | | | | | | |
Term Loan, 3.01%, Maturing May 1, 2018 | | | 420 | | | | 416,999 | |
Iasis Healthcare, LLC | | | | | | | | |
Term Loan, 4.50%, Maturing May 3, 2018 | | | 794 | | | | 788,394 | |
inVentiv Health, Inc. | | | | | | | | |
Term Loan, 7.75%, Maturing May 15, 2018 | | | 331 | | | | 329,901 | |
Term Loan, 7.75%, Maturing May 15, 2018 | | | 1,340 | | | | 1,336,074 | |
JLL/Delta Dutch Newco B.V. | | | | | | | | |
Term Loan, 4.25%, Maturing March 11, 2021 | | | 1,294 | | | | 1,259,142 | |
| | | | |
| | 13 | | See Notes to Financial Statements. |
Eaton Vance
VT Floating-Rate Income Fund
December 31, 2014
Portfolio of Investments — continued
| | | | | | | | |
| Borrower/Tranche Description | | Principal
Amount
(000’s omitted) | | | Value | |
| | | | | | | | |
|
Health Care (continued) | |
Kindred Healthcare, Inc. | | | | | | | | |
Term Loan, 4.25%, Maturing April 9, 2021 | | $ | 995 | | | $ | 967,637 | |
Kinetic Concepts, Inc. | | | | | | | | |
Term Loan, 4.00%, Maturing May 4, 2018 | | | 1,323 | | | | 1,311,145 | |
LHP Hospital Group, Inc. | | | | | | | | |
Term Loan, 9.00%, Maturing July 3, 2018 | | | 398 | | | | 383,592 | |
Mallinckrodt International Finance S.A. | | | | | | | | |
Term Loan, 3.25%, Maturing March 19, 2021 | | | 2,010 | | | | 1,972,547 | |
Term Loan, 3.50%, Maturing March 19, 2021 | | | 873 | | | | 860,539 | |
MedAssets, Inc. | | | | | | | | |
Term Loan, 4.00%, Maturing December 13, 2019 | | | 179 | | | | 178,159 | |
Millennium Laboratories, Inc. | | | | | | | | |
Term Loan, 5.25%, Maturing April 16, 2021 | | | 1,368 | | | | 1,363,423 | |
MMM Holdings, Inc. | | | | | | | | |
Term Loan, 9.75%, Maturing December 12, 2017 | | | 274 | | | | 266,133 | |
MSO of Puerto Rico, Inc. | | | | | | | | |
Term Loan, 9.75%, Maturing December 12, 2017 | | | 199 | | | | 197,471 | |
National Mentor Holdings, Inc. | | | | | | | | |
Term Loan, 4.25%, Maturing January 31, 2021 | | | 347 | | | | 339,776 | |
Onex Carestream Finance L.P. | | | | | | | | |
Term Loan, 5.00%, Maturing June 7, 2019 | | | 1,391 | | | | 1,384,600 | |
Opal Acquisition, Inc. | | | | | | | | |
Term Loan, 5.00%, Maturing November 27, 2020 | | | 1,436 | | | | 1,423,389 | |
Ortho-Clinical Diagnostics, Inc. | | | | | | | | |
Term Loan, 4.75%, Maturing June 30, 2021 | | | 1,541 | | | | 1,518,851 | |
Pharmaceutical Product Development, LLC | | | | | | | | |
Term Loan, 4.00%, Maturing December 5, 2018 | | | 2,818 | | | | 2,806,230 | |
PRA Holdings, Inc. | | | | | | | | |
Term Loan, 4.50%, Maturing September 23, 2020 | | | 2,306 | | | | 2,279,922 | |
Radnet Management, Inc. | | | | | | | | |
Term Loan, 4.27%, Maturing October 10, 2018 | | | 881 | | | | 875,889 | |
RegionalCare Hospital Partners, Inc. | | | | | | | | |
Term Loan, 6.00%, Maturing April 19, 2019 | | | 1,519 | | | | 1,514,828 | |
Sage Products Holdings III, LLC | | | | | | | | |
Term Loan, 5.00%, Maturing December 13, 2019 | | | 981 | | | | 979,422 | |
Salix Pharmaceuticals Ltd. | | | | | | | | |
Term Loan, 4.25%, Maturing January 2, 2020 | | | 1,168 | | | | 1,157,177 | |
Select Medical Corporation | | | | | | | | |
Term Loan, 2.99%, Maturing December 20, 2016 | | | 175 | | | | 171,937 | |
Term Loan, 3.75%, Maturing June 1, 2018 | | | 900 | | | | 877,500 | |
Steward Health Care System, LLC | | | | | | | | |
Term Loan, 6.75%, Maturing April 12, 2020 | | | 1,457 | | | | 1,444,525 | |
Tecomet, Inc. | | | | | | | | |
Term Loan, 5.75%, Maturing December 5, 2021 | | | 825 | | | | 796,125 | |
| | | | | | | | |
| Borrower/Tranche Description | | Principal
Amount
(000’s omitted) | | | Value | |
| | | | | | | | |
|
Health Care (continued) | |
Truven Health Analytics, Inc. | | | | | | | | |
Term Loan, 4.50%, Maturing June 6, 2019 | | $ | 806 | | | $ | 785,329 | |
U.S. Renal Care, Inc. | | | | | | | | |
Term Loan, 4.25%, Maturing July 3, 2019 | | | 198 | | | | 194,906 | |
| | | | | | | | | |
| | | | | | $ | 62,142,536 | |
| | | | | | | | | |
|
Home Furnishings — 0.9% | |
Interline Brands, Inc. | | | | | | | | |
Term Loan, 4.00%, Maturing March 17, 2021 | | $ | 149 | | | $ | 143,850 | |
Serta Simmons Holdings, LLC | | | | | | | | |
Term Loan, 4.25%, Maturing October 1, 2019 | | | 3,326 | | | | 3,290,268 | |
Tempur-Pedic International, Inc. | | | | | | | | |
Term Loan, 3.50%, Maturing March 18, 2020 | | | 2,282 | | | | 2,253,433 | |
| | | | | | | | | |
| | | | | | $ | 5,687,551 | |
| | | | | | | | | |
|
Industrial Equipment — 2.8% | |
Alliance Laundry Systems, LLC | | | | | | | | |
Term Loan, 4.25%, Maturing December 10, 2018 | | $ | 151 | | | $ | 150,039 | |
Apex Tool Group, LLC | | | | | | | | |
Term Loan, 4.50%, Maturing January 31, 2020 | | | 3,788 | | | | 3,683,392 | |
Delachaux S.A. | | | | | | | | |
Term Loan, 5.25%, Maturing September 25, 2021 | | | 400 | | | | 399,000 | |
Doosan Infracore International, Inc. | | | | | | | | |
Term Loan, 4.50%, Maturing May 28, 2021 | | | 2,502 | | | | 2,489,251 | |
Filtration Group Corporation | | | | | | | | |
Term Loan, 4.50%, Maturing November 21, 2020 | | | 173 | | | | 173,033 | |
Gardner Denver, Inc. | | | | | | | | |
Term Loan, 4.25%, Maturing July 30, 2020 | | | 1,086 | | | | 1,020,905 | |
Generac Power Systems, Inc. | | | | | | | | |
Term Loan, 3.25%, Maturing May 31, 2020 | | | 1,771 | | | | 1,717,870 | |
Husky Injection Molding Systems Ltd. | | | | | | | | |
Term Loan, 4.25%, Maturing June 30, 2021 | | | 1,818 | | | | 1,770,337 | |
Milacron, LLC | | | | | | | | |
Term Loan, 4.00%, Maturing March 28, 2020 | | | 296 | | | | 288,129 | |
NN, Inc. | | | | | | | | |
Term Loan, 6.00%, Maturing August 27, 2021 | | | 493 | | | | 492,549 | |
Paladin Brands Holding, Inc. | | | | | | | | |
Term Loan, 6.75%, Maturing August 16, 2019 | | | 422 | | | | 421,258 | |
Rexnord, LLC | | | | | | | | |
Term Loan, 4.00%, Maturing August 21, 2020 | | | 2,765 | | | | 2,711,774 | |
Signode Industrial Group US, Inc. | | | | | | | | |
Term Loan, 3.75%, Maturing May 1, 2021 | | | 729 | | | | 701,823 | |
Spansion, LLC | | | | | | | | |
Term Loan, 3.75%, Maturing December 19, 2019 | | | 515 | | | | 511,423 | |
| | | | |
| | 14 | | See Notes to Financial Statements. |
Eaton Vance
VT Floating-Rate Income Fund
December 31, 2014
Portfolio of Investments — continued
| | | | | | | | |
| Borrower/Tranche Description | | Principal
Amount
(000’s omitted) | | | Value | |
| | | | | | | | |
|
Industrial Equipment (continued) | |
STS Operating, Inc. | | | | | | | | |
Term Loan, 4.75%, Maturing February 12, 2021 | | $ | 199 | | | $ | 195,522 | |
Tank Holding Corp. | | | | | | | | |
Term Loan, 4.25%, Maturing July 9, 2019 | | | 797 | | | | 784,196 | |
Virtuoso US, LLC | | | | | | | | |
Term Loan, 4.75%, Maturing February 11, 2021 | | | 273 | | | | 271,232 | |
| | | | | | | | | |
| | | | | | $ | 17,781,733 | |
| | | | | | | | | |
|
Insurance — 2.6% | |
Alliant Holdings I, Inc. | | | | | | | | |
Term Loan, 4.25%, Maturing December 20, 2019 | | $ | 1,697 | | | $ | 1,675,390 | |
AmWINS Group, LLC | | | | | | | | |
Term Loan, 5.00%, Maturing September 6, 2019 | | | 2,313 | | | | 2,307,609 | |
Asurion, LLC | | | | | | | | |
Term Loan, 5.00%, Maturing May 24, 2019 | | | 5,589 | | | | 5,521,796 | |
Term Loan, 4.25%, Maturing July 8, 2020 | | | 542 | | | | 526,852 | |
Term Loan - Second Lien, 8.50%, Maturing March 3, 2021 | | | 675 | | | | 673,313 | |
CGSC of Delaware Holding Corporation | | | | | | | | |
Term Loan, 5.00%, Maturing April 16, 2020 | | | 271 | | | | 250,559 | |
CNO Financial Group, Inc. | | | | | | | | |
Term Loan, 3.75%, Maturing September 28, 2018 | | | 483 | | | | 471,978 | |
Cunningham Lindsey U.S., Inc. | | | | | | | | |
Term Loan, 5.00%, Maturing December 10, 2019 | | | 466 | | | | 455,618 | |
Hub International Limited | | | | | | | | |
Term Loan, 4.25%, Maturing October 2, 2020 | | | 2,001 | | | | 1,948,978 | |
USI, Inc. | | | | | | | | |
Term Loan, 4.25%, Maturing December 27, 2019 | | | 2,287 | | | | 2,248,451 | |
| | | | | | | | | |
| | | | | | $ | 16,080,544 | |
| | | | | | | | | |
|
Leisure Goods / Activities / Movies — 3.1% | |
AMC Entertainment, Inc. | | | | | | | | |
Term Loan, 3.50%, Maturing April 30, 2020 | | $ | 1,277 | | | $ | 1,262,348 | |
Aufinco Pty Limited | | | | | | | | |
Term Loan, 4.00%, Maturing May 29, 2020 | | | 246 | | | | 240,709 | |
Bombardier Recreational Products, Inc. | | | | | | | | |
Term Loan, 4.00%, Maturing January 30, 2019 | | | 1,603 | | | | 1,574,807 | |
ClubCorp Club Operations, Inc. | | | | | | | | |
Term Loan, 4.50%, Maturing July 24, 2020 | | | 818 | | | | 807,043 | |
Dave & Buster’s, Inc. | | | | | | | | |
Term Loan, 4.25%, Maturing July 25, 2020 | | | 101 | | | | 101,035 | |
Emerald Expositions Holding, Inc. | | | | | | | | |
Term Loan, 4.75%, Maturing June 17, 2020 | | | 572 | | | | 563,407 | |
Equinox Holdings, Inc. | | | | | | | | |
Term Loan, 5.00%, Maturing January 31, 2020 | | | 988 | | | | 981,335 | |
| | | | | | | | |
| Borrower/Tranche Description | | Principal
Amount
(000’s omitted) | | | Value | |
| | | | | | | | |
|
Leisure Goods / Activities / Movies (continued) | |
Fender Musical Instruments Corporation | | | | | | | | |
Term Loan, 5.75%, Maturing April 3, 2019 | | $ | 185 | | | $ | 184,189 | |
Kasima, LLC | | | | | | | | |
Term Loan, 3.25%, Maturing May 17, 2021 | | | 479 | | | | 467,906 | |
Live Nation Entertainment, Inc. | | | | | | | | |
Term Loan, 3.50%, Maturing August 17, 2020 | | | 171 | | | | 169,125 | |
Nord Anglia Education Finance, LLC | | | | | | | | |
Term Loan, 4.50%, Maturing March 31, 2021 | | | 1,667 | | | | 1,641,626 | |
Regal Cinemas, Inc. | | | | | | | | |
Term Loan, 2.70%, Maturing August 23, 2017 | | | 2,496 | | | | 2,455,440 | |
Sabre, Inc. | | | | | | | | |
Term Loan, 4.00%, Maturing February 19, 2019 | | | 637 | | | | 628,640 | |
SeaWorld Parks & Entertainment, Inc. | | | | | | | | |
Term Loan, 3.00%, Maturing May 14, 2020 | | | 1,482 | | | | 1,407,926 | |
SRAM, LLC | | | | | | | | |
Term Loan, 4.01%, Maturing April 10, 2020 | | | 914 | | | | 886,248 | |
Town Sports International, Inc. | | | | | | | | |
Term Loan, 4.50%, Maturing November 16, 2020 | | | 735 | | | | 531,138 | |
WMG Acquisition Corp. | | | | | | | | |
Term Loan, 3.75%, Maturing July 1, 2020 | | | 2,026 | | | | 1,954,716 | |
Zuffa, LLC | | | | | | | | |
Term Loan, 3.75%, Maturing February 25, 2020 | | | 3,445 | | | | 3,307,052 | |
| | | | | | | | | |
| | | | | | $ | 19,164,690 | |
| | | | | | | | | |
|
Lodging and Casinos — 2.9% | |
Amaya Holdings B.V. | | | | | | | | |
Term Loan, 5.00%, Maturing August 1, 2021 | | $ | 2,319 | | | $ | 2,305,852 | |
Boyd Gaming Corporation | | | | | | | | |
Term Loan, 4.00%, Maturing August 14, 2020 | | | 280 | | | | 276,046 | |
Caesars Entertainment Operating Company | | | | | | | | |
Term Loan, 6.99%, Maturing March 1, 2017(5) | | | 785 | | | | 693,670 | |
CityCenter Holdings, LLC | | | | | | | | |
Term Loan, 4.25%, Maturing October 16, 2020 | | | 500 | | | | 497,127 | |
Four Seasons Holdings, Inc. | | | | | | | | |
Term Loan, 3.50%, Maturing June 27, 2020 | | | 395 | | | | 388,334 | |
Golden Nugget, Inc. | | | | | | | | |
Term Loan, 5.50%, Maturing November 21, 2019 | | | 89 | | | | 88,487 | |
Term Loan, 5.50%, Maturing November 21, 2019 | | | 208 | | | | 206,471 | |
Hilton Worldwide Finance, LLC | | | | | | | | |
Term Loan, 3.50%, Maturing October 26, 2020 | | | 7,220 | | | | 7,146,327 | |
La Quinta Intermediate Holdings, LLC | | | | | | | | |
Term Loan, 4.00%, Maturing April 14, 2021 | | | 699 | | | | 692,144 | |
MGM Resorts International | | | | | | | | |
Term Loan, 3.50%, Maturing December 20, 2019 | | | 1,911 | | | | 1,869,197 | |
| | | | |
| | 15 | | See Notes to Financial Statements. |
Eaton Vance
VT Floating-Rate Income Fund
December 31, 2014
Portfolio of Investments — continued
| | | | | | | | |
| Borrower/Tranche Description | | Principal
Amount
(000’s omitted) | | | Value | |
| | | | | | | | |
|
Lodging and Casinos (continued) | |
Pinnacle Entertainment, Inc. | | | | | | | | |
Term Loan, 3.75%, Maturing August 13, 2020 | | $ | 444 | | | $ | 439,877 | |
Playa Resorts Holding B.V. | | | | | | | | |
Term Loan, 4.00%, Maturing August 6, 2019 | | | 1,286 | | | | 1,266,932 | |
RHP Hotel Properties L.P. | | | | | | | | |
Term Loan, 3.75%, Maturing January 15, 2021 | | | 423 | | | | 423,139 | |
Scientific Games International, Inc. | | | | | | | | |
Term Loan, 6.00%, Maturing October 18, 2020 | | | 1,881 | | | | 1,858,663 | |
Tropicana Entertainment, Inc. | | | | | | | | |
Term Loan, 4.00%, Maturing November 27, 2020 | | | 222 | | | | 218,716 | |
| | | | | | | | | |
| | | | | | $ | 18,370,982 | |
| | | | | | | | | |
|
Nonferrous Metals / Minerals — 1.9% | |
Alpha Natural Resources, LLC | | | | | | | | |
Term Loan, 3.50%, Maturing May 22, 2020 | | $ | 1,400 | | | $ | 1,135,801 | |
Arch Coal, Inc. | | | | | | | | |
Term Loan, 6.25%, Maturing May 16, 2018 | | | 2,419 | | | | 2,011,384 | |
Fairmount Minerals Ltd. | | | | | | | | |
Term Loan, 3.81%, Maturing March 15, 2017 | | | 247 | | | | 228,359 | |
Term Loan, 4.50%, Maturing September 5, 2019 | | | 2,224 | | | | 2,026,011 | |
Murray Energy Corporation | | | | | | | | |
Term Loan, 5.25%, Maturing December 5, 2019 | | | 844 | | | | 814,309 | |
Noranda Aluminum Acquisition Corporation | | | | | | | | |
Term Loan, 5.75%, Maturing February 28, 2019 | | | 486 | | | | 466,800 | |
Novelis, Inc. | | | | | | | | |
Term Loan, 3.75%, Maturing March 10, 2017 | | | 2,648 | | | | 2,626,885 | |
Oxbow Carbon, LLC | | | | | | | | |
Term Loan, 4.25%, Maturing July 19, 2019 | | | 1,203 | | | | 1,109,853 | |
Walter Energy, Inc. | | | | | | | | |
Term Loan, 7.25%, Maturing April 2, 2018 | | | 1,603 | | | | 1,247,247 | |
| | | | | | | | | |
| | | | | | $ | 11,666,649 | |
| | | | | | | | | |
|
Oil and Gas — 3.3% | |
Ameriforge Group, Inc. | | | | | | | | |
Term Loan, 5.00%, Maturing December 19, 2019 | | $ | 2,192 | | | $ | 2,006,045 | |
Bronco Midstream Funding, LLC | | | | | | | | |
Term Loan, 5.00%, Maturing August 15, 2020 | | | 1,010 | | | | 954,423 | |
Citgo Petroleum Corporation | | | | | | | | |
Term Loan, 4.50%, Maturing July 29, 2021 | | | 723 | | | | 721,380 | |
Crestwood Holdings, LLC | | | | | | | | |
Term Loan, 7.00%, Maturing June 19, 2019 | | | 1,243 | | | | 1,174,358 | |
Drillships Ocean Ventures, Inc. | | | | | | | | |
Term Loan, 5.50%, Maturing July 25, 2021 | | | 798 | | | | 647,377 | |
| | | | | | | | |
| Borrower/Tranche Description | | Principal
Amount
(000’s omitted) | | | Value | |
| | | | | | | | |
|
Oil and Gas (continued) | |
Energy Transfer Equity, L.P. | | | | | | | | |
Term Loan, 3.25%, Maturing December 2, 2019 | | $ | 1,025 | | | $ | 996,812 | |
Fieldwood Energy, LLC | | | | | | | | |
Term Loan, 3.88%, Maturing September 28, 2018 | | | 642 | | | | 610,539 | |
Term Loan - Second Lien, 8.38%, Maturing September 30, 2020 | | | 425 | | | | 313,013 | |
Floatel International, Ltd. | | | | | | | | |
Term Loan, 6.00%, Maturing June 27, 2020 | | | 1,690 | | | | 1,377,136 | |
MEG Energy Corp. | | | | | | | | |
Term Loan, 3.75%, Maturing March 31, 2020 | | | 3,209 | | | | 3,074,092 | |
Obsidian Natural Gas Trust | | | | | | | | |
Term Loan, 7.00%, Maturing November 2, 2015 | | | 341 | | | | 338,208 | |
Paragon Offshore Finance Company | | | | | | | | |
Term Loan, 3.75%, Maturing July 18, 2021 | | | 648 | | | | 538,151 | |
Samson Investment Company | | | | | | | | |
Term Loan - Second Lien, 5.00%, Maturing September 25, 2018 | | | 1,425 | | | | 1,126,937 | |
Seadrill Partners Finco, LLC | | | | | | | | |
Term Loan, 4.00%, Maturing February 21, 2021 | | | 2,452 | | | | 1,914,759 | |
Seventy Seven Operating, LLC | | | | | | | | |
Term Loan, 3.75%, Maturing June 25, 2021 | | | 348 | | | | 295,142 | |
Sheridan Investment Partners II, L.P. | | | | | | | | |
Term Loan, 4.25%, Maturing December 16, 2020 | | | 23 | | | | 18,339 | |
Term Loan, 4.25%, Maturing December 16, 2020 | | | 61 | | | | 49,173 | |
Term Loan, 4.25%, Maturing December 16, 2020 | | | 436 | | | | 353,486 | |
Sheridan Production Partners I, LLC | | | | | | | | |
Term Loan, 4.25%, Maturing October 1, 2019 | | | 78 | | | | 68,459 | |
Term Loan, 4.25%, Maturing October 1, 2019 | | | 128 | | | | 112,080 | |
Term Loan, 4.25%, Maturing October 1, 2019 | | | 967 | | | | 845,836 | |
Tallgrass Operations, LLC | | | | | | | | |
Term Loan, 4.25%, Maturing November 13, 2018 | | | 1,471 | | | | 1,439,787 | |
Tervita Corporation | | | | | | | | |
Term Loan, 6.25%, Maturing May 15, 2018 | | | 1,874 | | | | 1,739,858 | |
| | | | | | | | | |
| | | | | | $ | 20,715,390 | |
| | | | | | | | | |
|
Publishing — 2.0% | |
Ascend Learning, LLC | | | | | | | | |
Term Loan, 6.00%, Maturing July 31, 2019 | | $ | 819 | | | $ | 814,718 | |
Getty Images, Inc. | | | | | | | | |
Term Loan, 4.75%, Maturing October 18, 2019 | | | 3,802 | | | | 3,523,605 | |
Interactive Data Corporation | | | | | | | | |
Term Loan, 4.75%, Maturing May 2, 2021 | | | 1,045 | | | | 1,039,787 | |
Laureate Education, Inc. | | | | | | | | |
Term Loan, 5.00%, Maturing June 15, 2018 | | | 4,554 | | | | 4,360,855 | |
| | | | |
| | 16 | | See Notes to Financial Statements. |
Eaton Vance
VT Floating-Rate Income Fund
December 31, 2014
Portfolio of Investments — continued
| | | | | | | | |
| Borrower/Tranche Description | | Principal
Amount
(000’s omitted) | | | Value | |
| | | | | | | | |
|
Publishing (continued) | |
McGraw-Hill Global Education Holdings, LLC | | | | | | | | |
Term Loan, 5.75%, Maturing March 22, 2019 | | $ | 357 | | | $ | 356,166 | |
Merrill Communications, LLC | | | | | | | | |
Term Loan, 5.75%, Maturing March 8, 2018 | | | 337 | | | | 336,611 | |
Multi Packaging Solutions, Inc. | | | | | | | | |
Term Loan, 4.25%, Maturing September 30, 2020 | | | 223 | | | | 216,753 | |
Nelson Education, Ltd. | | | | | | | | |
Term Loan, 6.75%, Maturing July 3, 2014(7) | | | 302 | | | | 247,665 | |
Penton Media, Inc. | | | | | | | | |
Term Loan, 5.50%, Maturing October 3, 2019 | | | 370 | | | | 368,461 | |
ProQuest, LLC | | | | | | | | |
Term Loan, 5.25%, Maturing October 24, 2021 | | | 500 | | | | 498,542 | |
Springer Science+Business Media Deutschland GmbH | | | | | | | | |
Term Loan, 4.75%, Maturing August 14, 2020 | | | 667 | | | | 658,256 | |
| | | | | | | | | |
| | | | | | $ | 12,421,419 | |
| | | | | | | | | |
|
Radio and Television — 1.9% | |
ALM Media Holdings, Inc. | | | | | | | | |
Term Loan, 5.50%, Maturing July 31, 2020 | | $ | 323 | | | $ | 322,161 | |
AP NMT Acquisition B.V. | | | | | | | | |
Term Loan, 6.75%, Maturing August 13, 2021 | | | 324 | | | | 319,325 | |
Block Communications, Inc. | | | | | | | | |
Term Loan, 5.75%, Maturing October 21, 2021 | | | 150 | | | | 149,251 | |
Clear Channel Communications, Inc. | | | | | | | | |
Term Loan, 3.82%, Maturing January 29, 2016 | | | 4 | | | | 3,781 | |
Term Loan, 6.92%, Maturing January 30, 2019 | | | 453 | | | | 427,825 | |
Term Loan, 7.67%, Maturing July 30, 2019 | | | 146 | | | | 140,008 | |
Cumulus Media Holdings, Inc. | | | | | | | | |
Term Loan, 4.25%, Maturing December 23, 2020 | | | 2,609 | | | | 2,529,113 | |
Entercom Radio, LLC | | | | | | | | |
Term Loan, 4.00%, Maturing November 23, 2018 | | | 175 | | | | 174,012 | |
Entravision Communications Corporation | | | | | | | | |
Term Loan, 3.50%, Maturing May 31, 2020 | | | 2,155 | | | | 2,090,653 | |
Gray Television, Inc. | | | | | | | | |
Term Loan, 3.75%, Maturing June 10, 2021 | | | 156 | | | | 153,738 | |
Media General, Inc. | | | | | | | | |
Term Loan, 4.25%, Maturing July 31, 2020 | | | 960 | | | | 950,484 | |
Mission Broadcasting, Inc. | | | | | | | | |
Term Loan, 3.75%, Maturing October 1, 2020 | | | 427 | | | | 423,108 | |
Nexstar Broadcasting, Inc. | | | | | | | | |
Term Loan, 3.75%, Maturing October 1, 2020 | | | 485 | | | | 479,811 | |
Raycom TV Broadcasting, LLC | | | | | | | | |
Term Loan, 3.75%, Maturing August 4, 2021 | | | 435 | | | | 431,055 | |
| | | | | | | | |
| Borrower/Tranche Description | | Principal
Amount
(000’s omitted) | | | Value | |
| | | | | | | | |
|
Radio and Television (continued) | |
TWCC Holding Corp. | | | | | | | | |
Term Loan - Second Lien, 7.00%, Maturing June 26, 2020 | | $ | 375 | | | $ | 358,125 | |
Univision Communications, Inc. | | | | | | | | |
Term Loan, 4.00%, Maturing March 1, 2020 | | | 491 | | | | 481,072 | |
Term Loan, 4.00%, Maturing March 1, 2020 | | | 2,754 | | | | 2,698,815 | |
| | | | | | | | | |
| | | | | | $ | 12,132,337 | |
| | | | | | | | | |
|
Retailers (Except Food and Drug) — 5.4% | |
99 Cents Only Stores | | | | | | | | |
Term Loan, 4.50%, Maturing January 11, 2019 | | $ | 1,267 | | | $ | 1,257,086 | |
B.C. Unlimited Liability Company | | | | | | | | |
Term Loan, 4.50%, Maturing December 12, 2021 | | | 4,700 | | | | 4,702,096 | |
Bass Pro Group, LLC | | | | | | | | |
Term Loan, 3.75%, Maturing November 20, 2019 | | | 1,506 | | | | 1,484,850 | |
CDW, LLC | | | | | | | | |
Term Loan, 3.25%, Maturing April 29, 2020 | | | 2,169 | | | | 2,111,280 | |
David’s Bridal, Inc. | | | | | | | | |
Term Loan, 5.25%, Maturing October 11, 2019 | | | 597 | | | | 566,550 | |
Evergreen Acqco 1 L.P. | | | | | | | | |
Term Loan, 5.00%, Maturing July 9, 2019 | | | 318 | | | | 313,335 | |
Harbor Freight Tools USA, Inc. | | | | | | | | |
Term Loan, 4.75%, Maturing July 26, 2019 | | | 1,654 | | | | 1,652,409 | |
Hudson’s Bay Company | | | | | | | | |
Term Loan, 4.75%, Maturing November 4, 2020 | | | 821 | | | | 822,266 | |
J. Crew Group, Inc. | | | | | | | | |
Term Loan, 4.00%, Maturing March 5, 2021 | | | 1,915 | | | | 1,805,241 | |
Jo-Ann Stores, Inc. | | | | | | | | |
Term Loan, 4.00%, Maturing March 16, 2018 | | | 2,085 | | | | 2,033,220 | |
Men’s Wearhouse, Inc. (The) | | | | | | | | |
Term Loan, 4.50%, Maturing June 18, 2021 | | | 948 | | | | 944,071 | |
Michaels Stores, Inc. | | | | | | | | |
Term Loan, 3.75%, Maturing January 28, 2020 | | | 5,484 | | | | 5,391,861 | |
Term Loan, 4.00%, Maturing January 28, 2020 | | | 648 | | | | 640,270 | |
Neiman Marcus Group, Inc. (The) | | | | | | | | |
Term Loan, 4.25%, Maturing October 25, 2020 | | | 2,698 | | | | 2,646,467 | |
Party City Holdings, Inc. | | | | | | | | |
Term Loan, 4.00%, Maturing July 27, 2019 | | | 735 | | | | 720,374 | |
Pep Boys-Manny, Moe & Jack (The) | | | | | | | | |
Term Loan, 4.25%, Maturing October 11, 2018 | | | 221 | | | | 218,984 | |
Petco Animal Supplies, Inc. | | | | | | | | |
Term Loan, 4.00%, Maturing November 24, 2017 | | | 1,464 | | | | 1,449,360 | |
PFS Holding Corporation | | | | | | | | |
Term Loan, 4.50%, Maturing January 31, 2021 | | | 1,141 | | | | 953,048 | |
| | | | |
| | 17 | | See Notes to Financial Statements. |
Eaton Vance
VT Floating-Rate Income Fund
December 31, 2014
Portfolio of Investments — continued
| | | | | | | | |
| Borrower/Tranche Description | | Principal
Amount
(000’s omitted) | | | Value | |
| | | | | | | | |
|
Retailers (Except Food and Drug) (continued) | |
Pier 1 Imports (U.S.), Inc. | | | | | | | | |
Term Loan, 4.50%, Maturing April 30, 2021 | | $ | 348 | | | $ | 346,509 | |
Pilot Travel Centers, LLC | | | | | | | | |
Term Loan, 4.25%, Maturing October 1, 2021 | | | 1,450 | | | | 1,454,531 | |
Rent-A-Center, Inc. | | | | | | | | |
Term Loan, 3.75%, Maturing March 19, 2021 | | | 347 | | | | 339,993 | |
Spin Holdco, Inc. | | | | | | | | |
Term Loan, 4.25%, Maturing November 14, 2019 | | | 914 | | | | 901,755 | |
Toys ‘R’ Us Property Company I, LLC | | | | | | | | |
Term Loan, 6.00%, Maturing August 21, 2019 | | | 1,015 | | | | 972,468 | |
| | | | | | | | | |
| | | | | | $ | 33,728,024 | |
| | | | | | | | | |
|
Steel — 1.5% | |
FMG Resources (August 2006) Pty Ltd. | | | | | | | | |
Term Loan, 3.75%, Maturing June 30, 2019 | | $ | 4,539 | | | $ | 4,146,151 | |
JMC Steel Group, Inc. | | | | | | | | |
Term Loan, 4.75%, Maturing April 1, 2017 | | | 3,122 | | | | 3,063,927 | |
Neenah Foundry Company | | | | | | | | |
Term Loan, 6.75%, Maturing April 26, 2017 | | | 663 | | | | 657,722 | |
Patriot Coal Corporation | | | | | | | | |
Term Loan, 9.00%, Maturing December 15, 2018 | | | 1,485 | | | | 1,420,031 | |
| | |
| | | | | | $ | 9,287,831 | |
| | |
|
Surface Transport — 0.7% | |
Hertz Corporation (The) | | | | | | | | |
Term Loan, 3.50%, Maturing March 11, 2018 | | $ | 1,130 | | | $ | 1,103,772 | |
Term Loan, 3.75%, Maturing March 11, 2018 | | | 1,000 | | | | 995,000 | |
Term Loan, 4.00%, Maturing March 11, 2018 | | | 882 | | | | 870,607 | |
Stena International S.a.r.l. | | | | | | | | |
Term Loan, 4.00%, Maturing March 3, 2021 | | | 1,017 | | | | 900,322 | |
Swift Transportation Co., LLC | | | | | | | | |
Term Loan, 3.75%, Maturing June 9, 2021 | | | 769 | | | | 761,111 | |
| | | | | | | | | |
| | | | | | $ | 4,630,812 | |
| | | | | | | | | |
|
Telecommunications — 2.4% | |
Cellular South, Inc. | | | | | | | | |
Term Loan, 3.25%, Maturing May 22, 2020 | | $ | 197 | | | $ | 194,863 | |
Ciena Corporation | | | | | | | | |
Term Loan, 3.75%, Maturing July 15, 2019 | | | 2,494 | | | | 2,456,344 | |
Intelsat Jackson Holdings S.A. | | | | | | | | |
Term Loan, 3.75%, Maturing June 30, 2019 | | | 4,750 | | | | 4,692,606 | |
IPC Systems, Inc. | | | | | | | | |
Term Loan, 6.00%, Maturing November 8, 2020 | | | 697 | | | | 693,888 | |
| | | | | | | | |
| Borrower/Tranche Description | | Principal
Amount
(000’s omitted) | | | Value | |
| | | | | | | | |
|
Telecommunications (continued) | |
Sable International Finance Limited | | | | | | | | |
Term Loan, Maturing November 6, 2016(2) | | $ | 275 | | | $ | 275,000 | |
SBA Senior Finance II, LLC | | | | | | | | |
Term Loan, 3.25%, Maturing March 24, 2021 | | | 1,119 | | | | 1,098,387 | |
Syniverse Holdings, Inc. | | | | | | | | |
Term Loan, 4.00%, Maturing April 23, 2019 | | | 654 | | | | 635,885 | |
Term Loan, 4.00%, Maturing April 23, 2019 | | | 864 | | | | 839,368 | |
Telesat Canada | | | | | | | | |
Term Loan, 3.50%, Maturing March 28, 2019 | | | 3,788 | | | | 3,731,607 | |
Windstream Corporation | | | | | | | | |
Term Loan, 3.50%, Maturing August 8, 2019 | | | 440 | | | | 434,982 | |
| | | | | | | | | |
| | | | | | $ | 15,052,930 | |
| | | | | | | | | |
|
Utilities — 3.6% | |
Calpine Construction Finance Company, L.P. | | | | | | | | |
Term Loan, 3.00%, Maturing May 3, 2020 | | $ | 566 | | | $ | 549,030 | |
Term Loan, 3.25%, Maturing January 31, 2022 | | | 593 | | | | 576,076 | |
Calpine Corporation | | | | | | | | |
Term Loan, 4.00%, Maturing April 1, 2018 | | | 458 | | | | 455,052 | |
Term Loan, 4.00%, Maturing April 1, 2018 | | | 2,743 | | | | 2,722,552 | |
Term Loan, 4.00%, Maturing October 9, 2019 | | | 914 | | | | 904,449 | |
Term Loan, 4.00%, Maturing October 30, 2020 | | | 223 | | | | 220,140 | |
Dynegy Holdings, Inc. | | | | | | | | |
Term Loan, 4.00%, Maturing April 23, 2020 | | | 530 | | | | 525,081 | |
EFS Cogen Holdings I, LLC | | | | | | | | |
Term Loan, 3.75%, Maturing December 17, 2020 | | | 316 | | | | 311,895 | |
Electrical Components International, Inc. | | | | | | | | |
Term Loan, 5.75%, Maturing May 28, 2021 | | | 249 | | | | 249,061 | |
Energy Future Intermediate Holding Co., LLC | | | | | | | | |
DIP Loan, 4.25%, Maturing June 19, 2016 | | | 1,125 | | | | 1,126,758 | |
Equipower Resources Holdings, LLC | | | | | | | | |
Term Loan, 4.25%, Maturing December 21, 2018 | | | 943 | | | | 940,132 | |
Term Loan, 4.25%, Maturing December 31, 2019 | | | 296 | | | | 294,517 | |
Granite Acquisition, Inc. | | | | | | | | |
Term Loan, 5.00%, Maturing October 15, 2021 | | | 78 | | | | 78,749 | |
Term Loan, 5.00%, Maturing October 15, 2021 | | | 1,772 | | | | 1,789,751 | |
La Frontera Generation, LLC | | | | | | | | |
Term Loan, 4.50%, Maturing September 30, 2020 | | | 320 | | | | 316,256 | |
Lonestar Generation, LLC | | | | | | | | |
Term Loan, Maturing February 20, 2021(2) | | | 400 | | | | 392,000 | |
NRG Energy, Inc. | | | | | | | | |
Term Loan, 2.75%, Maturing July 2, 2018 | | | 4,310 | | | | 4,234,737 | |
PowerTeam Services, LLC | | | | | | | | |
Term Loan, 4.25%, Maturing May 6, 2020 | | | 8 | | | | 7,997 | |
Term Loan, 4.25%, Maturing May 6, 2020 | | | 153 | | | | 149,583 | |
| | | | |
| | 18 | | See Notes to Financial Statements. |
Eaton Vance
VT Floating-Rate Income Fund
December 31, 2014
Portfolio of Investments — continued
| | | | | | | | |
| Borrower/Tranche Description | | Principal
Amount
(000’s omitted) | | | Value | |
| | | | | | | | |
|
Utilities (continued) | |
Southcross Energy Partners L.P. | | | | | | | | |
Term Loan, 5.25%, Maturing August 4, 2021 | | $ | 498 | | | $ | 470,137 | |
Southcross Holdings Borrower L.P. | | | | | | | | |
Term Loan, 6.00%, Maturing August 4, 2021 | | | 299 | | | | 267,158 | |
TerraForm Power Operating, LLC | | | | | | | | |
Term Loan, 4.75%, Maturing July 23, 2019 | | | 1,169 | | | | 1,169,491 | |
TPF II Power, LLC | | | | | | | | |
Term Loan, 5.50%, Maturing October 2, 2021 | | | 975 | | | | 972,156 | |
WTG Holdings III Corp. | | | | | | | | |
Term Loan, 4.75%, Maturing January 15, 2021 | | | 3,730 | | | | 3,683,288 | |
| | | | | | | | | |
| | | | | | $ | 22,406,046 | |
| | |
| |
Total Senior Floating-Rate Interests
(identified cost $618,547,183) | | | $ | 603,436,496 | |
| | |
|
| Corporate Bonds & Notes — 1.7% | |
| | |
| | | | | | | | |
| Security | | Principal
Amount
(000’s omitted) | | | Value | |
|
Cable and Satellite Television — 0.1% | |
Virgin Media Secured Finance PLC | | | | | | | | |
5.375%, 4/15/21(8) | | $ | 500 | | | $ | 518,750 | |
| | |
| | | | | | $ | 518,750 | |
| | |
|
Chemicals and Plastics — 0.4% | |
Hexion US Finance Corp. | | | | | | | | |
6.625%, 4/15/20 | | $ | 1,475 | | | $ | 1,452,875 | |
Ineos Finance PLC | | | | | | | | |
8.375%, 2/15/19(8) | | | 575 | | | | 613,094 | |
Trinseo Materials Operating S.C.A. | | | | | | | | |
8.75%, 2/1/19(8) | | | 653 | | | | 665,243 | |
| | |
| | | | | | $ | 2,731,212 | |
| | |
|
Containers and Glass Products — 0.4% | |
Reynolds Group Holdings, Inc. | | | | | | | | |
5.75%, 10/15/20 | | $ | 1,925 | | | $ | 1,982,750 | |
Smurfit Kappa Acquisitions | | | | | | | | |
4.875%, 9/15/18(8) | | | 225 | | | | 234,000 | |
| | |
| | | | | | $ | 2,216,750 | |
| | |
| | | | | | | | |
| Security | | Principal
Amount
(000’s omitted) | | | Value | |
| | | | | | | | |
|
Financial Intermediaries — 0.1% | |
First Data Corp. | | | | | | | | |
6.75%, 11/1/20(8) | | $ | 423 | | | $ | 452,610 | |
| | |
| | | | | | $ | 452,610 | |
| | |
|
Health Care — 0.2% | |
CHS/Community Health Systems, Inc. | | | | | | | | |
5.125%, 8/15/18 | | $ | 1,050 | | | $ | 1,089,375 | |
| | |
| | | | | | $ | 1,089,375 | |
| | |
|
Industrial Equipment — 0.0%(4) | |
Erikson Air-Crane, Inc., Promissory Note | | | | | | | | |
6.00%, 11/2/20(3)(9) | | $ | 39 | | | $ | 25,604 | |
| | |
| | | | | | $ | 25,604 | |
| | |
|
Lodging and Casinos — 0.2% | |
Caesars Entertainment Operating Co., Inc. | | | | | | | | |
8.50%, 2/15/20 | | $ | 1,125 | | | $ | 855,000 | |
9.00%, 2/15/20 | | | 625 | | | | 462,500 | |
| | |
| | | | | | $ | 1,317,500 | |
| | |
|
Radio and Television — 0.1% | |
Clear Channel Communications, Inc. | | | | | | | | |
9.00%, 12/15/19 | | $ | 181 | | | $ | 178,964 | |
Univision Communications, Inc. | | | | | | | | |
6.75%, 9/15/22(8) | | | 384 | | | | 412,800 | |
| | |
| | | | | | $ | 591,764 | |
| | |
|
Telecommunications — 0.0%(4) | |
Wind Acquisition Finance SA | | | | | | | | |
6.50%, 4/30/20(8) | | $ | 250 | | | $ | 256,563 | |
| | |
| | | | | | $ | 256,563 | |
| | |
|
Utilities — 0.2% | |
Calpine Corp. | | | | | | | | |
7.875%, 1/15/23(8) | | $ | 1,029 | | | $ | 1,139,618 | |
| | |
| | | | | | $ | 1,139,618 | |
| | |
| |
Total Corporate Bonds & Notes
(identified cost $10,435,519) | | | $ | 10,339,746 | |
| | |
| | | | |
| | 19 | | See Notes to Financial Statements. |
Eaton Vance
VT Floating-Rate Income Fund
December 31, 2014
Portfolio of Investments — continued
| | | | | | | | |
| Common Stocks — 0.6% | |
| | |
| | | | | | | | |
| Security | | Shares | | | Value | |
| | | | | | | | |
|
Aerospace and Defense — 0.0%(4) | |
IAP Worldwide Services, LLC(3)(9)(10) | | | 24 | | | $ | 22,424 | |
| | | | | | | | | |
| | | | | | $ | 22,424 | |
| | | | | | | | | |
|
Automotive — 0.1% | |
Dayco Products, LLC(9) | | | 15,250 | | | $ | 564,250 | |
| | | | | | | | | |
| | | | | | $ | 564,250 | |
| | | | | | | | | |
|
Food Service — 0.0%(4) | |
Buffets Restaurants Holdings, Inc.(3)(9)(10) | | | 776 | | | $ | 318 | |
| | |
| | | | | | $ | 318 | |
| | |
|
Lodging and Casinos — 0.2% | |
Affinity Gaming, LLC(3)(9)(10) | | | 41,797 | | | $ | 438,869 | |
Tropicana Entertainment, Inc.(9)(10) | | | 71,982 | | | | 1,212,897 | |
| | |
| | | | | | $ | 1,651,766 | |
| | |
|
Publishing — 0.3% | |
ION Media Networks, Inc.(3)(9) | | | 399 | | | $ | 136,155 | |
MediaNews Group, Inc.(9)(10) | | | 45,600 | | | | 1,535,205 | |
| | |
| | | | | | $ | 1,671,360 | |
| | |
| |
Total Common Stocks
(identified cost $2,372,368) | | | $ | 3,910,118 | |
| | |
| |
Total Investments — 98.7%
(identified cost $631,355,070) | | | $ | 617,686,360 | |
| | |
| |
Less Unfunded Loan Commitments — (0.2)% | | | $ | (1,109,176 | ) |
| | |
| |
Net Investments — 98.5%
(identified cost $630,245,894) | | | $ | 616,577,184 | |
| | |
| |
Other Assets, Less Liabilities — 1.5% | | | $ | 9,675,449 | |
| | |
| |
Net Assets — 100.0% | | | $ | 626,252,633 | |
| | |
The percentage shown for each investment category in the Portfolio of Investments is based on net assets.
| | | | |
| DIP | | – | | Debtor in Possession |
| | (1) | Senior floating-rate interests (Senior Loans) often require prepayments from excess cash flows or permit the borrowers to repay at their election. The degree to which borrowers repay, whether as a contractual requirement or at their election, cannot be predicted with accuracy. As a result, the actual remaining maturity may be substantially less than the stated maturities shown. However, Senior Loans will have an expected average life of approximately two to four years. The stated interest rate represents the weighted average interest rate of all contracts within the senior loan facility and includes commitment fees on unfunded loan commitments, if any. Senior Loans typically have rates of interest which are redetermined either daily, monthly, quarterly or semi-annually by reference to a base lending rate, plus a premium. These base lending rates are primarily the London Interbank Offered Rate (“LIBOR”) and secondarily, the prime rate offered by one or more major United States banks (the “Prime Rate”) and the certificate of deposit (“CD”) rate or other base lending rates used by commercial lenders. |
| | (2) | This Senior Loan will settle after December 31, 2014, at which time the interest rate will be determined. |
| | (3) | For fair value measurement disclosure purposes, security is categorized as Level 3 (See Note 10). |
| | (4) | Amount is less than 0.05%. |
| | (5) | Represents a payment-in-kind security which may pay interest in additional principal at the issuer’s discretion. |
| | (6) | Unfunded or partially unfunded loan commitments. See Note 1G for description. |
| | (7) | The issuer is in default on the payment of principal but continues to pay interest. |
| | (8) | Security exempt from registration pursuant to Rule 144A under the Securities Act of 1933. These securities may be sold in certain transactions (normally to qualified institutional buyers) and remain exempt from registration. At December 31, 2014, the aggregate value of these securities is $4,292,678 or 0.7% of the Fund’s net assets. |
| | (9) | Security was acquired in connection with a restructuring of a Senior Loan and may be subject to restrictions on resale. |
| (10) | Non-income producing security. |
| | | | |
| | 20 | | See Notes to Financial Statements. |
Eaton Vance
VT Floating-Rate Income Fund
December 31, 2014
Statement of Assets and Liabilities
| | | | |
| Assets | | December 31, 2014 | |
Investments, at value (identified cost, $630,245,894) | | $ | 616,577,184 | |
Cash | | | 13,254,645 | |
Interest receivable | | | 1,875,186 | |
Receivable for investments sold | | | 1,361,894 | |
Receivable for Fund shares sold | | | 122,271 | |
Prepaid expenses | | | 30,427 | |
Total assets | | $ | 633,221,607 | |
|
| Liabilities | |
Payable for investments purchased | | $ | 4,677,290 | |
Payable for Fund shares redeemed | | | 1,545,469 | |
Payable to affiliates: | | | | |
Investment adviser fee | | | 310,677 | |
Distribution fees | | | 134,947 | |
Trustees’ fees | | | 6,839 | |
Payable for shareholder servicing fees | | | 176,912 | |
Accrued expenses | | | 116,840 | |
Total liabilities | | $ | 6,968,974 | |
Net Assets | | $ | 626,252,633 | |
|
| Sources of Net Assets | |
Paid-in capital | | $ | 636,338,727 | |
Accumulated net realized loss | | | (299,043 | ) |
Accumulated undistributed net investment income | | | 3,881,659 | |
Net unrealized depreciation | | | (13,668,710 | ) |
Total | | $ | 626,252,633 | |
| |
| Initial Class Shares | | | | |
Net Assets | | $ | 625,638,078 | |
Shares Outstanding | | | 68,096,904 | |
Net Asset Value, Offering Price and Redemption Price Per Share | | | | |
(net assets ÷ shares of beneficial interest outstanding) | | $ | 9.19 | |
|
| ADV Class Shares | |
Net Assets | | $ | 614,555 | |
Shares Outstanding | | | 66,850 | |
Net Asset Value, Offering Price and Redemption Price Per Share | | | | |
(net assets ÷ shares of beneficial interest outstanding) | | $ | 9.19 | |
| | | | |
| | 21 | | See Notes to Financial Statements. |
Eaton Vance
VT Floating-Rate Income Fund
December 31, 2014
Statement of Operations
| | | | |
| Investment Income | | Year Ended
December 31, 2014 | |
Interest and other income | | $ | 26,793,550 | |
Dividends | | | 201,035 | |
Total investment income | | $ | 26,994,585 | |
|
| Expenses | |
Investment adviser fee | | $ | 3,609,703 | |
Distribution fees | | | | |
Initial Class | | | 1,569,158 | |
Shareholder servicing fees | | | | |
Initial Class | | | 1,477,703 | |
ADV Class | | | 505 | |
Trustees’ fees and expenses | | | 27,900 | |
Custodian fee | | | 240,903 | |
Transfer and dividend disbursing agent fees | | | 14,003 | |
Legal and accounting services | | | 107,908 | |
Printing and postage | | | 56,292 | |
Interest expense and fees | | | 72,724 | |
Miscellaneous | | | 27,597 | |
Total expenses | | $ | 7,204,396 | |
Deduct — | | | | |
Reduction of custodian fee | | $ | 7,766 | |
Total expense reductions | | $ | 7,766 | |
| |
Net expenses | | $ | 7,196,630 | |
| |
Net investment income | | $ | 19,797,955 | |
|
| Realized and Unrealized Gain (Loss) | |
Net realized gain (loss) — | | | | |
Investment transactions | | $ | (272,558 | ) |
Net realized loss | | $ | (272,558 | ) |
Change in unrealized appreciation (depreciation) — | | | | |
Investments | | $ | (17,048,860 | ) |
Net change in unrealized appreciation (depreciation) | | $ | (17,048,860 | ) |
| |
Net realized and unrealized loss | | $ | (17,321,418 | ) |
| |
Net increase in net assets from operations | | $ | 2,476,537 | |
| | | | |
| | 22 | | See Notes to Financial Statements. |
Eaton Vance
VT Floating-Rate Income Fund
December 31, 2014
Statements of Changes in Net Assets
| | | | | | | | |
| | | Year Ended December 31, | |
| Increase (Decrease) in Net Assets | | 2014 | | | 2013 | |
From operations — | | | | | | | | |
Net investment income | | $ | 19,797,955 | | | $ | 17,833,918 | |
Net realized gain (loss) from investment transactions | | | (272,558 | ) | | | 776,431 | |
Net change in unrealized appreciation (depreciation) from investments | | | (17,048,860 | ) | | | 335,316 | |
Net increase in net assets from operations | | $ | 2,476,537 | | | $ | 18,945,665 | |
Distributions to shareholders — | | | | | | | | |
From net investment income | | | | | | | | |
Initial Class | | $ | (19,788,083 | ) | | $ | (18,012,037 | ) |
ADV Class | | | (7,528 | ) | | | — | |
From net realized gain | | | | | | | | |
Initial Class | | | — | | | | (3,269,569 | ) |
Total distributions to shareholders | | $ | (19,795,611 | ) | | $ | (21,281,606 | ) |
Transactions in shares of beneficial interest — | | | | | | | | |
Proceeds from sale of shares | | | | | | | | |
Initial Class | | $ | 206,484,771 | | | $ | 225,824,598 | |
ADV Class | | | 1,135,244 | | | | — | |
Net asset value of shares issued to shareholders in payment of distributions declared | | | | | | | | |
Initial Class | | | 19,788,083 | | | | 21,281,606 | |
ADV Class | | | 7,528 | | | | — | |
Cost of shares redeemed | | | | | | | | |
Initial Class | | | (169,211,032 | ) | | | (78,780,864 | ) |
ADV Class | | | (520,503 | ) | | | — | |
Net increase in net assets from Fund share transactions | | $ | 57,684,091 | | | $ | 168,325,340 | |
| | |
Net increase in net assets | | $ | 40,365,017 | | | $ | 165,989,399 | |
|
| Net Assets | |
At beginning of year | | $ | 585,887,616 | | | $ | 419,898,217 | |
At end of year | | $ | 626,252,633 | | | $ | 585,887,616 | |
|
Accumulated undistributed net investment income included in net assets | |
At end of year | | $ | 3,881,659 | | | $ | 3,085,349 | |
| | | | |
| | 23 | | See Notes to Financial Statements. |
Eaton Vance
VT Floating-Rate Income Fund
December 31, 2014
Financial Highlights
| | | | | | | | | | | | | | | | | | | | |
| | | Initial Class | |
| | | Year Ended December 31, | |
| | | 2014 | | | 2013 | | | 2012 | | | 2011 | | | 2010 | |
Net asset value — Beginning of year | | $ | 9.430 | | | $ | 9.460 | | | $ | 9.300 | | | $ | 9.460 | | | $ | 9.050 | |
| | | | | |
| Income (Loss) From Operations | | | | | | | | | | | | | | | | | | | | |
Net investment income(1) | | $ | 0.295 | | | $ | 0.327 | | | $ | 0.396 | | | $ | 0.399 | | | $ | 0.369 | |
Net realized and unrealized gain (loss) | | | (0.240 | ) | | | 0.031 | | | | 0.270 | | | | (0.161 | ) | | | 0.442 | |
| | | | | |
Total income from operations | | $ | 0.055 | | | $ | 0.358 | | | $ | 0.666 | | | $ | 0.238 | | | $ | 0.811 | |
| | | | | |
| Less Distributions | | | | | | | | | | | | | | | | | | | | |
From net investment income | | $ | (0.295 | ) | | $ | (0.332 | ) | | $ | (0.396 | ) | | $ | (0.398 | ) | | $ | (0.401 | ) |
From net realized gain | | | — | | | | (0.056 | ) | | | (0.110 | ) | | | — | | | | — | |
| | | | | |
Total distributions | | $ | (0.295 | ) | | $ | (0.388 | ) | | $ | (0.506 | ) | | $ | (0.398 | ) | | $ | (0.401 | ) |
| | | | | |
Net asset value — End of year | | $ | 9.190 | | | $ | 9.430 | | | $ | 9.460 | | | $ | 9.300 | | | $ | 9.460 | |
| | | | | |
Total Return(2) | | | 0.57 | % | | | 3.85 | % | | | 7.33 | % | | | 2.54 | % | | | 9.12 | % |
| | | | | |
| Ratios/Supplemental Data | | | | | | | | | | | | | | | | | | | | |
Net assets, end of year (000’s omitted) | | $ | 625,638 | | | $ | 585,888 | | | $ | 419,898 | | | $ | 354,692 | | | $ | 354,097 | |
Ratios (as a percentage of average daily net assets): | | | | | | | | | | | | | | | | | | | | |
Expenses | | | 1.15 | %(3) | | | 1.15 | %(4) | | | 1.16 | %(3) | | | 1.17 | %(3) | | | 1.15 | %(3) |
Net investment income | | | 3.15 | % | | | 3.45 | % | | | 4.21 | % | | | 4.24 | % | | | 3.98 | % |
Portfolio Turnover | | | 29 | % | | | 38 | % | | | 42 | % | | | 53 | % | | | 35 | % |
| (1) | Computed using average shares outstanding. |
| (2) | Returns are historical and are calculated by determining the percentage change in net asset value with all distributions reinvested. |
| (3) | Excludes the effect of custody fee credits, if any, of less than 0.005%. |
| (4) | Expenses after custodian fee reduction were 1.14%. |
| | | | |
| | 24 | | See Notes to Financial Statements. |
Eaton Vance
VT Floating-Rate Income Fund
December 31, 2014
Financial Highlights — continued
| | | | |
| | | ADV Class | |
| | | Period Ended
December 31, 2014(1) | |
Net asset value — Beginning of period | | $ | 9.400 | |
| |
| Income (Loss) From Operations | | | | |
Net investment income(2) | | $ | 0.234 | |
Net realized and unrealized loss | | | (0.216 | ) |
| |
Total income from operations | | $ | 0.018 | |
| |
| Less Distributions | | | | |
From net investment income | | $ | (0.228 | ) |
| |
Total distributions | | $ | (0.228 | ) |
| |
Net asset value — End of period | | $ | 9.190 | |
| |
Total Return(3) | | | 0.18 | %(4) |
| |
| Ratios/Supplemental Data | | | | |
Net assets, end of period (000’s omitted) | | $ | 615 | |
Ratios (as a percentage of average daily net assets): | | | | |
Expenses | | | 0.90 | %(5)(6) |
Net investment income | | | 3.52 | %(6) |
Portfolio Turnover | | | 29 | %(7) |
| (1) | For the period from commencement of operations on April 15, 2014 to December 31, 2014. |
| (2) | Computed using average shares outstanding. |
| (3) | Returns are historical and are calculated by determining the percentage change in net asset value with all distributions reinvested. |
| (5) | Excludes the effect of custody fee credits, if any, of less than 0.005%. |
| (7) | For the year ended December 31, 2014. |
| | | | |
| | 25 | | See Notes to Financial Statements. |
Eaton Vance
VT Floating-Rate Income Fund
December 31, 2014
Notes to Financial Statements
1 Significant Accounting Policies
Eaton Vance VT Floating-Rate Income Fund (the Fund) is a diversified series of Eaton Vance Variable Trust (the Trust). The Trust is a Massachusetts business trust registered under the Investment Company Act of 1940, as amended (the 1940 Act), as an open-end management investment company. The Fund’s investment objective is to provide a high level of current income. Effective April 15, 2014, the Fund designated its existing shares as Initial Class and established a new class of shares named ADV Class. Each class represents a pro-rata interest in the Fund, but votes separately on class-specific matters and (as noted below) is subject to different expenses. Realized and unrealized gains and losses are allocated daily to each class of shares based on the relative net assets of each class to the total net assets of the Fund. Net investment income, other than class-specific expenses, is allocated daily to each class of shares based upon the ratio of the value of each class’ paid shares to the total value of all paid shares. Each class of shares differs in its distribution plan and certain other class-specific expenses. The Fund is generally made available for purchase only to separate accounts established by participating insurance companies and qualified pension or retirement plans.
The following is a summary of significant accounting policies of the Fund. The policies are in conformity with accounting principles generally accepted in the United States of America (U.S. GAAP). The Fund is an investment company and follows accounting and reporting guidance in the Financial Accounting Standards Board (“FASB”) Accounting Standards Codification Topic 946.
A Investment Valuation — The following methodologies are used to determine the market value or fair value of investments.
Senior Floating-Rate Loans. Interests in senior floating-rate loans (Senior Loans) for which reliable market quotations are readily available are valued generally at the average mean of bid and ask quotations obtained from a third party pricing service. Other Senior Loans are valued at fair value by the investment adviser under procedures approved by the Trustees. In fair valuing a Senior Loan, the investment adviser utilizes one or more of the valuation techniques described in (i) through (iii) below to assess the likelihood that the borrower will make a full repayment of the loan underlying such Senior Loan relative to yields on other Senior Loans issued by companies of comparable credit quality. If the investment adviser believes that there is a reasonable likelihood of full repayment, the investment adviser will determine fair value using a matrix pricing approach that considers the yield on the Senior Loan. If the investment adviser believes there is not a reasonable likelihood of full repayment, the investment adviser will determine fair value using analyses that include, but are not limited to: (i) a comparison of the value of the borrower’s outstanding equity and debt to that of comparable public companies; (ii) a discounted cash flow analysis; or (iii) when the investment adviser believes it is likely that a borrower will be liquidated or sold, an analysis of the terms of such liquidation or sale. In certain cases, the investment adviser will use a combination of analytical methods to determine fair value, such as when only a portion of a borrower’s assets are likely to be sold. In conducting its assessment and analyses for purposes of determining fair value of a Senior Loan, the investment adviser will use its discretion and judgment in considering and appraising relevant factors. Fair value determinations are made by the portfolio managers of the Fund based on information available to such managers. The portfolio managers of other funds managed by the investment adviser that invest in Senior Loans may not possess the same information about a Senior Loan borrower as the portfolio managers of the Fund. At times, the fair value of a Senior Loan determined by the portfolio managers of other funds managed by the investment adviser that invest in Senior Loans may vary from the fair value of the same Senior Loan determined by the portfolio managers of the Fund. The fair value of each Senior Loan is periodically reviewed and approved by the investment adviser’s Valuation Committee and by the Trustees based upon procedures approved by the Trustees. Junior Loans (i.e., subordinated loans and second lien loans) are valued in the same manner as Senior Loans.
Debt Obligations. Debt obligations (including short-term obligations with a remaining maturity of more than sixty days) are generally valued on the basis of valuations provided by third party pricing services, as derived from such services’ pricing models. Inputs to the models may include, but are not limited to, reported trades, executable bid and asked prices, broker/dealer quotations, prices or yields of securities with similar characteristics, interest rates, anticipated prepayments, benchmark curves or information pertaining to the issuer, as well as industry and economic events. The pricing services may use a matrix approach, which considers information regarding securities with similar characteristics to determine the valuation for a security. Short-term obligations purchased with a remaining maturity of sixty days or less are generally valued at amortized cost, which approximates market value.
Equity Securities. Equity securities listed on a U.S. securities exchange generally are valued at the last sale or closing price on the day of valuation or, if no sales took place on such date, at the mean between the closing bid and asked prices therefore on the exchange where such securities are principally traded. Equity securities listed on the NASDAQ Global or Global Select Market generally are valued at the NASDAQ official closing price. Unlisted or listed securities for which closing sales prices or closing quotations are not available are valued at the mean between the latest available bid and asked prices.
Fair Valuation. Investments for which valuations or market quotations are not readily available or are deemed unreliable are valued at fair value using methods determined in good faith by or at the direction of the Trustees of the Fund in a manner that fairly reflects the security’s value, or the amount that the Fund might reasonably expect to receive for the security upon its current sale in the ordinary course. Each such determination is based on a consideration of relevant factors, which are likely to vary from one pricing context to another. These factors may include, but are not limited to, the type of security, the existence of any contractual restrictions on the security’s disposition, the price and extent of public trading in similar securities of the issuer or of comparable companies or entities, quotations or relevant information obtained from broker/dealers or other market participants, information obtained from the issuer, analysts, and/or the appropriate stock exchange (for exchange-traded securities), an analysis of the company’s or entity’s financial condition, and an evaluation of the forces that influence the issuer and the market(s) in which the security is purchased and sold.
B Investment Transactions — Investment transactions for financial statement purposes are accounted for on a trade date basis. Realized gains and losses on investments sold are determined on the basis of identified cost.
Eaton Vance
VT Floating-Rate Income Fund
December 31, 2014
Notes to Financial Statements — continued
C Income — Interest income is recorded on the basis of interest accrued, adjusted for amortization of premium or accretion of discount. Fees associated with loan amendments are recognized immediately. Dividend income is recorded on the ex-dividend date for dividends received in cash and/or securities.
D Federal Taxes — The Fund’s policy is to comply with the provisions of the Internal Revenue Code applicable to regulated investment companies and to distribute to shareholders each year substantially all of its net investment income, and all or substantially all of its net realized capital gains. Accordingly, no provision for federal income or excise tax is necessary.
As of December 31, 2014, the Fund had no uncertain tax positions that would require financial statement recognition, de-recognition, or disclosure. The Fund files a U.S. federal income tax return annually after its fiscal year-end, which is subject to examination by the Internal Revenue Service for a period of three years from the date of filing.
E Expenses — The majority of expenses of the Trust are directly identifiable to an individual fund. Expenses which are not readily identifiable to a specific fund are allocated taking into consideration, among other things, the nature and type of expense and the relative size of the funds.
F Expense Reduction — State Street Bank and Trust Company (SSBT) serves as custodian of the Fund. Pursuant to the custodian agreement, SSBT receives a fee reduced by credits, which are determined based on the average daily cash balance the Fund maintains with SSBT. All credit balances, if any, used to reduce the Fund’s custodian fees are reported as a reduction of expenses in the Statement of Operations.
G Unfunded Loan Commitments — The Fund may enter into certain loan or credit agreements all or a portion of which may be unfunded. The Fund is obligated to fund these commitments at the borrower’s discretion. These commitments are disclosed in the accompanying Portfolio of Investments. At December 31, 2014, the Fund had sufficient cash and/or securities to cover these commitments.
H Use of Estimates — The preparation of the financial statements in conformity with U.S. GAAP requires management to make estimates and assumptions that affect the reported amounts of assets and liabilities at the date of the financial statements and the reported amounts of income and expense during the reporting period. Actual results could differ from those estimates.
I Indemnifications — Under the Trust’s organizational documents, its officers and Trustees may be indemnified against certain liabilities and expenses arising out of the performance of their duties to the Fund. Under Massachusetts law, if certain conditions prevail, shareholders of a Massachusetts business trust (such as the Trust) could be deemed to have personal liability for the obligations of the Trust. However, the Trust’s Declaration of Trust contains an express disclaimer of liability on the part of Fund shareholders and the By-laws provide that the Trust shall assume the defense on behalf of any Fund shareholders. Moreover, the By-laws also provide for indemnification out of Fund property of any shareholder held personally liable solely by reason of being or having been a shareholder for all loss or expense arising from such liability. Additionally, in the normal course of business, the Fund enters into agreements with service providers that may contain indemnification clauses. The Fund’s maximum exposure under these arrangements is unknown as this would involve future claims that may be made against the Fund that have not yet occurred.
2 Distributions to Shareholders and Income Tax Information
The Fund declares dividends daily to shareholders of record at the time of declaration. Distributions are generally paid monthly. Distributions of realized capital gains are made at least annually. Distributions are declared separately for each class of shares. Shareholders may reinvest income and capital gain distributions in additional shares of the same class of the Fund at the net asset value as of the reinvestment date or, if an election is made on behalf of a separate account, to receive some or all of the distributions in cash. Distributions to shareholders are determined in accordance with income tax regulations, which may differ from U.S. GAAP. As required by U.S. GAAP, only distributions in excess of tax basis earnings and profits are reported in the financial statements as a return of capital. Permanent differences between book and tax accounting relating to distributions are reclassified to paid-in capital. For tax purposes, distributions from short-term capital gains are considered to be from ordinary income.
The tax character of distributions declared for the years ended December 31, 2014 and December 31, 2013 was as follows:
| | | | | | | | |
| | | Year Ended December 31, | |
| | | 2014 | | | 2013 | |
| | |
Distributions declared from: | | | | | | | | |
Ordinary income | | $ | 19,795,611 | | | $ | 18,855,996 | |
Long-term capital gains | | $ | — | | | $ | 2,425,610 | |
During the year ended December 31, 2014, accumulated net realized gain was decreased by $793,966 and accumulated undistributed net investment income was increased by $793,966 due to differences between book and tax accounting, primarily for dividend redesignations. These reclassifications had no effect on the net assets or net asset value per share of the Fund.
Eaton Vance
VT Floating-Rate Income Fund
December 31, 2014
Notes to Financial Statements — continued
As of December 31, 2014, the components of distributable earnings (accumulated losses) and unrealized appreciation (depreciation) on a tax basis were as follows:
| | | | |
Undistributed ordinary income | | $ | 3,881,659 | |
Deferred capital losses | | $ | (221,896 | ) |
Net unrealized depreciation | | $ | (13,745,857 | ) |
The differences between components of distributable earnings (accumulated losses) on a tax basis and the amounts reflected in the Statement of Assets and Liabilities are primarily due to wash sales.
At December 31, 2014, the Fund, for federal income tax purposes, had deferred capital losses of $221,896, which will reduce its taxable income arising from future net realized gains on investment transactions, if any, to the extent permitted by the Internal Revenue Code, and thus will reduce the amount of distributions to shareholders, which would otherwise be necessary to relieve the Fund of any liability for federal income or excise tax. The deferred capital losses are treated as arising on the first day of the Fund’s next taxable year and retain the same short-term or long-term character as when originally deferred. Of the deferred capital losses at December 31, 2014, $221,896 are long-term.
The cost and unrealized appreciation (depreciation) of investments of the Fund at December 31, 2014, as determined on a federal income tax basis, were as follows:
| | | | |
| |
Aggregate cost | | $ | 630,323,041 | |
| |
Gross unrealized appreciation | | $ | 2,477,575 | |
Gross unrealized depreciation | | | (16,223,432 | ) |
| |
Net unrealized depreciation | | $ | (13,745,857 | ) |
3 Investment Adviser Fee and Other Transactions with Affiliates
The investment adviser fee is earned by Eaton Vance Management (EVM) as compensation for investment advisory services rendered to the Fund. The fee is computed at an annual rate of 0.575% of the Fund’s average daily net assets up to $1 billion, 0.525% of average daily net assets from $1 billion but less than $2 billion, and at reduced rates on daily net assets of $2 billion or more, and is payable monthly. For the year ended December 31, 2014, the investment adviser fee amounted to $3,609,703 or 0.575 % of the Fund’s average daily net assets. EVM also serves as administrator of the Fund, but receives no compensation. Eaton Vance Distributors, Inc. (EVD), the Fund’s principal underwriter and an affiliate of EVM, received distribution fees (see Note 4).
Trustees and officers of the Fund who are members of EVM’s organization receive remuneration for their services to the Fund out of the investment adviser fee. Certain officers and Trustees of the Fund are officers of EVM.
4 Distribution Plan
The Fund has in effect a distribution plan for Initial Class shares (Initial Class Plan) pursuant to Rule 12b-1 under the 1940 Act. Pursuant to the Initial Class Plan, the Fund pays EVD a distribution fee of 0.25% per annum of its average daily net assets attributable to Initial Class shares for the sale and distribution of Initial Class shares. Distribution fees paid or accrued to EVD for the year ended December 31, 2014 amounted to $1,569,158. Insurance companies receive such fees from EVD based on the value of shares held by such companies. The insurance companies through which investors hold shares of the Fund may also pay fees to third parties in connection with the sale of variable contracts and for services provided to variable contract owners. The Fund, EVM or EVD are not a party to these arrangements. Investors should consult the prospectus and statement of additional information for their variable contracts for a discussion of these payments. EVD may, at its expense, provide promotional incentives to dealers that sell variable insurance products.
Distribution fees are subject to the limitations contained in the Financial Industry Regulatory Authority’s NASD Conduct Rule 2830(d).
5 Shareholder Servicing Plan
The Trust, on behalf of the Fund, has adopted a Shareholder Servicing Plan (Servicing Plan) for Initial Class and ADV Class. The Servicing Plan allows the Trust to enter into shareholder servicing agreements with insurance companies, investment dealers, broker/dealers or other financial intermediaries that provide shareholder services relating to Fund shares and their shareholders, including variable contract owners or plan participants with interests in the
Eaton Vance
VT Floating-Rate Income Fund
December 31, 2014
Notes to Financial Statements — continued
Fund. Under the Servicing Plan, the Fund may make payments at an annual rate of up to 0.25% of its average daily net assets attributable to each class that are subject to shareholder servicing agreements. No shareholder servicing fees are levied on shares owned by EVM, its affiliates, or their respective employees or clients and may be waived under certain other limited conditions. For the year ended December 31, 2014, shareholder servicing fees were equivalent to 0.24% per annum of each class’ average daily net assets and amounted to $1,477,703 and $505 for Initial Class and ADV Class, respectively.
6 Purchases and Sales of Investments
Purchases and sales of investments, other than short-term obligations, and including maturities and principal repayments on Senior Loans aggregated $248,178,814 and $174,679,833, respectively, for the year ended December 31, 2014.
7 Shares of Beneficial Interest
The Fund’s Declaration of Trust permits the Trustees to issue an unlimited number of full and fractional shares of beneficial interest (without par value). Such shares may be issued in a number of different series (such as the Fund) and classes. Transactions in Fund shares were as follows:
| | | | | | | | |
| | | Year Ended December 31, | |
| Initial Class | | 2014 | | | 2013 | |
| | |
Sales | | | 22,002,049 | | | | 23,823,631 | |
Issued to shareholders electing to receive payments of distributions in Fund shares | | | 2,115,606 | | | | 2,248,161 | |
Redemptions | | | (18,130,331 | ) | | | (8,327,676 | ) |
| | |
Net increase | | | 5,987,324 | | | | 17,744,116 | |
| | |
| | | | | | | | |
| ADV Class | | | | | Period Ended
December 31, 2014(1) | |
| | |
Sales | | | | | | | 121,464 | |
Issued to shareholders electing to receive payments of distributions in Fund shares | | | | | | | 807 | |
Redemptions | | | | | | | (55,421 | ) |
| | |
Net increase | | | | | | | 66,850 | |
| (1) | For the period from commencement of operations on April 15, 2014 to December 31, 2014. |
At December 31, 2014, separate accounts of 3 insurance companies each owned more than 10% of the value of the outstanding shares of the Fund aggregating 87.3%.
8 Line of Credit
The Fund participates with other portfolios managed by EVM and its affiliates in a $1.4 billion unsecured line of credit agreement with a group of banks, which is in effect through March 16, 2015. Borrowings are made by the Fund solely to facilitate the handling of unusual and/or unanticipated short-term cash requirements. Interest is charged to the Fund based on its borrowings at a prime rate or an amount above either the London Interbank Offered Rate (LIBOR) or the Federal Funds rate. In addition, a fee computed at an annual rate of 0.10% on the daily unused portion of the line of credit is allocated between the Fund and the other participating portfolios at the end of each quarter. Because the line of credit is not available exclusively to the Fund, it may be unable to borrow some or all of its requested amounts at any particular time. The Fund did not have any significant borrowings during the year ended December 31, 2014.
9 Credit Risk
The Fund invests primarily in below investment grade floating-rate loans, which are considered speculative because of the credit risk of their issuers. Changes in economic conditions or other circumstances are more likely to reduce the capacity of issuers of these securities to make principal and interest payments. Such companies are more likely to default on their payments of interest and principal owed than issuers of investment grade bonds. An
Eaton Vance
VT Floating-Rate Income Fund
December 31, 2014
Notes to Financial Statements — continued
economic downturn generally leads to a higher non-payment rate, and a loan or other debt obligation may lose significant value before a default occurs. Lower rated investments also may be subject to greater price volatility than higher rated investments. Moreover, the specific collateral used to secure a loan may decline in value or become illiquid, which would adversely affect the loan’s value.
10 Fair Value Measurements
Under generally accepted accounting principles for fair value measurements, a three-tier hierarchy to prioritize the assumptions, referred to as inputs, is used in valuation techniques to measure fair value. The three-tier hierarchy of inputs is summarized in the three broad levels listed below.
| Ÿ | | Level 1 – quoted prices in active markets for identical investments |
| Ÿ | | Level 2 – other significant observable inputs (including quoted prices for similar investments, interest rates, prepayment speeds, credit risk, etc.) |
| Ÿ | | Level 3 – significant unobservable inputs (including a fund’s own assumptions in determining the fair value of investments) |
In cases where the inputs used to measure fair value fall in different levels of the fair value hierarchy, the level disclosed is determined based on the lowest level input that is significant to the fair value measurement in its entirety. The inputs or methodology used for valuing securities are not necessarily an indication of the risk associated with investing in those securities.
At December 31, 2014, the hierarchy of inputs used in valuing the Fund’s investments and open derivative instruments, which are carried at value, were as follows:
| | | | | | | | | | | | | | | | |
| Asset Description | | Level 1 | | | Level 2 | | | Level 3* | | | Total | |
| | | | |
Senior Floating-Rate Interests (Less Unfunded Loan Commitments) | | $ | — | | | $ | 602,114,786 | | | $ | 212,534 | | | $ | 602,327,320 | |
Corporate Bonds & Notes | | | — | | | | 10,314,142 | | | | 25,604 | | | | 10,339,746 | |
Common Stocks | | | 1,212,897 | | | | 2,099,455 | | | | 597,766 | | | | 3,910,118 | |
| | | | |
Total Investments | | $ | 1,212,897 | | | $ | 614,528,383 | | | $ | 835,904 | | | $ | 616,577,184 | |
| * | None of the unobservable inputs for Level 3 assets, individually or collectively, had a material impact on the Fund. |
Level 3 investments at the beginning and/or end of the period in relation to net assets were not significant and accordingly, a reconciliation of Level 3 assets for the year ended December 31, 2014 is not presented.
At December 31, 2014, there were no investments transferred between Level 1 and Level 2 during the year then ended.
Eaton Vance
VT Floating-Rate Income Fund
December 31, 2014
Report of Independent Registered Public Accounting Firm
To the Trustees of Eaton Vance Variable Trust and Shareholders of Eaton Vance VT Floating-Rate Income Fund:
We have audited the accompanying statement of assets and liabilities of Eaton Vance VT Floating-Rate Income Fund (the “Fund”) (one of the funds constituting Eaton Vance Variable Trust), including the portfolio of investments, as of December 31, 2014, and the related statement of operations for the year then ended, the statements of changes in net assets for each of the two years in the period then ended, and the financial highlights for each of the periods presented. These financial statements and financial highlights are the responsibility of the Fund’s management. Our responsibility is to express an opinion on these financial statements and financial highlights based on our audits.
We conducted our audits in accordance with the standards of the Public Company Accounting Oversight Board (United States). Those standards require that we plan and perform the audit to obtain reasonable assurance about whether the financial statements and financial highlights are free of material misstatement. The Fund is not required to have, nor were we engaged to perform, an audit of its internal control over financial reporting. Our audits included consideration of internal control over financial reporting as a basis for designing audit procedures that are appropriate in the circumstances, but not for the purpose of expressing an opinion on the effectiveness of the Fund’s internal control over financial reporting. Accordingly, we express no such opinion. An audit also includes examining, on a test basis, evidence supporting the amounts and disclosures in the financial statements, assessing the accounting principles used and significant estimates made by management, as well as evaluating the overall financial statement presentation. Our procedures included confirmation of securities and senior loans owned as of December 31, 2014, by correspondence with the custodian, brokers, and selling or agent banks; where replies were not received from brokers and selling or agent banks, we performed other auditing procedures. We believe that our audits provide a reasonable basis for our opinion.
In our opinion, such financial statements and financial highlights referred to above present fairly, in all material respects, the financial position of Eaton Vance VT Floating-Rate Income Fund as of December 31, 2014, the results of its operations for the year then ended, the changes in its net assets for each of the two years in the period then ended, and the financial highlights for each of the periods presented, in conformity with accounting principles generally accepted in the United States of America.
DELOITTE & TOUCHE LLP
Boston, Massachusetts
February 20, 2015
Eaton Vance
VT Floating-Rate Income Fund
December 31, 2014
Federal Tax Information (Unaudited)
Shareholders are advised to consult their own tax adviser with respect to the tax consequences of their investment in the Fund.
Eaton Vance
VT Floating-Rate Income Fund
December 31, 2014
Management and Organization
Fund Management. The Trustees of Eaton Vance Variable Trust (the Trust) are responsible for the overall management and supervision of the Trust’s affairs. The Trustees and officers of the Trust are listed below. Except as indicated, each individual has held the office shown or other offices in the same company for the last five years. Trustees and officers of the Trust hold indefinite terms of office. The “Noninterested Trustees” consist of those Trustees who are not “interested persons” of the Trust, as that term is defined under the 1940 Act. The business address of each Trustee and officer is Two International Place, Boston, Massachusetts 02110. As used below, “EVC” refers to Eaton Vance Corp., “EV” refers to Eaton Vance, Inc., “EVM” refers to Eaton Vance Management, “BMR” refers to Boston Management and Research and “EVD” refers to Eaton Vance Distributors, Inc. EVC and EV are the corporate parent and trustee, respectively, of EVM and BMR. EVD is the Fund’s principal underwriter and a wholly-owned subsidiary of EVC. Each officer affiliated with Eaton Vance may hold a position with other Eaton Vance affiliates that is comparable to his or her position with EVM listed below. Each Trustee oversees 179 portfolios in the Eaton Vance Complex (including all master and feeder funds in a master feeder structure). Each officer serves as an officer of certain other Eaton Vance funds. Each Trustee and officer serves until his or her successor is elected.
| | | | | | |
| Name and Year of Birth | | Position(s) with the Trust | | Trustee Since(1) | | Principal Occupation(s) and Directorships During Past Five Years and Other Relevant Experience |
Interested Trustee |
| | | |
Thomas E. Faust Jr. 1958 | | Trustee | | 2007 | | Chairman, Chief Executive Officer and President of EVC, Director and President of EV, Chief Executive Officer and President of EVM and BMR, and Director of EVD. Trustee and/or officer of 179 registered investment companies. Mr. Faust is an interested person because of his positions with EVM, BMR, EVD, EVC and EV, which are affiliates of the Trust. Directorships in the Last Five Years.(2) Director of EVC and Hexavest Inc. |
| | | |
| | | | | | |
Noninterested Trustees |
| | | |
Scott E. Eston 1956 | | Trustee | | 2011 | | Private investor. Formerly held various positions at Grantham, Mayo, Van Otterloo and Co., L.L.C. (investment management firm) (1997-2009), including Chief Operating Officer (2002-2009), Chief Financial Officer (1997-2009) and Chairman of the Executive Committee (2002-2008); President and Principal Executive Officer, GMO Trust (open-end registered investment company) (2006-2009). Former Partner, Coopers and Lybrand L.L.P. (now PricewaterhouseCoopers) (public accounting firm) (1987-1997). Directorships in the Last Five Years.(2) None. |
| | | |
Cynthia E. Frost(3) 1961 | | Trustee | | 2014 | | Private investor. Formerly, Chief Investment Officer of Brown University (university endowment) (2000-2012); Portfolio Strategist for Duke Management Company (university endowment manager) (1995-2000); Managing Director, Cambridge Associates (1989-1995); Consultant, Bain and Company (1987-1989); Senior Equity Analyst, BA Investment Management Company (1983-1985). Directorships in the Last Five Years. None. |
| | | |
George J. Gorman(3) 1952 | | Trustee | | 2014 | | Principal at George J. Gorman LLC (consulting firm). Formerly, Senior Partner at Ernst & Young LLP (public accounting firm) (1974-2009). Directorships in the Last Five Years. Formerly, Trustee of the Bank of America Money Market Funds Series Trust (2011-2014) and of the Ashmore Funds (2010-2014). |
| | | |
Valerie A. Mosley(4) 1960 | | Trustee | | 2014 | | Chairwoman and Chief Executive Officer of Valmo Ventures (a consulting and investment firm). Former Partner and Senior Vice President, Portfolio Manager and Investment Strategist at Wellington Management Company, LLP (investment management firm) (1992-2012). Former Chief Investment Officer, PG Corbin Asset Management (1990-1992). Formerly worked in institutional corporate bond sales at Kidder Peabody (1986-1990). Directorships in the Last Five Years.(2) Director of Dynex Capital, Inc. (mortgage REIT) (since 2013). |
| | | |
William H. Park 1947 | | Trustee | | 2003 | | Consultant and private investor. Formerly, Chief Financial Officer, Aveon Group L.P. (investment management firm) (2010-2011). Formerly, Vice Chairman, Commercial Industrial Finance Corp. (specialty finance company) (2006-2010). Formerly, President and Chief Executive Officer, Prizm Capital Management, LLC (investment management firm) (2002-2005). Formerly, Executive Vice President and Chief Financial Officer, United Asset Management Corporation (investment management firm) (1982-2001). Formerly, Senior Manager, Price Waterhouse (now PricewaterhouseCoopers) (an independent registered public accounting firm) (1972-1981). Directorships in the Last Five Years.(2) None. |
Eaton Vance
VT Floating-Rate Income Fund
December 31, 2014
Management and Organization — continued
| | | | | | |
| Name and Year of Birth | | Position(s) with the Trust | | Trustee Since(1) | | Principal Occupation(s) and Directorships During Past Five Years and Other Relevant Experience |
Noninterested Trustees (continued) |
| | | |
Ronald A. Pearlman 1940 | | Trustee | | 2003 | | Lawyer and consultant. Formerly, Professor of Law, Georgetown University Law Center (1999-2014). Formerly, Partner, Covington & Burling LLP (law firm) (1991-2000). Formerly, Chief of Staff, Joint Committee on Taxation, U.S. Congress (1988-1990). Formerly, Deputy Assistant Secretary (Tax Policy) and Assistant Secretary (Tax Policy), U.S. Department of the Treasury (1983-1985). Directorships in the Last Five Years.(2) None. |
| | | |
Helen Frame Peters 1948 | | Trustee | | 2008 | | Professor of Finance, Carroll School of Management, Boston College. Formerly, Dean, Carroll School of Management, Boston College (2000-2002). Formerly, Chief Investment Officer, Fixed Income, Scudder Kemper Investments (investment management firm) (1998-1999). Formerly, Chief Investment Officer, Equity and Fixed Income, Colonial Management Associates (investment management firm) (1991-1998). Directorships in the Last Five Years.(2) Formerly, Director of BJ’s Wholesale Club, Inc. (wholesale club retailer) (2004-2011). Formerly, Trustee of SPDR Index Shares Funds and SPDR Series Trust (exchange traded funds) (2000-2009). Formerly, Director of Federal Home Loan Bank of Boston (a bank for banks) (2007-2009). |
| | | |
Harriett Tee Taggart 1948 | | Trustee | | 2011 | | Managing Director, Taggart Associates (a professional practice firm). Formerly, Partner and Senior Vice President, Wellington Management Company, LLP (investment management firm) (1983-2006). Directorships in the Last Five Years.(2) Director of Albemarle Corporation (chemicals manufacturer) (since 2007) and The Hanover Group (specialty property and casualty insurance company) (since 2009). Formerly, Director of Lubrizol Corporation (specialty chemicals) (2007-2011). |
| | | |
Ralph F. Verni 1943 | | Chairman of the Board and Trustee | | 2007 (Chairman) 2005 (Trustee) | | Consultant and private investor. Formerly, Chief Investment Officer (1982-1992), Chief Financial Officer (1988-1990) and Director (1982-1992), New England Life. Formerly, Chairperson, New England Mutual Funds (1982-1992). Formerly, President and Chief Executive Officer, State Street Management & Research (1992-2000). Formerly, Chairperson, State Street Research Mutual Funds (1992-2000). Formerly, Director, W.P. Carey, LLC (1998-2004) and First Pioneer Farm Credit Corp. (2002-2006). Directorships in the Last Five Years.(2) None. |
| | | |
| | | | | | |
Principal Officers who are not Trustees |
| Name and Year of Birth | | Position(s) with the Trust | | Officer Since(5) | | Principal Occupation(s) During Past Five Years |
Payson F. Swaffield 1956 | | President | | 2003 | | Vice President and Chief Income Investment Officer of EVM and BMR. |
| | | |
Maureen A. Gemma 1960 | | Vice President, Secretary and Chief Legal Officer | | 2005 | | Vice President of EVM and BMR. |
| | | |
James F. Kirchner 1967 | | Treasurer | | 2007 | | Vice President of EVM and BMR. |
| | | |
Paul M. O’Neil 1953 | | Chief Compliance Officer | | 2004 | | Vice President of EVM and BMR. |
| (1) | Year first appointed to serve as Trustee for a fund in the Eaton Vance family of funds. Each Trustee has served continuously since appointment unless indicated otherwise. |
| (2) | During their respective tenures, the Trustees (except for Ms. Frost and Mr. Gorman) also served as Board members of one or more of the following funds (which operated in the years noted): eUnitsTM 2 Year U.S. Market Participation Trust: Upside to Cap / Buffered Downside (launched in 2012 and terminated in 2014); eUnitsTM 2 Year U.S. Market Participation Trust II: Upside to Cap / Buffered Downside (launched in 2012 and terminated in 2014); Eaton Vance Credit Opportunities Fund (launched in 2005 and terminated in 2010); Eaton Vance Insured Florida Plus Municipal Bond Fund (launched in 2002 and terminated in 2009); and Eaton Vance National Municipal Income Trust (launched in 1998 and terminated in 2009). However, Ms. Mosley did not serve as a Board member of eUnitsTM 2 Year U.S. Market Participation Trust: Upside to Cap / Buffered Downside (launched in 2012 and terminated in 2014). |
| (3) | Ms. Frost and Mr. Gorman began serving as Trustees effective May 29, 2014. |
| (4) | Ms. Mosley began serving as a Trustee effective January 1, 2014. |
| (5) | Year first elected to serve as officer of a fund in the Eaton Vance family of funds when the officer has served continuously. Otherwise, year of most recent election as an officer of a fund in the Eaton Vance family of funds. Titles may have changed since initial election. |
The SAI for the Fund includes additional information about the Trustees and officers of the Fund and can be obtained without charge on Eaton Vance’s website at www.eatonvance.com or by calling 1-800-262-1122.
Eaton Vance Funds
IMPORTANT NOTICES
Privacy. The Eaton Vance organization is committed to ensuring your financial privacy. Each of the financial institutions identified below has in effect the following policy (“Privacy Policy”) with respect to nonpublic personal information about its customers:
| Ÿ | | Only such information received from you, through application forms or otherwise, and information about your Eaton Vance fund transactions will be collected. This may include information such as name, address, social security number, tax status, account balances and transactions. |
| Ÿ | | None of such information about you (or former customers) will be disclosed to anyone, except as permitted by law (which includes disclosure to employees necessary to service your account). In the normal course of servicing a customer’s account, Eaton Vance may share information with unaffiliated third parties that perform various required services such as transfer agents, custodians and broker-dealers. |
| Ÿ | | Policies and procedures (including physical, electronic and procedural safeguards) are in place that are designed to protect the confidentiality of such information. |
| Ÿ | | We reserve the right to change our Privacy Policy at any time upon proper notification to you. Customers may want to review our Privacy Policy periodically for changes by accessing the link on our homepage: www.eatonvance.com. |
Our pledge of privacy applies to the following entities within the Eaton Vance organization: the Eaton Vance Family of Funds, Eaton Vance Management, Eaton Vance Investment Counsel, Eaton Vance Distributors, Inc., Eaton Vance Trust Company, Eaton Vance Management’s Real Estate Investment Group and Boston Management and Research. In addition, our Privacy Policy applies only to those Eaton Vance customers who are individuals and who have a direct relationship with us. If a customer’s account (i.e., fund shares) is held in the name of a third-party financial advisor/broker-dealer, it is likely that only such advisor’s privacy policies apply to the customer. This notice supersedes all previously issued privacy disclosures. For more information about Eaton Vance’s Privacy Policy, please call 1-800-262-1122.
Delivery of Shareholder Documents. The Securities and Exchange Commission (SEC) permits funds to deliver only one copy of shareholder documents, including prospectuses, proxy statements and shareholder reports, to fund investors with multiple accounts at the same residential or post office box address. This practice is often called “householding” and it helps eliminate duplicate mailings to shareholders. Eaton Vance, or your financial advisor, may household the mailing of your documents indefinitely unless you instruct Eaton Vance, or your financial advisor, otherwise. If you would prefer that your Eaton Vance documents not be householded, please contact Eaton Vance at 1-800-262-1122, or contact your financial advisor. Your instructions that householding not apply to delivery of your Eaton Vance documents will be effective within 30 days of receipt by Eaton Vance or your financial advisor.
Portfolio Holdings. Each Eaton Vance Fund and its underlying Portfolio(s) (if applicable) will file a schedule of portfolio holdings on Form N-Q with the SEC for the first and third quarters of each fiscal year. The Form N-Q will be available on the Eaton Vance website at www.eatonvance.com, by calling Eaton Vance at 1-800-262-1122 or in the EDGAR database on the SEC’s website at www.sec.gov. Form N-Q may also be reviewed and copied at the SEC’s public reference room in Washington, D.C. (call 1-800-732-0330 for information on the operation of the public reference room).
Proxy Voting. From time to time, funds are required to vote proxies related to the securities held by the funds. The Eaton Vance Funds or their underlying Portfolios (if applicable) vote proxies according to a set of policies and procedures approved by the Funds’ and Portfolios’ Boards. You may obtain a description of these policies and procedures and information on how the Funds or Portfolios voted proxies relating to portfolio securities during the most recent 12-month period ended June 30, without charge, upon request, by calling 1-800-262-1122 and by accessing the SEC’s website at www.sec.gov.
This Page Intentionally Left Blank
Investment Adviser and Administrator
Eaton Vance Management
Two International Place
Boston, MA 02110
Principal Underwriter*
Eaton Vance Distributors, Inc.
Two International Place
Boston, MA 02110
(617) 482-8260
Custodian
State Street Bank and Trust Company
State Street Financial Center, One Lincoln Street
Boston, MA 02111
Transfer Agent
State Street Bank and Trust Company
State Street Financial Center, One Lincoln Street
Boston, MA 02111
Independent Registered Public Accounting Firm
Deloitte & Touche LLP
200 Berkeley Street
Boston, MA 02116-5022
Fund Offices
Two International Place
Boston, MA 02110
| * | FINRA BrokerCheck. Investors may check the background of their Investment Professional by contacting the Financial Industry Regulatory Authority (FINRA). FINRA BrokerCheck is a free tool to help investors check the professional background of current and former FINRA-registered securities firms and brokers. FINRA BrokerCheck is available by calling 1-800-289-9999 and at www.FINRA.org. The FINRA BrokerCheck brochure describing this program is available to investors at www.FINRA.org. |
1939 12.31.14

Eaton Vance
VT Large-Cap Value Fund
Annual Report
December 31, 2014

Commodity Futures Trading Commission Registration. Effective December 31, 2012, the Commodity Futures Trading Commission (“CFTC”) adopted certain regulatory changes that subject registered investment companies and advisers to regulation by the CFTC if a fund invests more than a prescribed level of its assets in certain CFTC-regulated instruments (including futures, certain options and swap agreements) or markets itself as providing investment exposure to such instruments. The Fund has claimed an exclusion from the definition of the term “commodity pool operator” under the Commodity Exchange Act. Accordingly, neither the Fund nor the adviser with respect to the operation of the Fund is subject to CFTC regulation. Because of its management of other strategies, the Fund’s adviser is registered with the CFTC as a commodity pool operator and a commodity trading advisor.
Fund shares are not insured by the FDIC and are not deposits or other obligations of, or guaranteed by, any depository institution. Shares are subject to investment risks, including possible loss of principal invested.
This report is prepared for the general information of contract owners. It is authorized for distribution to prospective investors only when preceded or accompanied by a current summary prospectus or prospectus. Before investing, investors should consider carefully the investment objective, risks, and charges and expenses of the Fund. This and other important information is contained in the summary prospectus and prospectus, which can be obtained from a financial advisor. Prospective investors should read the prospectus carefully before investing. For further information, please call 1-800-262-1122.
Annual Report December 31, 2014
Eaton Vance
VT Large-Cap Value Fund
Table of Contents
| | | | |
Management’s Discussion of Fund Performance | | | 2 | |
| |
Performance | | | 3 | |
| |
Fund Profile | | | 3 | |
| |
Endnotes and Additional Disclosures | | | 4 | |
| |
Fund Expenses | | | 5 | |
| |
Financial Statements | | | 6 | |
| |
Report of Independent Registered Public Accounting Firm | | | 18 | |
| |
Federal Tax Information | | | 19 | |
| |
Management and Organization | | | 20 | |
| |
Important Notices | | | 23 | |
Eaton Vance
VT Large-Cap Value Fund
December 31, 2014
Management’s Discussion of Fund Performance1
Economic and Market Conditions
For investors in U.S. stocks, 2014 was a good year. The S&P 500 Index2 recorded its third consecutive year of double-digit gains, advancing 13.69% for the 12-month period ended December 31, 2014. During the final month of the period, the Dow Jones Industrial Average (the Dow) topped 18,000 for the first time ever, finishing the year with a 10.04% gain. The technology-laden NASDAQ Composite Index added 14.75% for the period.
U.S. equities were driven upward by an ongoing, modest economic recovery that contrasted sharply with slowing growth in most other regions of the globe. U.S. corporate profits remained strong, while unemployment continued to decline. Falling crude oil prices, particularly in the fourth quarter, contributed to low inflation and higher consumer spending.
The year was not without market volatility, however. In January 2014, U.S. equities declined on worries that an unusually cold winter, which led to a spike in natural gas prices, might negatively impact consumer spending. The market also pulled back in October 2014 and again briefly in December, when concerns about the potential repercussions of slowing Chinese growth and possible deflation in Europe seemed to rattle U.S. investors.
But each time, U.S. stocks bounced back. The Dow and the S&P 500 Index both reached new all-time highs several times during the 12-month period. Large-cap U.S. stocks (as measured by the Russell 1000 Index) fared significantly better than their small-cap counterparts (as measured by the Russell 2000 Index). Within the large-cap space, value stocks modestly outpaced growth stocks. For small caps, the reverse was true, as growth stocks outperformed value stocks.
Fund Performance
For the 12-month period ended December 31, 2014, Eaton Vance VT Large-Cap Value Fund (the Fund) Initial Class had a total return of 14.43% at net asset value (NAV), outperforming the Fund’s benchmark, the Russell 1000 Value Index (the Index), which returned 13.45% for the same period.
Stock selection in the consumer staples, materials and industrials sectors helped the Fund’s performance relative to the Index. Within consumer staples, the Fund’s out-of-Index holding in Kroger Co., one of the nation’s largest
grocery chains, aided Fund performance versus the Index, as the firm delivered strong year-over-year sales growth and expanding profit margins. Also within consumer staples, a pair of tobacco company holdings, Altria Group, Inc. and Reynolds American, Inc., contributed to the Fund’s performance versus the Index. Both companies benefited from stronger cigarette pricing and smaller-than-expected sales declines. Within materials, the Fund’s avoidance of the metals and mining industry boosted Fund performance versus the Index, as the industry lost ground during the period. Within industrials, the Fund’s out-of-Index holding in C.H. Robinson Worldwide, Inc. contributed to Fund performance versus the Index, as the global transportation logistics provider saw increased truckload volume, solidifying its position as the largest player in its industry.
In contrast, stock selection in the information technology and health care sectors, along with stock selection and an underweight in the financials sector, detracted from the Fund’s performance relative to the Index. Within information technology, the Fund’s position in Telefonaktiebolaget LM Ericsson ADR, a European wireless equipment maker not in the Index, hampered Fund performance versus the Index amid a stagnating European economy that crimped the company’s profits. Elsewhere in the sector, Google, Inc., Class C stock detracted from Fund performance versus the Index after the company suffered from slowing advertising revenue and increased infrastructure spending. Within financials, not owning Index holding Berkshire Hathaway hurt the Fund’s performance versus the Index, as Warren Buffett’s conglomerate outperformed the Index. Within health care, the Fund’s out-of-Index position in Swiss pharmaceutical firm Roche Holding AG PC detracted from Fund performance after the company was negatively impacted by a setback in a clinical drug trial.
See Endnotes and Additional Disclosures in this report.
Past performance is no guarantee of future results. Returns are historical and are calculated by determining the percentage change in net asset value (NAV) or offering price (as applicable) with all distributions reinvested. Investment return and principal value will fluctuate so that shares, when redeemed, may be worth more or less than their original cost. Performance less than one year is cumulative. Performance is for the stated time period only; due to market volatility, the Fund’s current performance may be lower or higher than quoted. Returns are before taxes unless otherwise noted.
Eaton Vance
VT Large-Cap Value Fund
December 31, 2014
Performance2,3
Portfolio Managers Edward J. Perkin, CFA and John D. Crowley
| | | | | | | | | | | | | | | | | | | | |
| % Average Annual Total Returns | | Class
Inception Date | | | Performance
Inception Date | | | One Year | | | Five Years | | | Since Inception | |
Initial Class at NAV | | | 03/30/2007 | | | | 03/30/2007 | | | | 14.43 | % | | | 12.97 | % | | | 5.41 | % |
ADV Class at NAV | | | 04/15/2014 | | | | 03/30/2007 | | | | 14.77 | | | | 13.04 | | | | 5.45 | |
Russell 1000 Value Index | | | — | | | | — | | | | 13.45 | % | | | 15.42 | % | | | 5.60 | % |
| | | | | |
| | | | | | | | | | | | | | | | | | | | |
| % Total Annual Operating Expense Ratios4 | | | | | | | | | | | Initial
Class | | | ADV
Class | |
Gross | | | | | | | | | | | | | | | 1.36 | % | | | 1.11 | % |
Net | | | | | | | | | | | | | | | 1.30 | | | | 1.05 | |
Growth of $10,000
This graph shows the change in value of a hypothetical investment of $10,000 in Initial Class of the Fund for the period indicated. For comparison, the same investment is shown in the indicated index.
| | | | | | | | | | | | | | | | |
| Growth of Investment | | Amount Invested | | | Period Beginning | | | At NAV | | | With Maximum Sales Charge | |
ADV Class | | $ | 10,000 | | | | 03/30/2007 | | | $ | 15,095 | | | | N.A. | |
Fund Profile
Sector Allocation (% of net assets)
Top 10 Holdings (% of net assets)5
| | | | |
Exxon Mobil Corp. | | | 4.4 | % |
JPMorgan Chase & Co. | | | 3.3 | |
Merck & Co., Inc. | | | 3.2 | |
Citigroup, Inc. | | | 2.9 | |
Bank of America Corp. | | | 2.9 | |
Eli Lilly & Co. | | | 2.8 | |
Verizon Communications, Inc. | | | 2.8 | |
NextEra Energy, Inc. | | | 2.7 | |
Microsoft Corp. | | | 2.6 | |
Google, Inc., Class C | | | 2.3 | |
Total | | | 29.9 | % |
See Endnotes and Additional Disclosures in this report.
Past performance is no guarantee of future results. Returns are historical and are calculated by determining the percentage change in net asset value (NAV) or offering price (as applicable) with all distributions reinvested. Investment return and principal value will fluctuate so that shares, when redeemed, may be worth more or less than their original cost. Performance less than one year is cumulative. Performance is for the stated time period only; due to market volatility, the Fund’s current performance may be lower or higher than quoted. Returns are before taxes unless otherwise noted.
Eaton Vance
VT Large-Cap Value Fund
December 31, 2014
Endnotes and Additional Disclosures
| 1 | The views expressed in this report are those of the portfolio manager(s) and are current only through the date stated at the top of this page. These views are subject to change at any time based upon market or other conditions, and Eaton Vance and the Fund(s) disclaim any responsibility to update such views. These views may not be relied upon as investment advice and, because investment decisions are based on many factors, may not be relied upon as an indication of trading intent on behalf of any Eaton Vance fund. This commentary may contain statements that are not historical facts, referred to as “forward looking statements”. The Fund’s actual future results may differ significantly from those stated in any forward looking statement, depending on factors such as changes in securities or financial markets or general economic conditions, the volume of sales and purchases of Fund shares, the continuation of investment advisory, administrative and service contracts, and other risks discussed from time to time in the Fund’s filings with the Securities and Exchange Commission. |
| 2 | S&P 500 Index is an unmanaged index of large-cap stocks commonly used as a measure of U.S. stock market performance. Dow Jones Industrial Average is a price-weighted average of 30 blue-chip stocks that are generally the leaders in their industry. NASDAQ Composite Index is a market capitalization-weighted index of all domestic and international securities listed on NASDAQ. Russell 1000 Index is an unmanaged index of 1,000 U.S. large-cap stocks. Russell 2000 Index is an unmanaged index of 2,000 U.S. small-cap stocks. Russell 1000 Value Index is an unmanaged index of U.S. large-cap value stocks. Unless otherwise stated, index returns do not reflect the effect of any applicable sales charges, commissions, expenses, taxes or leverage, as applicable. It is not possible to invest directly in an index. |
| 3 | There is no sales charge. Insurance-related charges are not included in the calculation of returns. Such expenses would reduce the overall return shown. Please refer to the report for your insurance contract for performance data reflecting insurance-related charges. A large redemption from the Fund on 3/31/14 positively impacted Fund performance for the one year, five years and since inception periods. A large redemption from the Fund on 9/30/10 positively impacted performance for the five years and since inception periods. |
| | Performance prior to the inception date of a class may be linked to the performance of an older class of the Fund. This linked performance is not adjusted for class expense differences. If adjusted for such differences, the performance would be different. Performance presented in the financial highlights included in the financial statements is not linked. In the performance table, the performance of ADV Class is linked to Initial Class. Performance since inception for an index, if presented, is the performance since the Fund’s or oldest share class’ inception, as applicable. |
| 4 | Source: Fund prospectus. Net expense ratio reflects a contractual expense reimbursement that continues through 4/30/15. Without the reimbursement, if applicable, performance would have been lower. |
| 5 | Excludes cash and cash equivalents. |
| | Fund profile subject to change due to active management. |
Eaton Vance
VT Large-Cap Value Fund
December 31, 2014
Fund Expenses
Example: As a Fund shareholder, you incur ongoing costs, including management fees; distribution and/or service fees; and other Fund expenses. This Example is intended to help you understand your ongoing costs (in dollars) of Fund investing and to compare these costs with the ongoing costs of investing in other mutual funds. The Example is based on an investment of $1,000 invested at the beginning of the period and held for the entire period (July 1, 2014 – December 31, 2014).
Actual Expenses: The first section of the table below provides information about actual account values and actual expenses. You may use the information in this section, together with the amount you invested, to estimate the expenses that you paid over the period. Simply divide your account value by $1,000 (for example, an $8,600 account value divided by $1,000 = 8.6), then multiply the result by the number in the first section under the heading entitled “Expenses Paid During Period” to estimate the expenses you paid on your account during this period.
Hypothetical Example for Comparison Purposes: The second section of the table below provides information about hypothetical account values and hypothetical expenses based on the actual Fund expense ratio and an assumed rate of return of 5% per year (before expenses), which is not the actual Fund return. The hypothetical account values and expenses may not be used to estimate the actual ending account balance or expenses you paid for the period. You may use this information to compare the ongoing costs of investing in your Fund and other funds. To do so, compare this 5% hypothetical example with the 5% hypothetical examples that appear in the shareholder reports of the other funds.
Please note that the expenses shown in the table are meant to highlight your ongoing costs only and do not reflect expenses and charges which are, or may be imposed under the variable annuity contract or variable life insurance policy (variable contracts) (if applicable) through which your investment in the Fund is made. Therefore, the second section of the table is useful in comparing ongoing costs associated with an investment in vehicles which fund benefits under variable contracts and to qualified pension and retirement plans, and will not help you determine the relative total costs of investing in the Fund through variable contracts. In addition, if these expenses and charges imposed under the variable contracts were included, your costs would be higher.
| | | | | | | | | | | | | | | | |
| | | Beginning
Account Value
(7/1/14) | | | Ending
Account Value
(12/31/14) | | | Expenses Paid
During Period*
(7/1/14 – 12/31/14) | | | Annualized
Expense
Ratio | |
| | | | |
| | | | | | | | | | | | | | | | |
Actual | | | | | | | | | | | | | | | | |
Initial Class | | $ | 1,000.00 | | | $ | 1,022.90 | | | $ | 6.63 | ** | | | 1.30 | % |
ADV Class | | $ | 1,000.00 | | | $ | 1,023.60 | | | $ | 5.36 | ** | | | 1.05 | % |
| | | | | | | | | | | | | |
| | | | |
| | | | | | | | | | | | | | | | |
Hypothetical | | | | | | | | | | | | | | | | |
(5% return per year before expenses) | | | | | | | | | | | | | | | | |
Initial Class | | $ | 1,000.00 | | | $ | 1,018.70 | | | $ | 6.61 | ** | | | 1.30 | % |
ADV Class | | $ | 1,000.00 | | | $ | 1,019.90 | | | $ | 5.35 | ** | | | 1.05 | % |
| * | Expenses are equal to the Fund’s annualized expense ratio for the indicated Class, multiplied by the average account value over the period, multiplied by 184/365 (to reflect the one-half year period). The Example assumes that the $1,000 was invested at the net asset value per share determined at the close of business on June 30, 2014. Expenses shown do not include insurance-related charges. |
| ** | Absent an allocation of certain expenses to an affiliate, the expenses would be higher. |
Eaton Vance
VT Large-Cap Value Fund
December 31, 2014
Portfolio of Investments
| | | | | | | | |
| Common Stocks — 98.8% | |
| | |
| | | | | | | | |
| Security | | Shares | | | Value | |
| | | | | | | | |
| | |
Aerospace & Defense — 2.0% | | | | | | | | |
Honeywell International, Inc. | | | 627 | | | $ | 62,650 | |
United Technologies Corp. | | | 617 | | | | 70,955 | |
| | | | | | | | | |
| | | | | | $ | 133,605 | |
| | | | | | | | | |
| | |
Air Freight & Logistics — 1.8% | | | | | | | | |
C.H. Robinson Worldwide, Inc. | | | 1,557 | | | $ | 116,604 | |
| | | | | | | | | |
| | | | | | $ | 116,604 | |
| | | | | | | | | |
| | |
Banks — 13.9% | | | | | | | | |
Bank of America Corp. | | | 10,688 | | | $ | 191,208 | |
Citigroup, Inc. | | | 3,552 | | | | 192,199 | |
JPMorgan Chase & Co. | | | 3,484 | | | | 218,029 | |
KeyCorp | | | 6,598 | | | | 91,712 | |
PNC Financial Services Group, Inc. (The) | | | 1,233 | | | | 112,487 | |
Wells Fargo & Co. | | | 1,832 | | | | 100,430 | |
| | | | | | | | | |
| | | | | | $ | 906,065 | |
| | | | | | | | | |
| | |
Capital Markets — 2.1% | | | | | | | | |
Affiliated Managers Group, Inc.(1) | | | 653 | | | $ | 138,593 | |
| | | | | | | | | |
| | | | | | $ | 138,593 | |
| | | | | | | | | |
| | |
Chemicals — 2.8% | | | | | | | | |
Monsanto Co. | | | 716 | | | $ | 85,540 | |
Syngenta AG ADR | | | 1,553 | | | | 99,765 | |
| | | | | | | | | |
| | | | | | $ | 185,305 | |
| | | | | | | | | |
| | |
Communications Equipment — 3.3% | | | | | | | | |
QUALCOMM, Inc. | | | 2,030 | | | $ | 150,890 | |
Telefonaktiebolaget LM Ericsson ADR | | | 5,244 | | | | 63,452 | |
| | | | | | | | | |
| | | | | | $ | 214,342 | |
| | | | | | | | | |
| | |
Consumer Finance — 1.3% | | | | | | | | |
Discover Financial Services | | | 1,258 | | | $ | 82,387 | |
| | | | | | | | | |
| | | | | | $ | 82,387 | |
| | | | | | | | | |
| | |
Diversified Telecommunication Services — 2.8% | | | | | | | | |
Verizon Communications, Inc. | | | 3,931 | | | $ | 183,892 | |
| | | | | | | | | |
| | | | | | $ | 183,892 | |
| | | | | | | | | |
| | | | | | | | |
| Security | | Shares | | | Value | |
| | | | | | | | |
| | |
Electric Utilities — 2.7% | | | | | | | | |
NextEra Energy, Inc. | | | 1,679 | | | $ | 178,461 | |
| | | | | | | | | |
| | | | | | $ | 178,461 | |
| | | | | | | | | |
| | |
Energy Equipment & Services — 0.5% | | | | | | | | |
Halliburton Co. | | | 833 | | | $ | 32,762 | |
| | | | | | | | | |
| | | | | | $ | 32,762 | |
| | | | | | | | | |
| | |
Food & Staples Retailing — 4.2% | | | | | | | | |
CVS Health Corp. | | | 1,326 | | | $ | 127,707 | |
Kroger Co. (The) | | | 2,334 | | | | 149,866 | |
| | | | | | | | | |
| | | | | | $ | 277,573 | |
| | | | | | | | | |
| | |
Health Care Equipment & Supplies — 2.7% | | | | | | | | |
Covidien PLC | | | 940 | | | $ | 96,143 | |
Stryker Corp. | | | 837 | | | | 78,954 | |
| | | | | | | | | |
| | | | | | $ | 175,097 | |
| | | | | | | | | |
| | |
Industrial Conglomerates — 1.7% | | | | | | | | |
General Electric Co. | | | 4,451 | | | $ | 112,477 | |
| | | | | | | | | |
| | | | | | $ | 112,477 | |
| | | | | | | | | |
| | |
Insurance — 5.7% | | | | | | | | |
ACE, Ltd. | | | 1,264 | | | $ | 145,208 | |
Aflac, Inc. | | | 1,931 | | | | 117,965 | |
XL Group PLC | | | 3,095 | | | | 106,375 | |
| | | | | | | | | |
| | | | | | $ | 369,548 | |
| | | | | | | | | |
| | |
Internet Software & Services — 2.3% | | | | | | | | |
Google, Inc., Class C(1) | | | 289 | | | $ | 152,130 | |
| | | | | | | | | |
| | | | | | $ | 152,130 | |
| | | | | | | | | |
| | |
Life Sciences Tools & Services — 1.8% | | | | | | | | |
Thermo Fisher Scientific, Inc. | | | 946 | | | $ | 118,524 | |
| | | | | | | | | |
| | | | | | $ | 118,524 | |
| | | | | | | | | |
| | |
Machinery — 2.2% | | | | | | | | |
Caterpillar, Inc. | | | 1,226 | | | $ | 112,216 | |
Trinity Industries, Inc. | | | 1,035 | | | | 28,990 | |
| | | | | | | | | |
| | | | | | $ | 141,206 | |
| | | | | | | | | |
| | | | |
| | 6 | | See Notes to Financial Statements. |
Eaton Vance
VT Large-Cap Value Fund
December 31, 2014
Portfolio of Investments — continued
| | | | | | | | |
| Security | | Shares | | | Value | |
| | | | | | | | |
| | |
Media — 2.2% | | | | | | | | |
CBS Corp., Class B | | | 1,544 | | | $ | 85,445 | |
Walt Disney Co. (The) | | | 608 | | | | 57,268 | |
| | | | | | | | | |
| | | | | | $ | 142,713 | |
| | | | | | | | | |
| | |
Multi-Utilities — 3.7% | | | | | | | | |
PG&E Corp. | | | 2,272 | | | $ | 120,961 | |
Sempra Energy | | | 1,075 | | | | 119,712 | |
| | | | | | | | | |
| | | | | | $ | 240,673 | |
| | | | | | | | | |
| | |
Oil, Gas & Consumable Fuels — 11.4% | | | | | | | | |
Anadarko Petroleum Corp. | | | 801 | | | $ | 66,083 | |
Chevron Corp. | | | 1,138 | | | | 127,661 | |
Devon Energy Corp. | | | 1,009 | | | | 61,761 | |
Exxon Mobil Corp. | | | 3,132 | | | | 289,553 | |
Occidental Petroleum Corp. | | | 1,582 | | | | 127,525 | |
Phillips 66 | | | 1,016 | | | | 72,847 | |
| | | | | | | | | |
| | | | | | $ | 745,430 | |
| | | | | | | | | |
| | |
Paper & Forest Products — 1.1% | | | | | | | | |
International Paper Co. | | | 1,374 | | | $ | 73,619 | |
| | | | | | | | | |
| | | | | | $ | 73,619 | |
| | | | | | | | | |
| | |
Pharmaceuticals — 9.6% | | | | | | | | |
Eli Lilly & Co. | | | 2,680 | | | $ | 184,893 | |
Merck & Co., Inc. | | | 3,723 | | | | 211,429 | |
Roche Holding AG PC | | | 544 | | | | 147,393 | |
Teva Pharmaceutical Industries, Ltd. ADR | | | 1,433 | | | | 82,412 | |
| | | | | | | | | |
| | | | | | $ | 626,127 | |
| | | | | | | | | |
| | |
Real Estate Investment Trusts (REITs) — 5.0% | | | | | | | | |
Equity Residential | | | 1,614 | | | $ | 115,950 | |
Public Storage, Inc. | | | 562 | | | | 103,885 | |
Simon Property Group, Inc. | | | 599 | | | | 109,084 | |
| | | | | | | | | |
| | | | | | $ | 328,919 | |
| | | | | | | | | |
| | |
Road & Rail — 0.9% | | | | | | | | |
CSX Corp. | | | 1,549 | | | $ | 56,120 | |
| | | | | | | | | |
| | | | | | $ | 56,120 | |
| | | | | | | | | |
| | |
Software — 4.6% | | | | | | | | |
Microsoft Corp. | | | 3,712 | | | $ | 172,422 | |
Oracle Corp. | | | 2,811 | | | | 126,411 | |
| | | | | | | | | |
| | | | | | $ | 298,833 | |
| | | | | | | | | |
| | | | | | | | |
| Security | | Shares | | | Value | |
| | | | | | | | |
| | |
Specialty Retail — 3.0% | | | | | | | | |
Home Depot, Inc. (The) | | | 1,204 | | | $ | 126,384 | |
TJX Cos., Inc. (The) | | | 1,016 | | | | 69,677 | |
| | | | | | | | | |
| | | | | | $ | 196,061 | |
| | | | | | | | | |
| | |
Tobacco — 3.5% | | | | | | | | |
Altria Group, Inc. | | | 2,377 | | | $ | 117,115 | |
Reynolds American, Inc. | | | 1,731 | | | | 111,251 | |
| | | | | | | | | |
| | | | | | $ | 228,366 | |
| | | | | | | | | |
| | |
Total Common Stocks
(identified cost $5,424,955) | | | | | | $ | 6,455,432 | |
| | | | | | | | | |
| | |
Total Investments — 98.8%
(identified cost $5,424,955) | | | | | | $ | 6,455,432 | |
| | | | | | | | | |
| | |
Other Assets, Less Liabilities — 1.2% | | | | | | $ | 79,062 | |
| | | | | | | | | |
| | |
Net Assets — 100.0% | | | | | | $ | 6,534,494 | |
| | | | | | | | | |
The percentage shown for each investment category in the Portfolio of Investments is based on net assets.
| | | | |
| ADR | | – | | American Depositary Receipt |
| PC | | – | | Participation Certificate |
| (1) | Non-income producing security. |
| | | | |
| | 7 | | See Notes to Financial Statements. |
Eaton Vance
VT Large-Cap Value Fund
December 31, 2014
Statement of Assets and Liabilities
| | | | |
| Assets | | December 31, 2014 | |
Investments, at value (identified cost, $5,424,955) | | $ | 6,455,432 | |
Cash | | | 97,764 | |
Dividends receivable | | | 10,716 | |
Receivable for Fund shares sold | | | 2,141 | |
Tax reclaims receivable | | | 16,576 | |
Receivable from affiliate | | | 8,255 | |
Total assets | | $ | 6,590,884 | |
|
| Liabilities | |
Payable for Fund shares redeemed | | $ | 169 | |
Payable to affiliates: | | | | |
Investment adviser fee | | | 3,480 | |
Distribution fees | | | 1,392 | |
Trustees’ fees | | | 254 | |
Payable for shareholder servicing fees | | | 1,438 | |
Accrued expenses | | | 49,657 | |
Total liabilities | | $ | 56,390 | |
Net Assets | | $ | 6,534,494 | |
|
| Sources of Net Assets | |
Paid-in capital | | $ | 3,817,126 | |
Accumulated net realized gain | | | 1,668,046 | |
Accumulated undistributed net investment income | | | 20,296 | |
Net unrealized appreciation | | | 1,029,026 | |
Net Assets | | $ | 6,534,494 | |
|
| Initial Class Shares | |
Net Assets | | $ | 6,533,417 | |
Shares Outstanding | | | 493,939 | |
Net Asset Value, Offering Price and Redemption Price Per Share | | | | |
(net assets ÷ shares of beneficial interest outstanding) | | $ | 13.23 | |
|
| ADV Class Shares | |
Net Assets | | $ | 1,077 | |
Shares Outstanding | | | 81 | |
Net Asset Value, Offering Price and Redemption Price Per Share | | | | |
(net assets ÷ shares of beneficial interest outstanding, including fractional shares) | | $ | 13.27 | |
| | | | |
| | 8 | | See Notes to Financial Statements. |
Eaton Vance
VT Large-Cap Value Fund
December 31, 2014
Statement of Operations
| | | | |
| Investment Income | | Year Ended
December 31, 2014 | |
Dividends (net of foreign taxes, $5,835) | | $ | 382,492 | |
Total investment income | | $ | 382,492 | |
| |
| Expenses | | | | |
Investment adviser fee | | $ | 106,084 | |
Distribution fees | | | | |
Initial Class | | | 42,432 | |
Shareholder servicing fees | | | | |
Initial Class | | | 32,154 | |
ADV Class | | | 2 | |
Trustees’ fees and expenses | | | 1,300 | |
Custodian fee | | | 38,500 | |
Transfer and dividend disbursing agent fees | | | 14,000 | |
Legal and accounting services | | | 41,465 | |
Printing and postage | | | 8,574 | |
Miscellaneous | | | 6,003 | |
Total expenses | | $ | 290,514 | |
Deduct — | | | | |
Allocation of expenses to affiliate | | $ | 71,351 | |
Reduction of custodian fee | | | 92 | |
Total expense reductions | | $ | 71,443 | |
| |
Net expenses | | $ | 219,071 | |
| |
Net investment income | | $ | 163,421 | |
| |
| Realized and Unrealized Gain (Loss) | | | | |
Net realized gain (loss) — | | | | |
Investment transactions | | $ | 12,573,681 | |
Foreign currency transactions | | | (2,021 | ) |
Net realized gain | | $ | 12,571,660 | |
Change in unrealized appreciation (depreciation) — | | | | |
Investments | | $ | (10,712,564 | ) |
Foreign currency | | | (1,967 | ) |
Net change in unrealized appreciation (depreciation) | | $ | (10,714,531 | ) |
| |
Net realized and unrealized gain | | $ | 1,857,129 | |
| |
Net increase in net assets from operations | | $ | 2,020,550 | |
| | | | |
| | 9 | | See Notes to Financial Statements. |
Eaton Vance
VT Large-Cap Value Fund
December 31, 2014
Statements of Changes in Net Assets
| | | | | | | | |
| | | Year Ended December 31, | |
| Increase (Decrease) in Net Assets | | 2014 | | | 2013 | |
From operations — | | | | | | | | |
Net investment income | | $ | 163,421 | | | $ | 447,301 | |
Net realized gain from investment and foreign currency transactions | | | 12,571,660 | | | | 5,643,626 | |
Net change in unrealized appreciation (depreciation) from investments and foreign currency | | | (10,714,531 | ) | | | 6,470,812 | |
Net increase in net assets from operations | | $ | 2,020,550 | | | $ | 12,561,739 | |
Distributions to shareholders — | | | | | | | | |
From net investment income | | | | | | | | |
Initial Class | | $ | — | | | $ | (434,539 | ) |
From net realized gain | | | | | | | | |
Initial Class | | | (126,155 | ) | | | (6,278 | ) |
ADV Class | | | (21 | ) | | | — | |
Total distributions to shareholders | | $ | (126,176 | ) | | $ | (440,817 | ) |
Transactions in shares of beneficial interest — | | | | | | | | |
Proceeds from sale of shares | | | | | | | | |
Initial Class | | $ | 3,077,771 | | | $ | 6,720,297 | |
ADV Class | | | 1,000 | | | | — | |
Net asset value of shares issued to shareholders in payment of distributions declared | | | | | | | | |
Initial Class | | | 126,155 | | | | 435,727 | |
Cost of shares redeemed | | | | | | | | |
Initial Class | | | (47,757,322 | ) | | | (19,086,048 | ) |
Net decrease in net assets from Fund share transactions | | $ | (44,552,396 | ) | | $ | (11,930,024 | ) |
| | |
Net increase (decrease) in net assets | | $ | (42,658,022 | ) | | $ | 190,898 | |
|
| Net Assets | |
At beginning of year | | $ | 49,192,516 | | | $ | 49,001,618 | |
At end of year | | $ | 6,534,494 | | | $ | 49,192,516 | |
|
Accumulated undistributed (distributions in excess of) net investment income included in net assets | |
At end of year | | $ | 20,296 | | | $ | (41 | ) |
| | | | |
| | 10 | | See Notes to Financial Statements. |
Eaton Vance
VT Large-Cap Value Fund
December 31, 2014
Financial Highlights
| | | | | | | | | | | | | | | | | | | | |
| | | Initial Class | |
| | | Year Ended December 31, | |
| | | 2014 | | | 2013 | | | 2012 | | | 2011 | | | 2010 | |
Net asset value — Beginning of year | | $ | 11.790 | | | $ | 9.240 | | | $ | 8.140 | | | $ | 8.770 | | | $ | 8.000 | |
| | | | | |
| Income (Loss) From Operations | | | | | | | | | | | | | | | | | | | | |
Net investment income | | $ | 0.118 | (1) | | $ | 0.101 | | | $ | 0.129 | | | $ | 0.107 | | | $ | 0.467 | |
Net realized and unrealized gain (loss) | | | 1.580 | | | | 2.551 | | | | 1.101 | | | | (0.631 | ) | | | 0.768 | (2) |
| | | | | |
Total income (loss) from operations | | $ | 1.698 | | | $ | 2.652 | | | $ | 1.230 | | | $ | (0.524 | ) | | $ | 1.235 | |
| | | | | |
| Less Distributions | | | | | | | | | | | | | | | | | | | | |
From net investment income | | $ | — | | | $ | (0.101 | ) | | $ | (0.130 | ) | | $ | (0.106 | ) | | $ | (0.465 | ) |
From net realized gain | | | (0.258 | ) | | | (0.001 | ) | | | �� | | | | — | | | | — | |
Tax return of capital | | | — | | | | — | | | | (0.000 | )(3) | | | — | | | | — | |
| | | | | |
Total distributions | | $ | (0.258 | ) | | $ | (0.102 | ) | | $ | (0.130 | ) | | $ | (0.106 | ) | | $ | (0.465 | ) |
| | | | | |
Net asset value — End of year | | $ | 13.230 | | | $ | 11.790 | | | $ | 9.240 | | | $ | 8.140 | | | $ | 8.770 | |
| | | | | |
Total Return(4) | | | 14.43 | % | | | 28.74 | %(5) | | | 15.12 | % | | | (5.97 | )% | | | 15.44 | % |
| | | | | |
| Ratios/Supplemental Data | | | | | | | | | | | | | | | | | | | | |
Net assets, end of year (000’s omitted) | | $ | 6,533 | | | $ | 49,193 | | | $ | 49,002 | | | $ | 60,003 | | | $ | 74,409 | |
Ratios (as a percentage of average daily net assets): | | | | | | | | | | | | | | | | | | | | |
Expenses(6) | | | 1.30 | %(7) | | | 1.30 | %(7) | | | 1.30 | %(7) | | | 1.28 | % | | | 1.34 | %(7)(8) |
Net investment income | | | 0.97 | % | | | 0.88 | % | | | 1.25 | % | | | 1.17 | % | | | 0.70 | % |
Portfolio Turnover | | | 57 | % | | | 63 | % | | | 39 | % | | | 70 | % | | | 55 | % |
| (1) | Computed using average shares outstanding. |
| (2) | The per share amount is not in accord with the net realized and unrealized gain (loss) on investments for the period because of the timing of sales of Fund shares and the amount of the per share realized and unrealized gains and losses at such time. |
| (3) | Amount is less than $(0.0005). |
| (4) | Returns are historical and are calculated by determining the percentage change in net asset value with all distributions reinvested. |
| (5) | During the year ended December 31, 2013, the Fund received a payment made by an affiliate for a trading error which amounted to $0.02 per share. Had the Fund not received this payment, total return would have been lower by 0.21%. |
| (6) | Excludes the effect of custody fee credits, if any, of less than 0.005%. |
| (7) | The investment adviser subsidized certain operating expenses (equal to 0.42%, 0.01%, 0.01% and 0.10% of average daily net assets for the years ended December 31, 2014, 2013, 2012 and 2010, respectively). Absent this subsidy, total return would be lower. |
| (8) | Includes interest expense of 0.04%. |
| | | | |
| | 11 | | See Notes to Financial Statements. |
Eaton Vance
VT Large-Cap Value Fund
December 31, 2014
Financial Highlights — continued
| | | | |
| | | ADV Class | |
| | | Period Ended
December 31, 2014(1) | |
Net asset value — Beginning of period | | $ | 12.320 | |
| |
| Income (Loss) From Operations | | | | |
Net investment income | | $ | 0.101 | (2) |
Net realized and unrealized gain | | | 1.107 | |
| |
Total income from operations | | $ | 1.208 | |
| |
| Less Distributions | | | | |
From net realized gain | | $ | (0.258 | ) |
| |
Total distributions | | $ | (0.258 | ) |
| |
Net asset value — End of period | | $ | 13.270 | |
| |
Total Return(3) | | | 9.83 | %(4) |
| |
| Ratios/Supplemental Data | | | | |
Net assets, end of period (000’s omitted) | | $ | 1 | |
Ratios (as a percentage of average daily net assets): | | | | |
Expenses(5) | | | 1.05 | %(6)(7) |
Net investment income | | | 1.08 | %(6) |
Portfolio Turnover | | | 57 | %(8) |
| (1) | For the period from commencement of operations on April 15, 2014 to December 31, 2014. |
| (2) | Computed using average shares outstanding. |
| (3) | Returns are historical and are calculated by determining the percentage change in net asset value with all distributions reinvested. |
| (5) | Excludes the effect of custody fee credits, if any, of less than 0.005%. |
| (7) | The investment adviser subsidized certain operating expenses (equal to 0.42% of average daily net assets for the period ended December 31, 2014). Absent this subsidy, total return would be lower. |
| (8) | For the year ended December 31, 2014. |
| | | | |
| | 12 | | See Notes to Financial Statements. |
Eaton Vance
VT Large-Cap Value Fund
December 31, 2014
Notes to Financial Statements
1 Significant Accounting Policies
Eaton Vance VT Large-Cap Value Fund (the Fund) is a diversified series of Eaton Vance Variable Trust (the Trust). The Trust is a Massachusetts business trust registered under the Investment Company Act of 1940, as amended (the 1940 Act), as an open-end management investment company. The Fund’s investment objective is to seek total return. Effective April 15, 2014, the Fund designated its existing shares as Initial Class and established a new class of shares named ADV Class. Each class represents a pro-rata interest in the Fund, but votes separately on class-specific matters and (as noted below) is subject to different expenses. Realized and unrealized gains and losses and net investment income and losses, other than class-specific expenses, are allocated daily to each class of shares based on the relative net assets of each class to the total net assets of the Fund. Each class of shares differs in its distribution plan and certain other class-specific expenses. The Fund is generally made available for purchase only to separate accounts established by participating insurance companies and qualified pension or retirement plans.
The following is a summary of significant accounting policies of the Fund. The policies are in conformity with accounting principles generally accepted in the United States of America (U.S. GAAP). The Fund is an investment company and follows accounting and reporting guidance in the Financial Accounting Standards Board (“FASB”) Accounting Standards Codification Topic 946.
A Investment Valuation — The following methodologies are used to determine the market value or fair value of investments.
Equity Securities. Equity securities listed on a U.S. securities exchange generally are valued at the last sale or closing price on the day of valuation or, if no sales took place on such date, at the mean between the closing bid and asked prices therefore on the exchange where such securities are principally traded. Equity securities listed on the NASDAQ Global or Global Select Market generally are valued at the NASDAQ official closing price. Unlisted or listed securities for which closing sales prices or closing quotations are not available are valued at the mean between the latest available bid and asked prices.
Foreign Securities and Currencies. Foreign securities and currencies are valued in U.S. dollars, based on foreign currency exchange rate quotations supplied by a third party pricing service. The pricing service uses a proprietary model to determine the exchange rate. Inputs to the model include reported trades and implied bid/ask spreads. The daily valuation of exchange-traded foreign securities generally is determined as of the close of trading on the principal exchange on which such securities trade. Events occurring after the close of trading on foreign exchanges may result in adjustments to the valuation of foreign securities to more accurately reflect their fair value as of the close of regular trading on the New York Stock Exchange. When valuing foreign equity securities that meet certain criteria, the Fund’s Trustees have approved the use of a fair value service that values such securities to reflect market trading that occurs after the close of the applicable foreign markets of comparable securities or other instruments that have a strong correlation to the fair-valued securities.
Fair Valuation. Investments for which valuations or market quotations are not readily available or are deemed unreliable are valued at fair value using methods determined in good faith by or at the direction of the Trustees of the Fund in a manner that fairly reflects the security’s value, or the amount that the Fund might reasonably expect to receive for the security upon its current sale in the ordinary course. Each such determination is based on a consideration of relevant factors, which are likely to vary from one pricing context to another. These factors may include, but are not limited to, the type of security, the existence of any contractual restrictions on the security’s disposition, the price and extent of public trading in similar securities of the issuer or of comparable companies or entities, quotations or relevant information obtained from broker/dealers or other market participants, information obtained from the issuer, analysts, and/or the appropriate stock exchange (for exchange-traded securities), an analysis of the company’s or entity’s financial condition, and an evaluation of the forces that influence the issuer and the market(s) in which the security is purchased and sold.
B Investment Transactions — Investment transactions for financial statement purposes are accounted for on a trade date basis. Realized gains and losses on investments sold are determined on the basis of identified cost.
C Income — Dividend income is recorded on the ex-dividend date for dividends received in cash and/or securities. However, if the ex-dividend date has passed, certain dividends from foreign securities are recorded as the Fund is informed of the ex-dividend date. Withholding taxes on foreign dividends and capital gains have been provided for in accordance with the Fund’s understanding of the applicable countries’ tax rules and rates.
D Federal Taxes — The Fund’s policy is to comply with the provisions of the Internal Revenue Code applicable to regulated investment companies and to distribute to shareholders each year substantially all of its net investment income, and all or substantially all of its net realized capital gains. Accordingly, no provision for federal income or excise tax is necessary.
As of December 31, 2014, the Fund had no uncertain tax positions that would require financial statement recognition, de-recognition, or disclosure. The Fund files a U.S. federal income tax return annually after its fiscal year-end, which is subject to examination by the Internal Revenue Service for a period of three years from the date of filing.
E Expenses — The majority of expenses of the Trust are directly identifiable to an individual fund. Expenses which are not readily identifiable to a specific fund are allocated taking into consideration, among other things, the nature and type of expense and the relative size of the funds.
F Expense Reduction — State Street Bank and Trust Company (SSBT) serves as custodian of the Fund. Pursuant to the custodian agreement, SSBT receives a fee reduced by credits, which are determined based on the average daily cash balance the Fund maintains with SSBT. All credit balances, if any, used to reduce the Fund’s custodian fees are reported as a reduction of expenses in the Statement of Operations.
Eaton Vance
VT Large-Cap Value Fund
December 31, 2014
Notes to Financial Statements — continued
G Foreign Currency Translation — Investment valuations, other assets, and liabilities initially expressed in foreign currencies are translated each business day into U.S. dollars based upon current exchange rates. Purchases and sales of foreign investment securities and income and expenses denominated in foreign currencies are translated into U.S. dollars based upon currency exchange rates in effect on the respective dates of such transactions. Recognized gains or losses on investment transactions attributable to changes in foreign currency exchange rates are recorded for financial statement purposes as net realized gains and losses on investments. That portion of unrealized gains and losses on investments that results from fluctuations in foreign currency exchange rates is not separately disclosed.
H Use of Estimates — The preparation of the financial statements in conformity with U.S. GAAP requires management to make estimates and assumptions that affect the reported amounts of assets and liabilities at the date of the financial statements and the reported amounts of income and expense during the reporting period. Actual results could differ from those estimates.
I Indemnifications — Under the Trust’s organizational documents, its officers and Trustees may be indemnified against certain liabilities and expenses arising out of the performance of their duties to the Fund. Under Massachusetts law, if certain conditions prevail, shareholders of a Massachusetts business trust (such as the Trust) could be deemed to have personal liability for the obligations of the Trust. However, the Trust’s Declaration of Trust contains an express disclaimer of liability on the part of Fund shareholders and the By-laws provide that the Trust shall assume the defense on behalf of any Fund shareholders. Moreover, the By-laws also provide for indemnification out of Fund property of any shareholder held personally liable solely by reason of being or having been a shareholder for all loss or expense arising from such liability. Additionally, in the normal course of business, the Fund enters into agreements with service providers that may contain indemnification clauses. The Fund’s maximum exposure under these arrangements is unknown as this would involve future claims that may be made against the Fund that have not yet occurred.
2 Distributions to Shareholders and Income Tax Information
It is the present policy of the Fund to make at least one distribution annually (normally in December) of all or substantially all of its net investment income and to distribute annually all or substantially all of its net realized capital gains. Distributions to shareholders are recorded on the ex-dividend date. Distributions are declared separately for each class of shares. Shareholders may reinvest income and capital gain distributions in additional shares of the same class of the Fund at the net asset value as of the reinvestment date or, if an election is made on behalf of a separate account, to receive some or all of the distributions in cash. Distributions to shareholders are determined in accordance with income tax regulations, which may differ from U.S. GAAP. As required by U.S. GAAP, only distributions in excess of tax basis earnings and profits are reported in the financial statements as a return of capital. Permanent differences between book and tax accounting relating to distributions are reclassified to paid-in capital. For tax purposes, distributions from short-term capital gains are considered to be from ordinary income.
The tax character of distributions declared for the years ended December 31, 2014 and December 31, 2013 was as follows:
| | | | | | | | |
| | | Year Ended December 31, | |
| | | 2014 | | | 2013 | |
| | |
Distributions declared from: | | | | | | | | |
Ordinary income | | $ | — | | | $ | 434,539 | |
Long-term capital gains | | $ | 126,176 | | | $ | 6,278 | |
During the year ended December 31, 2014, accumulated net realized gain was decreased by $10,793,455, accumulated undistributed net investment income was decreased by $143,084 and paid-in capital was increased by $10,936,539 due to the Fund’s use of equalization accounting and differences between book and tax accounting, primarily for foreign currency gain (loss) and distributions from real estate investment trusts (REITs). Tax equalization accounting allows the Fund to treat as a distribution that portion of redemption proceeds representing a redeeming shareholder’s portion of undistributed taxable income and net capital gains. These reclassifications had no effect on the net assets or net asset value per share of the Fund.
As of December 31, 2014, the components of distributable earnings (accumulated losses) and unrealized appreciation (depreciation) on a tax basis were as follows:
| | | | |
Undistributed ordinary income | | $ | 275,810 | |
Undistributed long-term capital gains | | $ | 1,450,388 | |
Net unrealized appreciation | | $ | 991,170 | |
The differences between components of distributable earnings (accumulated losses) on a tax basis and the amounts reflected in the Statement of Assets and Liabilities are primarily due to wash sales, investments in partnerships and the tax treatment of short-term capital gains.
Eaton Vance
VT Large-Cap Value Fund
December 31, 2014
Notes to Financial Statements — continued
The cost and unrealized appreciation (depreciation) of investments of the Fund at December 31, 2014, as determined on a federal income tax basis, were as follows:
| | | | |
| |
Aggregate cost | | $ | 5,462,811 | |
| |
Gross unrealized appreciation | | $ | 1,043,293 | |
Gross unrealized depreciation | | | (50,672 | ) |
| |
Net unrealized appreciation | | $ | 992,621 | |
3 Investment Adviser Fee and Other Transactions with Affiliates
The investment adviser fee is earned by Eaton Vance Management (EVM) as compensation for management and investment advisory services rendered to the Fund. The fee is computed at an annual rate of 0.625% of the Fund’s average daily net assets up to $2 billion and at reduced rates on daily net assets of $2 billion or more, and is payable monthly. For the year ended December 31, 2014, the investment adviser fee amounted to $106,084 or 0.625% of the Fund’s average daily net assets. EVM has agreed to reimburse the Fund’s expenses to the extent that total annual operating expenses (relating to ordinary operating expenses only) exceed 1.30% and 1.05% of the Fund’s average daily net assets for Initial Class and ADV Class, respectively. This agreement may be changed or terminated after April 30, 2015. Pursuant to this agreement, EVM was allocated $71,351 of the Fund’s operating expenses for the year ended December 31, 2014. EVM also serves as administrator of the Fund, but receives no compensation. Eaton Vance Distributors, Inc. (EVD), the Fund’s principal underwriter and an affiliate of EVM, received distribution fees (see Note 4).
Trustees and officers of the Fund who are members of EVM’s organization receive remuneration for their services to the Fund out of the investment adviser fee. Certain officers and Trustees of the Fund are officers of EVM.
4 Distribution Plans
The Fund has in effect a distribution plan for Initial Class shares (Initial Class Plan) pursuant to Rule 12b-1 under the 1940 Act. Pursuant to the Initial Class Plan, the Fund pays EVD a distribution fee of 0.25% per annum of its average daily net assets attributable to Initial Class shares for the sale and distribution of Initial Class shares. Distribution fees paid or accrued to EVD for the year ended December 31, 2014 amounted to $42,432. Insurance companies receive such fees from EVD based on the value of shares held by such companies. The insurance companies through which investors hold shares of the Fund may also pay fees to third parties in connection with the sale of variable contracts and for services provided to variable contract owners. The Fund, EVM or EVD are not a party to these arrangements. Investors should consult the prospectus and statement of additional information for their variable contracts for a discussion of these payments. EVD may, at its expense, provide promotional incentives to dealers that sell variable insurance products.
Distribution fees are subject to the limitations contained in the Financial Industry Regulatory Authority’s NASD Conduct Rule 2830(d).
5 Shareholder Servicing Plan
The Trust, on behalf of the Fund, has adopted a Shareholder Servicing Plan (Servicing Plan) for Initial Class and ADV Class. The Servicing Plan allows the Trust to enter into shareholder servicing agreements with insurance companies, investment dealers, broker/dealers or other financial intermediaries that provide shareholder services relating to Fund shares and their shareholders, including variable contract owners or plan participants with interests in the Fund. Under the Servicing Plan, the Fund may make payments at an annual rate of up to 0.25% of its average daily net assets attributable to each class that are subject to shareholder servicing agreements. No shareholder servicing fees are levied on shares owned by EVM, its affiliates, or their respective employees or clients and may be waived under certain other limited conditions. For the year ended December 31, 2014, shareholder servicing fees were equivalent to 0.19% per annum of each class’ average daily net assets and amounted to $32,154 and $2 for Initial Class and ADV Class, respectively.
6 Purchases and Sales of Investments
Purchases and sales of investments, other than short-term obligations, aggregated $10,931,773 and $54,831,722, respectively, for the year ended December 31, 2014.
Eaton Vance
VT Large-Cap Value Fund
December 31, 2014
Notes to Financial Statements — continued
7 Shares of Beneficial Interest
The Fund’s Declaration of Trust permits the Trustees to issue an unlimited number of full and fractional shares of beneficial interest (without par value). Such shares may be issued in a number of different series (such as the Fund) and classes. Transactions in Fund shares were as follows:
| | | | | | | | |
| | | Year Ended December 31, | |
| Initial Class | | 2014 | | | 2013 | |
| | |
Sales | | | 240,067 | | | | 633,457 | |
Issued to shareholders electing to receive payments of distributions in Fund shares | | | 9,667 | | | | 38,458 | |
Redemptions | | | (3,929,165 | ) | | | (1,804,352 | ) |
| | |
Net decrease | | | (3,679,431 | ) | | | (1,132,437 | ) |
| | |
| ADV Class | | Period Ended
December 31, 2014(1) |
| |
Sales | | 81 |
| |
Net increase | | 81 |
| (1) | For the period from commencement of operations on April 15, 2014 to December 31, 2014. |
At December 31, 2014, separate accounts of 2 insurance companies each owned more than 10% of the value of the outstanding shares of the Fund aggregating 91.8%.
8 Line of Credit
The Fund participates with other portfolios and funds managed by EVM and its affiliates in a $750 million unsecured line of credit agreement with a group of banks. Borrowings are made by the Fund solely to facilitate the handling of unusual and/or unanticipated short-term cash requirements. Interest is charged to the Fund based on its borrowings at an amount above either the Eurodollar rate or Federal Funds rate. In addition, a fee computed at an annual rate of 0.08% on the daily unused portion of the line of credit is allocated among the participating portfolios and funds at the end of each quarter. Because the line of credit is not available exclusively to the Fund, it may be unable to borrow some or all of its requested amounts at any particular time. The Fund did not have any significant borrowings or allocated fees during the year ended December 31, 2014.
9 Fair Value Measurements
Under generally accepted accounting principles for fair value measurements, a three-tier hierarchy to prioritize the assumptions, referred to as inputs, is used in valuation techniques to measure fair value. The three-tier hierarchy of inputs is summarized in the three broad levels listed below.
| Ÿ | | Level 1 – quoted prices in active markets for identical investments |
| Ÿ | | Level 2 – other significant observable inputs (including quoted prices for similar investments, interest rates, prepayment speeds, credit risk, etc.) |
| Ÿ | | Level 3 – significant unobservable inputs (including a fund’s own assumptions in determining the fair value of investments) |
In cases where the inputs used to measure fair value fall in different levels of the fair value hierarchy, the level disclosed is determined based on the lowest level input that is significant to the fair value measurement in its entirety. The inputs or methodology used for valuing securities are not necessarily an indication of the risk associated with investing in those securities.
Eaton Vance
VT Large-Cap Value Fund
December 31, 2014
Notes to Financial Statements — continued
At December 31, 2014, the hierarchy of inputs used in valuing the Fund’s investments, which are carried at value, were as follows:
| | | | | | | | | | | | | | | | |
| Asset Description | | Level 1 | | | Level 2 | | | Level 3 | | | Total | |
| | | | |
Common Stocks | | | | | | | | | | | | | | | | |
Consumer Discretionary | | $ | 338,774 | | | $ | — | | | $ | — | | | $ | 338,774 | |
Consumer Staples | | | 505,939 | | | | — | | | | — | | | | 505,939 | |
Energy | | | 778,192 | | | | — | | | | — | | | | 778,192 | |
Financials | | | 1,825,512 | | | | — | | | | — | | | | 1,825,512 | |
Health Care | | | 772,355 | | | | 147,393 | | | | — | | | | 919,748 | |
Industrials | | | 560,012 | | | | — | | | | — | | | | 560,012 | |
Information Technology | | | 665,305 | | | | — | | | | — | | | | 665,305 | |
Materials | | | 258,924 | | | | — | | | | — | | | | 258,924 | |
Telecommunication Services | | | 183,892 | | | | — | | | | — | | | | 183,892 | |
Utilities | | | 419,134 | | | | — | | | | — | | | | 419,134 | |
| | | | |
Total Common Stocks | | $ | 6,308,039 | | | $ | 147,393 | * | | $ | — | | | $ | 6,455,432 | |
| | | | |
Total Investments | | $ | 6,308,039 | | | $ | 147,393 | | | $ | — | | | $ | 6,455,432 | |
| * | Includes foreign equity securities whose values were adjusted to reflect market trading of comparable securities or other correlated instruments that occurred after the close of trading in their applicable foreign markets. |
The Fund held no investments or other financial instruments as of December 31, 2013 whose fair value was determined using Level 3 inputs. At December 31, 2014, there were no investments transferred between Level 1 and Level 2 during the year then ended.
Eaton Vance
VT Large-Cap Value Fund
December 31, 2014
Report of Independent Registered Public Accounting Firm
To the Trustees of Eaton Vance Variable Trust and Shareholders of Eaton Vance VT Large-Cap Value Fund:
We have audited the accompanying statement of assets and liabilities of Eaton Vance VT Large-Cap Value Fund (the “Fund”) (one of the funds constituting Eaton Vance Variable Trust), including the portfolio of investments, as of December 31, 2014, and the related statement of operations for the year then ended, the statements of changes in net assets for each of the two years in the period then ended, and the financial highlights for each of the periods presented. These financial statements and financial highlights are the responsibility of the Fund’s management. Our responsibility is to express an opinion on these financial statements and financial highlights based on our audits.
We conducted our audits in accordance with the standards of the Public Company Accounting Oversight Board (United States). Those standards require that we plan and perform the audit to obtain reasonable assurance about whether the financial statements and financial highlights are free of material misstatement. The Fund is not required to have, nor were we engaged to perform, an audit of its internal control over financial reporting. Our audits included consideration of internal control over financial reporting as a basis for designing audit procedures that are appropriate in the circumstances, but not for the purpose of expressing an opinion on the effectiveness of the Fund’s internal control over financial reporting. Accordingly, we express no such opinion. An audit also includes examining, on a test basis, evidence supporting the amounts and disclosures in the financial statements, assessing the accounting principles used and significant estimates made by management, as well as evaluating the overall financial statement presentation. Our procedures included confirmation of securities owned as of December 31, 2014, by correspondence with the custodian and brokers; where replies were not received from brokers, we performed other auditing procedures. We believe that our audits provide a reasonable basis for our opinion.
In our opinion, such financial statements and financial highlights referred to above present fairly, in all material respects, the financial position of Eaton Vance VT Large-Cap Value Fund as of December 31, 2014, the results of its operations for the year then ended, the changes in its net assets for each of the two years in the period then ended, and the financial highlights for each of the periods presented, in conformity with accounting principles generally accepted in the United States of America.
DELOITTE & TOUCHE LLP
Boston, Massachusetts
February 20, 2015
Eaton Vance
VT Large-Cap Value Fund
December 31, 2014
Federal Tax Information (Unaudited)
As required by the Internal Revenue Code and/or regulations, shareholders must be notified regarding the status of capital gains dividends.
Capital Gains Dividends. The Fund hereby designates as a capital gain dividend with respect to the taxable year ended December 31, 2014, $10,639,538 or, if subsequently determined to be different, the net capital gain of such year.
Eaton Vance
VT Large-Cap Value Fund
December 31, 2014
Management and Organization
Fund Management. The Trustees of Eaton Vance Variable Trust (the Trust) are responsible for the overall management and supervision of the Trust’s affairs. The Trustees and officers of the Trust are listed below. Except as indicated, each individual has held the office shown or other offices in the same company for the last five years. Trustees and officers of the Trust hold indefinite terms of office. The “Noninterested Trustees” consist of those Trustees who are not “interested persons” of the Trust, as that term is defined under the 1940 Act. The business address of each Trustee and officer is Two International Place, Boston, Massachusetts 02110. As used below, “EVC” refers to Eaton Vance Corp., “EV” refers to Eaton Vance, Inc., “EVM” refers to Eaton Vance Management, “BMR” refers to Boston Management and Research and “EVD” refers to Eaton Vance Distributors, Inc. EVC and EV are the corporate parent and trustee, respectively, of EVM and BMR. EVD is the Fund’s principal underwriter and a wholly-owned subsidiary of EVC. Each officer affiliated with Eaton Vance may hold a position with other Eaton Vance affiliates that is comparable to his or her position with EVM listed below. Each Trustee oversees 179 portfolios in the Eaton Vance Complex (including all master and feeder funds in a master feeder structure). Each officer serves as an officer of certain other Eaton Vance funds. Each Trustee and officer serves until his or her successor is elected.
| | | | | | |
| Name and Year of Birth | | Position(s) with the
Trust | | Trustee Since(1) | | Principal Occupation(s) and Directorships During Past Five Years and Other Relevant Experience |
Interested Trustee |
| | | |
Thomas E. Faust Jr. 1958 | | Trustee | | 2007 | | Chairman, Chief Executive Officer and President of EVC, Director and President of EV, Chief Executive Officer and President of EVM and BMR, and Director of EVD. Trustee and/or officer of 179 registered investment companies. Mr. Faust is an interested person because of his positions with EVM, BMR, EVD, EVC and EV, which are affiliates of the Trust. Directorships in the Last Five Years.(2) Director of EVC and Hexavest Inc. |
| | | |
| | | | | | |
Noninterested Trustees |
| | | |
Scott E. Eston 1956 | | Trustee | | 2011 | | Private investor. Formerly held various positions at Grantham, Mayo, Van Otterloo and Co., L.L.C. (investment management firm) (1997-2009), including Chief Operating Officer (2002-2009), Chief Financial Officer (1997-2009) and Chairman of the Executive Committee (2002-2008); President and Principal Executive Officer, GMO Trust (open-end registered investment company) (2006-2009). Former Partner, Coopers and Lybrand L.L.P. (now PricewaterhouseCoopers) (public accounting firm) (1987-1997). Directorships in the Last Five Years.(2) None. |
| | | |
Cynthia E. Frost(3) 1961 | | Trustee | | 2014 | | Private investor. Formerly, Chief Investment Officer of Brown University (university endowment) (2000-2012); Portfolio Strategist for Duke Management Company (university endowment manager) (1995-2000); Managing Director, Cambridge Associates (1989-1995); Consultant, Bain and Company (1987-1989); Senior Equity Analyst, BA Investment Management Company (1983-1985). Directorships in the Last Five Years. None. |
| | | |
George J. Gorman(3) 1952 | | Trustee | | 2014 | | Principal at George J. Gorman LLC (consulting firm). Formerly, Senior Partner at Ernst & Young LLP (public accounting firm) (1974-2009). Directorships in the Last Five Years. Formerly, Trustee of the Bank of America Money Market Funds Series Trust (2011-2014) and of the Ashmore Funds (2010-2014). |
| | | |
Valerie A. Mosley(4) 1960 | | Trustee | | 2014 | | Chairwoman and Chief Executive Officer of Valmo Ventures (a consulting and investment firm). Former Partner and Senior Vice President, Portfolio Manager and Investment Strategist at Wellington Management Company, LLP (investment management firm) (1992-2012). Former Chief Investment Officer, PG Corbin Asset Management (1990-1992). Formerly worked in institutional corporate bond sales at Kidder Peabody (1986-1990). Directorships in the Last Five Years.(2) Director of Dynex Capital, Inc. (mortgage REIT) (since 2013). |
| | | |
William H. Park 1947 | | Trustee | | 2003 | | Consultant and private investor. Formerly, Chief Financial Officer, Aveon Group L.P. (investment management firm) (2010-2011). Formerly, Vice Chairman, Commercial Industrial Finance Corp. (specialty finance company) (2006-2010). Formerly, President and Chief Executive Officer, Prizm Capital Management, LLC (investment management firm) (2002-2005). Formerly, Executive Vice President and Chief Financial Officer, United Asset Management Corporation (investment management firm) (1982-2001). Formerly, Senior Manager, Price Waterhouse (now PricewaterhouseCoopers) (an independent registered public accounting firm) (1972-1981). Directorships in the Last Five Years.(2) None. |
Eaton Vance
VT Large-Cap Value Fund
December 31, 2014
Management and Organization — continued
| | | | | | |
| Name and Year of Birth | | Position(s) with the
Trust | | Trustee Since(1) | | Principal Occupation(s) and Directorships During Past Five Years and Other Relevant Experience |
Noninterested Trustees (continued) |
| | | |
Ronald A. Pearlman 1940 | | Trustee | | 2003 | | Lawyer and consultant. Formerly, Professor of Law, Georgetown University Law Center (1999-2014). Formerly, Partner, Covington & Burling LLP (law firm) (1991-2000). Formerly, Chief of Staff, Joint Committee on Taxation, U.S. Congress (1988-1990). Formerly, Deputy Assistant Secretary (Tax Policy) and Assistant Secretary (Tax Policy), U.S. Department of the Treasury (1983-1985). Directorships in the Last Five Years.(2) None. |
| | | |
Helen Frame Peters 1948 | | Trustee | | 2008 | | Professor of Finance, Carroll School of Management, Boston College. Formerly, Dean, Carroll School of Management, Boston College (2000-2002). Formerly, Chief Investment Officer, Fixed Income, Scudder Kemper Investments (investment management firm) (1998-1999). Formerly, Chief Investment Officer, Equity and Fixed Income, Colonial Management Associates (investment management firm) (1991-1998). Directorships in the Last Five Years.(2) Formerly, Director of BJ’s Wholesale Club, Inc. (wholesale club retailer) (2004-2011). Formerly, Trustee of SPDR Index Shares Funds and SPDR Series Trust (exchange traded funds) (2000-2009). Formerly, Director of Federal Home Loan Bank of Boston (a bank for banks) (2007-2009). |
| | | |
Harriett Tee Taggart 1948 | | Trustee | | 2011 | | Managing Director, Taggart Associates (a professional practice firm). Formerly, Partner and Senior Vice President, Wellington Management Company, LLP (investment management firm) (1983-2006). Directorships in the Last Five Years.(2) Director of Albemarle Corporation (chemicals manufacturer) (since 2007) and The Hanover Group (specialty property and casualty insurance company) (since 2009). Formerly, Director of Lubrizol Corporation (specialty chemicals) (2007-2011). |
| | | |
Ralph F. Verni 1943 | | Chairman of the Board and Trustee | | 2007 (Chairman) 2005 (Trustee) | | Consultant and private investor. Formerly, Chief Investment Officer (1982-1992), Chief Financial Officer (1988-1990) and Director (1982-1992), New England Life. Formerly, Chairperson, New England Mutual Funds (1982-1992). Formerly, President and Chief Executive Officer, State Street Management & Research (1992-2000). Formerly, Chairperson, State Street Research Mutual Funds (1992-2000). Formerly, Director, W.P. Carey, LLC (1998-2004) and First Pioneer Farm Credit Corp. (2002-2006). Directorships in the Last Five Years.(2) None. |
| | | |
| | | | | | |
Principal Officers who are not Trustees |
| Name and Year of Birth | | Position(s)
with the
Trust | | Officer
Since(5) | | Principal Occupation(s) During Past Five Years |
Payson F. Swaffield 1956 | | President | | 2003 | | Vice President and Chief Income Investment Officer of EVM and BMR. |
| | | |
Maureen A. Gemma 1960 | | Vice President, Secretary and Chief Legal Officer | | 2005 | | Vice President of EVM and BMR. |
| | | |
James F. Kirchner 1967 | | Treasurer | | 2007 | | Vice President of EVM and BMR. |
| | | |
Paul M. O’Neil 1953 | | Chief Compliance Officer | | 2004 | | Vice President of EVM and BMR. |
| (1) | Year first appointed to serve as Trustee for a fund in the Eaton Vance family of funds. Each Trustee has served continuously since appointment unless indicated otherwise. |
| (2) | During their respective tenures, the Trustees (except for Ms. Frost and Mr. Gorman) also served as Board members of one or more of the following funds (which operated in the years noted): eUnitsTM 2 Year U.S. Market Participation Trust: Upside to Cap / Buffered Downside (launched in 2012 and terminated in 2014); eUnitsTM 2 Year U.S. Market Participation Trust II: Upside to Cap / Buffered Downside (launched in 2012 and terminated in 2014); Eaton Vance Credit Opportunities Fund (launched in 2005 and terminated in 2010); Eaton Vance Insured Florida Plus Municipal Bond Fund (launched in 2002 and terminated in 2009); and Eaton Vance National Municipal Income Trust (launched in 1998 and terminated in 2009). However, Ms. Mosley did not serve as a Board member of eUnitsTM 2 Year U.S. Market Participation Trust: Upside to Cap / Buffered Downside (launched in 2012 and terminated in 2014). |
Eaton Vance
VT Large-Cap Value Fund
December 31, 2014
Management and Organization — continued
| (3) | Ms. Frost and Mr. Gorman began serving as Trustees effective May 29, 2014. |
| (4) | Ms. Mosley began serving as a Trustee effective January 1, 2014. |
| (5) | Year first elected to serve as officer of a fund in the Eaton Vance family of funds when the officer has served continuously. Otherwise, year of most recent election as an officer of a fund in the Eaton Vance family of funds. Titles may have changed since initial election. |
The SAI for the Fund includes additional information about the Trustees and officers of the Fund and can be obtained without charge on Eaton Vance’s website at www.eatonvance.com or by calling 1-800-262-1122.
Eaton Vance Funds
IMPORTANT NOTICES
Privacy. The Eaton Vance organization is committed to ensuring your financial privacy. Each of the financial institutions identified below has in effect the following policy (“Privacy Policy”) with respect to nonpublic personal information about its customers:
| Ÿ | | Only such information received from you, through application forms or otherwise, and information about your Eaton Vance fund transactions will be collected. This may include information such as name, address, social security number, tax status, account balances and transactions. |
| Ÿ | | None of such information about you (or former customers) will be disclosed to anyone, except as permitted by law (which includes disclosure to employees necessary to service your account). In the normal course of servicing a customer’s account, Eaton Vance may share information with unaffiliated third parties that perform various required services such as transfer agents, custodians and broker-dealers. |
| Ÿ | | Policies and procedures (including physical, electronic and procedural safeguards) are in place that are designed to protect the confidentiality of such information. |
| Ÿ | | We reserve the right to change our Privacy Policy at any time upon proper notification to you. Customers may want to review our Privacy Policy periodically for changes by accessing the link on our homepage: www.eatonvance.com. |
Our pledge of privacy applies to the following entities within the Eaton Vance organization: the Eaton Vance Family of Funds, Eaton Vance Management, Eaton Vance Investment Counsel, Eaton Vance Distributors, Inc., Eaton Vance Trust Company, Eaton Vance Management’s Real Estate Investment Group and Boston Management and Research. In addition, our Privacy Policy applies only to those Eaton Vance customers who are individuals and who have a direct relationship with us. If a customer’s account (i.e., fund shares) is held in the name of a third-party financial advisor/broker-dealer, it is likely that only such advisor’s privacy policies apply to the customer. This notice supersedes all previously issued privacy disclosures. For more information about Eaton Vance’s Privacy Policy, please call 1-800-262-1122.
Delivery of Shareholder Documents. The Securities and Exchange Commission (SEC) permits funds to deliver only one copy of shareholder documents, including prospectuses, proxy statements and shareholder reports, to fund investors with multiple accounts at the same residential or post office box address. This practice is often called “householding” and it helps eliminate duplicate mailings to shareholders. Eaton Vance, or your financial advisor, may household the mailing of your documents indefinitely unless you instruct Eaton Vance, or your financial advisor, otherwise. If you would prefer that your Eaton Vance documents not be householded, please contact Eaton Vance at 1-800-262-1122, or contact your financial advisor. Your instructions that householding not apply to delivery of your Eaton Vance documents will be effective within 30 days of receipt by Eaton Vance or your financial advisor.
Portfolio Holdings. Each Eaton Vance Fund and its underlying Portfolio(s) (if applicable) will file a schedule of portfolio holdings on Form N-Q with the SEC for the first and third quarters of each fiscal year. The Form N-Q will be available on the Eaton Vance website at www.eatonvance.com, by calling Eaton Vance at 1-800-262-1122 or in the EDGAR database on the SEC’s website at www.sec.gov. Form N-Q may also be reviewed and copied at the SEC’s public reference room in Washington, D.C. (call 1-800-732-0330 for information on the operation of the public reference room).
Proxy Voting. From time to time, funds are required to vote proxies related to the securities held by the funds. The Eaton Vance Funds or their underlying Portfolios (if applicable) vote proxies according to a set of policies and procedures approved by the Funds’ and Portfolios’ Boards. You may obtain a description of these policies and procedures and information on how the Funds or Portfolios voted proxies relating to portfolio securities during the most recent 12-month period ended June 30, without charge, upon request, by calling 1-800-262-1122 and by accessing the SEC’s website at www.sec.gov.
This Page Intentionally Left Blank
Investment Adviser and Administrator
Eaton Vance Management
Two International Place
Boston, MA 02110
Principal Underwriter*
Eaton Vance Distributors, Inc.
Two International Place
Boston, MA 02110
(617) 482-8260
Custodian
State Street Bank and Trust Company
State Street Financial Center, One Lincoln Street
Boston, MA 02111
Transfer Agent
State Street Bank and Trust Company
State Street Financial Center, One Lincoln Street
Boston, MA 02111
Independent Registered Public Accounting Firm
Deloitte & Touche LLP
200 Berkeley Street
Boston, MA 02116-5022
Fund Offices
Two International Place
Boston, MA 02110
| * | FINRA BrokerCheck. Investors may check the background of their Investment Professional by contacting the Financial Industry Regulatory Authority (FINRA). FINRA BrokerCheck is a free tool to help investors check the professional background of current and former FINRA-registered securities firms and brokers. FINRA BrokerCheck is available by calling 1-800-289-9999 and at www.FINRA.org. The FINRA BrokerCheck brochure describing this program is available to investors at www.FINRA.org. |
2990 12.31.14

Eaton Vance
VT Bond Fund
Annual Report
December 31, 2014

Commodity Futures Trading Commission Registration. Effective December 31, 2012, the Commodity Futures Trading Commission (“CFTC”) adopted certain regulatory changes that subject registered investment companies and advisers to regulation by the CFTC if a fund invests more than a prescribed level of its assets in certain CFTC-regulated instruments (including futures, certain options and swap agreements) or markets itself as providing investment exposure to such instruments. The Fund has claimed an exclusion from the definition of the term “commodity pool operator” under the Commodity Exchange Act. Accordingly, neither the Fund nor the adviser with respect to the operation of the Fund is subject to CFTC regulation. Because of its management of other strategies, the Fund’s adviser is registered with the CFTC as a commodity pool operator and a commodity trading advisor.
Fund shares are not insured by the FDIC and are not deposits or other obligations of, or guaranteed by, any depository institution. Shares are subject to investment risks, including possible loss of principal invested.
This report is prepared for the general information of contract owners. It is authorized for distribution to prospective investors only when preceded or accompanied by a current summary prospectus or prospectus. Before investing, investors should consider carefully the investment objective, risks, and charges and expenses of the Fund. This and other important information is contained in the summary prospectus and prospectus, which can be obtained from a financial advisor. Prospective investors should read the prospectus carefully before investing. For further information, please call 1-800-262-1122.
Annual Report December 31, 2014
Eaton Vance
VT Bond Fund
Table of Contents
| | | | |
Management’s Discussion of Fund Performance | | | 2 | |
| |
Performance | | | 3 | |
| |
Fund Profile | | | 3 | |
| |
Endnotes and Additional Disclosures | | | 4 | |
| |
Fund Expenses | | | 5 | |
| |
Financial Statements | | | 6 | |
| |
Report of Independent Registered Public Accounting Firm | | | 21 | |
| |
Federal Tax Information | | | 22 | |
| |
Management and Organization | | | 23 | |
| |
Important Notices | | | 26 | |
Eaton Vance
VT Bond Fund
December 31, 2014
Management’s Discussion of Fund Performance1
Economic & Market Conditions
For the 12-month period ended December 31, 2014, global equities, corporate credit and interest rates broadly rallied. The U.S. saw growth in employment, manufacturing activity, housing and auto sales during the period. In terms of central bank activity, the Federal Reserve (the Fed) announced in December 2013 that it would begin tapering its quantitative easing program; the Fed ultimately ended its bond purchases pursuant to the program in October 2014.
On the other hand, economies in Europe and Japan were generally weak; both the Bank of Japan and the European Central Bank announced additional stimulus measures. The U.S. dollar gained ground versus other major currencies during the period, reflecting the relative strength of the U.S. economy and the divergence in moves by central banks around the globe.
Emerging markets were influenced during the 12-month period by election results and geopolitical news. These included tensions over Russia’s annexation of the Crimean Peninsula as well as continued instability in the Middle East. In aggregate, sovereign and corporate emerging-market debt spreads tightened slightly, while emerging-market currencies were generally weaker versus the U.S. dollar.
Against this backdrop, the yield on 10-year U.S. Treasurys fell while yields on two-year U.S. Treasurys rose, resulting in a flatter yield curve. Perhaps the most important development was the drop in commodities prices, as measured by the Bloomberg Commodity Index Total Return2, during the second half of the period. Led by an oil price collapse, West Texas Intermediate (WTI) crude prices fell over 40%; this came amidst the highest U.S. output in more than three decades against a backdrop of slowing worldwide energy demand.
Fund Performance
From its inception on September 15, 2014, through period end on December 31, 2014, Eaton Vance VT Bond Fund (the Fund) Initial Class had a total return of –1.39% at net asset value (NAV). By comparison, its benchmark, the Barclays U.S. Government/Credit Bond Index (the Index), returned 2.12% for the same period.
Fund performance relative to the Index was negatively impacted during the period by allocations to high yield credit,
convertible securities and investment-grade credit and not owning any U.S. Treasury or agency issues.
Holdings of high-yield bonds were the single largest asset class detractor to the Fund’s performance relative to the Index for the period. Corporate credit spreads, particularly for below-investment grade credit, widened over comparable maturity Treasurys during the final quarter of 2014.
Foreign exchange detracted from the Fund’s performance relative to the Index for the period. A continued strengthening in the relative value of the U.S. dollar against most other currencies was a drag on the Fund’s performance relative to the Index, as the Fund held securities denominated in local currencies.
The Fund’s performance relative to the Index benefited from investments in common stocks. The Fund’s management team believed the economic fundamentals were favorable for domestic companies, and that the most positively valued asset class was equities.
Although convertible securities as a whole were a detractor from Fund performance relative to the Index for the period, within the asset class several convertible bonds of domestic homebuilders also contributed to relative performance versus the Index.
See Endnotes and Additional Disclosures in this report.
Past performance is no guarantee of future results. Returns are historical and are calculated by determining the percentage change in net asset value (NAV) or offering price (as applicable) with all distributions reinvested. Investment return and principal value will fluctuate so that shares, when redeemed, may be worth more or less than their original cost. Performance less than one year is cumulative. Performance is for the stated time period only; due to market volatility, the Fund’s current performance may be lower or higher than quoted. Returns are before taxes unless otherwise noted.
Eaton Vance
VT Bond Fund
December 31, 2014
Performance2,3
Portfolio Managers Kathleen C. Gaffney, CFA, Stephen C. Concannon, CFA, Michael J. Turgel, CFA and Henry Peabody, CFA
| | | | | | | | | | | | | | | | | | | | |
| % Cumulative Total Returns | | Class Inception Date | | | Performance Inception Date | | | One Year | | | Five Years | | | Since Inception | |
Initial Class at NAV | | | 09/15/2014 | | | | 09/15/2014 | | | | — | | | | — | | | | –1.39 | % |
ADV Class at NAV | | | 09/15/2014 | | | | 09/15/2014 | | | | — | | | | — | | | | –1.32 | |
Barclays U.S. Government/Credit Bond Index | | | — | | | | — | | | | 6.01 | % | | | 4.69 | % | | | 2.12 | % |
| | | | | |
| | | | | | | | | | | | | | | | | | | | |
| % Total Annual Operating Expense Ratios4 | | | | | | | | | | | Initial Class | | | ADV Class | |
Gross | | | | | | | | | | | | | | | 1.21 | % | | | 0.96 | % |
Net | | | | | | | | | | | | | | | 1.20 | | | | 0.95 | |
A line graph is not included since the Fund has less than six months of performance.
Fund Profile
Asset Mix (% of total investments)
Credit Quality (% of bond holdings)5
See Endnotes and Additional Disclosures in this report.
Past performance is no guarantee of future results. Returns are historical and are calculated by determining the percentage change in net asset value (NAV) or offering price (as applicable) with all distributions reinvested. Investment return and principal value will fluctuate so that shares, when redeemed, may be worth more or less than their original cost. Performance less than one year is cumulative. Performance is for the stated time period only; due to market volatility, the Fund’s current performance may be lower or higher than quoted. Returns are before taxes unless otherwise noted.
Eaton Vance
VT Bond Fund
December 31, 2014
Endnotes and Additional Disclosures
| 1 | The views expressed in this report are those of the portfolio manager(s) and are current only through the date stated at the top of this page. These views are subject to change at any time based upon market or other conditions, and Eaton Vance and the Fund(s) disclaim any responsibility to update such views. These views may not be relied upon as investment advice and, because investment decisions are based on many factors, may not be relied upon as an indication of trading intent on behalf of any Eaton Vance fund. This commentary may contain statements that are not historical facts, referred to as “forward looking statements”. The Fund’s actual future results may differ significantly from those stated in any forward looking statement, depending on factors such as changes in securities or financial markets or general economic conditions, the volume of sales and purchases of Fund shares, the continuation of investment advisory, administrative and service contracts, and other risks discussed from time to time in the Fund’s filings with the Securities and Exchange Commission. |
| 2 | Bloomberg Commodity Index Total Return is designed to provide diversified commodity exposure, with weightings based on each underlying commodity’s liquidity and economic significance. Prior to 7/1/14, this Index was named Dow Jones-UBS Commodity Index Total Return. Barclays U.S. Government/Credit Bond Index measures the performance of U.S. Treasuries, government-related and investment-grade U.S. corporate securities with a maturity of one year or more. Unless otherwise stated, index returns do not reflect the effect of any applicable sales charges, commissions, expenses, taxes or leverage, as applicable. It is not possible to invest directly in an index. |
| 3 | There is no sales charge. Insurance-related charges are not included in the calculation of returns. Such expenses would reduce the overall return shown. Please refer to the report for your insurance contract for performance data reflecting insurance-related charges. Performance since inception for an index, if presented, is the performance since the Fund’s or oldest share class’ inception, as applicable. |
| 4 | Source: Fund prospectus. Net expense ratio reflects a contractual expense reimbursement that continues through 4/30/2016. Without the reimbursement, if applicable, performance would have been lower. |
| 5 | Ratings are based on Moody’s, S&P or Fitch, as applicable. If securities are rated differently by the ratings agencies, the higher rating is applied. Ratings, which are subject to change, apply to the creditworthiness of the issuers of the underlying securities and not to the Fund or its shares. Credit ratings measure the quality of a bond based on the issuer’s creditworthiness, with ratings ranging from AAA, being the highest, to D, being the lowest based on S&P’s measures. Ratings of BBB or higher by S&P or Fitch (Baa or higher by Moody’s) are considered to be investment-grade quality. Credit ratings are based largely on the ratings agency’s analysis at the time of rating. The rating assigned to any particular security is not necessarily a reflection of the issuer’s current financial condition and does not necessarily reflect its assessment of the volatility of a security’s market value or of the liquidity of an investment in the security. Holdings designated as “Not Rated” are not rated by the national ratings agencies stated above. |
| | Fund profile subject to change due to active management. |
Eaton Vance
VT Bond Fund
December 31, 2014
Fund Expenses
Example: As a Fund shareholder, you incur ongoing costs, including management fees; distribution and/or service fees; and other Fund expenses. This Example is intended to help you understand your ongoing costs (in dollars) of Fund investing and to compare these costs with the ongoing costs of investing in other mutual funds. The actual expense Example is based on an investment of $1,000 invested at the beginning of the period and held for the entire period (September 15, 2014 – December 31, 2014). The hypothetical expense Example is based on an investment of $1,000 invested for the one-half year period (July 1, 2014 – December 31, 2014).
Actual Expenses: The first section of the table below provides information about actual account values and actual expenses. You may use the information in this section, together with the amount you invested, to estimate the expenses that you paid over the period. Simply divide your account value by $1,000 (for example, an $8,600 account value divided by $1,000 = 8.6), then multiply the result by the number in the first section under the heading entitled “Expenses Paid During Period” to estimate the expenses you paid on your account during this period.
Hypothetical Example for Comparison Purposes: The second section of the table below provides information about hypothetical account values and hypothetical expenses based on the actual Fund expense ratio and an assumed rate of return of 5% per year (before expenses), which is not the actual Fund return. The hypothetical account values and expenses may not be used to estimate the actual ending account balance or expenses you paid for the period. You may use this information to compare the ongoing costs of investing in your Fund and other funds. To do so, compare this 5% hypothetical example with the 5% hypothetical examples that appear in the shareholder reports of the other funds.
Please note that the expenses shown in the table are meant to highlight your ongoing costs only and do not reflect expenses and charges which are, or may be imposed under the variable annuity contract or variable life insurance policy (variable contracts) (if applicable) through which your investment in the Fund is made. Therefore, the second section of the table is useful in comparing ongoing costs associated with an investment in vehicles which fund benefits under variable contracts and to qualified pension and retirement plans, and will not help you determine the relative total costs of investing in the Fund through variable contracts. In addition, if these expenses and charges imposed under the variable contracts were included, your costs would be higher.
| | | | | | | | | | | | | | | | | | |
| | | Beginning
Account Value
(9/15/14) | | | Ending
Account Value
(12/31/14) | | | Expenses Paid
During Period
(9/15/14 – 12/31/14) | | | Annualized
Expense
Ratio | | | |
| | | | | |
| | | | | | | | | | | | | | | | | | |
Actual* | | | | | | | | | | | | | | | |
Initial Class | | $ | 1,000.00 | | | $ | 986.10 | | | $ | 3.53 | *** | | | 1.20 | % | | |
ADV Class | | $ | 1,000.00 | | | $ | 986.80 | | | $ | 2.79 | *** | | | 0.95 | % | | |
| | | | | |
| | | | | | | | | | | | | | | | | | |
* The Fund had not commenced operations on July 1, 2014. Actual expenses are equal to the Fund’s annualized expense ratio for the indicated Class, multiplied by the average account value over the period, multiplied by 108/365 (to reflect the period from commencement of operations on September 15, 2014 to December 31, 2014). The Example assumes that the $1,000 was invested at the net asset value per share determined at the opening of business on September 15, 2014. Expenses shown do not include insurance-related charges. |
| | | | | |
| | | | | | | | | | | | | | | | | | |
| | | Beginning
Account Value
(7/1/14) | | | Ending
Account Value
(12/31/14) | | | Expenses Paid
During Period
(7/1/14 – 12/31/14) | | | Annualized
Expense
Ratio | | | |
| | | | | |
| | | | | | | | | | | | | | | | | | |
Hypothetical** | | | | | | | | | | | | | | | |
(5% return per year before expenses) | | | | | | | | | | | | | | | |
Initial Class | | $ | 1,000.00 | | | $ | 1,019.20 | | | $ | 6.11 | *** | | | 1.20 | % | | |
ADV Class | | $ | 1,000.00 | | | $ | 1,020.40 | | | $ | 4.84 | *** | | | 0.95 | % | | |
| ** | Hypothetical expenses are equal to the Fund’s annualized expense ratio for the indicated Class, multiplied by the average account value over the period, multiplied by 184/365 (to reflect the one-half year period). The Example assumes that the $1,000 was invested at the net asset value per share determined at the opening of business on September 15, 2014. Expenses shown do not include insurance-related charges. |
| *** | Absent an allocation of certain expenses to an affiliate, the expenses would be higher. |
Eaton Vance
VT Bond Fund
December 31, 2014
Portfolio of Investments
| | | | | | | | | | |
| Corporate Bonds & Notes — 18.3% | |
| | | |
| | | | | | | | | | |
| Security | | Principal Amount
(000’s omitted) | | | Value | |
| | | | | | | | | | |
|
Commercial Services — 2.1% | |
Western Union Co. (The), 6.20%, 11/17/36 | | | | $ | 404 | | | $ | 415,700 | |
| | | | | | | | | | | |
| | | | | | | | $ | 415,700 | |
| | | | | | | | | | | |
|
Computers — 3.6% | |
Dell, Inc., 5.40%, 9/10/40 | | | | $ | 654 | | | $ | 578,790 | |
SunGard Availability Services Capital, Inc., 8.75%, 4/1/22(1) | | | | | 216 | | | | 128,520 | |
| | | | | | | | | | | |
| | | | | | | | $ | 707,310 | |
| | | | | | | | | | | |
|
Diversified Financial Services — 0.4% | |
Navient Corp., 5.625%, 8/1/33 | | | | $ | 115 | | | $ | 87,112 | |
| | | | | | | | | | | |
| | | | | | | | $ | 87,112 | |
| | | | | | | | | | | |
|
Home Builders — 1.1% | |
MDC Holdings, Inc., 6.00%, 1/15/43 | | | | $ | 255 | | | $ | 212,925 | |
| | | | | | | | | | | |
| | | | | | | | $ | 212,925 | |
| | | | | | | | | | | |
|
Insurance — 1.0% | |
XL Capital, Ltd., Series E, 6.50%, 10/29/49(2) | | | | $ | 200 | | | $ | 191,500 | |
| | | | | | | | | | | |
| | | | | | | | $ | 191,500 | |
| | | | | | | | | | | |
|
Iron & Steel — 0.7% | |
Cliffs Natural Resources, Inc., 6.25%, 10/1/40 | | | | $ | 241 | | | $ | 126,525 | |
| | | | | | | | | | | |
| | | | | | | | $ | 126,525 | |
| | | | | | | | | | | |
|
Mining — 2.0% | |
Alcoa, Inc., 5.95%, 2/1/37 | | | | $ | 200 | | | $ | 204,942 | |
Southern Copper Corp., 5.25%, 11/8/42 | | | | | 200 | | | | 179,669 | |
| | | | | | | | | | | |
| | | | | | | | $ | 384,611 | |
| | | | | | | | | | | |
|
Oil & Gas — 2.3% | |
Apache Corp., 4.25%, 1/15/44 | | | | $ | 55 | | | $ | 48,255 | |
Continental Resources, Inc., 3.80%, 6/1/24 | | | | | 50 | | | | 44,333 | |
Noble Energy, Inc., 5.05%, 11/15/44 | | | | | 86 | | | | 85,330 | |
Rowan Cos., Inc., 5.40%, 12/1/42 | | | | | 314 | | | | 274,456 | |
| | | | | | | | | | | |
| | | | | | | | $ | 452,374 | |
| | | | | | | | | | | |
|
Pipelines — 1.2% | |
Sabine Pass Liquefaction, LLC, 5.625%, 4/15/23 | | | | $ | 240 | | | $ | 235,800 | |
| | | | | | | | | | | |
| | | | | | | | $ | 235,800 | |
| | | | | | | | | | | |
| | | | | | | | | | |
| Security | | Principal Amount
(000’s omitted) | | | Value | |
| | | | | | | | | | |
|
Retail — 2.0% | |
JC Penney Corp., Inc., 6.375%, 10/15/36 | | | | $ | 580 | | | $ | 381,350 | |
| | | | | | | | | | | |
| | | | | | | | $ | 381,350 | |
| | | | | | | | | | | |
|
Telecommunications — 1.9% | |
Avaya, Inc., 10.50%, 3/1/21(1) | | | | $ | 330 | | | $ | 283,800 | |
Sprint Capital Corp., 6.875%, 11/15/28 | | | | | 100 | | | | 88,500 | |
| | | | | | | | | | | |
| | | | | | | | $ | 372,300 | |
| | | | | | | | | | | |
| |
Total Corporate Bonds & Notes
(identified cost $3,801,760) | | | $ | 3,567,507 | |
| | | | | | | | | | | |
|
| Foreign Corporate Bonds — 14.7% | |
| | | |
| | | | | | | | | | |
| Security | | Principal Amount*
(000’s omitted) | | | Value | |
|
Banks — 3.0% | |
ANZ Bank New Zealand, Ltd., 5.43%, 2/27/19 | | NZD | | | 720 | | | $ | 580,335 | |
| | | | | | | | | | | |
| | | | | | | | $ | 580,335 | |
| | | | | | | | | | | |
|
Engineering & Construction — 0.9% | |
Empresas ICA SAB de CV, 8.875%, 5/29/24(1) | | | | | 200 | | | $ | 183,500 | |
| | | | | | | | | | | |
| | | | | | | | $ | 183,500 | |
| | | | | | | | | | | |
|
Foods — 1.1% | |
Gruma SAB de CV, 4.875%, 12/1/24(1) | | | | | 200 | | | $ | 207,500 | |
| | | | | | | | | | | |
| | | | | | | | $ | 207,500 | |
| | | | | | | | | | | |
|
Mining — 2.5% | |
Barrick Gold Corp., 5.25%, 4/1/42 | | | | | 205 | | | $ | 190,151 | |
Newcrest Finance Pty, Ltd., 4.20%, 10/1/22(1) | | | | | 160 | | | | 144,593 | |
Newcrest Finance Pty, Ltd., 5.75%, 11/15/41(1) | | | | | 167 | | | | 147,140 | |
| | | | | | | | | | | |
| | | | | | | | $ | 481,884 | |
| | | | | | | | | | | |
|
Miscellaneous Manufacturing — 2.1% | |
Bombardier, Inc., 7.45%, 5/1/34(1) | | | | | 400 | | | $ | 410,000 | |
| | | | | | | | | | | |
| | | | | | | | $ | 410,000 | |
| | | | | | | | | | | |
|
Oil & Gas — 2.7% | |
Ecopetrol SA, 5.875%, 5/28/45 | | | | | 105 | | | $ | 97,650 | |
Ensco PLC, 5.75%, 10/1/44 | | | | | 48 | | | | 47,721 | |
Pacific Drilling SA, 5.375%, 6/1/20(1) | | | | | 155 | | | | 127,875 | |
| | | | |
| | 6 | | See Notes to Financial Statements. |
Eaton Vance
VT Bond Fund
December 31, 2014
Portfolio of Investments — continued
| | | | | | | | | | |
| Security | | Principal Amount*
(000’s omitted) | | | Value | |
| | | | | | | | | | |
|
Oil & Gas (continued) | |
Pacific Rubiales Energy Corp., 5.625%, 1/19/25(1) | | | | | 100 | | | $ | 77,000 | |
Petrobras Global Finance BV, 5.625%, 5/20/43 | | | | | 220 | | | | 180,455 | |
| | | | | | | | | | | |
| | | | | | | | $ | 530,701 | |
| | | | | | | | | | | |
|
Telecommunications — 2.4% | |
Axtel SAB de CV, 8.00% to 1/31/15, 1/31/20(1)(3) | | | | | 100 | | | $ | 97,125 | |
Telecom Italia Capital SA, 6.00%, 9/30/34 | | | | | 95 | | | | 95,475 | |
Telemar Norte Leste SA,
5.50%, 10/23/20(1) | | | | | 300 | | | | 280,500 | |
| | | | | | | | | | | |
| | | | | | | | $ | 473,100 | |
| | | | | | | | | | | |
| |
Total Foreign Corporate Bonds
(identified cost $2,950,521) | | | $ | 2,867,020 | |
| | | | | | | | | | | |
|
| Foreign Government Bonds — 11.3% | |
| | | |
| | | | | | | | | | |
| Security | | Principal Amount (000’s omitted) | | | Value | |
| | | |
Brazil — 2.2% | | | | | | | | | | |
Brazil Nota do Tesouro Nacional, 10.00%, 1/1/21 | | BRL | | | 960 | | | $ | 326,693 | |
Federative Republic of Brazil, 12.50%, 1/5/16 | | BRL | | | 250 | | | | 95,224 | |
| | | | | | | | | | | |
| | | | | | | | $ | 421,917 | |
| | | | | | | | | | | |
|
Mexico — 3.5% | |
Mexican Bonos, 7.75%, 5/29/31 | | MXN | | | 7,520 | | | $ | 580,034 | |
Mexican Bonos, 7.75%, 11/13/42 | | MXN | | | 1,382 | | | | 108,104 | |
| | | | | | | | | | | |
| | | | | | | | $ | 688,138 | |
| | | | | | | | | | | |
|
Supranational — 5.6% | |
European Bank for Reconstruction & Development, 6.00%, 3/3/16 | | INR | | | 23,900 | | | $ | 378,629 | |
Inter-American Development Bank, 6.10%, 9/2/16 | | INR | | | 1,200 | | | | 19,291 | |
Inter-American Development Bank, 7.20%, 11/14/17 | | IDR | | | 3,640,000 | | | | 285,204 | |
International Bank for Reconstruction & Development, 10.00%, 1/21/15 | | BRL | | | 115 | | | | 43,457 | |
International Finance Corp., 6.30%, 11/25/24 | | INR | | | 3,910 | | | | 63,225 | |
International Finance Corp., 8.25%, 6/10/21 | | INR | | | 16,650 | | | | 303,065 | |
| | | | | | | | | | | |
| | | | | | | | $ | 1,092,871 | |
| | | | | | | | | | | |
| |
Total Foreign Government Bonds
(identified cost $2,297,492) | | | $ | 2,202,926 | |
| | | | | | | | | | | |
| | | | | | | | | | |
| Convertible Bonds — 10.7% | |
| | | |
| | | | | | | | | | |
| Security | | Principal Amount (000’s omitted) | | | Value | |
| | | | | | | | | | |
|
Home Builders — 8.6% | |
KB Home, 1.375%, 2/1/19 | | | | $ | 445 | | | $ | 443,331 | |
Lennar Corp., 3.25%, 11/15/21(1) | | | | | 230 | | | | 446,775 | |
Ryland Group, Inc. (The), 0.25%, 6/1/19 | | | | | 530 | | | | 493,231 | |
Standard Pacific Corp., 1.25%, 8/1/32 | | | | | 255 | | | | 287,194 | |
| | | | | | | | | | | |
| | | | | | | | $ | 1,670,531 | |
| | | | | | | | | | | |
|
Machinery – Diversified — 0.9% | |
Chart Industries, Inc., 2.00%, 8/1/18 | | | | $ | 190 | | | $ | 182,756 | |
| | | | | | | | | | | |
| | | | | | | | $ | 182,756 | |
| | | | | | | | | | | |
|
Oil & Gas — 0.2% | |
American Energy - Permian Basin, LLC, 8.00% to 5/1/15, 5/1/22(1)(3)(4) | | | | $ | 50 | | | $ | 43,750 | |
| | | | | | | | | | | |
| | | | | | | | $ | 43,750 | |
| | | | | | | | | | | |
|
Telecommunications — 1.0% | |
Ciena Corp., 3.75%, 10/15/18(1) | | | | $ | 155 | | | $ | 192,685 | |
| | | | | | | | | | | |
| | | | | | | | $ | 192,685 | |
| | | | | | | | | | | |
| |
Total Convertible Bonds
(identified cost $2,093,846) | | | $ | 2,089,722 | |
| | | | | | | | | | | |
|
| Asset-Backed Securities — 1.6% | |
| | | |
| | | | | | | | | | |
| Security | | Principal Amount (000’s omitted) | | | Value | |
CAH, Series 2014-2A, Class D, 2.512%, 7/17/31(1)(5) | | | | $ | 110 | | | $ | 108,381 | |
SCFT, Series 2014-AA, Class B, 4.61%, 10/25/27(1) | | | | | 205 | | | | 207,404 | |
| | | | | | | | | | | |
| |
Total Asset-Backed Securities
(identified cost $311,921) | | | $ | 315,785 | |
| | | | | | | | | | | |
|
| Commercial Mortgage-Backed Securities — 4.0% | |
| | | |
| | | | | | | | | | |
| Security | | Principal Amount (000’s omitted) | | | Value | |
ACRE, Series 2010-ARTA, Class D, 7.443%, 1/14/29(1) | | | | $ | 100 | | | $ | 113,807 | |
COMM, Series 2013-CR10, Class D, 4.795%, 8/10/46(1)(6) | | | | | 150 | | | | 147,362 | |
COMM, Series 2014-CR21, Class D, 3.919%, 12/10/47(1)(6) | | | | | 200 | | | | 175,247 | |
COMM, Series 2014-LC17, Class D, 3.687%, 10/10/47(1) | | | | | 100 | | | | 83,334 | |
| | | | |
| | 7 | | See Notes to Financial Statements. |
Eaton Vance
VT Bond Fund
December 31, 2014
Portfolio of Investments — continued
| | | | | | | | | | |
| Security | | Principal Amount (000’s omitted) | | | Value | |
| | | | | | | | | | |
JPMBB, Series 2014-C23, Class D, 3.961%, 9/15/47(1)(6) | | | | $ | 100 | | | $ | 89,114 | |
JPMBB, Series 2014-C25, Class D, 3.95%, 11/15/47(1)(6) | | | | | 200 | | | | 175,918 | |
| | | | | | | | | | | |
| |
Total Commercial Mortgage-Backed Securities
(identified cost $772,614) | | | $ | 784,782 | |
| | | | | | | | | | | |
|
| Senior Floating-Rate Interests — 1.0%(7) | |
| | | |
| | | | | | | | | | |
| Borrower/Tranche Description | | Principal Amount (000’s omitted) | | | Value | |
|
Business Equipment and Services — 1.0% | |
AlixPartners, LLP, Term Loan - Second Lien, 9.00%, 7/10/21 | | | | $ | 200 | | | $ | 202,333 | |
| | | | | | | | | | | |
| |
Total Senior Floating-Rate Interests
(identified cost $203,865) | | | $ | 202,333 | |
| | | | | | | | | | | |
|
| Tax-Exempt Investments — 0.2% | |
| | | |
| | | | | | | | | | |
| Security | | Principal Amount (000’s omitted) | | | Value | |
|
Insured – Special Tax Revenue — 0.2% | |
Puerto Rico Sales Tax Financing Corp., (NPFG), 0.00%, 8/1/44 | | | | $ | 95 | | | $ | 14,216 | |
Puerto Rico Sales Tax Financing Corp., (NPFG), 0.00%, 8/1/45 | | | | | 235 | | | | 32,980 | |
| | | | | | | | | | | |
| |
Total Tax-Exempt Investments
(identified cost $46,234) | | | $ | 47,196 | |
| | | | | | | | | | | |
|
| U.S. Treasury Obligations — 12.7% | |
| | | |
| | | | | | | | | | |
| Security | | Principal Amount (000’s omitted) | | | Value | |
U.S. Treasury Notes, 2.25%, 1/31/15 | | | | $ | 2,470 | | | $ | 2,474,342 | |
| | | | | | | | | | | |
| |
Total U.S. Treasury Obligations
(identified cost $2,474,460) | | | $ | 2,474,342 | |
| | | | | | | | | | | |
|
| Common Stocks — 19.9% | |
| | | |
| | | | | | | | | | |
| Security | | | | Shares | | | Value | |
|
Banks — 2.3% | |
Bank of America Corp. | | | | | 10,303 | | | $ | 184,321 | |
Regions Financial Corp. | | | | | 25,067 | | | | 264,707 | |
| | | | | | | | | | | |
| | | | | | | | $ | 449,028 | |
| | | | | | | | | | | |
| | | | | | | | | | |
| Security | | | | Shares | | | Value | |
| | | | | | | | | | |
|
Beverages — 1.9% | |
Constellation Brands, Inc., Class A(8) | | | | | 3,728 | | | $ | 365,978 | |
| | | | | | | | | | | |
| | | | | | | | $ | 365,978 | |
| | | | | | | | | | | |
|
Chemicals — 1.7% | |
LyondellBasell Industries NV, Class A | | | | | 2,842 | | | $ | 225,626 | |
PPG Industries, Inc. | | | | | 516 | | | | 119,274 | |
| | | | | | | | | | | |
| | | | | | | | $ | 344,900 | |
| | | | | | | | | | | |
|
Health Care – Services — 1.4% | |
Amsurg Corp.(8) | | | | | 1,910 | | | $ | 104,535 | |
Humana, Inc. | | | | | 1,183 | | | | 169,914 | |
| | | | | | | | | | | |
| | | | | | | | $ | 274,449 | |
| | | | | | | | | | | |
|
Machinery – Construction & Mining — 1.5% | |
Caterpillar, Inc. | | | | | 3,160 | | | $ | 289,235 | |
| | | | | | | | | | | |
| | | | | | | | $ | 289,235 | |
| | | | | | | | | | | |
|
Media — 1.0% | |
Walt Disney Co. (The) | | | | | 2,196 | | | $ | 206,841 | |
| | | | | | | | | | | |
| | | | | | | | $ | 206,841 | |
| | | | | | | | | | | |
|
Mining — 0.6% | |
Freeport-McMoRan, Inc. | | | | | 4,908 | | | $ | 114,651 | |
| | | | | | | | | | | |
| | | | | | | | $ | 114,651 | |
| | | | | | | | | | | |
|
Miscellaneous Manufacturing — 1.2% | |
Ingersoll-Rand PLC | | | | | 3,674 | | | $ | 232,895 | |
| | | | | | | | | | | |
| | | | | | | | $ | 232,895 | |
| | | | | | | | | | | |
|
Oil & Gas — 1.0% | |
California Resources Corp.(8) | | | | | 702 | | | $ | 3,868 | |
Occidental Petroleum Corp. | | | | | 1,755 | | | | 141,470 | |
Seven Generations Energy, Ltd., Class A(8) | | | | | 3,182 | | | | 47,903 | |
| | | | | | | | | | | |
| | | | | | | | $ | 193,241 | |
| | | | | | | | | | | |
|
Pharmaceuticals — 0.8% | |
Eli Lilly & Co. | | | | | 2,273 | | | $ | 156,814 | |
| | | | | | | | | | | |
| | | | | | | | $ | 156,814 | |
| | | | | | | | | | | |
|
Pipelines — 1.7% | |
Kinder Morgan, Inc. | | | | | 7,759 | | | $ | 328,283 | |
| | | | | | | | | | | |
| | | | | | | | $ | 328,283 | |
| | | | | | | | | | | |
| | | | |
| | 8 | | See Notes to Financial Statements. |
Eaton Vance
VT Bond Fund
December 31, 2014
Portfolio of Investments — continued
| | | | | | | | | | |
| Security | | | | Shares | | | Value | |
| | | | | | | | | | |
|
Real Estate Investment Trusts (REITs) — 0.4% | |
American Realty Capital Properties, Inc. | | | | | 8,641 | | | $ | 78,201 | |
| | | | | | | | | | | |
| | | | | | | | $ | 78,201 | |
| | | | | | | | | | | |
|
Semiconductors — 1.7% | |
Intel Corp. | | | | | 9,324 | | | $ | 338,368 | |
| | | | | | | | | | | |
| | | | | | | | $ | 338,368 | |
| | | | | | | | | | | |
|
Telecommunications — 2.7% | |
Corning, Inc. | | | | | 12,786 | | | $ | 293,183 | |
Telefonaktiebolaget LM Ericsson ADR | | | | | 18,940 | | | | 229,174 | |
| | | | | | | | | | | |
| | | | | | | | $ | 522,357 | |
| | | | | | | | | | | |
| |
Total Common Stocks
(identified cost $3,769,689) | | | $ | 3,895,241 | |
| | | | | | | | | | | |
|
| Convertible Preferred Stocks — 3.4% | |
| | | |
| | | | | | | | | | |
| Security | | | | Shares | | | Value | |
|
Foods — 1.6% | |
Post Holdings, Inc., 2.50%(1) | | | | | 1,940 | | | $ | 163,566 | |
Post Holdings, Inc., 5.25% | | | | | 1,800 | | | | 159,561 | |
| | | | | | | | | | | |
| | | | | | | | $ | 323,127 | |
| | | | | | | | | | | |
|
Health Care – Products — 0.2% | |
Alere, Inc., 3.00% | | | | | 140 | | | $ | 43,785 | |
| | | | | | | | | | | |
| | | | | | | | $ | 43,785 | |
| | | | | | | | | | | |
|
Iron & Steel — 0.4% | |
Cliffs Natural Resources, Inc., 7.00% | | | | | 10,865 | | | $ | 73,257 | |
| | | | | | | | | | | |
| | | | | | | | $ | 73,257 | |
| | | | | | | | | | | |
|
Oil & Gas — 0.2% | |
SandRidge Energy, Inc., 8.50% | | | | | 1,000 | | | $ | 41,938 | |
| | | | | | | | | | | |
| | | | | | | | $ | 41,938 | |
| | | | | | | | | | | |
|
Real Estate Investment Trusts (REITs) — 1.0% | |
iStar Financial, Inc., Series J, 4.50% | | | | | 3,200 | | | $ | 189,984 | |
| | | | | | | | | | | |
| | | | | | | | $ | 189,984 | |
| | | | | | | | | | | |
| |
Total Convertible Preferred Stocks
(identified cost $791,288) | | | $ | 672,091 | |
| | | | | | | | | | | |
| | | | | | | | | | |
| Preferred Stocks — 1.6% | |
| | | |
| | | | | | | | | | |
| Security | | | | Shares | | | Value | |
| | | | | | | | | | |
|
Diversified Financial Services — 1.5% | |
SLM Corp., 1.941%(5) | | | | | 4,350 | | | $ | 287,915 | |
| | | | | | | | | | | |
| | | | | | | | $ | 287,915 | |
| | | | | | | | | | | |
|
Real Estate Investment Trusts (REITs) — 0.1% | |
Ventas Realty LP/Ventas Capital Corp., 5.45% | | | | | 604 | | | $ | 14,919 | |
| | | | | | | | | | | |
| | | | | | | | $ | 14,919 | |
| | | | | | | | | | | |
| |
Total Preferred Stocks
(identified cost $309,818) | | | $ | 302,834 | |
| | | | | | | | | | | |
| |
Total Investments — 99.4%
(identified cost $19,823,508) | | | $ | 19,421,779 | |
| | | | | | | | | | | |
| |
Other Assets, Less Liabilities — 0.6% | | | $ | 108,671 | |
| | | | | | | | | | | |
| |
Net Assets — 100.0% | | | $ | 19,530,450 | |
| | | | | | | | | | | |
The percentage shown for each investment category in the Portfolio of Investments is based on net assets.
| | | | |
| ADR | | – | | American Depositary Receipt |
| ACRE | | – | | Americold LLC Trust |
| CAH | | – | | Colony American Homes |
| COMM | | – | | Commercial Mortgage Trust |
| JPMBB | | – | | JPMBB Commercial Mortgage Securities Trust |
| NPFG | | – | | National Public Finance Guaranty Corp. |
| SCFT | | – | | SpringCastle Funding Trust |
| BRL | | – | | Brazilian Real |
| IDR | | – | | Indonesian Rupiah |
| INR | | – | | Indian Rupee |
| MXN | | – | | Mexican Peso |
| NZD | | – | | New Zealand Dollar |
| | * | In U.S. dollars unless otherwise indicated. |
| (1) | Security exempt from registration pursuant to Rule 144A under the Securities Act of 1933. These securities may be sold in certain transactions (normally to qualified institutional buyers) and remain exempt from registration. At December 31, 2014, the aggregate value of these securities is $4,034,896 or 20.7% of the Fund’s net assets. |
| (2) | Security converts to floating rate after the indicated fixed-rate coupon period. |
| (3) | Multi-step coupon bond. Interest rate represents the rate in effect at December 31, 2014. |
| (4) | Represents a payment-in-kind security which may pay all or a portion of interest in additional principal at the issuer’s discretion. |
| (5) | Variable rate security. The stated interest rate represents the rate in effect at December 31, 2014. |
| | | | |
| | 9 | | See Notes to Financial Statements. |
Eaton Vance
VT Bond Fund
December 31, 2014
Portfolio of Investments — continued
| (6) | Weighted average fixed-rate coupon that changes/updates monthly. Rate shown is the rate at December 31, 2014. |
| (7) | Senior floating-rate interests (Senior Loans) often require prepayments from excess cash flows or permit the borrowers to repay at their election. The degree to which borrowers repay, whether as a contractual requirement or at their election, cannot be predicted with accuracy. As a result, the actual remaining maturity may be substantially less than the stated maturities shown. However, Senior Loans will have an expected average life of approximately two to four years. The stated interest rate represents the weighted average interest rate of all contracts within the senior loan facility and includes commitment fees on unfunded loan commitments, if any. Senior Loans typically have rates of interest which are redetermined either daily, monthly, quarterly or semi-annually by reference to a base lending rate, plus a premium. These base lending rates are primarily the London Interbank Offered Rate (“LIBOR”) and secondarily, the prime rate offered by one or more major United States banks (the “Prime Rate”) and the certificate of deposit (“CD”) rate or other base lending rates used by commercial lenders. |
| (8) | Non-income producing security. |
| | | | | | | | |
| Country Concentration of Portfolio (based on country of risk) | |
| | |
| | | | | | | | |
| Country | | Percentage
of Net Assets | | | Value | |
United States | | | 72.0 | % | | $ | 14,058,852 | |
Mexico | | | 6.0 | | | | 1,176,263 | |
Supranational | | | 5.6 | | | | 1,092,871 | |
Brazil | | | 4.5 | | | | 882,872 | |
Canada | | | 3.3 | | | | 648,054 | |
New Zealand | | | 3.0 | | | | 580,335 | |
Australia | | | 1.5 | | | | 291,733 | |
Sweden | | | 1.2 | | | | 229,174 | |
Ireland | | | 1.0 | | | | 191,500 | |
Colombia | | | 0.9 | | | | 174,650 | |
Italy | | | 0.4 | | | | 95,475 | |
| | |
Total Investments | | | 99.4 | % | | $ | 19,421,779 | |
| | |
| | | | | | | | |
| Currency Concentration of Portfolio | |
| | |
| | | | | | | | |
| Currency | | Percentage
of Net Assets | | | Value | |
United States Dollar | | | 84.9 | % | | $ | 16,590,615 | |
Indian Rupee | | | 3.9 | | | | 764,210 | |
Mexican Peso | | | 3.5 | | | | 688,138 | |
New Zealand Dollar | | | 3.0 | | | | 580,335 | |
Brazilian Real | | | 2.4 | | | | 465,374 | |
Indonesian Rupiah | | | 1.5 | | | | 285,204 | |
Canadian Dollar | | | 0.2 | | | | 47,903 | |
| | |
Total Investments | | | 99.4 | % | | $ | 19,421,779 | |
| | |
| | | | |
| | 10 | | See Notes to Financial Statements. |
Eaton Vance
VT Bond Fund
December 31, 2014
Statement of Assets and Liabilities
| | | | |
| Assets | | December 31, 2014 | |
Investments, at value (identified cost, $19,823,508) | | $ | 19,421,779 | |
Foreign currency, at value (identified cost, $20,197) | | | 19,971 | |
Dividends receivable | | | 5,797 | |
Interest receivable | | | 180,210 | |
Receivable from affiliate | | | 3,533 | |
Total assets | | $ | 19,631,290 | |
|
| Liabilities | |
Due to custodian | | $ | 43,669 | |
Payable to affiliates: | | | | |
Investment adviser fee | | | 9,125 | |
Distribution fees | | | 2 | |
Trustees’ fees | | | 125 | |
Accrued expenses | | | 47,919 | |
Total liabilities | | $ | 100,840 | |
Net Assets | | $ | 19,530,450 | |
|
| Sources of Net Assets | |
Paid-in capital | | $ | 19,996,609 | |
Accumulated net realized loss | | | (61,196 | ) |
Accumulated distributions in excess of net investment income | | | (1,391 | ) |
Net unrealized depreciation | | | (403,572 | ) |
Total | | $ | 19,530,450 | |
|
| Initial Class Shares | |
Net Assets | | $ | 9,765 | |
Shares Outstanding | | | 1,000 | |
Net Asset Value and Redemption Price Per Share | | | | |
(net assets ÷ shares of beneficial interest outstanding) | | $ | 9.76 | |
|
| ADV Class Shares | |
Net Assets | | $ | 19,520,685 | |
Shares Outstanding | | | 1,999,000 | |
Net Asset Value, Offering Price and Redemption Price Per Share | | | | |
(net assets ÷ shares of beneficial interest outstanding) | | $ | 9.77 | |
| | | | |
| | 11 | | See Notes to Financial Statements. |
Eaton Vance
VT Bond Fund
December 31, 2014
Statement of Operations
| | | | |
| Investment Income | | Period Ended
December 31, 2014(1) | |
Interest (net of foreign taxes, $1,513) | | $ | 166,370 | |
Dividends | | | 34,898 | |
Interest allocated from affiliated investment | | | 88 | |
Expenses allocated from affiliated investment | | | (10 | ) |
Total investment income | | $ | 201,346 | |
| |
| Expenses | | | | |
Investment adviser fee | | $ | 31,795 | |
Distribution fees | | | | |
Initial Class | | | 7 | |
Trustees’ fees and expenses | | | 125 | |
Custodian fee | | | 10,370 | |
Transfer and dividend disbursing agent fees | | | 3,502 | |
Legal and accounting services | | | 43,457 | |
Printing and postage | | | 1,238 | |
Miscellaneous | | | 1,141 | |
Total expenses | | $ | 91,635 | |
Deduct — | | | | |
Allocation of expenses to affiliate | | $ | 36,596 | |
Reduction of custodian fee | | | 31 | |
Total expense reductions | | $ | 36,627 | |
| |
Net expenses | | $ | 55,008 | |
| |
Net investment income | | $ | 146,338 | |
| |
| Realized and Unrealized Gain (Loss) | | | | |
Net realized gain (loss) — | | | | |
Investment transactions | | $ | (12,604 | ) |
Foreign currency transactions | | | (1,720 | ) |
Net realized loss | | $ | (14,324 | ) |
Change in unrealized appreciation (depreciation) — | | | | |
Investments | | $ | (401,729 | ) |
Foreign currency | | | (1,843 | ) |
Net change in unrealized appreciation (depreciation) | | $ | (403,572 | ) |
| |
Net realized and unrealized loss | | $ | (417,896 | ) |
| |
Net decrease in net assets from operations | | $ | (271,558 | ) |
| (1) | For the period from the start of business, September 15, 2014, to December 31, 2014. |
| | | | |
| | 12 | | See Notes to Financial Statements. |
Eaton Vance
VT Bond Fund
December 31, 2014
Statement of Changes in Net Assets
| | | | |
| Increase (Decrease) in Net Assets | | Period Ended December 31, 2014(1) | |
From operations — | | | | |
Net investment income | | $ | 146,338 | |
Net realized loss from investment and foreign currency transactions | | | (14,324 | ) |
Net change in unrealized appreciation (depreciation) from investments and foreign currency | | | (403,572 | ) |
Net decrease in net assets from operations | | $ | (271,558 | ) |
Distributions to shareholders — | | | | |
From net investment income | | | | |
Initial Class | | $ | (89 | ) |
ADV Class | | | (194,516 | ) |
Tax return of capital | | | | |
Initial Class | | | (2 | ) |
ADV Class | | | (3,385 | ) |
Total distributions to shareholders | | $ | (197,992 | ) |
Transactions in shares of beneficial interest — | | | | |
Proceeds from sale of shares | | | | |
Initial Class | | $ | 10,000 | |
ADV Class | | | 19,990,000 | |
Net increase in net assets from Fund share transactions | | $ | 20,000,000 | |
| |
Net increase in net assets | | $ | 19,530,450 | |
| |
| Net Assets | | | | |
At beginning of period | | $ | — | |
At end of period | | $ | 19,530,450 | |
| |
| Accumulated distributions in excess of net investment income | | | | |
At end of period | | $ | (1,391 | ) |
| (1) | For the period from the start of business, September 15, 2014, to December 31, 2014. |
| | | | |
| | 13 | | See Notes to Financial Statements. |
Eaton Vance
VT Bond Fund
December 31, 2014
Financial Highlights
| | | | |
| | | Initial Class | |
| | | Period Ended December 31, 2014(1) | |
Net asset value — Beginning of period | | $ | 10.000 | |
| |
| Income (Loss) From Operations | | | | |
Net investment income(2) | | $ | 0.065 | |
Net realized and unrealized loss | | | (0.214 | ) |
| |
Total loss from operations | | $ | (0.149 | ) |
| |
| Less Distributions | | | | |
From net investment income | | $ | (0.089 | ) |
Tax return of capital | | | (0.002 | ) |
| |
Total distributions | | $ | (0.091 | ) |
| |
Net asset value — End of period | | $ | 9.760 | |
| |
Total Return(3) | | | (1.39 | )%(4) |
| |
| Ratios/Supplemental Data | | | | |
Net assets, end of period (000’s omitted) | | $ | 10 | |
Ratios (as a percentage of average daily net assets): | | | | |
Expenses(5)(6) | | | 1.20 | %(7) |
Net investment income | | | 2.26 | %(7) |
Portfolio Turnover | | | 5 | %(4) |
| (1) | For the period from the start of business, September 15, 2014, to December 31, 2014. |
| (2) | Computed using average shares outstanding. |
| (3) | Returns are historical and are calculated by determining the percentage change in net asset value with all distributions reinvested. |
| (5) | The investment adviser and administrator subsidized certain operating expenses (equal to 0.63% of average daily net assets for the period ended December 31, 2014). Absent this subsidy, total return would be lower. |
| (6) | Excludes the effect of custody fee credits, if any, of less than 0.005%. |
| | | | |
| | 14 | | See Notes to Financial Statements. |
Eaton Vance
VT Bond Fund
December 31, 2014
Financial Highlights — continued
| | | | |
| | | ADV Class | |
| | | Period Ended
December 31, 2014(1) | |
Net asset value — Beginning of period | | $ | 10.000 | |
| |
| Income (Loss) From Operations | | | | |
Net investment income(2) | | $ | 0.073 | |
Net realized and unrealized loss | | | (0.204 | ) |
| |
Total loss from operations | | $ | (0.131 | ) |
| |
| Less Distributions | | | | |
From net investment income | | $ | (0.097 | ) |
Tax return of capital | | | (0.002 | ) |
| |
Total distributions | | $ | (0.099 | ) |
| |
Net asset value — End of period | | $ | 9.770 | |
| |
Total Return(3) | | | (1.32 | )%(4) |
| |
| Ratios/Supplemental Data | | | | |
Net assets, end of period (000’s omitted) | | $ | 19,521 | |
Ratios (as a percentage of average daily net assets): | | | | |
Expenses(5)(6) | | | 0.95 | %(7) |
Net investment income | | | 2.53 | %(7) |
Portfolio Turnover | | | 5 | %(4) |
| (1) | For the period from the start of business, September 15, 2014, to December 31, 2014. |
| (2) | Computed using average shares outstanding. |
| (3) | Returns are historical and are calculated by determining the percentage change in net asset value with all distributions reinvested. |
| (5) | The investment adviser and administrator subsidized certain operating expenses (equal to 0.63% of average daily net assets for the period ended December 31, 2014). Absent this subsidy, total return would be lower. |
| (6) | Excludes the effect of custody fee credits, if any, of less than 0.005%. |
| | | | |
| | 15 | | See Notes to Financial Statements. |
Eaton Vance
VT Bond Fund
December 31, 2014
Notes to Financial Statements
1 Significant Accounting Policies
Eaton Vance VT Bond Fund (the Fund) is a non-diversified series of Eaton Vance Variable Trust (the Trust). The Trust is a Massachusetts business trust registered under the Investment Company Act of 1940, as amended (the 1940 Act), as an open-end management investment company. The Fund commenced operations on September 15, 2014. The Fund’s investment objective is total return. The Fund offers Initial Class and ADV Class shares. Each class represents a pro-rata interest in the Fund, but votes separately on class-specific matters and (as noted below) is subject to different expenses. Realized and unrealized gains and losses and net investment income and losses, other than class specific expenses, are allocated daily to each class of shares based on the relative net assets of each class to the total net assets of the Fund. Each class of shares differs in its distribution plan and certain other class-specific expenses. The Fund is generally made available for purchase only to separate accounts established by participating insurance companies and qualified pension or retirement plans.
The following is a summary of significant accounting policies of the Fund. The policies are in conformity with accounting principles generally accepted in the United States of America (U.S. GAAP). The Fund is an investment company and follows accounting and reporting guidance in the Financial Accounting Standards Board (“FASB”) Accounting Standards Codification Topic 946.
A Investment Valuation��— The following methodologies are used to determine the market value or fair value of investments.
Debt Obligations. Debt obligations (including short-term obligations with a remaining maturity of more than sixty days) are generally valued on the basis of valuations provided by third party pricing services, as derived from such services’ pricing models. Inputs to the models may include, but are not limited to, reported trades, executable bid and asked prices, broker/dealer quotations, prices or yields of securities with similar characteristics, interest rates, anticipated prepayments, benchmark curves or information pertaining to the issuer, as well as industry and economic events. The pricing services may use a matrix approach, which considers information regarding securities with similar characteristics to determine the valuation for a security. Short-term obligations purchased with a remaining maturity of sixty days or less are generally valued at amortized cost, which approximates market value.
Senior Floating-Rate Loans. Interests in senior floating-rate loans (Senior Loans) for which reliable market quotations are readily available are valued generally at the average mean of bid and ask quotations obtained from a third party pricing service. Other Senior Loans are valued at fair value by the investment adviser under procedures approved by the Trustees. In fair valuing a Senior Loan, the investment adviser utilizes one or more of the valuation techniques described in (i) through (iii) below to assess the likelihood that the borrower will make a full repayment of the loan underlying such Senior Loan relative to yields on other Senior Loans issued by companies of comparable credit quality. If the investment adviser believes that there is a reasonable likelihood of full repayment, the investment adviser will determine fair value using a matrix pricing approach that considers the yield on the Senior Loan. If the investment adviser believes there is not a reasonable likelihood of full repayment, the investment adviser will determine fair value using analyses that include, but are not limited to: (i) a comparison of the value of the borrower’s outstanding equity and debt to that of comparable public companies; (ii) a discounted cash flow analysis; or (iii) when the investment adviser believes it is likely that a borrower will be liquidated or sold, an analysis of the terms of such liquidation or sale. In certain cases, the investment adviser will use a combination of analytical methods to determine fair value, such as when only a portion of a borrower’s assets are likely to be sold. In conducting its assessment and analyses for purposes of determining fair value of a Senior Loan, the investment adviser will use its discretion and judgment in considering and appraising relevant factors. Fair value determinations are made by the portfolio managers of the Fund based on information available to such managers. The portfolio managers of other funds managed by the investment adviser that invest in Senior Loans may not possess the same information about a Senior Loan borrower as the portfolio managers of the Fund. At times, the fair value of a Senior Loan determined by the portfolio managers of other funds managed by the investment adviser that invest in Senior Loans may vary from the fair value of the same Senior Loan determined by the portfolio managers of the Fund. The fair value of each Senior Loan is periodically reviewed and approved by the investment adviser’s Valuation Committee and by the Trustees based upon procedures approved by the Trustees. Junior Loans (i.e., subordinated loans and second lien loans) are valued in the same manner as Senior Loans.
Equity Securities. Equity securities listed on a U.S. securities exchange generally are valued at the last sale or closing price on the day of valuation or, if no sales took place on such date, at the mean between the closing bid and asked prices therefore on the exchange where such securities are principally traded. Equity securities listed on the NASDAQ Global or Global Select Market generally are valued at the NASDAQ official closing price. Unlisted or listed securities for which closing sales prices or closing quotations are not available are valued at the mean between the latest available bid and asked prices or, in the case of preferred equity securities that are not listed or traded in the over-the-counter market, by a third party pricing service that uses various techniques that consider factors including, but not limited to, prices or yields of securities with similar characteristics, benchmark yields, broker/dealer quotes, quotes of underlying common stock, issuer spreads, as well as industry and economic events. The value of preferred equity securities that are valued by a pricing service on a bond basis is adjusted by an income factor, as determined by the investment adviser, to reflect the next anticipated regular dividend.
Foreign Securities and Currencies. Foreign securities and currencies are valued in U.S. dollars, based on foreign currency exchange rate quotations supplied by a third party pricing service. The pricing service uses a proprietary model to determine the exchange rate. Inputs to the model include reported trades and implied bid/ask spreads. The daily valuation of exchange-traded foreign securities generally is determined as of the close of trading on the principal exchange on which such securities trade. Events occurring after the close of trading on foreign exchanges may result in adjustments to the valuation of foreign securities to more accurately reflect their fair value as of the close of regular trading on the New York Stock Exchange. When valuing foreign equity securities that meet certain criteria, the Fund’s Trustees have approved the use of a fair value service that values such securities to reflect market trading that occurs after the close of the applicable foreign markets of comparable securities or other instruments that have a strong correlation to the fair-valued securities.
Eaton Vance
VT Bond Fund
December 31, 2014
Notes to Financial Statements — continued
Affiliated Fund. The Fund may invest in Eaton Vance Cash Reserves Fund, LLC (Cash Reserves Fund), an affiliated investment company managed by Eaton Vance Management (EVM). The value of the Fund’s investment in Cash Reserves Fund reflects the Fund’s proportionate interest in its net assets. Cash Reserves Fund generally values its investment securities utilizing the amortized cost valuation technique in accordance with Rule 2a-7 under the 1940 Act. This technique involves initially valuing a portfolio security at its cost and thereafter assuming a constant amortization to maturity of any discount or premium. If amortized cost is determined not to approximate fair value, Cash Reserves Fund may value its investment securities in the same manner as debt obligations described above.
Fair Valuation. Investments for which valuations or market quotations are not readily available or are deemed unreliable are valued at fair value using methods determined in good faith by or at the direction of the Trustees of the Fund in a manner that fairly reflects the security’s value, or the amount that the Fund might reasonably expect to receive for the security upon its current sale in the ordinary course. Each such determination is based on a consideration of relevant factors, which are likely to vary from one pricing context to another. These factors may include, but are not limited to, the type of security, the existence of any contractual restrictions on the security’s disposition, the price and extent of public trading in similar securities of the issuer or of comparable entities, quotations or relevant information obtained from broker/dealers or other market participants, information obtained from the issuer, analysts, and/or the appropriate stock exchange (for exchange-traded securities), an analysis of the company’s or entity’s financial condition, and an evaluation of the forces that influence the issuer and the market(s) in which the security is purchased and sold.
B Investment Transactions — Investment transactions for financial statement purposes are accounted for on a trade date basis. Realized gains and losses on investments sold are determined on the basis of identified cost.
C Income — Interest income is recorded on the basis of interest accrued, adjusted for amortization of premium or accretion of discount. Withholding taxes on foreign interest and capital gains have been provided for in accordance with the Fund’s understanding of the applicable countries’ tax rules and rates. Fees associated with loan amendments are recognized immediately. Dividend income is recorded on the ex-dividend date for dividends received in cash and/or securities. However, if the ex-dividend date has passed, certain dividends from foreign securities are recorded as the Fund is informed of the ex-dividend date.
D Federal Taxes — The Fund’s policy is to comply with the provisions of the Internal Revenue Code applicable to regulated investment companies and to distribute to shareholders each year substantially all of its net investment income, and all or substantially all of its net realized capital gains. Accordingly, no provision for federal income or excise tax is necessary.
As of December 31, 2014, the Fund had no uncertain tax positions that would require financial statement recognition, de-recognition, or disclosure. The Fund files a U.S. federal income tax return annually after its fiscal year-end, which is subject to examination by the Internal Revenue Service for a period of three years from the date of filing.
E Expenses — The majority of expenses of the Trust are directly identifiable to an individual fund. Expenses which are not readily identifiable to a specific fund are allocated taking into consideration, among other things, the nature and type of expense and the relative size of the funds.
F Expense Reduction — State Street Bank and Trust Company (SSBT) serves as custodian of the Fund. Pursuant to the custodian agreement, SSBT receives a fee reduced by credits, which are determined based on the average daily cash balance the Fund maintains with SSBT. All credit balances, if any, used to reduce the Fund’s custodian fees are reported as a reduction of expenses in the Statement of Operations.
G Foreign Currency Translation — Investment valuations, other assets, and liabilities initially expressed in foreign currencies are translated each business day into U.S. dollars based upon current exchange rates. Purchases and sales of foreign investment securities and income and expenses denominated in foreign currencies are translated into U.S. dollars based upon currency exchange rates in effect on the respective dates of such transactions. Recognized gains or losses on investment transactions attributable to changes in foreign currency exchange rates are recorded for financial statement purposes as net realized gains and losses on investments. That portion of unrealized gains and losses on investments that results from fluctuations in foreign currency exchange rates is not separately disclosed.
H Use of Estimates — The preparation of the financial statements in conformity with U.S. GAAP requires management to make estimates and assumptions that affect the reported amounts of assets and liabilities at the date of the financial statements and the reported amounts of income and expense during the reporting period. Actual results could differ from those estimates.
I Indemnifications — Under the Trust’s organizational documents, its officers and Trustees may be indemnified against certain liabilities and expenses arising out of the performance of their duties to the Fund. Under Massachusetts law, if certain conditions prevail, shareholders of a Massachusetts business trust (such as the Trust) could be deemed to have personal liability for the obligations of the Trust. However, the Trust’s Declaration of Trust contains an express disclaimer of liability on the part of Fund shareholders and the By-laws provide that the Trust shall assume the defense on behalf of any Fund shareholders. Moreover, the By-laws also provide for indemnification out of Fund property of any shareholder held personally liable solely by reason of being or having been a shareholder for all loss or expense arising from such liability. Additionally, in the normal course of business, the Fund enters into agreements with service providers that may contain indemnification clauses. The Fund’s maximum exposure under these arrangements is unknown as this would involve future claims that may be made against the Fund that have not yet occurred.
Eaton Vance
VT Bond Fund
December 31, 2014
Notes to Financial Statements — continued
2 Distributions to Shareholders and Income Tax Information
It is the present policy of the Fund to make monthly distributions of all or substantially all of its net investment income and to distribute annually all or substantially all of its net realized capital gains. Distributions are declared separately for each class of shares. Shareholders may reinvest income and capital gain distributions in additional shares of the same class of the Fund at the net asset value as of the ex-dividend date or, if an election is made on behalf of a separate account, to receive some or all of the distributions in cash. Distributions to shareholders are determined in accordance with income tax regulations, which may differ from U.S. GAAP. As required by U.S. GAAP, only distributions in excess of tax basis earnings and profits are reported in the financial statements as a return of capital. Permanent differences between book and tax accounting relating to distributions are reclassified to paid-in capital. For tax purposes, distributions from short-term capital gains are considered to be from ordinary income.
The tax character of distributions declared for the period ended December 31, 2014 was as follows:
| | | | |
| | | Period Ended
December 31, 2014(1) | |
| |
Distributions declared from: | | | | |
Ordinary income | | $ | 194,605 | |
Tax return of capital | | $ | 3,387 | |
| (1) | For the period from the start of business, September 15, 2014, to December 31, 2014. |
During the period ended December 31, 2014, accumulated net realized loss was increased by $46,872, accumulated distributions in excess of net investment income was decreased by $46,876 and paid-in capital was decreased by $4 due to differences between book and tax accounting, primarily for foreign currency gain (loss), non-deductible expenses, premium amortization and accretion of market discount. These reclassifications had no effect on the net assets or net asset value per share of the Fund.
As of December 31, 2014, the components of distributable earnings (accumulated losses) and unrealized appreciation (depreciation) on a tax basis were as follows:
| | | | |
Deferred capital losses | | $ | (24,364 | ) |
Late year ordinary losses | | $ | (1,391 | ) |
Net unrealized depreciation | | $ | (440,404 | ) |
The differences between components of distributable earnings (accumulated losses) on a tax basis and the amounts reflected in the Statement of Assets and Liabilities are primarily due to premium amortization and accretion of market discount.
At December 31, 2014, the Fund, for federal income tax purposes, had deferred capital losses of $24,364 which will reduce its taxable income arising from future net realized gains on investment transactions, if any, to the extent permitted by the Internal Revenue Code, and thus will reduce the amount of distributions to shareholders, which would otherwise be necessary to relieve the Fund of any liability for federal income or excise tax. The deferred capital losses are treated as arising on the first day of the Fund’s next taxable year and retain the same short-term or long-term character as when originally deferred. Of the deferred capital losses at December 31, 2014, $24,364 are short-term.
Additionally, at December 31, 2014, the Fund had a late year ordinary loss of $1,391, related to certain specified losses realized after October 31, 2014, which it has elected to defer to the following taxable year pursuant to income tax regulations.
The cost and unrealized appreciation (depreciation) of investments of the Fund at December 31, 2014, as determined on a federal income tax basis, were as follows:
| | | | |
| |
Aggregate cost | | $ | 19,860,340 | |
| |
Gross unrealized appreciation | | $ | 414,900 | |
Gross unrealized depreciation | | | (853,461 | ) |
| |
Net unrealized depreciation | | $ | (438,561 | ) |
Eaton Vance
VT Bond Fund
December 31, 2014
Notes to Financial Statements — continued
3 Investment Adviser Fee and Other Transactions with Affiliates
The investment adviser fee is earned by EVM as compensation for investment advisory services rendered to the Fund. The fee is computed at an annual rate of 0.55% of the Fund’s average daily net assets up to $1 billion and at reduced rates on daily net assets of $1 billion or more, and is payable monthly. For the period ended December 31, 2014, the investment adviser fee amounted to $31,795 or 0.55% (annualized) of the Fund’s average daily net assets. EVM has agreed to reimburse the Fund’s expenses to the extent that total annual operating expenses (relating to ordinary operating expenses only) exceed 1.20% and 0.95% of the Fund’s average daily net assets for Initial Class and ADV Class, respectively. This agreement may be changed or terminated after April 30, 2016. Pursuant to this agreement, EVM was allocated $36,596 of the Fund’s operating expenses for the period ended December 31, 2014. EVM also serves as administrator of the Fund, but receives no compensation. Eaton Vance Distributors, Inc. (EVD), the Fund’s principal underwriter and an affiliate of EVM, received distribution fees (see Note 4).
Trustees and officers of the Fund who are members of EVM’s organization receive remuneration for their services to the Fund out of the investment adviser fee. Certain officers and Trustees of the Fund are officers of EVM.
4 Distribution Plan
The Fund has in effect a distribution plan for Initial Class shares (Initial Class Plan) pursuant to Rule 12b-1 under the 1940 Act. Pursuant to the Initial Class Plan, the Fund pays EVD a distribution fee of 0.25% per annum of its average daily net assets attributable to Initial Class shares for the sale and distribution of Initial Class shares. Distribution fees paid or accrued to EVD for the period ended December 31, 2014 amounted to $7. Insurance companies receive such fees from EVD based on the value of shares held by such companies. The insurance companies through which investors hold shares of the Fund may also pay fees to third parties in connection with the sale of variable contracts and for services provided to variable contract owners. The Fund, EVM or EVD are not a party to these arrangements. Investors should consult the prospectus and statement of additional information for their variable contracts for a discussion of these payments. EVD may, at its expense, provide promotional incentives to dealers that sell variable insurance products.
Distribution fees are subject to the limitations contained in the Financial Industry Regulatory Authority’s NASD Conduct Rule 2830(d).
5 Shareholder Servicing Plan
The Trust, on behalf of the Fund, has adopted a Shareholder Servicing Plan (Servicing Plan) for Initial Class and ADV Class. The Servicing Plan allows the Trust to enter into shareholder servicing agreements with insurance companies, investment dealers, broker/dealers or other financial intermediaries that provide shareholder services relating to Fund shares and their shareholders, including variable contract owners or plan participants with interests in the Fund. Under the Servicing Plan, the Fund may make payments at an annual rate of up to 0.25% of its average daily net assets attributable to each class that are subject to shareholder servicing agreements. No shareholder servicing fees are levied on shares owned by EVM, its affiliates, or their respective employees or clients and may be waived under certain other limited conditions. For the period ended December 31, 2014, there were no shareholder servicing fees accrued for Initial Class and ADV Class shares.
6 Purchases and Sales of Investments
Purchases and sales of investments, other than short-term obligations and including maturities and principal repayments on Senior Loans, aggregated $18,042,403 and $718,697, respectively, for the period ended December 31, 2014.
7 Shares of Beneficial Interest
The Fund’s Declaration of Trust permits the Trustees to issue an unlimited number of full and fractional shares of beneficial interest (without par value). Such shares may be issued in a number of different series (such as the Fund) and classes. Transactions in Fund shares were as follows:
| | | | |
| Initial Class | | Period Ended
December 31, 2014(1) | |
| |
Sales | | | 1,000 | |
| |
Net increase | | | 1,000 | |
Eaton Vance
VT Bond Fund
December 31, 2014
Notes to Financial Statements — continued
| | | | |
| ADV Class | | Period Ended
December 31, 2014(1) | |
| |
Sales | | | 1,999,000 | |
| |
Net increase | | | 1,999,000 | |
| (1) | For the period from the start of business, September 15, 2014, to December 31, 2014. |
At December 31, 2014, EVM owned 100% of the value of the outstanding shares of the Fund.
8 Overdraft Advances
Pursuant to the custodian agreement, SSBT may, in its discretion, advance funds to the Fund to make properly authorized payments. When such payments result in an overdraft, the Fund is obligated to repay SSBT at the current rate of interest charged by SSBT for secured loans (currently, the Federal Funds rate plus 2%). This obligation is payable on demand to SSBT. SSBT has a lien on the Fund’s assets to the extent of any overdraft. At December 31, 2014, the Fund had a payment due to SSBT pursuant to the foregoing arrangement of $43,669. Based on the short-term nature of these payments and the variable interest rate, the carrying value of the overdraft advances approximated its fair value at December 31, 2014. If measured at fair value, overdraft advances would have been considered as Level 2 in the fair value hierarchy (see Note 9) at December 31, 2014. The Fund’s average overdraft advances during the period ended December 31, 2014 were not significant.
9 Fair Value Measurements
Under generally accepted accounting principles for fair value measurements, a three-tier hierarchy to prioritize the assumptions, referred to as inputs, is used in valuation techniques to measure fair value. The three-tier hierarchy of inputs is summarized in the three broad levels listed below.
| Ÿ | | Level 1 – quoted prices in active markets for identical investments |
| Ÿ | | Level 2 – other significant observable inputs (including quoted prices for similar investments, interest rates, prepayment speeds, credit risk, etc.) |
| Ÿ | | Level 3 – significant unobservable inputs (including a fund’s own assumptions in determining the fair value of investments) |
In cases where the inputs used to measure fair value fall in different levels of the fair value hierarchy, the level disclosed is determined based on the lowest level input that is significant to the fair value measurement in its entirety. The inputs or methodology used for valuing securities are not necessarily an indication of the risk associated with investing in those securities.
At December 31, 2014, the hierarchy of inputs used in valuing the Fund’s investments, which are carried at value, were as follows:
| | | | | | | | | | | | | | | | |
| Asset Description | | Level 1 | | | Level 2 | | | Level 3 | | | Total | |
| | | | |
Corporate Bonds & Notes | | $ | — | | | $ | 3,567,507 | | | $ | — | | | $ | 3,567,507 | |
Foreign Corporate Bonds | | | — | | | | 2,867,020 | | | | — | | | | 2,867,020 | |
Foreign Government Bonds | | | — | | | | 2,202,926 | | | | — | | | | 2,202,926 | |
Convertible Bonds | | | — | | | | 2,089,722 | | | | — | | | | 2,089,722 | |
Asset-Backed Securities | | | — | | | | 315,785 | | | | — | | | | 315,785 | |
Commercial Mortgage-Backed Securities | | | — | | | | 784,782 | | | | — | | | | 784,782 | |
Senior Floating-Rate Interests | | | — | | | | 202,333 | | | | — | | | | 202,333 | |
Tax-Exempt Investments | | | — | | | | 47,196 | | | | — | | | | 47,196 | |
U.S. Treasury Obligations | | | — | | | | 2,474,342 | | | | — | | | | 2,474,342 | |
Common Stocks | | | 3,895,241 | | | | — | | | | — | | | | 3,895,241 | |
Convertible Preferred Stocks | | | — | | | | 672,091 | | | | — | | | | 672,091 | |
Preferred Stocks | | | 14,919 | | | | 287,915 | | | | — | | | | 302,834 | |
| | | | |
Total Investments | | $ | 3,910,160 | | | $ | 15,511,619 | | | $ | — | | | $ | 19,421,779 | |
Eaton Vance
VT Bond Fund
December 31, 2014
Report of Independent Registered Public Accounting Firm
To the Trustees of Eaton Vance Variable Trust and Shareholder of Eaton Vance VT Bond Fund:
We have audited the accompanying statement of assets and liabilities of Eaton Vance VT Bond Fund (the “Fund”) (one of the funds constituting Eaton Vance Variable Trust), as of December 31, 2014, and the related statement of operations, the statement of changes in net assets, and the financial highlights for the period presented. These financial statements and financial highlights are the responsibility of the Fund’s management. Our responsibility is to express an opinion on these financial statements and financial highlights based on our audit.
We conducted our audit in accordance with the standards of the Public Company Accounting Oversight Board (United States). Those standards require that we plan and perform the audit to obtain reasonable assurance about whether the financial statements and financial highlights are free of material misstatement. The Fund is not required to have, nor were we engaged to perform, an audit of its internal control over financial reporting. Our audit included consideration of internal control over financial reporting as a basis for designing audit procedures that are appropriate in the circumstances, but not for the purpose of expressing an opinion on the effectiveness of the Fund’s internal control over financial reporting. Accordingly, we express no such opinion. An audit also includes examining, on a test basis, evidence supporting the amounts and disclosures in the financial statements, assessing the accounting principles used and significant estimates made by management, as well as evaluating the overall financial statement presentation. Our procedures included confirmation of securities and senior loans owned as of December 31, 2014, by correspondence with the custodian, brokers, and selling or agent banks; where replies were not received from brokers and selling or agent banks, we performed other auditing procedures. We believe that our audit provides a reasonable basis for our opinion.
In our opinion, such financial statements and financial highlights referred to above present fairly, in all material respects, the financial position of Eaton Vance VT Bond Fund as of December 31, 2014, and the results of its operations, the changes in its net assets, and the financial highlights for the period presented, in conformity with accounting principles generally accepted in the United States of America.
DELOITTE & TOUCHE LLP
Boston, Massachusetts
February 23, 2015
Eaton Vance
VT Bond Fund
December 31, 2014
Federal Tax Information (Unaudited)
As required by the Internal Revenue Code and/or regulations, shareholders must be notified regarding the status of qualified dividend income for individuals and the dividends received deduction for corporations.
Qualified Dividend Income. For the fiscal year ended December 31, 2014, the Fund designates approximately $32,702, or up to the maximum amount of such dividends allowable pursuant to the Internal Revenue Code, as qualified dividend income eligible for the reduced tax rate of 15%.
Dividends Received Deduction. Corporate shareholders are generally entitled to take the dividends received deduction on the portion of the Fund’s dividend distribution that qualifies under tax law. For the Fund’s fiscal 2014 ordinary income dividends, 15.72% qualifies for the corporate dividends received deduction.
Eaton Vance
VT Bond Fund
December 31, 2014
Management and Organization
Fund Management. The Trustees of Eaton Vance Variable Trust (the Trust) are responsible for the overall management and supervision of the Trust’s affairs. The Trustees and officers of the Trust are listed below. Except as indicated, each individual has held the office shown or other offices in the same company for the last five years. Trustees and officers of the Trust hold indefinite terms of office. The “Noninterested Trustees” consist of those Trustees who are not “interested persons” of the Trust, as that term is defined under the 1940 Act. The business address of each Trustee and officer is Two International Place, Boston, Massachusetts 02110. As used below, “EVC” refers to Eaton Vance Corp., “EV” refers to Eaton Vance, Inc., “EVM” refers to Eaton Vance Management, “BMR” refers to Boston Management and Research and “EVD” refers to Eaton Vance Distributors, Inc. EVC and EV are the corporate parent and trustee, respectively, of EVM and BMR. EVD is the Fund’s principal underwriter and a wholly-owned subsidiary of EVC. Each officer affiliated with Eaton Vance may hold a position with other Eaton Vance affiliates that is comparable to his or her position with EVM listed below. Each Trustee oversees 179 portfolios in the Eaton Vance Complex (including all master and feeder funds in a master feeder structure). Each officer serves as an officer of certain other Eaton Vance funds. Each Trustee and officer serves until his or her successor is elected.
| | | | | | |
| Name and Year of Birth | | Position(s) with the
Trust | | Trustee Since(1) | | Principal Occupation(s) and Directorships During Past Five Years and Other Relevant Experience |
Interested Trustee |
| | | |
Thomas E. Faust Jr. 1958 | | Trustee | | 2007 | | Chairman, Chief Executive Officer and President of EVC, Director and President of EV, Chief Executive Officer and President of EVM and BMR, and Director of EVD. Trustee and/or officer of 179 registered investment companies. Mr. Faust is an interested person because of his positions with EVM, BMR, EVD, EVC and EV, which are affiliates of the Trust. Directorships in the Last Five Years.(2) Director of EVC and Hexavest Inc. |
| | | |
| | | | | | |
Noninterested Trustees |
| | | |
Scott E. Eston 1956 | | Trustee | | 2011 | | Private investor. Formerly held various positions at Grantham, Mayo, Van Otterloo and Co., L.L.C. (investment management firm) (1997-2009), including Chief Operating Officer (2002-2009), Chief Financial Officer (1997-2009) and Chairman of the Executive Committee (2002-2008); President and Principal Executive Officer, GMO Trust (open-end registered investment company) (2006-2009). Former Partner, Coopers and Lybrand L.L.P. (now PricewaterhouseCoopers) (public accounting firm) (1987-1997). Directorships in the Last Five Years.(2) None. |
| | | |
Cynthia E. Frost(3) 1961 | | Trustee | | 2014 | | Private investor. Formerly, Chief Investment Officer of Brown University (university endowment) (2000-2012); Portfolio Strategist for Duke Management Company (university endowment manager) (1995-2000); Managing Director, Cambridge Associates (1989-1995); Consultant, Bain and Company (1987-1989); Senior Equity Analyst, BA Investment Management Company (1983-1985). Directorships in the Last Five Years. None. |
| | | |
George J. Gorman(3) 1952 | | Trustee | | 2014 | | Principal at George J. Gorman LLC (consulting firm). Formerly, Senior Partner at Ernst & Young LLP (public accounting firm) (1974-2009). Directorships in the Last Five Years. Formerly, Trustee of the Bank of America Money Market Funds Series Trust (2011-2014) and of the Ashmore Funds (2010-2014). |
| | | |
Valerie A. Mosley(4) 1960 | | Trustee | | 2014 | | Chairwoman and Chief Executive Officer of Valmo Ventures (a consulting and investment firm). Former Partner and Senior Vice President, Portfolio Manager and Investment Strategist at Wellington Management Company, LLP (investment management firm) (1992-2012). Former Chief Investment Officer, PG Corbin Asset Management (1990-1992). Formerly worked in institutional corporate bond sales at Kidder Peabody (1986-1990). Directorships in the Last Five Years.(2) Director of Dynex Capital, Inc. (mortgage REIT) (since 2013). |
Eaton Vance
VT Bond Fund
December 31, 2014
Management and Organization — continued
| | | | | | |
| Name and Year of Birth | | Position(s) with the
Trust | | Trustee Since(1) | | Principal Occupation(s) and Directorships During Past Five Years and Other Relevant Experience |
Noninterested Trustees (continued) |
| | | |
William H. Park 1947 | | Trustee | | 2003 | | Consultant and private investor. Formerly, Chief Financial Officer, Aveon Group L.P. (investment management firm) (2010-2011). Formerly, Vice Chairman, Commercial Industrial Finance Corp. (specialty finance company) (2006-2010). Formerly, President and Chief Executive Officer, Prizm Capital Management, LLC (investment management firm) (2002-2005). Formerly, Executive Vice President and Chief Financial Officer, United Asset Management Corporation (investment management firm) (1982-2001). Formerly, Senior Manager, Price Waterhouse (now PricewaterhouseCoopers) (an independent registered public accounting firm) (1972-1981). Directorships in the Last Five Years.(2) None. |
| | | |
Ronald A. Pearlman 1940 | | Trustee | | 2003 | | Lawyer and consultant. Formerly, Professor of Law, Georgetown University Law Center (1999-2014). Formerly, Partner, Covington & Burling LLP (law firm) (1991-2000). Formerly, Chief of Staff, Joint Committee on Taxation, U.S. Congress (1988-1990). Formerly, Deputy Assistant Secretary (Tax Policy) and Assistant Secretary (Tax Policy), U.S. Department of the Treasury (1983-1985). Directorships in the Last Five Years.(2) None. |
| | | |
Helen Frame Peters 1948 | | Trustee | | 2008 | | Professor of Finance, Carroll School of Management, Boston College. Formerly, Dean, Carroll School of Management, Boston College (2000-2002). Formerly, Chief Investment Officer, Fixed Income, Scudder Kemper Investments (investment management firm) (1998-1999). Formerly, Chief Investment Officer, Equity and Fixed Income, Colonial Management Associates (investment management firm) (1991-1998). Directorships in the Last Five Years.(2) Formerly, Director of BJ’s Wholesale Club, Inc. (wholesale club retailer) (2004-2011). Formerly, Trustee of SPDR Index Shares Funds and SPDR Series Trust (exchange traded funds) (2000-2009). Formerly, Director of Federal Home Loan Bank of Boston (a bank for banks) (2007-2009). |
| | | |
Harriett Tee Taggart 1948 | | Trustee | | 2011 | | Managing Director, Taggart Associates (a professional practice firm). Formerly, Partner and Senior Vice President, Wellington Management Company, LLP (investment management firm) (1983-2006). Directorships in the Last Five Years.(2) Director of Albemarle Corporation (chemicals manufacturer) (since 2007) and The Hanover Group (specialty property and casualty insurance company) (since 2009). Formerly, Director of Lubrizol Corporation (specialty chemicals) (2007-2011). |
| | | |
Ralph F. Verni 1943 | | Chairman of the Board and Trustee | | 2007 (Chairman) 2005 (Trustee) | | Consultant and private investor. Formerly, Chief Investment Officer (1982-1992), Chief Financial Officer (1988-1990) and Director (1982-1992), New England Life. Formerly, Chairperson, New England Mutual Funds (1982-1992). Formerly, President and Chief Executive Officer, State Street Management & Research (1992-2000). Formerly, Chairperson, State Street Research Mutual Funds (1992-2000). Formerly, Director, W.P. Carey, LLC (1998-2004) and First Pioneer Farm Credit Corp. (2002-2006). Directorships in the Last Five Years.(2) None. |
| | | |
| | | | | | |
Principal Officers who are not Trustees |
| Name and Year of Birth | | Position(s)
with the
Trust | | Officer
Since(5) | | Principal Occupation(s) During Past Five Years |
Payson F. Swaffield 1956 | | President | | 2003 | | Vice President and Chief Income Investment Officer of EVM and BMR. |
| | | |
Maureen A. Gemma 1960 | | Vice President, Secretary and Chief Legal Officer | | 2005 | | Vice President of EVM and BMR. |
| | | |
James F. Kirchner 1967 | | Treasurer | | 2007 | | Vice President of EVM and BMR. |
Eaton Vance
VT Bond Fund
December 31, 2014
Management and Organization — continued
| | | | | | |
| Name and Year of Birth | | Position(s)
with the
Trust | | Officer
Since(5) | | Principal Occupation(s) During Past Five Years |
Principal Officers who are not Trustees (continued) |
| | | |
Paul M. O’Neil 1953 | | Chief Compliance Officer | | 2004 | | Vice President of EVM and BMR. |
| (1) | Year first appointed to serve as Trustee for a fund in the Eaton Vance family of funds. Each Trustee has served continuously since appointment unless indicated otherwise. |
| (2) | During their respective tenures, the Trustees (except for Ms. Frost and Mr. Gorman) also served as Board members of one or more of the following funds (which operated in the years noted): eUnitsTM 2 Year U.S. Market Participation Trust: Upside to Cap / Buffered Downside (launched in 2012 and terminated in 2014); eUnitsTM 2 Year U.S. Market Participation Trust II: Upside to Cap / Buffered Downside (launched in 2012 and terminated in 2014); Eaton Vance Credit Opportunities Fund (launched in 2005 and terminated in 2010); Eaton Vance Insured Florida Plus Municipal Bond Fund (launched in 2002 and terminated in 2009); and Eaton Vance National Municipal Income Trust (launched in 1998 and terminated in 2009). However, Ms. Mosley did not serve as a Board member of eUnitsTM 2 Year U.S. Market Participation Trust: Upside to Cap / Buffered Downside (launched in 2012 and terminated in 2014). |
| (3) | Ms. Frost and Mr. Gorman began serving as Trustees effective May 29, 2014. |
| (4) | Ms. Mosley began serving as a Trustee effective January 1, 2014. |
| (5) | Year first elected to serve as officer of a fund in the Eaton Vance family of funds when the officer has served continuously. Otherwise, year of most recent election as an officer of a fund in the Eaton Vance family of funds. Titles may have changed since initial election. |
The SAI for the Fund includes additional information about the Trustees and officers of the Fund and can be obtained without charge on Eaton Vance’s website at www.eatonvance.com or by calling 1-800-262-1122.
Eaton Vance Funds
IMPORTANT NOTICES
Privacy. The Eaton Vance organization is committed to ensuring your financial privacy. Each of the financial institutions identified below has in effect the following policy (“Privacy Policy”) with respect to nonpublic personal information about its customers:
| Ÿ | | Only such information received from you, through application forms or otherwise, and information about your Eaton Vance fund transactions will be collected. This may include information such as name, address, social security number, tax status, account balances and transactions. |
| Ÿ | | None of such information about you (or former customers) will be disclosed to anyone, except as permitted by law (which includes disclosure to employees necessary to service your account). In the normal course of servicing a customer’s account, Eaton Vance may share information with unaffiliated third parties that perform various required services such as transfer agents, custodians and broker-dealers. |
| Ÿ | | Policies and procedures (including physical, electronic and procedural safeguards) are in place that are designed to protect the confidentiality of such information. |
| Ÿ | | We reserve the right to change our Privacy Policy at any time upon proper notification to you. Customers may want to review our Privacy Policy periodically for changes by accessing the link on our homepage: www.eatonvance.com. |
Our pledge of privacy applies to the following entities within the Eaton Vance organization: the Eaton Vance Family of Funds, Eaton Vance Management, Eaton Vance Investment Counsel, Eaton Vance Distributors, Inc., Eaton Vance Trust Company, Eaton Vance Management’s Real Estate Investment Group and Boston Management and Research. In addition, our Privacy Policy applies only to those Eaton Vance customers who are individuals and who have a direct relationship with us. If a customer’s account (i.e., fund shares) is held in the name of a third-party financial advisor/broker-dealer, it is likely that only such advisor’s privacy policies apply to the customer. This notice supersedes all previously issued privacy disclosures. For more information about Eaton Vance’s Privacy Policy, please call 1-800-262-1122.
Delivery of Shareholder Documents. The Securities and Exchange Commission (SEC) permits funds to deliver only one copy of shareholder documents, including prospectuses, proxy statements and shareholder reports, to fund investors with multiple accounts at the same residential or post office box address. This practice is often called “householding” and it helps eliminate duplicate mailings to shareholders. Eaton Vance, or your financial advisor, may household the mailing of your documents indefinitely unless you instruct Eaton Vance, or your financial advisor, otherwise. If you would prefer that your Eaton Vance documents not be householded, please contact Eaton Vance at 1-800-262-1122, or contact your financial advisor. Your instructions that householding not apply to delivery of your Eaton Vance documents will be effective within 30 days of receipt by Eaton Vance or your financial advisor.
Portfolio Holdings. Each Eaton Vance Fund and its underlying Portfolio(s) (if applicable) will file a schedule of portfolio holdings on Form N-Q with the SEC for the first and third quarters of each fiscal year. The Form N-Q will be available on the Eaton Vance website at www.eatonvance.com, by calling Eaton Vance at 1-800-262-1122 or in the EDGAR database on the SEC’s website at www.sec.gov. Form N-Q may also be reviewed and copied at the SEC’s public reference room in Washington, D.C. (call 1-800-732-0330 for information on the operation of the public reference room).
Proxy Voting. From time to time, funds are required to vote proxies related to the securities held by the funds. The Eaton Vance Funds or their underlying Portfolios (if applicable) vote proxies according to a set of policies and procedures approved by the Funds’ and Portfolios’ Boards. You may obtain a description of these policies and procedures and information on how the Funds or Portfolios voted proxies relating to portfolio securities during the most recent 12-month period ended June 30, without charge, upon request, by calling 1-800-262-1122 and by accessing the SEC’s website at www.sec.gov.
This Page Intentionally Left Blank
This Page Intentionally Left Blank
Investment Adviser and Administrator
Eaton Vance Management
Two International Place
Boston, MA 02110
Principal Underwriter*
Eaton Vance Distributors, Inc.
Two International Place
Boston, MA 02110
(617) 482-8260
Custodian
State Street Bank and Trust Company
State Street Financial Center, One Lincoln Street
Boston, MA 02111
Transfer Agent
State Street Bank and Trust Company
State Street Financial Center, One Lincoln Street
Boston, MA 02111
Independent Registered Public Accounting Firm
Deloitte & Touche LLP
200 Berkeley Street
Boston, MA 02116-5022
Fund Offices
Two International Place
Boston, MA 02110
| * | FINRA BrokerCheck. Investors may check the background of their Investment Professional by contacting the Financial Industry Regulatory Authority (FINRA). FINRA BrokerCheck is a free tool to help investors check the professional background of current and former FINRA-registered securities firms and brokers. FINRA BrokerCheck is available by calling 1-800-289-9999 and at www.FINRA.org. The FINRA BrokerCheck brochure describing this program is available to investors at www.FINRA.org. |
17305 12.31.14
Item 2. Code of Ethics
The registrant has adopted a code of ethics applicable to its Principal Executive Officer, Principal Financial Officer and Principal Accounting Officer. The registrant undertakes to provide a copy of such code of ethics to any person upon request, without charge, by calling 1-800-262-1122.
Item 3. Audit Committee Financial Expert
The registrant’s Board has designated William H. Park, an independent trustee, as its audit committee financial expert. Mr. Park is a certified public accountant who is a consultant and private investor. Previously, he served as the Chief Financial Officer of Aveon Group, L.P. (an investment management firm), as the Vice Chairman of Commercial Industrial Finance Corp. (specialty finance company), as President and Chief Executive Officer of Prizm Capital Management, LLC (investment management firm), as Executive Vice President and Chief Financial Officer of United Asset Management Corporation (an institutional investment management firm) and as a Senior Manager at Price Waterhouse (now PricewaterhouseCoopers) (an independent registered public accounting firm).
Item 4. Principal Accountant Fees and Services
(a)-(d)
Eaton Vance VT Bond Fund, Eaton Vance VT Floating-Rate Income Fund and Eaton Vance VT Large-Cap Value Fund (the “Fund(s)”) are series of Eaton Vance Variable Trust (the “Trust”), a Massachusetts business trust, which, including the Funds, contains a total of 3 series (the “Series”). The Trust is registered under the Investment Company Act of 1940 as an open-end management investment company. This Form N-CSR relates to the Funds’ annual reports.
The following table presents the aggregate fees billed to each Fund for the Fund’s fiscal years ended December 31, 2013 and December 31, 2014 by the Fund’s principal accountant, Deloitte & Touche LLP (“D&T”), for professional services rendered for the audit of the Fund’s annual financial statements and fees billed for other services rendered by D&T during such periods.
Eaton Vance VT Bond Fund
| | | | |
Fiscal Period Ended | | 12/31/14* | |
Audit Fees | | $ | 32,050 | |
Audit-Related Fees(1) | | $ | 0 | |
Tax Fees(2) | | $ | 12,500 | |
All Other Fees(3) | | $ | 0 | |
| | | | |
Total | | $ | 44,550 | |
| | | | |
| * | Fund commenced operations on 9/15/14 |
Eaton Vance VT Floating-Rate Income Fund
| | | | | | | | |
Fiscal Years Ended | | 12/31/13 | | | 12/31/14 | |
Audit Fees | | $ | 38,520 | | | $ | 62,683 | |
Audit-Related Fees(1) | | $ | 0 | | | $ | 0 | |
Tax Fees(2) | | $ | 7,760 | | | $ | 7,990 | |
All Other Fees(3) | | $ | 0 | | | $ | 0 | |
| | | | | | | | |
Total | | $ | 46,280 | | | $ | 70,673 | |
| | | | | | | | |
Eaton Vance VT Large-Cap Value Fund
| | | | | | | | |
Fiscal Years Ended | | 12/31/13 | | | 12/31/14 | |
Audit Fees | | $ | 30,010 | | | $ | 31,210 | |
Audit-Related Fees(1) | | $ | 0 | | | $ | 0 | |
Tax Fees(2) | | $ | 8,770 | | | $ | 9,390 | |
All Other Fees(3) | | $ | 0 | | | $ | 0 | |
| | | | | | | | |
Total | | $ | 38,780 | | | $ | 40,600 | |
| | | | | | | | |
| (1) | Audit-related fees consist of the aggregate fees billed for assurance and related services that are reasonably related to the performance of the audit of the registrant’s financial statements and are not reported under the category of audit fees. |
| (2) | Tax fees consist of the aggregate fees billed for professional services rendered by the principal accountant relating to tax compliance, tax advice, and tax planning and specifically include fees for tax return preparation and other tax related compliance/planning matters |
| (3) | All other fees consist of the aggregate fees billed for products and services provided by the registrant’s principal accountant other than audit, audit-related, and tax services. |
The following table presents the aggregate audit, audit-related, tax, and other fees billed to all of the Series in the Trust by D&T for the last two fiscal years of each Series.
| | | | | | | | |
| | | 12/31/13 | | | 12/31/14 | |
Audit Fees | | $ | 68,530 | | | $ | 125,943 | |
Audit-Related Fees(1) | | $ | 0 | | | $ | 0 | |
Tax Fees(2) | | $ | 16,530 | | | $ | 29,880 | |
All Other Fees(3) | | $ | 0 | | | $ | 0 | |
| | | | | | | | |
Total | | $ | 85,060 | | | $ | 155,823 | |
| | | | | | | | |
| (1) | Audit-related fees consist of the aggregate fees billed for assurance and related services that are reasonable related to the performance of the audit of financial statements and are not reported under the category of audit fees. |
| (2) | Tax fees consist of the aggregate fees billed for professional services rendered by the principal accountant relating to tax compliance, tax advice, and tax planning and specifically include fees for tax return preparation. |
| (3) | All other fees consist of the aggregate fees billed for products and services provided by the principal accountant other than audit, audit-related, and tax services. |
(e)(1) The registrant’s audit committee has adopted policies and procedures relating to the pre-approval of services provided by the registrant’s principal accountant (the “Pre-Approval Policies”). The Pre-Approval Policies establish a framework intended to assist the audit committee in the proper discharge of its pre-approval responsibilities. As a general matter, the Pre-Approval Policies (i) specify certain types of audit, audit-related, tax, and other services determined to be pre-approved by the audit committee; and (ii) delineate specific procedures governing the mechanics of the pre-approval process, including the approval and monitoring of audit and non-audit service fees. Unless a service is specifically pre-approved under the Pre-Approval Policies, it must be separately pre-approved by the audit committee.
The Pre-Approval Policies and the types of audit and non-audit services pre-approved therein must be reviewed and ratified by the registrant’s audit committee at least annually. The registrant’s audit committee maintains full responsibility for the appointment, compensation, and oversight of the work of the registrant’s principal accountant.
(e)(2) No services described in paragraphs (b)-(d) above were approved by the registrant’s audit committee pursuant to the “de minimis exception” set forth in Rule 2-01 (c)(7)(i)(C) of Regulation S-X.
(f) Not applicable.
(g) The following table presents (i) the aggregate non-audit fees (i.e., fees for audit-related, tax, and other services) billed for services rendered to all of the Series in the Trust by D&T for the last two fiscal years of each Series; and (ii) the aggregate non-audit fees (i.e., fees for audit-related, tax, and other services) billed to the Eaton Vance organization by D&T for the last two fiscal years of each Series.
| | | | | | | | |
Fiscal Years Ended | | 12/31/13 | | | 12/31/14 | |
Registrant(1) | | $ | 16,530 | | | $ | 29,880 | |
Eaton Vance(2) | | $ | 409,385 | | | $ | 99,750 | |
| (1) | Includes all of the Series in the Trust. |
| (2) | The investment adviser to the Funds, as well as any of its affiliates that provide ongoing services to the Funds, are subsidiaries of Eaton Vance Corp. |
(h) The registrant’s audit committee has considered whether the provision by the registrant’s principal accountant of non-audit services to the registrant’s investment adviser and any entity controlling, controlled by, or under common control with the adviser that provides ongoing services to the registrant that were not pre-approved pursuant to Rule 2-01(c)(7)(ii) of Regulation S-X is compatible with maintaining the principal accountant’s independence.
Item 5. Audit Committee of Listed Registrants
Not applicable.
Item 6. Schedule of Investments
Please see schedule of investments contained in the Report to Stockholders included under Item 1 of this Form N-CSR.
Item 7. Disclosure of Proxy Voting Policies and Procedures for Closed-End Management Investment Companies
Not applicable.
Item 8. Portfolio Managers of Closed-End Management Investment Companies
Not applicable.
Item 9. Purchases of Equity Securities by Closed-End Management Investment Company and Affiliated Purchasers
Not applicable.
Item 10. Submission of Matters to a Vote of Security Holders
No material changes.
Item 11. Controls and Procedures
(a) It is the conclusion of the registrant’s principal executive officer and principal financial officer that the effectiveness of the registrant’s current disclosure controls and procedures (such disclosure controls and procedures having been evaluated within 90 days of the date of this filing) provide reasonable assurance that the information required to be disclosed by the registrant has been recorded, processed, summarized and reported within the time period specified in the Commission’s rules and forms and that the information required to be disclosed by the registrant has been accumulated and communicated to the registrant’s principal executive officer and principal financial officer in order to allow timely decisions regarding required disclosure.
(b) There have been no changes in the registrant’s internal controls over financial reporting during the second fiscal quarter of the period covered by this report that has materially affected, or is reasonably likely to materially affect, the registrant’s internal control over financial reporting.
Item 12. Exhibits
| | |
| (a)(1) | | Registrant’s Code of Ethics – Not applicable (please see Item 2). |
| |
| (a)(2)(i) | | Treasurer’s Section 302 certification. |
| |
| (a)(2)(ii) | | President’s Section 302 certification. |
| |
| (b) | | Combined Section 906 certification. |
Signatures
Pursuant to the requirements of the Securities Exchange Act of 1934 and the Investment Company Act of 1940, the registrant has duly caused this report to be signed on its behalf by the undersigned, thereunto duly authorized.
| | |
| Eaton Vance Variable Trust |
| |
| By: | | /s/ Payson F. Swaffield |
| | Payson F. Swaffield President |
| |
| Date: | | February 17, 2015 |
Pursuant to the requirements of the Securities Exchange Act of 1934 and the Investment Company Act of 1940, this report has been signed below by the following persons on behalf of the registrant and in the capacities and on the dates indicated.
| | |
| By: | | /s/ James F. Kirchner |
| | James F. Kirchner Treasurer |
| |
| Date: | | February 17, 2015 |
| |
| By: | | /s/ Payson F. Swaffield |
| | Payson F. Swaffield President |
| |
| Date: | | February 17, 2015 |