UNITED STATES
SECURITIES AND EXCHANGE COMMISSION
Washington, D.C. 20549
Form N-CSR
CERTIFIED SHAREHOLDER REPORT OF REGISTERED
MANAGEMENT INVESTMENT COMPANIES
Investment Company Act File Number: 811-10067
Eaton Vance Variable Trust
(Exact Name of Registrant as Specified in Charter)
Two International Place, Boston, Massachusetts 02110
(Address of Principal Executive Offices)
Maureen A. Gemma
Two International Place, Boston, Massachusetts 02110
(Name and Address of Agent for Services)
(617) 482-8260
(Registrant’s Telephone Number)
December 31
Date of Fiscal Year End
December 31, 2012
Date of Reporting Period
Item 1. Reports to Stockholders
| | |
Eaton Vance VT Floating-Rate Income Fund Annual Report December 31, 2012 | | 
|

Fund shares are not insured by the FDIC and are not deposits or other obligations of, or guaranteed by, any depository institution. Shares are subject to investment risks, including possible loss of principal invested.
This report is prepared for the general information of contract owners. It is authorized for distribution to prospective investors only when preceded or accompanied by a current summary prospectus or prospectus. Before investing, investors should consider carefully the investment objective, risks, and charges and expenses of the Fund. This and other important information is contained in the summary prospectus and prospectus, which can be obtained from a financial advisor. Prospective investors should read the prospectus carefully before investing. For further information, please call 1-800-262-1122.
Annual Report December 31, 2012
Eaton Vance
VT Floating-Rate Income Fund
Table of Contents
| | | | |
Management’s Discussion of Fund Performance | | | 2 | |
| |
Performance | | | 3 | |
| |
Fund Profile | | | 4 | |
| |
Endnotes and Additional Disclosures | | | 5 | |
| |
Fund Expenses | | | 6 | |
| |
Financial Statements | | | 7 | |
| |
Report of Independent Registered Public Accounting Firm | | | 27 | |
| |
Federal Tax Information | | | 28 | |
| |
Management and Organization | | | 29 | |
| |
Important Notices | | | 31 | |
Eaton Vance
VT Floating-Rate Income Fund
December 31, 2012
Management’s Discussion of Fund Performance1
Economic and Market Conditions
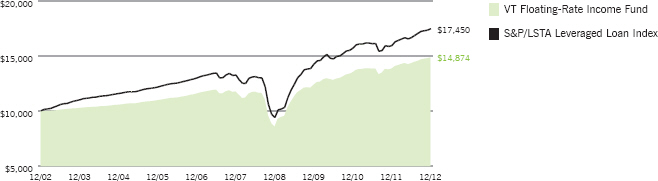
The U.S. floating-rate loan market generated solid results for the 12-month period ended December 31, 2012, as measured by the 9.67% return of the S&P/LSTA Leveraged Loan Index2, a broad barometer of the asset class. Returns of the Index reflected an increase in loan prices, plus investment income.
For 2012 as a whole, the loan market recorded its third-best calendar year return on record at 9.67%, following 2009’s return of 51.62% and 2010’s mark of 10.13%. In part, 2012’s returns resulted from a rebound in price performance from a volatile 2011. Considering the bigger picture—continued fiscal challenges in the United States, an unresolved debt problem in the eurozone and a slowdown in economic growth globally—loans have shown considerable resilience, thanks to a continuation of favorable technical and fundamental conditions in the market. Looking at the technical picture, the net supply of floating-rate loans was moderate, as refinancing activities and loan repayments by issuers helped offset new issue supply coming to market. At the same time, demand strengthened. Improved economic data and global central banks’ pledges to keep interest rates low appeared to have fueled investors’ appetite for higher-yielding alternatives to government bonds, such as floating-rate loans. Other investors turned to floating-rate loans for protection against potential inflation and rising interest-rate scenarios, concerned that these could be stoked by ongoing easy monetary conditions. In the institutional market, buying by pension funds, hedge funds, structured vehicles and other institutional investors, such as relative value crossover strategies, also expanded as the period progressed. For the period overall, the modest growth in the overall supply of loans was easily absorbed by widespread investor demand.
In terms of issuer fundamentals, improving corporate balance sheets and better-than-expected earnings growth also helped bolster loans. Furthermore, the default rate in the market remained well below longer-term averages, ending December 31, 2012 at 1.27% by principal amount on a last-12-months basis, according to S&P Leveraged Commentary & Data (LCD).
Fund Performance
For the fiscal year ended December 31, 2012, Eaton Vance VT Floating-Rate Income Fund (the Fund) at net asset value
(NAV) had a total return of 7.33%. By comparison, the Fund’s benchmark, the S&P/LSTA Leveraged Loan Index (the Index), gained 9.67% during the period.
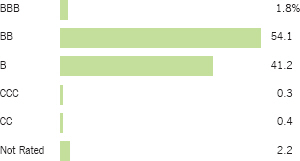
The Fund’s underweight to the lower-quality segment of the market detracted from Fund performance relative to the Index. Specifically, the Fund’s holdings were biased toward higher-quality BB- and B-rated6 loans. At the same time, the Fund had an underweight to CCC-rated loans. For the year, BB-rated loans in the Index returned 7.17%, B-rated loans in the Index gained 10.42% and CCC-rated loans in the Index rose 18.35%. Loans rated CCC performed best for the period as the discounted prices in this credit segment were pushed up by investor flows activity. Within the BB- and B-rated space, the Fund had a more pronounced overweight to the higher-rated BB-ratings tier, providing further detracting from relative Fund results versus the Index.
Contributing to relative Fund returns versus the Index, beneficial credit selection in a number of sectors helped provide a partial offset to the detraction of the Fund’s higher-quality positioning.
See Endnotes and Additional Disclosures in this report.
Past performance is no guarantee of future results. Returns are historical and are calculated by determining the percentage change in net asset value (NAV) or offering price (as applicable) with all distributions reinvested. Investment return and principal value will fluctuate so that shares, when redeemed, may be worth more or less than their original cost. Performance less than one year is cumulative. Performance is for the stated time period only; due to market volatility, the Fund’s current performance may be lower or higher than quoted. Returns are before taxes unless otherwise noted. For performance as of the most recent month end, please refer to www.eatonvance.com.
Eaton Vance
VT Floating-Rate Income Fund
December 31, 2012
Performance2,3
Portfolio Managers Scott H. Page, CFA, Craig P. Russ and Andrew Sveen, CFA
| | | | | | | | | | | | | | | | |
| % Average Annual Total Returns | | Inception Date | | | One Year | | | Five Years | | | Ten Years | |
Fund at NAV | | | 05/02/2001 | | | | 7.33 | % | | | 4.76 | % | | | 4.05 | % |
S&P/LSTA Leveraged Loan Index | | | — | | | | 9.67 | % | | | 5.67 | % | | | 5.72 | % |
| | | | |
| | | | | | | | | | | | | | | | |
| % Total Annual Operating Expense Ratios4 | | | | | | | | | | | | |
| | | | | | | | | | | | | | | 1.18 | % |
Growth of $10,000
This graph shows the change in value of a hypothetical investment of $10,000 in VT Floating-Rate Income Fund for the period indicated. For comparison, the same investment is shown in the indicated index.
See Endnotes and Additional Disclosures in this report.
Past performance is no guarantee of future results. Returns are historical and are calculated by determining the percentage change in net asset value (NAV) or offering price (as applicable) with all distributions reinvested. Investment return and principal value will fluctuate so that shares, when redeemed, may be worth more or less than their original cost. Performance less than one year is cumulative. Performance is for the stated time period only; due to market volatility, the Fund’s current performance may be lower or higher than quoted. Returns are before taxes unless otherwise noted. For performance as of the most recent month end, please refer to www.eatonvance.com.
Eaton Vance
VT Floating-Rate Income Fund
December 31, 2012
Fund Profile
Top 10 Holdings (% of total investments)5
| | | | |
Intelsat Jackson Holdings Ltd. | | | 1.3 | % |
Asurion LLC | | | 1.2 | |
Rite Aid Corporation | | | 1.2 | |
HCA, Inc. | | | 1.2 | |
Aramark Corporation | | | 1.1 | |
NRG Energy, Inc. | | | 1.1 | |
Community Health Systems, Inc. | | | 1.1 | |
Health Management Associates, Inc. | | | 1.0 | |
Chrysler Group LLC | | | 1.0 | |
Goodyear Tire & Rubber Company (The) | | | 1.0 | |
Total | | | 11.2 | % |
Credit Quality (% of loan holdings)6
Top 10 Sectors (% of total investments)5
| | | | |
Health Care | | | 13.9 | % |
Business Equipment and Services | | | 9.0 | |
Electronics/Electrical | | | 7.0 | |
Automotive | | | 5.1 | |
Publishing | | | 4.5 | |
Chemicals and Plastics | | | 4.0 | |
Leisure Goods/Activities/Movies | | | 4.0 | |
Food Service | | | 3.8 | |
Retailers (Except Food and Drug) | | | 3.6 | |
Utilities | | | 3.6 | |
Total | | | 58.5 | % |
See Endnotes and Additional Disclosures in this report.
Eaton Vance
VT Floating-Rate Income Fund
December 31, 2012
Endnotes and Additional Disclosures
| 1 | The views expressed in this report are those of the portfolio manager(s) and are current only through the date stated at the top of this page. These views are subject to change at any time based upon market or other conditions, and Eaton Vance and the Fund(s) disclaim any responsibility to update such views. These views may not be relied upon as investment advice and, because investment decisions are based on many factors, may not be relied upon as an indication of trading intent on behalf of any Eaton Vance fund. This commentary may contain statements that are not historical facts, referred to as “forward looking statements”. The Fund’s actual future results may differ significantly from those stated in any forward looking statement, depending on factors such as changes in securities or financial markets or general economic conditions, the volume of sales and purchases of Fund shares, the continuation of investment advisory, administrative and service contracts, and other risks discussed from time to time in the Fund’s filings with the Securities and Exchange Commission. |
| 2 | S&P/LSTA Leveraged Loan Index is an unmanaged index of the institutional leveraged loan market. Unless otherwise stated, index returns do not reflect the effect of any applicable sales charges, commissions, expenses, taxes or leverage, as applicable. It is not possible to invest directly in an index. |
| 3 | There is no sales charge. Insurance-related charges are not included in the calculation of returns. Such expenses would reduce the overall return shown. Please refer to the report for your insurance contract for performance data reflecting insurance-related charges. |
| 4 | Source: Fund prospectus. |
| 5 | Excludes cash and cash equivalents. |
| 6 | Ratings are based on Moody’s, S&P or Fitch, as applicable. Credit ratings are based largely on the rating agency’s investment analysis at the time of rating and the rating assigned to any particular security is not necessarily a reflection of the issuer’s current financial condition. The rating assigned to a security by a rating agency does not necessarily reflect its assessment of the volatility of a security’s market value or of the liquidity of an investment in the security. If securities are rated differently by the rating agencies, the higher rating is shown. Ratings of BBB or higher by Standard and Poor’s or Fitch (Baa or higher by Moody’s) are considered to be investment grade quality. |
| | Fund profile subject to change due to active management. |
Eaton Vance
VT Floating-Rate Income Fund
December 31, 2012
Fund Expenses
Example: As a Fund shareholder, you incur ongoing costs, including management fees; distribution or service fees; and other Fund expenses. This Example is intended to help you understand your ongoing costs (in dollars) of Fund investing and to compare these costs with the ongoing costs of investing in other mutual funds. The Example is based on an investment of $1,000 invested at the beginning of the period and held for the entire period (July 1, 2012 – December 31, 2012).
Actual Expenses: The first section of the table below provides information about actual account values and actual expenses. You may use the information in this section, together with the amount you invested, to estimate the expenses that you paid over the period. Simply divide your account value by $1,000 (for example, an $8,600 account value divided by $1,000 = 8.6), then multiply the result by the number in the first line under the heading entitled “Expenses Paid During Period” to estimate the expenses you paid on your account during this period.
Hypothetical Example for Comparison Purposes: The second section of the table below provides information about hypothetical account values and hypothetical expenses based on the actual Fund expense ratio and an assumed rate of return of 5% per year (before expenses), which is not the actual Fund return. The hypothetical account values and expenses may not be used to estimate the actual ending account balance or expenses you paid for the period. You may use this information to compare the ongoing costs of investing in your Fund and other funds. To do so, compare this 5% hypothetical example with the 5% hypothetical examples that appear in the shareholder reports of the other funds.
Please note that the expenses shown in the table are meant to highlight your ongoing costs only and do not reflect expenses and charges which are, or may be imposed under the variable annuity contract or variable life insurance policy (variable contracts) (if applicable) through which your investment in the Fund is made. Therefore, the second line of the table is useful in comparing ongoing costs associated with an investment in vehicles which fund benefits under variable contracts and to qualified pension and retirement plans, and will not help you determine the relative total costs of investing in the Fund through variable contracts. In addition, if these expenses and charges imposed under the variable contracts were included, your costs would be higher.
| | | | | | | | | | | | | | | | |
| | | Beginning
Account Value
(7/1/12) | | | Ending
Account Value
(12/31/12) | | | Expenses Paid
During Period*
(7/1/12 – 12/31/12) | | | Annualized
Expense
Ratio | |
| | | | |
| | | | | | | | | | | | | | | | |
Actual | | | | | | | | | | | | | | | | |
| | $ | 1,000.00 | | | $ | 1,036.80 | | | $ | 5.94 | | | | 1.16 | % |
| | | | | | | | | | | | | | | | | |
| | | | |
| | | | | | | | | | | | | | | | |
Hypothetical | | | | | | | | | | | | | | | | |
(5% return per year before expenses) | | | | | | | | | | | | | | | | |
| | $ | 1,000.00 | | | $ | 1,019.30 | | | $ | 5.89 | | | | 1.16 | % |
| * | Expenses are equal to the Fund’s annualized expense ratio multiplied by the average account value over the period, multiplied by 184/366 (to reflect the one-half year period). The Example assumes that the $1,000 was invested at the net asset value per share determined at the close of business on June 30, 2012. Expenses shown do not include insurance-related charges. |
Eaton Vance
VT Floating-Rate Income Fund
December 31, 2012
Portfolio of Investments
| | | | | | | | | | |
| Senior Floating-Rate Interests — 93.2%(1) | |
| | | |
| | | | | | | | | | |
| Borrower/Tranche Description | | | | Principal
Amount
(000’s omitted) | | | Value | |
| | | | | | | | | | |
|
Aerospace and Defense — 1.3% | |
Booz Allen Hamilton Inc. | |
Term Loan, 4.50%, Maturing July 31, 2019 | | | | $ | 399 | | | $ | 404,237 | |
DAE Aviation Holdings, Inc. | |
Term Loan, 6.25%, Maturing October 29, 2018 | | | | | 343 | | | | 348,324 | |
Term Loan, 6.25%, Maturing November 2, 2018 | | | | | 156 | | | | 157,907 | |
Ducommun Incorporated | |
Term Loan, 5.50%, Maturing June 28, 2017 | | | | | 171 | | | | 172,896 | |
Hamilton Sundstrand Industrial | |
Term Loan, 5.00%, Maturing December 13, 2019 | | | | | 1,000 | | | | 1,010,089 | |
IAP Worldwide Services, Inc. | |
Term Loan, 10.00%, Maturing December 31, 2015 | | | | | 726 | | | | 552,053 | |
Sequa Corporation | |
Term Loan, 5.25%, Maturing May 29, 2017 | | | | | 775 | | | | 781,458 | |
TASC, Inc. | |
Term Loan, 4.50%, Maturing December 18, 2015 | | | | | 713 | | | | 713,417 | |
Transdigm, Inc. | |
Term Loan, 4.00%, Maturing February 14, 2017 | | | | | 521 | | | | 524,683 | |
Term Loan, 4.00%, Maturing February 14, 2017 | | | | | 907 | | | | 913,724 | |
| | |
| | | | | | | | $ | 5,578,788 | |
| | |
|
Air Transport — 0.3% | |
Evergreen International Aviation, Inc. | |
Term Loan, 11.50%, Maturing June 30, 2015 | | | | $ | 414 | | | $ | 405,671 | |
Orbitz Worldwide Inc. | |
Term Loan, 3.21%, Maturing July 25, 2014 | | | | | 713 | | | | 687,910 | |
| | |
| | | | | | | | $ | 1,093,581 | |
| | |
|
Automotive — 4.8% | |
Allison Transmission, Inc. | |
Term Loan, 2.71%, Maturing August 7, 2014 | | | | $ | 637 | | | $ | 641,670 | |
Term Loan, 4.25%, Maturing August 23, 2019 | | | | | 1,892 | | | | 1,912,978 | |
Autoparts Holdings Limited | |
Term Loan, 6.50%, Maturing July 28, 2017 | | | | | 495 | | | | 496,534 | |
Chrysler Group LLC | |
Term Loan, 6.00%, Maturing May 24, 2017 | | | | | 4,050 | | | | 4,144,104 | |
Federal-Mogul Corporation | |
Term Loan, 2.15%, Maturing December 29, 2014 | | | | | 644 | | | | 592,453 | |
Term Loan, 2.15%, Maturing December 28, 2015 | | | | | 2,425 | | | | 2,232,679 | |
Goodyear Tire & Rubber Company (The) | |
Term Loan - Second Lien, 4.75%, Maturing April 30, 2019 | | | | | 3,975 | | | | 4,008,788 | |
HHI Holdings LLC | |
Term Loan, 6.00%, Maturing October 3, 2018 | | | | | 1,025 | | | | 1,040,375 | |
| | | | | | | | | | |
| Borrower/Tranche Description | | | | Principal
Amount
(000’s omitted) | | | Value | |
| | | | | | | | | | |
|
Automotive (continued) | |
Metaldyne Company LLC | |
Term Loan, 6.00%, Maturing December 18, 2018 | | | | $ | 650 | | | $ | 656,500 | |
SRAM, LLC | |
Term Loan, 4.78%, Maturing June 7, 2018 | | | | | 576 | | | | 578,516 | |
Term Loan - Second Lien, Maturing December 7, 2018(2) | | | | | 250 | | | | 253,750 | |
Tomkins LLC | |
Term Loan, 4.25%, Maturing September 29, 2016 | | | | | 1,319 | | | | 1,330,111 | |
TriMas Corporation | |
Term Loan, 3.75%, Maturing October 10, 2019 | | | | | 424 | | | | 426,057 | |
Veyance Technologies, Inc. | |
Term Loan, 2.47%, Maturing July 31, 2014 | | | | | 122 | | | | 121,435 | |
Term Loan, 2.47%, Maturing July 31, 2014 | | | | | 854 | | | | 847,807 | |
Term Loan - Second Lien, 5.96%, Maturing July 31, 2015 | | | | | 1,000 | | | | 965,000 | |
| | |
| | | | | | | | $ | 20,248,757 | |
| | |
|
Building and Development — 0.8% | |
Armstrong World Industries, Inc. | |
Term Loan, 4.00%, Maturing March 9, 2018 | | | | $ | 345 | | | $ | 347,829 | |
Preferred Proppants, LLC | |
Term Loan, 7.50%, Maturing December 15, 2016 | | | | | 347 | | | | 322,245 | |
RE/MAX International, Inc. | |
Term Loan, 5.50%, Maturing April 15, 2016 | | | | | 1,952 | | | | 1,956,986 | |
Summit Materials Companies I, LLC | |
Term Loan, 6.00%, Maturing January 30, 2019 | | | | | 720 | | | | 726,534 | |
| | |
| | | | | | | | $ | 3,353,594 | |
| | |
|
Business Equipment and Services — 8.7% | |
ACCO Brands Corporation | |
Term Loan, 4.25%, Maturing April 30, 2019 | | | | $ | 182 | | | $ | 183,230 | |
Acosta, Inc. | |
Term Loan, 5.00%, Maturing March 2, 2018 | | | | | 1,865 | | | | 1,884,004 | |
Advantage Sales & Marketing, Inc. | |
Term Loan, 5.25%, Maturing December 18, 2017 | | | | | 784 | | | | 791,595 | |
Affinion Group, Inc. | |
Term Loan, 6.50%, Maturing October 9, 2016 | | | | | 1,394 | | | | 1,278,627 | |
Allied Security Holdings, LLC | |
Term Loan, 5.25%, Maturing February 3, 2017 | | | | | 491 | | | | 492,482 | |
Altegrity, Inc. | |
Term Loan, 2.96%, Maturing February 21, 2015 | | | | | 1,033 | | | | 962,227 | |
Altisource Solutions S.a.r.l. | |
Term Loan, 5.75%, Maturing November 27, 2019 | | | | | 400 | | | | 402,000 | |
Audio Visual Services Group, Inc. | |
Term Loan, 6.75%, Maturing November 9, 2018 | | | | | 549 | | | | 540,396 | |
| | | | |
| | 7 | | See Notes to Financial Statements. |
Eaton Vance
VT Floating-Rate Income Fund
December 31, 2012
Portfolio of Investments — continued
| | | | | | | | | | |
| Borrower/Tranche Description | | | | Principal
Amount
(000’s omitted) | | | Value | |
| | | | | | | | | | |
|
Business Equipment and Services (continued) | |
BAR/BRI Review Courses, Inc. | |
Term Loan, 6.00%, Maturing June 16, 2017 | | | | $ | 305 | | | $ | 305,319 | |
Brand Energy & Infrastructure Services, Inc. | |
Term Loan, 5.75%, Maturing October 16, 2016 | | | | | 77 | | | | 76,671 | |
Term Loan, 6.25%, Maturing October 16, 2018 | | | | | 322 | | | | 318,456 | |
Brickman Group Holdings Inc. | |
Term Loan, 5.50%, Maturing October 14, 2016 | | | | | 1,436 | | | | 1,461,493 | |
Brock Holdings III, Inc. | |
Term Loan, 6.00%, Maturing March 16, 2017 | | | | | 492 | | | | 495,212 | |
ClientLogic Corporation | |
Term Loan, 7.10%, Maturing January 30, 2017 | | | | | 1,132 | | | | 1,106,781 | |
Corporate Executive Board Company, The | |
Term Loan, 5.00%, Maturing July 2, 2019 | | | | | 250 | | | | 251,719 | |
CPM Acquisition Corp. | |
Term Loan, 6.25%, Maturing August 29, 2017 | | | | | 249 | | | | 251,557 | |
DynCorp International LLC | |
Term Loan, 6.25%, Maturing July 7, 2016 | | | | | 244 | | | | 245,747 | |
Education Management LLC | |
Term Loan, 8.25%, Maturing March 29, 2018 | | | | | 1,017 | | | | 850,618 | |
EIG Investors Corp. | |
Term Loan, 6.25%, Maturing November 8, 2019 | | | | | 1,000 | | | | 1,002,500 | |
Expert Global Solutions, Inc. | |
Term Loan, 8.00%, Maturing April 3, 2018 | | | | | 941 | | | | 946,124 | |
Genesys Telecom Holdings, U.S., Inc. | |
Term Loan, 6.75%, Maturing January 31, 2019 | | | | | 273 | | | | 276,690 | |
Genpact International, Inc. | |
Term Loan, 4.25%, Maturing August 30, 2019 | | | | | 798 | | | | 806,977 | |
Go Daddy Operating Company, LLC | |
Term Loan, 5.50%, Maturing December 17, 2018 | | | | | 667 | | | | 668,507 | |
IG Investment Holdings, LLC | |
Term Loan, 6.00%, Maturing October 31, 2019 | | | | | 375 | | | | 375,937 | |
IMS Health Incorporated | |
Term Loan, 4.50%, Maturing August 25, 2017 | | | | | 521 | | | | 525,090 | |
KAR Auction Services, Inc. | |
Term Loan, 5.00%, Maturing May 19, 2017 | | | | | 1,404 | | | | 1,418,539 | |
Kronos Incorporated | |
Term Loan, 5.50%, Maturing October 25, 2019 | | | | | 775 | | | | 784,203 | |
Language Line, LLC | |
Term Loan, 6.25%, Maturing June 20, 2016 | | | | | 1,549 | | | | 1,545,075 | |
Meritas LLC | |
Term Loan, 7.50%, Maturing July 28, 2017 | | | | | 306 | | | | 306,400 | |
Monitronics International Inc. | |
Term Loan, 5.50%, Maturing March 23, 2018 | | | | | 422 | | | | 426,559 | |
National CineMedia, LLC | |
Term Loan, 3.47%, Maturing November 23, 2019 | | | | | 250 | | | | 250,833 | |
| | | | | | | | | | |
| Borrower/Tranche Description | | | | Principal
Amount
(000’s omitted) | | | Value | |
| | | | | | | | | | |
|
Business Equipment and Services (continued) | |
Quintiles Transnational Corp. | |
Term Loan, 4.50%, Maturing June 8, 2018 | | | | $ | 2,118 | | | $ | 2,134,957 | |
Renaissance Learning, Inc. | |
Term Loan, 5.75%, Maturing November 13, 2018 | | | | | 274 | | | | 275,684 | |
Sabre, Inc. | |
Term Loan, 2.21%, Maturing September 30, 2014 | | | | | 720 | | | | 720,667 | |
Sensus USA Inc. | |
Term Loan, 4.75%, Maturing May 9, 2017 | | | | | 344 | | | | 345,236 | |
Softlayer Technologies, Inc. | |
Term Loan, 7.25%, Maturing November 5, 2016 | | | | | 270 | | | | 271,184 | |
SunGard Data Systems, Inc. | |
Term Loan, 3.87%, Maturing February 26, 2016 | | | | | 2,837 | | | | 2,855,980 | |
Term Loan, 3.96%, Maturing February 28, 2017 | | | | | 740 | | | | 745,190 | |
SymphonyIRI Group, Inc. | |
Term Loan, 5.00%, Maturing December 1, 2017 | | | | | 837 | | | | 839,866 | |
Trans Union, LLC | |
Term Loan, 5.50%, Maturing February 12, 2018 | | | | | 1,798 | | | | 1,825,873 | |
Travelport LLC | |
Term Loan, 3.06%, Maturing August 23, 2013 | | | | | 154 | | | | 147,530 | |
Term Loan, 5.11%, Maturing August 21, 2015 | | | | | 1,674 | | | | 1,611,199 | |
U.S. Security Holdings, Inc. | |
Term Loan, 6.00%, Maturing July 28, 2017 | | | | | 53 | | | | 53,038 | |
Term Loan, 6.00%, Maturing July 28, 2017 | | | | | 269 | | | | 270,976 | |
West Corporation | |
Term Loan, 5.50%, Maturing July 15, 2016 | | | | | 740 | | | | 750,947 | |
Term Loan, 5.50%, Maturing July 15, 2016 | | | | | 1,803 | | | | 1,830,381 | |
Term Loan, 5.75%, Maturing June 29, 2018 | | | | | 572 | | | | 580,349 | |
| | |
| | | | | | | | $ | 36,490,625 | |
| | |
|
Cable and Satellite Television — 2.9% | |
Atlantic Broadband Finance, LLC | |
Term Loan, 4.50%, Maturing November 29, 2019 | | | | $ | 425 | | | $ | 429,604 | |
BBHI Acquisition LLC | |
Term Loan, 4.50%, Maturing December 14, 2017 | | | | | 1,005 | | | | 1,012,348 | |
Bragg Communications Incorporated | |
Term Loan, 4.00%, Maturing February 28, 2018 | | | | | 199 | | | | 200,237 | |
Cequel Communications, LLC | |
Term Loan, 4.00%, Maturing February 14, 2019 | | | | | 2,308 | | | | 2,321,664 | |
Charter Communications Operating, LLC | |
Term Loan, 3.47%, Maturing September 6, 2016 | | | | | 1,018 | | | | 1,024,638 | |
Term Loan, 4.00%, Maturing May 15, 2019 | | | | | 596 | | | | 600,990 | |
Crown Media Holdings, Inc. | |
Term Loan, 5.75%, Maturing July 14, 2018 | | | | | 225 | | | | 226,544 | |
| | | | |
| | 8 | | See Notes to Financial Statements. |
Eaton Vance
VT Floating-Rate Income Fund
December 31, 2012
Portfolio of Investments — continued
| | | | | | | | | | |
| Borrower/Tranche Description | | | | Principal
Amount
(000’s omitted) | | | Value | |
| | | | | | | | | | |
|
Cable and Satellite Television (continued) | |
Kabel Deutschland GMBH | |
Term Loan, 4.25%, Maturing February 1, 2019 | | | | $ | 2,675 | | | $ | 2,694,506 | |
MCC Iowa LLC | |
Term Loan, 1.95%, Maturing January 30, 2015 | | | | | 1,899 | | | | 1,891,881 | |
UPC Financing Partnership | |
Term Loan, 3.71%, Maturing December 30, 2016 | | | | | 753 | | | | 749,907 | |
Term Loan, 3.71%, Maturing December 29, 2017 | | | | | 1,000 | | | | 999,250 | |
Term Loan, 4.00%, Maturing January 29, 2021 | | | | | 175 | | | | 174,945 | |
| | |
| | | | | | | | $ | 12,326,514 | |
| | |
|
Chemicals and Plastics — 3.5% | |
AZ Chem US Inc. | |
Term Loan, 7.25%, Maturing December 22, 2017 | | | | $ | 1,237 | | | $ | 1,259,094 | |
Emerald Performance Materials, LLC | |
Term Loan, 6.75%, Maturing May 18, 2018 | | | | | 323 | | | | 325,800 | |
Harko C.V. | |
Term Loan, 5.75%, Maturing August 2, 2017 | | | | | 1,212 | | | | 1,225,799 | |
Huntsman International, LLC | |
Term Loan, 2.76%, Maturing April 19, 2017 | | | | | 1,180 | | | | 1,181,798 | |
Ineos US Finance LLC | |
Term Loan, 6.50%, Maturing May 4, 2018 | | | | | 2,657 | | | | 2,690,228 | |
Momentive Specialty Chemicals Inc. | |
Term Loan, 2.48%, Maturing May 3, 2013 | | | | | 486 | | | | 483,460 | |
Term Loan, 4.00%, Maturing May 5, 2015 | | | | | 675 | | | | 676,950 | |
Term Loan, 4.06%, Maturing May 5, 2015 | | | | | 289 | | | | 289,991 | |
Term Loan, 4.06%, Maturing May 5, 2015 | | | | | 473 | | | | 465,413 | |
Term Loan, 4.13%, Maturing May 5, 2015 | | | | | 765 | | | | 763,003 | |
Omnova Solutions Inc. | |
Term Loan, 5.50%, Maturing May 31, 2017 | | | | | 1,398 | | | | 1,415,697 | |
PolyOne Corp. | |
Term Loan, 5.00%, Maturing December 20, 2017 | | | | | 485 | | | | 489,773 | |
PQ Corporation | |
Term Loan, 5.25%, Maturing May 8, 2017 | | | | | 575 | | | | 578,738 | |
Trinseo Materials Operating S.C.A. | |
Term Loan, 8.00%, Maturing August 2, 2017 | | | | | 1,031 | | | | 1,010,888 | |
Tronox Pigments (Netherlands) B.V. | |
Term Loan, 4.25%, Maturing February 8, 2018 | | | | | 91 | | | | 91,551 | |
Term Loan, 4.25%, Maturing February 8, 2018 | | | | | 332 | | | | 335,997 | |
Univar Inc. | |
Term Loan, 5.00%, Maturing June 30, 2017 | | | | | 1,200 | | | | 1,200,166 | |
| | |
| | | | | | | | $ | 14,484,346 | |
| | |
| | | | | | | | | | |
| Borrower/Tranche Description | | | | Principal
Amount
(000’s omitted) | | | Value | |
| | | | | | | | | | |
|
Clothing / Textiles — 0.2% | |
Ascena Retail Group, Inc. | |
Term Loan, 4.75%, Maturing June 14, 2018 | | | | $ | 396 | | | $ | 399,313 | |
Wolverine Worldwide, Inc. | |
Term Loan, 4.00%, Maturing July 31, 2019 | | | | | 232 | | | | 233,299 | |
| | |
| | | | | | | | $ | 632,612 | |
| | |
|
Conglomerates — 2.0% | |
Jason Incorporated | |
Term Loan, 8.25%, Maturing September 21, 2014 | | | | $ | 112 | | | $ | 112,513 | |
Term Loan, 7.75%, Maturing September 22, 2014 | | | | | 74 | | | | 74,164 | |
Term Loan, 8.25%, Maturing September 22, 2014 | | | | | 45 | | | | 45,445 | |
Rexnord Corporation | |
Term Loan, 4.50%, Maturing April 2, 2018 | | | | | 1,609 | | | | 1,625,372 | |
RGIS Services, LLC | |
Term Loan, 4.56%, Maturing October 18, 2016 | | | | | 935 | | | | 942,286 | |
Term Loan, 5.50%, Maturing October 18, 2017 | | | | | 670 | | | | 676,637 | |
Rocket Software, Inc. | |
Term Loan, 5.75%, Maturing February 8, 2018 | | | | | 223 | | | | 223,585 | |
Spectrum Brands, Inc. | |
Term Loan, 4.50%, Maturing December 17, 2019 | | | | | 1,650 | | | | 1,666,371 | |
Walter Energy, Inc. | |
Term Loan, 5.75%, Maturing April 2, 2018 | | | | | 3,001 | | | | 3,029,079 | |
| | |
| | | | | | | | $ | 8,395,452 | |
| | |
|
Containers and Glass Products — 1.2% | |
Berry Plastics Holding Corporation | |
Term Loan, 2.21%, Maturing April 3, 2015 | | | | $ | 1,789 | | | $ | 1,782,920 | |
BWAY Corporation | |
Term Loan, 4.50%, Maturing August 7, 2017 | | | | | 1,025 | | | | 1,031,620 | |
Pelican Products, Inc. | |
Term Loan, 7.00%, Maturing July 11, 2018 | | | | | 199 | | | | 196,015 | |
Reynolds Group Holdings Inc. | |
Term Loan, 4.75%, Maturing September 28, 2018 | | | | | 1,721 | | | | 1,744,249 | |
TricorBraun, Inc. | |
Term Loan, 5.50%, Maturing May 3, 2018 | | | | | 299 | | | | 301,619 | |
| | |
| | | | | | | | $ | 5,056,423 | |
| | |
|
Cosmetics / Toiletries — 0.5% | |
Bausch & Lomb, Inc. | |
Term Loan, 5.25%, Maturing May 17, 2019 | | | | $ | 1,418 | | | $ | 1,432,560 | |
Huish Detergents, Inc. | |
Term Loan, 2.22%, Maturing April 25, 2014 | | | | | 567 | | | | 558,495 | |
| | |
| | | | | | | | $ | 1,991,055 | |
| | |
| | | | |
| | 9 | | See Notes to Financial Statements. |
Eaton Vance
VT Floating-Rate Income Fund
December 31, 2012
Portfolio of Investments — continued
| | | | | | | | | | |
| Borrower/Tranche Description | | | | Principal
Amount
(000’s omitted) | | | Value | |
| | | | | | | | | | |
|
Drugs — 0.8% | |
Aptalis Pharma, Inc. | |
Term Loan, 5.50%, Maturing February 10, 2017 | | | | $ | 1,032 | | | $ | 1,038,850 | |
Par Pharmaceutical Companies, Inc. | |
Term Loan, 5.00%, Maturing September 30, 2019 | | | | | 599 | | | | 599,310 | |
Warner Chilcott Company, LLC | |
Term Loan, 4.25%, Maturing March 15, 2018 | | | | | 350 | | | | 352,174 | |
Warner Chilcott Corporation | |
Term Loan, 4.25%, Maturing March 15, 2018 | | | | | 265 | | | | 267,491 | |
Term Loan, 4.25%, Maturing March 15, 2018 | | | | | 699 | | | | 704,349 | |
WC Luxco S.a.r.l. | |
Term Loan, 4.25%, Maturing March 15, 2018 | | | | | 481 | | | | 484,240 | |
| | |
| | | | | | | | $ | 3,446,414 | |
| | |
|
Ecological Services and Equipment — 0.3% | |
ADS Waste Holdings, Inc. | |
Term Loan, 5.25%, Maturing October 9, 2019 | | | | $ | 950 | | | $ | 963,062 | |
Progressive Waste Solutions Ltd. | |
Term Loan, 3.50%, Maturing October 24, 2019 | | | | | 250 | | | | 252,500 | |
| | |
| | | | | | | | $ | 1,215,562 | |
| | |
|
Electronics / Electrical — 6.8% | |
Aeroflex Incorporated | |
Term Loan, 5.75%, Maturing May 9, 2018 | | | | $ | 724 | | | $ | 731,770 | |
Aspect Software, Inc. | |
Term Loan, 7.00%, Maturing May 6, 2016 | | | | | 1,222 | | | | 1,234,705 | |
Attachmate Corporation | |
Term Loan, 7.25%, Maturing November 22, 2017 | | | | | 1,420 | | | | 1,435,405 | |
CommScope, Inc. | |
Term Loan, 4.25%, Maturing January 12, 2018 | | | | | 1,474 | | | | 1,485,724 | |
CompuCom Systems, Inc. | |
Term Loan, 6.50%, Maturing October 2, 2018 | | | | | 400 | | | | 402,500 | |
DG FastChannel, Inc. | |
Term Loan, 5.75%, Maturing July 26, 2018 | | | | | 724 | | | | 687,642 | |
Eagle Parent, Inc. | |
Term Loan, 5.00%, Maturing May 16, 2018 | | | | | 1,281 | | | | 1,291,704 | |
Edwards (Cayman Islands II) Limited | |
Term Loan, 5.50%, Maturing May 31, 2016 | | | | | 478 | | | | 479,474 | |
Freescale Semiconductor, Inc. | |
Term Loan, 4.46%, Maturing December 1, 2016 | | | | | 1,870 | | | | 1,839,092 | |
Hyland Software, Inc. | |
Term Loan, 5.50%, Maturing October 25, 2019 | | | | | 175 | | | | 175,738 | |
Infor (US), Inc. | |
Term Loan, 5.25%, Maturing April 5, 2018 | | | | | 2,488 | | | | 2,515,112 | |
| | | | | | | | | | |
| Borrower/Tranche Description | | | | Principal
Amount
(000’s omitted) | | | Value | |
| | | | | | | | | | |
|
Electronics / Electrical (continued) | |
Magic Newco LLC | |
Term Loan, 7.25%, Maturing December 12, 2018 | | | | $ | 673 | | | $ | 679,709 | |
Microsemi Corporation | |
Term Loan, 4.00%, Maturing February 2, 2018 | | | | | 670 | | | | 676,691 | |
NeuStar, Inc. | |
Term Loan, 5.00%, Maturing November 8, 2018 | | | | | 420 | | | | 422,704 | |
Nxp B.V. | |
Term Loan, 4.50%, Maturing March 3, 2017 | | | | | 1,277 | | | | 1,290,222 | |
Term Loan, 5.50%, Maturing March 3, 2017 | | | | | 469 | | | | 479,250 | |
Term Loan, 5.25%, Maturing March 19, 2019 | | | | | 844 | | | | 852,237 | |
Term Loan, 4.75%, Maturing January 11, 2020 | | | | | 450 | | | | 452,672 | |
Open Solutions, Inc. | |
Term Loan, 2.44%, Maturing January 23, 2014 | | | | | 995 | | | | 946,231 | |
Rovi Solutions Corporation | |
Term Loan, 4.00%, Maturing March 29, 2019 | | | | | 397 | | | | 392,534 | |
RP Crown Parent, LLC | |
Term Loan, 6.75%, Maturing December 14, 2018 | | | | | 1,300 | | | | 1,300,233 | |
SafeNet Inc. | |
Term Loan, 2.71%, Maturing April 12, 2014 | | | | | 85 | | | | 84,763 | |
Sensata Technologies Finance Company, LLC | |
Term Loan, 3.75%, Maturing May 11, 2018 | | | | | 1,748 | | | | 1,759,739 | |
Serena Software, Inc. | |
Term Loan, 4.21%, Maturing March 10, 2016 | | | | | 1,648 | | | | 1,653,547 | |
Shield Finance Co. S.A.R.L. | |
Term Loan, 6.50%, Maturing May 10, 2019 | | | | | 473 | | | | 473,807 | |
Sirius Computer Solutions, Inc. | |
Term Loan, 8.00%, Maturing November 30, 2018 | | | | | 294 | | | | 296,989 | |
Sophia, L.P. | |
Term Loan, 6.25%, Maturing July 19, 2018 | | | | | 582 | | | | 589,725 | |
Spansion LLC | |
Term Loan, 5.25%, Maturing December 11, 2018 | | | | | 374 | | | | 377,545 | |
SS&C Technologies Inc. | |
Term Loan, 5.00%, Maturing June 7, 2019 | | | | | 60 | | | | 60,356 | |
Term Loan, 5.00%, Maturing June 7, 2019 | | | | | 579 | | | | 585,789 | |
SumTotal Systems, Inc. | |
Term Loan, 6.25%, Maturing November 16, 2018 | | | | | 625 | | | | 621,875 | |
VeriFone Inc. | |
Term Loan, 4.25%, Maturing December 28, 2018 | | | | | 96 | | | | 96,581 | |
Vertafore, Inc. | |
Term Loan, 5.25%, Maturing July 29, 2016 | | | | | 490 | | | | 496,130 | |
Wall Street Systems, Inc. | |
Term Loan, 5.75%, Maturing October 24, 2019 | | | | | 575 | | | | 577,875 | |
Web.com Group, Inc. | |
Term Loan, 5.50%, Maturing October 27, 2017 | | | | | 899 | | | | 907,886 | |
| | |
| | | | | | | | $ | 28,353,956 | |
| | |
| | | | |
| | 10 | | See Notes to Financial Statements. |
Eaton Vance
VT Floating-Rate Income Fund
December 31, 2012
Portfolio of Investments — continued
| | | | | | | | | | |
| Borrower/Tranche Description | | | | Principal
Amount
(000’s omitted) | | | Value | |
| | | | | | | | | | |
|
Equipment Leasing — 0.9% | |
BakerCorp International, Inc. | |
Term Loan, 5.00%, Maturing June 1, 2018 | | | | $ | 1,346 | | | $ | 1,356,397 | |
Delos Aircraft Inc. | |
Term Loan, 4.75%, Maturing April 12, 2016 | | | | | 625 | | | | 632,813 | |
Flying Fortress Inc. | |
Term Loan, 5.00%, Maturing June 30, 2017 | | | | | 1,750 | | | | 1,763,125 | |
| | |
| | | | | | | | $ | 3,752,335 | |
| | |
|
Financial Intermediaries — 2.9% | |
American Capital Holdings, Inc. | |
Term Loan, 5.50%, Maturing August 22, 2016 | | | | $ | 400 | | | $ | 407,000 | |
Asset Acceptance Capital Corp. | |
Term Loan, 8.75%, Maturing November 14, 2017 | | | | | 546 | | | | 552,382 | |
CB Richard Ellis Services, Inc. | |
Term Loan, 3.46%, Maturing March 5, 2018 | | | | | 317 | | | | 317,794 | |
Term Loan, 3.71%, Maturing September 4, 2019 | | | | | 299 | | | | 299,765 | |
Citco Funding LLC | |
Term Loan, 5.50%, Maturing June 29, 2018 | | | | | 813 | | | | 821,767 | |
Clipper Acquisitions Corp. | |
Term Loan, Maturing December 20, 2019(2) | | | | | 275 | | | | 275,688 | |
First Data Corporation | |
Term Loan, 2.96%, Maturing September 24, 2014 | | | | | 22 | | | | 21,838 | |
Term Loan, 2.96%, Maturing September 24, 2014 | | | | | 22 | | | | 22,219 | |
Term Loan, 2.96%, Maturing September 24, 2014 | | | | | 23 | | | | 22,860 | |
Term Loan, 4.21%, Maturing March 23, 2018 | | | | | 830 | | | | 791,903 | |
Term Loan, 5.21%, Maturing September 24, 2018 | | | | | 625 | | | | 614,453 | |
Grosvenor Capital Management Holdings, LLP | |
Term Loan, 4.25%, Maturing December 5, 2016 | | | | | 939 | | | | 923,629 | |
Hamilton Lane Advisors, LLC | |
Term Loan, 6.50%, Maturing February 23, 2018 | | | | | 361 | | | | 360,938 | |
Harbourvest Partners, LLC | |
Term Loan, 5.00%, Maturing November 21, 2017 | | | | | 450 | | | | 453,375 | |
iPayment, Inc. | |
Term Loan, 5.75%, Maturing May 8, 2017 | | | | | 447 | | | | 444,826 | |
LPL Holdings, Inc. | |
Term Loan, 2.71%, Maturing March 29, 2017 | | | | | 385 | | | | 385,161 | |
Term Loan, 4.00%, Maturing March 29, 2019 | | | | | 1,514 | | | | 1,524,914 | |
Mercury Payment Systems Canada, LLC | |
Term Loan, 5.50%, Maturing July 3, 2017 | | | | | 320 | | | | 323,730 | |
MIP Delaware, LLC | |
Term Loan, 5.50%, Maturing July 12, 2018 | | | | | 311 | | | | 314,567 | |
Nuveen Investments, Inc. | |
Term Loan, 5.81%, Maturing May 12, 2017 | | | | | 776 | | | | 781,422 | |
Term Loan, 5.81%, Maturing May 13, 2017 | | | | | 989 | | | | 994,151 | |
| | | | | | | | | | |
| Borrower/Tranche Description | | | | Principal
Amount
(000’s omitted) | | | Value | |
| | | | | | | | | | |
|
Financial Intermediaries (continued) | |
Oz Management LP | |
Term Loan, 1.71%, Maturing November 15, 2016 | | | | $ | 645 | | | $ | 582,599 | |
RJO Holdings Corp. | |
Term Loan, 6.22%, Maturing December 10, 2015(3) | | | | | 7 | | | | 6,107 | |
Term Loan, 6.97%, Maturing December 10, 2015(3) | | | | | 235 | | | | 178,493 | |
RPI Finance Trust | |
Term Loan, 4.00%, Maturing November 9, 2018 | | | | | 421 | | | | 426,068 | |
Vantiv, LLC | |
Term Loan, 3.75%, Maturing March 27, 2019 | | | | | 223 | | | | 223,731 | |
Walter Investment Management Corp. | |
Term Loan, 5.75%, Maturing November 28, 2017 | | | | | 222 | | | | 223,437 | |
| | |
| | | | | | | | $ | 12,294,817 | |
| | |
|
Food Products — 3.4% | |
AdvancePierre Foods Inc. | |
Term Loan, 5.75%, Maturing July 10, 2017 | | | | $ | 625 | | | $ | 633,203 | |
Blue Buffalo Company, Ltd. | |
Term Loan, 6.50%, Maturing August 8, 2019 | | | | | 648 | | | | 654,859 | |
Del Monte Foods Company | |
Term Loan, 4.50%, Maturing March 8, 2018 | | | | | 3,040 | | | | 3,051,207 | |
Dole Food Company Inc. | |
Term Loan, 5.03%, Maturing July 6, 2018 | | | | | 483 | | | | 484,546 | |
High Liner Foods Incorporated | |
Term Loan, 7.00%, Maturing December 19, 2017 | | | | | 248 | | | | 249,202 | |
JBS USA Holdings Inc. | |
Term Loan, 4.25%, Maturing May 25, 2018 | | | | | 2,965 | | | | 2,964,899 | |
Michael Foods Group, Inc. | |
Term Loan, 4.25%, Maturing February 23, 2018 | | | | | 1,218 | | | | 1,227,949 | |
NBTY, Inc. | |
Term Loan, 4.25%, Maturing October 2, 2017 | | | | | 2,352 | | | | 2,377,732 | |
Pinnacle Foods Finance LLC | |
Term Loan, 4.75%, Maturing October 17, 2018 | | | | | 1,816 | | | | 1,836,304 | |
Solvest Ltd. | |
Term Loan, 5.02%, Maturing July 6, 2018 | | | | | 864 | | | | 867,084 | |
| | |
| | | | | | | | $ | 14,346,985 | |
| | |
|
Food Service — 3.6% | |
Aramark Corporation | |
Term Loan, 3.46%, Maturing July 26, 2016 | | | | $ | 3,285 | | | $ | 3,304,510 | |
Term Loan, 3.53%, Maturing July 26, 2016 | | | | | 898 | | | | 902,854 | |
Term Loan, 3.56%, Maturing July 26, 2016 | | | | | 48 | | | | 48,573 | |
Term Loan, 3.56%, Maturing July 26, 2016 | | | | | 216 | | | | 217,321 | |
Buffets, Inc. | |
Term Loan, 0.24%, Maturing April 22, 2015(3) | | | | | 92 | | | | 92,404 | |
| | | | |
| | 11 | | See Notes to Financial Statements. |
Eaton Vance
VT Floating-Rate Income Fund
December 31, 2012
Portfolio of Investments — continued
| | | | | | | | | | |
| Borrower/Tranche Description | | | | Principal
Amount
(000’s omitted) | | | Value | |
| | | | | | | | | | |
|
Food Service (continued) | |
Burger King Corporation | |
Term Loan, 3.75%, Maturing September 27, 2019 | | | | $ | 1,022 | | | $ | 1,030,745 | |
DineEquity, Inc. | |
Term Loan, 4.25%, Maturing October 19, 2017 | | | | | 1,120 | | | | 1,131,342 | |
Dunkin’ Brands, Inc. | |
Term Loan, 4.00%, Maturing November 23, 2017 | | | | | 1,867 | | | | 1,882,956 | |
Landry’s, Inc. | |
Term Loan, 6.50%, Maturing April 24, 2018 | | | | | 645 | | | | 653,189 | |
NPC International, Inc. | |
Term Loan, 4.50%, Maturing December 1, 2018 | | | | | 319 | | | | 322,232 | |
OSI Restaurant Partners, LLC | |
Term Loan, 4.80%, Maturing October 24, 2019 | | | | | 1,300 | | | | 1,314,490 | |
P.F. Chang’s China Bistro Inc. | |
Term Loan, 5.25%, Maturing July 2, 2019 | | | | | 200 | | | | 201,744 | |
US Foods, Inc. | |
Term Loan, 5.75%, Maturing March 31, 2017 | | | | | 1,723 | | | | 1,732,396 | |
Weight Watchers International, Inc. | |
Term Loan, 4.00%, Maturing March 15, 2019 | | | | | 645 | | | | 650,567 | |
Wendy’s International, Inc. | |
Term Loan, 4.75%, Maturing May 15, 2019 | | | | | 1,696 | | | | 1,715,131 | |
| | |
| | | | | | | | $ | 15,200,454 | |
| | |
|
Food / Drug Retailers — 2.0% | |
General Nutrition Centers, Inc. | |
Term Loan, 3.75%, Maturing March 2, 2018 | | | | $ | 2,922 | | | $ | 2,935,126 | |
Pantry, Inc. (The) | |
Term Loan, 5.75%, Maturing August 2, 2019 | | | | | 224 | | | | 226,752 | |
Rite Aid Corporation | |
Term Loan, 1.97%, Maturing June 4, 2014 | | | | | 3,840 | | | | 3,822,354 | |
Term Loan, 4.50%, Maturing March 2, 2018 | | | | | 989 | | | | 988,049 | |
Sprouts Farmers Markets Holdings, LLC | |
Term Loan, 6.00%, Maturing April 18, 2018 | | | | | 274 | | | | 276,703 | |
| | |
| | | | | | | | $ | 8,248,984 | |
| | |
|
Health Care — 13.1% | |
Alere, Inc. | |
Term Loan, 4.75%, Maturing June 30, 2017 | | | | $ | 223 | | | $ | 224,569 | |
Term Loan, 4.75%, Maturing June 30, 2017 | | | | | 248 | | | | 249,025 | |
Term Loan, 4.75%, Maturing June 30, 2017 | | | | | 1,185 | | | | 1,192,301 | |
Alliance Healthcare Services, Inc. | |
Term Loan, 7.25%, Maturing June 1, 2016 | | | | | 1,353 | | | | 1,338,260 | |
Ardent Medical Services, Inc. | |
Term Loan, 7.25%, Maturing September 15, 2015 | | | | | 1,300 | | | | 1,302,834 | |
| | | | | | | | | | |
| Borrower/Tranche Description | | | | Principal
Amount
(000’s omitted) | | | Value | |
| | | | | | | | | | |
|
Health Care (continued) | |
AssuraMed Holding, Inc. | |
Term Loan, 5.50%, Maturing October 24, 2019 | | | | $ | 400 | | | $ | 404,375 | |
Biomet Inc. | |
Term Loan, 4.01%, Maturing July 25, 2017 | | | | | 3,295 | | | | 3,319,622 | |
Catalent Pharma Solutions Inc. | |
Term Loan, 4.21%, Maturing September 15, 2016 | | | | | 2,256 | | | | 2,272,614 | |
CHG Buyer Corporation | |
Term Loan, 5.00%, Maturing November 22, 2019 | | | | | 324 | | | | 324,998 | |
Community Health Systems, Inc. | |
Term Loan, 3.81%, Maturing January 25, 2017 | | | | | 3,233 | | | | 3,256,747 | |
Convatec Inc. | |
Term Loan, 5.00%, Maturing December 22, 2016 | | | | | 540 | | | | 548,507 | |
CRC Health Corporation | |
Term Loan, 4.71%, Maturing November 16, 2015 | | | | | 1,462 | | | | 1,432,395 | |
DaVita, Inc. | |
Term Loan, 4.00%, Maturing November 1, 2019 | | | | | 1,550 | | | | 1,564,203 | |
DJO Finance LLC | |
Term Loan, 5.21%, Maturing November 1, 2016 | | | | | 899 | | | | 903,997 | |
Term Loan, 6.25%, Maturing September 15, 2017 | | | | | 769 | | | | 775,918 | |
Drumm Investors LLC | |
Term Loan, 5.00%, Maturing May 4, 2018 | | | | | 1,487 | | | | 1,401,587 | |
Emdeon, Inc. | |
Term Loan, 5.00%, Maturing November 2, 2018 | | | | | 397 | | | | 401,516 | |
Emergency Medical Services Corporation | |
Term Loan, 5.25%, Maturing May 25, 2018 | | | | | 408 | | | | 411,602 | |
Grifols Inc. | |
Term Loan, 4.50%, Maturing June 1, 2017 | | | | | 1,303 | | | | 1,317,803 | |
Hanger Orthopedic Group, Inc. | |
Term Loan, 4.00%, Maturing December 1, 2016 | | | | | 587 | | | | 589,533 | |
HCA, Inc. | |
Term Loan, 3.56%, Maturing March 31, 2017 | | | | | 4,772 | | | | 4,791,886 | |
Health Management Associates, Inc. | |
Term Loan, 4.50%, Maturing November 16, 2018 | | | | | 4,183 | | | | 4,221,574 | |
Hologic Inc. | |
Term Loan, 4.50%, Maturing August 1, 2019 | | | | | 923 | | | | 934,894 | |
Iasis Healthcare LLC | |
Term Loan, 5.00%, Maturing May 3, 2018 | | | | | 811 | | | | 814,615 | |
inVentiv Health, Inc. | |
Term Loan, 6.50%, Maturing August 4, 2016 | | | | | 1,340 | | | | 1,290,003 | |
Term Loan, 6.75%, Maturing May 15, 2018 | | | | | 333 | | | | 324,947 | |
Kindred Healthcare, Inc. | |
Term Loan, 5.25%, Maturing June 1, 2018 | | | | | 491 | | | | 480,783 | |
Kinetic Concepts, Inc. | |
Term Loan, 5.50%, Maturing May 4, 2018 | | | | | 997 | | | | 1,009,950 | |
| | | | |
| | 12 | | See Notes to Financial Statements. |
Eaton Vance
VT Floating-Rate Income Fund
December 31, 2012
Portfolio of Investments — continued
| | | | | | | | | | |
| Borrower/Tranche Description | | | | Principal
Amount
(000’s omitted) | | | Value | |
| | | | | | | | | | |
|
Health Care (continued) | |
LHP Hospital Group, Inc. | |
Term Loan, 9.00%, Maturing July 3, 2018 | | | | $ | 249 | | | $ | 251,548 | |
MedAssets, Inc. | |
Term Loan, 4.00%, Maturing November 30, 2019 | | | | | 300 | | | | 300,375 | |
Medpace, Inc. | |
Term Loan, 6.50%, Maturing June 16, 2017 | | | | | 392 | | | | 376,308 | |
MMM Holdings, Inc. | |
Term Loan, 9.75%, Maturing October 9, 2017 | | | | | 347 | | | | 345,632 | |
MSO of Puerto Rico, Inc. | |
Term Loan, 9.75%, Maturing October 26, 2017 | | | | | 253 | | | | 251,368 | |
Multiplan, Inc. | |
Term Loan, 4.75%, Maturing August 26, 2017 | | | | | 1,660 | | | | 1,672,530 | |
MX USA, Inc. | |
Term Loan, 6.50%, Maturing April 28, 2017 | | | | | 273 | | | | 273,620 | |
One Call Medical, Inc. | |
Term Loan, 7.00%, Maturing August 16, 2019 | | | | | 450 | | | | 452,250 | |
Onex Carestream Finance LP | |
Term Loan, 5.00%, Maturing February 25, 2017 | | | | | 982 | | | | 981,349 | |
Pharmaceutical Product Development, Inc. | |
Term Loan, 6.25%, Maturing December 5, 2018 | | | | | 866 | | | | 881,139 | |
Physiotherapy Associates Holdings, Inc. | |
Term Loan, 6.01%, Maturing April 30, 2018 | | | | | 149 | | | | 149,716 | |
Radnet Management, Inc. | |
Term Loan, 5.50%, Maturing September 30, 2018 | | | | | 748 | | | | 751,866 | |
Sage Products, Inc. | |
Term Loan, 5.25%, Maturing December 17, 2019 | | | | | 300 | | | | 302,625 | |
Select Medical Corporation | |
Term Loan, 5.50%, Maturing June 1, 2018 | | | | | 1,453 | | | | 1,461,350 | |
Sheridan Holdings, Inc. | |
Term Loan, 6.00%, Maturing June 29, 2018 | | | | | 274 | | | | 277,558 | |
TriZetto Group, Inc. (The) | |
Term Loan, 4.75%, Maturing May 2, 2018 | | | | | 714 | | | | 712,161 | |
Truven Health Analytics Inc. | |
Term Loan, 5.75%, Maturing June 1, 2019 | | | | | 823 | | | | 825,504 | |
Universal Health Services, Inc. | |
Term Loan, 3.75%, Maturing November 15, 2016 | | | | | 1,014 | | | | 1,019,971 | |
Valeant Pharmaceuticals International, Inc. | |
Term Loan, 4.25%, Maturing February 13, 2019 | | | | | 2,916 | | | | 2,937,032 | |
Term Loan, 4.25%, Maturing December 11, 2019 | | | | | 1,000 | | | | 1,008,000 | |
Vanguard Health Holding Company II, LLC | |
Term Loan, 5.00%, Maturing January 29, 2016 | | | | | 985 | | | | 994,944 | |
VWR Funding, Inc. | |
Term Loan, 2.71%, Maturing June 30, 2014 | | | | | 873 | | | | 874,069 | |
Term Loan, 4.46%, Maturing April 3, 2017 | | | | | 873 | | | | 877,523 | |
| | |
| | | | | | | | $ | 55,079,496 | |
| | |
| | | | | | | | | | |
| Borrower/Tranche Description | | | | Principal
Amount
(000’s omitted) | | | Value | |
| | | | | | | | | | |
|
Home Furnishings — 0.4% | |
Oreck Corporation | |
Term Loan - Second Lien, 3.81%, Maturing March 19, 2016(3) | | | | $ | 93 | | | $ | 84,426 | |
Serta Simmons Holdings, LLC | |
Term Loan, 5.00%, Maturing October 1, 2019 | | | | | 800 | | | | 802,278 | |
Tempur-Pedic International Inc. | |
Term Loan, Maturing December 12, 2019(2) | | | | | 900 | | | | 912,562 | |
| | |
| | | | | | | | $ | 1,799,266 | |
| | |
|
Industrial Equipment — 0.8% | |
Alliance Laundry Systems LLC | |
Term Loan, 5.50%, Maturing December 10, 2018 | | | | $ | 175 | | | $ | 176,969 | |
Colfax Corporation | |
Term Loan, 4.50%, Maturing January 11, 2019 | | | | | 569 | | | | 575,210 | |
Generac Power Systems, Inc. | |
Term Loan, 6.25%, Maturing May 30, 2018 | | | | | 723 | | | | 741,870 | |
Grede LLC | |
Term Loan, 7.00%, Maturing April 3, 2017 | | | | | 484 | | | | 486,420 | |
Husky Injection Molding Systems Ltd. | |
Term Loan, 5.75%, Maturing June 29, 2018 | | | | | 500 | | | | 507,500 | |
Manitowoc Company, Inc. (The) | |
Term Loan, 4.25%, Maturing November 13, 2017 | | | | | 66 | | | | 66,388 | |
Tank Holding Corp. | |
Term Loan, 5.50%, Maturing July 9, 2019 | | | | | 488 | | | | 491,830 | |
Terex Corporation | |
Term Loan, 4.50%, Maturing April 28, 2017 | | | | | 346 | | | | 349,781 | |
| | |
| | | | | | | | $ | 3,395,968 | |
| | |
|
Insurance — 2.9% | |
Alliant Holdings I, Inc. | |
Term Loan, 5.00%, Maturing December 20, 2019 | | | | $ | 1,000 | | | $ | 1,002,800 | |
AmWINS Group, Inc. | |
Term Loan, 5.75%, Maturing June 6, 2019 | | | | | 473 | | | | 475,579 | |
Applied Systems, Inc. | |
Term Loan, 5.50%, Maturing December 8, 2016 | | | | | 273 | | | | 275,667 | |
Asurion LLC | |
Term Loan, 5.50%, Maturing May 24, 2018 | | | | | 3,893 | | | | 3,937,809 | |
Term Loan - Second Lien, 9.00%, Maturing May 24, 2019 | | | | | 995 | | | | 1,027,568 | |
CCC Information Services, Inc. | |
Term Loan, Maturing December 25, 2019(2) | | | | | 150 | | | | 150,812 | |
CNO Financial Group, Inc. | |
Term Loan, 5.00%, Maturing September 20, 2018 | | | | | 503 | | | | 507,435 | |
Compass Investors Inc. | |
Term Loan, 5.50%, Maturing December 27, 2019 | | | | | 1,050 | | | | 1,049,125 | |
| | | | |
| | 13 | | See Notes to Financial Statements. |
Eaton Vance
VT Floating-Rate Income Fund
December 31, 2012
Portfolio of Investments — continued
| | | | | | | | | | |
| Borrower/Tranche Description | | | | Principal
Amount
(000’s omitted) | | | Value | |
| | | | | | | | | | |
|
Insurance (continued) | |
Cunningham Lindsey U.S. Inc. | |
Term Loan, 5.00%, Maturing October 29, 2019 | | | | $ | 350 | | | $ | 353,500 | |
Hub International Limited | |
Term Loan, 4.71%, Maturing June 13, 2017 | | | | | 2,042 | | | | 2,064,487 | |
Term Loan, 6.75%, Maturing December 13, 2017 | | | | | 847 | | | | 855,370 | |
Sedgwick CMS Holdings, Inc. | |
Term Loan, 5.00%, Maturing December 30, 2016 | | | | | 498 | | | | 499,693 | |
| | |
| | | | | | | | $ | 12,199,845 | |
| | |
|
Leisure Goods / Activities / Movies — 3.8% | |
Alpha D2 Limited | |
Term Loan, 6.00%, Maturing April 30, 2019 | | | | $ | 968 | | | $ | 983,425 | |
AMC Entertainment, Inc. | |
Term Loan, 4.25%, Maturing December 15, 2016 | | | | | 1,992 | | | | 2,006,239 | |
Term Loan, 4.75%, Maturing February 22, 2018 | | | | | 495 | | | | 499,683 | |
Bombardier Recreational Products, Inc. | |
Term Loan, 4.51%, Maturing June 28, 2016 | | | | | 1,478 | | | | 1,492,643 | |
Term Loan, Maturing June 28, 2016(2) | | | | | 225 | | | | 227,250 | |
Bright Horizons Family Solutions, Inc. | |
Term Loan, 4.22%, Maturing May 28, 2015 | | | | | 759 | | | | 760,496 | |
ClubCorp Club Operations, Inc. | |
Term Loan, 5.00%, Maturing November 30, 2016 | | | | | 540 | | | | 548,459 | |
Equinox Fitness Clubs | |
Term Loan, Maturing November 16, 2019(2) | | | | | 600 | | | | 606,000 | |
Fender Musical Instruments Corporation | |
Term Loan, 5.50%, Maturing June 9, 2014 | | | | | 556 | | | | 556,320 | |
Live Nation Entertainment, Inc. | |
Term Loan, 4.50%, Maturing November 7, 2016 | | | | | 174 | | | | 175,194 | |
Regal Cinemas, Inc. | |
Term Loan, 3.24%, Maturing August 23, 2017 | | | | | 2,548 | | | | 2,561,650 | |
Revolution Studios Distribution Company, LLC | |
Term Loan, 3.97%, Maturing December 21, 2014(3) | | | | | 412 | | | | 339,182 | |
SeaWorld Parks & Entertainment, Inc. | |
Term Loan, 4.00%, Maturing February 17, 2016 | | | | | 468 | | | | 469,250 | |
Term Loan, 4.00%, Maturing August 17, 2017 | | | | | 751 | | | | 757,538 | |
Six Flags Theme Parks, Inc. | |
Term Loan, 4.00%, Maturing December 20, 2018 | | | | | 1,659 | | | | 1,669,071 | |
Town Sports International Inc. | |
Term Loan, 5.75%, Maturing May 11, 2018 | | | | | 426 | | | | 431,211 | |
WMG Acquisition Corp. | |
Term Loan, 5.25%, Maturing November 1, 2018 | | | | | 275 | | | | 278,552 | |
Zuffa LLC | |
Term Loan, 2.25%, Maturing June 19, 2015 | | | | | 1,687 | | | | 1,672,673 | |
| | |
| | | | | | | | $ | 16,034,836 | |
| | |
| | | | | | | | | | |
| Borrower/Tranche Description | | | | Principal
Amount
(000’s omitted) | | | Value | |
| | | | | | | | | | |
|
Lodging and Casinos — 1.8% | |
Ameristar Casinos, Inc. | |
Term Loan, 4.00%, Maturing April 16, 2018 | | | | $ | 490 | | | $ | 494,431 | |
Caesars Entertainment Operating Company | |
Term Loan, 3.21%, Maturing January 28, 2015 | | | | | 1,500 | | | | 1,479,272 | |
Term Loan, 5.46%, Maturing January 26, 2018 | | | | | 1,447 | | | | 1,296,250 | |
Isle of Capri Casinos, Inc. | |
Term Loan, 4.75%, Maturing March 24, 2017 | | | | | 442 | | | | 448,296 | |
Las Vegas Sands LLC | |
Term Loan, 2.76%, Maturing November 23, 2016 | | | | | 1,090 | | | | 1,093,699 | |
MGM Resorts International | |
Term Loan, 4.25%, Maturing December 20, 2019 | | | | | 1,200 | | | | 1,214,626 | |
Penn National Gaming, Inc. | |
Term Loan, 3.75%, Maturing July 16, 2018 | | | | | 741 | | | | 744,878 | |
Pinnacle Entertainment, Inc. | |
Term Loan, 4.00%, Maturing March 19, 2019 | | | | | 273 | | | | 275,326 | |
Tropicana Entertainment Inc. | |
Term Loan, 7.50%, Maturing March 16, 2018 | | | | | 695 | | | | 705,171 | |
| | |
| | | | | | | | $ | 7,751,949 | |
| | |
|
Nonferrous Metals / Minerals — 2.1% | |
Arch Coal Inc. | |
Term Loan, 5.75%, Maturing May 16, 2018 | | | | $ | 1,966 | | | $ | 1,990,927 | |
Fairmount Minerals LTD | |
Term Loan, 5.25%, Maturing March 15, 2017 | | | | | 1,407 | | | | 1,404,491 | |
Noranda Aluminum Acquisition Corporation | |
Term Loan, 5.75%, Maturing February 24, 2019 | | | | | 496 | | | | 500,282 | |
Novelis, Inc. | |
Term Loan, 4.00%, Maturing March 10, 2017 | | | | | 296 | | | | 299,138 | |
Term Loan, 4.00%, Maturing March 10, 2017 | | | | | 2,181 | | | | 2,202,645 | |
Oxbow Carbon and Mineral Holdings LLC | |
Term Loan, 3.71%, Maturing May 8, 2016 | | | | | 1,696 | | | | 1,702,947 | |
United Distribution Group, Inc. | |
Term Loan, 7.50%, Maturing October 9, 2018 | | | | | 575 | | | | 554,875 | |
| | |
| | | | | | | | $ | 8,655,305 | |
| | |
|
Oil and Gas — 2.6% | |
Citgo Petroleum Corporation | |
Term Loan, 8.00%, Maturing June 24, 2015 | | | | $ | 83 | | | $ | 84,265 | |
Term Loan, 9.00%, Maturing June 23, 2017 | | | | | 1,067 | | | | 1,086,303 | |
Crestwood Holdings LLC | |
Term Loan, 9.75%, Maturing March 26, 2018 | | | | | 527 | | | | 535,961 | |
Energy Transfer Equity, L.P. | |
Term Loan, 3.75%, Maturing March 24, 2017 | | | | | 1,300 | | | | 1,312,086 | |
| | | | |
| | 14 | | See Notes to Financial Statements. |
Eaton Vance
VT Floating-Rate Income Fund
December 31, 2012
Portfolio of Investments — continued
| | | | | | | | | | |
| Borrower/Tranche Description | | | | Principal
Amount
(000’s omitted) | | | Value | |
| | | | | | | | | | |
|
Oil and Gas (continued) | |
Frac Tech International LLC | |
Term Loan, 8.50%, Maturing May 6, 2016 | | | | $ | 954 | | | $ | 795,990 | |
Gibson Energy ULC | |
Term Loan, 4.75%, Maturing June 15, 2018 | | | | | 1,092 | | | | 1,105,567 | |
Obsidian Natural Gas Trust | |
Term Loan, 7.00%, Maturing November 2, 2015 | | | | | 1,112 | | | | 1,117,220 | |
Plains Exploration & Production | |
Term Loan, 4.00%, Maturing November 30, 2019 | | | | | 1,000 | | | | 1,004,583 | |
Samson Investment Company | |
Term Loan - Second Lien, 6.00%, Maturing September 25, 2018 | | | | | 425 | | | | 429,516 | |
Sheridan Production Partners I, LLC | |
Term Loan, 5.00%, Maturing September 14, 2019 | | | | | 986 | | | | 999,704 | |
Term Loan, 5.00%, Maturing September 25, 2019 | | | | | 80 | | | | 80,913 | |
Term Loan, 5.00%, Maturing September 25, 2019 | | | | | 131 | | | | 132,469 | |
Tallgrass Operations, LLC | |
Term Loan, 5.25%, Maturing November 13, 2018 | | | | | 1,050 | | | | 1,063,125 | |
Tervita Corporation | |
Term Loan, 3.21%, Maturing November 14, 2014 | | | | | 997 | | | | 983,668 | |
| | |
| | | | | | | | $ | 10,731,370 | |
| | |
|
Publishing — 4.0% | |
Ascend Learning, Inc. | |
Term Loan, 6.50%, Maturing May 23, 2017 | | | | $ | 1,664 | | | $ | 1,670,073 | |
Black Press US Partnership | |
Term Loan, 2.31%, Maturing August 2, 2013 | | | | | 214 | | | | 208,762 | |
Term Loan, 2.31%, Maturing August 2, 2013 | | | | | 353 | | | | 343,843 | |
GateHouse Media Operating, Inc. | |
Term Loan, 2.22%, Maturing August 28, 2014 | | | | | 853 | | | | 317,494 | |
Term Loan, 2.22%, Maturing August 28, 2014 | | | | | 2,192 | | | | 815,788 | |
Term Loan, 2.47%, Maturing August 28, 2014 | | | | | 983 | | | | 365,575 | |
Getty Images, Inc. | |
Term Loan, 4.75%, Maturing October 18, 2019 | | | | | 2,375 | | | | 2,381,308 | |
Instant Web, Inc. | |
Term Loan, 3.59%, Maturing August 7, 2014 | | | | | 73 | | | | 57,234 | |
Term Loan, 3.59%, Maturing August 7, 2014 | | | | | 704 | | | | 549,043 | |
Interactive Data Corporation | |
Term Loan, 4.50%, Maturing February 12, 2018 | | | | | 1,482 | | | | 1,491,345 | |
John Henry Holdings, Inc. | |
Term Loan, 6.00%, Maturing December 4, 2018 | | | | | 300 | | | | 302,625 | |
Laureate Education, Inc. | |
Term Loan, 5.25%, Maturing June 18, 2018 | | | | | 3,570 | | | | 3,554,865 | |
MediaNews Group | |
Term Loan, 8.50%, Maturing March 19, 2014 | | | | | 329 | | | | 321,089 | |
| | | | | | | | | | |
| Borrower/Tranche Description | | | | Principal
Amount
(000’s omitted) | | | Value | |
| | | | | | | | | | |
|
Publishing (continued) | |
Nelson Education Ltd. | |
Term Loan, 2.81%, Maturing July 3, 2014 | | | | $ | 324 | | | $ | 257,218 | |
Newspaper Holdings Inc. | |
Term Loan, 1.88%, Maturing June 30, 2014 | | | | | 282 | | | | 265,402 | |
Nielsen Finance LLC | |
Term Loan, 3.96%, Maturing May 2, 2016 | | | | | 2,397 | | | | 2,412,848 | |
Source Interlink Companies, Inc. | |
Term Loan, 15.00%, Maturing March 18, 2014(3)(4) | | | | | 383 | | | | 163,358 | |
Term Loan - Second Lien, 10.75%, Maturing June 18, 2013 | | | | | 443 | | | | 389,924 | |
Star Tribune Company (The) | |
Term Loan, 8.00%, Maturing September 28, 2014 | | | | | 61 | | | | 58,573 | |
Term Loan, 8.00%, Maturing September 29, 2014 | | | | | 112 | | | | 106,983 | |
Tribune Company | |
Term Loan, Maturing December 17, 2019(2) | | | | | 850 | | | | 850,106 | |
| | |
| | | | | | | | $ | 16,883,456 | |
| | |
|
Radio and Television — 2.1% | |
Clear Channel Communications, Inc. | |
Term Loan, 3.86%, Maturing January 29, 2016 | | | | $ | 606 | | | $ | 504,081 | |
Cumulus Media Holdings Inc. | |
Term Loan, 4.50%, Maturing September 17, 2018 | | | | | 2,028 | | | | 2,035,503 | |
Entercom Radio, LLC | |
Term Loan, 5.00%, Maturing November 23, 2018 | | | | | 232 | | | | 234,418 | |
Foxco Acquisition Sub, LLC | |
Term Loan, 5.50%, Maturing July 14, 2017 | | | | | 673 | | | | 683,693 | |
Gray Television, Inc. | |
Term Loan, 4.75%, Maturing October 15, 2019 | | | | | 241 | | | | 242,648 | |
LIN Television Corp. | |
Term Loan, 4.00%, Maturing December 21, 2018 | | | | | 248 | | | | 249,348 | |
Local TV Finance, LLC | |
Term Loan, 4.22%, Maturing May 7, 2015 | | | | | 824 | | | | 828,030 | |
Mission Broadcasting, Inc. | |
Term Loan, 2.19%, Maturing December 3, 2019(5) | | | | | 201 | | | | 203,079 | |
Nexstar Broadcasting, Inc. | |
Term Loan, 4.50%, Maturing December 3, 2019 | | | | | 474 | | | | 480,359 | |
Raycom TV Broadcasting, Inc. | |
Term Loan, 4.25%, Maturing May 31, 2017 | | | | | 443 | | | | 442,696 | |
Sinclair Television Group Inc. | |
Term Loan, 4.00%, Maturing October 28, 2016 | | | | | 329 | | | | 330,927 | |
Univision Communications Inc. | |
Term Loan, 4.46%, Maturing March 31, 2017 | | | | | 2,803 | | | | 2,762,483 | |
| | |
| | | | | | | | $ | 8,997,265 | |
| | |
| | | | |
| | 15 | | See Notes to Financial Statements. |
Eaton Vance
VT Floating-Rate Income Fund
December 31, 2012
Portfolio of Investments — continued
| | | | | | | | | | |
| Borrower/Tranche Description | | | | Principal
Amount
(000’s omitted) | | | Value | |
| | | | | | | | | | |
|
Retailers (Except Food and Drug) — 3.5% | |
99 Cents Only Stores | |
Term Loan, 5.25%, Maturing January 11, 2019 | | | | $ | 994 | | | $ | 1,006,593 | |
Bass Pro Group, LLC | |
Term Loan, 4.00%, Maturing November 30, 2019 | | | | | 675 | | | | 676,406 | |
David’s Bridal, Inc. | |
Term Loan, 5.00%, Maturing October 11, 2019 | | | | | 325 | | | | 326,286 | |
Evergreen Acqco 1 LP | |
Term Loan, 5.00%, Maturing July 9, 2019 | | | | | 323 | | | | 325,095 | |
FTD, Inc. | |
Term Loan, 4.75%, Maturing June 11, 2018 | | | | | 603 | | | | 609,461 | |
Harbor Freight Tools USA, Inc. | |
Term Loan, 5.50%, Maturing November 14, 2017 | | | | | 474 | | | | 479,340 | |
J Crew Group, Inc. | |
Term Loan, 4.50%, Maturing March 7, 2018 | | | | | 788 | | | | 792,323 | |
Jo-Ann Stores, Inc. | |
Term Loan, 4.75%, Maturing March 16, 2018 | | | | | 2,128 | | | | 2,139,541 | |
Michaels Stores, Inc. | |
Term Loan, 4.81%, Maturing July 29, 2016 | | | | | 926 | | | | 935,353 | |
National Vision, Inc. | |
Term Loan, 7.00%, Maturing August 2, 2018 | | | | | 397 | | | | 402,955 | |
Neiman Marcus Group, Inc. (The) | |
Term Loan, 4.75%, Maturing May 16, 2018 | | | | | 1,975 | | | | 1,981,308 | |
Ollie’s Bargain Outlet, Inc. | |
Term Loan, 6.25%, Maturing September 27, 2019 | | | | | 250 | | | | 252,031 | |
Pep Boys-Manny, Moe & Jack (The) | |
Term Loan, 5.00%, Maturing October 11, 2018 | | | | | 225 | | | | 226,875 | |
Petco Animal Supplies, Inc. | |
Term Loan, 4.50%, Maturing November 24, 2017 | | | | | 1,495 | | | | 1,507,444 | |
Pilot Travel Centers LLC | |
Term Loan, 3.75%, Maturing March 30, 2018 | | | | | 848 | | | | 853,387 | |
Term Loan, 4.25%, Maturing August 7, 2019 | | | | | 274 | | | | 276,770 | |
ServiceMaster Company | |
Term Loan, 4.46%, Maturing January 31, 2017 | | | | | 973 | | | | 976,821 | |
Visant Holding Corp. | |
Term Loan, 5.25%, Maturing December 22, 2016 | | | | | 601 | | | | 545,784 | |
Wilton Brands LLC | |
Term Loan, 7.50%, Maturing August 30, 2018 | | | | | 321 | | | | 324,147 | |
| | |
| | | | | | | | $ | 14,637,920 | |
| | |
|
Steel — 1.7% | |
Essar Steel Algoma, Inc. | |
Term Loan, 8.75%, Maturing September 19, 2014 | | | | $ | 524 | | | $ | 522,378 | |
Firth Rixson PLC | |
Term Loan, 5.50%, Maturing June 30, 2017 | | | | | 150 | | | | 151,312 | |
| | | | | | | | | | |
| Borrower/Tranche Description | | | | Principal
Amount
(000’s omitted) | | | Value | |
| | | | | | | | | | |
|
Steel (continued) | |
FMG America Finance, Inc. | |
Term Loan, 5.25%, Maturing October 18, 2017 | | | | $ | 2,893 | | | $ | 2,921,903 | |
JMC Steel Group, Inc. | |
Term Loan, 4.75%, Maturing April 3, 2017 | | | | | 1,812 | | | | 1,834,381 | |
Patriot Coal Corporation | |
Term Loan, 9.25%, Maturing October 4, 2013 | | | | | 400 | | | | 403,000 | |
SunCoke Energy, Inc. | |
Term Loan, 4.00%, Maturing July 26, 2018 | | | | | 493 | | | | 493,733 | |
Waupaca Foundry, Inc. | |
Term Loan, 5.75%, Maturing June 29, 2017 | | | | | 488 | | | | 494,892 | |
WireCo WorldGroup, Inc. | |
Term Loan, 6.00%, Maturing February 15, 2017 | | | | | 299 | | | | 303,739 | |
| | |
| | | | | | | | $ | 7,125,338 | |
| | |
|
Surface Transport — 1.1% | |
Hertz Corporation (The) | |
Term Loan, 3.75%, Maturing March 9, 2018 | | | | $ | 1,000 | | | $ | 1,003,125 | |
Term Loan, 3.75%, Maturing March 9, 2018 | | | | | 1,153 | | | | 1,154,017 | |
Term Loan, 3.75%, Maturing March 11, 2018 | | | | | 900 | | | | 902,532 | |
Swift Transportation Co. Inc. | |
Term Loan, 3.96%, Maturing December 21, 2016 | | | | | 750 | | | | 754,312 | |
Term Loan, 5.00%, Maturing December 21, 2017 | | | | | 835 | | | | 844,158 | |
| | |
| | | | | | | | $ | 4,658,144 | |
| | |
|
Telecommunications — 3.3% | |
Alaska Communications Systems Holdings, Inc. | |
Term Loan, 5.50%, Maturing October 21, 2016 | | | | $ | 760 | | | $ | 721,525 | |
Cricket Communications, Inc. | |
Term Loan, 4.75%, Maturing October 10, 2019 | | | | | 250 | | | | 252,031 | |
Crown Castle International Corporation | |
Term Loan, 4.00%, Maturing January 31, 2019 | | | | | 817 | | | | 822,468 | |
Intelsat Jackson Holdings Ltd. | |
Term Loan, 4.50%, Maturing April 2, 2018 | | | | | 5,382 | | | | 5,431,851 | |
MetroPCS Wireless, Inc. | |
Term Loan, 4.00%, Maturing March 16, 2018 | | | | | 2,896 | | | | 2,908,066 | |
SBA Finance | |
Term Loan, 3.75%, Maturing June 29, 2018 | | | | | 443 | | | | 444,912 | |
Term Loan, 3.75%, Maturing September 27, 2019 | | | | | 200 | | | | 201,250 | |
Syniverse Holdings, Inc. | |
Term Loan, 5.00%, Maturing April 23, 2019 | | | | | 896 | | | | 903,336 | |
Telesat LLC | |
Term Loan, 4.25%, Maturing March 28, 2019 | | | | | 1,866 | | | | 1,881,949 | |
Windstream Corporation | |
Term Loan, 4.00%, Maturing August 8, 2019 | | | | | 448 | | | | 451,668 | |
| | |
| | | | | | | | $ | 14,019,056 | |
| | |
| | | | |
| | 16 | | See Notes to Financial Statements. |
Eaton Vance
VT Floating-Rate Income Fund
December 31, 2012
Portfolio of Investments — continued
| | | | | | | | | | |
| Borrower/Tranche Description | | | | Principal
Amount
(000’s omitted) | | | Value | |
| | | | | | | | | | |
|
Utilities — 3.1% | |
AES Corporation | |
Term Loan, 4.25%, Maturing June 1, 2018 | | | | $ | 979 | | | $ | 991,367 | |
Calpine Corporation | |
Term Loan, 4.50%, Maturing April 2, 2018 | | | | | 468 | | | | 473,139 | |
Term Loan, 4.50%, Maturing April 2, 2018 | | | | | 2,800 | | | | 2,832,422 | |
Term Loan, 4.50%, Maturing October 9, 2019 | | | | | 424 | | | | 428,658 | |
Dynegy Midwest Generation LLC | |
Term Loan, 9.25%, Maturing August 4, 2016 | | | | | 1,081 | | | | 1,126,582 | |
Dynegy Power, LLC | |
Term Loan, 9.25%, Maturing August 4, 2016 | | | | | 342 | | | | 358,858 | |
LSP Madison Funding, LLC | |
Term Loan, 5.50%, Maturing June 28, 2019 | | | | | 499 | | | | 507,388 | |
NRG Energy, Inc. | |
Term Loan, 4.00%, Maturing July 2, 2018 | | | | | 4,398 | | | | 4,451,356 | |
Raven Power Finance, LLC | |
Term Loan, 7.25%, Maturing November 15, 2018 | | | | | 250 | | | | 250,000 | |
Texas Competitive Electric Holdings Company, LLC | |
Term Loan, 4.75%, Maturing October 10, 2017 | | | | | 2,261 | | | | 1,522,690 | |
| | |
| | | | | | | | $ | 12,942,460 | |
| | |
| |
Total Senior Floating-Rate Interests
(identified cost $389,339,886) | | | $ | 391,422,928 | |
| | |
|
| Corporate Bonds & Notes — 2.3% | |
| | | |
| | | | | | | | | | |
| Security | | | | Principal
Amount
(000’s omitted) | | | Value | |
|
Chemicals and Plastics — 0.4% | |
Hexion US Finance Corp., Sr. Notes | |
6.625%, 4/15/20 | | | | $ | 1,000 | | | $ | 1,022,500 | |
Ineos Finance PLC, Sr. Notes | |
8.375%, 2/15/19(6) | | | | | 575 | | | | 621,719 | |
| | |
| | | | | | | | $ | 1,644,219 | |
| | |
|
Containers and Glass Products — 0.8% | |
Berry Plastics Corp., Sr. Notes | |
5.09%, 2/15/15(7) | | | | $ | 1,000 | | | $ | 1,004,000 | |
Reynolds Group Holdings, Inc., Sr. Notes | |
5.75%, 10/15/20(6) | | | | | 1,925 | | | | 1,992,375 | |
Smurfit Kappa Acquisitions, Sr. Notes | |
4.875%, 9/15/18(6) | | | | | 225 | | | | 230,625 | |
| | |
| | | | | | | | $ | 3,227,000 | |
| | |
| | | | | | | | | | |
| Security | | | | Principal
Amount
(000’s omitted) | | | Value | |
| | | | | | | | | | |
|
Financial Intermediaries — 0.1% | |
First Data Corp., Sr. Notes | |
6.75%, 11/1/20(6) | | | | $ | 650 | | | $ | 659,750 | |
| | |
| | | | | | | | $ | 659,750 | |
| | |
|
Health Care — 0.3% | |
Community Health Systems, Inc., Sr. Notes | |
5.125%, 8/15/18 | | | | $ | 1,050 | | | $ | 1,097,250 | |
| | |
| | | | | | | | $ | 1,097,250 | |
| | |
|
Lodging and Casinos — 0.3% | |
Caesars Entertainment Operating Co., Inc., Sr. Notes | |
8.50%, 2/15/20 | | | | $ | 1,125 | | | $ | 1,120,078 | |
| | |
| | | | | | | | $ | 1,120,078 | |
| | |
|
Radio and Television — 0.1% | |
Clear Channel Communications, Inc., Sr. Notes | |
9.00%, 12/15/19(6) | | | | $ | 181 | | | $ | 166,520 | |
Univision Communications, Inc., Sr. Notes | |
6.75%, 9/15/22(6) | | | | | 425 | | | | 440,937 | |
| | |
| | | | | | | | $ | 607,457 | |
| | |
|
Utilities — 0.3% | |
Calpine Corp., Sr. Notes | |
7.875%, 1/15/23(6) | | | | $ | 1,327 | | | $ | 1,506,145 | |
| | |
| | | | | | | | $ | 1,506,145 | |
| | |
| |
Total Corporate Bonds & Notes
(identified cost $9,453,074) | | | $ | 9,861,899 | |
| | |
|
| Common Stocks — 0.8% | |
| | | |
| | | | | | | | | | |
| Security | | | | Shares | | | Value | |
|
Automotive — 0.1% | |
Dayco Products, LLC(3)(8)(9) | | | | | 15,250 | | | $ | 388,875 | |
| | |
| | | | | | | | $ | 388,875 | |
| | |
|
Financial Intermediaries — 0.0%(10) | |
RTS Investor Corp.(3)(8)(9) | | | | | 82 | | | $ | 8,896 | |
| | |
| | | | | | | | $ | 8,896 | |
| | |
| | | | |
| | 17 | | See Notes to Financial Statements. |
Eaton Vance
VT Floating-Rate Income Fund
December 31, 2012
Portfolio of Investments — continued
| | | | | | | | | | |
| Security | | | | Shares | | | Value | |
| | | | | | | | | | |
|
Food Service — 0.0%(10) | |
Buffets Restaurants Holdings, Inc.(3)(8)(9) | | | | | 776 | | | $ | 7,023 | |
| | |
| | | | | | | | $ | 7,023 | |
| | |
|
Home Furnishings — 0.0%(10) | |
Oreck Corp.(3)(8)(9) | | | | | 1,658 | | | $ | 28,833 | |
| | |
| | | | | | | | $ | 28,833 | |
| | |
|
Lodging and Casinos — 0.4% | |
Affinity Gaming, LLC(8)(9) | | | | | 41,797 | | | $ | 480,667 | |
Tropicana Entertainment, Inc.(3)(8)(9) | | | | | 71,982 | | | | 1,025,743 | |
| | |
| | | | | | | | $ | 1,506,410 | |
| | |
|
Publishing — 0.3% | |
Ion Media Networks, Inc.(3)(8)(9) | | | | | 399 | | | $ | 253,764 | |
MediaNews Group, Inc.(3)(8)(9) | | | | | 45,600 | | | | 956,691 | |
Source Interlink Companies, Inc.(3)(8)(9) | | | | | 1,145 | | | | 0 | |
| | |
| | | | | | | | $ | 1,210,455 | |
| | |
| |
Total Common Stocks
(identified cost $2,597,525) | | | $ | 3,150,492 | |
| | |
| |
Total Investments — 96.3%
(identified cost $401,390,485) | | | $ | 404,435,319 | |
| | |
| |
Less Unfunded Loan Commitments — (0.0)%(10) | | | $ | (115,714 | ) |
| | |
| |
Net Investments — 96.3%
(identified cost $401,274,771) | | | $ | 404,319,605 | |
| | |
| |
Other Assets, Less Liabilities — 3.7% | | | $ | 15,578,612 | |
| | |
| |
Net Assets — 100.0% | | | $ | 419,898,217 | |
| | |
The percentage shown for each investment category in the Portfolio of Investments is based on net assets.
| | (1) | Senior floating-rate interests (Senior Loans) often require prepayments from excess cash flows or permit the borrowers to repay at their election. The degree to which borrowers repay, whether as a contractual requirement or at their election, cannot be predicted with accuracy. As a result, the actual remaining maturity may be substantially less than the stated maturities shown. However, Senior Loans will have an expected average life of approximately two to four years. The stated interest rate represents the weighted average interest rate of all contracts within the senior loan facility and includes commitment fees on unfunded loan commitments, if any. Senior Loans typically have rates of interest which are redetermined either daily, monthly, quarterly or semi-annually by reference to a base lending rate, plus a premium. These base lending rates are primarily the London Interbank Offered Rate (“LIBOR”) and secondarily, the prime rate offered by one or more major United States |
| | banks (the “Prime Rate”) and the certificate of deposit (“CD”) rate or other base lending rates used by commercial lenders. |
| | (2) | This Senior Loan will settle after December 31, 2012, at which time the interest rate will be determined. |
| | (3) | For fair value measurement disclosure purposes, security is categoried as Level 3 (See Note 11). |
| | (4) | Represents a payment-in-kind security which may pay all or a portion of interest in additional par. |
| | (5) | Unfunded or partially unfunded loan commitments. See Note 1G for description. |
| | (6) | Security exempt from registration pursuant to Rule 144A under the Securities Act of 1933. These securities may be sold in certain transactions (normally to qualified institutional buyers) and remain exempt from registration. At December 31, 2012, the aggregate value of these securities is $5,618,071 or 1.3% of the Fund’s net assets. |
| | (7) | Variable rate security. The stated interest rate represents the rate in effect at December 31, 2012. |
| | (8) | Security was acquired in connection with a restructuring of a Senior Loan and may be subject to restrictions on resale. |
| | (9) | Non-income producing security. |
| (10) | Amount is less than 0.05%. |
| | | | |
| | 18 | | See Notes to Financial Statements. |
Eaton Vance
VT Floating-Rate Income Fund
December 31, 2012
Statement of Assets and Liabilities
| | | | |
| Assets | | December 31, 2012 | |
Investments, at value (identified cost, $401,274,771) | | $ | 404,319,605 | |
Cash | | | 18,190,027 | |
Interest receivable | | | 1,286,123 | |
Receivable for investments sold | | | 8,587 | |
Receivable for Fund shares sold | | | 61,949 | |
Prepaid expenses | | | 17,428 | |
Total assets | | $ | 423,883,719 | |
|
| Liabilities | |
Payable for investments purchased | | $ | 3,225,875 | |
Payable for Fund shares redeemed | | | 212,418 | |
Payable to affiliates: | | | | |
Investment adviser fee | | | 203,131 | |
Distribution fees | | | 88,318 | |
Trustees’ fees | | | 4,100 | |
Payable for shareholder servicing fees | | | 177,009 | |
Accrued expenses | | | 74,651 | |
Total liabilities | | $ | 3,985,502 | |
Net Assets | | $ | 419,898,217 | |
| |
| Sources of Net Assets | | | | |
Paid-in capital | | $ | 410,330,948 | |
Accumulated net realized gain | | | 3,258,967 | |
Accumulated undistributed net investment income | | | 3,263,468 | |
Net unrealized appreciation | | | 3,044,834 | |
Total | | $ | 419,898,217 | |
| |
| Net Asset Value, Offering Price and Redemption Price Per Share | | | | |
($419,898,217 ÷ 44,365,464 shares of beneficial interest outstanding) | | $ | 9.46 | |
| | | | |
| | 19 | | See Notes to Financial Statements. |
Eaton Vance
VT Floating-Rate Income Fund
December 31, 2012
Statement of Operations
| | | | | | |
| Investment Income | | Year Ended
December 31, 2012 | |
Interest and other income | | $ | 21,438,781 | |
Dividends | | | 83,554 | |
Total investment income | | $ | 21,522,335 | |
| |
| Expenses | | | | |
Investment adviser fee | | $ | 2,303,918 | |
Distribution fees | | | 1,001,703 | |
Shareholder servicing fees | | | 948,225 | |
Trustees’ fees and expenses | | | 16,450 | |
Custodian fee | | | 239,618 | |
Transfer and dividend disbursing agent fees | | | 11,998 | |
Legal and accounting services | | | 69,859 | |
Printing and postage | | | 11,898 | |
Miscellaneous | | | 41,277 | |
Total expenses | | $ | 4,644,946 | |
Deduct — | | | | |
Reduction of custodian fee | | $ | 8,017 | |
Total expense reductions | | $ | 8,017 | |
| |
Net expenses | | $ | 4,636,929 | |
| |
Net investment income | | $ | 16,885,406 | |
| |
| Realized and Unrealized Gain (Loss) | | | | |
Net realized gain (loss) — | | | | |
Investment transactions | | $ | 3,296,463 | |
Net realized gain | | $ | 3,296,463 | |
Change in unrealized appreciation (depreciation) — | | | | |
Investments | | $ | 8,016,340 | |
Net change in unrealized appreciation (depreciation) | | $ | 8,016,340 | |
| |
Net realized and unrealized gain | | $ | 11,312,803 | |
| |
Net increase in net assets from operations | | $ | 28,198,209 | |
| | | | |
| | 20 | | See Notes to Financial Statements. |
Eaton Vance
VT Floating-Rate Income Fund
December 31, 2012
Statements of Changes in Net Assets
| | | | | | | | |
| | | Year Ended December 31, | |
| Increase (Decrease) in Net Assets | | 2012 | | | 2011 | |
From operations — | | | | | | | | |
Net investment income | | $ | 16,885,406 | | | $ | 16,172,932 | |
Net realized gain from investment transactions | | | 3,296,463 | | | | 6,728,763 | |
Net change in unrealized appreciation (depreciation) from investments | | | 8,016,340 | | | | (14,916,842 | ) |
Net increase in net assets from operations | | $ | 28,198,209 | | | $ | 7,984,853 | |
Distributions to shareholders — | | | | | | | | |
From net investment income | | $ | (16,865,273 | ) | | $ | (16,122,510 | ) |
From net realized gain | | | (4,632,085 | ) | | | — | |
Total distributions to shareholders | | $ | (21,497,358 | ) | | $ | (16,122,510 | ) |
Transactions in shares of beneficial interest — | | | | | | | | |
Proceeds from sale of shares | | $ | 100,099,634 | | | $ | 69,458,481 | |
Net asset value of shares issued to shareholders in payment of distributions declared | | | 21,497,358 | | | | 16,122,510 | |
Cost of shares redeemed | | | (63,091,437 | ) | | | (76,848,077 | ) |
Net increase in net assets from Fund share transactions | | $ | 58,505,555 | | | $ | 8,732,914 | |
| | |
Net increase in net assets | | $ | 65,206,406 | | | $ | 595,257 | |
| | |
| Net Assets | | | | | | | | |
At beginning of year | | $ | 354,691,811 | | | $ | 354,096,554 | |
At end of year | | $ | 419,898,217 | | | $ | 354,691,811 | |
| | |
Accumulated undistributed net investment income
included in net assets | | | | | | | | |
At end of year | | $ | 3,263,468 | | | $ | 1,579,894 | |
| | | | |
| | 21 | | See Notes to Financial Statements. |
Eaton Vance
VT Floating-Rate Income Fund
December 31, 2012
Financial Highlights
| | | | | | | | | | | | | | | | | | | | |
| | | Year Ended December 31, | |
| | | 2012 | | | 2011 | | | 2010 | | | 2009 | | | 2008 | |
Net asset value — Beginning of year | | $ | 9.300 | | | $ | 9.460 | | | $ | 9.050 | | | $ | 6.580 | | | $ | 9.580 | |
| | | | | |
| Income (Loss) From Operations | | | | | | | | | | | | | | | | | | | | |
Net investment income(1) | | $ | 0.396 | | | $ | 0.399 | | | $ | 0.369 | | | $ | 0.399 | | | $ | 0.501 | |
Net realized and unrealized gain (loss) | | | 0.270 | | | | (0.161 | ) | | | 0.442 | | | | 2.467 | | | | (3.006 | ) |
| | | | | |
Total income (loss) from operations | | $ | 0.666 | | | $ | 0.238 | | | $ | 0.811 | | | $ | 2.866 | | | $ | (2.505 | ) |
| | | | | |
| Less Distributions | | | | | | | | | | | | | | | | | | | | |
From net investment income | | $ | (0.396 | ) | | $ | (0.398 | ) | | $ | (0.401 | ) | | $ | (0.396 | ) | | $ | (0.495 | ) |
From net realized gain | | | (0.110 | ) | | | — | | | | — | | | | — | | | | — | |
| | | | | |
Total distributions | | $ | (0.506 | ) | | $ | (0.398 | ) | | $ | (0.401 | ) | | $ | (0.396 | ) | | $ | (0.495 | ) |
| | | | | |
Net asset value — End of year | | $ | 9.460 | | | $ | 9.300 | | | $ | 9.460 | | | $ | 9.050 | | | $ | 6.580 | |
| | | | | |
Total Return(2) | | | 7.33 | % | | | 2.54 | % | | | 9.12 | % | | | 44.29 | % | | | (27.17 | )% |
| | | | | |
| Ratios/Supplemental Data | | | | | | | | | | | | | | | | | | | | |
Net assets, end of year (000’s omitted) | | $ | 419,898 | | | $ | 354,692 | | | $ | 354,097 | | | $ | 1,232,209 | | | $ | 619,917 | |
Ratios (as a percentage of average daily net assets): | | | | | | | | | | | | | | | | | | | | |
Expenses before custodian fee reduction | | | 1.16 | % | | | 1.17 | % | | | 1.15 | % | | | 1.15 | % | | | 1.20 | % |
Expenses after custodian fee reduction | | | 1.16 | % | | | 1.17 | % | | | 1.15 | % | | | 1.15 | % | | | 1.19 | % |
Net investment income | | | 4.21 | % | | | 4.24 | % | | | 3.98 | % | | | 4.82 | % | | | 5.80 | % |
Portfolio Turnover | | | 42 | % | | | 53 | % | | | 35 | % | | | 26 | % | | | 16 | % |
| (1) | Computed using average shares outstanding. |
| (2) | Returns are historical and are calculated by determining the percentage change in net asset value with all distributions reinvested. |
| | | | |
| | 22 | | See Notes to Financial Statements. |
Eaton Vance
VT Floating-Rate Income Fund
December 31, 2012
Notes to Financial Statements
1 Significant Accounting Policies
Eaton Vance VT Floating-Rate Income Fund (the Fund) is a diversified series of Eaton Vance Variable Trust (the Trust). The Trust is a Massachusetts business trust registered under the Investment Company Act of 1940, as amended (the 1940 Act), as an open-end management investment company. The Fund’s investment objective is to provide a high level of current income. The Fund is generally made available for purchase only to separate accounts established by participating insurance companies and qualified pension or retirement plans.
The following is a summary of significant accounting policies of the Fund. The policies are in conformity with accounting principles generally accepted in the United States of America.
A Investment Valuation — Interests in senior floating-rate loans (Senior Loans) for which reliable market quotations are readily available are valued generally at the average mean of bid and ask quotations obtained from a third party pricing service. Other Senior Loans are valued at fair value by the investment adviser under procedures approved by the Trustees. In fair valuing a Senior Loan, the investment adviser utilizes one or more of the valuation techniques described in (i) through (iii) below to assess the likelihood that the borrower will make a full repayment of the loan underlying such Senior Loan relative to yields on other Senior Loans issued by companies of comparable credit quality. If the investment adviser believes that there is a reasonable likelihood of full repayment, the investment adviser will determine fair value using a matrix pricing approach that considers the yield on the Senior Loan. If the investment adviser believes there is not a reasonable likelihood of full repayment, the investment adviser will determine fair value using analyses that include, but are not limited to: (i) a comparison of the value of the borrower’s outstanding equity and debt to that of comparable public companies; (ii) a discounted cash flow analysis; or (iii) when the investment adviser believes it is likely that a borrower will be liquidated or sold, an analysis of the terms of such liquidation or sale. In certain cases, the investment adviser will use a combination of analytical methods to determine fair value, such as when only a portion of a borrower’s assets are likely to be sold. In conducting its assessment and analyses for purposes of determining fair value of a Senior Loan, the investment adviser will use its discretion and judgment in considering and appraising relevant factors. Fair value determinations are made by the portfolio managers of the Fund based on information available to such managers. The portfolio managers of other funds managed by the investment adviser that invest in Senior Loans may not possess the same information about a Senior Loan borrower as the portfolio managers of the Fund. At times, the fair value of a Senior Loan determined by the portfolio managers of other funds managed by the investment adviser that invest in Senior Loans may vary from the fair value of the same Senior Loan determined by the portfolio managers of the Fund. The fair value of each Senior Loan is periodically reviewed and approved by the investment adviser’s Valuation Committee and by the Trustees based upon procedures approved by the Trustees. Junior Loans (i.e., subordinated loans and second lien loans) are valued in the same manner as Senior Loans.
Debt obligations (including short-term obligations with a remaining maturity of more than sixty days) are generally valued on the basis of valuations provided by third party pricing services, as derived from such services’ pricing models. Inputs to the models may include, but are not limited to, reported trades, executable bid and asked prices, broker/dealer quotations, prices or yields of securities with similar characteristics, benchmark curves or information pertaining to the issuer, as well as industry and economic events. The pricing services may use a matrix approach, which considers information regarding securities with similar characteristics to determine the valuation for a security. Short-term obligations purchased with a remaining maturity of sixty days or less are generally valued at amortized cost, which approximates market value.
Equity securities (including common shares of closed-end investment companies) listed on a U.S. securities exchange generally are valued at the last sale or closing price on the day of valuation or, if no sales took place on such date, at the mean between the closing bid and asked prices therefore on the exchange where such securities are principally traded. Equity securities listed on the NASDAQ Global or Global Select Market generally are valued at the NASDAQ official closing price. Unlisted or listed securities for which closing sales prices or closing quotations are not available are valued at the mean between the latest available bid and asked prices or, in the case of preferred equity securities that are not listed or traded in the over-the-counter market, by a third party pricing service that will use various techniques that consider factors including, but not limited to, prices or yields of securities with similar characteristics, benchmark yields, broker/dealer quotes, quotes of underlying common stock, issuer spreads, as well as industry and economic events. Investments for which valuations or market quotations are not readily available or are deemed unreliable are valued at fair value using methods determined in good faith by or at the direction of the Trustees of the Fund in a manner that fairly reflects the security’s value, or the amount that the Fund might reasonably expect to receive for the security upon its current sale in the ordinary course. Each such determination is based on a consideration of relevant factors, which are likely to vary from one pricing context to another. These factors may include, but are not limited to, the type of security, the existence of any contractual restrictions on the security’s disposition, the price and extent of public trading in similar securities of the issuer or of comparable companies or entities, quotations or relevant information obtained from broker/dealers or other market participants, information obtained from the issuer, analysts, and/or the appropriate stock exchange (for exchange-traded securities), an analysis of the company’s or entity’s financial condition, and an evaluation of the forces that influence the issuer and the market(s) in which the security is purchased and sold.
B Investment Transactions — Investment transactions for financial statement purposes are accounted for on a trade date basis. Realized gains and losses on investments sold are determined on the basis of identified cost.
C Income — Interest income is recorded on the basis of interest accrued, adjusted for amortization of premium or accretion of discount. Fees associated with loan amendments are recognized immediately. Dividend income is recorded on the ex-dividend date for dividends received in cash and/or securities.
D Federal Taxes — The Fund’s policy is to comply with the provisions of the Internal Revenue Code applicable to regulated investment companies and to distribute to shareholders each year substantially all of its net investment income, and all or substantially all of its net realized capital gains. Accordingly, no provision for federal income or excise tax is necessary.
Eaton Vance
VT Floating-Rate Income Fund
December 31, 2012
Notes to Financial Statements — continued
As of December 31, 2012, the Fund had no uncertain tax positions that would require financial statement recognition, de-recognition, or disclosure. The Fund files a U.S. federal income tax return annually after its fiscal year-end, which is subject to examination by the Internal Revenue Service for a period of three years from the date of filing.
E Expenses — The majority of expenses of the Trust are directly identifiable to an individual fund. Expenses which are not readily identifiable to a specific fund are allocated taking into consideration, among other things, the nature and type of expense and the relative size of the funds.
F Expense Reduction — State Street Bank and Trust Company (SSBT) serves as custodian of the Fund. Pursuant to the custodian agreement, SSBT receives a fee reduced by credits, which are determined based on the average daily cash balance the Fund maintains with SSBT. All credit balances, if any, used to reduce the Fund’s custodian fees are reported as a reduction of expenses in the Statement of Operations.
G Unfunded Loan Commitments — The Fund may enter into certain credit agreements all or a portion of which may be unfunded. The Fund is obligated to fund these commitments at the borrower’s discretion. These commitments are disclosed in the accompanying Portfolio of Investments. At December 31, 2012, the Fund had sufficient cash and/or securities to cover these commitments.
H Use of Estimates — The preparation of the financial statements in conformity with accounting principles generally accepted in the United States of America requires management to make estimates and assumptions that affect the reported amounts of assets and liabilities at the date of the financial statements and the reported amounts of income and expense during the reporting period. Actual results could differ from those estimates.
I Indemnifications — Under the Trust’s organizational documents, its officers and Trustees may be indemnified against certain liabilities and expenses arising out of the performance of their duties to the Fund. Under Massachusetts law, if certain conditions prevail, shareholders of a Massachusetts business trust (such as the Trust) could be deemed to have personal liability for the obligations of the Trust. However, the Trust’s Declaration of Trust contains an express disclaimer of liability on the part of Fund shareholders and the By-laws provide that the Trust shall assume the defense on behalf of any Fund shareholders. Moreover, the By-laws also provide for indemnification out of Fund property of any shareholder held personally liable solely by reason of being or having been a shareholder for all loss or expense arising from such liability. Additionally, in the normal course of business, the Fund enters into agreements with service providers that may contain indemnification clauses. The Fund’s maximum exposure under these arrangements is unknown as this would involve future claims that may be made against the Fund that have not yet occurred.
2 Distributions to Shareholders
The Fund declares dividends daily to shareholders of record at the time of declaration. Distributions are generally paid monthly. Distributions of realized capital gains are made at least annually. Shareholders may reinvest income and capital gain distributions in additional shares of the Fund at the net asset value as of the reinvestment date or, if an election is made on behalf of a separate account, to receive some or all of the distributions in cash. The Fund distinguishes between distributions on a tax basis and a financial reporting basis. Accounting principles generally accepted in the United States of America require that only distributions in excess of tax basis earnings and profits be reported in the financial statements as a return of capital. Permanent differences between book and tax accounting relating to distributions are reclassified to paid-in capital. For tax purposes, distributions from short-term capital gains are considered to be from ordinary income.
The tax character of distributions declared for the years ended December 31, 2012 and December 31, 2011 was as follows:
| | | | | | | | |
| | | Year Ended December 31, | |
| | | 2012 | | | 2011 | |
| | |
Distributions declared from: | | | | | | | | |
Ordinary income | | $ | 16,865,273 | | | $ | 16,122,510 | |
Long-term capital gains | | $ | 4,632,085 | | | $ | — | |
During the year ended December 31, 2012, accumulated net realized gain was decreased by $1,663,441 and accumulated undistributed net investment income was increased by $1,663,441 due to dividend redesignations for short-term capital gains. These reclassifications had no effect on the net assets or net asset value per share of the Fund.
As of December 31, 2012, the components of distributable earnings (accumulated losses) and unrealized appreciation (depreciation) on a tax basis were as follows:
| | | | |
Undistributed ordinary income | | $ | 4,099,156 | |
Undistributed long-term capital gains | | $ | 2,425,610 | |
Net unrealized appreciation | | $ | 3,042,503 | |
Eaton Vance
VT Floating-Rate Income Fund
December 31, 2012
Notes to Financial Statements — continued
The differences between components of distributable earnings (accumulated losses) on a tax basis and the amounts reflected in the Statement of Assets and Liabilities are primarily due to wash sales, premium amortization and the tax treatment of short-term capital gains.
3 Investment Adviser Fee and Other Transactions with Affiliates
The investment adviser fee is earned by Eaton Vance Management (EVM) as compensation for investment advisory services rendered to the Fund. The fee is computed at an annual rate of 0.575% of the Fund’s average daily net assets up to $1 billion, 0.525% of average daily net assets from $1 billion but less than $2 billion, and at reduced rates on daily net assets of $2 billion or more, and is payable monthly. For the year ended December 31, 2012, the investment adviser fee amounted to $2,303,918 or 0.575% of the Fund’s average daily net assets. EVM also serves as administrator of the Fund, but receives no compensation. Eaton Vance Distributors, Inc. (EVD), the Fund’s principal underwriter and an affiliate of EVM, received distribution fees (see Note 4).
Trustees and officers of the Fund who are members of EVM’s organization, receive remuneration for their services to the Fund out of the investment adviser fee. Certain officers and Trustees of the Fund are officers of EVM.
4 Distribution Plan
The Fund has in effect a distribution plan pursuant to Rule 12b-1 under the 1940 Act. Pursuant to the distribution plan, the Fund pays EVD a distribution fee of 0.25% per annum of its average daily net assets for the sale and distribution of Fund shares. Distribution fees for the year ended December 31, 2012 amounted to $1,001,703. Insurance companies receive such fees from EVD based on the value of shares held by such companies. The insurance companies through which investors hold shares of the Fund may also pay fees to third parties in connection with the sale of variable contracts and for services provided to variable contract owners. The Fund, EVM or EVD are not a party to these arrangements. Investors should consult the prospectus and statement of additional information for their variable contracts for a discussion of these payments. EVD may, at its expense, provide promotional incentives to dealers that sell variable insurance products.
5 Shareholder Servicing Plan
The Trust, on behalf of the Fund, has adopted a Shareholder Servicing Plan (Servicing Plan). The Servicing Plan allows the Trust to enter into shareholder servicing agreements with insurance companies, investment dealers, broker/dealers or other financial intermediaries that provide shareholder services relating to Fund shares and their shareholders, including variable contract owners or plan participants with interests in the Fund. Under the Servicing Plan, the Fund may make payments at an annual rate of up to 0.25% of the Fund’s average daily net assets attributable to its shares that are subject to shareholder servicing agreements. For the year ended December 31, 2012, shareholder servicing fees were equivalent to 0.24% per annum of the Fund’s average daily net assets and amounted to $948,225.
6 Purchases and Sales of Investments
Purchases and sales of investments, other than short-term obligations and including maturities and principal repayments on Senior Loans, aggregated $207,379,108 and $164,536,442, respectively, for the year ended December 31, 2012.
7 Shares of Beneficial Interest
The Fund’s Declaration of Trust permits the Trustees to issue an unlimited number of full and fractional shares of beneficial interest (without par value). Such shares may be issued in a number of different series (such as the Fund). Transactions in Fund shares were as follows:
| | | | | | | | |
| | | Year Ended December 31, | |
| | | 2012 | | | 2011 | |
| | |
Sales | | | 10,649,263 | | | | 7,273,789 | |
Issued to shareholders electing to receive payments of distributions in Fund shares | | | 2,289,228 | | | | 1,711,754 | |
Redemptions | | | (6,712,862 | ) | | | (8,260,009 | ) |
| | |
Net increase | | | 6,225,629 | | | | 725,534 | |
At December 31, 2012, separate accounts of 2 insurance companies each owned more than 10% of the outstanding shares of the Fund aggregating 89%.
Eaton Vance
VT Floating-Rate Income Fund
December 31, 2012
Notes to Financial Statements — continued
8 Federal Income Tax Basis of Investments
The cost and unrealized appreciation (depreciation) of investments of the Fund at December 31, 2012, as determined on a federal income tax basis, were as follows:
| | | | |
| |
Aggregate cost | | $ | 401,277,102 | |
| |
Gross unrealized appreciation | | $ | 7,401,373 | |
Gross unrealized depreciation | | | (4,358,870 | ) |
| |
Net unrealized appreciation | | $ | 3,042,503 | |
9 Line of Credit
The Fund participates with other portfolios managed by EVM and its affiliates in a $800 million unsecured line of credit agreement with a group of banks. Borrowings are made by the Fund solely to facilitate the handling of unusual and/or unanticipated short-term cash requirements. Interest is charged to the Fund based on its borrowings at a prime rate or an amount above either the London Interbank Offered Rate (LIBOR) or the Federal Funds rate. In addition, a fee computed at an annual rate of 0.08% on the daily unused portion of the line of credit is allocated between the Fund and the other participating portfolios at the end of each quarter. Because the line of credit is not available exclusively to the Fund, it may be unable to borrow some or all of its requested amounts at any particular time. The Fund did not have any significant borrowings or allocated fee during the year ended December 31, 2012.
10 Credit Risk
The Fund invests primarily in below investment grade floating-rate loans and floating-rate debt obligations, which are considered speculative because of the credit risk of their issuers. Changes in economic conditions or other circumstances are more likely to reduce the capacity of issuers of these securities to make principal and interest payments. Such companies are more likely to default on their payments of interest and principal owed than issuers of investment grade bonds. An economic downturn generally leads to a higher non-payment rate, and a loan or other debt obligation may lose significant value before a default occurs. Lower rated investments also may be subject to greater price volatility than higher rated investments. Moreover, the specific collateral used to secure a loan may decline in value or become illiquid, which would adversely affect the loan’s value.
11 Fair Value Measurements
Under generally accepted accounting principles for fair value measurements, a three-tier hierarchy to prioritize the assumptions, referred to as inputs, is used in valuation techniques to measure fair value. The three-tier hierarchy of inputs is summarized in the three broad levels listed below.
| Ÿ | | Level 1 – quoted prices in active markets for identical investments |
| Ÿ | | Level 2 – other significant observable inputs (including quoted prices for similar investments, interest rates, prepayment speeds, credit risk, etc.) |
| Ÿ | | Level 3 – significant unobservable inputs (including a fund’s own assumptions in determining the fair value of investments) |
In cases where the inputs used to measure fair value fall in different levels of the fair value hierarchy, the level disclosed is determined based on the lowest level input that is significant to the fair value measurement in its entirety. The inputs or methodology used for valuing securities are not necessarily an indication of the risk associated with investing in those securities.
At December 31, 2012, the hierarchy of inputs used in valuing the Fund’s investments, which are carried at value, were as follows:
| | | | | | | | | | | | | | | | |
| Asset Description | | Level 1 | | | Level 2 | | | Level 3* | | | Total | |
| | | | |
Senior Floating-Rate Interests (Less Unfunded Loan Commitments) | | $ | — | | | $ | 390,443,244 | | | $ | 863,970 | | | $ | 391,307,214 | |
Corporate Bonds & Notes | | | — | | | | 9,861,899 | | | | — | | | | 9,861,899 | |
Common Stocks | | | — | | | | 480,667 | | | | 2,669,825 | | | | 3,150,492 | |
| | | | |
Total Investments | | $ | — | | | $ | 400,785,810 | | | $ | 3,533,795 | | | $ | 404,319,605 | |
| * | None of the unobservable inputs for Level 3 assets, individually or collectively, had a material impact on the Fund. |
Level 3 investments at the beginning and/or end of the period in relation to net assets were not significant and accordingly, a reconciliation of Level 3 assets for the year ended December 31, 2012 is not presented.
At December 31, 2012, there were no investments transferred between Level 1 and Level 2 during the year then ended.
VT Floating-Rate Income Fund
December 31, 2012
Report of Independent Registered Public Accounting Firm
To the Trustees of Eaton Vance Variable Trust and Shareholders of Eaton Vance VT Floating-Rate Income Fund:
We have audited the accompanying statement of assets and liabilities of Eaton Vance VT Floating-Rate Income Fund (the “Fund”) (one of the funds constituting Eaton Vance Variable Trust), including the portfolio of investments, as of December 31, 2012, and the related statement of operations for the year then ended, the statements of changes in net assets for each of the two years in the period then ended, and the financial highlights for each of the five years in the period then ended. These financial statements and financial highlights are the responsibility of the Fund’s management. Our responsibility is to express an opinion on these financial statements and financial highlights based on our audits.
We conducted our audits in accordance with the standards of the Public Company Accounting Oversight Board (United States). Those standards require that we plan and perform the audit to obtain reasonable assurance about whether the financial statements and financial highlights are free of material misstatement. The Fund is not required to have, nor were we engaged to perform, an audit of its internal control over financial reporting. Our audits included consideration of internal control over financial reporting as a basis for designing audit procedures that are appropriate in the circumstances, but not for the purpose of expressing an opinion on the effectiveness of the Fund’s internal control over financial reporting. Accordingly, we express no such opinion. An audit also includes examining, on a test basis, evidence supporting the amounts and disclosures in the financial statements, assessing the accounting principles used and significant estimates made by management, as well as evaluating the overall financial statement presentation. Our procedures included confirmation of securities and senior loans owned as of December 31, 2012, by correspondence with the custodian, brokers, and selling or agent banks; where replies were not received from brokers and selling or agent banks, we performed other auditing procedures. We believe that our audits provide a reasonable basis for our opinion.
In our opinion, such financial statements and financial highlights referred to above present fairly, in all material respects, the financial position of Eaton Vance VT Floating-Rate Income Fund as of December 31, 2012, the results of its operations for the year then ended, the changes in its net assets for each of the two years in the period then ended, and the financial highlights for each of the five years in the period then ended, in conformity with accounting principles generally accepted in the United States of America.
DELOITTE & TOUCHE LLP
Boston, Massachusetts
February 15, 2013
Eaton Vance
VT Floating-Rate Income Fund
December 31, 2012
Federal Tax Information (Unaudited)
As required by the Internal Revenue Code and/or regulations, shareholders must be notified regarding capital gains dividends.
Capital Gains Dividends. The Fund hereby designates as a capital gain dividend with respect to the taxable year ended December 31, 2012, $7,057,695 or, if subsequently determined to be different, the net capital gain of such year.
Eaton Vance
VT Floating-Rate Income Fund
December 31, 2012
Management and Organization
Fund Management. The Trustees of Eaton Vance Variable Trust (the Trust) are responsible for the overall management and supervision of the Trust’s affairs. The Trustees and officers of the Trust are listed below. Except as indicated, each individual has held the office shown or other offices in the same company for the last five years. Trustees and officers of the Trust hold indefinite terms of office. The “Noninterested Trustees” consist of those Trustees who are not “interested persons” of the Trust, as that term is defined under the 1940 Act. The business address of each Trustee and officer is Two International Place, Boston, Massachusetts 02110. As used below, “EVC” refers to Eaton Vance Corp., “EV” refers to Eaton Vance, Inc., “EVM” refers to Eaton Vance Management, “BMR” refers to Boston Management and Research and “EVD” refers to Eaton Vance Distributors, Inc. EVC and EV are the corporate parent and trustee, respectively, of EVM and BMR. EVD is the Fund’s principal underwriter and a wholly-owned subsidiary of EVC. Each officer affiliated with Eaton Vance may hold a position with other Eaton Vance affiliates that is comparable to his or her position with EVM listed below. Each Trustee oversees 188 portfolios in the Eaton Vance Complex (including all master and feeder funds in a master feeder structure). Each officer serves as an officer of certain other Eaton Vance funds. Each Trustee and officer serves until his or her successor is elected.
| | | | | | |
| Name and Year of Birth | | Position(s) with the
Trust | | Length of
Service | | Principal Occupation(s) and Directorships During Past Five Years and Other Relevant Experience |
Interested Trustee |
| | | |
Thomas E. Faust Jr. 1958 | | Trustee | | Since 2007 | | Chairman, Chief Executive Officer and President of EVC, Director and President of EV, Chief Executive Officer and President of EVM and BMR, and Director of EVD. Trustee and/or officer of 188 registered investment companies. Mr. Faust is an interested person because of his positions with EVM, BMR, EVD, EVC and EV, which are affiliates of the Trust. Directorships in the Last Five Years.(1) Director of EVC and Hexavest Inc. |
| | | |
| | | | | | |
Noninterested Trustees |
| | | |
Scott E. Eston 1956 | | Trustee | | Since 2011 | | Private investor. Formerly held various positions at Grantham, Mayo, Van Otterloo and Co., L.L.C. (investment management firm) (1997-2009), including Chief Operating Officer (2002-2009), Chief Financial Officer (1997-2009) and Chairman of the Executive Committee (2002-2008); President and Principal Executive Officer, GMO Trust (open-end registered investment company) (2006-2009). Former Partner, Coopers and Lybrand L.L.P. (now PricewaterhouseCoopers) (public accounting firm) (1987-1997). Directorships in the Last Five Years. None. |
| | | |
Benjamin C. Esty 1963 | | Trustee | | Since 2005 | | Roy and Elizabeth Simmons Professor of Business Administration and Finance Unit Head, Harvard University Graduate School of Business Administration. Directorships in the Last Five Years.(1) None. |
| | | |
Allen R. Freedman 1940 | | Trustee | | Since 2007 | | Private Investor. Former Chairman (2002-2004) and a Director (1983-2004) of Systems & Computer Technology Corp. (provider of software to higher education). Formerly, a Director of Loring Ward International (fund distributor) (2005-2007). Former Chairman and a Director of Indus International, Inc. (provider of enterprise management software to the power generating industry) (2005-2007). Former Chief Executive Officer of Assurant, Inc. (insurance provider) (1979-2000). Directorships in the Last Five Years.(1) Director of Stonemor Partners, L.P. (owner and operator of cemeteries). Formerly, Director of Assurant, Inc. (insurance provider) (1979-2011). |
| | | |
William H. Park 1947 | | Trustee | | Since 2003 | | Consultant and private investor. Formerly, Chief Financial Officer, Aveon Group L.P. (investment management firm) (2010-2011). Formerly, Vice Chairman, Commercial Industrial Finance Corp. (specialty finance company) (2006-2010). Formerly, President and Chief Executive Officer, Prizm Capital Management, LLC (investment management firm) (2002-2005). Formerly, Executive Vice President and Chief Financial Officer, United Asset Management Corporation (investment management firm) (1982-2001). Formerly, Senior Manager, Price Waterhouse (now PricewaterhouseCoopers) (an independent registered public accounting firm) (1972-1981). Directorships in the Last Five Years.(1) None. |
| | | |
Ronald A. Pearlman 1940 | | Trustee | | Since 2003 | | Professor of Law, Georgetown University Law Center. Formerly, Deputy Assistant Secretary (Tax Policy) and Assistant Secretary (Tax Policy), U.S. Department of the Treasury (1983-1985). Formerly, Chief of Staff, Joint Committee on Taxation, U.S. Congress (1988-1990). Directorships in the Last Five Years.(1) None. |
Eaton Vance
VT Floating-Rate Income Fund
December 31, 2012
Management and Organization — continued
| | | | | | |
| Name and Year of Birth | | Position(s) with the
Trust | | Length of
Service | | Principal Occupation(s) and Directorships During Past Five Years and Other Relevant Experience |
Noninterested Trustees (continued) |
| | | |
Helen Frame Peters 1948 | | Trustee | | Since 2008 | | Professor of Finance, Carroll School of Management, Boston College. Formerly, Dean, Carroll School of Management, Boston College (2000-2002). Formerly, Chief Investment Officer, Fixed Income, Scudder Kemper Investments (investment management firm) (1998-1999). Formerly, Chief Investment Officer, Equity and Fixed Income, Colonial Management Associates (investment management firm) (1991-1998). Directorships in the Last Five Years.(1) Formerly, Director of BJ’s Wholesale Club, Inc. (wholesale club retailer) (2004-2011). Formerly, Trustee of SPDR Index Shares Funds and SPDR Series Trust (exchange traded funds) (2000-2009). Formerly, Director of Federal Home Loan Bank of Boston (a bank for banks) (2007-2009). |
| | | |
Lynn A. Stout 1957 | | Trustee | | Since 2000 | | Distinguished Professor of Corporate and Business Law, Jack G. Clarke Business Law Institute, Cornell University Law School. Formerly, the Paul Hastings Professor of Corporate and Securities Law (2006-2012) and Professor of Law (2001-2006), University of California at Los Angeles School of Law. Directorships in the Last Five Years.(1) None. |
| | | |
Harriett Tee Taggart 1948 | | Trustee | | Since 2011 | | Managing Director, Taggart Associates (a professional practice firm). Formerly, Partner and Senior Vice President, Wellington Management Company, LLP (investment management firm) (1983-2006). Directorships in the Last Five Years. Director of Albemarle Corporation (chemicals manufacturer) (since 2007) and The Hanover Group (specialty property and casualty insurance company) (since 2009). Formerly, Director of Lubrizol Corporation (specialty chemicals) (2007-2011). |
| | | |
Ralph F. Verni 1943 | | Chairman of the Board and Trustee | | Chairman of the Board since 2007 and Trustee since 2005 | | Consultant and private investor. Formerly, Chief Investment Officer (1982-1992), Chief Financial Officer (1988-1990) and Director (1982-1992), New England Life. Formerly, Chairperson, New England Mutual Funds (1982-1992). Formerly, President and Chief Executive Officer, State Street Management & Research (1992-2000). Formerly, Chairperson, State Street Research Mutual Funds (1992-2000). Formerly, Director, W.P. Carey, LLC (1998-2004) and First Pioneer Farm Credit Corp. (2002-2006). Directorships in the Last Five Years.(1) None. |
| | | |
| | | | | | |
Principal Officers who are not Trustees |
| Name and Year of Birth | | Position(s) with the Trust | | Length of Service | | Principal Occupation(s) During Past Five Years |
Duncan W. Richardson 1957 | | President | | Since 2008 | | Director of EVC and Executive Vice President and Chief Equity Investment Officer of EVC, EVM and BMR. |
| | | |
Payson F. Swaffield 1956 | | Vice President | | Since 2011 | | Vice President and Chief Income Investment Officer of EVM and BMR. |
| | | |
Barbara E. Campbell 1957 | | Treasurer | | Since 2005 | | Vice President of EVM and BMR. |
| | | |
Maureen A. Gemma 1960 | | Vice President, Secretary and Chief Legal Officer | | Vice President since 2011; Secretary since 2007 and Chief Legal Officer since 2008 | | Vice President of EVM and BMR. |
| | | |
Paul M. O’Neil 1953 | | Chief Compliance Officer | | Since 2004 | | Vice President of EVM and BMR. |
| (1) | During their respective tenures, the Trustees (except Mr. Eston and Ms. Taggart) also served as trustees of one or more of the following Eaton Vance funds (which operated in the years noted): Eaton Vance Credit Opportunities Fund (launched in 2005 and terminated in 2010); Eaton Vance Insured Florida Plus Municipal Bond Fund (launched in 2002 and terminated in 2009); and Eaton Vance National Municipal Income Trust (launched in 1998 and terminated in 2009). |
The SAI for the Fund includes additional information about the Trustees and officers of the Fund and can be obtained without charge on Eaton Vance’s website at www.eatonvance.com or by calling 1-800-262-1122.
Eaton Vance Funds
IMPORTANT NOTICES
Privacy. The Eaton Vance organization is committed to ensuring your financial privacy. Each of the financial institutions identified below has in effect the following policy (“Privacy Policy”) with respect to nonpublic personal information about its customers:
| Ÿ | | Only such information received from you, through application forms or otherwise, and information about your Eaton Vance fund transactions will be collected. This may include information such as name, address, social security number, tax status, account balances and transactions. |
| Ÿ | | None of such information about you (or former customers) will be disclosed to anyone, except as permitted by law (which includes disclosure to employees necessary to service your account). In the normal course of servicing a customer’s account, Eaton Vance may share information with unaffiliated third parties that perform various required services such as transfer agents, custodians and broker-dealers. |
| Ÿ | | Policies and procedures (including physical, electronic and procedural safeguards) are in place that are designed to protect the confidentiality of such information. |
| Ÿ | | We reserve the right to change our Privacy Policy at any time upon proper notification to you. Customers may want to review our Privacy Policy periodically for changes by accessing the link on our homepage: www.eatonvance.com. |
Our pledge of privacy applies to the following entities within the Eaton Vance organization: the Eaton Vance Family of Funds, Eaton Vance Management, Eaton Vance Investment Counsel, Eaton Vance Distributors, Inc., Eaton Vance Trust Company, Eaton Vance Management’s Real Estate Investment Group and Boston Management and Research. In addition, our Privacy Policy applies only to those Eaton Vance customers who are individuals and who have a direct relationship with us. If a customer’s account (i.e., fund shares) is held in the name of a third-party financial advisor/broker-dealer, it is likely that only such advisor’s privacy policies apply to the customer. This notice supersedes all previously issued privacy disclosures. For more information about Eaton Vance’s Privacy Policy, please call 1-800-262-1122.
Delivery of Shareholder Documents. The Securities and Exchange Commission (SEC) permits funds to deliver only one copy of shareholder documents, including prospectuses, proxy statements and shareholder reports, to fund investors with multiple accounts at the same residential or post office box address. This practice is often called “householding” and it helps eliminate duplicate mailings to shareholders. Eaton Vance, or your financial advisor, may household the mailing of your documents indefinitely unless you instruct Eaton Vance, or your financial advisor, otherwise. If you would prefer that your Eaton Vance documents not be householded, please contact Eaton Vance at 1-800-262-1122, or contact your financial advisor. Your instructions that householding not apply to delivery of your Eaton Vance documents will be effective within 30 days of receipt by Eaton Vance or your financial advisor.
Portfolio Holdings. Each Eaton Vance Fund and its underlying Portfolio(s) (if applicable) will file a schedule of portfolio holdings on Form N-Q with the SEC for the first and third quarters of each fiscal year. The Form N-Q will be available on the Eaton Vance website at www.eatonvance.com, by calling Eaton Vance at 1-800-262-1122 or in the EDGAR database on the SEC’s website at www.sec.gov. Form N-Q may also be reviewed and copied at the SEC’s public reference room in Washington, D.C. (call 1-800-732-0330 for information on the operation of the public reference room).
Proxy Voting. From time to time, funds are required to vote proxies related to the securities held by the funds. The Eaton Vance Funds or their underlying Portfolios (if applicable) vote proxies according to a set of policies and procedures approved by the Funds’ and Portfolios’ Boards. You may obtain a description of these policies and procedures and information on how the Funds or Portfolios voted proxies relating to portfolio securities during the most recent 12-month period ended June 30, without charge, upon request, by calling 1-800-262-1122 and by accessing the SEC’s website at www.sec.gov.
This Page Intentionally Left Blank
Investment Adviser and Administrator
Eaton Vance Management
Two International Place
Boston, MA 02110
Principal Underwriter*
Eaton Vance Distributors, Inc.
Two International Place
Boston, MA 02110
(617) 482-8260
Custodian
State Street Bank and Trust Company
200 Clarendon Street
Boston, MA 02116
Transfer Agent
State Street Bank and Trust Company
200 Clarendon Street
Boston, MA 02116
Independent Registered Public Accounting Firm
Deloitte & Touche LLP
200 Berkeley Street
Boston, MA 02116-5022
Fund Offices
Two International Place
Boston, MA 02110
| * | FINRA BrokerCheck. Investors may check the background of their Investment Professional by contacting the Financial Industry Regulatory Authority (FINRA). FINRA BrokerCheck is a free tool to help investors check the professional background of current and former FINRA-registered securities firms and brokers. FINRA BrokerCheck is available by calling 1-800-289-9999 and at www.FINRA.org. The FINRA BrokerCheck brochure describing this program is available to investors at www.FINRA.org. |
| | |
Eaton Vance VT Large-Cap Value Fund Annual Report December 31, 2012 | | 
|

Fund shares are not insured by the FDIC and are not deposits or other obligations of, or guaranteed by, any depository institution. Shares are subject to investment risks, including possible loss of principal invested.
This report is prepared for the general information of contract owners. It is authorized for distribution to prospective investors only when preceded or accompanied by a current summary prospectus or prospectus. Before investing, investors should consider carefully the investment objective(s), risks, and charges and expenses of the Fund. This and other important information is contained in the summary prospectus and prospectus, which can be obtained from a financial advisor. Prospective investors should read the prospectus carefully before investing. For further information, please call 1-800-262-1122.
Annual Report December 31, 2012
Eaton Vance
VT Large-Cap Value Fund
Table of Contents
| | | | |
| |
Management’s Discussion of Fund Performance | | | 2 | |
| |
Performance | | | 3 | |
| |
Fund Profile | | | 3 | |
| |
Endnotes and Additional Disclosures | | | 4 | |
| |
Fund Expenses | | | 5 | |
| |
Financial Statements | | | 6 | |
| |
Report of Independent Registered Public Accounting Firm | | | 18 | |
| |
Federal Tax Information | | | 19 | |
| |
Management and Organization | | | 20 | |
| |
Important Notices | | | 22 | |
Eaton Vance
VT Large-Cap Value Fund
December 31, 2012
Management’s Discussion of Fund Performance1
Economic and Market Conditions
Early in the 12-month period ended December 31, 2012, U.S. stocks began a rally that continued through early April 2012. Equities were generally fueled by stronger economic growth, falling unemployment and what the markets perceived as a successful restructuring of Greek debt, which lowered the potential for European contagion. Then in May 2012, the third consecutive mid-year economic slowdown arrived amid renewed concerns over Europe, slowing growth in China and continuing political uncertainty in the United States ahead of the elections.
However, despite a slowdown in consumer spending, weakening employment data and downward revisions of growth expectations, U.S. stocks rallied from June 2012 through early October 2012. Several catalysts appeared to be driving a market rally that defied U.S. economic data. First, investors anticipated that worsening economic news would prompt the U.S. Federal Reserve to initiate another round of quantitative easing to stimulate the economy — which it did in September 2012. Second, many of the investors who were hunting for yield in a historically low interest-rate environment were driven to stocks that offered higher yields than bonds. Finally, Europe’s ongoing debt crisis and a slowdown in Chinese growth made the United States, despite its problems, look relatively attractive to many global investors.
In the final months of the fiscal year, however, from early October 2012 through December 2012, U.S. stocks gave back some of their gains amid elevated market volatility. With the U.S. elections leaving Congress still divided on economic issues, investors grew increasingly worried about a political deadlock on tax and spending policies — an impasse that left the United States rushing toward a so-called “fiscal cliff” that threatened to drag down its economy. On the positive side, investors appeared to be encouraged by improving employment numbers, signs of an accelerating recovery in the housing market, and the European Central Bank’s efforts to strengthen and centralize the European banking system.
Fund Performance
For the fiscal year ended December 31, 2012, Eaton Vance VT Large-Cap Value Fund (the Fund) had a total return of 15.12% at net asset value (NAV), underperforming the
17.51% return of the Fund’s benchmark, the Russell 1000 Value Index (the Index)2.
Stock selection and relative underweights in the financials, consumer discretionary and energy sectors detracted from the Fund’s performance relative to the Index. Stock selection in industrials also hurt relative Fund returns versus the Index. In a generally rising market during the period, the Fund’s modest cash position was a relative detractor from Fund performance as well.
While the Fund’s holdings in the financials sector contributed to Fund performance during the fiscal year, financials stocks held by the Index delivered even higher returns during the period. Within financials, stock selection and an underweight in diversified financial services proved detrimental to the Fund’s relative returns versus the Index during the period. Elsewhere in the sector, an underweight in capital markets and stock selection among commercial banks also held back relative Fund performance versus the Index. In the consumer discretionary sector, an underweight in automobile stocks and avoiding household durables holdings detracted from relative Fund performance versus the Index as well. Stock selection in energy equipment & services and an underweight in oil, gas & consumable fuels hurt Fund relative returns in the energy sector. In the industrials sector, stock selection in aerospace & defense, as well as stock selection and an underweight in machinery, detracted from relative Fund performance versus the Index.
In contrast, stock selection in the information technology (IT), utilities and health care sectors helped Fund performance relative to the Index during the period. Within IT, stock selection in computers & peripherals and avoiding semiconductors & semiconductor equipment stocks aided relative Fund performance versus the Index. Stock selection in multi-utilities, as well as an underweight and stock selection in electric utilities, contributed to Fund returns versus the Index in the utilities sector. In the health care sector, relative Fund performance versus the Index benefited from an overweight in biotechnology and stock selection in health care equipment & supplies.
See Endnotes and Additional Disclosures in this report.
Past performance is no guarantee of future results. Returns are historical and are calculated by determining the percentage change in net asset value (NAV) or offering price (as applicable) with all distributions reinvested. Investment return and principal value will fluctuate so that shares, when redeemed, may be worth more or less than their original cost. Performance less than one year is cumulative. Performance is for the stated time period only; due to market volatility, the Fund’s current performance may be lower or higher than quoted. Returns are before taxes unless otherwise noted. For performance as of the most recent month end, please refer to www.eatonvance.com.
Eaton Vance
VT Large-Cap Value Fund
December 31, 2012
Performance2,3
Portfolio Managers Michael R. Mach, CFA, Stephen J. Kaszynski, CFA, John D. Crowley and Matthew F. Beaudry, CMFC, CIMA
| | | | | | | | | | | | | | | | |
| % Average Annual Total Returns | | Inception Date | | | One Year | | | Five Years | | | Since
Inception | |
Fund at NAV | | | 03/30/2007 | | | | 15.12 | % | | | –0.79 | % | | | 0.37 | % |
Russell 1000 Value Index | | | 03/30/2007 | | | | 17.51 | % | | | 0.59 | % | | | 0.27 | % |
| | | | |
| | | | | | | | | | | | | | | | |
| % Total Annual Operating Expense Ratios4 | | | | | | | | | | | | |
Gross | | | | | | | | | | | | | | | 1.33 | % |
Net | | | | | | | | | | | | | | | 1.30 | |
Growth of $10,000
This graph shows the change in value of a hypothetical investment of $10,000 in VT Large-Cap Value Fund for the period indicated. For comparison, the same investment is shown in the indicated index.
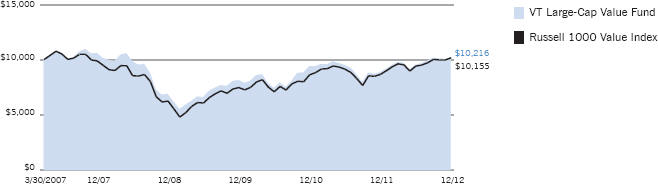
Fund Profile
Sector Allocation (% of net assets)5
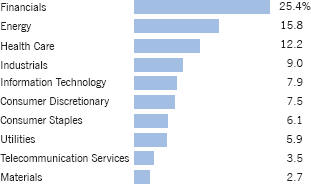
Top 10 Holdings (% of net assets)5
| | | | |
JPMorgan Chase & Co. | | | 3.1 | % |
Wells Fargo & Co. | | | 3.0 | |
Chevron Corp. | | | 3.0 | |
Pfizer, Inc. | | | 3.0 | |
Exxon Mobil Corp. | | | 2.9 | |
Merck & Co., Inc. | | | 2.7 | |
Citigroup, Inc. | | | 2.6 | |
Apple, Inc. | | | 2.4 | |
General Electric Co. | | | 2.3 | |
ConocoPhillips | | | 2.2 | |
Total | | | 27.2 | % |
See Endnotes and Additional Disclosures in this report.
Past performance is no guarantee of future results. Returns are historical and are calculated by determining the percentage change in net asset value (NAV) or offering price (as applicable) with all distributions reinvested. Investment return and principal value will fluctuate so that shares, when redeemed, may be worth more or less than their original cost. Performance less than one year is cumulative. Performance is for the stated time period only; due to market volatility, the Fund’s current performance may be lower or higher than quoted. Returns are before taxes unless otherwise noted. For performance as of the most recent month end, please refer to www.eatonvance.com.
Eaton Vance
VT Large-Cap Value Fund
December 31, 2012
Endnotes and Additional Disclosures
| 1 | The views expressed in this report are those of the portfolio manager(s) and are current only through the date stated at the top of this page. These views are subject to change at any time based upon market or other conditions, and Eaton Vance and the Fund(s) disclaim any responsibility to update such views. These views may not be relied upon as investment advice and, because investment decisions are based on many factors, may not be relied upon as an indication of trading intent on behalf of any Eaton Vance fund. This commentary may contain statements that are not historical facts, referred to as “forward looking statements”. The Fund’s actual future results may differ significantly from those stated in any forward looking statement, depending on factors such as changes in securities or financial markets or general economic conditions, the volume of sales and purchases of Fund shares, the continuation of investment advisory, administrative and service contracts, and other risks discussed from time to time in the Fund’s filings with the Securities and Exchange Commission. |
| 2 | Russell 1000 Value Index is an unmanaged index of U.S. large-cap value stocks. Unless otherwise stated, index returns do not reflect the effect of any applicable sales charges, commissions, expenses, taxes or leverage, as applicable. It is not possible to invest directly in an index. |
| 3 | There is no sales charge. Insurance-related charges are not included in the calculation of returns. Such expenses would reduce the overall return shown. Please refer to the report for your insurance contract for performance data reflecting insurance-related charges. A large redemption from the Fund on 9/30/10 positively impacted performance for the since inception period. |
| 4 | Source: Fund prospectus. Net expense ratio reflects a contractual expense reimbursement that continues through 4/30/13. Without the reimbursement, performance would have been lower. |
| 5 | Excludes cash and cash equivalents. |
| | Fund profile subject to change due to active management. |
Eaton Vance
VT Large-Cap Value Fund
December 31, 2012
Fund Expenses
Example: As a Fund shareholder, you incur ongoing costs, including management fees; distribution or service fees; and other Fund expenses. This Example is intended to help you understand your ongoing costs (in dollars) of Fund investing and to compare these costs with the ongoing costs of investing in other mutual funds. The Example is based on an investment of $1,000 invested at the beginning of the period and held for the entire period (July 1, 2012 – December 31, 2012).
Actual Expenses: The first section of the table below provides information about actual account values and actual expenses. You may use the information in this section, together with the amount you invested, to estimate the expenses that you paid over the period. Simply divide your account value by $1,000 (for example, an $8,600 account value divided by $1,000 = 8.6), then multiply the result by the number in the first line under the heading entitled “Expenses Paid During Period” to estimate the expenses you paid on your account during this period.
Hypothetical Example for Comparison Purposes: The second section of the table below provides information about hypothetical account values and hypothetical expenses based on the actual Fund expense ratio and an assumed rate of return of 5% per year (before expenses), which is not the actual Fund return. The hypothetical account values and expenses may not be used to estimate the actual ending account balance or expenses you paid for the period. You may use this information to compare the ongoing costs of investing in your Fund and other funds. To do so, compare this 5% hypothetical example with the 5% hypothetical examples that appear in the shareholder reports of the other funds.
Please note that the expenses shown in the table are meant to highlight your ongoing costs only and do not reflect expenses and charges which are, or may be imposed under the variable annuity contract or variable life insurance policy (variable contracts) (if applicable) through which your investment in the Fund is made. Therefore, the second line of the table is useful in comparing ongoing costs associated with an investment in vehicles which fund benefits under variable contracts and to qualified pension and retirement plans, and will not help you determine the relative total costs of investing in the Fund through variable contracts. In addition, if these expenses and charges imposed under the variable contracts were included, your costs would be higher.
| | | | | | | | | | | | | | | | |
| | | Beginning
Account Value
(7/1/12) | | | Ending
Account Value
(12/31/12) | | | Expenses Paid
During Period*
(7/1/12 – 12/31/12) | | | Annualized
Expense
Ratio | |
| | | | |
| | | | | | | | | | | | | | | | |
Actual | | | | | | | | | | | | | | | | |
| | $ | 1,000.00 | | | $ | 1,067.20 | | | $ | 6.76 | ** | | | 1.30 | % |
| | | | | | | | | | | | | | | | | |
| | | | |
| | | | | | | | | | | | | | | | |
Hypothetical | | | | | | | | | | | | | | | | |
(5% return per year before expenses) | | | | | | | | | | | | | | | | |
| | $ | 1,000.00 | | | $ | 1,018.60 | | | $ | 6.60 | ** | | | 1.30 | % |
| * | Expenses are equal to the Fund’s annualized expense ratio, multiplied by the average account value over the period, multiplied by 184/366 (to reflect the one-half year period). The Example assumes that the $1,000 was invested at the net asset value per share determined at the close of business on June 30, 2012. Expenses shown do not include insurance-related charges. |
| ** | Absent an allocation of certain expenses to an affiliate, expenses would be higher. |
Eaton Vance
VT Large-Cap Value Fund
December 31, 2012
Portfolio of Investments
| | | | | | | | |
| Common Stocks — 96.0% | |
| | |
| | | | | | | | |
| Security | | Shares | | | Value | |
| | | | | | | | |
|
Aerospace & Defense — 3.1% | |
Boeing Co. (The) | | | 6,329 | | | $ | 476,954 | |
Honeywell International, Inc. | | | 8,228 | | | | 522,231 | |
United Technologies Corp. | | | 6,329 | | | | 519,041 | |
| | | | | | | | | |
| | | | | | $ | 1,518,226 | |
| | | | | | | | | |
|
Biotechnology — 0.6% | |
Gilead Sciences, Inc.(1) | | | 3,732 | | | $ | 274,115 | |
| | | | | | | | | |
| | | | | | $ | 274,115 | |
| | | | | | | | | |
|
Capital Markets — 2.6% | |
Ameriprise Financial, Inc. | | | 5,851 | | | $ | 366,448 | |
Goldman Sachs Group, Inc. (The) | | | 4,747 | | | | 605,528 | |
State Street Corp. | | | 6,013 | | | | 282,671 | |
| | | | | | | | | |
| | | | | | $ | 1,254,647 | |
| | | | | | | | | |
|
Chemicals — 1.9% | |
Air Products and Chemicals, Inc. | | | 3,165 | | | $ | 265,923 | |
LyondellBasell Industries NV, Class A | | | 12,067 | | | | 688,905 | |
| | | | | | | | | |
| | | | | | $ | 954,828 | |
| | | | | | | | | |
|
Commercial Banks — 7.8% | |
Fifth Third Bancorp | | | 20,571 | | | $ | 312,473 | |
KeyCorp | | | 33,230 | | | | 279,797 | |
PNC Financial Services Group, Inc. | | | 14,828 | | | | 864,621 | |
Regions Financial Corp. | | | 55,348 | | | | 394,078 | |
U.S. Bancorp | | | 15,191 | | | | 485,201 | |
Wells Fargo & Co. | | | 43,041 | | | | 1,471,141 | |
| | | | | | | | | |
| | | | | | $ | 3,807,311 | |
| | | | | | | | | |
|
Computers & Peripherals — 3.1% | |
Apple, Inc. | | | 2,184 | | | $ | 1,164,137 | |
EMC Corp.(1) | | | 14,372 | | | | 363,612 | |
| | | | | | | | | |
| | | | | | $ | 1,527,749 | |
| | | | | | | | | |
|
Consumer Finance — 2.6% | |
American Express Co. | | | 10,091 | | | $ | 580,031 | |
Capital One Financial Corp. | | | 11,749 | | | | 680,619 | |
| | | | | | | | | |
| | | | | | $ | 1,260,650 | |
| | | | | | | | | |
|
Diversified Financial Services — 5.7% | |
Citigroup, Inc. | | | 31,937 | | | $ | 1,263,428 | |
JPMorgan Chase & Co. | | | 34,259 | | | | 1,506,368 | |
| | | | | | | | | |
| | | | | | $ | 2,769,796 | |
| | | | | | | | | |
| | | | | | | | |
| Security | | Shares | | | Value | |
| | | | | | | | |
|
Diversified Telecommunication Services — 2.3% | |
AT&T, Inc. | | | 13,292 | | | $ | 448,073 | |
CenturyLink, Inc. | | | 11,551 | | | | 451,875 | |
Deutsche Telekom AG | | | 21,362 | | | | 243,162 | |
| | | | | | | | | |
| | | | | | $ | 1,143,110 | |
| | | | | | | | | |
|
Electric Utilities — 3.0% | |
American Electric Power Co., Inc. | | | 16,893 | | | $ | 720,993 | |
NextEra Energy, Inc. | | | 10,573 | | | | 731,546 | |
| | | | | | | | | |
| | | | | | $ | 1,452,539 | |
| | | | | | | | | |
|
Electrical Equipment — 0.8% | |
Eaton Corp. PLC | | | 6,962 | | | $ | 377,340 | |
| | | | | | | | | |
| | | | | | $ | 377,340 | |
| | | | | | | | | |
|
Energy Equipment & Services — 2.2% | |
National Oilwell Varco, Inc. | | | 11,093 | | | $ | 758,207 | |
Schlumberger, Ltd. | | | 4,367 | | | | 302,589 | |
| | | | | | | | | |
| | | | | | $ | 1,060,796 | |
| | | | | | | | | |
|
Food & Staples Retailing — 2.1% | |
CVS Caremark Corp. | | | 21,520 | | | $ | 1,040,492 | |
| | | | | | | | | |
| | | | | | $ | 1,040,492 | |
| | | | | | | | | |
|
Food Products — 3.5% | |
Kraft Foods Group, Inc. | | | 6,013 | | | $ | 273,411 | |
Mondelez International, Inc., Class A | | | 18,039 | | | | 459,453 | |
Nestle SA | | | 6,962 | | | | 454,225 | |
Unilever NV - NY Shares | | | 13,925 | | | | 533,328 | |
| | | | | | | | | |
| | | | | | $ | 1,720,417 | |
| | | | | | | | | |
|
Health Care Equipment & Supplies — 1.1% | |
Covidien PLC | | | 9,020 | | | $ | 520,815 | |
| | | | | | | | | |
| | | | | | $ | 520,815 | |
| | | | | | | | | |
|
Health Care Providers & Services — 1.9% | |
UnitedHealth Group, Inc. | | | 17,406 | | | $ | 944,101 | |
| | | | | | | | | |
| | | | | | $ | 944,101 | |
| | | | | | | | | |
|
Industrial Conglomerates — 2.3% | |
General Electric Co. | | | 53,860 | | | $ | 1,130,521 | |
| | | | | | | | | |
| | | | | | $ | 1,130,521 | |
| | | | | | | | | |
| | | | |
| | 6 | | See Notes to Financial Statements. |
Eaton Vance
VT Large-Cap Value Fund
December 31, 2012
Portfolio of Investments — continued
| | | | | | | | |
| Security | | Shares | | | Value | |
| | | | | | | | |
|
Insurance — 4.1% | |
ACE, Ltd. | | | 6,329 | | | $ | 505,054 | |
Aflac, Inc. | | | 9,071 | | | | 481,851 | |
Travelers Companies, Inc. (The) | | | 10,918 | | | | 784,131 | |
XL Group PLC | | | 9,880 | | | | 247,593 | |
| | | | | | | | | |
| | | | | | $ | 2,018,629 | |
| | | | | | | | | |
|
Internet Software & Services — 0.7% | |
Google, Inc., Class A(1) | | | 506 | | | $ | 358,941 | |
| | | | | | | | | |
| | | | | | $ | 358,941 | |
| | | | | | | | | |
|
IT Services — 1.0% | |
International Business Machines Corp. | | | 2,532 | | | $ | 485,005 | |
| | | | | | | | | |
| | | | | | $ | 485,005 | |
| | | | | | | | | |
|
Life Sciences Tools & Services — 0.8% | |
Thermo Fisher Scientific, Inc. | | | 6,013 | | | $ | 383,509 | |
| | | | | | | | | |
| | | | | | $ | 383,509 | |
| | | | | | | | | |
|
Machinery — 1.2% | |
Deere & Co. | | | 3,323 | | | $ | 287,174 | |
PACCAR, Inc. | | | 6,329 | | | | 286,134 | |
| | | | | | | | | |
| | | | | | $ | 573,308 | |
| | | | | | | | | |
|
Media — 4.1% | |
Comcast Corp., Class A | | | 20,109 | | | $ | 751,674 | |
Time Warner, Inc. | | | 6,013 | | | | 287,602 | |
Walt Disney Co. (The) | | | 19,621 | | | | 976,930 | |
| | | | | | | | | |
| | | | | | $ | 2,016,206 | |
| | | | | | | | | |
|
Metals & Mining — 0.7% | |
Freeport-McMoRan Copper & Gold, Inc. | | | 10,732 | | | $ | 367,034 | |
| | | | | | | | | |
| | | | | | $ | 367,034 | |
| | | | | | | | | |
|
Multi-Utilities — 2.9% | |
National Grid PLC ADR | | | 10,612 | | | $ | 609,553 | |
Sempra Energy | | | 11,460 | | | | 812,973 | |
| | | | | | | | | |
| | | | | | $ | 1,422,526 | |
| | | | | | | | | |
|
Multiline Retail — 2.7% | |
Macy’s, Inc. | | | 15,507 | | | $ | 605,083 | |
Target Corp. | | | 11,935 | | | | 706,194 | |
| | | | | | | | | |
| | | | | | $ | 1,311,277 | |
| | | | | | | | | |
| | | | | | | | |
| Security | | Shares | | | Value | |
| | | | | | | | |
|
Oil, Gas & Consumable Fuels — 13.6% | |
Anadarko Petroleum Corp. | | | 5,697 | | | $ | 423,344 | |
Chevron Corp. | | | 13,445 | | | | 1,453,943 | |
ConocoPhillips | | | 18,988 | | | | 1,101,114 | |
EOG Resources, Inc. | | | 3,956 | | | | 477,845 | |
Exxon Mobil Corp. | | | 16,235 | | | | 1,405,139 | |
Occidental Petroleum Corp. | | | 13,359 | | | | 1,023,433 | |
Phillips 66 | | | 14,726 | | | | 781,951 | |
| | | | | | | | | |
| | | | | | $ | 6,666,769 | |
| | | | | | | | | |
|
Pharmaceuticals — 7.9% | |
Johnson & Johnson | | | 11,868 | | | $ | 831,947 | |
Merck & Co., Inc. | | | 32,703 | | | | 1,338,861 | |
Pfizer, Inc. | | | 57,667 | | | | 1,446,288 | |
Roche Holding AG PC | | | 1,341 | | | | 271,125 | |
| | | | | | | | | |
| | | | | | $ | 3,888,221 | |
| | | | | | | | | |
|
Real Estate Investment Trusts (REITs) — 2.8% | |
AvalonBay Communities, Inc. | | | 4,385 | | | $ | 594,562 | |
Boston Properties, Inc. | | | 3,695 | | | | 390,968 | |
Public Storage, Inc. | | | 2,514 | | | | 364,430 | |
| | | | | | | | | |
| | | | | | $ | 1,349,960 | |
| | | | | | | | | |
|
Road & Rail — 1.6% | |
Union Pacific Corp. | | | 6,329 | | | $ | 795,682 | |
| | | | | | | | | |
| | | | | | $ | 795,682 | |
| | | | | | | | | |
|
Software — 3.0% | |
Microsoft Corp. | | | 26,107 | | | $ | 697,840 | |
Oracle Corp. | | | 23,931 | | | | 797,381 | |
| | | | | | | | | |
| | | | | | $ | 1,495,221 | |
| | | | | | | | | |
|
Specialty Retail — 0.7% | |
Lowe’s Companies, Inc. | | | 9,494 | | | $ | 337,227 | |
| | | | | | | | | |
| | | | | | $ | 337,227 | |
| | | | | | | | | |
|
Tobacco — 0.5% | |
Philip Morris International, Inc. | | | 2,864 | | | $ | 239,545 | |
| | | | | | | | | |
| | | | | | $ | 239,545 | |
| | | | | | | | | |
| | | | |
| | 7 | | See Notes to Financial Statements. |
Eaton Vance
VT Large-Cap Value Fund
December 31, 2012
Portfolio of Investments — continued
| | | | | | | | |
| Security | | Shares | | | Value | |
| | | | | | | | |
|
Wireless Telecommunication Services — 1.1% | |
Rogers Communications, Inc., Class B | | | 12,343 | | | $ | 561,853 | |
| | | | | | | | | |
| | | | | | $ | 561,853 | |
| | | | | | | | | |
| | |
Total Common Stocks
(identified cost $41,755,463) | | | | | | $ | 47,028,366 | |
| | | | | | | | | |
| | |
Total Investments — 96.0%
(identified cost $41,755,463) | | | | | | $ | 47,028,366 | |
| | | | | | | | | |
| | |
Other Assets, Less Liabilities — 4.0% | | | | | | $ | 1,973,252 | |
| | | | | | | | | |
| | |
Net Assets — 100.0% | | | | | | $ | 49,001,618 | |
| | | | | | | | | |
The percentage shown for each investment category in the Portfolio of Investments is based on net assets.
| | | | |
| ADR | | – | | American Depositary Receipt |
| PC | | – | | Participation Certificate |
| (1) | Non-income producing security. |
| | | | |
| | 8 | | See Notes to Financial Statements. |
Eaton Vance
VT Large-Cap Value Fund
December 31, 2012
Statement of Assets and Liabilities
| | | | |
| Assets | | December 31, 2012 | |
Investments, at value (identified cost, $41,755,463) | | $ | 47,028,366 | |
Cash | | | 1,640,602 | |
Dividends receivable | | | 85,478 | |
Receivable for Fund shares sold | | | 335,222 | |
Tax reclaims receivable | | | 9,431 | |
Total assets | | $ | 49,099,099 | |
| |
| Liabilities | | | | |
Payable for Fund shares redeemed | | $ | 50 | |
Payable to affiliates: | | | | |
Investment adviser fee | | | 25,841 | |
Distribution fees | | | 10,295 | |
Trustees’ fees | | | 650 | |
Payable for shareholder servicing fees | | | 8,538 | |
Accrued expenses | | | 52,107 | |
Total liabilities | | $ | 97,481 | |
Net Assets | | $ | 49,001,618 | |
| |
| Sources of Net Assets | | | | |
Paid-in capital | | $ | 49,363,007 | |
Accumulated net realized loss | | | (5,634,369 | ) |
Accumulated undistributed net investment income | | | 235 | |
Net unrealized appreciation | | | 5,272,745 | |
Net Assets | | $ | 49,001,618 | |
| |
| Net Asset Value, Offering Price and Redemption Price Per Share | | | | |
($49,001,618 ÷ 5,305,807 shares of beneficial interest outstanding) | | $ | 9.24 | |
| | | | |
| | 9 | | See Notes to Financial Statements. |
Eaton Vance
VT Large-Cap Value Fund
December 31, 2012
Statement of Operations
| | | | |
| Investment Income | | Year Ended
December 31, 2012 | |
Dividends (net of foreign taxes, $12,241) | | $ | 1,384,925 | |
Total investment income | | $ | 1,384,925 | |
| |
| Expenses | | | | |
Investment adviser fee | | $ | 339,236 | |
Distribution fees | | | 135,694 | |
Shareholder servicing fees | | | 107,700 | |
Trustees’ fees and expenses | | | 2,694 | |
Custodian fee | | | 53,918 | |
Transfer and dividend disbursing agent fees | | | 11,933 | |
Legal and accounting services | | | 46,864 | |
Printing and postage | | | 7,231 | |
Miscellaneous | | | 8,235 | |
Total expenses | | $ | 713,505 | |
Deduct — | | | | |
Allocation of expenses to affiliate | | $ | 7,597 | |
Reduction of custodian fee | | | 659 | |
Total expense reductions | | $ | 8,256 | |
| |
Net expenses | | $ | 705,249 | |
| |
Net investment income | | $ | 679,676 | |
| |
| Realized and Unrealized Gain (Loss) | | | | |
Net realized gain (loss) — | | | | |
Investment transactions | | $ | 2,810,466 | |
Foreign currency transactions | | | 1,156 | |
Net realized gain | | $ | 2,811,622 | |
Change in unrealized appreciation (depreciation) — | | | | |
Investments | | $ | 4,768,326 | |
Foreign currency | | | (1,051 | ) |
Net change in unrealized appreciation (depreciation) | | $ | 4,767,275 | |
| |
Net realized and unrealized gain | | $ | 7,578,897 | |
| |
Net increase in net assets from operations | | $ | 8,258,573 | |
| | | | |
| | 10 | | See Notes to Financial Statements. |
Eaton Vance
VT Large-Cap Value Fund
December 31, 2012
Statements of Changes in Net Assets
| | | | | | | | |
| | | Year Ended December 31, | |
| Increase (Decrease) in Net Assets | | 2012 | | | 2011 | |
From operations — | | | | | | | | |
Net investment income | | $ | 679,676 | | | $ | 778,886 | |
Net realized gain (loss) from investment and foreign currency transactions | | | 2,811,622 | | | | (3,908,004 | ) |
Net change in unrealized appreciation (depreciation) from investments and foreign currency | | | 4,767,275 | | | | (468,164 | ) |
Net increase (decrease) in net assets from operations | | $ | 8,258,573 | | | $ | (3,597,282 | ) |
Distributions to shareholders — | | | | | | | | |
From net investment income | | $ | (678,124 | ) | | $ | (773,629 | ) |
Tax return of capital | | | (2,402 | ) | | | — | |
Total distributions to shareholders | | $ | (680,526 | ) | | $ | (773,629 | ) |
Transactions in shares of beneficial interest — | | | | | | | | |
Proceeds from sale of shares | | $ | 2,335,209 | | | $ | 6,452,252 | |
Reinvestment of distributions | | | 674,031 | | | | 768,339 | |
Cost of shares redeemed | | | (21,588,466 | ) | | | (17,256,008 | ) |
Net decrease in net assets from Fund share transactions | | $ | (18,579,226 | ) | | $ | (10,035,417 | ) |
| | |
Net decrease in net assets | | $ | (11,001,179 | ) | | $ | (14,406,328 | ) |
| | |
| Net Assets | | | | | | | | |
At beginning of year | | $ | 60,002,797 | | | $ | 74,409,125 | |
At end of year | | $ | 49,001,618 | | | $ | 60,002,797 | |
| | |
Accumulated undistributed net investment income
included in net assets | | | | | | | | |
At end of year | | $ | 235 | | | $ | 7,265 | |
| | | | |
| | 11 | | See Notes to Financial Statements. |
Eaton Vance
VT Large-Cap Value Fund
December 31, 2012
Financial Highlights
| | | | | | | | | | | | | | | | | | | | |
| | | Year Ended December 31, | |
| | | 2012 | | | 2011 | | | 2010 | | | 2009 | | | 2008 | |
Net asset value — Beginning of year | | $ | 8.140 | | | $ | 8.770 | | | $ | 8.000 | | | $ | 6.820 | | | $ | 10.630 | |
| | | | | |
| Income (Loss) From Operations | | | | | | | | | | | | | | | | | | | | |
Net investment income | | $ | 0.129 | | | $ | 0.107 | | | $ | 0.467 | | | $ | 0.074 | (1) | | $ | 0.105 | (1) |
Net realized and unrealized gain (loss) | | | 1.101 | | | | (0.631 | ) | | | 0.768 | (2) | | | 1.158 | | | | (3.812 | ) |
| | | | | |
Total income (loss) from operations | | $ | 1.230 | | | $ | (0.524 | ) | | $ | 1.235 | | | $ | 1.232 | | | $ | (3.707 | ) |
| | | | | |
| Less Distributions | | | | | | | | | | | | | | | | | | | | |
From net investment income | | $ | (0.130 | ) | | $ | (0.106 | ) | | $ | (0.465 | ) | | $ | (0.052 | ) | | $ | (0.103 | ) |
Tax return of capital | | | (0.000 | )(3) | | | — | | | | — | | | | — | | | | — | |
| | | | | |
Total distributions | | $ | (0.130 | ) | | $ | (0.106 | ) | | $ | (0.465 | ) | | $ | (0.052 | ) | | $ | (0.103 | ) |
| | | | | |
Net asset value — End of year | | $ | 9.240 | | | $ | 8.140 | | | $ | 8.770 | | | $ | 8.000 | | | $ | 6.820 | |
| | | | | |
Total Return(4) | | | 15.12 | % | | | (5.97 | )% | | | 15.44 | % | | | 18.25 | % | | | (34.96 | )% |
| | | | | |
| Ratios/Supplemental Data | | | | | | | | | | | | | | | | | | | | |
Net assets, end of year (000’s omitted) | | $ | 49,002 | | | $ | 60,003 | | | $ | 74,409 | | | $ | 44,761 | | | $ | 14,585 | |
Ratios (as a percentage of average daily net assets): | | | | | | | | | | | | | | | | | | | | |
Expenses(5) | | | 1.30 | %(6) | | | 1.28 | % | | | 1.34 | %(6)(7) | | | 1.30 | %(6) | | | 1.30 | %(6) |
Net investment income | | | 1.25 | % | | | 1.17 | % | | | 0.70 | % | | | 1.04 | % | | | 1.16 | % |
Portfolio Turnover | | | 39 | % | | | 70 | % | | | 55 | % | | | 71 | % | | | 86 | % |
| (1) | Computed using average shares outstanding. |
| (2) | The per share amount is not in accord with the net realized and unrealized gain (loss) on investments for the period because of the timing of sales of Fund shares and the amount of the per share realized and unrealized gains and losses at such time. |
| (3) | Amount is less than $(0.0005). |
| (4) | Returns are historical and are calculated by determining the percentage change in net asset value with all distributions reinvested. |
| (5) | Excludes the effect of custody credits, if any, of less than 0.005%. |
| (6) | The investment adviser subsidized certain operating expenses (equal to 0.01%, 0.10%, 0.31% and 0.32% of average daily net assets for years ended December 31, 2012, 2010, 2009, and 2008 respectively). Absent this subsidy, total return would be lower. |
| (7) | Includes interest expense of 0.04%. |
| | | | |
| | 12 | | See Notes to Financial Statements. |
Eaton Vance
VT Large-Cap Value Fund
December 31, 2012
Notes to Financial Statements
1 Significant Accounting Policies
Eaton Vance VT Large-Cap Value Fund (the Fund) is a diversified series of Eaton Vance Variable Trust (the Trust). The Trust is a Massachusetts business trust registered under the Investment Company Act of 1940, as amended (the 1940 Act), as an open-end management investment company. The Fund’s investment objective is to seek total return. The Fund is generally made available for purchase only to separate accounts established by participating insurance companies and qualified pension or retirement plans.
The following is a summary of significant accounting policies of the Fund. The policies are in conformity with accounting principles generally accepted in the United States of America.
A Investment Valuation — Equity securities (including common shares of closed-end investment companies) listed on a U.S. securities exchange generally are valued at the last sale or closing price on the day of valuation or, if no sales took place on such date, at the mean between the closing bid and asked prices therefore on the exchange where such securities are principally traded. Equity securities listed on the NASDAQ Global or Global Select Market generally are valued at the NASDAQ official closing price. Unlisted or listed securities for which closing sales prices or closing quotations are not available are valued at the mean between the latest available bid and asked prices or, in the case of preferred equity securities that are not listed or traded in the over-the-counter market, by a third party pricing service that will use various techniques that consider factors including, but not limited to, prices or yields of securities with similar characteristics, benchmark yields, broker/dealer quotes, quotes of underlying common stock, issuer spreads, as well as industry and economic events. Short-term obligations purchased with a remaining maturity of sixty days or less are generally valued at amortized cost, which approximates market value. Foreign securities and currencies are valued in U.S. dollars, based on foreign currency exchange rate quotations supplied by a third party pricing service. The pricing service uses a proprietary model to determine the exchange rate. Inputs to the model include reported trades and implied bid/ask spreads. The daily valuation of exchange-traded foreign securities generally is determined as of the close of trading on the principal exchange on which such securities trade. Events occurring after the close of trading on foreign exchanges may result in adjustments to the valuation of foreign securities to more accurately reflect their fair value as of the close of regular trading on the New York Stock Exchange. When valuing foreign equity securities that meet certain criteria, the Fund’s Trustees have approved the use of a fair value service that values such securities to reflect market trading that occurs after the close of the applicable foreign markets of comparable securities or other instruments that have a strong correlation to the fair-valued securities. Investments for which valuations or market quotations are not readily available or are deemed unreliable are valued at fair value using methods determined in good faith by or at the direction of the Trustees of the Fund in a manner that fairly reflects the security’s value, or the amount that the Fund might reasonably expect to receive for the security upon its current sale in the ordinary course. Each such determination is based on a consideration of relevant factors, which are likely to vary from one pricing context to another. These factors may include, but are not limited to, the type of security, the existence of any contractual restrictions on the security’s disposition, the price and extent of public trading in similar securities of the issuer or of comparable companies or entities, quotations or relevant information obtained from broker/dealers or other market participants, information obtained from the issuer, analysts, and/or the appropriate stock exchange (for exchange-traded securities), an analysis of the company’s or entity’s financial condition, and an evaluation of the forces that influence the issuer and the market(s) in which the security is purchased and sold.
B Investment Transactions — Investment transactions for financial statement purposes are accounted for on a trade date basis. Realized gains and losses on investments sold are determined on the basis of identified cost.
C Income — Dividend income is recorded on the ex-dividend date for dividends received in cash and/or securities. However, if the ex-dividend date has passed, certain dividends from foreign securities are recorded as the Fund is informed of the ex-dividend date. Withholding taxes on foreign dividends and capital gains have been provided for in accordance with the Fund’s understanding of the applicable countries’ tax rules and rates.
D Federal Taxes — The Fund’s policy is to comply with the provisions of the Internal Revenue Code applicable to regulated investment companies and to distribute to shareholders each year substantially all of its net investment income, and all or substantially all of its net realized capital gains. Accordingly, no provision for federal income or excise tax is necessary. At December 31, 2012, the Fund, for federal income tax purposes, had a capital loss carryforward of $4,450,627 and current year deferred capital losses of $1,155,083 which will reduce its taxable income arising from future net realized gains on investment transactions, if any, to the extent permitted by the Internal Revenue Code, and thus will reduce the amount of distributions to shareholders, which would otherwise be necessary to relieve the Fund of any liability for federal income or excise tax. The capital loss carryforward will expire on December 31, 2016 ($52,670) and December 31, 2017 ($4,397,957). The current year deferred capital losses are treated as arising on the first day of the Fund’s next taxable year and are treated as realized prior to the utilization of the capital loss carryforward.
As of December 31, 2012, the Fund had no uncertain tax positions that would require financial statement recognition, de-recognition, or disclosure. The Fund files a U.S. federal income tax return annually after its fiscal year-end, which is subject to examination by the Internal Revenue Service for a period of three years from the date of filing.
E Expenses — The majority of expenses of the Trust are directly identifiable to an individual fund. Expenses which are not readily identifiable to a specific fund are allocated taking into consideration, among other things, the nature and type of expense and the relative size of the funds.
F Expense Reduction — State Street Bank and Trust Company (SSBT) serves as custodian of the Fund. Pursuant to the custodian agreement, SSBT receives a fee reduced by credits, which are determined based on the average daily cash balance the Fund maintains with SSBT. All credit balances, if any, used to reduce the Fund’s custodian fees are reported as a reduction of expenses in the Statement of Operations.
Eaton Vance
VT Large-Cap Value Fund
December 31, 2012
Notes to Financial Statements — continued
G Foreign Currency Translation — Investment valuations, other assets, and liabilities initially expressed in foreign currencies are translated each business day into U.S. dollars based upon current exchange rates. Purchases and sales of foreign investment securities and income and expenses denominated in foreign currencies are translated into U.S. dollars based upon currency exchange rates in effect on the respective dates of such transactions. Recognized gains or losses on investment transactions attributable to changes in foreign currency exchange rates are recorded for financial statement purposes as net realized gains and losses on investments. That portion of unrealized gains and losses on investments that results from fluctuations in foreign currency exchange rates is not separately disclosed.
H Use of Estimates — The preparation of the financial statements in conformity with accounting principles generally accepted in the United States of America requires management to make estimates and assumptions that affect the reported amounts of assets and liabilities at the date of the financial statements and the reported amounts of income and expense during the reporting period. Actual results could differ from those estimates.
I Indemnifications — Under the Trust’s organizational documents, its officers and Trustees may be indemnified against certain liabilities and expenses arising out of the performance of their duties to the Fund. Under Massachusetts law, if certain conditions prevail, shareholders of a Massachusetts business trust (such as the Trust) could be deemed to have personal liability for the obligations of the Trust. However, the Trust’s Declaration of Trust contains an express disclaimer of liability on the part of Fund shareholders and the By-laws provide that the Trust shall assume the defense on behalf of any Fund shareholders. Moreover, the By-laws also provide for indemnification out of Fund property of any shareholder held personally liable solely by reason of being or having been a shareholder for all loss or expense arising from such liability. Additionally, in the normal course of business, the Fund enters into agreements with service providers that may contain indemnification clauses. The Fund’s maximum exposure under these arrangements is unknown as this would involve future claims that may be made against the Fund that have not yet occurred.
2 Distributions to Shareholders
It is the present policy of the Fund to make at least one distribution annually (normally in December) of all or substantially all of its net investment income and to distribute annually all or substantially all of its net realized capital gains (reduced by available capital loss carryforwards from prior years, if any). Distributions to shareholders are recorded on the ex-dividend date. Shareholders may reinvest income and capital gain distributions in additional shares of the Fund at the net asset value as of the ex-dividend date or, if an election is made on behalf of a separate account, to receive some or all of the distributions in cash. The Fund distinguishes between distributions on a tax basis and a financial reporting basis. Accounting principles generally accepted in the United States of America require that only distributions in excess of tax basis earnings and profits be reported in the financial statements as a return of capital. Permanent differences between book and tax accounting relating to distributions are reclassified to paid-in capital. For tax purposes, distributions from short-term capital gains are considered to be from ordinary income.
The tax character of distributions declared for the years ended December 31, 2012 and December 31, 2011 was as follows:
| | | | | | | | |
| | | Year Ended December 31, | |
| | | 2012 | | | 2011 | |
| | |
Distributions declared from: | | | | | | | | |
Ordinary income | | $ | 678,124 | | | $ | 773,629 | |
Tax return of capital | | $ | 2,402 | | | $ | — | |
During the year ended December 31, 2012, accumulated net realized loss was decreased by $8,582 and accumulated undistributed net investment income was decreased by $8,582 due to differences between book and tax accounting, primarily for foreign currency gain (loss) and distributions from real estate investment trusts (REITs). These reclassifications had no effect on the net assets or net asset value per share of the Fund.
As of December 31, 2012, the components of distributable earnings (accumulated losses) and unrealized appreciation (depreciation) on a tax basis were as follows:
| | | | |
Capital loss carryforward and deferred capital losses | | $ | (5,605,710 | ) |
Net unrealized appreciation | | $ | 5,244,321 | |
The differences between components of distributable earnings (accumulated losses) on a tax basis and the amounts reflected in the Statement of Assets and Liabilities are primarily due to wash sales and distributions from REITs.
Eaton Vance
VT Large-Cap Value Fund
December 31, 2012
Notes to Financial Statements — continued
3 Investment Adviser Fee and Other Transactions with Affiliates
The investment adviser fee is earned by Eaton Vance Management (EVM) as compensation for management and investment advisory services rendered to the Fund. The fee is computed at an annual rate of 0.625% of the Fund’s average daily net assets up to $2 billion and at reduced rates on daily net assets of $2 billion or more, and is payable monthly. For the year ended December 31, 2012, the investment adviser fee amounted to $339,236 or 0.625% of the Fund’s average net assets. EVM has agreed to reimburse the Fund’s expenses to the extent that total annual operating expenses (relating to ordinary operating expenses only) exceed 1.30% of the Fund’s average daily net assets. This agreement may be changed or terminated after April 30, 2013. Pursuant to this agreement, EVM was allocated $7,597 of the Fund’s operating expenses for the year ended December 31, 2012. EVM also serves as administrator of the Fund, but receives no compensation. Eaton Vance Distributors, Inc. (EVD), the Fund’s principal underwriter and an affiliate of EVM, received distribution fees (see Note 4).
Trustees and officers of the Fund who are members of EVM’s organization receive remuneration for their services to the Fund out of the investment adviser fee. Certain officers and Trustees of the Fund are officers of EVM.
4 Distribution Plan
The Fund has in effect a distribution plan pursuant to Rule 12b-1 under the 1940 Act. Pursuant to the distribution plan, the Fund pays EVD a distribution fee of 0.25% per annum of its average daily net assets for the sale and distribution of Fund shares. Distribution fees for the year ended December 31, 2012 amounted to $135,694. Insurance companies receive such fees from EVD based on the value of shares held by such companies. The insurance companies through which investors hold shares of the Fund may also pay fees to third parties in connection with the sale of variable contracts and for services provided to variable contract owners. The Fund, EVM or EVD are not a party to these arrangements. Investors should consult the prospectus and statement of additional information for their variable contracts for a discussion of these payments. EVD may, at its expense, provide promotional incentives to dealers that sell variable insurance products.
5 Shareholder Servicing Plan
The Trust, on behalf of the Fund, has adopted a Shareholder Servicing Plan (Servicing Plan). The Servicing Plan allows the Trust to enter into shareholder servicing agreements with insurance companies, investment dealers, broker/dealers or other financial intermediaries that provide shareholder services relating to Fund shares and their shareholders, including variable contract owners or plan participants with interests in the Fund. Under the Servicing Plan, the Fund may make payments at an annual rate of up to 0.25% of the Fund’s average daily net assets attributable to its shares that are subject to shareholder servicing agreements. No shareholder servicing fees are levied on shares owned by EVM, its affiliates, or their respective employees or clients and may be waived under certain other limited conditions. For the year ended December 31, 2012, shareholder servicing fees were equivalent to 0.20% per annum of the Fund’s average daily net assets and amounted to $107,700.
6 Purchases and Sales of Investments
Purchases and sales of investments, other than short-term obligations, aggregated $20,841,545 and $39,785,118, respectively, for the year ended December 31, 2012.
7 Shares of Beneficial Interest
The Fund’s Declaration of Trust permits the Trustees to issue an unlimited number of full and fractional shares of beneficial interest (without par value). Such shares may be issued in a number of different series (such as the Fund). Transactions in Fund shares were as follows:
| | | | | | | | |
| | | Year Ended December 31, | |
| | | 2012 | | | 2011 | |
| | |
Sales | | | 260,265 | | | | 774,280 | |
Issued to shareholders electing to receive payments of distributions in Fund shares | | | 73,446 | | | | 94,759 | |
Redemptions | | | (2,394,854 | ) | | | (1,986,625 | ) |
| | |
Net decrease | | | (2,061,143 | ) | | | (1,117,586 | ) |
At December 31, 2012, a separate account of an insurance company owned 98% of the outstanding shares of the Fund.
Eaton Vance
VT Large-Cap Value Fund
December 31, 2012
Notes to Financial Statements — continued
8 Federal Income Tax Basis of Investments
The cost and unrealized appreciation (depreciation) of investments of the Fund at December 31, 2012, as determined on a federal income tax basis, were as follows:
| | | | |
| |
Aggregate cost | | $ | 41,783,887 | |
| |
Gross unrealized appreciation | | $ | 6,113,838 | |
Gross unrealized depreciation | | | (869,359 | ) |
| |
Net unrealized appreciation | | $ | 5,244,479 | |
9 Line of Credit
The Fund participates with other portfolios and funds managed by EVM and its affiliates in a $600 million unsecured line of credit agreement with a group of banks. Borrowings are made by the Fund solely to facilitate the handling of unusual and/or unanticipated short-term cash requirements. Interest is charged to the Fund based on its borrowings at an amount above either the Eurodollar rate or Federal Funds rate. In addition, a fee computed at an annual rate of 0.08% on the daily unused portion of the line of credit is allocated among the participating portfolios and funds at the end of each quarter. Because the line of credit is not available exclusively to the Fund, it may be unable to borrow some or all of its requested amounts at any particular time. The Fund did not have any significant borrowings or allocated fees during the year ended December 31, 2012.
10 Fair Value Measurements
Under generally accepted accounting principles for fair value measurements, a three-tier hierarchy to prioritize the assumptions, referred to as inputs, is used in valuation techniques to measure fair value. The three-tier hierarchy of inputs is summarized in the three broad levels listed below.
| Ÿ | | Level 1 – quoted prices in active markets for identical investments |
| Ÿ | | Level 2 – other significant observable inputs (including quoted prices for similar investments, interest rates, prepayment speeds, credit risk, etc.) |
| Ÿ | | Level 3 – significant unobservable inputs (including a fund’s own assumptions in determining the fair value of investments) |
In cases where the inputs used to measure fair value fall in different levels of the fair value hierarchy, the level disclosed is determined based on the lowest level input that is significant to the fair value measurement in its entirety. The inputs or methodology used for valuing securities are not necessarily an indication of the risk associated with investing in those securities.
Eaton Vance
VT Large-Cap Value Fund
December 31, 2012
Notes to Financial Statements — continued
At December 31, 2012, the hierarchy of inputs used in valuing the Fund’s investments, which are carried at value, were as follows:
| | | | | | | | | | | | | | | | |
| Asset Description | | Level 1 | | | Level 2 | | | Level 3 | | | Total | |
| | | | |
Common Stocks | | | | | | | | | | | | | | | | |
Consumer Discretionary | | $ | 3,664,710 | | | $ | — | | | $ | — | | | $ | 3,664,710 | |
Consumer Staples | | | 2,546,229 | | | | 454,225 | | | | — | | | | 3,000,454 | |
Energy | | | 7,727,565 | | | | — | | | | — | | | | 7,727,565 | |
Financials | | | 12,460,993 | | | | — | | | | — | | | | 12,460,993 | |
Health Care | | | 5,739,636 | | | | 271,125 | | | | — | | | | 6,010,761 | |
Industrials | | | 4,395,077 | | | | — | | | | — | | | | 4,395,077 | |
Information Technology | | | 3,866,916 | | | | — | | | | — | | | | 3,866,916 | |
Materials | | | 1,321,862 | | | | — | | | | — | | | | 1,321,862 | |
Telecommunication Services | | | 1,461,801 | | | | 243,162 | | | | — | | | | 1,704,963 | |
Utilities | | | 2,875,065 | | | | — | | | | — | | | | 2,875,065 | |
| | | | |
Total Common Stocks | | $ | 46,059,854 | | | $ | 968,512 | * | | $ | — | | | $ | 47,028,366 | |
| | | | |
Total Investments | | $ | 46,059,854 | | | $ | 968,512 | | | $ | — | | | $ | 47,028,366 | |
| * | Includes foreign equity securities whose values were adjusted to reflect market trading of comparable securities or other correlated instruments that occurred after the close of trading in their applicable foreign markets. |
The Fund held no investments or other financial instruments as of December 31, 2011 whose fair value was determined using Level 3 inputs. At December 31, 2012, there were no investments transferred between Level 1 and Level 2 during the year then ended.
Eaton Vance
VT Large-Cap Value Fund
December 31, 2012
Report of Independent Registered Public Accounting Firm
To the Trustees of Eaton Vance Variable Trust and Shareholders of Eaton Vance VT Large-Cap Value Fund:
We have audited the accompanying statement of assets and liabilities of Eaton Vance VT Large-Cap Value Fund (the “Fund”) (one of the funds constituting Eaton Vance Variable Trust), including the portfolio of investments, as of December 31, 2012, and the related statement of operations for the year then ended, the statements of changes in net assets for each of the two years in the period then ended, and the financial highlights for each of the five years in the period then ended. These financial statements and financial highlights are the responsibility of the Fund’s management. Our responsibility is to express an opinion on these financial statements and financial highlights based on our audits.
We conducted our audits in accordance with the standards of the Public Company Accounting Oversight Board (United States). Those standards require that we plan and perform the audit to obtain reasonable assurance about whether the financial statements and financial highlights are free of material misstatement. The Fund is not required to have, nor were we engaged to perform, an audit of its internal control over financial reporting. Our audits included consideration of internal control over financial reporting as a basis for designing audit procedures that are appropriate in the circumstances, but not for the purpose of expressing an opinion on the effectiveness of the Fund’s internal control over financial reporting. Accordingly, we express no such opinion. An audit also includes examining, on a test basis, evidence supporting the amounts and disclosures in the financial statements, assessing the accounting principles used and significant estimates made by management, as well as evaluating the overall financial statement presentation. Our procedures included confirmation of securities owned as of December 31, 2012, by correspondence with the custodian and brokers. We believe that our audits provide a reasonable basis for our opinion.
In our opinion, such financial statements and financial highlights referred to above present fairly, in all material respects, the financial position of Eaton Vance VT Large-Cap Value Fund as of December 31, 2012, the results of its operations for the year then ended, the changes in its net assets for each of the two years in the period then ended, and the financial highlights for each of the five years in the period then ended, in conformity with accounting principles generally accepted in the United States of America.
DELOITTE & TOUCHE LLP
Boston, Massachusetts
February 20, 2013
Eaton Vance
VT Large-Cap Value Fund
December 31, 2012
Federal Tax Information (Unaudited)
As required by the Internal Revenue Code and/or regulations, shareholders must be notified regarding the status of qualified dividend income for individuals and the dividends received deduction for corporations.
Qualified Dividend Income. The Fund designates approximately $1,350,354, or up to the maximum amount of such dividends allowable pursuant to the Internal Revenue Code, as qualified dividend income eligible for the reduced tax rate of 15%.
Dividends Received Deduction. Corporate shareholders are generally entitled to take the dividends received deduction on the portion of the Fund’s dividend distribution that qualifies under tax law. For the Fund’s fiscal 2012 ordinary income dividends, 100% qualifies for the corporate dividends received deduction.
Eaton Vance
VT Large-Cap Value Fund
December 31, 2012
Management and Organization
Fund Management. The Trustees of Eaton Vance Variable Trust (the Trust) are responsible for the overall management and supervision of the Trust’s affairs. The Trustees and officers of the Trust are listed below. Except as indicated, each individual has held the office shown or other offices in the same company for the last five years. Trustees and officers of the Trust hold indefinite terms of office. The “Noninterested Trustees” consist of those Trustees who are not “interested persons” of the Trust, as that term is defined under the 1940 Act. The business address of each Trustee and officer is Two International Place, Boston, Massachusetts 02110. As used below, “EVC” refers to Eaton Vance Corp., “EV” refers to Eaton Vance, Inc., “EVM” refers to Eaton Vance Management, “BMR” refers to Boston Management and Research and “EVD” refers to Eaton Vance Distributors, Inc. EVC and EV are the corporate parent and trustee, respectively, of EVM and BMR. EVD is the Fund’s principal underwriter and a wholly-owned subsidiary of EVC. Each officer affiliated with Eaton Vance may hold a position with other Eaton Vance affiliates that is comparable to his or her position with EVM listed below. Each Trustee oversees 188 portfolios in the Eaton Vance Complex (including all master and feeder funds in a master feeder structure). Each officer serves as an officer of certain other Eaton Vance funds. Each Trustee and officer serves until his or her successor is elected.
| | | | | | |
Name and Year of Birth | | Position(s) with the
Trust | | Length of
Service | | Principal Occupation(s) and Directorships During Past Five Years and Other Relevant Experience |
Interested Trustee | | | | | | |
| | | |
Thomas E. Faust Jr. 1958 | | Trustee | | Since 2007 | | Chairman, Chief Executive Officer and President of EVC, Director and President of EV, Chief Executive Officer and President of EVM and BMR, and Director of EVD. Trustee and/or officer of 188 registered investment companies. Mr. Faust is an interested person because of his positions with EVM, BMR, EVD, EVC and EV, which are affiliates of the Trust. Directorships in the Last Five Years.(1) Director of EVC and Hexavest Inc. |
| | | |
| | | | | | |
Noninterested Trustees |
| | | |
Scott E. Eston 1956 | | Trustee | | Since 2011 | | Private investor. Formerly held various positions at Grantham, Mayo, Van Otterloo and Co., L.L.C. (investment management firm) (1997-2009), including Chief Operating Officer (2002-2009), Chief Financial Officer (1997-2009) and Chairman of the Executive Committee (2002-2008); President and Principal Executive Officer, GMO Trust (open-end registered investment company) (2006-2009). Former Partner, Coopers and Lybrand L.L.P. (now PricewaterhouseCoopers) (public accounting firm) (1987-1997). Directorships in the Last Five Years. None. |
| | | |
Benjamin C. Esty 1963 | | Trustee | | Since 2005 | | Roy and Elizabeth Simmons Professor of Business Administration and Finance Unit Head, Harvard University Graduate School of Business Administration. Directorships in the Last Five Years.(1) None. |
| | | |
Allen R. Freedman 1940 | | Trustee | | Since 2007 | | Private Investor. Former Chairman (2002-2004) and a Director (1983-2004) of Systems & Computer Technology Corp. (provider of software to higher education). Formerly, a Director of Loring Ward International (fund distributor) (2005-2007). Former Chairman and a Director of Indus International, Inc. (provider of enterprise management software to the power generating industry) (2005-2007). Former Chief Executive Officer of Assurant, Inc. (insurance provider) (1979-2000). Directorships in the Last Five Years.(1) Director of Stonemor Partners, L.P. (owner and operator of cemeteries). Formerly, Director of Assurant, Inc. (insurance provider) (1979-2011). |
| | | |
William H. Park 1947 | | Trustee | | Since 2003 | | Consultant and private investor. Formerly, Chief Financial Officer, Aveon Group L.P. (investment management firm) (2010-2011). Formerly, Vice Chairman, Commercial Industrial Finance Corp. (specialty finance company) (2006-2010). Formerly, President and Chief Executive Officer, Prizm Capital Management, LLC (investment management firm) (2002-2005). Formerly, Executive Vice President and Chief Financial Officer, United Asset Management Corporation (investment management firm) (1982-2001). Formerly, Senior Manager, Price Waterhouse (now PricewaterhouseCoopers) (an independent registered public accounting firm) (1972-1981). Directorships in the Last Five Years.(1) None. |
| | | |
Ronald A. Pearlman 1940 | | Trustee | | Since 2003 | | Professor of Law, Georgetown University Law Center. Formerly, Deputy Assistant Secretary (Tax Policy) and Assistant Secretary (Tax Policy), U.S. Department of the Treasury (1983-1985). Formerly, Chief of Staff, Joint Committee on Taxation, U.S. Congress (1988-1990). Directorships in the Last Five Years.(1) None. |
Eaton Vance
VT Large-Cap Value Fund
December 31, 2012
Management and Organization — continued
| | | | | | |
Name and Year of Birth | | Position(s) with the
Trust | | Length of
Service | | Principal Occupation(s) and Directorships During Past Five Years and Other Relevant Experience |
Noninterested Trustees (continued) |
| | | |
Helen Frame Peters 1948 | | Trustee | | Since 2008 | | Professor of Finance, Carroll School of Management, Boston College. Formerly, Dean, Carroll School of Management, Boston College (2000-2002). Formerly, Chief Investment Officer, Fixed Income, Scudder Kemper Investments (investment management firm) (1998-1999). Formerly, Chief Investment Officer, Equity and Fixed Income, Colonial Management Associates (investment management firm) (1991-1998). Directorships in the Last Five Years.(1) Formerly, Director of BJ’s Wholesale Club, Inc. (wholesale club retailer) (2004-2011). Formerly, Trustee of SPDR Index Shares Funds and SPDR Series Trust (exchange traded funds) (2000-2009). Formerly, Director of Federal Home Loan Bank of Boston (a bank for banks) (2007-2009). |
| | | |
Lynn A. Stout 1957 | | Trustee | | Since 2000 | | Distinguished Professor of Corporate and Business Law, Jack G. Clarke Business Law Institute, Cornell University Law School. Formerly, the Paul Hastings Professor of Corporate and Securities Law (2006-2012) and Professor of Law (2001-2006), University of California at Los Angeles School of Law. Directorships in the Last Five Years.(1) None. |
| | | |
Harriett Tee Taggart 1948 | | Trustee | | Since 2011 | | Managing Director, Taggart Associates (a professional practice firm). Formerly, Partner and Senior Vice President, Wellington Management Company, LLP (investment management firm) (1983-2006). Directorships in the Last Five Years. Director of Albemarle Corporation (chemicals manufacturer) (since 2007) and The Hanover Group (specialty property and casualty insurance company) (since 2009). Formerly, Director of Lubrizol Corporation (specialty chemicals) (2007-2011). |
| | | |
Ralph F. Verni 1943 | | Chairman of the Board and Trustee | | Chairman of the Board since 2007 and Trustee since 2005 | | Consultant and private investor. Formerly, Chief Investment Officer (1982-1992), Chief Financial Officer (1988-1990) and Director (1982-1992), New England Life. Formerly, Chairperson, New England Mutual Funds (1982-1992). Formerly, President and Chief Executive Officer, State Street Management & Research (1992-2000). Formerly, Chairperson, State Street Research Mutual Funds (1992-2000). Formerly, Director, W.P. Carey, LLC (1998-2004) and First Pioneer Farm Credit Corp. (2002-2006). Directorships in the Last Five Years.(1) None. |
| | | |
| | | | | | |
Principal Officers who are not Trustees |
| Name and Year of Birth | | Position(s)
with the Trust | | Length of Service | | Principal Occupation(s) During Past Five Years |
Duncan W. Richardson 1957 | | President | | Since 2008 | | Director of EVC and Executive Vice President and Chief Equity Investment Officer of EVC, EVM and BMR. |
| | | |
Payson F. Swaffield 1956 | | Vice President | | Since 2011 | | Vice President and Chief Income Investment Officer of EVM and BMR. |
| | | |
Barbara E. Campbell 1957 | | Treasurer | | Since 2005 | | Vice President of EVM and BMR. |
| | | |
Maureen A. Gemma 1960 | | Vice President, Secretary and Chief Legal Officer | | Vice President since 2011; Secretary since 2007 and Chief Legal Officer since 2008 | | Vice President of EVM and BMR. |
| | | |
Paul M. O’Neil 1953 | | Chief Compliance Officer | | Since 2004 | | Vice President of EVM and BMR. |
| (1) | During their respective tenures, the Trustees (except Mr. Eston and Ms. Taggart) also served as trustees of one or more of the following Eaton Vance funds (which operated in the years noted): Eaton Vance Credit Opportunities Fund (launched in 2005 and terminated in 2010); Eaton Vance Insured Florida Plus Municipal Bond Fund (launched in 2002 and terminated in 2009); and Eaton Vance National Municipal Income Trust (launched in 1998 and terminated in 2009). |
The SAI for the Fund includes additional information about the Trustees and officers of the Fund and can be obtained without charge on Eaton Vance’s website at www.eatonvance.com or by calling 1-800-262-1122.
Eaton Vance Funds
IMPORTANT NOTICES
Privacy. The Eaton Vance organization is committed to ensuring your financial privacy. Each of the financial institutions identified below has in effect the following policy (“Privacy Policy”) with respect to nonpublic personal information about its customers:
| Ÿ | | Only such information received from you, through application forms or otherwise, and information about your Eaton Vance fund transactions will be collected. This may include information such as name, address, social security number, tax status, account balances and transactions. |
| Ÿ | | None of such information about you (or former customers) will be disclosed to anyone, except as permitted by law (which includes disclosure to employees necessary to service your account). In the normal course of servicing a customer’s account, Eaton Vance may share information with unaffiliated third parties that perform various required services such as transfer agents, custodians and broker-dealers. |
| Ÿ | | Policies and procedures (including physical, electronic and procedural safeguards) are in place that are designed to protect the confidentiality of such information. |
| Ÿ | | We reserve the right to change our Privacy Policy at any time upon proper notification to you. Customers may want to review our Privacy Policy periodically for changes by accessing the link on our homepage: www.eatonvance.com. |
Our pledge of privacy applies to the following entities within the Eaton Vance organization: the Eaton Vance Family of Funds, Eaton Vance Management, Eaton Vance Investment Counsel, Eaton Vance Distributors, Inc., Eaton Vance Trust Company, Eaton Vance Management’s Real Estate Investment Group and Boston Management and Research. In addition, our Privacy Policy applies only to those Eaton Vance customers who are individuals and who have a direct relationship with us. If a customer’s account (i.e., fund shares) is held in the name of a third-party financial advisor/broker-dealer, it is likely that only such advisor’s privacy policies apply to the customer. This notice supersedes all previously issued privacy disclosures. For more information about Eaton Vance’s Privacy Policy, please call 1-800-262-1122.
Delivery of Shareholder Documents. The Securities and Exchange Commission (SEC) permits funds to deliver only one copy of shareholder documents, including prospectuses, proxy statements and shareholder reports, to fund investors with multiple accounts at the same residential or post office box address. This practice is often called “householding” and it helps eliminate duplicate mailings to shareholders. Eaton Vance, or your financial advisor, may household the mailing of your documents indefinitely unless you instruct Eaton Vance, or your financial advisor, otherwise. If you would prefer that your Eaton Vance documents not be householded, please contact Eaton Vance at 1-800-262-1122, or contact your financial advisor. Your instructions that householding not apply to delivery of your Eaton Vance documents will be effective within 30 days of receipt by Eaton Vance or your financial advisor.
Portfolio Holdings. Each Eaton Vance Fund and its underlying Portfolio(s) (if applicable) will file a schedule of portfolio holdings on Form N-Q with the SEC for the first and third quarters of each fiscal year. The Form N-Q will be available on the Eaton Vance website at www.eatonvance.com, by calling Eaton Vance at 1-800-262-1122 or in the EDGAR database on the SEC’s website at www.sec.gov. Form N-Q may also be reviewed and copied at the SEC’s public reference room in Washington, D.C. (call 1-800-732-0330 for information on the operation of the public reference room).
Proxy Voting. From time to time, funds are required to vote proxies related to the securities held by the funds. The Eaton Vance Funds or their underlying Portfolios (if applicable) vote proxies according to a set of policies and procedures approved by the Funds’ and Portfolios’ Boards. You may obtain a description of these policies and procedures and information on how the Funds or Portfolios voted proxies relating to portfolio securities during the most recent 12-month period ended June 30, without charge, upon request, by calling 1-800-262-1122 and by accessing the SEC’s website at www.sec.gov.
This Page Intentionally Left Blank
This Page Intentionally Left Blank
Investment Adviser and Administrator
Eaton Vance Management
Two International Place
Boston, MA 02110
Principal Underwriter*
Eaton Vance Distributors, Inc.
Two International Place
Boston, MA 02110
(617) 482-8260
Custodian
State Street Bank and Trust Company
200 Clarendon Street
Boston, MA 02116
Transfer Agent
State Street Bank and Trust Company
200 Clarendon Street
Boston, MA 02116
Independent Registered Public Accounting Firm
Deloitte & Touche LLP
200 Berkeley Street
Boston, MA 02116-5022
Fund Offices
Two International Place
Boston, MA 02110
| * | FINRA BrokerCheck. Investors may check the background of their Investment Professional by contacting the Financial Industry Regulatory Authority (FINRA). FINRA BrokerCheck is a free tool to help investors check the professional background of current and former FINRA-registered securities firms and brokers. FINRA BrokerCheck is available by calling 1-800-289-9999 and at www.FINRA.org. The FINRA BrokerCheck brochure describing this program is available to investors at www.FINRA.org. |
Item 2. Code of Ethics
Not required in this filing.
Item 3. Audit Committee Financial Expert
The registrant’s Board has designated William H. Park, an independent trustee, as its audit committee financial expert. Mr. Park is a certified public accountant who is a consultant and private investor. Previously, he served as the Chief Financial Officer of Aveon Group, L.P. (an investment management firm), as the Vice Chairman of Commercial Industrial Finance Corp. (specialty finance company), as President and Chief Executive Officer of Prizm Capital Management, LLC (investment management firm), as Executive Vice President and Chief Financial Officer of United Asset Management Corporation (an institutional investment management firm) and as a Senior Manager at Price Waterhouse (now PricewaterhouseCoopers) (an independent registered public accounting firm).
Item 4. Principal Accountant Fees and Services
(a)-(d)
Eaton Vance VT Floating-Rate Income Fund and Eaton Vance VT Large-Cap Value Fund (the “Fund(s)”) are series of Eaton Vance Variable Trust (the “Trust”), a Massachusetts business trust, which, including the Funds, contains a total of 2 series (the “Series”). The Trust is registered under the Investment Company Act of 1940 as an open-end management investment company. This Form N-CSR relates to the Funds’ annual reports.
The following table presents the aggregate fees billed to each Fund for the Fund’s fiscal years ended December 31, 2011 and December 31, 2012 by the Fund’s principal accountant, Deloitte & Touche LLP (“D&T”), for professional services rendered for the audit of the Fund’s annual financial statements and fees billed for other services rendered by D&T during such periods.
Eaton Vance VT Floating-Rate Income Fund
| | | | | | | | |
Fiscal Years Ended | | 12/31/11 | | | 12/31/12 | |
Audit Fees | | $ | 34,620 | | | $ | 39,784 | |
Audit-Related Fees(1) | | $ | 0 | | | $ | 0 | |
Tax Fees(2) | | $ | 7,200 | | | $ | 7,660 | |
All Other Fees(3) | | $ | 300 | | | $ | 0 | |
| | | | | | | | |
Total | | $ | 42,120 | | | $ | 47,444 | |
| | | | | | | | |
Eaton Vance VT Large-Cap Value Fund
| | | | | | | | |
Fiscal Years Ended | | 12/31/11 | | | 12/31/12 | |
Audit Fees | | $ | 32,400 | | | $ | 34,110 | |
Audit-Related Fees(1) | | $ | 0 | | | $ | 0 | |
Tax Fees(2) | | $ | 8,160 | | | $ | 9,600 | |
All Other Fees(3) | | $ | 1,200 | | | $ | 0 | |
| | | | | | | | |
Total | | $ | 41,760 | | | $ | 43,710 | |
| | | | | | | | |
| (1) | Audit-related fees consist of the aggregate fees billed for assurance and related services that are reasonably related to the performance of the audit of the registrant’s financial statements and are not reported under the category of audit fees. |
| (2) | Tax fees consist of the aggregate fees billed for professional services rendered by the principal accountant relating to tax compliance, tax advice, and tax planning and specifically include fees for tax return preparation and other tax related compliance/planning matters |
| (3) | All other fees consist of the aggregate fees billed for products and services provided by the registrant’s principal accountant other than audit, audit-related, and tax services. |
The following table presents the aggregate audit, audit-related, tax, and other fees billed to all of the Series in the Trust by D&T for the last two fiscal years of each Series.
| | | | | | | | |
| | | 12/31/11 | | | 12/31/12 | |
Audit Fees | | $ | 67,020 | | | $ | 73,894 | |
Audit-Related Fees(1) | | $ | 0 | | | $ | 0 | |
Tax Fees(2) | | $ | 15,360 | | | $ | 17,260 | |
All Other Fees(3) | | $ | 1,500 | | | $ | 0 | |
| | | | | | | | |
Total | | $ | 83,880 | | | $ | 91,154 | |
| | | | | | | | |
| (1) | Audit-related fees consist of the aggregate fees billed for assurance and related services that are reasonable related to the performance of the audit of financial statements and are not reported under the category of audit fees. |
| (2) | Tax fees consist of the aggregate fees billed for professional services rendered by the principal accountant relating to tax compliance, tax advice, and tax planning and specifically include fees for tax return preparation. |
| (3) | All other fees consist of the aggregate fees billed for products and services provided by the principal accountant other than audit, audit-related, and tax services. |
(e)(1) The registrant’s audit committee has adopted policies and procedures relating to the pre-approval of services provided by the registrant’s principal accountant (the “Pre-Approval Policies”). The Pre-Approval Policies establish a framework intended to assist the audit committee in the proper discharge of its pre-approval responsibilities. As a general matter, the Pre-Approval Policies (i) specify certain types of audit, audit-related, tax, and other services determined to be pre-approved by the audit committee; and (ii) delineate specific procedures governing the mechanics of the pre-approval process, including the approval and monitoring of audit and non-audit service fees. Unless a service is specifically pre-approved under the Pre-Approval Policies, it must be separately pre-approved by the audit committee.
The Pre-Approval Policies and the types of audit and non-audit services pre-approved therein must be reviewed and ratified by the registrant’s audit committee at least annually. The registrant’s audit committee maintains full responsibility for the appointment, compensation, and oversight of the work of the registrant’s principal accountant.
(e)(2) No services described in paragraphs (b)-(d) above were approved by the registrant’s audit committee pursuant to the
“de minimis exception” set forth in Rule 2-01 (c)(7)(i)(C) of Regulation S-X.
(f) Not applicable.
(g) The following table presents (i) the aggregate non-audit fees (i.e., fees for audit-related, tax, and other services) billed for services rendered to all of the Series in the Trust by D&T for the last two fiscal years of each Series; and (ii) the aggregate non-audit fees (i.e., fees for audit-related, tax, and other services) billed to the Eaton Vance organization by D&T for the last two fiscal years of each Series.
| | | | | | | | |
Fiscal Years Ended | | 12/31/11 | | | 12/31/12 | |
Registrant(1) | | $ | 16,860 | | | $ | 17,260 | |
Eaton Vance(2) | | $ | 334,561 | | | $ | 615,489 | |
| (1) | Includes all of the Series in the Trust. |
| (2) | The investment adviser to the Funds, as well as any of its affiliates that provide ongoing services to the Funds, are subsidiaries of Eaton Vance Corp. |
(h) The registrant’s audit committee has considered whether the provision by the registrant’s principal accountant of non-audit services to the registrant’s investment adviser and any entity controlling, controlled by, or under common control with the adviser that provides ongoing services to the registrant that were not pre-approved pursuant to Rule 2-01(c)(7)(ii) of Regulation S-X is compatible with maintaining the principal accountant’s independence.
Item 5. Audit Committee of Listed Registrants
Not required in this filing.
Item 6. Schedule of Investments
Please see schedule of investments contained in the Report to Stockholders included under Item 1 of this Form N-CSR.
Item 7. Disclosure of Proxy Voting Policies and Procedures for Closed-End Management Investment Companies
Not required in this filing.
Item 8. Portfolio Managers of Closed-End Management Investment Companies
Not required in this filing.
Item 9. Purchases of Equity Securities by Closed-End Management Investment Company and Affiliated Purchasers
Not required in this filing.
Item 10. Submission of Matters to a Vote of Security Holders
No Material Changes.
Item 11. Controls and Procedures
(a) It is the conclusion of the registrant’s principal executive officer and principal financial officer that the effectiveness of the registrant’s current disclosure controls and procedures (such disclosure controls and procedures having been evaluated within 90 days of the date of this filing) provide reasonable assurance that the information required to be disclosed by the registrant has been recorded, processed, summarized and reported within the time period specified in the Commission’s rules and forms and that the information required to be disclosed by the registrant has been accumulated and communicated to the registrant’s principal executive officer and principal financial officer in order to allow timely decisions regarding required disclosure.
(b) There have been no changes in the registrant’s internal controls over financial reporting during the second fiscal quarter of the period covered by this report that has materially affected, or is reasonably likely to materially affect, the registrant’s internal control over financial reporting.
Item 12. Exhibits
| | |
| (a)(1) | | Registrant’s Code of Ethics – Not applicable (please see Item 2). |
| |
| (a)(2)(i) | | Treasurer’s Section 302 certification. |
| |
| (a)(2)(ii) | | President’s Section 302 certification. |
| |
| (b) | | Combined Section 906 certification. |
Signatures
Pursuant to the requirements of the Securities Exchange Act of 1934 and the Investment Company Act of 1940, the registrant has duly caused this report to be signed on its behalf by the undersigned, thereunto duly authorized.
Eaton Vance Variable Trust
| | |
By: | | /s/ Duncan W. Richardson |
| | Duncan W. Richardson |
| | President |
| |
Date: | | February 15, 2013 |
Pursuant to the requirements of the Securities Exchange Act of 1934 and the Investment Company Act of 1940, this report has been signed below by the following persons on behalf of the registrant and in the capacities and on the dates indicated.
| | |
By: | | /s/ Barbara E. Campbell |
| | Barbara E. Campbell |
| | Treasurer |
| |
Date: | | February 15, 2013 |
| | |
By: | | /s/ Duncan W. Richardson |
| | Duncan W. Richardson |
| | President |
| |
Date: | | February 15, 2013 |