UNITED STATES
SECURITIES AND EXCHANGE COMMISSION
Washington, D.C. 20549
FormN-CSR
CERTIFIED SHAREHOLDER REPORT OF REGISTERED
MANAGEMENT INVESTMENT COMPANIES
Investment Company Act File Number:811-10067
Eaton Vance Variable Trust
(Exact Name of Registrant as Specified in Charter)
Two International Place, Boston, Massachusetts 02110
(Address of Principal Executive Offices)
Maureen A. Gemma
Two International Place, Boston, Massachusetts 02110
(Name and Address of Agent for Services)
(617)482-8260
(Registrant’s Telephone Number)
December 31
Date of Fiscal Year End
December 31, 2019
Date of Reporting Period
Item 1. Reports to Stockholders

Eaton Vance
VT Floating-Rate Income Fund
Annual Report
December 31, 2019
Important Note. Beginning on January 1, 2021, as permitted by regulations adopted by the Securities and Exchange Commission, you may not receive paper copies of the Fund’s annual and semi-annual shareholder reports from the insurance company or plan sponsor unless you specifically request paper copies. Instead, the reports will be made available on a website and you will be notified by mail each time a report is posted and provided with a website address to access the report. Instructions for requesting paper copies will be provided by the insurance company, plan sponsor or your financial intermediary, as applicable. Please contact the insurance company, plan sponsor or your financial intermediary, as applicable, or follow instructions included with this disclosure, if any, for more information.

Commodity Futures Trading Commission Registration. Effective December 31, 2012, the Commodity Futures Trading Commission (“CFTC”) adopted certain regulatory changes that subject registered investment companies and advisers to regulation by the CFTC if a fund invests more than a prescribed level of its assets in certain CFTC-regulated instruments (including futures, certain options and swap agreements) or markets itself as providing investment exposure to such instruments. The Fund has claimed an exclusion from the definition of the term “commodity pool operator” under the Commodity Exchange Act. Accordingly, neither the Fund nor the adviser with respect to the operation of the Fund is subject to CFTC regulation. Because of its management of other strategies, the Fund’s adviser is registered with the CFTC as a commodity pool operator and a commodity trading advisor.
Fund shares are not insured by the FDIC and are not deposits or other obligations of, or guaranteed by, any depository institution. Shares are subject to investment risks, including possible loss of principal invested.
This report must be preceded or accompanied by a current summary prospectus or prospectus. Before investing, investors should consider carefully the investment objective, risks, and charges and expenses of a mutual fund. This and other important information is contained in the summary prospectus and prospectus, which can be obtained from a financial intermediary. Prospective investors should read the prospectus carefully before investing. For further information, please call 1-800-262-1122.
Annual Report December 31, 2019
Eaton Vance
VT Floating-Rate Income Fund
Table of Contents
| | | | |
Management’s Discussion of Fund Performance | | | 2 | |
| |
Performance | | | 3 | |
| |
Fund Profile | | | 4 | |
| |
Endnotes and Additional Disclosures | | | 5 | |
| |
Fund Expenses | | | 6 | |
| |
Financial Statements | | | 7 | |
| |
Report of Independent Registered Public Accounting Firm | | | 37 | |
| |
Management and Organization | | | 38 | |
| |
Important Notices | | | 41 | |
Eaton Vance
VT Floating-Rate Income Fund
December 31, 2019
Management’s Discussion of Fund Performance1
Economic and Market Conditions
For the12-month period ended December 31, 2019, the U.S. floating-rate loan market rebounded from weak performance the previous calendar year, with the S&P/LSTA Leveraged Loan Index (the Index),2 a broad barometer of the U.S. loan market, posting a total return of 8.64%.
Floating-rate loan performance was uneven during the period, with strong returns from the start of 2019 through April, loan-price declines for much of the next six months, and renewed loan-price appreciation in November and December.
Retail investor demand in the asset class was dampened by falling interest rates during the period, which were generally viewed as less favorable for floating-rate instruments. After holding interest rates steady through the first half of 2019, the U.S. Federal Reserve cut the federal funds rate to2.00%-2.25% in July — its first reduction in over a decade — followed by two additional rate cuts in September and October, to end the period at1.50%-1.75%. Lower rates are intended to help stimulate economic activity by making borrowing costs relatively more affordable.
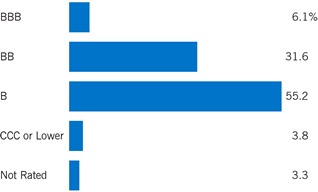
For the period as a whole within the Index, higher quality6 loans outperformed lower quality issues withBB-,B-,CCC-, andD-rated (defaulted) loans in the Index returning 9.31%, 8.99%, 3.41%, and-18.22%, respectively. A key driver of performance during the period was the dominance of institutional structured product demand, which had an inherent preference for higher quality paper. The average loan price of the Index began the year at $93.8 and ended at $96.7.
Issuer fundamentals painted a benign picture during the period. The trailing12-month default rate began 2019 at 1.63% and fell to 1.39% atperiod-end — less than half the level of the market’s long-term average. Similarly, signs of market stress remained low with the percentage of loans within the Index trading below $80 — often referred to as the distress ratio — representing an average of approximately 4% during the period.
Fund Performance
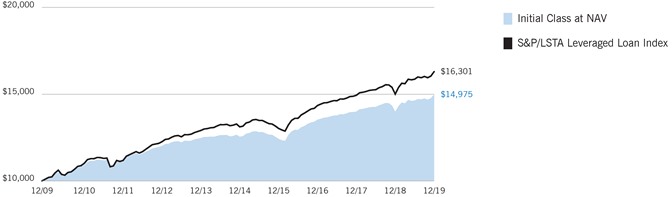
For the12-month period ended December 31, 2019, Eaton Vance VT Floating-Rate Income Fund (the Fund) returned 7.08% for Initial Class shares at net asset value (NAV), underperforming its benchmark, the Index, which returned
8.64%. The Index is unmanaged, and returns do not reflect any applicable sales charges, commissions, or expenses.
The Fund has historically tended to maintain underweight exposures, relative to the Index, to lower credit quality segments of the market — positioning that management believes may help the Fund experience limited credit losses over the long run, albeit with a potentially lower average coupon yield than the Index in shorter time frames.
The Fund’s cash position detracted from performance versus the Index. While holding cash benefited performance versus the Index when loan prices were falling during the middle of the period, it detracted from relative results when loan prices rose during the early and late months of the period, and the overall effect of the Fund’s cash position was negative. The Index does not include cash.
Loan selection during the period also detracted from Fund returns relative to the Index, most notably in the home furnishings and financial intermediaries sectors. While loan selection in the electronics/electrical, telecommunications, and leisure goods/activities/movies industries contributed to performance versus the Index, the net effect of loan selection during the period was negative.
The Fund’s overweight exposure toBB-rated loans and underweight exposure toB-rated issues contributed to the Fund’s performance versus the Index. The Fund’s underweight toCCC-rated loans was beneficial to performance versus the Index as well.
The Fund’s underweight exposures to the commodity-related oil and gas and metals & mining industries contributed to relative performance versus the Index, as those sectors trailed the loan market at large.
See Endnotes and Additional Disclosures in this report.
Past performance is no guarantee of future results. Returns are historical and are calculated by determining the percentage change in net asset value (NAV) or offering price (as applicable) with all distributions reinvested. Investment return and principal value will fluctuate so that shares, when redeemed, may be worth more or less than their original cost. Performance for periods less than or equal to one year is cumulative. Performance is for the stated time period only; due to market volatility, current Fund performance may be lower or higher than the quoted return.
Eaton Vance
VT Floating-Rate Income Fund
December 31, 2019
Performance2,3
Portfolio Managers Craig P. Russ, Andrew N. Sveen, CFA, Jeffrey R. Hesselbein, CFA and Michael J. Turgel, CFA
| | | | | | | | | | | | | | | | | | | | |
| % Average Annual Total Returns | | Class Inception Date | | | Performance Inception Date | | | One Year | | | Five Years | | | Ten Years | |
Initial Class at NAV | | | 05/02/2001 | | | | 05/02/2001 | | | | 7.08 | % | | | 3.61 | % | | | 4.12 | % |
ADV Class at NAV | | | 04/15/2014 | | | | 05/02/2001 | | | | 7.47 | | | | 3.89 | | | | 4.27 | |
Institutional Class at NAV | | | 05/02/2016 | | | | 05/02/2001 | | | | 7.65 | | | | 4.07 | | | | 4.36 | |
S&P/LSTA Leveraged Loan Index | | | — | | | | — | | | | 8.64 | % | | | 4.44 | % | | | 5.00 | % |
| | | | | |
| | | | | | | | | | | | | | | | | | | | |
| % Total Annual Operating Expense Ratios4 | | | | | | | | Initial Class | | | ADV
Class | | | Institutional Class | |
| | | | | | | | | | | 1.17 | % | | | 0.92 | % | | | 0.68 | % |
Growth of $10,000
This graph shows the change in value of a hypothetical investment of $10,000 in Initial Class of the Fund for the period indicated. For comparison, the same investment is shown in the indicated index.
| | | | | | | | | | | | | | | | |
| Growth of Investment3 | | Amount Invested | | | Period Beginning | | | At NAV | | | With Maximum Sales Charge | |
ADV Class | | $ | 10,000 | | | | 12/31/2009 | | | $ | 15,188 | | | | N.A. | |
Institutional Class | | $ | 10,000 | | | | 12/31/2009 | | | $ | 15,322 | | | | N.A. | |
See Endnotes and Additional Disclosures in this report.
Past performance is no guarantee of future results. Returns are historical and are calculated by determining the percentage change in net asset value (NAV) or offering price (as applicable) with all distributions reinvested. Investment return and principal value will fluctuate so that shares, when redeemed, may be worth more or less than their original cost. Performance for periods less than or equal to one year is cumulative. Performance is for the stated time period only; due to market volatility, current Fund performance may be lower or higher than the quoted return.
Eaton Vance
VT Floating-Rate Income Fund
December 31, 2019
Fund Profile
Top 10 Issuers (% of total investments)5
| | | | |
| |
Sprint Communications, Inc. | | | 1.3 | % |
| |
Ziggo Secured Finance BV | | | 1.3 | |
| |
Bausch Health Companies, Inc. | | | 1.2 | |
| |
Reynolds Group Holdings, Inc. | | | 1.2 | |
| |
Infor (US), Inc. | | | 1.1 | |
| |
Hyland Software, Inc. | | | 1.1 | |
| |
Asurion, LLC | | | 1.0 | |
| |
Epicor Software Corporation | | | 1.0 | |
| |
Jaguar Holding Company II | | | 1.0 | |
| |
CenturyLink, Inc. | | | 1.0 | |
| |
Total | | | 11.2 | % |
Top 10 Sectors (% of total investments)5
| | | | |
| |
Electronics/Electrical | | | 15.0 | % |
| |
Business Equipment and Services | | | 8.0 | |
| |
Health Care | | | 7.8 | |
| |
Chemicals and Plastics | | | 4.8 | |
| |
Cable and Satellite Television | | | 4.6 | |
| |
Drugs | | | 4.5 | |
| |
Telecommunications | | | 4.3 | |
| |
Leisure Goods/Activities/Movies | | | 4.1 | |
| |
Industrial Equipment | | | 3.5 | |
| |
Lodging and Casinos | | | 3.4 | |
| |
Total | | | 60.0 | % |
Credit Quality (% of bond and loan holdings)6
See Endnotes and Additional Disclosures in this report.
Eaton Vance
VT Floating-Rate Income Fund
December 31, 2019
Endnotes and Additional Disclosures
| 1 | The views expressed in this report are those of the portfolio manager(s) and are current only through the date stated at the top of this page. These views are subject to change at any time based upon market or other conditions, and Eaton Vance and the Fund(s) disclaim any responsibility to update such views. These views may not be relied upon as investment advice and, because investment decisions are based on many factors, may not be relied upon as an indication of trading intent on behalf of any Eaton Vance fund. This commentary may contain statements that are not historical facts, referred to as “forward looking statements.” The Fund’s actual future results may differ significantly from those stated in any forward looking statement, depending on factors such as changes in securities or financial markets or general economic conditions, the volume of sales and purchases of Fund shares, the continuation of investment advisory, administrative and service contracts, and other risks discussed from time to time in the Fund’s filings with the Securities and Exchange Commission. |
| 2 | S&P/LSTA Leveraged Loan Index is an unmanaged index of the institutional leveraged loan market. S&P/LSTA Leveraged Loan indices are a product of S&P Dow Jones Indices LLC (“S&P DJI”) and have been licensed for use. S&P® is a registered trademark of S&P DJI; Dow Jones® is a registered trademark of Dow Jones Trademark Holdings LLC (“Dow Jones”); LSTA is a trademark of Loan Syndications and Trading Association, Inc. S&P DJI, Dow Jones, their respective affiliates and their third party licensors do not sponsor, endorse, sell or promote the Fund, will not have any liability with respect thereto and do not have any liability for any errors, omissions, or interruptions of the S&P Dow Jones Indices. Unless otherwise stated, index returns do not reflect the effect of any applicable sales charges, commissions, expenses, taxes or leverage, as applicable. It is not possible to invest directly in an index. |
| 3 | There is no sales charge. Insurance-related charges are not included in the calculation of returns. If such charges were reflected, the returns would be lower. Please refer to the report for your insurance contract for performance data reflecting insurance-related charges. |
| | Performance prior to the inception date of a class may be linked to the performance of an older class of the Fund. This linked performance is not adjusted for class expense differences. If adjusted for such differences, the performance would be different. The performance of ADV Class is linked to Initial Class and the performance of Institutional Class is linked to ADV Class. Performance presented in the Financial Highlights included in the financial statements is not linked. |
| 4 | Source: Fund prospectus. The expense ratios for the current reporting period can be found in the Financial Highlights section of this report. |
| 5 | Excludes cash and cash equivalents. |
| 6 | Credit ratings are categorized using S&P Global Ratings (“S&P”). Ratings, which are subject to change, apply to the creditworthiness of the issuers of the underlying securities and not to the Fund or its shares. Credit ratings measure the quality of a bond based on the issuer’s creditworthiness, with ratings ranging from AAA, being the highest, to D, being the lowest based on S&P’s measures. Ratings of BBB or higher by S&P are considered to be investment- grade quality. Credit ratings are based largely on the ratings agency’s analysis at the time of rating. The rating assigned to any particular security is not necessarily a reflection of the issuer’s current financial condition and does not necessarily reflect its assessment of the volatility of a security’s market value or of the liquidity of an investment in the security. Holdings designated as “Not Rated” (if any) are not rated by S&P. |
| | Fund profile subject to change due to active management. |
Important Notice to Shareholders
| | Effective November 1, 2019, the Fund is managed by Craig P. Russ, Andrew N. Sveen, Jeffrey R. Hesselbein and Michael J. Turgel. |
Eaton Vance
VT Floating-Rate Income Fund
December 31, 2019
Fund Expenses
Example: As a Fund shareholder, you incur ongoing costs, including management fees; distribution and/or service fees; and other Fund expenses. This Example is intended to help you understand your ongoing costs (in dollars) of Fund investing and to compare these costs with the ongoing costs of investing in other mutual funds. The Example is based on an investment of $1,000 invested at the beginning of the period and held for the entire period (July 1, 2019 – December 31, 2019).
Actual Expenses: The first section of the table below provides information about actual account values and actual expenses. You may use the information in this section, together with the amount you invested, to estimate the expenses that you paid over the period. Simply divide your account value by $1,000 (for example, an $8,600 account value divided by $1,000 = 8.6), then multiply the result by the number in the first section under the heading entitled “Expenses Paid During Period” to estimate the expenses you paid on your account during this period.
Hypothetical Example for Comparison Purposes: The second section of the table below provides information about hypothetical account values and hypothetical expenses based on the actual Fund expense ratio and an assumed rate of return of 5% per year (before expenses), which is not the actual Fund return. The hypothetical account values and expenses may not be used to estimate the actual ending account balance or expenses you paid for the period. You may use this information to compare the ongoing costs of investing in your Fund and other funds. To do so, compare this 5% hypothetical example with the 5% hypothetical examples that appear in the shareholder reports of the other funds.
Please note that the expenses shown in the table are meant to highlight your ongoing costs only and do not reflect expenses and charges which are, or may be imposed under the variable annuity contract or variable life insurance policy (variable contracts) (if applicable) through which your investment in the Fund is made. Therefore, the second section of the table is useful in comparing ongoing costs associated with an investment in vehicles which fund benefits under variable contracts and to qualified pension and retirement plans, and will not help you determine the relative total costs of investing in the Fund through variable contracts. In addition, if these expenses and charges imposed under the variable contracts were included, your costs would be higher.
| | | | | | | | | | | | | | | | |
| | | Beginning
Account Value
(7/1/19) | | | Ending
Account Value
(12/31/19) | | | Expenses Paid
During Period*
(7/1/19 – 12/31/19) | | | Annualized
Expense
Ratio | |
| | | | |
Actual | | | | | | | | | | | | | | | | |
Initial Class | | $ | 1,000.00 | | | $ | 1,023.60 | | | $ | 6.02 | | | | 1.18 | % |
ADV Class | | $ | 1,000.00 | | | $ | 1,024.90 | | | $ | 4.75 | | | | 0.93 | % |
Institutional Class | | $ | 1,000.00 | | | $ | 1,026.50 | | | $ | 3.37 | | | | 0.66 | % |
| | | | | |
Hypothetical | | | | | | | | | | | | | | | | |
(5% return per year before expenses) | | | | | | | | | | | | | | | | |
Initial Class | | $ | 1,000.00 | | | $ | 1,019.30 | | | $ | 6.01 | | | | 1.18 | % |
ADV Class | | $ | 1,000.00 | | | $ | 1,020.50 | | | $ | 4.74 | | | | 0.93 | % |
Institutional Class | | $ | 1,000.00 | | | $ | 1,021.90 | | | $ | 3.36 | | | | 0.66 | % |
| * | Expenses are equal to the Fund’s annualized expense ratio for the indicated Class, multiplied by the average account value over the period, multiplied by 184/365 (to reflect the one-half year period). The Example assumes that the $1,000 was invested at the net asset value per share determined at the close of business on June 30, 2019. Expenses shown do not include insurance-related charges. |
Eaton Vance
VT Floating-Rate Income Fund
December 31, 2019
Portfolio of Investments
| | | | | | | | |
| Senior Floating-Rate Loans — 89.4%(1) | |
| Borrower/Tranche Description | | Principal
Amount
(000’s omitted) | | | Value | |
|
| Aerospace and Defense — 1.2% | |
| | |
| Dynasty Acquisition Co., Inc. | | | | | | |
| | |
Term Loan, 5.94%, (3 mo. USD LIBOR + 4.00%), Maturing April 6, 2026 | | $ | 422 | | | $ | 425,436 | |
| | |
| IAP Worldwide Services, Inc. | | | | | | |
| | |
Revolving Loan, 1.42%, (3 mo. USD LIBOR + 5.50%), Maturing July 19, 2021(2) | | | 133 | | | | 129,544 | |
| | |
Term Loan - Second Lien, 8.44%, (3 mo. USD LIBOR + 6.50%),
Maturing July 18, 2020(3) | | | 173 | | | | 138,254 | |
| | |
| TransDigm, Inc. | | | | | | |
| | |
Term Loan, 4.30%, (1 mo. USD LIBOR + 2.50%), Maturing August 22, 2024 | | | 3,063 | | | | 3,076,578 | |
| | |
Term Loan, 4.30%, (1 mo. USD LIBOR + 2.50%), Maturing May 30, 2025 | | | 1,965 | | | | 1,972,123 | |
| | |
| Wesco Aircraft Hardware Corp. | | | | | | |
| | |
Term Loan, 4.30%, (1 mo. USD LIBOR + 2.50%), Maturing November 30, 2020 | | | 1,403 | | | | 1,404,566 | |
| | |
| WP CPP Holdings, LLC | | | | | | |
| | |
Term Loan, 5.68%, (3 mo. USD LIBOR + 3.75%), Maturing April 30, 2025 | | | 519 | | | | 516,588 | |
| | |
| | | | | | | $ | 7,663,089 | |
|
| Automotive — 2.2% | |
| | |
| American Axle and Manufacturing, Inc. | | | | | | |
| | |
Term Loan, 4.07%, (USD LIBOR + 2.25%), Maturing April 6, 2024(4) | | $ | 1,696 | | | $ | 1,694,342 | |
| | |
| Autokiniton US Holdings, Inc. | | | | | | |
| | |
Term Loan, 8.17%, (1 mo. USD LIBOR + 6.38%), Maturing May 22, 2025 | | | 616 | | | | 591,000 | |
| | |
| Bright Bidco B.V. | | | | | | |
| | |
Term Loan, 5.40%, (USD LIBOR + 3.50%), Maturing June 30, 2024(4) | | | 1,122 | | | | 669,111 | |
| | |
| Chassix, Inc. | | | | | | |
| | |
Term Loan, 7.44%, (USD LIBOR + 5.50%), Maturing November 15, 2023(4) | | | 515 | | | | 475,912 | |
| | |
| CS Intermediate Holdco 2, LLC | | | | | | |
| | |
Term Loan, 3.80%, (1 mo. USD LIBOR + 2.00%), Maturing November 2, 2023 | | | 1,617 | | | | 1,531,568 | |
| | |
| Dayco Products, LLC | | | | | | |
| | |
Term Loan, 6.16%, (3 mo. USD LIBOR + 4.25%), Maturing May 19, 2023 | | | 756 | | | | 668,728 | |
| | |
| Garrett LX III S.a.r.l. | | | | | | |
| | |
Term Loan, 4.45%, (3 mo. USD LIBOR + 2.50%), Maturing September 27, 2025 | | | 1,210 | | | | 1,208,553 | |
| | |
| Goodyear Tire & Rubber Company (The) | | | | | | |
| | |
Term Loan - Second Lien, 3.97%, (3 mo. USD LIBOR + 2.00%),
Maturing March 7, 2025 | | | 1,325 | | | | 1,328,312 | |
| | | | | | | | |
| Borrower/Tranche Description | | Principal
Amount
(000’s omitted) | | | Value | |
|
| Automotive (continued) | |
| | |
| IAA, Inc. | | | | | | |
| | |
Term Loan, 4.06%, (1 mo. USD LIBOR + 2.25%), Maturing June 28, 2026 | | $ | 461 | | | $ | 464,490 | |
| | |
| Panther BF Aggregator 2 L.P. | | | | | | |
| | |
Term Loan, 5.30%, (1 mo. USD LIBOR + 3.50%), Maturing April 30, 2026 | | | 2,893 | | | | 2,910,202 | |
| | |
| Tenneco, Inc. | | | | | | |
| | |
Term Loan, 4.80%, (1 mo. USD LIBOR + 3.00%), Maturing October 1, 2025 | | | 1,337 | | | | 1,310,772 | |
| | |
| Thor Industries, Inc. | | | | | | |
| | |
Term Loan, 5.50%, (1 mo. USD LIBOR + 3.75%), Maturing February 1, 2026 | | | 459 | | | | 461,157 | |
| | |
| TI Group Automotive Systems, LLC | | | | | | |
| | |
Term Loan, 4.30%, (1 mo. USD LIBOR + 2.50%), Maturing June 30, 2022 | | | 817 | | | | 821,328 | |
| | |
| | | | | | | $ | 14,135,475 | |
|
| Beverage and Tobacco — 0.2% | |
| | |
| Flavors Holdings, Inc. | | | | | | |
| | |
Term Loan, 7.69%, (3 mo. USD LIBOR + 5.75%), Maturing April 3, 2020(3) | | $ | 416 | | | $ | 395,251 | |
| | |
Term Loan - Second Lien, 11.94%, (3 mo. USD LIBOR + 10.00%),
Maturing October 3, 2021(3) | | | 1,000 | | | | 950,000 | |
| | |
| | | | | | | $ | 1,345,251 | |
|
| Brokerage / Securities Dealers / Investment Houses — 0.2% | |
| | |
| Clipper Acquisitions Corp. | | | | | | |
| | |
Term Loan, 3.45%, (1 mo. USD LIBOR + 1.75%), Maturing December 27, 2024 | | $ | 858 | | | $ | 864,982 | |
| | |
| OZ Management L.P. | | | | | | |
| | |
Term Loan, 6.50%, (1 mo. USD LIBOR + 4.75%), Maturing April 10, 2023 | | | 90 | | | | 90,112 | |
| | |
| | | | | | | $ | 955,094 | |
|
| Building and Development — 2.9% | |
| | |
| Advanced Drainage Systems, Inc. | | | | | | |
| | |
Term Loan, 4.00%, (1 mo. USD LIBOR + 2.25%), Maturing July 31, 2026 | | $ | 232 | | | $ | 234,754 | |
| | |
| American Builders & Contractors Supply Co., Inc. | | | | | | |
| | |
Term Loan, 3.80%, (1 mo. USD LIBOR + 2.00%), Maturing January 15, 2027 | | | 4,564 | | | | 4,584,957 | |
| | |
| APi Group DE, Inc. | | | | | | |
| | |
Term Loan, 4.30%, (1 mo. USD LIBOR + 2.50%), Maturing October 1, 2026 | | | 1,100 | | | | 1,110,141 | |
| | | | |
| | 7 | | See Notes to Financial Statements. |
Eaton Vance
VT Floating-Rate Income Fund
December 31, 2019
Portfolio of Investments — continued
| | | | | | | | |
| Borrower/Tranche Description | | Principal
Amount
(000’s omitted) | | | Value | |
|
| Building and Development (continued) | |
| | |
| Brookfield Property REIT, Inc. | | | | | | |
| | |
Term Loan, 4.30%, (1 mo. USD LIBOR + 2.50%), Maturing August 27, 2025 | | $ | 741 | | | $ | 736,922 | |
| | |
| CPG International, Inc. | | | | | | |
| | |
Term Loan, 5.93%, (6 mo. USD LIBOR + 3.75%), Maturing May 5, 2024 | | | 1,341 | | | | 1,347,583 | |
| | |
| Cushman & Wakefield U.S. Borrower, LLC | | | | | | |
| | |
Term Loan, 5.05%, (1 mo. USD LIBOR + 3.25%), Maturing August 21, 2025 | | | 2,038 | | | | 2,048,097 | |
| | |
| Henry Company, LLC | | | | | | |
| | |
Term Loan, 5.80%, (1 mo. USD LIBOR + 4.00%), Maturing October 5, 2023 | | | 292 | | | | 293,376 | |
| | |
| NCI Building Systems, Inc. | | | | | | |
| | |
Term Loan, 5.49%, (1 mo. USD LIBOR + 3.75%), Maturing April 12, 2025 | | | 667 | | | | 666,258 | |
| | |
| Quikrete Holdings, Inc. | | | | | | |
| | |
Term Loan, 4.55%, (1 mo. USD LIBOR + 2.75%), Maturing November 15, 2023 | | | 3,216 | | | | 3,236,262 | |
| | |
| RE/MAX International, Inc. | | | | | | |
| | |
Term Loan, 4.55%, (1 mo. USD LIBOR + 2.75%), Maturing December 15, 2023 | | | 1,900 | | | | 1,900,768 | |
| | |
| Realogy Group, LLC | | | | | | |
| | |
Term Loan, 4.05%, (1 mo. USD LIBOR + 2.25%), Maturing February 8, 2025 | | | 845 | | | | 832,994 | |
| | |
| Summit Materials Companies I, LLC | | | | | | |
| | |
Term Loan, 3.80%, (1 mo. USD LIBOR + 2.00%), Maturing November 21, 2024 | | | 368 | | | | 369,682 | |
| | |
| Werner FinCo L.P. | | | | | | |
| | |
Term Loan, 5.80%, (1 mo. USD LIBOR + 4.00%), Maturing July 24, 2024 | | | 1,003 | | | | 1,002,611 | |
| | |
| WireCo WorldGroup, Inc. | | | | | | |
| | |
Term Loan, 6.80%, (1 mo. USD LIBOR + 5.00%), Maturing September 30, 2023 | | | 363 | | | | 345,760 | |
| | |
| | | | | | | $ | 18,710,165 | |
|
| Business Equipment and Services — 7.6% | |
| | |
| Adtalem Global Education, Inc. | | | | | | |
| | |
Term Loan, 4.80%, (1 mo. USD LIBOR + 3.00%), Maturing April 11, 2025 | | $ | 296 | | | $ | 295,993 | |
| | |
| AlixPartners, LLP | | | | | | |
| | |
Term Loan, 4.55%, (1 mo. USD LIBOR + 2.75%), Maturing April 4, 2024 | | | 748 | | | | 753,487 | |
| | |
| Allied Universal Holdco, LLC | | | | | | |
| | |
Term Loan, 6.05%, (1 mo. USD LIBOR + 4.25%), Maturing July 10, 2026 | | | 1,911 | | | | 1,925,381 | |
| | |
Term Loan, 6.05%, (1 mo. USD LIBOR + 4.25%), Maturing July 10, 2026 | | | 189 | | | | 190,632 | |
| | | | | | | | |
| Borrower/Tranche Description | | Principal
Amount
(000’s omitted) | | | Value | |
|
| Business Equipment and Services (continued) | |
| | |
| AppLovin Corporation | | | | | | |
| | |
Term Loan, 5.30%, (1 mo. USD LIBOR + 3.50%), Maturing August 15, 2025 | | $ | 3,820 | | | $ | 3,847,788 | |
| | |
| ASGN Incorporated | | | | | | |
| | |
Term Loan, 3.55%, (1 mo. USD LIBOR + 1.75%), Maturing April 2, 2025 | | | 574 | | | | 577,851 | |
| | |
| Belfor Holdings, Inc. | | | | | | |
| | |
Term Loan, 5.69%, (1 mo. USD LIBOR + 4.00%), Maturing April 6, 2026 | | | 423 | | | | 425,518 | |
| | |
| BidFair MergeRight, Inc. | | | | | | |
| | |
Term Loan, 7.24%, (1 mo. USD LIBOR + 5.50%), Maturing January 15, 2027 | | | 475 | | | | 471,438 | |
| | |
| Bracket Intermediate Holding Corp. | | | | | | |
| | |
Term Loan, 6.35%, (3 mo. USD LIBOR + 4.25%), Maturing September 5, 2025 | | | 741 | | | | 738,773 | |
| | |
| Brand Energy & Infrastructure Services, Inc. | | | | | | |
| | |
Term Loan, 6.24%, (3 mo. USD LIBOR + 4.25%), Maturing June 21, 2024 | | | 1,184 | | | | 1,181,960 | |
| | |
| Camelot U.S. Acquisition 1 Co. | | | | | | |
| | |
Term Loan, 5.05%, (1 mo. USD LIBOR + 3.25%), Maturing October 31, 2026 | | | 1,100 | | | | 1,108,021 | |
| | |
| Ceridian HCM Holding, Inc. | | | | | | |
| | |
Term Loan, 4.80%, (1 mo. USD LIBOR + 3.00%), Maturing April 30, 2025 | | | 2,098 | | | | 2,114,612 | |
| | |
| CM Acquisition Co. | | | | | | |
| | |
Term Loan, 11.94%, (3 mo. USD LIBOR + 10.00%), Maturing July 26, 2023 | | | 227 | | | | 219,734 | |
| | |
| Cypress Intermediate Holdings III, Inc. | | | | | | |
| | |
Term Loan, 4.55%, (1 mo. USD LIBOR + 2.75%), Maturing April 29, 2024 | | | 3,415 | | | | 3,436,142 | |
| | |
| Deerfield Dakota Holding, LLC | | | | | | |
| | |
Term Loan, 5.05%, (1 mo. USD LIBOR + 3.25%), Maturing February 13, 2025 | | | 730 | | | | 729,097 | |
| | |
| EAB Global, Inc. | | | | | | |
| | |
Term Loan, 5.74%, (USD LIBOR + 3.75%), Maturing November 15, 2024(4) | | | 933 | | | | 936,875 | |
| | |
| EIG Investors Corp. | | | | | | |
| | |
Term Loan, 5.67%, (3 mo. USD LIBOR + 3.75%), Maturing February 9, 2023 | | | 2,539 | | | | 2,517,622 | |
| | |
| Garda World Security Corporation | | | | | | |
| | |
Term Loan, 6.66%, (3 mo. USD LIBOR + 4.75%), Maturing October 30, 2026 | | | 1,250 | | | | 1,258,854 | |
| | |
| IG Investment Holdings, LLC | | | | | | |
| | |
Term Loan, 5.80%, (1 mo. USD LIBOR + 4.00%), Maturing May 23, 2025 | | | 1,482 | | | | 1,488,944 | |
| | |
| IRI Holdings, Inc. | | | | | | |
| | |
Term Loan, 6.30%, (USD LIBOR + 4.50%), Maturing December 1, 2025(4) | | | 3,045 | | | | 2,994,731 | |
| | | | |
| | 8 | | See Notes to Financial Statements. |
Eaton Vance
VT Floating-Rate Income Fund
December 31, 2019
Portfolio of Investments — continued
| | | | | | | | |
| Borrower/Tranche Description | | Principal
Amount
(000’s omitted) | | | Value | |
|
| Business Equipment and Services (continued) | |
| | |
| Iron Mountain, Inc. | | | | | | |
| | |
Term Loan, 3.55%, (1 mo. USD LIBOR + 1.75%), Maturing January 2, 2026 | | $ | 639 | | | $ | 638,087 | |
| | |
| KAR Auction Services, Inc. | | | | | | |
| | |
Term Loan, 4.06%, (1 mo. USD LIBOR + 2.25%), Maturing September 19, 2026 | | | 474 | | | | 478,053 | |
| | |
| Kronos Incorporated | | | | | | |
| | |
Term Loan, 4.91%, (3 mo. USD LIBOR + 3.00%), Maturing November 1, 2023 | | | 4,936 | | | | 4,967,272 | |
| | |
| KUEHG Corp. | | | | | | |
| | |
Term Loan, 5.69%, (3 mo. USD LIBOR + 3.75%), Maturing February 21, 2025 | | | 1,668 | | | | 1,673,976 | |
| | |
| Monitronics International, Inc. | | | | | | |
| | |
Term Loan, 8.30%, (1 mo. USD LIBOR + 6.50%), Maturing March 29, 2024 | | | 1,045 | | | | 875,526 | |
| | |
| Outfront Media Capital, LLC | | | | | | |
| | |
Term Loan, 3.49%, (1 mo. USD LIBOR + 1.75%), Maturing November 18, 2026 | | | 775 | | | | 780,189 | |
| | |
| PGX Holdings, Inc. | | | | | | |
| | |
Term Loan, 7.05%, (1 mo. USD LIBOR + 5.25%), Maturing September 29, 2020 | | | 745 | | | | 397,154 | |
| | |
| Pre-Paid Legal Services, Inc. | | | | | | |
| | |
Term Loan, 5.05%, (1 mo. USD LIBOR + 3.25%), Maturing May 1, 2025 | | | 358 | | | | 359,382 | |
| | |
| Prime Security Services Borrower, LLC | | | | | | |
| | |
Term Loan, 4.94%, (1 mo. USD LIBOR + 3.25%), Maturing September 23, 2026 | | | 979 | | | | 982,837 | |
| | |
| Prometric Holdings, Inc. | | | | | | |
| | |
Term Loan, 4.79%, (1 mo. USD LIBOR + 3.00%), Maturing January 29, 2025 | | | 221 | | | | 221,218 | |
| | |
| Red Ventures, LLC | | | | | | |
| | |
Term Loan, 4.80%, (1 mo. USD LIBOR + 3.00%), Maturing November 8, 2024 | | | 1,236 | | | | 1,248,240 | |
| | |
| ServiceMaster Company | | | | | | |
| | |
Term Loan, 3.56%, (1 mo. USD LIBOR + 1.75%), Maturing November 5, 2026 | | | 400 | | | | 402,122 | |
| | |
| Spin Holdco, Inc. | | | | | | |
| | |
Term Loan, 5.25%, (3 mo. USD LIBOR + 3.25%), Maturing November 14, 2022 | | | 5,743 | | | | 5,714,689 | |
| | |
| Trans Union, LLC | | | | | | |
| | |
Term Loan, 3.55%, (1 mo. USD LIBOR + 1.75%), Maturing November 16, 2026 | | | 1,234 | | | | 1,240,817 | |
| | |
| WASH Multifamily Laundry Systems, LLC | | | | | | |
| | |
Term Loan, 5.05%, (1 mo. USD LIBOR + 3.25%), Maturing May 14, 2022 | | | 916 | | | | 897,269 | |
| | | | | | | | |
| Borrower/Tranche Description | | Principal
Amount
(000’s omitted) | | | Value | |
|
| Business Equipment and Services (continued) | |
| | |
| West Corporation | | | | | | |
| | |
Term Loan, 5.43%, (3 mo. USD LIBOR + 3.50%), Maturing October 10, 2024 | | $ | 246 | | | $ | 207,825 | |
| | |
Term Loan, 5.93%, (3 mo. USD LIBOR + 4.00%), Maturing October 10, 2024 | | | 1,424 | | | | 1,210,571 | |
| | |
| | | | | | | $ | 49,508,680 | |
|
| Cable and Satellite Television — 3.9% | |
| | |
| Altice France S.A. | | | | | | |
| | |
Term Loan, 5.74%, (1 mo. USD LIBOR + 4.00%), Maturing August 14, 2026 | | $ | 495 | | | $ | 497,784 | |
| | |
| Charter Communications Operating, LLC | | | | | | |
| | |
Term Loan, 3.55%, (1 mo. USD LIBOR + 1.75%), Maturing February 1, 2027 | | | 2,595 | | | | 2,614,297 | |
| | |
| CSC Holdings, LLC | | | | | | |
| | |
Term Loan, 3.99%, (1 mo. USD LIBOR + 2.25%), Maturing July 17, 2025 | | | 3,534 | | | | 3,542,447 | |
| | |
Term Loan, 3.99%, (1 mo. USD LIBOR + 2.25%), Maturing January 15, 2026 | | | 893 | | | | 896,376 | |
| | |
Term Loan, 4.24%, (1 mo. USD LIBOR + 2.50%), Maturing April 15, 2027 | | | 938 | | | | 944,380 | |
| | |
| Mediacom Illinois, LLC | | | | | | |
| | |
Term Loan, 3.38%, (1 week USD LIBOR + 1.75%), Maturing February 15, 2024 | | | 310 | | | | 311,917 | |
| | |
| Numericable Group S.A. | | | | | | |
| | |
Term Loan, 4.55%, (1 mo. USD LIBOR + 2.75%), Maturing July 31, 2025 | | | 2,352 | | | | 2,340,091 | |
| | |
| Telenet Financing USD, LLC | | | | | | |
| | |
Term Loan, 3.99%, (1 mo. USD LIBOR + 2.25%), Maturing August 15, 2026 | | | 3,000 | | | | 3,021,564 | |
| | |
| Virgin Media Bristol, LLC | | | | | | |
| | |
Term Loan, 4.24%, (1 mo. USD LIBOR + 2.50%), Maturing January 31, 2028 | | | 5,725 | | | | 5,767,938 | |
| | |
| Ziggo Secured Finance Partnership | | | | | | |
| | |
Term Loan, 4.24%, (1 mo. USD LIBOR + 2.50%), Maturing April 15, 2025 | | | 5,525 | | | | 5,537,663 | |
| | |
| | | | | | | $ | 25,474,457 | |
|
| Chemicals and Plastics — 4.8% | |
| | |
| Alpha 3 B.V. | | | | | | |
| | |
Term Loan, 4.94%, (3 mo. USD LIBOR + 3.00%), Maturing January 31, 2024 | | $ | 1,903 | | | $ | 1,911,176 | |
| | |
| Aruba Investments, Inc. | | | | | | |
| | |
Term Loan, 5.05%, (1 mo. USD LIBOR + 3.25%), Maturing February 2, 2022 | | | 200 | | | | 200,283 | |
| | | | |
| | 9 | | See Notes to Financial Statements. |
Eaton Vance
VT Floating-Rate Income Fund
December 31, 2019
Portfolio of Investments — continued
| | | | | | | | |
| Borrower/Tranche Description | | Principal
Amount
(000’s omitted) | | | Value | |
|
| Chemicals and Plastics (continued) | |
| | |
| Axalta Coating Systems US Holdings, Inc. | | | | | | |
| | |
Term Loan, 3.69%, (3 mo. USD LIBOR + 1.75%), Maturing June 1, 2024 | | $ | 3,200 | | | $ | 3,211,605 | |
| | |
| Element Solutions, Inc. | | | | | | |
| | |
Term Loan, 3.80%, (1 mo. USD LIBOR + 2.00%), Maturing January 31, 2026 | | | 569 | | | | 573,086 | |
| | |
| Ferro Corporation | | | | | | |
| | |
Term Loan, 4.19%, (3 mo. USD LIBOR + 2.25%), Maturing February 14, 2024 | | | 243 | | | | 243,439 | |
| | |
Term Loan, 4.19%, (3 mo. USD LIBOR + 2.25%), Maturing February 14, 2024 | | | 248 | | | | 248,732 | |
| | |
Term Loan, 4.19%, (3 mo. USD LIBOR + 2.25%), Maturing February 14, 2024 | | | 292 | | | | 292,350 | |
| | |
| Flint Group GmbH | | | | | | |
| | |
Term Loan, 4.94%, (3 mo. USD LIBOR + 3.00%), Maturing September 7, 2021 | | | 242 | | | | 211,700 | |
| | |
| Flint Group US, LLC | | | | | | |
| | |
Term Loan, 4.94%, (3 mo. USD LIBOR + 3.00%), Maturing September 7, 2021 | | | 1,464 | | | | 1,280,612 | |
| | |
| Gemini HDPE, LLC | | | | | | |
| | |
Term Loan, 4.43%, (3 mo. USD LIBOR + 2.50%), Maturing August 7, 2024 | | | 740 | | | | 743,871 | |
| | |
| Hexion, Inc. | | | | | | |
| | |
Term Loan, 5.60%, (3 mo. USD LIBOR + 3.50%), Maturing July 1, 2026 | | | 1,592 | | | | 1,601,910 | |
| | |
| INEOS Enterprises Holdings US Finco, LLC | | | | | | |
| | |
Term Loan, 5.91%, (3 mo. USD LIBOR + 4.00%), Maturing August 31, 2026 | | | 200 | | | | 200,560 | |
| | |
| INEOS US Finance, LLC | | | | | | |
| | |
Term Loan, 3.80%, (1 mo. USD LIBOR + 2.00%), Maturing March 31, 2024 | | | 1,904 | | | | 1,907,225 | |
| | |
| Kraton Polymers, LLC | | | | | | |
| | |
Term Loan, 4.30%, (1 mo. USD LIBOR + 2.50%), Maturing March 5, 2025 | | | 526 | | | | 524,783 | |
| | |
| Messer Industries GmbH | | | | | | |
| | |
Term Loan, 4.44%, (3 mo. USD LIBOR + 2.50%), Maturing March 1, 2026 | | | 1,492 | | | | 1,502,275 | |
| | |
| Minerals Technologies, Inc. | | | | | | |
| | |
Term Loan, 4.06%, (USD LIBOR + 2.25%), Maturing February 14, 2024(4) | | | 990 | | | | 995,536 | |
| | |
| Momentive Performance Materials, Inc. | | | | | | |
| | |
Term Loan, 5.05%, (1 mo. USD LIBOR + 3.25%), Maturing May 15, 2024 | | | 2,861 | | | | 2,844,534 | |
| | |
| PMHC II, Inc. | | | | | | |
| | |
Term Loan, 5.44%, (3 mo. USD LIBOR + 3.50%), Maturing March 31, 2025 | | | 1,007 | | | | 896,286 | |
| | | | | | | | |
| Borrower/Tranche Description | | Principal
Amount
(000’s omitted) | | | Value | |
|
| Chemicals and Plastics (continued) | |
| | |
| Pregis TopCo Corporation | | | | | | |
| | |
Term Loan, 5.80%, (1 mo. USD LIBOR + 4.00%), Maturing July 31, 2026 | | $ | 475 | | | $ | 475,891 | |
| | |
| Spectrum Holdings III Corp. | | | | | | |
| | |
Term Loan, 5.05%, (1 mo. USD LIBOR + 3.25%), Maturing January 31, 2025 | | | 246 | | | | 229,274 | |
| | |
| Starfruit Finco B.V. | | | | | | |
| | |
Term Loan, 4.96%, (1 mo. USD LIBOR + 3.25%), Maturing October 1, 2025 | | | 1,863 | | | | 1,867,630 | |
| | |
| Tata Chemicals North America, Inc. | | | | | | |
| | |
Term Loan, 4.56%, (1 mo. USD LIBOR + 2.75%), Maturing August 7, 2020 | | | 536 | | | | 535,087 | |
| | |
| Trinseo Materials Operating S.C.A. | | | | | | |
| | |
Term Loan, 3.80%, (1 mo. USD LIBOR + 2.00%), Maturing September 6, 2024 | | | 1,341 | | | | 1,344,901 | |
| | |
| Tronox Finance, LLC | | | | | | |
| | |
Term Loan, 4.61%, (USD LIBOR + 2.75%), Maturing September 23, 2024(4) | | | 2,843 | | | | 2,851,159 | |
| | |
| Univar, Inc. | | | | | | |
| | |
Term Loan, 4.05%, (1 mo. USD LIBOR + 2.25%), Maturing July 1, 2024 | | | 3,924 | | | | 3,947,062 | |
| | |
| Venator Materials Corporation | | | | | | |
| | |
Term Loan, 4.80%, (1 mo. USD LIBOR + 3.00%), Maturing August 8, 2024 | | | 269 | | | | 267,804 | |
| | |
| | | | | | | $ | 30,908,771 | |
|
| Conglomerates — 0.0%(5) | |
| | |
| Penn Engineering & Manufacturing Corp. | | | | | | |
| | |
Term Loan, 4.55%, (1 mo. USD LIBOR + 2.75%), Maturing June 27, 2024 | | $ | 167 | | | $ | 166,996 | |
| | |
| | | | | | | $ | 166,996 | |
|
| Containers and Glass Products — 1.9% | |
| | |
| Berry Global, Inc. | | | | | | |
| | |
Term Loan, 3.72%, (1 mo. USD LIBOR + 2.00%), Maturing October 1, 2022 | | $ | 1,691 | | | $ | 1,699,644 | |
| | |
Term Loan, 4.22%, (1 mo. USD LIBOR + 2.50%), Maturing July 1, 2026 | | | 771 | | | | 774,606 | |
| | |
| BWAY Holding Company | | | | | | |
| | |
Term Loan, 5.23%, (3 mo. USD LIBOR + 3.25%), Maturing April 3, 2024 | | | 1,374 | | | | 1,371,422 | |
| | |
| Flex Acquisition Company, Inc. | | | | | | |
| | |
Term Loan, 5.09%, (USD LIBOR + 3.00%), Maturing December 29, 2023(4) | | | 2,539 | | | | 2,523,336 | |
| | |
Term Loan, 5.35%, (3 mo. USD LIBOR + 3.25%), Maturing June 29, 2025 | | | 1,150 | | | | 1,143,723 | |
| | | | |
| | 10 | | See Notes to Financial Statements. |
Eaton Vance
VT Floating-Rate Income Fund
December 31, 2019
Portfolio of Investments — continued
| | | | | | | | |
| Borrower/Tranche Description | | Principal
Amount
(000’s omitted) | | | Value | |
|
| Containers and Glass Products (continued) | |
| | |
| Libbey Glass, Inc. | | | | | | |
| | |
Term Loan, 4.71%, (1 mo. USD LIBOR + 3.00%), Maturing April 9, 2021 | | $ | 1,371 | | | $ | 1,126,235 | |
| | |
| Pelican Products, Inc. | | | | | | |
| | |
Term Loan, 5.24%, (1 mo. USD LIBOR + 3.50%), Maturing May 1, 2025 | | | 468 | | | | 430,445 | |
| | |
| Reynolds Group Holdings, Inc. | | | | | | |
| | |
Term Loan, 4.55%, (1 mo. USD LIBOR + 2.75%), Maturing February 5, 2023 | | | 2,915 | | | | 2,928,660 | |
| | |
| | | | | | | $ | 11,998,071 | |
|
| Cosmetics / Toiletries — 0.4% | |
| | |
| KIK Custom Products, Inc. | | | | | | |
| | |
Term Loan, 5.79%, (1 mo. USD LIBOR + 4.00%), Maturing May 15, 2023 | | $ | 1,943 | | | $ | 1,915,319 | |
| | |
| Prestige Brands, Inc. | | | | | | |
| | |
Term Loan, 3.80%, (1 mo. USD LIBOR + 2.00%), Maturing January 26, 2024 | | | 932 | | | | 939,936 | |
| | |
| | | | | | | $ | 2,855,255 | |
|
| Drugs — 4.2% | |
| | |
| Akorn, Inc. | | | | | | |
| | |
Term Loan, 11.81%, (11.06% cash (1 mo. USD LIBOR + 9.25%), 0.75% PIK), Maturing April 16, 2021 | | $ | 1,582 | | | $ | 1,519,260 | |
| | |
| Albany Molecular Research, Inc. | | | | | | |
| | |
Term Loan - Second Lien, 8.80%, (1 mo. USD LIBOR + 7.00%),
Maturing August 30, 2025 | | | 500 | | | | 500,000 | |
| | |
| Alkermes, Inc. | | | | | | |
| | |
Term Loan, 3.99%, (1 mo. USD LIBOR + 2.25%), Maturing March 23, 2023 | | | 187 | | | | 186,067 | |
| | |
| Amneal Pharmaceuticals, LLC | | | | | | |
| | |
Term Loan, 5.31%, (1 mo. USD LIBOR + 3.50%), Maturing May 4, 2025 | | | 3,133 | | | | 2,833,790 | |
| | |
| Arbor Pharmaceuticals, Inc. | | | | | | |
| | |
Term Loan, 6.94%, (3 mo. USD LIBOR + 5.00%), Maturing July 5, 2023 | | | 954 | | | | 846,731 | |
| | |
| Bausch Health Companies, Inc. | | | | | | |
| | |
Term Loan, 4.74%, (1 mo. USD LIBOR + 3.00%), Maturing June 2, 2025 | | | 5,276 | | | | 5,314,880 | |
| | |
| Catalent Pharma Solutions, Inc. | | | | | | |
| | |
Term Loan, 4.05%, (1 mo. USD LIBOR + 2.25%), Maturing May 18, 2026 | | | 670 | | | | 674,125 | |
| | |
| Endo Luxembourg Finance Company I S.a.r.l. | | | | | | |
| | |
Term Loan, 6.06%, (1 mo. USD LIBOR + 4.25%), Maturing April 29, 2024 | | | 4,872 | | | | 4,641,107 | |
| | | | | | | | |
| Borrower/Tranche Description | | Principal
Amount
(000’s omitted) | | | Value | |
|
| Drugs (continued) | |
| | |
| Horizon Therapeutics USA, Inc. | | | | | | |
| | |
Term Loan, 3.94%, (1 mo. USD LIBOR + 2.25%), Maturing May 22, 2026 | | $ | 668 | | | $ | 674,226 | |
| | |
| Jaguar Holding Company II | | | | | | |
| | |
Term Loan, 4.30%, (1 mo. USD LIBOR + 2.50%), Maturing August 18, 2022 | | | 6,278 | | | | 6,318,585 | |
| | |
| Mallinckrodt International Finance S.A. | | | | | | |
| | |
Term Loan, 4.69%, (3 mo. USD LIBOR + 2.75%), Maturing September 24, 2024 | | | 3,939 | | | | 3,211,229 | |
| | |
Term Loan, 4.91%, (3 mo. USD LIBOR + 3.00%), Maturing February 24, 2025 | | | 419 | | | | 342,457 | |
| | |
| | | | | | | $ | 27,062,457 | |
|
| Ecological Services and Equipment — 1.1% | |
| | |
| Advanced Disposal Services, Inc. | | | | | | |
| | |
Term Loan, 3.85%, (1 week USD LIBOR + 2.25%), Maturing November 10, 2023 | | $ | 2,666 | | | $ | 2,680,169 | |
| | |
| EnergySolutions, LLC | | | | | | |
| | |
Term Loan, 5.69%, (3 mo. USD LIBOR + 3.75%), Maturing May 9, 2025 | | | 1,434 | | | | 1,359,174 | |
| | |
| GFL Environmental, Inc. | | | | | | |
| | |
Term Loan, 4.80%, (1 mo. USD LIBOR + 3.00%), Maturing May 30, 2025 | | | 2,622 | | | | 2,629,276 | |
| | |
| Terrapure Environmental Ltd. | | | | | | |
| | |
Term Loan, Maturing November 25, 2026(6) | | | 300 | | | | 301,500 | |
| | |
| US Ecology Holdings, Inc. | | | | | | |
| | |
Term Loan, 4.30%, (1 mo. USD LIBOR + 2.50%), Maturing August 14, 2026 | | | 200 | | | | 201,812 | |
| | |
| | | | | | | $ | 7,171,931 | |
|
| Electronics / Electrical — 14.7% | |
| | |
| Almonde, Inc. | | | | | | |
| | |
Term Loan, 5.70%, (6 mo. USD LIBOR + 3.50%), Maturing June 13, 2024 | | $ | 3,017 | | | $ | 3,003,481 | |
| | |
| Applied Systems, Inc. | | | | | | |
| | |
Term Loan, 5.19%, (3 mo. USD LIBOR + 3.25%), Maturing September 19, 2024 | | | 2,677 | | | | 2,690,977 | |
| | |
| Aptean, Inc. | | | | | | |
| | |
Term Loan, 6.19%, (3 mo. USD LIBOR + 4.25%), Maturing April 23, 2026 | | | 447 | | | | 445,229 | |
| | |
| Banff Merger Sub, Inc. | | | | | | |
| | |
Term Loan, 6.05%, (1 mo. USD LIBOR + 4.25%), Maturing October 2, 2025 | | | 3,598 | | | | 3,562,096 | |
| | |
| CDW, LLC | | | | | | |
| | |
Term Loan, 3.55%, (1 mo. USD LIBOR + 1.75%), Maturing October 13, 2026 | | | 948 | | | | 954,652 | |
| | | | |
| | 11 | | See Notes to Financial Statements. |
Eaton Vance
VT Floating-Rate Income Fund
December 31, 2019
Portfolio of Investments — continued
| | | | | | | | |
| Borrower/Tranche Description | | Principal
Amount
(000’s omitted) | | | Value | |
|
| Electronics / Electrical (continued) | |
| | |
| Celestica, Inc. | | | | | | |
| | |
Term Loan, 3.92%, (1 mo. USD LIBOR + 2.13%), Maturing June 27, 2025 | | $ | 296 | | | $ | 292,668 | |
| | |
Term Loan, 4.29%, (1 mo. USD LIBOR + 2.50%), Maturing June 27, 2025 | | | 297 | | | | 297,279 | |
| | |
| Cohu, Inc. | | | | | | |
| | |
Term Loan, 4.80%, (1 mo. USD LIBOR + 3.00%), Maturing October 1, 2025 | | | 1,136 | | | | 1,129,947 | |
| | |
| CommScope, Inc. | | | | | | |
| | |
Term Loan, 5.05%, (1 mo. USD LIBOR + 3.25%), Maturing April 6, 2026 | | | 1,372 | | | | 1,382,185 | |
| | |
| CPI International, Inc. | | | | | | |
| | |
Term Loan, 5.30%, (1 mo. USD LIBOR + 3.50%), Maturing July 26, 2024 | | | 957 | | | | 922,073 | |
| | |
| Datto, Inc. | | | | | | |
| | |
Term Loan, 6.05%, (1 mo. USD LIBOR + 4.25%), Maturing April 2, 2026 | | | 299 | | | | 301,298 | |
| | |
| ECI Macola/Max Holding, LLC | | | | | | |
| | |
Term Loan, 6.19%, (3 mo. USD LIBOR + 4.25%), Maturing September 27, 2024 | | | 564 | | | | 565,720 | |
| | |
| Electro Rent Corporation | | | | | | |
| | |
Term Loan, 6.94%, (3 mo. USD LIBOR + 5.00%), Maturing January 31, 2024 | | | 1,612 | | | | 1,625,008 | |
| | |
| Energizer Holdings, Inc. | | | | | | |
| | |
Term Loan, 4.00%, (1 mo. USD LIBOR + 2.25%), Maturing December 17, 2025 | | | 281 | | | | 282,337 | |
| | |
| Epicor Software Corporation | | | | | | |
| | |
Term Loan, 5.05%, (1 mo. USD LIBOR + 3.25%), Maturing June 1, 2022 | | | 6,321 | | | | 6,372,614 | |
| | |
| EXC Holdings III Corp. | | | | | | |
| | |
Term Loan, 5.44%, (3 mo. USD LIBOR + 3.50%), Maturing December 2, 2024 | | | 343 | | | | 342,563 | |
| | |
| Financial & Risk US Holdings, Inc. | | | | | | |
| | |
Term Loan, 5.05%, (1 mo. USD LIBOR + 3.25%), Maturing October 1, 2025 | | | 965 | | | | 974,500 | |
| | |
| Flexera Software, LLC | | | | | | |
| | |
Term Loan, 5.30%, (1 mo. USD LIBOR + 3.50%), Maturing February 26, 2025 | | | 877 | | | | 880,854 | |
| | |
| Go Daddy Operating Company, LLC | | | | | | |
| | |
Term Loan, 3.55%, (1 mo. USD LIBOR + 1.75%), Maturing February 15, 2024 | | | 2,935 | | | | 2,954,311 | |
| | |
| Hyland Software, Inc. | | | | | | |
| | |
Term Loan, 5.30%, (1 mo. USD LIBOR + 3.50%), Maturing July 1, 2024 | | | 7,089 | | | | 7,156,605 | |
| | |
| Infoblox, Inc. | | | | | | |
| | |
Term Loan, 6.30%, (1 mo. USD LIBOR + 4.50%), Maturing November 7, 2023 | | | 1,479 | | | | 1,487,444 | |
| | | | | | | | |
| Borrower/Tranche Description | | Principal
Amount
(000’s omitted) | | | Value | |
|
| Electronics / Electrical (continued) | |
| | |
| Infor (US), Inc. | | | | | | |
| | |
Term Loan, 4.69%, (3 mo. USD LIBOR + 2.75%), Maturing February 1, 2022 | | $ | 7,429 | | | $ | 7,471,032 | |
| | |
| Informatica, LLC | | | | | | |
| | |
Term Loan, 5.05%, (1 mo. USD LIBOR + 3.25%), Maturing August 5, 2022 | | | 3,880 | | | | 3,901,138 | |
| | |
| MA FinanceCo., LLC | | | | | | |
| | |
Term Loan, 4.05%, (1 mo. USD LIBOR + 2.25%), Maturing November 19, 2021 | | | 1,995 | | | | 2,011,601 | |
| | |
Term Loan, 4.30%, (1 mo. USD LIBOR + 2.50%), Maturing June 21, 2024 | | | 339 | | | | 340,454 | |
| | |
| MACOM Technology Solutions Holdings, Inc. | | | | | | |
| | |
Term Loan, 4.05%, (1 mo. USD LIBOR + 2.25%), Maturing May 17, 2024 | | | 1,290 | | | | 1,235,512 | |
| | |
| Marcel LUX IV S.a.r.l. | | | | | | |
| | |
Term Loan, 5.05%, (1 mo. USD LIBOR + 3.25%), Maturing March 15, 2026 | | | 1,692 | | | | 1,686,214 | |
| | |
| Mirion Technologies, Inc. | | | | | | |
| | |
Term Loan, 5.80%, (1 mo. USD LIBOR + 4.00%), Maturing March 6, 2026 | | | 1,018 | | | | 1,027,942 | |
| | |
| MKS Instruments, Inc. | | | | | | |
| | |
Term Loan, 3.55%, (1 mo. USD LIBOR + 1.75%), Maturing February 2, 2026 | | | 259 | | | | 259,740 | |
| | |
| MTS Systems Corporation | | | | | | |
| | |
Term Loan, 5.05%, (1 mo. USD LIBOR + 3.25%), Maturing July 5, 2023 | | | 328 | | | | 330,056 | |
| | |
| NCR Corporation | | | | | | |
| | |
Term Loan, 4.30%, (1 mo. USD LIBOR + 2.50%), Maturing August 28, 2026 | | | 1,198 | | | | 1,205,739 | |
| | |
| Seattle Spinco, Inc. | | | | | | |
| | |
Term Loan, 4.30%, (1 mo. USD LIBOR + 2.50%), Maturing June 21, 2024 | | | 2,290 | | | | 2,299,171 | |
| | |
| SGS Cayman L.P. | | | | | | |
| | |
Term Loan, 7.32%, (3 mo. USD LIBOR + 5.38%), Maturing April 23, 2021 | | | 375 | | | | 372,157 | |
| | |
| SkillSoft Corporation | | | | | | |
| | |
Term Loan, 6.95%, (6 mo. USD LIBOR + 4.75%), Maturing April 28, 2021 | | | 3,822 | | | | 2,974,548 | |
| | |
| SolarWinds Holdings, Inc. | | | | | | |
| | |
Term Loan, 4.55%, (1 mo. USD LIBOR + 2.75%), Maturing February 5, 2024 | | | 5,461 | | | | 5,510,095 | |
| | |
| Solera, LLC | | | | | | |
| | |
Term Loan, 4.55%, (1 mo. USD LIBOR + 2.75%), Maturing March 3, 2023 | | | 3,914 | | | | 3,926,462 | |
| | |
| SS&C Technologies Holdings Europe S.a.r.l. | | | | | | |
| | |
Term Loan, 4.05%, (1 mo. USD LIBOR + 2.25%), Maturing April 16, 2025 | | | 1,002 | | | | 1,010,245 | |
| | | | |
| | 12 | | See Notes to Financial Statements. |
Eaton Vance
VT Floating-Rate Income Fund
December 31, 2019
Portfolio of Investments — continued
| | | | | | | | |
| Borrower/Tranche Description | | Principal
Amount
(000’s omitted) | | | Value | |
|
| Electronics / Electrical (continued) | |
| | |
| SS&C Technologies, Inc. | | | | | | |
| | |
Term Loan, 4.05%, (1 mo. USD LIBOR + 2.25%), Maturing April 16, 2025 | | $ | 790 | | | $ | 797,790 | |
| | |
Term Loan, 4.05%, (1 mo. USD LIBOR + 2.25%), Maturing April 16, 2025 | | | 1,446 | | | | 1,457,051 | |
| | |
| SurveyMonkey, Inc. | | | | | | |
| | |
Term Loan, 5.38%, (1 week USD LIBOR + 3.75%), Maturing October 10, 2025 | | | 905 | | | | 908,603 | |
| | |
| Sutherland Global Services, Inc. | | | | | | |
| | |
Term Loan, 7.32%, (3 mo. USD LIBOR + 5.38%), Maturing April 23, 2021 | | | 1,613 | | | | 1,598,770 | |
| | |
| Tibco Software, Inc. | | | | | | |
| | |
Term Loan, 5.71%, (1 mo. USD LIBOR + 4.00%), Maturing June 30, 2026 | | | 1,650 | | | | 1,659,897 | |
| | |
| TTM Technologies, Inc. | | | | | | |
| | |
Term Loan, 4.19%, (1 mo. USD LIBOR + 2.50%), Maturing September 28, 2024 | | | 850 | | | | 853,047 | |
| | |
| Uber Technologies, Inc. | | | | | | |
| | |
Term Loan, 5.30%, (1 mo. USD LIBOR + 3.50%), Maturing July 13, 2023 | | | 3,808 | | | | 3,810,865 | |
| | |
Term Loan, 5.74%, (1 mo. USD LIBOR + 4.00%), Maturing April 4, 2025 | | | 1,625 | | | | 1,630,329 | |
| | |
| Ultimate Software Group, Inc. (The) | | | | | | |
| | |
Term Loan, 5.55%, (1 mo. USD LIBOR + 3.75%), Maturing May 4, 2026 | | | 1,347 | | | | 1,355,603 | |
| | |
| Ultra Clean Holdings, Inc. | | | | | | |
| | |
Term Loan, 6.30%, (1 mo. USD LIBOR + 4.50%), Maturing August 27, 2025 | | | 643 | | | | 644,062 | |
| | |
| Verifone Systems, Inc. | | | | | | |
| | |
Term Loan, 5.90%, (3 mo. USD LIBOR + 4.00%), Maturing August 20, 2025 | | | 2,728 | | | | 2,700,559 | |
| | |
| Veritas Bermuda, Ltd. | | | | | | |
| | |
Term Loan, 6.32%, (USD LIBOR + 4.50%), Maturing January 27, 2023(4) | | | 2,074 | | | | 2,004,182 | |
| | |
| Vero Parent, Inc. | | | | | | |
| | |
Term Loan, 8.16%, (3 mo. USD LIBOR + 6.25%), Maturing August 16, 2024 | | | 1,075 | | | | 1,035,060 | |
| | |
| Vungle, Inc. | | | | | | |
| | |
Term Loan, 7.30%, (1 mo. USD LIBOR + 5.50%), Maturing September 30, 2026 | | | 499 | | | | 494,386 | |
| | |
| Western Digital Corporation | | | | | | |
| | |
Term Loan, 3.45%, (1 mo. USD LIBOR + 1.75%), Maturing April 29, 2023 | | | 1,061 | | | | 1,067,401 | |
| | |
| | | | | | | $ | 95,203,552 | |
| | | | | | | | |
| Borrower/Tranche Description | | Principal
Amount
(000’s omitted) | | | Value | |
|
| Equipment Leasing — 0.6% | |
| | |
| Avolon TLB Borrower 1 (US), LLC | | | | | | |
| | |
Term Loan, 3.51%, (1 mo. USD LIBOR + 1.75%), Maturing January 15, 2025 | | $ | 2,693 | | | $ | 2,713,079 | |
| | |
| IBC Capital Limited | | | | | | |
| | |
Term Loan, 5.65%, (3 mo. USD LIBOR + 3.75%), Maturing September 11, 2023 | | | 960 | | | | 962,807 | |
| | |
| | | | | | | $ | 3,675,886 | |
|
| Financial Intermediaries — 2.6% | |
| | |
| Apollo Commercial Real Estate Finance, Inc. | | | | | | |
| | |
Term Loan, 4.49%, (1 mo. USD LIBOR + 2.75%), Maturing May 15, 2026 | | $ | 373 | | | $ | 374,991 | |
| | |
| Aretec Group, Inc. | | | | | | |
| | |
Term Loan, 6.05%, (1 mo. USD LIBOR + 4.25%), Maturing October 1, 2025 | | | 1,836 | | | | 1,817,186 | |
| | |
| Citco Funding, LLC | | | | | | |
| | |
Term Loan, 4.30%, (1 mo. USD LIBOR + 2.50%), Maturing September 28, 2023 | | | 1,504 | | | | 1,505,236 | |
| | |
| Claros Mortgage Trust, Inc. | | | | | | |
| | |
Term Loan, 4.96%, (1 mo. USD LIBOR + 3.25%), Maturing August 9, 2026 | | | 574 | | | | 577,864 | |
| | |
| Ditech Holding Corporation | | | | | | |
| | |
Term Loan, 0.00%, Maturing June 30, 2022(7) | | | 2,071 | | | | 858,577 | |
| | |
| EIG Management Company, LLC | | | | | | |
| | |
Term Loan, 5.55%, (1 mo. USD LIBOR + 3.75%), Maturing February 22, 2025 | | | 197 | | | | 196,869 | |
| | |
| FinCo. I, LLC | | | | | | |
| | |
Term Loan, 3.80%, (1 mo. USD LIBOR + 2.00%), Maturing December 27, 2022 | | | 643 | | | | 647,412 | |
| | |
| Focus Financial Partners, LLC | | | | | | |
| | |
Term Loan, 4.30%, (1 mo. USD LIBOR + 2.50%), Maturing July 3, 2024 | | | 1,527 | | | | 1,539,656 | |
| | |
| Franklin Square Holdings L.P. | | | | | | |
| | |
Term Loan, 4.06%, (1 mo. USD LIBOR + 2.25%), Maturing August 1, 2025 | | | 444 | | | | 446,041 | |
| | |
| Greenhill & Co., Inc. | | | | | | |
| | |
Term Loan, 4.99%, (1 mo. USD LIBOR + 3.25%), Maturing April 12, 2024 | | | 780 | | | | 771,225 | |
| | |
| GreenSky Holdings, LLC | | | | | | |
| | |
Term Loan, 5.06%, (1 mo. USD LIBOR + 3.25%), Maturing March 31, 2025 | | | 1,007 | | | | 1,009,580 | |
| | |
| Guggenheim Partners, LLC | | | | | | |
| | |
Term Loan, 4.55%, (1 mo. USD LIBOR + 2.75%), Maturing July 21, 2023 | | | 2,023 | | | | 2,027,003 | |
| | |
| Harbourvest Partners, LLC | | | | | | |
| | |
Term Loan, 3.99%, (1 mo. USD LIBOR + 2.25%), Maturing March 3, 2025 | | | 549 | | | | 551,249 | |
| | | | |
| | 13 | | See Notes to Financial Statements. |
Eaton Vance
VT Floating-Rate Income Fund
December 31, 2019
Portfolio of Investments — continued
| | | | | | | | |
| Borrower/Tranche Description | | Principal
Amount
(000’s omitted) | | | Value | |
|
| Financial Intermediaries (continued) | |
| | |
| LPL Holdings, Inc. | | | | | | |
| | |
Term Loan, 3.54%, (1 mo. USD LIBOR + 1.75%), Maturing November 12, 2026 | | $ | 2,000 | | | $ | 2,015,416 | |
| | |
| Ocwen Loan Servicing, LLC | | | | | | |
| | |
Term Loan, 6.80%, (1 mo. USD LIBOR + 5.00%), Maturing December 7, 2020 | | | 176 | | | | 175,369 | |
| | |
| Starwood Property Trust, Inc. | | | | | | |
| | |
Term Loan, 4.30%, (1 mo. USD LIBOR + 2.50%), Maturing July 27, 2026 | | | 399 | | | | 402,237 | |
| | |
| StepStone Group L.P. | | | | | | |
| | |
Term Loan, 5.84%, (2 mo. USD LIBOR + 4.00%), Maturing March 27, 2025 | | | 442 | | | | 441,572 | |
| | |
| Victory Capital Holdings, Inc. | | | | | | |
| | |
Term Loan, 5.35%, (3 mo. USD LIBOR + 3.25%), Maturing July 1, 2026 | | | 952 | | | | 960,033 | |
| | |
| Virtus Investment Partners, Inc. | | | | | | |
| | |
Term Loan, 3.94%, (1 mo. USD LIBOR + 2.25%), Maturing June 1, 2024 | | | 391 | | | | 393,209 | |
| | |
| | | | | | | $ | 16,710,725 | |
|
| Food Products — 2.1% | |
| | |
| Alphabet Holding Company, Inc. | | | | | | |
| | |
Term Loan, 5.30%, (1 mo. USD LIBOR + 3.50%), Maturing September 26, 2024 | | $ | 2,470 | | | $ | 2,387,652 | |
| | |
| Atkins Nutritionals Holdings II, Inc. | | | | | | |
| | |
Term Loan, 5.73%, (3 mo. USD LIBOR + 3.75%), Maturing July 7, 2024 | | | 275 | | | | 278,438 | |
| | |
| B&G Foods, Inc. | | | | | | |
| | |
Term Loan, 4.30%, (1 mo. USD LIBOR + 2.50%), Maturing September 17, 2026 | | | 200 | | | | 201,495 | |
| | |
| Del Monte Foods, Inc. | | | | | | |
| | |
Term Loan, 5.16%, (3 mo. USD LIBOR + 3.25%), Maturing February 18, 2021 | | | 1,186 | | | | 1,059,333 | |
| | |
| Hearthside Food Solutions, LLC | | | | | | |
| | |
Term Loan, 5.49%, (1 mo. USD LIBOR + 3.69%), Maturing May 23, 2025 | | | 566 | | | | 562,481 | |
| | |
Term Loan, 5.80%, (1 mo. USD LIBOR + 4.00%), Maturing May 23, 2025 | | | 371 | | | | 371,250 | |
| | |
| HLF Financing S.a.r.l. | | | | | | |
| | |
Term Loan, 4.55%, (1 mo. USD LIBOR + 2.75%), Maturing August 18, 2025 | | | 615 | | | | 618,783 | |
| | |
| Jacobs Douwe Egberts International B.V. | | | | | | |
| | |
Term Loan, 3.75%, (1 mo. USD LIBOR + 2.00%), Maturing November 1, 2025 | | | 2,844 | | | | 2,858,992 | |
| | |
| JBS USA Lux S.A. | | | | | | |
| | |
Term Loan, 3.80%, (1 mo. USD LIBOR + 2.00%), Maturing May 1, 2026 | | | 5,215 | | | | 5,258,053 | |
| | |
| | | | | | | $ | 13,596,477 | |
| | | | | | | | |
| Borrower/Tranche Description | | Principal
Amount
(000’s omitted) | | | Value | |
|
| Food Service — 1.7% | |
| | |
| 1011778 B.C. Unlimited Liability Company | | | | | | |
| | |
Term Loan, 3.55%, (1 mo. USD LIBOR + 1.75%), Maturing November 19, 2026 | | $ | 4,225 | | | $ | 4,235,537 | |
| | |
| Aramark Services, Inc. | | | | | | |
| | |
Term Loan, Maturing January 27, 2027(6) | | | 825 | | | | 830,414 | |
| | |
| IRB Holding Corp. | | | | | | |
| | |
Term Loan, 5.22%, (3 mo. USD LIBOR + 3.25%), Maturing February 5, 2025 | | | 1,618 | | | | 1,627,726 | |
| | |
| NPC International, Inc. | | | | | | |
| | |
Term Loan, 5.43%, (3 mo. USD LIBOR + 3.50%), Maturing April 19, 2024 | | | 634 | | | | 295,328 | |
| | |
| Restaurant Technologies, Inc. | | | | | | |
| | |
Term Loan, 5.05%, (1 mo. USD LIBOR + 3.25%), Maturing October 1, 2025 | | | 173 | | | | 174,549 | |
| | |
| US Foods, Inc. | | | | | | |
| | |
Term Loan, 3.55%, (1 mo. USD LIBOR + 1.75%), Maturing June 27, 2023 | | | 2,531 | | | | 2,542,987 | |
| | |
Term Loan, 3.80%, (1 mo. USD LIBOR + 2.00%), Maturing September 13, 2026 | | | 1,272 | | | | 1,278,821 | |
| | |
| | | | | | | $ | 10,985,362 | |
|
| Food / Drug Retailers — 0.4% | |
| | |
| Albertsons, LLC | | | | | | |
| | |
Term Loan, 4.55%, (1 mo. USD LIBOR + 2.75%), Maturing November 17, 2025 | | $ | 750 | | | $ | 757,327 | |
| | |
Term Loan, 4.55%, (1 mo. USD LIBOR + 2.75%), Maturing August 17, 2026 | | | 906 | | | | 915,558 | |
| | |
| Allsup’s Convenience Stores, Inc. | | | | | | |
| | |
Term Loan, 8.00%, (1 mo. USD LIBOR + 6.25%), Maturing November 18, 2024 | | | 475 | | | | 473,813 | |
| | |
| Diplomat Pharmacy, Inc. | | | | | | |
| | |
Term Loan, 6.41%, (3 mo. USD LIBOR + 4.50%), Maturing December 20, 2024 | | | 337 | | | | 328,233 | |
| | |
| | | | | | | $ | 2,474,931 | |
|
| Forest Products — 0.0%(5) | |
| | |
| Clearwater Paper Corporation | | | | | | |
| | |
Term Loan, 5.00%, (1 mo. USD LIBOR + 3.25%), Maturing July 26, 2026 | | $ | 250 | | | $ | 250,937 | |
| | |
| | | | | | | $ | 250,937 | |
|
| Health Care — 7.1% | |
| | |
| Acadia Healthcare Company, Inc. | | | | | | |
| | |
Term Loan, 4.30%, (1 mo. USD LIBOR + 2.50%), Maturing February 11, 2022 | | $ | 160 | | | $ | 160,536 | |
| | | | |
| | 14 | | See Notes to Financial Statements. |
Eaton Vance
VT Floating-Rate Income Fund
December 31, 2019
Portfolio of Investments — continued
| | | | | | | | |
| Borrower/Tranche Description | | Principal
Amount
(000’s omitted) | | | Value | |
|
| Health Care (continued) | |
| | |
| Alliance Healthcare Services, Inc. | | | | | | |
| | |
Term Loan, 6.30%, (1 mo. USD LIBOR + 4.50%), Maturing October 24, 2023 | | $ | 570 | | | $ | 521,550 | |
| | |
| athenahealth, Inc. | | | | | | |
| | |
Term Loan, 6.40%, (3 mo. USD LIBOR + 4.50%), Maturing February 11, 2026 | | | 1,489 | | | | 1,498,662 | |
| | |
| Athletico Management, LLC | | | | | | |
| | |
Term Loan, 5.24%, (1 mo. USD LIBOR + 3.50%), Maturing October 31, 2025 | | | 470 | | | | 471,426 | |
| | |
| Avantor, Inc. | | | | | | |
| | |
Term Loan, 4.80%, (1 mo. USD LIBOR + 3.00%), Maturing November 21, 2024 | | | 667 | | | | 671,641 | |
| | |
| BioClinica, Inc. | | | | | | |
| | |
Term Loan, 6.06%, (1 mo. USD LIBOR + 4.25%), Maturing October 20, 2023 | | | 461 | | | | 449,039 | |
| | |
| BW NHHC Holdco, Inc. | | | | | | |
| | |
Term Loan, 6.91%, (3 mo. USD LIBOR + 5.00%), Maturing May 15, 2025 | | | 763 | | | | 629,784 | |
| | |
| Change Healthcare Holdings, LLC | | | | | | |
| | |
Term Loan, 4.30%, (1 mo. USD LIBOR + 2.50%), Maturing March 1, 2024 | | | 4,130 | | | | 4,150,367 | |
| | |
| CryoLife, Inc. | | | | | | |
| | |
Term Loan, 5.19%, (3 mo. USD LIBOR + 3.25%), Maturing November 14, 2024 | | | 368 | | | | 369,491 | |
| | |
| CTC AcquiCo GmbH | | | | | | |
| | |
Term Loan, 4.66%, (3 mo. USD LIBOR + 2.75%), Maturing March 7, 2025 | | | 812 | | | | 795,537 | |
| | |
| Da Vinci Purchaser Corp. | | | | | | |
| | |
Term Loan, Maturing December 3, 2026(6) | | | 300 | | | | 300,375 | |
| | |
| Ensemble RCM, LLC | | | | | | |
| | |
Term Loan, 5.66%, (3 mo. USD LIBOR + 3.75%), Maturing August 3, 2026 | | | 399 | | | | 402,242 | |
| | |
| Envision Healthcare Corporation | | | | | | |
| | |
Term Loan, 5.55%, (1 mo. USD LIBOR + 3.75%), Maturing October 10, 2025 | | | 4,110 | | | | 3,520,682 | |
| | |
| Gentiva Health Services, Inc. | | | | | | |
| | |
Term Loan, 5.56%, (1 mo. USD LIBOR + 3.75%), Maturing July 2, 2025 | | | 1,915 | | | | 1,927,696 | |
| | |
| Greatbatch Ltd. | | | | | | |
| | |
Term Loan, 4.22%, (1 mo. USD LIBOR + 2.50%), Maturing October 27, 2022 | | | 1,897 | | | | 1,901,689 | |
| | |
| Grifols Worldwide Operations USA, Inc. | | | | | | |
| | |
Term Loan, 3.74%, (1 mo. USD LIBOR + 2.00%), Maturing November 15, 2027 | | | 3,063 | | | | 3,092,032 | |
| | |
| Hanger, Inc. | | | | | | |
| | |
Term Loan, 5.30%, (1 mo. USD LIBOR + 3.50%), Maturing March 6, 2025 | | | 1,229 | | | | 1,235,763 | |
| | | | | | | | |
| Borrower/Tranche Description | | Principal
Amount
(000’s omitted) | | | Value | |
|
| Health Care (continued) | |
| | |
| Inovalon Holdings, Inc. | | | | | | |
| | |
Term Loan, 5.25%, (1 mo. USD LIBOR + 3.50%), Maturing April 2, 2025 | | $ | 890 | | | $ | 895,587 | |
| | |
| IQVIA, Inc. | | | | | | |
| | |
Term Loan, 3.69%, (3 mo. USD LIBOR + 1.75%), Maturing March 7, 2024 | | | 553 | | | | 555,954 | |
| | |
Term Loan, 3.69%, (3 mo. USD LIBOR + 1.75%), Maturing January 17, 2025 | | | 888 | | | | 892,340 | |
| | |
| Medical Solutions, LLC | | | | | | |
| | |
Term Loan, 6.30%, (1 mo. USD LIBOR + 4.50%), Maturing June 14, 2024 | | | 299 | | | | 298,783 | |
| | |
| MPH Acquisition Holdings, LLC | | | | | | |
| | |
Term Loan, 4.69%, (3 mo. USD LIBOR + 2.75%), Maturing June 7, 2023 | | | 3,161 | | | | 3,126,917 | |
| | |
| National Mentor Holdings, Inc. | | | | | | |
| | |
Term Loan, 5.80%, (1 mo. USD LIBOR + 4.00%), Maturing March 9, 2026 | | | 22 | | | | 22,149 | |
| | |
Term Loan, 5.80%, (1 mo. USD LIBOR + 4.00%), Maturing March 9, 2026 | | | 375 | | | | 379,113 | |
| | |
| Navicure, Inc. | | | | | | |
| | |
Term Loan, 5.80%, (1 mo. USD LIBOR + 4.00%), Maturing October 22, 2026 | | | 1,150 | | | | 1,155,031 | |
| | |
| One Call Corporation | | | | | | |
| | |
Term Loan, 7.16%, (3 mo. USD LIBOR + 5.25%), Maturing November 25, 2022 | | | 898 | | | | 835,546 | |
| | |
| Ortho-Clinical Diagnostics S.A. | | | | | | |
| | |
Term Loan, 5.31%, (3 mo. USD LIBOR + 3.25%), Maturing June 30, 2025 | | | 3,937 | | | | 3,897,726 | |
| | |
| Parexel International Corporation | | | | | | |
| | |
Term Loan, 4.55%, (1 mo. USD LIBOR + 2.75%), Maturing September 27, 2024 | | | 1,695 | | | | 1,664,521 | |
| | |
| Phoenix Guarantor, Inc. | | | | | | |
| | |
Term Loan, 6.21%, (1 mo. USD LIBOR + 4.50%), Maturing March 5, 2026 | | | 1,468 | | | | 1,477,715 | |
| | |
| Radiology Partners Holdings, LLC | | | | | | |
| | |
Term Loan, 6.66%, (USD LIBOR + 4.75%), Maturing July 9, 2025(4) | | | 446 | | | | 447,904 | |
| | |
| RadNet, Inc. | | | | | | |
| | |
Term Loan, 5.51%, (3 mo. USD LIBOR + 3.50%), Maturing June 30, 2023 | | | 1,387 | | | | 1,397,853 | |
| | |
| Select Medical Corporation | | | | | | |
| | |
Term Loan, 4.58%, (3 mo. USD LIBOR + 2.50%), Maturing March 6, 2025 | | | 2,469 | | | | 2,477,802 | |
| | |
| Syneos Health, Inc. | | | | | | |
| | |
Term Loan, 3.80%, (1 mo. USD LIBOR + 2.00%), Maturing August 1, 2024 | | | 679 | | | | 682,546 | |
| | | | |
| | 15 | | See Notes to Financial Statements. |
Eaton Vance
VT Floating-Rate Income Fund
December 31, 2019
Portfolio of Investments — continued
| | | | | | | | |
| Borrower/Tranche Description | | Principal
Amount
(000’s omitted) | | | Value | |
|
| Health Care (continued) | |
| | |
| Team Health Holdings, Inc. | | | | | | |
| | |
Term Loan, 4.55%, (1 mo. USD LIBOR + 2.75%), Maturing February 6, 2024 | | $ | 1,676 | | | $ | 1,363,206 | |
| | |
| Tecomet, Inc. | | | | | | |
| | |
Term Loan, 4.99%, (1 mo. USD LIBOR + 3.25%), Maturing May 1, 2024 | | | 1,175 | | | | 1,179,085 | |
| | |
| Verscend Holding Corp. | | | | | | |
| | |
Term Loan, 6.30%, (1 mo. USD LIBOR + 4.50%), Maturing August 27, 2025 | | | 1,281 | | | | 1,291,685 | |
| | |
| | | | | | | $ | 46,139,975 | |
|
| Home Furnishings — 0.4% | |
| | |
| Serta Simmons Bedding, LLC | | | | | | |
| | |
Term Loan, 5.25%, (1 mo. USD LIBOR + 3.50%), Maturing November 8, 2023 | | $ | 3,987 | | | $ | 2,593,706 | |
| | |
| | | | | | | $ | 2,593,706 | |
|
| Industrial Equipment — 3.5% | |
| | |
| AI Alpine AT Bidco GmbH | | | | | | |
| | |
Term Loan, 4.60%, (2 mo. USD LIBOR + 2.75%), Maturing October 31, 2025 | | $ | 198 | | | $ | 195,030 | |
| | |
| Altra Industrial Motion Corp. | | | | | | |
| | |
Term Loan, 3.80%, (1 mo. USD LIBOR + 2.00%), Maturing October 1, 2025 | | | 555 | | | | 557,577 | |
| | |
| Apex Tool Group, LLC | | | | | | |
| | |
Term Loan, 7.30%, (1 mo. USD LIBOR + 5.50%), Maturing August 1, 2024 | | | 1,758 | | | | 1,735,948 | |
| | |
| Carlisle Foodservice Products, Inc. | | | | | | |
| | |
Term Loan, 4.80%, (1 mo. USD LIBOR + 3.00%), Maturing March 20, 2025 | | | 689 | | | | 680,133 | |
| | |
| Clark Equipment Company | | | | | | |
| | |
Term Loan, 3.69%, (3 mo. USD LIBOR + 1.75%), Maturing May 18, 2024 | | | 806 | | | | 810,660 | |
| | |
| CPM Holdings, Inc. | | | | | | |
| | |
Term Loan, 5.55%, (1 mo. USD LIBOR + 3.75%), Maturing November 17, 2025 | | | 866 | | | | 861,197 | |
| | |
| Delachaux Group S.A. | | | | | | |
| | |
Term Loan, 6.50%, (3 mo. USD LIBOR + 4.50%), Maturing April 16, 2026 | | | 375 | | | | 371,836 | |
| | |
| DexKo Global, Inc. | | | | | | |
| | |
Term Loan, 5.30%, (1 mo. USD LIBOR + 3.50%), Maturing July 24, 2024 | | | 610 | | | | 608,846 | |
| | |
| DXP Enterprises, Inc. | | | | | | |
| | |
Term Loan, 6.54%, (1 mo. USD LIBOR + 4.75%), Maturing August 29, 2023 | | | 367 | | | | 367,479 | |
| | | | | | | | |
| Borrower/Tranche Description | | Principal
Amount
(000’s omitted) | | | Value | |
|
| Industrial Equipment (continued) | |
| | |
| Engineered Machinery Holdings, Inc. | | | | | | |
| | |
Term Loan, 4.94%, (3 mo. USD LIBOR + 3.00%), Maturing July 19, 2024 | | $ | 1,347 | | | $ | 1,337,956 | |
| | |
Term Loan, 6.19%, (3 mo. USD LIBOR + 4.25%), Maturing July 19, 2024 | | | 248 | | | | 247,913 | |
| | |
| EWT Holdings III Corp. | | | | | | |
| | |
Term Loan, 4.80%, (1 mo. USD LIBOR + 3.00%), Maturing December 20, 2024 | | | 3,971 | | | | 3,994,714 | |
| | |
| Filtration Group Corporation | | | | | | |
| | |
Term Loan, 4.80%, (1 mo. USD LIBOR + 3.00%), Maturing March 29, 2025 | | | 3,072 | | | | 3,088,730 | |
| | |
| Gardner Denver, Inc. | | | | | | |
| | |
Term Loan, 4.55%, (1 mo. USD LIBOR + 2.75%), Maturing July 30, 2024 | | | 974 | | | | 981,336 | |
| | |
| LTI Holdings, Inc. | | | | | | |
| | |
Term Loan, 5.30%, (1 mo. USD LIBOR + 3.50%), Maturing September 6, 2025 | | | 1,410 | | | | 1,277,507 | |
| | |
Term Loan, 6.55%, (1 mo. USD LIBOR + 4.75%), Maturing July 24, 2026 | | | 150 | | | | 137,281 | |
| | |
| Pro Mach Group, Inc. | | | | | | |
| | |
Term Loan, 4.54%, (1 mo. USD LIBOR + 2.75%), Maturing March 7, 2025 | | | 172 | | | | 170,702 | |
| | |
| Rexnord, LLC | | | | | | |
| | |
Term Loan, 3.54%, (1 mo. USD LIBOR + 1.75%), Maturing August 21, 2024 | | | 560 | | | | 563,847 | |
| | |
| Robertshaw US Holding Corp. | | | | | | |
| | |
Term Loan, 5.06%, (1 mo. USD LIBOR + 3.25%), Maturing February 28, 2025 | | | 1,719 | | | | 1,573,228 | |
| | |
| Shape Technologies Group, Inc. | | | | | | |
| | |
Term Loan, 4.93%, (3 mo. USD LIBOR + 3.00%), Maturing April 21, 2025 | | | 758 | | | | 684,445 | |
| | |
| Thermon Industries, Inc. | | | | | | |
| | |
Term Loan, 5.44%, (1 mo. USD LIBOR + 3.75%), Maturing October 24, 2024 | | | 196 | | | | 197,715 | |
| | |
| Titan Acquisition Limited | | | | | | |
| | |
Term Loan, 4.80%, (1 mo. USD LIBOR + 3.00%), Maturing March 28, 2025 | | | 2,211 | | | | 2,178,018 | |
| | |
| | | | | | | $ | 22,622,098 | |
|
| Insurance — 3.4% | |
| | |
| Alliant Holdings Intermediate, LLC | | | | | | |
| | |
Term Loan, 4.80%, (1 mo. USD LIBOR + 3.00%), Maturing May 9, 2025 | | $ | 1,684 | | | $ | 1,686,469 | |
| | |
Term Loan, 4.99%, (1 mo. USD LIBOR + 3.25%), Maturing May 9, 2025 | | | 373 | | | | 374,291 | |
| | |
| AmWINS Group, Inc. | | | | | | |
| | |
Term Loan, 4.53%, (1 mo. USD LIBOR + 2.75%), Maturing January 25, 2024 | | | 5,185 | | | | 5,232,014 | |
| | | | |
| | 16 | | See Notes to Financial Statements. |
Eaton Vance
VT Floating-Rate Income Fund
December 31, 2019
Portfolio of Investments — continued
| | | | | | | | |
| Borrower/Tranche Description | | Principal
Amount
(000’s omitted) | | | Value | |
|
| Insurance (continued) | |
| | |
| Asurion, LLC | | | | | | |
| | |
Term Loan, 4.80%, (1 mo. USD LIBOR + 3.00%), Maturing August 4, 2022 | | $ | 2,553 | | | $ | 2,571,124 | |
| | |
Term Loan, 4.80%, (1 mo. USD LIBOR + 3.00%), Maturing November 3, 2023 | | | 1,985 | | | | 1,999,280 | |
| | |
Term Loan - Second Lien, 8.30%, (1 mo. USD LIBOR + 6.50%), Maturing August 4, 2025 | | | 1,900 | | | | 1,928,025 | |
| | |
| Hub International Limited | | | | | | |
| | |
Term Loan, 4.69%, (3 mo. USD LIBOR + 2.75%), Maturing April 25, 2025 | | | 2,204 | | | | 2,205,725 | |
| | |
| NFP Corp. | | | | | | |
| | |
Term Loan, 4.80%, (1 mo. USD LIBOR + 3.00%), Maturing January 8, 2024 | | | 2,885 | | | | 2,878,457 | |
| | |
| USI, Inc. | | | | | | |
| | |
Term Loan, 4.94%, (3 mo. USD LIBOR + 3.00%), Maturing May 16, 2024 | | | 2,053 | | | | 2,055,059 | |
| | |
Term Loan, 5.94%, (3 mo. USD LIBOR + 4.00%), Maturing December 2, 2026 | | | 1,025 | | | | 1,030,125 | |
| | |
| | | | | | | $ | 21,960,569 | |
|
| Leisure Goods / Activities / Movies — 4.1% | |
| | |
| Ancestry.com Operations, Inc. | | | | | | |
| | |
Term Loan, 6.05%, (1 mo. USD LIBOR + 4.25%), Maturing August 27, 2026 | | $ | 3,736 | | | $ | 3,682,517 | |
| | |
| Bombardier Recreational Products, Inc. | | | | | | |
| | |
Term Loan, 3.80%, (1 mo. USD LIBOR + 2.00%), Maturing May 23, 2025 | | | 2,869 | | | | 2,882,256 | |
| | |
Term Loan, 4.30%, (1 mo. USD LIBOR + 2.50%), Maturing May 23, 2025 | | | 723 | | | | 727,105 | |
| | |
| ClubCorp Holdings, Inc. | | | | | | |
| | |
Term Loan, 4.69%, (3 mo. USD LIBOR + 2.75%), Maturing September 18, 2024 | | | 1,295 | | | | 1,229,888 | |
| | |
| Crown Finance US, Inc. | | | | | | |
| | |
Term Loan, 4.05%, (1 mo. USD LIBOR + 2.25%), Maturing February 28, 2025 | | | 1,726 | | | | 1,726,488 | |
| | |
Term Loan, 4.30%, (1 mo. USD LIBOR + 2.50%), Maturing September 30, 2026 | | | 1,097 | | | | 1,099,993 | |
| | |
| Delta 2 (LUX) S.a.r.l. | | | | | | |
| | |
Term Loan, 4.30%, (1 mo. USD LIBOR + 2.50%), Maturing February 1, 2024 | | | 2,684 | | | | 2,701,398 | |
| | |
| Emerald Expositions Holding, Inc. | | | | | | |
| | |
Term Loan, 4.55%, (1 mo. USD LIBOR + 2.75%), Maturing May 22, 2024 | | | 791 | | | | 755,239 | |
| | |
| Match Group, Inc. | | | | | | |
| | |
Term Loan, 4.44%, (3 mo. USD LIBOR + 2.50%), Maturing November 16, 2022 | | | 317 | | | | 317,782 | |
| | | | | | | | |
| Borrower/Tranche Description | | Principal
Amount
(000’s omitted) | | | Value | |
|
| Leisure Goods / Activities / Movies (continued) | |
| | |
| Motion Finco S.a.r.l. | | | | | | |
| | |
Term Loan, 0.50%,
Maturing November 4, 2026(2) | | $ | 49 | | | $ | 49,986 | |
| | |
Term Loan, 5.15%, (2 mo. USD LIBOR + 3.25%), Maturing November 13, 2026 | | | 376 | | | | 380,327 | |
| | |
| NASCAR Holdings, Inc. | | | | | | |
| | |
Term Loan, 4.49%, (1 mo. USD LIBOR + 2.75%), Maturing October 19, 2026 | | | 544 | | | | 550,346 | |
| | |
| Playtika Holding Corp. | | | | | | |
| | |
Term Loan, 7.80%, (1 mo. USD LIBOR + 6.00%), Maturing December 10, 2024 | | | 2,450 | | | | 2,480,625 | |
| | |
| SeaWorld Parks & Entertainment, Inc. | | | | | | |
| | |
Term Loan, 4.80%, (1 mo. USD LIBOR + 3.00%), Maturing March 31, 2024 | | | 2,399 | | | | 2,411,003 | |
| | |
| SRAM, LLC | | | | | | |
| | |
Term Loan, 4.59%, (USD LIBOR + 2.75%), Maturing March 15, 2024(4) | | | 771 | | | | 777,706 | |
| | |
| Steinway Musical Instruments, Inc. | | | | | | |
| | |
Term Loan, 5.49%, (1 mo. USD LIBOR + 3.75%), Maturing February 14, 2025 | | | 639 | | | | 637,827 | |
| | |
| Travel Leaders Group, LLC | | | | | | |
| | |
Term Loan, 5.79%, (1 mo. USD LIBOR + 4.00%), Maturing January 25, 2024 | | | 2,773 | | | | 2,788,484 | |
| | |
| UFC Holdings, LLC | | | | | | |
| | |
Term Loan, 5.05%, (1 mo. USD LIBOR + 3.25%), Maturing April 29, 2026 | | | 1,477 | | | | 1,489,291 | |
| | |
| | | | | | | $ | 26,688,261 | |
|
| Lodging and Casinos — 3.4% | |
| | |
| Aimbridge Acquisition Co., Inc. | | | | | | |
| | |
Term Loan, 5.54%, (1 mo. USD LIBOR + 3.75%), Maturing February 2, 2026 | | $ | 223 | | | $ | 225,548 | |
| | |
| Aristocrat Technologies, Inc. | | | | | | |
| | |
Term Loan, 3.72%, (3 mo. USD LIBOR + 1.75%), Maturing October 19, 2024 | | | 714 | | | | 718,148 | |
| | |
| Boyd Gaming Corporation | | | | | | |
| | |
Term Loan, 3.85%, (1 week USD LIBOR + 2.25%), Maturing September 15, 2023 | | | 816 | | | | 823,129 | |
| | |
| CityCenter Holdings, LLC | | | | | | |
| | |
Term Loan, 4.05%, (1 mo. USD LIBOR + 2.25%), Maturing April 18, 2024 | | | 2,806 | | | | 2,821,393 | |
| | |
| ESH Hospitality, Inc. | | | | | | |
| | |
Term Loan, 3.80%, (1 mo. USD LIBOR + 2.00%), Maturing September 18, 2026 | | | 2,359 | | | | 2,382,114 | |
| | |
| Four Seasons Hotels Limited | | | | | | |
| | |
Term Loan, 3.80%, (1 mo. USD LIBOR + 2.00%), Maturing November 30, 2023 | | | 631 | | | | 637,418 | |
| | | | |
| | 17 | | See Notes to Financial Statements. |
Eaton Vance
VT Floating-Rate Income Fund
December 31, 2019
Portfolio of Investments — continued
| | | | | | | | |
| Borrower/Tranche Description | | Principal
Amount
(000’s omitted) | | | Value | |
|
| Lodging and Casinos (continued) | |
| | |
| Golden Nugget, Inc. | | | | | | |
| | |
Term Loan, 4.69%, (USD LIBOR + 2.75%), Maturing October 4, 2023(4) | | $ | 4,112 | | | $ | 4,132,093 | |
| | |
| GVC Holdings PLC | | | | | | |
| | |
Term Loan, 4.45%, (6 mo. USD LIBOR + 2.25%), Maturing March 29, 2024 | | | 811 | | | | 815,967 | |
| | |
| Hanjin International Corp. | | | | | | |
| | |
Term Loan, 4.30%, (1 mo. USD LIBOR + 2.50%), Maturing October 18, 2020 | | | 375 | | | | 374,531 | |
| | |
| MGM Growth Properties Operating Partnership L.P. | | | | | | |
| | |
Term Loan, 3.80%, (1 mo. USD LIBOR + 2.00%), Maturing March 21, 2025 | | | 2,053 | | | | 2,066,081 | |
| | |
| Playa Resorts Holding B.V. | | | | | | |
| | |
Term Loan, 4.55%, (1 mo. USD LIBOR + 2.75%), Maturing April 29, 2024 | | | 2,097 | | | | 2,095,056 | |
| | |
| RHP Hotel Properties, L.P. | | | | | | |
| | |
Term Loan, 3.80%, (1 mo. USD LIBOR + 2.00%), Maturing May 11, 2024 | | | 1,451 | | | | 1,461,134 | |
| | |
| Stars Group Holdings B.V. (The) | | | | | | |
| | |
Term Loan, 5.44%, (3 mo. USD LIBOR + 3.50%), Maturing July 10, 2025 | | | 3,547 | | | | 3,583,111 | |
| | |
| | | | | | | $ | 22,135,723 | |
|
| Nonferrous Metals / Minerals — 0.3% | |
| | |
| Aleris International, Inc. | | | | | | |
| | |
Term Loan, 6.55%, (1 mo. USD LIBOR + 4.75%), Maturing February 27, 2023 | | $ | 985 | | | $ | 987,616 | |
| | |
| Murray Energy Corporation | | | | | | |
| | |
DIP Loan, 13.00%, (1 mo. USD LIBOR + 11.00%, Floor 2.00%), Maturing July 31, 2020 | | | 340 | | | | 347,747 | |
| | |
Term Loan, 0.00%,
Maturing October 17, 2022(7) | | | 1,221 | | | | 270,622 | |
| | |
| Noranda Aluminum Acquisition Corporation | | | | | | |
| | |
Term Loan, 0.00%,
Maturing February 28, 2020(7) | | | 215 | | | | 12,910 | |
| | |
| Oxbow Carbon, LLC | | | | | | |
| | |
Term Loan, 5.55%, (1 mo. USD LIBOR + 3.75%), Maturing January 4, 2023 | | | 428 | | | | 428,569 | |
| | |
| | | | | | | $ | 2,047,464 | |
|
| Oil and Gas — 2.8% | |
| | |
| Ameriforge Group, Inc. | | | | | | |
| | |
Term Loan, 8.94%, (3 mo. USD LIBOR + 7.00%), Maturing June 8, 2022 | | $ | 519 | | | $ | 517,506 | |
| | |
| Apergy Corporation | | | | | | |
| | |
Term Loan, 4.42%, (1 mo. USD LIBOR + 2.50%), Maturing May 9, 2025 | | | 176 | | | | 176,188 | |
| | | | | | | | |
| Borrower/Tranche Description | | Principal
Amount
(000’s omitted) | | | Value | |
|
| Oil and Gas (continued) | |
| | |
| Blackstone CQP Holdco L.P. | | | | | | |
| | |
Term Loan, 5.41%, (3 mo. USD LIBOR + 3.50%), Maturing September 30, 2024 | | $ | 1,396 | | | $ | 1,405,815 | |
| | |
| Buckeye Partners L.P. | | | | | | |
| | |
Term Loan, 4.44%, (1 mo. USD LIBOR + 2.75%), Maturing November 1, 2026 | | | 2,000 | | | | 2,019,584 | |
| | |
| Centurion Pipeline Company, LLC | | | | | | |
| | |
Term Loan, 5.05%, (1 mo. USD LIBOR + 3.25%), Maturing September 29, 2025 | | | 223 | | | | 223,028 | |
| | |
| CITGO Holding, Inc. | | | | | | |
| | |
Term Loan, 8.80%, (1 mo. USD LIBOR + 7.00%), Maturing August 1, 2023 | | | 200 | | | | 203,739 | |
| | |
| CITGO Petroleum Corporation | | | | | | |
| | |
Term Loan, 6.44%, (3 mo. USD LIBOR + 4.50%), Maturing July 29, 2021 | | | 1,225 | | | | 1,231,684 | |
| | |
Term Loan, 6.94%, (3 mo. USD LIBOR + 5.00%), Maturing March 28, 2024 | | | 2,605 | | | | 2,621,596 | |
| | |
| Delek US Holdings, Inc. | | | | | | |
| | |
Term Loan, 4.05%, (1 mo. USD LIBOR + 2.25%), Maturing March 31, 2025 | | | 4,007 | | | | 4,006,652 | |
| | |
| Fieldwood Energy, LLC | | | | | | |
| | |
Term Loan, 7.18%, (3 mo. USD LIBOR + 5.25%), Maturing April 11, 2022 | | | 761 | | | | 639,663 | |
| | |
| McDermott Technology Americas, Inc. | | | | | | |
| | |
Term Loan, 7.56%, (USD LIBOR + 10.00%), Maturing October 21, 2021(2)(4) | | | 525 | | | | 537,469 | |
| | |
Term Loan, 6.94%, (3 mo. USD LIBOR + 5.00%), Maturing May 9, 2025 | | | 1,431 | | | | 841,812 | |
| | |
| Prairie ECI Acquiror L.P. | | | | | | |
| | |
Term Loan, 6.69%, (3 mo. USD LIBOR + 4.75%), Maturing March 11, 2026 | | | 951 | | | | 945,575 | |
| | |
| PSC Industrial Holdings Corp. | | | | | | |
| | |
Term Loan, 5.49%, (1 mo. USD LIBOR + 3.75%), Maturing October 11, 2024 | | | 1,299 | | | | 1,292,007 | |
| | |
| Sheridan Investment Partners II L.P. | | | | | | |
| | |
DIP Loan, 8.76%, (1 mo. USD LIBOR + 7.00%), Maturing March 19, 2020 | | | 51 | | | | 51,037 | |
| | |
DIP Loan, 8.76%, (1 mo. USD LIBOR + 7.00%), Maturing March 19, 2020 | | | 51 | | | | 51,037 | |
| | |
Term Loan, 0.00%,
Maturing December 16, 2020(7) | | | 19 | | | | 5,736 | |
| | |
Term Loan, 0.00%,
Maturing December 16, 2020(7) | | | 52 | | | | 15,381 | |
| | |
Term Loan, 0.00%,
Maturing December 16, 2020(7) | | | 375 | | | | 110,572 | |
| | |
| Sheridan Production Partners I, LLC | | | | | | |
| | |
Term Loan, 0.00%, Maturing January 17, 2020(7) | | | 42 | | | | 24,914 | |
| | |
Term Loan, 0.00%,
Maturing January 17, 2020(7) | | | 69 | | | | 40,788 | |
| | |
Term Loan, 0.00%,
Maturing January 17, 2020(7) | | | 522 | | | | 307,815 | |
| | | | |
| | 18 | | See Notes to Financial Statements. |
Eaton Vance
VT Floating-Rate Income Fund
December 31, 2019
Portfolio of Investments — continued
| | | | | | | | |
| Borrower/Tranche Description | | Principal
Amount
(000’s omitted) | | | Value | |
|
| Oil and Gas (continued) | |
| | |
| UGI Energy Services, LLC | | | | | | |
| | |
Term Loan, 5.55%, (1 mo. USD LIBOR + 3.75%), Maturing August 13, 2026 | | $ | 771 | | | $ | 775,945 | |
| | |
| | | | | | | $ | 18,045,543 | |
|
| Publishing — 0.8% | |
| | |
| Ascend Learning, LLC | | | | | | |
| | |
Term Loan, 4.80%, (1 mo. USD LIBOR + 3.00%), Maturing July 12, 2024 | | $ | 850 | | | $ | 856,110 | |
| | |
| Getty Images, Inc. | | | | | | |
| | |
Term Loan, 6.31%, (1 mo. USD LIBOR + 4.50%), Maturing February 19, 2026 | | | 1,339 | | | | 1,344,846 | |
| | |
| Harland Clarke Holdings Corp. | | | | | | |
| | |
Term Loan, 6.69%, (3 mo. USD LIBOR + 4.75%), Maturing November 3, 2023 | | | 877 | | | | 685,519 | |
| | |
| LSC Communications, Inc. | | | | | | |
| | |
Term Loan, 7.12%, (1 week USD LIBOR + 5.50%), Maturing September 30, 2022 | | | 488 | | | | 314,666 | |
| | |
| ProQuest, LLC | | | | | | |
| | |
Term Loan, 5.30%, (1 mo. USD LIBOR + 3.50%), Maturing October 23, 2026 | | | 675 | | | | 676,266 | |
| | |
| Terrier Media Buyer, Inc. | | | | | | |
| | |
Term Loan, 6.15%, (3 mo. USD LIBOR + 4.25%), Maturing December 17, 2026 | | | 1,325 | | | | 1,339,906 | |
| | |
| | | | | | | $ | 5,217,313 | |
|
| Radio and Television — 2.5% | |
| | |
| Cumulus Media New Holdings, Inc. | | | | | | |
| | |
Term Loan, 5.55%, (1 mo. USD LIBOR + 3.75%), Maturing March 31, 2026 | | $ | 399 | | | $ | 403,821 | |
| | |
| Diamond Sports Group, LLC | | | | | | |
| | |
Term Loan, 5.03%, (1 mo. USD LIBOR + 3.25%), Maturing August 24, 2026 | | | 2,344 | | | | 2,344,125 | |
| | |
| Entercom Media Corp. | | | | | | |
| | |
Term Loan, 4.30%, (1 mo. USD LIBOR + 2.50%), Maturing November 18, 2024 | | | 1,432 | | | | 1,446,810 | |
| | |
| Entravision Communications Corporation | | | | | | |
| | |
Term Loan, 4.55%, (1 mo. USD LIBOR + 2.75%), Maturing November 29, 2024 | | | 582 | | | | 566,965 | |
| | |
| Gray Television, Inc. | | | | | | |
| | |
Term Loan, 3.95%, (1 mo. USD LIBOR + 2.25%), Maturing February 7, 2024 | | | 139 | | | | 139,633 | |
| | |
Term Loan, 4.20%, (1 mo. USD LIBOR + 2.50%), Maturing January 2, 2026 | | | 531 | | | | 534,412 | |
| | |
| Hubbard Radio, LLC | | | | | | |
| | |
Term Loan, 5.30%, (1 mo. USD LIBOR + 3.50%), Maturing March 28, 2025 | | | 485 | | | | 485,168 | |
| | | | | | | | |
| Borrower/Tranche Description | | Principal
Amount
(000’s omitted) | | | Value | |
|
| Radio and Television (continued) | |
| | |
| iHeartCommunications, Inc. | | | | | | |
| | |
Term Loan, 5.69%, (1 mo. USD LIBOR + 4.00%), Maturing May 1, 2026 | | $ | 1,036 | | | $ | 1,047,477 | |
| | |
| Mission Broadcasting, Inc. | | | | | | |
| | |
Term Loan, 3.94%, (1 mo. USD LIBOR + 2.25%), Maturing January 17, 2024 | | | 297 | | | | 298,279 | |
| | |
| Nexstar Broadcasting, Inc. | | | | | | |
| | |
Term Loan, 4.05%, (1 mo. USD LIBOR + 2.25%), Maturing January 17, 2024 | | | 1,494 | | | | 1,501,112 | |
| | |
Term Loan, 4.45%, (1 mo. USD LIBOR + 2.75%), Maturing September 18, 2026 | | | 400 | | | | 402,667 | |
| | |
| Sinclair Television Group, Inc. | | | | | | |
| | |
Term Loan, 4.05%, (1 mo. USD LIBOR + 2.25%), Maturing January 3, 2024 | | | 2,158 | | | | 2,162,728 | |
| | |
Term Loan, 4.24%, (1 mo. USD LIBOR + 2.50%), Maturing September 30, 2026 | | | 499 | | | | 501,166 | |
| | |
| Townsquare Media, Inc. | | | | | | |
| | |
Term Loan, 4.80%, (1 mo. USD LIBOR + 3.00%), Maturing April 1, 2022 | | | 1,027 | | | | 1,032,283 | |
| | |
| Univision Communications, Inc. | | | | | | |
| | |
Term Loan, 4.55%, (1 mo. USD LIBOR + 2.75%), Maturing March 15, 2024 | | | 3,432 | | | | 3,394,839 | |
| | |
| | | | | | | $ | 16,261,485 | |
|
| Rail Industries — 0.1% | |
| | |
| Genesee & Wyoming, Inc. | | | | | | |
| | |
Term Loan, 3.91%, (3 mo. USD LIBOR + 2.00%), Maturing December 30, 2026 | | $ | 700 | | | $ | 707,657 | |
| | |
| | | | | | | $ | 707,657 | |
|
| Retailers (Except Food and Drug) — 1.8% | |
| | |
| Apro, LLC | | | | | | |
| | |
Term Loan, 2.00%, Maturing November 14, 2026(2) | | $ | 100 | | | $ | 100,875 | |
| | |
Term Loan, 5.84%, (2 mo. USD LIBOR + 4.00%), Maturing November 14, 2026 | | | 350 | | | | 353,062 | |
| | |
| Ascena Retail Group, Inc. | | | | | | |
| | |
Term Loan, 6.31%, (1 mo. USD LIBOR + 4.50%), Maturing August 21, 2022 | | | 1,237 | | | | 848,661 | |
| | |
| Bass Pro Group, LLC | | | | | | |
| | |
Term Loan, 6.80%, (1 mo. USD LIBOR + 5.00%), Maturing September 25, 2024 | | | 880 | | | | 877,771 | |
| | |
| BJ’s Wholesale Club, Inc. | | | | | | |
| | |
Term Loan, 4.49%, (1 mo. USD LIBOR + 2.75%), Maturing February 3, 2024 | | | 2,604 | | | | 2,625,074 | |
| | |
| Coinamatic Canada, Inc. | | | | | | |
| | |
Term Loan, 5.05%, (1 mo. USD LIBOR + 3.25%), Maturing May 14, 2022 | | | 153 | | | | 150,341 | |
| | | | |
| | 19 | | See Notes to Financial Statements. |
Eaton Vance
VT Floating-Rate Income Fund
December 31, 2019
Portfolio of Investments — continued
| | | | | | | | |
| Borrower/Tranche Description | | Principal
Amount
(000’s omitted) | | | Value | |
|
| Retailers (Except Food and Drug) (continued) | |
| | |
| David’s Bridal, Inc. | | | | | | |
| | |
Term Loan, 7.92%, (3 mo. USD LIBOR + 6.00%), Maturing June 30, 2023 | | $ | 247 | | | $ | 239,786 | |
| | |
| Global Appliance, Inc. | | | | | | |
| | |
Term Loan, 5.80%, (1 mo. USD LIBOR + 4.00%), Maturing September 29, 2024 | | | 689 | | | | 688,626 | |
| | |
| Hoya Midco, LLC | | | | | | |
| | |
Term Loan, 5.30%, (1 mo. USD LIBOR + 3.50%), Maturing June 30, 2024 | | | 755 | | | | 753,270 | |
| | |
| J. Crew Group, Inc. | | | | | | |
| | |
Term Loan, 4.87%, (USD LIBOR + 3.00%), Maturing March 5, 2021(3)(4) | | | 1,878 | | | | 1,532,564 | |
| | |
| LSF9 Atlantis Holdings, LLC | | | | | | |
| | |
Term Loan, 7.74%, (1 mo. USD LIBOR + 6.00%), Maturing May 1, 2023 | | | 680 | | | | 631,685 | |
| | |
| PetSmart, Inc. | | | | | | |
| | |
Term Loan, 5.74%, (1 mo. USD LIBOR + 4.00%), Maturing March 11, 2022 | | | 2,222 | | | | 2,203,870 | |
| | |
| PFS Holding Corporation | | | | | | |
| | |
Term Loan, 5.41%, (3 mo. USD LIBOR + 3.50%), Maturing January 31, 2021 | | | 1,084 | | | | 417,292 | |
| | |
| Pier 1 Imports (U.S.), Inc. | | | | | | |
| | |
Term Loan, 5.44%, (3 mo. USD LIBOR + 3.50%), Maturing April 30, 2021 | | | 331 | | | | 89,302 | |
| | |
| | | | | | | $ | 11,512,179 | |
|
| Steel — 0.9% | |
| | |
| GrafTech Finance, Inc. | | | | | | |
| | |
Term Loan, 5.30%, (1 mo. USD LIBOR + 3.50%), Maturing February 12, 2025 | | $ | 2,151 | | | $ | 2,148,299 | |
| | |
| Neenah Foundry Company | | | | | | |
| | |
Term Loan, 8.35%, (2 mo. USD LIBOR + 6.50%), Maturing December 13, 2022 | | | 505 | | | | 495,024 | |
| | |
| Phoenix Services International, LLC | | | | | | |
| | |
Term Loan, 5.49%, (1 mo. USD LIBOR + 3.75%), Maturing March 1, 2025 | | | 658 | | | | 623,170 | |
| | |
| Zekelman Industries, Inc. | | | | | | |
| | |
Term Loan, 4.04%, (1 mo. USD LIBOR + 2.25%), Maturing June 14, 2021 | | | 2,511 | | | | 2,518,184 | |
| | |
| | | | | | | $ | 5,784,677 | |
|
| Surface Transport — 0.5% | |
| | |
| 1199169 B.C. Unlimited Liability Company | | | | | | |
| | |
Term Loan, 5.94%, (3 mo. USD LIBOR + 4.00%), Maturing April 6, 2026 | | $ | 227 | | | $ | 228,729 | |
| | | | | | | | |
| Borrower/Tranche Description | | Principal
Amount
(000’s omitted) | | | Value | |
|
| Surface Transport (continued) | |
| | |
| Agro Merchants NAI Holdings, LLC | | | | | | |
| | |
Term Loan, 5.69%, (3 mo. USD LIBOR + 3.75%), Maturing December 6, 2024 | | $ | 755 | | | $ | 747,513 | |
| | |
| Kenan Advantage Group, Inc. | | | | | | |
| | |
Term Loan, 4.80%, (1 mo. USD LIBOR + 3.00%), Maturing July 31, 2022 | | | 283 | | | | 281,863 | |
| | |
Term Loan, 4.80%, (1 mo. USD LIBOR + 3.00%), Maturing July 31, 2022 | | | 1,679 | | | | 1,671,340 | |
| | |
| XPO Logistics, Inc. | | | | | | |
| | |
Term Loan, 3.80%, (1 mo. USD LIBOR + 2.00%), Maturing February 24, 2025 | | | 450 | | | | 452,437 | |
| | |
| | | | | | | $ | 3,381,882 | |
|
| Telecommunications — 4.3% | |
| | |
| CenturyLink, Inc. | | | | | | |
| | |
Term Loan, 4.55%, (1 mo. USD LIBOR + 2.75%), Maturing January 31, 2025 | | $ | 6,193 | | | $ | 6,225,198 | |
| | |
| Ciena Corporation | | | | | | |
| | |
Term Loan, 3.76%, (1 mo. USD LIBOR + 2.00%), Maturing September 26, 2025 | | | 891 | | | | 896,383 | |
| | |
| Colorado Buyer, Inc. | | | | | | |
| | |
Term Loan, 4.74%, (1 mo. USD LIBOR + 3.00%), Maturing May 1, 2024 | | | 1,564 | | | | 1,389,353 | |
| | |
| Digicel International Finance Limited | | | | | | |
| | |
Term Loan, 5.34%, (6 mo. USD LIBOR + 3.25%), Maturing May 28, 2024 | | | 562 | | | | 505,156 | |
| | |
| Global Eagle Entertainment, Inc. | | | | | | |
| | |
Term Loan, 9.71%, (USD LIBOR + 7.50%), Maturing January 6, 2023(4) | | | 793 | | | | 719,307 | |
| | |
| Intelsat Jackson Holdings S.A. | | | | | | |
| | |
Term Loan, 5.68%, (6 mo. USD LIBOR + 3.75%), Maturing November 27, 2023 | | | 1,000 | | | | 1,003,250 | |
| | |
Term Loan, 6.43%, (6 mo. USD LIBOR + 4.50%), Maturing January 2, 2024 | | | 1,300 | | | | 1,314,219 | |
| | |
| IPC Corp. | | | | | | |
| | |
Term Loan, 6.43%, (3 mo. USD LIBOR + 4.50%), Maturing August 6, 2021 | | | 596 | | | | 503,383 | |
| | |
| Level 3 Financing, Inc. | | | | | | |
| | |
Term Loan, 3.55%, (1 mo. USD LIBOR + 1.75%), Maturing March 1, 2027 | | | 3,323 | | | | 3,342,755 | |
| | |
| Onvoy, LLC | | | | | | |
| | |
Term Loan, 6.30%, (1 mo. USD LIBOR + 4.50%), Maturing February 10, 2024 | | | 804 | | | | 729,429 | |
| | |
| Plantronics, Inc. | | | | | | |
| | |
Term Loan, 4.30%, (1 mo. USD LIBOR + 2.50%), Maturing July 2, 2025 | | | 989 | | | | 969,619 | |
| | | | |
| | 20 | | See Notes to Financial Statements. |
Eaton Vance
VT Floating-Rate Income Fund
December 31, 2019
Portfolio of Investments — continued
| | | | | | | | |
| Borrower/Tranche Description | | Principal
Amount
(000’s omitted) | | | Value | |
|
| Telecommunications (continued) | |
| | |
| Sprint Communications, Inc. | | | | | | |
| | |
Term Loan, 4.31%, (1 mo. USD LIBOR + 2.50%), Maturing February 2, 2024 | | $ | 7,806 | | | $ | 7,754,538 | |
| | |
Term Loan, 4.81%, (1 mo. USD LIBOR + 3.00%), Maturing February 2, 2024 | | | 644 | | | | 642,688 | |
| | |
| Syniverse Holdings, Inc. | | | | | | |
| | |
Term Loan, 6.85%, (2 mo. USD LIBOR + 5.00%), Maturing March 9, 2023 | | | 737 | | | | 686,522 | |
| | |
| Telesat Canada | | | | | | |
| | |
Term Loan, 4.63%, (3 mo. USD LIBOR + 2.75%), Maturing December 7, 2026 | | | 975 | | | | 982,313 | |
| | |
| | | | | | | $ | 27,664,113 | |
|
| Utilities — 0.8% | |
| | |
| Brookfield WEC Holdings, Inc. | | | | | | |
| | |
Term Loan, 5.30%, (1 mo. USD LIBOR + 3.50%), Maturing August 1, 2025 | | $ | 2,027 | | | $ | 2,042,919 | |
| | |
| Calpine Corporation | | | | | | |
| | |
Term Loan, 4.20%, (3 mo. USD LIBOR + 2.25%), Maturing April 5, 2026 | | | 721 | | | | 726,528 | |
| | |
| Lightstone Holdco, LLC | | | | | | |
| | |
Term Loan, 5.55%, (1 mo. USD LIBOR + 3.75%), Maturing January 30, 2024 | | | 46 | | | | 42,341 | |
| | |
Term Loan, 5.55%, (1 mo. USD LIBOR + 3.75%), Maturing January 30, 2024 | | | 815 | | | | 750,707 | |
| | |
| Longview Power, LLC | | | | | | |
| | |
Term Loan, 7.93%, (3 mo. USD LIBOR + 6.00%), Maturing April 13, 2021 | | | 1,122 | | | | 613,662 | |
| | |
| Vistra Operations Company, LLC | | | | | | |
| | |
Term Loan, 3.54%, (1 mo. USD LIBOR + 1.75%), Maturing December 31, 2025 | | | 1,013 | | | | 1,020,532 | |
| | |
| | | | | | | $ | 5,196,689 | |
| |
Total Senior Floating-Rate Loans
(identified cost $591,106,808) | | | $ | 578,812,896 | |
|
| Corporate Bonds & Notes — 4.3% | |
| Security | | Principal
Amount
(000’s omitted) | | | Value | |
|
| Automotive — 0.1% | |
| | |
Panther BF Aggregator 2 L.P./Panther Finance
Co., Inc. | | | | | | |
| | |
6.25%, 5/15/26(8) | | $ | 325 | | | $ | 350,797 | |
| | |
| | | | | | | $ | 350,797 | |
| | | | | | | | |
| Borrower/Tranche Description | | Principal
Amount
(000’s omitted) | | | Value | |
|
| Building and Development — 0.0%(5) | |
| | |
| American Builders & Contractors Supply Co., Inc. | | | | | | |
| | |
4.00%, 1/15/28(8) | | $ | 250 | | | $ | 254,212 | |
| | |
| | | | | | | $ | 254,212 | |
|
| Business Equipment and Services — 0.3% | |
| | |
Allied Universal Holdco, LLC/Allied Universal Finance
Corp. | | | | | | |
| | |
6.625%, 7/15/26(8) | | $ | 225 | | | $ | 242,229 | |
| | |
Prime Security Services Borrower, LLC/Prime
Finance, Inc. | | | | | | |
| | |
5.25%, 4/15/24(8) | | | 575 | | | | 609,549 | |
| | |
5.75%, 4/15/26(8) | | | 1,150 | | | | 1,252,067 | |
| | |
| | | | | | | $ | 2,103,845 | |
|
| Cable and Satellite Television — 0.6% | |
| | |
| Altice France S.A. | | | | | | |
| | |
7.375%, 5/1/26(8) | | $ | 1,000 | | | $ | 1,075,490 | |
| | |
5.50%, 1/15/28(8) | | | 400 | | | | 411,760 | |
| | |
| Ziggo B.V. | | | | | | |
| | |
5.50%, 1/15/27(8) | | | 2,500 | | | | 2,660,875 | |
| | |
| | | | | | | $ | 4,148,125 | |
|
| Containers and Glass Products — 0.7% | |
| | |
Reynolds Group Issuer, Inc./Reynolds Group Issuer,
LLC | | | | | | |
| | |
5.75%, 10/15/20 | | $ | 1,866 | | | $ | 1,870,196 | |
| | |
5.501%, (3 mo. USD LIBOR + 3.50%), 7/15/21(8)(9) | | | 650 | | | | 652,275 | |
| | |
5.125%, 7/15/23(8) | | | 2,000 | | | | 2,051,670 | |
| | |
| | | | | | | $ | 4,574,141 | |
|
| Drugs — 0.4% | |
| | |
| Bausch Health Companies, Inc. | | | | | | |
| | |
6.50%, 3/15/22(8) | | $ | 712 | | | $ | 728,910 | |
| | |
7.00%, 3/15/24(8) | | | 925 | | | | 963,929 | |
| | |
5.50%, 11/1/25(8) | | | 575 | | | | 602,074 | |
| | |
| | | | | | | $ | 2,294,913 | |
|
| Electronics / Electrical — 0.3% | |
| | |
| CommScope, Inc. | | | | | | |
| | |
6.00%, 3/1/26(8) | | $ | 2,000 | | | $ | 2,131,248 | |
| | |
| | | | | | | $ | 2,131,248 | |
| | | | |
| | 21 | | See Notes to Financial Statements. |
Eaton Vance
VT Floating-Rate Income Fund
December 31, 2019
Portfolio of Investments — continued
| | | | | | | | |
| Borrower/Tranche Description | | Principal
Amount
(000’s omitted) | | | Value | |
|
| Financial Intermediaries — 0.5% | |
| | |
| UPCB Finance IV, Ltd. | | | | | | |
| | |
5.375%, 1/15/25(8) | | $ | 3,000 | | | $ | 3,090,255 | |
| | |
| | | | | | | $ | 3,090,255 | |
|
| Food / Drug Retailers — 0.1% | |
|
| Fresh Market, Inc. (The) | |
| | |
9.75%, 5/1/23(8) | | $ | 800 | | | $ | 408,000 | |
| | |
| | | | | | | $ | 408,000 | |
|
| Health Care — 0.7% | |
|
| Avantor, Inc. | |
| | |
6.00%, 10/1/24(8) | | $ | 3,500 | | | $ | 3,739,103 | |
|
| RegionalCare Hospital Partners Holdings, Inc. | |
| | |
8.25%, 5/1/23(8) | | | 675 | | | | 714,234 | |
| | |
| | | | | | | $ | 4,453,337 | |
|
| Radio and Television — 0.4% | |
| | |
Diamond Sports Group, LLC/Diamond Sports
Finance Co. | | | | | | |
| | |
5.375%, 8/15/26(8) | | $ | 500 | | | $ | 506,713 | |
|
| iHeartCommunications, Inc. | |
| | |
6.375%, 5/1/26 | | | 47 | | | | 51,003 | |
| | |
8.375%, 5/1/27 | | | 85 | | | | 94,143 | |
| | |
5.25%, 8/15/27(8) | | | 150 | | | | 157,222 | |
| | |
4.75%, 1/15/28(8) | | | 200 | | | | 205,370 | |
|
| Univision Communications, Inc. | |
| | |
5.125%, 2/15/25(8) | | | 1,500 | | | | 1,486,875 | |
| | |
| | | | | | | $ | 2,501,326 | |
|
| Utilities — 0.2% | |
|
| Calpine Corp. | |
| | |
5.25%, 6/1/26(8) | | $ | 700 | | | $ | 730,501 | |
| | |
4.50%, 2/15/28(8) | | | 250 | | | | 252,530 | |
|
| Talen Energy Supply, LLC | |
| | |
6.625%, 1/15/28(8) | | | 375 | | | | 383,568 | |
| | |
| | | | | | | $ | 1,366,599 | |
| |
Total Corporate Bonds & Notes
(identified cost $27,038,878) | | | $ | 27,676,798 | |
| | | | | | | | |
| Common Stocks — 0.6% | |
| Security | | Shares | | | Value | |
|
| Aerospace and Defense — 0.0%(5) | |
| | |
IAP Global Services, LLC(3)(10)(11) | | | 24 | | | $ | 306,111 | |
| | |
| | | | | | | $ | 306,111 | |
|
| Automotive — 0.1% | |
| | |
Dayco Products, LLC(10)(11) | | | 15,250 | | | $ | 320,250 | |
| | |
| | | | | | | $ | 320,250 | |
|
| Business Equipment and Services — 0.0%(5) | |
| | |
Crossmark Holdings, Inc.(10)(11) | | | 3,059 | | | $ | 154,480 | |
| | |
| | | | | | | $ | 154,480 | |
|
| Chemicals and Plastics — 0.1% | |
| | |
Hexion Holdings Corp., Class B(10)(11) | | | 30,229 | | | $ | 364,259 | |
| | |
| | | | | | | $ | 364,259 | |
|
| Electronics / Electrical — 0.0%(5) | |
| | |
Answers Corp.(3)(11) | | | 20,672 | | | $ | 40,310 | |
| | |
| | | | | | | $ | 40,310 | |
|
| Health Care — 0.0% | |
| | |
New Millennium Holdco, Inc.(3)(10)(11) | | | 13,578 | | | $ | 0 | |
| | |
| | | | | | | $ | 0 | |
|
| Oil and Gas — 0.2% | |
| | |
AFG Holdings, Inc.(3)(10)(11) | | | 17,136 | | | $ | 776,604 | |
| | |
Fieldwood Energy, Inc.(10)(11) | | | 5,122 | | | | 107,562 | |
| | |
Samson Resources II, LLC, Class A(11) | | | 33,971 | | | | 713,391 | |
| | |
Southcross Holdings Group, LLC(3)(10)(11) | | | 44 | | | | 0 | |
| | |
Southcross Holdings L.P., Class A(10)(11) | | | 44 | | | | 3,212 | |
| | |
| | | | | | | $ | 1,600,769 | |
|
| Publishing — 0.0%(5) | |
| | |
ION Media Networks, Inc.(3)(11) | | | 399 | | | $ | 185,116 | |
| | |
| | | | | | | $ | 185,116 | |
|
| Radio and Television — 0.1% | |
| | |
Clear Channel Outdoor Holdings, Inc.(10)(11) | | | 19,512 | | | $ | 55,804 | |
| | |
Cumulus Media, Inc., Class A(10)(11) | | | 24,069 | | | | 422,893 | |
| | |
iHeartMedia, Inc., Class A(10)(11) | | | 8,298 | | | | 140,236 | |
| | |
| | | | | | | $ | 618,933 | |
| | | | |
| | 22 | | See Notes to Financial Statements. |
Eaton Vance
VT Floating-Rate Income Fund
December 31, 2019
Portfolio of Investments — continued
| | | | | | | | |
| Security | | Shares | | | Value | |
|
| Retailers (Except Food and Drug) — 0.1% | |
| | |
David’s Bridal, LLC(3)(10)(11) | | | 17,912 | | | $ | 387,974 | |
| | |
| | | | | | | $ | 387,974 | |
| |
Total Common Stocks
(identified cost $3,365,850) | | | $ | 3,978,202 | |
|
| Preferred Stocks — 0.0%(5) | |
| Security | | Shares | | | Value | |
|
| Retailers (Except Food and Drug) — 0.0%(5) | |
| | |
David’s Bridal, LLC, Series A(3)(10)(11) | | | 494 | | | $ | 39,520 | |
| | |
David’s Bridal, LLC, Series B(3)(10)(11) | | | 2,012 | | | | 162,892 | |
| |
Total Preferred Stocks
(identified cost $162,891) | | | $ | 202,412 | |
|
| Exchange-Traded Funds — 0.6% | |
| Security | | Shares | | | Value | |
| | |
SPDR Blackstone/GSO Senior Loan ETF | | | 76,000 | | | $ | 3,540,080 | |
| |
Total Exchange-Traded Funds
(identified cost $3,501,320) | | | $ | 3,540,080 | |
|
| Warrants — 0.0% | |
| Security | | Shares | | | Value | |
|
| Retailers (Except Food and Drug) — 0.0% | |
| | |
David’s Bridal, LLC, Exp. 11/26/22(3)(10)(11) | | | 3,427 | | | $ | 0 | |
| |
Total Warrants
(identified cost $0) | | | $ | 0 | |
|
| Miscellaneous — 0.0%(5) | |
| Security | | Shares | | | Value | |
|
| Oil and Gas — 0.0%(5) | |
| | |
Paragon Offshore Finance Company, Class A(10)(11) | | | 1,168 | | | $ | 350 | |
| | |
Paragon Offshore Finance Company, Class B(10)(11) | | | 584 | | | | 11,680 | |
| |
Total Miscellaneous
(identified cost $12,702) | | | $ | 12,030 | |
| | | | | | | | |
| Short-Term Investments — 5.6% | |
| Description | | Units | | | Value | |
| | |
Eaton Vance Cash Reserves Fund, LLC, 1.78%(12) | | | 36,378,249 | | | $ | 36,378,249 | |
| |
Total Short-Term Investments
(identified cost $36,377,528) | | | $ | 36,378,249 | |
| |
Total Investments — 100.5%
(identified cost $661,565,977) | | | $ | 650,600,667 | |
| |
Less Unfunded Loan Commitments — (0.1)% | | | $ | (470,578 | ) |
| |
Net Investments — 100.4%
(identified cost $661,095,399) | | | $ | 650,130,089 | |
| |
Other Assets, Less Liabilities — (0.4)% | | | $ | (2,515,458 | ) |
| |
Net Assets — 100.0% | | | $ | 647,614,631 | |
The percentage shown for each investment category in the Portfolio of Investments is based on net assets.
| | (1) | Senior floating-rate loans (Senior Loans) often require prepayments from excess cash flows or permit the borrowers to repay at their election. The degree to which borrowers repay, whether as a contractual requirement or at their election, cannot be predicted with accuracy. As a result, the actual remaining maturity may be substantially less than the stated maturities shown. However, Senior Loans will typically have an expected average life of approximately two to four years. Senior Loans typically have rates of interest which are redetermined periodically by reference to a base lending rate, plus a spread. These base lending rates are primarily the London Interbank Offered Rate (“LIBOR”) and secondarily, the prime rate offered by one or more major United States banks (the “Prime Rate”). Base lending rates may be subject to a floor, or minimum rate. |
| | (2) | Unfunded or partially unfunded loan commitments. The stated interest rate reflects the weighted average of the reference rate and spread for the funded portion, if any, and the commitment fees on the portion of the loan that is unfunded. At December 31, 2019, the total value of unfunded loan commitments is $474,169. See Note 1F for description. |
| | (3) | For fair value measurement disclosure purposes, security is categorized as Level 3 (see Note 11). |
| | (4) | The stated interest rate represents the weighted average interest rate at December 31, 2019 of contracts within the senior loan facility. Interest rates on contracts are primarily redetermined either weekly, monthly or quarterly by reference to the indicated base lending rate and spread and the reset period. |
| | (5) | Amount is less than 0.05%. |
| | (6) | This Senior Loan will settle after December 31, 2019, at which time the interest rate will be determined. |
| | (7) | Issuer is in default with respect to interest and/or principal payments. For a variable rate security, interest rate has been adjusted to reflect non-accrual status. |
| | (8) | Security exempt from registration pursuant to Rule 144A under the Securities Act of 1933, as amended. These securities may be sold in certain transactions in reliance on an exemption from registration (normally to qualified institutional buyers). At December 31, 2019, the aggregate value of these securities is $25,661,456 or 4.0% of the Fund’s net assets. |
| | | | |
| | 23 | | See Notes to Financial Statements. |
Eaton Vance
VT Floating-Rate Income Fund
December 31, 2019
Portfolio of Investments — continued
| | (9) | Variable rate security. The stated interest rate represents the rate in effect at December 31, 2019. |
| (10) | Non-income producing security. |
| (11) | Security was acquired in connection with a restructuring of a Senior Loan and may be subject to restrictions on resale. |
| (12) | Affiliated investment company, available to Eaton Vance portfolios and funds, which invests in high quality, U.S. dollar denominated money market instruments. The rate shown is the annualized seven-day yield as of December 31, 2019. |
Abbreviations:
| | | | |
| | |
| DIP | | – | | Debtor In Possession |
| | |
| LIBOR | | – | | London Interbank Offered Rate |
| | |
| PIK | | – | | Payment In Kind |
Currency Abbreviations:
| | | | |
| | |
| USD | | – | | United States Dollar |
| | | | |
| | 24 | | See Notes to Financial Statements. |
Eaton Vance
VT Floating-Rate Income Fund
December 31, 2019
Statement of Assets and Liabilities
| | | | |
| Assets | | December 31, 2019 | |
| |
Unaffiliated investments, at value (identified cost, $624,717,871) | | $ | 613,751,840 | |
| |
Affiliated investment, at value (identified cost, $36,377,528) | | | 36,378,249 | |
| |
Cash | | | 5,776,906 | |
| |
Interest receivable | | | 1,712,551 | |
| |
Dividends receivable from affiliated investment | | | 56,254 | |
| |
Receivable for investments sold | | | 1,499,567 | |
| |
Receivable for Fund shares sold | | | 82,088 | |
| |
Prepaid upfront fees on notes payable | | | 15,050 | |
| |
Prepaid expenses | | | 17,359 | |
| |
Total assets | | $ | 659,289,864 | |
| |
| Liabilities | | | | |
| |
Payable for investments purchased | | $ | 10,021,094 | |
| |
Payable for Fund shares redeemed | | | 605,855 | |
| |
Payable to affiliates: | | | | |
| |
Investment adviser fee | | | 314,191 | |
| |
Distribution fees | | | 135,264 | |
| |
Trustees’ fees | | | 8,638 | |
| |
Payable for shareholder servicing fees | | | 248,978 | |
| |
Accrued expenses | | | 341,213 | |
| |
Total liabilities | | $ | 11,675,233 | |
| |
Net Assets | | $ | 647,614,631 | |
| |
| Sources of Net Assets | | | | |
| |
Paid-in capital | | $ | 662,714,655 | |
| |
Accumulated loss | | | (15,100,024 | ) |
| |
Total | | $ | 647,614,631 | |
| |
| Initial Class Shares | | | | |
| |
Net Assets | | $ | 641,189,255 | |
| |
Shares Outstanding | | | 70,082,297 | |
| |
Net Asset Value, Offering Price and Redemption Price Per Share | | | | |
| |
(net assets ÷ shares of beneficial interest outstanding) | | $ | 9.15 | |
| |
| ADV Class Shares | | | | |
| |
Net Assets | | $ | 6,424,360 | |
| |
Shares Outstanding | | | 701,566 | |
| |
Net Asset Value, Offering Price and Redemption Price Per Share | | | | |
| |
(net assets ÷ shares of beneficial interest outstanding) | | $ | 9.16 | |
| |
| Institutional Class Shares | | | | |
| |
Net Assets | | $ | 1,016 | |
| |
Shares Outstanding | | | 111 | |
| |
Net Asset Value, Offering Price and Redemption Price Per Share | | | | |
| |
(net assets ÷ shares of beneficial interest outstanding) | | $ | 9.15 | |
| | | | |
| | 25 | | See Notes to Financial Statements. |
Eaton Vance
VT Floating-Rate Income Fund
December 31, 2019
Statement of Operations
| | | | |
| Investment Income | | Year Ended
December 31, 2019 | |
| |
Interest and other income | | $ | 36,939,568 | |
| |
Dividends | | | 257,273 | |
| |
Dividends from affiliated investment | | | 74,438 | |
| |
Total investment income | | $ | 37,271,279 | |
| |
| Expenses | | | | |
| |
Investment adviser fee | | $ | 3,900,529 | |
| |
Distribution fees | | | | |
| |
Initial Class | | | 1,681,890 | |
| |
Shareholder servicing fees | | | | |
| |
Initial Class | | | 1,664,784 | |
| |
ADV Class | | | 13,875 | |
| |
Trustees’ fees and expenses | | | 38,380 | |
| |
Custodian fee | | | 254,967 | |
| |
Transfer and dividend disbursing agent fees | | | 12,015 | |
| |
Legal and accounting services | | | 158,413 | |
| |
Printing and postage | | | 54,460 | |
| |
Interest expense and fees | | | 233,312 | |
| |
Miscellaneous | | | 40,154 | |
| |
Total expenses | | $ | 8,052,779 | |
| |
Net investment income | | $ | 29,218,500 | |
| |
| Realized and Unrealized Gain (Loss) | | | | |
| |
Net realized gain (loss) — | | | | |
| |
Investment transactions | | $ | (6,130,250 | ) |
| |
Investment transactions — affiliated investment | | | (327 | ) |
| |
Net realized loss | | $ | (6,130,577 | ) |
| |
Change in unrealized appreciation (depreciation) — | | | | |
| |
Investments | | $ | 24,544,824 | |
| |
Investments — affiliated investment | | | 721 | |
| |
Net change in unrealized appreciation (depreciation) | | $ | 24,545,545 | |
| |
Net realized and unrealized gain | | $ | 18,414,968 | |
| |
Net increase in net assets from operations | | $ | 47,633,468 | |
| | | | |
| | 26 | | See Notes to Financial Statements. |
Eaton Vance
VT Floating-Rate Income Fund
December 31, 2019
Statements of Changes in Net Assets
| | | | | | | | |
| | | Year Ended December 31, | |
| Increase (Decrease) in Net Assets | | 2019 | | | 2018 | |
|
From operations — | |
| | |
Net investment income | | $ | 29,218,500 | | | $ | 27,116,978 | |
| | |
Net realized gain (loss) | | | (6,130,577 | ) | | | 2,002,343 | |
| | |
Net change in unrealized appreciation (depreciation) | | | 24,545,545 | | | | (31,536,462 | ) |
| | |
Net increase (decrease) in net assets from operations | | $ | 47,633,468 | | | $ | (2,417,141 | ) |
| | |
Distributions to shareholders — | | | | | | | | |
| | |
Initial Class | | $ | (28,983,642 | ) | | $ | (26,925,968 | ) |
| | |
ADV Class | | | (253,949 | ) | | | (177,177 | ) |
| | |
Institutional Class | | | (49 | ) | | | (44 | ) |
| | |
Total distributions to shareholders | | $ | (29,237,640 | ) | | $ | (27,103,189 | ) |
| | |
Transactions in shares of beneficial interest — | | | | | | | | |
| | |
Proceeds from sale of shares | | | | | | | | |
| | |
Initial Class | | $ | 124,140,140 | | | $ | 290,048,185 | |
| | |
ADV Class | | | 2,604,643 | | | | 3,080,385 | |
| | |
Net asset value of shares issued to shareholders in payment of distributions declared | | | | | | | | |
| | |
Initial Class | | | 28,983,642 | | | | 26,925,968 | |
| | |
ADV Class | | | 253,949 | | | | 177,140 | |
| | |
Cost of shares redeemed | | | | | | | | |
| | |
Initial Class | | | (242,706,048 | ) | | | (217,460,863 | ) |
| | |
ADV Class | | | (868,731 | ) | | | (2,786,763 | ) |
| | |
Net increase (decrease) in net assets from Fund share transactions | | $ | (87,592,405 | ) | | $ | 99,984,052 | |
| | |
Net increase (decrease) in net assets | | $ | (69,196,577 | ) | | $ | 70,463,722 | |
|
| Net Assets | |
| | |
At beginning of year | | $ | 716,811,208 | | | $ | 646,347,486 | |
| | |
At end of year | | $ | 647,614,631 | | | $ | 716,811,208 | |
| | | | |
| | 27 | | See Notes to Financial Statements. |
Eaton Vance
VT Floating-Rate Income Fund
December 31, 2019
Financial Highlights
| | | | | | | | | | | | | | | | | | | | |
| | | Initial Class | |
| |
| | | Year Ended December 31, | |
| | | 2019 | | | 2018 | | | 2017 | | | 2016 | | | 2015 | |
| | | | | |
Net asset value — Beginning of year | | $ | 8.920 | | | $ | 9.270 | | | $ | 9.260 | | | $ | 8.800 | | | $ | 9.190 | |
| | | | | |
| Income (Loss) From Operations | | | | | | | | | | | | | | | | | | | | |
| | | | | |
Net investment income(1) | | $ | 0.393 | | | $ | 0.352 | | | $ | 0.303 | | | $ | 0.314 | | | $ | 0.306 | |
| | | | | |
Net realized and unrealized gain (loss) | | | 0.230 | | | | (0.352 | ) | | | 0.012 | | | | 0.460 | | | | (0.390 | ) |
| | | | | |
Total income (loss) from operations | | $ | 0.623 | | | $ | — | | | $ | 0.315 | | | $ | 0.774 | | | $ | (0.084 | ) |
| | | | | |
| Less Distributions | | | | | | | | | | | | | | | | | | | | |
| | | | | |
From net investment income | | $ | (0.393 | ) | | $ | (0.350 | ) | | $ | (0.305 | ) | | $ | (0.314 | ) | | $ | (0.306 | ) |
| | | | | |
Total distributions | | $ | (0.393 | ) | | $ | (0.350 | ) | | $ | (0.305 | ) | | $ | (0.314 | ) | | $ | (0.306 | ) |
| | | | | |
Net asset value — End of year | | $ | 9.150 | | | $ | 8.920 | | | $ | 9.270 | | | $ | 9.260 | | | $ | 8.800 | |
| | | | | |
Total Return(2)(3) | | | 7.08 | % | | | (0.07 | )% | | | 3.44 | % | | | 8.95 | % | | | (0.99 | )% |
| | | | | |
| Ratios/Supplemental Data | | | | | | | | | | | | | | | | | | | | |
| | | | | |
Net assets, end of year (000’s omitted) | | $ | 641,189 | | | $ | 712,486 | | | $ | 642,315 | | | $ | 626,950 | | | $ | 534,104 | |
| | | | | |
Ratios (as a percentage of average daily net assets): | | | | | | | | | | | | | | | | | | | | |
| | | | | |
Expenses(3) | | | 1.19 | % | | | 1.17 | % | | | 1.17 | % | | | 1.18 | % | | | 1.16 | %(4) |
| | | | | |
Net investment income | | | 4.31 | % | | | 3.79 | % | | | 3.26 | % | | | 3.48 | % | | | 3.34 | % |
| | | | | |
Portfolio Turnover | | | 29 | % | | | 30 | % | | | 41 | % | | | 44 | % | | | 19 | % |
| (1) | Computed using average shares outstanding. |
| (2) | Returns are historical and are calculated by determining the percentage change in net asset value with all distributions reinvested. |
| (3) | Excludes fees and expenses imposed by variable annuity contracts or variable life insurance policies. If included, total return would be lower. |
| (4) | Excludes the effect of custody fee credits, if any, of less than 0.005%. Effective September 1, 2015, custody fee credits, which were earned on cash deposit balances, were discontinued by the custodian. |
| | | | |
| | 28 | | See Notes to Financial Statements. |
Eaton Vance
VT Floating-Rate Income Fund
December 31, 2019
Financial Highlights — continued
| | | | | | | | | | | | | | | | | | | | |
| | | ADV Class | |
| |
| | | Year Ended December 31, | |
| | | 2019 | | | 2018 | | | 2017 | | | 2016 | | | 2015 | |
| | | | | |
Net asset value — Beginning of year | | $ | 8.920 | | | $ | 9.280 | | | $ | 9.270 | | | $ | 8.810 | | | $ | 9.190 | |
| | | | | |
| Income (Loss) From Operations | | | | | | | | | | | | | | | | | | | | |
| | | | | |
Net investment income(1) | | $ | 0.414 | | | $ | 0.374 | | | $ | 0.328 | | | $ | 0.337 | | | $ | 0.328 | |
| | | | | |
Net realized and unrealized gain (loss) | | | 0.242 | | | | (0.360 | ) | | | 0.010 | | | | 0.460 | | | | (0.379 | ) |
| | | | | |
Total income (loss) from operations | | $ | 0.656 | | | $ | 0.014 | | | $ | 0.338 | | | $ | 0.797 | | | $ | (0.051 | ) |
| | | | | |
| Less Distributions | | | | | | | | | | | | | | | | | | | | |
| | | | | |
From net investment income | | $ | (0.416 | ) | | $ | (0.374 | ) | | $ | (0.328 | ) | | $ | (0.337 | ) | | $ | (0.329 | ) |
| | | | | |
Total distributions | | $ | (0.416 | ) | | $ | (0.374 | ) | | $ | (0.328 | ) | | $ | (0.337 | ) | | $ | (0.329 | ) |
| | | | | |
Net asset value — End of year | | $ | 9.160 | | | $ | 8.920 | | | $ | 9.280 | | | $ | 9.270 | | | $ | 8.810 | |
| | | | | |
Total Return(2)(3) | | | 7.47 | % | | | 0.07 | % | | | 3.70 | % | | | 9.21 | % | | | (0.63 | )% |
| | | | | |
| Ratios/Supplemental Data | | | | | | | | | | | | | | | | | | | | |
| | | | | |
Net assets, end of year (000’s omitted) | | $ | 6,424 | | | $ | 4,324 | | | $ | 4,031 | | | $ | 2,532 | | | $ | 2,410 | |
| | | | | |
Ratios (as a percentage of average daily net assets): | | | | | | | | | | | | | | | | | | | | |
| | | | | |
Expenses(3) | | | 0.94 | % | | | 0.92 | % | | | 0.92 | % | | | 0.94 | % | | | 0.91 | %(4) |
| | | | | |
Net investment income | | | 4.53 | % | | | 4.03 | % | | | 3.53 | % | | | 3.73 | % | | | 3.62 | % |
| | | | | |
Portfolio Turnover | | | 29 | % | | | 30 | % | | | 41 | % | | | 44 | % | | | 19 | % |
| (1) | Computed using average shares outstanding. |
| (2) | Returns are historical and are calculated by determining the percentage change in net asset value with all distributions reinvested. |
| (3) | Excludes fees and expenses imposed by variable annuity contracts or variable life insurance policies. If included, total return would be lower. |
| (4) | Excludes the effect of custody fee credits, if any, of less than 0.005%. Effective September 1, 2015, custody fee credits, which were earned on cash deposit balances, were discontinued by the custodian. |
| | | | |
| | 29 | | See Notes to Financial Statements. |
Eaton Vance
VT Floating-Rate Income Fund
December 31, 2019
Financial Highlights — continued
| | | | | | | | | | | | | | | | |
| | | Institutional Class | |
| | |
| | | Year Ended December 31, | | | Period Ended
December 31, 2016(1) | |
| | | 2019 | | | 2018 | | | 2017 | |
| | | | |
Net asset value — Beginning of period | | $ | 8.920 | | | $ | 9.270 | | | $ | 9.270 | | | $ | 9.010 | |
| | | | |
| Income (Loss) From Operations | | | | | | | | | | | | | | | | |
| | | | |
Net investment income(2) | | $ | 0.441 | | | $ | 0.396 | | | $ | 0.342 | | | $ | 0.240 | |
| | | | |
Net realized and unrealized gain (loss) | | | 0.230 | | | | (0.341 | ) | | | 0.002 | | | | 0.266 | |
| | | | |
Total income from operations | | $ | 0.671 | | | $ | 0.055 | | | $ | 0.344 | | | $ | 0.506 | |
| | | | |
| Less Distributions | | | | | | | | | | | | | | | | |
| | | | |
From net investment income | | $ | (0.441 | ) | | $ | (0.405 | ) | | $ | (0.344 | ) | | $ | (0.246 | ) |
| | | | |
Total distributions | | $ | (0.441 | ) | | $ | (0.405 | ) | | $ | (0.344 | ) | | $ | (0.246 | ) |
| | | | |
Net asset value — End of period | | $ | 9.150 | | | $ | 8.920 | | | $ | 9.270 | | | $ | 9.270 | |
| | | | |
Total Return(3)(4) | | | 7.65 | % | | | 0.52 | % | | | 3.77 | % | | | 5.68 | %(5) |
| | | | |
| Ratios/Supplemental Data | | | | | | | | | | | | | | | | |
| | | | |
Net assets, end of period (000’s omitted) | | $ | 1 | | | $ | 1 | | | $ | 1 | | | $ | 1 | |
| | | | |
Ratios (as a percentage of average daily net assets): | | | | | | | | | | | | | | | | |
| | | | |
Expenses(4) | | | 0.67 | % | | | 0.68 | % | | | 0.68 | % | | | 0.69 | %(6) |
| | | | |
Net investment income | | | 4.83 | % | | | 4.27 | % | | | 3.69 | % | | | 3.95 | %(6) |
| | | | |
Portfolio Turnover | | | 29 | % | | | 30 | % | | | 41 | % | | | 44 | %(7) |
| (1) | For the period from commencement of operations on May 2, 2016 to December 31, 2016. |
| (2) | Computed using average shares outstanding. |
| (3) | Returns are historical and are calculated by determining the percentage change in net asset value with all distributions reinvested. |
| (4) | Excludes fees and expenses imposed by variable annuity contracts or variable life insurance policies. If included, total return would be lower. |
| (7) | For the year ended December 31, 2016. |
| | | | |
| | 30 | | See Notes to Financial Statements. |
Eaton Vance
VT Floating-Rate Income Fund
December 31, 2019
Notes to Financial Statements
1 Significant Accounting Policies
Eaton Vance VT Floating-Rate Income Fund (the Fund) is a diversified series of Eaton Vance Variable Trust (the Trust). The Trust is a Massachusetts business trust registered under the Investment Company Act of 1940, as amended (the 1940 Act), as an open-end management investment company. The Fund’s investment objective is to provide a high level of current income. The Fund offers Initial Class, ADV Class and Institutional Class shares, which are offered at net asset value and are not subject to a sales charge. Each class represents a pro-rata interest in the Fund, but votes separately on class-specific matters and (as noted below) is subject to different expenses. Realized and unrealized gains and losses and net investment income and losses, other than class-specific expenses, are allocated daily to each class of shares based on the relative net assets of each class to the total net assets of the Fund. Each class of shares differs in its distribution plan and certain other class-specific expenses. The Fund is generally made available for purchase only to separate accounts established by participating insurance companies and qualified pension or retirement plans.
The following is a summary of significant accounting policies of the Fund. The policies are in conformity with accounting principles generally accepted in the United States of America (U.S. GAAP). The Fund is an investment company and follows accounting and reporting guidance in the Financial Accounting Standards Board (FASB) Accounting Standards Codification Topic 946.
A Investment Valuation — The following methodologies are used to determine the market value or fair value of investments.
Senior Floating-Rate Loans. Interests in senior floating-rate loans (Senior Loans) for which reliable market quotations are readily available are valued generally at the average mean of bid and ask quotations obtained from a third party pricing service. Other Senior Loans are valued at fair value by the investment adviser under procedures approved by the Trustees. In fair valuing a Senior Loan, the investment adviser utilizes one or more of the valuation techniques described in (i) through (iii) below to assess the likelihood that the borrower will make a full repayment of the loan underlying such Senior Loan relative to yields on other Senior Loans issued by companies of comparable credit quality. If the investment adviser believes that there is a reasonable likelihood of full repayment, the investment adviser will determine fair value using a matrix pricing approach that considers the yield on the Senior Loan. If the investment adviser believes there is not a reasonable likelihood of full repayment, the investment adviser will determine fair value using analyses that include, but are not limited to: (i) a comparison of the value of the borrower’s outstanding equity and debt to that of comparable public companies; (ii) a discounted cash flow analysis; or (iii) when the investment adviser believes it is likely that a borrower will be liquidated or sold, an analysis of the terms of such liquidation or sale. In certain cases, the investment adviser will use a combination of analytical methods to determine fair value, such as when only a portion of a borrower’s assets are likely to be sold. In conducting its assessment and analyses for purposes of determining fair value of a Senior Loan, the investment adviser will use its discretion and judgment in considering and appraising relevant factors. Fair value determinations are made by the portfolio managers of the Fund based on information available to such managers. The portfolio managers of other funds managed by the investment adviser that invest in Senior Loans may not possess the same information about a Senior Loan borrower as the portfolio managers of the Fund. At times, the fair value of a Senior Loan determined by the portfolio managers of other funds managed by the investment adviser that invest in Senior Loans may vary from the fair value of the same Senior Loan determined by the portfolio managers of the Fund. The fair value of each Senior Loan is periodically reviewed and approved by the investment adviser’s Valuation Committee and by the Trustees based upon procedures approved by the Trustees. Junior Loans (i.e., subordinated loans and second lien loans) are valued in the same manner as Senior Loans.
Debt Obligations. Debt obligations are generally valued on the basis of valuations provided by third party pricing services, as derived from such services’ pricing models. Inputs to the models may include, but are not limited to, reported trades, executable bid and ask prices, broker/dealer quotations, prices or yields of securities with similar characteristics, interest rates, anticipated prepayments, benchmark curves or information pertaining to the issuer, as well as industry and economic events. The pricing services may use a matrix approach, which considers information regarding securities with similar characteristics to determine the valuation for a security. Short-term debt obligations purchased with a remaining maturity of sixty days or less for which a valuation from a third party pricing service is not readily available may be valued at amortized cost, which approximates fair value.
Equity Securities. Equity securities listed on a U.S. securities exchange generally are valued at the last sale or closing price on the day of valuation or, if no sales took place on such date, at the mean between the closing bid and ask prices on the exchange where such securities are principally traded. Equity securities listed on the NASDAQ Global or Global Select Market generally are valued at the NASDAQ official closing price. Unlisted or listed securities for which closing sales prices or closing quotations are not available are valued at the mean between the latest available bid and ask prices or, in the case of preferred equity securities that are not listed or traded in the over-the-counter market, by a third party pricing service that uses various techniques that consider factors including, but not limited to, prices or yields of securities with similar characteristics, benchmark yields, broker/dealer quotes, quotes of underlying common stock, issuer spreads, as well as industry and economic events.
Affiliated Fund. The Fund may invest in Eaton Vance Cash Reserves Fund, LLC (Cash Reserves Fund), an affiliated investment company managed by Eaton Vance Management (EVM). While Cash Reserves Fund is not a registered money market mutual fund, it conducts all of its investment activities in accordance with the requirements of Rule 2a-7 under the 1940 Act. Investments in Cash Reserves Fund are valued at the closing net asset value per unit on the valuation day. Cash Reserves Fund generally values its investment securities based on available market quotations provided by a third party pricing service.
Fair Valuation. Investments for which valuations or market quotations are not readily available or are deemed unreliable are valued at fair value using methods determined in good faith by or at the direction of the Trustees of the Fund in a manner that most fairly reflects the security’s “fair value”, which is the amount that the Fund might reasonably expect to receive for the security upon its current sale in the ordinary course. Each such determination is based on a consideration of relevant factors, which are likely to vary from one pricing context to another. These factors may include, but are not limited to, the type of security, the existence of any contractual restrictions on the security’s disposition, the price and extent of public trading in similar securities of the issuer or of comparable companies or entities, quotations or relevant information obtained from broker/dealers or other market participants, information
Eaton Vance
VT Floating-Rate Income Fund
December 31, 2019
Notes to Financial Statements — continued
obtained from the issuer, analysts, and/or the appropriate stock exchange (for exchange-traded securities), an analysis of the company’s or entity’s financial statements, and an evaluation of the forces that influence the issuer and the market(s) in which the security is purchased and sold.
B Investment Transactions — Investment transactions for financial statement purposes are accounted for on a trade date basis. Realized gains and losses on investments sold are determined on the basis of identified cost.
C Income — Interest income is recorded on the basis of interest accrued, adjusted for amortization of premium or accretion of discount. Fees associated with loan amendments are recognized immediately. Dividend income is recorded on the ex-dividend date for dividends received in cash and/or securities. Distributions from investment companies are recorded as dividend income, capital gains or return of capital based on the nature of the distribution.
D Federal Taxes — The Fund’s policy is to comply with the provisions of the Internal Revenue Code applicable to regulated investment companies and to distribute to shareholders each year substantially all of its net investment income, and all or substantially all of its net realized capital gains. Accordingly, no provision for federal income or excise tax is necessary.
As of December 31, 2019, the Fund had no uncertain tax positions that would require financial statement recognition, de-recognition, or disclosure. The Fund files a U.S. federal income tax return annually after its fiscal year-end, which is subject to examination by the Internal Revenue Service for a period of three years from the date of filing.
E Expenses — The majority of expenses of the Trust are directly identifiable to an individual fund. Expenses which are not readily identifiable to a specific fund are allocated taking into consideration, among other things, the nature and type of expense and the relative size of the funds.
F Unfunded Loan Commitments — The Fund may enter into certain loan agreements all or a portion of which may be unfunded. The Fund is obligated to fund these commitments at the borrower’s discretion. These commitments are disclosed in the accompanying Portfolio of Investments. At December 31, 2019, the Fund had sufficient cash and/or securities to cover these commitments.
G Use of Estimates — The preparation of the financial statements in conformity with U.S. GAAP requires management to make estimates and assumptions that affect the reported amounts of assets and liabilities at the date of the financial statements and the reported amounts of income and expense during the reporting period. Actual results could differ from those estimates.
H Indemnifications — Under the Trust’s organizational documents, its officers and Trustees may be indemnified against certain liabilities and expenses arising out of the performance of their duties to the Fund. Under Massachusetts law, if certain conditions prevail, shareholders of a Massachusetts business trust (such as the Trust) could be deemed to have personal liability for the obligations of the Trust. However, the Trust’s Declaration of Trust contains an express disclaimer of liability on the part of Fund shareholders and the By-laws provide that the Trust shall assume, upon request by the shareholder, the defense on behalf of any Fund shareholders. Moreover, the By-laws also provide for indemnification out of Fund property of any shareholder held personally liable solely by reason of being or having been a shareholder for all loss or expense arising from such liability. Additionally, in the normal course of business, the Fund enters into agreements with service providers that may contain indemnification clauses. The Fund’s maximum exposure under these arrangements is unknown as this would involve future claims that may be made against the Fund that have not yet occurred.
2 Distributions to Shareholders and Income Tax Information
The Fund declares dividends daily to shareholders of record at the time of declaration. Distributions are generally paid monthly. Distributions of realized capital gains are made at least annually. Distributions are declared separately for each class of shares. Shareholders may reinvest income and capital gain distributions in additional shares of the same class of the Fund at the net asset value as of the reinvestment date or, if an election is made on behalf of a separate account or qualified pension or retirement plan, to receive some or all of the distributions in cash. Distributions to shareholders are determined in accordance with income tax regulations, which may differ from U.S. GAAP. As required by U.S. GAAP, only distributions in excess of tax basis earnings and profits are reported in the financial statements as a return of capital. Permanent differences between book and tax accounting relating to distributions are reclassified to paid-in capital. For tax purposes, distributions from short-term capital gains are considered to be from ordinary income.
The tax character of distributions declared for the years ended December 31, 2019 and December 31, 2018 was as follows:
| | | | | | | | |
| | | Year Ended December 31, | |
| | | 2019 | | | 2018 | |
| | |
Ordinary income | | $ | 29,237,640 | | | $ | 27,103,189 | |
Eaton Vance
VT Floating-Rate Income Fund
December 31, 2019
Notes to Financial Statements — continued
As of December 31, 2019, the components of distributable earnings (accumulated loss) on a tax basis were as follows:
| | | | |
| | |
Undistributed ordinary income | | $ | 3,988,992 | |
| |
Deferred capital losses | | $ | (7,828,928 | ) |
| |
Net unrealized depreciation | | $ | (11,260,088 | ) |
At December 31, 2019, the Fund, for federal income tax purposes, had deferred capital losses of $7,828,928 which would reduce its taxable income arising from future net realized gains on investment transactions, if any, to the extent permitted by the Internal Revenue Code, and thus would reduce the amount of distributions to shareholders, which would otherwise be necessary to relieve the Fund of any liability for federal income or excise tax. The deferred capital losses are treated as arising on the first day of the Fund’s next taxable year and retain the same short-term or long-term character as when originally deferred. Of the deferred capital losses at December 31, 2019, $1,059,844 are short-term and $6,769,084 are long-term.
The cost and unrealized appreciation (depreciation) of investments of the Fund at December 31, 2019, as determined on a federal income tax basis, were as follows:
| | | | |
| |
Aggregate cost | | $ | 661,390,177 | |
| |
Gross unrealized appreciation | | $ | 5,427,378 | |
| |
Gross unrealized depreciation | | | (16,687,466 | ) |
| |
Net unrealized depreciation | | $ | (11,260,088 | ) |
3 Investment Adviser Fee and Other Transactions with Affiliates
The investment adviser fee is earned by Eaton Vance Management (EVM) as compensation for investment advisory services rendered to the Fund. The fee is computed at an annual rate of 0.575% of the Fund’s average daily net assets up to $1 billion, 0.525% on net assets of $1 billion but less than
$2 billion, and at reduced rates on daily net assets of $2 billion or more, and is payable monthly. For the year ended December 31, 2019, the investment adviser fee amounted to $3,900,529 or 0.575% of the Fund’s average daily net assets. EVM also serves as administrator of the Fund, but receives no compensation. Eaton Vance Distributors, Inc. (EVD), the Fund’s principal underwriter and an affiliate of EVM, received distribution fees (see Note 4).
Trustees and officers of the Fund who are members of EVM’s organization receive remuneration for their services to the Fund out of the investment adviser fee. Certain officers and Trustees of the Fund are officers of EVM.
4 Distribution Plan
The Fund has in effect a distribution plan for Initial Class shares (Initial Class Plan) pursuant to Rule 12b-1 under the 1940 Act. Pursuant to the Initial Class Plan, the Fund pays EVD a distribution fee of 0.25% per annum of its average daily net assets attributable to Initial Class shares for the sale and distribution of Initial Class shares. Distribution fees paid or accrued to EVD for the year ended December 31, 2019 amounted to $1,681,890. Insurance companies receive such fees from EVD based on the value of shares held by such companies. The insurance companies through which investors hold shares of the Fund may also pay fees to third parties in connection with the sale of variable contracts and for services provided to variable contract owners. The Fund, EVM or EVD are not a party to these arrangements. Investors should consult the prospectus and statement of additional information for their variable contracts for a discussion of these payments. EVD may, at its expense, provide promotional incentives to dealers that sell variable insurance products.
Distribution fees are subject to the limitations contained in the Financial Industry Regulatory Authority Rule 2341(d).
5 Shareholder Servicing Plan
The Trust, on behalf of the Fund, has adopted a Shareholder Servicing Plan (Servicing Plan) for Initial Class and ADV Class. The Servicing Plan allows the Trust to enter into shareholder servicing agreements with insurance companies, investment dealers, broker/dealers or other financial intermediaries that provide shareholder services relating to Fund shares and their shareholders, including variable contract owners or plan participants with interests in the Fund. Under the Servicing Plan, the Fund may make payments at an annual rate of up to 0.25% of its average daily net assets attributable to each class that are subject to shareholder servicing agreements. No shareholder servicing fees are levied on shares owned by EVM, its affiliates, or their respective employees or clients and may be waived under certain other limited conditions. For the year ended December 31, 2019, shareholder servicing fees were equivalent to 0.25% per annum of each class’ average daily net assets and amounted to $1,664,784 and $13,875 for Initial Class and ADV Class, respectively.
Eaton Vance
VT Floating-Rate Income Fund
December 31, 2019
Notes to Financial Statements — continued
6 Purchases and Sales of Investments
Purchases and sales of investments, other than short-term obligations and including maturities and principal repayments on Senior Loans, aggregated $191,749,953 and $287,356,003, respectively, for the year ended December 31, 2019.
7 Shares of Beneficial Interest
The Fund’s Declaration of Trust permits the Trustees to issue an unlimited number of full and fractional shares of beneficial interest (without par value). Such shares may be issued in a number of different series (such as the Fund) and classes. Transactions in Fund shares were as follows:
| | | | | | | | |
| | | Year Ended December 31, | |
| Initial Class | | 2019 | | | 2018 | |
| | |
Sales | | | 13,587,661 | | | | 31,202,462 | |
| | |
Issued to shareholders electing to receive payments of distributions in Fund shares | | | 3,176,208 | | | | 2,907,651 | |
| | |
Redemptions | | | (26,586,657 | ) | | | (23,487,559 | ) |
| | |
Net increase (decrease) | | | (9,822,788 | ) | | | 10,622,554 | |
| |
| | | Year Ended December 31, | |
| ADV Class | | 2019 | | | 2018 | |
| | |
Sales | | | 284,516 | | | | 330,919 | |
| | |
Issued to shareholders electing to receive payments of distributions in Fund shares | | | 27,812 | | | | 19,111 | |
| | |
Redemptions | | | (95,264 | ) | | | (299,977 | ) |
| | |
Net increase | | | 217,064 | | | | 50,053 | |
There were no transactions in Institutional Class shares for the years ended December 31, 2019 and December 31, 2018.
At December 31, 2019, separate accounts of 3 insurance companies each owned more than 10% of the value of the outstanding shares of the Fund aggregating 69.0%.
8 Credit Facility
The Fund participates with other portfolios managed by EVM and its affiliates in a $875 million unsecured credit facility agreement (Agreement) with a group of banks, which is in effect through March 9, 2020. Borrowings are made by the Fund solely to facilitate the handling of unusual and/or unanticipated short-term cash requirements. Interest is payable on amounts borrowed overnight at the Federal Funds rate plus a margin and for all other amounts borrowed for longer periods at a base rate or LIBOR, plus a margin. In addition, a fee computed at an annual rate of 0.15% on the daily unused portion of each lender’s commitment amount is allocated between the Fund and the other participating portfolios at the end of each quarter. Also included in interest expense and fees on the Statement of Operations is approximately $92,000 of amortization of upfront fees paid by the Fund in connection with the annual renewal of the Agreement. The unamortized balance of upfront fees at December 31, 2019 is $15,050 and is included in prepaid upfront fees on notes payable on the Statement of Assets and Liabilities. Because the credit facility is not available exclusively to the Fund and the maximum amount is capped, it may be unable to borrow some or all of a requested amount at any particular time. The Fund did not have any significant borrowings during the year ended December 31, 2019.
9 Credit Risk
The Fund invests primarily in below investment grade floating-rate loans, which are considered speculative because of the credit risk of their issuers. Changes in economic conditions or other circumstances are more likely to reduce the capacity of issuers of these securities to make principal and interest payments. Such companies are more likely to default on their payments of interest and principal owed than issuers of investment grade bonds. An economic downturn generally leads to a higher non-payment rate, and a loan or other debt obligation may lose significant value before a default occurs. Lower rated investments also may be subject to greater price volatility than higher rated investments. Moreover, the specific collateral used to secure a loan may decline in value or become illiquid, which would adversely affect the loan’s value.
Eaton Vance
VT Floating-Rate Income Fund
December 31, 2019
Notes to Financial Statements — continued
10 Investments in Affiliated Funds
At December 31, 2019, the value of the Fund’s investment in affiliated funds was $36,378,249, which represents 5.6% of the Fund’s net assets. Transactions in affiliated funds by the Fund for the year ended December 31, 2019 were as follows:
| | | | | | | | | | | | | | | | | | | | | | | | | | | | | | | | |
| Name of affiliated fund | | Value,
beginning
of period | | | Purchases | | | Sales proceeds | | | Net
realized
gain (loss) | | | Change in
unrealized
appreciation
(depreciation) | | | Value, end
of period | | | Dividend
income | | | Units, end
of period | |
|
Short-Term Investments | |
| | | | | | | | |
Eaton Vance Cash Reserves Fund, LLC, 1.78% | | $ | — | | | $ | 49,000,933 | | | $ | (12,623,078 | ) | | $ | (327 | ) | | $ | 721 | | | $ | 36,378,249 | | | $ | 74,438 | | | | 36,378,249 | |
11 Fair Value Measurements
Under generally accepted accounting principles for fair value measurements, a three-tier hierarchy to prioritize the assumptions, referred to as inputs, is used in valuation techniques to measure fair value. The three-tier hierarchy of inputs is summarized in the three broad levels listed below.
| • | | Level 1 – quoted prices in active markets for identical investments |
| • | | Level 2 – other significant observable inputs (including quoted prices for similar investments, interest rates, prepayment speeds, credit risk, etc.) |
| • | | Level 3 – significant unobservable inputs (including a fund’s own assumptions in determining the fair value of investments) |
In cases where the inputs used to measure fair value fall in different levels of the fair value hierarchy, the level disclosed is determined based on the lowest level input that is significant to the fair value measurement in its entirety. The inputs or methodology used for valuing securities are not necessarily an indication of the risk associated with investing in those securities.
At December 31, 2019, the hierarchy of inputs used in valuing the Fund’s investments, which are carried at value, were as follows:
| | | | | | | | | | | | | | | | |
| Asset Description | | Level 1 | | | Level 2 | | | Level 3* | | | Total | |
| | | | |
Senior Floating-Rate Loans (Less Unfunded Loan Commitments) | | $ | — | | | $ | 575,326,249 | | | $ | 3,016,069 | | | $ | 578,342,318 | |
| | | | |
Corporate Bonds & Notes | | | — | | | | 27,676,798 | | | | — | | | | 27,676,798 | |
| | | | |
Common Stocks | | | 983,192 | | | | 1,298,895 | | | | 1,696,115 | | | | 3,978,202 | |
| | | | |
Preferred Stocks | | | — | | | | — | | | | 202,412 | | | | 202,412 | |
| | | | |
Exchange-Traded Funds | | | 3,540,080 | | | | — | | | | — | | | | 3,540,080 | |
| | | | |
Miscellaneous | | | — | | | | 12,030 | | | | — | | | | 12,030 | |
| | | | |
Warrants | | | — | | | | — | | | | 0 | | | | 0 | |
| | | | |
Short-Term Investments | | | — | | | | 36,378,249 | | | | — | | | | 36,378,249 | |
| | | | |
Total Investments | | $ | 4,523,272 | | | $ | 640,692,221 | | | $ | 4,914,596 | | | $ | 650,130,089 | |
| * | None of the unobservable inputs for Level 3 assets, individually or collectively, had a material impact on the Fund. |
Level 3 investments at the beginning and/or end of the period in relation to net assets were not significant and accordingly, a reconciliation of Level 3 assets for the year ended December 31, 2019 is not presented.
12 Legal Proceedings
In May 2015, the Fund was served with an amended complaint filed in an adversary proceeding in the United States Bankruptcy Court for the Southern District of New York. The adversary proceeding was filed by the Motors Liquidation Company Avoidance Action Trust (“AAT”) against the former holders of a $1.5 billion term loan issued by General Motors Corp. (“GM”) in 2006 (the “Term Loan Lenders”) who received a full repayment of the term loan pursuant to a court order in the GM bankruptcy proceeding. The court order was made with the understanding that the term loan was fully secured at the time of GM’s bankruptcy filing in June 2009. The AAT sought (1) a determination from the Bankruptcy Court that the security interest held by the Term
Eaton Vance
VT Floating-Rate Income Fund
December 31, 2019
Notes to Financial Statements — continued
Loan Lenders was not perfected at the time GM filed for Chapter 11 Bankruptcy protection and thus the Term Loan Lenders should have been treated in the same manner as GM’s unsecured creditors, (2) disgorgement of any interest payments made to the Term Loan Lenders within ninety days of GM’s filing for Chapter 11 Bankruptcy protection, and (3) disgorgement of the $1.5 billion term loan repayment that was made to the Term Loan Lenders. The value of the payment received under the term loan agreement by the Fund was approximately $5,763,000. In April 2019, the parties to the litigation reached a settlement agreement in principle, subject to Court approval. On June 12, 2019, the Court approved the settlement, and all claims and cross claims in the litigation were dismissed on July 2, 2019. The Fund did not suffer any loss to the Fund’s net asset value as a result of the settlement and recovered a portion of the attorney’s fees and costs incurred, which were previously expensed by the Fund.
Eaton Vance
VT Floating-Rate Income Fund
December 31, 2019
Report of Independent Registered Public Accounting Firm
To the Trustees of Eaton Vance Variable Trust and Shareholders of Eaton Vance VT Floating-Rate Income Fund:
Opinion on the Financial Statements and Financial Highlights
We have audited the accompanying statement of assets and liabilities of Eaton Vance VT Floating-Rate Income Fund (the “Fund”) (one of the funds constituting Eaton Vance Variable Trust), including the portfolio of investments, as of December 31, 2019, the related statement of operations for the year then ended, the statements of changes in net assets for each of the two years in the period then ended, the financial highlights for each of the five years in the period then ended, and the related notes. In our opinion, the financial statements and financial highlights present fairly, in all material respects, the financial position of the Fund as of December 31, 2019, and the results of its operations for the year then ended, the changes in its net assets for each of the two years in the period then ended, and the financial highlights for each of the five years in the period then ended, in conformity with accounting principles generally accepted in the United States of America.
Basis for Opinion
These financial statements and financial highlights are the responsibility of the Fund’s management. Our responsibility is to express an opinion on the Fund’s financial statements and financial highlights based on our audits. We are a public accounting firm registered with the Public Company Accounting Oversight Board (United States) (PCAOB) and are required to be independent with respect to the Fund in accordance with the U.S. federal securities laws and the applicable rules and regulations of the Securities and Exchange Commission and the PCAOB.
We conducted our audits in accordance with the standards of the PCAOB. Those standards require that we plan and perform the audit to obtain reasonable assurance about whether the financial statements and financial highlights are free of material misstatement, whether due to error or fraud. The Fund is not required to have, nor were we engaged to perform, an audit of its internal control over financial reporting. As part of our audits we are required to obtain an understanding of internal control over financial reporting but not for the purpose of expressing an opinion on the effectiveness of the Fund’s internal control over financial reporting. Accordingly, we express no such opinion.
Our audits included performing procedures to assess the risks of material misstatement of the financial statements and financial highlights, whether due to error or fraud, and performing procedures that respond to those risks. Such procedures included examining, on a test basis, evidence regarding the amounts and disclosures in the financial statements and financial highlights. Our audits also included evaluating the accounting principles used and significant estimates made by management, as well as evaluating the overall presentation of the financial statements and financial highlights. Our procedures included confirmation of securities and senior loans owned as of December 31, 2019, by correspondence with the custodian, brokers and selling or agent banks; when replies were not received from brokers and selling or agent banks, we performed other auditing procedures. We believe that our audits provide a reasonable basis for our opinion.
/s/ Deloitte & Touche LLP
Boston, Massachusetts
February 21, 2020
We have served as the auditor of one or more Eaton Vance investment companies since 1959.
Eaton Vance
VT Floating-Rate Income Fund
December 31, 2019
Management and Organization
Fund Management. The Trustees of Eaton Vance Variable Trust (the Trust) are responsible for the overall management and supervision of the Trust’s affairs. The Trustees and officers of the Trust are listed below. Except as indicated, each individual has held the office shown or other offices in the same company for the last five years. Trustees and officers of the Trust hold indefinite terms of office. The “noninterested Trustees” consist of those Trustees who are not “interested persons” of the Trust, as that term is defined under the 1940 Act. The business address of each Trustee and officer is Two International Place, Boston, Massachusetts 02110. As used below, “EVC” refers to Eaton Vance Corp., “EV” refers to Eaton Vance, Inc., “EVM” refers to Eaton Vance Management, “BMR” refers to Boston Management and Research and “EVD” refers to Eaton Vance Distributors, Inc. EVC and EV are the corporate parent and trustee, respectively, of EVM and BMR. EVD is the Fund’s principal underwriter and a wholly-owned subsidiary of EVC. Each officer affiliated with Eaton Vance may hold a position with other Eaton Vance affiliates that is comparable to his or her position with EVM listed below. Each Trustee oversees 159 portfolios in the Eaton Vance Complex (including all master and feeder funds in a master feeder structure). Each officer serves as an officer of certain other Eaton Vance funds. Each Trustee and officer serves until his or her successor is elected.
| | | | | | |
| Name and Year of Birth | | Position(s)
with the
Trust | | Trustee
Since(1) | | Principal Occupation(s) and Directorships
During Past Five Years and Other Relevant Experience |
|
| Interested Trustee |
| | | |
Thomas E. Faust Jr. 1958 | | Trustee | | 2007 | | Chairman, Chief Executive Officer and President of EVC, Director and President of EV, Chief Executive Officer and President of EVM and BMR, and Director of EVD. Trustee and/or officer of 159 registered investment companies. Mr. Faust is an interested person because of his positions with EVM, BMR, EVD, EVC and EV, which are affiliates of the Trust. Directorships in the Last Five Years. Director of EVC and Hexavest Inc. (investment management firm). |
|
| Noninterested Trustees |
| | | |
Mark R. Fetting 1954 | | Trustee | | 2016 | | Private investor. Formerly held various positions at Legg Mason, Inc. (investment management firm) (2000-2012), including President, Chief Executive Officer, Director and Chairman (2008-2012), Senior Executive Vice President (2004-2008) and Executive Vice President (2001-2004). Formerly, President of Legg Mason family of funds (2001-2008). Formerly, Division President and Senior Officer of Prudential Financial Group, Inc. and related companies (investment management firm)(1991-2000). Other Directorships in the Last Five Years. None. |
| | | |
Cynthia E. Frost 1961 | | Trustee | | 2014 | | Private investor. Formerly, Chief Investment Officer of Brown University (university endowment) (2000-2012). Formerly, Portfolio Strategist for Duke Management Company (university endowment manager) (1995-2000). Formerly, Managing Director, Cambridge Associates (investment consulting company) (1989-1995). Formerly, Consultant, Bain and Company (management consulting firm) (1987-1989). Formerly, Senior Equity Analyst, BA Investment Management Company (1983-1985). Other Directorships in the Last Five Years. None. |
| | | |
George J. Gorman 1952 | | Trustee | | 2014 | | Principal at George J. Gorman LLC (consulting firm). Formerly, Senior Partner at Ernst & Young LLP (a registered public accounting firm) (1974-2009). Other Directorships in the Last Five Years. Formerly, Trustee of the BofA Funds Series Trust (11 funds) (2011-2014) and of the Ashmore Funds (9 funds) (2010-2014). |
| | | |
Valerie A. Mosley 1960 | | Trustee | | 2014 | | Chairwoman and Chief Executive Officer of Valmo Ventures (a consulting and investment firm). Former Partner and Senior Vice President, Portfolio Manager and Investment Strategist at Wellington Management Company, LLP (investment management firm) (1992-2012). Former Chief Investment Officer, PG Corbin Asset Management (1990-1992). Formerly worked in institutional corporate bond sales at Kidder Peabody (1986-1990). Other Directorships in the Last Five Years. Director of Envestnet, Inc. (provider of intelligent systems for wealth management and financial wellness) (since 2018). Director of Dynex Capital, Inc. (mortgage REIT) (since 2013). |
Eaton Vance
VT Floating-Rate Income Fund
December 31, 2019
Management and Organization — continued
| | | | | | |
| Name and Year of Birth | | Position(s)
with the
Trust | | Trustee
Since(1) | | Principal Occupation(s) and Directorships
During Past Five Years and Other Relevant Experience |
|
| Noninterested Trustees (continued) |
| | | |
William H. Park 1947 | | Chairperson of the Board and Trustee | | 2016 (Chairperson) 2003 (Trustee) | | Private investor. Formerly, Consultant (management and transactional) (2012-2014). Formerly, Chief Financial Officer, Aveon Group L.P. (investment management firm) (2010-2011). Formerly, Vice Chairman, Commercial Industrial Finance Corp. (specialty finance company) (2006-2010). Formerly, President and Chief Executive Officer, Prizm Capital Management, LLC (investment management firm)(2002-2005). Formerly, Executive Vice President and Chief Financial Officer, United Asset Management Corporation (investment management firm) (1982-2001). Formerly, Senior Manager, Price Waterhouse (now PricewaterhouseCoopers) (a registered public accounting firm) (1972-1981). Other Directorships in the Last Five Years. None. |
| | | |
Helen Frame Peters 1948 | | Trustee | | 2008 | | Professor of Finance, Carroll School of Management, Boston College. Formerly, Dean, Carroll School of Management, Boston College (2000-2002). Formerly, Chief Investment Officer, Fixed Income, Scudder Kemper Investments (investment management firm) (1998-1999). Formerly, Chief Investment Officer, Equity and Fixed Income, Colonial Management Associates (investment management firm)(1991-1998). Other Directorships in the Last Five Years. None. |
| | | |
Keith Quinton 1958 | | Trustee | | 2018 | | Independent Investment Committee Member at New Hampshire Retirement System (since 2017). Advisory Committee member at Northfield Information Services, Inc. (risk management analytics provider) (since 2016). Formerly, Portfolio Manager and Senior Quantitative Analyst at Fidelity Investments (investment management firm)(2001-2014). Other Directorships in the Last Five Years. Director of New Hampshire Municipal Bond Bank (since 2016). |
| | | |
Marcus L. Smith 1966 | | Trustee | | 2018 | | Member of Posse Boston Advisory Board (foundation) (since 2015). Trustee at University of Mount Union (since 2008). Formerly, Portfolio Manager at MFS Investment Management (investment management firm) (1994-2017). Other Directorships in the Last Five Years. Director of MSCI Inc. (global provider of investment decision support tools) (since 2017). Formerly, Director of DCT Industrial Trust Inc. (logistics real estate company) (2017-2018). |
| | | |
Susan J. Sutherland 1957 | | Trustee | | 2015 | | Private investor. Formerly, Associate, Counsel and Partner at Skadden, Arps, Slate, Meagher & Flom LLP (law firm) (1982-2013). Other Directorships in the Last Five Years. Formerly, Director of Montpelier Re Holdings Ltd. (global provider of customized insurance and reinsurance products) (2013-2015). |
| | | |
Scott E. Wennerholm 1959 | | Trustee | | 2016 | | Formerly, Trustee at Wheelock College (postsecondary institution) (2012-2018). Formerly, Consultant at GF Parish Group (executive recruiting firm) (2016-2017). Formerly, Chief Operating Officer and Executive Vice President at BNY Mellon Asset Management (investment management firm) (2005-2011). Formerly, Chief Operating Officer and Chief Financial Officer at Natixis Global Asset Management (investment management firm) (1997-2004). Formerly, Vice President at Fidelity Investments Institutional Services (investment management firm) (1994-1997). Other Directorships in the Last Five Years. None. |
| | | | | | |
| Name and Year of Birth | | Position(s)
with the
Trust | | Officer
Since(2) | | Principal Occupation(s)
During Past Five Years |
|
| Principal Officers who are not Trustees |
| | | |
Payson F. Swaffield 1956 | | President | | 2003 | | Vice President and Chief Income Investment Officer of EVM and BMR. Also Vice President of Calvert Research and Management (“CRM”). |
| | | |
Maureen A. Gemma 1960 | | Vice President, Secretary and Chief Legal Officer | | 2005 | | Vice President of EVM and BMR. Also Vice President of CRM. |
Eaton Vance
VT Floating-Rate Income Fund
December 31, 2019
Management and Organization — continued
| | | | | | |
| Name and Year of Birth | | Position(s)
with the
Trust | | Officer
Since(2) | | Principal Occupation(s)
During Past Five Years |
|
| Principal Officers who are not Trustees (continued) |
| | | |
James F. Kirchner 1967 | | Treasurer | | 2007 | | Vice President of EVM and BMR. Also Vice President of CRM. |
| | | |
Richard F. Froio 1968 | | Chief Compliance Officer | | 2017 | | Vice President of EVM and BMR since 2017. Formerly, Deputy Chief Compliance Officer (Adviser/Funds) and Chief Compliance Officer (Distribution) at PIMCO(2012-2017) and Managing Director at BlackRock/Barclays Global Investors(2009-2012). |
| (1) | Year first appointed to serve as Trustee for a fund in the Eaton Vance family of funds. Each Trustee has served continuously since appointment unless indicated otherwise. |
| (2) | Year first elected to serve as officer of a fund in the Eaton Vance family of funds when the officer has served continuously. Otherwise, year of most recent election as an officer of a fund in the Eaton Vance family of funds. Titles may have changed since initial election. |
The SAI for the Fund includes additional information about the Trustees and officers of the Fund and can be obtained without charge on Eaton Vance’s website at www.eatonvance.com or by calling 1-800-262-1122.
Eaton Vance Funds
IMPORTANT NOTICES
Privacy. The Eaton Vance organization is committed to ensuring your financial privacy. Each entity listed below has adopted a privacy policy and procedures (“Privacy Program”) Eaton Vance believes is reasonably designed to protect your personal information and to govern when and with whom Eaton Vance may share your personal information.
| • | | At the time of opening an account, Eaton Vance generally requires you to provide us with certain information such as name, address, social security number, tax status, account numbers, and account balances. This information is necessary for us to both open an account for you and to allow us to satisfy legal requirements such as applicable anti-money laundering reviews and know-your-customer requirements. |
| • | | On an ongoing basis, in the normal course of servicing your account, Eaton Vance may share your information with unaffiliated third parties that perform various services for Eaton Vance and/or your account. These third parties include transfer agents, custodians, broker/dealers and our professional advisers, including auditors, accountants, and legal counsel. Eaton Vance may additionally share your personal information with our affiliates. |
| • | | We believe our Privacy Program is reasonably designed to protect the confidentiality of your personal information and to prevent unauthorized access to that information. |
| • | | We reserve the right to change our Privacy Program at any time upon proper notification to you. You may want to review our Privacy Program periodically for changes by accessing the link on our homepage: www.eatonvance.com. |
Our pledge of protecting your personal information applies to the following entities within the Eaton Vance organization: the Eaton Vance Family of Funds, Eaton Vance Management, Eaton Vance Investment Counsel, Eaton Vance Distributors, Inc., Eaton Vance Trust Company, Eaton Vance Management (International) Limited, Eaton Vance Advisers International Limited, Eaton Vance Global Advisors Limited, Eaton Vance Management’s Real Estate Investment Group, Boston Management and Research, Calvert Research and Management, and Calvert Funds. This Privacy Notice supersedes all previously issued privacy disclosures. For more information about our Privacy Program or about how your personal information may be used, please call 1-800-262-1122.
Delivery of Shareholder Documents. The Securities and Exchange Commission (SEC) permits funds to deliver only one copy of shareholder documents, including prospectuses, proxy statements and shareholder reports, to fund investors with multiple accounts at the same residential or post office box address. This practice is often called “householding” and it helps eliminate duplicate mailings to shareholders.Eaton Vance, or your financial intermediary, may household the mailing of your documents indefinitely unless you instruct Eaton Vance, or your financial intermediary, otherwise.If you would prefer that your Eaton Vance documents not be householded, please contact Eaton Vance at1-800-262-1122, or contact your financial intermediary. Your instructions that householding not apply to delivery of your Eaton Vance documents will typically be effective within 30 days of receipt by Eaton Vance or your financial intermediary.
Portfolio Holdings. Each Eaton Vance Fund and its underlying Portfolio(s) (if applicable) files a schedule of portfolio holdings on Part F toForm N-PORT with the SEC for the first and third quarters of each fiscal year. The Form N-PORT will be available on the Eaton Vance website at www.eatonvance.com, by calling Eaton Vance at 1-800-262-1122 or in the EDGAR database on the SEC’s website at www.sec.gov.
Proxy Voting. From time to time, funds are required to vote proxies related to the securities held by the funds. The Eaton Vance Funds or their underlying Portfolios (if applicable) vote proxies according to a set of policies and procedures approved by the Funds’ and Portfolios’ Boards. You may obtain a description of these policies and procedures and information on how the Funds or Portfolios voted proxies relating to portfolio securities during the most recent 12-month period ended June 30, without charge, upon request, by calling 1-800-262-1122 and by accessing the SEC’s website at www.sec.gov.
This Page Intentionally Left Blank
This Page Intentionally Left Blank
This Page Intentionally Left Blank
Investment Adviser and Administrator
Eaton Vance Management
Two International Place
Boston, MA 02110
Principal Underwriter*
Eaton Vance Distributors, Inc.
Two International Place
Boston, MA 02110
(617) 482-8260
Custodian
State Street Bank and Trust Company
State Street Financial Center, One Lincoln Street
Boston, MA 02111
Transfer Agent
State Street Bank and Trust Company
State Street Financial Center, One Lincoln Street
Boston, MA 02111
Independent Registered Public Accounting Firm
Deloitte & Touche LLP
200 Berkeley Street
Boston, MA 02116-5022
Fund Offices
Two International Place
Boston, MA 02110
| * | FINRA BrokerCheck. Investors may check the background of their Investment Professional by contacting the Financial Industry Regulatory Authority (FINRA). FINRA BrokerCheck is a free tool to help investors check the professional background of current and former FINRA-registered securities firms and brokers. FINRA BrokerCheck is available by calling 1-800-289-9999 and at www.FINRA.org. The FINRA BrokerCheck brochure describing this program is available to investors at www.FINRA.org. |

1939 12.31.19
Item 2. Code of Ethics
The registrant has adopted a code of ethics applicable to its Principal Executive Officer, Principal Financial Officer and Principal Accounting Officer. The registrant undertakes to provide a copy of such code of ethics to any person upon request, without charge, by calling1-800-262-1122. The registrant has not amended the code of ethics as described in FormN-CSR during the period covered by this report. The registrant has not granted any waiver, including an implicit waiver, from a provision of the code of ethics as described in FormN-CSR during the period covered by this report.
Item 3. Audit Committee Financial Expert
The registrant’s Board has designated George J. Gorman and William H. Park, each an independent trustee, as audit committee financial experts. Mr. Gorman is a certified public accountant who is the Principal at George J. Gorman LLC (a consulting firm). Previously, Mr. Gorman served in various capacities at Ernst & Young LLP (a registered public accounting firm), including as Senior Partner. Mr. Gorman also has experience serving as an independent trustee and audit committee financial expert of other mutual fund complexes. Mr. Park is a certified public accountant who is a private investor. Previously, he served as a consultant, as the Chief Financial Officer of Aveon Group, L.P. (an investment management firm), as the Vice Chairman of Commercial Industrial Finance Corp. (specialty finance company), as President and Chief Executive Officer of Prizm Capital Management, LLC (investment management firm), as Executive Vice President and Chief Financial Officer of United Asset Management Corporation (an institutional investment management firm) and as a Senior Manager at Price Waterhouse (now PricewaterhouseCoopers) (a registered public accounting firm).
Item 4. Principal Accountant Fees and Services
Eaton Vance VT Floating-Rate Income Fund (the “Fund”) is a series of Eaton Vance Variable Trust (the “Trust”), a Massachusetts business trust, which, including the Fund, contains a total of 1series (the “Series”). The Trust is registered under the Investment Company Act of 1940 as anopen-end management investment company. This FormN-CSR relates to the Fund’s annual report.
(a)-(d)
The following table presents the aggregate fees billed to the Fund for the Fund’s fiscal years ended December 31, 2018 and December 31, 2019 by the registrant’s principal accountant, Deloitte & Touche LLP (“D&T”), for professional services rendered for the audit of the Fund’s annual financial statements and fees billed for other services rendered by D&T during such periods.
Eaton Vance VT Floating-Rate Income Fund
| | | | | | | | |
Fiscal Years Ended | | 12/31/18 | | | 12/31/19 | |
Audit Fees | | $ | 77,103 | | | $ | 77,138 | |
Audit-Related Fees(1) | | $ | 0 | | | $ | 0 | |
Tax Fees(2) | | $ | 14,210 | | | $ | 14,423 | |
All Other Fees(3) | | $ | 0 | | | $ | 0 | |
| | | | | | | | |
Total | | $ | 91,313 | | | $ | 91,561 | |
| | | | | | | | |
| (1) | Audit-related fees consist of the aggregate fees billed for assurance and related services that are reasonably related to the performance of the audit of the registrant’s financial statements and are not reported under the category of audit fees. |
| (2) | Tax fees consist of the aggregate fees billed for professional services rendered by the principal accountant relating to tax compliance, tax advice, and tax planning and specifically include fees for tax return preparation and other related tax compliance/planning matters. |
| (3) | All other fees consist of the aggregate fees billed for products and services provided by the registrant’s principal accountant other than audit, audit-related, and tax services. |
The following table presents the aggregate audit, audit-related, tax, and other fees billed to all of the Series in the Trust by D&T for the last two fiscal years of each Series.
| | | | | | | | |
| | | 12/31/18 | | | 12/31/19 | |
Audit Fees | | $ | 77,103 | | | $ | 77,138 | |
Audit-Related Fees(1) | | $ | 0 | | | $ | 0 | |
Tax Fees(2) | | $ | 14,210 | | | $ | 14,423 | |
All Other Fees(3) | | $ | 0 | | | $ | 0 | |
| | | | | | | | |
Total | | $ | 91,313 | | | $ | 91,561 | |
| | | | | | | | |
| (1) | Audit-related fees consist of the aggregate fees billed for assurance and related services that are reasonably related to the performance of the audit of financial statements and are not reported under the category of audit fees. |
| (2) | Tax fees consist of the aggregate fees billed for professional services rendered by the principal accountant relating to tax compliance, tax advice, and tax planning and specifically include fees for tax return preparation. |
| (3) | All other fees consist of the aggregate fees billed for products and services provided by the principal accountant other than audit, audit-related, and tax services. |
(e)(1) The registrant’s audit committee has adopted policies and procedures relating to thepre-approval of services provided by the registrant’s principal accountant (the“Pre-Approval Policies”). ThePre-Approval Policies establish a framework intended to assist the audit committee in the proper discharge of itspre-approval responsibilities. As a general matter, thePre-Approval Policies (i) specify certain types of audit, audit-related, tax, and other services determined to bepre-approved by the audit committee; and (ii) delineate specific procedures governing the mechanics of thepre-approval process, including the approval and monitoring of audit andnon-audit service fees. Unless a service is specificallypre-approved under thePre-Approval Policies, it must be separatelypre-approved by the audit committee.
ThePre-Approval Policies and the types of audit andnon-audit servicespre-approved therein must be reviewed and ratified by the registrant’s audit committee at least annually. The registrant’s audit committee maintains full responsibility for the appointment, compensation, and oversight of the work of the registrant’s principal accountant.
(e)(2) No services described in paragraphs (b)-(d) above were approved by the registrant’s audit committee pursuant to the “de minimis exception” set forth in Rule2-01 (c)(7)(i)(C) of RegulationS-X.
(f) Not applicable.
(g) The following table presents (i) the aggregatenon-audit fees (i.e., fees for audit-related, tax, and other services) billed for services rendered to all of the Series in the Trust by D&T for the last two fiscal years of each Series; and (ii) the aggregatenon-audit fees (i.e., fees for audit-related, tax, and other services) billed to the Eaton Vance organization by D&T for the last two fiscal years of each Series.
| | | | | | | | |
Fiscal Years Ended | | 12/31/18 | | | 12/31/19 | |
Registrant(1) | | $ | 14,210 | | | $ | 14,423 | |
Eaton Vance(2) | | $ | 126,485 | | | $ | 59,903 | |
| (1) | Includes all of the Series in the Trust. |
| (2) | The investment adviser to the Funds, as well as any of its affiliates that provide ongoing services to the Funds, are subsidiaries of Eaton Vance Corp. |
(h) The registrant’s audit committee has considered whether the provision by the registrant’s principal accountant ofnon-audit services to the registrant’s investment adviser and any entity controlling, controlled by, or under common control with the adviser that provides ongoing services to the registrant that were notpre-approved pursuant to Rule2-01(c)(7)(ii) of RegulationS-X is compatible with maintaining the principal accountant’s independence.
Item 5. Audit Committee of Listed Registrants
Not applicable.
Item 6. Schedule of Investments
Please see schedule of investments contained in the Report to Stockholders included under Item 1 of this FormN-CSR.
Item 7. Disclosure of Proxy Voting Policies and Procedures forClosed-End Management Investment Companies
Not applicable.
Item 8. Portfolio Managers ofClosed-End Management Investment Companies
Not applicable.
Item 9. Purchases of Equity Securities byClosed-End Management Investment Company and Affiliated Purchasers
Not applicable.
Item 10. Submission of Matters to a Vote of Security Holders
No material changes.
Item 11. Controls and Procedures
(a) It is the conclusion of the registrant’s principal executive officer and principal financial officer that the effectiveness of the registrant’s current disclosure controls and procedures (such disclosure controls and procedures having been evaluated within 90 days of the date of this filing) provide reasonable assurance that the information required to be disclosed by the registrant has been recorded, processed, summarized and reported within the time period specified in the Commission’s rules and forms and that the information required to be disclosed by the registrant has been accumulated and communicated to the registrant’s principal executive officer and principal financial officer in order to allow timely decisions regarding required disclosure.
(b) There have been no changes in the registrant’s internal controls over financial reporting during the period covered by this report that has materially affected, or is reasonably likely to materially affect, the registrant’s internal control over financial reporting.
Item 12. Disclosure of Securities Lending Activities forClosed-End Management Investment Companies
Not applicable.
Item 13. Exhibits
| | |
| |
| (a)(1) | | Registrant’s Code of Ethics – Not applicable (please see Item 2). |
| |
| (a)(2)(i) | | Treasurer’s Section 302 certification. |
| |
| (a)(2)(ii) | | President’s Section 302 certification. |
| |
| (b) | | Combined Section 906 certification. |
Signatures
Pursuant to the requirements of the Securities Exchange Act of 1934 and the Investment Company Act of 1940, the registrant has duly caused this report to be signed on its behalf by the undersigned, thereunto duly authorized.
| | |
| Eaton Vance Variable Trust |
| |
| By: | | /s/ Payson F. Swaffield |
| | Payson F. Swaffield |
| | President |
| |
| Date: | | February 24, 2020 |
Pursuant to the requirements of the Securities Exchange Act of 1934 and the Investment Company Act of 1940, this report has been signed below by the following persons on behalf of the registrant and in the capacities and on the dates indicated.
| | |
| By: | | /s/ James F. Kirchner |
| | James F. Kirchner |
| | Treasurer |
| |
| Date: | | February 24, 2020 |
| |
| By: | | /s/ Payson F. Swaffield |
| | Payson F. Swaffield |
| | President |
| |
| Date: | | February 24, 2020 |