UNITED STATES
SECURITIES AND EXCHANGE COMMISSION
Washington, D.C. 20549
Form N-CSR
CERTIFIED SHAREHOLDER REPORT OF REGISTERED
MANAGEMENT INVESTMENT COMPANIES
Investment Company Act File Number: 811-10067
Eaton Vance Variable Trust
(Exact Name of Registrant as Specified in Charter)
Two International Place, Boston, Massachusetts 02110
(Address of Principal Executive Offices)
Maureen A. Gemma
Two International Place, Boston, Massachusetts 02110
(Name and Address of Agent for Services)
(617) 482-8260
(Registrant’s Telephone Number)
December 31
Date of Fiscal Year End
December 31, 2020
Date of Reporting Period
| Item 1. | Reports to Stockholders |

Eaton Vance
VT Floating-Rate Income Fund
Annual Report
December 31, 2020

Commodity Futures Trading Commission Registration. The Commodity Futures Trading Commission (“CFTC”) has adopted regulations that subject registered investment companies and advisers to regulation by the CFTC if a fund invests more than a prescribed level of its assets in certain CFTC-regulated instruments (including futures, certain options and swap agreements) or markets itself as providing investment exposure to such instruments. The investment adviser has claimed an exclusion from the definition of “commodity pool operator” under the Commodity Exchange Act with respect to its management of the Fund. Accordingly, neither the Fund nor the adviser with respect to the operation of the Fund is subject to CFTC regulation. Because of its management of other strategies, the Fund’s adviser is registered with the CFTC as a commodity pool operator. The adviser is also registered as a commodity trading advisor.
Fund shares are not insured by the FDIC and are not deposits or other obligations of, or guaranteed by, any depository institution. Shares are subject to investment risks, including possible loss of principal invested.
This report must be preceded or accompanied by a current summary prospectus or prospectus. Before investing, investors should consider carefully the investment objective, risks, and charges and expenses of a mutual fund. This and other important information is contained in the summary prospectus and prospectus, which can be obtained from a financial intermediary. Prospective investors should read the prospectus carefully before investing. For further information, please call 1-800-262-1122.
Annual Report December 31, 2020
Eaton Vance
VT Floating-Rate Income Fund
Eaton Vance
VT Floating-Rate Income Fund
December 31, 2020
Management’s Discussion of Fund Performance1
Economic and Market Conditions
The 12-month period ended December 31, 2020, was dominated by the outbreak of the novel coronavirus, which turned into a global pandemic that ended the longest-ever U.S. economic expansion and led to a dramatic decline in economic activity around the globe.
The first signs of trouble appeared in late January 2020, as coronavirus headlines rattled investors’ nerves across capital markets. Loan prices, however, remained firm through January and retail fund flows turned positive for the first time in 16 months. But in the last week of February, as investors digested the potential economic effects of the spreading pandemic in the U.S., a global sell-off unfolded across both equity and credit markets, including the senior loan market.
March was the worst month of the period for the loan asset class, and the second-worst month in the loan market’s history. The S&P/LSTA Leveraged Loan Index (the Index), a broad measure of the asset class, returned –12.37% against the backdrop of a global slide in capital markets amid a “flight to safety” by investors. As investors withdrew $14.7 billion from retail loan funds during the month, the average price of loans in the Index bottomed for the period at $76.23 on March 23.
Beginning the last week of March, however, credit markets, including senior loans, turned a corner as central banks around the world stepped in to shore up capital markets. The U.S. Federal Reserve cut its benchmark federal funds rate to 0.00%-0.25% and announced a spectrum of support measures to help credit markets worldwide. In response, the loan market began a rally that continued through the end of the period. In the closing months of the period, the easing of political uncertainties with the election of Joe Biden as president, coupled with the emergency approval and initial rollout of two COVID-19 vaccines, added further fuel to the rally.
Technical factors were also a tailwind for loans as demand outpaced supply for most of the period. Contributing factors included an increase in institutional demand for structured loan products and eight months of easing retail fund redemptions from April through November. This culminated in a return to net monthly inflows for retail funds in December 2020, for the first time since the previous January. By period-end, the average price of loans had risen to $96.19 — a dramatic increase from its March low and just shy of its $96.72 level at the start of 2020.
For the period as a whole, BBB rated loans within the Index returned 1.37%, while BB rated loans returned 0.75%, B rated loans returned 3.80%, CCC rated loans returned 4.35%, D rated (defaulted) loans returned –31.71%, and the Index overall returned 3.12%. Issuer fundamentals deteriorated in response to the global economic slowdown, with the trailing 12-month default rate rising from 1.39% at the beginning of the period to 3.83% at period-end — nearly one percentage point above the long-term average.
Fund Performance
For the 12-month period ended December 31, 2020, Eaton Vance VT Floating-Rate Income Fund (the Fund) returned 2.00% for Initial Class shares at net asset value (NAV), underperforming its benchmark, the Index, which returned 3.12%. The Index is unmanaged, and returns do not reflect any applicable sales charges, commissions, or expenses.
The Fund has historically tended to maintain underweight exposures relative to the Index to lower credit quality segments of the market — positioning that may help the Fund experience limited credit losses over the long run, but may detract from relative performance versus the Index in times when lower quality loans perform well. This underweight to lower quality loans, which tend to have higher coupon yields, may also result in a lower average coupon yield for the Fund relative to the Index.
During the period, the Fund’s underweight exposure to lower quality CCC rated loans and second lien loans, which generally outperformed the broader Index, detracted from Fund performance versus the Index.
The Fund’s cash position also detracted from performance versus the Index. While holding cash benefited performance versus the Index when loan prices were falling in February and March 2020, it detracted from relative results when loan prices rose for much of the rest of the period, and the overall effect of the Fund’s cash position was negative. The Index does not include cash. Loan selection in the oil and gas and the retailers (ex-food and drug) industries detracted from Fund performance relative to the Index as well.
In contrast, an overweight position and loan selections in the drugs industry — which benefited from the search for COVID-19 vaccines and treatments — and an underweight position in the air transport industry — which was hit hard by falling demand during the pandemic — contributed to Fund performance versus the Index. Loan selections in the leisure goods/activities/movies and the business equipment and services industries helped relative performance as well during the period.
See Endnotes and Additional Disclosures in this report.
Past performance is no guarantee of future results. Returns are historical and are calculated by determining the percentage change in net asset value (NAV) or offering price (as applicable) with all distributions reinvested. Investment return and principal value will fluctuate so that shares, when redeemed, may be worth more or less than their original cost. Performance for periods less than or equal to one year is cumulative. Performance is for the stated time period only; due to market volatility, current Fund performance may be lower or higher than the quoted return.
Eaton Vance
VT Floating-Rate Income Fund
December 31, 2020
Performance2,3
Portfolio Managers Craig P. Russ, Andrew N. Sveen, CFA, Jeffrey R. Hesselbein, CFA and Michael J. Turgel, CFA
| | | | | | | | | | | | | | | | | | | | |
| % Average Annual Total Returns | | Class
Inception Date | | | Performance Inception Date | | | One Year | | | Five Years | | | Ten Years | |
| | | | | |
Initial Class at NAV | | | 05/02/2001 | | | | 05/02/2001 | | | | 2.00 | % | | | 4.22 | % | | | 3.42 | % |
ADV Class at NAV | | | 04/15/2014 | | | | 05/02/2001 | | | | 2.26 | | | | 4.48 | | | | 3.59 | |
Institutional Class at NAV | | | 05/02/2016 | | | | 05/02/2001 | | | | 2.64 | | | | 4.74 | | | | 3.72 | |
|
| |
| | | | | |
S&P/LSTA Leveraged Loan Index | | | — | | | | — | | | | 3.12 | % | | | 5.23 | % | | | 4.32 | % |
| | | | | |
| % Total Annual Operating Expense Ratios4 | | | | | | | | Initial Class | | | ADV Class | | | Institutional
Class | |
| | | | | |
| | | | | | | | | | | 1.19 | % | | | 0.94 | % | | | 0.67 | % |
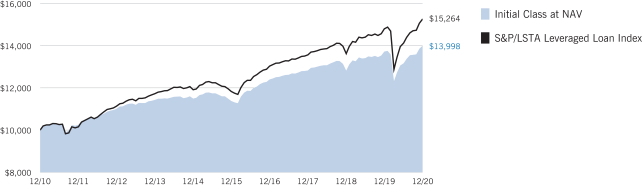
Growth of $10,000
This graph shows the change in value of a hypothetical investment of $10,000 in Initial Class of the Fund for the period indicated. For comparison, the same investment is shown in the indicated index.
| | | | | | | | | | | | | | | | |
| Growth of Investment3 | | Amount Invested | | | Period Beginning | | | At NAV | | | With Maximum Sales Charge | |
| | | | |
ADV Class | | | $10,000 | | | | 12/31/2010 | | | | $14,232 | | | | N.A. | |
Institutional Class | | | $10,000 | | | | 12/31/2010 | | | | $14,411 | | | | N.A. | |
See Endnotes and Additional Disclosures in this report.
Past performance is no guarantee of future results. Returns are historical and are calculated by determining the percentage change in net asset value (NAV) or offering price (as applicable) with all distributions reinvested. Investment return and principal value will fluctuate so that shares, when redeemed, may be worth more or less than their original cost. Performance for periods less than or equal to one year is cumulative. Performance is for the stated time period only; due to market volatility, current Fund performance may be lower or higher than the quoted return.
Eaton Vance
VT Floating-Rate Income Fund
December 31, 2020
Fund Profile
Top 10 Issuers (% of total investments)5
| | | | |
Virgin Media SFA Finance Limited | | | 1.4 | % |
| |
TransDigm, Inc. | | | 1.2 | |
| |
Ziggo B.V. | | | 1.2 | |
| |
Hyland Software, Inc. | | | 1.0 | |
| |
Informatica, LLC | | | 1.0 | |
| |
CenturyLink, Inc. | | | 0.9 | |
| |
Serta Simmons Bedding, LLC | | | 0.9 | |
| |
Ultimate Software Group, Inc. (The) | | | 0.9 | |
| |
UPC Broadband Holding B.V. | | | 0.9 | |
| |
JBS USA Lux S.A. | | | 0.9 | |
| |
Total | | | 10.3 | % |
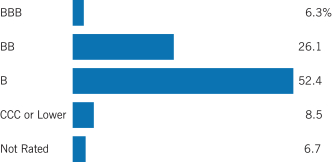
Credit Quality (% of bonds and loans)6
Top 10 Sectors (% of total investments)5
| | | | |
Electronics/Electrical | | | 19.1 | % |
| |
Business Equipment and Services | | | 9.2 | |
| |
Health Care | | | 7.3 | |
| |
Telecommunications | | | 4.3 | |
| |
Cable and Satellite Television | | | 4.1 | |
| |
Industrial Equipment | | | 4.0 | |
| |
Drugs | | | 3.9 | |
| |
Chemicals and Plastics | | | 3.9 | |
| |
Insurance | | | 3.8 | |
| |
Radio and Television | | | 3.6 | |
| |
Total | | | 63.2 | % |
See Endnotes and Additional Disclosures in this report.
Eaton Vance
VT Floating-Rate Income Fund
December 31, 2020
Endnotes and Additional Disclosures
| 1 | The views expressed in this report are those of the portfolio manager(s) and are current only through the date stated at the top of this page. These views are subject to change at any time based upon market or other conditions, and Eaton Vance and the Fund(s) disclaim any responsibility to update such views. These views may not be relied upon as investment advice and, because investment decisions are based on many factors, may not be relied upon as an indication of trading intent on behalf of any Eaton Vance fund. This commentary may contain statements that are not historical facts, referred to as “forward looking statements.” The Fund’s actual future results may differ significantly from those stated in any forward looking statement, depending on factors such as changes in securities or financial markets or general economic conditions, the volume of sales and purchases of Fund shares, the continuation of investment advisory, administrative and service contracts, and other risks discussed from time to time in the Fund’s filings with the Securities and Exchange Commission. |
| 2 | S&P/LSTA Leveraged Loan Index is an unmanaged index of the institutional leveraged loan market. S&P/LSTA Leveraged Loan indices are a product of S&P Dow Jones Indices LLC (“S&P DJI”) and have been licensed for use. S&P® is a registered trademark of S&P DJI; Dow Jones® is a registered trademark of Dow Jones Trademark Holdings LLC (“Dow Jones”); LSTA is a trademark of Loan Syndications and Trading Association, Inc. S&P DJI, Dow Jones, their respective affiliates and their third party licensors do not sponsor, endorse, sell or promote the Fund, will not have any liability with respect thereto and do not have any liability for any errors, omissions, or interruptions of the S&P Dow Jones Indices. Unless otherwise stated, index returns do not reflect the effect of any applicable sales charges, commissions, expenses, taxes or leverage, as applicable. It is not possible to invest directly in an index. |
| 3 | There is no sales charge. Insurance-related charges are not included in the calculation of returns. If such charges were reflected, the returns would be lower. Please refer to the report for your insurance contract for performance data reflecting insurance-related charges. |
Performance prior to the inception date of a class may be linked to the performance of an older class of the Fund. This linked performance is not adjusted for class expense differences. If adjusted for such differences, the performance would be different. The performance of ADV Class is linked to Initial Class and the performance of Institutional Class is linked to ADV Class. Performance presented in the Financial Highlights included in the financial statements is not linked.
| 4 | Source: Fund prospectus. The expense ratios for the current reporting period can be found in the Financial Highlights section of this report. |
| 5 | Excludes cash and cash equivalents. |
| 6 | For purposes of the Fund’s rating restrictions, ratings are categorized using S&P Global Ratings (“S&P”). Ratings, which are subject to change, apply to the creditworthiness of the issuers of the underlying securities and not to the Fund or its shares. Credit ratings measure the quality of a bond based on the issuer’s creditworthiness, with ratings ranging from AAA, being the highest, to D, being the lowest based on S&P’s measures. Ratings of BBB or higher by S&P are considered to be investment-grade quality. Credit ratings are based largely on the ratings agency’s analysis at the time of rating. The rating assigned to any particular security is not necessarily a reflection of the issuer’s current financial condition and does not necessarily reflect its assessment of the volatility of a security’s market value or of the liquidity of an investment in the security. Holdings designated as “Not Rated” (if any) are not rated by S&P. |
Fund profile subject to change due to active management.
Eaton Vance
VT Floating-Rate Income Fund
December 31, 2020
Fund Expenses
Example: As a Fund shareholder, you incur ongoing costs, including management fees; distribution and/or service fees; and other Fund expenses. This Example is intended to help you understand your ongoing costs (in dollars) of Fund investing and to compare these costs with the ongoing costs of investing in other mutual funds. The Example is based on an investment of $1,000 invested at the beginning of the period and held for the entire period (July 1, 2020 – December 31, 2020).
Actual Expenses: The first section of the table below provides information about actual account values and actual expenses. You may use the information in this section, together with the amount you invested, to estimate the expenses that you paid over the period. Simply divide your account value by $1,000 (for example, an $8,600 account value divided by $1,000 = 8.6), then multiply the result by the number in the first section under the heading entitled “Expenses Paid During Period” to estimate the expenses you paid on your account during this period.
Hypothetical Example for Comparison Purposes: The second section of the table below provides information about hypothetical account values and hypothetical expenses based on the actual Fund expense ratio and an assumed rate of return of 5% per year (before expenses), which is not the actual Fund return. The hypothetical account values and expenses may not be used to estimate the actual ending account balance or expenses you paid for the period. You may use this information to compare the ongoing costs of investing in your Fund and other funds. To do so, compare this 5% hypothetical example with the 5% hypothetical examples that appear in the shareholder reports of the other funds.
Please note that the expenses shown in the table are meant to highlight your ongoing costs only and do not reflect expenses and charges which are, or may be imposed under the variable annuity contract or variable life insurance policy (variable contracts) (if applicable) through which your investment in the Fund is made. Therefore, the second section of the table is useful in comparing ongoing costs associated with an investment in vehicles which fund benefits under variable contracts and to qualified pension and retirement plans, and will not help you determine the relative total costs of investing in the Fund through variable contracts. In addition, if these expenses and charges imposed under the variable contracts were included, your costs would be higher.
| | | | | | | | | | | | | | | | |
| | | Beginning
Account Value
(7/1/20) | | | Ending
Account Value
(12/31/20) | | | Expenses Paid
During Period*
(7/1/20 – 12/31/20) | | | Annualized
Expense
Ratio | |
| | | | |
Actual | | | | | | | | | | | | | | | | |
Initial Class | | $ | 1,000.00 | | | $ | 1,063.70 | | | $ | 6.07 | | | | 1.17 | % |
ADV Class | | $ | 1,000.00 | | | $ | 1,065.00 | | | $ | 4.78 | | | | 0.92 | % |
Institutional Class | | $ | 1,000.00 | | | $ | 1,067.00 | | | $ | 3.33 | | | | 0.64 | % |
| | | | | |
Hypothetical | | | | | | | | | | | | | | | | |
(5% return per year before expenses) | | | | | | | | | | | | | | | | |
Initial Class | | $ | 1,000.00 | | | $ | 1,019.30 | | | $ | 5.94 | | | | 1.17 | % |
ADV Class | | $ | 1,000.00 | | | $ | 1,020.50 | | | $ | 4.67 | | | | 0.92 | % |
Institutional Class | | $ | 1,000.00 | | | $ | 1,021.90 | | | $ | 3.25 | | | | 0.64 | % |
| * | Expenses are equal to the Fund’s annualized expense ratio for the indicated Class, multiplied by the average account value over the period, multiplied by 184/366 (to reflect the one-half year period). The Example assumes that the $1,000 was invested at the net asset value per share determined at the close of business on June 30, 2020. Expenses shown do not include insurance-related charges. |
Eaton Vance
VT Floating-Rate Income Fund
December 31, 2020
Portfolio of Investments
| | | | | | | | |
| Common Stocks — 1.1% | |
| Security | | Shares | | | Value | |
|
| Aerospace and Defense — 0.1% | |
| | |
IAP Global Services, LLC(1)(2)(3) | | | 24 | | | $ | 351,089 | |
| | |
| | | | | | | $ | 351,089 | |
|
| Automotive — 0.0%(4) | |
| | |
Dayco Products, LLC(2)(3) | | | 15,250 | | | $ | 83,875 | |
| | |
| | | | | | | $ | 83,875 | |
|
| Business Equipment and Services — 0.0%(4) | |
| | |
Crossmark Holdings, Inc.(2)(3) | | | 3,059 | | | $ | 175,892 | |
| | |
| | | | | | | $ | 175,892 | |
|
| Chemicals and Plastics — 0.1% | |
| | |
Hexion Holdings Corp., Class B(2)(3) | | | 30,229 | | | $ | 370,305 | |
| | |
| | | | | | | $ | 370,305 | |
|
| Containers and Glass Products — 0.0%(4) | |
| | |
LG Newco Holdco, Inc.(2)(3) | | | 33,758 | | | $ | 84,395 | |
| | |
| | | | | | | $ | 84,395 | |
|
| Electronics / Electrical — 0.4% | |
| | |
Answers Corp.(1)(2)(3) | | | 20,672 | | | $ | 11,990 | |
| | |
Software Luxembourg Holding S.A.(2)(3) | | | 10,695 | | | | 1,818,150 | |
| | |
| | | | | | | $ | 1,830,140 | |
|
| Health Care — 0.1% | |
| | |
Akorn Holding Company, LLC, Class A(2)(3) | | | 58,449 | | | $ | 781,755 | |
| | |
| | | | | | | $ | 781,755 | |
|
| Nonferrous Metals / Minerals — 0.0%(4) | |
| | |
ACNR Holdings, Inc., Class A(2)(3) | | | 2,056 | | | $ | 14,392 | |
| | |
| | | | | | | $ | 14,392 | |
|
| Oil and Gas — 0.1% | |
| | |
AFG Holdings, Inc.(1)(2)(3) | | | 17,136 | | | $ | 318,558 | |
| | |
Fieldwood Energy, Inc.(2)(3) | | | 5,122 | | | | 512 | |
| | |
McDermott International, Ltd.(2)(3) | | | 103,251 | | | | 83,633 | |
| | |
RDV Resources, Inc., Class A(1)(2)(3) | | | 10,680 | | | | 0 | |
| | |
Samson Resources II, LLC, Class A(1)(2)(3) | | | 33,971 | | | | 220,812 | |
| | |
Sunrise Oil & Gas, Inc., Class A(2)(3) | | | 7,468 | | | | 2,241 | |
| | |
| | | | | | | $ | 625,756 | |
| | | | | | | | |
| Security | | Shares | | | Value | |
|
| Publishing — 0.1% | |
| | |
ION Media Networks, Inc.(1)(2)(3) | | | 399 | | | $ | 264,988 | |
| | |
| | | | | | | $ | 264,988 | |
|
| Radio and Television — 0.1% | |
| | |
Clear Channel Outdoor Holdings, Inc.(2)(3) | | | 19,512 | | | $ | 32,195 | |
| | |
Cumulus Media, Inc., Class A(2)(3) | | | 24,069 | | | | 209,882 | |
| | |
iHeartMedia, Inc., Class A(2)(3) | | | 8,298 | | | | 107,708 | |
| | |
| | | | | | | $ | 349,785 | |
|
| Retailers (Except Food and Drug) — 0.0%(4) | |
| | |
David’s Bridal, LLC(1)(2)(3) | | | 17,912 | | | $ | 123,414 | |
| | |
Phillips Pet Holding Corp.(1)(2)(3) | | | 285 | | | | 122,912 | |
| | |
| | | | | | | $ | 246,326 | |
|
| Utilities — 0.1% | |
| | |
Longview Intermediate Holdings, LLC,
Class A(1)(2)(3) | | | 36,023 | | | $ | 290,706 | |
| | |
| | | | | | | $ | 290,706 | |
| |
Total Common Stocks
(identified cost $6,277,085) | | | $ | 5,469,404 | |
|
| Corporate Bonds & Notes — 5.1% | |
| Security | | Principal
Amount
(000’s omitted) | | | Value | |
|
| Aerospace and Defense — 0.1% | |
| | |
| Spirit AeroSystems, Inc. | | | | | | |
| | |
5.50%, 1/15/25(5) | | $ | 250 | | | $ | 264,038 | |
| | |
| Spirit Loyalty Cayman, Ltd./Spirit IP Cayman, Ltd. | | | | | | |
| | |
8.00%, 9/20/25(5) | | | 225 | | | | 253,125 | |
| | |
| | | | | | | $ | 517,163 | |
|
| Air Transport — 0.2% | |
| | |
| Delta Air Lines, Inc./SkyMiles IP, Ltd. | | | | | | |
| | |
4.50%, 10/20/25(5) | | $ | 550 | | | $ | 588,062 | |
| | |
4.75%, 10/20/28(5) | | | 550 | | | | 600,778 | |
| | |
| | | | | | | $ | 1,188,840 | |
|
| Automotive — 0.1% | |
| | |
| Clarios Global, L.P. | | | | | | |
| | |
6.75%, 5/15/25(5) | | $ | 200 | | | $ | 215,814 | |
| | |
6.25%, 5/15/26(5) | | | 325 | | | | 348,969 | |
| | |
| | | | | | | $ | 564,783 | |
| | | | |
| | 7 | | See Notes to Financial Statements. |
Eaton Vance
VT Floating-Rate Income Fund
December 31, 2020
Portfolio of Investments — continued
| | | | | | | | |
| Security | | Principal
Amount
(000’s omitted) | | | Value | |
|
| Building and Development — 0.1% | |
| | |
| American Builders & Contractors Supply Co., Inc. | | | | | | |
| | |
4.00%, 1/15/28(5) | | $ | 250 | | | $ | 259,173 | |
| | |
| Cushman & Wakefield U.S. Borrower, LLC | | | | | | |
| | |
6.75%, 5/15/28(5) | | | 300 | | | | 331,687 | |
| | |
| | | | | | | $ | 590,860 | |
|
| Business Equipment and Services — 0.5% | |
| | |
| Allied Universal Holdco, LLC | | | | | | |
| | |
6.625%, 7/15/26(5) | | $ | 575 | | | $ | 613,841 | |
| | |
| Garda World Security Corp. | | | | | | |
| | |
4.625%, 2/15/27(5) | | | 700 | | | | 708,750 | |
| | |
Prime Security Services
Borrower, LLC/Prime
Finance, Inc. | | | | | | |
| | |
5.25%, 4/15/24(5) | | | 575 | | | | 614,531 | |
| | |
| Sabre GLBL, Inc. | | | | | | |
| | |
9.25%, 4/15/25(5) | | | 225 | | | | 268,031 | |
| | |
7.375%, 9/1/25(5) | | | 175 | | | | 190,138 | |
| | |
| | | | | | | $ | 2,395,291 | |
|
| Cable and Satellite Television — 0.8% | |
| | |
| Altice France S.A. | | | | | | |
| | |
7.375%, 5/1/26(5) | | $ | 1,000 | | | $ | 1,053,750 | |
| | |
5.50%, 1/15/28(5) | | | 400 | | | | 418,704 | |
| | |
5.125%, 1/15/29(5) | | | 100 | | | | 103,687 | |
| | |
| Ziggo B.V. | | | | | | |
| | |
5.50%, 1/15/27(5) | | | 2,248 | | | | 2,350,498 | |
| | |
| | | | | | | $ | 3,926,639 | |
|
| Containers and Glass Products — 0.1% | |
| | |
| Reynolds Group Issuer, Inc./Reynolds Group Issuer, LLC | | | | | | |
| | |
5.125%, 7/15/23(5) | | $ | 76 | | | $ | 76,973 | |
| | |
4.00%, 10/15/27(5) | | | 450 | | | | 461,812 | |
| | |
| | | | | | | $ | 538,785 | |
|
| Cosmetics / Toiletries — 0.0%(4) | |
| | |
Kronos Acquisition Holdings,
Inc./KIK Custom
Products, Inc. | | | | | | |
| | |
5.00%, 12/31/26(5) | | $ | 100 | | | $ | 104,500 | |
| | |
| | | | | | | $ | 104,500 | |
|
| Diversified Financial Services — 0.1% | |
| | |
| AG Issuer, LLC | | | | | | |
| | |
6.25%, 3/1/28(5) | | $ | 350 | | | $ | 354,813 | |
| | |
| | | | | | | $ | 354,813 | |
| | | | | | | | |
| Security | | Principal
Amount
(000’s omitted) | | | Value | |
|
| Drugs — 0.3% | |
| | |
| Bausch Health Companies, Inc. | | | | | | |
| | |
7.00%, 3/15/24(5) | | $ | 925 | | | $ | 952,519 | |
| | |
5.50%, 11/1/25(5) | | | 575 | | | | 596,442 | |
| | |
| | | | | | | $ | 1,548,961 | |
|
| Ecological Services and Equipment — 0.1% | |
| | |
| GFL Environmental, Inc. | | | | | | |
| | |
4.25%, 6/1/25(5) | | $ | 475 | | | $ | 493,703 | |
| | |
| | | | | | | $ | 493,703 | |
|
| Electronics / Electrical — 0.6% | |
| | |
| CommScope, Inc. | | | | | | |
| | |
6.00%, 3/1/26(5) | | $ | 2,000 | | | $ | 2,109,830 | |
| | |
| LogMeIn, Inc. | | | | | | |
| | |
5.50%, 9/1/27(5) | | | 375 | | | | 393,281 | |
| | |
| Veritas US, Inc./Veritas Bermuda, Ltd. | | | | | | |
| | |
7.50%, 9/1/25(5) | | | 550 | | | | 565,125 | |
| | |
| | | | | | | $ | 3,068,236 | |
|
| Entertainment — 0.0%(4) | |
| | |
| Six Flags Theme Parks, Inc. | | | | | | |
| | |
7.00%, 7/1/25(5) | | $ | 200 | | | $ | 216,375 | |
| | |
| | | | | | | $ | 216,375 | |
|
| Food Products — 0.2% | |
| | |
| Del Monte Foods, Inc. | | | | | | |
| | |
11.875%, 5/15/25(5) | | $ | 750 | | | $ | 852,656 | |
| | |
| | | | | | | $ | 852,656 | |
|
| Food / Drug Retailers — 0.2% | |
| | |
| Fresh Market, Inc. (The) | | | | | | |
| | |
9.75%, 5/1/23(5) | | $ | 800 | | | $ | 825,676 | |
| | |
| | | | | | | $ | 825,676 | |
|
| Health Care — 0.0%(4) | |
| | |
| RP Escrow Issuer, LLC | | | | | | |
| | |
5.25%, 12/15/25(5) | | $ | 175 | | | $ | 183,255 | |
| | |
| | | | | | | $ | 183,255 | |
|
| Industrial Equipment — 0.0%(4) | |
| | |
| Clark Equipment Company | | | | | | |
| | |
5.875%, 6/1/25(5) | | $ | 100 | | | $ | 105,813 | |
| | |
| | | | | | | $ | 105,813 | |
| | | | |
| | 8 | | See Notes to Financial Statements. |
Eaton Vance
VT Floating-Rate Income Fund
December 31, 2020
Portfolio of Investments — continued
| | | | | | | | |
| Security | | Principal
Amount
(000’s omitted) | | | Value | |
|
| Leisure Goods / Activities / Movies — 0.1% | |
| | |
| SeaWorld Parks & Entertainment, Inc. | | | | | | |
| | |
8.75%, 5/1/25(5) | | $ | 200 | | | $ | 216,875 | |
| | |
| | | | | | | $ | 216,875 | |
|
| Machinery — 0.1% | |
| | |
| Vertical U.S. Newco, Inc. | | | | | | |
| | |
5.25%, 7/15/27(5) | | $ | 350 | | | $ | 371,656 | |
| | |
| | | | | | | $ | 371,656 | |
|
| Oil and Gas — 0.2% | |
| | |
| CITGO Petroleum Corporation | | | | | | |
| | |
7.00%, 6/15/25(5) | | $ | 1,025 | | | $ | 1,024,359 | |
| | |
| | | | | | | $ | 1,024,359 | |
|
| Packaging & Containers — 0.0%(4) | |
| | |
Intelligent Packaging, Ltd.
Finco, Inc./Intelligent
Packaging, Ltd. Co-Issuer, LLC | | | | | | |
| | |
6.00%, 9/15/28(5) | | $ | 25 | | | $ | 25,734 | |
| | |
| | | | | | | $ | 25,734 | |
|
| Radio and Television — 0.5% | |
| | |
Diamond Sports Group, LLC/Diamond Sports
Finance Co. | | | | | | |
| | |
5.375%, 8/15/26(5) | | $ | 500 | | | $ | 407,187 | |
| | |
| iHeartCommunications, Inc. | | | | | | |
| | |
6.375%, 5/1/26 | | | 47 | | | | 50,299 | |
| | |
8.375%, 5/1/27 | | | 85 | | | | 90,939 | |
| | |
5.25%, 8/15/27(5) | | | 150 | | | | 157,379 | |
| | |
4.75%, 1/15/28(5) | | | 200 | | | | 206,338 | |
| | |
| Univision Communications, Inc. | | | | | | |
| | |
5.125%, 2/15/25(5) | | | 1,500 | | | | 1,514,062 | |
| | |
| | | | | | | $ | 2,426,204 | |
|
| Real Estate Investment Trusts (REITs) — 0.1% | |
| | |
Park Intermediate Holdings,
LLC/PK Domestic
Property, LLC/PK Finance Co-Issuer | | | | | | |
| | |
5.875%, 10/1/28(5) | | $ | 550 | | | $ | 586,781 | |
| | |
| | | | | | | $ | 586,781 | |
|
| Software and Services — 0.1% | |
| | |
| Boxer Parent Co., Inc. | | | | | | |
| | |
7.125%, 10/2/25(5) | | $ | 375 | | | $ | 407,583 | |
| | |
| | | | | | | $ | 407,583 | |
| | | | | | | | |
| Security | | Principal
Amount
(000’s omitted) | | | Value | |
|
| Telecommunications — 0.4% | |
| | |
| CenturyLink, Inc. | | | | | | |
| | |
4.00%, 2/15/27(5) | | $ | 1,225 | | | $ | 1,266,491 | |
| | |
| Vmed O2 UK Financing I PLC | | | | | | |
| | |
4.25%, 1/31/31(5) | | | 750 | | | | 768,105 | |
| | |
| | | | | | | $ | 2,034,596 | |
|
| Utilities — 0.2% | |
| | |
| Calpine Corp. | | | | | | |
| | |
5.25%, 6/1/26(5) | | $ | 700 | | | $ | 725,200 | |
| | |
4.50%, 2/15/28(5) | | | 250 | | | | 260,375 | |
| | |
| | | | | | | $ | 985,575 | |
| |
Total Corporate Bonds & Notes
(identified cost $24,421,333) | | | $ | 25,555,712 | |
|
| Exchange-Traded Funds — 0.7% | |
| Security | | Shares | | | Value | |
| | |
SPDR Blackstone/GSO Senior Loan ETF | | | 76,000 | | | $ | 3,469,400 | |
| |
Total Exchange-Traded Funds
(identified cost $3,501,320) | | | $ | 3,469,400 | |
|
| Preferred Stocks — 0.1% | |
| Security | | Shares | | | Value | |
|
| Containers and Glass Products — 0.1% | |
| | |
LG Newco Holdco, Inc.(2)(3) | | | 5,114 | | | $ | 281,266 | |
| | |
| | | | | | | $ | 281,266 | |
|
| Financial Services — 0.0%(4) | |
| | |
DBI Investors, Inc., Series A-1(1)(2)(3) | | | 839 | | | $ | 67,397 | |
| | |
| | | | | | | $ | 67,397 | |
|
| Nonferrous Metals / Minerals — 0.0%(4) | |
| | |
ACNR Holdings, Inc., 15.00% (PIK)(2)(3) | | | 971 | | | $ | 45,880 | |
| | |
| | | | | | | $ | 45,880 | |
|
| Retailers (Except Food and Drug) — 0.0%(4) | |
| | |
David’s Bridal, LLC, Series A, 8.00% (PIK)(1)(2)(3) | | | 494 | | | $ | 39,520 | |
| | |
David’s Bridal, LLC, Series B, 10.00%
(PIK)(1)(2)(3) | | | 2,012 | | | | 162,891 | |
| | |
| | | | | | | $ | 202,411 | |
| |
Total Preferred Stocks
(identified cost $431,373) | | | $ | 596,954 | |
| | | | |
| | 9 | | See Notes to Financial Statements. |
Eaton Vance
VT Floating-Rate Income Fund
December 31, 2020
Portfolio of Investments — continued
| | | | | | | | |
| Senior Floating-Rate Loans — 89.7%(6) | |
| Borrower/Tranche Description | | Principal
Amount
(000’s omitted) | | | Value | |
|
| Aerospace and Defense — 2.4% | |
| | |
| AI Convoy (Luxembourg) S.a.r.l. | | | | | | |
| | |
Term Loan, 4.50%, (USD LIBOR + 3.50%, Floor 1.00%), Maturing January 17, 2027(7) | | $ | 496 | | | $ | 496,715 | |
| | |
| Dynasty Acquisition Co., Inc. | | | | | | |
| | |
Term Loan, 3.75%, (3 mo. USD LIBOR + 3.50%), Maturing April 6, 2026 | | | 972 | | | | 929,908 | |
| | |
Term Loan, 3.75%, (3 mo. USD LIBOR + 3.50%), Maturing April 6, 2026 | | | 1,807 | | | | 1,729,118 | |
| | |
| IAP Worldwide Services, Inc. | | | | | | |
| | |
Revolving Loan, 1.38%, (3 mo. USD LIBOR + 5.50%, Floor 1.50%), Maturing July 19, 2021(8) | | | 133 | | | | 131,228 | |
| | |
Term Loan - Second Lien, 8.00%, (3 mo. USD LIBOR + 6.50%, Floor 1.50%), Maturing July 18, 2021(1) | | | 171 | | | | 136,443 | |
| | |
| Spirit Aerosystems, Inc. | | | | | | |
| | |
Term Loan, 6.00%, (1 mo. USD LIBOR + 5.25%, Floor 0.75%), Maturing January 30, 2025 | | | 250 | | | | 253,281 | |
| | |
| TransDigm, Inc. | | | | | | |
| | |
Term Loan, 2.40%, (1 mo. USD LIBOR + 2.25%), Maturing August 22, 2024 | | | 3,032 | | | | 2,981,423 | |
| | |
Term Loan, 2.40%, (1 mo. USD LIBOR + 2.25%), Maturing May 30, 2025 | | | 3,434 | | | | 3,373,976 | |
| | |
| WP CPP Holdings, LLC | | | | | | |
| | |
Term Loan, 4.75%, (3 mo. USD LIBOR + 3.75%, Floor 1.00%), Maturing April 30, 2025 | | | 2,249 | | | | 2,113,563 | |
| | |
| | | | | | | $ | 12,145,655 | |
|
| Air Transport — 0.4% | |
| | |
| JetBlue Airways Corporation | | | | | | |
| | |
Term Loan, 6.25%, (3 mo. USD LIBOR + 5.25%, Floor 1.00%), Maturing June 17, 2024 | | $ | 293 | | | $ | 301,693 | |
| | |
| Mileage Plus Holdings, LLC | | | | | | |
| | |
Term Loan, 6.25%, (3 mo. USD LIBOR + 5.25%, Floor 1.00%), Maturing June 25, 2027 | | | 525 | | | | 548,005 | |
| | |
| SkyMiles IP, Ltd. | | | | | | |
| | |
Term Loan, 4.75%, (3 mo. USD LIBOR + 3.75%, Floor 1.00%), Maturing October 20, 2027 | | | 1,275 | | | | 1,324,566 | |
| | |
| | | | | | | $ | 2,174,264 | |
|
| Automotive — 3.4% | |
| | |
| Adient US, LLC | | | | | | |
| | |
Term Loan, 4.41%, (USD LIBOR + 4.25%), Maturing May 6, 2024(7) | | $ | 199 | | | $ | 199,843 | |
| | |
| American Axle and Manufacturing, Inc. | | | | | | |
| | |
Term Loan, 3.00%, (1 mo. USD LIBOR + 2.25%, Floor 0.75%), Maturing April 6, 2024 | | | 1,553 | | | | 1,534,833 | |
| | | | | | | | |
| Borrower/Tranche Description | | Principal
Amount
(000’s omitted) | | | Value | |
|
| Automotive (continued) | |
| | |
| Autokiniton US Holdings, Inc. | | | | | | |
| | |
Term Loan, 6.52%, (1 mo. USD LIBOR + 6.38%), Maturing May 22, 2025 | | $ | 609 | | | $ | 606,328 | |
| | |
| Bright Bidco B.V. | | | | | | |
| | |
Term Loan, 4.50%, (6 mo. USD LIBOR + 3.50%, Floor 1.00%), Maturing June 30, 2024 | | | 1,111 | | | | 647,834 | |
| | |
| Chassix, Inc. | | | | | | |
| | |
Term Loan, 6.50%, (USD LIBOR + 5.50%, Floor 1.00%), Maturing November 15, 2023(7) | | | 509 | | | | 488,880 | |
| | |
| Clarios Global L.P. | | | | | | |
| | |
Term Loan, 3.65%, (1 mo. USD LIBOR + 3.50%), Maturing April 30, 2026 | | | 2,812 | | | | 2,804,934 | |
| | |
| CS Intermediate Holdco 2, LLC | | | | | | |
| | |
Term Loan, 2.75%, (1 mo. USD LIBOR + 2.00%, Floor 0.75%), Maturing November 2, 2023 | | | 1,601 | | | | 1,519,447 | |
| | |
| Dayco Products, LLC | | | | | | |
| | |
Term Loan, 4.48%, (3 mo. USD LIBOR + 4.25%), Maturing May 19, 2023 | | | 748 | | | | 578,356 | |
| | |
| Garrett LX III S.a.r.l. | | | | | | |
| | |
Term Loan, 5.75%, (USD Prime + 2.50%), Maturing September 27, 2025 | | | 1,204 | | | | 1,187,014 | |
| | |
| Garrett Motion, Inc. | | | | | | |
| | |
DIP Loan, 5.50%, (1 mo. USD LIBOR + 4.50%, Floor 1.00%), Maturing March 15, 2021 | | | 254 | | | | 255,013 | |
| | |
| Goodyear Tire & Rubber Company (The) | | | | | | |
| | |
Term Loan - Second Lien, 2.15%, (1 mo. USD LIBOR + 2.00%), Maturing March 7, 2025 | | | 1,325 | | | | 1,293,531 | |
| | |
| IAA, Inc. | | | | | | |
| | |
Term Loan, 2.44%, (1 mo. USD LIBOR + 2.25%), Maturing June 28, 2026 | | | 460 | | | | 458,988 | |
| | |
| Les Schwab Tire Centers | | | | | | |
| | |
Term Loan, 4.25%, (3 mo. USD LIBOR + 3.50%, Floor 0.75%), Maturing November 2, 2027 | | | 2,325 | | | | 2,327,906 | |
| | |
| Tenneco, Inc. | | | | | | |
| | |
Term Loan, 3.15%, (1 mo. USD LIBOR + 3.00%), Maturing October 1, 2025 | | | 1,822 | | | | 1,784,534 | |
| | |
| Thor Industries, Inc. | | | | | | |
| | |
Term Loan, 3.94%, (1 mo. USD LIBOR + 3.75%), Maturing February 1, 2026 | | | 440 | | | | 439,996 | |
| | |
| TI Group Automotive Systems, LLC | | | | | | |
| | |
Term Loan, 4.00%, (3 mo. USD LIBOR + 3.75%), Maturing December 16, 2024 | | | 972 | | | | 974,417 | |
| | |
| | | | | | | $ | 17,101,854 | |
|
| Beverage and Tobacco — 0.1% | |
| | |
| Arterra Wines Canada, Inc. | | | | | | |
| | |
Term Loan, 4.25%, (3 mo. USD LIBOR + 3.50%, Floor 0.75%), Maturing November 24, 2027 | | $ | 600 | | | $ | 603,937 | |
| | |
| | | | | | | $ | 603,937 | |
| | | | |
| | 10 | | See Notes to Financial Statements. |
Eaton Vance
VT Floating-Rate Income Fund
December 31, 2020
Portfolio of Investments — continued
| | | | | | | | |
| Borrower/Tranche Description | | Principal
Amount
(000’s omitted) | | | Value | |
|
| Brokerage / Securities Dealers / Investment Houses — 0.6% | |
| | |
| Advisor Group, Inc. | | | | | | |
| | |
Term Loan, 5.15%, (1 mo. USD LIBOR + 5.00%), Maturing July 31, 2026 | | $ | 2,033 | | | $ | 2,023,709 | |
| | |
| Clipper Acquisitions Corp. | | | | | | |
| | |
Term Loan, 1.90%, (1 mo. USD LIBOR + 1.75%), Maturing December 27, 2024 | | | 849 | | | | 842,384 | |
| | |
| | | | | | | $ | 2,866,093 | |
|
| Building and Development — 3.4% | |
| | |
| ACProducts, Inc. | | | | | | |
| | |
Term Loan, 7.50%, (6 mo. USD LIBOR + 6.50%, Floor 1.00%), Maturing August 18, 2025 | | $ | 294 | | | $ | 303,022 | |
| | |
| Advanced Drainage Systems, Inc. | | | | | | |
| | |
Term Loan, 2.44%, (1 mo. USD LIBOR + 2.25%), Maturing July 31, 2026 | | | 158 | | | | 158,412 | |
| | |
| American Builders & Contractors Supply Co., Inc. | | | | | | |
| | |
Term Loan, 2.15%, (1 mo. USD LIBOR + 2.00%), Maturing January 15, 2027 | | | 2,533 | | | | 2,512,835 | |
| | |
| American Residential Services, LLC | | | | | | |
| | |
Term Loan, 4.25%, (3 mo. USD LIBOR + 3.50%, Floor 0.75%), Maturing October 15, 2027 | | | 350 | | | | 349,781 | |
| | |
| APi Group DE, Inc. | | | | | | |
| | |
Term Loan, 2.65%, (1 mo. USD LIBOR + 2.50%), Maturing October 1, 2026 | | | 1,089 | | | | 1,086,958 | |
| | |
Term Loan, 2.90%, (1 mo. USD LIBOR + 2.75%), Maturing October 1, 2026 | | | 175 | | | | 175,109 | |
| | |
| Brookfield Property REIT, Inc. | | | | | | |
| | |
Term Loan, 2.65%, (1 mo. USD LIBOR + 2.50%), Maturing August 27, 2025 | | | 733 | | | | 697,935 | |
| | |
| CP Atlas Buyer, Inc. | | | | | | |
| | |
Term Loan, 5.25%, (3 mo. USD LIBOR + 4.50%, Floor 0.75%), Maturing November 23, 2027 | | | 175 | | | | 175,547 | |
| | |
Term Loan, 5.25%, (3 mo. USD LIBOR + 4.50%, Floor 0.75%), Maturing November 23, 2027 | | | 525 | | | | 526,641 | |
| | |
| CPG International, Inc. | | | | | | |
| | |
Term Loan, 4.75%, (12 mo. USD LIBOR + 3.75%, Floor 1.00%), Maturing May 5, 2024 | | | 772 | | | | 774,406 | |
| | |
| Cushman & Wakefield U.S. Borrower, LLC | | | | | | |
| | |
Term Loan, 2.90%, (1 mo. USD LIBOR + 2.75%), Maturing August 21, 2025 | | | 1,526 | | | | 1,498,399 | |
| | |
| LSF11 Skyscraper Holdco S.a.r.l. | | | | | | |
| | |
Term Loan, 5.74%, (3 mo. USD LIBOR + 5.50%), Maturing September 29, 2027 | | | 530 | | | | 531,230 | |
| | |
| MI Windows and Doors, LLC | | | | | | |
| | |
Term Loan, 4.50%, (1 mo. USD LIBOR + 3.75%, Floor 0.75%), Maturing December 18, 2027 | | | 275 | | | | 276,031 | |
| | | | | | | | |
| Borrower/Tranche Description | | Principal
Amount
(000’s omitted) | | | Value | |
|
| Building and Development (continued) | |
| | |
| Northstar Group Services, Inc. | | | | | | |
| | |
Term Loan, 6.50%, (3 mo. USD LIBOR + 5.50%, Floor 1.00%), Maturing November 9, 2026 | | $ | 775 | | | $ | 769,188 | |
| | |
| Quikrete Holdings, Inc. | | | | | | |
| | |
Term Loan, 2.65%, (1 mo. USD LIBOR + 2.50%), Maturing February 1, 2027 | | | 2,143 | | | | 2,135,536 | |
| | |
| RE/MAX International, Inc. | | | | | | |
| | |
Term Loan, 3.50%, (3 mo. USD LIBOR + 2.75%, Floor 0.75%), Maturing December 15, 2023 | | | 1,880 | | | | 1,879,947 | |
| | |
| Realogy Group, LLC | | | | | | |
| | |
Term Loan, 3.00%, (1 mo. USD LIBOR + 2.25%, Floor 0.75%), Maturing February 8, 2025 | | | 836 | | | | 825,104 | |
| | |
| White Cap Buyer, LLC | | | | | | |
| | |
Term Loan, 4.50%, (6 mo. USD LIBOR + 4.00%, Floor 0.50%), Maturing October 19, 2027 | | | 1,300 | | | | 1,301,625 | |
| | |
| WireCo WorldGroup, Inc. | | | | | | |
| | |
Term Loan, 6.00%, (3 mo. USD LIBOR + 5.00%, Floor 1.00%), Maturing September 30, 2023 | | | 855 | | | | 820,234 | |
| | |
| | | | | | | $ | 16,797,940 | |
|
| Business Equipment and Services — 8.6% | |
| | |
| Adevinta ASA | | | | | | |
| | |
Term Loan, Maturing October 13, 2027(9) | | $ | 175 | | | $ | 175,328 | |
| | |
| Adtalem Global Education, Inc. | | | | | | |
| | |
Term Loan, 3.15%, (1 mo. USD LIBOR + 3.00%), Maturing April 11, 2025 | | | 293 | | | | 290,672 | |
| | |
| Airbnb, Inc. | | | | | | |
| | |
Term Loan, 8.50%, (3 mo. USD LIBOR + 7.50%, Floor 1.00%), Maturing April 17, 2025 | | | 597 | | | | 647,745 | |
| | |
| AlixPartners, LLP | | | | | | |
| | |
Term Loan, 2.65%, (1 mo. USD LIBOR + 2.50%), Maturing April 4, 2024 | | | 565 | | | | 559,922 | |
| | |
| Allied Universal Holdco, LLC | | | | | | |
| | |
Term Loan, 4.40%, (1 mo. USD LIBOR + 4.25%), Maturing July 10, 2026 | | | 2,279 | | | | 2,274,191 | |
| | |
| Amentum Government Services Holdings, LLC | | | | | | |
| | |
Term Loan, 3.65%, (1 mo. USD LIBOR + 3.50%), Maturing February 1, 2027 | | | 697 | | | | 695,629 | |
| | |
| AppLovin Corporation | | | | | | |
| | |
Term Loan, 3.65%, (1 mo. USD LIBOR + 3.50%), Maturing August 15, 2025 | | | 3,782 | | | | 3,778,191 | |
| | |
| ASGN Incorporated | | | | | | |
| | |
Term Loan, 1.90%, (1 mo. USD LIBOR + 1.75%), Maturing April 2, 2025 | | | 574 | | | | 574,144 | |
| | |
| Asplundh Tree Expert, LLC | | | | | | |
| | |
Term Loan, 2.65%, (1 mo. USD LIBOR + 2.50%), Maturing September 7, 2027 | | | 723 | | | | 726,287 | |
| | | | |
| | 11 | | See Notes to Financial Statements. |
Eaton Vance
VT Floating-Rate Income Fund
December 31, 2020
Portfolio of Investments — continued
| | | | | | | | |
| Borrower/Tranche Description | | Principal
Amount
(000’s omitted) | | | Value | |
|
| Business Equipment and Services (continued) | |
| | |
| BidFair MergeRight, Inc. | | | | | | |
| | |
Term Loan, 6.50%, (1 mo. USD LIBOR + 5.50%, Floor 1.00%), Maturing January 15, 2027 | | $ | 470 | | | $ | 473,045 | |
| | |
| Bracket Intermediate Holding Corp. | | | | | | |
| | |
Term Loan, 4.48%, (3 mo. USD LIBOR + 4.25%), Maturing September 5, 2025 | | | 733 | | | | 725,794 | |
| | |
| Brand Energy & Infrastructure Services, Inc. | | | | | | |
| | |
Term Loan, 5.25%, (3 mo. USD LIBOR + 4.25%, Floor 1.00%), Maturing June 21, 2024 | | | 1,668 | | | | 1,631,291 | |
| | |
| Camelot U.S. Acquisition 1 Co. | | | | | | |
| | |
Term Loan, 3.15%, (1 mo. USD LIBOR + 3.00%), Maturing October 30, 2026 | | | 1,336 | | | | 1,332,156 | |
| | |
Term Loan, 4.00%, (1 mo. USD LIBOR + 3.00%, Floor 1.00%), Maturing October 30, 2026 | | | 700 | | | | 699,854 | |
| | |
| Cardtronics USA, Inc. | | | | | | |
| | |
Term Loan, 5.00%, (1 mo. USD LIBOR + 4.00%, Floor 1.00%), Maturing June 29, 2027 | | | 398 | | | | 398,895 | |
| | |
| CCC Information Services, Inc. | | | | | | |
| | |
Term Loan, 4.00%, (1 mo. USD LIBOR + 3.00%, Floor 1.00%), Maturing April 29, 2024 | | | 3,798 | | | | 3,795,117 | |
| | |
| Ceridian HCM Holding, Inc. | | | | | | |
| | |
Term Loan, 2.60%, (1 week USD LIBOR + 2.50%), Maturing April 30, 2025 | | | 2,077 | | | | 2,054,251 | |
| | |
| CM Acquisition Co. | | | | | | |
| | |
Term Loan, 11.00%, (3 mo. USD LIBOR + 10.00%, Floor 1.00%), Maturing July 26, 2023 | | | 163 | | | | 150,582 | |
| | |
| Deerfield Dakota Holding, LLC | | | | | | |
| | |
Term Loan, 4.75%, (1 mo. USD LIBOR + 3.75%, Floor 1.00%), Maturing April 9, 2027 | | | 1,493 | | | | 1,497,164 | |
| | |
| EIG Investors Corp. | | | | | | |
| | |
Term Loan, 4.75%, (3 mo. USD LIBOR + 3.75%, Floor 1.00%), Maturing February 9, 2023 | | | 1,459 | | | | 1,459,697 | |
| | |
| Garda World Security Corporation | | | | | | |
| | |
Term Loan, 4.99%, (3 mo. USD LIBOR + 4.75%), Maturing October 30, 2026 | | | 1,202 | | | | 1,206,122 | |
| | |
| Greeneden U.S. Holdings II, LLC | | | | | | |
| | |
Term Loan, 4.75%, (1 mo. USD LIBOR + 4.00%, Floor 0.75%), Maturing December 1, 2027 | | | 500 | | | | 501,797 | |
| | |
| IG Investment Holdings, LLC | | | | | | |
| | |
Term Loan, 5.00%, (3 mo. USD LIBOR + 4.00%, Floor 1.00%), Maturing May 23, 2025 | | | 1,467 | | | | 1,466,858 | |
| | |
| Illuminate Buyer, LLC | | | | | | |
| | |
Term Loan, 4.15%, (1 mo. USD LIBOR + 4.00%), Maturing June 30, 2027 | | | 1,322 | | | | 1,324,166 | |
| | |
| IRI Holdings, Inc. | | | | | | |
| | |
Term Loan, 4.40%, (1 mo. USD LIBOR + 4.25%), Maturing December 1, 2025 | | | 3,510 | | | | 3,483,355 | |
| | | | | | | | |
| Borrower/Tranche Description | | Principal
Amount
(000’s omitted) | | | Value | |
|
| Business Equipment and Services (continued) | |
| | |
| Iron Mountain, Inc. | | | | | | |
| | |
Term Loan, 1.90%, (1 mo. USD LIBOR + 1.75%), Maturing January 2, 2026 | | $ | 632 | | | $ | 628,438 | |
| | |
| Ivanti Software, Inc. | | | | | | |
| | |
Term Loan, 5.75%, (1 mo. USD LIBOR + 4.75%, Floor 1.00%), Maturing December 1, 2027 | | | 1,575 | | | | 1,575,491 | |
| | |
| KUEHG Corp. | | | | | | |
| | |
Term Loan, 4.75%, (3 mo. USD LIBOR + 3.75%, Floor 1.00%), Maturing February 21, 2025 | | | 857 | | | | 817,480 | |
| | |
| Loire Finco Luxembourg S.a.r.l. | | | | | | |
| | |
Term Loan, 3.65%, (1 mo. USD LIBOR + 3.50%), Maturing April 21, 2027 | | | 249 | | | | 245,331 | |
| | |
| Monitronics International, Inc. | | | | | | |
| | |
Term Loan, 7.75%, (1 mo. USD LIBOR + 6.50%, Floor 1.25%), Maturing March 29, 2024 | | | 1,034 | | | | 922,981 | |
| | |
| PGX Holdings, Inc. | | | | | | |
| | |
Term Loan, 10.50%, (12 mo. USD LIBOR + 9.50%, Floor 1.00%), 6.25% cash, 4.25% PIK, Maturing September 29, 2023 | | | 557 | | | | 532,332 | |
| | |
| Rockwood Service Corporation | | | | | | |
| | |
Term Loan, 4.40%, (1 mo. USD LIBOR + 4.25%), Maturing January 23, 2027 | | | 846 | | | | 846,648 | |
| | |
| Sabre GLBL, Inc. | | | | | | |
| | |
Term Loan, Maturing December 10, 2027(9) | | | 250 | | | | 250,937 | |
| | |
| Spin Holdco, Inc. | | | | | | |
| | |
Term Loan, 4.25%, (3 mo. USD LIBOR + 3.25%, Floor 1.00%), Maturing November 14, 2022 | | | 2,708 | | | | 2,697,710 | |
| | |
| Trans Union, LLC | | | | | | |
| | |
Term Loan, 1.90%, (1 mo. USD LIBOR + 1.75%), Maturing November 16, 2026 | | | 1,148 | | | | 1,146,406 | |
| | |
| West Corporation | | | | | | |
| | |
Term Loan, 4.50%, (3 mo. USD LIBOR + 3.50%, Floor 1.00%), Maturing October 10, 2024 | | | 244 | | | | 235,409 | |
| | |
Term Loan, 5.00%, (3 mo. USD LIBOR + 4.00%, Floor 1.00%), Maturing October 10, 2024 | | | 1,063 | | | | 1,033,336 | |
| | |
| | | | | | | $ | 42,854,752 | |
|
| Cable and Satellite Television — 3.4% | |
| | |
| Altice France S.A. | | | | | | |
| | |
Term Loan, 4.24%, (3 mo. USD LIBOR + 4.00%), Maturing August 14, 2026 | | $ | 490 | | | $ | 488,826 | |
| | |
| Charter Communications Operating, LLC | | | | | | |
| | |
Term Loan, 1.90%, (1 mo. USD LIBOR + 1.75%), Maturing February 1, 2027 | | | 2,074 | | | | 2,065,717 | |
| | |
| CSC Holdings, LLC | | | | | | |
| | |
Term Loan, 2.41%, (1 mo. USD LIBOR + 2.25%), Maturing July 17, 2025 | | | 3,497 | | | | 3,458,753 | |
| | | | |
| | 12 | | See Notes to Financial Statements. |
Eaton Vance
VT Floating-Rate Income Fund
December 31, 2020
Portfolio of Investments — continued
| | | | | | | | |
| Borrower/Tranche Description | | Principal
Amount
(000’s omitted) | | | Value | |
|
| Cable and Satellite Television (continued) | |
| | |
| CSC Holdings, LLC (continued) | | | | | | |
| | |
Term Loan, 2.66%, (1 mo. USD LIBOR + 2.50%), Maturing April 15, 2027 | | $ | 931 | | | $ | 925,503 | |
| | |
| Mediacom Illinois, LLC | | | | | | |
| | |
Term Loan, 1.85%, (1 week USD LIBOR + 1.75%), Maturing February 15, 2024 | | | 105 | | | | 105,167 | |
| | |
| Numericable Group S.A. | | | | | | |
| | |
Term Loan, 2.90%, (1 mo. USD LIBOR + 2.75%), Maturing July 31, 2025 | | | 2,328 | | | | 2,285,287 | |
| | |
| UPC Broadband Holding B.V. | | | | | | |
| | |
Term Loan, 2.41%, (1 mo. USD LIBOR + 2.25%), Maturing April 30, 2028 | | | 625 | | | | 619,726 | |
| | |
Term Loan, 3.67%, (2 mo. USD LIBOR + 3.50%), Maturing January 31, 2029 | | | 1,200 | | | | 1,202,700 | |
| | |
Term Loan, 3.67%, (2 mo. USD LIBOR + 3.50%), Maturing January 31, 2029 | | | 1,200 | | | | 1,202,700 | |
| | |
| Virgin Media Bristol, LLC | | | | | | |
| | |
Term Loan, 2.66%, (1 mo. USD LIBOR + 2.50%), Maturing January 31, 2028 | | | 3,725 | | | | 3,695,066 | |
| | |
Term Loan, Maturing January 31, 2029(9) | | | 750 | | | | 750,234 | |
| | |
| | | | | | | $ | 16,799,679 | |
|
| Chemicals and Plastics — 3.9% | |
| | |
| Aruba Investments, Inc. | | | | | | |
| | |
Term Loan, 4.75%, (6 mo. USD LIBOR + 4.00%, Floor 0.75%), Maturing November 24, 2027 | | $ | 425 | | | $ | 425,000 | |
| | |
| Axalta Coating Systems US Holdings, Inc. | | | | | | |
| | |
Term Loan, 2.00%, (3 mo. USD LIBOR + 1.75%), Maturing June 1, 2024 | | | 1,972 | | | | 1,960,321 | |
| | |
| Charter NEX US, Inc. | | | | | | |
| | |
Term Loan, 5.00%, (1 mo. USD LIBOR + 4.25%, Floor 0.75%), Maturing December 1, 2027 | | | 275 | | | | 276,747 | |
| | |
| Element Solutions, Inc. | | | | | | |
| | |
Term Loan, 2.15%, (1 mo. USD LIBOR + 2.00%), Maturing January 31, 2026 | | | 564 | | | | 559,092 | |
| | |
| Ferro Corporation | | | | | | |
| | |
Term Loan, 2.50%, (3 mo. USD LIBOR + 2.25%), Maturing February 14, 2024 | | | 241 | | | | 239,115 | |
| | |
Term Loan, 2.50%, (3 mo. USD LIBOR + 2.25%), Maturing February 14, 2024 | | | 246 | | | | 244,313 | |
| | |
Term Loan, 2.50%, (3 mo. USD LIBOR + 2.25%), Maturing February 14, 2024 | | | 289 | | | | 287,156 | |
| | |
| Flint Group GmbH | | | | | | |
| | |
Term Loan, 6.00%, (3 mo. USD LIBOR + 5.00%, Floor 1.00%), 5.25% cash, 0.75% PIK, Maturing September 21, 2023 | | | 240 | | | | 226,514 | |
| | | | | | | | |
| Borrower/Tranche Description | | Principal
Amount
(000’s omitted) | | | Value | |
|
| Chemicals and Plastics (continued) | |
| | |
| Flint Group US, LLC | | | | | | |
| | |
Term Loan, 6.00%, (3 mo. USD LIBOR + 5.00%, Floor 1.00%), 5.25% cash, 0.75% PIK, Maturing September 21, 2023 | | $ | 1,453 | | | $ | 1,370,223 | |
| | |
| Gemini HDPE, LLC | | | | | | |
| | |
Term Loan, Maturing December 10, 2027(9) | | | 450 | | | | 448,313 | |
| | |
| INEOS Enterprises Holdings US Finco, LLC | | | | | | |
| | |
Term Loan, 4.50%, (3 mo. USD LIBOR + 3.50%, Floor 1.00%), Maturing August 28, 2026 | | | 162 | | | | 162,204 | |
| | |
| Messer Industries GmbH | | | | | | |
| | |
Term Loan, 2.75%, (3 mo. USD LIBOR + 2.50%), Maturing March 1, 2026 | | | 1,477 | | | | 1,468,440 | |
| | |
| Minerals Technologies, Inc. | | | | | | |
| | |
Term Loan, 3.00%, (USD LIBOR + 2.25%, Floor 0.75%), Maturing February 14, 2024(7) | | | 825 | | | | 825,157 | |
| | |
| Momentive Performance Materials, Inc. | | | | | | |
| | |
Term Loan, 3.40%, (1 mo. USD LIBOR + 3.25%), Maturing May 15, 2024 | | | 2,832 | | | | 2,800,900 | |
| | |
| PMHC II, Inc. | | | | | | |
| | |
Term Loan, 4.50%, (12 mo. USD LIBOR + 3.50%, Floor 1.00%), Maturing March 31, 2025 | | | 997 | | | | 937,004 | |
| | |
| PQ Corporation | | | | | | |
| | |
Term Loan, 4.00%, (3 mo. USD LIBOR + 3.00%, Floor 1.00%), Maturing February 7, 2027 | | | 1,005 | | | | 1,006,063 | |
| | |
| Rohm Holding GmbH | | | | | | |
| | |
Term Loan, 5.32%, (6 mo. USD LIBOR + 5.00%), Maturing July 31, 2026 | | | 272 | | | | 264,756 | |
| | |
| Starfruit Finco B.V. | | | | | | |
| | |
Term Loan, 3.15%, (1 mo. USD LIBOR + 3.00%), Maturing October 1, 2025 | | | 851 | | | | 843,301 | |
| | |
| Trinseo Materials Operating S.C.A. | | | | | | |
| | |
Term Loan, 2.15%, (1 mo. USD LIBOR + 2.00%), Maturing September 6, 2024 | | | 1,328 | | | | 1,321,459 | |
| | |
| Univar, Inc. | | | | | | |
| | |
Term Loan, 2.40%, (1 mo. USD LIBOR + 2.25%), Maturing July 1, 2024 | | | 3,449 | | | | 3,441,593 | |
| | |
| Venator Materials Corporation | | | | | | |
| | |
Term Loan, 3.15%, (1 mo. USD LIBOR + 3.00%), Maturing August 8, 2024 | | | 266 | | | | 262,737 | |
| | |
| | | | | | | $ | 19,370,408 | |
|
| Conglomerates — 0.0%(4) | |
| | |
| Penn Engineering & Manufacturing Corp. | | | | | | |
| | |
Term Loan, 3.75%, (1 mo. USD LIBOR + 2.75%, Floor 1.00%), Maturing June 27, 2024 | | $ | 135 | | | $ | 134,726 | |
| | |
| | | | | | | $ | 134,726 | |
| | | | |
| | 13 | | See Notes to Financial Statements. |
Eaton Vance
VT Floating-Rate Income Fund
December 31, 2020
Portfolio of Investments — continued
| | | | | | | | |
| Borrower/Tranche Description | | Principal
Amount
(000’s omitted) | | | Value | |
|
| Containers and Glass Products — 1.2% | |
| | |
| Berry Global, Inc. | | | | | | |
| | |
Term Loan, 2.15%, (1 mo. USD LIBOR + 2.00%), Maturing July 1, 2026 | | $ | 763 | | | $ | 760,990 | |
| | |
| BWAY Holding Company | | | | | | |
| | |
Term Loan, 3.48%, (3 mo. USD LIBOR + 3.25%), Maturing April 3, 2024 | | | 1,360 | | | | 1,318,903 | |
| | |
| Flex Acquisition Company, Inc. | | | | | | |
| | |
Term Loan, 4.00%, (USD LIBOR + 3.00%, Floor 1.00%), Maturing December 29, 2023(7) | | | 1,941 | | | | 1,935,438 | |
| | |
| Libbey Glass, Inc. | | | | | | |
| | |
Term Loan, 9.00%, (6 mo. USD LIBOR + 8.00%, Floor 1.00%), Maturing November 12, 2025 | | | 1,002 | | | | 961,765 | |
| | |
| Reynolds Group Holdings, Inc. | | | | | | |
| | |
Term Loan, 2.90%, (1 mo. USD LIBOR + 2.75%), Maturing February 5, 2023 | | | 342 | | | | 340,738 | |
| | |
Term Loan, 3.40%, (1 mo. USD LIBOR + 3.25%), Maturing February 5, 2026 | | | 900 | | | | 895,781 | |
| | |
| | | | | | | $ | 6,213,615 | |
|
| Cosmetics / Toiletries — 0.2% | |
| | |
| Kronos Acquisition Holdings, Inc. | | | | | | |
| | |
Term Loan, Maturing December 17, 2026(9) | | $ | 750 | | | $ | 751,875 | |
| | |
| | | | | | | $ | 751,875 | |
|
| Drugs — 3.7% | |
| | |
| Akorn, Inc. | | | | | | |
| | |
Term Loan, 8.50%, (3 mo. USD LIBOR + 7.50%, Floor 1.00%), Maturing October 1, 2025 | | $ | 687 | | | $ | 690,546 | |
| | |
| Albany Molecular Research, Inc. | | | | | | |
| | |
Term Loan, 4.50%, (3 mo. USD LIBOR + 3.50%, Floor 1.00%), Maturing August 30, 2024 | | | 150 | | | | 151,219 | |
| | |
| Alkermes, Inc. | | | | | | |
| | |
Term Loan, 2.41%, (1 mo. USD LIBOR + 2.25%), Maturing March 27, 2023 | | | 185 | | | | 184,751 | |
| | |
| Amneal Pharmaceuticals, LLC | | | | | | |
| | |
Term Loan, 3.69%, (1 mo. USD LIBOR + 3.50%), Maturing May 4, 2025 | | | 2,109 | | | | 2,060,374 | |
| | |
| Arbor Pharmaceuticals, Inc. | | | | | | |
| | |
Term Loan, 6.00%, (6 mo. USD LIBOR + 5.00%, Floor 1.00%), Maturing July 5, 2023 | | | 491 | | | | 475,845 | |
| | |
| Bausch Health Companies, Inc. | | | | | | |
| | |
Term Loan, 3.15%, (1 mo. USD LIBOR + 3.00%), Maturing June 2, 2025 | | | 2,847 | | | | 2,839,357 | |
| | |
| Cambrex Corporation | | | | | | |
| | |
Term Loan, 5.50%, (1 mo. USD LIBOR + 4.50%, Floor 1.00%), Maturing December 4, 2026 | | | 175 | | | | 176,313 | |
| | | | | | | | |
| Borrower/Tranche Description | | Principal
Amount
(000’s omitted) | | | Value | |
|
| Drugs (continued) | |
| | |
| Catalent Pharma Solutions, Inc. | | | | | | |
| | |
Term Loan, 3.25%, (1 mo. USD LIBOR + 2.25%, Floor 1.00%), Maturing May 18, 2026 | | $ | 663 | | | $ | 664,845 | |
| | |
| Endo Luxembourg Finance Company I S.a.r.l. | | | | | | |
| | |
Term Loan, 5.00%, (3 mo. USD LIBOR + 4.25%, Floor 0.75%), Maturing April 29, 2024 | | | 2,837 | | | | 2,802,517 | |
| | |
| Grifols Worldwide Operations USA, Inc. | | | | | | |
| | |
Term Loan, 2.10%, (1 week USD LIBOR + 2.00%), Maturing November 15, 2027 | | | 3,032 | | | | 3,004,877 | |
| | |
| Horizon Therapeutics USA, Inc. | | | | | | |
| | |
Term Loan, 2.19%, (1 mo. USD LIBOR + 2.00%), Maturing May 22, 2026 | | | 668 | | | | 666,428 | |
| | |
| Mallinckrodt International Finance S.A. | | | | | | |
| | |
Term Loan, 5.50%, (6 mo. USD LIBOR + 4.75%, Floor 0.75%), Maturing September 24, 2024 | | | 4,394 | | | | 4,152,599 | |
| | |
Term Loan, 5.75%, (6 mo. USD LIBOR + 5.00%, Floor 0.75%), Maturing February 24, 2025 | | | 415 | | | | 391,763 | |
| | |
| | | | | | | $ | 18,261,434 | |
|
| Ecological Services and Equipment — 0.6% | |
| | |
| EnergySolutions, LLC | | | | | | |
| | |
Term Loan, 4.75%, (3 mo. USD LIBOR + 3.75%, Floor 1.00%), Maturing May 9, 2025 | | $ | 1,420 | | | $ | 1,403,947 | |
| | |
| GFL Environmental, Inc. | | | | | | |
| | |
Term Loan, 3.50%, (3 mo. USD LIBOR + 3.00%, Floor 0.50%), Maturing May 30, 2025 | | | 1,266 | | | | 1,269,432 | |
| | |
| TruGreen Limited Partnership | | | | | | |
| | |
Term Loan, 4.75%, (1 mo. USD LIBOR + 4.00%, Floor 0.75%), Maturing November 2, 2027 | | | 350 | | | | 352,187 | |
| | |
| US Ecology Holdings, Inc. | | | | | | |
| | |
Term Loan, 2.65%, (1 mo. USD LIBOR + 2.50%), Maturing November 1, 2026 | | | 198 | | | | 198,248 | |
| | |
| | | | | | | $ | 3,223,814 | |
|
| Electronics / Electrical — 18.3% | |
| | |
| Allegro Microsystems, Inc. | | | | | | |
| | |
Term Loan, 4.15%, (1 mo. USD LIBOR + 4.00%), Maturing September 30, 2027 | | $ | 27 | | | $ | 26,889 | |
| | |
| Applied Systems, Inc. | | | | | | |
| | |
Term Loan, 4.00%, (3 mo. USD LIBOR + 3.00%, Floor 1.00%), Maturing September 19, 2024 | | | 2,650 | | | | 2,653,243 | |
| | |
| Aptean, Inc. | | | | | | |
| | |
Term Loan, 4.40%, (1 mo. USD LIBOR + 4.25%), Maturing April 23, 2026 | | | 591 | | | | 583,231 | |
| | |
| AQA Acquisition Holding, Inc. | | | | | | |
| | |
Term Loan, Maturing November 19, 2027(9) | | | 525 | | | | 524,344 | |
| | | | |
| | 14 | | See Notes to Financial Statements. |
Eaton Vance
VT Floating-Rate Income Fund
December 31, 2020
Portfolio of Investments — continued
| | | | | | | | |
| Borrower/Tranche Description | | Principal
Amount
(000’s omitted) | | | Value | |
|
| Electronics / Electrical (continued) | |
| | |
| Astra Acquisition Corp. | | | | | | |
| | |
Term Loan, 6.50%, (1 mo. USD LIBOR + 5.50%, Floor 1.00%), Maturing March 1, 2027 | | $ | 596 | | | $ | 601,455 | |
| | |
| Banff Merger Sub, Inc. | | | | | | |
| | |
Term Loan, 4.40%, (1 mo. USD LIBOR + 4.25%), Maturing October 2, 2025 | | | 4,551 | | | | 4,541,980 | |
| | |
| Buzz Merger Sub, Ltd. | | | | | | |
| | |
Term Loan, 3.75%, (1 mo. USD LIBOR + 3.25%, Floor 0.50%), Maturing January 29, 2027 | | | 125 | | | | 124,843 | |
| | |
| Cambium Learning Group, Inc. | | | | | | |
| | |
Term Loan, 4.75%, (3 mo. USD LIBOR + 4.50%), Maturing December 18, 2025 | | | 524 | | | | 522,137 | |
| | |
| Castle US Holding Corporation | | | | | | |
| | |
Term Loan, 4.00%, (3 mo. USD LIBOR + 3.75%), Maturing January 29, 2027 | | | 728 | | | | 715,587 | |
| | |
| Celestica, Inc. | | | | | | |
| | |
Term Loan, 2.27%, (1 mo. USD LIBOR + 2.13%), Maturing June 27, 2025 | | | 253 | | | | 248,431 | |
| | |
Term Loan, 2.65%, (1 mo. USD LIBOR + 2.50%), Maturing June 27, 2025 | | | 210 | | | | 208,688 | |
| | |
| Cloudera, Inc. | | | | | | |
| | |
Term Loan, 3.25%, (1 mo. USD LIBOR + 2.50%, Floor 0.75%), Maturing December 17, 2027 | | | 375 | | | | 375,938 | |
| | |
| Cohu, Inc. | | | | | | |
| | |
Term Loan, 3.15%, (1 mo. USD LIBOR + 3.00%), Maturing October 1, 2025 | | | 1,124 | | | | 1,112,404 | |
| | |
| CommScope, Inc. | | | | | | |
| | |
Term Loan, 3.40%, (1 mo. USD LIBOR + 3.25%), Maturing April 6, 2026 | | | 4,335 | | | | 4,315,847 | |
| | |
| Cornerstone OnDemand, Inc. | | | | | | |
| | |
Term Loan, 4.39%, (1 mo. USD LIBOR + 4.25%), Maturing April 22, 2027 | | | 1,185 | | | | 1,194,046 | |
| | |
| CPI International, Inc. | | | | | | |
| | |
Term Loan, 4.50%, (1 mo. USD LIBOR + 3.50%, Floor 1.00%), Maturing July 26, 2024 | | | 891 | | | | 879,431 | |
| | |
| Delta TopCo, Inc. | | | | | | |
| | |
Term Loan, 4.50%, (6 mo. USD LIBOR + 3.75%, Floor 0.75%), Maturing December 1, 2027 | | | 875 | | | | 876,641 | |
| | |
| E2open, LLC | | | | | | |
| | |
Term Loan, Maturing October 29, 2027(9) | | | 525 | | | | 524,672 | |
| | |
| ECI Macola/Max Holdings, LLC | | | | | | |
| | |
Term Loan, 4.50%, (3 mo. USD LIBOR + 3.75%, Floor 0.75%), Maturing November 9, 2027 | | | 700 | | | | 699,125 | |
| | |
| Electro Rent Corporation | | | | | | |
| | |
Term Loan, 6.00%, (3 mo. USD LIBOR + 5.00%, Floor 1.00%), Maturing January 31, 2024 | | | 1,892 | | | | 1,906,061 | |
| | | | | | | | |
| Borrower/Tranche Description | | Principal
Amount
(000’s omitted) | | | Value | |
|
| Electronics / Electrical (continued) | |
| | |
| Energizer Holdings, Inc. | | | | | | |
| | |
Term Loan, 2.75%, (1 mo. USD LIBOR + 2.25%, Floor 0.50%), Maturing December 22, 2027 | | $ | 656 | | | $ | 657,334 | |
| | |
| Epicor Software Corporation | | | | | | |
| | |
Term Loan, 5.25%, (1 mo. USD LIBOR + 4.25%, Floor 1.00%), Maturing July 30, 2027 | | | 5,278 | | | | 5,315,491 | |
| | |
| EXC Holdings III Corp. | | | | | | |
| | |
Term Loan, 4.50%, (3 mo. USD LIBOR + 3.50%, Floor 1.00%), Maturing December 2, 2024 | | | 340 | | | | 336,105 | |
| | |
| Finastra USA, Inc. | | | | | | |
| | |
Term Loan, 4.50%, (6 mo. USD LIBOR + 3.50%, Floor 1.00%), Maturing June 13, 2024 | | | 4,151 | | | | 4,075,689 | |
| | |
| Fiserv Investment Solutions, Inc. | | | | | | |
| | |
Term Loan, 4.97%, (3 mo. USD LIBOR + 4.75%), Maturing February 18, 2027 | | | 398 | | | | 401,897 | |
| | |
| GlobalLogic Holdings, Inc. | | | | | | |
| | |
Term Loan, 4.50%, (1 mo. USD LIBOR + 3.75%, Floor 0.75%), Maturing September 14, 2027 | | | 499 | | | | 499,373 | |
| | |
| Go Daddy Operating Company, LLC | | | | | | |
| | |
Term Loan, 1.90%, (1 mo. USD LIBOR + 1.75%), Maturing February 15, 2024 | | | 1,008 | | | | 1,006,840 | |
| | |
Term Loan, 2.65%, (1 mo. USD LIBOR + 2.50%), Maturing August 10, 2027 | | | 721 | | | | 726,034 | |
| | |
| Hyland Software, Inc. | | | | | | |
| | |
Term Loan, 4.25%, (1 mo. USD LIBOR + 3.50%, Floor 0.75%), Maturing July 1, 2024 | | | 4,537 | | | | 4,550,790 | |
| | |
| Imperva, Inc. | | | | | | |
| | |
Term Loan, 5.00%, (3 mo. USD LIBOR + 4.00%, Floor 1.00%), Maturing January 12, 2026 | | | 374 | | | | 374,986 | |
| | |
| Imprivata, Inc. | | | | | | |
| | |
Term Loan, 4.25%, (1 mo. USD LIBOR + 3.75%, Floor 0.50%), Maturing December 1, 2027 | | | 700 | | | | 701,167 | |
| | |
| Informatica, LLC | | | | | | |
| | |
Term Loan, 3.40%, (1 mo. USD LIBOR + 3.25%), Maturing February 25, 2027 | | | 4,392 | | | | 4,369,853 | |
| | |
| LogMeIn, Inc. | | | | | | |
| | |
Term Loan, 4.90%, (1 mo. USD LIBOR + 4.75%), Maturing August 31, 2027 | | | 900 | | | | 898,313 | |
| | |
| MA FinanceCo., LLC | | | | | | |
| | |
Term Loan, 2.90%, (1 mo. USD LIBOR + 2.75%), Maturing June 21, 2024 | | | 339 | | | | 335,104 | |
| | |
Term Loan, 5.25%, (3 mo. USD LIBOR + 4.25%, Floor 1.00%), Maturing June 5, 2025 | | | 1,366 | | | | 1,380,640 | |
| | |
| MACOM Technology Solutions Holdings, Inc. | | | | | | |
| | |
Term Loan, 2.40%, (1 mo. USD LIBOR + 2.25%), Maturing May 17, 2024 | | | 780 | | | | 764,588 | |
| | | | |
| | 15 | | See Notes to Financial Statements. |
Eaton Vance
VT Floating-Rate Income Fund
December 31, 2020
Portfolio of Investments — continued
| | | | | | | | |
| Borrower/Tranche Description | | Principal
Amount
(000’s omitted) | | | Value | |
|
| Electronics / Electrical (continued) | |
| | |
| Marcel LUX IV S.a.r.l. | | | | | | |
| | |
Term Loan, 3.40%, (1 mo. USD LIBOR + 3.25%), Maturing March 15, 2026 | | $ | 1,675 | | | $ | 1,644,150 | |
| | |
Term Loan, 4.75%, (3 mo. USD LIBOR + 4.00%, Floor 0.75%), Maturing December 31, 2027 | | | 275 | | | | 276,031 | |
| | |
| Milano Acquisition Corp. | | | | | | |
| | |
Term Loan, 4.75%, (3 mo. USD LIBOR + 4.00%, Floor 0.75%), Maturing October 1, 2027 | | | 1,825 | | | | 1,829,562 | |
| | |
| Mirion Technologies, Inc. | | | | | | |
| | |
Term Loan, 4.26%, (3 mo. USD LIBOR + 4.00%), Maturing March 6, 2026 | | | 1,207 | | | | 1,207,922 | |
| | |
| MTS Systems Corporation | | | | | | |
| | |
Term Loan, 4.00%, (1 mo. USD LIBOR + 3.25%, Floor 0.75%), Maturing July 5, 2023 | | | 319 | | | | 320,159 | |
| | |
| NCR Corporation | | | | | | |
| | |
Term Loan, 2.65%, (1 mo. USD LIBOR + 2.50%), Maturing August 28, 2026 | | | 1,185 | | | | 1,170,188 | |
| | |
| Recorded Books, Inc. | | | | | | |
| | |
Term Loan, 4.40%, (1 mo. USD LIBOR + 4.25%), Maturing August 29, 2025 | | | 188 | | | | 188,067 | |
| | |
| Redstone Buyer, LLC | | | | | | |
| | |
Term Loan, 6.00%, (2 mo. USD LIBOR + 5.00%, Floor 1.00%), Maturing September 1, 2027 | | | 1,525 | | | | 1,534,531 | |
| | |
| Seattle Spinco, Inc. | | | | | | |
| | |
Term Loan, 2.90%, (1 mo. USD LIBOR + 2.75%), Maturing June 21, 2024 | | | 2,290 | | | | 2,263,043 | |
| | |
| SkillSoft Corporation | | | | | | |
| | |
Term Loan, 8.50%, (1 mo. USD LIBOR + 7.50%, Floor 1.00%), Maturing December 27, 2024 | | | 346 | | | | 354,274 | |
| | |
Term Loan - Second Lien, 8.50%, (1 mo. USD LIBOR + 7.50%, Floor 1.00%), Maturing April 27, 2025 | | | 1,142 | | | | 1,144,821 | |
| | |
| SolarWinds Holdings, Inc. | | | | | | |
| | |
Term Loan, 2.90%, (1 mo. USD LIBOR + 2.75%), Maturing February 5, 2024 | | | 4,413 | | | | 4,233,837 | |
| | |
| Solera, LLC | | | | | | |
| | |
Term Loan, 2.90%, (1 mo. USD LIBOR + 2.75%), Maturing March 3, 2023 | | | 3,873 | | | | 3,850,548 | |
| | |
| Sophia L.P. | | | | | | |
| | |
Term Loan, 4.50%, (3 mo. USD LIBOR + 3.75%, Floor 0.75%), Maturing October 7, 2027 | | | 250 | | | | 250,781 | |
| | |
| STG-Fairway Holdings, LLC | | | | | | |
| | |
Term Loan, 3.40%, (1 mo. USD LIBOR + 3.25%), Maturing January 31, 2027 | | | 995 | | | | 981,941 | |
| | |
| SurveyMonkey, Inc. | | | | | | |
| | |
Term Loan, 3.86%, (1 week USD LIBOR + 3.75%), Maturing October 10, 2025 | | | 896 | | | | 893,242 | |
| | |
| Symplr Software, Inc. | | | | | | |
| | |
Term Loan, 5.25%, (6 mo. USD LIBOR + 4.50%, Floor 0.75%), Maturing December 22, 2027 | | | 475 | | | | 470,844 | |
| | | | | | | | |
| Borrower/Tranche Description | | Principal
Amount
(000’s omitted) | | | Value | |
|
| Electronics / Electrical (continued) | |
| | |
| Syncsort Incorporated | | | | | | |
| | |
Term Loan, 6.48%, (3 mo. USD LIBOR + 6.25%), Maturing August 16, 2024 | | $ | 1,064 | | | $ | 1,064,498 | |
| | |
| Tech Data Corporation | | | | | | |
| | |
Term Loan, 3.65%, (1 mo. USD LIBOR + 3.50%), Maturing June 30, 2025 | | | 798 | | | | 804,983 | |
| | |
| Tibco Software, Inc. | | | | | | |
| | |
Term Loan, 3.90%, (1 mo. USD LIBOR + 3.75%), Maturing June 30, 2026 | | | 3,403 | | | | 3,366,777 | |
| | |
| TTM Technologies, Inc. | | | | | | |
| | |
Term Loan, 2.65%, (1 mo. USD LIBOR + 2.50%), Maturing September 28, 2024 | | | 428 | | | | 427,495 | |
| | |
| Uber Technologies, Inc. | | | | | | |
| | |
Term Loan, 5.00%, (1 mo. USD LIBOR + 4.00%, Floor 1.00%), Maturing April 4, 2025 | | | 2,601 | | | | 2,617,914 | |
| | |
| Ultimate Software Group, Inc. (The) | | | | | | |
| | |
Term Loan, 3.90%, (1 mo. USD LIBOR + 3.75%), Maturing May 4, 2026 | | | 1,333 | | | | 1,334,458 | |
| | |
Term Loan, 4.75%, (3 mo. USD LIBOR + 4.00%, Floor 0.75%), Maturing May 4, 2026 | | | 2,768 | | | | 2,787,785 | |
| | |
| Ultra Clean Holdings, Inc. | | | | | | |
| | |
Term Loan, 4.65%, (1 mo. USD LIBOR + 4.50%), Maturing August 27, 2025 | | | 585 | | | | 582,348 | |
| | |
| Valkyr Purchaser, LLC | | | | | | |
| | |
Term Loan, 4.75%, (3 mo. USD LIBOR + 4.00%, Floor 0.75%), Maturing October 29, 2027 | | | 450 | | | | 445,500 | |
| | |
| Verifone Systems, Inc. | | | | | | |
| | |
Term Loan, 4.22%, (3 mo. USD LIBOR + 4.00%), Maturing August 20, 2025 | | | 1,705 | | | | 1,654,199 | |
| | |
| Veritas US, Inc. | | | | | | |
| | |
Term Loan, 6.50%, (3 mo. USD LIBOR + 5.50%, Floor 1.00%), Maturing September 1, 2025 | | | 1,621 | | | | 1,619,587 | |
| | |
| VS Buyer, LLC | | | | | | |
| | |
Term Loan, 3.40%, (1 mo. USD LIBOR + 3.25%), Maturing February 28, 2027 | | | 2,829 | | | | 2,820,374 | |
| | |
| Vungle, Inc. | | | | | | |
| | |
Term Loan, 5.65%, (1 mo. USD LIBOR + 5.50%), Maturing September 30, 2026 | | | 494 | | | | 495,910 | |
| | |
| | | | | | | $ | 91,664,966 | |
|
| Equipment Leasing — 0.5% | |
| | |
| Avolon TLB Borrower 1 (US), LLC | | | | | | |
| | |
Term Loan, 2.50%, (1 mo. USD LIBOR + 1.75%, Floor 0.75%), Maturing January 15, 2025 | | $ | 1,493 | | | $ | 1,482,103 | |
| | |
Term Loan, Maturing December 1, 2027(9) | | | 1,125 | | | | 1,127,109 | |
| | |
| | | | | | | $ | 2,609,212 | |
| | | | |
| | 16 | | See Notes to Financial Statements. |
Eaton Vance
VT Floating-Rate Income Fund
December 31, 2020
Portfolio of Investments — continued
| | | | | | | | |
| Borrower/Tranche Description | | Principal
Amount
(000’s omitted) | | | Value | |
|
| Financial Intermediaries — 1.5% | |
| | |
| Aretec Group, Inc. | | | | | | |
| | |
Term Loan, 4.40%, (1 mo. USD LIBOR + 4.25%), Maturing October 1, 2025 | | $ | 1,817 | | | $ | 1,783,690 | |
| | |
| Claros Mortgage Trust, Inc. | | | | | | |
| | |
Term Loan, 6.00%, (1 mo. USD LIBOR + 5.00%, Floor 1.00%), Maturing August 9, 2026 | | | 418 | | | | 421,328 | |
| | |
| Ditech Holding Corporation | | | | | | |
| | |
Term Loan, 0.00%, Maturing June 30,
2022(10) | | | 1,666 | | | | 529,006 | |
| | |
| EIG Management Company, LLC | | | | | | |
| | |
Term Loan, 4.50%, (1 mo. USD LIBOR + 3.75%, Floor 0.75%), Maturing February 22, 2025 | | | 195 | | | | 194,986 | |
| | |
| FinCo I, LLC | | | | | | |
| | |
Term Loan, 2.65%, (1 mo. USD LIBOR + 2.50%), Maturing June 27, 2025 | | | 581 | | | | 581,641 | |
| | |
| GreenSky Holdings, LLC | | | | | | |
| | |
Term Loan, 5.50%, (1 mo. USD LIBOR + 4.50%, Floor 1.00%), Maturing March 29, 2025 | | | 373 | | | | 369,394 | |
| | |
Term Loan, 3.44%, (1 mo. USD LIBOR + 3.25%), Maturing March 31, 2025 | | | 997 | | | | 981,860 | |
| | |
| LPL Holdings, Inc. | | | | | | |
| | |
Term Loan, 1.90%, (1 mo. USD LIBOR + 1.75%), Maturing November 12, 2026 | | | 1,484 | | | | 1,484,378 | |
| | |
| Victory Capital Holdings, Inc. | | | | | | |
| | |
Term Loan, 2.73%, (3 mo. USD LIBOR + 2.50%), Maturing July 1, 2026 | | | 836 | | | | 834,376 | |
| | |
| Virtus Investment Partners, Inc. | | | | | | |
| | |
Term Loan, 3.00%, (3 mo. USD LIBOR + 2.25%, Floor 0.75%), Maturing June 1, 2024 | | | 293 | | | | 293,113 | |
| | |
| | | | | | | $ | 7,473,772 | |
|
| Food Products — 2.8% | |
| | |
| Alphabet Holding Company, Inc. | | | | | | |
| | |
Term Loan, 3.65%, (1 mo. USD LIBOR + 3.50%), Maturing September 26, 2024 | | $ | 1,949 | | | $ | 1,935,368 | |
| | |
| Atkins Nutritionals Holdings II, Inc. | | | | | | |
| | |
Term Loan, 4.75%, (1 mo. USD LIBOR + 3.75%, Floor 1.00%), Maturing July 7, 2024 | | | 244 | | | | 245,137 | |
| | |
| B&G Foods, Inc. | | | | | | |
| | |
Term Loan, 2.65%, (1 mo. USD LIBOR + 2.50%), Maturing October 10, 2026 | | | 290 | | | | 290,400 | |
| | |
| Froneri International, Ltd. | | | | | | |
| | |
Term Loan, 2.40%, (1 mo. USD LIBOR + 2.25%), Maturing January 31, 2027 | | | 1,517 | | | | 1,505,236 | |
| | |
| H Food Holdings, LLC | | | | | | |
| | |
Term Loan, 3.83%, (1 mo. USD LIBOR + 3.69%), Maturing May 23, 2025 | | | 561 | | | | 552,816 | |
| | |
Term Loan, 4.15%, (1 mo. USD LIBOR + 4.00%), Maturing May 23, 2025 | | | 368 | | | | 363,333 | |
| | | | | | | | |
| Borrower/Tranche Description | | Principal
Amount
(000’s omitted) | | | Value | |
|
| Food Products (continued) | |
| | |
| HLF Financing S.a.r.l. | | | | | | |
| | |
Term Loan, 2.90%, (1 mo. USD LIBOR + 2.75%), Maturing August 18, 2025 | | $ | 1,601 | | | $ | 1,603,879 | |
| | |
| Jacobs Douwe Egberts International B.V. | | | | | | |
| | |
Term Loan, 2.19%, (1 mo. USD LIBOR + 2.00%), Maturing November 1, 2025 | | | 2,844 | | | | 2,839,736 | |
| | |
| JBS USA LUX S.A. | | | | | | |
| | |
Term Loan, 2.15%, (1 mo. USD LIBOR + 2.00%), Maturing May 1, 2026 | | | 4,168 | | | | 4,138,020 | |
| | |
| Shearer’s Foods, Inc. | | | | | | |
| | |
Term Loan, 4.75%, (6 mo. USD LIBOR + 4.00%, Floor 0.75%), Maturing September 23, 2027 | | | 249 | | | | 249,239 | |
| | |
| | | | | | | $ | 13,723,164 | |
|
| Food Service — 0.6% | |
| | |
| 1011778 B.C. Unlimited Liability Company | | | | | | |
| | |
Term Loan, 1.90%, (1 mo. USD LIBOR + 1.75%), Maturing November 19, 2026 | | $ | 1,203 | | | $ | 1,185,616 | |
| | |
| IRB Holding Corp. | | | | | | |
| | |
Term Loan, 4.25%, (3 mo. USD LIBOR + 3.25%, Floor 1.00%), Maturing December 15, 2027 | | | 2,025 | | | | 2,027,784 | |
| | |
| | | | | | | $ | 3,213,400 | |
|
| Food / Drug Retailers — 0.1% | |
| | |
| BW Gas & Convenience Holdings, LLC | | | | | | |
| | |
Term Loan, 6.40%, (1 mo. USD LIBOR + 6.25%), Maturing November 18, 2024 | | $ | 353 | | | $ | 355,126 | |
| | |
| | | | | | | $ | 355,126 | |
|
| Forest Products — 0.0%(4) | |
| | |
| Clearwater Paper Corporation | | | | | | |
| | |
Term Loan, 3.25%, (USD LIBOR + 3.00%), Maturing July 26, 2026(7) | | $ | 108 | | | $ | 108,516 | |
| | |
| | | | | | | $ | 108,516 | |
|
| Health Care — 7.1% | |
| | |
| Alliance Healthcare Services, Inc. | | | | | | |
| | |
Term Loan, 5.50%, (1 mo. USD LIBOR + 4.50%, Floor 1.00%), Maturing October 24, 2023 | | $ | 537 | | | $ | 487,332 | |
| | |
| athenahealth, Inc. | | | | | | |
| | |
Term Loan, 4.65%, (1 mo. USD LIBOR + 4.50%), Maturing February 11, 2026 | | | 1,971 | | | | 1,974,504 | |
| | |
| Avantor Funding, Inc. | | | | | | |
| | |
Term Loan, 3.25%, (1 mo. USD LIBOR + 2.25%, Floor 1.00%), Maturing November 21, 2024 | | | 539 | | | | 540,205 | |
| | | | |
| | 17 | | See Notes to Financial Statements. |
Eaton Vance
VT Floating-Rate Income Fund
December 31, 2020
Portfolio of Investments — continued
| | | | | | | | |
| Borrower/Tranche Description | | Principal
Amount
(000’s omitted) | | | Value | |
|
| Health Care (continued) | |
| | |
| Avantor Funding, Inc. (continued) | | | | | | |
| | |
Term Loan, 3.50%, (1 mo. USD LIBOR + 2.50%, Floor 1.00%), Maturing November 8, 2027 | | $ | 1,250 | | | $ | 1,253,125 | |
| | |
| BioClinica Holding I L.P. | | | | | | |
| | |
Term Loan, 5.25%, (1 mo. USD LIBOR + 4.25%, Floor 1.00%), Maturing October 20, 2023 | | | 1,198 | | | | 1,189,781 | |
| | |
| BW NHHC Holdco, Inc. | | | | | | |
| | |
Term Loan, 5.22%, (3 mo. USD LIBOR + 5.00%), Maturing May 15, 2025 | | | 756 | | | | 666,839 | |
| | |
| Cano Health, LLC | | | | | | |
| | |
Term Loan, 0.50%, Maturing November 19, 2027(8) | | | 207 | | | | 206,457 | |
| | |
Term Loan, 6.00%, (6 mo. USD LIBOR + 5.25%, Floor 0.75%), Maturing November 19, 2027 | | | 568 | | | | 566,282 | |
| | |
| CeramTec AcquiCo GmbH | | | | | | |
| | |
Term Loan, 2.90%, (1 mo. USD LIBOR + 2.75%), Maturing March 7, 2025 | | | 812 | | | | 783,360 | |
| | |
| Change Healthcare Holdings, LLC | | | | | | |
| | |
Term Loan, 3.50%, (USD LIBOR + 2.50%, Floor 1.00%), Maturing March 1, 2024(7) | | | 551 | | | | 549,502 | |
| | |
| CryoLife, Inc. | | | | | | |
| | |
Term Loan, 4.25%, (3 mo. USD LIBOR + 3.25%, Floor 1.00%), Maturing December 1, 2024 | | | 364 | | | | 364,659 | |
| | |
| Ensemble RCM, LLC | | | | | | |
| | |
Term Loan, 3.96%, (3 mo. USD LIBOR + 3.75%), Maturing August 3, 2026 | | | 395 | | | | 395,049 | |
| | |
| Envision Healthcare Corporation | | | | | | |
| | |
Term Loan, 3.90%, (1 mo. USD LIBOR + 3.75%), Maturing October 10, 2025 | | | 3,570 | | | | 2,996,894 | |
| | |
| Gentiva Health Services, Inc. | | | | | | |
| | |
Term Loan, 3.44%, (1 mo. USD LIBOR + 3.25%), Maturing July 2, 2025 | | | 1,755 | | | | 1,751,886 | |
| | |
| Greatbatch, Ltd. | | | | | | |
| | |
Term Loan, 3.50%, (1 mo. USD LIBOR + 2.50%, Floor 1.00%), Maturing October 27, 2022 | | | 1,710 | | | | 1,712,561 | |
| | |
| Hanger, Inc. | | | | | | |
| | |
Term Loan, 3.65%, (1 mo. USD LIBOR + 3.50%), Maturing March 6, 2025 | | | 1,217 | | | | 1,217,863 | |
| | |
| IQVIA, Inc. | | | | | | |
| | |
Term Loan, 1.90%, (1 mo. USD LIBOR + 1.75%), Maturing March 7, 2024 | | | 553 | | | | 550,873 | |
| | |
Term Loan, 1.90%, (1 mo. USD LIBOR + 1.75%), Maturing January 17, 2025 | | | 878 | | | | 874,260 | |
| | |
| Medical Solutions, LLC | | | | | | |
| | |
Term Loan, 5.50%, (3 mo. USD LIBOR + 4.50%, Floor 1.00%), Maturing June 14, 2024 | | | 791 | | | | 787,281 | |
| | |
| MPH Acquisition Holdings, LLC | | | | | | |
| | |
Term Loan, 3.75%, (3 mo. USD LIBOR + 2.75%, Floor 1.00%), Maturing June 7, 2023 | | | 2,731 | | | | 2,724,188 | |
| | | | | | | | |
| Borrower/Tranche Description | | Principal
Amount
(000’s omitted) | | | Value | |
|
| Health Care (continued) | |
| | |
| National Mentor Holdings, Inc. | | | | | | |
| | |
Term Loan, 4.40%, (1 mo. USD LIBOR + 4.25%), Maturing March 9, 2026 | | $ | 489 | | | $ | 489,586 | |
| | |
Term Loan, 4.51%, (3 mo. USD LIBOR + 4.25%), Maturing March 9, 2026 | | | 22 | | | | 22,384 | |
| | |
Term Loan, Maturing March 9, 2026(9) | | | 5 | | | | 4,773 | |
| | |
Term Loan, Maturing March 9, 2026(9) | | | 126 | | | | 126,475 | |
| | |
| Navicure, Inc. | | | | | | |
| | |
Term Loan, 4.75%, (1 mo. USD LIBOR + 4.00%, Floor 0.75%), Maturing October 22, 2026 | | | 324 | | | | 324,390 | |
| | |
| One Call Corporation | | | | | | |
| | |
Term Loan, 6.25%, (3 mo. USD LIBOR + 5.25%, Floor 1.00%), Maturing November 25, 2022 | | | 885 | | | | 857,211 | |
| | |
| Ortho-Clinical Diagnostics S.A. | | | | | | |
| | |
Term Loan, 3.40%, (1 mo. USD LIBOR + 3.25%), Maturing June 30, 2025 | | | 1,861 | | | | 1,838,579 | |
| | |
| Phoenix Guarantor, Inc. | | | | | | |
| | |
Term Loan, 3.40%, (1 mo. USD LIBOR + 3.25%), Maturing March 5, 2026 | | | 958 | | | | 954,506 | |
| | |
Term Loan, 4.25%, (1 mo. USD LIBOR + 3.75%, Floor 0.50%), Maturing March 5, 2026 | | | 350 | | | | 350,328 | |
| | |
| PointClickCare Technologies, Inc. | | | | | | |
| | |
Term Loan, Maturing December 29, 2027(9) | | | 375 | | | | 375,000 | |
| | |
| RadNet, Inc. | | | | | | |
| | |
Term Loan, 4.75%, (3 mo. USD LIBOR + 3.75%, Floor 1.00%), Maturing June 30, 2023 | | | 1,805 | | | | 1,804,615 | |
| | |
| Select Medical Corporation | | | | | | |
| | |
Term Loan, 2.53%, (6 mo. USD LIBOR + 2.25%), Maturing March 6, 2025 | | | 1,469 | | | | 1,461,079 | |
| | |
| Team Health Holdings, Inc. | | | | | | |
| | |
Term Loan, 3.75%, (1 mo. USD LIBOR + 2.75%, Floor 1.00%), Maturing February 6, 2024 | | | 2,154 | | | | 1,941,732 | |
| | |
| U.S. Anesthesia Partners, Inc. | | | | | | |
| | |
Term Loan, 4.00%, (6 mo. USD LIBOR + 3.00%, Floor 1.00%), Maturing June 23, 2024 | | | 1,813 | | | | 1,778,730 | |
| | |
| US Radiology Specialists, Inc. | | | | | | |
| | |
Term Loan, 6.25%, (3 mo. USD LIBOR + 5.50%, Floor 0.75%), Maturing December 10, 2027 | | | 475 | | | | 473,813 | |
| | |
| Verscend Holding Corp. | | | | | | |
| | |
Term Loan, 4.65%, (1 mo. USD LIBOR + 4.50%), Maturing August 27, 2025 | | | 1,268 | | | | 1,270,197 | |
| | |
| | | | | | | $ | 35,666,299 | |
|
| Home Furnishings — 0.8% | |
| | |
| Mattress Firm, Inc. | | | | | | |
| | |
Term Loan, 6.25%, (3 mo. USD LIBOR + 5.25%, Floor 1.00%), Maturing November 26, 2027 | | $ | 500 | | | $ | 505,000 | |
| | | | |
| | 18 | | See Notes to Financial Statements. |
Eaton Vance
VT Floating-Rate Income Fund
December 31, 2020
Portfolio of Investments — continued
| | | | | | | | |
| Borrower/Tranche Description | | Principal
Amount
(000’s omitted) | | | Value | |
|
| Home Furnishings (continued) | |
| | |
| Serta Simmons Bedding, LLC | | | | | | |
| | |
Term Loan, 8.50%, (1 mo. USD LIBOR + 7.50%, Floor 1.00%), Maturing August 10, 2023 | | $ | 886 | | | $ | 893,161 | |
| | |
Term Loan - Second Lien, 8.50%, (1 mo. USD LIBOR + 7.50%, Floor 1.00%), Maturing August 10, 2023 | | | 2,928 | | | | 2,646,231 | |
| | |
| | | | | | | $ | 4,044,392 | |
|
| Industrial Equipment — 4.1% | |
| | |
| AI Alpine AT Bidco GmbH | | | | | | |
| | |
Term Loan, 3.23%, (6 mo. USD LIBOR + 3.00%), Maturing October 31, 2025 | | $ | 196 | | | $ | 187,425 | |
| | |
| Alliance Laundry Systems, LLC | | | | | | |
| | |
Term Loan, 4.25%, (3 mo. USD LIBOR + 3.50%, Floor 0.75%), Maturing October 8, 2027 | | | 1,200 | | | | 1,201,625 | |
| | |
| Apex Tool Group, LLC | | | | | | |
| | |
Term Loan, 6.50%, (1 mo. USD LIBOR + 5.25%, Floor 1.25%), Maturing August 1, 2024 | | | 973 | | | | 964,408 | |
| | |
| CFS Brands, LLC | | | | | | |
| | |
Term Loan, 4.00%, (6 mo. USD LIBOR + 3.00%, Floor 1.00%), Maturing March 20, 2025 | | | 682 | | | | 634,897 | |
| | |
| Clark Equipment Company | | | | | | |
| | |
Term Loan, 2.00%, (3 mo. USD LIBOR + 1.75%), Maturing May 18, 2024 | | | 790 | | | | 784,786 | |
| | |
| CPM Holdings, Inc. | | | | | | |
| | |
Term Loan, 3.91%, (1 mo. USD LIBOR + 3.75%), Maturing November 17, 2025 | | | 858 | | | | 835,393 | |
| | |
| Delachaux Group S.A. | | | | | | |
| | |
Term Loan, 4.74%, (6 mo. USD LIBOR + 4.50%), Maturing April 16, 2026 | | | 371 | | | | 363,825 | |
| | |
| DexKo Global, Inc. | | | | | | |
| | |
Term Loan, 4.50%, (3 mo. USD LIBOR + 3.50%, Floor 1.00%), Maturing July 24, 2024 | | | 603 | | | | 598,786 | |
| | |
| DXP Enterprises, Inc. | | | | | | |
| | |
Term Loan, 5.75%, (1 mo. USD LIBOR + 4.75%, Floor 1.00%), Maturing December 16, 2027 | | | 375 | | | | 374,062 | |
| | |
| Engineered Machinery Holdings, Inc. | | | | | | |
| | |
Term Loan, 4.00%, (3 mo. USD LIBOR + 3.00%, Floor 1.00%), Maturing July 19, 2024 | | | 1,334 | | | | 1,331,249 | |
| | |
Term Loan, 5.25%, (3 mo. USD LIBOR + 4.25%, Floor 1.00%), Maturing July 19, 2024 | | | 245 | | | | 246,378 | |
| | |
| EWT Holdings III Corp. | | | | | | |
| | |
Term Loan, 2.65%, (1 mo. USD LIBOR + 2.50%), Maturing December 20, 2024 | | | 3,502 | | | | 3,497,460 | |
| | |
| Filtration Group Corporation | | | | | | |
| | |
Term Loan, 3.15%, (1 mo. USD LIBOR + 3.00%), Maturing March 29, 2025 | | | 558 | | | | 553,750 | |
| | |
Term Loan, 4.50%, (1 mo. USD LIBOR + 3.75%, Floor 0.75%), Maturing March 29, 2025 | | | 224 | | | | 225,185 | |
| | | | | | | | |
| Borrower/Tranche Description | | Principal
Amount
(000’s omitted) | | | Value | |
|
| Industrial Equipment (continued) | |
| | |
| Gardner Denver, Inc. | | | | | | |
| | |
Term Loan, 1.90%, (1 mo. USD LIBOR + 1.75%), Maturing March 1, 2027 | | $ | 1,141 | | | $ | 1,126,868 | |
| | |
Term Loan, 2.90%, (1 mo. USD LIBOR + 2.75%), Maturing March 1, 2027 | | | 896 | | | | 896,806 | |
| | |
| Ingersoll-Rand Services Company | | | | | | |
| | |
Term Loan, 1.90%, (1 mo. USD LIBOR + 1.75%), Maturing March 1, 2027 | | | 968 | | | | 956,110 | |
| | |
| LTI Holdings, Inc. | | | | | | |
| | |
Term Loan, 3.65%, (1 mo. USD LIBOR + 3.50%), Maturing September 6, 2025 | | | 1,395 | | | | 1,359,257 | |
| | |
Term Loan, 4.90%, (1 mo. USD LIBOR + 4.75%), Maturing July 24, 2026 | | | 148 | | | | 145,965 | |
| | |
| Robertshaw US Holding Corp. | | | | | | |
| | |
Term Loan, 4.50%, (1 mo. USD LIBOR + 3.50%, Floor 1.00%), Maturing February 28, 2025 | | | 1,702 | | | | 1,599,762 | |
| | |
| Thermon Industries, Inc. | | | | | | |
| | |
Term Loan, 4.75%, (1 mo. USD LIBOR + 3.75%, Floor 1.00%), Maturing October 30, 2024 | | | 186 | | | | 186,037 | |
| | |
| Titan Acquisition Limited | | | | | | |
| | |
Term Loan, 3.27%, (6 mo. USD LIBOR + 3.00%), Maturing March 28, 2025 | | | 2,188 | | | | 2,141,075 | |
| | |
| | | | | | | $ | 20,211,109 | |
|
| Insurance — 3.8% | |
| | |
| Alliant Holdings Intermediate, LLC | | | | | | |
| | |
Term Loan, 3.40%, (1 mo. USD LIBOR + 3.25%), Maturing May 9, 2025 | | $ | 369 | | | $ | 363,863 | |
| | |
Term Loan, 3.40%, (1 mo. USD LIBOR + 3.25%), Maturing May 9, 2025 | | | 969 | | | | 953,529 | |
| | |
Term Loan, 4.25%, (1 mo. USD LIBOR + 3.75%, Floor 0.50%), Maturing October 8, 2027 | | | 598 | | | | 599,534 | |
| | |
| AmWINS Group, Inc. | | | | | | |
| | |
Term Loan, 3.75%, (1 mo. USD LIBOR + 2.75%, Floor 1.00%), Maturing January 25, 2024 | | | 3,000 | | | | 3,003,442 | |
| | |
| AssuredPartners Capital, Inc. | | | | | | |
| | |
Term Loan, 5.50%, (1 mo. USD LIBOR + 4.50%, Floor 1.00%), Maturing February 12, 2027 | | | 372 | | | | 373,583 | |
| | |
| AssuredPartners, Inc. | | | | | | |
| | |
Term Loan, 3.65%, (1 mo. USD LIBOR + 3.50%), Maturing February 12, 2027 | | | 149 | | | | 146,582 | |
| | |
| Asurion, LLC | | | | | | |
| | |
Term Loan, 3.15%, (1 mo. USD LIBOR + 3.00%), Maturing November 3, 2023 | | | 1,325 | | | | 1,320,799 | |
| | |
Term Loan, Maturing December 23, 2026(9) | | | 3,000 | | | | 2,975,625 | |
| | |
Term Loan - Second Lien, 6.65%, (1 mo. USD LIBOR + 6.50%), Maturing August 4, 2025 | | | 1,785 | | | | 1,800,466 | |
| | | | |
| | 19 | | See Notes to Financial Statements. |
Eaton Vance
VT Floating-Rate Income Fund
December 31, 2020
Portfolio of Investments — continued
| | | | | | | | |
| Borrower/Tranche Description | | Principal
Amount
(000’s omitted) | | | Value | |
|
| Insurance (continued) | |
| | |
| Hub International Limited | | | | | | |
| | |
Term Loan, 2.96%, (3 mo. USD LIBOR + 2.75%), Maturing April 25, 2025 | | $ | 2,181 | | | $ | 2,145,265 | |
| | |
| NFP Corp. | | | | | | |
| | |
Term Loan, 3.40%, (1 mo. USD LIBOR + 3.25%), Maturing February 15, 2027 | | | 1,871 | | | | 1,834,237 | |
| | |
| Ryan Specialty Group, LLC | | | | | | |
| | |
Term Loan, 4.00%, (1 mo. USD LIBOR + 3.25%, Floor 0.75%), Maturing September 1, 2027 | | | 648 | | | | 648,375 | |
| | |
| USI, Inc. | | | | | | |
| | |
Term Loan, 3.25%, (3 mo. USD LIBOR + 3.00%), Maturing May 16, 2024 | | | 2,034 | | | | 2,008,648 | |
| | |
Term Loan, 4.25%, (3 mo. USD LIBOR + 4.00%), Maturing December 2, 2026 | | | 1,015 | | | | 1,015,257 | |
| | |
| | | | | | | $ | 19,189,205 | |
|
| Leisure Goods / Activities / Movies — 3.2% | |
| | |
| Bombardier Recreational Products, Inc. | | | | | | |
| | |
Term Loan, 2.15%, (1 mo. USD LIBOR + 2.00%), Maturing May 24, 2027 | | $ | 1,069 | | | $ | 1,058,965 | |
| | |
Term Loan, 6.00%, (3 mo. USD LIBOR + 5.00%, Floor 1.00%), Maturing May 24, 2027 | | | 499 | | | | 509,920 | |
| | |
| ClubCorp Holdings, Inc. | | | | | | |
| | |
Term Loan, 3.00%, (3 mo. USD LIBOR + 2.75%), Maturing September 18, 2024 | | | 1,778 | | | | 1,668,442 | |
| | |
| Crown Finance US, Inc. | | | | | | |
| | |
Term Loan, Maturing May 23, 2024(9) | | | 344 | | | | 411,969 | |
| | |
Term Loan, 3.50%, (USD LIBOR + 2.50%, Floor 1.00%), Maturing February 28, 2025(7) | | | 1,709 | | | | 1,167,376 | |
| | |
Term Loan, 3.02%, (USD LIBOR + 2.75%), Maturing September 30, 2026(7) | | | 1,089 | | | | 732,878 | |
| | |
| Delta 2 (LUX) S.a.r.l. | | | | | | |
| | |
Term Loan, 3.50%, (1 mo. USD LIBOR + 2.50%, Floor 1.00%), Maturing February 1, 2024 | | | 1,684 | | | | 1,671,397 | |
| | |
| Match Group, Inc. | | | | | | |
| | |
Term Loan, 1.96%, (3 mo. USD LIBOR + 1.75%), Maturing February 13, 2027 | | | 525 | | | | 521,063 | |
| | |
| Playtika Holding Corp. | | | | | | |
| | |
Term Loan, 7.00%, (3 mo. USD LIBOR + 6.00%, Floor 1.00%), Maturing December 10, 2024 | | | 2,809 | | | | 2,831,683 | |
| | |
| SeaWorld Parks & Entertainment, Inc. | | | | | | |
| | |
Term Loan, 3.75%, (1 mo. USD LIBOR + 3.00%, Floor 0.75%), Maturing March 31, 2024 | | | 884 | | | | 861,443 | |
| | |
| SRAM, LLC | | | | | | |
| | |
Term Loan, 3.75%, (USD LIBOR + 2.75%, Floor 1.00%), Maturing March 15,
2024(7) | | | 627 | | | | 627,863 | |
| | | | | | | | |
| Borrower/Tranche Description | | Principal
Amount
(000’s omitted) | | | Value | |
|
| Leisure Goods / Activities / Movies (continued) | |
| | |
| Steinway Musical Instruments, Inc. | | | | | | |
| | |
Term Loan, 4.75%, (1 mo. USD LIBOR + 3.75%, Floor 1.00%), Maturing February 14, 2025 | | $ | 216 | | | $ | 209,733 | |
| | |
| Travel Leaders Group, LLC | | | | | | |
| | |
Term Loan, 4.15%, (1 mo. USD LIBOR + 4.00%), Maturing January 25, 2024 | | | 2,745 | | | | 2,435,953 | |
| | |
| UFC Holdings, LLC | | | | | | |
| | |
Term Loan, 4.25%, (6 mo. USD LIBOR + 3.25%, Floor 1.00%), Maturing April 29, 2026 | | | 1,462 | | | | 1,461,287 | |
| | |
| | | | | | | $ | 16,169,972 | |
|
| Lodging and Casinos — 1.1% | |
| | |
| Golden Nugget, Inc. | | | | | | |
| | |
Term Loan, 3.25%, (2 mo. USD LIBOR + 2.50%, Floor 0.75%), Maturing October 4, 2023 | | $ | 2,083 | | | $ | 2,018,679 | |
| | |
| GVC Holdings (Gibraltar) Limited | | | | | | |
| | |
Term Loan, 3.25%, (3 mo. USD LIBOR + 2.25%, Floor 1.00%), Maturing March 29, 2024 | | | 802 | | | | 804,653 | |
| | |
| Playa Resorts Holding B.V. | | | | | | |
| | |
Term Loan, 3.75%, (1 mo. USD LIBOR + 2.75%, Floor 1.00%), Maturing April 29, 2024 | | | 1,083 | | | | 1,005,867 | |
| | |
| Stars Group Holdings B.V. (The) | | | | | | |
| | |
Term Loan, 3.75%, (3 mo. USD LIBOR + 3.50%), Maturing July 10, 2025 | | | 1,682 | | | | 1,689,775 | |
| | |
| | | | | | | $ | 5,518,974 | |
|
| Nonferrous Metals / Minerals — 0.1% | |
| | |
| American Consolidated Natural Resources, Inc. | | | | | | |
| | |
Term Loan, 14.00%, (1 mo. USD LIBOR + 13.00%, Floor 1.00%), Maturing September 16, 2025 | | $ | 397 | | | $ | 383,534 | |
| | |
| Oxbow Carbon, LLC | | | | | | |
| | |
Term Loan, 5.00%, (1 mo. USD LIBOR + 4.25%, Floor 0.75%), Maturing October 13, 2025 | | | 247 | | | | 247,492 | |
| | |
| | | | | | | $ | 631,026 | |
|
| Oil and Gas — 2.4% | |
| | |
| Ameriforge Group, Inc. | | | | | | |
| | |
Term Loan, 14.00%, (3 mo. USD LIBOR + 13.00%, Floor 1.00%), 9.00% cash, 5.00% PIK, Maturing June 8, 2022 | | $ | 530 | | | $ | 424,228 | |
| | |
| Apergy Corporation | | | | | | |
| | |
Term Loan, 2.69%, (1 mo. USD LIBOR + 2.50%), Maturing May 9, 2025 | | | 93 | | | | 91,727 | |
| | |
Term Loan, 6.00%, (3 mo. USD LIBOR + 5.00%, Floor 1.00%), Maturing May 28, 2027 | | | 171 | | | | 173,184 | |
| | | | |
| | 20 | | See Notes to Financial Statements. |
Eaton Vance
VT Floating-Rate Income Fund
December 31, 2020
Portfolio of Investments — continued
| | | | | | | | |
| Borrower/Tranche Description | | Principal
Amount
(000’s omitted) | | | Value | |
|
| Oil and Gas (continued) | |
| | |
| Blackstone CQP Holdco L.P. | | | | | | |
| | |
Term Loan, 3.74%, (3 mo. USD LIBOR + 3.50%), Maturing September 30, 2024 | | $ | 1,877 | | | $ | 1,872,950 | |
| | |
| Centurion Pipeline Company, LLC | | | | | | |
| | |
Term Loan, 4.15%, (1 mo. USD LIBOR + 4.00%), Maturing September 28, 2025 | | | 150 | | | | 149,625 | |
| | |
Term Loan, 3.40%, (1 mo. USD LIBOR + 3.25%), Maturing September 29, 2025 | | | 221 | | | | 220,500 | |
| | |
| CITGO Holding, Inc. | | | | | | |
| | |
Term Loan, 8.00%, (6 mo. USD LIBOR + 7.00%, Floor 1.00%), Maturing August 1, 2023 | | | 197 | | | | 183,457 | |
| | |
| CITGO Petroleum Corporation | | | | | | |
| | |
Term Loan, 7.25%, (6 mo. USD LIBOR + 6.25%, Floor 1.00%), Maturing March 28, 2024 | | | 2,803 | | | | 2,792,256 | |
| | |
| Delek US Holdings, Inc. | | | | | | |
| | |
Term Loan, 2.40%, (1 mo. USD LIBOR + 2.25%), Maturing March 31, 2025 | | | 1,975 | | | | 1,908,741 | |
| | |
Term Loan, 6.50%, (1 mo. USD LIBOR + 5.50%, Floor 1.00%), Maturing March 31, 2025 | | | 422 | | | | 418,122 | |
| | |
| Fieldwood Energy, LLC | | | | | | |
| | |
DIP Loan, 3.68%, (1 mo. USD LIBOR + 8.75%, Floor 1.00%), Maturing August 4, 2021(8) | | | 112 | | | | 112,107 | |
| | |
Term Loan, 0.00%, Maturing April 11,
2022(10) | | | 761 | | | | 176,874 | |
| | |
| Lealand Finance Company B.V. | | | | | | |
| | |
Term Loan, 4.15%, (1 mo. USD LIBOR + 4.00%), 1.15% cash, 3.00% PIK, Maturing June 30, 2025 | | | 235 | | | | 160,790 | |
| | |
| McDermott Technology Americas, Inc. | | | | | | |
| | |
Term Loan, 3.15%, (1 mo. USD LIBOR + 3.00%), Maturing June 30, 2024 | | | 18 | | | | 14,756 | |
| | |
| Prairie ECI Acquiror L.P. | | | | | | |
| | |
Term Loan, 4.90%, (1 mo. USD LIBOR + 4.75%), Maturing March 11, 2026 | | | 1,275 | | | | 1,246,666 | |
| | |
| PSC Industrial Holdings Corp. | | | | | | |
| | |
Term Loan, 4.75%, (1 mo. USD LIBOR + 3.75%, Floor 1.00%), Maturing October 11, 2024 | | | 1,285 | | | | 1,249,906 | |
| | |
| RDV Resources Properties, LLC | | | | | | |
| | |
Term Loan, 15.50%, (1 mo. USD LIBOR + 14.50%, Floor 1.00%), Maturing March 29, 2024(1) | | | 178 | | | | 118,058 | |
| | |
| Sunrise Oil & Gas Properties, LLC | | | | | | |
| | |
Term Loan, 8.00%, (1 mo. USD LIBOR + 7.00%, Floor 1.00%), Maturing January 17, 2023 | | | 49 | | | | 44,075 | |
| | |
Term Loan - Second Lien, 8.00%, (1 mo. USD LIBOR + 7.00%, Floor 1.00%), Maturing January 17, 2023 | | | 51 | | | | 37,508 | |
| | |
Term Loan - Third Lien, 8.00%, (1 mo. USD LIBOR + 7.00%, Floor 1.00%), Maturing January 17, 2023 | | | 59 | | | | 20,635 | |
| | | | | | | | |
| Borrower/Tranche Description | | Principal
Amount
(000’s omitted) | | | Value | |
|
| Oil and Gas (continued) | |
| | |
| UGI Energy Services, LLC | | | | | | |
| | |
Term Loan, 3.90%, (1 mo. USD LIBOR + 3.75%), Maturing August 13, 2026 | | $ | 763 | | | $ | 766,238 | |
| | |
| | | | | | | $ | 12,182,403 | |
|
| Publishing — 1.0% | |
|
| Alchemy Copyrights, LLC | |
| | |
Term Loan, 4.00%, (1 mo. USD LIBOR + 3.25%, Floor 0.75%), Maturing August 16, 2027 | | $ | 798 | | | $ | 803,985 | |
| | |
| Ascend Learning, LLC | | | | | | |
| | |
Term Loan, 4.00%, (1 mo. USD LIBOR + 3.00%, Floor 1.00%), Maturing July 12, 2024 | | | 841 | | | | 839,500 | |
| | |
Term Loan, 4.75%, (1 mo. USD LIBOR + 3.75%, Floor 1.00%), Maturing July 12, 2024 | | | 224 | | | | 225,466 | |
| | |
| Getty Images, Inc. | | | | | | |
| | |
Term Loan, 4.69%, (1 mo. USD LIBOR + 4.50%), Maturing February 19, 2026 | | | 1,311 | | | | 1,296,406 | |
| | |
| LSC Communications, Inc. | | | | | | |
| | |
Term Loan, 0.00%, Maturing September 30, 2022(10) | | | 462 | | | | 66,233 | |
| | |
| Nielsen Finance, LLC | | | | | | |
| | |
Term Loan, 4.75%, (1 mo. USD LIBOR + 3.75%, Floor 1.00%), Maturing June 4, 2025 | | | 597 | | | | 602,970 | |
| | |
| ProQuest, LLC | | | | | | |
| | |
Term Loan, 3.65%, (1 mo. USD LIBOR + 3.50%), Maturing October 23, 2026 | | | 937 | | | | 938,547 | |
| | |
| | | | | | | $ | 4,773,107 | |
|
| Radio and Television — 3.1% | |
|
| Cumulus Media New Holdings, Inc. | |
| | |
Term Loan, 4.75%, (6 mo. USD LIBOR + 3.75%, Floor 1.00%), Maturing March 31, 2026 | | $ | 358 | | | $ | 352,640 | |
| | |
| Diamond Sports Group, LLC | | | | | | |
| | |
Term Loan, 3.40%, (1 mo. USD LIBOR + 3.25%), Maturing August 24, 2026 | | | 1,626 | | | | 1,455,182 | |
| | |
| Entercom Media Corp. | | | | | | |
| | |
Term Loan, 2.65%, (1 mo. USD LIBOR + 2.50%), Maturing November 18, 2024 | | | 1,402 | | | | 1,370,335 | |
| | |
| Hubbard Radio, LLC | | | | | | |
| | |
Term Loan, 5.25%, (6 mo. USD LIBOR + 4.25%, Floor 1.00%), Maturing March 28, 2025 | | | 485 | | | | 472,851 | |
| | |
| iHeartCommunications, Inc. | | | | | | |
| | |
Term Loan, 3.15%, (1 mo. USD LIBOR + 3.00%), Maturing May 1, 2026 | | | 1,015 | | | | 999,952 | |
| | |
Term Loan, 4.75%, (1 mo. USD LIBOR + 4.00%, Floor 0.75%), Maturing May 1, 2026 | | | 249 | | | | 248,232 | |
| | | | |
| | 21 | | See Notes to Financial Statements. |
Eaton Vance
VT Floating-Rate Income Fund
December 31, 2020
Portfolio of Investments — continued
| | | | | | | | |
| Borrower/Tranche Description | | Principal
Amount
(000’s omitted) | | | Value | |
|
| Radio and Television (continued) | |
| | |
| Nexstar Broadcasting, Inc. | | | | | | |
| | |
Term Loan, 2.40%, (1 mo. USD LIBOR + 2.25%), Maturing January 17, 2024 | | $ | 1,148 | | | $ | 1,139,600 | |
| | |
Term Loan, 2.90%, (1 mo. USD LIBOR + 2.75%), Maturing September 18, 2026 | | | 3,039 | | | | 3,024,650 | |
| | |
| Sinclair Television Group, Inc. | | | | | | |
| | |
Term Loan, 2.40%, (1 mo. USD LIBOR + 2.25%), Maturing January 3, 2024 | | | 1,817 | | | | 1,801,606 | |
| | |
Term Loan, 2.65%, (1 mo. USD LIBOR + 2.50%), Maturing September 30, 2026 | | | 1,486 | | | | 1,474,137 | |
| | |
| Terrier Media Buyer, Inc. | | | | | | |
| | |
Term Loan, 4.40%, (1 mo. USD LIBOR + 4.25%), Maturing December 17, 2026 | | | 1,312 | | | | 1,313,754 | |
| | |
| Townsquare Media, Inc. | | | | | | |
| | |
Term Loan, 4.00%, (6 mo. USD LIBOR + 3.00%, Floor 1.00%), Maturing April 1, 2022 | | | 991 | | | | 989,709 | |
| | |
| Univision Communications, Inc. | | | | | | |
| | |
Term Loan, 3.75%, (1 mo. USD LIBOR + 2.75%, Floor 1.00%), Maturing March 15, 2024 | | | 150 | | | | 148,816 | |
| | |
Term Loan, 4.75%, (1 mo. USD LIBOR + 3.75%, Floor 1.00%), Maturing March 15, 2026 | | | 541 | | | | 541,713 | |
| | |
| | | | | | | $ | 15,333,177 | |
|
| Retailers (Except Food and Drug) — 1.7% | |
|
| Ascena Retail Group, Inc. | |
| | |
Term Loan, 0.00%, Maturing August 21, 2022(10) | | $ | 854 | | | $ | 172,942 | |
| | |
| Bass Pro Group, LLC | | | | | | |
| | |
Term Loan, 5.75%, (1 mo. USD LIBOR + 5.00%, Floor 0.75%), Maturing September 25, 2024 | | | 1,219 | | | | 1,224,378 | |
| | |
| BJ’s Wholesale Club, Inc. | | | | | | |
| | |
Term Loan, 2.15%, (1 mo. USD LIBOR + 2.00%), Maturing February 3, 2024 | | | 1,197 | | | | 1,197,753 | |
| | |
| CNT Holdings I Corp. | | | | | | |
| | |
Term Loan, 4.50%, (6 mo. USD LIBOR + 3.75%, Floor 0.75%), Maturing November 8, 2027 | | | 425 | | | | 425,721 | |
| | |
| David’s Bridal, Inc. | | | | | | |
| | |
Term Loan, 12.00%, (3 mo. USD LIBOR + 11.00%, Floor 1.00%), 6.00% cash, 6.00% PIK, Maturing June 23, 2023 | | | 224 | | | | 211,341 | |
| | |
Term Loan, 7.00%, (3 mo. USD LIBOR + 6.00%, Floor 1.00%), Maturing June 30, 2023 | | | 263 | | | | 221,899 | |
| | |
| Harbor Freight Tools USA, Inc. | | | | | | |
| | |
Term Loan, 4.00%, (1 mo. USD LIBOR + 3.25%, Floor 0.75%), Maturing October 19, 2027 | | | 875 | | | | 875,926 | |
| | |
| LSF9 Atlantis Holdings, LLC | | | | | | |
| | |
Term Loan, 7.00%, (1 mo. USD LIBOR + 6.00%, Floor 1.00%), Maturing May 1, 2023 | | | 653 | | | | 650,597 | |
| | | | | | | | |
| Borrower/Tranche Description | | Principal
Amount
(000’s omitted) | | | Value | |
|
| Retailers (Except Food and Drug) (continued) | |
| | |
| PetSmart, Inc. | | | | | | |
| | |
Term Loan, 4.50%, (3 mo. USD LIBOR + 3.50%, Floor 1.00%), Maturing March 11, 2022 | | $ | 2,000 | | | $ | 2,000,000 | |
| | |
| Phillips Feed Service, Inc. | | | | | | |
| | |
Term Loan, 8.00%, (2 mo. USD LIBOR + 7.00%, Floor 1.00%), Maturing November 13, 2024(1) | | | 53 | | | | 42,607 | |
| | |
| Pier 1 Imports (U.S.), Inc. | | | | | | |
| | |
Term Loan, 0.00%, Maturing April 30,
2021(1)(10) | | | 146 | | | | 58,346 | |
| | |
| WASH MultiFamily Laundry Systems, LLC | | | | | | |
| | |
Term Loan, 4.25%, (1 mo. USD LIBOR + 3.25%, Floor 1.00%), Maturing May 14, 2022 | | | 152 | | | | 150,980 | |
| | |
Term Loan, 4.25%, (1 mo. USD LIBOR + 3.25%, Floor 1.00%), Maturing May 14, 2022 | | | 904 | | | | 898,708 | |
| | |
| | | | | | | $ | 8,131,198 | |
|
| Steel — 0.5% | |
|
| Neenah Foundry Company | |
| | |
Term Loan, 10.00%, (USD LIBOR + 9.00%), Maturing December 13, 2022(7) | | $ | 455 | | | $ | 398,006 | |
| | |
| Phoenix Services International, LLC | | | | | | |
| | |
Term Loan, 4.75%, (1 mo. USD LIBOR + 3.75%, Floor 1.00%), Maturing March 1, 2025 | | | 651 | | | | 644,901 | |
| | |
| Zekelman Industries, Inc. | | | | | | |
| | |
Term Loan, 2.14%, (1 mo. USD LIBOR + 2.00%), Maturing January 24, 2027 | | | 1,211 | | | | 1,203,844 | |
| | |
| | | | | | | $ | 2,246,751 | |
|
| Surface Transport — 0.6% | |
| | |
| Kenan Advantage Group, Inc. | | | | | | |
| | |
Term Loan, 3.15%, (1 mo. USD LIBOR + 3.00%), Maturing July 31, 2022 | | $ | 2,141 | | | $ | 2,109,072 | |
| | |
Term Loan, 4.00%, (1 mo. USD LIBOR + 3.00%, Floor 1.00%), Maturing July 31, 2022 | | | 394 | | | | 388,356 | |
| | |
| XPO Logistics, Inc. | | | | | | |
| | |
Term Loan, 2.15%, (1 mo. USD LIBOR + 2.00%), Maturing February 24, 2025 | | | 450 | | | | 448,406 | |
| | |
| | | | | | | $ | 2,945,834 | |
|
| Telecommunications — 3.9% | |
|
| CCI Buyer, Inc. | |
| | |
Term Loan, Maturing December 10, 2027(9) | | $ | 375 | | | $ | 375,996 | |
| | |
| CenturyLink, Inc. | | | | | | |
| | |
Term Loan, 2.40%, (1 mo. USD LIBOR + 2.25%), Maturing March 15, 2027 | | | 3,138 | | | | 3,106,252 | |
| | | | |
| | 22 | | See Notes to Financial Statements. |
Eaton Vance
VT Floating-Rate Income Fund
December 31, 2020
Portfolio of Investments — continued
| | | | | | | | |
| Borrower/Tranche Description | | Principal
Amount
(000’s omitted) | | | Value | |
|
| Telecommunications (continued) | |
| | |
| Ciena Corporation | | | | | | |
| | |
Term Loan, 1.90%, (1 mo. USD LIBOR + 1.75%), Maturing September 26, 2025 | | $ | 884 | | | $ | 883,765 | |
| | |
| Digicel International Finance Limited | | | | | | |
| | |
Term Loan, 3.51%, (6 mo. USD LIBOR + 3.25%), Maturing May 28, 2024 | | | 1,400 | | | | 1,284,298 | |
| | |
| Global Eagle Entertainment, Inc. | | | | | | |
| | |
DIP Loan, 11.25%, (1 mo. USD LIBOR + 10.00%, Floor 1.25%), Maturing January 22, 2021 | | | 120 | | | | 118,130 | |
| | |
Term Loan, 0.00%, Maturing January 6, 2023(10) | | | 804 | | | | 610,478 | |
| | |
| Intelsat Jackson Holdings S.A. | | | | | | |
| | |
DIP Loan, 6.50%, (USD LIBOR + 5.50%, Floor 1.00%), Maturing July 13, 2022(7) | | | 533 | | | | 545,936 | |
| | |
Term Loan, 8.00%, (USD Prime + 4.75%), Maturing November 27, 2023 | | | 500 | | | | 506,771 | |
| | |
Term Loan, 8.75%, (USD Prime + 5.50%), Maturing January 2, 2024 | | | 1,300 | | | | 1,324,700 | |
| | |
| IPC Corp. | | | | | | |
| | |
Term Loan, 5.50%, (3 mo. USD LIBOR + 4.50%, Floor 1.00%), Maturing August 6, 2021(1) | | | 596 | | | | 439,691 | |
| | |
| Level 3 Financing, Inc. | | | | | | |
| | |
Term Loan, 1.90%, (1 mo. USD LIBOR + 1.75%), Maturing March 1, 2027 | | | 3,323 | | | | 3,277,587 | |
| | |
| Onvoy, LLC | | | | | | |
| | |
Term Loan, 5.50%, (1 mo. USD LIBOR + 4.50%, Floor 1.00%), Maturing February 10, 2024 | | | 1,292 | | | | 1,265,814 | |
| | |
| Plantronics, Inc. | | | | | | |
| | |
Term Loan, 2.65%, (1 mo. USD LIBOR + 2.50%), Maturing July 2, 2025 | | | 989 | | | | 970,083 | |
| | |
| Syniverse Holdings, Inc. | | | | | | |
| | |
Term Loan, 6.00%, (3 mo. USD LIBOR + 5.00%, Floor 1.00%), Maturing March 9, 2023 | | | 729 | | | | 663,959 | |
| | |
| Zayo Group Holdings, Inc. | | | | | | |
| | |
Term Loan, 3.15%, (1 mo. USD LIBOR + 3.00%), Maturing March 9, 2027 | | | 733 | | | | 729,172 | |
| | |
| Ziggo Financing Partnership | | | | | | |
| | |
Term Loan, 2.66%, (1 mo. USD LIBOR + 2.50%), Maturing April 30, 2028 | | | 3,525 | | | | 3,500,766 | |
| | |
| | | | | | | $ | 19,603,398 | |
|
| Utilities — 0.6% | |
|
| Brookfield WEC Holdings, Inc. | |
| | |
Term Loan, 3.75%, (1 mo. USD LIBOR + 3.00%, Floor 0.75%), Maturing August 1, 2025 | | $ | 1,016 | | | $ | 1,015,774 | |
| | |
| Calpine Corporation | | | | | | |
| | |
Term Loan, 2.40%, (1 mo. USD LIBOR + 2.25%), Maturing April 5, 2026 | | | 714 | | | | 710,108 | |
| | | | | | | | |
| Borrower/Tranche Description | | Principal
Amount
(000’s omitted) | | | Value | |
|
| Utilities (continued) | |
| | |
| Longview Power, LLC | | | | | | |
| | |
Term Loan, 11.50%, (3 mo. USD LIBOR + 10.00%, Floor 1.50%), Maturing July 30, 2025(1) | | $ | 143 | | | $ | 114,698 | |
| | |
| Vistra Operations Company, LLC | | | | | | |
| | |
Term Loan, 1.90%, (1 mo. USD LIBOR + 1.75%), Maturing December 31, 2025 | | | 1,002 | | | | 1,000,811 | |
| | |
| | | | | | | $ | 2,841,391 | |
| |
Total Senior Floating-Rate Loans
(identified cost $454,415,555) | | | $ | 447,936,438 | |
|
| Warrants — 0.0%(4) | |
| Security | | Shares | | | Value | |
|
| Health Care — 0.0%(4) | |
| | |
THAIHOT Investment Company US Limited, Exp. 10/13/27(1)(2)(3) | | | 16 | | | $ | 4,556 | |
| | |
THAIHOT Investment Company US Limited, Exp. 10/13/27 (Contingent Warrants)(1)(2)(3) | | | 898 | | | | 0 | |
| | |
| | | | | | | $ | 4,556 | |
|
| Retailers (Except Food and Drug) — 0.0% | |
| | |
David’s Bridal, LLC, Exp. 11/26/22(1)(2)(3) | | | 3,427 | | | $ | 0 | |
| | |
| | | | | | | $ | 0 | |
| |
Total Warrants
(identified cost $0) | | | $ | 4,556 | |
|
| Miscellaneous — 0.0%(4) | |
| Security | | Shares | | | Value | |
|
| Oil and Gas — 0.0%(4) | |
| | |
Paragon Offshore Finance Company,
Class A(2)(3) | | | 1,168 | | | $ | 350 | |
| | |
Paragon Offshore Finance Company,
Class B(2)(3) | | | 584 | | | | 7,154 | |
| |
Total Miscellaneous
(identified cost $12,702) | | | $ | 7,504 | |
| | | | |
| | 23 | | See Notes to Financial Statements. |
Eaton Vance
VT Floating-Rate Income Fund
December 31, 2020
Portfolio of Investments — continued
| | | | | | | | |
| Short-Term Investments — 4.3% | |
| Description | | Units | | | Value | |
| | |
Eaton Vance Cash Reserves Fund, LLC,
0.11%(11) | | | 21,593,096 | | | $ | 21,593,096 | |
| |
Total Short-Term Investments
(identified cost $21,593,096) | | | $ | 21,593,096 | |
| |
Total Investments — 101.0%
(identified cost $510,652,464) | | | $ | 504,633,064 | |
| |
Less Unfunded Loan Commitments — (0.1)% | | | $ | (427,496 | ) |
| |
Net Investments — 100.9%
(identified cost $510,224,968) | | | $ | 504,205,568 | |
| |
Other Assets, Less Liabilities — (0.9)% | | | $ | (4,664,890 | ) |
| |
Net Assets — 100.0% | | | $ | 499,540,678 | |
The percentage shown for each investment category in the Portfolio of Investments is based on net assets.
| | (1) | For fair value measurement disclosure purposes, security is categorized as Level 3 (see Note 10). |
| | (2) | Non-income producing security. |
| | (3) | Security was acquired in connection with a restructuring of a Senior Loan and may be subject to restrictions on resale. |
| | (4) | Amount is less than 0.05%. |
| | (5) | Security exempt from registration under Rule 144A of the Securities Act of 1933, as amended. These securities may be sold in certain transactions in reliance on an exemption from registration (normally to qualified institutional buyers). At December 31, 2020, the aggregate value of these securities is $25,414,474 or 5.1% of the Fund’s net assets. |
| | (6) | Senior floating-rate loans (Senior Loans) often require prepayments from excess cash flows or permit the borrowers to repay at their election. The degree to which borrowers repay, whether as a contractual requirement or at their election, cannot be predicted with accuracy. As a result, the actual remaining maturity may be substantially less than the stated maturities shown. However, Senior Loans will typically have an expected average life of approximately two to four years. Senior Loans typically have rates of interest which are redetermined periodically by reference to a base lending rate, plus a spread. These base lending rates are primarily the London Interbank Offered Rate (“LIBOR”) and secondarily, the prime rate offered by one or more major United States banks (the “Prime Rate”). Base lending rates may be subject to a floor, or minimum rate. Senior Loans are generally subject to contractual restrictions that must be satisfied before they can be bought or sold. |
| | (7) | The stated interest rate represents the weighted average interest rate at December 31, 2020 of contracts within the senior loan facility. Interest rates on contracts are primarily redetermined either weekly, monthly or quarterly by reference to the indicated base lending rate and spread and the reset period. |
| | (8) | Unfunded or partially unfunded loan commitments. The stated interest rate reflects the weighted average of the reference rate and spread for the funded portion, if any, and the commitment fees on the portion of the loan that is unfunded. At December 31, 2020, the total value of unfunded loan commitments is $425,459. See Note 1F for description. |
| | (9) | This Senior Loan will settle after December 31, 2020, at which time the interest rate will be determined. |
| (10) | Issuer is in default with respect to interest and/or principal payments. For a variable rate security, interest rate has been adjusted to reflect non-accrual status. |
| (11) | Affiliated investment company, available to Eaton Vance portfolios and funds, which invests in high quality, U.S. dollar denominated money market instruments. The rate shown is the annualized seven-day yield as of December 31, 2020. |
Abbreviations:
| | | | |
| | |
| DIP | | – | | Debtor In Possession |
| | |
| LIBOR | | – | | London Interbank Offered Rate |
| | |
| PIK | | – | | Payment In Kind |
Currency Abbreviations:
| | | | |
| | |
| USD | | – | | United States Dollar |
| | | | |
| | 24 | | See Notes to Financial Statements. |
Eaton Vance
VT Floating-Rate Income Fund
December 31, 2020
Statement of Assets and Liabilities
| | | | |
| Assets | | December 31, 2020 | |
| |
Unaffiliated investments, at value (identified cost, $488,631,872) | | $ | 482,612,472 | |
| |
Affiliated investment, at value (identified cost, $21,593,096) | | | 21,593,096 | |
| |
Cash | | | 4,625,699 | |
| |
Interest receivable | | | 1,287,640 | |
| |
Dividends receivable from affiliated investment | | | 1,861 | |
| |
Receivable for investments sold | | | 370,089 | |
| |
Receivable for Fund shares sold | | | 109,896 | |
| |
Prepaid upfront fees on notes payable | | | 17,741 | |
| |
Prepaid expenses | | | 13,140 | |
| |
Total assets | | $ | 510,631,634 | |
| |
| Liabilities | | | | |
| |
Payable for investments purchased | | $ | 10,249,499 | |
| |
Payable for Fund shares redeemed | | | 93,142 | |
| |
Distributions payable | | | 5,170 | |
| |
Payable to affiliates: | | | | |
| |
Investment adviser fee | | | 242,999 | |
| |
Distribution fees | | | 104,786 | |
| |
Trustees’ fees | | | 8,040 | |
| |
Payable for shareholder servicing fees | | | 134,008 | |
| |
Accrued expenses | | | 253,312 | |
| |
Total liabilities | | $ | 11,090,956 | |
| |
Net Assets | | $ | 499,540,678 | |
| |
| Sources of Net Assets | | | | |
| |
Paid-in capital | | $ | 528,734,625 | |
| |
Accumulated loss | | | (29,193,947 | ) |
| |
Total | | $ | 499,540,678 | |
| |
| Initial Class Shares | | | | |
| |
Net Assets | | $ | 495,425,936 | |
| |
Shares Outstanding | | | 54,879,149 | |
| |
Net Asset Value, Offering Price and Redemption Price Per Share | | | | |
| |
(net assets ÷ shares of beneficial interest outstanding) | | $ | 9.03 | |
| |
| ADV Class Shares | | | | |
| |
Net Assets | | $ | 4,113,740 | |
| |
Shares Outstanding | | | 455,246 | |
| |
Net Asset Value, Offering Price and Redemption Price Per Share | | | | |
| |
(net assets ÷ shares of beneficial interest outstanding) | | $ | 9.04 | |
| |
| Institutional Class Shares | | | | |
| |
Net Assets | | $ | 1,002 | |
| |
Shares Outstanding | | | 111 | |
| |
Net Asset Value, Offering Price and Redemption Price Per Share | | | | |
| |
(net assets ÷ shares of beneficial interest outstanding) | | $ | 9.03 | |
| | | | |
| | 25 | | See Notes to Financial Statements. |
Eaton Vance
VT Floating-Rate Income Fund
December 31, 2020
Statement of Operations
| | | | |
| Investment Income | | Year Ended December 31, 2020 | |
| |
Interest and other income | | $ | 23,920,155 | |
| |
Dividends | | | 218,079 | |
| |
Dividends from affiliated investment | | | 143,372 | |
| |
Total investment income | | $ | 24,281,606 | |
| |
| Expenses | | | | |
| |
Investment adviser fee | | $ | 3,089,163 | |
| |
Distribution fees | | | | |
| |
Initial Class | | | 1,330,577 | |
| |
Shareholder servicing fees | | | | |
| |
Initial Class | | | 1,321,533 | |
| |
ADV Class | | | 12,433 | |
| |
Trustees’ fees and expenses | | | 15,732 | |
| |
Custodian fee | | | 180,127 | |
| |
Transfer and dividend disbursing agent fees | | | 12,003 | |
| |
Legal and accounting services | | | 143,129 | |
| |
Printing and postage | | | 18,541 | |
| |
Interest expense and fees | | | 253,066 | |
| |
Miscellaneous | | | 39,621 | |
| |
Total expenses | | $ | 6,415,925 | |
| |
Net investment income | | $ | 17,865,681 | |
| |
| Realized and Unrealized Gain (Loss) | | | | |
| |
Net realized gain (loss) — | | | | |
| |
Investment transactions | | $ | (19,041,896 | ) |
| |
Investment transactions — affiliated investment | | | 3,197 | |
| |
Net realized loss | | $ | (19,038,699 | ) |
| |
Change in unrealized appreciation (depreciation) — | | | | |
| |
Investments | | $ | 4,946,631 | |
| |
Investments — affiliated investment | | | (721 | ) |
| |
Net change in unrealized appreciation (depreciation) | | $ | 4,945,910 | |
| |
Net realized and unrealized loss | | $ | (14,092,789 | ) |
| |
Net increase in net assets from operations | | $ | 3,772,892 | |
| | | | |
| | 26 | | See Notes to Financial Statements. |
Eaton Vance
VT Floating-Rate Income Fund
December 31, 2020
Statements of Changes in Net Assets
| | | | | | | | |
| | | Year Ended December 31, | |
| Increase (Decrease) in Net Assets | | 2020 | | | 2019 | |
|
From operations — | |
| | |
Net investment income | | $ | 17,865,681 | | | $ | 29,218,500 | |
| | |
Net realized loss | | | (19,038,699 | ) | | | (6,130,577 | ) |
| | |
Net change in unrealized appreciation (depreciation) | | | 4,945,910 | | | | 24,545,545 | |
| | |
Net increase in net assets from operations | | $ | 3,772,892 | | | $ | 47,633,468 | |
| | |
Distributions to shareholders — | | | | | | | | |
| | |
Initial Class | | $ | (17,686,717 | ) | | $ | (28,983,642 | ) |
| | |
ADV Class | | | (180,207 | ) | | | (253,949 | ) |
| | |
Institutional Class | | | (38 | ) | | | (49 | ) |
| | |
Total distributions to shareholders | | $ | (17,866,962 | ) | | $ | (29,237,640 | ) |
| | |
Transactions in shares of beneficial interest — | | | | | | | | |
| | |
Proceeds from sale of shares | | | | | | | | |
| | |
Initial Class | | $ | 147,658,882 | | | $ | 124,140,140 | |
| | |
ADV Class | | | 1,520,676 | | | | 2,604,643 | |
| | |
Net asset value of shares issued to shareholders in payment of distributions declared | | | | | | | | |
| | |
Initial Class | | | 17,681,301 | | | | 28,983,642 | |
| | |
ADV Class | | | 180,125 | | | | 253,949 | |
| | |
Cost of shares redeemed | | | | | | | | |
| | |
Initial Class | | | (297,255,047 | ) | | | (242,706,048 | ) |
| | |
ADV Class | | | (3,765,820 | ) | | | (868,731 | ) |
| | |
Net decrease in net assets from Fund share transactions | | $ | (133,979,883 | ) | | $ | (87,592,405 | ) |
| | |
Net decrease in net assets | | $ | (148,073,953 | ) | | $ | (69,196,577 | ) |
|
| Net Assets | |
| | |
At beginning of year | | $ | 647,614,631 | | | $ | 716,811,208 | |
| | |
At end of year | | $ | 499,540,678 | | | $ | 647,614,631 | |
| | | | |
| | 27 | | See Notes to Financial Statements. |
Eaton Vance
VT Floating-Rate Income Fund
December 31, 2020
Financial Highlights
| | | | | | | | | | | | | | | | | | | | |
| | | Initial Class | |
| |
| | | Year Ended December 31, | |
| | | 2020 | | | 2019 | | | 2018 | | | 2017 | | | 2016 | |
| | | | | |
Net asset value — Beginning of year | | $ | 9.150 | | | $ | 8.920 | | | $ | 9.270 | | | $ | 9.260 | | | $ | 8.800 | |
| | | | | |
| Income (Loss) From Operations | | | | | | | | | | | | | | | | | | | | |
| | | | | |
Net investment income(1) | | $ | 0.291 | | | $ | 0.393 | | | $ | 0.352 | | | $ | 0.303 | | | $ | 0.314 | |
| | | | | |
Net realized and unrealized gain (loss) | | | (0.122 | ) | | | 0.230 | | | | (0.352 | ) | | | 0.012 | | | | 0.460 | |
| | | | | |
Total income from operations | | $ | 0.169 | | | $ | 0.623 | | | $ | — | | | $ | 0.315 | | | $ | 0.774 | |
| | | | | |
| Less Distributions | | | | | | | | | | | | | | | | | | | | |
| | | | | |
From net investment income | | $ | (0.289 | ) | | $ | (0.393 | ) | | $ | (0.350 | ) | | $ | (0.305 | ) | | $ | (0.314 | ) |
| | | | | |
Total distributions | | $ | (0.289 | ) | | $ | (0.393 | ) | | $ | (0.350 | ) | | $ | (0.305 | ) | | $ | (0.314 | ) |
| | | | | |
Net asset value — End of year | | $ | 9.030 | | | $ | 9.150 | | | $ | 8.920 | | | $ | 9.270 | | | $ | 9.260 | |
| | | | | |
Total Return(2)(3) | | | 2.00 | % | | | 7.08 | % | | | (0.07 | )% | | | 3.44 | % | | | 8.95 | % |
| | | | | |
| Ratios/Supplemental Data | | | | | | | | | | | | | | | | | | | | |
| | | | | |
Net assets, end of year (000’s omitted) | | $ | 495,426 | | | $ | 641,189 | | | $ | 712,486 | | | $ | 642,315 | | | $ | 626,950 | |
| | | | | |
Ratios (as a percentage of average daily net assets): | | | | | | | | | | | | | | | | | | | | |
| | | | | |
Expenses(3) | | | 1.20 | % | | | 1.19 | % | | | 1.17 | % | | | 1.17 | % | | | 1.18 | % |
| | | | | |
Net investment income | | | 3.33 | % | | | 4.31 | % | | | 3.79 | % | | | 3.26 | % | | | 3.48 | % |
| | | | | |
Portfolio Turnover | | | 33 | % | | | 29 | % | | | 30 | % | | | 41 | % | | | 44 | % |
| (1) | Computed using average shares outstanding. |
| (2) | Returns are historical and are calculated by determining the percentage change in net asset value with all distributions reinvested. |
| (3) | Excludes fees and expenses imposed by variable annuity contracts or variable life insurance policies. If included, total return would be lower. |
| | | | |
| | 28 | | See Notes to Financial Statements. |
Eaton Vance
VT Floating-Rate Income Fund
December 31, 2020
Financial Highlights — continued
| | | | | | | | | | | | | | | | | | | | |
| | | ADV Class | |
| |
| | | Year Ended December 31, | |
| | | 2020 | | | 2019 | | | 2018 | | | 2017 | | | 2016 | |
| | | | | |
Net asset value — Beginning of year | | $ | 9.160 | | | $ | 8.920 | | | $ | 9.280 | | | $ | 9.270 | | | $ | 8.810 | |
| | | | | |
| Income (Loss) From Operations | | | | | | | | | | | | | | | | | | | | |
| | | | | |
Net investment income(1) | | $ | 0.316 | | | $ | 0.414 | | | $ | 0.374 | | | $ | 0.328 | | | $ | 0.337 | |
| | | | | |
Net realized and unrealized gain (loss) | | | (0.125 | ) | | | 0.242 | | | | (0.360 | ) | | | 0.010 | | | | 0.460 | |
| | | | | |
Total income from operations | | $ | 0.191 | | | $ | 0.656 | | | $ | 0.014 | | | $ | 0.338 | | | $ | 0.797 | |
| | | | | |
| Less Distributions | | | | | | | | | | | | | | | | | | | | |
| | | | | |
From net investment income | | $ | (0.311 | ) | | $ | (0.416 | ) | | $ | (0.374 | ) | | $ | (0.328 | ) | | $ | (0.337 | ) |
| | | | | |
Total distributions | | $ | (0.311 | ) | | $ | (0.416 | ) | | $ | (0.374 | ) | | $ | (0.328 | ) | | $ | (0.337 | ) |
| | | | | |
Net asset value — End of year | | $ | 9.040 | | | $ | 9.160 | | | $ | 8.920 | | | $ | 9.280 | | | $ | 9.270 | |
| | | | | |
Total Return(2)(3) | | | 2.26 | % | | | 7.47 | % | | | 0.07 | % | | | 3.70 | % | | | 9.21 | % |
| | | | | |
| Ratios/Supplemental Data | | | | | | | | | | | | | | | | | | | | |
| | | | | |
Net assets, end of year (000’s omitted) | | $ | 4,114 | | | $ | 6,424 | | | $ | 4,324 | | | $ | 4,031 | | | $ | 2,532 | |
| | | | | |
Ratios (as a percentage of average daily net assets): | | | | | | | | | | | | | | | | | | | | |
| | | | | |
Expenses(3) | | | 0.95 | % | | | 0.94 | % | | | 0.92 | % | | | 0.92 | % | | | 0.94 | % |
| | | | | |
Net investment income | | | 3.60 | % | | | 4.53 | % | | | 4.03 | % | | | 3.53 | % | | | 3.73 | % |
| | | | | |
Portfolio Turnover | | | 33 | % | | | 29 | % | | | 30 | % | | | 41 | % | | | 44 | % |
| (1) | Computed using average shares outstanding. |
| (2) | Returns are historical and are calculated by determining the percentage change in net asset value with all distributions reinvested. |
| (3) | Excludes fees and expenses imposed by variable annuity contracts or variable life insurance policies. If included, total return would be lower. |
| | | | |
| | 29 | | See Notes to Financial Statements. |
Eaton Vance
VT Floating-Rate Income Fund
December 31, 2020
Financial Highlights — continued
| | | | | | | | | | | | | | | | | | | | |
| | | Institutional Class | |
| | |
| | | Year Ended December 31, | | | Period Ended
December 31, 2016(1) | |
| | | 2020 | | | 2019 | | | 2018 | | | 2017 | |
| | | | | |
Net asset value — Beginning of period | | $ | 9.150 | | | $ | 8.920 | | | $ | 9.270 | | | $ | 9.270 | | | $ | 9.010 | |
| | | | | |
| Income (Loss) From Operations | | | | | | | | | | | | | | | | | | | | |
| | | | | |
Net investment income(2) | | $ | 0.343 | | | $ | 0.441 | | | $ | 0.396 | | | $ | 0.342 | | | $ | 0.240 | |
| | | | | |
Net realized and unrealized gain (loss) | | | (0.119 | ) | | | 0.230 | | | | (0.341 | ) | | | 0.002 | | | | 0.266 | |
| | | | | |
Total income from operations | | $ | 0.224 | | | $ | 0.671 | | | $ | 0.055 | | | $ | 0.344 | | | $ | 0.506 | |
| | | | | |
| Less Distributions | | | | | | | | | | | | | | | | | | | | |
| | | | | |
From net investment income | | $ | (0.344 | ) | | $ | (0.441 | ) | | $ | (0.405 | ) | | $ | (0.344 | ) | | $ | (0.246 | ) |
| | | | | |
Total distributions | | $ | (0.344 | ) | | $ | (0.441 | ) | | $ | (0.405 | ) | | $ | (0.344 | ) | | $ | (0.246 | ) |
| | | | | |
Net asset value — End of period | | $ | 9.030 | | | $ | 9.150 | | | $ | 8.920 | | | $ | 9.270 | | | $ | 9.270 | |
| | | | | |
Total Return(3)(4) | | | 2.64 | % | | | 7.65 | % | | | 0.52 | % | | | 3.77 | % | | | 5.68 | %(5) |
| | | | | |
| Ratios/Supplemental Data | | | | | | | | | | | | | | | | | | | | |
| | | | | |
Net assets, end of period (000’s omitted) | | $ | 1 | | | $ | 1 | | | $ | 1 | | | $ | 1 | | | $ | 1 | |
| | | | | |
Ratios (as a percentage of average daily net assets): | | | | | | | | | | | | | | | | | | | | |
| | | | | |
Expenses(4) | | | 0.67 | % | | | 0.67 | % | | | 0.68 | % | | | 0.68 | % | | | 0.69 | %(6) |
| | | | | |
Net investment income | | | 3.92 | % | | | 4.83 | % | | | 4.27 | % | | | 3.69 | % | | | 3.95 | %(6) |
| | | | | |
Portfolio Turnover | | | 33 | % | | | 29 | % | | | 30 | % | | | 41 | % | | | 44 | %(7) |
| (1) | For the period from commencement of operations on May 2, 2016 to December 31, 2016. |
| (2) | Computed using average shares outstanding. |
| (3) | Returns are historical and are calculated by determining the percentage change in net asset value with all distributions reinvested. |
| (4) | Excludes fees and expenses imposed by variable annuity contracts or variable life insurance policies. If included, total return would be lower. |
| (7) | For the year ended December 31, 2016. |
| | | | |
| | 30 | | See Notes to Financial Statements. |
Eaton Vance
VT Floating-Rate Income Fund
December 31, 2020
Notes to Financial Statements
1 Significant Accounting Policies
Eaton Vance VT Floating-Rate Income Fund (the Fund) is a diversified series of Eaton Vance Variable Trust (the Trust). The Trust is a Massachusetts business trust registered under the Investment Company Act of 1940, as amended (the 1940 Act), as an open-end management investment company. The Fund’s investment objective is to provide a high level of current income. The Fund offers Initial Class, ADV Class and Institutional Class shares, which are offered at net asset value and are not subject to a sales charge. Each class represents a pro-rata interest in the Fund, but votes separately on class-specific matters and (as noted below) is subject to different expenses. Realized and unrealized gains and losses and net investment income and losses, other than class-specific expenses, are allocated daily to each class of shares based on the relative net assets of each class to the total net assets of the Fund. Each class of shares differs in its distribution plan and certain other class-specific expenses. The Fund is generally made available for purchase only to separate accounts established by participating insurance companies and qualified pension or retirement plans.
The following is a summary of significant accounting policies of the Fund. The policies are in conformity with accounting principles generally accepted in the United States of America (U.S. GAAP). The Fund is an investment company and follows accounting and reporting guidance in the Financial Accounting Standards Board (FASB) Accounting Standards Codification Topic 946.
A Investment Valuation — The following methodologies are used to determine the market value or fair value of investments.
Senior Floating-Rate Loans. Interests in senior floating-rate loans (Senior Loans) for which reliable market quotations are readily available are valued generally at the average mean of bid and ask quotations obtained from a third party pricing service. Other Senior Loans are valued at fair value by the investment adviser under procedures approved by the Trustees. In fair valuing a Senior Loan, the investment adviser utilizes one or more of the valuation techniques described in (i) through (iii) below to assess the likelihood that the borrower will make a full repayment of the loan underlying such Senior Loan relative to yields on other Senior Loans issued by companies of comparable credit quality. If the investment adviser believes that there is a reasonable likelihood of full repayment, the investment adviser will determine fair value using a matrix pricing approach that considers the yield on the Senior Loan. If the investment adviser believes there is not a reasonable likelihood of full repayment, the investment adviser will determine fair value using analyses that include, but are not limited to: (i) a comparison of the value of the borrower’s outstanding equity and debt to that of comparable public companies; (ii) a discounted cash flow analysis; or (iii) when the investment adviser believes it is likely that a borrower will be liquidated or sold, an analysis of the terms of such liquidation or sale. In certain cases, the investment adviser will use a combination of analytical methods to determine fair value, such as when only a portion of a borrower’s assets are likely to be sold. In conducting its assessment and analyses for purposes of determining fair value of a Senior Loan, the investment adviser will use its discretion and judgment in considering and appraising relevant factors. Fair value determinations are made by the portfolio managers of the Fund based on information available to such managers. The portfolio managers of other funds managed by the investment adviser that invest in Senior Loans may not possess the same information about a Senior Loan borrower as the portfolio managers of the Fund. At times, the fair value of a Senior Loan determined by the portfolio managers of other funds managed by the investment adviser that invest in Senior Loans may vary from the fair value of the same Senior Loan determined by the portfolio managers of the Fund. The fair value of each Senior Loan is periodically reviewed and approved by the investment adviser’s Valuation Committee and by the Trustees based upon procedures approved by the Trustees. Junior Loans (i.e., subordinated loans and second lien loans) are valued in the same manner as Senior Loans.
Debt Obligations. Debt obligations are generally valued on the basis of valuations provided by third party pricing services, as derived from such services’ pricing models. Inputs to the models may include, but are not limited to, reported trades, executable bid and ask prices, broker/dealer quotations, prices or yields of securities with similar characteristics, interest rates, anticipated prepayments, benchmark curves or information pertaining to the issuer, as well as industry and economic events. The pricing services may use a matrix approach, which considers information regarding securities with similar characteristics to determine the valuation for a security. Short-term debt obligations purchased with a remaining maturity of sixty days or less for which a valuation from a third party pricing service is not readily available may be valued at amortized cost, which approximates fair value.
Equity Securities. Equity securities listed on a U.S. securities exchange generally are valued at the last sale or closing price on the day of valuation or, if no sales took place on such date, at the mean between the closing bid and ask prices on the exchange where such securities are principally traded. Equity securities listed on the NASDAQ Global or Global Select Market generally are valued at the NASDAQ official closing price. Unlisted or listed securities for which closing sales prices or closing quotations are not available are valued at the mean between the latest available bid and ask prices or, in the case of preferred equity securities that are not listed or traded in the over-the-counter market, by a third party pricing service that uses various techniques that consider factors including, but not limited to, prices or yields of securities with similar characteristics, benchmark yields, broker/dealer quotes, quotes of underlying common stock, issuer spreads, as well as industry and economic events.
Affiliated Fund. The Fund may invest in Eaton Vance Cash Reserves Fund, LLC (Cash Reserves Fund), an affiliated investment company managed by Eaton Vance Management (EVM). While Cash Reserves Fund is not a registered money market mutual fund, it conducts all of its investment activities in accordance with the requirements of Rule 2a-7 under the 1940 Act. Investments in Cash Reserves Fund are valued at the closing net asset value per unit on the valuation day. Cash Reserves Fund generally values its investment securities based on available market quotations provided by a third party pricing service.
Fair Valuation. Investments for which valuations or market quotations are not readily available or are deemed unreliable are valued at fair value using methods determined in good faith by or at the direction of the Trustees of the Fund in a manner that most fairly reflects the security’s “fair value”, which is the amount that the Fund might reasonably expect to receive for the security upon its current sale in the ordinary course. Each such determination is based on a consideration of relevant factors, which are likely to vary from one pricing context to another. These factors may include, but are not limited to, the type of security, the existence of any contractual restrictions on the security’s disposition, the price and extent of public trading in similar securities of the issuer or of comparable companies or entities, quotations or relevant information obtained from broker/dealers or other market participants, information
Eaton Vance
VT Floating-Rate Income Fund
December 31, 2020
Notes to Financial Statements — continued
obtained from the issuer, analysts, and/or the appropriate stock exchange (for exchange-traded securities), an analysis of the company’s or entity’s financial statements, and an evaluation of the forces that influence the issuer and the market(s) in which the security is purchased and sold.
B Investment Transactions — Investment transactions for financial statement purposes are accounted for on a trade date basis. Realized gains and losses on investments sold are determined on the basis of identified cost.
C Income — Interest income is recorded on the basis of interest accrued, adjusted for amortization of premium or accretion of discount. Fees associated with loan amendments are recognized immediately. Dividend income is recorded on the ex-dividend date for dividends received in cash and/or securities. Distributions from investment companies are recorded as dividend income, capital gains or return of capital based on the nature of the distribution.
D Federal Taxes — The Fund’s policy is to comply with the provisions of the Internal Revenue Code applicable to regulated investment companies and to distribute to shareholders each year substantially all of its net investment income, and all or substantially all of its net realized capital gains. Accordingly, no provision for federal income or excise tax is necessary.
As of December 31, 2020, the Fund had no uncertain tax positions that would require financial statement recognition, de-recognition, or disclosure. The Fund files a U.S. federal income tax return annually after its fiscal year-end, which is subject to examination by the Internal Revenue Service for a period of three years from the date of filing.
E Expenses — The majority of expenses of the Trust are directly identifiable to an individual fund. Expenses which are not readily identifiable to a specific fund are allocated taking into consideration, among other things, the nature and type of expense and the relative size of the funds.
F Unfunded Loan Commitments — The Fund may enter into certain loan agreements all or a portion of which may be unfunded. The Fund is obligated to fund these commitments at the borrower’s discretion. These commitments are disclosed in the accompanying Portfolio of Investments. At December 31, 2020, the Fund had sufficient cash and/or securities to cover these commitments.
G Use of Estimates — The preparation of the financial statements in conformity with U.S. GAAP requires management to make estimates and assumptions that affect the reported amounts of assets and liabilities at the date of the financial statements and the reported amounts of income and expense during the reporting period. Actual results could differ from those estimates.
H Indemnifications — Under the Trust’s organizational documents, its officers and Trustees may be indemnified against certain liabilities and expenses arising out of the performance of their duties to the Fund. Under Massachusetts law, if certain conditions prevail, shareholders of a Massachusetts business trust (such as the Trust) could be deemed to have personal liability for the obligations of the Trust. However, the Trust’s Declaration of Trust contains an express disclaimer of liability on the part of Fund shareholders and the By-laws provide that the Trust shall assume, upon request by the shareholder, the defense on behalf of any Fund shareholders. Moreover, the By-laws also provide for indemnification out of Fund property of any shareholder held personally liable solely by reason of being or having been a shareholder for all loss or expense arising from such liability. Additionally, in the normal course of business, the Fund enters into agreements with service providers that may contain indemnification clauses. The Fund’s maximum exposure under these arrangements is unknown as this would involve future claims that may be made against the Fund that have not yet occurred.
2 Distributions to Shareholders and Income Tax Information
The Fund declares dividends daily to shareholders of record at the time of declaration. Distributions are generally paid monthly. Distributions of realized capital gains are made at least annually. Distributions are declared separately for each class of shares. Shareholders may reinvest income and capital gain distributions in additional shares of the same class of the Fund at the net asset value as of the reinvestment date or, if an election is made on behalf of a separate account or qualified pension or retirement plan, to receive some or all of the distributions in cash. Distributions to shareholders are determined in accordance with income tax regulations, which may differ from U.S. GAAP. As required by U.S. GAAP, only distributions in excess of tax basis earnings and profits are reported in the financial statements as a return of capital. Permanent differences between book and tax accounting relating to distributions are reclassified to paid-in capital. For tax purposes, distributions from short-term capital gains are considered to be from ordinary income.
The tax character of distributions declared for the years ended December 31, 2020 and December 31, 2019 was as follows:
| | | | | | | | |
| | | Year Ended December 31, | |
| | | 2020 | | | 2019 | |
| | |
Ordinary income | | $ | 17,866,962 | | | $ | 29,237,640 | |
During the year ended December 31, 2020, accumulated loss was decreased by $147 and paid-in capital was decreased by $147 due to differences between book and tax accounting. These reclassifications had no effect on the net assets or net asset value per share of the Fund.
Eaton Vance
VT Floating-Rate Income Fund
December 31, 2020
Notes to Financial Statements — continued
As of December 31, 2020, the components of distributable earnings (accumulated loss) on a tax basis were as follows:
| | | | |
| | |
Undistributed ordinary income | | $ | 3,897,636 | |
| |
Deferred capital losses | | $ | (26,855,587 | ) |
| |
Net unrealized depreciation | | $ | (6,230,826 | ) |
| |
Distributions payable | | $ | (5,170 | ) |
At December 31, 2020, the Fund, for federal income tax purposes, had deferred capital losses of $26,855,587 which would reduce its taxable income arising from future net realized gains on investment transactions, if any, to the extent permitted by the Internal Revenue Code, and thus would reduce the amount of distributions to shareholders, which would otherwise be necessary to relieve the Fund of any liability for federal income or excise tax. The deferred capital losses are treated as arising on the first day of the Fund’s next taxable year and retain the same short-term or long-term character as when originally deferred. Of the deferred capital losses at December 31, 2020, $4,034,836 are short-term and $22,820,751 are long-term.
The cost and unrealized appreciation (depreciation) of investments of the Fund at December 31, 2020, as determined on a federal income tax basis, were as follows:
| | | | |
| |
Aggregate cost | | $ | 510,436,394 | |
| |
Gross unrealized appreciation | | $ | 5,498,792 | |
| |
Gross unrealized depreciation | | | (11,729,618 | ) |
| |
Net unrealized depreciation | | $ | (6,230,826 | ) |
3 Investment Adviser Fee and Other Transactions with Affiliates
The investment adviser fee is earned by Eaton Vance Management (EVM), a wholly-owned subsidiary of Eaton Vance Corp., as compensation for investment advisory services rendered to the Fund. The fee is computed at an annual rate of 0.575% of the Fund’s average daily net assets up to $1 billion, 0.525% of average daily net assets from $1 billion but less than $2 billion, and at reduced rates on daily net assets of $2 billion or more, and is payable monthly. For the year ended December 31, 2020, the investment adviser fee amounted to $3,089,163 or 0.575% of the Fund’s average daily net assets. The Fund invests its cash in Cash Reserves Fund. EVM does not currently receive a fee for advisory services provided to Cash Reserves Fund. EVM also serves as administrator of the Fund, but receives no compensation. Eaton Vance Distributors, Inc. (EVD), the Fund’s principal underwriter and an affiliate of EVM, received distribution fees (see Note 4).
Trustees and officers of the Fund who are members of EVM’s organization receive remuneration for their services to the Fund out of the investment adviser fee. Certain officers and Trustees of the Fund are officers of EVM.
4 Distribution Plan
The Fund has in effect a distribution plan for Initial Class shares (Initial Class Plan) pursuant to Rule 12b-1 under the 1940 Act. Pursuant to the Initial Class Plan, the Fund pays EVD a distribution fee of 0.25% per annum of its average daily net assets attributable to Initial Class shares for the sale and distribution of Initial Class shares. Distribution fees paid or accrued to EVD for the year ended December 31, 2020 amounted to $1,330,577. Insurance companies receive such fees from EVD based on the value of shares held by such companies. The insurance companies through which investors hold shares of the Fund may also pay fees to third parties in connection with the sale of variable contracts and for services provided to variable contract owners. The Fund, EVM or EVD are not a party to these arrangements. Investors should consult the prospectus and statement of additional information for their variable contracts for a discussion of these payments. EVD may, at its expense, provide promotional incentives to dealers that sell variable insurance products.
Distribution fees are subject to the limitations contained in the Financial Industry Regulatory Authority Rule 2341(d).
5 Shareholder Servicing Plan
The Trust, on behalf of the Fund, has adopted a Shareholder Servicing Plan (Servicing Plan) for Initial Class and ADV Class. The Servicing Plan allows the Trust to enter into shareholder servicing agreements with insurance companies, investment dealers, broker/dealers or other financial intermediaries that provide shareholder services relating to Fund shares and their shareholders, including variable contract owners or plan participants with interests in the Fund. Under the Servicing Plan, the Fund may make payments at an annual rate of up to 0.25% of its average daily net assets attributable to each class that are subject to shareholder servicing agreements. No shareholder servicing fees are levied on shares owned by EVM, its affiliates, or their respective employees or clients and may be waived under certain other limited conditions. For the year ended December 31, 2020, shareholder servicing fees were equivalent to 0.25% per annum of each class’ average daily net assets and amounted to $1,321,533 and $12,433 for Initial Class and ADV Class, respectively.
Eaton Vance
VT Floating-Rate Income Fund
December 31, 2020
Notes to Financial Statements — continued
6 Purchases and Sales of Investments
Purchases and sales of investments, other than short-term obligations and including maturities and principal repayments on Senior Loans, aggregated $169,308,988 and $287,330,523, respectively, for the year ended December 31, 2020.
7 Shares of Beneficial Interest
The Fund’s Declaration of Trust permits the Trustees to issue an unlimited number of full and fractional shares of beneficial interest (without par value). Such shares may be issued in a number of different series (such as the Fund) and classes. Transactions in Fund shares were as follows:
| | | | | | | | |
| | | Year Ended December 31, | |
| Initial Class | | 2020 | | | 2019 | |
| | |
Sales | | | 17,040,036 | | | | 13,587,661 | |
| | |
Issued to shareholders electing to receive payments of distributions in Fund shares | | | 2,023,238 | | | | 3,176,208 | |
| | |
Redemptions | | | (34,266,422 | ) | | | (26,586,657 | ) |
| | |
Net decrease | | | (15,203,148 | ) | | | (9,822,788 | ) |
| |
| | | Year Ended December 31, | |
| ADV Class | | 2020 | | | 2019 | |
| | |
Sales | | | 173,796 | | | | 284,516 | |
| | |
Issued to shareholders electing to receive payments of distributions in Fund shares | | | 20,593 | | | | 27,812 | |
| | |
Redemptions | | | (440,709 | ) | | | (95,264 | ) |
| | |
Net increase (decrease) | | | (246,320 | ) | | | 217,064 | |
There were no transactions in Institutional Class shares for the years ended December 31, 2020 and December 31, 2019.
At December 31, 2020, separate accounts of 5 insurance companies each owned more than 10% of the value of the outstanding shares of the Fund aggregating 77.5%.
8 Credit Facility
The Fund participates with other portfolios managed by EVM and its affiliates in a $750 million ($875 million prior to March 9, 2020) unsecured credit facility agreement (Agreement) with a group of banks, which is in effect through March 8, 2021. Borrowings are made by the Fund solely to facilitate the handling of unusual and/or unanticipated short-term cash requirements. Interest is payable on amounts borrowed overnight at the Federal Funds rate plus a margin and for all other amounts borrowed for longer periods at a base rate or LIBOR, plus a margin. Base rate is the highest of (a) the administrative agent’s prime rate, (b) the Federal Funds rate plus a margin and (c) the one month LIBOR rate plus a margin. In addition, a fee computed at an annual rate of 0.15% on the daily unused portion of each lender’s commitment amount is allocated between the Fund and the other participating portfolios at the end of each quarter. Also included in interest expense and fees on the Statement of Operations is approximately $95,000 of amortization of upfront fees paid by the Fund in connection with the annual renewal of the Agreement. The unamortized balance of upfront fees at December 31, 2020 is $17,741 and is included in prepaid upfront fees on notes payable in the Statement of Assets and Liabilities. Because the credit facility is not available exclusively to the Fund and the maximum amount is capped, it may be unable to borrow some or all of a requested amount at any particular time. Average borrowings and the average annual interest rate (excluding fees) for the year ended December 31, 2020 were $1,994,536 and 3.44%, respectively.
Eaton Vance
VT Floating-Rate Income Fund
December 31, 2020
Notes to Financial Statements — continued
9 Investments in Affiliated Funds
At December 31, 2020, the value of the Fund’s investment in affiliated funds was $21,593,096, which represents 4.3% of the Fund’s net assets. Transactions in affiliated funds by the Fund for the year ended December 31, 2020 were as follows:
| | | | | | | | | | | | | | | | | | | | | | | | | | | | | | | | |
| Name of affiliated fund | | Value,
beginning
of period | | | Purchases | | | Sales proceeds | | | Net
realized
gain (loss) | | | Change in
unrealized
appreciation
(depreciation) | | | Value, end
of period | | | Dividend
income | | | Units, end
of period | |
|
Short-Term Investments | |
| | | | | | | | |
Eaton Vance Cash Reserves Fund, LLC | | $ | 36,378,249 | | | $ | 264,848,589 | | | $ | (279,636,218 | ) | | $ | 3,197 | | | $ | (721 | ) | | $ | 21,593,096 | | | $ | 143,372 | | | | 21,593,096 | |
10 Fair Value Measurements
Under generally accepted accounting principles for fair value measurements, a three-tier hierarchy to prioritize the assumptions, referred to as inputs, is used in valuation techniques to measure fair value. The three-tier hierarchy of inputs is summarized in the three broad levels listed below.
| • | | Level 1 – quoted prices in active markets for identical investments |
| • | | Level 2 – other significant observable inputs (including quoted prices for similar investments, interest rates, prepayment speeds, credit risk, etc.) |
| • | | Level 3 – significant unobservable inputs (including a fund’s own assumptions in determining the fair value of investments) |
In cases where the inputs used to measure fair value fall in different levels of the fair value hierarchy, the level disclosed is determined based on the lowest level input that is significant to the fair value measurement in its entirety. The inputs or methodology used for valuing securities are not necessarily an indication of the risk associated with investing in those securities.
At December 31, 2020, the hierarchy of inputs used in valuing the Fund’s investments, which are carried at value, were as follows:
| | | | | | | | | | | | | | | | |
| Asset Description | | Level 1 | | | Level 2 | | | Level 3* | | | Total | |
| | | | |
Common Stocks | | $ | 803,723 | | | $ | 2,961,212 | | | $ | 1,704,469 | | | $ | 5,469,404 | |
| | | | |
Corporate Bonds & Notes | | | — | | | | 25,555,712 | | | | — | | | | 25,555,712 | |
| | | | |
Exchange-Traded Funds | | | 3,469,400 | | | | — | | | | — | | | | 3,469,400 | |
| | | | |
Preferred Stocks | | | — | | | | 327,146 | | | | 269,808 | | | | 596,954 | |
| | | | |
Senior Floating-Rate Loans (Less Unfunded Loan Commitments) | | | — | | | | 446,599,099 | | | | 909,843 | | | | 447,508,942 | |
| | | | |
Warrants | | | — | | | | — | | | | 4,556 | | | | 4,556 | |
| | | | |
Miscellaneous | | | — | | | | 7,504 | | | | — | | | | 7,504 | |
| | | | |
Short-Term Investments | | | — | | | | 21,593,096 | | | | — | | | | 21,593,096 | |
| | | | |
Total Investments | | $ | 4,273,123 | | | $ | 497,043,769 | | | $ | 2,888,676 | | | $ | 504,205,568 | |
| * | None of the unobservable inputs for Level 3 assets, individually or collectively, had a material impact on the Fund. |
Level 3 investments at the beginning and/or end of the period in relation to net assets were not significant and accordingly, a reconciliation of Level 3 assets for the year ended December 31, 2020 is not presented.
11 Risks and Uncertainties
Credit Risk
The Fund invests primarily in below investment grade floating-rate loans, which are considered speculative because of the credit risk of their issuers. Changes in economic conditions or other circumstances are more likely to reduce the capacity of issuers of these securities to make principal and interest payments. Such companies are more likely to default on their payments of interest and principal owed than issuers of investment grade bonds. An economic downturn generally leads to a higher non-payment rate, and a loan or other debt obligation may lose significant value before a default occurs. Lower rated investments also may be subject to greater price volatility than higher rated investments. Moreover, the specific collateral used to secure a loan may decline in value or become illiquid, which would adversely affect the loan’s value.
Eaton Vance
VT Floating-Rate Income Fund
December 31, 2020
Notes to Financial Statements — continued
Pandemic Risk
An outbreak of respiratory disease caused by a novel coronavirus was first detected in China in December 2019 and subsequently spread internationally. This coronavirus has resulted in closing borders, enhanced health screenings, changes to healthcare service preparation and delivery, quarantines, cancellations, disruptions to supply chains and customer activity, as well as general concern and uncertainty. Health crises caused by outbreaks, such as the coronavirus outbreak, may exacerbate other pre-existing political, social and economic risks and disrupt normal market conditions and operations. The impact of this outbreak has negatively affected the worldwide economy, the economies of individual countries, individual companies, and the market in general, and may continue to do so in significant and unforeseen ways, as may other epidemics and pandemics that may arise in the future. Any such impact could adversely affect the Fund’s performance, or the performance of the securities in which the Fund invests.
12 Additional Information
On October 8, 2020, Morgan Stanley and Eaton Vance Corp. (“Eaton Vance”) announced that they had entered into a definitive agreement under which Morgan Stanley would acquire Eaton Vance. Under the Investment Company Act of 1940, as amended, consummation of this transaction may be deemed to result in the automatic termination of an Eaton Vance Fund’s investment advisory agreement and, where applicable, any related sub-advisory agreement. On November 24, 2020, the Fund’s Board approved a new investment advisory agreement. The new investment advisory agreement was approved by Fund shareholders at a joint special meeting of shareholders held on February 18, 2021, and would take effect upon consummation of the transaction.
Eaton Vance
VT Floating-Rate Income Fund
December 31, 2020
Report of Independent Registered Public Accounting Firm
To the Trustees of Eaton Vance Variable Trust and Shareholders of Eaton Vance VT Floating-Rate Income Fund:
Opinion on the Financial Statements and Financial Highlights
We have audited the accompanying statement of assets and liabilities of Eaton Vance VT Floating-Rate Income Fund (the “Fund”) (one of the funds constituting Eaton Vance Variable Trust), including the portfolio of investments, as of December 31, 2020, the related statement of operations for the year then ended, the statements of changes in net assets for each of the two years in the period then ended, the financial highlights for each of the five years in the period then ended, and the related notes. In our opinion, the financial statements and financial highlights present fairly, in all material respects, the financial position of the Fund as of December 31, 2020, and the results of its operations for the year then ended, the changes in its net assets for each of the two years in the period then ended, and the financial highlights for each of the five years in the period then ended, in conformity with accounting principles generally accepted in the United States of America.
Basis for Opinion
These financial statements and financial highlights are the responsibility of the Fund’s management. Our responsibility is to express an opinion on the Fund’s financial statements and financial highlights based on our audits. We are a public accounting firm registered with the Public Company Accounting Oversight Board (United States) (PCAOB) and are required to be independent with respect to the Fund in accordance with the U.S. federal securities laws and the applicable rules and regulations of the Securities and Exchange Commission and the PCAOB.
We conducted our audits in accordance with the standards of the PCAOB. Those standards require that we plan and perform the audit to obtain reasonable assurance about whether the financial statements and financial highlights are free of material misstatement, whether due to error or fraud. The Fund is not required to have, nor were we engaged to perform, an audit of its internal control over financial reporting. As part of our audits we are required to obtain an understanding of internal control over financial reporting but not for the purpose of expressing an opinion on the effectiveness of the Fund’s internal control over financial reporting. Accordingly, we express no such opinion.
Our audits included performing procedures to assess the risks of material misstatement of the financial statements and financial highlights, whether due to error or fraud, and performing procedures that respond to those risks. Such procedures included examining, on a test basis, evidence regarding the amounts and disclosures in the financial statements and financial highlights. Our audits also included evaluating the accounting principles used and significant estimates made by management, as well as evaluating the overall presentation of the financial statements and financial highlights. Our procedures included confirmation of securities and senior loans owned as of December 31, 2020, by correspondence with the custodian, brokers and selling or agent banks; when replies were not received from brokers and selling or agent banks, we performed other auditing procedures. We believe that our audits provide a reasonable basis for our opinion.
/s/ Deloitte & Touche LLP
Boston, Massachusetts
February 19, 2021
We have served as the auditor of one or more Eaton Vance investment companies since 1959.
Eaton Vance
VT Floating-Rate Income Fund
December 31, 2020
Board of Trustees’ Contract Approval
Overview of the Contract Review Process
Even though the following description of the Board’s (as defined below) consideration of investment advisory and, as applicable, sub-advisory agreements covers multiple funds, for purposes of this shareholder report, the description is only relevant as to Eaton Vance VT Floating-Rate Income Fund.
| | | | |
| Fund | | Investment Adviser | | Investment Sub-Adviser |
| | |
Eaton Vance VT Floating-Rate Income Fund | | Eaton Vance Management | | None |
At a meeting held on November 24, 2020 (the “November Meeting”), the Board of each Eaton Vance open-end Fund (each, a “Fund” and, collectively, the “Funds”), including a majority of the Board members (the “Independent Trustees”) who are not “interested persons” (as defined in the Investment Company Act of 1940 (the “1940 Act”)) of the Funds, Eaton Vance Management (“EVM”) or Boston Management and Research (“BMR” and, together with EVM, the “Advisers”), voted to approve a new investment advisory agreement between each Fund and either EVM or BMR (the “New Investment Advisory Agreements”) and, for certain Funds, a new investment sub-advisory agreement between an Adviser and the applicable Sub-Adviser (the “New Investment Sub-Advisory Agreements”(1) and, together with the New Investment Advisory Agreements, the “New Agreements”), each of which is intended to go into effect upon the completion of the Transaction (as defined below), as more fully described below. In voting its approval of the New Agreements at the November Meeting, the Board relied on an order issued by the Securities and Exchange Commission in response to the impacts of the COVID-19 pandemic that provided temporary relief from the in-person meeting requirements under Section 15 of the 1940 Act.
In voting its approval of the New Agreements, the Board of each Fund relied upon the recommendation of its Contract Review Committee, which is a committee comprised exclusively of Independent Trustees. Prior to and during meetings leading up to the November Meeting, the Contract Review Committee reviewed and discussed information furnished by the Advisers, the Sub-Advisers, and Morgan Stanley, as requested by the Independent Trustees, that the Contract Review Committee considered reasonably necessary to evaluate the terms of the New Agreements and to form its recommendation. Such information included, among other things, the terms and anticipated impacts of Morgan Stanley’s pending acquisition of Eaton Vance Corp. (the “Transaction”) on the Funds and their shareholders. In addition to considering information furnished specifically to evaluate the impact of the Transaction on the Funds and their respective shareholders, the Board and its Contract Review Committee also considered information furnished for prior meetings of the Board and its committees, including information provided in connection with the annual contract review process for the Funds, which most recently culminated in April 2020 (the “2020 Annual Approval Process”).
The Board of each Fund, including the Independent Trustees, concluded that the applicable New Investment Advisory Agreement and, as applicable, New Investment Sub-Advisory Agreement, including the fees payable thereunder, was fair and reasonable, and it voted to approve the New Investment Advisory Agreement and, as applicable, New Investment Sub-Advisory Agreement and to recommend that shareholders do so as well.
Shortly after the announcement of the Transaction, the Board, including all of the Independent Trustees, met with senior representatives from the Advisers and Morgan Stanley at its meeting held on October 13, 2020 to discuss certain aspects of the Transaction and the expected impacts of the Transaction on the Funds and their shareholders. As part of the Board’s evaluation process, counsel to the Independent Trustees, on behalf of the Contract Review Committee, requested additional information to assist the Independent Trustees in their evaluation of the New Agreements and the implications of the Transaction, as well as other contractual arrangements that may be affected by the Transaction. The Contract Review Committee considered information furnished by the Advisers and Morgan Stanley, their respective affiliates, and, as applicable, the Sub-Advisers during meetings on November 5, 2020, November 10, 2020, November 13, 2020, November 17, 2020 and November 24, 2020.
During its meetings on November 10, 2020 and November 17, 2020, the Contract Review Committee further discussed the approval of the New Agreements with senior representatives of the Advisers, the Affiliated Sub-Advisers, and Morgan Stanley. The representatives from the Advisers, the Affiliated Sub-Advisers, and Morgan Stanley each made presentations to, and responded to questions from, the Independent Trustees. The Contract Review Committee considered the Advisers’, the Affiliated Sub-Advisers’ and Morgan Stanley’s responses related to the Transaction and specifically to the Funds, as well as information received in connection with the 2020 Annual Approval Process, with respect to its evaluation of the New Agreements. Among other information, the Board considered:
Information about the Transaction and its Terms
| | • | | Information about the material terms and conditions, and expected impacts, of the Transaction that relate to the Funds, including the expected impacts on the businesses conducted by the Advisers, the Affiliated Sub-Advisers and Eaton Vance Distributors, Inc., as the distributor of Fund shares; |
| | • | | Information about the advantages of the Transaction as they relate to the Funds and their shareholders; |
| (1) | With respect to certain of the Funds, the applicable Adviser is currently a party to a sub-advisory agreement (collectively, the “Current Sub-Advisory Agreements”) with Atlanta Capital Management Company, LLC (“Atlanta Capital”), BMO Global Asset Management (Asia) Limited, Eaton Vance Advisers International Ltd. (“EVAIL”), Goldman Sachs Asset Management, L.P., Hexavest Inc. (“Hexavest”), Parametric Portfolio Associates LLC (“Parametric”) or Richard Bernstein Advisors LLC (collectively, the “Sub-Advisers” and, with respect to Atlanta Capital, EVAIL, Hexavest and Parametric, each an affiliate of the Advisers, the “Affiliated Sub-Advisers”). Accordingly, references to the “Sub-Advisers,” the “Affiliated Sub-Advisers” or the “New Sub-Advisory Agreements” are not applicable to all Funds. |
Eaton Vance
VT Floating-Rate Income Fund
December 31, 2020
Board of Trustees’ Contract Approval — continued
| | • | | A commitment that the Funds would not bear any expenses, directly or indirectly, in connection with the Transaction; |
| | • | | A commitment that, for a period of three years after the Closing, at least 75% of each Fund’s Board members must not be “interested persons” (as defined in the 1940 Act) of the investment adviser (or predecessor investment adviser, if applicable) pursuant to Section 15(f)(1)(A) of the 1940 Act; |
| | • | | A commitment that Morgan Stanley would use its reasonable best efforts to ensure that it did not impose any “unfair burden” (as that term is used in section 15(f)(1)(B) of the 1940 Act) on the Funds as a result of the Transaction; |
| | • | | Information with respect to personnel and/or other resources of the Advisers and their affiliates, including the Affiliated Sub-Advisers, as a result of the Transaction, as well as any expected changes to compensation, including any retention-based compensation intended to incentivize key personnel at the Advisers and their affiliates, including the Affiliated Sub-Advisers; |
| | • | | Information regarding any changes that are expected with respect to the Funds’ slate of officers as a result of the Transaction; |
Information about Morgan Stanley
| | • | | Information about Morgan Stanley’s overall business, including information about the advisory, brokerage and related businesses that Morgan Stanley operates; |
| | • | | Information about Morgan Stanley’s financial condition, including its access to capital and other resources required to support the investment advisory businesses related to the Funds; |
| | • | | Information on how the Funds are expected to fit within Morgan Stanley’s overall business strategy, and any changes that Morgan Stanley contemplates implementing to the Funds in the short- or long-term following the closing of the Transaction (the “Closing”); |
| | • | | Information regarding risk management functions at Morgan Stanley and its affiliates, including how existing risk management protocols and procedures may impact the Funds and/or the businesses of the Advisers and their affiliates, including the Affiliated Sub-Advisers, as they relate to the Funds; |
| | • | | Information on the anticipated benefits of the Transaction to the Funds with respect to potential additional distribution capabilities and the ability to access new markets and customer segments through Morgan Stanley’s distribution network, including, in particular, its institutional client base; |
| | • | | Information regarding the financial condition and reputation of Morgan Stanley, its worldwide presence, experience as a fund sponsor and manager, commitment to maintain a high level of cooperation with, and support to, the Funds, strong client service capabilities, and relationships in the asset management industry; |
Information about the New Agreements for Funds
| | • | | A representation that, after the Closing, all of the Funds will continue to be advised by their current Adviser and Sub-Adviser, as applicable; |
| | • | | Information regarding the terms of the New Agreements, including certain changes as compared to the current investment advisory agreement between each Fund and its Adviser (collectively, the “Current Advisory Agreements”) and, as applicable, the current investment sub-advisory agreement between a Fund and a Sub-Adviser (together with the Current Advisory Agreements, the “Current Agreements”); |
| | • | | Information confirming that the fee rates payable under the New Agreements are not changed as compared to the Current Agreements; |
| | • | | A representation that the New Agreements will not cause any diminution in the nature, extent and quality of services provided by the Advisers and the Sub-Advisers to the Funds and their respective shareholders, including with respect to compliance and other non-advisory services; |
Information about Fund Performance, Fees and Expenses
| | • | | A report from an independent data provider comparing the investment performance of each Fund (including, as relevant, total return data, income data, Sharpe ratios and information ratios) to the investment performance of comparable funds and, as applicable, benchmark indices, over various time periods as of the 2020 Annual Approval Process, as well as performance information as of a more recent date; |
| | • | | A report from an independent data provider comparing each Fund’s total expense ratio (and its components) to those of comparable funds as of the 2020 Annual Approval Process, as well as fee and expense information as of a more recent date; |
| | • | | In certain instances, data regarding investment performance relative to customized groups of peer funds and blended indices identified by the Advisers in consultation with the Portfolio Management Committee of the Board as of the 2020 Annual Approval Process, as well as corresponding performance information as of a more recent date; |
| | • | | Comparative information concerning the fees charged and services provided by the Adviser and the Sub-Adviser to each Fund in managing other accounts (which may include other mutual funds, collective investment funds and institutional accounts) using investment strategies and techniques similar to those used in managing such Fund(s), if any; |
| | • | | Profitability analyses of the Advisers and the Affiliated Sub-Advisers, as applicable, with respect to each of the Funds as of the 2020 Annual Approval Process, as well as information regarding the impact of the Transaction on profitability; |
Information about Portfolio Management and Trading
| | • | | Descriptions of the investment management services currently provided and expected to be provided to each Fund after the Transaction, as well as each of the Funds’ investment strategies and policies; |
| | • | | The procedures and processes used to determine the fair value of Fund assets, when necessary, and actions taken to monitor and test the effectiveness of such procedures and processes; |
Eaton Vance
VT Floating-Rate Income Fund
December 31, 2020
Board of Trustees’ Contract Approval — continued
| | • | | Information about any changes to the policies and practices of the Advisers and, as applicable, each Fund’s Sub-Adviser with respect to trading, including their processes for seeking best execution of portfolio transactions; |
| | • | | Information regarding the impact on trading and access to capital markets associated with the Funds’ affiliations with Morgan Stanley and its affiliates, including potential restrictions with respect to the Funds’ ability to execute portfolio transactions with Morgan Stanley and its affiliates; |
Information about the Advisers and the Sub-Advisers
| | • | | Information about the financial results and condition of the Advisers and the Affiliated Sub-Advisers since the culmination of the 2020 Annual Approval Process and any material changes in financial condition that are reasonably expected to occur before and after the Closing; |
| | • | | Information regarding contemplated changes to the individual investment professionals whose responsibilities include portfolio management and investment research for the Funds, and, for portfolio managers and certain other investment professionals, information relating to their responsibilities with respect to managing other mutual funds and investment accounts, as applicable, post-Closing; |
| | • | | The Code of Ethics of the Advisers and their affiliates, including the Affiliated Sub-Advisers, together with information relating to compliance with, and the administration of, such codes; |
| | • | | Policies and procedures relating to proxy voting and the handling of corporate actions and class actions; |
| | • | | Information concerning the resources devoted to compliance efforts undertaken by the Advisers and their affiliates, including the Affiliated Sub-Advisers, including descriptions of their various compliance programs and their record of compliance; |
| | • | | Information concerning the business continuity and disaster recovery plans of the Advisers and their affiliates, including the Affiliated Sub-Advisers; |
| | • | | A description of the Advisers’ oversight of the Sub-Advisers, including with respect to regulatory and compliance issues, investment management and other matters; |
Other Relevant Information
| | • | | Information concerning the nature, cost and character of the administrative and other non-investment advisory services provided by the Advisers and their affiliates; |
| | • | | Information concerning oversight of the relationship with the custodian, subcustodians and fund accountants by EVM and/or administrator to each of the Funds; |
| | • | | Confirmation that the Advisers intend to continue to manage the Funds in a manner materially consistent with each Fund’s current investment objective(s) and principal investment strategies; |
| | • | | Information regarding Morgan Stanley’s commitment to maintaining competitive compensation arrangements to attract and retain highly qualified personnel; |
| | • | | Confirmation that the Advisers’ current senior management teams have indicated their strong support of the Transaction; and |
| | • | | Information regarding the fact that Morgan Stanley and Eaton Vance Corp. will each derive benefits from the Transaction and that, as a result, they have a financial interest in the matters that were being considered. |
As indicated above, the Board and its Contract Review Committee also considered information received at its regularly scheduled meetings throughout the year, which included information from portfolio managers and other investment professionals of the Advisers and the Sub-Advisers regarding investment and performance matters, and considered various investment and trading strategies used in pursuing the Funds’ investment objectives. The Board also received information regarding risk management techniques employed in connection with the management of the Funds. The Board and its committees evaluated issues pertaining to industry and regulatory developments, compliance procedures, fund governance and other issues with respect to the Funds, and received and participated in reports and presentations provided by the Advisers and their affiliates, including the Affiliated Sub-Advisers, with respect to such matters.
The Contract Review Committee was advised throughout the evaluation process by Goodwin Procter LLP, independent legal counsel for the Independent Trustees. The members of the Contract Review Committee, with the advice of such counsel, exercised their own business judgment in determining the material factors to be considered in evaluating the New Agreements and the weight to be given to each such factor. The conclusions reached with respect to the New Agreements were based on a comprehensive evaluation of all the information provided and not any single factor. Moreover, each Independent Trustee may have placed varying emphasis on particular factors in reaching conclusions with respect to the New Agreements.
Nature, Extent and Quality of Services
In considering whether to approve the New Agreements, the Board evaluated the nature, extent and quality of services currently provided to each Fund by the Advisers and, as applicable, the Sub-Advisers under the Current Agreements. In evaluating the nature, extent and quality of services to be provided by the Advisers and the Sub-Advisers under the New Agreements, the Board considered, among other information, the expected impact, if any, of the Transaction on the operations, facilities, organization and personnel of the Advisers and the Sub-Advisers, and that Morgan Stanley and the Advisers have advised the Board that, following the Transaction, there is not expected to be any diminution in the nature, extent and quality of services provided by the Advisers and the Sub-Advisers, as applicable, to the Funds and their shareholders, including compliance and other non-advisory services, and that there are not expected to be any changes in portfolio management personnel as a result of the Transaction.
Eaton Vance
VT Floating-Rate Income Fund
December 31, 2020
Board of Trustees’ Contract Approval — continued
The Board also considered the financial resources of Morgan Stanley and the Advisers and the importance of having a Fund manager with, or with access to, significant organizational and financial resources. The Board considered the benefits to the Funds of being part of a larger combined organization with greater financial resources following the Transaction, particularly during periods of market disruptions and volatility. In this regard, the Board considered information provided by Morgan Stanley regarding its business and operating structure, scale of operation, leadership and reputation, distribution capabilities, and financial condition, as well as information on how the Funds are expected to fit within Morgan Stanley’s overall business strategy and any changes that Morgan Stanley contemplates in the short- or long-term following the Closing. The Board also noted Morgan Stanley’s and the Advisers’ commitment to keep the Board apprised of developments with respect to its long-term integration plans for the Advisers, the Affiliated Sub-Advisers, and existing Morgan Stanley affiliates and their respective personnel.
The Board considered the Advisers’ and the Sub-Advisers’ management capabilities and investment processes in light of the types of investments held by each Fund, including the education, experience and number of investment professionals and other personnel who provide portfolio management, investment research, and similar services to each Fund. In particular, the Board considered the abilities and experience of the Advisers’ and, as applicable, the Sub-Advisers’ investment professionals in implementing each Fund’s investment strategies. The Board also took into account the resources dedicated to portfolio management and other services, the compensation methods of the Advisers and other factors, including the reputation and resources of the Advisers to recruit and retain highly qualified research, advisory and supervisory investment professionals. With respect to the recruitment and retention of key personnel, the Board noted information from Morgan Stanley and the Advisers regarding the benefits of joining Morgan Stanley. In addition, the Board considered the time and attention devoted to the Funds by senior management, as well as the infrastructure, operational capabilities and support staff in place to assist in the portfolio management and operations of the Funds, including the provision of administrative services. With respect to the foregoing, the Board also considered information from the Advisers and Morgan Stanley regarding the anticipated impact of the Transaction on such matters. The Board also considered the business-related and other risks to which the Advisers or their affiliates may be subject in managing the Funds and in connection with the Transaction.
The Board considered the compliance programs of the Advisers and relevant affiliates thereof, including the Affiliated Sub-Advisers. The Board considered compliance and reporting matters regarding, among other things, personal trading by investment professionals, disclosure of portfolio holdings, late trading, frequent trading, portfolio valuation, business continuity and the allocation of investment opportunities. The Board also considered the responses of the Advisers and their affiliates to requests in recent years from regulatory authorities, such as the Securities and Exchange Commission and the Financial Industry Regulatory Authority. The Board also considered certain information relating to the compliance record of Morgan Stanley and its affiliates, including information requests in recent years from regulatory authorities. With respect to the foregoing, including the compliance programs of the Advisers and the Sub-Advisers, the Board noted information regarding the impacts of the Transaction, as well as the Advisers’ and Morgan Stanley’s commitment to keep the Board apprised of developments with respect to its long-term integration plans for the Advisers, the Affiliated Sub-Advisers and existing Morgan Stanley affiliates and their respective personnel.
The Board considered other administrative services provided and to be provided or overseen by the Advisers and their affiliates, including transfer agency and accounting services. The Board evaluated the benefits to shareholders of investing in a fund that is a part of a large fund complex offering exposure to a variety of asset classes and investment disciplines, as well as the ability, in many cases, to exchange an investment among different funds without incurring additional sales charges. The Board noted information that the Transaction was not expected to have any material impact on such matters in the near-term.
In evaluating the nature, extent and quality of the services to be provided under the New Agreements, the Board also considered investment performance information provided for each Fund in connection with the 2020 Annual Approval Process, as well as information provided as of a more recent date. In this regard, the Board compared each Fund’s investment performance to that of comparable funds identified by an independent data provider (the peer group), as well as appropriate benchmark indices and, for certain Funds, a custom peer group of similarly managed funds. The Board also considered, where applicable, Fund-specific performance explanations based on criteria established by the Board in connection with the 2020 Annual Approval Process and, where applicable, performance explanations as of a more recent date. In addition to the foregoing information, it was also noted that the Board has received and discussed with management information throughout the year at periodic intervals comparing each Fund’s performance against applicable benchmark indices and peer groups. In addition, the Board considered each Fund’s performance in light of overall financial market conditions. Where a Fund’s relative underperformance to its peers was significant during one or more specified periods, the Board noted the explanation from the applicable Adviser concerning the Fund’s relative performance versus its peer group.
After consideration of the foregoing factors, among others, and based on their review of the materials provided and the assurances received from, and recommendations of, the Advisers and Morgan Stanley, the Board determined that the Transaction was not expected to adversely affect the nature, extent and quality of services provided to the Funds by the Advisers and their affiliates, including the Affiliated Sub-Advisers, and that the Transaction was not expected to have an adverse effect on the ability of the Advisers and their affiliates, including the Affiliated Sub-Advisers, to provide those services. The Board concluded that the nature, extent and quality of services expected to be provided by the Advisers and the Sub-Advisers, taken as a whole, are appropriate and expected to be consistent with the terms of the New Agreements.
Management Fees and Expenses
The Board considered contractual fee rates payable by each Fund for advisory and administrative services (referred to collectively as “management fees”) in connection with the 2020 Annual Approval Process, as well as information provided as of a more recent date. As part of its review, the Board considered each Fund’s management fees and total expense ratio over various periods, as compared to those of comparable funds, before and after giving effect to any
Eaton Vance
VT Floating-Rate Income Fund
December 31, 2020
Board of Trustees’ Contract Approval — continued
undertaking to waive fees or reimburse expenses. The Board also considered factors, and, where applicable, certain Fund-specific factors, that had an impact on a Fund’s total expense ratio relative to comparable funds, as identified by the Advisers in response to inquiries from the Contract Review Committee. The Board considered that the New Agreements do not change a Fund’s management fee rate or the computation method for calculating such fees, including any separately executed permanent contractual management fee reduction currently in place for the Fund.
The Board also received and considered, where applicable, information about the services offered and the fee rates charged by the Advisers and the Sub-Advisers to other types of accounts with investment objectives and strategies that are substantially similar to and/or managed in a similar investment style as a Fund. In this regard, the Board received information about the differences in the nature and scope of services the Advisers and the Sub-Advisers, as applicable, provide to the Funds as compared to other types of accounts and the material differences in compliance, reporting and other legal burdens and risks to the Advisers and such Sub-Advisers as between each Fund and other types of accounts.
After considering the foregoing information, and in light of the nature, extent and quality of the services expected to be provided by the Advisers and the Sub-Advisers, the Board concluded that the management fees charged for advisory and related services are reasonable with respect to its approval of the New Agreements.
Profitability and “Fall-Out” Benefits
During the 2020 Annual Approval Process, the Board considered the level of profits realized by the Advisers and relevant affiliates thereof, including the Affiliated Sub-Advisers, in providing investment advisory and administrative services to the Funds and to all Eaton Vance funds as a group. The Board considered the level of profits realized without regard to marketing support or other payments by the Advisers and their affiliates to third parties in respect of distribution or other services. In light of the foregoing factors and the nature, extent and quality of the services rendered, the profits realized by the Advisers and their affiliates, including the Sub-Advisers, were not deemed to be excessive by the Board.
The Board noted that Morgan Stanley and the Advisers are expected to realize, over time, cost savings from the Transaction based on eliminating duplicate corporate overhead expenses. The Board considered, however, information from the Advisers and Morgan Stanley that such cost savings are not expected to be realized immediately upon the Closing and that, accordingly, there are currently no specific expected changes in the levels of profitability associated with the advisory and other services provided to the Funds that are contemplated as a result of the Transaction. The Board noted that it will continue to receive information regarding profitability during its annual contract review processes, including the extent to which cost savings and/or other efficiencies result in changes to profitability levels.
The Board also considered direct or indirect fall-out benefits received by the Advisers and their affiliates, including the Affiliated Sub-Advisers, in connection with their respective relationships with the Funds, including the benefits of research services that may be available to the Advisers and their affiliates as a result of securities transactions effected for the Funds and other investment advisory clients. In evaluating the fall-out benefits to be received by the Advisers and their affiliates under the New Agreements, the Board considered whether the Transaction would have an impact on the fall-out benefits currently realized by the Advisers and their affiliates in connection with services provided pursuant to the Current Advisory Agreements.
The Board of each Fund considered that Morgan Stanley may derive reputational and other benefits from its ability to use the names of the Advisers and their affiliates in connection with operating and marketing the Funds. The Board considered that the Transaction, if completed, would significantly increase Morgan Stanley’s assets under management and expand Morgan Stanley’s investment capabilities.
Economies of Scale
The Board also considered the extent to which the Advisers and their affiliates, on the one hand, and the Funds, on the other hand, can expect to realize benefits from economies of scale as the assets of the Funds increase. The Board acknowledged the difficulty in accurately measuring the benefits resulting from economies of scale, if any, with respect to the management of any specific Fund or group of funds. As part of the 2020 Annual Approval Process, the Board reviewed data summarizing the increases and decreases in the assets of the Funds and of all Eaton Vance funds as a group over various time periods, and evaluated the extent to which the total expense ratio of each Fund and the profitability of the Advisers and their affiliates may have been affected by such increases or decreases.
The Board noted that Morgan Stanley and the Advisers are expected to benefit from possible growth of the Funds resulting from enhanced distribution capabilities, including with respect to the Funds’ potential access to Morgan Stanley’s institutional client base. Based upon the foregoing, the Board concluded that the Funds currently share in the benefits from economies of scale, if any, when they are realized by the Advisers, and that the Transaction is not expected to impede a Fund from continuing to benefit from any future economies of scale realized by its Adviser.
Conclusion
Based on its consideration of the foregoing, and such other information it deemed relevant, including the factors and conclusions described above, the Contract Review Committee recommended to the Board approval of the New Agreements. Based on the recommendation of the Contract Review Committee, the Board, including a majority of the Independent Trustees, unanimously voted to approve the New Agreements for the Funds and recommended that shareholders approve the New Agreements.
Eaton Vance
VT Floating-Rate Income Fund
December 31, 2020
Management and Organization
Fund Management. The Trustees of Eaton Vance Variable Trust (the Trust) are responsible for the overall management and supervision of the Trust’s affairs. The Trustees and officers of the Trust are listed below. Except as indicated, each individual has held the office shown or other offices in the same company for the last five years. Trustees and officers of the Trust hold indefinite terms of office. The “noninterested Trustees” consist of those Trustees who are not “interested persons” of the Trust, as that term is defined under the 1940 Act. The business address of each Trustee and officer is Two International Place, Boston, Massachusetts 02110. As used below, “EVC” refers to Eaton Vance Corp., “EV” refers to Eaton Vance, Inc., “EVM” refers to Eaton Vance Management, “BMR” refers to Boston Management and Research and “EVD” refers to Eaton Vance Distributors, Inc. EVC and EV are the corporate parent and trustee, respectively, of EVM and BMR. EVD is the Fund’s principal underwriter and a wholly-owned subsidiary of EVC. Each officer affiliated with Eaton Vance may hold a position with other Eaton Vance affiliates that is comparable to his or her position with EVM listed below. Each Trustee oversees 144 portfolios (with the exception of Messrs. Faust and Wennerholm and Ms. Frost who oversee 143 portfolios) in the Eaton Vance Complex (including all master and feeder funds in a master feeder structure). Each officer serves as an officer of certain other Eaton Vance funds. Each Trustee and officer serves until his or her successor is elected.
| | | | | | |
| Name and Year of Birth | | Position(s) with the
Trust | | Trustee
Since(1) | | Principal Occupation(s) and Directorships
During Past Five Years and Other Relevant Experience |
|
| Interested Trustee |
| | | |
Thomas E. Faust Jr. 1958 | | Trustee | | 2007 | | Chairman, Chief Executive Officer and President of EVC, Director and President of EV, Chief Executive Officer and President of EVM and BMR, and Director of EVD. Trustee and/or officer of 143 registered investment companies. Mr. Faust is an interested person because of his positions with EVM, BMR, EVD, EVC and EV, which are affiliates of the Trust. Directorships in the Last Five Years. Director of EVC and Hexavest Inc. (investment management firm). |
|
| Noninterested Trustees |
| | | |
Mark R. Fetting 1954 | | Trustee | | 2016 | | Private investor. Formerly held various positions at Legg Mason, Inc. (investment management firm) (2000-2012), including President, Chief Executive Officer, Director and Chairman (2008-2012), Senior Executive Vice President (2004-2008) and Executive Vice President (2001-2004). Formerly, President of Legg Mason family of funds (2001-2008). Formerly, Division President and Senior Officer of Prudential Financial Group, Inc. and related companies (investment management firm) (1991-2000). Other Directorships in the Last Five Years. None. |
| | | |
Cynthia E. Frost 1961 | | Trustee | | 2014 | | Private investor. Formerly, Chief Investment Officer of Brown University (university endowment) (2000-2012). Formerly, Portfolio Strategist for Duke Management Company (university endowment manager) (1995-2000). Formerly, Managing Director, Cambridge Associates (investment consulting company) (1989-1995). Formerly, Consultant, Bain and Company (management consulting firm) (1987-1989). Formerly, Senior Equity Analyst, BA Investment Management Company (1983-1985). Other Directorships in the Last Five Years. None. |
| | | |
George J. Gorman 1952 | | Trustee | | 2014 | | Principal at George J. Gorman LLC (consulting firm). Formerly, Senior Partner at Ernst & Young LLP (a registered public accounting firm) (1974-2009). Other Directorships in the Last Five Years. Formerly, Trustee of the BofA Funds Series Trust (11 funds) (2011-2014) and of the Ashmore Funds (9 funds) (2010-2014). |
| | | |
Valerie A. Mosley 1960 | | Trustee | | 2014 | | Chairwoman and Chief Executive Officer of Valmo Ventures (a consulting and investment firm). Formerly, Partner and Senior Vice President, Portfolio Manager and Investment Strategist at Wellington Management Company, LLP (investment management firm) (1992-2012). Formerly, Chief Investment Officer, PG Corbin Asset Management (1990-1992). Formerly worked in institutional corporate bond sales at Kidder Peabody (1986-1990). Other Directorships in the Last Five Years. Director of DraftKings, Inc. (digital sports entertainment and gaming company) (since September 2020). Director of Groupon, Inc. (e-commerce provider) (since April 2020). Director of Envestnet, Inc. (provider of intelligent systems for wealth management and financial wellness) (since 2018). Formerly, Director of Dynex Capital, Inc. (mortgage REIT) (2013-2020). |
Eaton Vance
VT Floating-Rate Income Fund
December 31, 2020
Management and Organization — continued
| | | | | | |
| Name and Year of Birth | | Position(s) with the
Trust | | Trustee
Since(1) | | Principal Occupation(s) and Directorships
During Past Five Years and Other Relevant Experience |
|
| Noninterested Trustees (continued) |
| | | |
William H. Park 1947 | | Chairperson of the Board and Trustee | | 2016 (Chairperson) 2003 (Trustee) | | Private investor. Formerly, Consultant (management and transactional) (2012-2014). Formerly, Chief Financial Officer, Aveon Group L.P. (investment management firm) (2010-2011). Formerly, Vice Chairman, Commercial Industrial Finance Corp. (specialty finance company) (2006-2010). Formerly, President and Chief Executive Officer, Prizm Capital Management, LLC (investment management firm) (2002-2005). Formerly, Executive Vice President and Chief Financial Officer, United Asset Management Corporation (investment management firm) (1982-2001). Formerly, Senior Manager, Price Waterhouse (now PricewaterhouseCoopers) (a registered public accounting firm) (1972-1981). Other Directorships in the Last Five Years. None. |
| | | |
Helen Frame Peters 1948 | | Trustee | | 2008 | | Professor of Finance, Carroll School of Management, Boston College. Formerly, Dean, Carroll School of Management, Boston College (2000-2002). Formerly, Chief Investment Officer, Fixed Income, Scudder Kemper Investments (investment management firm) (1998-1999). Formerly, Chief Investment Officer, Equity and Fixed Income, Colonial Management Associates (investment management firm) (1991-1998). Other Directorships in the Last Five Years. None. |
| | | |
Keith Quinton 1958 | | Trustee | | 2018 | | Private investor, researcher and lecturer. Independent Investment Committee Member at New Hampshire Retirement System (since 2017). Formerly, Portfolio Manager and Senior Quantitative Analyst at Fidelity Investments (investment management firm) (2001-2014). Other Directorships in the Last Five Years. Director (since 2016) and Chairman (since 2019) of New Hampshire Municipal Bond Bank. |
| | | |
Marcus L. Smith 1966 | | Trustee | | 2018 | | Private investor. Member of Posse Boston Advisory Board (foundation) (since 2015). Formerly, Portfolio Manager at MFS Investment Management (investment management firm) (1994-2017). Other Directorships in the Last Five Years. Director of MSCI Inc. (global provider of investment decision support tools) (since 2017). Formerly, Director of DCT Industrial Trust Inc. (logistics real estate company) (2017-2018). |
| | | |
Susan J. Sutherland 1957 | | Trustee | | 2015 | | Private investor. Director of Ascot Group Limited and certain of its subsidiaries (insurance and reinsurance) (since 2017). Formerly, Director of Hagerty Holding Corp. (insurance and reinsurance) (2015-2018). Formerly, Associate, Counsel and Partner at Skadden, Arps, Slate, Meagher & Flom LLP (law firm) (1982-2013). Other Directorships in the Last Five Years. Director of Kairos Acquisition Corp. (insurance/InsurTech acquisition company) (since 2021).Formerly, Director of Montpelier Re Holdings Ltd. (global provider of customized insurance and reinsurance products) (2013-2015). |
| | | |
Scott E. Wennerholm 1959 | | Trustee | | 2016 | | Private Investor. Formerly, Trustee at Wheelock College (postsecondary institution) (2012-2018). Formerly, Consultant at GF Parish Group (executive recruiting firm) (2016-2017). Formerly, Chief Operating Officer and Executive Vice President at BNY Mellon Asset Management (investment management firm) (2005-2011). Formerly, Chief Operating Officer and Chief Financial Officer at Natixis Global Asset Management (investment management firm) (1997-2004). Formerly, Vice President at Fidelity Investments Institutional Services (investment management firm) (1994-1997). Other Directorships in the Last Five Years. None. |
| | | | | | |
| Name and Year of Birth | | Position(s)
with the
Trust | | Officer
Since(2) | | Principal Occupation(s)
During Past Five Years |
|
| Principal Officers who are not Trustees |
| | | |
Eric A. Stein 1980 | | President | | 2020 | | Vice President and Chief Investment Officer, Fixed Income of EVM and BMR. Prior to November 1, 2020, Mr. Stein was a co-Director of Eaton Vance’s Global Income Investments. Also Vice President of Calvert Research and Management (“CRM”). |
Eaton Vance
VT Floating-Rate Income Fund
December 31, 2020
Management and Organization — continued
| | | | | | |
| Name and Year of Birth | | Position(s)
with the
Trust | | Officer
Since(2) | | Principal Occupation(s)
During Past Five Years |
|
| Principal Officers who are not Trustees (continued) |
| | | |
Deidre E. Walsh 1971 | | Vice President | | 2009 | | Vice President of EVM and BMR. |
| | | |
Maureen A. Gemma 1960 | | Secretary and Chief Legal Officer | | 2005 | | Vice President of EVM and BMR. Also Vice President of CRM. |
| | | |
James F. Kirchner 1967 | | Treasurer | | 2007 | | Vice President of EVM and BMR. Also Vice President of CRM. |
| | | |
Richard F. Froio 1968 | | Chief Compliance Officer | | 2017 | | Vice President of EVM and BMR since 2017. Formerly, Deputy Chief Compliance Officer (Adviser/Funds) and Chief Compliance Officer (Distribution) at PIMCO (2012-2017) and Managing Director at BlackRock/Barclays Global Investors (2009-2012). |
| (1) | Year first appointed to serve as Trustee for a fund in the Eaton Vance family of funds. Each Trustee has served continuously since appointment unless indicated otherwise. |
| (2) | Year first elected to serve as officer of a fund in the Eaton Vance family of funds when the officer has served continuously. Otherwise, year of most recent election as an officer of a fund in the Eaton Vance family of funds. Titles may have changed since initial election. |
The SAI for the Fund includes additional information about the Trustees and officers of the Fund and can be obtained without charge on Eaton Vance’s website at www.eatonvance.com or by calling 1-800-262-1122.
Eaton Vance Funds
IMPORTANT NOTICES
Privacy. The Eaton Vance organization is committed to ensuring your financial privacy. Each entity listed below has adopted privacy policy and procedures (“Privacy Program”) Eaton Vance believes is reasonably designed to protect your personal information and to govern when and with whom Eaton Vance may share your personal information.
| • | | At the time of opening an account, Eaton Vance generally requires you to provide us with certain information such as name, address, social security number, tax status, account numbers, and account balances. This information is necessary for us to both open an account for you and to allow us to satisfy legal requirements such as applicable anti-money laundering reviews and know-your-customer requirements. |
| • | | On an ongoing basis, in the normal course of servicing your account, Eaton Vance may share your information with unaffiliated third parties that perform various services for Eaton Vance and/or your account. These third parties include transfer agents, custodians, broker/dealers and our professional advisers including auditors, accountants, and legal counsel. Eaton Vance may share your personal information with our affiliates. Eaton Vance may also share your information as required or permitted by applicable law. |
| • | | We have adopted a Privacy Program we believe is reasonably designed to protect the confidentiality of your personal information and to prevent unauthorized access to your information. |
| • | | We reserve the right to change our Privacy Program at any time upon proper notification to you. You may want to review our Privacy Program periodically for changes by accessing the link on our homepage: www.eatonvance.com. |
Our pledge of protecting your personal information applies to the following entities within the Eaton Vance organization: the Eaton Vance Family of Funds, Eaton Vance Management, Eaton Vance WaterOak Advisors, Eaton Vance Distributors, Inc., Eaton Vance Trust Company, Eaton Vance Management (International) Limited, Eaton Vance Advisers International Ltd., Eaton Vance Global Advisors Limited, Eaton Vance Management’s Real Estate Investment Group, Boston Management and Research, Calvert Research and Management, and Calvert Funds. This notice supersedes all previously issued privacy disclosures. For more information about Eaton Vance’s Privacy Program or about how your personal information may be used, please call 1-800-262-1122.
Delivery of Shareholder Documents. The Securities and Exchange Commission (SEC) permits funds to deliver only one copy of shareholder documents, including prospectuses, proxy statements and shareholder reports, to fund investors with multiple accounts at the same residential or post office box address. This practice is often called “householding” and it helps eliminate duplicate mailings to shareholders. Eaton Vance, or your financial intermediary, may household the mailing of your documents indefinitely unless you instruct Eaton Vance, or your financial intermediary, otherwise. If you would prefer that your Eaton Vance documents not be householded, please contact Eaton Vance at 1-800-262-1122, or contact your financial intermediary. Your instructions that householding not apply to delivery of your Eaton Vance documents will typically be effective within 30 days of receipt by Eaton Vance or your financial intermediary.
Portfolio Holdings. Each Eaton Vance Fund and its underlying Portfolio(s) (if applicable) files a schedule of portfolio holdings on Part F to Form N-PORT with the SEC. Certain information filed on Form N-PORT may be viewed on the Eaton Vance website at www.eatonvance.com, by calling Eaton Vance at 1-800-262-1122 or in the EDGAR database on the SEC’s website at www.sec.gov.
Proxy Voting. From time to time, funds are required to vote proxies related to the securities held by the funds. The Eaton Vance Funds or their underlying Portfolios (if applicable) vote proxies according to a set of policies and procedures approved by the Funds’ and Portfolios’ Boards. You may obtain a description of these policies and procedures and information on how the Funds or Portfolios voted proxies relating to portfolio securities during the most recent 12-month period ended June 30, without charge, upon request, by calling 1-800-262-1122 and by accessing the SEC’s website at www.sec.gov.
This Page Intentionally Left Blank
This Page Intentionally Left Blank
Investment Adviser and Administrator
Eaton Vance Management
Two International Place
Boston, MA 02110
Principal Underwriter*
Eaton Vance Distributors, Inc.
Two International Place
Boston, MA 02110
(617) 482-8260
Custodian
State Street Bank and Trust Company
State Street Financial Center, One Lincoln Street
Boston, MA 02111
Transfer Agent
State Street Bank and Trust Company
State Street Financial Center, One Lincoln Street
Boston, MA 02111
Independent Registered Public Accounting Firm
Deloitte & Touche LLP
200 Berkeley Street
Boston, MA 02116-5022
Fund Offices
Two International Place
Boston, MA 02110
| * | FINRA BrokerCheck. Investors may check the background of their Investment Professional by contacting the Financial Industry Regulatory Authority (FINRA). FINRA BrokerCheck is a free tool to help investors check the professional background of current and former FINRA-registered securities firms and brokers. FINRA BrokerCheck is available by calling 1-800-289-9999 and at www.FINRA.org. The FINRA BrokerCheck brochure describing this program is available to investors at www.FINRA.org. |

1939 12.31.20
The registrant (sometimes referred to as the “Fund”) has adopted a code of ethics applicable to its Principal Executive Officer, Principal Financial Officer and Principal Accounting Officer. The registrant undertakes to provide a copy of such code of ethics to any person upon request, without charge, by calling 1-800-262-1122. The registrant has not amended the code of ethics as described in Form N-CSR during the period covered by this report. The registrant has not granted any waiver, including an implicit waiver, from a provision of the code of ethics as described in Form N-CSR during the period covered by this report.
| Item 3. | Audit Committee Financial Expert |
The registrant’s Board of Trustees (the “Board”) has designated George J. Gorman and William H. Park, each an independent trustee, as audit committee financial experts. Mr. Gorman is a certified public accountant who is the Principal at George J. Gorman LLC (a consulting firm). Previously, Mr. Gorman served in various capacities at Ernst & Young LLP (a registered public accounting firm), including as Senior Partner. Mr. Gorman also has experience serving as an independent trustee and audit committee financial expert of other
mutual fund complexes. Mr. Park is a certified public accountant who is a private investor. Previously, he served as a consultant, as the Chief Financial Officer of Aveon Group, L.P. (an investment management firm), as the Vice Chairman of Commercial Industrial Finance Corp. (specialty finance company), as President and Chief Executive Officer of Prizm Capital Management, LLC (investment management firm), as Executive Vice President and Chief Financial Officer of United Asset Management Corporation (an institutional investment management firm) and as a Senior Manager at Price Waterhouse (now PricewaterhouseCoopers) (a registered public accounting firm).
| Item 4. | Principal Accountant Fees and Services |
Eaton Vance VT Floating-Rate Income Fund (the “Fund”) is a series of Eaton Vance Variable Trust (the “Trust”), a Massachusetts business trust, which, including the Fund, contains a total of 1 series (the “Series”). The Trust is registered under the Investment Company Act of 1940 as an open-end management investment company. This Form N-CSR relates to the Fund’s annual report.
(a)-(d)
The following table presents the aggregate fees billed to the Fund for the Fund’s fiscal years ended December 31, 2019 and December 31, 2020 by the registrant’s principal accountant, Deloitte & Touche LLP (“D&T”), for professional services rendered for the audit of the Fund’s annual financial statements and fees billed for other services rendered by D&T during such periods.
Eaton Vance VT Floating-Rate Income Fund
| | | | | | | | |
Fiscal Years Ended | | 12/31/19 | | | 12/31/20 | |
Audit Fees | | $ | 77,138 | | | $ | 76,450 | |
Audit-Related Fees(1) | | $ | 0 | | | $ | 0 | |
Tax Fees(2) | | $ | 14,423 | | | $ | 13,713 | |
All Other Fees(3) | | $ | 0 | | | $ | 0 | |
| | | | | | | | |
Total | | $ | 91,561 | | | $ | 90,163 | |
| | | | | | | | |
| (1) | Audit-related fees consist of the aggregate fees billed for assurance and related services that are reasonably related to the performance of the audit of the registrant’s financial statements and are not reported under the category of audit fees. |
| (2) | Tax fees consist of the aggregate fees billed for professional services rendered by the principal accountant relating to tax compliance, tax advice, and tax planning and specifically include fees for tax return preparation and other related tax compliance/planning matters. |
| (3) | All other fees consist of the aggregate fees billed for products and services provided by the registrant’s principal accountant other than audit, audit-related, and tax services. |
The following table presents the aggregate audit, audit-related, tax, and other fees billed to all of the Series in the Trust by D&T for the last two fiscal years of each Series.
| | | | | | | | |
| | | 12/31/19 | | | 12/31/20 | |
Audit Fees | | $ | 77,138 | | | $ | 76,450 | |
Audit-Related Fees(1) | | $ | 0 | | | $ | 0 | |
Tax Fees(2) | | $ | 14,423 | | | $ | 13,713 | |
All Other Fees(3) | | $ | 0 | | | $ | 0 | |
| | | | | | | | |
Total | | $ | 91,561 | | | $ | 90,163 | |
| | | | | | | | |
| (1) | Audit-related fees consist of the aggregate fees billed for assurance and related services that are reasonably related to the performance of the audit of financial statements and are not reported under the category of audit fees. |
| (2) | Tax fees consist of the aggregate fees billed for professional services rendered by the principal accountant relating to tax compliance, tax advice, and tax planning and specifically include fees for tax return preparation. |
| (3) | All other fees consist of the aggregate fees billed for products and services provided by the principal accountant other than audit, audit-related, and tax services. |
(e)(1) The registrant’s audit committee has adopted policies and procedures relating to the pre-approval of services provided by the registrant’s principal accountant (the “Pre-Approval Policies”). The Pre-Approval Policies establish a framework intended to assist the audit committee in the proper discharge of its pre-approval responsibilities. As a general matter, the Pre-Approval Policies (i) specify certain types of audit, audit-related, tax, and other services determined to be pre-approved by the audit committee; and (ii) delineate specific procedures governing the mechanics of the pre-approval process, including the approval and monitoring of audit and non-audit service fees. Unless a service is specifically pre-approved under the Pre-Approval Policies, it must be separately pre-approved by the audit committee.
The Pre-Approval Policies and the types of audit and non-audit services pre-approved therein must be reviewed and ratified by the registrant’s audit committee at least annually. The registrant’s audit committee maintains full responsibility for the appointment, compensation, and oversight of the work of the registrant’s principal accountant.
(e)(2) No services described in paragraphs (b)-(d) above were approved by the registrant’s audit committee pursuant to the “de minimis exception” set forth in Rule 2-01 (c)(7)(i)(C) of Regulation S-X.
(f) Not applicable.
(g) The following table presents (i) the aggregate non-audit fees (i.e., fees for audit-related, tax, and other services) billed for services rendered to all of the Series in the Trust by D&T for the last two fiscal years of each Series; and (ii) the aggregate non-audit fees (i.e., fees for audit-related, tax, and other services) billed to the Eaton Vance organization by D&T for the last two fiscal years of each Series.
| | | | | | | | |
Fiscal Years Ended | | 12/31/19 | | | 12/31/20 | |
Registrant(1) | | $ | 14,423 | | | $ | 13,713 | |
Eaton Vance(2) | | $ | 59,903 | | | $ | 150,300 | |
| (1) | Includes all of the Series in the Trust. |
| (2) | The investment adviser to the Funds, as well as any of its affiliates that provide ongoing services to the Funds, are subsidiaries of |
Eaton Vance Corp.
(h) The registrant’s audit committee has considered whether the provision by the registrant’s principal accountant of non-audit services to the registrant’s investment adviser and any entity controlling, controlled by, or under common control with the adviser that provides ongoing services to the registrant that were not pre-approved pursuant to Rule 2-01(c)(7)(ii) of Regulation S-X is compatible with maintaining the principal accountant’s independence.
| Item 5. | Audit Committee of Listed Registrants |
Not applicable.
| Item 6. | Schedule of Investments |
Please see schedule of investments contained in the Report to Stockholders included under Item 1 of this Form N-CSR.
| Item 7. | Disclosure of Proxy Voting Policies and Procedures for Closed-End Management Investment Companies |
Not applicable.
| Item 8. | Portfolio Managers of Closed-End Management Investment Companies |
Not applicable.
| Item 9. | Purchases of Equity Securities by Closed-End Management Investment Company and Affiliated Purchasers |
Not applicable.
| Item 10. | Submission of Matters to a Vote of Security Holders |
No material changes.
| Item 11. | Controls and Procedures |
(a) It is the conclusion of the registrant’s principal executive officer and principal financial officer that the effectiveness of the registrant’s current disclosure controls and procedures (such disclosure controls and procedures having been evaluated within 90 days of the date of this filing) provide reasonable assurance that the information required to be disclosed by the registrant has been recorded, processed, summarized and reported within the time period specified in the Commission’s rules and forms and that the information required to be disclosed by the registrant has been accumulated and communicated to the registrant’s principal executive officer and principal financial officer in order to allow timely decisions regarding required disclosure.
(b) There have been no changes in the registrant’s internal controls over financial reporting during the period covered by this report that has materially affected, or is reasonably likely to materially affect, the registrant’s internal control over financial reporting.
| Item 12. | Disclosure of Securities Lending Activities for Closed-End Management Investment Companies |
Not applicable.
Signatures
Pursuant to the requirements of the Securities Exchange Act of 1934 and the Investment Company Act of 1940, the registrant has duly caused this report to be signed on its behalf by the undersigned, thereunto duly authorized.
Eaton Vance Variable Trust
| | |
| By: | | /s/ Eric A. Stein |
| | Eric A. Stein |
| | President |
| |
| Date: | | February 24, 2021 |
Pursuant to the requirements of the Securities Exchange Act of 1934 and the Investment Company Act of 1940, this report has been signed below by the following persons on behalf of the registrant and in the capacities and on the dates indicated.
| | |
| By: | | /s/ James F. Kirchner |
| | James F. Kirchner |
| | Treasurer |
| |
| Date: | | February 24, 2021 |
| |
| By: | | /s/ Eric A. Stein |
| | Eric A. Stein |
| | President |
| |
| Date: | | February 24, 2021 |