UNITED STATES
SECURITIES AND EXCHANGE COMMISSION
Washington, D.C. 20549
Form N-CSR
CERTIFIED SHAREHOLDER REPORT OF REGISTERED
MANAGEMENT INVESTMENT COMPANIES
Investment Company Act File Number: 811-10067
Eaton Vance Variable Trust
(Exact Name of Registrant as Specified in Charter)
Two International Place, Boston, Massachusetts 02110
(Address of Principal Executive Offices)
Deidre E. Walsh
Two International Place, Boston, Massachusetts 02110
(Name and Address of Agent for Services)
(617) 482-8260
(Registrant’s Telephone Number)
December 31
Date of Fiscal Year End
December 31, 2021
Date of Reporting Period
Item 1. Reports to Stockholders

Eaton Vance
VT Floating-Rate Income Fund
Annual Report
December 31, 2021

Commodity Futures Trading Commission Registration. The Commodity Futures Trading Commission (“CFTC”) has adopted regulations that subject registered investment companies and advisers to regulation by the CFTC if a fund invests more than a prescribed level of its assets in certain CFTC-regulated instruments (including futures, certain options and swap agreements) or markets itself as providing investment exposure to such instruments. The investment adviser has claimed an exclusion from the definition of “commodity pool operator” under the Commodity Exchange Act with respect to its management of the Fund. Accordingly, neither the Fund nor the adviser with respect to the operation of the Fund is subject to CFTC regulation. Because of its management of other strategies, the Fund’s adviser is registered with the CFTC as a commodity pool operator. The adviser is also registered as a commodity trading advisor.
Fund shares are not insured by the FDIC and are not deposits or other obligations of, or guaranteed by, any depository institution. Shares are subject to investment risks, including possible loss of principal invested.
This report must be preceded or accompanied by a current summary prospectus or prospectus. Before investing, investors should consider carefully the investment objective, risks, and charges and expenses of a mutual fund. This and other important information is contained in the summary prospectus and prospectus, which can be obtained from a financial intermediary. Prospective investors should read the prospectus carefully before investing. For further information, please call 1-800-262-1122.
Annual Report December 31, 2021
Eaton Vance
VT Floating-Rate Income Fund
Eaton Vance
VT Floating-Rate Income Fund
December 31, 2021
Management’s Discussion of Fund Performance1
Economic and Market Conditions
Amid a global recovery from the pandemic-induced sell-off that had engulfed equity and credit markets, senior loans displayed their value as a portfolio diversifier by outperforming most other U.S. fixed-income asset classes — including government debt and investment-grade corporate bonds — during the 12-month period ended December 31, 2021.
As the period opened on January 1, 2021, senior loans were in the midst of a rally that had begun the previous March when central banks around the world stepped in to support capital markets. At that time, the U.S. Federal Reserve had cut its benchmark federal funds rate to 0.00%-0.25%, initiated a significant bond-buying program, and announced other policy measures to help global credit markets.
Except for pauses in March and July 2021 when returns were flat — and in November 2021 when a new COVID-19 variant caused asset prices to plummet worldwide — the loan rally continued throughout the period. A massive fiscal stimulus package passed by the U.S. Congress, the rollout of vaccines, the reopening of U.S. businesses, and comparatively low yields in other fixed-income asset classes all provided tailwinds for senior loans during the period.
Technical factors also bolstered loan performance as demand outpaced supply for most of the period. Contributing factors included an increase in institutional demand for structured loan products and net monthly inflows for retail funds during every month of the period.
Issuer fundamentals improved as well, with rating upgrades outpacing rating downgrades. The trailing 12-month default rate plummeted from 3.83% at the beginning of the period to 0.29% at period-end, well below the market’s 3.20% long-term average. Reflecting the improved economic environment, the average loan price rose from $96.20 at the start of the period to $98.64 at period-end.
For the period as a whole, lower quality loans outperformed higher quality issues, with BBB, BB, B, CCC and D-rated (defaulted) loans in the S&P/LSTA Leveraged Loan Index (the Index), a broad measure of the asset class, returning 2.52%, 3.12%, 5.22%, 12.45%, and 7.31%, respectively. Overall, the Index returned 5.20% during the period.
Fund Performance
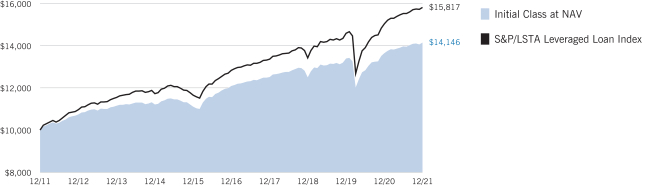
For the 12-month period ended December 31, 2021, Eaton Vance VT Floating-Rate Income Fund (the Fund) returned 3.63% for Initial Class shares at net asset value (NAV), underperforming its benchmark, the Index, which returned 5.20%.
The Index is unmanaged, and returns do not reflect any applicable sales charges, commissions, or expenses.
The Fund has historically tended to maintain underweight exposures relative to the Index to lower credit-quality segments of the market, namely the CCC and D (defaulted) rating tiers within the Index. This strategy may help the Fund experience limited credit losses over the long run, but may also detract from relative performance versus the Index in times when lower quality loans perform well. This underweight exposure to lower quality loans, which tend to have higher coupon yields, may also result in a lower average coupon yield for the Fund relative to the Index.
During the period, the Fund’s underweight exposure to CCC rated loans, which were the best-performing credit tier in the Index during the period,
detracted from performance versus the Index. Loan selections in the oil and gas, retailers (ex-food and drug), and aerospace and defense industries detracted from performance relative to the Index as well.
The Fund’s cash position also detracted from performance versus the Index as loan prices rose for much of the period. The Index does not include cash.
In contrast, loan selections in the containers and glass products, telecommunications, and nonferrous metals/minerals industries contributed to Fund performance versus the Index. The Fund’s underweight exposure to the utilities sector, which underperformed the Index as the market favored more cyclical sectors during the period, helped relative returns as well.
The Fund’s underweight exposure to BBB rated loans, the highest quality credit tier in the Index, also aided performance versus the Index. BBB loans were the weakest-performing credit tier in the Index during the period.
See Endnotes and Additional Disclosures in this report.
Past performance is no guarantee of future results. Returns are historical and are calculated by determining the percentage change in net asset value (NAV) or offering price (as applicable) with all distributions reinvested. Investment return and principal value will fluctuate so that shares, when redeemed, may be worth more or less than their original cost. Performance for periods less than or equal to one year is cumulative. Performance is for the stated time period only; due to market volatility, current Fund performance may be lower or higher than the quoted return.
Eaton Vance
VT Floating-Rate Income Fund
December 31, 2021
Performance2,3
Portfolio Manager(s) Craig P. Russ, Andrew N. Sveen, CFA, Jeffrey R. Hesselbein, CFA and Michael J. Turgel, CFA
| | | | | | | | | | | | | | | | | | | | |
| % Average Annual Total Returns | | Class
Inception Date | | | Performance
Inception Date | | | One Year | | | Five Years | | | Ten Years | |
| | | | | |
Initial Class at NAV | | | 05/02/2001 | | | | 05/02/2001 | | | | 3.63 | % | | | 3.19 | % | | | 3.53 | % |
ADV Class at NAV | | | 04/15/2014 | | | | 05/02/2001 | | | | 3.77 | | | | 3.42 | | | | 3.72 | |
Institutional Class at NAV | | | 05/02/2016 | | | | 05/02/2001 | | | | 4.07 | | | | 3.70 | | | | 3.89 | |
|
| |
| | | | | |
S&P/LSTA Leveraged Loan Index | | | — | | | | — | | | | 5.20 | % | | | 4.27 | % | | | 4.69 | % |
| | | | | |
| % Total Annual Operating Expense Ratios4 | | | | | | | | Initial
Class | | | ADV
Class | | | Institutional
Class | |
| | | | | |
| | | | | | | | | | | 1.20 | % | | | 0.95 | % | | | 0.67 | % |
Growth of $10,000
This graph shows the change in value of a hypothetical investment of $10,000 in Initial Class of the Fund for the period indicated. For comparison, the same investment is shown in the indicated index.
| | | | | | | | | | | | | | | | |
| Growth of Investment3 | | Amount Invested | | | Period Beginning | | | At NAV | | | With Maximum Sales Charge | |
| | | | |
ADV Class | | | $10,000 | | | | 12/31/2011 | | | | $14,420 | | | | N.A. | |
Institutional Class | | | $10,000 | | | | 12/31/2011 | | | | $14,646 | | | | N.A. | |
See Endnotes and Additional Disclosures in this report.
Past performance is no guarantee of future results. Returns are historical and are calculated by determining the percentage change in net asset value (NAV) or offering price (as applicable) with all distributions reinvested. Investment return and principal value will fluctuate so that shares, when redeemed, may be worth more or less than their original cost. Performance for periods less than or equal to one year is cumulative. Performance is for the stated time period only; due to market volatility, current Fund performance may be lower or higher than the quoted return.
Eaton Vance
VT Floating-Rate Income Fund
December 31, 2021
Fund Profile
Top 10 Issuers (% of total investments)5
| | | | |
Numericable Group S.A. | | | 1.1 | % |
| |
TransDigm, Inc. | | | 1.0 | |
| |
Ziggo B.V. | | | 0.9 | |
| |
Epicor Software Corporation | | | 0.9 | |
| |
CommScope, Inc. | | | 0.8 | |
| |
AppLovin Corporation | | | 0.8 | |
| |
Asurion, LLC | | | 0.8 | |
| |
Carnival Corporation | | | 0.8 | |
| |
Virgin Media SFA Finance Limited | | | 0.7 | |
| |
Hyland Software, Inc. | | | 0.7 | |
| |
Total | | | 8.5 | % |
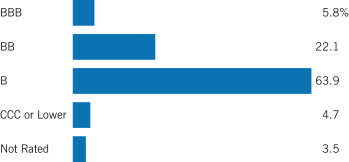
Credit Quality (% of bonds and loans)6
Top 10 Sectors (% of total investments)5
| | | | |
Electronics/Electrical | | | 19.4 | % |
| |
Business Equipment and Services | | | 8.7 | |
| |
Health Care | | | 8.0 | |
| |
Building and Development | | | 4.4 | |
| |
Chemicals and Plastics | | | 4.2 | |
| |
Industrial Equipment | | | 3.9 | |
| |
Leisure Goods/Activities/Movies | | | 3.6 | |
| |
Cable and Satellite Television | | | 3.5 | |
| |
Drugs | | | 3.1 | |
| |
Automotive | | | 2.8 | |
| |
Total | | | 61.6 | % |
See Endnotes and Additional Disclosures in this report.
Eaton Vance
VT Floating-Rate Income Fund
December 31, 2021
Endnotes and Additional Disclosures
| 1 | The views expressed in this report are those of the portfolio manager(s) and are current only through the date stated at the top of this page. These views are subject to change at any time based upon market or other conditions, and Eaton Vance and the Fund(s) disclaim any responsibility to update such views. These views may not be relied upon as investment advice and, because investment decisions are based on many factors, may not be relied upon as an indication of trading intent on behalf of any Eaton Vance fund. This commentary may contain statements that are not historical facts, referred to as “forward-looking statements.” The Fund’s actual future results may differ significantly from those stated in any forward-looking statement, depending on factors such as changes in securities or financial markets or general economic conditions, the volume of sales and purchases of Fund shares, the continuation of investment advisory, administrative and service contracts, and other risks discussed from time to time in the Fund’s filings with the Securities and Exchange Commission. |
| 2 | S&P/LSTA Leveraged Loan Index is an unmanaged index of the institutional leveraged loan market. S&P/LSTA Leveraged Loan indices are a product of S&P Dow Jones Indices LLC (“S&P DJI”) and have been licensed for use. S&P® is a registered trademark of S&P DJI; Dow Jones® is a registered trademark of Dow Jones Trademark Holdings LLC (“Dow Jones”); LSTA is a trademark of Loan Syndications and Trading Association, Inc. S&P DJI, Dow Jones, their respective affiliates and their third party licensors do not sponsor, endorse, sell or promote the Fund, will not have any liability with respect thereto and do not have any liability for any errors, omissions, or interruptions of the S&P Dow Jones Indices. Unless otherwise stated, index returns do not reflect the effect of any applicable sales charges, commissions, expenses, taxes or leverage, as applicable. It is not possible to invest directly in an index. |
| 3 | There is no sales charge. Insurance-related charges are not included in the calculation of returns. If such charges were reflected, the returns would be lower. Please refer to the report for your insurance contract for performance data reflecting insurance-related charges. |
Performance prior to the inception date of a class may be linked to the performance of an older class of the Fund. This linked performance is not adjusted for class expense differences. If adjusted for such differences, the performance would be different. The performance of ADV Class is linked to Initial Class and the performance of Institutional Class is linked to ADV Class. Performance presented in the Financial Highlights included in the financial statements is not linked.
| 4 | Source: Fund prospectus. The expense ratios for the current reporting period can be found in the Financial Highlights section of this report. |
| 5 | Excludes cash and cash equivalents. |
| 6 | Credit ratings are categorized using S&P Global Ratings (“S&P”). Ratings, which are subject to change, apply to the creditworthiness of the issuers of the underlying securities and not to the Fund or its shares. Credit ratings measure the quality of a bond based on the issuer’s creditworthiness, with ratings ranging from AAA, being the highest, to D, being the lowest based on S&P’s measures. Ratings of BBB or higher by S&P are considered to be investment-grade quality. Credit ratings are based largely on the ratings agency’s analysis at the time of rating. The rating assigned to any particular security is not |
| | necessarily a reflection of the issuer’s current financial condition and does not necessarily reflect its assessment of the volatility of a security’s market value or of the liquidity of an investment in the security. Holdings designated as “Not Rated” (if any) are not rated by S&P. |
Fund profile subject to change due to active management.
Eaton Vance
VT Floating-Rate Income Fund
December 31, 2021
Fund Expenses
Example: As a Fund shareholder, you incur ongoing costs, including management fees; distribution and/or service fees; and other Fund expenses. This Example is intended to help you understand your ongoing costs (in dollars) of Fund investing and to compare these costs with the ongoing costs of investing in other mutual funds. The Example is based on an investment of $1,000 invested at the beginning of the period and held for the entire period (July 1, 2021 – December 31, 2021).
Actual Expenses: The first section of the table below provides information about actual account values and actual expenses. You may use the information in this section, together with the amount you invested, to estimate the expenses that you paid over the period. Simply divide your account value by $1,000 (for example, an $8,600 account value divided by $1,000 = 8.6), then multiply the result by the number in the first section under the heading entitled “Expenses Paid During Period” to estimate the expenses you paid on your account during this period.
Hypothetical Example for Comparison Purposes: The second section of the table below provides information about hypothetical account values and hypothetical expenses based on the actual Fund expense ratio and an assumed rate of return of 5% per year (before expenses), which is not the actual Fund return. The hypothetical account values and expenses may not be used to estimate the actual ending account balance or expenses you paid for the period. You may use this information to compare the ongoing costs of investing in your Fund and other funds. To do so, compare this 5% hypothetical example with the 5% hypothetical examples that appear in the shareholder reports of the other funds.
Please note that the expenses shown in the table are meant to highlight your ongoing costs only and do not reflect expenses and charges which are, or may be imposed under the variable annuity contract or variable life insurance policy (variable contracts) (if applicable) or qualified pension or retirement plans (Qualified Plans) through which your investment in the Fund is made. Therefore, the second section of the table is useful in comparing ongoing costs associated with an investment in vehicles which fund benefits under variable contracts and Qualified Plans, and will not help you determine the relative total costs of investing in the Fund through variable contracts or Qualified Plans. In addition, if these expenses and charges imposed under the variable contracts or Qualified Plans were included, your costs would be higher.
| | | | | | | | | | | | | | | | |
| | | Beginning
Account Value
(7/1/21) | | | Ending
Account Value
(12/31/21) | | | Expenses Paid
During Period*
(7/1/21 – 12/31/21) | | | Annualized
Expense
Ratio | |
| | | | |
Actual | | | | | | | | | | | | | | | | |
Initial Class | | $ | 1,000.00 | | | $ | 1,012.40 | | | $ | 5.93 | | | | 1.17 | % |
ADV Class | | $ | 1,000.00 | | | $ | 1,013.70 | | | $ | 4.67 | | | | 0.92 | % |
Institutional Class | | $ | 1,000.00 | | | $ | 1,014.10 | | | $ | 3.25 | | | | 0.64 | % |
| | | | | |
Hypothetical | | | | | | | | | | | | | | | | |
(5% return per year before expenses) | | | | | | | | | | | | | | | | |
Initial Class | | $ | 1,000.00 | | | $ | 1,019.31 | | | $ | 5.96 | | | | 1.17 | % |
ADV Class | | $ | 1,000.00 | | | $ | 1,020.57 | | | $ | 4.69 | | | | 0.92 | % |
Institutional Class | | $ | 1,000.00 | | | $ | 1,021.98 | | | $ | 3.26 | | | | 0.64 | % |
| * | Expenses are equal to the Fund’s annualized expense ratio for the indicated Class, multiplied by the average account value over the period, multiplied by 184/365 (to reflect the one-half year period). The Example assumes that the $1,000 was invested at the net asset value per share determined at the close of business on June 30, 2021. Expenses shown do not include insurance-related charges or direct expenses of Qualified Plans. |
Eaton Vance
VT Floating-Rate Income Fund
December 31, 2021
Portfolio of Investments
| | | | | | | | |
| Asset-Backed Securities — 1.6% | |
| Security | | Principal
Amount
(000’s omitted) | | | Value | |
| | |
Benefit Street Partners CLO XXV, Ltd., Series 2021-25A, Class E, 7.093%, (3 mo. USD LIBOR + 6.85%), 1/15/35(1)(2) | | $ | 1,000 | | | $ | 986,379 | |
| | |
BlueMountain CLO XXIV, Ltd., Series 2019-24A, Class ER, 6.972%, (3 mo. USD LIBOR + 6.84%), 4/20/34(1)(2) | | | 1,000 | | | | 973,072 | |
| | |
Halseypoint CLO 5, Ltd., Series 2021-5A, Class E, 7.156%, (3 mo. USD LIBOR + 6.94%), 1/30/35(1)(2) | | | 1,000 | | | | 975,777 | |
| | |
Palmer Square CLO, Ltd., Series 2015-1A, Class DR4, 6.66%, (3 mo. USD LIBOR + 6.50%), 5/21/34(1)(2) | | | 1,000 | | | | 994,964 | |
| | |
Rad CLO 5, Ltd., Series 2019-5A, Class E, 6.824%, (3 mo. USD LIBOR + 6.70%), 7/24/32(1)(2) | | | 2,000 | | | | 2,000,001 | |
| | |
Rad CLO 11, Ltd., Series 2021-11A, Class E, 6.374%, (3 mo. USD LIBOR + 6.25%), 4/15/34(1)(2) | | | 2,000 | | | | 2,000,912 | |
| | |
Riserva CLO, Ltd., Series 2016-3A, Class ERR, 6.622%, (3 mo. USD LIBOR + 6.50%), 1/18/34(1)(2) | | | 2,250 | | | | 2,236,352 | |
| |
Total Asset-Backed Securities
(identified cost $10,222,920) | | | $ | 10,167,457 | |
|
| Common Stocks — 0.7% | |
| Security | | Shares | | | Value | |
|
| Aerospace and Defense — 0.0%(3) | |
| | |
IAP Global Services, LLC(4)(5)(6) | | | 24 | | | $ | 116,949 | |
| |
| | | | $ | 116,949 | |
|
| Automotive — 0.0%(3) | |
| | |
Dayco Products, LLC(5)(6) | | | 15,250 | | | $ | 114,375 | |
| |
| | | | $ | 114,375 | |
|
| Chemicals and Plastics — 0.1% | |
| | |
Hexion Holdings Corp., Class B(5)(6) | | | 30,229 | | | $ | 875,281 | |
| |
| | | | $ | 875,281 | |
|
| Containers and Glass Products — 0.1% | |
| | |
LG Newco Holdco, Inc., Class A(5)(6) | | | 33,758 | | | $ | 295,382 | |
| |
| | | | $ | 295,382 | |
|
| Electronics / Electrical — 0.1% | |
| | |
Skillsoft Corp.(5)(6) | | | 66,843 | | | $ | 611,613 | |
| |
| | | | $ | 611,613 | |
|
| Health Care — 0.1% | |
| | |
Akorn Holding Company, LLC, Class A(5)(6) | | | 58,449 | | | $ | 547,959 | |
| |
| | | | $ | 547,959 | |
| | | | | | | | |
| Security | | Shares | | | Value | |
|
| Nonferrous Metals / Minerals — 0.0%(3) | |
| | |
ACNR Holdings, Inc., Class A(5)(6) | | | 2,056 | | | $ | 94,747 | |
| |
| | | | $ | 94,747 | |
|
| Oil and Gas — 0.1% | |
| | |
AFG Holdings, Inc.(4)(5)(6) | | | 17,136 | | | $ | 133,832 | |
| | |
McDermott International, Ltd.(5)(6) | | | 103,251 | | | | 47,754 | |
| | |
QuarterNorth Energy, Inc.(5)(6) | | | 5,908 | | | | 561,260 | |
| | |
RDV Resources, Inc., Class A(5)(6) | | | 10,680 | | | | 1,602 | |
| |
| | | | $ | 744,448 | |
|
| Radio and Television — 0.1% | |
| | |
Clear Channel Outdoor Holdings, Inc.(5)(6) | | | 19,512 | | | $ | 64,585 | |
| | |
Cumulus Media, Inc., Class A(5)(6) | | | 24,069 | | | | 270,776 | |
| | |
iHeartMedia, Inc., Class A(5)(6) | | | 8,298 | | | | 174,590 | |
| |
| | | | $ | 509,951 | |
|
| Retailers (Except Food and Drug) — 0.0%(3) | |
| | |
David’s Bridal, LLC(4)(5)(6) | | | 17,912 | | | $ | 0 | |
| | |
Phillips Pet Holding Corp.(4)(5)(6) | | | 285 | | | | 110,848 | |
| |
| | | | $ | 110,848 | |
|
| Telecommunications — 0.1% | |
| | |
GEE Acquisition Holdings Corp.(4)(5)(6) | | | 13,555 | | | $ | 293,195 | |
| |
| | | | $ | 293,195 | |
|
| Utilities — 0.0%(3) | |
| | |
Longview Intermediate Holdings, LLC, Class A(4)(5)(6) | | | 36,023 | | | $ | 286,743 | |
| |
| | | | $ | 286,743 | |
| |
Total Common Stocks
(identified cost $5,320,465) | | | $ | 4,601,491 | |
|
| Convertible Preferred Stocks — 0.1% | |
| Security | | Shares | | | Value | |
|
| Containers and Glass Products — 0.1% | |
| | |
LG Newco Holdco, Inc., Series A, 13.00%(5)(6) | | | 5,114 | | | $ | 593,216 | |
| |
Total Convertible Preferred Stocks
(identified cost $268,481) | | | $ | 593,216 | |
| | | | |
| | 7 | | See Notes to Financial Statements. |
Eaton Vance
VT Floating-Rate Income Fund
December 31, 2021
Portfolio of Investments — continued
| | | | | | | | |
| Corporate Bonds — 7.9% | |
| Security | | Principal
Amount
(000’s omitted) | | | Value | |
|
| Aerospace and Defense — 0.0%(3) | |
| | |
Spirit AeroSystems, Inc., 5.50%, 1/15/25(1) | | $ | 250 | | | $ | 259,314 | |
| |
| | | | $ | 259,314 | |
|
| Air Transport — 0.7% | |
| | |
Air Canada, 3.875%, 8/15/26(1) | | $ | 475 | | | $ | 485,125 | |
| | |
American Airlines, Inc./AAdvantage Loyalty IP, Ltd.: | | | | | | | | |
| | |
5.50%, 4/20/26(1) | | | 1,275 | | | | 1,327,824 | |
| | |
5.75%, 4/20/29(1) | | | 950 | | | | 1,017,217 | |
| | |
Delta Air Lines, Inc./SkyMiles IP, Ltd., 4.75%, 10/20/28(1) | | | 550 | | | | 601,030 | |
| | |
United Airlines, Inc.: | | | | | | | | |
| | |
4.375%, 4/15/26(1) | | | 325 | | | | 339,316 | |
| | |
4.625%, 4/15/29(1) | | | 325 | | | | 335,832 | |
| |
| | | | $ | 4,106,344 | |
|
| Automotive — 0.2% | |
| | |
Clarios Global, L.P.: | | | | | | | | |
| | |
6.25%, 5/15/26(1) | | $ | 293 | | | $ | 306,922 | |
| | |
6.75%, 5/15/25(1) | | | 180 | | | | 188,732 | |
| | |
Tenneco, Inc., 5.125%, 4/15/29(1) | | | 675 | | | | 660,788 | |
| |
| | | | $ | 1,156,442 | |
|
| Building and Development — 0.1% | |
| | |
American Builders & Contractors Supply Co., Inc., 4.00%, 1/15/28(1) | | $ | 250 | | | $ | 256,166 | |
| | |
Cushman & Wakefield U.S. Borrower, LLC, 6.75%, 5/15/28(1) | | | 300 | | | | 321,428 | |
| | |
SRS Distribution, Inc., 4.625%, 7/1/28(1) | | | 325 | | | | 326,716 | |
| |
| | | | $ | 904,310 | |
|
| Business Equipment and Services — 0.7% | |
| | |
Allied Universal Holdco, LLC: | | | | | | | | |
| | |
4.625%, 6/1/28(1) | | $ | 2,000 | | | $ | 1,987,750 | |
| | |
6.625%, 7/15/26(1) | | | 575 | | | | 604,023 | |
| | |
Garda World Security Corp., 4.625%, 2/15/27(1) | | | 700 | | | | 697,298 | |
| | |
Prime Security Services Borrower, LLC/Prime Finance, Inc., 5.25%, 4/15/24(1) | | | 575 | | | | 612,478 | |
| | |
Sabre GLBL, Inc.: | | | | | | | | |
| | |
7.375%, 9/1/25(1) | | | 175 | | | | 183,113 | |
| | |
9.25%, 4/15/25(1) | | | 225 | | | | 254,509 | |
| |
| | | | $ | 4,339,171 | |
| | | | | | | | |
| Security | | Principal
Amount
(000’s omitted) | | | Value | |
|
| Cable and Satellite Television — 1.1% | |
| | |
Altice France S.A.: | | | | | | | | |
| | |
5.125%, 1/15/29(1) | | $ | 100 | | | $ | 97,644 | |
| | |
5.125%, 7/15/29(1) | | | 4,175 | | | | 4,079,768 | |
| | |
5.50%, 1/15/28(1) | | | 400 | | | | 397,570 | |
| | |
Ziggo B.V., 5.50%, 1/15/27(1) | | | 1,997 | | | | 2,054,234 | |
| |
| | | | $ | 6,629,216 | |
|
| Chemicals and Plastics — 0.1% | |
| | |
INEOS Quattro Finance 2 PLC, 3.375%, 1/15/26(1) | | $ | 250 | | | $ | 251,206 | |
| | |
Olympus Water US Holding Corp., 4.25%, 10/1/28(1) | | | 475 | | | | 473,050 | |
| |
| | | | $ | 724,256 | |
|
| Commercial Services — 0.2% | |
| | |
WASH Multifamily Acquisition, Inc., 5.75%, 4/15/26(1) | | $ | 1,000 | | | $ | 1,052,195 | |
| |
| | | | $ | 1,052,195 | |
|
| Cosmetics / Toiletries — 0.0%(3) | |
| | |
Kronos Acquisition Holdings, Inc./KIK Custom Products, Inc., 5.00%, 12/31/26(1) | | $ | 100 | | | $ | 98,892 | |
| |
| | | | $ | 98,892 | |
|
| Diversified Financial Services — 0.1% | |
| | |
AG Issuer, LLC, 6.25%, 3/1/28(1) | | $ | 350 | | | $ | 363,620 | |
| |
| | | | $ | 363,620 | |
|
| Drugs — 0.4% | |
| | |
Bausch Health Companies, Inc.: | | | | | | | | |
| | |
4.875%, 6/1/28(1) | | $ | 275 | | | $ | 280,998 | |
| | |
5.50%, 11/1/25(1) | | | 575 | | | | 585,071 | |
| | |
Endo Luxembourg Finance Co. I S.a.r.l./Endo US, Inc., 6.125%, 4/1/29(1) | | | 1,125 | | | | 1,104,722 | |
| | |
Jazz Securities DAC, 4.375%, 1/15/29(1) | | | 650 | | | | 674,160 | |
| |
| | | | $ | 2,644,951 | |
|
| Ecological Services and Equipment — 0.2% | |
| | |
GFL Environmental, Inc.: | | | | | | | | |
| | |
4.25%, 6/1/25(1) | | $ | 475 | | | $ | 489,250 | |
| | |
5.125%, 12/15/26(1) | | | 1,000 | | | | 1,041,225 | |
| |
| | | | $ | 1,530,475 | |
|
| Electronics / Electrical — 0.9% | |
| | |
CommScope, Inc.: | | | | | | | | |
| | |
4.75%, 9/1/29(1) | | $ | 1,000 | | | $ | 995,555 | |
| | |
6.00%, 3/1/26(1) | | | 2,000 | | | | 2,062,690 | |
| | | | |
| | 8 | | See Notes to Financial Statements. |
Eaton Vance
VT Floating-Rate Income Fund
December 31, 2021
Portfolio of Investments — continued
| | | | | | | | |
| Security | | Principal
Amount
(000’s omitted) | | | Value | |
|
| Electronics / Electrical (continued) | |
| | |
Imola Merger Corp., 4.75%, 5/15/29(1) | | $ | 1,325 | | | $ | 1,361,921 | |
| | |
LogMeIn, Inc., 5.50%, 9/1/27(1) | | | 375 | | | | 379,890 | |
| | |
Veritas US, Inc./Veritas Bermuda, Ltd., 7.50%, 9/1/25(1) | | | 550 | | | | 569,968 | |
| |
| | | | $ | 5,370,024 | |
|
| Entertainment — 0.0%(3) | |
| | |
Six Flags Theme Parks, Inc., 7.00%, 7/1/25(1) | | $ | 200 | | | $ | 213,813 | |
| |
| | | | $ | 213,813 | |
|
| Financial Intermediaries — 0.1% | |
| | |
CoreLogic, Inc., 4.50%, 5/1/28(1) | | $ | 400 | | | $ | 399,086 | |
| |
| | | | $ | 399,086 | |
|
| Food Products — 0.1% | |
| | |
Del Monte Foods, Inc., 11.875%, 5/15/25(1) | | $ | 750 | | | $ | 836,584 | |
| |
| | | | $ | 836,584 | |
|
| Health Care — 0.6% | |
| | |
Mozart Debt Merger Sub, Inc., 3.875%, 4/1/29(1) | | $ | 1,725 | | | $ | 1,722,361 | |
| | |
RP Escrow Issuer, LLC, 5.25%, 12/15/25(1) | | | 175 | | | | 176,762 | |
| | |
Tenet Healthcare Corp., 4.25%, 6/1/29(1) | | | 1,675 | | | | 1,703,927 | |
| |
| | | | $ | 3,603,050 | |
|
| Industrial Equipment — 0.1% | |
| | |
Clark Equipment Company, 5.875%, 6/1/25(1) | | $ | 100 | | | $ | 104,168 | |
| | |
Madison IAQ, LLC, 4.125%, 6/30/28(1) | | | 650 | | | | 652,584 | |
| |
| | | | $ | 756,752 | |
|
| Internet Software & Services — 0.1% | |
| | |
Arches Buyer, Inc., 4.25%, 6/1/28(1) | | $ | 450 | | | $ | 450,581 | |
| |
| | | | $ | 450,581 | |
|
| Leisure Goods / Activities / Movies — 0.4% | |
| | |
Carnival Corp., 4.00%, 8/1/28(1) | | $ | 2,450 | | | $ | 2,436,611 | |
| | |
SeaWorld Parks & Entertainment, Inc., 8.75%, 5/1/25(1) | | | 200 | | | | 212,200 | |
| |
| | | | $ | 2,648,811 | |
|
| Machinery — 0.1% | |
| | |
TK Elevator U.S. Newco, Inc., 5.25%, 7/15/27(1) | | $ | 350 | | | $ | 368,386 | |
| |
| | | | $ | 368,386 | |
| | | | | | | | |
| Security | | Principal
Amount
(000’s omitted) | | | Value | |
|
| Oil and Gas — 0.2% | |
| | |
CITGO Petroleum Corporation: | | | | | | | | |
| | |
6.375%, 6/15/26(1) | | $ | 150 | | | $ | 152,404 | |
| | |
7.00%, 6/15/25(1) | | | 1,025 | | | | 1,055,950 | |
| |
| | | | $ | 1,208,354 | |
|
| Packaging & Containers — 0.2% | |
| | |
Pactiv Evergreen Group Issuer, Inc./Pactiv Evergreen Group Issuer, LLC: | | | | | | | | |
| | |
4.00%, 10/15/27(1) | | $ | 450 | | | $ | 438,219 | |
| | |
4.375%, 10/15/28(1) | | | 625 | | | | 621,259 | |
| |
| | | | $ | 1,059,478 | |
|
| Radio and Television — 0.5% | |
| | |
Diamond Sports Group, LLC/Diamond Sports Finance Co., 5.375%, 8/15/26(1) | | $ | 875 | | | $ | 438,506 | |
| | |
iHeartCommunications, Inc.: | | | | | | | | |
| | |
4.75%, 1/15/28(1) | | | 200 | | | | 203,130 | |
| | |
5.25%, 8/15/27(1) | | | 150 | | | | 156,165 | |
| | |
6.375%, 5/1/26 | | | 47 | | | | 48,737 | |
| | |
8.375%, 5/1/27 | | | 85 | | | | 89,786 | |
| | |
Univision Communications, Inc.: | | | | | | | | |
| | |
4.50%, 5/1/29(1) | | | 650 | | | | 657,657 | |
| | |
5.125%, 2/15/25(1) | | | 1,500 | | | | 1,516,868 | |
| |
| | | | $ | 3,110,849 | |
|
| Real Estate Investment Trusts (REITs) — 0.1% | |
| | |
Park Intermediate Holdings, LLC/PK Domestic Property, LLC/PK Finance Co-Issuer, 5.875%, 10/1/28(1) | | $ | 550 | | | $ | 572,811 | |
| |
| | | | $ | 572,811 | |
|
| Retailers (Except Food and Drug) — 0.0%(3) | |
| | |
PetSmart, Inc./PetSmart Finance Corp., 4.75%, 2/15/28(1) | | $ | 100 | | | $ | 102,807 | |
| |
| | | | $ | 102,807 | |
|
| Software and Services — 0.1% | |
| | |
Boxer Parent Co., Inc., 7.125%, 10/2/25(1) | | $ | 375 | | | $ | 393,692 | |
| |
| | | | $ | 393,692 | |
|
| Technology — 0.1% | |
| | |
Clarivate Science Holdings Corp., 3.875%, 7/1/28(1) | | $ | 825 | | | $ | 830,787 | |
| |
| | | | $ | 830,787 | |
| | | | |
| | 9 | | See Notes to Financial Statements. |
Eaton Vance
VT Floating-Rate Income Fund
December 31, 2021
Portfolio of Investments — continued
| | | | | | | | |
| Security | | Principal
Amount
(000’s omitted) | | | Value | |
|
| Telecommunications — 0.4% | |
| | |
LCPR Senior Secured Financing DAC, 5.125%, 7/15/29(1) | | $ | 500 | | | $ | 503,250 | |
| | |
Lumen Technologies, Inc., 4.00%, 2/15/27(1) | | | 1,225 | | | | 1,244,355 | |
| | |
VMED O2 UK Financing I PLC, 4.25%, 1/31/31(1) | | | 750 | | | | 736,215 | |
| |
| | | | $ | 2,483,820 | |
|
| Utilities — 0.1% | |
| | |
Calpine Corp.: | | | | | | | | |
| | |
4.50%, 2/15/28(1) | | $ | 250 | | | $ | 259,808 | |
| | |
5.25%, 6/1/26(1) | | | 346 | | | | 355,416 | |
| |
| | | | $ | 615,224 | |
| |
Total Corporate Bonds
(identified cost $48,371,288) | | | $ | 48,834,095 | |
|
| Exchange-Traded Funds — 0.6% | |
| Security | | Shares | | | Value | |
| | |
SPDR Blackstone Senior Loan ETF | | | 76,000 | | | $ | 3,467,880 | |
| |
Total Exchange-Traded Funds
(identified cost $3,501,320) | | | $ | 3,467,880 | |
|
| Preferred Stocks — 0.1% | |
| Security | | Shares | | | Value | |
|
| Financial Services — 0.0% | |
| | |
DBI Investors, Inc., Series A-1(4)(5)(6) | | | 839 | | | $ | 0 | |
| |
| | | | $ | 0 | |
|
| Nonferrous Metals / Minerals — 0.1% | |
| | |
ACNR Holdings, Inc., 15.00% (PIK)(5)(6) | | | 971 | | | $ | 302,628 | |
| |
| | | | $ | 302,628 | |
|
| Retailers (Except Food and Drug) — 0.0% | |
| | |
David’s Bridal, LLC, Series A,
8.00% (PIK)(4)(5)(6) | | | 494 | | | $ | 0 | |
| | |
David’s Bridal, LLC, Series B,
10.00% (PIK)(4)(5)(6) | | | 2,012 | | | | 0 | |
| |
| | | | $ | 0 | |
| |
Total Preferred Stocks
(identified cost $162,891) | | | $ | 302,628 | |
| | | | | | | | |
| Senior Floating-Rate Loans — 84.8%(7) | |
| Borrower/Description | | Principal
Amount
(000’s omitted) | | | Value | |
|
| Aerospace and Defense — 2.1% | |
| | |
AI Convoy (Luxembourg) S.a.r.l., Term Loan, 4.50%, (3 mo. USD LIBOR + 3.50%, Floor 1.00%), 1/18/27 | | $ | 490 | | | $ | 491,071 | |
| | |
Dynasty Acquisition Co., Inc.: | | | | | | | | |
| | |
Term Loan, 3.724%, (3 mo. USD LIBOR + 3.50%), 4/6/26 | | | 1,135 | | | | 1,107,715 | |
| | |
Term Loan, 3.724%, (3 mo. USD LIBOR + 3.50%), 4/6/26 | | | 2,110 | | | | 2,059,834 | |
| | |
IAP Worldwide Services, Inc.: | | | | | | | | |
| | |
Revolving Loan, 0.75%, 7/18/23(8) | | | 133 | | | | 132,792 | |
| | |
Term Loan - Second Lien, 8.00%, (3 mo. USD LIBOR + 6.50%, Floor 1.50%), 7/18/23(4) | | | 169 | | | | 137,817 | |
| | |
Spirit Aerosystems, Inc., Term Loan, 4.25%, (1 mo. USD LIBOR + 3.75%, Floor 0.50%), 1/15/25 | | | 372 | | | | 373,239 | |
| | |
TransDigm, Inc.: | | | | | | | | |
| | |
Term Loan, 2.354%, (1 mo. USD LIBOR + 2.25%), 8/22/24 | | | 3,001 | | | | 2,972,113 | |
| | |
Term Loan, 2.354%, (1 mo. USD LIBOR + 2.25%), 5/30/25 | | | 3,399 | | | | 3,354,696 | |
| | |
WP CPP Holdings, LLC, Term Loan, 4.75%, (3 mo. USD LIBOR + 3.75%, Floor 1.00%), 4/30/25 | | | 2,227 | | | | 2,140,779 | |
| |
| | | | $ | 12,770,056 | |
|
| Air Transport — 0.7% | |
| | |
AAdvantage Loyalty IP, Ltd., Term Loan, 5.50%, (3 mo. USD LIBOR + 4.75%, Floor 0.75%), 4/20/28 | | $ | 650 | | | $ | 674,781 | |
| | |
Brown Group Holding, LLC, Term Loan, 3.00%, (3 mo. USD LIBOR + 2.50%, Floor 0.50%), 6/7/28 | | | 897 | | | | 896,180 | |
| | |
Mileage Plus Holdings, LLC, Term Loan, 6.25%, (3 mo. USD LIBOR + 5.25%, Floor 1.00%), 6/21/27 | | | 1,025 | | | | 1,084,578 | |
| | |
United Airlines, Inc., Term Loan, 4/21/28(9) | | | 500 | | | | 502,778 | |
| | |
Walker & Dunlop, Inc., Term Loan, 2.75%, (SOFR + 2.25%, Floor 0.50%), 12/16/28 | | | 900 | | | | 900,000 | |
| |
| | | | $ | 4,058,317 | |
|
| Automotive — 2.7% | |
| | |
Adient US, LLC, Term Loan, 3.604%, (1 mo. USD LIBOR + 3.50%), 4/8/28 | | $ | 572 | | | $ | 572,943 | |
| | |
American Axle and Manufacturing, Inc., Term Loan, 3.00%, (1 mo. USD LIBOR + 2.25%, Floor 0.75%), 4/6/24 | | | 1,213 | | | | 1,212,998 | |
| | |
Autokiniton US Holdings, Inc., Term Loan, 5.00%, (12 mo. USD LIBOR + 4.50%, Floor 0.50%), 4/6/28 | | | 1,144 | | | | 1,147,969 | |
| | |
Bright Bidco B.V., Term Loan, 4.50%, (6 mo. USD LIBOR + 3.50%, Floor 1.00%), 6/30/24 | | | 1,099 | | | | 850,376 | |
| | |
Chassix, Inc., Term Loan, 6.50%, (USD LIBOR + 5.50%, Floor 1.00%), 11/15/23(10) | | | 504 | | | | 453,600 | |
| | | | |
| | 10 | | See Notes to Financial Statements. |
Eaton Vance
VT Floating-Rate Income Fund
December 31, 2021
Portfolio of Investments — continued
| | | | | | | | |
| Borrower/Description | | Principal
Amount
(000’s omitted) | | | Value | |
|
| Automotive (continued) | |
| | |
Clarios Global, L.P., Term Loan, 3.354%, (1 mo. USD LIBOR + 3.25%), 4/30/26 | | $ | 2,451 | | | $ | 2,440,124 | |
| | |
CS Intermediate Holdco 2, LLC, Term Loan, 2.75%, (1 mo. USD LIBOR + 2.00%, Floor 0.75%), 11/2/23 | | | 1,584 | | | | 1,491,078 | |
| | |
Dayco Products, LLC, Term Loan, 4.425%, (3 mo. USD LIBOR + 4.25%), 5/19/23 | | | 740 | | | | 729,023 | |
| | |
Garrett LX I S.a.r.l., Term Loan, 3.75%, (3 mo. USD LIBOR + 3.25%, Floor 0.50%), 4/30/28 | | | 424 | | | | 422,878 | |
| | |
Gates Global, LLC, Term Loan, 3.25%, (1 mo. USD LIBOR + 2.50%, Floor 0.75%), 3/31/27 | | | 396 | | | | 395,678 | |
| | |
Les Schwab Tire Centers, Term Loan, 4.00%, (3 mo. USD LIBOR + 3.25%, Floor 0.75%), 11/2/27 | | | 3,299 | | | | 3,302,326 | |
| | |
MajorDrive Holdings IV, LLC, Term Loan, 4.50%, (3 mo. USD LIBOR + 4.00%, Floor 0.50%), 5/12/28 | | | 473 | | | | 473,216 | |
| | |
Tenneco, Inc., Term Loan, 3.104%, (1 mo. USD LIBOR + 3.00%), 10/1/25 | | | 813 | | | | 803,176 | |
| | |
TI Group Automotive Systems, LLC, Term Loan, 3.75%, (3 mo. USD LIBOR + 3.25%, Floor 0.50%), 12/16/26 | | | 422 | | | | 421,812 | |
| | |
Truck Hero, Inc., Term Loan, 4.00%, (1 mo. USD LIBOR + 3.25%, Floor 0.75%), 1/31/28 | | | 1,265 | | | | 1,263,065 | |
| | |
Wheel Pros, LLC, Term Loan, 5.25%, (1 mo. USD LIBOR + 4.50%, Floor 0.75%), 5/11/28 | | | 648 | | | | 648,020 | |
| |
| | | | $ | 16,628,282 | |
|
| Beverage and Tobacco — 0.3% | |
| | |
Arterra Wines Canada, Inc., Term Loan, 4.25%, (3 mo. USD LIBOR + 3.50%, Floor 0.75%), 11/24/27 | | $ | 594 | | | $ | 595,578 | |
| | |
City Brewing Company, LLC, Term Loan, 4.25%, (3 mo. USD LIBOR + 3.50%, Floor 0.75%), 4/5/28 | | | 524 | | | | 497,830 | |
| | |
Triton Water Holdings, Inc., Term Loan, 4.00%, (3 mo. USD LIBOR + 3.50%, Floor 0.50%), 3/31/28 | | | 821 | | | | 812,923 | |
| |
| | | | $ | 1,906,331 | |
|
| Brokerage / Securities Dealers / Investment Houses — 0.5% | |
| | |
Advisor Group, Inc., Term Loan, 4.604%, (1 mo. USD LIBOR + 4.50%), 7/31/26 | | $ | 2,012 | | | $ | 2,018,672 | |
| | |
Hudson River Trading, LLC, Term Loan, 3.104%, (1 mo. USD LIBOR + 3.00%), 3/20/28 | | | 1,290 | | | | 1,282,992 | |
| |
| | | | $ | 3,301,664 | |
|
| Building and Development — 4.4% | |
| | |
Aegion Corporation, Term Loan, 5.50%, (3 mo. USD LIBOR + 4.75%, Floor 0.75%), 5/17/28 | | $ | 324 | | | $ | 327,125 | |
| | |
American Residential Services, LLC, Term Loan, 4.25%, (3 mo. USD LIBOR + 3.50%, Floor 0.75%), 10/15/27 | | | 347 | | | | 346,933 | |
| | |
APi Group DE, Inc.: | | | | | | | | |
| | |
Term Loan, 12/18/28(9) | | | 650 | | | | 650,244 | |
| | |
Term Loan, 2.601%, (1 mo. USD LIBOR + 2.50%), 10/1/26 | | | 1,045 | | | | 1,044,129 | |
| | | | | | | | |
| Borrower/Description | | Principal
Amount
(000’s omitted) | | | Value | |
|
| Building and Development (continued) | |
| | |
Artera Services, LLC, Term Loan, 4.50%, (3 mo. USD LIBOR + 3.50%, Floor 1.00%), 3/6/25 | | $ | 771 | | | $ | 748,634 | |
| | |
Beacon Roofing Supply, Inc., Term Loan, 2.354%, (1 mo. USD LIBOR + 2.25%), 5/19/28 | | | 672 | | | | 668,687 | |
| | |
Brookfield Property REIT, Inc., Term Loan, 2.604%, (1 mo. USD LIBOR + 2.50%), 8/27/25 | | | 697 | | | | 688,967 | |
| | |
Centuri Group, Inc., Term Loan, 3.00%, (3 mo. USD LIBOR + 2.50%, Floor 0.50%), 8/27/28 | | | 634 | | | | 633,721 | |
| | |
Core & Main L.P., Term Loan, 2.602%, (1 mo. USD LIBOR + 2.50%), 7/27/28 | | | 1,022 | | | | 1,017,644 | |
| | |
Cornerstone Building Brands, Inc., Term Loan, 3.75%, (1 mo. USD LIBOR + 3.25%, Floor 0.50%), 4/12/28 | | | 2,814 | | | | 2,815,898 | |
| | |
Covanta Holding Corporation: | | | | | | | | |
| | |
Term Loan, 11/30/28(9) | | | 24 | | | | 24,444 | |
| | |
Term Loan, 11/30/28(9) | | | 326 | | | | 326,322 | |
| | |
CP Atlas Buyer, Inc., Term Loan, 4.25%, (3 mo. USD LIBOR + 3.75%, Floor 0.50%), 11/23/27 | | | 919 | | | | 916,143 | |
| | |
CPG International, Inc., Term Loan, 3.25%, (3 mo. USD LIBOR + 2.50%, Floor 0.75%), 5/5/24 | | | 2,772 | | | | 2,777,326 | |
| | |
Cushman & Wakefield U.S. Borrower, LLC, Term Loan, 2.852%, (1 mo. USD LIBOR + 2.75%), 8/21/25 | | | 521 | | | | 518,155 | |
| | |
Foundation Building Materials Holding Company, LLC, Term Loan, 3.75%, (3 mo. USD LIBOR + 3.25%, Floor 0.50%), 2/3/28 | | | 744 | | | | 739,955 | |
| | |
MI Windows and Doors, LLC, Term Loan, 4.50%, (1 mo. USD LIBOR + 3.75%, Floor 0.75%), 12/18/27 | | | 272 | | | | 273,645 | |
| | |
Northstar Group Services, Inc., Term Loan, 6.50%, (1 mo. USD LIBOR + 5.50%, Floor 1.00%), 11/12/26 | | | 929 | | | | 932,629 | |
| | |
Osmose Utilities Services, Inc., Term Loan, 3.75%, (1 mo. USD LIBOR + 3.25%, Floor 0.50%), 6/23/28 | | | 499 | | | | 496,646 | |
| | |
Park River Holdings, Inc., Term Loan, 4.00%, (3 mo. USD LIBOR + 3.25%, Floor 0.75%), 12/28/27 | | | 398 | | | | 394,848 | |
| | |
Quikrete Holdings, Inc.: | | | | | | | | |
| | |
Term Loan, 6/11/28(9) | | | 1,600 | | | | 1,597,083 | |
| | |
Term Loan, 2.604%, (1 mo. USD LIBOR + 2.50%), 2/1/27 | | | 2,121 | | | | 2,100,117 | |
| | |
RE/MAX International, Inc., Term Loan, 3.00%, (3 mo. USD LIBOR + 2.50%, Floor 0.50%), 7/21/28 | | | 1,169 | | | | 1,165,471 | |
| | |
SRS Distribution, Inc., Term Loan, 4.25%, (6 mo. USD LIBOR + 3.75%, Floor 0.50%), 6/2/28 | | | 723 | | | | 722,962 | |
| | |
Standard Industries, Inc., Term Loan, 3.00%, (3 mo. USD LIBOR + 2.50%, Floor 0.50%), 9/22/28 | | | 2,864 | | | | 2,868,714 | |
| | |
White Cap Buyer, LLC, Term Loan, 4.50%, (1 mo. USD LIBOR + 4.00%, Floor 0.50%), 10/19/27 | | | 2,033 | | | | 2,038,032 | |
| | |
WireCo WorldGroup, Inc., Term Loan, 4.75%, (6 mo. USD LIBOR + 4.25%, Floor 0.50%), 10/27/28 | | | 425 | | | | 424,469 | |
| |
| | | | $ | 27,258,943 | |
| | | | |
| | 11 | | See Notes to Financial Statements. |
Eaton Vance
VT Floating-Rate Income Fund
December 31, 2021
Portfolio of Investments — continued
| | | | | | | | |
| Borrower/Description | | Principal
Amount
(000’s omitted) | | | Value | |
|
| Business Equipment and Services — 8.3% | |
| | |
AlixPartners, LLP, Term Loan, 3.25%, (1 mo. USD LIBOR + 2.75%, Floor 0.50%), 2/4/28 | | $ | 943 | | | $ | 939,560 | |
| | |
Allied Universal Holdco, LLC, Term Loan, 4.25%, (3 mo. USD LIBOR + 3.75%, Floor 0.50%), 5/12/28 | | | 1,464 | | | | 1,460,399 | |
| | |
AppLovin Corporation: | | | | | | | | |
| | |
Term Loan, 3.354%, (1 mo. USD LIBOR + 3.25%), 8/15/25 | | | 3,743 | | | | 3,735,352 | |
| | |
Term Loan, 3.50%, (1 mo. USD LIBOR + 3.00%, Floor 0.50%), 10/25/28 | | | 1,222 | | | | 1,222,854 | |
| | |
Asplundh Tree Expert, LLC, Term Loan, 1.854%, (1 mo. USD LIBOR + 1.75%), 9/7/27 | | | 716 | | | | 713,636 | |
| | |
Bracket Intermediate Holding Corp., Term Loan, 4.377%, (3 mo. USD LIBOR + 4.25%), 9/5/25 | | | 726 | | | | 724,899 | |
| | |
Brand Energy & Infrastructure Services, Inc., Term Loan, 5.25%, (3 mo. USD LIBOR + 4.25%, Floor 1.00%), 6/21/24 | | | 1,650 | | | | 1,618,840 | |
| | |
Camelot U.S. Acquisition 1 Co., Term Loan, 3.104%, (1 mo. USD LIBOR + 3.00%), 10/30/26 | | | 1,323 | | | | 1,315,558 | |
| | |
Ceridian HCM Holding, Inc., Term Loan, 2.577%, (1 week USD LIBOR + 2.50%), 4/30/25 | | | 2,056 | | | | 2,035,378 | |
| | |
Deerfield Dakota Holding, LLC, Term Loan, 4.75%, (1 mo. USD LIBOR + 3.75%, Floor 1.00%), 4/9/27 | | | 1,478 | | | | 1,481,062 | |
| | |
EAB Global, Inc., Term Loan, 4.00%, (USD LIBOR + 3.50%, Floor 0.50%), 8/16/28(10) | | | 900 | | | | 896,531 | |
| | |
Employbridge, LLC, Term Loan, 5.50%, (3 mo. USD LIBOR + 4.75%, Floor 0.75%), 7/14/28 | | | 1,147 | | | | 1,138,701 | |
| | |
Endure Digital, Inc., Term Loan, 4.25%, (3 mo. USD LIBOR + 3.50%, Floor 0.75%), 2/10/28 | | | 2,438 | | | | 2,420,610 | |
| | |
First Advantage Holdings, LLC, Term Loan, 2.854%, (1 mo. USD LIBOR + 2.75%), 1/31/27 | | | 935 | | | | 932,574 | |
| | |
Foundational Education Group, Inc., Term Loan, 4.75%, (6 mo. USD LIBOR + 4.25%, Floor 0.50%), 8/31/28 | | | 1,425 | | | | 1,428,563 | |
| | |
Garda World Security Corporation, Term Loan, 4.36%, (1 mo. USD LIBOR + 4.25%), 10/30/26 | | | 1,727 | | | | 1,727,364 | |
| | |
Grab Holdings, Inc., Term Loan, 5.50%, (3 mo. USD LIBOR + 4.50%, Floor 1.00%), 1/29/26 | | | 1,390 | | | | 1,395,579 | |
| | |
Greeneden U.S. Holdings II, LLC, Term Loan, 4.75%, (1 mo. USD LIBOR + 4.00%, Floor 0.75%), 12/1/27 | | | 496 | | | | 498,628 | |
| | |
Hillman Group, Inc. (The): | | | | | | | | |
| | |
Term Loan, 2.785%, (1 mo. USD LIBOR + 2.75%, Floor 0.50%), 7/14/28(8) | | | 46 | | | | 45,861 | |
| | |
Term Loan, 3.25%, (1 mo. USD LIBOR + 2.75%, Floor 0.50%), 7/14/28 | | | 194 | | | | 193,480 | |
| | |
Indy US Bidco, LLC, Term Loan, 3.854%, (1 mo. USD LIBOR + 3.75%), 3/5/28 | | | 447 | | | | 447,375 | |
| | |
Intrado Corporation, Term Loan, 5.00%, (3 mo. USD LIBOR + 4.00%, Floor 1.00%), 10/10/24 | | | 943 | | | | 897,734 | |
| | |
IRI Holdings, Inc., Term Loan, 4.354%, (1 mo. USD LIBOR + 4.25%), 12/1/25 | | | 3,721 | | | | 3,720,152 | |
| | | | | | | | |
| Borrower/Description | | Principal
Amount
(000’s omitted) | | | Value | |
|
| Business Equipment and Services (continued) | |
| | |
Iron Mountain, Inc., Term Loan, 1.851%, (1 mo. USD LIBOR + 1.75%), 1/2/26 | | $ | 626 | | | $ | 617,414 | |
| | |
Ivanti Software, Inc.: | | | | | | | | |
| | |
Term Loan, 4.75%, (3 mo. USD LIBOR + 4.00%, Floor 0.75%), 12/1/27 | | | 447 | | | | 444,811 | |
| | |
Term Loan, 5.00%, (3 mo. USD LIBOR + 4.25%, Floor 0.75%), 12/1/27 | | | 1,567 | | | | 1,572,676 | |
| | |
KUEHG Corp., Term Loan, 4.75%, (3 mo. USD LIBOR + 3.75%, Floor 1.00%), 2/21/25 | | | 848 | | | | 831,677 | |
| | |
Loire Finco Luxembourg S.a.r.l., Term Loan, 3.354%, (1 mo. USD LIBOR + 3.25%), 4/21/27 | | | 246 | | | | 242,733 | |
| | |
Magnite, Inc., Term Loan, 5.75%, (6 mo. USD LIBOR + 5.00%, Floor 0.75%), 4/28/28 | | | 948 | | | | 945,381 | |
| | |
MedAssets Software Intermediate Holdings, Inc.: | | | | | | | | |
| | |
Term Loan, 4.50%, (6 mo. USD LIBOR + 4.00%, Floor 0.50%), 12/18/28 | | | 800 | | | | 800,500 | |
| | |
Term Loan - Second Lien, 11/18/29(9) | | | 575 | | | | 572,844 | |
| | |
Monitronics International, Inc., Term Loan, 7.75%, (3 mo. USD LIBOR + 6.50%, Floor 1.25%), 3/29/24 | | | 1,024 | | | | 960,553 | |
| | |
NAB Holdings, LLC, Term Loan, 3.50%, (SOFR + 3.00%, Floor 0.50%), 11/23/28 | | | 650 | | | | 647,969 | |
| | |
Packaging Coordinators Midco, Inc., Term Loan, 4.50%, (3 mo. USD LIBOR + 3.75%, Floor 0.75%), 11/30/27 | | | 224 | | | | 224,715 | |
| | |
Pike Corporation, Term Loan, 3.11%, (1 mo. USD LIBOR + 3.00%), 1/21/28 | | | 288 | | | | 287,072 | |
| | |
Rockwood Service Corporation, Term Loan, 4.104%, (1 mo. USD LIBOR + 4.00%), 1/23/27 | | | 917 | | | | 919,957 | |
| | |
Sabre GLBL, Inc.: | | | | | | | | |
| | |
Term Loan, 4.00%, (1 mo. USD LIBOR + 3.50%, Floor 0.50%), 12/17/27 | | | 211 | | | | 208,537 | |
| | |
Term Loan, 4.00%, (1 mo. USD LIBOR + 3.50%, Floor 0.50%), 12/17/27 | | | 336 | | | | 332,420 | |
| | |
SITEL Worldwide Corporation, Term Loan, 4.25%, (3 mo. USD LIBOR + 3.75%, Floor 0.50%), 8/28/28 | | | 1,921 | | | | 1,923,324 | |
| | |
Skopima Merger Sub, Inc., Term Loan, 4.50%, (1 mo. USD LIBOR + 4.00%, Floor 0.50%), 5/12/28 | | | 1,097 | | | | 1,091,861 | |
| | |
Sotheby’s, Term Loan, 5.00%, (3 mo. USD LIBOR + 4.50%, Floor 0.50%), 1/15/27 | | | 326 | | | | 327,194 | |
| | |
Spin Holdco, Inc., Term Loan, 4.75%, (3 mo. USD LIBOR + 4.00%, Floor 0.75%), 3/4/28 | | | 2,556 | | | | 2,566,692 | |
| | |
Tempo Acquisition, LLC, Term Loan, 3.75%, (1 mo. USD LIBOR + 3.25%, Floor 0.50%), 11/2/26 | | | 645 | | | | 646,802 | |
| | |
TPG VIII Elf Purchaser, LLC, Term Loan, 4.00%, (3 mo. USD LIBOR + 3.50%, Floor 0.50%), 11/6/28 | | | 350 | | | | 350,569 | |
| | |
Trans Union, LLC: | | | | | | | | |
| | |
Term Loan, 1.854%, (1 mo. USD LIBOR + 1.75%), 11/16/26 | | | 1,094 | | | | 1,082,875 | |
| | |
Term Loan, 2.75%, (1 mo. USD LIBOR + 2.25%, Floor 0.50%), 12/1/28 | | | 1,700 | | | | 1,697,992 | |
| | | | |
| | 12 | | See Notes to Financial Statements. |
Eaton Vance
VT Floating-Rate Income Fund
December 31, 2021
Portfolio of Investments — continued
| | | | | | | | |
| Borrower/Description | | Principal
Amount
(000’s omitted) | | | Value | |
|
| Business Equipment and Services (continued) | |
| | |
TTF Holdings, LLC, Term Loan, 5.00%, (1 mo. USD LIBOR + 4.25%, Floor 0.75%), 3/31/28 | | $ | 404 | | | $ | 405,427 | |
| | |
West Corporation, Term Loan, 4.50%, (3 mo. USD LIBOR + 3.50%, Floor 1.00%), 10/10/24 | | | 216 | | | | 204,382 | |
| | |
WEX, Inc., Term Loan, 2.354%, (1 mo. USD LIBOR + 2.25%), 3/31/28 | | | 298 | | | | 296,541 | |
| |
| | | | $ | 51,193,608 | |
|
| Cable and Satellite Television — 2.5% | |
| | |
Altice France S.A., Term Loan, 4.118%, (2 mo. USD LIBOR + 4.00%), 8/14/26 | | $ | 485 | | | $ | 483,383 | |
| | |
Charter Communications Operating, LLC, Term Loan, 1.86%, (1 mo. USD LIBOR + 1.75%), 2/1/27 | | | 2,053 | | | | 2,035,574 | |
| | |
CSC Holdings, LLC: | | | | | | | | |
| | |
Term Loan, 2.36%, (1 mo. USD LIBOR + 2.25%), 7/17/25 | | | 3,461 | | | | 3,412,673 | |
| | |
Term Loan, 2.61%, (1 mo. USD LIBOR + 2.50%), 4/15/27 | | | 922 | | | | 911,723 | |
| | |
Numericable Group S.A., Term Loan, 2.879%, (3 mo. USD LIBOR + 2.75%), 7/31/25 | | | 2,304 | | | | 2,265,783 | |
| | |
UPC Broadband Holding B.V., Term Loan, 2.36%, (1 mo. USD LIBOR + 2.25%), 4/30/28 | | | 625 | | | | 617,500 | |
| | |
UPC Financing Partnership, Term Loan, 3.11%, (1 mo. USD LIBOR + 3.00%), 1/31/29 | �� | | 2,050 | | | | 2,045,900 | |
| | |
Virgin Media Bristol, LLC: | | | | | | | | |
| | |
Term Loan, 2.61%, (1 mo. USD LIBOR + 2.50%), 1/31/28 | | | 3,225 | | | | 3,197,004 | |
| | |
Term Loan, 3.36%, (1 mo. USD LIBOR + 3.25%), 1/31/29 | | | 750 | | | | 750,469 | |
| |
| | | | $ | 15,720,009 | |
|
| Chemicals and Plastics — 4.1% | |
| | |
Aruba Investments, Inc., Term Loan, 4.75%, (6 mo. USD LIBOR + 4.00%, Floor 0.75%), 11/24/27 | | $ | 422 | | | $ | 422,872 | |
| | |
Atotech B.V., Term Loan, 3.00%, (1 mo. USD LIBOR + 2.50%, Floor 0.50%), 3/18/28 | | | 920 | | | | 919,758 | |
| | |
Axalta Coating Systems US Holdings, Inc., Term Loan, 1.974%, (3 mo. USD LIBOR + 1.75%), 6/1/24 | | | 705 | | | | 705,385 | |
| | |
Charter NEX US, Inc., Term Loan, 4.50%, (1 mo. USD LIBOR + 3.75%, Floor 0.75%), 12/1/27 | | | 272 | | | | 273,271 | |
| | |
CPC Acquisition Corp., Term Loan, 4.50%, (3 mo. USD LIBOR + 3.75%, Floor 0.75%), 12/29/27 | | | 1,390 | | | | 1,379,079 | |
| | |
Diamond (BC) B.V., Term Loan, 9/29/28(9) | | | 1,000 | | | | 995,000 | |
| | |
Ferro Corporation: | | | | | | | | |
| | |
Term Loan, 2.47%, (3 mo. USD LIBOR + 2.25%), 2/14/24 | | | 77 | | | | 76,602 | |
| | |
Term Loan, 2.47%, (3 mo. USD LIBOR + 2.25%), 2/14/24 | | | 78 | | | | 78,267 | |
| | |
Term Loan, 2.47%, (3 mo. USD LIBOR + 2.25%), 2/14/24 | | | 92 | | | | 91,992 | |
| | | | | | | | |
| Borrower/Description | | Principal
Amount
(000’s omitted) | | | Value | |
|
| Chemicals and Plastics (continued) | |
| | |
Gemini HDPE, LLC, Term Loan, 3.50%, (3 mo. USD LIBOR + 3.00%, Floor 0.50%), 12/31/27 | | $ | 435 | | | $ | 435,566 | |
| | |
Groupe Solmax, Inc., Term Loan, 5.50%, (3 mo. USD LIBOR + 4.75%, Floor 0.75%), 5/29/28 | | | 772 | | | | 773,008 | |
| | |
Illuminate Buyer, LLC, Term Loan, 3.604%, (1 mo. USD LIBOR + 3.50%), 6/30/27 | | | 1,249 | | | | 1,242,696 | |
| | |
INEOS Enterprises Holdings US Finco, LLC, Term Loan, 4.50%, (3 mo. USD LIBOR + 3.50%, Floor 1.00%), 8/28/26 | | | 161 | | | | 161,301 | |
| | |
INEOS Styrolution US Holding, LLC, Term Loan, 3.25%, (1 mo. USD LIBOR + 2.75%, Floor 0.50%), 1/29/26 | | | 1,517 | | | | 1,516,427 | |
| | |
INEOS US Finance, LLC, Term Loan, 11/8/28(9) | | | 500 | | | | 497,813 | |
| | |
Kraton Polymers, LLC, Term Loan, 11/18/28(9) | | | 375 | | | | 375,703 | |
| | |
Lonza Group AG, Term Loan, 4.75%, (6 mo. USD LIBOR + 4.00%, Floor 0.75%), 7/3/28 | | | 871 | | | | 870,972 | |
| | |
LSF11 Skyscraper Holdco S.a.r.l., Term Loan, 4.25%, (3 mo. USD LIBOR + 3.75%), 9/29/27 | | | 1,241 | | | | 1,241,424 | |
| | |
Messer Industries GmbH, Term Loan, 2.724%, (3 mo. USD LIBOR + 2.50%), 3/2/26 | | | 838 | | | | 832,505 | |
| | |
Momentive Performance Materials, Inc., Term Loan, 3.36%, (1 mo. USD LIBOR + 3.25%), 5/15/24 | | | 2,803 | | | | 2,803,562 | |
| | |
Orion Engineered Carbons GmbH, Term Loan, 2.75%, (3 mo. USD LIBOR + 2.25%, Floor 0.50%), 9/24/28 | | | 299 | | | | 300,746 | |
| | |
PMHC II, Inc., Term Loan, 4.50%, (3 mo. USD LIBOR + 3.50%, Floor 1.00%), 3/31/25 | | | 987 | | | | 982,863 | |
| | |
PQ Corporation, Term Loan, 3.25%, (3 mo. USD LIBOR + 2.75%, Floor 0.50%), 6/9/28 | | | 1,244 | | | | 1,245,563 | |
| | |
Pretium PKG Holdings, Inc., Term Loan, 4.50%, (3 mo. USD LIBOR + 4.00%, Floor 0.50%), 10/2/28 | | | 500 | | | | 499,643 | |
| | |
Rohm Holding GmbH, Term Loan, 4.904%, (6 mo. USD LIBOR + 4.75%), 7/31/26 | | | 567 | | | | 567,911 | |
| | |
Starfruit Finco B.V., Term Loan, 3.102%, (1 mo. USD LIBOR + 3.00%), 10/1/25 | | | 1,174 | | | | 1,170,462 | |
| | |
Trinseo Materials Operating S.C.A.: | | | | | | | | |
| | |
Term Loan, 2.104%, (1 mo. USD LIBOR + 2.00%), 9/6/24 | | | 1,314 | | | | 1,308,903 | |
| | |
Term Loan, 2.604%, (1 mo. USD LIBOR + 2.50%), 5/3/28 | | | 572 | | | | 568,668 | |
| | |
Tronox Finance, LLC, Term Loan, 2.454%, (USD LIBOR + 2.25%), 3/13/28(10) | | | 867 | | | | 860,315 | |
| | |
W.R. Grace & Co.-Conn., Term Loan, 4.25%, (3 mo. USD LIBOR + 3.75%, Floor 0.50%), 9/22/28 | | | 1,875 | | | | 1,880,625 | |
| |
| | | | $ | 25,078,902 | |
|
| Conglomerates — 0.0%(3) | |
| | |
Penn Engineering & Manufacturing Corp., Term Loan, 3.50%, (3 mo. USD LIBOR + 2.50%, Floor 1.00%), 6/27/24 | | $ | 133 | | | $ | 132,996 | |
| | |
| | | | | | | $ | 132,996 | |
| | | | |
| | 13 | | See Notes to Financial Statements. |
Eaton Vance
VT Floating-Rate Income Fund
December 31, 2021
Portfolio of Investments — continued
| | | | | | | | |
| Borrower/Description | | Principal
Amount
(000’s omitted) | | | Value | |
|
| Containers and Glass Products — 1.7% | |
| | |
Berlin Packaging, LLC, Term Loan, 4.25%, (USD LIBOR + 3.75%, Floor 0.50%), 3/11/28(10) | | $ | 973 | | | $ | 971,853 | |
| | |
Berry Global, Inc., Term Loan, 1.864%, (2 mo. USD LIBOR + 1.75%), 7/1/26 | | | 682 | | | | 678,567 | |
| | |
BWAY Holding Company, Term Loan, 3.354%, (1 mo. USD LIBOR + 3.25%), 4/3/24 | | | 1,346 | | | | 1,329,985 | |
| | |
Flex Acquisition Company, Inc., Term Loan, 4.00%, (3 mo. USD LIBOR + 3.50%, Floor 0.50%), 3/2/28 | | | 2,395 | | | | 2,393,592 | |
| | |
Libbey Glass, Inc., Term Loan, 11.00%, (1 mo. USD LIBOR + 10.00%, Floor 1.00%), 11/13/25 | | | 1,070 | | | | 1,112,291 | |
| | |
Proampac PG Borrower, LLC, Term Loan, 4.50%, (USD LIBOR + 3.75%, Floor 0.75%), 11/3/25(10) | | | 1,379 | | | | 1,381,542 | |
| | |
Reynolds Group Holdings, Inc.: | | | | | | | | |
| | |
Term Loan, 3.354%, (1 mo. USD LIBOR + 3.25%), 2/5/26 | | | 891 | | | | 887,023 | |
| | |
Term Loan, 4.00%, (1 mo. USD LIBOR + 3.50%, Floor 0.50%), 9/20/28 | | | 773 | | | | 772,386 | |
| | |
TricorBraun Holdings, Inc., Term Loan, 3.75%, (1 mo. USD LIBOR + 3.25%, Floor 0.50%), 3/3/28 | | | 373 | | | | 370,993 | |
| | |
Trident TPI Holdings, Inc.: | | | | | | | | |
| | |
Term Loan, 4.201%, (3 mo. USD LIBOR + 4.00%, Floor 0.50%), 9/15/28(8) | | | 74 | | | | 74,552 | |
| | |
Term Loan, 4.50%, (3 mo. USD LIBOR + 4.00%, Floor 0.50%), 9/15/28 | | | 524 | | | | 524,807 | |
| |
| | | | $ | 10,497,591 | |
|
| Cosmetics / Toiletries — 0.2% | |
| | |
Kronos Acquisition Holdings, Inc.: | | | | | | | | |
| | |
Term Loan, 4.25%, (3 mo. USD LIBOR + 3.75%, Floor 0.50%), 12/22/26 | | $ | 743 | | | $ | 724,247 | |
| | |
Term Loan, 12/22/26(9) | | | 350 | | | | 346,500 | |
| |
| | | | $ | 1,070,747 | |
|
| Drugs — 2.8% | |
| | |
Akorn, Inc., Term Loan, 8.50%, (3 mo. USD LIBOR + 7.50%, Floor 1.00%), 10/1/25 | | $ | 496 | | | $ | 503,796 | |
| | |
Alkermes, Inc., Term Loan, 3.00%, (3 mo. USD LIBOR + 2.50%, Floor 0.50%), 3/12/26 | | | 183 | | | | 180,615 | |
| | |
Amneal Pharmaceuticals, LLC, Term Loan, 3.625%, (1 mo. USD LIBOR + 3.50%), 5/4/25 | | | 2,076 | | | | 2,056,498 | |
| | |
Bausch Health Companies, Inc., Term Loan, 3.104%, (1 mo. USD LIBOR + 3.00%), 6/2/25 | | | 2,436 | | | | 2,428,119 | |
| | |
Cambrex Corporation, Term Loan, 4.25%, (1 mo. USD LIBOR + 3.50%, Floor 0.75%), 12/4/26 | | | 173 | | | | 173,539 | |
| | |
Catalent Pharma Solutions, Inc., Term Loan, 2.50%, (1 mo. USD LIBOR + 2.00%, Floor 0.50%), 2/22/28 | | | 733 | | | | 734,559 | |
| | |
Curia Global, Inc., Term Loan, 4.50%, (3 mo. USD LIBOR + 3.75%, Floor 0.75%), 8/30/26 | | | 149 | | | | 148,829 | |
| | | | | | | | |
| Borrower/Description | | Principal
Amount
(000’s omitted) | | | Value | |
|
| Drugs (continued) | |
| | |
Grifols Worldwide Operations USA, Inc., Term Loan, 2.104%, (1 mo. USD LIBOR + 2.00%), 11/15/27 | | $ | 2,835 | | | $ | 2,797,588 | |
| | |
Horizon Therapeutics USA, Inc.: | | | | | | | | |
| | |
Term Loan, 2.125%, (1 mo. USD LIBOR + 2.00%), 5/22/26 | | | 668 | | | | 666,498 | |
| | |
Term Loan, 2.25%, (1 mo. USD LIBOR + 1.75%, Floor 0.50%), 3/15/28 | | | 1,290 | | | | 1,287,562 | |
| | |
Jazz Financing Lux S.a.r.l., Term Loan, 4.00%, (1 mo. USD LIBOR + 3.50%, Floor 0.50%), 5/5/28 | | | 2,117 | | | | 2,128,020 | |
| | |
Mallinckrodt International Finance S.A.: | | | | | | | | |
| | |
Term Loan, 6.00%, (3 mo. USD LIBOR + 5.25%, Floor 0.75%), 9/24/24 | | | 4,088 | | | | 3,840,716 | |
| | |
Term Loan, 6.25%, (3 mo. USD LIBOR + 5.50%, Floor 0.75%), 2/24/25 | | | 386 | | | | 362,617 | |
| | |
Pearl Intermediate Parent, LLC, Term Loan - Second Lien, 6.354%, (1 mo. USD LIBOR + 6.25%), 2/13/26 | | | 150 | | | | 150,937 | |
| |
| | | | $ | 17,459,893 | |
|
| Ecological Services and Equipment — 0.7% | |
| | |
Clean Harbors, Inc., Term Loan, 2.104%, (1 mo. USD LIBOR + 2.00%), 10/8/28 | | $ | 375 | | | $ | 375,117 | |
| | |
EnergySolutions, LLC, Term Loan, 4.75%, (3 mo. USD LIBOR + 3.75%, Floor 1.00%), 5/9/25 | | | 1,335 | | | | 1,336,185 | |
| | |
GFL Environmental, Inc., Term Loan, 3.50%, (3 mo. USD LIBOR + 3.00%, Floor 0.50%), 5/30/25 | | | 2,253 | | | | 2,260,895 | |
| | |
TruGreen Limited Partnership, Term Loan, 4.75%, (1 mo. USD LIBOR + 4.00%, Floor 0.75%), 11/2/27 | | | 347 | | | | 347,529 | |
| |
| | | | $ | 4,319,726 | |
|
| Electronics / Electrical — 19.1% | |
| | |
Allegro Microsystems, Inc., Term Loan, 4.25%, (3 mo. USD LIBOR + 3.75%, Floor 0.50%), 9/30/27 | | $ | 27 | | | $ | 26,923 | |
| | |
Altar Bidco, Inc., Term Loan, 11/17/28(9) | | | 1,050 | | | | 1,047,375 | |
| | |
Applied Systems, Inc., Term Loan, 3.50%, (3 mo. USD LIBOR + 3.00%, Floor 0.50%), 9/19/24 | | | 3,850 | | | | 3,853,237 | |
| | |
Aptean, Inc., Term Loan, 4.354%, (1 mo. USD LIBOR + 4.25%), 4/23/26 | | | 2,174 | | | | 2,169,533 | |
| | |
AQA Acquisition Holding, Inc., Term Loan, 4.75%, (3 mo. USD LIBOR + 4.25%, Floor 0.50%), 3/3/28 | | | 522 | | | | 522,783 | |
| | |
Astra Acquisition Corp.: | | | | | | | | |
| | |
Term Loan, 5.75%, (1 mo. USD LIBOR + 5.25%, Floor 0.50%), 10/25/28 | | | 1,475 | | | | 1,450,416 | |
| | |
Term Loan - Second Lien, 9.625%, (1 mo. USD LIBOR + 8.875%, Floor 0.75%), 10/22/29 | | | 1,375 | | | | 1,361,250 | |
| | |
Banff Merger Sub, Inc., Term Loan, 3.974%, (3 mo. USD LIBOR + 3.75%), 10/2/25 | | | 4,062 | | | | 4,050,531 | |
| | | | |
| | 14 | | See Notes to Financial Statements. |
Eaton Vance
VT Floating-Rate Income Fund
December 31, 2021
Portfolio of Investments — continued
| | | | | | | | |
| Borrower/Description | | Principal
Amount
(000’s omitted) | | | Value | |
|
| Electronics / Electrical (continued) | |
| | |
Buzz Merger Sub, Ltd., Term Loan, 3.75%, (1 mo. USD LIBOR + 3.25%, Floor 0.50%), 1/29/27 | | $ | 33 | | | $ | 33,508 | |
| | |
CentralSquare Technologies, LLC, Term Loan, 3.974%, (3 mo. USD LIBOR + 3.75%), 8/29/25 | | | 496 | | | | 469,247 | |
| | |
Chamberlain Group, Inc., Term Loan, 4.00%, (1 mo. USD LIBOR + 3.50%, Floor 0.50%), 11/3/28 | | | 1,275 | | | | 1,275,398 | |
| | |
Cloudera, Inc.: | | | | | | | | |
| | |
Term Loan, 4.25%, (1 mo. USD LIBOR + 3.75%, Floor 0.50%), 10/8/28 | | | 2,650 | | | | 2,643,926 | |
| | |
Term Loan - Second Lien, 6.50%, (1 mo. USD LIBOR + 6.00%, Floor 0.50%), 10/8/29 | | | 600 | | | | 601,500 | |
| | |
Cohu, Inc., Term Loan, 3.104%, (1 mo. USD LIBOR + 3.00%), 10/1/25 | | | 376 | | | | 374,610 | |
| | |
CommScope, Inc., Term Loan, 3.354%, (1 mo. USD LIBOR + 3.25%), 4/6/26 | | | 2,114 | | | | 2,090,459 | |
| | |
Constant Contact, Inc., Term Loan, 4.75%, (3 mo. USD LIBOR + 4.00%, Floor 0.75%), 2/10/28 | | | 1,145 | | | | 1,145,945 | |
| | |
Cornerstone OnDemand, Inc., Term Loan, 4.25%, (6 mo. USD LIBOR + 3.75%, Floor 0.50%), 10/16/28 | | | 1,075 | | | | 1,074,059 | |
| | |
Creation Technologies, Inc., Term Loan, 6.00%, (3 mo. USD LIBOR + 5.50%, Floor 0.50%), 10/5/28 | | | 800 | | | | 795,000 | |
| | |
Cvent, Inc., Term Loan, 3.854%, (1 mo. USD LIBOR + 3.75%), 11/29/24 | | | 258 | | | | 258,189 | |
| | |
Delta TopCo, Inc., Term Loan, 4.50%, (6 mo. USD LIBOR + 3.75%, Floor 0.75%), 12/1/27 | | | 871 | | | | 872,530 | |
| | |
DG Investment Intermediate Holdings 2, Inc., Term Loan, 4.25%, (1 mo. USD LIBOR + 3.50%, Floor 0.75%), 3/31/28 | | | 1,493 | | | | 1,494,260 | |
| | |
E2open, LLC, Term Loan, 4.00%, (3 mo. USD LIBOR + 3.50%, Floor 0.50%), 2/4/28 | | | 1,070 | | | | 1,073,596 | |
| | |
ECI Macola Max Holding, LLC, Term Loan, 4.50%, (3 mo. USD LIBOR + 3.75%, Floor 0.75%), 11/9/27 | | | 867 | | | | 867,663 | |
| | |
Electro Rent Corporation, Term Loan, 6.00%, (3 mo. USD LIBOR + 5.00%, Floor 1.00%), 1/31/24 | | | 1,872 | | | | 1,874,894 | |
| | |
Energizer Holdings, Inc., Term Loan, 2.75%, (1 mo. USD LIBOR + 2.00%), 12/22/27 | | | 651 | | | | 650,506 | |
| | |
Epicor Software Corporation, Term Loan, 4.00%, (1 mo. USD LIBOR + 3.25%, Floor 0.75%), 7/30/27 | | | 5,225 | | | | 5,227,768 | |
| | |
EXC Holdings III Corp., Term Loan, 4.50%, (3 mo. USD LIBOR + 3.50%, Floor 1.00%), 12/2/24 | | | 336 | | | | 337,680 | |
| | |
Finastra USA, Inc., Term Loan, 4.50%, (6 mo. USD LIBOR + 3.50%, Floor 1.00%), 6/13/24 | | | 4,106 | | | | 4,092,407 | |
| | |
Fiserv Investment Solutions, Inc., Term Loan, 4.16%, (3 mo. USD LIBOR + 4.00%), 2/18/27 | | | 394 | | | | 394,739 | |
| | |
Gainwell Acquisition Corp., Term Loan, 4.75%, (3 mo. USD LIBOR + 4.00%, Floor 0.75%), 10/1/27 | | | 4,116 | | | | 4,132,233 | |
| | |
Go Daddy Operating Company, LLC: | | | | | | | | |
| | |
Term Loan, 1.854%, (1 mo. USD LIBOR + 1.75%), 2/15/24 | | | 994 | | | | 990,442 | |
| | |
Term Loan, 2.104%, (1 mo. USD LIBOR + 2.00%), 8/10/27 | | | 714 | | | | 709,265 | |
| | | | | | | | |
| Borrower/Description | | Principal
Amount
(000’s omitted) | | | Value | |
|
| Electronics / Electrical (continued) | |
| | |
Hyland Software, Inc., Term Loan, 4.25%, (1 mo. USD LIBOR + 3.50%, Floor 0.75%), 7/1/24 | | $ | 4,490 | | | $ | 4,502,398 | |
| | |
IGT Holding IV AB, Term Loan, 4.00%, (3 mo. USD LIBOR + 3.50%, Floor 0.50%), 3/31/28 | | | 1,092 | | | | 1,090,385 | |
| | |
II-VI Incorporated, Term Loan, 12/1/28(9) | | | 825 | | | | 825,172 | |
| | |
Imperva, Inc., Term Loan, 5.00%, (3 mo. USD LIBOR + 4.00%, Floor 1.00%), 1/12/26 | | | 370 | | | | 370,392 | |
| | |
Imprivata, Inc., Term Loan, 4.00%, (3 mo. USD LIBOR + 3.50%, Floor 0.50%), 12/1/27 | | | 2,187 | | | | 2,190,306 | |
| | |
Informatica, LLC, Term Loan, 2.875%, (1 mo. USD LIBOR + 2.75%), 10/27/28 | | | 2,175 | | | | 2,169,834 | |
| | |
LogMeIn, Inc., Term Loan, 4.839%, (1 mo. USD LIBOR + 4.75%), 8/31/27 | | | 1,711 | | | | 1,703,117 | |
| | |
MA FinanceCo., LLC: | | | | | | | | |
| | |
Term Loan, 2.854%, (1 mo. USD LIBOR + 2.75%), 6/21/24 | | | 331 | | | | 329,509 | |
| | |
Term Loan, 5.25%, (3 mo. USD LIBOR + 4.25%, Floor 1.00%), 6/5/25 | | | 1,332 | | | | 1,355,342 | |
| | |
Magenta Buyer, LLC: | | | | | | | | |
| | |
Term Loan, 5.75%, (3 mo. USD LIBOR + 5.00%, Floor 0.75%), 7/27/28 | | | 2,718 | | | | 2,717,054 | |
| | |
Term Loan - Second Lien, 9.00%, (3 mo. USD LIBOR + 8.25%, Floor 0.75%), 7/27/29 | | | 1,475 | | | | 1,470,391 | |
| | |
Marcel LUX IV S.a.r.l.: | | | | | | | | |
| | |
Term Loan, 3.354%, (1 mo. USD LIBOR + 3.25%), 3/15/26 | | | 2,158 | | | | 2,154,803 | |
| | |
Term Loan, 4.75%, (1 mo. USD LIBOR + 4.00%, Floor 0.75%), 12/31/27 | | | 61 | | | | 61,486 | |
| | |
Mavenir Systems, Inc., Term Loan, 5.25%, (3 mo. USD LIBOR + 4.75%, Floor 0.50%), 8/18/28 | | | 300 | | | | 300,875 | |
| | |
Maverick Bidco, Inc., Term Loan, 4.50%, (3 mo. USD LIBOR + 3.75%, Floor 0.75%), 5/18/28 | | | 625 | | | | 626,172 | |
| | |
Mediaocean, LLC, Term Loan, 4.00%, (1 mo. USD LIBOR + 3.50%, Floor 0.50%), 12/15/28 | | | 525 | | | | 523,359 | |
| | |
MH Sub I, LLC, Term Loan, 4.75%, (1 mo. USD LIBOR + 3.75%, Floor 1.00%), 9/13/24 | | | 324 | | | | 325,292 | |
| | |
Mirion Technologies, Inc., Term Loan, 3.25%, (6 mo. USD LIBOR + 2.75%, Floor 0.50%), 10/20/28 | | | 574 | | | | 573,432 | |
| | |
MKS Instruments, Inc., Term Loan, 10/21/28(9) | | | 3,325 | | | | 3,321,881 | |
| | |
N-Able International Holdings II, LLC, Term Loan, 3.50%, (3 mo. USD LIBOR + 3.00%, Floor 0.50%), 7/19/28 | | | 299 | | | | 298,502 | |
| | |
Panther Commercial Holdings L.P., Term Loan, 5.00%, (3 mo. USD LIBOR + 4.50%, Floor 0.50%), 1/7/28 | | | 1,617 | | | | 1,621,947 | |
| | |
PointClickCare Technologies, Inc., Term Loan, 3.75%, (6 mo. USD LIBOR + 3.00%, Floor 0.75%), 12/29/27 | | | 372 | | | | 372,420 | |
| | |
Polaris Newco, LLC, Term Loan, 4.50%, (3 mo. USD LIBOR + 4.00%, Floor 0.50%), 6/2/28 | | | 1,771 | | | | 1,772,445 | |
| | |
Proofpoint, Inc., Term Loan, 3.75%, (3 mo. USD LIBOR + 3.25%, Floor 0.50%), 8/31/28 | | | 1,850 | | | | 1,848,150 | |
| | | | |
| | 15 | | See Notes to Financial Statements. |
Eaton Vance
VT Floating-Rate Income Fund
December 31, 2021
Portfolio of Investments — continued
| | | | | | | | |
| Borrower/Description | | Principal
Amount
(000’s omitted) | | | Value | |
|
| Electronics / Electrical (continued) | |
| | |
Rackspace Technology Global, Inc., Term Loan, 3.50%, (3 mo. USD LIBOR + 2.75%, Floor 0.75%), 2/15/28 | | $ | 893 | | | $ | 887,779 | |
| | |
RealPage, Inc., Term Loan, 3.75%, (1 mo. USD LIBOR + 3.25%, Floor 0.50%), 4/24/28 | | | 2,295 | | | | 2,290,797 | |
| | |
Recorded Books, Inc., Term Loan, 4.105%, (1 mo. USD LIBOR + 4.00%), 8/29/25 | | | 1,188 | | | | 1,189,546 | |
| | |
Redstone Holdco 2 L.P., Term Loan, 5.50%, (3 mo. USD LIBOR + 4.75%, Floor 0.75%), 4/27/28 | | | 2,095 | | | | 2,009,651 | |
| | |
Seattle Spinco, Inc., Term Loan, 2.854%, (1 mo. USD LIBOR + 2.75%), 6/21/24 | | | 2,236 | | | | 2,225,254 | |
| | |
SkillSoft Corporation, Term Loan, 5.50%, (3 mo. USD LIBOR + 4.75%, Floor 0.75%), 6/30/28 | | | 525 | | | | 527,625 | |
| | |
SolarWinds Holdings, Inc., Term Loan, 2.854%, (1 mo. USD LIBOR + 2.75%), 2/5/24 | | | 3,871 | | | | 3,819,847 | |
| | |
Sophia L.P., Term Loan, 4.00%, (3 mo. USD LIBOR + 3.50%, Floor 0.50%), 10/7/27 | | | 2,498 | | | | 2,499,957 | |
| | |
Sovos Compliance, LLC: | | | | | | | | |
| | |
Term Loan, 4.50%, 8/11/28(8) | | | 162 | | | | 162,695 | |
| | |
Term Loan, 5.00%, (1 mo. USD LIBOR + 4.50%, Floor 0.50%), 8/11/28 | | | 938 | | | | 942,117 | |
| | |
SurveyMonkey, Inc., Term Loan, 3.86%, (1 mo. USD LIBOR + 3.75%), 10/10/25 | | | 887 | | | | 882,441 | |
| | |
Symplr Software, Inc., Term Loan, 5.25%, (3 mo. USD LIBOR + 4.50%, Floor 0.75%), 12/22/27 | | | 1,067 | | | | 1,070,805 | |
| | |
Synaptics Incorporated, Term Loan, 2.75%, (6 mo. USD LIBOR + 2.25%, Floor 0.50%), 12/2/28 | | | 324 | | | | 324,187 | |
| | |
Tibco Software, Inc., Term Loan, 3.852%, (1 mo. USD LIBOR + 3.75%), 6/30/26 | | | 1,930 | | | | 1,919,501 | |
| | |
TTM Technologies, Inc., Term Loan, 2.599%, (1 mo. USD LIBOR + 2.50%), 9/28/24 | | | 428 | | | | 428,386 | |
| | |
Turing Midco, LLC, Term Loan, 3.50%, (1 mo. USD LIBOR + 3.00%, Floor 0.50%), 3/23/28 | | | 356 | | | | 356,390 | |
| | |
Uber Technologies, Inc., Term Loan, 3.604%, (1 mo. USD LIBOR + 3.50%), 4/4/25 | | | 3,370 | | | | 3,375,317 | |
| | |
Ultimate Software Group, Inc. (The): | | | | | | | | |
| | |
Term Loan, 3.75%, (1 mo. USD LIBOR + 3.25%, Floor 0.50%), 5/4/26 | | | 2,946 | | | | 2,934,755 | |
| | |
Term Loan, 3.854%, (1 mo. USD LIBOR + 3.75%), 5/4/26 | | | 1,320 | | | | 1,317,810 | |
| | |
Ultra Clean Holdings, Inc., Term Loan, 3.854%, (1 mo. USD LIBOR + 3.75%), 8/27/25 | | | 848 | | | | 850,551 | |
| | |
Valkyr Purchaser, LLC, Term Loan, 4.75%, (3 mo. USD LIBOR + 4.00%, Floor 0.75%), 11/5/27 | | | 447 | | | | 447,742 | |
| | |
Verifone Systems, Inc., Term Loan, 4.178%, (3 mo. USD LIBOR + 4.00%), 8/20/25 | | | 1,688 | | | | 1,661,188 | |
| | |
Veritas US, Inc., Term Loan, 6.00%, (3 mo. USD LIBOR + 5.00%, Floor 1.00%), 9/1/25 | | | 1,605 | | | | 1,606,484 | |
| | |
Vision Solutions, Inc., Term Loan, 4.75%, (3 mo. USD LIBOR + 4.00%, Floor 0.75%), 4/24/28 | | | 623 | | | | 623,437 | |
| | | | | | | | |
| Borrower/Description | | Principal
Amount
(000’s omitted) | | | Value | |
|
| Electronics / Electrical (continued) | |
| | |
VS Buyer, LLC, Term Loan, 3.104%, (1 mo. USD LIBOR + 3.00%), 2/28/27 | | $ | 3,296 | | | $ | 3,288,920 | |
| |
| | | | $ | 118,129,718 | |
|
| Equipment Leasing — 0.5% | |
| | |
Avolon TLB Borrower 1 (US), LLC: | | | | | | | | |
| | |
Term Loan, 2.50%, (1 mo. USD LIBOR + 1.75%, Floor 0.75%), 1/15/25 | | $ | 1,493 | | | $ | 1,495,671 | |
| | |
Term Loan, 2.75%, (1 mo. USD LIBOR + 2.25%, Floor 0.50%), 12/1/27 | | | 1,114 | | | | 1,116,689 | |
| | |
PECF USS Intermediate Holding III Corporation, Term Loan, 12/15/28(9) | | | 525 | | | | 526,181 | |
| |
| | | | $ | 3,138,541 | |
|
| Financial Intermediaries — 2.4% | |
| | |
Aretec Group, Inc., Term Loan, 4.354%, (1 mo. USD LIBOR + 4.25%), 10/1/25 | | $ | 1,798 | | | $ | 1,803,330 | |
| | |
CoreLogic, Inc., Term Loan, 4.00%, (1 mo. USD LIBOR + 3.50%, Floor 0.50%), 6/2/28 | | | 3,591 | | | | 3,593,693 | |
| | |
Ditech Holding Corporation, Term Loan, 0.00%, 6/30/22(11) | | | 1,375 | | | | 275,062 | |
| | |
Edelman Financial Center, LLC, Term Loan, 4.25%, (1 mo. USD LIBOR + 3.50%, Floor 0.75%), 4/7/28 | | | 1,294 | | | | 1,294,129 | |
| | |
EIG Management Company, LLC, Term Loan, 4.50%, (1 mo. USD LIBOR + 3.75%, Floor 0.75%), 2/22/25 | | | 193 | | | | 191,838 | |
| | |
FinCo I, LLC, Term Loan, 2.604%, (1 mo. USD LIBOR + 2.50%), 6/27/25 | | | 576 | | | | 574,825 | |
| | |
Focus Financial Partners, LLC: | | | | | | | | |
| | |
Term Loan, 2.104%, (1 mo. USD LIBOR + 2.00%), 7/3/24 | | | 594 | | | | 589,764 | |
| | |
Term Loan, 3.00%, (1 mo. USD LIBOR + 2.50%, Floor 0.50%), 7/1/28 | | | 586 | | | | 583,980 | |
| | |
Term Loan, 4.75%, (USD Prime + 1.50%), 6/24/28 | | | 136 | | | | 135,102 | |
| | |
GreenSky Holdings, LLC: | | | | | | | | |
| | |
Term Loan, 3.352%, (1 mo. USD LIBOR + 3.25%), 3/31/25 | | | 987 | | | | 987,179 | |
| | |
Term Loan, 5.50%, (1 mo. USD LIBOR + 4.50%, Floor 1.00%), 3/29/25 | | | 369 | | | | 370,068 | |
| | |
HighTower Holdings, LLC, Term Loan, 4/21/28(9) | | | 1,000 | | | | 1,002,344 | |
| | |
KKR Apple Bidco, LLC, Term Loan, 3.50%, (1 mo. USD LIBOR + 3.00%, Floor 0.50%), 9/23/28 | | | 150 | | | | 149,708 | |
| | |
LPL Holdings, Inc., Term Loan, 1.854%, (1 mo. USD LIBOR + 1.75%), 11/12/26 | | | 1,469 | | | | 1,463,722 | |
| | |
Mariner Wealth Advisors, LLC: | | | | | | | | |
| | |
Term Loan, 3.45%, (3 mo. USD LIBOR + 3.25%, Floor 0.50%), 8/18/28(8) | | | 47 | | | | 46,653 | |
| | |
Term Loan, 3.75%, (3 mo. USD LIBOR + 3.25%, Floor 0.50%), 8/18/28 | | | 327 | | | | 326,077 | |
| | | | |
| | 16 | | See Notes to Financial Statements. |
Eaton Vance
VT Floating-Rate Income Fund
December 31, 2021
Portfolio of Investments — continued
| | | | | | | | |
| Borrower/Description | | Principal
Amount
(000’s omitted) | | | Value | |
|
| Financial Intermediaries (continued) | |
| | |
Victory Capital Holdings, Inc.: | | | | | | | | |
| | |
Term Loan, 2.377%, (3 mo. USD LIBOR + 2.25%), 7/1/26 | | $ | 685 | | | $ | 681,294 | |
| | |
Term Loan, 12/31/28(9) | | | 475 | | | | 472,922 | |
| |
| | | | $ | 14,541,690 | |
|
| Food Products — 1.6% | |
| | |
Alltech, Inc., Term Loan, 4.50%, (1 mo. USD LIBOR + 4.00%, Floor 0.50%), 10/13/28 | | $ | 875 | | | $ | 877,188 | |
| | |
CHG PPC Parent, LLC, Term Loan, 3.50%, (1 mo. USD LIBOR + 3.00%, Floor 0.50%), 12/8/28 | | | 375 | | | | 373,594 | |
| | |
Froneri International, Ltd., Term Loan, 2.354%, (1 mo. USD LIBOR + 2.25%), 1/29/27 | | | 1,502 | | | | 1,484,032 | |
| | |
H Food Holdings, LLC: | | | | | | | | |
| | |
Term Loan, 3.792%, (1 mo. USD LIBOR + 3.69%), 5/23/25 | | | 555 | | | | 552,216 | |
| | |
Term Loan, 4.104%, (1 mo. USD LIBOR + 4.00%), 5/23/25 | | | 364 | | | | 362,765 | |
| | |
HLF Financing S.a.r.l., Term Loan, 2.604%, (1 mo. USD LIBOR + 2.50%), 8/18/25 | | | 1,454 | | | | 1,448,573 | |
| | |
JBS USA LUX S.A., Term Loan, 2.101%, (1 mo. USD LIBOR + 2.00%), 5/1/26 | | | 4,126 | | | | 4,121,261 | |
| | |
Monogram Food Solutions, LLC, Term Loan, 4.50%, (1 mo. USD LIBOR + 4.00%, Floor 0.50%), 8/28/28 | | | 425 | | | | 425,000 | |
| | |
Shearer’s Foods, Inc., Term Loan, 4.25%, (1 mo. USD LIBOR + 3.50%, Floor 0.75%), 9/23/27 | | | 247 | | | | 246,778 | |
| | |
Simply Good Foods USA, Inc., Term Loan, 4.75%, (1 mo. USD LIBOR + 3.75%, Floor 1.00%), 7/7/24 | | | 181 | | | | 182,440 | |
| |
| | | | $ | 10,073,847 | |
|
| Food Service — 0.8% | |
| | |
AI Aqua Merger Sub, Inc.: | | | | | | | | |
| | |
Term Loan, 7/31/28(9) | | $ | 139 | | | $ | 139,236 | |
| | |
Term Loan, 7/31/28(9) | | | 1,111 | | | | 1,113,889 | |
| | |
Ali Group S.R.L., Term Loan, 10/12/28(9) | | | 1,275 | | | | 1,269,022 | |
| | |
IRB Holding Corp., Term Loan, 4.25%, (3 mo. USD LIBOR + 3.25%, Floor 1.00%), 12/15/27 | | | 2,005 | | | | 2,007,256 | |
| | |
Sovos Brands Intermediate, Inc., Term Loan, 4.50%, (3 mo. USD LIBOR + 3.75%, Floor 0.75%), 6/8/28 | | | 373 | | | | 373,326 | |
| |
| | | | $ | 4,902,729 | |
|
| Forest Products — 0.2% | |
| | |
Clearwater Paper Corporation, Term Loan, 3.125%, (1 mo. USD LIBOR + 3.00%), 7/26/26 | | $ | 42 | | | $ | 41,563 | |
| | |
Journey Personal Care Corp., Term Loan, 5.00%, (3 mo. USD LIBOR + 4.25%, Floor 0.75%), 3/1/28 | | | 1,194 | | | | 1,194,746 | |
| | | | | | | | |
| Borrower/Description | | Principal
Amount
(000’s omitted) | | | Value | |
|
| Forest Products (continued) | |
| | |
Neenah, Inc., Term Loan, 3.50%, (3 mo. USD LIBOR + 3.00%, Floor 0.50%), 4/6/28 | | $ | 249 | | | $ | 249,372 | |
| |
| | | | $ | 1,485,681 | |
|
| Health Care — 7.6% | |
| | |
AEA International Holdings (Lux) S.a.r.l., Term Loan, 4.25%, (3 mo. USD LIBOR + 3.75%, Floor 0.50%), 9/7/28 | | $ | 800 | | | $ | 801,000 | |
| | |
athenahealth, Inc., Term Loan, 4.40%, (3 mo. USD LIBOR + 4.25%), 2/11/26 | | | 2,304 | | | | 2,305,249 | |
| | |
Avantor Funding, Inc.: | | | | | | | | |
| | |
Term Loan, 2.50%, (1 mo. USD LIBOR + 2.00%, Floor 0.50%), 11/21/24 | | | 226 | | | | 225,948 | |
| | |
Term Loan, 2.75%, (1 mo. USD LIBOR + 2.25%, Floor 0.50%), 11/8/27 | | | 1,440 | | | | 1,439,916 | |
| | |
Bayou Intermediate II, LLC, Term Loan, 5.25%, (3 mo. USD LIBOR + 4.50%, Floor 0.75%), 8/2/28 | | | 525 | | | | 525,656 | |
| | |
BW NHHC Holdco, Inc., Term Loan, 5.16%, (3 mo. USD LIBOR + 5.00%), 5/15/25 | | | 748 | | | | 639,433 | |
| | |
Cano Health, LLC, Term Loan, 5.25%, (6 mo. USD LIBOR + 4.50%, Floor 0.75%), 11/23/27 | | | 1,046 | | | | 1,048,132 | |
| | |
CCRR Parent, Inc., Term Loan, 4.50%, (3 mo. USD LIBOR + 3.75%, Floor 0.75%), 3/6/28 | | | 869 | | | | 873,074 | |
| | |
CeramTec AcquiCo GmbH, Term Loan, 2.925%, (3 mo. USD LIBOR + 2.75%), 3/7/25 | | | 812 | | | | 803,655 | |
| | |
Change Healthcare Holdings, LLC, Term Loan, 3.50%, (1 mo. USD LIBOR + 2.50%, Floor 1.00%), 3/1/24 | | | 516 | | | | 515,579 | |
| | |
CHG Healthcare Services, Inc., Term Loan, 4.00%, (3 mo. USD LIBOR + 3.50%, Floor 0.50%), 9/29/28 | | | 873 | | | | 873,849 | |
| | |
CryoLife, Inc., Term Loan, 4.50%, (3 mo. USD LIBOR + 3.50%, Floor 1.00%), 6/1/27 | | | 360 | | | | 360,450 | |
| | |
Electron BidCo, Inc., Term Loan, 3.75%, (3 mo. USD LIBOR + 3.25%, Floor 0.50%), 11/1/28 | | | 650 | | | | 649,245 | |
| | |
Ensemble RCM, LLC, Term Loan, 3.879%, (3 mo. USD LIBOR + 3.75%), 8/3/26 | | | 1,529 | | | | 1,530,693 | |
| | |
Envision Healthcare Corporation, Term Loan, 3.854%, (1 mo. USD LIBOR + 3.75%), 10/10/25 | | | 3,533 | | | | 2,853,845 | |
| | |
eResearchTechnology, Inc., Term Loan, 5.50%, (1 mo. USD LIBOR + 4.50%, Floor 1.00%), 2/4/27 | | | 174 | | | | 174,676 | |
| | |
GHX Ultimate Parent Corporation, Term Loan, 4.25%, (3 mo. USD LIBOR + 3.25%, Floor 1.00%), 6/28/24 | | | 1,488 | | | | 1,488,309 | |
| | |
Hanger, Inc., Term Loan, 3.604%, (1 mo. USD LIBOR + 3.50%), 3/6/25 | | | 1,204 | | | | 1,204,963 | |
| | |
ICU Medical, Inc., Term Loan, 1/8/29(9) | | | 500 | | | | 501,562 | |
| | |
IQVIA, Inc., Term Loan, 1.854%, (1 mo. USD LIBOR + 1.75%), 1/17/25 | | | 811 | | | | 809,455 | |
| | |
LSCS Holdings, Inc., Term Loan, 12/18/28(9) | | | 1,125 | | | | 1,127,812 | |
| | |
MDVIP, Inc., Term Loan, 4.25%, (1 mo. USD LIBOR + 3.75%, Floor 0.50%), 10/16/28 | | | 225 | | | | 225,141 | |
| | | | |
| | 17 | | See Notes to Financial Statements. |
Eaton Vance
VT Floating-Rate Income Fund
December 31, 2021
Portfolio of Investments — continued
| | | | | | | | |
| Borrower/Description | | Principal
Amount
(000’s omitted) | | | Value | |
|
| Health Care (continued) | |
| | |
Medical Solutions, LLC: | | | | | | | | |
| | |
Term Loan, 0.00%, 11/1/28(8) | | $ | 188 | | | $ | 187,953 | |
| | |
Term Loan, 4.00%, (6 mo. USD LIBOR + 3.50%, Floor 0.50%), 11/1/28 | | | 987 | | | | 986,753 | |
| | |
Medline Borrower, L.P., Term Loan, 3.75%, (1 mo. USD LIBOR + 3.25%, Floor 0.50%), 10/23/28 | | | 625 | | | | 625,195 | |
| | |
Midwest Physician Administrative Services, LLC, Term Loan, 4.00%, (3 mo. USD LIBOR + 3.25%, Floor 0.75%), 3/12/28 | | | 298 | | | | 296,471 | |
| | |
National Mentor Holdings, Inc.: | | | | | | | | |
| | |
Term Loan, 3.75%, 3/2/28(8) | | | 57 | | | | 56,449 | |
| | |
Term Loan, 4.50%, (3 mo. USD LIBOR + 3.75%, Floor 0.75%), 3/2/28 | | | 39 | | | | 38,297 | |
| | |
Term Loan, 4.50%, (3 mo. USD LIBOR + 3.75%, Floor 0.75%), 3/2/28 | | | 1,396 | | | | 1,383,680 | |
| | |
Navicure, Inc., Term Loan, 4.104%, (1 mo. USD LIBOR + 4.00%), 10/22/26 | | | 2,782 | | | | 2,783,697 | |
| | |
Option Care Health, Inc., Term Loan, 3.25%, (1 mo. USD LIBOR + 2.75%, Floor 0.50%), 10/27/28 | | | 350 | | | | 349,913 | |
| | |
Ortho-Clinical Diagnostics S.A., Term Loan, 3.103%, (1 mo. USD LIBOR + 3.00%), 6/30/25 | | | 1,101 | | | | 1,102,058 | |
| | |
Pacific Dental Services, LLC, Term Loan, 4.00%, (1 mo. USD LIBOR + 3.25%, Floor 0.75%), 5/5/28 | | | 348 | | | | 348,794 | |
| | |
Padagis, LLC, Term Loan, 5.25%, (3 mo. USD LIBOR + 4.75%, Floor 0.50%), 7/6/28 | | | 565 | | | | 562,941 | |
| | |
PetVet Care Centers, LLC, Term Loan, 4.25%, (1 mo. USD LIBOR + 3.50%, Floor 0.75%), 2/14/25 | | | 748 | | | | 749,351 | |
| | |
Phoenix Guarantor, Inc.: | | | | | | | | |
| | |
Term Loan, 3.354%, (1 mo. USD LIBOR + 3.25%), 3/5/26 | | | 948 | | | | 943,870 | |
| | |
Term Loan, 3.604%, (1 mo. USD LIBOR + 3.50%), 3/5/26 | | | 1,863 | | | | 1,853,909 | |
| | |
Project Ruby Ultimate Parent Corp., Term Loan, 4.00%, (1 mo. USD LIBOR + 3.25%, Floor 0.75%), 3/3/28 | | | 695 | | | | 694,316 | |
| | |
Radiology Partners, Inc., Term Loan, 4.357%, (1 mo. USD LIBOR + 4.25%), 7/9/25 | | | 1,600 | | | | 1,580,250 | |
| | |
Radnet Management, Inc., Term Loan, 3.75%, (3 mo. USD LIBOR + 3.00%, Floor 0.75%), 4/21/28 | | | 2,736 | | | | 2,739,955 | |
| | |
Select Medical Corporation, Term Loan, 2.36%, (1 mo. USD LIBOR + 2.25%), 3/6/25 | | | 1,469 | | | | 1,461,309 | |
| | |
Signify Health, LLC, Term Loan, 3.75%, (3 mo. USD LIBOR + 3.25%, Floor 0.50%), 6/22/28 | | | 249 | | | | 248,985 | |
| | |
Sotera Health Holdings, LLC, Term Loan, 3.25%, (3 mo. USD LIBOR + 2.75%, Floor 0.50%), 12/11/26 | | | 375 | | | | 374,140 | |
| | |
Sunshine Luxembourg VII S.a.r.l., Term Loan, 4.50%, (3 mo. USD LIBOR + 3.75%, Floor 0.75%), 10/1/26 | | | 1,315 | | | | 1,317,940 | |
| | |
Team Health Holdings, Inc., Term Loan, 3.75%, (1 mo. USD LIBOR + 2.75%, Floor 1.00%), 2/6/24 | | | 2,132 | | | | 2,047,581 | |
| | | | | | | | |
| Borrower/Description | | Principal
Amount
(000’s omitted) | | | Value | |
|
| Health Care (continued) | |
| | |
U.S. Anesthesia Partners, Inc., Term Loan, 4.75%, (6 mo. USD LIBOR + 4.25%, Floor 0.50%), 10/1/28 | | $ | 1,122 | | | $ | 1,120,785 | |
| | |
Verscend Holding Corp., Term Loan, 4.104%, (1 mo. USD LIBOR + 4.00%), 8/27/25 | | | 1,706 | | | | 1,708,253 | |
| | |
WP CityMD Bidco, LLC, Term Loan, 3.75%, (6 mo. USD LIBOR + 3.25%, Floor 0.50%), 12/22/28 | | | 550 | | | | 550,137 | |
| |
| | | | $ | 47,090,624 | |
|
| Home Furnishings — 1.3% | |
| | |
ACProducts, Inc., Term Loan, 4.75%, (6 mo. USD LIBOR + 4.25%, Floor 0.50%), 5/17/28 | | $ | 2,244 | | | $ | 2,215,236 | |
| | |
Conair Holdings, LLC, Term Loan, 4.25%, (3 mo. USD LIBOR + 3.75%, Floor 0.50%), 5/17/28 | | | 1,072 | | | | 1,073,940 | |
| | |
Mattress Firm, Inc., Term Loan, 5.00%, (6 mo. USD LIBOR + 4.25%, Floor 0.75%), 9/25/28 | | | 998 | | | | 992,513 | |
| | |
Serta Simmons Bedding, LLC: | | | | | | | | |
| | |
Term Loan, 8.50%, (1 mo. USD LIBOR + 7.50%, Floor 1.00%), 8/10/23 | | | 877 | | | | 887,313 | |
| | |
Term Loan - Second Lien, 8.50%, (1 mo. USD LIBOR + 7.50%, Floor 1.00%), 8/10/23 | | | 2,899 | | | | 2,730,216 | |
| |
| | | | $ | 7,899,218 | |
|
| Industrial Equipment — 3.9% | |
| | |
Albion Financing 3 S.a.r.l., Term Loan, 5.75%, (3 mo. USD LIBOR + 5.25%, Floor 0.50%), 8/17/26 | | $ | 1,275 | | | $ | 1,280,578 | |
| | |
Alliance Laundry Systems, LLC, Term Loan, 4.25%, (3 mo. USD LIBOR + 3.50%, Floor 0.75%), 10/8/27 | | | 1,175 | | | | 1,176,822 | |
| | |
American Trailer World Corp., Term Loan, 4.50%, (1 mo. USD LIBOR + 3.75%, Floor 0.75%), 3/3/28 | | | 746 | | | | 744,617 | |
| | |
Apex Tool Group, LLC, Term Loan, 6.75%, (1 mo. USD LIBOR + 5.50%, Floor 1.25%), 8/1/24 | | | 948 | | | | 934,117 | |
| | |
Clark Equipment Company, Term Loan, 2.059%, (3 mo. USD LIBOR + 1.835%), 5/18/24 | | | 773 | | | | 770,102 | |
| | |
CPM Holdings, Inc., Term Loan, 3.599%, (1 mo. USD LIBOR + 3.50%), 11/17/25 | | | 1,443 | | | | 1,435,410 | |
| | |
Delachaux Group S.A., Term Loan, 4.629%, (3 mo. USD LIBOR + 4.50%), 4/16/26 | | | 368 | | | | 366,122 | |
| | |
DexKo Global, Inc.: | | | | | | | | |
| | |
Term Loan, 3.415%, (3 mo. USD LIBOR + 3.75%, Floor 0.50%), 10/4/28(8) | | | 104 | | | | 103,797 | |
| | |
Term Loan, 4.25%, (3 mo. USD LIBOR + 3.75%, Floor 0.50%), 10/4/28 | | | 546 | | | | 544,934 | |
| | |
DiversiTech Holdings, Inc.: | | | | | | | | |
| | |
Term Loan, 12/16/28(9) | | | 120 | | | | 121,050 | |
| | |
Term Loan, 12/16/28(9) | | | 580 | | | | 580,181 | |
| | |
DXP Enterprises, Inc., Term Loan, 5.75%, (1 mo. USD LIBOR + 4.75%, Floor 1.00%), 12/16/27 | | | 371 | | | | 370,322 | |
| | | | |
| | 18 | | See Notes to Financial Statements. |
Eaton Vance
VT Floating-Rate Income Fund
December 31, 2021
Portfolio of Investments — continued
| | | | | | | | |
| Borrower/Description | | Principal
Amount
(000’s omitted) | | | Value | |
|
| Industrial Equipment (continued) | |
| | |
Dynacast International, LLC, Term Loan, 5.75%, (3 mo. USD LIBOR + 4.75%, Floor 1.00%), 7/22/25 | | $ | 863 | | | $ | 864,048 | |
| | |
Engineered Machinery Holdings, Inc., Term Loan, 4.50%, (3 mo. USD LIBOR + 3.75%, Floor 0.75%), 5/19/28 | | | 1,870 | | | | 1,867,512 | |
| | |
Filtration Group Corporation, Term Loan, 4.00%, (1 mo. USD LIBOR + 3.50%, Floor 0.50%), 10/21/28 | | | 599 | | | | 598,650 | |
| | |
Gardner Denver, Inc., Term Loan, 1.854%, (1 mo. USD LIBOR + 1.75%), 3/1/27 | | | 1,129 | | | | 1,118,525 | |
| | |
Granite Holdings US Acquisition Co., Term Loan, 4.224%, (3 mo. USD LIBOR + 4.00%), 9/30/26 | | | 868 | | | | 869,397 | |
| | |
Harsco Corporation, Term Loan, 2.75%, (1 mo. USD LIBOR + 2.25%, Floor 0.50%), 3/10/28 | | | 249 | | | | 248,284 | |
| | |
Hayward Industries, Inc., Term Loan, 3.00%, (1 mo. USD LIBOR + 2.50%, Floor 0.50%), 5/12/28 | | | 522 | | | | 520,742 | |
| | |
Ingersoll-Rand Services Company, Term Loan, 1.854%, (1 mo. USD LIBOR + 1.75%), 3/1/27 | | | 958 | | | | 949,031 | |
| | |
LTI Holdings, Inc.: | | | | | | | | |
| | |
Term Loan, 3.604%, (1 mo. USD LIBOR + 3.50%), 9/6/25 | | | 1,381 | | | | 1,366,725 | |
| | |
Term Loan, 4.854%, (1 mo. USD LIBOR + 4.75%), 7/24/26 | | | 141 | | | | 141,020 | |
| | |
Term Loan, 4.854%, (1 mo. USD LIBOR + 4.75%), 7/24/26 | | | 147 | | | | 146,167 | |
| | |
Term Loan, 4.854%, (1 mo. USD LIBOR + 4.75%), 7/24/26 | | | 233 | | | | 233,859 | |
| | |
Madison IAQ, LLC, Term Loan, 3.75%, (6 mo. USD LIBOR + 3.25%, Floor 0.50%), 6/21/28 | | | 2,490 | | | | 2,491,291 | |
| | |
Rexnord, LLC, Term Loan, 2.75%, (1 mo. USD LIBOR + 2.25%, Floor 0.50%), 10/4/28 | | | 275 | | | | 275,550 | |
| | |
Robertshaw US Holding Corp., Term Loan, 4.50%, (USD LIBOR + 3.50%, Floor 1.00%), 2/28/25(10) | | | 1,239 | | | | 1,167,760 | |
| | |
Tiger Acquisition, LLC, Term Loan, 3.75%, (3 mo. USD LIBOR + 3.25%, Floor 0.50%), 6/1/28 | | | 374 | | | | 372,326 | |
| | |
Titan Acquisition Limited, Term Loan, 3.354%, (6 mo. USD LIBOR + 3.00%), 3/28/25 | | | 2,166 | | | | 2,131,275 | |
| | |
Vertical US Newco, Inc., Term Loan, 4.00%, (6 mo. USD LIBOR + 3.50%, Floor 0.50%), 7/30/27 | | | 298 | | | | 298,314 | |
| |
| | | | $ | 24,088,528 | |
|
| Insurance — 2.3% | |
| | |
Alliant Holdings Intermediate, LLC: | | | | | | | | |
| | |
Term Loan, 3.354%, (1 mo. USD LIBOR + 3.25%), 5/9/25 | | $ | 366 | | | $ | 362,273 | |
| | |
Term Loan, 3.354%, (1 mo. USD LIBOR + 3.25%), 5/9/25 | | | 464 | | | | 460,049 | |
| | |
AssuredPartners, Inc., Term Loan, 3.604%, (1 mo. USD LIBOR + 3.50%), 2/12/27 | | | 643 | | | | 639,183 | |
| | | | | | | | |
| Borrower/Description | | Principal
Amount
(000’s omitted) | | | Value | |
|
| Insurance (continued) | |
| | |
Asurion, LLC: | | | | | | | | |
| | |
Term Loan, 3.229%, (1 mo. USD LIBOR + 3.125%), 11/3/23 | | $ | 1,075 | | | $ | 1,073,174 | |
| | |
Term Loan, 3.354%, (1 mo. USD LIBOR + 3.25%), 12/23/26 | | | 2,970 | | | | 2,952,985 | |
| | |
Term Loan - Second Lien, 5.355%, (1 mo. USD LIBOR + 5.25%), 1/31/28 | | | 930 | | | | 930,145 | |
| | |
Hub International Limited, Term Loan, 2.875%, (3 mo. USD LIBOR + 2.75%), 4/25/25 | | | 2,159 | | | | 2,135,243 | |
| | |
NFP Corp., Term Loan, 3.354%, (1 mo. USD LIBOR + 3.25%), 2/15/27 | | | 1,852 | | | | 1,825,129 | |
| | |
Ryan Specialty Group, LLC, Term Loan, 3.75%, (1 mo. USD LIBOR + 3.00%, Floor 0.75%), 9/1/27 | | | 642 | | | | 643,012 | |
| | |
USI, Inc.: | | | | | | | | |
| | |
Term Loan, 3.224%, (3 mo. USD LIBOR + 3.00%), 5/16/24 | | | 2,013 | | | | 2,001,098 | |
| | |
Term Loan, 3.474%, (3 mo. USD LIBOR + 3.25%), 12/2/26 | | | 1,005 | | | | 999,368 | |
| |
| | | | $ | 14,021,659 | |
|
| Leisure Goods / Activities / Movies — 3.3% | |
| | |
AMC Entertainment Holdings, Inc., Term Loan, 3.103%, (1 mo. USD LIBOR + 3.00%), 4/22/26 | | $ | 997 | | | $ | 901,183 | |
| | |
Bombardier Recreational Products, Inc., Term Loan, 2.101%, (1 mo. USD LIBOR + 2.00%), 5/24/27 | | | 1,418 | | | | 1,402,412 | |
| | |
Carnival Corporation: | | | | | | | | |
| | |
Term Loan, 3.75%, (6 mo. USD LIBOR + 3.00%, Floor 0.75%), 6/30/25 | | | 273 | | | | 270,363 | |
| | |
Term Loan, 4.00%, (6 mo. USD LIBOR + 3.25%, Floor 0.75%), 10/18/28 | | | 2,175 | | | | 2,155,969 | |
| | |
City Football Group Limited, Term Loan, 4.00%, (6 mo. USD LIBOR + 3.50%, Floor 0.50%), 7/21/28 | | | 1,025 | | | | 1,021,156 | |
| | |
ClubCorp Holdings, Inc., Term Loan, 2.97%, (3 mo. USD LIBOR + 2.75%), 9/18/24 | | | 1,760 | | | | 1,699,380 | |
| | |
Creative Artists Agency, LLC, Term Loan, 11/27/26(9) | | | 750 | | | | 749,141 | |
| | |
Crown Finance US, Inc.: | | | | | | | | |
| | |
Term Loan, 2.908%, (3 mo. USD LIBOR + 2.75%), 9/30/26 | | | 1,078 | | | | 822,920 | |
| | |
Term Loan, 3.50%, (6 mo. USD LIBOR + 2.50%, Floor 1.00%), 2/28/25 | | | 1,708 | | | | 1,323,580 | |
| | |
Term Loan, 9.25%, (6 mo. USD LIBOR + 8.25%, Floor 1.00%), 5/23/24 | | | 318 | | | | 340,887 | |
| | |
Term Loan, 15.25%, (7.00% cash, 8.25% PIK), 5/23/24(12) | | | 405 | | | | 484,315 | |
| | |
Delta 2 (LUX) S.a.r.l., Term Loan, 3.50%, (1 mo. USD LIBOR + 2.50%, Floor 1.00%), 2/1/24 | | | 1,684 | | | | 1,684,655 | |
| | |
Fender Musical Instruments Corporation, Term Loan, 4.50%, (SOFR + 4.00%, Floor 0.50%), 12/1/28 | | | 275 | | | | 275,344 | |
| | | | |
| | 19 | | See Notes to Financial Statements. |
Eaton Vance
VT Floating-Rate Income Fund
December 31, 2021
Portfolio of Investments — continued
| | | | | | | | |
| Borrower/Description | | Principal
Amount
(000’s omitted) | | | Value | |
|
| Leisure Goods / Activities / Movies (continued) | |
| | |
Lindblad Expeditions, Inc.: | | | | | | | | |
| | |
Term Loan, 6.00%, (1 mo. USD LIBOR + 5.25%, Floor 0.75%), 4.75% cash, 1.25% PIK, 3/27/25 | | $ | 100 | | | $ | 96,405 | |
| | |
Term Loan, 6.00%, (1 mo. USD LIBOR + 5.25%, Floor 0.75%), 4.75% cash, 1.25% PIK, 3/27/25 | | | 400 | | | | 385,620 | |
| | |
Match Group, Inc., Term Loan, 1.908%, (3 mo. USD LIBOR + 1.75%), 2/13/27 | | | 525 | | | | 519,422 | |
| | |
Playtika Holding Corp., Term Loan, 2.854%, (1 mo. USD LIBOR + 2.75%), 3/13/28 | | | 1,856 | | | | 1,851,625 | |
| | |
SeaWorld Parks & Entertainment, Inc., Term Loan, 3.50%, (1 mo. USD LIBOR + 3.00%, Floor 0.50%), 8/25/28 | | | 698 | | | | 696,330 | |
| | |
SRAM, LLC, Term Loan, 3.25%, (USD LIBOR + 2.75%, Floor 0.50%), 5/18/28(10) | | | 185 | | | | 185,686 | |
| | |
Travel Leaders Group, LLC, Term Loan, 4.104%, (1 mo. USD LIBOR + 4.00%), 1/25/24 | | | 2,717 | | | | 2,494,164 | |
| | |
UFC Holdings, LLC, Term Loan, 3.50%, (6 mo. USD LIBOR + 2.75%, Floor 0.75%), 4/29/26 | | | 1,157 | | | | 1,155,395 | |
| |
| | | | $ | 20,515,952 | |
|
| Lodging and Casinos — 1.2% | |
| | |
Golden Nugget, LLC, Term Loan, 3.25%, (USD LIBOR + 2.50%, Floor 0.75%), 10/4/23(10) | | $ | 2,059 | | | $ | 2,049,565 | |
| | |
Hilton Grand Vacations Borrower, LLC, Term Loan, 3.50%, (1 mo. USD LIBOR + 3.00%, Floor 0.50%), 8/2/28 | | | 648 | | | | 650,198 | |
| | |
Playa Resorts Holding B.V., Term Loan, 3.75%, (1 mo. USD LIBOR + 2.75%, Floor 1.00%), 4/29/24 | | | 1,527 | | | | 1,492,293 | |
| | |
Raptor Acquisition Corp., Term Loan, 4.75%, (3 mo. USD LIBOR + 4.00%, Floor 0.75%), 11/1/26 | | | 400 | | | | 400,750 | |
| | |
Stars Group Holdings B.V. (The), Term Loan, 2.474%, (3 mo. USD LIBOR + 2.25%), 7/21/26 | | | 1,696 | | | | 1,691,799 | |
| | |
Twin River Worldwide Holdings, Inc., Term Loan, 3.75%, (6 mo. USD LIBOR + 3.25%, Floor 0.50%), 10/2/28 | | | 900 | | | | 901,293 | |
| |
| | | | $ | 7,185,898 | |
|
| Nonferrous Metals / Minerals — 0.1% | |
| | |
American Consolidated Natural Resources, Inc., Term Loan, 17.00%, (3 mo. USD LIBOR + 16.00%, Floor 1.00%), 14.00% cash, 3.00% PIK, 9/16/25 | | $ | 195 | | | $ | 200,038 | |
| | |
Oxbow Carbon, LLC, Term Loan, 5.00%, (1 mo. USD LIBOR + 4.25%, Floor 0.75%), 10/17/25 | | | 234 | | | | 235,108 | |
| |
| | | | $ | 435,146 | |
|
| Oil and Gas — 1.5% | |
| | |
Ameriforge Group, Inc.: | | | | | | | | |
| | |
Term Loan, 12.578%, (1 mo. USD LIBOR + 13.00%, Floor 1.00%), 12/31/23(8) | | $ | 72 | | | $ | 35,886 | |
| | |
Term Loan, 14.00%, (3 mo. USD LIBOR + 13.00%, Floor 1.00%), 9.00% cash, 5.00% PIK, 12/31/23 | | | 569 | | | | 284,394 | |
| | | | | | | | |
| Borrower/Description | | Principal
Amount
(000’s omitted) | | | Value | |
|
| Oil and Gas (continued) | |
| | |
Apergy Corporation: | | | | | | | | |
| | |
Term Loan, 2.625%, (1 mo. USD LIBOR + 2.50%), 5/9/25 | | $ | 93 | | | $ | 92,365 | |
| | |
Term Loan, 6.00%, (6 mo. USD LIBOR + 5.00%, Floor 1.00%), 6/3/27 | | | 162 | | | | 164,505 | |
| | |
Centurion Pipeline Company, LLC, Term Loan, 4.104%, (1 mo. USD LIBOR + 4.00%), 9/28/25 | | | 149 | | | | 148,500 | |
| | |
CITGO Holding, Inc., Term Loan, 8.00%, (3 mo. USD LIBOR + 7.00%, Floor 1.00%), 8/1/23 | | | 196 | | | | 193,178 | |
| | |
CITGO Petroleum Corporation, Term Loan, 7.25%, (3 mo. USD LIBOR + 6.25%, Floor 1.00%), 3/28/24 | | | 2,775 | | | | 2,778,405 | |
| | |
CQP Holdco L.P., Term Loan, 4.25%, (3 mo. USD LIBOR + 3.75%, Floor 0.50%), 6/5/28 | | | 1,468 | | | | 1,465,240 | |
| | |
Delek US Holdings, Inc.: | | | | | | | | |
| | |
Term Loan, 2.352%, (1 mo. USD LIBOR + 2.25%), 3/31/25 | | | 957 | | | | 931,122 | |
| | |
Term Loan, 6.50%, (1 mo. USD LIBOR + 5.50%, Floor 1.00%), 3/31/25 | | | 418 | | | | 419,476 | |
| | |
Freeport LNG Investments, LLLP, Term Loan, 4.00%, (3 mo. USD LIBOR + 3.50%, Floor 0.50%), 12/21/28 | | | 575 | | | | 570,088 | |
| | |
ITT Holdings, LLC, Term Loan, 3.25%, (1 mo. USD LIBOR + 2.75%, Floor 0.50%), 7/10/28 | | | 299 | | | | 299,437 | |
| | |
Lealand Finance Company B.V., Term Loan, 4.104%, (1 mo. USD LIBOR + 4.00%), 1.104% cash, 3.00% PIK, 6/30/25 | | | 243 | | | | 108,344 | |
| | |
Oryx Midstream Services Permian Basin, LLC, Term Loan, 3.75%, (3 mo. USD LIBOR + 3.25%, Floor 0.50%), 10/5/28 | | | 675 | | | | 671,504 | |
| | |
QuarterNorth Energy Holding, Inc., Term Loan - Second Lien, 9.00%, (3 mo. USD LIBOR + 8.00%, Floor 1.00%), 8/27/26 | | | 215 | | | | 215,448 | |
| | |
RDV Resources Properties, LLC, Term Loan, 9.50%, (1 mo. USD LIBOR + 8.50%, Floor 1.00%), 3/29/24 | | | 164 | | | | 121,598 | |
| | |
UGI Energy Services, LLC, Term Loan, 3.854%, (1 mo. USD LIBOR + 3.75%), 8/13/26 | | | 756 | | | | 758,459 | |
| |
| | | | $ | 9,257,949 | |
|
| Publishing — 0.6% | |
| | |
Adevinta ASA, Term Loan, 3.50%, (3 mo. USD LIBOR + 2.75%, Floor 0.75%), 6/26/28 | | $ | 672 | | | $ | 672,968 | |
| | |
Alchemy Copyrights, LLC, Term Loan, 3.50%, (1 mo. USD LIBOR + 3.00%, Floor 0.50%), 3/10/28 | | | 790 | | | | 791,995 | |
| | |
Ascend Learning, LLC, Term Loan, 12/11/28(9) | | | 550 | | | | 549,588 | |
| | |
Getty Images, Inc., Term Loan, 4.625%, (1 mo. USD LIBOR + 4.50%), 2/19/26 | | | 1,298 | | | | 1,301,146 | |
| | |
LABL, Inc., Term Loan, 5.50%, (1 mo. USD LIBOR + 5.00%, Floor 0.50%), 10/29/28 | | | 600 | | | | 600,187 | |
| |
| | | | $ | 3,915,884 | |
| | | | |
| | 20 | | See Notes to Financial Statements. |
Eaton Vance
VT Floating-Rate Income Fund
December 31, 2021
Portfolio of Investments — continued
| | | | | | | | |
| Borrower/Description | | Principal
Amount
(000’s omitted) | | | Value | |
|
| Radio and Television — 1.9% | |
| | |
Cumulus Media New Holdings, Inc., Term Loan, 4.75%, (3 mo. USD LIBOR + 3.75%, Floor 1.00%), 3/31/26 | | $ | 271 | | | $ | 271,704 | |
| | |
Diamond Sports Group, LLC, Term Loan, 3.36%, (1 mo. USD LIBOR + 3.25%), 8/24/26 | | | 1,238 | | | | 581,970 | |
| | |
Gray Television, Inc., Term Loan, 3.099%, (1 mo. USD LIBOR + 3.00%), 12/1/28 | | | 800 | | | | 797,250 | |
| | |
Hubbard Radio, LLC, Term Loan, 5.25%, (1 mo. USD LIBOR + 4.25%, Floor 1.00%), 3/28/25 | | | 450 | | | | 450,920 | |
| | |
iHeartCommunications, Inc.: | | | | | | | | |
| | |
Term Loan, 3.104%, (1 mo. USD LIBOR + 3.00%), 5/1/26 | | | 438 | | | | 435,864 | |
| | |
Term Loan, 3.75%, (1 mo. USD LIBOR + 3.25%, Floor 0.50%), 5/1/26 | | | 223 | | | | 223,364 | |
| | |
Mission Broadcasting, Inc., Term Loan, 2.599%, (1 mo. USD LIBOR + 2.50%), 5/26/28 | | | 274 | | | | 273,994 | |
| | |
Nexstar Broadcasting, Inc.: | | | | | | | | |
| | |
Term Loan, 2.354%, (1 mo. USD LIBOR + 2.25%), 1/17/24 | | | 781 | | | | 780,456 | |
| | |
Term Loan, 2.599%, (1 mo. USD LIBOR + 2.50%), 9/18/26 | | | 3,039 | | | | 3,036,981 | |
| | |
Sinclair Television Group, Inc.: | | | | | | | | |
| | |
Term Loan, 2.61%, (1 mo. USD LIBOR + 2.50%), 9/30/26 | | | 1,471 | | | | 1,448,175 | |
| | |
Term Loan, 3.11%, (1 mo. USD LIBOR + 3.00%), 4/1/28 | | | 1,808 | | | | 1,789,961 | |
| | |
Terrier Media Buyer, Inc., Term Loan, 3.604%, (1 mo. USD LIBOR + 3.50%), 12/17/26 | | | 1,299 | | | | 1,294,574 | |
| | |
Univision Communications, Inc.: | | | | | | | | |
| | |
Term Loan, 3.75%, (1 mo. USD LIBOR + 2.75%, Floor 1.00%), 3/15/24 | | | 148 | | | | 147,661 | |
| | |
Term Loan, 4.00%, (1 mo. USD LIBOR + 3.25%, Floor 0.75%), 3/15/26 | | | 531 | | | | 532,431 | |
| |
| | | | $ | 12,065,305 | |
|
| Retailers (Except Food and Drug) — 1.8% | |
| | |
CNT Holdings I Corp., Term Loan, 4.25%, (6 mo. USD LIBOR + 3.50%, Floor 0.75%), 11/8/27 | | $ | 1,518 | | | $ | 1,519,066 | |
| | |
David’s Bridal, Inc.: | | | | | | | | |
| | |
Term Loan, 7.00%, (3 mo. USD LIBOR + 6.00%, Floor 1.00%), 6/30/23 | | | 279 | | | | 260,894 | |
| | |
Term Loan, 11.00%, (3 mo. USD LIBOR + 10.00%, Floor 1.00%), 6.00% cash, 5.00% PIK, 6/23/23 | | | 236 | | | | 234,400 | |
| | |
Gloves Buyer, Inc., Term Loan, 4.75%, (1 mo. USD LIBOR + 4.00%, Floor 0.75%), 12/29/27 | | | 373 | | | | 372,442 | |
| | |
Go Wireless, Inc., Term Loan, 7.50%, (1 mo. USD LIBOR + 6.50%, Floor 1.00%), 12/22/24 | | | 716 | | | | 717,313 | |
| | |
Great Outdoors Group, LLC, Term Loan, 4.50%, (3 mo. USD LIBOR + 3.75%, Floor 0.75%), 3/6/28 | | | 3,146 | | | | 3,153,662 | |
| | | | | | | | |
| Borrower/Description | | Principal
Amount
(000’s omitted) | | | Value | |
|
| Retailers (Except Food and Drug) (continued) | |
| | |
Harbor Freight Tools USA, Inc., Term Loan, 3.25%, (1 mo. USD LIBOR + 2.75%, Floor 0.50%), 10/19/27 | | $ | 1,859 | | | $ | 1,857,134 | |
| | |
LIDS Holdings, Inc., Term Loan, 6.50%, (1 mo. USD LIBOR + 5.50%, Floor 1.00%), 12/14/26 | | | 425 | | | | 418,625 | |
| | |
PetSmart, Inc., Term Loan, 4.50%, (3 mo. USD LIBOR + 3.75%, Floor 0.75%), 2/11/28 | | | 2,369 | | | | 2,376,959 | |
| | |
Phillips Feed Service, Inc., Term Loan, 8.00%, (3 mo. USD LIBOR + 7.00%, Floor 1.00%), 11/13/24(4) | | | 53 | | | | 42,180 | |
| |
| | | | $ | 10,952,675 | |
|
| Steel — 0.4% | |
| | |
Atkore International, Inc., Term Loan, 2.50%, (3 mo. USD LIBOR + 2.00%, Floor 0.50%), 5/26/28 | | $ | 560 | | | $ | 559,850 | |
| | |
Phoenix Services International, LLC, Term Loan, 4.75%, (1 mo. USD LIBOR + 3.75%, Floor 1.00%), 3/1/25 | | | 644 | | | | 640,686 | |
| | |
TMS International Corp., Term Loan, 3.75%, (USD LIBOR + 2.75%, Floor 1.00%), 8/14/24(10) | | | 149 | | | | 148,871 | |
| | |
Zekelman Industries, Inc., Term Loan, 2.103%, (1 mo. USD LIBOR + 2.00%), 1/24/27 | | | 1,209 | | | | 1,198,138 | |
| |
| | | | $ | 2,547,545 | |
|
| Surface Transport — 0.6% | |
| | |
Hertz Corporation (The): | | | | | | | | |
| | |
Term Loan, 3.75%, (1 mo. USD LIBOR + 3.25%, Floor 0.50%), 6/30/28 | | $ | 147 | | | $ | 147,015 | |
| | |
Term Loan, 3.75%, (1 mo. USD LIBOR + 3.25%, Floor 0.50%), 6/30/28 | | | 774 | | | | 776,181 | |
| | |
Kenan Advantage Group, Inc., Term Loan, 4.50%, (1 mo. USD LIBOR + 3.75%, Floor 0.75%), 3/24/26 | | | 1,460 | | | | 1,459,337 | |
| | |
PODS, LLC, Term Loan, 3.75%, (1 mo. USD LIBOR + 3.00%, Floor 0.75%), 3/31/28 | | | 1,593 | | | | 1,589,594 | |
| |
| | | | $ | 3,972,127 | |
|
| Telecommunications — 2.4% | |
| | |
Avaya, Inc., Term Loan, 4.11%, (1 mo. USD LIBOR + 4.00%), 12/15/27 | | $ | 125 | | | $ | 125,088 | |
| | |
CenturyLink, Inc., Term Loan, 2.354%, (1 mo. USD LIBOR + 2.25%), 3/15/27 | | | 3,107 | | | | 3,073,338 | |
| | |
Digicel International Finance Limited, Term Loan, 3.50%, (6 mo. USD LIBOR + 3.25%), 5/28/24 | | | 1,385 | | | | 1,350,250 | |
| | |
GEE Holdings 2, LLC: | | | | | | | | |
| | |
Term Loan, 9.00%, (3 mo. USD LIBOR + 8.00%, Floor 1.00%), 3/24/25 | | | 120 | | | | 118,429 | |
| | |
Term Loan - Second Lien, 9.25%, (3 mo. USD LIBOR + 8.25%, Floor 1.00%), 2.50% cash, 6.75% PIK, 3/23/26 | | | 243 | | | | 220,695 | |
| | | | |
| | 21 | | See Notes to Financial Statements. |
Eaton Vance
VT Floating-Rate Income Fund
December 31, 2021
Portfolio of Investments — continued
| | | | | | | | |
| Borrower/Description | | Principal
Amount
(000’s omitted) | | | Value | |
|
| Telecommunications (continued) | |
| | |
Intelsat Jackson Holdings S.A.: | | | | | | | | |
| | |
DIP Loan, 5.392%, (3 mo. USD LIBOR + 4.75%, Floor 1.00%), 10/13/22(8) | | $ | 750 | | | $ | 752,813 | |
| | |
Term Loan, 8.00%, (USD Prime + 4.75%), 11/27/23 | | | 500 | | | | 500,625 | |
| | |
Term Loan, 8.75%, (USD Prime + 5.50%), 1/2/24 | | | 1,300 | | | | 1,300,813 | |
| | |
Level 3 Financing, Inc., Term Loan, 1.854%, (1 mo. USD LIBOR + 1.75%), 3/1/27 | | | 3,323 | | | | 3,283,222 | |
| | |
Syniverse Holdings, Inc., Term Loan, 6.00%, (3 mo. USD LIBOR + 5.00%, Floor 1.00%), 3/9/23 | | | 722 | | | | 717,814 | |
| | |
Ziggo Financing Partnership, Term Loan, 2.61%, (1 mo. USD LIBOR + 2.50%), 4/30/28 | | | 3,525 | | | | 3,491,953 | |
| |
| | | | $ | 14,935,040 | |
|
| Utilities — 0.3% | |
| | |
Longview Power, LLC, Term Loan, 11.50%, (3 mo. USD LIBOR + 10.00%, Floor 1.50%), 7/30/25 | | $ | 142 | | | $ | 144,415 | |
| | |
USIC Holdings, Inc., Term Loan, 4.25%, (1 mo. USD LIBOR + 3.50%, Floor 0.75%), 5/12/28 | | | 1,496 | | | | 1,496,250 | |
| |
| | | | $ | 1,640,665 | |
| |
Total Senior Floating-Rate Loans
(identified cost $527,768,665) | | | $ | 524,193,486 | |
|
| Warrants — 0.0% | |
| Security | | Shares | | | Value | |
|
| Leisure Goods / Activities / Movies — 0.0% | |
| | |
Cineworld Group PLC, Exp. 11/23/25(5)(6) | | | 118,649 | | | $ | 0 | |
| |
| | | | $ | 0 | |
|
| Retailers (Except Food and Drug) — 0.0% | |
| | |
David’s Bridal, LLC, Exp. 11/26/22(4)(5)(6) | | | 3,427 | | | $ | 0 | |
| |
| | | | $ | 0 | |
| |
Total Warrants
(identified cost $0) | | | $ | 0 | |
| | | | | | | | |
| Short-Term Investments — 7.7% | |
| Description | | Units | | | Value | |
| | |
Eaton Vance Cash Reserves Fund, LLC, 0.08%(13) | | | 47,735,009 | | | $ | 47,730,235 | |
| |
Total Short-Term Investments
(identified cost $47,731,785) | | | $ | 47,730,235 | |
| |
Total Investments — 103.5%
(identified cost $643,347,815) | | | $ | 639,890,488 | |
| |
Less Unfunded Loan Commitments — (0.1)% | | | $ | (742,635 | ) |
| |
Net Investments — 103.4%
(identified cost $642,605,180) | | | $ | 639,147,853 | |
| |
Other Assets, Less Liabilities — (3.4)% | | | $ | (21,268,720 | ) |
| |
Net Assets — 100.0% | | | $ | 617,879,133 | |
The percentage shown for each investment category in the Portfolio of Investments is based on net assets.
| | (1) | Security exempt from registration under Rule 144A of the Securities Act of 1933, as amended. These securities may be sold in certain transactions in reliance on an exemption from registration (normally to qualified institutional buyers). At December 31, 2021, the aggregate value of these securities is $58,863,029 or 9.5% of the Fund’s net assets. |
| | (2) | Variable rate security. The stated interest rate represents the rate in effect at December 31, 2021. |
| | (3) | Amount is less than 0.05%. |
| | (4) | For fair value measurement disclosure purposes, security is categorized as Level 3 (see Note 10). |
| | (5) | Non-income producing security. |
| | (6) | Security was acquired in connection with a restructuring of a Senior Loan and may be subject to restrictions on resale. |
| | (7) | Senior floating-rate loans (Senior Loans) often require prepayments from excess cash flows or permit the borrowers to repay at their election. The degree to which borrowers repay, whether as a contractual requirement or at their election, cannot be predicted with accuracy. As a result, the actual remaining maturity may be substantially less than the stated maturities shown. However, Senior Loans will typically have an expected average life of approximately two to four years. Senior Loans typically have rates of interest which are redetermined periodically by reference to a base lending rate, plus a spread. These base lending rates are primarily the London Interbank Offered Rate (“LIBOR”) and secondarily, the prime rate offered by one or more major United States banks (the “Prime Rate”). Base lending rates may be subject to a floor, or minimum rate. Senior Loans are generally subject to contractual restrictions that must be satisfied before they can be bought or sold. |
| | (8) | Unfunded or partially unfunded loan commitments. The stated interest rate reflects the weighted average of the reference rate and spread for the funded portion, if any, and the commitment fees on the portion of the loan that is unfunded. At December 31, 2021, the total value of unfunded loan commitments is $739,341. See Note 1F for description. |
| | (9) | This Senior Loan will settle after December 31, 2021, at which time the interest rate will be determined. |
| | | | |
| | 22 | | See Notes to Financial Statements. |
Eaton Vance
VT Floating-Rate Income Fund
December 31, 2021
Portfolio of Investments — continued
| (10) | The stated interest rate represents the weighted average interest rate at December 31, 2021 of contracts within the senior loan facility. Interest rates on contracts are primarily redetermined either weekly, monthly or quarterly by reference to the indicated base lending rate and spread and the reset period. |
| (11) | Issuer is in default with respect to interest and/or principal payments. For a variable rate security, interest rate has been adjusted to reflect non-accrual status. |
| (13) | Affiliated investment company, available to Eaton Vance portfolios and funds, which invests in high quality, U.S. dollar denominated money market instruments. The rate shown is the annualized seven-day yield as of December 31, 2021. |
Abbreviations:
| | | | |
| | |
| DIP | | – | | Debtor In Possession |
| | |
| LIBOR | | – | | London Interbank Offered Rate |
| | |
| PIK | | – | | Payment In Kind |
| | |
| SOFR | | – | | Secured Overnight Financing Rate |
Currency Abbreviations:
| | | | |
| | |
| USD | | – | | United States Dollar |
| | | | |
| | 23 | | See Notes to Financial Statements. |
Eaton Vance
VT Floating-Rate Income Fund
December 31, 2021
Statement of Assets and Liabilities
| | | | |
| Assets | | December 31, 2021 | |
| |
Unaffiliated investments, at value (identified cost, $594,873,395) | | $ | 591,417,618 | |
| |
Affiliated investment, at value (identified cost, $47,731,785) | | | 47,730,235 | |
| |
Cash | | | 4,726,125 | |
| |
Interest receivable | | | 1,798,641 | |
| |
Dividends receivable from affiliated investment | | | 2,434 | |
| |
Receivable for investments sold | | | 2,719,958 | |
| |
Receivable for Fund shares sold | | | 437,820 | |
| |
Prepaid upfront fees on notes payable | | | 18,218 | |
| |
Prepaid expenses | | | 9,118 | |
| |
Total assets | | $ | 648,860,167 | |
|
| Liabilities | |
| |
Payable for investments purchased | | $ | 29,955,574 | |
| |
Payable for Fund shares redeemed | | | 134,968 | |
| |
Distributions payable | | | 19,914 | |
|
Payable to affiliates: | |
| |
Investment adviser fee | | | 297,071 | |
| |
Distribution fees | | | 128,238 | |
| |
Trustees’ fees | | | 6,810 | |
| |
Payable for shareholder servicing fees | | | 232,670 | |
| |
Accrued expenses | | | 205,789 | |
| |
Total liabilities | | $ | 30,981,034 | |
| |
Net Assets | | $ | 617,879,133 | |
|
| Sources of Net Assets | |
| |
Paid-in capital | | $ | 643,920,896 | |
| |
Accumulated loss | | | (26,041,763 | ) |
| |
Net Assets | | $ | 617,879,133 | |
|
| Initial Class Shares | |
| |
Net Assets | | $ | 613,622,709 | |
| |
Shares Outstanding | | | 67,534,553 | |
| |
Net Asset Value, Offering Price and Redemption Price Per Share | | | | |
| |
(net assets ÷ shares of beneficial interest outstanding) | | $ | 9.09 | |
|
| ADV Class Shares | |
| |
Net Assets | | $ | 4,255,415 | |
| |
Shares Outstanding | | | 467,939 | |
| |
Net Asset Value, Offering Price and Redemption Price Per Share | | | | |
| |
(net assets ÷ shares of beneficial interest outstanding) | | $ | 9.09 | |
|
| Institutional Class Shares | |
| |
Net Assets | | $ | 1,009 | |
| |
Shares Outstanding | | | 111 | |
| |
Net Asset Value, Offering Price and Redemption Price Per Share | | | | |
| |
(net assets ÷ shares of beneficial interest outstanding) | | $ | 9.09 | |
| | | | |
| | 24 | | See Notes to Financial Statements. |
Eaton Vance
VT Floating-Rate Income Fund
December 31, 2021
Statement of Operations
| | | | |
| Investment Income | | Year Ended December 31, 2021 | |
| |
Interest and other income | | $ | 22,424,484 | |
| |
Dividends (net of foreign taxes, $3,919) | | | 352,513 | |
| |
Dividends from affiliated investment | | | 30,350 | |
| |
Total investment income | | $ | 22,807,347 | |
| |
| Expenses | | | | |
| |
Investment adviser fee | | $ | 3,218,426 | |
| |
Distribution fees | | | | |
| |
Initial Class | | | 1,389,681 | |
| |
Shareholder servicing fees | | | | |
| |
Initial Class | | | 1,378,602 | |
| |
ADV Class | | | 9,767 | |
| |
Trustees’ fees and expenses | | | 24,964 | |
| |
Custodian fee | | | 215,484 | |
| |
Transfer and dividend disbursing agent fees | | | 12,005 | |
| |
Legal and accounting services | | | 90,475 | |
| |
Printing and postage | | | 15,714 | |
| |
Interest expense and fees | | | 165,725 | |
| |
Miscellaneous | | | 27,132 | |
| |
Total expenses | | $ | 6,547,975 | |
| |
Net investment income | | $ | 16,259,372 | |
| |
| Realized and Unrealized Gain (Loss) | | | | |
| |
Net realized gain (loss) — | | | | |
| |
Investment transactions | | $ | 592,554 | |
| |
Investment transactions — affiliated investment | | | (2,928 | ) |
| |
Net realized gain | | $ | 589,626 | |
| |
Change in unrealized appreciation (depreciation) — | | | | |
| |
Investments | | $ | 2,563,623 | |
| |
Investments — affiliated investment | | | (1,550 | ) |
| |
Net change in unrealized appreciation (depreciation) | | $ | 2,562,073 | |
| |
Net realized and unrealized gain | | $ | 3,151,699 | |
| |
Net increase in net assets from operations | | $ | 19,411,071 | |
| | | | |
| | 25 | | See Notes to Financial Statements. |
Eaton Vance
VT Floating-Rate Income Fund
December 31, 2021
Statements of Changes in Net Assets
| | | | | | | | |
| | | Year Ended December 31, | |
| Increase (Decrease) in Net Assets | | 2021 | | | 2020 | |
| | |
From operations — | | | | | | | | |
| | |
Net investment income | | $ | 16,259,372 | | | $ | 17,865,681 | |
| | |
Net realized gain (loss) | | | 589,626 | | | | (19,038,699 | ) |
| | |
Net change in unrealized appreciation (depreciation) | | | 2,562,073 | | | | 4,945,910 | |
| | |
Net increase in net assets from operations | | $ | 19,411,071 | | | $ | 3,772,892 | |
| | |
Distributions to shareholders — | | | | | | | | |
| | |
Initial Class | | $ | (16,134,338 | ) | | $ | (17,686,717 | ) |
| | |
ADV Class | | | (124,515 | ) | | | (180,207 | ) |
| | |
Institutional Class | | | (34 | ) | | | (38 | ) |
| | |
Total distributions to shareholders | | $ | (16,258,887 | ) | | $ | (17,866,962 | ) |
| | |
Transactions in shares of beneficial interest — | | | | | | | | |
| | |
Proceeds from sale of shares | | | | | | | | |
| | |
Initial Class | | $ | 204,938,512 | | | $ | 147,658,882 | |
| | |
ADV Class | | | 3,048,389 | | | | 1,520,676 | |
| | |
Net asset value of shares issued to shareholders in payment of distributions declared | | | | | | | | |
| | |
Initial Class | | | 16,119,692 | | | | 17,681,301 | |
| | |
ADV Class | | | 124,387 | | | | 180,125 | |
| | |
Cost of shares redeemed | | | | | | | | |
| | |
Initial Class | | | (105,989,646 | ) | | | (297,255,047 | ) |
| | |
ADV Class | | | (3,055,063 | ) | | | (3,765,820 | ) |
| | |
Net increase (decrease) in net assets from Fund share transactions | | $ | 115,186,271 | | | $ | (133,979,883 | ) |
| | |
Net increase (decrease) in net assets | | $ | 118,338,455 | | | $ | (148,073,953 | ) |
|
| Net Assets | |
| | |
At beginning of year | | $ | 499,540,678 | | | $ | 647,614,631 | |
| | |
At end of year | | $ | 617,879,133 | | | $ | 499,540,678 | |
| | | | |
| | 26 | | See Notes to Financial Statements. |
Eaton Vance
VT Floating-Rate Income Fund
December 31, 2021
Financial Highlights
| | | | | | | | | | | | | | | | | | | | |
| | | Initial Class | |
| |
| | | Year Ended December 31, | |
| | | 2021 | | | 2020 | | | 2019 | | | 2018 | | | 2017 | |
| | | | | |
Net asset value — Beginning of year | | $ | 9.030 | | | $ | 9.150 | | | $ | 8.920 | | | $ | 9.270 | | | $ | 9.260 | |
|
| Income (Loss) From Operations | |
| | | | | |
Net investment income(1) | | $ | 0.264 | | | $ | 0.291 | | | $ | 0.393 | | | $ | 0.352 | | | $ | 0.303 | |
| | | | | |
Net realized and unrealized gain (loss) | | | 0.060 | | | | (0.122 | ) | | | 0.230 | | | | (0.352 | ) | | | 0.012 | |
| | | | | |
Total income from operations | | $ | 0.324 | | | $ | 0.169 | | | $ | 0.623 | | | $ | — | | | $ | 0.315 | |
|
| Less Distributions | |
| | | | | |
From net investment income | | $ | (0.264 | ) | | $ | (0.289 | ) | | $ | (0.393 | ) | | $ | (0.350 | ) | | $ | (0.305 | ) |
| | | | | |
Total distributions | | $ | (0.264 | ) | | $ | (0.289 | ) | | $ | (0.393 | ) | | $ | (0.350 | ) | | $ | (0.305 | ) |
| | | | | |
Net asset value — End of year | | $ | 9.090 | | | $ | 9.030 | | | $ | 9.150 | | | $ | 8.920 | | | $ | 9.270 | |
| | | | | |
Total Return(2)(3) | | | 3.63 | % | | | 2.00 | % | | | 7.08 | % | | | (0.07 | )% | | | 3.44 | % |
|
| Ratios/Supplemental Data | |
| | | | | |
Net assets, end of year (000’s omitted) | | $ | 613,623 | | | $ | 495,426 | | | $ | 641,189 | | | $ | 712,486 | | | $ | 642,315 | |
| | | | | |
Ratios (as a percentage of average daily net assets): | | | | | | | | | | | | | | | | | | | | |
| | | | | |
Expenses(3) | | | 1.17 | % | | | 1.20 | % | | | 1.19 | % | | | 1.17 | % | | | 1.17 | % |
| | | | | |
Net investment income | | | 2.90 | % | | | 3.33 | % | | | 4.31 | % | | | 3.79 | % | | | 3.26 | % |
| | | | | |
Portfolio Turnover | | | 35 | % | | | 33 | % | | | 29 | % | | | 30 | % | | | 41 | % |
| (1) | Computed using average shares outstanding. |
| (2) | Returns are historical and are calculated by determining the percentage change in net asset value with all distributions reinvested. |
| (3) | Excludes fees and expenses imposed by variable annuity contracts or variable life insurance policies. If included, total return would be lower. |
| | | | |
| | 27 | | See Notes to Financial Statements. |
Eaton Vance
VT Floating-Rate Income Fund
December 31, 2021
Financial Highlights — continued
| | | | | | | | | | | | | | | | | | | | |
| | | ADV Class | |
| |
| | | Year Ended December 31, | |
| | | 2021 | | | 2020 | | | 2019 | | | 2018 | | | 2017 | |
| | | | | |
Net asset value — Beginning of year | | $ | 9.040 | | | $ | 9.160 | | | $ | 8.920 | | | $ | 9.280 | | | $ | 9.270 | |
|
| Income (Loss) From Operations | |
| | | | | |
Net investment income(1) | | $ | 0.287 | | | $ | 0.316 | | | $ | 0.414 | | | $ | 0.374 | | | $ | 0.328 | |
| | | | | |
Net realized and unrealized gain (loss) | | | 0.050 | | | | (0.125 | ) | | | 0.242 | | | | (0.360 | ) | | | 0.010 | |
| | | | | |
Total income from operations | | $ | 0.337 | | | $ | 0.191 | | | $ | 0.656 | | | $ | 0.014 | | | $ | 0.338 | |
|
| Less Distributions | |
| | | | | |
From net investment income | | $ | (0.287 | ) | | $ | (0.311 | ) | | $ | (0.416 | ) | | $ | (0.374 | ) | | $ | (0.328 | ) |
| | | | | |
Total distributions | | $ | (0.287 | ) | | $ | (0.311 | ) | | $ | (0.416 | ) | | $ | (0.374 | ) | | $ | (0.328 | ) |
| | | | | |
Net asset value — End of year | | $ | 9.090 | | | $ | 9.040 | | | $ | 9.160 | | | $ | 8.920 | | | $ | 9.280 | |
| | | | | |
Total Return(2)(3) | | | 3.77 | % | | | 2.26 | % | | | 7.47 | % | | | 0.07 | % | | | 3.70 | % |
|
| Ratios/Supplemental Data | |
| | | | | |
Net assets, end of year (000’s omitted) | | $ | 4,255 | | | $ | 4,114 | | | $ | 6,424 | | | $ | 4,324 | | | $ | 4,031 | |
| | | | | |
Ratios (as a percentage of average daily net assets): | | | | | | | | | | | | | | | | | | | | |
| | | | | |
Expenses(3) | | | 0.92 | % | | | 0.95 | % | | | 0.94 | % | | | 0.92 | % | | | 0.92 | % |
| | | | | |
Net investment income | | | 3.16 | % | | | 3.60 | % | | | 4.53 | % | | | 4.03 | % | | | 3.53 | % |
| | | | | |
Portfolio Turnover | | | 35 | % | | | 33 | % | | | 29 | % | | | 30 | % | | | 41 | % |
| (1) | Computed using average shares outstanding. |
| (2) | Returns are historical and are calculated by determining the percentage change in net asset value with all distributions reinvested. |
| (3) | Excludes fees and expenses imposed by variable annuity contracts or variable life insurance policies. If included, total return would be lower. |
| | | | |
| | 28 | | See Notes to Financial Statements. |
Eaton Vance
VT Floating-Rate Income Fund
December 31, 2021
Financial Highlights — continued
| | | | | | | | | | | | | | | | | | | | |
| | | Institutional Class | |
| |
| | | Year Ended December 31, | |
| | | 2021 | | | 2020 | | | 2019 | | | 2018 | | | 2017 | |
| | | | | |
Net asset value — Beginning of year | | $ | 9.030 | | | $ | 9.150 | | | $ | 8.920 | | | $ | 9.270 | | | $ | 9.270 | |
|
| Income (Loss) From Operations | |
| | | | | |
Net investment income(1) | | $ | 0.303 | | | $ | 0.343 | | | $ | 0.441 | | | $ | 0.396 | | | $ | 0.342 | |
| | | | | |
Net realized and unrealized gain (loss) | | | 0.060 | | | | (0.119 | ) | | | 0.230 | | | | (0.341 | ) | | | 0.002 | |
| | | | | |
Total income from operations | | $ | 0.363 | | | $ | 0.224 | | | $ | 0.671 | | | $ | 0.055 | | | $ | 0.344 | |
|
| Less Distributions | |
| | | | | |
From net investment income | | $ | (0.303 | ) | | $ | (0.344 | ) | | $ | (0.441 | ) | | $ | (0.405 | ) | | $ | (0.344 | ) |
| | | | | |
Total distributions | | $ | (0.303 | ) | | $ | (0.344 | ) | | $ | (0.441 | ) | | $ | (0.405 | ) | | $ | (0.344 | ) |
| | | | | |
Net asset value — End of year | | $ | 9.090 | | | $ | 9.030 | | | $ | 9.150 | | | $ | 8.920 | | | $ | 9.270 | |
| | | | | |
Total Return(2)(3) | | | 4.07 | % | | | 2.64 | % | | | 7.65 | % | | | 0.52 | % | | | 3.77 | % |
|
| Ratios/Supplemental Data | |
| | | | | |
Net assets, end of year (000’s omitted) | | $ | 1 | | | $ | 1 | | | $ | 1 | | | $ | 1 | | | $ | 1 | |
| | | | | |
Ratios (as a percentage of average daily net assets): | | | | | | | | | | | | | | | | | | | | |
| | | | | |
Expenses(3) | | | 0.64 | % | | | 0.67 | % | | | 0.67 | % | | | 0.68 | % | | | 0.68 | % |
| | | | | |
Net investment income | | | 3.33 | % | | | 3.92 | % | | | 4.83 | % | | | 4.27 | % | | | 3.69 | % |
| | | | | |
Portfolio Turnover | | | 35 | % | | | 33 | % | | | 29 | % | | | 30 | % | | | 41 | % |
| (1) | Computed using average shares outstanding. |
| (2) | Returns are historical and are calculated by determining the percentage change in net asset value with all distributions reinvested. |
| (3) | Excludes fees and expenses imposed by variable annuity contracts or variable life insurance policies. If included, total return would be lower. |
| | | | |
| | 29 | | See Notes to Financial Statements. |
Eaton Vance
VT Floating-Rate Income Fund
December 31, 2021
Notes to Financial Statements
1 Significant Accounting Policies
Eaton Vance VT Floating-Rate Income Fund (the Fund) is a diversified series of Eaton Vance Variable Trust (the Trust). The Trust is a Massachusetts business trust registered under the Investment Company Act of 1940, as amended (the 1940 Act), as an open-end management investment company. The Fund’s investment objective is to provide a high level of current income. The Fund offers Initial Class, ADV Class and Institutional Class shares, which are offered at net asset value and are not subject to a sales charge. Each class represents a pro-rata interest in the Fund, but votes separately on class-specific matters and (as noted below) is subject to different expenses. Realized and unrealized gains and losses and net investment income and losses, other than class-specific expenses, are allocated daily to each class of shares based on the relative net assets of each class to the total net assets of the Fund. Each class of shares differs in its distribution plan and certain other class-specific expenses. The Fund is generally made available for purchase only to separate accounts established by participating insurance companies and qualified pension or retirement plans.
The following is a summary of significant accounting policies of the Fund. The policies are in conformity with accounting principles generally accepted in the United States of America (U.S. GAAP). The Fund is an investment company and follows accounting and reporting guidance in the Financial Accounting Standards Board (FASB) Accounting Standards Codification Topic 946.
A Investment Valuation — The following methodologies are used to determine the market value or fair value of investments.
Senior Floating-Rate Loans. Interests in senior floating-rate loans (Senior Loans) for which reliable market quotations are readily available are valued generally at the average mean of bid and ask quotations obtained from a third party pricing service. Other Senior Loans are valued at fair value by the investment adviser under procedures approved by the Trustees. In fair valuing a Senior Loan, the investment adviser utilizes one or more of the valuation techniques described in (i) through (iii) below to assess the likelihood that the borrower will make a full repayment of the loan underlying such Senior Loan relative to yields on other Senior Loans issued by companies of comparable credit quality. If the investment adviser believes that there is a reasonable likelihood of full repayment, the investment adviser will determine fair value using a matrix pricing approach that considers the yield on the Senior Loan. If the investment adviser believes there is not a reasonable likelihood of full repayment, the investment adviser will determine fair value using analyses that include, but are not limited to: (i) a comparison of the value of the borrower’s outstanding equity and debt to that of comparable public companies; (ii) a discounted cash flow analysis; or (iii) when the investment adviser believes it is likely that a borrower will be liquidated or sold, an analysis of the terms of such liquidation or sale. In certain cases, the investment adviser will use a combination of analytical methods to determine fair value, such as when only a portion of a borrower’s assets are likely to be sold. In conducting its assessment and analyses for purposes of determining fair value of a Senior Loan, the investment adviser will use its discretion and judgment in considering and appraising relevant factors. Fair value determinations are made by the portfolio managers of the Fund based on information available to such managers. The portfolio managers of other funds managed by the investment adviser that invest in Senior Loans may not possess the same information about a Senior Loan borrower as the portfolio managers of the Fund. At times, the fair value of a Senior Loan determined by the portfolio managers of other funds managed by the investment adviser that invest in Senior Loans may vary from the fair value of the same Senior Loan determined by the portfolio managers of the Fund. The fair value of each Senior Loan is periodically reviewed and approved by the investment adviser’s Valuation Committee and by the Trustees based upon procedures approved by the Trustees. Junior Loans (i.e., subordinated loans and second lien loans) are valued in the same manner as Senior Loans.
Debt Obligations. Debt obligations are generally valued on the basis of valuations provided by third party pricing services, as derived from such services’ pricing models. Inputs to the models may include, but are not limited to, reported trades, executable bid and ask prices, broker/dealer quotations, prices or yields of securities with similar characteristics, interest rates, anticipated prepayments, benchmark curves or information pertaining to the issuer, as well as industry and economic events. The pricing services may use a matrix approach, which considers information regarding securities with similar characteristics to determine the valuation for a security. Short-term debt obligations purchased with a remaining maturity of sixty days or less for which a valuation from a third party pricing service is not readily available may be valued at amortized cost, which approximates fair value.
Equity Securities. Equity securities listed on a U.S. securities exchange generally are valued at the last sale or closing price on the day of valuation or, if no sales took place on such date, at the mean between the closing bid and ask prices on the exchange where such securities are principally traded. Equity securities listed on the NASDAQ National Market System are valued at the NASDAQ official closing price. Unlisted or listed securities for which closing sales prices or closing quotations are not available are valued at the mean between the latest available bid and ask prices or, in the case of preferred equity securities that are not listed or traded in the over-the-counter market, by a third party pricing service that uses various techniques that consider factors including, but not limited to, prices or yields of securities with similar characteristics, benchmark yields, broker/dealer quotes, quotes of underlying common stock, issuer spreads, as well as industry and economic events.
Affiliated Fund. The Fund may invest in Eaton Vance Cash Reserves Fund, LLC (Cash Reserves Fund), an affiliated investment company managed by Eaton Vance Management (EVM). While Cash Reserves Fund is not a registered money market mutual fund, it conducts all of its investment activities in accordance with the requirements of Rule 2a-7 under the 1940 Act. Investments in Cash Reserves Fund are valued at the closing net asset value per unit on the valuation day. Cash Reserves Fund generally values its investment securities based on available market quotations provided by a third party pricing service.
Fair Valuation. Investments for which valuations or market quotations are not readily available or are deemed unreliable are valued at fair value using methods determined in good faith by or at the direction of the Trustees of the Fund in a manner that most fairly reflects the security’s “fair value”, which is the amount that the Fund might reasonably expect to receive for the security upon its current sale in the ordinary course. Each such determination is based on a consideration of relevant factors, which are likely to vary from one pricing context to another. These factors may include, but are not limited to, the type of security, the existence of any contractual restrictions on the security’s disposition, the price and extent of public trading in similar securities of the issuer or of comparable companies or entities, quotations or relevant information obtained from broker/dealers or other market participants, information
Eaton Vance
VT Floating-Rate Income Fund
December 31, 2021
Notes to Financial Statements — continued
obtained from the issuer, analysts, and/or the appropriate stock exchange (for exchange-traded securities), an analysis of the company’s or entity’s financial statements, and an evaluation of the forces that influence the issuer and the market(s) in which the security is purchased and sold.
B Investment Transactions — Investment transactions for financial statement purposes are accounted for on a trade date basis. Realized gains and losses on investments sold are determined on the basis of identified cost.
C Income — Interest income is recorded on the basis of interest accrued, adjusted for amortization of premium or accretion of discount. Fees associated with loan amendments are recognized immediately. Dividend income is recorded on the ex-dividend date for dividends received in cash and/or securities. Distributions from investment companies are recorded as dividend income, capital gains or return of capital based on the nature of the distribution.
D Federal Taxes — The Fund’s policy is to comply with the provisions of the Internal Revenue Code applicable to regulated investment companies and to distribute to shareholders each year substantially all of its net investment income, and all or substantially all of its net realized capital gains. Accordingly, no provision for federal income or excise tax is necessary.
As of December 31, 2021, the Fund had no uncertain tax positions that would require financial statement recognition, de-recognition, or disclosure. The Fund files a U.S. federal income tax return annually after its fiscal year-end, which is subject to examination by the Internal Revenue Service for a period of three years from the date of filing.
E Expenses — The majority of expenses of the Trust are directly identifiable to an individual fund. Expenses which are not readily identifiable to a specific fund are allocated taking into consideration, among other things, the nature and type of expense and the relative size of the funds.
F Unfunded Loan Commitments — The Fund may enter into certain loan agreements all or a portion of which may be unfunded. The Fund is obligated to fund these commitments at the borrower’s discretion. These commitments are disclosed in the accompanying Portfolio of Investments. At December 31, 2021, the Fund had sufficient cash and/or securities to cover these commitments.
G Use of Estimates — The preparation of the financial statements in conformity with U.S. GAAP requires management to make estimates and assumptions that affect the reported amounts of assets and liabilities at the date of the financial statements and the reported amounts of income and expense during the reporting period. Actual results could differ from those estimates.
H Indemnifications — Under the Trust’s organizational documents, its officers and Trustees may be indemnified against certain liabilities and expenses arising out of the performance of their duties to the Fund. Under Massachusetts law, if certain conditions prevail, shareholders of a Massachusetts business trust (such as the Trust) could be deemed to have personal liability for the obligations of the Trust. However, the Trust’s Declaration of Trust contains an express disclaimer of liability on the part of Fund shareholders and the By-laws provide that the Trust shall assume, upon request by the shareholder, the defense on behalf of any Fund shareholders. Moreover, the By-laws also provide for indemnification out of Fund property of any shareholder held personally liable solely by reason of being or having been a shareholder for all loss or expense arising from such liability. Additionally, in the normal course of business, the Fund enters into agreements with service providers that may contain indemnification clauses. The Fund’s maximum exposure under these arrangements is unknown as this would involve future claims that may be made against the Fund that have not yet occurred.
2 Distributions to Shareholders and Income Tax Information
The Fund declares dividends daily to shareholders of record at the time of declaration. Distributions are generally paid monthly. Distributions of realized capital gains are made at least annually. Distributions are declared separately for each class of shares. Shareholders may reinvest income and capital gain distributions in additional shares of the same class of the Fund at the net asset value as of the reinvestment date or, if an election is made on behalf of a separate account or qualified pension or retirement plan, to receive some or all of the distributions in cash. Distributions to shareholders are determined in accordance with income tax regulations, which may differ from U.S. GAAP. As required by U.S. GAAP, only distributions in excess of tax basis earnings and profits are reported in the financial statements as a return of capital. Permanent differences between book and tax accounting relating to distributions are reclassified to paid-in capital. For tax purposes, distributions from short-term capital gains are considered to be from ordinary income.
The tax character of distributions declared for the years ended December 31, 2021 and December 31, 2020 was as follows:
| | | | | | | | |
| | | Year Ended December 31, | |
| | | 2021 | | | 2020 | |
| | |
Ordinary income | | $ | 16,258,887 | | | $ | 17,866,962 | |
Eaton Vance
VT Floating-Rate Income Fund
December 31, 2021
Notes to Financial Statements — continued
As of December 31, 2021, the components of distributable earnings (accumulated loss) on a tax basis were as follows:
| | | | |
| | |
Undistributed ordinary income | | $ | 3,962,807 | |
| |
Deferred capital losses | | | (26,346,856 | ) |
| |
Net unrealized depreciation | | | (3,637,800 | ) |
| |
Distributions payable | | | (19,914 | ) |
| |
Accumulated loss | | $ | (26,041,763 | ) |
At December 31, 2021, the Fund, for federal income tax purposes, had deferred capital losses of $26,346,856 which would reduce its taxable income arising from future net realized gains on investment transactions, if any, to the extent permitted by the Internal Revenue Code, and thus would reduce the amount of distributions to shareholders, which would otherwise be necessary to relieve the Fund of any liability for federal income or excise tax. The deferred capital losses are treated as arising on the first day of the Fund’s next taxable year and retain the same short-term or long-term character as when originally deferred. Of the deferred capital losses at December 31, 2021, $2,274,885 are short-term and $24,071,971 are long-term.
The cost and unrealized appreciation (depreciation) of investments of the Fund at December 31, 2021, as determined on a federal income tax basis, were as follows:
| | | | |
| |
Aggregate cost | | $ | 642,785,653 | |
| |
Gross unrealized appreciation | | $ | 4,753,700 | |
| |
Gross unrealized depreciation | | | (8,391,500 | ) |
| |
Net unrealized depreciation | | $ | (3,637,800 | ) |
3 Investment Adviser Fee and Other Transactions with Affiliates
The investment adviser fee is earned by EVM as compensation for investment advisory services rendered to the Fund. On March 1, 2021, Morgan Stanley acquired Eaton Vance Corp. (the “Transaction”) and EVM became an indirect, wholly-owned subsidiary of Morgan Stanley. In connection with the Transaction, the Fund entered into a new investment advisory agreement (the “New Agreement”) with EVM, which took effect on March 1, 2021. Pursuant to the New Agreement (and the Fund’s investment advisory agreement with EVM in effect prior to March 1, 2021), the investment adviser fee is computed at an annual rate as a percentage of the Fund’s average daily net assets as follows and is payable monthly:
| | | | |
| Average Daily Net Assets | | Annual Fee
Rate | |
| |
Up to $1 billion | | | 0.575 | % |
| |
$1 billion but less than $2 billion | | | 0.525 | % |
| |
$2 billion but less than $5 billion | | | 0.500 | % |
| |
$5 billion and over | | | 0.480 | % |
For the year ended December 31, 2021, the investment adviser fee amounted to $3,218,426 or 0.575% of the Fund’s average daily net assets. The Fund may invests its cash in Cash Reserves Fund. EVM does not currently receive a fee or advisory services provided to Cash Reserves Fund. EVM also serves as administrator of the Fund, but receives no compensation. Eaton Vance Distributors, Inc. (EVD), the Fund’s principal underwriter and an affiliate of EVM, received distribution fees (see Note 4).
Trustees and officers of the Fund who are members of EVM’s organization receive remuneration for their services to the Fund out of the investment adviser fee. Certain officers and Trustees of the Fund are officers of EVM.
4 Distribution Plan
The Fund has in effect a distribution plan for Initial Class shares (Initial Class Plan) pursuant to Rule 12b-1 under the 1940 Act. Pursuant to the Initial Class Plan, the Fund pays EVD a distribution fee of 0.25% per annum of its average daily net assets attributable to Initial Class shares for the sale and distribution of Initial Class shares. Distribution fees paid or accrued to EVD for the year ended December 31, 2021 amounted to $1,389,681. Insurance
Eaton Vance
VT Floating-Rate Income Fund
December 31, 2021
Notes to Financial Statements — continued
companies receive such fees from EVD based on the value of shares held by such companies. The insurance companies through which investors hold shares of the Fund may also pay fees to third parties in connection with the sale of variable contracts and for services provided to variable contract owners. The Fund, EVM or EVD are not a party to these arrangements. Investors should consult the prospectus and statement of additional information for their variable contracts for a discussion of these payments. EVD may, at its expense, provide promotional incentives to dealers that sell variable insurance products.
Distribution fees are subject to the limitations contained in the Financial Industry Regulatory Authority Rule 2341(d).
5 Shareholder Servicing Plan
The Trust, on behalf of the Fund, has adopted a Shareholder Servicing Plan (Servicing Plan) for Initial Class and ADV Class. The Servicing Plan allows the Trust to enter into shareholder servicing agreements with insurance companies, investment dealers, broker/dealers or other financial intermediaries that provide shareholder services relating to Fund shares and their shareholders, including variable contract owners or plan participants with interests in the Fund. Under the Servicing Plan, the Fund may make payments at an annual rate of up to 0.25% of its average daily net assets attributable to each class that are subject to shareholder servicing agreements. No shareholder servicing fees are levied on shares owned by EVM, its affiliates, or their respective employees or clients and may be waived under certain other limited conditions. For the year ended December 31, 2021, shareholder servicing fees were equivalent to 0.25% per annum of each class’ average daily net assets and amounted to $1,378,602 and $9,767 for Initial Class and ADV Class, respectively.
6 Purchases and Sales of Investments
Purchases and sales of investments, other than short-term obligations and including maturities and principal repayments on Senior Loans, aggregated $296,431,981 and $191,286,511, respectively, for the year ended December 31, 2021.
7 Shares of Beneficial Interest
The Fund’s Declaration of Trust permits the Trustees to issue an unlimited number of full and fractional shares of beneficial interest (without par value). Such shares may be issued in a number of different series (such as the Fund) and classes. Transactions in Fund shares were as follows:
| | | | | | | | |
| | | Year Ended December 31, | |
| Initial Class | | 2021 | | | 2020 | |
| | |
Sales | | | 22,539,627 | | | | 17,040,036 | |
| | |
Issued to shareholders electing to receive payments of distributions in Fund shares | | | 1,773,664 | | | | 2,023,238 | |
| | |
Redemptions | | | (11,657,887 | ) | | | (34,266,422 | ) |
| | |
Net increase (decrease) | | | 12,655,404 | | | | (15,203,148 | ) |
| |
| | | Year Ended December 31, | |
| ADV Class | | 2021 | | | 2020 | |
| | |
Sales | | | 335,108 | | | | 173,796 | |
| | |
Issued to shareholders electing to receive payments of distributions in Fund shares | | | 13,674 | | | | 20,593 | |
| | |
Redemptions | | | (336,089 | ) | | | (440,709 | ) |
| | |
Net increase (decrease) | | | 12,693 | | | | (246,320 | ) |
There were no transactions in Institutional Class shares for the years ended December 31, 2021 and December 31, 2020.
At December 31, 2021, separate accounts of 4 insurance companies each owned more than 10% of the value of the outstanding shares of the Fund aggregating 70.1%.
8 Credit Facility
The Fund participates with other portfolios managed by EVM and its affiliates in a $650 million ($750 million prior to March 8, 2021) unsecured credit facility agreement (Agreement) with a group of banks, which is in effect through March 7, 2022. Borrowings are made by the Fund solely to facilitate the handling of unusual and/or unanticipated short-term cash requirements. Interest is payable on amounts borrowed overnight at the Federal Funds rate plus
Eaton Vance
VT Floating-Rate Income Fund
December 31, 2021
Notes to Financial Statements — continued
a margin and for all other amounts borrowed for longer periods at a base rate or the London Interbank Offered Rate (LIBOR), plus a margin. Base rate is the highest of (a) the administrative agent’s prime rate, (b) the Federal Funds Rate plus a margin and (c) the one month LIBOR rate plus a margin. In addition, a fee computed at an annual rate of 0.15% on the daily unused portion of each lender’s commitment amount is allocated between the Fund and the other participating portfolios at the end of each quarter. Also included in interest expense and fees on the Statement of Operations is approximately $100,000 of amortization of upfront fees paid by the Fund in connection with the annual renewal of the Agreement. The unamortized balance of upfront fees at December 31, 2021 is $18,218 and is included in prepaid upfront fees on notes payable in the Statement of Assets and Liabilities. Because the credit facility is not available exclusively to the Fund and the maximum amount is capped, it may be unable to borrow some or all of a requested amount at any particular time. The Fund did not have any significant borrowings during the year ended December 31, 2021.
9 Investments in Affiliated Funds
At December 31, 2021, the value of the Fund’s investment in affiliated funds was $47,730,235, which represents 7.7% of the Fund’s net assets. Transactions in affiliated funds by the Fund for the year ended December 31, 2021 were as follows:
| | | | | | | | | | | | | | | | | | | | | | | | | | | | | | | | |
| Name | | Value,
beginning
of period | | | Purchases | | | Sales
proceeds | | | Net
realized
gain (loss) | | | Change in
unrealized
appreciation
(depreciation) | | | Value, end
of period | | | Dividend
income | | | Units, end
of period | |
|
Short-Term Investments | |
| | | | | | | | |
Eaton Vance Cash Reserves Fund, LLC | | $ | 21,593,096 | | | $ | 236,397,233 | | | $ | (210,255,616 | ) | | $ | (2,928 | ) | | $ | (1,550 | ) | | $ | 47,730,235 | | | $ | 30,350 | | | | 47,735,009 | |
10 Fair Value Measurements
Under generally accepted accounting principles for fair value measurements, a three-tier hierarchy to prioritize the assumptions, referred to as inputs, is used in valuation techniques to measure fair value. The three-tier hierarchy of inputs is summarized in the three broad levels listed below.
| • | | Level 1 – quoted prices in active markets for identical investments |
| • | | Level 2 – other significant observable inputs (including quoted prices for similar investments, interest rates, prepayment speeds, credit risk, etc.) |
| • | | Level 3 – significant unobservable inputs (including a fund’s own assumptions in determining the fair value of investments) |
In cases where the inputs used to measure fair value fall in different levels of the fair value hierarchy, the level disclosed is determined based on the lowest level input that is significant to the fair value measurement in its entirety. The inputs or methodology used for valuing securities are not necessarily an indication of the risk associated with investing in those securities.
At December 31, 2021, the hierarchy of inputs used in valuing the Fund’s investments, which are carried at value, were as follows:
| | | | | | | | | | | | | | | | |
| Asset Description | | Level 1 | | | Level 2 | | | Level 3* | | | Total | |
| | | | |
Asset-Backed Securities | | $ | — | | | $ | 10,167,457 | | | $ | — | | | $ | 10,167,457 | |
| | | | |
Common Stocks | | | 1,996,845 | | | | 1,663,079 | | | | 941,567 | | | | 4,601,491 | |
| | | | |
Convertible Preferred Stocks | | | — | | | | 593,216 | | | | — | | | | 593,216 | |
| | | | |
Corporate Bonds | | | — | | | | 48,834,095 | | | | — | | | | 48,834,095 | |
| | | | |
Exchange-Traded Funds | | | 3,467,880 | | | | — | | | | — | | | | 3,467,880 | |
| | | | |
Preferred Stocks | | | — | | | | 302,628 | | | | 0 | | | | 302,628 | |
| | | | |
Senior Floating-Rate Loans (Less Unfunded Loan Commitments) | | | — | | | | 523,270,854 | | | | 179,997 | | | | 523,450,851 | |
| | | | |
Warrants | | | — | | | | 0 | | | | 0 | | | | 0 | |
| | | | |
Short-Term Investments | | | — | | | | 47,730,235 | | | | — | | | | 47,730,235 | |
| | | | |
Total Investments | | $ | 5,464,725 | | | $ | 632,561,564 | | | $ | 1,121,564 | | | $ | 639,147,853 | |
| * | None of the unobservable inputs for Level 3 assets, individually or collectively, had a material impact on the Fund. |
Eaton Vance
VT Floating-Rate Income Fund
December 31, 2021
Notes to Financial Statements — continued
Level 3 investments at the beginning and/or end of the period in relation to net assets were not significant and accordingly, a reconciliation of Level 3 assets for the year ended December 31, 2021 is not presented.
11 Risks and Uncertainties
Credit Risk
The Fund invests primarily in below investment grade floating-rate loans, which are considered speculative because of the credit risk of their issuers. Changes in economic conditions or other circumstances are more likely to reduce the capacity of issuers of these securities to make principal and interest payments. Such companies are more likely to default on their payments of interest and principal owed than issuers of investment grade bonds. An economic downturn generally leads to a higher non-payment rate, and a loan or other debt obligation may lose significant value before a default occurs. Lower rated investments also may be subject to greater price volatility than higher rated investments. Moreover, the specific collateral used to secure a loan may decline in value or become illiquid, which would adversely affect the loan’s value.
LIBOR Transition Risk
Certain instruments held by the Fund may pay an interest rate based on LIBOR, which is the average offered rate for various maturities of short-term loans between certain major international banks. LIBOR is used throughout global banking and financial industries to determine interest rates for a variety of financial instruments (such as debt instruments and derivatives) and borrowing arrangements. The ICE Benchmark Administration Limited, the administrator of LIBOR, ceased publishing certain LIBOR settings on December 31, 2021, and is expected to cease publishing the remaining LIBOR settings on June 30, 2023. Although the transition process away from LIBOR has become increasingly well-defined, the impact on certain debt securities, derivatives, and other financial instruments that utilize LIBOR remains uncertain. The phase-out of LIBOR may result in, among other things, increased volatility or illiquidity in markets for instruments based on LIBOR and changes in the value of such instruments.
Pandemic Risk
An outbreak of respiratory disease caused by a novel coronavirus was first detected in China in late 2019 and subsequently spread internationally. This coronavirus has resulted in closing borders, enhanced health screenings, changes to healthcare service preparation and delivery, quarantines, cancellations, disruptions to supply chains and customer activity, as well as general concern and uncertainty. Health crises caused by outbreaks, such as the coronavirus outbreak, may exacerbate other pre-existing political, social and economic risks and disrupt normal market conditions and operations. The impact of this outbreak has negatively affected the worldwide economy, the economies of individual countries, individual companies, and the market in general, and may continue to do so in significant and unforeseen ways, as may other epidemics and pandemics that may arise in the future. Any such impact could adversely affect the Fund’s performance, or the performance of the securities in which the Fund invests.
Eaton Vance
VT Floating-Rate Income Fund
December 31, 2021
Report of Independent Registered Public Accounting Firm
To the Trustees of Eaton Vance Variable Trust and Shareholders of Eaton Vance VT Floating-Rate Income Fund:
Opinion on the Financial Statements and Financial Highlights
We have audited the accompanying statement of assets and liabilities of Eaton Vance VT Floating-Rate Income Fund (the “Fund”) (one of the funds constituting Eaton Vance Variable Trust), including the portfolio of investments, as of December 31, 2021, the related statement of operations for the year then ended, the statements of changes in net assets for each of the two years in the period then ended, the financial highlights for each of the five years in the period then ended, and the related notes. In our opinion, the financial statements and financial highlights present fairly, in all material respects, the financial position of the Fund as of December 31, 2021, and the results of its operations for the year then ended, the changes in its net assets for each of the two years in the period then ended, and the financial highlights for each of the five years in the period then ended, in conformity with accounting principles generally accepted in the United States of America.
Basis for Opinion
These financial statements and financial highlights are the responsibility of the Fund’s management. Our responsibility is to express an opinion on the Fund’s financial statements and financial highlights based on our audits. We are a public accounting firm registered with the Public Company Accounting Oversight Board (United States) (PCAOB) and are required to be independent with respect to the Fund in accordance with the U.S. federal securities laws and the applicable rules and regulations of the Securities and Exchange Commission and the PCAOB.
We conducted our audits in accordance with the standards of the PCAOB. Those standards require that we plan and perform the audit to obtain reasonable assurance about whether the financial statements and financial highlights are free of material misstatement, whether due to error or fraud. The Fund is not required to have, nor were we engaged to perform, an audit of its internal control over financial reporting. As part of our audits, we are required to obtain an understanding of internal control over financial reporting but not for the purpose of expressing an opinion on the effectiveness of the Fund’s internal control over financial reporting. Accordingly, we express no such opinion.
Our audits included performing procedures to assess the risks of material misstatement of the financial statements and financial highlights, whether due to error or fraud, and performing procedures that respond to those risks. Such procedures included examining, on a test basis, evidence regarding the amounts and disclosures in the financial statements and financial highlights. Our audits also included evaluating the accounting principles used and significant estimates made by management, as well as evaluating the overall presentation of the financial statements and financial highlights. Our procedures included confirmation of securities and senior loans owned as of December 31, 2021, by correspondence with the custodian, brokers and selling or agent banks; when replies were not received from brokers and selling or agent banks, we performed other auditing procedures. We believe that our audits provide a reasonable basis for our opinion.
/s/ Deloitte & Touche LLP
Boston, Massachusetts
February 17, 2022
We have served as the auditor of one or more Eaton Vance investment companies since 1959.
Eaton Vance
VT Floating-Rate Income Fund
December 31, 2021
Federal Tax Information (Unaudited)
As required by the Internal Revenue Code and/or regulations, shareholders must be notified regarding the status of 163(j) interest dividends.
163(j) Interest Dividends. For the fiscal year ended December 31, 2021, the Fund designates 98.22% of distributions from net investment income as a 163(j) interest dividend.
Eaton Vance
VT Floating-Rate Income Fund
December 31, 2021
Management and Organization
Fund Management. The Trustees of Eaton Vance Variable Trust (the Trust) are responsible for the overall management and supervision of the Trust’s affairs. The Board members and officers of the Trust’s are listed below. Except as indicated, each individual has held the office shown or other offices in the same company for the last five years. Board members hold indefinite terms of office. Each Trustee holds office until his or her successor is elected and qualified, subject to a prior death, resignation, retirement, disqualification or removal. Under the terms of the Fund’s current Trustee retirement policy, an Independent Trustee must retire and resign as a Trustee on the earlier of: (i) the first day of July following his or her 74th birthday; or (ii), with limited exception, December 31st of the 20th year in which he or she has served as a Trustee. However, if such retirement and resignation would cause the Fund to be out of compliance with Section 16 of the 1940 Act or any other regulations or guidance of the SEC, then such retirement and resignation will not become effective until such time as action has been taken for the Fund to be in compliance therewith. The “noninterested Trustees” consist of those Trustees who are not “interested persons” of the Trust, as that term is defined under the 1940 Act. The business address of each Board member and officer is Two International Place, Boston, Massachusetts 02110. As used below, “BMR” refers to Boston Management and Research, “EVC” refers to Eaton Vance Corp., “EV” refers to EV LLC, “EVM” refers to Eaton Vance Management and “EVD” refers to Eaton Vance Distributors, Inc. EV is the trustee of each of EVM and BMR. Effective March 1, 2021, each of EVM, BMR, EVD and EV are indirect, wholly owned subsidiaries of Morgan Stanley. Each officer affiliated with EVM may hold a position with other EVM affiliates that is comparable to his or her position with EVM listed below. Each Trustee oversees 138 funds (with the exception of Messrs. Faust and Wennerholm and Ms. Frost who oversee 137 funds) in the Eaton Vance fund complex (including both funds and portfolios in a hub and spoke structure).
| | | | | | |
| Name and Year of Birth | | Trust
Position(s) | | Length of Service | | Principal Occupation(s) and Other Directorships
During Past Five Years and Other Relevant Experience |
|
| Interested Trustee |
| | | |
Thomas E. Faust Jr. 1958 | | Trustee | | Since 2007 | | Chairman of Morgan Stanley Investment Management, Inc. (MSIM), member of the Board of Managers and President of EV, Chief Executive Officer of EVM and BMR, and Director of EVD. Formerly, Chairman, Chief Executive Officer and President of EVC. Mr. Faust is an interested person because of his positions with MSIM, BMR, EVM, EVD, and EV, which are affiliates of the Trust, and his former position with EVC, which was an affiliate of the Trust prior to March 1, 2021. Other Directorships. Formerly, Director of EVC (2007-2021) and Hexavest Inc. (investment management firm) (2012-2021). |
|
| Noninterested Trustees |
| | | |
Mark R. Fetting 1954 | | Trustee | | Since 2016 | | Private investor. Formerly held various positions at Legg Mason, Inc. (investment management firm) (2000-2012), including President, Chief Executive Officer, Director and Chairman (2008-2012), Senior Executive Vice President (2004-2008) and Executive Vice President (2001-2004). Formerly, President of Legg Mason family of funds (2001-2008). Formerly, Division President and Senior Officer of Prudential Financial Group, Inc. and related companies (investment management firm) (1991-2000). Other Directorships. None. |
| | | |
Cynthia E. Frost 1961 | | Trustee | | Since 2014 | | Private investor. Formerly, Chief Investment Officer of Brown University (university endowment) (2000-2012). Formerly, Portfolio Strategist for Duke Management Company (university endowment manager) (1995-2000). Formerly, Managing Director, Cambridge Associates (investment consulting company) (1989-1995). Formerly, Consultant, Bain and Company (management consulting firm) (1987-1989). Formerly, Senior Equity Analyst, BA Investment Management Company (1983-1985). Other Directorships. None. |
| | | |
George J. Gorman 1952 | | Chairperson of the Board and Trustee | | Since 2021 (Chairperson) and 2014 (Trustee) | | Principal at George J. Gorman LLC (consulting firm). Formerly, Senior Partner at Ernst & Young LLP (a registered public accounting firm) (1974-2009). Other Directorships. None. |
| | | |
Valerie A. Mosley 1960 | | Trustee | | Since 2014 | | Chairwoman and Chief Executive Officer of Valmo Ventures (a consulting and investment firm). Founder of Upward Wealth, Inc., dba BrightUP, a fintech platform. Formerly, Partner and Senior Vice President, Portfolio Manager and Investment Strategist at Wellington Management Company, LLP (investment management firm) (1992-2012). Formerly, Chief Investment Officer, PG Corbin Asset Management (1990-1992). Formerly worked in institutional corporate bond sales at Kidder Peabody (1986-1990). Other Directorships. Director of DraftKings, Inc. (digital sports entertainment and gaming company) (since September 2020). Director of Groupon, Inc. (e-commerce provider) (since April 2020). Director of Envestnet, Inc. (provider of intelligent systems for wealth management and financial wellness) (since 2018). Formerly, Director of Dynex Capital, Inc. (mortgage REIT) (2013-2020). |
Eaton Vance
VT Floating-Rate Income Fund
December 31, 2021
Management and Organization — continued
| | | | | | |
| Name and Year of Birth | | Trust
Position(s) | | Length of Service | | Principal Occupation(s) and Other Directorships
During Past Five Years and Other Relevant Experience |
|
| Noninterested Trustees (continued) |
| | | |
William H. Park 1947 | | Trustee | | Since 2003 | | Private investor. Formerly, Consultant (management and transactional) (2012-2014). Formerly, Chief Financial Officer, Aveon Group L.P. (investment management firm) (2010-2011). Formerly, Vice Chairman, Commercial Industrial Finance Corp. (specialty finance company) (2006-2010). Formerly, President and Chief Executive Officer, Prizm Capital Management, LLC (investment management firm) (2002-2005). Formerly, Executive Vice President and Chief Financial Officer, United Asset Management Corporation (investment management firm) (1982-2001). Formerly, Senior Manager, Price Waterhouse (now PricewaterhouseCoopers) (a registered public accounting firm) (1972-1981). Other Directorships. None. |
| | | |
Helen Frame Peters 1948 | | Trustee | | Since 2008 | | Professor of Finance, Carroll School of Management, Boston College. Formerly, Dean, Carroll School of Management, Boston College (2000-2002). Formerly, Chief Investment Officer, Fixed Income, Scudder Kemper Investments (investment management firm) (1998-1999). Formerly, Chief Investment Officer, Equity and Fixed Income, Colonial Management Associates (investment management firm) (1991-1998). Other Directorships. None. |
| | | |
Keith Quinton 1958 | | Trustee | | Since 2018 | | Private investor, researcher and lecturer. Formerly, Independent Investment Committee Member at New Hampshire Retirement System (2017-2021). Formerly, Portfolio Manager and Senior Quantitative Analyst at Fidelity Investments (investment management firm) (2001-2014). Other Directorships. Formerly, Director (2016-2021) and Chairman (2019-2021) of New Hampshire Municipal Bond Bank. |
| | | |
Marcus L. Smith 1966 | | Trustee | | Since 2018 | | Private investor. Formerly, Portfolio Manager at MFS Investment Management (investment management firm) (1994-2017). Other Directorships. Director of First Industrial Realty Trust, Inc. (an industrial REIT) (since 2021). Director of MSCI Inc. (global provider of investment decision support tools) (since 2017). Formerly, Director of DCT Industrial Trust Inc. (logistics real estate company) (2017-2018). |
| | | |
Susan J. Sutherland 1957 | | Trustee | | Since 2015 | | Private investor. Director of Ascot Group Limited and certain of its subsidiaries (insurance and reinsurance) (since 2017). Formerly, Director of Hagerty Holding Corp. (insurance) (2015-2018) and Montpelier Re Holdings Ltd. (insurance and reinsurance) (2013-2015). Formerly, Associate, Counsel and Partner at Skadden, Arps, Slate, Meagher & Flom LLP (law firm) (1982-2013). Other Directorships. Director of Kairos Acquisition Corp. (insurance/InsurTech acquisition company) (since 2021). |
| | | |
Scott E. Wennerholm 1959 | | Trustee | | Since 2016 | | Private investor. Formerly, Trustee at Wheelock College (postsecondary institution) (2012-2018). Formerly, Consultant at GF Parish Group (executive recruiting firm) (2016-2017). Formerly, Chief Operating Officer and Executive Vice President at BNY Mellon Asset Management (investment management firm) (2005-2011). Formerly, Chief Operating Officer and Chief Financial Officer at Natixis Global Asset Management (investment management firm) (1997-2004). Formerly, Vice President at Fidelity Investments Institutional Services (investment management firm) (1994-1997). Other Directorships. None. |
| | | | | | |
| Name and Year of Birth | | Trust
Position(s) | | Length of Service | | Principal Occupation(s)
During Past Five Years |
|
| Principal Officers who are not Trustees |
| | | |
Eric A. Stein 1980 | | President | | Since 2020 | | Vice President and Chief Investment Officer, Fixed Income of EVM and BMR. Prior to November 1, 2020, Mr. Stein was a co-Director of Eaton Vance’s Global Income Investments. Also Vice President of Calvert Research and Management (“CRM”). |
| | | |
Deidre E. Walsh 1971 | | Vice President and Chief Legal Officer | | Since 2009 | | Vice President of EVM and BMR. Also Vice President of CRM. |
Eaton Vance
VT Floating-Rate Income Fund
December 31, 2021
Management and Organization — continued
| | | | | | |
| Name and Year of Birth | | Trust
Position(s) | | Length of Service | | Principal Occupation(s)
During Past Five Years |
|
| Principal Officers who are not Trustees (continued) |
| | | |
James F. Kirchner 1967 | | Treasurer | | Since 2007 | | Vice President of EVM and BMR. Also Vice President of CRM. |
| | | |
Jill R. Damon 1984 | | Secretary | | Since 2022 | | Vice President of EVM and BMR since 2017. Formerly, associate at Dechert LLP (2009-2017). |
| | | |
Richard F. Froio 1968 | | Chief Compliance Officer | | Since 2017 | | Vice President of EVM and BMR since 2017. Formerly, Deputy Chief Compliance Officer (Adviser/Funds) and Chief Compliance Officer (Distribution) at PIMCO (2012-2017) and Managing Director at BlackRock/Barclays Global Investors (2009-2012). |
The SAI for the Fund includes additional information about the Trustees and officers of the Trust and can be obtained without charge on Eaton Vance’s website at www.eatonvance.com or by calling 1-800-262-1122.
Eaton Vance Funds
| | |
| Privacy Notice | | April 2021 |
| | |
| |
| FACTS | | WHAT DOES EATON VANCE DO WITH YOUR
PERSONAL INFORMATION? |
| | | |
| |
| | |
| Why? | | Financial companies choose how they share your personal information. Federal law gives consumers the right to limit some but not all sharing. Federal law also requires us to tell you how we collect, share, and protect your personal information. Please read this notice carefully to understand what we do. |
| | |
| | | |
| What? | | The types of personal information we collect and share depend on the product or service you have with us. This information can include: ∎ Social Security number and income ∎ investment experience and risk tolerance ∎ checking account number and wire transfer instructions |
| | |
| | | |
| How? | | All financial companies need to share customers’ personal information to run their everyday business. In the section below, we list the reasons financial companies can share their customers’ personal information; the reasons Eaton Vance chooses to share; and whether you can limit this sharing. |
| | |
| | | |
| | | | |
Reasons we can share your
personal information | | Does Eaton Vance share? | | Can you limit this sharing? |
| For our everyday business purposes — such as to process your transactions, maintain your account(s), respond to court orders and legal investigations, or report to credit bureaus | | Yes | | No |
| For our marketing purposes — to offer our products and services to you | | Yes | | No |
| For joint marketing with other financial companies | | No | | We don’t share |
| For our investment management affiliates’ everyday business purposes — information about your transactions, experiences, and creditworthiness | | Yes | | Yes |
| For our affiliates’ everyday business purposes — information about your transactions and experiences | | Yes | | No |
| For our affiliates’ everyday business purposes — information about your creditworthiness | | No | | We don’t share |
| For our investment management affiliates to market to you | | Yes | | Yes |
| For our affiliates to market to you | | No | | We don’t share |
| For nonaffiliates to market to you | | No | | We don’t share |
| | |
| To limit our sharing | | Call toll-free 1-800-262-1122 or email: EVPrivacy@eatonvance.com Please note: If you are a new customer, we can begin sharing your information 30 days from the date we sent this notice. When you are no longer our customer, we continue to share your information as described in this notice. However, you can contact us at any time to limit our sharing. |
| | |
| | | |
| | |
| Questions? | | Call toll-free 1-800-262-1122 or email: EVPrivacy@eatonvance.com |
| | |
| | | |
Eaton Vance Funds
| | |
| Privacy Notice — continued | | April 2021 |
| | |
| Who we are |
| Who is providing this notice? | | Eaton Vance Management, Eaton Vance Distributors, Inc., Eaton Vance Trust Company, Eaton Vance Management (International) Limited, Eaton Vance Advisers International Ltd., Eaton Vance Global Advisors Limited, Eaton Vance Management’s Real Estate Investment Group, Boston Management and Research, Calvert Research and Management, Eaton Vance and Calvert Fund Families and our investment advisory affiliates (“Eaton Vance”) (see Investment Management Affiliates definition below) |
| What we do |
| How does Eaton Vance protect my personal information? | | To protect your personal information from unauthorized access and use, we use security measures that comply with federal law. These measures include computer safeguards and secured files and buildings. We have policies governing the proper handling of customer information by personnel and requiring third parties that provide support to adhere to appropriate security standards with respect to such information. |
| How does Eaton Vance collect my personal information? | | We collect your personal information, for example, when you ∎ open an account or make deposits or withdrawals from your account ∎ buy securities from us or make a wire transfer ∎ give us your contact information We also collect your personal information from others, such as credit bureaus, affiliates, or other companies. |
| Why can’t I limit all sharing? | | Federal law gives you the right to limit only ∎ sharing for affiliates’ everyday business purposes — information about your creditworthiness ∎ affiliates from using your information to market to you ∎ sharing for nonaffiliates to market to you State laws and individual companies may give you additional rights to limit sharing. See below for more on your rights under state law. |
| Definitions |
| Investment Management Affiliates | | Eaton Vance Investment Management Affiliates include registered investment advisers, registered broker-dealers, and registered and unregistered funds. Investment Management Affiliates does not include entities associated with Morgan Stanley Wealth Management, such as Morgan Stanley Smith Barney LLC and Morgan Stanley & Co. |
| Affiliates | | Companies related by common ownership or control. They can be financial and nonfinancial companies. ∎ Our affiliates include companies with a Morgan Stanley name and financial companies such as Morgan Stanley Smith Barney LLC and Morgan Stanley & Co. |
| Nonaffiliates | | Companies not related by common ownership or control. They can be financial and nonfinancial companies. ∎ Eaton Vance does not share with nonaffiliates so they can market to you. |
| Joint marketing | | A formal agreement between nonaffiliated financial companies that together market financial products or services to you. ∎ Eaton Vance doesn’t jointly market. |
| Other important information |
Vermont: Except as permitted by law, we will not share personal information we collect about Vermont residents with Nonaffiliates unless you provide us with your written consent to share such information. California: Except as permitted by law, we will not share personal information we collect about California residents with Nonaffiliates and we will limit sharing such personal information with our Affiliates to comply with California privacy laws that apply to us. |
Eaton Vance Funds
IMPORTANT NOTICES
Delivery of Shareholder Documents. The Securities and Exchange Commission (SEC) permits funds to deliver only one copy of shareholder documents, including prospectuses, proxy statements and shareholder reports, to fund investors with multiple accounts at the same residential or post office box address. This practice is often called “householding” and it helps eliminate duplicate mailings to shareholders. Eaton Vance, or your financial intermediary, may household the mailing of your documents indefinitely unless you instruct Eaton Vance, or your financial intermediary, otherwise. If you would prefer that your Eaton Vance documents not be householded, please contact Eaton Vance at 1-800-262-1122, or contact your financial intermediary. Your instructions that householding not apply to delivery of your Eaton Vance documents will typically be effective within 30 days of receipt by Eaton Vance or your financial intermediary.
Portfolio Holdings. Each Eaton Vance Fund and its underlying Portfolio(s) (if applicable) files a schedule of portfolio holdings on Part F to Form N-PORT with the SEC. Certain information filed on Form N-PORT may be viewed on the Eaton Vance website at www.eatonvance.com, by calling Eaton Vance at 1-800-262-1122 or in the EDGAR database on the SEC’s website at www.sec.gov.
Proxy Voting. From time to time, funds are required to vote proxies related to the securities held by the funds. The Eaton Vance Funds or their underlying Portfolios (if applicable) vote proxies according to a set of policies and procedures approved by the Funds’ and Portfolios’ Boards. You may obtain a description of these policies and procedures and information on how the Funds or Portfolios voted proxies relating to portfolio securities during the most recent 12-month period ended June 30, without charge, upon request, by calling 1-800-262-1122 and by accessing the SEC’s website at www.sec.gov.
This Page Intentionally Left Blank
Investment Adviser and Administrator
Eaton Vance Management
Two International Place
Boston, MA 02110
Principal Underwriter*
Eaton Vance Distributors, Inc.
Two International Place
Boston, MA 02110
(617) 482-8260
Custodian
State Street Bank and Trust Company
State Street Financial Center, One Lincoln Street
Boston, MA 02111
Transfer Agent
State Street Bank and Trust Company
State Street Financial Center, One Lincoln Street
Boston, MA 02111
Independent Registered Public Accounting Firm
Deloitte & Touche LLP
200 Berkeley Street
Boston, MA 02116-5022
Fund Offices
Two International Place
Boston, MA 02110
| * | FINRA BrokerCheck. Investors may check the background of their Investment Professional by contacting the Financial Industry Regulatory Authority (FINRA). FINRA BrokerCheck is a free tool to help investors check the professional background of current and former FINRA-registered securities firms and brokers. FINRA BrokerCheck is available by calling 1-800-289-9999 and at www.FINRA.org. The FINRA BrokerCheck brochure describing this program is available to investors at www.FINRA.org. |
1939 12.31.21
Item 2. Code of Ethics
The registrant (sometimes referred to as the “Fund”) has adopted a code of ethics applicable to its Principal Executive Officer, Principal Financial Officer and Principal Accounting Officer. The registrant undertakes to provide a copy of such code of ethics to any person upon request, without charge, by calling 1-800-262-1122. The registrant has not amended the code of ethics as described in Form N-CSR during the period covered by this report. The registrant has not granted any waiver, including an implicit waiver, from a provision of the code of ethics as described in Form N-CSR during the period covered by this report.
Item 3. Audit Committee Financial Expert
The registrant’s Board of Trustees (the “Board”) has designated George J. Gorman, William H. Park and Scott E. Wennerholm, each an independent trustee, as audit committee financial experts. Mr. Gorman is a certified public accountant who is the Principal at George J. Gorman LLC (a consulting firm). Previously, Mr. Gorman served in various capacities at Ernst & Young LLP (a registered public accounting firm), including as Senior Partner. Mr. Gorman also has experience serving as an independent trustee and audit committee financial
expert of other mutual fund complexes. Mr. Park is a certified public accountant who is a private investor. Previously, he served as a consultant, as the Chief Financial Officer of Aveon Group, L.P. (an investment management firm), as the Vice Chairman of Commercial Industrial Finance Corp. (specialty finance company), as President and Chief Executive Officer of Prizm Capital Management, LLC (investment management firm), as Executive Vice President and Chief Financial Officer of United Asset Management Corporation (an institutional investment management firm) and as a Senior Manager at Price Waterhouse (now PricewaterhouseCoopers) (a registered public accounting firm). Mr. Wennerholm is a private investor. Previously, Mr. Wennerholm served as a Trustee at Wheelock College (postsecondary institution), as a Consultant at GF Parish Group (executive recruiting firm), Chief Operating Officer and Executive Vice President at BNY Mellon Asset Management (investment management firm), Chief Operating Officer and Chief Financial Officer at Natixis Global Asset Management (investment management firm), and Vice President at Fidelity Investments Institutional Services (investment management firm).
Item 4. Principal Accountant Fees and Services
Eaton Vance VT Floating-Rate Income Fund (the “Fund”) is a series of Eaton Vance Variable Trust (the “Trust”), a Massachusetts business trust, which, including the Fund, contains a total of 1 series (the “Series”). The Trust is registered under the Investment Company Act of 1940 as an open-end management investment company. This Form N-CSR relates to the Fund’s annual report.
(a)-(d)
The following table presents the aggregate fees billed to the Fund for the Fund’s fiscal years ended December 31, 2020 and December 31, 2021 by the registrant’s principal accountant, Deloitte & Touche LLP (“D&T”), for professional services rendered for the audit of the Fund’s annual financial statements and fees billed for other services rendered by D&T during such periods.
Eaton Vance VT Floating-Rate Income Fund
| | | | | | | | |
Fiscal Years Ended | | 12/31/20 | | | 12/31/21 | |
Audit Fees | | $ | 76,450 | | | $ | 74,250 | |
Audit-Related Fees(1) | | $ | 0 | | | $ | 0 | |
Tax Fees(2) | | $ | 13,713 | | | $ | 14,063 | |
All Other Fees(3) | | $ | 0 | | | $ | 0 | |
| | | | | | | | |
Total | | $ | 90,163 | | | $ | 88,313 | |
| | | | | | | | |
| (1) | Audit-related fees consist of the aggregate fees billed for assurance and related services that are reasonably related to the performance of the audit of the registrant’s financial statements and are not reported under the category of audit fees. |
| (2) | Tax fees consist of the aggregate fees billed for professional services rendered by the principal accountant relating to tax compliance, tax advice, and tax planning and specifically include fees for tax return preparation and other related tax compliance/planning matters. |
| (3) | All other fees consist of the aggregate fees billed for products and services provided by the registrant’s principal accountant other than audit, audit-related, and tax services. |
The following table presents the aggregate audit, audit-related, tax, and other fees billed to all of the Series in the Trust by D&T for the last two fiscal years of each Series.
| | | | | | | | |
| | | 12/31/20 | | | 12/31/21 | |
Audit Fees | | $ | 76,450 | | | $ | 74,250 | |
Audit-Related Fees(1) | | $ | 0 | | | $ | 0 | |
Tax Fees(2) | | $ | 13,713 | | | $ | 14,063 | |
All Other Fees(3) | | $ | 0 | | | $ | 0 | |
| | | | | | | | |
Total | | $ | 90,163 | | | $ | 88,313 | |
| | | | | | | | |
| (1) | Audit-related fees consist of the aggregate fees billed for assurance and related services that are reasonably related to the performance of the audit of financial statements and are not reported under the category of audit fees. |
| (2) | Tax fees consist of the aggregate fees billed for professional services rendered by the principal accountant relating to tax compliance, tax advice, and tax planning and specifically include fees for tax return preparation. |
| (3) | All other fees consist of the aggregate fees billed for products and services provided by the principal accountant other than audit, audit-related, and tax services. |
(e)(1) The registrant’s audit committee has adopted policies and procedures relating to the pre-approval of services provided by the registrant’s principal accountant (the “Pre-Approval Policies”). The Pre-Approval Policies establish a framework intended to assist the audit committee in the proper discharge of its pre-approval responsibilities. As a general matter, the Pre-Approval Policies (i) specify certain types of audit, audit-related, tax, and other services determined to be pre-approved by the audit committee; and (ii) delineate specific procedures governing the mechanics of the pre-approval process, including the approval and monitoring of audit and non-audit service fees. Unless a service is specifically pre-approved under the Pre-Approval Policies, it must be separately pre-approved by the audit committee.
The Pre-Approval Policies and the types of audit and non-audit services pre-approved therein must be reviewed and ratified by the registrant’s audit committee at least annually. The registrant’s audit committee maintains full responsibility for the appointment, compensation, and oversight of the work of the registrant’s principal accountant.
(e)(2) No services described in paragraphs (b)-(d) above were approved by the registrant’s audit committee pursuant to the “de minimis exception” set forth in Rule 2-01 (c)(7)(i)(C) of Regulation S-X.
(f) Not applicable.
(g) The following table presents (i) the aggregate non-audit fees (i.e., fees for audit-related, tax, and other services) billed for services rendered to all of the Series in the Trust by D&T for the last two fiscal years of each Series; and (ii) the aggregate non-audit fees (i.e., fees for audit-related, tax, and other services) billed to the Eaton Vance organization by D&T for the last two fiscal years of each Series.
| | | | | | | | |
Fiscal Years Ended | | 12/31/20 | | | 12/31/21 | |
Registrant(1) | | $ | 13,713 | | | $ | 14,063 | |
Eaton Vance(2) | | $ | 150,300 | | | $ | 51,800 | |
| (1) | Includes all of the Series in the Trust. |
| (2) | The investment adviser to the Funds, as well as any of its affiliates that provide ongoing services to the Funds, are subsidiaries of Morgan Stanley. |
(h) The registrant’s audit committee has considered whether the provision by the registrant’s principal accountant of non-audit services to the registrant’s investment adviser and any entity controlling, controlled by, or under common control with the adviser that provides ongoing services to the registrant that were not pre-approved pursuant to Rule 2-01(c)(7)(ii) of Regulation S-X is compatible with maintaining the principal accountant’s independence.
Item 5. Audit Committee of Listed Registrants
Not applicable.
Item 6. Schedule of Investments
Please see schedule of investments contained in the Report to Stockholders included under Item 1 of this Form N-CSR.
Item 7. Disclosure of Proxy Voting Policies and Procedures for Closed-End Management Investment Companies
Not applicable.
Item 8. Portfolio Managers of Closed-End Management Investment Companies
Not applicable.
Item 9. Purchases of Equity Securities by Closed-End Management Investment Company and Affiliated Purchasers
Not applicable.
Item 10. Submission of Matters to a Vote of Security Holders
No material changes.
Item 11. Controls and Procedures
(a) It is the conclusion of the registrant’s principal executive officer and principal financial officer that the effectiveness of the registrant’s current disclosure controls and procedures (such disclosure controls and procedures having been evaluated within 90 days of the date of this filing) provide reasonable assurance that the information required to be disclosed by the registrant has been recorded, processed, summarized and reported within the time period specified in the Commission’s rules and forms and that the information required to be disclosed by the registrant has been accumulated and communicated to the registrant’s principal executive officer and principal financial officer in order to allow timely decisions regarding required disclosure.
(b) There have been no changes in the registrant’s internal controls over financial reporting during the period covered by this report that has materially affected, or is reasonably likely to materially affect, the registrant’s internal control over financial reporting.
Item 12. Disclosure of Securities Lending Activities for Closed-End Management Investment Companies
Not applicable.
Item 13. Exhibits
Signatures
Pursuant to the requirements of the Securities Exchange Act of 1934 and the Investment Company Act of 1940, the registrant has duly caused this report to be signed on its behalf by the undersigned, thereunto duly authorized.
| | |
| Eaton Vance Variable Trust |
| |
| By: | | /s/ Eric A. Stein |
| | Eric A. Stein |
| | President |
Date: February 23, 2022
Pursuant to the requirements of the Securities Exchange Act of 1934 and the Investment Company Act of 1940, this report has been signed below by the following persons on behalf of the registrant and in the capacities and on the dates indicated.
| | |
| By: | | /s/ James F. Kirchner |
| | James F. Kirchner |
| | Treasurer |
| |
| Date: | | February 23, 2022 |
| |
| By: | | /s/ Eric A. Stein |
| | Eric A. Stein |
| | President |
Date: February 23, 2022