UNITED STATES
SECURITIES AND EXCHANGE COMMISSION
SECURITIES AND EXCHANGE COMMISSION
Washington, DC 20549
FORM N-CSR
CERTIFIED SHAREHOLDER REPORT OF REGISTERED MANAGEMENT
INVESTMENT COMPANIES
INVESTMENT COMPANIES
Investment Company Act file number 811-10085
Hillman Capital Management Investment Trust
(Exact name of registrant as specified in charter)
116 South Franklin Street, Post Office Box 69, Rocky Mount, North Carolina 27802
(Address of principal executive offices) (Zip code)
A. Vason Hamrick
116 South Franklin Street, Post Office Box 69, Rocky Mount, North Carolina 27802
(Name and address of agent for service)
Registrant's telephone number, including area code: 252-972-9922
Date of fiscal year end: September 30
Date of reporting period: September 30, 2009
Item 1. REPORTS TO STOCKHOLDERS.
Annual Report 2009
September 30, 2009
The Hillman Advantage Equity Fund
The Hillman Focused Advantage Fund
No Load Shares
Class A Shares
Class C Shares

This report and the financial statements contained herein are submitted for the general information of the shareholders of the Hillman Capital Management Funds (“Funds”). This report is not authorized for distribution to prospective investors in the Funds unless preceded or accompanied by an effective prospectus. The Funds’ shares are not deposits or obligations of, or guaranteed by, any depository institution. The Funds’ shares are not insured by the FDIC, Federal Reserve Board or any other agency, and are subject to investment risks, including possible loss of principal amount invested. Neither the Funds nor the Funds’ distributor is a bank.
Distributor: Capital Investment Group, Inc., 17 Glenwood Ave., Raleigh, NC 27603, Phone 1-866-515-4626.
| Statements in this Annual Report that reflect projections or expectations of future financial or economic performance of the Hillman Capital Management Funds (“Funds”) and of the market in general and statements of the Funds’ plans and objectives for future operations are forward-looking statements. No assurance can be given that actual results or events will not differ materially from those projected, estimated, assumed or anticipated in any such forward-looking statements. Important factors that could result in such differences, in addition to the other factors noted with such forward-looking statements, include, without limitation, general economic conditions such as inflation, recession and interest rates. Past performance is not a guarantee of future results. Investments in the Funds are subject to investment risks, including the possible loss of some or the entire principal amount invested. There can be no assurance that the Funds will be successful in meeting their investment objective. Investment in the Funds is subject to the following risks: market risk, investment advisor risk, management style risk. In addition to the risks outlined above, the Focused Advantage Fund is also subject to non-diversified fund risk and sector focus risk. More information about these risks and other risks can be found in the Funds’ prospectus. The performance information quoted in this annual report represents past performance, which is not a guarantee of future results. Investment return and principal value of an investment will fluctuate so that an investor’s shares, when redeemed, may be worth more or less than their original cost. Current performance may be lower or higher than the performance data quoted. An investor may obtain performance data current to the most recent month-end by visiting www.hillmancapital.com. An investor should consider the investment objectives, risks, and charges and expenses of the Funds carefully before investing. The prospectus contains this and other information about the Funds. A copy of the prospectus is available at www.hillmancapital.com or by calling Shareholder Services at 1-800-773-3863. The prospectus should be read carefully before investing. |
Stated performance in the Funds was achieved at some or all points during the year by waiving or reimbursing part of the Funds’ total expenses to ensure shareholders did not absorb expenses significantly greater than the industry norm.
This Annual Report was first distributed to shareholders on or about November 30, 2009.
For More Information on Your Hillman Capital Management (Hillman) Mutual Funds:
See Our Website @ www.hillmancapital.com
or
Call Our Shareholder Services Group Toll-Free at 1-800-773-3863
Hillman Funds 2009 Annual Letter to Shareholders
The close of the U.S. equity markets on September 30th, 2009 marked the end of the ninth fiscal year for the Hillman Funds and we are proud of their achievements. Over the past twelve months, through one of the most tumultuous periods in United States financial history, the No Load Shares of the Hillman Focused Advantage Equity Fund (HCMAX) and the No Load Shares of the Hillman Advantage Equity Fund (HCMTX) achieved positive returns of 0.43% and 2.96% respectively. By contrast the benchmark Standard and Poor’s 500 Total Return Index produced a negative return of (6.91%) for the same time period. We believe that the funds’ continued performance is a testament to the prudence of our investment approach and to the effectiveness of our investment team as it manages through challenging financial markets.
In a 1942 speech delivered by Sir Winston Churchill he remarked “Now this is not the end. It is not even the beginning of the end. But it is perhaps, the end of the beginning.”1 Churchill’s comments on the status of World War II reflect our beliefs on the current stage of the economic predicament. After one of the swiftest declines in economic activity experienced since the Great Depression, the United States’ economy showed early signs of stabilization in the third quarter. GDP is widely expected to have increased during the past quarter and Federal Reserve Chairman Ben Bernanke made public his belief that “the recession is technically over”.2
Despite early signs of stabilization and a “technical” end to the recession, we believe it is important to recognize that the United States’ economy still faces significant longer-term challenges. Employment dropped by 263,000 jobs and the unemployment rate reached 9.8% in September.3 The Congressional Budget Office (CBO) estimated that the federal budget deficit will reach nearly $1.6 trillion in 2009, $1.4 trillion in 2010 and will maintain levels in excess of $500 billion through the end of its ten year forecasting period.4 In the near-term, deficit spending may provide needed economic support. Over longer periods, deficit spending can be self defeating. At some point, if continued, large budget deficits will likely have unwanted implications for domestic interest rates, asset values and real economic growth.
We believe that near-term economic recovery hinges on the ability and willingness of U.S. consumers and businesses to shift behavior from acute saving and deleveraging to rational consuming and investing in future growth. We believe that, in aggregate, consumers have a modest ability and a growing willingness to increase spending. For U.S. businesses, a general improvement in credit conditions has somewhat restored their ability to increase capital spending. Though many business leaders remain cautious, we believe that tight inventory levels and improving sentiment among small business leaders are likely precursors to sequential improvement.
Our supposition is that U.S. consumers have an ability to increase spending on smaller discretionary purchases, though credit availability for larger purchases remains tight. We believe that elevated savings rates paired with a reasonable relationship between financial obligations and disposable personal income are indications that consumers have an ability to consume. Over the twelve month period ending August 2009, the monthly personal savings rate averaged 3.9% versus 2% over the prior twelve months.5 Despite the large face value of consumer debt, low interest rates have pushed the Federal Reserve’s Financial Obligations Ratio (computed by adding required payments on outstanding debt, automobile lease payments, home rental payments, homeowners insurance and property tax payments then dividing by disposable personal income) downward. As of the end of June, consumers’ financial obligations as a percentage of disposable income had fallen to levels last seen during 2004.6 For those pursuing large purchases, tight lending standards may persist for some
________________________________________
6 The Federal Reserve Board, Household Debt Service and Financial Obligations Ratios, Q2 2009
time. That said, recent surveys of loan officers suggest that increasingly fewer banks foresee a need to tighten credit standards beyond current levels.7
Trends in the personal savings rate suggest that U.S. consumers incrementally chose to spend more and save less during the third quarter. The savings rate peaked at 6% in May of 2009 and has since declined steadily to 3% in August.8 Consumer behavior has likely been influenced by a positive wealth effect related to increasing equity and fixed income values, as well as expectations of slowing job losses and stabilizing home prices. Note that we believe that the resumption of consumers’ willingness to spend is largely predicated on their expectations of economic improvement. An unforeseen shock to employment, equity and fixed income markets, or housing could have a materially negative influence on aggregate consumer behavior.
Capital spending initiatives by U.S. businesses have been among the largest casualties of the financial crisis. The uncertain demand environment and frozen credit markets were likely causes of reduced capital spending. During the height of the liquidity crunch in the first quarter of 2009, the commercial paper markets seized, the interest rate spread between AAA corporate credit rates and U.S. Treasury securities increased to 174% of its prior 10 year average, and spreads between BAA and AAA corporate debt rose to 292% of their ten year average.9 In the Federal Reserve’s April Senior Loan Officer Opinion Survey, 80% of respondents indicated they were tightening standards for Commercial and Industrial (C&I) loans10. Amidst these adverse circumstances, capital spending versus prior year levels fell by 15.4% and 19.3% in the first and second quarters respectively.11
We believe that the credit environment affecting U.S. companies is normalizing, thereby increasing the availability of credit. AAA credit spreads and the spread between BAA and AAA debt have regressed toward historical means (resembling their ten year averages). The availability of C&I loans appears to be improving. In its July survey, the Federal Reserve indicated that only 30% of senior loan officers expect to further tighten C&I lending standards, a significant improvement from the 80% level in April. Demonstrating the diminished relevance of restricted credit on business spending, a recent National Federation of Independent Business (NFIB) survey found that only four percent of small business owners cited “financing” as their number one business problem.12
The broader issue affecting business spending appears to be the unwillingness of business leaders to borrow and invest for future growth. During their second quarter earnings calls, we continued to hear many CEO’s beating the drum of fiscal responsibility with the now familiar phrase “managing for cash”, as they worked to reduce inventories and cut discretionary spending. Their sentiment has also been noticed by loan officers, many of whom have suggested that demand for C&I loans remains weak.13 In the aftermath of the recent credit crisis, we believe that the majority of business leaders will be slow to authorize significant increases in capital spending. However, some leading indicators, including reduced inventory levels and a less negative outlook by small business leaders, support a premise that capital spending is near bottom.
Although the U.S. economy has endured significant pain over the past twelve months, we believe that the economy should continue to stabilize over time. Consumer activity appears to be improving and we expect business activity to eventually follow suit. There are many encouraging signs of progress that, if sustained, could trigger a self reinforcing loop with
________________________________________
13 The Federal Reserve Board, July 2009 Senior Loan Officer Opinion Survey on Bank Lending Practices
positive implications for the economy. The timing and force of a U.S. economic recovery are important variables when assessing the magnitude of the country’s longer-term challenges. We continue to be mindful of the longer-term picture and recognize that unforeseen shocks to consumers would negatively impact the nascent recovery.
Our investment strategy entails identifying companies our analysis shows to be industry leaders with sustainable competitive advantage and sufficient financial flexibility to weather troughs in economic activity. We believe that competitively advantaged companies will emerge stronger from the economic decline and that this period continues to represent opportunity to purchase great enterprises at attractive prices.
Thank you for your continued trust and support. We look forward to serving you through the years to come.
Sincerely,

Mark Hillman, President
Disclosure:
Past performance is not indicative of future results. An investment in the Funds is subject to investment risks, including the possible loss of some or all of the principal amount invested. There can be no assurance that the Funds will be successful in meeting its investment objective. Investment in the Funds is also subject to the following risks: market risk, investment advisor risk, management style risk, non-diversified status and sector focus risk. More information about these risks and other risks can be found in the Funds’ prospectus. The S&P 500 Total Return Index is the Standard & Poor’s Composite Index of 500 stocks and is a widely recognized, unmanaged index of common stock prices. It is not possible to invest in this index.
An investor should consider the investment objectives, risks, and charges and expenses of the Funds carefully before investing. The prospectus contains this and other information about the Funds. A copy of the prospectus is available at www.nottinghamco.com or by calling Shareholder Services at 1-800-773-3863. The prospectus should be read carefully before investing.
Statements in this Annual Report reflect projections or expectations of future financial or economic performance of the Fund and of the market in general and statements of the Fund’s plans and objectives for future operations are forward-looking statements. No assurance can be given that actual results or events will not differ materially from those projected, estimated, assumed or anticipated in any such forward-looking statements. Important factors that could result in such differences, in addition to the other factors noted with such forward-looking statements, include general economic conditions such as inflation, recession and interest rates.
Underwriter and Distributor: Capital Investment Group, Inc.
17 Glenwood Avenue
Raleigh, NC 27603
Phone (800) 773-3863
HCM-09-152
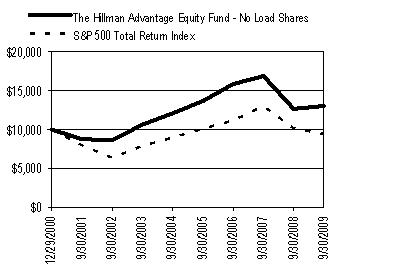
The Hillman Advantage Equity Fund No Load Shares
Performance Update - $10,000 Investment (Unaudited)
For the period from December 29, 2000 (Date of Initial Public Investment) to September 30, 2009
 | Performance Returns for the periods ended September 30, 2009 | ||||||||
Average Annual Total Returns | One Year | Five Year | Since Inception* | Gross Expense Ratio** | |||||
| The Hillman Advantage Equity Fund No Load Shares | 2.96% | 1.52% | 3.07% | 2.66% | |||||
Cumulative Total Investment Returns | Since Inception* | Final Value of $10,000 Investment | |||||||
The Hillman Advantage Equity Fund No Load Shares | 30.32% | $13,032 | |||||||
| S&P 500 Total Return Index | (5.69)% | $9,431 | |||||||
The Hillman Advantage Equity Fund - No Load Shares | S&P 500 Total Return Index | |
| 12/29/2000 | 10,000 | 10,000 |
| 9/30/2001 | 8,750 | 7,961 |
| 9/30/2002 | 8,614 | 6,330 |
| 9/30/2003 | 10,635 | 7,874 |
| 9/30/2004 | 12,084 | 8,967 |
| 9/30/2005 | 13,658 | 10,065 |
| 9/30/2006 | 15,866 | 11,151 |
| 9/30/2007 | 16,888 | 12,984 |
| 9/30/2008 | 12,658 | 10,131 |
| 9/30/2009 | 13,032 | 9,431 |
The graph assumes an initial $10,000 investment at December 29, 2000 (Date of Initial Public Investment). All dividends and distributions are reinvested. This graph depicts the performance of The Hillman Advantage Equity Fund - No Load Shares (the “Fund”) versus the S&P 500 Total Return Index. It is important to note that the Fund is a professionally managed mutual fund while the index is not available for investment and is unmanaged. The comparison is shown for illustrative purposes only. * The Fund’s inception date – December 29, 2000 (Date of Initial Public Investment). ** The gross expense ratio shown is from the Fund’s prospectus dated January 28, 2009. This number may vary from the expense ratio shown elsewhere in this report because it is based on a different time period and, if applicable, does not include fee or expense waivers. |
Performance quoted above represents past performance, which is no guarantee of future results. Investment return and principal value will fluctuate so that shares, when redeemed, may be worth more or less than their original cost. Current performance may be lower or higher than the performance data quoted. An investor may obtain performance data, current to the most recent month-end, by visiting www.hillmancapital.com.
The graph and table do not reflect the deduction of taxes that a shareholder would pay on Fund distributions or the redemption of Fund shares. Average annual total returns are historical in nature and measure net investment income and capital gain or loss from portfolio investments assuming reinvestments of dividends.
Fund Expenses (Unaudited)
As a shareholder of the Fund, you incur ongoing costs, including management fees; distribution (12b-1) fees; and other Fund expenses. This example is intended to help you understand your ongoing costs (in dollars) of investing in the Fund and to compare these costs with the ongoing costs of investing in other mutual funds. The example is based on an investment of $1,000 invested at the beginning of the period and held for the entire period as indicated below. Actual Expenses – The first line of the table below provides information about the actual account values and actual expenses. You may use the information in this line, together with the amount you invested, to estimate the expenses that you paid over the period. Simply divide your account value by $1,000 (for example, an $8,600 account value divided by $1,000 = 8.6), then multiply the result by the number in the first line under the heading entitled “Expenses Paid During Period” to estimate the expenses you paid on your account during this period. Hypothetical Example for Comparison Purposes – The second line of the table below provides information about hypothetical account values and hypothetical expenses based on the Fund’s actual expense ratio and an assumed annual rate of return of 5% before expenses, which is not the Fund’s actual return. The hypothetical account values and expenses may not be used to estimate the actual ending account balance or expenses you paid for the period. You may use this information to compare the ongoing costs of investing in the Fund and other funds by comparing this 5% hypothetical example with the 5% hypothetical examples that appear in the shareholder reports of other funds. | |||
| Expense Example | Beginning Account Value April 1, 2009 | Ending Account Value September 30, 2009 | Expenses Paid During Period* |
| Actual | $1,000.00 | $1407.70 | $8.75 |
| Hypothetical (5% return before expenses) | $1,000.00 | $1,017.80 | $7.33 |
* Actual expenses are based on expenses incurred in the most recent six-month period. The Fund’s annualized six-month expense ratio is 1.45%. The values under “Expenses Paid During Period” are equal to the annualized ratio multiplied by the average account value over the period, multiplied by 183/365 (to reflect the number of days in the six month period ending September 30, 2009).
The Hillman Advantage Equity Fund Class A Shares
Performance Update - $10,000 Investment (Unaudited)
For the period from July 18, 2006 (Date of Initial Public Offering) to September 30, 2009
 | Performance Returns for the periods ended September 30, 2009 | ||||||||
Average Annual Total Returns | One Year | Since Inception* | Gross Expense Ratio** | ||||||
The Hillman Advantage Equity Fund Class A Shares - No Sales Load | 3.94% | (1.33)% | 2.66% | ||||||
| The Hillman Advantage Equity Fund Class A Shares - 5.75% Maximum Sales Load | (2.04)% | (3.13)% | 2.66% | ||||||
Cumulative Total Investment Returns | Since Inception* | Final Value of $10,000 Investment | |||||||
The Hillman Advantage Equity Fund Class A Shares - No Sales Load | (4.19)% | $9,581 | |||||||
| The Hillman Advantage Equity Fund Class A Shares - 5.75% Maximum Sales Load | (9.70)% | $9,030 | |||||||
| S&P 500 Total Return Index | (8.29)% | $9,171 | |||||||
The Hillman Advantage Equity Fund - Class A Shares | S&P 500 Total Return Index | |
| 7/18/2006 | 9,425 | 10,000 |
| 9/30/2006 | 10,306 | 10,844 |
| 9/30/2007 | 11,586 | 12,626 |
| 9/30/2008 | 8,687 | 9,852 |
| 9/30/2009 | 9,030 | 9,581 |
The graph assumes an initial $10,000 investment ($9,425 after maximum sales load of 5.75%) at July 18, 2006 (Date of Initial Public Offering). All dividends and distributions are reinvested. This graph depicts the performance of The Hillman Advantage Equity Fund – Class A Shares (the “Fund”) versus the S&P 500 Total Return Index. It is important to note that the Fund is a professionally managed mutual fund while the index is not available for investment and is unmanaged. The comparison is shown for illustrative purposes only. * The Fund’s inception date – July 18, 2006 (Date of Initial Public Investment). ** The gross expense ratio shown is from the Fund’s prospectus dated January 28, 2009. This number may vary from the expense ratio shown elsewhere in this report because it is based on a different time period and, if applicable, does not include fee or expense waivers. |
Performance quoted above represents past performance, which is no guarantee of future results. Investment return and principal value will fluctuate so that shares, when redeemed, may be worth more or less than their original cost. Current performance may be lower or higher than the performance data quoted. An investor may obtain performance data, current to the most recent month-end, by visiting www.hillmancapital.com.
The graph and table do not reflect the deduction of taxes that a shareholder would pay on Fund distributions or the redemption of Fund shares. Average annual total returns are historical in nature and measure net investment income and capital gain or loss from portfolio investments assuming reinvestments of dividends.
Fund Expenses (Unaudited)
As a shareholder of the Fund, you incur two types of costs: (1) transaction costs, which may include sales charges (loads) on purchase payments and (2) ongoing costs, including management fees; distribution (12b-1) fees; and other Fund expenses. This example is intended to help you understand your ongoing costs (in dollars) of investing in the Fund and to compare these costs with the ongoing costs of investing in other mutual funds. The example is based on an investment of $1,000 invested at the beginning of the period and held for the entire period as indicated below. Actual Expenses – The first line of the table below provides information about the actual account values and actual expenses. You may use the information in this line, together with the amount you invested, to estimate the expenses that you paid over the period. Simply divide your account value by $1,000 (for example, an $8,600 account value divided by $1,000 = 8.6), then multiply the result by the number in the first line under the heading entitled “Expenses Paid During Period” to estimate the expenses you paid on your account during this period. Hypothetical Example for Comparison Purposes – The second line of the table below provides information about hypothetical account values and hypothetical expenses based on the Fund’s actual expense ratio and an assumed annual rate of return of 5% before expenses, which is not the Fund’s actual return. The hypothetical account values and expenses may not be used to estimate the actual ending account balance or expenses you paid for the period. You may use this information to compare the ongoing costs of investing in the Fund and other funds by comparing this 5% hypothetical example with the 5% hypothetical examples that appear in the shareholder reports of other funds. | |||
| Expense Example | Beginning Account Value April 1, 2009 | Ending Account Value September 30, 2009 | Expenses Paid During Period* |
| Actual | $1,000.00 | $1,408.10 | $7.43 |
| Hypothetical (5% return before expenses) | $1,000.00 | $1,018.90 | $6.23 |
* Actual expenses are based on expenses incurred in the most recent six-month period. The Fund’s annualized six-month expense ratio is 1.23%. The values under “Expenses Paid During Period” are equal to the annualized ratio multiplied by the average account value over the period, multiplied by 183/365 (to reflect the number of days in the six month period ending September 30, 2009).
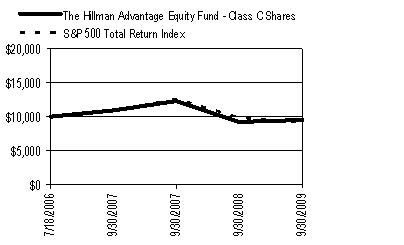
The Hillman Advantage Equity Fund Class C Shares
Performance Update - $10,000 Investment (Unaudited)
For the period from July 18, 2006 (Date of Initial Public Offering) to September 30, 2009
 | Performance Returns for the periods ended September 30, 2009 | ||||||||
Average Annual Total Returns | One Year | Since Inception* | Gross Expense Ratio** | ||||||
The Hillman Advantage Equity Fund Class C Shares - No Sales Load | 3.03% | (1.54)% | 3.41% | ||||||
Cumulative Total Investment Returns | Since Inception* | Final Value of $10,000 Investment | |||||||
The Hillman Advantage Equity Fund Class C Shares - No Sales Load | (4.85)% | $9,515 | |||||||
| S&P 500 Total Return Index | (8.29)% | $9,171 | |||||||
The Hillman Advantage Equity Fund - Class C Shares | S&P 500 Total Return Index | |
| 7/18/2006 | 10,000 | 10,000 |
| 9/30/2007 | 10,919 | 10,844 |
| 9/30/2007 | 12,301 | 12,626 |
| 9/30/2008 | 9,235 | 9,852 |
| 9/30/2009 | 9,515 | 9,171 |
The graph assumes an initial $10,000 investment at July 18, 2006 (Date of Initial Public Offering). The deduction of the maximum contingent deferred sales charge (“CDSC”) is not reflected in the graph or chart above because the 1% CDSC for the Class C Shares is imposed on proceeds redeemed within 1 year of the purchase date. The CDSC may be waived or reduced under certain circumstances. All dividends and distributions are reinvested. This graph depicts the performance of The Hillman Advantage Equity Fund – Class C Shares (the “Fund”) versus the S&P 500 Total Return Index. It is important to note that the Fund is a professionally managed mutual fund while the index is not available for investment and is unmanaged. The comparison is shown for illustrative purposes only. * The Fund’s inception date – July 18, 2006 (Date of Initial Public Investment). ** The gross expense ratio shown is from the Fund’s prospectus dated January 28, 2009. This number may vary from the expense ratio shown elsewhere in this report because it is based on a different time period and, if applicable, does not include fee or expense waivers. |
Performance quoted above represents past performance, which is no guarantee of future results. Investment return and principal value will fluctuate so that shares, when redeemed, may be worth more or less than their original cost. Current performance may be lower or higher than the performance data quoted. An investor may obtain performance data, current to the most recent month-end, by visiting www.hillmancapital.com.
The graph and table do not reflect the deduction of taxes that a shareholder would pay on Fund distributions or the redemption of Fund shares. Average annual total returns are historical in nature and measure net investment income and capital gain or loss from portfolio investments assuming reinvestments of dividends.
Fund Expenses (Unaudited)
As a shareholder of the Fund, you incur two types of costs: (1) transaction costs, which may include CDSC fees on redemption payments and (2) ongoing costs, including management fees; distribution (12b-1) fees; and other Fund expenses. This example is intended to help you understand your ongoing costs (in dollars) of investing in the Fund and to compare these costs with the ongoing costs of investing in other mutual funds. The example is based on an investment of $1,000 invested at the beginning of the period and held for the entire period as indicated below. Actual Expenses – The first line of the table below provides information about the actual account values and actual expenses. You may use the information in this line, together with the amount you invested, to estimate the expenses that you paid over the period. Simply divide your account value by $1,000 (for example, an $8,600 account value divided by $1,000 = 8.6), then multiply the result by the number in the first line under the heading entitled “Expenses Paid During Period” to estimate the expenses you paid on your account during this period. Hypothetical Example for Comparison Purposes – The second line of the table below provides information about hypothetical account values and hypothetical expenses based on the Fund’s actual expense ratio and an assumed annual rate of return of 5% before expenses, which is not the Fund’s actual return. The hypothetical account values and expenses may not be used to estimate the actual ending account balance or expenses you paid for the period. You may use this information to compare the ongoing costs of investing in the Fund and other funds by comparing this 5% hypothetical example with the 5% hypothetical examples that appear in the shareholder reports of other funds. | |||
| Expense Example | Beginning Account Value April 1, 2009 | Ending Account Value September 30, 2009 | Expenses Paid During Period* |
| Actual | $1,000.00 | $1,407.60 | $7.42 |
| Hypothetical (5% return before expenses) | $1,000.00 | $1,018.90 | $6.23 |
* Actual expenses are based on expenses incurred in the most recent six-month period. The Fund’s annualized six-month expense ratio is 1.23%. The values under “Expenses Paid During Period” are equal to the annualized ratio multiplied by the average account value over the period, multiplied by 183/365 (to reflect the number of days in the six month period ending September 30, 2009).
| The Hillman Advantage Equity Fund | |||||||||
| Schedule of Investments | |||||||||
| As of September 30, 2009 | |||||||||
| Shares | Value (Note 1) | ||||||||
| COMMON STOCKS - 95.41% | |||||||||
| Consumer Discretionary - 13.76% | |||||||||
| Best Buy Co., Inc. | 6,100 | $ | 228,872 | ||||||
| Black & Decker Corp. | 5,300 | 245,337 | |||||||
| Harley-Davidson, Inc. | 11,600 | 266,800 | |||||||
| * | Starbucks Corp. | 13,400 | 276,710 | ||||||
| The Walt Disney Co. | 9,100 | 249,886 | |||||||
| Time Warner, Inc. | 9,600 | 276,288 | |||||||
| 1,543,893 | |||||||||
| Consumer Staples - 11.07% | |||||||||
| Campbell Soup Co. | 7,100 | 231,602 | |||||||
| Clorox Co. | 3,100 | 182,342 | |||||||
| HJ Heinz Co. | 5,600 | 222,600 | |||||||
| McCormick & Co., Inc. | 6,800 | 230,792 | |||||||
| Sysco Corp. | 6,800 | 168,980 | |||||||
| Wal-Mart Stores, Inc. | 4,200 | 206,178 | |||||||
| 1,242,494 | |||||||||
| Energy - 4.03% | |||||||||
| Exxon Mobil Corp. | 3,100 | 212,691 | |||||||
| * | Transocean Ltd | 2,800 | 239,484 | ||||||
| 452,175 | |||||||||
| Financials - 9.60% | |||||||||
| American Express Co. | 8,100 | 274,590 | |||||||
| JPMorgan Chase & Co. | 6,700 | 293,594 | |||||||
| The Allstate Corp. | 8,200 | 251,084 | |||||||
| The Goldman Sachs Group, Inc. | 1,400 | 258,090 | |||||||
| 1,077,358 | |||||||||
| Health Care - 9.80% | |||||||||
| Aetna, Inc. | 9,200 | 256,036 | |||||||
| * | Amgen, Inc. | 3,200 | 192,736 | ||||||
| Johnson & Johnson | 3,100 | 188,759 | |||||||
| Merck & Co., Inc. | 8,500 | 268,855 | |||||||
| Pfizer, Inc. | 11,700 | 193,635 | |||||||
| 1,100,021 | |||||||||
| Industrials - 15.70% | |||||||||
| 3M Co. | 3,100 | 228,780 | |||||||
| General Electric Co. | 17,900 | 293,918 | |||||||
| Goodrich Corp. | 4,500 | 244,530 | |||||||
| Honeywell International, Inc. | 6,100 | 226,615 | |||||||
| Ingersoll-Rand PLC | 9,300 | 285,231 | |||||||
| Raytheon Co. | 5,000 | 239,850 | |||||||
| The Boeing Co. | 4,500 | 243,675 | |||||||
| 1,762,599 | |||||||||
| (Continued) | |||||||||
| The Hillman Advantage Equity Fund | |||||||||
| Schedule of Investments | |||||||||
| As of September 30, 2009 | |||||||||
| Shares | Value (Note 1) | ||||||||
| COMMON STOCKS - (Continued) | |||||||||
| Information Technology - 23.35% | |||||||||
| * | Cisco Systems, Inc. | 9,700 | $ | 228,338 | |||||
| Corning, Inc. | 13,500 | 206,685 | |||||||
| * | Google, Inc. | 500 | 247,925 | ||||||
| Hewlett-Packard Co. | 5,500 | 259,655 | |||||||
| Intel Corp. | 11,500 | 225,055 | |||||||
| International Business Machines Corp. | 1,800 | 215,298 | |||||||
| Microsoft Corp. | 9,900 | 256,311 | |||||||
| Oracle Corp. | 10,200 | 212,568 | |||||||
| Texas Instruments, Inc. | 9,800 | 232,162 | |||||||
| The Western Union Co. | 14,800 | 280,016 | |||||||
| * | Yahoo!, Inc. | 14,400 | 256,464 | ||||||
| 2,620,477 | |||||||||
| Materials - 2.35% | |||||||||
| EI Du Pont de Nemours & Co. | 8,200 | 263,548 | |||||||
| 263,548 | |||||||||
| Telecommunications - 3.60% | |||||||||
| AT&T, Inc. | 8,700 | 234,987 | |||||||
| Verizon Communications, Inc. | 5,600 | 169,512 | |||||||
| 404,499 | |||||||||
| Utilities - 2.15% | |||||||||
| American Electric Power Co., Inc. | 7,800 | 241,722 | |||||||
| 241,722 | |||||||||
| Total Common Stocks (Cost $9,869,441) | 10,708,786 | ||||||||
| INVESTMENT COMPANY - 2.13% | |||||||||
| § | HighMark 100% US Treasury Money Market Fund, 0.02% | 238,864 | 238,864 | ||||||
| Total Investment Company (Cost $238,864) | 238,864 | ||||||||
| Total Value of Investments (Cost $10,108,305) - 97.54% | $ | 10,947,650 | |||||||
| Other Assets Less Liabilities - 2.46% | 275,604 | ||||||||
| Net Assets - 100% | $ | 11,223,254 | |||||||
| * | Non-income producing investment | ||||||||
| § | Represents 7 day effective yield | ||||||||
| The following acronym is used in this portfolio: | |||||||||
| PLC - Public Limited Company | |||||||||
| (Continued) | |||||||||
| The Hillman Advantage Equity Fund | |||||||||
| Schedule of Investments | |||||||||
| As of September 30, 2009 | |||||||||
| Summary of Investments by Sector | |||||||||
| % of Net | |||||||||
| Sector | Assets | Value | |||||||
| Consumer Discretionary | 13.76% | $ | 1,543,893 | ||||||
| Consumer Staples | 11.07% | 1,242,494 | |||||||
| Energy | 4.03% | 452,175 | |||||||
| Financials | 9.60% | 1,077,358 | |||||||
| Health Care | 9.80% | 1,100,021 | |||||||
| Industrials | 15.70% | 1,762,599 | |||||||
| Information Technology | 23.35% | 2,620,477 | |||||||
| Materials | 2.35% | 263,548 | |||||||
| Telecommunications | 3.60% | 404,499 | |||||||
| Utilities | 2.15% | 241,722 | |||||||
| Investment Company | 2.13% | 238,864 | |||||||
| Total | 97.54% | $ | 10,947,650 | ||||||
| See Notes to Financial Statements | |||||||||
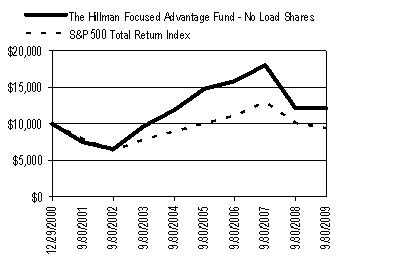
The Hillman Focused Advantage Fund No Load Shares
Performance Update - $10,000 Investment (Unaudited)
For the period from December 29, 2000 (Date of Initial Public Investment) to September 30, 2009
 | Performance Returns for the periods ended September 30, 2009 | ||||||||
Average Annual Total Returns | One Year | Five Year | Since Inception* | Gross Expense Ratio** | |||||
The Hillman Focused Advantage Fund No Load Shares | 0.43% | 0.47% | 2.26% | 1.74% | |||||
Cumulative Total Investment Returns | Since Inception* | Final Value of $10,000 Investment | |||||||
The Hillman Focused Advantage Fund No Load Shares | 21.58% | $12,158 | |||||||
| S&P 500 Total Return Index | (5.69)% | $9,431 | |||||||
The Hillman Focused Advantage Fund - No Load Shares | S&P 500 Total Return Index | |
| 12/29/2000 | 10,000 | 10,000 |
| 9/30/2001 | 7,500 | 7,961 |
| 9/30/2002 | 6,550 | 6,330 |
| 9/30/2003 | 9,668 | 7,874 |
| 9/30/2004 | 11,874 | 8,967 |
| 9/30/2005 | 14,806 | 10,065 |
| 9/30/2006 | 15,866 | 11,151 |
| 9/30/2007 | 18,057 | 12,984 |
| 9/30/2008 | 12,106 | 10,131 |
| 9/30/2009 | 12,158 | 9,431 |
The graph assumes an initial $10,000 investment at December 29, 2000 (Date of Initial Public Investment). All dividends and distributions are reinvested. This graph depicts the performance of The Hillman Focused Advantage Fund - No Load Shares (the “Fund”) versus the S&P 500 Total Return Index. It is important to note that the Fund is a professionally managed mutual fund while the index is not available for investment and is unmanaged. The comparison is shown for illustrative purposes only. * The Fund’s inception date – December 29, 2000 (Date of Initial Public Investment). ** The gross expense ratio shown is from the Fund’s prospectus dated January 28, 2009. This number may vary from the expense ratio shown elsewhere in this report because it is based on a different time period and, if applicable, does not include fee or expense waivers. |
Performance quoted above represents past performance, which is no guarantee of future results. Investment return and principal value will fluctuate so that shares, when redeemed, may be worth more or less than their original cost. Current performance may be lower or higher than the performance data quoted. An investor may obtain performance data, current to the most recent month-end, by visiting www.hillmancapital.com.
The graph and table do not reflect the deduction of taxes that a shareholder would pay on Fund distributions or the redemption of Fund shares. Average annual total returns are historical in nature and measure net investment income and capital gain or loss from portfolio investments assuming reinvestments of dividends.
Fund Expenses (Unaudited)
As a shareholder of the Fund, you incur ongoing costs, including management fees; distribution (12b-1) fees; and other Fund expenses. This example is intended to help you understand your ongoing costs (in dollars) of investing in the Fund and to compare these costs with the ongoing costs of investing in other mutual funds. The example is based on an investment of $1,000 invested at the beginning of the period and held for the entire period as indicated below. Actual Expenses – The first line of the table below provides information about the actual account values and actual expenses. You may use the information in this line, together with the amount you invested, to estimate the expenses that you paid over the period. Simply divide your account value by $1,000 (for example, an $8,600 account value divided by $1,000 = 8.6), then multiply the result by the number in the first line under the heading entitled “Expenses Paid During Period” to estimate the expenses you paid on your account during this period. Hypothetical Example for Comparison Purposes – The second line of the table below provides information about hypothetical account values and hypothetical expenses based on the Fund’s actual expense ratio and an assumed annual rate of return of 5% before expenses, which is not the Fund’s actual return. The hypothetical account values and expenses may not be used to estimate the actual ending account balance or expenses you paid for the period. You may use this information to compare the ongoing costs of investing in the Fund and other funds by comparing this 5% hypothetical example with the 5% hypothetical examples that appear in the shareholder reports of other funds. | |||
| Expense Example | Beginning Account Value April 1, 2009 | Ending Account Value September 30, 2009 | Expenses Paid During Period* |
| Actual | $1,000.00 | $1,443.10 | $8.88 |
| Hypothetical (5% return before expenses) | $1,000.00 | $1,017.80 | $7.33 |
* Actual expenses are based on expenses incurred in the most recent six-month period. The Fund’s annualized six-month expense ratio is 1.45%. The values under “Expenses Paid During Period” are equal to the annualized ratio multiplied by the average account value over the period, multiplied by 183/365 (to reflect the number of days in the six month period ending September 30, 2009).
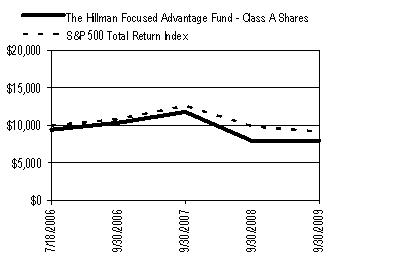
The Hillman Focused Advantage Fund Class A Shares
Performance Update - $10,000 Investment (Unaudited)
For the period from July 18, 2006 (Date of Initial Public Offering) to September 30, 2009
 | Performance Returns for the periods ended September 30, 2009 | ||||||||
Average Annual Total Returns | One Year | Since Inception* | Gross Expense Ratio** | ||||||
The Hillman Focused Advantage Fund Class A Shares - No Sales Load | 0.47% | (5.18)% | 1.74% | ||||||
| The Hillman Focused Advantage Fund Class A Shares - 5.75% Maximum Sales Load | (5.30)% | (6.92)% | 1.74% | ||||||
Cumulative Total Investment Returns | Since Inception* | Final Value of $10,000 Investment | |||||||
The Hillman Focused Advantage Fund Class A Shares - No Sales Load | (15.68)% | $8,432 | |||||||
| The Hillman Focused Advantage Fund Class A Shares - 5.75% Maximum Sales Load | (20.53)% | $7,947 | |||||||
| S&P 500 Total Return Index | (8.29)% | $9,171 | |||||||
The Hillman Focused Advantage Fund - Class A Shares | S&P 500 Total Return Index | |
| 7/18/2006 | 9,425 | 10,000 |
| 9/30/2006 | 10,343 | 10,844 |
| 9/30/2007 | 11,794 | 12,626 |
| 9/30/2008 | 7,909 | 9,852 |
| 9/30/2009 | 7,947 | 9171 |
The graph assumes an initial $10,000 investment ($9,425 after maximum sales load of 5.75%) at July 18, 2006 (Date of Initial Public Offering). All dividends and distributions are reinvested. This graph depicts the performance of The Hillman Focused Advantage Fund – Class A Shares (the “Fund”) versus the S&P 500 Total Return Index. It is important to note that the Fund is a professionally managed mutual fund while the index is not available for investment and is unmanaged. The comparison is shown for illustrative purposes only. * The Fund’s inception date – July 18, 2006 (Date of Initial Public Investment). ** The gross expense ratio shown is from the Fund’s prospectus dated January 28, 2009. This number may vary from the expense ratio shown elsewhere in this report because it is based on a different time period and, if applicable, does not include fee or expense waivers. |
Performance quoted above represents past performance, which is no guarantee of future results. Investment return and principal value will fluctuate so that shares, when redeemed, may be worth more or less than their original cost. Current performance may be lower or higher than the performance data quoted. An investor may obtain performance data, current to the most recent month-end, by visiting www.hillmancapital.com.
The graph and table do not reflect the deduction of taxes that a shareholder would pay on Fund distributions or the redemption of Fund shares. Average annual total returns are historical in nature and measure net investment income and capital gain or loss from portfolio investments assuming reinvestments of dividends.
Fund Expenses (Unaudited)
As a shareholder of the Fund, you incur two types of costs: (1) transaction costs, which may include sales charges (loads) on purchase payments and (2) ongoing costs, including management fees; distribution (12b-1) fees; and other Fund expenses. This example is intended to help you understand your ongoing costs (in dollars) of investing in the Fund and to compare these costs with the ongoing costs of investing in other mutual funds. The example is based on an investment of $1,000 invested at the beginning of the period and held for the entire period as indicated below. Actual Expenses – The first line of the table below provides information about the actual account values and actual expenses. You may use the information in this line, together with the amount you invested, to estimate the expenses that you paid over the period. Simply divide your account value by $1,000 (for example, an $8,600 account value divided by $1,000 = 8.6), then multiply the result by the number in the first line under the heading entitled “Expenses Paid During Period” to estimate the expenses you paid on your account during this period. Hypothetical Example for Comparison Purposes – The second line of the table below provides information about hypothetical account values and hypothetical expenses based on the Fund’s actual expense ratio and an assumed annual rate of return of 5% before expenses, which is not the Fund’s actual return. The hypothetical account values and expenses may not be used to estimate the actual ending account balance or expenses you paid for the period. You may use this information to compare the ongoing costs of investing in the Fund and other funds by comparing this 5% hypothetical example with the 5% hypothetical examples that appear in the shareholder reports of other funds. | |||
| Expense Example | Beginning Account Value April 1, 2009 | Ending Account Value September 30, 2009 | Expenses Paid During Period* |
| Actual | $1,000.00 | $1,444.50 | $9.13 |
| Hypothetical (5% return before expenses) | $1,000.00 | $1,017.60 | $7.54 |
* Actual expenses are based on expenses incurred in the most recent six-month period. The Fund’s annualized six-month expense ratio is 1.49%. The values under “Expenses Paid During Period” are equal to the annualized ratio multiplied by the average account value over the period, multiplied by 183/365 (to reflect the number of days in the six month period ending September 30, 2009).
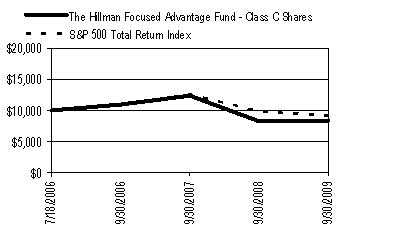
The Hillman Focused Advantage Fund Class C Shares
Performance Update - $10,000 Investment (Unaudited)
For the period from July 18, 2006 (Date of Initial Public Offering) to September 30, 2009
 | Performance Returns for the periods ended September 30, 2009 | ||||||||
Average Annual Total Returns | One Year | Since Inception* | Gross Expense Ratio** | ||||||
The Hillman Focused Advantage Fund Class C Shares - No Sales Load | (0.06)% | (5.89)% | 2.49% | ||||||
Cumulative Total Investment Returns | Since Inception* | Final Value of $10,000 Investment | |||||||
The Hillman Focused Advantage Fund Class C Shares - No Sales Load | (17.69)% | $8,231 | |||||||
| S&P 500 Total Return Index | (8.29)% | $9,171 | |||||||
The Hillman Focused Advantage Fund - Class C Shares | S&P 500 Total Return Index | |
| 7/18/2006 | 10,000 | 10,000 |
| 9/30/2006 | 10,952 | 10,844 |
| 9/30/2007 | 12,377 | 12,626 |
| 9/30/2008 | 8,245 | 9,852 |
| 9/30/2009 | 8,303 | 9,171 |
The graph assumes an initial $10,000 investment at July 18, 2006 (Date of Initial Public Offering). The deduction of the maximum contingent deferred sales charge (“CDSC”) is not reflected in the graph or chart above because the 1% CDSC for the Class C Shares is imposed on proceeds redeemed within 1 year of the purchase date. The CDSC may be waived or reduced under certain circumstances. All dividends and distributions are reinvested. This graph depicts the performance of The Hillman Focused Advantage Fund – Class C Shares (the “Fund”) versus the S&P 500 Total Return Index. It is important to note that the Fund is a professionally managed mutual fund while the index is not available for investment and is unmanaged. The comparison is shown for illustrative purposes only. * The Fund’s inception date – July 18, 2006 (Date of Initial Public Investment). ** The gross expense ratio shown is from the Fund’s prospectus dated January 28, 2009. This number may vary from the expense ratio shown elsewhere in this report because it is based on a different time period and, if applicable, does not include fee or expense waivers. |
Performance quoted above represents past performance, which is no guarantee of future results. Investment return and principal value will fluctuate so that shares, when redeemed, may be worth more or less than their original cost. Current performance may be lower or higher than the performance data quoted. An investor may obtain performance data, current to the most recent month-end, by visiting www.hillmancapital.com.
The graph and table do not reflect the deduction of taxes that a shareholder would pay on Fund distributions or the redemption of Fund shares. Average annual total returns are historical in nature and measure net investment income and capital gain or loss from portfolio investments assuming reinvestments of dividends.
Fund Expenses (Unaudited)
As a shareholder of the Fund, you incur two types of costs: (1) transaction costs, which may include CDSC fees on redemption payments and (2) ongoing costs, including management fees; distribution (12b-1) fees; and other Fund expenses. This example is intended to help you understand your ongoing costs (in dollars) of investing in the Fund and to compare these costs with the ongoing costs of investing in other mutual funds. The example is based on an investment of $1,000 invested at the beginning of the period and held for the entire period as indicated below. Actual Expenses – The first line of the table below provides information about the actual account values and actual expenses. You may use the information in this line, together with the amount you invested, to estimate the expenses that you paid over the period. Simply divide your account value by $1,000 (for example, an $8,600 account value divided by $1,000 = 8.6), then multiply the result by the number in the first line under the heading entitled “Expenses Paid During Period” to estimate the expenses you paid on your account during this period. Hypothetical Example for Comparison Purposes – The second line of the table below provides information about hypothetical account values and hypothetical expenses based on the Fund’s actual expense ratio and an assumed annual rate of return of 5% before expenses, which is not the Fund’s actual return. The hypothetical account values and expenses may not be used to estimate the actual ending account balance or expenses you paid for the period. You may use this information to compare the ongoing costs of investing in the Fund and other funds by comparing this 5% hypothetical example with the 5% hypothetical examples that appear in the shareholder reports of other funds. | |||
| Expense Example | Beginning Account Value April 1, 2009 | Ending Account Value September 30, 2009 | Expenses Paid During Period* |
| Actual | $1,000.00 | $1,437.70 | $13.38 |
| Hypothetical (5% return before expenses) | $1,000.00 | $1,014.09 | $11.06 |
* Actual expenses are based on expenses incurred in the most recent six-month period. The Fund’s annualized six-month expense ratio is 2.19%. The values under “Expenses Paid During Period” are equal to the annualized ratio multiplied by the average account value over the period, multiplied by 183/365 (to reflect the number of days in the six month period ending September 30, 2009).
| The Hillman Focused Advantage Fund | |||||||||
| Schedule of Investments | |||||||||
| As of September 30, 2009 | |||||||||
| Shares | Value (Note 1) | ||||||||
| COMMON STOCKS - 97.17% | |||||||||
| Consumer Discretionary - 5.35% | |||||||||
| * | Starbucks Corp. | 46,900 | $ | 968,485 | |||||
| 968,485 | |||||||||
| Consumer Staples - 9.32% | |||||||||
| McCormick & Co, Inc. | 24,500 | 831,530 | |||||||
| Sysco Corp. | 34,400 | 854,840 | |||||||
| 1,686,370 | |||||||||
| Energy - 8.80% | |||||||||
| Exxon Mobil Corp. | 10,000 | 686,100 | |||||||
| * | Transocean Ltd | 10,600 | 906,618 | ||||||
| 1,592,718 | |||||||||
| Financials - 10.69% | |||||||||
| JPMorgan Chase & Co. | 21,000 | 920,220 | |||||||
| The Goldman Sachs Group, Inc. | 5,500 | 1,013,925 | |||||||
| 1,934,145 | |||||||||
| Health Care - 8.25% | |||||||||
| Aetna, Inc. | 23,400 | 651,222 | |||||||
| Pfizer, Inc. | 50,800 | 840,740 | |||||||
| 1,491,962 | |||||||||
| Industrials - 21.39% | |||||||||
| General Electric Co. | 57,900 | 950,718 | |||||||
| Goodrich Corp. | 15,800 | 858,572 | |||||||
| Ingersoll-Rand PLC | 35,800 | 1,097,986 | |||||||
| The Boeing Co. | 17,800 | 963,870 | |||||||
| 3,871,146 | |||||||||
| Information Technology - 15.91% | |||||||||
| Corning, Inc. | 55,600 | 851,236 | |||||||
| Hewlett-Packard Co. | 21,600 | 1,019,736 | |||||||
| Microsoft Corp. | 38,900 | 1,007,121 | |||||||
| 2,878,093 | |||||||||
| Materials - 4.85% | |||||||||
| EI Du Pont de Nemours & Co. | 27,300 | 877,422 | |||||||
| 877,422 | |||||||||
| Telecommunications - 7.90% | |||||||||
| AT&T, Inc. | 33,400 | 902,134 | |||||||
| Verizon Communications, Inc. | 17,400 | 526,698 | |||||||
| 1,428,832 | |||||||||
| Utilities - 4.71% | |||||||||
| American Electric Power Co., Inc. | 27,500 | 852,225 | |||||||
| 852,225 | |||||||||
| Total Common Stocks (Cost $19,470,961) | 17,581,398 | ||||||||
| (Continued) | |||||||||
| The Hillman Focused Advantage Fund | |||||||||
| Schedule of Investments | |||||||||
| As of September 30, 2009 | |||||||||
| Shares | Value (Note 1) | ||||||||
| INVESTMENT COMPANY - 2.78% | |||||||||
| § | HighMark 100% US Treasury Money Market Fund, 0.02% | 502,501 | $ | 502,501 | |||||
| Total Investment Company (Cost $502,501) | 502,501 | ||||||||
| Total Value of Investments (Cost $19,973,462) - 99.95% | $ | 18,083,899 | |||||||
| Other Assets Less Liabilities - 0.05% | 9,872 | ||||||||
| Net Assets - 100% | $ | 18,093,771 | |||||||
| * | Non-income producing investment | ||||||||
| § | Represents 7 day effective yield | ||||||||
| The following acronym is used in this portfolio: | |||||||||
| PLC - Public Limited Company | �� | ||||||||
| Summary of Investments by Sector | |||||||||
| % of Net | |||||||||
| Sector | Assets | Value | |||||||
| Consumer Discretionary | 5.35% | $ | 968,485 | ||||||
| Consumer Staples | 9.32% | 1,686,370 | |||||||
| Energy | 8.80% | 1,592,718 | |||||||
| Financials | 10.69% | 1,934,145 | |||||||
| Health Care | 8.25% | 1,491,962 | |||||||
| Industrials | 21.39% | 3,871,146 | |||||||
| Information Technology | 15.91% | 2,878,093 | |||||||
| Materials | 4.85% | 877,422 | |||||||
| Telecommunications | 7.90% | 1,428,832 | |||||||
| Utilities | 4.71% | 852,225 | |||||||
| Investment Company | 2.78% | 502,501 | |||||||
| Total | 99.95% | $ | 18,083,899 | ||||||
| See Notes to Financial Statements | |||||||||
| Hillman Capital Management Funds | |||||||||||
| Statements of Assets and Liabilities | |||||||||||
| Advantage Equity | Focused Advantage | ||||||||||
| As of September 30, 2009 | Fund | Fund | |||||||||
| Assets: | |||||||||||
| Investments, at cost | $ | 10,108,305 | $ | 19,973,462 | |||||||
Investments, at value (note 1) | $ | 10,947,650 | $ | 18,083,899 | |||||||
| Receivables: | |||||||||||
| Fund shares sold | 250,720 | 51,509 | |||||||||
| Dividends and interest | 14,830 | 17,356 | |||||||||
| Prepaid expenses | |||||||||||
| Fund accounting fees | 4,527 | 5,234 | |||||||||
| Compliance services fees | 646 | 646 | |||||||||
| Other expenses | 18,592 | 20,227 | |||||||||
| Due from affiliates: | |||||||||||
Advisor (note 2) | 11,157 | - | |||||||||
| Total Assets | 11,248,122 | 18,178,871 | |||||||||
| Liabilities: | |||||||||||
| Payables: | |||||||||||
| Fund shares repurchased | 203 | 52,005 | |||||||||
| Distributions | 418 | 2,265 | |||||||||
| Accrued expenses | 24,247 | 25,807 | |||||||||
| Due to affiliates: | |||||||||||
Advisor (note 2) | - | 5,023 | |||||||||
| Total Liabilities | 24,868 | 85,100 | |||||||||
| Net Assets | $ | 11,223,254 | $ | 18,093,771 | |||||||
| Net Assets Consist of: | |||||||||||
| Capital | $ | 13,431,703 | $ | 48,924,045 | |||||||
| Undistributed net investment income | 12,193 | 188,027 | |||||||||
| Accumulated net realized loss on investments | (3,059,987) | (29,128,738) | |||||||||
| Net unrealized appreciation (depreciation) in investments | 839,345 | (1,889,563) | |||||||||
| Total Net Assets | $ | 11,223,254 | $ | 18,093,771 | |||||||
| No Load Shares Outstanding, no par value (unlimited shares authorized) | 1,120,865 | 1,802,059 | |||||||||
| Net Assets - No Load Shares | $ | 11,192,438 | $ | 17,444,604 | |||||||
| Net Asset Value, Maximum Offering Price and Redemption Price Per Share | $ | 9.99 | $ | 9.68 | |||||||
| Class A Shares Outstanding, no par value (unlimited shares authorized) | 941 | 29,895 | |||||||||
| Net Assets - Class A Shares | $ | 9,580 | $ | 289,935 | |||||||
| Net Asset Value and Redemption Price Per Share | $ | 10.18 | $ | 9.70 | |||||||
| Maximum Offering Price Per Share (Net Asset Value ÷ 94.25%) | $ | 10.80 | $ | 10.29 | |||||||
| Class C Shares Outstanding, no par value (unlimited shares authorized) | 2,094 | 37,084 | |||||||||
| Net Assets - Class C Shares | $ | 21,236 | $ | 359,232 | |||||||
| Net Asset Value, Maximum Offering Price and Redemption Price Per Share (a) | $ | 10.14 | $ | 9.69 | |||||||
| (a) | Class C shares have a contingent deferred sales charge (note 1). | ||||||||||
| See Notes to Financial Statements | |||||||||||
| Hillman Capital Management Funds | ||||||||||
| Statements of Operations | ||||||||||
| Advantage Equity | Focused Advantage | |||||||||
| For the fiscal year ended September 30, 2009 | Fund | Fund | ||||||||
| Investment Income: | ||||||||||
| Dividends | $ 252,864 | $ 472,979 | ||||||||
| Total Investment Income | 252,864 | 472,979 | ||||||||
| Expenses: | ||||||||||
Advisory fees (note 2) | 99,130 | 172,344 | ||||||||
Administration fees (note 2) | 24,000 | 24,484 | ||||||||
Transfer agent fees (note 2) | 40,555 | 45,310 | ||||||||
Registration and filing administration fees (note 2) | 29,962 | 29,962 | ||||||||
Fund accounting fees (note 2) | 51,991 | 52,723 | ||||||||
Compliance services fees (note 2) | 7,750 | 7,750 | ||||||||
Custody fees (note 2) | 5,514 | 8,388 | ||||||||
Distribution and service fees (note 3) | 24,911 | 45,054 | ||||||||
| Legal fees | 24,187 | 25,322 | ||||||||
| Audit and tax preparation fees | 16,500 | 16,500 | ||||||||
| Registration and filing expenses | 30,467 | 37,947 | ||||||||
| Printing expenses | 1,060 | 2,920 | ||||||||
| Trustees' fees and meeting expenses | 5,634 | 5,634 | ||||||||
| Securities pricing fees | 3,604 | 1,750 | ||||||||
| Other operating expenses | 9,687 | 24,426 | ||||||||
| Total Expenses | 374,952 | 500,514 | ||||||||
Expenses reimbursed by Advisor (note 2) | (35,423) | (28,537) | ||||||||
Expenses reimbursed by Administrator (note 2) | (92,578) | (47,862) | ||||||||
Advisory fees waived (note 2) | (99,130) | (165,499) | ||||||||
Distribution and service fees waived (note 3) | (4,358) | (6,531) | ||||||||
| Net Expenses | 143,463 | 252,085 | ||||||||
| Net Investment Income | 109,401 | 220,894 | ||||||||
| Net Realized and Unrealized (Loss) Gain from Investments: | ||||||||||
| Net realized loss from investments | (3,050,569) | (8,390,816) | ||||||||
| Change in unrealized appreciation on investments | 2,046,032 | 5,327,720 | ||||||||
| Net Realized and Unrealized Loss on Investments | (1,004,537) | (3,063,096) | ||||||||
| Net Decrease in Net Assets Resulting from Operations | $ (895,136) | $ (2,842,202) | ||||||||
| See Notes to Financial Statements | ||||||||||
| Hillman Capital Management Funds | ||||||||||||
| Statements of Changes in Net Assets | ||||||||||||
| Advantage Equity Fund | Focused Advantage Fund | |||||||||||
| For the fiscal years ended September 30, | 2009 | 2008 | 2009 | 2008 | ||||||||
| Operations: | ||||||||||||
| Net investment income | $ 109,401 | $ 171,955 | $ 220,894 | $ 834,160 | ||||||||
| Net realized (loss) gain from investment transactions | (3,050,569) | 524,942 | (8,390,816) | (18,075,122) | ||||||||
| Capital gain distributions from other | ||||||||||||
| investment companies | - | 27,536 | - | 193,293 | ||||||||
| Change in unrealized appreciation/depreciation | ||||||||||||
| on investments | 2,046,032 | (6,452,019) | 5,327,720 | (14,573,512) | ||||||||
| Net Decrease in Net Assets | ||||||||||||
| Resulting from Operations | (895,136) | (5,727,586) | (2,842,202) | (31,621,181) | ||||||||
Distributions to Shareholders: (note 5) | ||||||||||||
| Net investment income | ||||||||||||
| No Load Shares | (106,127) | (161,533) | (124,008) | (731,029) | ||||||||
| Class A Shares | (85) | (902) | (1,769) | (5,462) | ||||||||
| Class B Shares | (62) | (145) | (387) | (1,502) | ||||||||
| Class C Shares | (135) | (160) | (702) | (2,168) | ||||||||
| Net realized gain from investment transactions | ||||||||||||
| No Load Shares | (60,220) | (1,627,185) | (86,796) | (8,299,490) | ||||||||
| Class A Shares | (42) | (6,278) | (1,060) | (34,082) | ||||||||
| Class B Shares | (42) | (764) | (366) | (9,308) | ||||||||
| Class C Shares | (51) | (763) | (664) | (42,279) | ||||||||
| Decrease in Net Assets Resulting from Distributions | (166,764) | (1,797,730) | (215,752) | (9,125,320) | ||||||||
Capital Share Transactions: (note 6) | ||||||||||||
| No Load Shares | ||||||||||||
| Shares sold | 684,151 | 480,780 | 1,681,471 | 45,158,468 | ||||||||
| Reinvested distributions | 165,374 | 1,767,063 | 194,637 | 8,600,168 | ||||||||
| Shares repurchased | (3,010,805) | (6,301,988) | (11,096,148) | (88,916,832) | ||||||||
| Class A Shares | ||||||||||||
| Shares sold | 10,125 | 87,693 | 213,269 | 237,715 | ||||||||
| Reinvested distributions | 127 | 7,180 | 2,781 | 38,748 | ||||||||
| Shares repurchased | (52,974) | (17,314) | (200,055) | (365,832) | ||||||||
| Class B Shares | ||||||||||||
| Shares sold | - | - | 28,000 | 63,800 | ||||||||
| Reinvested distributions | 103 | 909 | 753 | 10,810 | ||||||||
| Shares repurchased | (8,145) | - | (135,348) | (12,499) | ||||||||
| Class C Shares | ||||||||||||
| Shares sold | 8,145 | 2,500 | 189,670 | 96,850 | ||||||||
| Reinvested distributions | 186 | 923 | 1,366 | 44,447 | ||||||||
| Shares repurchased | - | - | (125,958) | (206,326) | ||||||||
| Decrease in Net Assets | ||||||||||||
| Resulting from Capital Share Transactions | (2,203,713) | (3,972,254) | (9,245,562) | (35,250,483) | ||||||||
| Net Decrease in Net Assets | (3,265,613) | (11,497,570) | (12,303,516) | (75,996,984) | ||||||||
| Net Assets: | ||||||||||||
| Beginning of Year | 14,488,867 | 25,986,437 | 30,397,287 | 106,394,271 | ||||||||
| End of Year | $11,223,254 | $14,488,867 | $18,093,771 | $30,397,287 | ||||||||
| Undistributed Net Investment Income | $ 12,193 | $ 9,201 | $ 188,027 | $ 93,999 | ||||||||
| See Notes to Financial Statements | ||||||||||||
| Hillman Capital Management Funds | ||||||||||||||
| Financial Highlights | ||||||||||||||
| Advantage Equity Fund | ||||||||||||||
| For a share outstanding during the | No Load Shares | |||||||||||||
| fiscal years ended September 30, | 2009 | 2008 | 2007 | 2006 | 2005 | |||||||||
| Net Asset Value, Beginning of Year | $ 9.87 | $ 14.24 | $ 13.75 | $ 12.76 | $ 11.56 | |||||||||
| Income (Loss) from Investment Operations: | ||||||||||||||
| Net investment income | 0.09 | 0.12 | 0.07 | 0.08 | 0.09 | |||||||||
| Net realized and unrealized gain (loss) on securities | 0.16 | (3.48) | 1.53 | 1.23 | 1.40 | |||||||||
| Total from Investment Operations | 0.25 | (3.36) | 1.60 | 1.31 | 1.49 | |||||||||
| Less Distributions: | ||||||||||||||
| Dividends (from net investment income) | (0.09) | (0.11) | (0.09) | (0.15) | (0.10) | |||||||||
| Distributions (from capital gains) | (0.04) | (0.90) | (1.02) | (0.17) | (0.19) | |||||||||
| Total Distributions | (0.13) | (1.01) | (1.11) | (0.32) | (0.29) | |||||||||
| Net Asset Value, End of Year | $ 9.99 | $ 9.87 | $ 14.24 | $ 13.75 | $ 12.76 | |||||||||
| Total Return (e) | 2.96% | (25.05%) | 11.99% | 10.41% | 13.02% | |||||||||
| Net Assets, End of Year (in thousands) | $11,192 | $14,408 | $25,950 | $23,544 | $20,064 | |||||||||
| Average Net Assets for the Year (in thousands) | $ 9,885 | $19,919 | $25,544 | $20,994 | $18,682 | |||||||||
| Ratio of Gross Expenses to Average Net Assets (f) | 3.78% | 2.66% | 2.40% | 2.11% | 2.18% | |||||||||
| Ratio of Net Expenses to Average Net Assets (f) | 1.45% | 1.48% | 1.49% | 1.61% | 1.75% | |||||||||
| Ratio of Net Investment Income to Average Net Assets | 1.10% | 0.86% | 0.51% | 0.67% | 0.81% | |||||||||
| Portfolio Turnover Rate | 52.28% | 33.61% | 12.18% | 38.18% | 12.11% | |||||||||
| Advantage Equity Fund | ||||||||||||||
| For a share outstanding during the | Class A Shares | |||||||||||||
| fiscal years or period ended September 30, | 2009 | 2008 | 2007 | 2006 (a) | ||||||||||
| Net Asset Value, Beginning of Period | $ 9.96 | $ 14.38 | $ 13.79 | $ 12.62 | ||||||||||
| Income (Loss) from Investment Operations: | ||||||||||||||
| Net investment income | 0.15 | 0.09 | 0.10 | 0.02 | ||||||||||
| Net realized and unrealized gain (loss) on securities | 0.20 | (3.48) | 1.55 | 1.17 | ||||||||||
| Total from Investment Operations | 0.35 | (3.39) | 1.65 | 1.19 | ||||||||||
| Less Distributions: | ||||||||||||||
| Dividends (from net investment income) | (0.09) | (0.13) | (0.04) | (0.02) | ||||||||||
| Distributions (from capital gains) | (0.04) | (0.90) | (1.02) | - | ||||||||||
| Total Distributions | (0.13) | (1.03) | (1.06) | (0.02) | ||||||||||
| Net Asset Value, End of Period | $ 10.18 | $ 9.96 | $ 14.38 | $ 13.79 | ||||||||||
| Total Return (d)(e) | 3.94% | (25.01%) | 12.36% | 9.43% | (b) | |||||||||
| Net Assets, End of Period (in thousands) | $ 10 | $ 60 | $ 12 | $ 11 | ||||||||||
| Average Net Assets for the Period (in thousands) | $ 11 | $ 75 | $ 12 | $ 10 | ||||||||||
| Ratio of Gross Expenses to Average Net Assets (f) | 3.78% | 2.66% | 2.15% | 2.23% | (c) | |||||||||
| Ratio of Net Expenses to Average Net Assets (f) | 1.24% | 1.46% | 1.24% | 1.24% | (c) | |||||||||
| Ratio of Net Investment Income to Average Net Assets | 1.23% | 0.90% | 0.76% | 0.91% | (c) | |||||||||
| Portfolio Turnover Rate | 52.28% | 33.61% | 12.18% | 38.18% | (b) | |||||||||
| (a) | For the period from July 18, 2006 (Date of Initial Public Offering) to September 30, 2006. | |||||||||||||
| (b) | Not annualized. | |||||||||||||
| (c) | Annualized. | |||||||||||||
| (d) | Total return does not reflect payment of sales charge, if any. | |||||||||||||
| (e) | Includes adjustments in accordance with accounting principles generally accepted in the United States and, | |||||||||||||
| consequently, the net asset value for financial reporting purposes and the returns based upon those net asset | ||||||||||||||
| values may differ from the net asset values and returns for shareholder transactions. | ||||||||||||||
| (f) | The expense ratios listed reflect total expenses prior to any waivers and reimbursements (gross expense ratio) | |||||||||||||
| and after any waivers and reimbursements (net expense ratio). | ||||||||||||||
| See Notes to Financial Statements | (Continued) | |||||||||||||
| Hillman Capital Management Funds | ||||||||||||||
| Financial Highlights | ||||||||||||||
| Advantage Equity Fund | ||||||||||||||
| For a share outstanding during the | Class C Shares | |||||||||||||
| fiscal years or period ended September 30, | 2009 | 2008 | 2007 | 2006 (a) | ||||||||||
| Net Asset Value, Beginning of Period | $ 10.01 | $ 14.44 | $ 13.81 | $ 12.62 | ||||||||||
| Income (Loss) from Investment Operations: | ||||||||||||||
| Net investment income | 0.09 | 0.11 | 0.10 | 0.02 | ||||||||||
| Net realized and unrealized gain (loss) on securities | 0.17 | (3.50) | 1.55 | 1.17 | ||||||||||
| Total from Investment Operations | 0.26 | (3.39) | 1.65 | 1.19 | ||||||||||
| Less Distributions: | ||||||||||||||
| Dividends (from net investment income) | (0.09) | (0.14) | - | - | ||||||||||
| Distributions (from capital gains) | (0.04) | (0.90) | (1.02) | - | ||||||||||
| Total Distributions | (0.13) | (1.04) | (1.02) | - | ||||||||||
| Net Asset Value, End of Period | $ 10.14 | $ 10.01 | $ 14.44 | $ 13.81 | ||||||||||
| Total Return (d)(e) | 3.03% | (24.87%) | 12.33% | 9.43% | (b) | |||||||||
| Net Assets, End of Period (in thousands) | $ 21 | $ 11 | $ 12 | $ 11 | ||||||||||
| Average Net Assets for the Period (in thousands) | $ 12 | $ 12 | $ 12 | $ 10 | ||||||||||
| Ratio of Gross Expenses to Average Net Assets (f) | 4.53% | 3.41% | 2.15% | 2.23% | (c) | |||||||||
| Ratio of Net Expenses to Average Net Assets (f) | 1.25% | 1.36% | 1.24% | 1.24% | (c) | |||||||||
| Ratio of Net Investment Income to Average Net Assets | 1.15% | 1.02% | 0.76% | 0.91% | (c) | |||||||||
| Portfolio Turnover Rate | 52.28% | 33.61% | 12.18% | 38.18% | (b) | |||||||||
| Focused Advantage Fund | ||||||||||||||
| For a share outstanding during the | No Load Shares | |||||||||||||
| fiscal years ended September 30, | 2009 | 2008 | 2007 | 2006 | 2005 | |||||||||
| Net Asset Value, Beginning of Year | $ 9.76 | $ 16.15 | $ 15.26 | $ 14.73 | $ 11.82 | |||||||||
| Income (Loss) from Investment Operations: | ||||||||||||||
| Net investment income | 0.13 | 0.20 | 0.09 | 0.09 | - | |||||||||
| Net realized and unrealized (loss) gain on securities | (0.11) | (5.17) | 1.97 | 0.95 | 2.92 | |||||||||
| Total from Investment Operations | 0.02 | (4.97) | 2.06 | 1.04 | 2.92 | |||||||||
| Less Distributions: | ||||||||||||||
| Dividends (from net investment income) | (0.06) | (0.17) | (0.13) | (0.09) | (0.01) | |||||||||
| Distributions (from capital gains) | (0.04) | (1.25) | (1.04) | (0.42) | - | |||||||||
| Total Distributions | (0.10) | (1.42) | (1.17) | (0.51) | (0.01) | |||||||||
| Net Asset Value, End of Year | $ 9.68 | $ 9.76 | $ 16.15 | $ 15.26 | $ 14.73 | |||||||||
| Total Return (e) | 0.43% | (32.96%) | 13.81% | 7.15% | 24.69% | |||||||||
| Net Assets, End of Year (in thousands) | $17,445 | $29,674 | $105,093 | $78,144 | $65,180 | |||||||||
| Average Net Assets for the Year (in thousands) | $16,774 | $84,158 | $ 93,766 | $88,103 | $32,265 | |||||||||
| Ratio of Gross Expenses to Average Net Assets (f) | 2.89% | 1.74% | 1.71% | 1.62% | 1.89% | |||||||||
| Ratio of Net Expenses to Average Net Assets (f) | 1.45% | 1.48% | 1.48% | 1.53% | 1.75% | |||||||||
| Ratio of Net Investment Income to Average Net Assets | 1.29% | 0.98% | 0.60% | 0.57% | 0.02% | |||||||||
| Portfolio Turnover Rate | 29.79% | 47.31% | 37.86% | 43.27% | 39.94% | |||||||||
| (a) | For the period from July 18, 2006 (Date of Initial Public Offering) to September 30, 2006. | |||||||||||||
| (b) | Not annualized. | |||||||||||||
| (c) | Annualized. | |||||||||||||
| (d) | Total return does not reflect payment of sales charge, if any. | |||||||||||||
| (e) | Includes adjustments in accordance with accounting principles generally accepted in the United States and, | |||||||||||||
| consequently, the net asset value for financial reporting purposes and the returns based upon those net asset | ||||||||||||||
| values may differ from the net asset values and returns for shareholder transactions. | ||||||||||||||
| (f) | The expense ratios listed reflect total expenses prior to any waivers and reimbursements (gross expense ratio) | |||||||||||||
| and after any waivers and reimbursements (net expense ratio). | ||||||||||||||
| See Notes to Financial Statements | (Continued) | |||||||||||||
| Hillman Capital Management Funds | ||||||||||||
| Financial Highlights | ||||||||||||
| Focused Advantage Fund | ||||||||||||
| For a share outstanding during the | Class A Shares | |||||||||||
| fiscal years or period ended September 30, | 2009 | 2008 | 2007 | 2006 (a) | ||||||||
| Net Asset Value, Beginning of Period | $ 9.78 | $ 16.21 | $ 15.31 | $ 13.97 | ||||||||
| Income (Loss) from Investment Operations: | ||||||||||||
| Net investment income | 0.08 | 0.18 | 0.06 | 0.03 | ||||||||
| Net realized and unrealized (loss) gain on securities | (0.06) | (5.17) | 2.03 | 1.33 | ||||||||
| Total from Investment Operations | 0.02 | (4.99) | 2.09 | 1.36 | ||||||||
| Less Distributions: | ||||||||||||
| Dividends (from net investment income) | (0.06) | (0.19) | (0.15) | (0.02) | ||||||||
| Distributions (from capital gains) | (0.04) | (1.25) | (1.04) | - | ||||||||
| Total Distributions | (0.10) | (1.44) | (1.19) | (0.02) | ||||||||
| Net Asset Value, End of Period | $ 9.70 | $ 9.78 | $ 16.21 | $ 15.31 | ||||||||
| Total Return (d)(e) | 0.47% | (32.94%) | 14.03% | 9.74% | (b) | |||||||
| Net Assets, End of Period (in thousands) | $ 290 | $ 294 | $ 589 | $ 11 | ||||||||
| Average Net Assets for the Period (in thousands) | $ 198 | $ 437 | $ 269 | $ 10 | ||||||||
| Ratio of Gross Expenses to Average Net Assets (f) | 2.89% | 1.74% | 1.71% | 1.58% | (c) | |||||||
| Ratio of Net Expenses to Average Net Assets (f) | 1.49% | 1.48% | 1.48% | 1.24% | (c) | |||||||
| Ratio of Net Investment Income to Average Net Assets | 1.23% | 1.17% | 0.60% | 0.93% | (c) | |||||||
| Portfolio Turnover Rate | 29.79% | 47.31% | 37.86% | 43.27% | (b) | |||||||
| Focused Advantage Fund | ||||||||||||
| For a share outstanding during the | Class C Shares | |||||||||||
| fiscal years or period ended September 30, | 2009 | 2008 | 2007 | 2006 (a) | ||||||||
| Net Asset Value, Beginning of Period | $ 9.78 | $ 16.15 | $ 15.33 | $ 13.97 | ||||||||
| (Loss) Income from Investment Operations: | ||||||||||||
| Net investment income | 0.04 | 0.06 | 0.01 | 0.03 | ||||||||
| Net realized and unrealized (loss) gain on securities | (0.06) | (5.11) | 1.91 | 1.33 | ||||||||
| Total from Investment Operations | (0.02) | (5.05) | 1.92 | 1.36 | ||||||||
| Less Distributions: | ||||||||||||
| Dividends (from net investment income) | (0.03) | (0.07) | (0.06) | - | ||||||||
| Distributions (from capital gains) | (0.04) | (1.25) | (1.04) | - | ||||||||
| Total Distributions | (0.07) | (1.32) | (1.10) | - | ||||||||
| Net Asset Value, End of Period | $ 9.69 | $ 9.78 | $ 16.15 | $ 15.33 | ||||||||
| Total Return (d)(e) | (0.06)% | (33.45%) | 13.01% | 9.74% | (b) | |||||||
| Net Assets, End of Period (in thousands) | $ 359 | $ 304 | $ 592 | $ 11 | ||||||||
| Average Net Assets for the Period (in thousands) | $ 199 | $ 303 | $ 390 | $ 10 | ||||||||
| Ratio of Gross Expenses to Average Net Assets (f) | 3.64% | 2.49% | 2.44% | 1.58% | (c) | |||||||
| Ratio of Net Expenses to Average Net Assets (f) | 2.20% | 2.21% | 2.21% | 1.24% | (c) | |||||||
| Ratio of Net Investment Loss to Average Net Assets | 0.45% | 0.38% | (0.13)% | 0.93% | (c) | |||||||
| Portfolio Turnover Rate | 29.79% | 47.31% | 37.86% | 43.27% | (b) | |||||||
| (a) | For the period from July 18, 2006 (Date of Initial Public Offering) to September 30, 2006. | |||||||||||
| (b) | Not annualized. | |||||||||||
| (c) | Annualized. | |||||||||||
| (d) | Total return does not reflect payment of sales charge, if any. | |||||||||||
| (e) | Includes adjustments in accordance with accounting principles generally accepted in the United States and, | |||||||||||
| consequently, the net asset value for financial reporting purposes and the returns based upon those net asset | ||||||||||||
| values may differ from the net asset values and returns for shareholder transactions. | ||||||||||||
| (f) | The expense ratios listed reflect total expenses prior to any waivers and reimbursements (gross expense ratio) | |||||||||||
| and after any waivers and reimbursements (net expense ratio). | ||||||||||||
| See Notes to Financial Statements | ||||||||||||
Hillman Capital Management Funds
Notes to Financial Statements
1. Organization and Significant Accounting Policies
The Hillman Advantage Equity Fund and The Hillman Focused Advantage Fund, (collectively the “Funds” and individually a “Fund”) are series funds. The Funds are part of the Hillman Capital Management Investment Trust (the “Trust”), which was organized as a Delaware Business Statutory Trust and is registered under the Investment Company Act of 1940, (the “1940 Act”), as amended, as an open-ended management investment company.
The Hillman Advantage Equity Fund (“Advantage Equity Fund”) commenced operations on December 29, 2000. The investment objective of the Fund is to seek maximum total return through a combination of long-term capital appreciation and current income.
The Hillman Focused Advantage Fund (“Focused Advantage Fund”) commenced operations on December 29, 2000. The investment objective of the Fund is to seek long-term capital appreciation.
The Board of Trustees of the Trust (the “Trustees”) approved, on February 14, 2006, a plan to authorize three new classes of shares for both Funds designated as Class A Shares, Class B Shares, and Class C Shares. On July 18, 2006, the Class A Shares, Class B Shares, and Class C Shares became effective. The Funds currently have an unlimited number of authorized shares, which are divided into four classes – No Load Shares, Class A Shares, Class B Shares, and Class C Shares.
Between February 14, 2006, and June 15, 2009, the Funds offered four classes of shares (No Load Shares, Class A Shares, Class B Shares, and Class C Shares). On June 15, 2009, the Class B Shares of both Funds were converted into Class C Shares.
Each class of shares has equal rights as to assets of its corresponding Fund, and the classes are identical except for differences in their sales charge structures and ongoing distribution and service fees. Income, expenses (other than distribution and service fees), and realized and unrealized gains or losses on investments are allocated to each class of shares based upon its relative net assets. All classes have equal voting privileges, except where otherwise required by law or when the Trustees determine that the matter to be voted on affects only the interests of the shareholders of a particular class. The Funds’ Class C shares are sold without an initial sales charge; however, they are subject to a contingent deferred sales charge. Class C shares are charged at a rate of 1% if redeemed in the first year, which is payable to the Distributor of the Trust. Class A shares are sold with an initial sales charge of up to 5.75% of the amount invested. The No Load, Class A, and Class C shares are subject to distribution plan fees as described in Note 3. Class C shares are automatically converted into the No Load shares after ten years.
The following is a summary of significant accounting policies consistently followed by the Funds. The policies are in conformity with accounting principles generally accepted in the United States of America. In June 2009, the Financial Accounting Standards Board (“FASB”) codified its standards and accounting principles for the financial statements issued for years ending after September 15, 2009. Herein, the Funds will make reference to accounting principles generally accepted in the United States issued by FASB as Accounting Standards Codification (“ASC”).
Investment Valuation
The Funds’ investments in securities are carried at value. Securities listed on an exchange or quoted on a national market system are valued at the last sales price as of 4:00 p.m. Eastern Time. Securities traded in the NASDAQ over-the-counter market are generally valued at the NASDAQ Official Closing Price. Other securities traded in the over-the-counter market and listed securities for which no sale was reported on that date are valued at the most recent bid price. Securities and assets for which representative market quotations are not readily available or which cannot be accurately valued using the Funds’ normal pricing procedures are valued at fair value as determined in good faith under policies approved by the Trustees. Fair value pricing may be used, for example, in situations where (i) a portfolio security is so thinly traded that there have been no transactions for that security over an extended period of time; (ii) the exchange on which the portfolio security is principally traded closes early; or (iii) trading of the portfolio security is halted during the day and does not resume prior to the Funds’ net asset value calculation. A portfolio security’s “fair value” price may differ from the price next available for that portfolio security using the Funds’ normal pricing procedures. Instruments with maturities of 60 days or less are valued at amortized cost, which approximates market value.
(Continued)
Hillman Capital Management Funds
Notes to Financial Statements
Fair Value Measurement
The Funds have adopted ASC Topic 820, Fair Value Measurements, effectively October 1, 2008. ASC Topic 820 defines fair value, establishes a frame work for measuring fair value and expands disclosure about fair value measurements.
Various inputs are used in determining the value of the Funds’ investments. These inputs are summarized in the three broad levels listed below:
| a. | Level 1: quoted prices in active markets for identical securities |
| b. | Level 2: other significant observable inputs (including quoted prices for similar securities, interest rates, credit risk, etc.) |
| c. | Level 3: significant unobservable inputs (including the Funds’ own assumptions in determining fair value of investments) |
The Funds have adopted FASB guidance updating ASC Topic 820 titled, “Determining Fair Value When the Volume and Level of Activity for the Asset or Liability have Significantly Decreased and Identifying Transactions that are not Orderly” which provides guidance on determining when there has been a significant decrease in the volume and level of activity for an asset or liability, when a transaction that is not orderly, and how that information must be incorporated into fair value measurement. The guidance emphasizes that even if there has been a significant decrease in volume and level of activity for an asset or liability and regardless of the valuation techniques used, the objective of a fair value measurement remains the same.
An Investment asset’s or liability’s level within the fair value hierarchy is based on the lowest level input, individually or in aggregate, that is significant to fair value measurement.
The valuation techniques used by the Funds to measure fair value during the fiscal year ending September 30, 2009 maximized the use of observable inputs and minimized the use of unobservable inputs.
The inputs or methodology used for valuing securities are not necessarily an indication of the risk associated with investing in those securities. The following is a summary of the inputs used in valuing the Funds’ assets as of September 30, 2009:
| Advantage Equity Fund | ||||||||
| Assets | Total | Level 1 | Level 2 | Level 3 | ||||
| Common Stocks | $ | 10,708,786 | $ | 10,708,786 | $ | - - | $ | - - |
| Investment Company | 238,864 | - - | 238,864 | - - | ||||
| Total | $ | 10,947,650 | $ | 10,708,786 | $ | -238,864 | $ | - - |
| Focused Advantage Fund | ||||||||
| Assets | Total | Level 1 | Level 2 | Level 3 | ||||
| Common Stocks | $ | 17,581,398 | $ | 17,581,398 | $ | - - | $ | - - |
| Investment Company | 502,501 | - - | 502,501 | - - | ||||
| Total | $ | 18,083,899 | $ | 17,581,398 | $ | 502,501 | $ | - - |
Investment Transactions and Investment Income
Investment transactions are accounted for as of the date purchased or sold (trade date). Dividend income is recorded on the ex-dividend date. Certain dividends from foreign securities will be recorded as soon as the Trust is informed of the dividend if such information is obtained subsequent to the ex-dividend date. Interest income is recorded on the accrual basis and includes amortization of discounts and premiums. Gains and losses are determined on the identified cost basis, which is the same basis used for federal income tax purposes.
(Continued)
Hillman Capital Management Funds
Notes to Financial Statements
Expenses
The Funds bear expenses incurred specifically on their behalf as well as a portion of general trust expenses, which are allocated according to methods reviewed annually by the Trustees.
Dividend Distributions
The Funds may declare and distribute dividends from net investment income (if any) at the end of each calendar quarter. Distributions from capital gains (if any) are generally declared and distributed annually. Dividends and distributions to shareholders are recorded on ex-date.
Estimates
The preparation of financial statements in conformity with accounting principles generally accepted in the United States of America requires management to make estimates and assumptions that affect the reported amounts of assets and liabilities and disclosure of contingent assets and liabilities at the date of the financial statements and the reported amounts of increases and decreases in the net assets from operations during the reported period. Actual results could differ from those estimates.
Federal Income Taxes
No provision for income taxes is included in the accompanying financial statements, as the Funds intend to distribute to shareholders all taxable investment income and realized gains and otherwise comply with Subchapter M of the Internal Revenue Code applicable to regulated investment companies.
2. Transactions with Affiliates
Advisor
The Funds pays a monthly advisory fee to Hillman Capital Management, Inc., (the “Advisor”) based upon the average daily net assets of each Fund and calculated at an annual rate. The Advisor has agreed to waive or reduce its fees and to assume other expenses of each Fund, if necessary, in amounts that limit each Fund’s total operating expenses (exclusive of interest, taxes, brokerage fees and commissions, extraordinary expenses, and payments, if any, under a Rule 12b-1 Plan) to not more than a specified percentage of the average daily net assets of each Fund for the fiscal year ended September 30, 2009.
Fund | Advisor Fees Rate | Expense Limitation Ratio | Advisor Fees Waived | Expenses Reimbursed |
| Advantage Equity | 1.00% | 1.24% | $99,130 | $35,423 |
| Focused Advantage | 1.00% | 1.24% | $165,499 | $28,537 |
Administrator
Each Fund pays a monthly administration fee to The Nottingham Company (the “Administrator”) based upon the average daily net assets of each Fund and calculated at the annual rates as shown in the schedule below which is subject to a minimum of $2,000 per month per Fund. The Administrator also receives a fee to procure and pay the custodian for each Fund, additional compensation for fund accounting and recordkeeping services, and additional compensation for certain costs involved with the daily valuation of securities and as reimbursement for out-of-pocket expenses. A breakdown of these fees is provided in the following schedule. For the fiscal year ended September 30, 2009, the Administrator reimbursed expenses in the amounts of $92,578 to the Advantage Equity Fund and $47,862 to the Focused Advantage Fund.
Administration Fees (1) | Custody Fees (2) | Fund Accounting Fees (monthly) | Fund Accounting Asset Based | Blue Sky Administration Fees (annual) | ||||
Average Net Assets | Annual Rate | Average Net Assets | Annual Rate | Average Net Assets | Annual Rate | |||
| First $50 million | 0.125% | First $100 million | 0.020% | $2,250 | All Assets | 0.01% | $150 per state | |
| Next $50 million | 0.100% | Over $100 million | 0.009% | $750 (3) | per class | |||
| Over $100 million | 0.075% | |||||||
(1) Subject to a minimum fee of $2,000 per month (2) Subject to a minimum fee of $400 per month (3) For each additional class.
(Continued)
Hillman Capital Management Funds
Notes to Financial Statements
Compliance Services
Nottingham Compliance Services, LLC, a fully owned affiliate of The Nottingham Company, provides services which assist the Trust’s Chief Compliance Officer in monitoring and testing the policies and procedures of the Trust in conjunction with requirements under Rule 38a-1 of the Securities and Exchange Commission. It receives compensation for this service at an annual rate of $7,750 per Fund.
Transfer Agent
Nottingham Shareholder Services, LLC (“Transfer Agent”) serves as transfer, dividend paying, and shareholder servicing agent for the Funds. It receives compensation for its services based upon $15 per shareholder per year, subject to a minimum fee of $1,750 per month per Fund, plus $500 per month for each additional class of shares.
Distributor
Capital Investment Group, Inc. (the “Distributor”) serves as the Fund’s principal underwriter and distributor. The Distributor receives any sales charges imposed on purchases of shares and re-allocates a portion of such charges to dealers through whom the sale was made, if any. During the fiscal year ended September 30, 2009, there were no sales charges for the Advantage Equity Fund and sales charges of $415 for the Focused Advantage Fund.
Certain Trustees and officers of the Trust are also officers of the Advisor, the Distributor or the Administrator.
3. Distribution and Service Fees
The Trustees, including a majority of the Trustees who are not “interested persons” (as defined in the 1940 Act), of the Trust adopted distribution and service plans pursuant to Rule 12b-1 of the 1940 Act (the “Plans”) applicable to the No Load Shares, Class A Shares, Class B Shares, and Class C Shares. The 1940 Act regulates the manner in which a regulated investment company may assume costs of distributing and promoting the sales of its shares and servicing of its shareholder accounts. The Plans provide that the Fund may incur certain costs, which may not exceed 0.25% per annum of the average daily net assets of the No Load Shares and Class A Shares or 1.00% per annum of the average daily net assets of the Class B Shares or Class C Shares for each year elapsed subsequent to adoption of the Plans, for payment to the Distributor and others for items such as advertising expenses, selling expenses, commissions, travel, or other expenses reasonably intended to result in sales of No Load Shares, Class A Shares, Class B Shares, and Class C Shares in the Funds or support servicing of those classes’ shareholder accounts. See the table below for a breakout of the 12b-1 fees incurred and waived for the Advantage Equity Fund and the Focused Advantage Fund for the fiscal year ended September 30, 2009.
| Advantage Equity | Focused Advantage | |||
| Class | Incurred | Waived | Incurred | Waived |
| No Load Shares | $24,711 | $4,194 | $41,935 | $6,387 |
| Class A Shares | 28 | 20 | 495 | 17 |
| Class B Shares | 51 | 49 | 639 | 42 |
| Class C Shares | 121 | 95 | 1,985 | 85 |
4. Purchases and Sales of Investment Securities
For the fiscal year ended September 30, 2009 the aggregate cost of purchases and proceeds from sales of investment securities (excluding short-term securities) were as follows:
| Fund | Purchases of Securities | Proceeds from Sales of Securities |
| Advantage Equity | $ 5,165,700 | $ 7,693,119 |
| Focused Advantage | 5,312,256 | 16,346,029 |
There were no purchases of long-term U.S. Government Obligations for either Fund during the fiscal year ended September 30, 2009.
(Continued)
Hillman Capital Management Funds
Notes to Financial Statements
5. Federal Income Tax
Distributions are determined in accordance with Federal income tax regulations, which may differ from generally accepted accounting principles, and, therefore, may differ significantly in amount or character from net investment income and realized gains for financial reporting purposes. Financial reporting records are adjusted for permanent book/tax differences to reflect tax character but are not adjusted for temporary differences.
Management reviewed the tax positions in the open tax years of 2006, 2007, and 2008 and determined that the implementation of ASC Topic 740 “Accounting for Uncertainty in Income Taxes” had no impact on the Funds’ net assets or results of operations. As of and during the fiscal year ended September 30, 2009, the Funds do not have a liability for uncertain tax positions. The Funds recognize interest and penalties, if any, related to unrecognized tax benefits as income tax expense in the statement of operations. During the period, the Funds did not incur any interest or penalties.
Distributions during the fiscal years and period ended were characterized for tax purposes as follows:
| Distributions from | |||
| Fund | For the fiscal year ended | Ordinary Income | Long-Term Capital Gains |
| Advantage Equity | 09/30/2009 | $106,409 | $60,355 |
| 09/30/2008 | 291,078 | 1,506,652 | |
| Focused Advantage | 09/30/2009 | 215,752 | - |
| 09/30/2008 | 2,124,349 | 7,000,971 | |
At September 30, 2009, the tax-basis cost of investments and components of distributable earnings were as follows:
| Advantage Equity | Focused Advantage | ||||
| Cost of Investments | $ | 10,206,827 | $ | 20,190,571 | |
| Unrealized Appreciation | $ | 1,521,657 | $ | 1,277,281 | |
| Unrealized Depreciation | (780,834) | (3,383,953) | |||
| Net Unrealized Appreciation (Depreciation) | 740,823 | (2,106,672) | |||
| Undistributed Ordinary Income | 12,193 | 188,027 | |||
| Accumulated Capital Losses | (150,250) | (21,309,002) | |||
| Other Book/Tax Differences | (2,811,215) | (7,602,627) | |||
| Distributable Earnings | $ | (2,208,449) | $ | (30,830,274) |
The difference between book-basis and tax-basis net unrealized appreciation (depreciation) is attributable to the deferral of losses from wash sales. Accumulated capital losses noted above represent net capital loss carryovers as of September 30, 2009 that may be available to offset future realized capital gains and thereby reduce future taxable gain distributions. Capital loss carryforwards for the Advantage Equity Fund and the Focused Advantage Fund in the amounts of $150,250 and $21,309,002, respectively, are set to expire September 30, 2017.
Pursuant to federal income tax regulations applicable to investment companies, recognition of capital losses on certain transactions is deferred until the subsequent tax year. Consequently, realized losses reflected in the accompanying financial statements include net capital losses realized between November 1 and the Fund’s fiscal year-end that have not been recognized for tax purposes. Other book to tax differences in the current year primarily consists of these post-October loss deferrals.
(Continued)
Hillman Capital Management Funds
Notes to Financial Statements
| 6. | Capital Share Transactions |
| For the fiscal year ended | Advantage Equity Fund | ||||
| No Load Shares | Class A Shares | ||||
| September 30, 2009 | September 30, 2008 | September 30, 2009 | September 30, 2008 | ||
| Transactions in Capital Shares | 1,194 | 6,148 | |||
| Shares sold | 75,493 | 38,588 | |||
| Reinvested distributions | 21,227 | 141,795 | 16 | 573 | |
| Shares repurchased | (435,182) | (542,887) | (6,271) | (1,574) | |
| Net (Decrease) Increase in Capital Shares | (338,462) | (362,504) | (5,061) | 5,147 | |
| Shares Outstanding, Beginning of Year | 1,459,327 | 1,821,831 | 6,002 | 855 | |
| Shares Outstanding, End of Year | 1,120,865 | 1,459,327 | 941 | 6,002 | |
| For the fiscal year ended | Advantage Equity Fund | ||||
| Class B Shares | Class C Shares | ||||
| September 30, 2009 | September 30, 2008 | September 30, 2009 | September 30, 2008 | ||
| Transactions in Capital Shares | 936 | 210 | |||
| Shares sold | - | - | |||
| Reinvested distributions | 14 | 73 | 23 | 74 | |
| Shares repurchased | (938) | - | - | - | |
| Net (Decrease) Increase in Capital Shares | (924) | 73 | 959 | 284 | |
| Shares Outstanding, Beginning of Year | 924 | 851 | 1,135 | 851 | |
| Shares Outstanding, End of Year | - | 924 | 2,094 | 1,135 | |
| For the fiscal year ended | Focused Advantage Fund | ||||
| No Load Shares | Class A Shares | ||||
| September 30, 2009 | September 30, 2008 | September 30, 2009 | September 30, 2008 | ||
| Transactions in Capital Shares | 26,863 | 18,335 | |||
| Shares sold | 213,341 | 3,385,389 | |||
| Reinvested distributions | 26,256 | 642,455 | 367 | 2,960 | |
| Shares repurchased | (1,479,090) | (7,494,988) | (27,426) | (27,531) | |
| Net Decrease in Capital Shares | (1,239,493) | (3,467,144) | (196) | (6,236) | |
| Shares Outstanding, Beginning of Year | 3,041,552 | 6,508,696 | 30,091 | 36,327 | |
| Shares Outstanding, End of Year | 1,802,059 | 3,041,552 | 29,895 | 30,091 | |
| For the fiscal year ended | Focused Advantage Fund | ||||
| Class B Shares | Class C Shares | ||||
| September 30, 2009 | September 30, 2008 | September 30, 2009 | September 30, 2008 | ||
| Transactions in Capital Shares | 23,272 | 7,306 | |||
| Shares sold | 3,738 | 5,629 | |||
| Reinvested distributions | 107 | 836 | 191 | 3,312 | |
| Shares repurchased | (16,706) | (1,042) | (17,464) | (16,201) | |
| Net (Decrease) Increase in Capital Shares | (12,861) | 5,423 | 5,999 | (5,583) | |
| Shares Outstanding, Beginning of Year | 12,861 | 7,438 | 31,085 | 36,668 | |
| Shares Outstanding, End of Year | - | 12,861 | 37,084 | 31,085 | |
(Continued)
Hillman Capital Management Funds
Notes to Financial Statements
7. Commitments and Contingencies
Under the Trust’s organizational documents, its officers and Trustees are indemnified against certain liabilities arising out of the performance of their duties to the Fund. In addition, in the normal course of business, the Fund enters into contracts with its vendors and others that provide for general indemnifications. The Fund’s maximum exposure under these arrangements is unknown, as this would involve future claims that may be made against the Fund. The Fund expects that risk of loss to be remote.
8. Subsequent Events
In accordance with the adoption of ASC Topic 855, Subsequent Events, and in preparing these financial statements, the Funds have evaluated the need for disclosures and/or adjustments resulting from subsequent events through November 30, 2009. This evaluation did not result in any subsequent events that necessitated disclosures and/or adjustments.

REPORT OF INDEPENDENT REGISTERED PUBLIC ACCOUNTING FIRM
To the Board of Trustees of
Hillman Capital Management Investment Trust
and Shareholders of The Hillman Advantage Equity Fund
and The Hillman Focused Advantage Fund
We have audited the accompanying statements of assets and liabilities of The Hillman Advantage Equity Fund and The Hillman Focused Advantage Fund, each a series of shares of Hillman Capital Management Investment Trust, including the schedules of investments, as of September 30, 2009, and the related statements of operations for the year then ended, the statements of changes in net assets for each of the two years in the period then ended, and the financial highlights for each of the five years in the period then ended. These financial statements and financial highlights are the responsibility of the Funds' management. Our responsibility is to express an opinion on these financial statements and financial highlights based on our audits.
We conducted our audits in accordance with the standards of the Public Company Accounting Oversight Board (United States). Those standards require that we plan and perform the audits to obtain reasonable assurance about whether the financial statements and financial highlights are free of material misstatement. An audit includes examining, on a test basis, evidence supporting the amounts and disclosures in the financial statements. Our procedures included confirmation of securities owned as of September 30, 2009 by correspondence with the custodian. An audit also includes assessing the accounting principles used and significant estimates made by management, as well as evaluating the overall financial statement presentation. We believe that our audits provide a reasonable basis for our opinion.
In our opinion, the financial statements and financial highlights referred to above present fairly, in all material respects, the financial position of The Hillman Advantage Equity Fund and The Hillman Focused Advantage Fund as of September 30, 2009, the results of their operations for the year then ended, the changes in their net assets for each of the two years in the period then ended, and their financial highlights for each of the five years in the period then ended, in conformity with accounting principles generally accepted in the United States of America.

BRIGGS, BUNTING & DOUGHERTY, LLP
Philadelphia, Pennsylvania
November 30, 2009
Hillman Capital Management Funds
Additional Information (Unaudited)
1. Proxy Voting Policies and Voting Record
A copy of the Trust’s Proxy Voting and Disclosure Policy and the Advisor’s Proxy Voting and Disclosure Policy are included as Appendix B to the Funds’ Statement of Additional Information and are available, (1) without charge, upon request, by calling 1-800-773-3863 and (2) on the SEC’s website at http://ww.sec.gov. Information regarding how the Funds voted proxies relating to portfolio securities during the most recent 12-month period ended June 30 will be available (1) without charge, upon request, by calling the Funds at the number above and (2) on the SEC’s website at http://www.sec.gov.
2. Quarterly Portfolio Holdings
The Funds file their complete schedule of portfolio holdings with the SEC for the first and third quarters of each fiscal year on Form N-Q. The Funds’ Forms N-Q are available on the SEC’s website at http://www.sec.gov. You may review and make copies at the SEC’s Public Reference Room in Washington, D.C. You may also obtain copies after paying a duplicating fee by writing the SEC’s Public Reference Section, Washington, D.C. 20549-0102 or by electronic request to publicinfo@sec.gov, or is available without charge, upon request, by calling the Funds at 1-800-773-3863. Information on the operation of the Public Reference Room may be obtained by calling the SEC at 1-800-SEC-0330, (1-800-732-0330).
3. Information about Trustees and Officers
The business and affairs of the Funds and the Trust are managed under the direction of the Trustees. Information concerning the Trustees and officers of the Trust and Funds is set forth below. Generally, each Trustee and officer serves an indefinite term or until certain circumstances such as their resignation, death, or otherwise as specified in the Trust’s organizational documents. Any Trustee may be removed at a meeting of shareholders by a vote meeting the requirements of the Trust’s organizational documents. The Statement of Additional Information of the Funds includes additional information about the Trustees and officers and is available, without charge, upon request by calling the Funds toll-free at 1-800-773-3863. The address of each Trustee and officer, unless otherwise indicated below, is 116 South Franklin Street, Rocky Mount, North Carolina 27804. The Independent Trustees received aggregate compensation of $5,400 during the fiscal year ended September 30, 2009 from each Fund for their services to the Funds and Trust. The Interested Trustee and officers did not receive compensation from the Funds for their services to the Funds and Trust.
Name, Age, and Address | Position(s) held with Fund/Trust | Length of Time Served | Principal Occupation(s) During Past 5 Years | Number of Portfolios in Fund Complex Overseen by Trustee | Other Directorships Held by Trustee |
| Independent Trustees | |||||
Jack E. Brinson, 77 | Trustee | Since 12/2000 | Retired since January 2000; Previously, President, Brinson Investment Co. (personal investments) and President, Brinson Chevrolet, Inc. (auto dealership). | 2 | Independent Trustee of the following – DGHM Investment Trust for the one series of that trust; Gardner Lewis Investment Trust for the two series of that trust; The Nottingham Investment Trust II for the four series of that trust; New Providence Investment Trust for the one series of that trust; Tilson Investment Trust for the two series of that trust; and Starboard Investment Trust for the two series of that trust; (all registered investment companies) |
Hillman Capital Management Funds
Additional Information (Unaudited)
Name, Age, and Address | Position(s) held with Fund/Trust | Length of Time Served | Principal Occupation(s) During Past 5 Years | Number of Portfolios in Fund Complex Overseen by Trustee | Other Directorships Held by Trustee |
James H. Speed, Jr., 56 | Trustee | Since 3/2009 | President and CEO of NC Mutual Insurance Company (insurance company) since May 2003; President of Speed Financial Group, Inc. (consulting/private investments) from March 2000 to April 2003. | 4 | Independent Trustee of the following - New Providence Investment Trust for the one series of that trust; and Tilson Investment Trust for the two series of that trust; The Nottingham Investment Trust for the four series of that trust; and Starboard Investment Trust for the two series of that trust; (all registered investment companies). Member of Board of Directors of NC Mutual Life Insurance Company. Member of Board of Directors of M&F Bancorp. |
| Interested Trustee* | |||||
Mark A. Hillman, 47 7501 Wisconsin Avenue Suite 1100 E Bethesda, MD 20814 | Trustee and President (Principal Executive Officer) | Trustee and President since 12/2000 | President, Hillman Capital Management, Inc. (investment advisor to the Funds); previously, Chief Investment Officer, Menocal Capital Management, Inc. (investment advisor). | 2 | None |
| * Basis of Interestedness. Mr. Hillman is an Interested Trustee because he is an officer of Hillman Capital Management, Inc., the investment advisor to the Funds. | |||||
| Other Officers | |||||
John D. Marriott, Jr., 48 107 Glenwood Avenue Raleigh, NC 27603 | Treasurer (Principal Financial Officer) | Since 8/2007 | Manager, Fairview Investment Services, LLC (investment services) since February, 2007; Registered Principal, Capital Investment Group, Inc. (distributor to the Funds) since 1997; previously, Managing Director of North Carolina Shareholders, LLC (transfer agent to the funds). | n/a | n/a |
C. Frank Watson III, 39 107 Glenwood Avenue Raleigh, NC 27603 | Chief Compliance Officer | Since 5/2006 | President, Fairview Investment Services, LLC since 2005; previously, President and Chief Operating Officer, The Nottingham Company (administrator to the funds). | n/a | n/a |
Angela D. Mincher, 43 | Assistant Secretary | Since 8/2008 | Systems Analyst, The Nottingham Company since 2005; previously Fund Accountant since 2001. | n/a | n/a |
A. Vason Hamrick, 32 | Secretary and Assistant Treasurer | Since 3/2007 | Corporate Counsel, The Nottingham Company since 2004. | n/a | n/a |
The Hillman Capital Management
Mutual Funds are a series of the
Hillman Capital Management Investment Trust
| For Shareholder Service Inquiries: | For Investment Advisor Inquiries: |
| Documented: | Documented: |
| Nottingham Shareholder Services, LLC | Hillman Capital Management, Inc. |
| 116 South Franklin Street | 7501 Wisconsin Avenue |
| Post Office Drawer 4365 | Suite 1100 E |
| Rocky Mount, North Carolina 27803 | Bethesda, Maryland 20814 |
| Toll-Free Telephone: | Toll-Free Telephone: |
| 1-800-773-3863 | 1-800-773-3863 |
| World Wide Web @: | World Wide Web @: |
| ncfunds.com | hillmancapital.com |
Item 2. CODE OF ETHICS.
| (a) | The registrant, as of the end of the period covered by this report, has adopted a code of ethics that applies to its Principal Executive Officer, Principal Financial Officer, and Principal Accounting Officer(s), or persons performing similar functions, regardless of whether these individuals are employed by the registrant or a third party. |
| (c) | There have been no amendments during the period covered by this report. |
| (d) | The registrant has not granted, during the period covered by this report, any waivers, including an implicit waiver. |
| (f)(1) | A copy of the code of ethics that applies to the registrant’s Principal Executive Officer and Principal Financial Officer is filed pursuant to Item 12.(a)(1) below. |
| Item 3. | AUDIT COMMITTEE FINANCIAL EXPERT. |
The registrant’s Board of Trustees has determined that the registrant has an audit committee financial expert, as defined in Item 3 of Form N-CSR, serving on its audit committee.
As of the date of this report, September 30, 2009, the registrant’s audit committee financial expert is Mr. James H. Speed, Jr. Mr. Speed is “independent” for purposes of Item 3 of Form N-CSR.
| Item 4. | PRINCIPAL ACCOUNTANT FEES AND SERVICES. |
| (a) | Audit Fees – Audit fees billed for the registrant for the fiscal years ended September 30, 2008 and September 30, 2009 are reflected in the table below. These amounts represent aggregate fees billed by the registrant’s independent accountant, Briggs, Bunting & Dougherty, LLP (“Accountant”), in connection with the annual audits of the registrant’s financial statements and for services normally provided by the Accountant in connection with the registrant’s statutory and regulatory filings. |
| Fund | 2008 | 2009 |
| The Hillman Focused Advantage Fund (formerly The Hillman Aggressive Equity Fund) | $14,000 | $14,000 |
| The Hillman Advantage Equity Fund (formerly The Hillman Total Return Fund) | $14,000 | $14,000 |
| (b) | Audit-Related Fees – There were no additional fees billed in the fiscal years ended September 30, 2008 and September 30, 2009 for assurance and related services by the Accountant that were reasonably related to the performance of the audit of the registrant’s financial statements that were not reported under paragraph (a) of this Item. |
| (c) | Tax Fees – The tax fees billed in the fiscal years ended for September 30, 2008 and September 30, 2009 for professional services rendered by the Accountant for tax compliance, tax advice, and tax planning are reflected in the table below. These services were for the completion of each fund’s federal, state, and excise tax returns and assistance with distribution calculations. |
| Fund | 2008 | 2009 |
| The Hillman Focused Advantage Fund | $2,000 | $2,500 |
| The Hillman Advantage Equity Fund | $2,000 | $2,500 |
| (d) | All Other Fees –There were no other fees billed by the Accountant which were not disclosed in Items (a) through (c) above during the fiscal years ended September 30, 2008 and September 30, 2009. |
| (e)(1) | The registrant’s Board of Trustees pre-approved the engagement of the Accountant for the last two fiscal years at an audit committee meeting of the Board of Trustees called for such purpose and will pre-approve the Accountant for each fiscal year thereafter at an audit committee meeting called for such purpose. The charter of the audit committee states that the audit committee should pre-approve any audit services and, when appropriate, evaluate and pre-approve any non-audit services provided by the Accountant to the registrant and to pre-approve, when appropriate, any non-audit services provided by the Accountant to the registrant’s investment adviser, or any entity controlling, controlled by, or under common control with the investment adviser that provides ongoing services to the registrant if the engagement relates directly to the operations and financial reporting of the registrant. |
| (2) | There were no services as described in each of paragraph (b) through (d) of this Item that were approved by the audit committee pursuant to paragraph (c)(7)(i)(C) of Rule 2-01 of Regulation S-X. |
| (f) | Not Applicable. |
| (g) | Aggregate non-audit fees billed by the Accountant to the registrant for services rendered during the fiscal years ended September 30, 2008 and September 30, 2009 were $4,000 and $5,000, respectively. There were no non-audit fees billed by the Accountant for services rendered to the registrant’s investment adviser, or any other entity controlling, controlled by, or under common control with the registrant’s investment adviser. |
(h) Not applicable.
| Item 5. | AUDIT COMMITTEE OF LISTED REGISTRANTS. |
Not applicable.
| Item 6. | SCHEDULE OF INVESTMENTS. |
A copy of the schedule of investments of unaffiliated issuers as of the close of the reporting period is included as part of the report to shareholders filed under Item 1 of this Form.
| Item 7. | DISCLOSURE OF PROXY VOTING POLICIES AND PROCEDURES FOR CLOSED-END MANAGEMENT INVESTMENT COMPANIES. |
Not applicable.
| Item 8. | PORTFOLIO MANAGERS OF CLOSED-END MANAGEMENT INVESTMENT COMPANIES. |
Not applicable.
| Item 9. | PURCHASES OF EQUITY SECURITIES BY CLOSED-END MANAGEMENT INVESTMENT COMPANY AND AFFILIATED PURCHASERS. |
Not applicable.
| Item 10. | SUBMISSION OF MATTERS TO A VOTE OF SECURITY HOLDERS. |
None.
| Item 11. | CONTROLS AND PROCEDURES. |
| (a) | The Principal Executive Officer and the Principal Financial Officer have concluded that the registrant’s disclosure controls and procedures are effective based on their evaluation of the disclosure controls and procedures as of a date within 90 days of the filing of this report. |
| (b) | There were no changes in the registrant's internal control over financial reporting that occurred during the registrant’s second fiscal quarter of the period covered by this report that have materially affected, or are reasonably likely to materially affect, the registrant’s internal control over financial reporting. |
| Item 12. | EXHIBITS. |
| (a)(1) | Code of Ethics required by Item 2 of Form N-CSR is filed herewith as Exhibit 12.(a)(1). |
| (a)(2) | Certifications required by Item 12.(a)(2) of Form N-CSR are filed herewith as Exhibit 12.(a)(2). |
| (a)(3) | Not applicable. |
| (b) | Certifications required by Item 12.(b) of Form N-CSR are filed herewith as Exhibit 12.(b). |
SIGNATURES
Pursuant to the requirements of the Securities Exchange Act of 1934 and the Investment Company Act of 1940, the registrant has duly caused this report to be signed on its behalf by the undersigned, thereunto duly authorized.
Hillman Capital Management Investment Trust
By: (Signature and Title) | /s/ Mark A. Hillman Mark A. Hillman, Trustee, President and Principal Executive Officer |
Date: December 1, 2009
Pursuant to the requirements of the Securities Exchange Act of 1934 and the Investment Company Act of 1940, this report has been signed below by the following persons on behalf of the registrant and in the capacities and on the dates indicated.
By: (Signature and Title) | /s/ Mark A. Hillman Mark A. Hillman, Trustee, President and Principal Executive Officer |
Date: December 1, 2009
| By: (Signature and Title) | /s/ John D. Marriott, Jr. John D. Marriott, Jr., Treasurer and Principal Financial Officer |
Date: December 1, 2009