UNITED STATES
SECURITIES AND EXCHANGE COMMISSION
Washington, DC 20549
FORM N-CSR
CERTIFIED SHAREHOLDER REPORT OF REGISTERED
MANAGEMENT INVESTMENT COMPANIES
Investment Company Act file number 811-10085
Hillman Capital Management Investment Trust
(Exact name of registrant as specified in charter)
116 South Franklin Street, Post Office Box 69, Rocky Mount, North Carolina 27802
(Address of principal executive offices) (Zip code)
A. Vason Hamrick
116 South Franklin Street, Post Office Box 69, Rocky Mount, North Carolina 27802
(Name and address of agent for service)
Registrant's telephone number, including area code: 252-972-9922
Date of fiscal year end: September 30
Date of reporting period: September 30, 2010
Item 1. REPORTS TO STOCKHOLDERS.
Annual Report 2010
September 30, 2010
The Hillman Advantage Equity Fund
The Hillman Focused Advantage Fund
No Load Shares
Class A Shares
Class C Shares
This report and the financial statements contained herein are submitted for the general information of the shareholders of the Hillman Capital Management Funds (“Funds”). This report is not authorized for distribution to prospective investors in the Funds unless preceded or accompanied by an effective prospectus. The Funds’ shares are not deposits or obligations of, or guaranteed by, any depository institution. The Funds’ shares are not insured by the FDIC, Federal Reserve Board or any other agency, and are subject to investment risks, including possible loss of principal amount invested. Neither the Funds nor the Funds’ distributor is a bank.
Distributor: Capital Investment Group, Inc., 17 Glenwood Ave., Raleigh, NC 27603, Phone 1-800-773-3863.
Statements in this Annual Report that reflect projections or expectations of future financial or economic performance of the Hillman Capital Management Funds (“Funds”) and of the market in general and statements of the Funds’ plans and objectives for future operations are forward-looking statements. No assurance can be given that actual results or events will not differ materially from those projected, estimated, assumed or anticipated in any such forward-looking statements. Important factors that could result in such differenc es, in addition to the other factors noted with such forward-looking statements, include, without limitation, general economic conditions such as inflation, recession and interest rates. Past performance is not a guarantee of future results. Investments in the Funds are subject to investment risks, including the possible loss of some or the entire principal amount invested. There can be no assurance that the Funds will be successful in meeting their investment objective. Investment in the Funds is subject to the following risks: market risk, management style risk, investment advisor risk, and Small-Cap and Mid-Cap companies risk. In addition to the risks outlined above, the Focused Advantage Fund is also subject to non-diversified status risk and sector focus risk. More information about these risks and other risks can be found in the Funds’ prospectus. The performance information quoted in this annual report represents past performance, which is not a guarantee of future results. Investment return and principal value of an investment will fluctuate so that an investor’s shares, when redeemed, may be worth more or less than their original cost. Current performance may be lower or higher than the performance data quoted. An investor may obtain performance data current to the most recent month-end by visiting www.hillmancapital.com. An investor should consider the investment objectives, risks, and charges and expenses of the Funds carefully before investing. The prospectus contains this and other information about the Funds. A copy of the prospectus is available at www.hillmancapital.com or by calling Shareholder Services at 1-800-773-3863. The prospectus should be read carefully before investing. |
Stated performance in the Funds was achieved at some or all points during the year by waiving or reimbursing part of the Funds’ total expenses to ensure shareholders did not absorb expenses significantly greater than the industry norm.
This Annual Report was first distributed to shareholders on or about November 29, 2010.
For More Information on your Hillman Capital Management (Hillman) Mutual Funds:
See Our Website @ www.hillmancapital.com
or
Call Our Shareholder Services Group Toll-Free at 1-800-773-3863
Letter to Shareholders
Dear Shareholder,
We are pleased to provide the annual report for the Hillman Funds for the fiscal year ended 09/30/2010.
Navigating today’s investment waters remains challenging for many investors as they seek to preserve capital and earn returns sufficient to meet their long-term objectives. Those who follow the financial media have been bombarded with rhetoric surrounding the relative merits of differing asset classes and investment approaches. We have enclosed the attached commentary to remind our shareholders of Hillman Capital Management’s mission and to provide perspective on current market conditions.
On behalf of the team at Hillman Capital Management, I thank you for your ongoing confidence. It is our hope that we may continue to serve you throughout the years to come.
Sincerely,
Mark A. Hillman
President and Chief Investment Officer
Hillman Capital Management, Inc.
Market Commentary
At Hillman Capital Management (HCM) we take a long-term approach to investing, focusing on the identification of companies with sustainable competitive advantage. Our goal is to purchase securities of what we view to be advantaged firms when they sell at a discount to our estimates of intrinsic value. We believe that our approach offers a prudent way to control risk and outperform the market over time.
Market pundits and the media have devoted considerable attention to the recent anomalous ten year decline in U.S. equities,1 an event that had not occurred on a total return basis since the Great Depression. They refer to this period as the “lost decade” for equities and highlight the relative outperformance of fixed income investing. Critics have claimed that equity investing is “dead” and that investors are better served increasing their exposure to fixed income securities. We believe that this logic is far from the truth and have devoted this commentary to an evaluation of the relative merits of fixed income investing versus equity investing in the context of today& #8217;s markets in the United States. This discussion is a reflection of our general outlook for potential returns and does not take into account any individual investor’s needs or risk profile.
Over the past decade, fixed income investors have benefitted from declining yields as the combination of highly accommodative Federal Reserve policy and a recent flight to safety have driven down the yields on many fixed income investments. Given the inverse relationship between price and yield on fixed income securities, investors in fixed income have realized benefits from price appreciation as the prevailing yield on the benchmark 10 year treasury declined from 5.8% to 2.5% over the past ten years.2
We believe that, at today’s reduced yields, investments in many fixed income securities have become increasingly speculative. In his book, The Intelligent Investor, Benjamin Graham states that “an investment operation is one which, upon thorough analysis, promises safety of principal and a satisfactory return. Operations not meeting this requirement are speculative.” Over the last fifty years, the yield on the benchmark ten-year Treasury has averaged 6.8%, and, after adjusting
_______________________
2 St. Louis Fed, 10-Year Treasury Constant Maturity Rate
for inflation, the real yield has averaged 2.6%.3 Given a stated willingness by the Federal Reserve to reengage in quantitative easing as a means of raising the inflation rate and the United States’ long history of inflation rates in excess of 2.4%, we believe that the odds of generating satisfactory real returns by holding these securities are remote. Many owners of Treasury securities may be speculating that quantitative easing will increase demand for Treasuries and drive yields down further in the short-term. Longer-term, however, we expect that current rates will not be viewed as a satisfactory return and will likely rise. We find it is often the case that when asset prices diverge too signif icantly from levels justified by their underlying cash flows, corrections may occur that are often tumultuous and difficult to time.
The root cause of poor equity performance over the past ten years can be linked more to multiple compression than to actual business results. In spite of dislocations caused by the recent recession, earnings of S&P 500 companies increased at a compound annual growth rate of 2.5% over that period.4 At the market peak in 2000, investors valued the Standard and Poor’s 500 Index at 28.8x trailing twelve month earnings versus today’s value of 16.7x trailing twelve month earnings.5 Therefore, the modest decline in equity values is a function of rising earnings paired with a lower valuation mult iple on those earnings.
We believe that for investors with a sufficient time horizon, today’s U.S. equity markets offer fertile ground to create portfolios with a high probability of principal protection and satisfactory returns. One metric that may be employed when evaluating the relative return potential of fixed income versus equities is to compare the earnings yield on the S&P 500 Index to the yield on the ten-year Treasury. As seen in the accompanying chart, the low earnings yield relative to Treasuries in the year 2000 was indicative of the relative overvaluation of equities at that time. Today, the situation appears to be reversed. Earnings yields on the S&P 500 are greater than twice the yield on Treasuries, the highest premium in nearly thirty years.
Source: Robert Shiller, online data
_______________________
5 Robert Shiller online data, Hillman Capital Management, Inc.
In times of severe market dislocations, investors often lose sight of the basic principles driving investment returns. When observing value in equity versus fixed income markets, it is important to recognize that the expected cash flow streams differ in multiple respects. The ten-year Treasury rate is often used as a proxy for a long-term risk free rate because of the near certainty of static coupon payments and return of principle. Benefits to equity holders come in multiple forms including dividends, share repurchase and reinvestment for growth. With a dividend yield of 2%, S&P 500 Index companies are paying out about one third of the earnings that they generate; the remainder is either used to reduce share count or to reinvest in the underlying businesses.
We believe that opportunities exist for U.S. companies to grow earnings over the next decade. An observation of street consensus projections demonstrates an expected 15.5% growth rate in S&P 500 operating earnings from 2010 to 2011.6 Anecdotally, we see opportunities for earnings growth at many of the companies that we follow. These opportunities include the sale of attractive new products, efficiency improvements, and macro opportunities ranging from rebounding sectors of the domestic economy to continued expansion of international operations into emerging markets.
Other prospects to generate returns for shareholders exist for firms with limited growth prospects. Increased share repurchases could add meaningfully to earnings per share. Companies could increase dividend payouts. A reversion from today’s dividend payout ratio of 33% back to a longer-run average of 49% would increase the dividend yield on the S&P 500 to 3%.7 The current disconnect between low interest rates and equity values may continue to create attractive opportunities for mergers and acquisitions.
As Benjamin Graham astutely pointed out, “in the short-term markets are a voting machine, but over the long run they are a weighing machine”. It is clear which way the market has voted given the profound shift in the levels at which investors currently value the cash flows from Treasury securities versus equity securities. However, we believe that the current activity in long-term Treasury markets is increasingly speculative. In the long-run, as investors weigh the respective cash flow streams, we believe that confidence in equities will be renewed and that greater value can be realized.
Though we remain optimistic about the long-term prospects for U.S. equities, we recognize that the path of future activity is likely to be choppy. We continue to focus our energies on the financial prospects of companies that we view to have sustainable competitive advantage and sufficient financial flexibility to weather troughs in economic activity. We believe that competitively advantaged companies will outperform their peers through economic cycles and market cycles. Our goal is to invest in great enterprises at attractive prices. We will continue to invest according to this precept for the long-term interests of our clients.
Performance Review
At the close of fiscal year 2010 the Hillman Funds are nearing their ten year anniversary. Since their inception at the outset of 2001 the Hillman Advantage Equity Fund No Load Shares and the Hillman Focused Advantage Equity Fund No Load Shares have generated positive returns of 3.65% and 2.94% respectively, in a period within which the funds benchmark, the Standard and Poor’s 500 TR Index, returned only 0.39%. For the fiscal year ended 09/30/2010, both the Hillman Advantage Equity Fund No Load Shares and the Hillman Focused Advantage Equity Fund No Load Shares underperformed their benchmark, returning 8.85% and 9.15% respectively versus a return of 10.16% for the benchmark index. We believe that the funds’ recent underperformance is largely the result of several short-term factors includin g the oil spill in the Gulf of Mexico and the continued aftershocks in financial companies resulting from the recent financial crisis. While these events have created short-term volatility in the share prices of several portfolio holdings we believe that the portfolio is currently well positioned to return to long-term relative performance trends.
7 Average payout ratio 1957 – 2007, Robert Shiller online data, Hillman Capital Management, Inc.
The Hillman Advantage Equity Fund No Load Shares
Performance Update - $10,000 Investment (Unaudited)
For the period from December 29, 2000 (Date of Initial Public Investment) to September 30, 2010
Performance Returns for the periods ended September 30, 2010 | ||||||||
Average Annual Total Returns | One Year | Five Year | Since Inception* | Gross Expense Ratio** | ||||
The Hillman Advantage Equity Fund No Load Shares | 8.85% | 0.76% | 3.65% | 3.78% | ||||
Cumulative Total Investment Returns | Since Inception* | Final Value of $10,000 Investment | ||||||
The Hillman Advantage Equity Fund No Load Shares | 41.86% | $14,186 | ||||||
S&P 500 Total Return Index | 3.90% | $10,390 | ||||||
The graph assumes an initial $10,000 investment at December 29, 2000 (Date of Initial Public Investment). All dividends and distributions are reinvested. This graph depicts the performance of The Hillman Advantage Equity Fund - No Load Shares (the “Fund”) versus the S&P 500 Total Return Index. It is important to note that the Fund is a professionally managed mutual fund while the index is not available for investment and is unmanaged. The comparison is shown for illustrative purposes only. * The Fund’s inception date – December 29, 2000 (Date of Initial Public Investment). ** The gross expense ratio shown is from the Fund’s prospectus dated January 28, 2010. This number may vary from the expense ratio shown elsewhere in this report because it is based on a different time period and, if applicable, does not include fee or expense waivers. |
Performance quoted above represents past performance, which is no guarantee of future results. Investment return and principal value will fluctuate so that shares, when redeemed, may be worth more or less than their original cost. Current performance may be lower or higher than the performance data quoted. An investor may obtain performance data, current to the most recent month-end, by visiting www.hillmancapital.com.
The graph and table do not reflect the deduction of taxes that a shareholder would pay on Fund distributions or the redemption of Fund shares. Average annual total returns are historical in nature and measure net investment income and capital gain or loss from portfolio investments assuming reinvestments of dividends.
Fund Expenses (Unaudited)
As a shareholder of the Fund, you incur ongoing costs, including management fees; distribution (12b-1) fees; and other Fund expenses. This example is intended to help you understand your ongoing costs (in dollars) of investing in the Fund and to compare these costs with the ongoing costs of investing in other mutual funds. The example is based on an investment of $1,000 invested at the beginning of the period and held for the entire period as indicated below. Actual Expenses – The first line of the table below provides information about the actual account values and actual expenses. You may use the information in this line, together with the amount you invested, to estimate the expenses that you paid over the period. Simply divide your account value by $1,000 (for example, an $8,600 account value divided by $1,000 = 8.6), then multiply the result by the number in the first line under the heading entitled “Expenses Paid During Period” to estimate the expenses you paid on your account during this period. Hypothetical Example for Comparison Purposes – The second line of the table below provides information about hypothetical account values and hypothetical expenses based on the Fund’s actual expense ratio and an assumed annual rate of return of 5% before expenses, which is not the Fund’s actual return. The hypothetical account values and expenses may not be used to estimate the actual ending account balance or expenses you paid for the period. You may use this information to compare the ongoing costs of investing in the Fund and other funds by comparing this 5% hypothetical example with the 5% hypothetical examples that appear in the shareholder reports of other funds. | |||
Expense Example | Beginning Account Value April 1, 2010 | Ending Account Value September 30, 2010 | Expenses Paid During Period* |
Actual | $1,000.00 | $965.30 | $17.14 |
Hypothetical (5% return before expenses) | $1,000.00 | $1,007.62 | $17.51 |
* Actual expenses are based on expenses incurred in the most recent six-month period. The Fund’s annualized six-month expense ratio is 3.48%. The values under “Expenses Paid During Period” are equal to the annualized ratio multiplied by the average account value over the period, multiplied by 183/365 (to reflect the number of days in the six month period ending September 30, 2010).
The Hillman Advantage Equity Fund Class A Shares
Performance Update - $10,000 Investment (Unaudited)
For the period from July 18, 2006 (Date of Initial Public Offering) to September 30, 2010
Performance Returns for the periods ended September 30, 2010 | |||||||||
Average Annual Total Returns | One Year | Since Inception* | Gross Expense Ratio** | ||||||
The Hillman Advantage Equity Fund Class A Shares - No Sales Load | 8.98% | 1.03% | 3.78% | ||||||
The Hillman Advantage Equity Fund Class A Shares - 5.75% Maximum Sales Load | 2.71% | (0.38)% | 3.78% | ||||||
Cumulative Total Investment Returns | Since Inception* | Final Value of $10,000 Investment | |||||||
The Hillman Advantage Equity Fund Class A Shares - No Sales Load | 4.41% | $10,441 | |||||||
The Hillman Advantage Equity Fund Class A Shares - 5.75% Maximum Sales Load | (1.59)% | $9,841 | |||||||
S&P 500 Total Return Index | 1.03% | $10,103 | |||||||
The graph assumes an initial $10,000 investment ($9,425 after maximum sales load of 5.75%) at July 18, 2006 (Date of Initial Public Offering). All dividends and distributions are reinvested. This graph depicts the performance of The Hillman Advantage Equity Fund – Class A Shares (the “Fund”) versus the S&P 500 Total Return Index. It is important to note that the Fund is a professionally managed mutual fund while the index is not available for investment and is unmanaged. The comparison is shown for illustrative purposes only. * The Fund’s inception date – July 18, 2006 (Date of Initial Public Investment). ** The gross expense ratio shown is from the Fund’s prospectus dated January 28, 2010. This number may vary from the expense ratio shown elsewhere in this report because it is based on a different time period and, if applicable, does not include fee or expense waivers. |
Performance quoted above represents past performance, which is no guarantee of future results. Investment return and principal value will fluctuate so that shares, when redeemed, may be worth more or less than their original cost. Current performance may be lower or higher than the performance data quoted. An investor may obtain performance data, current to the most recent month-end, by visiting www.hillmancapital.com.
The graph and table do not reflect the deduction of taxes that a shareholder would pay on Fund distributions or the redemption of Fund shares. Average annual total returns are historical in nature and measure net investment income and capital gain or loss from portfolio investments assuming reinvestments of dividends.
Fund Expenses (Unaudited)
As a shareholder of the Fund, you incur two types of costs: (1) transaction costs, which may include sales charges (loads) on purchase payments and (2) ongoing costs, including management fees; distribution (12b-1) fees; and other Fund expenses. This example is intended to help you understand your ongoing costs (in dollars) of investing in the Fund and to compare these costs with the ongoing costs of investing in other mutual funds. The example is based on an investment of $1,000 invested at the beginning of the period and held for the entire period as indicated below. Actual Expenses – The first line of the table below provides information about the actual account values and actual expenses. You may use the information in this line, together with the amount you invested, to estimate the expenses that you paid over the period. Simply divide your account value by $1,000 (for example, an $8,600 account value divided by $1,000 = 8.6), then multiply the result by the number in the first line under the heading entitled “Expenses Paid During Period” to estimate the expenses you paid on your account during this period. Hypothetical Example for Comparison Purposes – The second line of the table below provides information about hypothetical account values and hypothetical expenses based on the Fund’s actual expense ratio and an assumed annual rate of return of 5% before expenses, which is not the Fund’s actual return. The hypothetical account values and expenses may not be used to estimate the actual ending account balance or expenses you paid for the period. You may use this information to compare the ongoing costs of investing in the Fund and other funds by comparing this 5% hypothetical example with the 5% hypothetical examples that appear in the shareholder reports of other funds. | |||
Expense Example | Beginning Account Value April 1, 2010 | Ending Account Value September 30, 2010 | Expenses Paid During Period* |
Actual | $1,000.00 | $966.00 | $17.30 |
Hypothetical (5% return before expenses) | $1,000.00 | $1,007.47 | $17.66 |
* Actual expenses are based on expenses incurred in the most recent six-month period. The Fund’s annualized six-month expense ratio is 3.51%. The values under “Expenses Paid During Period” are equal to the annualized ratio multiplied by the average account value over the period, multiplied by 183/365 (to reflect the number of days in the six month period ending September 30, 2010).
The Hillman Advantage Equity Fund Class C Shares
Performance Update - $10,000 Investment (Unaudited)
For the period from July 18, 2006 (Date of Initial Public Offering) to September 30, 2010
Performance Returns for the periods ended September 30, 2010 | |||||||||
Average Annual Total Returns | One Year | Since Inception* | Gross Expense Ratio** | ||||||
The Hillman Advantage Equity Fund Class C Shares - No Sales Load | 8.64% | 0.79% | 4.53% | ||||||
Cumulative Total Investment Returns | Since Inception* | Final Value of $10,000 Investment | |||||||
The Hillman Advantage Equity Fund Class C Shares - No Sales Load | 3.37% | $10,337 | |||||||
S&P 500 Total Return Index | 1.03% | $10,103 | |||||||
The graph assumes an initial $10,000 investment at July 18, 2006 (Date of Initial Public Offering). The deduction of the maximum contingent deferred sales charge (“CDSC”) is not reflected in the graph or chart above because the 1% CDSC for the Class C Shares is imposed on proceeds redeemed within 1 year of the purchase date. The CDSC may be waived or reduced under certain circumstances. All dividends and distributions are reinvested. This graph depicts the performance of The Hillman Advantage Equity Fund – Class C Shares (the “Fund”) versus the S&P 500 Total Return Index. It is important to note that the Fund is a professionally managed mutual fund while the index is not available for investment and is unmanaged. The compariso n is shown for illustrative purposes only. * The Fund’s inception date – July 18, 2006 (Date of Initial Public Investment). ** The gross expense ratio shown is from the Fund’s prospectus dated January 28, 2010. This number may vary from the expense ratio shown elsewhere in this report because it is based on a different time period and, if applicable, does not include fee or expense waivers. |
Performance quoted above represents past performance, which is no guarantee of future results. Investment return and principal value will fluctuate so that shares, when redeemed, may be worth more or less than their original cost. Current performance may be lower or higher than the performance data quoted. An investor may obtain performance data, current to the most recent month-end, by visiting www.hillmancapital.com.
The graph and table do not reflect the deduction of taxes that a shareholder would pay on Fund distributions or the redemption of Fund shares. Average annual total returns are historical in nature and measure net investment income and capital gain or loss from portfolio investments assuming reinvestments of dividends.
Fund Expenses (Unaudited)
As a shareholder of the Fund, you incur two types of costs: (1) transaction costs, which may include CDSC fees on redemption payments and (2) ongoing costs, including management fees; distribution (12b-1) fees; and other Fund expenses. This example is intended to help you understand your ongoing costs (in dollars) of investing in the Fund and to compare these costs with the ongoing costs of investing in other mutual funds. The example is based on an investment of $1,000 invested at the beginning of the period and held for the entire period as indicated below. Actual Expenses – The first line of the table below provides information about the actual account values and actual expenses. You may use the information in this line, together with the amount you invested, to estimate the expenses that you paid over the period. Simply divide your account value by $1,000 (for example, an $8,600 account value divided by $1,000 = 8.6), then multiply the result by the number in the first line under the heading entitled “Expenses Paid During Period” to estimate the expenses you paid on your account during this period. Hypothetical Example for Comparison Purposes – The second line of the table below provides information about hypothetical account values and hypothetical expenses based on the Fund’s actual expense ratio and an assumed annual rate of return of 5% before expenses, which is not the Fund’s actual return. The hypothetical account values and expenses may not be used to estimate the actual ending account balance or expenses you paid for the period. You may use this information to compare the ongoing costs of investing in the Fund and other funds by comparing this 5% hypothetical example with the 5% hypothetical examples that appear in the shareholder reports of other funds. | |||
Expense Example | Beginning Account Value April 1, 2010 | Ending Account Value September 30, 2010 | Expenses Paid During Period* |
Actual | $1,000.00 | $962.30 | $20.27 |
Hypothetical (5% return before expenses) | $1,000.00 | $1,004.41 | $20.70 |
* Actual expenses are based on expenses incurred in the most recent six-month period. The Fund’s annualized six-month expense ratio is 4.12%. The values under “Expenses Paid During Period” are equal to the annualized ratio multiplied by the average account value over the period, multiplied by 183/365 (to reflect the number of days in the six month period ending September 30, 2010).
The Hillman Advantage Equity Fund | |||||||||
Schedule of Investments | |||||||||
As of September 30, 2010 | |||||||||
Shares | Value (Note 1) | ||||||||
COMMON STOCKS - 98.80% | |||||||||
Consumer Discretionary - 11.03% | |||||||||
* | Apollo Group, Inc. | 5,100 | $ | 261,885 | |||||
Best Buy Co., Inc. | 6,300 | 257,229 | |||||||
Harley-Davidson, Inc. | 8,600 | 244,584 | |||||||
Starbucks Corp. | 9,700 | 247,835 | |||||||
The Walt Disney Co. | 7,300 | 241,630 | |||||||
1,253,163 | |||||||||
Consumer Staples - 8.62% | |||||||||
Campbell Soup Co. | 7,100 | 253,825 | |||||||
Clorox Co. | 3,800 | 253,688 | |||||||
HJ Heinz Co. | 5,200 | 246,324 | |||||||
Wal-Mart Stores, Inc. | 4,200 | 224,784 | |||||||
978,621 | |||||||||
Energy - 4.55% | |||||||||
Exxon Mobil Corp. | 4,100 | 253,339 | |||||||
* | Transocean Ltd. | 4,100 | 263,589 | ||||||
516,928 | |||||||||
Financials - 12.76% | |||||||||
American Express Co. | 6,200 | 260,586 | |||||||
Bank of America Corp. | 16,100 | 210,951 | |||||||
JPMorgan Chase & Co. | 6,700 | 255,002 | |||||||
The Allstate Corp. | 8,200 | 258,710 | |||||||
The Goldman Sachs Group, Inc. | 1,400 | 202,412 | |||||||
The Western Union Co. | 14,800 | 261,516 | |||||||
1,449,177 | |||||||||
Health Care - 13.29% | |||||||||
Aetna, Inc. | 8,100 | 256,041 | |||||||
* | Amgen, Inc. | 4,500 | 247,995 | ||||||
Johnson & Johnson | 4,100 | 254,036 | |||||||
* | Laboratory Corp. of America Holdings | 3,100 | 243,133 | ||||||
Merck & Co., Inc. | 7,200 | 265,032 | |||||||
Pfizer, Inc. | 14,200 | 243,814 | |||||||
1,510,051 | |||||||||
Industrials - 15.79% | |||||||||
3M Co. | 3,100 | 268,801 | |||||||
General Electric Co. | 16,500 | 268,125 | |||||||
Goodrich Corp. | 3,400 | 250,682 | |||||||
Honeywell International, Inc. | 6,100 | 268,034 | |||||||
Ingersoll-Rand PLC | 7,000 | 249,970 | |||||||
Raytheon Co. | 5,000 | 228,550 | |||||||
The Boeing Co. | 3,900 | 259,506 | |||||||
1,793,668 | |||||||||
(Continued) |
The Hillman Advantage Equity Fund | |||||||||
Schedule of Investments | |||||||||
As of September 30, 2010 | |||||||||
Shares | Value (Note 1) | ||||||||
COMMON STOCKS - (Continued) | |||||||||
Information Technology - 23.62% | |||||||||
* | Apple, Inc. | 900 | $ | 255,375 | |||||
* | Cisco Systems, Inc. | 9,700 | 212,430 | ||||||
Corning, Inc. | 13,500 | 246,780 | |||||||
* | Google, Inc. | 500 | 262,895 | ||||||
Hewlett-Packard Co. | 5,500 | 231,385 | |||||||
Intel Corp. | 11,500 | 220,800 | |||||||
International Business Machines Corp. | 1,800 | 241,452 | |||||||
Microsoft Corp. | 10,300 | 252,247 | |||||||
Oracle Corp. | 8,600 | 230,910 | |||||||
Texas Instruments, Inc. | 9,800 | 265,972 | |||||||
* | Yahoo!, Inc. | 18,500 | 262,145 | ||||||
2,682,391 | |||||||||
Materials - 4.51% | |||||||||
EI du Pont de Nemours & Co. | 6,100 | 272,182 | |||||||
Nucor Corp. | 6,300 | 240,660 | |||||||
512,842 | |||||||||
Telecommunications - 4.63% | |||||||||
AT&T, Inc. | 8,700 | 248,820 | |||||||
Verizon Communications, Inc. | 8,500 | 277,015 | |||||||
525,835 | |||||||||
Total Common Stocks (Cost $9,829,194) | 11,222,676 | ||||||||
INVESTMENT COMPANY - 1.51% | |||||||||
§ | HighMark 100% US Treasury Money Market Fund, 0.01% | 171,522 | 171,522 | ||||||
Total Investment Company (Cost $171,522) | 171,522 | ||||||||
Total Value of Investments (Cost $10,000,717) - 100.31% | $ | 11,394,198 | |||||||
Liabilities in Excess of Other Assets - (0.31)% | (35,331) | ||||||||
Net Assets - 100% | $ | 11,358,867 | |||||||
* | Non-income producing investment | ||||||||
§ | Represents 7 day effective yield | ||||||||
The following acronym is used in this portfolio: | |||||||||
PLC - Public Limited Company | |||||||||
(Continued) |
The Hillman Advantage Equity Fund | |||||||||
Schedule of Investments | |||||||||
As of September 30, 2010 | |||||||||
Summary of Investments by Sector | |||||||||
% of Net | |||||||||
Sector | Assets | Value | |||||||
Consumer Discretionary | 11.03% | $ | 1,253,163 | ||||||
Consumer Staples | 8.62% | 978,621 | |||||||
Energy | 4.55% | 516,928 | |||||||
Financials | 12.76% | 1,449,177 | |||||||
Health Care | 13.29% | 1,510,051 | |||||||
Industrials | 15.79% | 1,793,668 | |||||||
Information Technology | 23.62% | 2,682,391 | |||||||
Materials | 4.51% | 512,842 | |||||||
Telecommunications | 4.63% | 525,835 | |||||||
Other | 1.51% | 171,522 | |||||||
Total | 100.31% | $ | 11,394,198 | ||||||
See Notes to Financial Statements | |||||||||
The Hillman Focused Advantage Fund No Load Shares
Performance Update - $10,000 (Unaudited)
For the period from December 29, 2000 (Date of Initial Public Investment) to September 30, 2010
Performance Returns for the periods ended September 30, 2010 | ||||||||
Average Annual Total Returns | One Year | Five Year | Since Inception* | Gross Expense Ratio** | ||||
The Hillman Focused Advantage Fund No Load Shares | 9.15% | (2.17)% | 2.94% | 2.89% | ||||
Cumulative Total Investment Returns | Since Inception* | Final Value of $10,000 Investment | ||||||
The Hillman Focused Advantage Fund No Load Shares | 32.71% | $13,271 | ||||||
S&P 500 Total Return Index | 3.90% | $10,390 | ||||||
The graph assumes an initial $10,000 investment at December 29, 2000 (Date of Initial Public Investment). All dividends and distributions are reinvested. This graph depicts the performance of The Hillman Focused Advantage Fund - No Load Shares (the “Fund”) versus the S&P 500 Total Return Index. It is important to note that the Fund is a professionally managed mutual fund while the index is not available for investment and is unmanaged. The comparison is shown for illustrative purposes only. * The Fund’s inception date – December 29, 2000 (Date of Initial Public Investment). ** The gross expense ratio shown is from the Fund’s prospectus dated January 28, 2010. This number may vary from the expense ratio shown elsewhere in this report because it is based on a different time period and, if applicable, does not include fee or expense waivers. |
Performance quoted above represents past performance, which is no guarantee of future results. Investment return and principal value will fluctuate so that shares, when redeemed, may be worth more or less than their original cost. Current performance may be lower or higher than the performance data quoted. An investor may obtain performance data, current to the most recent month-end, by visiting www.hillmancapital.com.
The graph and table do not reflect the deduction of taxes that a shareholder would pay on Fund distributions or the redemption of Fund shares. Average annual total returns are historical in nature and measure net investment income and capital gain or loss from portfolio investments assuming reinvestments of dividends.
Fund Expenses (Unaudited)
As a shareholder of the Fund, you incur ongoing costs, including management fees; distribution (12b-1) fees; and other Fund expenses. This example is intended to help you understand your ongoing costs (in dollars) of investing in the Fund and to compare these costs with the ongoing costs of investing in other mutual funds. The example is based on an investment of $1,000 invested at the beginning of the period and held for the entire period as indicated below. Actual Expenses – The first line of the table below provides information about the actual account values and actual expenses. You may use the information in this line, together with the amount you invested, to estimate the expenses that you paid over the period. Simply divide your account value by $1,000 (for example, an $8,600 account value divided by $1,000 = 8.6), then multiply the result by the number in the first line under the heading entitled “Expenses Paid During Period” to estimate the expenses you paid on your account during this period. Hypothetical Example for Comparison Purposes – The second line of the table below provides information about hypothetical account values and hypothetical expenses based on the Fund’s actual expense ratio and an assumed annual rate of return of 5% before expenses, which is not the Fund’s actual return. The hypothetical account values and expenses may not be used to estimate the actual ending account balance or expenses you paid for the period. You may use this information to compare the ongoing costs of investing in the Fund and other funds by comparing this 5% hypothetical example with the 5% hypothetical examples that appear in the shareholder reports of other funds. | |||
Expense Example | Beginning Account Value April 1, 2010 | Ending Account Value September 30, 2010 | Expenses Paid During Period* |
Actual | $1,000.00 | $968.50 | $13.47 |
Hypothetical (5% return before expenses) | $1,000.00 | $1,011.38 | $13.77 |
* Actual expenses are based on expenses incurred in the most recent six-month period. The Fund’s annualized six-month expense ratio is 2.73%. The values under “Expenses Paid During Period” are equal to the annualized ratio multiplied by the average account value over the period, multiplied by 183/365 (to reflect the number of days in the six month period ending September 30, 2010).
The Hillman Focused Advantage Fund Class A Shares
Performance Update - $10,000 Investment (Unaudited)
For the period from July 18, 2006 (Date of Initial Public Offering) to September 30, 2010
Performance Returns for the periods ended September 30, 2010 | |||||||||
Average Annual Total Returns | One Year | Since Inception* | Gross Expense Ratio** | ||||||
The Hillman Focused Advantage Fund Class A Shares - No Sales Load | 9.04% | (1.98)% | 2.89% | ||||||
The Hillman Focused Advantage Fund Class A Shares - 5.75% Maximum Sales Load | 2.77% | (3.35)% | 2.89% | ||||||
Cumulative Total Investment Returns | Since Inception* | Final Value of $10,000 Investment | |||||||
The Hillman Focused Advantage Fund Class A Shares - No Sales Load | (8.06)% | $9,194 | |||||||
The Hillman Focused Advantage Fund Class A Shares - 5.75% Maximum Sales Load | (13.35)% | $8,665 | |||||||
S&P 500 Total Return Index | 1.03% | $10,103 | |||||||
The graph assumes an initial $10,000 investment ($9,425 after maximum sales load of 5.75%) at July 18, 2006 (Date of Initial Public Offering). All dividends and distributions are reinvested. This graph depicts the performance of The Hillman Focused Advantage Fund – Class A Shares (the “Fund”) versus the S&P 500 Total Return Index. It is important to note that the Fund is a professionally managed mutual fund while the index is not available for investment and is unmanaged. The comparison is shown for illustrative purposes only. * The Fund’s inception date – July 18, 2006 (Date of Initial Public Investment). ** The gross expense ratio shown is from the Fund’s prospectus dated January 28, 2010. This number may vary from the expense ratio shown elsewhere in this report because it is based on a different time period and, if applicable, does not include fee or expense waivers. |
Performance quoted above represents past performance, which is no guarantee of future results. Investment return and principal value will fluctuate so that shares, when redeemed, may be worth more or less than their original cost. Current performance may be lower or higher than the performance data quoted. An investor may obtain performance data, current to the most recent month-end, by visiting www.hillmancapital.com.
The graph and table do not reflect the deduction of taxes that a shareholder would pay on Fund distributions or the redemption of Fund shares. Average annual total returns are historical in nature and measure net investment income and capital gain or loss from portfolio investments assuming reinvestments of dividends.
Fund Expenses (Unaudited)
As a shareholder of the Fund, you incur two types of costs: (1) transaction costs, which may include sales charges (loads) on purchase payments and (2) ongoing costs, including management fees; distribution (12b-1) fees; and other Fund expenses. This example is intended to help you understand your ongoing costs (in dollars) of investing in the Fund and to compare these costs with the ongoing costs of investing in other mutual funds. The example is based on an investment of $1,000 invested at the beginning of the period and held for the entire period as indicated below. Actual Expenses – The first line of the table below provides information about the actual account values and actual expenses. You may use the information in this line, together with the amount you invested, to estimate the expenses that you paid over the period. Simply divide your account value by $1,000 (for example, an $8,600 account value divided by $1,000 = 8.6), then multiply the result by the number in the first line under the heading entitled “Expenses Paid During Period” to estimate the expenses you paid on your account during this period. Hypothetical Example for Comparison Purposes – The second line of the table below provides information about hypothetical account values and hypothetical expenses based on the Fund’s actual expense ratio and an assumed annual rate of return of 5% before expenses, which is not the Fund’s actual return. The hypothetical account values and expenses may not be used to estimate the actual ending account balance or expenses you paid for the period. You may use this information to compare the ongoing costs of investing in the Fund and other funds by comparing this 5% hypothetical example with the 5% hypothetical examples that appear in the shareholder reports of other funds. | |||
Expense Example | Beginning Account Value April 1, 2010 | Ending Account Value September 30, 2010 | Expenses Paid During Period* |
Actual | $1,000.00 | $967.70 | $13.52 |
Hypothetical (5% return before expenses) | $1,000.00 | $1,011.33 | $13.82 |
* Actual expenses are based on expenses incurred in the most recent six-month period. The Fund’s annualized six-month expense ratio is 2.74%. The values under “Expenses Paid During Period” are equal to the annualized ratio multiplied by the average account value over the period, multiplied by 183/365 (to reflect the number of days in the six month period ending September 30, 2010).
The Hillman Focused Advantage Fund Class C Shares
Performance Update - $10,000 Investment (Unaudited)
For the period from July 18, 2006 (Date of Initial Public Offering) to September 30, 2010
Performance Returns for the periods ended September 30, 2010 | |||||||||
Average Annual Total Returns | One Year | Since Inception* | Gross Expense Ratio** | ||||||
The Hillman Focused Advantage Fund Class C Shares - No Sales Load | 8.24% | (2.71)% | 3.64% | ||||||
Cumulative Total Investment Returns | Since Inception* | Final Value of $10,000 Investment | |||||||
The Hillman Focused Advantage Fund Class C Shares - No Sales Load | (10.90)% | $8,910 | |||||||
S&P 500 Total Return Index | 1.03% | $10,103 | |||||||
The graph assumes an initial $10,000 investment at July 18, 2006 (Date of Initial Public Offering). The deduction of the maximum contingent deferred sales charge (“CDSC”) is not reflected in the graph or chart above because the 1% CDSC for the Class C Shares is imposed on proceeds redeemed within 1 year of the purchase date. The CDSC may be waived or reduced under certain circumstances. All dividends and distributions are reinvested. This graph depicts the performance of The Hillman Focused Advantage Fund – Class C Shares (the “Fund”) versus the S&P 500 Total Return Index. It is important to note that the Fund is a professionally managed mutual fund while the index is not available for investment and is unmanaged. The comparis on is shown for illustrative purposes only. * The Fund’s inception date – July 18, 2006 (Date of Initial Public Investment). ** The gross expense ratio shown is from the Fund’s prospectus dated January 28, 2010. This number may vary from the expense ratio shown elsewhere in this report because it is based on a different time period and, if applicable, does not include fee or expense waivers. |
Performance quoted above represents past performance, which is no guarantee of future results. Investment return and principal value will fluctuate so that shares, when redeemed, may be worth more or less than their original cost. Current performance may be lower or higher than the performance data quoted. An investor may obtain performance data, current to the most recent month-end, by visiting www.hillmancapital.com.
The graph and table do not reflect the deduction of taxes that a shareholder would pay on Fund distributions or the redemption of Fund shares. Average annual total returns are historical in nature and measure net investment income and capital gain or loss from portfolio investments assuming reinvestments of dividends.
Fund Expenses (Unaudited)
As a shareholder of the Fund, you incur two types of costs: (1) transaction costs, which may include CDSC fees on redemption payments and (2) ongoing costs, including management fees; distribution (12b-1) fees; and other Fund expenses. This example is intended to help you understand your ongoing costs (in dollars) of investing in the Fund and to compare these costs with the ongoing costs of investing in other mutual funds. The example is based on an investment of $1,000 invested at the beginning of the period and held for the entire period as indicated below. Actual Expenses – The first line of the table below provides information about the actual account values and actual expenses. You may use the information in this line, together with the amount you invested, to estimate the expenses that you paid over the period. Simply divide your account value by $1,000 (for example, an $8,600 account value divided by $1,000 = 8.6), then multiply the result by the number in the first line under the heading entitled “Expenses Paid During Period” to estimate the expenses you paid on your account during this period. Hypothetical Example for Comparison Purposes – The second line of the table below provides information about hypothetical account values and hypothetical expenses based on the Fund’s actual expense ratio and an assumed annual rate of return of 5% before expenses, which is not the Fund’s actual return. The hypothetical account values and expenses may not be used to estimate the actual ending account balance or expenses you paid for the period. You may use this information to compare the ongoing costs of investing in the Fund and other funds by comparing this 5% hypothetical example with the 5% hypothetical examples that appear in the shareholder reports of other funds. | |||
Expense Example | Beginning Account Value April 1, 2010 | Ending Account Value September 30, 2010 | Expenses Paid During Period* |
Actual | $1,000.00 | $963.90 | $17.13 |
Hypothetical (5% return before expenses) | $1,000.00 | $1,007.62 | $17.51 |
* Actual expenses are based on expenses incurred in the most recent six-month period. The Fund’s annualized six-month expense ratio is 3.48%. The values under “Expenses Paid During Period” are equal to the annualized ratio multiplied by the average account value over the period, multiplied by 183/365 (to reflect the number of days in the six month period ending September 30, 2010).
The Hillman Focused Advantage Fund | |||||||||
Schedule of Investments | |||||||||
As of September 30, 2010 | |||||||||
Shares | Value (Note 1) | ||||||||
COMMON STOCKS - 99.20% | |||||||||
Consumer Discretionary - 5.03% | |||||||||
Starbucks Corp. | 28,500 | $ | 728,175 | ||||||
728,175 | |||||||||
Energy - 8.97% | |||||||||
Exxon Mobil Corp. | 10,000 | 617,900 | |||||||
* | Transocean Ltd. | 10,600 | 681,474 | ||||||
1,299,374 | |||||||||
Financials - 19.77% | |||||||||
Bank of America Corp. | 52,800 | 691,812 | |||||||
JPMorgan Chase & Co. | 18,300 | 696,498 | |||||||
The Goldman Sachs Group, Inc. | 4,900 | 708,442 | |||||||
The Western Union Co. | 43,500 | 768,645 | |||||||
2,865,397 | |||||||||
Health Care - 10.11% | |||||||||
Aetna, Inc. | 23,400 | 739,674 | |||||||
Pfizer, Inc. | 42,200 | 724,574 | |||||||
1,464,248 | |||||||||
Industrials - 20.46% | |||||||||
General Electric Co. | 44,100 | 716,625 | |||||||
Goodrich Corp. | 10,400 | 766,792 | |||||||
Ingersoll-Rand PLC | 20,800 | 742,768 | |||||||
The Boeing Co. | 11,100 | 738,594 | |||||||
2,964,779 | |||||||||
Information Technology - 20.61% | |||||||||
* | Apple, Inc. | 2,600 | 737,750 | ||||||
Corning, Inc. | 41,400 | 756,792 | |||||||
Hewlett-Packard Co. | 17,600 | 740,432 | |||||||
Microsoft Corp. | 30,700 | 751,843 | |||||||
2,986,817 | |||||||||
Materials - 5.20% | |||||||||
EI du Pont de Nemours & Co. | 16,900 | 754,078 | |||||||
754,078 | |||||||||
Telecommunications - 9.05% | |||||||||
AT&T, Inc. | 26,000 | 743,600 | |||||||
Verizon Communications, Inc. | 17,400 | 567,066 | |||||||
1,310,666 | |||||||||
Total Common Stocks (Cost $15,544,268) | 14,373,534 | ||||||||
(Continued) |
The Hillman Focused Advantage Fund | |||||||||
Schedule of Investments | |||||||||
As of September 30, 2010 | |||||||||
Shares | Value (Note 1) | ||||||||
INVESTMENT COMPANY - 0.85% | |||||||||
§ | HighMark 100% US Treasury Money Market Fund, 0.01% | 123,618 | $ | 123,618 | |||||
Total Investment Company (Cost $123,618) | 123,618 | ||||||||
Total Value of Investments (Cost $15,667,886) - 100.05% | $ | 14,497,152 | |||||||
Liabilities in Excess of Other Assets - (0.05)% | (6,941) | ||||||||
Net Assets - 100% | $ | 14,490,211 | |||||||
* | Non-income producing investment | ||||||||
§ | Represents 7 day effective yield | ||||||||
The following acronym is used in this portfolio: | |||||||||
PLC - Public Limited Company | |||||||||
Summary of Investments by Sector | |||||||||
% of Net | |||||||||
Sector | Assets | Value | |||||||
Consumer Discretionary | 5.03% | $ | 728,175 | ||||||
Energy | 8.97% | 1,299,374 | |||||||
Financials | 19.77% | 2,865,397 | |||||||
Health Care | 10.11% | 1,464,248 | |||||||
Industrials | 20.46% | 2,964,779 | |||||||
Information Technology | 20.61% | 2,986,817 | |||||||
Materials | 5.20% | 754,078 | |||||||
Telecommunications | 9.05% | 1,310,666 | |||||||
Other | 0.85% | 123,618 | |||||||
Total | 100.05% | $ | 14,497,152 | ||||||
See Notes to Financial Statements |
Hillman Capital Management Funds | |||||||||||
Statements of Assets and Liabilities | |||||||||||
Advantage Equity | Focused Advantage | ||||||||||
As of September 30, 2010 | Fund | Fund | |||||||||
Assets: | |||||||||||
Investments, at cost | $ | 10,000,717 | $ | 15,667,886 | |||||||
Investments, at value (note 1) | $ | 11,394,198 | $ | 14,497,152 | |||||||
Receivables: | |||||||||||
Fund shares sold | 679 | 4,315 | |||||||||
Dividends and interest | 14,072 | 12,469 | |||||||||
Prepaid expenses | |||||||||||
Administration fees | - | 617 | |||||||||
Advisor fees | - | 116 | |||||||||
Other expenses | 6,085 | 6,964 | |||||||||
Total Assets | 11,415,034 | 14,521,633 | |||||||||
Liabilities: | |||||||||||
Payables: | |||||||||||
Fund shares repurchased | 29,608 | 5,547 | |||||||||
Accrued expenses | |||||||||||
Administration fees | 3,312 | - | |||||||||
Advisor fees | 42 | - | |||||||||
Other expenses | 23,205 | 25,875 | |||||||||
Total Liabilities | 56,167 | 31,422 | |||||||||
Net Assets | $ | 11,358,867 | $ | 14,490,211 | |||||||
Net Assets Consist of: | |||||||||||
Capital | $ | 12,545,960 | $ | 44,015,761 | |||||||
Undistributed net investment (loss) income | - | 35,629 | |||||||||
Accumulated net realized loss on investments | (2,580,574) | (28,390,445) | |||||||||
Net unrealized appreciation (depreciation) in investments | 1,393,481 | (1,170,734) | |||||||||
Net Assets | $ | 11,358,867 | $ | 14,490,211 | |||||||
No Load Shares Outstanding, no par value (unlimited shares authorized) | 1,044,471 | 1,314,814 | |||||||||
Net Assets - No Load Shares | $ | 11,325,362 | $ | 13,746,970 | |||||||
Net Asset Value, Maximum Offering Price and Redemption Price Per Share | $ | 10.84 | $ | 10.46 | |||||||
Class A Shares Outstanding, no par value (unlimited shares authorized) | 943 | 39,351 | |||||||||
Net Assets - Class A Shares | $ | 10,420 | $ | 412,051 | |||||||
Net Asset Value and Redemption Price Per Share | $ | 11.05 | $ | 10.47 | |||||||
Maximum Offering Price Per Share (Net Asset Value ÷ 94.25%) | $ | 11.72 | $ | 11.11 | |||||||
Class C Shares Outstanding, no par value (unlimited shares authorized) | 2,099 | 31,842 | |||||||||
Net Assets - Class C Shares | $ | 23,085 | $ | 331,190 | |||||||
Net Asset Value, Maximum Offering Price and Redemption Price Per Share (a) | $ | 11.00 | $ | 10.40 | |||||||
(a) | Class C shares have a contingent deferred sales charge (note 1). | ||||||||||
See Notes to Financial Statements |
Hillman Capital Management Funds | |||||||||||
Statements of Operations | |||||||||||
Advantage Equity | Focused Advantage | ||||||||||
For the fiscal year ended September 30, 2010 | Fund | Fund | |||||||||
Investment Income: | |||||||||||
Dividends | $ | 249,887 | $ | 392,656 | |||||||
Total Investment Income | 249,887 | 392,656 | |||||||||
Expenses: | |||||||||||
Advisory fees (note 2) | 118,851 | 172,523 | |||||||||
Administration fees (note 2) | 24,000 | 24,000 | |||||||||
Transfer agent fees (note 2) | 35,396 | 37,480 | |||||||||
Registration and filing administration fees (note 2) | 24,000 | 24,000 | |||||||||
Fund accounting fees (note 2) | 46,964 | 48,214 | |||||||||
Compliance services fees (note 2) | 7,750 | 7,750 | |||||||||
Custody fees (note 2) | 4,398 | 2,393 | |||||||||
Distribution and service fees (note 3) | 29,879 | 45,946 | |||||||||
Legal fees | 34,394 | 34,951 | |||||||||
Audit and tax preparation fees | 13,572 | 13,795 | |||||||||
Registration and filing expenses | 69,602 | 71,202 | |||||||||
Printing expenses | 777 | 2,968 | |||||||||
Trustees' fees and meeting expenses | 5,775 | 5,775 | |||||||||
Securities pricing fees | 3,960 | 1,760 | |||||||||
Other operating expenses | 10,127 | 11,842 | |||||||||
Total Expenses | 429,445 | 504,599 | |||||||||
Expenses reimbursed by Advisor (note 2) | (63,837) | (22,754) | |||||||||
Advisory fees waived (note 2) | (70,317) | (120,992) | |||||||||
Distribution and service fees waived (note 3) | (2,593) | (3,826) | |||||||||
Net Expenses | 292,698 | 357,027 | |||||||||
Net Investment (Loss) Income | (42,811) | 35,629 | |||||||||
Net Realized and Unrealized Gain from Investments: | |||||||||||
Net realized gain from investments | 479,413 | 738,293 | |||||||||
Change in unrealized appreciation on investments | 554,136 | 718,829 | |||||||||
Net Realized and Unrealized Gain on Investments | 1,033,549 | 1,457,122 | |||||||||
Net Increase in Net Assets Resulting from Operations | $ | 990,738 | $ | 1,492,751 | |||||||
See Notes to Financial Statements |
Hillman Capital Management Funds | ||||||||||||
Statements of Changes in Net Assets | ||||||||||||
Advantage Equity Fund | Focused Advantage Fund | |||||||||||
For the fiscal years ended September 30, | 2010 | 2009 | 2010 | 2009 | ||||||||
Operations: | ||||||||||||
Net investment (loss) income | $ | (42,811) | $ | 109,401 | $ | 35,629 | $ | 220,894 | ||||
Net realized gain (loss) from investment transactions | 479,413 | (3,050,569) | 738,293 | (8,390,816) | ||||||||
Change in unrealized appreciation | ||||||||||||
on investments | 554,136 | 2,046,032 | 718,829 | 5,327,720 | ||||||||
Net Increase (Decrease) in Net Assets | ||||||||||||
Resulting from Operations | 990,738 | (895,136) | 1,492,751 | (2,842,202) | ||||||||
Distributions to Shareholders: (note 5) | ||||||||||||
Net investment income | ||||||||||||
No Load Shares | (38,842) | (106,127) | (180,343) | (124,008) | ||||||||
Class A Shares | (117) | (85) | (4,148) | (1,769) | ||||||||
Class B Shares | - | (62) | - | (387) | ||||||||
Class C Shares | (56) | (135) | (3,536) | (702) | ||||||||
Net realized gain from investment transactions | ||||||||||||
No Load Shares | - | (60,220) | - | (86,796) | ||||||||
Class A Shares | - | (42) | - | (1,060) | ||||||||
Class B Shares | - | (42) | - | (366) | ||||||||
Class C Shares | - | (51) | - | (664) | ||||||||
Decrease in Net Assets Resulting from Distributions | (39,015) | (166,764) | (188,027) | (215,752) | ||||||||
Capital Share Transactions: (note 6) | ||||||||||||
No Load Shares | ||||||||||||
Shares sold | 640,537 | 684,151 | 675,036 | 1,681,471 | ||||||||
Reinvested distributions | 37,516 | 165,374 | 168,884 | 194,637 | ||||||||
Shares repurchased | (1,494,437) | (3,010,805) | (5,793,189) | (11,096,148) | ||||||||
Class A Shares | ||||||||||||
Shares sold | 42,000 | 10,125 | 485,392 | 213,269 | ||||||||
Reinvested distributions | 117 | 127 | 4,032 | 2,781 | ||||||||
Shares repurchased | (41,899) | (52,974) | (395,767) | (200,055) | ||||||||
Class B Shares | ||||||||||||
Shares sold | - | - | - | 28,000 | ||||||||
Reinvested distributions | - | 103 | - | 753 | ||||||||
Shares repurchased | - | (8,145) | - | (135,348) | ||||||||
Class C Shares | ||||||||||||
Shares sold | - | 8,145 | 54,914 | 189,670 | ||||||||
Reinvested distributions | 56 | 186 | 3,536 | 1,366 | ||||||||
Shares repurchased | - | - | (111,122) | (125,958) | ||||||||
Decrease in Net Assets | ||||||||||||
Resulting from Capital Share Transactions | (816,110) | (2,203,713) | (4,908,284) | (9,245,562) | ||||||||
Net Increase (Decrease) in Net Assets | 135,613 | (3,265,613) | (3,603,560) | (12,303,516) | ||||||||
Net Assets: | ||||||||||||
Beginning of Year | 11,223,254 | 14,488,867 | 18,093,771 | 30,397,287 | ||||||||
End of Year | $ | 11,358,867 | $ | 11,223,254 | $ | 14,490,211 | $ | 18,093,771 | ||||
Undistributed Net Investment (Loss) Income | $ | - | $ | 12,193 | $ | 35,629 | $ | 188,027 | ||||
See Notes to Financial Statements | ||||||||||||
Hillman Capital Management Funds | ||||||||||||||
Financial Highlights | ||||||||||||||
Advantage Equity Fund | ||||||||||||||
For a share outstanding during the | No Load Shares | |||||||||||||
fiscal years ended September 30, | 2010 | 2009 | 2008 | 2007 | 2006 | |||||||||
Net Asset Value, Beginning of Year | $ 9.99 | $ 9.87 | $ 14.24 | $ 13.75 | $ 12.76 | |||||||||
Income (Loss) from Investment Operations: | ||||||||||||||
Net investment (loss) income | (0.05) | 0.09 | 0.12 | 0.07 | 0.08 | |||||||||
Net realized and unrealized gain (loss) on securities | 0.93 | 0.16 | (3.48) | 1.53 | 1.23 | |||||||||
Total from Investment Operations | 0.88 | 0.25 | (3.36) | 1.60 | 1.31 | |||||||||
Less Distributions: | ||||||||||||||
Dividends (from net investment income) | (0.03) | (0.09) | (0.11) | (0.09) | (0.15) | |||||||||
Distributions (from capital gains) | - | (0.04) | (0.90) | (1.02) | (0.17) | |||||||||
Total Distributions | (0.03) | (0.13) | (1.01) | (1.11) | (0.32) | |||||||||
Net Asset Value, End of Year | $ 10.84 | $ 9.99 | $ 9.87 | $ 14.24 | $ 13.75 | |||||||||
Total Return (e) | 8.85% | 2.96% | (25.05%) | 11.99% | 10.41% | |||||||||
Net Assets, End of Year (in thousands) | $11,325 | $11,192 | $14,408 | $25,950 | $23,544 | |||||||||
Average Net Assets for the Year (in thousands) | $11,840 | $ 9,885 | $19,919 | $25,544 | $20,994 | |||||||||
Ratio of Gross Expenses to Average Net Assets (f) | 3.61% | 3.78% | 2.66% | 2.40% | 2.11% | |||||||||
Ratio of Net Expenses to Average Net Assets (f) | 2.46% | 1.45% | 1.48% | 1.49% | 1.61% | |||||||||
Ratio of Net Investment (Loss) Income to | ||||||||||||||
Average Net Assets | (0.36)% | 1.10% | 0.86% | 0.51% | 0.67% | |||||||||
Portfolio Turnover Rate | 17.89% | 52.28% | 33.61% | 12.18% | 38.18% | |||||||||
Advantage Equity Fund | ||||||||||||||
For a share outstanding during the | Class A Shares | |||||||||||||
fiscal years or period ended September 30, | 2010 | 2009 | 2008 | 2007 | 2006 (a) | |||||||||
Net Asset Value, Beginning of Period | $ 10.18 | $ 9.96 | $ 14.38 | $ 13.79 | $ 12.62 | |||||||||
Income (Loss) from Investment Operations: | ||||||||||||||
Net investment (loss) income | (0.08) | 0.15 | 0.09 | 0.10 | 0.02 | |||||||||
Net realized and unrealized gain (loss) on securities | 0.97 | 0.20 | (3.48) | 1.55 | 1.17 | |||||||||
Total from Investment Operations | 0.89 | 0.35 | (3.39) | 1.65 | 1.19 | |||||||||
Less Distributions: | ||||||||||||||
Dividends (from net investment income) | (0.02) | (0.09) | (0.13) | (0.04) | (0.02) | |||||||||
Distributions (from capital gains) | - | (0.04) | (0.90) | (1.02) | - | |||||||||
Total Distributions | (0.02) | (0.13) | (1.03) | (1.06) | (0.02) | |||||||||
Net Asset Value, End of Period | $ 11.05 | $ 10.18 | $ 9.96 | $ 14.38 | $ 13.79 | |||||||||
Total Return (d)(e) | 8.78% | 3.94% | (25.01%) | 12.36% | 9.43% | (b) | ||||||||
Net Assets, End of Period (in thousands) | $ 10 | $ 10 | $ 60 | $ 12 | 11 | |||||||||
Average Net Assets for the Period (in thousands) | $ 21 | $ 11 | $ 75 | $ 12 | 10 | |||||||||
Ratio of Gross Expenses to Average Net Assets (f) | 3.61% | 3.78% | 2.66% | 2.15% | 2.23% | (c) | ||||||||
Ratio of Net Expenses to Average Net Assets (f) | 2.01% | 1.24% | 1.46% | 1.24% | 1.24% | (c) | ||||||||
Ratio of Net Investment Income to Average Net Assets | 0.11% | 1.23% | 0.90% | 0.76% | 0.91% | (c) | ||||||||
Portfolio Turnover Rate | 17.89% | 52.28% | 33.61% | 12.18% | 38.18% | (b) | ||||||||
(a) | For the period from July 18, 2006 (Date of Initial Public Offering) to September 30, 2006. | |||||||||||||
(b) | Not annualized. | |||||||||||||
(c) | Annualized. | |||||||||||||
(d) | Total return does not reflect payment of sales charge, if any. | |||||||||||||
(e) | Includes adjustments in accordance with accounting principles generally accepted in the United States and, | |||||||||||||
consequently, the net asset value for financial reporting purposes and the returns based upon those net asset | ||||||||||||||
values may differ from the net asset values and returns for shareholder transactions. | ||||||||||||||
(f) | The expense ratios listed reflect total expenses prior to any waivers and reimbursements (gross expense ratio) | |||||||||||||
and after any waivers and reimbursements (net expense ratio). | ||||||||||||||
See Notes to Financial Statements | (Continued) |
Hillman Capital Management Funds | ||||||||||||||
Financial Highlights | ||||||||||||||
Advantage Equity Fund | ||||||||||||||
For a share outstanding during the | Class C Shares | |||||||||||||
fiscal years or period ended September 30, | 2010 | 2009 | 2008 | 2007 | 2006 (a) | |||||||||
Net Asset Value, Beginning of Period | $ 10.14 | $ 10.01 | $ 14.44 | $ 13.81 | $ 12.62 | |||||||||
Income (Loss) from Investment Operations: | ||||||||||||||
Net investment (loss) income | (0.06) | 0.09 | 0.11 | 0.10 | 0.02 | |||||||||
Net realized and unrealized gain (loss) on securities | 0.95 | 0.17 | (3.50) | 1.55 | 1.17 | |||||||||
Total from Investment Operations | 0.89 | 0.26 | (3.39) | 1.65 | 1.19 | |||||||||
Less Distributions: | ||||||||||||||
Dividends (from net investment income) | (0.03) | (0.09) | (0.14) | - | - | |||||||||
Distributions (from capital gains) | - | (0.04) | (0.90) | (1.02) | - | |||||||||
Total Distributions | (0.03) | (0.13) | (1.04) | (1.02) | - | |||||||||
Net Asset Value, End of Period | $ 11.00 | $ 10.14 | $ 10.01 | $ 14.44 | $ 13.81 | |||||||||
Total Return (d)(e) | 8.74% | 3.03% | (24.87)% | 12.33% | 9.43% | (b) | ||||||||
Net Assets, End of Period (in thousands) | $ 23 | $ 21 | $ 11 | $ 12 | $ 11 | |||||||||
Average Net Assets for the Period (in thousands) | $ 23 | $ 12 | $ 12 | $ 12 | $ 10 | |||||||||
Ratio of Gross Expenses to Average Net Assets (f) | 4.36% | 4.53% | 3.41% | 2.15% | 2.23% | (c) | ||||||||
Ratio of Net Expenses to Average Net Assets (f) | 2.69% | 1.25% | 1.36% | 1.24% | 1.24% | (c) | ||||||||
Ratio of Net Investment (Loss) Income to | ||||||||||||||
Average Net Assets | (0.59%) | 1.15% | 1.02% | 0.76% | 0.91% | (c) | ||||||||
Portfolio Turnover Rate | 17.89% | 52.28% | 33.61% | 12.18% | 38.18% | (b) | ||||||||
Focused Advantage Fund | ||||||||||||||
For a share outstanding during the | No Load Shares | |||||||||||||
fiscal years ended September 30, | 2010 | 2009 | 2008 | 2007 | 2006 | |||||||||
Net Asset Value, Beginning of Year | $ 9.68 | $ 9.76 | $ 16.15 | $ 15.26 | $ 14.73 | |||||||||
Income (Loss) from Investment Operations: | ||||||||||||||
Net investment income | 0.04 | 0.13 | 0.20 | 0.09 | 0.09 | |||||||||
Net realized and unrealized gain (loss) on securities | 0.85 | (0.11) | (5.17) | 1.97 | 0.95 | |||||||||
Total from Investment Operations | 0.89 | 0.02 | (4.97) | 2.06 | 1.04 | |||||||||
Less Distributions: | ||||||||||||||
Dividends (from net investment income) | (0.11) | (0.06) | (0.17) | (0.13) | (0.09) | |||||||||
Distributions (from capital gains) | - | (0.04) | (1.25) | (1.04) | (0.42) | |||||||||
Total Distributions | (0.11) | (0.10) | (1.42) | (1.17) | (0.51) | |||||||||
Net Asset Value, End of Year | $ 10.46 | $ 9.68 | $ 9.76 | $ 16.15 | $ 15.26 | |||||||||
Total Return (e) | 9.15% | 0.43% | (32.96%) | 13.81% | 7.15% | |||||||||
Net Assets, End of Year (in thousands) | $13,747 | $17,445 | $ 29,674 | $105,093 | $78,144 | |||||||||
Average Net Assets for the Year (in thousands) | $16,460 | $16,774 | $ 84,158 | $ 93,766 | $88,103 | |||||||||
Ratio of Gross Expenses to Average Net Assets (f) | 2.91% | 2.89% | 1.74% | 1.71% | 1.62% | |||||||||
Ratio of Net Expenses to Average Net Assets (f) | 2.05% | 1.45% | 1.48% | 1.48% | 1.53% | |||||||||
Ratio of Net Investment Income to Average Net Assets | 0.23% | 1.29% | 0.98% | 0.60% | 0.57% | |||||||||
Portfolio Turnover Rate | 13.84% | 29.79% | 47.31% | 37.86% | 43.27% | |||||||||
(a) | For the period from July 18, 2006 (Date of Initial Public Offering) to September 30, 2006. | |||||||||||||
(b) | Not annualized. | |||||||||||||
(c) | Annualized. | |||||||||||||
(d) | Total return does not reflect payment of sales charge, if any. | |||||||||||||
(e) | Includes adjustments in accordance with accounting principles generally accepted in the United States and, | |||||||||||||
consequently, the net asset value for financial reporting purposes and the returns based upon those net asset | ||||||||||||||
values may differ from the net asset values and returns for shareholder transactions. | ||||||||||||||
(f) | The expense ratios listed reflect total expenses prior to any waivers and reimbursements (gross expense ratio) | |||||||||||||
and after any waivers and reimbursements (net expense ratio). | ||||||||||||||
See Notes to Financial Statements | (Continued) |
Hillman Capital Management Funds | ||||||||||||||
Financial Highlights | ||||||||||||||
Focused Advantage Fund | ||||||||||||||
For a share outstanding during the | Class A Shares | |||||||||||||
fiscal years or period ended September 30, | 2010 | 2009 | 2008 | 2007 | 2006 (a) | |||||||||
Net Asset Value, Beginning of Period | $ 9.70 | $ 9.78 | $ 16.21 | $ 15.31 | $ 13.97 | |||||||||
Income (Loss) from Investment Operations: | ||||||||||||||
Net investment income | 0.01 | 0.08 | 0.18 | 0.06 | 0.03 | |||||||||
Net realized and unrealized gain (loss) on securities | 0.87 | (0.06) | (5.17) | 2.03 | 1.33 | |||||||||
Total from Investment Operations | 0.88 | 0.02 | (4.99) | 2.09 | 1.36 | |||||||||
Less Distributions: | ||||||||||||||
Dividends (from net investment income) | (0.11) | (0.06) | (0.19) | (0.15) | (0.02) | |||||||||
Distributions (from capital gains) | - | (0.04) | (1.25) | (1.04) | - | |||||||||
Total Distributions | (0.11) | (0.10) | (1.44) | (1.19) | (0.02) | |||||||||
Net Asset Value, End of Period | $ 10.47 | $ 9.70 | $ 9.78 | $ 16.21 | $ 15.31 | |||||||||
Total Return (d)(e) | 9.04% | 0.47% | (32.94%) | 14.03% | 9.74% | (b) | ||||||||
Net Assets, End of Period (in thousands) | $ 412 | $ 290 | $ 294 | $ 589 | $ 11 | |||||||||
Average Net Assets for the Period (in thousands) | $ 417 | $ 198 | $ 437 | $ 269 | $ 10 | |||||||||
Ratio of Gross Expenses to Average Net Assets (f) | 2.91% | 2.89% | 1.74% | 1.71% | 1.58% | (c) | ||||||||
Ratio of Net Expenses to Average Net Assets (f) | 2.13% | 1.49% | 1.48% | 1.48% | 1.24% | (c) | ||||||||
Ratio of Net Investment Income to Average Net Assets | 0.13% | 1.23% | 1.17% | 0.60% | 0.93% | (c) | ||||||||
Portfolio Turnover Rate | 13.84% | 29.79% | 47.31% | 37.86% | 43.27% | (b) | ||||||||
Focused Advantage Fund | ||||||||||||||
For a share outstanding during the | Class C Shares | |||||||||||||
fiscal years or period ended September 30, | 2010 | 2009 | 2008 | 2007 | 2006 (a) | |||||||||
Net Asset Value, Beginning of Period | $ 9.69 | $ 9.78 | $ 16.15 | $ 15.33 | $ 13.97 | |||||||||
Income (Loss) from Investment Operations: | ||||||||||||||
Net investment (loss) income | (0.09) | 0.04 | 0.06 | 0.01 | 0.03 | |||||||||
Net realized and unrealized gain (loss) on securities | 0.89 | (0.06) | (5.11) | 1.91 | 1.33 | |||||||||
Total from Investment Operations | 0.80 | (0.02) | (5.05) | 1.92 | 1.36 | |||||||||
Less Distributions: | ||||||||||||||
Dividends (from net investment income) | (0.09) | (0.03) | (0.07) | (0.06) | - | |||||||||
Distributions (from capital gains) | - | (0.04) | (1.25) | (1.04) | - | |||||||||
Total Distributions | (0.09) | (0.07) | (1.32) | (1.10) | - | |||||||||
Net Asset Value, End of Period | $ 10.40 | $ 9.69 | $ 9.78 | $ 16.15 | $ 15.33 | |||||||||
Total Return (d)(e) | 8.24% | (0.06)% | (33.45%) | 13.01% | 9.74% | (b) | ||||||||
Net Assets, End of Period (in thousands) | $ 331 | $ 359 | $ 304 | $ 592 | $ 11 | |||||||||
Average Net Assets for the Period (in thousands) | $ 375 | $ 199 | $ 303 | $ 390 | $ 10 | |||||||||
Ratio of Gross Expenses to Average Net Assets (f) | 3.66% | 3.64% | 2.49% | 2.44% | 1.58% | (c) | ||||||||
Ratio of Net Expenses to Average Net Assets (f) | 2.81% | 2.20% | 2.21% | 2.21% | 1.24% | (c) | ||||||||
Ratio of Net Investment Income to Average Net Assets | (0.54%) | 0.45% | 0.38% | (0.13)% | 0.93% | (c) | ||||||||
Portfolio Turnover Rate | 13.84% | 29.79% | 47.31% | 37.86% | 43.27% | (b) | ||||||||
(a) | For the period from July 18, 2006 (Date of Initial Public Offering) to September 30, 2006. | |||||||||||||
(b) | Not annualized. | |||||||||||||
(c) | Annualized. | |||||||||||||
(d) | Total return does not reflect payment of sales charge, if any. | |||||||||||||
(e) | Includes adjustments in accordance with accounting principles generally accepted in the United States and, | |||||||||||||
consequently, the net asset value for financial reporting purposes and the returns based upon those net asset | ||||||||||||||
values may differ from the net asset values and returns for shareholder transactions. | ||||||||||||||
(f) | The expense ratios listed reflect total expenses prior to any waivers and reimbursements (gross expense ratio) | |||||||||||||
and after any waivers and reimbursements (net expense ratio). | ||||||||||||||
See Notes to Financial Statements |
Hillman Capital Management Funds
Notes to Financial Statements
1. Organization and Significant Accounting Policies
The Hillman Advantage Equity Fund and The Hillman Focused Advantage Fund, (collectively the “Funds” and individually a “Fund”) are series funds. The Funds are part of the Hillman Capital Management Investment Trust (the “Trust”), which was organized as a Delaware Business Statutory Trust and is registered under the Investment Company Act of 1940, (the “1940 Act”), as amended, as an open-ended management investment company.
The Hillman Advantage Equity Fund (“Advantage Equity Fund”) commenced operations on December 29, 2000. The investment objective of the Fund is to seek maximum total return through a combination of long-term capital appreciation and current income.
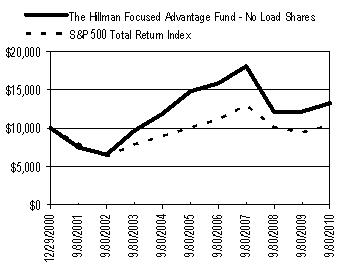
The Hillman Focused Advantage Fund (“Focused Advantage Fund”) commenced operations on December 29, 2000. The investment objective of the Fund is to seek long-term capital appreciation.
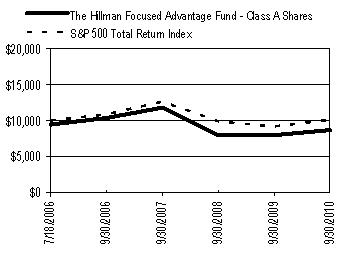
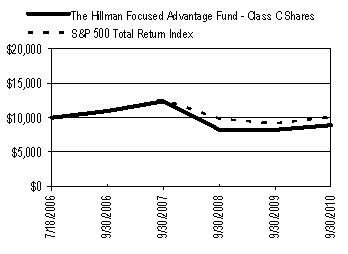
The Board of Trustees (the “Trustees”) approved, on February 14, 2006, a plan to authorize three new classes of shares for each of the Funds designated as Class A Shares, Class B Shares, and Class C Shares. On July 18, 2006, the Class A Shares, Class B Shares, and Class C Shares became effective. On June 15, 2009, the Class B Shares of both Funds were converted into Class C Shares. The Funds currently have an unlimited number of authorized shares, which are divided into three classes – No Load Shares, Class A Shares, and Class C Shares.
Each class of shares has equal rights as to assets of its corresponding Fund, and the classes are identical except for differences in their sales charge structures and ongoing distribution and service fees. Income, expenses (other than distribution and service fees), and realized and unrealized gains or losses on investments are allocated to each class of shares based upon its relative net assets. All classes have equal voting privileges, except where otherwise required by law or when the Trustees determine that the matter to be voted on affects only the interests of the shareholders of a particular class. The Funds’ Class C shares are sold without an initial sales charge; however, they are subject to a contingent de ferred sales charge. Class C shares are charged at a rate of 1% if redeemed in the first year, which is payable to the Distributor of the Trust. Class A shares are sold with an initial sales charge of up to 5.75% of the amount invested. The No Load, Class A, and Class C shares are subject to distribution plan fees as described in Note 3. Class C shares are automatically converted into the No Load shares after ten years.
The following is a summary of significant accounting policies consistently followed by the Funds. The policies are in conformity with accounting principles generally accepted in the United States of America (“GAAP”).
Investment Valuation
The Funds’ investments in securities are carried at value. Securities listed on an exchange or quoted on a national market system are valued at the last sales price as of 4:00 p.m. Eastern Time. Securities traded in the NASDAQ over-the-counter market are generally valued at the NASDAQ Official Closing Price. Other securities traded in the over-the-counter market and listed securities for which no sale was reported on that date are valued at the most recent bid price. Securities and assets for which representative market quotations are not readily available or which cannot be accurately valued using the Funds’ normal pricing procedures are valued at fair value as determined in good faith under policies approved by the Trustees. Fair value pricing may be used, f or example, in situations where (i) a security is so thinly traded that there have been no transactions for that security over an extended period of time; (ii) the exchange on which the security is principally traded closes early; or (iii) trading of the security is halted during the day and does not resume prior to the Funds’ net asset value calculation. A security’s “fair value” price may differ from the price next available for that security using the Funds’ normal pricing procedures. Instruments with maturities of 60 days or less are valued at amortized cost, which approximates market value.
Fair Value Measurement
Various inputs are used in determining the value of the Funds’ investments. These inputs are summarized in the three broad levels listed below:
Level 1: quoted prices in active markets for identical securities
(Continued)
Hillman Capital Management Funds
Notes to Financial Statements
Level 2: other significant observable inputs (including quoted prices for similar securities, interest rates, credit risk, etc.)
Level 3: significant unobservable inputs (including the Funds’ own assumptions in determining fair value of investments)
The availability of observable inputs can vary from security to security and is affected by a wide variety of factors, including, for example, the type of security, whether the security is new and not yet established in the marketplace, the liquidity of markets, and other characteristics particular to the security. To the extent that valuation is based on models or inputs that are less observable or unobservable in the market, the determination of fair value requires more judgment. Accordingly, the degree of judgment exercised in determining fair value is greatest for instruments categorized in Level 3.
The inputs used to measure fair value may fall into different levels of the fair value hierarchy. In such cases, for disclosure purposes, the level in the fair value hierarchy within which the fair value measurement falls in its entirety, is determined based on the lowest level input that is significant to the fair value measurement in its entirety.
The inputs or methodology used for valuing securities are not necessarily an indication of the risk associated with investing in those securities. The following tables summarize the inputs as of September 30, 2010 for the Funds’ assets and liabilities measured at fair value:
Advantage Equity Fund | ||||||||
Investments in Securities | Total | Level 1 | Level 2 | Level 3 | ||||
Assets | ||||||||
Common Stocks | $ | 11,222,676 | $ | 11,222,676 | $ | - | $ | - |
Investment Company | 171,522 | - - | 171,522 | - | ||||
Total Assets | $ | 11,394,198 | $ | 11,222,676 | $ | 171,522 | $ | - |
Focused Advantage Fund | ||||||||
Investments in Securities | Total | Level 1 | Level 2 | Level 3 | ||||
Assets | ||||||||
Common Stocks | $ | 14,373,534 | $ | 14,373,534 | $ | - | $ | - |
Investment Company | 123,618 | - | 123,618 | - | ||||
Total Assets | $ | 14,497,152 | $ | 14,373,534 | $ | 123,618 | $ | - |
Investment Transactions, Investment Income and Expenses
Investment transactions are accounted for as of the date purchased or sold (trade date). Dividend income is recorded on the ex-dividend date. Certain dividends from foreign securities will be recorded as soon as the Trust is informed of the dividend if such information is obtained subsequent to the ex-dividend date. Interest income is recorded on the accrual basis and includes amortization of discounts and premiums. Gains and losses are determined on the identified cost basis, which is the same basis used for federal income tax purposes. The Funds bear expenses incurred specifically on their behalf as well as a portion of general Trust expenses, which are allocated according to methods reviewed annually by the Trustees. Expenses, which are not readil y identifiable to a specific Fund, are allocated in such a manner as deemed equitable, taking into consideration the nature and type of expense and the relative sizes of the Funds. Each Fund’s income, expenses (other than class specific distribution fees) and realized and unrealized gains and losses are allocated proportionally each day between the classes based upon the relative net assets of each class.
Dividend Distributions
The Funds may declare and distribute dividends from net investment income (if any) at the end of each calendar quarter. Distributions from capital gains (if any) are generally declared and distributed annually. Dividends and distributions to shareholders are recorded on ex-date.
(Continued)
Hillman Capital Management Funds
Notes to Financial Statements
Estimates
The preparation of financial statements in conformity with accounting principles generally accepted in the United States of America requires management to make estimates and assumptions that affect the reported amounts of assets and liabilities and the disclosure of contingent assets and liabilities at the date of the financial statements and the reported amounts of increases and decreases in the net assets from operations during the reported period. Actual results could differ from those estimates.
Federal Income Taxes
No provision for income taxes is included in the accompanying financial statements, as the Funds intend to distribute to shareholders all taxable investment income and realized gains and otherwise comply with Subchapter M of the Internal Revenue Code applicable to regulated investment companies.
2. Transactions with Affiliates
Advisor
The Funds pay monthly advisory fees to Hillman Capital Management, Inc. (the “Advisor”) based upon the average daily net assets of each Fund and calculated at an annual rate. For the period from October 1, 2009 through April 30, 2010, the Advisor waived or reduced its fees and assumed other expenses of each Fund, in order to limit total operating expenses to not more than 1.24% (exclusive of interest, taxes, brokerage commissions, other expenditures which are capitalized in accordance with generally accepted accounting principles, other extraordinary expenses not incurred in the ordinary course of the Fund’s business, and amounts, if any, payable under a Rule 12b-1 distribution plan).
Fund | Advisor Fees Rate | Advisor Fees Waived | Expenses Reimbursed |
Advantage Equity | 1.00% | $ 70,317 | $63,837 |
Focused Advantage | 1.00% | $ 120,992 | $22,754 |
Administrator
Each Fund pays a monthly administration fee to The Nottingham Company (the “Administrator”) based upon the average daily net assets of each Fund and calculated at the annual rates as shown in the schedule below which is subject to a minimum of $2,000 per month per Fund. The Administrator also receives a fee to procure and pay the custodian for each Fund, additional compensation for fund accounting and recordkeeping services, and additional compensation for certain costs involved with the daily valuation of securities and as reimbursement for out-of-pocket expenses. A breakdown of these fees is provided in the following schedule.
Administration Fees (1) | Custody Fees (2) | Fund Accounting Fees (monthly) | Fund Accounting Asset Based | Blue Sky Administration Fees (annual) | ||||
Average Net Assets | Annual Rate | Average Net Assets | Annual Rate | Average Net Assets | Annual Rate | |||
First $50 million | 0.125% | First $100 million | 0.020% | $2,250 | All Assets | 0.01% | $150 per state | |
Next $50 million | 0.100% | Over $100 million | 0.009% | $750 (3) | per class | |||
Over $100 million | 0.075% |
(1) Subject to a minimum fee of $2,000 per month (2) Subject to a minimum fee of $400 per month (3) For each additional class.
Compliance Services
Nottingham Compliance Services, LLC, a fully owned affiliate of The Nottingham Company, provides services which assist the Trust’s Chief Compliance Officer in monitoring and testing the policies and procedures of the Trust in conjunction with requirements under Rule 38a-1 of the Securities and Exchange Commission. It receives compensation for this service at an annual rate of $7,750 per Fund.
(Continued)
Hillman Capital Management Funds
Notes to Financial Statements
Transfer Agent
Nottingham Shareholder Services, LLC (“Transfer Agent”) serves as transfer, dividend paying, and shareholder servicing agent for the Funds. It receives compensation for its services based upon $15 per shareholder per year, subject to a minimum fee of $1,750 per month per Fund, plus $500 per month for each additional class of shares.
Distributor
Capital Investment Group, Inc. (the “Distributor”) serves as the Fund’s principal underwriter and distributor. The Distributor receives any sales charges imposed on purchases of shares and re-allocates a portion of such charges to dealers through whom the sale was made, if any. During the fiscal year ended September 30, 2010, there were no sales charges for the Advantage Equity Fund and sales charges of $3,446 for the Focused Advantage Fund.
Certain Trustees and officers of the Trust are also officers of the Advisor, the Distributor or the Administrator.
3. Distribution and Service Fees
The Trustees, including a majority of the Trustees who are not “interested persons” (as defined in the 1940 Act), of the Trust adopted distribution and service plans pursuant to Rule 12b-1 of the 1940 Act (the “Plans”) applicable to the No Load Shares, Class A Shares, and Class C Shares. The 1940 Act regulates the manner in which a regulated investment company may assume costs of distributing and promoting the sales of its shares and servicing of its shareholder accounts. The Plans provide that the Fund may incur certain costs, which may not exceed 0.25% per annum of the average daily net assets of the No Load Shares and Class A Shares or 1.00% per annum of the average daily net assets of the Class C Shares for each year elapsed subsequent to adoption of the Plans, for payment to the Distributor and others for items such as advertising expenses, selling expenses, commissions, travel, or other expenses reasonably intended to result in sales of No Load Shares, Class A Shares, and Class C Shares in the Funds or support servicing of those classes’ shareholder accounts. See the table below for a breakout of the 12b-1 fees incurred and waived for the Advantage Equity Fund and the Focused Advantage Fund for the fiscal year ended September 30, 2010.
Advantage Equity | Focused Advantage | |||
Class | Incurred | Waived | Incurred | Waived |
No Load Shares | $29,599 | $2,464 | $41,149 | $3,713 |
Class A Shares | 53 | 15 | 1,044 | 14 |
Class C Shares | 227 | 115 | 3,753 | 99 |
4. Purchases and Sales of Investment Securities
For the fiscal year ended September 30, 2010, the aggregate cost of purchases and proceeds from sales of investment securities (excluding short-term securities) were as follows:
Fund | Purchases of Securities | Proceeds from Sales of Securities |
Advantage Equity | $2,034,713 | $2,553,071 |
Focused Advantage | $2,309,809 | $6,969,783 |
There were no purchases of long-term U.S. Government Obligations for either Fund during the fiscal year ended September 30, 2010.
5. Federal Income Tax
Distributions are determined in accordance with Federal income tax regulations, which may differ from generally accepted accounting principles, and, therefore, may differ significantly in amount or character from net investment income and realized gains for financial reporting purposes. Financial reporting records are adjusted for permanent book/tax differences to reflect tax character but are not adjusted for temporary differences.
(Continued)
Hillman Capital Management Funds
Notes to Financial Statements
Management reviewed the tax positions in the open tax years of 2007, 2008, and 2009 and determined that the implementation of ASC Topic 740 “Accounting for Uncertainty in Income Taxes” had no impact on the Funds’ net assets or results of operations. As of and during the fiscal year ended September 30, 2010, the Funds do not have a liability for uncertain tax positions. The Funds recognize interest and penalties, if any, related to unrecognized tax benefits as income tax expense in the statement of operations. During the period, the Funds did not incur any interest or penalties.
Reclassifications to paid-in capital relate primarily to differing book/tax treatment of ordinary net investment losses. For the fiscal year ended September 30, 2010, the following reclassifications, which had no impact on results of operations or net assets, were recorded to reflect tax character:
Advantage Equity Fund | Focused Advantage Fund | |
Paid-in Capital | $ (69,633) | $ - |
Undistributed Net Investment Income (Loss) | 69,633 | - |
Distributions during the fiscal years and period ended were characterized for tax purposes as follows:
Distributions from | |||
Fund | Fiscal year ended | Ordinary Income | Long-Term Capital Gains |
Advantage Equity | 09/30/2010 | $39,015 | $ - |
09/30/2009 | 106,409 | 60,355 | |
Focused Advantage | 09/30/2010 | 188,027 | - |
09/30/2009 | 126,866 | 88,886 |
At September 30, 2010, the tax-basis cost of investments and components of distributable earnings were as follows:
Advantage Equity | Focused Advantage | ||||
Cost of Investments | $ | 10,069,390 | $ | 15,884,991 | |
Unrealized Appreciation | $ | 1,844,101 | $ | 1,159,970 | |
Unrealized Depreciation | (519,293) | (2,547,809) | |||
Net Unrealized Appreciation (Depreciation) | 1,324,808 | (1,387,839) | |||
Undistributed Ordinary Income | - | 35,629 | |||
Accumulated Capital Losses | (2,511,901) | (28,173,340) | |||
Other Book/Tax Differences | - | - | |||
Distributable Earnings | $ | (1,187,093) | $ | (29,525,550) |
The difference between book-basis and tax-basis net unrealized appreciation (depreciation) is attributable to the deferral of losses from wash sales. Accumulated capital losses noted below represent net capital loss carry-forwards, as of September 30, 2010, that may be available to offset future realized capital gains and thereby reduce future taxable gains distributions. The following table shows the expiration dates of the carryovers.
Expiration Dates | Advantage Equity Fund | Focused Advantage Fund |
September 30, 2017 | $ 150,250 | $ 21,309,002 |
September 30, 2018 | 2,361,651 | 6,864,338 |
(Continued)
Hillman Capital Management Funds
Notes to Financial Statements
6. | Capital Share Transactions |
For the fiscal year ended | Advantage Equity Fund | ||||
No Load Shares | Class A Shares | ||||
September 30, 2010 | September 30, 2009 | September 30, 2010 | September 30, 2009 | ||
Transactions in Capital Shares | 3,846 | 1,194 | |||
Shares sold | 60,737 | 75,493 | |||
Reinvested distributions | 3,400 | 21,227 | 10 | 16 | |
Shares repurchased | (140,531) | (435,182) | (3,854) | (6,271) | |
Net (Decrease) Increase in Capital Shares | (76,394) | (338,462) | 2 | (5,061) | |
Shares Outstanding, Beginning of Year | 1,120,865 | 1,459,327 | 941 | 6,002 | |
Shares Outstanding, End of Year | 1,044,471 | 1,120,865 | 943 | 941 |
For the fiscal year ended | Advantage Equity Fund | ||||
Class B Shares | Class C Shares | ||||
September 30, 2010 | September 30, 2009 | September 30, 2010 | September 30, 2009 | ||
Transactions in Capital Shares | - | 936 | |||
Shares sold | - | - | |||
Reinvested distributions | - | 14 | 5 | 23 | |
Shares repurchased | - | (938) | - | - | |
Net (Decrease) Increase in Capital Shares | - | (924) | 5 | 959 | |
Shares Outstanding, Beginning of Year | - | 924 | 2,094 | 1,135 | |
Shares Outstanding, End of Year | - | - | 2,099 | 2,094 |
For the fiscal year ended | Focused Advantage Fund | ||||
No Load Shares | Class A Shares | ||||
September 30, 2010 | September 30, 2009 | September 30, 2010 | September 30, 2009 | ||
Transactions in Capital Shares | 47,467 | 26,863 | |||
Shares sold | 65,005 | 213,341 | |||
Reinvested distributions | 16,239 | 26,256 | 387 | 367 | |
Shares repurchased | (568,489) | (1,479,090) | (38,398) | (27,426) | |
Net (Decrease) Increase in Capital Shares | (487,245) | (1,239,493) | 9,456 | (196) | |
Shares Outstanding, Beginning of Year | 1,802,059 | 3,041,552 | 29,895 | 30,091 | |
Shares Outstanding, End of Year | 1,314,814 | 1,802,059 | 39,351 | 29,895 |
For the fiscal year ended | Focused Advantage Fund | ||||
Class B Shares | Class C Shares | ||||
September 30, 2010 | September 30, 2009 | September 30, 2010 | September 30, 2009 | ||
Transactions in Capital Shares | 5,353 | 23,272 | |||
Shares sold | - | 3,738 | |||
Reinvested distributions | - | 107 | 340 | 191 | |
Shares repurchased | - | (16,706) | (10,935) | (17,464) | |
Net (Decrease) Increase in Capital Shares | - | (12,861) | (5,242) | 5,999 | |
Shares Outstanding, Beginning of Year | - | 12,861 | 37,084 | 31,085 | |
Shares Outstanding, End of Year | - | - | 31,842 | 37,084 |
(Continued)
Hillman Capital Management Funds
Notes to Financial Statements
7. Commitments and Contingencies
Under the Trust’s organizational documents, its officers and Trustees are indemnified against certain liabilities arising out of the performance of their duties to the Funds. In addition, in the normal course of business, the Funds enter into contracts with vendors and others that provide for general indemnifications. The Funds’ maximum exposure under these arrangements is unknown, as this would involve future claims that may be made against the Funds. The Funds expect that risk of loss to be remote.
8. Subsequent Events
The Trust has evaluated the need for disclosures and/or adjustments resulting from subsequent events through the date of issuance of these financial statements. This evaluation did not result in any subsequent events that necessitated disclosures and/or adjustments in addition to the disclosure below.
The Trust has entered into a new Fund Accounting and Administration Agreement with the Administrator. The agreement was approved by the Board of Trustees on April 30, 2010 and became effective on October 1, 2010. Under the agreement, the Administrator will (i) provide the Funds with certain administrative, fund accounting, and compliance services and (ii) coordinate and pay for the services of each vendor and the regular operating expenses of the Funds. The Administrator receives compensation based on each Fund’s average daily net assets. The annual rate is 0.249% if the average daily net assets are under $170 million and gradually decreases to an annual rate of 0.050% if the average daily net assets are $1.48 billion or more. The Administrator and Adviso r have entered into an Operating Plan that facilitates the Administrator’s assumption of the Funds’ regular operating expenses. Under the Operating Plan, the Advisor will make two kinds of payments to the Administrator: (i) when a Fund’s assets are below $160 million, the Advisor pays the Administrator a fee based on the daily average net assets of the Fund; and (ii) when the consolidated fee collected by the Administrator is less than a designated minimum operating cost, then the Advisor pays the Administrator a fee that makes up the difference. The Operating Plan insures that the consolidated fee arrangement is sustainable for the Administrator.
REPORT OF INDEPENDENT REGISTERED PUBLIC ACCOUNTING FIRM
To the Board of Trustees of Hillman Capital Management Investment Trust
and the Shareholders of The Hillman Advantage Equity Fund
and The Hillman Focused Advantage Fund
We have audited the accompanying statements of assets and liabilities of The Hillman Advantage Equity Fund and The Hillman Focused Advantage Fund, each a series of shares of Hillman Capital Management Investment Trust, including the schedules of investments, as of September 30, 2010, and the related statements of operations for the year then ended, the statements of changes in net assets for each of the two years in the period then ended, and the financial highlights for each of the five years in the period then ended. These financial statements and financial highlights are the responsibility of the Funds' management. Our responsibility is to express an opinion on these financial statements and financial highlights based on our audits.
We conducted our audits in accordance with the standards of the Public Company Accounting Oversight Board (United States). Those standards require that we plan and perform the audits to obtain reasonable assurance about whether the financial statements and financial highlights are free of material misstatement. An audit includes examining, on a test basis, evidence supporting the amounts and disclosures in the financial statements. Our procedures included confirmation of securities owned as of September 30, 2010 by correspondence with the custodian. An audit also includes assessing the accounting principles used and significant estimates made by management, as well as evaluating the overall financial statement presentation. We believe that our audits provide a reasonable basis for our opinion.
In our opinion, the financial statements and financial highlights referred to above present fairly, in all material respects, the financial position of The Hillman Advantage Equity Fund and The Hillman Focused Advantage Fund as of September 30, 2010, the results of their operations for the year then ended, the changes in their net assets for each of the two years in the period then ended, and their financial highlights for each of the five years in the period then ended, in conformity with accounting principles generally accepted in the United States of America.
BBD, LLP
Philadelphia, Pennsylvania
November 19, 2010
Hillman Capital Management Funds
Additional Information
(Unaudited)
1. | Proxy Voting Policies and Voting Record |
A copy of the Trust’s Proxy Voting and Disclosure Policy and the Advisor’s Proxy Voting and Disclosure Policy are included in Appendix B to the Fund’s Statement of Additional Information and are available, (1) without charge, upon request, by calling 1-800-773-3863 and (2) on the SEC’s website at http://www.sec.gov. Information regarding how the Funds voted proxies relating to portfolio securities during the most recent 12-month period ended June 30 is available (1) without charge, upon request, by calling the Funds at the number above and (2) on the SEC’s website at http://www.sec.gov .
2. | Quarterly Portfolio Holdings |
The Funds file their complete schedule of portfolio holdings with the SEC for the first and third quarters of each fiscal year on Form N-Q. The Funds’ Forms N-Q are available on the SEC’s website at http://www.sec.gov. You may review and make copies at the SEC’s Public Reference Room in Washington, D.C. You may also obtain copies after paying a duplicating fee by writing the SEC’s Public Reference Section, Washington, D.C. 20549-0102 or by electronic request to publicinfo@sec.gov, or is available without charge, upon request, by calling the Funds at 1-800-773-3863. Information on the operation of the Public Reference Room may be obtained by calling the SEC at 1-800-SEC-0330.
3. | Tax Information |
We are required to advise you within 60 days of the Funds’ fiscal year-end regarding the federal tax status of certain distributions received by shareholders during each fiscal year. The following information is provided for the Funds’ fiscal year ending September 30, 2010.
During the fiscal year, the Hillman Advantage Equity Fund and the Hillman Focused Advantage Fund did not pay any long-term capital gains.
Individual shareholders are eligible for reduced tax rates on qualified dividend income. For the purposes of computing the dividends eligible for reduced tax rates, all of the dividends paid by the Funds from ordinary income earned during the fiscal year are considered qualified dividend income.
Corporate shareholders may exclude up to 70% of qualifying dividends. For the purposes of computing this exclusion, all of the dividends paid by the fund from ordinary income earned during the fiscal year represent qualifying dividends.
Dividends and distributions received by retirement plans such as IRAs, Keogh-type plans and 403(b) plans need not be reported as taxable income. However, many retirement plans may need this information for their annual information reporting.
4. Information about Trustees and Officers
The business and affairs of the Funds and the Trust are managed under the direction of the Trustees. Information concerning the Trustees and officers of the Trust and Funds is set forth below. Generally, each Trustee and officer serves an indefinite term or until certain circumstances such as their resignation, death, or otherwise as specified in the Trust’s organizational documents. Any Trustee may be removed at a meeting of shareholders by a vote meeting the requirements of the Trust’s organizational documents. The Statement of Additional Information of the Funds includes additional information about the Trustees and officers and is available, without charge, upon request by calling the Funds toll-free at 1-800-773-3863. The address of each Trustee and officer, unless otherwise indicated below, is 116 South Franklin Street, Rocky Mount, North Carolina 27804. The Independent Trustees received aggregate compensation of $3,700 during the fiscal year ended September 30, 2010 from each Fund for their services to the Funds and Trust. The Interested Trustee and officers did not receive compensation from the Funds for their services to the Funds and Trust.
(Continued)
Hillman Capital Management Funds
Additional Information
(Unaudited)
Name, Age, and Address | Position(s) held with Fund/Trust | Length of Time Served | Principal Occupation(s) During Past 5 Years | Number of Portfolios in Fund Complex Overseen by Trustee | Other Directorships Held by Trustee During Past 5 Years |
Independent Trustees | |||||
Jack E. Brinson, 78 | Trustee | Since 12/2000 | Retired since January 2000; Previously, President, Brinson Investment Co. (personal investments) and President, Brinson Chevrolet, Inc. (auto dealership). | 2 | Independent Trustee of DGHM Investment Trust for its two series, Gardner Lewis Investment Trust for its two series, New Providence Investment Trust, Nottingham Investment Trust II for its four series, Starboard Investment Trust for its nine series, and Tilson Investment Trust for its two series (all registered investment companies); previously, Independent Trustee of de Leon Funds Trust for its one series from 2000 to 2005, MurphyMorris Investment Trust for its one series from 2003 to 2006, and Piedmont Investment Trust for its one series from 2005 to 2006 (all registered investment companies). |
James H. Speed, Jr., 57 | Trustee | Since 3/2009 | President and CEO of NC Mutual Insurance Company (insurance company) since May 2003; President of Speed Financial Group, Inc. (consulting/private investments) from March 2000 to April 2003. | 4 | Independent Trustee of New Providence Investment Trust, Nottingham Investment Trust II for its four series, Starboard Investment Trust for its nine series, and Tilson Investment Trust for its two series (all registered investment companies); Member of Board of Directors of NC Mutual Life Insurance Company; Member of Board of Directors of M&F Bancorp. |
Interested Trustee* | |||||
Mark A. Hillman, 48 7501 Wisconsin Avenue Suite 1100 E Bethesda, MD 20814 | Trustee and President (Principal Executive Officer) | Trustee and President since 12/2000 | President, Hillman Capital Management, Inc. (investment advisor to the Funds); previously, Chief Investment Officer, Menocal Capital Management, Inc. (investment advisor). | 2 | None |
* Basis of Interestedness. Mr. Hillman is an Interested Trustee because he is an officer of Hillman Capital Management, Inc., the investment advisor to the Funds. |
(Continued)
Hillman Capital Management Funds
Additional Information
(Unaudited)
Other Officers | |||||
John D. Marriott, Jr., 49 107 Glenwood Avenue Raleigh, NC 27603 | Treasurer (Principal Financial Officer) | Since 8/2007 | Manager, Fairview Investment Services, LLC (investment services) since February, 2007; Registered Principal, Capital Investment Group, Inc. (distributor to the Funds) since 1997; previously, Managing Director of North Carolina Shareholders, LLC (transfer agent to the funds). | n/a | n/a |
C. Frank Watson III, 40 107 Glenwood Avenue Raleigh, NC 27603 | Chief Compliance Officer | Since 5/2006 | President, Fairview Investment Services, LLC since 2005; previously, President and Chief Operating Officer, The Nottingham Company (administrator to the funds). | n/a | n/a |
Angela D. Mincher, 44 | Assistant Secretary | Since 8/2008 | Systems Analyst, The Nottingham Company since 2005; previously Fund Accountant since 2001. | n/a | n/a |
A. Vason Hamrick, 33 | Secretary and Assistant Treasurer | Since 3/2007 | Corporate Counsel, The Nottingham Company since 2004. | n/a | n/a |
The Hillman Capital Management Mutual Funds are a series of the |
Hillman Capital Management Investment Trust |
For Shareholder Service Inquiries: | For Investment Advisor Inquiries: |
Documented: | Documented: |
Nottingham Shareholder Services, LLC | Hillman Capital Management, Inc. |
116 South Franklin Street | 7501 Wisconsin Avenue |
Post Office Drawer 4365 | Suite 1100 E |
Rocky Mount, North Carolina 27803 | Bethesda, Maryland 20814 |
Toll-Free Telephone: | Toll-Free Telephone: |
1-800-773-3863 | 1-800-773-3863 |
World Wide Web @: | World Wide Web @: |
ncfunds.com | hillmancapital.com |
Item 2. CODE OF ETHICS.
(a) | The registrant, as of the end of the period covered by this report, has adopted a code of ethics that applies to its Principal Executive Officer, Principal Financial Officer, and Principal Accounting Officer(s), or persons performing similar functions, regardless of whether these individuals are employed by the registrant or a third party. |
(c) | There have been no amendments during the period covered by this report. |
(d) | The registrant has not granted, during the period covered by this report, any waivers, including an implicit waiver. |
(f)(1) | A copy of the code of ethics that applies to the registrant’s Principal Executive Officer and Principal Financial Officer is filed pursuant to Item 12.(a)(1) below. |
Item 3. | AUDIT COMMITTEE FINANCIAL EXPERT. |
The registrant’s Board of Trustees has determined that the registrant has an audit committee financial expert, as defined in Item 3 of Form N-CSR, serving on its audit committee.
As of the date of this report, September 30, 2010, the registrant’s audit committee financial expert is Mr. James H. Speed, Jr. Mr. Speed is “independent” for purposes of Item 3 of Form N-CSR.
Item 4. | PRINCIPAL ACCOUNTANT FEES AND SERVICES. |
(a) | Audit Fees – Audit fees billed for the registrant for the fiscal years ended September 30, 2009 and September 30, 2010 are reflected in the table below. These amounts represent aggregate fees billed by the registrant’s independent accountant, BBD, LLP (“Accountant”), in connection with the annual audits of the registrant’s financial statements and for services normally provided by the Accountant in connection with the registrant’s statutory and regulatory filings. |
Fund | 2009 | 2010 |
The Hillman Focused Advantage Fund (formerly The Hillman Aggressive Equity Fund) | $14,000 | $11,500 |
The Hillman Advantage Equity Fund (formerly The Hillman Total Return Fund) | $14,000 | $11,500 |
(b) | Audit-Related Fees – There were no additional fees billed in the fiscal years ended September 30, 2009 and September 30, 2010 for assurance and related services by the Accountant that were reasonably related to the performance of the audit of the registrant’s financial statements that were not reported under paragraph (a) of this Item. |
(c) | Tax Fees – The tax fees billed in the fiscal years ended for September 30, 2009 and September 30, 2010 for professional services rendered by the Accountant for tax compliance, tax advice, and tax planning are reflected in the table below. These services were for the completion of each fund’s federal, state, and excise tax returns and assistance with distribution calculations. |
Fund | 2009 | 2010 |
The Hillman Focused Advantage Fund | $2,500 | $2,000 |
The Hillman Advantage Equity Fund | $2,500 | $2,000 |
(d) | All Other Fees –There were no other fees billed by the Accountant which were not disclosed in Items (a) through (c) above during the fiscal years ended September 30, 2009 and September 30, 2010. |
(e)(1) | The registrant’s Board of Trustees pre-approved the engagement of the Accountant for the last two fiscal years at an audit committee meeting of the Board of Trustees called for such purpose and will pre-approve the Accountant for each fiscal year thereafter at an audit committee meeting called for such purpose. The charter of the audit committee states that the audit committee should pre-approve any audit services and, when appropriate, evaluate and pre-approve any non-audit services provided by the Accountant to the registrant and to pre-approve, when appropriate, any non-audit services provided by the Accountant to the registrant’s investment adviser, or any entity controlling, controlled by, or under common control with the investment adviser that provides ongoing services to the registrant if the engagement relates directly to the operations and financial reporting of the registrant. |
(2) | There were no services as described in each of paragraph (b) through (d) of this Item that were approved by the audit committee pursuant to paragraph (c)(7)(i)(C) of Rule 2-01 of Regulation S-X. |
(f) | Not Applicable. |
(g) | Aggregate non-audit fees billed by the Accountant to the registrant for services rendered during the fiscal years ended September 30, 2009 and September 30, 2010 were $5,000 and $4,000, respectively. There were no non-audit fees billed by the Accountant for services rendered to the registrant’s investment adviser, or any other entity controlling, controlled by, or under common control with the registrant’s investment adviser. |
(h) Not applicable.
Item 5. | AUDIT COMMITTEE OF LISTED REGISTRANTS. |
Not applicable.
Item 6. | SCHEDULE OF INVESTMENTS. |
A copy of the schedule of investments of unaffiliated issuers as of the close of the reporting period is included as part of the report to shareholders filed under Item 1 of this Form.
Item 7. | DISCLOSURE OF PROXY VOTING POLICIES AND PROCEDURES FOR CLOSED-END MANAGEMENT INVESTMENT COMPANIES. |
Not applicable.
Item 8. | PORTFOLIO MANAGERS OF CLOSED-END MANAGEMENT INVESTMENT COMPANIES. |
Not applicable.
Item 9. | PURCHASES OF EQUITY SECURITIES BY CLOSED-END MANAGEMENT INVESTMENT COMPANY AND AFFILIATED PURCHASERS. |
Not applicable.
Item 10. SUBMISSION OF MATTERS TO A VOTE OF SECURITY HOLDERS.
None.
Item 11. CONTROLS AND PROCEDURES.
(a) | The Principal Executive Officer and the Principal Financial Officer have concluded that the registrant’s disclosure controls and procedures are effective based on their evaluation of the disclosure controls and procedures as of a date within 90 days of the filing of this report. |
(b) | There were no changes in the registrant's internal control over financial reporting that occurred during the registrant’s second fiscal quarter of the period covered by this report that have materially affected, or are reasonably likely to materially affect, the registrant’s internal control over financial reporting. |
Item 12. EXHIBITS.
(a)(1) | Code of Ethics required by Item 2 of Form N-CSR is filed herewith as Exhibit 12.(a)(1). |
(a)(2) | Certifications required by Item 12.(a)(2) of Form N-CSR are filed herewith as Exhibit 12.(a)(2). |
(a)(3) | Not applicable. |
(b) | Certifications required by Item 12.(b) of Form N-CSR are filed herewith as Exhibit 12.(b). |
SIGNATURES
Pursuant to the requirements of the Securities Exchange Act of 1934 and the Investment Company Act of 1940, the registrant has duly caused this report to be signed on its behalf by the undersigned, thereunto duly authorized.
Hillman Capital Management Investment Trust
By: (Signature and Title) /s/ Mark A. Hillman
Mark A. Hillman, Trustee, President and Principal Executive Officer
Date: November 30, 2010
Pursuant to the requirements of the Securities Exchange Act of 1934 and the Investment Company Act of 1940, this report has been signed below by the following persons on behalf of the registrant and in the capacities and on the dates indicated.
By: (Signature and Title) /s/ Mark A. Hillman
Mark A. Hillman, Trustee, President and Principal Executive Officer
Date: November 30, 2010
By: (Signature and Title) /s/ John D. Marriott, Jr.
John D. Marriott, Jr., Treasurer and Principal Financial Officer
Date: November 30, 2010