Terrence O. Davis

Disclosure:
Past performance is not indicative of future results. An investment in the Fund is subject to investment risks, including the possible loss of some or all of the principal amount invested. There can be no assurance that the Fund will be successful in meeting its investment objective. Investment in the Fund is subject to the following risks: market risk, management style risk, investment advisor risk, operating risk, non-diversified status risk, sector focus risk, small-cap and mid-cap companies risk, and risks from writing options. More information about these risks and other risks can be found in the Fund's prospectus. The S&P 500 Total Return Index is the Standard & Poor's Composite Index of 500 stocks and is a widely recognized, unmanaged index of common stock prices. It is not possible to invest in this index.
Statements in this Annual Report reflect projections or expectations of future financial or economic performance of the Fund and of the market in general and statements of the Fund's plans and objectives for future operations are forward-looking statements. No assurance can be given that actual results or events will not differ materially from those projected, estimated, assumed or anticipated in any such forward-looking statements. Important factors that could result in such differences, in addition to the other factors noted with such forward-looking statements, include general economic conditions such as inflation, recession and interest rates.
Underwriter and Distributor: Capital Investment Group, Inc.
116 South Franklin Street
Rocky Mount, NC 27804
Phone (800) 773-3863
There is no affiliation between Capital Investment Group, Inc. and Hillman Capital Management, Inc.
| Please see the table below for the Fund's historical performance information through the calendar quarter ended September 30, |
| 2014: |
Average Annual Total Returns (Unaudited) | | | | |
Period Ended September 30, 2014 | One Year* | Five Year* | Ten Year* | Gross Expense Ratio** |
| The Hillman Focused Advantage Fund - No Load Shares | 21.39% | 12.76% | 6.44% | 1.50% |
| S&P 500 Total Return Index*** | 19.73% | 15.70% | 8.11% | N/A |
The performance data quoted above represents past performance, which is not a guarantee of future results. Investment return and
principal value of an investment in the Fund will fluctuate so that an investor's shares, when redeemed, may be worth more or less than
their original cost. Current performance may be lower or higher than the performance data quoted. To obtain more current
performance data regarding the Fund, including performance data current to the Fund's most recent month-end, please visit
ncfunds.com or call the Fund at 1-800-773-3863. Fee waivers and expenses reimbursements have positively impacted Fund
performance.
*The Fund's inception date is December 29, 2000.
**Gross expense ratio is from the Fund's prospectus dated January 28, 2014. More recent expense ratios are found in the
Financial Highlights.
***You cannot invest directly in this index. The index does not have an investment advisor and does not pay any commissions,
expenses, or taxes. If the index did pay commissions, expenses, or taxes, the returns would be lower.
| The Hillman Focused Advantage Fund - No Load Shares | | | | | | | | | | |
| | | | | | | | | | | | | | | | | | | |
| Performance Update (Unaudited) | | | | | | | | | | | | | |
| | | | | | | | | | | | | | | | | | | |
| | | | | | | | | | | | | | | | | | | |
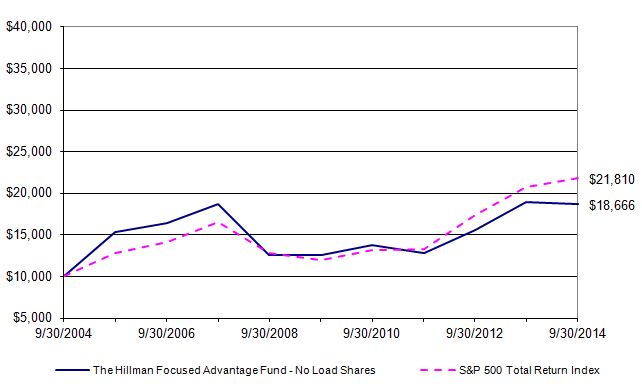
| For the period from September 30, 2004 to September 30, 2014 | | | | | | |
| | | | | | | | | | | | | | | | | | | |
| Comparison of the Change in Value of a $10,000 Investment | | | | | | | | |
| | | | | | | | | | | | | | | | | | | |
| | | |
| | | | | | | | | | | | | | | | | | | |
| This graph assumes an initial investment of $10,000 and represents the reinvestment of dividends and capital gains distributions. This graph depicts the performance of No Load Shares versus the S&P 500 Total Return Index. It is important to note that the Fund is a professionally managed mutual fund while the index is not available for investment and is unmanaged. The comparison is shown for illustrative purposes only. |
| | | | | | | | | | | | | | | | | | | |
| | | | | | | | | | | | | | | | | | | |
| Average Annual Total Returns | | |
| | | | | | | | | | | | | | | | | Gross | | |
| | As of | | | | | | | One | | Five | | Ten | | Expense | | |
| | September 30, 2014 | | | | | Year | | Year | | Year | | Ratio* | | |
| | No Load Shares | | | | | | 21.39% | | 12.76% | | 6.44% | | 1.50% | | |
| | S&P 500 Total Return Index | | | | | 19.73% | | 15.70% | | 8.11% | | N/A | | |
| | | | | | | | | | | | | | | | | | | |
| * The gross expense ratio shown is from the Fund's prospectus dated January 28, 2014, and includes acquired fund fees and expenses. |
| | | | | | | | | | | | | | |
| Performance quoted above represents past performance, which is no guarantee of future results. Investment return and principal value will fluctuate so that shares, when redeemed, may be worth more or less than their original cost. Current performance may be lower or higher than the performance data quoted. An investor may obtain performance data, current to the most recent month-end, by visiting ncfunds.com. |
| | | | | | | | | | | | | | | | | | | |
| The graph and table do not reflect the deduction of taxes that a shareholder would pay on Fund distributions or the redemption of Fund shares. Average annual total returns are historical in nature and measure net investment income and capital gain or loss from portfolio investments assuming reinvestments of dividends and distributions. |
| | | | | | | | | | | | | | | | | | | |
| | | | | | | | | | | | | | | | | | | |
| The Hillman Focused Advantage Fund | | | | | | | |
| | | | | | | | | | |
| Schedule of Investments | | | | | | | | |
| | | | | | | | | | |
| | | | | | | | | | |
| As of September 30, 2014 | | | | | | | | |
| | | | | | | | Shares | | Value (Note 1) |
| | | | | | | | | | |
| COMMON STOCKS - 88.27% | | | | | | | |
| | | | | | | | | | |
| Consumer Discretionary - 16.96% | | | | | | | |
| * | Amazon.com, Inc. | | | | | 3,000 | $ | 967,320 |
| | Best Buy Co., Inc. | | | | | 30,000 | | 1,007,700 |
| | Nordstrom, Inc. | | | | | | 11,000 | | 752,070 |
| | PetSmart, Inc. | | | | | | 11,000 | | 770,990 |
| | Staples, Inc. | | | | | | 60,000 | | 726,000 |
| | Target Corp. | | | | | | 10,000 | | 626,800 |
| | Yum! Brands, Inc. | | | | | | 10,000 | | 719,800 |
| | | | | | | | | | 5,570,680 |
| Consumer Staples - 10.55% | | | | | | | |
| | Campbell Soup Co. | | | | | 22,000 | | 940,060 |
| | Kellogg Co. | | | | | | 15,000 | | 924,000 |
| | Sysco Corp. | | | | | | 20,000 | | 759,000 |
| | Wal-Mart Stores, Inc. | | | | | 11,000 | | 841,170 |
| | | | | | | | | | 3,464,230 |
| Energy - 4.32% | | | | | | | | |
| | Exxon Mobil Corp. | | | | | 6,600 | | 620,730 |
| | Transocean Ltd. | | | | | | 25,000 | | 799,250 |
| | | | | | | | | | 1,419,980 |
| Financials - 8.48% | | | | | | | | |
| | The Allstate Corp. | | | | | | 100 | | 6,137 |
| | Bank of America Corp. | | | | | 55,000 | | 937,750 |
| | The Goldman Sachs Group, Inc. | | | | | 4,800 | | 881,136 |
| | The Western Union Co. | | | | | 60,000 | | 962,400 |
| | | | | | | | | | 2,787,423 |
| Health Care - 10.21% | | | | | | | | |
| | Amgen, Inc. | | | | | | 6,600 | | 927,036 |
| | Johnson & Johnson | | | | | 8,700 | | 927,333 |
| * | Laboratory Corp. of America Holdings | | | | 6,000 | | 610,500 |
| | Merck & Co., Inc. | | | | | | 15,000 | | 889,200 |
| | | | | | | | | | 3,354,069 |
| Industrials - 10.21% | | | | | | | | |
| | Caterpillar, Inc. | | | | | | 8,000 | | 792,240 |
| | Joy Global, Inc. | | | | | | 12,000 | | 654,480 |
| | Raytheon Co. | | | | | | 10,000 | | 1,016,200 |
| | The Boeing Co. | | | | | | 7,000 | | 891,660 |
| | | | | | | | | | 3,354,580 |
| Information Technology - 24.73% | | | | | | | |
| | Apple, Inc. | | | | | | 16,100 | | 1,622,075 |
| | Cisco Systems, Inc. | | | | | 30,400 | | 765,168 |
| | Corning, Inc. | | | | | | 45,000 | | 870,300 |
| | | | | | | | | | |
| | | | | | | | | | (Continued) |
| The Hillman Focused Advantage Fund | | | | | | | |
| | | | | | | | | | |
| Schedule of Investments | | | | | | | | |
| | | | | | | | | | |
| | | | | | | | | | |
| As of September 30, 2014 | | | | | | | | |
| | | | | | | | Shares | | Value (Note 1) |
| | | | | | | | | | |
| COMMON STOCKS - Continued | | | | | | | |
| | | | | | | | | | |
| Information Technology - Continued | | | | | | | |
| | | | | | | | | | |
| * | eBay, Inc. | | | | | | 24,000 | $ | 1,359,120 |
| | International Business Machines Corp. | | | | 4,000 | | 759,320 |
| | Microsoft Corp. | | | | | | 20,000 | | 927,200 |
| | Oracle Corp. | | | | | | 22,000 | | 842,160 |
| * | Universal Display Corp. | | | | | 30,000 | | 979,200 |
| | | | | | | | | | 8,124,543 |
| Materials - 2.81% | | | | | | | | |
| | Nucor Corp. | | | | | | 17,000 | | 922,760 |
| | | | | | | | | | |
| | Total Common Stocks (Cost $25,651,854) | | | | | | 28,998,265 |
| | | | | | | | | | |
| SHORT-TERM INVESTMENT - 11.30% | | | | | | | |
| § | Federated Prime Obligations Fund, 0.03% | | | | 3,711,122 | | 3,711,122 |
| | | | | | | | | | |
| | Total Short-Term Investment (Cost $3,711,122) | | | | | 3,711,122 |
| | | | | | | | | | |
| Total Value of Investments (Cost $29,362,976) - 99.57% | | | | $ | 32,709,387 |
| | | | | | | | | | |
| Other Assets Less Liabilities - 0.43% | | | | | | | 141,012 |
| | | | | | | | | | |
| Net Assets - 100.00% | | | | | | | $ | 32,850,399 |
| | | | | | | | | | |
| * | Non-income producing investment | | | | | | | |
| § | Represents 7 day effective yield as of September 30, 2014 | | | | |
| | | | | | | | | | |
| | | | | | | | | | |
| | | Summary of Investments | | | | | | |
| | | | | | % of Net | | | | |
| | | | | | Assets | | Value | | |
| | | Consumer Discretionary | | 16.96% | $ | 5,570,680 | | |
| | | Consumer Staples | | 10.55% | | 3,464,230 | | |
| | | Energy | | | 4.32% | | 1,419,980 | | |
| | | Financials | | | 8.48% | | 2,787,423 | | |
| | | Health Care | | | 10.21% | | 3,354,069 | | |
| | | Industrials | | | 10.21% | | 3,354,580 | | |
| | | Information Technology | | 24.73% | | 8,124,543 | | |
| | | Materials | | | 2.81% | | 922,760 | | |
| | | Short-Term Investment | | 11.30% | | 3,711,122 | | |
| | | Other Assets Less Liabilities | 0.43% | | 141,012 | | |
| | | Total | | | 100.00% | $ | 32,850,399 | | |
| | | | | | | | | | |
| See Notes to Financial Statements | | | | | | | |
| The Hillman Focused Advantage Fund | | |
| | | |
| Statement of Assets and Liabilities | | |
| | | |
| | | |
| As of September 30, 2014 | | |
| | | |
| Assets: | | |
| | Investments in securities, at value (cost $29,362,976) | $ | 32,709,387 |
| | Cash | | 36,324 |
| | Deposits at Broker | | 106,115 |
| | Receivables: | | |
| | | Fund shares sold | | 5,116 |
| | | Dividends | | 37,712 |
| | | |
| | Total assets | | 32,894,654 |
| | | |
| Liabilities: | | |
| | Accrued expenses: | | |
| | Advisory fees | | 28,982 |
| | Administration fees | | 14,491 |
| | Other operating expenses | | 782 |
| | | |
| | Total liabilities | | 44,255 |
| | | |
| Net Assets | $ | 32,850,399 |
| | | |
| Net Assets Consist of: | | |
| | Paid in capital | $ | 48,981,873 |
| | Undistributed net investment income | | 155,724 |
| | Acculumated net realized loss on investments and options written | | (19,633,609) |
| | Net unrealized appreciation on investments | | 3,346,411 |
| | | |
| | Total Net Assets | $ | 32,850,399 |
| | No Load Shares Outstanding, no par value (unlimited authorized shares) | | 1,903,533 |
| | Net Asset Value, Offering Price and Redemption Price Per Share | $ | 17.26 |
| | | |
| | | |
| | | |
| | | |
| | | |
| | | |
| | | |
| | | |
| | | |
| | | |
| | | |
| | | |
| | | |
| | | |
| | | |
| | | |
| | | |
| | | |
| See Notes to Financial Statements | | |
| The Hillman Focused Advantage Fund | | |
| | | | | | | |
| Statement of Operations | | | |
| | | | | | | |
| | | | | | | |
| For the year ended September 30, 2014 | | |
| | | | | | | |
| Investment Income: | | | |
| | Dividends | | $ | 615,004 |
| | | | | | | |
| Total Investment Income | | 615,004 |
| | | | | | | |
| Expenses: | | | | | |
| | Advisory fees (note 2) | | | 306,306 |
| | Administration fees (note 2) | | | 152,926 |
| | Other operating expenses | | | 48 |
| | | | | | | |
| | Total Expenses | | | 459,280 |
| | | | | | | |
| Net Investment Income | | | 155,724 |
| | | | | | | |
| Net Realized and Unrealized Gains on Investments: | | |
| | | | | | | |
| Net realized gain from investments | | 3,129,993 |
| Net realized gain from options written | | 681,186 |
| | | | | | | |
| Change in unrealized appreciation on investments | | 1,823,798 |
| Change in unrealized appreciation on options written | | 10,591 |
| | | | | | | |
| Net Realized and Unrealized Gain on Investments | | 5,645,568 |
| | | | | | | |
| Net Increase in Net Assets Resulting from Operations | $ | 5,801,292 |
| | | | | | | |
| | | | | | | |
| | | | | | | |
| | | | | | | |
| | | | | | | |
| | | | | | | |
| | | | | | | |
| | | | | | | |
| | | | | | | |
| | | | | | | |
| | | | | | | |
| | | | | | | |
| | | | | | | |
| | | | | | | |
| | | | | | | |
| | | | | | | |
| | | | | | | |
| | | | | | | |
| | | | | | | |
| | | | | | | |
| | | | | | | |
| | | | | | | |
| See Notes to Financial Statements | | |
| The Hillman Focused Advantage Fund | | | | | |
| | | | | | | | | | |
| Statements of Changes in Net Assets | | | | | | |
| | | | | | | | | | |
| | | | | | | | | | |
| For the year ended September 30, | | | | 2014 | | 2013 |
| | | | | | | | | | |
| Operations: | | | | | | | |
| | Net investment income | | | $ | 155,724 | $ | 108,743 |
| | Net realized gain from investments and options written | | | 3,811,179 | | 4,424,512 |
| | Change in unrealized appreciation on investments and options written | | 1,834,389 | | 937,954 |
| | | | | | | | | | |
| Net Increase in Net Assets Resulting from Operations | | | 5,801,292 | | 5,471,209 |
| | | | | | | | | | |
| Distributions to Shareholders: | | | | | | |
| | Net investment income | | | | (108,744) | | (65,304) |
| | | | | | | | | | |
| Net Decrease in Net Assets Resulting from Distributions | | | (108,744) | | (65,304) |
| | | | | | | | | | |
| Beneficial Interest Transactions: | | | | | | |
| | Shares sold | | | | 10,734,113 | | 8,006,288 |
| | Reinvested distributions | | | | 106,484 | | 63,503 |
| | Shares repurchased | | | | (11,869,266) | | (9,105,988) |
| | | | | | | | | | |
| Decrease from Beneficial Interest Transactions | | | (1,028,669) | | (1,036,197) |
| | | | | | | | | | |
| Net Increase in Net Assets | | | | 4,663,879 | | 4,369,708 |
| | | | | | | | | | |
| Net Assets: | | | | | | | |
| | Beginning of Year | | | | | 28,186,520 | | 23,816,812 |
| | End of Year | | | | $ | 32,850,399 | $ | 28,186,520 |
| | | | | | | | | | |
| Undistributed Net Investment Income | | | $ | 155,724 | $ | 108,744 |
| | | | | | | | | | |
| Share Information: | | | | | | |
| | Shares sold | | | | 666,556 | | 621,465 |
| | Reinvested distributions | | | | 6,809 | | 5,400 |
| | Shares repurchased | | | | (744,454) | | (672,425) |
| | | | | | | | | | |
| Net Decrease in Shares of Beneficial Interest | | | (71,089) | | (45,560) |
| | | | | | | | | | |
| Shares Outstanding, Beginning of Year | | | | 1,974,622 | | 2,020,182 |
| Shares Outstanding, End of Year | | | | 1,903,533 | | 1,974,622 |
| | | | | | | | | | |
| | | | | | | | | | |
| | | | | | | | | | |
| | | | | | | | | | |
| | | | | | | | | | |
| | | | | | | | | | |
| | | | | | | | | | |
| | | | | | | | | | |
| | | | | | | | | | |
| | | | | | | | | | |
| | | | | | | | | | |
| See Notes to Financial Statements | | | | | | |
| The Hillman Focused Advantage Fund | | | | | | | | |
| | | | | | | | | | | | | | |
| Financial Highlights | | | | | | | | | | |
| | | | | | | | | | | | | | |
| For a share outstanding during the | | | | | | | | | | |
| year ended September 30, | | 2014 | | 2013 | | 2012 | | 2011 | | 2010 |
| | | | | | | | | | | | | | |
| Net Asset Value, Beginning of Year | $ | 14.27 | $ | 11.79 | $ | 9.77 | $ | 10.46 | $ | 9.68 |
| | | | | | | | | | | | | | |
| Income (Loss) from Investment Operations: | | | | | | | | | |
| | Net investment income | | 0.08 | | 0.03 | | 0.05 | (c) | 0.07 | | 0.04 |
| | Net realized and unrealized gain (loss) | | | | | | | | | | |
| | on investments and options written | | 2.97 | | 2.48 | | 2.01 | | (0.73) | | 0.85 |
| | | | | | | | | | | | | | |
| Total from Investment Operations | | 3.05 | | 2.51 | | 2.06 | | (0.66) | | 0.89 |
| | | | | | | | | | | | | | |
| Less Distributions: | | | | | | | | | | |
| | Dividends (from net investment income) | | (0.06) | | (0.03) | | (0.04) | | (0.03) | | (0.11) |
| | | | | | | | | | | | | | |
| Total Distributions | | (0.06) | | (0.03) | | (0.04) | | (0.03) | | (0.11) |
| | | | | | | | | | | | | | |
| Net Asset Value, End of Year (a) | $ | 17.26 | $ | 14.27 | $ | 11.79 | $ | 9.77 | $ | 10.46 |
| | | | | | | | | | | | | | |
| Total Return | | | 21.39% | | 21.38% | (a) | 21.09% | (a) | (6.38)% | (a) | 9.15% |
| | | | | | | | | | | | | | |
| Net Assets, End of Year (in thousands) | $ | 32,850 | $ | 28,187 | $ | 23,817 | $ | 10,651 | $ | 13,747 |
| | | | | | | | | | | | | | |
| Ratios of: | | | | | | | | | | | | |
| Gross Expenses to Average Net Assets (b) | 1.50% | | 1.50% | | 1.50% | | 1.50% | | 2.91% |
| Net Expenses to Average Net Assets (b) | 1.50% | | 1.50% | | 1.50% | | 1.50% | | 2.05% |
| Net Investment Income to Average Net Assets | 0.51% | | 0.39% | | 0.41% | | 0.58% | | 0.23% |
| | | | | | | | | | | | | | |
| Portfolio turnover rate | | 55.51% | | 118.67% | | 39.09% | | 16.10% | | 13.84% |
| | | | | | | | | | | | | | |
| | | | | | | | | | | | | | |
| (a) | Includes adjustments in accordance with accounting principles generally accepted in the United States of America, and, consequently, the net asset value for financial reporting purposes and the total returns based upon those net asset values may differ from the net asset values and total returns for shareholder transactions. |
| (b) | The expense ratios listed reflect total expenses prior to any waivers and reimbursements (gross expense ratio) and after any waivers and reimbursements (net expense ratio). |
| (c) | Per share amounts calculated using the average shares method, which appropriately represents the per share data for the period. |
| | | | | | | | | | | |
| | | | | | | | | | | | | | |
| | | | | | | | | | | | | | |
| | | | | | | | | | | | | | |
| | | | | | | | | | | | | | |
| | | | | | | | | | | | | | |
| | | | | | | | | | | | | | |
| | | | | | | | | | | | | | |
| | | | | | | | | | | | | | |
| | | | | | | | | | | | | | |
| | | | | | | | | | | | | | |
| | | | | | | | | | | | | | |
| See Notes to Financial Statements | | | | | | | | | | |
The Hillman Focused Advantage Fund
Notes to Financial Statements
1. Organization and Significant Accounting Policies
The Hillman Focused Advantage Fund (the "Fund") is a series of the Hillman Capital Management Investment Trust (the "Trust"), which was organized on July 14, 2000 as a Delaware Business Statutory Trust and is registered under the Investment Company Act of 1940, (the "1940 Act"), as amended, as an open-ended management investment company.
The Fund commenced operations on December 29, 2000. The investment objective of the Fund is to seek long-term capital appreciation.
The following is a summary of significant accounting policies consistently followed by the Fund. The policies are in conformity with accounting principles generally accepted in the United States of America ("GAAP").
Investment Valuation
Securities listed on an exchange or quoted on a national market system are valued at the last sales price as of 4:00 p.m. Eastern Time. Securities traded in the NASDAQ over-the-counter market are generally valued at the NASDAQ Official Closing Price. Other securities traded in the over-the-counter market and listed securities for which no sale was reported on that date are valued at the most recent bid price. Securities and assets for which representative market quotations are not readily available (e.g., if the exchange on which the security is principally traded closes early or if trading of the particular security is halted during the day and does not resume prior to the Fund's net asset value calculation) or which cannot be accurately valued using the Fund's normal pricing procedures are valued at fair value as determined in good faith under policies approved by the Trustees. A security's "fair value" price may differ from the price next available for that security using the Fund's normal pricing procedures. Instruments with maturities of 60 days or less are valued at amortized cost, which approximates market value.
Option Valuation
Exchange-listed options are valued at the mean of the bid and ask prices as reported on their primary exchange as of 4:00 p.m. Eastern Time (the "Valuation Time"). For purposes of determining the primary exchange for each exchange-traded portfolio option the following shall apply: (i) if the option is traded on the Chicago Board Options Exchange ("CBOE"), the CBOE shall be considered the primary exchange for such option, unless the Advisor instructs the Administrator in writing to use a different exchange as the primary exchange for such option; and (ii) if the option does not trade on the CBOE, the Advisor shall instruct the Administrator in writing as to the primary exchange for such option. An option may be valued using Fair Valuation when (i) the option does not trade on the valuation date; and (ii) reliable last quoted bid and ask prices as of the Valuation Time are not readily available.
Fair Value Measurement
Various inputs are used in determining the value of the Fund's investments. These inputs are summarized in the three broad levels listed below:
| a. | Level 1: quoted prices in active markets for identical securities |
| b. | Level 2: other significant observable inputs (including quoted prices for similar securities and identical securities in inactive markets, interest rates, credit risk, etc.) |
| c. | Level 3: significant unobservable inputs (including the Fund's own assumptions in determining fair value of investments) |
The availability of observable inputs can vary from security to security and is affected by a wide variety of factors, including, for example, the type of security, whether the security is new and not yet established in the marketplace, the liquidity of markets, and other characteristics particular to the security. To the extent that valuation is based on models or inputs that are less observable or unobservable in the market, the determination of fair value requires more judgment. Accordingly, the degree of judgment exercised in determining fair value is greatest for instruments categorized in Level 3.
The inputs used to measure fair value may fall into different levels of the fair value hierarchy. In such cases, for disclosure purposes, the level in the fair value hierarchy within which the fair value measurement falls in its entirety, is determined based on the lowest level input that is significant to the fair value measurement in its entirety.
(Continued)
The Hillman Focused Advantage Fund
Notes to Financial Statements
The inputs or methodology used for valuing securities are not necessarily an indication of the risk associated with investing in those securities. The following table summarizes the inputs as of September 30, 2014 for the Fund's investments:
| | |
| Investments in Securities (a) | | Total | | Level 1 | | Level 2 | | Level 3 |
Common Stocks* | $ | 28,998,265 | $ | 28,998,265 | $ | - | $ | - |
| Short-Term Investment | | 3,711,122 | | 3,711,122 | | - | | - |
| Total Assets | $ | 32,709,387 | $ | 32,709,387 | $ | - | $ | - |
| | | | | | | | |
(a) The Fund did not hold any Level 3 securities during the year. There were no transfers into or out of Level 1 and Level 2 during the year. It is the Fund's policy to recognize transfers into or out of Level 1 and Level 2 at the end of the reporting year.
*For a detailed breakout by sector, please refer to the Schedule of Investments.
Derivative Financial Instruments
The Fund may invest in derivative financial instruments (derivatives) in order to manage risk or gain exposure to various other investments or markets. Derivatives may contain various risks including the potential inability of the counterparty to fulfill their obligations under the terms of the contract, the potential for an illiquid secondary market, and the potential for market movements which may expose the Fund to gains or losses in excess of the amounts shown on the Statement of Assets and Liabilities. As of September 30, 2014, the Fund did not hold any derivatives. There is no effect on the Statement of Assets and Liabilities.
Derivatives are marked to market daily based upon quotations from market makers or the Fund's independent pricing services and the Fund's net benefit or obligation under the contract, as measured by the fair market value of the contract, is included in the net assets. Realized gain and loss and unrealized appreciation and depreciation on these derivatives for the year are included in the Statement of Operations and serve as an indicator of the volume of derivative activity in the Fund.
Investment Transactions and Investment Income
Investment transactions are accounted for as of the date purchased or sold (trade date). Dividend income is recorded on the ex-dividend date. Interest income is recorded on the accrual basis and includes accretion and amortization of discounts and premiums. Gains and losses are determined on the identified cost basis, which is the same basis used for Federal income tax purposes.
Expenses
The Fund bears expenses incurred specifically on its behalf and Trust level expenses.
Distributions
The Fund may declare and distribute dividends from net investment income (if any) annually. Distributions from capital gains (if any) are generally declared and distributed annually. Dividends and distributions to shareholders are recorded on ex-date.
Estimates
The preparation of financial statements in conformity with GAAP requires management to make estimates and assumptions that affect the reported amounts of assets and liabilities and disclosure of contingent assets and liabilities at the date of the financial statements and the reported amounts of increases and decreases in the net assets from operations during the reporting period. Actual results could differ from those estimates.
(Continued)
The Hillman Focused Advantage Fund
Notes to Financial Statements
Federal Income Taxes
No provision for income taxes is included in the accompanying financial statements, as the Fund intends to distribute to shareholders all taxable investment income and realized gains and otherwise comply with Subchapter M of the Internal Revenue Code applicable to regulated investment companies.
Option Writing
When the Fund writes an option, an amount equal to the premium received by the Fund is recorded as a liability and is subsequently adjusted to the current fair value of the option written. Premiums received from writing options that expire unexercised are treated by the Fund on the expiration date as realized gains from options written. The difference between the premium and the amount paid on effecting a closing purchase transaction, including brokerage commissions, is also treated as a realized gain or loss (depending on if the premium is more or less than the amount paid for the closing purchase transaction). If a call option is exercised, the premium is added to the proceeds from the sale of the underlying security in determining whether the Fund has realized a gain or loss. If a put option is exercised, the premium reduces the cost basis of the securities purchased by the Fund. The Fund, as the writer of an option, bears the market risk of an unfavorable change in the price of the security underlying the written option. Written options are non-income producing securities.
A summary of option contracts written by the Fund during the fiscal year ended September 30, 2014 were as follows:
| Call Options | | Put Options |
| Number of Contracts | | Premiums Received | | Number of Contracts | | Premiums Received |
Options Outstanding, Beginning of Year | - | $ | - | | 830 | $ | 66,051 |
| Options written | 5,762 | | 354,824 | | 7,192 | | 622,226 |
| Options closed | (335) | | (10,264) | | - | | - |
| Options exercised | (2,676) | | (166,486) | | (1,618) | | (171,276) |
| Options expired | (2,751) | | (178,074) | | (6,404) | | (517,001) |
| Options Outstanding, End of Year | - | $ | - | | - | $ | - |
2. Transactions with Affiliates
Advisor
The Fund pays monthly advisory fees to Hillman Capital Management, Inc. (the "Advisor") based upon the average daily net assets and calculated at an annual rate of 1.00%. For the fiscal year ended September 30, 2014, the Fund incurred advisory fees in the amount of $306,306.
Administrator
Fund Accounting and Administration Agreement: The Nottingham Company ("Administrator") provides the Fund with administrative, fund accounting, and compliance services. The Administrator receives compensation from the Fund at a maximum annual rate of 0.499%, with lower fees at higher asset levels, and is responsible for the coordination and payment of vendor services and other Fund expenses for such compensation. Pursuant to this arrangement, the Administrator pays the following expenses: (i) compensation and expenses of any employees of the Trust and of any other persons rendering any services to the Fund; (ii) clerical and shareholder service staff salaries; (iii) office space and other office expenses; (iv) fees and expenses incurred by the Fund in connection with membership in investment company organizations; (v) fees and expenses of counsel to the Trustees who are not interested persons of the Fund and Trust; (vi) fees and expenses of counsel to the Fund and Trust engaged to assist with preparation of Fund and Trust documents and filings and provide other
(Continued)
The Hillman Focused Advantage Fund
Notes to Financial Statements
ordinary legal services; (vii) fees and expenses of independent public accountants to the Fund, including fees and expense for tax preparation; (viii) expenses of registering shares under federal and state securities laws; (ix) insurance expenses; (x) fees and expenses of the custodian, shareholder servicing, dividend disbursing and transfer agent, administrator, distributor, and accounting and pricing services agents of the Fund; (xi) compensation for a chief compliance officer for the Trust; (xii) expenses, including clerical expenses, of issue, sale, redemption, or repurchase of shares of the Fund; (xiii) the cost of preparing and distributing reports and notices to shareholders; (xiv) the cost of printing or preparing prospectuses and statements of additional information for delivery to the Fund's current shareholders; (xv) the cost of printing or preparing documents, statements or reports to shareholders; and (xvi) other expenses not specifically assumed by the Fund or Advisor. The Administrator cannot recoup from the Fund any Fund expenses in excess of the administration fees payable under the Fund Accounting and Administration Agreement. For the fiscal year ended September 30, 2014, the Fund incurred administration fees in the amount of $152,926.
Operating Plan: The Advisor has entered into an Operating Plan with the Administrator under which it has agreed make the following payments to the Administrator: (i) when the Fund's assets are below $40 million, the Advisor pays the Administrator a fee based on the daily average net assets of the Fund; and (ii) when the consolidated fee collected by the Administrator is less than a designated minimum operating cost, then the Advisor pays the Administrator a fee that makes up the difference. The Advisor is also obligated to pay the following Fund expenses under the Operating Plan: (i) marketing, distribution, and servicing expenses related to the sale or promotion of Fund shares that the Fund is not authorized to pay pursuant to the Investment Company Act; (ii) expenses incurred in connection with the organization and initial registration of shares of the Fund; (iii) expenses incurred in connection with the dissolution and liquidation of the Fund; (iv) expenses related to shareholder meetings and proxy solicitations; (v) fees and expenses related to legal, auditing, and accounting services that are outside of the scope of ordinary services; and (vi) hiring employees and retaining advisers and experts as contemplated by Rule 0-1(a)(7)(vii) of the Investment Company Act.
The Operating Plan may be terminated by either party at the conclusion of the then current term upon: (i) written notice of non-renewal to the other party not less than sixty days prior to the end of the term, or (ii) mutual written agreement of the parties. The Advisor cannot recoup from the Fund any amounts paid by the Advisor to the Administrator under the Operating Plan. If the Operating Plan is terminated when the Fund is at lower asset levels, the Administrator would likely need to terminate the Fund Accounting and Administration Agreement in order to avoid incurring expenses without reimbursement from the Advisor. Unless other expense limitation arrangements were put in place, the Fund's expenses would likely increase.
Compliance Services
Nottingham Compliance Services, LLC, a fully owned affiliate of the Administrator, provides services which assist the Trust's Chief Compliance Officer in monitoring and testing the policies and procedures of the Trust in conjunction with requirements under Rule 38a-1 of the 1940 Act.
In January 2014, Cipperman Compliance Services, LLC assumed providing services as the Trust's Chief Compliance Officer. Cipperman Compliance Services, LLC is entitled to receive compensation from the Administrator pursuant to the Administrator's fee arrangements with the Fund.
Transfer Agent
Nottingham Shareholder Services, LLC (the "Transfer Agent") serves as transfer, dividend paying, and shareholder servicing agent for the Fund. For its services, the Transfer Agent is entitled to receive compensation from the Administrator pursuant to the Administrator's fee arrangements with the Fund.
Distributor
Capital Investment Group, Inc. (the "Distributor") serves as the Fund's principal underwriter and distributor. For its services, the Distributor is entitled to receive compensation from the Administrator pursuant to the Administrator's fee arrangements with the Fund.
Certain Trustees and officers of the Trust are also officers of the Advisor or the Administrator.
(Continued)
The Hillman Focused Advantage Fund
Notes to Financial Statements
3. Purchases and Sales of Investment Securities
For the fiscal year ended September 30, 2014, the aggregate cost of purchases and proceeds from sales of investment securities (excluding short-term securities) were as follows:
| Fiscal Year Ended | Purchases of Securities | Proceeds from Sales of Securities |
| September 30, 2014 | $15,339,620 | $17,092,595 |
There were no long-term purchases or sales of U.S Government Obligations during the fiscal year ended September 30, 2014.
4. Federal Income Tax
Distributions are determined in accordance with Federal income tax regulations, which differ from GAAP, and, therefore, may differ significantly in amount or character from net investment income and realized gains for financial reporting purposes. Financial reporting records are adjusted for permanent book/tax differences to reflect tax character but are not adjusted for temporary differences. Permanent differences do not have an effect on the net asset values of the Fund.
Management reviewed the Fund's tax positions to be taken on Federal income tax returns for the open tax years of 2011, 2012, and 2013, and as of and during the fiscal year ended September 30, 2014, and determined that the Fund does not have a liability for uncertain tax positions. The Fund recognizes interest and penalties, if any, related to unrecognized tax benefits as income tax expense in the Statement of Operations. During the year, the Fund did not incur any interest or penalties.
Distributions during the fiscal years ended were characterized for tax purposes as follows:
| September 30, 2014 | September 30, 2013 |
| Ordinary Income | $108,744 | $65,304 |
At September 30, 2014, the tax-basis cost of investments and components of distributable earnings (deficit) were as follows:
| Cost of Investments | $ | 29,390,732 |
| | |
| Unrealized Appreciation | | 4,470,503 |
| Unrealized Depreciation | | (1,151,848) |
| Net Unrealized Appreciation | | 3,318,655 |
| | |
| Undistributed Net Investment Income | | 155,724 |
| Accumulated Net Realized Losses on Investments | | (19,605,853) |
| | |
| Accumulated Deficit | $ | (16,131,474) |
| | | | | |
The difference between book-basis and tax-basis net unrealized appreciation (depreciation) and accumulated realized losses is attributable to the tax deferral of losses from wash sales.
Captial Loss Carryforwards
Under the Regulated Investment Company Modernization Act of 2010 ("the Modernization Act"), net capital losses recognized in tax years beginning after December 22, 2010 may be carried forward indefinitely, and the character of the losses is retained as short‐term and/or long‐term. Under the law in effect prior to the Modernization Act, net capital losses were
(Continued)
The Hillman Focused Advantage Fund
Notes to Financial Statements
carried forward for eight years and treated as short‐term. As a transition rule, the Modernization Act requires that post‐enactment net capital losses be used before pre‐enactment net capital losses. Accumulated capital losses noted below represent pre‐enactment net capital loss carryforwards, as of September 30, 2014, that may be available to offset future realized capital gains and thereby reduce future taxable gains distributions. Short-term capital loss carryforwards in the amounts of $12,741,515 and $6,864,338 are set to expire September 30, 2017, and September 30, 2018, respectively.
5. Commitments and Contingencies
Under the Trust's organizational documents, its officers and Trustees are indemnified against certain liabilities arising out of the performance of their duties to the Fund. In addition, in the normal course of business, the Fund enters into contracts with its vendors and others that provide for general indemnifications. The Fund's maximum exposure under these arrangements is unknown, as this would involve future claims that may be made against the Fund. However, based on experience, the Fund expects the risk of loss to be remote.
6. Subsequent Events
The Fund has evaluated the need for disclosures and/or adjustments resulting from subsequent events through the date of issuance of these financial statements. This evaluation did not result in any subsequent events that necessitated disclosures and/or adjustments.
REPORT OF INDEPENDENT REGISTERED PUBLIC ACCOUNTING FIRM
To the Board of Trustees of Hillman Capital Management Investment Trust
and the Shareholders of Hillman Focused Advantage Fund
We have audited the accompanying statement of assets and liabilities of Hillman Focused Advantage Fund, a series of shares of beneficial interest in Hillman Capital Management Investment Trust, including the schedule of investments, as of September 30, 2014, and the related statement of operations for the year then ended, the statements of changes in net assets for each of the years in the two-year period then ended and the financial highlights for each of the years in the five-year period then ended. These financial statements and financial highlights are the responsibility of the Fund's management. Our responsibility is to express an opinion on these financial statements and financial highlights based on our audits.
We conducted our audits in accordance with the standards of the Public Company Accounting Oversight Board (United States). Those standards require that we plan and perform the audits to obtain reasonable assurance about whether the financial statements and financial highlights are free of material misstatement. An audit includes examining, on a test basis, evidence supporting the amounts and disclosures in the financial statements. Our procedures included confirmation of securities owned as of September 30, 2014 by correspondence with the custodian. An audit also includes assessing the accounting principles used and significant estimates made by management, as well as evaluating the overall financial statement presentation. We believe that our audits provide a reasonable basis for our opinion.
In our opinion, the financial statements and financial highlights referred to above present fairly, in all material respects, the financial position of Hillman Focused Advantage Fund as of September 30, 2014, and the results of its operations for the year then ended, the changes in its net assets for each of the years in the two-year period then ended and its financial highlights for each of the years in the five-year period then ended, in conformity with accounting principles generally accepted in the United States of America.
BBD, LLP
Philadelphia, Pennsylvania
The Hillman Focused Advantage Fund
Additional Information
(Unaudited)
1. Proxy Voting Policies and Voting Record
A copy of the Trust's Proxy Voting and Disclosure Policy and the Advisor's Proxy Voting and Disclosure Policy are included as Appendix B to the Fund's Statement of Additional Information and are available, (1) without charge, upon request, by calling 1-800-773-3863 and (2) on the Securities and Exchange Commission's ("SEC") website at sec.gov. Information regarding how the Fund voted proxies relating to portfolio securities during the most recent 12-month period ended June 30 will be available (1) without charge, upon request, by calling the Fund at the number above and (2) on the SEC's website at sec.gov.
2. Quarterly Portfolio Holdings
The Fund files its complete schedule of portfolio holdings with the SEC for the first and third quarters of each fiscal year on Form N-Q. The Fund's Forms N-Q is available on the SEC's website at sec.gov. You may review and make copies at the SEC's Public Reference Room in Washington, D.C. Information on the operation of the Public Reference Room may be obtained by calling the SEC at 1-800-SEC-0330. You may also obtain copies without charge, upon request, by calling the Fund at 1-800-773-3863.
3. Tax Information
We are required to advise you within 60 days of the Fund's fiscal year-end regarding the Federal tax status of certain distributions received by shareholders during each fiscal year. The following information is provided for the Fund's fiscal year ended September 30, 2014.
During the fiscal year, no long-term capital gain distributions were paid from the Fund.
Dividend and distributions received by retirement plans such as IRAs, Keogh-type plans, and 403(b) plans need not be reported as taxable income. However, many retirement plans may need this information for their annual information meeting.
4. Schedule of Shareholder Expenses
As a shareholder of the Fund, you incur two types of costs: (1) transaction costs, and (2) ongoing costs, including investment advisory fees and other Fund expenses. This example is intended to help you understand your ongoing costs (in dollars) of investing in the Fund and to compare these costs with the ongoing costs of investing in other mutual funds. The example is based on an investment of $1,000 invested at the beginning of the period and held for the entire period as indicated below.
Actual Expenses – The first line of the table below provides information about the actual account values and actual expenses. You may use the information in this line, together with the amount you invested, to estimate the expenses that you paid over the period. Simply divide your account value by $1,000 (for example, an $8,600 account value divided by $1,000 = 8.6), then multiply the result by the number in the first line under the heading entitled "Expenses Paid During Period" to estimate the expenses you paid on your account during this period.
Hypothetical Example for Comparison Purposes – The last line of the table below provides information about hypothetical account values and hypothetical expenses based on the Fund's actual expense ratio and an assumed annual rate of return of 5% before expenses, which is not the Fund's actual return. The hypothetical account values and expenses may not be used to estimate the actual ending account balance or expenses you paid for the period. You may use this information to compare the ongoing costs of investing in the Fund and other funds by comparing this 5% hypothetical example with the 5% hypothetical examples that appear in the shareholder reports of other funds.
(Continued)
The Hillman Focused Advantage Fund
Additional Information
(Unaudited)
| Beginning Account Value April 1, 2014 | Ending Account Value September 30, 2014 | Expenses Paid During Period* |
Actual Hypothetical (5% annual return before expenses) | | | |
| $1,000.00 | $ 1,064.10 | $7.76 |
| $1,000.00 | $ 1,017.55 | $7.59 |
*Expenses are equal to the average account value over the period multiplied by the Fund's annualized expense ratio of 1.50%, multiplied by 183/365 (to reflect the one-half year period).
5. Approval of Advisory Agreement
The Advisor supervises the investments of the Fund pursuant to an Investment Advisory Agreement. At the annual meeting of the Fund's
Board of Trustees on December 16, 2013, the Trustees unanimously approved the renewal of the Investment Advisory Agreement for another year. In considering whether to approve the renewal of the Investment Advisory Agreement, the Trustees reviewed and considered the information they deemed reasonably necessary, including the following material factors: (i) the nature, extent, and quality of the services provided by the Advisor; (ii) the investment performance of the Fund and the Advisor; (iii) the costs of the services to be provided and profits to be realized by the Advisor and its affiliates from the relationship with the Fund; (iv) the extent to which economies of scale would be realized as the Fund grows and whether advisory fee levels reflect those economies of scale for the benefit of the Fund's investors; (v) the Advisor's practices regarding brokerage and portfolio transactions; and (vi) the Advisor's practices regarding possible conflicts of interest.
At the meeting, the Trustees reviewed various informational materials, including the Investment Advisory Agreement for the Fund and a memorandum from the Advisor to the Trustees containing information about the advisory firm and its business. The memorandum provided information about the Advisor's finances, personnel, services to the Fund, investment advice, fees, and compliance program. It also contained information on Fund expenses, including comparative expense ratio information for other mutual funds with strategies similar to the Fund. The Trustees also reviewed a memorandum from the Fund's legal counsel that summarized the fiduciary duties and responsibilities of the Board of Trustees in reviewing and approving the Investment Advisory Agreement, including the types of information and factors that should be considered in order to make an informed decision. In addition, the Trustees consulted with separate independent legal counsel retained by them regarding their consideration of the Investment Advisory Agreement.
| (i) | In considering the nature, extent, and quality of the services provided by the Advisor to the Fund, the Trustees considered the responsibilities of the Advisor under the Investment Advisory Agreement. The Trustees reviewed the services being provided by the Advisor to the Fund, including, without limitation, the quality of its investment advisory services since the Fund's inception (including research and recommendations with respect to portfolio securities); its procedures for formulating investment recommendations and assuring compliance with the Fund's investment objectives and limitations; coordination of services for the Fund among the Fund's service providers; and efforts to promote the Fund, grow the Fund's assets, and assist in the distribution of Fund shares. |
The Trustees noted that the Advisor seeks to achieve the Fund's investment objectives by investing primarily in common stocks of U.S. companies that the Advisor believes have qualitative and quantitative competitive advantages and have temporarily fallen out of favor for reasons that are considered non-recurring or short-term; whose value is not currently well known; or whose value is not fully recognized by the public. The Trustees further noted that the Trust's president/principal executive officer and treasurer/principal financial officer were either employees of the Advisor or retained by the Advisor and serve without additional compensation from the Fund.
After reviewing the foregoing information and further information in the memorandum from the Advisor (e.g., descriptions of the Advisor's business, the Advisor's compliance program, and the Advisor's Form ADV), the Board of Trustees concluded that the nature, extent, and quality of the services provided by the Advisor were satisfactory and adequate for the Fund.
(Continued)
The Hillman Focused Advantage Fund
Additional Information
(Unaudited)
| (ii) | In considering the investment performance of the Fund and the Advisor, the Trustees compared the performance of the Fund with the performance of its benchmark index, comparable funds with similar objectives managed by other investment advisors, and applicable peer group data (e.g., Bloomberg peer group averages). The Trustees noted that the returns for the year-to-date, one-year, three-year, five-year, and ten-year periods ended November 30, 2013 were 8.50%, 11.10%%, 17.55%, 11.32%, and 5.41%, respectively, for the No Load Shares of the Fund. The Trustees compared these returns to those of the comparable funds and the peer group average. The Trustees also noted that for the one-year period ended September 30, 2014, the No Load Shares of the Fund returned 21.30%. The Trustees also considered the consistency of the Advisor's management of the Fund with its investment objective and policies. After reviewing the short and long-term investment performance of the Fund, the Advisor's experience managing the Fund and other advisory accounts, the Advisor's historical investment performance, and other factors, the Board of Trustees concluded that the investment performance of the Fund and the Advisor was satisfactory. |
| (iii) | In considering the costs of the services to be provided and profits to be realized by the Advisor and its affiliates from the relationship with the Fund, including any benefits derived or to be derived by the Advisor from the relationship with the Fund, the Trustees first noted that the management fee for the Fund under the Investment Advisory Agreement was 1.00% of average daily net assets. The Trustees evaluated the Advisor's staffing, personnel, and methods of operating; the education and experience of the Advisor's personnel; the Advisor's compliance program; the financial condition of the Advisor; the level of commitment to the Fund and the Advisor by the principals of the Advisor; the asset level of the Fund; and the overall expenses of the Fund, including certain prior fee waivers and reimbursements by the Advisor on behalf of the Fund and the nature and frequency of advisory fee payments. |
The Trustees reviewed the financial statements for the Advisor and discussed the financial stability and profitability of the firm. The Trustees noted that the Advisor either makes payments to the Administrator or directly pays for certain expenses of the Fund under an Operating Plan in order to help limit the Fund's annual operating expenses. The Trustees also considered potential benefits for the Advisor in managing the Fund, including promotion of the Advisor's name, the ability for the Advisor to place small accounts into the Fund, and the potential for the Advisor to generate soft dollars from the Fund's trades that may benefit the Advisor's other clients.
The Trustees then compared the fees and expenses of the Fund (including the management fee) to other funds comparable in terms of the type of fund, the nature of its investment strategy, and its style of investment management, among other factors. The Trustees determined that the management fee was higher than the comparable funds and the net expense ratio was higher than some of the comparable funds and lower than others. The Trustees also determined that the Fund's management fee and net expense ratio were higher than its peer group average. The Trustees noted that the Fund was much smaller in size than its peer group average. The Trustees also noted that the Advisor's fee for separate account clients was 1.00% on the first $5 million, 0.85% on the next $15 million, and 0.75% on the next $50 million, and 0.50% on assets in excess of $70 million.
Following this comparison and upon further consideration and discussion of the foregoing, the Board of Trustees concluded that the fees to be paid to the Advisor by the Fund were fair and reasonable in relation to the nature and quality of the services provided by the Advisor and that they reflected charges that were within a range of what could have been negotiated at arm's length.
| (iv) | In considering the extent to which economies of scale would be realized as the Fund grows and whether the advisory fee levels reflect these economies of scale for the benefit of the Fund's investors, the Trustees reviewed the Fund's operational history and noted that the size of the Fund had not provided an opportunity to realize economies of scale. The Trustees then reviewed the Fund's fee arrangements for breakpoints or other provisions that would allow the Fund's shareholders to benefit from economies of scale in the future as the Fund grows. The Trustees determined that the maximum management fee would stay the same regardless of the Fund's asset levels and, therefore, did not reflect economies of scale. The Trustees noted that the Fund was a relatively small size and economies of scale were unlikely to be achievable in the near future. It was pointed out that breakpoints in the advisory fee could be reconsidered in the future. |
(Continued)
The Hillman Focused Advantage Fund
Additional Information
(Unaudited)
The Trustees noted that the Fund will benefit from economies of scale under the agreement with the Administrator since it utilized breakpoints. The Trustees also noted that the Advisor had agreed to make payments to the Administrator at lower asset levels in order to help limit the Fund's expenses. The Trustees determined that these arrangements provided potential savings for the benefit of the Fund's investors.
Following further discussion of the Fund's asset levels, expectations for growth, and fee levels, the Board of Trustees determined that the Fund's fee arrangements were fair and reasonable at the present time in relation to the nature and quality of the services provided by the Advisor.
| (v) | In considering the Advisor's practices regarding brokerage and portfolio transactions, the Trustees considered the Advisor's standards, and performance in utilizing those standards, for seeking best execution for Fund portfolio transactions. The Trustees also considered the portfolio turnover rate for the Fund; the process by which evaluations are made of the overall reasonableness of commissions paid; the method and basis for selecting and evaluating the broker-dealers used; any anticipated allocation of portfolio business to persons affiliated with the Advisor; and the extent to which the Fund allocates portfolio business to broker-dealers who provide research, statistical, or other services ("soft dollars"). The Trustees noted, among other things, that the Fund rarely trades blocks of shares which require special handling and that the average commission rate for the Fund was under $0.02 per share. After further review and discussion, the Board of Trustees determined that the Advisor's practices regarding brokerage and portfolio transactions were satisfactory. |
| (vi) | In considering the Advisor's practices regarding possible conflicts of interest, the Trustees evaluated the potential for conflicts of interest and considered such matters as the experience and ability of the advisory personnel assigned to the Fund; the basis of decisions to buy or sell securities for the Fund and the Advisor's other accounts; the method for bunching of portfolio securities transactions; and the substance and administration of the Advisor's code of ethics. Following further consideration and discussion, the Board of Trustees indicated that the Advisor's standards and practices relating to the identification and mitigation of possible conflicts of interests were satisfactory. |
Based upon all of the foregoing considerations, the Board of Trustees, including a majority of the Trust's independent trustees, approved the renewal of the Investment Advisory Agreement.
6. Information about Trustees and Officers
The business and affairs of the Fund and the Trust are managed under the direction of the Trustees. Information concerning the Trustees and officers of the Trust and Fund is set forth below. Generally, each Trustee and officer serves an indefinite term or until certain circumstances such as their resignation, death, or otherwise as specified in the Trust's organizational documents. Any Trustee may be removed at a meeting of shareholders by a vote meeting the requirements of the Trust's organizational documents. The Statement of Additional Information of the Fund includes additional information about the Trustees and officers and is available, without charge, upon request by calling the Fund toll-free at 1-800-773-3863. The address of each Trustee and officer, unless otherwise indicated below, is 116 South Franklin Street, Rocky Mount, North Carolina 27804. The Independent Trustees received aggregate compensation of $5,250 during the fiscal year ended September 30, 2014 from each Fund for their services to the Fund and Trust. The Interested Trustee and officers did not receive compensation from the Fund for their services to the Fund and Trust.
(Continued)
The Hillman Focused Advantage Fund
Additional Information
(Unaudited)
Name, Age
and Address | Position
held with
Fund or Trust | Length of Time Served | Principal Occupation
During Past 5 Years | Number of Portfolios in Fund Complex Overseen by Trustee | Other Directorships
Held by Trustee
During Past 5 Years |
| Independent Trustees |
Theo H. Pitt, Jr.
Age: 78 | Independent Trustee | Since 9/10 | Senior Partner, Community Financial Institutions Consulting (financial consulting) since 1999; Partner, Pikar Properties (real estate) since 2001; Account Administrator, Holden Wealth Management Group of Wachovia Securities (money management firm) from 2003-2008. | 23 | Independent Trustee of World Funds Trust for its twelve series, Gardner Lewis Investment Trust for its two series, Vertical Capital Investors Trust for its two series (all registered investment companies); previously, Independent Trustee of, NCM Capital Investment Trust for its one series from 2007 to 2009, New Providence Investment Trust from 2008 to 2009, and Centaur Mutual Funds Trust for its two series from 2004 to 2009 (all registered investment companies). |
James H. Speed, Jr.
Age: 61 | Independent Trustee, Chairman | Trustee since 7/09, Chair since 5/12 | President and CEO of NC Mutual Insurance Company (insurance company) since 2003. | 23 | Independent Trustee of Brown Capital Management Funds for its three series, and Centaur Mutual Funds Trust for its one series (all registered investment companies). Member of Board of Directors of NC Mutual Life Insurance Company. Member of Board of Directors of M&F Bancorp. Previously, Independent Trustee of New Providence Investment Trust for its one series from 2009 until 2011 (registered investment company). |
| Other Officers |
Mark A. Hillman, 52 4350 East Highway Suite 502 Bethesda, MD 20814 | Trustee and President (Principal Executive Officer) | Trustee and President since 12/2000 | President, Hillman Capital Management, Inc. (investment advisor to the Fund); previously, Chief Investment Officer, Menocal Capital Management, Inc. (investment advisor). | 1 | None |
| *Basis of interestedness. Mr. Hilman is an Interested Trustee because he is an officer of Hillman Capital Management, Inc., the investment advisor of the Fund. |
Katherine M. Honey
Age: 40 | Secretary | Since 10/13 | EVP of The Nottingham Company since 2008. | n/a | n/a |
(Continued)
The registrant's Board of Trustees has determined that the registrant has an audit committee financial expert, as defined in Item 3 of Form N-CSR, serving on its audit committee.
As of the date of this report, September 30, 2014, the registrant's audit committee financial expert is Mr. James H. Speed, Jr. Mr. Speed is "independent" for purposes of Item 3 of Form N-CSR.
Item 4. PRINCIPAL ACCOUNTANT FEES AND SERVICES.
Not applicable.
A copy of the schedule of investments of unaffiliated issuers as of the close of the reporting period is included as part of the report to shareholders filed under Item 1 of this Form.
Not applicable.
Not applicable.
Not applicable.
None.
Pursuant to the requirements of the Securities Exchange Act of 1934 and the Investment Company Act of 1940, the registrant has duly caused this report to be signed on its behalf by the undersigned, thereunto duly authorized.
Pursuant to the requirements of the Securities Exchange Act of 1934 and the Investment Company Act of 1940, this report has been signed below by the following persons on behalf of the registrant and in the capacities and on the dates indicated.