Matthew J. Beck
Annual Report 2017
September 30, 2017
The Hillman Fund
No Load Shares
This report and the financial statements contained herein are submitted for the general information of the shareholders of The Hillman Fund ("Fund"). The Fund's shares are not deposits or obligations of, or guaranteed by, any depository institution. The Fund's shares are not insured by the FDIC, Federal Reserve Board or any other agency, and are subject to investment risks, including possible loss of principal amount invested. Neither the Fund nor the Fund's distributor is a bank.
The Hillman Fund is distributed by Capital Investment Group, Inc., Member FINRA/SIPC, 100 E. Six Forks Road, Suite 200, Raleigh, NC, 27609. There is no affiliation between The Hillman Fund, including its principals, and Capital Investment Group, Inc.
Statements in this Annual Report that reflect projections or expectations of future financial or economic performance of The Hillman Fund ("Fund") and of the market in general and statements of the Fund's plans and objectives for future operations are forward-looking statements. No assurance can be given that actual results or events will not differ materially from those projected, estimated, assumed or anticipated in any such forward-looking statements. Important factors that could result in such differences, in addition to the other factors noted with such forward-looking statements, include, without limitation, general economic conditions such as inflation, recession and interest rates. Past performance is not a guarantee of future results. Investments in the Fund are subject to investment risks, including the possible loss of some or the entire principal amount invested. There can be no assurance that the Fund will be successful in meeting its investment objective. Investment in the Fund is subject to the following risks: market risk, management style risk, investment advisor risk, operating risk, small-cap and mid-cap companies risk, non-diversified status risk, sector focus risk, and risks from writing options. More information about these risks and other risks can be found in the Fund's prospectus.
The performance information quoted in this annual report represents past performance, which is not a guarantee of future results. Investment return and principal value of an investment will fluctuate so that an investor's shares, when redeemed, may be worth more or less than their original cost. Current performance may be lower or higher than the performance data quoted. An investor may obtain performance data current to the most recent month-end by visiting hillmancapital.com.
An investor should consider the investment objectives, risks, charges and expenses of the Fund carefully before investing. The prospectus contains this and other information about the Fund. A copy of the prospectus is available at hillmancapital.com or by calling Shareholder Services at 800-773-3863. The prospectus should be read carefully before investing. |
This Annual Report was first distributed to shareholders on or about November 29, 2017.
For More Information on The Hillman Fund:
See Our Website @ hillmancapital.com
or
Call Our Shareholder Services Group at 800-773-3863
Letter to Shareholders
Dear Hillman Fund Shareholder,
We are pleased to provide the annual report for The Hillman Fund for the year ended September 30, 2017.
We have enclosed the attached performance summary to remind our shareholders of Hillman Capital Management's approach and to share some perspective on current economic conditions.
On behalf of the team at Hillman Capital Management, I thank you for your ongoing confidence. It is our hope that we may continue to serve you throughout the years to come.
Sincerely,
Mark A. Hillman
President and Chief Investment Officer
Hillman Capital Management, Inc.
Performance Summary
For the year ended September 30, 2017, The Hillman Fund returned 18.41% versus a return of 18.61% for the S&P 500 Total Return Index ("The Index"). The Fund continues to be, in my opinion, well positioned with investments in companies with sustainable competitive advantages, at prices that we believe to be reasonable. Option writing has been beneficial and I will continue to pursue opportunities that could potentially enhance returns and dampen volatility. It appears likely that the US economy will continue its course of a long and slow economic recovery, as political gridlock continues to dampen any potential major changes to policy. Interest rates remain at relatively low levels, and moderate increases are likely in the year ahead.
I believe that central banks will gradually unwind their aggressive quantitative easing programs and that we will continue to see a slow, but positive, economic growth environment. Through this period, we will continue to focus our energies on making prudent long term investment decisions within the context of our clients' needs. Our equity strategies continue to be driven by our core belief that competitively advantaged companies will outperform their peers through economic cycles and market cycles. Our goal is to invest in great enterprises at attractive prices. We will continue to invest according to this precept for the long-term interests of our clients.
Disclosure:
Past performance is not indicative of future results. An investment in the Fund is subject to investment risks, including the possible loss of some or all of the principal amount invested. There can be no assurance that the Fund will be successful in meeting its investment objective. Investment in the Fund is subject to the following risks: market risk, management style risk, investment advisor risk, operating risk, non-diversified status risk, sector focus risk, small-cap and mid-cap companies risk, and risks from writing options. More information about these risks and other risks can be found in the Fund's prospectus. The S&P 500 Total Return Index is the Standard & Poor's Composite Index of 500 stocks and is a widely recognized, unmanaged index of common stock prices. It is not possible to invest in this index.
Statements in this Annual Report reflect projections or expectations of future financial or economic performance of the Fund and of the market in general and statements of the Fund's plans and objectives for future operations are forward-looking statements. No assurance can be given that actual results or events will not differ materially from those projected, estimated, assumed or anticipated in any such forward-looking statements. Important factors that could result in such differences, in addition to the other factors noted with such forward-looking statements, include general economic conditions such as inflation, recession and interest rates.
Underwriter and Distributor: Capital Investment Group, Inc.
100 E. Six Forks Road
Suite 200
Raleigh, NC 27609
Phone (800) 773-3863
There is no affiliation between Capital Investment Group, Inc. and Hillman Capital Management, Inc.
Please see the table below for the Fund's historical performance information through the calendar quarter ended September 30, 2017:
Average Annual Total Returns (Unaudited) | | | | | |
Period Ended September 30, 2017 | One Year | Five Year | Ten Year | Since Inception | Gross Expense Ratio** |
The Hillman Fund - No Load Shares | 18.41% | 14.00% | 4.84% | 6.55% | 1.52% |
S&P 500 Total Return Index*** | 18.61% | 14.22% | 7.44% | 6.01% | N/A |
The performance data quoted above represents past performance, which is not a guarantee of future results. Investment return and principal value of an investment in the Fund will fluctuate so that an investor's shares, when redeemed, may be worth more or less than their original cost. Current performance may be lower or higher than the performance data quoted. To obtain more current performance data regarding the Fund, including performance data current to the Fund's most recent month-end, please visit ncfunds.com or call the Fund at 1-800-773-3863. Fee waivers and expenses reimbursements have positively impacted Fund performance.
*The Fund's inception date is December 29, 2000.
**Gross expense ratio is from the Fund's prospectus dated January 30, 2017. More recent expense ratios are found in the Financial Highlights.
***You cannot invest directly in this index. The index does not have an investment advisor and does not pay any commissions, expenses, or taxes. If the index did pay commissions, expenses, or taxes, the returns would be lower.
(HCM-17-76)
| The Hillman Fund | | | | | | | | | | | | | | |
| | | | | | | | | | | | | | | | | | | | |
| Performance Update (Unaudited) | | | | | | | | | | | | | |
| | | | | | | | | | | | | | | | | | | | |
| For the period from September 30, 2007 to September 30, 2017 | | | | | | |
| | | | | | | | | | | | | | | | | | | | |
| Comparison of the Change in Value of a $10,000 Investment | | | | | | | | |
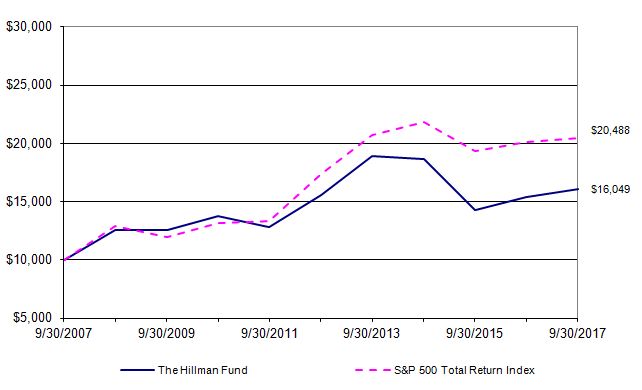
| This graph assumes an initial investment of $10,000 and represents the reinvestment of dividends and capital gains distributions. This graph depicts the performance of The Hillman Fund versus the S&P 500 Total Return Index. It is important to note that the Fund is a professionally managed mutual fund while the index is not available for investment and is unmanaged. The comparison is shown for illustrative purposes only. |
| | | | | | | | | | | | | | | |
| | Average Annual Total Returns | |
| | | | | | | | | | | | | | | | | | Gross | | |
| | | As of | | | | | | | One | | Five | | Ten | | Expense | | |
| | | September 30, 2017 | | | | | Year | | Year | | Year | | Ratio* | | |
| | | The Hillman Fund - No Load Shares | | | | 18.41% | | 14.00% | | 4.84% | | 1.52% | | |
| | | S&P 500 Total Return Index | | | | | 18.61% | | 14.22% | | 7.44% | | N/A | | |
| | | | | | | | | | | | | | | | | | | | |
| * The gross expense ratio shown is from the Fund's prospectus dated January 28, 2017, and includes acquired fund fees and expenses. |
| | | | | | | | | | | | | |
| Performance quoted above represents past performance, which is no guarantee of future results. Investment return and principal value will fluctuate so that shares, when redeemed, may be worth more or less than their original cost. Current performance may be lower or higher than the performance data quoted. An investor may obtain performance data, current to the most recent month-end, by visiting ncfunds.com. |
| | | | | | | | | | | | | | | | | | | | |
| The graph and table do not reflect the deduction of taxes that a shareholder would pay on Fund distributions or the redemption of Fund shares. Average annual total returns are historical in nature and measure net investment income and capital gain or loss from portfolio investments assuming reinvestments of dividends and distributions. |
| | | | | | | | | | | | | | | | | | | | |
| | | | | | | | | | | | | | | | | | | | |
| The Hillman Fund | | | | | | | | |
| | | | | | | | | | | |
| Schedule of Investments | | | | | | | | |
| | | | | | | | | | | |
| As of September 30, 2017 | | | | | | | | |
| | | | | | | | | Shares | | Value (Note 1) |
| | | | | | | | | | | |
| COMMON STOCKS - 85.07% | | | | | | | | |
| | | | | | | | | | | |
| | Consumer Discretionary - 21.01% | | | | | | | | |
| | * | Amazon.com, Inc. | | | | | | 1,100 | $ | 1,057,485 |
| | | Dunkin' Brands Group, Inc. | | | | | | 10,000 | | 530,800 |
| | | Nordstrom, Inc. | | | | | | 30,000 | | 1,414,500 |
| | | Starbucks Corp. (a) | | | | | | 36,700 | | 1,971,157 |
| | | Target Corp. | | | | | | 15,000 | | 885,150 |
| | | The Gap, Inc. (a) | | | | | | 30,000 | | 885,900 |
| | | The Walt Disney Co. (a) | | | | | | 10,000 | | 985,700 |
| | | | | | | | | | | 7,730,692 |
| | Consumer Staples - 9.16% | | | | | | | | |
| | µ | Anheuser-Busch InBev SA/NV | | | | | | 10,000 | | 1,193,000 |
| | | Mondelez International, Inc. | | | | | | 26,000 | | 1,057,160 |
| | | The Hershey Co. | | | | | | 9,600 | | 1,048,032 |
| | | The J.M. Smucker Co. | | | | | | 700 | | 73,451 |
| | | | | | | | | | | 3,371,643 |
| | Energy - 5.86% | | | | | | | | |
| | | Exxon Mobil Corp. (a) | | | | | | 13,200 | | 1,082,136 |
| | * | Transocean Ltd. | | | | | | 100,000 | | 1,076,000 |
| | | | | | | | | | | 2,158,136 |
| | Financials - 8.94% | | | | | | | | |
| | | Bank of America Corp. (a) | | | | | | 30,000 | | 760,200 |
| | | The Western Union Co. | | | | | | 74,400 | | 1,428,480 |
| | | Wells Fargo & Co. (a) | | | | | | 20,000 | | 1,103,000 |
| | | | | | | | | | | 3,291,680 |
| | Health Care - 16.23% | | | | | | | | |
| | | Amgen, Inc. | | | | | | 6,600 | | 1,230,570 |
| | | Bristol-Myers Squibb Co. | | | | | | 27,000 | | 1,720,980 |
| | | Eli Lilly & Co. | | | | | | 12,200 | | 1,043,588 |
| | * | Laboratory Corp of America Holdings | | | | | 6,000 | | 905,820 |
| | | Pfizer, Inc. | | | | | | 30,000 | | 1,071,000 |
| | | | | | | | | | | 5,971,958 |
| | Industrials - 8.17% | | | | | | | | |
| | | Emerson Electric Co. | | | | | | 18,000 | | 1,131,120 |
| | | General Electric Co. | | | | | | 42,000 | | 1,015,560 |
| | * | Stericycle, Inc. (a) | | | | | | 12,000 | | 859,440 |
| | | | | | | | | | | 3,006,120 |
| | Information Technology - 13.05% | | | | | | | | |
| | | Apple, Inc. | | | | | | 8,000 | | 1,232,960 |
| | | International Business Machines Corp. | | | | | 7,200 | | 1,044,576 |
| | | Microsoft Corp. | | | | | | 20,000 | | 1,489,800 |
| | | QUALCOMM, Inc. | | | | | | 20,000 | | 1,036,800 |
| | | | | | | | | | | 4,804,136 |
| | | | | | | | | | | |
| | | | | | | | | | | |
| | | | | | | | | | | |
| | | | | | | | | | | (Continued) |
| The Hillman Fund | | | | | | | | |
| | | | | | | | | | | |
| Schedule of Investments - Continued | | | | | | | | |
| | | | | | | | | | | |
| As of September 30, 2017 | | | | | | | | |
| | | | | | | | | Shares | | Value (Note 1) |
| | | | | | | | | | | |
| COMMON STOCKS - Continued | | | | | | | | |
| | | | | | | | | | | |
| | Materials - 2.65% | | | | | | | | |
| | | Compass Minerals International, Inc. (a) | | | | | 15,000 | $ | 973,500 |
| | | | | | | | | | | 973,500 |
| | | | | | | | | | | |
| | | Total Common Stocks (Cost $28,299,088) | | | | | | | 31,307,865 |
| | | | | | | | | | | |
| EXCHANGE-TRADED PRODUCT - 4.26% | | | | | | | |
| | * | ProShares Short 20+ Year Treasury | | | | | 70,000 | | 1,568,700 |
| | | | | | | | | | | |
| | | Total Exchange-Traded Product (Cost $1,599,451) | | | | | | 1,568,700 |
| | | | | | | | | | | |
| SHORT-TERM INVESTMENT - 9.57% | | | | | | | |
| | | Money Market Fiduciary Portfolio, 0.01% § | | | | 3,520,880 | | 3,520,880 |
| | | | | | | | | | | |
| | | Total Short-Term Investment (Cost $3,520,880) | | | | | | 3,520,880 |
| | | | | | | | | | | |
| Total Value of Investments (Cost $33,639,582) - 98.90% | | | | | $ | 36,397,445 |
| | | | | | | | | | | |
| Total Options Written (Premiums Received $104,716) - (0.33)% | | | | | | (120,542) |
| | | | | | | | | | | |
| Other Assets Less Liabilities - 1.43% | | | | | | | 524,616 |
| | | | | | | | | | | |
| | Net Assets - 100.00% | | | | | | | $ | 36,801,519 |
| | | | | | | | | | | |
| * | Non-income producing investment | | | | | | | | |
| § | Represents 7 day effective yield as of September 30, 2017 | | | | | | |
| µ | American Depositary Receipt | | | | | | | | |
| (a) | All or a portion of this security is held as collateral for put options written. | | | | |
| | | | | | | | | | | |
| The following abbreviation or acronym is used in this portfolio: | | | | | | |
| | NV - Netherlands security | | | | | | | | |
| | | | | | | | | | | |
| | | | | | | | | | | |
| | | | | | | | | | | (Continued) |
| The Hillman Fund | | |
| | | | |
| Statement of Assets and Liabilities | | |
| | | | |
| As of September 30, 2017 | | |
| | | | |
| Assets: | | |
| Investments in securities, at value (cost $33,639,582) | $ | 36,397,445 |
| Receivables: | | |
| | Due from broker | | 422,800 |
| Fund shares sold | | 101,368 |
| Dividends and interest | | 15,829 |
| Prepaid expenses: | | |
| | Registation and filing fees | | 21,808 |
| | Fund accounting fees | | 2,220 |
| | Trustee fees and meeting expenses | | 500 |
| | Compliance fees | | 452 |
| | | | |
| Total assets | | 36,962,422 |
| | | | |
| Liabilities: | | |
| Options written, at value (premiums received $104,716) | | 120,542 |
| Accrued expenses: | | |
| | Advisory fees | | 22,816 |
| | Professional fees | | 15,500 |
| | Custody fees | | 660 |
| | Shareholder fulfillment expenses | | 500 |
| | Miscellaneous compensation expenses | | 350 |
| | Administration fees | | 310 |
| | Insurance fees | | 225 |
| | | | |
| Total liabilities | | 160,903 |
| | | | |
| Net Assets | $ | 36,801,519 |
| | | | |
| Net Assets Consist of: | | |
| Paid in capital | $ | 40,747,180 |
| Undistributed net investment income | | 178,993 |
| Accumulated net realized loss on investments and options written | | (6,866,691) |
| Net unrealized appreciation on investments and options written | | 2,742,037 |
| | | | |
| Total Net Assets | $ | 36,801,519 |
| No Load Shares Outstanding, no par value (unlimited authorized shares) | | 1,657,914 |
| Net Asset Value, Offering Price and Redemption Price Per Share | $ | 22.20 |
| | | | |
| | | | |
| | | | |
| | | | |
| See Notes to Financial Statements | | |
| The Hillman Fund | | | | | | | | |
| | | | | | | | | | | |
| Schedule of Investments - Continued | | | | | | | | |
| | | | | | | | | | | |
| As of September 30, 2017 | | | | | | | | |
| | | | Number of Contracts | Exercise Price | | Expiration Date | | Notional Value | | Value (Note 1) |
| | | | | | | | | | | |
| PUT OPTIONS WRITTEN - 0.33% | | | | | | | | |
| | | | | | | | | | | |
| * | Compass Minerals International, Inc. | 18 | $ | 60.00 | | 11/17/2017 | | $ | 116,820 | $ | 990 |
| * | Compass Minerals International, Inc. | 82 | 62.50 | | 11/17/2017 | | 532,180 | | 9,225 |
| * | General Electric Co. | 180 | 24.00 | | 11/17/2017 | | 435,240 | | 10,800 |
| * | Nike, Inc. | 250 | 52.50 | | 10/20/2017 | | 1,296,250 | | 29,375 |
| * | The J.M. Smucker Co. | 100 | 110.00 | | 10/20/2017 | | 1,049,300 | | 52,000 |
| * | Verizon Communications, Inc. | 265 | 48.50 | | 10/20/2017 | | 1,311,485 | | 18,152 |
| | | | | | | | | | | |
| | | Put Options Written (Premiums Received $104,716) | | | | | $ | 120,542 |
| | | | | | | | | | | |
| | | | | | | | | | | |
| | | | | | | | | | | |
| | | | Summary of Investments | | | | | | |
| | | | by Sector | | | % of Net | | | | |
| | | | | | | Assets | | Value | | |
| | | | Consumer Discretionary | | 21.01% | $ | 7,730,692 | | |
| | | | Consumer Staples | | 9.16% | | 3,371,643 | | |
| | | | Energy | | | 5.86% | | 2,158,136 | | |
| | | | Financials | | | 8.94% | | 3,291,680 | | |
| | | | Health Care | | 16.23% | | 5,971,958 | | |
| | | | Industrials | | | 8.17% | | 3,006,120 | | |
| | | | Information Technology | | 13.05% | | 4,804,136 | | |
| | | | Materials | | | 2.65% | | 973,500 | | |
| | | | Exchange-Traded Product | 4.26% | | 1,568,700 | | |
| | | | Short-Term Investment | | 9.57% | | 3,520,880 | | |
| | | | Put Options Written | | -0.33% | | (120,542) | | |
| | | | Other Assets Less Liabilities | 1.43% | | 524,616 | | |
| | | | Total | | | 100.00% | $ | 36,801,519 | | |
| | | | | | | | | | | |
| | | | | | | | | | | |
| | | | | | | | | | | |
| | | | | | | | | | | |
| See Notes to Financial Statements | | | | | | | | |
| The Hillman Fund | | | |
| | | | | | | | |
| Statement of Operations | | | |
| | | | | | | | |
| For the Year Ended September 30, 2017 | | |
| | | | | | | | |
| Investment Income: | | | |
| Dividends (net of withholding tax $6,578) | $ | 698,342 |
| | | | | | | | |
| | Total Investment Income | | 698,342 |
| | | | | | | | |
| Expenses: | | | | | |
Advisory fees (Note 2) | | | 349,362 |
| Professional fees | | | 38,662 |
Administration fees (Note 2) | | 34,936 |
| Registration & filing expenses | | 32,991 |
| Fund accounting fees (Note 2) | | 30,493 |
Transfer agent fees (Note 2) | | 21,000 |
Compliance fees (Note 2) | | | 11,369 |
Custody fees (Note 2) | | | 10,775 |
| Trustee fees and meeting expenses | | 10,437 |
| Shareholder servicing expenses | | 7,771 |
| Security pricing fees | | | 4,488 |
Miscellaneous compensation expenses (Note 2) | | 4,200 |
| Insurance fees | | | | 3,152 |
| | | | | | | | |
| Total Expenses | | | | 559,636 |
| | | | | | | | |
Fees waived by the Advisor (Note 2) | | (40,287) |
| | | | | | | | |
| Net Expenses | | | | 519,349 |
| | | | | | | | |
| Net Investment Income | | | 178,993 |
| | | | | | | | |
| Net Realized and Unrealized Gain (Loss) on Investments: | | |
| | | | | | | | |
| Net realized gain from investments | | 2,953,450 |
| Net realized gain from options written | | 728,081 |
| | | | | | | | |
| Change in unrealized appreciation on investments | | 2,040,060 |
| Change in unrealized depreciation on options written | | (13,740) |
| | | | | | | | |
| Net Realized and Unrealized Gain on Investments | | 5,707,851 |
| | | | | | | | |
| Net Increase in Net Assets Resulting from Operations | $ | 5,886,844 |
| | | | | | | | |
| | | | | | | | |
| | | | | | | | |
| See Notes to Financial Statements | | |
| The Hillman Fund | | | | | | |
| | | | | | | | | | | |
| Statements of Changes in Net Assets | | | | | | |
| | | | | | | | | | | |
| | | | | | | | | | | |
| For the year ended September 30, | | | | 2017 | | 2016 |
| | | | | | | | | | | |
| Operations: | | | | | | | |
| Net investment income | | | $ | 178,993 | $ | 203,109 |
| Net realized gain from investments and options written | | | 3,681,531 | | 1,785,110 |
| Change in unrealized appreciation on investments and options written | | 2,026,320 | | 2,954,836 |
| | | | | | | | | | | |
| Net Increase in Net Assets Resulting from Operations | | | 5,886,844 | | 4,943,055 |
| | | | | | | | | | | |
| Distributions to Shareholders: | | | | | | |
| Net investment income | | | | (203,106) | | (185,373) |
| | | | | | | | | | | |
| Net Decrease in Net Assets Resulting from Distributions | | | (203,106) | | (185,373) |
| | | | | | | | | | | |
| Beneficial Interest Transactions: | | | | | | |
| | | Shares sold | | | | 2,508,417 | | 29,918,540 |
| | | Reinvested distributions | | | | 185,485 | | 184,629 |
| | | Shares repurchased | | | | (4,357,194) | | (35,012,658) |
| | | | | | | | | | | |
| Decrease from Beneficial Interest Transactions | | | (1,663,292) | | (4,909,489) |
| | | | | | | | | | | |
| Net Increase (Decrease) in Net Assets | | | | 4,020,446 | | (151,807) |
| | | | | | | | | | | |
| Net Assets: | | | | | | | |
| Beginning of Year | | | | 32,781,073 | | 32,932,880 |
| End of Year | | | | $ | 36,801,519 | $ | 32,781,073 |
| | | | | | | | | | | |
| Undistributed Net Investment Income | | | $ | 178,993 | $ | 203,106 |
| | | | | | | | | | | |
| Share Information: | | | | | | |
| | | Shares sold | | | | 119,997 | | 1,731,242 |
| | | Reinvested distributions | | | | 9,311 | | 10,703 |
| | | Shares repurchased | | | | (209,780) | | (2,013,255) |
| | | | | | | | | | | |
| | Net Decrease in Shares of Beneficial Interest | | | (80,472) | | (271,310) |
| | | | | | | | | | | |
| | Shares Outstanding, Beginning of Year | | | | 1,738,386 | | 2,009,696 |
| | Shares Outstanding, End of Year | | | | 1,657,914 | | 1,738,386 |
| | | | | | | | | | | |
| | | | | | | | | | | |
| | | | | | | | | | | |
| See Notes to Financial Statements | | | | | | |
| The Hillman Fund | | | | | | | | | | | |
| | | | | | | | | | | | | | | | |
| Financial Highlights | | | | | | | | | | | |
| | | | | | | | | | | | | | | | |
| For a share outstanding during the | | | | | | | | | | | |
| years ended September 30, | | 2017 | | 2016 | | 2015 | | 2014 | | 2013 | |
| | | | | | | | | | | | | | | | |
| Net Asset Value, Beginning of Year | $ | 18.86 | $ | 16.39 | $ | 17.26 | $ | 14.27 | $ | 11.79 | |
| | | | | | | | | | | | | | | | |
| Income (Loss) from Investment Operations: | | | | | | | | | | |
| Net investment income | | 0.11 | | 0.12 | | 0.09 | | 0.08 | | 0.03 | |
| Net realized and unrealized gain (loss) | | | | | | | | | | | |
| | on investments and options written | | 3.35 | | 2.44 | | (0.88) | | 2.97 | | 2.48 | |
| | | | | | | | | | | | | | | | |
| Total from Investment Operations | | 3.46 | | 2.56 | | (0.79) | | 3.05 | | 2.51 | |
| | | | | | | | | | | | | | | | |
| Less Distributions: | | | | | | | | | | | |
| From net investment income | | (0.12) | | (0.09) | | (0.08) | | (0.06) | | (0.03) | |
| | | | | | | | | | | | | | | | |
| Total Distributions | | (0.12) | | (0.09) | | (0.08) | | (0.06) | | (0.03) | |
| | | | | | | | | | | | | | | | |
| Net Asset Value, End of Year (a) | $ | 22.20 | $ | 18.86 | $ | 16.39 | $ | 17.26 | $ | 14.27 | |
| | | | | | | | | | | | | | | | |
| Total Return | | | 18.41% | | 15.69% | | (4.62)% | | 21.39% | | 21.38% | (a) |
| | | | | | | | | | | | | | | | |
| Net Assets, End of Year (in thousands) | $ | 36,802 | $ | 32,781 | $ | 32,933 | $ | 32,850 | $ | 28,187 | |
| | | | | | | | | | | | | | | | |
| Ratios of: | | | | | | | | | | | | | |
| Gross Expenses to Average Net Assets (b) | 1.60% | | 1.50% | | 1.50% | | 1.50% | | 1.50% | |
| Net Expenses to Average Net Assets (b) | 1.50% | | 1.50% | | 1.50% | | 1.50% | | 1.50% | |
| Net Investment Income to Average Net Assets | 0.51% | | 0.60% | | 0.53% | | 0.51% | | 0.39% | |
| | | | | | | | | | | | | | | | |
| Portfolio turnover rate | | 89.92% | | 48.41% | | 67.77% | | 55.51% | | 118.67% | |
| | | | | | | | | | | | | | | | |
| | | | | | | | | | | | | | | | |
| | | | | | | | | | | | | | | | |
| (a) | Includes adjustments in accordance with accounting principles generally accepted in the United States of America, and, consequently, the net asset value for financial reporting purposes and the total returns based upon those net asset values may differ from the net asset values and total returns for shareholder transactions. |
| (b) | The expense ratios listed reflect total expenses prior to any waivers and reimbursements (gross expense ratio) and after any waivers and reimbursements (net expense ratio). |
| | | | | | |
| | | | | | | | | | | | | | | | |
| | | | | | | | | | | | | | | | |
| See Notes to Financial Statements | | | | | | | | | | | |
The Hillman Fund
Notes to Financial Statements
1. Organization and Significant Accounting Policies
The Hillman Fund, formerly the Hillman Focused Advantage Fund, (the "Fund") is a series of the Hillman Capital Management Investment Trust (the "Trust"), which was organized on July 14, 2000 as a Delaware Business Statutory Trust and is registered under the Investment Company Act of 1940, (the "1940 Act"), as amended, as an open-ended management investment company.
The Fund commenced operations on December 29, 2000. The investment objective of the Fund is to seek long-term capital appreciation.
The following is a summary of significant accounting policies consistently followed by the Fund. The policies are in conformity with accounting principles generally accepted in the United States of America ("GAAP").
Investment Valuation
Securities listed on an exchange or quoted on a national market system are valued at the last sales price as of 4:00 p.m. Eastern Time. Securities traded in the NASDAQ over-the-counter market are generally valued at the NASDAQ Official Closing Price. Other securities traded in the over-the-counter market and listed securities for which no sale was reported on that date are valued at the most recent bid price. Securities and assets for which representative market quotations are not readily available (e.g., if the exchange on which the security is principally traded closes early or if trading of the particular security is halted during the day and does not resume prior to the Fund's net asset value calculation) or which cannot be accurately valued using the Fund's normal pricing procedures are valued at fair value as determined in good faith under policies approved by the Board of Trustees. A security's "fair value" price may differ from the price next available for that security using the Fund's normal pricing procedures. Instruments with maturities of 60 days or less are valued at amortized cost, which approximates market value.
Option Valuation
Exchange-listed options are valued at the mean of the bid and ask prices as reported on their primary exchange as of 4:00 p.m. Eastern Time (the "Valuation Time"). For purposes of determining the primary exchange for each exchange-traded portfolio option the following shall apply: (i) if the option is traded on the Chicago Board Options Exchange ("CBOE"), the CBOE shall be considered the primary exchange for such option, unless the Advisor instructs the Administrator in writing to use a different exchange as the primary exchange for such option; and (ii) if the option does not trade on the CBOE, the Advisor shall instruct the Administrator in writing as to the primary exchange for such option. An option may be valued using Fair Valuation when (i) the option does not trade on the valuation date; and (ii) reliable last quoted bid and ask prices as of the Valuation Time are not readily available.
Fair Value Measurement
Various inputs are used in determining the value of the Fund's investments. These inputs are summarized in the three broad levels listed below:
| a. | Level 1: quoted prices in active markets for identical securities |
| b. | Level 2: other significant observable inputs (including quoted prices for similar securities and identical securities in inactive markets, interest rates, credit risk, etc.) |
| c. | Level 3: significant unobservable inputs (including the Fund's own assumptions in determining fair value of investments) |
The availability of observable inputs can vary from security to security and is affected by a wide variety of factors, including, for example, the type of security, whether the security is new and not yet established in the marketplace, the liquidity of markets, and other characteristics particular to the security. To the extent that valuation is based on models or inputs that are less observable or unobservable in the market, the determination of fair value requires more judgment. Accordingly, the degree of judgment exercised in determining fair value is greatest for instruments categorized in Level 3.
(Continued)
The Hillman Fund
Notes to Financial Statements
The inputs used to measure fair value may fall into different levels of the fair value hierarchy. In such cases, for disclosure purposes, the level in the fair value hierarchy within which the fair value measurement falls in its entirety, is determined based on the lowest level input that is significant to the fair value measurement in its entirety.
The inputs or methodology used for valuing securities are not necessarily an indication of the risk associated with investing in those securities. The following table summarizes the inputs as of September 30, 2017 for the Fund's investments:
| | | |
| Investments in Securities (a) | | Total | | Level 1 | | Level 2 | | Level 3 |
Assets Common Stocks* | $ | 31,307,865 | $ | 31,307,865 | $ | - | $ | - |
| Exchange-Traded Product | | 1,568,700 | | 1,568,700 | | - | | - |
| Short-Term Investment | | 3,520,880 | | 3,520,880 | | - | | - |
| Total Assets | $ | 36,397,445 | $ | 36,397,445 | $ | - | $ | - |
| | | | | | | | | |
Liabilities Put Options Written | $ | 120,542 | $ | - | $ | 120,542 | $ | - |
| Total Liabilities | $ | 120,542 | $ | - | $ | 120,542 | $ | - |
| | | | | | | | | |
(a) The Fund did not hold any Level 3 securities during the year. There were no transfers into or out of Level 1 and Level 2 during the year. It is the Fund's policy to recognize transfers into or out of Level 1 and Level 2 at the end of the reporting year.
*For a detailed breakout by sector, please refer to the Schedule of Investments.
Investment Transactions and Investment Income
Investment transactions are accounted for as of the date purchased or sold (trade date). Dividend income is recorded on the ex-dividend date. Interest income is recorded on the accrual basis and includes accretion and amortization of discounts and premiums using the effective interest method. Gains and losses are determined on the identified cost basis, which is the same basis used for Federal income tax purposes.
Expenses
The Fund bears expenses incurred specifically on its behalf and Trust level expenses.
Distributions
The Fund may declare and distribute dividends from net investment income (if any) annually. Distributions from capital gains (if any) are generally declared and distributed annually. Dividends and distributions to shareholders are recorded on ex-date.
Estimates
The preparation of financial statements in conformity with GAAP requires management to make estimates and assumptions that affect the reported amounts of assets and liabilities and disclosure of contingent assets and liabilities at the date of the financial statements and the reported amounts of increases and decreases in the net assets from operations during the reporting period. Actual results could differ from those estimates.
Federal Income Taxes
No provision for income taxes is included in the accompanying financial statements, as the Fund intends to distribute to shareholders all taxable investment income and realized gains and otherwise comply with Subchapter M of the Internal Revenue Code applicable to regulated investment companies.
(Continued)
The Hillman Fund
Notes to Financial Statements
Option Writing
When the Fund writes an option, an amount equal to the premium received by the Fund is recorded as a liability and is subsequently adjusted to the current fair value of the option written. Premiums received from writing options that expire unexercised are treated by the Fund on the expiration date as realized gains (losses) from options written. The difference between the premium and the amount paid on effecting a closing purchase transaction, including brokerage commissions, is also treated as a realized gain or loss (depending on if the premium is less than the amount paid for the closing purchase transaction). If a call option is exercised, the premium is added to the proceeds from the sale of the underlying security in determining whether the Fund has realized a gain or loss. If a put option is exercised, the premium reduces the cost basis of the securities purchased by the Fund. The Fund, as the writer of an option, bears the market risk of an unfavorable change in the price of the security underlying the written option. Written options are non-income producing securities.
Derivative Financial Instruments
The Fund may invest in derivative financial instruments (derivatives) in order to manage risk or gain exposure to various other investments or markets. Derivatives may contain various risks including the potential inability of the counterparty to fulfill their obligations under the terms of the contract, the potential for an illiquid secondary market, and the potential for market movements which may expose the Fund to gains or losses in excess of the amounts shown on the Statement of Assets and Liabilities.
Derivatives are marked to market daily based upon quotations from market makers or the Fund's independent pricing services and the Fund's net benefit or obligation under the contract, as measured by the fair market value of the contract, is included in Investments, at value on the Statement of Assets and Liabilities for options purchased and the Options Written, at value on the Statement of Assets and Liabilities for options written. Net realized gains and losses and net change in unrealized appreciation and depreciation on these contracts for the year are included in the Realized and Unrealized Gain on Investments on the Statement of Operations for options purchased and Realized and Unrealized Gain on Options Written on the Statement of Operations for options written.
The derivative instruments outstanding as of September 30, 2017 are disclosed below and the amounts of realized and changes in unrealized gains and losses on derivative instruments during the year as disclosed below serve as indicators of the volume of derivative activity for the Fund.
The following table sets forth the effect of the derivative instruments on the Statement of Assets and Liabilities as of September 30, 2017:
Derivative Type | Location | | Market Value | Notional Value |
| | | | | |
| Equity Contracts – written options | Liabilities-Options written, at value | | $ 120,542 | $4,741,275 |
The following table sets forth the effect of the derivative instruments on the Statement of Operations for the fiscal year ended September 30, 2017:
| Derivative Type | Location | | Gains/Losses |
| | | |
| Equity Contracts – written options | Net realized gain from options written | | $ 728,081 |
| | | | |
| Equity Contracts – written options | Net change in unrealized depreciation on options written | | $ (13,740) |
| | | | |
(Continued)
The Hillman Fund
Notes to Financial Statements
The following table presents the Fund's liabilities available for offset under a master netting arrangement of collateral pledged as of September 30, 2017:
Gross Amounts of Assets Presented in the Statement of Assets & Liabilities |
| | Gross Amounts of Recognized Liabilities | Financial Instruments Pledged | Cash Collateral Pledged | Net Amount of Assets |
Description of Liability: | | | | |
Options Written | $120,542 | $120,542 | $ - | $ - |
Total | $120,542 | $120,542 | $ - | $ - |
| | | | | |
The actual financial instruments and cash collateral pledged may be in excess of the amounts shown in the table. The table only reflects collateral amounts up to the amount of the financial instrument disclosed on the Statement of Assets and Liabilities
2. Transactions with Affiliates
Advisor
The Fund pays a monthly fee to the Advisor calculated at the annual rate of 1.00% of the Fund's average daily net assets.
The Advisor has entered into a contractual agreement (the "Expense Limitation Agreement") with the Trust, on behalf of the Fund, under which it had agreed to waive or reduce its fees and to assume other expenses of the Fund, if necessary, in amounts that limit the Fund's total operating expenses (exclusive of interest, dividends on securities sold short, taxes, brokerage commissions, borrowing costs, fees and expenses of other investment companies in which the Fund invests, and other expenditures which are capitalized in accordance with generally accepted accounting principles, other extraordinary expenses not incurred in the ordinary course of the Fund's business, and amounts, if any, payable under a Rule 12b-1 distribution plan) to not more than 1.499% of the average daily net assets of the Fund. The current term of the Expense Limitation Agreement remains in effect until January 31, 2018. While there can be no assurance that the Expense Limitation Agreement will continue after that date, it is expected to continue from year-to-year thereafter. The Advisor cannot recoup any amounts previously waived or reimbursed.
For the fiscal year ended September 30, 2017, $349,362 in advisory fees were incurred, of which $40,287 in advisory fees were waived by the Advisor.
Administrator
The Fund pays a monthly fee to The Nottingham Company (the "Administrator") based upon the average daily net assets of the Fund and calculated at the annual rates as shown in the schedule below subject to a minimum of $2,000 per month. The Administrator also receives a fee as to procure and pay the Fund's custodian, as additional compensation for fund accounting and recordkeeping services, and additional compensation for certain costs involved with the daily valuation of securities and as reimbursement for out-of-pocket expenses. The Administrator also receives a miscellaneous compensation fee for peer group, comparative analysis, and compliance support totaling $350 per month. As of September 30, 2017, the Administrator received $4,200 in miscellaneous expenses.
The Hillman Fund
Notes to Financial Statements
A breakdown of the fees is provided in the following table:
| Administration Fees* | Custody Fees* | Fund Accounting Fees (minimum monthly) | Fund Accounting Fees (asset- based fee) | Blue Sky Administration Fees (annual) |
Average Net Assets | Annual Rate | Average Net Assets | Annual Rate |
| First $250 million | 0.100% | First $200 million | 0.020% | $2,250 | 0.01% | $150 per state |
| Next $250 million | 0.080% | Over $200 million | 0.009% | | | |
| Next $250 million | 0.060% | | | | | |
| Next $250 million | 0.050% | *Minimum monthly fees of $2,000 and $417 for Administration and Custody, respectively. |
| Next $1 billion | 0.040% |
| Over $2 billion | 0.035% |
The Fund incurred $34,936 in administration fees, $10,775 in custody fees, and $30,493 in fund accounting fees for the fiscal year ended September 30, 2017.
Compliance Services
Cipperman Compliance Services, LLC provides services as the Trust's Chief Compliance Officer. Cipperman Compliance Services, LLC is entitled to receive customary fees from the Fund for their services pursuant to the Compliance Services Agreement with the Fund.
Transfer Agent
Nottingham Shareholder Services, LLC ("Transfer Agent") serves as transfer, dividend paying, and shareholder servicing agent for the Fund. For its services, the Transfer Agent is entitled to receive compensation from the Fund pursuant to the Transfer Agent's fee arrangements with the Fund. The Fund incurred $21,000 in transfer agent fees during the fiscal year ended September 30, 2017.
Distributor
Capital Investment Group, Inc. (the "Distributor") serves as the Fund's principal underwriter and distributor. The Distributor receives $5,000 per year paid in monthly installments for services provided and expenses assumed.
Certain officers of the Trust are also officers of the Administrator.
3. Purchases and Sales of Investment Securities
For the fiscal year ended September 30, 2017, the aggregate cost of purchases and proceeds from sales of investment securities (excluding short-term securities) were as follows:
Purchases of Securities | | Proceeds from Sales of Securities |
| $28,621,366 | | $32,392,735 |
There were no long-term purchases or sales of U.S Government Obligations during the fiscal year ended September 30, 2017.
4. Federal Income Tax
Distributions are determined in accordance with Federal income tax regulations, which differ from GAAP, and, therefore, may differ significantly in amount or character from net investment income and realized gains for financial reporting purposes. Financial reporting records are adjusted for permanent book/tax differences to reflect tax character but are not adjusted for temporary differences. Permanent differences do not have an effect on the net asset values of the Fund.
(Continued)
The Hillman Fund
Notes to Financial Statements
Management reviewed the Fund's tax positions taken or to be taken on Federal income tax returns for the open tax years September 30, 2014 through September 30, 2017, and determined that the Fund does not have a liability for uncertain tax positions. The Fund recognizes interest and penalties, if any, related to unrecognized tax benefits as income tax expense in the Statement of Operations. During the year, the Fund did not incur any interest or penalties.
For the fiscal year ended September 30, 2017, the following reclassifications were made:
| Paid In Capital | $ (3,400,116) |
| Accumulated Realized Loss | | 3,400,116 |
Distributions during the fiscal years ended were characterized for tax purposes as follows:
| | September 30, 2017 | September 30, 2016 |
| Ordinary Income | $203,106 | $185,373 |
At September 30, 2017, the tax-basis cost of investments and components of distributable earnings (deficit) were as follows:
| Cost of Investments | $ | 33,562,622 |
| | | |
| Gross Unrealized Appreciation | | 3,745,229 |
| Gross Unrealized Depreciation | | (1,030,948) |
| Net Unrealized Appreciation | | 2,714,281 |
| | | |
| Undistributed Net Investment Income | | 178,993 |
| Accumulated Net Capital Losses | | (6,864,338) |
| | | |
| Accumulated Deficit | $ | (3,971,064) |
| | | | | | |
The difference between book-basis and tax-basis net unrealized appreciation (depreciation) and accumulated realized losses is attributable to the tax deferral of losses from wash sales.
Capital Loss Carryforwards
Under the Regulated Investment Company Modernization Act of 2010 ("the Modernization Act"), net capital losses recognized in tax years beginning after December 22, 2010 may be carried forward indefinitely, and the character of the losses is retained as short‐term and/or long‐term. Under the law in effect prior to the Modernization Act, net capital losses were carried forward for eight years and treated as short‐term. As a transition rule, the Modernization Act requires that post‐enactment net capital losses be used before pre‐enactment net capital losses. Accumulated capital losses noted below represent pre‐enactment net capital loss carryforwards, as of September 30, 2017, that may be available to offset future realized capital gains and thereby reduce future taxable gains distributions. The short-term capital loss carryforward in the amount of $6,864,338 is set to expire September 30, 2018. Short-term capital loss carryforwards totaling $3,374,713 expired this fiscal year end as of September 30, 2017.
5. Commitments and Contingencies
Under the Trust's organizational documents, its officers and Trustees are indemnified against certain liabilities arising out of the performance of their duties to the Fund. In addition, in the normal course of business, the Fund enters into contracts with its vendors and others that provide for general indemnifications. The Fund's maximum exposure under these arrangements is unknown, as this would involve future claims that may be made against the Fund. However, based on experience, the Fund expects the risk of loss to be remote.
(Continued)
The Hillman Fund
Notes to Financial Statements
6. Subsequent Events
The Fund has evaluated the need for disclosures and/or adjustments resulting from subsequent events through the date of issuance of these financial statements. This evaluation did not result in any subsequent events that necessitated disclosures and/or adjustments.
REPORT OF INDEPENDENT REGISTERED PUBLIC ACCOUNTING FIRM
To the Board of Trustees of Hillman Capital Management Investment Trust
and the Shareholders of The Hillman Fund
We have audited the accompanying statement of assets and liabilities of The Hillman Fund, a series of shares of beneficial interest in Hillman Capital Management Investment Trust, (the "Fund") including the schedule of investments, as of September 30, 2017, and the related statement of operations for the year then ended, the statements of changes in net assets for each of the years in the two-year period then ended and the financial highlights for each of the years in the five-year period then ended. These financial statements and financial highlights are the responsibility of the Fund's management. Our responsibility is to express an opinion on these financial statements and financial highlights based on our audits.
We conducted our audits in accordance with the standards of the Public Company Accounting Oversight Board (United States). Those standards require that we plan and perform the audits to obtain reasonable assurance about whether the financial statements and financial highlights are free of material misstatement. An audit includes examining, on a test basis, evidence supporting the amounts and disclosures in the financial statements. Our procedures included confirmation of securities owned as of September 30, 2017 by correspondence with the custodian and brokers. An audit also includes assessing the accounting principles used and significant estimates made by management, as well as evaluating the overall financial statement presentation. We believe that our audits provide a reasonable basis for our opinion.
In our opinion, the financial statements and financial highlights referred to above present fairly, in all material respects, the financial position of The Hillman Fund as of September 30, 2017, and the results of its operations for the year then ended, the changes in its net assets for each of the years in the two-year period then ended and its financial highlights for each of the years in the five-year period then ended, in conformity with accounting principles generally accepted in the United States of America.
BBD, LLP
Philadelphia, Pennsylvania
November 29, 2017
A copy of the Trust's Proxy Voting and Disclosure Policy and the Advisor's Proxy Voting and Disclosure Policy are included as Appendix B to the Fund's Statement of Additional Information and are available, (1) without charge, upon request, by calling 1-800-773-3863 and (2) on the Securities and Exchange Commission's ("SEC") website at sec.gov. Information regarding how the Fund voted proxies relating to portfolio securities during the most recent 12-month period ended June 30 will be available (1) without charge, upon request, by calling the Fund at the number above and (2) on the SEC's website at sec.gov.
The Fund files its complete schedule of portfolio holdings with the SEC for the first and third quarters of each fiscal year on Form N-Q. The Fund's Forms N-Q is available on the SEC's website at sec.gov. You may review and make copies at the SEC's Public Reference Room in Washington, D.C. Information on the operation of the Public Reference Room may be obtained by calling the SEC at 1-800-SEC-0330. You may also obtain copies without charge, upon request, by calling the Fund at 1-800-773-3863.
We are required to advise you within 60 days of the Fund's fiscal year-end regarding the Federal tax status of certain distributions received by shareholders during each fiscal year. The following information is provided for the Fund's fiscal year ended September 30, 2017.
During the fiscal year, income distributions totaling $203,106 were paid from the Fund, but there were no long-term capital gain distributions.
Dividend and distributions received by retirement plans such as IRAs, Keogh-type plans, and 403(b) plans need not be reported as taxable income. However, many retirement plans may need this information for their annual information meeting.
As a shareholder of the Fund, you incur other Fund expenses, including Advisory fees. This Example is intended to help you understand your ongoing costs (in dollars) of investing in the Fund and to compare these costs with the ongoing costs of investing in other mutual funds.
The Example is based on an investment of $1,000 invested at the beginning of the period and held for the entire period from April 1, 2017 through September 30, 2017.