Exhibit 99.28
Project IslandPresentation to Special Committee[January 21, 2016]PRELIMINARYDRAFTConfidential – For Discussion & General Information Purposes Only
DisclaimerThese materials are provided solely for the information of the Special Committee of the Board of Directors (the “Special Committee”) of Barbados, Ltd. (the “Company” or “Barbados”) byWells Fargo Securities, LLC (“Wells Fargo Securities”) in connection with a potential merger (the “Transaction”) involving the Company and Tahiti, Inc. (“Tahiti”). These materials are for discussion purposes only, are incomplete without reference to, and should be viewed solely in conjunction with, the oral briefing provided by Wells Fargo Securities and may not be relied upon by any security holder of the Company or any other third party for any purpose whatsoever. These materials were prepared for a specific use by specific persons and were not prepared with a view to public disclosure or to conform with any disclosure standards under securities laws or otherwise. These materials were not prepared for use by readers not as familiar with the businesses and affairs of the Company and Tahiti as the Special Committee and, accordingly, none of the Special Committee, the Company, Wells Fargo Securities or their respective advisors takes any responsibility for these materials if used by persons other than the Special Committee.These materials were provided on a confidential basis solely for the information of the Special Committee and may not be disclosed to or shared with others, in whole or in part, or summarized or otherwise referred to except as agreed to in writing by Wells Fargo Securities. Notwithstanding the foregoing, Wells Fargo Securities imposes no restrictions on the disclosure by the Company (including its employees, representatives and agents) of the tax treatment or tax structure of any transaction, including those portions of any materials containing such information that are provided by Wells Fargo Securities to the Company. Any tax statement contained in these materials is not intended or written to be used, and cannot be used, for the purpose of (i) avoiding any penalties under the United States Internal Revenue Code or other tax related penalties or (ii) promoting, marketing, or recommending the transaction or matters to which the statement relates. Each taxpayer should seek advice based on the taxpayer’s particular circumstances from an independent tax advisor. Wells Fargo Securities is not an expert on, and nothing contained herein should be construed as advice with regard to, legal, accounting, regulatory, insurance or tax matters.These materials necessarily are based on financial, economic, market and other conditions as in effect on, and the information made available to us as of, the date of these materials. None of the Special Committee, the Company or Wells Fargo Securities undertakes any obligation to update, revise or reaffirm these materials. Any views expressed in these materials are subject to change without notice and may differ from or be contrary to other views expressed by Wells Fargo Securities or its affiliates. These materials are not intended to provide the sole basis for evaluation of the Transaction, do not purport to contain all information that may be required and should not be considered a recommendation with respect to the Transaction. The analyses contained in these materials must be considered as a whole. Selecting portions of the analyses, without considering all analyses, would create an incomplete view and may be misleading. The analyses, the order in which they are presented and the results thereof do not represent relative importance or weight given to them by Wells FargoSecurities. The implied reference ranges indicated by Wells Fargo Securities’ analyses are illustrative and not necessarily indicative of actual values or predictive of future results or values, which may be significantly more or less favorable than those suggested by the analyses. In addition, any analyses relating to the value of assets, businesses or securities do not purport to be appraisals or to reflect the prices at which businesses or securities actually may be sold or acquired, which may depend on a variety of factors, many of which are beyond the control of Wells Fargo Securities. In preparing these materials, Wells Fargo Securities has not conducted any physical inspection or independent appraisal or evaluation of any of the assets, properties or liabilities (contingent or otherwise) of the Company or any other participant in the Transaction, and Wells Fargo Securities was not provided with any such appraisal or evaluation.Wells Fargo Securities has assumed and relied upon the accuracy and completeness of the financial and other information obtained from management of the Company and other participants in the Transaction and public sources without assuming any responsibility for independent verification of such information, makes no representation or warranty (express or implied) in respect of the accuracy or completeness of such information and has further relied upon the assurances of the Company and other participants in the Transaction that they are not aware of any facts or circumstances that would make such information inaccurate or misleading. To the extent such information includes estimates and forecasts of future financial performance (including estimates of potential cost savings and synergies) prepared by or reviewed or discussed with management of the Company, other participants in the Transaction or obtained from public sources, we have assumed that such estimates and forecasts have been reasonably prepared on bases reflecting the best currently available estimates and judgments of such management (or, with respect to estimates and forecasts obtained from public sources, represent reasonable estimates). Wells Fargo Securities takes no responsibility for such estimates or forecasts or the assumptions on which they are based. In addition, Wells Fargo Securities has relied upon and assumed, without independent verification, that the final forms of the draft documents reviewed by Wells Fargo Securities will not differ in any material respect from such draft documents.Wells Fargo Securities is the trade name for certain capital markets and investment banking services of Wells Fargo & Company and its subsidiaries, including Wells Fargo Securities, LLC, member FINRA and SIPC.Project Island 2
Table of ContentsI. Proposed Transaction SummaryII. Tahiti OverviewIII. Barbados OverviewIV. Financial AnalysisAppendixThis document and any other materials accompanying this document (collectively, the “Materials”) are provided for general informational purposes only. By accepting any Materials, the recipient acknowledges and agrees to keep the Materials confidential and not to distribute the Materials to any other party. ©2016 Wells Fargo Securities. All Rights Reserved.Project Island 3
 Proposed Transaction Summary
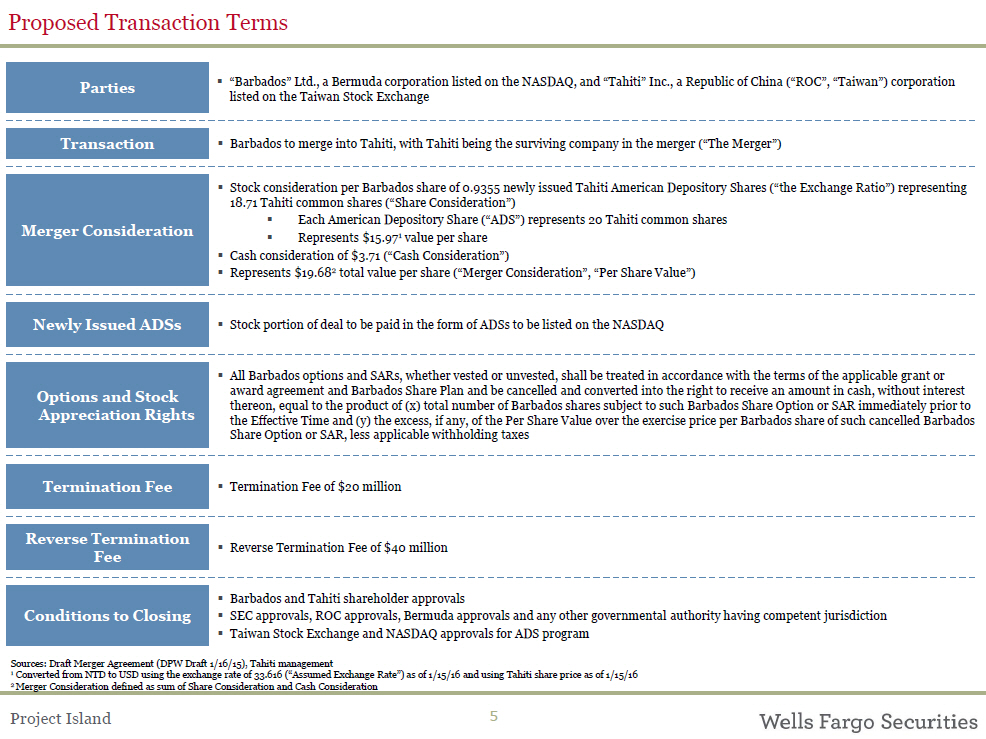
Proposed Transaction TermsPartiesTransactionMerger Consideration? “Barbados” Ltd., a Bermuda corporation listed on the NASDAQ, and “Tahiti” Inc., a Republic of China (“ROC”, “Taiwan”) corporation listed on the Taiwan Stock Exchange? Barbados to merge into Tahiti, with Tahiti being the surviving company in the merger (“The Merger”)? Stock consideration per Barbados share of 0.9355 newly issued Tahiti American Depository Shares (“the Exchange Ratio”) representing 18.71 Tahiti common shares (“Share Consideration”) ? Each American Depository Share (“ADS”) represents 20 Tahiti common shares ? Represents $15.971 value per share ? Cash consideration of $3.71 (“Cash Consideration”) ? Represents $19.682 total value per share (“Merger Consideration”, “Per Share Value”)Newly Issued ADSsOptions and StockAppreciation RightsTermination FeeReverse TerminationFeeConditions to Closing? Stock portion of deal to be paid in the form of ADSs to be listed on the NASDAQ? All Barbados options and SARs, whether vested or unvested, shall be treated in accordance with the terms of the applicable grant or award agreement and Barbados Share Plan and be cancelled and converted into the right to receive an amount in cash, without interest thereon, equal to the product of (x) total number of Barbados shares subject to such Barbados Share Option or SAR immediately prior to the Effective Time and (y) the excess, if any, of the Per Share Value over the exercise price per Barbados share of such cancelled Barbados Share Option or SAR, less applicable withholding taxes? Termination Fee of $20 million? Reverse Termination Fee of $40 million? Barbados and Tahiti shareholder approvals? SEC approvals, ROC approvals, Bermuda approvals and any other governmental authority having competent jurisdiction? Taiwan Stock Exchange and NASDAQ approvals for ADS programSources: Draft Merger Agreement (DPW Draft 1/16/15), Tahiti management 1 Converted from NTD to USD using the exchange rate of 33.616 (“Assumed Exchange Rate”) as of 1/15/16 and using Tahiti share price as of 1/15/162 Merger Consideration defined as sum of Share Consideration and Cash ConsiderationProject Island 5
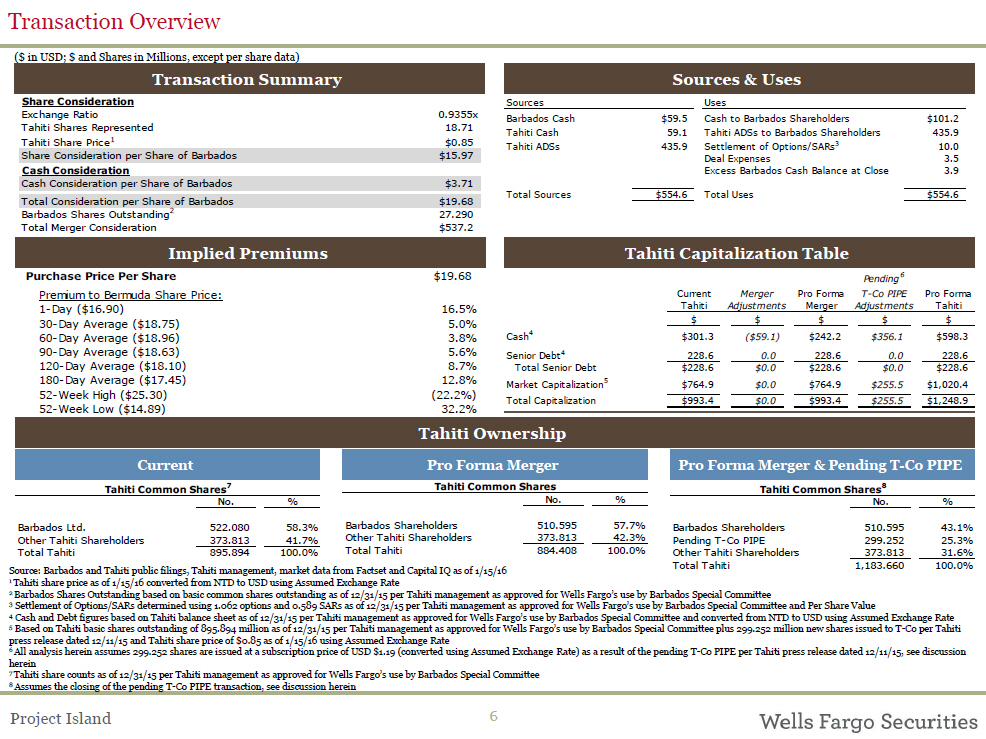
Transaction Overview($ in USD; $ and Shares in Millions, except per share data) Transaction Summary Sources & Uses Share Consideration Sources Uses Exchange Ratio 0.9355x Barbados Cash $59.5 Cash to Barbados Shareholders $101.2 Tahiti Shares Represented 18.71 Tahiti Cash 59.1 Tahiti ADSs to Barbados Shareholders 435.9 Tahiti Share Price1 $0.85 Tahiti ADSs 435.9 Settlement of Options/SARs3 10.0 Share Consideration per Share of Barbados $15.97 Deal Expenses 3.5Cash Consideration Excess Barbados Cash Balance at Close 3.9 Cash Consideration per Share of Barbados $3.71 Total Consideration per Share of Barbados $19.68 Total Sources $554.6 Total Uses $554.6Barbados Shares Outstanding2 27.290 Total Merger Consideration $537.2Implied Premiums Tahiti Capitalization Table Purchase Price Per Share $19.68 Pending 6 Premium to Bermuda Share Price: Current Merger Pro Forma T-Co PIPE Pro Forma 1-Day ($16.90) 16.5% Tahiti Adjustments Merger Adjustments Tahiti $ $ $ $ $ 30-Day Average ($18.75) 5.0% Cash4 $301.3 ($59.1) $242.2 $356.1 $598.3 60-Day Average ($18.96) 3.8% 90-Day Average ($18.63) 5.6% Senior Debt 4 228.6 0.0 228.6 0.0 228.6120-Day Average ($18.10) 8.7% Total Senior Debt $228.6 $0.0 $228.6 $0.0 $228.6 180-Day Average ($17.45) 12.8% Market Capitalization 5 $764.9 $0.0 $764.9 $255.5 $1,020.452-Week High ($25.30) (22.2%) Total Capitalization $993.4 $0.0 $993.4 $255.5 $1,248.9 52-Week Low ($14.89) 32.2%Tahiti Ownership Current Pro Forma Merger Pro Forma Merger & Pending T-Co PIPE Tahiti Common Shares7 Tahiti Common Shares Tahiti Common Shares8 No. % No. % No. % Barbados Ltd. 522.080 58.3% Barbados Shareholders 510.595 57.7% Barbados Shareholders 510.595 43.1% Other Tahiti Shareholders 373.813 41.7% Other Tahiti Shareholders 373.813 42.3% Pending T-Co PIPE 299.252 25.3% Total Tahiti 895.894 100.0% Total Tahiti 884.408 100.0% Other Tahiti Shareholders 373.813 31.6% Total Tahiti 1,183.660 100.0% Source: Barbados and Tahiti public filings, Tahiti management, market data from Factset and Capital IQ as of 1/15/16 1 Tahiti share price as of 1/15/16 converted from NTD to USD using Assumed Exchange Rate2 Barbados Shares Outstanding based on basic common shares outstanding as of 12/31/15 per Tahiti management as approved for Wells Fargo’s use by Barbados Special Committee3 Settlement of Options/SARs determined using 1.062 options and 0.589 SARs as of 12/31/15 per Tahiti management as approved for Wells Fargo’s use by Barbados Special Committee and Per Share Value4 Cash and Debt figures based on Tahiti balance sheet as of 12/31/15 per Tahiti management as approved for Wells Fargo’s use by Barbados Special Committee and converted from NTD to USD using Assumed Exchange Rate5 Based on Tahiti basic shares outstanding of 895.894 million as of 12/31/15 per Tahiti management as approved for Wells Fargo’s use by Barbados Special Committee plus 299.252 million new shares issued to T-Co per Tahiti press release dated 12/11/15 and Tahiti share price of $0.85 as of 1/15/16 using Assumed Exchange Rate6 All analysis herein assumes 299.252 shares are issued at a subscription price of USD $1.19 (converted using Assumed Exchange Rate) as a result of the pending T-Co PIPE per Tahiti press release dated 12/11/15, see discussion herein7 Tahiti share counts as of 12/31/15 per Tahiti management as approved for Wells Fargo’s use by Barbados Special Committee8 Assumes the closing of the pending T-Co PIPE transaction, see discussion hereinProject Island 6

Tahiti Overview
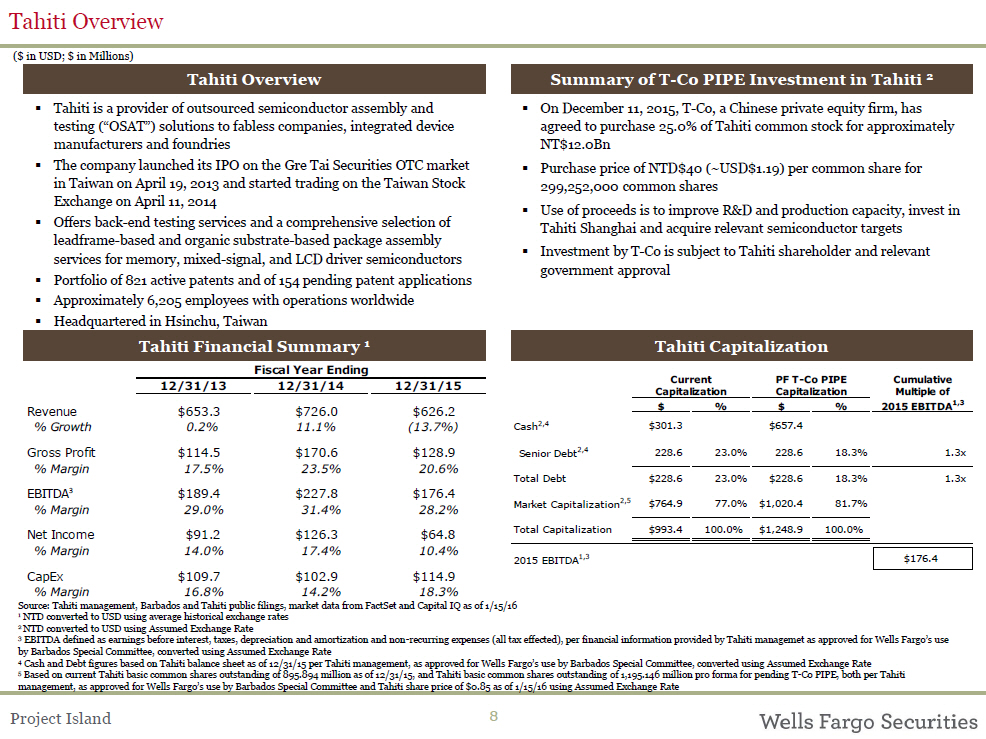
Tahiti Overview($ in USD; $ in Millions)Tahiti Overview Summary of T-Co PIPE Investment in Tahiti 2? Tahiti is a provider of outsourced semiconductor assembly and testing (“OSAT”) solutions to fabless companies, integrated device manufacturers and foundries? The company launched its IPO on the Gre Tai Securities OTC market in Taiwan on April 19, 2013 and started trading on the Taiwan Stock Exchange on April 11, 2014? Offers back-end testing services and a comprehensive selection of leadframe-based and organic substrate-based package assembly services for memory, mixed-signal, and LCD driver semiconductors? Portfolio of 821 active patents and of 154 pending patent applications? Approximately 6,205 employees with operations worldwide? Headquartered in Hsinchu, TaiwanTahiti Financial Summary 1 Fiscal Year Ending 12/31/13 12/31/14 12/31/15 Revenue $653.3 $726.0 $626.2 % Growth 0.2% 11.1% (13.7%) Gross Profit $114.5 $170.6 $128.9 % Margin 17.5% 23.5% 20.6%? On December 11, 2015, T-Co, a Chinese private equity firm, has agreed to purchase 25.0% of Tahiti common stock for approximately NT$12.0Bn? Purchase price of NTD$40 (~USD$1.19) per common share for 299,252,000 common shares? Use of proceeds is to improve R&D and production capacity, invest in Tahiti Shanghai and acquire relevant semiconductor targets? Investment by T-Co is subject to Tahiti shareholder and relevant government approvalTahiti CapitalizationCurrent PF T-Co PIPE Cumulative Capitalization Capitalization Multiple of $ % $ % 2015 EBITDA1,3 Cash2,4 $301.3 $657.4 Senior Debt2,4 228.6 23.0% 228.6 18.3% 1.3xTotal Debt $228.6 23.0% $228.6 18.3% 1.3xEBITDA3 $189.4 $227.8 $176.4 Market Capitalization2,5 $764.9 77.0% $1,020.4 81.7% % Margin 29.0% 31.4% 28.2%Net Income $91.2 $126.3 $64.8 Total Capitalization $993.4 100.0% $1,248.9 100.0%% Margin 14.0% 17.4% 10.4% 2015 EBITDA1,3 $176.4CapEx $109.7 $102.9 $114.9 % Margin 16.8% 14.2% 18.3%Source: Tahiti management, Barbados and Tahiti public filings, market data from FactSet and Capital IQ as of 1/15/16 1 NTD converted to USD using average historical exchange rates2 NTD converted to USD using Assumed Exchange Rate3 EBITDA defined as earnings before interest, taxes, depreciation and amortization and non-recurring expenses (all tax effected), per financial information provided by Tahiti managemet as approved for Wells Fargo’s use by Barbados Special Committee, converted using Assumed Exchange Rate 4 Cash and Debt figures based on Tahiti balance sheet as of 12/31/15 per Tahiti management, as approved for Wells Fargo’s use by Barbados Special Committee, converted using Assumed Exchange Rate5 Based on current Tahiti basic common shares outstanding of 895.894 million as of 12/31/15, and Tahiti basic common shares outstanding of 1,195.146 million pro forma for pending T-Co PIPE, both per Tahiti management, as approved for Wells Fargo’s use by Barbados Special Committee and Tahiti share price of $0.85 as of 1/15/16 using Assumed Exchange RateProject Island 8
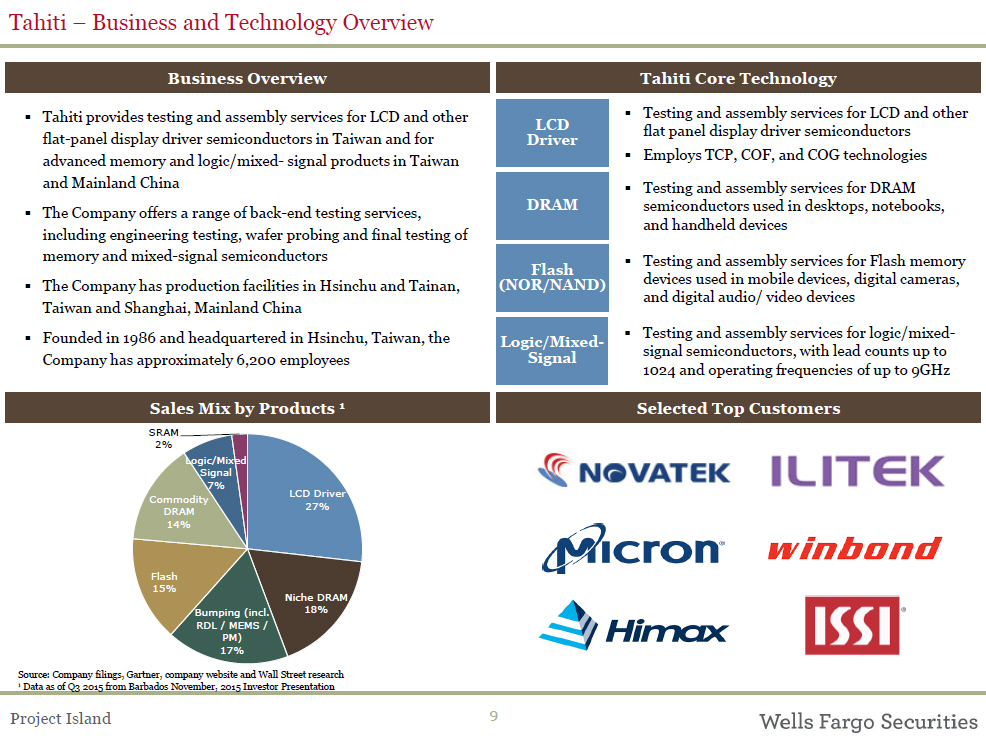
Tahiti – Business and Technology OverviewBusiness Overview? Tahiti provides testing and assembly services for LCD and other flat-panel display driver semiconductors in Taiwan and for advanced memory and logic/mixed- signal products in Taiwan and Mainland China? The Company offers a range of back-end testing services, including engineering testing, wafer probing and final testing of memory and mixed-signal semiconductors? The Company has production facilities in Hsinchu and Tainan,Taiwan and Shanghai, Mainland China? Founded in 1986 and headquartered in Hsinchu, Taiwan, the Company has approximately 6,200 employeesSales Mix by Products 1SRAM 2%Logic/Mixed Signal 7% LCD Driver Commodity 27% DRAM14% Flash 15% Niche DRAMBumping (incl. 18%RDL / MEMS / PM) 17%Source: Company filings, Gartner, company website and Wall Street research 1 Data as of Q3 2015 from Barbados November, 2015 Investor PresentationLCD DriverDRAMFlash (NOR/NAND)Logic/Mixed- SignalTahiti Core Technology? Testing and assembly services for LCD and other flat panel display driver semiconductors ? Employs TCP, COF, and COG technologies? Testing and assembly services for DRAM semiconductors used in desktops, notebooks, and handheld devices? Testing and assembly services for Flash memory devices used in mobile devices, digital cameras, and digital audio/ video devices? Testing and assembly services for logic/mixed-signal semiconductors, with lead counts up to 1024 and operating frequencies of up to 9GHzSelected Top CustomersProject Island 9
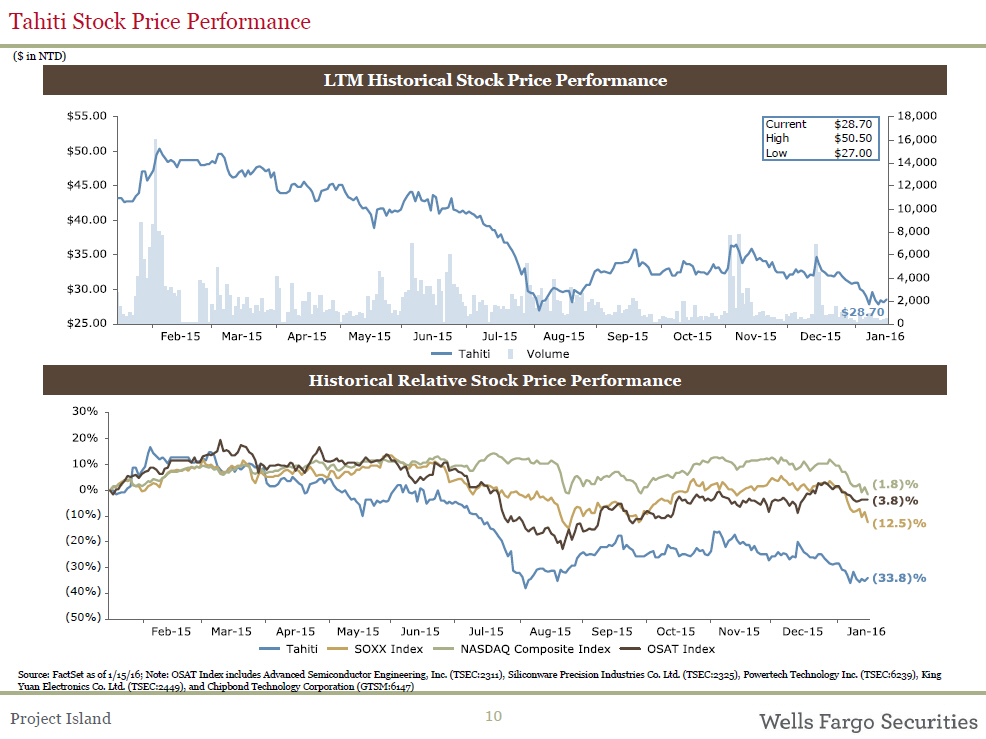
Tahiti Stock Price Performance($ in NTD)LTM Historical Stock Price PerformanceCurrent $28.70High $50.50Low $27.00$28.70Historical Relative Stock Price Performance(10%)(20%)(30%)(40%)(50%)Source: FactSet as of 1/15/16; Note: OSAT Index includes Advanced Semiconductor Engineering, Inc. (TSEC:2311), Siliconware Precision Industries Co. Ltd. (TSEC:2325), Powertech Technology Inc. (TSEC:6239), King Yuan Electronics Co. Ltd. (TSEC:2449), and Chipbond Technology Corporation (GTSM:6147)Project Island 10
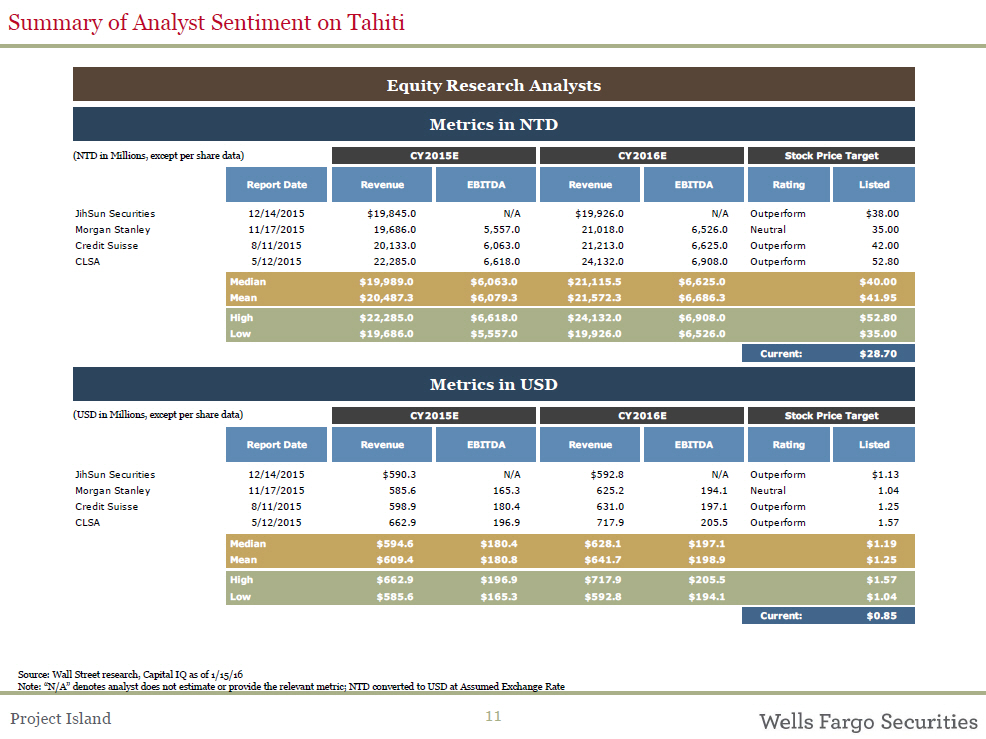
Summary of Analyst Sentiment on TahitiEquity Research AnalystsMetrics in NTD(NTD in Millions, except per share data) CY2015E CY2016E Stock Price Target Report Date Revenue EBITDA Revenue EBITDA Rating Listed JihSun Securities 12/14/2015 $19,845.0 N/A $19,926.0 N/A Outperform $38.00 Morgan Stanley 11/17/2015 19,686.0 5,557.0 21,018.0 6,526.0 Neutral 35.00 Credit Suisse 8/11/2015 20,133.0 6,063.0 21,213.0 6,625.0 Outperform 42.00 CLSA 5/12/2015 22,285.0 6,618.0 24,132.0 6,908.0 Outperform 52.80 Median $19,989.0 $6,063.0 $21,115.5 $6,625.0 $40.00 Mean $20,487.3 $6,079.3 $21,572.3 $6,686.3 $41.95 High $22,285.0 $6,618.0 $24,132.0 $6,908.0 $52.80 Low $19,686.0 $5,557.0 $19,926.0 $6,526.0 $35.00 Current: $28.70 Metrics in USD (USD in Millions, except per share data) CY2015E CY2016E Stock Price Target Report Date Revenue EBITDA Revenue EBITDA Rating Listed JihSun Securities 12/14/2015 $590.3 N/A $592.8 N/A Outperform $1.13 Morgan Stanley 11/17/2015 585.6 165.3 625.2 194.1 Neutral 1.04 Credit Suisse 8/11/2015 598.9 180.4 631.0 197.1 Outperform 1.25 CLSA 5/12/2015 662.9 196.9 717.9 205.5 Outperform 1.57 Median $594.6 $180.4 $628.1 $197.1 $1.19 Mean $609.4 $180.8 $641.7 $198.9 $1.25 High $662.9 $196.9 $717.9 $205.5 $1.57 Low $585.6 $165.3 $592.8 $194.1 $1.04 Current: $0.85Source: Wall Street research, Capital IQ as of 1/15/16Note: “N/A” denotes analyst does not estimate or provide the relevant metric; NTD converted to USD at Assumed Exchange RateProject Island 11
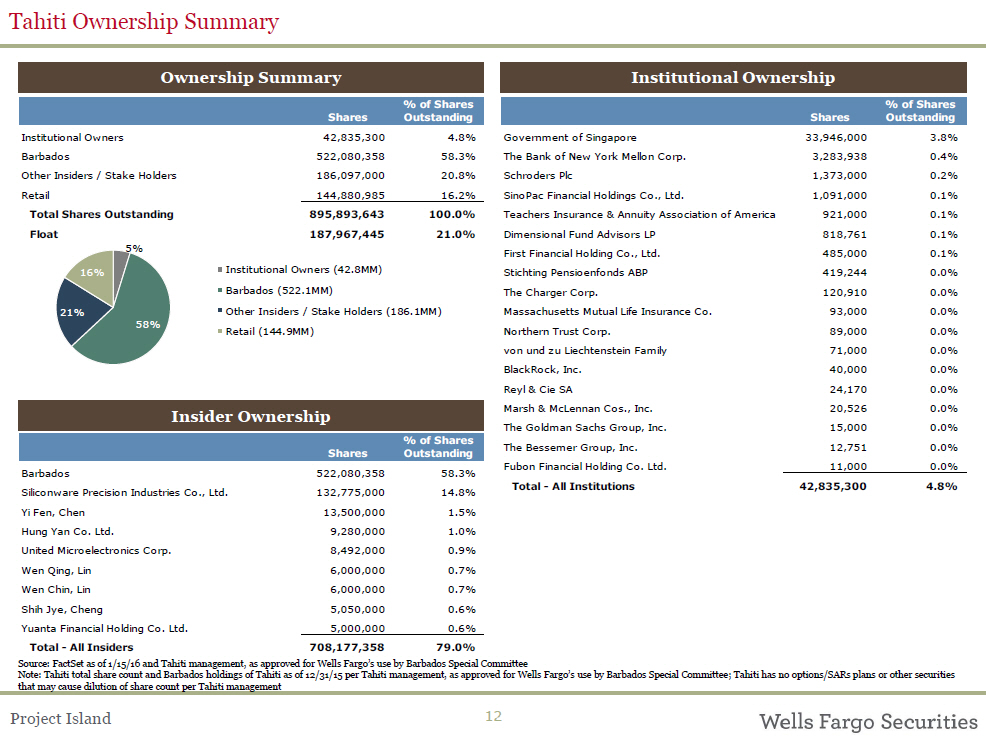
Tahiti Ownership SummaryOwnership Summary Institutional Ownership% of Shares Shares Outstanding Institutional Owners 42,835,300 4.8% Barbados 522,080,358 58.3% Other Insiders / Stake Holders 186,097,000 20.8% Retail 144,880,985 16.2% Total Shares Outstanding 895,893,643 100.0% Float 187,967,445 21.0% 5% 16% Institutional Owners (42.8MM) Barbados (522.1MM) 21% Other Insiders / Stake Holders (186.1MM) 58% Retail (144.9MM)Insider Ownership% of Shares Shares Outstanding Barbados 522,080,358 58.3% Siliconware Precision Industries Co., Ltd. 132,775,000 14.8% Yi Fen, Chen 13,500,000 1.5% Hung Yan Co. Ltd. 9,280,000 1.0% United Microelectronics Corp. 8,492,000 0.9% Wen Qing, Lin 6,000,000 0.7% Wen Chin, Lin 6,000,000 0.7% Shih Jye, Cheng 5,050,000 0.6% Yuanta Financial Holding Co. Ltd. 5,000,000 0.6% Total - All Insiders 708,177,358 79.0%% of Shares Shares Outstanding Government of Singapore 33,946,000 3.8% The Bank of New York Mellon Corp. 3,283,938 0.4% Schroders Plc 1,373,000 0.2% SinoPac Financial Holdings Co., Ltd. 1,091,000 0.1% Teachers Insurance & Annuity Association of America 921,000 0.1% Dimensional Fund Advisors LP 818,761 0.1% First Financial Holding Co., Ltd. 485,000 0.1% Stichting Pensioenfonds ABP 419,244 0.0% The Charger Corp. 120,910 0.0% Massachusetts Mutual Life Insurance Co. 93,000 0.0% Northern Trust Corp. 89,000 0.0% von und zu Liechtenstein Family 71,000 0.0% BlackRock, Inc. 40,000 0.0% Reyl & Cie SA 24,170 0.0% Marsh & McLennan Cos., Inc. 20,526 0.0% The Goldman Sachs Group, Inc. 15,000 0.0% The Bessemer Group, Inc. 12,751 0.0% Fubon Financial Holding Co. Ltd. 11,000 0.0% Total - All Institutions 42,835,300 4.8%Source: FactSet as of 1/15/16 and Tahiti management, as approved for Wells Fargo’s use by Barbados Special CommitteeNote: Tahiti total share count and Barbados holdings of Tahiti as of 12/31/15 per Tahiti management, as approved for Wells Fargo’s use by Barbados Special Committee; Tahiti has no options/SARs plans or other securities that may cause dilution of share count per Tahiti managementProject Island 12
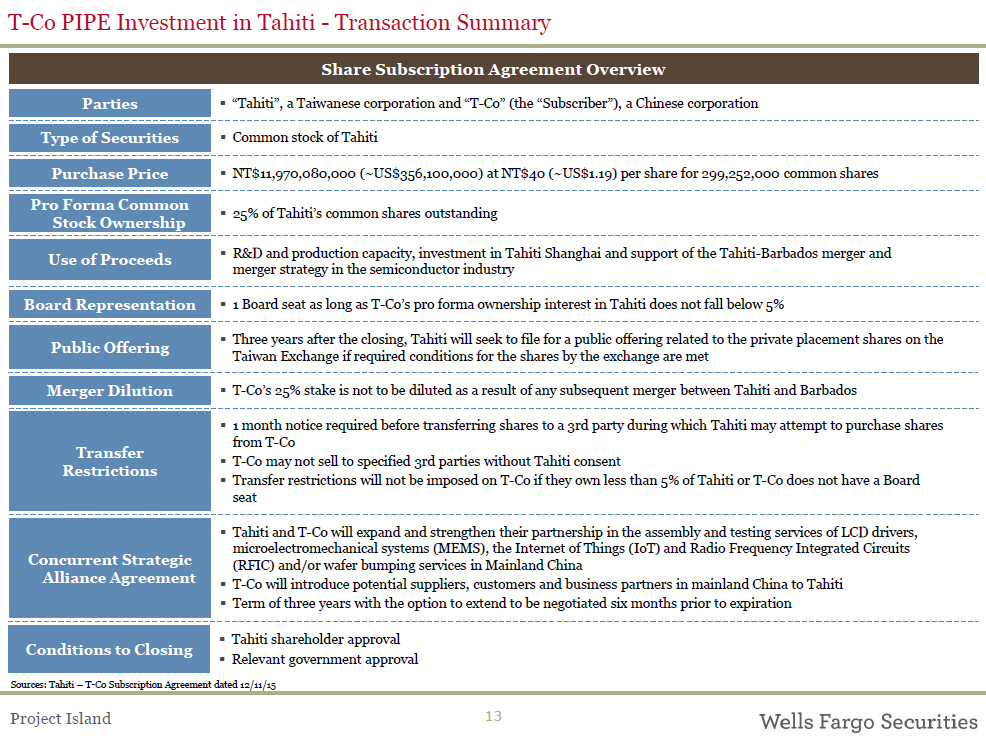
T-Co PIPE Investment in Tahiti - Transaction SummaryPartiesType of SecuritiesPurchase PricePro Forma CommonStock OwnershipUse of ProceedsBoard RepresentationPublic OfferingMerger DilutionTransferRestrictionsConcurrent StrategicAlliance AgreementShare Subscription Agreement Overview? “Tahiti”, a Taiwanese corporation and “T-Co” (the “Subscriber”), a Chinese corporation? Common stock of Tahiti? NT$11,970,080,000 (~US$356,100,000) at NT$40 (~US$1.19) per share for 299,252,000 common shares? 25% of Tahiti’s common shares outstanding? R&D and production capacity, investment in Tahiti Shanghai and support of the Tahiti-Barbados merger and merger strategy in the semiconductor industry? 1 Board seat as long as T-Co’s pro forma ownership interest in Tahiti does not fall below 5%? Three years after the closing, Tahiti will seek to file for a public offering related to the private placement shares on the Taiwan Exchange if required conditions for the shares by the exchange are met? T-Co’s 25% stake is not to be diluted as a result of any subsequent merger between Tahiti and Barbados? 1 month notice required before transferring shares to a 3rd party during which Tahiti may attempt to purchase shares from T-Co? T-Co may not sell to specified 3rd parties without Tahiti consent? Transfer restrictions will not be imposed on T-Co if they own less than 5% of Tahiti or T-Co does not have a Board seat? Tahiti and T-Co will expand and strengthen their partnership in the assembly and testing services of LCD drivers, microelectromechanical systems (MEMS), the Internet of Things (IoT) and Radio Frequency Integrated Circuits (RFIC) and/or wafer bumping services in Mainland China? T-Co will introduce potential suppliers, customers and business partners in mainland China to Tahiti? Term of three years with the option to extend to be negotiated six months prior to expiration? Tahiti shareholder approval Conditions to Closing ? Relevant government approval Sources: Tahiti – T-Co Subscription Agreement dated 12/11/15Project Island 13

Barbados Overview
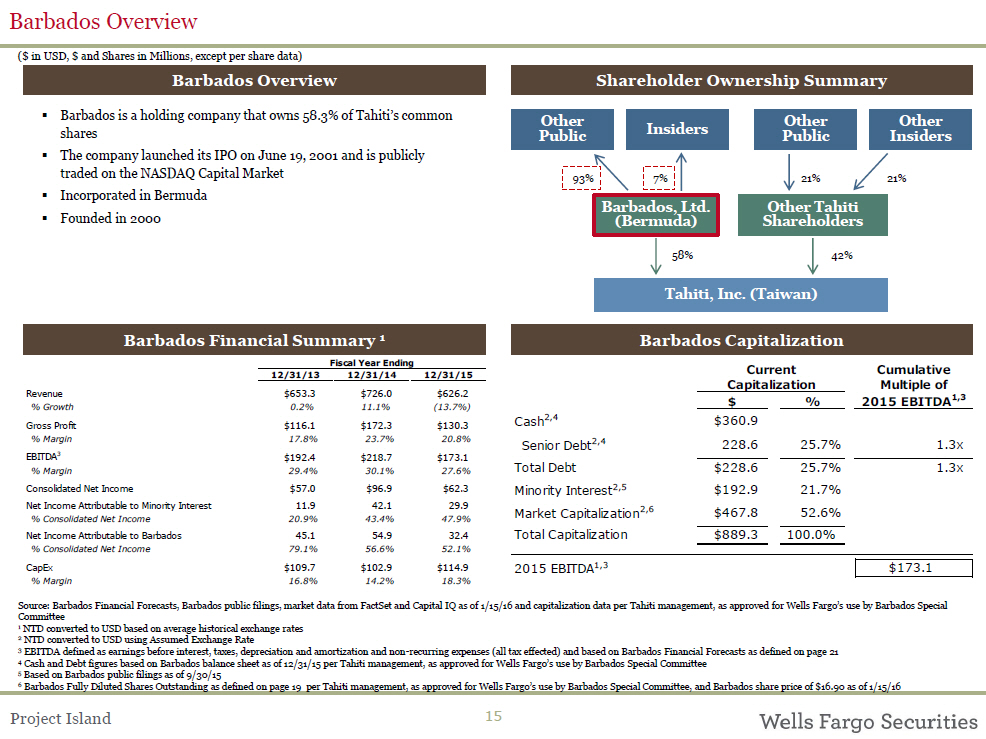
Barbados Overview($ in USD, $ and Shares in Millions, except per share data)Barbados Overview? Barbados is a holding company that owns 58.3% of Tahiti’s common shares? The company launched its IPO on June 19, 2001 and is publicly traded on the NASDAQ Capital Market ? Incorporated in Bermuda? Founded in 2000Shareholder Ownership SummaryOther Insiders Other Other Public Public Insiders93% 7% 21% 21%Barbados, Ltd. Other Tahiti (Bermuda) Shareholders58% 42%Tahiti, Inc. (Taiwan)Barbados Financial Summary 1 Barbados Capitalization Fiscal Year Ending Current Cumulative 12/31/13 12/31/14 12/31/15Revenue $653.3 $726.0 $626.2 Capitalization Multiple of $ % 2015 EBITDA1,3 % Growth 0.2% 11.1% (13.7%) Cash2,4 $360.9 Gross Profit $116.1 $172.3 $130.3 % Margin 17.8% 23.7% 20.8% Senior Debt2,4 228.6 25.7% 1.3x EBITDA3 $192.4 $218.7 $173.1 Total Debt $228.6 25.7% 1.3x % Margin 29.4% 30.1% 27.6% Consolidated Net Income $57.0 $96.9 $62.3 Minority Interest2,5 $192.9 21.7% Net Income Attributable to Minority Interest 11.9 42.1 29.9 Market Capitalization2,6 $467.8 52.6% % Consolidated Net Income 20.9% 43.4% 47.9%Net Income Attributable to Barbados 45.1 54.9 32.4 Total Capitalization $889.3 100.0% % Consolidated Net Income 79.1% 56.6% 52.1% 2015 EBITDA1,3 CapEx $109.7 $102.9 $114.9 $173.1 % Margin 16.8% 14.2% 18.3%Source: Barbados Financial Forecasts, Barbados public filings, market data from FactSet and Capital IQ as of 1/15/16 and capitalization data per Tahiti management, as approved for Wells Fargo’s use by Barbados Special Committee 1 NTD converted to USD based on average historical exchange rates2 NTD converted to USD using Assumed Exchange Rate3 EBITDA defined as earnings before interest, taxes, depreciation and amortization and non-recurring expenses (all tax effected) and based on Barbados Financial Forecasts as defined on page 214 Cash and Debt figures based on Barbados balance sheet as of 12/31/15 per Tahiti management, as approved for Wells Fargo’s use by Barbados Special Committee5 Based on Barbados public filings as of 9/30/156 Barbados Fully Diluted Shares Outstanding as defined on page 19 per Tahiti management, as approved for Wells Fargo’s use by Barbados Special Committee, and Barbados share price of $16.90 as of 1/15/16Project Island 15
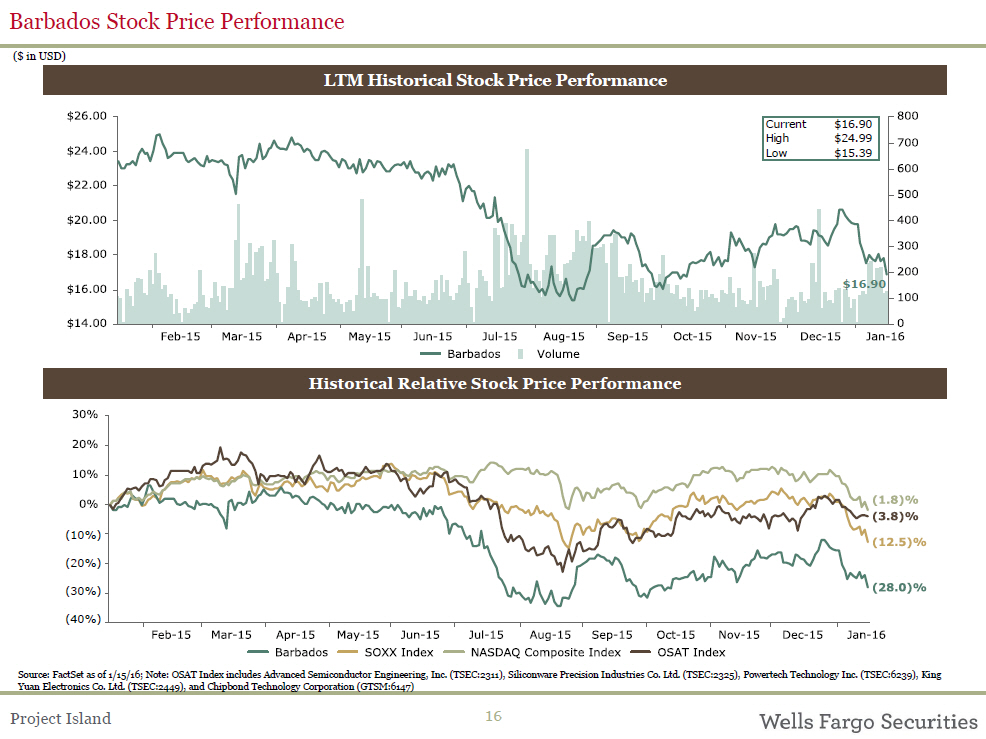
Barbados Stock Price Performance($ in USD)LTM Historical Stock Price PerformanceCurrent $16.90High $24.99Low $15.39$16.90Historical Relative Stock Price Performance(10%)(20%)(30%)(40%)Source: FactSet as of 1/15/16; Note: OSAT Index includes Advanced Semiconductor Engineering, Inc. (TSEC:2311), Siliconware Precision Industries Co. Ltd. (TSEC:2325), Powertech Technology Inc. (TSEC:6239), King Yuan Electronics Co. Ltd. (TSEC:2449), and Chipbond Technology Corporation (GTSM:6147)Project Island 16
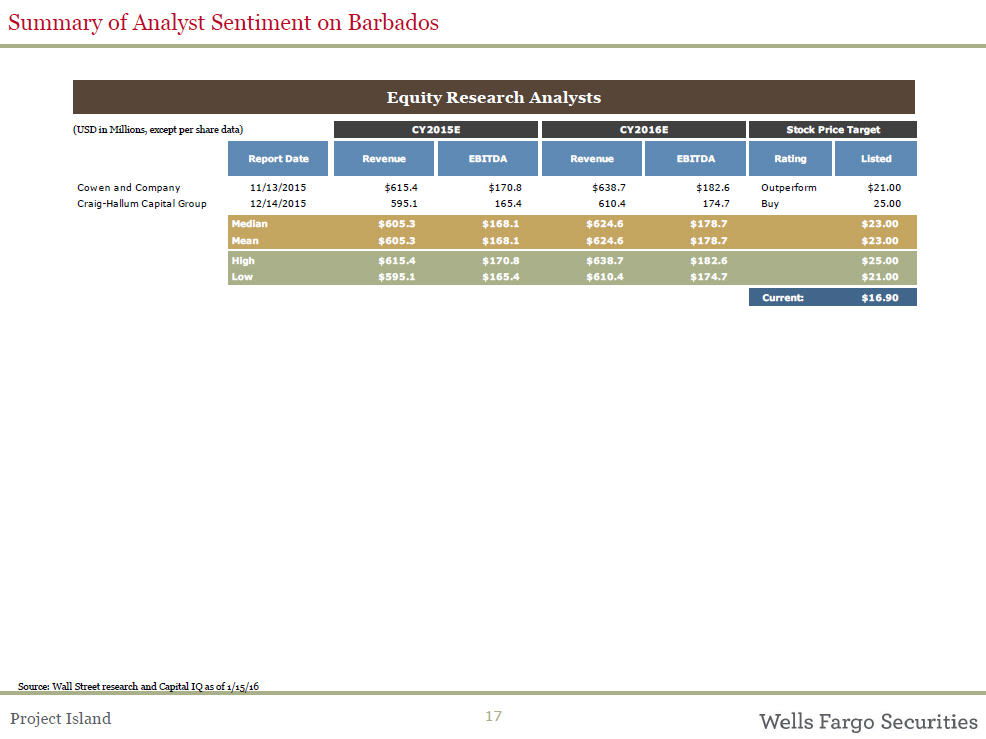
Summary of Analyst Sentiment on BarbadosEquity Research Analysts(USD in Millions, except per share data) CY2015E CY2016E Stock Price Target Report Date Revenue EBITDA Revenue EBITDA Rating Listed Cowen and Company 11/13/2015 $615.4 $170.8 $638.7 $182.6 Outperform $21.00 Craig-Hallum Capital Group 12/14/2015 595.1 165.4 610.4 174.7 Buy 25.00 Median $605.3 $168.1 $624.6 $178.7 $23.00 Mean $605.3 $168.1 $624.6 $178.7 $23.00 High $615.4 $170.8 $638.7 $182.6 $25.00 Low $595.1 $165.4 $610.4 $174.7 $21.00 Current: $16.90Source: Wall Street research and Capital IQ as of 1/15/16Project Island 17
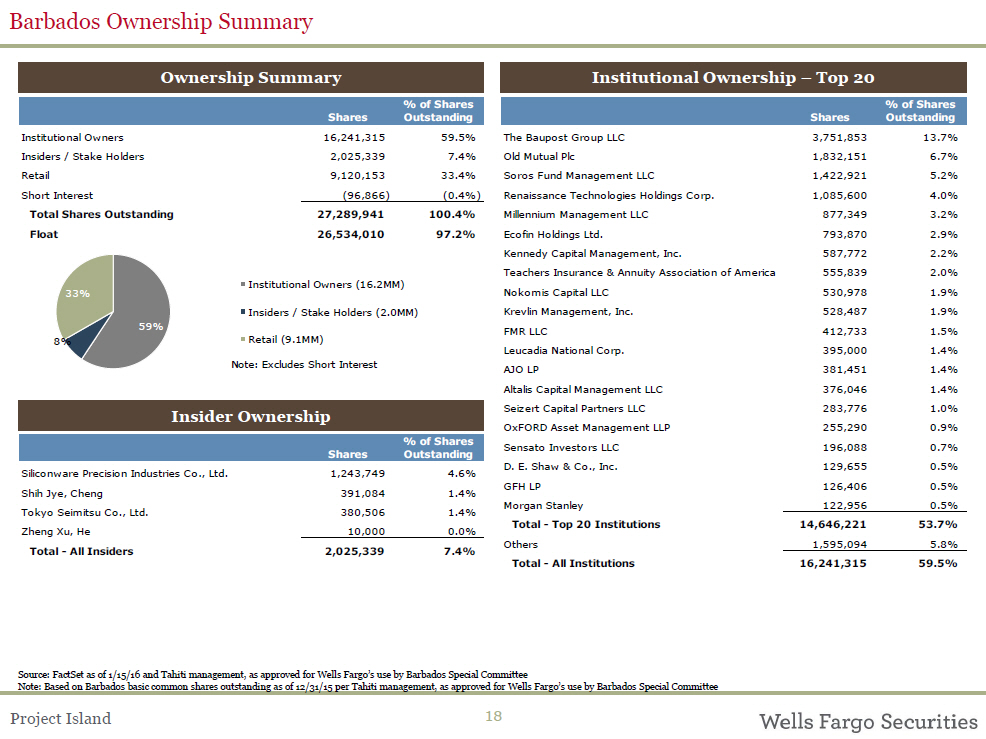
Barbados Ownership SummaryOwnership Summary% of Shares Shares Outstanding Institutional Owners 16,241,315 59.5% Insiders / Stake Holders 2,025,339 7.4% Retail 9,120,153 33.4% Short Interest (96,866) (0.4%) Total Shares Outstanding 27,289,941 100.4% Float 26,534,010 97.2%33% Institutional Owners (16.2MM)Insiders / Stake Holders (2.0MM) 59% 8% Retail (9.1MM) Note: Excludes Short InterestInsider Ownership% of Shares Shares Outstanding Siliconware Precision Industries Co., Ltd. 1,243,749 4.6% Shih Jye, Cheng 391,084 1.4% Tokyo Seimitsu Co., Ltd. 380,506 1.4% Zheng Xu, He 10,000 0.0% Total - All Insiders 2,025,339 7.4%Institutional Ownership – Top 20% of Shares Shares Outstanding The Baupost Group LLC 3,751,853 13.7% Old Mutual Plc 1,832,151 6.7% Soros Fund Management LLC 1,422,921 5.2% Renaissance Technologies Holdings Corp. 1,085,600 4.0% Millennium Management LLC 877,349 3.2% Ecofin Holdings Ltd. 793,870 2.9% Kennedy Capital Management, Inc. 587,772 2.2% Teachers Insurance & Annuity Association of America 555,839 2.0% Nokomis Capital LLC 530,978 1.9% Krevlin Management, Inc. 528,487 1.9% FMR LLC 412,733 1.5% Leucadia National Corp. 395,000 1.4% AJO LP 381,451 1.4% Altalis Capital Management LLC 376,046 1.4% Seizert Capital Partners LLC 283,776 1.0% OxFORD Asset Management LLP 255,290 0.9% Sensato Investors LLC 196,088 0.7% D. E. Shaw & Co., Inc. 129,655 0.5% GFH LP 126,406 0.5% Morgan Stanley 122,956 0.5% Total - Top 20 Institutions 14,646,221 53.7% Others 1,595,094 5.8% Total - All Institutions 16,241,315 59.5%Source: FactSet as of 1/15/16 and Tahiti management, as approved for Wells Fargo’s use by Barbados Special CommitteeNote: Based on Barbados basic common shares outstanding as of 12/31/15 per Tahiti management, as approved for Wells Fargo’s use by Barbados Special CommitteeProject Island 18
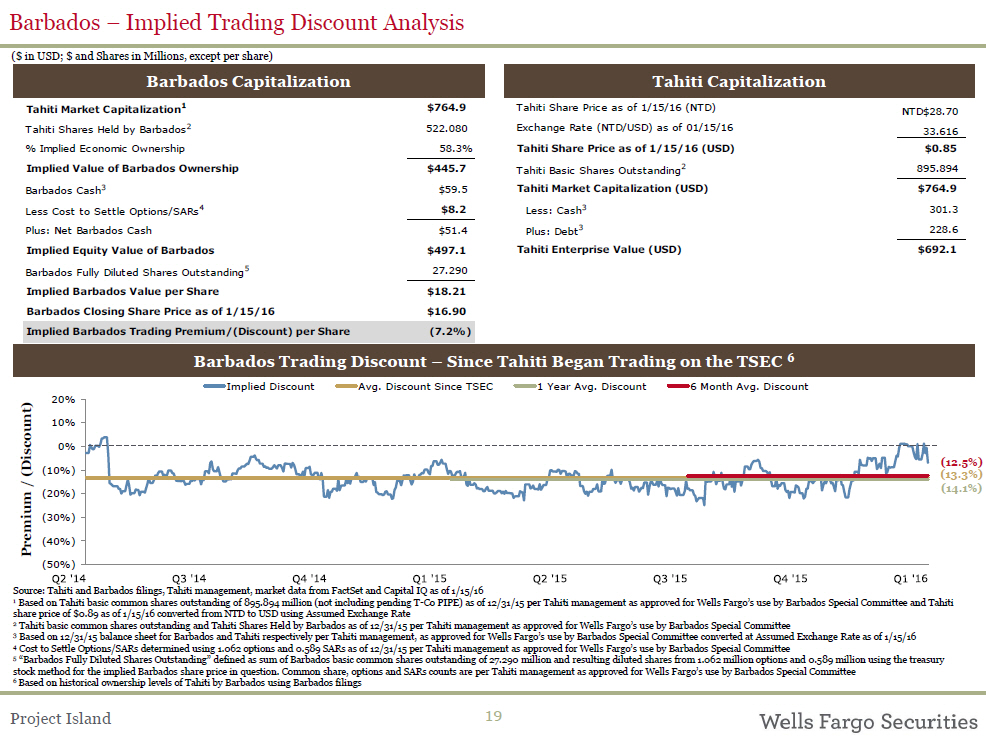
Barbados – Implied Trading Discount Analysis($ in USD; $ and Shares in Millions, except per share) Barbados Capitalization Tahiti Capitalization Tahiti Market Capitalization1 $764.9 Tahiti Share Price as of 1/15/16 (NTD) NTD$28.70 Tahiti Shares Held by Barbados2 522.080 Exchange Rate (NTD/USD) as of 01/15/16 33.616 % Implied Economic Ownership 58.3% Tahiti Share Price as of 1/15/16 (USD) $0.85 Tahiti Basic Shares Outstanding2 895.894 Implied Value of Barbados Ownership $445.7 Barbados Cash3 $59.5 Tahiti Market Capitalization (USD) $764.9 Less Cost to Settle Options/SARs4 $8.2 Less: Cash3 301.3 Plus: Net Barbados Cash $51.4 Plus: Debt3 228.6 Implied Equity Value of Barbados $497.1 Tahiti Enterprise Value (USD) $692.1 Barbados Fully Diluted Shares Outstanding5 27.290 Implied Barbados Value per Share $18.21 Barbados Closing Share Price as of 1/15/16 $16.90 Implied Barbados Trading Premium/(Discount) per Share (7.2%)Barbados Trading Discount – Since Tahiti Began Trading on the TSEC 6Implied Discount Avg. Discount Since TSEC 1 Year Avg. Discount 6 Month Avg. Discount (Discount) 20% 10% 0% (10%) (12.5%) (13.3%)/ (14.1%) Premium (20%)(30%) (40%)(50%)Source: Tahiti and Barbados filings, Tahiti management, market data from FactSet and Capital IQ as of 1/15/161 Based on Tahiti basic common shares outstanding of 895.894 million (not including pending T-Co PIPE) as of 12/31/15 per Tahiti management as approved for Wells Fargo’s use by Barbados Special Committee and Tahiti share price of $0.89 as of 1/15/16 converted from NTD to USD using Assumed Exchange Rate 2 Tahiti basic common shares outstanding and Tahiti Shares Held by Barbados as of 12/31/15 per Tahiti management as approved for Wells Fargo’s use by Barbados Special Committee3 Based on 12/31/15 balance sheet for Barbados and Tahiti respectively per Tahiti management, as approved for Wells Fargo’s use by Barbados Special Committee converted at Assumed Exchange Rate as of 1/15/164 Cost to Settle Options/SARs determined using 1.062 options and 0.589 SARs as of 12/31/15 per Tahiti management as approved for Wells Fargo’s use by Barbados Special Committee5 “Barbados Fully Diluted Shares Outstanding” defined as sum of Barbados basic common shares outstanding of 27.290 million and resulting diluted shares from 1.062 million options and 0.589 million using the treasury stock method for the implied Barbados share price in question. Common share, options and SARs counts are per Tahiti management as approved for Wells Fargo’s use by Barbados Special Committee 6 Based on historical ownership levels of Tahiti by Barbados using Barbados filingsProject Island 19
 Financial Analysis
Financial Analysis OverviewFinancial Forecasts? Financial analysis is based, among other items, upon non-public information made available by Tahiti management and reviewed by the Barbados Special Committee? The 5-year financial forecasts that the Barbados special committee directed Wells Fargo to use in performing its financial analysis are the following:? The financial forecasts for pro forma Tahiti for fiscal years 2015A -2020E including the pro forma adjustments related to the Merger prepared by Tahiti management (“Pro Forma Tahiti Financial Forecasts”)? Tahiti management expects the pending T-Co PIPE to close in 2H 2016E and the above forecasts assume the closing of this deal, and the impact of the pending T-Co PIPEOverview of Methodologies? Shareholder Impact Analysis compares what Barbados shareholders currently have with what they will receive in the Merger? Compared current Tahiti shares owned with shares owned post transaction to calculate the difference in shares and the aggregate $ difference based on:? Current market price of Tahiti shares? Implied price of Tahiti shares based on discounted cash flow analysis using Pro Forma Tahiti Financial Forecasts? Also compared Barbados current cash with the cash consideration shareholders will receive in the Merger? An Implied Exchange Ratio Analysis was also prepared? An ADS Analysis was also preparedProject Island 21
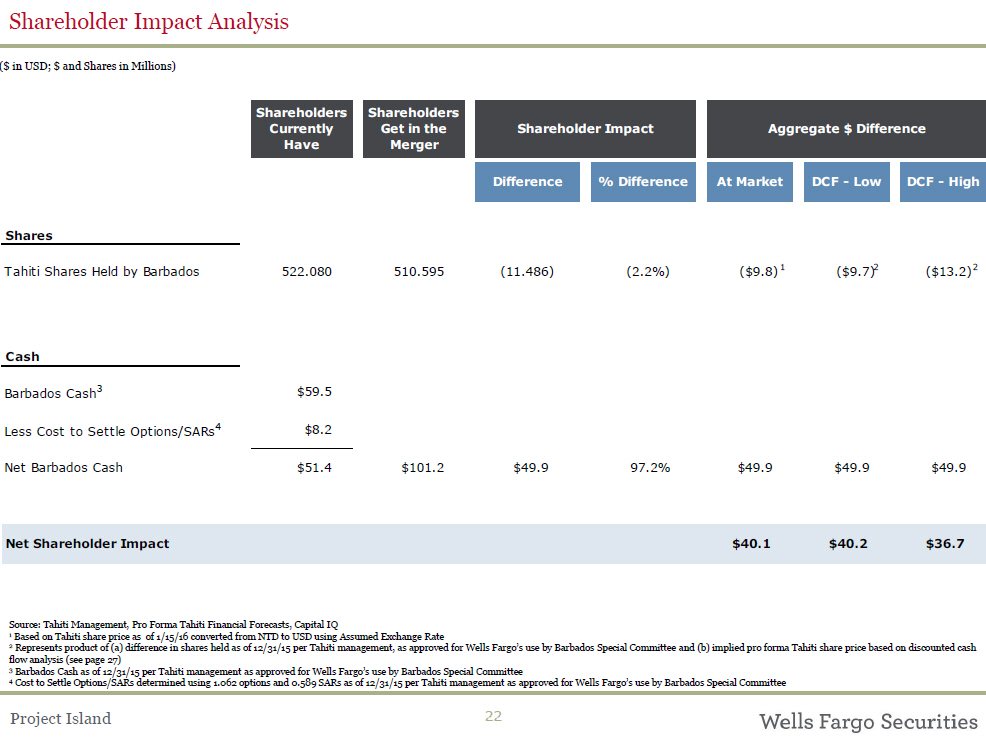
Shareholder Impact Analysis($ in USD; $ and Shares in Millions)Shareholders Shareholders Currently Get in the Shareholder Impact Aggregate $ Difference Have Merger Difference % Difference At Market DCF - Low DCF - High Shares Tahiti Shares Held by Barbados 522.080 510.595 (11.486) (2.2%) ($9.8) 1 ($9.7)2 ($13.2)2Cash Barbados Cash3 $59.5 Less Cost to Settle Options/SARs4 $8.2Net Barbados Cash $51.4 $101.2 $49.9 97.2% $49.9 $49.9 $49.9Net Shareholder Impact $40.1 $40.2 $36.7Source: Tahiti Management, Pro Forma Tahiti Financial Forecasts, Capital IQ 1 Based on Tahiti share price as of 1/15/16 converted from NTD to USD using Assumed Exchange Rate2 Represents product of (a) difference in shares held as of 12/31/15 per Tahiti management, as approved for Wells Fargo’s use by Barbados Special Committee and (b) implied pro forma Tahiti share price based on discounted cash flow analysis (see page 27) 3 Barbados Cash as of 12/31/15 per Tahiti management as approved for Wells Fargo’s use by Barbados Special Committee4 Cost to Settle Options/SARs determined using 1.062 options and 0.589 SARs as of 12/31/15 per Tahiti management as approved for Wells Fargo’s use by Barbados Special CommitteeProject Island 22
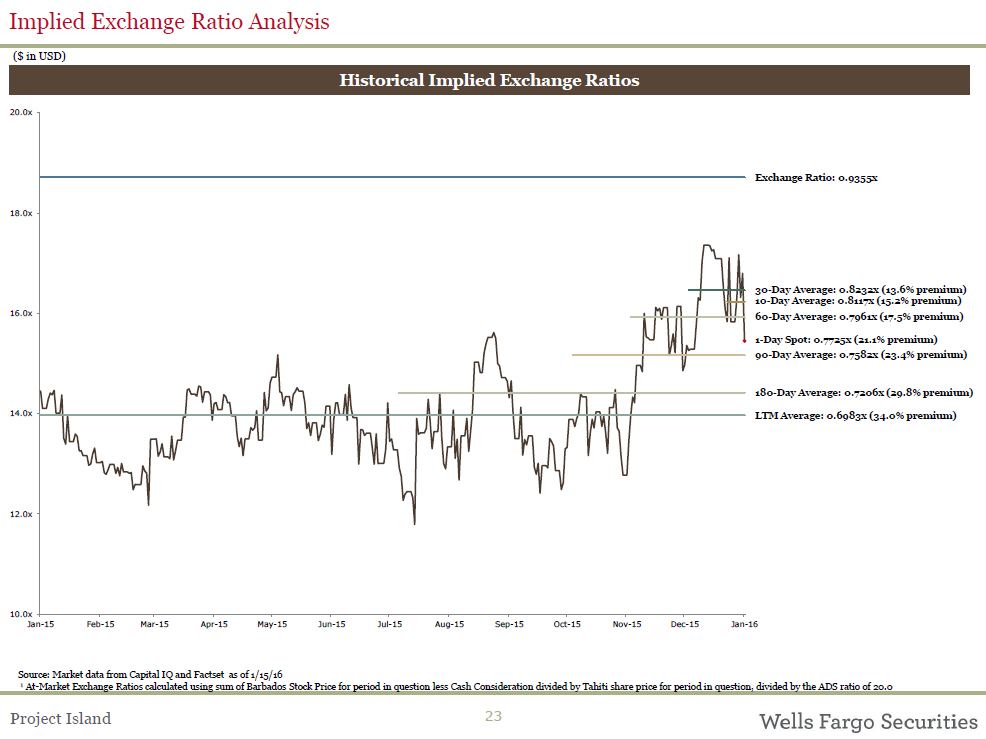
Implied Exchange Ratio Analysis($ in USD)Historical Implied Exchange Ratios20.0x Exchange Ratio: 0.9355x 18.0x 30-Day Average: 0.8232x (13.6% premium) 10-Day Average: 0.8117x (15.2% premium) 16.0x 60-Day Average: 0.7961x (17.5% premium)1-Day Spot: 0.7725x (21.1% premium) 90-Day Average: 0.7582x (23.4% premium) 180-Day Average: 0.7206x (29.8% premium) 14.0x LTM Average: 0.6983x (34.0% premium) 12.0x 10.0x Jan-15 Feb-15 Mar-15 Apr-15 May-15 Jun-15 Jul-15 Aug-15 Sep-15 Oct-15 Nov-15 Dec-15 Jan-16Source: Market data from Capital IQ and Factset as of 1/15/161 At-Market Exchange Ratios calculated using sum of Barbados Stock Price for period in question less Cash Consideration divided by Tahiti share price for period in question, divided by the ADS ratio of 20.0Project Island 23
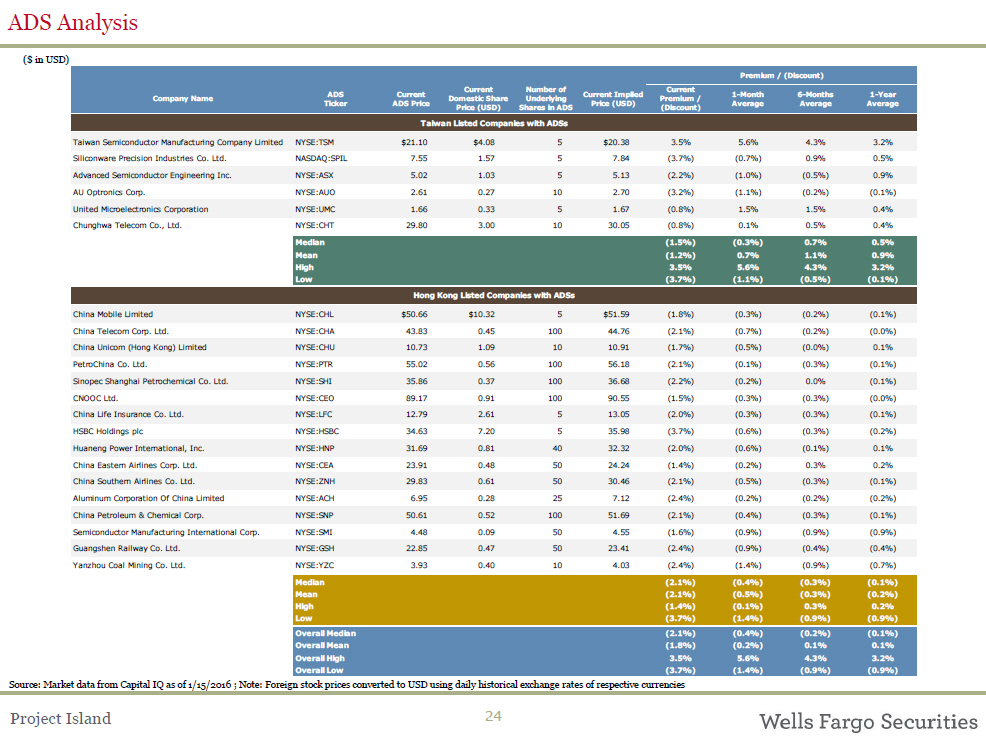
ADS Analysis($ in USD)Premium / (Discount) ADS Current Current Number of Current Implied Current 1-Month 6-Months 1-Year Company Name Domestic Share Underlying Premium / Ticker ADS Price Price (USD) Average Average Average Price (USD) Shares in ADS (Discount)Taiwan Listed Companies with ADSs Taiwan Semiconductor Manufacturing Company Limited NYSE:TSM $21.10 $4.08 5 $20.38 3.5% 5.6% 4.3% 3.2% Siliconware Precision Industries Co. Ltd. NASDAQ:SPIL 7.55 1.57 5 7.84 (3.7%) (0.7%) 0.9% 0.5% Advanced Semiconductor Engineering Inc. NYSE:ASX 5.02 1.03 5 5.13 (2.2%) (1.0%) (0.5%) 0.9% AU Optronics Corp. NYSE:AUO 2.61 0.27 10 2.70 (3.2%) (1.1%) (0.2%) (0.1%) United Microelectronics Corporation NYSE:UMC 1.66 0.33 5 1.67 (0.8%) 1.5% 1.5% 0.4% Chunghwa Telecom Co., Ltd. NYSE:CHT 29.80 3.00 10 30.05 (0.8%) 0.1% 0.5% 0.4% Median (1.5%) (0.3%) 0.7% 0.5% Mean (1.2%) 0.7% 1.1% 0.9% High 3.5% 5.6% 4.3% 3.2% Low (3.7%) (1.1%) (0.5%) (0.1%) Hong Kong Listed Companies with ADSs China Mobile Limited NYSE:CHL $50.66 $10.32 5 $51.59 (1.8%) (0.3%) (0.2%) (0.1%) China Telecom Corp. Ltd. NYSE:CHA 43.83 0.45 100 44.76 (2.1%) (0.7%) (0.2%) (0.0%) China Unicom (Hong Kong) Limited NYSE:CHU 10.73 1.09 10 10.91 (1.7%) (0.5%) (0.0%) 0.1% PetroChina Co. Ltd. NYSE:PTR 55.02 0.56 100 56.18 (2.1%) (0.1%) (0.3%) (0.1%) Sinopec Shanghai Petrochemical Co. Ltd. NYSE:SHI 35.86 0.37 100 36.68 (2.2%) (0.2%) 0.0% (0.1%) CNOOC Ltd. NYSE:CEO 89.17 0.91 100 90.55 (1.5%) (0.3%) (0.3%) (0.0%) China Life Insurance Co. Ltd. NYSE:LFC 12.79 2.61 5 13.05 (2.0%) (0.3%) (0.3%) (0.1%) HSBC Holdings plc NYSE:HSBC 34.63 7.20 5 35.98 (3.7%) (0.6%) (0.3%) (0.2%) Huaneng Power International, Inc. NYSE:HNP 31.69 0.81 40 32.32 (2.0%) (0.6%) (0.1%) 0.1% China Eastern Airlines Corp. Ltd. NYSE:CEA 23.91 0.48 50 24.24 (1.4%) (0.2%) 0.3% 0.2% China Southern Airlines Co. Ltd. NYSE:ZNH 29.83 0.61 50 30.46 (2.1%) (0.5%) (0.3%) (0.1%) Aluminum Corporation Of China Limited NYSE:ACH 6.95 0.28 25 7.12 (2.4%) (0.2%) (0.2%) (0.2%) China Petroleum & Chemical Corp. NYSE:SNP 50.61 0.52 100 51.69 (2.1%) (0.4%) (0.3%) (0.1%) Semiconductor Manufacturing International Corp. NYSE:SMI 4.48 0.09 50 4.55 (1.6%) (0.9%) (0.9%) (0.9%) Guangshen Railway Co. Ltd. NYSE:GSH 22.85 0.47 50 23.41 (2.4%) (0.9%) (0.4%) (0.4%) Yanzhou Coal Mining Co. Ltd. NYSE:YZC 3.93 0.40 10 4.03 (2.4%) (1.4%) (0.9%) (0.7%) Median (2.1%) (0.4%) (0.3%) (0.1%) Mean (2.1%) (0.5%) (0.3%) (0.2%) High (1.4%) (0.1%) 0.3% 0.2% Low (3.7%) (1.4%) (0.9%) (0.9%) Overall Median (2.1%) (0.4%) (0.2%) (0.1%) Overall Mean (1.8%) (0.2%) 0.1% 0.1% Overall High 3.5% 5.6% 4.3% 3.2% Overall Low (3.7%) (1.4%) (0.9%) (0.9%) Source: Market data from Capital IQ as of 1/15/2016 ; Note: Foreign stock prices converted to USD using daily historical exchange rates of respective currenciesProject Island 24

Appendix
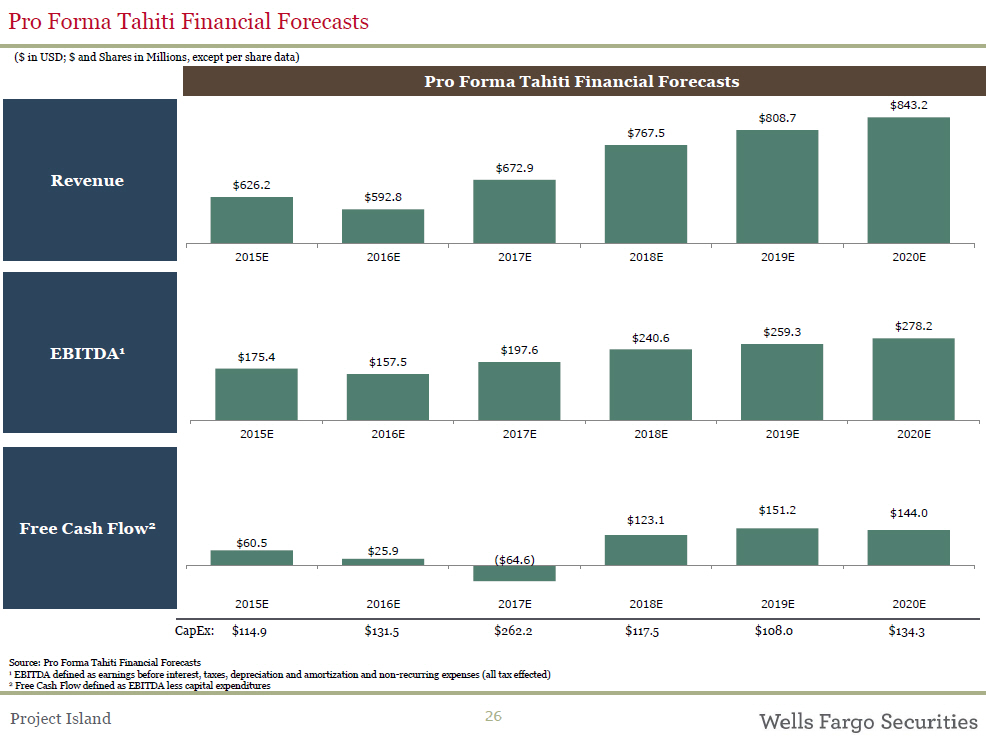
Pro Forma Tahiti Financial Forecasts($ in USD; $ and Shares in Millions, except per share data)Pro Forma Tahiti Financial Forecasts$843.2$808.7 $767.5 Revenue $672.9 $626.2 $592.82015E 2016E 2017E 2018E 2019E 2020E$259.3 $278.2 $240.6EBITDA1 $175.4 $197.6 $157.52015E 2016E 2017E 2018E 2019E 2020E$151.2 $144.0 $123.1 Free Cash Flow2$60.5 $25.9 ($64.6)2015E 2016E 2017E 2018E 2019E 2020ECapEx: $114.9 $131.5 $262.2 $117.5 $108.0 $134.3Source: Pro Forma Tahiti Financial Forecasts 1 EBITDA defined as earnings before interest, taxes, depreciation and amortization and non-recurring expenses (all tax effected)2 Free Cash Flow defined as EBITDA less capital expendituresProject Island 26
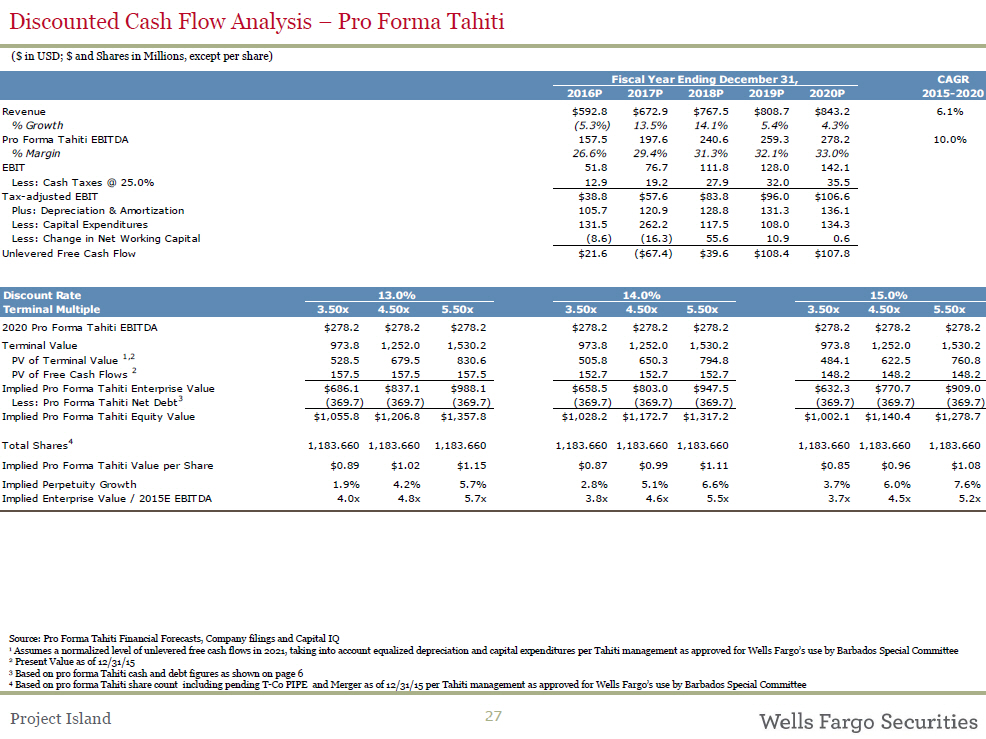
Discounted Cash Flow Analysis – Pro Forma Tahiti($ in USD; $ and Shares in Millions, except per share)Fiscal Year Ending December 31, CAGR 2016P 2017P 2018P 2019P 2020P 2015-2020 Revenue $592.8 $672.9 $767.5 $808.7 $843.2 6.1% % Growth (5.3%) 13.5% 14.1% 5.4% 4.3% Pro Forma Tahiti EBITDA 157.5 197.6 240.6 259.3 278.2 10.0% % Margin 26.6% 29.4% 31.3% 32.1% 33.0% EBIT 51.8 76.7 111.8 128.0 142.1 Less: Cash Taxes @ 25.0% 12.9 19.2 27.9 32.0 35.5 Tax-adjusted EBIT $38.8 $57.6 $83.8 $96.0 $106.6 Plus: Depreciation & Amortization 105.7 120.9 128.8 131.3 136.1 Less: Capital Expenditures 131.5 262.2 117.5 108.0 134.3 Less: Change in Net Working Capital (8.6) (16.3) 55.6 10.9 0.6 Unlevered Free Cash Flow $21.6 ($67.4) $39.6 $108.4 $107.8Discount Rate 13.0% 14.0% 15.0% Terminal Multiple 3.50x 4.50x 5.50x 3.50x 4.50x 5.50x 3.50x 4.50x 5.50x 2020 Pro Forma Tahiti EBITDA $278.2 $278.2 $278.2 $278.2 $278.2 $278.2 $278.2 $278.2 $278.2 Terminal Value 973.8 1,252.0 1,530.2 973.8 1,252.0 1,530.2 973.8 1,252.0 1,530.2 PV of Terminal Value 1 ,2 528.5 679.5 830.6 505.8 650.3 794.8 484.1 622.5 760.8 PV of Free Cash Flows 2 157.5 157.5 157.5 152.7 152.7 152.7 148.2 148.2 148.2 Implied Pro Forma Tahiti Enterprise Value $686.1 $837.1 $988.1 $658.5 $803.0 $947.5 $632.3 $770.7 $909.0 Less: Pro Forma Tahiti Net Debt3 (369.7) (369.7) (369.7) (369.7) (369.7) (369.7) (369.7) (369.7) (369.7) Implied Pro Forma Tahiti Equity Value $1,055.8 $1,206.8 $1,357.8 $1,028.2 $1,172.7 $1,317.2 $1,002.1 $1,140.4 $1,278.7 Total Shares4 1,183.660 1,183.660 1,183.660 1,183.660 1,183.660 1,183.660 1,183.660 1,183.660 1,183.660 Implied Pro Forma Tahiti Value per Share $0.89 $1.02 $1.15 $0.87 $0.99 $1.11 $0.85 $0.96 $1.08 Implied Perpetuity Growth 1.9% 4.2% 5.7% 2.8% 5.1% 6.6% 3.7% 6.0% 7.6% Implied Enterprise Value / 2015E EBITDA 4.0x 4.8x 5.7x 3.8x 4.6x 5.5x 3.7x 4.5x 5.2xSource: Pro Forma Tahiti Financial Forecasts, Company filings and Capital IQ 1 Assumes a normalized level of unlevered free cash flows in 2021, taking into account equalized depreciation and capital expenditures per Tahiti management as approved for Wells Fargo’s use by Barbados Special Committee2 Present Value as of 12/31/153 Based on pro forma Tahiti cash and debt figures as shown on page 64 Based on pro forma Tahiti share count including pending T-Co PIPE and Merger as of 12/31/15 per Tahiti management as approved for Wells Fargo’s use by Barbados Special CommitteeProject Island 27
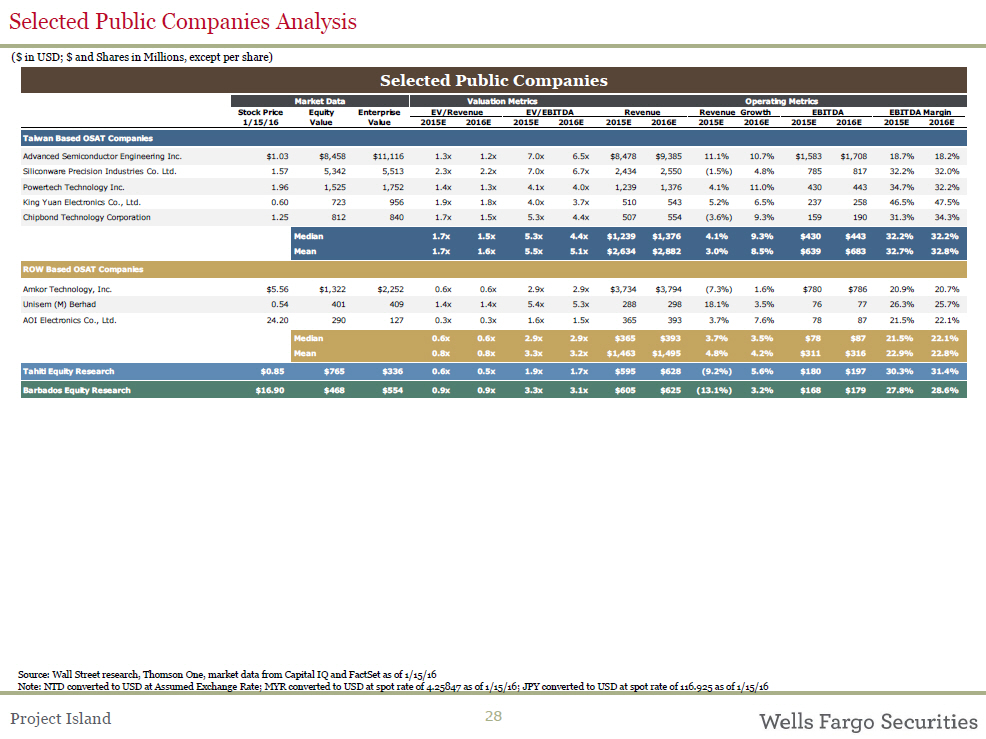 Selected Public Companies Analysis($ in USD; $ and Shares in Millions, except per share)Selected Public CompaniesMarket Data Valuation Metrics Operating Metrics Stock Price Equity Enterprise EV/Revenue EV/EBITDA Revenue Revenue Growth EBITDA EBITDA Margin 1/15/16 Value Value 2015E 2016E 2015E 2016E 2015E 2016E 2015E 2016E 2015E 2016E 2015E 2016E Taiwan Based OSAT Companies Advanced Semiconductor Engineering Inc. $1.03 $8,458 $11,116 1.3x 1.2x 7.0x 6.5x $8,478 $9,385 11.1% 10.7% $1,583 $1,708 18.7% 18.2% Siliconware Precision Industries Co. Ltd. 1.57 5,342 5,513 2.3x 2.2x 7.0x 6.7x 2,434 2,550 (1.5%) 4.8% 785 817 32.2% 32.0% Powertech Technology Inc. 1.96 1,525 1,752 1.4x 1.3x 4.1x 4.0x 1,239 1,376 4.1% 11.0% 430 443 34.7% 32.2% King Yuan Electronics Co., Ltd. 0.60 723 956 1.9x 1.8x 4.0x 3.7x 510 543 5.2% 6.5% 237 258 46.5% 47.5% Chipbond Technology Corporation 1.25 812 840 1.7x 1.5x 5.3x 4.4x 507 554 (3.6%) 9.3% 159 190 31.3% 34.3% Median 1.7x 1.5x 5.3x 4.4x $1,239 $1,376 4.1% 9.3% $430 $443 32.2% 32.2% Mean 1.7x 1.6x 5.5x 5.1x $2,634 $2,882 3.0% 8.5% $639 $683 32.7% 32.8% ROW Based OSAT Companies Amkor Technology, Inc. $5.56 $1,322 $2,252 0.6x 0.6x 2.9x 2.9x $3,734 $3,794 (7.3%) 1.6% $780 $786 20.9% 20.7% Unisem (M) Berhad 0.54 401 409 1.4x 1.4x 5.4x 5.3x 288 298 18.1% 3.5% 76 77 26.3% 25.7% AOI Electronics Co., Ltd. 24.20 290 127 0.3x 0.3x 1.6x 1.5x 365 393 3.7% 7.6% 78 87 21.5% 22.1% Median 0.6x 0.6x 2.9x 2.9x $365 $393 3.7% 3.5% $78 $87 21.5% 22.1% Mean 0.8x 0.8x 3.3x 3.2x $1,463 $1,495 4.8% 4.2% $311 $316 22.9% 22.8% Tahiti Equity Research $0.85 $765 $336 0.6x 0.5x 1.9x 1.7x $595 $628 (9.2%) 5.6% $180 $197 30.3% 31.4% Barbados Equity Research $16.90 $468 $554 0.9x 0.9x 3.3x 3.1x $605 $625 (13.1%) 3.2% $168 $179 27.8% 28.6%Source: Wall Street research, Thomson One, market data from Capital IQ and FactSet as of 1/15/16Note: NTD converted to USD at Assumed Exchange Rate; MYR converted to USD at spot rate of 4.25847 as of 1/15/16; JPY converted to USD at spot rate of 116.925 as of 1/15/16Project Island 28
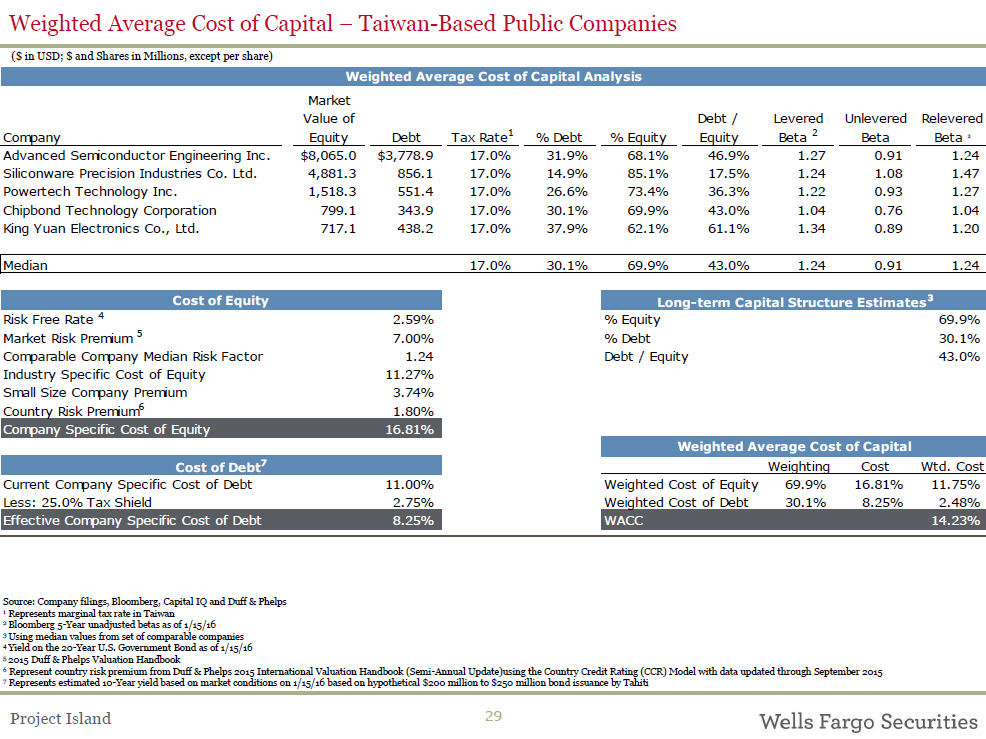
Weighted Average Cost of Capital – Taiwan-Based Public Companies($ in USD; $ and Shares in Millions, except per share) Weighted Average Cost of Capital Analysis Market Value of Debt / Levered Unlevered Relevered Company Equity Debt Tax Rate1 % Debt % Equity Equity Beta 2 Beta Beta 3 Advanced Semiconductor Engineering Inc. $8,065.0 $3,778.9 17.0% 31.9% 68.1% 46.9% 1.27 0.91 1.24 Siliconware Precision Industries Co. Ltd. 4,881.3 856.1 17.0% 14.9% 85.1% 17.5% 1.24 1.08 1.47 Powertech Technology Inc. 1,518.3 551.4 17.0% 26.6% 73.4% 36.3% 1.22 0.93 1.27 Chipbond Technology Corporation 799.1 343.9 17.0% 30.1% 69.9% 43.0% 1.04 0.76 1.04 King Yuan Electronics Co., Ltd. 717.1 438.2 17.0% 37.9% 62.1% 61.1% 1.34 0.89 1.20Median 17.0% 30.1% 69.9% 43.0% 1.24 0.91 1.24Cost of Equity Risk Free Rate 4 2.59% Market Risk Premium 5 7.00% Comparable Company Median Risk Factor 1.24 Industry Specific Cost of Equity 11.27% Small Size Company Premium 3.74% Country Risk Premium6 1.80% Company Specific Cost of Equity 16.81% Cost of Debt7 Current Company Specific Cost of Debt 11.00% Less: 25.0% Tax Shield 2.75% Effective Company Specific Cost of Debt 8.25%Long-term Capital Structure Estimates3 % Equity 69.9% % Debt 30.1% Debt / Equity 43.0%Weighted Average Cost of Capital Weighting Cost Wtd. Cost Weighted Cost of Equity 69.9% 16.81% 11.75% Weighted Cost of Debt 30.1% 8.25% 2.48% WACC 14.23%Source: Company filings, Bloomberg, Capital IQ and Duff & Phelps 1 Represents marginal tax rate in Taiwan2 Bloomberg 5-Year unadjusted betas as of 1/15/163 Using median values from set of comparable companies4 Yield on the 20-Year U.S. Government Bond as of 1/15/165 2015 Duff & Phelps Valuation Handbook6 Represent country risk premium from Duff & Phelps 2015 International Valuation Handbook (Semi-Annual Update)using the Country Credit Rating (CCR) Model with data updated through September 20157 Represents estimated 10-Year yield based on market conditions on 1/15/16 based on hypothetical $200 million to $250 million bond issuance by TahitiProject Island 29
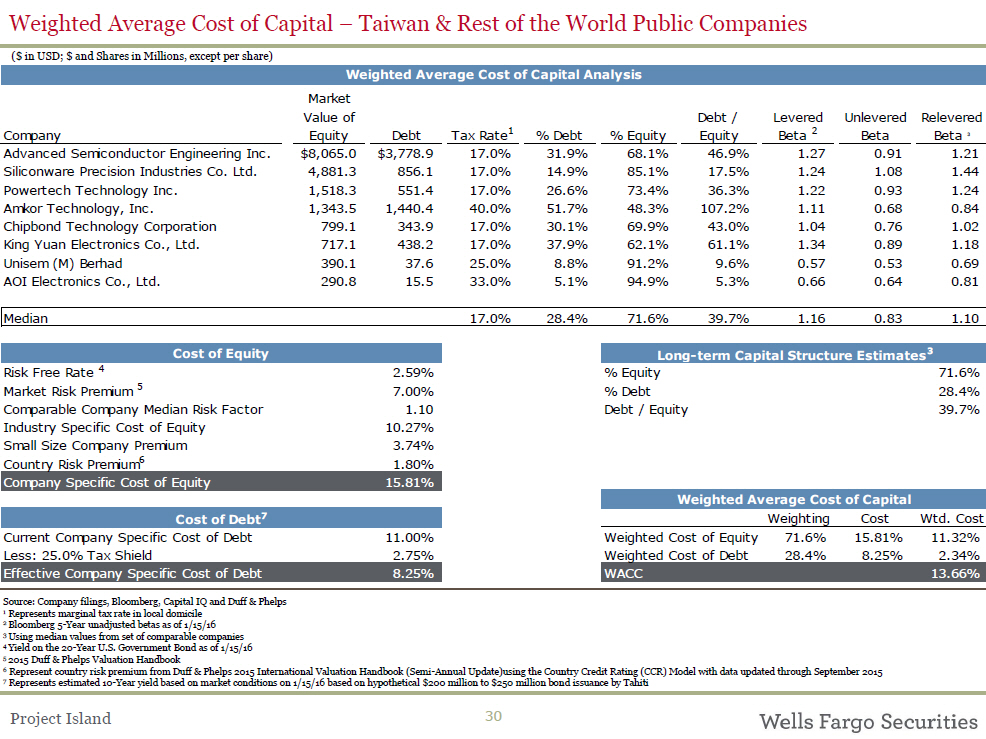
Weighted Average Cost of Capital – Taiwan & Rest of the World Public Companies($ in USD; $ and Shares in Millions, except per share)Weighted Average Cost of Capital Analysis Market Value of Debt / Levered Unlevered Relevered Company Equity Debt Tax Rate1 % Debt % Equity Equity Beta 2 Beta Beta 3 Advanced Semiconductor Engineering Inc. $8,065.0 $3,778.9 17.0% 31.9% 68.1% 46.9% 1.27 0.91 1.21 Siliconware Precision Industries Co. Ltd. 4,881.3 856.1 17.0% 14.9% 85.1% 17.5% 1.24 1.08 1.44 Powertech Technology Inc. 1,518.3 551.4 17.0% 26.6% 73.4% 36.3% 1.22 0.93 1.24 Amkor Technology, Inc. 1,343.5 1,440.4 40.0% 51.7% 48.3% 107.2% 1.11 0.68 0.84 Chipbond Technology Corporation 799.1 343.9 17.0% 30.1% 69.9% 43.0% 1.04 0.76 1.02 King Yuan Electronics Co., Ltd. 717.1 438.2 17.0% 37.9% 62.1% 61.1% 1.34 0.89 1.18 Unisem (M) Berhad 390.1 37.6 25.0% 8.8% 91.2% 9.6% 0.57 0.53 0.69 AOI Electronics Co., Ltd. 290.8 15.5 33.0% 5.1% 94.9% 5.3% 0.66 0.64 0.81Median 17.0% 28.4% 71.6% 39.7% 1.16 0.83 1.10Cost of Equity Risk Free Rate 4 2.59% Market Risk Premium 5 7.00% Comparable Company Median Risk Factor 1.10 Industry Specific Cost of Equity 10.27% Small Size Company Premium 3.74% Country Risk Premium6 1.80% Company Specific Cost of Equity 15.81% Cost of Debt7 Current Company Specific Cost of Debt 11.00% Less: 25.0% Tax Shield 2.75% Effective Company Specific Cost of Debt 8.25%Long-term Capital Structure Estimates3 % Equity 71.6% % Debt 28.4% Debt / Equity 39.7%Weighted Average Cost of Capital Weighting Cost Wtd. Cost Weighted Cost of Equity 71.6% 15.81% 11.32% Weighted Cost of Debt 28.4% 8.25% 2.34% WACC 13.66%Source: Company filings, Bloomberg, Capital IQ and Duff & Phelps 1 Represents marginal tax rate in local domicile2 Bloomberg 5-Year unadjusted betas as of 1/15/163 Using median values from set of comparable companies4 Yield on the 20-Year U.S. Government Bond as of 1/15/165 2015 Duff & Phelps Valuation Handbook6 Represent country risk premium from Duff & Phelps 2015 International Valuation Handbook (Semi-Annual Update)using the Country Credit Rating (CCR) Model with data updated through September 20157 Represents estimated 10-Year yield based on market conditions on 1/15/16 based on hypothetical $200 million to $250 million bond issuance by TahitiProject Island 30
DisclaimerThis document and any other materials accompanying this document (collectively, the “Materials”) are provided for general informational purposes. By accepting any Materials, the recipient thereof acknowledges and agrees to the matters set forth below in this notice.Wells Fargo Securities makes no representation or warranty (express or implied) regarding the adequacy, accuracy or completeness of any information in the Materials. Information in the Materials is preliminary and is not intended to be complete, and such information is qualified in its entirety. Any opinions or estimates contained in the Materials represent the judgment of Wells Fargo Securities at this time, and are subject to change without notice. Interested parties are advised to contact Wells Fargo Securities for more information. The Materials are not an offer to sell, or a solicitation of an offer to buy, the securities or instruments named or described herein. The Materials are not intended to provide, and must not be relied on for accounting, legal, regulatory, tax, business, financial or related advice or investment recommendations. No person providing any Materials is acting as fiduciary or advisor with respect to the Materials. You must consult with your own advisors as to the legal, regulatory, tax, business, financial, investment and other aspects of the Materials.Wells Fargo Securities is the trade name for the capital markets and investment banking services of Wells Fargo & Company and its subsidiaries, including but not limited to Wells Fargo Securities, LLC, a member of NYSE, FINRA, NFA and SIPC, Wells Fargo Prime Services, LLC, a member of FINRA, NFA and SIPC, and Wells Fargo Bank, N.A. Wells Fargo Securities, LLC and Wells Fargo Prime Services, LLC are distinct entities from affiliated banks and thrifts.Notwithstanding anything to the contrary contained in the Materials, all persons may disclose to any and all persons, without limitations of any kind, the U.S. federal, state or local tax treatment or tax structure of any transaction, any fact that may be relevant to understanding the U.S. federal, state or local tax treatment or tax structure of any transaction, and all materials of any kind (including opinions or other tax analyses) relating to such U.S. federal, state or local tax treatment or tax structure, other than the name of the parties or any other person named herein, or information that would permit identification of the parties or such other persons, and any pricing terms or nonpublic business or financial information that is unrelated to the U.S. federal, state or local tax treatment or tax structure of the transaction to the taxpayer and is not relevant to understanding the U.S. federal, state or local tax treatment or tax structure of the transaction to the taxpayer.IRS Circular 230 Disclosure:To ensure compliance with requirements imposed by the IRS, we inform you that any tax advice contained in the Materials is not intended or written to be used, and cannot be used, for the purpose of (i) avoiding tax penalties or (ii) promoting, marketing or recommending to another party any transaction or matter addressed herein. © 2015 Wells Fargo. All Rights Reserved.Project Island 31