Exhibit 99.11

Discussion MaterialsOctober 9, 2015Project Island

Confidential – For Discussion & General Information Purposes OnlyTable of ContentsI. Economic Structure Alternatives – Review and AnalysisII. Options and SARs ConsiderationsIII. Pro Forma Combined Company – Illustrative EPS Accretion/DilutionIV. Review of Alternative Approaches to Responding to Tahiti ProposalV. Illustrative Draft Response LetterVI. Wells Fargo Securities’ Project Island Deal TeamThis document and any other materials accompanying this document (collectively, the “Materials”) are provided for general informational purposes only. By accepting any Materials, the recipient acknowledges and agrees to keep the Materials confidential and not to distribute the Materials to any other party. ©2015 Wells Fargo. All Rights Reserved.
Economic Structure Alternatives – Review and Analysis

Consideration AlternativesStock and Cash All Stock All Cash Do NothingFeasibilityFutureAppreciationPotentialImmediateLiquidityRemainingLeverageCapacityEPSAccretion /DilutionTaxTreatment Project Island 4
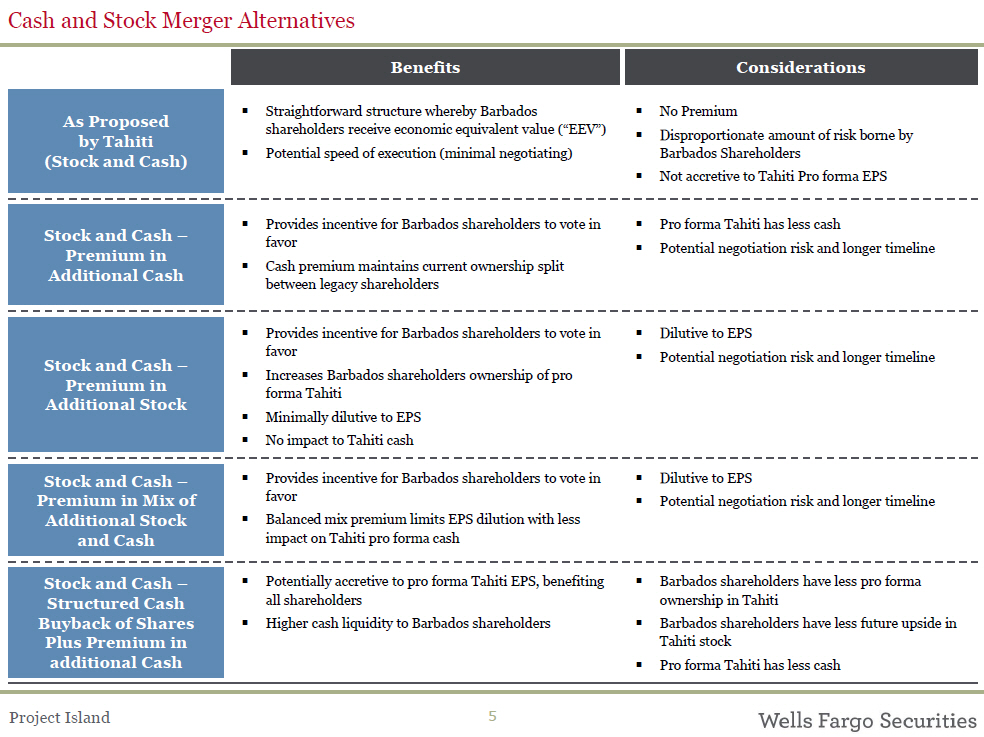
Cash and Stock Merger AlternativesBenefits ConsiderationsAs Proposedby Tahiti(Stock and Cash)Stock and Cash –Premium inAdditional Cash? Straightforward structure whereby Barbados shareholders receive economic equivalent value (“EEV”)? Potential speed of execution (minimal negotiating)? Provides incentive for Barbados shareholders to vote in favor? Cash premium maintains current ownership split between legacy shareholders? No Premium? Disproportionate amount of risk borne by Barbados Shareholders? Not accretive to Tahiti Pro forma EPS? Pro forma Tahiti has less cash? Potential negotiation risk and longer timelineStock and Cash –Premium inAdditional StockStock and Cash –Premium in Mix ofAdditional Stockand CashStock and Cash –Structured CashBuyback of SharesPlus Premium inadditional Cash? Provides incentive for Barbados shareholders to vote in favor? Increases Barbados shareholders ownership of pro forma Tahiti? Minimally dilutive to EPS? No impact to Tahiti cash? Provides incentive for Barbados shareholders to vote in favor? Balanced mix premium limits EPS dilution with less impact on Tahiti pro forma cash? Potentially accretive to pro forma Tahiti EPS, benefiting all shareholders? Higher cash liquidity to Barbados shareholders? Dilutive to EPS? Potential negotiation risk and longer timeline? Dilutive to EPS? Potential negotiation risk and longer timeline? Barbados shareholders have less pro forma ownership in Tahiti? Barbados shareholders have less future upside in Tahiti stock? Pro forma Tahiti has less cashProject Island 5

Economic Alternative Structures Analysis – As Proposed by Tahiti (EEV Stock and Cash)($ in millions USD, except per share data)Based on 17th Sep Tahiti Offer Assumptions / Definitions0% Premium to EEV % Stock / % Cash 91.9% / 8.1% Consideration to Barbados Current Tahiti Shares Outstanding 900.551 Tahiti Shares Owned by Barbados 522.080 Existing Barbados Ownership of Tahiti 58.0% ADSs Issued to Barbados 522.080 Pro Forma Barbados Equity Ownership 58.0% Barbados Shares Outstanding 28.503 Implied Exchange Ratio 18.317x ADSs Issued to Barbados / Barbados Shares Outstanding Pro Forma Tahiti Shares 900.551 Tahiti Shares Outstanding - Tahiti Shares Owned by Barbados + ADSs Issued to Barbados Tahiti Share Price (in USD)1 $0.99 Implied Equity Consideration $518.0 ADSs Issued to Barbados * Tahiti Share Price (in USD) Implied Tahiti Equity Value per Share of Barbados $18.17 Equity Consideration / Barbados Shares Outstanding Initial Barbados Cash $60.4 Less Cash Settled SARs/Options 14.7 Number of Options and SARs * (Offer Price - Average Exercise Price) Plus Additional Cash Consideration 0.0 Net Cash to Barbados Shareholders $45.7 Cash Consideration per Share of Barbados $1.60 Net Cash to Barbados Shareholders / Barbados Shares Outstanding Implied Total Consideration $563.6 Sum of Equity Consideration and Cash Consideration Implied Total Consideration per Share of Barbados $19.77 Implied Premium to Barbados Stock Value ($17.04) 16.0% Premium to EEV per Share ($19.77) 0.0% Pro Forma Tahiti Equity Value1 $893.5 Cash 416.4 Debt 274.5 Implied Enterprise Value $751.6 2016E EPS Accretion / (Dilution) 0.0%Source: Capital IQ, Company filings and Wall Street research; Market data as of 10/07/15Note: “EEV” defined as Economic Equivalent Value; Excludes potential purchase accounting implications of merger(1) Based on exchange rate of 32.405 NTD per USDProject Island 6

Economic Alternative Structures Analysis – Stock and Cash, with Premium in Additional Cash($ in millions USD, except per share data)Assumed Premium Based on 17th Sep Tahiti Offer 0% Premium to EEV 5.0% 10.0% 15.0% 20.0% 25.0%% Stock / % Cash 91.9% / 8.1% 87.5% / 12.5% 83.5% / 16.5% 79.9% / 20.1% 76.6% / 23.4% 73.5% / 26.5% Consideration to Barbados Current Tahiti Shares Outstanding 900.551 900.551 900.551 900.551 900.551 900.551 Tahiti Shares Owned by Barbados 522.080 522.080 522.080 522.080 522.080 522.080 Existing Barbados Ownership of Tahiti 58.0% 58.0% 58.0% 58.0% 58.0% 58.0% ADSs Issued to Barbados 522.080 522.080 522.080 522.080 522.080 522.080 Pro Forma Barbados Equity Ownership 58.0% 58.0% 58.0% 58.0% 58.0% 58.0% Barbados Shares Outstanding 28.503 28.503 28.503 28.503 28.503 28.503 Implied Exchange Ratio 18.317x 18.317x 18.317x 18.317x 18.317x 18.317x Pro Forma Tahiti Shares 900.551 900.551 900.551 900.551 900.551 900.551 Tahiti Share Price (in USD)1 $0.99 $0.99 $0.99 $0.99 $0.99 $0.99 Implied Equity Consideration $518.0 $518.0 $518.0 $518.0 $518.0 $518.0 Implied Tahiti Equity Value per Share of Barbados $18.17 $18.17 $18.17 $18.17 $18.17 $18.17 Initial Barbados Cash $60.4 $60.4 $60.4 $60.4 $60.4 $60.4 Less Cash Settled SARs/Options 14.7 16.7 19.8 23.9 28.6 33.7 Plus Additional Cash Consideration 0.0 30.1 61.5 93.7 126.6 159.8Net Cash to Barbados Shareholders $45.7 $73.8 $102.0 $130.2 $158.4 $186.6 Cash Consideration per Share of Barbados $1.60 $2.59 $3.58 $4.57 $5.56 $6.55 Implied Total Consideration $563.6 $591.8 $620.0 $648.2 $676.3 $704.5 Implied Total Consideration per Share of Barbados $19.77 $20.76 $21.75 $22.74 $23.73 $24.72 Implied Premium to Barbados Stock Value ($17.04) 16.0% 21.8% 27.7% 33.5% 39.3% 45.1% Premium to EEV per Share ($19.77) 0.0% 5.0% 10.0% 15.0% 20.0% 25.0% Pro Forma Tahiti Enterprise Value $751.6 $751.6 $751.6 $751.6 $751.6 $751.6 Cash 416.4 386.3 354.9 322.7 289.8 256.6 Debt 274.5 274.5 274.5 274.5 274.5 274.5 Implied Equity Value $893.5 $863.3 $832.0 $799.7 $766.8 $733.6 2016E EPS Accretion / (Dilution) 0.0% (0.1%) (0.2%) (0.2%) (0.3%) (0.4%) Source: Capital IQ, Company filings and Wall Street research; Market data as of 10/07/15 Note: “EEV” defined as Economic Equivalent Value; Excludes potential purchase accounting implications of merger (1) Based on exchange rate of 32.405 NTD per USD Project Island 7

Economic Alternative Structures Analysis – Stock and Cash, with Premium in Additional Stock($ in millions USD, except per share data)Assumed Premium Based on 17th Sep Tahiti Offer 0% Premium to EEV 5.0% 10.0% 15.0% 20.0% 25.0%% Stock / % Cash 91.9% / 8.1% 92.6% / 7.4% 93.5% / 6.5% 94.4% / 5.6% 95.3% / 4.7% 96.2% / 3.8% Consideration to Barbados Current Tahiti Shares Outstanding 900.551 900.551 900.551 900.551 900.551 900.551 Tahiti Shares Owned by Barbados 522.080 522.080 522.080 522.080 522.080 522.080 Existing Barbados Ownership of Tahiti 58.0% 58.0% 58.0% 58.0% 58.0% 58.0% ADSs Issued to Barbados 522.080 552.463 584.020 616.540 649.710 683.189 Pro Forma Barbados Equity Ownership 58.0% 59.3% 60.7% 62.0% 63.2% 64.4% Barbados Shares Outstanding 28.503 28.503 28.503 28.503 28.503 28.503 Implied Exchange Ratio 18.317x 19.383x 20.490x 21.631x 22.795x 23.969x Pro Forma Tahiti Shares 900.551 930.933 962.491 995.010 1,028.180 1,061.660 Tahiti Share Price (in USD)1 $0.99 $0.99 $0.99 $0.99 $0.99 $0.99 Implied Equity Consideration $518.0 $548.1 $579.4 $611.7 $644.6 $677.8 Implied Tahiti Equity Value per Share of Barbados $18.17 $19.23 $20.33 $21.46 $22.62 $23.78Initial Barbados Cash $60.4 $60.4 $60.4 $60.4 $60.4 $60.4 Less Cash Settled SARs/Options 14.7 16.7 19.8 23.9 28.6 33.7 Plus Additional Cash Consideration 0.0 0.0 0.0 0.0 0.0 0.0 Net Cash to Barbados Shareholders $45.7 $43.7 $40.6 $36.5 $31.8 $26.7 Cash Consideration per Share of Barbados $1.60 $1.53 $1.42 $1.28 $1.11 $0.94 Implied Total Consideration $563.6 $591.8 $620.0 $648.2 $676.3 $704.5 Implied Total Consideration per Share of Barbados $19.77 $20.76 $21.75 $22.74 $23.73 $24.72 Implied Premium to Barbados Stock Value ($17.04) 16.0% 21.8% 27.7% 33.5% 39.3% 45.1% Premium to EEV per Share ($19.77) 0.0% 5.0% 10.0% 15.0% 20.0% 25.0% Pro Forma Tahiti Enterprise Value $751.6 $751.6 $751.6 $751.6 $751.6 $751.6 Cash 416.4 416.4 416.4 416.4 416.4 416.4 Debt 274.5 274.5 274.5 274.5 274.5 274.5 Implied Equity Value $893.5 $893.5 $893.5 $893.5 $893.5 $893.5 2016E EPS Accretion / (Dilution) 0.0% (3.3%) (6.4%) (9.5%) (12.4%) (15.2%) Source: Capital IQ, Company filings and Wall Street research; Market data as of 10/07/15 Note: “EEV” defined as Economic Equivalent Value; Excludes potential purchase accounting implications of merger (1) Based on exchange rate of 32.405 NTD per USD Project Island 8
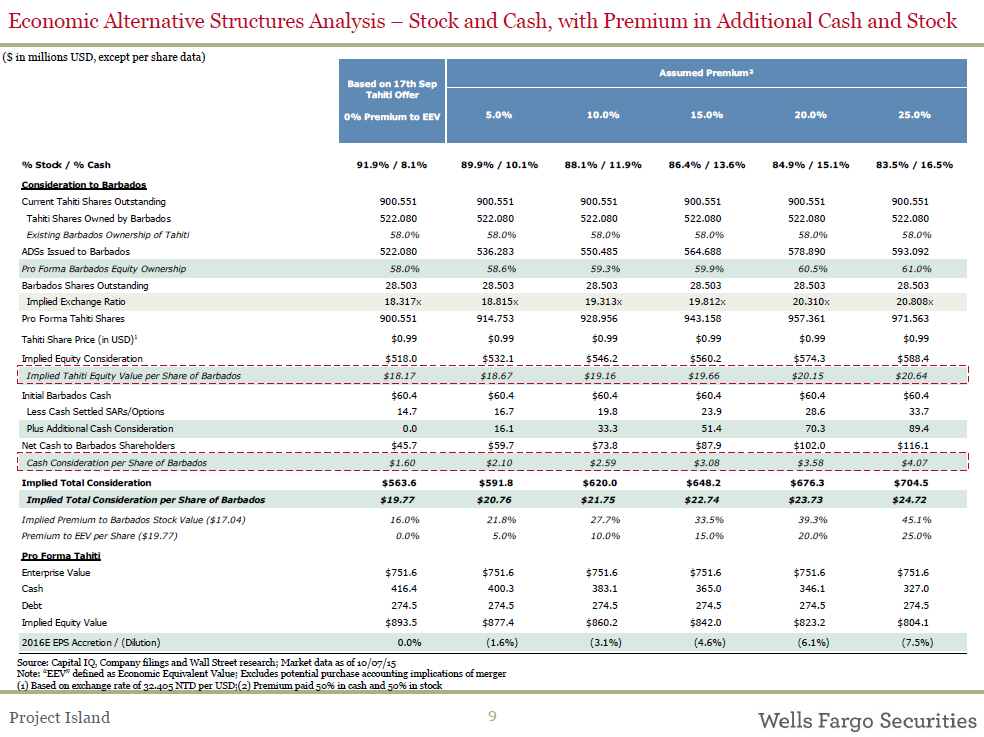
Economic Alternative Structures Analysis – Stock and Cash, with Premium in Additional Cash and Stock($ in millions USD, except per share data)Assumed Premium² Based on 17th Sep Tahiti Offer 0% Premium to EEV 5.0% 10.0% 15.0% 20.0% 25.0%% Stock / % Cash 91.9% / 8.1% 89.9% / 10.1% 88.1% / 11.9% 86.4% / 13.6% 84.9% / 15.1% 83.5% / 16.5% Consideration to Barbados Current Tahiti Shares Outstanding 900.551 900.551 900.551 900.551 900.551 900.551 Tahiti Shares Owned by Barbados 522.080 522.080 522.080 522.080 522.080 522.080 Existing Barbados Ownership of Tahiti 58.0% 58.0% 58.0% 58.0% 58.0% 58.0% ADSs Issued to Barbados 522.080 536.283 550.485 564.688 578.890 593.092 Pro Forma Barbados Equity Ownership 58.0% 58.6% 59.3% 59.9% 60.5% 61.0% Barbados Shares Outstanding 28.503 28.503 28.503 28.503 28.503 28.503 Implied Exchange Ratio 18.317x 18.815x 19.313x 19.812x 20.310x 20.808x Pro Forma Tahiti Shares 900.551 914.753 928.956 943.158 957.361 971.563 Tahiti Share Price (in USD)1 $0.99 $0.99 $0.99 $0.99 $0.99 $0.99 Implied Equity Consideration $518.0 $532.1 $546.2 $560.2 $574.3 $588.4 Implied Tahiti Equity Value per Share of Barbados $18.17 $18.67 $19.16 $19.66 $20.15 $20.64Initial Barbados Cash $60.4 $60.4 $60.4 $60.4 $60.4 $60.4 Less Cash Settled SARs/Options 14.7 16.7 19.8 23.9 28.6 33.7 Plus Additional Cash Consideration 0.0 16.1 33.3 51.4 70.3 89.4 Net Cash to Barbados Shareholders $45.7 $59.7 $73.8 $87.9 $102.0 $116.1 Cash Consideration per Share of Barbados $1.60 $2.10 $2.59 $3.08 $3.58 $4.07Implied Total Consideration $563.6 $591.8 $620.0 $648.2 $676.3 $704.5 Implied Total Consideration per Share of Barbados $19.77 $20.76 $21.75 $22.74 $23.73 $24.72 Implied Premium to Barbados Stock Value ($17.04) 16.0% 21.8% 27.7% 33.5% 39.3% 45.1% Premium to EEV per Share ($19.77) 0.0% 5.0% 10.0% 15.0% 20.0% 25.0% Pro Forma Tahiti Enterprise Value $751.6 $751.6 $751.6 $751.6 $751.6 $751.6 Cash 416.4 400.3 383.1 365.0 346.1 327.0 Debt 274.5 274.5 274.5 274.5 274.5 274.5 Implied Equity Value $893.5 $877.4 $860.2 $842.0 $823.2 $804.1 2016E EPS Accretion / (Dilution) 0.0% (1.6%) (3.1%) (4.6%) (6.1%) (7.5%) Source: Capital IQ, Company filings and Wall Street research; Market data as of 10/07/15 Note: “EEV” defined as Economic Equivalent Value; Excludes potential purchase accounting implications of merger (1) Based on exchange rate of 32.405 NTD per USD;(2) Premium paid 50% in cash and 50% in stock Project Island 9

Economic Alternative Structures Analysis – Stock and Cash, Structured Buyback with 55.0% Economic Ownership($ in millions USD, except per share data)Assumed Premium Based on 17th Sep Tahiti Offer 0% Premium to EEV 5.0% 10.0% 15.0% 20.0% 25.0%% Stock / % Cash 91.9% / 8.1% 77.5% / 22.5% 74.0% / 26.0% 70.8% / 29.2% 67.9% / 32.1% 65.1% / 34.9% Consideration to Barbados Current Tahiti Shares Outstanding 900.551 900.551 900.551 900.551 900.551 900.551 Tahiti Shares Owned by Barbados 522.080 522.080 522.080 522.080 522.080 522.080 Existing Barbados Ownership of Tahiti 58.0% 58.0% 58.0% 58.0% 58.0% 58.0% ADSs Issued to Barbados 522.080 462.575 462.575 462.575 462.575 462.575 Pro Forma Barbados Equity Ownership 58.0% 55.0% 55.0% 55.0% 55.0% 55.0%Barbados Shares Outstanding 28.503 28.503 28.503 28.503 28.503 28.503 Implied Exchange Ratio 18.317x 16.229x 16.229x 16.229x 16.229x 16.229x Pro Forma Tahiti Shares 900.551 841.046 841.046 841.046 841.046 841.046 Tahiti Share Price (in USD)1 $0.99 $0.99 $0.99 $0.99 $0.99 $0.99 Implied Equity Consideration $518.0 $458.9 $458.9 $458.9 $458.9 $458.9 Implied Tahiti Equity Value per Share of Barbados $18.17 $16.10 $16.10 $16.10 $16.10 $16.10 Initial Barbados Cash $60.4 $60.4 $60.4 $60.4 $60.4 $60.4 Less Cash Settled SARs/Options 14.7 16.7 19.8 23.9 28.6 33.7 Plus Additional Cash Consideration 0.0 89.2 120.5 152.8 185.7 218.9Net Cash to Barbados Shareholders $45.7 $132.9 $161.1 $189.2 $217.4 $245.6 Cash Consideration per Share of Barbados $1.60 $4.66 $5.65 $6.64 $7.63 $8.62 Implied Total Consideration $563.6 $591.8 $620.0 $648.2 $676.3 $704.5 Implied Total Consideration per Share of Barbados $19.77 $20.76 $21.75 $22.74 $23.73 $24.72 Implied Premium to Barbados Stock Value ($17.04) 16.0% 21.8% 27.7% 33.5% 39.3% 45.1% Premium to EEV per Share ($19.77) 0.0% 5.0% 10.0% 15.0% 20.0% 25.0% Pro Forma Tahiti Enterprise Value $751.6 $751.6 $751.6 $751.6 $751.6 $751.6 Cash 416.4 327.2 295.9 263.6 230.7 197.5 Debt 274.5 274.5 274.5 274.5 274.5 274.5 Implied Equity Value $893.5 $804.3 $773.0 $740.7 $707.8 $674.6 2016E EPS Accretion / (Dilution) 0.0% 6.8% 6.7% 6.7% 6.6% 6.5% Source: Capital IQ, Company filings and Wall Street research; Market data as of 10/07/15 Note: “EEV” defined as Economic Equivalent Value; Excludes potential purchase accounting implications of merger (1) Based on exchange rate of 32.405 NTD per USD Project Island 10

Economic Alternative Structures Analysis – Stock and Cash, Structured Buyback at a 15.0% Premium($ in millions USD, except per share data)Assumed Premium Based on 17th Sep Tahiti Offer 0% Premium to EEV 15.0% 15.0% 15.0% 15.0% 15.0%% Stock / % Cash 91.9% / 8.1% 76.8% / 23.2% 73.7% / 26.3% 70.8% / 29.2% 68.0% / 32.0% 65.3% / 34.7% Consideration to Barbados Current Tahiti Shares Outstanding 900.551 900.551 900.551 900.551 900.551 900.551 Tahiti Shares Owned by Barbados 522.080 522.080 522.080 522.080 522.080 522.080 Existing Barbados Ownership of Tahiti 58.0% 58.0% 58.0% 58.0% 58.0% 58.0% ADSs Issued to Barbados 522.080 501.694 481.690 462.575 444.292 426.786 Pro Forma Barbados Equity Ownership 58.0% 57.0% 56.0% 55.0% 54.0% 53.0%Barbados Shares Outstanding 28.503 28.503 28.503 28.503 28.503 28.503 Implied Exchange Ratio 18.317x 17.602x 16.900x 16.229x 15.588x 14.973x Pro Forma Tahiti Shares 900.551 880.164 860.161 841.046 822.762 805.257 Tahiti Share Price (in USD)1 $0.99 $0.99 $0.99 $0.99 $0.99 $0.99 Implied Equity Consideration $518.0 $497.7 $477.9 $458.9 $440.8 $423.4 Implied Tahiti Equity Value per Share of Barbados $18.17 $17.46 $16.77 $16.10 $15.46 $14.86 Initial Barbados Cash $60.4 $60.4 $60.4 $60.4 $60.4 $60.4 Less Cash Settled SARs/Options 14.7 23.9 23.9 23.9 23.9 23.9 Plus Additional Cash Consideration 0.0 113.9 133.8 152.8 170.9 188.3Net Cash to Barbados Shareholders $45.7 $150.4 $170.3 $189.2 $207.4 $224.7 Cash Consideration per Share of Barbados $1.60 $5.28 $5.97 $6.64 $7.28 $7.88 Implied Total Consideration $563.6 $648.2 $648.2 $648.2 $648.2 $648.2 Implied Total Consideration per Share of Barbados $19.77 $22.74 $22.74 $22.74 $22.74 $22.74 Implied Premium to Barbados Stock Value ($17.04) 16.0% 33.5% 33.5% 33.5% 33.5% 33.5% Premium to EEV per Share ($19.77) 0.0% 15.0% 15.0% 15.0% 15.0% 15.0% Pro Forma Tahiti Enterprise Value $751.6 $751.6 $751.6 $751.6 $751.6 $751.6 Cash 416.4 302.5 282.6 263.6 245.5 228.1 Debt 274.5 274.5 274.5 274.5 274.5 274.5 Implied Equity Value $893.5 $779.5 $759.7 $740.7 $722.6 $705.2 2016E EPS Accretion / (Dilution) 0.0% 2.0% 4.3% 6.7% 9.0% 11.3% Source: Capital IQ, Company filings and Wall Street research; Market data as of 10/07/15 Note: “EEV” defined as Economic Equivalent Value; Excludes potential purchase accounting implications of merger (1) Based on exchange rate of 32.405 NTD per USD Project Island 11
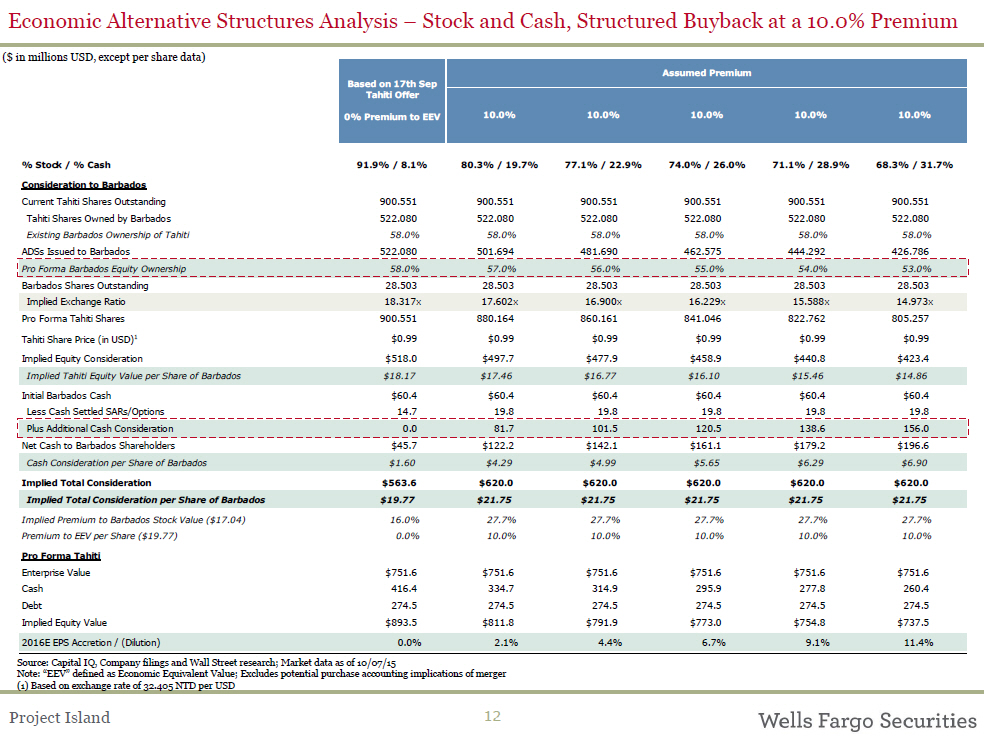
Economic Alternative Structures Analysis – Stock and Cash, Structured Buyback at a 10.0% Premium($ in millions USD, except per share data)Assumed Premium Based on 17th Sep Tahiti Offer 0% Premium to EEV 10.0% 10.0% 10.0% 10.0% 10.0%% Stock / % Cash 91.9% / 8.1% 80.3% / 19.7% 77.1% / 22.9% 74.0% / 26.0% 71.1% / 28.9% 68.3% / 31.7% Consideration to Barbados Current Tahiti Shares Outstanding 900.551 900.551 900.551 900.551 900.551 900.551 Tahiti Shares Owned by Barbados 522.080 522.080 522.080 522.080 522.080 522.080 Existing Barbados Ownership of Tahiti 58.0% 58.0% 58.0% 58.0% 58.0% 58.0% ADSs Issued to Barbados 522.080 501.694 481.690 462.575 444.292 426.786 Pro Forma Barbados Equity Ownership 58.0% 57.0% 56.0% 55.0% 54.0% 53.0%Barbados Shares Outstanding 28.503 28.503 28.503 28.503 28.503 28.503 Implied Exchange Ratio 18.317x 17.602x 16.900x 16.229x 15.588x 14.973x Pro Forma Tahiti Shares 900.551 880.164 860.161 841.046 822.762 805.257 Tahiti Share Price (in USD)1 $0.99 $0.99 $0.99 $0.99 $0.99 $0.99 Implied Equity Consideration $518.0 $497.7 $477.9 $458.9 $440.8 $423.4 Implied Tahiti Equity Value per Share of Barbados $18.17 $17.46 $16.77 $16.10 $15.46 $14.86 Initial Barbados Cash $60.4 $60.4 $60.4 $60.4 $60.4 $60.4 Less Cash Settled SARs/Options 14.7 19.8 19.8 19.8 19.8 19.8 Plus Additional Cash Consideration 0.0 81.7 101.5 120.5 138.6 156.0Net Cash to Barbados Shareholders $45.7 $122.2 $142.1 $161.1 $179.2 $196.6 Cash Consideration per Share of Barbados $1.60 $4.29 $4.99 $5.65 $6.29 $6.90 Implied Total Consideration $563.6 $620.0 $620.0 $620.0 $620.0 $620.0 Implied Total Consideration per Share of Barbados $19.77 $21.75 $21.75 $21.75 $21.75 $21.75 Implied Premium to Barbados Stock Value ($17.04) 16.0% 27.7% 27.7% 27.7% 27.7% 27.7% Premium to EEV per Share ($19.77) 0.0% 10.0% 10.0% 10.0% 10.0% 10.0% Pro Forma Tahiti Enterprise Value $751.6 $751.6 $751.6 $751.6 $751.6 $751.6 Cash 416.4 334.7 314.9 295.9 277.8 260.4 Debt 274.5 274.5 274.5 274.5 274.5 274.5 Implied Equity Value $893.5 $811.8 $791.9 $773.0 $754.8 $737.5 2016E EPS Accretion / (Dilution) 0.0% 2.1% 4.4% 6.7% 9.1% 11.4% Source: Capital IQ, Company filings and Wall Street research; Market data as of 10/07/15 Note: “EEV” defined as Economic Equivalent Value; Excludes potential purchase accounting implications of merger (1) Based on exchange rate of 32.405 NTD per USD Project Island 12

Economic Alternative Structures Analysis – Stock and Cash, Structured Buyback at a 5.0% Premium($ in millions USD, except per share data)Assumed Premium Based on 17th Sep Tahiti Offer 0% Premium to EEV 5.0% 5.0% 5.0% 5.0% 5.0%% Stock / % Cash 91.9% / 8.1% 84.1% / 15.9% 80.8% / 19.2% 77.5% / 22.5% 74.5% / 25.5% 71.5% / 28.5% Consideration to Barbados Current Tahiti Shares Outstanding 900.551 900.551 900.551 900.551 900.551 900.551 Tahiti Shares Owned by Barbados 522.080 522.080 522.080 522.080 522.080 522.080 Existing Barbados Ownership of Tahiti 58.0% 58.0% 58.0% 58.0% 58.0% 58.0% ADSs Issued to Barbados 522.080 501.694 481.690 462.575 444.292 426.786 Pro Forma Barbados Equity Ownership 58.0% 57.0% 56.0% 55.0% 54.0% 53.0%Barbados Shares Outstanding 28.503 28.503 28.503 28.503 28.503 28.503 Implied Exchange Ratio 18.317x 17.602x 16.900x 16.229x 15.588x 14.973x Pro Forma Tahiti Shares 900.551 880.164 860.161 841.046 822.762 805.257 Tahiti Share Price (in USD)1 $0.99 $0.99 $0.99 $0.99 $0.99 $0.99 Implied Equity Consideration $518.0 $497.7 $477.9 $458.9 $440.8 $423.4 Implied Tahiti Equity Value per Share of Barbados $18.17 $17.46 $16.77 $16.10 $15.46 $14.86 Initial Barbados Cash $60.4 $60.4 $60.4 $60.4 $60.4 $60.4 Less Cash Settled SARs/Options 14.7 16.7 16.7 16.7 16.7 16.7 Plus Additional Cash Consideration 0.0 50.4 70.2 89.2 107.3 124.7Net Cash to Barbados Shareholders $45.7 $94.1 $113.9 $132.9 $151.0 $168.4 Cash Consideration per Share of Barbados $1.60 $3.30 $4.00 $4.66 $5.30 $5.91 Implied Total Consideration $563.6 $591.8 $591.8 $591.8 $591.8 $591.8 Implied Total Consideration per Share of Barbados $19.77 $20.76 $20.76 $20.76 $20.76 $20.76 Implied Premium to Barbados Stock Value ($17.04) 16.0% 21.8% 21.8% 21.8% 21.8% 21.8% Premium to EEV per Share ($19.77) 0.0% 5.0% 5.0% 5.0% 5.0% 5.0% Pro Forma Tahiti Enterprise Value $751.6 $751.6 $751.6 $751.6 $751.6 $751.6 Cash 416.4 366.0 346.2 327.2 309.1 291.7 Debt 274.5 274.5 274.5 274.5 274.5 274.5 Implied Equity Value $893.5 $843.1 $823.2 $804.3 $786.1 $768.8 2016E EPS Accretion / (Dilution) 0.0% 2.2% 4.5% 6.8% 9.2% 11.5% Source: Capital IQ, Company filings and Wall Street research; Market data as of 10/07/15 Note: “EEV” defined as Economic Equivalent Value; Excludes potential purchase accounting implications of merger (1) Based on exchange rate of 32.405 NTD per USD Project Island 13
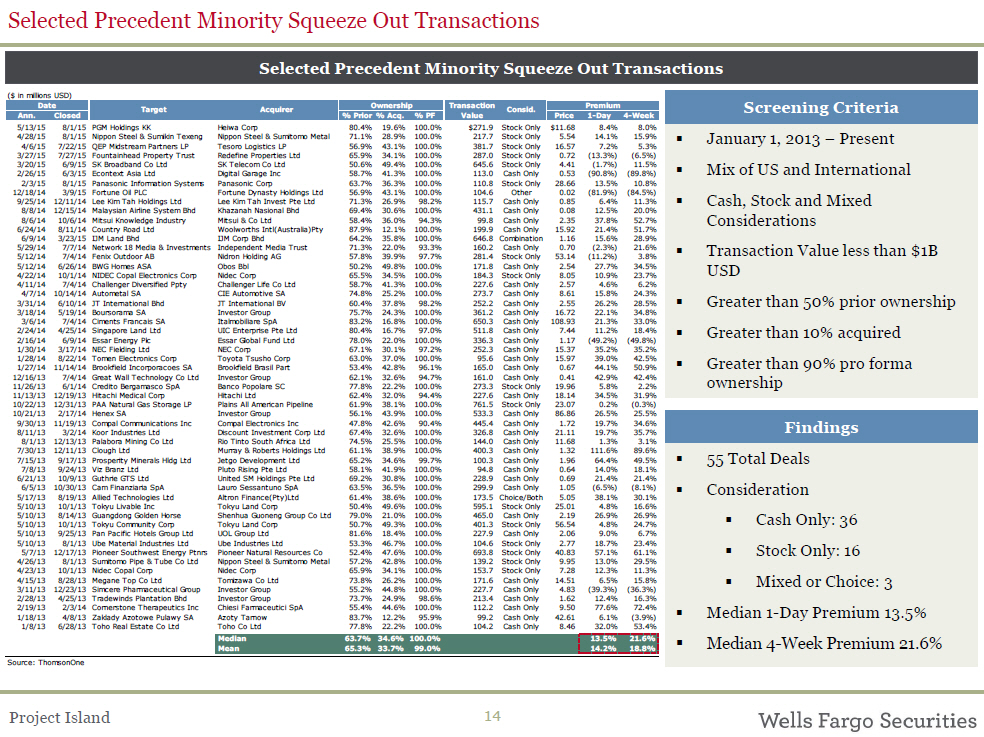
Selected Precedent Minority Squeeze Out TransactionsSelected Precedent Minority Squeeze Out Transactions($ in millions USD) Date Target Acquirer Ownership Transaction Consid. Premium Ann. Closed % Prior % Acq. % PF Value Price 1-Day 4-Week5/13/15 8/1/15 PGM Holdings KK Heiwa Corp 80.4% 19.6% 100.0% $271.9 Stock Only $11.68 8.4% 8.0% 4/28/15 8/1/15 Nippon Steel & Sumikin Texeng Nippon Steel & Sumitomo Metal 71.1% 28.9% 100.0% 217.7 Stock Only 5.54 14.1% 15.9% 4/6/15 7/22/15 QEP Midstream Partners LP Tesoro Logistics LP 56.9% 43.1% 100.0% 381.7 Stock Only 16.57 7.2% 5.3% 3/27/15 7/27/15 Fountainhead Property Trust Redefine Properties Ltd 65.9% 34.1% 100.0% 287.0 Stock Only 0.72 (13.3%) (6.5%) 3/20/15 6/9/15 SK Broadband Co Ltd SK Telecom Co Ltd 50.6% 49.4% 100.0% 645.6 Stock Only 4.41 (1.7%) 11.5% 2/26/15 6/3/15 Econtext Asia Ltd Digital Garage Inc 58.7% 41.3% 100.0% 113.0 Cash Only 0.53 (90.8%) (89.8%) 2/3/15 8/1/15 Panasonic Information Systems Panasonic Corp 63.7% 36.3% 100.0% 110.8 Stock Only 28.66 13.5% 10.8% 12/18/14 3/9/15 Fortune Oil PLC Fortune Dynasty Holdings Ltd 56.9% 43.1% 100.0% 104.6 Other 0.02 (81.9%) (84.5%) 9/25/14 12/11/14 Lee Kim Tah Holdings Ltd Lee Kim Tah Invest Pte Ltd 71.3% 26.9% 98.2% 115.7 Cash Only 0.85 6.4% 11.3% 8/8/14 12/15/14 Malaysian Airline System Bhd Khazanah Nasional Bhd 69.4% 30.6% 100.0% 431.1 Cash Only 0.08 12.5% 20.0% 8/6/14 10/6/14 Mitsui Knowledge Industry Mitsui & Co Ltd 58.4% 36.0% 94.3% 99.8 Cash Only 2.35 37.8% 52.7% 6/24/14 8/11/14 Country Road Ltd Woolworths Intl(Australia)Pty 87.9% 12.1% 100.0% 199.9 Cash Only 15.92 21.4% 51.7% 6/9/14 3/23/15 IJM Land Bhd IJM Corp Bhd 64.2% 35.8% 100.0% 646.8 Combination 1.16 15.6% 28.9% 5/29/14 7/7/14 Network 18 Media & Investments Independent Media Trust 71.3% 22.0% 93.3% 160.2 Cash Only 0.70 (2.3%) 21.6% 5/12/14 7/4/14 Fenix Outdoor AB Nidron Holding AG 57.8% 39.9% 97.7% 281.4 Stock Only 53.14 (11.2%) 3.8% 5/12/14 6/26/14 BWG Homes ASA Obos Bbl 50.2% 49.8% 100.0% 171.8 Cash Only 2.54 27.7% 34.5% 4/22/14 10/1/14 NIDEC Copal Electronics Corp Nidec Corp 65.5% 34.5% 100.0% 184.3 Stock Only 8.05 10.9% 23.7% 4/11/14 7/4/14 Challenger Diversified Ppty Challenger Life Co Ltd 58.7% 41.3% 100.0% 227.6 Cash Only 2.57 4.6% 6.2% 4/7/14 10/14/14 Autometal SA CIE Automotive SA 74.8% 25.2% 100.0% 273.7 Cash Only 8.61 15.8% 24.3% 3/31/14 6/10/14 JT International Bhd JT International BV 60.4% 37.8% 98.2% 252.2 Cash Only 2.55 26.2% 28.5% 3/18/14 5/19/14 Boursorama SA Investor Group 75.7% 24.3% 100.0% 361.2 Cash Only 16.72 22.1% 34.8% 3/6/14 7/4/14 Ciments Francais SA Italmobiliare SpA 83.2% 16.8% 100.0% 650.3 Cash Only 108.93 21.3% 33.0% 2/24/14 4/25/14 Singapore Land Ltd UIC Enterprise Pte Ltd 80.4% 16.7% 97.0% 511.8 Cash Only 7.44 11.2% 18.4% 2/16/14 6/9/14 Essar Energy Plc Essar Global Fund Ltd 78.0% 22.0% 100.0% 336.3 Cash Only 1.17 (49.2%) (49.8%) 1/30/14 3/17/14 NEC Fielding Ltd NEC Corp 67.1% 30.1% 97.2% 252.3 Cash Only 15.37 35.2% 35.2% 1/28/14 8/22/14 Tomen Electronics Corp Toyota Tsusho Corp 63.0% 37.0% 100.0% 95.6 Cash Only 15.97 39.0% 42.5% 1/27/14 11/14/14 Brookfield Incorporacoes SA Brookfield Brasil Part 53.4% 42.8% 96.1% 165.0 Cash Only 0.67 44.1% 50.9% 12/16/13 7/4/14 Great Wall Technology Co Ltd Investor Group 62.1% 32.6% 94.7% 161.0 Cash Only 0.41 42.9% 42.4% 11/26/13 6/1/14 Credito Bergamasco SpA Banco Popolare SC 77.8% 22.2% 100.0% 273.3 Stock Only 19.96 5.8% 2.2% 11/13/13 12/19/13 Hitachi Medical Corp Hitachi Ltd 62.4% 32.0% 94.4% 227.6 Cash Only 18.14 34.5% 31.9% 10/22/13 12/31/13 PAA Natural Gas Storage LP Plains All American Pipeline 61.9% 38.1% 100.0% 761.5 Stock Only 23.07 0.2% (0.3%) 10/21/13 2/17/14 Henex SA Investor Group 56.1% 43.9% 100.0% 533.3 Cash Only 86.86 26.5% 25.5% 9/30/13 11/19/13 Compal Communications Inc Compal Electronics Inc 47.8% 42.6% 90.4% 445.4 Cash Only 1.72 19.7% 34.6% 8/11/13 3/2/14 Koor Industries Ltd Discount Investment Corp Ltd 67.4% 32.6% 100.0% 326.8 Cash Only 21.11 19.7% 35.7% 8/1/13 12/13/13 Palabora Mining Co Ltd Rio Tinto South Africa Ltd 74.5% 25.5% 100.0% 144.0 Cash Only 11.68 1.3% 3.1% 7/30/13 12/11/13 Clough Ltd Murray & Roberts Holdings Ltd 61.1% 38.9% 100.0% 400.3 Cash Only 1.32 111.6% 89.6% 7/15/13 9/17/13 Prosperity Minerals Hldg Ltd Jetgo Development Ltd 65.2% 34.6% 99.7% 100.3 Cash Only 1.96 64.4% 49.5% 7/8/13 9/24/13 Viz Branz Ltd Pluto Rising Pte Ltd 58.1% 41.9% 100.0% 94.8 Cash Only 0.64 14.0% 18.1% 6/21/13 10/9/13 Guthrie GTS Ltd United SM Holdings Pte Ltd 69.2% 30.8% 100.0% 228.9 Cash Only 0.69 21.4% 21.4% 6/5/13 10/30/13 Cam Finanziaria SpA Lauro Sessantuno SpA 63.5% 36.5% 100.0% 299.9 Cash Only 1.05 (6.5%) (8.1%) 5/17/13 8/19/13 Allied Technologies Ltd Altron Finance(Pty)Ltd 61.4% 38.6% 100.0% 173.5 Choice/Both 5.05 38.1% 30.1% 5/10/13 10/1/13 Tokyu Livable Inc Tokyu Land Corp 50.4% 49.6% 100.0% 595.1 Stock Only 25.01 4.8% 16.6% 5/10/13 8/14/13 Guangdong Golden Horse Shenhua Guoneng Group Co Ltd 79.0% 21.0% 100.0% 465.0 Cash Only 2.19 26.9% 26.9% 5/10/13 10/1/13 Tokyu Community Corp Tokyu Land Corp 50.7% 49.3% 100.0% 401.3 Stock Only 56.54 4.8% 24.7% 5/10/13 9/25/13 Pan Pacific Hotels Group Ltd UOL Group Ltd 81.6% 18.4% 100.0% 227.9 Cash Only 2.06 9.0% 6.7% 5/10/13 8/1/13 Ube Material Industries Ltd Ube Industries Ltd 53.3% 46.7% 100.0% 104.6 Stock Only 2.77 18.7% 23.4% 5/7/13 12/17/13 Pioneer Southwest Energy Ptnrs Pioneer Natural Resources Co 52.4% 47.6% 100.0% 693.8 Stock Only 40.83 57.1% 61.1% 4/26/13 8/1/13 Sumitomo Pipe & Tube Co Ltd Nippon Steel & Sumitomo Metal 57.2% 42.8% 100.0% 139.2 Stock Only 9.95 13.0% 29.5% 4/23/13 10/1/13 Nidec Copal Corp Nidec Corp 65.9% 34.1% 100.0% 153.7 Stock Only 7.28 12.3% 11.3% 4/15/13 8/28/13 Megane Top Co Ltd Tomizawa Co Ltd 73.8% 26.2% 100.0% 171.6 Cash Only 14.51 6.5% 15.8% 3/11/13 12/23/13 Simcere Pharmaceutical Group Investor Group 55.2% 44.8% 100.0% 227.7 Cash Only 4.83 (39.3%) (36.3%) 2/28/13 4/25/13 Tradewinds Plantation Bhd Investor Group 73.7% 24.9% 98.6% 213.4 Cash Only 1.62 12.4% 16.3% 2/19/13 2/3/14 Cornerstone Therapeutics Inc Chiesi Farmaceutici SpA 55.4% 44.6% 100.0% 112.2 Cash Only 9.50 77.6% 72.4% 1/18/13 4/8/13 Zaklady Azotowe Pulawy SA Azoty Tarnow 83.7% 12.2% 95.9% 99.2 Cash Only 42.61 6.1% (3.9%) 1/8/13 6/28/13 Toho Real Estate Co Ltd Toho Co Ltd 77.8% 22.2% 100.0% 104.2 Cash Only 8.46 32.0% 53.4% Median 63.7% 34.6% 100.0% 13.5% 21.6% Mean 65.3% 33.7% 99.0% 14.2% 18.8%Source: ThomsonOneScreening Criteria ? January 1, 2013 – Present? Mix of US and International? Cash, Stock and Mixed Considerations? Transaction Value less than $1B USD? Greater than 50% prior ownership? Greater than 10% acquired? Greater than 90% pro forma ownershipFindings ? 55 Total Deals? Consideration? Cash Only: 36? Stock Only: 16? Mixed or Choice: 3? Median 1-Day Premium 13.5%? Median 4-Week Premium 21.6%Project Island 14

Selected ADS Trading Analysis($ in USD)Average Premium / (Discount) ADS Current Current ADS Current Implied Company Name Taiwan Implied 1-Week 1-Month 6-Months 1-Year Ticker ADS Price Ratio Premium Price PriceTaiwan-Based Semiconductor Companies Taiwan Semiconductor Manufacturing Company Limited NYSE:TSM $21.93 $4.17 1:5 $20.83 5.3% 4.2% 3.6% 2.3% 2.2% Siliconware Precision Industries Co. Ltd. NASDAQ:SPIL 6.27 1.23 1:5 6.16 1.8% 1.9% 1.2% 0.1% 0.3% Advanced Semiconductor Engineering Inc. NYSE:ASX 5.38 1.08 1:5 5.42 (0.7%) (0.1%) (1.1%) (0.6%) 1.6% AU Optronics Corp. NYSE:AUO 3.08 0.31 1:10 3.08 (0.1%) 0.0% 0.4% 0.5% 0.6% United Microelectronics Corporation NYSE:UMC 1.77 0.35 1:5 1.74 1.5% 0.8% 0.7% (0.1%) (0.7%) Taiwan-Based Semiconductor Companies Mean 1.6% 1.4% 1.0% 0.4% 0.8% Other Technology / Hardware Companies ASML Holding NV NASDAQGS:ASML $90.06 $89.30 1:1 $89.30 0.9% 0.8% 0.3% (0.1%) (0.1%) NICE Systems Ltd. NASDAQGS:NICE 57.70 57.80 1:1 57.80 (0.2%) (0.1%) (0.2%) (0.1%) (0.0%) ARM Holdings plc NASDAQGS:ARMH 43.53 14.36 1:3 43.09 1.0% 0.4% 0.0% (0.0%) 0.2% Chunghwa Telecom Co., Ltd. NYSE:CHT 30.49 3.04 1:10 30.40 0.3% 0.7% 0.8% 0.4% (2.2%) Canon Inc. NYSE:CAJ 30.03 29.93 1:1 29.93 0.3% 0.2% 0.1% (0.1%) 0.0% UBIC, Inc. NASDAQGS:UBIC 13.59 6.83 1:2 13.65 (0.5%) (0.6%) (1.1%) (0.3%) (0.4%) Ericsson NASDAQGS:ERIC 10.37 10.33 1:1 10.33 0.4% 0.2% (0.0%) 0.0% 0.1% LG Display Co., Ltd. NYSE:LPL 9.88 19.86 2:1 9.93 (0.5%) (0.4%) (0.6%) 0.3% 0.2% Advantest Corporation NYSE:ATE 7.85 7.82 1:1 7.82 0.4% 1.3% 0.2% 0.3% 0.1% STMicroelectronics NV NYSE:STM 7.25 7.17 1:1 7.17 1.1% 0.3% (0.3%) (0.5%) (0.2%) Nokia Corporation NYSE:NOK 7.04 6.98 1:1 6.98 0.8% 0.0% (0.4%) (0.5%) (0.5%) Aixtron SE NASDAQGS:AIXG 6.11 6.05 1:1 6.05 1.0% 0.6% 0.1% (0.1%) (0.3%) MiX Telematics Limited NYSE:MIXT 5.69 0.23 1:25 5.87 (3.0%) (2.0%) (1.7%) (0.1%) (1.1%) Semiconductor Manufacturing International Corp. NYSE:SMI 4.80 0.10 1:50 4.90 (2.1%) (1.2%) (1.7%) (0.7%) (1.1%) Alcatel-Lucent NYSE:ALU 3.77 3.75 1:1 3.75 0.4% (0.5%) (1.1%) (1.3%) (1.0%) Other Technology / Hardware Companies Mean 0.0% (0.0%) (0.4%) (0.2%) (0.4%) Overall Median 0.4% 0.2% (0.0%) (0.1%) (0.1%) Overall Mean 0.4% 0.3% (0.0%) (0.0%) (0.1%) Overall High 5.3% 4.2% 3.6% 2.3% 2.2% Overall Low (3.0%) (2.0%) (1.7%) (1.3%) (2.2%) Source: Capital IQ as of 10/07/15 Note: Historical exchange rate applied to convert various currencies to USD Project Island 15
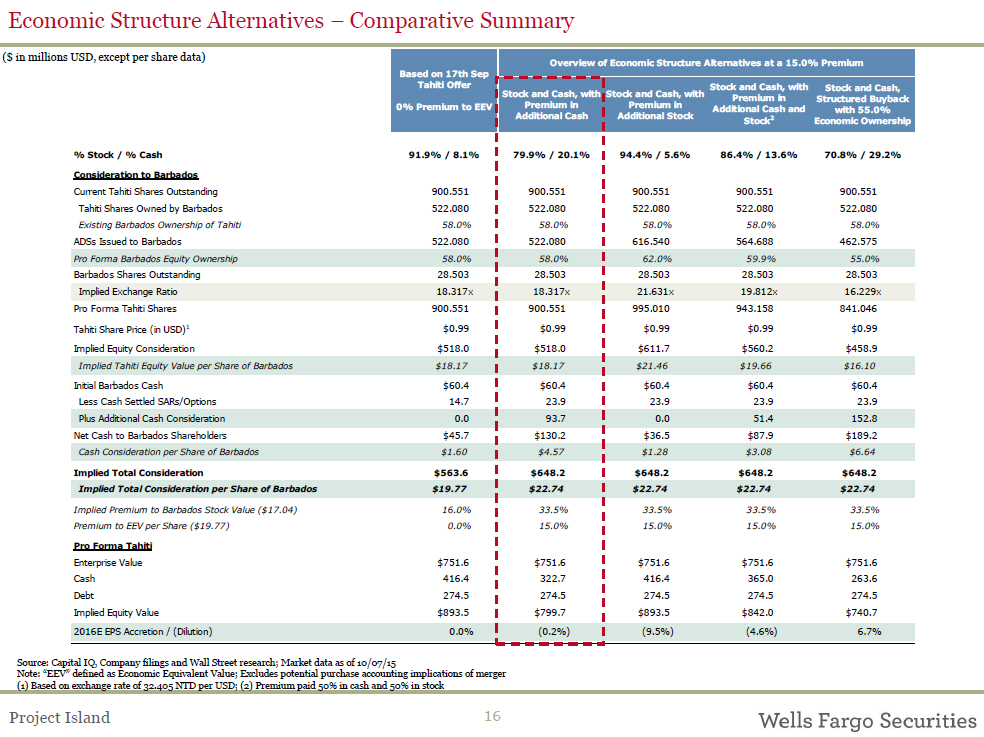
Economic Structure Alternatives – Comparative Summary($ in millions USD, except per share data) Overview of Economic Structure Alternatives at a 15.0% PremiumBased on 17th Sep Tahiti Offer Stock and Cash, with Stock and Cash, with Stock and Cash, Stock and Cash, with 0% Premium to EEV Premium in Premium in Premium in Structured Buyback Additional Cash and with 55.0%Additional Cash Additional Stock Stock2 Economic Ownership % Stock / % Cash 91.9% / 8.1% 79.9% / 20.1% 94.4% / 5.6% 86.4% / 13.6% 70.8% / 29.2% Consideration to Barbados Current Tahiti Shares Outstanding 900.551 900.551 900.551 900.551 900.551 Tahiti Shares Owned by Barbados 522.080 522.080 522.080 522.080 522.080 Existing Barbados Ownership of Tahiti 58.0% 58.0% 58.0% 58.0% 58.0% ADSs Issued to Barbados 522.080 522.080 616.540 564.688 462.575 Pro Forma Barbados Equity Ownership 58.0% 58.0% 62.0% 59.9% 55.0% Barbados Shares Outstanding 28.503 28.503 28.503 28.503 28.503 Implied Exchange Ratio 18.317x 18.317x 21.631x 19.812x 16.229x Pro Forma Tahiti Shares 900.551 900.551 995.010 943.158 841.046 Tahiti Share Price (in USD)1 $0.99 $0.99 $0.99 $0.99 $0.99 Implied Equity Consideration $518.0 $518.0 $611.7 $560.2 $458.9 Implied Tahiti Equity Value per Share of Barbados $18.17 $18.17 $21.46 $19.66 $16.10 Initial Barbados Cash $60.4 $60.4 $60.4 $60.4 $60.4 Less Cash Settled SARs/Options 14.7 23.9 23.9 23.9 23.9 Plus Additional Cash Consideration 0.0 93.7 0.0 51.4 152.8 Net Cash to Barbados Shareholders $45.7 $130.2 $36.5 $87.9 $189.2 Cash Consideration per Share of Barbados $1.60 $4.57 $1.28 $3.08 $6.64 Implied Total Consideration $563.6 $648.2 $648.2 $648.2 $648.2 Implied Total Consideration per Share of Barbados $19.77 $22.74 $22.74 $22.74 $22.74 Implied Premium to Barbados Stock Value ($17.04) 16.0% 33.5% 33.5% 33.5% 33.5% Premium to EEV per Share ($19.77) 0.0% 15.0% 15.0% 15.0% 15.0% Pro Forma Tahiti Enterprise Value $751.6 $751.6 $751.6 $751.6 $751.6 Cash 416.4 322.7 416.4 365.0 263.6 Debt 274.5 274.5 274.5 274.5 274.5 Implied Equity Value $893.5 $799.7 $893.5 $842.0 $740.7 2016E EPS Accretion / (Dilution) 0.0% (0.2%) (9.5%) (4.6%) 6.7%Source: Capital IQ, Company filings and Wall Street research; Market data as of 10/07/15 Note: “EEV” defined as Economic Equivalent Value; Excludes potential purchase accounting implications of merger (1) Based on exchange rate of 32.405 NTD per USD; (2) Premium paid 50% in cash and 50% in stock Project Island 16

Options and SARs Considerations

Discussion on Alternative Treatment of SARs / Options? The WFS team has had initial discussion with Johnson Partners regarding potential treatment of options which are outlined below: Convert to CommonRollforward Full Vesting and Exercise Only ExercisableDescriptionBenefits? Tahiti will assume the rights and obligations of Barbados under the existing option and SARs plans? Exercise price and number of shares/ADSs issued will be adjusted for overall “deal” exchange ratio including both cash and stock consideration? No consent required? Option and SARs holders maintain underlying economic interest? All unvested options and SARs will accelerate? All options and SARs will be automatically exercised in merger and receive same consideration as common shareholders? Immediate value for option and SARs holders? Holders of unvested securities also enjoy immediate benefits? Unvested options and SARs are terminated ? Exercisable options and SARs areautomatically converted to Barbadosshares and receive sameconsideration as commonshareholders? Immediate value for holders or exercisable securities? May be required to leave cash to ??Requires consent cover payment of cash settled SARs Considerations ? Tahiti will have to administer newoptions/SARs programs based onADSs? Requires consent ? Holders of unvested securities lose economic valueProject Island 18

Tahiti Proposal Under Different Option Treatments($ in millions USD, except per share data)Based on 17th Sep Tahiti Offer Based on 17th September0% Premium to EEV Tahiti Offer, Exchange Ratio Adjusted for Options Dilution% Stock / % Cash 91.9% / 8.1% 90.4% / 9.6% Consideration to Barbados Current Tahiti Shares Outstanding 900.551 900.551 Tahiti Shares Owned by Barbados 522.080 522.080 Existing Barbados Ownership of Tahiti 58.0% 58.0% ADSs Issued to Barbados 522.080 522.080 Pro Forma Barbados Equity Ownership 58.0% 58.0% Barbados Shares Outstanding 28.503 28.503 Dilution from Options 0.0 0.5 Fully Diluted Shares 28.503 28.977 Implied Exchange Ratio 18.317x 18.017xPro Forma Tahiti Shares 900.551 900.551 Tahiti Share Price (in USD)1 $0.99 $0.99 Implied Equity Consideration $518.0 $518.0 Implied Tahiti Equity Value per Share of Barbados $18.17 $17.88 Initial Barbados Cash $60.4 $60.4 Less Cash Settled SARs/Options 14.7 5.4Plus Additional Cash Consideration 0.0 0.0 Net Cash to Barbados Shareholders $45.7 $55.0 Cash Consideration per Share of Barbados $1.60 $1.90 Implied Total Consideration $563.6 $573.0 Implied Total Consideration per Share of Barbados $19.77 $19.77 Implied Premium to Barbados Stock Value ($17.04) 16.0% 16.0% Premium to EEV ($19.77) 0.0% 0.0% Pro Forma Tahiti Equity Value1 $893.5 $893.5 Cash 416.4 416.4 Debt 274.5 274.5 Implied Enterprise Value $751.6 $751.6 2016E EPS Accretion / (Dilution) 0.0% 0.0% Source: Capital IQ, Company filings and Wall Street research; Market data as of 10/07/15 Note: Excludes potential purchase accounting implications of merger (1) Based on exchange rate of 32.405 NTD per USD Project Island 19

Pro Forma Combined Company –Illustrative EPS Accretion/Dilution
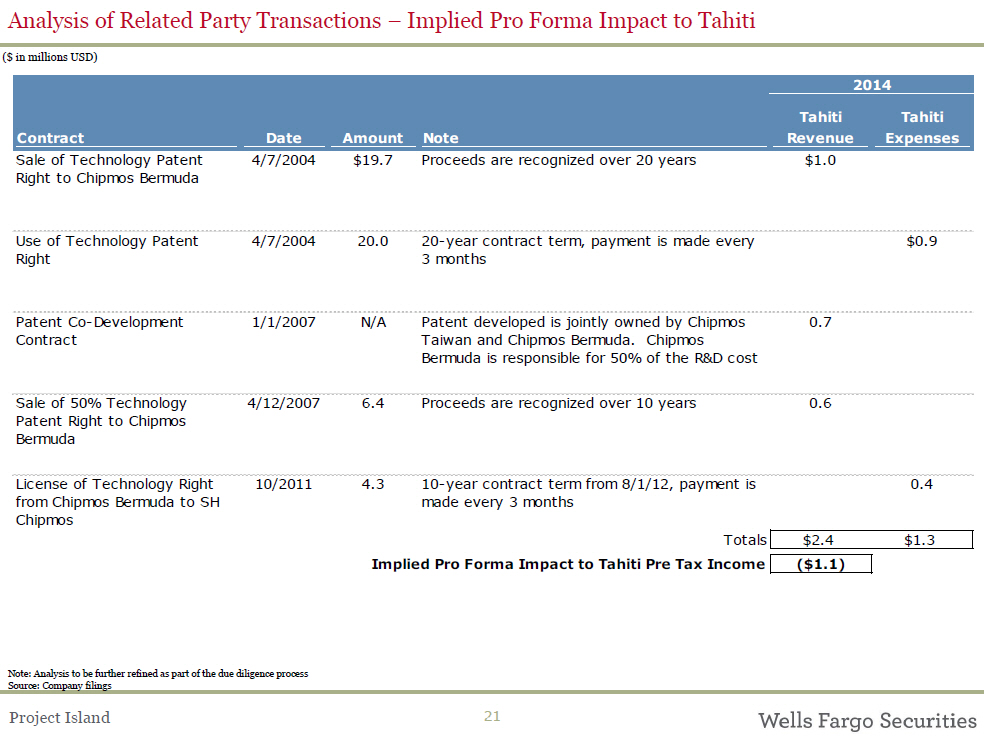
Analysis of Related Party Transactions – Implied Pro Forma Impact to Tahiti($ in millions USD) 2014 Tahiti Tahiti Contract Date Amount Note Revenue Expenses Sale of Technology Patent 4/7/2004 $19.7 Proceeds are recognized over 20 years $1.0 Right to Chipmos Bermuda Use of Technology Patent 4/7/2004 20.0 20-year contract term, payment is made every $0.9 Right 3 months Patent Co-Development 1/1/2007 N/A Patent developed is jointly owned by Chipmos 0.7 Contract Taiwan and Chipmos Bermuda. Chipmos Bermuda is responsible for 50% of the R&D cost Sale of 50% Technology 4/12/2007 6.4 Proceeds are recognized over 10 years 0.6 Patent Right to Chipmos Bermuda License of Technology Right 10/2011 4.3 10-year contract term from 8/1/12, payment is 0.4 from Chipmos Bermuda to SH made every 3 monthsChipmos Totals $2.4 $1.3Implied Pro Forma Impact to Tahiti Pre Tax Income ($1.1)Note: Analysis to be further refined as part of the due diligence processSource: Company filingsProject Island 21
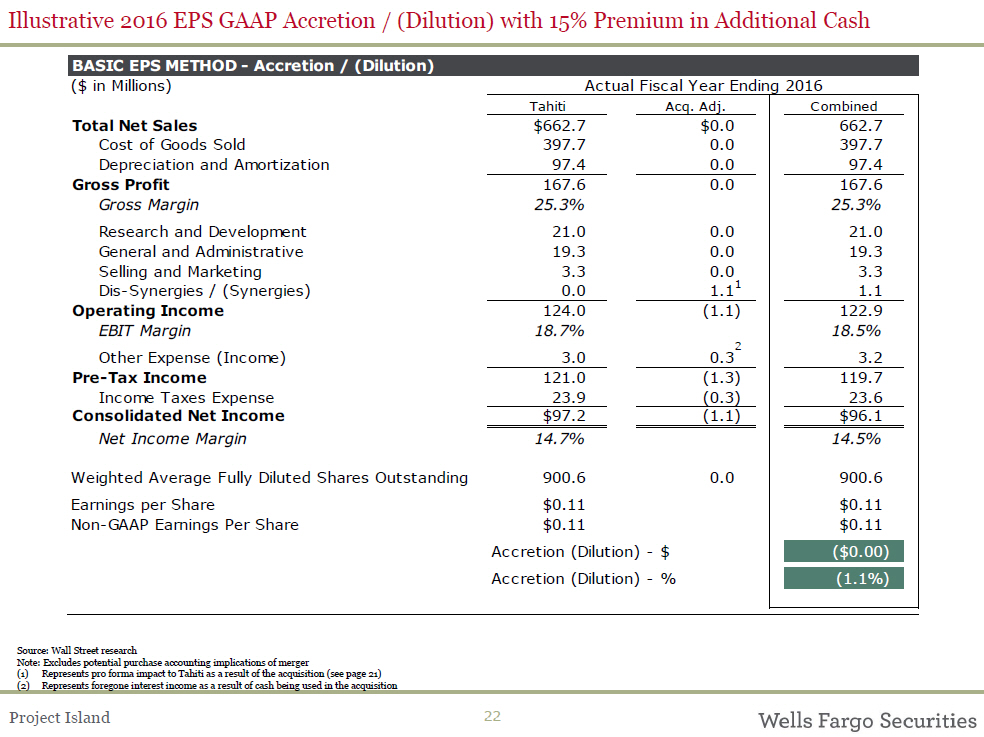
Illustrative 2016 EPS GAAP Accretion / (Dilution) with 15% Premium in Additional CashBASIC EPS METHOD - Accretion / (Dilution) ($ in Millions) Actual Fiscal Year Ending 2016 Tahiti Acq. Adj. Combined Total Net Sales $662.7 $0.0 662.7 Cost of Goods Sold 397.7 0.0 397.7 Depreciation and Amortization 97.4 0.0 97.4 Gross Profit 167.6 0.0 167.6 Gross Margin 25.3% 25.3% Research and Development 21.0 0.0 21.0 General and Administrative 19.3 0.0 19.3 Selling and Marketing 3.3 0.0 3.3 Dis-Synergies / (Synergies) 0.0 1.11 1.1 Operating Income 124.0 (1.1) 122.9 EBIT Margin 18.7% 18.5% Other Expense (Income) 3.0 0.32 3.2 Pre-Tax Income 121.0 (1.3) 119.7 Income Taxes Expense 23.9 (0.3) 23.6 Consolidated Net Income $97.2 (1.1) $96.1 Net Income Margin 14.7% 14.5% Weighted Average Fully Diluted Shares Outstanding 900.6 0.0 900.6 Earnings per Share $0.11 $0.11 Non-GAAP Earnings Per Share $0.11 $0.11 Accretion (Dilution) - $ ($0.00) Accretion (Dilution) - % (1.1%)Source: Wall Street researchNote: Excludes potential purchase accounting implications of merger(1) Represents pro forma impact to Tahiti as a result of the acquisition (see page 21)(2) Represents foregone interest income as a result of cash being used in the acquisitionProject Island 22
Review of AlternativeApproaches to Responding to Tahiti Proposal

Review of Alternative Potential Responses to Tahiti LetterDescription Benefits ConsiderationsJust Say NoAsk Tahiti to Try Again? Indicate 17 September Offer was outside the range of what Special Committee deems appropriate? Do not offer specific next steps? Ask Tahiti to “rebid” as 17September Offer was outside the range of what Special Committee deems appropriate? Strong signal a meaningful premium is required to consummate the Restructuring? Prevents Tahiti from “anchoring” negotiations at no-premium transaction? Strong signal a meaningful premium is required, but maintains negotiating cadence? Prevents Tahiti from “anchoring” negotiations at no-premium transaction? Likely not viewed as constructive response to move Restructuring forward ? May delay process? Tahiti may expect a formal counter to 17 September Offer? May delay process? Indicate premium is required Provide ? Ask Tahiti to “rebid” based on a Outline of framework that a premium is Issues and appropriate Questions? Constructive cadence of formal response? Asks for premium without “capping” our negotiating positions with specific figures? May provide additional information on Tahiti negotiating positions to inform a specific ask on premiums? Tahiti may counter with a minimal premium – adding an extra cycle in negotiations ? May delay process? Counter proposal asking for ? Straightforward approach likely to lead ? May leave “upside on the table” Submit specific terms and specific to constructive cadence to move process ? If outside the range of what Tahiti premiums forward considers reasonable, may delay Counter ? Potentially fastest timeline forward process Offer ? Any counters from Tahiti likely will beat less attractive termsProject Island 24

Illustrative Draft Response Letter
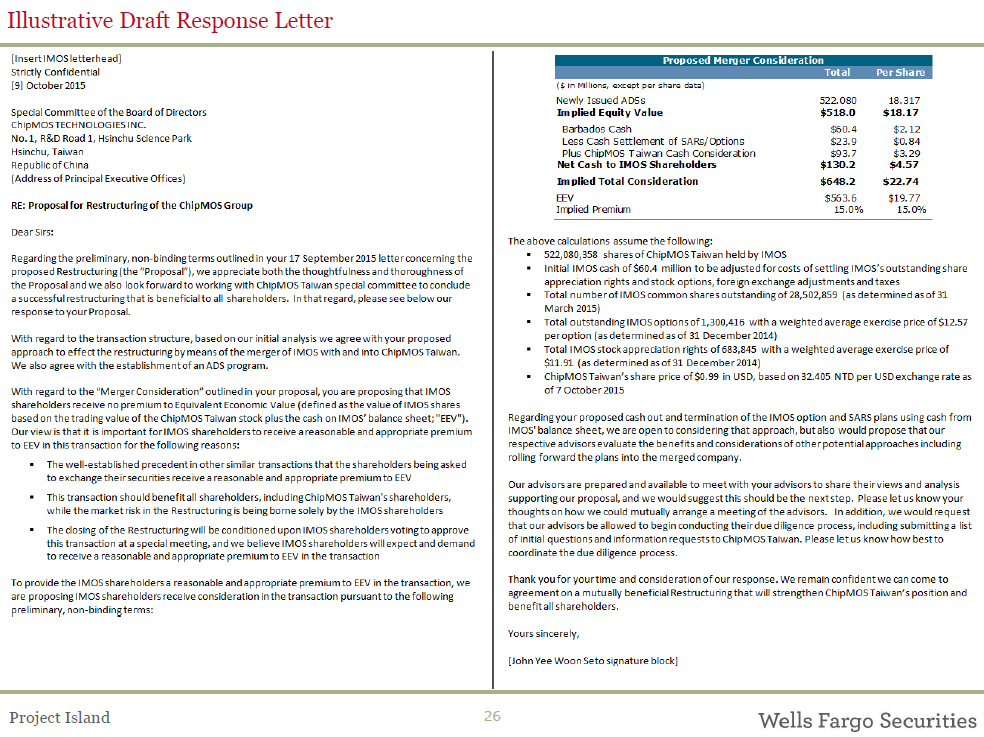
Illustrative Draft Response Letter Project Island 26
Wells Fargo Securities’ Project Island Deal Team

The Wells Fargo Securities Project Island Deal TeamSenior ManagementDoug BrengelVice Chairman of Investment Banking(213) 253-6743Los Angeles, CASemiconductor Investment Banking Mergers & Acquisitions APAC Investment BankingJennie Raubacher John Jinishian Barbara Wong Head of Semiconductor & CleanTech Head of West Coast Technology Managing Director Investment Banking Mergers & Acquisitions APAC Mergers & Acquisitions (415) 834-4735 (415) 834-4727 852-3650-8508 San Francisco, CA San Francisco, CA Hong Kong, Preeti Raghupathi J.T. Cecchini Frederick Fu Vice President Director Director (415) 834-4732 (415) 834-4725 852-3650-8509 San Francisco, CA San Francisco, CA Hong Kong Wayne Smith Yusuf Kazi David LauAssociate Associate Associate (415) 834-4787 (415) 834-4777 852-3650-8503 San Francisco, CA San Francisco, CA Hong KongCharles Ng Ian Mackay Lydia Wang Analyst Analyst Analyst (415) 834-4727 (415) 834-4776 852-3650-8502 San Francisco, CA San Francisco, CA Hong KongProject Island 28
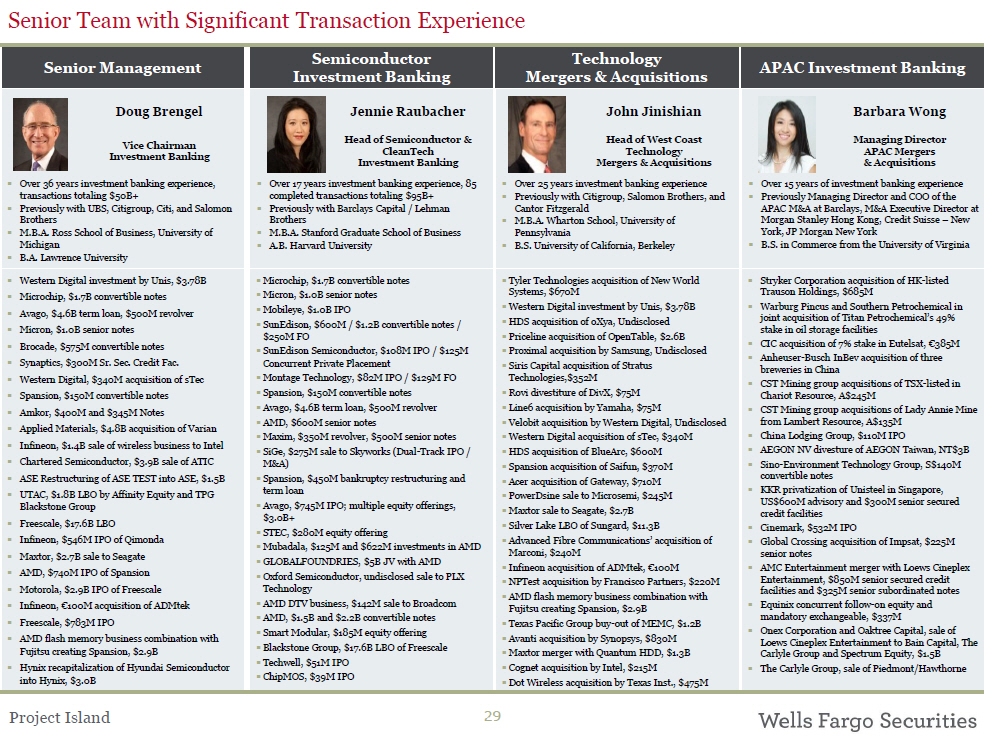
Senior Team with Significant Transaction ExperienceSenior ManagementDoug BrengelVice ChairmanInvestment Banking? Over 36 years investment banking experience, transactions totaling $50B+? Previously with UBS, Citigroup, Citi, and Salomon Brothers? M.B.A. Ross School of Business, University of Michigan? B.A. Lawrence University? Western Digital investment by Unis, $3.78B? Microchip, $1.7B convertible notes? Avago, $4.6B term loan, $500M revolver? Micron, $1.0B senior notes? Brocade, $575M convertible notes? Synaptics, $300M Sr. Sec. Credit Fac.? Western Digital, $340M acquisition of sTec? Spansion, $150M convertible notes? Amkor, $400M and $345M Notes? Applied Materials, $4.8B acquisition of Varian? Infineon, $1.4B sale of wireless business to Intel? Chartered Semiconductor, $3.9B sale of ATIC? ASE Restructuring of ASE TEST into ASE, $1.5B? UTAC, $1.8B LBO by Affinity Equity and TPG Blackstone Group ? Freescale, $17.6B LBO? Infineon, $546M IPO of Qimonda? Maxtor, $2.7B sale to Seagate? AMD, $740M IPO of Spansion? Motorola, $2.9B IPO of Freescale? Infineon, €100M acquisition of ADMtek? Freescale, $783M IPO? AMD flash memory business combination with Fujitsu creating Spansion, $2.9B? Hynix recapitalization of Hyundai Semiconductor into Hynix, $3.0BSemiconductorInvestment BankingJennie RaubacherHead of Semiconductor &CleanTechInvestment Banking? Over 17 years investment banking experience, 85 completed transactions totaling $95B+? Previously with Barclays Capital / Lehman Brothers? M.B.A. Stanford Graduate School of Business? A.B. Harvard University? Microchip, $1.7B convertible notes? Micron, $1.0B senior notes? Mobileye, $1.0B IPO? SunEdison, $600M / $1.2B convertible notes / $250M FO? SunEdison Semiconductor, $108M IPO / $125M Concurrent Private Placement? Montage Technology, $82M IPO / $129M FO? Spansion, $150M convertible notes? Avago, $4.6B term loan, $500M revolver? AMD, $600M senior notes? Maxim, $350M revolver, $500M senior notes? SiGe, $275M sale to Skyworks (Dual-Track IPO / M&A)? Spansion, $450M bankruptcy restructuring and term loan? Avago, $745M IPO; multiple equity offerings, $3.0B+ ? STEC, $280M equity offering? Mubadala, $125M and $622M investments in AMD? GLOBALFOUNDRIES, $5B JV with AMD? Oxford Semiconductor, undisclosed sale to PLX Technology ? AMD DTV business, $142M sale to Broadcom? AMD, $1.5B and $2.2B convertible notes? Smart Modular, $185M equity offering? Blackstone Group, $17.6B LBO of Freescale? Techwell, $51M IPO? ChipMOS, $39M IPOTechnologyMergers & AcquisitionsJohn JinishianHead of West CoastTechnologyMergers & Acquisitions ? Over 25 years investment banking experience? Previously with Citigroup, Salomon Brothers, and Cantor Fitzgerald? M.B.A. Wharton School, University of Pennsylvania? B.S. University of California, Berkeley? Tyler Technologies acquisition of New World Systems, $670M? Western Digital investment by Unis, $3.78B? HDS acquisition of oXya, Undisclosed? Priceline acquisition of OpenTable, $2.6B? Proximal acquisition by Samsung, Undisclosed? Siris Capital acquisition of Stratus Technologies,$352M ? Rovi divestiture of DivX, $75M? Line6 acquisition by Yamaha, $75M? Velobit acquisition by Western Digital, Undisclosed? Western Digital acquisition of sTec, $340M? HDS acquisition of BlueArc, $600M? Spansion acquisition of Saifun, $370M? Acer acquisition of Gateway, $710M? PowerDsine sale to Microsemi, $245M? Maxtor sale to Seagate, $2.7B? Silver Lake LBO of Sungard, $11.3B? Advanced Fibre Communications’ acquisition ofMarconi, $240M ? Infineon acquisition of ADMtek, €100M? NPTest acquisition by Francisco Partners, $220M? AMD flash memory business combination with Fujitsu creating Spansion, $2.9B ? Texas Pacific Group buy-out of MEMC, $1.2B? Avanti acquisition by Synopsys, $830M? Maxtor merger with Quantum HDD, $1.3B? Cognet acquisition by Intel, $215M? Dot Wireless acquisition by Texas Inst., $475MAPAC Investment BankingBarbara WongManaging DirectorAPAC Mergers& Acquisitions ? Over 15 years of investment banking experience? Previously Managing Director and COO of the APAC M&A at Barclays, M&A Executive Director at Morgan Stanley Hong Kong, Credit Suisse – New York, JP Morgan New York? B.S. in Commerce from the University of Virginia? Stryker Corporation acquisition of HK-listed Trauson Holdings, $685M? Warburg Pincus and Southern Petrochemical in joint acquisition of Titan Petrochemical’s 49% stake in oil storage facilities ? CIC acquisition of 7% stake in Eutelsat, €385M? Anheuser-Busch InBev acquisition of three breweries in China? CST Mining group acquisitions of TSX-listed in Chariot Resource, A$245M? CST Mining group acquisitions of Lady Annie Mine from Lambert Resource, A$135M? China Lodging Group, $110M IPO? AEGON NV divesture of AEGON Taiwan, NT$3B? Sino-Environment Technology Group, S$140M convertible notes? KKR privatization of Unisteel in Singapore, US$600M advisory and $300M senior secured credit facilities ? Cinemark, $532M IPO? Global Crossing acquisition of Impsat, $225M senior notes? AMC Entertainment merger with Loews Cineplex Entertainment, $850M senior secured credit facilities and $325M senior subordinated notes? Equinix concurrent follow-on equity and mandatory exchangeable, $337M? Onex Corporation and Oaktree Capital, sale of Loews Cineplex Entertainment to Bain Capital, The Carlyle Group and Spectrum Equity, $1.5B ? The Carlyle Group, sale of Piedmont/HawthorneProject Island 29

DisclaimerThis document and any other materials accompanying this document (collectively, the “Materials”) are provided for general informational purposes. By accepting any Materials, the recipient thereof acknowledges and agrees to the matters set forth below in this notice.Wells Fargo Securities makes no representation or warranty (express or implied) regarding the adequacy, accuracy or completeness of any information in the Materials. Information in the Materials is preliminary and is not intended to be complete, and such information is qualified in its entirety. Any opinions or estimates contained in the Materials represent the judgment of Wells Fargo Securities at this time, and are subject to change without notice. Interested parties are advised to contact Wells Fargo Securities for more information. The Materials are not an offer to sell, or a solicitation of an offer to buy, the securities or instruments named or described herein. The Materials are not intended to provide, and must not be relied on for accounting, legal, regulatory, tax, business, financial or related advice or investment recommendations. No person providing any Materials is acting as fiduciary or advisor with respect to the Materials. You must consult with your own advisors as to the legal, regulatory, tax, business, financial, investment and other aspects of the Materials.Wells Fargo Securities is the trade name for the capital markets and investment banking services of Wells Fargo & Company and its subsidiaries, including but not limited to Wells Fargo Securities, LLC, a member of NYSE, FINRA, NFA and SIPC, Wells Fargo Prime Services, LLC, a member of FINRA, NFA and SIPC, and Wells Fargo Bank, N.A. Wells Fargo Securities, LLC and Wells Fargo Prime Services, LLC are distinct entities from affiliated banks and thrifts.Notwithstanding anything to the contrary contained in the Materials, all persons may disclose to any and all persons, without limitations of any kind, the U.S. federal, state or local tax treatment or tax structure of any transaction, any fact that may be relevant to understanding the U.S. federal, state or local tax treatment or tax structure of any transaction, and all materials of any kind (including opinions or other tax analyses) relating to such U.S. federal, state or local tax treatment or tax structure, other than the name of the parties or any other person named herein, or information that would permit identification of the parties or such other persons, and any pricing terms or nonpublic business or financial information that is unrelated to the U.S. federal, state or local tax treatment or tax structure of the transaction to the taxpayer and is not relevant to understanding the U.S. federal, state or local tax treatment or tax structure of the transaction to the taxpayer.IRS Circular 230 Disclosure:To ensure compliance with requirements imposed by the IRS, we inform you that any tax advice contained in the Materials is not intended or written to be used, and cannot be used, for the purpose of (i) avoiding tax penalties or (ii) promoting, marketing or recommending to another party any transaction or matter addressed herein. © 2015 Wells Fargo. All Rights Reserved.Project Island 30