united states
securities and exchange commission
washington, d.c. 20549
form n-csr
certified shareholder report of registered management
investment companies
Investment Company Act file number 811-10123
The North Country Funds
(Exact name of Registrant as specified in charter)
250 Glen Street, Glens Falls, NY 12801
(Address of principal executive offices) (Zip code)
Richard Malinowski
c/o Ultimus Fund Solutions, LLC., 225 Pictoria Drive, Suite 450, Cincinnati, OH 45246
(Name and address of agent for service)
Registrant's telephone number, including area code: 631-470-2619
Date of fiscal year end: 11/30
Date of reporting period: 11/30/21
Item 1. Reports to Stockholders.
| | | The North Country Funds |
| | | |
| | | Large Cap Equity Fund
(formerly, the Equity Growth Fund)
Intermediate Bond Fund |
| | | |
| | |  |
| | | |
| | | |
| | | |
| | | |
| | | Annual Report
November 30, 2021 |
| | | |
| Investment Adviser | | |
| North Country Investment Advisers, Inc. | | |
| 250 Glen Street | | |
| Glens Falls, NY 12801 | | |
| | | |
Administrator and
Fund Accountant
Ultimus Fund Solutions, LLC
225 Pictoria Drive, Suite 450
Cincinnati, Ohio 45246
Investor Information: (888) 350-2990 | |
This report and the financial statements contained herein are submitted for the general information of shareholders and are not authorized for distribution to prospective investors unless preceded or accompanied by an effective prospectus. Nothing herein contained is to be considered an offer of sale or solicitation of an offer to buy shares of the North Country Funds. Such offering is made only by prospectus, which includes details as to offering price and other material information. |
The North Country Funds
ANNUAL REPORT
November 30, 2021
ECONOMIC SUMMARY
As we entered 2021, there was a fairly positive consensus view on the economy and potential returns in equity markets, while fixed income returns were predicted to be muted. The initiation of COVID-19 vaccinations, global re-openings, unprecedented economic stimulus and strong consumer demand were the driving factors behind this view. Most of the first half of the year went according to plan. GDP growth averaged a strong annualized 6.5 percent during the first half of the year, and major equity indexes were up across the board.
During summer, the Delta variant, inflation, global supply chain issues and labor shortages led to slowing GDP growth and higher volatility in financial markets. With wide spread vaccines and last winter’s COVID-19 spike behind us, it was generally thought that the pandemic was mostly behind us. The emergence of the Delta variant overturned these thoughts. Supply chain issues and labor shortages neutralized strong consumer demand in many circumstances. Annualized GDP growth in the third quarter fell to a disappointing 2 percent.
As we ended November, economic growth appeared to be rebounding in the fourth quarter and the labor market continued to gain strength. However, inflation and the new Omicron variant again led to volatile markets. Inflation continued to swell throughout the year, hitting 40-year highs in November. Due to the strong labor market and inflation concerns, the Federal Reserve announced that they were beginning to taper their asset purchase program. The Omicron variant further extends the pandemic as we head into the third calendar year of the crisis.
The Large Cap Equity Fund
While the economic recovery was under way throughout 2021, we remained balanced with a tilt toward growth and continued to monitor incremental risks that represented headwinds for U.S. stocks, including elevated inflation, microchip shortages, surging imports and clogged U.S. distribution channels. Yet while risks remained, as they always do, the market prospects appeared encouraging: consumer balance sheets were in good shape, housing starts were only at average levels with lots of demand in the pipeline, the banking system was sound, and there was demand for hiring and business investment. Through the year’s volatility, we maintained exposure to quality, focused on high-conviction stocks, and continued to take advantage of market dislocations for compelling stock-selection opportunities.
For the one-year period ending November 30, 2021, the North Country Large Cap Equity Fund returned 22.73% while the S&P 500 returned 27.92%. On an annualized basis, the three, five and 10-year total returns for the North Country Large Cap Equity Fund were 20.57%, 18.49%, and 15.46% versus the S&P 500 at 20.38%, 17.90% and 16.16%, respectively.
The Equity Fund’s underperformance over the one-year time period can be attributed to stock selection – outsized positions in companies primarily in the Communications Services and Information Technology sectors. Other select names across the portfolio still generated strong returns this year, as these companies with unique products and services have been widely viewed as beneficiaries of this new global economic environment. The greater focus on quality factors throughout the year has benefited the relative performance of the portfolio in times of stress, and we will continue to implement an investment process that focuses on sustainable free cash flow from operations, profit margins, capital discipline and strong balance sheets.
The Intermediate Bond Fund
It was a volatile year for interest rates in 2021. Intermediate and long-term rates rose as the economy improved and the year ended with a much steeper yield curve.
The emergency policies that have been in place for the past 20 months are in the early stages of being slowly removed. The pace of the Fed’s bond tapering effort is expected to be faster than initially announced and one or more rate hikes is potentially expected in the second half of 2022.
The North Country Intermediate Bond Fund returned -1.89% for the 12-month period ending November 30, 2021 while the ICE Bank of America Merrill Lynch Corporate/Government “A” rated or better 1-10 year index1 returned -0.96% and the Bloomberg Barclays U.S. Aggregate Bond Index2 returned -1.15%.
The North Country Intermediate Bond Fund had annualized total returns for the three-year, five-year and 10-year periods ending November 30, 2021 of 4.64%, 2.73% and 2.23% while the ICE Bank of America Merrill Lynch Corporate/Government “A” rated or better 1-10 year index returned 4.40%, 2.99% and 2.54% for the respective time periods.
The North Country Intermediate Bond Fund underperformed its benchmark for the one-year, five-year and 10-year periods and outperformed its benchmark for the three-year period, ending November 30, 2021. This was due to an average maturity and duration longer than the benchmark in a time when intermediate term interest rates increased, in general, and as credit spreads widened, both contributing to underperformance of longer duration and longer maturity fixed income investments.
In 2022, the Fed is expected to be faced with keeping the economic recovery going, tackling any uncertainties new coronavirus variants could pose to the labor market, and dealing with an economy that has been running hot with inflation for several months. The Fed’s proactive stance while the economy slows may put some additional upward pressure on short-, intermediate-, and long-term U.S. interest rates.
| 1 | The ICE Bank of America Merrill Lynch Corporate/Government “A” rated or better 1-10 year index is based upon publicly issued intermediate corporate and government debt securities with maturities ranging between 1 and 10 years. |
| 2 | The Barclays US Aggregate Bond Index measures a broad spectrum of U.S. investment grade taxable fixed income securities including treasury, agency, corporate, mortgage-backed, asset backed and international dollar denominated issues with maturities of 1 year or more. |
Large Cap Equity Fund:
| Annual Fund Operating Expenses: | | (As a Percentage of Net Assets) |
| Total Annual Operating Expenses: | | 0.99% |
| | | |
| Intermediate Bond Fund: | | |
| | | |
| Annual Fund Operating Expenses: | | (As a Percentage of Net Assets) |
| Total Annual Operating Expenses: | | 0.82% |
Average Annual Total Returns as of September 30, 2021 (Latest Calendar Quarter)
| | 1 Year | | 5 Years | | 10 Years | |
| North Country Large Cap Equity Fund | 22.17% | | 17.49% | | 15.90% | |
| North Country Intermediate Bond Fund | -0.70% | | 2.22% | | 2.31% | |
Average Annual Total Returns as of November 30, 2021 (Fiscal Year-End)
| | 1 Year | | 5 Years | | 10 Years | |
| North Country Large Cap Equity Fund | 22.73% | | 18.49% | | 15.46% | |
| North Country Intermediate Bond Fund | -1.89% | | 2.73% | | 2.23% | |
Performance data quoted above is historical and is no guarantee of future results. Current performance may be higher or lower than the performance data quoted. The principal value and investment return of an investment will fluctuate so that your shares, when redeemed, may be worth more or less than their original cost. You can obtain performance data current to the most recent month-end by calling 1-888-350-2990. Information provided is unaudited.
The views expressed are as November 30, 2021 and are those of the adviser, North Country Investment Advisers, Inc. The views are subject to change at any time in response to changing circumstances in the markets and are not intended to predict or guarantee the future performance of any individual security market sector or the markets generally, or the North Country Funds.
Not FDIC insured. Not obligations of or guaranteed by the bank. May involve investment risks, including possible loss of the principal invested.
6002-NLD-01/03/2022
| North Country Large Cap Equity Fund |
| Growth of $10,000 Investment (Unaudited) |
This chart illustrates the comparison of a hypothetical investment of $10,000 in the North Country Large Cap Equity Fund (assuming reinvestment of all dividends and distributions) versus the Fund’s benchmark index.
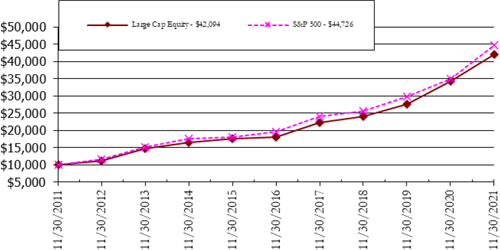
Average Annual Total Returns as of November 30, 2021
| | 1 Year | | 5 Years | | 10 Years | |
| North Country Large Cap Equity Fund | 22.73% | | 18.49% | | 15.46% | |
| S&P 500 | 27.92% | | 17.90% | | 16.16% | |
The S&P 500 is a market capitalization-weighted index of 500 widely held common stocks. Indexes and benchmarks are unmanaged and do not reflect the deduction of expenses associated with a mutual fund, such as investment management and fund accounting fees. Investors cannot invest directly in an index or benchmark, although they can invest in its underlying securities or funds.
Past performance is not indicative of future results. The investment return and NAV will fluctuate, so that an investor’s shares, when redeemed, may be worth more or less than their original cost. Total returns are calculated assuming reinvestment of all dividends and capital gains distributions.
| The returns do not reflect a reduction for taxes a shareholder would pay on the redemption of fund shares or fund distributions. |
| |
| North Country Intermediate Bond Fund |
| Growth of $10,000 Investment (Unaudited) |
This chart illustrates the comparison of a hypothetical investment of $10,000 in the North Country Intermediate Bond Fund (assuming reinvestment of all dividends and distributions) versus the Fund’s benchmark indexes.
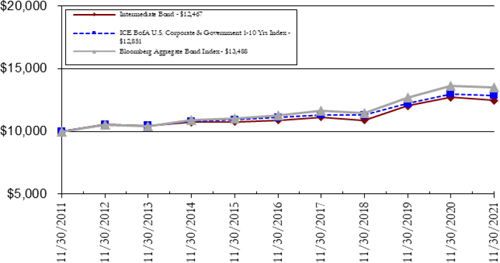
Average Annual Total Returns as of November 30, 2021
| | 1 Year | | 5 Years | | 10 Years | |
| North Country Intermediate Bond Fund | -1.89% | | 2.73% | | 2.23% | |
| ICE BofA U.S. Corporate & Government 1-10 Yrs Index | -0.96% | | 2.99% | | 2.54% | |
| Bloomberg Aggregate Bond Index | -1.15% | | 3.65% | | 3.04% | |
The ICE BofA U.S. Corporate & Government 1-10 Yrs Index tracks the performance of U.S. dollar denominated investment grade debt publicly issued in the U.S. domestic market, including U.S. Treasury, U.S. agency, foreign government, supranational and corporate securities with a remaining term to final maturity less than 10 years. The Bloomberg Aggregate Bond Index is an unmanaged index which represents the U.S. investment-grade fixed-rate bond market (including government and corporate securities, mortgage pass-through securities and asset-backed securities). Investors cannot invest directly in an index or benchmark. The indexes are unmanaged and do not reflect the deduction of expenses associated with a mutual fund, such as investment management and fund accounting fees. Investors cannot invest directly in an index, although they can invest in its underlying securities.
Past performance is not indicative of future results. The investment return and NAV will fluctuate, so that an investor’s shares, when redeemed, may be worth more or less than their original cost. Total returns are calculated assuming reinvestment of all dividends and capital gains distributions.
| The returns do not reflect a reduction for taxes a shareholder would pay on the redemption of fund shares or fund distributions. |
| |
| North Country Large Cap Equity Fund |
| Portfolio Summary (Unaudited) |
| November 30, 2021 |
| Industries | % of Net Assets | | Industries | % of Net Assets |
| Common Stock | 97.9% | | Apparel & Textile Products | 1.7% |
| Software | 14.9% | | Insurance | 1.5% |
| Internet Media & Services | 8.2% | | Household Products | 1.4% |
| Technology Hardware | 7.6% | | Beverages | 1.3% |
| Medical Equipment & Devices | 6.8% | | Electric Utilities | 1.3% |
| E-Commerce Discretionary | 5.1% | | Commercial Support Services | 1.3% |
| Biotech & Pharma | 4.8% | | Diversified Industrials | 1.2% |
| Technology Services | 4.4% | | Entertainment Content | 1.1% |
| Banking | 4.3% | | Wholesale - Consumer Staples | 0.7% |
| Retail - Discretionary | 3.5% | | Specialty Finance | 0.6% |
| Institutional Financial Services | 3.4% | | Machinery | 0.5% |
| Retail - Consumer Staples | 3.4% | | Telecommunications | 0.4% |
| Chemicals | 2.7% | | Infrastructure REIT | 0.4% |
| Healthcare Facilities & Services | 2.6% | | Construction Materials | 0.3% |
| Transportation & Logistics | 2.3% | | Self-Storage REIT | 0.3% |
| Leisure Facilities & Services | 2.1% | | Office REIT | 0.3% |
| Oil & Gas Producers | 1.9% | | Money Market Fund | 2.1% |
| Home Construction | 1.9% | | Liabilities in excess of other assets | (0.0)% |
| Semiconductors | 1.9% | | Total Net Assets | 100.0% |
| Asset Management | 1.8% | | | |
| | | | | |
| Top Ten Holdings | % of Net Assets | | Top Ten Holdings | % of Net Assets |
| Apple, Inc. | 6.6% | | Alphabet, Inc. | 3.7% |
| Microsoft Corporation | 6.6% | | salesforce.com, Inc. | 3.2% |
| Amazon.com, Inc. | 5.1% | | UnitedHealth Group, Inc. | 2.6% |
| Adobe, Inc. | 3.9% | | Home Depot, Inc. (The) | 2.6% |
| Visa, Inc. | 3.8% | | Intercontinental Exchange, Inc. | 2.2% |
| | | | | |
| North Country Intermediate Bond Fund |
| Portfolio Summary (Unaudited) |
| November 30, 2021 |
| Industries | % of Net Assets | | Industries | % of Net Assets |
| Corporate Bonds | 72.2% | | Aerospace & Defense | 2.1% |
| Banking | 15.0% | | Software | 1.8% |
| Institutional Financial Services | 5.1% | | Biotech & Pharma | 1.5% |
| Technology Hardware | 4.8% | | Machinery | 1.5% |
| Semiconductors | 4.5% | | Health Care Facilities & Services | 1.3% |
| Oil & Gas Producers | 4.2% | | Apparel & Textile Products | 1.3% |
| Retail - Discretionary | 3.5% | | Medical Equipment & Devices | 1.2% |
| Transportation & Logistics | 2.9% | | Cable & Satellite | 1.1% |
| Telecommunications | 2.7% | | Household Products | 0.6% |
| Beverages | 2.6% | | Retail - Consumer Staples | 0.3% |
| Insurance | 2.5% | | U.S. Government & Agencies | 23.4% |
| Real Estate Investment Trusts | 2.5% | | Government Sponsored | 20.7% |
| Electric Utilities | 2.5% | | Agency Fixed Rate | 2.7% |
| Food | 2.3% | | Money Market Fund | 3.9% |
| Entertainment Content | 2.2% | | Other assets less liabilities | 0.5% |
| Chemicals | 2.2% | | Total Net Assets | 100.0% |
| Top Ten Holdings | % of Net Assets |
| Federal Home Loan Banks 3.4%, Due 03/14/2029 | 3.5% |
| AT&T, Inc. 4.35%, Due 03/01/2029 | 2.6% |
| Anheuser-Busch InBev Worldwide, Inc. 4%, Due 04/13/2028 | 2.6% |
| Federal Farm Credit Banks Funding Corporation 3.15%, Due 04/03/2028 | 2.6% |
| Georgia Power Company 3.25%, Due 03/30/2027 | 2.5% |
| Federal Home Loan Banks 2.75%, Due 12/13/2024 | 2.5% |
| Federal Farm Credit Banks Funding Corporation 2.35%, Due 08/14/2024 | 2.4% |
| Wells Fargo & Company 3.45%, Due 02/13/2023 | 2.4% |
| Federal Farm Credit Banks Funding Corporation 3.27%, Due 03/22/2029 | 2.4% |
| Southwest Airlines Company 5.125%, Due 06/15/2027 | 2.3% |
| | |
| NORTH COUNTRY LARGE CAP EQUITY FUND |
| SCHEDULE OF INVESTMENTS |
| November 30, 2021 |
| Shares | | | | | Fair Value | |
| | | | | COMMON STOCKS — 97.9% | | | | |
| | | | | APPAREL & TEXTILE PRODUCTS - 1.7% | | | | |
| | 12,000 | | | NIKE, Inc., Class B | | $ | 2,030,880 | |
| | 12,500 | | | VF Corporation | | | 896,625 | |
| | | | | | | | 2,927,505 | |
| | | | | ASSET MANAGEMENT - 1.8% | | | | |
| | 3,350 | | | BlackRock, Inc. | | | 3,030,443 | |
| | | | | | | | | |
| | | | | BANKING - 4.3% | | | | |
| | 83,000 | | | Bank of America Corporation | | | 3,691,010 | |
| | 23,000 | | | JPMorgan Chase & Company | | | 3,653,090 | |
| | | | | | | | 7,344,100 | |
| | | | | BEVERAGES - 1.3% | | | | |
| | 14,200 | | | PepsiCo, Inc. | | | 2,268,876 | |
| | | | | | | | | |
| | | | | BIOTECH & PHARMA - 4.8% | | | | |
| | 11,900 | | | Amgen, Inc. | | | 2,366,672 | |
| | 18,500 | | | Johnson & Johnson | | | 2,884,705 | |
| | 54,500 | | | Pfizer, Inc. | | | 2,928,285 | |
| | | | | | | | 8,179,662 | |
| | | | | CHEMICALS - 2.7% | | | | |
| | 2,700 | | | Air Products and Chemicals, Inc. | | | 776,088 | |
| | 3,900 | | | Ecolab, Inc. | | | 863,733 | |
| | 8,500 | | | LyondellBasell Industries N.V., Class A | | | 740,605 | |
| | 6,300 | | | Sherwin-Williams Company (The) | | | 2,086,812 | |
| | | | | | | | 4,467,238 | |
| | | | | COMMERCIAL SUPPORT SERVICES - 1.3% | | | | |
| | 13,500 | | | Waste Management, Inc. | | | 2,169,045 | |
| | | | | | | | | |
| | | | | CONSTRUCTION MATERIALS - 0.3% | | | | |
| | 3,000 | | | Vulcan Materials Company | | | 574,920 | |
| | | | | | | | | |
| | | | | DIVERSIFIED INDUSTRIALS - 1.2% | | | | |
| | 10,000 | | | Honeywell International, Inc. | | | 2,022,400 | |
| | | | | | | | | |
The accompanying notes are an integral part of these financial statements
| NORTH COUNTRY LARGE CAP EQUITY FUND |
| SCHEDULE OF INVESTMENTS (Continued) |
| November 30, 2021 |
| Shares | | | | | Fair Value | |
| | | | | COMMON STOCKS — 97.9% (Continued) | | | | |
| | | | | E-COMMERCE DISCRETIONARY - 5.1% | | | | |
| | 2,475 | | | Amazon.com, Inc.(a) | | $ | 8,679,998 | |
| | | | | | | | | |
| | | | | ELECTRIC UTILITIES - 1.3% | | | | |
| | 8,000 | | | Dominion Energy, Inc. | | | 569,600 | |
| | 9,500 | | | NextEra Energy, Inc. | | | 824,410 | |
| | 13,750 | | | Southern Company (The) | | | 840,125 | |
| | | | | | | | 2,234,135 | |
| | | | | ENTERTAINMENT CONTENT - 1.1% | | | | |
| | 17,500 | | | Activision Blizzard, Inc. | | | 1,025,500 | |
| | 6,350 | | | Walt Disney Company (The)(a) | | | 920,115 | |
| | | | | | | | 1,945,615 | |
| | | | | HEALTH CARE FACILITIES & SERVICES - 2.6% | | | | |
| | 10,075 | | | UnitedHealth Group, Inc. | | | 4,475,517 | |
| | | | | | | | | |
| | | | | HOME CONSTRUCTION - 1.9% | | | | |
| | 50,000 | | | Masco Corporation | | | 3,295,000 | |
| | | | | | | | | |
| | | | | HOUSEHOLD PRODUCTS - 1.4% | | | | |
| | 16,500 | | | Procter & Gamble Company (The) | | | 2,385,570 | |
| | | | | | | | | |
| | | | | INFRASTRUCTURE REIT - 0.4% | | | | |
| | 2,350 | | | American Tower Corporation | | | 616,828 | |
| | | | | | | | | |
| | | | | INSTITUTIONAL FINANCIAL SERVICES - 3.4% | | | | |
| | 2,600 | | | Goldman Sachs Group, Inc. (The) | | | 990,574 | |
| | 29,150 | | | Intercontinental Exchange, Inc. | | | 3,810,488 | |
| | 11,300 | | | Morgan Stanley | | | 1,071,466 | |
| | | | | | | | 5,872,528 | |
| | | | | INSURANCE - 1.5% | | | | |
| | 9,550 | | | Berkshire Hathaway, Inc., Class B(a) | | | 2,642,390 | |
| | | | | | | | | |
| | | | | INTERNET MEDIA & SERVICES - 8.2% | | | | |
| | 2,200 | | | Alphabet, Inc., Class A(a) | | | 6,243,490 | |
| | 9,500 | | | Meta Platforms, Inc.(a) | | | 3,082,370 | |
| | | | | | | | | |
The accompanying notes are an integral part of these financial statements
| NORTH COUNTRY LARGE CAP EQUITY FUND |
| SCHEDULE OF INVESTMENTS (Continued) |
| November 30, 2021 |
| Shares | | | | | Fair Value | |
| | | | | COMMON STOCKS — 97.9% (Continued) | | | | |
| | | | | INTERNET MEDIA & SERVICES - 8.2% (Continued) | | | | |
| | 5,700 | | | Netflix, Inc.(a) | | $ | 3,658,830 | |
| | 20,000 | | | Twitter, Inc.(a) | | | 878,800 | |
| | | | | | | | 13,863,490 | |
| | | | | LEISURE FACILITIES & SERVICES - 2.1% | | | | |
| | 5,600 | | | Domino’s Pizza, Inc. | | | 2,935,184 | |
| | 2,600 | | | McDonald’s Corporation | | | 635,960 | |
| | | | | | | | 3,571,144 | |
| | | | | MACHINERY - 0.5% | | | | |
| | 4,000 | | | Caterpillar, Inc. | | | 773,400 | |
| | | | | | | | | |
| | | | | MEDICAL EQUIPMENT & DEVICES - 6.8% | | | | |
| | 20,000 | | | Abbott Laboratories | | | 2,515,400 | |
| | 5,000 | | | Danaher Corporation | | | 1,608,200 | |
| | 19,000 | | | Medtronic PLC | | | 2,027,300 | |
| | 9,000 | | | Stryker Corporation | | | 2,129,670 | |
| | 5,245 | | | Thermo Fisher Scientific, Inc. | | | 3,319,193 | |
| | | | | | | | 11,599,763 | |
| | | | | OFFICE REIT - 0.3% | | | | |
| | 2,500 | | | Alexandria Real Estate Equities, Inc. | | | 500,175 | |
| | | | | | | | | |
| | | | | OIL & GAS PRODUCERS - 1.9% | | | | |
| | 10,200 | | | Chevron Corporation | | | 1,151,274 | |
| | 18,100 | | | Exxon Mobil Corporation | | | 1,083,104 | |
| | 40,000 | | | Williams Companies, Inc. (The) | | | 1,071,600 | |
| | | | | | | | 3,305,978 | |
| | | | | RETAIL - CONSUMER STAPLES - 3.4% | | | | |
| | 5,075 | | | Costco Wholesale Corporation | | | 2,737,354 | |
| | 6,100 | | | Dollar Tree, Inc.(a) | | | 816,363 | |
| | 15,500 | | | Walmart, Inc. | | | 2,179,765 | |
| | | | | | | | 5,733,482 | |
| | | | | RETAIL - DISCRETIONARY - 3.5% | | | | |
| | 10,900 | | | Home Depot, Inc. (The) | | | 4,366,649 | |
| | 23,050 | | | TJX Companies, Inc. (The) | | | 1,599,670 | |
| | | | | | | | 5,966,319 | |
| | | | | | | | | |
The accompanying notes are an integral part of these financial statements
| NORTH COUNTRY LARGE CAP EQUITY FUND |
| SCHEDULE OF INVESTMENTS (Continued) |
| November 30, 2021 |
| Shares | | | | | Fair Value | |
| | | | | COMMON STOCKS — 97.9% (Continued) | | | | |
| | | | | SELF-STORAGE REIT - 0.3% | | | | |
| | 1,750 | | | Public Storage | | $ | 572,915 | |
| | | | | | | | | |
| | | | | SEMICONDUCTORS - 1.9% | | | | |
| | 24,100 | | | Intel Corporation | | | 1,185,720 | |
| | 11,250 | | | QUALCOMM, Inc. | | | 2,031,300 | |
| | | | | | | | 3,217,020 | |
| | | | | SOFTWARE - 14.9% | | | | |
| | 10,000 | | | Adobe, Inc.(a) | | | 6,698,500 | |
| | 34,200 | | | Microsoft Corporation | | | 11,306,177 | |
| | 19,000 | | | Oracle Corporation | | | 1,724,060 | |
| | 19,400 | | | salesforce.com, Inc.(a) | | | 5,528,224 | |
| | | | | | | | 25,256,961 | |
| | | | | SPECIALTY FINANCE - 0.6% | | | | |
| | 6,800 | | | Capital One Financial Corporation | | | 955,604 | |
| | | | | | | | | |
| | | | | TECHNOLOGY HARDWARE - 7.6% | | | | |
| | 68,500 | | | Apple, Inc. | | | 11,323,050 | |
| | 30,750 | | | Cisco Systems, Inc. | | | 1,686,330 | |
| | | | | | | | 13,009,380 | |
| | | | | TECHNOLOGY SERVICES - 4.4% | | | | |
| | 6,000 | | | PayPal Holdings, Inc.(a) | | | 1,109,340 | |
| | 33,125 | | | Visa, Inc., Class A | | | 6,418,631 | |
| | | | | | | | 7,527,971 | |
| | | | | TELECOMMUNICATIONS - 0.4% | | | | |
| | 15,000 | | | Verizon Communications, Inc. | | | 754,050 | |
| | | | | | | | | |
| | | | | TRANSPORTATION & LOGISTICS - 2.3% | | | | |
| | 5,700 | | | FedEx Corporation | | | 1,313,109 | |
| | 4,500 | | | Union Pacific Corporation | | | 1,060,380 | |
| | 9,000 | | | United Parcel Service, Inc., Class B | | | 1,785,330 | |
| | | | | | | | 4,158,819 | |
| | | | | WHOLESALE - CONSUMER STAPLES - 0.7% | | | | |
| | 17,500 | | | Sysco Corporation | | | 1,225,700 | |
| | | | | | | | | |
The accompanying notes are an integral part of these financial statements
| NORTH COUNTRY LARGE CAP EQUITY FUND |
| SCHEDULE OF INVESTMENTS (Continued) |
| November 30, 2021 |
| Shares | | | | | Fair Value | |
| | | | | TOTAL COMMON STOCKS (Cost $57,686,698) | | $ | 167,123,941 | |
| | | | | | | | | |
| | | | | SHORT-TERM INVESTMENTS — 2.1% | | | | |
| | | | | MONEY MARKET FUNDS - 2.1% | | | | |
| | 3,565,852 | | | BlackRock Liquidity Funds Treasury Trust Fund, Institutional Class, 0.02% (Cost $3,565,852)(b) | | | 3,565,852 | |
| | | | | | | | | |
| | | | | TOTAL INVESTMENTS - 100.0% (Cost $61,252,550) | | $ | 170,689,793 | |
| | | | | LIABILITIES IN EXCESS OF OTHER ASSETS - 0.0% | | | (64,184 | ) |
| | | | | NET ASSETS - 100.0% | | $ | 170,625,609 | |
N.V. - Naamioze Vennootschap
PLC - Public Limited Company
REIT - Real Estate Investment Trust
| (a) | Non-income producing security. |
| (b) | Rate disclosed is the seven day effective yield as of November 30, 2021. |
The accompanying notes are an integral part of these financial statements
| NORTH COUNTRY INTERMEDIATE BOND FUND |
| SCHEDULE OF INVESTMENTS |
| November 30, 2021 |
| Principal | | | | | | | Coupon Rate | | | | | |
| Amount ($) | | | | | Spread | | (%) | | Maturity | | Fair Value | |
| | | | | CORPORATE BONDS — 72.2% | | | | | | | | | | |
| | | | | AEROSPACE & DEFENSE — 2.1% | | | | | | | | | | |
| | 250,000 | | | Boeing Company (The) | | | | 2.2500 | | 06/15/26 | | $ | 251,002 | |
| | 1,000,000 | | | Boeing Company (The) | | | | 3.2500 | | 03/01/28 | | | 1,036,223 | |
| | 500,000 | | | General Dynamics Corporation | | | | 2.2500 | | 11/15/22 | | | 506,503 | |
| | | | | | | | | | | | | | 1,793,728 | |
| | | | | APPAREL & TEXTILE PRODUCTS — 1.3% | | | | | | | | | | |
| | 1,000,000 | | | Ralph Lauren Corporation | | | | 3.7500 | | 09/15/25 | | | 1,083,117 | |
| | | | | | | | | | | | | | | |
| | | | | BANKING — 15.0% | | | | | | | | | | |
| | 500,000 | | | Bank of America Corporation | | | | 4.1830 | | 11/25/27 | | | 547,562 | |
| | 1,250,000 | | | Bank of America Corporation(a) | | USD LIBOR 3M + 1.190% | | 2.8840 | | 10/22/30 | | | 1,296,655 | |
| | 500,000 | | | Citigroup, Inc. | | | | 4.4500 | | 09/29/27 | | | 556,611 | |
| | 1,000,000 | | | JPMorgan Chase & Company | | | | 3.8750 | | 09/10/24 | | | 1,069,088 | |
| | 1,000,000 | | | JPMorgan Chase & Company | | | | 3.1250 | | 01/23/25 | | | 1,052,070 | |
| | 500,000 | | | JPMorgan Chase & Company | | | | 3.3000 | | 04/01/26 | | | 533,707 | |
| | 1,500,000 | | | Mitsubishi UFJ Financial Group, Inc. | | | | 3.1950 | | 07/18/29 | | | 1,594,575 | |
| | 500,000 | | | PNC Financial Services Group, Inc. (The) | | | | 3.4500 | | 04/23/29 | | | 546,268 | |
| | 1,500,000 | | | Sumitomo Mitsui Financial Group, Inc. | | | | 2.1300 | | 07/08/30 | | | 1,475,705 | |
| | 500,000 | | | US Bancorp | | | | 3.6000 | | 09/11/24 | | | 534,749 | |
| | 500,000 | | | US Bancorp Series MTN | | | | 3.1000 | | 04/27/26 | | | 531,377 | |
| | 2,000,000 | | | Wells Fargo & Company | | | | 3.4500 | | 02/13/23 | | | 2,063,402 | |
| | 1,000,000 | | | Wells Fargo & Company | | | | 3.0000 | | 02/19/25 | | | 1,044,185 | |
| | | | | | | | | | | | | | 12,845,954 | |
| | | | | BEVERAGES — 2.6% | | | | | | | | | | |
| | 2,000,000 | | | Anheuser-Busch InBev Worldwide, Inc. | | | | 4.0000 | | 04/13/28 | | | 2,240,880 | |
| | | | | | | | | | | | | | | |
| | | | | BIOTECH & PHARMA — 1.5% | | | | | | | | | | |
| | 1,000,000 | | | Merck & Company, Inc. | | | | 2.8000 | | 05/18/23 | | | 1,032,685 | |
| | 250,000 | | | Pfizer, Inc. | | | | 2.7500 | | 06/03/26 | | | 265,538 | |
| | | | | | | | | | | | | | 1,298,223 | |
| | | | | CABLE & SATELLITE — 1.1% | | | | | | | | | | |
| | 750,000 | | | TCI Communications, Inc. | | | | 7.8750 | | 02/15/26 | | | 944,800 | |
| | | | | | | | | | | | | | | |
| | | | | CHEMICALS — 2.2% | | | | | | | | | | |
| | 500,000 | | | Air Products and Chemicals, Inc. | | | | 2.7500 | | 02/03/23 | | | 513,067 | |
| | | | | | | | | | | | | | | |
The accompanying notes are an integral part of these financial statements
| NORTH COUNTRY INTERMEDIATE BOND FUND |
| SCHEDULE OF INVESTMENTS (Continued) |
| November 30, 2021 |
| Principal | | | | | | | Coupon Rate | | | | | |
| Amount ($) | | | | | Spread | | (%) | | Maturity | | Fair Value | |
| | | | | CORPORATE BONDS — 72.2% (Continued) | | | | | | | | | | |
| | | | | CHEMICALS — 2.2% (Continued) | | | | | | | | | | |
| | 1,250,000 | | | DuPont de Nemours, Inc. | | | | 4.2050 | | 11/15/23 | | $ | 1,322,988 | |
| | | | | | | | | | | | | | 1,836,055 | |
| | | | | ELECTRIC UTILITIES — 2.5% | | | | | | | | | | |
| | 2,000,000 | | | Georgia Power Company | | | | 3.2500 | | 03/30/27 | | | 2,121,065 | |
| | | | | | | | | | | | | | | |
| | | | | ENTERTAINMENT CONTENT — 2.2% | | | | | | | | | | |
| | 300,000 | | | TWDC Enterprises 18 Corporation | | | | 3.1500 | | 09/17/25 | | | 318,937 | |
| | 1,500,000 | | | Walt Disney Company (The) | | | | 2.6500 | | 01/13/31 | | | 1,558,754 | |
| | | | | | | | | | | | | | 1,877,691 | |
| | | | | FOOD — 2.3% | | | | | | | | | | |
| | 1,000,000 | | | Hershey Company (The) | | | | 1.7000 | | 06/01/30 | | | 989,064 | |
| | 1,000,000 | | | Hormel Foods Corporation | | | | 1.8000 | | 06/11/30 | | | 981,726 | |
| | | | | | | | | | | | | | 1,970,790 | |
| | | | | HEALTH CARE FACILITIES & SERVICES — 1.3% | | | | | | | | | | |
| | 1,000,000 | | | CVS Health Corporation | | | | 4.3000 | | 03/25/28 | | | 1,127,104 | |
| | | | | | | | | | | | | | | |
| | | | | HOUSEHOLD PRODUCTS — 0.6% | | | | | | | | | | |
| | 500,000 | | | Kimberly-Clark Corporation | | | | 2.4000 | | 03/01/22 | | | 502,535 | |
| | | | | | | | | | | | | | | |
| | | | | INSTITUTIONAL FINANCIAL SERVICES — 5.1% | | | | | | | | | | |
| | 1,000,000 | | | Bank of New York Mellon Corporation (The) | | | | 3.2500 | | 05/16/27 | | | 1,080,219 | |
| | 500,000 | | | Goldman Sachs Group, Inc. (The) | | | | 3.6250 | | 01/22/23 | | | 516,602 | |
| | 500,000 | | | Goldman Sachs Group, Inc. (The) | | | | 3.8500 | | 01/26/27 | | | 537,196 | |
| | 1,000,000 | | | Morgan Stanley | | | | 3.6250 | | 01/20/27 | | | 1,083,719 | |
| | 1,000,000 | | | Morgan Stanley | | | | 3.9500 | | 04/23/27 | | | 1,094,470 | |
| | | | | | | | | | | | | | 4,312,206 | |
| | | | | INSURANCE — 2.5% | | | | | | | | | | |
| | 1,000,000 | | | American International Group, Inc. | | | | 3.9000 | | 04/01/26 | | | 1,091,385 | |
| | 550,000 | | | Berkshire Hathaway Finance Corporation | | | | 1.8500 | | 03/12/30 | | | 547,240 | |
| | 500,000 | | | MetLife, Inc. | | | | 3.0000 | | 03/01/25 | | | 529,543 | |
| | | | | | | | | | | | | | 2,168,168 | |
| | | | | MACHINERY — 1.5% | | | | | | | | | | |
| | 1,000,000 | | | Deere & Company | | | | 5.3750 | | 10/16/29 | | | 1,251,162 | |
| | | | | | | | | | | | | | | |
The accompanying notes are an integral part of these financial statements
| NORTH COUNTRY INTERMEDIATE BOND FUND |
| SCHEDULE OF INVESTMENTS (Continued) |
| November 30, 2021 |
| Principal | | | | | | | Coupon Rate | | | | | |
| Amount ($) | | | | | Spread | | (%) | | Maturity | | Fair Value | |
| | | | | CORPORATE BONDS — 72.2% (Continued) | | | | | | | | | | |
| | | | | MEDICAL EQUIPMENT & DEVICES — 1.2% | | | | | | | | | | |
| | 1,000,000 | | | Stryker Corporation | | | | 1.9500 | | 06/15/30 | | $ | 984,060 | |
| | | | | | | | | | | | | | | |
| | | | | OIL & GAS PRODUCERS — 4.2% | | | | | | | | | | |
| | 1,000,000 | | | BP Capital Markets PLC | | | | 2.7500 | | 05/10/23 | | | 1,026,445 | |
| | 1,000,000 | | | BP Capital Markets PLC | | | | 3.5350 | | 11/04/24 | | | 1,064,086 | |
| | 500,000 | | | BP Capital Markets PLC | | | | 3.0170 | | 01/16/27 | | | 522,879 | |
| | 1,000,000 | | | Occidental Petroleum Corporation | | | | 3.4000 | | 04/15/26 | | | 992,500 | |
| | | | | | | | | | | | | | 3,605,910 | |
| | | | | REAL ESTATE INVESTMENT TRUSTS — 2.5% | | | | | | | | | | |
| | 1,000,000 | | | Simon Property Group, L.P. | | | | 3.5000 | | 09/01/25 | | | 1,071,161 | |
| | 1,000,000 | | | Simon Property Group, L.P. | | | | 3.3750 | | 06/15/27 | | | 1,078,464 | |
| | | | | | | | | | | | | | 2,149,625 | |
| | | | | RETAIL - CONSUMER STAPLES — 0.3% | | | | | | | | | | |
| | 250,000 | | | Target Corporation | | | | 2.5000 | | 04/15/26 | | | 262,456 | |
| | | | | | | | | | | | | | | |
| | | | | RETAIL - DISCRETIONARY — 3.5% | | | | | | | | | | |
| | 750,000 | | | Home Depot, Inc. (The) | | | | 2.9500 | | 06/15/29 | | | 802,633 | |
| | 1,000,000 | | | Lowe’s Companies, Inc. | | | | 3.1000 | | 05/03/27 | | | 1,066,607 | |
| | 1,000,000 | | | TJX Companies, Inc. (The) | | | | 3.8750 | | 04/15/30 | | | 1,129,942 | |
| | | | | | | | | | | | | | 2,999,182 | |
| | | | | SEMICONDUCTORS — 4.5% | | | | | | | | | | |
| | 500,000 | | | Intel Corporation | | | | 2.4500 | | 11/15/29 | | | 514,704 | |
| | 1,000,000 | | | Intel Corporation | | | | 3.9000 | | 03/25/30 | | | 1,136,031 | |
| | 1,250,000 | | | NVIDIA Corporation | | | | 2.8500 | | 04/01/30 | | | 1,329,718 | |
| | 800,000 | | | Texas Instruments, Inc. | | | | 2.2500 | | 09/04/29 | | | 828,297 | |
| | | | | | | | | | | | | | 3,808,750 | |
| | | | | SOFTWARE — 1.8% | | | | | | | | | | |
| | 500,000 | | | Oracle Corporation | | | | 3.4000 | | 07/08/24 | | | 526,482 | |
| | 500,000 | | | Oracle Corporation | | | | 2.9500 | | 04/01/30 | | | 516,773 | |
| | 500,000 | | | Oracle Corporation | | | | 3.2500 | | 05/15/30 | | | 528,307 | |
| | | | | | | | | | | | | | 1,571,562 | |
| | | | | TECHNOLOGY HARDWARE — 4.8% | | | | | | | | | | |
| | 1,000,000 | | | Apple, Inc. | | | | 2.9000 | | 09/12/27 | | | 1,064,151 | |
| | 500,000 | | | Apple, Inc. | | | | 1.4000 | | 08/05/28 | | | 488,769 | |
| | | | | | | | | | | | | | | |
The accompanying notes are an integral part of these financial statements
| NORTH COUNTRY INTERMEDIATE BOND FUND |
| SCHEDULE OF INVESTMENTS (Continued) |
| November 30, 2021 |
| Principal | | | | | | | Coupon Rate | | | | | |
| Amount ($) | | | | | Spread | | (%) | | Maturity | | Fair Value | |
| | | | | CORPORATE BONDS — 72.2% (Continued) | | | | | | | | | | |
| | | | | TECHNOLOGY HARDWARE — 4.8% (Continued) | | | | | | | | | | |
| | 1,500,000 | | | Apple, Inc. | | | | 1.6500 | | 05/11/30 | | $ | 1,461,311 | |
| | 1,000,000 | | | Cisco Systems, Inc. | | | | 3.5000 | | 06/15/25 | | | 1,081,366 | |
| | | | | | | | | | | | | | 4,095,597 | |
| | | | | TELECOMMUNICATIONS — 2.7% | | | | | | | | | | |
| | 2,000,000 | | | AT&T, Inc. | | | | 4.3500 | | 03/01/29 | | | 2,255,630 | |
| | | | | | | | | | | | | | | |
| | | | | TRANSPORTATION & LOGISTICS — 2.9% | | | | | | | | | | |
| | 1,750,000 | | | Southwest Airlines Company | | | | 5.1250 | | 06/15/27 | | | 1,996,433 | |
| | 500,000 | | | Union Pacific Corporation | | | | 2.7500 | | 04/15/23 | | | 511,719 | |
| | | | | | | | | | | | | | 2,508,152 | |
| | | | | TOTAL CORPORATE BONDS (Cost $60,425,175) | | | | | | | | | 61,614,402 | |
| | | | | | | | | | | | | | | |
| | | | | U.S. GOVERNMENT & AGENCIES — 23.4% | | | | | | | | | | |
| | | | | AGENCY FIXED RATE — 2.7% | | | | | | | | | | |
| | 687,274 | | | Fannie Mae Pool MA3735 | | | | 3.0000 | | 08/01/29 | | | 720,730 | |
| | 509,617 | | | Fannie Mae Pool MA3862 | | | | 3.0000 | | 12/01/29 | | | 535,056 | |
| | 1,004,180 | | | Fannie Mae Pool MA3929 | | | | 3.0000 | | 02/01/30 | | | 1,055,111 | |
| | | | | | | | | | | | | | 2,310,897 | |
| | | | | GOVERNMENT SPONSORED — 20.7% | | | | | | | | | | |
| | 2,000,000 | | | Federal Farm Credit Banks Funding Corporation | | | | 2.3500 | | 08/14/24 | | | 2,085,275 | |
| | 500,000 | | | Federal Farm Credit Banks Funding Corporation | | | | 3.1000 | | 12/06/24 | | | 533,011 | |
| | 750,000 | | | Federal Farm Credit Banks Funding Corporation | | | | 2.6200 | | 11/17/25 | | | 793,281 | |
| | 1,000,000 | | | Federal Farm Credit Banks Funding Corporation | | | | 2.8750 | | 01/18/28 | | | 1,086,535 | |
| | 2,000,000 | | | Federal Farm Credit Banks Funding Corporation | | | | 3.1500 | | 04/03/28 | | | 2,211,447 | |
| | 2,000,000 | | | Federal Farm Credit Banks Funding Corporation | | | | 3.2700 | | 03/22/29 | | | 2,019,586 | |
| | 2,000,000 | | | Federal Home Loan Banks | | | | 2.7500 | | 12/13/24 | | | 2,113,772 | |
| | 1,000,000 | | | Federal Home Loan Banks | | | | 2.6250 | | 09/12/25 | | | 1,057,443 | |
| | 1,000,000 | | | Federal Home Loan Banks | | | | 2.6000 | | 12/04/25 | | | 1,060,322 | |
| | 500,000 | | | Federal Home Loan Banks | | | | 2.7000 | | 12/29/25 | | | 532,554 | |
| | 1,000,000 | | | Federal Home Loan Banks | | | | 3.2500 | | 09/08/28 | | | 1,117,759 | |
| | 3,000,000 | | | Federal Home Loan Banks | | | | 3.4000 | | 03/14/29 | | | 3,023,512 | |
| | | | | | | | | | | | | | 17,634,497 | |
| | | | | | | | | | | | | | | |
The accompanying notes are an integral part of these financial statements
| NORTH COUNTRY INTERMEDIATE BOND FUND |
| SCHEDULE OF INVESTMENTS (Continued) |
| November 30, 2021 |
| | | | | | Fair Value | |
| | | | | | | |
| | | | | TOTAL U.S. GOVERNMENT & AGENCIES (Cost $19,021,899) | | $ | 19,945,394 | |
| | | | | | | | | |
| Shares | | | | | | | |
| | | | | SHORT-TERM INVESTMENTS — 3.9% | | | | |
| | | | | MONEY MARKET FUNDS - 3.9% | | | | |
| | 3,288,033 | | | BlackRock Liquidity Funds Treasury Trust Fund, Institutional Class, 0.02% (Cost $3,288,033)(b) | | | 3,288,033 | |
| | | | | | | | | |
| | | | | TOTAL INVESTMENTS - 99.5% (Cost $82,735,107) | | $ | 84,847,829 | |
| | | | | OTHER ASSETS IN EXCESS OF LIABILITIES- 0.5% | | | 464,952 | |
| | | | | NET ASSETS - 100.0% | | $ | 85,312,781 | |
LP - Limited Partnership
PLC - Public Limited Company
REIT - Real Estate Investment Trust
| (a) | Variable rate security; the rate shown represents the rate on November 30, 2021. |
| (b) | Rate disclosed is the seven day effective yield as of November 30, 2021. |
The accompanying notes are an integral part of these financial statements
| | THE NORTH COUNTRY FUNDS | |
| |
| STATEMENTS OF ASSETS AND LIABILITIES |
| November 30, 2021 |
| | | Large Cap | | | Intermediate | |
| | | Equity Fund | | | Bond Fund | |
| ASSETS: | | | | | | |
| Investments in securities, at fair value (Cost $61,252,550 and $82,735,107 respectively) | | $ | 170,689,793 | | | $ | 84,847,829 | |
| Dividends and interest receivable | | | 188,912 | | | | 590,017 | |
| Receivable for fund shares sold | | | 10,328 | | | | 386 | |
| Prepaid expenses and other assets | | | 6,429 | | | | 6,349 | |
| Total Assets | | | 170,895,462 | | | | 85,444,581 | |
| | | | | | | | | |
| LIABILITIES: | | | | | | | | |
| Accrued advisory fees | | | 107,808 | | | | 31,605 | |
| Payable for fund shares redeemed | | | 74,682 | | | | 27,765 | |
| Accrued administrative fees | | | 28,710 | | | | 19,351 | |
| Accrued audit fees | | | 17,773 | | | | 17,774 | |
| Accrued legal fees | | | 15,877 | | | | 16,245 | |
| Payable to related parties | | | 18,007 | | | | 12,158 | |
| Accrued expenses and other liabilities | | | 6,996 | | | | 6,902 | |
| Total Liabilities | | | 269,853 | | | | 131,800 | |
| Net Assets | | $ | 170,625,609 | | | $ | 85,312,781 | |
| | | | | | | | | |
| NET ASSETS CONSIST OF: | | | | | | | | |
| Paid in capital | | $ | 47,486,384 | | | $ | 83,032,024 | |
| Accumulated earnings | | | 123,139,225 | | | | 2,280,757 | |
| Net Assets | | $ | 170,625,609 | | | $ | 85,312,781 | |
| | | | | | | | | |
| Shares outstanding (unlimited number of shares authorized; no par value) | | | 6,596,891 | | | | 8,059,454 | |
| | | | | | | | | |
| Net asset value, offering and redemption price per share($170,625,609/6,596,891 and $85,312,781/8,059,454, respectively) | | $ | 25.86 | | | $ | 10.59 | |
| The accompanying notes are an integral part of these financial statements |
| | THE NORTH COUNTRY FUNDS | |
| |
| STATEMENTS OF OPERATIONS |
| For the Year Ended November 30, 2021 |
| | | Large Cap | | | Intermediate | |
| | | Equity Fund | | | Bond Fund | |
| INVESTMENT INCOME: | | | | | | | | |
| Dividends | | $ | 2,143,259 | | | $ | — | |
| Interest | | | 336 | | | | 2,096,027 | |
| Total investment income | | | 2,143,595 | | | | 2,096,027 | |
| | | | | | | | | |
| EXPENSES: | | | | | | | | |
| Investment advisory fees | | | 1,230,738 | | | | 444,290 | |
| Administration and fund accounting fees | | | 213,475 | | | | 157,414 | |
| Legal fees | | | 40,001 | | | | 40,001 | |
| Transfer agency fees | | | 35,905 | | | | 31,305 | |
| Trustees’ fees | | | 27,798 | | | | 16,701 | |
| Audit fees | | | 17,801 | | | | 17,802 | |
| Printing expense | | | 13,507 | | | | 7,007 | |
| Chief Compliance Officer fees | | | 14,001 | | | | 8,001 | |
| Registration and filing fees | | | 13,501 | | | | 14,501 | |
| Custody fees | | | 12,409 | | | | 8,904 | |
| Insurance expense | | | 6,801 | | | | 4,100 | |
| Miscellaneous expenses | | | 3,896 | | | | 3,696 | |
| Total expenses | | | 1,629,833 | | | | 753,722 | |
| | | | | | | | | |
| Less: Advisory fee waiver | | | — | | | | (29,377 | ) |
| Net expenses | | | 1,629,833 | | | | 724,345 | |
| | | | | | | | | |
| Net investment income | | | 513,762 | | | | 1,371,682 | |
| | | | | | | | | |
| NET REALIZED AND UNREALIZED GAIN/(LOSS) ON INVESTMENTS: | | | | | | | | |
| Net realized gain from investment transactions | | | 13,246,537 | | | | 135,416 | |
| Net change in unrealized appreciation/(depreciation) of investments | | | 19,569,412 | | | | (3,234,237 | ) |
| Net realized and unrealized gain /(loss) on investments | | | 32,815,949 | | | | (3,098,821 | ) |
| | | | | | | | | |
| Net increase/(decrease) in net assets resulting from operations | | $ | 33,329,711 | | | $ | (1,727,139 | ) |
| The accompanying notes are an integral part of these financial statements |
| | THE NORTH COUNTRY FUNDS | |
| |
| LARGE CAP EQUITY FUND |
| STATEMENTS OF CHANGES IN NET ASSETS |
| | | For the Year | | | For the Year | |
| | | Ended | | | Ended | |
| | | November 30, 2021 | | | November 30, 2020 | |
| FROM OPERATIONS: | | | | | | | | |
| Net investment income | | $ | 513,762 | | | $ | 556,375 | |
| Net realized gain from investment transactions | | | 13,246,537 | | | | 15,038,533 | |
| Net change in unrealized appreciation | | | 19,569,412 | | | | 14,539,350 | |
| Net increase in net assets resulting from operations | | | 33,329,711 | | | | 30,134,258 | |
| | | | | | | | | |
| DISTRIBUTIONS TO SHAREHOLDERS: | | | | | | | | |
| Total distributions to shareholders | | | (15,652,516 | ) | | | (9,144,023 | ) |
| | | | | | | | | |
| CAPITAL SHARE TRANSACTIONS (Note 4) | | | 1,605,134 | | | | (6,012,715 | ) |
| | | | | | | | | |
| Net increase in net assets | | | 19,282,329 | | | | 14,977,520 | |
| | | | | | | | | |
| NET ASSETS: | | | | | | | | |
| Beginning of year | | | 151,343,280 | | | | 136,365,760 | |
| | | | | | | | | |
| End of year | | $ | 170,625,609 | | | $ | 151,343,280 | |
| The accompanying notes are an integral part of these financial statements |
| | THE NORTH COUNTRY FUNDS | |
| |
| INTERMEDIATE BOND FUND |
| STATEMENTS OF CHANGES IN NET ASSETS |
| | | For the Year | | | For the Year | |
| | | Ended | | | Ended | |
| | | November 30, 2021 | | | November 30, 2020 | |
| FROM OPERATIONS: | | | | | | | | |
| Net investment income | | $ | 1,371,682 | | | $ | 1,431,392 | |
| Net realized gain from investment transactions | | | 135,416 | | | | 640,978 | |
| Net change in unrealized appreciation/(depreciation) | | | (3,234,237 | ) | | | 2,535,305 | |
| Net increase/(decrease) in net assets resulting from operations | | | (1,727,139 | ) | | | 4,607,675 | |
| | | | | | | | | |
| DISTRIBUTIONS TO SHAREHOLDERS: | | | | | | | | |
| Total distributions to shareholders | | | (1,602,758 | ) | | | (1,450,252 | ) |
| | | | | | | | | |
| CAPITAL SHARE TRANSACTIONS (Note 4) | | | (3,711,506 | ) | | | 9,893,163 | |
| | | | | | | | | |
| Net increase/(decrease) in net assets | | | (7,041,403 | ) | | | 13,050,586 | |
| | | | | | | | | |
| NET ASSETS: | | | | | | | | |
| Beginning of year | | | 92,354,184 | | | | 79,303,598 | |
| | | | | | | | | |
| End of year | | $ | 85,312,781 | | | $ | 92,354,184 | |
| The accompanying notes are an integral part of these financial statements |
| | THE NORTH COUNTRY FUNDS | |
| |
| LARGE CAP EQUITY FUND |
| FINANCIAL HIGHLIGHTS |
| |
| (For a fund share outstanding throughout each year) |
| | | For the Year Ended November 30, | |
| | | 2021 | | | 2020 | | | 2019 | | | 2018 | | | 2017 | |
| Net asset value, beginning of year | | $ | 23.48 | | | $ | 20.32 | | | $ | 18.99 | | | $ | 18.87 | | | $ | 15.54 | |
| | | | | | | | | | | | | | | | | | | | | |
| INCOME FROM INVESTMENT OPERATIONS: | | | | | | | | | | | | | | | | | | | | |
| Net investment income (1) | | | 0.07 | | | | 0.08 | | | | 0.08 | | | | 0.05 | | | | 0.07 | |
| Net realized and unrealized gain on investments | | | 4.74 | | | | 4.44 | | | | 2.55 | | | | 1.28 | | | | 3.59 | |
| Total from investment operations | | | 4.81 | | | | 4.52 | | | | 2.63 | | | | 1.33 | | | | 3.66 | |
| | | | | | | | | | | | | | | | | | | | | |
| LESS DISTRIBUTIONS: | | | | | | | | | | | | | | | | | | | | |
| Dividends from net investment income | | | (0.10 | ) | | | (0.08 | ) | | | (0.05 | ) | | | (0.07 | ) | | | (0.07 | ) |
| Distribution from net realized gains from security transactions | | | (2.33 | ) | | | (1.28 | ) | | | (1.25 | ) | | | (1.14 | ) | | | (0.26 | ) |
| Total distributions | | | (2.43 | ) | | | (1.36 | ) | | | (1.30 | ) | | | (1.21 | ) | | | (0.33 | ) |
| | | | | | | | | | | | | | | | | | | | | |
| Net asset value, end of year | | $ | 25.86 | | | $ | 23.48 | | | $ | 20.32 | | | $ | 18.99 | | | $ | 18.87 | |
| | | | | | | | | | | | | | | | | | | | | |
| Total return (2) | | | 22.73 | % | | | 23.90 | % | | | 15.25 | % | | | 7.52 | % | | | 23.96 | % |
| | | | | | | | | | | | | | | | | | | | | |
| RATIOS/SUPPLEMENTAL DATA: | | | | | | | | | | | | | | | | | | | | |
| Net assets, end of year (in 000’s) | | $ | 170,626 | | | $ | 151,343 | | | $ | 136,366 | | | $ | 127,978 | | | $ | 127,703 | |
| Ratios to average net assets: | | | | | | | | | | | | | | | | | | | | |
| Expenses | | | 0.99 | % | | | 1.02 | % | | | 1.04 | % | | | 1.03 | % | | | 1.03 | % |
| Net investment income | | | 0.31 | % | | | 0.40 | % | | | 0.41 | % | | | 0.29 | % | | | 0.39 | % |
| Portfolio turnover rate | | | 7 | % | | | 5 | % | | | 15 | % | | | 22 | % | | | 12 | % |
| (1) | Net investment income per share is based on average shares outstanding during the year. |
| (2) | Total returns are historical and assume changes in share price and reinvestment of dividends and capital gain distributions, if any. Total return does not reflect the deductions of taxes that a shareholder would pay on distributions or on the redemption of shares. |
| The accompanying notes are an integral part of these financial statements |
| | THE NORTH COUNTRY FUNDS | |
| |
| INTERMEDIATE BOND FUND |
| FINANCIAL HIGHLIGHTS |
| |
| (For a fund share outstanding throughout each year) |
| | | For the Year Ended November 30, | |
| | | 2021 | | | 2020 | | | 2019 | | | 2018 | | | 2017 | |
| Net asset value, beginning of year | | $ | 10.99 | | | $ | 10.58 | | | $ | 9.76 | | | $ | 10.17 | | | $ | 10.14 | |
| | | | | | | | | | | | | | | | | | | | |
| INCOME (LOSS) FROM INVESTMENT OPERATIONS: | | | | | | | | | | | | | | | | | | | | |
| Net investment income (1) | | | 0.17 | | | | 0.18 | | | | 0.21 | | | | 0.19 | | | | 0.17 | |
| Net realized and unrealized gain/(loss) on investments | | | (0.38 | ) | | | 0.41 | | | | 0.81 | | | | (0.41 | ) | | | 0.04 | |
| Total from investment operations | | | (0.21 | ) | | | 0.59 | | | | 1.02 | | | | (0.22 | ) | | | 0.21 | |
| | | | | | | | | | | | | | | | | | | | | |
| LESS DISTRIBUTIONS: | | | | | | | | | | | | | | | | | | | | |
| Dividends from net investment income | | | (0.17 | ) | | | (0.18 | ) | | | (0.20 | ) | | | (0.19 | ) | | | (0.18 | ) |
| Distribution from net realized gains from security transactions | | | (0.02 | ) | | | — | | | | — | | | | — | | | | — | |
| Total distributions | | | (0.19 | ) | | | (0.18 | ) | | | (0.20 | ) | | | (0.19 | ) | | | (0.18 | ) |
| | | | | | | | | | | | | | | | | | | | | |
| Net asset value, end of year | | $ | 10.59 | | | $ | 10.99 | | | $ | 10.58 | | | $ | 9.76 | | | $ | 10.17 | |
| | | | | | | | | | | | | | | | | | | | | |
| Total return (2) | | | (1.89 | )% | | | 5.66 | % | | | 10.53 | % | | | (2.17 | )% | | | 2.08 | % |
| | | | | | | | | | | | | | | | | | | | | |
| RATIOS/SUPPLEMENTAL DATA: | | | | | | | | | | | | | | | | | | | | |
| Net assets, end of year (in 000’s) | | $ | 85,313 | | | $ | 92,354 | | | $ | 79,304 | | | $ | 71,188 | | | $ | 73,902 | |
| Ratios to average net assets: | | | | | | | | | | | | | | | | | | | | |
| Expenses, before waiver | | | 0.85 | % | | | 0.86 | % | | | 0.88 | % | | | 0.89 | % | | | 0.88 | % |
| Expenses, after waiver | | | 0.82 | % | | | 0.86 | % | | | 0.88 | % | | | 0.89 | % | | | 0.88 | % |
| Net investment income | | | 1.54 | % | | | 1.68 | % | | | 2.00 | % | | | 1.93 | % | | | 1.67 | % |
| Portfolio turnover rate | | | 7 | % | | | 25 | % | | | 22 | % | | | 23 | % | | | 18 | % |
| (1) | Net investment income per share is based on average shares outstanding during the year. |
| (2) | Total returns are historical and assume changes in share price and reinvestment of dividends and capital gain distributions, if any. Total return does not reflect the deductions of taxes that a shareholder would pay on distributions or on the redemption of shares. |
| The accompanying notes are an integral part of these financial statements |
| | THE NORTH COUNTRY FUNDS | |
| | | |
| | NOTES TO FINANCIAL STATEMENTS | |
| | November 30, 2021 | |
| | | |
NOTE 1. ORGANIZATION
The North Country Funds (the “Trust”) was organized as a Massachusetts business trust on June 1, 2000, and registered under the Investment Company Act of 1940 as an open-end, diversified, management investment company on September 11, 2000. The Trust currently offers two series: the North Country Large Cap Equity Fund formerly known as the North Country Equity Growth Fund (the “Equity Fund”) and the North Country Intermediate Bond Fund (the “Bond Fund”, and together with the Equity Fund, the “Funds”). The Equity Fund’s principal investment objective is to provide investors with long-term capital appreciation while the Bond Fund seeks to provide investors with current income and total return with minimum fluctuations of principal value. Both Funds commenced operations on March 1, 2001.
The Bond Fund and the Equity Fund were initially organized on March 26, 1984 under New York law as Collective Investment Trusts sponsored by Glens Falls National Bank & Trust Company. Prior to their conversion to regulated investment companies (mutual funds) investor participation was limited to qualified employee benefit plans.
NOTE 2. SUMMARY OF SIGNIFICANT ACCOUNTING POLICIES
The following is a summary of the significant accounting policies followed by the Trust in the preparation of its financial statements. These policies are in conformity with accounting principles generally accepted in the United States of America (“GAAP”). The preparation of financial statements in conformity with these generally accepted accounting principles requires management to make estimates and assumptions that affect the reported amounts of assets and liabilities and disclosure of contingent assets and liabilities at the date of the financial statements and the reported amounts of revenue and expenses during the year. Actual results could differ from these estimates. The Funds are investment companies and accordingly follow the investment company accounting and reporting guidance of the Financial Accounting Standards Board (“FASB”) Accounting Standard Codification Topic 946 Financial Services - Investment Companies.
Security Valuation – Securities which are traded on a national securities exchange are valued at the last quoted sale price. NASDAQ traded securities are valued using the NASDAQ official closing price (“NOCP”). Investments for which no sales are reported are valued at the mean between the current bid and ask prices on the day of valuation. To the extent these securities are actively traded and valuation adjustments are not applied, they are categorized in level 1 of the fair value hierarchy described below. When an equity security is valued by the independent pricing service using factors other than market quotations or the market is considered inactive, they will be categorized in level 2.
Fixed income securities such as corporate bonds, municipal bonds, and U.S. government and agency obligations, when valued using market quotations in an active market, are categorized as level 1 securities. However, fair value may be determined using an independent pricing service that considers market observable data such as reported sales of similar securities, broker quotes, yields, bids, offers, and other reference data. These securities would be categorized as level 2 securities.
The fair value of mortgage-backed securities is estimated by an independent pricing service which uses models that consider interest rate movements, new issue information and other security pertinent data. Evaluations of tranches
| | THE NORTH COUNTRY FUNDS | |
| | | |
| | NOTES TO FINANCIAL STATEMENTS (Continued) | |
| | November 30, 2021 | |
| | | |
(non-volatile, volatile, or credit sensitive) are based on interpretations of accepted Wall Street modeling and pricing conventions. Mortgage-backed securities are categorized in level 2 of the fair value hierarchy described below to the extent the inputs are observable and timely.
Any securities or other assets for which market quotations are not readily available, or securities for which the last bid price does not accurately reflect the current value, are valued at fair value as determined by the Trust’s Fair Value Committee (the “Committee”) in accordance with the Trust’s Portfolio Securities Valuation Procedures (the “Procedures”). Pursuant to the Procedures, the Committee will consider, among others, the following factors to determine a security’s fair value: (i) the nature and pricing history (if any) of the security; (ii) whether any dealer quotations for the security are available; and (iii) possible valuation methodologies that could be used to determine the fair value of the security. In the absence of readily available market quotations, or other observable inputs, securities valued at fair value pursuant to the Procedures would be categorized as level 3.
Money market funds are valued at their net asset value of $1.00 per share and are categorized as level 1. Securities with maturities of 60 days or less may be valued at amortized cost, which approximates fair value and would be categorized as level 2. The ability of issuers of debt securities held by the Funds to meet their obligations may be affected by economic or political developments in a specific country or region.
The Funds utilize various methods to measure the fair value of most of their investments on a recurring basis. GAAP establishes a hierarchy that prioritizes inputs to valuation methods. The three levels of input are:
Level 1 – Unadjusted quoted prices in active markets for identical assets and liabilities that the Funds have the ability to access.
Level 2 – Observable inputs other than quoted prices included in level 1 that are observable for the asset or liability, either directly or indirectly. These inputs may include quoted prices for the identical instrument on an inactive market, prices for similar instruments, interest rates, prepayment speeds, credit risk, yield curves, default rates and similar data.
Level 3 – Unobservable inputs for the asset or liability, to the extent relevant observable inputs are not available, representing the Funds’ own assumptions about the assumptions a market participant would use in valuing the asset or liability, and would be based on the best information available.
The availability of observable inputs can vary from security to security and is affected by a wide variety of factors, including, for example, the type of security, whether the security is new and not yet established in the marketplace, the liquidity of markets, and other characteristics particular to the security. To the extent that valuation is based on models or inputs that are less observable or unobservable in the market, the determination of fair value requires more judgment. Accordingly, the degree of judgment exercised in determining fair value is greatest for instruments categorized in Level 3.
| | THE NORTH COUNTRY FUNDS | |
| | | |
| | NOTES TO FINANCIAL STATEMENTS (Continued) | |
| | November 30, 2021 | |
| | | |
The inputs used to measure fair value may fall into different levels of the fair value hierarchy. In such cases, for disclosure purposes, the level in the fair value hierarchy within which the fair value measurement falls in its entirety, is determined based on the lowest level input that is significant to the fair value measurement in its entirety.
The following is a summary of inputs used as of November 30, 2021, in valuing the Funds’ assets carried at fair value.
North Country Large Cap Equity Fund:
| Assets | | Level 1 | | | Level 2 | | | Level 3* | | | Total | |
| Common Stock ** | | $ | 167,123,941 | | | $ | — | | | $ | — | | | $ | 167,123,941 | |
| Money Market Fund | | | 3,565,852 | | | | — | | | | — | | | | 3,565,852 | |
| Total | | $ | 170,689,793 | | | $ | — | | | $ | — | | | $ | 170,689,793 | |
North Country Intermediate Bond Fund:
| Assets | | Level 1 | | | Level 2 | | | Level 3* | | | Total | |
| Corporate Bonds** | | $ | — | | | $ | 61,614,402 | | | $ | — | | | $ | 61,614,402 | |
| U.S. Government Agency Obligations | | | — | | | | 19,945,394 | | | | — | | | | 19,945,394 | |
| Money Market Fund | | | 3,288,033 | | | | — | | | | — | | | | 3,288,033 | |
| Total | | $ | 3,288,033 | | | $ | 81,559,796 | | | $ | — | | | $ | 84,847,829 | |
| * | The Funds did not hold any Level 3 investments during the period. |
| ** | See Schedule of Investments for industry classifications. |
Federal Income Taxes – The Funds make no provision for federal income or excise tax. The Funds intend to qualify each year as regulated investment companies (“RICs”) under subchapter M of the Internal Revenue Code of 1986, as amended, by complying with the requirements applicable to RICs and by distributing substantially all of their taxable income. The Funds also intend to distribute sufficient net investment income and net capital gains, if any, so that they will not be subject to excise tax on undistributed income and gains. If the required amount of net investment income or gains is not distributed, the Funds could incur a tax expense.
Management has analyzed the Fund’s tax positions and has concluded that no liability for unrecognized tax benefits should be recorded related to uncertain tax positions taken on returns filed for open tax years November 30, 2018 to November 30, 2020 or expected to be taken in the Fund’s November 30, 2021 year-end tax returns. The Funds recognize interest and penalties, if any, related to unrecognized tax benefits as income tax expense in the statements of operations. The Funds identify their major tax jurisdictions as U.S. Federal and New York State.
| | THE NORTH COUNTRY FUNDS | |
| | | |
| | NOTES TO FINANCIAL STATEMENTS (Continued) | |
| | November 30, 2021 | |
| | | |
Dividends and Distributions – The Bond Fund pays dividends from net investment income on a monthly basis. The Equity Fund will pay dividends from net investment income, if any, on an annual basis. Both Funds will declare and pay distributions from net realized capital gains, if any, annually. Income and capital gain distributions to shareholders are recorded on the ex-dividend date and are determined in accordance with income tax regulations, which may differ from generally accepted accounting principles.
Security Transactions – Securities transactions are recorded no later than the first business day after the trade date, except for reporting purposes when trade date is used. Realized gains and losses on sales of securities are calculated on the identified cost basis. Dividend income is recorded on the ex-dividend date and interest income is recorded on an accrual basis. Discounts and premiums on securities purchased are amortized over the life of the respective securities using the effective yield method. Withholding taxes on foreign dividends have been provided for in accordance with the Funds’ understanding of the applicable country’s tax rules and rates.
Expenses – Most expenses of the Trust can be directly attributed to a Fund. Expenses which are not readily identifiable to a specific Fund are allocated in such a manner as deemed equitable, taking into consideration the nature and type of expense and the relative sizes of the Funds.
Indemnification – The Trust indemnifies its officers and trustees for certain liabilities that may arise from the performance of their duties to the Trust. Additionally, in the normal course of business, each Fund enters into contracts that contain a variety of representations and warranties and which provide general indemnities. A Fund’s maximum exposure under these arrangements is unknown, as this would involve future claims that may be made against the Fund that have not yet occurred. However, based on experience, the Funds expect the risk of loss due to these warranties and indemnities to be remote.
Cash and cash equivalents – Cash and cash equivalents are held with a financial institution. The assets of the Funds may be placed in deposit accounts at U.S. banks and such deposits generally exceed Federal Deposit Insurance Corporation (“FDIC”) insurance limits. The FDIC insures deposit accounts up to $250,000 for each accountholder. The counterparty is generally a single bank rather than a group of financial institutions; thus there may be a greater counterparty credit risk. The Funds place deposits only with those counterparties which are believed to be creditworthy and there has been no history of loss.
NOTE 3. INVESTMENT ADVISORY AGREEMENT AND TRANSACTIONS WITH RELATED PARTIES
The Trust has entered into an investment advisory agreement (the “Advisory Agreement”) with North Country Investment Advisers, Inc. (the “Adviser”). Pursuant to the Advisory Agreement, the Adviser is responsible for formulating the Trust’s investment programs, making day-to-day investment decisions and engaging in portfolio transactions, subject to the authority of the Board of Trustees. Under the terms of the agreement, each Fund pays a fee, calculated daily and paid monthly, at an annual rate of 0.75% and 0.50% of the average daily net assets of the Equity Fund and Bond Fund, respectively. For the year ended November 30, 2021, the Adviser received advisory fees of $1,230,738 from the Equity Fund and $444,290 from the Bond Fund.
| | THE NORTH COUNTRY FUNDS | |
| | | |
| | NOTES TO FINANCIAL STATEMENTS (Continued) | |
| | November 30, 2021 | |
| | | |
Effective April 1, 2021, North Country Investment Advisers, Inc. (the “Adviser”) agreed to waive, through March 31, 2022, a portion of its advisory fees for the Bond Fund, which reduces the 0.50% contractual fee rate by 0.05% to 0.45%. This waiver may not be terminated prior to that date without the approval of the Trustees of The North Country Funds. For the year ended November 30, 2021, the Advisor waived $29,377 of its advisory fee. This amount waived is not subject to recoupment.
The Trust has entered into an Underwriting Agreement with Northern Lights Distributors, LLC (“the Distributor”) to serve as the principal underwriter for each Fund and distributor for each Fund’s shares.
In addition, certain affiliates of the Distributor provide services to the Funds as follows:
Ultimus Fund Solutions, LLC (“UFS”) – UFS, an affiliate of the Distributor, provides administration, fund accounting, and transfer agent services to the Trust. Pursuant to separate servicing agreements with UFS, the Fund pays UFS customary fees for providing administration, fund accounting, and transfer agency services to the Fund. Certain officers of the Trust are also officers of UFS, and are not paid any fees directly by the Funds for serving in such capacities.
Northern Lights Compliance Services, LLC (“NLCS”) – NLCS, an affiliate of UFS and the Distributor, provides a Chief Compliance Officer to the Trust, as well as related compliance services, pursuant to a consulting agreement between NLCS and the Trust. Under the terms of such agreement, NLCS receives customary fees from the Funds.
BluGiant, LLC (“BluGiant”), an affiliate of UFS and the Distributor, provides EDGAR conversion and filing services as well as print management services for the Funds on an ad-hoc basis. For the provision of these services, BluGiant receives customary fees from the Funds.
Certain officers and/or trustees of the Adviser are also officers/trustees of the Trust.
| | THE NORTH COUNTRY FUNDS | |
| | | |
| | NOTES TO FINANCIAL STATEMENTS (Continued) | |
| | November 30, 2021 | |
| | | |
NOTE 4. CAPITAL SHARE TRANSACTIONS
At November 30, 2021, there were an unlimited number of shares authorized with no par value. Paid in capital for the Equity Fund and Bond Fund amounted to $47,486,384 and $83,032,024, respectively.
Transactions in capital shares were as follows:
Equity Fund:
| | | For the Year | | | For the Year | |
| | | Ended | | | Ended | |
| | | November 30, 2021 | | | November 30, 2020 | |
| | | Shares | | | Amount | | | Shares | | | Amount | |
| Shares sold | | | 388,578 | | | $ | 9,092,502 | | | | 895,280 | | | $ | 17,523,730 | |
| Shares issued for reinvestment of dividends | | | 701,718 | | | | 14,897,468 | | | | 89,207 | | | | 1,682,446 | |
| Shares redeemed | | | (940,379 | ) | | | (22,384,836 | ) | | | (1,248,045 | ) | | | (25,218,891 | ) |
| Net increase (decrease) | | | 149,917 | | | $ | 1,605,134 | | | | (263,558 | ) | | $ | (6,012,715 | ) |
Bond Fund:
| | | For the Year | | | For the Year | |
| | | Ended | | | Ended | |
| | | November 30, 2021 | | | November 30, 2020 | |
| | | Shares | | | Amount | | | Shares | | | Amount | |
| Shares sold | | | 1,077,999 | | | $ | 11,621,164 | | | | 1,628,904 | | | $ | 17,607,247 | |
| Shares issued for reinvestment of dividends | | | 5,141 | | | | 55,306 | | | | 5,630 | | | | 60,781 | |
| Shares redeemed | | | (1,429,368 | ) | | | (15,387,976 | ) | | | (725,357 | ) | | | (7,774,865 | ) |
| Net increase (decrease) | | | (346,228 | ) | | $ | (3,711,506 | ) | | | 909,177 | | | $ | 9,893,163 | |
| | THE NORTH COUNTRY FUNDS | |
| | | |
| | NOTES TO FINANCIAL STATEMENTS (Continued) | |
| | November 30, 2021 | |
| | | |
NOTE 5. INVESTMENTS
Investment transactions, excluding short-term securities, for the year ended November 30, 2021 were as follows:
| | | | | | Bond Fund | |
| | | | | | Excluding U.S. | | | U.S. | |
| | | | | | Government | | | Government | |
| | | Equity Fund | | | Securities | | | Securities | |
| Purchases | | $ | 10,500,966 | | | $ | 5,869,200 | | | $ | 0 | |
| Sales | | $ | 23,727,749 | | | $ | 7,167,955 | | | $ | 3,046,544 | |
| | | | | | | | | | | | | |
NOTE 6. AGGREGATE UNREALIZED APPRECIATION AND DEPRECIATION – TAX BASIS
The identified cost of investments in securities owned by each Fund for federal income tax purposes, and its respective gross unrealized appreciation and depreciation at November 30, 2021, were as follows:
| | | | | | Gross | | | Gross | | | Net Unrealized | |
| | | Tax | | | Unrealized | | | Unrealized | | | Appreciation | |
| Fund | | Cost | | | Appreciation | | | Depreciation | | | (Depreciation) | |
| Equity | | $ | 61,228,841 | | | $ | 110,083,664 | | | $ | (622,712 | ) | | $ | 109,460,952 | |
| Intermediate Bond | | $ | 82,735,107 | | | $ | 2,818,941 | | | $ | (706,219 | ) | | $ | 2,112,722 | |
NOTE 7. TAX INFORMATION
The tax character of distributions paid during the fiscal year ended November 30, 2021 and fiscal year ended November 30, 2020 was as follows:
For the year ended November 30, 2021:
| | | Ordinary | | | Long-Term | | | Return of | | | | |
| | | Income | | | Capital Gains | | | Capital | | | Total | |
| North Country Large Cap Equity Fund | | $ | 611,331 | | | $ | 15,041,185 | | | $ | — | | | $ | 15,652,516 | |
| North Country Intermediate Bond Fund | | | 1,440,392 | | | | 162,366 | | | | — | | | | 1,602,758 | |
For the year ended November 30, 2020:
| | | Ordinary | | | Long-Term | | | Return of | | | | |
| | | Income | | | Capital Gains | | | Capital | | | Total | |
| North Country Large Cap Equity Fund | | $ | 522,754 | | | $ | 8,621,269 | | | $ | — | | | $ | 9,144,023 | |
| North Country Intermediate Bond Fund | | | 1,450,252 | | | | — | | | | — | | | | 1,450,252 | |
| | THE NORTH COUNTRY FUNDS | |
| | | |
| | NOTES TO FINANCIAL STATEMENTS (Continued) | |
| | November 30, 2021 | |
| | | |
As of November 30, 2021, the components of distributable earnings/ (deficit) on a tax basis were as follows:
| | | Undistributed | | | Undistributed | | | Post October Loss | | | Capital Loss | | | Other | | | Unrealized | | | Total | |
| | | Ordinary | | | Long-Term | | | and | | | Carry | | | Book/Tax | | | Appreciation | | | Accumulated | |
| | | Income | | | Capital Gains | | | Late Year Loss | | | Forwards | | | Differences | | | (Depreciation) | | | Earnings/(Deficits) | |
| North Country Large Cap Equity Fund | | $ | 594,682 | | | $ | 13,083,591 | | | $ | — | | | $ | — | | | $ | — | | | $ | 109,460,952 | | | $ | 123,139,225 | |
| North Country Intermediate Bond Fund | | | 80,685 | | | | 87,350 | | | | — | | | | — | | | | — | | | | 2,112,722 | | | | 2,280,757 | |
| | | | | | | | | | | | | | | | | | | | | | | | | | | | | |
NOTE 8. CONTROL OWNERSHIP
The beneficial ownership, either directly or indirectly, of more than 25% of the voting securities of a Fund creates presumption of control of the Fund, under Section 2(a) 9 of the Act. As of November 30, 2021, SEI Private Trust Company, an account holding shares for the benefit of others in nominee name, held approximately 87% of the voting securities of the Equity Fund and approximately 97% of the Bond Fund.
NOTE 9. SUBSEQUENT EVENTS
Subsequent events after the date of the Statements of Assets and Liabilities have been evaluated through the date the financial statements were issued. Except as noted below, management has concluded that there is no impact requiring additional adjustment or disclosure in the financial statements. On December 8, 2021, the Bond Fund paid an ordinary income dividend of $0.0243 and a long-term capital gain dividend of $0.0109 per share to shareholders of record on December 7, 2021. On December 8, 2021, the Equity Fund paid an ordinary income dividend of $0.0661 per share, a short-term capital gain dividend of $ 0.0244 per share and a long-term capital gain dividend of $1.9901 per share to shareholders of record on December 7, 2021.

REPORT OF INDEPENDENT REGISTERED PUBLIC ACCOUNTING FIRM
To the Shareholders and Board of Trustees of
The North Country Funds
Opinion on the Financial Statements
We have audited the accompanying statements of assets and liabilities, including the schedules of investments, of The North Country Funds comprising North Country Large Cap Equity Fund and North Country Intermediate Bond Fund (the “Funds”) as of November 30, 2021, the related statements of operations for the year then ended, the statements of changes in net assets for each of the two years in the period then ended, the related notes, and the financial highlights for each of the five years in the period then ended (collectively referred to as the “financial statements”). In our opinion, the financial statements present fairly, in all material respects, the financial position of each of the Funds as of November 30, 2021, the results of their operations for the year then ended, the changes in net assets for each of the two years in the period then ended, and the financial highlights for each of the five years in the period then ended, in conformity with accounting principles generally accepted in the United States of America.
Basis for Opinion
These financial statements are the responsibility of the Funds’ management. Our responsibility is to express an opinion on the Funds’ financial statements based on our audits. We are a public accounting firm registered with the Public Company Accounting Oversight Board (United States) (“PCAOB”) and are required to be independent with respect to the Funds in accordance with the U.S. federal securities laws and the applicable rules and regulations of the Securities and Exchange Commission and the PCAOB.
We conducted our audits in accordance with the standards of the PCAOB. Those standards require that we plan and perform the audit to obtain reasonable assurance about whether the financial statements are free of material misstatement whether due to error or fraud.
Our audits included performing procedures to assess the risks of material misstatement of the financial statements, whether due to error or fraud, and performing procedures that respond to those risks. Such procedures included examining, on a test basis, evidence regarding the amounts and disclosures in the financial statements. Our procedures included confirmation of securities owned as of November 30, 2021, by correspondence with the custodian. Our audits also included evaluating the accounting principles used and significant estimates made by management, as well as evaluating the overall presentation of the financial statements. We believe that our audits provide a reasonable basis for our opinion.
We have served as the Funds’ auditor since 2004.

COHEN & COMPANY, LTD.
Cleveland, Ohio
January 24, 2022
COHEN & COMPANY, LTD.
800.229.1099 | 866.818.4538 fax | cohencpa.com
Registered with the Public Company Accounting Oversight Board
| | THE NORTH COUNTRY FUNDS | |
| | | |
| | ADDITIONAL INFORMATION (Unaudited) | |
| | | |
FACTORS CONSIDERED BY THE INDEPENDENT TRUSTEES IN APPROVING THE INVESTMENT ADVISORY AGREEMENT
At a meeting (the “Meeting”) of the Board of Trustees (the “Board” or the “Trustees”) held on July 20, 2021, a majority of the Board, including a majority of trustees who are not “interested persons” of the Trust, as that term is defined in Section 2(a)(19) of the Investment Company Act of 1940, as amended (hereafter, the “Independent Trustees”), unanimously approved the continuance of the investment advisory agreement (the “Advisory Agreement”) between North Country Investment Advisers, Inc. (“NCIA” or the “Adviser”) and the Funds. Fund counsel discussed with the Board its fiduciary responsibility to shareholders and the importance of assessing certain specific factors in its deliberations. Prior to the Meeting, the Adviser provided the Board with a number of written materials, including information relating to: a) the terms of the Advisory Agreement and fee arrangements with the Funds; b) the Adviser’s management and investment personnel; c) the financial condition and stability of the Adviser; d) data comparing each Fund’s fees, operating expenses and performance with that of a group of mutual funds in the same category, as determined by Lipper, Inc., that the Funds’ administrator determined were similar in size to the Funds (each, a “Peer Group”); and e) past performance of each Fund as compared to its respective benchmark. In addition, the Board engaged in in-person discussions with representatives of the Adviser. The Board also met outside the presence of the Adviser to consider this matter and consulted with independent counsel and the Funds’ Chief Compliance Officer.
The Board, including the Independent Trustees, unanimously approved continuance of the Advisory Agreement based upon its review of the written materials provided at the Meeting, the reports provided at each quarterly meeting of the Board, the Board’s discussions with key personnel of the Adviser, and the Board’s deliberations. In their deliberations, the Trustees did not identify any particular information that was all-important or controlling, and individual Trustees may have attributed different weights to the various factors. Below is a summary of the Board’s conclusions regarding various factors relevant to approval of continuance of the Advisory Agreement:
Nature, Extent and Quality of Services. The Board examined the nature, extent and quality of the services provided by the Adviser to the Funds. The Board, including the Independent Trustees, reviewed the qualifications of the Adviser’s key personnel, including the experience of the Funds’ portfolio managers, and agreed that sharing resources with its parent bank is a positive aspect of the Adviser’s services to the Funds. The Trustees discussed their satisfaction with the Adviser’s compliance program and noted the financial strength and stability of the Adviser. Based on these considerations, the Trustees determined that the Adviser has the capabilities, resources and personnel necessary to manage the Funds and concluded that they were satisfied with the nature, extent and quality of the services provided to the Funds under the Advisory Agreement.
Performance of the Adviser. The Independent Trustees discussed in detail the information provided to them regarding each Fund’s performance over various time periods ended May 31, 2021 as compared to the arithmetic average of the total return of the Funds’ respective Peer Groups. The Independent Trustees also discussed in detail the information provided to them regarding each Fund’s performance over various time periods ended June 31, 2021 compared to its benchmarks and to the BAML Govt. Corp. 1-10A Index (“BAML Index”) (a broad measure of performance of bonds with maturities of less than 10 years), with respect to the Bond Fund. The Trustees noted that the Bond Fund outperformed 1 of the 10 funds in the Peer Group for the 1-year period and 2 out of 10 funds for the 3-year period, but underperformed the Peer Group for the 5- and 10- year periods. The Trustees further noted that the Bond Fund outperformed the Barclays Index for the 1-year period but underperformed for the 3-year, 5-year, and 10-year periods. The Trustees noted the Bond Fund outperformed the BAML Index for the 3-year period but underperformed for the 1-year, 5-year and 10-year periods. The Trustees then noted that the Large Cap Fund outperformed 3 out of 12 funds in the Peer Group for the 1-year period, 7 out of 12 funds for the 3-year period, 8 out of 12 funds for the 5-year period, and 7 out of 8 funds for the 10-year period. The Trustees then noted that the Large Cap Fund outperformed the S&P 500 for the 5-year period but underperformed for the 1 -year, 3-year, and 10 -year periods. The Large Cap Fund also outperformed the Lipper Large Cap Core Index (“Lipper LCC Index”) for the 3-year, 5-year, and 10 -year periods and underperformed for the 1-year period. The Trustees considered that the Funds’ performance reflects, in part, the conservative manner in which they are managed and concluded that the investment performance of each Fund was sufficient to warrant continuation of the Advisory Agreement.
Cost of Services. With regard to cost of services and fees and expenses, the Trustees reviewed comparative fees charged by advisers to the Peer Group. The Trustees noted that the Bond Fund’s effective management fee was the highest of the Peer Group, while net expenses as of November 30, 2020 were between the median and the high for the Peer
| | THE NORTH COUNTRY FUNDS | |
| | | |
| | ADDITIONAL INFORMATION (Unaudited)(Continued) | |
| | | |
Group. The Trustees also noted that as of November 30, 2020, the Large Cap Fund’s effective management fee was the highest when compared to the Peer Group and net expenses were between the average and the high for the Peer Group.
The Trustees considered that, at the Independent Trustees’ request, the Adviser agreed to voluntarily waive 0.05% of its advisory fees for the Bond Fund for a one-year period that began on April 1, 2021.
The Trustees concluded that the cost of the services provided by the Adviser is within a reasonable range and supported continuation of the Advisory Agreement.
Profitability. Trustees considered the Adviser’s profits realized in connection with the operation of the Funds. The Trustees noted that the Adviser was not receiving 12b-1 fees, soft dollars or affiliated brokerage fees in connection with its services to the Funds. The Independent Trustees considered that NCIA had voluntarily limited the overall expense ratio of each Fund from its inception through the fiscal year ended November 30, 2009 and noted that the Funds are continuing to operate within those limitations. The Independent Trustees also noted NCIA’s agreement to voluntarily waive 0.05% of its advisory fees for the Bond Fund for a one-year period that began on April 1, 2021. The Trustees concluded that, based on the quality of services provided, the profitability of the Adviser’s relationship with the Funds warranted continuation of the Advisory Agreement.
Economies of Scale. The Trustees noted that the Adviser represented that certain efficiencies may be realized when the level of assets under management in each Fund nears $500 million. The Trustees concluded that they would re-visit the issue of certain benefits to the Funds’ shareholders that might ensue from economies of scale following any significant growth in Fund assets or other change in circumstances.
Conclusion. Having requested and received such information from the Adviser as the Board believed to be reasonably necessary to evaluate the terms of the Advisory Agreement, and with the assistance of independent legal counsel, the Board concluded that the overall arrangements provided under the terms of the Advisory Agreement were reasonable, and that continuance of the Advisory Agreement was in the best interests of the Funds’ shareholders.
| | THE NORTH COUNTRY FUNDS | |
| | | |
| INFORMATION REGARDING |
| TRUSTEES AND OFFICERS (Unaudited) |
The following table provides information regarding each Independent Trustee:
Name, Address(1)
and Year of Birth | Position(s)
Held with the
Fund | Term of Office
and Length of
Time Served | Principal Occupation(s)
During Past 5 Years | Number of
Portfolios in Fund
Complex Overseen
by Trustee | Other
Directorships
Held by
Trustees |
John C. Olsen
Born in 1955 | Chairman of the Board and Trustee | Indefinite Since 2004 (Chairman since 2021) | Retired (2019–Present); Firm Ambassador, Bonadio & Co., LLP (2018–2020); CPA, Partner of Bonadio & Co., LLP (2008–2018). | 2 | None |
James E. Amell
Born in 1959 | Trustee | Indefinite Since 2017 | Director and Shareholder of Marvin and Co. PC (CPA Firm) (1981–Present). | 2 | None |
Keith P. McAfee
Born in 1963 | Trustee | Indefinite Since 2017 | Retired (2020–Present); Vice President of Electric Operations for New York, National Grid (2011–2020); Employee, National Grid (1992–2020). | 2 | None |
Amie Gonzales
Born in 1980 | Trustee | Indefinite Since 2021 | President (2019–Present), Hunt Companies Inc; Project Manager (2012–2019), Hunt Companies Inc. | 2 | None |
The following table provides information regarding each Trustee who is an “interested person” of the Trust, as defined in the 1940 Act:
Name, Address(1)
and Age | Position(s)
Held with the
Fund | Term of Office
and Length of
Time Served | Principal Occupation(s)
During Past 5 Years | Number of
Portfolios in Fund
Complex Overseen
by Trustee | Other
Directorships
Held by
Trustees |
John E. Arsenault *
Born in 1947 | Trustee | Indefinite Since 2009 | Retired (2013–Present). | 2 | None |
Thomas L. Hoy**
Born in 1948 | Trustee | Indefinite Since 2015 | Consultant and Chairman of the Board, Arrow Financial Corp. and Glen Falls National Bank (2005–Present); Director, New York Business Development Corp. (2012–Present); Chairman of the Board, AAA Northway (travel insurance and auto services) (1990– Present). | 2 | Director, Federal Home Loan Bank of New York (2012–Present) |
| * | Mr. Arsenault is an “interested person” because of his former position as an officer of the Adviser. |
| ** | Mr. Hoy is an “interested person” because of his position with Arrow Financial Corp., the parent holding company of the Adviser and GFNB. |
| (1) | The business address for each Trustee is 4221 North 203rd Street, Elkhorn, Nebraska 68022 |
| | THE NORTH COUNTRY FUNDS | |
| | | |
| INFORMATION REGARDING |
| TRUSTEES AND OFFICERS (Unaudited)(Continued) |
Name, Address
and Age | Position(s)
Held with the
Fund | Term of Office *
and Length of
Time
Served | Principal Occupation(s)
During Past 5 Years | Number of
Portfolios in Fund
Complex Overseen
by Trustee | Other
Directorships
Held by
Trustees |
James Colantino(1)
Born in 1969 | President | Since 2012 | Senior Vice President of Fund Administration (2012– Present), Ultimus Fund Solutions, LLC. | N/A | None |
James Ash(2)
Born in 1976 | Chief Compliance Officer | Since 2019 | Senior Compliance Officer, Northern Lights Compliance, LLC (2019–Present); Senior Vice President, National Sales Gemini Fund Services, LLC (2017–2019); Senior Vice President and Director of Legal Administration, Gemini Fund Services, LLC (2012–2017). | N/A | None |
Richard Gleason(1)
Born in 1977 | Treasurer | Since 2017 | Assistant Vice President of Fund Administration (2012-Present), Ultimus Fund Solutions, LLC. | N/A | None |
Colleen A. Murray(2)
Born in 1977 | AML Compliance Officer | Since 2014 | Assistant Vice President (2010-Present); GFNB & SNB Bank Secrecy Act Officer (2014–Present). | N/A | None |
Sean Lawler(1)
Born in 1987 | Secretary | Since 2020 | Senior Legal Administrator (2020 – Present), Ultimus Fund Solutions, LLC; Legal Administrator (2014–2020), Gemini Fund Services, LLC. | N/A | None |
| * | Officers of the Trust are elected annually. |
| (1) | The business address of this officer is 80 Arkay Drive, Suite 110, Hauppauge, New York 11788 |
| (2) | The business address of this officer is 4221 North 203rd Street, Elkhorn, Nebraska 68022 |
The Trust’s Statement of Additional Information includes additional information about the Trustees of the Trust and is available, without charge, upon request by calling 1-888-350-2990.
| | THE NORTH COUNTRY FUNDS | |
| | | |
| ADDITIONAL INFORMATION (Unaudited) |
LIQUIDITY RISK MANAGEMENT PROGRAM
The Funds have adopted and implemented a written liquidity risk management program as required by Rule 22e-4 (the “Liquidity Rule”) under the Investment Company Act. The program is reasonably designed to assess and manage the Fund’s liquidity risk, taking into consideration, among other factors, the Funds’ investment strategy and the liquidity of its portfolio investments during normal and reasonably foreseeable stressed conditions; its short and long-term cash flow projections; and its cash holdings and access to other funding sources.
During the year ended November 30, 2021, the Trust’s Liquidity Risk Management Program Committee (the “Committee”) reviewed the Funds’ investments and determined that the Funds held adequate levels of cash and highly liquid investments to meet shareholder redemption activities in accordance with applicable requirements. Accordingly, the Committee concluded that (i) the Funds’ liquidity risk management program is reasonably designed to prevent violations of the Liquidity Rule and (ii) the Funds’ liquidity risk management program has been effectively implemented.
| | THE NORTH COUNTRY FUNDS | |
| |
| DISCLOSURE OF FUND EXPENSES (Unaudited) |
As a shareholder of a Fund in The North Country Funds, you incur ongoing costs, including management fees and other Fund expenses. This example is intended to help you understand your ongoing costs (in dollars) of investing in the Funds and to compare these costs with the ongoing costs of investing in other mutual funds. Please note, the expenses shown in the tables are meant to highlight ongoing costs only and do not reflect any transactional costs, such as sales charges (loads), or contingent deferred sales charges (CDSCs) on redemptions.
This example is based on an investment of $1,000 invested at June 1, 2021 and held until November 30, 2021.
Actual Expenses: The “Actual” section of the table provides information about actual account values and actual expenses. You may use the information in this line, together with the amount you invested, to estimate the expenses that you paid over the period. Simply divide your account value by $1,000 (for example, an $8,600 account value divided by $1,000 = 8.6), then multiply the result by the number in the column under the heading entitled “Expenses Paid During the Period” to estimate the expenses you paid on your account during the period.
Hypothetical Examples for Comparison Purposes: The “Hypothetical” section of the table below provides information about hypothetical account values and hypothetical expenses based on the Fund’s actual expense ratio and an assumed rate of return of 5% per year before expenses, which is not the Fund’s actual return. The hypothetical account values and expenses may not be used to estimate the actual ending account balance or expenses you paid for the period. You may use this information to compare the ongoing costs of investing in the Fund with other funds. To do so, compare this 5% hypothetical example with the 5% hypothetical examples that appear in the shareholder reports of other funds.
Please note that the expenses shown in the table are meant to highlight your ongoing costs only and do not reflect any transactional costs which may be applicable to your account. Therefore, the “Hypothetical” example is useful in comparing ongoing costs only, and will not help you determine the relative total costs of owning different funds. In addition, if transactional costs were included, your costs would have been higher.
| | | Beginning | | Ending | | Expense | | Expenses Paid During |
| | | Account Value | | Account Value | | Ratio | | the Period* |
| | | (6/1/21) | | (11/30/21) | | (Annualized) | | (6/1/21 – 11/30/21) |
| Large Cap Equity Fund | | | | | | | | |
| Actual | | $1,000.00 | | $1,088.40 | | 0.99% | | $5.18 |
| Hypothetical | | | | | | | | |
| (5% return before expenses) | | $1,000.00 | | $1020.10 | | 0.99% | | $5.01 |
| Intermediate Bond Fund | | | | | | | | |
| Actual | | $1,000.00 | | $995.00 | | 0.79% | | $3.95 |
| Hypothetical | | | | | | | | |
| (5% return before expenses) | | $1,000.00 | | $1,021.11 | | 0.79% | | $4.00 |
| * | Expenses are equal to the Fund’s annualized expense ratio multiplied by the average account value over the period, multiplied by 183 days divided by 365 days. |
Rev July 2011
| FACTS | WHAT DO THE NORTH COUNTRY FUNDS DO WITH YOUR PERSONAL INFORMATION? |
| Why? | Financial companies choose how they share your personal information. Federal law gives consumers the right to limit some but not all sharing. Federal law also requires us to tell you how we collect, share, and protect your personal information. Please read this notice carefully to understand what we do. |
| What? | The types of personal information we collect and share depend on the product or service you have with us. This information can include: ● Social Security number and wire transfer instructions ● account transactions and transaction history ● investment experience and purchase history When you are no longer our customer, we continue to share your information as described in this notice. |
| How? | All financial companies need to share customers’ personal information to run their everyday business. In the section below, we list the reasons financial companies can share their customers’ personal information; the reasons The North Country Funds (“The Funds”) choose to share; and whether you can limit this sharing. |
| Reasons we can share your personal information | | Do The Funds share? | | Can you limit this sharing? |
| For our everyday business purposes — such as to process your transactions, maintain your account(s), respond to court orders and legal investigations, or report to credit bureaus | | Yes | | No |
| For our marketing purposes — to offer our products and services to you | | Yes | | No |
| For joint marketing with other financial companies | | Yes | | No |
| For our affiliates’ everyday business purposes — information about your transactions and experiences | | Yes | | No |
| For our affiliates’ everyday business purposes — information about your creditworthiness | | No | | We don’t share |
| For our affiliates to market to you | | No | | We don’t share |
| For nonaffiliates to market to you | | No | | We don’t share |
| Questions? | Call 1-888-350-2990 |
| Who we are |
Who is providing this notice? | The North Country Funds |
| What we do |
How do The Funds protect my personal information? | To protect your personal information from unauthorized access and use, we use security measures that comply with federal law. These measures include computer safeguards and secured files and buildings. We restrict access to nonpublic personal information about you to those employees who need to know that information to provide products or services to you. |
How do The Funds collect my personal information? | We collect your personal information, for example, when you ● open an account or deposit money ● direct us to buy securities or direct us to sell your securities ● seek advice about your investments We also collect your personal information from others, such as credit bureaus, affiliates, or other companies. |
Why can’t I limit all sharing? | Federal law gives you the right to limit only ● sharing for affiliates’ everyday business purposes — information about your creditworthiness ● affiliates from using your information to market to you ● sharing for non-affiliates to market to you ● State laws and individual companies may give you additional rights to limit sharing. |
| Definitions |
| Affiliates | Companies related by common ownership or control. They can be financial and nonfinancial companies. ● Our affiliates include financial companies such as Glens Falls National Bank and Trust Company and North Country Investment Advisers. |
| Nonaffiliates | Companies not related by common ownership or control. They can be financial and nonfinancial companies. ● The Funds do not share with nonaffiliates so they can market you. |
| Joint marketing | A formal agreement between nonaffiliated financial companies that together market financial products or services to you. ● The Funds do not jointly market. |
How to Obtain Proxy Voting Information
Information regarding how the Funds voted proxies relating to portfolio securities during the most recent 12-month period ending June 30, as well as a description of the policies and procedures that the Funds use to determine how to vote proxies is available without charge, upon request, by calling toll-free 1-888-350-2990 or by referring to the Securities and Exchange Commission’s (“SEC”) website at http://www.sec.gov.
How to Obtain 1st and 3rd Fiscal Quarter Portfolio Holdings
Each Fund files its complete schedule of portfolio holdings with the SEC for the first and third quarters of each fiscal year as an exhibit on Form N-PORT, within sixty days of the end of the period. Form N-PORT is available on the SEC’s website at http://www.sec.gov. The information on Form N-PORT is available without charge, upon request, by calling 1-888-350-2990.
NC-AR21
Item 2. Code of Ethics.
As of the end of the period covered by this report, the Registrant has adopted a code of ethics that applies to the Registrant's principal executive officer and principal financial officer.
Item 3. Audit Committee Financial Expert.
The Registrant’s board of trustees has determined that John C. Olsen is an audit committee financial expert, as defined in Item 3 of Form N-CSR. Mr. Olsen is independent for purposes of this Item 3.
Item 4. Principal Accountant Fees and Services.
For the fiscal year ended November 30, 2021, the aggregate audit, audit-related and tax fees billed by Cohen Fund Audit Services, Ltd. for professional services rendered for the audits of the financial statement, or services that are normally provided in connection with statutory and regulatory filings or engagements for that fiscal year, for The North Country Funds are shown below. The aggregate tax fees billed by Cohen Fund Audit Services, Ltd. were rendered for tax compliance, tax advice and tax planning for each fund.
FY 2021 $ 28,000
FY 2020 $ 28,000
FY 2019 $ 28,000
FY 2021 $ 0
FY 2020 $ 0
FY 2019 $ 0
FY 2021 $ 6,000
FY 2020 $ 6,000
FY 2019 $ 6,000
FY 2021 $ 0
FY 2020 $ 0
FY 2019 $ 0
| (e) | (1) Audit Committee’s Pre-Approval Policies |
The Registrant’s Audit Committee is required to pre-approve all audit services and, when appropriate, any non-audit services (including audit-related, tax and all other services) to the Registrant. The Registrant’s Audit Committee also is required to pre-approve, when appropriate, any non-audit services (including audit-related, tax and all other services) to its adviser, or any entity controlling, controlled by or under common control with the adviser that provides ongoing services to the Registrant, to the extent that the services may be determined to have an impact on the operations or financial reporting of the Registrant. Services are reviewed on an engagement by engagement basis by the Audit Committee.
| (2) | There were no amounts that were approved by the Audit Committee pursuant to paragraph (c)(7)(i)(c) of Rule 2-01 of Regulation S-X for the fiscal year ended November 30, 2021. |
(f) During the audit of Registrant's financial statements for the most recent fiscal year, less than 50 percent of the hours expended on the principal accountant's engagement were attributed to work performed by persons other than the principal accountant's full-time, permanent employees.
(g) The aggregate non-audit fees billed by the Registrant's accountant for services rendered to the Registrant, and rendered to the Registrant's investment adviser (not including any sub-adviser whose role is primarily portfolio management and is subcontracted with or overseen by another investment adviser), and any entity controlling, controlled by, or under common control with the adviser that provides ongoing services to the Registrant:
| | | Registrant | | Adviser |
| | FY 2021 | | | $6,000 | | | $0 | |
| | FY 2020 | | | $6,000 | | | $0 | |
| | FY 2019 | | | $6,000 | | | $0 | |
(h) Not applicable. All non-audit services to the Registrant were pre-approved by the Audit Committee for FY 2021.
Item 5. Audit Committee of Listed Registrants. Not applicable to open-end investment companies.
Item 6. Schedule of Investments. Not applicable.
Item 7. Disclosure of Proxy Voting Policies and Procedures for Closed-End Management Investment Companies. Not applicable to open-end investment companies.
Item 8. Portfolio Managers of Closed-End Management Investment Companies. Not applicable to open-end investment companies.
Item 9. Purchases of Equity Securities by Closed-End Management Investment Company and Affiliated Purchases . Not applicable to open-end investment companies.
Item 10. Submission of Matters to a Vote of Security Holders. None
Item 11. Controls and Procedures.
(a) Based on an evaluation of the Registrant’s disclosure controls and procedures as of a date within 90 days of filing date of this Form N-CSR, the principal executive officer and principal financial officer of the Registrant have concluded that the disclosure controls and procedures of the Registrant are reasonably designed to ensure that the information required in filings on Form N-CSR is recorded, processed, summarized, and reported by the filing date, including that information required to be disclosed is accumulated and communicated to the Registrant’s management, including the Registrant’s principal executive officer and principal financial officer, as appropriate to allow timely decisions regarding required disclosure.
(b) There were no significant changes in the Registrant’s internal control over financial reporting that occurred during the Registrant’s second fiscal quarter of the period covered by this report that has materially affected, or are reasonably likely to materially affect, the Registrant’s internal control over financial reporting.
Item 12. Disclosure of securities lending activities for closed-end management investment companies.
Not applicable to open-end investment companies.
Item 13. Exhibits.
(a)(1) Code of Ethics filed herewith.
(a)(2) Certifications required by Section 302 of the Sarbanes-Oxley Act of 2002 (and Item 11(a)(2) of Form N-CSR) are filed herewith.
(a)(3) Not applicable for open-end investment companies.
(b) Certifications required by Section 906 of the Sarbanes-Oxley Act of 2002 (and Item 11(b) of Form N-CSR) are filed herewith.
SIGNATURES
Pursuant to the requirements of the Securities Exchange Act of 1934 and the Investment Company Act of 1940, the Registrant has duly caused this report to be signed on its behalf by the undersigned, thereunto duly authorized.
(Registrant) The North Country Funds
By (Signature and Title)
/s/ James Colantino
James Colantino, Principal Executive Officer
Date 2/4/22
Pursuant to the requirements of the Securities Exchange Act of 1934 and the Investment Company Act of 1940, this report has been signed below by the following persons on behalf of the Registrant and in the capacities and on the dates indicated.
By (Signature and Title)
/s/ James Colantino
James Colantino, Principal Executive Officer
Date 2/4/22
By (Signature and Title)
/s/ Rich Gleason
Rich Gleason, Principal Financial Officer
Date 2/4/22