Exhibit 99.2 Performance for the Quarter ended June 30, 2019 Jatin Dalal Chief Financial Officer Wipro LimitedExhibit 99.2 Performance for the Quarter ended June 30, 2019 Jatin Dalal Chief Financial Officer Wipro Limited
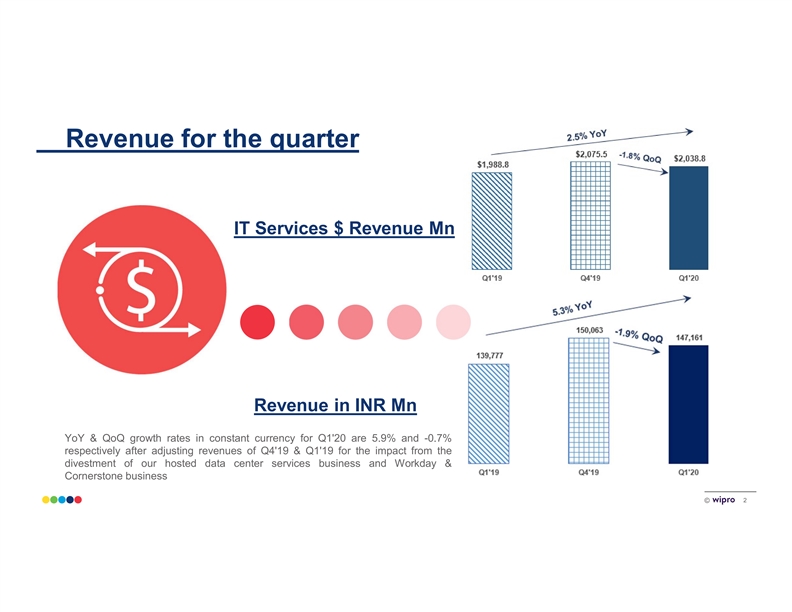
Revenue for the quarter IT Services $ Revenue Mn Revenue in INR Mn YoY & QoQ growth rates in constant currency for Q1'20 are 5.9% and -0.7% respectively after adjusting revenues of Q4'19 & Q1'19 for the impact from the divestment of our hosted data center services business and Workday & Cornerstone business 2 ©Revenue for the quarter IT Services $ Revenue Mn Revenue in INR Mn YoY & QoQ growth rates in constant currency for Q1'20 are 5.9% and -0.7% respectively after adjusting revenues of Q4'19 & Q1'19 for the impact from the divestment of our hosted data center services business and Workday & Cornerstone business 2 ©

Operating Margins IT Services Operating Margin Operating Profit in INR Mn 3 ©Operating Margins IT Services Operating Margin Operating Profit in INR Mn 3 ©
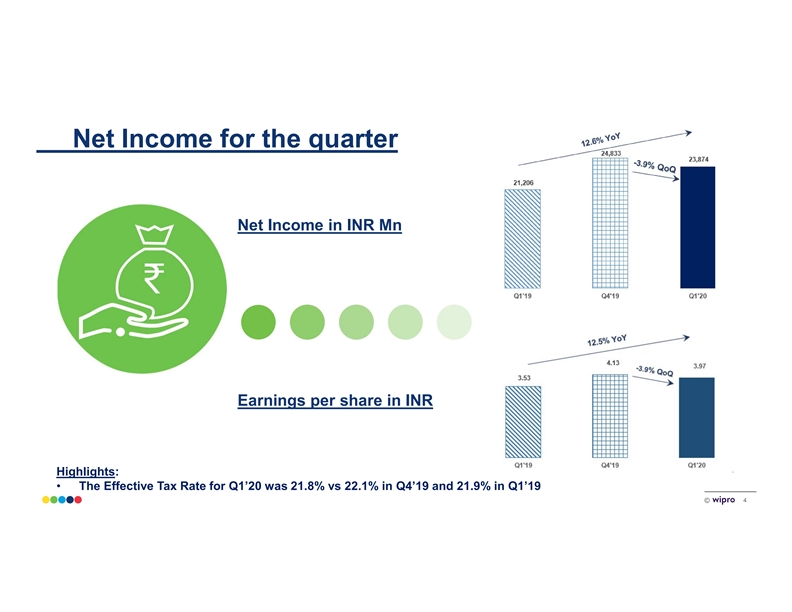
Net Income for the quarter Net Income in INR Mn Earnings per share in INR Highlights: • The Effective Tax Rate for Q1’20 was 21.8% vs 22.1% in Q4’19 and 21.9% in Q1’19 4 ©Net Income for the quarter Net Income in INR Mn Earnings per share in INR Highlights: • The Effective Tax Rate for Q1’20 was 21.8% vs 22.1% in Q4’19 and 21.9% in Q1’19 4 ©
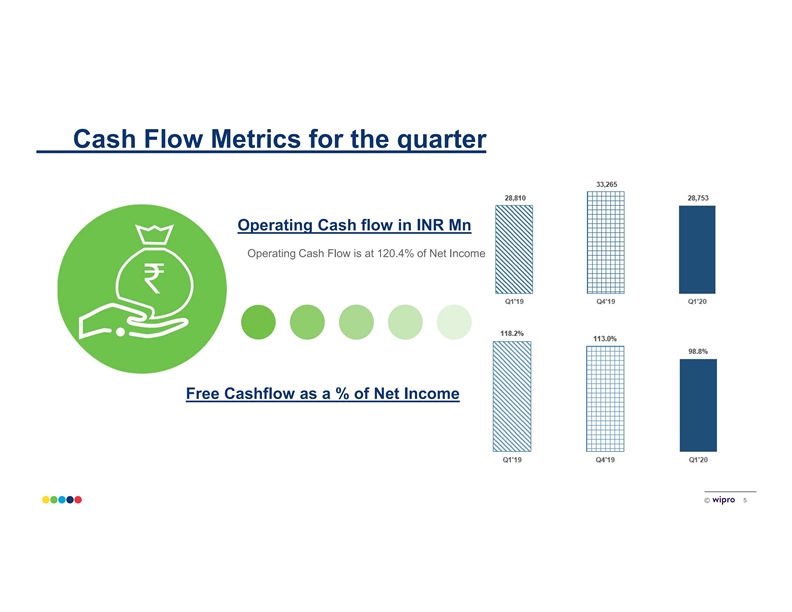
Cash Flow Metrics for the quarter Operating Cash flow in INR Mn Operating Cash Flow is at 120.4% of Net Income Free Cashflow as a % of Net Income 5 ©Cash Flow Metrics for the quarter Operating Cash flow in INR Mn Operating Cash Flow is at 120.4% of Net Income Free Cashflow as a % of Net Income 5 ©
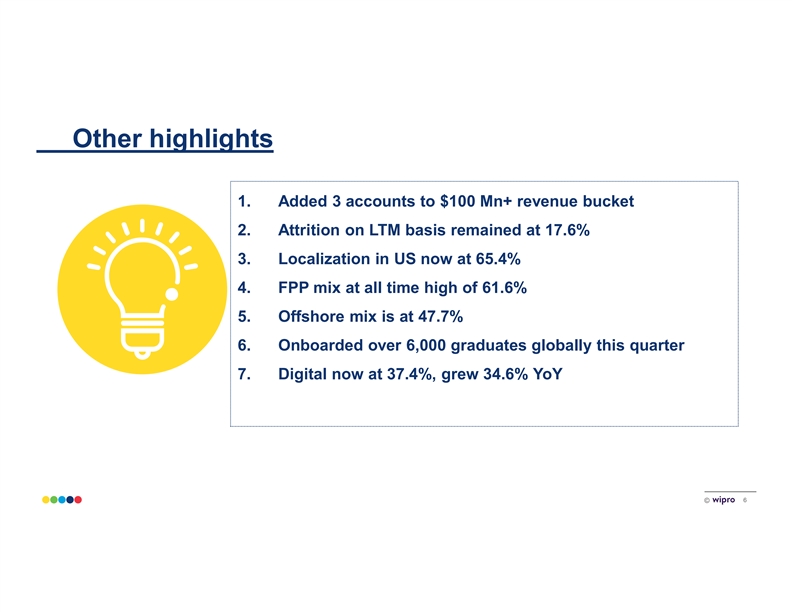
Other highlights 1. Added 3 accounts to $100 Mn+ revenue bucket 2. Attrition on LTM basis remained at 17.6% 3. Localization in US now at 65.4% 4. FPP mix at all time high of 61.6% 5. Offshore mix is at 47.7% 6. Onboarded over 6,000 graduates globally this quarter 7. Digital now at 37.4%, grew 34.6% YoY 6 ©Other highlights 1. Added 3 accounts to $100 Mn+ revenue bucket 2. Attrition on LTM basis remained at 17.6% 3. Localization in US now at 65.4% 4. FPP mix at all time high of 61.6% 5. Offshore mix is at 47.7% 6. Onboarded over 6,000 graduates globally this quarter 7. Digital now at 37.4%, grew 34.6% YoY 6 ©
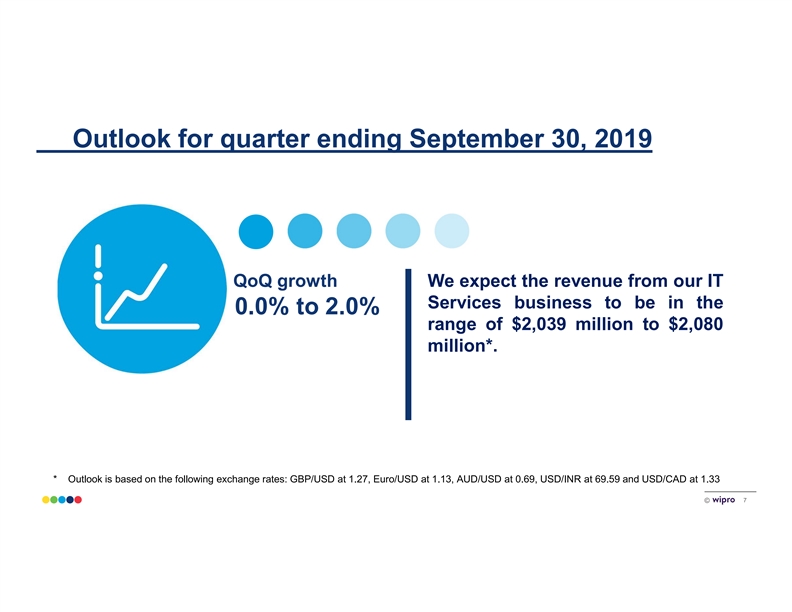
Outlook for quarter ending September 30, 2019 QoQ growth We expect the revenue from our IT Services business to be in the 0.0% to 2.0% range of $2,039 million to $2,080 million*. * Outlook is based on the following exchange rates: GBP/USD at 1.27, Euro/USD at 1.13, AUD/USD at 0.69, USD/INR at 69.59 and USD/CAD at 1.33 7 ©Outlook for quarter ending September 30, 2019 QoQ growth We expect the revenue from our IT Services business to be in the 0.0% to 2.0% range of $2,039 million to $2,080 million*. * Outlook is based on the following exchange rates: GBP/USD at 1.27, Euro/USD at 1.13, AUD/USD at 0.69, USD/INR at 69.59 and USD/CAD at 1.33 7 ©
Buy Back The Company had previously announced a buyback proposal for purchase of up to 323.1 million equity shares of ₹2 each from the shareholders on a proportionate basis by way of a tender offer at a price of ₹325 per equity share payable in cash for an aggregate amount not exceeding ₹105 billion. After receipt of shareholders’ approval, the Company has filed the draft letter of offer for the buyback with SEBI. Upon approval from SEBI, we will complete the process. 8 ©Buy Back The Company had previously announced a buyback proposal for purchase of up to 323.1 million equity shares of ₹2 each from the shareholders on a proportionate basis by way of a tender offer at a price of ₹325 per equity share payable in cash for an aggregate amount not exceeding ₹105 billion. After receipt of shareholders’ approval, the Company has filed the draft letter of offer for the buyback with SEBI. Upon approval from SEBI, we will complete the process. 8 ©

Thank YouThank You
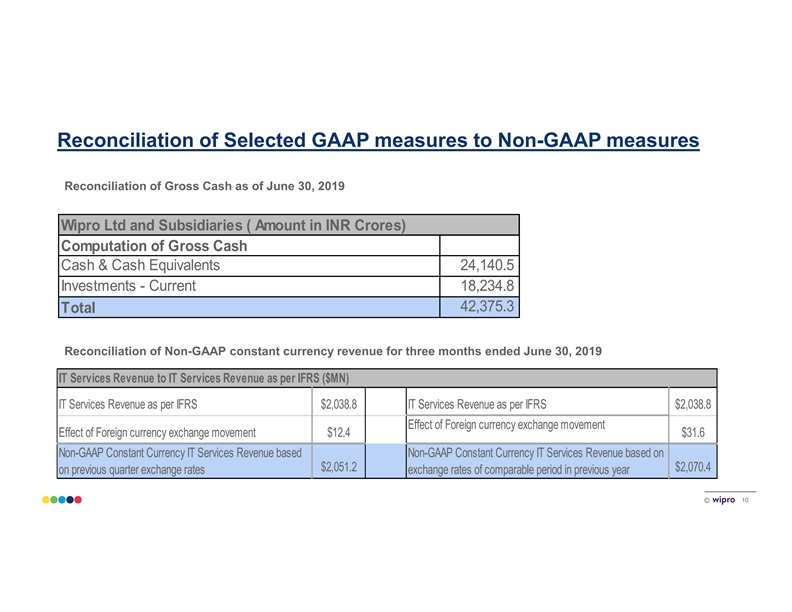
Reconciliation of Selected GAAP measures to Non-GAAP measures Reconciliation of Gross Cash as of June 30, 2019 Wipro Ltd and Subsidiaries ( Amount in INR Crores) Computation of Gross Cash Cash & Cash Equivalents 24,140.5 Investments - Current 18,234.8 42,375.3 Total Reconciliation of Non-GAAP constant currency revenue for three months ended June 30, 2019 IT Services Revenue to IT Services Revenue as per IFRS ($MN) IT Services Revenue as per IFRS $2,038.8 IT Services Revenue as per IFRS $2,038.8 Effect of Foreign currency exchange movement Effect of Foreign currency exchange movement $12.4 $31.6 Non-GAAP Constant Currency IT Services Revenue based Non-GAAP Constant Currency IT Services Revenue based on $2,051.2 $2,070.4 on previous quarter exchange rates exchange rates of comparable period in previous year 10 ©Reconciliation of Selected GAAP measures to Non-GAAP measures Reconciliation of Gross Cash as of June 30, 2019 Wipro Ltd and Subsidiaries ( Amount in INR Crores) Computation of Gross Cash Cash & Cash Equivalents 24,140.5 Investments - Current 18,234.8 42,375.3 Total Reconciliation of Non-GAAP constant currency revenue for three months ended June 30, 2019 IT Services Revenue to IT Services Revenue as per IFRS ($MN) IT Services Revenue as per IFRS $2,038.8 IT Services Revenue as per IFRS $2,038.8 Effect of Foreign currency exchange movement Effect of Foreign currency exchange movement $12.4 $31.6 Non-GAAP Constant Currency IT Services Revenue based Non-GAAP Constant Currency IT Services Revenue based on $2,051.2 $2,070.4 on previous quarter exchange rates exchange rates of comparable period in previous year 10 ©