Exhibit 99.4

ALLSCRIPTS TM
Inform. Connect. Transform.
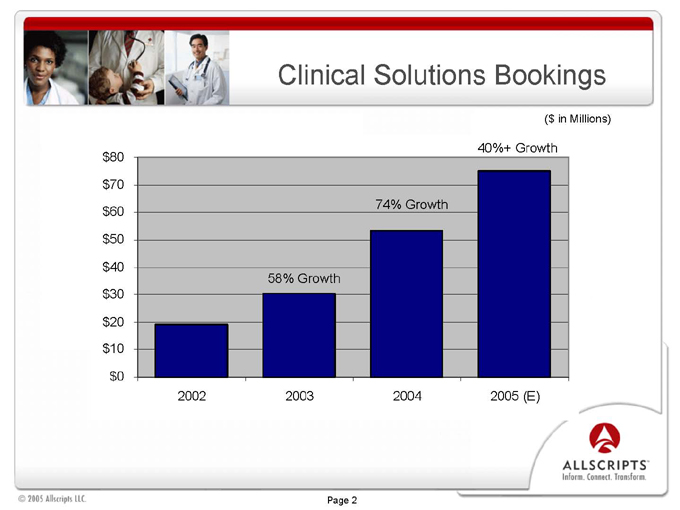
Clinical Solutions Bookings
($ in Millions) $80
$70 $60
$50
$40 $30
$20 $10
$0
40%+ Growth
74% Growth
58% Growth
2002
2003
2004
2005 (E)
Page 2
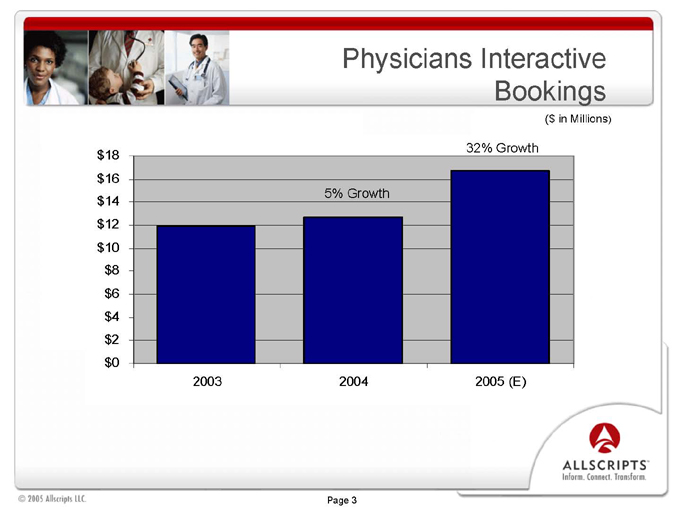
Physicians Interactive Bookings
($ in Millions) $18 $16 $14 $12 $10 $8 $6 $4 $2 $0
5% Growth
32% Growth
2003
2004
2005 (E)
Page 3
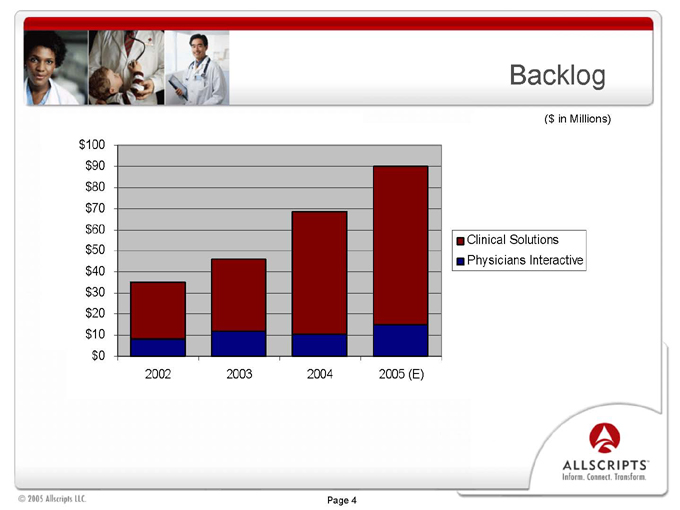
Backlog
($ in Millions) $100 $90 $80 $70 $60 $50 $40 $30 $20 $10 $0
2002 2003 2004 2005 (E)
Clinical Solutions
Physicians Interactive
Page 4
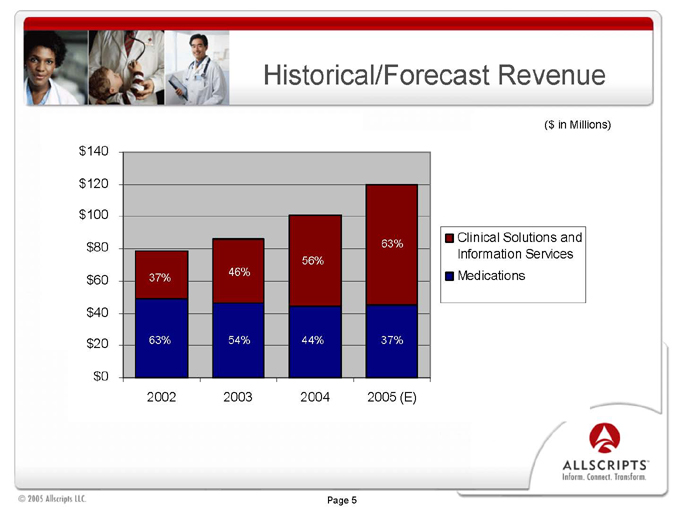
Historical/Forecast Revenue
($ in Millions) $140 $120 $100 $80 $60 $40 $20 $0
63% 56% 46% 37%
63% 54% 44% 37%
2002 2003 2004 2005 (E)
Clinical Solutions and Information Services
Medications
Page 5
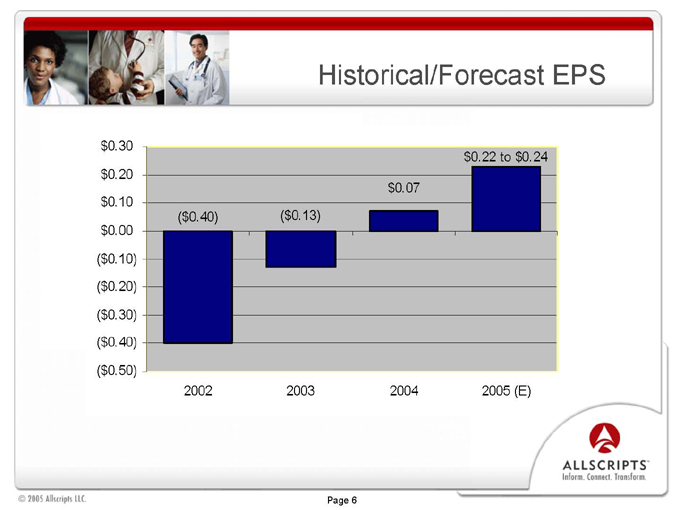
Historical/Forecast EPS
$0.30
$0.20 $0.10
$0.00
($ 0.10)
($ 0.20)
($ 0.30)
($ 0.40)
($ 0.50) $0.22 to $0.24
$0.07
($ 0.40) ($0.13)
2002 2003 2004 2005 (E)
Page 6
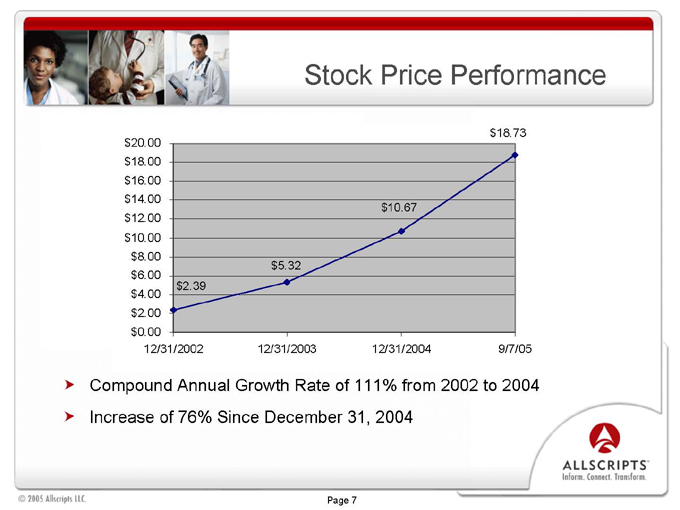
Stock Price Performance $20.00 $18.00 $16.00 $14.00 $12.00 $10.00 $8.00 $6.00 $4.00 $2.00 $0.00 $18.73
$10.67
$5.32 $2.39
12/31/2002 12/31/2003 12/31/2004 9/7/05
Compound Annual Growth Rate of 111% from 2002 to 2004
Increase of 76% Since December 31, 2004
Page 7
Top 10 Questions…
Page 8
Top 10 Questions
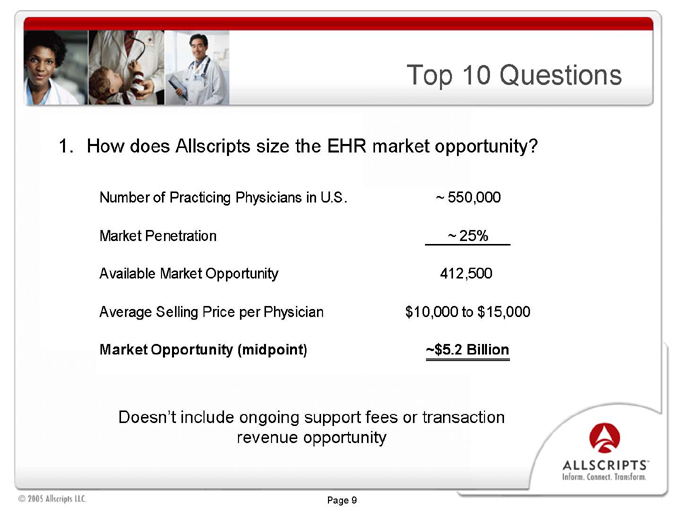
1. How does Allscripts size the EHR market opportunity?
Number of Practicing Physicians in U.S. ~ 550,000 Market Penetration ~ 25% Available Market Opportunity 412,500 Average Selling Price per Physician $10,000 to $15,000
Market Opportunity (midpoint) ~$5.2 Billion
Doesn’t include ongoing support fees or transaction revenue opportunity
Page 9
Top 10 Questions (cont.)
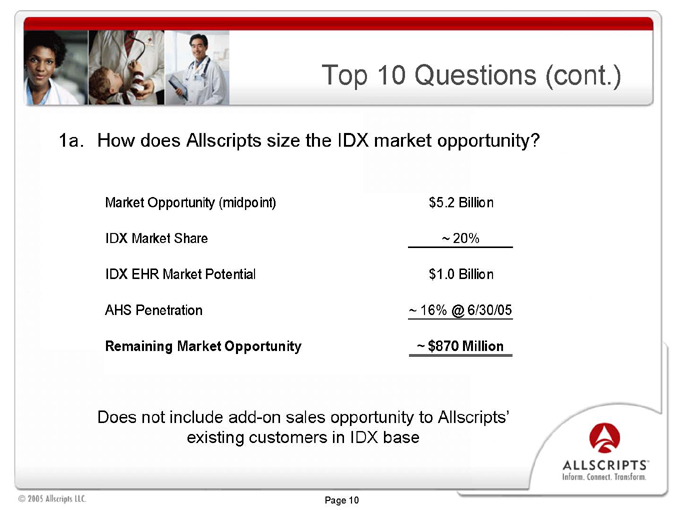
1a. How does Allscripts size the IDX market opportunity?
Market Opportunity (midpoint) $5.2 Billion IDX Market Share ~ 20% IDX EHR Market Potential $1.0 Billion AHS Penetration ~ 16% @ 6/30/05
Remaining Market Opportunity ~ $870 Million
Does not include add-on sales opportunity to Allscripts’ existing customers in IDX base
Page 10

Top 10 Questions (cont.)
2. Is there seasonality in your bookings? What about revenue?
Short answer is yes…
Clinical Software Business – ~35% of our bookings historically have occurred in Q4. Remaining 65% tends to be evenly distributed over first three quarters. Revenue largely insulated from seasonality due to revenue recognition policy Medication Distribution Business – Seasonality largely a function of when people are more likely to be sick (Winter months) and distribution of flu vaccine (Q3 and Q4) Physicians Interactive Business – Moderate amount of seasonality tied to large pharma budgeting process. Less prominent than in Clinical Software business
Page 11
Top 10 Questions (cont.)
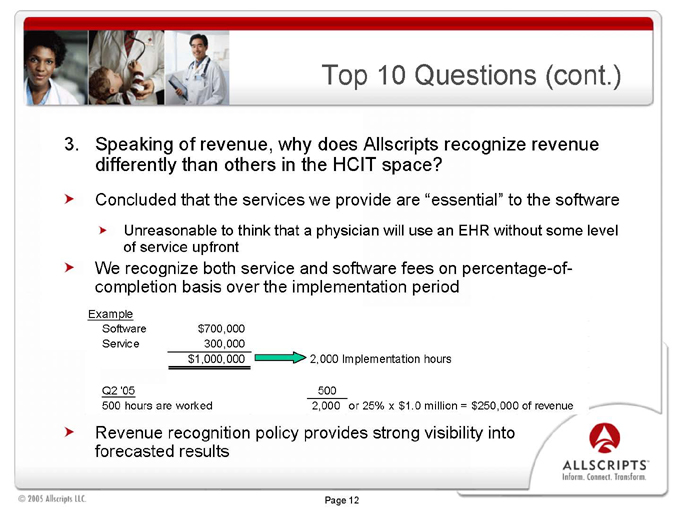
3. Speaking of revenue, why does Allscripts recognize revenue differently than others in the HCIT space?
Concluded that the services we provide are “essential” to the software
Unreasonable to think that a physician will use an EHR without some level of service upfront
We recognize both service and software fees on percentage-of-completion basis over the implementation period
Example
Software $700,000 Service 300,000 $1,000,000
2,000 Implementation hours
Q2 ‘05 500
500 hours are worked 2,000 or 25% x $1.0 million = $250,000 of revenue
Revenue recognition policy provides strong visibility into forecasted results
Page 12
Top 10 Questions (cont.)
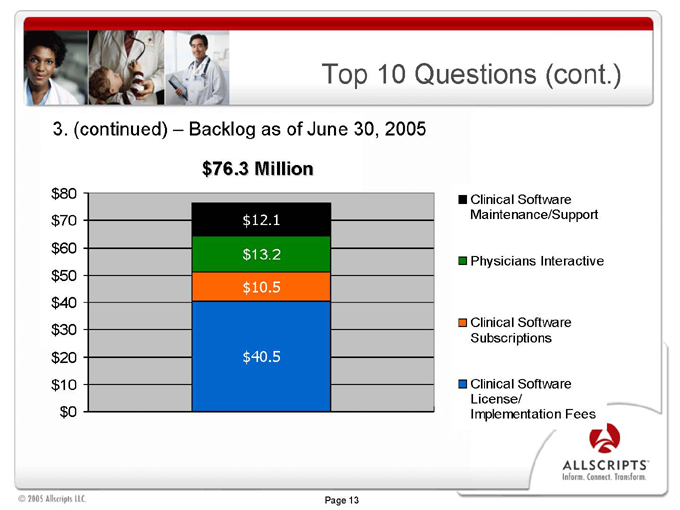
3. (continued) – Backlog as of June 30, 2005 $76.3 Million $80 $70 $60 $50 $40 $30 $20 $10 $0 $13.2 $10.5 $40.5
Clinical Software Maintenance/Support
Physicians Interactive
Clinical Software Subscriptions
Clinical Software License/ Implementation Fees
Page 13
Top 10 Questions (cont.)
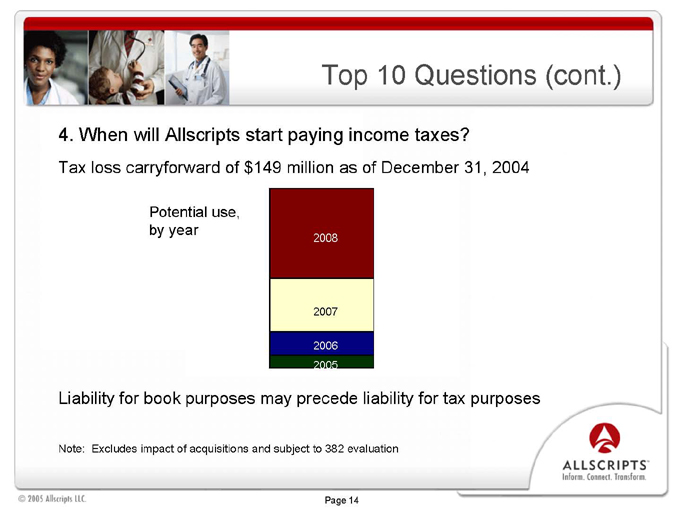
4. When will Allscripts start paying income taxes?
Tax loss carryforward of $149 million as of December 31, 2004
Potential use,
by year
2008
2007
2006
2005
Liability for book purposes may precede liability for tax purposes
Note: Excludes impact of acquisitions and subject to 382 evaluation
Page 14
Top 10 Questions (cont.)
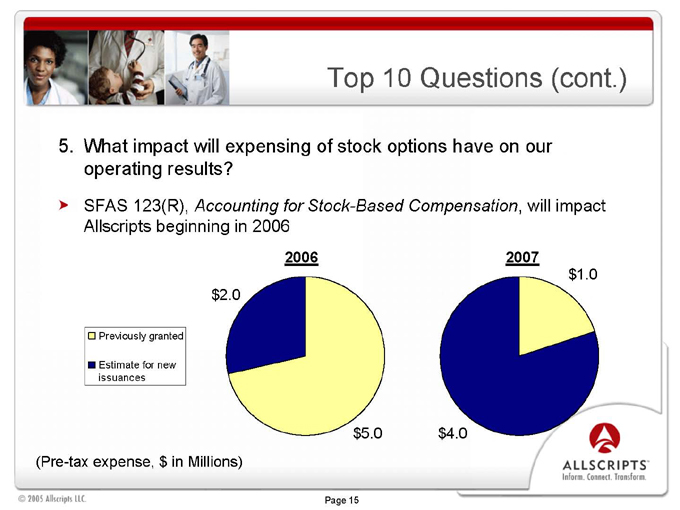
5. What impact will expensing of stock options have on our operating results?
SFAS 123(R), Accounting for Stock-Based Compensation, will impact Allscripts beginning in 2006
2006 $2.0 $5.0
2007 $1.0 $4.0
Previously granted
Estimate for new issuances
(Pre-tax expense, $ in Millions)
Page 15
Top 10 Questions (cont.)
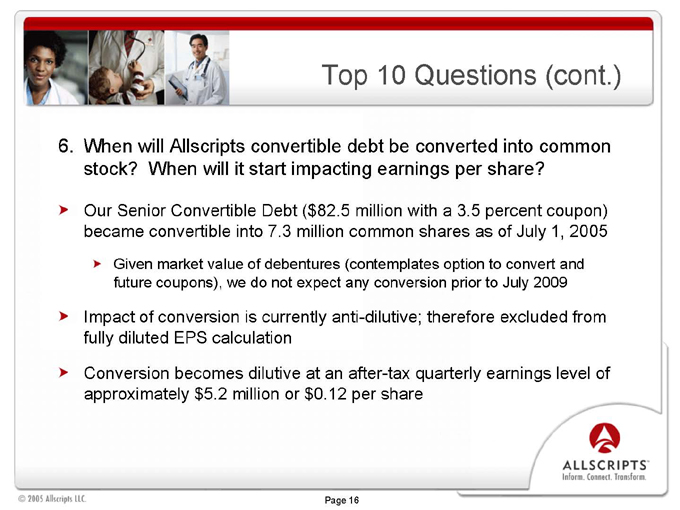
6. When will Allscripts convertible debt be converted into common stock? When will it start impacting earnings per share?
Our Senior Convertible Debt ($82.5 million with a 3.5 percent coupon) became convertible into 7.3 million common shares as of July 1, 2005
Given market value of debentures (contemplates option to convert and future coupons), we do not expect any conversion prior to July 2009
Impact of conversion is currently anti-dilutive; therefore excluded from fully diluted EPS calculation
Conversion becomes dilutive at an after-tax quarterly earnings level of approximately $5.2 million or $0.12 per share
Page 16

Top 10 Questions (cont.)
7. By the way, what are you going to do with all of that cash?
Page 17
Top 10 Questions (cont.)
8. Do you intend to sell the Medication Distribution business?
Page 18
Top 10 Questions (cont.)
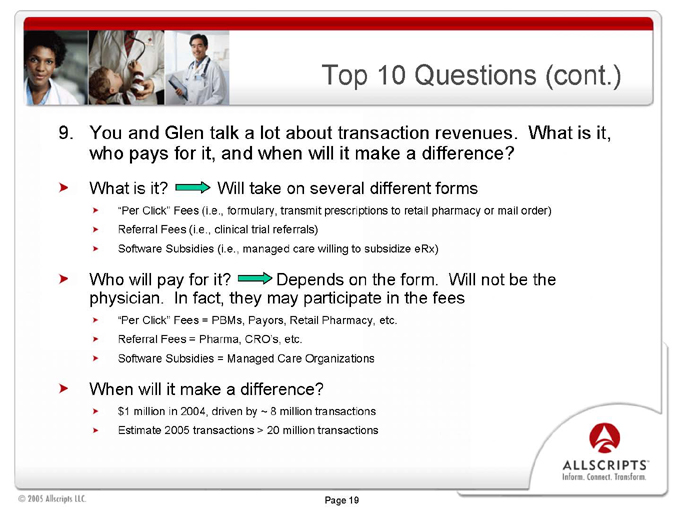
9. You and Glen talk a lot about transaction revenues. What is it, who pays for it, and when will it make a difference?
What is it? Will take on several different forms
“Per Click” Fees (i.e., formulary, transmit prescriptions to retail pharmacy or mail order) Referral Fees (i.e., clinical trial referrals) Software Subsidies (i.e., managed care willing to subsidize eRx)
Who will pay for it? Depends on the form. Will not be the physician. In fact, they may participate in the fees
“Per Click” Fees = PBMs, Payors, Retail Pharmacy, etc. Referral Fees = Pharma, CRO’s, etc.
Software Subsidies = Managed Care Organizations
When will it make a difference?
$1 million in 2004, driven by ~ 8 million transactions Estimate 2005 transactions > 20 million transactions
Page 19
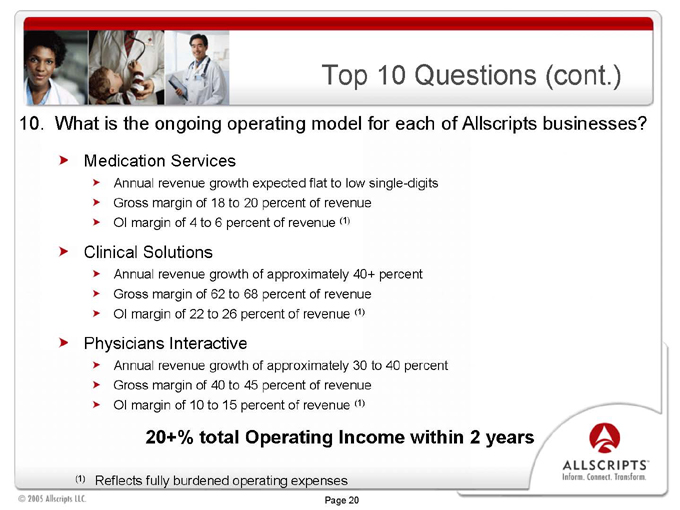
Top 10 Questions (cont.)
10. What is the ongoing operating model for each of Allscripts businesses?
Medication Services
Annual revenue growth expected flat to low single-digits Gross margin of 18 to 20 percent of revenue OI margin of 4 to 6 percent of revenue (1)
Clinical Solutions
Annual revenue growth of approximately 40+ percent Gross margin of 62 to 68 percent of revenue OI margin of 22 to 26 percent of revenue (1)
Physicians Interactive
Annual revenue growth of approximately 30 to 40 percent Gross margin of 40 to 45 percent of revenue OI margin of 10 to 15 percent of revenue (1)
20+% total Operating Income within 2 years
(1) Reflects fully burdened operating expenses
Page 20

ALLSCRIPTS TM
Inform. Connect. Transform.
Private and Confidential