UNITED STATES
SECURITIES AND EXCHANGE COMMISSION
WASHINGTON, D.C. 20549
FORM N-CSR
CERTIFIED SHAREHOLDER REPORT OF REGISTERED MANAGEMENT
INVESTMENT COMPANIES
Investment Company Act file number: 811-10201
The Appleton Funds
(Exact name of registrant as specified in charter)
One Post Office Square, 6th Floor
Boston, Massachusetts 02109
(Address of principal executive offices) (Zip code)
Daniel T. Buckley
One Post Office Square, 6th Floor
Boston, Massachusetts 02109
(Name and address of agent for service)
Registrant's telephone number, including area code: (617) 338-0700
Date of fiscal year end: December 31
Date of reporting period: December 31, 2015
Form N-CSR is to be used by management investment companies to file reports with the Commission not later than 10 days after the transmission to stockholders of any report that is required to be transmitted to stockholders under Rule 30e-1 under the Investment Company Act of 1940 (17 CFR 270.30e-1). The Commission may use the information provided on Form N-CSR in its regulatory, disclosure review, inspection and policymaking roles.
A registrant is required to disclose the information specified by Form N-CSR, and the Commission will make this information public. A registrant is not required to respond to the collection of information contained in Form N-CSR unless the Form displays a currently valid Office of Management and Budget ("OMB") control number. Please direct comments concerning the accuracy of the information collection burden estimate and any suggestions for reducing the burden to Secretary, Securities and Exchange Commission, 450 Fifth Street, NW, Washington, DC 20549-0609. The OMB has reviewed this collection of information under the clearance requirements of 44 U.S.C. § 3507.
Item 1. Reports to Stockholders.
The following is a copy of the report transmitted to shareholders pursuant to Rule 30e-1 under the Investment Company Act of 1940 (17 CFR 270.30e-1.)
| | | |
| | | |
| | | |
| | | |
| | APPLETON EQUITY GROWTH FUND | |
| | Symbol: APLEX | |
| | Annual Report December 31, 2015 | |
| | Investment Adviser Appleton Partners, Inc. One Post Office Square, Sixth Floor Boston, MA 02109 | |
| | | |
Table of Contents

The second half of 2015 was a volatile period for the stock market, as worries surrounding an economic slowdown in China and the timing of a Fed rate hike shook investor confidence. The third quarter was the worst in four years for the S&P 500, as the index dropped 6.44%. After holding the lows made during the Ebola scare of October 2014, the market rebounded with an 8.44% gain in the month of October and finished the year with a 1.38% total return. The 2015 net asset value return for the Appleton Equity Growth Fund was 0.19%. Below, we offer our thoughts on what drove the performance of the Fund and what we see heading into 2016.
The overarching theme that investors will remember most about 2015 is the rise of the “FANG” stocks. FANG is the popular acronym given to a group of four stocks that greatly outperformed the overall market: Facebook, Amazon.com, Netflix, and Google. The average 2015 gain for this small group was over 80%! Given their large size and the market cap weighted composition of the S&P 500 index, removing just these four names would have greatly diminished results. The equal-weighted S&P 500 closed 2015 with a price return (not including dividends) of -4.11%, 3.38% worse than the cap-weighted index. The median stock in the Russell 3000, which comprises 98% of domestic equities, finished 2015 in bear market territory, over 20% off from its 52-week high. All of this illustrates the lack of breadth in the market and highlights a point we made in our last letter regarding the importance of stock picking. The Fund had a number of stocks that gained 25% or more on the year: Palo Alto Networks, Starbucks, Facebook, and Home Depot. On the flipside, there were a number of holdings that did not perform as we hoped and detracted from performance: Rackspace, United Rentals, and Union Pacific. However, the largest driver of the relative underperformance over the course of the second half of 2015 can be tied directly to not owning a handful of strong performers, particularly Amazon (+55% from 6/30 – 12/31) and Google (+45% from 6/30 – 12/31). Of the four FANG stocks, the Fund owned only Facebook for the entire year, and started a position in Netflix on a pullback in October. The strong performance of the FANGs comes with lofty valuation multiples that we were not comfortable with given the volatility we experienced in late summer. Given our outlook of continued volatility, we believed that these momentum names could see some profit taking should the market retrace. We will continue to monitor these names, among others, to see if opportunities arise on any pullbacks.
As we turn the calendar to 2016, Chinese market gyrations are once again roiling global financial markets. The heart of the matter is identical to what sent markets tumbling in late summer: the Chinese yuan has depreciated relative to other currencies causing investors to fear that Chinese officials are seeking to prop up an economy that is potentially trending below their set target. Government officials would never admit it but currency wars have been going on for several years now, with both the U.S. and the Eurozone attempting to devalue their currencies by embarking on massive amounts of quantitative easing. Despite the short term choppiness, we would welcome a cheaper yuan if it brought about stability in the Chinese economy and continued the risk-on trend that our markets have enjoyed since the Fed embarked on “QE1” back in December of 2008. If the yuan stabilizes and the fears of a hard landing in China subside, we believe that our markets will trade less on fear, and more on fundamentals.
Another issue facing investors as we head into 2016 is the continued drop in the price of oil. The price of a barrel of WTI crude oil dropped by just over 30% in 2015, extending the slide that began in the summer of 2014. Oil is currently facing a number of headwinds: an overabundance of supply, weaker global demand, and the strengthening of the U.S. dollar. While it is difficult to attribute the daily fluctuations in the price of oil to any one of these reasons, we believe the most recent downtrend is related to the move in the dollar. Our currency is a key factor because oil is dollar-denominated, leading to an inverse relationship between the two. The Fed has begun a gradual rise of interest rates at the same time that China, as noted above, and other central banks continue to lower their rates. This divergence in monetary policy has put upward pressure on the dollar, weighing on oil. At Appleton, we cannot predict when and at what price oil will bottom, but believe that the price of oil will stay relatively low for the foreseeable future. In regards to the Fund, we have maintained our underweight to the energy sector and will continue to do so until we see prospects for a meaningful recovery.
As the presidential election cycle heats up we would be remiss not to mention the potential for politics to create some uncertainty in the latter half of 2016. Currently, there appears to be no strong consensus on who will emerge victorious from the primaries on either side, and any policy discussion has not been meaningful. Investors loathe uncertainty, so, as we get closer to the election, we anticipate some politically-based volatility in the stock market as politicians begin to shape more concrete policy platforms. All else equal, we would expect markets to regain their footing once we gain clarity on who will occupy the White House.
Despite the poor market action to start this year, we believe that stocks can achieve modest gains in 2016. We’ve just completed a record year for merger and acquisition activity, and we expect the trend to continue as companies look to put their cash hordes to work in an effort to bolster top line growth. Similarly, corporate boards will likely continue the record trend of authorizing the return of capital to shareholders via share repurchase programs. The domestic economy, particularly service-oriented industries, continues to grow at a modest pace and the yield curve, though flattening, has not inverted. Historically, the likelihood of entering a bear market in stocks while not in a recession and with a normal yield curve is low. Given the continued pressure on commodities and subsequent low inflationary outlook, we would expect the Federal Reserve to take a more dovish tone than their most recent forecast, which implied several rate hikes in 2016. Finally, we look for the pattern of companies beating lowered earnings expectations to continue. There should be fewer sequential headwinds from oil and the dollar and we would look for the market to reward companies that beat consensus revenue and earnings. As volatility persists, we anticipate that investor fear and angst should subside, fundamentals will return to focus, and stock selection will be paramount.
While the market will likely remain fickle, we do believe in a long-term approach and that the conviction we have in our current holdings should be rewarded. We continue to favor the Healthcare, Consumer Discretionary, and Technology sectors as areas of the market that offer growth at reasonable valuations. Given the volatile start to the year, more defensive sectors such as Telecommunications, Utilities, and Consumer Staples have outperformed the overall market, but we believe that in the long run, investors will seek out companies that can show sustainable revenue and earnings growth. As we view pullbacks with an opportunistic eye, we will continually seek to capitalize on these market periods by rotating into those companies we believe offer a greater risk/return profile.
Happy New Year and best wishes for 2016!
Daniel Buckley
Opinions expressed as those of the fund, are subject to change, are not guaranteed and should not be considered investment advice.
Mutual fund investing involves risk. Principal loss is possible. The Fund may invest in smaller companies, which involve additional risks such as limited liquidity and greater volatility. Growth stocks typically are more volatile than value stocks; however, value stocks have a lower expected growth rate in earnings and sales.
Fund holdings are subject to change and are not recommendations to buy or sell any security. For a complete list of fund holdings, please refer to the Schedule of Investments found in this report.
Past performance does not guarantee future results.
This report must be preceded or accompanied by a prospectus.
The Russell 3000 Index is a broad-market index of the largest 3,000 U.S. companies representing approximately 98% of the investable U.S. equity market.
The S&P 500 Index is a broad based unmanaged index of 500 stocks, which is widely recognized as representative of the equity market in general. You cannot invest directly in an index.
Distributed by Quasar Distributors, LLC.
December 31, 2015 (Unaudited)
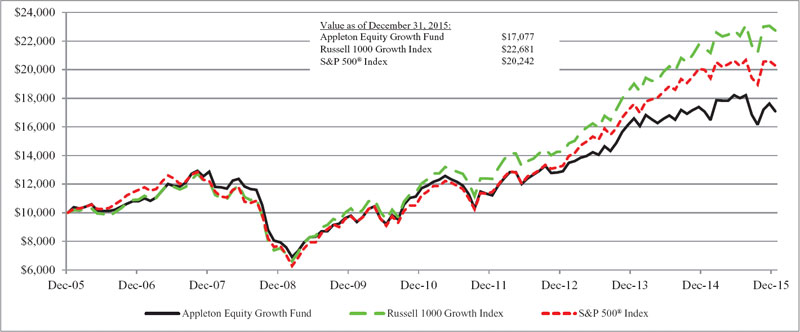
Comparison of the Change in Value of a $10,000 Investment
in the Appleton Equity Growth Fund, S&P 500® Index and the Russell 1000 Growth Index
| | Average Annual Total Returns* |
| | 1 Year | | 3 Year | | 5 Year | | 10 Year |
| Appleton Equity Growth Fund | 0.19% | | 9.85% | | 7.83% | | 5.50% |
S&P 500® Index | 1.38% | | 15.13% | | 12.57% | | 7.31% |
| Russell 1000 Growth Index | 5.67% | | 16.83% | | 13.53% | | 8.53% |
The S&P® 500 Index is a capitalization-weighted index composed of 500 domestic common stocks. Most of the stock in the S&P® 500 Index are issued by the 500 largest companies, in terms of the aggregate market value of their outstanding stock, and are generally listed on NYSE. The Russell 1000 Growth Index measures the performance of large- and mid-capitalization growth sectors of the U.S. equity market. The Russell 1000 Growth Index is a subset of the Russell 1000® Index, which measures the performance of the large-capitalization sector of the U.S. equity market.
This chart assumes an initial gross investment of $10,000 made on December 31, 2005. Returns shown include the reinvestment of all dividends. Past performance does not guarantee future results. The graph and table do not reflect the deduction of taxes that a shareholder would pay on Fund distributions or the redemption of Fund shares. Investment return and principal value will fluctuate, so that your shares, when redeemed, may be worth more or less than the original cost.
December 31, 2015 (Unaudited)
As a shareholder of the Fund, you incur ongoing costs, including investment advisory fees and other Fund expenses. This example is intended to help you understand your ongoing costs (in dollars) of investing in the Fund and to compare these costs with the ongoing costs of investing in other mutual funds.
The example is based on an investment of $1,000 invested at the beginning of the period and held for the entire period (July 1, 2015 through December 31, 2015).
Actual Expenses
The first line of the table below provides information about actual account values and actual expenses. You may use the information in this line, together with the amount you invested, to estimate the expenses that you paid over the period. Simply divide your account value by $1,000 (for example, an $8,600 account value divided by $1,000 = 8.6), then multiply the result by the number in the first line under the heading entitled “Expenses Paid During the Six Months Ended December 31, 2015” to estimate the expenses you paid on your account during this period.
Hypothetical Example for Comparison Purposes
The second line of the table below provides information about hypothetical account values and hypothetical expenses based on the Fund’s actual expense ratio and an assumed rate of return of 5% per year before expenses, which is not the Fund’s actual return. The hypothetical account values and expenses may not be used to estimate the actual ending account balance or expenses you paid for the period. You may use this information to compare the ongoing costs of investing in the Fund’s and other funds. To do so, compare this 5% hypothetical example with the 5% hypothetical examples that appear in the shareholder reports of the other funds.
| | Annualized Net Expense Ratio December 31, 2015 | Beginning Account Value July 1, 2015 | Ending Account Value December 31, 2015 | Expenses Paid During the Six Months Ended December 31, 2015* |
| Actual | 1.50% | $ 1,000.00 | $ 949.20 | $7.37 |
| Hypothetical (5% annual return before expenses) | 1.50% | 1,000.00 | 1,017.64 | 7.63 |
| * | Expenses are equal to the Fund’s annualized net expense ratio, multiplied by the average account value over the period, multiplied by 184/365 to reflect the one-half year period. |
As of December 31, 2015
| | | |
| Sector | % of Net Assets |
| Information Technology | 22.3 | % |
| Health Care | 21.8 | % |
| Consumer Discretionary | 18.9 | % |
| Financials | 18.9 | % |
| Industrials | 4.8 | % |
| Consumer Staples | 4.7 | % |
| Materials | 4.2 | % |
| Money Market Fund | 2.4 | % |
| Energy | 2.2 | % |
| Liabilities in Excess of Other Assets | (0.2 | %) |
| | 100.0 | % |
December 31, 2015
| Shares | | | | Market Value | |
| | | | | | |
| | | Common Stocks — 97.8% | | | |
| | | Consumer Discretionary — 18.9% | | | |
| 8,250 | | Carnival Corp. | | $ | 449,460 | |
| 5,400 | | Delphi Automotive PLC | | | 462,942 | |
| 3,875 | | Home Depot, Inc. | | | 512,469 | |
| 4,000 | | Netflix, Inc. * | | | 457,520 | |
| 9,100 | | Starbucks Corp. | | | 546,273 | |
| 4,700 | | The Walt Disney Co. | | | 493,876 | |
| 4,000 | | Under Armour, Inc. * | | | 322,440 | |
| | | | | | 3,244,980 | |
| | | Consumer Staples — 4.7% | | | | |
| 2,800 | | Constellation Brands, Inc. | | | 398,832 | |
| 2,500 | | Costco Wholesale Corp. | | | 403,750 | |
| | | | | | 802,582 | |
| | | Energy — 2.2% | | | | |
| 5,250 | | Valero Energy Corp. | | | 371,228 | |
| | | Financials — 18.9% | | | | |
| 4,100 | | American Tower Corp. | | | 397,495 | |
| 23,000 | | Bank Of America Corp. | | | 387,090 | |
| 8,050 | | Citigroup, Inc. | | | 416,587 | |
| 2,400 | | Goldman Sachs Group, Inc. | | | 432,552 | |
| 1,700 | | Intercontinental Exchange, Inc. | | | 435,642 | |
| 6,100 | | JPMorgan Chase & Co. | | | 402,783 | |
| 5,000 | | Northern Trust Corp. | | | 360,450 | |
| 7,500 | | Wells Fargo & Co. | | | 407,700 | |
| | | | | | 3,240,299 | |
| | | Health Care — 21.8% | | | | |
| 6,700 | | AbbVie, Inc. | | | 396,908 | |
| 1,400 | | Allergan, Inc. * | | | 437,500 | |
| 2,900 | | Amgen, Inc. | | | 470,757 | |
| 6,500 | | Cerner Corp. * | | | 391,105 | |
| 4,300 | | Express Scripts Holding Co. * | | | 375,863 | |
| 2,650 | | Illumina, Inc. * | | | 508,654 | |
| 4,450 | | Medtronic PLC | | | 342,294 | |
| 3,500 | | Thermo Fisher Scientific, Inc. | | | 496,475 | |
| 6,400 | | Zoetis, Inc. | | | 306,688 | |
| | | | | | 3,726,244 | |
The accompanying notes are an integral part of these financial statements.
SCHEDULE OF INVESTMENTS, continued
December 31, 2015
| Shares | | | | Market Value | |
| | | Industrials — 4.8% | | | |
| 2,350 | | Roper Industries, Inc. | | $ | 446,007 | |
| 5,250 | | Wabtec Corp. | | | 373,380 | |
| | | | | | 819,387 | |
| | | Information Technology — 22.3% | | | | |
| 6,000 | | Akamai Technologies, Inc. * | | | 315,780 | |
| 8,015 | | Apple, Inc. | | | 843,659 | |
| 2,800 | | Electronic Arts, Inc. * | | | 192,416 | |
| 5,400 | | Facebook, Inc. * | | | 565,164 | |
| 5,000 | | IAC/InterActiveCorp | | | 300,250 | |
| 4,000 | | NXP Semiconductors N.V. * | | | 337,000 | |
| 3,100 | | Palo Alto Networks, Inc. * | | | 546,034 | |
| 6,500 | | PayPal Holdings, Inc. * | | | 235,300 | |
| 6,350 | | Visa, Inc. | | | 492,442 | |
| | | | | | 3,828,045 | |
| | | Materials — 4.2% | | | | |
| 2,925 | | Ecolab, Inc. | | | 334,561 | |
| 1,500 | | The Sherwin-Williams Co. | | | 389,400 | |
| | | | | | 723,961 | |
| | | Total Common Stocks (Cost $11,728,026) | | | 16,756,726 | |
| | | | | | | |
| | | Short-Term Investment — 2.4% | | | | |
| | | Money Market Fund — 2.4% | | | | |
| 411,863 | | Fidelity Money Market Portfolio Select Class, 0.23% (a) | | | 411,863 | |
| | | Total Short-Term Investment (Cost $411,863) | | | 411,863 | |
| | | Total Investments — 100.2% (Cost $12,139,889) | | | 17,168,589 | |
| | | Liabilities in excess of other assets — (0.2)% | | | (40,390 | ) |
| | | Total Net Assets — 100.0% | | $ | 17,128,199 | |
Percentages are stated as a percent of net assets.
| | * Non-income producing. |
| | (a) Represents annualized seven-day yield at December 31, 2015. |
The Global Industry Classification Standard (GICS®) was developed by and/or is the exclusive property of MSCI, Inc. and Standard & Poor’s Financial Services LLP (“S&P”). GICS is a service mark of MSCI and S&P and has been licensed for use by U.S. Bancorp Fund Services, LLC.
The accompanying notes are an integral part of these financial statements.
December 31, 2015
| Assets: | | | |
| Investments, at market value (cost $12,139,889) | | $ | 17,168,589 | |
| Receivable for Fund shares sold | | | 8,368 | |
| Dividends reclaims and interest receivable | | | 11,238 | |
| Prepaid expenses | | | 5,226 | |
| Total Assets | | | 17,193,421 | |
| | | | | |
| Liabilities: | | | | |
| Investment advisory fees | | | 11,172 | |
| Fund shares redeemed | | | 11,540 | |
| Payable to other affiliates | | | 23,215 | |
| Professional fees | | | 13,254 | |
| Accrued expenses and other liabilities | | | 6,041 | |
| Total Liabilities | | | 65,222 | |
| Total Net Assets | | $ | 17,128,199 | |
| | | | | |
| Net Assets Consist of: | | | | |
| Capital Stock | | $ | 12,385,138 | |
| Accumulated net investment loss | | | — | |
| Accumulated net realized loss on investments | | | (285,639 | ) |
| Net unrealized appreciation on investments | | | 5,028,700 | |
| Total Net Assets | | $ | 17,128,199 | |
| | | | | |
| Shares outstanding (unlimited number of shares authorized, no par value) | | | 1,664,758 | |
| | | | | |
| Net asset value, offering price and redemption price per share | | $ | 10.29 | |
The accompanying notes are an integral part of these financial statements.
Year Ended December 31, 2015
| Investment Income: | | | |
| Dividend income (net of foreign taxes withheld of $260) | | $ | 204,566 | |
| Interest income | | | 316 | |
| Total Investment Income | | | 204,882 | |
| | | | | |
| Expenses: | | | | |
| Investment advisory fees | | | 187,247 | |
| Accounting services fees | | | 33,441 | |
| Administration fees | | | 32,159 | |
| Transfer agent fees | | | 30,299 | |
| Trustees’ fees and expenses | | | 21,250 | |
| Professional fees | | | 15,952 | |
| Other expenses | | | 8,050 | |
| Insurance expense | | | 7,250 | |
| Custodian fees | | | 6,649 | |
| Compliance expense | | | 4,601 | |
| Registration fees | | | 3,450 | |
| Reports to shareholders | | | 2,251 | |
| Total Expenses | | | 352,599 | |
| Fees waived and expenses reimbursed by Adviser | | | (71,728 | ) |
| Net Expenses | | | 280,871 | |
| | | | | |
| Net Investment Loss | | | (75,989 | ) |
| | | | | |
| Realized and Unrealized Gain (Loss) on investments | | | | |
| Net realized gain on investment transactions | | | 672,706 | |
| Change in unrealized appreciation of investments | | | (555,930 | ) |
| Net realized and unrealized gain on investments | | | 116,776 | |
| | | | | |
| Net Increase in Net Assets from Operations | | $ | 40,787 | |
The accompanying notes are an integral part of these financial statements.
| | | | | | | |
| Operations: | | Year Ended December 31, 2015 | | | Year Ended December 31, 2014 | |
| Net investment loss | | $ | (75,989 | ) | | $ | (65,322 | ) |
| Net realized gain on investment transactions | | | 672,706 | | | | 1,205,133 | |
| Change in unrealized appreciation on investments | | | (555,930 | ) | | | (608,569 | ) |
| Net increase in net assets from operations | | | 40,787 | | | | 531,242 | |
| | | | | | | | | |
| Distributions to Shareholders: | | | | | | | | |
| Net investment income | | | — | | | | — | |
| Net realized gain | | | (1,305,918 | ) | | | (1,258,813 | ) |
| Total distributions to shareholders | | | (1,305,918 | ) | | | (1,258,813 | ) |
| | | | | | | | | |
| Capital Share Transactions: | | | | | | | | |
| Proceeds from shares sold | | | 1,265,903 | | | | 2,272,770 | |
| Shares issued in reinvestment of dividends | | | 315,915 | | | | 305,766 | |
| Payments for shares redeemed | | | (1,440,739 | ) | | | (1,144,231 | ) |
| Net increase in net assets from capital share transactions | | | 141,079 | | | | 1,434,305 | |
| | | | | | | | | |
| Increase (Decrease) in Net Assets | | | (1,124,052 | ) | | | 706,734 | |
| | | | | | | | | |
| Net Assets: | | | | | | | | |
| Beginning of year | | | 18,252,251 | | | | 17,545,517 | |
| End of year | | $ | 17,128,199 | | | $ | 18,252,251 | |
| | | | | | | | | |
| Capital Share Transactions (in shares): | | Year Ended December 31, 2015 | | | Year Ended December 31, 2014 | |
| Shares sold | | | 112,450 | | | | 197,314 | |
| Shares issued in reinvestment of dividends | | | 30,694 | | | | 27,534 | |
| Shares redeemed | | | (127,718 | ) | | | (100,049 | ) |
| Net increase in shares outstanding | | | 15,426 | | | | 124,799 | |
| Shares outstanding: | | | | | | | | |
| Beginning of year | | | 1,649,332 | | | | 1,524,533 | |
| End of year | | | 1,664,758 | | | | 1,649,332 | |
The accompanying notes are an integral part of these financial statements.
| | | | | | | | | | | | | | | | |
| Per Share Data: | | Year Ended December 31, 2015 | | | Year Ended December 31, 2014 | | | Year Ended December 31, 2013 | | | Year Ended December 31, 2012 | | | Year Ended December 31, 2011 | |
| Net asset value, beginning of year | | $ | 11.07 | | | $ | 11.51 | | | $ | 8.96 | | | $ | 7.81 | | | $ | 8.16 | |
| Income (loss) from investment operations: | | | | | | | | | | | | | | | | | | | | |
| Net investment (loss) income | | | (0.05 | ) | | | (0.04 | ) | | | (0.01 | ) | | | 0.01 | | | | (0.03 | ) |
| Net realized and unrealized gain (loss) on investments | | | 0.06 | | | | 0.38 | | | | 2.56 | | | | 1.15 | | | | (0.32 | ) |
| Total from investment operations | | | 0.01 | | | | 0.34 | | | | 2.55 | | | | 1.16 | | | | (0.35 | ) |
| | | | | | | | | | | | | | | | | | | | | |
| Less distributions: | | | | | | | | | | | | | | | | | | | | |
| Dividends from investment income | | | — | | | | — | | | | — | | | | (0.01 | ) | | | — | |
| From realized gains | | | (0.79 | ) | | | (0.78 | ) | | | — | | | | — | | | | — | |
| Total distributions | | | (0.79 | ) | | | (0.78 | ) | | | — | | | | (0.01 | ) | | | — | |
| Net asset value, end of year | | $ | 10.29 | | | $ | 11.07 | | | $ | 11.51 | | | $ | 8.96 | | | $ | 7.81 | |
| | | | | | | | | | | | | | | | | | | | | |
| Total return | | | 0.19 | % | | | 2.98 | % | | | 28.46 | % | | | 14.90 | % | | | (4.29 | %) |
| | | | | | | | | | | | | | | | | | | | | |
| Supplemental Data and Ratios: | | | | | | | | | | | | | | | | | | | | |
| Net assets, end of year | | $ | 17,128,199 | | | $ | 18,252,251 | | | $ | 17,545,517 | | | $ | 13,408,081 | | | $ | 12,305,007 | |
| Ratio of net expenses to average net assets | | | 1.50 | % | | | 1.50 | % | | | 1.50 | % | | | 1.50 | % | | | 1.50 | % |
| Ratio of net investment income (loss) to average net assets | | | (0.41 | %) | | | (0.36 | %) | | | (0.14 | %) | | | 0.14 | % | | | (0.35 | %) |
| Portfolio turnover rate | | | 42 | % | | | 30 | % | | | 34 | % | | | 17 | % | | | 31 | % |
The accompanying notes are an integral part of these financial statements.
December 31, 2015
The Appleton Funds (the “Trust”) was organized as an Ohio business trust on October 31, 2000 and is registered under the Investment Company Act of 1940, as amended (the “1940 Act”), as a diversified, no-load, open-end management investment company issuing its shares in series, each series representing a distinct portfolio with its own investment objective and policies. The Trust currently offers one series of shares to investors: the Appleton Equity Growth Fund (the “Fund”). The Trust was capitalized on December 29, 2000, when the initial shares of the Fund were purchased at $10 per share. The Fund commenced operations on December 31, 2000. The Fund seeks long-term growth of capital by investing primarily in common stocks. The Fund is listed with the symbol APLEX.
| 2. | Significant Accounting Policies |
The following is a summary of significant accounting policies consistently followed by the Fund. The Fund is an investment company and follows the specialized accounting and reporting requirements for investment companies in accordance with accounting principles generally accepted in the United States of America (“GAAP”).
a) Securities Valuation – The net asset value of the Fund (“NAV”) is determined daily, Monday through Friday, as of the close of regular trading on the New York Stock Exchange (“NYSE”), each day the NYSE is open for business. The Fund’s portfolio securities are valued as of the close of business of the regular session of the NYSE (normally 4:00 p.m., Eastern Time). Portfolio securities traded on stock exchanges are valued at their last sales price as of the close of the regular session of trading on the day the securities are being valued. Securities quoted by NASDAQ are valued at the NASDAQ Official Closing Price. Money market instruments are valued at the reported net asset value. Securities for which market quotations are not readily available are valued at their fair value as determined in good faith in accordance with consistently applied procedures established by and under the general supervision of the Board of Trustees.
The Fund has adopted fair valuation accounting standards which establish a definition of fair value and set out a hierarchy for measuring fair value. These standards require additional disclosures about the various inputs and valuation techniques used to develop the measurements of fair value and a discussion of changes in valuation techniques and related inputs during the period. These inputs are summarized in the three broad levels listed below:
| | | |
| | ● | Level 1 – Quoted prices in active markets for identical securities |
| | | |
| | ● | Level 2 – Evaluated price based on other significant observable inputs (including quoted prices for similar securities, interest rates, prepayment speeds, credit risk, etc.) |
| | | |
| | ● | Level 3 – Significant unobservable inputs (including the Fund’s own assumptions in determining the fair value of investments) |
The inputs or methodology used for valuing securities are not necessarily an indication of the risk associated with investing in those securities.
The following is a summary of the market value of the Fund’s investments as of December 31, 2015, based on the inputs used to value them:
| | | Level 1 | | | Level 2 | | | Level 3 | | | Total | |
| Common Stocks | | $ | 16,756,726 | | | $ — | | | | $ — | | | | $ | 16,756,726 | |
| Short-Term Investments | | | 411,863 | | | — | | | | — | | | | | 411,863 | |
Please refer to the Schedule of Investments for industry classification of the Fund’s holdings.
There were no transfers between any of the Levels during the year ended December 31, 2015. There were no Level 3 securities held during the period.
b) Share Valuation – The NAV per share of the Fund is calculated daily by dividing the total value of the Fund’s assets, less liabilities, by the number of shares outstanding, rounded to the nearest cent. The offering and redemption price per share are equal to the NAV per share.
c) Security Transactions and Investment Income – Security transactions are accounted for on trade date. Gains and losses realized on sales of securities are determined on a specific identification basis. Dividend income less foreign taxes withheld, if any, is recorded on the ex-dividend date. Interest income includes income distributions received from money market funds and is accrued daily.
d) Dividends and Distributions to Shareholders – Dividends arising from net investment income are declared and paid annually. Net realized short-term capital gains, if any, may be distributed throughout the year and net realized long-term capital gains, if any, are distributed at least once each year. Distributions are recorded on the ex-dividend date.
e) Use of Estimates – The preparation of financial statements in conformity with GAAP requires management to make estimates and assumptions that affect the reported amounts of assets and liabilities and disclosure of contingent assets and liabilities at the date of the financial statements and the reported amounts of income and expenses during the reporting period. Actual results could differ from those estimates.
f) Federal Income Tax – The Fund intends to comply with the requirements of Subchapter M of the Internal Revenue Code necessary to qualify as a regulated investment company and to make the requisite distributions of income and capital gains to its shareholders sufficient to relieve it from all or substantially all Federal income taxes and excise taxes. No provisions for income or excise taxes have been made.
The Fund follows the authoritative guidance on accounting for and disclosure of uncertainty in tax positions. The Fund recognizes tax benefits of uncertain tax positions only where the position is “more likely than not” of being sustained by the applicable tax authorities. The Fund has analyzed its tax positions taken on federal income tax returns for all open tax years (tax years ended December 31, 2012 –December 31, 2015), and has concluded that no tax liability resulting from unrecognized tax benefits relating to uncertain income tax positions should be recorded. The Fund recognizes interest and penalties, if any, related to uncertain tax benefits as an expense on the Statement of Operations. The Fund did not incur any interest or penalties during the year ended December 31, 2015. The Fund is not aware of any tax positions for which it is reasonably possible that the total amounts of unrecognized tax benefits will materially change in the next year.
g) Guarantees and Indemnifications – The Fund indemnifies the Trust’s Officers and Trustees for certain liabilities that might arise from the performance of their duties to the Fund. Additionally, in the normal course of business, the Fund enters into contracts that contain a variety of representations and warranties and which provide general indemnifications. The Fund’s maximum exposure under these arrangements is unknown, as this would involve future claims that may be made against the Fund that have not yet occurred. However, based on experience, the Fund expects the risk of loss to be remote.
h) Subsequent Events – In preparing these financial statements, the Fund has evaluated events and transactions for potential recognition or disclosure through the date the financial statements were issued. This evaluation did not result in any subsequent events that necessitated recognition or disclosure.
| 3. | Investment Transactions |
For the year ended December 31, 2015, the cost of purchases and proceeds from sales of portfolio securities, excluding short-term investments, were $7,584,659 and $8,835,597, respectively. There were no transactions in U.S. Government securities during the year ended December 31, 2015.
| 4. | Federal Income Tax and Distribution Information |
The cost basis of the Fund’s investments for federal income tax purposes as of December 31, 2015 was as follows:
| Tax cost of investments | | $ | 12,139,889 | |
| Gross unrealized appreciation of investments | | | 5,242,273 | |
| Gross unrealized depreciation of investments | | | (213,573 | ) |
| Net unrealized appreciation of investments | | $ | 5,028,700 | |
As of December 31, 2015, the components of distributable earnings of the Fund for federal income tax purposes were as follows:
| Net unrealized appreciation of investments | | $ | 5,028,700 | |
| Undistributed long-term capital gain | | | — | |
| Other accumulated losses | | | (285,639 | ) |
| Total accumulated earnings | | $ | 4,743,061 | |
Other accumulated losses are comprised of post-October capital losses. Post-October capital losses are any net capital losses incurred between November 1 and the end of the Fund’s fiscal year, December 31. At December 31, 2015, the Fund deferred $285,639 of post-October capital losses.
Certain reclassifications, the result of permanent differences between financial statement and income tax reporting requirements have been made to the components of net assets. The reclassifications resulted from the difference in the tax treatment of net investment losses and distributions to shareholders. These reclassifications have no impact on the net assets or net asset value per share of the Fund and are designed to present the Fund’s components of net assets on a tax basis. For the year ended December 31, 2015, the Fund reclassified $75,989 of net investment loss and $175,547 of accumulated net realized loss on investments to capital stock on the Statement of Assets and Liabilities.
During the year ended December 31, 2015, the Fund paid $1,305,918 of long-term capital gain distribution. For the year ended December 31, 2014, the Fund paid $1,258,813 of long-term capital gain distribution.
| 5. | Related Party Transactions and Fees |
The following is a summary of certain agreements entered into by the Trust on behalf of the Fund.
a) Investment Adviser – The Fund’s investment adviser is Appleton Partners, Inc. (the “Adviser”) pursuant to an Investment Advisory Agreement with the Adviser. Under the terms of this agreement, the Adviser manages the Fund’s investments and for these services is entitled to receive a fee, computed and accrued daily and paid monthly, at an annual rate of 1.00% of the Fund’s average daily net assets. Certain Trustees and Officers of the Trust are also Officers of the Adviser. The Adviser and certain affiliates of the Adviser own shares of the Fund.
b) Fee Waivers and Expense Reimbursement – Pursuant to an Operating Expenses Limitation Agreement between the Adviser and the Fund, the Adviser has agreed to waive a portion of its advisory fees and/or assume certain expenses of the Fund (other than brokerage commissions, extraordinary items, interest and taxes) to the extent annualized Fund operating expenses exceed 1.50% of the Fund’s average daily net assets. Effective March 21, 2014, the Adviser retained the right to recoup any fees waived or expenses reimbursed pursuant to the Operating Expenses Limitation Agreement in the prior three fiscal years subject to the limitation on the Fund’s expenses in effect at the time such recoupment is paid to the Adviser and at the time such fees were waived and/or expenses were reimbursed. The Adviser has agreed to maintain these expense limitations with regard to the Fund through at least April 30, 2017. As of December 31, 2015, the amounts subject to potential recoupment by the Adviser were:
| | | |
| Amount | | Expiring |
| $78,727 | | December 31, 2017 |
| 71,728 | | December 31, 2018 |
c) Distribution – The Fund has adopted a plan of distribution (the “Plan”) pursuant to Rule 12b-1 under the 1940 Act. The Plan permits the Fund to pay for expenses incurred in the distribution and promotion of the Fund’s shares including but not limited to, the printing of prospectuses, statements of additional information and reports used for sales purposes, advertisements, expenses of preparation and printing of sales literature, promotion, marketing and sales expenses and other distribution-related expenses, including any distribution fees paid to securities dealers or other firms who have executed a distribution or service agreement with the Trust. The Plan limits payment of distribution expenses in any fiscal year to a maximum of 0.25% of the Fund’s average daily net assets. For the year ended December 31, 2015, the Fund did not assess, accrue or collect a distribution fee.
The Trust entered into an Underwriting Agreement on behalf of the Fund with Quasar Distributors, LLC, a subsidiary of U.S. Bancorp (the “Distributor”). Pursuant to the Underwriting Agreement, the Distributor acts as principal underwriter and, as such, is the exclusive agent for distribution of shares of the Fund. The Adviser pays the Distributor a monthly fee for its services.
d) Other Service Providers – U.S. Bancorp Fund Services, LLC (“USBFS”), a subsidiary of U.S. Bancorp, a publicly held bank holding company, serves as transfer agent, administrator, fund accountant, dividend paying agent and shareholder servicing agent for the Fund. Certain Officers of the Trust are also employees of USBFS. U.S. Bank, N.A. serves as custodian for the Fund. Both USBFS and U.S. Bank, N.A. receive a monthly fee based on the Fund’s average daily net assets, subject to a monthly minimum fee.
To the Board of Trustees and Shareholders
of the Appleton Funds
We have audited the accompanying statement of assets and liabilities of Appleton Equity Growth Fund (the Fund), including the schedule of investments, as of December 31, 2015, and the related statement of operations for the year then ended, the statements of changes in net assets for each of the two years in the period then ended and the financial highlights for the two years in the period then ended. These financial statements and financial highlights are the responsibility of the Fund’s management. Our responsibility is to express an opinion on these financial statements and financial highlights based on our audits.
We conducted our audits in accordance with the standards of the Public Company Accounting Oversight Board (United States). Those standards require that we plan and perform the audit to obtain reasonable assurance about whether the financial statements and financial highlights are free of material misstatement. The Fund is not required to have, nor were we engaged to perform, an audit of its internal control over financial reporting. Our audit included consideration of internal control over financial reporting as a basis for designing audit procedures that are appropriate in the circumstances, but not for the purpose of expressing an opinion on the effectiveness of the Fund’s internal control over financial reporting. Accordingly, we express no such opinion. An audit also includes examining, on a test basis, evidence supporting the amounts and disclosures in the financial statements, assessing the accounting principles used and significant estimates made by management, as well as evaluating the overall financial statement presentation. Our procedures included confirmation of securities owned as of December 31, 2015, by correspondence with the custodian. We believe that our audit provides a reasonable basis for our opinion.
In our opinion, the financial statements and financial highlights referred to above present fairly, in all material respects, the financial position of the Appleton Equity Growth Fund as of December 31, 2015, the results of its operations for the year then ended, the changes in its net assets for each of the two years in the period then ended, and the financial highlights for each of the two years in the period then ended, in conformity with accounting principles generally accepted in the United States of America.
The financial highlights of the Appleton Equity Growth Fund for the three years ended December 31, 2013 were audited by another auditor who expressed an unmodified opinion on February 25, 2014.
Milwaukee, Wisconsin
February 17, 2016
Investment Advisory Agreement Approval
At a meeting held on December 8, 2015, the Board of Trustees (the “Board”) of the Appleton Funds (the “Trust”), including a majority of the Trustees who are not interested persons of the Trust (the “Independent Trustees”), reviewed and approved the Trust’s Investment Advisory Agreement with Appleton Partners, Inc. (the “Adviser”) for the Appleton Equity Growth Fund (the “Fund”). At this meeting, the Board, at its request, received information from the Adviser regarding the Fund and the services provided by the Adviser to the Fund under the Investment Advisory Agreement. This information, together with the information provided to the Board throughout the course of the year, formed the primary, but not exclusive, basis for the Board’s determination. The following is a summary of the factors considered by the Board and the conclusions that formed the basis for the Board’s approval of the continuance of the Investment Advisory Agreement:
1. The nature, extent and quality of the services provided by the Adviser. The Trustees considered the nature, extent and quality of the Adviser’s overall services provided to the Fund, as well as their specific responsibilities in all aspects of day-to-day investment management of the Fund. The Board considered the qualifications, experience and responsibilities of the portfolio managers, as well as the responsibilities of other key personnel of the Adviser involved in the day-to-day activities of the Fund. The Board also considered the resources and compliance structure of the Adviser, including information regarding its compliance program, its chief compliance officer and the Adviser’s compliance record. The Board acknowledged the long-tenured relationship between the Adviser and the Trust, and further took into account its knowledge of the Adviser’s operations. The Board noted that during the course of the prior year they had met with the Adviser periodically to discuss fund performance, investment outlook and various marketing and compliance topics, including the Adviser’s risk management process. The Board concluded that the Adviser had the quality and depth of personnel, resources, investment methods and compliance policies and procedures essential to performing its duties under the Investment Advisory Agreement and that the nature, overall quality and extent of such services are satisfactory.
2. The investment performance of the Fund and the Adviser. In assessing the quality of the portfolio management delivered by the Adviser, the Board reviewed the short-term and long-term performance of the Fund on both an absolute basis, and in comparison to appropriate securities benchmarks and comparable funds utilizing Morningstar peer groups. The Board noted that the Fund had underperformed its peer group median for the one-year, three-year, five-year and ten-year time periods ended September 30, 2015, and further noted underperformance to the S&P 500 Index for the same periods. The Board noted that this underperformance narrowed for the longer term periods. The Board also reviewed the volatility of the Fund’s performance, and noted that the standard deviation of its returns was lower than in comparison to its peer group median for the longer term periods referenced above. The Board also noted that the Fund’s standard deviation was the lowest amongst its peer group for the ten-year period, which reflects a disciplined investment approach which can cause the Fund to underperform relative to other funds in bullish markets, but also can provide downside protection when markets retreat.
3. The costs of the services to be provided by the Adviser. In considering the management fee and total fees and expenses of the Fund, the Board reviewed comparisons to its Morningstar expense peer group of funds and similarly managed separate accounts for other types of clients advised by the Adviser, as well as all expense waivers and reimbursements. The Board noted that the Adviser has a contractual agreement to reimburse Fund expenses to a level where net expenses do not exceed 1.50% of the Fund’s net assets. The Board noted that the Fund’s net expense ratios were 0.29% above the peer group median. The Board further noted that the Fund’s contractual management fee was higher than that of the expense peer group median. The Board took into account, however, the Adviser’s agreement to cap expenses of the Fund. The Board concluded that the fees paid to the Adviser were fair and reasonable in light of the comparative expense and management fee information. The Board took into consideration the services the Adviser provided to its separately managed account clients, comparing the fees charged for those management services to the fees charged to the Fund and noting that additional services were required for the Fund due to requirements of the Investment Company Act of 1940, as amended and the regulations under the Act.
4. The extent to which economies of scale would be realized. The Board also considered that economies of scale would likely be realized as the assets of the Fund grow, and, that despite asset growth in the past year, assets were not yet sufficient to achieve economies of scale. The Board determined that they would continue to examine this issue to ensure that economies of scales are being shared with the Fund as asset levels increase.
5. The profits to be realized by the Adviser and its affiliates from their relationship with the Fund. The Board reviewed the Adviser’s financial information, and took into account both the direct benefits and the indirect benefits to the Adviser from advising the Fund. The Board considered the profitability to the Adviser from its relationship with the Fund and considered any additional benefits derived by the Adviser from this relationship. After such review, the Board determined that the profitability to the Adviser with respect to the Advisory Agreements was not excessive, and that the Adviser had maintained adequate profit levels to support the services it provides to the Fund. The Fund did not generate any 12b-1 fees during the period under review.
No single factor was determinative of the Board’s decision to approve the continuance of the Investment Advisory Agreement, but rather the Board based its determination on the total combination of information available to them. Based on this review, which included an executive session of the Independent Trustees, it was the consensus of the Trustees that the Investment Advisory Agreement was fair and reasonable in light of the services to be performed, fees, expenses and other matters as the Board considered relevant. The Board, therefore, determined that the continuance of the Investment Advisory Agreement would be in the best interests of the Fund and its shareholders.
Proxy Voting Policies and Procedures
The Adviser is responsible for exercising the voting rights associated with the securities purchased and held by the Fund. A description of the policies and procedures the Adviser uses in fulfilling this responsibility and information regarding how those proxies are voted during the twelve month period ended December 31 are available without charge, upon request, by calling 617-338-0700. They are also available on the Securities and Exchange Commission’s website at http://www.sec.gov.
Quarterly Portfolio Disclosure
The Trust files a complete listing of the portfolio holdings for the Fund as of the end of the first and third quarters of each fiscal year on Form N-Q. The complete listing (i) is available on the Securities and Exchange Commission’s website; (ii) may be reviewed and copied at the Securities and Exchange Commission’s Public Reference Room in Washington, D.C.; and (iii) will be made available to shareholders upon request by calling 1-800-543-0407. Information on the operation of the Public Reference Room may be obtained by calling 1-800-SEC-0330.
Listed in the chart below is basic information regarding the Trustees and Officers of the Fund. The address for each Trustee and officer is c/o Appleton Partners, Inc., One Post Office Square, Floor Six, Boston, MA 02109, unless otherwise indicated. Additional information about the Funds’ Trustees and officers is included in the Statement of Additional Information and is available without charge, upon request by calling 1-877-71-APPLE or on the Fund’s website appletonfunds.com/filings.
INDEPENDENT TRUSTEES*
| Name and Year of Birth | | Position with Trust
and Length of Term | | Principal Occupation(s) in the Past 5 Years | | Number of Portfolios in Fund Complex Overseen by Trustee | | Other Directorships Held in the Past 5 Years |
| | | | | | | | | |
John M. Cornish, Esq. c/o Choate Hall & Stewart LLP 2 International Place Boston, MA 02110 Born: 1947 | | Trustee
(since 2000) | | Partner, Choate Hall & Stewart (since 1985) | | 1 | | None. |
| | | | | | | | | |
Grady B. Hedgespeth c/o Small Business Administration 409 Third Street SW, Suite 8112 Washington, DC 20003 Born: 1955 | | Trustee
(since 2000) | | Director, Office of Capital Access Small Business Administration (since 2007) | | 1 | | None. |
| | | | | | | | | |
INTERESTED TRUSTEES** | | | | | | |
| | | | | | | | | |
| Name and Year of Birth | | Position with Trust and Length of Term | | Principal Occupation(s) in the Past 5 Years | | Number of Portfolios in Fund Complex Overseen by Trustee | | Other Directorships Held in the Past 5 Years |
| | | | | | | | | |
James I. Ladge, CFA Born: 1968 | | Trustee
(since 2000);
Treasurer
(since 2003) | | Senior Vice-President, COO Appleton Partners, Inc. (since 1993) | | 1 | | Director, Cambridge Appleton Trust, N.A. since 2005 |
| | | | | | | | | |
| OFFICERS | | | | | | | | |
| | | | | | | | | |
| Name and Year of Birth | | Position with Trust and Length of Term | | Principal Occupation(s) in the Past 5 Years | | | | |
| | | | | | | | | |
Daniel T. Buckley, CFA Born: 1975 | | President
(since 2014) | | Vice President, Portfolio Manager and Senior Research Analyst, Appleton Partners (since 2005) | | | | |
| | | | | | | | | |
Benjamin T. Doherty, Esq.*** Born: 1986 | | Secretary and Chief
Compliance Officer
(since 2015) | | Legal & Compliance Officer, Appleton Partners, Inc. (since 2014); Assistant Vice President, Regulatory Administration Advisor, J.P. Morgan Chase Bank, N.A. (2011-2014) | | | | |
| | | | | | | | | |
Brandon Sliga c/o U.S. Bancorp Fund Services, LLC 777 E. Wisconsin Ave, 4th Floor
Milwaukee, WI 53202 Born: 1977 | | Assistant Secretary (since 2013) | | Vice President, U.S. Bancorp Fund Services, LLC (since 2007) | | | | |
| * | “Independent Trustee” refers to a Trustee of the Trust who is not an interested person of the Trust as defined in the 1940 Act. |
| ** | The Interested Trustee is such because of his interest in the investment adviser, as defined in the 1940 Act. |
| *** | Mr. Doherty replaced Michele D. Hubley as Secretary and Chief Compliance Officer effective December 8, 2015. |
THE APPLETON FUNDS
Thank you for your decision to invest with us. Your privacy is very important to us. The following constitutes a description of our policies regarding disclosure of nonpublic personal information that you provide to us or that we collect from other sources.
Categories of Information We Collect
We collect the following nonpublic personal information about you:
| | ● | Information we receive from you on or in applications or other forms, correspondence, or conversations, including, but not limited to, your name, address, phone number, social security number and date of birth; and |
| | ● | Information about your transactions with us, our affiliates, or others, including, but not limited to, your account number and balance, payment history, parties to transactions, cost basis information, and other financial information. |
Categories of Information We Disclose and Parties to Whom We Disclose
We do not disclose any nonpublic personal information about our current or former shareholders to nonaffiliated third parties, except as required or permitted by law.
Service Provider/Transfer Agent Exception
We are permitted by law to disclose all of the information we collect, as described above, to our service provider/ transfer agent to process your transactions. Our service provider/transfer agent does not disclose the information to any third parties, except as required or permitted by law.
Confidentiality and Security
We restrict access to your nonpublic personal information to those persons who require such information to provide products or services to you. We maintain physical, electronic, and procedural safeguards that comply with federal standards to guard your nonpublic personal information.
Intermediaries
In the event that you hold shares of the fund(s) through a financial intermediary, including, but not limited to, a broker-dealer, bank or trust company, the privacy policy of your financial intermediary would govern how your nonpublic personal information would be shared with nonaffiliated third parties.
Appleton Funds
One Post Office Square, Sixth Floor
Boston, Massachusetts 02109
| | |
Investment Adviser Appleton Partners, Inc. One Post Office Square, Sixth Floor Boston, Massachusetts 02109 | Shareholder Services Nationwide: (Toll-Free) 877-71-APPLE
Trustees
|
| | John M. Cornish |
Distributor Quasar Distributors, LLC 615 East Michigan Street Milwaukee, WI 53202 | Grady B. Hedgespeth James I. Ladge Independent Registered Public |
| | |
Fund Administrator, Transfer Agent
and Fund Accountant | Baker Tilly Virchow Krause, LLP 777 East Wisconsin Avenue |
U.S. Bancorp Fund Services, LLC 615 East Michigan Street Milwaukee, WI 53202 | Legal Counsel Mintz, Levin, Cohn, Ferris, Glovsky, and Popeo, P.C |
| Custodian | One Financial Center |
U.S. Bank, N.A. 1555 North Rivercenter Drive, Suite 302 Milwaukee, WI 53212 | Boston, Massachusetts 02411 |
Item 2. Code of Ethics.
The registrant has adopted a code of ethics that applies to its principal executive officer and principal financial officer. During the period covered by this report, no amendments were made to the provisions of the code of ethics, nor did the registrant grant any waivers, including any implicit waivers, from the provisions of the code of ethics.
Item 3. Audit Committee Financial Expert.
The registrant’s Board of Trustees has determined that it does not have an audit committee financial expert serving on its Audit Committee. At this time, the Board of Trustees believes that the experience provided by each member of the Audit Committee together offers the registrant adequate oversight for the registrant’s level of financial complexity.
Item 4. Principal Accountant Fees and Services.
The registrant has engaged its principal accountant to perform audit services, audit-related services, tax services and other services during the past fiscal year. “Audit services” refer to performing an audit of the registrant's annual financial statements or services that are normally provided by the accountant in connection with statutory and regulatory filings or engagements for those fiscal years. “Audit-related services” refer to the assurance and related services by the principal accountant that are reasonably related to the performance of the audit. “Tax services” refer to professional services rendered by the principal accountant for tax compliance, tax advice, and tax planning. There were no “Other services” provided by the principal accountant.
| (a) | Audit Fees. Audit fees totaled $10,750 for the December 31, 2015 fiscal year and $11,500 for the December 31, 2014 fiscal year. |
| (b) | Audit-Related Fees. There were no audit-related fees for the December 31, 2015 or December 31, 2014 fiscal years. |
| (c) | Tax Fees. Tax fees totaled $2,500 for the December 31, 2015 fiscal year and $1,500 for the December 31, 2014 fiscal year. |
| (d) | All Other Fees. There were no other fees for the December 31, 2015 or December 31, 2014 fiscal years. |
| (e)(1) | Audit Committee Pre-Approval Policies. The Audit Committee’s pre-approval policies describe the types of audit, audit-related, tax and other services that may receive the general pre-approval of the Audit Committee. The pre-approval policies provide that annual audit service fees, tax services not specifically granted pre-approval, services exceeding pre-approved cost levels and other services that have not received general pre-approval will be subject to specific pre-approval by the Audit Committee. The pre-approval policies further provide that the Committee may grant general pre-approval to other audit services (statutory audits and services associated with SEC registration statements, periodic reports and other documents filed with the SEC or other documents issued in connection with securities offerings), audit-related services (accounting consultations related to accounting, financial reporting or disclosure matters not classified as “audit services,” assistance with understanding and implementing new accounting and financial reporting guidance from rulemaking authorities, agreed-upon or expanded audit procedures related to accounting and/or billing records required to respond to or comply with financial, accounting or regulatory reporting matters and assistance with internal control reporting requirements under Form N-SAR and Form N-CSR), tax services that have historically been provided by the auditor that the Committee believes would not impair the independence of the auditor and are consistent with the SEC’s rules on auditor independence and permissible non-audit services classified as “all other services” that are routine and recurring services. |
| (e)(2) | All services described in paragraphs (b) through (d) of Item 4 were approved by the Audit Committee. |
| (f) | All of the principal accountant’s hours spent on auditing the registrant’s financial statements were attributed to work performed by full-time permanent employees of the principal accountant. |
| (g) | There were no non-audit fees billed or expected to be billed by the registrant’s accountant for services to the registrant and to the registrant’s investment adviser for the December 31, 2015 or December 31, 2014 fiscal years. |
(h) Not applicable
Item 5. Audit Committee of Listed Companies.
Not applicable to registrants who are not listed issuers (as defined by Rule 10A-3 under the Securities Exchange Act of 1934).
Item 6. Schedule of Investments.
| (a) | The Schedule of Investments is included as part of the report to shareholders filed under Item 1 of this Form. |
| (b) | The registrant made no divestments of securities in accordance with Section 13(c) of the Investment Company Act of 1940. |
Item 7. Disclosure of Proxy Voting Policies and Procedures for Closed-End Funds.
Not applicable to open-end investment companies.
Item 8. Portfolio Managers of Closed-End Funds.
Not applicable to open-end investment companies.
Item 9. Purchases of Equity Securities by Closed-End Funds.
Not applicable to open-end investment companies.
Item 10. Submission of Matters to a Vote of Security Holders.
There have been no material changes to the procedures by which shareholders may recommend nominees to the registrant’s Board of Trustees.
Item 11. Controls and Procedures.
| (a) | The registrant’s principal executive officer and principal financial officer have concluded, based on their evaluation of the registrant’s disclosure controls and procedures as conducted within 90 days of the filing date of this report, that those disclosure controls and procedures provide reasonable assurance that the material information required to be disclosed by the registrant on this report is recorded, processed, summarized and reported within the time periods specified in the Securities and Exchange Commission’s rules and forms. |
| (b) | There were no changes in the registrant’s internal control over financial reporting that occurred during the registrant’s second fiscal half year covered by this report that have materially affected, or are reasonably likely to materially affect, the registrant’s internal control over financial reporting. |
Item 12. Exhibits.
| (a)(1) | Code of Ethics for Principal Executive and Financial Officers is filed herewith. |
| (a)(2) | Certifications required by Rule 30a-2(a) under the Act (17 CFR 270.30a-2) are filed herewith. |
| (a)(3) | Not applicable to open-end investment companies. |
| (b)(1) | Certifications required by Rule 30a-2(b) of the Investment Company Act of 1940 and Section 906 of the Sarbanes-Oxley Act of 2002 are filed herewith. |
SIGNATURES
Pursuant to the requirements of the Securities Exchange Act of 1934 and the Investment Company Act of 1940, the registrant has duly caused this report to be signed on its behalf by the undersigned, thereunto duly authorized.
The Appleton Funds
By: /s/ Daniel T. Buckley
Daniel T. Buckley
President
Date: March 1, 2016
Pursuant to the requirements of the Securities Exchange Act of 1934 and the Investment Company Act of 1940, this report has been signed below by the following persons on behalf of the registrant and in the capacities and on the dates indicated.
By: /s/ Daniel T. Buckley
Daniel T. Buckley
President
Date: March 1, 2016
By: /s/ James I. Ladge
James I. Ladge
Treasurer
Date: March 1, 2016