Daniel T. Buckley
Form N-CSR is to be used by management investment companies to file reports with the Commission not later than 10 days after the transmission to stockholders of any report that is required to be transmitted to stockholders under Rule 30e-1 under the Investment Company Act of 1940 (17 CFR 270.30e-1). The Commission may use the information provided on Form N-CSR in its regulatory, disclosure review, inspection and policymaking roles.
A Registrant is required to disclose the information specified by Form N-CSR, and the Commission will make this information public. A Registrant is not required to respond to the collection of information contained in Form N-CSR unless the Form displays a currently valid Office of Management and Budget ("OMB") control number. Please direct comments concerning the accuracy of the information collection burden estimate and any suggestions for reducing the burden to Secretary, Securities and Exchange Commission, 450 Fifth Street, NW, Washington, DC 20549-0609. The OMB has reviewed this collection of information under the clearance requirements of 44 U.S.C. § 3507.
Item 1. Reports to Stockholders.
The following is a copy of the report transmitted to shareholders pursuant to Rule 30e-1 under the Investment Company Act of 1940 (17 CFR 270.30e-1.)
Table of Contents
| Letter to Shareholders | 1 |
| Fund Performance | 4 |
| Expense Example | 5 |
| Tabular Presentation of Schedule of Investments | 5 |
| Schedule of Investments | 6 |
| Statement of Assets and Liabilities | 8 |
| Statement of Operations | 9 |
| Statements of Changes in Net Assets | 10 |
| Financial Highlights | 11 |
| Notes to the Financial Statements | 12 |
| Report of Independent Registered Public Accounting Firm | 17 |
| Supplemental Information | 18 |
| Trustees and Officers Information | 20 |
| Privacy Policy Disclosure | 21 |
Dear Shareholder,
Many felt that we would see higher interest rates and a slowdown in the four and a half year old rally in stocks during 2014. Neither came to fruition, as accommodative monetary policy from global central banks kept rates anchored, providing a tailwind for equities. The S&P 500 Index rose 4.93% over the final quarter to finish the year, returning 13.69% for the full year. While the S&P 500 produced another year of robust returns, many active managers struggled to keep pace this past year. According to Morningstar, only about 13% of U.S. large cap equity managers beat the S&P 500 Index in 20141. The Appleton Equity Growth Fund finished with a gain of 2.98% for the one year period ending December 31, 2014.
Looking back at the second half of the year, the Fund’s relative performance was most negatively impacted by the steep decline in the price of oil. Stock selection within the Energy and Industrial sectors was the primary detractor, and dwarfed the positive allocation effect of being underweight the Energy sector as a whole. The Energy sector, in addition to Chicago Bridge and Iron, subtracted 333 basis points from the Fund’s relative performance. On the positive side, Apple, the Fund’s largest holding, continued to perform well on the heels of a strong iPhone 6 launch and an accelerated capital return program. Healthcare stocks Amgen, Cerner, Express Scripts, and AbbVie all were among the Fund’s top ten performers for the second half of the year.
Looking ahead to 2015, we would offer the following thoughts. We continue to be constructive on stocks for many of the same reasons we have discussed in prior letters: sustained accommodative monetary policy from global central banks, a low interest rate environment, increased merger and acquisition activity as companies look to bolster growth using their ample balance sheets, and a healthy corporate profit outlook as earnings have continued to rise and beat analyst expectations. According to data from FactSet, analysts’ earnings estimates for the fourth quarter 2014 (+1.1%) and for the year 2015 (+7.7%) have both been cut dramatically, almost entirely due to the drop in energy producers’ profit projections. As we have witnessed over several quarters, reduced earnings expectations have been advantageous for the stock market, with more room for upside surprises once the bar has been lowered. With the equity rally standing just months shy of its sixth birthday, stock valuations have garnered more attention. Nevertheless, earnings are expected to continue to grow at a mid-to-high single digit rate, allowing the market to potentially appreciate without P/E multiple expansion.
Financial markets will not be without volatility in the coming year, however. The Fed faces the unenviable task of weaning the U.S. economy off of an unprecedented amount of monetary stimulus at the same time the rest of the world contemplates easing. This divergence of monetary policy will undoubtedly lead to investor angst as markets attempt to forecast the path of global interest rates. Inflation has shown no signs of increasing and the drop in oil should only exacerbate the matter. More importantly, wage growth has been anemic, with annualized hourly wage growth dropping to 1.65% in the latest jobs report. We believe that the Fed will exercise self-proclaimed “patience” in raising rates domestically, and easy monetary policy abroad will likely keep foreign rates low, further anchoring
Wall Street Journal, “Behind a Bad Year for Active Managers”, January 5, 2015
U.S. rates. The guessing game, of when and by how much the Fed moves, may lead to choppy trading for stocks.
As the Fund witnessed firsthand last year, the sharp decline in the price of oil and subsequent debate over the ultimate winners and losers, will continue to influence the direction of trades as we enter 2015. As 2014 came to a close, the price of West Texas Intermediate crude oil had dropped roughly 50% from its June high. Multiple explanations have been given for the decline, with a global economic slowdown and excess supply being the two most common.
We tend to side with the latter. The Organization of the Petroleum Exporting Countries has decided not to cut production, regardless of some member nations’ precarious financial positions. Despite the drop in the price of oil, U.S. shale producers have continued to ramp up productions as producers have gained efficiencies and decreased their marginal costs. We cannot ignore the fact that we are likely entering an age of energy surplus, with the days of $100/barrel oil behind us for the time being. The impacts of this shift will vary: (i) there is the immediate impact, seen in the decline in stock prices of energy producers; (ii) the implicit positive impact to consumers of cheaper gasoline to fuel their cars and cheaper heating oil to warm their homes; and (iii) the ancillary impacts on geopolitics. The thawing of the relationship between the U.S. and Cuba can no doubt be partially tied to Venezuela no longer being able to prop up the Cuban economy due to the impact of the oil price drop on Venezuela’s balance sheet. We will be closely monitoring the changing landscape as we look for investable opportunities in the coming year.
We believe that the equity market is poised to potentially continue its course of positive performance heading into 2015, although likely not at the pace we’ve seen in the last several years. Risks in the form of economic contagion from overseas, ambiguous monetary policy, and unforeseen geopolitical tensions are present, and we would anticipate volatile trading similar to the second half of 2014, as opposed to the first half. Amidst the volatility, we anticipate that the Healthcare sector can continue to outperform the overall market as earnings growth should continue to trend above market while investors may look to the traditionally defensive sector as a potential refuge. In addition to overweighting Healthcare, we are positioning the Fund to overweight the Technology sector, as valuations and growth prospects across multiple tech segments continue to look attractive.
Best wishes for a peaceful and healthy New Year.
Sincerely,
Daniel Buckley
Opinions expressed as those of the fund, are subject to change, are not guaranteed and should not be considered investment advice.
Mutual fund investing involves risk. Principal loss is possible. The Funds invest in smaller companies, which involve additional risks such as limited liquidity and greater volatility. Growth stocks typically are more volatile than value stocks; however, value stocks have a lower expected growth rate in earnings and sales.
Fund holdings are subject to change and are not recommendations to buy or sell any security. For a complete list of fund holdings, please refer to the Schedule of Investments found in this report.
Performance data quoted represents past performance; past performance does not guarantee future results.
This report must be preceded or accompanied by a prospectus.
The S&P 500 Index is a broad based unmanaged index of 500 stocks, which is widely recognized as representative of the equity market in general. You cannot invest directly in an index.
Price-to-earnings (P/E) ratio is a common tool for comparing the prices of different common stocks and is calculated by dividing the current market price of a stock by the earnings per share.
Distributed by Quasar Distributors, LLC.
February 2015
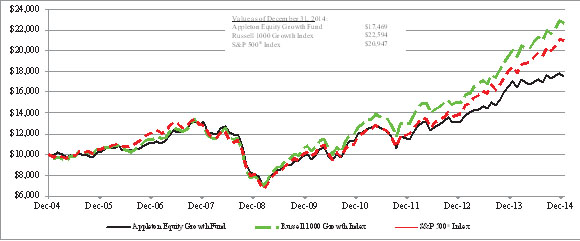
FUND PERFORMANCE
December 31, 2014 (Unaudited)
Comparison of the Change in Value of a $10,000 Investment
in the Appleton Equity Growth Fund, S&P 500® Index and the Russell 1000 Growth Index
| | Average Annual Total Returns* |
| | 1 Year | | 3 Year | | 5 Year | | 10 Year |
| Appleton Equity Growth Fund | 2.98% | | 14.98% | | 11.72% | | 5.74% |
S&P 500® Index | 13.69% | | 20.41% | | 15.45% | | 7.67% |
| Russell 1000 Growth Index | 13.05% | | 20.26% | | 15.81% | | 8.49% |
The S&P 500® Index is a capitalization-weighted index composed of 500 domestic common stocks. Most of the stock in the S&P 500® Index are issued by the 500 largest companies, in terms of the aggregate market value of their outstanding stock, and are generally listed on NYSE. The Russell 1000 Growth Index measures the performance of large- and mid-capitalization growth sectors of the U.S. equity market. The Russell 1000 Growth Index is a subset of the Russell 1000® Index, which measures the performance of the large-capitalization sector of the U.S. equity market.
This chart assumes an initial gross investment of $10,000 made on December 31, 2004. Returns shown include the reinvestment of all dividends. Past performance does not guarantee future results. The graph and table do not reflect the deduction of taxes that a shareholder would pay on Fund distributions or the redemption of Fund shares. Investment return and principal value will fluctuate, so that your shares, when redeemed, may be worth more or less than the original cost.
EXPENSE EXAMPLE
December 31, 2014 (Unaudited)
As a shareholder of the Fund, you incur ongoing costs, including investment advisory fees; distribution (12b-1) fees; and other Fund expenses. This example is intended to help you understand your ongoing costs (in dollars) of investing in the Fund and to compare these costs with the ongoing costs of investing in other mutual funds.
The example is based on an investment of $1,000 invested at the beginning of the period and held for the entire period (July 1, 2014 through December 31, 2014).
Actual Expenses
The first line of the table below provides information about actual account values and actual expenses. You may use the information in this line, together with the amount you invested, to estimate the expenses that you paid over the period. Simply divide your account value by $1,000 (for example, an $8,600 account value divided by $1,000 = 8.6), then multiply the result by the number in the first line under the heading entitled “Expenses Paid During the Six Months Ended December 31, 2014” to estimate the expenses you paid on your account during this period.
Hypothetical Example for Comparison Purposes
The second line of the table below provides information about hypothetical account values and hypothetical expenses based on the Fund’s actual expense ratio and an assumed rate of return of 5% per year before expenses, which is not the Fund’s actual return. The hypothetical account values and expenses may not be used to estimate the actual ending account balance or expenses you paid for the period. You may use this information to compare the ongoing costs of investing in the Fund’s and other funds. To do so, compare this 5% hypothetical example with the 5% hypothetical examples that appear in the shareholder reports of the other funds.
| | | | | | | | | | | | |
| | | | | | | | | | | | |
| | Annualized Net Expense Ratio | | | Beginning Account Value | | | Ending Account Value | | | Expenses Paid During the Six Months Ended | |
| | December 31, 2014 | | | July 1, 2014 | | | December 31, 2014 | | | December 31, 2014* | |
| Actual | 1.50% | | $ | 1,000.00 | | $ | 1,017.10 | | $ | 7.63 | |
| Hypothetical (5% annual | | | | | | | | | | | |
| return before expenses) | 1.50% | | | 1,000.00 | | | 1,017.64 | | | 7.63 | |
| * Expenses are equal to the Fund’s annualized net expense ratio, multiplied by the average account value over the period, multiplied by 184/365 to reflect the one-half year period. |
TABULAR PRESENTATION OF SCHEDULE OF INVESTMENTS
As of December 31, 2014 (Unaudited)
| Sector | % of Net Assets |
| Information Technology | 23.4% |
| Health Care | 18.0% |
| Financials | 14.2% |
| Industrials | 13.4% |
| Consumer Discretionary | 12.8% |
| Energy | 5.8% |
| Consumer Staples | 5.5% |
| Materials | 4.9% |
| Money Market Fund | 2.2% |
| Liabilities in Excess of Other Assets | (0.2%) |
| | 100.0% |
SCHEDULE OF INVESTMENTS
December 31, 2014
| Shares | | | | Market Value | |
| | | Common Stocks — 98.0% | | | |
| | | Consumer Discretionary — 12.8% | | | |
| | 5,400 | | Delphi Automotive PLC | | $ | 392,688 | |
| | 5,300 | | Dunkin’ Brands Group, Inc. | | | 226,045 | |
| | 4,250 | | Home Depot, Inc. | | | 446,122 | |
| | 400 | | Priceline.com, Inc. * | | | 456,084 | |
| | 4,550 | | Starbucks Corp. | | | 373,328 | |
| | 4,700 | | The Walt Disney Co. | | | 442,693 | |
| | | | | | | 2,336,960 | |
| | | | Consumer Staples — 5.5% | | | | |
| | 3,000 | | Church & Dwight Co., Inc. | | | 236,430 | |
| | 2,500 | | Costco Wholesale Corp. | | | 354,375 | |
| | 4,450 | | PepsiCo, Inc. | | | 420,792 | |
| | | | | | | 1,011,597 | |
| | | | Energy — 5.8% | | | | |
| | 4,000 | | Continental Resources, Inc. * | | | 153,440 | |
| | 3,000 | | EOG Resources, Inc. | | | 276,210 | |
| | 6,700 | | Halliburton Co. | | | 263,511 | |
| | 4,250 | | Schlumberger Ltd. | | | 362,992 | |
| | | | | | | 1,056,153 | |
| | | | Financials — 14.2% | | | | |
| | 4,100 | | American Tower Corp. | | | 405,285 | |
| | 23,000 | | Bank Of America Corp. | | | 411,470 | |
| | 8,050 | | Citigroup, Inc. | | | 435,585 | |
| | 2,400 | | Goldman Sachs Group, Inc. | | | 465,192 | |
| | 6,100 | | JPMorgan Chase & Co. | | | 381,738 | |
| | 9,000 | | Wells Fargo & Co. | | | 493,380 | |
| | | | | | | 2,592,650 | |
| | | | Health Care — 18.0% | | | | |
| | 7,300 | | Abbott Laboratories | | | 328,646 | |
| | 6,700 | | AbbVie, Inc. | | | 438,448 | |
| | 2,900 | | Amgen, Inc. | | | 461,941 | |
| | 6,500 | | Cerner Corp. * | | | 420,290 | |
| | 4,300 | | Express Scripts Holding Co. * | | | 364,081 | |
| | 2,400 | | Perrigo Co. | | | 401,184 | |
| | 3,500 | | Thermo Fisher Scientific, Inc. | | | 438,515 | |
| | 3,000 | | Valeant Pharmaceuticals International, Inc. * | | | 429,330 | |
| | | | | | | 3,282,435 | |
The accompanying notes are an integral part of these financial statements.
SCHEDULE OF INVESTMENTS, continued
December 31, 2014
| Shares | | | | Market Value |
| | | Industrials — 13.4% | | |
| | 8,250 | | Chicago Bridge & Iron Company N.V. | $ | 346,335 |
| | 1,300 | | Precision Castparts Corp. | | 313,144 |
| | 2,850 | | Roper Industries, Inc. | | 445,597 |
| | 4,000 | | Union Pacific Corp. | | 476,520 |
| | 4,000 | | United Rentals, Inc. * | | 408,040 |
| | 5,250 | | Wabtec Corp. | | 456,173 |
| | | | | | 2,445,809 |
| | | | Information Technology — 23.4% | | |
| | 6,000 | | Akamai Technologies, Inc. * | | 377,760 |
| | 8,015 | | Apple, Inc. | | 884,696 |
| | 6,500 | | eBay, Inc. * | | 364,780 |
| | 6,750 | | Facebook, Inc. * | | 526,635 |
| | 400 | | Google, Inc. Class A * | | 212,264 |
| | 400 | | Google, Inc. Class C * | | 210,560 |
| | 5,000 | | IAC/InterActiveCorp | | 303,950 |
| | 3,800 | | Palo Alto Networks, Inc. * | | 465,766 |
| | 7,500 | | Verisign, Inc. * | | 427,500 |
| | 1,900 | | Visa, Inc. | | 498,180 |
| | | | | | 4,272,091 |
| | | | Materials — 4.9% | | |
| | 3,675 | | Ecolab, Inc. | | 384,111 |
| | 5,250 | | The Dow Chemical Company | | 239,453 |
| | 10,500 | | U.S. Silica Holdings, Inc. | | 269,745 |
| | | | | | 893,309 |
| | | | Total Common Stocks (Cost $12,306,374) | | 17,891,004 |
| Short-Term Investment — 2.2% |
| Money Market Fund — 2.2% |
| 400,031 Fidelity Money Market Portfolio Select Class, 0.02% (a) | | 400,031 |
Total Short-Term Investment (Cost $400,031) | | 400,031 |
Total Investments — 100.2% (Cost $12,706,405) | | 18,291,035 |
| Liabilities in excess of other assets — (0.2)% | | (38,784) |
| | $ | 18,252,25 |
Percentages are stated as a percent of net assets.
* Non-income producing.
(a) Represents annualized seven-day yield at December 31, 2014.
The Global Industry Classification Standard (GICS®) was developed by and/or is the exclusive property of MSCI, Inc. and Standard & Poor’s Financial Services LLP (“S&P”). GICS is a service mark of MSCI and S&P and has been licensed for use by U.S. Bancorp Fund Services, LLC.
The accompanying notes are an integral part of these financial statements.
STATEMENT OF ASSETS AND LIABILITIES
December 31, 2014
| Assets | | | |
| Investments, at market value (cost $12,706,405) | | $ | 18,291,035 |
| Cash | | | 491 |
| Receivable for Fund shares sold | | | 563 |
| Dividends, reclaims and interest receivable | | | 19,128 |
| Prepaid expenses | | | 4,880 |
| Total Assets | | | 18,316,097 |
Liabilities: Investment advisory fees | | | 16,086 |
| Payable to other affiliates | | | 24,894 |
| Professional fees | | | 15,002 |
| Accrued expenses and other liabilities | | | 7,864 |
| Total Liabilities | | | 63,846 |
| Total Net Assets | | $ | 18,252,251 |
Net Assets Consist of: | | | |
Capital Stock Accumulated net investment loss Undistributed net realized gain on investments | | $ | 12,495,595- 172,026 |
| Net unrealized appreciation of investments | | | 5,584,630 |
| Total Net Assets | | $ | 18,252,251 |
| | | | |
| Shares outstanding (unlimited number of shares authorized, no par value) | | | 1,649,332 |
| | | | |
| Net asset value, offering price and redemption price per share | | $ | 11.07 |
The accompanying notes are an integral part of these financial statements.
STATEMENT OF OPERATIONS
Year Ended December 31, 2014
| Investment Income: | | | | |
| Dividend income (net of foreign taxes withheld of $1,633) | | $ | 207,414 | |
| Interest income | | | 59 | |
| Total Investment Income | | | 207,473 | |
| Expenses: | | | | |
| Investment advisory fees | | | 181,863 | |
| Distribution expenses | | | 45,466 | |
| Transfer agent fees | | | 44,473 | |
| Accounting services fees | | | 33,356 | |
| Administration fees | | | 33,029 | |
| Trustees’ fees and expenses | | | 30,949 | |
| Other expenses | | | 21,191 | |
| Professional fees | | | 15,103 | |
| Reports to shareholders | | | 7,068 | |
| Custodian fees | | | 6,276 | |
| Registration fees | | | 4,489 | |
| Insurance expense | | | 3,370 | |
| Total Expenses | | | 426,633 | |
| Fees waived and expenses reimbursed by Adviser | | | (153,838 | ) |
| Net Expenses | | | 272,795 | |
| Net Investment Loss | | | (65,322 | ) |
| Realized and Unrealized Gain (Loss) on Investments | |
| Net realized gain on investment transactions | | | 1,205,133 | |
| Change in unrealized appreciation of investments | | | (608,569 | ) |
| Net realized and unrealized gain on investments | | | 596,564 | |
| Net Increase in Net Assets from Operations | | $ | 531,242 | |
The accompanying notes are an integral part of these financial statements.
STATEMENTS OF CHANGES IN NET ASSETS
Operations: | | Year Ended December 31, 2014 | | | Year Ended December 31, 2013 | |
| Net investment loss | | $ | (65,322 | ) | | $ | (21,939 | ) |
| Net realized gain on investment transactions | | | 1,205,133 | | | | 1,348,507 | |
| Change in unrealized appreciation of investments | | | (608,569 | ) | | | 2,570,025 | |
| Net increase in net assets from operations | | | 531,242 | | | | 3,896,593 | |
| | | | | | | | | |
| Distributions to Shareholders: | | | | | | | | |
| Net investment income | | | - | | | | - | |
| Net realized gain | | | (1,258,813 | ) | | | - | |
| Total distributions to shareholders | | | (1,258,813 | ) | | | - | |
| | | | | | | | | |
| Capital Share Transactions: | | | 2,272,770 | | | | 1,321,672 | |
| Proceeds from shares sold | | | | | | | | |
| Shares issued in reinvestment of dividends | | | 305,766 | | | | - | |
| Payments for shares redeemed | | | (1,144,231 | ) | | | (1,080,829 | ) |
| Net increase in net assets from capital share transactions | | | 1,434,305 | | | | 240,843 | |
| | | | | | | | | |
| Increase in Net Assets | | | 706,734 | | | | 4,137,436 | |
| Net Assets: | | | 17,545,517 | | | | 13,408,081 | |
| Beginning of year | | | | | | | | |
| End of year | | $ | 18,252,251 | | | $ | 17,545,517 | |
| Capital Share Transactions (in shares): | | Year Ended December 31, 2014 | | | Year Ended December 31, 2013 | |
| Shares sold | | | 197,314 | | | | 131,830 | |
| Shares issued in reinvestment of dividends | | | 27,534 | | | | - | |
| Shares redeemed | | | (100,049 | ) | | | (104,394 | ) |
| Net increase in shares outstanding Shares outstanding: | | | 124,799 | | | | 27,436 | |
| Beginning of year | | | 1,524,533 | | | | 1,497,097 | |
| End of year | | | 1,649,332 | | | | 1,524,533 | |
The accompanying notes are an integral part of these financial statements.
FINANCIAL HIGHLIGHTS
| Per Share Data: | | | | | | | | | | | | | | | |
| | | | | | | | | | | | | | | | |
| | | Year Ended December 31, | | | Year Ended December 31, | | | Year Ended December 31, | | | Year Ended December 31, | | | Year Ended December 31, | |
| | | 2014 | | | 2013 | | | 2012 | | | 2011 | | | 2010 | |
| Net asset value, beginning of year | | $ | 11.51 | | | $ | 8.96 | | | $ | 7.81 | | | $ | 8.16 | | | $ | 6.82 | |
Income (loss) from operations: Net investment income (loss) | | | (0.04 | ) | | | (0.01 | ) | | | 0.01 | | | | (0.03 | ) | | | (0.02 | ) |
Net realized and unrealized | | | | | | | | | | | | | | | | | | | | |
| gain (loss) on investments | | | 0.38 | | | | 2.56 | | | | 1.15 | | | | (0.32 | ) | | | 1.36 | |
| Total from operations | | | 0.34 | | | | 2.55 | | | | 1.16 | | | | (0.35 | ) | | | 1.34 | |
| Less distributions: | | | | | | | | | | | | | | | | | | | | |
| Dividends from investment | | | | | | | | | | | | | | | | | | | | |
| income | | | - | | | | - | | | | (0.01 | ) | | | - | | | | - | |
| Dividends from realized | | | | | | | | | | | | | | | | | | | | |
| gains | | | (0.78 | ) | | | - | | | | - | | | | - | | | | - | |
| Total distributions | | | (0.78 | ) | | | - | | | | (0.01 | ) | | | - | | | | - | |
| Net asset value, end of year | | $ | 11.07 | | | $ | 11.51 | | | $ | 8.96 | | | $ | 7.81 | | | $ | 8.16 | |
| | | | | | | | | | | | | | | | | | | | | |
| Total return | | | | | | | 2.98 | % | | | 28.46 | % | | | 14.90 | % | | | 19.65 | % |
| | | | | | |
| Supplemental Data and Ratios: | | | | | |
| Net assets, end of year | | $ | 18,252,251 | | | $ | 17,545,517 | | | $ | 13,408,081 | | | $ | 12,305,007 | | | $ | 12,834,022 | |
| Ratio of net expenses to average | | | | | | | | | | | | | | | | | | | | |
| net assets | | | 1.50 | %1 | | | 1.50 | % | | | 1.50 | % | | | 1.50 | % | | | 1.50 | % |
| Ratio of net investment income | | | | | | | | | | | | | | | | | | | | |
| (loss) to average net assets | | | (0.36 | %)1 | | | (0.14 | %) | | | 0.14 | % | | | (0.35 | %) | | | (0.30 | %) |
| Portfolio turnover rate | | | 30 | % | | | 34 | % | | | 17 | % | | | 31 | % | | | 38 | % |
The Adviser voluntarily waived distribution expenses equal to 0.25% of average net assets. This ratio is presented after the effect of the waiver.
The accompanying notes are an integral part of these financial statements.
NOTES TO THE FINANCIAL STATEMENTS
December 31, 2014
The Appleton Funds (the “Trust”) was organized as an Ohio business trust on October 31, 2000 and is registered under the Investment Company Act of 1940, as amended (the “1940 Act”), as a diversified, no- load, open-end management investment company issuing its shares in series, each series representing a distinct portfolio with its own investment objective and policies. The Trust currently offers one series of shares to investors: the Appleton Equity Growth Fund (the “Fund”). The Trust was capitalized on December 29, 2000, when the initial shares of the Fund were purchased at $10 per share. The Fund commenced operations on December 31, 2000. The Fund seeks long-term growth of capital by investing primarily in common stocks.
| 2. | Significant Accounting Policies |
The following is a summary of significant accounting policies consistently followed by the Fund. The Fund is an investment company and follows the specialized accounting and reporting requirements for investment companies in accordance with accounting principles generally accepted in the United States of America (“GAAP”).
a) Securities Valuation – The net asset value of the Fund (“NAV”) is determined daily, Monday through Friday, as of the close of regular trading on the New York Stock Exchange (“NYSE”), each day the NYSE is open for business. The Fund’s portfolio securities are valued as of the close of business of the regular session of the NYSE (normally 4:00 p.m., Eastern Time). Portfolio securities traded on stock exchanges are valued at their last sales price as of the close of the regular session of trading on the day the securities are being valued. Securities quoted by NASDAQ are valued at the NASDAQ Official Closing Price. Money market instruments are valued at the reported net asset value. Securities for which market quotations are not readily available are valued at their fair value as determined in good faith in accordance with consistently applied policies and procedures established by and under the general supervision of the Board of Trustees.
The Fund has adopted fair valuation accounting standards which establish a definition of fair value and set out a hierarchy for measuring fair value. These standards require additional disclosures about the various inputs and valuation techniques used to develop the measurements of fair value and a discussion of changes in valuation techniques and related inputs during the period. These inputs are summarized in the three broad levels listed below:
| ● | Level 1 – Quoted prices in active markets for identical securities |
| ● | Level 2 – Evaluated price based on other significant observable inputs (including quoted prices for similar securities, interest rates, prepayment speeds, credit risk, etc.) |
| ● | Level 3 – Significant unobservable inputs (including the Fund’s own assumptions in determining the fair value of investments) |
The inputs or methodology used for valuing securities are not necessarily an indication of the risk associated with investing in those securities.
The following is a summary of the market value of the Fund’s investments as of December 31, 2014, based on the inputs used to value them:
| | | Level 1 | | | Level 2 | | | Level 3 | | | Total | |
| Common Stocks | | $ | 17,891,004 | | | $ | - | | | $ | - | | | $ | 17,891,004 | |
| Short-Term Investments | | | 400,031 | | | | - | | | | - | | | | 400,031 | |
Please refer to the Schedule of Investments for industry classification of the Fund’s holdings.
There were no transfers between any of the Levels during the year ended December 31, 2014. There were no Level 3 securities held during the period.
b) Share Valuation – The NAV per share of the Fund is calculated daily by dividing the total value of the Fund’s assets, less liabilities, by the number of shares outstanding, rounded to the nearest cent. The offering and redemption price per share are equal to the NAV per share.
c) Security transactions and investment income – Security transactions are accounted for on trade date. Gains and losses realized on sales of securities are determined on a specific identification basis. Dividend income less foreign taxes withheld, if any, is recorded on the ex-dividend date. Interest income includes income distributions received from money market funds and is accrued daily.
d) Dividends and distributions to shareholders – Dividends arising from net investment income are declared and paid annually. Net realized short-term capital gains, if any, may be distributed throughout the year and net realized long-term capital gains, if any, are distributed at least once each year. Distributions are recorded on the ex-dividend date.
e) Use of Estimates – The preparation of financial statements in conformity with GAAP requires management to make estimates and assumptions that affect the reported amounts of assets and liabilities and disclosure of contingent assets and liabilities at the date of the financial statements and the reported amounts of income and expenses during the reporting period. Actual results could differ from those estimates.
f) Federal Income Tax – The Fund intends to comply with the requirements of Subchapter M of the Internal Revenue Code necessary to qualify as a regulated investment company and to make the requisite distributions of income and capital gains to its shareholders sufficient to relieve it from all or substantially all Federal income taxes and excise taxes. No provisions for income or excise taxes have been made.
The Fund follows the authoritative guidance on accounting for and disclosure of uncertainty in tax positions. The Fund recognizes tax benefits of uncertain tax positions only where the position is “more likely than not” of being sustained by the applicable tax authorities. The Fund has analyzed its tax positions taken on federal income tax returns for all open tax years (tax years ended December 31, 2011 – December 31, 2014), and has concluded that no tax liability resulting from unrecognized tax benefits relating to uncertain income tax positions should be recorded. The Fund recognizes interest and penalties, if any, related to uncertain tax benefits as an expense on the Statement of Operations. The Fund did not incur any interest or penalties during the year ended December 31, 2014. The Fund is not aware of any tax positions for which it is reasonably possible that the total amounts of unrecognized tax benefits will materially change in the next year.
g) Guarantees and Indemnifications – The Fund indemnifies the Trust’s Officers and Trustees for certain liabilities that might arise from the performance of their duties to the Fund. Additionally, in the normal course of business, the Fund enters into contracts that contain a variety of representations and warranties and which provide general indemnifications. The Fund’s maximum exposure under these arrangements is unknown, as this would involve future claims that may be made against the Fund that have not yet occurred. However, based on experience, the Fund expects the risk of loss to be remote.
h) Subsequent Events – In preparing these financial statements, the Fund has evaluated events and transactions for potential recognition or disclosure through the date the financial statements were issued. This evaluation did not result in any subsequent events that necessitated recognition or disclosure.
3. Investment Transactions
For the year ended December 31, 2014, the cost of purchases and proceeds from sales of investments, excluding short-term investments, were $5,497,414 and $5,355,626, respectively. There were no transactions in U.S. Government securities during the year ended December 31, 2014.
4. Federal Income Tax and Distribution Information
The cost basis of the Fund’s investments for federal income tax purposes as of December 31, 2014 was as follows:
| Tax cost of investments | | $ | 12,706,405 | |
| Gross unrealized appreciation of investments | | | 5,897,150 | |
| Gross unrealized depreciation of investments | | | (312,520 | ) |
| Net unrealized appreciation of investments | | | 5,584,630 | |
As of December 31, 2014, the components of distributable earnings of the Fund for federal income tax purposes were as follows:
| Net unrealized appreciation of investments | | | 5,584,630 | |
| Undistributed long-term capital gain | | | 172,026 | |
| Total accumulated earnings | | | 5,756,656 | |
Certain reclassifications, the result of permanent differences between financial statement and income tax reporting requirements, have been made to the components of net assets. The reclassifications resulted from the difference in the tax treatment of net investment losses. These reclassifications have no impact on the net assets or net asset value per share of the Fund and are designed to present the Fund’s components of net assets on a tax basis. For the year ended December 31, 2014, the Fund reclassified $65,322 of accumulated net investment loss to capital stock on the Statement of Assets and Liabilities.
During the year ended December 31, 2014, the Fund paid $1,258,813 of long-term capital gain distributions. For the year ended December 31, 2013, the Fund did not make any distributions of income or capital gains.
| 5. | Related Party Transactions and Fees |
The following is a summary of certain agreements entered into by the Trust on behalf of the Fund.
a) Investment Adviser – The Fund’s investment adviser is Appleton Partners, Inc. (the “Adviser”) pursuant to an Investment Advisory Agreement with the Adviser. Under the terms of this agreement, the Adviser manages the Fund’s investments and for these services is entitled to receive a fee, computed and accrued daily and paid monthly, at an annual rate of 1.00% of the Fund’s average daily net assets. Certain Trustees and Officers of the Trust are also Officers of the Adviser. The Adviser owns shares of the Fund through an Adviser-sponsored retirement plan.
b) Fee Waivers and Expense Reimbursement – Pursuant to an Operating Expenses Limitation Agreement between the Adviser and the Fund, the Adviser has agreed to waive a portion of its advisory fees and/or assume certain expenses of the Fund (other than brokerage commissions, extraordinary items, interest and taxes) to the extent annualized Fund operating expenses exceed 1.50% of the Fund’s average daily net assets. Effective March 21, 2014, the Adviser retained the right to recoup any fees waived or expenses reimbursed pursuant to the Operating Expenses Limitation Agreement in the prior three fiscal years subject to the limitation on the Fund’s expenses in effect at the time such recoupment is paid to the Adviser and at the time such fees were waived and/or expenses were reimbursed. The Adviser has agreed to maintain these expense limitations with regard to the Fund through at least April 30, 2016. For the period of March 21, 2014 to December 31, 2014, the Adviser waived $114,661 which is subject to recoupment expiring on December 31, 2017. For the year ended December 31, 2014, the Adviser waived $153,838, in aggregate, which includes the reimbursement of distribution expenses described below.
c) Distribution – The Fund has adopted a plan of distribution (the “Plan”) pursuant to Rule 12b-1 under the 1940 Act. The Plan permits the Fund to pay for expenses incurred in the distribution and promotion of the Fund’s shares including but not limited to, the printing of prospectuses, statements of additional information and reports used for sales purposes, advertisements, expenses of preparation and printing of sales literature, promotion, marketing and sales expenses and other distribution-related expenses, including any distribution fees paid to securities dealers or other firms who have executed a distribution or service agreement with the Trust. The Plan limits payment of distribution expenses in any fiscal year to a maximum of 0.25% of the Fund’s average daily net assets. For the year ended December 31, 2014, the Fund accrued and the Adviser subsequently reimbursed $45,466 of distribution expenses under the Plan.
The Trust entered into an Underwriting Agreement on behalf of the Fund with Quasar Distributors, LLC, a subsidiary of U.S. Bancorp (the “Distributor”). Pursuant to the Underwriting Agreement, the Distributor acts as principal underwriter and, as such, is the exclusive agent for distribution of shares of the Fund. The Distributor receives a monthly fee for its services.
d) Other Service Providers – U.S Bancorp Fund Services, LLC (“USBFS”), a subsidiary of U.S. Bancorp, serves as transfer agent, administrator, fund accountant, dividend paying agent and shareholder servicing agent for the Fund. Certain Officers of the Trust are also employees of USBFS. U.S. Bank, N.A. serves as custodian for the Fund. Both USBFS and U.S. Bank, N.A. receive a monthly fee based on the Fund’s average daily net assets, subject to a monthly minimum fee.
6. Change in Independent Registered Public Accounting Firm
The Board of Trustees of the Trust, with the approval and recommendation of the Audit Committee, appointed Baker Tilly Virchow Krause, LLP to serve as the Trust’s independent registered public accounting firm for the fiscal year ending December 31, 2014. Baker Tilly Virchow Krause, LLP replaces Ernst & Young LLP, which resigned as the Trust’s independent registered public accounting firm, effective upon completion of the audit of the Trust’s financial statements for the fiscal year ended December 31, 2013.
During the periods that Ernst & Young LLP served as the Trust’s independent registered public accounting firm, including the Trust’s fiscal years ended December 31, 2013 and December 31, 2012, Ernst & Young LLP’s reports on the financial statements of the Trust have not contained an adverse opinion or disclaimer of opinion and have not been qualified or modified as to uncertainty, audit scope or accounting principles. Further, there have been no disagreements with Ernst & Young LLP on any matter of accounting principles or practices, financial statement disclosure, or auditing scope or procedure, which, if not resolved to the satisfaction of Ernst & Young LLP would have caused Ernst & Young LLP to make reference to the subject matter of the disagreement in connection with its report on the financial statements. In addition, there have been no reportable events of the kind described in Item 304(a)(1)(v) of Regulation S-K under the Securities Act of 1933, as amended.
Report of Independent Registered Public Accounting Firm
To the Board of Trustees and Shareholders of the Appleton Funds
We have audited the accompanying statement of assets and liabilities of Appleton Equity Growth Fund (the Fund), including the schedule of investments, as of December 31, 2014, and the related statements of operations, statement of changes in net assets and the financial highlights the year then ended. These financial statements and financial highlights are the responsibility of the Fund’s management. Our responsibility is to express an opinion on these financial statements and financial highlights based on our audits.
We conducted our audits in accordance with the standards of the Public Company Accounting Oversight Board (United States). Those standards require that we plan and perform the audit to obtain reasonable assurance about whether the financial statements and financial highlights are free of material misstatement. The Fund is not required to have, nor were we engaged to perform, an audit of its internal control over financial reporting. Our audit included consideration of internal control over financial reporting as a basis for designing audit procedures that are appropriate in the circumstances, but not for the purpose of expressing an opinion on the effectiveness of the Fund’s internal control over financial reporting.
Accordingly, we express no such opinion. An audit also includes examining, on a test basis, evidence supporting the amounts and disclosures in the financial statements, assessing the accounting principles used and significant estimates made by management, as well as evaluating the overall financial statement presentation. Our procedures included confirmation of securities owned as of December 31, 2014, by correspondence with the custodian. We believe that our audit provides a reasonable basis for our opinion.
In our opinion, the financial statements and financial highlights referred to above present fairly, in all material respects, the financial position of the Appleton Equity Growth Fund as of December 31, 2014, the results of its operations, the changes in its net assets, and the financial highlights for the year then ended, in conformity with accounting principles generally accepted in the United States of America.
The financial statements of the Appleton Equity Growth Fund for the year ended December 31, 2013 and the financial highlights for the four years in the period then ended were audited by another auditor who expressed an unmodified opinion on February 25, 2014.
Milwaukee, Wisconsin
February 18, 2015
SUPPLEMENTAL INFORMATION
December 31, 2014 (Unaudited)
Investment Advisory Agreement Approval
At a meeting held on December 12, 2014, the Board of Trustees (the “Board”) of the Appleton Funds (the “Trust”), including a majority of the Trustees who are not interested persons of the Trust (the “Independent Trustees”), reviewed and approved the Trust’s Investment Advisory Agreement with Appleton Partners, Inc. (the “Adviser”) for the Appleton Equity Growth Fund (the “Fund”). At this meeting, the Board, at its request, received information from the Adviser regarding the Fund and the services provided by the Adviser to the Fund under the Investment Advisory Agreement. This information, together with the information provided to the Board throughout the course of the year, formed the primary, but not exclusive, basis for the Board’s determination. The following is a summary of the factors considered by the Board and the conclusions that formed the basis for the Board’s approval of the continuance of the Investment Advisory Agreement:
1. The nature, extent and quality of the services provided by the Adviser. The Trustees considered the nature, extent and quality of the Adviser’s overall services provided to the Fund, as well as their specific responsibilities in all aspects of day-to-day investment management of the Fund. The Board considered the qualifications, experience and responsibilities of the portfolio managers, as well as the responsibilities of other key personnel of the Adviser involved in the day-to-day activities of the Fund. The Board also considered the resources and compliance structure of the Adviser, including information regarding its compliance program, its chief compliance officer and the Adviser’s compliance record. The Board acknowledged the long-tenured relationship between the Adviser and the Trust, and further took into account its knowledge of the Adviser’s operations. Continuing, the Board noted that during the course of the prior year they had met with the Adviser periodically to discuss fund performance, investment outlook and various marketing and compliance topics, including the Adviser’s risk management process. The Board concluded that the Adviser had the quality and depth of personnel, resources, investment methods and compliance policies and procedures essential to performing its duties under the Investment Advisory Agreement and that the nature, overall quality and extent of such services are satisfactory.
2. The investment performance of the Fund and the Adviser. In assessing the quality of the portfolio management delivered by the Adviser, the Board reviewed the short-term and long-term performance of the Fund on both an absolute basis, and in comparison to appropriate securities benchmarks and comparable funds utilizing Morningstar peer groups. The Board noted that the Fund had underperformed its peer group median for the one-year, three-year, five-year and ten-year time periods ended October 31, 2014, and further noted underperformance to the S&P 500 Index for the same periods. The Board noted the underperformance to both the peer group median and the S&P 500 Index narrowed for the longer term performance data. The Board also reviewed the volatility of the Fund’s performance, and noted that the standard deviation of its returns was lower than in comparison to its peer group median for the periods referenced above. The Board also noted that the Fund’s standard deviation was amongst the lowest, reflecting a disciplined investment approach which can cause the Fund to underperform relative to other funds in bullish markets, but also can provide downside protection when markets retreat. The Board evaluated additional metrics of volatility, and noted that the Fund was amongst most favorable in its peer group when measuring downside volatility.
3. The costs of the services to be provided by the Adviser. In considering the management fee and total fees and expenses of the Fund, the Board reviewed comparisons to its Morningstar expense peer group of funds and similarly managed separate accounts for other types of clients advised by the Adviser, as well as all expense waivers and reimbursements. The Board noted that the Adviser has a contractual agreement to reimburse Fund expenses to a level where net expenses do not exceed 1.50% of the Fund’s net assets. The Board noted that the Fund’s net expense ratios were 0.25% above the peer group median, but further commented that when compared to the peer group mean the difference decreased. The Board further noted that the Fund’s contractual management fee was higher than that of the expense peer group median. The Board took into account, however, the Adviser’s agreement to cap expenses of the Fund. The Board concluded that the fees paid to the Adviser were fair and reasonable in light of the comparative expense and management fee information. The Board took into consideration the services the Adviser provided to its separately managed account clients, comparing the fees charged for those management services to the fees charged to the Fund and noting that additional services were required for the Fund due to requirements of the Investment Company Act of 1940, as amended.
4. The extent to which economies of scale would be realized. The Board also considered that economies of scale would likely be realized as the assets of the Fund grow, and, that despite asset growth in the past year, assets were not yet sufficient to achieve economies of scale. The Board noted the Adviser previously was willing to consider instituting a breakpoint in the management fee for the Fund if assets continued to grow. The Board determined that they would continue to examine this issue to ensure that economies of scales are being shared with the Fund as asset levels increase.
5. The profits to be realized by the Adviser and its affiliates from their relationship with the Fund. The Board reviewed the Adviser’s financial information, and took into account both the direct benefits and the indirect benefits to the Adviser from advising the Fund. The Board considered the profitability to the Adviser from their relationship with the Fund and considered any additional benefits derived by the Adviser from their relationship with the Fund. After such review, the Board determined that the profitability to the Adviser with respect to the Advisory Agreements was not excessive, and that the Adviser had maintained adequate profit levels to support the services they provide to the Fund. The Fund does not generate any 12b-1 fees.
No single factor was determinative of the Board’s decision to approve the continuance of the Investment Advisory Agreement, but rather the Board based its determination on the total combination of information available to them. Based on this review, which included an executive session of the Independent Trustees, it was the consensus of the Trustees that the Investment Advisory Agreement was fair and reasonable in light of the services to be performed, fees, expenses and other matters as the Board considered relevant. The Board, therefore, determined that the continuance of the Investment Advisory Agreement would be in the best interests of the Fund and its shareholders.
Proxy Voting Policies and Procedures
The Adviser is responsible for exercising the voting rights associated with the securities purchased and held by the Fund. A description of the policies and procedures the Adviser uses in fulfilling this responsibility and information regarding how those proxies are voted during the twelve month period ended December 31 are available without charge, upon request, by calling 617-338-0700. They are also available on the Securities and Exchange Commission’s website at http://www.sec.gov.
Quarterly Portfolio Disclosure
The Trust files a complete listing of the portfolio holdings for the Fund as of the end of the first and third quarters of each fiscal year on Form N-Q. The complete listing (i) is available on the Securities and Exchange Commission’s website; (ii) may be reviewed and copied at the Securities and Exchange Commission’s Public Reference Room in Washington, D.C.; and (iii) will be made available to shareholders upon request by calling 1-800-543-0407. Information on the operation of the Public Reference Room may be obtained by calling 1-800-SEC-0330.
TRUSTEES AND OFFICERS INFORMATION
The names, ages, addresses, present position(s) with the Fund, principal occupation(s) during the past five years and other directorships held outside the Fund complex of the Fund’s Trustees and officers are set forth in the table below. The Board of Trustees is responsible for managing the business affairs of the Fund. The address of each Trustee and officer is c/o Appleton Partners, Inc., One Post Office Square, Floor Six, Boston, MA 02109, unless otherwise indicated. Additional information about the Funds’ Trustees and officers is included in the Statement of Additional Information and is available without charge, upon request by calling 1-877-71-APPLE or on the Fund’s website appletonfunds.com/filings.
| INDEPENDENT TRUSTEES* | | | | | | |
| | Position with | | | Number of Portfolios in | | |
| Name and Year of Birth | Trust and Length of Term | | Principal Occupation(s) in the Past 5 Years | Fund Complex Overseen by Trustee | | Other Directorships Held in the Past 5 Years |
| Jack W. Aber, PhD | Trustee | | Professor Emeritus, | 1 | | Trustee, The Managers |
| 51 Columbia Street | (since 2000) | | Boston University | | | Funds (6 portfolios), |
| Brookline MA 02446-2407 | | | School of Management | | | Managers Trust I |
| Born: 1937 | | | (since 2012); Professor, | | | (12 portfolios), Managers |
| | | | Boston University | | | Trust II (5 portfolios) and |
| | | | School of Management | | | Managers AMG Funds |
| | | | (1972 to 2012) | | | (16 portfolios) (each since |
| | | | | | | 1999); Trustee, Aston |
| | | | | | | Funds (23 portfolios) |
| | | | | | | (2010 to 2013); Director, |
| | | | | | | Third Avenue Trust |
| | | | | | | (5 portfolios) and Third |
| | | | | | | Avenue Variable Series |
| | | | | | | Trust (each since 2002). |
| | | | | | | |
| John M. Cornish, Esq. | Trustee (since | | Partner, Choate Hall & | 1 | | None. |
| c/o Choate Hall & Stewart LLP | 2000) | | Stewart (since 1985) | | | |
| 2 International Place | | | | | | |
| Boston, MA 02110 | | | | | | |
| Born: 1947 | | | | | | |
| | | | | | | |
| Grady B. Hedgespeth | Trustee (since | | Director, Financial | 1 | | None. |
| c/o Small Business Administration | 2000) | | Assistance Small | | | |
| 409 Third Street SW, Suite 8112 | | | Business Administration | | |
| Washington, DC 20003 | | | (since 2007) | | | |
| Born: 1955 | | | | | | |
| | | | | | | |
| INTERESTED TRUSTEES** | | | | | | |
| | | | | | | |
| Name and Year of Birth | | | | | | |
| | Position with Trust and Length of Term | | Principal Occupation(s) in the Past 5 Years | Number of Portfolios in Fund Complex Overseen by Trustee | | Other Directorships Held in the Past 5 Years |
| | | | | | | |
James I. Ladge, CFA | Trustee | | Senior Vice-President, | 1 | | Director, Cambridge |
| Born: 1968 | (since 2000); | | COO Appleton Partners, Inc. | | | Appleton Trust, N.A. |
| | Treasurer | | (since 1993) | | | since 2005 |
| | (since 2003) | | | | | |
| | | | | | | |
Douglas C. Chamberlain, CFA | Trustee | | President, CEO | 1 | | Co-operator, Cambridge |
| Born: 1947 | (since 2000) | | Appleton Partners, Inc. | | | Savings Bank since 2005; |
| | | | (since 1998) | | | Director, Cambridge |
| | | | | | | Appleton Trust, N.A. |
| | | | | | | since 2005 |
| OFFICERS | | | | |
| Name and Year of Birth | Position with Trust and Length of Term | Principal Occupation(s) in the Past 5 Years | | |
| | | | | |
Daniel T. Buckley, CFA | President (since 2014) | Vice President, Portfolio Manager and Senior Research | |
| Born: 1975 | | Analyst, Appleton Partners (since 2005) | |
| | | | | |
| Michele D. Hubley | Secretary and Chief Compliance Officer | Senior Vice President & Chief Compliance Officer, | |
| Born: 1957 | (since 2004) | Appleton Partners, Inc. (since 1995) | |
| | | | | |
| Brandon Sliga | Assistant Secretary (since 2013) | Vice President, U.S. Bancorp Fund Services, LLC | |
| c/o U.S. Bancorp Fund Services, LLC | | (since 2007) | | |
| 777 E. Wisconsin Ave, 4th Floor | | | | |
| Milwaukee, WI 53202 | | | | |
| Born: 1977 | | | | |
| * | “Independent Trustee” refers to a Trustee of the Trust who is not an interested person of the Trust as defined in the 1940 Act. |
| ** | All Interested Trustees are such because of their interest in the investment adviser, as defined in the 1940 Act. |
THE APPLETON FUNDS PRIVACY POLICY DISCLOSURE
Thank you for your decision to invest with us. Your privacy is very important to us. The following constitutes a description of our policies regarding disclosure of nonpublic personal information that you provide to us or that we collect from other sources.
Categories of Information We Collect
We collect the following nonpublic personal information about you:
| ● | Information we receive from you on or in applications or other forms, correspondence, or conversations, including, but not limited to, your name, address, phone number, social security number and date of birth; and |
| ● | Information about your transactions with us, our affiliates, or others, including, but not limited to, your account number and balance, payment history, parties to transactions, cost basis information, and other financial information. |
Categories of Information We Disclose and Parties to Whom We Disclose
We do not disclose any nonpublic personal information about our current or former shareholders to nonaffiliated third parties, except as required or permitted by law.
Service Provider/Transfer Agent Exception
We are permitted by law to disclose all of the information we collect, as described above, to our service provider/ transfer agent to process your transactions. Our service provider/transfer agent does not disclose the information to any third parties, except as required or permitted by law.
Confidentiality and Security
We restrict access to your nonpublic personal information to those persons who require such information to provide products or services to you. We maintain physical, electronic, and procedural safeguards that comply with federal standards to guard your nonpublic personal information.
Intermediaries
In the event that you hold shares of the fund(s) through a financial intermediary, including, but not limited to, a broker-dealer, bank or trust company, the privacy policy of your financial intermediary would govern how your nonpublic personal information would be shared with nonaffiliated third parties.
Appleton Funds
One Post Office Square, Sixth Floor
Boston, Massachusetts 02109
| Investment Adviser | Shareholder Services |
| Appleton Partners, Inc. | Nationwide: (Toll-Free) 877-71-APPLE |
| One Post Office Square, Sixth Floor | |
| Boston, Massachusetts 02109 | |
| | Trustees |
| | Jack W. Aber |
| Distributor | Douglas C. Chamberlain |
| Quasar Distributors, LLC | John M. Cornish |
| 615 East Michigan Street | Grady B. Hedgespeth |
| Milwaukee, WI 53202 | James I. Ladge |
| | |
| | |
| Fund Administrator, Transfer Agent | Independent Registered Public |
| and Fund Accountant | Accounting Firm |
| U.S. Bancorp Fund Services, LLC | Ernst & Young LLP |
| 615 East Michigan Street | 1900 Scripps Center |
| Milwaukee, WI 53202 | 312 Walnut Street |
| | Cincinnati, Ohio 45202 |
| | |
| Custodian | |
| U.S. Bank, N.A. | Legal Counsel |
| 1555 North Rivercenter Drive, Suite 302 | Mintz, Levin, Cohn, Ferris, Glovsky, and Popeo, P.C |
| Milwaukee, WI 53212 | One Financial Center |
| | Boston, Massachusetts 02411 |
Item 2. Code of Ethics.
The Registrant has adopted a code of ethics that applies to its principal executive officer and principal financial officer. During the period covered by this report, no amendments were made to the provisions of the code of ethics, nor did the Registrant grant any waivers, including any implicit waivers, from the provisions of the code of ethics.
Item 3. Audit Committee Financial Expert.
The Registrant’s Board of Trustees has determined that it does not have an audit committee financial expert serving on its Audit Committee. At this time, the registrant believes that the experience provided by each member of the Audit Committee together offers the Registrant adequate oversight for the Registrant’s level of financial complexity.
Item 4. Principal Accountant Fees and Services.
The registrant has engaged its principal accountant to perform audit services, audit-related services, tax services and other services during the past fiscal year. “Audit services” refer to performing an audit of the registrant's annual financial statements or services that are normally provided by the accountant in connection with statutory and regulatory filings or engagements for those fiscal years. “Audit-related services” refer to the assurance and related services by the principal accountant that are reasonably related to the performance of the audit. “Tax services” refer to professional services rendered by the principal accountant for tax compliance, tax advice, and tax planning. There were no “Other services” provided by the principal accountant.
Item 5. Audit Committee of Listed Companies.
Not applicable to registrants who are not listed issuers (as defined by Rule 10A-3 under the Securities Exchange Act of 1934).
Item 6. Schedule of Investments.
Item 7. Disclosure of Proxy Voting Policies and Procedures for Closed-End Funds.
Not applicable to open-end investment companies.
Item 8. Portfolio Managers of Closed-End Funds.
Not applicable to open-end investment companies.
Item 9. Purchases of Equity Securities by Closed-End Funds.
Not applicable to open-end investment companies.
Item 10. Submission of Matters to a Vote of Security Holders.
There have been no material changes to the procedures by which shareholders may recommend nominees to the Registrant’s Board of Trustees.
Item 11. Controls and Procedures.
Item 12. Exhibits.
Pursuant to the requirements of the Securities Exchange Act of 1934 and the Investment Company Act of 1940, the registrant has duly caused this report to be signed on its behalf by the undersigned, thereunto duly authorized.
By: /s/ Daniel T. Buckley
Daniel T. Buckley
Pursuant to the requirements of the Securities Exchange Act of 1934 and the Investment Company Act of 1940, this report has been signed below by the following persons on behalf of the registrant and in the capacities and on the dates indicated.
By: /s/ Daniel T. Buckley
Daniel T. Buckley
By: /s/ James I. Ladge
James I. Ladge