UNITED STATES
SECURITIES AND EXCHANGE COMMISSION
WASHINGTON, D.C. 20549
FORM N-CSR
CERTIFIED SHAREHOLDER REPORT OF REGISTERED MANAGEMENT
INVESTMENT COMPANIES
Investment Company Act file number 811-10201
The Appleton Funds
(Exact name of Registrant as specified in charter)
45 Milk Street, Boston, Massachusetts 02109
(Address of principal executive offices) (Zip code)
James I. Ladge, 45 Milk Street, Boston, Massachusetts 02109
(Name and address of agent for service)
Registrant’s telephone number, including area code:(617) 338-0700
Date of fiscal year end: 12/31
Date of reporting period: 12/31/12
Form N-CSR is to be used by management investment companies to file reports with the Commission not later than 10 days after the transmission to stockholders of any report that is required to be transmitted to stockholders under Rule 30e-1 under the Investment Company Act of 1940 (17 CFR 270.30e-1). The Commission may use the information provided on Form N-CSR in its regulatory, disclosure review, inspection and policymaking roles.
A Registrant is required to disclose the information specified by Form N-CSR, and the Commission will make this information public. A Registrant is not required to respond to the collection of information contained in Form N-CSR unless the Form displays a currently valid Office of Management and Budget (“OMB”) control number. Please direct comments concerning the accuracy of the information collection burden estimate and any suggestions for reducing the burden to Secretary, Securities and Exchange Commission, 450 Fifth Street, NW, Washington, DC 20549-0609. The OMB has reviewed this collection of information under the clearance requirements of 44 U.S.C. § 3507.
| Item 1. | Reports to Stockholders. |
The following is a copy of the report transmitted to shareholders pursuant to Rule 30e-1 under the Investment Company Act of 1940 (17 CFR 270.30e-1.)

APPLETON EQUITY GROWTH FUND
Annual Report
December 31, 2012
| | |
Investment Adviser | | Administrator |
| Appleton Partners, Inc. | | JPMorgan |
| 45 Milk Street, Eighth Floor | | 303 Broadway |
| Boston, MA 02109 | | Suite 900 |
| | Cincinnati, OH 45202 |
| | 1-877-712-7753 |
Dear Shareholder,
Looking back, 2012 was the year of the incredulous rally, as investors resiliently shed various uncertainties to finish with the third best equity returns of the past ten calendar years. After substantial gains in the third quarter, the stock market slipped off its highs in October and sold off through the election. Ultimately, equities bottomed in mid-November as the country hurdled towards the Fiscal Cliff but resumed their upward path as hope of a compromise materialized. The S&P 500 Index rallied near prior period highs to finish the quarter moderately lower, (0.38%), bringing the 2012 return to 16%. The Appleton Equity Growth Fund, net of fees, returned 14.90% over the same period. The largest contributor to the return was stock selection, particularly in the Technology and Consumer Staples sectors. Sector weightings had a much more muted impact on performance, but the underweight in the Financials sector, the S&P 500’s best, was the largest detractor.
The year began amidst improving economic data, albeit with several unsettling geopolitical issues at hand. The debt crisis in Europe reemerged as public protests of austerity measures drew headlines, and made investors wary of resolutions being implemented. Meanwhile, China’s slowing growth raised concerns of a hard landing for their economy. Fears of inflation, waning production and demand, as well as a pending regime change all weighed on investors. Here in the U.S., politicians began posturing ahead of the upcoming elections and the well-publicized Fiscal Cliff. As the year rolled on, central bank moves by the ECB helped waylay concerns in Europe and markets responded, sending sovereign debt yields of the troubled Euro nations significantly lower. Economic numbers in China appeared to bottom during the fourth quarter and the Shanghai Index responded, rallying nearly 16% in December alone. Of these three overhangs, which we have discussed at length in prior letters, the only one that had not yet been addressed heading into year-end was the fiscal cliff.
The fiscal cliff impacted the markets and investor confidence long before the actual cliff deadline on January 1, 2013. After several months of positive stock performance fueled by central bank accommodation, October brought an earnings season full of gloom. With the uncertainty of the upcoming election and Fiscal Cliff, companies became paralyzed with the fear of the unknown and issued guidance that corresponded. What were healthcare costs going to look like? What was going happen with taxes? Was government spending going to be slashed? With their coffers full after years of cutting costs and gaining efficiencies, companies certainly had the ability to spend but not the willingness. Investors became nervous and sold stocks throughout October. In early November, Election Day brought answers, but not the ones the stock market was hoping for, and further gridlock was likely heading into the final months of the year. Once it became apparent that there would be no substantial changes to the composition of the White House and Congress, investors feared that further gridlock was likely heading into the final two months of the year. The S&P traded down over 5% in the week following the election, as all eyes turned to the Fiscal Cliff.
The much-publicized Fiscal Cliff was debated both behind closed doors and in front of cameras as politicians looked to jockey for position. It was feared that the Cliff, a combination of automatic spending cuts, and increased taxes, would force our economy back
1
into recession. However, the stock market rallied 8% over the final six weeks of the year as investors optimistically believed a compromise would be reached, in spite of legislators’ prior inability to do so. Congress, always one for brinksmanship, got down to work in the final week of the year and came to an agreement on January 1st. Highlights of the American Taxpayer Relief Act of 2012 include: for married couples making more than $450,000 per year, a higher marginal tax rate (39.6%, up from 35%) and higher dividend and capital gains tax rates (20%, up from 15%), estate taxes up to 40% from 35% on estates valued at over $5 million, unemployment benefits extended for one year, and a phase out of deductions and credits for couples making more than $300,000 per year. More important, than what was included in the deal, was what was not incorporated in the agreement.
Unfortunately, the eleventh hour compromise neglected certain items, and failed to materially address the spending side of the equation. The budget cuts set to begin on January 1, 2013 were delayed for two months to give Congress more time to negotiate the deficit reduction. Excluded were the two year old payroll tax cut (2%) and a rise in the debt ceiling. The 2% payroll tax increase impacts every wage earner in the country and threatens to hamper consumer spending. Meanwhile, the country is on course to exceed its borrowing limit sometime in the latter half of February; many anticipate that the debate over the debt ceiling will be far worse than the tax policy talks we just emerged from. Market participants will be particularly focused on these negotiations and how ratings agencies like S&P and Moody’s respond. We remember all too well the summer of 2011, which is the last time our elected leaders brought the country to the brink of the debt ceiling. The country’s debt was downgraded for the first time in history and markets suffered steep losses. The circus in Washington will be front and center for the first quarter of the new year.
Despite Congress and the White House showing little to no ability to work things out, there are a number of positive catalysts that could drive the market higher. The nascent housing recovery continues to show signs of life as prices have stabilized and housing starts continue to rise. The latest ISM survey number was back above 50, signaling expansion in the manufacturing sector. China continues to show signs of recovery while in Europe, sovereign debt yields are dropping as the crisis seems to have abated. The natural gas boom that we are experiencing in the U.S. could add meaningful jobs, lower energy prices, and looking further ahead, potentially turn the United States into an energy exporter. Finally, we would be remiss not to mention the accommodative stance taken by the Fed and other Central Banks around the world. Recently, the Fed has given the public specific unemployment and inflation targets and has pledged to remain accommodative until well after these target rates have been achieved. These are all potential catalysts to equity appreciation, if investors can become comfortable with the lingering issues in Washington.
While little has truly changed from a political standpoint, putting at least some uncertainty in the rearview mirror may have effectively untethered the financial markets a bit. Thus, if GDP and other economic numbers continue to provide some positive indications, the stock market could move briskly higher as investors seek out higher risk assets. Ideally, more simplistic tax reform and spending refinement could truly spur optimism. However, if government spending continues unchecked and job growth flounders, worry could set back in quickly. We anticipate further volatility in the months ahead as debate and deliberation grip Washington. We will continue our focus on broad cyclical recovery trends, and continue to overweight the Materials, Industrials, and Technology sectors accordingly. We will also look to opportunistically deploy cash when appropriate.
Sincerely,

James Ladge, CFA
President
2
Comparison of the Change in Value of a $10,000 Investment
in the Appleton Equity Growth Fund, S&P 500 Index
and the Russell 1000 Growth Index
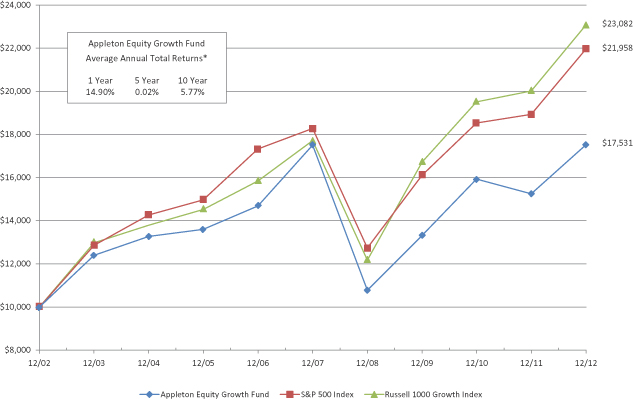
* The returns shown do not reflect the deduction that a shareholder would pay on Fund distributions or the redemption of Fund shares.
Tabular Presentation of Portfolio of Investments
As of December 31, 2012 (Unaudited)
| | | | |
| Sector | | % of Net Assets | |
| |
Consumer Discretionary | | | 2.0% | |
Consumer Staples | | | 1.8% | |
Consumer, Cyclical | | | 11.0% | |
Consumer, Non-Cyclical | | | 8.9% | |
Energy | | | 9.9% | |
Financials | | | 13.2% | |
Healthcare | | | 10.7% | |
Industrials | | | 12.0% | |
Information Technology | | | 19.8% | |
Materials | | | 6.8% | |
Telecommunication Services | | | 2.3% | |
Money Market Mutual Fund | | | 1.8% | |
Liabilities in Excess of Other Assets | | | (0.2% | ) |
| | | | |
| | | 100.0% | |
| | | | |
3
APPLETON EQUITY GROWTH FUND
PORTFOLIO OF INVESTMENTS
December 31, 2012
| | | | | | | | |
| Shares | | | | | Market
Value | |
| | |
| | | | COMMON STOCKS — 98.4% | | | | |
| | | | CONSUMER DISCRETIONARY — 2.0% | | | | |
| | 8,500 | | | Toll Brothers, Inc.* | | $ | 274,805 | |
| | | | | | | | |
| | |
| | | | CONSUMER STAPLES — 1.8% | | | | |
| | 2,000 | | | Kraft Foods Group, Inc. | | | 90,940 | |
| | 6,000 | | | Mondelez International, Inc. — Class A | | | 152,820 | |
| | | | | | | | |
| | | | | | | 243,760 | |
| | | | | | | | |
| | |
| | | | CONSUMER, CYCLICAL — 11.0% | | | | |
| | 3,175 | | | McDonald’s Corp. | | | 280,067 | |
| | 500 | | | priceline.com, Inc.* | | | 310,600 | |
| | 5,000 | | | The Home Depot, Inc. | | | 309,250 | |
| | 7,650 | | | TJX Cos., Inc. | | | 324,742 | |
| | 5,100 | | | Under Armour, Inc. — Class A* | | | 247,503 | |
| | | | | | | | |
| | | | | | | 1,472,162 | |
| | | | | | | | |
| | |
| | | | CONSUMER, NON-CYCLICAL — 8.9% | | | | |
| | 5,600 | | | Church & Dwight Co., Inc. | | | 299,992 | |
| | 2,850 | | | Colgate-Palmolive Co. | | | 297,939 | |
| | 3,500 | | | Costco Wholesale Corp. | | | 345,695 | |
| | 3,700 | | | PepsiCo, Inc. | | | 253,191 | |
| | | | | | | | |
| | | | | | | 1,196,817 | |
| | | | | | | | |
| | |
| | | | ENERGY — 9.9% | | | | |
| | 3,200 | | | Continental Resources, Inc.* | | | 235,168 | |
| | 2,150 | | | Core Laboratories N.V. | | | 235,016 | |
| | 4,360 | | | Exxon Mobil Corp. | | | 377,358 | |
| | 3,500 | | | National Oilwell Varco, Inc. | | | 239,225 | |
| | 3,500 | | | Schlumberger Ltd. | | | 242,515 | |
| | | | | | | | |
| | | | | | | 1,329,282 | |
| | | | | | | | |
| | |
| | | | FINANCIALS — 13.2% | | | | |
| | 4,750 | | | American Tower Corp. REIT | | | 367,033 | |
| | 16,000 | | | Bank of America Corp. | | | 185,600 | |
| | 5,100 | | | Bank of Nova Scotia | | | 295,188 | |
| | 7,000 | | | JPMorgan Chase & Co. | | | 307,790 | |
| | 2,400 | | | The Goldman Sachs Group, Inc. | | | 306,144 | |
| | 9,000 | | | Wells Fargo & Co. | | | 307,620 | |
| | | | | | | | |
| | | | | | | 1,769,375 | |
| | | | | | | | |
| | |
| | | | HEALTHCARE — 10.7% | | | | |
| | 4,000 | | | Abbott Laboratories | | | 262,000 | |
| | 4,800 | | | Cerner Corp.* | | | 372,672 | |
| | 3,000 | | | Edwards Lifesciences Corp.* | | | 270,510 | |
| | 5,300 | | | Express Scripts Holding Co.* | | | 286,200 | |
| | 2,400 | | | Perrigo Co. | | | 249,672 | |
| | | | | | | | |
| | | | | | | 1,441,054 | |
| | | | | | | | |
4
APPLETON EQUITY GROWTH FUND
PORTFOLIO OF INVESTMENTS
December 31, 2012
| | | | | | | | |
| Shares | | | | | Market
Value | |
| | |
| | | | INDUSTRIALS — 12.0% | | | | |
| | 4,575 | | | Caterpillar, Inc. | | $ | 409,828 | |
| | 13,000 | | | General Electric Co. | | | 272,870 | |
| | 3,250 | | | Roper Industries, Inc. | | | 362,310 | |
| | 1,350 | | | W.W. Grainger, Inc. | | | 273,200 | |
| | 3,250 | | | Wabtec Corp. | | | 284,505 | |
| | | | | | | | |
| | | | | | | 1,602,713 | |
| | | | | | | | |
| | |
| | | | INFORMATION TECHNOLOGY — 19.8% | | | | |
| | 5,900 | | | Akamai Technologies, Inc.* | | | 241,369 | |
| | 3,000 | | | ANSYS, Inc.* | | | 202,020 | |
| | 1,145 | | | Apple, Inc. | | | 610,319 | |
| | 10,000 | | | EMC Corp.* | | | 253,000 | |
| | 400 | | | Google, Inc. — Class A* | | | 283,748 | |
| | 1,950 | | | International Business Machines Corp. | | | 373,523 | |
| | 5,000 | | | QUALCOMM, Inc. | | | 310,100 | |
| | 2,500 | | | Visa, Inc. — Class A | | | 378,950 | |
| | | | | | | | |
| | | | | | | 2,653,029 | |
| | | | | | | | |
| | |
| | | | MATERIALS — 6.8% | | | | |
| | 2,325 | | | Agrium, Inc. | | | 232,290 | |
| | 3,000 | | | BHP Billiton, Ltd. — ADR | | | 235,320 | |
| | 2,800 | | | Ecolab, Inc. | | | 201,320 | |
| | 2,175 | | | Praxair, Inc. | | | 238,054 | |
| | | | | | | | |
| | | | | | | 906,984 | |
| | | | | | | | |
| | |
| | | | TELECOMMUNICATION SERVICES — 2.3% | | | | |
| | 7,150 | | | Verizon Communications, Inc. | | | 309,381 | |
| | | | | | | | |
| | |
| | | | TOTAL COMMON STOCKS
(COST $9,576,188) | | $ | 13,199,362 | |
| | | | | | | | |
| | |
| | | | Money Market Mutual Fund — 1.8% | | | | |
| | 241,813 | | | Fidelity Money Market Fund
(Cost $241,813) | | | 241,813 | |
| | | | | | | | |
| | |
| | | | TOTAL INVESTMENT SECURITIES — 100.2% (Cost $9,818,001) | | $ | 13,441,175 | |
| | |
| | | | LIABILITIES IN EXCESS OF OTHER ASSETS — (0.2%) | | | (33,094 | ) |
| | | | | | | | |
| | |
| | | | NET ASSETS — 100.0% | | $ | 13,408,081 | |
| | | | | | | | |
* Non-income producing security.
ADR — American Depositary Receipt.
REIT — Real Estate Investment Trust.
See accompanying notes to financial statements.
5
APPLETON EQUITY GROWTH FUND
STATEMENT OF ASSETS AND LIABILITIES
December 31, 2012
| | | | | | | | |
ASSETS | | | | | | | | |
Investment securities: | | | | | | | | |
At acquisition cost | | $ | | | | | 9,818,001 | |
| | | | | | | | |
At market value | | $ | | | | | 13,441,175 | |
| | | | | | | | |
Dividends receivable | | | | | | | 11,593 | |
Receivable for shares sold | | | | | | | 1,000 | |
| | | | | | | | |
TOTAL ASSETS | | | | | | | 13,453,768 | |
| | | | | | | | |
| | |
LIABILITIES | | | | | | | | |
Payable to Adviser | | | | | | | 3,970 | |
Payable to other affiliates | | | | | | | 14,261 | |
Professional fees | | | | | | | 24,400 | |
Capital shares payable | | | | | | | 808 | |
Other accrued expenses and liabilities | | | | | | | 2,248 | |
| | | | | | | | |
TOTAL LIABILITIES | | | | | | | 45,687 | |
| | | | | | | | |
| | |
NET ASSETS | | $ | | | | | 13,408,081 | |
| | | | | | | | |
| | |
NET ASSETS CONSIST OF | | | | | | | | |
Paid-in capital | | $ | | | | | 10,907,708 | |
Accumulated net realized losses from security transactions | | | | | | | (1,122,801 | ) |
Net unrealized appreciation on investments | | | | | | | 3,623,174 | |
| | | | | | | | |
NET ASSETS | | $ | | | | | 13,408,081 | |
| | | | | | | | |
| | |
Shares of beneficial interest outstanding (unlimited number of shares authorized, no par value) | | | | | | | 1,497,097 | |
| | | | | | | | |
| | |
Net asset value, offering price and redemption price per share | | $ | | | | | 8.96 | |
| | | | | | | | |
See accompanying notes to financial statements.
6
APPLETON EQUITY GROWTH FUND
STATEMENT OF OPERATIONS
For the Year Ended December 31, 2012
| | | | | | | | |
INVESTMENT INCOME | | | | | | | | |
Dividends | | $ | | | | | 227,687 | |
Foreign taxes withheld on dividends | | | | | | | (2,451 | ) |
| | | | | | | | |
TOTAL INVESTMENT INCOME | | | | | | | 225,236 | |
| | | | | | | | |
| | |
EXPENSES | | | | | | | | |
Investment advisory fees | | | | | | | 137,319 | |
Distribution expenses | | | | | | | 34,329 | |
Accounting services fees | | | | | | | 30,082 | |
Professional fees | | | | | | | 21,067 | |
Administration fees | | | | | | | 24,065 | |
Transfer agent fees | | | | | | | 35,586 | |
Trustees’ fees and expenses | | | | | | | 27,574 | |
Custodian fees | | | | | | | 12,116 | |
Reports to shareholders | | | | | | | 4,011 | |
Insurance expense | | | | | | | 3,030 | |
Registration fees | | | | | | | 5,491 | |
| | | | | | | | |
TOTAL EXPENSES | | | | | | | 334,670 | |
Fees waived and expenses reimbursed by Adviser | | | | | | | (128,658 | ) |
| | | | | | | | |
NET EXPENSES | | | | | | | 206,012 | |
| | | | | | | | |
| | |
NET INVESTMENT INCOME | | | | | | | 19,224 | |
| | | | | | | | |
| | |
REALIZED AND UNREALIZED GAINS (LOSSES) ON INVESTMENTS | | | | | | | | |
Net realized gains from securities transactions | | | | | | | 92,744 | |
Change in unrealized appreciation/depreciation of investments | | | | | | | 1,710,769 | |
| | |
NET REALIZED AND UNREALIZED GAINS ON INVESTMENTS | | | | | | | 1,803,513 | |
| | | | | | | | |
| | |
NET INCREASE IN NET ASSETS FROM OPERATIONS | | $ | | | | | 1,822,737 | |
| | | | | | | | |
See accompanying notes to financial statements.
7
APPLETON EQUITY GROWTH FUND
STATEMENTS OF CHANGES IN NET ASSETS
| | | | | | | | | | | | | | | | |
| | | | | | For the
Year Ended
December 31,
2012 | | | | | | For the
Year Ended
December 31,
2011 | |
FROM OPERATIONS | | | | | | | | | | | | | | | | |
Net investment income (loss) | | $ | | | | | 19,224 | | | $ | | | | | (45,445 | ) |
Net realized gains from securities transactions | | | | | | | 92,744 | | | | | | | | 570,986 | |
Net change in unrealized appreciation/depreciation on investments and foreign currency translations | | | | | | | 1,710,769 | | | | | | | | (1,121,135 | ) |
| | | | | | | | | | | | | | | | |
Net increase (decrease) in net assets from operations | | | | | | | 1,822,737 | | | | | | | | (595,594 | ) |
| | | | | | | | | | | | | | | | |
| | | | |
DISTRIBUTIONS TO SHAREHOLDERS: | | | | | | | | | | | | | | | | |
Net investment income | | | | | | | (19,679 | ) | | | | | | | - | |
| | | | | | | | | | | | | | | | |
Total Distributions | | | | | | | (19,679 | ) | | | | | | | - | |
| | | | | | | | | | | | | | | | |
| | | | |
FROM CAPITAL SHARE TRANSACTIONS | | | | | | | | | | | | | | | | |
Proceeds from shares sold | | | | | | | 1,653,286 | | | | | | | | 1,512,395 | |
Dividends reinvested | | | | | | | 5,324 | | | | | | | | - | |
Payments for shares redeemed | | | | | | | (2,358,594 | ) | | | | | | | (1,445,816 | ) |
| | | | | | | | | | | | | | | | |
Net increase (decrease) in net assets from capital share transactions | | | | | | | (699,984 | ) | | | | | | | 66,579 | |
| | | | | | | | | | | | | | | | |
| | | | |
TOTAL INCREASE (DECREASE) IN NET ASSETS | | | | | | | 1,103,074 | | | | | | | | (529,015 | ) |
| | | | |
NET ASSETS | | | | | | | | | | | | | | | | |
Beginning of period | | | | | | | 12,305,007 | | | | | | | | 12,834,022 | |
| | | | | | | | | | | | | | | | |
End of period | | $ | | | | | 13,408,081 | | | $ | | | | | 12,305,007 | |
| | | | | | | | | | | | | | | | |
| | | | |
CAPITAL SHARE ACTIVITY | | | | | | | | | | | | | | | | |
Sold | | | | | | | 191,296 | | | | | | | | 186,591 | |
Reinvested | | | | | | | 605 | | | | | | | | - | |
Redeemed | | | | | | | (269,364 | ) | | | | | | | (185,015 | ) |
| | | | | | | | | | | | | | | | |
Net increase (decrease) in shares outstanding | | | | | | | (77,463 | ) | | | | | | | 1,576 | |
Shares outstanding, beginning of period | | | | | | | 1,574,560 | | | | | | | | 1,572,984 | |
| | | | | | | | | | | | | | | | |
Shares outstanding, end of period | | | | | | | 1,497,097 | | | | | | | | 1,574,560 | |
| | | | | | | | | | | | | | | | |
See accompanying notes to financial statements.
8
APPLETON EQUITY GROWTH FUND
FINANCIAL HIGHLIGHTS
Selected Per Share Data and Ratios for a Share Outstanding Throughout Each Period
| | | | | | | | | | | | | | | | | | | | |
| | | For the
Year Ended
December 31,
2012 | | | For the
Year Ended
December 31,
2011 | | | For the
Year Ended
December 31,
2010 | | | For the
Year Ended
December 31,
2009 | | | For the
Year Ended
December 31,
2008 | |
| | | | | |
Net asset value at beginning of period | | $ | 7.81 | | | $ | 8.16 | | | $ | 6.82 | | | $ | 5.52 | | | $ | 8.97 | |
| | | | | | | | | | | | | | | | | | | | |
| | | | | |
Income (loss) from investment operations: | | | | | | | | | | | | | | | | | | | | |
Net investment income (loss) | | | 0.01 | | | | (0.03 | ) | | | (0.02 | ) | | | (0.01 | ) | | | 0.00 | (a) |
Net realized and unrealized gains (losses) on investments | | | 1.15 | | | | (0.32 | ) | | | 1.36 | | | | 1.31 | | | | (3.45 | ) |
| | | | | | | | | | | | | | | | | | | | |
Total from investment operations | | | 1.16 | | | | (0.35 | ) | | | 1.34 | | | | 1.30 | | | | (3.45 | ) |
| | | | | | | | | | | | | | | | | | | | |
| | | | | |
Less distributions: | | | | | | | | | | | | | | | | | | | | |
Dividends from investment income | | | (0.01 | ) | | | - | | | | - | | | | - | | | | (0.00 | )(a) |
| | | | | | | | | | | | | | | | | | | | |
| | | | | |
Total distributions | | | (0.01 | ) | | | - | | | | - | | | | - | | | | - | |
| | | | | | | | | | | | | | | | | | | | |
| | | | | |
Net asset value at end of period | | $ | 8.96 | | | $ | 7.81 | | | $ | 8.16 | | | $ | 6.82 | | | $ | 5.52 | |
| | | | | | | | | | | | | | | | | | | | |
| | | | | |
Total return | | | 14.90% | | | | (4.29% | ) | | | 19.65% | | | | 23.55% | | | | (38.41% | ) |
| | | | | | | | | | | | | | | | | | | | |
| | | | | |
Net assets at end of period | | $ | 13,408,081 | | | $ | 12,305,007 | | | $ | 12,834,022 | | | $ | 10,287,384 | | | $ | 7,650,640 | |
| | | | | | | | | | | | | | | | | | | | |
| | | | | |
Ratio of net expenses to average net assets | | | 1.50% | | | | 1.50% | | | | 1.50% | | | | 1.50% | | | | 1.50% | |
| | | | | |
Ratio of net investment income (loss) to average net assets | | | 0.14% | | | | (0.35% | ) | | | (0.30% | ) | | | (0.25% | ) | | | 0.06% | |
| | | | | |
Portfolio turnover rate | | | 17% | | | | 31% | | | | 38% | | | | 62% | | | | 40% | |
| (a) | Amount is less than $0.01 per share. |
9
APPLETON EQUITY GROWTH FUND
NOTES TO FINANCIAL STATEMENTS
December 31, 2012
1. Significant Accounting Policies
The Appleton Funds (the Trust) is registered under the Investment Company Act of 1940, as amended, (the 1940 Act), as a diversified, no-load, open-end management investment company. The Trust was organized as an Ohio business trust on October 31, 2000. The Trust currently offers one series of shares to investors: the Appleton Equity Growth Fund (the Fund). The Trust was capitalized on December 29, 2000, when the initial shares of the Fund were purchased at $10 per share. The Fund commenced operations on December 31, 2000.
The Fund seeks long-term growth of capital by investing primarily in common stocks.
The following is a summary of the Fund’s significant accounting policies:
Securities valuation – The Fund’s portfolio securities are valued as of the close of business of the regular session of the New York Stock Exchange (normally 4:00 p.m., Eastern Time). Portfolio securities traded on stock exchanges are valued at their last sales price as of the close of the regular session of trading on the day the securities are being valued. Securities quoted by NASDAQ are valued at the NASDAQ Official Closing Price. Securities for which market quotations are not readily available are valued at their fair value as determined in good faith in accordance with consistently applied procedures established by and under the general supervision of the Board of Trustees. Money market instruments are valued at amortized cost, which approximates market value.
The various inputs that are used in determining the fair value of the Fund’s investments are summarized into the three broad levels listed below:
| | — | | Level 1 – quoted prices in active markets for identical securities |
| | — | | Level 2 – other significant observable inputs (including quoted prices for similar securities, interest rates, prepayment speeds, credit risk, etc.) |
| | — | | Level 3 – significant unobservable inputs (including the Fund’s own assumptions in determining the fair value of investments) |
The inputs or methodology used for valuing securities are not necessarily an indication of the risk associated with investing in those securities.
The strategy of the Fund is to invest in Level 1 securities. The Fund’s Board of Trustees has adopted a Fair Valuation policy should there be an exception to this strategy and in that event, has delegated authority to the members of the Valuation Committee (“FVC”) to make fair value determinations. In the event it would be necessary to do so, the FVC would make fair value determinations and provide recommendations to the Board of Trustees. The FVC includes Grady Hedgespeth, Douglas Chamberlain, and James Ladge.
10
In the event that fair value determinations would be necessary, the FVC would follow fair valuation guidelines that contain standing recommendations, approved by the Board of Trustees. Fair valuation determinations made under standing recommendations would be reported on a regular, likely quarterly, basis, to the Board of Trustees. Pricing decisions, processes, and controls over fair value determinations would then be subject to internal and external reviews, by individuals connected with the management of the Fund, appointed in that event.
Fair valuation determinations that require greater levels of judgment would be referred to the FVC. Fair value situations could include, but are not limited to: (1) a significant event that affects the value of a Fund’s securities (e.g., news relating to natural disasters affecting an issuer’s operations or earnings announcements); (2) illiquid securities; (3) securities that may be defaulted or de-listed from an exchange and are no longer trading; or (4) any other circumstance in which the FVC believes that market quotations do not accurately reflect the value of a security. The FVC may consider various inputs in order to make a good faith determination of a security’s fair value. These inputs might include, but are not limited to, use of related or comparable assets or liabilities, recent transactions, market multiples, book values, and other relevant information for the investment to determine the fair value of the investment. An income-based valuation approach, in which the anticipated future cash flows of the investment are discounted to calculate fair value, may also be used. In the event that the situation were to warrant it, discounts might also be applied due to the nature or duration of any restrictions on the disposition of the investments.
In the event it were necessary, the FVC would monitor the results of fair valuation determinations and regularly report the results to the Fund’s Board of Trustees. A description of the update process to fair valuation guidelines that may occur periodically based upon back-testing results or industry best practices would be determined at that time.
The following is a summary of the inputs used to value the Portfolio’s net assets as of December 31, 2012
| | | | | | | | | | | | | | | | |
| | | Level 1 | | | Level 2 | | | Level 3 | | | Total | |
Total Investment in Securities # | | $ | 13,199,362 | | | $ | 241,813 | | | $ | - | | | $ | 13,441,175 | |
There were no transfers between Levels 1 and 2 during the year ended December 31, 2012. There were no Level 3 securities held during the period.
# Portfolio holdings designated as Level 1 and Level 2 are disclosed individually in the Portfolio of Investments (“POI”). Level 2 consists of a Money Market Mutual Fund. Please refer to the POI for industry specifics of the portfolio holdings.
Share valuation – The net asset value per share of the Fund is calculated daily by dividing the total value of the Fund’s assets, less liabilities, by the number of shares outstanding, rounded to the nearest cent. The offering and redemption price per share are equal to the net asset value per share.
Investment income and distributions to shareholders – Interest income is accrued as earned. Dividend income is recorded on the ex-dividend date. Dividends arising from net investment income are declared and paid annually. Net realized short-term capital gains, if any, may be distributed throughout the year and net realized long-term capital gains, if any, are distributed at least once each year. Income dividends and capital gain distributions are determined in accordance with income tax regulations. Differences between book and tax distributions are considered temporary or permanent in nature. To the extent these differences are permanent in nature, such amounts are reclassified within the composition of net assets based on their federal tax basis treatment; temporary differences do not require reclassifications.
11
Security transactions – Security transactions are accounted for on trade date. Securities sold are determined on a specific identification basis.
Estimates – The preparation of financial statements in conformity with U.S. Generally Accepted Accounting Principles (“GAAP”) requires management to make estimates and assumptions that affect the reported amounts of assets and liabilities and disclosure of contingent assets and liabilities at the date of the financial statements and the reported amounts of income and expenses during the reporting period. Actual results could differ from those estimates.
Federal income tax – It is the Fund’s policy to continue to comply with the special provisions of the Internal Revenue Code applicable to regulated investment companies. As provided therein, in any fiscal year in which the Fund so qualifies and distributes at least 90% of its investment company taxable income, the Fund (but not the shareholders) will be relieved of federal income tax on the income distributed. Accordingly, no provision for income taxes has been made.
In order to avoid imposition of the excise tax applicable to regulated investment companies, it is also the Fund’s intention to declare and pay as dividends in each calendar year at least 98% of its investment company taxable income (earned during the calendar year) and 98.2% of its realized capital gains (earned during the twelve months ended October 31) plus undistributed amounts from prior years.
During the fiscal years ended December 31, 2012 and 2011, distributions paid were $19,679 and $0, respectively.
The following information is computed on a tax basis as of December 31, 2012:
| | | | |
Tax cost of portfolio investments | | $ | 9,818,001 | |
| | | | |
Gross unrealized appreciation on investments | | $ | 3,680,553 | |
Gross unrealized depreciation on investments | | | (57,379 | ) |
| | | | |
Net unrealized appreciation on investments | | | 3,623,174 | |
Capital loss carryforwards | | | (1,122,801 | ) |
| | | | |
Total accumulated earnings | | $ | 2,500,373 | |
| | | | |
The capital loss carryforwards in the above table expire as follows:
| | |
| Amount | | December 31, |
| $1,122,801 | | 2017 |
These capital loss carryforwards may be utilized in future years to offset gains, if any, prior to distributing such gains to shareholders.
During the year ended December 31, 2012, the Fund utilized capital loss carryforwards of $92,744.
Certain reclassifications, the result of permanent differences between financial statement and income tax reporting requirements have been made to the components of capital. The reclassifications resulted from the difference in the tax treatment of net investment losses. These reclassifications have no impact on the net assets or net asset value per share of the Fund and are designed to present the Fund’s capital accounts on a tax basis. For the year ended December 31, 2012, the Fund reclassified $455 of net investment losses to paid-in capital on the Statement of Assets and Liabilities.
12
The Fund evaluates tax positions taken or expected to be taken in the course of preparing the Fund’s tax returns to determine whether the tax positions are “more-likely-than-not” of being sustained by the applicable tax authorities. Tax positions not deemed to meet the more-likely-than-not threshold are recorded as tax benefits or expenses in the current year. Management has analyzed the Fund’s tax positions taken on federal income tax returns for all open tax years (tax years ended December 31, 2008 – December 31, 2012), and has concluded that no provision for federal income tax is required in the Fund’s financial statements.
2. Investment Transactions
For the year ended December 31, 2012, the cost of purchases and proceeds from sales of portfolio securities, other than short-term investments, amounted to $2,283,528 and $2,629,446, respectively.
3. Transactions with Affiliates
Certain Trustees and Officers of the Trust are also Officers of Appleton Partners, Inc. (the Adviser) or JPMorgan Chase Bank, N.A. (JPMorgan) the administrative services agent, shareholder servicing and transfer agent, and accounting services agent for the Trust.
Investment Advisory Agreement
Pursuant to an Investment Advisory Agreement between the Trust and the Adviser, the Adviser manages the Fund’s investments. For these services, the Fund pays the Adviser an advisory fee, which is computed and accrued daily and paid monthly, at an annual rate of 1.00% of its average daily net assets.
Pursuant to a written contract between the Adviser and the Fund, the Adviser has agreed to waive a portion of its advisory fees and/or assume certain expenses of the Fund, other than brokerage commissions, extraordinary items, interest and taxes, to the extent annualized Fund operating expenses exceed 1.50% of the Fund’s average daily net assets. The Adviser has agreed to maintain these expense limitations with regard to the Fund through April 30, 2013. For the year ended December 31, 2012, the Adviser waived $94,329.
Administration, Accounting and Transfer Agency Agreement
Under the terms of an Administration, Accounting and Transfer Agency Agreement between the Trust and JPMorgan, JPMorgan supplies non-investment related statistical and research data, internal regulatory compliance services and executive and administrative services for the Fund. JPMorgan supervises the preparation of tax returns, reports to shareholders of the Fund, reports to and filings with the Securities and Exchange Commission and state securities commissions, and materials for meetings of the Board of Trustees. For these administrative services, JPMorgan receives a monthly fee based on the Fund’s average daily net assets, subject to a monthly minimum fee.
JPMorgan maintains the records of each shareholder’s account, answers shareholders’ inquiries concerning their accounts, processes purchases and redemptions of the Fund’s shares, acts as dividend and distribution disbursing agent and performs other shareholder service functions. For these transfer agency and shareholder services, JPMorgan receives a monthly fee per shareholder account, subject to a monthly minimum fee. In addition, the Fund pays JPMorgan out-of-pocket expenses including, but not limited to, postage and supplies.
JPMorgan also calculates the daily net asset value per share and maintains the financial books and records of the Fund. For these accounting services, JPMorgan receives a monthly fee, based on average daily net assets, from the Fund. In addition, the Fund pays JPMorgan certain out-of-pocket expenses incurred by JPMorgan in obtaining valuations of the Fund’s portfolio securities.
13
Distribution Plan
The Fund has adopted a plan of distribution (the “Plan”) pursuant to Rule 12b-1 under the 1940 Act. The Plan permits the Fund to pay for expenses incurred in the distribution and promotion of the Fund’s shares including but not limited to, the printing of prospectuses, statements of additional information and reports used for sales purposes, advertisements, expenses of preparation and printing of sales literature, promotion, marketing and sales expenses and other distribution-related expenses, including any distribution fees paid to securities dealers or other firms who have executed a distribution or service agreement with the Trust.
The Plan limits payment of distribution expenses in any fiscal year to a maximum of 0.25% of the Fund’s average daily net assets. For the year ended December 31, 2012, the Fund accrued and the Adviser subsequently reimbursed $34,329 of distribution expenses under the Plan.
Underwriting Agreement
The Trust entered into an Underwriting Agreement on behalf of the Fund with Unified Financial Securities, Inc. (the “Distributor”). Pursuant to the Underwriting Agreement, the Distributor acts as principal underwriter and, as such, is the exclusive agent for distribution of shares of the Fund. The Distributor receives a monthly fee for its services.
Compliance Services Agreement
Under the terms of the Compliance Services Agreement between the Trust and JPMorgan, JPMorgan provides certain compliance services to the Trust, including developing and assisting in implementing a compliance program for JPMorgan on behalf of the Fund and providing administrative support services to the Fund’s Compliance Program and Chief Compliance Officer.
In addition, the Trust has contracted with JPMorgan to provide certain compliance services on behalf of the Trust. Subject to the direction of the Trustees of the Trust, JPMorgan developed and assisted in implementing a compliance program for JPMorgan on behalf of the Fund and; provides administrative support services to the Fund’s Compliance Program and Chief Compliance Officer. For these services, JPMorgan receives a quarterly fee from the Trust.
4. Commitments and Contingencies
The Fund indemnifies the Trust’s Officers and Trustees for certain liabilities that might arise from the performance of their duties to the Fund. Additionally, in the normal course of business, the Fund enters into contracts that contain a variety of representations and warranties and which provide general indemnifications. The Fund’s maximum exposure under these arrangements is unknown, as this would involve future claims that may be made against the Fund that have not yet occurred. However, based on experience, the Fund expects the risk of loss to be remote.
5. Subsequent Events
Management has evaluated subsequent events through the date of this filing. This evaluation did not result in any subsequent events that necessitated recognition or disclosures.
14
REPORT OF INDEPENDENT REGISTERED PUBLIC ACCOUNTING FIRM
The Board of Trustees and Shareholders of the Appleton Funds:
We have audited the accompanying statement of assets and liabilities of the Appleton Equity Growth Fund (the Fund) of the Appleton Funds, including the portfolio of investments, as of December 31, 2012, and the related statement of operations for the year then ended, the statements of changes in net assets for each of the two years in the period then ended, and the financial highlights for each of the five years in the period then ended. These financial statements and financial highlights are the responsibility of the Fund’s management. Our responsibility is to express an opinion on these financial statements and financial highlights based on our audits.
We conducted our audits in accordance with the standards of the Public Company Accounting Oversight Board (United States). Those standards require that we plan and perform the audit to obtain reasonable assurance about whether the financial statements and financial highlights are free of material misstatement. We were not engaged to perform an audit of the Fund’s internal control over financial reporting. Our audit included consideration of internal control over financial reporting as a basis for designing audit procedures that are appropriate in the circumstances, but not for the purpose of expressing an opinion on the effectiveness of the Fund’s internal control over financial reporting. Accordingly, we express no such opinion. An audit also includes examining, on a test basis, evidence supporting the amounts and disclosures in the financial statements and financial highlights, assessing the accounting principles used and significant estimates made by management, and evaluating the overall financial statement presentation. Our procedures included confirmation of securities owned as of December 31, 2012, by correspondence with the custodian. We believe that our audit provides a reasonable basis for our opinion.
In our opinion, the financial statements and financial highlights referred to above present fairly, in all material respects, the financial position of the Appleton Equity Growth Fund at December 31, 2012, the results of its operations for the year then ended, the changes in its net assets for each of the two years in the period then ended, and the financial highlights for each of the five years in the period then ended, in conformity with U.S. generally accepted accounting principles.

Cincinnati, Ohio
February 25, 2013
15
APPLETON EQUITY GROWTH FUND
OTHER ITEMS
December 31, 2012 (Unaudited)
PROXY VOTING POLICIES AND PROCEDURES
The Adviser is responsible for exercising the voting rights associated with the securities purchased and held by the Fund. A description of the policies and procedures the Adviser uses in fulfilling this responsibility and information regarding how those proxies were voted during the twelve month period ended December 31 are available without charge, upon request, by calling 1-617-338-0700. They are also available on the Securities and Exchange Commission’s website at http://www.sec.gov.
QUARTERLY PORTFOLIO DISCLOSURE
The Trust files a complete listing of portfolio holdings for the Fund as of the end of the first and third quarters of each fiscal year on Form N-Q. The complete listing (i) is available on the Securities and Exchange Commission’s website; (ii) may be reviewed and copied at the Securities and Exchange Commission’s Public Reference Room in Washington, DC; and (iii) will be made available to shareholders upon request by calling 1-800-543-0407. Information on the operation of the Public Reference Room may be obtained by calling 1-800-SEC-0330.
SCHEDULE OF SHAREHOLDER EXPENSES
As a shareholder of the Fund, you incur ongoing costs, including investment advisory fees; distribution (12b-1) fees; and other Fund expenses. This example is intended to help you understand your ongoing costs (in dollars) of investing in the Fund and to compare these costs with the ongoing costs of investing in other mutual funds.
The example is based on an investment of $1,000 invested at the beginning of the period and held for the entire period (July 1, 2012 through December 31, 2012).
Actual Expenses
The first line of the table below provides information about actual account values and actual expenses. You may use the information in this line, together with the amount you invested, to estimate the expenses that you paid over the period. Simply divide your account value by $1,000 (for example, an $8,600 account value divided by $1,000 = 8.6), then multiply the result by the number in the first line under the heading entitled “Expenses Paid During the Six Months Ended December 31, 2012” to estimate the expenses you paid on your account during this period.
Hypothetical Example for Comparison Purposes
The second line of the table below provides information about hypothetical account values and hypothetical expenses based on the Fund’s actual expense ratio and an assumed rate of return of 5% per year before expenses, which is not the Fund’s actual return. The hypothetical account values and expenses may not be used to estimate the actual ending account balance or expenses you paid for the period. You may use this information to compare the ongoing costs of investing in the Fund’s and other funds. To do so, compare this 5% hypothetical example with the 5% hypothetical examples that appear in the shareholder reports of the other funds.
| | | | | | | | | | | | | | | | |
| | | Net Expense Ratio
Annualized
December 31, 2012 | | | Beginning
Account Value
July 1, 2012 | | | Ending
Account Value
December 31, 2012 | | | Expenses Paid During
the Six Months Ended
December 31, 2012* | |
Actual | | | 1.50 | % | | $ | 1,000.00 | | | $ | 1,039.80 | | | $ | 7.69 | |
Hypothetical | | | 1.50 | % | | $ | 1,000.00 | | | $ | 1,017.60 | | | $ | 7.61 | |
* Expenses are equal to the Fund’s annualized expense ratio, multiplied by the average account value over the period, multiplied by [number of days in most recent fiscal half-year/366] (to reflect the one-half year period).
16
APPLETON EQUITY GROWTH FUND
ADVISORY AGREEMENT APPROVAL (unaudited)
December 31, 2012
The Board of Trustees of the Fund, including a majority of the Trustees who are not interested persons of the Trust (the “Independent Trustees”), reviewed and approved the Trust’s Investment Advisory Agreement with the Adviser at a meeting held on December 11, 2012.
The Adviser made a presentation to the Board with information requested by the Independent Trustees. Such information included: (a) memoranda and materials prepared by fund counsel, describing the relevant statutory considerations governing the contract review process; (b) information independently compiled and prepared by Lipper, Inc. (“Lipper”) relating to the Fund’s fees, expenses, and performance relative to its peer group; (c) a discussion of the financial statements of the Adviser; and (d) a discussion of the compliance programs of the Adviser.
The Board reviewed and discussed the financial information provided by the Adviser. The Board reviewed and considered the Adviser’s profitability derived from its relationship with the Fund and it was noted that the potential profitability was within ranges generally determined to be reasonable given the services rendered and the Fund’s overall performance. The Board determined that the Adviser was solvent and sufficiently well capitalized to perform its ongoing responsibilities to the Fund and to satisfy its obligations under the Investment Advisory Agreement.
The Board reviewed the advisory fee and discussed the appropriateness of such fee. The Board reviewed and considered the possibility of any economies of scale which could be realized by the Fund and how the current advisory fee for the Fund reflects the economies of scale for the benefit of the shareholders of the Fund. The Board noted that due to the Fund’s relatively small size, no economies of scale had yet been realized. The Board also reviewed and considered the fees or other payments received by the Adviser, including information about fees generally charged by the Adviser to private clients, noting that the Adviser is required to provide services to the Fund, as a registered investment company, that it does not provide to private clients. Specifically, the Board reviewed and considered comparison of fees charged by investment advisers to the Fund’s peer group, as outlined in the Lipper report, noting that the existence of the expense limitation agreement. The Board also considered and reviewed information regarding brokerage commissions, observing that the Fund, given its size, generates relatively little in brokerage fees.
The Board reviewed and considered the qualifications of the portfolio management team to manage the portfolio of the Fund, including the managers’ history managing equity investments generally, and their experience with the types of securities included in the Fund’s portfolio. The Board also discussed the portfolio managers’ backgrounds and expertise and the amount of time each would be able to devote to the affairs of the Fund. The Board expressed its satisfaction with the professional qualifications and overall commitment to the Fund of the portfolio managers.
The Board considered the nature, extent and quality of services rendered to the Fund by the Adviser and the investment performance of the Fund based on the data provided in the Materials. The Board determined that in light of the data taken as a whole, and the nature of the investment program of the Fund, the investment performance was reasonable and acceptable. The Board concluded that the fees paid to the Adviser were reasonable in light of comparative performance and advisory fee information, costs of the services provided, profits to be realized and benefits derived by the Adviser from its relationship with the Fund.
Based on this review, which included an executive session of the Trustees, it was the consensus of the Independent Trustees that the continuation of the Investment Advisory Agreement was in the best interest of the Fund and its shareholders.
APPLETON EQUITY GROWTH FUND
MANAGEMENT OF THE TRUST (Unaudited)
December 31, 2012
Listed in the chart below is basic information regarding the Trustees and Officers of the Trust
| | | | | | | | | | |
| Name/Address/Age | | Current Position with Trust and Length of Time Served | | Principal Occupation(s) During Last 5 years | | Number of Portfolios In Fund Complex Overseen by Trustee | | | Other Directorships Held by Trustee Outside the Fund Complex |
| | | | |
INTERESTED TRUSTEES* | | | | | | | | | | |
| | | | |
James I. Ladge, CFA 45 Milk Street, 8th floor Boston, MA 02109 Age: 43 | | President, Trustee (December 2000 - Present) Treasurer (December 2003 - Present) | | Senior Vice President, COO Appleton Partners, Inc. (1993 - Present) | | | 1 | | | Director, Cambridge Appleton Trust, NA |
| | | | |
Douglas C. Chamberlain, CFA 45 Milk Street, 8th floor Boston, MA 02109 Age: 64 | | Trustee (December 2000 - Present) | | President, CEO Appleton Partners, Inc. (1998 - Present) | | | 1 | | | Director, Cambridge Appleton Trust, NA |
| | | | |
DISINTERESTED TRUSTEES: | | | | | | | | | | |
| | | | |
Jack W. Aber PhD Boston University School of
Management 595 Commonwealth Avenue Boston, MA 02215 Age: 74 | | Trustee (December 2000 - Present) | | Professor, Boston University (1972 - Present) | | | 1 | | | Director, Manager Funds Director, Third Avenue Funds |
| | | | |
John M. Cornish, Esquire Choate Hall & Stewart 2 International Place Boston, MA 02110 Age: 64 | | Trustee (December 2000 - Present) | | Partner, Choate, Hall & Stewart (1985 - Present) | | | 1 | | | Director, Thompson Steel Company |
| | | | |
Grady B. Hedgespeth 1315 Independence Ave. SE #8 Washington, DC 20003 Age: 56 | | Trustee (December 2000 - Present) | | Director, Financial Assistance Small Business Administration (2008 - Present) Independent Consultant (2005 - 2008) | | | 1 | | | Director, National Cooperative Bank |
| | | | |
OFFICERS: | | | | | | | | | | |
| | | | |
Michele D. Hubley 45 Milk Street, 8th floor Boston, MA 02109 Age: 54 | | Secretary and Chief Compliance Officer (December 2004 - Present) | | Senior Vice President & Chief Compliance Officer,
Appleton Partners, Inc. (1995 - Present) | | | N/A | | | N/A |
| | | | |
Kelli A. O’Brien 70 Fargo Street, 3 East Boston, MA 02210 Age: 29 | | Assistant Secretary (December 2011 - Present) | | Vice President, Regulatory Administration Advisor,
J.P. Morgan Chase Bank, N.A (2011 - Present);
Assistant Vice President, Investor Services Associate Counsel, Brown Brothers Harriman & Co.
(2008 - 2011) | | | N/A | | | N/A |
| | | | |
Benjamin T. Doherty 70 Fargo Street, 3 East Boston, MA 02210 Age: 26 | | Assistant Secretary (December 2011 - Present) | | Assistant Vice President, Regulatory Administration Advisor, J.P. Morgan Chase Bank, N.A. (2011- Present) | | | N/A | | | N/A |
| | | | |
Jason O’Connell 70 Fargo Street, 3 East Boston, MA 02210 Age: 32 | | Assistant Treasurer (December 2010 - Present) | | Vice President, Treasury and Compliance, J.P. Morgan Chase Bank, N.A. (2005 - Present) | | | N/A | | | N/A |
• All Interested Trustees are such because of their interest in the investment adviser, as defined in the Investment Company Act of 1940.
The Statement of Additional Information contains additional information about the Trustees and is available without charge upon request by calling 1-877-71-Apple.
17
As of the end of the period covered by this report, the Registrant has adopted a code of ethics that applies to its principal executive officers and principal financial officers. During the period covered by this report, no amendments were made to the provisions of the code of ethics, nor did the Registrant grant any waivers, including any implicit waivers, from the provisions of the code of ethics.
| Item 3. | Audit Committee Financial Expert. |
The Registrant’s Board of Trustees has determined that the Registrant has at least one audit committee financial expert. Mr. Jack Aber is the Registrant’s “audit committee financial expert” and is “independent” (as each term is defined in Item 3 of Form N-CSR).
| Item 4. | Principal Accountant Fees and Services. |
| (a) | Audit Fees. Audit fees totaled $23,150 for the December 31, 2012 fiscal year and $22,050 for the December 31, 2011 fiscal year, including fees associated with the annual audit and filings of the Registrant’s of Form N-SAR. |
| (b) | Audit-Related Fees. There were no audit-related fees for the December 31, 2012 or December 31, 2011 fiscal years. |
| (c) | Tax Fees. Tax fees totaled $3,650 for the December 31, 2012 fiscal year and $3,480 for the December 31, 2011 fiscal year. |
| (d) | All Other Fees. There were no other fees for the December 31, 2012 or December 31, 2011 fiscal years. |
| (e)(1) | Audit Committee Pre-Approval Policies. The Audit Committee’s pre-approval policies describe the types of audit, audit-related, tax and other services that may receive the general pre-approval of the Audit Committee. The pre-approval policies provide that annual audit service fees, tax services not specifically granted pre-approval, services exceeding pre-approved cost levels and other services that have not received general pre-approval will be subject to specific pre-approval by the Audit Committee. The pre-approval policies further provide that the Committee may grant general pre-approval to other audit services (statutory audits and services associated with SEC registration statements, periodic reports and other documents filed with the SEC or other documents issued in connection with securities offerings), audit-related services (accounting consultations related to accounting, financial reporting or disclosure matters not classified as “audit services,” assistance with understanding and implementing new accounting and financial reporting guidance from rulemaking authorities, agreed-upon or expanded audit procedures related to accounting and/or billing records required to respond to or comply with financial, accounting or regulatory reporting matters and assistance with internal control reporting |
| | requirements under Form N-SAR and Form N-CSR), tax services that have historically been provided by the auditor that the Committee believes would not impair the independence of the auditor and are consistent with the SEC’s rules on auditor independence and permissible non-audit services classified as “all other services” that are routine and recurring services. |
| (e)(2) | All services described in paragraphs (b) through (d) of Item 4 were approved by the Audit Committee. |
| (g) | The aggregate non-audit fees for services to the Registrant, its investment adviser and any entity controlling, controlled by, or under common control with the adviser that provides ongoing services to the Registrant were $3,650 for the fiscal year ended December 31, 2012 and $3,480 for the fiscal year ended December 31, 2011. |
| Item 5. | Audit Committee of Listed Companies. |
Not applicable.
| Item 6. | Schedule of Investments. |
| (a) | The Schedule of Investments in securities of unaffiliated issuers is included as part of the report to shareholders filed under Item 1 of this Form. |
| (b) | The Registrant made no divestments of securities in accordance with Section 13(c) of the Investment Company Act of 1940. |
| Item 7. | Disclosure of Proxy Voting Policies and Procedures for Closed-End Funds. |
Not applicable.
| Item 8. | Portfolio Managers of Closed-End Funds. |
Not Applicable.
| Item 9. | Purchases of Equity Securities by Closed-End Funds. |
Not Applicable.
| Item 10. | Submission of Matters to a Vote of Security Holders. |
Not Applicable.
| Item 11. | Controls and Procedures. |
| (a) | The Registrant’s principal executive officer and principal financial officer have concluded, based on their evaluation of the Registrant’s disclosure controls and procedures as conducted within 90 days of the filing date of this report, that those disclosure controls and procedures provide reasonable assurance that the material information required to be disclosed by the Registrant on this report is recorded, processed, summarized and reported within the time periods specified in the Securities and Exchange Commission’s rules and forms. |
| (b) | There were no changes in the Registrant’s internal control over financial reporting that occurred during the Registrant’s second fiscal half year covered by this report that have materially affected, or are reasonably likely to materially affect, the Registrant’s internal control over financial reporting. |
| (a)(1) | Code of Ethics for Principal Executive and Financial Officers was filed on March 3, 2006 with Form N-CSR for period ending December 31, 2005 and is hereby incorporated by reference. |
| (a)(2) | Certifications required by Rule 30a-2(a) under the Act (17 CFR 270.30a-2) are filed herewith. |
| (b)(1) | Certifications required by Rule 30a-2(b) of the Investment Company Act of 1940 and Section 906 of the Sarbanes-Oxley Act of 2002 are filed herewith. |
SIGNATURES
Pursuant to the requirements of the Securities Exchange Act of 1934 and the Investment Company Act of 1940, the registrant has duly caused this report to be signed on its behalf by the undersigned, thereunto duly authorized.
| | |
| The Appleton Funds |
| |
| By: | | /s/ James I. Ladge |
| | James I. Ladge President and Treasurer March 6, 2013 |
Pursuant to the requirements of the Securities Exchange Act of 1934 and the Investment Company Act of 1940, this report has been signed below by the following persons on behalf of the registrant and in the capacities and on the dates indicated.
| | |
| |
| By: | | /s/ James I. Ladge |
| | James I. Ladge President and Treasurer March 6, 2013 |