Daniel T. Buckley
Form N-CSR is to be used by management investment companies to file reports with the Commission not later than 10 days after the transmission to stockholders of any report that is required to be transmitted to stockholders under Rule 30e-1 under the Investment Company Act of 1940 (17 CFR 270.30e-1). The Commission may use the information provided on Form N-CSR in its regulatory, disclosure review, inspection and policymaking roles.
A Registrant is required to disclose the information specified by Form N-CSR, and the Commission will make this information public. A Registrant is not required to respond to the collection of information contained in Form N-CSR unless the Form displays a currently valid Office of Management and Budget ("OMB") control number. Please direct comments concerning the accuracy of the information collection burden estimate and any suggestions for reducing the burden to Secretary, Securities and Exchange Commission, 450 Fifth Street, NW, Washington, DC 20549-0609. The OMB has reviewed this collection of information under the clearance requirements of 44 U.S.C. § 3507.
Item 1. Reports to Stockholders.
The following is a copy of the report transmitted to shareholders pursuant to Rule 30e-1 under the Investment Company Act of 1940 (17 CFR 270.30e-1.)
| APPLETON EQUITY GROWTH FUND
Annual Report December 31, 2013
Investment Adviser Appleton Partners, Inc. One Post Office Square, Sixth Floor Boston, MA 02109 |
Table of Contents
| Letter to Shareholders | 1 |
| Fund Performance | 4 |
| Expense Example | 5 |
| Tabular Presentation of Schedule of Investments | 5 |
| Schedule of Investments | 6 |
| Statement of Assets and Liabilities | 8 |
| Statement of Operations | 9 |
| Statements of Changes in Net Assets | 10 |
| Financial Highlights | 11 |
| Notes to the Financial Statements | 12 |
| Report of Independent Registered Public Accounting Firm | 16 |
| Additional Information | 17 |
| Trustees and Officers Information | 19 |
| Privacy Policy Disclosure | 20 |
Dear Shareholder,
The stock market continued its strong run during the second half of 2013, as taper concerns and the debt ceiling debate did little to derail the rally. The S&P 500 Index rose 16.31% during the second half, to bring the year-to-date return to 32.39%. The Appleton Equity Growth Fund returned 17.93% over the same six month period, ending December 31, 2013, raising the year-to date return through December 31, 2013 up to 28.46%. The largest driver of outperformance in the second half was stock selection, particularly in the Information Technology and Energy sectors. Tech companies such as 3D Systems, Google, and Visa all outpaced the general stock market over the final six months of 2013, but the largest contributor to performance was Apple. Apple’s stock rallied over 40% since the end of the second quarter as stronger than anticipated iPhone 5S sales, and hope of an increase to the company’s return of capital to shareholders buoyed the stock. In the Energy sector, the decision to overweight oilfield service names such as Schlumberger, Halliburton, and Core Labs benefitted relative performance. Cash, which is on hand to meet liquidity needs, detracted nearly 65 basis points from second half performance and nearly 1% from the full year figure.
Stocks slumped twice during the second half of 2013, once during late summer as the threat of tighter monetary policy alarmed investors, and again to start the fourth quarter as the debt ceiling spectacle played out in Washington. As was the case most of the year, however, the dips proved to be buying opportunities as the stock market rallied to close the year at an all- time high, only the fifth time that has happened since 1930. Cyclical sectors, such as Industrial and Consumer Discretionary, led the way in the second half and finished the year among the top performers in the index. We continue to favor these sectors as the global economy slowly recovers, and believe that cyclicals have the ability to outperform their defensive counterparts in the year ahead.
For the stock market, a number of positive catalysts potentially remain. Valuation levels on stocks have risen and no longer can be considered cheap, though by no means expensive. We expect a pickup in Merger & Acquisition activity as corporate management teams look to make deals ahead of a potential increase in their cost of capital should interest rates rise. The Initial Public Offering market picked up noticeably in 2013, and we believe that will
continue into 2014. This past year, there has been a remarkable increase in the amount of money returned to shareholders through buybacks and dividends, which has been a tailwind for stocks. We expect returns to shareholders can continue, but expect management may begin to redirect excess cash towards growing their business as confidence returns in 2014. Recent strong returns seen in equity markets coupled with the low interest rate environment, have compelled cash to come off the sidelines and into stocks, a trend we expect to continue. According to Lipper, from July through the end of the year, over $170 billion flowed into stock mutual funds. Lastly, despite commencing the gradual reduction in their monthly asset purchases, the Fed has pledged to remain accommodative until well after the economic recovery has been established. This continual support from the Fed may help support stocks, as it has for the past several years.
Many will remember 2013 as the year of the taper. The Fed’s decision on whether or not to scale back asset purchases dominated trading in both equity and fixed income markets for most of the year. Both stocks and bonds sold off in the summer when Fed Chairman Bernanke first mentioned the mere prospect of tapering, and rallied in September when the “dreaded” taper was put on hold. In December, by the time Bernanke and the Fed announced their decision to reduce their asset purchases by $10 billion or a mere 12%, most investors welcomed the news. Stocks took another leg up to continue the rally, as the S&P 500 ended the year at record highs. As we move into this New Year, investor focus will continue to be on the Federal Reserve and monetary policy. Given the elevated importance of the Fed in recent years, the transition to a new leader of the central bank will be closely monitored by all. Incoming Chairman Janet Yellen has been a champion of greater transparency at the Fed, and will likely follow in Chairman Bernanke’s footsteps in keeping an open line of communication with investors. The Fed has already taken steps to shift the market’s attention away from asset purchases and towards forward rate guidance. With moderate improvements seen in the jobs market, the Fed will most likely shift their emphasis towards their other primary mandate, price stability. Swooning commodity prices and nonexistent real wage growth have been a drag on nominal prices. With inflation trending below target levels, the Fed will be tasked with fighting deflationary pressures in the year to come.
The upcoming year will not be without additional challenges. With stocks sitting at or near all-time highs to end the year, we’ll need to see some of the new catalysts mentioned earlier to propel the market higher. On the heels of such a strong period of returns, some reallocation or profit taking is to be expected and could explain some selling pressure to start the year. The economy has continued to recover, but has yet to fully turn the corner. Any weak economic data will spark growth fears, particularly as the Fed continues to scale back its asset purchases. Not to be ruled out, with further political debate inevitable, there is always the potential for our elected officials to upset the applecart. With those points in mind, we feel the aforementioned positives outweigh the concerns and remain constructive on stocks, but with a higher level of volatility as we head into 2014.
Best wishes for a peaceful and healthy New Year.
James Ladge
Opinions expressed as those of the Fund, are subject to change, are not guaranteed and should not be considered investment advice.
Mutual fund investing involves risk. Principal loss is possible. The Fund may invest in smaller companies, which involve additional risks such as limited liquidity and greater volatility. Growth stocks typically are more volatile than value stocks; however, value stocks have a lower expected growth rate in earnings and sales.
Fund holdings are subject to change and are not recommendations to buy or sell any security. For a complete list of Fund holdings, please refer to the Schedule of Investments found in this report.
Performance data quoted represents past performance; past performance does not guarantee future results.
This report must be preceded or accompanied by a prospectus.
The S&P 500 Index is a broad based unmanaged index of 500 stocks, which is widely recognized as representative of the equity market in general. You cannot invest directly in an index.
A basis point is one hundredth of one percent (0.01%).
Distributed by Quasar Distributors, LLC.
February 2014
FUND PERFORMANCE
December 31, 2013 (Unaudited)
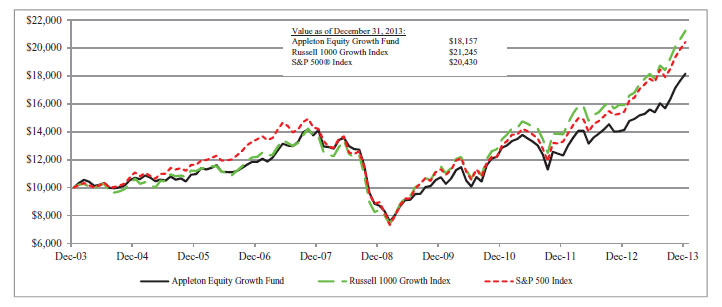
Comparison of the Change in Value of a $10,000 Investment
in the Appleton Equity Growth Fund, S&P 500® Index and the Russell 1000 Growth Index
| | Average Annual Total Returns as of December 31, 2013 |
| | 1 Year | | 3 Year | | 5 Year | | 10 Year |
| Appleton Equity Growth Fund | 28.46% | | 12.20% | | 15.87% | | 6.15% |
| S&P 500® Index | 32.39% | | 16.18% | | 17.94% | | 7.41% |
| Russell 1000 Growth Index | 33.48% | | 16.45% | | 20.39% | | 7.83% |
The S&P 500® Index is a capitalization-weighted index composed of 500 domestic common stocks. Most of the stock in the S&P 500® Index are issued by the 500 largest companies, in terms of the aggregate market value of their outstanding stock, and are generally listed on NYSE. The Russell 1000 Growth Index measures the performance of the large- and mid-capitalization growth sectors of the U.S. equity market. The Russell 1000 Growth Index is a subset of the Russell 1000® Index, which measures the performance of the large-capitalization sector of the U.S. equity market.
This chart assumes an initial gross investment of $10,000 made on December 31, 2003. Returns shown include the reinvestment of all dividends. Past performance does not guarantee future results. The graph and table do not reflect the deduction of taxes that a shareholder would pay on Fund distributions or the redemption of Fund shares. Investment return and principal value will fluctuate, so that your shares, when redeemed, may be worth more or less than the original cost.
EXPENSE EXAMPLE
December 31, 2013 (Unaudited)
As a shareholder of the Fund, you incur ongoing costs, including investment advisory fees; distribution (12b-1) fees; and other Fund expenses. This example is intended to help you understand your ongoing costs (in dollars) of investing in the Fund and to compare these costs with the ongoing costs of investing in other mutual funds.
The example is based on an investment of $1,000 invested at the beginning of the period and held for the entire period (July 1, 2013 through December 31, 2013).
Actual Expenses
The first line of the table below provides information about actual account values and actual expenses. You may use the information in this line, together with the amount you invested, to estimate the expenses that you paid over the period. Simply divide your account value by $1,000 (for example, an $8,600 account value divided by $1,000 = 8.6), then multiply the result by the number in the first line under the heading entitled “Expenses Paid During the Six Months Ended December 31, 2013” to estimate the expenses you paid on your account during this period.
Hypothetical Example for Comparison Purposes
The second line of the table below provides information about hypothetical account values and hypothetical expenses based on the Fund’s actual expense ratio and an assumed rate of return of 5% per year before expenses, which is not the Fund’s actual return. The hypothetical account values and expenses may not be used to estimate the actual ending account balance or expenses you paid for the period. You may use this information to compare the ongoing costs of investing in the Fund’s and other funds. To do so, compare this 5% hypothetical example with the
5% hypothetical examples that appear in the shareholder reports of the other funds.
| | | BeginningAccount ValueJuly 1, 2013 | EndingAccount Valuendi December 31, 2013 | Expenses Paid During the Six Months Ended |
| Actual | 1.50% | $1,000.00 | $1,179.30 | $8.24 |
| Hypothetical (5% annual | | | | |
| return before expenses) | 1.50% | 1,000.00 | 1,017.64 | 7.63 |
| * Expenses are equal to the Fund’s annualized net expense ratio, multiplied by the average account value over the period, multiplied by 184/365 to reflect the one-half year period. |
TABULAR PRESENTATION OF SCHEDULE OF INVESTMENTS
December 31, 2013 (Unaudited)
| Sector | % of Net Assets |
| Information Technology | 18.2% |
| Consumer Discretionary | 15.7% |
| Financials | 14.5% |
| Health Care | 13.8% |
| Industrials | 13.1% |
| Consumer Staples | 8.9% |
| Energy | 8.4% |
| Materials | 3.2% |
| Money Market Fund | 2.3% |
| Telecommunication Services | 2.0% |
| Liabilities in Excess of Other Assets | (0.1%) |
| | 100.0% |
SCHEDULE OF INVESTMENTS
December 31, 2013
| | | | | | | |
| | | | Common Stocks — 97.8% | | | | |
| | | | Consumer Discretionary — 15.7% | | | | |
| | 7,500 | | Dunkin’ Brands Group, Inc. | | $ | 361,500 | |
| | 6,000 | | GNC Holdings, Inc. | | | 350,700 | |
| | 5,000 | | Home Depot, Inc. | | | 411,700 | |
| | 3,175 | | McDonald’s Corp. | | | 308,070 | |
| | 500 | | Priceline.com, Inc. * | | | 581,200 | |
| | 6,200 | | TJX Companies, Inc. | | | 395,126 | |
| | 6,250 | | Volkswagen AG ADR | | | 341,875 | |
| | | | | | | 2,750,171 | |
| | | | Consumer Staples — 8.9% | | | | |
| | 4,550 | | Church & Dwight Co., Inc. | | | 301,574 | |
| | 5,300 | | Colgate-Palmolive Co. | | | 345,613 | |
| | 2,875 | | Costco Wholesale Corp. | | | 342,154 | |
| | 7,650 | | Mondelez International, Inc. | | | 270,045 | |
| | 3,700 | | PepsiCo, Inc. | | | 306,878 | |
| | | | | | | 1,566,264 | |
| | | | Energy — 8.4% | | | | |
| | 6,400 | | Cabot Oil & Gas Corp. | | | 248,064 | |
| | 2,000 | | Continental Resources, Inc. * | | | 225,040 | |
| | 1,500 | | Core Laboratories N.V. | | | 286,425 | |
| | 6,700 | | Halliburton Co. | | | 340,025 | |
| | 4,250 | | Schlumberger Ltd. | | | 382,967 | |
| | | | | | | 1,482,521 | |
| | | | Financials — 14.5% | | | | |
| | 4,100 | | American Tower Corp. | | | 327,262 | |
| | 23,000 | | Bank Of America Corp. | | | 358,110 | |
| | 6,250 | | Citigroup, Inc. | | | 325,688 | |
| | 2,400 | | Goldman Sachs Group, Inc. | | | 425,424 | |
| | 6,100 | | JPMorgan Chase & Co. | | | 356,728 | |
| | 4,000 | | T. Rowe Price Group, Inc. | | | 335,080 | |
| | 9,000 | | Wells Fargo & Co. | | | 408,600 | |
| | | | | | | 2,536,892 | |
| | | | Health Care — 13.8% | | | | |
| | 7,300 | | Abbott Laboratories | | | 279,809 | |
| | 6,700 | | AbbVie, Inc. | | | 353,827 | |
| | 2,900 | | Amgen, Inc. | | | 331,064 | |
| | 6,500 | | Cerner Corp. * | | | 362,310 | |
| | 5,300 | | Express Scripts Holding Co. * | | | 372,272 | |
| | 2,400 | | Perrigo Co. | | | 368,304 | |
| | 3,000 | | Valeant Pharmaceuticals International, Inc. * | | | 352,200 | |
| | | | | | | 2,419,786 | |
The accompanying notes are an integral part of these financial statements.
SCHEDULE OF INVESTMENTS, continued
December 31, 2013
| Shares | | | | Market Value | |
| | | Industrials — 13.1% | | | |
| | 5,750 | | Chicago Bridge & Iron Company N.V. | | $ | 478,055 | |
| | 4,250 | | Generac Holdings, Inc. | | | 240,720 | |
| | 1,300 | | Precision Castparts Corp. | | | 350,090 | |
| | 2,850 | | Roper Industries, Inc. | | | 395,238 | |
| | 1,350 | | W.W. Grainger, Inc. | | | 344,817 | |
| | 6,500 | | Wabtec Corp. | | | 482,755 | |
| | | | | | | 2,291,675 | |
| | | | Information Technology — 18.2% | | | | |
| | 3,350 | | 3D Systems Corp. * | | | 311,315 | |
| | 3,000 | | ANSYS, Inc. * | | | 261,600 | |
| | 1,145 | | Apple, Inc. | | | 642,471 | |
| | 6,750 | | Facebook, Inc. * | | | 368,955 | |
| | 400 | | Google, Inc. * | | | 448,284 | |
| | 4,250 | | QUALCOMM, Inc. | | | 315,563 | |
| | 6,000 | | Verisign, Inc. * | | | 358,680 | |
| | 2,200 | | Visa, Inc. | | | 489,896 | |
| | | | | | | 3,196,764 | |
| | | | Materials — 3.2% | | | | |
| | 3,600 | | Ecolab, Inc. | | | 375,372 | |
| | 1,400 | | Praxair, Inc. | | | 182,042 | |
| | | | | | | 557,414 | |
| | | | Telecommunication Services — 2.0% | | | | |
| | 7,150 | | Verizon Communications, Inc. | | | 351,351 | |
| | | | Total Common Stocks (Cost $10,959,639) | | $ | 17,152,838 | |
| | | | Short-Term Investment — 2.3% | | | | |
| | | | Money Market Fund — 2.3% | | | | |
| | 409,042 | | Fidelity Money Market Portfolio Select Class, 0.01% (a) | | $ | 409,042 | |
| | | | Total Short-Term Investment (Cost $409,042) | | $ | 409,042 | |
| | | | Total Investments — 100.1% (Cost $11,368,681) | | $ | 17,561,880 | |
| | | | Liabilities in excess of other assets — (0.1)% | | $ | (16,363 | ) |
| | | | Total Net Assets — 100.0% | | $ | 17,545,517 | |
Percentages are stated as a percent of net assets.
* Non-income producing.
(a) Represents annualized seven-day yield at December 31, 2013.
ADR American Depositary Receipt
The Global Industry Classification Standard (GICS®) was developed by and/or is the exclusive property of MSCI, Inc. and Standard & Poor’s Financial Services LLP (“S&P”). GICS is a service mark of MSCI and S&P and has been licensed for use by U.S. Bancorp Fund Services, LLC.
The accompanying notes are an integral part of these financial statements
STATEMENT OF ASSETS AND LIABILITIES
December 31, 2013
| Assets: | | | |
| Investments, at market value (cost $11,368,681) | | $ | 17,561,880 | |
| Cash | | | 244 | |
| Receivable for Fund shares sold | | | 10,486 | |
| Due from Adviser | | | 22,026 | |
| Dividends and interest receivable | | | 5,492 | |
| Prepaid expenses | | | 1,321 | |
| Total Assets | | | 17,601,449 | |
| | | | | |
| Liabilities: | | | | |
| Payable to other affiliates | | | 22,961 | |
| Professional fees | | | 27,500 | |
| Accrued expenses and other liabilities | | | 5,471 | |
| Total Liabilities | | | 55,932 | |
| Total Net Assets | | $ | 17,545,517 | |
| | | | | |
| Net Assets Consist of: | | | | |
| Capital Stock | | $ | 11,126,612 | |
| Accumulated net investment loss | | | - | |
| Undistributed net realized gain | | | 225,706 | |
| Net unrealized appreciation on investments | | | 6,193,199 | |
| Total Net Assets | | $ | 17,545,517 | |
| | | | | |
| Shares outstanding (unlimited number of shares authorized, no par value) | | | 1,524,533 | |
| | | | | |
| Net asset value, offering price and redemption price per share | | $ | 11.51 | |
The accompanying notes are an integral part of these financial statements.
STATEMENT OF OPERATIONS
Year Ended December 31, 2013
| Investment Income: | | | |
| Dividend income (net of foreign taxes withheld of $1,023) | | $ | 209,145 | |
| Interest income | | | 122 | |
| Total Investment Income | | | 209,267 | |
| | | | | |
| Expenses: | | | | |
| Investment advisory fees | | | 154,062 | |
| Transfer agent fees | | | 48,180 | |
| Distribution expenses | | | 38,516 | |
| Accounting services fees | | | 37,920 | |
| Reports to shareholders | | | 31,861 | |
| Trustees’ fees and expenses | | | 30,844 | |
| Professional fees | | | 29,900 | |
| Administration fees | | | 27,202 | |
| Custodian fees | | | 5,187 | |
| Insurance expense | | | 4,487 | |
| Registration fees | | | 3,190 | |
| Total Expenses | | | 411,349 | |
| Fees waived and expenses reimbursed by Adviser | | | (180,143 | ) |
| Net Expenses | | | 231,206 | |
| | | | | |
| Net Investment Loss | | | (21,939 | ) |
| | | | | |
| Realized and Unrealized Gain on investments | | | | |
| Net realized gain on investment transactions | | | 1,348,507 | |
| Change in unrealized appreciation on investments | | | 2,570,025 | |
| Net realized and unrealized gain on investments | | | 3,918,532 | |
| | | | | |
| Net Increase in Net Assets from Operations | | $ | 3,896,593 | |
| | | | | |
The accompanying notes are an integral part of these financial statements.
STATEMENTS OF CHANGES IN NET ASSETS
| Operations: | | December 31, 2013 | | | December 31, 2012 | |
| Net investment income (loss) | | $ | (21,939 | ) | | $ | 19,224 | |
| Net realized gain on investment transactions | | | 1,348,507 | | | | 92,744 | |
| Change in unrealized appreciation on investments | | | 2,570,025 | | | | 1,710,769 | |
| Net increase in net assets from operations | | | 3,896,593 | | | | 1,822,737 | |
| | | | | | | | | |
| Distributions to Shareholders: | | | | | | | | |
| Net investment income | | | - | | | | (19,679 | ) |
| Total distributions to shareholders | | | - | | | | (19,679 | ) |
| | | | | | | | | |
| Capital Share Transactions: | |
| Proceeds from shares sold | | | 1,321,672 | | | | 1,653,286 | |
| Shares issued in reinvestment of dividends | | | - | | | | 5,324 | |
| Payments for shares redeemed | | | (1,080,829 | ) | | | (2,358,594 | ) |
| Net increase (decrease) in net assets from capital share | | | | | | | | |
| transactions | | | 240,843 | | | | (699,984 | ) |
| | | | | | | | | |
| Increase in Net Assets | | | 4,137,436 | | | | 1,103,074 | |
| | | | | | | | | |
| Net Assets: | | | | | | | | |
| Beginning of year | | | 13,408,081 | | | | 12,305,007 | |
| End of year | | $ | 17,545,517 | | | $ | 13,408,081 | |
| | | | | | | | | |
| Capital Share Transactions (in shares): | | Year Ended December 31, 2013 | | | December 31, 2012 | |
| Shares sold | | | 131,830 | | | | 191,296 | |
| Shares issued in reinvestment of dividends | | | - | | | | 605 | |
| Shares redeemed | | | (104,394 | ) | | | (269,364 | ) |
| Net increase (decrease) in shares outstanding Shares outstanding: | | | 27,436 | | | | (77,463 | ) |
| Beginning of year | | | 1,497,097 | | | | 1,574,560 | |
| End of year | | | 1,524,533 | | | | 1,497,097 | |
The accompanying notes are an integral part of these financial statements.
FINANCIAL HIGHLIGHTS
| Per Share Data: | | Year Ended December 31, 2013 | | | Year Ended December 31, 2012 | | | Year EndedDecember 31, 2011 | | | Year EndedDecember 31, 2010 | | | Year EndedDecember 31, 2009 | |
| | | | | | | | | | | | | | | | |
| Net asset value, beginning of year | | $ | 8.96 | | | $ | 7.81 | | | $ | 8.16 | | | $ | 6.82 | | | $ | 5.52 | |
| Income (loss) from investment | | | | | | | | | | | | | | | | | | | | |
| operations: | | | | | | | | | | | | | | | | | | | | |
| Net investment income (loss) | | | (0.01 | ) | | | 0.01 | | | | (0.03 | ) | | | (0.02 | ) | | | (0.01 | ) |
| Net realized and unrealized | | | | | | | | | | | | | | | | | | | | |
gain (loss) on investments | | | 2.56 | | | | 1.15 | | | | (0.32 | ) | | | 1.36 | | | | 1.31 | |
| Total from investment | | | | | | | | | | | | | | | | | | | | |
| operations | | | 2.55 | | | | 1.16 | | | | (0.35 | ) | | | 1.34 | | | | 1.30 | |
| Less distributions: | | | | | | | | | | | | | | | | | | | | |
| Dividends from investment | | | | | | | | | | | | | | | | | | | | |
| income | | | - | | | | 0.01 | | | | - | | | | - | | | | - | |
| | | - | | | | 0.01 | | | | - | | | | - | | | | - | |
| Net asset value, end of year | | $ | 11.51 | | | $ | 8.96 | | | $ | 7.81 | | | $ | 8.16 | | | $ | 6.82 | |
| | | | | | | | | | | | | | | | | | | | | |
| Total return | | | 28.46 | % | | | 14.90 | % | | | (4.29 | % | ) | | 19.65 | % | | | 23.55 | % |
| | | | | | | | | | | | | | | | | | | | | |
| Supplemental Data and Ratios: | | | | | | | | | | | | | | | | | | | | |
| Net assets, end of year | | $ | 17,545,517 | | | $ | 13,408,081 | | | $ | 12,305,007 | | | $ | 12,834,022 | | | $ | 10,287,384 | |
| Ratio of net expenses to average | | | | | | | | | | | | | | | | | | | | |
| net assets | | | 1.50 | %1 | | | 1.50 | % | | | 1.50 | % | | | 1.50 | % | | | 1.50 | % |
| Ratio of net investment income | | | | | | | | | | | | | | | | | | | | |
| (loss) to average net assets | | | (0.14 | %)1 | | | 0.14 | % | | | (0.35 | % | ) | | (0.30 | % | ) | | (0.25 | %) |
| Portfolio turnover rate | | | 34 | % | | | 17 | % | | | 31 | % | | | 38 | % | | | 62 | % |
The Adviser voluntarily waived distribution expenses equal to 0.25% of average net assets. This ratio is presented after the effect of the waiver. |
The accompanying notes are an integral part of these financial statements.
NOTES TO THE FINANCIAL STATEMENTS
December 31, 2013
1. Organization
The Appleton Funds (the “Trust”) was organized as an Ohio business trust on October 31, 2000 and is registered under the Investment Company Act of 1940, as amended (the “1940 Act”), as a diversified, no- load, open-end management investment company issuing its shares in series, each series representing a distinct portfolio with its own investment objective and policies. The Trust currently offers one series of shares to investors: the Appleton Equity Growth Fund (the “Fund”). The Trust was capitalized on December 29, 2000, when the initial shares of the Fund were purchased at $10 per share. The Fund commenced operations on December 31, 2000.
The Fund seeks long-term growth of capital by investing primarily in common stocks.
2. Significant Accounting Policies
The following is a summary of significant accounting policies consistently followed by the Fund in the preparation of its financial statements. These policies are in conformity with U.S. generally accepted accounting principles (“GAAP”).
a) Securities valuation – The net asset value of the Fund (“NAV”) is determined daily, Monday through Friday, as of the close regular trading on the New York Stock Exchange (“NYSE”), each day the NYSE is open for business. The Fund’s portfolio securities are valued as of the close of business of the regular session of the NYSE (normally 4:00 p.m., Eastern Time). Portfolio securities traded on stock exchanges are valued at their last sales price as of the close of the regular session of trading on the day the securities are being valued. Securities quoted by NASDAQ are valued at the NASDAQ Official Closing Price.
Securities for which market quotations are not readily available are valued at their fair value as determined in good faith in accordance with consistently applied procedures established by and under the general supervision of the Board of Trustees. Money market instruments are valued at amortized cost, which approximates market value.
The various inputs that are used in determining the fair value of the Fund’s investments are summarized into the three broad levels listed below:
| | ● | Level 1 – quoted prices in active markets for identical securities |
| | ● | Level 2 – other significant observable inputs (including quoted prices for similar securities, interest rates, prepayment speeds, credit risk, etc.) |
| | ● | Level 3 – significant unobservable inputs (including the Fund’s own assumptions in determining the fair value of investments) |
The inputs or methodology used for valuing securities are not necessarily an indication of the risk associated with investing in those securities.
The Fund will typically invest in Level 1 securities. The Fund’s Board of Trustees has adopted a Fair Valuation policy should there be an exception to this and in that event, has delegated authority to the members of the Valuation Committee (“FVC”) to make fair value determinations. In the event it would be necessary to do so, the FVC would make fair value determinations and provide recommendations to the Board of Trustees. The FVC includes Grady Hedgespeth, Douglas Chamberlain, and James Ladge.
In the event that fair value determinations would be necessary, the FVC would follow fair valuation guidelines that contain standing recommendations, approved by the Board of Trustees. Fair valuation determinations made under standing recommendations would be reported on a regular basis to the Board of Trustees. Pricing decisions, processes, and controls over fair value determinations would then be subject to internal and external reviews, by individuals connected with the management of the Fund.
Fair valuation determinations that require greater levels of judgment would also be referred to the FVC. Fair value situations could include, but are not limited to: (1) a significant event that affects the value of a Fund’s securities (e.g., news relating to natural disasters affecting an issuer’s operations or earnings announcements); (2) illiquid securities; (3) securities that may be defaulted or de-listed from an exchange and are no longer trading; or (4) any other circumstance in which the FVC believes that market quotations do not accurately reflect the value of a security. The FVC may consider various inputs in order to make a good faith determination of a security’s fair value. These inputs might include, but are not limited to, use of related or comparable assets or liabilities, recent transactions, market multiples, book values, and other relevant information for the investment to determine the fair value of the investment. An income-based valuation approach, in which the anticipated future cash flows of the investment are discounted to calculate fair value, may also be used. In the event that the situation were to warrant it, discounts might also be applied due to the nature or duration of any restrictions on the disposition of the investment.
In the event it were necessary, the FVC would monitor the results of fair valuation determinations and regularly report the results to the Fund’s Board of Trustees. A description of the update process to fair valuation guidelines that may occur periodically based upon back-testing results or industry best practices would be determined at that time.
The following is a summary of the inputs used to value the Fund’s net assets as of December 31, 2013:
| | Level 1 | Level 2 | Level 3 | Total |
| Total Investments* | $17,152,838 | $409,042 | $- | $17,561,880 |
* Portfolio holdings designated as Level 1 and Level 2 are disclosed individually in the Schedule of Investments (“SOI”). Level 2 consists of a Money Market Mutual Fund. Please refer to the SOI for industry classification of the portfolio holdings.
There were no transfers between Levels 1 and 2 during the year ended December 31, 2013. There were no Level 3 securities held during the period.
b) Share valuation – The net asset value per share of the Fund is calculated daily by dividing the total value of the Fund’s assets, less liabilities, by the number of shares outstanding, rounded to the nearest cent. The offering and redemption price per share are equal to the net asset value per share.
c) Investment income and distributions to shareholders – Interest income is accrued as earned. Dividend income is recorded on the ex-dividend date. Dividends arising from net investment income are declared and paid annually. Net realized short-term capital gains, if any, may be distributed throughout the year and net realized long-term capital gains, if any, are distributed at least once each year. Income dividends and capital gain distributions are determined in accordance with income tax regulations. Differences between book and tax distributions are considered temporary or permanent in nature. To the extent these differences are permanent in nature, such amounts are reclassified within the composition of net assets based on their federal tax basis treatment; temporary differences do not require reclassifications.
d) Security transactions – Security transactions are accounted for on trade date. Securities sold are determined on a specific identification basis.
e) Use of estimates – The preparation of financial statements in conformity with GAAP requires management to make estimates and assumptions that affect the reported amounts of assets and liabilities and disclosure of contingent assets and liabilities at the date of the financial statements and the reported amounts of income and expenses during the reporting period. Actual results could differ from those estimates.
f) Federal income tax – The Fund intends to comply with the requirements of Subchapter M of the Internal Revenue Code necessary to qualify as a regulated investment company and to make the requisite distributions of income and capital gains to its shareholders sufficient to relieve it from all or substantially all Federal income taxes and excise taxes. No provision for income taxes has been made.
During the fiscal years ended December 31, 2013 and 2012, the Fund paid income distributions of $0 and $19,679, respectively.
As of December 31, 2013, the components of distributable earnings of the Fund on a tax basis were as follows:
| Tax cost of portfolio investments | | $ | 11,368,681 | |
| Gross unrealized appreciation of investments | | | 6,352,099 | |
| Gross unrealized depreciation of investments | | | (158,900 | ) |
| Net unrealized appreciation of investments | | | 6,193,199 | |
| Undistributed long-term capital gain | | | 225,706 | |
| Total accumulated earnings | | | 6,418,905 | |
During the year ended December 31, 2013, the Fund utilized capital loss carryforwards of $1,122,801.
Certain reclassifications, the result of permanent differences between financial statement and income tax reporting requirements have been made to the components of capital. The reclassifications resulted from the difference in the tax treatment of net investment losses. These reclassifications have no impact on the net assets or net asset value per share of the Fund and are designed to present the Fund’s capital accounts on a tax basis. For the year ended December 31, 2013, the Fund reclassified $21,939 of net investment losses to paid-in capital on the Statement of Assets and Liabilities.
The Fund evaluates tax positions taken or expected to be taken in the course of preparing the Fund’s tax returns to determine whether the tax positions are “more-likely-than-not” of being sustained by the applicable tax authorities. Tax positions not deemed to meet the more-likely-than-not threshold are recorded as tax benefits or expenses in the current year. Management has analyzed the Fund’s tax positions taken on federal income tax returns for all open tax years (tax years ended December 31, 2009 –
December 31, 2013), and has concluded that no provision for federal income tax is required in the Fund’s financial statements.
3. Investment Transactions
For the year ended December 31, 2013, the cost of purchases and proceeds from sales of portfolio securities, other than short-term investments, amounted to $5,058,915 and $5,023,857, respectively.
4. Agreements with Affiliates
The following is a summary of certain agreements entered into by the Trust on behalf of the Fund.
a) Investment Advisory Agreement
The Fund’s investment adviser is Appleton Partners, Inc. pursuant to an Investment Advisory Agreement with the Adviser. Under the terms of this agreement, the Adviser manages the Fund’s investments and for these services is entitled to receive a fee, computed and accrued daily and paid monthly, at an annual rate of 1.00% of its average daily net assets. Pursuant to a written contract between the Adviser and the Fund, the Adviser has agreed to waive a portion of its advisory fees and/or assume certain expenses of the Fund, other than brokerage commissions, extraordinary items, interest and taxes, to the extent annualized Fund operating expenses exceed 1.50% of the Fund’s average daily net assets. The Adviser has agreed to maintain these expense limitations with regard to the Fund through April 30, 2015. For the year ended December 31, 2013, the Adviser waived $141,627. Certain Trustees and Officers of the Trust are also Officers of the Adviser.
b) Distribution Plan
The Fund has adopted a plan of distribution (the “Plan”) pursuant to Rule 12b-1 under the 1940 Act. The Plan permits the Fund to pay for expenses incurred in the distribution and promotion of the Fund’s shares including but not limited to, the printing of prospectuses, statements of additional information and reports used for sales purposes, advertisements, expenses of preparation and printing of sales literature, promotion, marketing and sales expenses and other distribution-related expenses, including any distribution fees paid
to securities dealers or other firms who have executed a distribution or service agreement with the Trust.
The Plan limits payment of distribution expenses in any fiscal year to a maximum of 0.25% of the Fund’s average daily net assets. For the year ended December 31, 2013, the Fund accrued and the Adviser subsequently reimbursed $38,516 of distribution expenses under the Plan.
c) Underwriting Agreement
The Trust entered into an Underwriting Agreement on behalf of the Fund with Quasar Distributors, LLC, a subsidiary of U.S. Bancorp (the “Distributor”). Pursuant to the Underwriting Agreement, the Distributor acts as principal underwriter and, as such, is the exclusive agent for distribution of shares of the Fund. The Distributor receives a monthly fee for its services.
d) Administration, Accounting, Custody and Transfer Agency Agreement
U.S Bancorp Fund Services, LLC (“USBFS”), a subsidiary of U.S. Bancorp, a publicly held bank holding company, serves as transfer agent, administrator, fund accountant, dividend paying agent and shareholder servicing agent for the Fund. Certain Officers of the Trust are also Officers of USBFS. U.S. Bank, N.A. serves as custodian for the Fund. Both USBFS and U.S. Bank, N.A. receive a monthly fee based on the Fund’s average daily net assets, subject to a monthly minimum fee.
5. Commitments and Contingencies
The Fund indemnifies the Trust’s Officers and Trustees for certain liabilities that might arise from the performance of their duties to the Fund. Additionally, in the normal course of business, the Fund enters into contracts that contain a variety of representations and warranties and which provide general indemnifications. The Fund’s maximum exposure under these arrangements is unknown, as this would involve future claims that may be made against the Fund that have not yet occurred. However, based on experience, the Fund expects the risk of loss to be remote.
6. Subsequent Events
Management has evaluated subsequent events through the date of this filing. This evaluation did not result in any subsequent events that necessitated recognition or disclosures.
Report of Independent Registered Public Accounting Firm
The Board of Trustees and Shareholders of the Appleton Funds:
We have audited the accompanying statement of assets and liabilities of the Appleton Equity Growth Fund (the Fund) of the Appleton Funds, including the portfolio of investments, as of December 31, 2013, and the related statement of operations for the year then ended, the statements of changes in net assets for each of the two years in the period then ended, and the financial highlights for each of the five years in the period then ended. These financial statements and financial highlights are the responsibility of the Fund’s management. Our responsibility is to express an opinion on these financial statements and financial highlights based on our audits.
We conducted our audits in accordance with the standards of the Public Company Accounting Oversight Board (United States). Those standards require that we plan and perform the audit to obtain reasonable assurance about whether the financial statements and financial highlights are free of material misstatement. We were not engaged to perform an audit of the Fund’s internal control over financial reporting. Our audit included consideration of internal control over financial reporting as a basis for designing audit procedures that are appropriate in the circumstances, but not for the purpose of expressing an opinion on the effectiveness of the Fund’s internal control over financial reporting. Accordingly, we express no such opinion. An audit also includes examining, on a test basis, evidence supporting the amounts and disclosures in the financial statements and financial highlights, assessing the accounting principles used and significant estimates made by management, and evaluating the overall financial statement presentation. Our procedures included confirmation of securities owned as of December 31,
2013, by correspondence with the custodian. We believe that our audit provides a reasonable basis for our opinion.
In our opinion, the financial statements and financial highlights referred to above present fairly, in all material respects, the financial position of the Appleton Equity Growth Fund at December 31, 2013, the results of its operations for the year then ended, the changes in its net assets for each of the two years in the period then ended, and the financial highlights for each of the five years in the period then ended, in conformity with U.S. generally accepted accounting principles.
Cincinnati, Ohio
February 25, 2014
ADDITIONAL INFORMATION
December 31, 2013 (Unaudited)
Investment Advisory Agreement Approval
At a meeting held on December 9, 2013, the Board of Trustees (the “Board”) of the Appleton Funds {the “Trust”), including a majority of the Trustees who are not interested persons of the Trust (the “Independent Trustees”), reviewed and approved the Trust’s Investment Advisory Agreement with Appleton Partners, Inc. (the “Adviser”) for the Appleton Equity Growth Fund (the “Fund”). At this meeting, the Board, at its request, received information from the Adviser regarding the Fund and the services provided by the Adviser to the Fund under the Investment Advisory Agreement. This information, together with the information provided to the Board throughout the course of the year, formed the primary, but not exclusive, basis for the Board’s determination. The following is a summary of the
factors considered by the Board and the conclusions that formed the basis for the Board’s approval of the continuance of the Investment Advisory Agreement:
| | 1. | The nature, extent and quality of the services provided by the Adviser. The Trustees considered the nature, extent and quality of the Adviser’s overall services provided to the Fund as well as their specific responsibilities in all aspects of day-to-day investment management of the Fund. The Board considered the qualifications, experience and responsibilities of the portfolio managers, as well as the responsibilities of other key personnel of the Adviser involved in the day-to-day activities of the Fund. The Board also considered the resources and compliance structure of the Adviser, including information regarding its compliance program, its chief compliance officer and the Adviser’s compliance record. The Board also considered the long-tenured relationship between the Adviser and the Trust, and further took into account its knowledge of the Adviser’s operations, and noted that during the course of the prior year they had met with the Adviser periodically to discuss fund performance, investment outlook as well as various marketing and compliance topics, including the Adviser’s risk management process. The Board concluded that the Adviser had the quality and depth of personnel, resources, investment methods and compliance policies and procedures essential to performing its duties under the Investment Advisory Agreement and that the nature, overall quality and extent of such services are satisfactory. |
| | 2. | The investment performance of the Fund and the Adviser. In assessing the quality of the portfolio management delivered by the Adviser, the Board reviewed the short-term and long-term performance of the Fund on both an absolute basis, and in comparison to appropriate securities benchmarks and comparable funds utilizing Morningstar classifications. The Board noted that the Fund had underperformed its peer group median for the one-year, three-year, five-year and ten-year time periods, and further noted underperformance to the S&P 500 Index for the similar time periods. The Board noted the underperformance to both the peer group median and the S&P 500 Index narrowed for the longer term performance data. The Board also reviewed the volatility of the Fund and noted that the standard deviation of its returns was lower than in comparison to its peer group median. The Board also noted that the Fund’s standard deviation was amongst the lowest, reflecting a disciplined investment approach which can cause the Fund to underperform relative to other funds in bullish markets, but also can provide downside protection when markets retreat. |
| | 3. | The costs of the services to be provided by the Adviser. In considering the Advisory fee and total fees and expenses of the Fund, the Board reviewed comparisons to its peer funds and similarly managed separate accounts for other types of clients advised by the Adviser, as well as all expense waivers and reimbursements. The Board noted that the Adviser has a contractual agreement to reimburse Fund expenses to a level where net expenses do not exceed 1.50% of the Fund’s net assets. The Board noted that the Fund’s net expense ratios were 0.25% above the peer group median, but further commented that when compared to the peer group mean the difference decreased. The Board noted that the Fund’s contractual Advisory fee equaled that of the peer group median. The Board further considered the Adviser’s willingness to consider instituting breakpoints in its Advisory fee in order to share economies of scale with the Fund as the Fund’s assets grew. The Board concluded that the fees paid to the Adviser were fair and reasonable in light of the comparative performance and expense and Advisory fee information. The Trustees took into consideration the services the Adviser provided to its separately managed account clients comparing the fees charged for those management services to the fees charged to the Fund and noting that additional services were required for the Fund due to requirements of the Investment Company Act of 1940. |
| | 4. | The extent to which economies of scale would be realized. The Board also considered that economies of scale would be expected to be realized as the assets of the Fund grow and that despite asset growth in the past year, assets were not yet sufficient to achieve economies of scale. The Board noted that the Adviser was willing to consider instituting a breakpoint in the Advisory fee for the Fund if assets continued to grow. The Board concluded that they would continue to examine this issue to ensure that economies of scales are being shared with the Fund as asset levels increase. |
| | 5. | The profits to be realized by the Adviser and its affiliates from their relationship with the Fund. The Board reviewed the Adviser’s financial information and took into account both the direct benefits and the indirect benefits to the Adviser from advising the Fund. The Board considered the profitability to the Adviser from their relationship with the Funds and considered any additional benefits derived by the Adviser from their relationship with the Fund. After such review, the Board determined that the profitability to the Adviser with respect to the Advisory Agreements was not excessive, and that the Adviser had maintained adequate profit levels to support the services they provide to the Fund. The Fund does not generate any 12b-1 fees. |
No single factor was determinative of the Board’s decision to approve the continuance of the Investment Advisory
Agreement, but rather the Board based its determination on the total combination of information available to
them. Based on this review, which included an executive session of the Independent Trustees, it was the consensus of the Trustees that the Investment Advisory Agreement was fair and reasonable in light of the services to be performed, fees, expenses and other matters as the Board considered relevant. The Board therefore determined that the continuance of the Investment Advisory Agreement would be in the best interests of the Fund and its shareholders.
Proxy Voting Policies and Procedures
The Adviser is responsible for exercising the voting rights associated with the securities purchased and held by the Fund. A description of the policies and procedures the Adviser uses in fulfilling this responsibility and information regarding how those proxies are voted during the twelve month period ended December 31 are available without charge, upon request, by calling 617-338-0700. They are also available on the Securities and Exchange Commission’s website at http://www.sec.gov.
Quarterly Portfolio Disclosure
The Trust files a complete listing of the portfolio holdings for the Fund as of the end of the first and third quarters of each fiscal year on Form N-Q. The complete listing (i) is available on the Securities and Exchange Commission’s website; (ii) may be reviewed and copied at the Securities and Exchange Commission’s Public Reference Room in Washington, D.C.; and (iii) will be made available to shareholders upon request by calling 1-800-543-0407. Information on the operation of the Public Reference Room may be obtained by calling 1-800-SEC-0330.
TRUSTEES AND OFFICERS INFORMATION
The names, ages, addresses, present position(s) with the Fund, principal occupation(s) during the past five years and other directorships held outside the Fund complex of the Fund’s Trustees and officers are set forth in the table below. The Board of Trustees is responsible for managing the business affairs of the Fund.
| INTERESTED TRUSTEES | Current Position with Trust and Length of Time Served | | | Principal Occupation(s) During Last 5 Years | | Number of Portfolios in Fund Complex Overseen by Trustee | Other Directorships Held by Trustee Outside the Fund Complex |
| | | | | | | | |
| Name/Address/Age | | | | | | | |
| | | | | | | | |
James I. Ladge, CFA | President, Trustee | | | Portfolio Manager | | | |
| One Post Office Square, | (December 2000-Present) | | | Appleton Partners, Inc. | | 1 | Director, Cambridge |
6th Floor | Treasurer | | | (1993-Present) | | | Appleton Trust, N.A. |
| Boston, MA 02109 | (December 2003-Present) | | | | | | |
| Age: 45 | | | | | | | |
| | | | | | | | |
Douglas C. Chamberlain, CFA | | | | | | | |
| One Post Office Square, | | | | President, CEO | | | Co-operator, Cambridge |
6th Floor | Trustee | | | Appleton Partners, Inc. | | 1 | Savings Bank, |
| Boston, MA 02109 | (December 2000-Present) | | | (1998-Present) | | | Director, Cambridge |
| Age: 66 | | | | | | | Appleton Trust, N.A. |
| | | | | | | | |
| | | | | | | | |
| INDEPENDENT TRUSTEES | | | | | | | |
| | | | | | | | |
| Name/Address/Age | Current Position with Trust and Length of Time Served | | | Principal Occupation(s) During Last 5 Years | | Number of Portfolios in Fund Complex Overseen by Trustee | Other Directorships Held by Trustee Outside the Fund Complex |
| | | | | | | | |
| Jack W. Aber, PhD | | | | | | | |
| Boston University School of Management | Trustee | | | Professor, Boston | | | Director, Manager |
| 595 Commonwealth Avenue | (December 2000-Present) | | | University (1972-2012) | | 1 | Funds Director, Third |
| Boston, MA 02215 | | | | | | | Avenue Funds Director, |
| Age: 76 | | | | | | | Aston Funds |
| | | | | | | | |
| John M. Cornish , Esq. | | | | | | | |
| Choate Hall & Stewart | | | | | | | Director, Thompson Steel |
| 2 International Place | Trustee | | | Partner, Choate Hall & | | | Company Director, The |
| Boston, MA 02210 | (December 2000-Present) | | | Stewart (1985-Present) | | 1 | Swan Group Director, |
| Age: 66 | | | | | | | Boston Mutual Life Ins. |
| | | | | | | | Co. |
| Grady B. Hedgespeth | | | | | | | |
| 1315 Independence Ave. | | | | Director, Financial | | | |
| SE#8 | Trustee | | | Assistance Small | | | |
| Washington, D.C. 20003 | (December 2000-Present) | | | Business Administration | | 1 | |
| Age: 58 | | | | (2007-Present) | | | |
| | | | | | | | |
| | | | | | | | |
| OFFICERS | | | | | | | |
| | | | | | | | |
| Name/Address/Age | Current Position with Trust and Length of Time Served | | | Principal Occupation(s) During Last 5 Years | | Number of Portfolios in Fund Complex Overseen by Trustee | Other Directorships Held by Trustee Outside the Fund Complex |
| | | | | | | | |
| Michele D. Hubley | Secretary and Chief | | | Senior Vice President & | | | |
| One Post Office Square, | Compliance Officer | | | Chief Compliance Officer, | | | |
6th Floor | December 2004-Present) | | | Appleton Partners, Inc. | | N/A | N/A |
| Boston, MA 02109 | | | | (1995-Present) | | | |
| Age: 56 | | | | | | | |
| | | | | | | | |
| Brandon J. Sliga | | | | | | | |
| 777 E. Wisconsin Ave, 4th Floor | Assistant Secretary | | | Vice President, U.S. | | | |
| Milwaukee, WI 53202 | (December 2013-Present) | | | Bancorp Fund Services, | | N/A | N/A |
| Age: 36 | | | | LLC (2007-Present) | | | |
THE APPLETON FUNDS PRIVACY POLICY DISCLOSURE
Thank you for your decision to invest with us. Your privacy is very important to us. The following constitutes a description of our policies regarding disclosure of nonpublic personal information that you provide to us or that we collect from other sources.
Categories of Information We Collect
We collect the following nonpublic personal information about you:
| | • | Information we receive from you on or in applications or other forms, correspondence, or conversations, including, but not limited to, your name, address, phone number, social security number and date of birth; and |
| | • | Information about your transactions with us, our affiliates, or others, including, but not limited to, your account number and balance, payment history, parties to transactions, cost basis information, and other financial information. |
Categories of Information We Disclose and Parties to Whom We Disclose
We do not disclose any nonpublic personal information about our current or former shareholders to nonaffiliated third parties, except as required or permitted by law.
Service Provider/Transfer Agent Exception
We are permitted by law to disclose all of the information we collect, as described above, to our service provider/ transfer agent to process your transactions. Our service provider/transfer agent does not disclose the information to any third parties, except as required or permitted by law.
Confidentiality and Security
We restrict access to your nonpublic personal information to those persons who require such information to provide products or services to you. We maintain physical, electronic, and procedural safeguards that comply with federal standards to guard your nonpublic personal information.
Intermediaries
In the event that you hold shares of the fund(s) through a financial intermediary, including, but not limited to, a broker-dealer, bank or trust company, the privacy policy of your financial intermediary would govern how your nonpublic personal information would be shared with nonaffiliated third parties.
Appleton Funds
One Post Office Square, Sixth Floor
Boston, Massachusetts 02109
| Investment Adviser | Shareholder Services |
| Appleton Partners, Inc. | Nationwide: (Toll-Free) 877-71-APPLE |
| One Post Office Square, Sixth Floor | |
| Boston, Massachusetts 02109 | |
| | Trustees |
| | Jack W. Aber |
| Distributor | Douglas C. Chamberlain |
| Quasar Distributors, LLC | John M. Cornish |
| 615 East Michigan Street | Grady B. Hedgespeth |
Milwaukee, WI 53202 | James I. Ladge |
| | |
| | |
| Fund Administrator, Transfer Agent | Independent Registered Public |
| and Fund Accountant | Accounting Firm |
| U.S. Bancorp Fund Services, LLC | Ernst & Young LLP |
| 615 East Michigan Street | 1900 Scripps Center |
| Milwaukee, WI 53202 | 312 Walnut Street |
| | Cincinnati, Ohio 45202 |
| | |
| Custodian | |
| U.S. Bank, N.A. | Legal Counsel |
| 1555 North Rivercenter Drive, Suite 302 | Mintz, Levin, Cohn, Ferris, Glovsky, and Popeo, P.C |
| Milwaukee, WI 53212 | One Financial Center |
| | Boston, Massachusetts 02411 |
Item 2. Code of Ethics.
The Registrant has adopted a code of ethics that applies to its principal executive officer and principal financial officer. During the period covered by this report, no amendments were made to the provisions of the code of ethics, nor did the Registrant grant any waivers, including any implicit waivers, from the provisions of the code of ethics.
Item 3. Audit Committee Financial Expert.
The Registrant’s Board of Trustees has determined that the Registrant has at least one audit committee financial expert. Jack Aber is the Registrant’s “audit committee financial expert” and is “independent�� (as each term is defined in Item 3 of Form N-CSR).
Item 4. Principal Accountant Fees and Services.
The registrant has engaged its principal accountant to perform audit services, audit-related services, tax services and other services during the past fiscal year. “Audit services” refer to performing an audit of the registrant's annual financial statements or services that are normally provided by the accountant in connection with statutory and regulatory filings or engagements for those fiscal years. “Audit-related services” refer to the assurance and related services by the principal accountant that are reasonably related to the performance of the audit. “Tax services” refer to professional services rendered by the principal accountant for tax compliance, tax advice, and tax planning. There were no “Other services” provided by the principal accountant.
Item 5. Audit Committee of Listed Companies.
Not applicable to registrants who are not listed issuers (as defined by Rule 10A-3 under the Securities Exchange Act of 1934).
Item 6. Schedule of Investments.
Item 7. Disclosure of Proxy Voting Policies and Procedures for Closed-End Funds.
Not applicable to open-end investment companies.
Item 8. Portfolio Managers of Closed-End Funds.
Not applicable to open-end investment companies.
Item 9. Purchases of Equity Securities by Closed-End Funds.
Not applicable to open-end investment companies.
Item 10. Submission of Matters to a Vote of Security Holders.
There have been no material changes to the procedures by which shareholders may recommend nominees to the Registrant’s Board of Trustees.
Item 11. Controls and Procedures.
Item 12. Exhibits.
Pursuant to the requirements of the Securities Exchange Act of 1934 and the Investment Company Act of 1940, the registrant has duly caused this report to be signed on its behalf by the undersigned, thereunto duly authorized.
By: /s/ Daniel T. Buckley
Daniel T. Buckley
Pursuant to the requirements of the Securities Exchange Act of 1934 and the Investment Company Act of 1940, this report has been signed below by the following persons on behalf of the registrant and in the capacities and on the dates indicated.
By: /s/ Daniel T. Buckley
Daniel T. Buckley
By: /s/ James I. Ladge
James I. Ladge