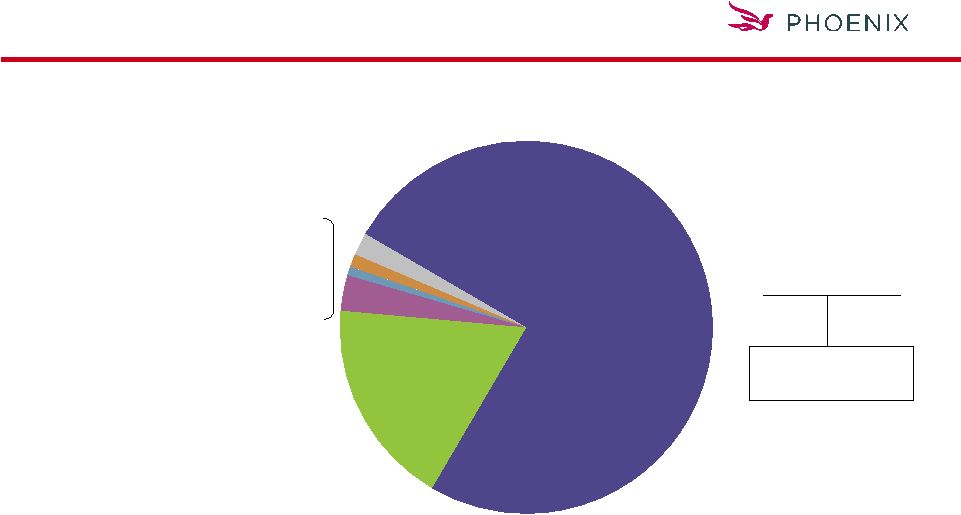
  1 Investment Portfolio Public 72% Private 28% Bonds $10,699 75% Policy Loans $2,490 18% Cash & Short-Term $312 2% Venture Capital $202 1% Stock $166 1% Mortgages & Real Estate $12 0% Other Invested Assets $475 3% Invested Assets: $14.4 Billion $ in millions Market value as of September 30, 2008 Exhibit 99.2 |
  2 Financial Sector Holdings 40.2% 0.4% 51.6 64.2 Consumer Finance 53.5% 11.1% $1,590.9 $1,845.5 Total - - 4.3 4.2 Project Finance 54.5% 1.5% 216.9 240.1 REITS 52.9% 0.6% 88.4 93.0 Leasing/Rental 60.9% 2.4% 344.7 385.6 Insurance 33.2% 1.9% 272.4 322.6 Diversified Financial 45.5% 0.6% 83.6 98.2 Commercial Finance 58.9% 1.0% 146.8 158.5 Broker-Dealer 63.1% 2.7% $382.2 $479.1 Bank Book Value Market Value % General Account % in Closed Block Sector As of September 30, 2008 Percentages based on market value $ in millions |
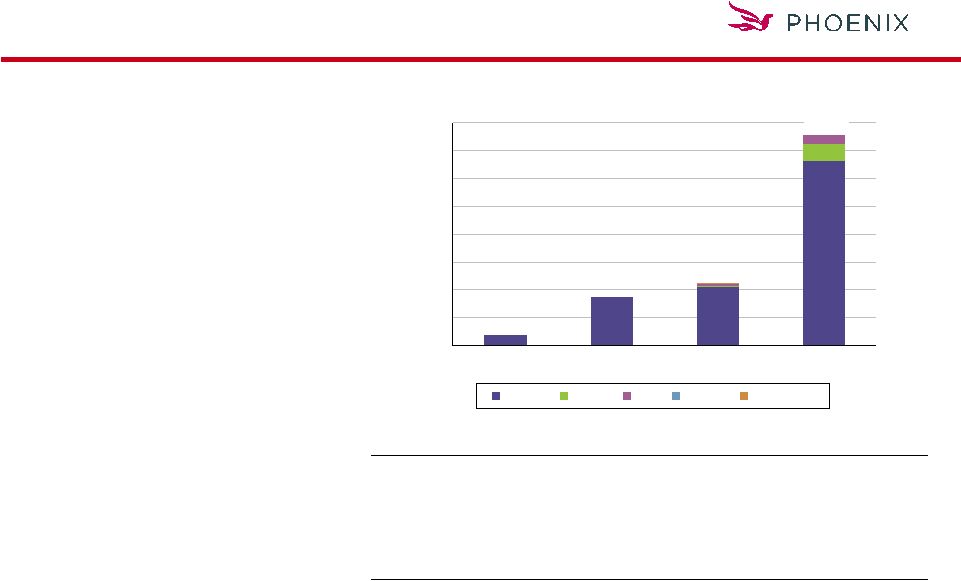
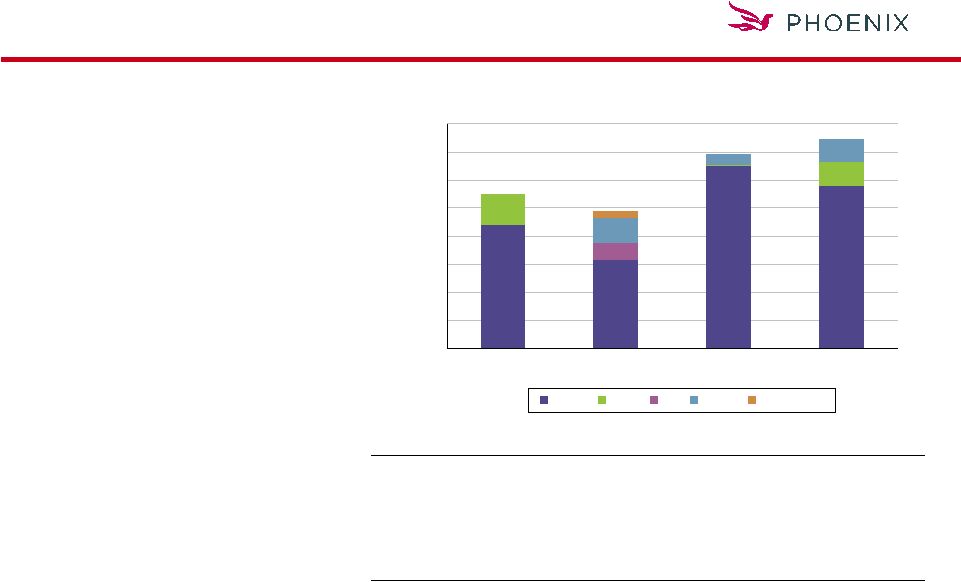
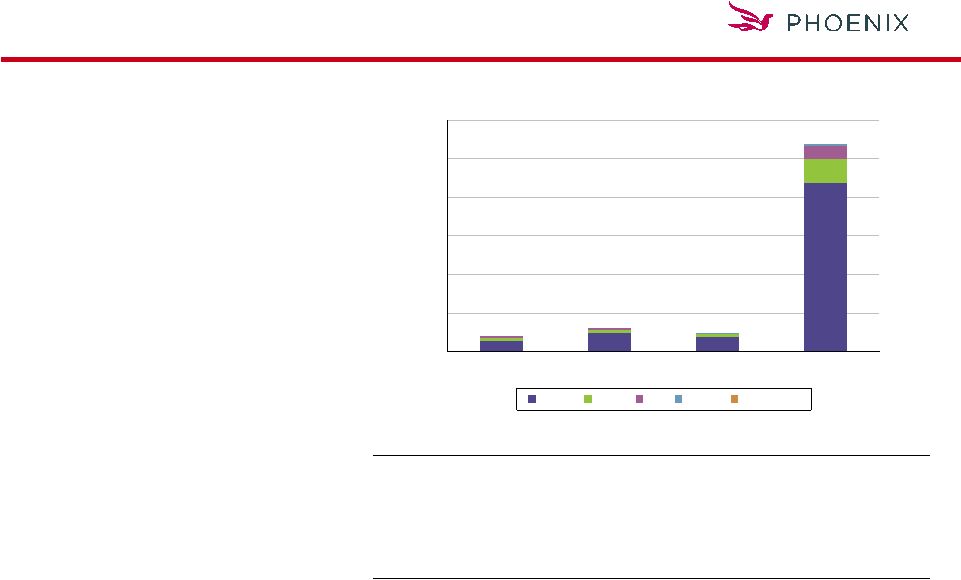  3 CMBS Holdings > $1.372 billion in book value > 80% AAA and only 1% BBB or below > 85% 2005 and prior origination > No CMBX exposure > 5% in CMBS CDO $ in millions As of September 30, 2008 $0 $200 $400 $600 $800 $1,000 $1,200 2007 2006 2005 2004 and Prior AAA AA A BBB Below BBB $79.5 $123.8 $93.8 $1,075.1 AAA $58.2 $93.4 $77.9 $872.3 $1,101.8 AA 14.8 19.3 11.8 126.8 172.7 A 6.5 11.1 0.0 69.8 87.5 BBB 0.0 0.0 4.1 6.2 10.3 Below BBB 0.0 0.0 0.0 0.0 0.0 Total $79.5 $123.8 $93.8 $1,075.1 $1,372.2 2007 2006 2005 2004 and Prior Total |
  4 CMBS by Year of Origination Year of Issue 5.2% - 3.9% 8.1% 4.9% 2007 8.1% - 10.0% 10.8% 7.5% 2006 5.9% 32.5% - 6.5% 6.1% 2005 80.8% 67.5% 86.1% 74.6% 81.5% 2004 & Prior 70.2% 9.0% $1,285.3 $1,372.2 Total - 0.1% 7.9 10.3 BBB 52.0% 0.5% 74.5 87.4 A 61.3% 1.1% 151.7 172.8 AA 73.3% 7.3% $1,051.2 $1,101.7 AAA % in Closed Block % General Account Market Value Book Value Rating As of September 30, 2008 Percentages based on market value $ in millions |
  5 CMBS Portfolio As of September 30, 2008 Sources: Barclays CMBS Index, Trepp Weighted average credit enhancement 27% 25% Weighted average credit enhancement (U.S. Treasury defeasance adjusted) 36% 28% Interest Only (I/O) loans 29% 65% Weighted average coupon 6.89 5.93 Weighted average LTV 68.8% 68.5% Weighted average DSC 1.81x 1.53x Weighted average loan age 81 months 40 months Phoenix Market |
  6 Residential MBS by Rating As of September 30, 2008 Percentages based on market value $ in millions 0.5% 0.8% 3.0% 0.2% - BB & Below 53.1% 5.0% 34.7% 39.6% 76.6% % in Closed Block 1.5% 0.5% 3.7% 93.8% 12.8% $1,839.9 $2,043.7 Total 4.7% 1.3% 6.4% 86.8% 1.4% 201.9 247.9 Subprime 1.3% 2.6% 12.9% 80.2% 1.6% 231.5 302.0 Alt-A 3.0% - 4.9% 91.9% 3.6% 513.4 594.7 Prime - - - 100.0% 6.2% $893.1 $899.1 Agency BBB A AA AAA % General Account Market Value Book Value Rating |
  7 Non-Agency Prime RMBS Holdings > $594.7 million book value > 91% AAA rated > 83% 2005 and prior origination > 88% fixed rate > 82% 2006-2007 originations are super senior classes $ in millions As of September 30, 2008 $0 $50 $100 $150 $200 $250 $300 $350 $400 2007 2006 2005 2004 and Prior AAA AA A BBB Below BBB $17.6 $86.2 $112.2 2007 2006 2005 2004 and Prior Total AAA $17.6 $86.2 $106.1 $331.7 $541.6 AA 0.0 0.0 0.8 31.4 32.2 A 0.0 0.0 4.2 15.5 19.8 BBB 0.0 0.0 0.0 0.0 0.0 Below BBB 0.0 0.0 1.1 0.0 1.1 Total $17.6 $86.2 $112.2 $378.6 $594.7 $378.6 |
  8 Non-Agency Prime RMBS Holdings As of September 30, 2008 Source: JP Morgan MBS Research – November 2008 Phoenix Market Weighted average credit enhancement 9.05% 4.50% Weighted average 60+ day delinquent loan 1.76% 2.59% Phoenix prime portfolio loss coverage: using 25% loss severity 20.6x 6.9x |
  9 AAA $12.3 $92.5 $72.8 $62.5 $240.1 AA 0.0 0.0 0.0 43.6 43.6 A 0.0 0.0 2.7 5.7 8.4 BBB 0.0 0.0 3.0 0.0 3.0 Below BBB 0.0 7.0 0.0 0.0 7.0 Total $12.3 $99.5 $78.5 $111.8 $302.1 Non-Agency Alt-A RMBS Holdings > $302 million book value > 94% AAA or AA rated > 63% 2005 and prior originations > Below AAA ratings are concentrated in 2004 and prior vintages $0 $20 $40 $60 $80 $100 $120 2007 2006 2005 2004 and Prior AAA AA A BBB Below BBB $ in millions As of September 30, 2008 $12.3 $99.5 $78.5 $111.6 2007 2006 2005 2004 and Prior Total |
  10 Residential MBS ALT-A Collateral As of September 30, 2008 Percentages based on market value $ in millions - - - 100.0% - - 7.0 7.0 BB & Below Year of Issue 8.5% 27.1% 25.9% 34.4% 4.1% 1.6% $231.5 $302.0 Total - - 100.0% - - - 3.0 3.0 BBB 53.2% 12.0% 34.8% - - 0.1% 5.9 8.3 A 47.5% 52.5% - - - 0.2% 29.9 43.6 AA 1.3% 25.0% 29.6% 39.0% 5.1% 1.3% $185.7 $240.1 AAA 2003 & Prior 2004 2005 2006 2007 % General Account Market Value Book Value Rating |
  11 Non-Agency Alt-A RMBS Holdings > 97% fixed versus 30% market > 1% in option ARM exposure As of September 30, 2008 Sources: JP Morgan MBS Research – November 2008 Merrill Lynch Loan Performance – October 2008 Option ARM 1% 32% Alt-A ARM 2% 38% Alt-A Fixed 97% 30% 60+ Delinquent 10% 16.6% Phoenix Alt-A Market |
  12 Residential MBS Subprime Collateral As of September 30, 2008 Percentages based on market value $ in millions - - 29.2% 70.8% - - 1.6 2.4 BB & Below Year of Issue 8.5% 22.6% 29.8% 17.0% 22.1% 1.4% $201.9 $247.9 Total 7.0% 43.4% 9.3% 40.3% - 0.1% 9.6 21.2 BBB - - - 100.0% - - 2.7 6.3 A 46.4% - 1.0% - 52.6% 0.1% 12.8 19.8 AA 6.1% 23.7% 33.5% 15.1% 21.6% 1.2% $175.2 $198.2 AAA 2003 & Prior 2004 2005 2006 2007 % General Account Market Value Book Value Rating |
  13 AAA $44.1 $31.2 $65.0 $57.9 $198.2 AA 11.1 0.0 0.2 8.5 19.8 A 0.0 6.2 0.0 0.0 6.2 BBB 0.0 9.0 4.0 8.2 21.2 Below BBB 0.0 2.5 0.0 0.0 2.5 Total $55.2 $48.9 $69.2 $74.6 $247.9 Non-Agency Subprime RMBS Holdings > $247.9 million book value > 88% rated AAA or AA > 81% fixed rate vs. 24.2% for ABX index > Phoenix 60+ day delinquent 16.3% vs. 38.9% for the ABX index $0 $10 $20 $30 $40 $50 $60 $70 $80 2007 2006 2005 2004 and Prior AAA AA A BBB Below BBB $ in millions As of September 30, 2008 1 ABX=2007-2, 2007-1, 2006-2 and 2006-1 subprime Index $55.2 $48.9 $69.2 $74.6 2007 2006 2005 2004 and Prior Total 1 |
  14 Non-Agency Subprime RMBS Holdings > Phoenix fixed rate loan 60+ day delinquent equals 10.5% > Phoenix weighted average credit enhancement 38.7% > 81% of Phoenix subprime mortgages collateralized by fixed rate loans 60+ Day Delinquent Fixed Rate vs. ARM Loan Performance Source: JP Morgan HEL ABS Performance – November 2008 12.0% 10.5% 35.6% 31.0% Market ARM Phoenix ARM Market Fixed Phoenix Fixed |
  15 CDO Holdings As of September 30, 2008 Percentages based on market value $ in millions 11.3% 100.0% - - - 13.7% BB & Below 41.3% - 55.3% 100.0% 51.1% 36.9% % in Closed Block 15.7% 22.8% 34.9% 26.6% 0.3% 50.2 72.9 CMBS 36.6% 28.7% 19.5% 3.9% 2.3% $340.7 $389.6 Total - - - - - 4.6 4.6 RMBS - - 100.0% - - 3.7 3.9 High-Yield Debt 10.2% 3.9% 85.9% - 0.3% 36.4 36.5 Inv Grade Debt 46.1% 34.5% 5.7% - 1.7% $245.8 $271.7 Bank Loans BBB A AA AAA % General Account Market Value Book Value Collateral - - BB & Below - - % in Closed Block 100.0% - - - 0.1% $8.1 $16.9 Total 100.0% - - - 0.1% $8.1 $16.9 Bank Loans BBB A AA AAA % General Account Market Value Book Value Collateral |