Table of Contents
UNITED STATES
SECURITIES AND EXCHANGE COMMISSION
Washington, D.C. 20549
FORM N-CSR
CERTIFIED SHAREHOLDER REPORT OF REGISTERED
MANAGEMENT INVESTMENT COMPANIES
Investment Company Act file number 811-10263
GuideStone Funds
(Exact name of registrant as specified in charter)
2401 Cedar Springs Road
Dallas, TX 75201-1407
(Address of principal executive offices) (Zip code)
Rodney R. Miller, Esq.
GuideStone Financial Resources of the Southern Baptist Convention
2401 Cedar Springs Road
Dallas, TX 75201-1407
(Name and address of agent for service)
registrant’s telephone number, including area code: 214-720-2142
Date of fiscal year end: December 31
Date of reporting period: June 30, 2008
Form N-CSR is to be used by management investment companies to file reports with the Commission not later than 10 days after the transmission to stockholders of any report that is required to be transmitted to stockholders under Rule 30e-1 under the Investment Company Act of 1940 (17 CFR 270.30e-1). The Commission may use the information provided on Form N-CSR in its regulatory, disclosure review, inspection, and policymaking roles.
A registrant is required to disclose the information specified by Form N-CSR, and the Commission will make this information public. A registrant is not required to respond to the collection of information contained in Form N-CSR unless the Form displays a currently valid Office of Management and Budget (“OMB”) control number. Please direct comments concerning the accuracy of the information collection burden estimate and any suggestions for reducing the burden to Secretary, Securities and Exchange Commission, 100 F Street, NE, Washington, DC 20549. The OMB has reviewed this collection of information under the clearance requirements of 44 U.S.C. § 3507.
Table of Contents
| Item 1. | Reports to Stockholders. |
The Report to Shareholders is attached herewith.
Table of Contents
Table of Contents
GuideStone Funds
GuideStone Financial Resources of the Southern Baptist Convention (“GuideStone Financial Resources”)
GuideStone Capital Management (“GSCM”)
GuideStone Trust Services (“GSTS”)
GuideStone Financial Services (“GFS”)
GuideStone Advisors (“GA”)
PFPC Distributors, Inc. (“PFPC”)
NOTICE CONCERNING YOUR PRIVACY RIGHTS
This notice will provide you with information concerning our policies with respect to nonpublic personal information that we collect about you in connection with the following financial products and services provided and/or serviced by the entities listed above: individual retirement accounts (“IRAs”) and/or personal mutual fund accounts.
The confidentiality of your information is important to us as we recognize that you depend on us to keep your information confidential, as described in this notice.
We collect nonpublic personal information about you with regard to your IRA and/or personal mutual fund accounts from the following sources:
| • | Information we receive from you on applications or other forms; |
| • | Information about your transactions with us, our affiliates or others (including our third-party service providers); |
| • | Information we receive from others such as service providers, broker-dealers and your personal agents or representatives; and |
| • | Information you and others provide to us in correspondence sent to us, whether written, electronic or by telephone. |
We may disclose such nonpublic personal financial information about you to one or more of our affiliates. An affiliate of an organization means any entity that controls, is controlled by, or is under common control with that organization. For example, GuideStone Financial Resources, GSCM, GSTS, GFS and GA are affiliates of one another. GuideStone Funds, GuideStone Financial Resources, GSCM, GSTS, GFS, GA and PFPC do not sell your personal information to nonaffiliated third parties.
We may also disclose any of the personal information that we collect about you to nonaffiliated third parties as permitted by law. For example, we may provide your information to nonaffiliated companies that provide account services or that perform marketing services on our behalf and to other financial institutions with whom we have joint marketing agreements. We restrict access to nonpublic personal information about you to those of our employees who need to know that information in order for us to provide and/or service products or services to you. We also maintain physical, electronic, and procedural safeguards to guard your personal information.
These procedures will continue to remain in effect after you cease to receive financial products and services from us.
If you have any questions concerning our customer information policy, please contact a customer service representative at 1-888-98-GUIDE.
Table of Contents
| 2 | ||
| 3 | ||
| 4 | ||
Date Target Funds: | ||
| 7 | ||
| 8 | ||
| 9 | ||
| 10 | ||
| 11 | ||
| 12 | ||
Asset Allocation Funds: | ||
| 17 | ||
| 18 | ||
| 19 | ||
| 20 | ||
| 21 | ||
| 28 | ||
| 29 | ||
| 30 | ||
| 31 | ||
| 32 | ||
Select Funds: | ||
| 37 | ||
| 39 | ||
| 51 | ||
| 73 | ||
| 78 | ||
| 87 | ||
| 93 | ||
| 94 | ||
| 97 | ||
| 99 | ||
| 109 | ||
| 120 | ||
| 122 | ||
| 135 | ||
| 158 | ||
| 160 | ||
This report has been prepared for shareholders of GuideStone Funds. It is not authorized for distribution to prospective investors unless accompanied or preceded by a current prospectus, which contains more complete information about the Funds. Investors are reminded to read the prospectus carefully before investing. Past performance is no guarantee of future results. Share prices will fluctuate and there may be a gain or loss when shares are redeemed. Fund shares are distributed by PFPC Distributors, Inc., 760 Moore Rd., King of Prussia, PA 19406.
1
Table of Contents

We are pleased to bring you the 2008 GuideStone Funds Semi-Annual Report and would like to highlight several enhancements realized during the first six months of 2008:
| • | Global Bond Fund opened to direct investment by participants. Prior to June 1, 2008, shareholders could only indirectly invest in the Fund through the MyDestination Funds™. |
| • | Blended Funds were renamed as Asset Allocation Funds to better describe the investment strategies and risk levels. The names of the Funds and their target asset allocations follow: |
Name (as of June 1, 2008) | Previous Name | Target Allocation | ||
| Conservative Allocation Fund | Flexible Income Fund | 75% fixed income 25% equities | ||
| Balanced Allocation Fund | Growth & Income Fund | 50% fixed income 50% equities | ||
| Growth Allocation Fund | Capital Opportunities Fund | 25% fixed income 75% equities | ||
| Aggressive Allocation Fund | Global Equity Fund | 100% equities | ||
| Conservative Allocation Fund I | Flexible Income Fund I | 75% fixed income 25% equities | ||
| Balanced Allocation Fund I | Growth & Income Fund I | 50% fixed income 50% equities | ||
| Growth Allocation Fund I | Capital Opportunities Fund I | 25% fixed income 75% equities | ||
| Aggressive Allocation Fund I | Global Equity Fund I | 100% equities | ||
We appreciate your ongoing confidence in GuideStone Funds and will continue to enhance the products and services delivered to you — our shareholders. Thank you for choosing to invest in GuideStone Funds.
For more information, please contact us at 1-888-98-GUIDE (1-888-984-8433) or visit our website at www.GuideStoneFunds.org.
Sincerely,

John R. Jones
2
Table of Contents
FROM THE CHIEF INVESTMENT OFFICER

Rodric E. Cummins, CFA
Our current market climate is a harsh reminder of the truth that economic prosperity is cyclical and investments in capital markets are volatile. At the mid-way point of 2008, worldwide economies and global financial markets are under the strain of several converging factors. The financial crisis, which surfaced well over a year ago in the form of sub-prime loans, has since hung as a cloud over capital market performance and continues to deepen amid the complex interaction of global markets. Adding to the woes in the financial system are growing concerns about global economic health and inflation.
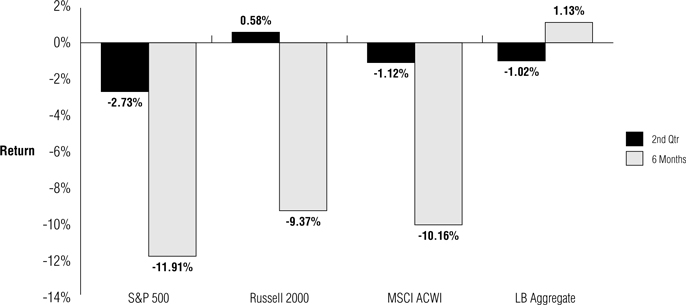
A positive tone to the market developed early in the second quarter as a result of the tax rebate stimulus and government intervention to shore up liquidity needs among financial institutions. However, that optimism was short-lived under the weight of a global economic downturn and sharply rising energy prices. The unique combination of a threatening recession with rising inflation provided a knockout punch to the capital markets during the later half of the second quarter. For the six months ending June 30, U.S. stocks, as represented by the S&P 500® Index, returned -11.91% and are down close to 20% from the cyclical high in October 2007. Bonds, which often act as a safe harbor during turbulent times, have been only a minor refuge due to the pressure of rising inflation. The Lehman Brothers Aggregate Bond Index posted a return of -1.02% during the second quarter and 1.13% for the first six months of 2008.
The year 2008 is expected to be a period marked by heightened market volatility as global financial systems and economies work through current uncertainties. Understandably, these conditions can cause concerns among investors. Such conditions can lead to emotional decisions that result in untimely, ad hoc changes to investment portfolios that may not be consistent with long-term investment objectives. However, short-term diversions and volatile market conditions need not divert one’s attention away from long-term financial goals. Long-term financial objectives which are properly tuned to long-term investment strategies provide the reminder and the assurance that the distance target is the ultimate goal. As has historically been the case, a focused investment discipline, diversification and persistence will likely be the key to weathering this storm.
Market volatility and indiscriminate selling of assets by others often creates investment opportunities that can be captured by insightful investors. Shareholders of GuideStone Funds have the advantage of 30 of the finest institutional investment management firms in the world navigating these difficult waters and taking advantage of opportunities as they surface.
Asset Class Performance Comparison
The following graph illustrates the performance of the major assets classes during 2008.
Index
1 | The S&P 500® Index includes 500 of the largest stocks (in terms of market value) in the United States. |
2 | The Russell 2000® Index is a small-cap index consisting of approximately 2000 of the smallest companies in the Russell 3000® index, representing approximately 10% of the Russell 3000® Index total market capitalization. |
3 | The MSCI ACWI® Ex-U.S. is a free float-adjusted market capitalization index that is designed to measure equity market performance in the global developed and emerging markets excluding the U.S. |
4 | The Lehman Brothers Aggregate Bond Index includes fixed rate debt issues rated investment grade or higher by Moody’s Investor’s Service, Standard and Poor’s® Corporation, or Fitch Investor’s Service, in that order. |
3
Table of Contents
About Your Expenses (Unaudited)
As a shareholder of the Funds, you incur ongoing costs, including advisory fees and to the extent applicable, distribution (12b-1) fees and/or shareholder services fees, as well as other Fund expenses. This example is intended to help you to understand your ongoing costs (in dollars) of investing in the Funds and to compare these costs with the ongoing costs of investing in other mutual funds. It is based on an investment of $1,000 invested at the beginning of the period and held for the entire period from January 1, 2008 to June 30, 2008.
Actual Expenses
The first section of the table below provides information about actual account values and actual expenses. You may use the information in this section, together with the amount you invested, to estimate the expenses that you incurred over the period. Simply divide your account value by $1,000 (for example, an $8,600 account value divided by $1,000 = 8.6), then multiply the result by the number in the first section under the heading entitled “Expenses Paid During Period” to estimate the expenses attributable to your investment during this period.
Hypothetical Example for Comparison Purposes
The second section of the table below provides information about hypothetical account values and hypothetical expenses based on the Fund’s actual expense ratio and an assumed rate of return of 5% per year before expenses, which is not the Fund’s actual return. Thus, you should not use the hypothetical account values and expenses to estimate the actual ending account balance or your expenses for the period. Rather, these figures are provided to enable you to compare the ongoing costs of investing in the Fund and other funds. To do so, compare this 5% hypothetical example with the 5% hypothetical examples that appear in the shareholder reports of the other funds. Please note that the expenses shown in the table are meant to highlight your ongoing costs only. Therefore, the second section of the table is useful in comparing ongoing costs only and will not help you determine the relative total costs of owning different funds.
ACTUAL
Fund | Class | Beginning Account Value 01/01/2008 | Ending Account Value 06/30/2008 | Annualized Expense Ratio (1) | Expenses Paid During Period (2) | |||||||||
MyDestination 2005 | GS4 | $ | 1,000.00 | $ | 951.69 | 0.20 | % | $ | 0.97 | |||||
| GS6 | 1,000.00 | 950.63 | 0.50 | 2.42 | ||||||||||
MyDestination 2015 | GS4 | 1,000.00 | 930.30 | 0.20 | 0.96 | |||||||||
| GS6 | 1,000.00 | 928.22 | 0.50 | 2.40 | ||||||||||
MyDestination 2025 | GS4 | 1,000.00 | 911.13 | 0.20 | 0.95 | |||||||||
| GS6 | 1,000.00 | 909.09 | 0.50 | 2.37 | ||||||||||
MyDestination 2035 | GS4 | 1,000.00 | 897.46 | 0.20 | 0.94 | |||||||||
| GS6 | 1,000.00 | 896.28 | 0.50 | 2.36 | ||||||||||
MyDestination 2045 | GS4 | 1,000.00 | 893.28 | 0.20 | 0.94 | |||||||||
| GS6 | 1,000.00 | 891.41 | 0.50 | 2.35 | ||||||||||
Conservative Allocation | GS4 | 1,000.00 | 970.82 | 0.12 | 0.59 | |||||||||
| GS6 | 1,000.00 | 969.84 | 0.45 | 2.20 | ||||||||||
Balanced Allocation | GS4 | 1,000.00 | 937.01 | 0.12 | 0.58 | |||||||||
| GS6 | 1,000.00 | 936.17 | 0.45 | 2.17 | ||||||||||
Growth Allocation | GS4 | 1,000.00 | 909.39 | 0.12 | 0.57 | |||||||||
| GS6 | 1,000.00 | 907.95 | 0.45 | 2.13 | ||||||||||
Aggressive Allocation | GS4 | 1,000.00 | 882.28 | 0.12 | 0.56 | |||||||||
| GS6 | 1,000.00 | 880.37 | 0.45 | 2.10 | ||||||||||
Conservative Allocation I | GS2 | 1,000.00 | 971.60 | 0.15 | 0.74 | |||||||||
Balanced Allocation I | GS2 | 1,000.00 | 937.67 | 0.14 | 0.67 | |||||||||
Growth Allocation I | GS2 | 1,000.00 | 909.81 | 0.15 | 0.71 | |||||||||
Aggressive Allocation I | GS2 | 1,000.00 | 882.73 | 0.15 | 0.70 | |||||||||
4
Table of Contents
ACTUAL
Fund | Class | Beginning Account Value 01/01/2008 | Ending Account Value 06/30/2008 | Annualized Expense Ratio (1) | Expenses Paid During Period (2) | |||||||||
Money Market | GS2 | $ | 1,000.00 | $ | 1,016.66 | 0.19 | % | $ | 0.95 | |||||
| GS4 | �� | 1,000.00 | 1,015.66 | 0.39 | 1.95 | |||||||||
| GS6 | 1,000.00 | 1,011.98 | 0.80 | 4.00 | ||||||||||
Low-Duration Bond | GS2 | 1,000.00 | 1,001.40 | 0.36 | 1.79 | |||||||||
| GS4 | 1,000.00 | 1,000.98 | 0.52 | 2.59 | ||||||||||
| GS6 | 1,000.00 | 998.85 | 0.91 | 4.52 | ||||||||||
Medium-Duration Bond | GS2 | 1,000.00 | 989.93 | 0.47 | 2.33 | |||||||||
| GS4 | 1,000.00 | 990.36 | 0.58 | 2.87 | ||||||||||
| GS6 | 1,000.00 | 987.92 | 0.93 | 4.60 | ||||||||||
Extended-Duration Bond | GS2 | 1,000.00 | 983.74 | 0.52 | 2.56 | |||||||||
| GS4 | 1,000.00 | 982.09 | 0.69 | 3.40 | ||||||||||
| GS6 | 1,000.00 | 980.33 | 0.97 | 4.78 | ||||||||||
Global Bond | GS4 | 1,000.00 | 972.17 | 0.82 | 4.02 | |||||||||
Equity Index | GS2 | 1,000.00 | 880.22 | 0.23 | 1.08 | |||||||||
| GS4 | 1,000.00 | 879.97 | 0.37 | 1.73 | ||||||||||
| GS6 | 1,000.00 | 878.94 | 0.60 | 2.80 | ||||||||||
Real Estate Securities | GS4 | 1,000.00 | 960.53 | 1.29 | 6.29 | |||||||||
Value Equity | GS2 | 1,000.00 | 857.89 | 0.66 | 3.05 | |||||||||
| GS4 | 1,000.00 | 857.47 | 0.84 | 3.88 | ||||||||||
| GS6 | 1,000.00 | 855.90 | 1.13 | 5.21 | ||||||||||
Growth Equity | GS2 | 1,000.00 | 895.49 | 0.87 | 4.10 | |||||||||
| GS4 | 1,000.00 | 894.58 | 0.96 | 4.52 | ||||||||||
| GS6 | 1,000.00 | 893.26 | 1.28 | 6.03 | ||||||||||
Small Cap Equity | GS2 | 1,000.00 | 913.54 | 1.04 | 4.95 | |||||||||
| GS4 | 1,000.00 | 912.65 | 1.14 | 5.42 | ||||||||||
| GS6 | 1,000.00 | 912.43 | 1.42 | 6.75 | ||||||||||
International Equity | GS2 | 1,000.00 | 892.54 | 0.93 | 4.38 | |||||||||
| GS4 | 1,000.00 | 891.92 | 1.11 | 5.22 | ||||||||||
| GS6 | 1,000.00 | 890.59 | 1.37 | 6.44 | ||||||||||
HYPOTHETICAL (assuming a 5% return before expenses)
Fund | Class | Beginning Account Value 01/01/2008 | Ending Account Value 06/30/2008 | Annualized Expense Ratio (1) | Expenses Paid During Period (2) | |||||||||
MyDestination 2005 | GS4 | $ | 1,000.00 | $ | 1,023.87 | 0.20 | % | $ | 1.01 | |||||
| GS6 | 1,000.00 | 1,022.38 | 0.50 | 2.51 | ||||||||||
MyDestination 2015 | GS4 | 1,000.00 | 1,023.87 | 0.20 | 1.01 | |||||||||
| GS6 | 1,000.00 | 1,022.38 | 0.50 | 2.51 | ||||||||||
MyDestination 2025 | GS4 | 1,000.00 | 1,023.87 | 0.20 | 1.01 | |||||||||
| GS6 | 1,000.00 | 1,022.38 | 0.50 | 2.51 | ||||||||||
MyDestination 2035 | GS4 | 1,000.00 | 1,023.87 | 0.20 | 1.01 | |||||||||
| GS6 | 1,000.00 | 1,022.38 | 0.50 | 2.51 | ||||||||||
MyDestination 2045 | GS4 | 1,000.00 | 1,023.87 | 0.20 | 1.01 | |||||||||
| GS6 | 1,000.00 | 1,022.38 | 0.50 | 2.51 | ||||||||||
Conservative Allocation | �� | GS4 | 1,000.00 | 1,024.27 | 0.12 | 0.60 | ||||||||
| GS6 | 1,000.00 | 1,022.63 | 0.45 | 2.26 | ||||||||||
5
Table of Contents
About Your Expenses (Unaudited) (Continued)
HYPOTHETICAL (assuming a 5% return before expenses)
Fund | Class | Beginning Account Value 01/01/2008 | Ending Account Value 06/30/2008 | Annualized Expense Ratio (1) | Expenses Paid During Period (2) | |||||||||
Balanced Allocation | GS4 | $ | 1,000.00 | $ | 1,024.27 | 0.12 | % | $ | 0.60 | |||||
| GS6 | 1,000.00 | 1,022.63 | 0.45 | 2.26 | ||||||||||
Growth Allocation | GS4 | 1,000.00 | 1,024.27 | 0.12 | 0.60 | |||||||||
| GS6 | 1,000.00 | 1,022.63 | 0.45 | 2.26 | ||||||||||
Aggressive Allocation | GS4 | 1,000.00 | 1,024.27 | 0.12 | 0.60 | |||||||||
| GS6 | 1,000.00 | 1,022.63 | 0.45 | 2.26 | ||||||||||
Conservative Allocation I | GS2 | 1,000.00 | 1,024.12 | 0.15 | 0.75 | |||||||||
Balanced Allocation I | GS2 | 1,000.00 | 1,024.17 | 0.14 | 0.70 | |||||||||
Growth Allocation I | GS2 | 1,000.00 | 1,024.12 | 0.15 | 0.75 | |||||||||
Aggressive Allocation I | GS2 | 1,000.00 | 1,024.12 | 0.15 | 0.75 | |||||||||
Money Market | GS2 | 1,000.00 | 1,023.92 | 0.19 | 0.96 | |||||||||
| GS4 | 1,000.00 | 1,022.92 | 0.39 | 1.96 | ||||||||||
| GS6 | 1,000.00 | 1,020.89 | 0.80 | 4.02 | ||||||||||
Low-Duration Bond | GS2 | 1,000.00 | 1,023.07 | 0.36 | 1.81 | |||||||||
| GS4 | 1,000.00 | 1,022.28 | 0.52 | 2.61 | ||||||||||
| GS6 | 1,000.00 | 1,020.34 | 0.91 | 4.57 | ||||||||||
Medium-Duration Bond | GS2 | 1,000.00 | 1,022.53 | 0.47 | 2.36 | |||||||||
| GS4 | 1,000.00 | 1,021.98 | 0.58 | 2.92 | ||||||||||
| GS6 | 1,000.00 | 1,020.24 | 0.93 | 4.67 | ||||||||||
Extended-Duration Bond | GS2 | 1,000.00 | 1,022.28 | 0.52 | 2.61 | |||||||||
| GS4 | 1,000.00 | 1,021.43 | 0.69 | 3.47 | ||||||||||
| GS6 | 1,000.00 | 1,020.04 | 0.97 | 4.87 | ||||||||||
Global Bond | GS4 | 1,000.00 | 1,020.79 | 0.82 | 4.12 | |||||||||
Equity Index | GS2 | 1,000.00 | 1,023.72 | 0.23 | 1.16 | |||||||||
| GS4 | 1,000.00 | 1,023.02 | 0.37 | 1.86 | ||||||||||
| GS6 | 1,000.00 | 1,021.88 | 0.60 | 3.02 | ||||||||||
Real Estate Securities | GS4 | 1,000.00 | 1,018.45 | 1.29 | 6.47 | |||||||||
Value Equity | GS2 | 1,000.00 | 1,021.58 | 0.66 | 3.32 | |||||||||
| GS4 | 1,000.00 | 1,020.69 | 0.84 | 4.22 | ||||||||||
| GS6 | 1,000.00 | 1,019.24 | 1.13 | 5.67 | ||||||||||
Growth Equity | GS2 | 1,000.00 | 1,020.54 | 0.87 | 4.37 | |||||||||
| GS4 | 1,000.00 | 1,020.09 | 0.96 | 4.82 | ||||||||||
| GS6 | 1,000.00 | 1,018.50 | 1.28 | 6.42 | ||||||||||
Small Cap Equity | GS2 | 1,000.00 | 1,019.69 | 1.04 | 5.22 | |||||||||
| GS4 | 1,000.00 | 1,019.19 | 1.14 | 5.72 | ||||||||||
| GS6 | 1,000.00 | 1,017.80 | 1.42 | 7.12 | ||||||||||
International Equity | GS2 | 1,000.00 | 1,020.24 | 0.93 | 4.67 | |||||||||
| GS4 | 1,000.00 | 1,019.34 | 1.11 | 5.57 | ||||||||||
| GS6 | 1,000.00 | 1,018.05 | 1.37 | 6.87 | ||||||||||
| (1) | Expenses include the effect of contractual waivers by GuideStone Capital Management. The Date Target Funds’ and Asset Allocation Funds’ proportionate share of the operating expenses of the Select Funds is not reflected in the tables above. |
| (2) | Expenses are equal to the Fund’s annualized expense ratios for the period January 1, 2008 through June 30, 2008, multiplied by the average account value over the period, multiplied by 182/366 (to reflect the one-half year period). |
6
Table of Contents
| MyDestination 2005 Fund | ||
| SCHEDULE OF INVESTMENTS | June 30, 2008 (Unaudited) |
| Shares | Value | |||||
AFFILIATED MUTUAL FUNDS — 83.4% | ||||||
GuideStone Money Market Fund (GS4 Class)¥ | 453,448 | $ | 453,448 | |||
GuideStone Low-Duration Bond Fund (GS4 Class)¥ | 783,578 | 9,920,095 | ||||
GuideStone Medium-Duration Bond Fund (GS4 Class)¥ | 819,617 | 10,745,173 | ||||
GuideStone Extended-Duration Bond Fund (GS4 Class)¥ | 59,854 | 865,488 | ||||
GuideStone Global Bond Fund (GS4 Class)¥ | 179,920 | 1,693,046 | ||||
GuideStone Equity Index Fund (GS4 Class)¥ | 92,333 | 1,529,027 | ||||
GuideStone Real Estate Securities Fund (GS4 Class)¥ | 301,469 | 2,592,634 | ||||
GuideStone Value Equity Fund (GS4 Class)¥ | 552,053 | 7,955,088 | ||||
GuideStone Growth Equity Fund (GS4 Class)¥ | 444,864 | 8,043,144 | ||||
GuideStone Small Cap Equity Fund (GS4 Class)¥ | 173,095 | 2,260,620 | ||||
GuideStone International Equity Fund (GS4 Class)¥ | 510,226 | 8,337,092 | ||||
Total Affiliated Mutual Funds | 54,394,855 | |||||
EXCHANGE TRADED FUND — 15.1% | ||||||
iShares Lehman Treasury | ||||||
Inflation Protected Securities Fund | ||||||
(Cost $9,337,475) | 91,654 | 9,884,884 | ||||
| Par | ||||||
U.S. TREASURY OBLIGATIONS — 0.8% | ||||||
U.S. Treasury Bill | ||||||
2.09%, 12/04/08‡‡ | $ | 75,000 | 74,327 | |||
U.S. Treasury Note | ||||||
2.75%, 02/28/13 | 425,000 | 415,039 | ||||
Total U.S. Treasury Obligations | 489,366 | |||||
TOTAL INVESTMENTS — 99.3% | 64,769,105 | |||||
Other Assets in Excess of Liabilities — 0.7% | 485,083 | |||||
NET ASSETS — 100.0% | $ | 65,254,188 | ||||
PORTFOLIO SUMMARY (based on net assets) | ||||||
| % | ||||||
Bond Funds | 35.6 | |||||
Domestic Equity Funds | 34.3 | |||||
Exchange Traded Fund | 15.1 | |||||
International Equity Fund | 12.8 | |||||
U.S. Treasury Obligations | 0.8 | |||||
Futures Contracts | 0.7 | |||||
Money Market Fund | 0.7 | |||||
| 100.0 | ||||||
FAS 157 DISCLOSURE
The following is a summary of the inputs used, as of June 30, 2008, in valuing the Fund’s investments carried at fair value:
Valuation Inputs | Investments in Securities | Other Financial Instruments* | |||||
Level 1 — Quoted Prices | $ | 64,279,739 | $ | (20,072 | ) | ||
Level 2 — Other Significant Observable Inputs | 489,366 | — | |||||
Level 3 — Significant Unobservable Inputs | — | — | |||||
Total | $ | 64,769,105 | $ | (20,072 | ) | ||
| * | Other financial instruments are derivative instruments not reflected in the Schedule of Investments, such as futures, forwards and swap contracts, which are valued at the unrealized appreciation (depreciation) on the investment. |
| See Notes to Financial Statements. | 7 |
Table of Contents
| MyDestination 2015 Fund | ||
| SCHEDULE OF INVESTMENTS | June 30, 2008 (Unaudited) |
| Shares | Value | ||||||
AFFILIATED MUTUAL FUNDS — 91.1% | |||||||
GuideStone Money Market Fund (GS4 Class)¥ | 2,488,952 | $ | 2,488,952 | ||||
GuideStone Low-Duration Bond Fund (GS4 Class)¥ | 947,164 | 11,991,095 | |||||
GuideStone Medium-Duration Bond Fund (GS4 Class)¥ | 1,572,729 | 20,618,475 | |||||
GuideStone Extended-Duration Bond Fund (GS4 Class)¥ | 549,559 | 7,946,617 | |||||
GuideStone Global Bond Fund (GS4 Class)¥ | 1,015,017 | 9,551,314 | |||||
GuideStone Equity Index Fund (GS4 Class)¥ | 321,533 | 5,324,580 | |||||
GuideStone Real Estate Securities Fund (GS4 Class)¥ | 1,225,076 | 10,535,655 | |||||
GuideStone Value Equity Fund (GS4 Class)¥ | 2,050,004 | 29,540,551 | |||||
GuideStone Growth Equity Fund (GS4 Class)¥ | 1,665,823 | 30,118,082 | |||||
GuideStone Small Cap Equity Fund (GS4 Class)¥ | 660,758 | 8,629,502 | |||||
GuideStone International Equity Fund (GS4 Class)¥ | 1,934,446 | 31,608,840 | |||||
Total Affiliated Mutual Funds | 168,353,663 | ||||||
EXCHANGE TRADED FUND — 8.7% | |||||||
iShares Lehman Treasury | |||||||
Inflation Protected Securities Fund | |||||||
(Cost $15,243,094) | 149,325 | 16,104,701 | |||||
| Par | |||||||
U.S. TREASURY OBLIGATIONS — 0.6% | |||||||
U.S. Treasury Bill | |||||||
2.09%, 12/04/08‡‡ | $ | 150,000 | 148,653 | ||||
U.S. Treasury Note | |||||||
4.75%, 05/15/14 | 815,000 | 873,960 | |||||
Total U.S. Treasury Obligations | 1,022,613 | ||||||
TOTAL INVESTMENTS — 100.4% | 185,480,977 | ||||||
Liabilities in Excess of Other Assets — (0.4)% | (716,939 | ) | |||||
NET ASSETS — 100.0% | $ | 184,764,038 | |||||
PORTFOLIO SUMMARY (based on net assets) | |||||||
| % | |||||||
Domestic Equity Funds | 45.6 | ||||||
Bond Funds | 27.1 | ||||||
International Equity Fund | 17.1 | ||||||
Exchange Traded Fund | 8.7 | ||||||
Money Market Fund | 1.3 | ||||||
Futures Contracts | 0.9 | ||||||
U.S. Treasury Obligations | 0.6 | ||||||
| 101.3 | |||||||
FAS 157 DISCLOSURE
The following is a summary of the inputs used, as of June 30, 2008, in valuing the Fund’s investments carried at fair value:
Valuation Inputs | Investments in Securities | Other Financial Instruments* | |||||
Level 1 — Quoted Prices | $ | 184,458,364 | $ | (70,506 | ) | ||
Level 2 — Other Significant Observable Inputs | 1,022,613 | — | |||||
Level 3 — Significant Unobservable Inputs | — | — | |||||
Total | $ | 185,480,977 | $ | (70,506 | ) | ||
| * | Other financial instruments are derivative instruments not reflected in the Schedule of Investments, such as futures, forwards and swap contracts, which are valued at the unrealized appreciation (depreciation) on the investment. |
| 8 | See Notes to Financial Statements. |
Table of Contents
| MyDestination 2025 Fund | ||
| SCHEDULE OF INVESTMENTS | June 30, 2008 (Unaudited) |
| Shares | Value | |||||
AFFILIATED MUTUAL FUNDS — 99.4% | ||||||
GuideStone Money Market Fund (GS4 Class)¥ | 1,564,570 | $ | 1,564,570 | |||
GuideStone Medium-Duration Bond Fund (GS4 Class)¥ | 572,501 | 7,505,494 | ||||
GuideStone Extended-Duration Bond Fund (GS4 Class)¥ | 518,705 | 7,500,473 | ||||
GuideStone Global Bond Fund (GS4 Class)¥ | 936,281 | 8,810,408 | ||||
GuideStone Equity Index Fund (GS4 Class)¥ | 237,173 | 3,927,584 | ||||
GuideStone Real Estate Securities Fund (GS4 Class)¥ | 930,118 | 7,999,014 | ||||
GuideStone Value Equity Fund (GS4 Class)¥ | 1,613,055 | 23,244,124 | ||||
GuideStone Growth Equity Fund (GS4 Class)¥ | 1,291,298 | 23,346,668 | ||||
GuideStone Small Cap Equity Fund (GS4 Class)¥ | 614,844 | 8,029,860 | ||||
GuideStone International Equity Fund (GS4 Class)¥ | 1,541,293 | 25,184,723 | ||||
Total Affiliated Mutual Funds | 117,112,918 | |||||
| Par | ||||||
U.S. TREASURY OBLIGATIONS — 0.3% | ||||||
U.S. Treasury Bill | ||||||
2.09%, 12/04/08‡‡ | $ | 125,000 | 123,878 | |||
U.S. Treasury Note | ||||||
5.13%, 05/15/16 | 235,000 | 256,297 | ||||
Total U.S. Treasury Obligations | 380,175 | |||||
TOTAL INVESTMENTS — 99.7% | 117,493,093 | |||||
Other Assets in Excess of Liabilities — 0.3% | 393,040 | |||||
NET ASSETS — 100.0% | $ | 117,886,133 | ||||
PORTFOLIO SUMMARY (based on net assets) | ||||||
| % | ||||||
Domestic Equity Funds | 56.5 | |||||
International Equity Fund | 21.4 | |||||
Bond Funds | 20.2 | |||||
Money Market Fund | 1.3 | |||||
Futures Contracts | 1.0 | |||||
U.S. Treasury Obligations | 0.3 | |||||
| 100.7 | ||||||
FAS 157 DISCLOSURE
The following is a summary of the inputs used, as of June 30, 2008, in valuing the Fund’s investments carried at fair value:
Valuation Inputs | Investments in Securities | Other Financial Instruments* | |||||
Level 1 — Quoted Prices | $ | 117,112,918 | $ | (50,464 | ) | ||
Level 2 — Other Significant Observable Inputs | 380,175 | — | |||||
Level 3 — Significant Unobservable Inputs | — | — | |||||
Total | $ | 117,493,093 | $ | (50,464 | ) | ||
| * | Other financial instruments are derivative instruments not reflected in the Schedule of Investments, such as futures, forwards and swap contracts, which are valued at the unrealized appreciation (depreciation) on the investment. |
| See Notes to Financial Statements. | 9 |
Table of Contents
| MyDestination 2035 Fund | ||
| SCHEDULE OF INVESTMENTS | June 30, 2008 (Unaudited) |
| Shares | Value | ||||||
AFFILIATED MUTUAL FUNDS — 100.0% | |||||||
GuideStone Money Market Fund (GS4 Class)¥ | 961,238 | $ | 961,238 | ||||
GuideStone Medium-Duration Bond Fund (GS4 Class)¥ | 45,768 | 600,024 | |||||
GuideStone Extended-Duration Bond Fund (GS4 Class)¥ | 41,406 | 598,731 | |||||
GuideStone Global Bond Fund (GS4 Class)¥ | 186,084 | 1,751,051 | |||||
GuideStone Equity Index Fund (GS4 Class)¥ | 106,041 | 1,756,041 | |||||
GuideStone Real Estate Securities Fund (GS4 Class)¥ | 372,447 | 3,203,043 | |||||
GuideStone Value Equity Fund (GS4 Class)¥ | 686,324 | 9,889,930 | |||||
GuideStone Growth Equity Fund (GS4 Class)¥ | 547,078 | 9,891,163 | |||||
GuideStone Small Cap Equity Fund (GS4 Class)¥ | 301,204 | 3,933,720 | |||||
GuideStone International Equity Fund (GS4 Class)¥ | 686,785 | 11,222,064 | |||||
Total Affiliated Mutual Funds | 43,807,005 | ||||||
| Par | |||||||
U.S. TREASURY OBLIGATIONS — 0.2% | |||||||
U.S. Treasury Bill | |||||||
2.09%, 12/04/08‡‡ | $ | 75,000 | 74,327 | ||||
U.S. Treasury Note | |||||||
4.13%, 05/15/15 | 39,000 | 40,313 | |||||
Total U.S. Treasury Obligations | 114,640 | ||||||
TOTAL INVESTMENTS — 100.2% | 43,921,645 | ||||||
Liabilities in Excess of Other Assets — (0.2)% | (108,511 | ) | |||||
NET ASSETS — 100.0% | $ | 43,813,134 | |||||
PORTFOLIO SUMMARY (based on net assets) | |||||||
| % | |||||||
Domestic Equity Funds | 65.5 | ||||||
International Equity Fund | 25.6 | ||||||
Bond Funds | 6.7 | ||||||
Money Market Fund | 2.2 | ||||||
Futures Contracts | 1.7 | ||||||
U.S. Treasury Obligations | 0.2 | ||||||
| 101.9 | |||||||
FAS 157 DISCLOSURE
The following is a summary of the inputs used, as of June 30, 2008, in valuing the Fund’s investments carried at fair value:
Valuation Inputs | Investments in Securities | Other Financial Instruments* | |||||
Level 1 — Quoted Prices | $ | 43,807,005 | $ | (25,115 | ) | ||
Level 2 — Other Significant Observable Inputs | 114,640 | — | |||||
Level 3 — Significant Unobservable Inputs | — | — | |||||
Total | $ | 43,921,645 | $ | (25,115 | ) | ||
| * | Other financial instruments are derivative instruments not reflected in the Schedule of Investments, such as futures, forwards and swap contracts, which are valued at the unrealized appreciation (depreciation) on the investment. |
| 10 | See Notes to Financial Statements. |
Table of Contents
| MyDestination 2045 Fund | ||
| SCHEDULE OF INVESTMENTS | June 30, 2008 (Unaudited) |
| Shares | Value | ||||||
AFFILIATED MUTUAL FUNDS — 100.5% | |||||||
GuideStone Money Market Fund (GS4 Class)¥ | 646,464 | $ | 646,464 | ||||
GuideStone Equity Index Fund (GS4 Class)¥ | 50,119 | 829,965 | |||||
GuideStone Real Estate Securities Fund (GS4 Class)¥ | 194,437 | 1,672,159 | |||||
GuideStone Value Equity Fund (GS4 Class)¥ | 278,141 | 4,008,010 | |||||
GuideStone Growth Equity Fund (GS4 Class)¥ | 221,927 | 4,012,445 | |||||
GuideStone Small Cap Equity Fund (GS4 Class)¥ | 128,536 | 1,678,682 | |||||
GuideStone International Equity Fund (GS4 Class)¥ | 286,846 | 4,687,056 | |||||
Total Affiliated Mutual Funds | 17,534,781 | ||||||
| Par | |||||||
U.S. TREASURY OBLIGATION — 0.3% | |||||||
U.S. Treasury Bill | |||||||
2.09%, 12/04/08‡‡ | |||||||
(Cost $44,598) | $ | 45,000 | 44,596 | ||||
TOTAL INVESTMENTS — 100.8% | 17,579,377 | ||||||
Liabilities in Excess of Other Assets — (0.8)% | (137,702 | ) | |||||
NET ASSETS — 100.0% | $ | 17,441,675 | |||||
PORTFOLIO SUMMARY (based on net assets) | |||||||
| % | |||||||
Domestic Equity Funds | 69.9 | ||||||
International Equity Fund | 26.9 | ||||||
Money Market Fund | 3.7 | ||||||
Futures Contracts | 3.3 | ||||||
U.S. Treasury Obligation | 0.3 | ||||||
| 104.1 | |||||||
FAS 157 DISCLOSURE
The following is a summary of the inputs used, as of June 30, 2008, in valuing the Fund’s investments carried at fair value:
Valuation Inputs | Investments in Securities | Other Financial Instruments* | |||||
Level 1 — Quoted Prices | $ | 17,534,781 | $ | (22,292 | ) | ||
Level 2 — Other Significant Observable Inputs | 44,596 | — | |||||
Level 3 — Significant Unobservable Inputs | — | — | |||||
Total | $ | 17,579,377 | $ | (22,292 | ) | ||
| * | Other financial instruments are derivative instruments not reflected in the Schedule of Investments, such as futures, forwards and swap contracts, which are valued at the unrealized appreciation (depreciation) on the investment. |
| See Notes to Financial Statements. | 11 |
Table of Contents
STATEMENTS OF ASSETS AND LIABILITIES
June 30, 2008 (Unaudited)
| MyDestination 2005 Fund | MyDestination 2015 Fund | MyDestination 2025 Fund | MyDestination 2035 Fund | MyDestination 2045 Fund | ||||||||||||||||
Assets | ||||||||||||||||||||
Investments in securities of affiliated issuers, at value | $ | 54,394,855 | $ | 168,353,663 | $ | 117,112,918 | $ | 43,807,005 | $ | 17,534,781 | ||||||||||
Investments in securities of unaffiliated issuers, at value | 10,374,250 | 17,127,314 | 380,175 | 114,640 | 44,596 | |||||||||||||||
Total investments (1) | 64,769,105 | 185,480,977 | 117,493,093 | 43,921,645 | 17,579,377 | |||||||||||||||
Receivables: | ||||||||||||||||||||
Dividends | 1,421 | 4,060 | 3,376 | 1,564 | 1,203 | |||||||||||||||
Interest | 3,911 | 4,954 | 1,540 | 206 | — | |||||||||||||||
Investment securities sold | 246,487 | — | 164,699 | — | — | |||||||||||||||
Fund shares sold | 326,180 | 1,833 | 321,175 | 3,328 | 7,913 | |||||||||||||||
Variation margin | 385 | 1,430 | 990 | 720 | 555 | |||||||||||||||
Receivable from advisor | 20,341 | — | 9,412 | 25,418 | 23,726 | |||||||||||||||
Prepaid expenses and other assets | (72,544 | ) | (65,726 | ) | (63,090 | ) | (61,116 | ) | (59,187 | ) | ||||||||||
Total Assets | 65,295,286 | 185,427,528 | 117,931,195 | 43,891,765 | 17,553,587 | |||||||||||||||
Liabilities | ||||||||||||||||||||
Payables: | ||||||||||||||||||||
Fund shares redeemed | — | 617,264 | — | 35,287 | 76,894 | |||||||||||||||
Accrued expenses: | ||||||||||||||||||||
Advisory fees | — | 770 | — | — | — | |||||||||||||||
Distribution (12b-1) fees | 143 | 161 | 209 | 155 | 119 | |||||||||||||||
Shareholder servicing fees | 144 | 164 | 216 | 159 | 117 | |||||||||||||||
Other expenses | 40,811 | 45,131 | 44,637 | 43,030 | 34,782 | |||||||||||||||
Total Liabilities | 41,098 | 663,490 | 45,062 | 78,631 | 111,912 | |||||||||||||||
Net Assets | $ | 65,254,188 | $ | 184,764,038 | $ | 117,886,133 | $ | 43,813,134 | $ | 17,441,675 | ||||||||||
Net Assets Consist of: | ||||||||||||||||||||
Paid-in capital | $ | 68,253,468 | $ | 199,564,461 | $ | 130,919,366 | $ | 49,073,498 | $ | 19,413,519 | ||||||||||
Undistributed net investment income | 795,086 | 1,844,921 | 870,357 | 191,919 | 52,260 | |||||||||||||||
Undistributed net realized gain on investments and futures transactions | 1,517,409 | 4,862,039 | 4,270,244 | 1,722,657 | 660,868 | |||||||||||||||
Net unrealized depreciation on investments and futures transactions | (5,311,775 | ) | (21,507,383 | ) | (18,173,834 | ) | (7,174,940 | ) | (2,684,972 | ) | ||||||||||
Net Assets | $ | 65,254,188 | $ | 184,764,038 | $ | 117,886,133 | $ | 43,813,134 | $ | 17,441,675 | ||||||||||
Net Asset Value: | ||||||||||||||||||||
$0.001 par value, unlimited shares authorized Net assets applicable to the GS4 Class | $ | 63,768,506 | $ | 182,985,305 | $ | 115,564,409 | �� | $ | 42,084,208 | $ | 16,192,789 | |||||||||
GS4 shares outstanding | 6,471,455 | 19,050,976 | 12,391,571 | 4,579,046 | 1,791,947 | |||||||||||||||
Net asset value, offering and redemption price per GS4 share | $ | 9.85 | $ | 9.61 | $ | 9.33 | $ | 9.19 | $ | 9.04 | ||||||||||
Net assets applicable to the GS6 Class | $ | 1,485,682 | $ | 1,778,733 | $ | 2,321,724 | $ | 1,728,926 | $ | 1,248,886 | ||||||||||
GS6 shares outstanding | 151,343 | 185,803 | 249,594 | 188,794 | 138,302 | |||||||||||||||
Net asset value, offering and redemption price per GS6 share | $ | 9.82 | $ | 9.57 | $ | 9.30 | $ | 9.16 | $ | 9.03 | ||||||||||
| ||||||||||||||||||||
(1) Investments in securities of affiliated issuers, at cost | $ | 60,237,187 | $ | 190,659,172 | $ | 135,238,689 | $ | 50,957,334 | $ | 20,197,459 | ||||||||||
Investments in securities of unaffiliated issuers, at cost | 9,823,621 | 16,258,682 | 377,774 | 114,136 | 44,598 | |||||||||||||||
Total investments at cost | $ | 70,060,808 | $ | 206,917,854 | $ | 135,616,463 | $ | 51,071,470 | $ | 20,242,057 | ||||||||||
| 12 | See Notes to Financial Statements. |
Table of Contents
STATEMENTS OF OPERATIONS
For the Six Months Ended June 30, 2008 (Unaudited)
| MyDestination 2005 Fund | MyDestination 2015 Fund | MyDestination 2025 Fund | MyDestination 2035 Fund | MyDestination 2045 Fund | ||||||||||||||||
Investment Income | ||||||||||||||||||||
Income dividends received from affiliated funds | $ | 597,602 | $ | 1,613,000 | $ | 976,183 | $ | 231,437 | $ | 67,929 | ||||||||||
Dividends | 253,653 | 393,895 | — | — | — | |||||||||||||||
Interest | 8,361 | 16,761 | 7,887 | 1,887 | 643 | |||||||||||||||
Total Investment Income | 859,616 | 2,023,656 | 984,070 | 233,324 | 68,572 | |||||||||||||||
Expenses | ||||||||||||||||||||
Investment advisory fees | 31,852 | 90,184 | 56,598 | 19,982 | 7,746 | |||||||||||||||
Transfer agent fees: | ||||||||||||||||||||
GS4 | 4,055 | 4,360 | 4,771 | 3,876 | 3,798 | |||||||||||||||
GS6 | 3,902 | 3,900 | 3,922 | 3,902 | 3,882 | |||||||||||||||
Custodian fees | 17,614 | 22,492 | 22,102 | 21,396 | 13,121 | |||||||||||||||
Distribution (12b-1) fees: | ||||||||||||||||||||
GS6 | 777 | 846 | 1,095 | 785 | 608 | |||||||||||||||
Shareholder servicing fees: | ||||||||||||||||||||
GS6 | 851 | 926 | 1,199 | 861 | 666 | |||||||||||||||
Accounting and administration fees | 4,754 | 7,174 | 5,460 | 7,190 | 3,074 | |||||||||||||||
Professional fees | 23,323 | 23,323 | 23,323 | 23,323 | 23,323 | |||||||||||||||
Blue sky fees: | ||||||||||||||||||||
GS4 | 72,643 | 66,248 | 61,699 | 58,379 | 54,159 | |||||||||||||||
GS6 | 23,270 | 22,868 | 23,035 | 23,767 | 25,695 | |||||||||||||||
Shareholder reporting fees: | ||||||||||||||||||||
GS4 | 999 | 1,088 | 875 | 821 | 859 | |||||||||||||||
GS6 | — | — | — | 71 | — | |||||||||||||||
Trustee fees | 206 | 132 | 137 | 158 | 133 | |||||||||||||||
Line of credit facility fees | 198 | 348 | 291 | 126 | 40 | |||||||||||||||
Other expenses | 6,953 | 7,178 | 7,048 | 6,910 | 6,855 | |||||||||||||||
Total Expenses | 191,397 | 251,067 | 211,555 | 171,547 | 143,959 | |||||||||||||||
Expenses waived and reimbursed(1) | (126,510 | ) | (71,426 | ) | (97,201 | ) | (130,142 | ) | (127,235 | ) | ||||||||||
Net Expenses | 64,887 | 179,641 | 114,354 | 41,405 | 16,724 | |||||||||||||||
Net Investment Income | 794,729 | 1,844,015 | 869,716 | 191,919 | 51,848 | |||||||||||||||
Realized and Unrealized Gain (Loss) | ||||||||||||||||||||
Capital gain distributions received from affiliated funds | 143,769 | 440,279 | 291,929 | 76,734 | 24,117 | |||||||||||||||
Net realized loss on investment securities of affiliated issuers | (199,952 | ) | (1,090,876 | ) | (515,212 | ) | (130,992 | ) | — | |||||||||||
Net realized gain (loss) on investment securities of unaffiliated issuers | 95,372 | 128,700 | 4,448 | 37 | (42,165 | ) | ||||||||||||||
Net realized loss on futures transactions | (16,586 | ) | (150,009 | ) | (148,002 | ) | (84,070 | ) | (24,108 | ) | ||||||||||
Net realized gain (loss) | 22,603 | (671,906 | ) | (366,837 | ) | (138,291 | ) | (42,156 | ) | |||||||||||
Change in unrealized appreciation (depreciation) on investment securities of affiliated issuers | (3,852,328 | ) | (14,136,582 | ) | (10,751,065 | ) | (4,277,459 | ) | (1,620,292 | ) | ||||||||||
Change in unrealized appreciation (depreciation) on investment securities of unaffiliated issuers | 78,835 | 157,538 | (184 | ) | 297 | (34 | ) | |||||||||||||
Change in unrealized appreciation (depreciation) on futures | (17,907 | ) | (50,270 | ) | (38,955 | ) | (19,886 | ) | (17,436 | ) | ||||||||||
Net change in unrealized appreciation (depreciation) | (3,791,400 | ) | (14,029,314 | ) | (10,790,204 | ) | (4,297,048 | ) | (1,637,762 | ) | ||||||||||
Net Realized and Unrealized Loss | (3,768,797 | ) | (14,701,220 | ) | (11,157,041 | ) | (4,435,339 | ) | (1,679,918 | ) | ||||||||||
Net Decrease in Net Assets Resulting from Operations | $ | (2,974,068 | ) | $ | (12,857,205 | ) | $ | (10,287,325 | ) | $ | (4,243,420 | ) | $ | (1,628,070 | ) | |||||
(1) | See Note 3a and 3c in Notes to Financial Statements. |
| See Notes to Financial Statements. | 13 |
Table of Contents
STATEMENTS OF CHANGES IN NET ASSETS
| MyDestination 2005 Fund | ||||||||
| For the Six Months Ended 06/30/08 (Unaudited) | For the Year Ended 12/31/07 | |||||||
Operations: | ||||||||
Net investment income | $ | 794,729 | $ | 1,071,155 | ||||
Net realized gain (loss) on investment securities and futures transactions | 22,603 | 2,045,019 | ||||||
Net change in unrealized appreciation (depreciation) on investment securities and futures transactions | (3,791,400 | ) | (1,520,375 | ) | ||||
Net increase (decrease) in net assets resulting from operations | (2,974,068 | ) | 1,595,799 | |||||
Dividends and Distributions to Shareholders: | ||||||||
Dividends from net investment income | ||||||||
GS4 shares | — | (1,524,510 | ) | |||||
GS6 shares | — | (37,112 | ) | |||||
Distributions from net realized capital gains | ||||||||
GS4 shares | — | (57,922 | ) | |||||
GS6 shares | — | (1,467 | ) | |||||
Total dividends and distributions | — | (1,621,011 | ) | |||||
Capital Share Transactions: | ||||||||
Proceeds from shares sold | ||||||||
GS4 shares | 14,824,853 | 63,731,938 | ||||||
GS6 shares | 260,808 | 1,384,145 | ||||||
GS8 shares(1) | — | 1,019,207 | ||||||
Proceeds from exchange of GS8 shares for GS6 shares(1) | ||||||||
GS6 shares | — | 15,504 | ||||||
GS8 shares | — | (15,504 | ) | |||||
Reinvestment of dividends and distributions | ||||||||
GS2 shares | ||||||||
GS4 shares | — | 1,582,432 | ||||||
GS6 shares | — | 38,579 | ||||||
Total proceeds from shares sold and reinvested | 15,085,661 | 67,756,301 | ||||||
Value of shares redeemed | ||||||||
GS2 shares | ||||||||
GS4 shares | (5,823,910 | ) | (7,563,551 | ) | ||||
GS6 shares | (158,249 | ) | (14,703 | ) | ||||
GS8 shares(1) | — | (1,058,081 | ) | |||||
Total value of shares redeemed | (5,982,159 | ) | (8,636,335 | ) | ||||
Net increase from capital share transactions(2) | 9,103,502 | 59,119,966 | ||||||
Total increase in net assets | 6,129,434 | 59,094,754 | ||||||
Net Assets: | ||||||||
Beginning of Period | 59,124,754 | 30,000 | ||||||
End of Period* | $ | 65,254,188 | $ | 59,124,754 | ||||
* Including undistributed net investment income | $ | 795,086 | $ | 357 | ||||
(1) See Note 1 in Notes to Financial Statements. (2) See Note 7 in Notes to Financial Statements. | ||||||||
| 14 | See Notes to Financial Statements. |
Table of Contents
| MyDestination 2015 Fund | MyDestination 2025 Fund | MyDestination 2035 Fund | MyDestination 2045 Fund | |||||||||||||||||||||||||||
| For the Six Months Ended 06/30/08 (Unaudited) | For the Year Ended 12/31/07 | For the Six Months Ended 06/30/08 (Unaudited) | For the Year Ended 12/31/07 | For the Six Months Ended 06/30/08 (Unaudited) | For the Year Ended 12/31/07 | For the Six Months Ended 06/30/08 (Unaudited) | For the Year Ended 12/31/07 | |||||||||||||||||||||||
| $1,844,015 | $ | 2,598,220 | $ | 869,716 | $ | 1,380,844 | $ | 191,919 | $ | 359,894 | $ | 51,848 | $ | 108,327 | ||||||||||||||||
| (671,906 | ) | 7,487,379 | (366,837 | ) | 6,201,951 | (138,291 | ) | 2,472,233 | (42,156 | ) | 1,000,704 | |||||||||||||||||||
| (14,029,314 | ) | (7,478,069 | ) | (10,790,204 | ) | (7,383,630 | ) | (4,297,048 | ) | (2,877,892 | ) | (1,637,762 | ) | (1,047,210 | ) | |||||||||||||||
| (12,857,205 | ) | 2,607,530 | (10,287,325 | ) | 199,165 | (4,243,420 | ) | (45,765 | ) | (1,628,070 | ) | 61,821 | ||||||||||||||||||
| — | (4,415,924 | ) | — | (2,831,806 | ) | — | (920,638 | ) | — | (317,266 | ) | |||||||||||||||||||
| — | (37,265 | ) | — | (52,369 | ) | — | (33,623 | ) | — | (28,833 | ) | |||||||||||||||||||
| — | (96,678 | ) | — | (59,730 | ) | — | (16,283 | ) | — | (53,860 | ) | |||||||||||||||||||
| — | (881 | ) | — | (1,168 | ) | — | (635 | ) | — | (5,636 | ) | |||||||||||||||||||
| — | (4,550,748 | ) | — | (2,945,073 | ) | — | (971,179 | ) | — | (405,595 | ) | |||||||||||||||||||
| 33,428,289 | 172,884,135 | 23,411,168 | 109,691,374 | 12,769,902 | 38,732,919 | 6,853,832 | 15,819,931 | |||||||||||||||||||||||
| 376,450 | 1,378,364 | 538,150 | 1,736,960 | 506,792 | 1,252,606 | 182,556 | 1,162,386 | |||||||||||||||||||||||
| 1,126,394 | 1,307,164 | 1,101,749 | 1,040,708 | |||||||||||||||||||||||||||
| — | 129,470 | — | 295,419 | — | 106,056 | — | 37,390 | |||||||||||||||||||||||
| — | (129,470 | ) | — | (295,419 | ) | — | (106,056 | ) | — | (37,390 | ) | |||||||||||||||||||
| — | 4,512,602 | — | 2,891,536 | — | 936,921 | — | 371,048 | |||||||||||||||||||||||
| — | 38,146 | — | 53,537 | — | 34,258 | — | 34,469 | |||||||||||||||||||||||
| 33,804,739 | 179,939,641 | 23,949,318 | 115,680,571 | 13,276,694 | 42,058,453 | 7,036,388 | 18,428,542 | |||||||||||||||||||||||
| (7,657,409 | ) | (5,433,303 | ) | (2,864,218 | ) | (4,692,332 | ) | (1,723,592 | ) | (3,464,770 | ) | (833,739 | ) | (4,122,936 | ) | |||||||||||||||
| (8,781 | ) | (42,562 | ) | (74,320 | ) | (13,674 | ) | (929 | ) | (17,005 | ) | (21,692 | ) | (10,183 | ) | |||||||||||||||
| — | (1,067,864 | ) | — | (1,095,979 | ) | — | (1,085,353 | ) | — | (1,092,861 | ) | |||||||||||||||||||
| (7,666,190 | ) | (6,543,729 | ) | (2,938,538 | ) | (5,801,985 | ) | (1,724,521 | ) | (4,567,128 | ) | (855,431 | ) | (5,225,980 | ) | |||||||||||||||
| 26,138,549 | 173,395,912 | 21,010,780 | 109,878,586 | 11,552,173 | 37,491,325 | 6,180,957 | 13,202,562 | |||||||||||||||||||||||
| 13,281,344 | 171,452,694 | 10,723,455 | 107,132,678 | 7,308,753 | 36,474,381 | 4,552,887 | 12,858,788 | |||||||||||||||||||||||
| 171,482,694 | 30,000 | 107,162,678 | 30,000 | 36,504,381 | 30,000 | 12,888,788 | 30,000 | |||||||||||||||||||||||
| $ | 184,764,038 | $ | 171,482,694 | $ | 117,886,133 | $ | 107,162,678 | $ | 43,813,134 | $ | 36,504,381 | $ | 17,441,675 | $ | 12,888,788 | |||||||||||||||
| $ | 1,844,921 | $ | 906 | $ | 870,357 | $ | 641 | $ | 191,919 | $ | — | $ | 52,260 | $ | 412 | |||||||||||||||
| See Notes to Financial Statements. | 15 |
Table of Contents
FINANCIAL HIGHLIGHTS (Unaudited)
For a Share Outstanding For the Years Ended December 31, unless otherwise indicated
| Ratios to Average Net Assets | |||||||||||||||||||||||||||||||||||||||||||||||||
| Net Asset Value, Beginning of Period | Net Investment Income (1) | Capital Gain Distributions Received from Affiliated Funds | Realized and Unrealized Gain (Loss) on Investments | Dividends from Net Investment Income | Distributions from Net Realized Capital Gains | Net Asset Value, End of Period | Total Return | Net Assets, End of Period (000) | Expenses, Net (2) | Expenses, Including Expense Reduction (2) | Expenses, Before Waivers and Expense Reduction (2) | Investment Income, Net (1) | Investment Income/ (Loss), Excluding Waivers and Expense Reduction (1) | Portfolio Turnover Rate | |||||||||||||||||||||||||||||||||||
MyDestination 2005 Fund* |
| ||||||||||||||||||||||||||||||||||||||||||||||||
GS4 Class | |||||||||||||||||||||||||||||||||||||||||||||||||
2008(3) | $ | 10.35 | $ | 0.13 | # | $ | 0.02 | $ | (0.65 | ) | $ | — | $ | — | $ | 9.85 | (4.83 | )% | $ | 63,769 | 0.20 | % | 0.20 | % | 0.53 | % | 2.55 | % | 2.22 | % | 16 | % | |||||||||||||||||
2007 | 10.00 | 0.33 | # | 0.62 | (0.31 | ) | (0.28 | ) | (0.01 | ) | 10.35 | 6.42 | 57,667 | 0.20 | 0.20 | 0.43 | 3.16 | 2.93 | 21 | ||||||||||||||||||||||||||||||
GS6 Class | |||||||||||||||||||||||||||||||||||||||||||||||||
2008(3) | $ | 10.33 | $ | 0.11 | # | $ | 0.02 | $ | (0.64 | ) | $ | — | $ | — | $ | 9.82 | (4.94 | )% | $ | 1,486 | 0.50 | % | 0.50 | % | 3.99 | % | 2.24 | % | (1.25 | )% | 16 | % | |||||||||||||||||
2007 | 10.00 | 0.26 | # | 0.62 | (0.27 | ) | (0.27 | ) | (0.01 | ) | 10.33 | 6.11 | 1,458 | 0.50 | 0.50 | 2.87 | 2.54 | 0.17 | 21 | ||||||||||||||||||||||||||||||
MyDestination 2015 Fund* |
| ||||||||||||||||||||||||||||||||||||||||||||||||
GS4 Class | |||||||||||||||||||||||||||||||||||||||||||||||||
2008(3) | $ | 10.33 | $ | 0.10 | # | $ | 0.02 | $ | (0.84 | ) | $ | — | $ | — | $ | 9.61 | (6.97 | )% | $ | 182,985 | 0.20 | % | 0.20 | % | 0.25 | % | 2.08 | % | 2.03 | % | 10 | % | |||||||||||||||||
2007 | 10.00 | 0.29 | # | 0.83 | (0.50 | ) | (0.28 | ) | (0.01 | ) | 10.33 | 6.12 | 169,953 | 0.20 | 0.20 | 0.24 | 2.74 | 2.70 | 7 | ||||||||||||||||||||||||||||||
GS6 Class | |||||||||||||||||||||||||||||||||||||||||||||||||
2008(3) | $ | 10.31 | $ | 0.09 | # | $ | 0.02 | $ | (0.85 | ) | $ | — | $ | — | $ | 9.57 | (7.18 | )% | $ | 1,779 | 0.50 | % | 0.50 | % | 3.56 | % | 1.81 | % | (1.25 | )% | 10 | % | |||||||||||||||||
2007 | 10.00 | 0.22 | # | 0.83 | (0.47 | ) | (0.26 | ) | (0.01 | ) | 10.31 | 5.74 | 1,529 | 0.50 | 0.50 | 2.54 | 2.12 | 0.08 | 7 | ||||||||||||||||||||||||||||||
MyDestination 2025 Fund* |
| ||||||||||||||||||||||||||||||||||||||||||||||||
GS4 Class | |||||||||||||||||||||||||||||||||||||||||||||||||
2008(3) | $ | 10.24 | $ | 0.08 | # | $ | 0.03 | $ | (1.02 | ) | $ | — | $ | — | $ | 9.33 | (8.89 | )% | $ | 115,564 | 0.20 | % | 0.20 | % | 0.33 | % | 1.57 | % | 1.44 | % | 6 | % | |||||||||||||||||
2007 | 10.00 | 0.25 | # | 1.13 | (0.85 | ) | (0.28 | ) | (0.01 | ) | 10.24 | 5.29 | 105,102 | 0.20 | 0.20 | 0.30 | 2.37 | 2.27 | 5 | ||||||||||||||||||||||||||||||
GS6 Class | |||||||||||||||||||||||||||||||||||||||||||||||||
2008(3) | $ | 10.23 | $ | 0.06 | # | $ | 0.03 | $ | (1.02 | ) | $ | — | $ | — | $ | 9.30 | (9.09 | )% | $ | 2,322 | 0.50 | % | 0.50 | % | 2.89 | % | 1.29 | % | (1.10 | )% | 6 | % | |||||||||||||||||
2007 | 10.00 | 0.19 | # | 1.13 | (0.81 | ) | (0.27 | ) | (0.01 | ) | 10.23 | 5.04 | 2,061 | 0.50 | 0.50 | 2.25 | 1.80 | 0.05 | 5 | ||||||||||||||||||||||||||||||
MyDestination 2035 Fund* |
| ||||||||||||||||||||||||||||||||||||||||||||||||
GS4 Class | |||||||||||||||||||||||||||||||||||||||||||||||||
2008(3) | $ | 10.24 | $ | 0.05 | # | $ | 0.02 | $ | (1.12 | ) | $ | — | $ | — | $ | 9.19 | (10.25 | )% | $ | 42,084 | 0.20 | % | 0.20 | % | 0.74 | % | 0.99 | % | 0.45 | % | 3 | % | |||||||||||||||||
2007 | 10.00 | 0.19 | # | 1.31 | (0.98 | ) | (0.28 | ) | — | † | 10.24 | 5.20 | 35,117 | 0.20 | 0.20 | 0.64 | 1.83 | 1.39 | 2 | ||||||||||||||||||||||||||||||
GS6 Class | |||||||||||||||||||||||||||||||||||||||||||||||||
2008(3) | $ | 10.22 | $ | 0.03 | # | $ | 0.02 | $ | (1.11 | ) | $ | — | $ | — | $ | 9.16 | (10.37 | )% | $ | 1,729 | 0.50 | % | 0.50 | % | 4.16 | % | 0.70 | % | (2.96 | )% | 3 | % | |||||||||||||||||
2007 | 10.00 | 0.11 | # | 1.31 | (0.94 | ) | (0.26 | ) | — | † | 10.22 | 4.82 | 1,387 | 0.50 | 0.50 | 2.97 | 1.09 | (1.38 | ) | 2 | |||||||||||||||||||||||||||||
MyDestination 2045 Fund* |
| ||||||||||||||||||||||||||||||||||||||||||||||||
GS4 Class | |||||||||||||||||||||||||||||||||||||||||||||||||
2008(3) | $ | 10.12 | $ | 0.03 | # | $ | 0.02 | $ | (1.13 | ) | $ | — | $ | — | $ | 9.04 | (10.67 | )% | $ | 16,193 | 0.20 | % | 0.20 | % | 1.59 | % | 0.73 | % | (0.66 | )% | 1 | % | |||||||||||||||||
2007 | 10.00 | 0.17 | # | 1.37 | (1.09 | ) | (0.28 | ) | (0.05 | ) | 10.12 | 4.46 | 11,659 | 0.19 | 0.19 | 1.48 | 1.60 | 0.31 | 9 | ||||||||||||||||||||||||||||||
GS6 Class | |||||||||||||||||||||||||||||||||||||||||||||||||
2008(3) | $ | 10.13 | $ | 0.02 | # | $ | 0.02 | $ | (1.14 | ) | $ | — | $ | — | $ | 9.03 | (10.86 | )% | $ | 1,249 | 0.50 | % | 0.50 | % | 5.82 | % | 0.34 | % | (4.98 | )% | 1 | % | |||||||||||||||||
2007 | 10.00 | 0.08 | # | 1.37 | (1.03 | ) | (0.24 | ) | (0.05 | ) | 10.13 | 4.20 | 1,230 | 0.50 | 0.50 | 3.51 | 0.79 | (2.22 | ) | 9 | |||||||||||||||||||||||||||||
| † | Amount represents less than $0.005 per share. |
| # | Calculated using the average shares outstanding method. |
| * | Inception date was December 29, 2006. |
| (1) | Recognition of net investment income by the Fund is affected by the timing of the declaration of dividends by the underlying investment companies in which the Fund invests. |
| (2) | Does not include expenses of the investment companies in which the Fund invests. |
| (3) | For the six months ended June 30, 2008. All ratios for the period have been annualized. Total return and portfolio turnover for the period have not been annualized. |
| 16 | See Notes to Financial Statements. |
Table of Contents
| Conservative Allocation Fund | ||
| SCHEDULE OF INVESTMENTS | June 30, 2008 (Unaudited) |
| Shares | Value | |||||
AFFILIATED MUTUAL FUNDS — 98.8% | ||||||
GuideStone Money Market Fund (GS4 Class)¥ | 2,990,117 | $ | 2,990,117 | |||
GuideStone Low-Duration Bond Fund (GS4 Class)¥ | 18,962,385 | 240,063,789 | ||||
GuideStone Equity Index Fund (GS4 Class)¥ | 289,748 | 4,798,223 | ||||
GuideStone Value Equity Fund (GS4 Class)¥ | 1,512,609 | 21,796,690 | ||||
GuideStone Growth Equity Fund (GS4 Class)¥ | 1,229,932 | 22,237,178 | ||||
GuideStone Small Cap Equity Fund (GS4 Class)¥ | 424,080 | 5,538,482 | ||||
GuideStone International Equity Fund (GS4 Class)¥ | 1,386,981 | 22,663,268 | ||||
Total Affiliated Mutual Funds | 320,087,747 | |||||
| Par | ||||||
U.S. TREASURY OBLIGATIONS — 1.1% | ||||||
U.S. Treasury Bill | $ | 115,000 | 113,968 | |||
2.09%, 12/04/08‡‡ | ||||||
U.S. Treasury Note | ||||||
3.50%, 02/15/10 | 3,560,000 | 3,621,189 | ||||
Total U.S. Treasury Obligations | 3,735,157 | |||||
TOTAL INVESTMENTS — 99.9% | 323,822,904 | |||||
Other Assets in Excess of Liabilities — 0.1% | 220,134 | |||||
NET ASSETS — 100.0% | $ | 324,043,038 | ||||
PORTFOLIO SUMMARY (based on net assets) | ||||||
| % | ||||||
Bond Fund | 74.1 | |||||
Domestic Equity Funds | 16.8 | |||||
International Equity Fund | 7.0 | |||||
U.S. Treasury Obligations | 1.1 | |||||
Money Market Fund | 0.9 | |||||
Futures Contracts | 0.3 | |||||
| 100.2 | ||||||
FAS 157 DISCLOSURE
The following is a summary of the inputs used, as of June 30, 2008, in valuing the Fund’s investments carried at fair value:
Valuation Inputs | Investments in Securities | Other Financial Instruments* | |||||
Level 1 — Quoted Prices | $ | 320,087,747 | $ | (41,613 | ) | ||
Level 2 — Other Significant Observable Inputs | 3,735,157 | — | |||||
Level 3 — Significant Unobservable Inputs | — | — | |||||
Total | $ | 323,822,904 | $ | (41,613 | ) | ||
| * | Other financial instruments are derivative instruments not reflected in the Schedule of Investments, such as futures, forwards and swap contracts, which are valued at the unrealized appreciation (depreciation) on the investment. |
| See Notes to Financial Statements. | 17 |
Table of Contents
| Balanced Allocation Fund | ||
| SCHEDULE OF INVESTMENTS | June 30, 2008 (Unaudited) |
| Shares | Value | ||||||
AFFILIATED MUTUAL FUNDS — 99.5% | |||||||
GuideStone Money Market Fund (GS4 Class)¥ | 8,480,426 | $ | 8,480,426 | ||||
GuideStone Low-Duration Bond Fund (GS4 Class)¥ | 14,990,477 | 189,779,443 | |||||
GuideStone Medium-Duration Bond Fund (GS4 Class)¥ | 20,289,336 | 265,993,189 | |||||
GuideStone Extended-Duration Bond Fund (GS4 Class)¥ | 7,238,125 | 104,663,285 | |||||
GuideStone Global Bond Fund (GS4 Class)¥ | 6,625,383 | 62,344,850 | |||||
GuideStone Equity Index Fund (GS4 Class)¥ | 2,249,643 | 37,254,095 | |||||
GuideStone Value Equity Fund (GS4 Class)¥ | 11,664,486 | 168,085,248 | |||||
GuideStone Growth Equity Fund (GS4 Class)¥ | 9,489,678 | 171,573,376 | |||||
GuideStone Small Cap Equity Fund (GS4 Class)¥ | 3,243,988 | 42,366,487 | |||||
GuideStone International Equity Fund (GS4 Class)¥ | 10,978,880 | 179,394,907 | |||||
Total Affiliated Mutual Funds | 1,229,935,306 | ||||||
| Par | |||||||
U.S. TREASURY OBLIGATIONS — 0.5% | |||||||
U.S. Treasury Bill | |||||||
2.09%, 12/04/08‡‡ | $ | 815,000 | 807,682 | ||||
U.S. Treasury Note | |||||||
4.25%, 11/15/13 | 5,325,000 | 5,558,805 | |||||
Total U.S. Treasury Obligations | 6,366,487 | ||||||
TOTAL INVESTMENTS — 100.0% | 1,236,301,793 | ||||||
Liabilities in Excess of Other Assets — 0.0% | (69,385 | ) | |||||
NET ASSETS — 100.0% | $ | 1,236,232,408 | |||||
PORTFOLIO SUMMARY (based on net assets) | |||||||
| % | |||||||
Bond Funds | 50.4 | ||||||
Domestic Equity Funds | 33.9 | ||||||
International Equity Fund | 14.5 | ||||||
Money Market Fund | 0.7 | ||||||
U.S. Treasury Obligations | 0.5 | ||||||
Futures Contracts | 0.4 | ||||||
| 100.4 | |||||||
FAS 157 DISCLOSURE
The following is a summary of the inputs used, as of June 30, 2008, in valuing the Fund’s investments carried at fair value:
Valuation Inputs | Investments in Securities | Other Financial Instruments* | |||||
Level 1 — Quoted Prices | $ | 1,229,935,306 | $ | (319,772 | ) | ||
Level 2 — Other Significant Observable Inputs | 6,366,487 | — | |||||
Level 3 — Significant Unobservable Inputs | — | — | |||||
Total | $ | 1,236,301,793 | $ | (319,772 | ) | ||
| * | Other financial instruments are derivative instruments not reflected in the Schedule of Investments, such as futures, forwards and swap contracts, which are valued at the unrealized appreciation (depreciation) on the investment. |
| 18 | See Notes to Financial Statements. |
Table of Contents
| Growth Allocation Fund | ||
| SCHEDULE OF INVESTMENTS | June 30, 2008 (Unaudited) |
| Shares | Value | ||||||
AFFILIATED MUTUAL FUNDS — 99.8% | |||||||
GuideStone Money Market Fund (GS4 Class)¥ | 9,126,898 | $ | 9,126,898 | ||||
GuideStone Low-Duration Bond Fund (GS4 Class)¥ | 6,000,116 | 75,961,475 | |||||
GuideStone Medium-Duration Bond Fund (GS4 Class)¥ | 7,987,464 | 104,715,659 | |||||
GuideStone Extended-Duration Bond Fund (GS4 Class)¥ | 2,839,760 | 41,062,924 | |||||
GuideStone Global Bond Fund (GS4 Class)¥ | 2,641,978 | 24,861,014 | |||||
GuideStone Equity Index Fund (GS4 Class)¥ | 2,661,949 | 44,081,872 | |||||
GuideStone Value Equity Fund (GS4 Class)¥ | 13,824,461 | 199,210,489 | |||||
GuideStone Growth Equity Fund (GS4 Class)¥ | 11,268,759 | 203,739,159 | |||||
GuideStone Small Cap Equity Fund (GS4 Class)¥ | 3,814,568 | 49,818,264 | |||||
GuideStone International Equity Fund (GS4 Class)¥ | 12,917,133 | 211,065,949 | |||||
Total Affiliated Mutual Funds | 963,643,703 | ||||||
| Par | |||||||
U.S. TREASURY OBLIGATIONS — 0.3% | |||||||
U.S. Treasury Bill | |||||||
2.09%, 12/04/08‡‡ | $ | 875,000 | 867,144 | ||||
U.S. Treasury Note | |||||||
4.25%, 11/15/13 | 2,180,000 | 2,275,717 | |||||
Total U.S. Treasury Obligations | 3,142,861 | ||||||
TOTAL INVESTMENTS — 100.1% | 966,786,564 | ||||||
Liabilities in Excess of Other Assets — (0.1)% | (749,998 | ) | |||||
NET ASSETS — 100.0% | $ | 966,036,566 | |||||
| PORTFOLIO SUMMARY (based on net assets) | |||||||
| % | |||||||
Domestic Equity Funds | 51.4 | ||||||
Bond Funds | 25.5 | ||||||
International Equity Fund | 21.9 | ||||||
Money Market Fund | 1.0 | ||||||
Futures Contracts | 0.8 | ||||||
U.S. Treasury Obligations | 0.3 | ||||||
| 100.9 | |||||||
FAS 157 DISCLOSURE
The following is a summary of the inputs used, as of June 30, 2008, in valuing the Fund’s investments carried at fair value:
Valuation Inputs | Investments in Securities | Other Financial Instruments* | |||||
Level 1 — Quoted Prices | $ | 963,643,703 | $ | (390,164 | ) | ||
Level 2 — Other Significant Observable Inputs | 3,142,861 | — | |||||
Level 3 — Significant Unobservable Inputs | — | — | |||||
Total | $ | 966,786,564 | $ | (390,164 | ) | ||
| * | Other financial instruments are derivative instruments not reflected in the Schedule of Investments, such as futures, forwards and swap contracts, which are valued at the unrealized appreciation (depreciation) on the investment. |
| See Notes to Financial Statements. | 19 |
Table of Contents
| Aggressive Allocation Fund | ||
| SCHEDULE OF INVESTMENTS | June 30, 2008 (Unaudited) |
| Shares | Value | ||||||
AFFILIATED MUTUAL FUNDS — 100.0% | |||||||
GuideStone Money Market Fund (GS4 Class)¥ | 11,829,799 | $ | 11,829,799 | ||||
GuideStone Equity Index Fund (GS4 Class)¥ | 3,166,522 | 52,437,598 | |||||
GuideStone Value Equity Fund (GS4 Class)¥ | 16,441,645 | 236,924,098 | |||||
GuideStone Growth Equity Fund (GS4 Class)¥ | 13,623,783 | 246,317,998 | |||||
GuideStone Small Cap Equity Fund (GS4 Class)¥ | 4,661,579 | 60,880,225 | |||||
GuideStone International Equity Fund (GS4 Class)¥ | 15,600,266 | 254,908,341 | |||||
Total Affiliated Mutual Funds | 863,298,059 | ||||||
| Par | |||||||
U.S. TREASURY OBLIGATION — 0.1% | |||||||
U.S. Treasury Bill | |||||||
2.09%, 12/04/08‡‡ | |||||||
(Cost $872,145) | $ | 880,000 | 872,099 | ||||
TOTAL INVESTMENTS — 100.1% | 864,170,158 | ||||||
Liabilities in Excess of Other Assets — (0.1)% | (737,359 | ) | |||||
NET ASSETS — 100.0% | $ | 863,432,799 | |||||
| PORTFOLIO SUMMARY (based on net assets) | |||||||
| % | |||||||
Domestic Equity Funds | 69.1 | ||||||
International Equity Fund | 29.5 | ||||||
Money Market Fund | 1.4 | ||||||
Futures Contracts | 1.1 | ||||||
U.S. Treasury Obligation | 0.1 | ||||||
| 101.2 | |||||||
FAS 157 DISCLOSURE
The following is a summary of the inputs used, as of June 30, 2008, in valuing the Fund’s investments carried at fair value:
Valuation Inputs | Investments in Securities | Other Financial Instruments* | |||||
Level 1 — Quoted Prices | $ | 863,298,059 | $ | (571,645 | ) | ||
Level 2 — Other Significant Observable Inputs | 872,099 | — | |||||
Level 3 — Significant Unobservable Inputs | — | — | |||||
Total | $ | 864,170,158 | $ | (571,645 | ) | ||
| * | Other financial instruments are derivative instruments not reflected in the Schedule of Investments, such as futures, forwards and swap contracts, which are valued at the unrealized appreciation (depreciation) on the investment. |
| 20 | See Notes to Financial Statements. |
Table of Contents
| STATEMENTS OF ASSETS AND LIABILITIES | ||
| June 30, 2008 (Unaudited) |
| Conservative Allocation Fund | Balanced Allocation Fund | Growth Allocation Fund | Aggressive Allocation Fund | |||||||||||||
Assets | ||||||||||||||||
Investments in securities of affiliated issuers, at value | $ | 320,087,747 | $ | 1,229,935,306 | $ | 963,643,703 | $ | 863,298,059 | ||||||||
Investments in securities of unaffiliated issuers, at value | 3,735,157 | 6,366,487 | 3,142,861 | 872,099 | ||||||||||||
Total investments (1) | 323,822,904 | 1,236,301,793 | 966,786,564 | 864,170,158 | ||||||||||||
Receivables: | ||||||||||||||||
Dividends | 4,410 | 17,470 | 17,409 | 21,287 | ||||||||||||
Interest | 46,756 | 28,974 | 11,862 | — | ||||||||||||
Investment securities sold | — | 734,835 | 315,008 | — | ||||||||||||
Fund shares sold | 268,947 | 10,924 | 134,971 | 156,675 | ||||||||||||
Variation Margin | 825 | 4,675 | 5,775 | 8,525 | ||||||||||||
Prepaid expenses and other assets | (37,926 | ) | (74,075 | ) | (44,563 | ) | (41,947 | ) | ||||||||
Total Assets | 324,105,916 | 1,237,024,596 | 967,227,026 | 864,314,698 | ||||||||||||
Liabilities | ||||||||||||||||
Payables: | ||||||||||||||||
Fund shares redeemed | 4,321 | 607,361 | 1,039,714 | 741,275 | ||||||||||||
Accrued expenses: | ||||||||||||||||
Advisory fees | 14,489 | 91,979 | 70,625 | 62,839 | ||||||||||||
Distribution (12b-1) fees | 1,246 | 1,842 | 1,279 | 1,704 | ||||||||||||
Shareholder servicing fees | 1,263 | 1,880 | 1,295 | 1,721 | ||||||||||||
Other expenses | 41,559 | 89,126 | 77,547 | 74,360 | ||||||||||||
Total Liabilities | 62,878 | 792,188 | 1,190,460 | 881,899 | ||||||||||||
Net Assets | $ | 324,043,038 | $ | 1,236,232,408 | $ | 966,036,566 | $ | 863,432,799 | ||||||||
Net Assets Consist of: | ||||||||||||||||
Paid-in-capital | $ | 287,630,151 | $ | 1,095,806,445 | $ | 838,831,426 | $ | 730,192,339 | ||||||||
Undistributed net investment income | 4,451,973 | 14,560,889 | 6,966,686 | 2,170,056 | ||||||||||||
Undistributed net realized gain on investments and futures transactions | 5,542,168 | 79,748,471 | 71,290,405 | 75,108,976 | ||||||||||||
Net unrealized appreciation on investments and futures transactions | 26,418,746 | 46,116,603 | 48,948,049 | 55,961,428 | ||||||||||||
Net Assets | $ | 324,043,038 | $ | 1,236,232,408 | $ | 966,036,566 | $ | 863,432,799 | ||||||||
Net Asset Value: | ||||||||||||||||
$0.001 par value, unlimited shares authorized | ||||||||||||||||
Net assets applicable to the GS4 Class | $ | 310,157,778 | $ | 1,215,824,454 | $ | 952,079,788 | $ | 845,114,757 | ||||||||
GS4 shares outstanding | 24,530,114 | 91,821,944 | 68,229,803 | 58,733,788 | ||||||||||||
Net asset value, offering and redemption price per GS4 share | $ | 12.64 | $ | 13.24 | $ | 13.95 | $ | 14.39 | ||||||||
Net assets applicable to the GS6 Class | $ | 13,885,260 | $ | 20,407,954 | $ | 13,956,778 | $ | 18,318,042 | ||||||||
GS6 shares outstanding | 1,660,364 | 2,576,714 | 1,607,517 | 1,944,600 | ||||||||||||
Net asset value, offering and redemption price per GS6 share | $ | 8.36 | $ | 7.92 | $ | 8.68 | $ | 9.42 | ||||||||
| ||||||||||||||||
(1) Investments in securities of affiliated issuers, at cost | $ | 293,623,381 | $ | 1,183,567,852 | $ | 914,335,552 | $ | 806,764,940 | ||||||||
Investments in securities of unaffiliated issuers, at cost | 3,739,164 | 6,297,566 | 3,112,799 | 872,145 | ||||||||||||
Total investments at cost | $ | 297,362,545 | $ | 1,189,865,418 | $ | 917,448,351 | $ | 807,637,085 | ||||||||
| See Notes to Financial Statements. | 21 |
Table of Contents
STATEMENTS OF OPERATIONS
For the Six Months Ended June 30, 2008 (Unaudited)
| Conservative Allocation Fund | Balanced Allocation Fund | Growth Allocation Fund | Aggressive Allocation Fund | |||||||||||||
Investment Income | ||||||||||||||||
Income dividends received from affiliated funds | $ | 4,626,281 | $ | 15,245,058 | $ | 7,541,490 | $ | 2,729,853 | ||||||||
Interest | 43,500 | 121,496 | 54,251 | 12,386 | ||||||||||||
Total Investment Income | 4,669,781 | 15,366,554 | 7,595,741 | 2,742,239 | ||||||||||||
Expenses | ||||||||||||||||
Investment advisory fees | 165,768 | 651,609 | 514,223 | 463,616 | ||||||||||||
Transfer agent fees | ||||||||||||||||
GS4 shares | 17,829 | 33,743 | 27,271 | 27,076 | ||||||||||||
GS6 shares | 3,466 | 3,476 | 3,351 | 3,419 | ||||||||||||
GS8 shares(1) | — | — | — | — | ||||||||||||
Custodian fees | 7,036 | 18,890 | 15,173 | 13,785 | ||||||||||||
Distribution (12b-1) fees: | ||||||||||||||||
GS6 shares | 7,038 | 10,410 | 7,072 | 9,507 | ||||||||||||
GS8 shares(1) | — | — | — | — | ||||||||||||
Shareholder servicing fees: | ||||||||||||||||
GS6 shares | 7,692 | 11,342 | 7,709 | 10,360 | ||||||||||||
GS8 shares(1) | — | — | — | — | ||||||||||||
Accounting and administration fees | 11,153 | 35,796 | 28,892 | 26,353 | ||||||||||||
Professional fees | 16,466 | 16,453 | 16,453 | 16,453 | ||||||||||||
Blue sky fees | ||||||||||||||||
GS4 shares | 44,584 | 74,456 | 49,790 | 46,917 | ||||||||||||
GS6 shares | 11,778 | 18,434 | 16,027 | 13,884 | ||||||||||||
GS8 shares(1) | — | — | — | — | ||||||||||||
Shareholder reporting fees | ||||||||||||||||
GS4 shares | 5,047 | 18,420 | 17,026 | 16,957 | ||||||||||||
GS6 shares | 14 | 113 | 155 | 118 | ||||||||||||
GS8 shares(1) | — | — | — | — | ||||||||||||
Trustee fees | 2,624 | 11,197 | 9,353 | 8,665 | ||||||||||||
Line of credit facility fees | 595 | 2,561 | 2,202 | 2,044 | ||||||||||||
Other expenses | 6,217 | 7,122 | 6,822 | 6,722 | ||||||||||||
Total Expenses | 307,307 | 914,022 | 721,519 | 665,876 | ||||||||||||
Expenses waived/reimbursed(2) | (88,822 | ) | (108,357 | ) | (88,998 | ) | (85,435 | ) | ||||||||
Net Expenses | 218,485 | 805,665 | 632,521 | 580,441 | ||||||||||||
Net Investment Income | 4,451,296 | 14,560,889 | 6,963,220 | 2,161,798 | ||||||||||||
Realized and Unrealized Loss | ||||||||||||||||
Capital gain distributions received from affiliated funds | 129,688 | 4,257,735 | 2,481,481 | 1,448,929 | ||||||||||||
Net realized gain on investment securities of affiliated issuers | 1,199,577 | 36,657,371 | 24,597,700 | 19,186,958 | ||||||||||||
Net realized gain on investment securities of unaffiliated issuers | 28,656 | 380,751 | 160,502 | — | ||||||||||||
Net realized loss on futures transactions | (60,333 | ) | (826,980 | ) | (1,150,059 | ) | (1,216,765 | ) | ||||||||
Net realized gain | 1,297,588 | 40,468,877 | 26,089,624 | 19,419,122 | ||||||||||||
Change in unrealized appreciation (depreciation) on investment securities of affiliated issuers | (15,140,256 | ) | (139,643,798 | ) | (132,181,148 | ) | (140,641,509 | ) | ||||||||
Change in unrealized appreciation (depreciation) on investment securities of unaffiliated issuers | 725 | (137,613 | ) | (64,030 | ) | (587 | ) | |||||||||
Change in unrealized appreciation (depreciation) on futures | (41,025 | ) | (289,719 | ) | (361,149 | ) | (537,838 | ) | ||||||||
Net change in unrealized appreciation (depreciation) | (15,180,556 | ) | (140,071,130 | ) | (132,606,327 | ) | (141,179,934 | ) | ||||||||
Net Realized and Unrealized Loss | (13,882,968 | ) | (99,602,253 | ) | (106,516,703 | ) | (121,760,812 | ) | ||||||||
Net Decrease in Net Assets Resulting from Operations | $ | (9,431,672 | ) | $ | (85,041,364 | ) | $ | (99,553,483 | ) | $ | (119,599,014 | ) | ||||
(1) | See Note 1 in Notes to Financial Statements. |
(2) | See Note 3a and 3c in Notes to Financial Statements. |
| 22 | See Notes to Financial Statements. |
Table of Contents
(This page intentionally left blank)
| 23 |
Table of Contents
STATEMENTS OF CHANGES IN NET ASSETS
| Conservative Allocation Fund | Balanced Allocation Fund | |||||||||||||||
| For the Six Months Ended 06/30/08 (Unaudited) | For the Year Ended 12/31/07 | For the Six Months Ended 06/30/08 (Unaudited) | For the Year Ended 12/31/07 | |||||||||||||
Operations: | ||||||||||||||||
Net investment income | $ | 4,451,296 | $ | 9,888,875 | $ | 14,560,889 | $ | 36,460,587 | ||||||||
Net realized gain on investment securities and futures transactions | 1,297,588 | 13,399,627 | 40,468,877 | 102,089,576 | ||||||||||||
Net change in unrealized appreciation (depreciation) on investment securities and futures | (15,180,556 | ) | (3,540,166 | ) | (140,071,130 | ) | (45,174,455 | ) | ||||||||
Net increase (decrease) in net assets resulting from operations | (9,431,672 | ) | 19,748,336 | (85,041,364 | ) | 93,375,708 | ||||||||||
Dividends and Distributions to Shareholders: | ||||||||||||||||
Dividends from net investment income(1) | ||||||||||||||||
GS4 shares | — | (10,257,249 | ) | — | (43,958,470 | ) | ||||||||||
GS6 shares | — | (645,141 | ) | — | (1,077,383 | ) | ||||||||||
Distributions from net realized capital gains | ||||||||||||||||
GS4 shares | — | (12,085,382 | ) | — | (90,170,185 | ) | ||||||||||
GS6 shares | — | (794,773 | ) | — | (2,229,400 | ) | ||||||||||
Total dividends and distributions | — | (23,782,545 | ) | — | (137,435,438 | ) | ||||||||||
Capital Share Transactions: | ||||||||||||||||
Proceeds from shares sold | ||||||||||||||||
GS4 shares | 26,521,185 | 42,265,946 | 29,925,425 | 65,136,033 | ||||||||||||
GS6 shares | 322,778 | 148,296 | 891,293 | 1,397,888 | ||||||||||||
GS8 shares(2) | — | 71,747 | — | 466,712 | ||||||||||||
Proceeds from exchange of GS8 shares for GS6 shares(2) | ||||||||||||||||
GS6 shares | — | 319,625 | — | 3,063,229 | ||||||||||||
GS8 shares | — | (319,625 | ) | — | (3,063,229 | ) | ||||||||||
Reinvestment of dividends and distributions | ||||||||||||||||
GS4 shares | — | 22,330,442 | — | 134,110,793 | ||||||||||||
GS6 shares | — | 1,439,913 | — | 3,306,782 | ||||||||||||
Total proceeds from shares sold and reinvested | 26,843,963 | 66,256,344 | 30,816,718 | 204,418,208 | ||||||||||||
Value of shares redeemed | ||||||||||||||||
GS4 shares | (21,189,157 | ) | (56,005,754 | ) | (78,647,765 | ) | (208,709,539 | ) | ||||||||
GS6 shares | (113,506 | ) | (19,909 | ) | (322,751 | ) | (476,452 | ) | ||||||||
GS8 shares(2) | — | (5,669,148 | ) | — | (6,269,702 | ) | ||||||||||
Total value of shares redeemed | (21,302,663 | ) | (61,694,811 | ) | (78,970,516 | ) | (215,455,693 | ) | ||||||||
Net increase (decrease) from capital share transactions(3) | 5,541,300 | 4,561,533 | (48,153,798 | ) | (11,037,485 | ) | ||||||||||
Total increase (decrease) in net assets | (3,890,372 | ) | 527,324 | (133,195,162 | ) | (55,097,215 | ) | |||||||||
Net Assets: | ||||||||||||||||
Beginning of Period | 327,933,410 | 327,406,086 | 1,369,427,570 | 1,424,524,785 | ||||||||||||
End of Period* | $ | 324,043,038 | $ | 327,933,410 | $ | 1,236,232,408 | $ | 1,369,427,570 | ||||||||
* Including undistributed net investment income | $ | 4,451,973 | $ | 677 | $ | 14,560,889 | $ | — | ||||||||
(1) Includes dividends paid from the short-term portion of capital gain distributions received from affiliated funds. |
| |||||||||||||||
(2) See Note 1 in Notes to Financial Statements. |
| |||||||||||||||
(3) See Note 7 in Notes to Financial Statements. |
| |||||||||||||||
| 24 | See Notes to Financial Statements. |
Table of Contents
Growth Allocation Fund | Aggressive Allocation Fund | |||||||||||||
| For the Six Months Ended 06/30/08 (Unaudited) | For the Year Ended 12/31/07 | For the Six Months Ended 06/30/08 (Unaudited) | For the Year Ended 12/31/07 | |||||||||||
| $ | 6,963,220 | $ | 20,060,739 | $ | 2,161,798 | $ | 9,676,356 | |||||||
| 26,089,624 | 101,920,099 | 19,419,122 | 111,338,317 | |||||||||||
| (132,606,327 | ) | (43,842,358 | ) | (141,179,934 | ) | (49,451,797 | ) | |||||||
| (99,553,483 | ) | 78,138,480 | (119,599,014 | ) | 71,562,876 | |||||||||
| — | (29,803,490 | ) | — | (21,728,269 | ) | |||||||||
| — | (586,886 | ) | — | (610,351 | ) | |||||||||
| — | (91,054,947 | ) | — | (97,810,986 | ) | |||||||||
| — | (1,828,932 | ) | — | (2,859,391 | ) | |||||||||
| — | (123,274,255 | ) | — | (123,008,997 | ) | |||||||||
| 20,714,984 | 52,886,509 | 18,536,491 | 63,137,976 | |||||||||||
| 1,097,009 | 1,817,294 | 665,435 | 980,856 | |||||||||||
| — | 874,231 | — | 743,774 | |||||||||||
| — | 2,837,014 | — | 1,505,369 | |||||||||||
| — | (2,837,014 | ) | — | (1,505,369 | ) | |||||||||
| — | 120,855,938 | — | 119,537,254 | |||||||||||
| — | 2,415,818 | — | 3,469,742 | |||||||||||
| 21,811,993 | 178,849,790 | 19,201,926 | 187,869,602 | |||||||||||
| (65,545,943 | ) | (171,694,646 | ) | (57,134,020 | ) | (164,016,299 | ) | |||||||
| (331,744 | ) | (192,271 | ) | (230,892 | ) | (149,759 | ) | |||||||
| — | (6,756,589 | ) | — | (7,106,675 | ) | |||||||||
| (65,877,687 | ) | (178,643,506 | ) | (57,364,912 | ) | (171,272,733 | ) | |||||||
| (44,065,694 | ) | 206,284 | (38,162,986 | ) | 16,596,869 | |||||||||
| (143,619,177 | ) | (44,929,491 | ) | (157,762,000 | ) | (34,849,252 | ) | |||||||
| 1,109,655,743 | 1,154,585,234 | 1,021,194,799 | 1,056,044,051 | |||||||||||
| $ | 966,036,566 | $ | 1,109,655,743 | $ | 863,432,799 | $ | 1,021,194,799 | |||||||
| $ | 6,966,686 | $ | 3,466 | $ | 2,170,056 | $ | 8,258 | |||||||
| See Notes to Financial Statements. | 25 |
Table of Contents
FINANCIAL HIGHLIGHTS (Unaudited)
For a Share Outstanding For the Years Ended December 31, unless otherwise indicated
| Ratios to Average Net Assets | ||||||||||||||||||||||||||||||||||||||||||||||||||
| Net Asset Value, Beginning of Period | Net Investment Income (1) | Capital Gain Distributions Received from Affiliated Funds | Realized and Unrealized Gain (Loss) on Investments | Dividends from Net Investment Income (2) | Distributions from Net Realized Capital Gains | Net Asset Value, End of Period | Total Return | Net Assets, End of Period (000) | Expenses, Net (3) | Expenses, Including Expense Reduction (3) | Expenses, Before Waivers and Expense Reduction (3) | Investment Income, Net (1) | Investment Income/ (Loss), Excluding Waivers and Expense Reduction (1) | Portfolio Turnover Rate | ||||||||||||||||||||||||||||||||||||
Conservative Allocation Fund |
| |||||||||||||||||||||||||||||||||||||||||||||||||
GS4 Class |
| |||||||||||||||||||||||||||||||||||||||||||||||||
2008(4) | $ | 13.02 | $ | 0.18 | # | $ | — | † | $ | (0.56 | ) | $ | — | $ | — | $ | 12.64 | (2.92 | )% | $ | 310,158 | 0.12 | % | 0.12 | % | 0.17 | % | 2.75 | % | 2.70 | % | 7 | % | |||||||||||||||||
2007 | 13.15 | 0.43 | # | 0.21 | 0.21 | (0.44 | ) | (0.54 | ) | 13.02 | 6.48 | 313,829 | 0.13 | 0.13 | 0.16 | 3.13 | 3.10 | 13 | ||||||||||||||||||||||||||||||||
2006 | 12.94 | 0.40 | # | 0.17 | 0.20 | (0.41 | ) | (0.15 | ) | 13.15 | 5.99 | 308,802 | 0.13 | 0.13 | 0.18 | 3.08 | 3.03 | 9 | ||||||||||||||||||||||||||||||||
2005 | 13.18 | 0.33 | # | 0.09 | 0.02 | (0.32 | ) | (0.36 | ) | 12.94 | 3.31 | 280,256 | 0.13 | 0.13 | 0.19 | 2.51 | 2.45 | 20 | ||||||||||||||||||||||||||||||||
2004 | 13.00 | 0.21 | # | 0.04 | 0.37 | (0.31 | ) | (0.13 | ) | 13.18 | 4.76 | 270,913 | 0.13 | 0.13 | 0.17 | 1.60 | 1.56 | 11 | ||||||||||||||||||||||||||||||||
2003 | 12.40 | 0.31 | 0.02 | 0.82 | (0.22 | ) | (0.33 | ) | 13.00 | 9.33 | 253,828 | 0.13 | 0.13 | 0.20 | 2.01 | 1.94 | 13 | |||||||||||||||||||||||||||||||||
GS6 Class |
| |||||||||||||||||||||||||||||||||||||||||||||||||
2008(4) | $ | 8.62 | $ | 0.10 | # | $ | — | † | $ | (0.36 | ) | $ | — | $ | — | $ | 8.36 | (3.02 | )% | $ | 13,885 | 0.45 | % | 0.45 | % | 0.56 | % | 2.41 | % | 2.30 | % | 7 | % | |||||||||||||||||
2007 | 9.03 | 0.26 | # | 0.21 | 0.07 | (0.41 | ) | (0.54 | ) | 8.62 | 6.04 | 14,105 | 0.44 | 0.44 | 0.47 | 2.83 | 2.80 | 13 | ||||||||||||||||||||||||||||||||
2006 | 9.05 | 0.25 | # | 0.17 | 0.09 | (0.38 | ) | (0.15 | ) | 9.03 | 5.66 | 12,860 | 0.50 | 0.50 | 0.53 | 2.70 | 2.67 | 9 | ||||||||||||||||||||||||||||||||
2005 | 9.42 | 0.20 | # | 0.09 | (0.02 | ) | (0.28 | ) | (0.36 | ) | 9.05 | 2.90 | 12,161 | 0.50 | 0.50 | 0.56 | 2.10 | 2.04 | 20 | |||||||||||||||||||||||||||||||
2004 | 9.41 | 0.11 | # | 0.04 | 0.27 | (0.28 | ) | (0.13 | ) | 9.42 | 4.52 | 11,815 | 0.36 | 0.36 | 0.45 | 1.14 | 1.05 | 11 | ||||||||||||||||||||||||||||||||
2003 | 9.12 | 0.21 | 0.02 | 0.59 | (0.20 | ) | (0.33 | ) | 9.41 | 9.06 | 19,674 | 0.35 | 0.35 | 0.46 | 1.90 | 1.79 | 13 | |||||||||||||||||||||||||||||||||
Balanced Allocation Fund |
| |||||||||||||||||||||||||||||||||||||||||||||||||
GS4 Class |
| |||||||||||||||||||||||||||||||||||||||||||||||||
2008(4) | $ | 14.13 | $ | 0.15 | # | $ | 0.04 | $ | (1.08 | ) | $ | — | $ | — | $ | 13.24 | (6.30 | )% | $ | 1,215,824 | 0.12 | % | 0.12 | % | 0.14 | % | 2.27 | % | 2.25 | % | 12 | % | ||||||||||||||||||
2007 | 14.61 | 0.41 | # | 0.48 | 0.16 | (0.48 | ) | (1.05 | ) | 14.13 | 7.16 | 1,348,204 | 0.13 | 0.13 | 0.13 | 2.68 | 2.68 | 7 | ||||||||||||||||||||||||||||||||
2006 | 14.20 | 0.36 | # | 0.39 | 0.50 | (0.40 | ) | (0.44 | ) | 14.61 | 8.78 | 1,400,001 | 0.13 | 0.13 | 0.14 | 2.44 | 2.43 | 7 | ||||||||||||||||||||||||||||||||
2005 | 14.27 | 0.32 | # | 0.21 | 0.36 | (0.36 | ) | (0.60 | ) | 14.20 | 6.24 | 1,273,855 | 0.13 | 0.13 | 0.14 | 2.18 | 2.17 | 10 | ||||||||||||||||||||||||||||||||
2004 | 13.41 | 0.26 | # | 0.11 | 0.99 | (0.30 | ) | (0.20 | ) | 14.27 | 10.13 | 1,283,982 | 0.13 | 0.13 | 0.13 | 1.90 | 1.90 | 6 | ||||||||||||||||||||||||||||||||
2003 | 11.82 | 0.29 | 0.15 | 1.78 | (0.36 | ) | (0.27 | ) | 13.41 | 18.79 | 1,120,080 | 0.13 | 0.13 | 0.13 | 2.22 | 2.22 | 10 | |||||||||||||||||||||||||||||||||
GS6 Class |
| |||||||||||||||||||||||||||||||||||||||||||||||||
2008(4) | $ | 8.46 | $ | 0.08 | # | $ | 0.04 | $ | (0.66 | ) | $ | — | $ | — | $ | 7.92 | (6.38 | )% | $ | 20,408 | 0.45 | % | 0.45 | % | 0.54 | % | 1.94 | % | 1.85 | % | 12 | % | ||||||||||||||||||
2007 | 9.33 | 0.24 | # | 0.48 | (0.09 | ) | (0.45 | ) | (1.05 | ) | 8.46 | 6.77 | 21,224 | 0.43 | 0.43 | 0.44 | 2.45 | 2.44 | 7 | |||||||||||||||||||||||||||||||
2006 | 9.36 | 0.20 | # | 0.39 | 0.19 | (0.37 | ) | (0.44 | ) | 9.33 | 8.30 | 16,080 | 0.48 | 0.48 | 0.48 | 2.11 | 2.11 | 7 | ||||||||||||||||||||||||||||||||
2005 | 9.71 | 0.18 | # | 0.21 | 0.19 | (0.33 | ) | (0.60 | ) | 9.36 | 5.96 | 13,888 | 0.48 | 0.48 | 0.48 | 1.82 | 1.82 | 10 | ||||||||||||||||||||||||||||||||
2004 | 9.28 | 0.12 | # | 0.11 | 0.66 | (0.26 | ) | (0.20 | ) | 9.71 | 9.66 | 13,118 | 0.46 | 0.46 | 0.52 | 1.28 | 1.22 | 6 | ||||||||||||||||||||||||||||||||
2003 | 8.34 | 0.16 | 0.15 | 1.23 | (0.33 | ) | (0.27 | ) | 9.28 | 18.52 | 22,650 | 0.45 | 0.45 | 0.54 | 2.00 | 1.91 | 10 | |||||||||||||||||||||||||||||||||
| † | Amount represents less than $0.005 per share. |
| # | Calculated using the average shares outstanding method. |
| (1) | Recognition of net investment income by the Fund is affected by the timing of the declaration of dividends by the underlying investment companies in which the Fund invests. |
| (2) | Includes dividends paid from the short-term portion of capital gain distributions received from affiliated funds. |
| (3) | Does not include expenses of the investment companies in which the Fund invests. |
| (4) | For the six months ended June 30, 2008. All ratios for the period have been annualized. Total return and portfolio turnover for the period have not been annualized. |
| 26 | See Notes to Financial Statements. |
Table of Contents
| Ratios to Average Net Assets | |||||||||||||||||||||||||||||||||||||||||||||||||
| Net Asset Value, Beginning of Period | Net Investment Income (1) | Capital Gain Distributions Received from Affiliated Funds | Realized and Unrealized Gain (Loss) on Investments | Dividends from Net Investment Income (2) | Distributions from Net Realized Capital Gains | Net Asset Value, End of Period | Total Return | Net Assets, End of Period (000) | Expenses, Net (3) | Expenses, Including Expense Reduction (3) | Expenses, Before Waivers and Expense Reduction (3) | Investment Income, Net (1) | Investment Income/ (Loss), Excluding Waivers and Expense Reduction (1) | Portfolio Turnover Rate | |||||||||||||||||||||||||||||||||||
Growth Allocation Fund |
| ||||||||||||||||||||||||||||||||||||||||||||||||
GS4 Class |
| ||||||||||||||||||||||||||||||||||||||||||||||||
2008(4) | $ | 15.34 | $ | 0.10 | # | $ | 0.03 | $ | (1.52 | ) | $ | — | $ | — | $ | 13.95 | (9.06 | )% | $ | 952,080 | 0.12 | % | 0.12 | % | 0.14 | % | 1.38 | % | 1.36 | % | 9 | % | |||||||||||||||||
2007 | 16.05 | 0.30 | # | 0.78 | 0.07 | (0.43 | ) | (1.43 | ) | 15.34 | 7.16 | 1,095,092 | 0.13 | 0.13 | 0.13 | 1.80 | 1.80 | 5 | |||||||||||||||||||||||||||||||
2006 | 15.45 | 0.27 | # | 0.63 | 0.81 | (0.35 | ) | (0.76 | ) | 16.05 | 11.03 | 1,137,039 | 0.13 | 0.13 | 0.14 | 1.66 | 1.65 | 7 | |||||||||||||||||||||||||||||||
2005 | 15.03 | 0.23 | # | 0.31 | 0.68 | (0.31 | ) | (0.49 | ) | 15.45 | 8.09 | 1,046,061 | 0.13 | 0.13 | 0.14 | 1.50 | 1.49 | 5 | |||||||||||||||||||||||||||||||
2004 | 13.62 | 0.19 | # | 0.08 | 1.47 | (0.21 | ) | (0.12 | ) | 15.03 | 12.80 | 1,043,625 | 0.13 | 0.13 | 0.13 | 1.33 | 1.33 | 3 | |||||||||||||||||||||||||||||||
2003 | 11.17 | 0.19 | 0.07 | 2.56 | (0.23 | ) | (0.14 | ) | 13.62 | 25.23 | 900,021 | 0.13 | 0.13 | 0.14 | 1.54 | 1.53 | 8 | ||||||||||||||||||||||||||||||||
GS6 Class |
| ||||||||||||||||||||||||||||||||||||||||||||||||
2008(4) | $ | 9.56 | $ | 0.05 | # | $ | 0.03 | $ | (0.96 | ) | $ | — | $ | — | $ | 8.68 | (9.21 | )% | $ | 13,957 | 0.45 | % | 0.45 | % | 0.61 | % | 1.06 | % | 0.90 | % | 9 | % | |||||||||||||||||
2007 | 10.67 | 0.18 | # | 0.78 | (0.24 | ) | (0.40 | ) | (1.43 | ) | 9.56 | 6.75 | 14,564 | 0.47 | 0.46 | 0.49 | 1.60 | 1.58 | 5 | ||||||||||||||||||||||||||||||
2006 | 10.61 | 0.14 | # | 0.63 | 0.35 | (0.30 | ) | (0.76 | ) | 10.67 | 10.58 | 9,448 | 0.59 | 0.59 | 0.59 | 1.27 | 1.27 | 7 | |||||||||||||||||||||||||||||||
2005 | 10.57 | 0.11 | # | 0.31 | 0.37 | (0.26 | ) | (0.49 | ) | 10.61 | 7.43 | 7,571 | 0.62 | 0.62 | 0.62 | 1.01 | 1.01 | 5 | |||||||||||||||||||||||||||||||
2004 | 9.67 | 0.07 | # | 0.08 | 1.03 | (0.16 | ) | (0.12 | ) | 10.57 | 12.28 | 7,042 | 0.56 | 0.56 | 0.61 | 0.66 | 0.61 | 3 | |||||||||||||||||||||||||||||||
2003 | 8.01 | 0.11 | 0.07 | 1.82 | (0.20 | ) | (0.14 | ) | 9.67 | 24.93 | 13,585 | 0.52 | 0.52 | 0.62 | 1.20 | 1.10 | 8 | ||||||||||||||||||||||||||||||||
Aggressive Allocation Fund |
| ||||||||||||||||||||||||||||||||||||||||||||||||
GS4 Class |
| ||||||||||||||||||||||||||||||||||||||||||||||||
2008(4) | $ | 16.31 | $ | 0.04 | # | $ | 0.02 | $ | (1.98 | ) | $ | — | $ | — | $ | 14.39 | (11.77 | )% | $ | 845,115 | 0.12 | % | 0.12 | % | 0.14 | % | 0.48 | % | 0.46 | % | 4 | % | |||||||||||||||||
2007 | 17.23 | 0.17 | # | 1.11 | (0.04 | ) | (0.36 | ) | (1.80 | ) | 16.31 | 7.17 | 1,000,850 | 0.13 | 0.13 | 0.13 | 0.94 | 0.94 | 2 | ||||||||||||||||||||||||||||||
2006 | 16.28 | 0.15 | # | 0.88 | 1.13 | (0.28 | ) | (0.93 | ) | 17.23 | 13.20 | 1,031,999 | 0.13 | 0.13 | 0.14 | 0.90 | 0.89 | 4 | |||||||||||||||||||||||||||||||
2005 | 15.55 | 0.13 | # | 0.41 | 0.98 | (0.23 | ) | (0.56 | ) | 16.28 | 9.75 | 940,769 | 0.13 | 0.13 | 0.14 | 0.85 | 0.84 | 4 | |||||||||||||||||||||||||||||||
2004 | 13.64 | 0.11 | # | 0.04 | 1.96 | (0.12 | ) | (0.08 | ) | 15.55 | 15.47 | 936,734 | 0.13 | 0.13 | 0.13 | 0.77 | 0.77 | 2 | |||||||||||||||||||||||||||||||
2003 | 10.40 | 0.10 | — | 3.23 | (0.09 | ) | — | 13.64 | 31.99 | 801,407 | 0.13 | 0.13 | 0.14 | 0.82 | 0.81 | 4 | |||||||||||||||||||||||||||||||||
GS6 Class |
| ||||||||||||||||||||||||||||||||||||||||||||||||
2008(4) | $ | 10.70 | $ | 0.01 | # | $ | 0.02 | $ | (1.31 | ) | $ | — | $ | — | $ | 9.42 | (11.96 | )% | $ | 18,318 | 0.45 | % | 0.45 | % | 0.51 | % | 0.16 | % | 0.10 | % | 4 | % | |||||||||||||||||
2007 | 12.00 | 0.09 | # | 1.11 | (0.37 | ) | (0.33 | ) | (1.80 | ) | 10.70 | 6.89 | 20,345 | 0.43 | 0.43 | 0.43 | 0.71 | 0.71 | 2 | ||||||||||||||||||||||||||||||
2006 | 11.67 | 0.07 | # | 0.88 | 0.55 | (0.24 | ) | (0.93 | ) | 12.00 | 12.79 | 16,887 | 0.47 | 0.47 | 0.47 | 0.58 | 0.58 | 4 | |||||||||||||||||||||||||||||||
2005 | 11.35 | 0.06 | # | 0.41 | 0.60 | (0.19 | ) | (0.56 | ) | 11.67 | 9.40 | 14,441 | 0.50 | 0.50 | 0.50 | 0.48 | 0.48 | 4 | |||||||||||||||||||||||||||||||
2004 | 10.00 | 0.04 | # | 0.04 | 1.43 | (0.08 | ) | (0.08 | ) | 11.35 | 15.17 | 13,202 | 0.44 | 0.44 | 0.50 | 0.37 | 0.31 | 2 | |||||||||||||||||||||||||||||||
2003 | 7.65 | 0.05 | — | 2.36 | (0.06 | ) | — | 10.00 | 31.53 | 17,973 | 0.43 | 0.43 | 0.48 | 0.53 | 0.48 | 4 | |||||||||||||||||||||||||||||||||
| # | Calculated using the average shares outstanding method. |
| (1) | Recognition of net investment income by the Fund is affected by the timing of the declaration of dividends by the underlying investment companies in which the Fund invests. |
| (2) | Includes dividends paid from the short-term portion of capital gain distributions received from affiliated funds. |
| (3) | Does not include expenses of the investment companies in which the Fund invests. |
| (4) | For the six months ended June 30, 2008. All ratios for the period have been annualized. Total return and portfolio turnover for the period have not been annualized. |
| See Notes to Financial Statements. | 27 |
Table of Contents
| Conservative Allocation Fund I | ||
| SCHEDULE OF INVESTMENTS | June 30, 2008 (Unaudited) |
| Shares | Value | |||||
AFFILIATED MUTUAL FUNDS — 98.5% | ||||||
GuideStone Money Market Fund (GS2 Class)¥ | 601,809 | $ | 601,809 | |||
GuideStone Low-Duration Bond Fund (GS2 Class)¥ | 5,498,702 | 47,673,742 | ||||
GuideStone Equity Index Fund (GS2 Class)¥ | 105,409 | 956,063 | ||||
GuideStone Value Equity Fund (GS2 Class)¥ | 569,479 | 4,328,043 | ||||
GuideStone Growth Equity Fund (GS2 Class)¥ | 387,385 | 4,420,067 | ||||
GuideStone Small Cap Equity Fund (GS2 Class)¥ | 126,002 | 1,105,037 | ||||
GuideStone International Equity Fund (GS2 Class)¥ | 345,501 | 4,505,338 | ||||
Total Affiliated Mutual Funds | 63,590,099 | |||||
| Par | ||||||
U.S. TREASURY OBLIGATIONS — 1.4% | ||||||
U.S. Treasury Bill | ||||||
2.09%, 12/04/08‡‡ | $ | 20,000 | 19,820 | |||
U.S. Treasury Note | ||||||
3.50%, 02/15/10 | 875,000 | 890,040 | ||||
Total U.S. Treasury Obligations | 909,860 | |||||
TOTAL INVESTMENTS — 99.9% | 64,499,959 | |||||
Other Assets in Excess of Liabilities — 0.1% | 85,499 | |||||
NET ASSETS — 100.0% | $ | 64,585,458 | ||||
PORTFOLIO SUMMARY (based on net assets) | ||||||
| % | ||||||
Bond Fund | 73.9 | |||||
Domestic Equity Funds | 16.7 | |||||
International Equity Fund | 7.0 | |||||
U.S. Treasury Obligations | 1.4 | |||||
Money Market Fund | 0.9 | |||||
Futures Contracts | 0.4 | |||||
| 100.3 | ||||||
FAS 157 DISCLOSURE
The following is a summary of the inputs used, as of June 30, 2008, in valuing the Fund’s investments carried at fair value:
Valuation Inputs | Investments in Securities | Other Financial Instruments* | |||||
Level 1 — Quoted Prices | $ | 63,590,099 | $ | (9,831 | ) | ||
Level 2 — Other Significant Observable Inputs | 909,860 | — | |||||
Level 3 — Significant Unobservable Inputs | — | — | |||||
Total | $ | 64,499,959 | $ | (9,831 | ) | ||
| * | Other financial instruments are derivative instruments not reflected in the Schedule of Investments, such as futures, forwards and swap contracts, which are valued at the unrealized appreciation (depreciation) on the investment. |
| 28 | See Notes to Financial Statements. |
Table of Contents
| Balanced Allocation Fund I | ||
| SCHEDULE OF INVESTMENTS | June 30, 2008 (Unaudited) |
| Shares | Value | ||||||
AFFILIATED MUTUAL FUNDS — 99.4% | |||||||
GuideStone Money Market Fund (GS2 Class)¥ | 3,427,546 | $ | 3,427,546 | ||||
GuideStone Low-Duration Bond Fund (GS2 Class)¥ | 5,859,011 | 50,797,628 | |||||
GuideStone Medium-Duration Bond Fund (GS2 Class)¥ | 8,987,941 | 71,364,253 | |||||
GuideStone Extended-Duration Bond Fund (GS2 Class)¥ | 3,820,332 | 28,041,237 | |||||
GuideStone Global Bond Fund (GS4 Class)¥ | 1,775,066 | 16,703,371 | |||||
GuideStone Equity Index Fund (GS2 Class)¥ | 1,100,621 | 9,982,631 | |||||
GuideStone Value Equity Fund (GS2 Class)¥ | 5,920,788 | 44,997,990 | |||||
GuideStone Growth Equity Fund (GS2 Class)¥ | 4,028,752 | 45,968,056 | |||||
GuideStone Small Cap Equity Fund (GS2 Class)¥ | 1,295,603 | 11,362,436 | |||||
GuideStone International Equity Fund (GS2 Class)¥ | 3,684,797 | 48,049,753 | |||||
Total Affiliated Mutual Funds | 330,694,901 | ||||||
| Par | |||||||
U.S. TREASURY OBLIGATIONS — 0.7% | |||||||
U.S. Treasury Bill | |||||||
2.09%, 12/04/08‡‡ | $ | 210,000 | 208,114 | ||||
U.S. Treasury Note | |||||||
4.25%, 11/15/13 | 2,025,000 | 2,113,912 | |||||
Total U.S. Treasury Obligations | 2,322,026 | ||||||
TOTAL INVESTMENTS — 100.1% | 333,016,927 | ||||||
Liabilities in Excess of Other Assets — (0.1)% | (374,414 | ) | |||||
NET ASSETS — 100.0% | $ | 332,642,513 | |||||
PORTFOLIO SUMMARY (based on net assets) | |||||||
| % | |||||||
Bond Funds | 50.2 | ||||||
Domestic Equity Funds | 33.8 | ||||||
International Equity Fund | 14.4 | ||||||
Money Market Fund | 1.0 | ||||||
U.S. Treasury Obligations | 0.7 | ||||||
Futures Contracts | 0.6 | ||||||
| 100.7 | |||||||
FAS 157 DISCLOSURE
The following is a summary of the inputs used, as of June 30, 2008, in valuing the Fund’s investments carried at fair value:
Valuation Inputs | Investments in Securities | Other Financial Instruments* | |||||
Level 1 — Quoted Prices | $ | 330,694,901 | $ | (103,189 | ) | ||
Level 2 — Other Significant Observable Inputs | 2,322,026 | — | |||||
Level 3 — Significant Unobservable Inputs | — | — | |||||
Total | $ | 333,016,927 | $ | (103,189 | ) | ||
| * | Other financial instruments are derivative instruments not reflected in the Schedule of Investments, such as futures, forwards and swap contracts, which are valued at the unrealized appreciation (depreciation) on the investment. |
| See Notes to Financial Statements. | 29 |
Table of Contents
| Growth Allocation Fund I | ||
| SCHEDULE OF INVESTMENTS | June 30, 2008 (Unaudited) |
| Shares | Value | ||||||
AFFILIATED MUTUAL FUNDS — 99.7% | |||||||
GuideStone Money Market Fund (GS2 Class)¥ | 2,706,845 | $ | 2,706,845 | ||||
GuideStone Low-Duration Bond Fund (GS2 Class)¥ | 2,032,127 | 17,618,545 | |||||
GuideStone Medium-Duration Bond Fund (GS2 Class)¥ | 3,066,467 | 24,347,750 | |||||
GuideStone Extended-Duration Bond Fund (GS2 Class)¥ | 1,298,812 | 9,533,283 | |||||
GuideStone Global Bond Fund (GS4 Class)¥ | 613,568 | 5,773,671 | |||||
GuideStone Equity Index Fund (GS2 Class)¥ | 1,128,517 | 10,235,645 | |||||
GuideStone Value Equity Fund (GS2 Class)¥ | 6,080,863 | 46,214,562 | |||||
GuideStone Growth Equity Fund (GS2 Class)¥ | 4,145,416 | 47,299,196 | |||||
GuideStone Small Cap Equity Fund (GS2 Class)¥ | 1,320,043 | 11,576,774 | |||||
GuideStone International Equity Fund (GS2 Class)¥ | 3,757,010 | 48,991,411 | |||||
Total Affiliated Mutual Funds | 224,297,682 | ||||||
| Par | |||||||
U.S. TREASURY OBLIGATIONS — 0.4% | |||||||
U.S. Treasury Bill | |||||||
2.09%, 12/04/08‡‡ | $ | 190,000 | 188,294 | ||||
U.S. Treasury Note | |||||||
4.25%, 11/15/13 | 595,000 | 621,125 | |||||
Total U.S. Treasury Obligations | 809,419 | ||||||
TOTAL INVESTMENTS — 100.1% | 225,107,101 | ||||||
Liabilities in Excess of Other Assets — (0.1)% | (260,268 | ) | |||||
NET ASSETS — 100.0% | $ | 224,846,833 | |||||
PORTFOLIO SUMMARY (based on net assets) | |||||||
| % | |||||||
Domestic Equity Funds | 51.2 | ||||||
Bond Funds | 25.5 | ||||||
International Equity Fund | 21.8 | ||||||
Money Market Fund | 1.2 | ||||||
Futures Contracts | 0.8 | ||||||
U.S. Treasury Obligations | 0.4 | ||||||
| 100.9 | |||||||
FAS 157 DISCLOSURE
The following is a summary of the inputs used, as of June 30, 2008, in valuing the Fund’s investments carried at fair value:
Valuation Inputs | Investments in Securities | Other Financial Instruments* | |||||
Level 1 — Quoted Prices | $ | 224,297,682 | $ | (85,731 | ) | ||
Level 2 — Other Significant Observable Inputs | 809,419 | — | |||||
Level 3 — Significant Unobservable Inputs | — | — | |||||
Total | $ | 225,107,101 | $ | (85,731 | ) | ||
| * | Other financial instruments are derivative instruments not reflected in the Schedule of Investments, such as futures, forwards and swap contracts, which are valued at the unrealized appreciation (depreciation) on the investment. |
| 30 | See Notes to Financial Statements. |
Table of Contents
| Aggressive Allocation Fund I | ||
| SCHEDULE OF INVESTMENTS | June 30, 2008 (Unaudited) |
| Shares | Value | ||||||
AFFILIATED MUTUAL FUNDS — 99.9% | |||||||
GuideStone Money Market Fund (GS2 Class)¥ | 3,085,506 | $ | 3,085,506 | ||||
GuideStone Equity Index Fund (GS2 Class)¥ | 1,126,911 | 10,221,083 | |||||
GuideStone Value Equity Fund (GS2 Class)¥ | 6,073,406 | 46,157,883 | |||||
GuideStone Growth Equity Fund (GS2 Class)¥ | 4,208,806 | 48,022,473 | |||||
GuideStone Small Cap Equity Fund (GS2 Class)¥ | 1,354,655 | 11,880,321 | |||||
GuideStone International Equity Fund (GS2 Class)¥ | 3,810,066 | 49,683,266 | |||||
Total Affiliated Mutual Funds | 169,050,532 | ||||||
| Par | |||||||
U.S. TREASURY OBLIGATION — 0.1% | |||||||
U.S. Treasury Bill | |||||||
2.09%, 12/04/08‡‡ | |||||||
(Cost $193,259) | $ | 195,000 | 193,249 | ||||
TOTAL INVESTMENTS — 100.0% | 169,243,781 | ||||||
Liabilities in Excess of Other Assets — 0.0% | (9,539 | ) | |||||
NET ASSETS — 100.0% | $ | 169,234,242 | |||||
PORTFOLIO SUMMARY (based on net assets) | |||||||
| % | |||||||
Domestic Equity Funds | 68.7 | ||||||
International Equity Fund | 29.4 | ||||||
Money Market Fund | 1.8 | ||||||
Futures Contracts | 1.5 | ||||||
U.S. Treasury Obligation | 0.1 | ||||||
| 101.5 | |||||||
FAS 157 DISCLOSURE
The following is a summary of the inputs used, as of June 30, 2008, in valuing the Fund’s investments carried at fair value:
Valuation Inputs | Investments in Securities | Other Financial Instruments* | |||||
Level 1 — Quoted Prices | $ | 169,050,532 | $ | (115,941 | ) | ||
Level 2 — Other Significant Observable Inputs | 193,249 | — | |||||
Level 3 — Significant Unobservable Inputs | — | — | |||||
Total | $ | 169,243,781 | $ | (115,941 | ) | ||
| * | Other financial instruments are derivative instruments not reflected in the Schedule of Investments, such as futures, forwards and swap contracts, which are valued at the unrealized appreciation (depreciation) on the investment. |
| See Notes to Financial Statements. | 31 |
Table of Contents
STATEMENTS OF ASSETS AND LIABILITIES
June 30, 2008 (Unaudited)
| Conservative Allocation Fund I | Balanced Allocation Fund I | Growth Allocation Fund I | Aggressive Allocation Fund I | |||||||||||||
Assets | ||||||||||||||||
Investments in securities of affiliated issuers, at value | $ | 63,590,099 | $ | 330,694,901 | $ | 224,297,682 | $ | 169,050,532 | ||||||||
Investments in securities of unaffiliated issuers, at value | 909,860 | 2,322,026 | 809,419 | 193,249 | ||||||||||||
Total investments (1) | 64,499,959 | 333,016,927 | 225,107,101 | 169,243,781 | ||||||||||||
Receivables: | ||||||||||||||||
Dividends | 1,202 | 7,555 | 6,853 | 6,785 | ||||||||||||
Interest | 11,497 | 11,027 | 3,240 | — | ||||||||||||
Investment securities sold | — | — | 104,957 | — | ||||||||||||
Fund shares sold | 134,827 | — | 17,500 | 17,924 | ||||||||||||
Variation Margin | 220 | 1,760 | 1,540 | 2,145 | ||||||||||||
Receivable from advisor | 3,244 | — | — | — | ||||||||||||
Prepaid expenses and other assets | — | 880 | — | — | ||||||||||||
Total Assets | 64,650,949 | 333,038,149 | 225,241,191 | 169,270,635 | ||||||||||||
Liabilities | ||||||||||||||||
Payables: | ||||||||||||||||
Investment securities purchased | — | — | 459 | — | ||||||||||||
Fund shares redeemed | 28,764 | 339,277 | 350,227 | 11 | ||||||||||||
Accrued expenses: | ||||||||||||||||
Advisory fees | — | 28,434 | 17,509 | 10,388 | ||||||||||||
Other expenses | 36,727 | 27,925 | 26,163 | 25,994 | ||||||||||||
Total Liabilities | 65,491 | 395,636 | 394,358 | 36,393 | ||||||||||||
Net Assets | $ | 64,585,458 | $ | 332,642,513 | $ | 224,846,833 | $ | 169,234,242 | ||||||||
Net Assets Consist of: | ||||||||||||||||
Paid-in-capital | $ | 68,236,923 | $ | 352,308,866 | $ | 235,050,229 | $ | 179,616,287 | ||||||||
Undistributed net investment income | 1,383,004 | 6,898,838 | 3,000,038 | 976,294 | ||||||||||||
Undistributed net realized gain on investments and futures transactions | 135,750 | 8,671,771 | 12,977,782 | 13,467,107 | ||||||||||||
Net unrealized depreciation on investments and futures transactions | (5,170,219 | ) | (35,236,962 | ) | (26,181,216 | ) | (24,825,446 | ) | ||||||||
Net Assets | $ | 64,585,458 | $ | 332,642,513 | $ | 224,846,833 | $ | 169,234,242 | ||||||||
Net Asset Value: | ||||||||||||||||
$0.001 par value, unlimited shares authorized Net assets applicable to the GS2 Class | $ | 64,585,458 | $ | 332,642,513 | $ | 224,846,833 | $ | 169,234,242 | ||||||||
GS2 shares outstanding | 6,744,311 | 32,044,261 | 19,719,665 | 13,626,857 | ||||||||||||
Net asset value, offering and redemption price per GS2 share | $ | 9.58 | $ | 10.38 | $ | 11.40 | $ | 12.42 | ||||||||
| ||||||||||||||||
(1) Investments in securities of affiliated issuers, at cost | $ | 68,749,698 | $ | 365,829,333 | $ | 250,394,087 | $ | 193,760,027 | ||||||||
Investments in securities of unaffiliated issuers, at cost | 910,649 | 2,321,368 | 808,499 | 193,259 | ||||||||||||
Total investments at cost | $ | 69,660,347 | $ | 368,150,701 | $ | 251,202,586 | $ | 193,953,286 | ||||||||
| 32 | See Notes to Financial Statements. |
Table of Contents
STATEMENTS OF OPERATIONS
For the Six Months Ended June 30, 2008 (Unaudited)
| Conservative Allocation Fund I | Balanced Allocation Fund I | Growth Allocation Fund I | Aggressive Allocation Fund I | |||||||||||||
Investment Income | ||||||||||||||||
Income dividends received from affiliated funds | $ | 1,423,565 | $ | 7,094,551 | $ | 3,158,717 | $ | 1,106,856 | ||||||||
Interest | 8,307 | 44,697 | 16,104 | 2,761 | ||||||||||||
Total Investment Income | 1,431,872 | 7,139,248 | 3,174,821 | 1,109,617 | ||||||||||||
Expenses | ||||||||||||||||
Investment advisory fees | 33,196 | 173,386 | 118,598 | 90,138 | ||||||||||||
Transfer agent fees | 21,226 | 8,791 | 8,782 | 8,996 | ||||||||||||
Custodian fees | 6,441 | 7,244 | 6,900 | 6,656 | ||||||||||||
Accounting and administration fees | 4,293 | 11,492 | 8,575 | 7,134 | ||||||||||||
Professional fees | 16,453 | 16,453 | 16,453 | 16,334 | ||||||||||||
Shareholder reporting fees | 164 | 468 | 408 | 318 | ||||||||||||
Trustee fees | 592 | 2,883 | 2,053 | 1,689 | ||||||||||||
Line of credit facility fees | 147 | 772 | 544 | 464 | ||||||||||||
Other expenses | 5,700 | 7,835 | 6,550 | 7,044 | ||||||||||||
Total Expenses | 88,212 | 229,324 | 168,863 | 138,773 | ||||||||||||
Expenses waived/reimbursed(1) | (39,106 | ) | 12,577 | 6,485 | (5,450 | ) | ||||||||||
Net expenses | 49,106 | 241,901 | 175,348 | 133,323 | ||||||||||||
Net Investment Income | 1,382,766 | 6,897,347 | 2,999,473 | 976,294 | ||||||||||||
Realized and Unrealized Loss | ||||||||||||||||
Capital gain distributions received from affiliated funds | 47,941 | 1,979,127 | 1,019,881 | 523,242 | ||||||||||||
Net realized loss on investment securities of affiliated issuers | (332,546 | ) | (3,627,636 | ) | (315,310 | ) | (1,201,395 | ) | ||||||||
Net realized gain on investment securities of unaffiliated issuers | 2,687 | 118,130 | 33,518 | — | ||||||||||||
Net realized loss on futures transactions | (19,214 | ) | (335,541 | ) | (355,587 | ) | (332,403 | ) | ||||||||
Net realized gain (loss) | (301,132 | ) | (1,865,920 | ) | 382,502 | (1,010,556 | ) | |||||||||
Change in unrealized appreciation (depreciation) on investment securities of affiliated issuers | (2,955,771 | ) | (26,810,602 | ) | (25,807,309 | ) | (23,040,525 | ) | ||||||||
Change in unrealized appreciation (depreciation) on investment securities of unaffiliated issuers | (30 | ) | (83,120 | ) | (24,127 | ) | (122 | ) | ||||||||
Change in unrealized appreciation (depreciation) on futures | (7,135 | ) | (71,460 | ) | (46,236 | ) | (85,099 | ) | ||||||||
Net change in unrealized appreciation (depreciation) | (2,962,936 | ) | (26,965,182 | ) | (25,877,672 | ) | (23,125,746 | ) | ||||||||
Net Realized and Unrealized Loss | (3,264,068 | ) | (28,831,102 | ) | (25,495,170 | ) | (24,136,302 | ) | ||||||||
Net Decrease in Net Assets Resulting from Operations | $ | (1,881,302 | ) | $ | (21,933,755 | ) | $ | (22,495,697 | ) | $ | (23,160,008 | ) | ||||
(1) | See Note 3a and 3c in Notes to Financial Statements. |
| See Notes to Financial Statements. | 33 |
Table of Contents
STATEMENTS OF CHANGES IN NET ASSETS
| Conservative Allocation Fund I | Balanced Allocation Fund I | |||||||||||||||
| For the Six Months Ended 06/30/08 (Unaudited) | For the Year Ended 12/31/07 | For the Six Months Ended 06/30/08 (Unaudited) | For the Year Ended 12/31/07 | |||||||||||||
Operations: | ||||||||||||||||
Net investment income | $ | 1,382,766 | $ | 3,162,674 | $ | 6,897,347 | $ | 15,686,367 | ||||||||
Net realized gain (loss) on investment securities and futures transactions | (301,132 | ) | 1,850,911 | (1,865,920 | ) | 19,520,707 | ||||||||||
Net change in unrealized appreciation (depreciation) on investment securities and futures transactions | (2,962,936 | ) | (787,872 | ) | (26,965,182 | ) | (11,354,896 | ) | ||||||||
Net increase (decrease) in net assets resulting from operations | (1,881,302 | ) | 4,225,713 | (21,933,755 | ) | 23,852,178 | ||||||||||
Dividends and Distributions to Shareholders: | ||||||||||||||||
Dividends from net investment income(1) | — | (3,469,288 | ) | — | (18,895,697 | ) | ||||||||||
Distributions from net realized capital gains | — | (1,941,086 | ) | — | (14,070,859 | ) | ||||||||||
Total dividends and distributions | — | (5,410,374 | ) | — | (32,966,556 | ) | ||||||||||
Capital Share Transactions: | ||||||||||||||||
Proceeds from GS2 shares sold | 3,569,061 | 15,180,761 | 12,204,336 | 94,490,963 | ||||||||||||
Reinvestment of dividends and distributions into GS2 shares | — | 5,410,374 | — | 32,966,555 | ||||||||||||
Value of GS2 shares redeemed | (4,333,216 | ) | (9,363,744 | ) | (11,421,551 | ) | (27,000,872 | ) | ||||||||
Net increase (decrease) from capital share transactions(2) | (764,155 | ) | 11,227,391 | 782,785 | 100,456,646 | |||||||||||
Total increase (decrease) in net assets | (2,645,457 | ) | 10,042,730 | (21,150,970 | ) | 91,342,268 | ||||||||||
Net Assets: | ||||||||||||||||
Beginning of Period | 67,230,915 | 57,188,185 | 353,793,483 | 262,451,215 | ||||||||||||
End of Period* | $ | 64,585,458 | $ | 67,230,915 | $ | 332,642,513 | $ | 353,793,483 | ||||||||
| ||||||||||||||||
* Including undistributed net investment income | $ | 1,383,004 | $ | 238 | $ | 6,898,838 | $ | 1,491 | ||||||||
(1) Includes dividends paid from the short-term portion of capital gain distributions received from affiliated funds. (2) See Note 7 in Notes to Financial Statements. |
| |||||||||||||||
| 34 | See Notes to Financial Statements. |
Table of Contents
| Growth Allocation Fund I | Aggressive Allocation Fund I | ||||||||||||
For the Six | For the Year Ended 12/31/07 | For the Six Months Ended 06/30/08 (Unaudited) | For the Year Ended 12/31/07 | ||||||||||
| $ | 2,999,473 | $ | 7,788,791 | $ | 976,294 | $ | 3,525,764 | ||||||
| | 382,502 | 20,648,256 | (1,010,556 | ) | 21,225,219 | ||||||||
| (25,877,672) | (11,069,434 | ) | (23,125,746 | ) | (11,081,739 | ) | |||||||
| (22,495,697) | 17,367,613 | (23,160,008 | ) | 13,669,244 | |||||||||
| — | (11,179,109 | ) | — | (7,120,845 | ) | ||||||||
| — | (14,541,067 | ) | — | (13,366,408 | ) | ||||||||
| — | (25,720,176 | ) | — | (20,487,253 | ) | ||||||||
| 7,254,271 | 66,034,239 | 5,361,377 | 60,914,409 | ||||||||||
| — | 25,720,176 | — | 20,487,253 | ||||||||||
| (11,490,471) | (19,359,471 | ) | (11,813,651 | ) | (17,955,008 | ) | |||||||
| (4,236,200) | 72,394,944 | (6,452,274 | ) | 63,446,654 | |||||||||
| (26,731,897) | 64,042,381 | (29,612,282 | ) | 56,628,645 | |||||||||
| 251,578,730 | 187,536,349 | 198,846,524 | 142,217,879 | ||||||||||
| $ | 224,846,833 | $ | 251,578,730 | $ | 169,234,242 | $ | 198,846,524 | ||||||
| $ | 3,000,038 | $ | 565 | $ | 976,294 | $ | — | ||||||
| See Notes to Financial Statements. | 35 |
Table of Contents
FINANCIAL HIGHLIGHTS (Unaudited)
For a Share Outstanding For the Years Ended December 31, unless otherwise indicated
| Ratios to Average Net Assets | |||||||||||||||||||||||||||||||||||||||||||||||||
| Net Asset Value, Beginning of Period | Net Investment Income (1) | Capital Gain Distributions Received from Affiliated Funds | Realized and Unrealized Gain (Loss) on Investments | Dividends from Net Investment Income (2) | Distributions from Net Realized Capital Gains | Net Asset Value, End of Period | Total Return | Net Assets, End of Period (000) | Expenses, Net (3) | Expenses, Including Expense Reduction (3) | Expenses, Before Waivers/ Reimburse- ments and Expense Reduction (3) | Investment Income, Net (1) | Investment Income, Excluding Waivers/ Reimburse- ments and Expense Reduction (1) | Portfolio Turnover Rate | |||||||||||||||||||||||||||||||||||
Conservative Allocation Fund I |
| ||||||||||||||||||||||||||||||||||||||||||||||||
GS2 Class |
| ||||||||||||||||||||||||||||||||||||||||||||||||
2008(4) | $ | 9.86 | $ | 0.21 | $ | 0.01 | $ | (0.50 | ) | $ | — | $ | — | $ | 9.58 | (2.84 | )% | $ | 64,585 | 0.15 | % | 0.15 | % | 0.27 | % | 4.24 | % | 4.12 | % | 10 | % | ||||||||||||||||||
2007 | 10.05 | 0.50 | 0.23 | (0.07 | ) | (0.54 | ) | (0.31 | ) | 9.86 | 6.55 | 67,231 | 0.16 | 0.16 | 0.22 | 4.77 | 4.71 | 25 | |||||||||||||||||||||||||||||||
2006 | 10.15 | 0.46 | 0.19 | (0.02 | ) | (0.49 | ) | (0.24 | ) | 10.05 | 6.21 | 57,188 | 0.17 | 0.17 | 0.30 | 4.53 | 4.40 | 16 | |||||||||||||||||||||||||||||||
2005 | 10.31 | 0.36 | 0.10 | (0.10 | ) | (0.38 | ) | (0.14 | ) | 10.15 | 3.46 | 54,231 | 0.17 | 0.17 | 0.30 | 3.52 | 3.39 | 16 | |||||||||||||||||||||||||||||||
2004 | 10.31 | 0.25 | 0.05 | 0.19 | (0.36 | ) | (0.13 | ) | 10.31 | 4.77 | 31,447 | 0.17 | 0.17 | 0.39 | 2.42 | 2.20 | 23 | ||||||||||||||||||||||||||||||||
2003(5)(6) | 10.00 | 0.18 | 0.10 | 0.16 | (0.12 | ) | (0.01 | ) | 10.31 | 4.40 | 28,636 | 0.17 | 0.17 | 0.51 | 4.16 | 3.82 | 8 | ||||||||||||||||||||||||||||||||
Balanced Allocation Fund I |
| ||||||||||||||||||||||||||||||||||||||||||||||||
GS2 Class |
| ||||||||||||||||||||||||||||||||||||||||||||||||
2008(4) | $ | 11.07 | $ | 0.21 | # | $ | 0.06 | $ | (0.96 | ) | $ | — | $ | — | $ | 10.38 | (6.23 | )% | $ | 332,643 | 0.14 | % | 0.14 | % | 0.13 | % | 4.04 | % | 4.05 | % | 13 | % | |||||||||||||||||
2007 | 11.35 | 0.55 | # | 0.66 | (0.38 | ) | (0.62 | ) | (0.49 | ) | 11.07 | 7.32 | 353,793 | 0.16 | 0.16 | 0.14 | 4.62 | 4.64 | 12 | ||||||||||||||||||||||||||||||
2006 | 11.32 | 0.46 | # | 0.45 | 0.09 | (0.50 | ) | (0.47 | ) | 11.35 | 8.85 | 262,451 | 0.17 | 0.17 | 0.18 | 3.93 | 3.92 | 13 | |||||||||||||||||||||||||||||||
2005 | 11.23 | 0.40 | # | 0.25 | 0.07 | (0.46 | ) | (0.17 | ) | 11.32 | 6.42 | 239,244 | 0.17 | 0.17 | 0.18 | 3.49 | 3.48 | 11 | |||||||||||||||||||||||||||||||
2004 | 10.62 | 0.34 | # | 0.14 | 0.60 | (0.36 | ) | (0.11 | ) | 11.23 | 10.26 | 122,166 | 0.17 | 0.17 | 0.22 | 3.07 | 3.02 | 10 | |||||||||||||||||||||||||||||||
2003(5)(6) | 10.00 | 0.21 | 0.17 | 0.51 | (0.26 | ) | (0.01 | ) | 10.62 | 8.94 | 71,982 | 0.17 | 0.17 | 0.28 | 4.76 | 4.65 | 5 | ||||||||||||||||||||||||||||||||
Growth Allocation Fund I |
| ||||||||||||||||||||||||||||||||||||||||||||||||
GS2 Class |
| ||||||||||||||||||||||||||||||||||||||||||||||||
2008(4) | $ | 12.53 | $ | 0.15 | $ | 0.05 | $ | (1.33 | ) | $ | — | $ | — | $ | 11.40 | (9.02 | )% | $ | 224,847 | 0.15 | % | 0.15 | % | 0.14 | % | 2.57 | % | 2.58 | % | 11 | % | ||||||||||||||||||
2007 | 12.96 | 0.41 | 0.92 | (0.37 | ) | (0.58 | ) | (0.81 | ) | 12.53 | 7.40 | 251,579 | 0.16 | 0.16 | 0.15 | 3.20 | 3.21 | 9 | |||||||||||||||||||||||||||||||
2006 | 12.62 | 0.34 | 0.73 | 0.35 | (0.44 | ) | (0.64 | ) | 12.96 | 11.21 | 187,536 | 0.17 | 0.17 | 0.20 | 2.73 | 2.70 | 9 | ||||||||||||||||||||||||||||||||
2005 | 12.17 | 0.29 | 0.38 | 0.33 | (0.39 | ) | (0.16 | ) | 12.62 | 8.20 | 159,849 | 0.17 | 0.17 | 0.20 | 2.42 | 2.39 | 8 | ||||||||||||||||||||||||||||||||
2004 | 11.11 | 0.24 | 0.09 | 1.09 | (0.26 | ) | (0.10 | ) | 12.17 | 12.88 | 70,608 | 0.17 | 0.17 | 0.27 | 2.13 | 2.03 | 7 | ||||||||||||||||||||||||||||||||
2003(5)(6) | 10.00 | 0.15 | 0.09 | 1.07 | (0.18 | ) | (0.02 | ) | 11.11 | 13.02 | 57,489 | 0.17 | 0.17 | 0.31 | 3.24 | 3.10 | 3 | ||||||||||||||||||||||||||||||||
Aggressive Allocation Fund I |
| ||||||||||||||||||||||||||||||||||||||||||||||||
GS2 Class |
| ||||||||||||||||||||||||||||||||||||||||||||||||
2008(4) | $ | 14.07 | $ | 0.07 | $ | 0.04 | $ | (1.76 | ) | $ | — | $ | — | $ | 12.42 | (11.73 | )% | $ | 169,234 | 0.15 | % | 0.15 | % | 0.16 | % | 1.10 | % | 1.09 | % | 6 | % | ||||||||||||||||||
2007 | 14.56 | 0.27 | 1.37 | (0.56 | ) | (0.52 | ) | (1.05 | ) | 14.07 | 7.38 | 198,847 | 0.16 | 0.16 | 0.15 | 1.81 | 1.82 | 7 | |||||||||||||||||||||||||||||||
2006 | 14.01 | 0.21 | 1.09 | 0.57 | (0.36 | ) | (0.96 | ) | 14.56 | 13.33 | 142,218 | 0.17 | 0.17 | 0.21 | 1.47 | 1.43 | 8 | ||||||||||||||||||||||||||||||||
2005 | 13.16 | 0.18 | 0.52 | 0.62 | (0.31 | ) | (0.16 | ) | 14.01 | 9.98 | 125,826 | 0.17 | 0.17 | 0.21 | 1.38 | 1.34 | 5 | ||||||||||||||||||||||||||||||||
2004 | 11.62 | 0.15 | 0.05 | 1.60 | (0.15 | ) | (0.11 | ) | 13.16 | 15.48 | 33,543 | 0.17 | 0.17 | 0.41 | 1.29 | 1.05 | 7 | ||||||||||||||||||||||||||||||||
2003(5)(6) | 10.00 | 0.09 | — | 1.63 | (0.09 | ) | (0.01 | ) | 11.62 | 17.16 | 25,678 | 0.17 | 0.17 | 0.50 | 1.69 | 1.36 | 1 | ||||||||||||||||||||||||||||||||
| # | Calculated using the average shares outstanding method. |
| (1) | Recognition of net investment income by the Fund is affected by the timing of the declaration of dividends by the underlying investment companies in which the Fund invests. |
| (2) | Includes dividends paid from the short-term portion of capital gain distributions received from affiliated funds. |
| (3) | Does not include expenses of the investment companies in which the Fund invests. |
| (4) | For the six months ended June 30, 2008. All ratios for the period have been annualized. Total return and portfolio turnover for the period have not been annualized. |
| (5) | Inception date was July 1, 2003. |
| (6) | Total return is not annualized. Ratios are annualized. Portfolio turnover is not annualized. |
| 36 | See Notes to Financial Statements. |
Table of Contents
| Money Market Fund | ||
| SCHEDULE OF INVESTMENTS | June 30, 2008 (Unaudited) |
| Par | Value | |||||
AGENCY OBLIGATIONS — 4.2% | ||||||
Federal Home Loan Bank | ||||||
2.38%, 03/13/09† | $ | 30,000,000 | $ | 30,000,000 | ||
Federal Home Loan Mortgage Corporation | ||||||
2.50%, 08/18/08 | 2,510,000 | 2,501,633 | ||||
Federal National Mortgage Association | ||||||
2.50%, 08/06/08 | 2,925,000 | 2,917,687 | ||||
2.50%, 08/20/08 | 2,320,000 | 2,311,961 | ||||
2.49%, 09/10/08 | 7,995,000 | 7,955,738 | ||||
Total Agency Obligations | 45,687,019 | |||||
CERTIFICATES OF DEPOSIT — 22.7% | ||||||
American Express Bank FSB | ||||||
2.58%, 08/21/08 | 13,000,000 | 13,000,000 | ||||
American Express Centurion Bank | ||||||
2.81%, 09/24/08 | 25,000,000 | 25,000,000 | ||||
Bank of Nova Scotia NY | ||||||
2.40%, 07/03/08† | 20,000,000 | 19,999,956 | ||||
Bank of Scotland PLC NY | ||||||
4.39%, 07/07/08 | 4,000,000 | 4,000,000 | ||||
2.68%, 08/13/08 | 10,000,000 | 10,000,000 | ||||
BNP Paribas NY | ||||||
4.50%, 07/01/08 | 5,000,000 | 5,000,000 | ||||
2.91%, 08/19/08 | 10,000,000 | 10,000,000 | ||||
2.95%, 10/28/08 | 10,000,000 | 10,000,000 | ||||
2.85%, 12/04/08 | 8,000,000 | 8,000,000 | ||||
2.85%, 12/08/08 | 9,000,000 | 9,000,000 | ||||
Deutsche Bank AG NY | ||||||
3.01%, 09/25/08† | 8,230,000 | 8,230,000 | ||||
DnB NORBank ASA | ||||||
2.84%, 12/05/08 | 1,950,000 | 1,950,000 | ||||
Nordea Bank Finland PLC NY | ||||||
2.66%, 10/17/08 | 7,000,000 | 7,000,000 | ||||
4.82%, 10/22/08 | 16,000,000 | 16,004,792 | ||||
Rabobank Nederland NV NY | ||||||
2.67%, 09/12/08 | 12,000,000 | 12,000,000 | ||||
Sanpaolo IMI SpA NY | ||||||
2.86%, 12/05/08 | 8,020,000 | 8,020,000 | ||||
Societe Generale NY | ||||||
2.92%, 11/14/08 | 4,000,000 | 4,000,075 | ||||
2.92%, 12/05/08 | 9,000,000 | 9,000,000 | ||||
3.18%, 12/23/08 | 6,220,000 | 6,220,298 | ||||
Toronto Dominion Bank NY | ||||||
2.83%, 12/05/08 | 2,800,000 | 2,800,000 | ||||
3.00%, 12/16/08 | 1,450,000 | 1,450,000 | ||||
3.11%, 12/30/08 | 20,000,000 | 20,000,000 | ||||
US Bank NA | ||||||
2.77%, 10/27/08 | 39,000,000 | 39,000,000 | ||||
Total Certificates of Deposit | 249,675,121 | |||||
COMMERCIAL PAPER — 64.6% | ||||||
ABN Amro North America Finance, Inc. | ||||||
2.55%, 08/21/08 | 10,000,000 | 9,963,875 | ||||
Amsterdam Funding Corporation | ||||||
2.72%, 07/11/08 | 8,000,000 | 7,993,956 | ||||
2.70%, 08/22/08 | 30,000,000 | 29,883,000 | ||||
AT&T, Inc. | ||||||
2.50%, 07/01/08 | 34,757,000 | 34,757,000 | ||||
Atlantis One Funding Corporation | ||||||
2.75%, 07/02/08 | 8,000,000 | 7,999,389 | ||||
2.88%, 07/23/08 | 31,000,000 | 30,945,440 | ||||
2.81%, 09/15/08 | 5,000,000 | 4,970,339 | ||||
Bryant Park Funding LLC | ||||||
2.65%, 09/02/08 | 23,000,000 | 22,893,337 | ||||
Chariot Funding LLC | ||||||
2.65%, 07/07/08 | 31,000,000 | 30,986,308 | ||||
Citigroup Funding, Inc. | ||||||
2.75%, 08/19/08 | 1,050,000 | 1,046,070 | ||||
2.75%, 08/20/08 | 1,050,000 | 1,045,990 | ||||
2.78%, 09/08/08 | 28,000,000 | 27,850,807 | ||||
2.94%, 10/02/08 | 10,000,000 | 9,924,050 | ||||
CRC Funding LLC | ||||||
2.77%, 07/07/08 | 20,000,000 | 19,990,767 | ||||
2.66%, 08/04/08 | 11,000,000 | 10,972,366 | ||||
Dexia LLC | ||||||
2.92%, 07/18/08 | 2,000,000 | 1,997,242 | ||||
2.61%, 08/11/08 | 20,000,000 | 19,940,550 | ||||
2.77%, 09/17/08 | 10,000,000 | 9,940,092 | ||||
DnB NORBank ASA | ||||||
3.02%, 10/20/08 | 10,000,000 | 9,906,883 | ||||
Falcon Asset Securitization Co., LLC | ||||||
2.61%, 08/14/08 | 14,000,000 | 13,955,340 | ||||
General Electric Capital Corporation | ||||||
3.83%, 07/10/08 | 2,000,000 | 1,998,085 | ||||
General Electric Capital Services, Inc. | ||||||
2.63%, 10/20/08 | 30,000,000 | 29,756,725 | ||||
ING America Insurance Holdings | ||||||
2.70%, 09/12/08 | 24,000,000 | 23,868,600 | ||||
ING US Funding LLC | ||||||
2.56%, 08/14/08 | 10,000,000 | 9,968,711 | ||||
JPMorgan Chase & Co. | ||||||
2.35%, 08/21/08 | 20,000,000 | 19,933,417 | ||||
2.50%, 09/04/08 | 15,000,000 | 14,932,292 | ||||
2.70%, 12/02/08 | 20,000,000 | 19,769,000 | ||||
Jupiter Securitization Co., LLC | ||||||
2.75%, 08/29/08 | 10,000,000 | 9,954,930 | ||||
KBC Financial Products International, Ltd. | ||||||
2.77%, 09/15/08 | 20,000,000 | 19,883,044 | ||||
Liberty Street Funding LLC | ||||||
2.67%, 08/20/08 | 20,000,000 | 19,925,833 | ||||
2.69%, 09/02/08 | 11,000,000 | 10,948,217 | ||||
Nestle Capital Corporation | ||||||
2.13%, 08/07/08 | 17,000,000 | 16,962,784 | ||||
2.12%, 10/06/08 | 17,000,000 | 16,902,892 | ||||
Old Line Funding LLC | ||||||
2.58%, 07/25/08 | 17,000,000 | 16,970,760 | ||||
Park Avenue Receivables Corporation | ||||||
2.60%, 09/02/08 | 11,681,000 | 11,627,851 | ||||
Prudential Funding LLC | ||||||
2.30%, 07/16/08 | 10,000,000 | 9,990,417 | ||||
2.50%, 09/02/08 | 20,000,000 | 19,912,500 | ||||
Ranger Funding Co., LLC | ||||||
2.90%, 07/21/08 | 18,000,000 | 17,971,000 | ||||
| See Notes to Financial Statements. | 37 |
Table of Contents
Money Market Fund
SCHEDULE OF INVESTMENTS (Continued)
| Par | Value | ||||||
Societe Generale North America, Inc. | |||||||
2.48%, 07/15/08 | $ | 7,000,000 | $ | 6,993,249 | |||
2.74%, 09/08/08 | 27,000,000 | 26,858,205 | |||||
Toyota Motor Credit Corporation | |||||||
2.68%, 07/15/08 | 17,000,000 | 16,982,282 | |||||
2.60%, 08/19/08 | 50,000,000 | 49,823,056 | |||||
Windmill Funding I Corporation | |||||||
2.73%, 07/03/08 | 8,000,000 | 7,998,787 | |||||
Yorktown Capital LLC | |||||||
2.60%, 08/18/08 | 3,000,000 | 2,989,600 | |||||
Total Commercial Paper | 709,885,038 | ||||||
MASTER NOTES — 3.3% | |||||||
Citigroup Global Markets, Inc. | |||||||
2.68%, 02/28/09† | 15,000,000 | 15,000,000 | |||||
Goldman Sachs Group, Inc. | |||||||
2.53%, 08/22/08 144A†@ | 21,150,000 | 21,150,000 | |||||
Total Master Notes | 36,150,000 | ||||||
VARIABLE RATE OBLIGATIONS — 4.9% | |||||||
American Express Bank FSB | |||||||
2.70%, 07/10/08† | 10,000,000 | 10,000,000 | |||||
Bank of Montreal | |||||||
2.95%, 07/07/08 144A† | 9,200,000 | 9,200,000 | |||||
HSBC Bank USA, Inc. | |||||||
3.22%, 07/14/08† | 1,645,000 | 1,645,000 | |||||
ING USA Global Funding | |||||||
3.14%, 08/29/08† | 2,725,000 | 2,725,000 | |||||
Skandinaviska Enskilda Banken AB | |||||||
2.67%, 09/08/08 144A† | 10,000,000 | 10,000,000 | |||||
Societe Generale North America, Inc. | |||||||
2.50%, 07/24/08† | 5,500,000 | 5,500,000 | |||||
Wachovia Bank NA | |||||||
2.91%, 07/07/08†D | 6,250,000 | 6,250,000 | |||||
Westpac Banking Corporation | |||||||
2.75%, 09/11/08† | 8,250,000 | 8,250,000 | |||||
Total Variable Rate Obligations | 53,570,000 | ||||||
| Shares | |||||||
MONEY MARKET FUND — 0.5% | |||||||
Northern Institutional Liquid Assets Portfolio§ | 6,120,000 | 6,120,000 | |||||
TOTAL INVESTMENTS — 100.2% | 1,101,087,178 | ||||||
Liabilities in Excess of Other Assets — (0.2)% | (2,353,915 | ) | |||||
NET ASSETS — 100.0% | $ | 1,098,733,263 | |||||
PORTFOLIO SUMMARY (based on net assets) | ||
| % | ||
Commercial Paper | 64.6 | |
Certificates of Deposit | 22.7 | |
Variable Rate Obligations | 4.9 | |
Agency Obligations | 4.2 | |
Master Notes | 3.3 | |
Money Market Fund | 0.5 | |
| 100.2 | ||
FAS 157 DISCLOSURE
The following is a summary of the inputs used, as of June 30, 2008, in valuing the Fund’s investments carried at fair value:
Valuation Inputs | Investments in Securities | Other Financial Instruments* | ||||
Level 1 — Quoted Prices | $ | 6,120,000 | $ | — | ||
Level 2 — Other Significant Observable Inputs | 1,094,967,178 | — | ||||
Level 3 — Significant Unobservable Inputs | — | |||||
Total | $ | 1,101,087,178 | $ | — | ||
| * | Other financial instruments are derivative instruments not reflected in the Schedule of Investments, such as futures, forwards and swap contracts, which are valued at the unrealized appreciation (depreciation) on the investment. |
| 38 | See Notes to Financial Statements. |
Table of Contents
| Low-Duration Bond Fund | ||
| SCHEDULE OF INVESTMENTS | June 30, 2008 (Unaudited) |
| Par | Value | |||||
AGENCY OBLIGATIONS — 6.5% | ||||||
Federal Home Loan Bank | ||||||
2.17%, 07/02/08 | $ | 3,100,000 | $ | 3,099,813 | ||
2.21%, 07/11/08 | 4,000,000 | 3,997,545 | ||||
2.13%, 07/16/08 | 25,000,000 | 24,977,813 | ||||
2.21%, 07/16/08 | 3,300,000 | 3,296,961 | ||||
2.20%, 07/25/08 | 1,000,000 | 998,533 | ||||
2.23%, 07/25/08 | 1,300,000 | 1,298,067 | ||||
2.20%, 04/01/09 | 1,480,000 | 1,474,453 | ||||
5.00%, 09/18/09 | 2,880,000 | 2,951,853 | ||||
Federal Home Loan Mortgage Corporation | ||||||
3.25%, 02/25/11 | 5,000,000 | 4,976,235 | ||||
3.00%, 04/01/11 | 4,000,000 | 3,949,208 | ||||
Small Business Administration | ||||||
6.95%, 11/10/16 | 717,760 | 740,712 | ||||
Total Agency Obligations | 51,761,193 | |||||
ASSET-BACKED SECURITIES — 11.7% | ||||||
Accredited Mortgage Loan Trust | ||||||
2.53%, 02/25/37† | 1,581,071 | 1,547,816 | ||||
Amresco Independence Funding, Inc. | ||||||
6.75%, 06/15/26 144A | 375,559 | 289,213 | ||||
Asset-Backed Securities Corporation Home Equity | ||||||
2.76%, 09/25/34† | 100,868 | 86,384 | ||||
2.44%, 11/25/36† | 479,686 | 475,882 | ||||
BA Credit Card Trust | ||||||
2.51%, 08/15/12† | 2,625,000 | 2,599,850 | ||||
Bear Stearns Asset-Backed Securities Trust | ||||||
2.44%, 11/25/36† | 861,655 | 802,417 | ||||
2.67%, 02/25/37† | 2,651,745 | 2,557,578 | ||||
3.48%, 10/25/37† | 1,499,100 | 1,233,712 | ||||
Business Loan Express | ||||||
4.25%, 01/01/25 144A† | 231,574 | 201,896 | ||||
Capital Auto Receivables Asset Trust | ||||||
5.32%, 03/20/10 144A‡‡ | 2,300,000 | 2,322,461 | ||||
Carmax Auto Owner Trust | ||||||
5.24%, 07/15/11 | 4,000,000 | 4,055,670 | ||||
Carrington Mortgage Loan Trust | ||||||
2.66%, 02/25/36† | 1,440,511 | 1,373,329 | ||||
Chase Issuance Trust | ||||||
2.72%, 09/15/11† | 3,100,000 | 3,093,142 | ||||
2.49%, 03/15/13† | 3,100,000 | 3,051,105 | ||||
4.26%, 05/15/13 | 2,880,000 | 2,861,262 | ||||
Citibank Credit Card Issuance Trust | ||||||
2.48%, 12/15/10† | 3,180,000 | 3,175,234 | ||||
Citigroup Mortgage Loan Trust, Inc. | ||||||
2.54%, 07/25/45† | 3,485,713 | 3,237,901 | ||||
Countrywide Asset-Backed Certificates | ||||||
2.63%, 03/25/25† | 116,906 | 116,787 | ||||
CSAB Mortgage Backed Trust | ||||||
5.72%, 09/25/36 | 900,000 | 735,714 | ||||
Daimler Chrysler Auto Trust | ||||||
3.63%, 07/08/11† | 1,500,000 | 1,506,265 | ||||
FHLMC Structured Pass-Through Securities | ||||||
2.65%, 08/25/31† | 1,294,320 | 1,257,469 | ||||
First Franklin Mortgage Loan Asset-Backed Certificates | ||||||
2.44%, 12/25/36† | 718,741 | 700,025 | ||||
Ford Credit Auto Owner Trust | ||||||
2.49%, 12/15/09† | 910,082 | 909,775 | ||||
5.07%, 12/15/10 | 2,598,000 | 2,635,780 | ||||
3.37%, 01/15/11† | 1,500,000 | 1,504,273 | ||||
3.96%, 04/15/12 | 3,585,000 | 3,577,356 | ||||
Fremont Home Loan Trust | ||||||
2.44%, 10/25/36† | 229,235 | 215,401 | ||||
Green Tree Financial Corporation | ||||||
6.04%, 11/01/29 | 28,732 | 28,309 | ||||
GSAA Trust | ||||||
2.71%, 12/25/34† | 623,331 | 570,439 | ||||
IFC SBA Loan-Backed Adjustable Rate Certificate | ||||||
3.25%, 01/15/24 144A† | 276,116 | 269,730 | ||||
JP Morgan Mortgage Acquisition Corporation | ||||||
2.53%, 06/25/37† | 2,932,928 | 2,825,894 | ||||
Long Beach Mortgage Loan Trust | ||||||
2.42%, 06/25/36† | 10,472 | 10,472 | ||||
2.64%, 11/25/36† | 637,125 | 618,334 | ||||
Merrill Lynch Mortgage Investors, Inc. | ||||||
2.51%, 06/25/37† | 497,825 | 492,605 | ||||
Morgan Stanley ABS Capital I | ||||||
2.43%, 06/25/36† | 7,536 | 7,536 | ||||
2.51%, 06/25/36† | 242,265 | 241,687 | ||||
2.53%, 11/25/36† | 2,460,001 | 2,410,787 | ||||
2.52%, 01/25/37† | 1,402,279 | 1,356,634 | ||||
2.59%, 02/25/37† | 2,258,654 | 2,215,869 | ||||
2.54%, 05/25/37† | 2,381,684 | 2,338,754 | ||||
Nelnet Student Loan Trust | ||||||
2.93%, 01/26/15† | 363,685 | 363,558 | ||||
3.01%, 07/25/16† | 82,606 | 82,584 | ||||
Option One Mortgage Loan Trust | ||||||
2.44%, 07/25/36† | 155,366 | 154,815 | ||||
2.43%, 02/25/37† | 651,146 | 646,957 | ||||
PG&E Energy Recovery Funding LLC | ||||||
4.37%, 06/25/14 | 350,000 | 348,396 | ||||
Residential Asset Mortgage Products, Inc. | ||||||
2.56%, 07/25/36† | 563,792 | 559,151 | ||||
Securitized Asset-Backed Receivables LLC Trust | ||||||
2.53%, 05/25/36† | 179,122 | 178,653 | ||||
2.52%, 01/25/37† | 1,465,015 | 1,418,874 | ||||
SLM Student Loan Trust | ||||||
4.00%, 10/25/16† | 3,985,000 | 4,045,397 | ||||
4.20%, 01/25/18† | 3,975,000 | 4,078,104 | ||||
2.91%, 10/25/18† | 1,166,344 | 1,158,690 | ||||
Soundview Home Equity Loan Trust | ||||||
2.60%, 01/25/37† | 1,460,979 | 1,438,847 | ||||
2.54%, 08/25/37† | 1,599,244 | 1,567,766 | ||||
| See Notes to Financial Statements. | 39 |
Table of Contents
Low-Duration Bond Fund
SCHEDULE OF INVESTMENTS (Continued)
| Par | Value | |||||
Specialty Underwriting & Residential Finance | ||||||
2.42%, 06/25/37† | $ | 154,210 | $ | 152,890 | ||
2.44%, 11/25/37† | 714,067 | 680,373 | ||||
Structured Asset Investment Loan Trust | ||||||
2.44%, 07/25/36† | 288,862 | 280,348 | ||||
Structured Asset Securities Corporation | ||||||
4.33%, 01/21/09 144A | 1,851,660 | 1,823,886 | ||||
4.90%, 04/25/35† | 1,431,977 | 1,100,291 | ||||
2.53%, 10/25/36† | 898,828 | 877,580 | ||||
Structured Asset Receivables Trust | ||||||
5.86%, 04/21/11 144A | 2,520,380 | 2,416,540 | ||||
TXU Electric Delivery Transition Bond Co., LLC | ||||||
4.81%, 11/17/14 | 2,360,000 | 2,377,700 | ||||
USAA Auto Owner Trust | ||||||
4.89%, 08/15/12 | 2,500,000 | 2,530,999 | ||||
Wachovia Auto Loan Owner Trust | ||||||
5.08%, 04/20/12 144A | 3,000,000 | 3,017,575 | ||||
Wells Fargo Home Equity Trust | ||||||
2.57%, 04/25/37† | 2,021,704 | 1,981,745 | ||||
World Omni Auto Receivables Trust | ||||||
5.01%, 10/15/10 | 883,060 | 888,099 | ||||
Total Asset-Backed Securities | 93,680,565 | |||||
COMMERCIAL PAPER — 2.4% | ||||||
Apreco LLC | ||||||
2.66%, 07/15/08 | 6,200,000 | 6,193,598 | ||||
Bryant Park Funding LLC | ||||||
2.80%, 09/16/08 | 6,271,000 | 6,229,967 | ||||
Dexia LLC | ||||||
6.27%, 08/20/08 | 6,500,000 | 6,475,256 | ||||
Total Commercial Paper | 18,898,821 | |||||
CORPORATE BONDS — 14.5% | ||||||
AEP Texas Central Transition Funding LLC | ||||||
4.98%, 07/01/15 | 2,900,000 | 2,935,403 | ||||
American Electric Power Co., Inc. | ||||||
5.25%, 06/01/15 | 1,600,000 | 1,543,072 | ||||
American Express Co. | ||||||
7.00%, 03/19/18 | 1,400,000 | 1,419,666 | ||||
Amgen, Inc. | ||||||
4.00%, 11/18/09D | 1,000,000 | 1,001,416 | ||||
Anadarko Petroleum Corporation | ||||||
3.18%, 09/15/09† | 925,000 | 914,677 | ||||
AT&T, Inc. | ||||||
5.50%, 02/01/18 | 5,600,000 | 5,436,385 | ||||
Bank of America Corporation | ||||||
8.13%, 12/15/49† | 3,100,000 | 2,934,181 | ||||
Bank of America NA | ||||||
3.37%, 05/12/10† | 3,100,000 | 3,087,733 | ||||
3.35%, 06/23/10† | 3,300,000 | 3,291,291 | ||||
Bear Stearns Co., Inc. | ||||||
7.25%, 02/01/18 | 3,300,000 | 3,449,711 | ||||
BellSouth Corporation | ||||||
4.20%, 09/15/09D | 2,217,000 | 2,222,163 | ||||
Caterpillar Financial Services Corporation | ||||||
2.98%, 10/28/08† | 5,500,000 | 5,498,598 | ||||
CenterPoint Energy Transition Bond Co., LLC | ||||||
4.97%, 08/01/14 | 2,875,000 | 2,911,627 | ||||
Citigroup, Inc. | ||||||
6.13%, 05/15/18 | 6,400,000 | 6,135,699 | ||||
8.30%, 12/21/47† | 3,100,000 | 2,935,139 | ||||
8.40%, 04/30/49† | 3,900,000 | 3,712,254 | ||||
ConocoPhillips Australia Funding Co. | ||||||
2.81%, 04/09/09† | 835,000 | 835,587 | ||||
CVS Caremark Corporation | ||||||
4.00%, 09/15/09D | 1,085,000 | 1,079,424 | ||||
Florida Power Corporation | ||||||
6.65%, 07/15/11 | 600,000 | 633,903 | ||||
General Electric Capital Corporation | ||||||
9.83%, 12/15/08 | 350,000 | 359,966 | ||||
2.82%, 03/16/09† | 3,800,000 | 3,800,813 | ||||
4.25%, 09/13/10D | 2,400,000 | 2,421,552 | ||||
5.00%, 12/01/10‡‡ | 2,225,000 | 2,283,811 | ||||
6.50%, 09/15/37 144A(U) | 1,600,000 | 2,959,991 | ||||
Goldman Sachs Capital III | ||||||
3.45%, 12/01/49† | 1,560,000 | 1,108,645 | ||||
Goldman Sachs Group, Inc. | ||||||
6.15%, 04/01/18 | 3,100,000 | 3,012,912 | ||||
HSBC Finance Corporation | ||||||
4.13%, 12/15/08 | 700,000 | 698,991 | ||||
John Deere Capital Corporation | ||||||
3.44%, 06/10/11†D | 4,700,000 | 4,698,604 | ||||
Kraft Foods, Inc. | ||||||
5.63%, 08/11/10 | 495,000 | 507,111 | ||||
6.13%, 02/01/18 | 600,000 | 584,288 | ||||
6.88%, 02/01/38 | 1,100,000 | 1,072,740 | ||||
Lehman Brothers Holdings, Inc. | ||||||
6.20%, 09/26/14 | 500,000 | 477,838 | ||||
6.75%, 12/28/17D | 3,200,000 | 3,011,283 | ||||
6.88%, 05/02/18D | 2,400,000 | 2,327,525 | ||||
Macy’s Retail Holdings, Inc. | ||||||
6.63%, 09/01/08 | 150,000 | 150,178 | ||||
Morgan Stanley | ||||||
2.82%, 05/07/09† | 300,000 | 295,394 | ||||
4.78%, 05/14/10† | 2,200,000 | 2,192,670 | ||||
5.63%, 01/09/12 | 2,451,000 | 2,454,752 | ||||
5.95%, 12/28/17D | 7,600,000 | 6,911,410 | ||||
Nabors Industries, Inc. | ||||||
6.15%, 02/15/18 144AD | 3,300,000 | 3,341,534 | ||||
Oracle Corporation and Ozark Holding, Inc. | ||||||
5.00%, 01/15/11D | 1,040,000 | 1,060,877 | ||||
Overseas Private Investment Corporation | ||||||
3.98%, 07/12/10 | 2,600,000 | 2,577,278 | ||||
4.81%, 07/12/12 | 2,100,000 | 2,071,569 | ||||
SLM Corporation | ||||||
4.00%, 01/15/09D | 841,000 | 830,757 | ||||
Sprint Capital Corporation | ||||||
8.38%, 03/15/12D | 1,000,000 | 990,773 | ||||
Time Warner Cable, Inc. | ||||||
5.40%, 07/02/12D | 1,325,000 | 1,312,780 | ||||
| 40 | See Notes to Financial Statements. |
Table of Contents
| Par | Value | |||||
Time Warner, Inc. | ||||||
2.92%, 11/13/09† | $ | 6,000,000 | $ | 5,832,612 | ||
Transocean, Inc. | ||||||
2.87%, 09/05/08† | 1,900,000 | 1,897,583 | ||||
Wachovia Corporation | ||||||
2.90%, 03/15/11† | 540,000 | 510,130 | ||||
Wachovia Mortgage FSB | ||||||
4.50%, 06/15/09 | 750,000 | 749,362 | ||||
ZFS Finance USA Trust I | ||||||
5.88%, 05/09/32 144A† | 845,000 | 773,678 | ||||
6.15%, 12/15/49 144A† | 845,000 | 771,066 | ||||
Total Corporate Bonds | 116,028,402 | |||||
FOREIGN BONDS — 5.1% | ||||||
Australia — 0.2% | ||||||
National Australia Bank, Ltd. | ||||||
3.21%, 02/08/10 144A† | 1,600,000 | 1,600,395 | ||||
Canada — 0.1% | ||||||
Province of Ontario | ||||||
2.75%, 02/22/11D | 775,000 | 758,651 | ||||
Cayman Islands — 0.2% | ||||||
Petroleum Export, Ltd. | ||||||
4.62%, 06/15/10 144A | 850,000 | 844,484 | ||||
4.63%, 06/15/10 144A | 850,000 | 844,557 | ||||
| 1,689,041 | ||||||
France — 0.3% | ||||||
Caisse d’Amortissement de la Dette Sociale | ||||||
3.75%, 07/12/09(E) | 1,600,000 | 2,491,293 | ||||
French Government Bond | ||||||
5.75%, 10/25/32(E) | 100,000 | 173,122 | ||||
| 2,664,415 | ||||||
Germany — 0.5% | ||||||
Deutsche Bundesrepublik | ||||||
6.25%, 01/04/30(E) | 100,000 | 183,687 | ||||
4.25%, 07/04/39(E) | 1,400,000 | 1,994,152 | ||||
Kreditanstalt fuer Wiederaufbau | ||||||
4.38%, 06/30/09(E) | 1,000,000 | 1,566,584 | ||||
| 3,744,423 | ||||||
Luxembourg — 0.6% | ||||||
Unicredito Luxembourg Finance SA | ||||||
2.97%, 10/24/08 144A† | 3,800,000 | 3,797,652 | ||||
VTB Capital SA | ||||||
3.38%, 08/01/08 144A† | 800,000 | 793,000 | ||||
| 4,590,652 | ||||||
Netherlands — 0.1% | ||||||
Bank Nederlandse Gemeenten | ||||||
4.00%, 03/02/09(E) | 500,000 | 782,111 | ||||
South Korea — 0.2% | ||||||
Export-Import Bank of Korea | ||||||
2.77%, 06/01/09† | 1,300,000 | 1,288,638 | ||||
Switzerland — 0.6% | ||||||
UBS AG | ||||||
3.73%, 06/19/10† | 3,100,000 | 3,092,966 | ||||
5.88%, 12/20/17 | 2,000,000 | 1,948,974 | ||||
| 5,041,940 | ||||||
United Kingdom — 2.3% | ||||||
HSBC Holdings PLC | ||||||
6.50%, 09/15/37 | 1,600,000 | 1,463,039 | ||||
Network Rail MTN Finance PLC | ||||||
3.13%, 03/30/09(E) | 1,854,000 | 2,880,510 | ||||
Permanent Financing PLC | ||||||
2.86%, 06/10/34(U)† | 3,255,000 | 3,234,396 | ||||
Permanent Master Issuer PLC | ||||||
2.76%, 01/15/16(U)† | 2,195,000 | 2,165,196 | ||||
United Kingdom Gilt | ||||||
4.75%, 06/07/10(U) | 4,100,000 | 8,096,283 | ||||
Vodafone Group PLC | ||||||
2.92%, 02/27/12† | 950,000 | 917,243 | ||||
| 18,756,667 | ||||||
Total Foreign Bonds | 40,916,933 | |||||
MORTGAGE-BACKED SECURITIES — 55.1% | ||||||
Adjustable Rate Mortgage Trust | ||||||
2.75%, 11/25/35† | 1,069,579 | 828,776 | ||||
2.73%, 03/25/36† | 1,851,378 | 1,352,654 | ||||
5.94%, 03/25/37† | 3,670,645 | 2,827,453 | ||||
American Home Mortgage Assets | ||||||
2.75%, 11/25/35† | 990,910 | 755,628 | ||||
American Home Mortgage Investment Trust | ||||||
4.29%, 10/25/34† | 1,532,099 | 1,343,447 | ||||
Bank of America Commercial Mortgage, Inc. | ||||||
3.88%, 09/11/36 | 1,861,771 | 1,826,387 | ||||
Bank of America Funding Corporation | ||||||
4.59%, 12/20/36† | 2,441,342 | 2,379,213 | ||||
6.14%, 01/20/47† | 1,363,836 | 1,106,944 | ||||
Bank of America Mortgage Securities, Inc. | ||||||
6.50%, 10/01/19 | 425,433 | 426,701 | ||||
6.17%, 11/20/36† | 2,238,124 | 2,051,534 | ||||
Bear Stearns Adjustable Rate Mortgage Trust | ||||||
4.76%, 12/01/33† | 704,211 | 683,550 | ||||
4.62%, 01/25/34† | 675,269 | 621,508 | ||||
4.00%, 07/25/34† | 1,752,699 | 1,723,124 | ||||
4.13%, 03/25/35† | 2,765,805 | 2,638,358 | ||||
Bear Stearns Alt-A Trust | ||||||
2.85%, 06/25/34† | 671,731 | 525,823 | ||||
5.70%, 09/25/35† | 863,382 | 711,067 | ||||
Bear Stearns Commercial Mortgage Securities | ||||||
2.62%, 03/15/19 144A† | 1,430,660 | 1,366,916 | ||||
4.48%, 06/11/41 | 600,000 | 592,665 | ||||
4.03%, 02/13/46 | 398,348 | 395,491 | ||||
Chase Manhattan Bank - First Union National Bank | ||||||
7.44%, 08/15/31† | 1,989,530 | 2,034,653 | ||||
Citigroup Commercial Mortgage Trust | ||||||
4.15%, 09/20/49 144A | 53,194 | 53,077 | ||||
Citigroup Mortgage Loan Trust, Inc. | ||||||
5.81%, 07/25/36† | 2,970,262 | 2,783,079 | ||||
| See Notes to Financial Statements. | 41 |
Table of Contents
Low-Duration Bond Fund
SCHEDULE OF INVESTMENTS (Continued)
| Par | Value | |||||
Commercial Mortgage Pass-Through Certificates | ||||||
7.42%, 08/15/33† | $ | 1,836,363 | $ | 1,893,633 | ||
Countrywide Alternative Loan Trust | ||||||
6.00%, 10/25/32 | 246,747 | 223,012 | ||||
5.50%, 05/31/35 | 1,143,249 | 1,053,185 | ||||
3.21%, 11/25/35† | 2,343,524 | 1,777,682 | ||||
Countrywide Home Loan Mortgage Pass-Through Trust | ||||||
4.24%, 09/25/33† | 1,932,523 | 1,871,595 | ||||
2.75%, 01/25/35† | 267,883 | 219,763 | ||||
Deutsche ALT-A Securities, Inc. | ||||||
2.56%, 03/30/36† | 391,702 | 368,448 | ||||
5.87%, 10/25/36 | 800,000 | 655,991 | ||||
5.89%, 10/25/36 | 800,000 | 653,805 | ||||
DLJ Commercial Mortgage Corporation | ||||||
7.18%, 11/10/33 | 1,990,435 | 2,062,341 | ||||
Federal Home Loan Mortgage Corporation | ||||||
8.00%, 01/01/09 | 28 | 28 | ||||
7.50%, 03/01/09 | 1,185 | 1,194 | ||||
16.25%, 07/01/11 | 43 | 44 | ||||
15.25%, 08/01/11 | 1,200 | 1,370 | ||||
5.38%, 09/15/11 | 3,859,801 | 3,924,564 | ||||
4.00%, 08/01/15 | 1,560,238 | 1,513,353 | ||||
5.00%, 11/15/16 | 1,391,616 | 1,410,352 | ||||
5.50%, 04/15/17 | 3,300,509 | 3,381,777 | ||||
3.50%, 12/01/18 | 2,936,510 | 2,739,497 | ||||
10.75%, 02/01/19 | 71,821 | 76,128 | ||||
2.74%, 02/15/19† | 5,226,894 | 5,120,047 | ||||
4.25%, 06/15/24 | 1,045,219 | 1,047,700 | ||||
7.22%, 07/01/27† | 26,916 | 27,286 | ||||
5.88%, 06/01/28 STRIP† | 237,871 | 239,538 | ||||
2.86%, 12/15/30† | 1,014,329 | 1,001,588 | ||||
6.00%, 04/01/33 | 1,323,522 | 1,347,485 | ||||
4.58%, 06/01/33† | 2,289,580 | 2,303,017 | ||||
3.98%, 04/01/34† | 2,531,777 | 2,530,480 | ||||
4.39%, 10/01/34† | 805,082 | 805,365 | ||||
4.72%, 08/01/35† | 2,440,054 | 2,461,392 | ||||
4.80%, 08/01/35† | 1,626,858 | 1,644,385 | ||||
4.82%, 10/01/35† | 1,067,788 | 1,074,097 | ||||
5.03%, 12/01/35† | 5,453,531 | 5,510,130 | ||||
5.83%, 04/01/36† | 3,411,133 | 3,476,029 | ||||
37.59%, 04/15/38† | 11,768,642 | 997,575 | ||||
5.50%, 07/14/38 TBA | 1,000,000 | 985,000 | ||||
Federal Housing Authority | ||||||
7.43%, 09/01/22 | 1,603 | 1,635 | ||||
Federal National Mortgage Association | ||||||
6.00%, 08/01/08 | 946 | 943 | ||||
6.50%, 11/01/08 | 3,284 | 3,276 | ||||
5.50%, 12/01/17 | 6,092,823 | 6,189,864 | ||||
4.00%, 07/01/18 | 166,083 | 157,903 | ||||
4.00%, 08/01/18 | 694,594 | 660,385 | ||||
4.00%, 05/01/19 | 3,758,587 | 3,561,731 | ||||
4.00%, 06/01/19 | 6,355,238 | 6,022,382 | ||||
4.00%, 08/01/19 | 348,969 | 330,692 | ||||
4.00%, 10/01/19 | 1,275,099 | 1,208,316 | ||||
4.00%, 11/25/19 | 730,705 | 675,420 | ||||
4.00%, 12/01/19 | 833,831 | 790,159 | ||||
4.00%, 01/01/20 | 200,861 | 189,211 | ||||
4.00%, 07/01/20 | 45,264 | 42,639 | ||||
5.50%, 09/25/24 | 1,860,915 | 1,878,759 | ||||
6.42%, 12/01/24† | 91,327 | 92,137 | ||||
9.00%, 05/01/25 | 83,712 | 92,213 | ||||
9.00%, 07/01/25 | 94,923 | 104,436 | ||||
6.00%, 02/25/27 | 2,292,634 | 2,339,233 | ||||
5.50%, 11/25/27 | 3,136,569 | 3,192,472 | ||||
3.08%, 05/25/30† | 1,949,051 | 1,934,714 | ||||
3.26%, 05/25/30† | 1,978,141 | 1,953,742 | ||||
2.86%, 09/25/30† | 59,477 | 59,274 | ||||
6.73%, 09/01/31† | 74,207 | 74,616 | ||||
3.31%, 03/25/32 | 375,538 | 359,327 | ||||
5.50%, 09/25/32 | 2,900,000 | 2,934,477 | ||||
5.46%, 04/01/33† | 426,002 | 435,556 | ||||
4.24%, 06/01/33† | 141,293 | 141,656 | ||||
5.50%, 06/01/33 | 22,457 | 22,267 | ||||
5.50%, 07/01/33 | 19,768 | 19,601 | ||||
4.24%, 10/01/33† | 1,198,035 | 1,204,694 | ||||
5.50%, 10/01/33 | 113,612 | 112,651 | ||||
4.24%, 12/01/33† | 348,871 | 351,930 | ||||
4.50%, 06/01/34 | 65,375 | 60,914 | ||||
4.50%, 09/01/34 | 249,681 | 232,252 | ||||
4.90%, 09/01/34† | 991,755 | 1,006,393 | ||||
5.09%, 09/01/34† | 705,310 | 714,120 | ||||
4.72%, 10/01/34† | 1,066,482 | 1,083,387 | ||||
5.08%, 10/01/34† | 1,200,990 | 1,224,004 | ||||
4.50%, 12/01/34 | 79,018 | 73,502 | ||||
4.50%, 02/01/35 | 2,832,052 | 2,628,167 | ||||
4.50%, 03/01/35 | 1,657,242 | 1,537,933 | ||||
4.50%, 04/01/35 | 2,747,575 | 2,549,772 | ||||
4.50%, 05/01/35 | 791,473 | 734,493 | ||||
4.50%, 06/01/35 | 61,579 | 57,145 | ||||
4.85%, 06/01/35† | 1,665,559 | 1,681,933 | ||||
5.00%, 06/01/35 | 49,612,170 | 47,721,675 | ||||
4.50%, 08/01/35 | 1,708,492 | 1,585,494 | ||||
4.69%, 08/01/35† | 5,062,405 | 5,105,915 | ||||
4.44%, 09/01/35† | 2,492,327 | 2,498,429 | ||||
4.50%, 09/01/35 | 1,054,139 | 978,249 | ||||
4.64%, 09/01/35† | 3,236,552 | 3,272,285 | ||||
7.50%, 09/01/35 | 1,598,726 | 1,722,702 | ||||
4.50%, 10/01/35 | 643,829 | 597,478 | ||||
5.33%, 10/01/35† | 2,153,214 | 2,155,323 | ||||
4.50%, 11/01/35 | 675,479 | 626,850 | ||||
4.90%, 12/01/35† | 226,922 | 226,441 | ||||
6.00%, 02/01/36 | 712,582 | 720,585 | ||||
4.50%, 06/01/36 | 54,850 | 50,884 | ||||
4.50%, 07/01/36 | 805,481 | 747,241 | ||||
6.00%, 07/01/36 | 1,467,082 | 1,482,182 | ||||
8.56%, 10/01/36 IOW | 2,169,765 | 558,711 | ||||
5.50%, 01/01/37 | 7,529,369 | 7,444,516 | ||||
43.26%, 03/25/37† | 8,025,110 | 734,577 | ||||
4.55%, 07/25/37 | 5,143,973 | 1,299,821 | ||||
5.50%, 07/14/38 TBA | 13,400,000 | 13,207,375 | ||||
6.00%, 07/14/38 TBA | 42,000,000 | 42,367,500 | ||||
6.22%, 04/01/40† | 289,510 | 295,753 | ||||
4.99%, 07/01/44† | 350,095 | 349,892 | ||||
6.50%, 12/31/49 | 1,752,000 | 1,778,245 | ||||
FHLMC Structured Pass-Through Securities | ||||||
3.60%, 05/25/43† | 1,565,766 | 1,566,101 | ||||
5.19%, 07/25/44† | 2,381,324 | 2,227,040 | ||||
First Horizon Alternative Mortgage Securities | ||||||
4.73%, 06/25/34† | 850,610 | 742,853 | ||||
| 42 | See Notes to Financial Statements. |
Table of Contents
| Par | Value | |||||
General Electric Capital Commercial Mortgage Corporation | ||||||
4.09%, 01/10/38 | $ | 1,111,082 | $ | 1,102,510 | ||
5.56%, 06/10/38 | 591,009 | 596,420 | ||||
GMAC Commercial Mortgage Securities, Inc. | ||||||
7.72%, 03/15/33† | 2,029,821 | 2,096,858 | ||||
7.18%, 08/15/36† | 1,065,246 | 1,088,090 | ||||
Government National Mortgage Association | ||||||
6.00%, 12/15/08 | 12,880 | 12,915 | ||||
6.00%, 02/15/11 | 44,314 | 44,705 | ||||
6.38%, 06/20/17† | 19,540 | 19,890 | ||||
6.38%, 06/20/21† | 9,574 | 9,766 | ||||
5.13%, 10/20/27† | 69,119 | 69,381 | ||||
8.50%, 10/15/29 | 28,370 | 31,187 | ||||
8.50%, 01/15/30 | 25,312 | 27,820 | ||||
3.07%, 02/16/30† | 270,346 | 272,777 | ||||
8.50%, 03/15/30 | 4,534 | 4,983 | ||||
8.50%, 04/15/30 | 14,043 | 15,434 | ||||
8.50%, 05/15/30 | 139,656 | 153,491 | ||||
8.50%, 06/15/30 | 15,981 | 17,564 | ||||
8.50%, 07/15/30 | 116,754 | 128,322 | ||||
8.50%, 08/15/30 | 23,084 | 25,371 | ||||
8.50%, 09/15/30 | 2,505 | 2,753 | ||||
8.50%, 11/15/30 | 67,378 | 74,052 | ||||
8.50%, 12/15/30 | 66,375 | 72,950 | ||||
8.50%, 02/15/31 | 42,758 | 46,924 | ||||
4.75%, 05/20/34† | 1,244,892 | 1,252,132 | ||||
4.75%, 06/20/34† | 1,705,838 | 1,715,759 | ||||
6.00%, 06/15/36 | 879,489 | 894,388 | ||||
5.50%, 04/15/37 | 6,425,838 | 6,403,486 | ||||
6.50%, 09/15/37 | 562,333 | 581,591 | ||||
5.00%, 07/01/38 TBA | 4,000,000 | 3,875,000 | ||||
6.00%, 07/21/38 TBA | 7,500,000 | 7,612,500 | ||||
6.50%, 07/21/38 TBA | 17,000,000 | 17,557,804 | ||||
Greenpoint Mortgage Funding Trust | ||||||
2.75%, 11/25/45† | 431,164 | 343,716 | ||||
GS Mortgage Securities Corporation II | ||||||
6.04%, 08/15/18 144A | 290,502 | 295,965 | ||||
6.14%, 10/18/30 | 161,559 | 161,254 | ||||
3.04%, 01/10/40 IO 144AW† | 23,473,681 | 298,562 | ||||
GSR Mortgage Loan Trust | ||||||
5.71%, 06/01/34† | 735,995 | 723,781 | ||||
4.77%, 09/25/34† | 1,834,218 | 1,771,550 | ||||
6.01%, 09/25/34† | 968,645 | 872,906 | ||||
4.54%, 09/25/35† | 4,159,362 | 4,029,074 | ||||
4.55%, 09/25/35† | 2,143,344 | 2,115,489 | ||||
5.25%, 10/25/35† | 1,255,902 | 1,221,481 | ||||
6.02%, 03/25/37† | 2,808,373 | 2,589,556 | ||||
HarborView Mortgage Loan Trust | ||||||
2.79%, 11/19/35 STEP | 1,594,238 | 1,211,098 | ||||
5.30%, 12/19/35† | 3,298,267 | 3,245,891 | ||||
2.69%, 11/19/36† | 2,682,285 | 1,889,776 | ||||
2.74%, 11/19/36† | 2,247,320 | 1,310,464 | ||||
Impac Secured Assets CMN Owner Trust | ||||||
2.47%, 01/25/37† | 870,182 | 815,137 | ||||
Indymac Index Mortgage Loan Trust | ||||||
3.17%, 06/25/37† | 958,638 | 557,425 | ||||
JP Morgan Mortgage Trust | ||||||
3.89%, 08/25/34† | 2,820,876 | 2,749,923 | ||||
5.02%, 02/25/35† | 1,041,445 | 982,449 | ||||
4.76%, 07/25/35† | 3,541,035 | 3,500,113 | ||||
LB-UBS Commercial Mortgage Trust | ||||||
6.16%, 07/14/16 | 2,165,974 | 2,207,887 | ||||
7.95%, 05/15/25† | 4,378,929 | 4,551,193 | ||||
7.07%, 04/15/37 IO 144AW† | 18,115,685 | 193,139 | ||||
Luminent Mortgage Trust | ||||||
2.74%, 11/26/35† | 2,211,263 | 1,689,351 | ||||
MASTR Adjustable Rate Mortgages Trust | ||||||
4.67%, 12/25/33† | 1,323,280 | 1,297,253 | ||||
Merrill Lynch Mortgage Investors, Inc. | ||||||
4.23%, 08/25/34† | 2,560,965 | 2,466,922 | ||||
MLCC Mortgage Investors, Inc. | ||||||
2.85%, 03/15/25 STEP | 378,209 | 284,574 | ||||
4.73%, 12/25/34† | 1,832,525 | 1,782,891 | ||||
5.40%, 02/25/36 STRIP† | 1,912,115 | 1,848,063 | ||||
Morgan Stanley Capital I | ||||||
6.53%, 03/15/31† | 1,800,436 | 1,809,795 | ||||
5.36%, 12/15/44 | 3,657,944 | 3,614,296 | ||||
NationsLink Funding Corporation | ||||||
6.32%, 01/20/31 | 1,351,199 | 1,353,886 | ||||
Opteum Mortgage Acceptance Corporation | ||||||
2.57%, 12/25/35† | 1,074,456 | 1,023,195 | ||||
2.54%, 07/25/36† | 1,097,295 | 1,031,620 | ||||
PNC Mortgage Acceptance Corporation | ||||||
5.91%, 03/12/34 | 1,001,023 | 1,007,971 | ||||
Provident Funding Mortgage Loan Trust | ||||||
4.05%, 04/25/34† | 2,789,907 | 2,779,064 | ||||
Residential Accredit Loans, Inc. | ||||||
3.00%, 01/25/33† | 533,147 | 478,848 | ||||
Residential Asset Securitization Trust | ||||||
2.78%, 05/25/35† | 1,393,380 | 1,288,486 | ||||
Residential Funding Mortgage Securities I | ||||||
6.50%, 03/25/32 | 113,763 | 111,416 | ||||
Structured Adjustable Rate Mortgage Loan Trust | ||||||
4.92%, 03/25/34† | 1,078,310 | 1,067,052 | ||||
5.31%, 08/25/34† | 1,344,271 | 1,217,316 | ||||
2.78%, 09/25/34† | 218,560 | 193,092 | ||||
Structured Asset Mortgage Investments, Inc. | ||||||
5.04%, 10/19/34† | 587,092 | 519,123 | ||||
2.76%, 05/25/35† | 1,152,611 | 890,820 | ||||
2.73%, 07/19/35† | 190,979 | 145,932 | ||||
2.55%, 08/25/36† | 630,199 | 613,722 | ||||
Structured Asset Securities Corporation | ||||||
2.65%, 05/25/36† | 612,564 | 596,491 | ||||
TBW Mortgage Backed Pass Through Certificates | ||||||
6.01%, 07/25/37 STEP | 700,000 | 559,373 | ||||
| See Notes to Financial Statements. | 43 |
Table of Contents
Low-Duration Bond Fund
SCHEDULE OF INVESTMENTS (Continued)
| Par | Value | |||||
Thornburg Mortgage Securities Trust | ||||||
2.51%, 04/25/36† | $ | 1,900,000 | $ | 1,883,555 | ||
TIAA Retail Commercial Trust | ||||||
6.68%, 06/19/31 144A† | 2,437,876 | 2,478,603 | ||||
5.69%, 08/15/39† | 2,694,783 | 2,696,399 | ||||
Wachovia Bank Commercial Mortgage Trust | ||||||
4.04%, 02/15/34 | 1,389,153 | 1,362,285 | ||||
5.74%, 05/15/43 STRIP† | 1,600,000 | 1,561,151 | ||||
Washington Mutual Alternative Mortgage Pass-Through Certificates | ||||||
2.72%, 05/04/37† | 2,744,247 | 1,936,056 | ||||
Washington Mutual Mortgage Pass-Through Certificates | ||||||
3.02%, 12/25/27† | 2,890,348 | 2,636,670 | ||||
3.92%, 06/25/34† | 2,445,096 | 2,413,352 | ||||
4.68%, 05/25/35† | 3,550,000 | 3,450,273 | ||||
6.07%, 10/25/36† | 2,747,725 | 2,665,329 | ||||
5.35%, 03/25/37† | 3,252,562 | 3,033,124 | ||||
5.88%, 06/25/37† | 3,744,103 | 3,363,817 | ||||
4.93%, 06/25/42† | 55,640 | 50,437 | ||||
2.91%, 01/25/45† | 1,214,232 | 939,266 | ||||
2.80%, 08/25/45† | 579,146 | 460,769 | ||||
2.77%, 10/25/45† | 612,722 | 477,065 | ||||
5.06%, 06/25/46† | 2,172,917 | 1,585,795 | ||||
4.92%, 05/25/47† | 1,152,440 | 709,511 | ||||
Washington Mutual Mortgage Securities Corporation | ||||||
7.45%, 03/25/32† | 130,888 | 122,941 | ||||
Wells Fargo Mortgage-Backed Securities Trust | ||||||
4.75%, 04/25/19 | 2,736,811 | 2,637,602 | ||||
3.99%, 01/25/35† | 2,160,293 | 2,109,073 | ||||
4.54%, 02/25/35† | 3,636,520 | 3,584,837 | ||||
5.24%, 04/25/36† | 3,266,592 | 3,143,547 | ||||
5.65%, 07/25/36† | 2,516,097 | 2,434,667 | ||||
6.00%, 07/25/37 | 3,425,269 | 3,416,628 | ||||
Total Mortgage-Backed Securities | 440,481,323 | |||||
MUNICIPAL BONDS — 0.6% | ||||||
New York City Municipal Water Finance Authority Series A Revenue Bond | ||||||
5.00%, 06/15/38 | 1,000,000 | 1,009,310 | ||||
Sales Tax Asset Receivable Corporation, New York, Series B Revenue Bond (FSA Insured) | ||||||
3.60%, 10/15/08 | 425,000 | 426,075 | ||||
State of California General Obligation Bond | ||||||
5.00%, 11/01/32 | 3,200,000 | 3,173,088 | ||||
Total Municipal Bonds | 4,608,473 | |||||
| Number of Contracts | ||||||
PURCHASED OPTIONS — 0.5% | ||||||
Call Options — 0.0% | ||||||
10-Year U.S. Treasury Note Futures, Strike Price $135.00, Expires 08/22/08 | 100 | 1,562 | ||||
15-Year U.S. Treasury Long Bond Futures, Strike Price $142.00, Expires 08/22/08 | 827 | 12,922 | ||||
1-Year Eurodollar Mid-CRV Futures, Strike Price $96.75, Expires 09/12/08 | 121 | 45,375 | ||||
1-Year Eurodollar Mid-CRV Futures, Strike Price $97.75, Expires 09/12/08 | 121 | 6,806 | ||||
2-Year U.S. Treasury Note Futures, Strike Price $111.00, Expires 08/22/08 | 1,150 | 17,969 | ||||
5-Year U.S. Treasury Note Futures, Strike Price $126.00, Expires 08/22/08 | 283 | 2,211 | ||||
5-Year U.S. Treasury Note Futures, Strike Price $129.50, Expires 08/22/08 | 140 | 1,094 | ||||
90-Day Eurodollar Futures, Strike Price $97.375, Expires 09/15/08 | 74 | 8,325 | ||||
| 96,264 | ||||||
Call Swaptions — 0.5% | ||||||
3-Month LIBOR, Strike Price $3.15, Expires 02/02/09 | 4,080 | 126,666 | ||||
3-Month LIBOR, Strike Price $3.50, Expires 02/02/09 | 1,890 | 90,435 | ||||
3-Month LIBOR, Strike Price $3.70, Expires 12/15/08 | 14,520 | 897,272 | ||||
3-Month LIBOR, Strike Price $4.00, Expires 04/20/09 | 9,700 | 121,991 | ||||
3-Month LIBOR, Strike Price $4.18, Expires 04/20/09 | 29,210 | 526,193 | ||||
3-Month LIBOR, Strike Price $5.05, Expires 12/18/09 | 102 | 286,984 | ||||
3-Month LIBOR, Strike Price $7.00, Expires 03/18/09 | 4,850 | 1,631,790 | ||||
Euro vs. U.S. Dollar, Strike Price $1.38, Expires 05/21/10 | 18,000 | 317,881 | ||||
U.S. Dollar vs. Japanese Yen, Strike Price $118.00, Expires 09/16/08 | 137,000 | 7,371 | ||||
| 4,006,583 | ||||||
Put Options — 0.0% | ||||||
10-Year U.S. Treasury Note Futures, Strike Price $92.00, Expires 08/22/08 | 1,095 | 17,110 | ||||
30-Year Federal National Mortgage Association, Strike Price $88.50, Expires 09/04/08 | 450 | 17 | ||||
30-Year Government National Mortgage Association, Strike Price $94.00, Expires 08/13/08 | 1,700 | — | ||||
| 17,127 | ||||||
Put Swaptions — 0.0% | ||||||
3-Month LIBOR, Strike Price $5.05, Expires 12/18/09 | 34 | 72,754 | ||||
Euro vs. U.S. Dollar, Strike Price $1.38, Expires 05/21/10 | 18,000 | 55,397 | ||||
| 128,151 | ||||||
Total Purchased Options | 4,248,125 | |||||
| 44 | See Notes to Financial Statements. |
Table of Contents
| Shares | Value | |||||||
MONEY MARKET FUNDS — 14.5% | ||||||||
GuideStone Money Market Fund (GS4 Class)¥ | 14,990,850 | $ | 14,990,850 | |||||
Northern Institutional Liquid Assets Portfolio§ | 101,052,603 | 101,052,603 | ||||||
Total Money Market Funds | 116,043,453 | |||||||
| Par | ||||||||
U.S. TREASURY OBLIGATIONS — 12.1% | ||||||||
U.S. Treasury Bonds | ||||||||
8.13%, 08/15/19D | $ | 3,900,000 | 5,210,158 | |||||
4.38%, 02/15/38D | 5,300,000 | 5,167,506 | ||||||
| 10,377,664 | ||||||||
U.S. Treasury Inflationary Index Bonds | ||||||||
2.38%, 01/15/17D | 1,300,000 | 1,499,103 | ||||||
2.38%, 01/15/25D | 1,400,000 | 1,673,482 | ||||||
2.38%, 01/15/27D | 200,000 | 223,376 | ||||||
| 3,395,961 | ||||||||
U.S. Treasury Notes | ||||||||
3.13%, 11/30/09D‡‡ | 3,050,000 | 3,082,647 | ||||||
2.63%, 05/31/10D | 34,515,000 | 34,547,375 | ||||||
3.88%, 09/15/10D | 25,388,000 | 26,054,460 | ||||||
4.50%, 11/15/10D | 16,800,000 | 17,494,327 | ||||||
3.50%, 05/31/13D | 1,500,000 | 1,511,603 | ||||||
| 82,690,412 | ||||||||
Total U.S. Treasury Obligations | 96,464,037 | |||||||
TOTAL INVESTMENTS — 123.0% | 983,131,325 | |||||||
| Number of Contracts | ||||||||
WRITTEN OPTIONS — (0.6)% | ||||||||
Call Options — 0.0% | ||||||||
10-Year U.S. Treasury Note Futures, Strike Price $116.00, Expires 08/22/08 | (76 | ) | (41,562 | ) | ||||
10-Year U.S. Treasury Note Futures, Strike Price $117.00, Expires 08/22/08 | (33 | ) | (11,344 | ) | ||||
1-Year Eurodollar Mid-CRV Futures, Strike Price $97.25, Expires 09/12/08 | (242 | ) | (37,812 | ) | ||||
90-Day Eurodollar Futures, Strike Price $97.875, Expires 09/15/08 | (74 | ) | (1,388 | ) | ||||
| (92,106 | ) | |||||||
Call Swaptions — (0.5)% | ||||||||
3-Month LIBOR, Strike Price $4.25, Expires 02/02/09 | (1,360 | ) | (179,976 | ) | ||||
3-Month LIBOR, Strike Price $4.26, Expires 04/20/09 | (3,380 | ) | (170,394 | ) | ||||
3-Month LIBOR, Strike Price $4.30, Expires 12/15/08 | (4,780 | ) | (625,996 | ) | ||||
3-Month LIBOR, Strike Price $4.30, Expires 12/15/08 | (60 | ) | (7,858 | ) | ||||
3-Month LIBOR, Strike Price $4.44, Expires 04/20/09 | (9,420 | ) | (731,546 | ) | ||||
3-Month LIBOR, Strike Price $4.60, Expires 02/02/09 | (630 | ) | (137,187 | ) | ||||
3-Month LIBOR, Strike Price $5.25, Expires 10/27/08 | (10 | ) | (57,732 | ) | ||||
3-Month LIBOR, Strike Price $5.25, Expires 10/27/08 | (7 | ) | (40,413 | ) | ||||
3-Month LIBOR, Strike Price $5.25, Expires 10/27/08 | (34 | ) | (192,975 | ) | ||||
3-Month LIBOR, Strike Price $7.00, Expires 03/18/09 | (1,490 | ) | (1,991,884 | ) | ||||
Euro vs. U.S. Dollar, Strike Price $1.50, Expires 06/20/13 | (160 | ) | (17,360 | ) | ||||
| (4,153,321 | ) | |||||||
Put Options — (0.1)% | ||||||||
10-Year U.S. Treasury Note Futures, Strike Price $110.00, Expires 08/22/08 | (76 | ) | (15,438 | ) | ||||
10-Year U.S. Treasury Note Futures, Strike Price $113.00, Expires 08/22/08 | (33 | ) | (29,391 | ) | ||||
1-Year Eurodollar Mid-CRV Futures, Strike Price $96.50, Expires 09/12/08 | (159 | ) | (204,712 | ) | ||||
90-Day Eurodollar Futures, Strike Price $96.75, Expires 12/15/08 | (37 | ) | (27,981 | ) | ||||
| (277,522 | ) | |||||||
Put Swaptions — 0.0% | ||||||||
3-Month LIBOR, Strike Price $5.25, Expires 10/27/08 | (34 | ) | (71,574 | ) | ||||
3-Month LIBOR, Strike Price $5.25, Expires 10/27/08 | (7 | ) | (15,307 | ) | ||||
3-Month LIBOR, Strike Price $5.25, Expires 10/27/08 | (10 | ) | (21,866 | ) | ||||
Euro vs. U.S. Dollar, Strike Price $1.83, Expires 09/20/08 | (160 | ) | (15,920 | ) | ||||
U.S. Dollar vs. Japanese Yen, Strike Price $100.00, Expires 09/16/08 | (68,000 | ) | (48,811 | ) | ||||
| (173,478 | ) | |||||||
Total Written Options | (4,696,427 | ) | ||||||
| See Notes to Financial Statements. | 45 |
Table of Contents
Low-Duration Bond Fund
SCHEDULE OF INVESTMENTS (Continued)
| Par | Value | |||||||
SECURITIES SOLD SHORT — (18.9)% | ||||||||
Mortgage-Backed Securities — (10.3)% | ||||||||
Federal National Mortgage Association | ||||||||
5.00%, 07/01/38 TBA | $ | (42,000,000 | ) | $ | (40,254,396 | ) | ||
5.50%, 01/14/38 TBA | (36,800,000 | ) | (36,271,000 | ) | ||||
Government National Mortgage Association | ||||||||
5.50%, 07/21/38 TBA | (6,000,000 | ) | (5,970,000 | ) | ||||
U.S. Treasury Obligations — (8.6)% | ||||||||
U.S. Treasury Bond | ||||||||
5.00%, 05/15/37 | (12,800,000 | ) | (13,760,013 | ) | ||||
U.S. Treasury Notes | ||||||||
4.25%, 11/15/17 | (36,300,000 | ) | (37,091,231 | ) | ||||
3.50%, 02/15/18 | (8,800,000 | ) | (8,473,441 | ) | ||||
3.63%, 06/30/13 | (9,500,000 | ) | (9,517,071 | ) | ||||
Total Securities Sold Short | (151,337,152 | ) | ||||||
Liabilities in Excess of Other Assets — (3.5)% | (27,718,143 | ) | ||||||
NET ASSETS — 100.0% | $ | 799,379,603 | ||||||
Swap agreements outstanding at June 30, 2008:
Description | Expiration Date | Notional Value | Unrealized Appreciation (Depreciation) | |||||
Australian Dollars | ||||||||
Receive fixed rate payments of 7.00% and pay variable rate payments on the three month BBSW floating rate(d) | 04/15/09 | 15,300,000 | $ | (105,892 | ) | |||
Receive fixed rate payments of 7.00% and pay variable rate payments on the three month BBSW floating rate(d) | 09/15/09 | 20,500,000 | (177,678 | ) | ||||
Receive fixed rate payments of 7.00% and pay variable rate payments on the three month BBSW floating rate(n) | 09/15/09 | 38,500,000 | (333,688 | ) | ||||
Receive fixed rate payments of 7.50% and pay variable rate payments on the six month LIBOR floating rate(f) | 03/15/11 | 7,100,000 | (43,206 | ) | ||||
| (660,464 | ) | |||||||
British Pounds | ||||||||
Receive variable rate payments on the six month LIBOR floating rate and pay fixed rate payments of 4.25%(k) | 06/15/37 | 1,200,000 | (58,534 | ) | ||||
Receive fixed rate payments of 4.50% and pay variable rate payments on the six month LIBOR floating rate(m) | 09/17/11 | 6,000,000 | (545,265 | ) | ||||
Receive fixed rate payments of 4.50% and pay variable rate payments on the six month LIBOR floating rate(b) | 09/17/11 | 4,800,000 | (436,212 | ) | ||||
Receive variable rate payments on the six month LIBOR floating rate and pay fixed rate payments of 4.25%(f) | 06/15/37 | 3,400,000 | (165,845 | ) | ||||
| 46 | See Notes to Financial Statements. |
Table of Contents
Description | Expiration Date | Notional Value | Unrealized Appreciation (Depreciation) | ||||||
Receive fixed rate payments of 4.50% and pay variable rate payments on the six month LIBOR floating rate(g) | 09/17/11 | 30,200,000 | $ | (2,744,500 | ) | ||||
Receive variable rate payments on the six month LIBOR floating rate and pay fixed rate payments of 4.00%(g) | 06/15/37 | 3,200,000 | (70,327 | ) | |||||
| (4,020,683 | ) | ||||||||
Canadian Dollars | |||||||||
Receive variable rate payments on the six month LIBOR floating rate and pay fixed rate payments of 4.50%(j) | 06/21/38 | 1,400,000 | (8,286 | ) | |||||
Euro | |||||||||
Receive fixed rate payments of 4.50% and pay variable rate payments on the six month LIBOR floating rate(f) | 06/15/10 | 12,200,000 | (310,116 | ) | |||||
Receive fixed rate payments of 2.09% and pay variable rate payments on the France CPI Ex Tobacco(c) | 10/15/10 | 1,500,000 | (35,798 | ) | |||||
Receive variable rate payments on the six month LIBOR floating rate and pay fixed rate payments of 5.00%(b) | 09/17/38 | 700,000 | (5,231 | ) | |||||
Receive variable rate payments on the six month LIBOR floating rate and pay fixed rate payments of 5.00%(m). | 09/17/38 | 700,000 | (5,231 | ) | |||||
Receive fixed rate payments of 5.50% and pay variable rate payments on the six month LIBOR floating rate(b) | 12/17/10 | 1,000,000 | 4,397 | ||||||
Receive fixed rate payments of 5.50% and pay variable rate payments on the six month LIBOR floating rate(k) | 12/17/10 | 4,400,000 | 19,349 | ||||||
Receive fixed rate payments of 5.50% and pay variable rate payments on the six month LIBOR floating rate(f) | 09/15/10 | 14,200,000 | 59,266 | ||||||
| (273,364 | ) | ||||||||
Japanese Yen | |||||||||
Receive variable rate payments on the six month LIBOR floating rate and pay fixed rate payments of 2.00%(m) | 12/17/17 | 130,000,000 | (12,930 | ) | |||||
Receive variable rate payments on the six month LIBOR floating rate and pay fixed rate payments of 2.00%(f) | 12/17/17 | 120,000,000 | (11,935 | ) | |||||
Receive variable rate payments on the six month LIBOR floating rate and pay fixed rate payments of 2.00%(b) | 12/17/17 | 30,000,000 | (2,984 | ) | |||||
| (27,849 | ) | ||||||||
U.S. Dollars | |||||||||
Receive variable rate payments on maturity and pay fixed rate payments of 4.50%(j) | 01/23/09 | $ | 4,300,000 | 532,793 | |||||
Receive fixed rate payments of 0.55% and pay floating par in the event of default on Deutsche Bank AG(m) | 12/20/08 | 3,200,000 | 2,390 | ||||||
Receive variable rate payments in the event of default on Citigroup, Inc. and pay fixed rate payments of 1.01%(f) | 06/20/18 | 6,400,000 | 201,467 | ||||||
| See Notes to Financial Statements. | 47 |
Table of Contents
Low-Duration Bond Fund
SCHEDULE OF INVESTMENTS (Continued)
Description | Expiration Date | Notional Value | Unrealized Appreciation (Depreciation) | ||||||
Receive variable rate payments in the event of default on Nabors Industries and pay fixed rate payments of 0.63%(d) | 03/20/18 | $ | 3,300,000 | $ | 63,407 | ||||
Receive variable rate payments in event of default on the Dow Jones CDX IG9 Index and pay fixed rate payments of 0.80%(g) | 12/20/17 | 7,100,000 | 284,617 | ||||||
Receive floating par in the event of default on the Dow Jones CDX HVOL7 Index and pay fixed rate payments of 0.75%(b) | 12/20/11 | 9,000,000 | 761,554 | ||||||
Receive floating par in the event of default on the Dow Jones CDX IG9 Index and pay fixed rate payments of 0.80%(k) | 12/20/17 | 5,400,000 | 216,470 | ||||||
Receive floating par in the event of default on Target Corporation BP MYC, 5.88% due 03/01/12 and pay fixed rate payments of 0.11%(k) | 06/20/12 | 900,000 | 16,758 | ||||||
Receive floating par in the event of default on the Dow Jones CDX HY-8 Index and pay fixed rate payments of 1.63%(d) | 06/20/12 | 4,900,000 | 390,288 | ||||||
Receive variable rate payments in the event of default on the Dow Jones CDX IG9 Index and pay fixed rate payments of 0.60%(g) | 12/20/12 | 1,500,000 | 50,231 | ||||||
Receive variable rate payments in the event of default on the Dow Jones CDX IG9 Index and pay fixed rate payments of 0.80%(b) | 12/20/17 | 2,500,000 | 100,217 | ||||||
Receive variable rate payments in the event of default on the Dow Jones CDX IG9 Index and pay fixed rate payments of 0.80%(m) | 12/20/17 | 2,100,000 | 84,183 | ||||||
Receive fixed rate payments of 4.00% and pay variable rate payments on the three month LIBOR floating rate(m) | 12/17/13 | 7,300,000 | (150,901 | ) | |||||
Receive fixed rate payments of 4.00% and pay variable rate payments on the three month LIBOR floating rate(d) | 12/17/13 | 21,800,000 | (450,637 | ) | |||||
Receive fixed rate payments of 4.00% and pay variable rate payments on the three month LIBOR floating rate(k) | 12/17/13 | 27,900,000 | (576,733 | ) | |||||
Receive variable rate payments on the three month LIBOR floating rate and pay fixed rate payments of 4.00%(m) | 12/17/10 | 121,700,000 | (149,131 | ) | |||||
Receive fixed rate payments of 5.00% and pay variable rate payments on the three month LIBOR floating rate(k) | 12/17/38 | 9,000,000 | (50,178 | ) | |||||
Receive fixed rate payments of 4.00% and pay variable rate payments on the three month LIBOR floating rate(f) | 12/17/13 | 8,500,000 | (175,707 | ) | |||||
Receive floating par in the event of default on American Electric Power and pay fixed rate payments of 6.26%(d) | 06/20/15 | 1,600,000 | 7,665 | ||||||
| 48 | See Notes to Financial Statements. |
Table of Contents
Description | Expiration Date | Notional Value | Unrealized Appreciation (Depreciation) | ||||||
Receive floating par in the event of default on the Dow Jones CDX IG7 Index and pay fixed rate payments of 0.65%(k) | 12/20/16 | $ | 3,600,000 | $ | 194,517 | ||||
Receive floating par in the event of default on Autozone, 5.88% due 10/15/12 and pay fixed rate payments of 0.64%(m) | 06/20/17 | 600,000 | 18,593 | ||||||
Receive floating par in the event of default on Autozone, 5.88% due 10/15/12 and pay fixed rate payments of 0.64%(m) | 06/20/17 | 500,000 | 15,321 | ||||||
Receive floating par in the event of default on Autozone, 5.88% due 10/15/12 and pay fixed rate payments of 0.67%(m) | 06/20/17 | 1,300,000 | 37,578 | ||||||
Receive variable rate payments on the three month LIBOR floating rate and pay fixed rate payments of 5.00%(j) | 12/17/23 | 2,900,000 | (15,599 | ) | |||||
Receive variable rate payments on the three month LIBOR floating rate and pay fixed rate payments of 5.00%(f) | 12/17/15 | 37,000,000 | (804,303 | ) | |||||
Receive floating par in the event of default on the Bear Stearns Co., Inc. and pay fixed rate payments of 2.20%(i) | 03/20/18 | 1,600,000 | (134,349 | ) | |||||
Receive floating par in the event of default on Bear Stearns Co., Inc. and pay fixed rate payments of 2.18%(c) | 03/20/18 | 1,700,000 | (140,264 | ) | |||||
Receive variable rate payments on the three month LIBOR floating rate and pay fixed rate payments of 5.00%(d) | 12/17/15 | 8,100,000 | (176,077 | ) | |||||
Receive variable rate payments on the three month LIBOR floating rate and pay fixed rate payments of 5.00%(m) | 12/17/23 | 15,800,000 | (84,989 | ) | |||||
Receive variable rate payments on the three month LIBOR floating rate and pay fixed rate payments of 5.00%(m) | 12/17/15 | 3,400,000 | (73,909 | ) | |||||
Receive floating par in the event of default on Morgan Stanley ABS Capital I, 7.02% due 12/27/33 and pay fixed rate payments of 0.54%(k) | 12/27/33 | 658,458 | 145,621 | ||||||
Receive floating par in the event of default on Long Beach Mortgage Trust, 6.72% due 02/25/34 and pay fixed rate payments of 0.49%(b) | 02/25/34 | 860,618 | 146,546 | ||||||
Receive floating par in the event of default on Specialty Underwriting & Residential Finance, 6.62% due 02/25/35 and pay fixed rate payments of 0.59%(b) | 02/25/35 | 1,024,593 | 138,111 | ||||||
Receive floating par in the event of default on Structured Asset Investment Loan Trust, 6.14% due 02/25/35 and pay fixed rate payments of 0.61%(b) | 02/25/35 | 1,137,620 | 1,035,993 | ||||||
Receive fixed rate payments of 5.00% and pay variable rate payments on the three month LIBOR floating rate(d) | 12/17/18 | 2,400,000 | 36,552 | ||||||
| See Notes to Financial Statements. | 49 |
Table of Contents
Low-Duration Bond Fund
SCHEDULE OF INVESTMENTS (Continued)
Description | Expiration Date | Notional Value | Unrealized Appreciation (Depreciation) | ||||||
Receive fixed rate payments of 4.00% and pay variable rate payments on the three month LIBOR floating rate(m) | 06/17/10 | $ | 205,300,000 | $ | 66,745 | ||||
Receive fixed rate payments of 4.00% and pay variable rate payments on the three month LIBOR floating rate(k) | 06/17/10 | 158,000,000 | 51,367 | ||||||
| 1,616,207 | |||||||||
| $ | (3,374,439 | ) | |||||||
PORTFOLIO SUMMARY (based on net assets) | |||
| % | |||
Mortgage-Backed Securities | 55.1 | ||
Futures Contracts | 25.1 | ||
Corporate Bonds | 14.5 | ||
Money Market Funds | 14.5 | ||
U.S. Treasury Obligations | 12.1 | ||
Asset-Backed Securities | 11.7 | ||
Agency Obligations | 6.5 | ||
Foreign Bonds | 5.1 | ||
Commercial Paper | 2.4 | ||
Municipal Bonds | 0.6 | ||
Purchased Options | 0.5 | ||
Swap Agreements | (0.4 | ) | |
Written Options | (0.6 | ) | |
Forward Foreign Currency Contracts | (1.1 | ) | |
Securities Sold Short | (18.9 | ) | |
| 131.1 | |||
FAS 157 DISCLOSURE
The following is a summary of the inputs used, as of June 30, 2008, in valuing the Fund’s investments carried at fair value:
Valuation Inputs | Investments in Securities | Other Financial Instruments* | ||||||
Assets: | ||||||||
Level 1 — Quoted Prices | $ | 119,841,405 | $ | (987,003 | ) | |||
Level 2 — Other Significant Observable Inputs | 858,641,073 | (220,643 | ) | |||||
Level 3 — Significant Unobservable Inputs | 4,648,847 | — | ||||||
Total Assets | $ | 983,131,325 | $ | (1,207,646 | ) | |||
Liabilities: | ||||||||
Level 1 — Quoted Prices | $ | (4,390,642 | ) | $ | — | |||
Level 2 — Other Significant Observable Inputs | (151,642,937 | ) | (3,374,439 | ) | ||||
Level 3 — Significant Unobservable Inputs | — | — | ||||||
Total Liabilities | $ | (156,033,579 | ) | $ | (3,374,439 | ) | ||
| * | Other financial instruments are derivative instruments not reflected in the Schedule of Investments, such as futures, forwards and swap contracts, which are valued at the unrealized appreciation (depreciation) on the investment. |
| ** | The fair value of Level 3 securities is equal to 0.58% of the Fund’s Net Assets. The fair value of the Level 3 securities does not have a significant impact on the amounts reported. |
| 50 | See Notes to Financial Statements. |
Table of Contents
SCHEDULE OF INVESTMENTS | June 30, 2008 (Unaudited) |
| Par | Value | |||||
AGENCY OBLIGATIONS — 8.2% | ||||||
Federal Home Loan Bank | ||||||
2.11%, 07/02/08 | $ | 6,600,000 | $ | 6,599,613 | ||
2.17%, 07/02/08 | 13,200,000 | 13,199,204 | ||||
2.12%, 07/07/08 | 400,000 | 399,859 | ||||
2.21%, 07/11/08 | 32,700,000 | 32,679,926 | ||||
2.21%, 07/16/08 | 18,300,000 | 18,283,149 | ||||
2.20%, 07/18/08 | 8,000,000 | 7,991,689 | ||||
2.34%, 09/10/08 | 2,200,000 | 2,189,955 | ||||
4.63%, 10/10/12 | 890,000 | 912,438 | ||||
Federal Home Loan Mortgage Corporation | ||||||
5.25%, 07/18/11 | 3,160,000 | 3,310,030 | ||||
5.63%, 11/23/35 | 1,260,000 | 1,258,531 | ||||
Federal National Mortgage Association | ||||||
1.38%, 12/15/08‡‡ | 367,000 | 362,769 | ||||
2.28%, 12/15/08‡‡ | 22,000 | 21,746 | ||||
Government National Mortgage Association | ||||||
5.50%, 07/21/38 | 2,400,000 | 2,388,000 | ||||
Tennessee Valley Authority | ||||||
5.38%, 04/01/46 | 1,800,000 | 1,823,848 | ||||
Total Agency Obligations |
| 91,420,757 | ||||
ASSET-BACKED SECURITIES — 3.7% | ||||||
Amortizing Residential Collateral Trust | ||||||
3.18%, 04/25/32† | 51,236 | 34,848 | ||||
Argent Securities, Inc. | ||||||
2.53%, 10/25/36† | 652,962 | 634,584 | ||||
Asset-Backed Securities Corporation Home Equity | ||||||
2.76%, 09/25/34† | 168,112 | 143,973 | ||||
Bayview Financial Acquisition Trust | ||||||
3.06%, 02/28/44† | 728,610 | 653,679 | ||||
Bear Stearns Asset-Backed Securities, Inc. | ||||||
6.00%, 02/01/36 | 4,329,011 | 3,773,006 | ||||
6.50%, 02/01/36 | 4,174,444 | 3,276,939 | ||||
Chase Issuance Trust | ||||||
3.12%, 11/15/11† | 4,400,000 | 4,410,127 | ||||
CIT Mortgage Loan Trust | ||||||
4.35%, 09/25/24 144A† | 800,000 | 420,000 | ||||
3.90%, 10/25/37 144A† | 1,417,657 | 1,275,891 | ||||
4.15%, 10/25/37 144A† | 430,000 | 279,500 | ||||
Countrywide Home Equity Loan Trust | ||||||
2.76%, 05/15/29† | 526,303 | 330,481 | ||||
2.71%, 12/15/35† | 1,483,382 | 871,902 | ||||
2.61%, 08/15/36† | 2,205,565 | 1,392,053 | ||||
Daimler Chrysler Auto Trust | ||||||
3.98%, 09/10/12† | 4,300,000 | 4,342,777 | ||||
EMC Mortgage Loan Trust | ||||||
3.03%, 11/25/41 144A† | 291,528 | 287,075 | ||||
FBR Securitization Trust | ||||||
2.74%, 10/25/35 STEP | 2,799,191 | 2,720,624 | ||||
Ford Credit Auto Owner Trust | ||||||
3.37%, 01/15/11† | 2,100,000 | 2,105,982 | ||||
Franklin Auto Trust | ||||||
4.03%, 06/20/12† | 700,000 | 698,693 | ||||
GMAC Mortgage Corporation Loan Trust | ||||||
7.00%, 09/25/37 | 663,717 | 499,740 | ||||
HFC Home Equity Loan Asset-Backed Certificates | ||||||
4.00%, 11/20/36† | 1,425,695 | 1,202,702 | ||||
Lehman XS Trust | ||||||
2.78%, 11/25/35† | 1,470,826 | 1,110,303 | ||||
3.20%, 11/25/35† | 1,193,781 | 894,954 | ||||
2.75%, 02/25/36† | 1,514,301 | 1,149,129 | ||||
Madison Avenue Manufactured Housing Contract | ||||||
2.83%, 09/25/08† | 881,832 | 778,705 | ||||
Morgan Stanley Dean Witter Credit Corporation HELOC Trust | ||||||
2.79%, 07/25/17 STEP | 132,289 | 89,501 | ||||
Nelnet Student Loan Trust | ||||||
2.93%, 01/26/15† | 258,523 | 258,433 | ||||
4.10%, 04/25/24† | 780,000 | 782,028 | ||||
Provident Bank Home Equity Loan Trust | ||||||
3.02%, 08/25/31† | 175,574 | 118,348 | ||||
Residential Asset Mortgage Products, Inc. | ||||||
2.96%, 03/25/34 STEP | 454,648 | 359,527 | ||||
Residential Funding Securities Corporation | ||||||
2.93%, 06/25/33 144A† | 591,626 | 461,006 | ||||
Salomon Brothers Mortgage Securities VII | ||||||
2.96%, 03/25/28 STEP | 65,929 | 64,676 | ||||
Securitized Asset-Backed Receivables LLC Trust | ||||||
2.62%, 02/25/37† | 4,130,967 | 2,797,434 | ||||
Structured Asset Securities Corporation | ||||||
2.78%, 04/25/31 144A† | 3,845,605 | 2,881,201 | ||||
Total Asset-Backed Securities |
| 41,099,821 | ||||
COMMERCIAL PAPER — 1.4% | ||||||
General Electric Capital Corporation | ||||||
2.40%, 08/01/08 | ||||||
(Cost $15,268,380) | 15,300,000 | 15,268,380 | ||||
CORPORATE BONDS — 25.9% | ||||||
Ace INA Holdings, Inc. | ||||||
5.80%, 03/15/18D | 575,000 | 553,571 | ||||
AES Corporation | ||||||
8.75%, 05/15/13 144A | 325,000 | 338,812 | ||||
7.75%, 10/15/15D | 270,000 | 267,300 | ||||
8.00%, 10/15/17D | 1,490,000 | 1,467,650 | ||||
Allied Waste North America, Inc. | ||||||
7.13%, 05/15/16D | 125,000 | 125,000 | ||||
Allstate Life Global Funding Trusts | ||||||
5.38%, 04/30/13 | 400,000 | 398,850 | ||||
American Achievement Corporation | ||||||
8.25%, 04/01/12 | 30,000 | 29,550 | ||||
American Electric Power Co., Inc. | ||||||
5.25%, 06/01/15 | 2,300,000 | 2,218,166 | ||||
| See Notes to Financial Statements. | 51 |
Table of Contents
Medium-Duration Bond Fund
SCHEDULE OF INVESTMENTS (Continued)
| Par | Value | |||||
American Express Bank UT | ||||||
6.00%, 09/13/17 | $ | 3,100,000 | $ | 2,996,258 | ||
American Express Co. | ||||||
7.00%, 03/19/18 | 2,500,000 | 2,535,118 | ||||
6.80%, 09/01/49†D | 1,340,000 | 1,240,770 | ||||
American Express Credit Corporation | ||||||
5.88%, 05/02/13D | 4,300,000 | 4,279,394 | ||||
American General Finance Corporation | ||||||
6.90%, 12/15/17 | 780,000 | 680,945 | ||||
American International Group, Inc. | ||||||
5.85%, 01/16/18D | 1,220,000 | 1,144,997 | ||||
6.25%, 03/15/37D | 805,000 | 631,935 | ||||
AmerisourceBergen Corporation | ||||||
5.88%, 09/15/15D | 130,000 | 127,638 | ||||
Ameritech Capital Funding Corporation | ||||||
6.25%, 05/18/09 | 100,000 | 101,310 | ||||
AMFM, Inc. | ||||||
8.00%, 11/01/08 | 1,075,000 | 1,091,064 | ||||
Anadarko Petroleum Corporation | ||||||
3.18%, 09/15/09† | 1,070,000 | 1,058,059 | ||||
6.45%, 09/15/36 | 140,000 | 138,637 | ||||
ANZ Capital Trust I | ||||||
4.48%, 01/29/49 144A | 125,000 | 121,090 | ||||
ANZ Capital Trust II | ||||||
5.36%, 12/29/49 144A | 800,000 | 728,482 | ||||
ASIF Global Financing XIX | ||||||
4.90%, 01/17/13 144A | 100,000 | 96,171 | ||||
Astoria Financial Corporation | ||||||
5.75%, 10/15/12 | 450,000 | 419,568 | ||||
AT&T, Inc. | ||||||
5.10%, 09/15/14D | 550,000 | 539,856 | ||||
5.50%, 02/01/18 | 7,700,000 | 7,475,029 | ||||
6.40%, 05/15/38 | 275,000 | 264,105 | ||||
BAC Capital Trust XIV | ||||||
5.63%, 12/31/49† | 40,000 | 31,238 | ||||
Bank of America Corporation | ||||||
2.97%, 10/14/16†D | 1,700,000 | 1,539,748 | ||||
5.75%, 12/01/17 | 3,130,000 | 2,944,648 | ||||
5.65%, 05/01/18 | 5,925,000 | 5,541,676 | ||||
8.13%, 12/15/49† | 20,000 | 18,930 | ||||
8.00%, 12/29/49†D | 12,300,000 | 11,542,197 | ||||
Bank of America NA | ||||||
3.37%, 05/12/10† | 4,100,000 | 4,083,776 | ||||
Bear Stearns Co., Inc. | ||||||
6.95%, 08/10/12 | 900,000 | 936,625 | ||||
6.40%, 10/02/17 | 750,000 | 742,420 | ||||
7.25%, 02/01/18 | 3,260,000 | 3,407,896 | ||||
BellSouth Capital Funding | ||||||
7.88%, 02/15/30 | 460,000 | 509,503 | ||||
BellSouth Corporation | ||||||
4.75%, 11/15/12D | 40,000 | 39,347 | ||||
6.88%, 10/15/31 | 10,000 | 10,018 | ||||
Boardwalk Pipelines LP | ||||||
5.88%, 11/15/16 | 625,000 | 601,009 | ||||
Boeing Co. | ||||||
6.63%, 02/15/38 | 210,000 | 223,952 | ||||
Caterpillar Financial Services Corporation | ||||||
3.56%, 06/24/11† | 3,800,000 | 3,797,997 | ||||
CenterPoint Energy Resources Corporation | ||||||
5.95%, 01/15/14 | 525,000 | 515,242 | ||||
Chesapeake Energy Corporation | ||||||
6.25%, 01/15/18 | 140,000 | 129,500 | ||||
7.25%, 12/15/18 | 205,000 | 200,388 | ||||
Chubb Corporation | ||||||
6.50%, 05/15/38 | 150,000 | 143,798 | ||||
6.38%, 03/29/49† | 375,000 | 343,588 | ||||
CitiFinancial, Inc. | ||||||
6.63%, 06/01/15 | 300,000 | 296,746 | ||||
Citigroup, Inc. | ||||||
5.50%, 04/11/13 | 1,780,000 | 1,739,035 | ||||
5.85%, 07/02/13D | 1,050,000 | 1,040,377 | ||||
5.50%, 02/15/17 | 1,160,000 | 1,059,623 | ||||
6.13%, 05/15/18D | 8,700,000 | 8,340,716 | ||||
6.88%, 03/05/38D | 1,965,000 | 1,902,071 | ||||
8.40%, 04/30/49† | 425,000 | 404,540 | ||||
Citizens Communications Co. | ||||||
9.25%, 05/15/11D | 415,000 | 431,600 | ||||
7.88%, 01/15/27 | 150,000 | 132,000 | ||||
Clear Channel Communications, Inc. | ||||||
4.25%, 05/15/09 | 250,000 | 241,300 | ||||
5.50%, 09/15/14 | 765,000 | 459,535 | ||||
Comcast Cable Communications Holdings, Inc. | ||||||
6.75%, 01/30/11 | 230,000 | 238,415 | ||||
8.38%, 03/15/13 | 225,000 | 247,915 | ||||
9.46%, 11/15/22 | 275,000 | 333,170 | ||||
Comcast Corporation | ||||||
6.50%, 01/15/17 | 60,000 | 60,454 | ||||
5.70%, 05/15/18D | 1,890,000 | 1,796,396 | ||||
Comcast Holdings Corporation | ||||||
10.63%, 07/15/12 | 550,000 | 632,680 | ||||
Commonwealth Edison Co. | ||||||
5.40%, 12/15/11 | 650,000 | 652,594 | ||||
5.90%, 03/15/36 | 200,000 | 181,151 | ||||
Community Health Systems, Inc. | ||||||
8.88%, 07/15/15D | 405,000 | 409,556 | ||||
Complete Production Services, Inc. | ||||||
8.00%, 12/15/16D | 280,000 | 281,050 | ||||
ConocoPhillips | ||||||
8.75%, 05/25/10 | 230,000 | 250,408 | ||||
ConocoPhillips Holding Co. | ||||||
6.95%, 04/15/29 | 1,570,000 | 1,726,801 | ||||
Countrywide Home Loans, Inc. | ||||||
6.25%, 04/15/09D | 375,000 | 369,474 | ||||
5.63%, 07/15/09 | 2,100,000 | 2,048,392 | ||||
4.13%, 09/15/09 | 475,000 | 453,794 | ||||
Cox Communications, Inc. | ||||||
4.63%, 01/15/10D | 800,000 | 795,877 | ||||
CSC Holdings, Inc. | ||||||
7.63%, 04/01/11D | 590,000 | 581,150 | ||||
6.75%, 04/15/12D | 60,000 | 56,700 | ||||
CVS Pass-Through Trust | ||||||
6.94%, 01/10/30 144A | 995,518 | 959,436 | ||||
Daimler Finance NA LLC | ||||||
5.88%, 03/15/11D | 590,000 | 597,958 | ||||
5.75%, 09/08/11D | 900,000 | 918,431 | ||||
7.30%, 01/15/12 | 550,000 | 582,487 | ||||
6.50%, 11/15/13 | 100,000 | 103,814 | ||||
| 52 | See Notes to Financial Statements. |
Table of Contents
| Par | Value | |||||
DaVita, Inc. | ||||||
6.63%, 03/15/13 144AD | $ | 310,000 | $ | 299,150 | ||
Dean Foods Co. | ||||||
7.00%, 06/01/16D | 375,000 | 327,187 | ||||
Delta Air Lines, Inc. | ||||||
6.82%, 08/10/22 | 486,420 | 396,432 | ||||
DI Finance | ||||||
9.50%, 02/15/13 | 90,000 | 90,000 | ||||
DirecTV Holdings LLC | ||||||
8.38%, 03/15/13 | 155,000 | 160,425 | ||||
Dominion Resources, Inc. | ||||||
5.13%, 12/15/09 | 230,000 | 232,651 | ||||
3.83%, 06/17/10† | 4,000,000 | 4,004,648 | ||||
4.75%, 12/15/10 | 70,000 | 70,489 | ||||
5.70%, 09/17/12D | 1,230,000 | 1,250,026 | ||||
DRS Technologies, Inc. | ||||||
6.63%, 02/01/16D | 90,000 | 91,800 | ||||
Dryden Investor Trust | ||||||
7.16%, 07/23/08 144A | 240,754 | 240,952 | ||||
Duke Energy Corporation | ||||||
5.63%, 11/30/12D | 580,000 | 597,365 | ||||
Dynegy Holdings, Inc. | ||||||
7.75%, 06/01/19 | 395,000 | 361,425 | ||||
Eastman Kodak Co. | ||||||
7.25%, 11/15/13D | 490,000 | 478,975 | ||||
EchoStar DBS Corporation | ||||||
7.00%, 10/01/13D | 10,000 | 9,575 | ||||
6.63%, 10/01/14 | 30,000 | 27,825 | ||||
7.13%, 02/01/16 | 200,000 | 185,500 | ||||
Edison Mission Energy | ||||||
7.00%, 05/15/17D | 240,000 | 225,600 | ||||
7.20%, 05/15/19D | 320,000 | 300,000 | ||||
7.63%, 05/15/27 | 120,000 | 108,300 | ||||
El Paso Corporation | ||||||
7.00%, 06/15/17D | 890,000 | 875,482 | ||||
8.05%, 10/15/30D | 400,000 | 411,006 | ||||
7.80%, 08/01/31D | 950,000 | 961,459 | ||||
7.75%, 01/15/32D | 99,000 | 99,672 | ||||
El Paso Natural Gas Co. | ||||||
7.50%, 11/15/26 | 300,000 | 306,472 | ||||
8.38%, 06/15/32 | 210,000 | 235,558 | ||||
El Paso Performance-Linked Trust | ||||||
7.75%, 07/15/11 144A | 1,460,000 | 1,478,151 | ||||
Electronic Data Systems Corporation | ||||||
7.13%, 10/15/09 | 1,000,000 | 1,031,582 | ||||
Energy Future Holdings Corporation | ||||||
6.50%, 11/15/24 | 370,000 | 274,837 | ||||
6.55%, 11/15/34D | 1,620,000 | 1,188,396 | ||||
Energy Transfer Partners LP | ||||||
5.65%, 08/01/12 | 275,000 | 277,523 | ||||
5.95%, 02/01/15 | 975,000 | 961,360 | ||||
6.70%, 07/01/18 | 1,180,000 | 1,189,815 | ||||
Entergy Gulf States, Inc. | ||||||
3.43%, 12/08/08 144A†D | 881,000 | 880,523 | ||||
Enterprise Products Operating LP | ||||||
4.95%, 06/01/10 | 650,000 | 650,151 | ||||
7.03%, 01/15/38† | 350,000 | 306,498 | ||||
8.38%, 08/01/45† | 350,000 | 350,406 | ||||
Exelon Corporation | ||||||
5.63%, 06/15/35D | 675,000 | 583,657 | ||||
Ferro Corporation | ||||||
9.13%, 01/01/09 | 375,000 | 388,702 | ||||
FirstEnergy Corporation | ||||||
6.45%, 11/15/11 | 60,000 | 61,612 | ||||
7.38%, 11/15/31D | 1,490,000 | 1,624,914 | ||||
Fiserv, Inc. | ||||||
6.13%, 11/20/12 | 575,000 | 578,454 | ||||
Ford Motor Co. | ||||||
7.45%, 07/16/31 | 550,000 | 323,125 | ||||
Ford Motor Credit Co. | ||||||
7.38%, 10/28/09 | 650,000 | 592,182 | ||||
5.70%, 01/15/10 | 125,000 | 106,683 | ||||
7.88%, 06/15/10D | 500,000 | 431,762 | ||||
10.94%, 06/15/11†D | 607,000 | 494,257 | ||||
8.00%, 12/15/16 | 1,300,000 | 946,092 | ||||
Ford Motor Credit Co., LLC | ||||||
12.00%, 05/15/15 | 1,320,000 | 1,162,440 | ||||
Forest City Enterprises, Inc. | ||||||
7.63%, 06/01/15D | 20,000 | 18,700 | ||||
6.50%, 02/01/17 | 70,000 | 61,250 | ||||
Freeport-McMoRan Copper & Gold, Inc. | ||||||
8.38%, 04/01/17 | 1,420,000 | 1,500,429 | ||||
Freescale Semiconductor, Inc. | ||||||
8.88%, 12/15/14D | 75,000 | 61,312 | ||||
General Electric Capital Corporation | ||||||
5.45%, 01/15/13D | 150,000 | 153,279 | ||||
General Electric Co. | ||||||
5.00%, 02/01/13 | 920,000 | 927,561 | ||||
General Motors Acceptance Corporation | ||||||
5.85%, 01/14/09D | 220,000 | 208,933 | ||||
5.63%, 05/15/09D | 1,490,000 | 1,379,865 | ||||
7.75%, 01/19/10D | 500,000 | 427,710 | ||||
6.88%, 09/15/11 | 2,315,000 | 1,664,585 | ||||
6.75%, 12/01/14 | 1,900,000 | 1,256,305 | ||||
8.00%, 11/01/31D | 200,000 | 130,373 | ||||
General Motors Corporation | ||||||
8.25%, 07/15/23D | 210,000 | 123,375 | ||||
8.38%, 07/05/33(E) | 170,000 | 145,005 | ||||
Georgia Gulf Corporation | ||||||
9.50%, 10/15/14D | 60,000 | 45,150 | ||||
Georgia-Pacific Corporation | ||||||
8.13%, 05/15/11 | 4,000 | 3,970 | ||||
GlaxoSmithKline Capital, Inc. | ||||||
5.65%, 05/15/18D | 1,470,000 | 1,467,129 | ||||
Glen Meadow Pass-Through Trust | ||||||
6.51%, 02/12/47 144A† | 600,000 | 518,839 | ||||
Goldman Sachs Capital II | ||||||
5.79%, 12/29/49† | 60,000 | 41,755 | ||||
Goldman Sachs Group LP | ||||||
4.50%, 06/15/10D | 930,000 | 931,678 | ||||
Goldman Sachs Group, Inc. | ||||||
5.75%, 10/01/16D | 1,900,000 | 1,845,822 | ||||
6.25%, 09/01/17D | 4,000,000 | 3,961,060 | ||||
5.95%, 01/18/18 | 3,500,000 | 3,365,848 | ||||
GrafTech Finance, Inc. | ||||||
10.25%, 02/15/12D | 139,000 | 144,560 | ||||
| See Notes to Financial Statements. | 53 |
Table of Contents
Medium-Duration Bond Fund
SCHEDULE OF INVESTMENTS (Continued)
| Par | Value | |||||
HCA, Inc. | ||||||
6.30%, 10/01/12 | $ | 32,000 | $ | 28,880 | ||
9.13%, 11/15/14D | 60,000 | 61,500 | ||||
6.50%, 02/15/16D | 686,000 | 574,525 | ||||
9.25%, 11/15/16 | 480,000 | 495,600 | ||||
9.63%, 11/15/16 PIK | 466,000 | 481,145 | ||||
7.69%, 06/15/25 | 250,000 | 205,692 | ||||
Hertz Corporation | ||||||
8.88%, 01/01/14D | 115,000 | 105,800 | ||||
10.50%, 01/01/16D | 65,000 | 59,475 | ||||
Hess Corporation | ||||||
7.88%, 10/01/29 | 260,000 | 299,015 | ||||
7.30%, 08/15/31 | 1,060,000 | 1,187,339 | ||||
Host Hotels & Resorts LP | ||||||
6.75%, 06/01/16 | 30,000 | 26,775 | ||||
HSBC Finance Corporation | ||||||
8.00%, 07/15/10D | 440,000 | 460,324 | ||||
7.00%, 05/15/12 | 390,000 | 404,302 | ||||
6.38%, 11/27/12 | 70,000 | 71,846 | ||||
Idearc, Inc. | ||||||
8.00%, 11/15/16 | 340,000 | 215,475 | ||||
ILFC E-Capital Trust II | ||||||
6.25%, 12/21/45 144A†D | 280,000 | 234,037 | ||||
International Lease Finance Corporation | ||||||
4.95%, 02/01/11 | 300,000 | 284,228 | ||||
iStar Financial, Inc. | ||||||
5.13%, 04/01/11D | 175,000 | 149,717 | ||||
5.65%, 09/15/11 | 250,000 | 213,900 | ||||
5.95%, 10/15/13 | 200,000 | 164,177 | ||||
6.50%, 12/15/13D | 125,000 | 107,618 | ||||
JC Penny Co., Inc. | ||||||
7.40%, 04/01/37 | 50,000 | 45,018 | ||||
John Deere Capital Corporation | ||||||
3.44%, 06/10/11†D | 6,100,000 | 6,098,188 | ||||
JPMorgan Chase & Co. | ||||||
5.75%, 01/02/13 | 320,000 | 322,388 | ||||
5.15%, 10/01/15D | 1,890,000 | 1,822,501 | ||||
6.00%, 01/15/18 | 1,025,000 | 1,000,279 | ||||
7.90%, 04/30/49† | 875,000 | 822,876 | ||||
JPMorgan Chase Bank NA | ||||||
6.00%, 10/01/17 | 475,000 | 462,241 | ||||
Jupiter Securitization Co., LLC | ||||||
3.00%, 07/12/10 | 700,000 | 697,177 | ||||
Kansas City Southern Railway | ||||||
8.00%, 06/01/15D | 120,000 | 121,800 | ||||
Kerr-McGee Corporation | ||||||
6.95%, 07/01/24 | 1,000,000 | 1,039,783 | ||||
7.88%, 09/15/31 | 1,830,000 | 2,135,185 | ||||
Kinder Morgan Energy Partners LP | ||||||
6.30%, 02/01/09D | 150,000 | 151,543 | ||||
6.75%, 03/15/11D | 150,000 | 154,711 | ||||
7.13%, 03/15/12 | 500,000 | 522,378 | ||||
5.00%, 12/15/13 | 200,000 | 191,906 | ||||
6.00%, 02/01/17 | 510,000 | 504,762 | ||||
5.95%, 02/15/18 | 830,000 | 810,087 | ||||
6.95%, 01/15/38D | 60,000 | 59,737 | ||||
Kraft Foods, Inc. | ||||||
6.50%, 08/11/17 | 300,000 | 300,893 | ||||
Kroger Co. | ||||||
6.15%, 01/15/20 | 500,000 | 495,717 | ||||
L-3 Communications Corporation | ||||||
7.63%, 06/15/12 | 250,000 | 253,125 | ||||
6.38%, 10/15/15 | 370,000 | 347,800 | ||||
Lamar Media Corporation | ||||||
7.25%, 01/01/13D | 110,000 | 106,288 | ||||
6.63%, 08/15/15 | 80,000 | 73,200 | ||||
Land O’Lakes, Inc. | ||||||
9.00%, 12/15/10 | 125,000 | 129,375 | ||||
Lehman Brothers Holdings Capital Trust V | ||||||
5.86%, 11/29/49† | 2,605,000 | 1,701,101 | ||||
Lehman Brothers Holdings, Inc. | ||||||
5.25%, 02/06/12D | 390,000 | 369,365 | ||||
5.38%, 10/17/12(E) | 600,000 | 842,082 | ||||
5.63%, 01/24/13D | 2,575,000 | 2,439,645 | ||||
6.20%, 09/26/14D | 925,000 | 884,000 | ||||
6.50%, 07/19/17 | 150,000 | 138,998 | ||||
6.75%, 12/28/17 | 4,340,000 | 4,084,053 | ||||
Liberty Media Corporation | ||||||
7.88%, 07/15/09D | 10,000 | 10,147 | ||||
5.70%, 05/15/13D | 25,000 | 22,529 | ||||
3.75%, 02/15/30 CONV | 40,000 | 20,650 | ||||
Lincoln National Corporation | ||||||
7.00%, 05/17/49† | 775,000 | 706,954 | ||||
Merrill Lynch & Co., Inc. | ||||||
5.45%, 02/05/13 | 2,645,000 | 2,497,245 | ||||
5.70%, 05/02/17 | 400,000 | 352,763 | ||||
6.40%, 08/28/17D | 775,000 | 719,347 | ||||
Metlife Capital Trust IV | ||||||
7.88%, 12/15/37 144A | 300,000 | 294,825 | ||||
MetLife Capital Trust X | ||||||
9.25%, 04/08/38 144A† | 300,000 | 323,900 | ||||
MetLife, Inc. | ||||||
6.40%, 12/15/36 | 150,000 | 131,363 | ||||
Midamerican Energy Holdings Co. | ||||||
6.13%, 04/01/36D | 750,000 | 722,542 | ||||
5.95%, 05/15/37 | 150,000 | 141,188 | ||||
Mizuho JGB Investment LLC | ||||||
9.87%, 12/31/49 144A†@ | 250,000 | 250,000 | ||||
Morgan Stanley | ||||||
4.78%, 05/14/10† | 3,100,000 | 3,089,671 | ||||
5.63%, 01/09/12 | 410,000 | 410,628 | ||||
5.75%, 08/31/12D | 3,325,000 | 3,301,662 | ||||
3.18%, 10/18/16† | 340,000 | 295,454 | ||||
5.75%, 10/18/16D | 3,700,000 | 3,425,664 | ||||
5.95%, 12/28/17 | 450,000 | 409,228 | ||||
6.63%, 04/01/18 | 5,475,000 | 5,196,788 | ||||
Nelnet, Inc. | ||||||
7.40%, 09/29/36† | 475,000 | 310,752 | ||||
Nevada Power Co. | ||||||
5.88%, 01/15/15 | 350,000 | 351,122 | ||||
6.65%, 04/01/36 | 300,000 | 291,060 | ||||
New Cingular Wireless Services, Inc. | ||||||
8.13%, 05/01/12 | 135,000 | 147,987 | ||||
Nextel Communications, Inc. | ||||||
5.95%, 03/15/14 | 294,000 | 236,205 | ||||
7.38%, 08/01/15 | 130,000 | 107,970 | ||||
Niagara Mohawk Power Corporation | ||||||
7.75%, 10/01/08 | 1,340,000 | 1,351,424 | ||||
Nortek, Inc. | ||||||
8.50%, 09/01/14D | 62,000 | 39,990 | ||||
| 54 | See Notes to Financial Statements. |
Table of Contents
| Par | Value | |||||
NRG Energy, Inc. | ||||||
7.25%, 02/01/14 | $ | 285,000 | $ | 272,888 | ||
7.38%, 02/01/16 | 80,000 | 75,500 | ||||
7.38%, 01/15/17D | 35,000 | 33,162 | ||||
Omnicom Group, Inc. | ||||||
5.90%, 04/15/16 | 700,000 | 685,015 | ||||
ONEOK Partners LP | ||||||
6.65%, 10/01/36D | 375,000 | 358,527 | ||||
6.85%, 10/15/37 | 325,000 | 318,600 | ||||
Overseas Private Investment Corporation | ||||||
3.98%, 07/12/10 | 3,600,000 | 3,568,538 | ||||
4.81%, 07/12/12 | 3,000,000 | 2,959,384 | ||||
Oxford Industries, Inc. | ||||||
8.88%, 06/01/11 | 95,000 | 92,150 | ||||
Pacific Energy Partners LP | ||||||
7.13%, 06/15/14 | 60,000 | 60,557 | ||||
Pacific Gas & Electric Co. | ||||||
6.05%, 03/01/34 | 580,000 | 561,038 | ||||
5.80%, 03/01/37D | 250,000 | 233,863 | ||||
PartnerRe Finance II | ||||||
6.44%, 12/01/49† | 75,000 | 59,668 | ||||
Patrons’ Legacy | ||||||
5.65%, 01/17/17 144A | 1,320,891 | 1,084,121 | ||||
Peabody Energy Corporation | ||||||
6.88%, 03/15/13 | 145,000 | 146,088 | ||||
7.88%, 11/01/26 | 2,000,000 | 2,020,000 | ||||
Pemex Project Funding Master Trust | ||||||
9.13%, 10/13/10 | 235,000 | 256,738 | ||||
6.63%, 06/15/35 | 159,000 | 157,665 | ||||
Phoenix Life Insurance Co. | ||||||
7.15%, 12/15/34 144A | 425,000 | 422,231 | ||||
Pricoa Global Funding I | ||||||
3.00%, 01/30/12 144A† | 2,300,000 | 2,248,229 | ||||
3.01%, 09/27/13 144A† | 1,700,000 | 1,657,503 | ||||
Pride International, Inc. | ||||||
7.38%, 07/15/14 | 130,000 | 130,325 | ||||
Private Export Funding Corporation | ||||||
5.45%, 09/15/17 | 3,200,000 | 3,368,637 | ||||
Progress Energy, Inc. | ||||||
5.63%, 01/15/16D | 150,000 | 148,655 | ||||
7.75%, 03/01/31 | 350,000 | 401,100 | ||||
PVNGS II Funding Corporation, Inc. | ||||||
8.00%, 12/30/15 | 1,431,000 | 1,577,072 | ||||
Qwest Capital Funding, Inc. | ||||||
7.25%, 02/15/11 | 200,000 | 195,000 | ||||
Qwest Corporation | ||||||
5.63%, 11/15/08 | 600,000 | 601,500 | ||||
8.88%, 03/15/12 | 200,000 | 205,000 | ||||
7.50%, 06/15/23 | 500,000 | 447,500 | ||||
Rabobank Capital Funding II | ||||||
5.26%, 12/29/13 144A† | 50,000 | 45,857 | ||||
Rabobank Capital Funding Trust III | ||||||
5.25%, 10/31/49 144A† | 350,000 | 301,061 | ||||
Reinsurance Group of America, Inc. | ||||||
6.75%, 12/15/35† | 250,000 | 196,855 | ||||
Residential Capital LLC | ||||||
6.46%, 04/17/09† | 90,000 | 65,250 | ||||
6.46%, 05/22/09† | 260,000 | 188,500 | ||||
8.38%, 06/30/10D | 600,000 | 255,000 | ||||
6.00%, 02/22/11 | 490,000 | 193,550 | ||||
6.50%, 06/01/12 | 30,000 | 11,850 | ||||
RH Donnelley Corporation | ||||||
8.88%, 10/15/17 144A | 115,000 | 69,000 | ||||
SemGroup LP | ||||||
8.75%, 11/15/15 144AD | 65,000 | 63,375 | ||||
Service Corporation International | ||||||
7.63%, 10/01/18 | 90,000 | 90,225 | ||||
7.50%, 04/01/27 | 200,000 | 171,000 | ||||
Simon Property Group LP REIT | ||||||
6.13%, 05/30/18 | 1,000,000 | 974,574 | ||||
SLM Corporation | ||||||
5.45%, 04/25/11D | 350,000 | 319,838 | ||||
5.00%, 10/01/13 | 350,000 | 302,969 | ||||
Sonat, Inc. | ||||||
7.63%, 07/15/11D | 460,000 | 466,655 | ||||
Southern Natural Gas Co. | ||||||
8.00%, 03/01/32 | 400,000 | 434,069 | ||||
Sovereign Bank | ||||||
4.38%, 08/01/13† | 525,000 | 406,741 | ||||
Sprint Capital Corporation | ||||||
7.63%, 01/30/11 | 250,000 | 245,766 | ||||
8.38%, 03/15/12D | 340,000 | 336,863 | ||||
6.90%, 05/01/19 | 30,000 | 26,373 | ||||
6.88%, 11/15/28 | 275,000 | 229,508 | ||||
8.75%, 03/15/32D | 170,000 | 162,316 | ||||
Sprint United Telephone Co. of Kansas | ||||||
6.89%, 07/01/08@ | 500,000 | 492,198 | ||||
Steel Dynamics, Inc. | ||||||
7.38%, 11/01/12 144A | 65,000 | 65,325 | ||||
6.75%, 04/01/15D | 225,000 | 216,562 | ||||
Suburban Propane Partners LP | ||||||
6.88%, 12/15/13D | 195,000 | 185,250 | ||||
Sungard Data Systems, Inc. | ||||||
9.13%, 08/15/13D | 120,000 | 121,800 | ||||
SunTrust Preferred Capital I | ||||||
5.85%, 12/31/49† | 2,120,000 | 1,543,411 | ||||
Swiss Re Capital I LP | ||||||
6.85%, 05/29/49 144A† | 650,000 | 573,963 | ||||
Target Corporation | ||||||
7.00%, 01/15/38 | 4,400,000 | 4,525,545 | ||||
Tenet Healthcare Corporation | ||||||
9.88%, 07/01/14 | 7,000 | 7,070 | ||||
9.25%, 02/01/15D | 1,382,000 | 1,361,270 | ||||
Tennessee Gas Pipeline Co. | ||||||
7.00%, 10/15/28 | 175,000 | 171,545 | ||||
7.63%, 04/01/37 | 50,000 | 52,289 | ||||
TEPPCO Partners LP | ||||||
6.65%, 04/15/18D | 650,000 | 658,966 | ||||
Terex Corporation | ||||||
7.38%, 01/15/14 | 90,000 | 89,100 | ||||
Time Warner Cable, Inc. | ||||||
5.40%, 07/02/12 | 1,100,000 | 1,089,855 | ||||
6.55%, 05/01/37 | 325,000 | 300,247 | ||||
Time Warner, Inc. | ||||||
2.92%, 11/13/09† | 7,600,000 | 7,387,975 | ||||
6.88%, 05/01/12 | 110,000 | 112,629 | ||||
7.70%, 05/01/32 | 600,000 | 615,973 | ||||
Time Warner Entertainment Co. LP | ||||||
8.38%, 07/15/33 | 590,000 | 640,277 | ||||
| See Notes to Financial Statements. | 55 |
Table of Contents
Medium-Duration Bond Fund
SCHEDULE OF INVESTMENTS (Continued)
| Par | Value | |||||
Toronto Dominion Bank NY | ||||||
7.20%, 06/15/18D | $ | 240,000 | $ | 238,211 | ||
Transocean, Inc. | ||||||
2.87%, 09/05/08† | 2,000,000 | 1,997,456 | ||||
7.50%, 04/15/31 | 325,000 | 356,931 | ||||
6.80%, 03/15/38 | 450,000 | 461,714 | ||||
Travelers Cos., Inc. | ||||||
6.25%, 03/15/37† | 400,000 | 344,207 | ||||
TXU Corporation | ||||||
5.55%, 11/15/14D | 120,000 | 94,545 | ||||
Unilever Capital Corporation | ||||||
7.13%, 11/01/10 | 285,000 | 304,292 | ||||
Union Pacific Corporation | ||||||
6.65%, 01/15/11D | 260,000 | 271,530 | ||||
United Air Lines, Inc. | ||||||
9.21%, 01/21/17#@ | 107,258 | 617 | ||||
9.56%, 10/19/18#@ | 190,819 | 86,345 | ||||
United Parcel Service, Inc. | ||||||
4.50%, 01/15/13D | 1,480,000 | 1,484,492 | ||||
UnitedHealth Group, Inc. | ||||||
4.88%, 02/15/13D | 370,000 | 358,391 | ||||
4.88%, 04/01/13 | 410,000 | 394,347 | ||||
Ventas Realty LP | ||||||
8.75%, 05/01/09 | 70,000 | 71,750 | ||||
9.00%, 05/01/12 | 40,000 | 42,100 | ||||
6.50%, 06/01/16 | 70,000 | 67,200 | ||||
Verizon Communications, Inc. | ||||||
5.55%, 02/15/16 | 2,100,000 | 2,048,621 | ||||
6.10%, 04/15/18 | 640,000 | 636,534 | ||||
5.85%, 09/15/35D | 600,000 | 530,510 | ||||
6.40%, 02/15/38 | 675,000 | 630,335 | ||||
Verizon Global Funding Corporation | ||||||
7.38%, 09/01/12D | 290,000 | 313,177 | ||||
4.38%, 06/01/13D | 140,000 | 134,804 | ||||
Visteon Corporation | ||||||
8.25%, 08/01/10 | 28,000 | 25,060 | ||||
12.25%, 12/31/16 | 70,000 | 56,350 | ||||
Wachovia Bank NA | ||||||
2.84%, 03/23/09† | 750,000 | 746,897 | ||||
Wachovia Capital Trust III | ||||||
5.80%, 08/29/49† | 580,000 | 394,622 | ||||
Wachovia Corporation | ||||||
5.25%, 08/01/14D | 1,850,000 | 1,724,701 | ||||
5.75%, 02/01/18 | 1,120,000 | 1,022,607 | ||||
7.98%, 02/15/49†D | 7,600,000 | 6,999,980 | ||||
Waste Management, Inc. | ||||||
7.75%, 05/15/32 | 980,000 | 1,093,407 | ||||
WEA Finance LLC | ||||||
7.13%, 04/15/18 144A | 500,000 | 513,448 | ||||
WellPoint, Inc. | ||||||
5.88%, 06/15/17D | 720,000 | 697,131 | ||||
Wells Fargo & Co. | ||||||
4.38%, 01/31/13 | 600,000 | 581,578 | ||||
Wells Fargo Capital X | ||||||
5.95%, 12/15/36D | 200,000 | 182,019 | ||||
Wells Fargo Capital XIII | ||||||
7.70%, 12/29/49† | 850,000 | 845,764 | ||||
Westlake Chemical Corporation | ||||||
6.63%, 01/15/16D | 85,000 | 71,825 | ||||
Weyerhaeuser Co. | ||||||
6.75%, 03/15/12 | 735,000 | 757,607 | ||||
Williams Cos., Inc. | ||||||
7.50%, 01/15/31D | 20,000 | 20,325 | ||||
7.75%, 06/15/31 | 200,000 | 209,000 | ||||
8.75%, 03/15/32 | 983,000 | 1,120,620 | ||||
Windstream Corporation | ||||||
8.63%, 08/01/16D | 630,000 | 631,575 | ||||
Xerox Corporation | ||||||
7.13%, 06/15/10 | 250,000 | 258,314 | ||||
6.75%, 02/01/17 | 70,000 | 70,661 | ||||
XTO Energy, Inc. | ||||||
7.50%, 04/15/12 | 43,000 | 46,172 | ||||
5.50%, 06/15/18D | 1,120,000 | 1,071,588 | ||||
ZFS Finance USA Trust I | ||||||
6.15%, 12/15/49 144A† | 525,000 | 479,065 | ||||
Total Corporate Bonds |
| 288,035,810 | ||||
FOREIGN BONDS — 7.9% | ||||||
Argentina — 0.1% | ||||||
Republic of Argentina | ||||||
3.09%, 08/03/12† | 1,060,000 | 563,178 | ||||
7.00%, 09/12/13 | 450,000 | 340,388 | ||||
| 903,566 | ||||||
Australia — 0.2% | ||||||
National Australia Bank, Ltd. | ||||||
3.21%, 02/08/10 144A† | 2,100,000 | 2,100,519 | ||||
QBE Insurance Group, Ltd. | ||||||
5.65%, 07/01/23 144A†@ | 525,000 | 515,750 | ||||
| 2,616,269 | ||||||
Bermuda — 0.5% | ||||||
Arch Capital Group, Ltd. | ||||||
7.35%, 05/01/34 | 400,000 | 422,607 | ||||
Aspen Insurance Holdings, Ltd. | ||||||
6.00%, 08/15/14 | 325,000 | 309,024 | ||||
Catlin Insurance Co., Ltd. | ||||||
7.25%, 12/31/49 144A†@ | 375,000 | 274,118 | ||||
Endurance Specialty Holdings, Ltd. | ||||||
6.15%, 10/15/15 | 425,000 | 402,808 | ||||
Intelsat Bermuda, Ltd. | ||||||
9.25%, 06/15/16 | 60,000 | 60,750 | ||||
Merna Reinsurance, Ltd. | ||||||
4.55%, 07/07/10 144A† | 950,000 | 903,165 | ||||
Tyco International Group SA | ||||||
6.13%, 11/01/08 | 90,000 | 90,290 | ||||
6.00%, 11/15/13 | 2,920,000 | 2,820,714 | ||||
| 5,283,476 | ||||||
Brazil — 0.1% | ||||||
Petrobras International Finance Co. | ||||||
6.13%, 10/06/16D | 870,000 | 874,350 | ||||
Canada — 0.6% | ||||||
Anadarko Finance Co. | ||||||
7.50%, 05/01/31 | 460,000 | 494,482 | ||||
Bombardier, Inc. | ||||||
7.25%, 11/15/16 144A(E)@ | 250,000 | 376,885 | ||||
Canadian Government Inflationary Index | ||||||
4.00%, 12/01/31(C) | 230,000 | 422,569 | ||||
| 56 | See Notes to Financial Statements. |
Table of Contents
| Par | Value | |||||
Canadian Natural Resources, Ltd. | ||||||
5.70%, 05/15/17D | $ | 225,000 | $ | 220,800 | ||
5.85%, 02/01/35 | 50,000 | 45,165 | ||||
6.50%, 02/15/37 | 450,000 | 439,793 | ||||
6.25%, 03/15/38 | 150,000 | 141,183 | ||||
Conoco Funding Co. | ||||||
7.25%, 10/15/31 | 315,000 | 361,624 | ||||
Encana Corporation | ||||||
6.50%, 02/01/38D | 725,000 | 719,489 | ||||
General Motors Nova Scotia Finance Co. | ||||||
6.85%, 10/15/08D | 1,670,000 | 1,619,900 | ||||
Hydro Quebec | ||||||
6.30%, 05/11/11 | 305,000 | 324,624 | ||||
Nexen, Inc. | ||||||
5.88%, 03/10/35 | 800,000 | 716,736 | ||||
OPTI Canada, Inc. | ||||||
8.25%, 12/15/14D | 125,000 | 125,000 | ||||
Rogers Cable, Inc. | ||||||
5.50%, 03/15/14D | 250,000 | 240,947 | ||||
6.75%, 03/15/15 | 10,000 | 10,213 | ||||
Rogers Wireless, Inc. | ||||||
6.38%, 03/01/14 | 90,000 | 90,210 | ||||
Sun Media Corporation | ||||||
7.63%, 02/15/13 | 90,000 | 87,525 | ||||
| 6,437,145 | ||||||
Cayman Islands — 0.5% | ||||||
MUFG Capital Finance 1, Ltd. | ||||||
6.35%, 07/25/25† | 450,000 | 397,305 | ||||
Petroleum Export, Ltd. | ||||||
4.62%, 06/15/10 144A | 400,000 | 397,404 | ||||
4.63%, 06/15/10 144A | 533,333 | 529,918 | ||||
Resona Preferred Global Securities Cayman, Ltd. | ||||||
7.19%, 07/30/49 144A† | 690,000 | 637,991 | ||||
Shinsei Finance Cayman, Ltd. | ||||||
6.42%, 07/20/49 144A†D | 1,130,000 | 794,686 | ||||
Systems 2001 Asset Trust LLC | ||||||
6.66%, 09/15/13 144A | 753,304 | 775,605 | ||||
Vale Overseas, Ltd. | ||||||
8.25%, 01/17/34 | 40,000 | 43,477 | ||||
6.88%, 11/21/36 | 1,491,000 | 1,392,199 | ||||
Willow Re, Ltd. | ||||||
10.49%, 06/16/10 144A† | 300,000 | 300,783 | ||||
| 5,269,368 | ||||||
Chile — 0.0% | ||||||
Codelco, Inc. | ||||||
4.75%, 10/15/14 144A | 210,000 | 202,218 | ||||
France — 0.1% | ||||||
AXA SA | ||||||
6.46%, 12/14/18 144A† | 150,000 | 120,207 | ||||
Compagnie Generale de Geophysique - Veritas | ||||||
7.50%, 05/15/15(E) | 200,000 | 200,500 | ||||
7.75%, 05/15/17 | 155,000 | 155,968 | ||||
French Government Bond | ||||||
5.75%, 10/25/32(E) | 500,000 | 865,610 | ||||
Legrand SA | ||||||
8.50%, 02/15/25 | 250,000 | 281,746 | ||||
| 1,624,031 | ||||||
Germany — 0.9% | ||||||
Deutsche Bank AG | ||||||
6.00%, 09/01/17 | 3,100,000 | 3,117,980 | ||||
Deutsche Bundesrepublik | ||||||
3.75%, 01/04/15(E) | 1,450,000 | 2,168,966 | ||||
6.25%, 01/04/30(E) | 500,000 | 918,436 | ||||
4.25%, 07/04/39(E) | 2,800,000 | 3,988,305 | ||||
| 10,193,687 | ||||||
Hungary — 0.1% | ||||||
Hungary Government Bond | ||||||
6.00%, 10/24/12(H)D | 162,630,000 | 964,656 | ||||
Iceland — 0.5% | ||||||
Glitnir Banki HF | ||||||
6.33%, 07/28/11 144A | 600,000 | 486,978 | ||||
6.38%, 09/25/12 144A | 580,000 | 498,965 | ||||
6.69%, 06/15/16 144A† | 1,000,000 | 643,450 | ||||
7.45%, 09/14/16 144A† | 100,000 | 60,263 | ||||
Kaupthing Bank HF | ||||||
5.75%, 10/04/11 144A | 250,000 | 202,538 | ||||
7.63%, 02/28/15 144A@ | 2,490,000 | 2,081,770 | ||||
7.13%, 05/19/16 144A | 350,000 | 246,982 | ||||
Landsbanki Islands HF | ||||||
6.10%, 08/25/11 144A | 1,500,000 | 1,323,348 | ||||
| 5,544,294 | ||||||
India — 0.1% | ||||||
ICICI Bank, Ltd. | ||||||
6.38%, 04/30/22 144A†D | 1,048,000 | 944,023 | ||||
Ireland — 0.1% | ||||||
DEPFA ACS Bank | ||||||
5.13%, 03/16/37 144A | 800,000 | 762,643 | ||||
VTB 24 Capital PLC | ||||||
6.54%, 12/07/09 | 370,000 | 359,899 | ||||
| 1,122,542 | ||||||
Italy — 0.1% | ||||||
Telecom Italia Capital SA | ||||||
6.20%, 07/18/11 | 150,000 | 153,063 | ||||
5.25%, 11/15/13 | 165,000 | 156,045 | ||||
4.95%, 09/30/14D | 835,000 | 765,236 | ||||
5.25%, 10/01/15 | 130,000 | 119,145 | ||||
| 1,193,489 | ||||||
Japan — 0.1% | ||||||
Aiful Corporation | ||||||
5.00%, 08/10/10 144A | 600,000 | 534,001 | ||||
Resona Bank, Ltd. | ||||||
4.13%, 06/27/49 144A(E)†@ | 500,000 | 651,894 | ||||
5.85%, 07/15/49 144A†@ | 475,000 | 409,201 | ||||
| 1,595,096 | ||||||
Luxembourg — 1.3% | ||||||
ArcelorMittal | ||||||
6.13%, 06/01/18 144A | 800,000 | 783,235 | ||||
Enel Finance International SA | ||||||
5.70%, 01/15/13 144A@D | 700,000 | 708,581 | ||||
Evraz Group SA | ||||||
8.88%, 04/24/13 144A | 680,000 | 684,216 | ||||
FMC Finance III SA | ||||||
6.88%, 07/15/17 | 250,000 | 246,875 | ||||
| See Notes to Financial Statements. | 57 |
Table of Contents
Medium-Duration Bond Fund
SCHEDULE OF INVESTMENTS (Continued)
| Par | Value | |||||
Gaz Capital for Gazprom | ||||||
6.21%, 11/22/16 144A | $ | 840,000 | $ | 786,912 | ||
6.51%, 03/07/22 144A | 640,000 | 576,000 | ||||
GazInvest Luxemburg SA for Gazprombank | ||||||
7.25%, 10/30/08 | 700,000 | 706,335 | ||||
Hellas Telecommunications SA | ||||||
8.25%, 10/15/12(E)† | 375,000 | 547,911 | ||||
RSHB Capital SA for OJSC Russian Agricultural Bank | ||||||
6.30%, 05/15/17 144A | 1,240,000 | 1,147,186 | ||||
TNK-BP Finance SA | ||||||
7.50%, 07/18/16 144A | 780,000 | 739,986 | ||||
6.63%, 03/20/17 144A | 260,000 | 230,750 | ||||
7.88%, 03/13/18 144A | 340,000 | 328,950 | ||||
Tyco Electronics Group SA | ||||||
6.00%, 10/01/12 | 250,000 | 252,663 | ||||
Unicredito Luxembourg Finance SA | ||||||
2.97%, 10/24/08 144A† | 4,000,000 | 3,997,528 | ||||
Vimpel Communications | ||||||
8.38%, 04/30/13 144A | 850,000 | 838,770 | ||||
VTB Capital SA | ||||||
3.38%, 08/01/08† | 800,000 | 799,421 | ||||
3.38%, 08/01/08 144A† | 970,000 | 961,512 | ||||
6.61%, 10/31/12 144A | 400,000 | 390,480 | ||||
| 14,727,311 | ||||||
Marshall Islands — 0.0% | ||||||
Teekay Shipping Corporation | ||||||
8.88%, 07/15/11 | 176,000 | 191,180 | ||||
Mexico — 0.3% | ||||||
America Movil Sab de CV | ||||||
5.50%, 03/01/14 | 300,000 | 296,504 | ||||
5.63%, 11/15/17 | 460,000 | 445,322 | ||||
United Mexican States | ||||||
6.75%, 09/27/34 | 2,001,000 | 2,128,063 | ||||
| 2,869,889 | ||||||
Netherlands — 0.5% | ||||||
Deutsche Telekom International Finance BV | ||||||
5.75%, 03/23/16 | 510,000 | 498,378 | ||||
8.25%, 06/15/30 | 600,000 | 690,229 | ||||
HSBK Europe BV | ||||||
9.25%, 10/16/13 144A | 710,000 | 717,100 | ||||
Intergas Finance BV | ||||||
6.38%, 05/14/17 144A | 980,000 | 874,650 | ||||
Koninklijke KPN NV | ||||||
8.00%, 10/01/10 | 780,000 | 825,693 | ||||
NXP BV | ||||||
7.88%, 10/15/14D | 30,000 | 27,750 | ||||
9.50%, 10/15/15 | 105,000 | 91,612 | ||||
TuranAlem Finance BV | ||||||
8.25%, 01/22/37 144A | 2,090,000 | 1,742,997 | ||||
| 5,468,409 | ||||||
Panama — 0.1% | ||||||
Republic of Panama | ||||||
6.70%, 01/26/36D | 549,000 | 559,980 | ||||
Russia — 0.1% | ||||||
Russian Federation | ||||||
8.25%, 03/31/10 | 1,273,868 | 1,330,249 | ||||
South Korea — 0.0% | ||||||
Export-Import Bank of Korea | ||||||
5.25%, 02/10/14 144A | 235,000 | 225,077 | ||||
Spain — 0.1% | ||||||
Santander Perpetual SA Unipersonal | ||||||
6.67%, 10/24/17 144A†D | 100,000 | 96,770 | ||||
Telefonica Emisones SAU | ||||||
7.05%, 06/20/36 | 550,000 | 566,181 | ||||
| 662,951 | ||||||
Switzerland — 1.0% | ||||||
Credit Suisse Group | ||||||
5.00%, 05/15/13D | 6,500,000 | 6,332,306 | ||||
UBS AG | ||||||
3.73%, 06/19/10† | 4,000,000 | 3,990,924 | ||||
5.88%, 12/20/17 | 1,400,000 | 1,364,282 | ||||
| 11,687,512 | ||||||
United Kingdom — 0.4% | ||||||
British Telecommunications PLC | ||||||
8.88%, 12/15/30 | 600,000 | 723,153 | ||||
HBOS Capital Funding LP | ||||||
6.07%, 12/31/49 144A† | 600,000 | 519,377 | ||||
HSBC Capital Funding LP | ||||||
4.61%, 12/29/49 144A†D | 960,000 | 848,774 | ||||
HSBC Holdings PLC | ||||||
6.80%, 06/01/38 | 425,000 | 401,461 | ||||
Inmarsat Finance PLC | ||||||
8.76%, 11/15/12 STEPW | 375,000 | 380,625 | ||||
Royal Bank of Scotland Group PLC | ||||||
9.12%, 03/31/10 | 550,000 | 554,431 | ||||
7.64%, 03/31/45† | 300,000 | 274,736 | ||||
6.99%, 10/29/45 144A†D | 770,000 | 694,156 | ||||
| 4,396,713 | ||||||
Venezuela — 0.1% | ||||||
Petrozuata Finance, Inc. | ||||||
8.22%, 04/01/17 144A | 697,087 | 726,505 | ||||
8.22%, 04/01/17 144A | 326,760 | 340,549 | ||||
| 1,067,054 | ||||||
Total Foreign Bonds |
| 87,954,535 | ||||
LOAN AGREEMENTS — 1.2% | ||||||
Chrysler Finance Co. Bridge Loan | ||||||
6.78%, 08/03/14 | 8,634,750 | 7,138,780 | ||||
Ford Motor Co. Tranche B | ||||||
5.48%, 11/29/13† | 2,659,500 | 2,156,854 | ||||
Georgia Pacific Corporation | ||||||
4.40%, 12/20/12 | 380,952 | 360,456 | ||||
4.45%, 12/20/12† | 3,529,048 | 3,339,178 | ||||
Total Loan Agreements |
| 12,995,268 | ||||
MORTGAGE-BACKED SECURITIES — 74.0% | ||||||
ABN AMRO Mortgage Corporation | ||||||
9.92%, 06/25/33 IOW | 513,717 | 50,483 | ||||
Adjustable Rate Mortgage Trust | ||||||
4.99%, 04/25/35† | 289,994 | 277,857 | ||||
| 58 | See Notes to Financial Statements. |
Table of Contents
| Par | Value | |||||
American Home Mortgage Assets | ||||||
4.49%, 02/25/47† | $ | 2,585,476 | $ | 1,689,143 | ||
Bank of America Commercial Mortgage, Inc. | ||||||
5.12%, 10/10/45† | 3,000,000 | 2,861,525 | ||||
5.35%, 09/10/47† | 3,000,000 | 2,883,508 | ||||
Bank of America Funding Corporation | ||||||
2.56%, 07/20/36† | 2,434,695 | 2,236,260 | ||||
Bank of America Mortgage Securities, Inc. | ||||||
4.72%, 07/25/34† | 592,053 | 574,581 | ||||
Bear Stearns Adjustable Rate Mortgage Trust | ||||||
5.62%, 02/25/33† | 310,641 | 291,634 | ||||
4.45%, 04/25/34† | 441,577 | 424,344 | ||||
5.32%, 05/25/34† | 1,355,044 | 1,283,787 | ||||
3.56%, 06/25/34† | 1,300,000 | 1,284,327 | ||||
4.13%, 03/25/35† | 2,667,858 | 2,544,926 | ||||
5.08%, 06/25/35† | 1,082,807 | 1,030,008 | ||||
Bear Stearns Alt-A Trust | ||||||
3.12%, 02/25/34 STEP | 146,202 | 122,580 | ||||
5.37%, 05/25/35† | 763,502 | 653,648 | ||||
5.70%, 09/25/35† | 1,121,714 | 923,825 | ||||
Bear Stearns Alt-A Trust II | ||||||
6.26%, 09/25/47† | 2,714,859 | 2,035,987 | ||||
Bear Stearns Structured Products, Inc. | ||||||
5.67%, 09/25/37† | 1,923,217 | 1,600,817 | ||||
2.74%, 09/26/37 144A† | 4,044,427 | 4,018,907 | ||||
3.50%, 09/27/37 144A† | 4,740,270 | 4,506,528 | ||||
Chase Mortgage Finance Corporation | ||||||
4.35%, 02/01/37† | 1,497,200 | 1,477,888 | ||||
4.47%, 02/01/37† | 748,925 | 738,853 | ||||
Citigroup Commercial Mortgage Trust | ||||||
2.54%, 11/15/36 144A† | 42,445 | 39,804 | ||||
Citigroup Mortgage Loan Trust, Inc. | ||||||
4.90%, 12/25/35† | 2,692,661 | 2,562,766 | ||||
Commercial Mortgage Asset Trust | ||||||
7.55%, 01/17/10† | 359,268 | 367,473 | ||||
Countrywide Alternative Loan Trust | ||||||
5.50%, 10/25/33 | 201,105 | 184,137 | ||||
2.83%, 09/25/35† | 2,570,903 | 1,931,134 | ||||
5.03%, 09/25/35† | 360,270 | 279,290 | ||||
2.81%, 10/25/35† | 1,610,107 | 1,250,374 | ||||
2.78%, 11/20/35† | 833,408 | 635,608 | ||||
2.80%, 11/20/35† | 1,921,655 | 1,473,018 | ||||
2.81%, 11/20/35† | 2,939,728 | 2,149,852 | ||||
2.75%, 12/25/35† | 929,612 | 724,484 | ||||
2.78%, 12/25/35† | 1,693,684 | 1,323,853 | ||||
2.75%, 02/25/36† | 1,800,208 | 1,369,220 | ||||
5.17%, 04/25/43† | 2,936,625 | 2,002,967 | ||||
Countrywide Home Loan Mortgage Pass-Through Trust | ||||||
4.50%, 02/19/34† | 2,658,709 | 2,534,855 | ||||
4.55%, 11/20/34† | 380,407 | 335,288 | ||||
4.90%, 08/20/35† | 1,583,807 | 1,290,463 | ||||
2.72%, 03/25/36† | 641,572 | 450,030 | ||||
Credit Suisse Mortgage Capital Certificates | ||||||
5.85%, 03/15/39 STRIP† | 800,000 | 776,816 | ||||
5.38%, 02/15/40 | 4,180,000 | 3,878,050 | ||||
CS First Boston Mortgage Securities Corporation | ||||||
0.70%, 04/25/33 IOW@ | 20,060 | 398 | ||||
5.74%, 05/25/33 IOW@ | 7,354 | 38 | ||||
5.50%, 06/25/33 IOW@ | 22,333 | 618 | ||||
7.82%, 07/25/33 IOW†@ | 355,360 | — | ||||
9.72%, 07/25/33 IOW@ | 702,021 | 75,243 | ||||
6.18%, 08/25/33 IOW†@ | 379,996 | — | ||||
6.53%, 06/15/34 | 1,500,000 | 1,541,646 | ||||
Federal Home Loan Mortgage Corporation | ||||||
7.00%, 11/01/14 | 40,420 | 42,412 | ||||
7.00%, 04/01/15 | 51,585 | 54,128 | ||||
7.00%, 12/01/15 | 38,435 | 40,251 | ||||
8.50%, 06/01/16 | 14,076 | 15,275 | ||||
4.50%, 05/01/18 | 174,470 | 170,608 | ||||
4.50%, 06/01/18 | 41,730 | 40,797 | ||||
8.50%, 06/01/18 | 8,167 | 8,862 | ||||
4.50%, 09/01/18 | 160,562 | 156,970 | ||||
4.50%, 10/01/18 | 122,093 | 119,365 | ||||
4.50%, 11/01/18 | 126,005 | 123,190 | ||||
4.50%, 12/01/18 | 389,750 | 381,029 | ||||
5.00%, 12/01/18 | 723,734 | 722,116 | ||||
4.50%, 01/01/19 | 46,447 | 45,408 | ||||
4.50%, 03/01/19 | 92,091 | 90,019 | ||||
4.50%, 06/01/19 | 1,686,717 | 1,648,976 | ||||
5.00%, 06/01/20 | 602,926 | 600,012 | ||||
5.00%, 07/01/20 | 622,239 | 617,676 | ||||
4.62%, 04/15/22 POW@ | 35,965 | 31,147 | ||||
8.00%, 08/01/24 | 5,800 | 6,286 | ||||
7.50%, 11/01/29 | 18,425 | 19,939 | ||||
6.50%, 12/01/29 | 401,157 | 417,948 | ||||
7.50%, 12/01/29 | 30,635 | 33,152 | ||||
7.50%, 02/01/31 | 33,866 | 36,573 | ||||
7.13%, 07/01/31† | 55,309 | 55,516 | ||||
7.11%, 08/01/31† | 3,885 | 3,906 | ||||
7.50%, 11/01/31 | 10,495 | 11,328 | ||||
7.35%, 04/01/32† | 9,854 | 9,873 | ||||
4.27%, 03/01/34† | 14,391 | 14,600 | ||||
5.00%, 12/01/34 | 138,597 | 133,489 | ||||
5.50%, 05/01/35 | 2,317,400 | 2,289,518 | ||||
0.00%, 08/15/35W†@ | 133,682 | 150,190 | ||||
5.00%, 09/01/35 | 2,053,011 | 1,974,138 | ||||
5.00%, 10/01/35 | 812,605 | 781,387 | ||||
5.00%, 11/01/35 | 1,895,099 | 1,822,293 | ||||
5.50%, 11/01/35 | 747,103 | 738,114 | ||||
5.00%, 12/01/35 | 3,991,425 | 3,838,083 | ||||
6.00%, 02/01/36 | 1,722,418 | 1,742,299 | ||||
5.00%, 03/01/36 | 1,425,620 | 1,370,851 | ||||
5.00%, 04/01/36 | 1,209,318 | 1,162,859 | ||||
5.00%, 06/01/36 | 2,045,051 | 1,967,486 | ||||
6.06%, 01/01/37† | 2,356,622 | 2,407,264 | ||||
5.50%, 03/01/37 | 954,403 | 941,130 | ||||
5.69%, 04/01/37† | 4,012,353 | 4,065,386 | ||||
0.00%, 04/15/37W†@ | 71,717 | 78,731 | ||||
0.00%, 06/15/37W†@ | 183,829 | 193,340 | ||||
5.50%, 07/01/37 | 667,262 | 657,983 | ||||
5.66%, 09/01/37† | 4,739,325 | 4,803,654 | ||||
7.00%, 11/01/37 | 819,895 | 860,481 | ||||
5.50%, 02/01/38 | 7,749,283 | 7,641,519 | ||||
| See Notes to Financial Statements. | 59 |
Table of Contents
Medium-Duration Bond Fund
SCHEDULE OF INVESTMENTS (Continued)
| Par | Value | |||||
5.00%, 07/01/38 TBA | $ | 200,000 | $ | 191,625 | ||
5.50%, 07/14/38 TBA | 5,000,000 | 4,925,000 | ||||
4.00%, 01/01/49 | 24,506 | 23,250 | ||||
Federal Housing Administration | ||||||
7.43%, 10/01/18 | 200,904 | 194,815 | ||||
Federal National Mortgage Association | ||||||
4.00%, 06/01/13 | 71,851 | 70,823 | ||||
4.00%, 07/01/13 | 97,834 | 97,315 | ||||
4.00%, 08/01/13 | 137,042 | 135,028 | ||||
4.00%, 09/01/13 | 261,373 | 257,425 | ||||
4.00%, 10/01/13 | 542,799 | 534,359 | ||||
8.00%, 06/01/15 | 34,747 | 36,662 | ||||
8.00%, 06/15/15 | 12,368 | 13,050 | ||||
8.00%, 07/01/15 | 26,274 | 27,722 | ||||
8.00%, 09/01/15 | 54,855 | 57,027 | ||||
5.00%, 12/25/15 | 105,438 | 105,862 | ||||
7.50%, 04/01/16 | 16,838 | 17,851 | ||||
6.00%, 05/01/16 | 161,215 | 165,870 | ||||
6.00%, 07/01/16 | 19,816 | 20,388 | ||||
5.00%, 11/01/17 | 206,181 | 205,985 | ||||
5.00%, 12/01/17 | 1,040,885 | 1,038,877 | ||||
5.00%, 01/01/18 | 2,662,393 | 2,659,694 | ||||
5.00%, 02/01/18 | 521,480 | 520,915 | ||||
5.50%, 02/01/18 | 185,727 | 187,176 | ||||
5.00%, 04/01/18 | 869,666 | 868,570 | ||||
5.00%, 05/01/18 | 1,192,074 | 1,190,642 | ||||
4.50%, 06/01/18 | 4,329,658 | 4,236,040 | ||||
5.00%, 06/01/18 | 139,560 | 139,384 | ||||
4.00%, 09/01/18 | 3,771,997 | 3,586,226 | ||||
4.50%, 09/01/18 | 119,142 | 116,514 | ||||
5.00%, 11/01/18 | 247,798 | 247,564 | ||||
4.50%, 12/01/18 | 3,244,816 | 3,173,227 | ||||
4.50%, 01/01/19 | 65,997 | 64,541 | ||||
5.00%, 02/01/19 | 167,053 | 166,425 | ||||
4.50%, 03/01/19 | 91,138 | 89,127 | ||||
5.00%, 03/01/19 | 1,232,224 | 1,227,591 | ||||
5.00%, 04/01/19 | 1,695,891 | 1,691,374 | ||||
4.00%, 05/01/19 | 10,076,733 | 9,567,862 | ||||
4.50%, 07/01/19 | 57,220 | 55,815 | ||||
5.00%, 07/01/19 TBA | 8,500,000 | 8,404,375 | ||||
4.50%, 08/01/19 | 51,791 | 50,519 | ||||
5.00%, 08/01/19 | 604,633 | 602,359 | ||||
6.00%, 09/01/19 | 867,869 | 892,929 | ||||
5.00%, 10/01/19 | 264,576 | 263,582 | ||||
5.00%, 11/01/19 | 1,115,213 | 1,111,019 | ||||
4.50%, 04/01/20 | 565,788 | 553,305 | ||||
4.50%, 08/01/20 | 353,447 | 343,882 | ||||
4.50%, 09/01/20 | 282,224 | 274,586 | ||||
6.00%, 12/01/20 | 1,641,091 | 1,688,477 | ||||
4.50%, 03/01/21 | 354,843 | 343,355 | ||||
4.50%, 08/01/21 | 32,366 | 31,318 | ||||
23.90%, 08/25/21 IOW@ | 215 | 4,236 | ||||
23.39%, 10/25/21 IOW@ | 390 | 9,435 | ||||
19.77%, 01/25/22† | 83,846 | 88,976 | ||||
3.75%, 03/25/22† | 32,530 | 32,559 | ||||
4.50%, 04/01/22 | 299,739 | 289,971 | ||||
9.50%, 05/01/22 | 5,829 | 6,453 | ||||
4.50%, 06/01/22 | 1,449,088 | 1,401,866 | ||||
5.22%, 07/01/22† | 27,870 | 27,855 | ||||
6.00%, 01/01/23 | 154,252 | 157,520 | ||||
5.50%, 07/01/23 TBA | 10,800,000 | 10,870,870 | ||||
6.00%, 07/01/23 TBA | 550,000 | 563,750 | ||||
9.50%, 07/01/24 | 10,327 | 11,388 | ||||
5.47%, 07/01/27† | 36,183 | 36,221 | ||||
6.04%, 08/01/27† | 84,782 | 86,134 | ||||
4.53%, 11/01/27† | 76,550 | 76,629 | ||||
7.39%, 02/01/30† | 175,975 | 178,311 | ||||
3.08%, 05/25/30† | 2,025,787 | 2,010,886 | ||||
7.34%, 06/01/30† | 31,825 | 32,221 | ||||
8.00%, 10/01/30 | 62,621 | 67,755 | ||||
2.93%, 10/18/30† | 65,813 | 65,688 | ||||
7.15%, 12/01/30† | 10,956 | 11,079 | ||||
4.53%, 01/01/31† | 9,243 | 9,262 | ||||
5.07%, 05/01/31† | 18,889 | 19,039 | ||||
7.50%, 05/01/31 | 16,461 | 17,737 | ||||
7.00%, 06/01/31† | 7,521 | 7,672 | ||||
6.00%, 01/01/32 | 103,151 | 104,795 | ||||
6.00%, 03/01/32 | 319,623 | 324,860 | ||||
6.50%, 03/01/32 | 286,659 | 301,269 | ||||
6.00%, 04/01/32 | 671,187 | 681,661 | ||||
4.53%, 06/01/32† | 10,369 | 10,390 | ||||
5.22%, 08/01/32† | 39,325 | 39,448 | ||||
5.59%, 02/01/33† | 4,330 | 4,407 | ||||
5.22%, 05/01/33† | 91,591 | 91,835 | ||||
0.10%, 07/25/33 IOW†@ | 412,218 | 18,551 | ||||
0.10%, 04/25/34 IOW†@ | 604,727 | 18,709 | ||||
0.10%, 06/25/34 IOW†@ | 892,496 | 25,196 | ||||
6.50%, 07/01/34 TBA | 1,000,000 | 1,029,375 | ||||
5.50%, 07/14/34 TBA | 11,000,000 | 10,841,875 | ||||
5.00%, 08/01/34 | 329,222 | 317,191 | ||||
6.00%, 10/01/34 | 112,882 | 114,326 | ||||
4.50%, 12/01/34 | 370,679 | 344,804 | ||||
4.57%, 12/01/34† | 710,714 | 720,332 | ||||
6.00%, 01/01/35 | 2,458,791 | 2,490,247 | ||||
4.50%, 02/01/35 | 412,441 | 383,650 | ||||
4.50%, 03/01/35 | 1,288,232 | 1,195,489 | ||||
5.00%, 03/01/35 | 283,423 | 273,066 | ||||
4.50%, 04/01/35 | 907,467 | 842,136 | ||||
4.50%, 05/01/35 | 759,238 | 704,579 | ||||
6.00%, 05/01/35 | 3,142,754 | 3,178,049 | ||||
0.25%, 05/25/35W†@ | 87,105 | 90,438 | ||||
4.50%, 07/01/35 | 460,802 | 427,628 | ||||
6.00%, 07/01/35 TBA | 974,006 | 984,944 | ||||
6.00%, 07/01/35 TBA | 2,000,000 | 2,017,500 | ||||
5.00%, 08/01/35 | 229,727 | 220,973 | ||||
5.50%, 08/01/35 TBA | 400,000 | 393,250 | ||||
4.50%, 09/01/35 | 120,261 | 111,603 | ||||
5.50%, 09/01/35 | 851,446 | 841,850 | ||||
4.50%, 10/01/35 | 305,306 | 283,327 | ||||
6.00%, 10/01/35 | 269,562 | 272,590 | ||||
4.53%, 11/01/35† | 36,607 | 36,692 | ||||
6.00%, 11/01/35 | 1,383,485 | 1,399,022 | ||||
6.29%, 11/01/35† | 544,954 | 556,725 | ||||
6.30%, 11/01/35† | 479,830 | 490,194 | ||||
6.52%, 11/01/35† | 969,572 | 990,534 | ||||
6.54%, 11/01/35† | 489,947 | 500,561 | ||||
5.50%, 04/01/36 | 718,286 | 702,451 | ||||
6.50%, 04/01/36 | 884,054 | 911,387 | ||||
4.86%, 05/01/36† | 466,498 | 467,381 | ||||
5.00%, 09/01/36 | 893,840 | 859,780 | ||||
6.50%, 09/01/36 | 419,103 | 432,061 | ||||
0.00%, 09/25/36W†@ | 79,508 | 80,960 | ||||
6.50%, 10/01/36 | 981,006 | 1,011,337 | ||||
5.00%, 11/01/36 | 919,805 | 883,606 | ||||
5.50%, 11/01/36 | 2,117,299 | 2,090,791 | ||||
6.50%, 11/01/36 | 916,006 | 944,668 | ||||
| 60 | See Notes to Financial Statements. |
Table of Contents
| Par | Value | |||||
5.00%, 02/01/37 | $ | 25,245 | $ | 24,222 | ||
5.51%, 02/01/37† | 4,365,370 | 4,435,970 | ||||
5.00%, 03/01/37 | 759,836 | 729,058 | ||||
6.50%, 03/01/37 | 828,978 | 854,432 | ||||
6.50%, 04/01/37 | 844,988 | 870,933 | ||||
7.00%, 04/01/37 | 15,280,054 | 16,033,367 | ||||
5.50%, 05/01/37 | 1,984,624 | 1,958,736 | ||||
6.50%, 05/01/37 | 820,452 | 845,644 | ||||
5.62%, 06/01/37† | 3,708,848 | 3,756,779 | ||||
5.00%, 07/01/37 | 25,515 | 24,481 | ||||
6.00%, 07/01/37 | 15,123,031 | 15,275,478 | ||||
6.50%, 08/01/37 | 1,135,803 | 1,170,679 | ||||
7.00%, 08/01/37 | 8,245,201 | 8,655,948 | ||||
6.50%, 09/01/37 | 865,155 | 891,720 | ||||
7.00%, 09/01/37 | 5,493,477 | 5,764,516 | ||||
6.50%, 10/01/37 | 1,356,605 | 1,398,383 | ||||
7.00%, 10/01/37 | 894,452 | 938,583 | ||||
7.00%, 11/01/37 | 3,768,781 | 3,954,726 | ||||
7.50%, 11/01/37 | 2,571,965 | 2,716,535 | ||||
4.53%, 12/01/37† | 164,923 | 165,196 | ||||
5.50%, 12/01/37 | 80,814 | 79,760 | ||||
7.50%, 12/01/37 | 918,282 | 969,899 | ||||
4.53%, 01/01/38† | 74,360 | 74,484 | ||||
5.50%, 02/01/38 | 949,742 | 937,258 | ||||
5.50%, 03/01/38 | 3,676,496 | 3,628,170 | ||||
5.00%, 04/01/38 | 174,475 | 167,391 | ||||
5.50%, 04/01/38‡‡ | 1,033,689 | 1,020,102 | ||||
5.00%, 06/01/38 | 2,999,700 | 2,877,896 | ||||
4.50%, 07/01/38 TBA | 1,800,000 | 1,667,812 | ||||
5.00%, 07/01/38 TBA | 47,450,000 | 45,477,883 | ||||
4.50%, 07/14/38 TBA | 2,000,000 | 1,853,124 | ||||
5.00%, 07/14/38 TBA | 30,000,000 | 28,753,140 | ||||
5.50%, 07/14/38 TBA | 100,000 | 98,563 | ||||
6.00%, 07/14/38 TBA | 170,500,000 | 171,991,875 | ||||
6.50%, 07/14/38 TBA | 11,200,000 | 11,529,000 | ||||
5.00%, 08/01/38 TBA | 34,350,000 | 32,847,188 | ||||
5.19%, 06/01/40† | 132,952 | 132,839 | ||||
5.19%, 10/01/40† | 345,817 | 345,547 | ||||
5.48%, 10/01/40† | 26,832 | 26,809 | ||||
5.47%, 11/01/40† | 53,501 | 53,593 | ||||
FFCA Secured Lending Corporation | ||||||
8.00%, 07/18/20 IO 144AW†@ | 1,305,158 | 29,927 | ||||
FHLMC Structured Pass-Through Securities | ||||||
5.19%, 07/25/44† | 2,232,321 | 2,087,691 | ||||
First Horizon Alternative Mortgage Securities | ||||||
4.73%, 06/25/34† | 907,318 | 792,377 | ||||
First Horizon Asset Securities, Inc. | ||||||
4.75%, 12/25/34† | 169,134 | 161,216 | ||||
First Union National Bank Commercial Mortgage Trust | ||||||
7.20%, 10/01/32 | 1,468,690 | 1,521,748 | ||||
General Electric Capital Commercial Mortgage Corporation | ||||||
5.51%, 11/10/45† | 1,230,000 | 1,193,393 | ||||
GMAC Commercial Mortgage Securities, Inc. | ||||||
6.28%, 11/15/39 | 2,000,000 | 2,045,937 | ||||
GMAC Mortgage Corporation Loan Trust | ||||||
4.40%, 06/25/34† | 795,810 | 776,307 | ||||
Government National Mortgage Association | ||||||
7.00%, 10/15/25 | 65,590 | 70,043 | ||||
7.00%, 01/15/26 | 23,337 | 24,913 | ||||
7.00%, 07/15/27 | 182,192 | 194,414 | ||||
7.00%, 12/15/27 | 2,782 | 2,969 | ||||
7.00%, 01/15/28 | 32,309 | 34,451 | ||||
7.00%, 03/15/28 | 218,184 | 232,828 | ||||
7.00%, 07/15/28 | 24,179 | 25,782 | ||||
7.50%, 07/15/28 | 15,349 | 16,524 | ||||
6.50%, 08/15/28 | 22,379 | 23,265 | ||||
7.00%, 08/15/28 | 39,914 | 42,560 | ||||
7.50%, 08/15/28 | 18,936 | 20,386 | ||||
6.50%, 09/15/28 | 147,165 | 152,987 | ||||
6.00%, 10/15/28 | 16,818 | 17,171 | ||||
7.00%, 10/15/28 | 78,110 | 83,290 | ||||
6.00%, 12/15/28 | 2,601 | 2,655 | ||||
6.00%, 01/15/29 | 564 | 576 | ||||
7.50%, 03/15/29 | 58,885 | 63,420 | ||||
7.50%, 11/15/29 | 25,064 | 26,972 | ||||
5.13%, 11/20/29† | 97,822 | 98,296 | ||||
8.50%, 08/15/30 | 5,021 | 5,518 | ||||
8.50%, 11/20/30 | 31,220 | 34,188 | ||||
6.00%, 04/15/31 | 4,523 | 4,614 | ||||
6.50%, 08/15/31 | 202,448 | 209,381 | ||||
7.50%, 08/15/31 | 74,146 | 79,721 | ||||
6.50%, 10/15/31 | 360,697 | 373,394 | ||||
6.00%, 11/15/31 | 978,677 | 994,963 | ||||
6.50%, 11/15/31 | 381,411 | 394,474 | ||||
6.00%, 12/15/31 | 264,102 | 268,496 | ||||
6.00%, 01/15/32 | 426,059 | 434,347 | ||||
6.00%, 02/15/32 | 533,697 | 542,589 | ||||
6.50%, 02/15/32 | 566,774 | 587,913 | ||||
26.03%, 02/16/32† | 204,515 | 265,355 | ||||
6.00%, 04/15/32 | 468,427 | 477,539 | ||||
6.50%, 04/15/32 | 338,455 | 350,046 | ||||
7.50%, 04/15/32 | 95,884 | 102,981 | ||||
6.50%, 06/15/32 | 1,157,470 | 1,200,228 | ||||
6.50%, 07/15/32 | 156,565 | 161,927 | ||||
6.50%, 08/15/32 | 456,606 | 472,244 | ||||
6.50%, 09/15/32 | 552,296 | 571,211 | ||||
6.00%, 10/15/32 | 599,502 | 609,479 | ||||
6.00%, 11/15/32 | 546,300 | 555,773 | ||||
6.00%, 12/15/32 | 238,970 | 242,960 | ||||
6.50%, 12/15/32 | 42,296 | 43,745 | ||||
6.00%, 01/15/33 | 273,748 | 278,304 | ||||
6.00%, 02/15/33 | 194,132 | 197,363 | ||||
6.50%, 03/15/33 | 83,863 | 86,735 | ||||
5.00%, 04/15/33 | 287,403 | 279,716 | ||||
6.50%, 04/15/33 | 1,391,138 | 1,438,782 | ||||
5.00%, 05/15/33 | 2,123,190 | 2,067,413 | ||||
6.00%, 05/15/33 | 1,394,048 | 1,417,246 | ||||
5.00%, 06/15/33 | 267,700 | 260,539 | ||||
6.00%, 06/15/33 | 171,088 | 173,935 | ||||
5.00%, 07/15/33 | 649,575 | 632,200 | ||||
5.00%, 08/15/33 | 1,299,305 | 1,262,118 | ||||
5.00%, 09/15/33 | 925,083 | 897,882 | ||||
5.00%, 10/15/33 | 498,886 | 484,629 | ||||
6.00%, 10/15/33 | 887,499 | 902,268 | ||||
6.50%, 10/15/33 | 298,526 | 308,750 | ||||
5.00%, 11/15/33 | 63,207 | 61,549 | ||||
| See Notes to Financial Statements. | 61 |
Table of Contents
Medium-Duration Bond Fund
SCHEDULE OF INVESTMENTS (Continued)
| Par | Value | |||||
6.00%, 12/15/33 | $ | 934,505 | $ | 950,056 | ||
5.00%, 01/15/34 | 416,360 | 404,963 | ||||
5.00%, 03/15/34 | 522,207 | 507,912 | ||||
5.00%, 04/15/34 | 208,831 | 203,114 | ||||
5.00%, 05/15/34 | 123,078 | 119,709 | ||||
5.00%, 06/15/34 | 794,308 | 772,565 | ||||
6.00%, 06/15/34 | 98,233 | 100,021 | ||||
5.00%, 08/15/34 | 540,723 | 525,922 | ||||
5.00%, 11/15/34 | 1,206,581 | 1,173,553 | ||||
5.00%, 12/15/34 | 1,071,960 | 1,042,617 | ||||
5.00%, 01/15/35 | 762,495 | 741,028 | ||||
5.00%, 02/15/35 | 23,757 | 23,089 | ||||
5.00%, 03/15/35 | 28,093 | 27,302 | ||||
5.00%, 04/15/35 | 4,273,225 | 4,152,915 | ||||
5.00%, 05/15/35 | 62,456 | 60,698 | ||||
5.00%, 06/15/35 | 124,959 | 121,441 | ||||
5.00%, 07/15/35 | 321,742 | 312,684 | ||||
5.00%, 08/15/35 | 341,741 | 332,120 | ||||
5.00%, 09/15/35 | 1,633,285 | 1,587,301 | ||||
5.00%, 10/15/35 | 1,143,006 | 1,110,825 | ||||
5.00%, 11/15/35 | 6,512,958 | 6,329,590 | ||||
5.00%, 12/15/35 | 25,597 | 24,876 | ||||
6.00%, 02/15/36 | 16,143 | 16,416 | ||||
5.00%, 03/15/36 | 776,613 | 754,353 | ||||
5.00%, 05/15/36 | 55,712 | 54,090 | ||||
5.00%, 06/15/36 | 29,835 | 28,967 | ||||
6.00%, 06/15/36 | 879,489 | 894,388 | ||||
6.00%, 07/15/36 | 103,168 | 104,916 | ||||
6.00%, 08/15/36 | 1,045,557 | 1,063,264 | ||||
6.00%, 10/15/36 | 267,168 | 271,675 | ||||
6.00%, 07/21/38 TBA | 18,100,000 | 18,371,500 | ||||
6.50%, 07/21/38 TBA | 43,000,000 | 44,410,916 | ||||
GreenPoint Mortgage Funding Trust | ||||||
2.56%, 03/25/37† | 4,009,537 | 2,919,587 | ||||
GS Mortgage Securities Corporation II | ||||||
4.68%, 07/10/39 | 1,300,000 | 1,252,329 | ||||
GSMPS Mortgage Loan Trust | ||||||
2.71%, 02/25/35 144A† | 353,206 | 321,365 | ||||
2.83%, 09/25/35 144A† | 2,373,847 | 2,024,901 | ||||
GSR Mortgage Loan Trust | ||||||
4.54%, 09/25/35† | 1,243,153 | 1,204,212 | ||||
HarborView Mortgage Loan Trust | ||||||
2.79%, 11/19/35 STEP | 459,516 | 349,082 | ||||
5.73%, 12/19/35† | 719,147 | 541,596 | ||||
2.73%, 01/19/36 STEP | 1,244,273 | 930,617 | ||||
3.04%, 01/19/36 STEP | 270,712 | 209,512 | ||||
6.02%, 08/19/36† | 1,821,978 | 1,445,330 | ||||
2.99%, 12/19/37† | 1,569,639 | 1,120,472 | ||||
Impac CMB Trust | ||||||
3.20%, 10/25/34† | 166,953 | 66,529 | ||||
2.74%, 11/25/35 STEP | 1,528,374 | 1,276,136 | ||||
Impac Secured Assets CMN Owner Trust | ||||||
2.73%, 05/25/35† | 1,228,085 | 910,059 | ||||
Indymac ARM Trust | ||||||
6.45%, 09/28/31† | 21,360 | 21,046 | ||||
Indymac INDA Mortgage Loan Trust | ||||||
6.29%, 11/01/37† | 895,692 | 879,127 | ||||
Indymac Index Mortgage Loan Trust | ||||||
5.38%, 08/25/35† | 505,665 | 419,610 | ||||
5.10%, 09/25/35† | 611,421 | 500,837 | ||||
5.45%, 09/25/35† | 659,807 | 515,335 | ||||
2.70%, 04/25/46† | 1,184,655 | 832,244 | ||||
JP Morgan Chase Commercial Mortgage Securities Corporation | ||||||
4.90%, 09/12/37 | 3,400,000 | 3,208,393 | ||||
4.92%, 10/15/42† | 200,000 | 188,683 | ||||
JP Morgan Mortgage Trust | ||||||
5.02%, 02/25/35† | 1,357,019 | 1,280,146 | ||||
4.07%, 07/25/35† | 856,008 | 828,697 | ||||
4.20%, 07/25/35† | 889,898 | 861,560 | ||||
4.77%, 07/25/35† | 826,728 | 801,852 | ||||
5.07%, 07/25/35† | 637,836 | 623,993 | ||||
LB-UBS Commercial Mortgage Trust | ||||||
4.66%, 07/15/30 | 1,000,000 | 956,611 | ||||
4.74%, 07/15/30 | 830,000 | 777,992 | ||||
5.16%, 02/15/31 | 2,000,000 | 1,880,662 | ||||
13.14%, 06/15/36 IO 144AW†@ | 4,290,895 | 98,842 | ||||
4.95%, 09/15/40 | 900,000 | 853,457 | ||||
Liberty Street Funding LLC | ||||||
5.50%, 09/01/37 | 992,513 | 979,566 | ||||
Luminent Mortgage Trust | ||||||
2.67%, 07/25/36† | 666,610 | 467,454 | ||||
2.65%, 12/25/36† | 4,109,268 | 2,953,604 | ||||
2.68%, 02/25/46† | 1,193,016 | 855,227 | ||||
MASTR Adjustable Rate Mortgages Trust | ||||||
5.20%, 05/25/34† | 362,832 | 323,609 | ||||
5.65%, 11/25/35† | 1,449,976 | 1,180,890 | ||||
4.64%, 12/25/46† | 808,538 | 545,989 | ||||
6.03%, 12/25/46† | 2,425,614 | 1,875,187 | ||||
2.68%, 05/25/47† | 4,136,263 | 2,896,463 | ||||
MASTR Reperforming Loan Trust | ||||||
7.00%, 08/25/34 144A | 975,884 | 963,582 | ||||
Merrill Lynch-Countrywide Financial Corporation Commercial Mortgage Trust | ||||||
5.49%, 03/01/45† | 960,000 | 894,028 | ||||
MLCC Mortgage Investors, Inc. | ||||||
2.86%, 09/25/27 STEP | 540,239 | 483,404 | ||||
Morgan Stanley Capital I | ||||||
5.16%, 10/12/42† | 3,000,000 | 2,827,165 | ||||
5.51%, 11/12/49† | 2,300,000 | 2,156,156 | ||||
Prime Mortgage Trust | ||||||
5.50%, 05/25/35 144A | 7,585,519 | 6,872,755 | ||||
6.00%, 05/25/35 144A | 1,007,452 | 986,988 | ||||
6.00%, 11/25/36 144A | 3,969,233 | 3,592,465 | ||||
RBSGC Mortgage Pass-Through Certificates | ||||||
2.93%, 01/25/37† | 1,495,612 | 1,119,447 | ||||
Residential Accredit Loans, Inc. | ||||||
4.53%, 01/25/46† | 1,142,036 | 879,952 | ||||
Residential Funding Mortgage Securities I | ||||||
5.19%, 09/25/35† | 757,997 | 693,051 | ||||
5.21%, 09/25/35† | 708,763 | 671,897 | ||||
Sequoia Mortgage Trust | ||||||
4.14%, 07/20/33† | 272,017 | 258,430 | ||||
2.74%, 10/20/34 STEP | 270,253 | 253,281 | ||||
| 62 | See Notes to Financial Statements. |
Table of Contents
| Par | Value | |||||
Structured Adjustable Rate Mortgage Loan Trust | ||||||
4.38%, 05/25/34† | $ | 503,873 | $ | 460,366 | ||
5.25%, 09/25/34† | 231,226 | 195,849 | ||||
5.45%, 11/25/34† | 937,884 | 863,660 | ||||
2.82%, 08/25/35† | 762,231 | 593,626 | ||||
Structured Asset Mortgage Investments, Inc. | ||||||
2.73%, 07/19/35† | 241,299 | 184,383 | ||||
2.79%, 12/25/35† | 1,130,838 | 810,178 | ||||
2.71%, 02/25/36† | 1,169,282 | 873,411 | ||||
5.29%, 11/25/37† | 2,946,402 | 2,188,813 | ||||
Structured Asset Securities Corporation | ||||||
4.53%, 09/25/33† | 1,000,000 | 997,866 | ||||
Thornburg Mortgage Securities Trust | ||||||
2.59%, 06/25/09† | 3,492,138 | 3,461,819 | ||||
2.68%, 12/25/35† | 3,809,278 | 3,780,197 | ||||
2.65%, 01/25/36† | 4,266,630 | 4,216,198 | ||||
6.22%, 09/25/37† | 3,249,899 | 3,095,200 | ||||
Wachovia Bank Commercial Mortgage Trust | ||||||
5.21%, 10/15/44† | 3,000,000 | 2,903,985 | ||||
WAMU Alternative Mortgage Pass-Through Certificates | ||||||
4.37%, 11/25/46† | 2,599,613 | 1,853,534 | ||||
Washington Mutual Mortgage Pass-Through Certificates | ||||||
0.00%, 07/25/08 IOW† | 510,188 | 5 | ||||
3.02%, 12/25/27† | 2,592,613 | 2,365,066 | ||||
6.55%, 02/25/33† | 31,694 | 30,179 | ||||
4.24%, 06/25/34† | 645,324 | 630,276 | ||||
4.93%, 06/25/42† | 48,683 | 44,131 | ||||
2.77%, 07/25/45† | 1,587,956 | 1,275,194 | ||||
2.80%, 07/25/45† | 1,041,227 | 825,516 | ||||
2.80%, 08/25/45† | 3,401,485 | 2,706,224 | ||||
2.77%, 10/25/45† | 3,126,818 | 2,434,537 | ||||
2.74%, 11/25/45† | 1,350,233 | 1,033,749 | ||||
2.75%, 12/25/45† | 873,275 | 700,709 | ||||
2.77%, 12/25/45† | 1,834,864 | 1,605,720 | ||||
5.18%, 01/01/49 IOW†@ | 1,499,601 | 2,414 | ||||
Wells Fargo Alternative Loan Trust | ||||||
6.61%, 11/01/37† | 2,641,377 | 2,105,193 | ||||
Wells Fargo Mortgage-Backed Securities Trust | ||||||
3.54%, 09/25/34† | 2,440,000 | 2,413,810 | ||||
5.04%, 04/25/35† | 2,180,253 | 2,058,296 | ||||
5.47%, 10/25/35† | 968,678 | 949,423 | ||||
5.11%, 03/25/36† | 3,041,949 | 2,946,832 | ||||
Zuni Mortgage Loan Trust | ||||||
3.03%, 07/25/36† | 1,793,431 | 1,711,295 | ||||
Total Mortgage-Backed Securities | 824,651,907 | |||||
MUNICIPAL BONDS — 0.3% | ||||||
South Carolina Transportation Infrastructure Bank, Series A Revenue Bond (AMBAC Insured) | ||||||
5.00%, 10/01/23 | 2,700,000 | 2,745,036 | ||||
Virginia State Housing Development Authority, Commonwealth Mortgage, Series H Revenue Bond (MBIA Insured) | ||||||
5.38%, 07/01/36 | 1,000,000 | 1,005,070 | ||||
Total Municipal Bonds | 3,750,106 | |||||
| Number of Contracts | ||||||
PURCHASED OPTIONS — 0.5% | ||||||
Call Options — 0.0% | ||||||
10-Year U.S. Treasury Note Futures, Strike Price $135.00, Expires 08/22/08 | 1,106 | 17,281 | ||||
15-Year U.S. Treasury Long Bond Futures, Strike Price $150.00, Expires 08/22/08 | 1,064 | 16,625 | ||||
1-Year Eurodollar Mid-CRV Futures, Strike Price $118.00, Expires 08/22/08 | 198 | 1,559 | ||||
2-Year U.S. Treasury Note Futures, Strike Price $111.00, Expires 08/22/08 | 1,465 | 22,891 | ||||
30-Year Federal National Mortgage Association, Strike Price $106.00, Expires 08/06/08 | 6,800 | — | ||||
3-Month LIBOR, Strike Price $127.00, Expires 08/22/08 | 56 | 882 | ||||
5-Year U.S. Treasury Note Futures, Strike Price $126.00, Expires 08/22/08 | 1,514 | 11,828 | ||||
5-Year U.S. Treasury Note Futures, Strike Price $128.50, Expires 08/22/08 | 121 | 945 | ||||
5-Year U.S. Treasury Note Futures, Strike Price $129.50, Expires 08/22/08 | 104 | 812 | ||||
Euro vs. U.S. Dollar, Strike Price $1.375, Expires 05/21/10 | 17,000 | 300,189 | ||||
Euro-Schatz Future, Strike Price $106.00, Expires 08/22/08 | 100 | 787 | ||||
| 373,799 | ||||||
Call Swaptions — 0.5% | ||||||
3-Month LIBOR, Strike Price $3.15, Expires 02/02/09 | 5,100 | 158,333 | ||||
3-Month LIBOR, Strike Price $3.50, Expires 02/02/09 | 2,380 | 113,881 | ||||
3-Month LIBOR, Strike Price $3.70, Expires 12/15/08 | 12,290 | 759,468 | ||||
3-Month LIBOR, Strike Price $4.18, Expires 04/20/09 | 39,550 | 712,459 | ||||
3-Month LIBOR, Strike Price $4.25, Expires 07/06/09 | 6,640 | 669,391 | ||||
3-Month LIBOR, Strike Price $5.05, Expires 12/18/09 | 1,320 | 371,391 | ||||
3-Month LIBOR, Strike Price $7.00, Expires 03/18/09 | 6,600 | 2,220,581 | ||||
Euro vs. Japanese Yen, Strike Price $148.40, Expires 06/03/10 | 10,000 | 127,526 | ||||
| See Notes to Financial Statements. | 63 |
Table of Contents
Medium-Duration Bond Fund
SCHEDULE OF INVESTMENTS (Continued)
| Number of Contracts | Value | |||||
U.S. Dollar vs. Japanese Yen, Strike Price $118.00, Expires 09/16/08 | 186,000 | $ | 10,007 | |||
| 5,143,037 | ||||||
Put Options — 0.0% | ||||||
10-Year U.S. Treasury Inflation Protected Bond, Strike Price $82.00, Expires 07/15/08 | 160 | 96 | ||||
10-Year U.S. Treasury Inflation Protected Bond, Strike Price $87.50, Expires 07/15/08 | 230 | 345 | ||||
10-Year U.S. Treasury Note Futures, Strike Price $93.00, Expires 08/22/08 | 1,946 | 30,406 | ||||
30-Year Federal National Mortgage Association, Strike Price $83.00, Expires 08/06/08 | 4,080 | 1 | ||||
30-Year Federal National Mortgage Association, Strike Price $86.00, Expires 08/06/08 | 6,650 | 1 | ||||
30-Year Federal National Mortgage Association, Strike Price $87.00, Expires 07/07/08 | 1,100 | — | ||||
30-Year Federal National Mortgage Association, Strike Price $88.00, Expires 07/07/08 | 13,300 | — | ||||
30-Year Federal National Mortgage Association, Strike Price $88.50, Expires 09/04/08 | 3,300 | 12 | ||||
30-Year Federal National Mortgage Association, Strike Price $90.00, Expires 08/06/08 | 4,650 | 2 | ||||
30-Year Government National Mortgage Association, Strike Price $81.0325, Expires 09/15/08 | 90 | — | ||||
30-Year Government National Mortgage Association, Strike Price $83.00, Expires 08/13/08 | 150 | — | ||||
30-Year Government National Mortgage Association, Strike Price $85.4375, Expires 09/15/08 | 110 | — | ||||
30-Year Government National Mortgage Association, Strike Price $88.50, Expires 09/15/08 | 900 | 5 | ||||
30-Year Government National Mortgage Association, Strike Price $90.00, Expires 08/13/08 | 800 | 1 | ||||
30-Year Government National Mortgage Association, Strike Price $92.00, Expires 07/14/08 | 2,800 | — | ||||
30-Year Government National Mortgage Association, Strike Price $92.00, Expires 09/15/08 | 1,500 | 4 | ||||
Euro vs. U.S. Dollar, Strike Price $1.375, Expires 05/21/10 | 17,000 | 52,308 | ||||
| 83,181 | ||||||
Put Swaptions — 0.0% | ||||||
3-Month LIBOR, Strike Price $5.05, Expires 12/18/09 | 440 | 94,153 | ||||
Euro vs. Japanese Yen, Strike Price $148.40, Expires 06/03/10 | 10,000 | 127,586 | ||||
| 221,739 | ||||||
Total Purchased Options | 5,821,756 | |||||
| Shares | ||||||
PREFERRED STOCKS — 0.4% | ||||||
CORTS Trust for Ford Motor Co.* | 9,100 | 127,400 | ||||
Fannie MaeD | 67,050 | 1,584,789 | ||||
Freddie MacD | 55,675 | 1,352,903 | ||||
General Motors Corporation CONV | 40,650 | 556,905 | ||||
Wachovia Corporation | 1,000 | 881,380 | ||||
Total Preferred Stocks | 4,503,377 | |||||
MONEY MARKET FUNDS — 15.6% | ||||||
GuideStone Money Market Fund (GS4 Class)¥ | 43,896,530 | 43,896,530 | ||||
Northern Institutional Liquid Assets Portfolio§ | 129,641,599 | 129,641,599 | ||||
Total Money Market Funds | 173,538,129 | |||||
| Par | ||||||
U.S. TREASURY OBLIGATIONS — 8.0% | ||||||
U.S. Treasury Bonds | ||||||
8.13%, 08/15/19D | $ | 1,900,000 | 2,538,282 | |||
4.75%, 02/15/37D | 2,120,000 | 2,189,894 | ||||
5.00%, 05/15/37D | 2,600,000 | 2,795,003 | ||||
4.38%, 02/15/38D | 17,400,000 | 16,965,017 | ||||
| 24,488,196 | ||||||
U.S. Treasury Inflationary Index Bonds | ||||||
3.38%, 01/15/12D | 60,000 | 80,139 | ||||
2.00%, 07/15/14D | 1,000,000 | 1,210,388 | ||||
1.88%, 07/15/15D | 6,400,000 | 7,402,072 | ||||
2.50%, 07/15/16D | 4,980,000 | 5,788,724 | ||||
2.38%, 01/15/25D | 3,240,000 | 3,872,916 | ||||
2.00%, 01/15/26D | 3,160,000 | 3,391,512 | ||||
2.38%, 01/15/27D | 3,160,000 | 3,529,333 | ||||
1.75%, 01/15/28D | 4,200,000 | 4,098,030 | ||||
3.88%, 04/15/29D | 4,468,000 | 7,587,309 | ||||
| 36,960,423 | ||||||
U.S. Treasury Notes | ||||||
2.63%, 05/31/10D | 150,000 | 150,141 | ||||
4.75%, 08/15/17D | 6,140,000 | 6,506,484 | ||||
3.88%, 05/15/18D | 7,000,000 | 6,943,678 | ||||
| 13,600,303 | ||||||
| 64 | See Notes to Financial Statements. |
Table of Contents
| Par | Value | |||||||
U.S. Treasury STRIPS | ||||||||
4.62%, 05/15/20 | $ | 600,000 | $ | 349,265 | ||||
4.70%, 11/15/21WD | 13,480,000 | 7,252,092 | ||||||
4.83%, 08/15/24W | 8,200,000 | 3,846,948 | ||||||
4.90%, 05/15/26WD | 1,500,000 | 642,578 | ||||||
4.90%, 11/15/26WD | 3,600,000 | 1,503,338 | ||||||
4.80%, 02/15/27D | 500,000 | 207,083 | ||||||
| 13,801,304 | ||||||||
Total U.S. Treasury Obligations | 88,850,226 | |||||||
TOTAL INVESTMENTS — 147.1% | 1,637,890,072 | |||||||
| Number of Contracts | ||||||||
WRITTEN OPTIONS — (0.5)% | ||||||||
Call Swaptions — (0.5)% | ||||||||
3-Month LIBOR, Strike Price $4.25, Expires 02/02/09 | (1,700 | ) | (224,970 | ) | ||||
3-Month LIBOR, Strike Price $4.30, Expires 12/15/08 | (3,740 | ) | (489,796 | ) | ||||
3-Month LIBOR, Strike Price $4.30, Expires 12/15/08 | (390 | ) | (51,075 | ) | ||||
3-Month LIBOR, Strike Price $4.44, Expires 04/20/09 | (12,750 | ) | (990,150 | ) | ||||
3-Month LIBOR, Strike Price $4.60, Expires 02/02/09 | (800 | ) | (174,206 | ) | ||||
3-Month LIBOR, Strike Price $4.90, Expires 07/06/09 | (2,210 | ) | (693,805 | ) | ||||
3-Month LIBOR, Strike Price $5.25, Expires 10/27/08 | (120 | ) | (69,279 | ) | ||||
3-Month LIBOR, Strike Price $5.25, Expires 10/27/08 | (100 | ) | (57,732 | ) | ||||
3-Month LIBOR, Strike Price $5.25, Expires 10/27/08 | (420 | ) | (238,381 | ) | ||||
3-Month LIBOR, Strike Price $7.00, Expires 03/18/09 | (2,030 | ) | (2,713,776 | ) | ||||
Euro vs. U.S. Dollar, Strike Price $1.50, Expires 06/20/13 | (120 | ) | (13,020 | ) | ||||
| (5,716,190 | ) | |||||||
Put Swaptions — 0.0% | ||||||||
3-Month LIBOR, Strike Price $5.25, Expires 10/27/08 | (420 | ) | (88,415 | ) | ||||
3-Month LIBOR, Strike Price $5.25, Expires 10/27/08 | (100 | ) | (21,866 | ) | ||||
3-Month LIBOR, Strike Price $5.25, Expires 10/27/08 | (120 | ) | (26,240 | ) | ||||
Euro vs. U.S. Dollar, Strike Price $1.83, Expires 09/20/08 | (120 | ) | (11,940 | ) | ||||
U.S. Dollar vs. Japanese Yen, Strike Price $100.00, Expires 09/16/08 | (93,000 | ) | (66,756 | ) | ||||
| (215,217 | ) | |||||||
Total Written Options | (5,931,407 | ) | ||||||
| Par | ||||||||
SECURITIES SOLD SHORT — (1.5)% | ||||||||
Federal National Mortgage Association | ||||||||
7.00%, 07/14/38 TBA | $ | (5,000,000 | ) | (5,242,190 | ) | |||
Government National Mortgage Association | ||||||||
5.00%, 07/01/38 TBA | (11,600,000 | ) | (11,237,500 | ) | ||||
Total Securities Sold Short | (16,479,690 | ) | ||||||
Liabilities in Excess of Other Assets — (45.1)% | (501,727,280 | ) | ||||||
NET ASSETS — 100.0% | $ | 1,113,751,695 | ||||||
| See Notes to Financial Statements. | 65 |
Table of Contents
Medium-Duration Bond Fund
SCHEDULE OF INVESTMENTS (Continued)
Swap agreements outstanding at June 30, 2008:
Description | Expiration Date | Notional Value | Unrealized Appreciation (Depreciation) | |||||
Australian Dollars | ||||||||
Receive fixed rate payments of 7.00% and pay variable rate payments on the three month BBSW floating rate(d) | 04/15/09 | 26,700,000 | $ | (184,791 | ) | |||
Receive fixed rate payments of 7.00% and pay variable rate payments on the three month BBSW floating rate(n) | 09/15/09 | 50,000,000 | (433,361 | ) | ||||
Receive fixed rate payments of 7.00% and pay variable rate payments on the three month BBSW floating rate(d) | 09/15/09 | 28,300,000 | (245,283 | ) | ||||
Receive fixed rate payments of 7.50% and pay variable rate payments on the six month BBSW floating rate(f) | 03/15/11 | 8,600,000 | (52,334 | ) | ||||
| (915,769 | ) | |||||||
Brazilian Real | ||||||||
Receive fixed rate payments of 12.40% and pay floating par of 3.10%(h) | 01/04/10 | 3,930,000 | (41,111 | ) | ||||
Receive fixed rate payments of 14.17% and pay floating rate of 2.68%(h) | 01/03/11 | 3,000,000 | (18,606 | ) | ||||
Receive fixed rate payments of 13.95% and pay floating rate of 2.68%(f) | 01/02/12 | 2,200,000 | (15,755 | ) | ||||
Receive fixed rate payments of 13.98% and pay floating rate of 2.68%(f) | 01/02/12 | 2,000,000 | (1,841 | ) | ||||
Receive variable rate payments on the three month BRL BRR CDI and pay fixed rate payments of 10.58%(n) | 01/02/12 | 1,000,000 | (61,625 | ) | ||||
Receive variable rate payments on the three month BRL BRR CDI and pay fixed rate payments of 10.12%(k) | 01/02/12 | 51,100,000 | (3,628,908 | ) | ||||
| (3,767,846 | ) | |||||||
British Pounds | ||||||||
Receive fixed rate payments of 5.00% and pay variable rate payments on the six month LIBOR floating rate(f) | 09/15/10 | 4,000,000 | (196,704 | ) | ||||
Receive fixed rate payments of 5.00% and pay variable rate payments on the six month LIBOR floating rate(b) | 09/15/10 | 10,200,000 | (501,595 | ) | ||||
Receive fixed rate payments of 4.50% and pay variable rate payments on the six month LIBOR floating rate(k) | 09/17/11 | 32,100,000 | (2,917,169 | ) | ||||
Receive fixed rate payments of 5.00% and pay variable rate payments on the six month LIBOR floating rate(m) | 09/17/11 | 12,000,000 | (1,090,530 | ) | ||||
Receive fixed rate payments of 4.50% and pay variable rate payments on the six month LIBOR floating rate(b) | 09/17/11 | 3,600,000 | (327,159 | ) | ||||
Receive fixed rate payments of 5.00% and pay variable rate payments on the six month LIBOR floating rate(d) | 09/15/15 | 2,500,000 | (245,403 | ) | ||||
Receive fixed rate payments of 5.00% and pay variable rate payments on the six month LIBOR floating rate(m) | 09/15/15 | 400,000 | (39,264 | ) | ||||
Receive variable rate payments on the six month LIBOR floating rate and pay fixed rate payments of 4.00%(b) | 06/15/37 | 1,900,000 | (41,757 | ) | ||||
| 66 | See Notes to Financial Statements. |
Table of Contents
Description | Expiration Date | Notional Value | Unrealized Appreciation (Depreciation) | |||||
Pay fixed rate payments of 4.25% and receive variable rate payments on the six month LIBOR floating rate(f) | 06/15/37 | 4,800,000 | $ | (234,134 | ) | |||
Pay fixed rate payments of 4.25% and receive variable rate payments on the six month LIBOR floating rate(k) | 06/15/37 | 1,600,000 | (78,045 | ) | ||||
| (5,671,760 | ) | |||||||
Euro | ||||||||
Receive fixed rate payments of 4.50% and pay variable rate payments on the six month EURIBOR floating rate(f) | 06/15/10 | 16,900,000 | (429,587 | ) | ||||
Receive fixed rate payments of 5.50% and pay variable rate payments on the six month EURIBOR floating rate(f) | 09/15/10 | 17,400,000 | 72,621 | |||||
Receive fixed rate payments of 2.15% and pay variable rate payments on the France CPI Ex Tobacco(n) | 10/15/10 | 300,000 | (5,876 | ) | ||||
Receive fixed rate payments of 5.50% and pay variable rate payments on the six month EURIBOR floating rate(b) | 12/17/10 | 1,300,000 | 5,717 | |||||
Receive fixed rate payments of 5.50% and pay variable rate payments on the six month EURIBOR floating rate(k) | 12/17/10 | 5,700,000 | 25,065 | |||||
Receive fixed rate payments of 4.00% and pay variable rate payments on the six month EURIBOR floating rate(f) | 06/15/13 | 6,000,000 | (466,788 | ) | ||||
Receive variable rate payments on the six month EURIBOR floating rate and pay fixed rate payments of 5.00%(m) | 09/17/38 | 1,400,000 | (10,462 | ) | ||||
Receive variable rate payments on the six month EURIBOR floating rate and pay fixed rate payments of 5.00%(b) | 09/17/38 | 1,400,000 | (10,462 | ) | ||||
| (819,772 | ) | |||||||
Hungarian Forint | ||||||||
Receive fixed rate payments of 8.47% and pay variable rate payments on the six month LIBOR floating rate(o) | 04/03/13 | 57,000,000 | (22 | ) | ||||
Receive fixed rate payments of 8.28% and pay variable rate payments on the six month LIBOR floating rate(o) | 04/04/13 | 57,000,000 | (40 | ) | ||||
Receive fixed rate payments of 8.28% and pay variable rate payments on the six month LIBOR floating rate(h) | 04/04/13 | 54,000,000 | (41 | ) | ||||
Receive fixed rate payments of 8.14% and pay variable rate payments on the six month floating rate(o) | 04/18/13 | 120,000,000 | (106 | ) | ||||
Receive fixed rate payments of 8.20% and pay variable rate payments on the six month floating rate(d) | 04/22/13 | 110,000,000 | (86 | ) | ||||
| (295 | ) | |||||||
Japanese Yen | ||||||||
Receive variable rate payments on the six month LIBOR floating rate and pay fixed rate payments of 2.00%(m) | 12/17/17 | 130,000,000 | (12,930 | ) | ||||
| See Notes to Financial Statements. | 67 |
Table of Contents
Medium-Duration Bond Fund
SCHEDULE OF INVESTMENTS (Continued)
Description | Expiration Date | Notional Value | Unrealized Appreciation (Depreciation) | ||||||
Receive variable rate payments on the six month LIBOR floating rate and pay fixed rate payments of 2.00%(f) | 12/17/17 | 130,000,000 | $ | (12,930 | ) | ||||
Receive variable rate payments on the six month LIBOR floating rate and pay fixed rate payments of 2.00%(b) | 12/17/17 | 30,000,000 | (2,984 | ) | |||||
| (28,844 | ) | ||||||||
Mexican Pesos | |||||||||
Receive fixed rate payments of 8.17% and pay variable rate payments on the six month MX BRR TIIE(j) | 11/04/16 | 93,000,000 | (829,896 | ) | |||||
U.S. Dollars | |||||||||
Receive floating par in the event of default on Emerson Electric Co., 4.63% due 10/15/12 and pay fixed rate payments of 0.22%(k) | 12/20/08 | $ | 300,000 | (14 | ) | ||||
Receive floating par in the event of default on Devon Financing Corporation, 6.88% due 9/30/11 and pay fixed rate payments of 0.35%(j) | 12/20/08 | 500,000 | (83 | ) | |||||
Receive floating par in the event of default on Carnival Corporation, 6.15% due 4/15/08 and pay fixed rate payments of 0.44%(n) | 12/20/08 | 300,000 | 501 | ||||||
Receive floating par in the event of default on Kroger Co., 6.75% due 4/15/12 and pay fixed rate payments of 0.53%(k) | 12/20/08 | 300,000 | (254 | ) | |||||
Pay variable in the event of default on Deutsche Bank and receive fixed rate payments of 0.55%(m) | 12/20/08 | 800,000 | 598 | ||||||
Receive variable rate payments on CMM FRA Index and pay fixed rate payments of 4.50%(j) | 01/23/09 | 5,800,000 | 718,651 | ||||||
Receive fixed rate payments of 4.00% and pay variable rate payments on the three month LIBOR floating rate(k) | 06/17/10 | 9,000,000 | 2,926 | ||||||
Pay fixed rate payments of 4.00% and receive variable rate payments on the three month LIBOR floating rate(m) | 12/17/10 | 38,600,000 | (47,300 | ) | |||||
Receive variable rate payments on the three month LIBOR floating rate and pay fixed rate payments of 4.00%(k) | 12/17/10 | 111,900,000 | (137,122 | ) | |||||
Receive floating par in the event of default on DaimlerChrysler NA Holding, 5.75% due 09/08/11 and pay fixed rate payments of 0.58%(b) | 09/20/11 | 900,000 | 5,975 | ||||||
Receive floating par in the event of default on the Dow Jones CDX X07 Index and pay fixed rate payments of 1.65%(h) | 12/20/11 | 3,885,716 | 281,804 | ||||||
Receive floating par in the event of default on the Dow Jones CDX HVOL7 Index and pay fixed rate payments of 0.75%(b) | 12/20/11 | 1,700,000 | 143,849 | ||||||
| 68 | See Notes to Financial Statements. |
Table of Contents
Description | Expiration Date | Notional Value | Unrealized Appreciation (Depreciation) | ||||||
Receive floating par in the event of default on International Lease Finance Corporation, 5.40% due 02/15/12 and pay fixed rate payments of 0.17%(b) | 03/20/12 | $ | 400,000 | $ | 43,350 | ||||
Receive floating par in the event of default on XL Capital (Europe) PLC, 6.50% due 01/15/12 and pay fixed rate payments of 0.21%(b) | 03/20/12 | 500,000 | 47,586 | ||||||
Receive floating par in the event of default on the Dow Jones CDX HY-8 and pay fixed rate payments of 2.75%(j) | 06/20/12 | 1,188,000 | 107,386 | ||||||
Receive floating par in the event of default on Target Corporation BP MYC, 5.88% due 03/01/12 and pay fixed rate payments of 0.11%(k) | 06/20/12 | 1,200,000 | 22,344 | ||||||
Receive floating par in the event of default on the Dow Jones CDX HY-8 and pay fixed rate payments of 1.60%(j) | 06/20/12 | 1,200,000 | 96,862 | ||||||
Receive floating par in the event of default on Morgan Stanley, 6.6% due 04/01/12 and pay fixed rate of 0.87%(c) | 09/20/12 | 700,000 | (34,508 | ) | |||||
Receive variable rate payments on the Dow Jones CDX IG50 Index and pay fixed rate payments of 1.55%(f) | 06/20/13 | 30,000,000 | (160,734 | ) | |||||
Receive floating par in the event of default on the Dow Jones CDX HY-10 Index and pay fixed rate payments of 5.00%(b) | 06/20/13 | 1,800,000 | 106,503 | ||||||
Receive floating par in the event of default on the Dow Jones CDX HY-10 Index and pay fixed rate payments of 5.00%(n) | 06/20/13 | 1,800,000 | 106,503 | ||||||
Receive floating par in the event of default on Sealed Air Corporation, 5.63% due 07/15/13 and pay fixed rate payments of 0.58%(k) | 09/20/13 | 400,000 | 17,975 | ||||||
Receive fixed rate payments of 4.25% and pay variable rate payments on the three month LIBOR floating rate(h) | 12/17/13 | 1,000,000 | (11,486 | ) | |||||
Receive fixed rate payments of 4.25% and pay variable rate payments on the three month LIBOR floating rate(f) | 12/17/13 | 4,800,000 | (52,828 | ) | |||||
Receive fixed rate payments of 4.00% and pay variable rate payments on the three month LIBOR floating rate(d) | 12/17/13 | 28,300,000 | (585,001 | ) | |||||
Receive fixed rate payments of 4.00% and pay variable rate payments on the three month LIBOR floating rate(k) | 12/17/13 | 66,700,000 | (1,378,784 | ) | |||||
Receive fixed rate payments of 4.25% and pay variable rate payments on the three month LIBOR floating rate(f) | 12/17/13 | 1,600,000 | (17,609 | ) | |||||
Receive floating par in the event of default on American Electric Power and pay fixed rate payments of 6.26%(d) | 06/20/15 | 2,300,000 | 11,018 | ||||||
| See Notes to Financial Statements. | 69 |
Table of Contents
Medium-Duration Bond Fund
SCHEDULE OF INVESTMENTS (Continued)
Description | Expiration Date | Notional Value | Unrealized Appreciation (Depreciation) | ||||||
Receive floating par in the event of default on CitiFinancial, 6.63% due 06/01/15 and pay fixed rate payments of 0.15%(b) | 06/20/15 | $ | 300,000 | $ | 21,125 | ||||
Receive variable rate payments on the three month LIBOR floating rate and pay fixed rate payments at 4.50%(a) | 12/17/15 | 24,000,000 | 205,468 | ||||||
Receive floating par in the event of default on Omnicom Group, Inc., 5.90% due 04/15/16 and pay fixed rate payments of 0.39%(k) | 06/20/16 | 700,000 | 12,751 | ||||||
Receive floating par in the event of default on Bank of America, 5.62% due 10/14/16 and pay fixed rate payments of 0.17%(d) | 12/20/16 | 1,700,000 | 104,534 | ||||||
Receive floating par in the event of default on the Dow Jones CDX IG7 Index and pay fixed rate payments of 0.65%(k) | 12/20/16 | 3,900,000 | 210,727 | ||||||
Receive floating par in the event of default on Federal Republic of Brazil, 12.50% due 03/06/30 and pay fixed rate payments of 1.04%(f) | 05/20/17 | 1,000,000 | (28,285 | ) | |||||
Receive floating par in the event of default on Autozone, 5.88% due 10/15/12 and pay fixed rate payments of 0.67%(m) | 06/20/17 | 1,700,000 | 49,141 | ||||||
Receive floating par in the event of default on Autozone, 5.88% due 10/15/12 and pay fixed rate payments of 0.64%(m) | 06/20/17 | 900,000 | 27,890 | ||||||
Receive floating par in the event of default on Autozone, 5.88% due 10/15/12 and pay fixed rate payments of 0.64%(m) | 06/20/17 | 600,000 | 18,385 | ||||||
Receive floating par in the event of default on GMAC LLC, 6.88% due 08/28/12 and pay fixed rate payments of 3.53%(f) | 09/20/17 | 8,400,000 | (2,715,430 | ) | |||||
Receive floating par in the event of default on the Dow Jones CDX IG9 Index and pay fixed rate payments of 0.80%(m) | 12/20/17 | 7,400,000 | 296,644 | ||||||
Receive floating par in the event of default on Citigroup, Inc. and pay fixed rate payments of 1.01%(f) | 06/20/18 | 8,700,000 | 273,869 | ||||||
Receive variable rate payments in the event of default on the Dow Jones CDX IG10 Index and pay fixed rate payments of 1.50%(f) | 06/20/18 | 3,100,000 | (38,016 | ) | |||||
Receive floating par in the event of default on the Dow Jones CDX IG10 Index and pay fixed rate payments of 1.50%(k) | 06/20/18 | 12,400,000 | (152,063 | ) | |||||
Receive fixed rate payments of 4.75% and pay variable rate payments on the three month LIBOR floating rate(h) | 12/17/18 | 3,600,000 | (23,124 | ) | |||||
Receive fixed rate payments of 5.00% and pay variable rate payments on the three month LIBOR floating rate(d) | 12/17/18 | 14,300,000 | 217,792 | ||||||
| 70 | See Notes to Financial Statements. |
Table of Contents
Description | Expiration Date | Notional Value | Unrealized Appreciation (Depreciation) | ||||||
Receive fixed rate payments of 5.00% and pay variable rate payments on the three month LIBOR floating rate(k) | 12/17/18 | $ | 31,100,000 | $ | 473,659 | ||||
Receive fixed rate payments of 4.75% and pay variable rate payments on the three month LIBOR floating rate(h) | 12/17/18 | 13,300,000 | (85,429 | ) | |||||
Receive variable rate payments on the three month LIBOR floating rate and pay fixed rate payments of 5.00%(j) | 12/17/23 | 4,000,000 | (21,516 | ) | |||||
Receive variable rate payments on the three month LIBOR floating rate | 12/17/23 | 2,700,000 | 53,276 | ||||||
Receive variable rate payments on the three month LIBOR floating rate and pay fixed rate payments of 5.00%(m) | 12/17/23 | 22,600,000 | (121,567 | ) | |||||
Receive fixed rate payments of 5.00% and pay variable rate payments on the three month LIBOR floating rate(f) | 12/17/28 | 900,000 | (3,288 | ) | |||||
Receive floating par in the event of default on the ABX HE AAA and pay fixed rate payments of 0.09%(p) | 08/25/37 | 1,000,000 | (508,200 | ) | |||||
Receive variable rate payments on the three month LIBOR floating rate and pay fixed rate payments of 5.00%(i) | 12/17/38 | 3,000,000 | 16,726 | ||||||
Receive variable rate payments on the three month LIBOR floating rate and pay fixed rate payments of 5.00%(p) | 12/17/38 | 1,000,000 | 5,575 | ||||||
Receive fixed rate payments of 5.00% and pay variable rate payments on the three month LIBOR floating rate(h) | 12/17/38 | 1,700,000 | (16,441 | ) | |||||
| (2,437,689 | ) | ||||||||
| $ | (14,471,871 | ) | |||||||
PORTFOLIO SUMMARY (based on net assets)
| % | |||
Mortgage-Backed Securities | 74.0 | ||
Corporate Bonds | 25.9 | ||
Money Market Funds | 15.6 | ||
Futures Contracts | 12.5 | ||
Agency Obligations | 8.2 | ||
U.S. Treasury Obligations | 8.0 | ||
Foreign Bonds | 7.9 | ||
Asset-Backed Securities | 3.7 | ||
Commercial Paper | 1.4 | ||
Loan Agreements | 1.2 | ||
Purchased Options | 0.5 | ||
Preferred Stocks | 0.4 | ||
Municipal Bonds | 0.3 | ||
Written Options | (0.5 | ) | |
Swap Agreements | (1.3 | ) | |
Securities Sold Short | (1.5 | ) | |
Forward Foreign Currency Contracts | — | ** | |
| 156.3 | |||
| ** | Rounds to less than 0.005%. |
| See Notes to Financial Statements. | 71 |
Table of Contents
Medium-Duration Bond Fund
SCHEDULE OF INVESTMENTS (Continued)
FAS 157 DISCLOSURE
The following is a summary of the inputs used, as of June 30, 2008, in valuing the Fund’s investments carried at fair value:
Valuation Inputs | Investments in Securities | Other Financial Instruments* | ||||||
Assets: | ||||||||
Level 1 — Quoted Prices | $ | 183,283,837 | $ | (1,471,120 | ) | |||
Level 2 — Other Significant Observable Inputs | 1,444,912,029 | 1,049,694 | ||||||
Level 3 — Significant Unobservable Inputs** | 9,694,206 | — | ||||||
Total Assets | $ | 1,637,890,072 | $ | (421,426 | ) | |||
Liabilities: | ||||||||
Level 1 — Quoted Prices | $ | (5,557,124 | ) | $ | — | |||
Level 2 — Other Significant Observable Inputs | (16,853,973 | ) | (14,471,871 | ) | ||||
Level 3 — Significant Unobservable Inputs | — | — | ||||||
Total Liabilities | $ | (22,411,097 | ) | $ | (14,471,871 | ) | ||
| * | Other financial instruments are derivative instruments not reflected in the Schedule of Investments, such as futures, forwards and swap contracts, which are valued at the unrealized appreciation (depreciation) on the investment. |
| ** | The fair value of Level 3 securities is equal to 0.87% of the Fund’s Net Assets. The fair value of the Level 3 securities does not have a significant impact on the amounts reported. |
| 72 | See Notes to Financial Statements. |
Table of Contents
| Extended-Duration Bond Fund | ||
| SCHEDULE OF INVESTMENTS | June 30, 2008 (Unaudited) |
| Par | Value | |||||
ASSET-BACKED SECURITIES — 7.7% | ||||||
Capital One Multi-Asset Execution Trust | ||||||
5.75%, 07/15/20 | $ | 14,300,000 | $ | 14,083,269 | ||
Citibank Credit Card Issuance Trust | ||||||
6.15%, 06/15/39 | 12,650,000 | 12,353,580 | ||||
Community Program Loan Trust | ||||||
4.50%, 04/01/29 | 1,950,000 | 1,743,163 | ||||
Discover Card Master Trust | ||||||
5.65%, 03/16/20 | 12,100,000 | 11,553,612 | ||||
Total Asset-Backed Securities | 39,733,624 | |||||
CORPORATE BONDS — 60.1% | ||||||
Abbott Laboratories | ||||||
6.15%, 11/30/37D | 9,156,000 | 9,211,348 | ||||
Albertson’s, Inc. | ||||||
7.75%, 06/15/26 | 800,000 | 788,562 | ||||
6.63%, 06/01/28 | 105,000 | 90,577 | ||||
7.45%, 08/01/29 | 985,000 | 936,696 | ||||
8.00%, 05/01/31 | 110,000 | 113,061 | ||||
American Express Co. | ||||||
8.15%, 03/19/38 | 9,925,000 | 11,064,092 | ||||
American International Group, Inc. | ||||||
5.85%, 01/16/18 | 12,740,000 | 11,956,770 | ||||
Anadarko Petroleum Corporation | ||||||
5.95%, 09/15/16 | 1,080,000 | 1,082,316 | ||||
6.45%, 09/15/36 | 760,000 | 752,598 | ||||
Apache Corporation | ||||||
6.00%, 01/15/37D | 1,640,000 | 1,614,642 | ||||
Archer-Daniels-Midland Co. | ||||||
6.45%, 01/15/38 | 1,795,000 | 1,805,573 | ||||
Arrow Electronics, Inc. | ||||||
6.88%, 07/01/13 | 205,000 | 209,587 | ||||
ASIF Global Financing XXVII | ||||||
2.38%, 02/26/09 144A(G) | 6,700,000 | 4,919,574 | ||||
AT&T Corporation | ||||||
6.50%, 03/15/29 | 125,000 | 119,015 | ||||
6.50%, 09/01/37 | 11,130,000 | 10,806,284 | ||||
Avnet, Inc. | ||||||
6.00%, 09/01/15 | 875,000 | 849,450 | ||||
Bank of America Corporation | ||||||
8.00%, 12/29/49† | 9,210,000 | 8,642,572 | ||||
Barclays Financial LLC | ||||||
4.16%, 02/22/10 144A(T) | 25,000,000 | 744,047 | ||||
4.10%, 03/22/10 144A(T) | 7,000,000 | 203,353 | ||||
4.06%, 09/16/10 144A(W) | 730,000,000 | 703,097 | ||||
Baxter International, Inc. | ||||||
6.25%, 12/01/37 | 2,332,000 | 2,345,948 | ||||
Borden, Inc. | ||||||
7.88%, 02/15/23 | 1,200,000 | 690,000 | ||||
Bruce Mansfield Unit | ||||||
6.85%, 06/01/34 | 1,255,000 | 1,270,112 | ||||
Camden Property Trust | ||||||
5.70%, 05/15/17 | 25,000 | 21,900 | ||||
Chesapeake Energy Corporation | ||||||
6.88%, 01/15/16 | 610,000 | 591,700 | ||||
6.50%, 08/15/17 | 45,000 | 42,300 | ||||
6.88%, 11/15/20D | 320,000 | 302,400 | ||||
CIT Group Holdings, Inc. | ||||||
5.40%, 01/30/16 | 50,000 | 34,484 | ||||
CIT Group, Inc. | ||||||
7.63%, 11/30/12D | 8,440,000 | 7,021,346 | ||||
5.00%, 02/13/14 | 265,000 | 190,508 | ||||
5.13%, 09/30/14 | 590,000 | 423,110 | ||||
5.50%, 12/01/14(U) | 600,000 | 829,062 | ||||
5.00%, 02/01/15D | 55,000 | 38,079 | ||||
5.65%, 02/13/17 | 215,000 | 148,547 | ||||
5.80%, 10/01/36 | 220,000 | 169,638 | ||||
Citigroup, Inc. | ||||||
6.63%, 06/15/32 | 3,128,000 | 2,862,874 | ||||
5.88%, 05/29/37D | 4,141,000 | 3,532,451 | ||||
6.88%, 03/05/38D | 4,149,000 | 4,016,128 | ||||
Comcast Corporation | ||||||
5.50%, 03/15/11 | 500,000 | 500,687 | ||||
5.65%, 06/15/35 | 660,000 | 562,604 | ||||
6.50%, 11/15/35 | 555,000 | 529,232 | ||||
6.45%, 03/15/37D | 2,415,000 | 2,254,644 | ||||
6.95%, 08/15/37 | 625,000 | 616,638 | ||||
Commonwealth Edison Co. | ||||||
4.75%, 12/01/11@ | 267,000 | 249,228 | ||||
ConocoPhillips | ||||||
5.90%, 05/15/38D | 5,642,000 | 5,582,770 | ||||
Constellation Energy Group, Inc. | ||||||
4.55%, 06/15/15D | 750,000 | 669,108 | ||||
Continental Airlines, Inc. | ||||||
6.95%, 02/02/11 | 192,631 | 179,146 | ||||
8.31%, 04/02/18 | 461,837 | 384,521 | ||||
7.57%, 03/15/20 | 405,072 | 340,260 | ||||
Corning, Inc. | ||||||
6.20%, 03/15/16 | 230,000 | 238,006 | ||||
7.25%, 08/15/36 | 850,000 | 864,815 | ||||
Cox Communications, Inc. | ||||||
6.75%, 03/15/11 | 250,000 | 258,168 | ||||
Cummins, Inc. | ||||||
6.75%, 02/15/27 | 750,000 | 658,292 | ||||
5.65%, 03/01/28D | 1,520,000 | 1,046,839 | ||||
7.13%, 03/01/28 | 425,000 | 404,297 | ||||
DCP Midstream LP | ||||||
6.45%, 11/03/36 144A | 490,000 | 448,080 | ||||
Devon Energy Corporation | ||||||
4.95%, 08/15/08 CONV | 963,000 | 1,793,588 | ||||
Dillard’s, Inc. | ||||||
7.75%, 07/15/26 | 890,000 | 627,450 | ||||
7.00%, 12/01/28D | 500,000 | 317,500 | ||||
Duke Energy Carolinas LLC | ||||||
6.10%, 06/01/37D | 1,483,000 | 1,413,774 | ||||
6.00%, 01/15/38 | 375,000 | 366,972 | ||||
Duke Realty LP | ||||||
5.95%, 02/15/17 | 70,000 | 64,757 | ||||
El Paso Corporation | ||||||
7.00%, 05/15/11D | 400,000 | 403,286 | ||||
Emerson Electric Co. | ||||||
5.25%, 10/15/18 | 3,000,000 | 2,963,424 | ||||
First Industrial LP | ||||||
7.60%, 07/15/28 | 1,000,000 | 891,656 | ||||
Foot Locker, Inc. | ||||||
8.50%, 01/15/22 | 1,000,000 | 940,000 | ||||
Ford Motor Co. | ||||||
6.63%, 10/01/28D | 680,000 | 367,200 | ||||
6.38%, 02/01/29D | 1,255,000 | 665,150 | ||||
Ford Motor Credit Co. | ||||||
5.70%, 01/15/10 | 135,000 | 115,217 | ||||
| See Notes to Financial Statements. | 73 |
Table of Contents
Extended-Duration Bond Fund
SCHEDULE OF INVESTMENTS (Continued)
| Par | Value | |||||
7.00%, 10/01/13 | $ | 315,000 | $ | 232,204 | ||
8.00%, 12/15/16 | 1,000,000 | 727,763 | ||||
General Electric Capital Corporation | ||||||
6.75%, 03/15/32 | 4,865,000 | 4,913,280 | ||||
6.15%, 08/07/37 | 6,114,000 | 5,755,940 | ||||
General Motors Acceptance Corporation | ||||||
6.88%, 08/28/12D | 250,000 | 171,334 | ||||
Georgia-Pacific Corporation | ||||||
8.00%, 01/15/24D | 30,000 | 27,900 | ||||
7.38%, 12/01/25 | 240,000 | 204,000 | ||||
7.25%, 06/01/28 | 300,000 | 252,000 | ||||
7.75%, 11/15/29D | 3,700,000 | 3,274,500 | ||||
8.88%, 05/15/31D | 60,000 | 55,800 | ||||
GTE Corporation | ||||||
6.94%, 04/15/28 | 10,000 | 9,926 | ||||
HCA, Inc. | ||||||
6.30%, 10/01/12 | 1,500,000 | 1,353,750 | ||||
7.58%, 09/15/25 | 1,000,000 | 816,096 | ||||
7.05%, 12/01/27 | 500,000 | 381,146 | ||||
HCP, Inc. | ||||||
6.00%, 03/01/15 | 1,500,000 | 1,390,066 | ||||
Highwoods Properties, Inc. | ||||||
7.50%, 04/15/18 | 1,500,000 | 1,427,642 | ||||
Historic TW, Inc. | ||||||
6.63%, 05/15/29 | 60,000 | 54,746 | ||||
Home Depot, Inc. | ||||||
5.88%, 12/16/36 | 875,000 | 717,009 | ||||
HSBC Bank USA NA | ||||||
3.31%, 08/25/10 144A | 700,000 | 821,310 | ||||
5.88%, 11/01/34D | 6,960,000 | 6,107,456 | ||||
iStar Financial, Inc. | ||||||
8.63%, 06/01/13 | 635,000 | 581,586 | ||||
5.95%, 10/15/13 | 305,000 | 250,369 | ||||
5.70%, 03/01/14D | 1,171,000 | 984,777 | ||||
JC Penney Corporation, Inc. | ||||||
6.38%, 10/15/36D | 810,000 | 678,494 | ||||
Johnson & Johnson | ||||||
5.95%, 08/15/37D | 1,000,000 | 1,041,806 | ||||
JPMorgan Chase Capital XXV | ||||||
6.80%, 10/01/37 | 15,210,000 | 13,692,696 | ||||
Kimberly-Clark Corporation | ||||||
6.63%, 08/01/37 | 1,424,000 | 1,530,205 | ||||
Kinder Morgan Energy Partners LP | ||||||
5.80%, 03/15/35 | 280,000 | 243,694 | ||||
Koninklijke Philips Electronics NV | ||||||
6.88%, 03/11/38 | 8,052,000 | 8,339,787 | ||||
Kraft Foods, Inc. | ||||||
6.50%, 11/01/31 | 815,000 | 756,497 | ||||
Lehman Brothers Holdings, Inc. | ||||||
6.00%, 05/03/32† | 45,000 | 34,491 | ||||
6.88%, 07/17/37 | 635,000 | 548,166 | ||||
Lennar Corporation | ||||||
5.60%, 05/31/15 | 935,000 | 688,394 | ||||
6.50%, 04/15/16 | 625,000 | 482,031 | ||||
Lowe’s Cos., Inc. | ||||||
6.65%, 09/15/37 | 3,051,000 | 2,983,384 | ||||
M&T Bank Corporation | ||||||
6.63%, 12/04/17 | 9,370,000 | 9,062,411 | ||||
Macy’s Retail Holdings, Inc. | ||||||
6.38%, 03/15/37 | 240,000 | 185,361 | ||||
MBIA Insurance Corporation | ||||||
14.00%, 01/15/33 144A†D | 4,750,000 | 1,972,613 | ||||
McDonald’s Corporation | ||||||
6.30%, 10/15/37 | 6,763,000 | 6,748,723 | ||||
MidAmerican Energy Holdings Co. | ||||||
5.88%, 10/01/12 | 1,000,000 | 1,029,499 | ||||
6.50%, 09/15/37 | 685,000 | 694,100 | ||||
Monsanto Co. | ||||||
5.88%, 04/15/38 | 2,054,000 | 1,983,842 | ||||
Mosaic Global Holdings, Inc. | ||||||
7.38%, 08/01/18 | 500,000 | 513,125 | ||||
7.30%, 01/15/28 | 690,000 | 700,350 | ||||
Motorola, Inc. | ||||||
6.50%, 11/15/28D | 500,000 | 391,556 | ||||
Nextel Communications, Inc. | ||||||
5.95%, 03/15/14 | 5,000 | 4,017 | ||||
7.38%, 08/01/15 | 35,000 | 29,069 | ||||
NGPL PipeCo LLC | ||||||
7.12%, 12/15/17 144A | 640,000 | 655,238 | ||||
NiSource Finance Corporation | ||||||
6.15%, 03/01/13D | 1,000,000 | 998,366 | ||||
6.40%, 03/15/18 | 1,640,000 | 1,585,627 | ||||
Northern Telecom Capital | ||||||
7.88%, 06/15/26 | 450,000 | 324,000 | ||||
Nucor Corporation | ||||||
6.40%, 12/01/37 | 9,294,000 | 9,460,967 | ||||
Owens Corning, Inc. | ||||||
6.50%, 12/01/16 | 240,000 | 218,857 | ||||
7.00%, 12/01/36 | 355,000 | 297,384 | ||||
PacifiCorp | ||||||
6.25%, 10/15/37 | 6,943,000 | 6,888,692 | ||||
Pioneer Natural Resources Co. | ||||||
7.20%, 01/15/28D | 2,500,000 | 2,219,668 | ||||
PPL Electric Utilities Corporation | ||||||
6.45%, 08/15/37 | 3,076,000 | 3,158,594 | ||||
Preston Corporation | ||||||
7.00%, 05/01/11 CONV | 201,000 | 186,428 | ||||
Prologis | ||||||
5.63%, 11/15/15 | 35,000 | 32,931 | ||||
Pulte Homes, Inc. | ||||||
5.20%, 02/15/15 | 40,000 | 32,800 | ||||
7.88%, 06/15/32 | 1,500,000 | 1,290,000 | ||||
6.38%, 05/15/33 | 1,000,000 | 780,000 | ||||
Qwest Corporation | ||||||
7.25%, 09/15/25 | 1,000,000 | 890,000 | ||||
6.88%, 09/15/33 | 2,250,000 | 1,867,500 | ||||
Regions Financial Corporation | ||||||
7.38%, 12/10/37 | 11,088,000 | 10,015,569 | ||||
SLM Corporation | ||||||
5.38%, 05/15/14 | 200,000 | 175,920 | ||||
Southern Natural Gas Co. | ||||||
7.35%, 02/15/31 | 1,750,000 | 1,781,178 | ||||
Sprint Capital Corporation | ||||||
6.90%, 05/01/19 | 75,000 | 65,932 | ||||
6.88%, 11/15/28 | 3,400,000 | 2,837,555 | ||||
Swift Energy Co. | ||||||
7.63%, 07/15/11D | 150,000 | 150,000 | ||||
Target Corporation | ||||||
6.50%, 10/15/37 | 5,400,000 | 5,211,243 | ||||
7.00%, 01/15/38 | 5,150,000 | 5,296,945 | ||||
Tennessee Gas Pipeline Co. | ||||||
7.00%, 10/15/28 | 750,000 | 735,193 | ||||
| 74 | See Notes to Financial Statements. |
Table of Contents
| Par | Value | |||||
Time Warner, Inc. | ||||||
7.63%, 04/15/31 | $ | 35,000 | $ | 35,630 | ||
6.50%, 11/15/36 | 120,000 | 107,146 | ||||
Toll Brothers Finance Corporation | ||||||
5.15%, 05/15/15 | 1,285,000 | 1,114,365 | ||||
Toro Co. | ||||||
6.63%, 05/01/37 | 300,000 | 307,795 | ||||
Union Pacific Resources Group | ||||||
7.15%, 05/15/28 | 250,000 | 258,185 | ||||
United Technologies Corporation | ||||||
6.13%, 07/15/38 | 6,030,000 | 6,078,035 | ||||
Verizon Communications, Inc. | ||||||
6.40%, 02/15/38D | 2,068,000 | 1,931,158 | ||||
6.90%, 04/15/38 | 2,570,000 | 2,547,808 | ||||
Verizon Global Funding Corporation | ||||||
5.85%, 09/15/35 | 2,420,000 | 2,139,725 | ||||
Verizon Maryland, Inc. | ||||||
5.13%, 06/15/33 | 50,000 | 38,730 | ||||
Verizon New York, Inc. | ||||||
7.38%, 04/01/32 | 385,000 | 392,197 | ||||
Wachovia Bank NA | ||||||
5.85%, 02/01/37 | 6,077,000 | 4,852,102 | ||||
6.60%, 01/15/38 | 7,257,000 | 6,342,509 | ||||
Wal-Mart Stores, Inc. | ||||||
5.25%, 09/01/35 | 1,822,000 | 1,588,314 | ||||
6.50%, 08/15/37 | 9,385,000 | 9,690,585 | ||||
WellPoint, Inc. | ||||||
6.38%, 06/15/37D | 2,080,000 | 1,882,772 | ||||
Wells Fargo Bank NA | ||||||
5.95%, 08/26/36 | 4,625,000 | 4,344,207 | ||||
Western Union Co. | ||||||
6.20%, 11/17/36 | 2,155,000 | 2,017,470 | ||||
Williams Cos., Inc. | ||||||
7.50%, 01/15/31 | 1,250,000 | 1,270,312 | ||||
Xerox Capital Trust I | ||||||
8.00%, 02/01/27 | 1,500,000 | 1,467,568 | ||||
XTO Energy, Inc. | ||||||
6.10%, 04/01/36 | 50,000 | 47,778 | ||||
Total Corporate Bonds | 308,316,999 | |||||
FOREIGN BONDS — 28.5% | ||||||
Australia — 1.9% | ||||||
New South Wales Treasury Corporation | ||||||
7.00%, 12/01/10(A) | 1,125,000 | 1,070,734 | ||||
6.00%, 05/01/12(A) | 120,000 | 110,058 | ||||
Qantas Airways, Ltd. | ||||||
6.05%, 04/15/16 144A | 345,000 | 313,215 | ||||
Queensland Treasury Corporation | ||||||
6.00%, 06/14/11(A) | 1,385,000 | 1,284,364 | ||||
Rio Tinto Finance USA, Ltd. | ||||||
7.13%, 07/15/28 | 6,830,000 | 6,929,820 | ||||
| 9,708,191 | ||||||
Brazil — 1.4% | ||||||
Federative Republic of Brazil | ||||||
10.25%, 01/10/28(B) | 2,525,000 | 1,397,878 | ||||
8.25%, 01/20/34D | 4,750,000 | 5,852,000 | ||||
| 7,249,878 | ||||||
Canada — 7.6% | ||||||
British Columbia Generic Residual | ||||||
4.14%, 06/09/14 STRIP(C)W | 10,230,000 | 7,905,502 | ||||
Canada Generic Residual | ||||||
4.23%, 06/01/25 STRIP(C)W | 4,110,000 | 1,974,993 | ||||
Canadian Government | ||||||
4.00%, 06/01/16(C) | 575,000 | 576,635 | ||||
Canadian National Railway Co. | ||||||
6.38%, 11/15/37 | 7,938,000 | 7,850,999 | ||||
CIT Group Funding Co. | ||||||
5.20%, 06/01/15 | 240,000 | 165,529 | ||||
Kinder Morgan Finance Co. | ||||||
5.70%, 01/05/16 | 125,000 | 111,875 | ||||
Methanex Corporation | ||||||
6.00%, 08/15/15 | 25,000 | 23,293 | ||||
Ontario Generic Residual | ||||||
4.82%, 07/13/22 STRIP(C)W | 3,900,000 | 1,939,100 | ||||
4.91%, 03/08/29(C) | 7,000,000 | 2,539,963 | ||||
Saskatchewan Residual | ||||||
4.13%, 04/10/14 STRIP(C)W | 7,500,000 | 5,817,888 | ||||
4.76%, 02/04/22 STRIP(C)W | 3,000,000 | 1,571,050 | ||||
Talisman Energy, Inc. | ||||||
5.85%, 02/01/37 | 670,000 | 579,111 | ||||
6.25%, 02/01/38 | 450,000 | 414,971 | ||||
TransCanada Pipelines, Ltd. | ||||||
6.20%, 10/15/37(C) | 8,412,000 | 7,735,641 | ||||
| 39,206,550 | ||||||
Cayman Islands — 0.1% | ||||||
Enersis SA | ||||||
7.40%, 12/01/16D | 625,000 | 670,024 | ||||
Iceland — 1.1% | ||||||
Glitnir Banki HF | ||||||
6.38%, 09/25/12 144A | 6,275,000 | 5,398,288 | ||||
Luxembourg — 1.2% | ||||||
Covidien International Finance SA | ||||||
6.55%, 10/15/37 | 5,307,000 | 5,370,153 | ||||
Telecom Italia Capital SA | ||||||
6.38%, 11/15/33 | 410,000 | 366,086 | ||||
6.00%, 09/30/34 | 415,000 | 356,241 | ||||
| 6,092,480 | ||||||
Malaysia — 0.1% | ||||||
Telekom Malaysia BHD | ||||||
7.88%, 08/01/25 144A | 225,000 | 255,908 | ||||
Mexico — 1.0% | ||||||
Mexican Bonos | ||||||
9.00%, 12/20/12(M) | 23,000,000 | 2,243,844 | ||||
8.00%, 12/07/23(M) | 34,000,000 | 2,950,946 | ||||
| 5,194,790 | ||||||
Netherlands — 0.3% | ||||||
Rabobank Nederland NV | ||||||
14.00%, 01/28/09(I) | 110,000,000 | 1,403,242 | ||||
Philippines — 0.1% | ||||||
Quezon Power (Philippines), Ltd. | ||||||
8.86%, 06/15/17 | 385,000 | 381,150 | ||||
| See Notes to Financial Statements. | 75 |
Table of Contents
Extended-Duration Bond Fund
SCHEDULE OF INVESTMENTS (Continued)
| Par | Value | ||||||
Spain — 2.8% | |||||||
Santander Perpetual SA Unipersonal | |||||||
6.67%, 10/24/17 144A†D | $ | 11,600,000 | $ | 11,225,367 | |||
Telefonica Emisones SAU | |||||||
7.05%, 06/20/36 | 3,105,000 | 3,196,349 | |||||
| 14,421,716 | |||||||
Supranational — 2.0% | |||||||
Inter-American Development Bank | |||||||
12.03%, 05/11/09(B) | 7,500,000 | 4,235,388 | |||||
6.00%, 12/15/17(Z)D | 8,765,000 | 6,153,973 | |||||
| 10,389,361 | |||||||
United Kingdom — 8.9% | |||||||
AstraZeneca PLC | |||||||
6.45%, 09/15/37 | 2,700,000 | 2,757,829 | |||||
Barclays Bank PLC | |||||||
6.05%, 12/04/17 144A | 4,531,000 | 4,449,120 | |||||
7.70%, 10/25/49†D | 5,537,000 | 5,661,522 | |||||
HBOS PLC | |||||||
6.75%, 05/21/18 | 9,556,000 | 9,155,164 | |||||
HSBC Holdings PLC | |||||||
6.50%, 09/15/37D | 6,500,000 | 5,943,593 | |||||
Standard Chartered Bank | |||||||
6.40%, 09/26/17 144AD | 10,027,000 | 9,819,060 | |||||
Tesco PLC | |||||||
6.15%, 11/15/37 144A | 7,550,000 | 7,020,783 | |||||
Vodafone Group PLC | |||||||
6.15%, 02/27/37D | 1,000,000 | 917,438 | |||||
| 45,724,509 | |||||||
Total Foreign Bonds | 146,096,087 | ||||||
MORTGAGE-BACKED SECURITIES — 0.0% | |||||||
Federal Home Loan Mortgage Corporation | |||||||
5.00%, 12/01/31 | 183,018 | 176,699 | |||||
Federal National Mortgage Association | |||||||
5.00%, 07/25/23 | 22,150 | 22,110 | |||||
Total Mortgage-Backed Securities | 198,809 | ||||||
| Shares | |||||||
PREFERRED STOCKS — 0.1% | |||||||
Chesapeake Energy Corporation CONV | 330 | 57,362 | |||||
El Paso Energy Capital Trust I CONV | 5,350 | 219,350 | |||||
Total Preferred Stocks | 276,712 | ||||||
MONEY MARKET FUNDS — 9.7% | |||||||
GuideStone Money Market Fund (GS4 Class)¥ | 4,963,945 | 4,963,945 | |||||
Northern Institutional Liquid Assets Portfolio§ | 44,639,752 | 44,639,752 | |||||
Total Money Market Funds | 49,603,697 | ||||||
| Par | |||||||
U.S. TREASURY OBLIGATIONS — 0.7% | |||||||
U.S. Treasury Bond | |||||||
4.75%, 02/15/37D | $ | 1,000,000 | 1,032,969 | ||||
U.S. Treasury Note | |||||||
4.63%, 10/31/11D | 1,055,000 | 1,107,668 | |||||
U.S. Treasury STRIPS | |||||||
4.70%, 02/15/36D | 1,500,000 | 428,242 | |||||
4.66%, 05/15/37D | 4,000,000 | 1,082,052 | |||||
| 1,510,294 | |||||||
Total U.S. Treasury Obligations | 3,650,931 | ||||||
TOTAL INVESTMENTS — 106.8% | 547,876,859 | ||||||
Liabilities in Excess of Other Assets — (6.8)% | (34,937,986 | ) | |||||
NET ASSETS — 100.0% | $ | 512,938,873 | |||||
| 76 | See Notes to Financial Statements. |
Table of Contents
PORTFOLIO SUMMARY (based on net assets)
| % | |||
Corporate Bonds | 60.1 | ||
Foreign Bonds | 28.5 | ||
Money Market Funds | 9.7 | ||
Asset-Backed Securities | 7.7 | ||
U.S. Treasury Obligations | 0.7 | ||
Preferred Stocks | 0.1 | ||
Mortgage-Backed Securities | — | ** | |
| 106.8 | |||
| ** | Rounds to less than 0.005%. |
FAS 157 DISCLOSURE
The following is a summary of the inputs used, as of June 30, 2008, in valuing the Fund’s assets carried at fair value:
Valuation Inputs | Investments in Securities | Other Financial Instruments* | ||||
Level 1 — Quoted Prices | $ | 49,880,409 | $ | — | ||
Level 2 — Other Significant Observable Inputs | 497,996,450 | — | ||||
Level 3 — Significant Unobservable Inputs | — | — | ||||
Total | $ | 547,876,859 | $ | — | ||
| * | Other financial instruments are derivative instruments not reflected in the Schedule of Investments, such as futures, forwards and swap contracts, which are valued at the unrealized appreciation (depreciation) on the investment. |
| See Notes to Financial Statements. | 77 |
Table of Contents
| Global Bond Fund | ||
| SCHEDULE OF INVESTMENTS | June 30, 2008 (Unaudited) |
| Par | Value | |||||
AGENCY OBLIGATIONS — 0.2% | ||||||
Federal National Mortgage Association | ||||||
1.25%, 12/15/08‡‡ | $ | 153,000 | $ | 151,236 | ||
1.38%, 12/15/08‡‡ | 445,000 | 439,870 | ||||
Total Agency Obligations | 591,106 | |||||
ASSET-BACKED SECURITIES — 2.2% | ||||||
ARG Funding Corporation | ||||||
2.64%, 05/20/11† | 460,000 | 421,333 | ||||
Bear Stearns Asset-Backed Securities Trust | ||||||
2.87%, 10/25/33 STEP | 150,306 | 137,532 | ||||
Carrington Mortgage Loan Trust | ||||||
2.80%, 10/25/35† | 124,349 | 122,134 | ||||
Chase Issuance Trust | ||||||
2.72%, 04/15/19† | 760,000 | 606,792 | ||||
Citibank Credit Card Issuance Trust | ||||||
7.75%, 06/20/14 | 710,000 | 656,085 | ||||
GMAC Mortgage Corporation Loan Trust | ||||||
2.55%, 12/25/36† | 1,830,778 | 1,306,272 | ||||
Lehman XS Trust | ||||||
2.57%, 02/25/37† | 683,709 | 622,301 | ||||
Morgan Stanley Mortgage Loan Trust | ||||||
2.60%, 10/25/36† | 352,595 | 335,837 | ||||
Origen Manufactured Housing | ||||||
2.62%, 11/15/18† | 119,537 | 101,833 | ||||
RAAC Series | ||||||
2.73%, 07/25/37 144A† | 320,009 | 314,649 | ||||
Residential Asset Securities Corporation | ||||||
6.35%, 03/25/32 | 81,576 | 56,666 | ||||
SACO I, Inc. | ||||||
2.56%, 09/25/35† | 140,882 | 78,967 | ||||
Security National Mortgage Loan Trust | ||||||
2.67%, 01/25/37 144A† | 261,838 | 253,942 | ||||
Total Asset-Backed Securities | 5,014,343 | |||||
CORPORATE BONDS — 35.1% | ||||||
Activant Solutions, Inc. | ||||||
9.50%, 05/01/16 | 65,000 | 51,675 | ||||
Advanced Medical Optics, Inc. | ||||||
7.50%, 05/01/17D | 45,000 | 41,625 | ||||
AES Corporation | ||||||
8.38%, 03/01/11(U) | 50,000 | 98,596 | ||||
8.75%, 05/15/13 144A | 312,000 | 325,260 | ||||
8.00%, 10/15/17 | 315,000 | 310,275 | ||||
Affinion Group, Inc. | ||||||
10.13%, 10/15/13 | 100,000 | 100,750 | ||||
11.50%, 10/15/15 | 105,000 | 105,263 | ||||
Allegheny Energy Supply | ||||||
7.80%, 03/15/11 | 90,000 | 92,475 | ||||
Allied Security Escrow Corporation | ||||||
11.38%, 07/15/11 | 160,000 | 138,400 | ||||
Allied Waste North America, Inc. | ||||||
7.13%, 05/15/16D | 225,000 | 225,000 | ||||
American International Group, Inc. | ||||||
5.05%, 10/01/15 | 100,000 | 90,741 | ||||
Amkor Technologies, Inc. | ||||||
7.75%, 05/15/13 | 585,000 | 544,781 | ||||
Anadarko Petroleum Corporation | ||||||
5.95%, 09/15/16 | 20,000 | 20,043 | ||||
Appleton Papers, Inc. | ||||||
8.13%, 06/15/11 | 40,000 | 38,000 | ||||
9.75%, 06/15/14 | 100,000 | 93,500 | ||||
Ashtead Capital, Inc. | ||||||
9.00%, 08/15/16 144AD | 140,000 | 123,900 | ||||
Ashton Woods USA LLC | ||||||
9.50%, 10/01/15 | 40,000 | 23,400 | ||||
Associated Materials, Inc. | ||||||
9.75%, 04/15/12D | 120,000 | 119,400 | ||||
19.23%, 03/01/14 STEPWD | 190,000 | 126,350 | ||||
AT&T Corporation | ||||||
6.50%, 03/15/29 | 580,000 | 552,230 | ||||
Autonation, Inc. | ||||||
4.71%, 04/15/13† | 200,000 | 170,000 | ||||
Avis Budget Car Rental LLC | ||||||
5.18%, 05/15/14†D | 225,000 | 175,500 | ||||
Baltimore Gas & Electric Co. | ||||||
5.20%, 06/15/33 | 1,125,000 | 881,272 | ||||
Banca Popolare di Lodi Investors Trust III | ||||||
6.74%, 06/30/36(E)† | 260,000 | 360,686 | ||||
Belden & Blake Corporation | ||||||
8.75%, 07/15/12 | 120,000 | 123,300 | ||||
Blockbuster, Inc. | ||||||
9.00%, 09/01/12D | 110,000 | 90,475 | ||||
Boeing Capital Corporation, Ltd. | ||||||
5.80%, 01/15/13 | 60,000 | 63,032 | ||||
Boston Scientific Corporation | ||||||
7.00%, 11/15/35D | 215,000 | 190,275 | ||||
Buffets, Inc. | ||||||
12.50%, 11/01/14 | 105,000 | 2,100 | ||||
CCH I Holdings LLC | ||||||
11.00%, 10/01/15D | 520,000 | 388,050 | ||||
CDX North America High Yield | ||||||
7.63%, 06/29/12 144A | 1,950,000 | 1,795,170 | ||||
Ceridian Corporation | ||||||
12.25%, 11/15/15 PIK 144AD | 60,000 | 54,600 | ||||
Charter Communications Holdings LLC | ||||||
12.13%, 01/15/12 STEPD | 70,000 | 51,100 | ||||
Charter Communications, Inc. | ||||||
10.88%, 09/15/14 144AD | 140,000 | 144,550 | ||||
Chesapeake Energy Corporation | ||||||
7.50%, 09/15/13D | 265,000 | 266,325 | ||||
6.50%, 08/15/17 | 1,190,000 | 1,118,600 | ||||
6.25%, 01/15/18 | 30,000 | 27,750 | ||||
7.25%, 12/15/18 | 95,000 | 92,862 | ||||
Chiquita Brands International, Inc. | ||||||
7.50%, 11/01/14D | 385,000 | 315,700 | ||||
CII Carbon LLC | ||||||
11.13%, 11/15/15 144AD | 190,000 | 188,100 | ||||
Cincinnati Bell Telephone Co. | ||||||
6.30%, 12/01/28 | 155,000 | 124,775 | ||||
| 78 | See Notes to Financial Statements. |
Table of Contents
| Par | Value | |||||
CIT Group Holdings, Inc. | ||||||
5.40%, 01/30/16D | $ | 10,000 | $ | 6,897 | ||
CIT Group, Inc. | ||||||
5.13%, 09/30/14 | 240,000 | 172,113 | ||||
5.00%, 02/01/15 | 1,575,000 | 1,090,458 | ||||
5.85%, 09/15/16 | 240,000 | 165,837 | ||||
5.65%, 02/13/17 | 5,000 | 3,455 | ||||
Citizens Communications Co. | ||||||
9.25%, 05/15/11D | 200,000 | 208,000 | ||||
7.13%, 03/15/19 | 500,000 | 450,000 | ||||
Clear Channel Communications, Inc. | ||||||
5.50%, 09/15/14 | 40,000 | 24,028 | ||||
6.88%, 06/15/18D | 770,000 | 454,984 | ||||
CMP Susquehanna Corporation | ||||||
9.88%, 05/15/14 | 80,000 | 56,400 | ||||
Colorado Interstate Gas Co. | ||||||
5.95%, 03/15/15 | 20,000 | 19,690 | ||||
6.80%, 11/15/15 | 125,000 | 128,307 | ||||
Comcast Corporation | ||||||
6.50%, 01/15/15 | 60,000 | 61,008 | ||||
6.50%, 01/15/17 | 60,000 | 60,454 | ||||
Commerzbank Capital Funding Trust I | ||||||
5.01%, 04/12/37(E)† | 900,000 | 1,103,497 | ||||
Community Health Systems, Inc. | ||||||
8.88%, 07/15/15D | 100,000 | 101,125 | ||||
Complete Production Services, Inc. | ||||||
8.00%, 12/15/16 | 80,000 | 80,300 | ||||
Countrywide Financial Corporation | ||||||
5.80%, 06/07/12 | 90,000 | 85,196 | ||||
6.25%, 05/15/16D | 280,000 | 249,670 | ||||
CSC Holdings, Inc. | ||||||
8.13%, 08/15/09D | 270,000 | 272,700 | ||||
Cummins, Inc. | ||||||
5.65%, 03/01/28 | 1,500,000 | 1,033,065 | ||||
DAE Aviation Holdings, Inc. | ||||||
11.25%, 08/01/15 144AD | 230,000 | 229,425 | ||||
DaVita, Inc. | ||||||
6.63%, 03/15/13D | 140,000 | 135,100 | ||||
Delhaize America, Inc. | ||||||
9.00%, 04/15/31 | 301,000 | 355,275 | ||||
Deutsche Postbank Funding Trust IV | ||||||
5.98%, 06/29/49(E) | 300,000 | 401,510 | ||||
Dex Media West LLC | ||||||
9.88%, 08/15/13 | 275,000 | 248,188 | ||||
Dex Media, Inc. | ||||||
16.11%, 11/15/13 STEPWD | 10,000 | 7,200 | ||||
DI Finance | ||||||
9.50%, 02/15/13 | 180,000 | 180,000 | ||||
Dole Food Co., Inc. | ||||||
7.25%, 06/15/10 | 100,000 | 91,000 | ||||
Dollar General Corporation | ||||||
11.88%, 07/15/17 PIKD | 195,000 | 185,250 | ||||
DP World, Ltd. | ||||||
6.85%, 07/02/37 | 300,000 | 258,156 | ||||
Dynegy Holdings, Inc. | ||||||
7.50%, 06/01/15D | 307,000 | 284,743 | ||||
7.75%, 06/01/19 | 746,000 | 682,590 | ||||
EchoStar DBS Corporation | ||||||
7.00%, 10/01/13D | 600,000 | 574,500 | ||||
Education Management LLC | ||||||
8.75%, 06/01/14 | 60,000 | 56,100 | ||||
10.25%, 06/01/16 | 95,000 | 87,875 | ||||
El Paso Corporation | ||||||
7.75%, 01/15/32D | 150,000 | 151,018 | ||||
El Paso Natural Gas Co. | ||||||
8.63%, 01/15/22 | 90,000 | 100,319 | ||||
8.38%, 06/15/32 | 75,000 | 84,128 | ||||
Energy Future Holdings Corporation | ||||||
11.25%, 11/01/17 PIK 144A | 850,000 | 852,125 | ||||
6.50%, 11/15/24 | 20,000 | 14,856 | ||||
6.55%, 11/15/34 | 360,000 | 264,088 | ||||
Enterprise Products Operating LP | ||||||
8.38%, 08/01/45† | 60,000 | 60,070 | ||||
EPL Finance Corporation | ||||||
11.75%, 11/15/13 | 45,000 | 45,000 | ||||
Erac USA Finance Co. | ||||||
7.00%, 10/15/37 | 775,000 | 646,407 | ||||
EXCO Resources, Inc. | ||||||
7.25%, 01/15/11D | 125,000 | 123,438 | ||||
Expedia, Inc. | ||||||
8.50%, 07/01/16 | 50,000 | 49,125 | ||||
FirstEnergy Corporation | ||||||
7.38%, 11/15/31 | 45,000 | 49,075 | ||||
Ford Motor Co. | ||||||
6.63%, 10/01/28D | 850,000 | 459,000 | ||||
7.45%, 07/16/31 | 2,300,000 | 1,351,250 | ||||
Ford Motor Credit Co. | ||||||
5.63%, 10/01/08D | 240,000 | 235,942 | ||||
5.70%, 01/15/10 | 1,250,000 | 1,066,828 | ||||
5.46%, 01/13/12† | 37,500 | 26,674 | ||||
7.16%, 04/15/12† | 100,000 | 93,742 | ||||
7.00%, 10/01/13D | 650,000 | 479,151 | ||||
Freeport-McMoRan Copper & Gold, Inc. | ||||||
8.38%, 04/01/17 | 470,000 | 496,621 | ||||
Freescale Semiconductor, Inc. | ||||||
10.13%, 12/15/16D | 661,000 | 507,318 | ||||
General Electric Capital Corporation | ||||||
6.75%, 03/15/32 | 30,000 | 30,298 | ||||
General Motors Acceptance Corporation | ||||||
6.75%, 12/01/14D | 650,000 | 429,788 | ||||
8.00%, 11/01/31 | 600,000 | 391,119 | ||||
General Motors Corporation | ||||||
8.25%, 07/15/23D | 375,000 | 220,313 | ||||
8.38%, 07/05/33(E) | 250,000 | 213,243 | ||||
8.38%, 07/15/33D | 1,700,000 | 1,015,750 | ||||
Georgia Gulf Corporation | ||||||
9.50%, 10/15/14D | 125,000 | 94,062 | ||||
Georgia-Pacific Corporation | ||||||
8.88%, 05/15/31 | 625,000 | 581,250 | ||||
GMAC LLC | ||||||
5.38%, 06/06/11(E) | 470,000 | 488,951 | ||||
6.00%, 12/15/11D | 1,515,000 | 1,043,274 | ||||
Goldman Sachs Group, Inc. | ||||||
6.65%, 05/15/09 | 20,000 | 20,398 | ||||
Goodyear Tire & Rubber Co. | ||||||
7.00%, 03/15/28 | 690,000 | 579,600 | ||||
Graham Packaging Co., Inc. | ||||||
8.50%, 10/15/12 | 25,000 | 23,812 | ||||
9.88%, 10/15/14D | 105,000 | 93,450 | ||||
| See Notes to Financial Statements. | 79 |
Table of Contents
Global Bond Fund
SCHEDULE OF INVESTMENTS (Continued)
| Par | Value | |||||
Graphic Packaging International Corporation | ||||||
9.50%, 08/15/13D | $ | 145,000 | $ | 139,200 | ||
H&E Equipment Services, Inc. | ||||||
8.38%, 07/15/16 | 205,000 | 180,400 | ||||
Hawaiian Telcom Communications, Inc. | ||||||
12.50%, 05/01/15 | 65,000 | 16,575 | ||||
Hawker Beechcraft Acquisition Co., LLC | ||||||
8.88%, 04/01/15 PIKD | 20,000 | 20,200 | ||||
9.75%, 04/01/17D | 260,000 | 261,300 | ||||
HCA, Inc. | ||||||
8.75%, 11/01/10(U) | 140,000 | 269,097 | ||||
7.88%, 02/01/11 | 240,000 | 237,600 | ||||
6.38%, 01/15/15D | 765,000 | 638,775 | ||||
7.19%, 11/15/15 | 205,000 | 177,605 | ||||
6.50%, 02/15/16 | 320,000 | 268,000 | ||||
9.25%, 11/15/16 | 60,000 | 61,950 | ||||
9.63%, 11/15/16 PIK | 85,000 | 87,763 | ||||
7.50%, 12/15/23 | 500,000 | 409,060 | ||||
7.69%, 06/15/25 | 745,000 | 612,962 | ||||
7.58%, 09/15/25 | 570,000 | 465,175 | ||||
Hertz Corporation | ||||||
8.88%, 01/01/14 | 500,000 | 460,000 | ||||
Hess Corporation | ||||||
6.65%, 08/15/11D | 60,000 | 62,975 | ||||
Hexion US Finance Corporation | ||||||
9.75%, 11/15/14 | 1,170,000 | 1,064,700 | ||||
Home Depot, Inc. | ||||||
5.88%, 12/16/36 | 590,000 | 483,469 | ||||
Host Hotels & Resorts LP | ||||||
2.63%, 04/15/27D | 750,000 | 610,313 | ||||
Idearc, Inc. | ||||||
8.00%, 11/15/16 | 1,034,000 | 655,298 | ||||
International Paper Co. | ||||||
5.50%, 01/15/14 | 575,000 | 528,987 | ||||
iStar Financial, Inc. | ||||||
5.65%, 09/15/11 | 92,000 | 78,715 | ||||
8.63%, 06/01/13 | 75,000 | 68,691 | ||||
5.95%, 10/15/13 | 954,000 | 783,122 | ||||
5.70%, 03/01/14 | 62,000 | 52,140 | ||||
6.05%, 04/15/15 | 20,000 | 16,021 | ||||
5.88%, 03/15/16 | 22,000 | 17,357 | ||||
Jarden Corporation | ||||||
7.50%, 05/01/17 | 100,000 | 87,500 | ||||
JC Penney Corporation, Inc. | ||||||
7.63%, 03/01/38 | 1,300,000 | 1,065,115 | ||||
Jefferson Smurfit Corporation | ||||||
7.50%, 06/01/13 | 625,000 | 518,750 | ||||
Jones Apparel Group, Inc. | ||||||
6.13%, 11/15/34 | 135,000 | 92,475 | ||||
Kerr-McGee Corporation | ||||||
6.95%, 07/01/24 | 30,000 | 31,193 | ||||
Keystone Automotive Operations, Inc. | ||||||
9.75%, 11/01/13D | 85,000 | 41,225 | ||||
Kinder Morgan Energy Partners LP | ||||||
5.95%, 02/15/18D | 1,060,000 | 1,034,568 | ||||
Knight, Inc. | ||||||
5.15%, 03/01/15 | 150,000 | 133,125 | ||||
Kraft Foods, Inc. | ||||||
4.13%, 11/12/09 | 40,000 | 39,953 | ||||
6.50%, 11/01/31D | 1,200,000 | 1,113,860 | ||||
L-3 Communications Corporation | ||||||
7.63%, 06/15/12 | 600,000 | 607,500 | ||||
6.13%, 01/15/14D | 45,000 | 42,412 | ||||
6.38%, 10/15/15 | 450,000 | 423,000 | ||||
Lamar Media Corporation | ||||||
6.63%, 08/15/15 | 100,000 | 91,500 | ||||
Lehman Brothers Holdings, Inc. | ||||||
5.25%, 02/06/12 | 130,000 | 123,122 | ||||
6.88%, 07/17/37 | 500,000 | 431,627 | ||||
Leiner Health Products, Inc. | ||||||
11.00%, 06/01/12@D | 285,000 | 6,412 | ||||
Lennar Corporation | ||||||
5.60%, 05/31/15 | 1,400,000 | 1,030,750 | ||||
Level 3 Financing, Inc. | ||||||
9.25%, 11/01/14D | 260,000 | 237,900 | ||||
8.75%, 02/15/17 | 985,000 | 852,025 | ||||
Mariner Energy, Inc. | ||||||
8.00%, 05/15/17D | 70,000 | 68,075 | ||||
Marsh & McLennan Cos., Inc. | ||||||
5.88%, 08/01/33 | 1,000,000 | 841,565 | ||||
MBIA Insurance Corporation | ||||||
14.00%, 01/15/33 144A†D | 410,000 | 170,268 | ||||
Merrill Lynch & Co., Inc. | ||||||
6.11%, 01/29/37 | 2,000,000 | 1,593,086 | ||||
Metals USA, Inc. | ||||||
11.13%, 12/01/15 | 140,000 | 146,300 | ||||
MetroPCS Wireless, Inc. | ||||||
9.25%, 11/01/14 | 40,000 | 38,700 | ||||
Michaels Stores, Inc. | ||||||
11.38%, 11/01/16D | 60,000 | 48,000 | ||||
Midwest Generation LLC | ||||||
8.30%, 07/02/09 | 52,609 | 53,003 | ||||
Mirant Mid-Atlantic LLC | ||||||
9.13%, 06/30/17 | 152,070 | 167,277 | ||||
Morgan Stanley | ||||||
4.75%, 04/01/14 | 50,000 | 45,617 | ||||
Mutual of Omaha Insurance Co. | ||||||
6.80%, 06/15/36 | 1,200,000 | 1,148,743 | ||||
Neiman-Marcus Group, Inc. | ||||||
9.00%, 10/15/15 PIKD | 85,000 | 84,363 | ||||
10.38%, 10/15/15D | 270,000 | 271,350 | ||||
7.13%, 06/01/28 | 30,000 | 26,700 | ||||
Nevada Power Co. | ||||||
8.25%, 06/01/11D | 290,000 | 313,257 | ||||
5.88%, 01/15/15 | 100,000 | 100,321 | ||||
NewPage Corporation | ||||||
9.12%, 05/01/12† | 265,000 | 267,650 | ||||
Nextel Communications, Inc. | ||||||
5.95%, 03/15/14 | 970,000 | 779,314 | ||||
7.38%, 08/01/15 | 430,000 | 357,131 | ||||
Noranda Aluminium Holding Corporation | ||||||
8.58%, 11/15/14† | 90,000 | 74,250 | ||||
Norcraft Holdings LP | ||||||
11.24%, 09/01/12 STEPW | 195,000 | 182,569 | ||||
Nortek, Inc. | ||||||
8.50%, 09/01/14D | 15,000 | 9,675 | ||||
Nortel Networks Corporation | ||||||
2.13%, 04/15/14 | 1,675,000 | 1,130,625 | ||||
NRG Energy, Inc. | ||||||
7.38%, 02/01/16 | 300,000 | 283,125 | ||||
NTK Holdings, Inc. | ||||||
25.91%, 03/01/14WD | 160,000 | 73,600 | ||||
| 80 | See Notes to Financial Statements. |
Table of Contents
| Par | Value | |||||
Oncor Electric Delivery Co. | ||||||
6.38%, 01/15/15 | $ | 100,000 | $ | 98,803 | ||
Orion Power Holdings, Inc. | ||||||
12.00%, 05/01/10 | 55,000 | 59,675 | ||||
Owens Corning, Inc. | ||||||
7.00%, 12/01/36 | 220,000 | 184,294 | ||||
Panhandle Eastern Pipeline Co. | ||||||
7.00%, 06/15/18 | 1,100,000 | 1,099,707 | ||||
Pemex Project Funding Master Trust | ||||||
6.63%, 06/15/35D | 1,810,000 | 1,794,801 | ||||
Penhall International Corporation | ||||||
12.00%, 08/01/14 144A | 205,000 | 154,775 | ||||
PetroHawk Energy Corporation | ||||||
9.13%, 07/15/13D | 70,000 | 72,100 | ||||
Pioneer Natural Resources Co. | ||||||
5.88%, 07/15/16 | 900,000 | 818,512 | ||||
7.20%, 01/15/28 | 315,000 | 279,678 | ||||
Qwest Communications International, Inc. | ||||||
6.18%, 02/15/09† | 33,000 | 33,000 | ||||
7.25%, 02/15/11D | 35,000 | 33,994 | ||||
7.50%, 02/15/14 | 20,000 | 19,100 | ||||
Qwest Corporation | ||||||
7.88%, 09/01/11 | 100,000 | 100,500 | ||||
6.03%, 06/15/13† | 100,000 | 96,000 | ||||
7.63%, 06/15/15 | 300,000 | 290,250 | ||||
6.50%, 06/01/17 | 15,000 | 13,462 | ||||
7.50%, 06/15/23 | 165,000 | 147,675 | ||||
6.88%, 09/15/33 | 3,415,000 | 2,834,450 | ||||
7.25%, 10/15/35 | 110,000 | 92,950 | ||||
Realogy Corporation | ||||||
12.38%, 04/15/15 | 235,000 | 116,325 | ||||
Rental Service Corporation | ||||||
9.50%, 12/01/14D | 160,000 | 134,400 | ||||
Residential Capital LLC | ||||||
9.63%, 05/15/15 | 667,000 | 326,830 | ||||
RH Donnelley Corporation | ||||||
6.88%, 01/15/13D | 320,000 | 192,000 | ||||
Rural Cellular Corporation | ||||||
5.68%, 06/01/13† | 60,000 | 60,450 | ||||
Ryerson, Inc. | ||||||
12.00%, 11/01/15 144A | 160,000 | 159,600 | ||||
Saint Acquisition Corporation | ||||||
10.43%, 05/15/15 144A† | 70,000 | 22,750 | ||||
12.50%, 05/15/17 144AD | 185,000 | 63,825 | ||||
Sbarro, Inc. | ||||||
10.38%, 02/01/15D | 70,000 | 60,200 | ||||
SemGroup LP | ||||||
8.75%, 11/15/15 144A | 105,000 | 102,375 | ||||
Sequa Corporation | ||||||
11.75%, 12/01/15 | 50,000 | 44,750 | ||||
13.50%, 12/01/15D | 50,000 | 46,250 | ||||
Service Corporation International | ||||||
7.50%, 04/01/27 | 75,000 | 64,125 | ||||
SLM Corporation | ||||||
5.38%, 01/15/13 | 650,000 | 573,055 | ||||
5.00%, 10/01/13 | 380,000 | 328,938 | ||||
4.75%, 03/17/14(E) | 170,000 | 215,210 | ||||
5.38%, 05/15/14 | 1,000,000 | 879,599 | ||||
8.45%, 06/15/18 | 385,000 | 369,950 | ||||
Smurfit-Stone Container Enterprises, Inc. | ||||||
8.00%, 03/15/17D | 335,000 | 269,675 | ||||
Sprint Capital Corporation | ||||||
8.38%, 03/15/12 | 60,000 | 59,446 | ||||
Steel Dynamics, Inc. | ||||||
7.38%, 11/01/12 144A | 45,000 | 45,225 | ||||
Stone Energy Corporation | ||||||
8.25%, 12/15/11 | 115,000 | 112,700 | ||||
Suburban Propane Partners LP | ||||||
6.88%, 12/15/13D | 145,000 | 137,750 | ||||
Sungard Data Systems, Inc. | ||||||
10.25%, 08/15/15 | 190,000 | 191,900 | ||||
Tenet Healthcare Corporation | ||||||
6.38%, 12/01/11D | 110,000 | 104,775 | ||||
7.38%, 02/01/13D | 1,100,000 | 1,039,500 | ||||
9.88%, 07/01/14D | 375,000 | 378,750 | ||||
6.88%, 11/15/31 | 85,000 | 61,625 | ||||
Terex Corporation | ||||||
7.38%, 01/15/14 | 20,000 | 19,800 | ||||
Time Warner Cable, Inc. | ||||||
5.85%, 05/01/17 | 1,200,000 | 1,141,685 | ||||
Time Warner, Inc. | ||||||
6.88%, 05/01/12 | 90,000 | 92,151 | ||||
TL Acquisitions, Inc. | ||||||
10.50%, 01/15/15 144A | 100,000 | 87,500 | ||||
Toronto Dominion Bank NY | ||||||
6.38%, 12/15/14D | 795,000 | 520,725 | ||||
Toys “R” Us, Inc. | ||||||
7.38%, 10/15/18 | 80,000 | 59,600 | ||||
TRW Automotive, Inc. | ||||||
6.38%, 03/15/14 144A(E) | 147,000 | 190,942 | ||||
Tube City IMS Corporation | ||||||
9.75%, 02/01/15 | 80,000 | 74,200 | ||||
TXU Corporation | ||||||
5.55%, 11/15/14D | 1,370,000 | 1,079,386 | ||||
Unicredito Italiano Capital Trust III | ||||||
4.03%, 10/29/49(E)† | 250,000 | 307,666 | ||||
United Rentals, Inc. | ||||||
7.00%, 02/15/14 | 250,000 | 195,000 | ||||
UnitedHealth Group, Inc. | ||||||
5.80%, 03/15/36 | 790,000 | 655,905 | ||||
Universal Hospital Services, Inc. | ||||||
6.30%, 06/01/15† | 20,000 | 18,800 | ||||
8.50%, 06/01/15 PIK | 20,000 | 20,100 | ||||
US Investigations Services, Inc. | ||||||
10.50%, 11/01/15 144AD | 150,000 | 138,750 | ||||
US Oncology Holdings, Inc. | ||||||
10.76%, 03/15/12 PIK | 105,364 | 83,764 | ||||
USG Corporation | ||||||
6.30%, 11/15/16 | 675,000 | 546,750 | ||||
Valor Telecommunications Enterprises LLC | ||||||
7.75%, 02/15/15D | 125,000 | 128,033 | ||||
Vanguard Health Holding Co. II LLC | ||||||
9.00%, 10/01/14D | 220,000 | 218,900 | ||||
Verizon Global Funding Corporation | ||||||
6.88%, 06/15/12 | 30,000 | 31,815 | ||||
Visteon Corporation | ||||||
8.25%, 08/01/10 | 57,000 | 51,015 | ||||
12.25%, 12/31/16 | 145,000 | 116,725 | ||||
| See Notes to Financial Statements. | 81 |
Table of Contents
Global Bond Fund
SCHEDULE OF INVESTMENTS (Continued)
| Par | Value | |||||
W&T Offshore, Inc. | ||||||
8.25%, 06/15/14 144A | $ | 50,000 | $ | 48,500 | ||
Wachovia Corporation | ||||||
5.25%, 08/01/14 | 120,000 | 111,873 | ||||
Waste Management, Inc. | ||||||
7.38%, 08/01/10 | 50,000 | 52,254 | ||||
7.38%, 05/15/29 | 50,000 | 52,686 | ||||
Western Union Co. | ||||||
6.20%, 11/17/36 | 620,000 | 580,432 | ||||
Westvaco Corporation | ||||||
7.95%, 02/15/31 | 135,000 | 126,533 | ||||
Weyerhaeuser Co. | ||||||
6.75%, 03/15/12 | 120,000 | 123,691 | ||||
Whiting Petroleum Corporation | ||||||
7.00%, 02/01/14 | 130,000 | 128,212 | ||||
Williams Cos., Inc. | ||||||
7.13%, 09/01/11D | 525,000 | 546,000 | ||||
7.50%, 01/15/31 | 130,000 | 132,113 | ||||
Windstream Corporation | ||||||
8.63%, 08/01/16D | 650,000 | 651,625 | ||||
Xerox Corporation | ||||||
9.75%, 01/15/09 | 500,000 | 514,750 | ||||
XTO Energy, Inc. | ||||||
7.50%, 04/15/12 | 30,000 | 32,213 | ||||
Total Corporate Bonds | 80,103,289 | |||||
FOREIGN BONDS — 33.7% | ||||||
Argentina — 0.3% | ||||||
Republic of Argentina | ||||||
2.00%, 01/03/10(P)† | 1,140,000 | 320,490 | ||||
7.00%, 09/12/13 | 488,000 | 369,131 | ||||
| 689,621 | ||||||
Australia — 1.8% | ||||||
National Capital Instruments LLC | ||||||
5.91%, 12/29/49(E)† | 150,000 | 194,225 | ||||
New South Wales Treasury Corporation | ||||||
7.00%, 12/01/10(A) | 2,825,000 | 2,688,731 | ||||
Queensland Treasury Corporation | ||||||
6.00%, 06/14/11(A) | 1,220,000 | 1,131,353 | ||||
| 4,014,309 | ||||||
Bermuda — 0.5% | ||||||
AES China Generating Co., Ltd. | ||||||
8.25%, 06/26/10 | 78,000 | 74,127 | ||||
White Mountains Re Group, Ltd. | ||||||
6.38%, 03/20/17D | 1,250,000 | 1,120,252 | ||||
| 1,194,379 | ||||||
Brazil — 3.2% | ||||||
Brazil Notas do Tesouro Nacional, Series F | ||||||
10.00%, 07/01/10(B) | 2,000,000 | 1,203,356 | ||||
10.00%, 01/01/12(B) | 2,000,000 | 1,083,526 | ||||
Federative Republic of Brazil | ||||||
10.25%, 01/10/28(B) | 6,000,000 | 3,321,689 | ||||
11.00%, 08/17/40D | 1,210,000 | 1,601,737 | ||||
| 7,210,308 | ||||||
Canada — 5.7% | ||||||
Bell Canada | ||||||
5.00%, 02/15/17(C) | 410,000 | 326,496 | ||||
6.10%, 03/16/35(C) | 265,000 | 198,606 | ||||
Bombardier, Inc. | ||||||
7.25%, 11/15/16(E) | 161,000 | 245,870 | ||||
Canadian Government | ||||||
5.25%, 06/01/12(C) | 10,000,000 | 10,453,957 | ||||
Conoco Funding Co. | ||||||
6.35%, 10/15/11 | 70,000 | 74,084 | ||||
Methanex Corporation | ||||||
8.75%, 08/15/12 | 70,000 | 74,200 | ||||
Novelis, Inc. | ||||||
7.25%, 02/15/15 | 115,000 | 109,250 | ||||
OPTI Canada, Inc. | ||||||
7.88%, 12/15/14 | 100,000 | 99,250 | ||||
8.25%, 12/15/14 | 70,000 | 70,000 | ||||
Rogers Cable, Inc. | ||||||
7.88%, 05/01/12D | 240,000 | 260,776 | ||||
Rogers Wireless, Inc. | ||||||
9.63%, 05/01/11 | 450,000 | 498,423 | ||||
Stone Container Finance | ||||||
7.38%, 07/15/14D | 650,000 | 523,250 | ||||
Sun Media Corporation | ||||||
7.63%, 02/15/13 | 100,000 | 97,250 | ||||
| 13,031,412 | ||||||
Cayman Islands — 1.0% | ||||||
MUFG Capital Finance 2, Ltd. | ||||||
4.85%, 07/25/36(E)† | 500,000 | 616,203 | ||||
Odebrecht Finance, Ltd. | ||||||
7.50%, 10/18/17 | 100,000 | 103,250 | ||||
Shinsei Finance Cayman, Ltd. | ||||||
6.42%, 07/20/49 144A† | 120,000 | 84,391 | ||||
SMFG Preferred Capital, Ltd. | ||||||
6.16%, 12/31/49(U) | 350,000 | 546,407 | ||||
Vale Overseas, Ltd. | ||||||
6.88%, 11/21/36 | 927,000 | 865,572 | ||||
| 2,215,823 | ||||||
Colombia — 0.2% | ||||||
Republic of Colombia | ||||||
7.38%, 09/18/37 | 400,000 | 429,000 | ||||
Denmark — 0.2% | ||||||
Nordic Telephone Co. Holdings ApS | ||||||
8.88%, 05/01/16 144A | 265,000 | 261,025 | ||||
10.36%, 05/01/16(E)† | 111,000 | 173,017 | ||||
| 434,042 | ||||||
Ecuador — 0.1% | ||||||
Republic of Ecuador | ||||||
10.00%, 08/15/30 STEP | 150,000 | 147,000 | ||||
Egypt — 0.8% | ||||||
Egyptian Treasury Bills | ||||||
10.85%, 03/03/09W(Y) | 6,975,000 | 1,221,205 | ||||
10.90%, 04/14/09(Y) | 3,375,000 | 583,980 | ||||
| 1,805,185 | ||||||
Finland — 0.2% | ||||||
M-real OYJ | ||||||
8.98%, 12/15/10(E)† | 300,000 | 396,361 | ||||
| 82 | See Notes to Financial Statements. |
Table of Contents
| Par | Value | |||||
France — 1.3% | ||||||
Akerys Holdings SA | ||||||
8.11%, 08/01/14 144A(E) | $ | 260,000 | $ | 102,340 | ||
AXA SA | ||||||
6.21%, 10/05/49(E) | 360,000 | 495,613 | ||||
Banque Federative du Credit Mutuel | ||||||
4.47%, 10/28/35(E)† | 157,000 | 196,689 | ||||
Compagnie Generale de Geophysique - Veritas | ||||||
7.50%, 05/15/15(E) | 90,000 | 90,225 | ||||
Credit Agricole SA | ||||||
4.13%, 11/09/49(E)† | 500,000 | 611,597 | ||||
Dexia Credit Local | ||||||
4.30%, 11/18/49(E)† | 500,000 | 577,825 | ||||
Europcar Groupe SA | ||||||
8.36%, 05/15/13(E)† | 155,000 | 191,572 | ||||
French Government Bond | ||||||
5.07%, 10/25/32(E) | 1,030,000 | 491,048 | ||||
Zlomrex International Finance SA | ||||||
8.50%, 02/01/14(E) | 200,000 | 234,594 | ||||
| 2,991,503 | ||||||
Germany — 0.7% | ||||||
Bayerische Landesbank | ||||||
5.75%, 10/23/17(E) | 550,000 | 801,091 | ||||
Eurohypo Capital Funding Trust 1 | ||||||
6.45%, 12/23/49(E)† | 27,000 | 38,306 | ||||
HSH Nordbank AG | ||||||
5.16%, 02/14/17(E) | 52,000 | 65,893 | ||||
HT1 Funding GmbH | ||||||
6.35%, 07/29/49(E)† | 450,000 | 551,111 | ||||
Kabel Deutschland GmbH | ||||||
10.75%, 07/01/14(E) | 106,000 | 168,144 | ||||
| 1,624,545 | ||||||
Hungary — 1.0% | ||||||
Hungary Government Bond | ||||||
6.00%, 10/24/12(H) | 206,970,000 | 1,227,663 | ||||
5.50%, 02/12/14(H) | 210,000,000 | 1,183,185 | ||||
| 2,410,848 | ||||||
Iceland — 0.3% | ||||||
Kaupthing Bank HF | ||||||
7.13%, 05/19/16 144A | 150,000 | 105,849 | ||||
6.13%, 10/04/16 | 700,000 | 511,618 | ||||
| 617,467 | ||||||
Ireland — 0.6% | ||||||
Ardagh Glass Finance PLC | ||||||
7.13%, 06/15/17(E) | 112,000 | 144,598 | ||||
Ardagh Glass Finance PLC | ||||||
7.13%, 06/15/17 144A(E) | 170,000 | 218,810 | ||||
Elan Finance PLC | ||||||
7.75%, 11/15/11 | 845,000 | 823,875 | ||||
Smurfit Kappa Funding PLC | ||||||
7.75%, 04/01/15(E)D | 200,000 | 283,528 | ||||
| 1,470,811 | ||||||
Italy — 0.1% | ||||||
Banco Popolare SC | ||||||
6.16%, 06/29/49(E) | 200,000 | 250,442 | ||||
Japan — 1.3% | ||||||
Japanese 10-Year Government Bond | ||||||
1.70%, 09/20/17(J) | 98,000,000 | 936,728 | ||||
Japanese 20-Year Government Bond | ||||||
2.10%, 03/20/27(J) | 84,000,000 | 783,693 | ||||
Japanese 30-Year Government Bond | ||||||
2.30%, 12/20/36(J) | 74,000,000 | 680,747 | ||||
Resona Bank, Ltd. | ||||||
5.99%, 08/10/49(U)† | 300,000 | 542,725 | ||||
| 2,943,893 | ||||||
Jersey — 0.4% | ||||||
HSBC Capital Funding LP | ||||||
5.13%, 12/29/49(E)† | 420,000 | 562,544 | ||||
RZB Finance Jersey IV, Ltd. | ||||||
5.17%, 05/16/16(E)† | 250,000 | 306,881 | ||||
| 869,425 | ||||||
Kazakhstan — 0.1% | ||||||
KazMunaiGaz Finance Sub BV | ||||||
8.38%, 07/02/13 | 230,000 | 230,402 | ||||
Luxembourg — 2.0% | ||||||
Basell AF SCA | ||||||
8.38%, 08/15/15 144AD | 200,000 | 128,000 | ||||
Evraz Group SA | ||||||
8.88%, 04/24/13 144A | 160,000 | 160,992 | ||||
9.50%, 04/24/18 | 100,000 | 100,750 | ||||
Fortis Hybrid Financing | ||||||
5.13%, 06/29/49(E)†D | 250,000 | 293,975 | ||||
Gaz Capital for Gazprom | ||||||
6.21%, 11/22/16 144A | 200,000 | 187,360 | ||||
Gaz Capital SA | ||||||
7.29%, 08/16/37 | 190,000 | 173,005 | ||||
HSH Nordbank Luxembourg | ||||||
7.41%, 06/30/49(E)† | 450,000 | 562,624 | ||||
Kuznetski Capital for Bank of Moscow | ||||||
6.81%, 05/10/17 | 271,000 | 246,271 | ||||
Lecta SA | ||||||
7.48%, 02/15/14(E) | 200,000 | 227,981 | ||||
Lecta SA | ||||||
7.48%, 02/15/14 144A(E) | 102,000 | 116,833 | ||||
RSHB Capital SA for OJSC Russian Agricultural Bank | ||||||
7.13%, 01/14/14 | 120,000 | 118,944 | ||||
6.97%, 09/21/16† | 100,000 | 95,860 | ||||
6.30%, 05/15/17 144A | 386,000 | 357,108 | ||||
TNK-BP Finance SA | ||||||
7.50%, 07/18/16 144A | 250,000 | 237,175 | ||||
7.88%, 03/13/18 | 870,000 | 822,455 | ||||
Tyco International Group SA | ||||||
6.38%, 10/15/11 | 90,000 | 92,167 | ||||
UBS Luxembourg SA for OJSC Vimpel Communications | ||||||
8.25%, 05/23/16 | 255,000 | 248,064 | ||||
Vimpel Communications | ||||||
8.38%, 04/30/13 144A | 100,000 | 98,679 | ||||
Wind Acquisition Finance SA | ||||||
9.75%, 12/01/15(E) | 53,000 | 83,759 | ||||
9.75%, 12/01/15 144A(E) | 200,000 | 316,072 | ||||
| 4,668,074 | ||||||
| See Notes to Financial Statements. | 83 |
Table of Contents
Global Bond Fund
SCHEDULE OF INVESTMENTS (Continued)
| Par | Value | |||||
Mexico — 1.4% | ||||||
Axtel SAB de CV | ||||||
7.63%, 02/01/17 | $ | 20,000 | $ | 20,575 | ||
Axtel SAB de CV | ||||||
7.63%, 02/01/17 144A | 490,000 | 504,088 | ||||
Kansas City Southern de Mexico SA de CV | ||||||
7.63%, 12/01/13 | 140,000 | 136,500 | ||||
Mexican Bonos | ||||||
8.00%, 12/07/23(M) | 30,500,000 | 2,647,172 | ||||
United Mexican States | ||||||
6.05%, 01/11/40 | 20,000 | 19,330 | ||||
| 3,327,665 | ||||||
Netherlands — 2.9% | ||||||
ABN Amro Bank NV | ||||||
4.31%, 02/10/49(E)† | 595,000 | 687,331 | ||||
Arpeni Pratama Ocean Line Investment BV | ||||||
8.75%, 05/03/13 | 160,000 | 128,304 | ||||
Carlson Wagonlit BV | ||||||
10.61%, 05/01/15 144A(E)† | 200,000 | 258,211 | ||||
Clondalkin Acquisition BV | ||||||
6.96%, 12/15/13 144A(E) | 66,000 | 92,302 | ||||
Clondalkin Industries BV | ||||||
8.00%, 03/15/14 144A(E) | 150,000 | 188,935 | ||||
Deutsche Telekom International Finance BV | ||||||
5.75%, 03/23/16 | 80,000 | 78,177 | ||||
ELM BV for Swiss Life Insurance & Pension Group | ||||||
5.85%, 04/12/49(E) | 300,000 | 369,580 | ||||
ELM BV for Swiss Reinsurance Co. | ||||||
5.25%, 05/25/49(E)† | 400,000 | 501,147 | ||||
GMAC International Finance BV | ||||||
5.75%, 05/21/10(E) | 632,000 | 781,169 | ||||
Impress Holdings BV | ||||||
7.87%, 09/15/13 144A(E)† | 200,000 | 292,061 | ||||
9.25%, 09/15/14 144A(E) | 150,000 | 211,371 | ||||
Lukoil International Finance BV | ||||||
6.36%, 06/07/17 | 650,000 | 598,585 | ||||
NXP BV | ||||||
9.50%, 10/15/15 | 100,000 | 87,250 | ||||
OI European Group BV | ||||||
6.88%, 03/31/17 144A(E) | 220,000 | 327,329 | ||||
SNS Reaal | ||||||
6.26%, 03/17/38(E) | 260,000 | 323,577 | ||||
TuranAlem Finance BV | ||||||
7.13%, 12/21/09(U) | 650,000 | 1,180,072 | ||||
UPC Holding BV | ||||||
8.00%, 11/01/16(E) | 304,000 | 420,002 | ||||
| 6,525,403 | ||||||
Panama — 0.2% | ||||||
Republic of Panama | ||||||
9.38%, 04/01/29D | 80,000 | 105,000 | ||||
6.70%, 01/26/36D | 355,000 | 362,100 | ||||
| 467,100 | ||||||
Peru — 0.0% | ||||||
Republic of Peru | ||||||
7.35%, 07/21/25 | 40,000 | 44,800 | ||||
6.55%, 03/14/37 | 19,000 | 19,285 | ||||
| 64,085 | ||||||
Russia — 0.8% | ||||||
OAO Gazprom | ||||||
6.79%, 10/29/09(R) | 10,040,000 | 426,776 | ||||
7.00%, 10/27/11(R) | 3,350,000 | 140,829 | ||||
RSHB Capital SA for OJSC Russian Agricultural Bank | ||||||
9.50%, 02/11/11(R) | 16,277,500 | 694,027 | ||||
Russian Federation | ||||||
7.50%, 03/31/30 STEP | 592,970 | 666,203 | ||||
| 1,927,835 | ||||||
South Africa — 0.2% | ||||||
Edcon Holdings Proprietary, Ltd. | ||||||
8.21%, 06/15/14 144A(E) | 67,000 | 71,073 | ||||
10.46%, 06/15/15(E) | 320,000 | 256,951 | ||||
New Reclamation Group (Proprietary), Ltd. | ||||||
8.13%, 02/01/13 144A(E) | 153,040 | 208,425 | ||||
| 536,449 | ||||||
Sweden — 0.1% | ||||||
Corral Finans AB | ||||||
6.25%, 04/15/10 PIK 144A(E) | 147,161 | 207,370 | ||||
Thailand — 0.2% | ||||||
True Move Co., Ltd. | ||||||
10.75%, 12/16/13 144A | 461,000 | 403,951 | ||||
Turkey — 2.1% | ||||||
Republic of Turkey | ||||||
14.00%, 01/19/11(L) | 3,440,000 | 2,395,097 | ||||
10.00%, 02/15/12(L)W | 1,190,000 | 933,349 | ||||
6.88%, 03/17/36 | 1,695,000 | 1,408,969 | ||||
| 4,737,415 | ||||||
United Kingdom — 3.0% | ||||||
Ashtead Holdings PLC | ||||||
8.63%, 08/01/15 144AD | 160,000 | 140,000 | ||||
Barclays Bank PLC | ||||||
6.37%, 12/15/49(U) | 350,000 | 597,067 | ||||
FCE Bank PLC | ||||||
5.96%, 09/30/09(E)† | 470,000 | 684,680 | ||||
7.13%, 01/16/12(E) | 200,000 | 256,321 | ||||
First Hydro Finance PLC | ||||||
9.00%, 07/31/21(U) | 100,000 | 211,632 | ||||
Lloyds TSB Bank PLC | ||||||
4.39%, 05/12/17(E)† | 470,000 | 578,824 | ||||
Royal Bank of Scotland Group PLC | ||||||
7.09%, 10/29/49(E) | 500,000 | 676,622 | ||||
United Kingdom Gilt | ||||||
4.25%, 03/07/11(U) | 1,000,000 | 1,945,224 | ||||
Virgin Media Finance PLC | ||||||
9.75%, 04/15/14(U)D | 550,000 | 1,018,001 | ||||
9.13%, 08/15/16 | 860,000 | 810,550 | ||||
| 6,918,921 | ||||||
| 84 | See Notes to Financial Statements. |
Table of Contents
| Par | Value | |||||
Venezuela — 0.7% | ||||||
Petrozuata Finance, Inc. | ||||||
8.22%, 04/01/17 | $ | 99,018 | $ | 103,197 | ||
8.22%, 04/01/17 144A | 372,308 | 388,019 | ||||
Republic of Venezuela | ||||||
8.50%, 10/08/14D | 26,000 | 24,570 | ||||
5.75%, 02/26/16 | 835,000 | 657,354 | ||||
9.38%, 01/13/34D | 207,000 | 188,577 | ||||
Venezuela Government Bond | ||||||
7.00%, 03/31/38 | 246,000 | 168,510 | ||||
| 1,530,227 | ||||||
Virgin Islands (British) — 0.3% | ||||||
GTL Trade Finance, Inc. | ||||||
7.25%, 10/20/17 | 320,000 | 321,280 | ||||
7.25%, 10/20/17 144A | 309,000 | 310,963 | ||||
| 632,243 | ||||||
Total Foreign Bonds | 76,923,514 | |||||
MORTGAGE-BACKED SECURITIES — 12.2% | ||||||
Bayview Commercial Asset Trust | ||||||
2.71%, 07/25/36 144A† | 297,571 | 249,855 | ||||
Countrywide Alternative Loan Trust | ||||||
2.71%, 07/20/35† | 570,191 | 441,250 | ||||
Countrywide Home Loan Mortgage Pass-Through Trust | ||||||
2.79%, 09/25/35 144A† | 719,799 | 629,144 | ||||
Federal Home Loan Bank | ||||||
5.50%, 12/17/37 | 3,186,176 | 3,142,563 | ||||
Federal Home Loan Mortgage Corporation | ||||||
5.00%, 03/01/38 | 3,482,394 | 3,339,901 | ||||
Federal National Mortgage Association | ||||||
5.00%, 07/01/19 TBA | 1,000,000 | 988,750 | ||||
5.00%, 08/01/22 TBA | 300,000 | 295,969 | ||||
5.50%, 07/01/23 TBA | 1,300,000 | 1,308,531 | ||||
5.50%, 08/01/35 TBA | 3,800,000 | 3,735,875 | ||||
6.50%, 10/01/36 | 684,354 | 705,513 | ||||
5.50%, 07/01/37 TBA | 600,000 | 591,375 | ||||
5.00%, 07/01/38 TBA | 7,000,000 | 6,709,066 | ||||
5.00%, 08/01/38 TBA | 3,000,000 | 2,868,750 | ||||
Government National Mortgage Association | ||||||
6.00%, 08/01/37 TBA | 800,000 | 809,500 | ||||
6.00%, 07/01/38 TBA | 200,000 | 202,688 | ||||
MASTR Adjustable Rate Mortgages Trust | ||||||
4.60%, 12/25/46† | 806,715 | 571,903 | ||||
MASTR Reperforming Loan Trust | ||||||
2.83%, 05/25/35 144A† | 753,136 | 664,706 | ||||
Thornburg Mortgage Securities Trust | ||||||
2.65%, 01/25/36† | 719,374 | 710,871 | ||||
Total Mortgage-Backed Securities | 27,966,210 | |||||
| Number of Contracts | ||||||
PURCHASED OPTIONS — 0.1% | ||||||
Call Options — 0.1% | ||||||
90-Day Eurodollar Futures, Strike Price $96.75, Expires 03/16/09 | 138 | 140,588 | ||||
90-Day Sterling Futures, Strike Price $94.50, Expires 03/19/09 | 134 | 73,399 | ||||
90-Day Sterling Futures, Strike Price $95.00, Expires 03/19/09 | 115 | 32,927 | ||||
90-Day Sterling Futures. Strike Price $94.75, Expires 09/17/08 | 6 | 75 | ||||
| 246,989 | ||||||
Total Purchased Options | 246,989 | |||||
| Shares | ||||||
COMMON STOCK — 0.4% | ||||||
Financial Services — 0.4% | ||||||
Freddie Mac | 55,000 | 902,000 | ||||
PREFERRED STOCKS — 0.8% | ||||||
Bank of America Corporation CONVD | 475 | 420,375 | ||||
CIT Group, Inc. | 2,295 | 29,261 | ||||
El Paso Energy Capital Trust I CONV | 500 | 20,500 | ||||
General Motors Corporation CONV | 140 | 1,857 | ||||
Lehman Brothers Holdings, Inc.D | 5,634 | 225,705 | ||||
Lucent Technologies Capital Trust I CONV | 1,374 | 1,044,240 | ||||
Total Preferred Stocks | 1,741,938 | |||||
MONEY MARKET FUNDS — 30.5% | ||||||
GuideStone Money Market Fund (GS4 Class)¥ | 44,659,877 | 44,659,877 | ||||
Northern Institutional Liquid Assets Portfolio§ | 25,070,608 | 25,070,608 | ||||
Total Money Market Funds | 69,730,485 | |||||
| Par | ||||||
U.S. TREASURY OBLIGATIONS — 2.4% | ||||||
U.S. Treasury Bonds | ||||||
6.25%, 05/15/30D | $ | 570,000 | 701,768 | |||
4.75%, 02/15/37D | 1,600,000 | 1,652,750 | ||||
| 2,354,518 | ||||||
U.S. Treasury Inflationary Index Bonds | ||||||
2.00%, 01/15/16D | 900,000 | 1,026,123 | ||||
3.88%, 04/15/29D | 600,000 | 1,035,599 | ||||
| 2,061,722 | ||||||
| See Notes to Financial Statements. | 85 |
Table of Contents
Global Bond Fund
SCHEDULE OF INVESTMENTS (Continued)
| Par | Value | ||||||
U.S. Treasury Notes | |||||||
4.50%, 04/30/12D | $ | 30,000 | $ | 31,458 | |||
4.50%, 05/15/17D | 920,000 | 958,526 | |||||
| 989,984 | |||||||
Total U.S. Treasury Obligations | 5,406,224 | ||||||
TOTAL INVESTMENTS — 117.6% | 268,626,098 | ||||||
Liabilities in Excess of Other Assets — (17.6)% | (40,330,125 | ) | |||||
NET ASSETS — 100.0% | $ | 228,295,973 | |||||
| PORTFOLIO SUMMARY (based on net assets) | |||||||
| % | |||||||
Corporate Bonds | 35.1 | ||||||
Foreign Bonds | 33.7 | ||||||
Money Market Funds | 30.5 | ||||||
Futures Contracts | 12.4 | ||||||
Mortgage-Backed Securities | 12.2 | ||||||
U.S. Treasury Obligations | 2.4 | ||||||
Asset-Backed Securities | 2.2 | ||||||
Preferred Stocks | 0.8 | ||||||
Common Stock | 0.4 | ||||||
Agency Obligations | 0.2 | ||||||
Purchased Options | 0.1 | ||||||
Forward Foreign Currency Contracts | (3.9 | ) | |||||
| 126.1 | |||||||
FAS 157 DISCLOSURE
The following is a summary of the inputs used, as of June 30, 2008, in valuing the Fund’s assets carried at fair value:
Valuation Inputs | Investments in Securities | Other Financial Instruments* | |||||
Level 1 — Quoted Prices | $ | 72,621,412 | $ | (138,385 | ) | ||
Level 2 — Other Significant Observable Inputs | 196,004,686 | (789,153 | ) | ||||
Level 3 — Significant Unobservable Inputs | — | — | |||||
Total | $ | 268,626,098 | $ | (927,538 | ) | ||
| * | Other financial instruments are derivative instruments not reflected in the Schedule of Investments, such as futures, forwards and swap contracts, which are valued at the unrealized appreciation (depreciation) on the investment. |
| 86 | See Notes to Financial Statements. |
Table of Contents
| Equity Index Fund | ||
| SCHEDULE OF INVESTMENTS | June 30, 2008 (Unaudited) |
| Shares | Value | ||||
COMMON STOCKS — 97.3% | |||||
Auto & Transportation — 2.5% | |||||
Burlington Northern Santa Fe Corporation | 11,200 | $ | 1,118,768 | ||
CH Robinson Worldwide, Inc.D | 6,500 | 356,460 | |||
CSX Corporation | 15,300 | 960,993 | |||
Expeditors International Washington, Inc. | 8,100 | 348,300 | |||
FedEx Corporation | 11,800 | 929,722 | |||
Ford Motor Co.* | 86,293 | 415,069 | |||
General Motors Corporation | 21,700 | 249,550 | |||
Genuine Parts Co. | 6,200 | 246,016 | |||
Goodyear Tire & Rubber Co. (The)* | 9,100 | 162,253 | |||
Harley-Davidson, Inc. | 9,000 | 326,340 | |||
Norfolk Southern Corporation | 14,300 | 896,181 | |||
PACCAR, Inc. | 13,868 | 580,099 | |||
Southwest Airlines Co. | 28,100 | 366,424 | |||
Union Pacific Corporation | 19,800 | 1,494,900 | |||
United Parcel Service, Inc. Class B | 39,200 | 2,409,624 | |||
| 10,860,699 | |||||
Consumer Discretionary — 10.4% | |||||
Allied Waste Industries, Inc.* | 12,300 | 155,226 | |||
Amazon.com, Inc.* | 11,784 | 864,121 | |||
Apollo Group, Inc. Class A* | 5,221 | 231,081 | |||
AutoNation, Inc.D* | 5,125 | 51,352 | |||
AutoZone, Inc.* | 1,600 | 193,616 | |||
Avon Products, Inc. | 16,300 | 587,126 | |||
Bed Bath & Beyond, Inc.* | 10,000 | 281,000 | |||
Best Buy Co., Inc. | 13,225 | 523,710 | |||
Big Lots, Inc.* | 3,100 | 96,844 | |||
Black & Decker Corporation | 2,300 | 132,273 | |||
Carnival Corporation | 16,700 | 550,432 | |||
CBS Corporation Class B | 25,800 | 502,842 | |||
Cintas Corporation | 5,000 | 132,550 | |||
Clear Channel Communications, Inc. | 18,900 | 665,280 | |||
Coach, Inc.* | 13,000 | 375,440 | |||
Convergys Corporation* | 5,000 | 74,300 | |||
Costco Wholesale Corporation | 16,500 | 1,157,310 | |||
Darden Restaurants, Inc. | 5,450 | 174,073 | |||
Dillard’s, Inc. Class A | 2,300 | 26,611 | |||
DIRECTV Group, Inc. (The)D* | 27,000 | 699,570 | |||
Donnelley (R.R.) & Sons Co. | 8,200 | 243,458 | |||
Eastman Kodak Co. | 11,000 | 158,730 | |||
eBay, Inc.* | 42,100 | 1,150,593 | |||
Electronic Arts, Inc.* | 12,000 | 533,160 | |||
Estee Lauder Cos., Inc. Class A | 4,400 | 204,380 | |||
Expedia, Inc.* | 8,039 | 147,757 | |||
Family Dollar Stores, Inc. | 5,300 | 105,682 | |||
Gannett Co., Inc. | 8,700 | 188,529 | |||
Gap, Inc. (The) | 17,100 | 285,057 | |||
Google, Inc.* | 8,835 | 4,650,921 | |||
Harman International Industries, Inc. | 2,300 | 95,197 | |||
Hasbro, Inc. | 5,400 | 192,888 | |||
Home Depot, Inc. (The) | 64,920 | 1,520,426 | |||
IAC InterActiveCorp* | 6,800 | 131,104 | |||
Ingersoll-Rand Co., Ltd. Class A | 11,895 | 445,230 | |||
International Flavors & Fragrances, Inc. | 3,200 | 124,992 | |||
Interpublic Group Cos., Inc.* | 18,048 | 155,213 | |||
Jones Apparel Group, Inc. | 3,400 | 46,750 | |||
Kimberly-Clark Corporation | 15,900 | 950,502 | |||
Kohl’s Corporation* | 11,700 | 468,468 | |||
Leggett & Platt, Inc. | 6,500 | 109,005 | |||
Limited Brands | 11,400 | 192,090 | |||
Liz Claiborne, Inc. | 3,808 | 53,883 | |||
Lowe’s Cos., Inc. | 55,500 | 1,151,625 | |||
Macy’s, Inc. | 16,012 | 310,953 | |||
Manitowoc Co., Inc. | 5,000 | 162,650 | |||
Marriott International, Inc. Class A | 11,400 | 299,136 | |||
Mattel, Inc. | 13,700 | 234,544 | |||
McDonald’s Corporation | 43,200 | 2,428,704 | |||
McGraw-Hill Co., Inc. (The) | 12,300 | 493,476 | |||
Meredith Corporation | 1,400 | 39,606 | |||
Monster Worldwide, Inc.* | 4,900 | 100,989 | |||
New York Times Co. Class A | 5,400 | 83,106 | |||
Newell Rubbermaid, Inc. | 10,500 | 176,295 | |||
NIKE, Inc. Class B | 14,500 | 864,345 | |||
Nordstrom, Inc. | 6,700 | 203,010 | |||
Office Depot, Inc.* | 10,500 | 114,870 | |||
Omnicom Group, Inc. | 12,100 | 543,048 | |||
Penney (JC) Co., Inc. | 8,500 | 308,465 | |||
Polo Ralph Lauren Corporation | 2,200 | 138,116 | |||
RadioShack Corporation | 5,200 | 63,804 | |||
Robert Half International, Inc. | 6,000 | 143,820 | |||
Scripps Co. (E.W.) Class A | 3,500 | 145,390 | |||
Sears Holdings Corporation* | 2,689 | 198,072 | |||
Snap-On, Inc. | 2,200 | 114,422 | |||
Stanley Works (The) | 3,000 | 134,490 | |||
Staples, Inc. | 26,600 | 631,750 | |||
Starbucks Corporation* | 27,900 | 439,146 | |||
Target Corporation | 29,700 | 1,380,753 | |||
Tiffany & Co. | 4,800 | 195,600 | |||
Time Warner, Inc. | 135,700 | 2,008,360 | |||
TJX Cos., Inc. | 16,200 | 509,814 | |||
Total System Services, Inc. | 7,387 | 164,139 | |||
VeriSign, Inc.* | 7,400 | 279,720 | |||
VF Corporation | 3,300 | 234,894 | |||
Wal-Mart Stores, Inc. | 88,700 | 4,984,940 | |||
Walt Disney Co. (The) | 72,202 | 2,252,702 | |||
Washington Post Co | 231 | 135,574 | |||
Waste Management, Inc. | 18,900 | 712,719 | |||
Wendy’s International, Inc. | 3,400 | 92,548 | |||
Whirlpool Corporation | 2,895 | 178,689 | |||
Wyndham Worldwide Corporation | 6,780 | 121,430 | |||
Yahoo!, Inc.* | 52,200 | 1,078,452 | |||
Yum! Brands, Inc. | 18,000 | 631,620 | |||
| 44,114,558 | |||||
Consumer Staples — 6.1% | |||||
Campbell Soup Co. | 8,300 | 277,718 | |||
Clorox Co. | 5,300 | 276,660 | |||
Coca-Cola Co. (The) | 76,100 | 3,955,678 | |||
Coca-Cola Enterprises, Inc. | 10,900 | 188,570 | |||
Colgate-Palmolive Co. | 19,300 | 1,333,630 | |||
ConAgra Foods, Inc. | 18,600 | 358,608 | |||
Dean Foods Co.* | 5,200 | 102,024 | |||
General Mills, Inc. | 12,800 | 777,856 | |||
Heinz (H.J.) Co. | 11,900 | 569,415 | |||
Hershey Co. (The) | 6,400 | 209,792 | |||
Kellogg Co. | 9,700 | 465,794 | |||
Kraft Foods, Inc. Class A | 57,800 | 1,644,410 | |||
Kroger Co. | 25,200 | 727,524 | |||
| See Notes to Financial Statements. | 87 |
Table of Contents
Equity Index Fund
SCHEDULE OF INVESTMENTS (Continued)
| Shares | Value | ||||
McCormick & Co., Inc. | 4,900 | $ | 174,734 | ||
Pepsi Bottling Group, Inc. | 5,300 | 147,976 | |||
PepsiCo, Inc. | 60,440 | 3,843,379 | |||
Procter & Gamble Co. | 116,317 | 7,073,237 | |||
Safeway, Inc. | 16,700 | 476,785 | |||
Sara Lee Corporation | 27,200 | 333,200 | |||
SUPERVALU, Inc.* | 8,048 | 248,603 | |||
SYSCO Corporation | 22,900 | 629,979 | |||
Tyson Foods, Inc. Class A | 10,400 | 155,376 | |||
Walgreen Co. | 37,600 | 1,222,376 | |||
Whole Foods Market, Inc. | 5,300 | 125,557 | |||
Wrigley (W.M.), Jr. Co. | 8,225 | 639,740 | |||
| 25,958,621 | |||||
Financial Services — 15.5% | |||||
ACE, Ltd. | 12,500 | 688,625 | |||
AFLAC, Inc. | 18,000 | 1,130,400 | |||
Allstate Corporation (The) | 21,252 | 968,879 | |||
American Capital Strategies, Ltd. | 7,400 | 175,898 | |||
American Express Co. | 43,800 | 1,649,946 | |||
American International Group, Inc. | 102,592 | 2,714,584 | |||
Ameriprise Financial, Inc. | 8,440 | 343,255 | |||
AON Corporation | 11,600 | 532,904 | |||
Apartment Investment & Management Co. Class A REITD | 3,467 | 118,088 | |||
Assurant, Inc. | 3,600 | 237,456 | |||
Automatic Data Processing, Inc. | 19,800 | 829,620 | |||
AvalonBay Communities, Inc. REIT | 2,900 | 258,564 | |||
Bank of America Corporation | 170,263 | 4,064,178 | |||
Bank of New York Mellon Corporation | 43,262 | 1,636,616 | |||
BB&T Corporation | 20,700 | 471,339 | |||
Block (H&R), Inc. | 12,500 | 267,500 | |||
Boston Properties, Inc. REIT | 4,500 | 405,990 | |||
Capital One Financial CorporationD | 14,437 | 548,750 | |||
CB Richard Ellis Group, Inc. Class AD* | 6,700 | 128,640 | |||
Chubb Corporation | 14,100 | 691,041 | |||
CIGNA Corporation | 10,700 | 378,673 | |||
Cincinnati Financial Corporation | 6,386 | 162,204 | |||
CIT Group, Inc. | 10,700 | 72,867 | |||
Citigroup, Inc. | 207,830 | 3,483,231 | |||
CME Group, Inc.* | 2,060 | 789,371 | |||
Comerica, Inc. | 5,800 | 148,654 | |||
Countrywide Financial Corporation | 23,348 | 99,229 | |||
Developers Diversified Realty Corporation REIT | 4,500 | 156,195 | |||
Discover Financial Services | 18,300 | 241,011 | |||
Dynegy, Inc. Class AD* | 18,824 | 160,945 | |||
E*TRADE Financial Corporation* | 17,500 | 54,950 | |||
Equifax, Inc. | 5,000 | 168,100 | |||
Equity Residential Properties Trust REIT | 10,200 | 390,354 | |||
Fannie Mae* | 40,800 | 796,008 | |||
Federated Investors, Inc. Class B | 3,300 | 113,586 | |||
Fidelity National Information Services, Inc. | 6,500 | 239,915 | |||
Fifth Third Bancorp | 20,394 | 207,611 | |||
First Horizon National Corporation* | 6,300 | 46,809 | |||
Fiserv, Inc.* | 6,300 | 285,831 | |||
Franklin Resources, Inc. | 5,900 | 540,735 | |||
Freddie Mac | 24,700 | 405,080 | |||
General Growth Properties, Inc. REIT | 9,900 | 346,797 | |||
Genworth Financial, Inc. Class A | 16,600 | 295,646 | |||
Goldman Sachs Group, Inc. | 15,054 | 2,632,945 | |||
Hartford Financial Services Group, Inc. | 11,900 | 768,383 | |||
HCP, Inc. REIT | 8,600 | 273,566 | |||
Honeywell International, Inc. | 28,300 | 1,422,924 | |||
Host Hotels & Resorts, Inc. REIT | 20,000 | 273,000 | |||
Hudson City Bancorp, Inc. | 19,900 | 331,932 | |||
Huntington Bancshares, Inc. | 14,000 | 80,780 | |||
IntercontinentalExchange, Inc.* | 2,700 | 307,800 | |||
Janus Capital Group, Inc. | 5,700 | 150,879 | |||
JPMorgan Chase & Co. | 131,989 | 4,528,543 | |||
KeyCorp | 18,400 | 202,032 | |||
Kimco Realty Corporation REIT | 9,700 | 334,844 | |||
Legg Mason, Inc. | 5,240 | 228,307 | |||
Lehman Brothers Holdings, Inc. | 26,400 | 522,984 | |||
Leucadia National Corporation | 6,600 | 309,804 | |||
Lincoln National Corporation | 10,019 | 454,040 | |||
Loews Corporation | 13,691 | 642,108 | |||
Lorillard, Inc.* | — | 35 | |||
M&T Bank CorporationD | 2,800 | 197,512 | |||
Marsh & McLennan Cos., Inc. | 19,900 | 528,345 | |||
Marshall & Ilsley Corporation | 9,800 | 150,234 | |||
MBIA, Inc.D* | 7,900 | 34,681 | |||
Merrill Lynch & Co., Inc. | 37,780 | 1,198,004 | |||
MetLife, Inc. | 26,900 | 1,419,513 | |||
MGIC Investment Corporation | 4,300 | 26,273 | |||
Moody’s Corporation | 7,900 | 272,076 | |||
Morgan Stanley | 42,100 | 1,518,547 | |||
National City Corporation | 27,857 | 132,878 | |||
Northern Trust Corporation | 8,100 | 555,417 | |||
NYSE Euronext | 10,100 | 511,666 | |||
Paychex, Inc. | 12,200 | 381,616 | |||
Plum Creek Timber Co., Inc. REIT | 6,600 | 281,886 | |||
PNC Financial Services Group, Inc. | 12,900 | 736,590 | |||
Principal Financial Group | 9,800 | 411,306 | |||
Progressive Corporation (The) | 25,696 | 481,029 | |||
ProLogis REIT | 9,800 | 532,630 | |||
Prudential Financial, Inc. | 16,900 | 1,009,606 | |||
Public Storage REIT | 4,725 | 381,733 | |||
Regions Financial CorporationD | 26,329 | 287,249 | |||
Ryder System, Inc. | 2,200 | 151,536 | |||
Safeco Corporation | 3,400 | 228,344 | |||
Schwab (Charles) Corporation (The) | 35,406 | 727,239 | |||
Simon Property Group, Inc. REIT | 8,600 | 773,054 | |||
SLM Corporation* | 17,800 | 344,430 | |||
Sovereign Bancorp, Inc.* | 18,165 | 133,695 | |||
Starwood Hotels & Resorts Worldwide, Inc. | 7,200 | 288,504 | |||
State Street Corporation | 16,100 | 1,030,239 | |||
SunTrust Banks, Inc. | 13,300 | 481,726 | |||
| 88 | See Notes to Financial Statements. |
Table of Contents
| Shares | Value | ||||
T. Rowe Price Group, Inc.D | 10,000 | $ | 564,700 | ||
Torchmark Corporation | 3,500 | 205,275 | |||
Travelers Cos., Inc. | 23,356 | 1,013,650 | |||
Unum Group | 13,300 | 271,985 | |||
US Bancorp | 65,900 | 1,837,951 | |||
Vornado Realty Trust REIT | 5,100 | 448,800 | |||
Wachovia Corporation | 81,983 | 1,273,195 | |||
Washington Mutual, Inc. | 41,146 | 202,850 | |||
Wells Fargo & Co. | 125,260 | 2,974,925 | |||
Western Union Co. | 28,417 | 702,468 | |||
XL Capital, Ltd. Class AD | 6,800 | 139,808 | |||
Zions Bancorporation | 4,100 | 129,109 | |||
| 65,883,255 | |||||
Healthcare — 12.2% | |||||
Abbott Laboratories | 58,800 | 3,114,636 | |||
Aetna, Inc. | 18,500 | 749,805 | |||
Allergan, Inc. | 11,630 | 605,341 | |||
AmerisourceBergen Corporation | 6,244 | 249,698 | |||
Amgen, Inc.* | 41,265 | 1,946,057 | |||
Bard (C.R.), Inc. | 3,800 | 334,210 | |||
Baxter International, Inc. | 24,100 | 1,540,954 | |||
Becton Dickinson & Co. | 9,300 | 756,090 | |||
Biogen Idec, Inc.* | 11,230 | 627,645 | |||
Boston Scientific Corporation* | 50,900 | 625,561 | |||
Bristol-Myers Squibb Co. | 75,100 | 1,541,803 | |||
Cardinal Health, Inc. | 13,579 | 700,405 | |||
Celgene Corporation* | 16,600 | 1,060,242 | |||
Conventry Health Care, Inc.* | 5,730 | 174,307 | |||
Covidien, Ltd. | 18,946 | 907,324 | |||
CVS Caremark Corporation | 54,627 | 2,161,590 | |||
Eli Lilly & Co. | 37,500 | 1,731,000 | |||
Express Scripts, Inc.* | 9,538 | 598,223 | |||
Forest Laboratories, Inc.* | 11,600 | 402,984 | |||
Genzyme Corporation* | 10,200 | 734,604 | |||
Gilead Sciences, Inc.* | 35,200 | 1,863,840 | |||
Hospira, Inc* | 6,050 | 242,666 | |||
Humana, Inc.* | 6,500 | 258,505 | |||
IMS Health, Inc. | 7,000 | 163,100 | |||
Intuitive Surgical, Inc.D* | 1,500 | 404,100 | |||
Johnson & Johnson | 107,390 | 6,909,473 | |||
King Pharmaceuticals, Inc.* | 9,400 | 98,418 | |||
Laboratory Corporation of America HoldingsD* | 4,200 | 292,446 | |||
McKesson Corporation | 10,700 | 598,237 | |||
Medco Health Solutions, Inc.* | 19,252 | 908,694 | |||
Medtronic, Inc. | 42,600 | 2,204,550 | |||
Merck & Co., Inc. | 81,800 | 3,083,042 | |||
Millipore Corporation* | 2,100 | 142,506 | |||
Mylan Laboratories, Inc.* | 11,500 | 138,805 | |||
Patterson Cos., Inc.* | 4,900 | 144,011 | |||
Pfizer, Inc. | 258,483 | 4,515,698 | |||
Quest Diagnostics, Inc. | 6,000 | 290,820 | |||
Schering-Plough Corporation | 61,500 | 1,210,935 | |||
St. Jude Medical, Inc.* | 12,900 | 527,352 | |||
Stryker Corporation | 9,100 | 572,208 | |||
Tenet Healthcare CorporationD* | 18,150 | 100,914 | |||
Thermo Fisher Scientific, Inc.* | 15,910 | 886,664 | |||
UnitedHealth Group, Inc. | 46,800 | 1,228,500 | |||
Varian Medical Systems, Inc.* | 4,800 | 248,880 | |||
Watson Pharmaceuticals, Inc.* | 3,900 | 105,963 | |||
WellPoint, Inc.* | 20,112 | 958,538 | |||
Wyeth | 50,700 | 2,431,572 | |||
Zimmer Holdings, Inc.* | 8,820 | 600,201 | |||
| 51,693,117 | |||||
Integrated Oils — 9.0% | |||||
Chevron Corporation | 78,841 | 7,815,528 | |||
ConocoPhillips | 58,958 | 5,565,046 | |||
Exterran Holdings, Inc.* | 13 | 929 | |||
Exxon Mobil Corporation | 201,444 | 17,753,260 | |||
Hess Corporation | 10,600 | 1,337,614 | |||
Marathon Oil Corporation | 26,884 | 1,394,473 | |||
Murphy Oil Corporation | 7,200 | 705,960 | |||
Occidental Petroleum | |||||
Corporation | 31,400 | 2,821,604 | |||
Southwestern Energy Co.* | 13,000 | 618,930 | |||
Tesoro Corporation | 5,200 | 102,804 | |||
| 38,116,148 | |||||
Materials & Processing — 5.0% | |||||
Air Products & Chemicals, Inc. | 8,100 | 800,766 | |||
AK Steel Corporation | 4,300 | 296,700 | |||
Alcoa, Inc. | 30,900 | 1,100,658 | |||
Allegheny Technologies, Inc.D | 3,800 | 225,264 | |||
Archer-Daniels-Midland Co. | 24,427 | 824,411 | |||
Ashland, Inc. | 2,200 | 106,040 | |||
Avery Dennison Corporation | 4,100 | 180,113 | |||
Ball Corporation | 3,792 | 181,030 | |||
Bemis Co. | 3,800 | 85,196 | |||
Cameron International Corporation* | 8,300 | 459,405 | |||
Dover Corporation | 7,200 | 348,264 | |||
Dow Chemical Co. (The) | 35,600 | 1,242,796 | |||
du Pont (E.I.) de Nemours & Co. | 34,055 | 1,460,619 | |||
Ecolab, Inc. | 6,700 | 288,033 | |||
Fluor Corporation | 3,400 | 632,672 | |||
Freeport-McMoRan Copper & Gold, Inc. | 14,662 | 1,718,240 | |||
Hercules, Inc. | 4,300 | 72,799 | |||
International Paper Co. | 16,335 | 380,605 | |||
Masco Corporation | 13,800 | 217,074 | |||
MeadWestvaco Corporation | 6,745 | 160,801 | |||
Monsanto Co. | 20,920 | 2,645,125 | |||
Newmont Mining Corporation | 17,500 | 912,800 | |||
Nucor Corporation | 11,889 | 887,752 | |||
Pactiv Corporation* | 5,000 | 106,150 | |||
Peabody Energy Corporation | 10,500 | 924,525 | |||
PPG Industries, Inc. | 6,200 | 355,694 | |||
Praxair, Inc. | 11,880 | 1,119,571 | |||
Precision Castparts Corporation | 5,300 | 510,761 | |||
Rohm & Haas Co. | 4,800 | 222,912 | |||
Sealed Air Corporation | 6,200 | 117,862 | |||
Sherwin-Williams Co. | 3,800 | 174,534 | |||
Sigma-Aldrich Corporation | 4,900 | 263,914 | |||
Smith International, Inc. | 7,600 | 631,864 | |||
Terex Corporation* | 3,800 | 195,206 | |||
Titanium Metals Corporation | 3,500 | 48,965 | |||
United States Steel Corporation | 4,500 | 831,510 | |||
Vulcan Materials Co. | 4,100 | 245,098 | |||
Weyerhaeuser Co. | 7,960 | 407,074 | |||
| 21,382,803 | |||||
Other — 3.6% | |||||
3M Co. | 26,800 | 1,865,012 | |||
Eaton Corporation | 6,228 | 529,193 | |||
General Electric Co. | 379,400 | 10,126,186 | |||
| See Notes to Financial Statements. | 89 |
Table of Contents
Equity Index Fund
SCHEDULE OF INVESTMENTS (Continued)
| Shares | Value | ||||
ITT Industries, Inc. | 6,900 | $ | 436,977 | ||
Jacobs Engineering Group, Inc.* | 4,600 | 371,220 | |||
Johnson Controls, Inc. | 22,476 | 644,612 | |||
Textron, Inc. | 9,500 | 455,335 | |||
Tyco International, Ltd. | 18,346 | 734,574 | |||
| 15,163,109 | |||||
Other Energy — 7.0% | |||||
Ameren Corporation | 7,900 | 333,617 | |||
Anadarko Petroleum Corporation | 17,700 | 1,324,668 | |||
Apache Corporation | 12,648 | 1,758,072 | |||
Baker Hughes, Inc. | 11,700 | 1,021,878 | |||
BJ Services Co. | 11,200 | 357,728 | |||
Cabot Oil & Gas Corporation | 3,700 | 250,601 | |||
Chesapeake Energy Corporation | 18,466 | 1,218,017 | |||
Consol Energy, Inc. | 7,000 | 786,590 | |||
Devon Energy Corporation | 16,900 | 2,030,704 | |||
El Paso Corporation | 26,800 | 582,632 | |||
ENSCO International, Inc. | 5,500 | 444,070 | |||
EOG Resources, Inc. | 9,400 | 1,233,280 | |||
FPL Group, Inc. | 15,500 | 1,016,490 | |||
Halliburton Co. | 33,375 | 1,771,211 | |||
Massey Energy Co. | 3,000 | 281,250 | |||
Nabors Industries, Ltd.D* | 10,700 | 526,761 | |||
National Oilwell Varco, Inc.* | 15,900 | 1,410,648 | |||
Noble Corporation | 10,200 | 662,592 | |||
Noble Energy, Inc. | 6,500 | 653,640 | |||
Questar Corporation | 6,600 | 468,864 | |||
Range ResourcesCorporation | 5,784 | 379,083 | |||
Rowan Cos., Inc. | 4,200 | 196,350 | |||
Schlumberger, Ltd. | 45,600 | 4,898,808 | |||
Sunoco, Inc.D | 4,500 | 183,105 | |||
Transocean, Inc.* | 12,199 | 1,859,006 | |||
Valero Energy Corporation | 20,100 | 827,718 | |||
Weatherford International, Ltd.* | 25,796 | 1,279,224 | |||
Williams Cos., Inc. | 22,200 | 894,882 | |||
XTO Energy, Inc. | 19,582 | 1,341,563 | |||
| 29,993,052 | |||||
Producer Durables — 4.4% | |||||
Agilent Technologies, Inc.* | 13,800 | 490,452 | |||
American Tower Corporation Class A* | 15,200 | 642,200 | |||
Applied Materials, Inc. | 51,300 | 979,317 | |||
Boeing Co. (The) | 28,600 | 1,879,592 | |||
Caterpillar, Inc. | 23,400 | 1,727,388 | |||
Centex Corporation | 4,800 | 64,176 | |||
Cooper Industries, Ltd. Class A | 6,700 | 264,650 | |||
Cummins, Inc. | 7,700 | 504,504 | |||
Danaher Corporation | 9,700 | 749,810 | |||
Deere & Co. | 16,500 | 1,190,145 | |||
DR Horton, Inc. | 10,600 | 115,010 | |||
Eastman Chemical Co. | 3,000 | 206,580 | |||
Emerson Electric Co. | 29,700 | 1,468,665 | |||
Goodrich Corporation | 4,800 | 227,808 | |||
Grainger (W.W.), Inc. | 2,500 | 204,500 | |||
Illinois Tool Works, Inc. | 15,200 | 722,152 | |||
KB HomeD | 2,900 | 49,097 | |||
KLA-Tencor Corporation | 6,500 | 264,615 | |||
Lennar Corporation Class A | 5,300 | 65,402 | |||
Lexmark International, Inc.* | 3,600 | 120,348 | |||
Lockheed Martin Corporation | 12,900 | 1,272,714 | |||
Molex, Inc. | 5,450 | 133,035 | |||
Northrop Grumman Corporation | 12,856 | 860,066 | |||
Novellus Systems, Inc.* | 3,900 | 82,641 | |||
Pall Corporation | 4,600 | 182,528 | |||
Parker Hannifin Corporation | 6,450 | 460,014 | |||
Pitney Bowes, Inc. | 8,100 | 276,210 | |||
Pulte Homes, Inc. | 8,108 | 78,080 | |||
Rockwell Collins, Inc. | 6,200 | 297,352 | |||
Teradyne, Inc.* | 6,900 | 76,383 | |||
United Technologies Corporation | 37,100 | 2,289,070 | |||
Waters Corporation* | 3,800 | 245,100 | |||
Xerox Corporation | 34,800 | 471,888 | |||
| 18,661,492 | |||||
Technology — 16.0% | |||||
Adobe Systems, Inc.* | 20,200 | 795,678 | |||
Advanced Micro Devices, Inc.* | 23,100 | 134,673 | |||
Affiliated Computer Services, Inc. Class A* | 3,700 | 197,913 | |||
Akamai Technologies, Inc.D* | 6,400 | 222,656 | |||
Altera Corporation | 11,600 | 240,120 | |||
Analog Devices, Inc. | 11,000 | 349,470 | |||
Apple, Inc.* | 33,600 | 5,625,984 | |||
Applera Corporation-Applied Biosystems Group | 6,400 | 214,272 | |||
AT&T, Inc. | 226,472 | 7,629,842 | |||
Autodesk, Inc.* | 8,560 | 289,414 | |||
BMC Software, Inc.* | 7,300 | 262,800 | |||
Broadcom Corporation Class A* | 17,050 | 465,294 | |||
CA, Inc. | 14,970 | 345,657 | |||
Ciena Corporation* | 3,328 | 77,110 | |||
Cisco Systems, Inc.* | 225,200 | 5,238,152 | |||
Citrix Systems, Inc.* | 7,100 | 208,811 | |||
Cognizant Technology Solutions Corporation Class A* | 10,900 | 354,359 | |||
Computer Sciences Corporation* | 5,700 | 266,988 | |||
Compuware Corporation* | 10,000 | 95,400 | |||
Corning, Inc. | 59,700 | 1,376,085 | |||
Dell, Inc.* | 77,000 | 1,684,760 | |||
Electronic Data Systems Corporation | 19,300 | 475,552 | |||
EMC Corporation* | 78,800 | 1,157,572 | |||
GameStop Corporation Class A* | 6,100 | 246,440 | |||
General Dynamics Corporation | 15,200 | 1,279,840 | |||
Hewlett-Packard Co. | 93,802 | 4,146,986 | |||
Intel Corporation | 218,300 | 4,689,084 | |||
International Business Machines Corporation | 52,500 | 6,222,825 | |||
Intuit, Inc.* | 12,200 | 336,354 | |||
Jabil Circuit, Inc. | 8,100 | 132,921 | |||
JDS Uniphase CorporationD* | 8,475 | 96,276 | |||
Juniper Networks, Inc.* | 19,800 | 439,164 | |||
L-3 Communications Holdings, Inc. | 4,700 | 427,089 | |||
Linear Technology Corporation | 8,500 | 276,845 | |||
LSI Corporation* | 24,300 | 149,202 | |||
MEMC Electronic Materials, Inc.* | 8,700 | 535,398 | |||
Microchip Technology, Inc. | 7,000 | 213,780 | |||
Micron Technology, Inc.* | 29,100 | 174,600 | |||
Microsoft Corporation | 304,830 | 8,385,873 | |||
| 90 | See Notes to Financial Statements. |
Table of Contents
| Shares | Value | ||||||
Motorola, Inc. | 85,500 | $ | 627,570 | ||||
National Semiconductor Corporation | 8,200 | 168,428 | |||||
NetApp, Inc.D* | 13,200 | 285,912 | |||||
Novell, Inc.* | 13,400 | 78,926 | |||||
Nvidia Corporation* | 21,250 | 397,800 | |||||
Oracle Corporation* | 150,700 | 3,164,700 | |||||
PerkinElmer, Inc. | 4,600 | 128,110 | |||||
QLogic Corporation* | 5,100 | 74,409 | |||||
QUALCOMM, Inc. | 61,500 | 2,728,755 | |||||
Raytheon Co. | 16,100 | 906,108 | |||||
Rockwell Automation, Inc. | 5,600 | 244,888 | |||||
SanDisk CorporationD* | 8,700 | 162,690 | |||||
Sun Microsystems, Inc.* | 30,100 | 327,488 | |||||
Symantec Corporation* | 32,370 | 626,360 | |||||
Tellabs, Inc.* | 16,000 | 74,400 | |||||
Teradata Corporation* | 6,900 | 159,666 | |||||
Texas Instruments, Inc. | 50,300 | 1,416,448 | |||||
Tyco Electronics, Ltd. | 18,446 | 660,736 | |||||
Unisys Corporation* | 13,900 | 54,905 | |||||
Xilinx, Inc. | 10,600 | 267,650 | |||||
| 68,017,188 | |||||||
Utilities — 5.6% | |||||||
AES Corporation* | 25,600 | 491,776 | |||||
Allegheny Energy, Inc. | 6,400 | 320,704 | |||||
American Electric Power Co., Inc. | 15,300 | 615,519 | |||||
Centerpoint Energy, Inc. | 12,300 | 197,415 | |||||
CenturyTel, Inc. | 4,000 | 142,360 | |||||
Citizens Communications Co.D | 12,600 | 142,884 | |||||
CMS Energy Corporation | 8,600 | 128,140 | |||||
Comcast Corporation Class A | 113,572 | 2,154,461 | |||||
Consolidated Edison, Inc. | 10,400 | 406,536 | |||||
Constellation Energy Group, Inc. | 6,800 | 558,280 | |||||
Dominion Resources, Inc. | 21,740 | 1,032,433 | |||||
DTE Energy Co. | 6,300 | 267,372 | |||||
Duke Energy Corporation | 47,868 | 831,946 | |||||
Edison International | 12,300 | 631,974 | |||||
Embarq Corporation | 5,844 | 276,246 | |||||
Entergy Corporation | 7,252 | 873,721 | |||||
Exelon Corporation | 25,224 | 2,269,151 | |||||
FirstEnergy Corporation | 11,584 | 953,711 | |||||
Integrys Energy Group, Inc.D | 2,900 | 147,407 | |||||
Nicor, Inc. | 1,700 | 72,403 | |||||
NiSource, Inc.D | 10,500 | 188,160 | |||||
Pepco Holdings, Inc. | 7,800 | 200,070 | |||||
PG&E Corporation | 13,600 | 539,784 | |||||
Pinnacle West Capital Corporation | 3,800 | 116,926 | |||||
PPL Corporation | 14,200 | 742,234 | |||||
Progress Energy, Inc. | 9,900 | 414,117 | |||||
Public Service Enterprise Group, Inc. | 19,400 | 891,042 | |||||
Qwest Communications International, Inc. | 58,900 | 231,477 | |||||
Sempra Energy | 9,900 | 558,855 | |||||
Southern Co. (The) | 29,000 | 1,012,680 | |||||
Spectra Energy Corporation | 23,984 | 689,300 | |||||
Sprint Nextel Corporation* | 108,093 | 1,026,883 | |||||
TECO Energy, Inc. | 8,100 | 174,069 | |||||
Verizon Communications, Inc. | 109,074 | 3,861,219 | |||||
Windstream CorporationD | 17,399 | 214,704 | |||||
Xcel Energy Inc. | 16,100 | 323,127 | |||||
| 23,699,086 | |||||||
Total Common Stocks | 413,543,128 | ||||||
MONEY MARKET FUNDS — 9.7% | |||||||
GuideStone Money Market Fund (GS4 Class)¥ | 9,794,845 | 9,794,845 | |||||
Northern Institutional Liquid Assets Portfolio§ | 31,386,372 | 31,386,372 | |||||
Total Money Market Funds | 41,181,217 | ||||||
| Par | |||||||
U.S. TREASURY OBLIGATION — 0.5% | |||||||
U.S. Treasury Bill | |||||||
2.09%, 12/04/08‡‡ | |||||||
(Cost $2,006,924) | $ | 2,025,000 | 2,006,818 | ||||
TOTAL INVESTMENTS — 107.5% | 456,731,163 | ||||||
Liabilities in Excess of Other Assets — (7.5)% | (31,870,478 | ) | |||||
NET ASSETS — 100.0% | $ | 424,860,685 | |||||
PORTFOLIO SUMMARY (based on net assets)
| % | ||
Technology | 16.0 | |
Financial Services | 15.5 | |
Healthcare | 12.2 | |
Consumer Discretionary | 10.4 | |
Money Market Funds | 9.7 | |
Integrated Oils | 9.0 | |
Other Energy | 7.0 | |
Consumer Staples | 6.1 | |
Utilities | 5.6 | |
Materials & Processing | 5.0 | |
Producer Durables | 4.4 | |
Other | 3.6 | |
Auto & Transportation | 2.5 | |
Futures Contracts | 2.3 | |
U.S. Treasury Obligation | 0.5 | |
| 109.8 | ||
| See Notes to Financial Statements. | 91 |
Table of Contents
Equity Index Fund
SCHEDULE OF INVESTMENTS (Continued)
FAS 157 DISCLOSURE
The following is a summary of the inputs used, as of June 30, 2008, in valuing the Fund’s assets carried at fair value:
Valuation Inputs | Investments in Securities | Other Financial Instruments* | |||||
Level 1 — Quoted Prices | $ | 454,724,345 | $ | (545,382 | ) | ||
Level 2 — Other Significant Observable Inputs | 2,006,818 | — | |||||
Level 3 — Significant Unobservable Inputs | — | — | |||||
Total | $ | 456,731,163 | $ | (545,382 | ) | ||
| * | Other financial instruments are derivative instruments not reflected in the Schedule of Investments, such as futures, forwards and swap contracts, which are valued at the unrealized appreciation (depreciation) on the investment. |
| 92 | See Notes to Financial Statements. |
Table of Contents
| Real Estate Securities Fund | ||
| SCHEDULE OF INVESTMENTS | June 30, 2008 (Unaudited) |
| Shares | Value | ||||||
COMMON STOCKS — 96.8% | |||||||
Financial Services — 96.8% | |||||||
American Campus Communities, Inc. REIT | 37,800 | $ | 1,052,352 | ||||
AvalonBay Communities, Inc. REITD | 85,875 | 7,656,615 | |||||
BioMed Realty Trust, Inc. REITD | 136,450 | 3,347,118 | |||||
Boston Properties, Inc. REITD | 67,800 | 6,116,916 | |||||
BRE Properties, Inc. REITD | 70,750 | 3,062,060 | |||||
Brookfield Properties Corporation | 60,763 | 1,080,974 | |||||
Camden Property Trust REITD | 33,200 | 1,469,432 | |||||
Digital Realty Trust, Inc. REITD | 83,250 | 3,405,758 | |||||
Equity Lifestyle Properties, Inc. REITD | 58,300 | 2,565,200 | |||||
Equity Residential Properties Trust REIT | 108,650 | 4,158,036 | |||||
Extra Space Storage, Inc. REITD | 49,150 | 754,944 | |||||
Federal Realty Investors Trust REITD | 58,300 | 4,022,700 | |||||
General Growth Properties, Inc. REITD | 212,550 | 7,445,626 | |||||
Host Hotels & Resorts, Inc. REITD | 270,427 | 3,691,329 | |||||
Liberty Property Trust REIT | 49,950 | 1,655,842 | |||||
LTC Properties, Inc. REITD | 28,255 | 722,198 | |||||
Macerich Co. (The) REITD | 5,900 | 366,567 | |||||
Maguire Properties, Inc. REITD* | 35,400 | 430,818 | |||||
Medical Properties Trust, Inc. REITD | 102,359 | 1,035,873 | |||||
Nationwide Health Properties, Inc. REITD | 98,200 | 3,092,318 | |||||
Post Properties, Inc. REITD | 80,875 | 2,406,031 | |||||
ProLogis REIT | 203,650 | 11,068,378 | |||||
Public Storage REIT | 63,880 | 5,160,865 | |||||
Regency Centers Corporation REITD | 78,950 | 4,667,524 | |||||
Saul Centers, Inc. REITD | 8,550 | 401,764 | |||||
Senior Housing Properties Trust REITD | 135,935 | 2,654,811 | |||||
Simon Property Group, Inc. REIT | 120,925 | 10,869,948 | |||||
Starwood Hotels & Resorts Worldwide, Inc.D | 15,615 | 625,693 | |||||
Tanger Factory Outlet Centers REITD | 64,150 | 2,304,910 | |||||
Taubman Centers, Inc. REITD | 55,250 | 2,687,912 | |||||
Ventas, Inc. REITD | 94,735 | 4,032,869 | |||||
Vornado Realty Trust REITD | 97,238 | 8,556,944 | |||||
Total Common Stocks | 112,570,325 | ||||||
MONEY MARKET FUNDS — 49.3% | |||||||
GuideStone Money Market Fund (GS4 Class)¥ | 2,046,144 | 2,046,144 | |||||
Northern Institutional Liquid Assets Portfolio§ | 55,211,103 | 55,211,103 | |||||
Total Money Market Funds | 57,257,247 | ||||||
| Par | |||||||
U.S. TREASURY OBLIGATION — 0.6% | |||||||
U.S. Treasury Bill | |||||||
2.09%, 12/04/08‡‡ | |||||||
(Cost $723,484) | $ | 730,000 | 723,445 | ||||
TOTAL INVESTMENTS — 146.7% | 170,551,017 | ||||||
Liabilities in Excess of Other Assets — (46.7)% | (54,318,321 | ) | |||||
NET ASSETS — 100.0% | $ | 116,232,696 | |||||
PORTFOLIO SUMMARY (based on net assets)
| % | ||
Financial Services | 96.8 | |
Money Market Funds | 49.3 | |
Futures Contracts | 2.8 | |
U.S. Treasury Obligation | 0.6 | |
| 149.5 | ||
FAS 157 DISCLOSURE
The following is a summary of the inputs used, as of June 30, 2008, in valuing the Fund’s assets carried at fair value:
Valuation Inputs | Investments in Securities | Other Financial Instruments* | |||||
Level 1 — Quoted Prices | $ | 169,827,572 | $ | (71,741 | ) | ||
Level 2 — Other Significant Observable Inputs | 723,445 | — | |||||
Level 3 — Significant Unobservable Inputs | — | — | |||||
Total | $ | 170,551,017 | $ | (71,741 | ) | ||
| * | Other financial instruments are derivative instruments not reflected in the Schedule of Investments, such as futures, forwards and swap contracts, which are valued at the unrealized appreciation (depreciation) on the investment. |
| See Notes to Financial Statements. | 93 |
Table of Contents
| Value Equity Fund | ||
| SCHEDULE OF INVESTMENTS | June 30, 2008 (Unaudited) |
| Shares | Value | ||||
COMMON STOCKS — 95.9% | |||||
Auto & Transportation — 1.8% | |||||
Autoliv, Inc.D | 28,300 | $ | 1,319,346 | ||
Burlington Northern Santa Fe Corporation | 126,600 | 12,646,074 | |||
CSX Corporation | 30,500 | 1,915,705 | |||
DryShips, Inc.D | 21,500 | 1,723,870 | |||
FedEx Corporation | 16,700 | 1,315,793 | |||
General Motors CorporationD | 350,580 | 4,031,670 | |||
Norfolk Southern Corporation | 13,900 | 871,113 | |||
TRW Automotive Holdings CorporationD* | 91,100 | 1,682,617 | |||
| 25,506,188 | |||||
Consumer Discretionary — 11.0% | |||||
Aeropostale, Inc.D* | 52,600 | 1,647,958 | |||
Best Buy Co., Inc. | 41,600 | 1,647,360 | |||
Big Lots, Inc.D* | 69,100 | 2,158,684 | |||
Carnival CorporationD | 285,300 | 9,403,488 | |||
Clear Channel Communications, Inc. | 26,800 | 943,360 | |||
Coach, Inc.* | 91,600 | 2,645,408 | |||
DIRECTV Group, Inc. (The)D* | 179,600 | 4,653,436 | |||
Gannett Co., Inc.D | 154,000 | 3,337,180 | |||
Gap, Inc. (The) | 369,400 | 6,157,898 | |||
Hasbro, Inc. | 101,300 | 3,618,436 | |||
Hewitt Associates, Inc. Class AD* | 91,200 | 3,495,696 | |||
Home Depot, Inc. (The) | 412,688 | 9,665,153 | |||
Interpublic Group Cos., Inc.D* | 438,100 | 3,767,660 | |||
Jack in the Box, Inc.* | 17,600 | 394,416 | |||
Kimberly-Clark Corporation | 162,600 | 9,720,228 | |||
Louisiana-Pacific CorporationD | 283,000 | 2,402,670 | |||
Lowe’s Cos., Inc. | 74,200 | 1,539,650 | |||
Macy’s, Inc. | 144,900 | 2,813,958 | |||
Mattel, Inc. | 288,900 | 4,945,968 | |||
McDonald’s Corporation | 275,700 | 15,499,854 | |||
Netflix, Inc.D* | 96,400 | 2,513,148 | |||
Office Depot, Inc.* | 106,100 | 1,160,734 | |||
Omnicom Group, Inc. | 1,100 | 49,368 | |||
Shaw Communications, Inc. Class BD | 139,500 | 2,840,220 | |||
Sony Corporation ADRD | 134,400 | 5,878,656 | |||
Stanley Works (The) | 228,600 | 10,248,138 | |||
Staples, Inc. | 4,900 | 116,375 | |||
Target Corporation | 3,200 | 148,768 | |||
Time Warner Cable, Inc.D* | 3,800 | 100,624 | |||
Time Warner, Inc. | 1,374,100 | 20,336,680 | |||
Wal-Mart Stores, Inc. | 224,700 | 12,628,140 | |||
Walt Disney Co. (The) | 90,000 | 2,808,000 | |||
Waste Management, Inc. | 103,500 | 3,902,985 | |||
| 153,190,297 | |||||
Consumer Staples — 5.4% | |||||
Coca-Cola Co. (The) | 140,000 | 7,277,200 | |||
ConAgra Foods, Inc. | 185,400 | 3,574,512 | |||
Dean Foods Co.* | 166,900 | 3,274,578 | |||
General Mills, Inc. | 103,300 | 6,277,541 | |||
Herbalife, Ltd.D | 62,200 | 2,410,250 | |||
Kellogg Co.D | 5,200 | 249,704 | |||
Kraft Foods, Inc. Class A | 733,000 | 20,853,850 | |||
Kroger Co. | 172,200 | 4,971,414 | |||
Pepsi Bottling Group, Inc. | 51,500 | 1,437,880 | |||
PepsiCo, Inc. | 4,700 | 298,873 | |||
Procter & Gamble Co. | 224,900 | 13,676,169 | |||
Safeway, Inc. | 68,900 | 1,967,095 | |||
Sara Lee Corporation | 202,500 | 2,480,625 | |||
SYSCO Corporation | 120,500 | 3,314,955 | |||
Walgreen Co. | 3,500 | 113,785 | |||
Whole Foods Market, Inc.D | 153,200 | 3,629,308 | |||
Wrigley (W.M.), Jr. Co. | 2,000 | 155,560 | |||
| 75,963,299 | |||||
Financial Services — 20.5% | |||||
ACE, Ltd. | 17,200 | 947,548 | |||
Allstate Corporation (The) | 286,900 | 13,079,771 | |||
American Express Co. | 317,000 | 11,941,390 | |||
American Financial Group, Inc. | 72,200 | 1,931,350 | |||
American International Group, Inc. | 486,900 | 12,883,374 | |||
Ameriprise Financial, Inc. | 94,500 | 3,843,315 | |||
Assurant, Inc. | 55,000 | 3,627,800 | |||
AXIS Capital Holdings, Ltd. | 97,000 | 2,891,570 | |||
Bank of America CorporationD | 639,300 | 15,260,091 | |||
Bank of New York Mellon Corporation | 60,090 | 2,273,205 | |||
BB&T CorporationD | 29,200 | 664,884 | |||
Capital One Financial CorporationD | 244,455 | 9,291,735 | |||
Chubb Corporation | 132,445 | 6,491,129 | |||
CIGNA Corporation | 42,600 | 1,507,614 | |||
Citigroup, Inc. | 825,733 | 13,839,285 | |||
CME Group, Inc.* | 1,000 | 383,190 | |||
Credicorp, Ltd. | 3,500 | 287,420 | |||
Endurance Specialty Holdings, Ltd.D | 84,700 | 2,607,913 | |||
Fairfax Financial Holdings, Ltd.D | 12,600 | 3,199,140 | |||
Fannie Mae* | 472,900 | 9,226,279 | |||
Fifth Third BancorpD | 242,900 | 2,472,722 | |||
Franklin Resources, Inc. | 41,300 | 3,785,145 | |||
Freddie Mac | 122,600 | 2,010,640 | |||
Goldman Sachs Group, Inc.D | 67,365 | 11,782,139 | |||
Hartford Financial Services Group, Inc.D | 119,104 | 7,690,545 | |||
Honeywell International, Inc. | 300,600 | 15,114,168 | |||
JPMorgan Chase & Co. | 915,680 | 31,416,981 | |||
Lehman Brothers Holdings, Inc.D | 29,700 | 588,357 | |||
Loews CorporationD | 16,648 | 780,791 | |||
Lorillard, Inc.* | 1 | 55 | |||
Merrill Lynch & Co., Inc.D | 51,800 | 1,642,578 | |||
MetLife, Inc. | 24,300 | 1,282,311 | |||
Morgan StanleyD | 141,700 | 5,111,119 | |||
NYSE Euronext | 5,800 | 293,828 | |||
PNC Financial Services Group, Inc. | 18,300 | 1,044,930 | |||
Prudential Financial, Inc. | 18,700 | 1,117,138 | |||
Regions Financial CorporationD | 389,400 | 4,248,354 | |||
Safeco Corporation | 70,700 | 4,748,212 | |||
Schwab (Charles) Corporation (The) | 103,700 | 2,129,998 | |||
SEI Investments Co. | 53,400 | 1,255,968 | |||
SLM Corporation* | 417,400 | 8,076,690 | |||
State Street CorporationD | 15,100 | 966,249 | |||
SunTrust Banks, Inc.D | 19,300 | 699,046 | |||
Torchmark Corporation | 71,400 | 4,187,610 | |||
Travelers Cos., Inc. | 489,600 | 21,248,640 | |||
UnionBanCal Corporation | 38,900 | 1,572,338 | |||
US BancorpD | 217,300 | 6,060,497 | |||
W.R. Berkley Corporation | 119,400 | 2,884,704 | |||
| 94 | See Notes to Financial Statements. |
Table of Contents
| Shares | Value | ||||
Wachovia Corporation | 114,445 | $ | 1,777,331 | ||
Washington Mutual, Inc.D | 445,200 | 2,194,836 | |||
Wells Fargo & Co.D | 638,400 | 15,162,000 | |||
Willis Group Holdings, Ltd.D | 87,300 | 2,738,601 | |||
XL Capital, Ltd. Class AD | 140,500 | 2,888,680 | |||
| 285,151,204 | |||||
Healthcare — 11.9% | |||||
Aetna, Inc. | 182,700 | 7,404,831 | |||
AmerisourceBergen Corporation | 85,600 | 3,423,144 | |||
Amgen, Inc.D* | 292,404 | 13,789,773 | |||
Baxter International, Inc. | 145,700 | 9,316,058 | |||
Boston Scientific Corporation* | 537,400 | 6,604,646 | |||
Bristol-Myers Squibb Co. | 353,800 | 7,263,514 | |||
Cardinal Health, Inc. | 72,600 | 3,744,708 | |||
Covidien, Ltd. | 88,500 | 4,238,265 | |||
CVS Caremark Corporation | 35,273 | 1,395,752 | |||
Eli Lilly & Co. | 47,500 | 2,192,600 | |||
Express Scripts, Inc.* | 21,500 | 1,348,480 | |||
Forest Laboratories, Inc.* | 52,500 | 1,823,850 | |||
Johnson & Johnson | 250,200 | 16,097,868 | |||
King Pharmaceuticals, Inc.* | 151,500 | 1,586,205 | |||
McKesson Corporation | 78,400 | 4,383,344 | |||
Merck & Co., Inc. | 81,600 | 3,075,504 | |||
Pfizer, Inc. | 2,131,400 | 37,235,558 | |||
Tenet Healthcare CorporationD* | 1,363,400 | 7,580,504 | |||
Thermo Fisher Scientific, Inc.* | 14,900 | 830,377 | |||
UnitedHealth Group, Inc. | 448,800 | 11,781,000 | |||
Watson Pharmaceuticals, Inc.D* | 255,300 | 6,936,501 | |||
WellPoint, Inc.* | 199,059 | 9,487,152 | |||
Wyeth | 70,900 | 3,400,364 | |||
Zimmer Holdings, Inc.* | 4,200 | 285,810 | |||
| 165,225,808 | |||||
Integrated Oils — 14.3% | |||||
Chevron Corporation | 563,370 | 55,846,868 | |||
ConocoPhillips | 622,200 | 58,729,458 | |||
Exxon Mobil Corporation | 533,600 | 47,026,168 | |||
Marathon Oil Corporation | 37,796 | 1,960,479 | |||
Murphy Oil CorporationD | 31,800 | 3,117,990 | |||
Occidental Petroleum Corporation | 311,300 | 27,973,418 | |||
W&T Offshore, Inc.D | 68,500 | 4,007,935 | |||
| 198,662,316 | |||||
Materials & Processing — 4.3% | |||||
Alcoa, Inc. | 337,700 | 12,028,874 | |||
Archer-Daniels-Midland Co. | 82,000 | 2,767,500 | |||
Dover Corporation | 34,700 | 1,678,439 | |||
Dow Chemical Co. (The) | 123,200 | 4,300,912 | |||
du Pont (E.I.) de Nemours & Co. | 261,400 | 11,211,446 | |||
Freeport-McMoRan Copper & Gold, Inc. | 20,200 | 2,367,238 | |||
Gardner Denver, Inc.D* | 45,200 | 2,567,360 | |||
Greif, Inc. Class AD | 28,900 | 1,850,467 | |||
Lennox International, Inc. | 48,700 | 1,410,352 | |||
Lubrizol Corporation | 31,100 | 1,440,863 | |||
MeadWestvaco CorporationD | 272,800 | 6,503,552 | |||
Methanex CorporationD | 63,900 | 1,790,478 | |||
Nucor CorporationD | 91,400 | 6,824,838 | |||
Schnitzer Steel Industries, Inc. Class A | 21,200 | 2,429,520 | |||
Timken Co. | 17,000 | 559,980 | |||
United States Steel Corporation | 400 | 73,912 | |||
| 59,805,731 | |||||
Other — 3.6% | |||||
3M Co. | 62,700 | 4,363,293 | |||
General Electric Co. | 1,436,200 | 38,332,178 | |||
Johnson Controls, Inc. | 26,300 | 754,284 | |||
Tyco International, Ltd. | 183,500 | 7,347,340 | |||
| 50,797,095 | |||||
Other Energy — 2.0% | |||||
Ameren CorporationD | 80,400 | 3,395,292 | |||
Anadarko Petroleum Corporation | 24,800 | 1,856,032 | |||
Apache Corporation | 17,700 | 2,460,300 | |||
Chesapeake Energy Corporation | 16,900 | 1,114,724 | |||
Cimarex Energy Co.D | 26,000 | 1,811,420 | |||
Devon Energy Corporation | 23,500 | 2,823,760 | |||
EOG Resources, Inc. | 3,400 | 446,080 | |||
FPL Group, Inc. | 21,200 | 1,390,296 | |||
Petro-Canada | 72,500 | 4,041,875 | |||
Valero Energy Corporation | 159,000 | 6,547,620 | |||
XTO Energy, Inc. | 24,200 | 1,657,942 | |||
| 27,545,341 | |||||
Producer Durables — 3.5% | |||||
Applied Materials, Inc.D | 238,600 | 4,554,874 | |||
Caterpillar, Inc. | 29,400 | 2,170,308 | |||
Cummins, Inc. | 59,900 | 3,924,648 | |||
Danaher Corporation | 3,900 | 301,470 | |||
Emerson Electric Co. | 220,900 | 10,923,505 | |||
Illinois Tool Works, Inc. | 229,700 | 10,913,047 | |||
Lockheed Martin Corporation | 21,900 | 2,160,654 | |||
Northrop Grumman Corporation | 86,300 | 5,773,470 | |||
NVR, Inc.D* | 5,500 | 2,750,440 | |||
Parker Hannifin Corporation | 51,500 | 3,672,980 | |||
United Technologies Corporation | 22,500 | 1,388,250 | |||
| 48,533,646 | |||||
Technology — 8.5% | |||||
AT&T, Inc. | 1,373,577 | 46,275,809 | |||
Compuware Corporation* | 294,100 | 2,805,714 | |||
Dell, Inc.* | 297,100 | 6,500,548 | |||
EMC Corporation* | 32,300 | 474,487 | |||
Flextronics International, Ltd.* | 675,338 | 6,348,177 | |||
General Dynamics Corporation | 20,900 | 1,759,780 | |||
Hewlett-Packard Co. | 202,200 | 8,939,262 | |||
Hologic, Inc.D* | 155,400 | 3,387,720 | |||
Intel Corporation | 41,800 | 897,864 | |||
International Business Machines Corporation | 54,400 | 6,448,032 | |||
L-3 Communications Holdings, Inc. | 38,500 | 3,498,495 | |||
LSI Corporation* | 983,200 | 6,036,848 | |||
Microsoft Corporation | 133,000 | 3,658,830 | |||
Motorola, Inc. | 626,700 | 4,599,978 | |||
QLogic CorporationD* | 111,600 | 1,628,244 | |||
Raytheon Co. | 13,900 | 782,292 | |||
Symantec Corporation* | 293,800 | 5,685,030 | |||
Tyco Electronics, Ltd. | 222,900 | 7,984,278 | |||
| 117,711,388 | |||||
| See Notes to Financial Statements. | 95 |
Table of Contents
Value Equity Fund
SCHEDULE OF INVESTMENTS (Continued)
| Shares | Value | ||||||
Utilities — 9.1% | |||||||
Alliant Energy CorporationD | 111,000 | $ | 3,802,860 | ||||
American Electric Power Co., Inc. | 214,600 | 8,633,358 | |||||
Comcast Corporation Class A | 533,200 | 10,114,804 | |||||
Dominion Resources, Inc. | 199,600 | 9,479,004 | |||||
DTE Energy Co.D | 84,500 | 3,586,180 | |||||
Duke Energy CorporationD | 314,100 | 5,459,058 | |||||
Edison International | 80,500 | 4,136,090 | |||||
Entergy Corporation | 78,900 | 9,505,872 | |||||
Exelon Corporation | 17,400 | 1,565,304 | |||||
FirstEnergy Corporation | 89,652 | 7,381,049 | |||||
Nokia Corporation ADRD | 303,700 | 7,440,650 | |||||
Progress Energy, Inc. Contingent Value Obligation+* | 3,100 | 1,209 | |||||
Public Service Enterprise Group, Inc. | 102,800 | 4,721,604 | |||||
Qwest Communications International, Inc.D | 1,528,900 | 6,008,577 | |||||
Sierra Pacific Resources | 208,000 | 2,643,680 | |||||
Southern Co. (The) | 40,500 | 1,414,260 | |||||
Spectra Energy Corporation | 202,350 | 5,815,539 | |||||
Sprint Nextel Corporation* | 516,700 | 4,908,650 | |||||
Verizon Communications, Inc. | 844,524 | 29,896,150 | |||||
| 126,513,898 | |||||||
Total Common Stocks | 1,334,606,211 | ||||||
MONEY MARKET FUNDS — 14.1% | |||||||
GuideStone Money Market Fund (GS4 Class)¥ | 58,643,549 | 58,643,549 | |||||
Northern Institutional Liquid Assets Portfolio§ | 137,988,044 | 137,988,044 | |||||
Total Money Market Funds | 196,631,593 | ||||||
| Par | |||||||
U.S. TREASURY OBLIGATION — 0.4% | |||||||
U.S. Treasury Bill | |||||||
2.09%, 12/04/08‡‡ | |||||||
(Cost $4,727,420) | $ | 4,770,000 | 4,732,183 | ||||
TOTAL INVESTMENTS — 110.4% | 1,535,969,987 | ||||||
Liabilities in Excess of Other Assets — (10.4)% | (144,655,075 | ) | |||||
Net Assets — 100.0% | $ | 1,391,314,912 | |||||
PORTFOLIO SUMMARY (based on net assets)
| % | ||
Financial Services | 20.5 | |
Integrated Oils | 14.3 | |
Money Market Funds | 14.1 | |
Healthcare | 11.9 | |
Consumer Discretionary | 11.0 | |
Utilities | 9.1 | |
Technology | 8.5 | |
Consumer Staples | 5.4 | |
Futures Contracts | 4.3 | |
Materials & Processing | 4.3 | |
Other | 3.6 | |
Producer Durables | 3.5 | |
Other Energy | 2.0 | |
Auto & Transportation | 1.8 | |
U.S. Treasury Obligation | 0.4 | |
| 114.7 | ||
FAS 157 DISCLOSURE
The following is a summary of the inputs used, as of June 30, 2008, in valuing the Fund’s assets carried at fair value:
Valuation Inputs | Investments in Securities | Other Financial Instruments* | |||||
Level 1 — Quoted Prices | $ | 1,531,236,595 | $ | (2,533,422 | ) | ||
Level 2 — Other Significant Observable Inputs | 4,732,183 | — | |||||
Level 3 — Significant Unobservable Inputs** | 1,209 | — | |||||
Total | $ | 1,535,969,987 | $ | (2,533,422 | ) | ||
| * | Other financial instruments are derivative instruments not reflected in the Schedule of Investments, such as futures, forwards and swap contracts, which are valued at the unrealized appreciation (depreciation) on the investment. |
| ** | The fair value of Level 3 securities is equal to 0.00% of the Fund’s Net Assets. The fair value of the Level 3 securities does not have a significant impact on the amounts reported. |
| 96 | See Notes to Financial Statements. |
Table of Contents
| Growth Equity Fund | ||
| SCHEDULE OF INVESTMENTS | June 30, 2008 (Unaudited) |
| Shares | Value | ||||
COMMON STOCKS — 95.3% | |||||
Auto & Transportation — 3.3% | |||||
CH Robinson Worldwide, Inc. | 168,960 | $ | 9,265,766 | ||
CSX Corporation | 57,018 | 3,581,301 | |||
Expeditors International Washington, Inc.D | 332,790 | 14,309,970 | |||
Norfolk Southern CorporationD | 88,492 | 5,545,794 | |||
Union Pacific Corporation | 205,260 | 15,497,130 | |||
| 48,199,961 | |||||
Consumer Discretionary — 16.8% | |||||
Amazon.com, Inc.* | 632,450 | 46,377,558 | |||
Avon Products, Inc. | 188,625 | 6,794,272 | |||
Costco Wholesale Corporation | 141,023 | 9,891,353 | |||
eBay, Inc.* | 97,800 | 2,672,874 | |||
Google, Inc.* | 143,514 | 75,548,640 | |||
Iron Mountain, Inc.D* | 176,200 | 4,678,110 | |||
Lowe’s Cos., Inc. | 284,842 | 5,910,472 | |||
McDonald’s Corporation | 575,928 | 32,378,672 | |||
Starbucks CorporationD* | 989,968 | 15,582,096 | |||
VeriSign, Inc.D* | 218,956 | 8,276,537 | |||
Wal-Mart Stores, Inc. | 180,375 | 10,137,075 | |||
Walt Disney Co. (The) | 241,875 | 7,546,500 | |||
Yahoo!, Inc.* | 88,325 | 1,824,795 | |||
Yum! Brands, Inc. | 592,398 | 20,787,246 | |||
| 248,406,200 | |||||
Consumer Staples — 3.0% | |||||
Coca-Cola Co. (The) | 269,703 | 14,019,162 | |||
Colgate-Palmolive Co. | 138,550 | 9,573,805 | |||
PepsiCo, Inc. | 92,950 | 5,910,690 | |||
Procter & Gamble Co. | 246,105 | 14,965,645 | |||
| 44,469,302 | |||||
Financial Services — 10.4% | |||||
Abraxis Bioscience, Inc.D* | 37,100 | 2,354,366 | |||
CME Group, Inc.D* | 31,100 | 11,917,209 | |||
Goldman Sachs Group, Inc. | 113,191 | 19,797,106 | |||
IntercontinentalExchange, Inc.* | 248,135 | 28,287,390 | |||
M&T Bank CorporationD | 43,950 | 3,100,233 | |||
Mastercard, Inc. Class A | 83,436 | 22,153,927 | |||
Moody’s CorporationD | 326,200 | 11,234,328 | |||
Progressive Corporation (The) | 151,880 | 2,843,194 | |||
Schwab (Charles) Corporation (The) | 288,850 | 5,932,979 | |||
US BancorpD | 169,950 | 4,739,905 | |||
Visa, Inc. | 392,038 | 31,876,610 | |||
Wachovia CorporationD | 203,100 | 3,154,143 | |||
Wells Fargo & Co. | 275,079 | 6,533,126 | |||
| 153,924,516 | |||||
Healthcare — 18.3% | |||||
Abbott Laboratories | 170,975 | 9,056,546 | |||
Allergan, Inc. | 437,800 | 22,787,490 | |||
Amylin Pharmaceuticals, Inc.D* | 78,943 | 2,004,363 | |||
Baxter International, Inc. | 118,125 | 7,552,913 | |||
Celgene Corporation* | 128,635 | 8,215,917 | |||
Cephalon, Inc.D* | 90,800 | 6,055,452 | |||
Cerner CorporationD* | 262,990 | 11,881,888 | |||
CVS Caremark Corporation | 497,774 | 19,696,917 | |||
Genentech, Inc.* | 542,856 | 41,202,770 | |||
Genzyme CorporationD* | 461,800 | 33,258,836 | |||
Gilead Sciences, Inc.* | 322,850 | 17,094,908 | |||
Intuitive Surgical, Inc.D* | 76,200 | 20,528,280 | |||
Medco Health Solutions, Inc.* | 90,800 | 4,285,760 | |||
Merck & Co., Inc. | 221,500 | 8,348,335 | |||
Shire PLC ADRD | 123,937 | 6,089,025 | |||
St. Jude Medical, Inc.* | 156,225 | 6,386,478 | |||
Stryker Corporation | 151,400 | 9,520,032 | |||
Teva Pharmaceutical Industries, Ltd. ADRD | 182,075 | 8,339,035 | |||
Thermo Fisher Scientific, Inc.* | 161,900 | 9,022,687 | |||
Varian Medical Systems, Inc.* | 380,900 | 19,749,665 | |||
| 271,077,297 | |||||
Integrated Oils — 1.4% | |||||
Exxon Mobil Corporation | 150,175 | 13,234,923 | |||
Oceaneering International, Inc.D* | 76,700 | 5,909,735 | |||
PetroHawk Energy CorporationD* | 49,988 | 2,314,944 | |||
| 21,459,602 | |||||
Materials & Processing — 5.8% | |||||
Air Products & Chemicals, Inc. | 118,180 | 11,683,275 | |||
Allegheny Technologies, Inc.D | 60,200 | 3,568,656 | |||
Cameron International Corporation* | 59,630 | 3,300,520 | |||
Companhia Vale do Rio Doce ADRD | 120,550 | 4,318,101 | |||
Fluor Corporation | 48,925 | 9,103,964 | |||
McDermott International, Inc.* | 76,815 | 4,754,080 | |||
Monsanto Co. | 177,675 | 22,465,227 | |||
Praxair, Inc. | 123,116 | 11,602,452 | |||
Precision Castparts Corporation | 109,878 | 10,588,943 | |||
St. Joe Co.D* | 113,571 | 3,897,757 | |||
| 85,282,975 | |||||
Other — 1.2% | |||||
Berkshire Hathaway, Inc.* | 87 | 10,505,250 | |||
Textron, Inc. | 144,056 | 6,904,604 | |||
| 17,409,854 | |||||
Other Energy — 12.7% | |||||
Equitable Resources, Inc.D | 19,214 | 1,326,919 | |||
FMC Technologies, Inc.* | 200,746 | 15,443,390 | |||
National Oilwell Varco, Inc.* | 382,800 | 33,962,016 | |||
Petroleo Brasileiro SA ADRD* | 107,258 | 7,597,084 | |||
Schlumberger, Ltd. | 680,116 | 73,064,862 | |||
Transocean, Inc.* | 156,624 | 23,867,913 | |||
Weatherford International, Ltd.D* | 343,913 | 17,054,646 | |||
XTO Energy, Inc. | 222,395 | 15,236,281 | |||
| 187,553,111 | |||||
Producer Durables — 1.6% | |||||
Deere & Co. | 113,125 | 8,159,706 | |||
Lockheed Martin CorporationD | 150,736 | 14,871,614 | |||
| 23,031,320 | |||||
Technology — 18.9% | |||||
Adobe Systems, Inc.* | 159,975 | 6,301,415 | |||
Akamai Technologies, Inc.D* | 160,265 | 5,575,619 | |||
Apple, Inc.* | 382,791 | 64,094,525 | |||
AT&T, Inc. | 497,689 | 16,767,142 | |||
Broadcom Corporation Class AD* | 650,200 | 17,743,958 | |||
Cisco Systems, Inc.* | 364,325 | 8,474,200 | |||
Cognizant Technology Solutions Corporation Class A* | 155,600 | 5,058,556 | |||
Corning, Inc. | 264,156 | 6,088,796 | |||
| See Notes to Financial Statements. | 97 |
Table of Contents
Growth Equity Fund
SCHEDULE OF INVESTMENTS (Continued)
| Shares | Value | ||||||
EMC Corporation* | 1,079,000 | $ | 15,850,510 | ||||
General Dynamics Corporation | 157,765 | 13,283,813 | |||||
Hewlett-Packard Co. | 182,915 | 8,086,672 | |||||
Intel Corporation | 420,425 | 9,030,729 | |||||
Macrovision Solutions Corporation* | 7 | 105 | |||||
Marvell Technology Group, Ltd.* | 323,100 | 5,705,946 | |||||
Microsoft Corporation | 349,400 | 9,611,994 | |||||
NetApp, Inc.D* | 125,325 | 2,714,540 | |||||
Oracle Corporation* | 346,550 | 7,277,550 | |||||
QUALCOMM, Inc. | 652,026 | 28,930,394 | |||||
Research In Motion, Ltd.* | 115,085 | 13,453,436 | |||||
Salesforce.com, Inc.D* | 445,710 | 30,410,793 | |||||
Texas Instruments, Inc. | 177,250 | 4,991,360 | |||||
| 279,452,053 | |||||||
Utilities — 1.9% | |||||||
America Movil SA de CV ADR Series LD* | 443,480 | 23,393,570 | |||||
Verizon Communications, Inc.D | 121,100 | 4,286,940 | |||||
| 27,680,510 | |||||||
Total Common Stocks | 1,407,946,701 | ||||||
FOREIGN COMMON STOCKS — 1.3% | |||||||
Canada — 0.5% | |||||||
Potash Corporation of SaskatchewanD | 29,141 | 6,660,758 | |||||
China — 0.8% | |||||||
Industrial & Commercial Bank of China Class HD | 17,371,000 | 11,874,370 | |||||
Total Foreign Common Stocks | 18,535,128 | ||||||
PREFERRED STOCK — 0.2% | |||||||
Lehman Brothers Holdings, Inc. CONVD | |||||||
(Cost $3,844,154) | 3,953 | 3,179,912 | |||||
MONEY MARKET FUNDS — 14.1% | |||||||
GuideStone Money Market Fund (GS4 Class)¥ | 42,888,022 | 42,888,022 | |||||
Northern Institutional Liquid Assets Portfolio§ | 166,028,518 | 166,028,518 | |||||
Total Money Market Funds | 208,916,540 | ||||||
| Par | |||||||
U.S. TREASURY OBLIGATION — 0.6% | |||||||
U.S. Treasury Bill | |||||||
2.09%, 12/04/08‡‡ | |||||||
(Cost $8,300,239) | $ | 8,375,000 | 8,299,801 | ||||
TOTAL INVESTMENTS — 111.5% | 1,646,878,082 | ||||||
Liabilities in Excess of Other Assets — (11.5)% | (169,317,548 | ) | |||||
NET ASSETS — 100.0% | $ | 1,477,560,534 | |||||
PORTFOLIO SUMMARY (based on net assets)
| % | ||
Technology | 18.9 | |
Healthcare | 18.3 | |
Consumer Discretionary | 16.8 | |
Money Market Funds | 14.1 | |
Other Energy | 12.7 | |
Financial Services | 10.4 | |
Materials & Processing | 5.8 | |
Auto & Transportation | 3.3 | |
Consumer Staples | 3.0 | |
Futures Contracts | 3.0 | |
Utilities | 1.9 | |
Producer Durables | 1.6 | |
Integrated Oils | 1.4 | |
Foreign Common Stocks | 1.3 | |
Other | 1.2 | |
U.S. Treasury Obligation | 0.6 | |
Preferred Stock | 0.2 | |
| 114.5 | ||
FAS 157 DISCLOSURE
The following is a summary of the inputs used, as of June 30, 2008, in valuing the Fund’s assets carried at fair value:
Valuation Inputs | Investments in Securities | Other Financial Instruments* | |||||
Level 1 — Quoted Prices | $ | 1,638,578,281 | $ | (2,120,691 | ) | ||
Level 2 — Other Significant Observable Inputs | 8,299,801 | — | |||||
Level 3 — Significant Unobservable Inputs | — | — | |||||
Total | $ | 1,646,878,082 | $ | (2,120,691 | ) | ||
| * | Other financial instruments are derivative instruments not reflected in the Schedule of Investments, such as futures, forwards and swap contracts, which are valued at the unrealized appreciation (depreciation) on the investment. |
| 98 | See Notes to Financial Statements. |
Table of Contents
| Small Cap Equity Fund | ||
| SCHEDULE OF INVESTMENTS | June 30, 2008 (Unaudited) |
| Shares | Value | ||||
COMMON STOCKS — 85.4% | |||||
Auto & Transportation — 3.0% | |||||
Autoliv, Inc.D | 37,000 | $ | 1,724,940 | ||
Celadon Group, Inc.D* | 41,900 | 418,581 | |||
CSG Systems International, Inc.D* | 47,800 | 526,756 | |||
DryShips, Inc.D | 7,200 | 577,296 | |||
Excel Maritime Carriers, Ltd. | 4,200 | 164,850 | |||
HUB Group, Inc.* | 46,600 | 1,590,458 | |||
JB Hunt Transport Services, Inc.D | 33,700 | 1,121,536 | |||
Knight Transportation, Inc.D | 69,200 | 1,266,360 | |||
Lear CorporationD* | 19,900 | 282,182 | |||
Old Dominion Freight Line, Inc.D* | 10,100 | 303,202 | |||
Overseas Shipholding Group, Inc.D | 17,500 | 1,391,600 | |||
Pinnacle Airlines CorporationD* | 38,600 | 121,976 | |||
Polaris Industries, Inc.D | 15,300 | 617,814 | |||
Republic Airways Holdings, Inc.D* | 40,800 | 353,328 | |||
Seaspan CorporationD | 15,300 | 367,506 | |||
Skywest, Inc.D | 46,200 | 584,430 | |||
Thames Asset Global Securitization, Inc.D | 59,400 | 885,654 | |||
Titan International, Inc.D | 11,100 | 395,382 | |||
TRW Automotive Holdings Corporation* | 42,100 | 777,587 | |||
UTI Worldwide, Inc. | 54,600 | 1,089,270 | |||
Vitran Corporation, Inc.* | 19,800 | 296,802 | |||
| 14,857,510 | |||||
Consumer Discretionary — 12.1% | |||||
Aaron Rents, Inc.D | 15,400 | 343,882 | |||
Advisory Board Co. (The)D* | 60,600 | 2,383,398 | |||
Aeropostale, Inc.D* | 29,100 | 911,703 | |||
American Public Education, Inc.D* | 30,200 | 1,179,008 | |||
AMN Healthcare Services, Inc.* | 157,200 | 2,659,824 | |||
AnnTaylor Stores CorporationD* | 40,900 | 979,964 | |||
Arbitron, Inc.D | 17,300 | 821,750 | |||
Big Lots, Inc.D* | 29,500 | 921,580 | |||
BJ’s Wholesale Club, Inc.D* | 17,500 | 677,250 | |||
Bowne & Co., Inc.D | 24,900 | 317,475 | |||
Build-A-Bear Workshop, Inc.D* | 73,900 | 537,253 | |||
Capella Education Co.D* | 29,150 | 1,738,797 | |||
Casey’s General Stores, Inc.D | 32,700 | 757,659 | |||
CEC Entertainment, Inc.D* | 35,400 | 991,554 | |||
Citi Trends, Inc.D* | 21,600 | 489,456 | |||
Constant Contact, Inc.D* | 37,300 | 703,105 | |||
Corinthian Colleges, Inc.D* | 71,800 | 833,598 | |||
Corporate Executive Board Co. | 24,300 | 1,021,815 | |||
CoStar Group, Inc.D* | 24,900 | 1,106,805 | |||
Ctrip.com International, Ltd. ADRD | 25,900 | 1,185,702 | |||
Diamond Foods, Inc. | 27,400 | 631,296 | |||
Dice Holdings, Inc.D* | 45,200 | 373,352 | |||
Dolan Media Co.D* | 39,100 | 711,620 | |||
EarthLink, Inc.D* | 123,100 | 1,064,815 | |||
Emergency Medical Services LP Class AD* | 21,200 | 479,756 | |||
Entravision Communications Corporation Class AD* | 94,158 | 378,515 | |||
EZCORP, Inc. Class AD* | 82,200 | 1,048,050 | |||
Gaiam, Inc.D* | 15,100 | 204,001 | |||
Gaylord Entertainment Co.D* | 31,500 | 754,740 | |||
Gymboree CorporationD* | 20,300 | 813,421 | |||
Hasbro, Inc.D | 48,300 | 1,725,276 | |||
Helen of Troy, Ltd.D* | 37,583 | 605,838 | |||
Hewitt Associates, Inc. Class AD* | 40,200 | 1,540,866 | |||
Hibbett Sports, Inc.D* | 26,800 | 565,480 | |||
Home Inns & Hotels Management, Inc. ADRD* | 30,600 | 581,706 | |||
Houston Wire & Cable Co.D | 43,800 | 871,620 | |||
Iconix Brand Group, Inc.D* | 59,994 | 724,728 | |||
Kforce, Inc.* | 70,700 | 600,243 | |||
Knot, Inc.D* | 35,800 | 350,124 | |||
Korn/Ferry InternationalD* | 24,200 | 380,666 | |||
Life Time Fitness, Inc.D* | 30,700 | 907,185 | |||
Liz Claiborne, Inc. | 95,200 | 1,347,080 | |||
Lululemon Athletica, Inc.D* | 11,700 | 340,002 | |||
MAXIMUS, Inc.D | 18,200 | 633,724 | |||
MercadoLibre, Inc.D* | 24,600 | 848,454 | |||
Monro Muffler Brake, Inc. | 30,500 | 472,445 | |||
MPS Group, Inc.* | 17,900 | 190,277 | |||
MWI Veterinary Supply, Inc.D* | 9,900 | 327,789 | |||
Navigant Consulting, Inc.D* | 38,400 | 751,104 | |||
Netflix, Inc.D* | 36,700 | 956,769 | |||
On Assignment, Inc.* | 118,600 | 951,172 | |||
Orient-Express Hotels, Ltd. Class A | 15,200 | 660,288 | |||
Panera Bread Co.D* | 26,800 | 1,239,768 | |||
PetMed Express, Inc.D* | 37,400 | 458,150 | |||
Pool CorporationD | 32,025 | 568,764 | |||
PriceSmart, Inc.* | 49,600 | 981,088 | |||
RC2 CorporationD* | 23,700 | 439,872 | |||
Rent-A-Center, Inc.D* | 34,400 | 707,608 | |||
Resources Connection, Inc.* | 64,200 | 1,306,470 | |||
Ritchie Bros. Auctioneers, Inc.D | 48,400 | 1,313,092 | |||
Rush Enterprises, Inc. Class AD* | 65,721 | 789,309 | |||
Skechers USA, Inc. Class A* | 16,500 | 326,040 | |||
Sohu.com, Inc.D* | 11,200 | 788,928 | |||
Strayer Education, Inc.D | 8,600 | 1,798,002 | |||
Team, Inc.D* | 11,100 | 380,952 | |||
TeleTech Holdings, Inc.D* | 77,600 | 1,548,896 | |||
Texas Roadhouse, Inc. Class AD* | 20,900 | 187,473 | |||
United Natural Foods, Inc.D* | 30,500 | 594,140 | |||
United Online, Inc.D | 48,900 | 490,467 | |||
Universal Electronics, Inc.D* | 54,182 | 1,132,404 | |||
WESCO International, Inc.D* | 34,400 | 1,377,376 | |||
Westwood One, Inc.D* | 89,400 | 110,856 | |||
| 59,893,635 | |||||
Consumer Staples — 0.9% | |||||
Green Mountain Coffee Roasters, Inc.D* | 15,500 | 582,335 | |||
Herbalife, Ltd.D | 50,200 | 1,945,250 | |||
| See Notes to Financial Statements. | 99 |
Table of Contents
Small Cap Equity Fund
SCHEDULE OF INVESTMENTS (Continued)
| Shares | Value | ||||
J & J Snack Foods CorporationD | 31,752 | $ | 870,322 | ||
Nash Finch Co.D | 26,200 | 897,874 | |||
Smart Balance, Inc.D* | 55,900 | 403,039 | |||
| 4,698,820 | |||||
Financial Services — 16.3% | |||||
Advance America Cash Advance Centers, Inc.D | 60,400 | 306,832 | |||
American Financial Group, Inc. | 60,400 | 1,615,700 | |||
American Physicians Capital, Inc.D | 11,700 | 566,748 | |||
Amerisafe, Inc.* | 34,500 | 549,930 | |||
Argo Group International Holdings, Ltd.D* | 32,952 | 1,105,869 | |||
Assured Guaranty, Ltd.D | 48,700 | 876,113 | |||
AXIS Capital Holdings, Ltd. | 51,800 | 1,544,158 | |||
Banco Latinoamericano de Exportaciones SAD | 62,000 | 1,003,780 | |||
Bank of Florida CorporationD* | 41,600 | 301,600 | |||
Boston Private Financial Holdings, Inc.D | 80,300 | 455,301 | |||
Cash America International, Inc. | 55,350 | 1,715,850 | |||
Cathay General BancorpD | 116,500 | 1,266,355 | |||
CB Richard Ellis Group, Inc. Class AD* | 37,100 | 712,320 | |||
Central Pacific Financial CorporationD | 50,300 | 536,198 | |||
Chemical Financial CorporationD | 44,700 | 911,880 | |||
City Holding Co.D | 26,500 | 1,080,405 | |||
Cohen & Steers, Inc.D | 15,100 | 392,147 | |||
Credicorp, Ltd.D | 18,600 | 1,527,432 | |||
Duff & Phelps CorporationD* | 30,800 | 510,048 | |||
DuPont Fabros Technology, Inc. REITD | 45,500 | 848,120 | |||
eHealth, Inc.D* | 11,300 | 199,558 | |||
Endurance Specialty Holdings, Ltd. | 43,300 | 1,333,207 | |||
Evercore Partners, Inc. Class AD | 33,700 | 320,150 | |||
ExlService Holdings, Inc.D* | 15,700 | 220,271 | |||
Fair Isaac & Co., Inc.D | 33,300 | 691,641 | |||
Fairfax Financial Holdings, Ltd.D | 1,900 | 482,410 | |||
FCStone Group, Inc.D* | 20,600 | 575,358 | |||
Federated Investors, Inc. Class B | 30,700 | 1,056,694 | |||
First Niagara Financial Group, Inc.D | 31,800 | 408,948 | |||
First Potomac Realty Trust REITD | 68,400 | 1,042,416 | |||
FPIC Insurance Group, Inc.D* | 25,900 | 1,173,788 | |||
GATX CorporationD | 36,000 | 1,595,880 | |||
GFI Group, Inc. | 29,600 | 266,696 | |||
Global Payments, Inc. | 108,500 | 5,056,100 | |||
Greenhill & Co., Inc.D | 13,400 | 721,724 | |||
Hanover Insurance Group, Inc. | 35,500 | 1,508,750 | |||
HCC Insurance Holdings, Inc. | 85,935 | 1,816,666 | |||
Hilb, Rogal & Hobbs Co. | 42,082 | 1,828,884 | |||
Hill International, Inc.* | 28,800 | 473,472 | |||
Huron Consulting Group, Inc.D* | 17,900 | 811,586 | |||
Infinity Property & Casualty CorporationD | 29,400 | 1,220,688 | |||
Interactive Brokers Group, Inc.D* | 41,900 | 1,346,247 | |||
Investment Technology Group, Inc.* | 28,000 | 936,880 | |||
IPC Holdings, Ltd.D | 44,100 | 1,170,855 | |||
Jack Henry & Associates, Inc. | 60,000 | 1,298,400 | |||
Jefferies Group, Inc.D | 42,000 | 706,440 | |||
Jones Lang LaSalle, Inc.D | 17,700 | 1,065,363 | |||
Knight Capital Group, Inc. Class AD* | 82,300 | 1,479,754 | |||
LandAmerica Financial Group, Inc.D | 38,400 | 852,096 | |||
Montpelier Re Holdings, Ltd.D | 59,600 | 879,100 | |||
National Financial Partners CorporationD | 22,100 | 438,022 | |||
Ocwen Financial CorporationD* | 53,200 | 247,380 | |||
optionsXpress Holdings, Inc.D | 194,790 | 4,351,609 | |||
PartnerRe, Ltd.D | 18,700 | 1,292,731 | |||
Platinum Underwriters Holdings, Ltd.D | 40,300 | 1,314,183 | |||
Portfolio Recovery Associates, Inc.D* | 27,900 | 1,046,250 | |||
Primus Guaranty, Ltd.D* | 45,400 | 132,114 | |||
PrivateBancorp, Inc.D | 55,261 | 1,678,829 | |||
Provident Financial Services, Inc.D | 43,600 | 610,836 | |||
RenaissanceRe Holdings, Ltd.D | 27,300 | 1,219,491 | |||
RLI CorporationD | 21,300 | 1,053,711 | |||
Ryder System, Inc.D | 20,800 | 1,432,704 | |||
Safeco Corporation | 25,400 | 1,705,864 | |||
Safety Insurance Group, Inc.D | 40,700 | 1,450,955 | |||
Smithtown Bancorp, Inc.D | 14,400 | 234,000 | |||
Stancorp Financial Group, Inc. | 29,300 | 1,375,928 | |||
SWS Group, Inc.D | 39,600 | 657,756 | |||
Tower Group, Inc.D | 42,800 | 906,932 | |||
TradeStation Group, Inc.D* | 65,500 | 664,825 | |||
Trustmark CorporationD | 35,200 | 621,280 | |||
W.R. Berkley Corporation | 52,200 | 1,261,152 | |||
Webster Financial Corporation | 51,900 | 965,340 | |||
Willis Group Holdings, Ltd. | 38,700 | 1,214,019 | |||
Wintrust Financial CorporationD | 60,478 | 1,442,400 | |||
World Acceptance CorporationD* | 40,000 | 1,346,800 | |||
Wright Express Corporation* | 46,000 | 1,140,800 | |||
| 80,172,719 | |||||
Healthcare — 10.1% | |||||
Align Technology, Inc.D* | 47,200 | 495,128 | |||
Amedisys, Inc.D* | 46,834 | 2,361,371 | |||
American Dental Partners, Inc.D* | 41,200 | 489,044 | |||
| 100 | See Notes to Financial Statements. |
Table of Contents
| Shares | Value | ||||
Arthrocare CorporationD* | 20,000 | $ | 816,200 | ||
AtriCure, Inc.D* | 56,900 | 613,951 | |||
BioMarin Pharmaceuticals, Inc.D* | 42,000 | 1,217,160 | |||
Bio-Rad Laboratories, Inc. Class A* | 24,100 | 1,949,449 | |||
Cepheid, Inc.D* | 12,000 | 337,440 | |||
Chattem, Inc.D* | 27,200 | 1,769,360 | |||
CONMED CorporationD* | 20,800 | 552,240 | |||
Cooper Cos., Inc.D | 54,400 | 2,020,960 | |||
Cubist Pharmaceuticals, Inc.D* | 31,700 | 566,162 | |||
Endo Pharmaceuticals Holdings, Inc.D* | 41,500 | 1,003,885 | |||
Five Star Quality Care, Inc.+ | 2,086 | — | |||
Haemonetics CorporationD* | 35,200 | 1,952,192 | |||
HealthExtras, Inc.D* | 100,900 | 3,041,126 | |||
Icon PLC ADRD* | 34,410 | 2,598,643 | |||
Immucor, Inc.* | 60,500 | 1,565,740 | |||
IRIS International, Inc.D* | 28,300 | 442,895 | |||
King Pharmaceuticals, Inc.* | 144,700 | 1,515,009 | |||
Lincare Holdings, Inc.D* | 47,800 | 1,357,520 | |||
Luminex CorporationD* | 51,700 | 1,062,435 | |||
Magellan Health Services, Inc.* | 27,000 | 999,810 | |||
Martek Biosciences CorporationD* | 31,400 | 1,058,494 | |||
Mentor CorporationD | 69,200 | 1,925,144 | |||
Meridian Bioscience, Inc.D | 35,550 | 957,006 | |||
NBTY, Inc.D* | 23,200 | 743,792 | |||
Owens & Minor, Inc.D | 33,300 | 1,521,477 | |||
Parexel International Corporation* | 9,400 | 247,314 | |||
Pediatrix Medical Group, Inc.* | 2,200 | 108,306 | |||
Phase Forward, Inc.D* | 34,800 | 625,356 | |||
Psychiatric Solutions, Inc.D* | 87,900 | 3,326,136 | |||
Qiagen NVD* | 36,502 | 734,785 | |||
Stereotaxis, Inc.D* | 57,000 | 305,520 | |||
Stericycle, Inc.* | 8,600 | 444,620 | |||
STERIS Corporation | 22,500 | 647,100 | |||
Symmetry Medical, Inc.D* | 106,800 | 1,732,296 | |||
Techne Corporation* | 22,900 | 1,772,231 | |||
Universal Health Services, Inc. Class B | 23,500 | 1,485,670 | |||
VCA Antech, Inc.D* | 82,900 | 2,302,962 | |||
Virtual Radiologic CorporationD* | 11,500 | 152,375 | |||
Vital Images, Inc.D* | 40,500 | 503,820 | |||
Volcano CorporationD* | 54,000 | 658,800 | |||
| 49,980,924 | |||||
Integrated Oils — 2.5% | |||||
Berry Petroleum Co.D | 24,400 | 1,436,672 | |||
Encore Acquisition Co.* | 21,300 | 1,601,547 | |||
Exterran Holdings, Inc.D* | 21,900 | 1,565,631 | |||
GMX Resources, Inc.* | 5,000 | 370,500 | |||
Goodrich Petroleum CorporationD* | 6,300 | 522,396 | |||
Mariner Energy, Inc.D* | 42,600 | 1,574,922 | |||
NATCO Group, Inc. Class AD* | 48,500 | 2,644,705 | |||
Petroleum Development Corporation* | 4,000 | 265,960 | |||
Rosetta Resources, Inc.D* | 24,700 | 703,950 | |||
W&T Offshore, Inc.D | 26,600 | 1,556,366 | |||
| 12,242,649 | |||||
Materials & Processing — 10.9% | |||||
Acuity Brands, Inc.D | 25,500 | 1,226,040 | |||
Albemarle CorporationD | 34,400 | 1,372,904 | |||
Beacon Roofing Supply, Inc.D* | 134,067 | 1,422,451 | |||
Cal Dive International, Inc.D* | 58,200 | 831,678 | |||
Carpenter Technology CorporationD | 23,000 | 1,003,950 | |||
Chemtura Corporation | 145,000 | 846,800 | |||
CIRCOR International, Inc.D | 8,200 | 401,718 | |||
Clarcor, Inc.D | 41,200 | 1,446,120 | |||
Clean Harbors, Inc.* | 8,700 | 618,222 | |||
Cleveland-Cliffs, Inc.D | 8,100 | 965,439 | |||
Colfax CorporationD* | 1,800 | 45,162 | |||
Commercial Metals Co. | 16,272 | 613,454 | |||
Cytec Industries, Inc. | 28,500 | 1,554,960 | |||
Darling International, Inc.* | 40,900 | 675,668 | |||
Dynamic Materials CorporationD | 29,450 | 970,377 | |||
Encore Wire CorporationD | 62,400 | 1,322,256 | |||
Ennis, Inc.D | 66,300 | 1,037,595 | |||
Entegris, Inc.D* | 88,800 | 581,640 | |||
Ferro Corporation | 67,700 | 1,270,052 | |||
FGX International Holdings, Ltd.D* | 35,400 | 284,616 | |||
Gardner Denver, Inc.* | 50,500 | 2,868,400 | |||
Gibraltar Industries, Inc.D | 52,900 | 844,813 | |||
Greif, Inc. Class A | 20,600 | 1,319,018 | |||
Haynes International, Inc.D* | 22,400 | 1,289,120 | |||
Hercules, Inc. | 66,700 | 1,129,231 | |||
Hexcel Corporation* | 59,272 | 1,143,950 | |||
Insteel Industries, Inc.D | 60,600 | 1,109,586 | |||
Interline Brands, Inc.* | 46,900 | 747,117 | |||
Intrepid Potash, Inc.* | 44,300 | 2,914,054 | |||
Ladish Co., Inc.* | 19,900 | 409,741 | |||
Lennox International, Inc. | 38,300 | 1,109,168 | |||
Lubrizol Corporation | 10,000 | 463,300 | |||
Metalico, Inc.D* | 20,300 | 355,656 | |||
Minerals Technologies, Inc.D | 20,000 | 1,271,800 | |||
Mobile Mini, Inc.D* | 61,900 | 1,238,000 | |||
Mueller Industries, Inc. | 47,900 | 1,542,380 | |||
NCI Building Systems, Inc.D* | 29,000 | 1,065,170 | |||
Olympic Steel, Inc.D | 12,400 | 941,408 | |||
RBC Bearings, Inc.D* | 51,200 | 1,705,984 | |||
Reliance Steel & Aluminum Co. | 42,500 | 3,276,325 | |||
Schnitzer Steel Industries, Inc. Class AD | 21,650 | 2,481,090 | |||
Schulman A, Inc.D | 62,200 | 1,432,466 | |||
Superior Essex, Inc.D* | 35,000 | 1,562,050 | |||
Timken Co. | 21,500 | 708,210 | |||
Watsco, Inc.D | 50,000 | 2,090,000 | |||
| 53,509,139 | |||||
Other — 0.1% | |||||
Information Services Group, Inc.D* | 87,700 | 420,960 | |||
Other Energy — 8.1% | |||||
Approach Resources, Inc.D* | 40,100 | 1,074,279 | |||
Arena Resources, Inc.* | 93,100 | 4,917,542 | |||
Bill Barrett CorporationD* | 21,400 | 1,271,374 | |||
| See Notes to Financial Statements. | 101 |
Table of Contents
Small Cap Equity Fund
SCHEDULE OF INVESTMENTS (Continued)
| Shares | Value | ||||
Bolt Technology CorporationD* | 24,100 | $ | 543,937 | ||
CARBO Ceramics, Inc.D | 18,200 | 1,061,970 | |||
Carrizo Oil & Gas, Inc.* | 5,800 | 394,922 | |||
Cimarex Energy Co.D | 30,900 | 2,152,803 | |||
Comstock Resources, Inc.* | 44,300 | 3,740,249 | |||
Concho Resources, Inc.* | 116,800 | 4,356,640 | |||
Core Laboratories NVD* | 4,800 | 683,280 | |||
Energy Partners, Ltd.D* | 90,600 | 1,351,752 | |||
EXCO Resources, Inc.D* | 124,800 | 4,606,368 | |||
Frontier Oil CorporationD | 28,300 | 676,653 | |||
Hercules Offshore, Inc.D* | 29,639 | 1,126,875 | |||
Monolithic Power Systems, Inc.D* | 45,200 | 977,224 | |||
Oil States International, Inc.D* | 12,000 | 761,280 | |||
Parallel Petroleum CorporationD* | 87,000 | 1,751,310 | |||
Patriot Coal Corporation* | 3,000 | 459,870 | |||
Patterson-UTI Energy, Inc.D | 47,700 | 1,719,108 | |||
Quicksilver Resources, Inc.D* | 14,500 | 560,280 | |||
Rex Energy CorporationD* | 21,300 | 562,320 | |||
SCANA CorporationD | 43,800 | 1,620,600 | |||
SEACOR Holdings, Inc.D* | 7,900 | 707,129 | |||
Swift Energy Co.D* | 13,800 | 911,628 | |||
T-3 Energy Services, Inc.* | 20,200 | 1,605,294 | |||
W-H Energy Services, Inc.* | 2,200 | 210,628 | |||
| 39,805,315 | |||||
Producer Durables — 5.7% | |||||
Actuant Corporation Class AD | 58,368 | 1,829,837 | |||
Altra Holdings, Inc.* | 59,700 | 1,003,557 | |||
Bucyrus International, Inc. Class A | 18,700 | 1,365,474 | |||
Chart Industries, Inc.* | 26,400 | 1,284,096 | |||
Cognex Corporation | 49,600 | 1,143,280 | |||
CPI International, Inc.D* | 57,700 | 709,710 | |||
Curtiss-Wright CorporationD | 40,900 | 1,829,866 | |||
Cymer, Inc.D* | 16,600 | 446,208 | |||
EnPro Industries, Inc.D* | 23,400 | 873,756 | |||
Faro Technologies, Inc.D* | 46,700 | 1,175,439 | |||
Flow International CorporationD* | 69,100 | 538,980 | |||
Foster Wheeler, Ltd.* | 15,700 | 1,148,455 | |||
Graco, Inc. | 54,300 | 2,067,201 | |||
Headwaters, Inc.D* | 45,400 | 534,358 | |||
Heico CorporationD* | 29,500 | 959,930 | |||
Heico Corporation Class A* | 9,300 | 247,194 | |||
IDEX Corporation | 18,700 | 688,908 | |||
Innospec, Inc.D | 52,000 | 978,640 | |||
KHD Humboldt Wedag International, Ltd.* | 49,500 | 1,560,735 | |||
Littelfuse, Inc.D* | 45,500 | 1,435,525 | |||
Measurement Specialties, Inc.* | 71,600 | 1,259,444 | |||
MedAssets, Inc.D* | 51,000 | 869,550 | |||
Middleby CorporationD* | 22,600 | 992,366 | |||
Moog, Inc. Class A* | 13,700 | 510,188 | |||
NVR, Inc.D* | 1,000 | 500,080 | |||
Orbital Sciences Corporation* | 47,500 | 1,119,100 | |||
Regal-Beloit Corporation | 18,000 | 760,500 | |||
Tennant Co.D | 12,800 | 384,896 | |||
| 28,217,273 | |||||
Technology — 11.4% | |||||
Advanced Analogic Technologies, Inc.* | 99,100 | 409,283 | |||
Alvarion, Ltd.D* | 92,800 | 655,168 | |||
American Reprographics Co.D* | 113,400 | 1,888,110 | |||
Applied Micro Circuits CorporationD* | 68,200 | 583,792 | |||
Ariba, Inc.D* | 31,700 | 466,307 | |||
Atheros Communications, Inc.D* | 9,520 | 285,600 | |||
AuthenTec, Inc.D* | 57,300 | 597,066 | |||
Avnet, Inc.D* | 23,500 | 641,080 | |||
Check Point Software Technologies, Ltd.* | 29,300 | 693,531 | |||
CommVault Systems, Inc.* | 35,600 | 592,384 | |||
Compuware Corporation* | 170,000 | 1,621,800 | |||
Cybersource CorporationD* | 61,362 | 1,026,590 | |||
DealerTrack Holdings, Inc.D* | 121,000 | 1,707,310 | |||
Equinix, Inc.D* | 24,150 | 2,154,663 | |||
FormFactor, Inc.D* | 30,000 | 552,900 | |||
Foundry Networks, Inc.D* | 57,600 | 680,832 | |||
II-VI, Inc.D* | 5,700 | 199,044 | |||
Informatica Corporation* | 60,600 | 911,424 | |||
Innerworkings, Inc.D* | 14,700 | 175,812 | |||
j2 Global Communications, Inc.* | 60,900 | 1,400,700 | |||
Lawson Software, Inc.D* | 58,800 | 427,476 | |||
Mantech International Corporation Class AD* | 5,900 | 283,908 | |||
Masimo CorporationD* | 5,200 | 178,620 | |||
Methode Electronics, Inc.D | 62,500 | 653,125 | |||
Micros Systems, Inc.D* | 39,700 | 1,210,453 | |||
Monotype Imaging Holdings, Inc.D* | 35,600 | 433,608 | |||
Netezza CorporationD* | 65,600 | 753,088 | |||
Netlogic Microsystems, Inc.D* | 25,700 | 853,240 | |||
Nuance Communications, Inc.D* | 18,500 | 289,895 | |||
Omniture, Inc.D* | 15,770 | 292,849 | |||
PerkinElmer, Inc. | 91,400 | 2,545,490 | |||
Power Intergrations, Inc.* | 76,500 | 2,418,165 | |||
QLogic CorporationD* | 92,600 | 1,351,034 | |||
Rackable Systems, Inc.* | 71,000 | 951,400 | |||
Scansource, Inc.D* | 71,600 | 1,916,016 | |||
Sequenom, Inc.D* | 28,300 | 451,668 | |||
Shanda Interactive Entertainment, Ltd. ADR* | 43,400 | 1,178,310 | |||
SI International, Inc.D* | 40,900 | 856,446 | |||
Silicon Image, Inc.D* | 109,900 | 796,775 | |||
Silicon Motion Technology Corporation ADRD* | 12,700 | 183,515 | |||
SkillSoft PLC ADRD* | 145,200 | 1,312,608 | |||
Solera Holdings, Inc.D* | 143,500 | 3,969,210 | |||
SonoSite, Inc.D* | 18,000 | 504,180 | |||
SRA International, Inc. Class AD* | 33,200 | 745,672 | |||
Stanley, Inc.D* | 38,800 | 1,300,576 | |||
Starent Networks CorporationD* | 30,600 | 384,948 | |||
STEC, Inc.D* | 55,000 | 564,850 | |||
Stratasys, Inc.D* | 38,092 | 703,178 | |||
Sybase, Inc.D* | 54,500 | 1,603,390 | |||
SYKES Enterprises, Inc.* | 73,600 | 1,388,096 | |||
| 102 | See Notes to Financial Statements. |
Table of Contents
| Shares | Value | |||||
Synaptics, Inc.D* | 20,800 | $ | 784,784 | |||
TNS, Inc.* | 52,100 | 1,248,316 | ||||
Ultimate Software Group, Inc.D* | 52,901 | 1,884,863 | ||||
Varian Semiconductor Equipment Associates, Inc.D* | 18,025 | 627,630 | ||||
Viasat, Inc.* | 45,800 | 925,618 | ||||
Vishay Intertechnology, Inc.D* | 54,200 | 480,754 | ||||
Vocus, Inc.D* | 13,100 | 421,427 | ||||
Voltaire, Ltd.* | 73,600 | 365,792 | ||||
Websense, Inc.* | 90,102 | 1,517,318 | ||||
| 56,001,687 | ||||||
Utilities — 4.3% | ||||||
Alliant Energy CorporationD | 49,800 | 1,706,148 | ||||
CenturyTel, Inc. | 14,800 | 526,732 | ||||
Cogent Communications Group, Inc.D* | 13,400 | 179,560 | ||||
El Paso Electric Co.* | 60,500 | 1,197,900 | ||||
General Communication, Inc. Class AD* | 79,600 | 546,852 | ||||
MDU Resources Group, Inc. | 31,650 | 1,103,319 | ||||
Neutral Tandem, Inc.D* | 24,700 | 432,250 | ||||
NiSource, Inc.D | 76,400 | 1,369,088 | ||||
NTELOS Holdings CorporationD | 50,200 | 1,273,574 | ||||
OGE Energy Corporation | 22,900 | 726,159 | ||||
Oneok, Inc.D | 43,300 | 2,114,339 | ||||
Orbcomm, Inc.D* | 63,400 | 361,380 | ||||
PAETEC Holding Corporation* | 106,000 | 673,100 | ||||
Pepco Holdings, Inc.D | 82,400 | 2,113,560 | ||||
Portland General Electric Co.D | 42,200 | 950,344 | ||||
Premiere Global Services, Inc.D* | 92,900 | 1,354,482 | ||||
Sierra Pacific Resources | 117,000 | 1,487,070 | ||||
UGI Corporation | 25,400 | 729,234 | ||||
USA Mobility, Inc.D* | 37,300 | 281,615 | ||||
Wisconsin Energy CorporationD | 41,400 | 1,872,108 | ||||
| 20,998,814 | ||||||
Total Common Stocks | 420,799,445 | |||||
FOREIGN COMMON STOCKS — 1.6% | ||||||
Canada — 0.3% | ||||||
Celestica, Inc.D* | 164,100 | 1,383,363 | ||||
Cayman Islands — 0.1% | ||||||
Consolidated Water Co., Inc.D | 11,000 | 217,800 | ||||
China — 0.1% | ||||||
Cogo Group, Inc.D* | 72,500 | 660,475 | ||||
Israel — 0.1% | ||||||
RRSat Global Communications Network, Ltd. | 38,900 | 418,564 | ||||
Marshall Islands — 0.5% | ||||||
Aegean Marine Petroleum Network, Inc.D | 38,250 | 1,556,393 | ||||
Eagle Bulk Shipping, Inc.D | 37,500 | 1,108,875 | ||||
| 2,665,268 | ||||||
Netherlands — 0.1% | ||||||
AerCap Holdings NVD* | 50,600 | 639,078 | ||||
Panama — 0.1% | ||||||
Willbros Group, Inc.D* | 12,000 | 525,720 | ||||
Puerto Rico — 0.2% | ||||||
Oriental Financial GroupD | 62,700 | 894,102 | ||||
Singapore — 0.1% | ||||||
Verigy, Ltd.* | 30,500 | 692,655 | ||||
Total Foreign Common Stocks | 8,097,025 | |||||
PREFERRED STOCKS — 0.0% | ||||||
Fannie MaeD | 3,750 | 90,904 | ||||
Freddie MacD | 5,125 | 124,537 | ||||
Total Preferred Stocks | 215,441 | |||||
MONEY MARKET FUNDS — 47.4% | ||||||
GuideStone Money Market Fund (GS4 Class)¥ | 18,372,509 | 18,372,509 | ||||
Northern Institutional Liquid Assets Portfolio§ | 215,005,582 | 215,005,582 | ||||
Total Money Market Funds | 233,378,091 | |||||
| Par | ||||||
AGENCY OBLIGATIONS — 0.7% | ||||||
Federal Home Loan Mortgage Corporation | ||||||
2.55%, 12/15/08‡‡ | $ | 22,000 | 21,746 | |||
Federal National Mortgage Association | ||||||
1.25%, 12/15/08‡‡ | 3,102,000 | 3,066,240 | ||||
2.00%, 12/15/08‡‡ | 150,000 | 148,271 | ||||
2.48%, 12/15/08‡‡ | 42,000 | 41,516 | ||||
2.55%, 12/26/08‡‡ | 30,000 | 29,632 | ||||
Total Agency Obligations | 3,307,405 | |||||
ASSET-BACKED SECURITIES — 0.6% | ||||||
Bear Stearns Asset-Backed Securities Trust | ||||||
3.35%, 10/27/32† | 34,821 | 31,726 | ||||
3.35%, 12/25/33† | 350,149 | 263,861 | ||||
Drive Auto Receivables Trust | ||||||
5.33%, 04/15/14 STEP 144A | 400,000 | 374,080 | ||||
EMC Mortgage Loan Trust | ||||||
3.04%, 02/25/41 STEP 144A | 98,454 | 79,178 | ||||
GSAA Trust | ||||||
3.17%, 07/25/37† | 200,000 | 120,616 | ||||
Lehman XS Trust | ||||||
3.20%, 11/25/35† | 334,259 | 250,587 | ||||
3.20%, 12/25/35† | 166,494 | 110,558 | ||||
3.02%, 06/25/37† | 310,657 | 259,738 | ||||
2.65%, 02/25/46† | 334,606 | 234,357 | ||||
2.97%, 08/25/46† | 276,057 | 249,715 | ||||
MASTR Specialized Loan Trust | ||||||
2.74%, 05/25/37 144A† | 334,167 | 262,150 | ||||
Nelnet Student Loan Trust | ||||||
4.10%, 04/25/24† | 80,000 | 80,208 | ||||
| See Notes to Financial Statements. | 103 |
Table of Contents
Small Cap Equity Fund
SCHEDULE OF INVESTMENTS (Continued)
| Par | Value | |||||
Option One Mortgage Loan Trust | ||||||
3.70%, 11/25/32† | $ | 30,799 | $ | 27,154 | ||
Renaissance Home Equity Loan Trust | ||||||
3.33%, 06/25/33† | 20,444 | 15,739 | ||||
Securitized Asset-Backed Receivables LLC Trust | ||||||
2.62%, 02/25/37† | 344,301 | 233,156 | ||||
Wachovia Asset Securitization, Inc. | ||||||
2.76%, 09/27/32† | 91,260 | 77,236 | ||||
3.33%, 12/25/32† | 47,420 | 36,358 | ||||
2.68%, 03/25/33† | 53,920 | 42,583 | ||||
Washington Mutual Master Note Trust | ||||||
2.54%, 09/15/13 144A† | 200,000 | 188,391 | ||||
Total Asset-Backed Securities | 2,937,391 | |||||
CORPORATE BONDS — 2.0% | ||||||
AES Corporation | ||||||
7.75%, 10/15/15 | 30,000 | 29,700 | ||||
8.00%, 10/15/17 | 140,000 | 137,900 | ||||
8.00%, 06/01/20 | 190,000 | 184,300 | ||||
American Express Co. | ||||||
6.80%, 09/01/49† | 140,000 | 129,633 | ||||
American International Group, Inc. | ||||||
5.85%, 01/16/18 | 190,000 | 178,319 | ||||
Anadarko Petroleum Corporation | ||||||
5.95%, 09/15/16 | 20,000 | 20,043 | ||||
6.45%, 09/15/36 | 320,000 | 316,884 | ||||
Apache Corporation | ||||||
5.63%, 01/15/17D | 110,000 | 111,484 | ||||
AT&T, Inc. | ||||||
5.50%, 02/01/18 | 90,000 | 87,370 | ||||
BAC Capital Trust XIV | ||||||
5.63%, 12/31/49† | 10,000 | 7,809 | ||||
Bank of America Corporation | ||||||
5.75%, 12/01/17 | 190,000 | 178,749 | ||||
8.13%, 12/15/49† | 20,000 | 18,930 | ||||
8.00%, 12/29/49† | 60,000 | 56,303 | ||||
Bear Stearns Co., Inc. | ||||||
7.25%, 02/01/18 | 110,000 | 114,990 | ||||
Cardinal Health, Inc. | ||||||
5.85%, 12/15/17D | 60,000 | 58,785 | ||||
Chesapeake Energy Corporation | ||||||
6.88%, 11/15/20D | 100,000 | 94,500 | ||||
Citigroup, Inc. | ||||||
5.50%, 04/11/13 | 300,000 | 293,096 | ||||
6.88%, 03/05/38 | 130,000 | 125,837 | ||||
Comcast Corporation | ||||||
6.50%, 01/15/17 | 360,000 | 362,727 | ||||
Community Health Systems, Inc. | ||||||
8.88%, 07/15/15D | 30,000 | 30,338 | ||||
ConocoPhillips Holding Co. | ||||||
6.95%, 04/15/29 | 180,000 | 197,977 | ||||
Countrywide Financial Corporation | ||||||
6.25%, 05/15/16 | 50,000 | 44,584 | ||||
CVS Pass-Through Trust | ||||||
6.94%, 01/10/30 144A | 89,597 | 86,349 | ||||
Devon Financing Corporation | ||||||
6.88%, 09/30/11 | 150,000 | 159,319 | ||||
Dominion Resources, Inc. | ||||||
5.70%, 09/17/12 | 120,000 | 121,954 | ||||
Duke Energy Corporation | ||||||
5.63%, 11/30/12D | 130,000 | 133,892 | ||||
Dynegy Holdings, Inc. | ||||||
7.75%, 06/01/19 | 20,000 | 18,300 | ||||
Edison Mission Energy | ||||||
7.20%, 05/15/19D | 100,000 | 93,750 | ||||
Embarq Corporation | ||||||
6.74%, 06/01/13 | 150,000 | 144,881 | ||||
Energy Future Holdings Corporation | ||||||
11.25%, 11/01/17 PIK 144A | 500,000 | 501,250 | ||||
6.50%, 11/15/24 | 20,000 | 14,856 | ||||
6.55%, 11/15/34D | 10,000 | 7,336 | ||||
Energy Transfer Partners LP | ||||||
6.70%, 07/01/18 | 100,000 | 100,832 | ||||
FirstEnergy Corporation | ||||||
7.38%, 11/15/31 | 110,000 | 119,960 | ||||
Ford Motor Credit Co. | ||||||
7.38%, 10/28/09 | 550,000 | 501,078 | ||||
Ford Motor Credit Co., LLC | ||||||
12.00%, 05/15/15 | 140,000 | 123,289 | ||||
Freeport-McMoRan Copper & Gold, Inc. | ||||||
8.38%, 04/01/17 | 65,000 | 68,682 | ||||
General Electric Capital Corporation | ||||||
6.38%, 11/15/47† | 130,000 | 123,167 | ||||
GMAC LLC | ||||||
6.63%, 05/15/12D | 550,000 | 377,601 | ||||
Goldman Sachs Capital II | ||||||
5.79%, 12/29/49† | 10,000 | 6,959 | ||||
Goldman Sachs Group LP | ||||||
4.50%, 06/15/10 | 100,000 | 100,180 | ||||
Goldman Sachs Group, Inc. | ||||||
5.95%, 01/18/18 | 100,000 | 96,167 | ||||
HCA, Inc. | ||||||
9.63%, 11/15/16 PIK | 50,000 | 51,625 | ||||
Hertz Corporation | ||||||
8.88%, 01/01/14 | 10,000 | 9,200 | ||||
10.50%, 01/01/16D | 5,000 | 4,575 | ||||
Hess Corporation | ||||||
7.30%, 08/15/31 | 130,000 | 145,617 | ||||
HSBC Finance Corporation | ||||||
4.63%, 09/15/10D | 290,000 | 287,736 | ||||
Idearc, Inc. | ||||||
8.00%, 11/15/16 | 65,000 | 41,194 | ||||
JPMorgan Chase & Co. | ||||||
6.13%, 06/27/17D | 250,000 | 246,442 | ||||
Kansas City Southern Railway | ||||||
8.00%, 06/01/15D | 20,000 | 20,300 | ||||
Kinder Morgan Energy Partners LP | ||||||
6.00%, 02/01/17 | 70,000 | 69,281 | ||||
6.95%, 01/15/38 | 120,000 | 119,473 | ||||
Kroger Co. | ||||||
6.15%, 01/15/20 | 70,000 | 69,400 | ||||
L-3 Communications Corporation | ||||||
6.38%, 10/15/15 | 85,000 | 79,900 | ||||
| 104 | See Notes to Financial Statements. |
Table of Contents
| Par | Value | |||||
Lehman Brothers Holdings Capital Trust V | ||||||
5.86%, 11/29/49† | $ | 10,000 | $ | 6,530 | ||
Lehman Brothers Holdings E-Capital Trust I | ||||||
3.50%, 08/19/47† | 50,000 | 37,153 | ||||
Lehman Brothers Holdings, Inc. | ||||||
6.50%, 07/19/17 | 160,000 | 148,264 | ||||
6.75%, 12/28/17 | 120,000 | 112,923 | ||||
Merrill Lynch & Co., Inc. | ||||||
5.45%, 02/05/13 | 220,000 | 207,710 | ||||
MetLife, Inc. | ||||||
6.40%, 12/15/36 | 120,000 | 105,090 | ||||
Morgan Stanley | ||||||
5.63%, 01/09/12 | 160,000 | 160,245 | ||||
NewPage Corporation | ||||||
10.00%, 05/01/12 | 30,000 | 30,525 | ||||
NRG Energy, Inc. | ||||||
7.25%, 02/01/14 | 10,000 | 9,575 | ||||
7.38%, 02/01/16 | 30,000 | 28,313 | ||||
Oncor Electric Delivery Co. | ||||||
6.38%, 01/15/15 | 50,000 | 49,401 | ||||
Pacific Gas & Electric Co. | ||||||
5.63%, 11/30/17 | 30,000 | 29,938 | ||||
6.05%, 03/01/34 | 80,000 | 77,385 | ||||
Pemex Project Funding Master Trust | ||||||
6.63%, 06/15/35 | 90,000 | 89,244 | ||||
Qwest Communications International, Inc. | ||||||
7.50%, 02/15/14 | 70,000 | 66,850 | ||||
Residential Capital LLC | ||||||
6.46%, 04/17/09† | 10,000 | 7,250 | ||||
6.46%, 05/22/09† | 20,000 | 14,500 | ||||
6.00%, 02/22/11D | 260,000 | 102,700 | ||||
RH Donnelley Corporation | ||||||
8.88%, 10/15/17 144A | 10,000 | 6,000 | ||||
SemGroup LP | ||||||
8.75%, 11/15/15 144A | 60,000 | 58,500 | ||||
Sprint Capital Corporation | ||||||
6.90%, 05/01/19 | 100,000 | 87,909 | ||||
Steel Dynamics, Inc. | ||||||
7.38%, 11/01/12 144A | 25,000 | 25,125 | ||||
SunTrust Capital VIII | ||||||
6.10%, 12/15/36† | 100,000 | 79,653 | ||||
Terex Corporation | ||||||
7.38%, 01/15/14 | 10,000 | 9,900 | ||||
Time Warner Cable, Inc. | ||||||
6.75%, 07/01/18 | 110,000 | 110,929 | ||||
7.30%, 07/01/38 | 90,000 | 89,717 | ||||
Toronto Dominion Bank NY | ||||||
7.20%, 06/15/18 | 30,000 | 29,776 | ||||
Travelers Cos., Inc. | ||||||
6.25%, 03/15/37† | 100,000 | 86,052 | ||||
United Parcel Service, Inc. | ||||||
4.50%, 01/15/13 | 150,000 | 150,455 | ||||
UnitedHealth Group, Inc. | ||||||
4.88%, 02/15/13 | 100,000 | 96,863 | ||||
Ventas Realty LP | ||||||
9.00%, 05/01/12 | 20,000 | 21,050 | ||||
Verizon Global Funding Corporation | ||||||
7.38%, 09/01/12 | 100,000 | 107,992 | ||||
Wachovia Corporation | ||||||
5.63%, 10/15/16 | 270,000 | 245,899 | ||||
WellPoint, Inc. | ||||||
5.88%, 06/15/17D | 110,000 | 106,506 | ||||
Weyerhaeuser Co. | ||||||
6.75%, 03/15/12 | 80,000 | 82,461 | ||||
Williams Cos., Inc. | ||||||
7.88%, 09/01/21 | 50,000 | 53,250 | ||||
7.50%, 01/15/31 | 30,000 | 30,488 | ||||
7.75%, 06/15/31 | 50,000 | 52,250 | ||||
8.75%, 03/15/32 | 10,000 | 11,400 | ||||
Windstream Corporation | ||||||
8.63%, 08/01/16 | 20,000 | 20,050 | ||||
Wyeth | ||||||
5.95%, 04/01/37 | 60,000 | 58,109 | ||||
XTO Energy, Inc. | ||||||
7.50%, 04/15/12 | 110,000 | 118,113 | ||||
Total Corporate Bonds | 9,846,846 | |||||
FOREIGN BONDS — 0.5% | ||||||
Brazil — 0.0% | ||||||
Petrobras International Finance Co. | ||||||
6.13%, 10/06/16 | 80,000 | 80,400 | ||||
Canada — 0.0% | ||||||
OPTI Canada, Inc. | ||||||
7.88%, 12/15/14 | 30,000 | 29,775 | ||||
8.25%, 12/15/14 | 10,000 | 10,000 | ||||
| 39,775 | ||||||
Cayman Islands — 0.1% | ||||||
Resona Preferred Global Securities Cayman, Ltd. | ||||||
7.19%, 07/30/49 144A† | 60,000 | 55,477 | ||||
Shinsei Finance Cayman, Ltd. | ||||||
6.42%, 07/20/49 144A† | 100,000 | 70,326 | ||||
Vale Overseas, Ltd. | ||||||
6.88%, 11/21/36 | 140,000 | 130,723 | ||||
| 256,526 | ||||||
Germany — 0.0% | ||||||
Bundesrepublik Deutschland | ||||||
4.25%, 01/04/14(E) | 80,000 | 123,544 | ||||
Iceland — 0.1% | ||||||
Glitnir Banki HF | ||||||
6.69%, 06/15/16 144A† | 130,000 | 83,649 | ||||
Kaupthing Bank HF | ||||||
7.63%, 02/28/15 144A@ | 310,000 | 259,176 | ||||
| 342,825 | ||||||
India — 0.0% | ||||||
ICICI Bank, Ltd. | ||||||
6.38%, 04/30/22 144A† | 110,000 | 98,739 | ||||
Italy — 0.0% | ||||||
Telecom Italia Capital SA | ||||||
5.25%, 10/01/15 | 60,000 | 54,990 | ||||
Japan — 0.0% | ||||||
Aiful Corporation | ||||||
6.00%, 12/12/11 144A | 100,000 | 82,709 | ||||
Kazakhstan — 0.0% | ||||||
KazMunaiGaz Finance Sub BV | ||||||
8.38%, 07/02/13 | 120,000 | 120,210 | ||||
| See Notes to Financial Statements. | 105 |
Table of Contents
Small Cap Equity Fund
SCHEDULE OF INVESTMENTS (Continued)
| Par | Value | |||||
Luxembourg — 0.2% | ||||||
Evraz Group SA | ||||||
8.88%, 04/24/13 144A | $ | 120,000 | $ | 120,744 | ||
FMC Finance III SA | ||||||
6.88%, 07/15/17 | 40,000 | 39,500 | ||||
Gaz Capital for Gazprom | ||||||
6.21%, 11/22/16 144A | 110,000 | 103,048 | ||||
RSHB Capital SA for OJSC Russian Agricultural Bank | ||||||
6.30%, 05/15/17 144A | 110,000 | 101,766 | ||||
TNK-BP Finance SA | ||||||
6.63%, 03/20/17 144A | 100,000 | 88,750 | ||||
7.88%, 03/13/18 144A | 100,000 | 96,750 | ||||
Vimpel Communications | ||||||
8.38%, 04/30/13 144A | 100,000 | 98,679 | ||||
| 649,237 | ||||||
Mexico — 0.0% | ||||||
America Movil Sab de CV | ||||||
5.63%, 11/15/17 | 40,000 | 38,724 | ||||
United Mexican States | ||||||
6.75%, 09/27/34 | 100,000 | 106,350 | ||||
| 145,074 | ||||||
Netherlands — 0.1% | ||||||
Deutsche Telekom International Finance BV | ||||||
5.75%, 03/23/16 | 75,000 | 73,291 | ||||
HSBK Europe BV | ||||||
9.25%, 10/16/13 144A | 100,000 | 101,000 | ||||
Intergas Finance BV | ||||||
6.38%, 05/14/17 144A | 110,000 | 98,175 | ||||
Koninklijke KPN NV | ||||||
8.00%, 10/01/10 | 110,000 | 116,444 | ||||
TuranAlem Finance BV | ||||||
8.25%, 01/22/37 144AD | 210,000 | 175,875 | ||||
| 564,785 | ||||||
Russia — 0.0% | ||||||
Russian Federation | ||||||
7.50%, 03/31/30 STEP | 12,805 | 14,386 | ||||
United Kingdom — 0.0% | ||||||
Vedanta Resources PLC | ||||||
8.75%, 01/15/14 | 100,000 | 100,000 | ||||
Total Foreign Bonds | 2,673,200 | |||||
MORTGAGE-BACKED SECURITIES — 6.7% | ||||||
American Home Mortgage Investment Trust | ||||||
3.25%, 04/25/44 STEP | 40,810 | 40,684 | ||||
3.19%, 11/25/45† | 283,522 | 214,174 | ||||
Bear Stearns Adjustable Rate Mortgage Trust | ||||||
6.65%, 02/25/35† | 134,103 | 103,842 | ||||
5.08%, 08/25/35† | 324,247 | 294,906 | ||||
Bear Stearns Mortgage Funding Trust | ||||||
3.11%, 12/25/36† | 281,564 | 156,974 | ||||
Bear Stearns Structured Products, Inc. | ||||||
3.50%, 09/27/37 144A† | 773,923 | 735,761 | ||||
Commercial Mortgage Lease-Backed Certificates | ||||||
6.75%, 06/20/31 144A | 326,687 | 338,069 | ||||
Countrywide Alternative Loan Trust | ||||||
2.63%, 07/25/35† | 241,353 | 183,061 | ||||
2.65%, 07/25/35† | 330,951 | 250,089 | ||||
3.15%, 06/25/37† | 147,769 | 99,377 | ||||
2.58%, 09/25/46† | 355,743 | 249,511 | ||||
Credit Suisse Mortgage Capital Certificates | ||||||
5.47%, 09/15/39 | 390,000 | 370,722 | ||||
CS First Boston Mortgage Securities Corporation | ||||||
6.00%, 10/25/35 | 138,717 | 125,492 | ||||
Federal Home Loan Bank | ||||||
5.50%, 12/17/37 | 1,134,234 | 1,118,695 | ||||
Federal Home Loan Mortgage Corporation | ||||||
5.50%, 11/01/35 | 150,929 | 149,113 | ||||
5.50%, 12/01/36 | 1,358,927 | 1,340,879 | ||||
5.90%, 05/01/37† | 584,931 | 594,112 | ||||
6.04%, 05/01/37† | 80,304 | 81,848 | ||||
6.22%, 09/01/37† | 65,081 | 66,336 | ||||
Federal National Mortgage Association | ||||||
5.00%, 08/01/22 TBA | 1,200,000 | 1,183,875 | ||||
5.50%, 08/01/22 TBA | 1,400,000 | 1,405,687 | ||||
4.62%, 09/01/35† | 177,429 | 177,856 | ||||
5.00%, 02/01/36 | 678,656 | 652,795 | ||||
5.50%, 11/01/36 | 279,933 | 276,429 | ||||
5.50%, 01/01/37 | 345,105 | 340,784 | ||||
5.50%, 07/01/37 TBA | 5,300,000 | 5,223,813 | ||||
5.83%, 09/01/37† | 407,742 | 414,826 | ||||
5.00%, 07/01/38 TBA | 4,400,000 | 4,217,127 | ||||
5.00%, 08/01/38 TBA | 5,000,000 | 4,781,250 | ||||
First Horizon Alternative Mortgage Securities | ||||||
5.93%, 02/25/36† | 193,753 | 167,307 | ||||
2.76%, 02/25/37† | 115,511 | 88,864 | ||||
General Electric Capital Commercial Mortgage Corporation | ||||||
5.52%, 03/10/44† | 300,000 | 286,772 | ||||
GMAC Commercial Mortgage Securities, Inc. | ||||||
5.24%, 11/10/45† | 100,000 | 94,563 | ||||
Government National Mortgage Association | ||||||
5.50%, 08/01/23 TBA | 400,000 | 395,750 | ||||
6.00%, 08/01/37 TBA | 800,000 | 809,500 | ||||
5.00%, 07/01/38 TBA | 500,000 | 484,375 | ||||
6.00%, 07/01/38 TBA | 200,000 | 202,688 | ||||
Greenpoint Mortgage Funding Trust | ||||||
3.16%, 10/25/45† | 93,746 | 68,302 | ||||
Harborview Mortgage Loan Trust | ||||||
2.74%, 06/19/35† | 312,460 | 234,613 | ||||
Homestar Mortgage Acceptance Corporation | ||||||
3.05%, 07/25/34† | 137,279 | 116,239 | ||||
Impac CMB Trust | ||||||
3.70%, 03/25/33† | 24,879 | 22,719 | ||||
Indymac INDA Mortgage Loan Trust | ||||||
6.29%, 11/01/37† | 197,792 | 194,134 | ||||
| 106 | See Notes to Financial Statements. |
Table of Contents
| Par | Value | |||||||
MASTR Adjustable Rate Mortgages Trust | ||||||||
3.79%, 11/21/34† | $ | 200,000 | $ | 191,676 | ||||
4.60%, 12/25/46† | 324,076 | 229,747 | ||||||
Merrill Lynch Mortgage Investors, Inc. | ||||||||
5.03%, 05/25/34† | 60,419 | 57,428 | ||||||
4.49%, 02/25/35† | 337,744 | 326,478 | ||||||
Morgan Stanley Capital I | ||||||||
5.69%, 04/15/49† | 270,000 | 254,608 | ||||||
Residential Accredit Loans, Inc. | ||||||||
5.54%, 12/26/34† | 328,901 | 275,761 | ||||||
2.79%, 10/25/45† | 205,928 | 159,870 | ||||||
Structured Adjustable Rate Mortgage Loan Trust | ||||||||
6.76%, 11/25/34† | 107,306 | 89,160 | ||||||
Structured Asset Mortgage Investments, Inc. | ||||||||
2.60%, 08/25/36† | 309,389 | 222,748 | ||||||
2.57%, 09/25/37† | 375,282 | 268,935 | ||||||
Terwin Mortgage Trust | ||||||||
2.47%, 10/25/37† | 262,129 | 243,275 | ||||||
Thornburg Mortgage Securities Trust | ||||||||
3.13%, 12/25/35† | 327,487 | 325,100 | ||||||
3.15%, 07/25/45† | 235,315 | 235,287 | ||||||
Washington Mutual Mortgage Pass-Through Certificates | ||||||||
4.63%, 05/25/47† | 678 | 498 | ||||||
4.92%, 05/25/47† | 354,597 | 218,311 | ||||||
Washington Mutual, Inc. | ||||||||
5.65%, 11/25/36† | 291,986 | 269,483 | ||||||
Wells Fargo Mortgage-Backed Securities Trust | ||||||||
3.30%, 05/25/33† | 343,415 | 319,996 | ||||||
3.54%, 09/25/34† | 400,000 | 395,707 | ||||||
5.24%, 04/25/36† | 314,052 | 309,174 | ||||||
Total Mortgage-Backed Securities | 32,747,155 | |||||||
| Number of Contracts | ||||||||
PURCHASED OPTION — 0.0% | ||||||||
Call Option — 0.0% | ||||||||
90-Day Eurodollar Futures, Strike Price $97.25, Expires 09/15/08 | 2 | 375 | ||||||
(Cost $2,435) | ||||||||
| Par | ||||||||
U.S. TREASURY OBLIGATIONS — 1.8% | ||||||||
U.S. Treasury Bill | ||||||||
2.09%, 12/04/08‡‡ | $ | 3,255,000 | 3,225,773 | |||||
U.S. Treasury Bonds | ||||||||
4.75%, 02/15/37D | 730,000 | 754,067 | ||||||
5.00%, 05/15/37D | 10,000 | 10,750 | ||||||
4.38%, 02/15/38D | 900,000 | 877,501 | ||||||
| 1,642,318 | ||||||||
U.S. Treasury Inflationary Index Bonds | ||||||||
2.50%, 07/15/16D | 90,000 | 104,616 | ||||||
2.63%, 07/15/17D | 450,000 | 515,227 | ||||||
2.38%, 01/15/27D | 295,000 | 329,479 | ||||||
1.75%, 01/15/28D | 100,000 | 97,572 | ||||||
| 1,046,894 | ||||||||
U.S. Treasury Notes | ||||||||
3.25%, 12/31/09D | 1,550,000 | 1,569,012 | ||||||
2.63%, 05/31/10D | 150,000 | 150,141 | ||||||
3.50%, 05/31/13D | 100,000 | 100,773 | ||||||
3.63%, 06/30/13D | 800,000 | 801,688 | ||||||
4.75%, 08/15/17D | 30,000 | 31,791 | ||||||
4.25%, 11/15/17D | 110,000 | 112,398 | ||||||
| 2,765,803 | ||||||||
Total U.S. Treasury Obligations | 8,680,788 | |||||||
TOTAL INVESTMENTS — 146.7% | 722,683,162 | |||||||
| Number of Contracts | ||||||||
WRITTEN OPTIONS — 0.0% | ||||||||
Call Options — 0.0% | ||||||||
10-Year U.S. Treasury Note Futures, Strike Price $117.00, Expires 08/22/08 | (22 | ) | (7,563 | ) | ||||
Put Options — 0.0% | ||||||||
10-Year U.S. Treasury Note Futures, Strike Price $111.00, Expires 08/22/08 | (22 | ) | (7,562 | ) | ||||
5-Year U.S. Treasury Note Futures, Strike Price $109.00, Expires 08/23/08 | (8 | ) | (3,563 | ) | ||||
Total Written Options | (18,688 | ) | ||||||
Liabilities in Excess of Other Assets — (46.7)% | (229,801,817 | ) | ||||||
NET ASSETS — 100.0% | $ | 492,862,657 | ||||||
| See Notes to Financial Statements. | 107 |
Table of Contents
Small Cap Equity Fund
SCHEDULE OF INVESTMENTS (Continued)
PORTFOLIO SUMMARY (based on net assets)
| % | |||
Money Market Funds | 47.4 | ||
Futures Contracts | 20.7 | ||
Financial Services | 16.3 | ||
Consumer Discretionary | 12.1 | ||
Technology | 11.4 | ||
Materials & Processing | 10.9 | ||
Healthcare | 10.1 | ||
Other Energy | 8.1 | ||
Mortgage-Backed Securities | 6.7 | ||
Producer Durables | 5.7 | ||
Utilities | 4.3 | ||
Auto & Transportation | 3.0 | ||
Integrated Oils | 2.5 | ||
Corporate Bonds | 2.0 | ||
U.S. Treasury Obligations | 1.8 | ||
Foreign Common Stocks | 1.6 | ||
Consumer Staples | 0.9 | ||
Agency Obligations | 0.7 | ||
Asset-Backed Securities | 0.6 | ||
Foreign Bonds | 0.5 | ||
Other | 0.1 | ||
Preferred Stocks | — | ** | |
Purchased Option | — | ** | |
Written Options | — | ** | |
Forward Foreign Currency Contracts | (0.1 | ) | |
| 167.3 | |||
| ** | Rounds to less than 0.005%. |
FAS 157 DISCLOSURE
The following is a summary of the inputs used, as of June 30, 2008, in valuing the Fund’s assets carried at fair value:
Valuation Inputs | Investments in Securities | Other Financial Instruments* | ||||||
Assets: | ||||||||
Level 1 — Quoted Prices | $ | 662,490,002 | $ | (3,509,993 | ) | |||
Level 2 — Other Significant Observable Inputs | 60,193,160 | 790 | ||||||
Level 3 — Significant Unobservable Inputs | — | — | ||||||
Total Assets | $ | 722,683,162 | $ | (3,509,203 | ) | |||
Liabilities: | ||||||||
Level 1 — Quoted Prices | $ | — | $ | — | ||||
Level 2 — Other Significant Observable Inputs | (18,688 | ) | — | |||||
Level 3 — Significant Unobservable Inputs | — | — | ||||||
Total Liabilities | $ | (18,688 | ) | $ | — | |||
| * | Other financial instruments are derivative instruments not reflected in the Schedule of Investments, such as futures, forwards and swap contracts, which are valued at the unrealized appreciation (depreciation) on the investment. |
| 108 | See Notes to Financial Statements. |
Table of Contents
| International Equity Fund | ||
| SCHEDULE OF INVESTMENTS | June 30, 2008 (Unaudited) |
| Shares | Value | ||||
FOREIGN COMMON STOCKS — 95.9% | |||||
Argentina — 0.0% | |||||
Banco Macro SA ADRD | 21,400 | $ | 355,668 | ||
Australia — 4.5% | |||||
ABC Learning Centres, Ltd. | 2,281 | 2,187 | |||
AGL Energy, Ltd.D | 2,362 | 32,380 | |||
Amcor, Ltd. | 756,823 | 3,663,930 | |||
AMP, Ltd. | 118,826 | 762,077 | |||
Ansell, Ltd.D | 13,730 | 121,883 | |||
Asciano GroupD | 613 | 2,039 | |||
Austereo Group, Ltd. | 4,353 | 6,406 | |||
Australand Property Group REIT | 98,155 | 111,975 | |||
Australia and New Zealand Banking Group, Ltd. | 5,292 | 94,970 | |||
AXA Asia Pacific Holdings, Ltd. | 44,491 | 199,609 | |||
BHP Billiton, Ltd.D | 171,436 | 7,181,992 | |||
Billabong International, Ltd.D | 111,286 | 1,152,194 | |||
BlueScope Steel, Ltd. | 14,187 | 154,229 | |||
Brambles, Ltd. | 171,000 | 1,431,106 | |||
Caltex Australia, Ltd.D | 1,847 | 23,124 | |||
CFS Retail Property Trust REIT | 2,438 | 4,324 | |||
Challenger Financial Services Group, Ltd.D | 22,785 | 41,283 | |||
Coca-Cola Amatil, Ltd. | 1,288,422 | 8,658,399 | |||
Commonwealth Bank of Australia | 3,231 | 124,423 | |||
Computershare, Ltd. | 59,226 | 522,918 | |||
CSL, Ltd. | 137,230 | 4,696,547 | |||
CSR, Ltd. | 39,446 | 92,647 | |||
Dexus Property Group REIT | 761,696 | 1,007,679 | |||
Fairfax Media, Ltd. | 37,721 | 105,953 | |||
Fortescue Metals Group LtdD* | 6,199 | 70,718 | |||
Goodman Fielder, Ltd.D | 111,394 | 150,037 | |||
Goodman Group REITD | 8,072 | 23,911 | |||
GPT Group REITD | 13,315 | 28,337 | |||
Harvey Norman Holdings, Ltd. | 26,066 | 77,214 | |||
Incitec Pivot, Ltd. | 23,586 | 4,182,996 | |||
Leighton Holdings, Ltd.D | 50,367 | 2,455,266 | |||
Lend Lease Corporation, Ltd. | 12,722 | 116,472 | |||
Macquarie Group, Ltd.D | 43,100 | 2,009,705 | |||
Macquarie Infrastructure Group | 10,311 | 22,932 | |||
Mineral Deposits, Ltd.D* | 138,300 | 108,717 | |||
Mirvac Group REIT | 4,874 | 13,831 | |||
National Australia Bank, Ltd. | 366,002 | 9,298,026 | |||
Newcrest Mining, Ltd. | 132,510 | 3,722,011 | |||
Orica, Ltd. | 1,746 | 49,043 | |||
Origin Energy, Ltd. | 4,993 | 77,159 | |||
Oxiana, Ltd. | 8,347 | 21,044 | |||
PaperlinX, Ltd. | 24,779 | 40,739 | |||
QBE Insurance Group, Ltd. | 7,438 | 159,722 | |||
Quantas Airways, Ltd. | 55,370 | 161,365 | |||
Rio Tinto, Ltd.D | 15,508 | 2,014,450 | |||
Santos, Ltd. | 12,353 | 254,016 | |||
SP AusNet | 151,468 | 153,918 | |||
Stockland REIT | 10,657 | 55,066 | |||
Suncorp-Metway, Ltd. | 205,038 | 2,563,146 | |||
Telstra Corporation, Ltd. | 2,747,554 | 11,167,952 | |||
Toll Holdings, Ltd.D | 4,299 | 24,810 | |||
Wesfarmers, Ltd.D* | 140,096 | 5,009,684 | |||
Westfield Group REIT | 11,486 | 179,260 | |||
Westpac Banking Corporation | 3,377 | 64,747 | |||
Woodside Petroleum, Ltd. | 3,116 | 201,633 | |||
| 74,672,201 | |||||
Austria — 0.4% | |||||
Erste Bank Der Oesterreichischen Sparkassen AGD | 65,923 | 4,103,970 | |||
Raiffeisen International Bank Holding AGD | 13,151 | 1,680,679 | |||
Verbund AG | 9,429 | 845,009 | |||
| 6,629,658 | |||||
Bahrain — 0.0% | |||||
Investcorp Bank BSC GDR | 13,338 | 340,119 | |||
Belgium — 0.5% | |||||
Colruyt SAD* | 1,279 | 337,944 | |||
FortisD* | 342,803 | 5,488,746 | |||
Mobistar SAD* | 20,000 | 1,620,115 | |||
| 7,446,805 | |||||
Bermuda — 0.3% | |||||
Aquarius Platinum, Ltd.D* | 90,616 | 1,453,862 | |||
Catlin Group, Ltd. | 6,339 | 44,192 | |||
Credicorp, Ltd. | 25,105 | 2,061,623 | |||
Hiscox, Ltd. | 66,853 | 276,973 | |||
Seadrill, Ltd.D | 57,600 | 1,761,407 | |||
| 5,598,057 | |||||
Brazil — 2.5% | |||||
Amil Participacoes SA* | 80,851 | 728,774 | |||
Banco do Brasil SA* | 294,300 | 4,789,649 | |||
BR Malls Participacoes SA* | 24,900 | 236,093 | |||
Brasil Telecom Participacoes SA ADRD* | 35,900 | 2,633,983 | |||
Centrais Eletricas Brasileiras SA | 29,570 | 544,696 | |||
Companhia Brasileira de Distribuicao Grupo Pao de Acucar ADRD | 12,797 | 543,361 | |||
Companhia Vale do Rio Doce ADRD | 197,882 | 6,289,803 | |||
Gafisa SA ADRD | 14,800 | 508,676 | |||
Gerdau SA ADRD | 44,000 | 1,056,440 | |||
Global Village Telecom Holding SA* | 30,800 | 748,338 | |||
Hypermarcas SA* | 16,800 | 204,878 | |||
Localiza Rent A Car SA* | 25,100 | 281,829 | |||
Lojas Renner SA | 36,400 | 719,780 | |||
Magnesita Refratarios SA | 41,000 | 576,726 | |||
Marfrig Frigorificos e Comercio de Alimentos SA* | 116,237 | 1,471,905 | |||
Petroleo Brasileiro SA ADRD* | 189,150 | 12,144,270 | |||
Tegma Gestao Logistica SA | 31,778 | 393,880 | |||
Tele Norte Leste Participacoes SA ADRD | 132,600 | 3,303,066 | |||
Terna Participacoes SA | 35,600 | 710,623 | |||
Totvs SA | 10,865 | 353,040 | |||
Triunfo Participacoes e Investimentos SA* | 50,300 | 170,689 | |||
Unibanco GDRD | 12,633 | 1,603,507 | |||
Usinas Siderurgicas de Minas Gerais SA | 22,800 | 1,072,372 | |||
Votorantim Celulose e Papel SA ADRD* | 12,800 | 341,888 | |||
| 41,428,266 | |||||
Canada — 1.8% | |||||
Eastern Platinum, Ltd.* | 486,300 | 1,335,334 | |||
Encana Corporation | 56,200 | 5,110,266 | |||
Falcon Oil & Gas, Ltd.* | 335,000 | 374,522 | |||
First Quantum Minerals, Ltd. | 34,526 | 2,381,979 | |||
| See Notes to Financial Statements. | 109 |
Table of Contents
International Equity Fund
SCHEDULE OF INVESTMENTS (Continued)
| Shares | Value | ||||
Goldcorp, Inc. | 78,610 | $ | 3,629,424 | ||
Potash Corporation of Saskatchewan | 10,840 | 2,477,699 | |||
Research In Motion, Ltd.* | 55,630 | 6,503,147 | |||
Rogers Communications, Inc. Class B | 124,673 | 4,836,779 | |||
Talisman Energy, Inc.D | 140,200 | 3,104,556 | |||
Teck Cominco, Ltd. Class BD | 15,000 | 723,301 | |||
| 30,477,007 | |||||
Chile — 0.2% | |||||
Banco de Credito e Inversiones | 23,100 | 638,334 | |||
Banco Santander Chile SA ADRD | 6,300 | 270,963 | |||
Centros Comerciales Sudamericanos SA | 79,659 | 240,620 | |||
Embotelladora Andina SA ADR Class A@D | 20,000 | 285,200 | |||
Embotelladora Andina SA ADR Class BD | 36,200 | 553,498 | |||
Enersis SA ADRD | 39,500 | 615,410 | |||
Multiexport Foods SA* | 115,516 | 35,662 | |||
S.A.C.I. Falabella SA | 91,175 | 389,026 | |||
| 3,028,713 | |||||
China — 1.6% | |||||
Anhui Conch Cement Co., Ltd.D | 88,405 | 591,275 | |||
Asia Cement China Holdings Corporation* | 111,000 | 71,606 | |||
Bank of Communications Co., Ltd.D | 1,567,000 | 1,834,841 | |||
BYD Electronic International Co., Ltd.* | 442,500 | 262,756 | |||
China Communications Construction Co., Ltd. Class HD* | 490,000 | 838,321 | |||
China Construction Bank Class HD | 771,000 | 620,973 | |||
China COSCO Holdings Co., Ltd. | 754,000 | 1,841,182 | |||
China Life Insurance Co., Ltd. Class HD | 615,000 | 2,153,259 | |||
China Medical Technologies, Inc. ADRD* | 14,300 | 706,420 | |||
China Petroleum & Chemical Corporation Class H | 2,815,000 | 2,635,480 | |||
China Shenhua Energy Co., Ltd. Class H | 425,000 | 1,667,896 | |||
China Shipping Development Co., Ltd. | 358,000 | 1,074,379 | |||
China Yurun Food Group, Ltd. | 1,328,000 | 2,183,457 | |||
Golden Eagle Retail Group, Ltd.D | 583,726 | 567,462 | |||
Great Wall Motor Co., Ltd. | 477,500 | 316,608 | |||
Harbin Power EquipmentD | 340,000 | 492,738 | |||
Hidili Industry International Development, Ltd.* | 638,000 | 1,112,803 | |||
Industrial & Commercial Bank of China Class H | 5,215,305 | 3,565,049 | |||
New World Department Store China, Ltd.D* | 533,337 | 469,913 | |||
Parkson Retail Group, Ltd.D | 201,422 | 1,469,866 | |||
Shandong Weigao Group Medical Polymer Co., Ltd. | 216,000 | 312,479 | |||
Simcere Pharmaceutical Group ADR* | 39,300 | 495,180 | |||
Xinao Gas Holdings, Ltd.D | 242,740 | 416,539 | |||
Yangzijiang Shipbuilding Holdings, Ltd.D | 667,000 | 416,707 | |||
ZTE Corporation Class H | 15,000 | 71,948 | |||
| 26,189,137 | |||||
Colombia — 0.1% | |||||
BanColombia SA | 76,200 | 566,273 | |||
BanColombia SA ADRD | 13,000 | 408,070 | |||
| 974,343 | |||||
Cyprus — 0.1% | |||||
Bank of Cyprus Public Co., Ltd. | 67,843 | 826,754 | |||
Czech Republic — 0.4% | |||||
CEZ AS | 79,770 | 7,077,650 | |||
Denmark — 1.1% | |||||
D/S Norden | 2,300 | 247,646 | |||
East Asiatic Co., Ltd. A/SD | 7,200 | 498,586 | |||
FLSmidth & Co. A/S | 5,450 | 598,319 | |||
H Lundbeck A/SD | 121,300 | 2,765,781 | |||
Novo-Nordisk A/S Class B | 141,542 | 9,263,611 | |||
Topdanmark A/SD* | 5,750 | 867,975 | |||
Vestas Wind Systems A/SD* | 35,100 | 4,594,435 | |||
| 18,836,353 | |||||
Egypt — 0.5% | |||||
El Sewedy Cables Holding Co.* | 40,185 | 997,141 | |||
Maridive & Oil Services SAE | 11,912 | 69,923 | |||
Orascom Construction Industries* | 53,294 | 3,602,308 | |||
Orascom Construction Industries GDRD* | 1,828 | 247,491 | |||
Orascom Construction Industries GDR 144A* | 1,549 | 209,718 | |||
Orascom Telecom Holding SAE GDRD | 33,887 | 2,180,371 | |||
Talaat Moustafa Group* | 369,846 | 623,833 | |||
| 7,930,785 | |||||
Estonia — 0.1% | |||||
Tallink Group, Ltd.* | 746,660 | 858,176 | |||
Finland — 0.9% | |||||
Fortum OYJD | 16,574 | 841,826 | |||
Konecranes OYJ | 619 | 25,632 | |||
Nokia Corporation ADR | 95,300 | 2,334,850 | |||
Nokia OYJ ADR | 253,864 | 6,191,317 | |||
Outokumpu OYJD | 33,123 | 1,160,353 | |||
Outotec OYJD | 17,445 | 1,111,839 | |||
UPM-Kymmene OYJ | 233,934 | 3,830,516 | |||
| 15,496,333 | |||||
France — 7.4% | |||||
Accor SA | 6,271 | 418,929 | |||
Air Liquide SAD | 16,889 | 2,230,160 | |||
AlstomD | 6,671 | 1,540,504 | |||
AXA SAD | 103,400 | 3,070,385 | |||
BNP Paribas SA | 61,305 | 5,553,877 | |||
Bouygues SAD | 255 | 16,927 | |||
Carrefour SAD | 127,372 | 7,211,476 | |||
Casino Guichard Perrachon SAD | 19,303 | 2,188,204 | |||
Christian Dior SA | 18,763 | 1,934,969 | |||
Compagnie de Saint-GobainD | 131,045 | 8,199,339 | |||
Compagnie Generale de Geophysique - VeritasD* | 26,480 | 1,252,832 | |||
ErametD | 1,430 | 1,420,679 | |||
France Telecom SAD | 366,435 | 10,794,469 | |||
| 110 | See Notes to Financial Statements. |
Table of Contents
| Shares | Value | ||||
Gaz de France SA | 2,013 | $ | 129,374 | ||
Groupe DanoneD | 13,253 | 930,636 | |||
Klepierre REITD | 10,242 | 516,019 | |||
Lafarge SAD | 24,438 | 3,747,232 | |||
L’Oreal SAD | 16,021 | 1,743,003 | |||
Nexans SA | 643 | 79,340 | |||
Peugeot SAD | 268 | 14,553 | |||
Rallye SA | 8,361 | 491,676 | |||
Renault SAD | 79,730 | 6,540,185 | |||
Sanofi-Aventis | 43,232 | 2,888,078 | |||
Schneider Electric SAD | 23,082 | 2,493,397 | |||
Societe BIC SAD | 22,800 | 1,191,800 | |||
Societe Generale Class AD | 70,900 | 6,171,964 | |||
Societe Television Francaise 1D | 60,434 | 1,011,452 | |||
Suez SA | 84,101 | 5,725,552 | |||
Technip SAD | 34,692 | 3,211,170 | |||
Total SAD | 365,795 | 31,215,305 | |||
Total SA ADR | 18,800 | 1,603,076 | |||
UBISOFT Entertainment* | 18,774 | 1,647,314 | |||
Unibail-Rodamco REITD | 67 | 15,498 | |||
Valeo SAD | 71,400 | 2,293,290 | |||
Vallourec | 436 | 153,019 | |||
Veolia Environnement SA | 9,680 | 543,027 | |||
Vivendi SA | 29,315 | 1,112,340 | |||
| 121,301,050 | |||||
Germany — 7.3% | |||||
Adidas-Salomon AG | 29,409 | 1,857,220 | |||
Allianz AGD | 41,455 | 7,303,609 | |||
BASF AG | 157,718 | 10,881,385 | |||
Bauer AG | 13,846 | 1,336,771 | |||
Bayer AGD | 105,953 | 8,918,108 | |||
Bayerische Motoren Werke AGD | 69,951 | 3,364,617 | |||
Commerzbank AGD | 121,600 | 3,606,991 | |||
Continental AGD | 38,870 | 3,994,466 | |||
Daimler AG | 63,683 | 3,938,452 | |||
Demag Cranes AG | 19,142 | 912,887 | |||
Deutsche Boerse AGD | 16,870 | 1,904,163 | |||
Deutsche Lufthansa AGD | 124,400 | 2,683,314 | |||
Deutsche Telekom AG | 384,630 | 6,298,063 | |||
E.ON AG | 31,817 | 6,419,606 | |||
ElringKlinger AGD | 4,345 | 411,761 | |||
Fresenius Medical Care AG & Co. KGaA | 77,800 | 4,288,469 | |||
GEA Group AGD | 53,777 | 1,899,984 | |||
Gildemeister AG | 13,270 | 375,866 | |||
Hannover Rueckversicherung AGD | 82,845 | 4,089,163 | |||
Heidelberger Druckmaschinen AGD* | 49,800 | 1,021,655 | |||
Hypo Real Estate Holding AGD | 1,409 | 39,665 | |||
Lanxess AG | 7,693 | 315,889 | |||
Linde AGD | 20,923 | 2,941,751 | |||
MAN AG | 1,301 | 144,430 | |||
Merck KGaA | 12,230 | 1,738,588 | |||
Muenchener Rueckversicherungs AG | 11,495 | 2,013,625 | |||
Q-Cells AGD* | 13,680 | 1,390,099 | |||
RWE AGD | 161,005 | 20,337,927 | |||
Salzgitter AG | 255 | 46,733 | |||
SAP AGD | 37,304 | 1,953,476 | |||
SGL Carbon AGD* | 43,300 | 3,039,876 | |||
Siemens AG | 18,299 | 2,031,750 | |||
SolarWorld AGD | 29,625 | 1,411,892 | |||
Stada Arzneimittel AGD | 5,108 | 366,891 | |||
Suedzucker AGD* | 10,412 | 188,850 | |||
Symrise AGD | 90,329 | 1,962,623 | |||
ThyssenKrupp AG | 22,976 | 1,442,647 | |||
Tognum AG | 8,784 | 236,770 | |||
United Internet AGD | 54,556 | 1,075,418 | |||
Vossloh AGD | 200 | 26,073 | |||
Wacker Chemie AGD | 7,521 | 1,572,075 | |||
| 119,783,598 | |||||
Greece — 0.8% | |||||
Alpha Bank AE | 64,676 | 1,955,127 | |||
Coca Cola Hellenic Bottling Co. SA | 111,980 | 3,050,121 | |||
National Bank of Greece SA | 125,835 | 5,670,233 | |||
Public Power Corporation | 93,700 | 3,245,584 | |||
| 13,921,065 | |||||
Hong Kong — 2.8% | |||||
AAC Acoustic Technology Holdings, Inc.* | 588,000 | 491,681 | |||
Bank of East Asia, Ltd. | 800 | 4,345 | |||
BOC Hong Kong Holdings, Ltd. | 37,500 | 99,314 | |||
Cheung Kong Holdings, Ltd. | 10,000 | 134,791 | |||
China Mobile, Ltd. | 442,000 | 5,940,761 | |||
China Overseas Land & Investment, Ltd.D | 470,000 | 742,621 | |||
CLP Holdings, Ltd. | 6,500 | 55,686 | |||
CNOOC, Ltd. | 1,303,000 | 2,242,619 | |||
Dairy Farm International Holdings, Ltd. | 324,900 | 1,572,516 | |||
Esprit Holdings, Ltd. | 81,100 | 842,489 | |||
Giordano International, Ltd. | 70,000 | 28,728 | |||
Great Eagle Holdings, Ltd. | 3,000 | 8,849 | |||
Hang Lung Group, Ltd. | 9,000 | 39,995 | |||
Hang Lung Properties, Ltd. | 8,000 | 25,650 | |||
Hang Seng Bank, Ltd. | 200,400 | 4,227,875 | |||
Henderson Land Development Co., Ltd. | 7,000 | 43,631 | |||
Hengan International Group Co., Ltd.D | 350,000 | 1,032,415 | |||
Hong Kong & China Gas Co. | 16,600 | 39,471 | |||
Hong Kong Electric Holdings, Ltd. | 765,500 | 4,579,894 | |||
Hong Kong Exchanges and Clearing, Ltd.D | 4,400 | 64,330 | |||
Hongkong Land Holdings, Ltd. | 369,000 | 1,564,560 | |||
Hopewell Holdings | 4,000 | 14,210 | |||
Hutchison Telecommunications International, Ltd.* | 7,000 | 9,929 | |||
Hutchison Whampoa, Ltd. | 397,600 | 4,007,998 | |||
Hysan Development Co., Ltd. | 10,000 | 27,446 | |||
Industrial and Commercial Bank of China Asia, Ltd. | 16,000 | 43,195 | |||
Jardine Matheson Holdings, Ltd. | 124,400 | 3,856,400 | |||
Kerry Properties, Ltd. | 500 | 2,626 | |||
Lenovo Group, Ltd.D* | 2,562,000 | 1,734,889 | |||
Li & Fung, Ltd. | 646,000 | 1,946,968 | |||
Lifestyle International Holdings, Ltd. | 3,000 | 4,217 | |||
Link REIT | 10,000 | 22,777 | |||
Midland Holdings, Ltd. | 830,000 | 515,207 | |||
MTR Corporation | 6,000 | 18,891 | |||
New World Development, Ltd. | 13,000 | 26,476 | |||
Noble Group, Ltd.D | 6,000 | 10,452 | |||
| See Notes to Financial Statements. | 111 |
Table of Contents
International Equity Fund
SCHEDULE OF INVESTMENTS (Continued)
| Shares | Value | ||||
Orient Overseas International, Ltd. | 2,500 | $ | 12,504 | ||
Pacific Basin Shipping, Ltd. | 471,000 | 672,922 | |||
PCCW, Ltd. | 3,000 | 1,816 | |||
Shangri-La Asia, Ltd. | 6,000 | 14,005 | |||
Shenzhen International Holdings | 260,000 | 24,342 | |||
Shui On Land, Ltd. | 1,428,723 | 1,189,190 | |||
Sun Hung Kai Properties, Ltd. | 188,600 | 2,559,092 | |||
Swire Pacific, Ltd. Class A | 7,000 | 71,596 | |||
Television Broadcasts, Ltd. | 3,000 | 17,314 | |||
Wharf Holdings, Ltd. | 1,391,250 | 5,825,684 | |||
Wheelock & Co., Ltd. | 13,000 | 34,846 | |||
Wing Hang Bank, Ltd. | 2,000 | 26,496 | |||
WM Morrison Supermarkets PLC | 70,943 | 376,229 | |||
| 46,849,938 | |||||
Hungary — 0.1% | |||||
MOL Hungarian Oil and Gas PLCD* | 11,268 | 1,517,743 | |||
MOL Hungarian Oil and Gas PLC ADR* | 12,666 | 846,722 | |||
| 2,364,465 | |||||
India — 1.8% | |||||
Ambuja Cements, Ltd. | 587,628 | 1,037,312 | |||
Andhra Bank, Ltd. | 685,968 | 871,311 | |||
Asian Paints, Ltd. | 42,751 | 1,141,931 | |||
Bharti Airtel, Ltd.* | 32,591 | 546,339 | |||
Cairn India, Ltd.* | 158,067 | 1,009,204 | |||
Container Corporation of India, Ltd.* | 48,644 | 876,836 | |||
GAIL India, Ltd.* | 147,046 | 1,138,603 | |||
Hindustan Unilever, Ltd. | 120,091 | 578,195 | |||
Housing Development Finance Corporation | 81,309 | 3,713,190 | |||
Indraprastha Gas, Ltd.* | 93,800 | 239,923 | |||
Infosys Technologies, Ltd. | 104,156 | 4,204,489 | |||
Infosys Technologies, Ltd. ADRD | 98,510 | 4,281,245 | |||
Phoenix Mills, Ltd. | 43,616 | 157,383 | |||
Ranbaxy Laboratories, Ltd. | 91,585 | 1,113,388 | |||
Reliance Industries, Ltd. | 23,487 | 1,143,725 | |||
Reliance Industries, Ltd. GDR | 23,600 | 2,298,456 | |||
Rural Electrification Corporation, Ltd.* | 273,024 | 531,136 | |||
Satyam Computer Services, Ltd.* | 158,771 | 1,612,065 | |||
Sun Pharma Advanced Research Co., Ltd.* | 28,979 | 54,085 | |||
Sun Pharmaceuticals Industries, Ltd.* | 49,300 | 1,605,272 | |||
Welspun-Gujarat Stahl, Ltd.* | 104,000 | 734,224 | |||
| 28,888,312 | |||||
Indonesia — 0.7% | |||||
Bank Rakyat Indonesia | 6,743,209 | 3,729,975 | |||
PT Bumi Resources TBK* | 3,702,000 | 3,292,451 | |||
PT Panin Life TBK* | 26,999,000 | 614,945 | |||
PT Ramayana Lestari Sentosa TBK@ | 3,484,500 | 260,770 | |||
PT Telekomunikasi Indonesia TBK* | 4,540,696 | 3,595,128 | |||
| 11,493,269 | |||||
Ireland — 0.6% | |||||
Allied Irish Banks PLC | 166,000 | 2,569,166 | |||
Anglo Irish Bank Corporation PLCD | 104,525 | 979,191 | |||
Bank of IrelandD | 192,600 | 1,681,467 | |||
CRH PLC | 108,337 | 3,138,522 | |||
Dragon Oil PLC* | 108,010 | 984,256 | |||
| 9,352,602 | |||||
Israel — 0.9% | |||||
Check Point Software | |||||
Technologies, Ltd.* | 57,432 | 1,359,416 | |||
Israel Chemicals, Ltd. | 72,788 | 1,696,031 | |||
Makhteshim-Agan Industries, Ltd. | 207,479 | 1,932,545 | |||
Nice Systems, Ltd. ADRD* | 40,086 | 1,185,343 | |||
Syneron Medical, Ltd.D* | 13,200 | 217,008 | |||
Teva Pharmaceutical Industries, Ltd. ADRD | 191,100 | 8,752,380 | |||
| 15,142,723 | |||||
Italy — 2.1% | |||||
Assicurazioni Generali SpA | 104,464 | 4,008,231 | |||
Banca Italease SpAD* | 17,115 | 163,702 | |||
ENI SpA | 116,267 | 4,338,457 | |||
Fiat SpA | 37,171 | 609,236 | |||
Impregilo SpAD* | 22,927 | 102,066 | |||
Intesa Sanpaolo SpA | 1,646,779 | 9,405,314 | |||
Maire Tecnimont SpA* | 32,223 | 217,394 | |||
Mediaset SpAD | 538,824 | 3,552,485 | |||
Prysmian SpA | 7,157 | 181,308 | |||
Saipem SpA | 3,648 | 171,332 | |||
Terna Rete Elettrica Nazionale SpAD | 356,328 | 1,509,151 | |||
UniCredito Italiano SpA | 1,662,699 | 10,176,878 | |||
Unione di Banche Italiane SCPA | 754 | 17,677 | |||
| 34,453,231 | |||||
Japan — 14.6% | |||||
77 Bank, Ltd. (The)* | 4,000 | 25,126 | |||
Acom Co., Ltd.* | 280 | 8,675 | |||
Aeon Credit Service Co., Ltd.* | 129,200 | 1,619,487 | |||
Aiful CorporationD* | 1,250 | 14,479 | |||
Aisin Seiki Co., Ltd.* | 17,500 | 573,527 | |||
Alfresa Holdings Corporation* | 500 | 35,692 | |||
Alps Electric Co., Ltd.* | 3,400 | 35,126 | |||
Amada Co., Ltd.* | 10,000 | 78,825 | |||
Aoyama Trading Co., Ltd.* | 2,300 | 42,346 | |||
Asahi Glass Co., Ltd.D | 4,000 | 48,368 | |||
Asahi Kasei Corporation* | 14,000 | 73,306 | |||
Astellas Pharma, Inc.* | 277,800 | 11,772,849 | |||
Autobacs Seven Co., Ltd.* | 3,300 | 92,301 | |||
Bridgestone Corporation | 8,500 | 129,920 | |||
Brother Industries, Ltd.D* | 1,500 | 20,610 | |||
Calsonic Kansei Corporation* | 10,000 | 40,025 | |||
Canon Marketing Japan, Inc.D | 5,500 | 96,756 | |||
Canon, Inc.D | 320,150 | 16,462,014 | |||
Central Glass Co., Ltd.* | 18,000 | 73,400 | |||
Central Japan Railway Co.* | 354 | 3,900,551 | |||
Chuo Mitsui Trust Holdings, Inc.* | 16,000 | 95,230 | |||
Circle K Sunkus Co., Ltd.* | 7,600 | 133,556 | |||
Coca-Cola West Holdings Co., Ltd.D | 400 | 9,323 | |||
| 112 | See Notes to Financial Statements. |
Table of Contents
| Shares | Value | ||||
COMSYS Holdings CorporationD* | 21,000 | $ | 185,111 | ||
Dai Nippon Printing Co., Ltd.* | 3,000 | 44,215 | |||
Daiei, Inc. (The)D* | 7,700 | 48,005 | |||
Daiichi Sankyo Co., Ltd.* | 2,400 | 66,111 | |||
Dainippon Screen Manufacturing Co., Ltd.D* | 5,000 | 20,106 | |||
Dainippon Sumitomo Pharma Co., Ltd.* | 2,000 | 16,179 | |||
Daishi Bank, Ltd.* | 12,000 | 53,341 | |||
Daito Trust Construction Co., Ltd.* | 37,900 | 1,838,160 | |||
Daiwa Securities Group, Inc. | 270,000 | 2,481,706 | |||
Denso Corporation* | 3,300 | 113,434 | |||
Duskin Co., Ltd.D* | 4,200 | 72,660 | |||
East Japan Railway Co.* | 291 | 2,370,533 | |||
Eisai Co., Ltd.D* | 400 | 14,126 | |||
Exedy Corporation* | 3,500 | 92,127 | |||
FamilyMart Co., Ltd.* | 6,300 | 257,494 | |||
Fanuc, Ltd. | 6,700 | 654,320 | |||
Fast Retailing Co., Ltd.D* | 11,000 | 1,042,143 | |||
Fuji Fire & Marine Insurance Co., Ltd. (The)D* | 3,000 | 7,995 | |||
Fuji Heavy Industries, Ltd.D* | 2,000 | 9,794 | |||
FUJIFILM Holdings Corporation* | 5,300 | 182,182 | |||
Fujitsu, Ltd.* | 253,000 | 1,877,516 | |||
Fukuyama Transporting Co., Ltd.* | 2,000 | 6,931 | |||
Funai Electric Co., Ltd.* | 3,600 | 92,216 | |||
Glory, Ltd.* | 3,800 | 89,288 | |||
H2O Retailing CorporationD* | 17,000 | 117,832 | |||
Hachijuni Bank, Ltd.D* | 9,000 | 58,313 | |||
Haseko Corporation* | 8,500 | 11,367 | |||
Higo Bank, Ltd.* | 10,000 | 60,272 | |||
Hino Motors, Ltd.* | 12,000 | 74,361 | |||
Hirose Electric Co., Ltd.D* | 18,800 | 1,887,348 | |||
Hisamitsu Pharmaceutical Co., Inc.D* | 47,600 | 2,071,027 | |||
Hitachi Cable, Ltd.* | 2,000 | 7,515 | |||
Hitachi Capital CorporationD* | 900 | 14,494 | |||
Hitachi Construction Machinery Co., Ltd.* | 106,900 | 2,995,032 | |||
Hitachi High-Technologies Corporation* | 1,100 | 25,484 | |||
Hitachi Kokusai Electric, Inc.* | 13,000 | 115,939 | |||
Hitachi Transport System, Ltd.* | 4,000 | 50,553 | |||
Hitachi, Ltd. | 4,000 | 28,855 | |||
Hokkoku Bank, Ltd.* | 28,000 | 109,959 | |||
Honda Motor Co., Ltd.D | 9,200 | 312,775 | |||
Hosiden CorporationD* | 45,900 | 976,918 | |||
Hoya CorporationD | 90,100 | 2,083,114 | |||
Inpex Holdings, Inc.* | 455 | 5,741,866 | |||
Itochu Corporation* | 150,000 | 1,597,683 | |||
Itoham Foods, Inc.* | 34,000 | 168,103 | |||
Japan Aviation Electronics Industry, Ltd.D* | 12,000 | 104,987 | |||
Japan Steel Works, Ltd.* | 293,000 | 5,698,027 | |||
JFE Holdings, Inc. | 71,900 | 3,622,593 | |||
JFE Shoji Holdings, Inc.* | 19,000 | 142,610 | |||
JGC Corporation* | 7,000 | 137,778 | |||
JTEKT CorporationD* | 4,000 | 63,436 | |||
Kagoshima Bank, Ltd.* | 10,000 | 75,717 | |||
Kaken Pharmaceutical Co., Ltd.* | 22,000 | 183,359 | |||
Kanto Auto Works, Ltd. | 11,300 | 146,644 | |||
Kao Corporation* | 402,000 | 10,543,580 | |||
Kawasaki Kisen Kaisha, Ltd.* | 6,000 | 56,336 | |||
KDDI Corporation* | 1,186 | 7,326,986 | |||
Keihin CorporationD* | 9,100 | 137,890 | |||
Keiyo Bank, Ltd.* | 6,000 | 36,163 | |||
Keyence CorporationD* | 6,800 | 1,619,551 | |||
Kikkoman Corporation* | 1,000 | 12,215 | |||
Kobe Steel, Ltd.D | 39,000 | 111,654 | |||
Komatsu, Ltd.* | 22,800 | 635,570 | |||
Konami CorporationD* | 13,700 | 478,665 | |||
Konica Minolta Holdings, Inc.* | 86,500 | 1,460,607 | |||
Kose Corporation* | 4,600 | 102,670 | |||
Kuraray Co., Ltd.* | 188,500 | 2,247,408 | |||
Kureha CorporationD* | 8,000 | 48,293 | |||
Kurita Water Industries, Ltd.D* | 28,600 | 1,058,511 | |||
Kyocera Corporation | 800 | 75,340 | |||
Kyowa Exeo CorporationD* | 3,000 | 27,829 | |||
Lawson, Inc.* | 1,100 | 53,557 | |||
Leopalace21 CorporationD* | 1,500 | 21,472 | |||
Lintec CorporationD* | 4,300 | 74,714 | |||
Makita Corporation* | 400 | 16,349 | |||
Marubeni Corporation* | 363,000 | 3,032,264 | |||
Matsumotokiyoshi Holdings Co., Ltd.D* | 900 | 19,282 | |||
Matsushita Electric Industrial Co., Ltd.* | 224,000 | 4,830,814 | |||
Matsushita Electric Works, Ltd.* | 3,000 | 30,598 | |||
Mazda Motor Corporation* | 11,000 | 57,080 | |||
Meiji Dairies CorporationD* | 13,000 | 66,723 | |||
Millea Holdings, Inc.* | 202,600 | 7,899,082 | |||
Minebea Co., Ltd.* | 163,000 | 931,779 | |||
Mitsubishi Corporation* | 314,700 | 10,372,934 | |||
Mitsubishi Electric Corporation | 230,000 | 2,480,105 | |||
Mitsubishi Estate Co., Ltd.D* | 6,000 | 137,308 | |||
Mitsubishi Gas Chemical Co., Inc.* | 443,000 | 3,195,724 | |||
Mitsubishi Materials Corporation* | 9,000 | 38,480 | |||
Mitsubishi UFJ Financial Group, Inc.* | 35,200 | 311,939 | |||
Mitsui & Co., Ltd.* | 33,000 | 728,775 | |||
Mitsui Fudosan Co., Ltd.* | 79,000 | 1,688,845 | |||
Mitsui OSK Lines, Ltd.* | 85,000 | 1,211,141 | |||
Mizuho Financial Group, Inc.* | 27 | 126,120 | |||
Musashino Bank, Ltd. (The)* | 2,300 | 93,139 | |||
Nachi-Fujikoshi CorporationD* | 3,000 | 11,668 | |||
NEC Corporation* | 18,000 | 94,251 | |||
NEC Electronics CorporationD* | 4,800 | 119,565 | |||
NGK Insulators, Ltd.D* | 2,000 | 38,894 | |||
NHK Spring Co., Ltd.* | 1,000 | 7,967 | |||
Nichirei CorporationD* | 13,000 | 66,723 | |||
Nifco, Inc.* | 2,600 | 61,336 | |||
Nintendo Co., Ltd.* | 13,800 | 7,784,715 | |||
Nippon Electric Glass Co., Ltd.D* | 131,000 | 2,266,299 | |||
Nippon Express Co., Ltd.* | 41,000 | 196,534 | |||
Nippon Konpo Unyu Soko Co., Ltd.* | 16,000 | 204,172 | |||
Nippon Mining Holdings, Inc.* | 10,000 | 62,627 | |||
Nippon Oil Corporation* | 25,000 | 167,867 | |||
Nippon Sheet Glass Co., Ltd.* | 8,000 | 39,554 | |||
Nippon Steel Corporation | 24,000 | 129,962 | |||
Nippon Telegraph & Telephone Corporation* | 1,064 | 5,210,529 | |||
| See Notes to Financial Statements. | 113 |
Table of Contents
International Equity Fund
SCHEDULE OF INVESTMENTS (Continued)
| Shares | Value | ||||
Nippon Yusen Kabushiki Kaisha* | 11,000 | $ | 105,768 | ||
Nishi-Nippon City Bank, Ltd. (The)* | 17,000 | 50,591 | |||
Nissan Chemical Industries, Ltd.D* | 6,000 | 73,796 | |||
Nissan Motor Co., Ltd. | 3,100 | 25,603 | |||
Nissan Shatai Co., Ltd.* | 15,000 | 117,248 | |||
Nissin Kogyo Co., Ltd.D* | 1,700 | 25,792 | |||
Nitto Denko Corporation* | 155,400 | 5,971,013 | |||
Nomura Holdings, Inc. | 83,300 | 1,233,987 | |||
Nomura Real Estate Holdings, Inc.* | 1,000 | 21,095 | |||
NSK, Ltd.* | 79,000 | 691,162 | |||
NTT Data CorporationD* | 154 | 601,874 | |||
NTT DoCoMo, Inc.* | 104 | 152,790 | |||
OMC Card, Inc.* | 8,100 | 25,783 | |||
Omron Corporation* | 92,000 | 1,975,420 | |||
ORIX Corporation | 14,430 | 2,064,244 | |||
Osaka Gas Co., Ltd.* | 34,000 | 124,556 | |||
QP CorporationD* | 21,400 | 187,831 | |||
Rakuten, Inc. | 2,090 | 1,054,989 | |||
Resona Holdings, Inc.D* | 37 | 56,797 | |||
Ricoh Co., Ltd.* | 145,000 | 2,616,377 | |||
Rohm Co., Ltd.D* | 1,500 | 86,312 | |||
San-in Godo Bank, Ltd. (The)* | 2,000 | 17,479 | |||
Sankyo Co., Ltd.* | 1,700 | 110,788 | |||
Secom Co., Ltd. | 600 | 29,157 | |||
Seiko Epson CorporationD* | 1,000 | 27,499 | |||
Seino Holdings CorporationD* | 3,000 | 18,336 | |||
Sekisui House, Ltd.D* | 186,000 | 1,735,895 | |||
Seven & Holdings Co., Ltd.* | 229,300 | 6,543,099 | |||
Sharp Corporation* | 2,000 | 32,566 | |||
Shima Seiki Manufacturing, Ltd.D* | 1,700 | 46,268 | |||
Shimano, Inc. | 1,100 | 55,215 | |||
Shimizu CorporationD* | 5,000 | 23,685 | |||
Shin-Etsu Chemical Co., Ltd.* | 127,900 | 7,925,620 | |||
Shinko Electric Industries Co., Ltd.* | 3,800 | 46,916 | |||
Shinwa Kaiun Kaisha, Ltd.* | 2,000 | 10,924 | |||
Shionogi & Co., Ltd.* | 50,000 | 986,486 | |||
Shizuoka Bank, Ltd. (The)* | 129,000 | 1,316,909 | |||
Showa Shell Sekiyu KKD | 5,900 | 64,620 | |||
Sony Corporation* | 3,400 | 148,571 | |||
Stanley Electric Co., Ltd.* | 31,200 | 755,135 | |||
Sumco Corporation* | 74,500 | 1,648,773 | |||
Sumitomo Bakelite Co., Ltd.D* | 3,000 | 16,358 | |||
Sumitomo Chemical Co., Ltd.* | 3,000 | 18,901 | |||
Sumitomo CorporationD* | 190,400 | 2,501,370 | |||
Sumitomo Electric Industries, Ltd.D* | 177,100 | 2,248,254 | |||
Sumitomo Heavy Industries, Ltd.* | 10,000 | 67,712 | |||
Sumitomo Metal Industries, Ltd.* | 3,000 | 13,194 | |||
Sumitomo Metal Mining Co., Ltd.* | 5,000 | 76,659 | |||
Sumitomo Mitsui Financial Group, Inc.* | 22 | 165,541 | |||
Sumitomo Realty & Development Co., Ltd.* | 2,000 | 39,742 | |||
Suzuken Co., Ltd.D* | 4,800 | 177,200 | |||
Taisei Corporation* | 6,000 | 14,296 | |||
Takeda Pharmaceutical Co., Ltd.* | 222,100 | 11,294,816 | |||
Takefuji CorporationD* | 3,120 | 43,398 | |||
TDK Corporation* | 1,500 | 89,843 | |||
Terumo Corporation* | 23,000 | 1,173,989 | |||
THK Co., Ltd.D* | 5,200 | 100,881 | |||
Toagosei Co., Ltd. | 45,000 | 166,125 | |||
Toho Pharmaceutical Co., Ltd.D* | 3,400 | 65,480 | |||
Tokai Rika Co., Ltd.* | 3,800 | 78,552 | |||
Tokai Rubber Industries, Inc.* | 8,400 | 108,298 | |||
Tokyo Ohka Kogyo Co., Ltd.* | 1,400 | 26,092 | |||
Tokyo Steel Manufacturing Co., Ltd.* | 5,600 | 64,710 | |||
Tokyo Style Co., Ltd.D* | 4,000 | 35,824 | |||
Tokyo Tatemono Co., Ltd.D | 1,000 | 6,470 | |||
Tokyu Land CorporationD* | 341,000 | 1,936,460 | |||
Toppan Printing Co., Ltd.* | 9,000 | 99,082 | |||
Toshiba Machine Co., Ltd.* | 9,000 | 61,365 | |||
Toshiba TEC Corporation* | 27,000 | 168,583 | |||
Toyo Engineering CorporationD* | 3,000 | 19,297 | |||
Toyo Seikan Kaisha, Ltd.D* | 1,700 | 30,002 | |||
Toyo Suisan Kaisha, Ltd.D* | 11,000 | 248,623 | |||
Toyoda Gosei Co., Ltd.* | 500 | 14,597 | |||
Toyota Auto Body Co., Ltd.* | 4,100 | 76,529 | |||
Toyota Boshoku Corporation* | 600 | 16,076 | |||
Toyota Motor Corporation | 349,840 | 16,506,083 | |||
Ube Industries, Ltd.D* | 17,000 | 60,197 | |||
Uni-Charm CorporationD* | 32,400 | 2,303,715 | |||
Urban CorporationD* | 4,300 | 12,594 | |||
Ushio, Inc.D* | 69,200 | 1,130,687 | |||
USS Co., Ltd.* | 670 | 44,231 | |||
West Japan Railway Co.* | 880 | 4,317,747 | |||
Yamaha Motor Co., Ltd. | 5,900 | 110,405 | |||
Yamato Holdings Co., Ltd.D* | 8,000 | 111,654 | |||
Yodogawa Steel Works, Ltd.* | 12,000 | 61,930 | |||
| 240,291,832 | |||||
Kazakhstan — 0.2% | |||||
Eurasian Natural Resources Corporation* | 114,039 | 3,027,865 | |||
KazakhGold Group, Ltd. GDR* | 14,827 | 341,021 | |||
| 3,368,886 | |||||
Luxembourg — 0.5% | |||||
Arcelor | 4,594 | 454,236 | |||
ArcelorMittalD | 50,100 | 4,953,679 | |||
Evraz Group SA GDR | 15,350 | 1,792,112 | |||
Oriflame Cosmetics SA ADR | 18,900 | 1,216,075 | |||
Tenaris SA ADRD | 7,100 | 528,950 | |||
| 8,945,052 | |||||
Malaysia — 0.3% | |||||
AirAsia BHD* | 1,471,200 | 391,720 | |||
Astro All Asia Networks PLC* | 112,541 | 117,104 | |||
Bumiputra-Commerce Holdings BHD | 1,168,532 | 2,860,981 | |||
Sime Darby BHD | 328,100 | 928,822 | |||
| 4,298,627 | |||||
Mexico — 1.1% | |||||
America Movil SA de CV ADR Series L* | 152,193 | 8,028,181 | |||
Cemex SA de CV* | 1,271,059 | 3,146,497 | |||
Corporacion Moctezuma SA de CV | 181,059 | 435,219 | |||
Empresas ICA SAB de CV* | 54,100 | 338,771 | |||
| 114 | See Notes to Financial Statements. |
Table of Contents
| Shares | Value | ||||
Empresas ICA SAB de CV ADRD* | 7,500 | $ | 186,300 | ||
Grupo Financiero Inbursa SAD | 327,783 | 1,207,760 | |||
Grupo Televisa SA ADR | 106,646 | 2,518,978 | |||
Kimberly-Clark de Mexico SAB de CV Class A | 117,500 | 478,518 | |||
Megacable Holdings SAB de CV* | 304,162 | 884,488 | |||
Urbi Desarrollos Urbanos SA* | 122,300 | 422,763 | |||
Wal-Mart de Mexico SAB de CV Series VD | 308,774 | 1,229,036 | |||
| 18,876,511 | |||||
Netherlands — 3.7% | |||||
Aegon NVD | 242,300 | 3,209,481 | |||
Akzo Nobel NV | 73,118 | 5,026,186 | |||
Fugro NV | 17,103 | 1,460,840 | |||
ING Groep NVD | 352,234 | 11,232,956 | |||
Koninklijke Ahold NV | 39,968 | 537,404 | |||
Koninklijke Philips Electronics NV ADRD | 86,600 | 2,938,907 | |||
Reed Elsevier NV | 495,878 | 8,361,705 | |||
Royal Dutch Shell PLC | 21,258 | 873,523 | |||
Royal Dutch Shell PLC Class A | 250,961 | 10,326,646 | |||
Royal Dutch Shell PLC Class B | 206,661 | 8,315,011 | |||
Royal KPN NV | 6,002 | 103,004 | |||
SNS Reaal | 29,639 | 575,383 | |||
TNT NVD | 80,000 | 2,735,775 | |||
Unilever NVD | 175,700 | 4,987,673 | |||
Vimetco NV GDR* | 40,445 | 347,827 | |||
| 61,032,321 | |||||
New Zealand — 0.2% | |||||
Telecom Corporation of New Zealand, Ltd.D | 1,060,562 | 2,885,653 | |||
Nigeria — 0.1% | |||||
First City Monument Bank PLC | 1,789,926 | 227,131 | |||
Guaranty Trust Bank GDR@D* | 85,745 | 991,209 | |||
United Bank for Africa PLC* | 3,392,944 | 950,076 | |||
| 2,168,416 | |||||
Norway — 1.0% | |||||
DnB NOR ASA | 60,700 | 772,277 | |||
Norsk Hydro ASA | 94,000 | 1,373,125 | |||
Petroleum Geo-Services ASA* | 32,250 | 791,497 | |||
StatoilHydro ASA | 81,037 | 3,021,465 | |||
Telenor ASA | 281,300 | 5,291,082 | |||
Yara International ASA | 49,900 | 4,418,617 | |||
| 15,668,063 | |||||
Peru — 0.0% | |||||
Compania de Minas Buenaventura SA ADRD | 6,300 | 411,831 | |||
Philippines — 0.0% | |||||
International Container Terminal Services, Inc. | 1,246,288 | 818,922 | |||
Poland — 0.0% | |||||
Powszechna Kasa Oszczednosci Bank Polski SA* | 27,596 | 593,863 | |||
Portugal — 0.1% | |||||
Portugal Telecom SGPS SA | 123,391 | 1,400,713 | |||
Russia — 2.3% | |||||
Evraz Group SA GDR | 7,658 | 892,157 | |||
Gazprom OAO ADR | 262,916 | 15,222,836 | |||
Kalina ADR | 7,200 | 237,600 | |||
LUKOIL ADR | 58,490 | 5,770,039 | |||
Magnit OAO@* | 26,719 | 1,275,832 | |||
Mining and Metallurgical Co. Norilsk Nickel ADR | 84,289 | 2,124,083 | |||
Mobile Telesystems ADR | 39,762 | 3,046,167 | |||
Novorossiysk Commercial Sea Port GDR* | 81,295 | 1,216,986 | |||
Pharmstandard GDR* | 14,085 | 388,042 | |||
Seventh Continent | 26,700 | 694,200 | |||
Severstal GDR 144AD* | 30,369 | 798,705 | |||
Vimpel-Communications ADRD | 30,800 | 914,144 | |||
VTB Bank OJSC GDRD* | 454,293 | 3,157,336 | |||
VTB Bank OJSC GDR 144A* | 19,000 | 130,340 | |||
X 5 Retail Group NV GDR* | 66,915 | 2,255,031 | |||
| 38,123,498 | |||||
Singapore — 0.9% | |||||
Ascendas, Ltd. REIT | 2,000 | 3,249 | |||
CapitaCommercial Trust REITD* | 2,000 | 2,808 | |||
CapitaLand, Ltd.D | 3,000 | 12,568 | |||
CapitaMall Trust REITD | 4,000 | 8,791 | |||
Cosco Corporation Singapore, Ltd. | 755,000 | 1,775,752 | |||
DBS Group Holdings, Ltd. | 6,000 | 83,172 | |||
Golden Agri-Resources, Ltd. | 38,000 | 25,137 | |||
Haw Par Corporation, Ltd. | 7,000 | 33,597 | |||
Indofood Agri Resources, Ltd.* | 10,000 | 18,742 | |||
Jardine Cycle & Carriage, Ltd. | 4,000 | 49,980 | |||
Keppel Corporation, Ltd.* | 11,000 | 90,066 | |||
Keppel Land, Ltd.D | 145,000 | 528,610 | |||
Neptune Orient Lines, Ltd. | 19,000 | 45,107 | |||
Oversea-Chinese Banking Corporation | 657,800 | 3,950,039 | |||
Parkway Holdings, Ltd. | 4,000 | 6,821 | |||
SembCorp Industries, Ltd. | 675,000 | 2,063,871 | |||
Singapore Airlines, Ltd.* | 2,000 | 21,609 | |||
Singapore Exchange, Ltd. | 207,000 | 1,051,317 | |||
Singapore Land, Ltd. | 1,000 | 4,579 | |||
Singapore Petroleum Co., Ltd. | 12,000 | 58,212 | |||
Singapore Press Holdings, Ltd. | 370,000 | 1,155,783 | |||
Singapore Telecommunications, Ltd.* | 720,000 | 1,915,696 | |||
StarHub, Ltd. | 4,000 | 8,379 | |||
Straits Asia Resources, Ltd. | 442,000 | 1,146,786 | |||
United Overseas Bank, Ltd. | 4,000 | 54,743 | |||
United Overseas Land, Ltd. | 11,000 | 27,489 | |||
Venture Corporation, Ltd. | 139,000 | 1,002,234 | |||
Wing Tai Holdings, Ltd.D | 11,000 | 13,017 | |||
| 15,158,154 | |||||
South Africa — 1.4% | |||||
Barloworld, Ltd. | 26,179 | 267,474 | |||
Bidvest Group Ltd | 150,718 | 1,893,697 | |||
Impala Platinum Holdings, Ltd. | 56,972 | 2,248,320 | |||
Massmart Holdings, Ltd. | 132,527 | 1,044,306 | |||
MTN Group, Ltd.D | 168,169 | 2,673,951 | |||
Murray & Roberts Holdings, Ltd. | 108,018 | 1,200,062 | |||
Pick’n Pay Stores, Ltd. | 86,790 | 299,276 | |||
Sasol, Ltd. | 174,748 | 10,288,484 | |||
Standard Bank Group, Ltd. | 351,166 | 3,421,962 | |||
| 23,337,532 | |||||
| See Notes to Financial Statements. | 115 |
Table of Contents
International Equity Fund
SCHEDULE OF INVESTMENTS (Continued)
| Shares | Value | ||||
South Korea — 1.4% | |||||
Amorepacific Corporation | 1,466 | $ | 908,148 | ||
Hyundai Motor Co. | 2,138 | 145,115 | |||
Kookmin Bank | 38,853 | 2,295,412 | |||
Korea Electric Power Corporation | 88,710 | 2,607,746 | |||
KTBNetwork* | 22,929 | 164,397 | |||
LG Electronics, Inc. | 29,120 | 3,298,810 | |||
Lotte Shopping Co., Ltd. | 2,426 | 722,431 | |||
POSCO | 2,093 | 1,088,468 | |||
Samsung Electronics Co., Ltd. | 10,733 | 6,412,815 | |||
Samsung Electronics Co., Ltd. (Non-Voting Shares) GDR 144A | 6,007 | 1,294,946 | |||
Samsung Fire & Marine Insurance Co., Ltd. | 3,568 | 745,288 | |||
Samsung Securities Co., Ltd. | 6,965 | 434,792 | |||
Shinhan Financial Group Co., Ltd. | 44,591 | 2,016,303 | |||
STX Pan Ocean Co., Ltd.D | 209,000 | 419,367 | |||
| 22,554,038 | |||||
Spain — 4.3% | |||||
Banco Bilbao Vizcaya | |||||
Argentaria SA | 216,445 | 4,147,331 | |||
Banco Santander SAD | 1,132,358 | 20,805,835 | |||
Bankinter SAD | 1,181 | 13,444 | |||
EnagasD* | 21,851 | 619,262 | |||
Gamesa Corporation Tecnologica SA | 30,327 | 1,490,709 | |||
Gas Natural SDG SA* | 74,300 | 4,333,016 | |||
Iberdrola SAD* | 860,025 | 11,523,149 | |||
Inditex SAD* | 45,611 | 2,101,234 | |||
Red Electrica de Espana* | 42,683 | 2,778,823 | |||
Tecnicas Reunidas SA* | 14,362 | 1,204,107 | |||
Telefonica SA | 823,182 | 21,877,558 | |||
Union Fenosa SA* | 4,072 | 237,342 | |||
| 71,131,810 | |||||
Sri Lanka — 0.0% | |||||
Dialog Telekom, Ltd.@ | 2,196,610 | 290,638 | |||
Sweden — 0.7% | |||||
Alfa Laval AB | 47,400 | 737,864 | |||
Assa Abloy AB Class BD | 168,600 | 2,442,586 | |||
D. Carnegie & Co. AB | 3,400 | 45,447 | |||
Hennes & Mauritz AB Class BD | 15,550 | 843,025 | |||
Investor AB | 800 | 16,903 | |||
NCC AB | 3,200 | 48,219 | |||
Nordea Bank AB | 235,100 | 3,281,992 | |||
Scania ABD | 36,600 | 501,374 | |||
Skanska AB | 23,200 | 333,220 | |||
SKF ABD | 86,600 | 1,358,866 | |||
Svenska Cellulosa AB | 39,000 | 552,059 | |||
Tele2 AB | 33,500 | 656,377 | |||
Vostok Gas, Ltd. ADR* | 450 | 42,217 | |||
| 10,860,149 | |||||
Switzerland — 6.6% | |||||
ABB, Ltd.* | 278,884 | 7,933,404 | |||
Actelion, Ltd.* | 35,370 | 1,893,925 | |||
Alcon, Inc. | 10,300 | 1,676,737 | |||
Baloise Holding AG | 479 | 50,453 | |||
Bucher Industries AG | 149 | 39,381 | |||
Compagnie Financiere Richemont AG Class A* | 41,800 | 2,328,246 | |||
Credit Suisse Group | 14,810 | 679,936 | |||
Geberit AGD | 3,225 | 475,124 | |||
Helvetia Holding AG* | 1,097 | 427,127 | |||
Julius Baer Holding AG | 76,807 | 5,187,884 | |||
Lonza Group AG | 6,518 | 904,117 | |||
Nestle SA | 547,300 | 24,730,427 | |||
Novartis AG | 348,585 | 19,194,270 | |||
Partners GroupD | 16,546 | 2,282,151 | |||
Roche Holding AG | 87,287 | 15,721,999 | |||
Swatch Group AGD | 30,428 | 1,519,830 | |||
Swiss Life Holding* | 2,145 | 573,232 | |||
Syngenta AG | 24,598 | 8,000,280 | |||
Synthes, Inc. | 17,084 | 2,354,684 | |||
UBS AG* | 95,951 | 2,013,792 | |||
Xstrata PLC | 86,984 | 6,971,886 | |||
Zurich Financial Services AG | 12,957 | 3,316,779 | |||
| 108,275,664 | |||||
Taiwan — 1.3% | |||||
AU Optronics Corporation* | 368,000 | 578,315 | |||
Cathay Financial Holding Co., Ltd. | 456,273 | 992,126 | |||
First Financial Holding Co., Ltd.* | 933,000 | 1,023,586 | |||
High Tech Computer Corporation* | 54,160 | 1,213,350 | |||
HON HAI Precision Industry Co., Ltd.* | 52,000 | 256,120 | |||
MediaTek, Inc.* | 124,050 | 1,430,419 | |||
Novatek Microelectronics Corp., Ltd.* | 376,919 | 1,095,254 | |||
Silicon Motion Technology Corporation ADRD* | 11,700 | 169,065 | |||
Taiwan Fertilizer Co., Ltd.* | 221,000 | 830,033 | |||
Taiwan Semiconductor Manufacturing Co., Ltd.* | 3,764,117 | 8,060,739 | |||
Taiwan Semiconductor Manufacturing Co., Ltd. ADRD* | 366,035 | 3,993,442 | |||
Vanguard International Semiconductor Corporation | 627,382 | 459,897 | |||
Yuanta Financial Holding Co., Ltd.* | 1,239,000 | 867,418 | |||
| 20,969,764 | |||||
Thailand — 0.2% | |||||
Airports of Thailand Public Co., Ltd.D | 229,542 | 334,685 | |||
Bangkok Bank PCL | 114,900 | 412,382 | |||
Bank of Ayudhya PCL ADR | 376,416 | 247,679 | |||
Banpu PCL ADR | 73,100 | 1,154,383 | |||
Central Pattana PCL ADR | 555,200 | 388,565 | |||
Siam Commercial Bank Public Co., Ltd. | 339,300 | 786,474 | |||
| 3,324,168 | |||||
Turkey — 0.4% | |||||
Akbank TAS | 223,344 | 773,865 | |||
Coca-Cola Icecek Uretim AS | 81,653 | 754,008 | |||
Migros Turk TAS REIT | 90,513 | 1,494,122 | |||
Sinpas Gayrimenkul Yatirim Ortakligi AS REIT* | 22,462 | 81,133 | |||
Turkcell Iletisim Hizmet AS | 27,871 | 159,432 | |||
Turkcell Iletisim Hizmet AS ADRD | 6,300 | 91,665 | |||
Türkiye Garanti Bankasi AS | 681,593 | 1,570,722 | |||
Türkiye Is Bankasi | 1 | 2 | |||
Yapi ve Kredi Bankasi* | 700,527 | 1,282,324 | |||
| 6,207,273 | |||||
| 116 | See Notes to Financial Statements. |
Table of Contents
| Shares | Value | ||||
United Kingdom — 15.1% | |||||
Acergy SAD | 85,334 | $ | 1,910,013 | ||
Admiral Group PLC | 78,594 | 1,250,021 | |||
Aegis Group PLC | 279,282 | 599,395 | |||
AMEC PLC | 230,930 | 4,093,769 | |||
Anglo American PLC | 289,735 | 20,315,009 | |||
Antofagasta PLC | 337 | 4,417 | |||
Ashmore Group PLC | 88,490 | 381,597 | |||
Associated British Foods PLC | 28,728 | 434,024 | |||
AstraZeneca PLC | 9,459 | 403,569 | |||
Atkins WS PLC* | 12,555 | 267,080 | |||
Autonomy Corporation PLC* | 195,282 | 3,526,005 | |||
Aviva PLC | 556,815 | 5,556,503 | |||
BAE Systems PLC | 406,864 | 3,586,043 | |||
Balfour Beatty PLC | 10,806 | 91,476 | |||
BBA Aviation PLC | 22,093 | 55,777 | |||
BG Group PLC | 596,924 | 15,539,876 | |||
BHP Billiton PLC | 411,799 | 15,740,449 | |||
BP PLC | 1,610,395 | 18,708,548 | |||
Brit Insurance Holdings PLC | 31,196 | 108,895 | |||
British Energy Group PLC | 8,748 | 124,150 | |||
British Land Co. PLC REIT | 2,339 | 33,008 | |||
BT Group PLC* | 734,446 | 2,924,325 | |||
Capita Group PLC (The) | 166,819 | 2,284,395 | |||
Cattles PLC | 296,400 | 791,108 | |||
Centrica PLC | 98,943 | 611,434 | |||
Close Brothers Group PLC | 35,049 | 386,059 | |||
Compass Group PLC | 736,547 | 5,567,563 | |||
CSR PLCD* | 15,015 | 80,077 | |||
Davis Service Group PLC | 7,244 | 64,497 | |||
De La Rue PLC* | 112,744 | 2,004,262 | |||
Friends Provident PLC | 6,676 | 13,590 | |||
GKN PLC | 574,106 | 2,550,057 | |||
GlaxoSmithKline PLC | 732,086 | 16,229,689 | |||
Hammerson PLC REIT | 536 | 9,529 | |||
Hays PLC | 70,265 | 126,660 | |||
Hikma Pharmaceuticals PLC | 48,800 | 489,895 | |||
Home Retail Group PLC | 39,135 | 169,932 | |||
HSBC Holdings PLCD | 403,229 | 6,234,862 | |||
ICAP PLC* | 162,941 | 1,759,068 | |||
IG Group Holdings PLC | 207,585 | 1,365,500 | |||
IMI PLC | 46,942 | 408,130 | |||
International Power PLC | 139,777 | 1,202,742 | |||
Intertek Group PLC | 56,659 | 1,115,010 | |||
JKX Oil & Gas PLC | 52,093 | 544,224 | |||
John Wood Group PLC | 156,374 | 1,540,224 | |||
Kesa Electricals PLC* | 13,463 | 42,436 | |||
Land Securities Group PLC REIT | 3,550 | 87,115 | |||
Lloyds TSB Group PLC | 1,323,435 | 8,191,561 | |||
Man Group PLC* | 180,672 | 2,245,579 | |||
Marks & Spencer Group PLC | 551,300 | 3,607,250 | |||
Michael Page International PLCD | 412,800 | 1,921,959 | |||
National Express Group PLC | 138,147 | 2,619,578 | |||
National Grid PLC | 21,379 | 281,263 | |||
Next PLC | 1,345 | 25,973 | |||
Northumbrian Water Group PLC* | 422,141 | 2,644,424 | |||
Old Mutual PLC | 85,643 | 158,304 | |||
Persimmon PLCD | 183,800 | 1,156,873 | |||
Petrofac, Ltd. | 115,943 | 1,705,485 | |||
Premier Foods PLC | 533,000 | 1,011,219 | |||
Prudential PLC | 446,275 | 4,737,865 | |||
Reckitt Benckiser Group PLC | 179,723 | 9,110,545 | |||
Reed Elsevier PLC | 62,150 | 713,044 | |||
Regus Group PLC | 35,135 | 56,686 | |||
Rexam PLC | 301,800 | 2,329,399 | |||
Rio Tinto PLC | 51,048 | 6,109,897 | |||
Rolls-Royce Group PLC | 289,478 | 1,969,061 | |||
Royal Bank of Scotland Group PLC | 2,118,719 | 9,073,289 | |||
Signet Group PLC | 1,163,800 | 1,153,252 | |||
Spectris PLC | 2,478 | 35,266 | |||
Spirax-Sarco Engineering PLC | 36,480 | 780,391 | |||
Standard Chartered PLC | 157,441 | 4,484,425 | |||
Taylor Wimpey PLC* | 382,700 | 472,610 | |||
Tesco PLC | 566,003 | 4,163,427 | |||
Travis Perkins PLC | 120,294 | 1,289,078 | |||
Trinity Mirror PLC | 2,255 | 4,896 | |||
Tullett Prebon PLC | 15,861 | 135,848 | |||
Tullow Oil PLC | 212,462 | 4,041,453 | |||
Unilever PLC | 403,968 | 11,498,260 | |||
United Business Media PLC | 8,072 | 87,706 | |||
Vedanta Resources PLCD | 31,913 | 1,390,175 | |||
Vodafone Group PLC | 3,747,807 | 11,134,056 | |||
Wellstream Holdings PLC* | 38,874 | 1,006,597 | |||
WPP Group PLC | 572,510 | 5,522,117 | |||
| 248,200,818 | |||||
Total Foreign Common Stocks | 1,580,910,474 | ||||
FOREIGN PREFERRED STOCKS — 0.7% | |||||
Belgium — 0.0% | |||||
Fortis* | 106,120 | 1,671 | |||
Brazil — 0.4% | |||||
Banco Bradesco SA | 102,450 | 2,084,660 | |||
Centrais Eletricas Brasileiras SA Class B | 29,763 | 485,870 | |||
Eletropaulo Metropolitana de Sao Paulo SA Class B | 42,667 | 1,000,740 | |||
Investimentos Itau SA@ | 545,015 | 3,460,950 | |||
Usinas Siderurgicas de Minas Gerais SA | 1,200 | 59,038 | |||
| 7,091,258 | |||||
Chile — 0.0% | |||||
Embotelladora Andina SA | 66,700 | 164,355 | |||
Germany — 0.1% | |||||
Fresenius AG | 7,260 | 627,194 | |||
Porsche AG | 4,368 | 673,211 | |||
Volkswagen AGD | 120 | 17,388 | |||
| 1,317,793 | |||||
Russia — 0.1% | |||||
URSA Bank@ | 860,100 | 1,169,736 | |||
South Korea — 0.1% | |||||
Samsung Electronics Co., Ltd. | 4,643 | 2,001,810 | |||
United Kingdom — 0.0% | |||||
HBOS PLC* | 237,372 | 50,827 | |||
Total Foreign Preferred Stocks | 11,797,450 | ||||
| See Notes to Financial Statements. | 117 |
Table of Contents
International Equity Fund
SCHEDULE OF INVESTMENTS (Continued)
| Shares | Value | |||||
RIGHTS — 0.2% | ||||||
Brazil — 0.0% | ||||||
Magnesita Refratarios SA* | 2,177 | $ | 3,803 | |||
United Kingdom — 0.2% | ||||||
HBOS PLC | 668,551 | 3,675,332 | ||||
Total Rights | 3,679,135 | |||||
MONEY MARKET FUNDS — 19.8% | ||||||
GuideStone Money Market Fund (GS4 Class)¥ | 39,825,543 | 39,825,543 | ||||
Northern Institutional Liquid Assets Portfolio§ | 287,196,178 | 287,196,178 | ||||
Total Money Market Funds | 327,021,721 | |||||
TOTAL INVESTMENTS —116.6% | 1,923,408,780 | |||||
Liabilities in Excess of Other Assets — (16.6)% | (274,642,393 | ) | ||||
NET ASSETS — 100.0% | $ | 1,648,766,387 | ||||
PORTFOLIO SUMMARY (based on net assets)
| % | |||
Foreign Common Stocks | |||
United Kingdom | 15.3 | ||
Japan | 14.6 | ||
France | 7.4 | ||
Germany | 7.3 | ||
Switzerland | 6.6 | ||
Australia | 4.5 | ||
Spain | 4.3 | ||
Netherlands | 3.7 | ||
Hong Kong | 2.8 | ||
Brazil | 2.5 | ||
Russia | 2.3 | ||
Italy | 2.1 | ||
Canada | 1.8 | ||
India | 1.8 | ||
China | 1.6 | ||
South Africa | 1.4 | ||
South Korea | 1.4 | ||
Taiwan | 1.3 | ||
Denmark | 1.1 | ||
Mexico | 1.1 | ||
Norway | 1.0 | ||
Finland | 0.9 | ||
Israel | 0.9 | ||
Singapore | 0.9 | ||
Greece | 0.8 | ||
Indonesia | 0.7 | ||
Sweden | 0.7 | ||
Ireland | 0.6 | ||
Belgium | 0.5 | ||
Egypt | 0.5 | ||
Luxembourg | 0.5 | ||
Austria | 0.4 | ||
Czech Republic | 0.4 | ||
Turkey | 0.4 | ||
Bermuda | 0.3 | ||
Malaysia | 0.3 | ||
Chile | 0.2 | ||
Kazakhstan | 0.2 | ||
New Zealand | 0.2 | ||
Thailand | 0.2 | ||
Colombia | 0.1 | ||
Cyprus | 0.1 | ||
Estonia | 0.1 | ||
Hungary | 0.1 | ||
Nigeria | 0.1 | ||
Portugal | 0.1 | ||
Argentina | — | ** | |
Bahrain | — | ** | |
Peru | — | ** | |
Philippines | — | ** | |
Poland | — | ** | |
Sri Lanka | — | ** | |
Total Foreign Common Stocks | 96.1 | ||
Total Money Market Funds | 19.8 | ||
Total Futures Contracts | 2.5 | ||
Total Foreign Preferred Stocks | 0.7 | ||
Total Forward Foreign Currency Contracts | (1.5 | ) | |
Total Investments | 117.6 | ||
| ** | Rounds to less than 0.005%. |
| 118 | See Notes to Financial Statements. |
Table of Contents
FAS 157 DISCLOSURE
The following is a summary of the inputs used, as of June 30, 2008, in valuing the Fund’s assets carried at fair value:
Valuation Inputs | Investments in Securities | Other Financial Instruments* | |||||
Level 1 — Quoted Prices | $ | 1,923,408,780 | $ | (1,704,595 | ) | ||
Level 2 — Other Significant Observable Inputs | — | (111,546 | ) | ||||
Level 3 — Significant Unobservable Inputs | — | — | |||||
Total | $ | 1,923,408,780 | $ | (1,816,141 | ) | ||
| * | Other financial instruments are derivative instruments not reflected in the Schedule of Investments, such as futures, forwards and swap contracts, which are valued at the unrealized appreciation (depreciation) on the investment. |
| See Notes to Financial Statements. | 119 |
Table of Contents
SCHEDULE OF INVESTMENTS – ABBREVIATIONS AND FOOTNOTES
INVESTMENT ABBREVIATIONS:
| ADR | — | American Depository Receipt | ||
| CONV | — | Convertible | ||
| GDR | — | Global Depository Receipt | ||
| IO | — | Interest Only (Principal amount shown is notional) | ||
| PIK | — | Payment-in-Kind Bonds | ||
| PO | — | Principal Only | ||
| REIT | — | Real Estate Investment Trust | ||
| STEP | — | Stepped Coupon Bonds (1) | ||
| STRIP | — | Stripped Security | ||
| TBA | — | To be announced. | ||
| 144A | — | Security was purchased pursuant to Rule 144A under the Securities Act of 1933 and may not be resold subject to that rule except to qualified institutional buyers. As of June 30, 2008, the total market values and percentages of net assets for 144A securities by fund were as follows: |
Fund | Value of 144A Securities | Percentage of 144A Securities | |||
Money Market | $ | 40,350,000 | 3.67% | ||
Low-Duration Bond | 30,753,920 | 3.85 | |||
Medium-Duration Bond | 79,083,649 | 7.10 | |||
Extended-Duration Bond | 48,949,053 | 9.54 | |||
Global Bond | 12,988,668 | 5.69 | |||
Small Cap Equity | 4,289,716 | 0.87 | |||
International Equity | 2,433,709 | 0.15 | |||
INVESTMENT FOOTNOTES:
| ‡‡ | — | All or a portion of the security was held as collateral for open futures, options and/or swap contracts. | ||
| @ | — | Illiquid. | ||
| * | — | Non-income producing security. | ||
| # | — | Security in default. | ||
| + | — | Security is valued at fair value (2). | ||
| § | — | Security purchased with the cash proceeds from securities loaned. | ||
| † | — | Variable rate security (1). | ||
| W | — | Interest rates shown reflect the effective yields as of June 30, 2008. | ||
| ¥ | — | Affiliated fund. | ||
| D | — | Security either partially or fully on loan. |
| (1) | Interest rates shown reflect the rates currently in effect. Maturity date for money market instruments is the date of the next interest rate reset. |
| (2) | Fair valued securities were held in the Value Equity Fund and Small Cap Equity Fund at an aggregate market value of $1,209 and $0, respectively, which amounted to 0.00% of each of those funds. |
FOREIGN BOND FOOTNOTES:
| (A) | — | Par is denominated in Australian Dollars. | ||
| (B) | — | Par is denominated in Brazilian Real. | ||
| (C) | — | Par is denominated in Canadian Dollars. | ||
| (E) | — | Par is denominated in Euro. | ||
| (G) | — | Par is denominated in Singapore Dollars. | ||
| (H) | — | Par is denominated in Hungarian Fornit. | ||
| (I) | — | Par is denominated in Iceland Kronur. | ||
| (J) | — | Par is denominated in Japanese Yen. | ||
| (L) | — | Par is denominated in Turkish Lira. | ||
| (M) | — | Par is denominated in Mexican Pesos. | ||
| (P) | — | Par is denominated in Argentinian Pesos. | ||
| (R) | — | Par is denominated in Russian Rubles. | ||
| (T) | — | Par is denominated in Thailand Baht. | ||
| (U) | — | Par is denominated in British Pounds. | ||
| (W) | — | Par is denominated in South Korean Won. | ||
| (Y) | — | Par is denominated in Egyptian Pounds. | ||
| (Z) | — | Par is denominated in New Zealand Dollars. |
SWAP AGREEMENT FOOTNOTES:
| (a) | — | Counterparty to contract is Bank of America. | ||
| (b) | — | Counterparty to contract is Barclays Capital. | ||
| (c) | — | Counterparty to contract is BNP Paribas. | ||
| (d) | — | Counterparty to contract is Citibank NA London. | ||
| (f) | — | Counterparty to contract is Deutsche Bank AG. | ||
| (g) | — | Counterparty to contract is Goldman Sachs Capital Markets, LP. | ||
| (h) | — | Counterparty to contract is JPMorgan Chase Bank. | ||
| (i) | — | Counterparty to contract is Lehman Brothers Special Financing, Inc. | ||
| (j) | — | Counterparty to contract is Merrill Lynch Capital Services, Inc. | ||
| (k) | — | Counterparty to contract is Morgan Stanley Capital Services. | ||
| (m) | — | Counterparty to contract is Royal Bank of Scotland. | ||
| (n) | — | Counterparty to contract is UBS AG. | ||
| (o) | — | Counterparty to contract is Salomon Smith Barney, Inc. | ||
| (p) | — | Counterparty to contract is Credit Suisse International. |
120
Table of Contents
(This page intentionally left blank)
121
Table of Contents
STATEMENTS OF ASSETS AND LIABILITIES
June 30, 2008 (Unaudited)
| Money Market Fund | Low-Duration Bond Fund | Medium-Duration Bond Fund | ||||||||||
Assets | ||||||||||||
Investments in securities of unaffiliated issuers, at value | $ | 1,101,087,178 | $ | 968,140,475 | $ | 1,593,993,542 | ||||||
Investments in securities of affiliated issuers, at value | — | 14,990,850 | 43,896,530 | |||||||||
Total investments (1)(2) | 1,101,087,178 | 983,131,325 | 1,637,890,072 | |||||||||
Cash | 688 | 1,169,196 | 4,798,759 | |||||||||
Cash collateral for futures and swaps | — | 4,680,500 | 6,322,000 | |||||||||
Foreign currency (3) | — | 1,462,427 | 3,186,857 | |||||||||
Receivables: | ||||||||||||
Dividends and reclaims | — | 24,173 | 162,786 | |||||||||
Interest | 1,995,729 | 4,482,686 | 10,491,010 | |||||||||
Interest on swaps | — | — | 109,858 | |||||||||
Securities lending | 2,387 | 14,241 | 19,405 | |||||||||
Investment securities sold | — | 195,729,453 | 183,373,268 | |||||||||
Maturities | — | 536,463 | 369,821 | |||||||||
Fund shares sold | 7,902,217 | 302,910 | 491,656 | |||||||||
Variation margin | — | 639,565 | 1,028,617 | |||||||||
Unrealized appreciation on foreign currency exchange contracts | — | 267,378 | 1,670,548 | |||||||||
Unrealized appreciation on swap agreements | — | 4,681,997 | 3,804,795 | |||||||||
Prepaid expenses and other assets | (3,134 | ) | (54,104 | ) | (33,945 | ) | ||||||
Total Assets | 1,110,985,065 | 1,197,068,210 | 1,853,685,507 | |||||||||
Liabilities | ||||||||||||
Securities sold short, at value (5) | — | 151,337,152 | 16,479,690 | |||||||||
Options written at value (4) | — | 4,696,427 | 5,931,407 | |||||||||
Unrealized depreciation on foreign currency exchange contracts | — | 488,021 | 620,854 | |||||||||
Unrealized depreciation on swap agreements | — | 8,056,436 | 18,276,666 | |||||||||
Collateral held for securities on loan at value | 6,120,000 | 101,052,603 | 129,641,599 | |||||||||
Payables: | ||||||||||||
Investment securities purchased | — | 130,770,167 | 567,140,997 | |||||||||
Fund shares redeemed | 5,017,201 | 43,469 | 84,044 | |||||||||
Interest on swaps | — | 107,759 | 278,435 | |||||||||
Variation margin | — | 766,452 | 869,048 | |||||||||
Distributions | 713,260 | — | — | |||||||||
Securities lending | 457 | 2,849 | 3,881 | |||||||||
Deferred foreign capital gains taxes | — | — | — | |||||||||
Accrued expenses | ||||||||||||
Advisory fees | 141,423 | 176,828 | 301,441 | |||||||||
Distribution (12b-1) fees | 697 | 518 | 1,300 | |||||||||
Shareholder servicing fees | 155,218 | 103,963 | 156,159 | |||||||||
Other expenses | 103,546 | 85,963 | 148,291 | |||||||||
Total Liabilities | 12,251,802 | 397,688,607 | 739,933,812 | |||||||||
Net Assets | $ | 1,098,733,263 | $ | 799,379,603 | $ | 1,113,751,695 | ||||||
Net Assets Consist of: | ||||||||||||
Paid-in-capital | $ | 1,098,664,217 | $ | 824,358,644 | $ | 1,152,032,617 | ||||||
Undistributed (distributions in excess of) net investment income | — | 992,593 | (53,897 | ) | ||||||||
Undistributed (accumulated) net realized gain (loss) on investments, foreign currency transactions and derivative transactions | 69,046 | (7,856,410 | ) | 20,869,360 | ||||||||
Net unrealized appreciation (depreciation) on investments, foreign currency translations and derivative transactions | — | (18,115,224 | ) | (59,096,385 | ) | |||||||
Net Assets | $ | 1,098,733,263 | $ | 799,379,603 | $ | 1,113,751,695 | ||||||
Net Asset Value: | ||||||||||||
$0.001 par value, unlimited shares authorized Net assets applicable to the GS2 Class | $ | 123,868,067 | $ | 131,194,640 | $ | 146,140,646 | ||||||
GS2 shares outstanding | 123,860,616 | 15,125,998 | 18,418,234 | |||||||||
Net asset value, offering and redemption price per GS2 share | $ | 1.00 | $ | 8.67 | $ | 7.93 | ||||||
Net assets applicable to the GS4 Class | $ | 968,362,979 | $ | 662,530,925 | $ | 952,784,217 | ||||||
GS4 shares outstanding | 968,265,116 | 52,331,648 | 72,663,787 | |||||||||
Net asset value, offering and redemption price per GS4 share | $ | 1.00 | $ | 12.66 | $ | 13.11 | ||||||
Net assets applicable to the GS6 class | $ | 6,502,217 | $ | 5,654,038 | $ | 14,826,832 | ||||||
GS6 shares outstanding | 6,503,979 | 648,859 | 1,852,420 | |||||||||
Net asset value, offering and redemption price per GS6 share | $ | 1.00 | $ | 8.71 | $ | 8.00 | ||||||
(1) Investments in securities of unaffiliated issuers, at cost | $ | 1,101,087,178 | $ | 988,693,087 | $ | 1,646,132,489 | ||||||
Investments in securities of affiliated issuers, at cost | — | 14,990,850 | 43,896,530 | |||||||||
Total investments at cost | $ | 1,101,087,178 | $ | 1,003,683,937 | $ | 1,690,029,019 | ||||||
(2) Includes securities loaned of: | $ | 6,030,320 | $ | 98,992,357 | $ | 127,037,687 | ||||||
(3) Foreign currency at cost | $ | — | $ | 1,439,807 | $ | 3,160,659 | ||||||
(4) Premiums received on options written | $ | — | $ | (8,466,251 | ) | $ | (10,047,804 | ) | ||||
(5) Securities Sold Short at cost | $ | — | $ | (149,972,136 | ) | $ | (16,268,089 | ) | ||||
(6) Net of ($83,484) accrued foreign capital gains taxes on appreciated securities | ||||||||||||
| 122 | See Notes to Financial Statements. |
Table of Contents
Extended-Duration | Global Bond Fund | Equity Index Fund | Real Estate Securities Fund | Value Equity Fund | Growth Equity Fund | Small Cap Equity Fund | International Equity Fund | |||||||||||||||||||||||
| $ | 542,912,914 | $ | 223,966,221 | $ | 446,936,318 | $ | 168,504,873 | $ | 1,477,326,438 | $ | 1,603,990,060 | $ | 704,310,653 | $ | 1,883,583,237 | |||||||||||||||
| 4,963,945 | 44,659,877 | 9,794,845 | 2,046,144 | 58,643,549 | 42,888,022 | 18,372,509 | 39,825,543 | |||||||||||||||||||||||
| 547,876,859 | 268,626,098 | 456,731,163 | 170,551,017 | 1,535,969,987 | 1,646,878,082 | 722,683,162 | 1,923,408,780 | |||||||||||||||||||||||
| — | — | — | — | — | — | 8,943,058 | 10,015,572 | |||||||||||||||||||||||
| — | — | — | — | — | — | — | 10,822,670 | |||||||||||||||||||||||
| 2,681,480 | 1,465,228 | — | — | — | — | 29,139 | (6,416,565 | ) | ||||||||||||||||||||||
| 18,849 | 99,399 | 516,044 | 464,029 | 2,092,445 | 1,232,777 | 225,301 | 5,175,506 | |||||||||||||||||||||||
| 7,574,163 | 3,704,027 | — | — | — | — | 373,078 | — | |||||||||||||||||||||||
| — | — | — | — | — | — | — | — | |||||||||||||||||||||||
| 7,853 | 4,966 | 13,054 | 9,350 | 54,337 | 45,002 | 112,524 | 251,795 | |||||||||||||||||||||||
| 9,361,439 | 8,217,969 | 71 | 718,103 | 42,360,656 | 308,128 | 11,523,323 | 5,563,447 | |||||||||||||||||||||||
| — | — | — | — | — | — | — | — | |||||||||||||||||||||||
| 80,776 | 142,190 | 5,065 | 1,505,086 | 199,548 | 8,350 | 7,151 | 4,373 | |||||||||||||||||||||||
| — | 394,048 | 6,821 | — | 49,804 | 38,225 | 27,081 | 1,884,031 | |||||||||||||||||||||||
| — | 267,228 | — | — | — | — | 3,442 | 244,856 | |||||||||||||||||||||||
| — | — | — | — | — | — | — | — | |||||||||||||||||||||||
| (31,757 | ) | (2,807 | ) | (39,137 | ) | (46,086 | ) | (42,818 | ) | (35,061 | ) | (46,691 | ) | (48,955 | ) | |||||||||||||||
| 567,569,662 | 282,918,346 | 457,233,081 | 173,201,499 | 1,580,683,959 | 1,648,475,503 | 743,880,568 | 1,950,905,510 | |||||||||||||||||||||||
| — | — | — | — | — | — | — | — | |||||||||||||||||||||||
| — | — | — | — | — | — | 18,688 | — | |||||||||||||||||||||||
| — | 1,056,381 | — | — | — | — | 2,652 | 356,402 | |||||||||||||||||||||||
| — | — | — | — | — | — | — | — | |||||||||||||||||||||||
| 44,639,752 | 25,070,608 | 31,386,372 | 55,211,103 | 137,988,044 | 166,028,518 | 215,005,582 | 287,196,178 | |||||||||||||||||||||||
| 9,525,266 | 28,232,667 | 296,681 | 952,888 | 49,808,334 | 2,879,074 | 34,450,261 | 9,621,788 | |||||||||||||||||||||||
| 141,562 | — | 465,846 | 556,755 | 496,314 | 732,439 | 256,566 | 1,313,439 | |||||||||||||||||||||||
| — | — | — | — | — | — | — | — | |||||||||||||||||||||||
| — | 97,757 | — | 13,207 | — | — | 717,124 | 1,670,802 | |||||||||||||||||||||||
| (15 | ) | — | — | — | — | — | — | — | ||||||||||||||||||||||
| 1,571 | 993 | 2,610 | 1,869 | 10,868 | 9,001 | 22,488 | 50,358 | |||||||||||||||||||||||
| — | — | — | — | — | — | — | 83,484 | |||||||||||||||||||||||
| 184,139 | 64,670 | 10,737 | 74,885 | 703,674 | 936,005 | 372,489 | 1,068,612 | |||||||||||||||||||||||
| 1,471 | — | 115 | — | 1,471 | 1,140 | 1,531 | 2,311 | |||||||||||||||||||||||
| 72,880 | 31,321 | 58,179 | 19,291 | 196,578 | 207,590 | 69,587 | 218,390 | |||||||||||||||||||||||
| 64,163 | 67,976 | 151,856 | 138,805 | 163,764 | 121,202 | 100,943 | 557,359 | |||||||||||||||||||||||
| 54,630,789 | 54,622,373 | 32,372,396 | 56,968,803 | 189,369,047 | 170,914,969 | 251,017,911 | 302,139,123 | |||||||||||||||||||||||
| $ | 512,938,873 | $ | 228,295,973 | $ | 424,860,685 | $ | 116,232,696 | $ | 1,391,314,912 | $ | 1,477,560,534 | $ | 492,862,657 | $ | 1,648,766,387 | |||||||||||||||
| $ | 514,296,837 | $ | 237,966,064 | $ | 357,300,583 | $ | 145,074,426 | $ | 1,492,434,187 | $ | 1,332,404,029 | $ | 525,647,850 | $ | 1,402,132,230 | |||||||||||||||
| 973,479 | (374,373 | ) | 95,244 | 69,557 | 368,924 | (214,852 | ) | 1,293,947 | 27,470,311 | |||||||||||||||||||||
| 3,382,169 | (302,511 | ) | 2,069,085 | (11,196,950 | ) | (11,537,929 | ) | (83,748,337 | ) | (33,533,309 | ) | 112,691,634 | ||||||||||||||||||
| (5,713,612 | ) | (8,993,207 | ) | 65,395,773 | (17,714,337 | ) | (89,950,270 | ) | 229,119,694 | (545,831 | ) | 106,472,212 | (6) | |||||||||||||||||
| $ | 512,938,873 | $ | 228,295,973 | $ | 424,860,685 | $ | 116,232,696 | $ | 1,391,314,912 | $ | 1,477,560,534 | $ | 492,862,657 | $ | 1,648,766,387 | |||||||||||||||
| $ | 70,604,699 | N/A | $ | 69,361,986 | N/A | $ | 196,384,925 | $ | 213,043,086 | $ | 78,715,240 | $ | 312,499,080 | |||||||||||||||||
| 9,620,415 | N/A | 7,647,957 | N/A | 25,823,958 | 18,673,726 | 8,979,675 | 23,968,181 | |||||||||||||||||||||||
| $ | 7.34 | N/A | $ | 9.07 | N/A | $ | 7.60 | $ | 11.41 | $ | 8.77 | $ | 13.04 | |||||||||||||||||
| $ | 425,535,574 | $ | 228,295,973 | $ | 354,737,643 | $ | 116,232,696 | $ | 1,179,334,209 | $ | 1,252,254,946 | $ | 397,762,029 | $ | 1,311,293,294 | |||||||||||||||
| 29,421,786 | 24,254,226 | 21,422,494 | 13,513,824 | 81,829,143 | 69,255,122 | 30,453,441 | 80,259,339 | |||||||||||||||||||||||
| $ | 14.46 | $ | 9.41 | $ | 16.56 | $ | 8.60 | $ | 14.41 | $ | 18.08 | $ | 13.06 | $ | 16.34 | |||||||||||||||
| $ | 16,798,600 | N/A | $ | 761,056 | N/A | $ | 15,595,778 | $ | 12,262,502 | $ | 16,385,388 | $ | 24,974,013 | |||||||||||||||||
| 2,290,784 | N/A | 82,563 | N/A | 2,068,406 | 1,101,448 | 1,941,959 | 1,954,451 | |||||||||||||||||||||||
| $ | 7.33 | N/A | $ | 9.22 | N/A | $ | 7.54 | $ | 11.13 | $ | 8.44 | $ | 12.78 | |||||||||||||||||
| $ | 548,626,276 | $ | 232,017,294 | $ | 380,995,163 | $ | 186,147,469 | $ | 1,564,743,286 | $ | 1,372,750,241 | $ | 701,336,751 | $ | 1,775,342,877 | |||||||||||||||
| 4,963,945 | 44,659,877 | 9,794,845 | 2,046,144 | 58,643,549 | 42,888,022 | 18,372,509 | 39,825,543 | |||||||||||||||||||||||
| $ | 553,590,221 | $ | 276,677,171 | $ | 390,790,008 | $ | 188,193,613 | $ | 1,623,386,835 | $ | 1,415,638,263 | $ | 719,709,260 | $ | 1,815,168,420 | |||||||||||||||
| $ | 43,616,241 | $ | 24,484,534 | $ | 30,313,433 | $ | 54,122,608 | $ | 132,605,210 | $ | 161,650,866 | $ | 206,729,943 | $ | 272,957,833 | |||||||||||||||
| $ | 2,678,461 | $ | 1,413,149 | $ | — | $ | — | $ | — | $ | — | $ | 29,152 | $ | (6,401,589 | ) | ||||||||||||||
| $ | — | $ | — | $ | — | $ | — | $ | — | $ | — | $ | (35,974 | ) | $ | — | ||||||||||||||
| $ | — | $ | — | $ | — | $ | — | $ | — | $ | — | $ | — | $ | — | |||||||||||||||
| See Notes to Financial Statements. | 123 |
Table of Contents
STATEMENTS OF OPERATIONS
For the Six Months Ended June 30, 2008 (Unaudited)
| Money Market Fund | Low-Duration Bond Fund | Medium-Duration Bond Fund | ||||||||||
Investment Income | ||||||||||||
Dividends | $ | — | $ | — | $ | 189,907 | ||||||
Income dividends received from affiliated funds | 4,517 | 661,486 | 1,405,593 | |||||||||
Interest | 19,608,856 | 16,279,530 | 30,007,466 | |||||||||
Securities Lending | 3,555 | 301,397 | 303,303 | |||||||||
Less foreign taxes withheld | — | — | — | |||||||||
Total Investment Income | 19,616,928 | 17,242,413 | 31,906,269 | |||||||||
Expenses | ||||||||||||
Investment advisory fees | 863,289 | 1,348,886 | 2,478,011 | |||||||||
Transfer agent fees: | ||||||||||||
GS2 shares | 2,344 | 2,286 | 2,259 | |||||||||
GS4 shares | 21,949 | 14,650 | 17,612 | |||||||||
GS6 shares | 3,336 | 3,287 | 3,360 | |||||||||
Custodian fees | 12,291 | 52,977 | 104,155 | |||||||||
Distribution (12b-1) fees: | ||||||||||||
GS6 shares | 3,161 | 2,835 | 7,445 | |||||||||
Shareholder servicing fees: | ||||||||||||
GS4 shares | 941,450 | 625,804 | 990,450 | |||||||||
GS6 shares | 9,428 | 8,472 | 22,239 | |||||||||
Accounting and administration fees | 112,744 | 119,301 | 206,234 | |||||||||
Professional fees | 16,784 | 25,420 | 17,840 | |||||||||
Blue sky fees: | ||||||||||||
GS2 shares | 1,021 | 6,519 | 6,491 | |||||||||
GS4 shares | 28,407 | 40,678 | 41,796 | |||||||||
GS6 shares | 7,719 | 28,801 | 11,586 | |||||||||
Shareholder reporting fees: | ||||||||||||
GS2 shares | (239 | ) | 233 | 187 | ||||||||
GS4 shares | 16,901 | 2,144 | 2,810 | |||||||||
GS6 shares | 226 | 95 | 228 | |||||||||
Trustee fees | 8,900 | 6,658 | 10,066 | |||||||||
Line of credit facility fees | 1,643 | 1,425 | 2,382 | |||||||||
Other expenses | 13,734 | 20,438 | 46,238 | |||||||||
Total expenses | 2,065,088 | 2,310,909 | 3,971,389 | |||||||||
Expenses waived/reimbursed net of amount recaptured(2) | (4,612 | ) | (337,788 | ) | (503,980 | ) | ||||||
Fees paid indirectly | — | — | — | |||||||||
Net expenses | 2,060,476 | 1,973,121 | 3,467,409 | |||||||||
Net Investment Income | 17,556,452 | 15,269,292 | 28,438,860 | |||||||||
Realized and Unrealized Gain (Loss) | ||||||||||||
Net realized gain (loss) from: | �� | |||||||||||
Investment securities (net of capital gains taxes of $30,090 for International Equity) | 71,667 | 2,712,462 | 8,487,048 | |||||||||
Futures transactions | — | 2,401,628 | 12,145,582 | |||||||||
Swap agreements | — | 1,751,750 | 2,101,738 | |||||||||
Option contracts written | — | (7,024,478 | ) | 10,429,593 | ||||||||
Option contracts purchased | — | 10,923,080 | (7,334,579 | ) | ||||||||
Foreign currency transactions | — | 737,388 | (193,842 | ) | ||||||||
Net realized gain (loss) | 71,667 | 11,501,830 | 25,635,540 | |||||||||
Net change in unrealized appreciation (depreciation) on: | ||||||||||||
Investment securities (net of estimated deferred capital gains taxes of $117,515 for International Equity) | — | (17,546,445 | ) | (50,017,356 | ) | |||||||
Futures | — | (3,806,039 | ) | (2,701,891 | ) | |||||||
Swap agreements | — | (1,107,796 | ) | (8,241,423 | ) | |||||||
Option contracts written | — | 7,449,250 | 7,681,127 | |||||||||
Option contracts purchased | — | (10,522,518 | ) | (12,683,224 | ) | |||||||
Foreign currency translations | — | (325,381 | ) | 709,519 | ||||||||
Net change in unrealized appreciation (depreciation) | — | (25,858,929 | ) | (65,253,248 | ) | |||||||
Net Realized and Unrealized Gain (Loss) | 71,667 | (14,357,099 | ) | (39,617,708 | ) | |||||||
Net Increase (Decrease) in Net Assets Resulting from Operations | $ | 17,628,119 | $ | 912,193 | $ | (11,178,848 | ) | |||||
(1) | See Note 1 in Notes to Financial Statements. |
(2) | See Note 3a and 3c in Notes to Financial Statements. |
| 124 | See Notes to Financial Statements. |
Table of Contents
Extended-Duration | Global Bond Fund | Equity Index Fund | Real Estate Securities Fund | Value Equity Fund | Growth Equity Fund | Small Cap Equity Fund | International Equity Fund | |||||||||||||||||||||||
| $ | 825 | $ | 10,576 | $ | 4,592,175 | $ | 1,751,883 | $ | 19,486,646 | $ | 6,382,004 | $ | 1,857,060 | $ | 40,867,206 | |||||||||||||||
| 219,939 | 182,192 | 152,000 | 81,425 | 603,983 | 1,308,503 | 472,305 | 951,656 | |||||||||||||||||||||||
| 18,480,404 | 4,617,134 | 17,766 | 9,613 | 69,979 | 124,111 | 1,024,723 | 16,146 | |||||||||||||||||||||||
| 82,404 | 39,556 | 71,636 | 54,909 | 301,266 | 322,776 | 728,172 | 1,522,319 | |||||||||||||||||||||||
| — | (4,266 | ) | — | (1,276 | ) | (48,155 | ) | (17,259 | ) | (4,804 | ) | (3,652,431 | ) | |||||||||||||||||
| 18,783,572 | 4,845,192 | 4,833,577 | 1,896,554 | 20,413,719 | 8,120,135 | 4,077,456 | 39,704,896 | |||||||||||||||||||||||
| 1,298,045 | 278,698 | 341,366 | 489,279 | 4,692,179 | 6,511,533 | 2,429,267 | 7,786,638 | |||||||||||||||||||||||
| 2,488 | — | 2,550 | — | 2,593 | 2,435 | 2,784 | 2,793 | |||||||||||||||||||||||
| 17,598 | 1,546 | 19,369 | 36,854 | 24,068 | 18,544 | 25,442 | 26,652 | |||||||||||||||||||||||
| 3,449 | — | 3,452 | — | 3,382 | 3,322 | 3,443 | 3,390 | |||||||||||||||||||||||
| 18,824 | 40,938 | 26,631 | 46,932 | 48,326 | 36,655 | 79,679 | 799,752 | |||||||||||||||||||||||
| 8,508 | — | 275 | — | 8,420 | 6,201 | 8,294 | 13,051 | |||||||||||||||||||||||
| 448,352 | 127,287 | 363,591 | 104,492 | 1,219,551 | 1,258,325 | 391,623 | 1,281,823 | |||||||||||||||||||||||
| 25,410 | — | 1,038 | — | 25,071 | 18,522 | 24,642 | 38,761 | |||||||||||||||||||||||
| 69,220 | 28,021 | 59,818 | 18,383 | 162,916 | 167,974 | 66,550 | 288,051 | |||||||||||||||||||||||
| 17,690 | 40,131 | 41,376 | 49,140 | 41,376 | 20,056 | 16,276 | 24,844 | |||||||||||||||||||||||
| 6,491 | — | 6,519 | — | 6,519 | 6,519 | 6,519 | 6,519 | |||||||||||||||||||||||
| 35,379 | 19,327 | 41,568 | 64,271 | 53,923 | 35,414 | 45,804 | 58,808 | |||||||||||||||||||||||
| 11,657 | — | 11,097 | — | 12,487 | 13,479 | 14,399 | 13,851 | |||||||||||||||||||||||
| 45 | — | 18 | — | 37 | 33 | 57 | 32 | |||||||||||||||||||||||
| 3,069 | 2,497 | 8,310 | 14,196 | 16,842 | 4,450 | 6,152 | 26,097 | |||||||||||||||||||||||
| 33 | — | 111 | — | 284 | 273 | — | 180 | |||||||||||||||||||||||
| 4,861 | 788 | 4,423 | 835 | 14,280 | 14,090 | 5,271 | 13,865 | |||||||||||||||||||||||
| 1,294 | 244 | 990 | 249 | 3,500 | 3,604 | 1,334 | 3,569 | |||||||||||||||||||||||
| 11,759 | 21,647 | 19,360 | 7,270 | 24,293 | 23,697 | 17,883 | 96,497 | |||||||||||||||||||||||
| 1,984,172 | 561,124 | 951,862 | 831,901 | 6,360,047 | 8,145,126 | 3,145,419 | 10,485,173 | |||||||||||||||||||||||
| (71,841 | ) | (12,762 | ) | (157,230 | ) | (122,580 | ) | (104,954 | ) | (665,623 | ) | (250,140 | ) | (1,339,927 | ) | |||||||||||||||
| — | — | — | — | (49,572 | ) | (50,904 | ) | (16,398 | ) | (35,226 | ) | |||||||||||||||||||
| 1,912,331 | 548,362 | 794,632 | 709,321 | 6,205,521 | 7,428,599 | 2,878,881 | 9,110,020 | |||||||||||||||||||||||
| 16,871,241 | 4,296,830 | 4,038,945 | 1,187,233 | 14,208,198 | 691,536 | 1,198,575 | 30,594,876 | |||||||||||||||||||||||
| 2,343,776 | (831,827 | ) | 6,882,058 | (8,274,352 | ) | 13,588,152 | (9,589,942 | ) | (23,894,060 | ) | 99,430,216 | |||||||||||||||||||
| — | 384,668 | (1,591,802 | ) | (285,648 | ) | (7,300,424 | ) | (9,019,799 | ) | (5,619,496 | ) | (5,800,674 | ) | |||||||||||||||||
| — | — | — | — | — | — | — | — | |||||||||||||||||||||||
| — | — | — | — | — | — | — | — | |||||||||||||||||||||||
| — | 111,342 | — | — | — | — | — | — | |||||||||||||||||||||||
| 1,224,936 | 398,475 | — | — | — | 3,467 | (41,969 | ) | 210,014 | ||||||||||||||||||||||
| 3,568,712 | 62,658 | 5,290,256 | (8,560,000 | ) | 6,287,728 | (18,606,274 | ) | (29,555,525 | ) | 93,839,556 | ||||||||||||||||||||
| (30,540,833 | ) | (7,407,215 | ) | (70,157,704 | ) | 2,095,148 | (254,570,601 | ) | (165,106,642 | ) | (18,030,306 | ) | (304,577,045 | ) | ||||||||||||||||
| — | (434,682 | ) | (532,188 | ) | (93,324 | ) | (2,517,650 | ) | (2,058,377 | ) | (3,662,955 | ) | (679,026 | ) | ||||||||||||||||
| — | — | — | — | — | — | — | — | |||||||||||||||||||||||
| — | — | — | — | — | — | — | — | |||||||||||||||||||||||
| — | (542,577 | ) | — | — | — | — | 8,024 | — | ||||||||||||||||||||||
| (6,487 | ) | (711,317 | ) | — | — | — | 567 | 13,287 | (2,099,567 | ) | ||||||||||||||||||||
| (30,547,320 | ) | (9,095,791 | ) | (70,689,892 | ) | 2,001,824 | (257,088,251 | ) | (167,164,452 | ) | (21,671,950 | ) | (307,355,638 | ) | ||||||||||||||||
| (26,978,608 | ) | (9,033,133 | ) | (65,399,636 | ) | (6,558,176 | ) | (250,800,523 | ) | (185,770,726 | ) | (51,227,475 | ) | (213,516,082 | ) | |||||||||||||||
| $ | (10,107,367 | ) | $ | (4,736,303 | ) | $ | (61,360,691 | ) | $ | (5,370,943 | ) | $ | (236,592,325 | ) | $ | (185,079,190 | ) | $ | (50,028,900 | ) | $ | (182,921,206 | ) | |||||||
| See Notes to Financial Statements. | 125 |
Table of Contents
STATEMENTS OF CHANGES IN NET ASSETS
| Money Market Fund | ||||||||
| For the Six Months Ended 06/30/08 (Unaudited) | For the Year Ended 12/31/07 | |||||||
Operations: | ||||||||
Net investment income | $ | 17,556,452 | $ | 53,685,126 | ||||
Net realized gain on investment securities, foreign currency transactions and derivative transactions | 71,667 | 6,543 | ||||||
Net change in unrealized appreciation (depreciation) on investment securities, foreign currency translations and derivative transactions | — | — | ||||||
Net increase (decrease) in net assets resulting from operations | 17,628,119 | 53,691,669 | ||||||
Dividends and Distributions to Shareholders: | ||||||||
Dividends from net investment income | ||||||||
GS2 shares | (1,972,933 | ) | (5,538,291 | ) | ||||
GS4 shares | (15,498,685 | ) | (47,809,133 | ) | ||||
GS6 shares | (84,834 | ) | (238,657 | ) | ||||
GS8 shares(1) | — | (99,045 | ) | |||||
Distributions from net realized capital gains | ||||||||
GS2 shares | — | — | ||||||
GS4 shares | — | — | ||||||
GS6 shares | — | — | ||||||
GS8 shares(1) | — | — | ||||||
Total dividends and distributions | (17,556,452 | ) | (53,685,126 | ) | ||||
Capital Share Transactions: | ||||||||
Proceeds from shares sold | ||||||||
GS2 shares | 61,596,537 | 178,932,360 | ||||||
GS4 shares | 2,235,984,110 | 3,334,006,987 | ||||||
GS6 shares | 854,476 | 2,164,993 | ||||||
GS8 shares(1) | — | 214,065 | ||||||
Proceeds from exchange of GS8 shares for GS6 shares(1) | ||||||||
GS6 shares | — | 301,818 | ||||||
GS8 shares | — | (301,818 | ) | |||||
Reinvestment of dividends and distributions | ||||||||
GS2 shares | 1,773,219 | 4,895,984 | ||||||
GS4 shares | 8,908,387 | 24,364,936 | ||||||
GS6 shares | 84,834 | 238,657 | ||||||
GS8 shares(1) | — | 96,906 | ||||||
Total proceeds from shares sold and reinvested | 2,309,201,563 | 3,544,914,888 | ||||||
Value of shares redeemed | ||||||||
GS2 shares | (52,090,428 | ) | (171,806,826 | ) | ||||
GS4 shares | (2,216,189,197 | ) | (3,349,363,902 | ) | ||||
GS6 shares | (416,209 | ) | (1,510,697 | ) | ||||
GS8 shares(1) | — | (5,466,591 | ) | |||||
Total value of shares redeemed | (2,268,695,834 | ) | (3,528,148,016 | ) | ||||
Net increase (decrease) from capital share transactions(2) | 40,505,729 | 16,766,872 | ||||||
Total increase (decrease) in net assets | 40,577,396 | 16,773,415 | ||||||
Net Assets: | ||||||||
Beginning of Period | 1,058,155,867 | 1,041,382,452 | ||||||
End of Period* | $ | 1,098,733,263 | $ | 1,058,155,867 | ||||
* Including undistributed (distributions in excess of) net investment income | $ | — | $ | — | ||||
(1) See Note 1 in Notes to Financial Statements. (2) See Note 7 in Notes to Financial Statements. |
| |||||||
| 126 | See Notes to Financial Statements. |
Table of Contents
| Low-Duration Bond Fund | Medium-Duration Bond Fund | Extended-Duration Bond Fund | Global Bond Fund | |||||||||||||||||||||||||||
For the Six | For the Year Ended 12/31/07 | For the Six Months Ended 06/30/08 (Unaudited) | For the Year Ended 12/31/07 | For the Six Months Ended 06/30/08 (Unaudited) | For the Year Ended 12/31/07 | For the Six Months Ended 06/30/08 (Unaudited) | For the Year Ended 12/31/07 | |||||||||||||||||||||||
| $ | 15,269,292 | $ | 36,001,977 | $ | 28,438,860 | $ | 59,912,304 | $ | 16,871,241 | $ | 28,299,838 | $ | 4,296,830 | $ | 7,087,278 | |||||||||||||||
| 11,501,830 | 361,395 | 25,635,540 | 12,982,749 | 3,568,712 | 6,718,044 | 62,658 | 1,363,429 | |||||||||||||||||||||||
| (25,858,929 | ) | 11,142,622 | (65,253,248 | ) | 5,195,793 | (30,547,320 | ) | 10,327,793 | (9,095,791 | ) | (441,595 | ) | ||||||||||||||||||
| 912,193 | 47,505,994 | (11,178,848 | ) | 78,090,846 | (10,107,367 | ) | 45,345,675 | (4,736,303 | ) | 8,009,112 | ||||||||||||||||||||
| (3,590,876 | ) | (7,672,524 | ) | (5,866,320 | ) | (10,666,648 | ) | (3,855,449 | ) | (6,092,828 | ) | — | — | |||||||||||||||||
| (11,984,387 | ) | (26,263,698 | ) | (22,795,381 | ) | (49,428,227 | ) | (11,644,642 | ) | (21,342,760 | ) | (4,672,845 | ) | (7,440,952 | ) | |||||||||||||||
| (141,150 | ) | (283,996 | ) | (512,125 | ) | (987,213 | ) | (814,639 | ) | (1,340,200 | ) | — | — | |||||||||||||||||
| — | (97,187 | ) | — | (131,335 | ) | — | (148,346 | ) | — | — | ||||||||||||||||||||
| — | — | (2,050,288 | ) | (57,748 | ) | (990,525 | ) | (1,089,726 | ) | — | — | |||||||||||||||||||
| — | — | (8,104,138 | ) | (261,757 | ) | (3,113,344 | ) | (4,016,550 | ) | (996,177 | ) | (362,235 | ) | |||||||||||||||||
| — | — | (186,251 | ) | (5,694 | ) | (215,874 | ) | (250,814 | ) | — | — | |||||||||||||||||||
| — | — | — | — | — | (88,500 | ) | — | — | ||||||||||||||||||||||
| (15,716,413 | ) | (34,317,405 | ) | (39,514,503 | ) | (61,538,622 | ) | (20,634,473 | ) | (34,369,724 | ) | (5,669,022 | ) | (7,803,187 | ) | |||||||||||||||
| 7,956,413 | 31,333,771 | 22,602,411 | 39,644,411 | 8,400,579 | 21,710,537 | — | — | |||||||||||||||||||||||
| 55,629,064 | 66,354,406 | 72,305,630 | 101,252,003 | 16,642,521 | 59,533,256 | 116,419,388 | 20,015,199 | |||||||||||||||||||||||
| 320,911 | 62,248 | 433,288 | 1,034,684 | 83,759 | 154,752 | — | — | |||||||||||||||||||||||
| — | 3,014 | — | 22,979 | — | 4,960 | — | — | |||||||||||||||||||||||
| — | 32,919 | — | 62,954 | — | 14,692 | — | — | |||||||||||||||||||||||
| — | (32,919 | ) | — | (62,954 | ) | — | (14,692 | ) | — | — | ||||||||||||||||||||
| 3,590,005 | 7,645,639 | 7,635,563 | 10,671,347 | 4,844,302 | 7,157,871 | — | — | |||||||||||||||||||||||
| 11,983,469 | 26,261,575 | 30,897,942 | 49,687,483 | 14,757,667 | 25,352,570 | 5,669,022 | 7,803,187 | |||||||||||||||||||||||
| 141,150 | 283,996 | 698,376 | 992,907 | 1,030,513 | 1,591,014 | — | — | |||||||||||||||||||||||
| — | 97,187 | — | 131,335 | — | 236,846 | — | — | |||||||||||||||||||||||
| 79,621,012 | 132,041,836 | 134,573,210 | 203,437,149 | 45,759,341 | 115,741,806 | 122,088,410 | 27,818,386 | |||||||||||||||||||||||
| (10,415,753 | ) | (11,842,391 | ) | (25,991,587 | ) | (10,331,020 | ) | (12,277,491 | ) | (11,480,654 | ) | — | ||||||||||||||||||
| (59,030,128 | ) | (137,993,498 | ) | (189,204,087 | ) | (199,257,167 | ) | (82,934,697 | ) | (65,500,790 | ) | (8,719,775 | ) | (7,326,950 | ) | |||||||||||||||
| (183,036 | ) | (25,141 | ) | (86,448 | ) | (996,214 | ) | (116,971 | ) | (559 | ) | — | ||||||||||||||||||
| — | (5,027,787 | ) | — | (5,325,871 | ) | (5,555,877 | ) | — | ||||||||||||||||||||||
| (69,628,917 | ) | (154,888,817 | ) | (215,282,122 | ) | (215,910,272 | ) | (95,329,159 | ) | (82,537,880 | ) | (8,719,775 | ) | (7,326,950 | ) | |||||||||||||||
| 9,992,095 | (22,846,981 | ) | (80,708,912 | ) | (12,473,123 | ) | (49,569,818 | ) | 33,203,926 | 113,368,635 | 20,491,436 | |||||||||||||||||||
| (4,812,125 | ) | (9,658,392 | ) | (131,402,263 | ) | 4,079,101 | (80,311,658 | ) | 44,179,877 | 102,963,310 | 20,697,361 | |||||||||||||||||||
| 804,191,728 | 813,850,120 | 1,245,153,958 | 1,241,074,857 | 593,250,531 | 549,070,654 | 125,332,663 | 104,635,302 | |||||||||||||||||||||||
| $ | 799,379,603 | $ | 804,191,728 | $ | 1,113,751,695 | $ | 1,245,153,958 | $ | 512,938,873 | $ | 593,250,531 | $ | 228,295,973 | $ | 125,332,663 | |||||||||||||||
| $ | 992,593 | $ | 1,439,714 | $ | (53,897 | ) | $ | 681,069 | $ | 973,479 | $ | 416,968 | $ | (374,373 | ) | $ | 1,642 | |||||||||||||
| See Notes to Financial Statements. | 127 |
Table of Contents
STATEMENTS OF CHANGES IN NET ASSETS
| Equity Index Fund | Real Estate Securities Fund | |||||||||||||||
| For the Six Months Ended 06/30/08 (Unaudited) | For the Year Ended 12/31/07 | For the Six Months Ended 06/30/08 (Unaudited) | For the Year Ended 12/31/07 | |||||||||||||
Operations: | ||||||||||||||||
Net investment income | $ | 4,038,945 | $ | 8,787,369 | $ | 1,187,233 | $ | 1,174,244 | ||||||||
Net realized gain (loss) on investment securities, foreign currency transactions and derivative transactions | 5,290,256 | 25,461,196 | (8,560,000 | ) | 9,946,333 | |||||||||||
Net change in unrealized appreciation (depreciation) on investment securities, foreign currency translations and derivative transactions | (70,689,892 | ) | (7,317,962 | ) | 2,001,824 | (33,430,076 | ) | |||||||||
Net increase (decrease) in net assets resulting from operations | (61,360,691 | ) | 26,930,603 | (5,370,943 | ) | (22,309,499 | ) | |||||||||
Dividends and Distributions to Shareholders: | ||||||||||||||||
Dividends from net investment income | ||||||||||||||||
GS2 shares | (1,098,947 | ) | (2,396,727 | ) | — | — | ||||||||||
GS4 shares | (2,841,219 | ) | (6,279,342 | ) | (1,177,601 | ) | (1,114,099 | ) | ||||||||
GS6 shares | (10,679 | ) | (143,849 | ) | — | — | ||||||||||
Distributions from net realized capital gains | ||||||||||||||||
GS2 shares | (695,874 | ) | (5,483,594 | ) | — | — | ||||||||||
GS4 shares | (1,977,422 | ) | (16,735,167 | ) | — | (12,550,773 | ) | |||||||||
GS6 shares | (7,511 | ) | (42,505 | ) | — | — | ||||||||||
Total dividends and distributions | (6,631,652 | ) | (31,081,184 | ) | (1,177,601 | ) | (13,664,872 | ) | ||||||||
Capital Share Transactions: | ||||||||||||||||
Proceeds from shares sold | ||||||||||||||||
GS2 shares | 3,727,990 | 17,318,452 | — | — | ||||||||||||
GS4 shares | 12,620,011 | 42,486,377 | 47,819,344 | 111,957,141 | ||||||||||||
GS6 shares | 330,195 | 310,469 | — | — | ||||||||||||
GS8 shares(1) | — | 80,168 | — | — | ||||||||||||
Proceeds from exchange of GS8 shares for GS6 shares(1) | ||||||||||||||||
GS6 shares | — | 129,566 | — | — | ||||||||||||
GS8 shares | — | (129,566 | ) | — | — | |||||||||||
Reinvestment of dividends and distributions | ||||||||||||||||
GS2 shares | 1,792,168 | 7,880,321 | — | — | ||||||||||||
GS4 shares | 4,818,177 | 23,014,028 | 1,137,338 | 13,663,336 | ||||||||||||
GS6 shares | 18,190 | 186,354 | — | — | ||||||||||||
Total proceeds from shares sold and reinvested | 23,306,731 | 91,276,169 | 48,956,682 | 125,620,477 | ||||||||||||
Value of shares redeemed | ||||||||||||||||
GS2 shares | (5,629,925 | ) | (15,312,753 | ) | — | — | ||||||||||
GS4 shares | (35,866,419 | ) | (100,650,924 | ) | (22,950,645 | ) | (99,906,353 | ) | ||||||||
GS6 shares | (116,923 | ) | (14,837,734 | ) | — | — | ||||||||||
GS8 shares(1) | — | (6,709,689 | ) | — | — | |||||||||||
Total value of shares redeemed | (41,613,267 | ) | (137,511,100 | ) | (22,950,645 | ) | (99,906,353 | ) | ||||||||
Net increase (decrease) from capital share transactions(2) | (18,306,536 | ) | (46,234,931 | ) | 26,006,037 | 25,714,124 | ||||||||||
Total increase (decrease) in net assets | (86,298,879 | ) | (50,385,512 | ) | 19,457,493 | (10,260,247 | ) | |||||||||
Net Assets: | ||||||||||||||||
Beginning of Period | 511,159,564 | 561,545,076 | 96,775,203 | 107,035,450 | ||||||||||||
End of Period* | $ | 424,860,685 | $ | 511,159,564 | $ | 116,232,696 | $ | 96,775,203 | ||||||||
| ||||||||||||||||
* Including undistributed (distributions in excess of) net investment income | $ | 95,244 | $ | 7,144 | $ | 69,557 | $ | 59,925 | ||||||||
(1) See Note 1 in Notes to Financial Statements. (2) See Note 7 in Notes to Financial Statements. |
| |||||||||||||||
| 128 | See Notes to Financial Statements. |
Table of Contents
| Value Equity Fund | Growth Equity Fund | Small Cap Equity Fund | International Equity Fund | |||||||||||||||||||||||||||
For the Six Months | For the Year Ended 12/31/07 | For the Six Months Ended 06/30/08 (Unaudited) | For the Year Ended 12/31/07 | For the Six Months Ended 06/30/08 (Unaudited) | For the Year Ended 12/31/07 | For the Six Months Ended 06/30/08 (Unaudited) | For the Year Ended 12/31/07 | |||||||||||||||||||||||
| $ | 14,208,198 | $ | 25,750,914 | $ | 691,536 | $ | 2,291,785 | $ | 1,198,575 | $ | 2,031,110 | $ | 30,594,876 | $ | 22,903,965 | |||||||||||||||
| | 6,287,728 | | 109,509,564 | (18,606,274 | ) | 101,225,925 | (29,555,525 | ) | 53,354,323 | 93,839,556 | 251,442,073 | |||||||||||||||||||
| (257,088,251 | ) | (156,542,760 | ) | (167,164,452 | ) | 109,546,540 | (21,671,950 | ) | (50,321,205 | ) | (307,355,638 | ) | (80,256,374 | ) | ||||||||||||||||
| | (236,592,325 | ) | (21,282,282 | ) | (185,079,190 | ) | 213,064,250 | (50,028,900 | ) | 5,064,228 | (182,921,206 | ) | 194,089,664 | |||||||||||||||||
| (3,495,731 | ) | (6,198,596 | ) | (318,141 | ) | (764,503 | ) | — | (513,194 | ) | — | (4,950,877 | ) | |||||||||||||||||
| (10,096,889 | ) | (19,213,656 | ) | (604,203 | ) | (1,487,807 | ) | — | (1,456,206 | ) | — | (17,856,534 | ) | |||||||||||||||||
| (246,654 | ) | (432,944 | ) | — | — | — | (43,468 | ) | — | (395,926 | ) | |||||||||||||||||||
| (1,791,283 | ) | (24,783,302 | ) | — | — | — | (11,936,809 | ) | — | (45,519,702 | ) | |||||||||||||||||||
| (5,776,508 | ) | (88,434,175 | ) | — | — | — | (52,445,036 | ) | — | (192,888,593 | ) | |||||||||||||||||||
| (145,613 | ) | (2,026,807 | ) | — | — | — | (2,922,577 | ) | — | (4,700,995 | ) | |||||||||||||||||||
| (21,552,678 | ) | (141,089,480 | ) | (922,344 | ) | (2,252,310 | ) | — | (69,317,290 | ) | — | (266,312,627 | ) | |||||||||||||||||
| 17,099,062 | 69,148,249 | 15,690,256 | 54,095,628 | 16,343,115 | 17,551,589 | 78,145,959 | 76,072,933 | |||||||||||||||||||||||
| 74,754,239 | 181,185,102 | 67,351,716 | 135,306,396 | 15,148,887 | 56,487,534 | 160,960,618 | 194,576,950 | |||||||||||||||||||||||
| 218,440 | 2,030,826 | 152,503 | 2,907,748 | 134,398 | 1,233,647 | 418,061 | 1,761,039 | |||||||||||||||||||||||
| — | 176,742 | — | 80,594 | — | 66,601 | — | 179,320 | |||||||||||||||||||||||
| — | 445,015 | — | 181,274 | — | 174,140 | — | 333,450 | |||||||||||||||||||||||
| — | (445,015 | ) | — | (181,274 | ) | — | (174,140 | ) | — | (333,450 | ) | |||||||||||||||||||
| 5,280,037 | 30,977,959 | 317,750 | 764,503 | — | 12,450,002 | — | 50,460,024 | |||||||||||||||||||||||
| 15,872,061 | 107,637,522 | 604,193 | 1,487,784 | — | 53,895,325 | — | 210,719,957 | |||||||||||||||||||||||
| 392,267 | 2,459,750 | — | — | — | 2,966,045 | — | 5,096,921 | |||||||||||||||||||||||
| 113,616,106 | 393,616,150 | 84,116,418 | 194,642,653 | 31,626,400 | 144,650,743 | 239,524,638 | 538,867,144 | |||||||||||||||||||||||
| (17,819,436 | ) | (18,557,205 | ) | (18,804,452 | ) | (20,464,151 | ) | (7,384,034 | ) | (8,315,547 | ) | (13,347,968 | ) | (27,617,520 | ) | |||||||||||||||
| (102,288,657 | ) | (188,885,419 | ) | (145,964,592 | ) | (172,307,927 | ) | (42,488,456 | ) | (79,779,484 | ) | (102,297,444 | ) | (207,849,507 | ) | |||||||||||||||
| (71,118 | ) | (1,867,609 | ) | (100,728 | ) | (2,710,726 | ) | (22,116 | ) | (1,121,796 | ) | (189,305 | ) | (1,211,740 | ) | |||||||||||||||
| — | (7,266,923 | ) | — | (6,136,980 | ) | — | (6,946,803 | ) | — | (8,483,456 | ) | |||||||||||||||||||
| (120,179,211 | ) | (216,577,156 | ) | (164,869,772 | ) | (201,619,784 | ) | (49,894,606 | ) | (96,163,630 | ) | (115,834,717 | ) | (245,162,223 | ) | |||||||||||||||
| (6,563,105 | ) | 177,038,994 | (80,753,354 | ) | (6,977,131 | ) | (18,268,206 | ) | 48,487,113 | 123,689,921 | 293,704,921 | |||||||||||||||||||
| (264,708,108 | ) | 14,667,232 | (266,754,888 | ) | 203,834,809 | (68,297,106 | ) | (15,765,949 | ) | (59,231,285 | ) | 221,481,958 | ||||||||||||||||||
| 1,656,023,020 | 1,641,355,788 | 1,744,315,422 | 1,540,480,613 | 561,159,763 | 576,925,712 | 1,707,997,672 | 1,486,515,714 | |||||||||||||||||||||||
| $ | 1,391,314,912 | $ | 1,656,023,020 | $ | 1,477,560,534 | $ | 1,744,315,422 | $ | 492,862,657 | $ | 561,159,763 | $ | 1,648,766,387 | $ | 1,707,997,672 | |||||||||||||||
| $ | 368,924 | | $ | — | $ | (214,852 | ) | $ | 15,956 | $ | 1,293,947 | $ | 95,372 | $ | 27,470,311 | $ | (3,124,565 | ) | ||||||||||||
| See Notes to Financial Statements. | 129 |
Table of Contents
FINANCIAL HIGHLIGHTS (Unaudited)
For a Share Outstanding For the Years Ended December 31, unless otherwise indicated
| Ratios to Average Net Assets | ||||||||||||||||||||||||||||||||||||||||||||||
| Net Asset Value, Beginning of Period | Net Investment Income | Realized and Unrealized Gain (Loss) on Investments | Dividends from Net Investment Income | Distributions from Net Realized Capital Gains | Net Asset Value, End of Period | Total Return | Net Assets, End of Period (000) | Expenses, Net | Expenses, Including Expense Reduction | Expenses, Before Waivers and Expense Reduction | Investment Income, Net | Investment Income/ (Loss), Excluding Waivers and Expense Reduction | Portfolio Turnover Rate | |||||||||||||||||||||||||||||||||
Money Market Fund |
| |||||||||||||||||||||||||||||||||||||||||||||
GS2 Class |
| |||||||||||||||||||||||||||||||||||||||||||||
2008(1) | $ | 1.00 | $ | 0.02 | $ | — | $ | (0.02 | ) | $ | — | $ | 1.00 | 1.67 | % | $ | 123,868 | 0.19 | % | 0.19 | % | 0.19 | % | 3.31 | % | 3.31 | % | N/A | ||||||||||||||||||
2007 | 1.00 | 0.05 | — | † | (0.05 | ) | — | 1.00 | 5.23 | 112,581 | 0.23 | 0.23 | 0.23 | 5.11 | 5.11 | N/A | ||||||||||||||||||||||||||||||
2006 | 1.00 | 0.05 | — | † | (0.05 | ) | — | 1.00 | 4.92 | 100,559 | 0.26 | 0.26 | 0.26 | 4.82 | 4.82 | N/A | ||||||||||||||||||||||||||||||
2005 | 1.00 | 0.03 | — | † | (0.03 | ) | — | 1.00 | 3.07 | 93,103 | 0.27 | 0.27 | 0.26 | 3.03 | 3.04 | N/A | ||||||||||||||||||||||||||||||
2004 | 1.00 | 0.01 | — | † | (0.01 | ) | — | 1.00 | 1.19 | 61,374 | 0.27 | 0.27 | 0.27 | 1.17 | 1.17 | N/A | ||||||||||||||||||||||||||||||
2003 | 1.00 | 0.01 | — | † | (0.01 | ) | — | † | 1.00 | 1.04 | 63,373 | 0.27 | 0.27 | 0.28 | 0.91 | 0.90 | N/A | |||||||||||||||||||||||||||||
GS4 Class |
| |||||||||||||||||||||||||||||||||||||||||||||
2008(1) | $ | 1.00 | $ | 0.02 | $ | — | $ | (0.02 | ) | $ | — | $ | 1.00 | 1.57 | % | $ | 968,363 | 0.39 | % | 0.39 | % | 0.39 | % | 3.14 | % | 3.14 | % | N/A | ||||||||||||||||||
2007 | 1.00 | 0.05 | — | † | (0.05 | ) | — | 1.00 | 5.03 | 939,596 | 0.43 | 0.43 | 0.43 | 4.92 | 4.92 | N/A | ||||||||||||||||||||||||||||||
2006 | 1.00 | 0.05 | — | † | (0.05 | ) | — | 1.00 | 4.72 | 930,582 | 0.46 | 0.46 | 0.46 | 4.64 | 4.64 | N/A | ||||||||||||||||||||||||||||||
2005 | 1.00 | 0.03 | — | † | (0.03 | ) | — | 1.00 | 2.88 | 766,322 | 0.46 | 0.46 | 0.46 | 2.84 | 2.84 | N/A | ||||||||||||||||||||||||||||||
2004 | 1.00 | 0.01 | — | † | (0.01 | ) | — | 1.00 | 0.99 | 838,087 | 0.46 | 0.46 | 0.45 | 0.98 | 0.99 | N/A | ||||||||||||||||||||||||||||||
2003 | 1.00 | 0.01 | — | † | (0.01 | ) | — | † | 1.00 | 0.85 | 853,062 | 0.45 | 0.45 | 0.45 | 0.84 | 0.84 | N/A | |||||||||||||||||||||||||||||
GS6 Class |
| |||||||||||||||||||||||||||||||||||||||||||||
2008(1) | $ | 1.00 | $ | 0.01 | $ | — | $ | (0.01 | ) | $ | — | $ | 1.00 | 1.36 | % | $ | 6,502 | 0.80 | % | 0.80 | % | 0.95 | % | 2.71 | % | 2.56 | % | N/A | ||||||||||||||||||
2007 | 1.00 | 0.04 | — | † | (0.04 | ) | — | 1.00 | 4.59 | 5,979 | 0.85 | 0.85 | 0.92 | 4.49 | 4.42 | N/A | ||||||||||||||||||||||||||||||
2006 | 1.00 | 0.04 | — | † | (0.04 | ) | — | 1.00 | 4.29 | 4,784 | 0.87 | 0.87 | 1.09 | 4.21 | 3.99 | N/A | ||||||||||||||||||||||||||||||
2005 | 1.00 | 0.02 | — | † | (0.02 | ) | — | 1.00 | 2.50 | 4,587 | 0.83 | 0.83 | 1.43 | 2.47 | 1.87 | N/A | ||||||||||||||||||||||||||||||
2004 | 1.00 | 0.01 | — | † | (0.01 | ) | — | 1.00 | 0.73 | 4,476 | 0.72 | 0.72 | 1.09 | 0.68 | 0.31 | N/A | ||||||||||||||||||||||||||||||
2003 | 1.00 | 0.01 | — | † | (0.01 | ) | — | † | 1.00 | 0.57 | 8,035 | 0.73 | 0.73 | 0.91 | 0.61 | 0.43 | N/A | |||||||||||||||||||||||||||||
Low-Duration Bond Fund |
| |||||||||||||||||||||||||||||||||||||||||||||
GS2 Class |
| |||||||||||||||||||||||||||||||||||||||||||||
2008(1) | $ | 8.90 | $ | 0.18 | # | $ | (0.17 | ) | $ | (0.24 | ) | $ | — | $ | 8.67 | 0.14 | % | $ | 131,195 | 0.36 | % | 0.36 | % | 0.41 | % | 3.98 | % | 3.93 | % | 403 | % | |||||||||||||||
2007 | 8.89 | 0.42 | # | 0.12 | (0.53 | ) | — | 8.90 | 6.22 | 133,374 | 0.42 | 0.42 | 0.45 | 4.71 | 4.68 | 248 | ||||||||||||||||||||||||||||||
2006 | 9.06 | 0.38 | # | (0.03 | ) | (0.52 | ) | — | 8.89 | 3.94 | 105,991 | 0.45 | 0.45 | 0.47 | 4.22 | 4.20 | 168 | |||||||||||||||||||||||||||||
2005 | 9.32 | 0.30 | # | (0.15 | ) | (0.41 | ) | — | † | 9.06 | 1.60 | 104,681 | 0.45 | 0.45 | 0.48 | 3.30 | 3.27 | 196 | ||||||||||||||||||||||||||||
2004 | 9.51 | 0.21 | # | (0.07 | ) | (0.28 | ) | (0.05 | ) | 9.32 | 1.47 | 59,777 | 0.45 | 0.45 | 0.49 | 2.22 | 2.18 | 289 | ||||||||||||||||||||||||||||
2003 | 9.76 | 0.22 | # | 0.03 | (0.37 | ) | (0.13 | ) | 9.51 | 2.61 | 53,726 | 0.45 | 0.45 | 0.50 | 2.30 | 2.25 | 179 | |||||||||||||||||||||||||||||
GS4 Class |
| |||||||||||||||||||||||||||||||||||||||||||||
2008(1) | $ | 12.88 | $ | 0.24 | # | $ | (0.23 | ) | $ | (0.23 | ) | $ | — | $ | 12.66 | 0.10 | % | $ | 662,531 | 0.52 | % | 0.52 | % | 0.60 | % | 3.82 | % | 3.74 | % | 403 | % | |||||||||||||||
2007 | 12.63 | 0.58 | # | 0.17 | (0.50 | ) | — | 12.88 | 6.11 | 665,292 | 0.58 | 0.58 | 0.64 | 4.54 | 4.48 | 248 | ||||||||||||||||||||||||||||||
2006 | 12.66 | 0.58 | # | (0.11 | ) | (0.50 | ) | — | 12.63 | 3.75 | 697,687 | 0.61 | 0.61 | 0.66 | 4.05 | 4.00 | 168 | |||||||||||||||||||||||||||||
2005 | 12.87 | 0.40 | # | (0.22 | ) | (0.39 | ) | — | † | 12.66 | 1.39 | 789,077 | 0.61 | 0.61 | 0.67 | 3.13 | 3.07 | 196 | ||||||||||||||||||||||||||||
2004 | 13.00 | 0.27 | # | (0.09 | ) | (0.26 | ) | (0.05 | ) | 12.87 | 1.38 | 789,866 | 0.61 | 0.61 | 0.67 | 2.06 | 2.00 | 289 | ||||||||||||||||||||||||||||
2003 | 13.16 | 0.32 | # | — | (0.35 | ) | (0.13 | ) | 13.00 | 2.45 | 727,265 | 0.61 | 0.61 | 0.67 | 2.43 | 2.37 | 179 | |||||||||||||||||||||||||||||
GS6 Class |
| |||||||||||||||||||||||||||||||||||||||||||||
2008(1) | $ | 8.95 | $ | 0.15 | # | $ | (0.17 | ) | $ | (0.22 | ) | $ | — | $ | 8.71 | (0.12 | )% | $ | 5,654 | 0.91 | % | 0.91 | % | 1.94 | % | 3.43 | % | 2.40 | % | 403 | % | |||||||||||||||
2007 | 8.93 | 0.37 | # | 0.13 | (0.48 | ) | — | 8.95 | 5.72 | 5,526 | 0.97 | 0.97 | 1.57 | 4.15 | 3.55 | 248 | ||||||||||||||||||||||||||||||
2006 | 9.09 | 0.60 | # | (0.30 | ) | (0.46 | ) | — | 8.93 | 3.43 | 5,159 | 1.00 | 1.00 | 1.05 | 3.63 | 3.58 | 168 | |||||||||||||||||||||||||||||
2005 | 9.36 | 0.25 | # | (0.16 | ) | (0.36 | ) | — | † | 9.09 | 0.96 | 11,380 | 0.94 | 0.94 | 1.05 | 2.74 | 2.63 | 196 | ||||||||||||||||||||||||||||
2004 | 9.54 | 0.17 | # | (0.06 | ) | (0.24 | ) | (0.05 | ) | 9.36 | 1.17 | 16,087 | 0.85 | 0.85 | 0.90 | 1.82 | 1.77 | 289 | ||||||||||||||||||||||||||||
2003 | 9.79 | 0.21 | # | — | (0.33 | ) | (0.13 | ) | 9.54 | 2.20 | 22,452 | 0.85 | 0.84 | 0.87 | 2.18 | 2.15 | 179 | |||||||||||||||||||||||||||||
| † | Amount represents less than $0.005 per share. |
| # | Calculated using the average shares outstanding method. |
| (1) | For the six months ended June 30, 2008. All ratios for the period have been annualized. Total return and portfolio turnover for the period have not been annualized. |
| 130 | See Notes to Financial Statements. |
Table of Contents
| Ratios to Average Net Assets | ||||||||||||||||||||||||||||||||||||||||||||||||||
| Net Asset Value, Beginning of Period | Net Investment Income | Realized and Unrealized Gain (Loss) on Investments | Dividends from Net Investment Income | Distributions from Net Realized Capital Gains | Return of Capital | Net Asset Value, End of Period | Total Return | Net Assets, End of Period (000) | Expenses, Net | Expenses, Including Expense Reduction | Expenses, Before Waivers and Expense Reduction | Investment Income, Net | Investment Income/ (Loss), Excluding Waivers and Expense Reduction | Portfolio Turnover Rate | ||||||||||||||||||||||||||||||||||||
Medium-Duration Bond Fund |
| |||||||||||||||||||||||||||||||||||||||||||||||||
GS2 Class |
| |||||||||||||||||||||||||||||||||||||||||||||||||
2008(1) | $ | 8.42 | $ | 0.20 | # | $ | (0.28 | ) | $ | (0.31 | ) | $ | (0.10 | ) | $ | — | $ | 7.93 | (1.01 | )% | $ | 146,141 | 0.47 | % | 0.47 | % | 0.48 | % | 4.77 | % | 4.76 | % | 348 | % | ||||||||||||||||
2007 | 8.52 | 0.42 | # | 0.12 | (0.64 | ) | — | † | — | 8.42 | 6.65 | 151,466 | 0.48 | 0.48 | 0.49 | 5.02 | 5.01 | 428 | ||||||||||||||||||||||||||||||||
2006 | 8.71 | 0.39 | # | (0.01 | ) | (0.57 | ) | — | — | 8.52 | 4.50 | 113,051 | 0.50 | 0.50 | 0.50 | 4.60 | 4.60 | 440 | ||||||||||||||||||||||||||||||||
2005 | 9.06 | 0.34 | # | (0.10 | ) | (0.53 | ) | (0.06 | ) | — | 8.71 | 2.62 | 100,800 | 0.50 | 0.50 | 0.53 | 3.84 | 3.81 | 465 | |||||||||||||||||||||||||||||||
2004 | 9.24 | 0.28 | # | 0.21 | (0.45 | ) | (0.22 | ) | — | 9.06 | 5.34 | 52,865 | 0.50 | 0.50 | 0.53 | 2.97 | 2.94 | 372 | ||||||||||||||||||||||||||||||||
2003 | 9.47 | 0.28 | # | 0.36 | (0.58 | ) | (0.29 | ) | — | 9.24 | 6.80 | 46,521 | 0.50 | 0.50 | 0.55 | 2.96 | 2.91 | 458 | ||||||||||||||||||||||||||||||||
GS4 Class |
| |||||||||||||||||||||||||||||||||||||||||||||||||
2008(1) | $ | 13.64 | $ | 0.31 | # | $ | (0.44 | ) | $ | (0.30 | ) | $ | (0.10 | ) | $ | — | $ | 13.11 | (0.96 | )% | $ | 952,784 | 0.58 | % | 0.58 | % | 0.67 | % | 4.66 | % | 4.57 | % | 348 | % | ||||||||||||||||
2007 | 13.42 | 0.66 | # | 0.18 | (0.62 | ) | — | † | — | 13.64 | 6.46 | 1,079,034 | 0.61 | 0.61 | 0.68 | 4.88 | 4.81 | 428 | ||||||||||||||||||||||||||||||||
2006 | 13.40 | 0.60 | # | (0.03 | ) | (0.55 | ) | — | — | 13.42 | 4.37 | 1,108,958 | 0.62 | 0.62 | 0.69 | 4.48 | 4.41 | 440 | ||||||||||||||||||||||||||||||||
2005 | 13.63 | 0.50 | # | (0.16 | ) | (0.51 | ) | (0.06 | ) | — | 13.40 | 2.50 | 981,935 | 0.62 | 0.62 | 0.71 | 3.71 | 3.62 | 465 | |||||||||||||||||||||||||||||||
2004 | 13.58 | 0.39 | # | 0.31 | (0.43 | ) | (0.22 | ) | — | 13.63 | 5.20 | 853,377 | 0.62 | 0.62 | 0.72 | 2.85 | 2.75 | 372 | ||||||||||||||||||||||||||||||||
2003 | 13.54 | 0.46 | # | 0.43 | (0.56 | ) | (0.29 | ) | — | 13.58 | 6.62 | 741,743 | 0.62 | 0.62 | 0.71 | 3.37 | 3.28 | 458 | ||||||||||||||||||||||||||||||||
GS6 Class |
| |||||||||||||||||||||||||||||||||||||||||||||||||
2008(1) | $ | 8.49 | $ | 0.18 | # | $ | (0.28 | ) | $ | (0.29 | ) | $ | (0.10 | ) | $ | — | $ | 8.00 | (1.21 | )% | $ | 14,827 | 0.93 | % | 0.93 | % | 1.08 | % | 4.32 | % | 4.17 | % | 348 | % | ||||||||||||||||
2007 | 8.59 | 0.38 | # | 0.12 | (0.60 | ) | — | † | — | 8.49 | 6.08 | 14,654 | 0.97 | 0.97 | 1.00 | 4.52 | 4.49 | 428 | ||||||||||||||||||||||||||||||||
2006 | 8.78 | 0.35 | # | (0.02 | ) | (0.52 | ) | — | — | 8.59 | 3.89 | 13,709 | 1.05 | 1.05 | 1.05 | 4.05 | 4.05 | 440 | ||||||||||||||||||||||||||||||||
2005 | 9.12 | 0.29 | # | (0.09 | ) | (0.48 | ) | (0.06 | ) | — | 8.78 | 2.18 | 13,195 | 1.00 | 1.00 | 1.06 | 3.29 | 3.21 | 465 | |||||||||||||||||||||||||||||||
2004 | 9.30 | 0.24 | # | 0.21 | (0.41 | ) | (0.22 | ) | — | 9.12 | 4.88 | 16,524 | 0.90 | 0.90 | 0.95 | 2.61 | 2.56 | 372 | ||||||||||||||||||||||||||||||||
2003 | 9.53 | 0.29 | # | 0.31 | (0.54 | ) | (0.29 | ) | — | 9.30 | 6.33 | 22,640 | 0.90 | 0.90 | 0.96 | 3.03 | 2.97 | 458 | ||||||||||||||||||||||||||||||||
Extended-Duration Bond Fund |
| |||||||||||||||||||||||||||||||||||||||||||||||||
GS2 Class |
| |||||||||||||||||||||||||||||||||||||||||||||||||
2008(1) | $ | 7.95 | $ | 0.23 | # | $ | (0.36 | ) | $ | (0.38 | ) | $ | (0.10 | ) | $ | — | $ | 7.34 | (1.63 | )% | $ | 70,605 | 0.52 | % | 0.52 | % | 0.52 | % | 6.12 | % | 6.12 | % | 25 | % | ||||||||||||||||
2007 | 8.13 | 0.41 | # | 0.23 | (0.69 | ) | (0.13 | ) | — | 7.95 | 8.45 | 75,841 | 0.53 | 0.53 | 0.53 | 5.21 | 5.21 | 101 | ||||||||||||||||||||||||||||||||
2006 | 8.44 | 0.40 | # | (0.03 | ) | (0.65 | ) | (0.03 | ) | — | 8.13 | 4.75 | 59,916 | 0.57 | 0.57 | 0.57 | 4.91 | 4.91 | 100 | |||||||||||||||||||||||||||||||
2005 | 8.90 | 0.44 | # | 0.04 | (0.68 | ) | (0.26 | ) | — | 8.44 | 5.65 | 57,372 | 0.56 | 0.56 | 0.57 | 4.90 | 4.89 | 38 | ||||||||||||||||||||||||||||||||
2004 | 9.23 | 0.47 | # | 0.27 | (0.76 | ) | (0.31 | ) | — | 8.90 | 8.49 | 32,309 | 0.57 | 0.57 | 0.57 | 5.17 | 5.17 | 66 | ||||||||||||||||||||||||||||||||
2003 | 9.64 | 0.54 | # | 0.51 | (0.79 | ) | (0.67 | ) | — | 9.23 | 11.32 | 29,004 | 0.59 | 0.59 | 0.60 | 5.49 | 5.48 | 121 | ||||||||||||||||||||||||||||||||
GS4 Class |
| |||||||||||||||||||||||||||||||||||||||||||||||||
2008(1) | $ | 15.20 | $ | 0.44 | # | $ | (0.71 | ) | $ | (0.37 | ) | $ | (0.10 | ) | $ | — | $ | 14.46 | (1.79 | )% | $ | 425,536 | 0.69 | % | 0.69 | % | 0.72 | % | 5.94 | % | 5.91 | % | 25 | % | ||||||||||||||||
2007 | 14.81 | 0.74 | # | 0.44 | (0.66 | ) | (0.13 | ) | — | 15.20 | 8.29 | 500,252 | 0.72 | 0.72 | 0.72 | 5.02 | 5.02 | 101 | ||||||||||||||||||||||||||||||||
2006 | 14.82 | 0.69 | # | (0.04 | ) | (0.63 | ) | (0.03 | ) | — | 14.81 | 4.56 | 467,877 | 0.73 | 0.73 | 0.76 | 4.75 | 4.72 | 100 | |||||||||||||||||||||||||||||||
2005 | 14.93 | 0.71 | # | 0.10 | (0.66 | ) | (0.26 | ) | — | 14.82 | 5.54 | 393,851 | 0.73 | 0.73 | 0.76 | 4.72 | 4.69 | 38 | ||||||||||||||||||||||||||||||||
2004 | 14.78 | 0.75 | # | 0.45 | (0.74 | ) | (0.31 | ) | — | 14.93 | 8.37 | 399,459 | 0.73 | 0.73 | 0.75 | 5.01 | 4.99 | 66 | ||||||||||||||||||||||||||||||||
2003 | 14.62 | 0.83 | # | 0.77 | (0.77 | ) | (0.67 | ) | — | 14.78 | 11.19 | 385,110 | 0.73 | 0.73 | 0.75 | 5.46 | 5.44 | 121 | ||||||||||||||||||||||||||||||||
GS6 Class |
| |||||||||||||||||||||||||||||||||||||||||||||||||
2008(1) | $ | 7.95 | $ | 0.22 | # | $ | (0.37 | ) | $ | (0.37 | ) | $ | (0.10 | ) | $ | — | $ | 7.33 | (1.97 | )% | $ | 16,799 | 0.97 | % | 0.97 | % | 1.08 | % | 5.68 | % | 5.57 | % | 25 | % | ||||||||||||||||
2007 | 8.13 | 0.38 | # | 0.23 | (0.66 | ) | (0.13 | ) | — | 7.95 | 7.96 | 17,157 | 0.99 | 0.99 | 1.01 | 4.74 | 4.72 | 101 | ||||||||||||||||||||||||||||||||
2006 | 8.44 | 0.36 | # | (0.03 | ) | (0.61 | ) | (0.03 | ) | — | 8.13 | 4.09 | 15,730 | 1.08 | 1.08 | 1.08 | 4.39 | 4.39 | 100 | |||||||||||||||||||||||||||||||
2005 | 8.89 | 0.39 | # | 0.05 | (0.63 | ) | (0.26 | ) | — | 8.44 | 5.19 | 15,100 | 1.09 | 1.09 | 1.09 | 4.37 | 4.37 | 38 | ||||||||||||||||||||||||||||||||
2004 | 9.22 | 0.44 | # | 0.27 | (0.73 | ) | (0.31 | ) | — | 8.89 | 8.05 | 24,043 | 0.98 | 0.98 | 0.96 | 4.76 | 4.78 | 66 | ||||||||||||||||||||||||||||||||
2003 | 9.63 | 0.52 | # | 0.50 | (0.76 | ) | (0.67 | ) | — | 9.22 | 10.95 | 27,978 | 0.93 | 0.93 | 0.94 | 5.25 | 5.24 | 121 | ||||||||||||||||||||||||||||||||
Global Bond Fund |
| |||||||||||||||||||||||||||||||||||||||||||||||||
GS4 Class |
| |||||||||||||||||||||||||||||||||||||||||||||||||
2008(1) | $ | 10.14 | $ | 0.32 | # | $ | (0.59 | ) | $ | (0.38 | ) | $ | (0.08 | ) | $ | — | $ | 9.41 | (2.78 | )% | $ | 228,296 | 0.82 | % | 0.82 | % | 0.84 | % | 6.46 | % | 6.44 | % | 114 | % | ||||||||||||||||
2007 | 10.12 | 0.61 | 0.08 | (0.64 | ) | (0.03 | ) | — | 10.14 | 7.00 | 125,333 | 0.79 | 0.79 | 0.80 | 6.07 | 6.06 | 255 | |||||||||||||||||||||||||||||||||
2006(2)(3) | 10.12 | — | † | — | † | — | † | — | — | † | 10.12 | 0.04 | 104,635 | 1.04 | 1.04 | 1.42 | 4.32 | 3.94 | — | |||||||||||||||||||||||||||||||
| † | Amount represents less than $0.005 per share. |
| # | Calculated using the average shares outstanding method. |
| (1) | For the six months ended June 30, 2008. All ratios for the period have been annualized. Total return and portfolio turnover for the period have not been annualized. |
| (2) | Inception date was December 29, 2006. |
| (3) | Total return is not annualized. Ratios are annualized. |
| See Notes to Financial Statements. | 131 |
Table of Contents
FINANCIAL HIGHLIGHTS (Unaudited) (Continued)
For a Share Outstanding For the Years Ended December 31, unless otherwise indicated
| Ratios to Average Net Assets | ||||||||||||||||||||||||||||||||||||||||||||||||||
| Net Asset Value, Beginning of Period | Net Investment Income | Realized and Unrealized Gain (Loss) on Investments | Dividends from Net Investment Income | Distributions from Net Realized Capital Gains | Excess Distribution/ Return of Capital | Net Asset Value, End of Period | Total Return | Net Assets, End of Period (000) | Expenses, Net | Expenses, Including Expense Reduction | Expenses, Before Waivers and Expense Reduction | Investment Income/ (Loss), Net | Investment Income/ (Loss), Excluding Waivers and Expense Reduction | Portfolio Turnover Rate | ||||||||||||||||||||||||||||||||||||
Equity Index Fund |
| |||||||||||||||||||||||||||||||||||||||||||||||||
GS2 Class |
| |||||||||||||||||||||||||||||||||||||||||||||||||
2008(1) | $ | 10.57 | $ | 0.09 | # | $ | (1.35 | ) | $ | (0.15 | ) | $ | (0.09 | ) | $ | — | $ | 9.07 | (11.98 | )% | $ | 69,362 | 0.23 | % | 0.23 | % | 0.24 | % | 1.89 | % | 1.88 | % | 2 | % | ||||||||||||||||
2007 | 11.08 | 0.20 | # | 0.39 | (0.32 | ) | (0.78 | ) | — | 10.57 | 5.19 | 81,104 | 0.22 | 0.22 | 0.22 | 1.77 | 1.77 | 5 | ||||||||||||||||||||||||||||||||
2006 | 9.96 | 0.18 | # | 1.33 | (0.28 | ) | (0.11 | ) | — | 11.08 | 15.37 | 74,634 | 0.23 | 0.23 | 0.23 | 1.74 | 1.74 | 5 | ||||||||||||||||||||||||||||||||
2005 | 9.78 | 0.16 | # | 0.30 | (0.24 | ) | (0.04 | ) | — | 9.96 | 4.80 | 62,214 | 0.23 | 0.23 | 0.24 | 1.63 | 1.62 | 6 | ||||||||||||||||||||||||||||||||
2004 | 9.08 | 0.16 | # | 0.81 | (0.27 | ) | — | — | † | 9.78 | 10.77 | 36,148 | 0.25 | 0.25 | 0.23 | 1.75 | 1.77 | 2 | ||||||||||||||||||||||||||||||||
2003 | 7.22 | 0.12 | # | 1.91 | (0.17 | ) | — | — | 9.08 | 28.19 | 33,009 | 0.25 | 0.25 | 0.28 | 1.46 | 1.43 | 2 | |||||||||||||||||||||||||||||||||
GS4 Class |
| |||||||||||||||||||||||||||||||||||||||||||||||||
2008(1) | $ | 19.07 | $ | 0.15 | # | $ | (2.44 | ) | $ | (0.13 | ) | $ | (0.09 | ) | $ | — | $ | 16.56 | (12.00 | )% | $ | 354,738 | 0.37 | % | 0.37 | % | 0.44 | % | 1.74 | % | 1.67 | % | 2 | % | ||||||||||||||||
2007 | 19.17 | 0.32 | # | 0.64 | (0.28 | ) | (0.78 | ) | — | 19.07 | 4.95 | 429,423 | 0.39 | 0.39 | 0.42 | 1.59 | 1.56 | 5 | ||||||||||||||||||||||||||||||||
2006 | 16.97 | 0.28 | # | 2.28 | (0.25 | ) | (0.11 | ) | — | 19.17 | 15.19 | 466,429 | 0.40 | 0.40 | 0.43 | 1.57 | 1.54 | 5 | ||||||||||||||||||||||||||||||||
2005 | 16.47 | 0.24 | # | 0.51 | (0.21 | ) | (0.04 | ) | — | 16.97 | 4.61 | 402,865 | 0.40 | 0.40 | 0.43 | 1.46 | 1.43 | 6 | ||||||||||||||||||||||||||||||||
2004 | 15.12 | 0.25 | # | 1.35 | (0.25 | ) | — | — | 16.47 | 10.60 | 417,962 | 0.40 | 0.40 | 0.41 | 1.60 | 1.59 | 2 | |||||||||||||||||||||||||||||||||
2003 | 11.93 | 0.18 | # | 3.16 | (0.15 | ) | — | — | 15.12 | 28.03 | 382,067 | 0.40 | 0.40 | 0.44 | 1.33 | 1.29 | 2 | |||||||||||||||||||||||||||||||||
GS6 Class |
| |||||||||||||||||||||||||||||||||||||||||||||||||
2008(1) | $ | 10.74 | $ | 0.07 | # | $ | (1.37 | ) | $ | (0.13 | ) | $ | (0.09 | ) | $ | — | $ | 9.22 | (12.11 | )% | $ | 761 | 0.60 | % | 0.60 | % | 4.84 | % | 1.52 | % | (2.72 | )% | 2 | % | ||||||||||||||||
2007 | 11.15 | 0.15 | # | 0.35 | (0.13 | ) | (0.78 | ) | — | 10.74 | 4.38 | 633 | 0.60 | 0.60 | 0.75 | 1.33 | 1.18 | 5 | ||||||||||||||||||||||||||||||||
2006 | 10.02 | 0.14 | # | 1.34 | (0.24 | ) | (0.11 | ) | — | 11.15 | 14.97 | 14,233 | 0.60 | 0.60 | 0.78 | 1.37 | 1.19 | 5 | ||||||||||||||||||||||||||||||||
2005 | 9.83 | 0.13 | # | 0.31 | (0.21 | ) | (0.04 | ) | — | 10.02 | 4.54 | 12,019 | 0.56 | 0.56 | 0.82 | 1.30 | 1.04 | 6 | ||||||||||||||||||||||||||||||||
2004 | 9.14 | 0.13 | # | 0.81 | (0.25 | ) | — | — | 9.83 | 10.37 | 11,502 | 0.45 | 0.45 | 0.72 | 1.41 | 1.14 | 2 | |||||||||||||||||||||||||||||||||
2003 | 7.26 | 0.10 | # | 1.93 | (0.15 | ) | — | — | 9.14 | 28.09 | 17,395 | 0.45 | 0.45 | 0.73 | 1.28 | 1.00 | 2 | |||||||||||||||||||||||||||||||||
Real Estate Securities Fund |
| |||||||||||||||||||||||||||||||||||||||||||||||||
GS4 Class |
| |||||||||||||||||||||||||||||||||||||||||||||||||
2008(1) | $ | 9.04 | $ | 0.10 | # | $ | (0.45 | ) | $ | (0.09 | ) | $ | — | $ | — | $ | 8.60 | (3.95 | )% | $ | 116,233 | 1.29 | % | 1.29 | % | 1.51 | % | 2.16 | % | 1.94 | % | 40 | % | |||||||||||||||||
2007 | 12.55 | 0.11 | # | (2.12 | ) | (0.11 | ) | (1.39 | ) | — | 9.04 | (16.23 | ) | 96,775 | 1.20 | 1.20 | 1.22 | 0.94 | 0.92 | 119 | ||||||||||||||||||||||||||||||
2006(2)(3) | 12.50 | — | † | 0.05 | — | — | — | 12.55 | 0.40 | 107,035 | 1.33 | 1.33 | 1.88 | (1.16 | ) | (1.71 | ) | — | ||||||||||||||||||||||||||||||||
Value Equity Fund |
| |||||||||||||||||||||||||||||||||||||||||||||||||
GS2 Class |
| |||||||||||||||||||||||||||||||||||||||||||||||||
2008(1) | $ | 9.10 | $ | 0.09 | # | $ | (1.38 | ) | $ | (0.14 | ) | $ | (0.07 | ) | $ | — | $ | 7.60 | (14.21 | )% | $ | 196,385 | 0.67 | % | 0.66 | % | 0.67 | % | 2.04 | % | 2.03 | % | 32 | % | ||||||||||||||||
2007 | 10.62 | 0.18 | # | (0.27 | ) | (0.28 | ) | (1.15 | ) | — | 9.10 | (1.18 | ) | 230,436 | 0.69 | 0.69 | 0.69 | 1.70 | 1.70 | 45 | ||||||||||||||||||||||||||||||
2006 | 10.75 | 0.18 | # | 1.78 | (0.28 | ) | (1.81 | ) | — | 10.62 | 18.76 | 181,940 | 0.72 | 0.71 | 0.72 | 1.70 | 1.69 | 76 | ||||||||||||||||||||||||||||||||
2005 | 11.44 | 0.20 | # | 0.65 | (0.28 | ) | (1.26 | ) | — | 10.75 | 7.40 | 156,279 | 0.73 | 0.72 | 0.73 | 1.72 | 1.71 | 54 | ||||||||||||||||||||||||||||||||
2004 | 9.94 | 0.17 | # | 1.59 | (0.26 | ) | — | † | — | 11.44 | 17.83 | 75,123 | 0.75 | 0.74 | 0.74 | 1.64 | 1.64 | 56 | ||||||||||||||||||||||||||||||||
2003 | 7.77 | 0.14 | # | 2.26 | (0.23 | ) | — | — | 9.94 | 31.09 | 69,991 | 0.76 | 0.75 | 0.78 | 1.62 | 1.59 | 54 | |||||||||||||||||||||||||||||||||
GS4 Class |
| |||||||||||||||||||||||||||||||||||||||||||||||||
2008(1) | $ | 17.03 | $ | 0.15 | # | $ | (2.57 | ) | $ | (0.13 | ) | $ | (0.07 | ) | $ | — | $ | 14.41 | (14.25 | )% | $ | 1,179,334 | 0.85 | % | 0.84 | % | 0.86 | % | 1.86 | % | 1.84 | % | 32 | % | ||||||||||||||||
2007 | 18.65 | 0.29 | # | (0.52 | ) | (0.24 | ) | (1.15 | ) | — | 17.03 | (1.39 | ) | 1,407,534 | 0.88 | 0.88 | 0.88 | 1.50 | 1.50 | 45 | ||||||||||||||||||||||||||||||
2006 | 17.50 | 0.28 | # | 2.93 | (0.25 | ) | (1.81 | ) | — | 18.65 | 18.64 | 1,434,773 | 0.90 | 0.89 | 0.91 | 1.52 | 1.50 | 76 | ||||||||||||||||||||||||||||||||
2005 | 17.74 | 0.28 | # | 0.99 | (0.25 | ) | (1.26 | ) | — | 17.50 | 7.13 | 1,279,940 | 0.90 | 0.89 | 0.93 | 1.53 | 1.49 | 54 | ||||||||||||||||||||||||||||||||
2004 | 15.28 | 0.24 | # | 2.45 | (0.23 | ) | — | — | 17.74 | 17.71 | 1,305,669 | 0.90 | 0.89 | 0.92 | 1.49 | 1.46 | 56 | |||||||||||||||||||||||||||||||||
2003 | 11.85 | 0.21 | # | 3.43 | (0.21 | ) | — | — | 15.28 | 30.84 | 1,152,116 | 0.90 | 0.88 | 0.94 | 1.59 | 1.53 | 54 | |||||||||||||||||||||||||||||||||
GS6 Class |
| |||||||||||||||||||||||||||||||||||||||||||||||||
2008(1) | $ | 9.03 | $ | 0.06 | # | $ | (1.36 | ) | $ | (0.12 | ) | $ | (0.07 | ) | $ | — | $ | 7.54 | (14.41 | )% | $ | 15,596 | 1.14 | % | 1.13 | % | 1.25 | % | 1.56 | % | 1.44 | % | 32 | % | ||||||||||||||||
2007 | 10.55 | 0.13 | # | (0.27 | ) | (0.23 | ) | (1.15 | ) | — | 9.03 | (1.61 | ) | 18,053 | 1.16 | 1.16 | 1.18 | 1.23 | 1.21 | 45 | ||||||||||||||||||||||||||||||
2006 | 10.69 | 0.12 | # | 1.78 | (0.23 | ) | (1.81 | ) | — | 10.55 | 18.21 | 17,798 | 1.24 | 1.23 | 1.24 | 1.18 | 1.17 | 76 | ||||||||||||||||||||||||||||||||
2005 | 11.39 | 0.14 | # | 0.64 | (0.22 | ) | (1.26 | ) | — | 10.69 | 6.78 | 15,003 | 1.25 | 1.24 | 1.27 | 1.17 | 1.14 | 54 | ||||||||||||||||||||||||||||||||
2004 | 9.90 | 0.12 | # | 1.59 | (0.22 | ) | — | — | 11.39 | 17.35 | 17,968 | 1.15 | 1.14 | 1.22 | 1.20 | 1.12 | 56 | |||||||||||||||||||||||||||||||||
2003 | 7.75 | 0.11 | # | 2.23 | (0.19 | ) | — | — | 9.90 | 30.46 | 19,680 | 1.15 | 1.13 | 1.20 | 1.33 | 1.26 | 54 | |||||||||||||||||||||||||||||||||
| † | Amount represents less than $0.005 per share. |
| # | Calculated using the average shares outstanding method. |
| (1) | For the six months ended June 30, 2008. All ratios for the period have been annualized. Total return and portfolio turnover for the period have not been annualized. |
| (2) | Inception date was December 29, 2006. |
| (3) | Total return is not annualized. Ratios are annualized. |
| 132 | See Notes to Financial Statements. |
Table of Contents
| Ratios to Average Net Assets | ||||||||||||||||||||||||||||||||||||||||||||||
| Net Asset Value, Beginning of Period | Net Investment Income/ (Loss) | Realized and Unrealized Gain (Loss) on Investments | Dividends from Net Investment Income | Distributions from Net Realized Capital Gains | Net Asset Value, End of Period | Total Return | Net Assets, End of Period (000) | Expenses, Net | Expenses, Including Expense Reduction | Expenses, Before Waivers/ Reimbursements and Expense Reduction | Investment Income/ (Loss), Net | Investment Income/ (Loss), Excluding Waivers/ Reimbursements and Expense Reduction | Portfolio Turnover Rate | |||||||||||||||||||||||||||||||||
Growth Equity Fund |
| |||||||||||||||||||||||||||||||||||||||||||||
GS2 Class |
| |||||||||||||||||||||||||||||||||||||||||||||
2008(1) | $ | 12.76 | $ | 0.01 | $ | (1.34 | ) | $ | (0.02 | ) | $ | — | $ | 11.41 | (10.45 | )% | $ | 213,043 | 0.88 | % | 0.87 | % | 0.88 | % | 0.17 | % | 0.16 | % | 32 | % | ||||||||||||||||
2007 | 11.23 | 0.02 | 1.55 | (0.04 | ) | — | 12.76 | 13.99 | 242,557 | 0.89 | 0.89 | 0.88 | 0.24 | 0.25 | 51 | |||||||||||||||||||||||||||||||
2006 | 11.18 | — | † | 0.05 | — | — | 11.23 | 0.45 | 179,852 | 0.89 | 0.88 | 0.90 | 0.00 | (0.02 | ) | 48 | ||||||||||||||||||||||||||||||
2005 | 10.29 | (0.03 | ) | 0.92 | — | — | 11.18 | 8.65 | 172,118 | 0.87 | 0.86 | 0.89 | (0.10 | ) | (0.13 | ) | 49 | |||||||||||||||||||||||||||||
2004 | 9.16 | — | † | 1.13 | — | — | 10.29 | 12.34 | 84,177 | 0.87 | 0.86 | 0.89 | 0.01 | (0.02 | ) | 56 | ||||||||||||||||||||||||||||||
2003 | 7.07 | (0.01 | ) | 2.10 | — | — | 9.16 | 29.56 | 79,547 | 0.81 | 0.79 | 0.85 | (0.03 | ) | (0.09 | ) | 77 | |||||||||||||||||||||||||||||
GS4 Class |
| |||||||||||||||||||||||||||||||||||||||||||||
2008(1) | $ | 20.22 | $ | 0.01 | $ | (2.14 | ) | $ | (0.01 | ) | $ | — | $ | 18.08 | (10.54 | )% | $ | 1,252,255 | 0.97 | % | 0.96 | % | 1.07 | % | 0.08 | % | (0.03 | )% | 32 | % | ||||||||||||||||
2007 | 17.77 | 0.02 | 2.45 | (0.02 | ) | — | 20.22 | 13.90 | 1,488,091 | 1.00 | 1.00 | 1.07 | 0.13 | 0.06 | 51 | |||||||||||||||||||||||||||||||
2006 | 17.71 | (0.02 | ) | 0.08 | — | — | 17.77 | 0.34 | 1,343,147 | 1.01 | 1.00 | 1.09 | (0.12 | ) | (0.21 | ) | 48 | |||||||||||||||||||||||||||||
2005 | 16.33 | (0.04 | ) | 1.42 | — | — | 17.71 | 8.45 | 1,362,599 | 0.99 | 0.98 | 1.08 | (0.22 | ) | (0.32 | ) | 49 | |||||||||||||||||||||||||||||
2004 | 14.55 | (0.02 | ) | 1.80 | — | — | 16.33 | 12.23 | 1,405,754 | 0.99 | 0.98 | 1.08 | (0.11 | ) | (0.21 | ) | 56 | |||||||||||||||||||||||||||||
2003 | 11.23 | (0.01 | ) | 3.33 | — | — | 14.55 | 29.56 | 1,285,223 | 0.92 | 0.90 | 1.01 | (0.07 | ) | (0.18 | ) | 77 | |||||||||||||||||||||||||||||
GS6 Class |
| |||||||||||||||||||||||||||||||||||||||||||||
2008(1) | $ | 12.46 | $ | (0.01 | ) | $ | (1.32 | ) | $ | — | $ | — | $ | 11.13 | (10.67 | )% | $ | 12,263 | 1.29 | % | 1.28 | % | 1.55 | % | (0.24 | )% | (0.51 | )% | 32 | % | ||||||||||||||||
2007 | 10.99 | (0.02 | ) | 1.49 | — | — | 12.46 | 13.38 | 13,668 | 1.36 | 1.36 | 1.41 | (0.23 | ) | (0.28 | ) | 51 | |||||||||||||||||||||||||||||
2006 | 10.99 | (0.05 | ) | 0.05 | — | — | 10.99 | — | 11,706 | 1.41 | 1.40 | 1.48 | (0.52 | ) | (0.60 | ) | 48 | |||||||||||||||||||||||||||||
2005 | 10.17 | (0.09 | ) | 0.91 | — | — | 10.99 | 8.06 | 11,406 | 1.34 | 1.33 | 1.47 | (0.57 | ) | (0.71 | ) | 49 | |||||||||||||||||||||||||||||
2004 | 9.08 | (0.07 | ) | 1.16 | — | — | 10.17 | 12.00 | 13,780 | 1.24 | 1.23 | 1.44 | (0.42 | ) | (0.63 | ) | 56 | |||||||||||||||||||||||||||||
2003 | 7.03 | (0.02 | ) | 2.07 | — | — | 9.08 | 29.16 | 18,099 | 1.17 | 1.15 | 1.33 | (0.33 | ) | (0.51 | ) | 77 | |||||||||||||||||||||||||||||
Small Cap Equity Fund |
| |||||||||||||||||||||||||||||||||||||||||||||
GS2 Class |
| |||||||||||||||||||||||||||||||||||||||||||||
2008(1) | $ | 9.60 | $ | 0.03 | # | $ | (0.86 | ) | $ | — | $ | — | $ | 8.77 | (8.65 | )% | $ | 78,715 | 1.05 | % | 1.04 | % | 1.06 | % | 0.57 | % | 0.55 | % | 73 | % | ||||||||||||||||
2007 | 11.33 | 0.06 | # | 0.09 | (0.07 | ) | (1.81 | ) | 9.60 | 1.05 | 76,792 | 1.05 | 1.05 | 1.05 | 0.48 | 0.48 | 119 | |||||||||||||||||||||||||||||
2006 | 11.40 | (0.01 | )# | 1.32 | — | (1.38 | ) | 11.33 | 11.40 | 66,695 | 1.06 | 1.05 | 1.06 | (0.05 | ) | (0.06 | ) | 86 | ||||||||||||||||||||||||||||
2005 | 12.51 | (0.01 | )# | 0.84 | — | (1.94 | ) | 11.40 | 6.48 | 62,009 | 1.10 | 1.09 | 1.07 | (0.06 | ) | (0.04 | ) | 97 | ||||||||||||||||||||||||||||
2004 | 11.52 | (0.01 | ) | 1.74 | — | (0.74 | ) | 12.51 | 15.04 | 28,639 | 1.18 | 1.15 | 1.20 | (0.10 | ) | (0.15 | ) | 148 | ||||||||||||||||||||||||||||
2003 | 7.88 | (0.03 | ) | 3.67 | — | — | 11.52 | 46.19 | 25,415 | 1.18 | 1.12 | 1.27 | (0.26 | ) | (0.41 | ) | 131 | |||||||||||||||||||||||||||||
GS4 Class |
| |||||||||||||||||||||||||||||||||||||||||||||
2008(1) | $ | 14.31 | $ | 0.03 | # | $ | (1.28 | ) | $ | — | $ | — | $ | 13.06 | (8.74 | )% | $ | 397,762 | 1.15 | % | 1.14 | % | 1.26 | % | 0.47 | % | 0.35 | % | 73 | % | ||||||||||||||||
2007 | 16.00 | 0.06 | # | 0.11 | (0.05 | ) | (1.81 | ) | 14.31 | 0.87 | 466,522 | 1.18 | 1.18 | 1.25 | 0.34 | 0.27 | 119 | |||||||||||||||||||||||||||||
2006 | 15.61 | (0.03 | )# | 1.80 | — | (1.38 | ) | 16.00 | 11.27 | 486,358 | 1.21 | 1.20 | 1.25 | (0.20 | ) | (0.25 | ) | 86 | ||||||||||||||||||||||||||||
2005 | 16.48 | (0.03 | )# | 1.10 | — | (1.94 | ) | 15.61 | 6.37 | 463,367 | 1.22 | 1.21 | 1.27 | (0.19 | ) | (0.26 | ) | 97 | ||||||||||||||||||||||||||||
2004 | 14.99 | (0.02 | ) | 2.25 | — | (0.74 | ) | 16.48 | 14.89 | 432,763 | 1.25 | 1.22 | 1.37 | (0.16 | ) | (0.31 | ) | 148 | ||||||||||||||||||||||||||||
2003 | 10.25 | (0.04 | ) | 4.78 | — | — | 14.99 | 46.24 | 357,703 | 1.25 | 1.19 | 1.43 | (0.34 | ) | (0.58 | ) | 131 | |||||||||||||||||||||||||||||
GS6 Class |
| |||||||||||||||||||||||||||||||||||||||||||||
2008(1) | $ | 9.25 | $ | 0.01 | # | $ | (0.82 | ) | $ | — | $ | — | $ | 8.44 | (8.76 | )% | $ | 16,385 | 1.43 | % | 1.42 | % | 1.65 | % | 0.19 | % | (0.04 | )% | 73 | % | ||||||||||||||||
2007 | 11.00 | — | †# | 0.08 | (0.02 | ) | (1.81 | ) | 9.25 | 0.50 | 17,846 | 1.50 | 1.50 | 1.54 | 0.03 | (0.01 | ) | 119 | ||||||||||||||||||||||||||||
2006 | 11.16 | (0.07 | )# | 1.29 | — | (1.38 | ) | 11.00 | 10.84 | 17,483 | 1.58 | 1.57 | 1.57 | (0.57 | ) | (0.57 | ) | 86 | ||||||||||||||||||||||||||||
2005 | 12.34 | (0.06 | )# | 0.82 | — | (1.94 | ) | 11.16 | 6.00 | 15,577 | 1.57 | 1.56 | 1.59 | (0.53 | ) | (0.56 | ) | 97 | ||||||||||||||||||||||||||||
2004 | 11.41 | (0.08 | ) | 1.75 | — | (0.74 | ) | 12.34 | 14.66 | 17,875 | 1.50 | 1.47 | 1.69 | (0.43 | ) | (0.65 | ) | 148 | ||||||||||||||||||||||||||||
2003 | 7.83 | (0.04 | ) | 3.62 | — | — | 11.41 | 45.72 | 22,520 | 1.50 | 1.44 | 1.70 | (0.59 | ) | (0.85 | ) | 131 | |||||||||||||||||||||||||||||
| † | Amount represents less than $0.005 per share. |
| # | Calculated using the average shares outstanding method. |
| (1) | For the six months ended June 30, 2008. All ratios for the period have been annualized. Total return and portfolio turnover for the period have not been annualized. |
| See Notes to Financial Statements. | 133 |
Table of Contents
FINANCIAL HIGHLIGHTS (Unaudited) (Continued)
For a Share Outstanding For the Years Ended December 31, unless otherwise indicated
| Ratios to Average Net Assets | |||||||||||||||||||||||||||||||||||||||||||||||||
| Net Asset Value, Beginning of Period | Net Investment Income | Realized and Unrealized Gain (Loss) on Investments | Dividends from Net Investment Income | Distributions from Net Realized Capital Gains | Return of Capital | Net Asset Value, End of Period | Total Return | Net Assets, End of Period (000) | Expenses, Net | Expenses, Including Expense Reduction | Expenses, Before Waivers and Expense Reduction | Investment Income, Net | Investment Income/ (Loss), Excluding Waivers and Expense Reduction | Portfolio Turnover Rate | |||||||||||||||||||||||||||||||||||
International Equity Fund |
| ||||||||||||||||||||||||||||||||||||||||||||||||
GS2 Class |
| ||||||||||||||||||||||||||||||||||||||||||||||||
2008(1) | $ | 14.61 | $ | 0.26 | # | $ | (1.83 | ) | $ | — | $ | — | $ | — | $ | 13.04 | (10.75 | )% | $ | 312,499 | 0.94 | % | 0.93 | % | 1.08 | % | 3.85 | % | 3.70 | % | 54 | % | |||||||||||||||||
2007 | 15.80 | 0.26 | # | 1.79 | (0.27 | ) | (2.97 | ) | — | 14.61 | 13.21 | 279,652 | 0.96 | 0.96 | 1.07 | 1.55 | 1.44 | 66 | |||||||||||||||||||||||||||||||
2006 | 14.71 | 0.25 | 3.23 | (0.35 | ) | (2.04 | ) | — | 15.80 | 23.78 | 199,989 | 0.97 | 0.96 | 1.10 | 1.60 | 1.46 | 26 | ||||||||||||||||||||||||||||||||
2005 | 12.93 | 0.29 | 1.99 | (0.30 | ) | (0.20 | ) | — | 14.71 | 17.66 | 176,819 | 0.97 | 0.95 | 1.12 | 1.59 | 1.43 | 30 | ||||||||||||||||||||||||||||||||
2004 | 11.06 | 0.16 | 1.93 | (0.22 | ) | — | — | 12.93 | 18.93 | 87,300 | 0.97 | 0.95 | 1.13 | 1.32 | 1.14 | 33 | |||||||||||||||||||||||||||||||||
2003 | 8.26 | 0.08 | # | 2.90 | (0.18 | ) | — | — | 11.06 | 36.06 | 50,390 | 0.97 | 0.95 | 1.14 | 0.86 | 0.67 | 33 | ||||||||||||||||||||||||||||||||
GS4 Class |
| ||||||||||||||||||||||||||||||||||||||||||||||||
2008(1) | $ | 18.32 | $ | 0.31 | # | $ | (2.29 | ) | $ | — | $ | — | $ | — | $ | 16.34 | (10.81 | )% | $ | 1,311,293 | 1.12 | % | 1.11 | % | 1.28 | % | 3.61 | % | 3.44 | % | 54 | % | |||||||||||||||||
2007 | 19.09 | 0.28 | # | 2.16 | (0.24 | ) | (2.97 | ) | — | 18.32 | 12.96 | 1,400,548 | 1.14 | 1.14 | 1.27 | 1.38 | 1.25 | 66 | |||||||||||||||||||||||||||||||
2006 | 17.37 | 0.26 | 3.82 | (0.32 | ) | (2.04 | ) | — | 19.09 | 23.58 | 1,254,839 | 1.15 | 1.14 | 1.29 | 1.43 | 1.28 | 26 | ||||||||||||||||||||||||||||||||
2005 | 15.20 | 0.23 | 2.41 | (0.27 | ) | (0.20 | ) | — | 17.37 | 17.39 | 1,120,234 | 1.15 | 1.13 | 1.31 | 1.42 | 1.24 | 30 | ||||||||||||||||||||||||||||||||
2004 | 12.96 | 0.17 | 2.26 | (0.19 | ) | — | — | 15.20 | 18.80 | 1,072,556 | 1.15 | 1.13 | 1.31 | 1.22 | 1.04 | 33 | |||||||||||||||||||||||||||||||||
2003 | 9.66 | 0.15 | # | 3.31 | (0.16 | ) | — | — | 12.96 | 35.81 | 920,664 | 1.15 | 1.13 | 1.31 | 1.39 | 1.21 | 33 | ||||||||||||||||||||||||||||||||
GS6 Class |
| ||||||||||||||||||||||||||||||||||||||||||||||||
2008(1) | $ | 14.35 | $ | 0.22 | # | $ | (1.79 | ) | $ | — | $ | — | $ | — | $ | 12.78 | (10.94 | )% | $ | 24,974 | 1.37 | % | 1.37 | % | 1.61 | % | 3.29 | % | 3.05 | % | 54 | % | |||||||||||||||||
2007 | 15.59 | 0.19 | # | 1.75 | (0.21 | ) | (2.97 | ) | — | 14.35 | 12.68 | 27,798 | 1.40 | 1.40 | 1.54 | 1.11 | 0.97 | 66 | |||||||||||||||||||||||||||||||
2006 | 14.56 | 0.18 | 3.17 | (0.28 | ) | (2.04 | ) | — | 15.59 | 23.14 | 23,877 | 1.47 | 1.46 | 1.60 | 1.10 | 0.96 | 26 | ||||||||||||||||||||||||||||||||
2005 | 12.80 | 0.13 | 2.06 | (0.23 | ) | (0.20 | ) | — | 14.56 | 17.15 | 19,123 | 1.45 | 1.43 | 1.64 | 1.11 | 0.91 | 30 | ||||||||||||||||||||||||||||||||
2004 | 10.95 | 0.12 | 1.90 | (0.17 | ) | — | — | 12.80 | 18.52 | 19,551 | 1.35 | 1.33 | 1.58 | 1.06 | 0.81 | 33 | |||||||||||||||||||||||||||||||||
2003 | 8.19 | 0.10 | # | 2.80 | (0.14 | ) | — | — | 10.95 | 35.47 | 20,434 | 1.36 | 1.34 | 1.50 | 1.14 | 0.98 | 33 | ||||||||||||||||||||||||||||||||
| # | Calculated using the average shares outstanding method. |
| (1) | For the six months ended June 30, 2008. All ratios for the period have been annualized. Total return and portfolio turnover for the period have not been annualized. |
| 134 | See Notes to Financial Statements. |
Table of Contents
NOTES TO FINANCIAL STATEMENTS (Unaudited)
1. DESCRIPTION OF THE FUNDS
GuideStone Funds (the “Trust”) was organized as a Delaware statutory trust on March 2, 2000. The Trust has established twenty-four series (each a “Fund” and together, the “Funds”). Each Fund is a diversified, open-end management investment company, registered under the Investment Company Act of 1940, as amended (the “1940 Act”). The MyDestination 2005, MyDestination 2015, MyDestination 2025, MyDestination 2035 and MyDestination 2045 Funds, each referred to as a “Date Target Fund” and together as the “Date Target Funds,” commenced operations on December 29, 2006. Effective June 1, 2008, the Blended Funds were renamed to provide shareholders with a more accurate depiction of their investment strategies and risk tolerance. All references to the Blended Funds category have been replaced with “Asset Allocation Funds.” The Conservative Allocation Fund (formerly Flexible Income Fund), Balanced Allocation Fund (formerly Growth & Income Fund), Growth Allocation Fund (formerly Capital Opportunities Fund), Aggressive Allocation Fund (formerly Global Equity Fund), Conservative Allocation Fund I (formerly Flexible Income Fund I), Balanced Allocation Fund I (formerly Growth & Income Fund I), Growth Allocation Fund I (formerly Capital Opportunities Fund I) and Aggressive Allocation Fund I (formerly Global Equity Fund I) are each referred to as an “Asset Allocation Fund” and together are referred to as the “Asset Allocation Funds.” The remaining Funds are each referred to as a “Select Fund” and are together referred to as the “Select Funds.” The Low-Duration Bond Fund, Medium-Duration Bond Fund, Extended-Duration Bond Fund and Global Bond Fund are together referred to as the “Bond Funds.” The Equity Index Fund, Real Estate Securities Fund, Value Equity Fund, Growth Equity Fund, Small Cap Equity Fund, and International Equity Fund are together referred to as the “Equity Funds.” The Money Market Fund is referred to as the “Money Market Fund.”
There are three classes of shares issued by the Funds — the GS2 Class, the GS4 Class and the GS6 Class, except for the Global Bond Fund and the Real Estate Securities Fund, which issued the GS4 Class only, and the Date Target Funds, which issued the GS4 Class and the GS6 Class only. The Conservative Allocation Fund I, Balanced Allocation Fund I, Growth Allocation Fund I and Aggressive Allocation Fund I issued the GS2 Class only. All classes of shares have identical voting, dividend and liquidation rights. The distribution fee (class specific expense) differs among classes. Income, expenses (other than class specific expenses) and realized and unrealized gains or losses on investments are allocated to each class of shares based upon its relative net assets.
Prior to June 1, 2007, GS8 Class shares of the Funds were also available. On June 1, 2007, shares of the GS8 Class of each Fund were exchanged at each Fund’s applicable net asset value for equivalent shares of the GS6 Class of the same Fund and the GS8 Class was terminated.
Each Fund is a separate mutual fund with its own investment objective, strategies and risks. The Select Funds invest directly in particular types of fixed income obligations, stocks and other investments. The Asset Allocation and Date Target Funds primarily invest in a different mix of the Select Funds to meet a specified investment strategy. The Asset Allocation and Date Target Funds are commonly referred to as “Fund of Funds”.
2. SIGNIFICANT ACCOUNTING POLICIES
The following significant accounting policies are in conformity with generally accepted accounting principles in the United States of America which requires management to make estimates and assumptions that affect the reported amounts of assets and liabilities and disclosures of contingent assets and liabilities at the date of the financial statements and the reported amounts of income and expenses during the reporting period. Actual results could differ from those estimates.
a. Valuation of Securities
The Funds (except the Money Market Fund) each value securities traded on national securities exchanges or included in national market systems at the last quoted sale price, or
135
Table of Contents
official close price, on the principal exchange on which they were traded, or, in the absence of any sale or official close price, at the closing bid price. Securities which are primarily traded on foreign exchanges are generally valued at the closing values of such securities on their respective exchanges, except that when an occurrence subsequent to the time when the foreign security is valued is likely to have changed such value, then the fair value of those securities will be determined through procedures established by or under the direction of the Board of Trustees. Non-exchange traded securities for which an over-the-counter quotation is readily available are valued at the last quoted bid price. Debt securities, excluding asset-backed and mortgage-backed securities, are valued at the mean of the last bid and asked prices available. Asset-backed and mortgage-backed securities are valued at the last bid price. Options and warrants for which the primary market is a national securities exchange are valued at the last sale price on the exchange on which they are traded, or, in the absence of any sale, at the closing bid price. Options and warrants not traded on a national securities exchange are valued at the last quoted bid price. Short-term securities maturing in more than 60 days from the valuation date are valued at the mean of the last bid and asked prices; those maturing in 60 days or less are valued at amortized cost. Futures contracts are valued at the closing settlement price on the exchange on which they are primarily traded. Forward foreign exchange contracts are valued based upon closing exchange rates from each respective foreign market. Swap agreements are valued daily based upon the terms specific to each agreement with its counterparty. To the extent available, valuations of portfolio securities are provided by independent pricing services approved by the Board of Trustees. Debt securities are valued on the basis of broker quotations or valuations provided by a pricing service which may use a matrix, formula or other objective method that takes into consideration market indices, matrices, yield curves and other specific adjustments. Certain fixed income securities are valued by the sub-adviser using various methodologies. Securities for which market quotations are not readily available are valued at fair value according to methods established in good faith by the Board of Trustees. For securities that principally trade on a foreign market or exchange, a significant gap in time can exist between the time of a particular security’s last trade and the time at which a Fund calculates its net asset value. The closing prices of such securities may no longer reflect their market value at the time the Fund calculates its net asset value if an event that could materially affect the value of those securities (a “Significant Event”) has occurred between the time of the security’s last close and the time that the Fund calculates its net asset value. A Significant Event may relate to a single issuer or to an entire market sector. If a Fund becomes aware of a Significant Event that has occurred with respect to a security or group of securities after the closing of the exchange or market on which the security or securities principally trade, but before the time at which the Fund calculates its net asset value, a Valuation Committee meeting may be called. The Trust uses Interactive Data (“ID”) as a third party fair valuation vendor. ID provides a fair value for foreign equity securities held by the Trust based on certain factors and methodologies applied by ID in the event that there is movement in the U.S. market that exceeds a specific threshold established by the Valuation Committee in consultation with, and approved by, the Trustees. Such methodologies generally involve tracking valuation correlations between the U.S. market and each non-U.S. security. As part of the valuation procedures a “confidence interval” is used, when the threshold is exceeded, to determine the level of correlation between the value of a foreign equity security and movements in the U.S. market before a particular security will be fair valued. In the event that the threshold established by the Committee is exceeded on a specific day, the Trust will typically value non-U.S. equity securities in its portfolio that exceed the applicable confidence interval based upon the fair values provided by ID.
The Money Market Fund uses the amortized cost method, which approximates market value, to determine the value of its portfolio securities.
The Asset Allocation and Date Target Funds value their investments in the underlying Select Funds daily at the closing net asset value of each respective Select Fund.
136
Table of Contents
In September 2006, the Financial Accounting Standards Board issued FAS 157 effective for fiscal years beginning after November 15, 2007. This standard clarifies the definition of fair value for financial reporting, establishes a framework for measuring fair value and requires additional disclosures about the use of fair value measurements. The Funds adopted FAS 157 as of the commencement of investment operations, January 1, 2008. The three levels of the fair value hierarchy under FAS 157 are described below:
Level 1 — quoted prices in active markets for identical securities.
Level 2 — other significant observable inputs (including quoted prices for similar securities, interest rates, prepayment speeds, credit risk, etc.).
Level 3 — significant unobservable inputs (including the Fund’s own assumptions in determining the fair value of investments).
A summary of the fair value hierarchy for each Fund is included at the end of each Fund’s Schedule of Investments.
b. Repurchase Agreements
Each Fund may agree to purchase securities from financial institutions subject to the seller’s agreement to repurchase them at a mutually agreed upon date and price. It is the Fund’s policy that repurchase agreements are fully collateralized by U.S. Treasury and Government Agency securities. All collateral is held by the Fund’s custodian bank or a bank with which the custodian bank has entered into a subcustodian agreement, or is segregated in the Federal Reserve Book Entry System. In connection with transactions in repurchase agreements, if the seller defaults and the value of the collateral declines, or if the seller enters an insolvency proceeding, realization of the collateral by the Fund may be delayed or limited.
c. Derivative Financial Instruments
The Funds may engage in various portfolio strategies to seek to increase its return by hedging its portfolio against adverse movements in the equity, debt and currency markets. Losses may arise due to changes in the value of the contract if the counterparty does not perform under the contract. The Funds, in their normal course of business, may enter into contracts that contain a variety of representations and warranties, and which provide general indemnifications. The Funds’ exposure may include future claims that may be made against the Funds that have not yet occurred. However, based on experience, the Funds expect the risk of loss to be remote.
Financial Futures Contracts — The Funds (except the Money Market Fund) may purchase or sell financial futures contracts and the options on such futures contracts for the purpose of hedging risk on existing securities, the intended purchase of securities or to gain market exposure on cash balances. Financial futures contracts are contracts for the delivery of securities at a specified future date at an agreed upon price or yield. Upon entering into a contract, the Funds deposit and maintain as collateral such initial margin as required by the exchange on which the transaction is effected.
Pursuant to the contract, the Funds agree to pay to or receive from the broker an amount of cash equal to the daily fluctuation in the value of the contract. Such payments or receipts are known as variation margin and are recorded by the Funds as unrealized gains or losses until the contract is closed or settled.
Risks of entering into futures contracts include the possibility that there will be an imperfect price correlation between the futures and the underlying securities. Second, it is possible that a lack of liquidity for futures contracts could exist in the secondary market, resulting in an inability to close a futures position prior to its maturity date. Third, the purchase of a futures contract involves the risk that a Fund could lose more than the original margin deposit required to initiate a futures transaction.
Options — Certain Funds are authorized to write and purchase put and call options. The risk in writing a call option is that the Funds give up the opportunity for profit if the market price of the security increases. The risk in writing a put option is that the Funds may incur
137
Table of Contents
a loss if the market price of the security decreases and the option is exercised. The risk in purchasing an option is that the Funds pay a premium whether or not the option is exercised. The Funds also have the additional risk of being unable to enter into a closing transaction at an acceptable price if a liquid secondary market does not exist. The Funds also may write over-the-counter options where completing the obligation depends upon the credit standing of the other party and that party’s ability to perform. Option contracts also involve the risk that they may not work as intended due to unanticipated developments in market conditions or other causes.
Options purchased are recorded as an asset and written options are recorded as liabilities to the extent of premiums paid or received. Each Fund will realize a gain or loss when the option transaction expires or closes. When an option is exercised, the proceeds on sales for a written call option, the purchase cost for a written put option or the cost of a security for a purchased put or call option is adjusted by the amount of the premium received or paid.
Certain Funds may write swaption contracts to manage exposure to fluctuations in interest rates and to enhance portfolio yield. Swaption contracts written by the Funds represent an option that gives the purchaser the right, but not the obligation, to enter into a previously agreed upon swap contract on a future date. If a written call swaption is exercised, the writer will enter a swap and is obligated to pay the fixed rate and receive a floating rate in exchange. If a written put swaption is exercised, the writer will enter a swap and is obligated to pay the floating rate and receive a fixed rate in exchange. Swaptions are marked to market daily based upon quotations from market makers. When a Fund writes a swaption, the premium received is recorded as a liability and is subsequently adjusted to the current market value of the swaption.
Entering into a swaption contract involves, to varying degrees, the elements of credit, market and interest rate risk in excess of the amounts reported in the Statement of Assets and Liabilities, associated with both option contracts and swap contracts. The Funds bear the market risk arising from any change in index values or interest rates.
Forward Foreign Exchange Contracts — Certain Funds may enter into forward foreign currency exchange contracts to hedge against adverse exchange rate fluctuation to the U.S. dollar or between different foreign currencies in connection with either specific security transactions or portfolio positions. Each contract is valued daily and the change in value is recorded as an unrealized gain or loss. When the contract is closed, a realized gain or loss is recorded equal to the difference between the opening value and the closing value of the contract. The Funds could be exposed to risk if the counterparties to the contracts are unable to meet the terms of the contract and from unanticipated movements in the value of a foreign currency relative to the U.S. dollar.
Foreign Currency Options and Futures — The International Equity Fund, Small Cap Equity Fund and the Bond Funds may also enter into futures contracts on foreign currencies and related options on transactions as a short or long hedge against possible variations in foreign exchange rates.
TBAs — The Bond Funds and the Small Cap Equity Fund may enter into “TBA” (to be announced) purchase commitments to purchase securities for a fixed price at a future date, typically not exceeding 45 days. TBAs may be considered securities in themselves, and involve a risk of loss if the value of the security to be purchased declines prior to settlement date. This risk is in addition to the risk of decline in each Fund’s other assets. Unsettled TBAs are valued at the current market value of the underlying securities, according to the procedures described under “Valuation of Securities” above.
Dollar Rolls — During the period ended June 30, 2008, the Trust entered into dollar roll transactions,
138
Table of Contents
pursuant to which they sell a mortgage-backed TBA or security and simultaneously purchase a similar, but not identical, TBA with the same issuer, rate and terms. The Funds may execute a “roll” to obtain better underlying mortgage securities or to increase yield. The Funds account for dollar roll transactions as purchases and sales, which has the effect of increasing their portfolio turnover rates. Risks associated with dollar rolls are that actual mortgages received by the Funds may be less favorable than those anticipated or that counterparties may fail to perform under the terms of the contracts.
Swap Agreements — Each Select Fund may enter into swap agreements. The Equity Funds may enter into equity swap contracts, the Bond Funds and the Small Cap Equity Fund may enter into interest rate and credit default swaps, the International Equity and Bond Funds may enter into currency swaps and each Select Fund may enter into total return swaps.
Swap agreements are the exchange of one security or asset for another. A swap may be entered into in order to, among other things, change the maturity of a fund’s portfolio, to protect a fund’s value from changes in interest rates, to expose a fund to a different security or market, or to help a fund achieve a strategy relative to an index or other benchmark. By entering into a swap agreement, a fund is exposed to the risk of unanticipated movements in interest rates or in the value of an underlying security or index, or that the counterparty will not fulfill its obligation under the agreement. Credit default swaps involve the payment of amounts based on a specified rate multiplied by a notional amount as well as upon an event of default. In connection with these agreements, securities are set aside as collateral by the Fund’s custodian.
d. Foreign Currency Translations
Securities and other assets and liabilities denominated in foreign currencies are translated daily into U.S. dollars. Foreign currency amounts related to the purchase or sale of securities and income and expenses are translated at the exchange rate on the transaction date. The effect of changes in foreign exchange rates on realized and unrealized security gains or losses is reflected as a component of such gains or losses. In the statement of operations, net realized gains or losses from foreign currency transactions, if any, may arise from sales of foreign currency, closed forward contracts, exchange gains or losses realized between the trade date and settlement date on securities transactions, and other translation gains or losses on dividends, interest income and foreign withholding taxes.
e. Dividends and Distributions to Shareholders
Dividends from net investment income for the Money Market Fund are declared daily and paid monthly. Dividends from net investment income for the Bond Funds are declared and paid monthly. Dividends from net investment income, if any, for the Equity Index Fund, Real Estate Securities Fund, Value Equity Fund and Growth Equity Fund are declared and paid semi-annually. Dividends from net investment income, if any, for the Small Cap Equity Fund, International Equity Fund, the Asset Allocation Funds and the Date Target Funds are declared and paid annually. Net realized capital gains, if any, will be distributed at least annually by each of the Funds. Dividends and distributions to shareholders are recorded on the ex-dividend date.
f. Security Transactions, Income and Realized Gains and Losses
Security transactions are accounted for on the date securities are purchased or sold (the trade date). Dividend income is recognized on the ex-dividend date and interest income is accrued daily, including the amortization of market premium and the accretion of market discount. Realized gains and losses from security transactions are on an identified cost basis.
g. Expenses
Expenses arising in connection with a Fund are charged directly to that Fund. Expenses common to all Funds of the Trust are generally allocated to each Fund in proportion to their relative net assets. Each class of shares bears its pro-rata portion of expenses attributable to its class, except that each class separately bears expenses related specifically to that class, such as printing, registration, transfer agent, shareholder servicing and distribution fees.
139
Table of Contents
h. REITs
The Real Estate Securities Fund invests substantial assets in real estate investment trusts (REITs) that involve risks not associated with investing in stocks. Risks include declines in the value of real estate, general and economic conditions, changes in the value of the underlying property and defaults by borrowers. The value of assets in the real estate industry may go through cycles of relative underperformance and outperformance in comparison to equity securities markets in general.
Dividend income is recorded using management’s estimate of the income included in distributions received from REIT investments. The actual amounts of income, return of capital, and capital gains are only determined by each REIT after its fiscal year-end, and may differ from the estimated amount. Estimates of income are adjusted in the Funds to the actual amounts when the amounts are determined.
i. Short Sales
A short sale is a transaction in which a Fund sells a security it does not own. The Fund’s obligation to replace the security borrowed and sold short will be fully collateralized at all times by cash equivalents deposited in an account with the Fund’s custodian. If the price of the security sold short increases between the time of the short sale and the time the Fund replaces the borrowed security, the Fund will realize a loss, and if the price declines during the period, the Fund will realize a gain. Any realized gain will be decreased, and any realized loss increased, by the amount of transaction costs.
The Equity Funds may sell short exchange-listed equity futures contracts to reduce market exposure. The Date Target Funds, Asset Allocation Funds, Bond Funds and Small Cap Equity Fund may sell short U.S. Treasury securities and exchange-listed U.S. Treasury futures contracts to reduce market exposure. The Low-Duration Bond, Medium-Duration Bond and Small Cap Equity Funds will occasionally enter into a short sale to initiate a dollar roll transaction.
At June 30, 2008, the value of securities sold short in the Low-Duration Bond Fund and the Medium-Duration Bond Fund amounted to $151,337,152 and $16,479,690 respectively.
j. Loan Participations
Loan participations typically represent direct participation in a loan to a corporate borrower, and generally are offered by banks or other financial institutions or lending syndicates. The Bond Funds and the Small Cap Equity Fund may participate in such syndications, or can buy part of a loan, becoming a part lender. When purchasing loan participations, a Fund assumes the credit risk associated with the corporate borrower and may assume the credit risk associated with an interposed bank or other financial intermediary.
The Bond Funds and the Small Cap Equity Fund invest in loan participations with credit quality comparable to that of issuers of its securities investments. Indebtedness of companies whose creditworthiness is poor involves substantially greater risks, and may be highly speculative.
3. FEES AND OTHER TRANSACTIONS WITH AFFILIATES
a. Investment Advisory Fees
Pursuant to a separate investment advisory agreement, GuideStone Capital Management (“GSCM” or “Investment Advisor”) acts as the Investment Advisor to the Funds. As Investment Advisor it supervises the investments of the Funds and for such services is paid a fee. GSCM and the Trust have entered into sub-advisory agreements with various sub-advisers to manage each Select Fund’s investments. Under the general supervision of GSCM, the sub-advisers make the day-to-day investment decisions for the Select Funds and for such services each sub-adviser receives a fee from the Funds.
140
Table of Contents
The advisory fees paid to GSCM and aggregate sub-advisory fees paid to the sub-advisers, listed at the end of this report, are computed daily based upon the net assets of each Fund. The actual advisory fees accrued and the sub-advisory fees accrued during the six months ended June 30, 2008, based upon average daily net assets, were as follows:
Fund | Advisory Fees | Sub-Adviser Fees | ||||
MyDestination 2005 | 0.10 | % | — | |||
MyDestination 2015 | 0.10 | % | — | |||
MyDestination 2025 | 0.10 | % | — | |||
MyDestination 2035 | 0.10 | % | — | |||
MyDestination 2045 | 0.10 | % | — | |||
Conservative Allocation | 0.10 | % | — | |||
Balanced Allocation | 0.10 | % | — | |||
Growth Allocation | 0.10 | % | — | |||
Aggressive Allocation | 0.10 | % | — | |||
Conservative Allocation I | 0.10 | % | — | |||
Balanced Allocation I | 0.10 | % | — | |||
Growth Allocation I | 0.10 | % | — | |||
Aggressive Allocation I | 0.10 | % | — | |||
Money Market | 0.09 | % | 0.07 | % | ||
Low-Duration Bond | 0.13 | % | 0.21 | % | ||
Medium-Duration Bond | 0.21 | % | 0.20 | % | ||
Extended-Duration Bond | 0.25 | % | 0.21 | % | ||
Global Bond | 0.21 | % | 0.21 | % | ||
Equity Index | 0.13 | % | 0.02 | % | ||
Real Estate Securities | 0.28 | % | 0.61 | % | ||
Value Equity | 0.40 | % | 0.22 | % | ||
Growth Equity | 0.45 | % | 0.38 | % | ||
Small Cap Equity | 0.27 | % | 0.69 | % | ||
International Equity | 0.47 | % | 0.46 | % |
For the six months ended June 30, 2008, advisory fees and waivers for each Fund were as follows:
| Gross Advisory Fee | Waiver/ Reimbursements | Net Advisory Fee (Reimbursement) | |||||||||
MyDestination 2005 | $ | 31,282 | $ | (126,510 | ) | $ | (95,228 | ) | |||
MyDestination 2015 | 88,558 | (71,426 | ) | 17,132 | |||||||
MyDestination 2025 | 55,543 | (97,201 | ) | (41,658 | ) | ||||||
MyDestination 2035 | 19,528 | (130,142 | ) | (110,614 | ) | ||||||
MyDestination 2045 | 7,454 | (127,235 | ) | (119,781 | ) | ||||||
Conservative Allocation | 162,840 | (88,822 | ) | 74,018 | |||||||
Balanced Allocation | 643,033 | (108,357 | ) | 534,676 | |||||||
Growth Allocation | 507,830 | (88,998 | ) | 418,832 | |||||||
Aggressive Allocation | 457,802 | (85,435 | ) | 372,367 | |||||||
Conservative Allocation I | 32,629 | (39,106 | ) | (6,477 | ) | ||||||
Balanced Allocation I | 170,445 | 12,577 | 183,022 | ||||||||
Growth Allocation I | 116,628 | 6,485 | 123,113 | ||||||||
Aggressive Allocation I | 88,671 | (5,450 | ) | 83,221 | |||||||
Money Market | 501,265 | (4,612 | ) | 496,653 | |||||||
Low-Duration Bond | 516,604 | (337,788 | ) | 178,816 | |||||||
Medium-Duration Bond | 1,277,242 | (503,980 | ) | 773,262 | |||||||
| Gross Advisory Fee | Waiver/ Reimbursements | Net Advisory Fee (Reimbursement) | |||||||||
Extended-Duration Bond | $ | 707,946 | $ | (71,841 | ) | $ | 636,105 | ||||
Global Bond | 140,686 | (12,762 | ) | 127,924 | |||||||
Equity Index | 296,989 | (157,230 | ) | 139,759 | |||||||
Real Estate Securities | 153,988 | (122,580 | ) | 31,408 | |||||||
Value Equity | 3,025,259 | (104,954 | ) | 2,920,305 | |||||||
Growth Equity | 3,507,004 | (665,623 | ) | 2,841,381 | |||||||
Small Cap Equity | 683,561 | (250,140 | ) | 433,421 | |||||||
International Equity | 3,937,665 | (1,339,927 | ) | 2,597,738 | |||||||
b. Distribution and Shareholder Servicing Fees
The Board of Trustees has adopted Shareholder Service Plans for the GS4 and GS6 Class of each Select Fund and the GS6 Class of each Asset Allocation and Date Target Fund (“Service Plans”) and a separate Plan of Distribution for the GS6 Class of each Select Fund, Asset Allocation Fund and Date Target Fund pursuant to Rule 12b-1 under the 1940 Act (“12b-1 Plan”).
Under the Service Plans, the GS4 and GS6 Class of each Select Fund and the GS6 Class of each applicable Asset Allocation and Date Target Fund are authorized to pay fees to parties that provide services for and maintain shareholder accounts. The GS4 and GS6 Class of each Select Fund are authorized to pay service fees of 0.19% and 0.30% of average daily net assets, respectively. The GS6 Class of each applicable Asset Allocation and Date Target Fund is authorized to pay shareholder servicing fees of 0.11% of average daily net assets.
Under the 12b-1 Plan, the assets of each Select Fund, Asset Allocation Fund and Date Target Fund may be used to compensate GuideStone Financial Resources, the Distributor or others for certain expenses relating to the distribution of shares of the Funds to investors. Under the 12b-1 Plan, the maximum amount payable as a percentage of average daily net assets on an annual basis is 0.10% by the GS6 Class of each Select Fund, Asset Allocation Fund and Date Target Fund.
141
Table of Contents
c. Expense Limitation
GSCM has agreed, through April 30, 2009, to waive fees and reimburse expenses of the GS2 Class, GS4 Class and GS6 Class of each Fund (excluding interest, taxes, brokerage commissions and extraordinary expenses) which exceed, in the aggregate, the annual percentage rate of each class’s average daily net assets as follows:
Fund | GS2 Class | GS4 Class | GS6 Class | ||||||
MyDestination 2005 | NA | 0.20 | % | 0.50 | % | ||||
MyDestination 2015 | NA | 0.20 | % | 0.50 | % | ||||
MyDestination 2025 | NA | 0.20 | % | 0.50 | % | ||||
MyDestination 2035 | NA | 0.20 | % | 0.50 | % | ||||
MyDestination 2045 | NA | 0.20 | % | 0.50 | % | ||||
Conservative Allocation | NA | 0.12 | % | 0.45 | % | ||||
Balanced Allocation | NA | 0.12 | % | 0.45 | % | ||||
Growth Allocation | NA | 0.12 | % | 0.45 | % | ||||
Aggressive Allocation | NA | 0.12 | % | 0.45 | % | ||||
Conservative Allocation I | 0.15 | % | NA | NA | |||||
Balanced Allocation I | 0.15 | % | NA | NA | |||||
Growth Allocation I | 0.15 | % | NA | NA | |||||
Aggressive Allocation I | 0.15 | % | NA | NA | |||||
Money Market | 0.20 | % | 0.39 | % | 0.80 | % | |||
Low-Duration Bond | 0.36 | % | 0.52 | % | 0.91 | % | |||
Medium-Duration Bond | 0.48 | % | 0.58 | % | 0.93 | % | |||
Extended-Duration Bond | 0.63 | % | 0.69 | % | 0.97 | % | |||
Global Bond | NA | 1.02 | % | NA | |||||
Equity Index | 0.23 | % | 0.37 | % | 0.60 | % | |||
Real Estate Securities | NA | 1.29 | % | NA | |||||
Value Equity | 0.74 | % | 0.85 | % | 1.14 | % | |||
Growth Equity | 0.88 | % | 0.97 | % | 1.29 | % | |||
Small Cap Equity | 1.12 | % | 1.15 | % | 1.43 | % | |||
International Equity | 0.94 | % | 1.12 | % | 1.37 | % |
Each Fund in turn agrees to reimburse GSCM for any operating expenses in excess of the expense limitation paid, waived or assumed by GSCM for that Fund during the limitation period, provided GSCM would not be entitled to reimbursement for any amount that would cause operating expenses to exceed the expense limitation during the year in which the reimbursement would be made, and provided further that no amount will be reimbursed by the Fund more than three years after the year in which it was incurred or waived by GSCM.
At June 30, 2008 the amounts subject to possible future reimbursement under the expense limitation agreement are as follows:
| GS2 Class | GS4 Class | GS6 Class | |||||||
MyDestination 2005 | NA | $ | 173,153 | $ | 53,570 | ||||
MyDestination 2015 | NA | 79,197 | 49,496 | ||||||
MyDestination 2025 | NA | 131,092 | 50,939 | ||||||
MyDestination 2035 | NA | 185,303 | 56,432 | ||||||
MyDestination 2045 | NA | 176,758 | 64,870 | ||||||
Conservative Allocation | NA | 483,351 | 21,833 | ||||||
Balanced Allocation | NA | 323,697 | 12,299 | ||||||
Growth Allocation | NA | 313,065 | 14,521 | ||||||
Aggressive Allocation | NA | 337,217 | 6,315 | ||||||
Conservative Allocation I | $ | 221,413 | NA | NA | |||||
Balanced Allocation I | NA | NA | NA | ||||||
Growth Allocation I | 87,356 | NA | NA | ||||||
Aggressive Allocation I | 104,999 | NA | NA | ||||||
Money Market | NA | NA | 46,391 | ||||||
Low-Duration Bond | 115,712 | 1,504,473 | 79,638 | ||||||
Medium-Duration Bond | NA | 2,375,833 | 21,250 | ||||||
Extended-Duration Bond | NA | 292,407 | 12,223 | ||||||
Global Bond | NA | NA | NA | ||||||
Equity Index | 2,661 | 478,202 | 86,143 | ||||||
Real Estate Securities | NA | 142,862 | NA | ||||||
Value Equity | NA | 6,388,860 | 13,899 | ||||||
Growth Equity | 6,474 | 3,713,734 | 44,709 | ||||||
Small Cap Equity | NA | 927,903 | 25,161 | ||||||
International Equity | 972,798 | 6,135,734 | 125,656 | ||||||
During the six months ended June 30, 2008, GSCM recaptured the following amounts:
| GS2 Class | GS4 Class | ||||
Balanced Allocation I | $ | 12,577 | NA | ||
Growth Allocation I | 6,485 | NA | |||
Growth Equity | 12,582 | — | |||
d. Brokerage Service and Other Arrangements
The Investment Advisor directs the sub-advisers to place security trades with designated brokers who have agreed to pay certain custody, transfer agency or other operating expenses through the use of Brokerage Service Arrangements on behalf of the Equity Funds.
Fund | Expenses Paid Through Brokerage Service Arrangements | ||
Value Equity | $ | 49,572 | |
Growth Equity | 50,904 | ||
Small Cap Equity | 16,398 | ||
International Equity | 35,226 | ||
142
Table of Contents
e. Administrator, Transfer Agent and Distributor
Certain employees of PNC Global Investment Servicing (U.S.), Inc. (“PNC”), formerly known as PFPC, Inc., an indirect, wholly-owned subsidiary of The PNC Financial Services Group, Inc., are officers of the Funds. PNC serves as Administrator and Transfer Agent of the Funds.
For its services as Administrator, PNC is entitled to receive fees, computed daily and paid monthly, based upon the average daily net assets of each Fund. The fees, excluding out of pocket expenses, currently range between 0.004% and 0.02% of average daily net assets. For its services as Transfer Agent, PNC receives a fee based mainly upon the number of accounts serviced. Certain minimum fees and transaction charges may apply. For the six months ended June 30, 2008, PNC received $1,714,943 in aggregate fees and expenses for services rendered under the various agreements described above.
PFPC Distributors, Inc. (“PDI”), also an indirect, wholly owned subsidiary of The PNC Financial Services Group, Inc., serves as the Distributor for the Funds. The Funds do not pay any fees to PDI in its capacity as Distributor. The fees are paid by GSCM.
4. SECURITIES LENDING
Through an agreement with The Northern Trust Company (“Northern Trust”) (the Funds’ custodian) the Select Funds may lend portfolio securities to certain brokers, dealers and other financial institutions that pay the Select Funds a negotiated fee. The Select Funds receive cash or U.S. Government securities as collateral against the loaned securities in an amount at least equal to the market value of the loaned securities. The Funds continue to own the loaned securities and the securities remain in the investment portfolio. However, in the event of default or bankruptcy by the other party to the agreement, realization and/or retention of the collateral may be subject to legal proceedings. Cash collateral has been invested in a short-term money market fund of Northern Trust. At June 30, 2008, the market values of loaned securities and collateral received were as follows:
Fund | Value of Securities Loaned | Value of Collateral | ||||
Money Market | $ | 6,030,320 | $ | 6,120,000 | ||
Low-Duration Bond | 98,992,357 | 101,052,603 | ||||
Medium-Duration Bond | 127,037,687 | 129,641,599 | ||||
Extended-Duration Bond | 43,616,241 | 44,639,752 | ||||
Global Bond | 24,484,534 | 25,070,608 | ||||
Equity Index | 30,313,433 | 31,386,372 | ||||
Real Estate Securities | 54,122,608 | 55,211,103 | ||||
Value Equity | 132,605,210 | 137,988,044 | ||||
Growth Equity | 161,650,866 | 166,028,518 | ||||
Small Cap Equity | 206,729,943 | 215,005,582 | ||||
International Equity | 272,957,833 | 287,196,178 | ||||
143
Table of Contents
5. 10% SHAREHOLDERS
The Date Target and Asset Allocation Funds do not invest in the underlying funds for the purpose of exercising management or control; however, investments made by each Date Target and Asset Allocation Fund within each of its principal investment strategies may represent a significant portion of an underlying fund’s net assets. At June 30, 2008, the Asset Allocation Funds were the owner of record of the following approximate percentages of the total outstanding shares of the underlying funds as detailed below:
Fund | Conservative Allocation | Balanced Allocation | Growth Allocation | Aggressive Allocation | Conservative Allocation I | Balanced Allocation I | Growth Allocation I | Aggressive Allocation I | ||||||||||||||||
Low-Duration Bond | 27.84 | % | 22.01 | % | 8.81 | % | — | 8.07 | % | 8.60 | % | 2.98 | % | — | ||||||||||
Medium-Duration Bond | — | 21.83 | 8.59 | — | — | 0.10 | 0.03 | — | ||||||||||||||||
Extended-Duration Bond | — | 17.51 | 6.87 | — | — | 9.24 | 3.14 | — | ||||||||||||||||
Global Bond | — | 16.03 | 6.39 | — | — | 4.29 | 1.48 | — | ||||||||||||||||
Equity Index | 0.99 | 7.72 | 9.13 | 10.86 | % | 0.36 | 3.78 | 3.87 | 3.87 | % | ||||||||||||||
Value Equity | 1.38 | 10.63 | 12.60 | 14.98 | 0.52 | 5.40 | 5.54 | 5.54 | ||||||||||||||||
Growth Equity | 1.38 | 10.66 | 12.66 | 15.30 | 0.44 | 4.53 | 4.66 | 4.73 | ||||||||||||||||
Small Cap Equity | 1.02 | 7.84 | 9.22 | 11.27 | 0.30 | 3.13 | 3.19 | 3.27 | ||||||||||||||||
International Equity | 1.31 | 10.34 | 12.17 | 14.69 | 0.33 | 3.47 | 3.54 | 3.59 |
As of June 30, 2008, the Date Target Funds did not own 10% or more of the total outstanding shares of the underlying funds they invested in.
6. INVESTMENT TRANSACTIONS
For the six months ended June 30, 2008, the cost of purchases and proceeds from sales and maturities (other than short-term and U.S. Government obligations) for each Fund were as follows:
| Purchases | Sale and Maturity Proceeds | |||||
MyDestination 2005 | $ | 13,629,857 | $ | 3,754,583 | ||
MyDestination 2015 | 39,115,567 | 9,072,266 | ||||
MyDestination 2025 | 25,569,116 | 3,683,500 | ||||
MyDestination 2035 | 12,839,536 | 544,000 | ||||
MyDestination 2045 | 6,206,763 | 165,000 | ||||
Conservative Allocation | 21,312,834 | 11,250,000 | ||||
Balanced Allocation | 145,486,620 | 168,550,000 | ||||
Growth Allocation | 86,809,616 | 116,600,000 | ||||
Aggressive Allocation | 44,510,152 | 78,500,000 | ||||
Conservative Allocation I | 4,596,543 | 4,158,000 | ||||
Balanced Allocation I | 48,399,199 | 36,739,000 | ||||
Growth Allocation I | 26,952,727 | 24,913,395 | ||||
Aggressive Allocation I | 11,338,088 | 17,533,396 | ||||
Low-Duration Bond | 1,977,805,473 | 2,015,051,108 | ||||
Medium-Duration Bond | 4,614,460,686 | 4,600,944,257 | ||||
Extended-Duration Bond | 136,926,663 | 164,968,974 | ||||
Global Bond | 154,049,989 | 230,971,991 | ||||
Equity Index | 7,415,648 | 28,750,209 | ||||
Real Estate Securities | 72,272,686 | 41,954,765 | ||||
Value Equity | 473,001,905 | 494,066,852 | ||||
Growth Equity | 471,501,246 | 510,640,136 | ||||
Small Cap Equity | 218,090,982 | 230,407,162 | ||||
International Equity | 1,027,118,190 | 866,061,747 | ||||
For the six months ended June 30, 2008, the cost of purchases and proceeds from sales and maturities of long-term U.S. Government obligations for each Fund were as follows:
| Purchases | Sale and Maturity Proceeds | |||||
MyDestination 2005 | $ | 5,936,556 | $ | 5,957,014 | ||
MyDestination 2015 | 8,335,919 | 8,623,718 | ||||
MyDestination 2025 | 3,017,779 | 3,067,553 | ||||
MyDestination 2035 | 419,088 | 419,248 | ||||
Conservative Allocation | 12,484,076 | 12,520,934 | ||||
Balanced Allocation | 33,811,927 | 36,281,578 | ||||
Growth Allocation | 11,628,369 | 12,704,395 | ||||
Conservative Allocation I | 3,332,463 | 5,946,304 | ||||
Balanced Allocation I | 5,196,860 | 2,907,297 | ||||
Growth Allocation I | 2,297,407 | — | ||||
Low-Duration Bond | 766,767,274 | 750,347,899 | ||||
Medium-Duration Bond | 270,741,951 | 279,120,441 | ||||
Extended-Duration Bond | 1,163,895 | 20,246,346 | ||||
Global Bond | 800,669 | — | ||||
Small Cap Equity | 148,051,407 | 148,620,130 | ||||
144
Table of Contents
Futures Contracts
Investments as of June 30, 2008, included cash and securities that were valued and pledged as collateral to cover initial margin deposits. The market value of this collateral and open futures contracts is as follows:
| Open Long (Short) Contracts | Notional Value on Futures | Net Unrealized Gain (Loss) on Futures | |||||||||
MyDestination 2005 | |||||||||||
September 2008 S&P 500® E-Mini | 7 | $ | 448,385 | $ | (20,072 | ) | |||||
MyDestination 2015 | |||||||||||
September 2008 S&P 500® E-Mini | 26 | $ | 1,665,430 | $ | (70,506 | ) | |||||
MyDestination 2025 | |||||||||||
September 2008 S&P 500® E-Mini | 18 | $ | 1,152,990 | $ | (50,464 | ) | |||||
MyDestination 2035 | |||||||||||
September 2008 S&P 500® E-Mini | 12 | $ | 768,660 | $ | (25,115 | ) | |||||
MyDestination 2045 | |||||||||||
September 2008 S&P 500® E-Mini | 9 | $ | 576,495 | $ | (22,292 | ) | |||||
Conservative Allocation Fund | |||||||||||
September 2008 S&P 500® | 3 | $ | 960,825 | $ | (41,613 | ) | |||||
Balanced Allocation Fund | |||||||||||
September 2008 S&P 500® | 17 | $ | 5,444,675 | $ | (319,772 | ) | |||||
Growth Allocation Fund | |||||||||||
September 2008 S&P 500® | 21 | $ | 6,725,775 | $ | (390,164 | ) | |||||
Aggressive Allocation Fund | |||||||||||
September 2008 S&P 500® | 31 | $ | 9,928,525 | $ | (571,645 | ) | |||||
Conservative Allocation Fund I | |||||||||||
September 2008 S&P 500® E-Mini | 4 | $ | 256,220 | $ | (9,831 | ) | |||||
Balanced Allocation Fund I | |||||||||||
September 2008 S&P 500® E-Mini | 32 | $ | 2,049,760 | $ | (103,189 | ) | |||||
Growth Allocation Fund I | |||||||||||
September 2008 S&P 500® E-Mini | 28 | $ | 1,793,540 | $ | (85,731 | ) | |||||
Aggressive Allocation Fund I | |||||||||||
September 2008 S&P 500® E-Mini | 39 | $ | 2,498,145 | $ | (115,941 | ) | |||||
Low-Duration Bond Fund | |||||||||||
December 2008 90-Day Euro | 350 | $ | 84,717,500 | $ | (26,121 | ) | |||||
December 2008 90-Day Sterling | 94 | 21,947,136 | (186,858 | ) | |||||||
December 2009 90-Day Euro | 40 | 9,593,500 | (169,737 | ) | |||||||
December 2009 90-Day Sterling | 104 | 24,298,769 | (118,091 | ) | |||||||
December 2010 90-Day Euro | (9 | ) | (2,144,925 | ) | 7,248 | ||||||
June 2009 90-Day Euro | (2 | ) | (1,929,400 | ) | 6,713 | ||||||
June 2009 90-Day Sterling | 136 | 31,777,007 | (117,717 | ) | |||||||
June 2010 90-Day Euro | (9 | ) | (2,150,438 | ) | 7,660 | ||||||
March 2009 90-Day Euro | 58 | 14,018,600 | 27,342 | ||||||||
March 2010 90-Day Euro | (12 | ) | (2,872,350 | ) | 8,613 | ||||||
March 2011 90-Day Euro | (9 | ) | (2,143,800 | ) | 6,535 | ||||||
September 2008 2-Year U.S. Treasury Note | (153 | ) | (32,314,078 | ) | (194,413 | ) | |||||
September 2008 5-Year U.S . Treasury Note | (565 | ) | (62,463,398 | ) | (660,015 | ) | |||||
September 2008 90-Day Euro | 94 | 22,811,450 | 420,442 | ||||||||
September 2008 90-Day Sterling | 135 | 31,561,839 | (300,563 | ) | |||||||
September 2008 Euro-BOBL | 8 | 1,332,368 | (21,184 | ) | |||||||
145
Table of Contents
| Open Long (Short) Contracts | Notional Value on Futures | Net Unrealized Gain (Loss) on Futures | |||||||||
September 2008 Euro-Bund | 30 | $ | 5,222,628 | $ | (64,106 | ) | |||||
September 2008 U.S. Long Treasury Bond | (332 | ) | (38,377,125 | ) | 134,078 | ||||||
September 2008 10-Year U.S. Treasury Note | 691 | 78,720,016 | 192,463 | ||||||||
September 2008 Euro-Schatz | (155 | ) | (24,971,463 | ) | (28,065 | ) | |||||
September 2008 Long Gilt | (14 | ) | (2,910,984 | ) | 47,127 | ||||||
September 2009 90-Day Euro | 126 | 30,307,725 | 122,163 | ||||||||
September 2009 90-Day Sterling | 81 | 18,928,028 | (88,027 | ) | |||||||
September 2010 90-Day Euro | (9 | ) | (2,147,512 | ) | 7,510 | ||||||
| $ | (987,003 | ) | |||||||||
Medium-Duration Bond Fund | |||||||||||
December 2008 90-Day Euro | 518 | $ | 125,381,900 | $ | (43,163 | ) | |||||
December 2008 90-Day Sterling | 274 | 63,973,568 | (516,082 | ) | |||||||
December 2009 90-Day Euro | 272 | 65,235,800 | (399,800 | ) | |||||||
June 2009 90-Day Euro | 323 | 77,899,525 | 154,950 | ||||||||
March 2009 90-Day Euro | 119 | 28,762,300 | 38,890 | ||||||||
March 2009 90-Day Sterling | 22 | 5,138,481 | (24,911 | ) | |||||||
March 2010 90-Day Euro | 132 | 31,595,850 | (127,050 | ) | |||||||
September 2008 2-Year U.S. Treasury Note | (1,435 | ) | (303,076,484 | ) | (1,006,409 | ) | |||||
September 2008 5-Year U.S . Treasury Note | (1,123 | ) | (124,152,914 | ) | (417,572 | ) | |||||
September 2008 90-Day Euro | 51 | 12,376,425 | (29,538 | ) | |||||||
September 2008 90-Day Sterling | 200 | 46,758,280 | (460,586 | ) | |||||||
September 2008 Euro-BOBL | (198 | ) | (32,976,100 | ) | 498,142 | ||||||
September 2008 Euro-Bund | 56 | 9,748,906 | 147,243 | ||||||||
September 2008 Euro-Bund | (56 | ) | (9,748,906 | ) | (158,233 | ) | |||||
September 2008 U.S. Long Treasury Bond | (746 | ) | (86,232,938 | ) | (118,165 | ) | |||||
September 2008 10-Year U.S. Treasury Note | 1,154 | 131,465,844 | 850,414 | ||||||||
September 2008 Euro-Schatz | (193 | ) | (31,093,499 | ) | (34,945 | ) | |||||
September 2008 Long Gilt | (46 | ) | (9,564,663 | ) | 154,845 | ||||||
September 2009 90-Day Euro | 573 | 137,827,988 | 20,850 | ||||||||
| $ | (1,471,120 | ) | |||||||||
Global Bond Fund | |||||||||||
September 2008 5-Year U.S. Treasury Note | 45 | $ | 4,974,961 | $ | 32,408 | ||||||
September 2008 90-Day Euro | 77 | 18,685,975 | (61,023 | ) | |||||||
September 2008 Euro-BOBL | 27 | 4,496,741 | (65,379 | ) | |||||||
September 2008 Euro-Bund | 9 | 1,566,788 | (25,435 | ) | |||||||
September 2008 10-Year U.S. Treasury Note | (13 | ) | (1,480,984 | ) | (18,956 | ) | |||||
| $ | (138,385 | ) | |||||||||
Equity Index Fund | |||||||||||
September 2008 S&P 500® | 31 | $ | 9,928,525 | $ | (545,382 | ) | |||||
Real Estate Securities Fund | |||||||||||
September 2008 Russell 2000® IMM-Mini | 47 | $ | 3,250,990 | $ | (71,741 | ) | |||||
Value Equity Fund | |||||||||||
September 2008 S&P 500® | 177 | $ | 56,688,675 | $ | (2,472,353 | ) | |||||
September 2008 S&P 500® E-Mini | 52 | 3,330,860 | (61,069 | ) | |||||||
| $ | (2,533,422 | ) | |||||||||
Growth Equity Fund | |||||||||||
September 2008 S&P 500® | 139 | $ | 44,518,225 | $ | (2,120,691 | ) | |||||
Small Cap Equity Fund | |||||||||||
September 2008 90-Day Euro | 10 | $ | 2,426,750 | $ | (1,738 | ) | |||||
146
Table of Contents
| Open Long (Short) Contracts | Notional Value on Futures | Net Unrealized Gain (Loss) on Futures | |||||||||
December 2008 90-Day Euro | 5 | $ | 1,210,250 | $ | (4,863 | ) | |||||
March 2009 90-Day Euro | 90 | 21,753,000 | 11,325 | ||||||||
September 2008 90-Day EURIBOR | 3 | 1,120,914 | (18,917 | ) | |||||||
December 2008 90-Day EURIBOR | 14 | 5,221,014 | (52,048 | ) | |||||||
September 2008 5-Year U.S . Treasury Note | (19 | ) | (2,100,539 | ) | (4,228 | ) | |||||
September 2008 90-Day Sterling | 5 | 1,168,957 | (17,045 | ) | |||||||
December 2008 90-Day Sterling | 13 | 3,035,242 | (51,057 | ) | |||||||
March 2009 90-Day Sterling | 13 | 3,036,375 | 2,187 | ||||||||
September 2008 Euro-BOBL | 19 | 3,164,373 | (31,914 | ) | |||||||
September 2008 Russell 2000® IMM-Mini | 904 | 62,529,680 | (3,359,899 | ) | |||||||
September 2008 2-Year U.S. Treasury Note | 7 | 1,478,422 | (176 | ) | |||||||
September 2008 10-Year U.S. Treasury Note | (51 | ) | (5,810,016 | ) | (2,411 | ) | |||||
September 2008 U.S. Long Treasury Bond | 34 | 3,930,188 | 20,791 | ||||||||
| $ | (3,509,993 | ) | |||||||||
International Equity Fund | |||||||||||
July 2008 CAC-40 Index | 16 | $ | 1,119,501 | $ | (54,953 | ) | |||||
July 2008 AEX Index | 43 | 5,769,531 | (426,568 | ) | |||||||
September 2008 DAX Index Future | (13 | ) | (3,315,804 | ) | 202,111 | ||||||
July 2008 Hang Seng Index | 16 | 2,269,518 | (59,618 | ) | |||||||
July 2008 IBEX 35 | (19 | ) | (3,575,999 | ) | 243,592 | ||||||
July 2008 OMXS30 Index Future | (134 | ) | (1,919,069 | ) | 206,136 | ||||||
July 2008 MSCI Singapore Index | 2 | 105,340 | (1,579 | ) | |||||||
September 2008 S&P/MIB Index | 7 | 1,635,325 | (87,010 | ) | |||||||
September 2008 TOPIX Index | 60 | 7,450,205 | (387,670 | ) | |||||||
September 2008DJ Euro Stoxx | 333 | 17,721,132 | (925,920 | ) | |||||||
September 2008 SPI 200 Futures | (16 | ) | (1,991,314 | ) | 137,324 | ||||||
September 2008 FTSE 100 Index | 138 | 15,524,824 | (550,440 | ) | |||||||
| $ | (1,704,595 | ) | |||||||||
Forward Foreign Currency Contracts
As of June 30, 2008, the following Funds have forward foreign currency exchange contracts that obligate it to deliver currencies at specified future dates. The unrealized appreciation and/or depreciation on these contracts is included in the accompanying financial statements. The terms of the open contracts are as follows:
Fund/Expiration Date | Currency to be Delivered | Amount of Currency to be Delivered | Currency to be Received | Amount of Currency to be Received | Net Unrealized Appreciation (Depreciation) | |||||||
Low-Duration Bond Fund | ||||||||||||
07/09/08 | Euro | 4,981,000 | US Dollars | 7,686,979 | $ | (151,597 | ) | |||||
07/09/08 | British Pounds | 4,049,000 | US Dollars | 7,875,953 | (183,069 | ) | ||||||
07/23/08 | Euro | 108,779 | US Dollars | 169,834 | (1,222 | ) | ||||||
07/23/08 | US Dollars | 169,794 | Euro | 108,779 | 1,262 | |||||||
07/23/08 | Euro | 175,221 | US Dollars | 275,727 | 190 | |||||||
07/23/08 | US Dollars | 275,504 | Euro | 175,221 | 2,033 | |||||||
07/24/08 | Euro | 4,448,000 | US Dollars | 6,922,734 | (71,415 | ) | ||||||
07/28/08 | US Dollars | 4,504,666 | Japanese Yen | 485,603,000 | 76,074 | |||||||
07/28/08 | Japanese Yen | 339,025,296 | US Dollars | 3,176,000 | (22,058 | ) | ||||||
08/11/08 | US Dollars | 143,283 | Canadian Dollars | 145,000 | (1,174 | ) | ||||||
08/11/08 | British Pounds | 2,898,000 | US Dollars | 5,703,620 | (49,424 | ) | ||||||
08/11/08 | US Dollars | 10,564,140 | British Pounds | 5,333,000 | 22,812 | |||||||
08/11/08 | British Pounds | 2,430,000 | US Dollars | 4,815,920 | (8,062 | ) | ||||||
10/10/08 | US Dollars | 4,360,000 | Chinese Yuan | 29,961,920 | 80,425 | |||||||
10/10/08 | US Dollars | 3,840,537 | Chinese Yuan | 26,334,560 | 62,305 | |||||||
10/10/08 | US Dollars | 4,238,220 | Chinese Yuan | 28,747,845 | 22,277 | |||||||
| $ | (220,643 | ) | ||||||||||
147
Table of Contents
Fund/Expiration Date | Currency to be Delivered | Amount of Currency to be Delivered | Currency to be Received | Amount of Currency to be Received | Net Unrealized Appreciation (Depreciation) | |||||||
Medium-Duration Bond Fund | ||||||||||||
07/02/08 | US Dollars | 3,175,344 | Chinese Yuan | 21,780,000 | $ | 2,224 | ||||||
07/02/08 | Chinese Yuan | 21,780,000 | US Dollars | 3,175,344 | (2,224 | ) | ||||||
07/02/08 | US Dollar | 972,000 | Brazilian Real | 1,858,950 | 186,987 | |||||||
07/02/08 | Brazilian Real | 1,858,950 | US Dollars | 1,099,751 | (59,237 | ) | ||||||
07/02/08 | US Dollar | 973,000 | Brazilian Real | 1,856,971 | 184,753 | |||||||
07/02/08 | Brazilian Real | 1,856,971 | US Dollars | 1,132,299 | (25,454 | ) | ||||||
07/02/08 | US Dollar | 972,000 | Brazilian Real | 1,860,408 | 187,896 | |||||||
07/02/08 | Brazilian Real | 1,860,408 | US Dollars | 1,134,395 | (25,501 | ) | ||||||
07/02/08 | US Dollars | 3,000,000 | Chinese Yuan | 21,780,000 | 178,294 | |||||||
07/02/08 | Chinese Yuan | 21,780,000 | US Dollars | 3,172,615 | (5,679 | ) | ||||||
07/09/08 | Euro | 1,742,179 | US Dollars | 2,701,187 | (40,471 | ) | ||||||
07/10/08 | US Dollars | 512,000 | Russian Rubles | 12,980,480 | 41,331 | |||||||
07/10/08 | Russian Rubles | 12,980,480 | US Dollars | 544,255 | (9,076 | ) | ||||||
07/10/08 | US Dollars | 2,928,042 | Russian Rubles | 74,079,460 | 229,810 | |||||||
07/10/08 | Russian Rubles | 74,079,460 | US Dollars | 3,106,057 | (51,795 | ) | ||||||
07/10/08 | US Dollars | 512,000 | Russian Rubles | 12,981,760 | 41,385 | |||||||
07/10/08 | Russian Rubles | 12,981,760 | US Dollars | 544,309 | (9,077 | ) | ||||||
07/10/08 | US Dollars | 2,747,000 | Russian Rubles | 68,221,745 | 161,150 | |||||||
07/10/08 | Russian Rubles | 68,221,745 | US Dollars | 2,860,451 | (47,699 | ) | ||||||
07/24/08 | Euro | 5,576,000 | US Dollars | 8,678,320 | (89,526 | ) | ||||||
07/28/08 | US Dollars | 2,956,820 | Japanese Yen | 318,745,226 | 49,935 | |||||||
07/28/08 | US Dollars | 1,395,050 | Japanese Yen | 150,000,000 | 19,914 | |||||||
07/28/08 | Japanese Yen | 150,000,000 | US Dollars | 1,405,205 | (9,760 | ) | ||||||
07/28/08 | US Dollars | 1,697,039 | Japanese Yen | 182,940,774 | 28,659 | |||||||
07/28/08 | Japanese Yen | 182,940,774 | US Dollars | 1,713,795 | (11,903 | ) | ||||||
08/04/08 | US Dollars | 1,345,000 | Malaysian Ringit | 4,326,865 | (20,612 | ) | ||||||
08/05/08 | Canadian Dollars | 667,776 | US Dollars | 661,081 | 6,569 | |||||||
08/05/08 | Euro | 1,448,485 | US Dollars | 2,291,330 | 15,109 | |||||||
08/11/08 | British Pounds | 2,540,000 | US Dollars | 4,999,032 | (43,318 | ) | ||||||
08/11/08 | British Pounds | 2,130,000 | US Dollars | 4,221,362 | (7,066 | ) | ||||||
08/15/08 | Hungarian Forint | 150,021,381 | US Dollars | 904,016 | (91,670 | ) | ||||||
10/10/08 | US Dollars | 2,480,599 | Chinese Yuan | 17,009,464 | 40,243 | |||||||
10/10/08 | US Dollars | 2,816,000 | Chinese Yuan | 19,351,552 | 51,944 | |||||||
10/10/08 | US Dollars | 1,894,479 | Chinese Yuan | 12,850,250 | 9,958 | |||||||
10/10/08 | US Dollars | 3,226,667 | Chinese Yuan | 21,780,000 | 1,179 | |||||||
11/19/08 | US Dollars | 365,338 | Russian Rubles | 9,062,200 | 18,914 | |||||||
12/02/08 | US Dollars | 1,879,675 | Brazilian Real | 3,199,207 | 38,923 | |||||||
12/02/08 | Brazilian Real | 245,228 | US Dollars | 135,000 | (12,065 | ) | ||||||
12/02/08 | US Dollars | 144,082 | Brazilian Real | 245,228 | 2,983 | |||||||
12/02/08 | Brazilian Real | 228,000 | US Dollars | 125,000 | (11,734 | ) | ||||||
12/02/08 | US Dollars | 133,960 | Brazilian Real | 228,000 | 2,774 | |||||||
12/02/08 | Brazilian Real | 146,120 | US Dollars | 80,000 | (7,630 | ) | ||||||
12/02/08 | US Dollars | 85,852 | Brazilian Real | 146,120 | 1,778 | |||||||
12/02/08 | Brazilian Real | 237,055 | US Dollars | 130,000 | (12,164 | ) | ||||||
12/02/08 | US Dollars | 139,280 | Brazilian Real | 237,055 | 2,884 | |||||||
12/02/08 | Brazilian Real | 183,350 | US Dollars | 100,000 | (9,957 | ) | ||||||
12/02/08 | US Dollars | 107,726 | Brazilian Real | 183,350 | 2,231 | |||||||
12/02/08 | Brazilian Real | 36,670 | US Dollars | 20,000 | (1,991 | ) | ||||||
12/02/08 | US Dollars | 21,545 | Brazilian Real | 36,670 | 446 | |||||||
12/02/08 | Brazilian Real | 408,940 | US Dollars | 230,000 | (15,245 | ) | ||||||
12/02/08 | US Dollars | 240,270 | Brazilian Real | 408,940 | 4,975 | |||||||
05/06/09 | US Dollars | 6,895,336 | Russian Rubles | 168,263,445 | 157,300 | |||||||
| $ | 1,049,694 | |||||||||||
148
Table of Contents
Fund/Expiration Date | Currency to be Delivered | Amount of Currency to be Delivered | Currency to be Received | Amount of Currency to be Received | Net Unrealized Appreciation (Depreciation) | |||||||
Global Bond Fund | ||||||||||||
08/05/08 | Turkish Lira | 1,821,870 | Euro | 930,000 | $ | (4,935 | ) | |||||
08/05/08 | US Dollars | 545,059 | Australian Dollars | 587,221 | 14,991 | |||||||
08/05/08 | US Dollars | 1,120,838 | Canadian Dollars | 1,130,208 | (13,081 | ) | ||||||
08/05/08 | US Dollars | 501,411 | Canadian Dollars | 510,000 | (1,541 | ) | ||||||
08/05/08 | US Dollars | 1,589,560 | Euro | 1,000,000 | (18,111 | ) | ||||||
08/05/08 | US Dollars | 2,960,958 | Euro | 1,870,000 | (22,348 | ) | ||||||
08/05/08 | US Dollars | 398,489 | Euro | 250,898 | (4,215 | ) | ||||||
08/05/08 | US Dollars | 9,815,783 | Japanese Yen | 1,011,467,400 | (270,402 | ) | ||||||
08/05/08 | US Dollars | 5,862,105 | Japanese Yen | 600,226,840 | (197,667 | ) | ||||||
08/05/08 | US Dollars | 400,664 | Mexican Pesos | 4,246,240 | 8,827 | |||||||
08/05/08 | US Dollars | 123,732 | South African Rand | 988,065 | 1,161 | |||||||
08/05/08 | Australian Dollars | 603,028 | US Dollars | 562,095 | (13,030 | ) | ||||||
08/05/08 | Australian Dollars | 250,000 | US Dollars | 232,913 | (5,519 | ) | ||||||
08/05/08 | Australian Dollars | 631,336 | US Dollars | 588,424 | (13,699 | ) | ||||||
08/05/08 | Euro | 279,420 | US Dollars | 441,419 | 2,325 | |||||||
08/05/08 | Euro | 808,255 | US Dollars | 1,284,762 | 14,630 | |||||||
08/05/08 | Euro | 4,967,336 | US Dollars | 7,857,730 | 51,812 | |||||||
08/05/08 | Euro | 5,141,675 | US Dollars | 8,131,045 | 51,164 | |||||||
08/05/08 | Euro | 500,000 | US Dollars | 783,865 | (1,860 | ) | ||||||
08/05/08 | Euro | 200,000 | US Dollars | 309,900 | (4,390 | ) | ||||||
08/05/08 | Euro | 770,000 | US Dollars | 1,183,975 | (26,041 | ) | ||||||
08/05/08 | British Pounds | 200,000 | US Dollars | 394,740 | (2,474 | ) | ||||||
08/05/08 | British Pounds | 500,000 | US Dollars | 982,625 | (10,411 | ) | ||||||
08/05/08 | British Pounds | 1,700,000 | US Dollars | 3,346,620 | (29,702 | ) | ||||||
08/05/08 | British Pounds | 500,000 | US Dollars | 981,100 | (11,936 | ) | ||||||
08/05/08 | Hungarian Forint | 359,036,188 | US Dollars | 2,241,874 | (144,411 | ) | ||||||
08/05/08 | Japanese Yen | 128,025,470 | US Dollars | 1,250,261 | 42,064 | |||||||
08/05/08 | Japanese Yen | 122,796,100 | US Dollars | 1,199,181 | 40,334 | |||||||
08/05/08 | Japanese Yen | 62,658,000 | US Dollars | 600,000 | 8,686 | |||||||
08/05/08 | Japanese Yen | 125,860,000 | US Dollars | 1,182,617 | (5,144 | ) | ||||||
08/05/08 | Turkish Lira | 1,752,060 | US Dollars | 1,281,683 | (128,511 | ) | ||||||
08/12/08 | US Dollars | 667,198 | Indonesian Rupiahs | 6,231,625,000 | 3,538 | |||||||
08/12/08 | US Dollars | 1,146,084 | Indian Rupees | 47,700,000 | (46,461 | ) | ||||||
08/12/08 | US Dollars | 678,032 | South Korean Won | 700,000,000 | (9,991 | ) | ||||||
08/12/08 | US Dollars | 643,511 | Malaysian Ringgits | 2,048,938 | (16,336 | ) | ||||||
08/12/08 | US Dollars | 600,000 | Malaysian Ringgits | 1,938,900 | (6,508 | ) | ||||||
08/12/08 | Brazilian Real | 648,165 | US Dollars | 379,933 | (19,961 | ) | ||||||
| $ | (789,153 | ) | ||||||||||
149
Table of Contents
Fund/Expiration Date | Currency to be Delivered | Amount of Currency to be Delivered | Currency to be Received | Amount of Currency to be Received | Net Unrealized Appreciation (Depreciation) | |||||||
Small Cap Equity Fund |
| |||||||||||
08/05/08 | Euro | 330,000 | US Dollars | 522,020 | $ | 3,442 | ||||||
08/05/08 | Euro | 80,685 | US Dollars | 124,140 | (2,652 | ) | ||||||
| $ | 790 | |||||||||||
International Equity Fund |
| |||||||||||
07/31/08 | �� | Euro | 13,749,500 | US Dollars | 21,363,630 | $ | (248,396 | ) | ||||
07/31/08 | British Pounds | 5,875,000 | US Dollars | 11,620,515 | (52,032 | ) | ||||||
09/17/08 | Australian Dollars | 2,462,000 | US Dollars | 2,321,235 | (14,259 | ) | ||||||
09/17/08 | Swiss Francs | 2,324,000 | US Dollars | 2,272,838 | (3,781 | ) | ||||||
09/17/08 | Danish Kroner | 2,657,000 | US Dollars | 557,572 | (928 | ) | ||||||
09/17/08 | Euro | 1,355,000 | US Dollars | 2,092,376 | (32,288 | ) | ||||||
09/17/08 | US Dollars | 848,669 | British Pounds | 433,000 | 8,519 | |||||||
09/17/08 | US Dollars | 202,143 | Hong Kong Dollars | 1,575,000 | 166 | |||||||
09/17/08 | US Dollars | 1,577,242 | Japanese Yen | 167,104,000 | 3,364 | |||||||
09/17/08 | US Dollars | 12,884,859 | Norwegian Krone | 67,351,000 | 232,804 | |||||||
09/17/08 | US Dollars | 269,002 | Swedish Kronor | 1,605,000 | (3,675 | ) | ||||||
09/17/08 | Singapore Dollars | 1,023,000 | US Dollars | 753,689 | (1,043 | ) | ||||||
09/17/08 | US Dollars | 735 | Singapore Dollars | 1,000 | 3 | |||||||
| $ | (111,546 | ) | ||||||||||
Options Written
Transactions in options written during the six months ended June 30, 2008, were as follows:
Low-Duration Bond Fund | Number of Contracts | Premiums Received | |||||
Options written, 12/31/07 | 91,760 | $ | 4,422,364 | ||||
Options written | 14,645 | 6,531,717 | |||||
Options expired | (383 | ) | (52,902 | ) | |||
Options closed | (15,750 | ) | (2,434,928 | ) | |||
Options written, 06/30/08 | 90,272 | $ | 8,466,251 | ||||
Medium-Duration Bond Fund | Number of Contracts | Premiums Received | |||||
Options written, 12/31/07 | 122,568 | $ | 5,592,094 | ||||
Options written | 12,299 | 6,795,672 | |||||
Options expired | (257 | ) | (159,507 | ) | |||
Options closed | (16,470 | ) | (2,180,455 | ) | |||
Options written, 06/30/08 | 118,140 | $ | 10,047,804 | ||||
Small Cap Equity Fund | Number of Contracts | Premiums Received | |||||
Options written, 12/31/07 | 33 | $ | 25,110 | ||||
Options written | 90 | 62,113 | |||||
Options expired | — | — | |||||
Options closed | (71 | ) | (51,249 | ) | |||
Options written, 06/30/08 | 52 | $ | 35,974 | ||||
150
Table of Contents
7. CAPITAL SHARE TRANSACTIONS
Transactions in shares of capital stock were as follows:
| Six Months Ended June 30, 2008 | Year Ended December 31, 2007 | ||||||||||||||
| GS4 | GS6 | GS4 | GS6 | GS8 | |||||||||||
MyDestination 2005 | |||||||||||||||
Shares sold | 1,477,408 | 25,958 | 6,148,997 | 136,448 | 101,780 | ||||||||||
Shares exchanged | — | — | — | 1,482 | (1,484 | ) | |||||||||
Shares reinvested | — | — | 152,755 | 3,735 | — | ||||||||||
Shares redeemed | (578,003 | ) | (15,822 | ) | (730,702 | ) | (1,458 | ) | (101,296 | ) | |||||
Net increase (decrease) | 899,405 | 10,136 | 5,571,050 | 140,207 | (1,000 | ) | |||||||||
MyDestination 2015 | |||||||||||||||
Shares sold | 3,370,874 | 38,362 | 16,541,145 | 135,535 | 112,014 | ||||||||||
Shares exchanged | — | — | — | 12,203 | (12,214 | ) | |||||||||
Shares reinvested | — | — | 436,184 | 3,694 | — | ||||||||||
Shares redeemed | (774,230 | ) | (884 | ) | (523,997 | ) | (4,107 | ) | (100,800 | ) | |||||
Net increase (decrease) | 2,596,644 | 37,478 | 16,453,332 | 147,325 | (1,000 | ) | |||||||||
MyDestination 2025 | |||||||||||||||
Shares sold | 2,420,900 | 55,668 | 10,440,156 | 169,074 | 129,123 | ||||||||||
Shares exchanged | — | — | — | 27,558 | (27,583 | ) | |||||||||
Shares reinvested | — | — | 281,677 | 5,220 | — | ||||||||||
Shares redeemed | (296,175 | ) | (7,578 | ) | (455,987 | ) | (1,348 | ) | (102,540 | ) | |||||
Net increase (decrease) | 2,124,725 | 48,090 | 10,265,846 | 200,504 | (1,000 | ) | |||||||||
MyDestination 2035 | |||||||||||||||
Shares sold | 1,332,274 | 53,135 | 3,675,043 | 123,285 | 109,187 | ||||||||||
Shares exchanged | — | — | — | 9,784 | (9,802 | ) | |||||||||
Shares reinvested | — | — | 91,100 | 3,341 | — | ||||||||||
Shares redeemed | (182,223 | ) | (100 | ) | (338,148 | ) | (1,651 | ) | (100,385 | ) | |||||
Net increase (decrease) | 1,150,051 | 53,035 | 3,427,995 | 134,759 | (1,000 | ) | |||||||||
MyDestination 2045 | |||||||||||||||
Shares sold | 728,893 | 19,175 | 1,514,661 | 114,644 | 103,251 | ||||||||||
Shares exchanged | — | — | — | 3,443 | (3,446 | ) | |||||||||
Shares reinvested | — | — | 36,409 | 3,379 | — | ||||||||||
Shares redeemed | (89,304 | ) | (2,321 | ) | (399,712 | ) | (1,018 | ) | (100,805 | ) | |||||
Net increase (decrease) | 639,589 | 16,854 | 1,151,358 | 120,448 | (1,000 | ) | |||||||||
151
Table of Contents
| Six Months Ended June 30, 2008 | Year Ended December 31, 2007 | ||||||||||||||
| GS4 | GS6 | GS4 | GS6 | GS8 | |||||||||||
Conservative Allocation Fund | |||||||||||||||
Shares sold | 2,066,634 | 37,754 | 3,101,631 | 15,787 | 8,171 | ||||||||||
Shares exchanged | — | — | — | 34,331 | (34,405 | ) | |||||||||
Shares reinvested | — | — | 1,689,255 | 163,129 | — | ||||||||||
Shares redeemed | (1,649,330 | ) | (13,246 | ) | (4,161,710 | ) | (2,128 | ) | (610,247 | ) | |||||
Net increase (decrease) | 417,304 | 24,508 | 629,176 | 211,119 | (636,481 | ) | |||||||||
Balanced Allocation Fund | |||||||||||||||
Shares sold | 2,195,537 | 108,956 | 4,276,596 | 142,844 | 49,264 | ||||||||||
Shares exchanged | — | — | — | 312,574 | (313,534 | ) | |||||||||
Shares reinvested | — | — | 9,292,073 | 377,694 | — | ||||||||||
Shares redeemed | (5,805,741 | ) | (39,665 | ) | (13,938,640 | ) | (48,496 | ) | (642,064 | ) | |||||
Net increase (decrease) | (3,610,204 | ) | 69,291 | (369,971 | ) | 784,616 | (906,334 | ) | |||||||
Growth Allocation Fund | |||||||||||||||
Shares sold | 1,427,224 | 121,268 | 3,127,389 | 161,689 | 80,894 | ||||||||||
Shares exchanged | — | — | — | 247,991 | (248,643 | ) | |||||||||
Shares reinvested | — | — | 7,709,244 | 244,649 | — | ||||||||||
Shares redeemed | (4,566,924 | ) | (36,729 | ) | (10,322,926 | ) | (17,198 | ) | (592,647 | ) | |||||
Net increase (decrease) | (3,139,700 | ) | 84,539 | 513,707 | 637,131 | (760,396 | ) | ||||||||
Aggressive Allocation Fund | |||||||||||||||
Shares sold | 1,233,329 | 66,968 | 3,459,912 | 76,547 | 60,068 | ||||||||||
Shares exchanged | — | — | — | 114,564 | (114,914 | ) | |||||||||
Shares reinvested | — | — | 7,170,968 | 315,184 | — | ||||||||||
Shares redeemed | (3,845,445 | ) | (24,099 | ) | (9,170,824 | ) | (11,888 | ) | (542,557 | ) | |||||
Net increase (decrease) | (2,612,116 | ) | 42,869 | 1,460,056 | 494,407 | (597,403 | ) | ||||||||
| GS2 | GS2 | ||||||||||||||
Conservative Allocation Fund I | |||||||||||||||
Shares sold | 367,337 | 1,491,042 | |||||||||||||
Shares reinvested | — | 539,752 | |||||||||||||
Shares redeemed | (444,830 | ) | (901,269 | ) | |||||||||||
Net increase (decrease) | (77,493 | ) | 1,129,525 | ||||||||||||
Balanced Allocation Fund I | |||||||||||||||
Shares sold | 1,143,316 | 8,238,644 | |||||||||||||
Shares reinvested | — | 2,911,117 | |||||||||||||
Shares redeemed | (1,071,632 | ) | (2,301,545 | ) | |||||||||||
Net increase | 71,684 | 8,848,216 | |||||||||||||
Growth Allocation Fund I | |||||||||||||||
Shares sold | 612,282 | 5,024,682 | |||||||||||||
Shares reinvested | — | 2,000,500 | |||||||||||||
Shares redeemed | (978,319 | ) | (1,414,424 | ) | |||||||||||
Net increase (decrease) | (366,037 | ) | 5,610,758 | ||||||||||||
Aggressive Allocation Fund I | |||||||||||||||
Shares sold | 412,397 | 4,117,743 | |||||||||||||
Shares reinvested | — | 1,417,048 | |||||||||||||
Shares redeemed | (921,580 | ) | (1,167,436 | ) | |||||||||||
Net increase (decrease) | (509,183 | ) | 4,367,355 | ||||||||||||
152
Table of Contents
| Six Months Ended June 30, 2008 | Year Ended December 31, 2007 | ||||||||||||||||||||
| GS2 | GS4 | GS6 | GS2 | GS4 | GS6 | GS8 | |||||||||||||||
Money Market Fund | |||||||||||||||||||||
Shares sold | 61,596,537 | 2,235,984,110 | 854,476 | 178,932,360 | 3,334,006,987 | 2,164,993 | 214,065 | ||||||||||||||
Shares exchanged | — | — | — | — | — | 301,818 | (301,818 | ) | |||||||||||||
Shares reinvested | 1,773,219 | 8,908,387 | 84,834 | 4,895,984 | 24,364,936 | 238,657 | 96,906 | ||||||||||||||
Shares redeemed | (52,090,428 | ) | (2,216,189,197 | ) | (416,209 | ) | (171,806,826 | ) | (3,349,363,902 | ) | (1,510,697 | ) | (5,466,591 | ) | |||||||
Net increase (decrease) | 11,279,328 | 28,703,300 | 523,101 | 12,021,518 | 9,008,021 | 1,194,771 | (5,457,438 | ) | |||||||||||||
Low-Duration Bond Fund | |||||||||||||||||||||
Shares sold | 897,955 | 4,306,182 | 35,785 | 3,526,093 | 5,216,637 | 6,980 | 299 | ||||||||||||||
Shares exchanged | — | — | — | — | — | 3,724 | (3,724 | ) | |||||||||||||
Shares reinvested | 407,526 | 934,901 | 15,949 | 863,634 | 2,066,787 | 31,928 | 10,905 | ||||||||||||||
Shares redeemed | (1,159,334 | ) | (4,543,012 | ) | (20,586 | ) | (1,333,936 | ) | (10,869,252 | ) | (2,816 | ) | (568,754 | ) | |||||||
Net increase (decrease) | 146,147 | 698,071 | 31,148 | 3,055,791 | (3,585,828 | ) | 39,816 | (561,274 | ) | ||||||||||||
Medium-Duration Bond Fund | |||||||||||||||||||||
Shares sold | 2,656,251 | 5,247,474 | 51,742 | 4,677,595 | 7,532,324 | 121,884 | 2,619 | ||||||||||||||
Shares exchanged | — | — | — | — | — | 7,495 | (7,495 | ) | |||||||||||||
Shares reinvested | 931,564 | 2,296,638 | 84,524 | 1,272,358 | 3,701,683 | 117,394 | 15,364 | ||||||||||||||
Shares redeemed | (3,165,472 | ) | (13,974,866 | ) | (10,188 | ) | (1,226,651 | ) | (14,782,322 | ) | (117,212 | ) | (634,032 | ) | |||||||
Net increase (decrease) | 422,343 | (6,430,754 | ) | 126,078 | 4,723,302 | (3,548,315 | ) | 129,561 | (623,544 | ) | |||||||||||
Extended-Duration Bond Fund | |||||||||||||||||||||
Shares sold | 1,059,912 | 1,105,544 | 10,895 | 2,707,881 | 4,015,105 | 19,397 | 636 | ||||||||||||||
Shares exchanged | — | — | — | — | — | 1,879 | (1,881 | ) | |||||||||||||
Shares reinvested | 640,159 | 1,001,272 | 136,327 | 907,747 | 1,718,398 | 201,887 | 29,671 | ||||||||||||||
Shares redeemed | (1,615,803 | ) | (5,600,651 | ) | (15,150 | ) | (1,448,373 | ) | (4,410,805 | ) | (71 | ) | (711,380 | ) | |||||||
Net increase (decrease) | 84,268 | (3,493,835 | ) | 132,072 | 2,167,255 | 1,322,698 | 223,092 | (682,954 | ) | ||||||||||||
Global Bond Fund | |||||||||||||||||||||
Shares sold | 12,180,019 | 1,970,318 | |||||||||||||||||||
Shares reinvested | 578,242 | 772,252 | |||||||||||||||||||
Shares redeemed | (870,171 | ) | (719,165 | ) | |||||||||||||||||
Net increase | 11,888,090 | 2,023,405 | |||||||||||||||||||
Equity Index Fund | |||||||||||||||||||||
Shares sold | 375,764 | 712,496 | 33,480 | 1,533,810 | 2,103,745 | 26,070 | 7,212 | ||||||||||||||
Shares exchanged | — | — | — | — | — | 10,673 | (10,690 | ) | |||||||||||||
Shares reinvested | 191,881 | 282,591 | 1,917 | 720,035 | 1,178,005 | 16,160 | — | ||||||||||||||
Shares redeemed | (594,327 | ) | (2,085,858 | ) | (11,742 | ) | (1,314,474 | ) | (5,101,066 | ) | (1,270,974 | ) | (557,038 | ) | |||||||
Net increase (decrease) | (26,682 | ) | (1,090,771 | ) | 23,655 | 939,371 | (1,819,316 | ) | (1,218,071 | ) | (560,516 | ) | |||||||||
153
Table of Contents
| Six Months Ended June 30, 2008 | Year Ended December 31, 2007 | ||||||||||||||||||||
| GS2 | GS4 | GS6 | GS2 | GS4 | GS6 | GS8 | |||||||||||||||
Real Estate Securities Fund | |||||||||||||||||||||
Shares sold | 5,187,975 | 8,779,566 | |||||||||||||||||||
Shares reinvested | 126,091 | 1,474,799 | |||||||||||||||||||
Shares redeemed | (2,504,816 | ) | (8,076,816 | ) | |||||||||||||||||
Net increase | 2,809,250 | 2,177,549 | |||||||||||||||||||
Value Equity Fund | |||||||||||||||||||||
Shares sold | 2,007,215 | 4,762,306 | 26,387 | 6,634,605 | 9,488,670 | 184,049 | 16,806 | ||||||||||||||
Shares exchanged | — | — | — | — | — | 38,330 | (38,463 | ) | |||||||||||||
Shares reinvested | 674,334 | 1,068,826 | 50,485 | 3,241,859 | 6,099,780 | 260,082 | — | ||||||||||||||
Shares redeemed | (2,175,737 | ) | (6,647,829 | ) | (8,510 | ) | (1,686,305 | ) | (9,883,557 | ) | (169,598 | ) | (628,190 | ) | |||||||
Net increase (decrease) | 505,812 | (816,697 | ) | 68,362 | 8,190,159 | 5,704,893 | 312,863 | (649,847 | ) | ||||||||||||
Growth Equity Fund | |||||||||||||||||||||
Shares sold | 1,322,708 | 3,721,932 | 13,743 | 4,615,624 | 7,073,383 | 232,706 | 7,396 | ||||||||||||||
Shares exchanged | — | — | — | — | — | 15,272 | (15,401 | ) | |||||||||||||
Shares reinvested | 27,020 | 32,431 | — | 58,763 | 72,223 | — | — | ||||||||||||||
Shares redeemed | (1,682,089 | ) | (8,107,816 | ) | (9,124 | ) | (1,680,960 | ) | (9,107,022 | ) | (216,686 | ) | (521,411 | ) | |||||||
Net increase (decrease) | (332,361 | ) | (4,353,453 | ) | 4,619 | 2,993,427 | (1,961,416 | ) | 31,292 | (529,416 | ) | ||||||||||
Small Cap Equity Fund | |||||||||||||||||||||
Shares sold | 1,831,932 | 1,153,180 | 16,055 | 1,552,429 | 3,352,291 | 104,506 | 5,878 | ||||||||||||||
Shares exchanged | — | — | — | — | — | 14,321 | (14,475 | ) | |||||||||||||
Shares reinvested | — | — | — | 1,268,795 | 3,698,109 | 314,823 | — | ||||||||||||||
Shares redeemed | (854,158 | ) | (3,307,992 | ) | (2,582 | ) | (704,104 | ) | (4,839,342 | ) | (94,262 | ) | (577,495 | ) | |||||||
Net increase (decrease) | 977,774 | (2,154,812 | ) | 13,473 | 2,117,120 | 2,211,058 | 339,388 | (586,092 | ) | ||||||||||||
International Equity Fund | |||||||||||||||||||||
Shares sold | 5,807,261 | 9,797,086 | 31,372 | 4,671,748 | 9,531,264 | 100,030 | 10,936 | ||||||||||||||
Shares exchanged | — | — | — | — | — | 19,330 | (19,398 | ) | |||||||||||||
Shares reinvested | — | — | — | 3,434,905 | 11,491,189 | 354,520 | — | ||||||||||||||
Shares redeemed | (984,169 | ) | (5,979,901 | ) | (14,425 | ) | (1,616,635 | ) | (10,308,303 | ) | (67,938 | ) | (493,635 | ) | |||||||
Net increase (decrease) | 4,823,092 | 3,817,185 | 16,947 | 6,490,018 | 10,714,150 | 405,942 | (502,097 | ) | |||||||||||||
8. BANK BORROWINGS
The Trust, on behalf of and for the benefit of the Funds, has a credit agreement with Bank of America, N.A., dated December 3, 2007, whereby each Fund is permitted to have bank borrowings for temporary or emergency purposes to fund shareholder redemptions. The agreement permits borrowings up to $50 million, collectively. Interest is charged to each Fund based on its borrowings at a rate equal to the Bank prime rate minus two percent or the Wall Street Journal LIBOR One Month Floating Rate plus 0.50%. Each Fund also pays a facility fee equal to its pro rata share of the amount of the credit facility at a rate of 0.12% per annum. None of the Funds had any outstanding borrowings during the six months ended June 30, 2008.
154
Table of Contents
9. FEDERAL INCOME TAXES
Each Fund’s policy is to comply with all sections of the Internal Revenue Code that apply to regulated investment companies and to distribute substantially all of its taxable income to shareholders. No provision for income or excise taxes is thus required. Each Fund is treated as a separate entity for federal income tax purposes.
Net investment income (loss) and net realized gains (losses) may differ for financial statement and tax purposes primarily because of deferred losses on certain futures contracts and losses deferred due to “wash sale” transactions. The character of distributions made during the year from net investment income or net realized gains may differ from their ultimate characterization for federal income tax purposes. Also, due to the timing of dividend distributions, the fiscal year in which amounts are distributed may differ from the year that the income or realized gains (losses) were recorded by the funds.
Income dividends and capital gain distributions are determined in accordance with federal income tax regulations, which may differ from GAAP. These differences are primarily due to differing treatments for futures and options transactions, foreign currency transactions, paydowns, losses deferred due to wash sales and investments in Passive Foreign Investment Companies (“PFIC’s”).
Distributions during the year ended December 31, 2007 were characterized as follows for tax purposes:
Fund | Ordinary Income | Long-Term Capital Gain | Return of Capital | ||||||
MyDestination 2005 | $ | 1,613,240 | $ | 7,771 | $ | — | |||
MyDestination 2015 | 4,521,960 | 28,788 | — | ||||||
MyDestination 2025 | 2,919,699 | 25,374 | — | ||||||
MyDestination 2035 | 963,562 | 7,617 | — | ||||||
MyDestination 2045 | 395,513 | 10,082 | — | ||||||
Conservative Allocation | 10,983,286 | 12,799,259 | — | ||||||
Balanced Allocation | 45,528,937 | 91,906,501 | — | ||||||
Growth Allocation | 30,965,170 | 92,309,085 | — | ||||||
Aggressive Allocation | 22,723,860 | 100,285,137 | — | ||||||
Conservative Allocation I | 3,488,023 | 1,922,351 | — | ||||||
Balanced Allocation I | 19,049,303 | 13,917,253 | — | ||||||
Growth Allocation I | 11,337,811 | 14,382,365 | — | ||||||
Aggressive Allocation I | 7,242,215 | 13,245,038 | — | ||||||
Money Market | 53,685,126 | — | — | ||||||
Low-Duration Bond | 34,317,405 | — | — | ||||||
Medium-Duration Bond | 61,213,423 | 325,199 | — | ||||||
Extended-Duration Bond | 29,148,913 | 5,220,811 | — | ||||||
Global Bond | 7,590,035 | 213,152 | — | ||||||
Equity Index | 9,377,214 | 21,703,970 | — | ||||||
Real Estate Securities | 6,816,862 | 6,848,010 | — | ||||||
Value Equity | 57,448,170 | 83,641,310 | — | ||||||
Growth Equity | 2,252,310 | — | — | ||||||
Small Cap Equity | 26,496,997 | 42,820,293 | — | ||||||
International Equity | 57,208,698 | 209,103,929 | — | ||||||
At December 31, 2007, the components of distributable earnings on a tax basis were as follows:
Fund | Undistributed Ordinary Income | Undistributed Long-Term Capital Gain/ (Capital Loss Carryforward) | Net Unrealized Appreciation (Depreciation) on Investments | ||||||||
MyDestination 2005 | $ | 3,870 | $ | 1,504,355 | $ | (1,533,437 | ) | ||||
MyDestination 2015 | 906 | 5,518,766 | (7,462,890 | ) | |||||||
MyDestination 2025 | 641 | 4,629,258 | (7,375,807 | ) | |||||||
MyDestination 2035 | — | 1,855,760 | (2,872,704 | ) | |||||||
MyDestination 2045 | 412 | 699,916 | (1,044,102 | ) | |||||||
Conservative Allocation | 29,256 | 4,499,098 | 41,316,205 | ||||||||
Balanced Allocation | — | 40,296,437 | 185,170,890 | ||||||||
Growth Allocation | 3,466 | 45,171,766 | 181,583,391 | ||||||||
Aggressive Allocation | 10,526 | 55,788,343 | 197,040,605 | ||||||||
Conservative Allocation I | 6,476 | 1,163,656 | (2,940,295 | ) | |||||||
Balanced Allocation I | 1,491 | 13,132,319 | (10,866,408 | ) | |||||||
Growth Allocation I | 565 | 13,478,283 | (1,186,547 | ) | |||||||
Aggressive Allocation I | — | 14,453,009 | (1,675,046 | ) | |||||||
Money Market | 2,139 | — | — | ||||||||
Low-Duration Bond | 1,616,716 | (14,933,954 | ) | 3,288,447 | |||||||
Medium-Duration Bond | 11,269,977 | 769,936 | 372,516 | ||||||||
Extended-Duration Bond | 4,068,240 | 660,309 | 24,655,327 | ||||||||
Global Bond | 2,192,644 | 266,282 | (1,723,692 | ) | |||||||
Equity Index | 7,144 | 2,678,739 | 132,866,562 | ||||||||
Real Estate Securities | 59,925 | — | (21,298,044 | ) | |||||||
Value Equity | — | 7,704,593 | 149,321,135 | ||||||||
Growth Equity | 17,656 | (61,825,937 | ) | 392,968,020 | |||||||
Small Cap Equity | 83,860 | 1,846 | 18,325,767 | ||||||||
International Equity | 8,750 | 24,334,709 | 405,347,904 | ||||||||
Post-October loss deferrals have been included in undistributed ordinary income and undistributed long-term capital gains, depending upon the character of the loss deferral.
155
Table of Contents
For federal income tax purposes, capital loss carryovers and their expiration dates, were as follows as of December 31, 2007:
| Expiring December 31, | Low-Duration Bond | Growth Equity | ||||
2011 | $ | — | $ | 61,825,937 | ||
2013 | 6,476,136 | — | ||||
2014 | 8,457,818 | — | ||||
Total | $ | 14,933,954 | $ | 61,825,937 | ||
For federal income tax purposes, post-October loss deferrals, which will reverse in 2008, were as follows as of December 31, 2007:
| Capital | FX | Total | |||||||
Money Market | $ | 4,760 | — | $ | 4,760 | ||||
Low-Duration Bond | 146,030 | — | 146,030 | ||||||
Real Estate Securities | 1,055,067 | — | 1,055,067 | ||||||
Growth Equity | — | $ | 1,700 | 1,700 | |||||
Small Cap Equity | 1,167,766 | — | 1,167,766 | ||||||
International Equity | — | 136,000 | 136,000 | ||||||
At June 30, 2008, the net unrealized appreciation from investments for those securities having an excess of value over cost and net unrealized depreciation from investments for those securities having an excess of cost over value (based on cost for federal income tax purposes) was as follows:
Fund | Net Unrealized Appreciation (Depreciation) | Appreciated Securities | Depreciated Securities | ||||||||
MyDestination 2005 | $ | (5,306,930 | ) | $ | 535,405 | $ | (5,842,335 | ) | |||
MyDestination 2015 | (21,441,934 | ) | 863,585 | (22,305,519 | ) | ||||||
MyDestination 2025 | (18,127,056 | ) | — | (18,127,056 | ) | ||||||
MyDestination 2035 | (7,149,866 | ) | 467 | (7,150,333 | ) | ||||||
MyDestination 2045 | (2,664,428 | ) | — | (2,664,428 | ) | ||||||
Conservative Allocation | 26,176,674 | 28,735,433 | (2,558,759 | ) | |||||||
Balanced Allocation | 45,389,480 | 61,448,867 | (16,059,387 | ) | |||||||
Growth Allocation | 49,338,213 | 66,481,820 | (17,143,607 | ) | |||||||
Aggressive Allocation | 56,398,509 | 72,126,991 | (15,728,482 | ) | |||||||
Conservative Allocation I | (5,896,096 | ) | — | (5,896,096 | ) | ||||||
Balanced Allocation I | (37,760,131 | ) | 642,325 | (38,402,456 | ) | ||||||
Growth Allocation I | (27,017,983 | ) | 2,957,377 | (29,975,360 | ) | ||||||
Aggressive Allocation I | (24,715,693 | ) | 2,832,859 | (27,548,552 | ) | ||||||
Low-Duration Bond | (20,572,483 | ) | 4,795,198 | (25,367,681 | ) | ||||||
Medium-Duration Bond | (53,282,559 | ) | 9,857,499 | (63,140,058 | ) | ||||||
Extended-Duration Bond | (5,891,743 | ) | 17,200,611 | (23,092,354 | ) | ||||||
Global Bond | (9,458,781 | ) | 621,469 | (10,080,250 | ) | ||||||
Equity Index | 62,708,858 | 124,819,634 | (62,110,776 | ) | |||||||
Real Estate Securities | (19,202,896 | ) | — | (19,202,896 | ) | ||||||
Value Equity | (105,249,466 | ) | 139,052,499 | (244,301,965 | ) | ||||||
Growth Equity | 227,861,379 | 274,568,680 | (46,707,301 | ) | |||||||
Small Cap Equity | 397,281 | 52,876,222 | (52,478,941 | ) | |||||||
International Equity | 100,375,009 | 212,561,115 | (112,186,106 | ) | |||||||
The differences between book basis and tax-basis unrealized appreciation is attributable primarily to the tax deferral of losses on wash sales and on investments in PFIC’s.
At June 30, 2008, the aggregate cost of investment securities for federal income tax purposes was as follows (excluding foreign currency and derivative related items):
Fund | Federal Tax Cost | ||
MyDestination 2005 | $ | 70,076,035 | |
MyDestination 2015 | 206,922,911 | ||
MyDestination 2025 | 135,620,149 | ||
MyDestination 2035 | 51,071,511 | ||
MyDestination 2045 | 20,243,805 | ||
Conservative Allocation | 297,646,230 | ||
Balanced Allocation | 1,190,912,313 | ||
Growth Allocation | 917,448,351 | ||
Aggressive Allocation | 807,771,649 | ||
Conservative Allocation I | 70,396,055 | ||
Balanced Allocation I | 370,777,058 | ||
Growth Allocation I | 252,125,084 | ||
Aggressive Allocation I | 193,959,474 | ||
Money Market | 1,101,087,178 | ||
Low-Duration Bond | 1,003,703,808 | ||
Medium-Duration Bond | 1,691,172,631 | ||
Extended-Duration Bond | 553,768,602 | ||
Global Bond | 278,084,879 | ||
Equity Index | 394,022,305 | ||
Real Estate Securities | 189,753,913 | ||
Value Equity | 1,641,219,453 | ||
Growth Equity | 1,419,016,703 | ||
Small Cap Equity | 722,285,881 | ||
International Equity | 1,823,033,771 | ||
156
Table of Contents
At December 31, 2007, capital contributions, accumulated undistributed net investment income and accumulated net realized gain (loss) from investments have been adjusted for current period permanent book/tax differences which arose principally from differing book/tax treatments of paydown gains, net operating losses and foreign currency transactions. The following amounts were reclassified within the capital accounts:
Fund | Paid in Capital | Accumulated Undistributed Income | Accumulated Net Realized Gain (Loss) on Investments, Currency Translations and Derivative Transactions | ||||||||
MyDestination 2005 | $ | — | $ | 490,824 | $ | (490,824 | ) | ||||
MyDestination 2015 | — | 1,855,875 | (1,855,875 | ) | |||||||
MyDestination 2025 | — | 1,503,972 | (1,503,972 | ) | |||||||
MyDestination 2035 | — | 594,367 | (594,367 | ) | |||||||
MyDestination 2045 | — | 238,184 | (238,184 | ) | |||||||
Conservative Allocation | — | 1,013,959 | (1,013,959 | ) | |||||||
Balanced Allocation | — | 8,575,266 | (8,575,266 | ) | |||||||
Growth Allocation | — | 10,323,703 | (10,323,703 | ) | |||||||
Aggressive Allocation | — | 12,670,522 | (12,670,522 | ) | |||||||
Conservative Allocation I | — | 306,771 | (306,771 | ) | |||||||
Balanced Allocation I | — | 3,210,821 | (3,210,821 | ) | |||||||
Growth Allocation I | — | 3,390,883 | (3,390,883 | ) | |||||||
Aggressive Allocation I | — | 3,594,562 | (3,594,562 | ) | |||||||
Low-Duration Bond | — | 138,274 | (138,274 | ) | |||||||
Medium-Duration Bond | — | 2,705,274 | (2,705,274 | ) | |||||||
Extended-Duration Bond | — | 871,871 | (871,871 | ) | |||||||
Global Bond | — | 370,186 | (370,186 | ) | |||||||
Equity Index | — | (122 | ) | 122 | |||||||
Real Estate Securities | — | (220 | ) | 220 | |||||||
Value Equity | — | 12,326 | (12,326 | ) | |||||||
Growth Equity | — | (23,519 | ) | 23,519 | |||||||
Small Cap Equity | — | 77,130 | (77,130 | ) | |||||||
International Equity | — | 8,459,494 | (8,459,494 | ) | |||||||
Net investment income, net realized gain (loss) on investments and net assets were not affected by these reclassifications.
10. NEW ACCOUNTING PRONOUNCEMENTS
In July 2006, the Financial Accounting Standards Board (“FASB”) issued FASB Interpretation No. 48 (“FIN 48”) “Accounting for Uncertainty in Income Taxes, an interpretation of FAS Statement No. 109”. FIN 48 provides guidance for how uncertain tax positions should be recognized, measured, presented and disclosed in the financial statements. FIN 48 requires the evaluation of tax positions taken in the course of preparing the Funds’ tax returns to determine whether the tax positions are “more-likely-than-not” of being sustained by the applicable tax authority. Tax benefits of positions not deemed to meet the more-likely-than-not threshold would be booked as a tax expense in the current year and recognized as: a liability for unrecognized tax benefits; a reduction of an income tax refund receivable; a reduction of deferred tax asset; an increase in deferred tax liability; or a combination thereof. The Funds adopted the provisions of Financial Accounting Standards Board Interpretation No. 48 (“FIN 48”), Accounting for Uncertainty in Income Taxes, on June 29, 2007. Management has analyzed the Funds’ tax positions taken on federal income tax returns for all open tax years (tax years ended December 31, 2004 – 2007) for purposes of implementing FIN 48, and has concluded that no provision for income tax is required in the Funds’ financial statements. Management is not aware of any events that are reasonably possible to occur in the next twelve months that would result in the amount of any unrecognized tax benefits significantly increasing or decreasing for any of the Funds.
In March 2008, FASB issued Statement No. 161, “Disclosures about Derivative Instruments and Hedging Activities” (“FAS 161”), an amendment to FASB Statement No. 133. FAS 161 is intended to improve financial reporting for derivative instruments by requiring enhanced disclosure that enables investors to understand how and why an entity uses derivatives, how derivatives are accounted for, and how derivative instruments affect an entity’s results of operations and financial position. FAS 161 is effective for financial statements issued for fiscal years and interim periods beginning after November 15, 2008. Management is currently evaluating the implications of FAS 161. The impact on the Funds’ financial statement disclosures, if any, is currently being assessed.
157
Table of Contents
Information pertaining to the Trustees and officers of the Trust is set forth below. The statement of additional information (SAI) includes additional information about the Trustees and is available without charge, upon request, by calling 1-888-98-GUIDE.
Name, (DOB), Address and Position(s) with Trust | Term of Office | Principal Occupation(s) During Past 5 Years | Number of | Other Trusteeships/ Held by Trusteee | ||||
DISINTERESTED TRUSTEES | ||||||||
Michael R. Buster (1957) 2401 Cedar Springs Road Dallas, TX 75201-1407 Trustee | Since 2002 | Executive Pastor, Prestonwood Baptist Church, 1989 - present. | 24 | None | ||||
Julie P. Fry (1956) 2401 Cedar Springs Road Dallas, TX 75201-1407 Trustee | Since 2007 | Chief Financial Officer, Salmon, Sims, Thomas & Associates, PLLC (formerly Salmon, Beach, & Associates, PLLC), 1996 - Present | 24 | National Charity League, DFW Metroport Chapter — President | ||||
William Craig George (1958) 2401 Cedar Springs Road Dallas, TX 75201-1407 Trustee | Since 2004 | Regional loan administrator, SunTrust Bank, 1995 - present. | 24 | None | ||||
Joseph A. Mack (1939) 2401 Cedar Springs Road Dallas, TX 75201-1407 Trustee | Since 2002 | Director, Office of Public Policy, South Carolina Baptist Convention, 1999 - Present, | 24 | None | ||||
Franklin Raymond Morgan (1943) 2401 Cedar Springs Road Dallas, TX 75201-1407 Trustee | Since 2005 | Retired - Senior Vice President, Director of International Administration, Prudential Securities, Inc., January 1962 - May 2003. | 24 | None | ||||
James Ray Taylor (1933) 2401 Cedar Springs Road Dallas, TX 75201-1407 Trustee | Since 2002 | Retired since 1994. | 24 | None | ||||
| INTERESTED TRUSTEES2 | ||||||||
Barry Hartis (1945) 2401 Cedar Springs Road Dallas, TX 75201-1407 Trustee | Since 2005 | Certified Public Accountant, 1976 - Present; Vice President of Business and Finance, Greensboro College, January 1998 - June 30, 2005. | 24 | None | ||||
Gerald B. Jones (1932) 2401 Cedar Springs Road Dallas, TX 75201-1407 Trustee | Since 2000 | President, Flying Investments, November 2006 - present. Owner Jones Motorcars, Inc. 1957 - October 2006. | 24 | Bank of Arkansas — Director | ||||
| OFFICERS WHO ARE NOT TRUSTEES | ||||||||
Jeffrey P. Billinger (1946) 2401 Cedar Springs Road Dallas, TX 75201-1407 Vice President and Treasurer | Since 2000 | Executive Officer and Treasurer, GuideStone Financial Resources of the Southern Baptist Convention, 1995 - present. | N/A | N/A | ||||
158
Table of Contents
FUND MANAGEMENT (Continued)
Name, (DOB), Address and Position(s) with Trust | Term of Office | Principal Occupation(s) During Past 5 Years | Number of | Other Trusteeships/ Held by Trusteee | ||||
Rodric E. Cummins (1957) 2401 Cedar Springs Road Dallas, TX 75201-1407 Vice President and Investment Officer | Since 2000 | Executive Officer and Chief Investment Officer, GuideStone Financial Resources of the Southern Baptist Convention, 1998 - present. | N/A | N/A | ||||
John R. Jones (1953) 2401 Cedar Springs Road Dallas, TX 75201-1407 President | Since 2000 | Executive Vice President and Chief Operating Officer, GuideStone Financial Resources of the Southern Baptist Convention, 1995 - present. | N/A | N/A | ||||
Rodney R. Miller (1953) 2401 Cedar Springs Road Dallas, TX 75201-1407 Vice President, Secretary and Chief Legal Officer | Since 2000 | General Counsel, Legal and Compliance, GuideStone Financial Resources of the Southern Baptist Convention, 1995 - present. | N/A | N/A | ||||
Curtis D. Sharp (1947) 2401 Cedar Springs Road Dallas, TX 75201-1407 Chief Compliance Officer and AML Officer | Since 2006 | Executive Officer, Denominational and Public Relations Services, GuideStone Financial Resources of the Southern Baptist Convention, 1985 - present. | N/A | N/A | ||||
Patricia A. Weiland (1959) 2401 Cedar Springs Road Dallas, TX 75201-1407 Vice President — Fund Operations and Sales | Since 2000 | Executive Officer, Financial Solutions and Services, GuideStone Financial Resources of the Southern Baptist Convention, 2006 - present; Director, Mutual Funds, GuideStone Financial Resources of the Southern Baptist Convention, 2000 - 2006. | N/A | N/A | ||||
1 | Each Trustee and officer serves for an indefinite term, until his/her successor is elected. Officers serve at the pleasure of the Board of Trustees. |
2 | Messrs. Gerald Jones and Hartis serve as trustees and are to be “interested persons” of the Trust as the term is defined in the Investment Company Act of 1940, as amended, due to their positions on the Board of Trustees of GuideStone Financial Resources of the Southern Baptist Convention. |
PROXY VOTING
A description of the policies and procedures that GuideStone Funds uses to determine how to vote proxies relating to their portfolio securities as well as information regarding how GuideStone Funds voted proxies during the most recent 12-month period ended June 30 is available without charge by calling 1-888-98-GUIDE, by visiting our website at www.GuideStoneFunds.org or by visiting the SEC’s website at www.sec.gov.
QUARTERLY SCHEDULES OF INVESTMENTS
In addition to the semi-annual and annual reports that GuideStone Funds delivers to shareholders and makes available through its website, GuideStone Funds files a complete schedule of portfolio holdings with the Securities and Exchange Commission (SEC) for each Fund’s first and third fiscal quarters on Form N-Q. GuideStone Funds does not deliver the schedule for the first and third fiscal quarters to shareholders, however the schedule is posted to our website, www.GuideStoneFunds.org. You may also obtain the Form N-Q filings by accessing the SEC’s website at www.sec.gov or copy them at the SEC’s Public Reference Room in Washington, DC. Information on the operation of the SEC’s Public Reference Room may be obtained by calling the SEC at (800) 732-0330. You can also request copies of this information, upon payment of a fee for duplication, at the SEC’s email address (publicinfo@sec.gov) or by writing the Public Reference section of the SEC, Washington, DC 20549-0102.
159
Table of Contents
BOARD REVIEW OF NEW SUB-ADVISORY AGREEMENTS FOR INTERNATIONAL EQUITY FUND AND GLOBAL BOND FUND
As required by the Investment Company Act of 1940, as amended (the “1940 Act”), the Board of Trustees (the “Board”) of GuideStone Funds (the “Trust”), including all of the Trustees who are not “interested persons” of the Trust, as that term is defined in the 1940 Act (the “Independent Trustees”), recently considered the approval of new sub-advisory agreements among GuideStone Capital Management (the “Adviser”), the Trust on behalf of the International Equity Fund and the following sub-advisers: (1) AQR Capital Management, LLC (“AQR”); (2) Lazard Asset Management LLC (“Lazard”); (3) MFS Institutional Advisors, Inc. (“MFSI”); (4) McKinley Capital Management, Inc. (“McKinley”); and (5) UBS Global Asset Management (Americas) Inc. (“UBS Global AM”) (each, a “New Sub-Adviser”). The Board approved the new sub-advisory agreements (each, a “New Sub-Advisory Agreement”) for an initial two-year term at the meeting of the Board held on February 21-22, 2008. At a Board meeting held on May 19-20, 2008, the Board approved an amendment to the fee schedule for the sub-advisory agreement with AQR (“AQR Amended Fee Schedule”). Also, as required by the 1940 Act, the Board, including the Independent Trustees, recently considered the approval of the sub-advisory agreement among the Adviser, the Trust on behalf of the Global Bond Fund and Loomis, Sayles & Company, L.P. (“Loomis” or “New Sub-Adviser” and, together with each above New Sub-Adviser, the “New Sub-Advisers”). The sub-advisory agreement (the “Loomis Sub-Advisory Agreement”, or together with each above New Sub-Advisory Agreement, the “New Sub-Advisory Agreements”) was approved for an initial two year term at the meeting of the Board held on May 19-20, 2008. The Board’s decision to approve the New Sub-Advisory Agreements and the AQR Amended Fee Schedule reflects the exercise of its business judgment to enter into or amend each new sub-advisory arrangement. In approving the New Sub-Advisory Agreements and the AQR Amended Fee Schedule, the Board considered information provided by the Adviser and each New Sub-Adviser with the assistance and advice of counsel to the Independent Trustees and counsel to the Trust.
The Board’s consideration of various factors and its conclusions with respect to such factors formed the basis for the Board’s determination to approve the New Sub-Advisory Agreements and the AQR Amended Fee Schedule. The factors considered by the Board included, but were not limited to: (i) the resources of the New Sub-Adviser; (ii) the experience and expertise of the New Sub-Adviser; (iii) the financial capability of the New Sub-Adviser; (iv) the compliance procedures and history of the New Sub-Adviser; (v) the performance of similarly managed funds and accounts in comparison to relevant benchmarks for the Funds; (vi) the amount of the contractual sub-advisory fee in comparison to similarly managed funds and the New Sub-Adviser’s other similarly situated clients and the effect of any fee waiver and expense reimbursement arrangement; (vii) the total expenses of the fund in comparison to similarly managed funds and the use of past and anticipated expense caps; (viii) the anticipated profitability of the New Sub-Adviser with respect to the fund and its overall business; (ix) the extent of any anticipated economies of scale and whether the fee structure reflects such economies of scale; (x) the existence of any collateral benefits to be realized by the New Sub-Adviser; and (xi) the existence of any collateral benefits to be realized by the Fund. No one factor was determinative in the Board’s consideration of the New Sub-Advisory Agreements and the AQR Amended Fee Schedule.
The Board undertook a review of the terms of the New Sub-Advisory Agreements and the AQR Amended Fee Schedule and the nature and quality of the services to be provided by each New Sub-Adviser. The Adviser provided the Board with substantial detailed information in the form of reports about the New Sub-Advisers prior to the meetings which addressed most, if not all, of the factors listed previously. The Adviser also provided additional information about the New Sub-Advisers in presentations made during the meetings, discussed the comprehensive screening process used to recommend the New Sub-Advisers and responded to questions from the Board. In addition, the Independent Trustees met separately in executive session with counsel to the Independent Trustees to discuss and consider information presented in connection with the approval of the New Sub-Advisory Agreements and the AQR Amended Fee Schedule as well as the Board’s responsibilities and duties in approving each agreement.
APPROVAL OF NEW SUB-ADVISORY AGREEMENTS FOR INTERNATIONAL EQUITY FUND AND GLOBAL BOND FUND
In considering the approval of the New Sub-Advisory Agreements, the Board took into account the materials provided prior to and during the meetings and the extensive
160
Table of Contents
discussions during the meetings, including the discussions the Independent Trustees had during their executive sessions with their independent legal counsel. More specifically, the Board examined the nature, extent and quality of the services to be provided by the New Sub-Advisers to the International Equity Fund and the Global Bond Fund (together, the “Funds”). The Board evaluated each New Sub-Adviser’s experience in serving as a sub-adviser to its client accounts and portfolios and noted that each New Sub-Adviser currently provides investment advice to various clients, although none of the New Sub-Advisers, with the exception of Loomis, provide investment advice to other series of the Trust. The Board considered the experience of key personnel at each New Sub-Adviser in providing investment management services and the systems used by such persons, and the ability of each New Sub-Adviser to attract and retain capable personnel. The Board also considered the reputation, compliance history, compliance program and financial condition of the New Sub-Advisers. The Board noted the terms of the New Sub-Advisory Agreements and the AQR Amended Fee Schedule and the responsibilities that each New Sub-Adviser would have to the International Equity Fund and the Global Bond Fund, respectively, including the responsibility of the day-to-day management of the investment portfolio of the Funds, compliance with the Funds’ policies and objectives, and the implementation of Board of Trustees directives as they relate to the Funds. The Board concluded that the Funds are likely to benefit from the extent and quality of these services as a result of each New Sub-Adviser’s experience, personnel, operations and resources.
The Board considered reports for each New Sub-Adviser. The reports compiled by management included, among other things, a summary of the composite investment performance of the New Sub-Advisers’ client accounts and portfolios, including a comparison with the relevant benchmark for the Funds and the peer universe of similarly managed funds, information regarding management style, risk versus return analysis, organizational structures, investment management experience, investment philosophies and personnel. The Adviser also provided additional information regarding compliance procedures and policies, brokerage and soft dollar practices, compliance history, financial information and potential economies of scale. The Board reviewed the services to be provided to the Funds by each New Sub-Adviser, examined the investment philosophy and process of each New Sub-Adviser and noted that each New Sub-Adviser would fulfill a particular investment mandate for the Funds.
With respect to the International Equity Fund, the Board was able to review a composite performance record for the client accounts managed by each of the New Sub-Advisers and determined that, although past performance is not a guarantee of future performance, the performance was favorable and the International Equity Fund would benefit from the investment management expertise of the New Sub-Advisers. In particular, the Board considered the Adviser’s assessment that the investment strategy to be implemented by AQR would help solidify the International Equity Fund’s core international equity exposure and offer potential for increased returns and the favorable past performance history of AQR’s investment strategy. The Board also considered the Adviser’s assessment that Lazard’s strategy would help solidify developed market, core international equity market exposure and offer the potential for increased returns. The Board also noted that the international equity team at Lazard had moved to Lazard in 2007 from another former sub-adviser to the International Equity Fund, where it had been responsible for managing substantially the same strategy. With respect to MFSI, the Board considered the Adviser’s assessment that the strategy would provide developed market, relative growth-oriented international equity exposure, and to a lesser extent, emerging markets exposure to the Fund and offer the potential for increased returns. The Board also considered the Adviser’s assessment that McKinley’s strategy would provide developed market, growth-oriented international equity exposure, and to a lesser extent, emerging markets exposure to the International Equity Fund and offer potential for increased returns. The Board also considered the strategy to be implemented by UBS Global AM and the Adviser’s assessment that the strategy would provide developed market, growth-oriented international equity exposure and offer the potential for increased returns.
With respect to the International Equity Fund, at the February Board meeting, the Board examined the proposed fees, noting that each of the International Equity Fund’s New Sub-Adviser’s fee schedules incorporates fee breakpoints which will benefit shareholders as the International Equity Fund’s assets grow in market value. However, at the May meeting, the Board noted that the AQR Amended Fee Schedule does not include such breakpoints. The Board considered that, for all of the International Equity Funds’ New Sub-Advisers except McKinley, the Adviser had been able to negotiate fees
161
Table of Contents
that favorably compared to the sub-advisers’ stated fee schedules. The Board considered that McKinley’s fee schedule was reasonable given that the firm has an excellent track record and is moving towards closing the strategy in the near future. At the February meeting, the Board considered that the aggregate management fee for the International Equity Fund would be reduced by two and a quarter basis points after the hiring of the New Sub-Advisers given the Adviser’s proposed allocation of the International Equity Fund’s assets among Sub-Advisers based on both the International Equity Fund’s assets as of the date of the February Board meeting and projected asset growth in the near term after that meeting. At the May meeting, the Board noted that, under the AQR Amended Fee Schedule, the International Equity Fund would pay a higher fee to AQR as a result of the implementation of a 130/30 strategy for the International Equity Fund. The Board noted that, as a result of the higher fee that would be paid to AQR, the aggregate management fee for the International Equity Fund would increase by approximately one basis point after the implementation of the 130/30 strategy based on both current International Equity Fund assets and projected asset growth in the near term. The Board further noted that the Adviser had been able to negotiate fees that were favorable compared to the fees AQR charged its other clients for managing a 130/ 30 strategy under different investment mandates, the increased costs of managing a 130/30 strategy compared to the long-only strategy currently managed by AQR for the International Equity Fund and the relatively small amount of International Equity Fund assets that would be allocated to the 130/30 strategy.
With respect to the Global Bond Fund, the Board examined composite performance information for client accounts and portfolios managed by Loomis. The Board noted Loomis’ long successful history in managing its sector rotation strategy; in particular that the composite performance for the strategy outperformed the relevant benchmark for each of the last eight calendar years and ranked in the top quartile among peers during the five-year period ended March 31, 2008. The Board concluded that, although past performance is no guarantee of future performance, the composite performance record for Loomis’ client accounts and portfolios managed by it was favorable and that the Global Bond Fund was likely to benefit from the investment management expertise of Loomis.
The Board examined the investment philosophy and process of Loomis, noting that it would fulfill a particular investment mandate for the Global Bond Fund and the Adviser’s assessment that the appointment of Loomis would complement the investment strategy of the Global Bond Fund’s current sub-advisers.
The Board also examined the fee schedule for Loomis, noting how the fee levels to be charged to the Global Bond Fund compared with available information about fees charged by the sub-adviser to its other similarly situated clients, as well as how the sub-advisory fee to be charged the Global Bond Fund by Loomis compared to fees generally charged by other sub-advisers to similarly managed funds. The Board noted that the Adviser had been able to negotiate fees that were favorable compared with the fees Loomis charged its other clients. It was noted that the aggregate management fees for the Global Bond Fund would increase by seven basis points, but as a result of increased allocations of assets to the Global Bond Fund by other series of the Trust, the Global Bond Fund’s expenses are expected to be reduced such that total operating expenses for the Global Bond Fund will not increase after the appointment of Loomis.
The Board considered the extent to which the fees to be paid to Loomis reflected economies of scale. The Board noted that Loomis’ fee schedule included breakpoints, but that no breakpoints would be available in the future based on current asset levels or projected asset growth. The Board noted again, however, that Loomis’ fees were negotiated and below Loomis’ standard fees.
The Board also considered information related to the financial capability of each New Sub-Adviser. Specifically, the Board considered the representations of the Adviser with respect to the level of assets and shareholder’s equity for the New Sub-Advisers who made their most recent year-end financial statements available to the Adviser for review. The Board also relied upon other relevant information, particularly the independent negotiation of the fee schedules, the level of the fees, and the New Sub-Advisers’ performance history. The Board noted that, based on the Adviser’s representations and the other information provided, no concerns appeared to be raised regarding the financial capability of the New Sub-Advisers.
162
Table of Contents
The Board noted that there is no historical profitability information with regard to the New Sub-Advisers’ arrangement with the Funds. It was noted that any fee changes would affect the Adviser’s profitability with respect to the Funds only insofar as the Adviser’s expense waiver/reimbursement obligation may be affected, as sub-advisory fees are paid directly by the Funds and not by the Adviser.
Finally, the Board reviewed information regarding the compliance history and compliance program of each New Sub-Adviser, noting that none of the New Sub-Advisers had significant compliance or regulatory issues based on available information. The Board also considered that the Trust currently employs Loomis to manage the assets of another series of the Trust and the Adviser’s and the Board’s familiarity with the Loomis organization generally.
163
Table of Contents
INVESTMENT SUB-ADVISERS (Assets under management as of 06/30/08) (Unaudited)
GuideStone Funds employs a broad array of proven investment managers for the benefit of their investors. Each manager is distinctive in their investment management process and business approach.
Fund | Sub-Adviser | Firm Established | Total Assets Managed | |||||
| Money Market | BlackRock Institutional Management Corporation | 1988 | $ | 1.4Tr | ||||
| Low-Duration Bond | BlackRock Financial Management, Inc. | 1988 | $ | 1.4Tr | ||||
| Payden & Rygel | 1983 | $ | 50.1B | |||||
| PIMCO (Pacific Investment Management Company LLC) | 1971 | $ | 829B | |||||
| Medium-Duration Bond | Goldman Sachs Asset Management, L.P. | 1984 | $ | 781B | (1) | |||
| PIMCO (Pacific Investment Management Company LLC) | 1971 | $ | 829B | |||||
| Western Asset Management Company | 1971 | $ | 624B | |||||
| Western Asset Management Company, Ltd. | 1971 | $ | 90.4B | |||||
| Extended-Duration Bond | Loomis, Sayles & Company, L.P. | 1926 | $ | 135B | ||||
| STW Fixed Income Management Ltd. | 1977 | $ | 10.8B | |||||
| Global Bond | Loomis, Sayles & Company, L.P. | 1926 | $ | 135B | ||||
| Western Asset Management Company | 1971 | $ | 624B | |||||
| Western Asset Management Company, Ltd. | 1971 | $ | 90.4B | |||||
| Equity Index | Northern Trust Investments, N.A. | 1889 | $ | 751B | ||||
| Real Estate Securities | RREEF America L.L.C. | 1975 | $ | 87.0B | ||||
| Value Equity | Aronson+Johnson+Ortiz, LP | 1984 | $ | 22.5B | ||||
| Barrow, Hanley, Mewhinney & Straus, Inc. | 1979 | $ | 58.6B | |||||
| Northern Trust Investments, N.A. | 1889 | $ | 751B | |||||
| TCW Investment Management Company | 1971 | $ | 127B | |||||
| Growth Equity | Marsico Capital Management, LLC | 1997 | $ | 94.2B | ||||
| RCM Capital Management LLC | 1970 | $ | 116B | |||||
| Sands Capital Management, LLC | 1992 | $ | 17.6B | |||||
| TCW Investment Management Company | 1971 | $ | 127B | |||||
| Small Cap Equity | Aronson+Johnson+Ortiz, L.P. | 1984 | $ | 22.5B | ||||
| Lord, Abbett & Company LLC | 1929 | $ | 96.8B | |||||
| Provident Investment Council, Inc. | 1951 | $ | 2.6B | |||||
| TimesSquare Capital Management, LLC | 2000 | $ | 10.2B | |||||
| Western Asset Management Company | 1971 | $ | 624B | |||||
| Western Asset Management Company, Ltd. | 1971 | $ | 90.4B | |||||
| International Equity | AllianceBernstein L.P. | 1962 | $ | 717B | ||||
| AQR Capital Management, LLC | 1998 | $ | 29.3B | |||||
| Genesis Asset Managers, LLP | 1989 | $ | 21.4B | |||||
| Lazard Asset Management LLC | 1970 | $ | 119B | |||||
| MFS Institutional Advisors, Inc. | 1970 | $ | 180B | |||||
| Mondrian Investment Partners Ltd. | 1990 | $ | 61.7B | |||||
| McKinley Capital Management, Inc. | 1990 | $ | 16.8B | |||||
| Philadelphia International Advisors, L.P. | 1956 | $ | 9.4B | |||||
| UBS Global Asset Management (Americas), Inc. | 1998 | $ | 160B | |||||
| Custodian for GuideStone Funds Assets | The Northern Trust Company | 1889 | $ | 4.0Tr | ||||
Cash Overlay for GuideStone Date Target, Asset Allocation, Bond and Equity Funds | Northern Trust Investments, N.A. | 1889 | $ | 751B | ||||
(1) | Total assets managed are as of March 31, 2008. |
164
Table of Contents
 | 2401 Cedar Springs Road, Dallas, TX 75201-1498 1-888-98-GUIDE www.GuideStoneFunds.org | Funds distributed by PFPC Distributors, Inc. 760 Moore Road, King of Prussia, PA 19406 |
Table of Contents
| Item 2. | Code of Ethics. |
Not applicable.
| Item 3. | Audit Committee Financial Expert. |
Not applicable.
| Item 4. | Principal Accountant Fees and Services. |
Not applicable.
| Item 5. | Audit Committee of Listed registrants. |
Not applicable.
| Item 6. | Investments. |
| (a) | Schedule of Investments in securities of unaffiliated issuers as of the close of the reporting period is included as part of the report to shareholders filed under Item 1 of this form. |
| (b) | Not applicable. |
| Item 7. | Disclosure of Proxy Voting Policies and Procedures for Closed-End Management Investment Companies. |
Not applicable.
| Item 8. | Portfolio Managers of Closed-End Management Investment Companies. |
Not applicable.
Table of Contents
| Item 9. | Purchases of Equity Securities by Closed-End Management Investment Company and Affiliated Purchasers. |
Not applicable.
| Item 10. | Submission of Matters to a Vote of Security Holders. |
There have been no material changes to the procedures by which the shareholders may recommend nominees to the registrant’s board of directors, where those changes were implemented after the registrant last provided disclosure in response to the requirements of Item 407(c)(2)(iv) of Regulation S-K (17 CFR 229.407) (as required by Item 22(b)(15) of Schedule 14A (17 CFR 240.14a-101)), or this Item.
| Item 11. | Controls and Procedures. |
| (a) | The registrant’s principal executive and principal financial officers, or persons performing similar functions, have concluded that the registrant’s disclosure controls and procedures (as defined in Rule 30a-3(c) under the Investment Company Act of 1940, as amended (the “1940 Act”) (17 CFR 270.30a-3(c))) are effective, as of a date within 90 days of the filing date of the report that includes the disclosure required by this paragraph, based on their evaluation of these controls and procedures required by Rule 30a-3(b) under the 1940 Act (17 CFR 270.30a-3(b)) and Rules 13a-15(b) or 15d-15(b) under the Securities Exchange Act of 1934, as amended (17 CFR 240.13a-15(b) or 240.15d-15(b)). |
| (b) | There were no changes in the registrant’s internal control over financial reporting (as defined in Rule 30a-3(d) under the 1940 Act (17 CFR 270.30a-3(d)) that occurred during the registrant’s second fiscal quarter of the period covered by this report that has materially affected, or is reasonably likely to materially affect, the registrant’s internal control over financial reporting. |
| Item 12. | Exhibits. |
| (a)(1) | Not applicable. |
| (a)(2) | Certifications pursuant to Rule 30a-2(a) under the 1940 Act and Section 302 of the Sarbanes-Oxley Act of 2002 are attached hereto. |
| (a)(3) | Not applicable. |
| (b) | Certifications pursuant to Rule 30a-2(b) under the 1940 Act and Section 906 of the Sarbanes- Oxley Act of 2002 are attached hereto. |
Table of Contents
SIGNATURES
Pursuant to the requirements of the Securities Exchange Act of 1934 and the Investment Company Act of 1940, the registrant has duly caused this report to be signed on its behalf by the undersigned, thereunto duly authorized.
| (registrant) | GuideStone Funds | |||
| By (Signature and Title)* | /s/ John R. Jones | |||
| John R. Jones, President | ||||
| (principal executive officer) | ||||
| Date 8/27/08 | ||||
Pursuant to the requirements of the Securities Exchange Act of 1934 and the Investment Company Act of 1940, this report has been signed below by the following persons on behalf of the registrant and in the capacities and on the dates indicated.
| By (Signature and Title)* | /s/ John R. Jones | |||
| John R. Jones, President | ||||
| (principal executive officer) | ||||
| Date 8/27/08 | ||||
| By (Signature and Title)* | /s/ Jeffrey P. Billinger | |||
| Jeffrey P. Billinger, Vice President and Treasurer | ||||
| (principal financial officer) | ||||
| Date 8/27/08 | ||||
| * | Print the name and title of each signing officer under his or her signature. |