UNITED STATES
SECURITIES AND EXCHANGE COMMISSION
Washington, D.C. 20549
FORM N-CSR
CERTIFIED SHAREHOLDER REPORT OF REGISTERED
MANAGEMENT INVESTMENT COMPANIES
Investment Company Act file number | 811-10303 | |||||||
| ||||||||
Buffalo Funds | ||||||||
(Exact name of registrant as specified in charter) | ||||||||
| ||||||||
5420 W. 61st Place Shawnee Mission, KS |
| 66205 | ||||||
(Address of principal executive offices) |
| (Zip code) | ||||||
| ||||||||
Clay E. Brethour 5420 W. 61st Place Shawnee Mission, KS 66205 | ||||||||
(Name and address of agent for service) | ||||||||
| ||||||||
Registrant’s telephone number, including area code: | (913) 677-7778 |
| ||||||
| ||||||||
Date of fiscal year end: | March 31, 2017 |
| ||||||
| ||||||||
Date of reporting period: | March 31, 2017 |
| ||||||
Item 1. Reports to Stockholders.

AnnualReport

BuffaloFunds
March 31, 2017
 Message to Our Shareholders
The world experienced significant changes over the past 12 months, but investors took it all in stride as most of the world's major capital markets continued to march upward. The U.S. equity market generated a double-digit return for the 12 month period ending March 31, 2017 with the S&P 500 Index and Russell 3000 Index producing returns of 17.17% and 18.07%, respectively. Meanwhile bond markets experienced more dispersion in performance based on credit quality as more speculative issues, which were perhaps oversold in early 2016, rebounded strongly during the year. The Bank of America ML U.S. High Yield Master II Index, a fixed income index designed to track lower quality, non-investment grade bonds, produced a return of 16.88% while investment grade bonds, which are more dependent on the future direction of interest rates, were relatively flat for the year as measured by the Bloomberg Barclays U.S. Aggregate return of 0.44%. Equity markets outside of the U.S. also produced a strong showing for the past 12 months ending March 31, 2017 as global economic data has been consistently improving, particularly near the end of the period. In December, the European Central Bank announced that it would dial back its monthly bond buying program beginning in April 2017 from 80 billion euros ($86 billion U.S.) a month to 60 billion euros ($64.5 billion U.S.) a month until at least December 2017. And with the tapering of the buying program in effect, underlying sovereign interest rates are starting to increase. For example, the yield on Germany's 10-year government bond more than doubled, rising 18 basis points year to date to 0.39%. But even with the doubling of the yield on the German Bund, foreign buyers continue to struggle to find attractive absolute yield within the Eurozone. In fact, strong foreign investment in U.S. Treasuries has kept a lid on government bond yields through March 31, 2017. With that said, the consensus expectation is that the yield on the 10-year Treasury will be in a range of 3.00% to 3.50% by calendar year-end (compared to 2.37% as we write this update), but that expectation is dependent on the economy continuing to be strong, and assumes the Fed will continue to follow its plan of two additional rate increases before year-end. However, as reported at the end of April, the initial Gross Domestic Product for the first quarter of 2017 only increased at an annualized rate of 0.7%, which is the slowest pace since the first quarter of 2014 and could cast doubt on additional Fed Fund increases for this year.
With interest rates likely to remain low by historical standards, investors may continue to seek capital appreciation in the equity markets, now in the eighth year of the current bull market. As we write this update, geopolitical risks seem to become more elevated by the week, as President Trump keeps the world guessing about what United States foreign policy will look like over the next several years. Additionally,
key elections in Europe continue to put pressure on multi-national companies, as the populous vote moves away from Globalism toward one that embraces Nationalism. Closer to home, the on again, off again healthcare reform decision is casting doubt about whether Republicans will also be able to act upon President Trump's pro-growth agenda of infrastructure spending and tax reform. As of May, Congress had just three months to address tax reform and an infrastructure plan before another full month's recess in August. It has been more than 35 years since any major tax reform has occurred in America, so it will be unlikely that a change will take place within a three month period, but any increased visibility on changes being discussed could help investors determine the potential benefit to the economy and businesses. A significant portion of earnings growth since the Great Recession has been driven by operational efficiencies (cost cutting), but a moderate amount of inflation and positive tax reform could help propel corporate earnings to the next leg of earnings growth. Regardless, any revisions to tax and regulatory policies should reinvigorate economic growth. An additional jolt to the economy could be any move on President Trump's infrastructure plan, which while lagging details, has been described by one of the President's cabinet members as an investment program valued at $1 trillion over 10 years focusing on multiple sectors outside of transportation infrastructure, including energy, water and potentially broadband and veterans hospitals.
In closing we remind you that at Buffalo Funds, we take a long-term approach to investing. Just like our namesake, the buffalo, we are steady, strong, and proud. We have a record of growth that is a testament to our philosophy of trend-based, deeply-researched investing and commitment to long-term growth. Patience is our mantra, and our great strength. Those who invest in Buffalo Funds learn that patience truly is a virtue. We believe that the best way to invest for long-term growth is through a structured, disciplined process. Our steady approach avoids the histrionics of market reactions and allows us to focus on buying opportunities that fit our strategic goals. We appreciate your trust in our management teams and our organization. We will continue to work diligently to meet your expectations.
Sincerely,

Clay E. Brethour
President
2
The Funds' investment objectives, risks, charges and expenses must be considered carefully before investing. The Prospectus contains this and other important information about the investment company, and it may be obtained by calling 1-800-49-BUFFALO or visiting www.buffalofunds.com. Read it carefully before investing.
Past performance does not guarantee future results. Mutual fund investing involves risk. Principal loss is possible.
Kornitzer Capital Management is the Advisor to the Buffalo Funds which are distributed by Quasar Distributors, LLC.
Nothing contained in this communication constitutes tax, legal or investment advice. Investors must consult their tax advisors or legal counsel for advice and information concerning their particular situation.
The opinions expressed are those of the Portfolio Manager(s) and are subject to change, are not guaranteed and should not be considered recommendations to buy or sell any security.
3
 Portfolio Management Review
Buffalo Discovery Fund
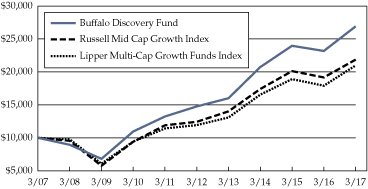
For the fiscal year ending March 31, 2017, the Buffalo Discovery Fund appreciated 16.13% and outperformed the Russell Mid Cap Growth Index which rose 14.07%. The outperformance of the Fund relative to the benchmark for the fiscal year was due to stock selection particularly within industrial and information technology sectors.
The top contributors to the Fund's performance for the year were Align Technology and FMC Corporation. Micron Technologies was also a top contributor and partly responsible for the strong stock selection in information technology during the twelve month period. Align has been a holding in the Fund for over ten years, a testament to our long term investment philosophy. The company continued to grow as penetration of Invisalign clear aligners for malocclusion expands. The company gained share as innovative adaptations of the base technology have increased the addressable population. FMC Corporation is a diversified chemical company serving the agricultural, health and industrial markets. The stock had strong twelve month performance for three primary reasons. The lithium business exceeded expectations in calendar 2016 due to strong demand, favorable pricing and good cost control. Secondly, the agriculture business is recovering from a cyclical downturn which was a result of oversupply and weakening agricultural commodity prices. Thirdly, during the agricultural downturn the industry consolidated with FMC a beneficiary of the consolidation. FMC will acquire Dupont's agricultural business at favorable terms as a result of a divesture required by regulators for the Dupont / Dow merger to close. Micron's stock staged an impressive recovery in fiscal year 2017, as memory chip oversupply corrected and pricing inflated.
Top detractors for the year included Stericycle and Under Armour. Under Armour entered the fiscal year with a lofty valuation. As top line growth slowed, management deferred the highly anticipated margin expansion, and the stock declined. The decelerating top line was partly due to weaker apparel demand in North America, a fashion cycle in footwear that missed the mark, and store closures by brick and mortar retailers such as The Sport's Authority and Macy's. We started to build a position mid-year and while the growth reacceleration is likely to take longer than we originally forecasted, the valuation is compelling and we believe the company has a huge opportunity in front of it with less than 8% share in its addressable markets globally. Under Armour has benefitted from the trend to healthier living and the brand equity remains strong despite the weaker than expected 2016 operating performance. Acuity Brands provides both residential and commercial LED
lighting solutions. We have owned the stock for several years and the company has been a key beneficiary of the transition to LED lighting. As the stock appreciated we trimmed the position. Over the past two quarters growth has slowed modestly and the stock sold off, leading to the more compelling current valuation, in our view. We anticipate growth will reaccelerate in the back half of calendar year 2017. Finally Stericycle was a detractor in the fiscal year primarily due to a substantial reset of the pricing for its regulated and specialized wastes disposal services to small accounts. We believe that the pricing environment is now well understood by management and investors, the valuation is attractive and the current guidance is conservative. The regulated waste business has significant barriers to entry, differentiated service levels and economies of scale. While the pricing reset was unexpected, we continue to like the long term fundamentals of the business.
The Fund ended the fiscal year with 86 stocks representing 85 companies, as we hold both the Class A and Class B shares of Lion's Gate Entertainment. The cash weighting as of March 31, 2017 was 2.6%. After three months of optimism related to the Republican sweep in November's elections, the reality of a laborious and uncertain political process is setting in. Regardless of the Administration's success on the legislative front, certainly the regulatory backdrop has improved, resulting in increased business confidence. Nevertheless we are now eight years into an expansion, and the cycle is maturing. Our valuation discipline should prove to be a differentiator, particularly as the broader equity market appreciates and valuations extend. The Buffalo Discovery Fund's process is to invest based on the Buffalo Long Term Growth Trends. By limiting our investment universe to companies that we believe are potential beneficiaries of the Trends, we are exposed to businesses operating in secular growth markets. The Trends are relevant in any political environment. Over the intermediate to long term, the capital markets are highly efficient and companies exposed to the long term trends driving growth in our economy should outperform.
Buffalo Dividend Focus Fund
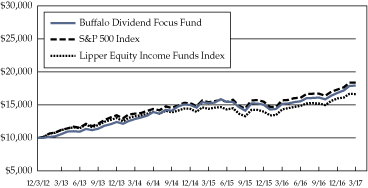
The Buffalo Dividend Focus Fund produced a return of 18.35% for the twelve month period ending March 31, 2017 and outperformed the S&P 500 Index return of 17.17%. The Fund's relative outperformance was driven by the Energy, Real Estate and Consumer Discretionary sectors while the top detracting sectors were Information Technology and Industrials. The outperformance in the Energy sector relative to the benchmark reflects both an overweight sector allocation and security selection. Specific companies that contributed to positive performance over the past year
4
(Unaudited)
included Noble Midstream Partners, Devon Energy Corporation and Chevron. Within Real Estate the outperformance was driven by security selection specifically CoreCivic, which rose 34.13%. CoreCivic had declined due to certain policies implemented by the prior President and which were endorsed by his party's candidate but when she lost the U.S. Presidential election, the market's perception of the new President's policies was much improved and more favorable to CoreCivic. The relative outperformance within Consumer Discretionary was also due to security selection. Specific securities that generated some of the outperformance included Twenty-First Century Fox, Comcast, Marriott and Jack in the Box.
The primary sectors detracting from performance were Information Technology and Industrials. The relative underperformance within Information Technology was due to an underweight sector allocation while the relative underperformance within Industrials was due to security selection and to a lesser degree being underweight the sector. Specific subsectors within Information Technology which detracted from performance were Semiconductors and Technology Hardware. Within Industrials, the subsectors that detracted from performance were Rails, Airlines and Machinery. Cash was also a detractor over the year.
The top contributors to the Fund in fiscal 2017 were Noble Midstream Partners, Bank of America and Apple. Noble Midstream benefitted from the markets growth expectations associated with its parent as well as an improved underlying commodity environment. Bank of America's performance primarily reflects the election of a new U.S. President and a perception that his policies will be beneficial to banks via less regulation and more growth which should steepen the yield curve and improve net interest margins. Apple's stock was trading at a depressed valuation multiple and when earnings proved to be better than feared the stock price improved and it received a higher multiple. The top three detractors to the Fund in fiscal 2017 were Gilead Sciences, CVS and Target. The underperformance in Gilead reflects fears surrounding future growth as the company's Hepatitis C market shrinks as these patients are cured of their illness. CVS' underperformance reflects increased competition with Walgreens and the loss of several large contracts while Target continues to face fierce competition from both online and brick and mortar competitors. During the past year, the Fund exited its stake in Target.
Going forward, we continue to have a consistent message in that we look for companies that we believe 1) exhibit long term sustainable competitive advantages, 2) have a history of growing their revenues, earnings, and dividends,
3) generate significant amounts of free cash flow, 4) have rock solid balance sheets, 5) have management teams who exhibit stellar capital allocation skills and whose interests are aligned with shareholders, and 6) are trading at an adequate discount to our estimate of fair value. As the market has moved up and multiples have expanded over the last year, it has become more difficult to continue to find undervalued companies. We continue to search for companies that meet our criteria for purchase and sell those that no longer exhibit the qualities we desire.
We expect the market to experience continued volatility in the coming quarters as the Federal Reserve continues to normalize interest rates along with a focus on the ability of the Trump administration to enact infrastructure spending, deregulation, and corporate tax reform. Prospective tailwinds for the economy include further job growth, wage increases, lower tax rates, and simply more optimism from both businesses and consumers; all of which could lead to higher Gross Domestic Product (GDP) growth. On the other hand, potential headwinds include strengthening of the U.S. dollar, further increases in interest rates, and valuation metrics that are above historical market averages leading us to believe that the stock market may have a hard time achieving further multiple expansions.
Despite the expectation of continued volatility we continue to focus on wide moat, large capitalization companies that are trading at reasonable valuations, in our view. As always, the Fund will continue to focus on competitively advantaged companies that can be purchased at a fair price, in our opinion. As the stock market has continued to climb, it is getting harder to find companies that fit our investment criteria, but we continue to follow our process of finding new investment ideas and to be ready when market declines provide better opportunities.
Buffalo Emerging Opportunities Fund
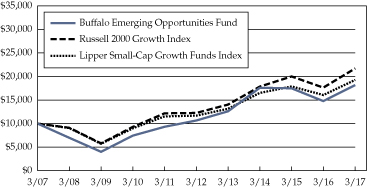
For the 12-month period ending March 31, 2017, the Buffalo Emerging Opportunities Fund posted a positive return of 22.99%, roughly in-line with the Russell 2000 Growth Index return of 23.03%.
The Fund generated outperformance in the Information Technology ("IT") and Industrials sectors. Information Technology was the largest sector weighting in the Fund and generated average returns of 51.18% during the period compared to the index's return of 31.76%. Industrials were also an area of competitive stock selection, with the Fund's holdings returning 57.20% versus the index returns of 21.88%. Offsetting this outperformance was the Fund's Consumer Discretionary holdings which returned 2.76% compared to the 14.28% return posted by the index.
5
 Portfolio Management Review
(Continued)
Additionally, our cash balance for the year presented a drag on relative performance given the significant positive market returns over this time period.
The Fund took advantage of the market sell-off that occurred in the quarter ended March 2016 to add to existing Information Technology holdings or build new positions. Actions taken during this time period helped generate the outperformance among our technology holdings over the past fiscal year. Strategic acquirers also saw the disconnect in valuations that occurred during the period as portfolio companies inContact, Demandware, and Apogee were acquired by NICE Systems, Salesforce.com, and Google, respectively during the course of the past 12 months. Additionally, LogMeIn merged with the GoTo unit of Citrix Systems in a very favorable transaction for LogMeIn shareholders, a development that contributed significantly to our outperformance in the technology sector.
We remain focused on valuations and fundamentals and continue to monitor the risk/reward profile of our holdings. We will make changes to the portfolio based on market moves that provide either an opportunity to trim or add to a position based on potential inefficiencies in the smaller end of the market capitalization spectrum. The correction that began in calendar 2016 was one of those events and the Fund was rewarded in these cases by strategic acquirers supporting our thoughts with their capital being put to use to acquire the above mentioned holdings.
In the Industrials sector, Kornit Digital was a leading contributor to returns after being added to the Fund in June 2016 following several meetings with the management team. Kornit is the leading provider of digital direct to garment and roll-to-roll printing, allowing for high throughput of custom apparel and other use cases based on demand. With Kornit hardware and proprietary ink, online apparel designers can produce short runs of custom pieces based solely on demand. Kornit has been a prime beneficiary in the shift in consumer's increasing desire to purchase apparel online and a desire to have more unique pieces of clothing. In January, Amazon selected Kornit to deliver a large number of its Avalanche 1000 printers in support of Amazon's growing Merch program. In conjunction with this agreement, Kornit granted Amazon warrants that do not vest until Amazon purchases significant amounts of equipment and supplies from Kornit.
Meanwhile the Consumer Discretionary sector was a headwind to relative performance during the period as a few of our restaurant holdings detracted from results. Several investments in this area struggled with porting their success in a couple of existing markets to new markets. Additionally, the subtle but still meaningful shift in
consumer's spending to eat-at-home versus eat-away-from home proved to be a drag on same store sales metrics.
As the daily political headlines pass, geopolitical tensions heat up, and the realization that getting legislation passed in Washington is never easy, we aim to stay consistent to our strategy of building a portfolio of securities that should benefit from underlying secular growth trends that could have thriving business models over the long term regardless of the political climate. The Buffalo Emerging Opportunities Fund is focused primarily on identifying innovation within U.S. companies with North American revenue bases. Therefore the universe of companies we review for inclusion in the Fund is typically much more U.S. centric than most mid and large cap companies. We like this positioning given the dollar appreciation and foreign policy uncertainty. In addition, U.S. consumer and small business confidence are near or at all-time highs which should also bode well for our smaller, U.S. centric companies. Additionally, we continue to believe the landscape for potential acquisitions could benefit the Fund as larger companies continue to search out areas for growth as we enter year eight of the current bull market.
Buffalo Flexible Income Fund
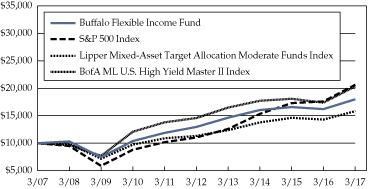
The Buffalo Flexible Income Fund produced a return of 11.02% for the twelve month period ending March 31, 2017. During the same time period, the S&P 500 returned 17.17% and the Bank of America Merrill Lynch High Yield Master II Index returned 16.88%. The equity portion of the portfolio returned 12.85%. The Flexible Income Fund's equity component is primarily focused on large cap dividend payers which we believe possess significant competitive advantages. The primary sectors that led to the underperformance were industrials, financials and information technology. The underperformance within industrials was primarily due to security selection. Specifically, Pitney Bowes detracted 127 basis points from performance which was due to weak operating results and continued pressure on mail volumes as businesses transition away from traditional mail based marketing to digital. The underperformance in financials was due to sector allocation as the Fund was significantly underweight the best performing sector in the index. The underperformance in information technology was due to sector allocation and security selection as the Fund was significantly underweight the second best performing sector in the index. The security that negatively impacted performance the most during the period was Qualcomm. Additionally, several non-dividend paying companies generated positive returns during the year for the index. The Fund does not typically invest in these kinds of companies as our mandate is focused on companies that
6
(Unaudited)
pay dividends. The top contributors to the Fund in fiscal 2017 were Boeing, BB&T and Microsoft. Boeing continued to benefit from strong operating results and significant cash flow generation. BB&T share price improvement reflects investor expectations of a lower regulatory burden due to the new U.S. President and the hope of more favorable banking policies. Additionally, investors anticipate that the President's policies will improve growth which could lead to a steeper yield curve and better net interest margins. The top detractors to the Fund in fiscal 2017 were Pitney Bowes, HollyFrontier and Verizon.
The fixed income portion of the Buffalo Flexible Income Fund generated a return of 10.78% over the past 12 months and underperformed the Bank of America Merrill Lynch Master II Index which generated a return of 16.88%. The primary sectors detracting from performance were consumer discretionary, energy and information technology. The underperformance in the discretionary sector relative to the benchmark reflects both a significant overweight as well as security selection. The Fund was overweight the sector and the sector underperformed the index while the underperformance from security selection was due to our investment in Lions Gate Entertainment which reported weak fourth quarter earnings. Within energy, the underperformance was primarily due to security selection. Energy was the best performing sector within the high yield index over the past year and this partially reflects the significant return generated by various distressed energy credits. Fund management has historically avoided investing in distressed credit. The underperformance in the discretionary sector relative to the benchmark reflects both a significant overweight as well as security selection. The top contributors to the portfolio's fixed income performance included Valeant, Medicines Company and Bankrate while the three top detractors were Community Health, Alere and Wildhorse Resource Development.
As we look ahead, we remain focused on finding attractive yield opportunities that we believe have favorable risk reward outlooks. Within the equity space we remain focused on large cap dividend payers as well as select master limited partnerships (MLPs). Within fixed income, we are primarily focused on three asset classes, high yield bonds, convertible bonds and floating rate bank debt.
Buffalo Growth Fund
The Buffalo Growth Fund returned 12.88% in the fiscal year ending March 31, 2017, compared to its benchmark the Russell 1000 Growth Index return of 15.76%. Relative to the benchmark, energy, financials, and health care ended the fiscal year as the largest overweight sectors. While infor-
mation technology and consumer staples were the most underweight.
Among the leading contributors, Amazon.com was the top contributor for the fiscal year. Shares set all-time highs after the company reported record profits during the year. Results were robust as profit margins improved in its North American ecommerce business as sales continued to grow at a rapid pace. In addition, its web services business continued to grow profitably while maintaining a high level of growth throughout the year. Next, shares of Apple were driven by a strong launch of the new iPhone 7 in September 2016, leading growth to inflect higher. Also, the market position of the iPhone 7 has been helped by the product reliability issues at Samsung, providing an opportunity for Apple to gain market share. Finally, Align Technology shares were higher on continued strong growth of its innovative correction dental product, Invisalign. The company continued to have opportunities to invest to sustain its profit growth including geographic expansion and new products.
Among the detractors for the fiscal year, Nielsen shares declined on weaker than expected earnings growth. Results were negatively impacted by ongoing cost rationalization of many large consumer products companies with particular emphasis on more discretionary spending by these customers. However, the company has maintained growth in its core measurement businesses. Next, shares of Stericycle declined on weaker growth and guidance for the year. The company has experienced pricing headwinds in its medical waste business and two larger acquisitions have taken longer to integrate and yield synergies. We believe Stericycle remains a beneficiary of increasing utilization of medical care with an aging population. Finally, Under Armour shares fell on disappointing growth and profit forecasts for fiscal 2017. The company has experienced a setback of its growth due to some product innovation missteps combined with increasing competition in the athletic apparel space.
We continue to hold a more positive view on the domestic economic outlook relative to the global outlook. In Europe, elections in France and Germany this year continue to brew uncertainty on the heels of the surprise vote by the United Kingdom to exit the European Union last summer (Brexit). In addition, Europe still suffers from a debt problem among many European Union member nations. Greece and Italy have been widely reported as highly indebted countries but several other nations are not far from burdensome debt levels as well. In Asia, Japan continues to limp along in a lethargic recovery, while China's growth has moderated but remains at a high absolute level. In the U.S.,
7
 Portfolio Management Review
(Continued)
the initial optimism for economic stimulus from the new administration has diminished as President Trump met more resistance than expected in overhauling health care. This has resulted in the timeline being pushed out for policies expected to boost economic growth, such as tax reform and infrastructure spending. Even if approved, these growth boosting initiatives are unlikely to be significant in 2017 due to the delay caused by the focus on healthcare policy. In this environment, we continue to stay focused on attempts to hedge capital from potential downside risks, while taking incremental risk when justified by positively skewed potential return outcomes.
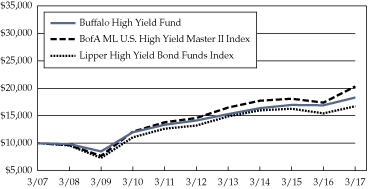
Buffalo High Yield Fund
The Buffalo High Yield Fund increased 8.37% for the fiscal year ended March 31, 2017. During the period, the Fund underperformed our primary benchmark, the Bank of America Merrill Lynch High Yield Master II Index (the "Index") which had a return of 16.88% by 851 basis points during the comparable period. Our underperformance relative to the Index can largely be attributed the Fund's strategy of owning higher credit quality issues with shorter durations which underperformed riskier names for much of the year. The Fund was also significantly underweight in the energy and mineral/mining sectors which were by far the two strongest performing sectors in the Index. In fiscal 2017, the high yield markets experienced significant volatility driven by: (i) highly volatile crude oil and other commodity prices that cratered in the first fiscal quarter before rallying significantly; (ii) investor concern over continued interest rate increases by the Fed; (iii) and uncertainty about the health of the global economies and state of the credit cycle. The Fund's energy allocation was roughly 5% compared to the Index's 14% weighting, and this was a key driver of the Fund's underperformance in the last nine months of the fiscal year.
The approximate rate and contribution of return from the various asset classes in the portfolio during the fiscal year 2017 was as follows:
| APPROXIMATE UNWEIGHTED RETURN | APPROXIMATE CONTRIBUTION TO RETURN | ||||||||||
Straight Corporates | 9.6 | % | 6.6 | % | |||||||
Convertibles | 13.4 | % | 1.8 | % | |||||||
Bank Loans | 6.9 | % | 0.6 | % | |||||||
Convertible Preferred | 12.2 | % | 0.1 | % | |||||||
Common Stocks | 8.5 | % | 0.3 | % | |||||||
Cash | 0.0 | % | -1.0 | % | |||||||
Total | 50.6 | % | 8.4 | % | |||||||
All asset classes provided positive returns for the Fund in the fiscal year. Given the heavy allocation in the Fund and overall strong performance in the asset class, straight
corporate bonds contributed the most to the Fund's performance. Primary contributors to the straight corporate bond portfolio included KCG Holdings 6.875% '20, Neustar 4.50% '23, and DigitalGlobe 5.250% '21. KCG Holdings notes started the fiscal year at depressed levels due to disappointing earnings but steadily improved over the year as earning performance improved and its low duration attracted investors. Neustar was acquired and DigitalGlobe refinanced its notes both of which drove prices back to par. Securities that underperformed in this asset class included Concordia Healthcare 9.500% '22, MDC Partners 6.500% '24, and Community Health Systems 7.125% '20.
As an asset class, convertible bonds posted the strongest unweighted return and were the second largest contributor to Fund performance. The Medicine Company 2.500% '22 and 2.750% '23 issues along with Greenbrier 3.500% '18 were the top performers. The stock of Medicine Company nearly doubled in early 2017 after a competitor's favorable clinical trials for a similar cholesterol drug were announced which drove the value of the convertible notes considerably higher. Greenbrier benefited from better than expected earnings and the "Trump Effect" following the November elections.
During the fiscal year, the Fund continued to increase its exposure to bank loans as we were able to find additional issues with attractive pricing, favorable credit quality, and perceived less exposure to rising interest rates than fixed rate bonds. Primary contributors in this segment included Akorn, Valeant Pharmaceuticals, and Diebold. The Fund only owned one convertible preferred stock position at the end of the fiscal year which was the Allergan 5.500% '27 convertible preferred. It had minimal impact on the Fund's returns during the year. Within the common stock segment of the portfolio, we liquidated all of our positions in September to raise liquidity for a pending redemption. In January, we received shares of Lions Gate Entertainment common stock as payment from a maturing convertible bond issue that we held.
After significant declines in the first calendar quarter ending March 31, 2016, the broad high yield market saw significant strength throughout fiscal 2016 as the Index recorded gains in all four quarters. Recent economic news continues to be mixed with the unemployment rate relatively strong, while the number of jobs created and inflation numbers remain benign. Thus, the rhetoric coming out of Federal Open Market Committee (FOMC) meetings continues to imply restrained optimism and a regime of slow incremental rate increases over the next two years. The U.S. Treasury yield curve has flattened in response to rising short term Fed Funds rate and lack of significant inflation.
8
(Unaudited)
Within this environment, we continue to manage the Fund cautiously yet actively as we look into the new fiscal year. In managing the Fund, we continue to focus on high-quality issuers with defensive business models and manageable credit metrics. As yields and spreads tightened throughout fiscal 2017 to the lowest levels since 2013, we increased the weighting in floating rate bank loans and tried to add shorter duration issues when possible. We will continue to deploy the Fund's cash in opportunities that we believe offer the most appealing risk/reward tradeoffs with a bias toward high credit quality, appealing business models, relatively short duration, and attractive relative values. We will also remain opportunistic in adding floating rate bank loans and convertible bonds, the former providing some hedging to a rising rate environment and the latter giving the Fund exposure to underlying equity movements.
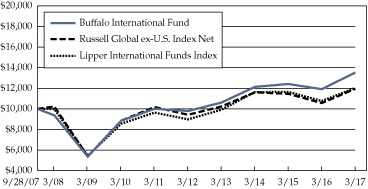
Buffalo International Fund
For the fiscal year ending March 31, 2017, the Buffalo International Fund appreciated 13.46%, slightly ahead of the Russell Global ex-U.S. Index, which returned 13.13%. The performance of the Fund was challenged by its sector allocation, but positively impacted due to stock selection, with the strongest benefit coming from stock selection within the information technology sector.
Broadcom, Kering and Adidas were the top contributors for the fiscal year. Broadcom, a stock we've owned almost since the Fund's inception, is a semiconductor manufacturer which continued to benefit as cellular handset and base station suppliers continue their roll-out of 4G capabilities, which requires greater use of semiconductor filters to handle the bandwidth and spectrum density. Kering and Adidas both benefited from a renewed focus on core brands, to which the consumer responded favorably.
Top detractors for the year's performance included Amer Sports Oyj, and several healthcare holdings, including Teva Pharmaceuticals and Allergan. Amer Sports Oyj develops and manufactures sports and fitness equipment and clothing, including the brands Wilson, Precor and Salomon. The brands had a poor showing during the holiday season, amid delays in new product launches. Overall the healthcare market is facing a great deal of uncertainty due to efforts to repeal and replace the Affordable Care Act and intense scrutiny on pharmaceutical pricing practices. Both Teva and Allergan have been recipients of this scrutiny and the stocks have suffered accordingly. In addition, Teva's acquisition of Actavis hasn't provided the anticipated synergies.
Having shrugged off hysteria caused by Britain's vote to exit the European Union (BREXIT) in mid-year 2016, and
gotten past a Fed rate hike last December, the outlook for global growth has turned positive with reflationary forces being felt in China, Europe and Japan. We are however concerned that some of the reflationary forces being propagated are due to another credit push from China, which may not be sustainable in the medium turn. In any event, the markets are acting with relief that the worst has passed and perhaps Central Banks may be moving toward market price discovery among and between asset classes. Elections are front and center in the European Union (EU), but for now, polls seem to indicate that the status quo will continue. We believe the political uncertainty in Europe should ameliorate as we move to the second half of the year, and attention again will focus on future Central Bank actions.
Overall, we continue to expect modestly improving economic growth around the globe. Our investment process is designed to favor a long-term secular growth perspective coupled within the context of our valuation and country specific macro analyses. While our process remains unchanged, we are taking incremental risks were it makes sense, while continuing to keep an eye towards the pursuit of hedging capital from potential downside risks. We continue to look for opportunities to buy or add to companies that are exposed to secular growth, improving balance sheets and sustainable business models that possess valuations which could provide appropriate prospective returns for our investors.
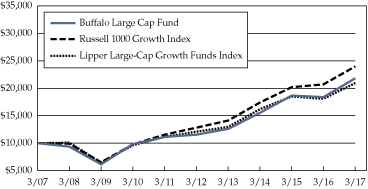
Buffalo Large Cap Fund
For the fiscal year ending March 31, 2017, the Buffalo Large Cap Fund appreciated 18.67% significantly outperforming the Russell 1000 Growth Index return of 15.76%. The outperformance of the Fund relative to the benchmark for the fiscal year was due to stock selection within the consumer discretionary sector. To a lesser extent, stock picking within the information technology and healthcare sectors also contributed to relative performance.
Amazon, Apple, and Micron Technologies were top contributors for the fiscal year. While many brick and mortar retailers are struggling to grow in the face of store closures, Amazon appears to be gaining share with overall top line growth having accelerated in 2016 over 2014 and 2015. The company remains extremely well positioned to potentially benefit from ecommerce growth and cloud computing. Apple's iPhone 7 sales meaningfully exceeded expectations in the fourth quarter of 2016 which were reported in January. The installed base of iPhones is approximately 570 million globally. The iPhone 8 launch later this year, the ten year anniversary product, will have a large target audience. Micron's stock staged an impressive recovery in 2016 as memory chip oversupply corrected and pricing inflated.
9
 Portfolio Management Review
(Continued)
Ending the quarter, we no longer believe that the company is undervalued.
Top detractors for the year's performance involved several healthcare holdings, including CVS Health and athenahealth. CVS Health's equity has been under pressure since early 2016 for a myriad of reasons including lost market share to several rivals over the past six months, concerns about drug pricing pressure that could affect the company's growth profile, and angst over the lack of transparency in the drug supply chain resulting in perhaps outsized profits for pharmacy benefit managers such as CVS at the expense of other businesses along the supply chain. While controversy surrounding the stock is elevated, we see little long term fundamental risk to the company and find the valuation compelling. athenahealth offers a cloud based information technology management system for healthcare providers. The company's operations underperformed expectations in the fourth quarter of 2016. Overall the healthcare provider market is facing a great deal of uncertainty due to efforts to repeal and replace the Affordable Care Act. We expect athenahealth's bookings and operating performance to improve as the uncertainty lifts.
The Fund ended the fiscal annual period with 46 stocks representing 45 companies, as we hold both the Class A and Class C shares of Alphabet, Inc. The cash weighting stood at 5.2% ending the period.
After three months of optimism related to the Republican sweep in November's elections, the reality of a laborious and uncertain political process is setting in. Regardless of the Administration's success on the legislative front, certainly the regulatory backdrop has improved, resulting in increased business confidence. Nevertheless we are now eight years into an expansion, and the cycle is maturing. Our valuation discipline should prove to be a differentiator, particularly as the broader equity market appreciates and valuations extend.
The Buffalo Large Cap Fund's process is to invest based on the Buffalo Long Term Growth Trends. By limiting our investment universe to companies that we believe are potential beneficiaries of the Trends, we are exposed to businesses operating in secular growth markets. The Trends are relevant in any political environment. Over the intermediate to long term, the capital markets are highly efficient and companies exposed to the long term trends driving growth in our economy should outperform.
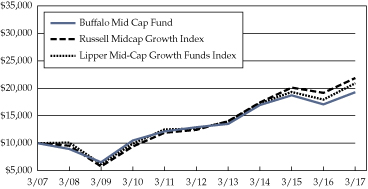
Buffalo Mid Cap Fund
The Buffalo Mid Cap Fund generated a return of 12.94% for the 12 month period ending March 31, 2017, which
underperformed the Russell Midcap Growth Index return of 14.07% during the same period. The index was primarily driven higher by contributions from the information technology, health care, industrial and financial sectors with the Fund producing positive stock selection in all but one of those areas. Negative stock selection in consumer discretionary and materials contributed to the Fund's underperformance. Positive stock selection in financials, real estate and information technology sectors helped partially offset soft relative performance in the areas mentioned above. Also negatively impacting performance was our attention to valuation as we trimmed stocks, particularly in the fiscal fourth quarter, that continued to move higher. We are actively deploying capital into areas we believe have a more favorable risk/reward profile.
The Fund's consumer discretionary sector experienced negative selection effect for the period with Tractor Supply Company and Under Armour most negatively affecting the performance. Tractor Supply Company's results were impacted by unfavorable weather in certain areas of the country. We remain positive on the fundamentals of the company as stores in areas of the country not affected by weather continue to perform well. For Under Armour, weaker apparel demand in North America and dislocation at some retail sporting goods stores have caused sales to slow. Also hurting the stock is the company's desire to invest for long-term growth which is pressuring margins. Despite the weakness from both stocks, we remain positive on the long term fundamentals of both companies and believe the valuation profiles are compelling.
The Fund's financials performed well in the quarter as MarketAxess and MSCI were the top performers in the sector. MarketAxess Holdings, which operates an electronic trading platform for fixed-income securities, and provides market data and post-trade services for the global fixed-income markets, benefitted from the trend in electronic trading of fixed income securities away from traditional phone orders. The stock was up over 50% for the period. MSCI, which provides benchmark indexes and portfolio risk analytics tools to institutional investors, benefitted from the growth in Exchange Traded Funds (ETFs) and risk management solutions. MSCI operates what we view as an attractive business model that has a substantial recurring revenue stream with meaningful barriers to entry. The stock was up about 33% for the period.
The Fund's largest contributor to performance was Cepheid, a healthcare diagnostic company. The company received an offer to be acquired by Danaher at a greater than 50% premium to where the stock was trading. We had taken a position in the company at attractive prices,
10
(Unaudited)
believing that the market was not recognizing the value of the company correctly after a period of poor execution that was largely in the rear view mirror.
The setup for 2017 appears to bode well for both accelerated economic growth and performance of U.S equities. The new Presidential administration's focus on deregulation, infrastructure spending, and tax reform point to a more pro-growth, business-friendly environment, which could portend an extended cycle of economic growth. Investors are now keeping a close eye on President Trump's ability to pass meaningful tax reform, especially after promises of healthcare reform have so far fallen short. Inability to provide tax reform may cause market volatility though expectations for the timing of results are being actively managed by the new administration.
While we are pleased with the number of positions in the portfolio, we continue to look for additional ideas that could provide greater risk adjusted return potential. We have spent considerable time over the past few months analyzing companies with a greater cyclical profile that could stand to benefit from factors like accelerating job growth, improved construction activity, and increased energy production. We would expect those kinds of companies to outperform in this environment of an elongated economic cycle. While we have added some new positions in these areas, we are remaining true to our process of identifying what we believe to be beneficiaries of long-term trends and implementing our valuation discipline. We continue to actively reduce stocks with potential disproportionate downside risk and appreciate your continued support and confidence.
Buffalo Small Cap Fund
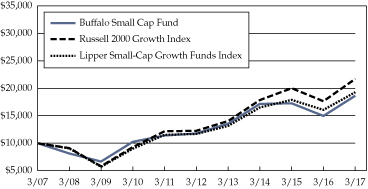
The Buffalo Small Cap Fund produced a return of 24.51% for the 12 month period ending March 31, 2017, outperforming the Russell 2000 Growth Index return of 23.03% during the same period. The Fund's relative performance was strongest in healthcare and technology, while weakest in consumer discretionary.
Technology was the Fund's best-performing sector relative to the index. The top-performing holding in the sector was LogMeIn, which announced a large synergistic merger with Citrix's GoTo business in July 2016 that could position the company for margin expansion and accelerated free cash flow growth. Another holding that outperformed in the sector was Cognex, a company focused on machine vision and factory automation, which benefited from strong performance with its consumer electronics, automotive, and logistics customers. The Fund also outperformed the index in healthcare with Exact Sciences providing the highest
contribution in the sector. The company continued to gain payer, doctor and patient support for Cologuard, a commercialized alternative to colonoscopy for detecting colorectal cancer. Investors are now starting to give some attention to the company's pipeline of screening tests in other areas of oncology like lung and breast cancer. Other portfolio holdings in this sector that drove above index returns included Supernus, a specialty pharmaceutical company that settled a generic challenge over their lead compound, and Cepheid, a diagnostic company that was purchased by Danaher.
Our Consumer Discretionary holdings represented the biggest underperformer relative to index sector results. The Fund's investment in Fitbit detracted from performance as consumer demand for the company's wearable devices declined significantly. The Fund's holdings in restaurants, specialty retail, and apparel also represented a drag relative to the index as our holdings underperformed. We have taken steps to potentially improve performance in this sector, including eliminating some holdings where fundamentals have failed to materialize, and redeploying the capital into companies we believe are poised for stronger returns.
Other sectors were more muted in their contribution to the Fund's relative performance. Consumer Staples and Financials contributed to outperformance, while Industrials and Materials served as slight drags. During the year, we were quite active in making changes to the portfolio in an attempt to position it for improved performance. The Fund finished the fiscal year with 73 holdings, a significant increase compared to 62 positions at the end of the previous year. While we are pleased with strong idea-generation and the increased number of securities in the portfolio, we continue to look for additional ideas that could provide greater risk-adjusted returns.
The setup for 2017 appears to bode well for both accelerated economic growth and performance of U.S equities. The new Presidential administration's focus on deregulation, infrastructure spending, and tax reform point to a more pro-growth, business-friendly environment. We have spent considerable time over the past few months looking at companies with a greater cyclical profile that could stand to benefit from factors like accelerating job growth, improved construction activity, and increased energy production. At the same time, uncertainties in the global geopolitical environment, and questions about the new administration's ultimate ability to pass reforms could lead to enhanced market volatility in coming quarters as well. While we have added some new positions in these areas, we are remaining true to our process of identifying potential beneficiaries of long-term trends and implementing our
11
 Portfolio Management Review
(Unaudited)
valuation discipline. We continue to actively reduce stocks with disproportionate downside risk and those that have graduated well into being midcap stocks. We appreciate your continued support and confidence.
Sincerely,

John C. Kornitzer
President, KCM
Bond ratings are grades given to bonds that indicate their credit quality as determined by a private independent rating service such as Standard & Poor's. The firm evaluates a bond issuer's financial strength, or its ability to pay a bond's principal and interest in a timely fashion. Ratings are expressed as letters ranging from 'AAA', which is the highest grade, to 'D', which is the lowest grade. In limited situations when the rating agency has not issued a formal rating, the Advisor will classify the security as nonrated.
Earnings growth is not representative of a fund's future performance.
A basis point is one hundredth of a percentage point (0.01%)
Cash flow is the net amount of cash moving into and out of a business.
Yield is the income return on an investment.
Yield Curve is a curve on a graph in which the yield of fixed-interest securities is plotted against the length of time they have to run to maturity.
Free Cash Flow is revenue less operating expenses including interest expense and maintenance capital spending. It is the discretionary cash that a company has after all expenses and is available for purposes such as dividend payments, investing back into the business, or share repurchases.
Duration is a commonly used measure of the potential volatility of the price of a debt security, or the aggregate market value of a portfolio of debt securities, prior to maturity. Securities with a longer duration generally have more volatile prices than securities of comparable quality with a shorter duration.
12
 Investment Results
Total Returns as of March 31, 2017 (Unaudited)
AVERAGE ANNUAL | |||||||||||||||||||||||||||
| GROSS EXPENSE RATIO* | THREE MONTHS | ONE YEAR | FIVE YEARS | TEN YEARS | SINCE INCEPTION | ||||||||||||||||||||||
| Buffalo Discovery Fund (inception date 4/16/01) | 1.02 | % | 8.22 | % | 16.13 | % | 12.76 | % | 10.40 | % | 8.82 | % | |||||||||||||||
Russell Mid Cap Growth Index | N/A | 6.89 | % | 14.07 | % | 11.95 | % | 8.13 | % | 8.13 | % | ||||||||||||||||
Lipper Multi-Cap Growth Funds Index | N/A | 9.22 | % | 17.11 | % | 11.94 | % | 7.69 | % | 5.92 | % | ||||||||||||||||
| Buffalo Dividend Focus Fund (inception date 12/03/12) | 0.98 | % | 6.56 | % | 18.35 | % | N/A | N/A | 14.45 | % | |||||||||||||||||
S&P 500 Index | N/A | 6.07 | % | 17.17 | % | N/A | N/A | 15.11 | % | ||||||||||||||||||
Lipper Equity Income Funds Index | N/A | 4.03 | % | 16.09 | % | N/A | N/A | 12.59 | % | ||||||||||||||||||
| Buffalo Emerging Opportunities Fund (inception date 5/21/04) | 1.48 | % | 7.13 | % | 22.99 | % | 11.28 | % | 6.16 | % | 7.59 | % | |||||||||||||||
Russell 2000 Growth Index | N/A | 5.35 | % | 23.03 | % | 12.10 | % | 8.06 | % | 9.08 | % | ||||||||||||||||
Lipper Small-Cap Growth Funds Index | N/A | 6.51 | % | 19.93 | % | 10.52 | % | 6.78 | % | 7.95 | % | ||||||||||||||||
| Buffalo Flexible Income Fund (inception date 8/12/94) | 1.01 | % | 1.61 | % | 11.02 | % | 6.78 | % | 6.05 | % | 7.18 | % | |||||||||||||||
S&P 500 Index | N/A | 6.07 | % | 17.17 | % | 13.30 | % | 7.51 | % | 9.58 | % | ||||||||||||||||
Lipper Mixed-Asset Target Allocation Moderate Funds Index | N/A | 4.23 | % | 10.61 | % | 6.91 | % | 4.69 | % | 6.94 | % | ||||||||||||||||
Bank of America Merrill Lynch U.S. High Yield Master II Index | N/A | 2.71 | % | 16.88 | % | 6.85 | % | 7.34 | % | 7.40 | % | ||||||||||||||||
| Buffalo Growth Fund (inception date 5/19/95) | 0.92 | % | 8.06 | % | 12.88 | % | 11.09 | % | 8.20 | % | 9.75 | % | |||||||||||||||
Russell 1000 Growth Index | N/A | 8.91 | % | 15.76 | % | 13.32 | % | 9.13 | % | 8.66 | % | ||||||||||||||||
Lipper Large Cap Growth Funds Index | N/A | 10.26 | % | 15.77 | % | 11.60 | % | 7.67 | % | 7.51 | % | ||||||||||||||||
| Buffalo High Yield Fund (inception date 5/19/95) | 1.03 | % | 2.14 | % | 8.37 | % | 5.32 | % | 6.24 | % | 7.27 | % | |||||||||||||||
Bank of America Merrill Lynch U.S. High Yield Master II Index | N/A | 2.71 | % | 16.88 | % | 6.85 | % | 7.34 | % | 7.40 | % | ||||||||||||||||
Lipper High Yield Bond Funds Index | N/A | 2.14 | % | 8.37 | % | 5.32 | % | 6.24 | % | 7.27 | % | ||||||||||||||||
| Buffalo International Fund (inception date 9/28/07) | 1.06 | % | 10.63 | % | 13.46 | % | 6.67 | % | N/A | 3.22 | % | ||||||||||||||||
Russell Global (ex USA) Index Net | N/A | 8.12 | % | 13.13 | % | 4.86 | % | N/A | 0.56 | % | |||||||||||||||||
Lipper International Funds Index | N/A | 8.10 | % | 11.70 | % | 6.01 | % | N/A | 0.82 | % | |||||||||||||||||
| Buffalo Large Cap Fund (inception date 5/19/95) | 0.95 | % | 8.37 | % | 18.67 | % | 13.56 | % | 8.11 | % | 9.29 | % | |||||||||||||||
Russell 1000 Growth Index | N/A | 8.91 | % | 15.76 | % | 13.32 | % | 9.13 | % | 8.66 | % | ||||||||||||||||
Lipper Large-Cap Growth Funds Index | N/A | 10.26 | % | 15.77 | % | 11.60 | % | 7.67 | % | 7.51 | % | ||||||||||||||||
| Buffalo Mid Cap Fund (inception date 12/17/01) | 1.02 | % | 4.60 | % | 12.94 | % | 8.35 | % | 6.78 | % | 7.77 | % | |||||||||||||||
Russell Midcap Growth Index | N/A | 6.89 | % | 14.07 | % | 11.95 | % | 8.13 | % | 8.37 | % | ||||||||||||||||
Lipper Mid-Cap Growth Funds Index | N/A | 8.01 | % | 16.55 | % | 10.55 | % | 7.65 | % | 7.45 | % | ||||||||||||||||
| Buffalo Small Cap Fund (inception date 4/14/98) | 1.01 | % | 10.51 | % | 24.51 | % | 9.62 | % | 6.42 | % | 11.24 | % | |||||||||||||||
Russell 2000 Growth Index | N/A | 5.35 | % | 23.03 | % | 12.10 | % | 8.06 | % | 5.61 | % | ||||||||||||||||
Lipper Small-Cap Growth Funds Index | N/A | 6.51 | % | 19.93 | % | 10.52 | % | 6.78 | % | 7.11 | % | ||||||||||||||||
* As reported in the Funds' Prospectus dated July 29, 2016.
Performance data quoted represents past performance; past performance does not guarantee future results. The investment return and principal value of an investment will fluctuate so that an investor's shares, when redeemed, may be worth more or less than their original cost. Current performance of the Funds may be lower or higher than the performance quoted. Performance data current of the most recent month-end may be obtained by calling 1-800-49-BUFFALO or by visiting the website at www.buffalofunds.com.
Until December 1, 2016, the Buffalo Discovery, Dividend Focus, Flexible Income, International, Large Cap, Mid Cap, and Growth Funds imposed a 2.00% redemption fee on shares held for less than 60 days and the Buffalo High Yield, Emerging Opportunities and Small Cap Funds imposed a 2.00% redemption fee on shares held less than 180 days.
13
 Investment Results
(Continued) (Unaudited)
The Funds' returns shown do not reflect the deduction of taxes that a shareholder would pay on distributions or the redemption of shares. The benchmark returns shown, excluding the Lipper Indices, reflect the reinvestment of dividends and capital gains but do not reflect the deduction of any investment management fees, other expenses or taxes. The performance of the Lipper Indices is presented net of the Funds' fees and expenses; however, applicable sales charges are not taken into consideration. One cannot invest directly in an index.
The Lipper Multi-Cap Growth Funds Index is an unmanaged index that reflects the net asset value weighted return of 30 of the largest multi-cap growth funds tracked by Lipper. Its returns include net reinvested dividends. The S&P 500 Index is a capitalization weighted index of 500 large capitalization stocks which is designed to measure broad domestic securities markets. The Lipper Mixed-Asset Target Allocation Moderate Funds Index is an average of funds that, by portfolio practice, maintain a mix of between 40%-60% equity securities, with the remainder invested in bonds, cash, and cash equivalents. The total return of the Lipper Average does not include the effect of sales charges. The Russell 1000 Growth Index measures the performance of those Russell 1000 Index companies with higher price-to-book ratios and higher forecasted growth values. The Lipper Large-Cap Growth Funds Index is an unmanaged, equally weighted performance index of the 30 largest qualifying mutual funds (based on net assets) in the Lipper Large-Cap classification. The Bank of America Merrill Lynch U.S. High Yield Master II Index tracks the performance of below investment grade U.S. dollar-denominated corporate bonds publicly issued in the U.S. domestic market. The Lipper High Yield Bond Funds Index is a widely recognized index of the 30 largest mutual funds that invest primarily in high yield bonds. The Lipper International Funds Index is an unmanaged, equally weighted performance index of the 30 largest qualifying mutual funds (based on net assets) in the Lipper International classification. The Russell Midcap Growth Index measures the performance of those Russell Midcap companies with higher price-to-book ratios and higher forecasted growth values. The Lipper Mid-Cap Growth Funds Index is an unmanaged, equally weighted performance index of the 30 largest qualifying mutual funds (based on net assets) in the Lipper Mid-Cap classification. The Russell 2000 Growth Index measures the performance of those Russell 2000 Index companies with higher price-to-book ratios and higher forecasted growth values. The Lipper Small-Cap Growth Funds Index is an unmanaged, equally weighted performance index of the 30 largest qualifying mutual funds (based on net assets) in the Lipper Small-Cap classification. Lipper Equity Income Funds Index tracks funds that seek relatively high current income and growth of income by investing at least 65% of their portfolio in dividend-paying equity securities. These funds' gross or net yield must be at least 125% of the average gross or net yield of the U.S. diversified equity fund universe. The Russell Global (ex USA) Index Net measures the performance of the global equity market based on all investable equity securities, excluding companies assigned to the United States. The Russell 3000 Growth Index measures the performance of the broad growth segment of the U.S. equity universe. It includes those Russell 3000 Index companies with higher price-to-book ratios and higher forecasted growth values. The Russell 2000 Index is a small-cap stock market index of the bottom 2,000 stocks in the Russell 3000 Index. The Russell 2000 is by far the most common benchmark for mutual funds that identify themselves as "small-cap", while the S&P 500 index is used primarily for large capitalization stocks.
Please refer to the prospectus for special risks associated with investing in the Buffalo Funds, including, but not limited to, risks involved with investments in science and technology companies, foreign securities, debt securities, lower- or unrated securities and smaller companies. Fund holdings and sector allocations are subject to change at any time and should not be considered a recommendation to buy or sell any security. Please refer to the Schedule of Investments for a complete list of Fund holdings.
14
(Unaudited)
Buffalo Discovery Fund
Growth of a $10,000 Investment
Buffalo Dividend Focus Fund
Growth of a $10,000 Investment
Buffalo Emerging Opportunities Fund
Growth of a $10,000 Investment
Buffalo Flexible Income Fund
Growth of a $10,000 Investment
Buffalo Growth Fund
Growth of a $10,000 Investment

Buffalo High Yield Fund
Growth of a $10,000 Investment
Buffalo International Fund
Growth of a $10,000 Investment
Buffalo Large Cap Fund
Growth of a $10,000 Investment
15
(Unaudited)
Buffalo Mid Cap Fund
Growth of a $10,000 Investment
Buffalo Small Cap Fund
Growth of a $10,000 Investment
16
 Expense Example
As a shareholder of the Funds, you incur two types of costs: (1) transaction costs (including redemption fees) and (2) ongoing costs, including management fees and other Fund specific expenses. The examples below are intended to help you understand your ongoing costs (in dollars) of investing in the Funds and to compare these costs with the ongoing costs of investing in other mutual funds. The example is based on an investment of $1,000 invested at the beginning of the period and held for the entire period (October 1, 2016 – March 31, 2017).
ACTUAL EXPENSES
The first line of the tables below provides information about actual account values and actual expenses. You may use the information in this line, together with the amount you invested, to estimate the expenses that you paid over the period. Simply divide your account by $1,000 (for exam- ple, an $8,600 account value divided by $1,000 = 8.6), then multiply the result by the number in the first line under the heading entitled "Expenses Paid During the Period" to esti- mate the expenses you paid on your account during the period. Although the Funds charge no sales load or trans- action fees, you will be assessed fees for outgoing wire transfers, returned checks and stop payment orders at pre- vailing rates charged by U.S. Bancorp Fund Services, LLC, the Funds' transfer agent. If you request that a redemption be made by wire transfer, currently a $15.00 fee is charged by the Funds' transfer agent. To the extent a Fund invests in shares of other investment companies as part of its invest- ment strategy, you will indirectly bear your proportionate share of any fees and expenses charged by the underlying
funds in which the Fund invests in addition to the expenses of the Fund. Actual expenses of the underlying funds are expected to vary among the various underlying funds. These expenses are not included in the examples below. The examples below include management fees, registration fees and other expenses. However, the examples below do not include portfolio trading commissions and related expenses and other extraordinary expenses as determined under U.S. generally accepted accounting principles.
HYPOTHETICAL EXAMPLE FOR COMPARISON PURPOSES
The second line of each table below provides information about hypothetical account values and hypothetical expenses based on the Funds' actual expense ratios and an assumed rate of return of 5% per year before expenses, which are not the Funds' actual returns. The hypothetical account values and expenses may not be used to estimate the actual ending account balance or expenses you paid for the period. You may use this information to compare the ongoing costs of investing in our Funds and other funds. To do so, compare this 5% hypothetical example with the 5% hypothetical examples that appear in the shareholder reports of the other funds. Please note that the expenses shown in the tables are meant to highlight your ongoing costs only and do not reflect any transactional costs. Therefore, the second line of the tables is useful in comparing ongoing costs only, and will not help you determine the relative total costs of owning different Funds. In addition, if these transactional costs were included, your costs would have been higher.
BUFFALO DISCOVERY FUND | BEGINNING ACCOUNT VALUE OCTOBER 1, 2016 | ENDING ACCOUNT VALUE MARCH 31, 2017 | EXPENSES PAID DURING PERIOD OCTOBER 1, 2016 - MARCH 31, 2017* | ||||||||||||
Actual | $ | 1,000.00 | $ | 1,077.60 | $ | 5.23 | |||||||||
Hypothetical (5% return before expenses) | $ | 1,000.00 | $ | 1,014.83 | $ | 5.07 | |||||||||
* Expenses are equal to the Fund's annualized expense ratio of 1.01%, multiplied by the average account value over the period, multiplied by 182/365 to reflect the one-half year period.
BUFFALO DIVIDEND FOCUS FUND | BEGINNING ACCOUNT VALUE OCTOBER 1, 2016 | ENDING ACCOUNT VALUE MARCH 31, 2017 | EXPENSES PAID DURING PERIOD OCTOBER 1, 2016 - MARCH 31, 2017* | ||||||||||||
Actual | $ | 1,000.00 | $ | 1,112.50 | $ | 5.00 | |||||||||
Hypothetical (5% return before expenses) | $ | 1,000.00 | $ | 1,015.43 | $ | 4.77 | |||||||||
* Expenses are equal to the Fund's annualized expense ratio of 0.95%, multiplied by the average account value over the period, multiplied by 182/365 to reflect the one-half year period.
BUFFALO EMERGING OPPORTUNITIES FUND | BEGINNING ACCOUNT VALUE OCTOBER 1, 2016 | ENDING ACCOUNT VALUE MARCH 31, 2017 | EXPENSES PAID DURING PERIOD OCTOBER 1, 2016 - MARCH 31, 2017* | ||||||||||||
Actual | $ | 1,000.00 | $ | 1,082.60 | $ | 7.68 | |||||||||
Hypothetical (5% return before expenses) | $ | 1,000.00 | $ | 1,010.13 | $ | 7.42 | |||||||||
* Expenses are equal to the Fund's annualized expense ratio of 1.48%, multiplied by the average account value over the period, multiplied by 182/365 to reflect the one-half year period.
17
 Expense Example
(Continued) (Unaudited)
BUFFALO FLEXIBLE INCOME FUND | BEGINNING ACCOUNT VALUE OCTOBER 1, 2016 | ENDING ACCOUNT VALUE MARCH 31, 2017 | EXPENSES PAID DURING PERIOD OCTOBER 1, 2016 - MARCH 31, 2017* | ||||||||||||
Actual | $ | 1,000.00 | $ | 1,060.10 | $ | 5.19 | |||||||||
Hypothetical (5% return before expenses) | $ | 1,000.00 | $ | 1,014.83 | $ | 5.07 | |||||||||
* Expenses are equal to the Fund's annualized expense ratio of 1.01%, multiplied by the average account value over the period, multiplied by 182/365 to reflect the one-half year period.
BUFFALO GROWTH FUND | BEGINNING ACCOUNT VALUE OCTOBER 1, 2016 | ENDING ACCOUNT VALUE MARCH 31, 2017 | EXPENSES PAID DURING PERIOD OCTOBER 1, 2016 - MARCH 31, 2017* | ||||||||||||
Actual | $ | 1,000.00 | $ | 1,067.10 | $ | 4.69 | |||||||||
Hypothetical (5% return before expenses) | $ | 1,000.00 | $ | 1,015.83 | $ | 4.57 | |||||||||
* Expenses are equal to the Fund's annualized expense ratio of 0.91%, multiplied by the average account value over the period, multiplied by 182/365 to reflect the one-half year period.
BUFFALO HIGH YIELD FUND | BEGINNING ACCOUNT VALUE OCTOBER 1, 2016 | ENDING ACCOUNT VALUE MARCH 31, 2017 | EXPENSES PAID DURING PERIOD OCTOBER 1, 2016 - MARCH 31, 2017* | ||||||||||||
Actual | $ | 1,000.00 | $ | 1,027.80 | $ | 5.16 | |||||||||
Hypothetical (5% return before expenses) | $ | 1,000.00 | $ | 1,014.73 | $ | 5.12 | |||||||||
* Expenses are equal to the Fund's annualized expense ratio of 1.02%, multiplied by the average account value over the period, multiplied by 182/365 to reflect the one-half year period.
BUFFALO INTERNATIONAL FUND | BEGINNING ACCOUNT VALUE OCTOBER 1, 2016 | ENDING ACCOUNT VALUE MARCH 31, 2017 | EXPENSES PAID DURING PERIOD OCTOBER 1, 2016 - MARCH 31, 2017* | ||||||||||||
Actual | $ | 1,000.00 | $ | 1,076.20 | $ | 5.28 | |||||||||
Hypothetical (5% return before expenses) | $ | 1,000.00 | $ | 1,014.73 | $ | 5.12 | |||||||||
* Expenses are equal to the Fund's annualized expense ratio of 1.02%, multiplied by the average account value over the period, multiplied by 182/365 to reflect the one-half year period.
BUFFALO LARGE CAP FUND | BEGINNING ACCOUNT VALUE OCTOBER 1, 2016 | ENDING ACCOUNT VALUE MARCH 31, 2017 | EXPENSES PAID DURING PERIOD OCTOBER 1, 2016 - MARCH 31, 2017* | ||||||||||||
Actual | $ | 1,000.00 | $ | 1,077.10 | $ | 4.92 | |||||||||
Hypothetical (5% return before expenses) | $ | 1,000.00 | $ | 1,015.43 | $ | 4.77 | |||||||||
* Expenses are equal to the Fund's annualized expense ratio of 0.95%, multiplied by the average account value over the period, multiplied by 182/365 to reflect the one-half year period.
BUFFALO MID CAP FUND | BEGINNING ACCOUNT VALUE OCTOBER 1, 2016 | ENDING ACCOUNT VALUE MARCH 31, 2017 | EXPENSES PAID DURING PERIOD OCTOBER 1, 2016 - MARCH 31, 2017* | ||||||||||||
Actual | $ | 1,000.00 | $ | 1,057.70 | $ | 5.18 | |||||||||
Hypothetical (5% return before expenses) | $ | 1,000.00 | $ | 1,014.83 | $ | 5.07 | |||||||||
* Expenses are equal to the Fund's annualized expense ratio of 1.01%, multiplied by the average account value over the period, multiplied by 182/365 to reflect the one-half year period.
BUFFALO SMALL CAP FUND | BEGINNING ACCOUNT VALUE OCTOBER 1, 2016 | ENDING ACCOUNT VALUE MARCH 31, 2017 | EXPENSES PAID DURING PERIOD OCTOBER 1, 2016 - MARCH 31, 2017* | ||||||||||||
Actual | $ | 1,000.00 | $ | 1,102.00 | $ | 5.29 | |||||||||
Hypothetical (5% return before expenses) | $ | 1,000.00 | $ | 1,014.83 | $ | 5.07 | |||||||||
* Expenses are equal to the Fund's annualized expense ratio of 1.01%, multiplied by the average account value over the period, multiplied by 182/365 to reflect the one-half year period.
18
 Allocation of Portfolio Holdings
Percentages represent market value as a percentage of investments as of March 31, 2017
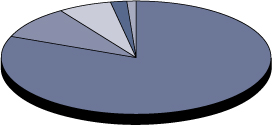
BUFFALO DISCOVERY FUND
Common Stock | 92.41 | % | |||||
REITS | 2.85 | % | |||||
Short-Term Investments | 4.74 | % | |||||
100.00 | % | ||||||
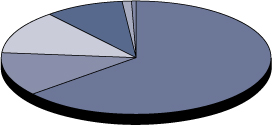
BUFFALO DIVIDEND FOCUS FUND
Common Stock | 86.97 | % | |||||
Short-Term Investments | 8.91 | % | |||||
REITS | 3.01 | % | |||||
Convertible Preferred Stock | 1.11 | % | |||||
100.00 | % | ||||||
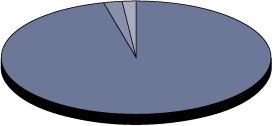
BUFFALO EMERGING OPPORTUNITIES FUND
Common Stock | 93.71 | % | |||||
Short-Term Investments | 6.29 | % | |||||
100.00 | % | ||||||
BUFFALO FLEXIBLE INCOME FUND
Common Stocks | 81.21 | % | |||||
Corporate Bonds | 9.60 | % | |||||
Convertible Bonds | 6.26 | % | |||||
REITS | 2.06 | % | |||||
Short-Term Investments | 0.87 | % | |||||
100.00 | % | ||||||
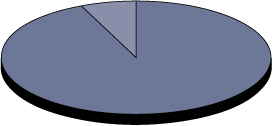
BUFFALO GROWTH FUND
Common Stock | 96.22 | % | |||||
REITS | 2.15 | % | |||||
Short-Term Investments | 1.63 | % | |||||
100.00 | % | ||||||
BUFFALO HIGH YIELD FUND
Corporate Bonds | 64.08 | % | |||||
Bank Loans | 12.43 | % | |||||
Convertible Bonds | 12.41 | % | |||||
Short-Term Investments | 9.64 | % | |||||
Convertible Preferred Stock | 0.91 | % | |||||
Common Stock | 0.53 | % | |||||
100.00 | % | ||||||
BUFFALO INTERNATIONAL FUND
Common Stock | 93.60 | % | |||||
Short-Term Investments | 6.40 | % | |||||
100.00 | % | ||||||
BUFFALO LARGE CAP FUND
Common Stock | 91.64 | % | |||||
REITS | 6.16 | % | |||||
Short-Term Investments | 2.20 | % | |||||
100.00 | % | ||||||
19
 Allocation of Portfolio Holdings
(Unaudited)
BUFFALO MID CAP FUND
Common Stock | 83.25 | % | |||||
Short-Term Investments | 11.92 | % | |||||
REITS | 4.83 | % | |||||
100.00 | % | ||||||
BUFFALO SMALL CAP FUND
Common Stock | 93.97 | % | |||||
REITS | 3.48 | % | |||||
Short-Term Investments | 2.55 | % | |||||
100.00 | % | ||||||
20
 Buffalo Discovery Fund
SCHEDULE OF INVESTMENTS
March 31, 2017
| SHARES OR FACE AMOUNT | FAIR VALUE* | ||||||||||
COMMON STOCKS — 94.27% | |||||||||||
CONSUMER DISCRETIONARY — 15.45% | |||||||||||
Distributors — 0.90% | |||||||||||
387,720 | LKQ Corp.(a) | $ | 11,348,564 | ||||||||
Diversified Consumer Services — 1.35% | |||||||||||
404,352 | ServiceMaster Global Holdings Inc.(a) | 16,881,696 | |||||||||
Hotels, Restaurants & Leisure — 1.46% | |||||||||||
41,160 | Chipotle Mexican Grill, Inc.(a) | 18,337,603 | |||||||||
Household Durables — 1.72% | |||||||||||
421,715 | Garmin Ltd.(c) | 21,553,854 | |||||||||
Internet & Direct Marketing Retail — 0.50% | |||||||||||
49,810 | Expedia, Inc. | 6,284,528 | |||||||||
Internet Software & Services — 0.84% | |||||||||||
896,000 | Pandora Media Inc.(a) | 10,581,760 | |||||||||
Leisure Products — 0.90% | |||||||||||
134,715 | Polaris Industries Inc. | 11,289,117 | |||||||||
Media — 1.18% | |||||||||||
289,627 | Lions Gate Entertainment Corp. — Class A(a)(c) | 7,692,493 | |||||||||
289,627 | Lions Gate Entertainment Corp. — Class B(a)(c) | 7,061,106 | |||||||||
14,753,599 | |||||||||||
Specialty Retail — 1.33% | |||||||||||
310,285 | Williams-Sonoma, Inc. | 16,637,482 | |||||||||
Textiles, Apparel & Luxury Goods — 5.27% | |||||||||||
250,723 | Columbia Sportswear Co. | 14,729,976 | |||||||||
805,500 | Hanesbrands, Inc. | 16,722,180 | |||||||||
309,190 | Luxottica Group S.p.A. — ADR(b)(c) | 17,020,910 | |||||||||
961,451 | Under Armour, Inc. — Class C(a) | 17,594,553 | |||||||||
66,067,619 | |||||||||||
Total Consumer Discretionary (Cost $183,253,506) | 193,735,822 | ||||||||||
CONSUMER STAPLES — 3.88% | |||||||||||
Food Products — 1.16% | |||||||||||
133,525 | The Hershey Co. | 14,587,606 | |||||||||
Household Products — 1.25% | |||||||||||
116,115 | The Clorox Co. | 15,655,786 | |||||||||
Personal Products — 1.47% | |||||||||||
216,670 | The Estee Lauder Companies Inc. — Class A | 18,371,449 | |||||||||
Total Consumer Staples (Cost $46,504,822) | 48,614,841 | ||||||||||
ENERGY — 3.38% | |||||||||||
Energy Equipment & Services — 3.38% | |||||||||||
318,118 | Forum Energy Technologies Inc.(a) | 6,585,043 | |||||||||
617,216 | Oceaneering International, Inc. | 16,714,209 | |||||||||
586,916 | TechnipFMC plc(a) | 19,074,770 | |||||||||
Total Energy (Cost $43,047,226) | 42,374,022 | ||||||||||
FINANCIALS — 8.28% | |||||||||||
Capital Markets — 8.28% | |||||||||||
362,325 | Intercontinental Exchange, Inc. | 21,692,398 | |||||||||
233,210 | MSCI, Inc. | 22,665,680 | |||||||||
21
 Buffalo Discovery Fund
SCHEDULE OF INVESTMENTS
March 31, 2017
(Continued)
| SHARES OR FACE AMOUNT | FAIR VALUE* | ||||||||||
| FINANCIALS (Continued) | |||||||||||
312,778 | Nasdaq, Inc. | $ | 21,722,432 | ||||||||
156,490 | S&P Global, Inc. | 20,459,502 | |||||||||
344,525 | SEI Investments Co. | 17,377,841 | |||||||||
Total Financials (Cost $79,716,100) | 103,917,853 | ||||||||||
HEALTH CARE — 18.69% | |||||||||||
Biotechnology — 2.96% | |||||||||||
1,051,600 | Dynavax Technologies Corp.(a) | 6,257,020 | |||||||||
88,700 | Shire — ADR(c) | 15,454,201 | |||||||||
141,600 | Vertex Pharmaceuticals Inc.(a) | 15,483,960 | |||||||||
37,195,181 | |||||||||||
Health Care Equipment & Supplies — 8.48% | |||||||||||
1,153,533 | Accuray Inc.(a) | 5,479,282 | |||||||||
209,233 | Align Technology, Inc.(a) | 24,001,117 | |||||||||
260,520 | Danaher Corp. | 22,282,276 | |||||||||
244,200 | Dentsply Sirona Inc. | 15,247,848 | |||||||||
109,761 | Inogen Inc.(a) | 8,513,063 | |||||||||
265,650 | Insulet Corp.(a) | 11,446,859 | |||||||||
206,980 | Nevro Corp.(a) | 19,394,026 | |||||||||
106,364,471 | |||||||||||
Health Care Providers & Services — 0.78% | |||||||||||
337,900 | Tivity Health, Inc.(a) | 9,832,890 | |||||||||
Health Care Technology — 2.43% | |||||||||||
146,210 | athenahealth Inc.(a) | 16,476,405 | |||||||||
237,010 | Cerner Corp.(a) | 13,948,038 | |||||||||
30,424,443 | |||||||||||
Life Sciences Tools & Services — 2.71% | |||||||||||
221,280 | Accelerate Diagnostics, Inc.(a) | 5,354,976 | |||||||||
164,085 | Agilent Technologies, Inc. | 8,675,174 | |||||||||
706,725 | VWR Corp.(a) | 19,929,645 | |||||||||
33,959,795 | |||||||||||
Pharmaceuticals — 1.33% | |||||||||||
691,470 | Akorn, Inc.(a) | 16,650,598 | |||||||||
Total Health Care (Cost $187,515,461) | 234,427,378 | ||||||||||
INDUSTRIALS — 15.15% | |||||||||||
Aerospace & Defense — 0.98% | |||||||||||
225,652 | Hexcel Corp. | 12,309,317 | |||||||||
Commercial Services & Supplies — 3.12% | |||||||||||
343,835 | Republic Services, Inc. | 21,596,276 | |||||||||
211,985 | Stericycle, Inc.(a) | 17,571,437 | |||||||||
39,167,713 | |||||||||||
Electrical Equipment — 1.80% | |||||||||||
49,310 | Acuity Brands, Inc. | 10,059,240 | |||||||||
80,220 | Rockwell Automation, Inc. | 12,491,056 | |||||||||
22,550,296 | |||||||||||
Industrial Conglomerates — 1.25% | |||||||||||
75,580 | Roper Industries, Inc. | 15,606,514 | |||||||||
22
| SHARES OR FACE AMOUNT | FAIR VALUE* | ||||||||||
| INDUSTRIALS (Continued) | |||||||||||
Machinery — 2.86% | |||||||||||
81,985 | Parker-Hannifin Corp. | $ | 13,143,835 | ||||||||
453,154 | Xylem, Inc. | 22,757,394 | |||||||||
35,901,229 | |||||||||||
Professional Services — 5.14% | |||||||||||
453,920 | IHS Markit Ltd.(a)(c) | 19,041,944 | |||||||||
539,167 | Nielsen Holdings PLC | 22,272,989 | |||||||||
285,238 | Verisk Analytics, Inc.(a) | 23,144,211 | |||||||||
64,459,144 | |||||||||||
Total Industrials (Cost $157,661,163) | 189,994,213 | ||||||||||
INFORMATION TECHNOLOGY — 20.62% | |||||||||||
Communications Equipment — 2.15% | |||||||||||
65,925 | F5 Networks, Inc.(a) | 9,398,927 | |||||||||
112,825 | Harris Corp. | 12,554,038 | |||||||||
180,955 | Juniper Networks, Inc. | 5,035,978 | |||||||||
26,988,943 | |||||||||||
Electronic Equipment, Instruments & Components — 1.58% | |||||||||||
132,420 | National Instruments Corp. | 4,311,595 | |||||||||
80,260 | Trimble Inc.(a) | 2,569,123 | |||||||||
142,279 | Zebra Technologies Corp. — Class A(a) | 12,982,959 | |||||||||
19,863,677 | |||||||||||
Internet Software & Services — 3.60% | |||||||||||
94,238 | Akamai Technologies, Inc.(a) | 5,626,009 | |||||||||
23,115 | Alphabet, Inc. — Class A(a) | 19,596,897 | |||||||||
140,105 | Facebook, Inc. — Class A(a) | 19,901,915 | |||||||||
45,124,821 | |||||||||||
IT Services — 3.37% | |||||||||||
103,825 | Cognizant Technology Solutions Corp. — Class A(a) | 6,179,664 | |||||||||
203,575 | Fidelity National Information Services, Inc. | 16,208,642 | |||||||||
176,809 | MasterCard, Inc. — Class A | 19,885,708 | |||||||||
42,274,014 | |||||||||||
Semiconductors & Semiconductor Equipment — 2.46% | |||||||||||
77,935 | Analog Devices, Inc. | 6,386,773 | |||||||||
243,877 | Micron Technology, Inc.(a) | 7,048,045 | |||||||||
192,650 | QUALCOMM, Inc. | 11,046,551 | |||||||||
79,190 | Texas Instruments, Inc. | 6,379,547 | |||||||||
30,860,916 | |||||||||||
Software — 5.93% | |||||||||||
224,130 | Aspen Technology, Inc.(a) | 13,205,739 | |||||||||
53,705 | CommVault Systems, Inc.(a) | 2,728,214 | |||||||||
153,735 | Electronic Arts Inc.(a) | 13,762,357 | |||||||||
150,714 | Red Hat, Inc.(a) | 13,036,761 | |||||||||
76,720 | salesforce.com, Inc.(a) | 6,328,633 | |||||||||
175,015 | Synopsys, Inc.(a) | 12,623,832 | |||||||||
212,900 | Take-Two Interactive Software, Inc.(a) | 12,618,583 | |||||||||
74,304,119 | |||||||||||
Technology Hardware, Storage & Peripherals — 1.53% | |||||||||||
133,725 | Apple Inc. | 19,210,933 | |||||||||
Total Information Technology (Cost $181,092,287) | 258,627,423 | ||||||||||
23
 Buffalo Discovery Fund
SCHEDULE OF INVESTMENTS
March 31, 2017
(Continued)
| SHARES OR FACE AMOUNT | FAIR VALUE* | ||||||||||
MATERIALS — 8.82% | |||||||||||
Chemicals — 6.82% | |||||||||||
132,745 | Ecolab Inc. | $ | 16,638,258 | ||||||||
311,710 | FMC Corp. | 21,691,899 | |||||||||
266,499 | Ingevity Corp.(a) | 16,216,464 | |||||||||
73,275 | International Flavors & Fragrances Inc. | 9,711,136 | |||||||||
179,480 | Praxair, Inc. | 21,286,328 | |||||||||
85,544,085 | |||||||||||
Containers & Packaging — 2.00% | |||||||||||
269,745 | Bemis Company, Inc. | 13,179,741 | |||||||||
274,580 | Sealed Air Corp. | 11,966,196 | |||||||||
25,145,937 | |||||||||||
Total Materials (Cost $90,592,477) | 110,690,022 | ||||||||||
| TOTAL COMMON STOCKS (COST $969,383,042) | 1,182,381,574 | ||||||||||
REAL ESTATE INVESTMENT TRUSTS (REITS) — 2.91% | |||||||||||
REAL ESTATE — 2.91% | |||||||||||
147,675 | American Tower Corp. | 17,948,420 | |||||||||
46,279 | Equinix Inc. | 18,528,723 | |||||||||
Total Real Estate (Cost $24,408,013) | 36,477,143 | ||||||||||
| TOTAL REITS (COST $24,408,013) | 36,477,143 | ||||||||||
SHORT TERM INVESTMENT — 4.84% | |||||||||||
INVESTMENT COMPANY — 4.84% | |||||||||||
60,696,439 | Fidelity Institutional Money Market Fund — Government Portfolio — 0.01%(d) | 60,696,439 | |||||||||
Total Investment Company | 60,696,439 | ||||||||||
| TOTAL SHORT TERM INVESTMENT (COST $60,696,439) | 60,696,439 | ||||||||||
| TOTAL INVESTMENTS — 102.02% (COST $1,054,487,494) | 1,279,555,156 | ||||||||||
Liabilities in Excess of Other Assets — (2.02)% | (25,316,883 | ) | |||||||||
TOTAL NET ASSETS — 100.00% | $ | 1,254,238,273 | |||||||||
ADR — American Depositary Receipt
PLC — Public Limited Company
(a) Non income producing.
(b) A portion of this security is deemed illiquid. The total value of this security amounted to $2,713,415 (0.22% of net assets) at March 31, 2017.
(c) Foreign Issued securities. The total value of these securities amounted to $87,824,508 (7.00% of net assets) at March 31, 2017.
(d) The rate quoted is the annualized seven-day effective yield as of March 31, 2017.
* See Note 1A of accompanying Notes to Financial Statements regarding valuation of securities.
The Global Industry Classification Standard (GICS) was developed by and/or is the exclusive property of MSCI, Inc. and Standard & Poor's Financial Services LLC ("S&P"). GICS is a service mark of MSCI and S&P and has been licensed for use by U.S. Bancorp Fund Services, LLC.
The accompanying notes are an integral part of these financial statements.
24
 Buffalo Dividend Focus Fund
SCHEDULE OF INVESTMENTS
March 31, 2017
| SHARES OR FACE AMOUNT | FAIR VALUE* | ||||||||||
COMMON STOCKS — 86.67% | |||||||||||
CONSUMER DISCRETIONARY — 12.95% | |||||||||||
Auto Components — 1.09% | |||||||||||
18,050 | The Goodyear Tire & Rubber Co. | $ | 649,800 | ||||||||
Automobiles — 0.78% | |||||||||||
13,200 | General Motors Co. | 466,752 | |||||||||
Hotels, Restaurants & Leisure — 4.23% | |||||||||||
11,625 | Carnival Corp. | 684,829 | |||||||||
6,775 | Cedar Fair, L.P. | 459,413 | |||||||||
3,400 | Jack in the Box, Inc. | 345,848 | |||||||||
4,475 | Marriott International, Inc. — Class A | 421,455 | |||||||||
10,600 | Starbucks Corp. | 618,934 | |||||||||
2,530,479 | |||||||||||
Internet & Direct Marketing Retail — 1.04% | |||||||||||
700 | Amazon.com, Inc.(a) | 620,578 | |||||||||
Media — 3.03% | |||||||||||
15,200 | Comcast Corp. — Class A | 571,368 | |||||||||
22,400 | Twenty-First Century Fox, Inc. — Class A | 725,536 | |||||||||
4,550 | The Walt Disney Co. | 515,925 | |||||||||
1,812,829 | |||||||||||
Specialty Retail — 1.80% | |||||||||||
6,125 | Foot Locker, Inc. | 458,211 | |||||||||
4,225 | The Home Depot, Inc. | 620,357 | |||||||||
1,078,568 | |||||||||||
Textiles, Apparel & Luxury Goods — 0.98% | |||||||||||
28,300 | Hanesbrands, Inc. | 587,508 | |||||||||
Total Consumer Discretionary (Cost $6,412,037) | 7,746,514 | ||||||||||
CONSUMER STAPLES — 7.77% | |||||||||||
Beverages — 1.25% | |||||||||||
6,650 | PepsiCo, Inc. | 743,869 | |||||||||
Food & Staples Retailing — 1.67% | |||||||||||
5,050 | CVS Health Corp. | 396,425 | |||||||||
8,350 | Wal-Mart Stores, Inc. | 601,868 | |||||||||
998,293 | |||||||||||
Food Products — 2.13% | |||||||||||
8,375 | The Kraft Heinz Co. | 760,534 | |||||||||
8,900 | Pinnacle Foods Inc. | 515,043 | |||||||||
1,275,577 | |||||||||||
Household Products — 1.95% | |||||||||||
6,450 | Colgate-Palmolive Co. | 472,075 | |||||||||
7,725 | The Procter & Gamble Co. | 694,091 | |||||||||
1,166,166 | |||||||||||
Tobacco — 0.77% | |||||||||||
6,450 | Altria Group, Inc. | 460,659 | |||||||||
Total Consumer Staples (Cost $3,752,784) | 4,644,564 | ||||||||||
25
 Buffalo Dividend Focus Fund
SCHEDULE OF INVESTMENTS
March 31, 2017
(Continued)
| SHARES OR FACE AMOUNT | FAIR VALUE* | ||||||||||
ENERGY — 9.10% | |||||||||||
Energy Equipment & Services — 1.20% | |||||||||||
7,600 | Halliburton Co. | $ | 373,996 | ||||||||
4,400 | Schlumberger Ltd.(b) | 343,640 | |||||||||
717,636 | |||||||||||
Oil, Gas & Consumable Fuels — 7.90% | |||||||||||
8,850 | Devon Energy Corp. | 369,222 | |||||||||
22,350 | Enterprise Products Partners L.P. | 617,083 | |||||||||
5,275 | EQT Midstream Partners LP | 405,648 | |||||||||
8,450 | Exxon Mobil Corp. | 692,984 | |||||||||
11,575 | Hess Corp. | 558,031 | |||||||||
14,200 | Noble Midstream Partners LP | 739,536 | |||||||||
15,200 | Royal Dutch Shell PLC. — Class A — ADR(b) | 801,496 | |||||||||
6,650 | Tesoro Corp. | 539,049 | |||||||||
4,723,049 | |||||||||||
Total Energy (Cost $4,742,365) | 5,440,685 | ||||||||||
FINANCIALS — 13.11% | |||||||||||
Banks — 7.80% | |||||||||||
48,050 | Bank of America Corp. | 1,133,499 | |||||||||
21,650 | BB&T Corp. | 967,755 | |||||||||
7,150 | Citigroup Inc. | 427,713 | |||||||||
14,025 | JPMorgan Chase & Co. | 1,231,956 | |||||||||
16,250 | Wells Fargo & Co. | 904,475 | |||||||||
4,665,398 | |||||||||||
Capital Markets — 2.76% | |||||||||||
950 | BlackRock, Inc. | 364,334 | |||||||||
4,025 | CME Group Inc. | 478,170 | |||||||||
4,580 | Hamilton Lane Inc. — Class A(a) | 85,509 | |||||||||
5,550 | S&P Global, Inc. | 725,607 | |||||||||
1,653,620 | |||||||||||
Diversified Financial Services — 1.56% | |||||||||||
5,600 | Berkshire Hathaway Inc. — Class B(a) | 933,408 | |||||||||
Insurance — 0.99% | |||||||||||
10,425 | Arthur J. Gallagher & Co. | 589,430 | |||||||||
Total Financials (Cost $5,920,655) | 7,841,856 | ||||||||||
HEALTH CARE — 10.68% | |||||||||||
Biotechnology — 2.53% | |||||||||||
9,125 | AbbVie Inc. | 594,585 | |||||||||
3,100 | Amgen Inc. | 508,617 | |||||||||
6,050 | Gilead Sciences, Inc. | 410,916 | |||||||||
1,514,118 | |||||||||||
Health Care Equipment & Supplies — 0.60% | |||||||||||
4,450 | Medtronic, PLC(b) | 358,492 | |||||||||
Health Care Providers & Services — 3.12% | |||||||||||
4,275 | Anthem, Inc. | 707,000 | |||||||||
5,775 | Cardinal Health, Inc. | 470,951 | |||||||||
4,200 | UnitedHealth Group Inc. | 688,842 | |||||||||
1,866,793 | |||||||||||
26
| SHARES OR FACE AMOUNT | FAIR VALUE* | ||||||||||
| HEALTH CARE (Continued) | |||||||||||
Pharmaceuticals — 4.43% | |||||||||||
4,450 | Bristol-Myers Squibb Co. | $ | 241,991 | ||||||||
3,150 | Eli Lilly & Co. | 264,946 | |||||||||
6,825 | Johnson & Johnson | 850,054 | |||||||||
9,600 | Merck & Co., Inc. | 609,984 | |||||||||
19,800 | Pfizer Inc. | 677,358 | |||||||||
2,644,333 | |||||||||||
Total Health Care (Cost $5,461,127) | 6,383,736 | ||||||||||
INDUSTRIALS — 6.43% | |||||||||||
Aerospace & Defense — 1.70% | |||||||||||
3,425 | The Boeing Co. | 605,745 | |||||||||
3,650 | United Technologies Corp. | 409,567 | |||||||||
1,015,312 | |||||||||||
Airlines — 0.77% | |||||||||||
9,950 | Delta Air Lines, Inc. | 457,302 | |||||||||
Commercial Services & Supplies — 0.84% | |||||||||||
6,900 | Waste Management, Inc. | 503,148 | |||||||||
Industrial Conglomerates — 2.64% | |||||||||||
2,150 | 3M Co. | 411,360 | |||||||||
26,850 | General Electric Co. | 800,130 | |||||||||
2,950 | Honeywell International, Inc. | 368,366 | |||||||||
1,579,856 | |||||||||||
Machinery — 0.48% | |||||||||||
1,800 | Parker-Hannifin Corp. | 288,576 | |||||||||
Total Industrials (Cost $3,060,571) | 3,844,194 | ||||||||||
INFORMATION TECHNOLOGY — 18.22% | |||||||||||
Communications Equipment — 1.00% | |||||||||||
17,750 | Cisco Systems, Inc. | 599,950 | |||||||||
Internet Software & Services — 1.97% | |||||||||||
430 | Alphabet, Inc. — Class A(a) | 364,554 | |||||||||
450 | Alphabet, Inc. — Class C(a) | 373,302 | |||||||||
3,100 | Facebook, Inc. — Class A(a) | 440,355 | |||||||||
1,178,211 | |||||||||||
IT Services — 1.92% | |||||||||||
12,925 | Visa Inc. — Class A | 1,148,645 | |||||||||
Semiconductors & Semiconductor Equipment — 4.24% | |||||||||||
4,150 | Broadcom Ltd.(b) | 908,684 | |||||||||
12,500 | Intel Corp. | 450,875 | |||||||||
7,675 | QUALCOMM, Inc. | 440,085 | |||||||||
9,150 | Texas Instruments Inc. | 737,124 | |||||||||
2,536,768 | |||||||||||
Software — 4.93% | |||||||||||
13,850 | Activision Blizzard, Inc. | 690,561 | |||||||||
25,150 | Microsoft Corp. | 1,656,379 | |||||||||
13,425 | Oracle Corp. | 598,889 | |||||||||
2,945,829 | |||||||||||
27
 Buffalo Dividend Focus Fund
SCHEDULE OF INVESTMENTS
March 31, 2017
(Continued)
| SHARES OR FACE AMOUNT | FAIR VALUE* | ||||||||||
| INFORMATION TECHNOLOGY (Continued) | |||||||||||
Technology Hardware, Storage & Peripherals — 4.16% | |||||||||||
15,720 | Apple Inc. | $ | 2,258,335 | ||||||||
7,350 | Diebold Nixdorf, Inc. | 225,645 | |||||||||
2,483,980 | |||||||||||
Total Information Technology (Cost $7,753,737) | 10,893,383 | ||||||||||
MATERIALS — 3.42% | |||||||||||
Chemicals — 2.39% | |||||||||||
8,475 | The Dow Chemical Co. | 538,502 | |||||||||
7,900 | Monsanto Co. | 894,280 | |||||||||
1,432,782 | |||||||||||
Metals & Mining — 1.03% | |||||||||||
9,050 | Compass Minerals International, Inc. | 614,042 | |||||||||
Total Materials (Cost $1,941,720) | 2,046,824 | ||||||||||
TELECOMMUNICATION SERVICES — 1.79% | |||||||||||
Diversified Telecommunication Services — 1.79% | |||||||||||
13,300 | AT&T Inc. | 552,615 | |||||||||
10,625 | Verizon Communications, Inc. | 517,969 | |||||||||
Total Telecommunication Services (Cost $953,782) | 1,070,584 | ||||||||||
UTILITIES — 3.20% | |||||||||||
Electric Utilities — 3.20% | |||||||||||
18,000 | American Electric Power Co., Inc. | 1,208,340 | |||||||||
8,850 | Edison International | 704,549 | |||||||||
Total Utilities (Cost $1,700,609) | 1,912,889 | ||||||||||
| TOTAL COMMON STOCKS (COST $41,699,387) | 51,825,229 | ||||||||||
REAL ESTATE INVESTMENT TRUSTS (REITS) — 3.00% | |||||||||||
REAL ESTATE — 3.00% | |||||||||||
2,200 | American Tower Corp. | 267,388 | |||||||||
33,135 | CoreCivic, Inc. | 1,041,102 | |||||||||
1,050 | Public Storage | 229,855 | |||||||||
7,400 | Weyerhaeuser Co. | 251,452 | |||||||||
Total Real Estate (Cost $1,559,945) | 1,789,797 | ||||||||||
| TOTAL REITS (COST $1,559,945) | 1,789,797 | ||||||||||
CONVERTIBLE PREFERRED STOCKS — 1.11% | |||||||||||
HEALTH CARE — 0.46% | |||||||||||
Pharmaceuticals — 0.46% | |||||||||||
320 | Allergan plc | 271,930 | |||||||||
Total Health Care (Cost $252,917) | 271,930 | ||||||||||
28
| SHARES OR FACE AMOUNT | FAIR VALUE* | ||||||||||
INDUSTRIALS — 0.65% | |||||||||||
Commercial Services & Supplies — 0.65% | |||||||||||
5,470 | Stericycle, Inc. | $ | 391,378 | ||||||||
Total Industrials (Cost $352,758) | 391,378 | ||||||||||
| TOTAL CONVERTIBLE PREFERRED STOCKS (COST $605,675) | 663,308 | ||||||||||
SHORT TERM INVESTMENT — 8.88% | |||||||||||
INVESTMENT COMPANY — 8.88% | |||||||||||
5,311,330 | Fidelity Institutional Money Market Fund — Government Portfolio — 0.01%(c) | 5,311,330 | |||||||||
Total Investment Company | 5,311,330 | ||||||||||
| TOTAL SHORT TERM INVESTMENT (COST $5,311,330) | 5,311,330 | ||||||||||
| TOTAL INVESTMENTS — 99.66% (COST $49,176,337) | 59,589,664 | ||||||||||
Other Assets in Excess of Liabilities — 0.34% | 205,054 | ||||||||||
TOTAL NET ASSETS — 100.00% | $ | 59,794,718 | |||||||||
ADR — American Depositary Receipt
PLC — Public Limited Company
(a) Non income producing.
(b) Foreign Issued Securities. The total value of these securities amounted to $2,412,312 (4.03% of net assets) at March 31, 2017.
(c) The rate quoted is the annualized seven-day effective yield as of March 31, 2017.
* See Note 1A of accompanying Notes to Financial Statements regarding valuation of securities.
The Global Industry Classification Standard (GICS) was developed by and/or is the exclusive property of MSCI, Inc. and Standard & Poor's Financial Services LLC ("S&P"). GICS is a service mark of MSCI and S&P and has been licensed for use by U.S. Bancorp Fund Services, LLC.
The accompanying notes are an integral part of these financial statements.
29
 Buffalo Emerging Opportunities Fund
SCHEDULE OF INVESTMENTS
March 31, 2017
| SHARES OR FACE AMOUNT | FAIR VALUE* | ||||||||||
COMMON STOCKS — 94.24% | |||||||||||
CONSUMER DISCRETIONARY — 23.82% | |||||||||||
Auto Components — 3.01% | |||||||||||
83,600 | Motorcar Parts of America, Inc.(a) | $ | 2,569,028 | ||||||||
Hotels, Restaurants & Leisure — 4.87% | |||||||||||
140,500 | Del Taco Restaurants, Inc.(a) | 1,863,030 | |||||||||
89,000 | The Habit Restaurants, Inc. — Class A(a) | 1,575,300 | |||||||||
113,800 | Kona Grill, Inc.(a) | 716,940 | |||||||||
4,155,270 | |||||||||||
Household Durables — 6.60% | |||||||||||
32,400 | Installed Building Products Inc(a) | 1,709,100 | |||||||||
20,500 | iRobot Corp.(a) | 1,355,870 | |||||||||
39,000 | LGI Homes, Inc.(a) | 1,322,490 | |||||||||
172,100 | ZAGG Inc.(a) | 1,239,120 | |||||||||
5,626,580 | |||||||||||
Leisure Products — 3.84% | |||||||||||
75,200 | MCBC Holdings, Inc. | 1,215,984 | |||||||||
113,000 | Nautilus, Inc.(a) | 2,062,250 | |||||||||
3,278,234 | |||||||||||
Media — 2.28% | |||||||||||
82,300 | Liberty Media Corp.-Liberty Braves(a) | 1,946,395 | |||||||||
Specialty Retail — 3.22% | |||||||||||
96,555 | At Home Group Inc.(a) | 1,463,774 | |||||||||
66,700 | The Tile Shop Holdings, Inc. | 1,283,975 | |||||||||
2,747,749 | |||||||||||
Total Consumer Discretionary (Cost $17,815,786) | 20,323,256 | ||||||||||
CONSUMER STAPLES — 2.48% | |||||||||||
Beverages — 2.48% | |||||||||||
39,100 | MGP Ingredients, Inc. | 2,120,393 | |||||||||
Total Consumer Staples (Cost $1,396,681) | 2,120,393 | ||||||||||
FINANCIALS — 6.12% | |||||||||||
Capital Markets — 2.28% | |||||||||||
26,100 | Financial Engines Inc. | 1,136,655 | |||||||||
43,085 | Hamilton Lane Inc. — Class A(a) | 804,397 | |||||||||
1,941,052 | |||||||||||
Diversified Financial Services — 1.07% | |||||||||||
55,000 | Compass Diversified Holdings | 913,000 | |||||||||
Insurance — 1.36% | |||||||||||
36,300 | Kinsale Capital Group, Inc. | 1,163,052 | |||||||||
Thrifts & Mortgage Finance — 1.41% | |||||||||||
9,600 | LendingTree, Inc.(a) | 1,203,360 | |||||||||
Total Financials (Cost $4,207,074) | 5,220,464 | ||||||||||
HEALTH CARE — 17.44% | |||||||||||
Biotechnology — 0.59% | |||||||||||
36,900 | Syndax Pharmaceuticals, Inc.(a) | 506,268 | |||||||||
30
| SHARES OR FACE AMOUNT | FAIR VALUE* | ||||||||||
| HEALTH CARE (Continued) | |||||||||||
Health Care Equipment & Supplies — 5.47% | |||||||||||
170,992 | Accuray Inc.(a) | $ | 812,212 | ||||||||
12,400 | Inogen Inc.(a) | 961,744 | |||||||||
99,885 | Obalon Therapeutics, Inc.(a) | 1,067,771 | |||||||||
60,300 | Oxford Immunotec Global PLC(a)(b) | 934,047 | |||||||||
47,100 | Tactile Systems Technology, Inc.(a) | 892,545 | |||||||||
4,668,319 | |||||||||||
Health Care Providers & Services — 5.18% | |||||||||||
119,800 | Cross Country Healthcare, Inc.(a) | 1,720,328 | |||||||||
11,700 | HealthEquity, Inc.(a) | 496,665 | |||||||||
40,900 | LHC Group, Inc.(a) | 2,204,510 | |||||||||
4,421,503 | |||||||||||
Health Care Technology — 4.34% | |||||||||||
60,809 | HealthStream, Inc.(a) | 1,473,402 | |||||||||
54,800 | Omnicell, Inc.(a) | 2,227,620 | |||||||||
3,701,022 | |||||||||||
Pharmaceuticals — 1.86% | |||||||||||
75,000 | Clearside Biomedical, Inc.(a) | 595,500 | |||||||||
57,500 | Intersect ENT, Inc.(a) | 986,125 | |||||||||
1,581,625 | |||||||||||
Total Health Care (Cost $12,260,382) | 14,878,737 | ||||||||||
INDUSTRIALS — 12.91% | |||||||||||
Aerospace & Defense — 1.69% | |||||||||||
45,400 | Astronics Corp.(a) | 1,440,542 | |||||||||
Building Products — 1.86% | |||||||||||
26,700 | Apogee Enterprises, Inc. | 1,591,587 | |||||||||
Machinery — 3.97% | |||||||||||
133,100 | Kornit Digital Ltd.(a)(b) | 2,542,210 | |||||||||
16,500 | Proto Labs, Inc.(a) | 843,150 | |||||||||
3,385,360 | |||||||||||
Trading Companies & Distributors — 5.39% | |||||||||||
111,000 | Foundation Building Materials, Inc.(a) | 1,772,670 | |||||||||
154,000 | Nexeo Solutions, Inc.(a) | 1,364,440 | |||||||||
30,300 | SiteOne Landscape Supply, Inc.(a) | 1,466,823 | |||||||||
4,603,933 | |||||||||||
Total Industrials (Cost $8,259,968) | 11,021,422 | ||||||||||
INFORMATION TECHNOLOGY — 27.69% | |||||||||||
Internet Software & Services — 12.71% | |||||||||||
26,595 | Alteryx, Inc. — Class A(a) | 415,680 | |||||||||
142,800 | Amber Road Inc.(a) | 1,102,416 | |||||||||
119,400 | CommerceHub, Inc. — Class C(a) | 1,854,282 | |||||||||
30,505 | Envestnet, Inc.(a) | 985,311 | |||||||||
118,000 | Five9, Inc.(a) | 1,942,280 | |||||||||
88,100 | Instructure, Inc.(a) | 2,061,540 | |||||||||
82,620 | Mimecast Ltd(a)(b) | 1,849,862 | |||||||||
31,500 | NIC, Inc. | 636,300 | |||||||||
10,847,671 | |||||||||||
IT Services — 1.79% | |||||||||||
50,400 | Virtusa Corp.(a) | 1,523,088 | |||||||||
31
 Buffalo Emerging Opportunities Fund
SCHEDULE OF INVESTMENTS
March 31, 2017
(Continued)
| SHARES OR FACE AMOUNT | FAIR VALUE* | ||||||||||
| INFORMATION TECHNOLOGY (Continued) | |||||||||||
Semiconductors & Semiconductor Equipment — 4.75% | |||||||||||
115,880 | Everspin Technologies, Inc.(a) | $ | 971,075 | ||||||||
81,800 | Ichor Holdings, Ltd.(a) | 1,622,094 | |||||||||
52,200 | MaxLinear, Inc. — Class A(a) | 1,464,210 | |||||||||
4,057,379 | |||||||||||
Software — 8.44% | |||||||||||
89,100 | 8x8, Inc.(a) | 1,358,775 | |||||||||
131,486 | Exa Corp.(a) | 1,669,872 | |||||||||
102,500 | Materialise NV — ADR(a)(b) | 932,750 | |||||||||
54,700 | RingCentral, Inc. — Class A(a) | 1,548,010 | |||||||||
53,300 | Varonis Systems, Inc.(a) | 1,694,940 | |||||||||
7,204,347 | |||||||||||
Total Information Technology (Cost $18,850,060) | 23,632,485 | ||||||||||
MATERIALS — 3.13% | |||||||||||
Chemicals — 1.56% | |||||||||||
21,900 | Ingevity Corp.(a) | 1,332,615 | |||||||||
Construction Materials — 1.57% | |||||||||||
20,700 | US Concrete Inc.(a) | 1,336,185 | |||||||||
Total Materials (Cost $2,161,657) | 2,668,800 | ||||||||||
UTILITIES — 0.65% | |||||||||||
Water Utilities — 0.65% | |||||||||||
32,500 | AquaVenture Holdings Ltd.(a)(b) | 554,775 | |||||||||
Total Utilities (Cost $585,000) | 554,775 | ||||||||||
| TOTAL COMMON STOCKS (COST $65,536,608) | 80,420,332 | ||||||||||
SHORT TERM INVESTMENT — 6.32% | |||||||||||
INVESTMENT COMPANY — 6.32% | |||||||||||
5,394,110 | Fidelity Institutional Money Market Fund — Government Portfolio — 0.01%(c) | 5,394,110 | |||||||||
Total Investment Company | 5,394,110 | ||||||||||
| TOTAL SHORT TERM INVESTMENT (COST $5,394,110) | 5,394,110 | ||||||||||
| TOTAL INVESTMENTS — 100.56% (COST $70,930,718) | 85,814,442 | ||||||||||
Liabilities in Excess of Other Assets — (0.56)% | (478,021 | ) | |||||||||
TOTAL NET ASSETS — 100.00% | $ | 85,336,421 | �� | ||||||||
ADR — American Depositary Receipt
PLC — Public Limited Company
(a) Non income producing.
(b) Foreign Issued Securities. The total value of these securities amounted to $6,813,644 (7.98% of net assets) at March 31, 2017.
(c) The rate quoted is the annualized seven-day effective yield as of March 31, 2017.
* See Note 1A of accompanying Notes to Financial Statements regarding valuation of securities.
The Global Industry Classification Standard (GICS) was developed by and/or is the exclusive property of MSCI, Inc. and Standard & Poor's Financial Services LLC ("S&P"). GICS is a service mark of MSCI and S&P and has been licensed for use by U.S. Bancorp Fund Services, LLC.
The accompanying notes are an integral part of these financial statements.
32
 Buffalo Flexible Income Fund
SCHEDULE OF INVESTMENTS
March 31, 2017
| SHARES OR FACE AMOUNT | FAIR VALUE* | ||||||||||
COMMON STOCKS — 80.91% | |||||||||||
CONSUMER DISCRETIONARY — 3.82% | |||||||||||
Automobiles — 0.64% | |||||||||||
435,000 | Ford Motor Co. | $ | 5,063,400 | ||||||||
Media — 3.18% | |||||||||||
497,943 | Lions Gate Entertainment Corp. — Class A(a)(d) | 13,225,366 | |||||||||
497,943 | Lions Gate Entertainment Corp. — Class B(a)(d) | 12,139,850 | |||||||||
25,365,216 | |||||||||||
Total Consumer Discretionary (Cost $33,069,707) | 30,428,616 | ||||||||||
CONSUMER STAPLES — 15.45% | |||||||||||
Beverages — 5.38% | |||||||||||
400,000 | The Coca Cola Co. | 16,976,000 | |||||||||
35,000 | Diageo PLC — ADR(d) | 4,045,300 | |||||||||
75,000 | Dr. Pepper Snapple Group, Inc. | 7,344,000 | |||||||||
130,000 | PepsiCo, Inc. | 14,541,800 | |||||||||
42,907,100 | |||||||||||
Food & Staples Retailing — 1.84% | |||||||||||
50,000 | Costco Wholesale Corp. | 8,384,500 | |||||||||
100,000 | Sysco Corp. | 5,192,000 | |||||||||
15,000 | Wal-Mart Stores, Inc. | 1,081,200 | |||||||||
14,657,700 | |||||||||||
Food Products — 2.23% | |||||||||||
5,000 | B&G Foods Inc. | 201,250 | |||||||||
200,000 | General Mills, Inc. | 11,802,000 | |||||||||
50,000 | Kellogg Co. | 3,630,500 | |||||||||
50,000 | Mondelez International Inc. — Class A | 2,154,000 | |||||||||
17,787,750 | |||||||||||
Household Products — 6.00% | |||||||||||
100,000 | The Clorox Co. | 13,483,000 | |||||||||
30,000 | Colgate-Palmolive Co. | 2,195,700 | |||||||||
50,000 | Kimberly-Clark Corp. | 6,581,500 | |||||||||
285,000 | The Procter & Gamble Co. | 25,607,250 | |||||||||
47,867,450 | |||||||||||
Total Consumer Staples (Cost $77,882,119) | 123,220,000 | ||||||||||
ENERGY — 19.50% | |||||||||||
Energy Equipment & Services — 1.80% | |||||||||||
75,000 | Helmerich & Payne, Inc. | 4,992,750 | |||||||||
120,000 | Schlumberger Ltd.(d) | 9,372,000 | |||||||||
14,364,750 | |||||||||||
Oil, Gas & Consumable Fuels — 17.70% | |||||||||||
399,000 | BP PLC — ADR(d) | 13,773,480 | |||||||||
170,000 | Chevron Corp. | 18,252,900 | |||||||||
370,000 | ConocoPhillips | 18,451,900 | |||||||||
140,000 | Delek Logistics Partners LP | 4,662,000 | |||||||||
134,490 | EQT Midstream Partners LP | 10,342,281 | |||||||||
250,000 | Exxon Mobil Corp. | 20,502,500 | |||||||||
138,000 | Hess Corp.(f) | 6,652,980 | |||||||||
600,000 | HollyFrontier Corp. | 17,004,000 | |||||||||
115,000 | Kinder Morgan, Inc. | 2,500,100 | |||||||||
100,000 | Marathon Petroleum Corp. | 5,054,000 | |||||||||
33
 Buffalo Flexible Income Fund
SCHEDULE OF INVESTMENTS
March 31, 2017
(Continued)
| SHARES OR FACE AMOUNT | FAIR VALUE* | ||||||||||
| ENERGY (Continued) | |||||||||||
25,000 | Phillips 66 | $ | 1,980,500 | ||||||||
300,000 | Royal Dutch Shell PLC. — Class A — ADR(d) | 15,819,000 | |||||||||
200,000 | Suncor Energy, Inc.(d) | 6,150,000 | |||||||||
929 | Swift Energy Co.(a) | 25,548 | |||||||||
141,171,189 | |||||||||||
Total Energy (Cost $152,907,770) | 155,535,939 | ||||||||||
FINANCIALS — 4.79% | |||||||||||
Banks — 2.24% | |||||||||||
400,000 | BB&T Corp. | 17,880,000 | |||||||||
Insurance — 2.55% | |||||||||||
180,000 | The Allstate Corp. | 14,668,200 | |||||||||
100,000 | Arthur J. Gallagher & Co. | 5,654,000 | |||||||||
20,322,200 | |||||||||||
Total Financials (Cost $25,636,278) | 38,202,200 | ||||||||||
HEALTH CARE — 9.63% | |||||||||||
Health Care Equipment & Supplies — 1.42% | |||||||||||
80,000 | Abbott Laboratories | 3,552,800 | |||||||||
150,000 | Baxter International, Inc. | 7,779,000 | |||||||||
11,331,800 | |||||||||||
Pharmaceuticals — 8.21% | |||||||||||
75,000 | Eli Lilly & Co. | 6,308,250 | |||||||||
500,000 | GlaxoSmithKline PLC — ADR(d) | 21,080,000 | |||||||||
140,000 | Johnson & Johnson | 17,437,000 | |||||||||
180,000 | Merck & Co., Inc. | 11,437,200 | |||||||||
270,000 | Pfizer Inc. | 9,236,700 | |||||||||
65,499,150 | |||||||||||
Total Health Care (Cost $54,006,036) | 76,830,950 | ||||||||||
INDUSTRIALS — 9.69% | |||||||||||
Aerospace & Defense — 2.55% | |||||||||||
115,000 | The Boeing Co. | 20,338,900 | |||||||||
Commercial Services & Supplies — 3.93% | |||||||||||
1,000,000 | Pitney Bowes Inc. | 13,110,000 | |||||||||
250,000 | Waste Management, Inc. | 18,230,000 | |||||||||
31,340,000 | |||||||||||
Industrial Conglomerates — 3.06% | |||||||||||
820,000 | General Electric Co. | 24,436,000 | |||||||||
Road & Rail — 0.15% | |||||||||||
25,000 | CSX Corp.(f) | 1,163,750 | |||||||||
Total Industrials (Cost $49,422,344) | 77,278,650 | ||||||||||
INFORMATION TECHNOLOGY — 9.40% | |||||||||||
Communications Equipment — 0.85% | |||||||||||
200,000 | Cisco Systems, Inc. | 6,760,000 | |||||||||
IT Services — 2.51% | |||||||||||
115,000 | International Business Machines Corp. (IBM) | 20,026,100 | |||||||||
34
| SHARES OR FACE AMOUNT | FAIR VALUE* | ||||||||||
| INFORMATION TECHNOLOGY (Continued) | |||||||||||
Semiconductors & Semiconductor Equipment — 2.74% | |||||||||||
580,000 | Intel Corp. | $ | 20,920,600 | ||||||||
15,800 | QUALCOMM, Inc. | 905,972 | |||||||||
21,826,572 | |||||||||||
Software — 3.30% | |||||||||||
400,000 | Microsoft Corp. | 26,344,000 | |||||||||
Total Information Technology (Cost $49,790,652) | 74,956,672 | ||||||||||
MATERIALS — 3.15% | |||||||||||
Chemicals — 2.86% | |||||||||||
320,000 | The Dow Chemical Co. | 20,332,800 | |||||||||
30,000 | Eastman Chemical Co. | 2,424,000 | |||||||||
22,756,800 | |||||||||||
Metals & Mining — 0.29% | |||||||||||
57,000 | Rio Tinto PLC — ADR(d) | 2,318,760 | |||||||||
Total Materials (Cost $14,344,190) | 25,075,560 | ||||||||||
TELECOMMUNICATION SERVICES — 5.48% | |||||||||||
Diversified Telecommunication Services — 5.48% | |||||||||||
587,500 | AT&T Inc. | 24,410,625 | |||||||||
396,000 | Verizon Communications, Inc. | 19,305,000 | |||||||||
Total Telecommunication Services (Cost $39,291,322) | 43,715,625 | ||||||||||
| TOTAL COMMON STOCKS (COST $496,350,418) | 645,244,212 | ||||||||||
REAL ESTATE INVESTMENT TRUSTS (REITS) — 2.05% | |||||||||||
REAL ESTATE — 2.05% | |||||||||||
85,300 | Digital Realty Trust, Inc. | 9,075,067 | |||||||||
215,000 | Weyerhaeuser Co. | 7,305,700 | |||||||||
Total Real Estate (Cost $11,199,794) | 16,380,767 | ||||||||||
| TOTAL REITS (COST $11,199,794) | 16,380,767 | ||||||||||
CONVERTIBLE BONDS — 6.24% | |||||||||||
CONSUMER DISCRETIONARY — 3.89% | |||||||||||
Media — 3.89% | |||||||||||
Lions Gate Entertainment Inc. | |||||||||||
$ | 30,000,000 | 1.250%, 04/15/2018 | 31,012,500 | ||||||||
Total Consumer Discretionary (Cost $30,000,000) | 31,012,500 | ||||||||||
HEALTH CARE — 0.40% | |||||||||||
Pharmaceuticals — 0.40% | |||||||||||
The Medicines Co. | |||||||||||
2,000,000 | 2.500%, 01/15/2022 | 3,162,500 | |||||||||
Total Health Care (Cost $2,060,607) | 3,162,500 | ||||||||||
35
 Buffalo Flexible Income Fund
SCHEDULE OF INVESTMENTS
March 31, 2017
(Continued)
| SHARES OR FACE AMOUNT | FAIR VALUE* | ||||||||||
INDUSTRIALS — 0.34% | |||||||||||
Air Freight & Logistics — 0.34% | |||||||||||
UTi Worldwide, Inc. | |||||||||||
$ | 2,600,000 | 4.500%, 03/01/2019(d) | $ | 2,717,000 | |||||||
Total Industrials (Cost $2,600,000) | 2,717,000 | ||||||||||
INFORMATION TECHNOLOGY — 1.61% | |||||||||||
Internet Software & Services — 0.61% | |||||||||||
Cornerstone OnDemand, Inc. | |||||||||||
4,750,000 | 1.500%, 07/01/2018 | 4,865,781 | |||||||||
Software — 1.00% | |||||||||||
Nuance Communications, Inc. | |||||||||||
7,725,000 | 1.500%, 11/01/2035(b) | 7,961,578 | |||||||||
Total Information Technology (Cost $12,119,624) | 12,827,359 | ||||||||||
| TOTAL CONVERTIBLE BONDS (COST $46,780,231) | 49,719,359 | ||||||||||
CORPORATE BONDS — 9.57% | |||||||||||
CONSUMER DISCRETIONARY — 0.68% | |||||||||||
Leisure Products — 0.33% | |||||||||||
Brunswick Corp. | |||||||||||
2,200,000 | 7.375%, 09/01/2023 | 2,582,424 | |||||||||
Media — 0.25% | |||||||||||
Sirius XM Radio, Inc. | |||||||||||
2,000,000 | 4.250%, 05/15/2020 (Acquired Various Dates, Cost $1,962,329)(b)(c) | 2,020,000 | |||||||||
Multiline Retail — 0.10% | |||||||||||
Dollar Tree, Inc. | |||||||||||
800,000 | 5.250%, 03/01/2020 | 825,160 | |||||||||
Total Consumer Discretionary (Cost $4,859,083) | 5,427,584 | ||||||||||
ENERGY — 1.17% | |||||||||||
Energy Equipment & Services — 0.62% | |||||||||||
Forum Energy Technologies Inc. | |||||||||||
5,000,000 | 6.250%, 10/01/2021 | 4,950,000 | |||||||||
Oil, Gas & Consumable Fuels — 0.55% | |||||||||||
Approach Resources, Inc. | |||||||||||
3,000,000 | 7.000%, 06/15/2021 | 2,460,000 | |||||||||
WildHorse Resource Development Corp. | |||||||||||
2,000,000 | 6.875%, 02/01/2025 (Acquired Various Dates, Cost $1,984,880)(b)(c) | 1,915,000 | |||||||||
4,375,000 | |||||||||||
Total Energy (Cost $9,740,574) | 9,325,000 | ||||||||||
HEALTH CARE — 1.43% | |||||||||||
Pharmaceuticals — 1.43% | |||||||||||
Valeant Pharmaceuticals International, Inc. | |||||||||||
1,179,000 | 6.750%, 08/15/2018 (Acquired Various Dates, Cost $1,179,000)(b)(c) | 1,182,684 | |||||||||
10,000,000 | 6.375%, 10/15/2020 (Acquired Various Dates, Cost $10,239,816)(b)(c) | 9,100,000 | |||||||||
VRX Escrow Corp. | |||||||||||
1,250,000 | 5.375%, 03/15/2020 (Acquired Various Dates, Cost $1,253,938)(b)(c)(d) | 1,123,438 | |||||||||
Total Health Care (Cost $12,672,754) | 11,406,122 | ||||||||||
36
| SHARES OR FACE AMOUNT | FAIR VALUE* | ||||||||||
INDUSTRIALS — 1.08% | |||||||||||
Aerospace & Defense — 0.38% | |||||||||||
TransDigm, Inc. | |||||||||||
$ | 3,000,000 | 5.500%, 10/15/2020 | $ | 3,018,750 | |||||||
Construction & Engineering — 0.70% | |||||||||||
Tutor Perini Corp. | |||||||||||
5,575,000 | 7.625%, 11/01/2018 | 5,585,453 | |||||||||
Total Industrials (Cost $8,557,500) | 8,604,203 | ||||||||||
INFORMATION TECHNOLOGY — 4.60% | |||||||||||
Diversified Telecommunication Services — 0.48% | |||||||||||
CCO Holdings LLC / CCO Holdings Capital Corp. | |||||||||||
3,706,000 | 5.250%, 03/15/2021 | 3,810,231 | |||||||||
Internet Software & Services — 2.78% | |||||||||||
Bankrate Inc. | |||||||||||
22,000,000 | 6.125%, 08/15/2018(b)(e) | 22,165,000 | |||||||||
IT Services — 0.51% | |||||||||||
NeuStar, Inc. | |||||||||||
4,000,000 | 4.500%, 01/15/2023 | 4,125,000 | |||||||||
Software — 0.83% | |||||||||||
ACI Worldwide, Inc. | |||||||||||
3,750,000 | 6.375%, 08/15/2020(b)(e) | 3,853,125 | |||||||||
Nuance Communications, Inc. | |||||||||||
2,722,000 | 5.375%, 08/15/2020 (Acquired Various Dates, Cost $2,756,025)(b)(c) | 2,769,703 | |||||||||
6,622,828 | |||||||||||
Total Information Technology (Cost $35,727,904) | 36,723,059 | ||||||||||
TELECOMMUNICATION SERVICES — 0.61% | |||||||||||
Diversified Telecommunication Services — 0.61% | |||||||||||
Consolidated Communications Inc | |||||||||||
5,000,000 | 6.500%, 10/01/2022 | 4,825,000 | |||||||||
Total Telecommunication Services (Cost $4,956,500) | 4,825,000 | ||||||||||
| TOTAL CORPORATE BONDS (COST $76,514,315) | 76,310,968 | ||||||||||
37
 Buffalo Flexible Income Fund
SCHEDULE OF INVESTMENTS
March 31, 2017
(Continued)
| SHARES OR FACE AMOUNT | FAIR VALUE* | ||||||||||
SHORT TERM INVESTMENT — 0.86% | |||||||||||
INVESTMENT COMPANY — 0.86% | |||||||||||
6,886,214 | Fidelity Institutional Money Market Fund — Government Portfolio — 0.01%(g) | $ | 6,886,214 | ||||||||
Total Investment Company | 6,886,214 | ||||||||||
| TOTAL SHORT TERM INVESTMENT (COST $6,886,214) | 6,886,214 | ||||||||||
| TOTAL INVESTMENTS — 99.63% (COST $637,730,972) | 794,541,520 | ||||||||||
Other Assets in Excess of Liabilities — 0.37% | 2,911,243 | ||||||||||
TOTAL NET ASSETS — 100.00% | $ | 797,452,763 | |||||||||
ADR — American Depositary Receipt
PLC — Public Limited Company
(a) Non income producing.
(b) These securities are deemed illiquid. The total value of these securities amounted to $31,012,500 (3.89% of net assets) at March 31, 2017.
(c) Restricted security deemed liquid. The total value of restricted securities is $18,110,825 (2.27% of net assets) at March 31, 2017.
(d) Foreign Issued Securities. The total value of these securities amounted to $101,764,194 (12.76% of net assets) at March 31, 2017
(e) 144A Securities. The total value of restricted securities is $26,018,125 (3.26% of net assets) at March 31, 2017.
(f) A portion of these investments are segregated as collateral for open written option contracts.
(g) The rate quoted is the annualized seven-day effective yield as of March 31, 2017.
* See Note 1A of accompanying Notes to Financial Statements regarding valuation of securities.
38
SCHEDULE OF OPTIONS WRITTEN
March 31, 2017
CONTRACTS | VALUE | ||||||||||
CALL OPTIONS WRITTEN | |||||||||||
CSX Corp. | |||||||||||
250 | Expiration: April 2017, Exercise Price: $50.00 | $ | 5,750 | ||||||||
Hess Corp. | |||||||||||
150 | Expiration: June 2017, Exercise Price: $55.00 | 10,500 | |||||||||
Total Written Options (Premium received $59,767) | $ | 16,250 | |||||||||
The Global Industry Classification Standard (GICS) was developed by and/or is the exclusive property of MSCI, Inc. and Standard & Poor's Financial Services LLC ("S&P"). GICS is a service mark of MSCI and S&P and has been licensed for use by U.S. Bancorp Fund Services, LLC.
The accompanying notes are an integral part of these financial statements.
39
 Buffalo Growth Fund
SCHEDULE OF INVESTMENTS
March 31, 2017
| SHARES OR FACE AMOUNT | FAIR VALUE* | ||||||||||
COMMON STOCKS — 97.44% | |||||||||||
CONSUMER DISCRETIONARY — 19.12% | |||||||||||
Hotels, Restaurants & Leisure — 3.18% | |||||||||||
7,930 | Chipotle Mexican Grill, Inc.(a) | $ | 3,532,974 | ||||||||
117,780 | Starbucks Corp. | 6,877,174 | |||||||||
10,410,148 | |||||||||||
Internet & Direct Marketing Retail — 5.47% | |||||||||||
11,625 | Amazon.com, Inc.(a) | 10,306,028 | |||||||||
4,260 | The Priceline Group Inc.(a) | 7,582,672 | |||||||||
17,888,700 | |||||||||||
Internet Software & Services — 0.62% | |||||||||||
170,405 | Pandora Media Inc.(a) | 2,012,483 | |||||||||
Media — 1.91% | |||||||||||
55,015 | The Walt Disney Co. | 6,238,151 | |||||||||
Specialty Retail — 4.81% | |||||||||||
28,825 | Advance Auto Parts, Inc. | 4,273,594 | |||||||||
56,145 | The Home Depot, Inc. | 8,243,770 | |||||||||
60,085 | Williams-Sonoma, Inc. | 3,221,758 | |||||||||
15,739,122 | |||||||||||
Textiles, Apparel & Luxury Goods — 3.13% | |||||||||||
88,580 | Hanesbrands, Inc. | 1,838,921 | |||||||||
105,270 | NIKE, Inc. — Class B | 5,866,697 | |||||||||
27,375 | Under Armour, Inc. — Class A(a) | 541,477 | |||||||||
107,619 | Under Armour, Inc. — Class C(a) | 1,969,428 | |||||||||
10,216,523 | |||||||||||
Total Consumer Discretionary (Cost $46,545,321) | 62,505,127 | ||||||||||
CONSUMER STAPLES — 7.44% | |||||||||||
Beverages — 1.27% | |||||||||||
37,670 | Anheuser-Busch InBev SA/NV — ADR(b) | 4,134,659 | |||||||||
Food & Staples Retailing — 2.98% | |||||||||||
29,560 | Costco Wholesale Corp. | 4,956,916 | |||||||||
61,135 | CVS Health Corp. | 4,799,098 | |||||||||
9,756,014 | |||||||||||
Food Products — 0.99% | |||||||||||
75,457 | Mondelez International Inc. — Class A | 3,250,688 | |||||||||
Household Products — 2.20% | |||||||||||
28,165 | Kimberly-Clark Corp. | 3,707,359 | |||||||||
38,870 | The Procter & Gamble Co. | 3,492,469 | |||||||||
7,199,828 | |||||||||||
Total Consumer Staples (Cost $20,693,175) | 24,341,189 | ||||||||||
ENERGY — 3.18% | |||||||||||
Energy Equipment & Services — 3.18% | |||||||||||
64,015 | Baker Hughes, Inc. | 3,829,377 | |||||||||
116,172 | Oceaneering International, Inc. | 3,145,938 | |||||||||
43,623 | Schlumberger Ltd.(b) | 3,406,956 | |||||||||
Total Energy (Cost $8,864,201) | 10,382,271 | ||||||||||
40
| SHARES OR FACE AMOUNT | FAIR VALUE* | ||||||||||
FINANCIALS — 9.79% | |||||||||||
Banks — 3.65% | |||||||||||
167,480 | Bank of America Corp. | $ | 3,950,853 | ||||||||
45,860 | JPMorgan Chase & Co. | 4,028,342 | |||||||||
71,130 | Wells Fargo & Co. | 3,959,096 | |||||||||
11,938,291 | |||||||||||
Capital Markets — 6.14% | |||||||||||
61,045 | CME Group Inc. | 7,252,146 | |||||||||
129,170 | Intercontinental Exchange, Inc. | 7,733,408 | |||||||||
38,998 | S&P Global, Inc. | 5,098,599 | |||||||||
20,084,153 | |||||||||||
Total Financials (Cost $22,718,379) | 32,022,444 | ||||||||||
HEALTH CARE — 17.59% | |||||||||||
Biotechnology — 3.73% | |||||||||||
17,808 | Biogen Idec Inc.(a) | 4,869,063 | |||||||||
47,910 | Gilead Sciences, Inc. | 3,254,047 | |||||||||
23,435 | Shire — ADR(b) | 4,083,080 | |||||||||
12,206,190 | |||||||||||
Health Care Equipment & Supplies — 9.06% | |||||||||||
171,114 | Abbott Laboratories | 7,599,173 | |||||||||
70,172 | Align Technology, Inc.(a) | 8,049,430 | |||||||||
152,834 | Baxter International, Inc. | 7,925,971 | |||||||||
70,615 | Danaher Corp. | 6,039,701 | |||||||||
29,614,275 | |||||||||||
Health Care Providers & Services — 1.60% | |||||||||||
59,320 | AmerisourceBergen Corp. | 5,249,820 | |||||||||
Pharmaceuticals — 3.20% | |||||||||||
34,175 | Johnson & Johnson | 4,256,496 | |||||||||
97,486 | Merck & Co., Inc. | 6,194,261 | |||||||||
10,450,757 | |||||||||||
Total Health Care (Cost $39,770,371) | 57,521,042 | ||||||||||
INDUSTRIALS — 10.17% | |||||||||||
Air Freight & Logistics — 2.05% | |||||||||||
34,370 | FedEx Corp. | 6,707,306 | |||||||||
Commercial Services & Supplies — 1.31% | |||||||||||
51,678 | Stericycle, Inc.(a) | 4,283,589 | |||||||||
Industrial Conglomerates — 4.35% | |||||||||||
36,847 | 3M Co. | 7,049,936 | |||||||||
57,470 | Honeywell International, Inc. | 7,176,279 | |||||||||
14,226,215 | |||||||||||
Professional Services — 1.35% | |||||||||||
107,137 | Nielsen Holdings PLC | 4,425,830 | |||||||||
Road & Rail — 1.11% | |||||||||||
34,220 | Union Pacific Corp. | 3,624,582 | |||||||||
Total Industrials (Cost $23,717,401) | 33,267,522 | ||||||||||
41
 Buffalo Growth Fund
SCHEDULE OF INVESTMENTS
March 31, 2017
(Continued)
| SHARES OR FACE AMOUNT | FAIR VALUE* | ||||||||||
INFORMATION TECHNOLOGY — 24.27% | |||||||||||
Communications Equipment — 0.61% | |||||||||||
58,875 | Cisco Systems, Inc. | $ | 1,989,975 | ||||||||
Internet Software & Services — 10.55% | |||||||||||
10,210 | Alphabet, Inc. — Class A(a) | 8,656,038 | |||||||||
12,166 | Alphabet, Inc. — Class C(a) | 10,092,427 | |||||||||
110,867 | Facebook Inc. — Class A(a) | 15,748,657 | |||||||||
34,497,122 | |||||||||||
IT Services — 2.81% | |||||||||||
103,253 | Visa Inc. — Class A | 9,176,094 | |||||||||
Semiconductors & Semiconductor Equipment — 1.03% | |||||||||||
59,026 | QUALCOMM, Inc. | 3,384,551 | |||||||||
Software — 5.01% | |||||||||||
103,560 | Microsoft Corp. | 6,820,462 | |||||||||
112,905 | Oracle Corp. | 5,036,692 | |||||||||
23,570 | Red Hat, Inc.(a) | 2,038,805 | |||||||||
30,190 | salesforce.com, inc.(a) | 2,490,373 | |||||||||
16,386,332 | |||||||||||
Technology Hardware, Storage & Peripherals — 4.26% | |||||||||||
96,860 | Apple Inc. | 13,914,908 | |||||||||
Total Information Technology (Cost $29,242,165) | 79,348,982 | ||||||||||
MATERIALS — 3.14% | |||||||||||
Chemicals — 3.14% | |||||||||||
30,155 | Ecolab Inc. | 3,779,628 | |||||||||
54,565 | Praxair, Inc. | 6,471,409 | |||||||||
Total Materials (Cost $7,178,058) | 10,251,037 | ||||||||||
TELECOMMUNICATION SERVICES — 2.74% | |||||||||||
Diversified Telecommunication Services — 2.74% | |||||||||||
130,390 | AT&T Inc. | 5,417,705 | |||||||||
72,395 | Verizon Communications, Inc. | 3,529,256 | |||||||||
Total Telecommunication Services (Cost $8,745,642) | 8,946,961 | ||||||||||
| TOTAL COMMON STOCKS (COST $207,474,713) | 318,586,575 | ||||||||||
REAL ESTATE INVESTMENT TRUST (REIT) — 1.65% | |||||||||||
REAL ESTATE — 1.65% | |||||||||||
13,464 | Equinix Inc. | 5,390,582 | |||||||||
Total Real Estate (Cost $2,254,174) | 5,390,582 | ||||||||||
| TOTAL REIT (COST $2,254,174) | 5,390,582 | ||||||||||
42
| SHARES OR FACE AMOUNT | FAIR VALUE* | ||||||||||
SHORT TERM INVESTMENT — 2.18% | |||||||||||
INVESTMENT COMPANY — 2.18% | |||||||||||
7,129,003 | Fidelity Institutional Money Market Fund — Government Portfolio — 0.01%(c) | $ | 7,129,003 | ||||||||
Total Investment Company | 7,129,003 | ||||||||||
| TOTAL SHORT TERM INVESTMENT (COST $7,129,003) | 7,129,003 | ||||||||||
| TOTAL INVESTMENTS — 101.27% (COST $216,857,890) | 331,106,160 | ||||||||||
Liabilities in Excess of Other Assets — (1.27)% | (4,161,941 | ) | |||||||||
TOTAL NET ASSETS — 100.00% | $ | 326,944,219 | |||||||||
ADR — American Depositary Receipt
PLC — Public Limited Company
(a) Non income producing.
(b) Foreign Issued Securities. The total value of these securities amounted to $11,624,695 (3.56% of net assets) at March 31, 2017.
(c) The rate quoted is the annualized seven-day effective yield as of March 31, 2017.
* See Note 1A of accompanying Notes to Financial Statements regarding valuation of securities.
The Global Industry Classification Standard (GICS) was developed by and/or is the exclusive property of MSCI, Inc. and Standard & Poor's Financial Services LLC ("S&P"). GICS is a service mark of MSCI and S&P and has been licensed for use by U.S. Bancorp Fund Services, LLC.
The accompanying notes are an integral part of these financial statements.
43
 Buffalo High Yield Fund
SCHEDULE OF INVESTMENTS
March 31, 2017
| SHARES OR FACE AMOUNT | FAIR VALUE* | ||||||||||
CONVERTIBLE PREFERRED STOCK — 0.90% | |||||||||||
HEALTH CARE — 0.90% | |||||||||||
Pharmaceuticals — 0.90% | |||||||||||
2,500 | Allergan plc | $ | 2,124,450 | ||||||||
Total Health Care (Cost $2,186,889) | 2,124,450 | ||||||||||
| TOTAL CONVERTIBLE PREFERRED STOCK (COST $2,186,889) | 2,124,450 | ||||||||||
COMMON STOCKS — 0.53% | |||||||||||
CONSUMER DISCRETIONARY — 0.53% | |||||||||||
Media — 0.53% | |||||||||||
24,485 | Lions Gate Entertainment Corp. — Class A(a)(d) | 650,322 | |||||||||
24,485 | Lions Gate Entertainment Corp. — Class B(a)(d) | 596,944 | |||||||||
Total Consumer Discretionary (Cost $499,984) | 1,247,266 | ||||||||||
| TOTAL COMMON STOCKS (COST $499,984) | 1,247,266 | ||||||||||
CONVERTIBLE BONDS — 12.28% | |||||||||||
CONSUMER DISCRETIONARY — 4.05% | |||||||||||
Auto Components — 0.39% | |||||||||||
Horizon Global Corp. | |||||||||||
$ | 1,000,000 | 2.750%, 07/01/2022 | 910,625 | ||||||||
Diversified Consumer Services — 0.55% | |||||||||||
Carriage Services, Inc. | |||||||||||
1,000,000 | 2.750%, 03/15/2021 | 1,303,750 | |||||||||
Media — 3.11% | |||||||||||
Lions Gate Entertainment Inc. | |||||||||||
5,000,000 | 1.250%, 04/15/2018(b) | 5,168,750 | |||||||||
Live Nation Entertainment Inc. | |||||||||||
2,000,000 | 2.500%, 05/15/2019 | 2,178,750 | |||||||||
7,347,500 | |||||||||||
Total Consumer Discretionary (Cost $9,043,550) | 9,561,875 | ||||||||||
ENERGY — 0.74% | |||||||||||
Oil, Gas & Consumable Fuels — 0.74% | |||||||||||
Whiting Petroleum Corp. | |||||||||||
2,000,000 | 1.250%, 04/01/2020 | 1,752,500 | |||||||||
Total Energy (Cost $1,627,029) | 1,752,500 | ||||||||||
HEALTH CARE — 2.88% | |||||||||||
Health Care Equipment & Supplies — 1.66% | |||||||||||
Accuray, Inc. | |||||||||||
1,500,000 | 3.500%, 02/01/2018 | 1,634,062 | |||||||||
Insulet Corp. | |||||||||||
1,000,000 | 2.000%, 06/15/2019 | 1,132,500 | |||||||||
The Spectranetics Corp. | |||||||||||
1,000,000 | 2.625%, 06/01/2034 | 1,144,375 | |||||||||
3,910,937 | |||||||||||
44
| SHARES OR FACE AMOUNT | FAIR VALUE* | ||||||||||
| HEALTH CARE (Continued) | |||||||||||
Pharmaceuticals — 1.22% | |||||||||||
Innoviva, Inc. | |||||||||||
$ | 500,000 | 2.125%, 01/15/2023 | $ | 474,375 | |||||||
The Medicines Co. | |||||||||||
2,000,000 | 2.750%, 07/15/2023 (Acquired Various Dates, Cost $2,000,000)(b)(c) | 2,420,000 | |||||||||
2,894,375 | |||||||||||
Total Health Care (Cost $5,810,258) | 6,805,312 | ||||||||||
INDUSTRIALS — 1.25% | |||||||||||
Machinery — 1.25% | |||||||||||
Chart Industries, Inc. | |||||||||||
1,000,000 | 2.000%, 08/01/2018 | 992,500 | |||||||||
The Greenbrier Companies, Inc. | |||||||||||
1,500,000 | 3.500%, 04/01/2018 | 1,945,313 | |||||||||
Total Industrials (Cost $2,407,522) | 2,937,813 | ||||||||||
INFORMATION TECHNOLOGY — 3.36% | |||||||||||
Internet Software & Services — 2.46% | |||||||||||
Blucora, Inc. | |||||||||||
2,000,000 | 4.250%, 04/01/2019 | 2,015,000 | |||||||||
Envestnet, Inc. | |||||||||||
1,500,000 | 1.750%, 12/15/2019 | 1,401,562 | |||||||||
Twitter, Inc. | |||||||||||
1,500,000 | 1.000%, 09/15/2021 | 1,374,375 | |||||||||
WebMD Health Corp. | |||||||||||
1,000,000 | 2.500%, 01/31/2018(b) | 1,020,000 | |||||||||
5,810,937 | |||||||||||
Software — 0.90% | |||||||||||
Nuance Communications, Inc. | |||||||||||
2,060,000 | 1.500%, 11/01/2035(b) | 2,123,088 | |||||||||
Total Information Technology (Cost $7,601,221) | 7,934,025 | ||||||||||
| TOTAL CONVERTIBLE BONDS (COST $26,489,580) | 28,991,525 | ||||||||||
CORPORATE BONDS — 63.45% | |||||||||||
CONSUMER DISCRETIONARY — 16.85% | |||||||||||
Auto Components — 0.43% | |||||||||||
Allison Transmission Holdings, Inc. | |||||||||||
1,000,000 | 5.000%, 10/01/2024 (Acquired Various Dates, Cost $1,000,000)(c) | 1,012,500 | |||||||||
Commercial Services — 0.88% | |||||||||||
Cimpress NV | |||||||||||
2,000,000 | 7.000%, 04/01/2022 (Acquired Various Dates, Cost $2,021,250)(b)(c) | 2,080,000 | |||||||||
Distributors — 0.53% | |||||||||||
LKQ Corp. | |||||||||||
1,250,000 | 4.750%, 05/15/2023 | 1,250,000 | |||||||||
45
 Buffalo High Yield Fund
SCHEDULE OF INVESTMENTS
March 31, 2017
(Continued)
| SHARES OR FACE AMOUNT | FAIR VALUE* | ||||||||||
| CONSUMER DISCRETIONARY (Continued) | |||||||||||
Diversified Consumer Services — 1.07% | |||||||||||
Perry Ellis International, Inc. | |||||||||||
$ | 1,510,000 | 7.875%, 04/01/2019(e) | $ | 1,515,285 | |||||||
Service Corp International | |||||||||||
1,000,000 | 4.500%, 11/15/2020 | 1,018,750 | |||||||||
2,534,035 | |||||||||||
Hotels, Restaurants & Leisure — 1.51% | |||||||||||
Royal Caribbean Cruises Ltd. | |||||||||||
1,615,000 | 7.500%, 10/15/2027 | 2,051,050 | |||||||||
Six Flags Entertainment Corp. | |||||||||||
1,500,000 | 5.500%, 04/15/2027 (Acquired Various Dates, Cost $1,500,000)(c) | 1,500,000 | |||||||||
3,551,050 | |||||||||||
Internet & Direct Marketing Retail — 0.57% | |||||||||||
Netflix, Inc. | |||||||||||
250,000 | 5.500%, 02/15/2022 | 266,875 | |||||||||
1,000,000 | 5.750%, 03/01/2024 | 1,071,200 | |||||||||
1,338,075 | |||||||||||
Leisure Products — 1.49% | |||||||||||
Brunswick Corp. | |||||||||||
3,000,000 | 7.375%, 09/01/2023 | 3,521,487 | |||||||||
Media — 7.10% | |||||||||||
AMC Networks Inc. | |||||||||||
1,500,000 | 5.000%, 04/01/2024 | 1,503,750 | |||||||||
Cinemark USA, Inc. | |||||||||||
1,000,000 | 5.125%, 12/15/2022 | 1,025,000 | |||||||||
Gray Television, Inc. | |||||||||||
1,500,000 | 5.875%, 07/15/2026 (Acquired Various Dates, Cost $1,507,487)(b)(c) | 1,530,000 | |||||||||
Lions Gate Entertainment Corp. | |||||||||||
250,000 | 5.875%, 11/01/2024 (Acquired Various Dates, Cost $250,000)(b)(c)(d) | 260,625 | |||||||||
Live Nation Entertainment Inc. | |||||||||||
3,100,000 | 5.375%, 06/15/2022 (Acquired Various Dates, Cost $3,110,000)(b)(c) | 3,239,500 | |||||||||
1,000,000 | 4.875%, 11/01/2024 (Acquired Various Dates, Cost $1,000,000)(c) | 1,002,500 | |||||||||
Regal Entertainment Group | |||||||||||
2,600,000 | 5.750%, 06/15/2023 | 2,710,500 | |||||||||
Sirius XM Radio, Inc. | |||||||||||
3,095,000 | 4.250%, 05/15/2020 (Acquired Various Dates, Cost $3,038,655)(b)(c) | 3,125,950 | |||||||||
250,000 | 5.375%, 07/15/2026 (Acquired Various Dates, Cost $250,000)(b)(c) | 256,250 | |||||||||
Townsquare Media, Inc. | |||||||||||
2,100,000 | 6.500%, 04/01/2023 (Acquired Various Dates, Cost $2,033,547)(b)(c) | 2,105,250 | |||||||||
16,759,325 | |||||||||||
Specialty Retail — 1.72% | |||||||||||
Penske Automotive Group, Inc. | |||||||||||
2,500,000 | 5.750%, 10/01/2022 | 2,600,000 | |||||||||
Sonic Automotive, Inc. | |||||||||||
1,500,000 | 5.000%, 05/15/2023 | 1,465,320 | |||||||||
4,065,320 | |||||||||||
Textiles, Apparel & Luxury Goods — 1.55% | |||||||||||
PVH Corp. | |||||||||||
3,120,000 | 7.750%, 11/15/2023 | 3,666,000 | |||||||||
Total Consumer Discretionary (Cost $36,927,467) | 39,777,792 | ||||||||||
46
| SHARES OR FACE AMOUNT | FAIR VALUE* | ||||||||||
CONSUMER STAPLES — 4.65% | |||||||||||
Beverages — 0.13% | |||||||||||
Cott Beverages, Inc. | |||||||||||
$ | 300,000 | 5.375%, 07/01/2022 | $ | 307,125 | |||||||
Food Products — 4.52% | |||||||||||
Darling Ingredients, Inc. | |||||||||||
1,100,000 | 5.375%, 01/15/2022 | 1,142,625 | |||||||||
Lamb Weston Holdings, Inc. | |||||||||||
1,500,000 | 4.875%, 11/01/2026(b) | 1,533,750 | |||||||||
Smithfield Foods, Inc. | |||||||||||
2,750,000 | 7.750%, 07/01/2017 | 2,784,444 | |||||||||
TreeHouse Foods, Inc. | |||||||||||
2,000,000 | 4.875%, 03/15/2022 | 2,055,000 | |||||||||
3,000,000 | 6.000%, 02/15/2024 (Acquired Various Dates, Cost $3,000,000)(b)(c) | 3,157,500 | |||||||||
10,673,319 | |||||||||||
Total Consumer Staples (Cost $10,638,009) | 10,980,444 | ||||||||||
ENERGY — 4.49% | |||||||||||
Energy Equipment & Services — 0.42% | |||||||||||
Forum Energy Technologies Inc. | |||||||||||
1,000,000 | 6.250%, 10/01/2021 | 990,000 | |||||||||
Oil, Gas & Consumable Fuels — 4.07% | |||||||||||
Diamondback Energy Inc. | |||||||||||
1,000,000 | 4.750%, 11/01/2024 (Acquired Various Dates, Cost $1,000,000)(b)(c) | 1,010,900 | |||||||||
Gulfport Energy Corp. | |||||||||||
1,000,000 | 6.000%, 10/15/2024 (Acquired Various Dates, Cost $1,000,000)(b)(c) | 975,000 | |||||||||
Holly Energy Partners, L.P. | |||||||||||
500,000 | 6.000%, 08/01/2024 (Acquired Various Dates, Cost $500,000)(b)(c) | 526,250 | |||||||||
Parsley Energy LLC / Parsley Finance Corp. | |||||||||||
250,000 | 6.250%, 06/01/2024 (Acquired Various Dates, Cost $250,000)(b)(c) | 266,250 | |||||||||
500,000 | 5.375%, 01/15/2025 (Acquired Various Dates, Cost $500,000)(b)(c) | 508,750 | |||||||||
Seven Generations Energy Ltd. | |||||||||||
1,275,000 | 6.750%, 05/01/2023 (Acquired Various Dates, Cost $1,245,814)(b)(c)(d) | 1,338,750 | |||||||||
Suburban Propane Partners, L.P. / Suburban Energy Finance Corp. | |||||||||||
500,000 | 5.500%, 06/01/2024 | 495,000 | |||||||||
1,000,000 | 5.875%, 03/01/2027 | 990,000 | |||||||||
Tesoro Logistics LP / Tesoro Logistics Finance Corp. | |||||||||||
1,000,000 | 5.500%, 10/15/2019 | 1,060,000 | |||||||||
500,000 | 6.125%, 10/15/2021 | 524,375 | |||||||||
WildHorse Resource Development Corp. | |||||||||||
2,000,000 | 6.875%, 02/01/2025 (Acquired Various Dates, Cost $1,984,880)(b)(c) | 1,915,000 | |||||||||
9,610,275 | |||||||||||
Total Energy (Cost $10,409,376) | 10,600,275 | ||||||||||
FINANCIALS — 4.48% | |||||||||||
Capital Markets — 2.64% | |||||||||||
KCG Holdings, Inc. | |||||||||||
4,500,000 | 6.875%, 03/15/2020 (Acquired Various Dates, Cost $4,396,585)(b)(c) | 4,635,000 | |||||||||
MSCI Inc. | |||||||||||
1,500,000 | 5.250%, 11/15/2024 (Acquired Various Dates, Cost $1,500,000)(b)(c) | 1,586,250 | |||||||||
6,221,250 | |||||||||||
47
 Buffalo High Yield Fund
SCHEDULE OF INVESTMENTS
March 31, 2017
(Continued)
| SHARES OR FACE AMOUNT | FAIR VALUE* | ||||||||||
| FINANCIALS (Continued) | |||||||||||
Diversified Financial Services — 1.84% | |||||||||||
Cogent Communications Finance Inc. | |||||||||||
$ | 3,000,000 | 5.625%, 04/15/2021 (Acquired Various Dates, Cost $2,973,750)(b)(c) | $ | 3,067,500 | |||||||
Cott Holdings, Inc. | |||||||||||
1,250,000 | 5.500%, 04/01/2025 (Acquired Various Dates, Cost $1,249,500)(b)(c) | 1,275,375 | |||||||||
4,342,875 | |||||||||||
Total Financials (Cost $8,870,336) | 10,564,125 | ||||||||||
HEALTH CARE — 3.70% | |||||||||||
Health Care Equipment & Supplies — 0.43% | |||||||||||
Alere, Inc. | |||||||||||
1,000,000 | 6.500%, 06/15/2020 | 1,012,500 | |||||||||
1,012,500 | |||||||||||
Health Care Providers & Services — 0.90% | |||||||||||
Centene Corp. | |||||||||||
1,500,000 | 5.625%, 02/15/2021 | 1,573,650 | |||||||||
500,000 | 6.125%, 02/15/2024 | 538,125 | |||||||||
2,111,775 | |||||||||||
Pharmaceuticals — 2.37% | |||||||||||
Endo Finance LLC | |||||||||||
4,500,000 | 5.750%, 01/15/2022 (Acquired Various Dates, Cost $4,409,962)(b)(c) | 4,117,500 | |||||||||
Valeant Pharmaceuticals International, Inc. | |||||||||||
583,000 | 6.750%, 08/15/2018 (Acquired Various Dates, Cost $576,990)(b)(c) | 584,822 | |||||||||
| 1,000,000 | 5.375%, 03/15/2020(b)(d) | 898,750 | |||||||||
5,601,072 | |||||||||||
Total Health Care (Cost $8,869,460) | 8,725,347 | ||||||||||
INDUSTRIALS — 14.65% | |||||||||||
Aerospace & Defense — 4.24% | |||||||||||
KLX Inc. | |||||||||||
2,000,000 | 5.875%, 12/01/2022 (Acquired Various Dates, Cost $2,000,000)(b)(c) | 2,070,000 | |||||||||
LMI Aerospace, Inc. | |||||||||||
1,000,000 | 7.375%, 07/15/2019 | 1,042,500 | |||||||||
TransDigm, Inc. | |||||||||||
2,000,000 | 5.500%, 10/15/2020 | 2,012,500 | |||||||||
250,000 | 6.000%, 07/15/2022 | 253,900 | |||||||||
500,000 | 6.375%, 06/15/2026 | 501,545 | |||||||||
Triumph Group Inc. | |||||||||||
4,000,000 | 4.875%, 04/01/2021 | 3,880,000 | |||||||||
250,000 | 5.250%, 06/01/2022 | 241,250 | |||||||||
10,001,695 | |||||||||||
Commercial Services & Supplies — 2.57% | |||||||||||
Covanta Holding Corp. | |||||||||||
1,000,000 | 7.250%, 12/01/2020 | 1,024,170 | |||||||||
250,000 | 5.875%, 03/01/2024 | 254,375 | |||||||||
500,000 | 5.875%, 07/01/2025 | 502,187 | |||||||||
LSC Communications, Inc. | |||||||||||
1,000,000 | 8.750%, 10/15/2023 (Acquired Various Dates, Cost $1,030,000)(b)(c) | 1,030,000 | |||||||||
Mobile Mini, Inc. | |||||||||||
| 1,000,000 | 5.875%, 07/01/2024 | 1,035,000 | |||||||||
48
| SHARES OR FACE AMOUNT | FAIR VALUE* | ||||||||||
| INDUSTRIALS (Continued) | |||||||||||
Quad Graphics, Inc. | |||||||||||
$ | 2,200,000 | 7.000%, 05/01/2022 | $ | 2,211,000 | |||||||
6,056,732 | |||||||||||
Construction & Engineering — 1.91% | |||||||||||
Tutor Perini Corp. | |||||||||||
4,500,000 | 7.625%, 11/01/2018 | 4,508,438 | |||||||||
Electrical Equipment — 1.65% | |||||||||||
General Cable Corp. | |||||||||||
1,000,000 | 5.750%, 10/01/2022 | 981,180 | |||||||||
Monitronics International Inc. | |||||||||||
3,000,000 | 9.125%, 04/01/2020 | 2,915,640 | |||||||||
3,896,820 | |||||||||||
Professional Services — 2.52% | |||||||||||
CEB, Inc. | |||||||||||
2,000,000 | 5.625%, 06/15/2023(b)(e) | 2,177,500 | |||||||||
FTI Consulting, Inc. | |||||||||||
3,625,000 | 6.000%, 11/15/2022 | 3,765,469 | |||||||||
5,942,969 | |||||||||||
Trading Companies & Distributors — 1.76% | |||||||||||
Fly Leasing Ltd. | |||||||||||
2,000,000 | 6.750%, 12/15/2020 | 2,102,500 | |||||||||
2,000,000 | 6.375%, 10/15/2021 | 2,065,000 | |||||||||
4,167,500 | |||||||||||
Total Industrials (Cost $34,031,248) | 34,574,154 | ||||||||||
INFORMATION TECHNOLOGY — 9.97% | |||||||||||
Diversified Telecommunication Services — 0.96% | |||||||||||
CCO Holdings LLC / CCO Holdings Capital Corp. | |||||||||||
2,200,000 | 5.250%, 03/15/2021 | 2,261,875 | |||||||||
Electronic Equipment, Instruments & Components — 0.88% | |||||||||||
Anixter Inc. | |||||||||||
500,000 | 5.625%, 05/01/2019 | 526,250 | |||||||||
500,000 | 5.125%, 10/01/2021 | 523,750 | |||||||||
Cardtronics plc | |||||||||||
1,000,000 | 5.500%, 05/01/2025 (Acquired Various Dates, Cost $1,000,000)(c) | 1,013,750 | |||||||||
2,063,750 | |||||||||||
Internet Software & Services — 3.04% | |||||||||||
Bankrate Inc. | |||||||||||
6,000,000 | 6.125%, 08/15/2018(b)(e) | 6,045,000 | |||||||||
j2 Global, Inc. | |||||||||||
1,100,000 | 8.000%, 08/01/2020(e) | 1,137,812 | |||||||||
7,182,812 | |||||||||||
IT Services — 2.14% | |||||||||||
NeuStar, Inc. | |||||||||||
3,000,000 | 4.500%, 01/15/2023 | 3,093,750 | |||||||||
ServiceSource International Inc. | |||||||||||
2,000,000 | 1.500%, 08/01/2018 | 1,950,000 | |||||||||
5,043,750 | |||||||||||
49
 Buffalo High Yield Fund
SCHEDULE OF INVESTMENTS
March 31, 2017
(Continued)
| SHARES OR FACE AMOUNT | FAIR VALUE* | ||||||||||
| INFORMATION TECHNOLOGY (Continued) | |||||||||||
Semiconductors & Semiconductor Equipment — 0.64% | |||||||||||
National Semiconductor Corp. | |||||||||||
$ | 1,500,000 | 6.600%, 06/15/2017 | $ | 1,516,008 | |||||||
Software — 2.31% | |||||||||||
ACI Worldwide, Inc. | |||||||||||
1,250,000 | 6.375%, 08/15/2020(b)(e) | 1,284,375 | |||||||||
Nuance Communications, Inc. | |||||||||||
3,000,000 | 6.000%, 07/01/2024 (Acquired Various Dates, Cost $3,000,000)(b)(c) | 3,112,500 | |||||||||
SS&C Technologies Holdings, Inc. | |||||||||||
1,000,000 | 5.875%, 07/15/2023 | 1,063,120 | |||||||||
5,459,995 | |||||||||||
Total Information Technology (Cost $22,730,185) | 23,528,190 | ||||||||||
MATERIALS — 1.92% | |||||||||||
Chemicals — 1.92% | |||||||||||
A. Schulman, Inc. | |||||||||||
2,000,000 | 6.875%, 06/01/2023 | 2,085,000 | |||||||||
GCP Applied Technologies Inc. | |||||||||||
1,250,000 | 9.500%, 02/01/2023 (Acquired Various Dates, Cost $1,299,217)(b)(c) | 1,421,875 | |||||||||
Kraton Polymers LLC / Kraton Polymers Capital Corp. | |||||||||||
1,000,000 | 7.000%, 04/15/2025 (Acquired Various Dates, Cost $1,000,000)(b)(c) | 1,018,750 | |||||||||
Total Materials (Cost $4,234,017) | 4,525,625 | ||||||||||
TELECOMMUNICATION SERVICES — 2.74% | |||||||||||
Broadcast Media — 1.10% | |||||||||||
Nexstar Broadcasting, Inc. | |||||||||||
2,000,000 | 6.125%, 02/15/2022 (Acquired Various Dates, Cost $1,995,000)(b)(c) | 2,090,000 | |||||||||
Nexstar Escrow Corp. | |||||||||||
500,000 | 5.625%, 08/01/2024 (Acquired Various Dates, Cost $500,000)(b)(c) | 508,750 | |||||||||
2,598,750 | |||||||||||
Diversified Telecommunication Services — 1.64% | |||||||||||
Consolidated Communications Inc. | |||||||||||
4,000,000 | 6.500%, 10/01/2022 | 3,860,000 | |||||||||
Total Telecommunication Services (Cost $6,270,793) | 6,458,750 | ||||||||||
| TOTAL CORPORATE BONDS (COST $144,230,391) | 149,734,702 | ||||||||||
BANK LOANS — 12.31% | |||||||||||
Aerospace & Defense — 2.12% | |||||||||||
4,987,500 | DigitalGlobe Inc. — Term Loan B (Acquired Various Dates, Cost $4,975,031)(c) | 5,013,236 | |||||||||
Building Products — 0.42% | |||||||||||
997,500 | Builders FirstSource, Inc. — Term Loan B (Acquired Various Dates, Cost $998,730)(c) | 998,622 | |||||||||
Chemicals — 1.18% | |||||||||||
779,930 | Kraton Polymers LLC — Term Loan B (Acquired Various Dates, Cost $748,502)(c) | 788,540 | |||||||||
1,985,025 | Nexeo Solutions, Inc. — Term Loan B (Acquired Various Dates, Cost $1,991,055)(c) | 2,006,364 | |||||||||
2,794,904 | |||||||||||
Diversified Telecommunicaiton Services — 0.69% | |||||||||||
1,590,000 | Diebold Nixdorf, Inc. — Term Loan B(e) | 1,617,324 | |||||||||
50
| SHARES OR FACE AMOUNT | FAIR VALUE* | ||||||||||
Food Products — 1.03% | |||||||||||
$ | 2,486,253 | Amplify Snack Brands, Inc.(e) | $ | 2,420,218 | |||||||
Health Care Equipment & Supplies — 0.74% | |||||||||||
1,720,035 | Catalent, Inc.(e) | 1,741,897 | |||||||||
Hotels, Restaurants & Leisure — 0.85% | |||||||||||
1,994,987 | Planet Fitness Holdings, LLC — Term Loan B (Acquired Various Dates, Cost $2,012,397)(c) | 2,009,950 | |||||||||
Machinery — 0.18% | |||||||||||
423,077 | Welbilt, Inc. (Acquired Various Dates, Cost $415,659)(c) | 428,190 | |||||||||
Media — 0.04% | |||||||||||
100,000 | CBS Radio Inc. — Term Loan B (Acquired Various Dates, Cost $100,000)(c) | 100,688 | |||||||||
Pharmaceuticals — 4.21% | |||||||||||
5,915,783 | Akorn, Inc. — Term Loan B (Acquired Various Dates, Cost $5,835,043)(c) | 5,989,730 | |||||||||
3,917,577 | Valeant Pharmaceuticals International, Inc. (Acquired Various Dates, Cost $3,906,459)(c) | 3,933,012 | |||||||||
9,922,742 | |||||||||||
Trading Companies & Distributors — 0.85% | |||||||||||
1,980,050 | SiteOne Landscape Supply, Inc. — Term Loan B (Acquired Various Dates, Cost $1,992,207)(c) | 2,002,335 | |||||||||
| TOTAL BANK LOANS (COST $28,750,136) | 29,050,106 | ||||||||||
SHORT TERM INVESTMENTS — 9.54% | |||||||||||
INVESTMENT COMPANY — 9.54% | |||||||||||
20,621,979 | Fidelity Institutional Money Market Fund — Government Portfolio — 0.01%(f) | 20,621,979 | |||||||||
1,904,576 | The STIT-Treasury Portfolio — 0.01%(f) | 1,904,576 | |||||||||
Total Investment Company | 22,526,555 | ||||||||||
| TOTAL SHORT TERM INVESTMENTS (COST $22,526,555) | 22,526,555 | ||||||||||
| TOTAL INVESTMENTS — 99.01% (COST $224,683,535) | 233,674,604 | ||||||||||
Other Assets in Excess of Liabilities — 0.99% | 2,331,577 | ||||||||||
TOTAL NET ASSETS — 100.00% | $ | 236,006,181 | |||||||||
PLC — Public Limited Company
(a) Non income producing.
(b) These securities are deemed illiquid. The total value of these securities amounted to $5,168,750 (2.19% of net assets) at March 31, 2017.
(c) Restricted security deemed liquid. The total value of these securities amounted to $79,033,714 (33.49% of net assets) at March 31, 2017.
(d) Foreign Issued Securities. The total value of these securities amounted to $3,745,391 (1.59% of net assets) at March 31, 2017.
(e) 144A Securities. The total value of these securities amounted to $17,939,411 (7.60% of net assets) at March 31, 2017.
(f) The rate quoted is the annualized seven-day effective yield as of March 31, 2017.
* See Note 1A of accompanying Notes to Financial Statements regarding valuation of securities.
The Global Industry Classification Standard (GICS) was developed by and/or is the exclusive property of MSCI, Inc. and Standard & Poor's Financial Services LLC ("S&P"). GICS is a service mark of MSCI and S&P and has been licensed for use by U.S. Bancorp Fund Services, LLC.
The accompanying notes are an integral part of these financial statements.
51
 Buffalo International Fund
SCHEDULE OF INVESTMENTS
March 31, 2017
| SHARES OR FACE AMOUNT | FAIR VALUE* | ||||||||||
COMMON STOCKS — 93.30% | |||||||||||
BELGIUM — 1.03% | |||||||||||
Beverages — 1.03% | |||||||||||
19,000 | Anheuser-Busch InBev SA/NV | $ | 2,085,707 | ||||||||
Total Belgium (Cost $1,902,411) | 2,085,707 | ||||||||||
BRAZIL — 0.82% | |||||||||||
Beverages — 0.82% | |||||||||||
288,400 | Ambev SA — ADR | 1,661,184 | |||||||||
Total Brazil (Cost $1,538,935) | 1,661,184 | ||||||||||
CANADA — 1.53% | |||||||||||
Road & Rail — 1.53% | |||||||||||
42,000 | Canadian National Railway Co. | 3,105,060 | |||||||||
Total Canada (Cost $2,765,770) | 3,105,060 | ||||||||||
FINLAND — 0.41% | |||||||||||
Leisure Products — 0.41% | |||||||||||
37,000 | Amer Sports Corp. | 836,011 | |||||||||
Total Finland (Cost $1,022,776) | 836,011 | ||||||||||
FRANCE — 15.54% | |||||||||||
Beverages — 1.25% | |||||||||||
21,500 | Pernod Ricard SA | 2,543,632 | |||||||||
Chemicals — 1.06% | |||||||||||
18,820 | Air Liquide SA | 2,150,272 | |||||||||
Electrical Equipment — 1.01% | |||||||||||
28,000 | Schneider Electric SE | 2,050,012 | |||||||||
Food Products — 1.67% | |||||||||||
27,503 | Naturex(a)(b) | 2,417,053 | |||||||||
14,280 | Vilmorin & Cie S.A. | 983,656 | |||||||||
3,400,709 | |||||||||||
Health Care Equipment & Supplies — 0.14% | |||||||||||
4,341 | Sartorius Stedim Biotech | 292,447 | |||||||||
Hotels, Restaurants & Leisure — 1.60% | |||||||||||
78,000 | Accor SA | 3,249,376 | |||||||||
Internet Software & Services — 1.05% | |||||||||||
42,800 | Criteo SA — ADR(a) | 2,139,572 | |||||||||
Life Sciences Tools & Services — 0.69% | |||||||||||
3,200 | Eurofins Scientific SE | 1,392,306 | |||||||||
Media — 1.53% | |||||||||||
44,500 | Publicis Groupe SA | 3,109,939 | |||||||||
Software — 1.70% | |||||||||||
40,000 | Dassault Systemes SE | 3,462,417 | |||||||||
Textiles, Apparel & Luxury Goods — 3.84% | |||||||||||
17,000 | Kering | 4,396,990 | |||||||||
15,500 | LVMH Moet Hennessy Louis Vuitton SE | 3,403,822 | |||||||||
7,800,812 | |||||||||||
Total France (Cost $27,836,987) | 31,591,494 | ||||||||||
52
| SHARES OR FACE AMOUNT | FAIR VALUE* | ||||||||||
GERMANY — 26.25% | |||||||||||
Chemicals — 3.80% | |||||||||||
24,000 | Linde A.G. | $ | 3,996,671 | ||||||||
56,000 | Symrise AG | 3,724,253 | |||||||||
7,720,924 | |||||||||||
Construction Materials — 1.91% | |||||||||||
41,500 | HeidelbergCement AG | 3,885,340 | |||||||||
Electronic Equipment, Instruments & Components — 1.75% | |||||||||||
143,711 | Jenoptik AG | 3,562,956 | |||||||||
1,000 | PA Power Automation AG(a) | 1,760 | |||||||||
3,564,716 | |||||||||||
Health Care Equipment & Supplies — 1.46% | |||||||||||
69,525 | Carl Zeiss Meditec AG | 2,965,297 | |||||||||
Health Care Providers & Services — 2.88% | |||||||||||
73,000 | Fresenius SE & Co. KGaA | 5,866,447 | |||||||||
Household Products — 1.96% | |||||||||||
35,900 | Henkel AG & Co. KGaA | 3,988,761 | |||||||||
Industrial Conglomerates — 2.00% | |||||||||||
29,700 | Siemens A.G. — ADR | 4,068,233 | |||||||||
Insurance — 0.93% | |||||||||||
9,700 | Muenchener Rueckversicherungs-Gesellschaft AG. | 1,897,821 | |||||||||
IT Services — 1.96% | |||||||||||
72,000 | Wirecard AG | 3,986,430 | |||||||||
Machinery — 0.09% | |||||||||||
3,000 | Aumann AG(a) | 173,462 | |||||||||
Media — 0.19% | |||||||||||
10,000 | CTS Eventim AG & Co. KGaA | 387,036 | |||||||||
Pharmaceuticals — 2.10% | |||||||||||
9,000 | Bayer AG — ADR | 1,037,880 | |||||||||
28,000 | Bayer AG | 3,227,507 | |||||||||
4,265,387 | |||||||||||
Software — 2.86% | |||||||||||
59,300 | SAP SE — ADR | 5,821,481 | |||||||||
Textiles, Apparel & Luxury Goods — 1.80% | |||||||||||
19,200 | adidas AG | 3,652,052 | |||||||||
Trading Companies & Distributors — 0.55% | |||||||||||
20,000 | Brenntag AG | 1,121,210 | |||||||||
Total Germany (Cost $38,368,972) | 53,364,597 | ||||||||||
HONG KONG — 3.96% | |||||||||||
Industrial Conglomerates — 3.33% | |||||||||||
300,000 | Beijing Enterprise Holdings Ltd. | 1,551,824 | |||||||||
44,184 | Jardine Matheson Holding Ltd. | 2,838,822 | |||||||||
56,695 | Jardine Strategic Holdings Ltd. | 2,381,190 | |||||||||
6,771,836 | |||||||||||
Specialty Retail — 0.63% | |||||||||||
630,750 | L'Occitane International SA | 1,283,982 | |||||||||
Total Hong Kong (Cost $6,969,225) | 8,055,818 | ||||||||||
53
 Buffalo International Fund
SCHEDULE OF INVESTMENTS
March 31, 2017
(Continued)
| SHARES OR FACE AMOUNT | FAIR VALUE* | ||||||||||
INDIA — 1.45% | |||||||||||
Banks — 1.45% | |||||||||||
343,800 | ICICI Bank Ltd. — ADR | $ | 2,956,680 | ||||||||
Total India (Cost $3,620,595) | 2,956,680 | ||||||||||
IRELAND — 1.88% | |||||||||||
Pharmaceuticals — 1.88% | |||||||||||
16,000 | Allergan plc | 3,822,720 | |||||||||
Total Ireland (Cost $2,679,874) | 3,822,720 | ||||||||||
ITALY — 2.87% | |||||||||||
Beverages — 2.11% | |||||||||||
370,000 | Davide Campari-Milano SpA | 4,290,576 | |||||||||
Internet & Direct Marketing Retail — 0.76% | |||||||||||
65,000 | Yoox Net-A-Porter Group SpA(a) | 1,547,718 | |||||||||
Total Italy (Cost $4,499,139) | 5,838,294 | ||||||||||
JAPAN — 6.26% | |||||||||||
Beverages — 0.59% | |||||||||||
32,000 | Asahi Group Holdings Ltd. | 1,209,521 | |||||||||
Electronic Equipment, Instruments & Components — 3.37% | |||||||||||
25,000 | Murata Manufacturing Co., Ltd. | 3,555,870 | |||||||||
75,000 | Omron Corp. | 3,290,892 | |||||||||
6,846,762 | |||||||||||
Internet & Direct Marketing Retail — 0.88% | |||||||||||
81,000 | START TODAY Co., LTD. | 1,791,997 | |||||||||
Machinery — 1.41% | |||||||||||
14,000 | FANUC Corp. | 2,869,667 | |||||||||
Total Japan (Cost $9,595,045) | 12,717,947 | ||||||||||
MEXICO — 0.44% | |||||||||||
Beverages — 0.44% | |||||||||||
500,000 | Becle, S.A.B. de C.V.(a) | 886,378 | |||||||||
Total Mexico (Cost $834,141) | 886,378 | ||||||||||
NETHERLANDS — 5.83% | |||||||||||
Internet Software & Services — 0.67% | |||||||||||
104,810 | Trivago N.V. — ADR(a) | 1,365,674 | |||||||||
IT Services — 2.09% | |||||||||||
107,499 | InterXion Holding NV(a) | 4,252,661 | |||||||||
Personal Products — 1.58% | |||||||||||
64,700 | Unilever N.V. — NY Shares — ADR | 3,214,296 | |||||||||
Semiconductors & Semiconductor Equipment — 1.49% | |||||||||||
22,741 | ASML Holding NV — NY Shares — ADR | 3,020,005 | |||||||||
Total Netherlands (Cost $7,351,132) | 11,852,636 | ||||||||||
NORWAY — 1.49% | |||||||||||
Commercial Services & Supplies — 1.03% | |||||||||||
192,000 | Tomra Systems ASA | 2,101,978 | |||||||||
54
| SHARES OR FACE AMOUNT | FAIR VALUE* | ||||||||||
| NORWAY (Continued) | |||||||||||
Diversified Telecommunication Services — 0.46% | |||||||||||
56,000 | Telenor ASA | $ | 932,007 | ||||||||
Total Norway (Cost $2,699,747) | 3,033,985 | ||||||||||
REPUBLIC OF KOREA — 0.72% | |||||||||||
Semiconductors & Semiconductor Equipment — 0.72% | |||||||||||
800 | Samsung Electronic Co., Ltd. | 1,473,665 | |||||||||
Total Republic of Korea (Cost $894,090) | 1,473,665 | ||||||||||
SINGAPORE — 2.35% | |||||||||||
Semiconductors & Semiconductor Equipment — 2.34% | |||||||||||
21,770 | Broadcom Ltd. | 4,766,759 | |||||||||
Total Singapore (Cost $736,033) | 4,766,759 | ||||||||||
SPAIN — 0.96% | |||||||||||
Specialty Retail — 0.96% | |||||||||||
55,500 | Industria de Diseno Textil, S.A. | 1,956,218 | |||||||||
Total Spain (Cost $994,637) | 1,956,218 | ||||||||||
SWITZERLAND — 7.38% | |||||||||||
Building Products — 0.19% | |||||||||||
500 | dormakaba Holding AG | 397,844 | |||||||||
Capital Markets — 1.31% | |||||||||||
53,337 | Julius Baer Group Ltd. | 2,662,457 | |||||||||
Construction Materials — 1.41% | |||||||||||
48,500 | LafargeHolcim Ltd. | 2,866,470 | |||||||||
Insurance — 1.55% | |||||||||||
35,000 | Swiss Re AG | 3,143,064 | |||||||||
Pharmaceuticals — 1.67% | |||||||||||
50,000 | Roche Holding AG — ADR | 1,601,500 | |||||||||
7,000 | Roche Holding AG | 1,787,650 | |||||||||
3,389,150 | |||||||||||
Specialty Retail — 1.25% | |||||||||||
16,700 | Dufry AG(a) | 2,544,222 | |||||||||
Total Switzerland (Cost $14,645,846) | 15,003,207 | ||||||||||
TAIWAN, PROVINCE OF CHINA — 2.61% | |||||||||||
Semiconductors & Semiconductor Equipment — 2.61% | |||||||||||
161,281 | Taiwan Semiconductor Manufacturing Co. Ltd. — ADR | 5,296,468 | |||||||||
Total Taiwan, Province of China (Cost $2,178,768) | 5,296,468 | ||||||||||
UNITED KINGDOM — 9.52% | |||||||||||
Beverages — 1.38% | |||||||||||
24,300 | Diageo PLC — ADR | 2,808,594 | |||||||||
Health Care Equipment & Supplies — 1.22% | |||||||||||
80,100 | Smith & Nephew plc — ADR | 2,477,493 | |||||||||
Hotels, Restaurants & Leisure — 2.59% | |||||||||||
66,076 | InterContinental Hotels Group PLC | 3,235,294 | |||||||||
40,800 | Whitbread PLC | 2,023,259 | |||||||||
5,258,553 | |||||||||||
55
 Buffalo International Fund
SCHEDULE OF INVESTMENTS
March 31, 2017
(Continued)
| SHARES OR FACE AMOUNT | FAIR VALUE* | ||||||||||
| UNITED KINGDOM (Continued) | |||||||||||
Insurance — 1.87% | |||||||||||
32,000 | Aon PLC | $ | 3,798,080 | ||||||||
Media — 1.56% | |||||||||||
90,600 | Liberty Global PLC — Series C(a) | 3,174,624 | |||||||||
Textiles, Apparel & Luxury Goods — 0.90% | |||||||||||
85,000 | Burberry Group PLC | 1,835,996 | |||||||||
Total United Kingdom (Cost $17,505,631) | 19,353,340 | ||||||||||
| TOTAL COMMON STOCKS (COST $148,639,754) | 189,658,168 | ||||||||||
SHORT TERM INVESTMENT — 6.38% | |||||||||||
INVESTMENT COMPANY — 6.38% | |||||||||||
12,972,330 | Fidelity Institutional Money Market Fund — Government Portfolio — 0.01%(c) | 12,972,330 | |||||||||
Total Investment Company | 12,972,330 | ||||||||||
| TOTAL SHORT TERM INVESTMENT (COST $12,972,330) | 12,972,330 | ||||||||||
| TOTAL INVESTMENTS — 99.68% (COST $161,612,084) | 202,630,498 | ||||||||||
| Other Assets in Excess of Liabilities — 0.32% | 645,808 | ||||||||||
TOTAL NET ASSETS — 100.00% | $ | 203,276,306 | |||||||||
ADR — American Depositary Receipt
PLC — Public Limited Company
(a) Non income producing.
(b) A portion of this security is deemed illiquid. The total value of this security amounted to $567,902 (0.28% of net assets) at March 31, 2017.
(c) The rate quoted is the annualized seven-day effective yield as of March 31, 2017.
* See Note 1A of accompanying Notes to Financial Statements regarding valuation of securities.
56
As of March 31, 2017, the industry diversification was as follows:
FAIR VALUE | PERCENTAGE | ||||||||||
Common Stocks | |||||||||||
Banks | $ | 2,956,680 | 1.45 | % | |||||||
Beverages | 15,485,592 | 7.62 | % | ||||||||
Building Products | 397,844 | 0.20 | % | ||||||||
Capital Markets | 2,662,457 | 1.31 | % | ||||||||
Chemicals | 9,871,196 | 4.86 | % | ||||||||
Commercial Services & Supplies | 2,101,978 | 1.03 | % | ||||||||
Construction Materials | 6,751,810 | 3.32 | % | ||||||||
Diversified Telecommunication Services | 932,007 | 0.46 | % | ||||||||
Electrical Equipment | 2,050,012 | 1.01 | % | ||||||||
Electronic Equipment, Instruments & Components | 10,411,478 | 5.12 | % | ||||||||
Food Products | 3,400,709 | 1.67 | % | ||||||||
Health Care Equipment & Supplies | 5,735,237 | 2.82 | % | ||||||||
Health Care Providers & Services | 5,866,447 | 2.89 | % | ||||||||
Hotels, Restaurants & Leisure | 8,507,929 | 4.19 | % | ||||||||
Household Products | 3,988,761 | 1.96 | % | ||||||||
Industrial Conglomerates | 10,840,069 | 5.33 | % | ||||||||
Insurance | 8,838,965 | 4.35 | % | ||||||||
Internet & Direct Marketing Retail | 3,339,715 | 1.64 | % | ||||||||
Internet Software & Services | 3,505,246 | 1.72 | % | ||||||||
IT Services | 8,239,091 | 4.05 | % | ||||||||
Leisure Products | 836,011 | 0.41 | % | ||||||||
Life Sciences Tools & Services | 1,392,306 | 0.68 | % | ||||||||
Machinery | 3,043,129 | 1.50 | % | ||||||||
Media | 6,671,600 | 3.28 | % | ||||||||
Personal Products | 3,214,296 | 1.58 | % | ||||||||
Pharmaceuticals | 11,477,257 | 5.65 | % | ||||||||
Road & Rail | 3,105,060 | 1.53 | % | ||||||||
Semiconductors & Semiconductor Equipment | 14,556,897 | 7.16 | % | ||||||||
Software | 9,283,898 | 4.57 | % | ||||||||
Specialty Retail | 5,784,422 | 2.84 | % | ||||||||
Textiles, Apparel & Luxury Goods | 13,288,859 | 6.54 | % | ||||||||
Trading Companies & Distributors | 1,121,210 | 0.55 | % | ||||||||
Total Common Stocks | 189,658,168 | 93.30 | % | ||||||||
Short Term Investment | |||||||||||
Investment Company | 12,972,330 | 6.38 | % | ||||||||
Total Short Term Investment | 12,972,330 | 6.38 | % | ||||||||
Total Investments | 202,630,498 | 99.68 | % | ||||||||
| Other Assets in Excess of Liabilities | 645,808 | 0.32 | % | ||||||||
TOTAL NET ASSETS | $ | 203,276,306 | 100.00 | % | |||||||
The Global Industry Classification Standard (GICS) was developed by and/or is the exclusive property of MSCI, Inc. and Standard & Poor's Financial Services LLC ("S&P"). GICS is a service mark of MSCI and S&P and has been licensed for use by U.S. Bancorp Fund Services, LLC.
The accompanying notes are an integral part of these financial statements.
57
 Buffalo Large Cap Fund
SCHEDULE OF INVESTMENTS
March 31, 2017
| SHARES OR FACE AMOUNT | FAIR VALUE* | ||||||||||
COMMON STOCKS — 92.42% | |||||||||||
CONSUMER DISCRETIONARY — 18.16% | |||||||||||
Hotels, Restaurants & Leisure — 3.41% | |||||||||||
2,325 | Chipotle Mexican Grill, Inc.(a) | $ | 1,035,834 | ||||||||
9,955 | Marriott International, Inc. — Class A | 937,562 | |||||||||
1,973,396 | |||||||||||
Internet & Direct Marketing Retail — 5.64% | |||||||||||
2,425 | Amazon.com, Inc.(a) | 2,149,860 | |||||||||
625 | The Priceline Group Inc.(a) | 1,112,481 | |||||||||
3,262,341 | |||||||||||
Media — 0.99% | |||||||||||
1,759 | Charter Communications, Inc. — Class A(a) | 575,756 | |||||||||
Multiline Retail — 1.35% | |||||||||||
11,200 | Dollar General Corp. | 780,976 | |||||||||
Specialty Retail — 3.91% | |||||||||||
14,700 | Lowe's Companies, Inc. | 1,208,487 | |||||||||
13,300 | The TJX Companies, Inc. | 1,051,764 | |||||||||
2,260,251 | |||||||||||
Textiles, Apparel & Luxury Goods — 2.86% | |||||||||||
15,500 | Luxottica Group S.p.A. — ADR(b) | 853,275 | |||||||||
43,900 | Under Armour, Inc. — Class C(a) | 803,370 | |||||||||
1,656,645 | |||||||||||
Total Consumer Discretionary (Cost $7,114,327) | 10,509,365 | ||||||||||
CONSUMER STAPLES — 6.13% | |||||||||||
Food & Staples Retailing — 4.17% | |||||||||||
7,800 | Costco Wholesale Corp. | 1,307,982 | |||||||||
14,100 | CVS Health Corp. | 1,106,850 | |||||||||
2,414,832 | |||||||||||
Personal Products — 1.96% | |||||||||||
13,400 | The Estee Lauder Companies Inc. — Class A | 1,136,186 | |||||||||
Total Consumer Staples (Cost $2,930,636) | 3,551,018 | ||||||||||
ENERGY — 2.91% | |||||||||||
Energy Equipment & Services — 2.91% | |||||||||||
21,579 | Schlumberger Ltd.(b) | 1,685,320 | |||||||||
Total Energy (Cost $1,382,078) | 1,685,320 | ||||||||||
FINANCIALS — 8.33% | |||||||||||
Capital Markets — 8.33% | |||||||||||
11,900 | CME Group Inc. | 1,413,720 | |||||||||
22,875 | Intercontinental Exchange, Inc. | 1,369,526 | |||||||||
8,800 | S&P Global, Inc. | 1,150,512 | |||||||||
13,000 | T. Rowe Price Group Inc. | 885,950 | |||||||||
Total Financials (Cost $3,468,825) | 4,819,708 | ||||||||||
HEALTH CARE — 17.08% | |||||||||||
Biotechnology — 4.50% | |||||||||||
3,750 | Biogen Idec Inc.(a) | 1,025,325 | |||||||||
4,900 | Shire — ADR(b) | 853,727 | |||||||||
6,600 | Vertex Pharmaceuticals Inc.(a) | 721,710 | |||||||||
2,600,762 | |||||||||||
58
| SHARES OR FACE AMOUNT | FAIR VALUE* | ||||||||||
| HEALTH CARE (Continued) | |||||||||||
Health Care Equipment & Supplies — 5.22% | |||||||||||
11,300 | Danaher Corp. | $ | 966,489 | ||||||||
15,900 | Dentsply Sirona Inc. | 992,796 | |||||||||
13,200 | Medtronic, PLC(b) | 1,063,392 | |||||||||
3,022,677 | |||||||||||
Health Care Technology — 2.25% | |||||||||||
11,550 | athenahealth Inc.(a) | 1,301,569 | |||||||||
Pharmaceuticals — 5.11% | |||||||||||
64,200 | Roche Holding AG — ADR(b) | 2,056,326 | |||||||||
16,900 | Zoetis Inc. | 901,953 | |||||||||
2,958,279 | |||||||||||
Total Health Care (Cost $9,524,725) | 9,883,287 | ||||||||||
INDUSTRIALS — 9.10% | |||||||||||
Air Freight & Logistics — 1.90% | |||||||||||
10,250 | United Parcel Service, Inc. — Class B | 1,099,825 | |||||||||
Commercial Services & Supplies — 3.39% | |||||||||||
14,000 | Stericycle, Inc.(a) | 1,160,460 | |||||||||
11,000 | Waste Management, Inc. | 802,120 | |||||||||
1,962,580 | |||||||||||
Industrial Conglomerates — 2.09% | |||||||||||
9,700 | Honeywell International, Inc. | 1,211,239 | |||||||||
Road & Rail — 1.72% | |||||||||||
11,600 | Kansas City Southern | 994,816 | |||||||||
Total Industrials (Cost $4,698,295) | 5,268,460 | ||||||||||
INFORMATION TECHNOLOGY — 28.13% | |||||||||||
Electronic Equipment, Instruments & Components — 1.07% | |||||||||||
19,300 | Trimble Inc.(a) | 617,793 | |||||||||
Internet Software & Services — 7.09% | |||||||||||
2,245 | Alphabet, Inc. — Class A(a) | 1,903,311 | |||||||||
1,148 | Alphabet, Inc. — Class C(a) | 952,335 | |||||||||
8,800 | Facebook, Inc. — Class A(a) | 1,250,040 | |||||||||
4,105,686 | |||||||||||
IT Services — 4.59% | |||||||||||
4,750 | Alliance Data Systems Corp. | 1,182,750 | |||||||||
16,600 | Visa Inc. — Class A | 1,475,242 | |||||||||
2,657,992 | |||||||||||
Semiconductors & Semiconductor Equipment — 3.46% | |||||||||||
33,800 | Intel Corp. | 1,219,166 | |||||||||
13,715 | QUALCOMM, Inc. | 786,418 | |||||||||
2,005,584 | |||||||||||
Software — 8.17% | |||||||||||
40,100 | Microsoft Corp. | 2,640,986 | |||||||||
27,940 | Oracle Corp. | 1,246,403 | |||||||||
9,700 | Red Hat, Inc.(a) | 839,050 | |||||||||
4,726,439 | |||||||||||
59
 Buffalo Large Cap Fund
SCHEDULE OF INVESTMENTS
March 31, 2017
(Continued)
| SHARES OR FACE AMOUNT | FAIR VALUE* | ||||||||||
| INFORMATION TECHNOLOGY (Continued) | |||||||||||
Technology Hardware, Storage & Peripherals — 3.75% | |||||||||||
15,095 | Apple Inc. | $ | 2,168,548 | ||||||||
Total Information Technology (Cost $10,574,809) | 16,282,042 | ||||||||||
MATERIALS — 2.58% | |||||||||||
Chemicals — 2.58% | |||||||||||
12,600 | Praxair, Inc. | 1,494,360 | |||||||||
Total Materials (Cost $1,437,618) | 1,494,360 | ||||||||||
| TOTAL COMMON STOCKS (COST $41,131,313) | 53,493,560 | ||||||||||
REAL ESTATE INVESTMENT TRUST (REIT) — 2.22% | |||||||||||
REAL ESTATE — 2.22% | |||||||||||
3,211 | Equinix Inc. | 1,285,588 | |||||||||
Total Real Estate (Cost $539,541) | 1,285,588 | ||||||||||
| TOTAL REIT (COST $539,541) | 1,285,588 | ||||||||||
SHORT TERM INVESTMENT — 6.21% | |||||||||||
INVESTMENT COMPANY — 6.21% | |||||||||||
3,596,018 | Fidelity Institutional Money Market Fund — Government Portfolio — 0.01%(c) | 3,596,018 | |||||||||
Total Investment Company | 3,596,018 | ||||||||||
| TOTAL SHORT TERM INVESTMENT (COST $3,596,018) | 3,596,018 | ||||||||||
| TOTAL INVESTMENTS — 100.85% (COST $45,266,872) | 58,375,166 | ||||||||||
Liabilities in Excess of Other Assets — (0.85)% | (494,562 | ) | |||||||||
TOTAL NET ASSETS — 100.00% | $ | 57,880,604 | |||||||||
ADR — American Depositary Receipt
PLC — Public Limited Company
(a) Non income producing.
(b) Foreign Issued Securities. The total value of these securities amounted to $6,512,040 (11.25% of net assets) at March 31, 2017.
(c) The rate quoted is the annualized seven-day effective yield as of March 31, 2017.
* See Note 1A of accompanying Notes to Financial Statements regarding valuation of securities.
The Global Industry Classification Standard (GICS) was developed by and/or is the exclusive property of MSCI, Inc. and Standard & Poor's Financial Services LLC ("S&P"). GICS is a service mark of MSCI and S&P and has been licensed for use by U.S. Bancorp Fund Services, LLC.
The accompanying notes are an integral part of these financial statements.
60
 Buffalo Mid Cap Fund
SCHEDULE OF INVESTMENTS
March 31, 2017
| SHARES OR FACE AMOUNT | FAIR VALUE* | ||||||||||
COMMON STOCKS — 86.83% | |||||||||||
CONSUMER DISCRETIONARY — 18.31% | |||||||||||
Auto Components — 0.61% | |||||||||||
57,550 | BorgWarner, Inc. | $ | 2,405,014 | ||||||||
Distributors — 1.19% | |||||||||||
160,815 | LKQ Corp.(a) | 4,707,055 | |||||||||
Hotels, Restaurants & Leisure — 1.05% | |||||||||||
9,330 | Chipotle Mexican Grill, Inc.(a) | 4,156,702 | |||||||||
Household Durables — 1.27% | |||||||||||
21,890 | Mohawk Industries, Inc.(a) | 5,023,536 | |||||||||
Internet & Direct Marketing Retail — 1.13% | |||||||||||
35,237 | Expedia, Inc. | 4,445,852 | |||||||||
Internet Software & Services — 0.95% | |||||||||||
317,590 | Pandora Media Inc.(a) | 3,750,738 | |||||||||
Leisure Products — 1.12% | |||||||||||
52,780 | Polaris Industries Inc. | 4,422,964 | |||||||||
Media — 3.08% | |||||||||||
113,015 | AMC Networks, Inc. — Class A(a) | 6,631,720 | |||||||||
102,943 | Lions Gate Entertainment Corp. — Class A(a)(b) | 2,734,153 | |||||||||
115,513 | Lions Gate Entertainment Corp. — Class B(a)(b) | 2,816,195 | |||||||||
12,182,068 | |||||||||||
Multiline Retail — 1.40% | |||||||||||
70,660 | Dollar Tree, Inc.(a) | 5,543,984 | |||||||||
Specialty Retail — 4.56% | |||||||||||
42,655 | Advance Auto Parts, Inc. | 6,324,030 | |||||||||
6,965 | O'Reilly Automotive, Inc.(a) | 1,879,435 | |||||||||
76,575 | Tractor Supply Co. | 5,281,378 | |||||||||
84,840 | Williams-Sonoma, Inc. | 4,549,121 | |||||||||
18,033,964 | |||||||||||
Textiles, Apparel & Luxury Goods — 1.95% | |||||||||||
160,330 | Hanesbrands, Inc. | 3,328,451 | |||||||||
18,345 | Ralph Lauren Corp. | 1,497,319 | |||||||||
158,130 | Under Armour, Inc. — Class C(a) | 2,893,779 | |||||||||
7,719,549 | |||||||||||
Total Consumer Discretionary (Cost $67,809,660) | 72,391,426 | ||||||||||
CONSUMER STAPLES — 8.38% | |||||||||||
Beverages — 0.89% | |||||||||||
21,585 | Constellation Brands, Inc. — Class A | 3,498,281 | |||||||||
Food & Staples Retailing — 1.39% | |||||||||||
185,055 | Whole Foods Market, Inc. | 5,499,835 | |||||||||
Food Products — 5.41% | |||||||||||
123,255 | The Hain Celestial Group, Inc.(a) | 4,585,086 | |||||||||
49,195 | Ingredion, Inc. | 5,924,554 | |||||||||
37,355 | Kellogg Co. | 2,712,346 | |||||||||
145,345 | The WhiteWave Foods Co.(a) | 8,161,122 | |||||||||
21,383,108 | |||||||||||
Personal Products — 0.69% | |||||||||||
95,370 | e.l.f. Beauty, Inc.(a) | 2,746,656 | |||||||||
Total Consumer Staples (Cost $27,077,152) | 33,127,880 | ||||||||||
61
 Buffalo Mid Cap Fund
SCHEDULE OF INVESTMENTS
March 31, 2017
(Continued)
| SHARES OR FACE AMOUNT | FAIR VALUE* | ||||||||||
ENERGY — 2.87% | |||||||||||
Energy Equipment & Services — 2.15% | |||||||||||
158,320 | Forum Energy Technologies Inc.(a) | $ | 3,277,224 | ||||||||
160,375 | TechnipFMC plc(a) | 5,212,187 | |||||||||
8,489,411 | |||||||||||
Oil, Gas & Consumable Fuels — 0.72% | |||||||||||
219,790 | Jagged Peak Energy Inc.(a) | 2,866,062 | |||||||||
Total Energy (Cost $11,553,242) | 11,355,473 | ||||||||||
FINANCIALS — 11.61% | |||||||||||
Capital Markets — 11.61% | |||||||||||
52,310 | CME Group Inc. | 6,214,428 | |||||||||
90,205 | Financial Engines Inc. | 3,928,428 | |||||||||
18,685 | MarketAxess Holdings, Inc. | 3,503,251 | |||||||||
49,110 | Moody's Corp. | 5,502,284 | |||||||||
73,355 | MSCI, Inc. | 7,129,372 | |||||||||
72,625 | Northern Trust Corp. | 6,287,872 | |||||||||
102,840 | Oaktree Capital Group LLC | 4,658,652 | |||||||||
98,715 | SEI Investments Co. | 4,979,185 | |||||||||
54,410 | T. Rowe Price Group Inc. | 3,708,042 | |||||||||
Total Financials (Cost $27,729,520) | 45,911,514 | ||||||||||
HEALTH CARE — 12.20% | |||||||||||
Health Care Equipment & Supplies — 2.53% | |||||||||||
20,185 | Align Technology, Inc.(a) | 2,315,422 | |||||||||
77,025 | Dentsply Sirona Inc. | 4,809,441 | |||||||||
30,780 | Nevro Corp.(a) | 2,884,086 | |||||||||
10,008,949 | |||||||||||
Health Care Providers & Services — 2.17% | |||||||||||
79,815 | AmerisourceBergen Corp. | 7,063,628 | |||||||||
35,685 | HealthEquity, Inc.(a) | 1,514,828 | |||||||||
8,578,456 | |||||||||||
Health Care Technology — 1.35% | |||||||||||
90,825 | Cerner Corp.(a) | 5,345,051 | |||||||||
Life Sciences Tools & Services — 2.85% | |||||||||||
62,890 | Bio-Techne Corp. | 6,392,768 | |||||||||
28,490 | Illumina, Inc.(a) | 4,861,534 | |||||||||
11,254,302 | |||||||||||
Pharmaceuticals — 3.30% | |||||||||||
193,595 | Akorn, Inc.(a) | 4,661,767 | |||||||||
25,030 | Perrigo Co. PLC(b) | 1,661,742 | |||||||||
125,905 | Zoetis Inc | 6,719,550 | |||||||||
13,043,059 | |||||||||||
Total Health Care (Cost $41,034,106) | 48,229,817 | ||||||||||
INDUSTRIALS — 14.73% | |||||||||||
Building Products — 1.89% | |||||||||||
112,565 | Masco Corp. | 3,826,085 | |||||||||
52,570 | Trex Co., Inc.(a) | 3,647,832 | |||||||||
7,473,917 | |||||||||||
62
| SHARES OR FACE AMOUNT | FAIR VALUE* | ||||||||||
| INDUSTRIALS (Continued) | |||||||||||
Commercial Services & Supplies — 1.68% | |||||||||||
80,300 | Stericycle, Inc.(a) | $ | 6,656,067 | ||||||||
Electrical Equipment — 2.29% | |||||||||||
23,062 | Acuity Brands, Inc. | 4,704,648 | |||||||||
80,150 | AMETEK, Inc. | 4,334,512 | |||||||||
9,039,160 | |||||||||||
Machinery — 1.55% | |||||||||||
17,395 | Nordson Corp. | 2,136,802 | |||||||||
79,580 | Xylem, Inc. | 3,996,507 | |||||||||
6,133,309 | |||||||||||
Professional Services — 3.69% | |||||||||||
176,930 | Nielsen Holdings PLC | 7,308,979 | |||||||||
89,830 | Verisk Analytics, Inc(a) | 7,288,806 | |||||||||
14,597,785 | |||||||||||
Road & Rail — 1.83% | |||||||||||
84,470 | Kansas City Southern | 7,244,147 | |||||||||
Trading Companies & Distributors — 1.80% | |||||||||||
61,620 | Fastenal Co. | 3,173,430 | |||||||||
95,880 | HD Supply Holdings, Inc.(a) | 3,943,065 | |||||||||
7,116,495 | |||||||||||
Total Industrials (Cost $50,106,018) | 58,260,880 | ||||||||||
INFORMATION TECHNOLOGY — 14.25% | |||||||||||
Communications Equipment — 1.09% | |||||||||||
30,425 | F5 Networks, Inc.(a) | 4,337,692 | |||||||||
Electronic Equipment, Instruments & Components — 1.41% | |||||||||||
29,535 | Cognex Corp. | 2,479,463 | |||||||||
94,780 | National Instruments Corp. | 3,086,037 | |||||||||
5,565,500 | |||||||||||
Internet Software & Services — 1.98% | |||||||||||
41,175 | Akamai Technologies, Inc.(a) | 2,458,148 | |||||||||
24,520 | CoStar Group, Inc.(a) | 5,081,034 | |||||||||
11,870 | MuleSoft, Inc. — Class A(a) | 288,797 | |||||||||
7,827,979 | |||||||||||
IT Services — 2.61% | |||||||||||
8,505 | Alliance Data Systems Corp. | 2,117,745 | |||||||||
77,880 | Fidelity National Information Services, Inc. | 6,200,805 | |||||||||
64,030 | Teradata Corp.(a) | 1,992,614 | |||||||||
10,311,164 | |||||||||||
Semiconductors & Semiconductor Equipment — 1.71% | |||||||||||
36,420 | Analog Devices, Inc. | 2,984,619 | |||||||||
39,610 | KLA-Tencor Corp. | 3,765,723 | |||||||||
6,750,342 | |||||||||||
Software — 5.45% | |||||||||||
20,745 | ANSYS, Inc.(a) | 2,217,018 | |||||||||
71,510 | Aspen Technology, Inc.(a) | 4,213,369 | |||||||||
17,615 | CommVault Systems, Inc.(a) | 894,842 | |||||||||
57,695 | Electronic Arts Inc.(a) | 5,164,856 | |||||||||
63
 Buffalo Mid Cap Fund
SCHEDULE OF INVESTMENTS
March 31, 2017
(Continued)
| SHARES OR FACE AMOUNT | FAIR VALUE* | ||||||||||
| INFORMATION TECHNOLOGY (Continued) | |||||||||||
130,355 | RealPage, Inc.(a) | $ | 4,549,390 | ||||||||
52,220 | Red Hat, Inc.(a) | 4,517,030 | |||||||||
21,556,505 | |||||||||||
Total Information Technology (Cost $41,152,297) | 56,349,182 | ||||||||||
MATERIALS — 4.48% | |||||||||||
Chemicals — 3.78% | |||||||||||
49,725 | Air Products & Chemicals, Inc. | 6,727,295 | |||||||||
118,245 | FMC Corp. | 8,228,670 | |||||||||
14,955,965 | |||||||||||
Construction Materials — 0.70% | |||||||||||
112,125 | Summit Materials, Inc. — Class A(a) | 2,770,608 | |||||||||
Total Materials (Cost $12,824,943) | 17,726,573 | ||||||||||
| TOTAL COMMON STOCKS (COST $279,286,938) | 343,352,745 | ||||||||||
REAL ESTATE INVESTMENT TRUSTS (REITS) — 5.03% | |||||||||||
REAL ESTATE — 5.03% | |||||||||||
227,145 | CoreCivic, Inc. | 7,136,896 | |||||||||
59,665 | Crown Castle International Corp. | 5,635,359 | |||||||||
17,819 | Equinix Inc. | 7,134,193 | |||||||||
Total Real Estate (Cost $14,839,440) | 19,906,448 | ||||||||||
| TOTAL REITS (COST $14,839,440) | 19,906,448 | ||||||||||
SHORT TERM INVESTMENTS — 12.44% | |||||||||||
INVESTMENT COMPANY — 12.44% | |||||||||||
39,341,400 | Fidelity Institutional Money Market Fund — Government Portfolio — 0.01%(c) | 39,341,400 | |||||||||
9,824,818 | The STIT-Treasury Portfolio — 0.01%(c) | 9,824,818 | |||||||||
Total Investment Company | 49,166,218 | ||||||||||
| TOTAL SHORT TERM INVESTMENTS (COST $49,166,218) | 49,166,218 | ||||||||||
| TOTAL INVESTMENTS — 104.30% (COST $343,292,596) | 412,425,411 | ||||||||||
Liabilities in Excess of Other Assets — (4.30)% | (17,012,718 | ) | |||||||||
TOTAL NET ASSETS — 100.00% | $ | 395,412,693 | |||||||||
PLC — Public Limited Company
(a) Non income producing.
(b) Foreign Issued Securities. The total value of these securities amounted to $7,212,090 (1.82% of net assets) at March 31, 2017.
(c) The rate quoted is the annualized seven-day effective yield as of March 31, 2017.
* See Note 1A of accompanying Notes to Financial Statements regarding valuation of securities.
The Global Industry Classification Standard (GICS) was developed by and/or is the exclusive property of MSCI, Inc. and Standard & Poor's Financial Services LLC ("S&P"). GICS is a service mark of MSCI and S&P and has been licensed for use by U.S. Bancorp Fund Services, LLC.
The accompanying notes are an integral part of these financial statements.
64
 Buffalo Small Cap Fund
SCHEDULE OF INVESTMENTS
March 31, 2017
| SHARES OR FACE AMOUNT | FAIR VALUE* | ||||||||||
COMMON STOCKS — 94.07% | |||||||||||
CONSUMER DISCRETIONARY — 15.12% | |||||||||||
Auto Components — 2.02% | |||||||||||
79,755 | Dorman Products, Inc.(a) | $ | 6,550,278 | ||||||||
157,285 | Motorcar Parts of America, Inc.(a) | 4,833,368 | |||||||||
11,383,646 | |||||||||||
Hotels, Restaurants & Leisure — 2.96% | |||||||||||
34,970 | Buffalo Wild Wings Inc.(a) | 5,341,668 | |||||||||
185,155 | Dave & Buster's Entertainment, Inc.(a) | 11,311,119 | |||||||||
16,652,787 | |||||||||||
Household Durables — 1.39% | |||||||||||
148,380 | Installed Building Products Inc(a) | 7,827,045 | |||||||||
Internet Software & Services — 0.88% | |||||||||||
419,165 | Pandora Media Inc.(a) | 4,950,339 | |||||||||
Media — 1.75% | |||||||||||
289,135 | IMAX Corp.(a)(c) | 9,830,590 | |||||||||
Specialty Retail — 4.46% | |||||||||||
464,780 | At Home Group Inc.(a) | 7,046,065 | |||||||||
239,765 | Five Below, Inc.(a) | 10,384,222 | |||||||||
147,700 | Monro Muffler Brake, Inc. | 7,695,170 | |||||||||
25,125,457 | |||||||||||
Textiles, Apparel & Luxury Goods — 1.66% | |||||||||||
51,477 | Oxford Industries, Inc. | 2,947,573 | |||||||||
166,635 | Steven Madden, Ltd.(a) | 6,423,779 | |||||||||
9,371,352 | |||||||||||
Total Consumer Discretionary (Cost $68,136,960) | 85,141,216 | ||||||||||
CONSUMER STAPLES — 4.70% | |||||||||||
Beverages — 1.23% | |||||||||||
127,640 | MGP Ingredients, Inc. | 6,921,917 | |||||||||
Food Products — 2.39% | |||||||||||
157,820 | The Hain Celestial Group, Inc.(a) | 5,870,904 | |||||||||
189,110 | Snyder's-Lance, Inc. | 7,623,024 | |||||||||
13,493,928 | |||||||||||
Personal Products — 1.08% | |||||||||||
210,865 | e.l.f. Beauty, Inc.(a) | 6,072,912 | |||||||||
Total Consumer Staples (Cost $22,836,202) | 26,488,757 | ||||||||||
ENERGY — 1.82% | |||||||||||
Energy Equipment & Services — 1.82% | |||||||||||
331,140 | Forum Energy Technologies Inc.(a) | 6,854,598 | |||||||||
196,850 | Hi-Crush Partners LP(a) | 3,415,348 | |||||||||
Total Energy (Cost $9,007,437) | 10,269,946 | ||||||||||
FINANCIALS — 3.61% | |||||||||||
Capital Markets — 3.61% | |||||||||||
214,483 | Financial Engines Inc. | 9,340,734 | |||||||||
152,040 | Hamilton Lane Inc. — Class A(a) | 2,838,587 | |||||||||
43,326 | MarketAxess Holdings, Inc. | 8,123,192 | |||||||||
Total Financials (Cost $6,857,952) | 20,302,513 | ||||||||||
65
 Buffalo Small Cap Fund
SCHEDULE OF INVESTMENTS
March 31, 2017
(Continued)
| SHARES OR FACE AMOUNT | FAIR VALUE* | ||||||||||
HEALTH CARE — 19.54% | |||||||||||
Biotechnology — 3.34% | |||||||||||
423,055 | Exact Sciences Corp.(a) | $ | 9,992,559 | ||||||||
56,470 | Ligand Pharmaceuticals Inc.(a) | 5,976,785 | |||||||||
320,725 | Natera, Inc.(a) | 2,844,831 | |||||||||
18,814,175 | |||||||||||
Health Care Equipment & Supplies — 3.13% | |||||||||||
155,138 | Nevro Corp.(a) | 14,536,430 | |||||||||
287,385 | Obalon Therapeutics, Inc.(a)(b) | 3,072,146 | |||||||||
17,608,576 | |||||||||||
Health Care Providers & Services — 2.08% | |||||||||||
275,628 | HealthEquity, Inc.(a) | 11,700,409 | |||||||||
Health Care Technology — 2.00% | |||||||||||
144,155 | Medidata Solutions, Inc.(a) | 8,316,302 | |||||||||
72,880 | Omnicell, Inc.(a) | 2,962,572 | |||||||||
11,278,874 | |||||||||||
Life Sciences Tools & Services — 3.69% | |||||||||||
112,585 | Bio-Techne Corp. | 11,444,265 | |||||||||
40,310 | Cambrex Corp.(a) | 2,219,065 | |||||||||
155,075 | INC Research Holdings Inc. — Class A(a) | 7,110,189 | |||||||||
20,773,519 | |||||||||||
Pharmaceuticals — 5.30% | |||||||||||
323,780 | Akorn, Inc.(a) | 7,796,622 | |||||||||
376,565 | Catalent, Inc.(a) | 10,664,321 | |||||||||
362,570 | Supernus Pharmaceuticals Inc.(a) | 11,348,441 | |||||||||
29,809,384 | |||||||||||
Total Health Care (Cost $72,679,292) | 109,984,937 | ||||||||||
INDUSTRIALS — 9.30% | |||||||||||
Aerospace & Defense — 1.36% | |||||||||||
140,390 | Hexcel Corp. | 7,658,274 | |||||||||
Building Products — 1.92% | |||||||||||
58,665 | Masonite International Corp.(a)(c) | 4,649,202 | |||||||||
88,975 | Trex Co., Inc.(a) | 6,173,975 | |||||||||
10,823,177 | |||||||||||
Construction & Engineering — 1.51% | |||||||||||
212,265 | MasTec, Inc.(a) | 8,501,213 | |||||||||
Electrical Equipment — 1.59% | |||||||||||
239,425 | Generac Holdings, Inc.(a) | 8,925,764 | |||||||||
Professional Services — 2.92% | |||||||||||
145,490 | Korn/Ferry International | 4,581,480 | |||||||||
163,960 | WageWorks, Inc.(a) | 11,854,308 | |||||||||
16,435,788 | |||||||||||
Total Industrials (Cost $34,675,241) | 52,344,216 | ||||||||||
66
| SHARES OR FACE AMOUNT | FAIR VALUE* | ||||||||||
INFORMATION TECHNOLOGY — 31.04% | |||||||||||
Electronic Equipment, Instruments & Components — 3.96% | |||||||||||
101,990 | Cognex Corp. | $ | 8,562,060 | ||||||||
30,290 | Coherent, Inc.(a) | 6,228,836 | |||||||||
87,425 | Universal Display Corp. | 7,527,293 | |||||||||
22,318,189 | |||||||||||
Internet Software & Services — 8.68% | |||||||||||
176,255 | Alteryx, Inc. — Class A(a) | 2,754,866 | |||||||||
47,365 | CoStar Group, Inc.(a) | 9,814,975 | |||||||||
519,915 | Five9, Inc.(a) | 8,557,801 | |||||||||
153,775 | GoDaddy, Inc. — Class A(a) | 5,828,072 | |||||||||
78,900 | LogMeIn, Inc. | 7,692,750 | |||||||||
445,936 | Mimecast Ltd.(a)(c) | 9,984,507 | |||||||||
145,810 | Twilio Inc. — Class A(a) | 4,209,535 | |||||||||
48,842,506 | |||||||||||
IT Services — 3.05% | |||||||||||
95,730 | ExlService Holdings, Inc.(a) | 4,533,773 | |||||||||
318,896 | InterXion Holding NV(a)(c) | 12,615,526 | |||||||||
17,149,299 | |||||||||||
Semiconductors & Semiconductor Equipment — 5.86% | |||||||||||
158,560 | Cavium, Inc.(a) | 11,362,410 | |||||||||
190,075 | Inphi Corp.(a) | 9,279,461 | |||||||||
134,130 | Monolithic Power Systems Inc. | 12,353,373 | |||||||||
32,995,244 | |||||||||||
Software — 9.49% | |||||||||||
180,861 | BroadSoft Inc.(a) | 7,270,612 | |||||||||
212,765 | CyberArk Software Ltd.(a)(c) | 10,823,356 | |||||||||
43,505 | Ellie Mae, Inc.(a) | 4,362,246 | |||||||||
165,105 | HubSpot, Inc.(a) | 9,997,108 | |||||||||
167,615 | Paylocity Holding Corp.(a) | 6,474,967 | |||||||||
114,335 | Take-Two Interactive Software, Inc.(a) | 6,776,635 | |||||||||
276,070 | Zendesk, Inc.(a) | 7,741,003 | |||||||||
53,445,927 | |||||||||||
Total Information Technology (Cost $112,546,642) | 174,751,165 | ||||||||||
MATERIALS — 4.00% | |||||||||||
Construction Materials — 4.00% | |||||||||||
339,370 | Forterra, Inc.(a) | 6,617,715 | |||||||||
319,895 | Summit Materials, Inc. — Class A(a) | 7,904,606 | |||||||||
124,035 | US Concrete Inc.(a) | 8,006,459 | |||||||||
Total Materials (Cost $20,789,625) | 22,528,780 | ||||||||||
REAL ESTATE — 3.18% | |||||||||||
Real Estate Management & Development — 3.18% | |||||||||||
123,220 | Colliers International Group, Inc.(c) | 5,815,984 | |||||||||
130,905 | FirstService Corp. | 7,893,572 | |||||||||
150,630 | HFF Inc. — Class A | 4,167,932 | |||||||||
Total Real Estate (Cost $5,020,722) | 17,877,488 | ||||||||||
67
 Buffalo Small Cap Fund
SCHEDULE OF INVESTMENTS
March 31, 2017
(Continued)
| SHARES OR FACE AMOUNT | FAIR VALUE* | ||||||||||
TELECOMMUNICATION SERVICES — 1.76% | |||||||||||
Diversified Telecommunication Services — 1.76% | |||||||||||
230,405 | Cogent Communications Holdings Inc. | $ | 9,918,935 | ||||||||
Total Telecommunication Services (Cost $7,023,229) | 9,918,935 | ||||||||||
| TOTAL COMMON STOCKS (COST $359,573,302) | 529,607,953 | ||||||||||
REAL ESTATE INVESTMENT TRUSTS (REITS) — 3.48% | |||||||||||
REAL ESTATE — 3.48% | |||||||||||
391,215 | CoreCivic, Inc. | 12,291,975 | |||||||||
142,160 | CyrusOne Inc | 7,316,975 | |||||||||
Total Real Estate (Cost $16,425,871) | 19,608,950 | ||||||||||
| TOTAL REITS (COST $16,425,871) | 19,608,950 | ||||||||||
SHORT TERM INVESTMENT — 2.55% | |||||||||||
INVESTMENT COMPANY — 2.55% | |||||||||||
14,351,852 | Fidelity Institutional Money Market Fund — Government Portfolio — 0.01%(d) | 14,351,852 | |||||||||
Total Investment Company | 14,351,852 | ||||||||||
| TOTAL SHORT TERM INVESTMENT (COST $14,351,852) | 14,351,852 | ||||||||||
| TOTAL INVESTMENTS — 100.10% (COST $390,351,025) | 563,568,755 | ||||||||||
Liabilities in Excess of Other Assets — (0.10)% | (566,908 | ) | |||||||||
TOTAL NET ASSETS — 100.00% | $ | 563,001,847 | |||||||||
(a) Non income producing.
(b) A portion of this security is deemed illiquid. The total value of this security amounted to $135,464 (0.02% of net assets) at March 31, 2017.
(c) Foreign Issued Securities. The total value of these securities amounted to $53,719,165 (9.54% of net assets) at March 31, 2017.
(d) The rate quoted is the annualized seven-day effective yield as of March 31, 2017.
* See Note 1A of accompanying Notes to Financial Statements regarding valuation of securities.
The Global Industry Classification Standard (GICS) was developed by and/or is the exclusive property of MSCI, Inc. and Standard & Poor's Financial Services LLC ("S&P"). GICS is a service mark of MSCI and S&P and has been licensed for use by U.S. Bancorp Fund Services, LLC.
The accompanying notes are an integral part of these financial statements.
68
This page intentionally left blank.
69
 Statements of Assets and Liabilities
March 31, 2017
| BUFFALO DISCOVERY FUND | BUFFALO DIVIDEND FOCUS FUND | BUFFALO EMERGING OPPORTUNITIES FUND | BUFFALO FLEXIBLE INCOME FUND | BUFFALO GROWTH FUND | |||||||||||||||||||
ASSETS: | |||||||||||||||||||||||
Investments in securities, at cost: | $ | 1,054,487,494 | $ | 49,176,337 | $ | 70,930,718 | $ | 637,730,972 | $ | 216,857,890 | |||||||||||||
Total investments, at cost | $ | 1,054,487,494 | $ | 49,176,337 | $ | 70,930,718 | $ | 637,730,972 | $ | 216,857,890 | |||||||||||||
Investments in securities, at value: | $ | 1,279,555,156 | $ | 59,589,664 | $ | 85,814,442 | $ | 794,541,520 | $ | 331,106,160 | |||||||||||||
Total investments, at value | 1,279,555,156 | 59,589,664 | 85,814,442 | 794,541,520 | 331,106,160 | ||||||||||||||||||
Cash: | — | — | — | 239,400 | — | ||||||||||||||||||
Cash denominated in foreign currencies, at value:(1) | — | — | — | — | — | ||||||||||||||||||
Receivables: | |||||||||||||||||||||||
Investments sold | 14,148,723 | — | 191,362 | 1,877,622 | 5,311,661 | ||||||||||||||||||
Fund shares sold | 3,366,686 | 380,873 | 13,679 | 396,512 | 145,507 | ||||||||||||||||||
Dividends | 333,608 | 59,942 | 6,049 | 1,251,037 | 212,564 | ||||||||||||||||||
Interest | 35,828 | 2,776 | 1,899 | 1,541,099 | 2,241 | ||||||||||||||||||
Other assets | 54,174 | 17,932 | 16,535 | 22,799 | 21,589 | ||||||||||||||||||
Total assets | 1,297,494,175 | 60,051,187 | 86,043,966 | 799,869,989 | 336,799,722 | ||||||||||||||||||
LIABILITIES: | |||||||||||||||||||||||
Payables: | |||||||||||||||||||||||
Investments purchased | 41,718,416 | 99,432 | 515,442 | 724,509 | 4,120,410 | ||||||||||||||||||
Written options, at value(2) (Note 8) | — | — | — | 16,250 | — | ||||||||||||||||||
Fund shares purchased | 490,151 | 110,358 | 80,008 | 908,003 | 5,461,048 | ||||||||||||||||||
Management fees (Note 3) | 1,045,798 | 43,828 | 103,363 | 683,194 | 255,976 | ||||||||||||||||||
Custodian fees (Note 3) | — | — | — | — | — | ||||||||||||||||||
Accrued expenses | 1,537 | 2,851 | 8,732 | 85,270 | 18,069 | ||||||||||||||||||
Total liabilities | 43,255,902 | 256,469 | 707,545 | 2,417,226 | 9,855,503 | ||||||||||||||||||
NET ASSETS | $ | 1,254,238,273 | $ | 59,794,718 | $ | 85,336,421 | $ | 797,452,763 | $ | 326,944,219 | |||||||||||||
NET ASSETS CONSIST OF: | |||||||||||||||||||||||
| Capital (capital stock and paid-in capital) | $ | 983,961,263 | $ | 49,136,083 | $ | 69,595,708 | $ | 634,845,548 | $ | 203,483,708 | |||||||||||||
| Undistributed (distribution in excess of) net investment income (loss) | — | 32,967 | — | (115,923 | ) | 330,645 | |||||||||||||||||
| Accumulated net realized gain (loss) from investment and foreign currency transactions | 45,209,348 | 212,341 | 856,989 | 5,869,073 | 8,881,596 | ||||||||||||||||||
Net unrealized appreciation from: | |||||||||||||||||||||||
Investments and translation of assets and liabilities in foreign currency | 225,067,662 | 10,413,327 | 14,883,724 | 156,854,065 | 114,248,270 | ||||||||||||||||||
NET ASSETS APPLICABLE TO OUTSTANDING SHARES | $ | 1,254,238,273 | $ | 59,794,718 | $ | 85,336,421 | $ | 797,452,763 | $ | 326,944,219 | |||||||||||||
Capital shares, $1.00 par value: | |||||||||||||||||||||||
Authorized | Unlimited | Unlimited | Unlimited | Unlimited | Unlimited | ||||||||||||||||||
Outstanding | 57,375,774 | 3,904,203 | 5,407,958 | 54,086,902 | 10,603,168 | ||||||||||||||||||
NET ASSET VALUE PER SHARE | $ | 21.86 | $ | 15.32 | $ | 15.78 | $ | 14.74 | $ | 30.83 | |||||||||||||
| (1) Cash denominated in foreign currencies, at cost | — | — | — | — | — | ||||||||||||||||||
| (2) Written options, premiums received | — | — | — | 59,767 | — | ||||||||||||||||||
The accompanying notes are an integral part of these financial statements.
70
| BUFFALO HIGH YIELD FUND | BUFFALO INTERNATIONAL FUND | BUFFALO LARGE CAP FUND | BUFFALO MID CAP FUND | BUFFALO SMALL CAP FUND | |||||||||||||||||||
ASSETS: | |||||||||||||||||||||||
Investments in securities, at cost: | $ | 224,683,535 | $ | 161,612,084 | $ | 45,266,872 | $ | 343,292,596 | $ | 390,351,025 | |||||||||||||
Total investments, at cost | $ | 224,683,535 | $ | 161,612,084 | $ | 45,266,872 | $ | 343,292,596 | $ | 390,351,025 | |||||||||||||
Investments in securities, at value: | $ | 233,674,604 | $ | 202,630,498 | $ | 58,375,166 | $ | 412,425,411 | $ | 563,568,755 | |||||||||||||
Total investments, at value | 233,674,604 | 202,630,498 | 58,375,166 | 412,425,411 | 563,568,755 | ||||||||||||||||||
Cash: | — | — | — | — | — | ||||||||||||||||||
Cash denominated in foreign currencies, at value:(1) | — | 23,376 | — | — | — | ||||||||||||||||||
Receivables: | |||||||||||||||||||||||
Investments sold | 5,997,364 | — | 602,608 | — | 2,807,914 | ||||||||||||||||||
Fund shares sold | 254,358 | 247,612 | 32,625 | 656,367 | 751,205 | ||||||||||||||||||
Dividends | 111 | 652,933 | 87,415 | 250,961 | 317,438 | ||||||||||||||||||
Interest | 3,027,434 | 4,137 | 1,781 | 23,236 | 6,209 | ||||||||||||||||||
Other assets | 21,082 | 14,753 | 13,601 | 20,175 | 25,883 | ||||||||||||||||||
Total assets | 242,974,953 | 203,573,309 | 59,113,196 | 413,376,150 | 567,477,404 | ||||||||||||||||||
LIABILITIES: | |||||||||||||||||||||||
Payables: | |||||||||||||||||||||||
Investments purchased | 6,616,587 | — | 1,178,162 | 17,308,750 | 1,727,376 | ||||||||||||||||||
Written options, at value(2) (Note 8) | — | — | — | — | — | ||||||||||||||||||
Fund shares purchased | 149,001 | 36,868 | 10 | 326,782 | 2,264,883 | ||||||||||||||||||
Management fees (Note 3) | 200,545 | 169,334 | 43,776 | 314,824 | 476,662 | ||||||||||||||||||
Custodian fees (Note 3) | — | 8,994 | — | — | — | ||||||||||||||||||
Accrued expenses | 2,639 | 81,807 | 10,644 | 13,101 | 6,636 | ||||||||||||||||||
Total liabilities | 6,968,772 | 297,003 | 1,232,592 | 17,963,457 | 4,475,557 | ||||||||||||||||||
NET ASSETS | $ | 236,006,181 | $ | 203,276,306 | $ | 57,880,604 | $ | 395,412,693 | $ | 563,001,847 | |||||||||||||
NET ASSETS CONSIST OF: | |||||||||||||||||||||||
| Capital (capital stock and paid-in capital) | $ | 226,146,793 | $ | 163,009,631 | $ | 42,480,169 | $ | 294,216,835 | $ | 298,557,811 | |||||||||||||
| Undistributed (distribution in excess of) net investment income (loss) | 467,217 | 29,945 | 96,719 | — | — | ||||||||||||||||||
| Accumulated net realized gain (loss) from investment and foreign currency transactions | 401,102 | (781,594 | ) | 2,195,422 | 32,063,043 | 91,226,306 | |||||||||||||||||
Net unrealized appreciation from: | |||||||||||||||||||||||
Investments and translation of assets and liabilities in foreign currency | 8,991,069 | 41,018,324 | 13,108,294 | 69,132,815 | 173,217,730 | ||||||||||||||||||
NET ASSETS APPLICABLE TO OUTSTANDING SHARES | $ | 236,006,181 | $ | 203,276,306 | $ | 57,880,604 | $ | 395,412,693 | $ | 563,001,847 | |||||||||||||
Capital shares, $1.00 par value: | |||||||||||||||||||||||
Authorized | Unlimited | Unlimited | Unlimited | Unlimited | Unlimited | ||||||||||||||||||
Outstanding | 21,054,922 | 15,885,671 | 2,181,951 | 25,219,876 | 33,885,472 | ||||||||||||||||||
NET ASSET VALUE PER SHARE | $ | 11.21 | $ | 12.80 | $ | 26.53 | $ | 15.68 | $ | 16.61 | |||||||||||||
| (1) Cash denominated in foreign currencies, at cost | — | 23,466 | — | — | — | ||||||||||||||||||
| (2) Written options, premiums received | — | — | — | — | — | ||||||||||||||||||
71
 Statements of Operations
For the Year Ended March 31, 2017
| BUFFALO DISCOVERY FUND | BUFFALO DIVIDEND FOCUS FUND | BUFFALO EMERGING OPPORTUNITIES FUND | BUFFALO FLEXIBLE INCOME FUND | BUFFALO GROWTH FUND | |||||||||||||||||||
INVESTMENT INCOME: | |||||||||||||||||||||||
Interest | $ | 317,109 | $ | 12,159 | $ | 21,282 | $ | 8,380,856 | $ | 33,504 | |||||||||||||
Dividends | 9,905,165 | 1,006,062 | 803,738 | 21,105,784 | 5,815,618 | ||||||||||||||||||
Foreign tax withheld | (7,820 | ) | (5,738 | ) | (10,811 | ) | (206,971 | ) | (34,266 | ) | |||||||||||||
Total investment income | 10,214,454 | 1,012,483 | 814,209 | 29,279,669 | 5,814,856 | ||||||||||||||||||
EXPENSES: | |||||||||||||||||||||||
Management fees (Note 3) | 11,336,442 | 398,136 | 1,378,251 | 8,466,583 | 3,239,860 | ||||||||||||||||||
Registration fees | 67,208 | 21,777 | 22,592 | 28,591 | 28,717 | ||||||||||||||||||
Custodian fees | — | — | — | — | — | ||||||||||||||||||
Other | 20,149 | 2,059 | 3,394 | 33,157 | 8,745 | ||||||||||||||||||
Total expenses | 11,423,799 | 421,972 | 1,404,237 | 8,528,331 | 3,277,322 | ||||||||||||||||||
Net investment income (loss) | (1,209,345 | ) | 590,511 | (590,028 | ) | 20,751,338 | 2,537,534 | ||||||||||||||||
NET REALIZED AND UNREALIZED GAIN (LOSS) ON INVESTMENTS: | |||||||||||||||||||||||
Net realized gain from: | |||||||||||||||||||||||
Investment transactions | 83,705,424 | 792,324 | 16,179,729 | 12,207,245 | 27,294,684 | ||||||||||||||||||
Options written (Note 8) | — | — | — | 285,805 | — | ||||||||||||||||||
Net unrealized appreciation/depreciation during the year on: | |||||||||||||||||||||||
Investments | 89,835,284 | 6,379,865 | 3,579,145 | 54,830,558 | 11,218,294 | ||||||||||||||||||
Options written (Note 8) | — | — | — | 77,883 | — | ||||||||||||||||||
Net realized and unrealized gain on investments | 173,540,708 | 7,172,189 | 19,758,874 | 67,401,491 | 38,512,978 | ||||||||||||||||||
Net increase in net assets resulting from operations | $ | 172,331,363 | $ | 7,762,700 | $ | 19,168,846 | $ | 88,152,829 | $ | 41,050,512 | |||||||||||||
The accompanying notes are an integral part of these financial statements.
72
| BUFFALO HIGH YIELD FUND | BUFFALO INTERNATIONAL FUND | BUFFALO LARGE CAP FUND | BUFFALO MID CAP FUND | BUFFALO SMALL CAP FUND | |||||||||||||||||||
INVESTMENT INCOME: | |||||||||||||||||||||||
Interest | $ | 13,787,846 | $ | 20,393 | $ | 9,539 | $ | 93,023 | $ | 76,334 | |||||||||||||
Dividends | 313,613 | 4,651,828 | 652,465 | 3,660,482 | 3,371,492 | ||||||||||||||||||
Foreign tax withheld | — | (433,187 | ) | (9,723 | ) | (3,505 | ) | (22,174 | ) | ||||||||||||||
Total investment income | 14,101,459 | 4,239,034 | 652,281 | 3,750,000 | 3,425,652 | ||||||||||||||||||
EXPENSES: | |||||||||||||||||||||||
Management fees (Note 3) | 2,668,857 | 2,059,431 | 457,399 | 3,857,816 | 7,303,541 | ||||||||||||||||||
Registration fees | 31,392 | 24,661 | 22,210 | 33,810 | 36,096 | ||||||||||||||||||
Custodian fees | — | 47,796 | — | — | — | ||||||||||||||||||
Other | 10,087 | 5,641 | 2,259 | 9,823 | 18,506 | ||||||||||||||||||
Total expenses | 2,710,336 | 2,137,529 | 481,868 | 3,901,449 | 7,358,143 | ||||||||||||||||||
Net investment income (loss) | 11,391,123 | 2,101,505 | 170,413 | (151,449 | ) | (3,932,491 | ) | ||||||||||||||||
NET REALIZED AND UNREALIZED GAIN (LOSS) ON INVESTMENTS: | |||||||||||||||||||||||
Net realized gain from: | |||||||||||||||||||||||
Investment transactions | 6,579,730 | 3,951,597 | 3,933,436 | 70,684,739 | 283,885,565 | ||||||||||||||||||
Options written (Note 8) | — | — | — | — | — | ||||||||||||||||||
Net unrealized appreciation/depreciation during the year on: | |||||||||||||||||||||||
Investments | 3,796,141 | 18,322,445 | 4,674,794 | (24,212,935 | ) | (123,237,124 | ) | ||||||||||||||||
Options written (Note 8) | — | — | — | — | — | ||||||||||||||||||
Net realized and unrealized gain on investments | 10,375,871 | 22,274,042 | 8,608,230 | 46,471,804 | 160,648,441 | ||||||||||||||||||
Net increase in net assets resulting from operations | $ | 21,766,994 | $ | 24,375,547 | $ | 8,778,643 | $ | 46,320,355 | $ | 156,715,950 | |||||||||||||
73
 Statements of Changes in Net Assets
| BUFFALO DISCOVERY FUND | BUFFALO DIVIDEND FOCUS FUND | BUFFALO EMERGING OPPORTUNITIES FUND | |||||||||||||||||||||||||
| YEAR ENDED MARCH 31, 2017 | YEAR ENDED MARCH 31, 2016 | YEAR ENDED MARCH 31, 2017 | YEAR ENDED MARCH 31, 2016 | YEAR ENDED MARCH 31, 2017 | YEAR ENDED MARCH 31, 2016 | ||||||||||||||||||||||
OPERATIONS: | |||||||||||||||||||||||||||
Net investment income (loss) | $ | (1,209,345 | ) | $ | (1,583,910 | ) | $ | 590,511 | $ | 446,550 | $ | (590,028 | ) | $ | (2,047,541 | ) | |||||||||||
Net realized gain on investment transactions | 83,705,424 | 25,128,654 | 792,324 | 336,393 | 16,179,729 | 9,756,332 | |||||||||||||||||||||
Net unrealized appreciation/depreciation during the year on investments | 89,835,284 | (49,860,804 | ) | 6,379,865 | (1,055,808 | ) | 3,579,145 | (37,776,879 | ) | ||||||||||||||||||
Net increase (decrease) in net assets resulting from operations | 172,331,363 | (26,316,060 | ) | 7,762,700 | (272,865 | ) | 19,168,846 | (30,068,088 | ) | ||||||||||||||||||
DISTRIBUTIONS TO SHAREHOLDERS: | |||||||||||||||||||||||||||
Net investment income | — | — | (584,414 | ) | (457,462 | ) | — | — | |||||||||||||||||||
Net realized gain from investment transactions | (29,140,167 | ) | (64,511,020 | ) | (333,681 | ) | (713,884 | ) | (6,936,235 | ) | (10,988,773 | ) | |||||||||||||||
Total distributions to shareholders | (29,140,167 | ) | (64,511,020 | ) | (918,095 | ) | (1,171,346 | ) | (6,936,235 | ) | (10,988,773 | ) | |||||||||||||||
CAPITAL SHARE TRANSACTIONS: | |||||||||||||||||||||||||||
Shares sold | 400,612,949 | 528,747,474 | 26,179,442 | 14,439,497 | 4,820,805 | 10,707,189 | |||||||||||||||||||||
Reinvested dividends and distributions | 28,321,194 | 62,796,612 | 896,091 | 1,147,831 | 6,693,755 | 10,621,854 | |||||||||||||||||||||
Shares issued | 428,934,143 | 591,544,086 | 27,075,533 | 15,587,328 | 11,514,560 | 21,329,043 | |||||||||||||||||||||
Redemptions | (328,497,280 | ) | (264,387,236 | ) | (12,348,977 | ) | (17,053,654 | ) | (52,692,174 | ) | (104,856,342 | ) | |||||||||||||||
Redemption fees (Note 5) | 27,342 | 65,718 | 1,579 | 16,168 | 11,726 | 25,924 | |||||||||||||||||||||
Shares repurchased | (328,469,938 | ) | (264,321,518 | ) | (12,347,398 | ) | (17,037,486 | ) | (52,680,448 | ) | (104,830,418 | ) | |||||||||||||||
Net increase (decrease) from capital share transactions | 100,464,205 | 327,222,568 | 14,728,135 | (1,450,158 | ) | (41,165,888 | ) | (83,501,375 | ) | ||||||||||||||||||
Total increase (decrease) in net assets | 243,655,401 | 236,395,488 | 21,572,740 | (2,894,369 | ) | (28,933,277 | ) | (124,558,236 | ) | ||||||||||||||||||
NET ASSETS: | |||||||||||||||||||||||||||
Beginning of year | 1,010,582,872 | 774,187,384 | 38,221,978 | 41,116,347 | 114,269,698 | 238,827,934 | |||||||||||||||||||||
End of year | $ | 1,254,238,273 | $ | 1,010,582,872 | $ | 59,794,718 | $ | 38,221,978 | $ | 85,336,421 | $ | 114,269,698 | |||||||||||||||
Undistributed (distribution in excess of) net investment income (loss) at end of year | $ | — | $ | (254,936 | ) | $ | 32,967 | $ | 14,641 | $ | — | $ | (339,286 | ) | |||||||||||||
Fund share transactions: | |||||||||||||||||||||||||||
Shares sold | 19,736,102 | 26,128,516 | 1,817,661 | 1,073,035 | 331,021 | 661,955 | |||||||||||||||||||||
Reinvested dividends and distributions | 1,383,546 | 3,253,710 | 62,156 | 88,056 | 449,547 | 748,018 | |||||||||||||||||||||
21,119,648 | 29,382,226 | 1,879,817 | 1,161,091 | 780,568 | 1,409,973 | ||||||||||||||||||||||
Shares repurchased | (16,097,347 | ) | (13,041,105 | ) | (872,206 | ) | (1,251,594 | ) | (3,601,491 | ) | (6,562,809 | ) | |||||||||||||||
Net increase (decrease) in fund shares | 5,022,301 | 16,341,121 | 1,007,611 | (90,503 | ) | (2,820,923 | ) | (5,152,836 | ) | ||||||||||||||||||
The accompanying notes are an integral part of these financial statements.
74
| BUFFALO FLEXIBLE INCOME FUND | BUFFALO GROWTH FUND | ||||||||||||||||||
| YEAR ENDED MARCH 31, 2017 | YEAR ENDED MARCH 31, 2016 | YEAR ENDED MARCH 31, 2017 | YEAR ENDED MARCH 31, 2016 | ||||||||||||||||
OPERATIONS: | |||||||||||||||||||
Net investment income (loss) | $ | 20,751,338 | $ | 30,375,157 | $ | 2,537,534 | $ | 2,205,233 | |||||||||||
Net realized gain on investment transactions | 12,493,050 | 14,041,671 | 27,294,684 | 25,988,182 | |||||||||||||||
Net unrealized appreciation/depreciation during the year on investments | 54,908,441 | (77,603,528 | ) | 11,218,294 | (33,316,627 | ) | |||||||||||||
Net increase (decrease) in net assets resulting from operations | 88,152,829 | (33,186,700 | ) | 41,050,512 | (5,123,212 | ) | |||||||||||||
DISTRIBUTIONS TO SHAREHOLDERS: | |||||||||||||||||||
Net investment income | (22,766,287 | ) | (32,779,631 | ) | (2,454,321 | ) | (2,369,512 | ) | |||||||||||
Net realized gain from investment transactions | (3,743,194 | ) | (7,227,411 | ) | (15,879,107 | ) | (62,948,313 | ) | |||||||||||
Total distributions to shareholders | (26,509,481 | ) | (40,007,042 | ) | (18,333,428 | ) | (65,317,825 | ) | |||||||||||
CAPITAL SHARE TRANSACTIONS: | |||||||||||||||||||
Shares sold | 46,305,311 | 96,165,630 | 58,306,301 | 58,592,597 | |||||||||||||||
Reinvested dividends and distributions | 25,370,370 | 38,728,360 | 18,123,622 | 63,144,602 | |||||||||||||||
Shares issued | 71,675,681 | 134,893,990 | 76,429,923 | 121,737,199 | |||||||||||||||
Redemptions | (235,118,638 | ) | (513,424,639 | ) | (167,715,776 | ) | (118,957,106 | ) | |||||||||||
Redemption fees (Note 5) | 6,139 | 25,282 | 2,426 | 4,115 | |||||||||||||||
Shares repurchased | (235,112,499 | ) | (513,399,357 | ) | (167,713,350 | ) | (118,952,991 | ) | |||||||||||
Net increase (decrease) from capital share transactions | (163,436,818 | ) | (378,505,367 | ) | (91,283,427 | ) | 2,784,208 | ||||||||||||
Total increase (decrease) in net assets | (101,793,470 | ) | (451,699,109 | ) | (68,566,343 | ) | (67,656,829 | ) | |||||||||||
NET ASSETS: | |||||||||||||||||||
Beginning of year | 899,246,233 | 1,350,945,342 | 395,510,562 | 463,167,391 | |||||||||||||||
End of year | $ | 797,452,763 | $ | 899,246,233 | $ | 326,944,219 | $ | 395,510,562 | |||||||||||
Undistributed (distribution in excess of) net investment income (loss) at end of year | $ | (115,923 | ) | $ | 17,077 | $ | 330,645 | $ | 247,432 | ||||||||||
Fund share transactions: | |||||||||||||||||||
Shares sold | 3,253,602 | 6,893,485 | 1,942,699 | 1,828,437 | |||||||||||||||
Reinvested dividends and distributions | 1,781,633 | 2,773,162 | 622,591 | 2,228,895 | |||||||||||||||
5,035,235 | 9,666,647 | 2,565,290 | 4,057,332 | ||||||||||||||||
Shares repurchased | (16,580,010 | ) | (36,991,716 | ) | (5,666,440 | ) | (3,739,828 | ) | |||||||||||
Net increase (decrease) in fund shares | (11,544,775 | ) | (27,325,069 | ) | (3,101,150 | ) | 317,504 | ||||||||||||
75
 Statements of Changes in Net Assets
| BUFFALO HIGH YIELD FUND | BUFFALO INTERNATIONAL FUND | BUFFALO LARGE CAP FUND | |||||||||||||||||||||||||
| YEAR ENDED MARCH 31, 2017 | YEAR ENDED MARCH 31, 2016 | YEAR ENDED MARCH 31, 2017 | YEAR ENDED MARCH 31, 2016 | YEAR ENDED MARCH 31, 2017 | YEAR ENDED MARCH 31, 2016 | ||||||||||||||||||||||
OPERATIONS: | |||||||||||||||||||||||||||
Net investment income (loss) | $ | 11,391,123 | $ | 9,910,366 | $ | 2,101,505 | $ | 1,317,437 | $ | 170,413 | $ | 197,030 | |||||||||||||||
Net realized gain (loss) on investment transactions | 6,579,730 | 6,340,981 | 3,951,597 | (805,435 | ) | 3,933,436 | 1,861,798 | ||||||||||||||||||||
Net unrealized appreciation/depreciation during the year on investments | 3,796,141 | (17,065,889 | ) | 18,322,445 | (13,191,116 | ) | 4,674,794 | (3,292,171 | ) | ||||||||||||||||||
Net increase (decrease) in net assets resulting from operations | 21,766,994 | (814,542 | ) | 24,375,547 | (12,679,114 | ) | 8,778,643 | (1,233,343 | ) | ||||||||||||||||||
DISTRIBUTIONS TO SHAREHOLDERS: | |||||||||||||||||||||||||||
Net investment income | (11,249,302 | ) | (10,414,211 | ) | (1,951,475 | ) | (1,095,729 | ) | (270,724 | ) | (77,505 | ) | |||||||||||||||
Net realized gain from investment transactions | (5,343,506 | ) | (3,950,308 | ) | — | — | (1,433,777 | ) | (3,311,860 | ) | |||||||||||||||||
Total distributions to shareholders | (16,592,808 | ) | (14,364,519 | ) | (1,951,475 | ) | (1,095,729 | ) | (1,704,501 | ) | (3,389,365 | ) | |||||||||||||||
CAPITAL SHARE TRANSACTIONS: | |||||||||||||||||||||||||||
Shares sold | 74,443,813 | 118,275,987 | 22,213,758 | 37,639,666 | 14,821,145 | 21,633,409 | |||||||||||||||||||||
Reinvested dividends and distributions | 15,845,140 | 13,711,474 | 1,815,899 | 1,037,216 | 1,683,580 | 3,301,395 | |||||||||||||||||||||
Shares issued | 90,288,953 | 131,987,461 | 24,029,657 | 38,676,882 | 16,504,725 | 24,934,804 | |||||||||||||||||||||
Redemptions | (141,895,079 | ) | (90,457,053 | ) | (77,623,457 | ) | (47,082,015 | ) | (13,492,552 | ) | (16,538,370 | ) | |||||||||||||||
Redemption fees (Note 5) | 52,939 | 46,711 | 413 | 18,013 | 480 | 7,542 | |||||||||||||||||||||
Shares repurchased | (141,842,140 | ) | (90,410,342 | ) | (77,623,044 | ) | (47,064,002 | ) | (13,492,072 | ) | (16,530,828 | ) | |||||||||||||||
Net increase (decrease) from capital share transactions | (51,553,187 | ) | 41,577,119 | (53,593,387 | ) | (8,387,120 | ) | 3,012,653 | 8,403,976 | ||||||||||||||||||
Total increase (decrease) in net assets | (46,379,001 | ) | 26,398,058 | (31,169,315 | ) | (22,161,963 | ) | 10,086,795 | 3,781,268 | ||||||||||||||||||
NET ASSETS: | |||||||||||||||||||||||||||
Beginning of year | 282,385,182 | 255,987,124 | 234,445,621 | 256,607,584 | 47,793,809 | 44,012,541 | |||||||||||||||||||||
End of year | $ | 236,006,181 | $ | 282,385,182 | $ | 203,276,306 | $ | 234,445,621 | $ | 57,880,604 | $ | 47,793,809 | |||||||||||||||
Undistributed (distribution in excess of) net investment income (loss) at end of year | $ | 467,217 | $ | (473,362 | ) | $ | 29,945 | $ | 8,937 | $ | 96,719 | $ | 197,030 | ||||||||||||||
Fund share transactions: | |||||||||||||||||||||||||||
Shares sold | 6,620,775 | 10,459,674 | 1,868,427 | 3,234,146 | 592,852 | 876,830 | |||||||||||||||||||||
Reinvested dividends and distributions | 1,417,825 | 1,212,906 | 159,289 | 92,941 | 67,749 | 142,363 | |||||||||||||||||||||
8,038,600 | 11,672,580 | 2,027,716 | 3,327,087 | 660,601 | 1,019,193 | ||||||||||||||||||||||
Shares repurchased | (12,562,657 | ) | (7,959,324 | ) | (6,706,530 | ) | (4,267,736 | ) | (548,272 | ) | (703,631 | ) | |||||||||||||||
Net increase (decrease) in fund shares | (4,524,057 | ) | 3,713,256 | (4,678,814 | ) | (940,649 | ) | 112,329 | 315,562 | ||||||||||||||||||
The accompanying notes are an integral part of these financial statements.
76
| BUFFALO MID CAP FUND | BUFFALO SMALL CAP FUND | ||||||||||||||||||
| YEAR ENDED MARCH 31, 2017 | YEAR ENDED MARCH 31, 2016 | YEAR ENDED MARCH 31, 2017 | YEAR ENDED MARCH 31, 2016 | ||||||||||||||||
OPERATIONS: | |||||||||||||||||||
Net investment income (loss) | $ | (151,449 | ) | $ | (507,123 | ) | $ | (3,932,491 | ) | $ | (9,873,361 | ) | |||||||
Net realized gain (loss) on investment transactions | 70,684,739 | 38,443,497 | 283,885,565 | 670,683,441 | |||||||||||||||
Net unrealized appreciation/depreciation during the year on investments | (24,212,935 | ) | (87,809,809 | ) | (123,237,124 | ) | (864,853,179 | ) | |||||||||||
Net increase (decrease) in net assets resulting from operations | 46,320,355 | (49,873,435 | ) | 156,715,950 | (204,043,099 | ) | |||||||||||||
DISTRIBUTIONS TO SHAREHOLDERS: | |||||||||||||||||||
Net investment income | — | — | — | — | |||||||||||||||
Net realized gain from investment transactions | (26,203,319 | ) | (56,352,667 | ) | (117,589,649 | ) | (519,691,625 | ) | |||||||||||
Total distributions to shareholders | (26,203,319 | ) | (56,352,667 | ) | (117,589,649 | ) | (519,691,625 | ) | |||||||||||
CAPITAL SHARE TRANSACTIONS: | |||||||||||||||||||
Shares sold | 121,170,294 | 140,844,215 | 49,158,842 | 126,590,067 | |||||||||||||||
Reinvested dividends and distributions | 26,001,800 | 55,822,440 | 115,150,325 | 510,033,365 | |||||||||||||||
Shares issued | 147,172,094 | 196,666,655 | 164,309,167 | 636,623,432 | |||||||||||||||
Redemptions | (230,514,295 | ) | (198,116,230 | ) | (601,879,098 | ) | (1,957,479,802 | ) | |||||||||||
Redemption fees (Note 5) | 2,646 | 9,366 | 34,301 | 22,168 | |||||||||||||||
Shares repurchased | (230,511,649 | ) | (198,106,864 | ) | (601,844,797 | ) | (1,957,457,634 | ) | |||||||||||
Net increase (decrease) from capital share transactions | (83,339,555 | ) | (1,440,209 | ) | (437,535,630 | ) | (1,320,834,202 | ) | |||||||||||
Total increase (decrease) in net assets | (63,222,519 | ) | (107,666,311 | ) | (398,409,329 | ) | (2,044,568,926 | ) | |||||||||||
NET ASSETS: | |||||||||||||||||||
Beginning of year | 458,635,212 | 566,301,523 | 961,411,176 | 3,005,980,102 | |||||||||||||||
End of year | $ | 395,412,693 | $ | 458,635,212 | $ | 563,001,847 | $ | 961,411,176 | |||||||||||
Undistributed (distribution in excess of) net investment income (loss) at end of year | $ | — | $ | (98,171 | ) | $ | — | $ | (1,371,626 | ) | |||||||||
Fund share transactions: | |||||||||||||||||||
Shares sold | 7,877,092 | 8,005,587 | 2,905,706 | 4,836,540 | |||||||||||||||
Reinvested dividends and distributions | 1,701,688 | 3,691,961 | 7,521,250 | 29,278,609 | |||||||||||||||
9,578,780 | 11,697,548 | 10,426,956 | 34,115,149 | ||||||||||||||||
Shares repurchased | (14,848,116 | ) | (11,521,235 | ) | (34,334,506 | ) | (67,881,153 | ) | |||||||||||
Net increase (decrease) in fund shares | (5,269,336 | ) | 176,313 | (23,907,550 | ) | (33,766,004 | ) | ||||||||||||
77
 Financial Highlights
The following tables are intended to help you understand the Fund's financial performance. The information reflects financial results for the Fund held for the periods shown. Total returns assume reinvestment of all dividends and distributions. Total returns do not reflect payment of sales charges, if any, and are not annualized for periods of less than one year.
BUFFALO DISCOVERY FUND
Data for a share of capital stock | YEARS ENDED MARCH 31, | ||||||||||||||||||||||
outstanding throughout the year. | 2017 | 2016 | 2015 | 2014 | 2013(2) | ||||||||||||||||||
Net asset value, beginning of year | $ | 19.30 | $ | 21.50 | $ | 20.53 | $ | 17.08 | $ | 16.96 | |||||||||||||
Income from investment operations: | |||||||||||||||||||||||
Net investment income (loss) | (0.02 | ) | (0.03 | ) | (0.05 | ) | (0.08 | ) | 0.02 | ||||||||||||||
Net realized and unrealized gains (losses) | 3.10 | (0.69 | ) | 3.08 | 5.04 | 1.32 | |||||||||||||||||
Total from investment operations | 3.08 | (0.72 | ) | 3.03 | 4.96 | 1.34 | |||||||||||||||||
Less distributions from: | |||||||||||||||||||||||
Net investment income | — | — | — | — | (0.03 | ) | |||||||||||||||||
Net realized gain from investment transactions | (0.52 | ) | (1.48 | ) | (2.06 | ) | (1.51 | ) | (1.19 | ) | |||||||||||||
Total distributions | (0.52 | ) | (1.48 | ) | (2.06 | ) | (1.51 | ) | (1.22 | ) | |||||||||||||
Paid-in capital from redemption fees(1) (Note 5) | — | — | — | — | — | ||||||||||||||||||
Net asset value, end of year | $ | 21.86 | $ | 19.30 | $ | 21.50 | $ | 20.53 | $ | 17.08 | |||||||||||||
| Total return | �� | 16.13 | % | (3.33 | %) | 15.56 | % | 29.54 | % | 8.46 | % | ||||||||||||
Ratios/Supplemental Data | |||||||||||||||||||||||
Net assets, end of year (in thousands) | $ | 1,254,238 | $ | 1,010,583 | $ | 774,187 | $ | 649,536 | $ | 515,429 | |||||||||||||
Ratio of expenses to average net assets | 1.01 | % | 1.01 | % | 1.01 | % | 1.01 | % | 1.01 | % | |||||||||||||
Ratio of net investment income (loss) to average net assets | (0.11 | %) | (0.18 | %) | (0.28 | %) | (0.47 | %) | 0.09 | % | |||||||||||||
Portfolio turnover rate | 51 | % | 59 | % | 52 | % | 48 | % | 53 | % | |||||||||||||
(1) Less than $0.01 per share.
(2) Effective June 29, 2012, the Fund name was changed to Buffalo Discovery Fund. Prior to June 29, 2012, the Fund was known as the Buffalo Science & Technology Fund.
The accompanying notes are an integral part of these financial statements.
78
 Financial Highlights
The following tables are intended to help you understand the Fund's financial performance. The information reflects financial results for the Fund held for the periods shown. Total returns assume reinvestment of all dividends and distributions. Total returns do not reflect payment of sales charges, if any, and are not annualized for periods of less than one year.
BUFFALO DIVIDEND FOCUS FUND
Data for a share of capital stock | FOR THE YEARS ENDED MARCH 31, | FOR THE PERIOD FROM DECEMBER 3, 2012 (COMMENCEMENT OF OPERATIONS) TO | |||||||||||||||||||||
outstanding throughout the period. | 2017 | 2016 | 2015 | 2014 | MARCH 31, 2013 | ||||||||||||||||||
Net asset value, beginning of period | $ | 13.20 | $ | 13.76 | $ | 12.25 | $ | 10.55 | $ | 10.00 | |||||||||||||
Income from investment operations: | |||||||||||||||||||||||
Net investment income | 0.18 | 0.16 | 0.13 | 0.16 | 0.01 | ||||||||||||||||||
Net realized and unrealized gains (losses) | 2.22 | (0.30 | ) | 2.16 | 2.08 | 0.55 | |||||||||||||||||
Total from investment operations | 2.40 | (0.14 | ) | 2.29 | 2.24 | 0.56 | |||||||||||||||||
Less distributions from: | |||||||||||||||||||||||
Net investment income | (0.18 | ) | (0.17 | ) | (0.13 | ) | (0.16 | ) | (0.01 | ) | |||||||||||||
Net realized gain from investment transactions | (0.10 | ) | (0.26 | ) | (0.65 | ) | (0.38 | ) | — | ||||||||||||||
Total distributions | (0.28 | ) | (0.43 | ) | (0.78 | ) | (0.54 | ) | (0.01 | ) | |||||||||||||
Paid-in capital from redemption fees (Note 5) | — | (1) | 0.01 | — | (1) | — | (1) | — | (1) | ||||||||||||||
Net asset value, end of period | $ | 15.32 | $ | 13.20 | $ | 13.76 | $ | 12.25 | $ | 10.55 | |||||||||||||
Total return* | 18.35 | % | (0.88 | %) | 18.86 | % | 21.65 | % | 5.65 | % | |||||||||||||
Ratios/Supplemental Data | |||||||||||||||||||||||
Net assets, end of period (in thousands) | $ | 59,795 | $ | 38,222 | $ | 41,116 | $ | 18,701 | $ | 13,802 | |||||||||||||
Ratio of expenses to average net assets** | 0.95 | % | 0.97 | % | 0.94 | % | 0.93 | % | 1.61 | % | |||||||||||||
Ratio of net investment income to average net assets** | 1.34 | % | 1.21 | % | 1.04 | % | 1.47 | % | 0.59 | % | |||||||||||||
| Portfolio turnover rate* | 26 | % | 65 | % | 62 | % | 77 | % | 8 | % | |||||||||||||
* Not annualized for periods less than one full year.
** Annualized for periods less than one full year.
(1) Less than $0.01 per share.
The accompanying notes are an integral part of these financial statements.
79
 Financial Highlights
The following tables are intended to help you understand the Fund's financial performance. The information reflects financial results for the Fund held for the periods shown. Total returns assume reinvestment of all dividends and distributions. Total returns do not reflect payment of sales charges, if any, and are not annualized for periods of less than one year.
BUFFALO EMERGING OPPORTUNITIES FUND
Data for a share of capital stock | YEARS ENDED MARCH 31, | ||||||||||||||||||||||
outstanding throughout the year. | 2017 | 2016 | 2015 | 2014(2) | 2013 | ||||||||||||||||||
Net asset value, beginning of year | $ | 13.89 | $ | 17.85 | $ | 19.31 | $ | 13.86 | $ | 11.71 | |||||||||||||
Income from investment operations: | |||||||||||||||||||||||
Net investment loss | (0.13 | ) | (0.28 | ) | (0.31 | ) | (0.14 | ) | (0.05 | ) | |||||||||||||
Net realized and unrealized gains (losses) | 3.25 | (2.45 | ) | 0.06 | 5.59 | 2.20 | |||||||||||||||||
Total from investment operations | 3.12 | (2.73 | ) | (0.25 | ) | 5.45 | 2.15 | ||||||||||||||||
Less distributions from: | |||||||||||||||||||||||
Net realized gain from investment transactions | (1.23 | ) | (1.23 | ) | (1.25 | ) | (0.05 | ) | — | ||||||||||||||
Paid-in capital from redemption fees (Note 5) | — | (1) | — | (1) | 0.04 | 0.05 | — | (1) | |||||||||||||||
Net asset value, end of year | $ | 15.78 | $ | 13.89 | $ | 17.85 | $ | 19.31 | $ | 13.86 | |||||||||||||
Total return | 22.99 | % | (15.47 | %) | (0.71 | %) | 39.66 | % | 18.36 | % | |||||||||||||
Ratios/Supplemental Data | |||||||||||||||||||||||
Net assets, end of year (in thousands) | $ | 85,336 | $ | 114,270 | $ | 238,828 | $ | 525,856 | $ | 92,959 | |||||||||||||
Ratio of expenses to average net assets | 1.48 | % | 1.47 | % | 1.47 | % | 1.48 | % | 1.50 | % | |||||||||||||
Ratio of net investment loss to average net assets | (0.62 | %) | (1.19 | %) | (1.29 | %) | (1.36 | %) | (0.69 | %) | |||||||||||||
| Portfolio turnover rate | 95 | % | 70 | % | 19 | % | 23 | % | 21 | % | |||||||||||||
(1) Less than $0.01 per share.
(2) Effective June 3, 2013, the Fund name was changed to Buffalo Emerging Opportunities Fund. Prior to June 3, 2013 the Fund was known as the Buffalo Micro Cap Fund.
The accompanying notes are an integral part of these financial statements.
80
 Financial Highlights
The following tables are intended to help you understand the Fund's financial performance. The information reflects financial results for the Fund held for the periods shown. Total returns assume reinvestment of all dividends and distributions. Total returns do not reflect payment of sales charges, if any, and are not annualized for periods of less than one year.
BUFFALO FLEXIBLE INCOME FUND
Data for a share of capital stock | YEARS ENDED MARCH 31, | ||||||||||||||||||||||
outstanding throughout the year. | 2017 | 2016 | 2015 | 2014 | 2013 | ||||||||||||||||||
Net asset value, beginning of year | $ | 13.70 | $ | 14.53 | $ | 14.41 | $ | 13.54 | $ | 12.39 | |||||||||||||
Income from investment operations: | |||||||||||||||||||||||
Net investment income | 0.35 | 0.38 | 0.30 | 0.29 | 0.37 | ||||||||||||||||||
Net realized and unrealized gains (losses) | 1.14 | (0.70 | ) | 0.18 | 0.99 | 1.20 | |||||||||||||||||
Total from investment operations | 1.49 | (0.32 | ) | 0.48 | 1.28 | 1.57 | |||||||||||||||||
Less distributions from: | |||||||||||||||||||||||
Net investment income | (0.38 | ) | (0.41 | ) | (0.30 | ) | (0.28 | ) | (0.42 | ) | |||||||||||||
Net realized gain from investment transactions | (0.07 | ) | (0.10 | ) | (0.06 | ) | (0.13 | ) | — | ||||||||||||||
Total distributions | (0.45 | ) | (0.51 | ) | (0.36 | ) | (0.41 | ) | (0.42 | ) | |||||||||||||
Paid-in capital from redemption fees(1) (Note 5) | — | — | — | — | — | ||||||||||||||||||
Net asset value, end of year | $ | 14.74 | $ | 13.70 | $ | 14.53 | $ | 14.41 | $ | 13.54 | |||||||||||||
Total return | 11.02 | % | (2.24 | %) | 3.33 | % | 9.56 | % | 12.96 | % | |||||||||||||
Ratios/Supplemental Data | |||||||||||||||||||||||
Net assets, end of year (in thousands) | $ | 797,453 | $ | 899,246 | $ | 1,350,945 | $ | 1,397,857 | $ | 862,681 | |||||||||||||
Ratio of expenses to average net assets | 1.01 | % | 1.01 | % | 1.01 | % | 1.01 | % | 1.02 | % | |||||||||||||
Ratio of net investment income to average net assets | 2.45 | % | 2.72 | % | 2.05 | % | 2.06 | % | 2.89 | % | |||||||||||||
Portfolio turnover rate . | 1 | % | 5 | % | 42 | % | 13 | % | 25 | % | |||||||||||||
(1) Less than $0.01 per share.
The accompanying notes are an integral part of these financial statements.
81
 Financial Highlights
The following tables are intended to help you understand the Fund's financial performance. The information reflects financial results for the Fund held for the periods shown. Total returns assume reinvestment of all dividends and distributions. Total returns do not reflect payment of sales charges, if any, and are not annualized for periods of less than one year.
BUFFALO GROWTH FUND
Data for a share of capital stock | YEARS ENDED MARCH 31, | ||||||||||||||||||||||
outstanding throughout the year. | 2017 | 2016 | 2015 | 2014 | 2013 | ||||||||||||||||||
Net asset value, beginning of year | $ | 28.86 | $ | 34.60 | $ | 35.45 | $ | 29.53 | $ | 27.93 | |||||||||||||
Income from investment operations: | |||||||||||||||||||||||
Net investment income | 0.23 | 0.18 | 0.19 | 0.15 | 0.15 | ||||||||||||||||||
Net realized and unrealized gains (losses) | 3.36 | (0.61 | ) | 3.63 | 8.02 | 1.57 | |||||||||||||||||
Total from investment operations | 3.59 | (0.43 | ) | 3.82 | 8.17 | 1.72 | |||||||||||||||||
Less distributions from: | |||||||||||||||||||||||
Net investment income | (0.22 | ) | (0.19 | ) | (0.18 | ) | (0.22 | ) | (0.12 | ) | |||||||||||||
Net realized gain from investment transactions | (1.40 | ) | (5.12 | ) | (4.49 | ) | (2.03 | ) | — | ||||||||||||||
Total distributions | (1.62 | ) | (5.31 | ) | (4.67 | ) | (2.25 | ) | (0.12 | ) | |||||||||||||
Paid-in capital from redemption fees(1) (Note 5) | — | — | — | — | — | ||||||||||||||||||
Net asset value, end of year | $ | 30.83 | $ | 28.86 | $ | 34.60 | $ | 35.45 | $ | 29.53 | |||||||||||||
Total return | 12.88 | % | (0.96 | %) | 11.32 | % | 27.98 | % | 6.20 | % | |||||||||||||
Ratios/Supplemental Data | |||||||||||||||||||||||
Net assets, end of year (in thousands) | $ | 326,944 | $ | 395,511 | $ | 463,167 | $ | 616,043 | $ | 493,659 | |||||||||||||
Ratio of expenses to average net assets | 0.91 | % | 0.91 | % | 0.91 | % | 0.91 | % | 0.91 | % | |||||||||||||
Ratio of net investment income to average net assets | 0.70 | % | 0.52 | % | 0.48 | % | 0.44 | % | 0.51 | % | |||||||||||||
Portfolio turnover rate | 18 | % | 42 | % | 30 | % | 37 | % | 44 | % | |||||||||||||
(1) Less than $0.01 per share.
The accompanying notes are an integral part of these financial statements.
82
 Financial Highlights
The following tables are intended to help you understand the Fund's financial performance. The information reflects financial results for the Fund held for the periods shown. Total returns assume reinvestment of all dividends and distributions. Total returns do not reflect payment of sales charges, if any, and are not annualized for periods of less than one year.
BUFFALO HIGH YIELD FUND
Data for a share of capital stock | YEARS ENDED MARCH 31, | ||||||||||||||||||||||
outstanding throughout the year. | 2017 | 2016 | 2015 | 2014 | 2013 | ||||||||||||||||||
Net asset value, beginning of year | $ | 11.04 | $ | 11.71 | $ | 11.84 | $ | 11.67 | $ | 11.40 | |||||||||||||
Income from investment operations: | |||||||||||||||||||||||
Net investment income | 0.48 | 0.44 | 0.44 | 0.44 | 0.55 | ||||||||||||||||||
Net realized and unrealized gains (losses) | 0.42 | (0.48 | ) | (0.03 | ) | 0.37 | 0.35 | ||||||||||||||||
Total from investment operations | 0.90 | (0.04 | ) | 0.41 | 0.81 | 0.90 | |||||||||||||||||
Less distributions from: | |||||||||||||||||||||||
Net investment income | (0.47 | ) | (0.46 | ) | (0.42 | ) | (0.46 | ) | (0.62 | ) | |||||||||||||
Net realized gain from investment transactions | (0.26 | ) | (0.17 | ) | (0.12 | ) | (0.18 | ) | (0.01 | ) | |||||||||||||
Total distributions | (0.73 | ) | (0.63 | ) | (0.54 | ) | (0.64 | ) | (0.63 | ) | |||||||||||||
Paid-in capital from redemption fees(1) (Note 5) | — | — | — | — | — | ||||||||||||||||||
Net asset value, end of year | $ | 11.21 | $ | 11.04 | $ | 11.71 | $ | 11.84 | $ | 11.67 | |||||||||||||
Total return | 8.37 | % | (0.41 | %) | 3.58 | % | 7.12 | % | 8.20 | % | |||||||||||||
Ratios/Supplemental Data | |||||||||||||||||||||||
Net assets, end of year (in thousands) | $ | 236,006 | $ | 282,385 | $ | 255,987 | $ | 290,538 | $ | 261,112 | |||||||||||||
Ratio of expenses to average net assets | 1.02 | % | 1.01 | % | 1.02 | % | 1.01 | % | 1.01 | % | |||||||||||||
Ratio of net investment income to average net assets | 4.27 | % | 3.79 | % | 3.71 | % | 3.72 | % | 4.85 | % | |||||||||||||
Portfolio turnover rate | 40 | % | 44 | % | 25 | % | 39 | % | 32 | % | |||||||||||||
(1) Less than $0.01 per share.
The accompanying notes are an integral part of these financial statements.
83
 Financial Highlights
The following tables are intended to help you understand the Fund's financial performance. The information reflects financial results for the Fund held for the periods shown. Total returns assume reinvestment of all dividends and distributions. Total returns do not reflect payment of sales charges, if any, and are not annualized for periods of less than one year.
BUFFALO INTERNATIONAL FUND
Data for a share of capital stock | YEARS ENDED MARCH 31, | ||||||||||||||||||||||
outstanding throughout the period. | 2017 | 2016 | 2015 | 2014 | 2013(1) | ||||||||||||||||||
Net asset value, beginning of period | $ | 11.40 | $ | 11.93 | $ | 11.73 | $ | 10.28 | $ | 9.52 | |||||||||||||
Income from investment operations: | |||||||||||||||||||||||
Net investment income | 0.13 | 0.06 | 0.09 | 0.04 | 0.04 | ||||||||||||||||||
Net realized and unrealized gains (losses) | 1.39 | (0.54 | ) | 0.18 | 1.43 | 0.76 | |||||||||||||||||
Total from investment operations | 1.52 | (0.48 | ) | 0.27 | 1.47 | 0.80 | |||||||||||||||||
Less distributions from: | |||||||||||||||||||||||
Net investment income | (0.12 | ) | (0.05 | ) | (0.07 | ) | (0.02 | ) | (0.04 | ) | |||||||||||||
| Paid-in capital from redemption fees(2) (Note 5) | — | — | — | — | — | ||||||||||||||||||
Net asset value, end of period | $ | 12.80 | $ | 11.40 | $ | 11.93 | $ | 11.73 | $ | 10.28 | |||||||||||||
Total return | 13.46 | % | (4.02 | %) | 2.32 | % | 14.31 | % | 8.44 | % | |||||||||||||
Ratios/Supplemental Data | |||||||||||||||||||||||
Net assets, end of period (in thousands) | $ | 203,276 | $ | 234,446 | $ | 256,608 | $ | 225,299 | $ | 106,500 | |||||||||||||
Ratio of expenses to average net assets | 1.04 | % | 1.04 | % | 1.05 | % | 1.07 | % | 1.09 | % | |||||||||||||
Ratio of net investment income to average net assets | 1.02 | % | 0.52 | % | 0.77 | % | 0.38 | % | 0.42 | % | |||||||||||||
Portfolio turnover rate | 4 | % | 7 | % | 21 | % | 15 | % | 23 | % | |||||||||||||
(1) Effective end of business January 25, 2013, the Buffalo China Fund was reorganized into the Buffalo International Fund. During the year ended March 31, 2013, the Fund incurred $17.3 million in purchases associated with the transfer of assets of the Buffalo China Fund, which merged into the Fund on January 25, 2013. The purchases were excluded from portfolio turnover calculation. Activity after January 25, 2013 reflects the Funds' combined operations.
(2) Less than $0.01 per share.
The accompanying notes are an integral part of these financial statements.
84
 Financial Highlights
The following tables are intended to help you understand the Fund's financial performance. The information reflects financial results for the Fund held for the periods shown. Total returns assume reinvestment of all dividends and distributions. Total returns do not reflect payment of sales charges, if any, and are not annualized for periods of less than one year.
BUFFALO LARGE CAP FUND
Data for a share of capital stock | YEARS ENDED MARCH 31, | ||||||||||||||||||||||
outstanding throughout the year. | 2017 | 2016 | 2015 | 2014 | 2013 | ||||||||||||||||||
Net asset value, beginning of year | $ | 23.09 | $ | 25.09 | $ | 23.34 | $ | 21.89 | $ | 21.58 | |||||||||||||
Income from investment operations: | |||||||||||||||||||||||
Net investment income | 0.08 | 0.09 | 0.05 | 0.06 | 0.08 | ||||||||||||||||||
Net realized and unrealized gains (losses) | 4.18 | (0.47 | ) | 4.51 | 4.94 | 1.79 | |||||||||||||||||
Total from investment operations | 4.26 | (0.38 | ) | 4.56 | 5.00 | 1.87 | |||||||||||||||||
Less distributions from: | |||||||||||||||||||||||
Net investment income | (0.13 | ) | (0.04 | ) | (0.05 | ) | (0.08 | ) | (0.15 | ) | |||||||||||||
Net realized gain from investment transactions | (0.69 | ) | (1.58 | ) | (2.76 | ) | (3.47 | ) | (1.41 | ) | |||||||||||||
Total distributions | (0.82 | ) | (1.62 | ) | (2.81 | ) | (3.55 | ) | (1.56 | ) | |||||||||||||
Paid-in capital from redemption fees(1) (Note 5) | — | — | — | — | — | ||||||||||||||||||
Net asset value, end of year | $ | 26.53 | $ | 23.09 | $ | 25.09 | $ | 23.34 | $ | 21.89 | |||||||||||||
Total return | 18.67 | % | (1.56 | %) | 20.29 | % | 23.13 | % | 9.17 | % | |||||||||||||
Ratios/Supplemental Data | |||||||||||||||||||||||
Net assets, end of year (in thousands) | $ | 57,881 | $ | 47,794 | $ | 44,013 | $ | 32,111 | $ | 28,352 | |||||||||||||
Ratio of expenses to average net assets | 0.95 | % | 0.94 | % | 0.96 | % | 0.97 | % | 0.97 | % | |||||||||||||
Ratio of net investment income to average net assets | 0.34 | % | 0.41 | % | 0.23 | % | 0.21 | % | 0.33 | % | |||||||||||||
Portfolio turnover rate | 41 | % | 62 | % | 30 | % | 45 | % | 49 | % | |||||||||||||
(1) Less than $0.01 per share.
The accompanying notes are an integral part of these financial statements.
85
 Financial Highlights
The following tables are intended to help you understand the Fund's financial performance. The information reflects financial results for the Fund held for the periods shown. Total returns assume reinvestment of all dividends and distributions. Total returns do not reflect payment of sales charges, if any, and are not annualized for periods of less than one year.
BUFFALO MID CAP FUND
Data for a share of capital stock | YEARS ENDED MARCH 31, | ||||||||||||||||||||||
outstanding throughout the year. | 2017 | 2016 | 2015 | 2014 | 2013 | ||||||||||||||||||
Net asset value, beginning of year | $ | 15.04 | $ | 18.68 | $ | 19.27 | $ | 17.94 | $ | 17.95 | |||||||||||||
Income from investment operations: | |||||||||||||||||||||||
Net investment income (loss) | (0.01 | ) | (0.02 | ) | (0.04 | ) | (0.04 | ) | 0.01 | ||||||||||||||
Net realized and unrealized gains (losses) | 1.85 | (1.62 | ) | 1.87 | 4.45 | 0.78 | |||||||||||||||||
Total from investment operations | 1.84 | (1.64 | ) | 1.83 | 4.41 | 0.79 | |||||||||||||||||
Less distributions from: | |||||||||||||||||||||||
Net investment income | — | — | (1) | — | (1) | — | (1) | (0.01 | ) | ||||||||||||||
Net realized gain from investment transactions | (1.20 | ) | (2.00 | ) | (2.42 | ) | (3.08 | ) | (0.79 | ) | |||||||||||||
Total distributions | (1.20 | ) | (2.00 | ) | (2.42 | ) | (3.08 | ) | (0.80 | ) | |||||||||||||
Paid-in capital from redemption fees(1) (Note 5) | — | — | — | — | — | ||||||||||||||||||
Net asset value, end of year | $ | 15.68 | $ | 15.04 | $ | 18.68 | $ | 19.27 | $ | 17.94 | |||||||||||||
Total return | 12.94 | % | (8.83 | %) | 10.43 | % | 25.46 | % | 4.67 | % | |||||||||||||
Ratios/Supplemental Data | |||||||||||||||||||||||
Net assets, end of year (in thousands) | $ | 395,413 | $ | 458,635 | $ | 566,302 | $ | 620,255 | $ | 625,178 | |||||||||||||
Ratio of expenses to average net assets | 1.01 | % | 1.01 | % | 1.01 | % | 1.01 | % | 1.01 | % | |||||||||||||
Ratio of net investment income (loss) to average net assets | (0.09 | %) | (0.10 | %) | (0.18 | %) | (0.20 | %) | 0.07 | % | |||||||||||||
Portfolio turnover rate | 51 | % | 46 | % | 12 | % | 45 | % | 31 | % | |||||||||||||
(1) Less than $0.01 per share.
The accompanying notes are an integral part of these financial statements.
86
 Financial Highlights
The following tables are intended to help you understand the Fund's financial performance. The information reflects financial results for the Fund held for the periods shown. Total returns assume reinvestment of all dividends and distributions. Total returns do not reflect payment of sales charges, if any, and are not annualized for periods of less than one year.
BUFFALO SMALL CAP FUND
Data for a share of capital stock | YEARS ENDED MARCH 31, | ||||||||||||||||||||||
outstanding throughout the year. | 2017 | 2016 | 2015 | 2014 | 2013 | ||||||||||||||||||
Net asset value, beginning of year | $ | 16.64 | $ | 32.83 | $ | 36.02 | $ | 30.93 | $ | 28.54 | |||||||||||||
Income from investment operations: | |||||||||||||||||||||||
Net investment loss | (0.13 | ) | (0.20 | ) | (0.24 | ) | (0.16 | ) | (0.09 | ) | |||||||||||||
Net realized and unrealized gains (losses) | 3.19 | (3.60 | ) | 0.31 | 8.44 | 4.20 | |||||||||||||||||
Total from investment operations | 3.06 | (3.80 | ) | 0.07 | 8.28 | 4.11 | |||||||||||||||||
Less distributions from: | |||||||||||||||||||||||
Net realized gain from investment transactions | (3.09 | ) | (12.39 | ) | (3.26 | ) | (3.19 | ) | (1.72 | ) | |||||||||||||
Paid-in capital from redemption fees(1) (Note 5) | — | — | — | — | — | ||||||||||||||||||
Net asset value, end of year | $ | 16.61 | $ | 16.64 | $ | 32.83 | $ | 36.02 | $ | 30.93 | |||||||||||||
Total return | 24.51 | % | (13.28 | %) | 0.56 | % | 26.71 | % | 15.02 | % | |||||||||||||
Ratios/Supplemental Data | |||||||||||||||||||||||
Net assets, end of year (in thousands) | $ | 563,002 | $ | 961,411 | $ | 3,005,980 | $ | 3,803,381 | $ | 3,144,179 | |||||||||||||
Ratio of expenses to average net assets | 1.01 | % | 1.01 | % | 1.00 | % | 1.00 | % | 1.00 | % | |||||||||||||
Ratio of net investment loss to average net assets | (0.52 | %) | (0.61 | %) | (0.63 | %) | (0.45 | %) | (0.31 | %) | |||||||||||||
| Portfolio turnover rate | 45 | % | 41 | % | 17 | % | 22 | % | 34 | % | |||||||||||||
(1) Less than $0.01 per share.
(2) Less than 0.01%.
The accompanying notes are an integral part of these financial statements.
87
 Notes to Financial Statements
March 31, 2017
1. SIGNIFICANT ACCOUNTING POLICIES:
The Buffalo Funds (comprised of the Buffalo Discovery Fund, Buffalo Dividend Focus Fund, Buffalo Emerging Opportunities Fund, Buffalo Flexible Income Fund, Buffalo Growth Fund, Buffalo High Yield Fund, Buffalo International Fund, Buffalo Large Cap Fund, Buffalo Mid Cap Fund, and Buffalo Small Cap Fund) (the "Funds"), are registered under the Investment Company Act of 1940, as amended (the "1940 Act"), as a diversified open-end management investment company. The shares of the Buffalo Funds are issued in multiple series, with each series, in effect, representing a separate fund.
The investment objective of the Buffalo Discovery Fund, Buffalo Emerging Opportunities Fund, Buffalo Growth Fund, Buffalo International Fund, Buffalo Large Cap Fund, Buffalo Mid Cap Fund and Buffalo Small Cap Fund is long-term growth of capital.
The investment objectives of the Buffalo Flexible Income Fund are the generation of high current income and, as a secondary objective, the long-term growth of capital.
The investment objectives of the Buffalo Dividend Focus Fund and the Buffalo High Yield Fund are current income, with long- term growth of capital as a secondary objective.
Each Fund is an investment company and accordingly follows the investment company accounting and reporting guidance of the Financial Accounting Standards Board ("FASB") Accounting Standard Codification ("ASC") Topic 946 "Financial Services — Investment Companies."
The following is a summary of significant accounting policies consistently followed by the Funds in the preparation of their financial statements.
A. INVESTMENT VALUATION — Equity securities and debt securities traded on a national securities exchange or national market, except those traded using the National Association of Securities Dealers' Automated Quotation System ("NASDAQ"), are valued at the latest sales price thereof, or if no sale was reported on that date, the mean between the most recent quoted bid and ask price is used. All equity securities that are traded using NASDAQ are valued using the NASDAQ Official Closing Price ("NOCP"), which may not necessarily represent the last sales price. If there has been no sale on such exchange or on NASDAQ on such day, the security is valued at the mean between the most recent quoted bid and ask price.
When market quotations are not readily available, any security or other asset is valued at its fair value as determined in good faith under procedures approved by the Board of Trustees (the "Board"). If events occur that will affect the value of a Fund's portfolio securities before the net asset value ("NAV") has been calculated (a "significant event"), the security will generally be priced using a fair value procedure. The Board has adopted specific procedures for valuing portfolio securities and delegated the responsibility of fair value determinations to the Valuation Committee. Some of the factors that may be considered by the Valuation Committee in determining fair value are fundamental analytical data relating to the investment; the nature and duration of any restriction on disposition; trading in similar securities of the same issuer or comparable companies; information from broker-dealers; and an evaluation of the forces that influence the market in which the securities are purchased or sold. As of March 31, 2017, none of the Buffalo Funds held valued securities. In addition, with respect to the valuation of securities principally traded on foreign markets, the Buffalo International Fund uses a fair value pricing service approved by the Funds' Board which employs quantitative models to adjust for "stale" prices caused by the movement of other markets and other factors occurring after the close of the foreign markets, but before the close of the New York Stock Exchange ("NYSE"). The fair valuation trigger was not met on March 31, 2017 and the fair value price was not applied.
Debt securities with remaining maturities of 60 days or less are normally valued at last sale price reported. If there is no trade on the particular day, then the security will be priced at the mean between the most recent bid and asked prices.
Restricted securities include securities that have not been registered under the Securities Act of 1933, as amended, and securities that are subject to restrictions on resale. The Funds may invest in restricted securities that are consistent with the Funds' investment objective and investment strategies. In some cases, the issuer of restricted securities has agreed to register such securities for resale, at the issuer's expense either upon demand by the Funds or in connection with another registered offering of the securities. Investments in restricted securities are valued utilizing the Funds' corporate bond valuation policies.
In accordance with FASB ASC 820, Fair Value Measurements ("ASC 820"), fair value is defined as the price that a Fund would receive to sell an investment or pay to transfer a liability in an orderly transaction with an independent buyer in the principal market, or in the absence of a principal market, the most advantageous market for the investment or liability. ASC 820 establishes a three-tier hierarchy to distinguish between (1) inputs that reflect the assumptions market participants would use in pricing an asset or liability developed based on market data obtained from sources independent of the reporting entity (observable inputs) and (2) inputs that reflect the reporting entity's own assumptions about the assumptions market participants would use in pricing an asset or liability developed based on the best information available in the circumstances (unobservable inputs) and to establish classification of fair value measurements for disclosure purposes. Various inputs are used in determining the value of the Funds' investments. The inputs are summarized in the three broad levels listed below:
Level 1 — Valuations based on quoted prices for investments in active markets that a Fund has the ability to access at the meas- urement date. Valuation adjustments are not applied to Level 1 investments.
Level 2 — Valuations based on other significant observable inputs (including quoted prices for similar securities, interest rates, prepayment speeds, credit risks, etc.).
88
Level 3 — Valuations based on significant unobservable inputs (including a Fund's own assumptions and judgment in determining the fair value of investments).
Inputs that are used in determining fair value of an investment may include price information, credit data, volatility statistics, and other factors. These inputs can be either observable or unobservable. The availability of observable inputs can vary between invest- ments, and is affected by various factors such as the type of investment, and the volume and level of activity for that investment or similar investments in the market place. The inputs will be considered by the Advisor, along with any other relevant factors in the calculation of an investment's fair value. The Funds use prices and inputs that are current as of the measurement date, which may include periods of market dislocations. During these periods, the availability of prices and inputs may be reduced for many investments. This condition could cause an investment to be reclassified between the various levels within the hierarchy.
Non-U.S. equity securities actively traded in foreign markets may be reflected in Level 2 despite the availability of closing prices, because the Funds evaluate and determine whether those closing prices reflect fair value at the close of the NYSE or require adjust- ment, as described above and in Note 9 — Foreign Investment Risk.
Investments falling into the Level 3 category are primarily supported by quoted prices from brokers and dealers participating in the market for those investments. However, these may be classified as Level 3 investments due to lack of market transparency and corroboration to support these quoted prices. Additionally, valuation models may be used as the pricing source for any remaining investments classified as Level 3. These models rely on one or more significant unobservable inputs and/or significant assumptions made by the Valuation Committee. Inputs used in valuations may include, but are not limited to, financial statement analysis, capital account balances, discount rates and estimated cash flows, and comparable company data.
The inputs or methodology used for valuing securities are not necessarily an indication of the risk associated with investing in those securities.
The following table provides the fair value measurement of applicable Fund assets and liabilities by level within the fair value hierarchy as of March 31, 2017. These assets are measured on a recurring basis.
BUFFALO DISCOVERY FUND
Level 1 | Level 2 | Level 3 | Total | ||||||||||||||||
Common Stocks | $ | 1,182,381,574 | $ | — | $ | — | $ | 1,182,381,574 | |||||||||||
REITS | 36,477,143 | — | — | 36,477,143 | |||||||||||||||
Short Term Investment | 60,696,439 | — | — | 60,696,439 | |||||||||||||||
Total* | $ | 1,279,555,156 | $ | — | $ | — | $ | 1,279,555,156 | |||||||||||
BUFFALO DIVIDEND FOCUS FUND
Level 1 | Level 2 | Level 3 | Total | ||||||||||||||||
Common Stocks | $ | 51,825,229 | $ | — | $ | — | $ | 51,825,229 | |||||||||||
REITS | 1,789,797 | — | — | 1,789,797 | |||||||||||||||
Convertible Preferred Stocks | 663,308 | — | — | 663,308 | |||||||||||||||
Short Term Investment | 5,311,330 | — | — | 5,311,330 | |||||||||||||||
Total* | $ | 59,589,664 | $ | — | $ | — | $ | 59,589,664 | |||||||||||
BUFFALO EMERGING OPPORTUNIES FUND
Level 1 | Level 2 | Level 3 | Total | ||||||||||||||||
Common Stocks | $ | 80,420,332 | $ | — | $ | — | $ | 80,420,332 | |||||||||||
Short Term Investment | 5,394,110 | — | — | 5,394,110 | |||||||||||||||
Total* | $ | 85,814,442 | $ | — | $ | — | $ | 85,814,442 | |||||||||||
BUFFALO FLEXIBLE INCOME FUND
Level 1 | Level 2 | Level 3 | Total | ||||||||||||||||
Common Stocks | $ | 645,244,212 | $ | — | $ | — | $ | 645,244,212 | |||||||||||
REITS | 16,380,767 | — | — | 16,380,767 | |||||||||||||||
Convertible Bonds | — | 49,719,359 | — | 49,719,359 | |||||||||||||||
Corporate Bonds | — | 76,310,968 | — | 76,310,968 | |||||||||||||||
Short Term Investment | 6,886,214 | — | — | 6,886,214 | |||||||||||||||
Total* | $ | 668,511,193 | $ | 126,030,327 | $ | — | $ | 794,541,520 | |||||||||||
Written Options | $ | (16,250 | ) | $ | — | $ | — | $ | (16,250 | ) | |||||||||
89
 Notes to Financial Statements
March 31, 2017
(Continued)
BUFFALO GROWTH FUND
Level 1 | Level 2 | Level 3 | Total | ||||||||||||||||
Common Stocks | $ | 318,586,575 | $ | — | $ | — | $ | 318,586,575 | |||||||||||
REIT | 5,390,582 | — | — | 5,390,582 | |||||||||||||||
Short Term Investment | 7,129,003 | — | — | 7,129,003 | |||||||||||||||
Total* | $ | 331,106,160 | $ | — | $ | — | $ | 331,106,160 | |||||||||||
BUFFALO HIGH YIELD FUND
Level 1 | Level 2 | Level 3 | Total | ||||||||||||||||
Convertible Preferred Stock | $ | 2,124,450 | $ | — | $ | — | $ | 2,124,450 | |||||||||||
| Common Stocks | 1,247,266 | — | — | 1,247,266 | |||||||||||||||
Convertible Bonds | — | 28,991,525 | — | 28,991,525 | |||||||||||||||
Corporate Bonds | — | 149,734,702 | — | 149,734,702 | |||||||||||||||
Bank Loans | — | 29,050,106 | — | 29,050,106 | |||||||||||||||
Short Term Investments | 22,526,555 | — | — | 22,526,555 | |||||||||||||||
Total* | $ | 25,898,271 | $ | 207,776,333 | $ | — | $ | 233,674,604 | |||||||||||
BUFFALO INTERNATIONAL FUND
Level 1 | Level 2 | Level 3 | Total | ||||||||||||||||
Common Stocks | $ | 189,658,168 | $ | — | $ | — | $ | 189,658,168 | |||||||||||
Short Term Investment | 12,972,330 | — | — | 12,972,330 | |||||||||||||||
Total* | $ | 202,630,498 | $ | — | $ | — | $ | 202,630,498 | |||||||||||
BUFFALO LARGE CAP FUND
Level 1 | Level 2 | Level 3 | Total | ||||||||||||||||
Common Stocks | $ | 53,493,560 | $ | — | $ | — | $ | 53,493,560 | |||||||||||
REIT | 1,285,588 | — | — | 1,285,588 | |||||||||||||||
Short Term Investment | 3,596,018 | — | — | 3,596,018 | |||||||||||||||
Total* | $ | 58,375,166 | $ | — | $ | — | $ | 58,375,166 | |||||||||||
BUFFALO MID CAP FUND
Level 1 | Level 2 | Level 3 | Total | ||||||||||||||||
Common Stocks | $ | 343,352,745 | $ | — | $ | — | $ | 343,352,745 | |||||||||||
REITS | 19,906,448 | — | — | 19,906,448 | |||||||||||||||
Short Term Investments | 49,166,218 | — | — | 49,166,218 | |||||||||||||||
Total* | $ | 412,425,411 | $ | — | $ | — | $ | 412,425,411 | |||||||||||
BUFFALO SMALL CAP FUND
Level 1 | Level 2 | Level 3 | Total | ||||||||||||||||
Common Stocks | $ | 529,607,953 | $ | — | $ | — | $ | 529,607,953 | |||||||||||
REITS | 19,608,950 | — | 19,608,950 | ||||||||||||||||
Short Term Investment | 14,351,852 | — | — | 14,351,852 | |||||||||||||||
Total* | $ | 563,568,755 | $ | — | $ | — | $ | 563,568,755 | |||||||||||
* Additional information regarding the industry and/or geographical classification of these investments is disclosed in the schedule of investments.
There were no transfers into or out of Level 1, Level 2 or Level 3 fair value measurements during the reporting year. The basis for recognizing and valuing transfers is as of the beginning of the year in which transfers occur.
B. FEDERAL INCOME TAXES — Each Fund complies with the requirements of Subchapter M of the Internal Revenue Code nec- essary to qualify as a regulated investment company and makes the requisite distributions of income and capital gains to its share- holders sufficient to relieve it from all or substantially all federal income and excise taxes. Therefore, no federal income tax provision has been provided.
At March 31, 2017, the Funds did not have any tax positions that did not meet the "more likely-than-not" threshold of being sus- tained by the applicable tax authority. The Funds recognize interest and penalties, if any, related to unrecognized tax benefits as other expense in the Statement of Operations. During the year, the Funds did not incur any interest or penalties.
The Funds have analyzed all open tax years, as defined by the Statute of Limitations, for all major jurisdictions. Open tax years are those that are open for exam by taxing authorities. Open tax years include the tax years ended March 31, 2014 through March 31, 2017. The Funds have no examinations in progress.
90
C. INVESTMENT TRANSACTIONS AND INVESTMENT INCOME — Investment transactions are accounted for on the date the securities are purchased or sold (trade date). Dividend income is recorded on the ex-dividend date except that certain dividends for foreign securities where the ex-dividend date may have passed are recorded as soon as the Fund is informed of the dividend in the exercise of reasonable diligence. Interest income is recognized on the accrual basis. Realized gains and losses from investment transactions are reported on the identified cost basis. All discounts/premiums are accreted/amortized for financial reporting pur- poses and are included in interest income.
D. DISTRIBUTIONS TO SHAREHOLDERS — Distributions to shareholders are recorded on the ex-dividend date. Distributions are determined in accordance with income tax regulations, which may differ from U.S. Generally Accepted Accounting Principles ("GAAP"). These differences are primarily due to differing treatments for premium amortization on debt securities, deferral of late year and wash sale losses, and partnership investment income.
E. USE OF ESTIMATES — The preparation of financial statements in conformity with GAAP requires management to make esti- mates and assumptions that affect the amounts reported in the financial statements and accompanying notes. Actual results could differ from such estimates.
F. FOREIGN CURRENCY TRANSLATION — Values of investments denominated in foreign currencies are converted into U.S. dollars using a spot market rate of exchange on the day of valuation. Purchases and sales of investments and dividend and interest income are translated to U.S. dollars using a spot market rate of exchange prevailing on the respective dates of such transactions. The portion of security gains or losses resulting from changes in foreign exchange rates is included with net realized and unrealized gain or loss from investments, as appropriate, for both financial reporting and tax purposes.
G. PURCHASED AND WRITTEN OPTION CONTRACTS — Certain of the Funds may purchase and write call or put options on securities and indices and enter into related closing transactions. As a holder of a call option, a Fund has the right, but not the obli- gation, to purchase a security at the exercise price during the exercise period. As the writer of a call option, a Fund has the obligation to sell the security at the exercise price during the exercise period. The Fund's maximum payout in the case of written call option contracts cannot be determined. As a holder of a put option, a Fund has the right, but not the obligation, to sell a security at the exercise price during the exercise period. As the writer of a put option, a Fund has the obligation to buy the underlying security at the exercise price during the exercise period.
The premium that a Fund pays when purchasing an option or receives when writing an option will reflect, among other things, the market price of the security, the relationship of the exercise price to the market price of the security, the relationship of the exercise price to the volatility of the security, the length of the option period and supply and demand factors. The premium is the market value of an option at the time of purchase.
A purchaser (holder) of a put option pays a non-refundable premium to the seller (writer) of a put option to obtain the right to sell a specified amount of a security at a fixed price (the exercise price) during a specified period (exercise period). Conversely, the seller (writer) of a put option, upon payment by the holder of the premium, has the obligation to buy the security from the holder of the put option at the exercise price during the exercise period.
Exchange traded options are valued at the composite price, using the National Best Bid and Offer quotes ("NBBO"). NBBO consists of the highest bid prices and lowest ask prices across any of the exchanges on which an option is quoted, thus providing a view across the entire U.S. options marketplace. Specifically, composite pricing looks at the last trades on the exchanges where the options are traded. If there are no trades for the option on a given business day, composite option pricing calculates the mean of the highest bid price and lowest ask price across the exchanges where the option is traded. Non exchange traded options also will be valued at the mean between the last bid and ask quotations. For options where market quotations are not readily available, a fair value shall be determined as set forth in the Funds' fair valuation guidelines.
The Funds may use options with the objective to generate income as a non-principal investment strategy. Currently, the Buffalo Flexible Income Fund makes use of the options strategy to a greater extent than the other Funds because income generation is a primary investment objective of the Buffalo Flexible Income Fund. The primary strategy used by Buffalo Flexible Income Fund to achieve income generation through the use of options is to write covered calls with the strike price above the cost basis and the value the portfolio managers believe will be achieved before the expiration of the option and also at a value that the portfolio man- agers are willing to sell if the option is exercised. The collected premiums generate income for the Fund, and if the option is exer- cised, a gain will also be achieved. A risk of using derivatives is that the counterparty to a derivative may fail to comply with their obligation to the Funds. See Note 8 for written option activity.
H. INDEMNIFICATIONS — Under the Funds' organizational documents, officers and trustees are indemnified against certain lia- bilities arising out of the performance of their duties to the Funds. In addition, in the normal course of business, the Funds enter into contracts that provide general indemnification to other parties. The Funds' maximum exposure under these arrangements is unknown as this would involve future claims that may be made against the Funds that have not yet occurred, and may not occur. However, the Funds have not had prior claims or losses pursuant to these contracts and expect the risk of loss to be remote.
91
 Notes to Financial Statements
March 31, 2017
(Continued)
I. RECENT ACCOUNTING PRONOUNCEMENT — In October 2016, the U.S. Securities and Exchange Commission adopted new rules and amended existing rules (together, "final rules") intended to modernize the reporting and disclosure of information by registered investment companies. In part, the final rules amend Regulation S-X and require standardized, enhanced disclosure about derivatives in investment company financial statements, as well as other amendments. The updates to Regulation S-X are effective August 1, 2017 and may result in additional disclosure relating to the presentation of derivatives and certain other financial instruments. These updates have no impact on the Fund's net assets or results of operations.
2. FEDERAL TAX MATTERS:
The tax character of distributions paid during the years ended March 31, 2017 and March 31, 2016 were as follows:
YEAR ENDED MARCH 31, 2017 | YEAR ENDED MARCH 31, 2016 | ||||||||||||||||||
| ORDINARY INCOME | LONG-TERM CAPITAL GAINS* | ORDINARY INCOME | LONG-TERM CAPITAL GAINS* | ||||||||||||||||
Buffalo Discovery Fund | $ | 15,902,043 | $ | 13,238,124 | $ | 10,904,931 | $ | 53,606,089 | |||||||||||
Buffalo Dividend Focus Fund | 801,005 | 117,090 | 846,019 | 325,327 | |||||||||||||||
Buffalo Emerging Opportunities Fund | 419,660 | 6,516,575 | — | 10,988,773 | |||||||||||||||
Buffalo Flexible Income Fund | 23,160,691 | 3,348,790 | 32,779,631 | 7,227,411 | |||||||||||||||
Buffalo Growth Fund | 2,721,685 | 15,611,743 | 3,645,391 | 61,672,434 | |||||||||||||||
Buffalo High Yield Fund | 11,249,302 | 5,343,506 | 10,414,211 | 3,950,308 | |||||||||||||||
Buffalo International Fund | 1,951,475 | — | 1,095,729 | — | |||||||||||||||
Buffalo Large Cap Fund | 270,724 | 1,433,777 | 813,502 | 2,575,863 | |||||||||||||||
Buffalo Mid Cap Fund | 1,537,011 | 24,666,308 | — | 56,352,667 | |||||||||||||||
Buffalo Small Cap Fund | 21,738,524 | 95,851,125 | — | 519,691,625 | |||||||||||||||
* The Funds designate as long-term capital gain dividends, pursuant to Internal Revenue Code Section 852(b)(3)(C), the amounts necessary to reduce the earnings and profits of the Funds related to net capital gain to zero for the tax period ended March 31, 2017.
Distributions paid differ from the Statements of Changes in Net Assets due primarily to the recharacterization of short-term capital gain distributions to ordinary distributions for tax purposes.
Additionally, GAAP requires that certain components of net assets relating to permanent differences be reclassified between finan- cial and tax reporting. These reclassifications have no effect on net assets or net asset value per share. For the year ended March 31, 2017, the following table shows the reclassifications made:
| UNDISTRIBUTED NET INVESTMENT INCOME/(LOSS) | ACCUMULATED NET REALIZED GAIN/(LOSS) | PAID IN CAPITAL | |||||||||||||
| Buffalo Discovery Fund | $ | 1,464,281 | $ | (7,792,612 | ) | $ | 6,328,331 | ||||||||
Buffalo Dividend Focus Fund | 12,229 | (62,001 | ) | 49,772 | |||||||||||
Buffalo Emerging Opportunities Fund | 929,314 | (3,324,356 | ) | 2,395,042 | |||||||||||
Buffalo Flexible Income Fund | 1,881,949 | (4,017,931 | ) | 2,135,982 | |||||||||||
Buffalo Growth Fund | — | (4,247,915 | ) | 4,247,915 | |||||||||||
Buffalo High Yield Fund | 798,758 | (3,035,224 | ) | 2,236,466 | |||||||||||
Buffalo International Fund | (129,022 | ) | 1,265,104 | (1,136,082 | ) | ||||||||||
Buffalo Large Cap Fund | — | (275,447 | ) | 275,447 | |||||||||||
| Buffalo Mid Cap Fund | 249,620 | (10,429,841 | ) | 10,180,221 | |||||||||||
Buffalo Small Cap Fund | 5,304,117 | (74,267,139 | ) | 68,963,022 | |||||||||||
92
The permanent differences primarily relate to foreign currency adjustments, sale of discount bonds, partnership adjustments, net operating losses, expiration of capital loss carryover and utilization of earnings and profit distributions to shareholders on redemption of shares.
As of March 31, 2017, the components of accumulated earnings (losses) for income tax purposes were as follows:
| BUFFALO DISCOVERY FUND | BUFFALO DIVIDEND FOCUS FUND | BUFFALO EMERGING OPPORTUNITIES FUND | BUFFALO FLEXIBLE INCOME FUND | BUFFALO GROWTH FUND | |||||||||||||||||||
Tax cost of Investments(a) | $ | 1,055,583,703 | $ | 49,259,032 | $ | 71,533,930 | $ | 639,938,106 | $ | 217,163,213 | |||||||||||||
Unrealized Appreciation | 252,754,671 | 10,917,152 | 17,479,165 | 196,024,611 | 118,320,615 | ||||||||||||||||||
Unrealized Depreciation | (28,783,218 | ) | (586,520 | ) | (3,198,653 | ) | (41,421,197 | ) | (4,377,668 | ) | |||||||||||||
Net unrealized appreciation | 223,971,453 | 10,330,632 | 14,280,512 | 154,603,414 | 113,942,947 | ||||||||||||||||||
Undistributed Ordinary Income | 24,347,703 | 328,004 | 1,460,201 | 889,572 | 633,548 | ||||||||||||||||||
Undistributed Long Term Capital Gain | 21,957,854 | — | — | 7,085,355 | 8,884,016 | ||||||||||||||||||
Distributable earnings | 46,305,557 | 328,004 | 1,460,201 | 7,974,927 | 9,517,564 | ||||||||||||||||||
Other accumulated gain (loss) | — | (1 | ) | — | 28,874 | — | |||||||||||||||||
Total accumulated gain | 270,277,010 | 10,658,635 | 15,740,713 | 162,607,215 | 123,460,511 | ||||||||||||||||||
| BUFFALO HIGH YIELD FUND | BUFFALO INTERNATIONAL FUND | BUFFALO LARGE CAP FUND | BUFFALO MID CAP FUND | BUFFALO SMALL CAP FUND | |||||||||||||||||||
Tax cost of Investments(a) | $ | 224,795,088 | $ | 161,684,276 | $ | 45,295,658 | $ | 344,463,058 | $ | 391,109,159 | |||||||||||||
Unrealized Appreciation | 9,970,332 | 47,322,659 | 13,718,850 | 77,464,416 | 178,446,326 | ||||||||||||||||||
Unrealized Depreciation | (1,090,816 | ) | (6,376,437 | ) | (639,342 | ) | (9,502,063 | ) | (5,986,730 | ) | |||||||||||||
Net unrealized appreciation | 8,879,516 | 40,946,222 | 13,079,508 | 67,962,353 | 172,459,596 | ||||||||||||||||||
Undistributed Ordinary Income | 874,685 | 29,945 | 1,227,011 | 8,773,432 | 12,079,328 | ||||||||||||||||||
Undistributed Long Term Capital Gain | 105,187 | 168,412 | 1,093,916 | 24,460,073 | 79,905,113 | ||||||||||||||||||
Distributable earnings | 979,872 | 198,357 | 2,320,927 | 33,233,505 | 91,984,441 | ||||||||||||||||||
Other accumulated loss | — | (877,904 | ) | — | — | (1 | ) | ||||||||||||||||
Total accumulated gain | 9,859,388 | 40,266,675 | 15,400,435 | 101,195,858 | 264,444,036 | ||||||||||||||||||
The differences between book-basis and tax-basis unrealized appreciation are attributable primarily to the tax deferral of losses on wash sales, premium amortization, and publicly traded partnership investments.
Other accumulated gain/(loss) is generally comprised of capital loss carryforwards, and/or unrealized gain/(loss) on derivative positions.
(a) Represents cost for federal income tax purposes and may differ from the cost for financial reporting purposes.
The following Funds utilized the amounts below of prior year capital loss carryover in the year ended March 31, 2017.
Buffalo International Fund | 3,873,430 | ||||||
As of March 31, 2017, the accumulated net realized loss on sales of investments and losses deferred for federal income tax purposes which are available to offset future taxable gains are as follows:
BUFFALO INTERNATIONAL FUND
MONTH/YEAR REALIZED | MONTH/YEAR EXPIRING | ST | LT | ||||||||||||
March-10 | March-18 | 843,515 | N/A | ||||||||||||
Totals | 843,515 | — | |||||||||||||
The utilization of certain capital loss carryovers are subject to annual limitations of $652,599, pursuant to IRC Sec. 382 as a result of acquisition of the Buffalo China Fund on January 25, 2013.
In order to meet certain excise tax distribution requirements, the Funds are required to measure and distribute annually net capital gains realized during a twelve month period ending October 31 and net investment income earned during a twelve month period ending December 31. In connection with this, the Funds are permitted for tax purposes to defer into their next fiscal year qualified late year losses. Qualified late year capital losses are any net capital losses incurred between November 1 and the end of their fiscal year, March 31, 2017. Qualified late year ordinary losses are generally losses incurred between January 1 and the end of their fiscal year, March 31, 2017.
93
 Notes to Financial Statements
March 31, 2017
(Continued)
At March 31, 2017, none of the Buffalo Funds deferred, on a tax basis, qualified late year losses, consisting of ordinary and capital losses.
For the year ended March 31, 2017, the Buffalo International Fund earned foreign source income and paid foreign taxes which it intends to pass through to its shareholders pursuant to Section 853 of the Internal Revenue Code as follows:
BUFFALO INTERNATIONAL FUND
Country | GROSS DIVIDEND | TAXES WITHHELD | |||||||||
Belgium | $ | 96,236 | $ | 14,435 | |||||||
Bermuda | 83,285 | — | |||||||||
Brazil | 67,321 | 3,827 | |||||||||
Canada | 49,327 | 7,399 | |||||||||
Chile | 26,925 | 5,210 | |||||||||
France | 642,721 | 83,378 | |||||||||
Germany | 992,009 | 139,361 | |||||||||
Hong Kong | 85,266 | 6,024 | |||||||||
India | 61,655 | — | |||||||||
Ireland | 11,200 | — | |||||||||
Israel | 55,114 | 8,267 | |||||||||
Italy | 37,353 | 5,603 | |||||||||
Japan | 202,091 | 20,209 | |||||||||
Netherlands | 120,938 | 18,141 | |||||||||
Norway | 127,482 | 19,122 | |||||||||
Singapore | 91,229 | — | |||||||||
South Korea | 18,864 | 3,113 | |||||||||
Spain | 45,154 | 6,773 | |||||||||
Sweden | 93,665 | 14,050 | |||||||||
Switzerland | 607,861 | 59,841 | |||||||||
Taiwan | 151,512 | 30,301 | |||||||||
United Kingdom | 972,275 | — | |||||||||
$ | 4,639,483 | $ | 445,054 | ||||||||
3. RELATED PARTY TRANSACTIONS:
Management fees are paid to Kornitzer Capital Management, Inc. ("KCM") at the rate of 1.00% per annum of the average daily net asset values of the Funds, except for the Buffalo Emerging Opportunities Fund, Buffalo Dividend Focus Fund, Buffalo Growth Fund and Buffalo Large Cap Fund which have a management fee rate of 1.45%, 0.90%, 0.90% and 0.90%, respectively. The man- agement fees are for services which include the costs of all management, supervisory and administrative services required in the normal operation of the Funds. This includes investment management and supervision; fees of the custodian (except for the addi- tional cost of maintaining custody of assets in foreign jurisdictions, when compared to domestic custody costs), independent reg- istered public accounting firm and legal counsel; fees and expenses of officers, trustees and other personnel; rent; shareholder services; and other items incidental to corporate administration. Pursuant to a Master Services Agreement with U.S. Bancorp Fund Services, LLC ("USBFS"), KCM pays USBFS a fee of 30/100 of 1% (0.30%) of each Fund's average daily net assets out of the fees KCM receives from the Funds, except for the Buffalo Dividend Focus Fund, Buffalo Growth Fund and the Buffalo Large Cap Fund, where USBFS receives 25/100 of 1% (0.25%). USBFS provides or obtains various operational services required by the Funds, pays various Fund expenses and acts as paying agent to compensate other Fund service providers. Some of the other Fund service providers are affiliates of USBFS.
With respect to the Buffalo Small Cap Fund only, the annual management fee rate of one percent (1.00%) of the Buffalo Small Cap Fund's average daily net assets is a base fee paid to KCM that is subject to reduced fees paid on assets in excess of certain levels (breakpoints). The fee paid by KCM to USBFS is also subject to breakpoints on assets in excess of certain levels. The breakpoint schedules for the management fees paid by the Buffalo Small Cap Fund to KCM and the fees paid by KCM to USBFS are set forth in the following table:
BUFFALO SMALL CAP FUND FEE BREAKPOINTS
(AS A % OF AVERAGE DAILY NET ASSETS) | |||||||||||
ASSET LEVEL | MANAGEMENT FEE | USBFS FEE | |||||||||
Assets up to $6 billion | 1.00 | % | 0.300 | % | |||||||
Assets over $6 billion up to $7 billion | 0.95 | % | 0.275 | % | |||||||
Assets over $7 billion up to $8 billion | 0.90 | % | 0.250 | % | |||||||
Assets over $8 billion up to $9 billion | 0.85 | % | 0.225 | % | |||||||
Assets over $9 billion | 0.80 | % | 0.200 | % | |||||||
94
The management fees do not include the cost of acquiring and disposing of portfolio securities, taxes, if any, imposed directly on the Funds and their shares, insurance, certain trustee expenses and the cost of qualifying the Funds' shares for sale in any juris- diction. Certain officers and a trustee of the Funds are also officers and/or directors of KCM.
A trustee of the Funds is affiliated with USBFS and U.S. Bank, N.A., which provide accounting, administration, transfer agency and custodian services to the Funds, as described above. The Buffalo International Fund incurred $47,796 in custody fees during the year ended March 31, 2017, and owed $8,994 custody fees as of March 31, 2017.
4. AGGREGATE COMPENSATION TO TRUSTEES:
The Funds do not directly compensate any of their trustees. USBFS pays trustee fees to non-interested Board members from its share of the management fee that it receives from KCM. The aggregate compensation paid to the Funds' non-interested trustees for their service on the Funds' Board for the year ended March 31, 2017 was $200,000. Interested trustees who are affiliated with either KCM or the Funds' service providers do not receive any compensation from the Funds, but are compensated directly by the advisor or service provider in connection with their employment with those entities.
5. REDEMPTION FEE:
Effective December 1, 2016, the Board approved the elimination of redemption fees on shares of the Funds. Prior to December 1, 2016, shares of the Buffalo Discovery Fund, Buffalo Dividend Focus Fund, Buffalo Flexible Income Fund, Buffalo Growth Fund, Buffalo International Fund, Buffalo Large Cap Fund and Buffalo Mid Cap Fund, sold or exchanged within 60 days of their purchase and shares of the Buffalo Emerging Opportunities Fund, Buffalo High Yield Fund and Buffalo Small Cap Fund sold or exchanged within 180 days of their purchase were subject to a redemption fee of 2.00% of the value of the shares sold or exchanged. The redemption fee was used by the Funds to help pay transaction and tax costs that long-term investors would bear when the Funds realized capital gains as a result of selling securities to meet investor redemptions.
6. INVESTMENT TRANSACTIONS:
The aggregate purchases and sales of securities, excluding short-term investments and U.S. government securities, for the Funds for the year ended March 31, 2017 were as follows:
| BUFFALO DISCOVERY FUND | BUFFALO DIVIDEND FOCUS FUND | BUFFALO EMERGING OPPORTUNITIES FUND | BUFFALO FLEXIBLE INCOME FUND | BUFFALO GROWTH FUND | |||||||||||||||||||
Purchases | $ | 664,013,361 | $ | 23,621,359 | $ | 83,311,916 | $ | 11,412,023 | $ | 63,807,031 | |||||||||||||
Proceeds from Sales | $ | 523,175,683 | $ | 10,601,054 | $ | 128,368,924 | $ | 164,243,569 | $ | 154,286,152 | |||||||||||||
| BUFFALO HIGH YIELD FUND | BUFFALO INTERNATIONAL FUND | BUFFALO LARGE CAP FUND | BUFFALO MID CAP FUND | BUFFALO SMALL CAP FUND | |||||||||||||||||||
Purchases | $ | 96,895,278 | $ | 7,609,511 | $ | 21,228,014 | $ | 184,125,605 | $ | 319,568,638 | |||||||||||||
Proceeds from Sales | $ | 145,797,344 | $ | 69,876,091 | $ | 19,597,780 | $ | 270,138,258 | $ | 873,635,828 | |||||||||||||
There were no purchases or sales of long-term U.S. government securities for any Funds during the year ended March 31, 2017.
7. TRANSACTIONS WITH AFFILIATES:
Investments representing 5% or more of the outstanding voting securities of a portfolio company result in that company being considered an affiliated company, as defined in the 1940 Act. There were no affiliated companies held in any of the Buffalo Funds during the year ended March 31, 2017.
8. OPTIONS WRITTEN:
FASB ASC 815, Derivatives and Hedging (ASC 815) is intended to improve financial reporting about derivative instruments by requir- ing enhanced disclosures to enable investors to better understand how and why the Funds use derivative instruments, how these derivative instruments are accounted for and their effects on the Funds' financial position and results of operations. The Buffalo Flexible Income Fund is the only Fund that has maintained any positions in derivative instruments or engaged in hedging activities during the period ended March 31, 2017.
95
 Notes to Financial Statements
March 31, 2017
(Continued)
The number of option contracts written and the premiums received by the Buffalo Flexible Income Fund during the period ended March 31, 2017 were as follows:
BUFFALO FLEXIBLE INCOME FUND
CALL OPTIONS WRITTEN | |||||||||||
CONTRACTS | PREMIUMS | ||||||||||
Outstanding, March 31, 2016 | 2,400 | 113,034 | |||||||||
Options written | 6,621 | 362,271 | |||||||||
Options exercised | (3,195 | ) | (129,734 | ) | |||||||
Options expired | (5,426 | ) | (285,805 | ) | |||||||
| Outstanding, March 31, 2017 | 400 | 59,767 | |||||||||
The following is a summary of the location of derivative investments on the Fund's Statement of Assets and Liabilities as of March 31, 2017:
DERIVATIVE INVESTMENT TYPE | VALUE | ||||||
Liability Derivatives | |||||||
Buffalo Flexible Income Fund | |||||||
Written Options — equity contracts | $ | 16,250 | |||||
The following is a summary of the effect of derivative investments on Realized Gain (loss) and Change in Unrealized Appreciation/Depreciation on Written Options in the Funds as of March 31, 2017:
DERIVATIVE INVESTMENT TYPE | REALIZED GAIN (LOSS) ON WRITTEN OPTIONS | ||||||
Liability Derivatives | |||||||
Buffalo Flexible Income Fund | |||||||
Written Options — equity contracts | $ | 285,805 | |||||
DERIVATIVE INVESTMENT TYPE | CHANGE IN UNREALIZED APPRECIATION/DEPRECIATION WRITTEN ON OPTIONS | ||||||
Liability Derivatives | |||||||
Buffalo Flexible Income Fund | |||||||
Written Options — equity contracts | $ | 77,883 | |||||
The following tables present derivative assets and liabilities net of amounts available for offset under Master Netting Agreements (MNA) and net of related collateral received or pledged, if any, as of March 31, 2017:
GROSS AMOUNTS NOT OFFSET IN THE STATEMENT OF ASSETS AND LIABILITIES AND SUBJECT TO MASTER NETTING AGREEMENTS (MNA)
GROSS | GROSS AMOUNTS OFFSET IN THE | NET AMOUNTS PRESENTED IN | GROSS AMOUNTS NOT OFFSET IN THE STATEMENT OF FINANCIAL POSITION | ||||||||||||||||||||||||
DESCRIPTION | AMOUNTS OF RECOGNIZED LIABILITIES | STATEMENT OF FINANCIAL POSITION | THE STATEMENT OF FINANCIAL POSITION | FINANCIAL INSTRUMENTS | COLLATERAL PLEDGED/ RECEIVED | NET AMOUNT | |||||||||||||||||||||
LIABILITIES: | |||||||||||||||||||||||||||
Written Options | $ | 16,250 | $ | — | $ | 16,250 | $ | 16,250 | $ | — | $ | 16,250 | |||||||||||||||
$ | 16,250 | $ | — | $ | 16,250 | $ | 16,250 | $ | — | $ | 16,250 | ||||||||||||||||
9. FOREIGN INVESTMENT RISK:
When the Buffalo International Fund buys or sells securities on a foreign stock exchange, the transaction is undertaken in the local currency rather than in U.S. dollars. In purchasing or selling local currency to execute transactions on foreign exchanges, the Buffalo International Fund will be exposed to the risk that the value of the foreign currency will increase or decrease, which may impact the value of the portfolio holdings. China has, and may continue to adopt, internal economic policies that affect its currency valu- ations in a manner that may be disadvantageous for U.S. investors or U.S. companies seeking to do business in China. In addition, a country may impose formal or informal currency exchange controls (or "capital controls"). These types of controls may restrict or prohibit the Buffalo International Fund's ability to repatriate both investment capital and income, which could undermine the value of the portfolio holdings and potentially place the Buffalo International Fund's assets at risk of total loss.
Investing in securities of foreign corporations and governments involves additional risks relating to: political, social, religious and economic developments abroad; market instability; fluctuations in foreign exchange rates; different regulatory requirements, market practices, accounting standards and practices; and less publicly available information about foreign issuers. Additionally, these investments may be less liquid, carry higher brokerage commissions and other fees, and procedures and regulations governing transactions and custody in foreign markets also may involve delays in payment, delivery or recovery of money or investments. Investments in common stocks of U.S. companies with international operations, and the purchase of sponsored or unsponsored
96
ADRs (American Depositary Receipt) carry similar risks. In addition to risks associated with investing in foreign securities, there are special risks associated with investments in China and Hong Kong, including exposure to currency fluctuations, less liquidity, expropriation, confiscatory taxation, nationalization, exchange control regulations, differing legal standards and rapid fluctuations in inflation and interest rates. The Chinese government could, at any time, alter or discontinue economic reform programs imple- mented since 1978.
10. LINE OF CREDIT
U.S. Bank, N.A. has made available to the Buffalo Funds an unsecured line of credit pursuant to a Loan Agreement for the Funds which matures, unless renewed, on August 1, 2017. The line of credit is intended to provide short-term financing, if necessary, subject to certain restrictions, in connection with shareholder redemptions. The Buffalo Funds may borrow up to the lesser of $50,000,000 or certain percentage amounts based on the net assets of the Funds.
The interest rate paid by the Buffalo Funds on outstanding borrowings is equal to the Prime Rate. During the year ended March 31, 2017, the Funds did not borrow from the line of credit.
11. SUBSEQUENT EVENTS:
Management has evaluated the events and transactions that have occurred after March 31, 2017 and through the date the financial statements were issued and determined that there were no significant subsequent events that would require adjustment of the financial statements or additional disclosures.
97
 Report of Independent Registered Public Accounting Firm
The Board of Trustees and Shareholders of
Buffalo Funds
We have audited the accompanying statements of assets and liabilities, including the schedules of investments, of the Buffalo Funds (comprising, respectively, the Buffalo Discovery Fund, Buffalo Dividend Focus Fund, Buffalo Emerging Opportunities Fund, Buffalo Flexible Income Fund, Buffalo Growth Fund, Buffalo High Yield Fund, Buffalo International Fund, Buffalo Large Cap Fund, Buffalo Mid Cap Fund, and Buffalo Small Cap Fund) (collectively referred to herein as the Funds), as of March 31, 2017, and the related statements of operations for the year then ended, the statements of changes in net assets for each of the two years in the period then ended and the financial highlights for each of the periods indicated therein. These financial statements and financial highlights are the responsibility of the Funds' management. Our responsibility is to express an opinion on these financial statements and financial highlights based on our audits.
We conducted our audits in accordance with the standards of the Public Company Accounting Oversight Board (United States). Those standards require that we plan and perform the audit to obtain reasonable assurance about whether the financial statements and financial highlights are free of material misstatement. We were not engaged to perform an audit of the Funds' internal control over financial reporting. Our audits included consideration of internal control over financial reporting as a basis for designing audit procedures that are appropriate in the circumstances, but not for the purpose of expressing an opinion on the
effectiveness of the Funds' internal control over financial reporting. Accordingly, we express no such opinion. An audit also includes examining, on a test basis, evidence supporting the amounts and disclosures in the financial statements and financial highlights, assessing the accounting principles used and significant estimates made by management, and evaluating the overall financial statement presentation. Our procedures included confirmation of securities owned as of March 31, 2017, by correspondence with the custodian, agent banks and brokers or by other appropriate auditing procedures where replies from agent banks and brokers were not received. We believe that our audits provide a reasonable basis for our opinion.
In our opinion, the financial statements and financial highlights referred to above present fairly, in all material respects, the financial position of each of the respective funds constituting the Buffalo Funds at March 31, 2017, the results of their operations for the year then ended, the changes in their net assets for each of the two years in the period then ended and the financial highlights for each of the periods indicated therein in conformity with U.S. generally accepted accounting principles.
Kansas City, Missouri
May 25, 2017
98
 Notice to Shareholders
March 31, 2017 (Unaudited)
TAX INFORMATION
For the fiscal year ended March 31, 2017, certain dividends paid by the Funds may be subject to a maximum tax rate of 15%, as provided for by the Jobs and Growth Tax Relief Reconciliation Act of 2003. The percentage of dividends declared from ordinary income designated as qualified dividend income was as follows (unaudited):
Buffalo Discovery Fund | 23.69 | % | |||||
Buffalo Dividend Focus Fund | 83.77 | % | |||||
Buffalo Emerging Opportunities Fund | 38.94 | % | |||||
Buffalo Flexible Income Fund | 91.77 | % | |||||
Buffalo Growth Fund | 100.00 | % | |||||
Buffalo High Yield Fund | 2.67 | % | |||||
Buffalo International Fund | 100.00 | % | |||||
Buffalo Large Cap Fund | 85.39 | % | |||||
Buffalo Mid Cap Fund | 32.00 | % | |||||
Buffalo Small Cap Fund | 9.29 | % | |||||
For corporate shareholders, the percent of ordinary income distributions qualifying for the corporate dividends received deduction for the fiscal year ended March 31, 2017 was as follows (unaudited):
Buffalo Discovery Fund | 21.19 | % | |||||
Buffalo Dividend Focus Fund | 79.25 | % | |||||
Buffalo Emerging Opportunities Fund | 35.71 | % | |||||
Buffalo Flexible Income Fund | 75.89 | % | |||||
Buffalo Growth Fund | 100.00 | % | |||||
Buffalo High Yield Fund | 2.67 | % | |||||
Buffalo International Fund | 0.34 | % | |||||
Buffalo Large Cap Fund | 83.44 | % | |||||
Buffalo Mid Cap Fund | 31.16 | % | |||||
Buffalo Small Cap Fund | 9.15 | % | |||||
FOREIGN SHAREHOLDERS: The percentage of ordinary income distributions that are designated as interest-related dividends under Internal Revenue Code Section 871(k)(1)(C) for the year ended March 31, 2017 was as follows (unaudited):
Buffalo Discovery Fund | 0.00 | % | |||||
Buffalo Dividend Focus Fund | 0.77 | % | |||||
Buffalo Emerging Opportunities Fund | 0.00 | % | |||||
Buffalo Flexible Income Fund | 28.18 | % | |||||
Buffalo Growth Fund | 0.48 | % | |||||
Buffalo High Yield Fund | 94.34 | % | |||||
Buffalo International Fund | 0.45 | % | |||||
Buffalo Large Cap Fund | 0.15 | % | |||||
Buffalo Mid Cap Fund | 0.00 | % | |||||
Buffalo Small Cap Fund | 0.00 | % | |||||
FOREIGN SHAREHOLDERS: The percentage of taxable ordinary income distributions that are designated as short-term capital gain distributions under Internal Revenue Section 871(k)(2)(C) for the year ended March 31, 2017 was as follows (unaudited).
Buffalo Discovery Fund | 100.00 | % | |||||
Buffalo Dividend Focus Fund | 27.04 | % | |||||
Buffalo Emerging Opportunities Fund | 100.00 | % | |||||
Buffalo Flexible Income Fund | 1.70 | % | |||||
Buffalo Growth Fund | 9.82 | % | |||||
Buffalo High Yield Fund | 0.00 | % | |||||
Buffalo International Fund | 0.00 | % | |||||
Buffalo Large Cap Fund | 0.00 | % | |||||
Buffalo Mid Cap Fund | 100.00 | % | |||||
Buffalo Small Cap Fund | 100.00 | % | |||||
With respect to the taxable year ended March 31, 2017, the Funds hereby designate as capital gain dividends the amounts listed below, or, if subsequently determined to be different, the net capital gains of such year:
| FUNDS | FROM LONG-TERM CAPITAL GAINS, SUBJECT TO THE 15% RATE GAINS CATEGORY: | FROM LONG-TERM CAPITAL GAINS, USING PROCEEDS FROM SHAREHOLDER REDEMPTIONS: | |||||||||
Buffalo Discovery Fund | $ | 13,238,124 | $ | 6,328,331 | |||||||
Buffalo Dividend Focus Fund | 117,090 | 32,632 | |||||||||
Buffalo Emerging Opportunities Fund | 6,516,575 | 809,002 | |||||||||
Buffalo Flexible Income Fund | 3,348,790 | 2,141,456 | |||||||||
Buffalo Growth Fund | 15,611,743 | 4,247,915 | |||||||||
Buffalo High Yield Fund | 5,343,506 | 2,236,467 | |||||||||
Buffalo International Fund | — | 45,863 | |||||||||
Buffalo Large Cap Fund | 1,433,777 | 275,447 | |||||||||
Buffalo Mid Cap Fund | 24,666,308 | 10,180,221 | |||||||||
Buffalo Small Cap Fund | 95,851,125 | 68,963,022 | |||||||||
99
 Notice to Shareholders
March 31, 2017 (Unaudited)
(Continued)
Trustees and Officers of the Funds (unaudited)
The management and affairs for the Funds are supervised by the Board of Trustees ("Trustees") under the laws of the State of Delaware. The Trustees and executive officers of the Funds and their principal occupations for the last five years are set forth below. Each may have held other positions with the named companies during that period. The Funds' Statement of Additional Information includes additional information about the Trustees and is available without charge, upon request, by calling the Funds toll-free at 1-800-49-BUFFALO.
NAME, AGE AND ADDRESS | POSITION(S) HELD WITH FUNDS | TERM OF OFFICE AND LENGTH OF TIME SERVED | PRINCIPAL OCCUPATION(S) DURING PAST FIVE YEARS | NUMBER OF PORTFOLIOS IN FUND COMPLEX OVERSEEN BY TRUSTEE | OTHER DIRECTORSHIPS HELD BY TRUSTEE DURING THE PAST FIVE YEARS | ||||||||||||||||||
INTERESTED TRUSTEES(1) | |||||||||||||||||||||||
| Joseph C. Neuberger (54) 615 East Michigan Street, Milwaukee, WI 53202 | Trustee Chairman | Indefinite term and served since May 2003. One year term and served since May 2003. | Executive Vice President, U.S. Bancorp Fund Services, LLC 1994-present. | 10 | Trustee, USA MUTUALS (an open-end investment company with one portfolio); Trustee, Trust for Professional Managers (an open-end investment company with thirty-five portfolios) | ||||||||||||||||||
| Clay E. Brethour (47) 5420 West 61st Place Shawnee Mission, KS 66205 | Trustee President and Treasurer | Indefinite term and served since August 2013 One year term and served since September 2014. | Portfolio Manager, Kornitzer Capital Management, Inc. (management company) 2000-present. | 10 | None | ||||||||||||||||||
NON-INTERESTED TRUSTEES | |||||||||||||||||||||||
| J. Gary Gradinger (73) 5420 West 61st Place Shawnee Mission, KS 66205 | Trustee | Indefinite term and served since February 2001. | Chairman and Chief Executive Officer, Golden Star Inc. (manufacturer of textile cleaning products) 1969-present. | 10 | Formerly, Director, MGP Ingredients, Inc. (a food ingredients company) (2005-2014) | ||||||||||||||||||
| Philip J. Kennedy (71) 5420 West 61st Place Shawnee Mission, KS 66205 | Trustee | Indefinite term and served since May 1995. | Business Consultant and C.P.A. Finance and Accounting Professor, Penn State Shenango (2001-2011). | 10 | None | ||||||||||||||||||
| Rachel F. Lupardus (43) 5420 West 61st Place Shawnee Mission, KS 66205 | Trustee | Indefinite term and served since October 2015. | Chief Operating Officer/Chief Financial Officer, Trozzolo Communications Group (marketing communications agency), 2015-present; Chief Financial Officer, Customer Engagement, KBM Group LLC (marketing services company) 2014-2015; Chief Financial Officer, DataCore Marketing, LLC (marketing services company), 2004-2013. | 10 | None | ||||||||||||||||||
| Jeffrey D. Yowell (49) 5420 West 61st Place Shawnee Mission, KS 66205 | Trustee | Indefinite term and served since October 2015. | President and Owner, Getter Farms, LLC (agriculture and farm-related operations), 2007-present; President, Strategic Services, KBM Group LLC (marketing services company), 2013; President and Chief Executive Officer, DataCore Marketing, LLC (marketing services company), 1992-2012. | 10 | None | ||||||||||||||||||
OFFICERS | |||||||||||||||||||||||
| Fred Coats (51) 5420 West 61st Place Shawnee Mission, KS 66205 | Chief Compliance Officer | Indefinite term and served since May 2015 | Chief Compliance Officer, Kornitzer Capital Management, Inc. (management company) May 2015-present; Private Practice Attorney May 1993-present. | N/A | None | ||||||||||||||||||
| Rachel Spearo (37) 615 East Michigan Street Milwaukee, WI 53202 | Secretary | One year term and served since November 2016 | Vice President, U.S. Bancorp Fund Services, LLC 2004-present. | N/A | N/A | ||||||||||||||||||
(1) Each of these Trustees may be deemed to be an "interested person" of the Funds as that term is defined in the 1940 Act. Mr. Neuberger is an interested person of the Trust by virtue of the fact that he is a board member and an interested person of Quasar Distributors LLC, the Funds' principal underwriter. Mr. Brethour is an interested person of the Trust by virtue of the fact that he is a board member and an employee of the Advisor.
100
A NOTE ON FORWARD-LOOKING STATEMENTS
Except for historical information contained in this annual report for the Funds, the matters discussed in this report may constitute forward-looking statements made pursuant to the safe harbor provisions of the Securities Litigation Reform Act of 1995. These include any advisor and/or port- folio manager predictions, assessments, analyses or outlooks for individual securities, industries, market sectors and/or markets. These statements involve risks and uncertainties. In addition to the general risks described for the Funds in the current Prospectus, other factors bearing on these reports include the accuracy of the advisor's or portfolio managers' forecasts and predictions, and the appropriateness of the investment programs designed by the advisor or portfolio manager to implement their strategies efficiently and effectively. Any one or more of these factors, as well as other risks affecting the securities markets and investment instruments generally, could cause the actual results of the Funds to differ materially as compared to benchmarks associated with the Funds.
ADDITIONAL INFORMATION
The Buffalo Funds have adopted proxy voting policies and procedures that delegate to Kornitzer Capital Management, Inc., the Funds' investment advisor, the authority to vote proxies. A description of the Buffalo Funds' proxy voting policies and procedures is available without charge, upon request, by calling the Funds toll free at 1-800-49-BUFFALO. A description of these policies and procedures is also included in the Funds' Statement of Additional Information, which is available on the SEC's website at http://www.sec.gov.
The actual voting records relating to portfolio securities during the most recent twelve month period ended June 30 (as filed with the SEC on Form N-PX) are available without charge, upon request, by calling the Funds toll free at 1-800-49-BUFFALO or by accessing the SEC's website at http://www.sec.gov.
The Funds file their complete schedule of portfolio holdings with the SEC four times each fiscal year at quarter-ends. The Funds file the Schedule of Portfolio Holdings with the SEC on Form N-CSR (second and fourth quarters) and on Form N-Q (first and third quarters). Shareholders may view the Funds' Forms N-CSR and N-Q on the SEC's website at http://www.sec.gov. Forms N-CSR and N-Q may also be reviewed and copied at the SEC's Public Reference Room in Washington, D.C. Information on the SEC's Public Reference Room may be obtained by calling 1-202-551-8090 (direct) or 1-800-SEC-0330 (general SEC number).
101
 Notice to Shareholders
March 31, 2017 (Unaudited)
(Continued)
APPROVAL OF INVESTMENT
ADVISORY CONTRACTS
The Board of Trustees (the "Trustees") of Buffalo Funds, a Delaware statutory trust, on behalf of its series, Buffalo Flexible Income Fund, Buffalo High Yield Fund, Buffalo Large Cap Fund, Buffalo Small Cap Fund, Buffalo Growth Fund, Buffalo Discovery Fund, Buffalo Mid Cap Fund, Buffalo Emerging Opportunities Fund, Buffalo International Fund and Buffalo Dividend Focus Fund (all such funds referred to collectively as the "Funds") met on November 16, 2016, to consider the renewal of the Amended and Restated Management Agreements (the "Agreements") between the Trust, on behalf of the Funds, and Kornitzer Capital Management, Inc., the Funds' investment adviser (the "Adviser" or "KCM"). In advance of the meeting, the Trustees requested and received materials to assist them in considering the renewal of the Agreements. The materials provided contained information with respect to the factors enumerated below, including the Agreements, a memorandum prepared by the Trustees' independent legal counsel discussing in detail the Trustees' fiduciary obligations and the factors they should assess in considering the approval of the Agreements, detailed comparative information relating to the advisory fees, overall expenses and performance of the Funds, due diligence materials relating to the Adviser (including the Adviser's Form ADV, information regarding key personnel, information relating to the Adviser's and the Funds' compliance programs, including risk management, and the Code of Ethics), information that the Adviser regularly provides to the Trustees in connection with reports on its activities and the activities of the Funds at the Trustees' periodic Board meetings, and other pertinent information. In addition, the Independent Trustees, as defined below, met via teleconference with their independent counsel on November 8, 2016 and immediately prior to the Board meeting held on November 16, 2016, to review and discuss the information provided to them and their duties and responsibilities in connection with the renewal of the Agreements. Based on their evaluation of information provided by the Adviser, in conjunction with the Funds' other service providers, the Trustees, by a unanimous vote (including a separate vote of the Trustees who are not "interested persons," as that term is defined in the Investment Company Act of 1940, as amended (the "Independent Trustees")), approved the renewal of the Agreements for an additional term of one year ending November 30, 2017.
DISCUSSION OF FACTORS CONSIDERED
In considering the renewal of the Agreements between the Trust, on behalf of the Funds, and the Adviser, the Trustees reviewed and analyzed various factors that they deter-
mined were relevant, including the factors enumerated below.
1. Nature, Extent and Quality of Services Provided to the Funds
The Trustees considered the nature, extent and quality of services provided by KCM to the Funds and the amount of time devoted to the Funds' affairs by KCM's staff. The Trustees considered KCM's specific responsibilities in all aspects of day-to-day management of the Funds, including the investment strategies implemented by KCM, as well as the qualifications, experience and responsibilities of the Funds' portfolio managers and other key personnel at KCM involved in the day-to-day activities of the Funds. In executive session the Independent Trustees reviewed information provided by KCM in response to the Board's 15(c) requests, including the structure of KCM's compliance program and KCM's continuing commitment to the growth of the Funds' assets. The Trustees noted that during the course of the prior year they had met with representatives of KCM in person to discuss the Funds' performance and outlook, along with the marketing and compliance efforts made by KCM throughout the year. The Trustees also noted any services that extended beyond portfolio management, and they considered the trading capability of KCM, and the lack of both shareholder complaints and financial statement issues. The Trustees discussed in detail KCM's handling of compliance matters, including the quarterly and annual reports of the Trust's chief compliance officer to the Trustees on the effectiveness of KCM's compliance program. The Trustees concluded that KCM had sufficient quality and depth of personnel, resources, investment methods and compliance policies and procedures essential to performing its duties under the Agreements and that the nature, overall quality and extent of the management services provided to the Funds, as well as KCM's compliance program, were satisfactory and reliable.
2. Investment Performance of the Funds and the Adviser
In assessing the quality of the portfolio management services delivered by KCM, the Trustees compared the short-term and longer-term performance of each Fund on both an absolute basis and in comparison to a benchmark index and in comparison to a peer group as constructed using data from Morningstar, Inc. (each a "Morningstar Peer Group").
Buffalo Discovery Fund. The Trustees noted the Buffalo Discovery Fund's performance for the year-to-date, one-year, three-year, five-year and ten-year periods ended September 30, 2016 was above the median for the Morningstar Peer Group of U.S. open-end mid cap growth
102
funds, falling within the first quartile of the Morningstar Peer Group for all periods except the year-to-date, which fell into the second quartile of the Morningstar Peer Group. The Trustees further noted for the year-to-date, one-year, three-year, five-year, ten-year and since inception periods ended September 30, 2016, the Buffalo Discovery Fund outperformed the Russell Midcap Growth Index and the Lipper Multi Cap Growth Funds Index. The Trustees further noted the Discovery Fund had underperformed the Russell 3000 Growth Total Return Index for the one-year and three-year periods ended September 30, 2016, but outperformed the Index over all other time periods. The Trustees also compared the performance of the Buffalo Discovery Fund to that of other accounts managed by KCM using investment strategies substantially similar to that of the Fund, and noted that for all periods the performance of the Fund was comparable to that of the other accounts.
Buffalo Dividend Focus Fund. The Trustees noted the Dividend Focus Fund's performance for the year-to-date, one-year and three-year periods ended September 30, 2016 was above the median for the Morningstar Peer Group of U.S. open-end large blend category funds, falling within the second quartile for the year-to-date period and the first quartile for the one-year and three-year periods. The Trustees further noted that for the three-year period ended September 30, 2016, the Buffalo Dividend Focus Fund outperformed the Lipper Equity Income Funds Index and the S&P 500 Index, but had underperformed the same indexes for the one-year period ended September 30, 2016. The Trustees also compared the performance of the Buffalo Dividend Focus Fund to that of other accounts managed by KCM using investment strategies substantially similar to that of the Fund, and noted that for all periods the performance of the Fund was comparable to that of the other accounts.
Buffalo Emerging Opportunities Fund. The Trustees noted that the Buffalo Emerging Opportunities Fund's performance for the three-year and ten-year periods ended September 30, 2016 was below the median for the Morningstar Peer Group of U.S. open-end small growth funds, falling in the fourth quartile of the Morningstar Peer Group for both periods. The Trustees further noted that the Buffalo Emerging Opportunities Fund's performance for the year-to-date and five-year periods ended September 30, 2016 was above the Morningstar Peer Group median, falling into the first quartile for the five-year period, and the second quartile for the year-to-date period, and that Buffalo Emerging Opportunities Fund's performance for the one-year period ended September 30, 2016 was equal to the Morningstar Peer Group median. The Trustees further noted that for the one-year and five-year periods end-
ed September 30, 2016, the Buffalo Emerging Opportunities Fund outperformed the Russell 2000 Growth Total Return Index and the Lipper Small Cap Growth Funds Index, but had underperformed the same indexes for the ten-year period ended September 30, 2016, and had significantly underperformed the same indexes for the three-year period ended September 30, 2016. The Trustees also compared the performance of the Buffalo Emerging Opportunities Fund to that of other accounts managed by KCM using investment strategies substantially similar to that of the Fund, and noted that for all periods the performance of the Fund was comparable to that of the other accounts.
Buffalo Flexible Income Fund. The Trustees noted that the Buffalo Flexible Income Fund's performance for the one-year and ten-year periods ended September 30, 2016 was above the median for the Morningstar Peer Group of U.S. open-end allocation 50 — 70% equity funds, falling within the first quartile of the Morningstar Peer Group for the one-year period, and at the top of the second quartile for the ten-year period. The Trustees also noted the Buffalo Flexible Income Fund's performance was below the Morningstar Peer Group median for the year-to-date, three-year and five-year periods ended September 30, 2016, falling at the bottom of the third quartile for the year-to-date period, and falling within the fourth quartile for the three-year and five-year periods. The Trustees further noted that for the fifteen-year period ended September 30, 2016, the Buffalo Flexible Income Fund outperformed the S&P 500 Index, and for all other periods the Fund had trailed the S&P 500 Index. The Trustees also noted for the one-year, ten-year and since-inception periods ended September 30, 2016, the Buffalo Flexible Income Fund outperformed the Lipper Mixed-Asset Target Allocation Moderate Funds Index. The Trustees also compared the performance of the Buffalo Flexible Income Fund to that of other accounts managed by KCM using investment strategies substantially similar to that of the Fund, and noted that for all periods the performance of the Fund was comparable to that of the other accounts.
Buffalo Growth Fund. The Trustees noted the Buffalo Growth Fund's performance for the year-to-date, one-year, five-year and ten-year periods ended September 30, 2016 was above the median for the Morningstar Peer Group of U.S. open-end large growth funds, falling within the first quartile of the Morningstar Peer Group for the year-to-date and ten-year periods, and falling within the second quartile for the one-year and five-year periods. The Trustees further noted for the three-year period ended September 30, 2016, the Buffalo Growth Fund's performance was below that of the Morningstar Peer Group median, falling within the third quartile of the Morningstar Peer Group. The Trustees
103
 Notice to Shareholders
March 31, 2017 (Unaudited)
(Continued)
further noted that for the one-year, three-year, five-year, ten-year, fifteen-year and since inception periods ended September 30, 2016, the Buffalo Growth Fund outperformed the Lipper Large Cap Growth Funds Index. The Trustees also noted for the three-year, five-year and since inception periods ended September 30, 2016, the Fund had outperformed the Russell 1000 Growth Total Return Index. The Trustees also compared the performance of the Buffalo Growth Fund to that of other accounts managed by KCM using investment strategies substantially similar to that of the Fund, and noted that for all periods the performance of the Fund was comparable to that of the other accounts.
Buffalo High Yield Fund. The Trustees noted that the Buffalo High Yield Fund's performance for the three-year, five-year and ten-year periods ended September 30, 2016 was above the median for the Morningstar Peer Group of U.S. open-end high yield bond funds, falling within the second quartile of the Morningstar Peer Group for all periods. The Trustees further noted that the Buffalo High Yield Fund's performance for the year-to-date and one-year periods ended September 30, 2016 was below the median for the Morningstar Peer Group, falling within the fourth quartile of the Morningstar Peer Group for all periods. The Trustees further noted that for the ten-year period ended September 30, 2016, the Buffalo High Yield Fund outperformed the Lipper High Yield Bond Funds Index, but had underperformed the Index for all other periods. The Trustees also compared the performance of the Buffalo High Yield Fund to that of other accounts managed by KCM using investment strategies substantially similar to that of the Fund, and noted that for all periods the performance of the Fund was comparable to that of the other accounts.
Buffalo International Fund. The Trustees noted that the Buffalo International Fund's performance for the year-to-date, one-year, three-year and five-year periods ended September 30, 2016 was above the median for the Morningstar Peer Group of U.S. open-end foreign large growth funds, falling into the first quartile for the Morningstar Peer Group for all periods. The Trustees further noted that for the one-year, three-year, five-year and since-inception periods ended September 30, 2016, the Buffalo International Fund outperformed the MSCI All World Index ex USA Net, the Russell Global (ex USA) Index and the Lipper International Funds Index. The Trustees also compared the performance of the Buffalo International Fund to that of other accounts managed by KCM using investment strategies substantially similar to that of the Fund, and noted that for all periods the performance of the Fund was comparable to that of the other accounts.
Buffalo Large Cap Fund. The Trustees noted that the Buffalo Large Cap Fund's performance for the year-to-date, one-year, three-year, five-year and ten-year periods ended September 30, 2016 was above the median for the Morningstar Peer Group of U.S. open-end large growth funds, falling within the first quartile for each period. The Trustees further noted that for the three-year, five-year and since-inception periods ended September 30, 2016, the Buffalo Large Cap Fund outperformed the Russell 1000 Growth Total Return Index and the Lipper Large Cap Growth Funds Index, and that the Buffalo Large Cap Fund had also outperformed the Lipper Large Cap Growth Index for the one-year, ten-year and fifteen-year periods ended September 30, 2016, and only slightly underperformed the Russell 1000 Growth Total Return Index for the same periods. The Trustees also compared the performance of the Buffalo Large Cap Fund to that of other accounts managed by KCM using investment strategies substantially similar to that of the Fund, and noted that for all periods the performance of the Fund was comparable to that of the other accounts.
Buffalo Mid Cap Fund. The Trustees noted that the Buffalo Mid Cap Fund's performance for the year-to-date, one-year, three-year, five-year and ten-year periods ended September 30, 2016 was below the median for the Morningstar Peer Group of U.S. open-end mid-cap growth funds. The Trustees also noted that for the one-year, three-year, five-year and ten-year periods ended September 30, 2016, the Buffalo Mid Cap Fund's performance underperformed the Lipper Mid Cap Growth Funds Index and the Russell Midcap Total Return Index, but the Buffalo Mid Cap Fund had slightly outperformed the Lipper Mid Cap Growth Funds Index for the since inception period ended September 30, 2016. The Trustees also compared the performance of the Buffalo Mid Cap Fund to that of other accounts managed by KCM using investment strategies substantially similar to that of the Fund, and noted that for all periods the performance of the Fund was comparable to that of the other accounts. The Trustees noted that they continued to review the Buffalo Mid Cap Fund's performance each quarter.
Buffalo Small Cap Fund. The Trustees noted that the Buffalo Small Cap Fund's performance for the year-to-date, three-year, five-year and ten-year periods ended September 30, 2016 was below the median of the Morningstar Peer Group of U.S. open-end small growth funds. The Trustees noted that the Buffalo Small Cap Fund's performance for the one-year period ended September 30, 2016 was above the median for the Morningstar Peer Group, falling within the second quartile. The Trustees further noted that for the fifteen-year and since-inception periods ended September 30,
104
2016, the Buffalo Small Cap Fund outperformed the Russell 2000 Growth Total Return Index and the Lipper Small Cap Growth Funds Index. The Trustees also compared the performance of the Buffalo Small Cap Fund to that of other accounts managed by KCM using investment strategies substantially similar to that of the Fund, and noted that for all periods the performance of the Fund was comparable to that of the other accounts.
After considering all of the information including specific responses regarding Fund performance, including KCM's efforts to improve performance of underperforming Funds, the Trustees concluded that the performance obtained by KCM for the Funds was satisfactory under current market conditions and in light of each Fund's investment objective, strategies and policies. Although past performance is not a guarantee or indication of future results, the Trustees determined that the Funds and their shareholders were likely to benefit from KCM's continued management.
3. Costs of Services Provided and Profits Realized by the Adviser
The Trustees considered the cost of services and the structure of KCM's fees, including a review of the expense analyses and other pertinent material with respect to the Funds. The Trustees reviewed related statistical information, including the comparative expenses, expense components and peer group selections. The Trustees considered the cost structure of each Fund relative to its Morningstar Peer Group.
The Trustees also considered the overall profitability of the Funds to KCM and examined the level of profits that could be expected to accrue to KCM from the fees payable under the Management Agreements, as well as the Funds' brokerage commissions and use of soft dollars by KCM. These considerations were based on materials requested by the Trustees specifically for the meeting, as well as the presentations made by KCM over the course of the year.
In reviewing the Morningstar 15(c) materials, the Board noted that the Buffalo Funds operate under a unitary fee structure whereby many of the Funds' ordinary operating expenses are paid by KCM out of its advisory fee rather than paid directly by the Funds. The Board noted the difficulty of comparing the Buffalo Funds' to non-unitary fee funds and observed that the advisory fee comparison in the Board materials which used the management fee excluding the fees paid by KCM to U.S. Bancorp Fund Services, LLC under a master servicing agreement, and referred to below as the net management fee, was the most appropriate. The Board also noted that the net expense ratio used in the Morningstar comparative data excludes any 12b-1 fees imposed by other funds.
Buffalo Discovery Fund. The Trustees noted that the Buffalo Discovery Fund's net management fee of 0.70% fell within the second quartile and was below the Morningstar Peer Group average of 0.76% and median of 0.75%. The Trustees further noted that the net expense ratio of 1.01% for the Buffalo Discovery Fund fell in the third quartile, equal to the Morningstar Peer Group average of 1.01%.
Buffalo Dividend Focus Fund. The Trustees noted that the Buffalo Dividend Focus Fund's net management fee of 0.65% fell within the second quartile and was below the Morningstar Peer Group average of 0.79% and median of 0.75%. The Trustees further noted that the net expense ratio of 0.95% for the Buffalo Dividend Focus Fund fell within the first quartile, below the Morningstar Peer Group average of 1.16%, which fell within the third quartile.
Buffalo Emerging Opportunities Fund. The Trustees noted that the Buffalo Emerging Opportunities Fund's net management fee of 1.15% fell within the third quartile and was above the Morningstar Peer Group average of 0.98% and median of 1.00%. The Trustees further noted that the net expense ratio of 1.47% for the Buffalo Emerging Opportunities Fund fell within the fourth quartile, above the Morningstar Peer Group average of 1.28%, which fell within the third quartile. KCM noted the challenges in providing a comparable peer group in evaluating the management fees and expense ratio for the Emerging Opportunities Fund explaining that the Morningstar Peer Group for the Emerging Opportunities Fund is composed of a majority of small cap funds (noting that Morningstar does not have a peer group category specifically tailored for micro capitalization funds which more closely reflect the companies owned by the Emerging Opportunities Fund).
Buffalo Flexible Income Fund. The Trustees noted that the Buffalo Flexible Income Fund's net management fee of 0.70% fell at the bottom of the fourth quartile and was above the Morningstar Peer Group average of 0.58% and median of 0.63%. The Trustees further noted that the net expense ratio of 1.01% for the Buffalo Flexible Income Fund fell within the fourth quartile, above the Morningstar Peer Group average of 0.67%, which fell within the second quartile. Mr. Brethour noted the challenges in providing a comparable peer group in evaluating the management fees and expense ratio for the Flexible Income Fund explaining that the Morningstar Peer Group for the Flexible Income Fund is composed of funds that incorporate government treasuries within their fixed income portion of assets, versus high yield corporate bonds, as used by the Flexible Income Fund.
Buffalo Growth Fund. The Trustees noted that the Buffalo Growth Fund's net management fee of 0.65% fell at the top
105
 Notice to Shareholders
March 31, 2017 (Unaudited)
(Continued)
of the first quartile, below the Morningstar Peer Group average of 0.74% and median of 0.73%. The Trustees further noted that the net expense ratio of 0.91% for the Buffalo Growth Fund fell within the second quartile, below the Morningstar Peer Group average and median of 0.97%, which fell at the top of the second quartile.
Buffalo High Yield Fund. The Trustees noted that the Buffalo High Yield Fund's net management fee of 0.70% fell within the fourth quartile, above the Morningstar Peer Group average of 0.64% and median of 0.63%. The Trustees further noted that the net expense ratio of 1.01% for the Buffalo High Yield Fund fell in the fourth quartile, above the Morningstar Peer Group average of 0.85%, which fell within the third quartile.
Buffalo International Fund. The Trustees noted that the Buffalo International Fund's net management fee of 0.70% fell in the first quartile, below the Morningstar Peer Group average and median of 0.81%. The Trustees further noted that the net expense ratio of 1.05% for the Buffalo International Fund fell within the second quartile, below the Morningstar Peer Group average of 1.13%, which fell within the third quartile.
Buffalo Large Cap Fund. The Trustees noted that the Buffalo Large Cap Fund's net management fee of 0.65% fell at the top of the first quartile, below the Morningstar Peer Group average of 0.85% and median of 0.80%. The Trustees further noted that the net expense ratio of 0.95% for the Buffalo Large Cap Fund fell within the first quartile, below the Morningstar Peer Group average of 1.17%, which fell within the third quartile.
Buffalo Mid Cap Fund. The Trustees noted that the Buffalo Mid Cap Fund's net management fee of 0.70% fell within the first quartile, below the Morningstar Peer Group average of 0.82% and median of 0.79%. The Trustees further noted that the net expense ratio of 1.01% for the Buffalo Mid Cap Fund fell in the second quartile, below the Morningstar Peer Group average of 1.06%, which fell within the third quartile.
Buffalo Small Cap Fund. The Trustees noted that the Buffalo Small Cap Fund's net management fee of 0.70% fell within the second quartile and was below the Morningstar Peer Group average of 0.78% and median of 0.77%. The Trustees further noted that the net expense ratio of 1.01% for the Buffalo Small Cap Fund fell within the second quartile, below the Morningstar Peer Group average of 1.03%, which also fell within the second quartile. The Trustees further noted that the annual management fee is subject to reduced fees paid on assets in excess of certain levels.
The Trustees concluded that the Funds' expenses and the management fees paid to KCM were fair and reasonable in light of the comparative performance, expense and management fee information. The Trustees further concluded that KCM's profit from sponsoring the Funds had not been, and currently was not, excessive and that KCM maintained adequate profit levels to support the services to the Funds.
4. Extent of Economies of Scale as the Funds Grow
The Trustees compared each Fund's expenses relative to its peer group and discussed realized and potential economies of scale. The Trustees also reviewed the structure of each Fund's management fee and whether each Fund was large enough to generate economies of scale for shareholders or whether economies of scale would be expected to be realized as Fund assets grow (and if so, how those economies of scale were being or would be shared with shareholders). The Trustees noted that, with the exception of the breakpoint management fee schedule for the Buffalo Small Cap Fund, the Funds' management fee structures did not contain any breakpoint reductions as the Funds' assets grow in size, but that the feasibility of incorporating breakpoints would continue to be reviewed on a regular basis. With respect to the Trust's unitary fee structure, the Trustees concluded that the current fee structure was reasonable and reflected a sharing of economies of scale between KCM and the Funds at the Funds' current asset levels.
5. Benefits Derived from the Relationship with the Funds
The Trustees considered the direct and indirect benefits that could be received by KCM from its association with the Funds. The Trustees examined the brokerage and commissions of KCM with respect to the Funds. The Trustees concluded that the benefits KCM may receive, such as greater name recognition, growth in separate account management services, greater exposure to press coverage, or increased ability to obtain research or brokerage services, appear to be reasonable, and in many cases may benefit the Funds through growth in assets.
CONCLUSIONS
The Trustees considered all of the foregoing factors. In considering the Agreements, the Trustees did not identify any one factor as all-important, but rather considered these factors collectively in light of the Funds' surrounding circumstances and concluded that the Funds and their shareholders would benefit from the Adviser's continued management. Based on this review, the Trustees, including a majority of the Independent Trustees, approved the renewal of the Agreements with the Funds as being in the best interests of the Funds and their shareholders.
106
This Privacy Policy has been adopted by the Buffalo Funds. The Funds are each an open-end diversified management investment company registered under the Investment Company Act of 1940 (the "1940 Act").
This Privacy Policy has also been adopted by KCM, an investment advisor registered with the Securities and Exchange Commission that serves as the investment advisor and manager of the Funds.
The Funds and the Adviser are collectively referred to as the "Companies," "we," "our" or "us."
As a part of providing you services and products we collect non-public personally identifiable information ("Personal Information") about you. Some of this is information you provide and some is obtained from other sources. In some circumstances, a necessary part of providing products and services to you requires that we disclose Personal Information about you to third parties.
We want you to understand how we handle your Personal Information. Please read the Privacy Policy carefully. It has information about our policies for the collection, use, dis- closure, and protection of your Personal Information. If you have any questions, you can obtain additional information from the following:
Buffalo Funds
c/o U.S. Bancorp Fund Services, LLC
P.O. Box 701
Milwaukee, Wisconsin 53201-0701 www.buffalofunds.com
1-800-492-8332
Please be aware that we periodically update or revise the Privacy Policy. As methods of doing business change, we reflect any applicable changes in our Privacy Policy. If you are our customer, we will send you an update as and when it occurs.
SALE/DISCLOSURE OF YOUR PERSONAL INFORMATION
We promise that we will not sell your Personal Information to any person.
Also, we will not disclose your Personal Information to any third person aside from the disclosures described below. These disclosures generally relate to marketing or maintaining products or services provided to you.
WHAT INFORMATION DO WE COLLECT?
Personal, Financial and Product Information
To be able to offer, provide and maintain these products and services, the Companies collect a variety of Personal
Information about you. The Personal Information we collect will vary depending upon the product or service you select.
The following is a general list of the Personal Information. Not all of the Personal Information will be collected every time you do business with us.
Personal Information
• Name
• Address
• Birthdate
• Phone number
• Social Security Number
• E-mail address
• Product-Related Personal Information
• Product Activity History (things you have done with your mutual funds such as deposits, transfers, redemptions, etc.)
GENERAL PRIVACY PROCESSES
How do we collect Personal Information?
We use a variety of methods to collect Personal Information. We collect Personal Information directly from you with paper forms (for example, new account and other administrative forms), over the phone or through facsimile transmissions. We also collect Personal Information from our web site and through other electronic means. We collect some Personal Information through joint marketing programs where we offer a product or service through another financial institution. In some of these instances, you may be considered a customer of both entities.
Who has access to this Personal Information?
Generally, only the Companies' staff and certain companies working on the Companies' behalf have access to this Personal Information.
Those Working on Our Behalf
Depending on the product or service you select, there may be a number of third parties that will have access to your Personal Information since they are working on our behalf. This access is necessary because these third parties perform a task or provide administrative services for the product you seek or have purchased from us. If we do not share the Personal Information, we cannot provide you the product or service you requested. In certain cases, affiliates are the entities performing such services on our behalf.
When we share Personal Information with non-affiliated companies working on our behalf, we protect your
107
 Privacy Policy
Personal Information by requiring such companies to adopt our privacy policy or have a policy providing protection similar to ours.
Required Disclosures
Certain Personal Information may also be disclosed to third parties without your consent if disclosure is necessary to comply with: 1) legal processes; 2) to protect the rights, property, or personal safety of the Funds, their shareholders or the public; 3) as part of inspections or examinations con- ducted by our regulatory agencies; and 4) in other situations required by law.
Joint Marketing
In certain circumstances, the Companies may jointly market a product or service with another financial institution. In these circumstances, we have arranged to offer our products through these entities and their representatives or through electronic systems (for example, the Internet).
The Companies may make other disclosures authorized by law.
Requested Disclosures
We will disclose your Personal Information if you request it to those persons that you designate. Examples of this are to: members of your family; registered investment advisors, attorneys and CPAs who you have retained to advise you in a transaction; and persons whom you have designated to represent you in dealings with us.
What do we do with the Personal Information?
The Companies make use of the Personal Information to provide you with the financial products and services that we offer.
At the point that you cease being a customer, we will maintain your Personal Information and handle it just the same as our current customers.
The Companies restrict access to the Personal Information to those who need to know it for ordinary business purposes. We also maintain physical, electronic, and procedural safeguards that comply with federal standards to guard your Personal Information.
What are your options regarding corrections of Personal Information?
Generally, upon your written request, we will make avail- able Personal Information for your review. Please note, Personal Information collected that relates to a disputed claim or legal proceeding will not be made available. If you notify us that the Personal Information is incorrect, we will review it and if we agree, correct our records. If we do not agree, you may submit a short comment, which we will include in future third party disclosures, if any occur, of Personal Information.
108
This page intentionally left blank.
This page intentionally left blank.
This page intentionally left blank.

1-800-49-BUFFALO
(1-800-492-8332)
www.buffalofunds.com
BUFFALOFUNDANNUAL
Item 2. Code of Ethics.
The Registrant has adopted a code of ethics that applies to the Registrant’s principal executive officer and principal financial officer. The Registrant has not made any amendments to its code of ethics during the period covered by this report. The Registrant has not granted any waivers from any provisions of the code of ethics during the period covered by this report. A copy of the Registrant’s Code of Ethics is incorporated by reference to the Registrant’s Form N-CSR filed on June 3, 2011.
Item 3. Audit Committee Financial Expert.
The Registrant’s Board of Trustees has determined that there is at least one audit committee financial expert serving on its audit committee. The name of the audit committee financial expert is Philip J. Kennedy. Mr. Kennedy is “independent” as defined in Item 3(a)(2) of Form N-CSR.
Item 4. Principal Accountant Fees and Services.
(1) (a) – (d) Aggregate fees billed to the Registrant for each of the last two fiscal years for professional services rendered by the Registrant’s Independent Registered Public Accounting Firm were as follows:
|
| FYE 03/31/2017 |
| FYE 03/31/2016 |
| ||
Audit Fees |
| $ | 171,520 |
| $ | 214,400 |
|
Audit-Related Fees |
| $ | 5,840 |
| $ | 7,300 |
|
Tax Fees |
| $ | 28,060 |
| $ | 35,080 |
|
All Other Fees |
| $ |
|
| $ | 0 |
|
Audit fees include amounts related to the audit of the Registrant’s annual financial statements and services normally provided by the Independent Registered Public Accounting Firm in connection with statutory and regulatory filings, including registration statements. Audit-related fees refer to the reading and commenting on the Registrant’s semi-annual reports. Tax fees include amounts related to tax compliance, tax planning, and tax advice, including specifically tax return review and excise tax distribution review services. There were no fees billed for services rendered to the Registrant’s investment adviser or any entity controlling, controlled by or under common control with the investment adviser that provides ongoing services to the Registrant that were required to be approved pursuant to paragraph (c)(7)(ii) of Rule 2-01 of Regulation S-X.
(e) (1) The Registrant’s audit committee charter requires pre-approval in advance of (i) audit and non-audit services performed by the Registrant’s Independent Registered Public Accounting Firm for the Registrant; and (ii) audit and non-audit services relating directly to the operations and financial reporting of the Registrant performed by the Registrant’s principal accounting officer for the Registrant’s investment adviser, and any entity controlling, controlled by, or under common control with the investment adviser that provides ongoing services to the Registrant.
(2) None of the services described in (b) – (d) above were approved by the audit committee specifically pursuant to paragraph (c)(7)(i)(C) of Rule 2-01 of Regulation S-X.
(f) Not applicable.
(g) The aggregate non-audit fees were for audit-related and tax services rendered to the Registrant. As disclosed above, the amount of fees billed for such services were $33,900 and $42,380 for the 2017 and 2016 fiscal years, respectively.
(h) The aggregate fees billed for non-audit services rendered to the Registrant’s investment advisor related to surprise security count procedures were $12,500 and $12,000 for the 2017 and 2016 fiscal years respectively. These fees were not required to be pre-approved pursuant to paragraph (c)(7)(ii) of Rule 2-01 of Regulation S-X.
Item 5. Audit Committee of Listed Registrants.
Not applicable because the Registrant is not a listed issuer.
Item 6. Investments.
Schedule of Investments is included as part of the report to shareholders filed under Item 1 of this Form.
Item 7. Disclosure of Proxy Voting Policies and Procedures for Closed-End Management Investment Companies.
Not applicable because the Registrant is an open-end investment company.
Item 8. Portfolio Managers of Closed-End Management Investment Companies.
Not applicable because the Registrant is an open-end investment company.
Item 9. Purchases of Equity Securities by Closed-End Management Investment Company and Affiliated Purchasers.
Not applicable because the Registrant is an open-end investment company.
Item 10. Submission of Matters to a Vote of Security Holders.
There have been no material changes to the procedures by which shareholders may recommend nominees to the Registrant’s Board of Trustees.
Item 11. Controls and Procedures.
(a) The Registrant’s Principal Executive Officer and Principal Financial Officer has reviewed and evaluated the Registrant’s disclosure controls and procedures (as defined in Rule 30a-3(c) under the Investment Company Act of 1940 (the “Act”)) as of a date within 90 days of the filing of this report, as required by Rule 30a-3(b) under the Act and Rules 13a-15(b) or 15d-15(b) under the Securities Exchange Act of 1934. Based on his review, the Principal Executive Office and Principal Financial Officer has concluded that the disclosure controls and procedures are effective in ensuring that information required to be disclosed in this report is appropriately recorded, processed, summarized and reported and made known to him by others within the Registrant and by the Registrant’s service provider.
(b) There were no changes in the Registrant’s internal control over financial reporting that occurred during the Registrant’s second fiscal quarter of the period covered by this report that have materially affected, are is reasonably likely to materially affect, the Registrant’s internal control over financial reporting.
Item 12. Exhibits.
(a) (1) Code of Ethics. Incorporated by reference to the Registrant’s Form N-CSR filed on June 3, 2011.
(2) Certifications pursuant to Section 302(a) of the Sarbanes-Oxley Act of 2002 are filed herewith.
(3) Not applicable to open-end investment companies.
(b) Certifications pursuant to Section 906 of the Sarbanes-Oxley Act of 2002. Furnished herewith.
SIGNATURES
Pursuant to the requirements of the Securities Exchange Act of 1934 and the Investment Company Act of 1940, the registrant has duly caused this report to be signed on its behalf by the undersigned, thereunto duly authorized.
Buffalo Funds |
| ||
|
| ||
|
| ||
By | /s/ Clay E. Brethour |
| |
| Clay E. Brethour |
| |
| President and Treasurer |
| |
|
| ||
|
| ||
Date | 6/7/17 |
| |
Pursuant to the requirements of the Securities Exchange Act of 1934 and the Investment Company Act of 1940, this report has been signed below by the following persons on behalf of the registrant and in the capacities and on the dates indicated.
Buffalo Funds |
| ||
|
| ||
|
| ||
By | /s/ Clay E. Brethour |
| |
| Clay E. Brethour |
| |
| President and Treasurer |
| |
|
| ||
|
| ||
Date | 6/7/17 |
| |