UNITED STATES
SECURITIES AND EXCHANGE COMMISSION
Washington, D.C. 20549
FORM N-CSR
CERTIFIED SHAREHOLDER REPORT OF REGISTERED
MANAGEMENT INVESTMENT COMPANIES
Investment Company Act file number 811-10303
Buffalo Funds
(Exact name of registrant as specified in charter)
5420 W. 61st Place
Shawnee Mission, KS 66205
(Address of principal executive offices) (Zip code)
Clay E. Brethour
5420 W. 61st Place
Shawnee Mission, KS 66205
(Name and address of agent for service)
(913) 677-7778
Registrant’s telephone number, including area code
Date of fiscal year end: March 31, 2015
Date of reporting period: March 31, 2015
Item 1. Reports to Stockholders.
 Message to Our Shareholders
O
ur most recent fiscal year, ended March 31, 2015, anniversaries the stock market’s sixth year of the current bull market. In general there are a number of issues facing the market which we believe will increase its “choppiness” going forward. We believe this volatility will transition the market place from a general momentum market, into a “stock-pickers” market, which may provide opportunities for our shareholders to outperform.
While the U.S. market is in its sixth year of recovery from the “great” recession, the health of the economy continues to be mixed. According to the U.S. Bureau of Labor Statistics, the U.S. unemployment rate stood at 5.5% in March 2015, its lowest level since 2008. Wage inflation remains muted, and the general economy has felt more “Wall Street” driven than ‘Main Street”. Given the strengthening of U.S. companies’ balance sheets over the past several years, the economy is in a favorable position going forward.
Our shareholders living in the Northeast certainly understand the slowing of the economy, given the significant impact of that region’s record snowfall. However, there are a number of other factors affecting the entire country, notably the port strikes impacting the movement of goods throughout the U.S. The recently released 2015 first quarter gross domestic product initial report showed the economy grew only 0.2%.
The mixed economic news has put a hold on the Federal Reserve’s imminent rise in short-term interest rates. The initial consensus view of a mid-year increase has been revised to this fall, and is expected to be in smaller increments than previously anticipated. We would not be surprised to see the Fed wait until 2016 to raise rates, given the unprecedented Quantitative Easing programs initiated throughout the world. In addition to India and China, the European Central Bank and the Bank of Japan have lowered interest rates in support of their respective countries’ monetary stimulus policies.
The current environment places the Fed in a precarious position. Low interest rates prevail throughout the world. The current yield on the 10-year U.S. Treasury note of 2.1% is high compared to its German counterpart’s yield of 0.36%. Capital throughout the world has gravitated towards the highest return. This gravitation has led to the strengthening of the U.S. Dollar Index and having an adverse impact on multinational companies. The Fed will be sensitive to a strengthening dollar, particularly since 71.2% of the U.S. Dollar Index is weighted towards the euro and the yen, which represent 57.6% and 13.6%, respectively.
Regardless of the timing, interest rates are unsustainably low throughout the world and even negative in some countries within Europe. In a rising interest-rate environment, stock-pickers (actively managed funds) have historically outperformed passive funds. We believe our investment strategy of constructing our Funds with detailed bottom-up analysis of companies should benefit from our internally identified broad secular growth trends providing shareholders with a group of companies which has the potential to grow long-term, regardless of overall economic conditions.
As always, we appreciate your trust in our management teams and our organization. We will continue to work diligently to meet your expectations.
Sincerely,

Clay E. Brethour
President
Active investing has higher management fees because of the manager’s increased level of involvement while passive investing has lower management and operating fees. Investing in both actively and passively managed mutual funds involves risk and principal loss is possible. Both actively and passively managed mutual funds generally have daily liquidity. There are no guarantees regarding the performance of actively and passively managed mutual funds. Actively managed mutual funds may have higher portfolio turnover than passively managed funds. Excessive turnover can limit returns and can incur capital gains.
The Funds’ investment objectives, risks, charges and expenses must be considered carefully before investing. The Prospectus contains this and other important information about the investment company, and it may be obtained by calling 1-800-49-BUFFALO or visiting www.buffalofunds. com. Read it carefully before investing.
Past performance does not guarantee future results. Mutual fund investing involves risk. Principal loss is possible.
The opinions expressed above are those of the author, are subject to change and are not guaranteed and should not be considered investment advice.
The Buffalo Funds are distributed by Quasar Distributors, LLC.
2
Portfolio Management Review
Buffalo Discovery Fund
While growth slowed in the first quarter of 2015, over the past year the United States economy outperformed other developed markets delivering relatively consistent and modest expansion. Growth in U.S. gross domestic product (GDP) reached 2.2% in 2014, consistent with 2013. The first quarter 2015 initial measurement of GDP growth came in at 0.2% for a myriad of reasons. A harsh winter in the northeast and the west coast port closures arising from the dock workers’ strike both contributed to the deceleration. The strength of the U.S. dollar relative to other developed and developing market currencies, as these economies provide stimulus to drive economic expansion, has negatively impacted U.S. exports. In addition, the drop in oil prices had an impact on GDP, reducing corporate profits from the energy sector. The offset is reduced manufacturing input costs resulting in increased corporate profit from the industrial sector and increased consumer discretionary income driving retail sales growth, yet these positive effects typically lag. So the economy faced some headwinds in the first quarter of 2015, and consequently expectations for first quarter earnings have come down.
However, despite a relatively slow start to 2015 in terms of domestic economic growth, the equity market has continued its ascent with the Russell 3000 Growth Index returning 4.05% in the most recent quarter and 15.76% for the twelve months ending March 31, 2015. The strength of the dollar has led some foreign investors to the U.S. capital markets as a perceived safe haven. Fixed income yields remained depressed and equities offered an attractive alternative. The moderating pace of U.S. economic growth is likely to delay the inevitable interest rate hikes expected from the Federal Reserve to late-2015 from mid-2015. Expectations remain high for U.S. economic growth to accelerate for the remainder of the calendar year. These factors present a favorable backdrop for equities.
The Buffalo Discovery Fund invests in companies which create value through the commercial application of innovative products, services, or intellectual property. The Fund invests in companies across all market capitalizations and sectors. While we are cognizant of the macroeconomic environment, our top down process is driven by the Buffalo secular trends rather than predictions related to global economic factors. The majority of our research efforts focus on bottom up stock and company analysis. Whether we buy, trim or exit a holding is primarily driven by the investment thesis and valuation.
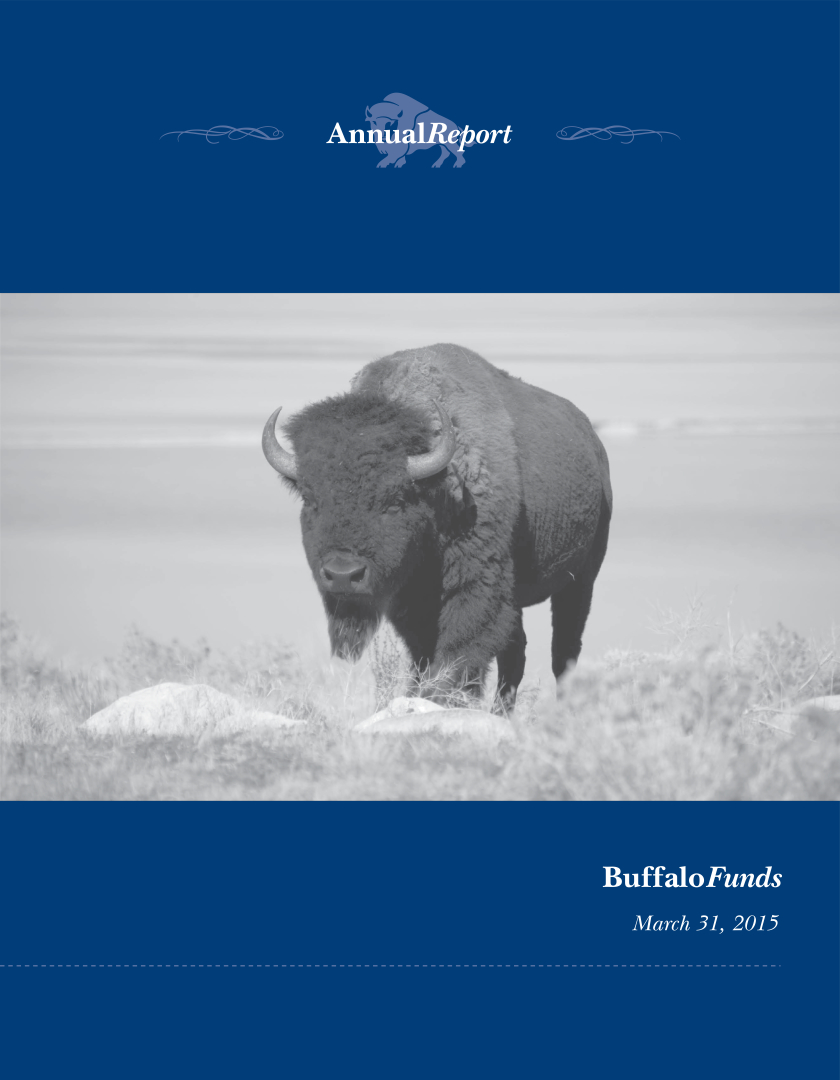
The Buffalo Discovery Fund returned 15.56% in fiscal 2015, roughly in-line with the Russell 3000 Growth Index, which appreciated 15.76% in the same period. The Fund outperformed its peers, as measured by the Lipper Multi
Cap Growth Funds Index, which gained 14.25% for the year. Sector allocation relative to the benchmark was strong driven by the Fund’s almost 1400 basis point overweight healthcare, the top performing sector in the benchmark. Stock selection was a modest detractor in the period. Strong stock selection in Consumer Discretionary, Financial and Healthcare holdings was more than offset by weak selection within the energy and industrial sectors. The precipitous fall in the price of crude oil, due to what we believe is a near-term oversupply issue, had a profound impact on the operating performance of our companies with exposure to the oil and gas end markets.
The top three contributors to the Fund in fiscal year 2015 were Hospira, Apple and Allergan. Hospira, a maker of lower cost injectable drugs, was the Fund’s largest holding entering fiscal 2015 given the company’s focus on containing health care costs and the attractive valuation of the equity. In February 2015, Pfizer announced plans to acquire Hospira for cash consideration of $90 per share, a significant premium to where the equity was trading. Apple’s stock appreciated in response to the iPhone 6 launch which exceeded expectations and drove upward earnings revisions. Allergan has a strong global healthcare franchise in two highly profitable businesses, aesthetic medicine and ophthalmology. Particularly in aesthetic medicine Allergan has several products with unmatched brand equity. Given these strong and sustainable fundamentals, the company became an acquisition target in fiscal 2015 with several suitors. Actavis ultimately had the winning bid and has completed the acquisition.
The three top detractors in the period were CARBO Ceramics, Chart Industries and Forum Energy Technologies, all companies with exposure to energy end markets. Oil had a big move over the past year, peaking in June 2014 at nearly $107 a barrel, then reaching a low in the $40s in March of 2015. The decrease in the price accelerated after Organization of the Petroleum Exporting Countries (OPEC) November 2014 decision to not cut its output quota in spite of lower worldwide demand for oil. OPEC decided to instead focus its efforts on maintaining market share, and in some instances, increasing market share in particular markets by driving the price of oil to a level that would make it uneconomical for non-OPEC members to compete. The majority of the incremental worldwide crude oil production for the past several years has been the result of non-OPEC producers, which have taken market share away from OPEC. In North America, the number of rigs drilling for oil has dropped significantly with the drop in oil prices, negatively impacting two of the Fund’s holdings; CARBO Ceramics and Forum Energy Technologies. We believe that the valuation of these two stocks is attractive and that they will recover as the oil supply contracts, driving the price of oil higher.
3
Portfolio Management Review
(Continued)
The lower crude prices also pressured the incentives to incorporate the use of natural gas as a substitute for diesel, negatively impacting Chart Industries, a leading manufacturer of equipment used in the liquefied natural gas (LNG) supply chain. Additionally, China took a hiatus in the build out of its LNG infrastructure as its economy slowed. More recently interest in the LNG build out in China has resurfaced. North America is also exploring increased investment in LNG facilities to export natural gas. These factors reinforce our belief that Chart Industries’ long term outlook is bright.
The Buffalo Discovery Fund ended fiscal 2015 holding 73 stocks, up from 69 at the end of fiscal 2014. During the year eighteen new positions were added to the Fund and fourteen holdings were eliminated, a few of which were acquired by other companies. Cash at the end of the fiscal year was 7.1%, up from 5.6% at the end of fiscal 2014. This cash level is outside the normal range as we reduced the Fund’s exposure to Healthcare in the last week of the quarter. We see ample opportunities to reinvest the excess cash and plan to do so in the near term opportunistically.
We are optimistic U.S. economic growth will accelerate for the remainder of 2015. The harsh winter is behind us, the west coast ports are working through backlogs, employment and wage growth are improving and residential housing continues its recovery. We believe that the U.S. economy can deliver modest growth consistent with the last several years for the full year 2015. The upside case would be that global GDP growth accelerates driven by economic stimulus emanating from the Euro Zone, Japan and China. Many cash-generating, pro-cyclical companies within the technology and industrial sectors have been reluctant to invest their excess liquidity due to wavering business confidence, and instead have returned it to shareholders and paid down debt. An acceleration of global economic growth would favor growers over payers, and discretionary over stable businesses. Increased business confidence should ultimately lead to increased business growth investment, as opposed to return of capital. If global GDP accelerates, we believe investors will rotate into pro-cyclical multinational companies. Furthermore the valuations of the pro-cyclical multinational companies appear attractive compared to more defensive areas such as healthcare. Healthcare stocks have led the market the past three years. And while growth remains robust, the stock prices frequently incorporate that growth. Our valuation discipline led us to exit two of our biotech holdings in that last quarter of fiscal 2015. We plan to reinvest that capital into stocks that could offer a more compelling risk reward, which at this juncture appears to be more pro-cyclical industrial and technology companies, as well as within the energy sector.
Buffalo Dividend Focus Fund
For the twelve month period ending March 31, 2015, the Buffalo Dividend Focus Fund returned 18.86%, significantly outperforming the benchmark S&P 500 Index which had a return of 12.73%.
While the Fund’s allocation across various sectors had a negative impact for the year, we more than offset that impact through stock selection. In terms of relative sector contributions, Energy was the largest contributor to the Fund’s outperformance in the year ending 3/31/2015, followed by Industrials. The largest detractors from relative performance were Health Care and our cash position. Our cash position averaged approximately 10.7% for the year and caused a 1.0% drag to our performance.
In the Energy sector we have found a number of master limited partnerships (MLP’s) that we are attracted to due to their stable cash flow generating asset base, generous yields, and strong distribution growth. Many of these companies are engaged in the midstream segment of the energy markets, which is the link between the exploration and production of crude oil and natural gas from the wellhead and the delivery of these commodities to refineries or other end use markets. Assets included in the midstream segment include transportation pipelines, storage, natural gas processing, and natural gas fractionation just to name a few. Many (but not all) of these types of midstream assets have stable fee structures that have very little direct commodity price risk, thus allowing the assets to produce a steady and growing source of cash flow that allows the asset owners to pay stable and growing distributions.
Dominion Midstream Partners and Shell Midstream Partners are just a couple examples of MLP’s that performed well in the past year for the Fund. Although these two MLP’s own different assets in different geographies throughout the midstream value chain in the U.S., the thesis for owning them is relatively straightforward. They both have, in our view, great assets and strong parent companies that will likely sell assets down to the partnership over time and should allow them to grow significantly in the future. We believe both partnerships could be able to grow their distribution at 15% or greater per year for at least the next three years.
In the Industrials segment, the Fund benefited from positive stock selection relative to the benchmark. Notable winners included Robert Half and Southwest Airlines. Robert Half was up approximately 46% for the Fund during the period while Southwest Airlines was up approximately 72%. Robert Half benefited from the improving labor market as unemployment continued to decline. Southwest Airlines benefited from a more rational airline industry as well as the tailwind of declining energy prices as fuel is a large component of their cost structure.
4
Our worst performing sector relative to the benchmark was Health Care. Notable relative detractors during the year included both stocks that were owned (Novo Nordisk, GlaxoSmithKline, and Sanofi) as well as stock that were not owned, namely companies that do not have a dividend but contributed nicely to the benchmark return such as Celgene and Actavis. GlaxoSmithKline performed poorly due to worries by the market that the company’s dividend might be at risk of being cut. Sanofi and Novo Nordisk both suffered from concerns over pricing power in the insulin market, while Sanofi also suffered from the board’s decision to abruptly remove CEO Chris Viehbacher based on the board’s concerns over a lack of communication by Viehbacher with the board.
Going forward, we continue to have a consistent message in that we look for companies that we believe 1) exhibit long-term sustainable competitive advantages, 2) have a history of growing their revenues, earnings, and dividends, 3) generate significant amounts of free cash flow, 4) have rock solid balance sheets, 5) have management teams who exhibit stellar capital allocation skills and whose interests are aligned with shareholders, and 6) are trading at an adequate discount to our estimate of fair value. As the market has moved up and multiples have expanded over the last year, it has become more difficult to continue to find undervalued companies. We continue to search for companies that meet our criteria for purchase and sell those that no longer exhibit the qualities we desire.
Buffalo Emerging Opportunities Fund
The Buffalo Emerging Opportunities Fund focuses on early stage growth companies that have the potential to deliver significant capital appreciation over the long term. The Fund invests primarily in companies with a market capitalization below $1 billion.
This past fiscal year began with concerns over stretched valuations in the technology sector. As the year progressed, geopolitical issues including the Ukraine crisis and downward volatility in foreign currencies and commodities developed. Despite these events, the broader markets continued their march higher as the U.S. economy continued to advance and successfully navigate the weakness in a number of other geographies.
For the 12-month period ending March 31, 2015, the Buffalo Emerging Opportunities Fund posted a return of -0.71%, trailing the Russell 2000 Growth Index return of 12.06%. The underperformance was due primarily to stock selection as we construct our portfolio by investing in premier, early stage growth companies with less attention paid to the weightings and allocations of our benchmark. While that can lead to periods of outperformance such as the
trailing three and five years, it can also lead to periods of underperformance as seen in the past 12 months ended March 31, 2015.
During the year, the Information Technology sector was the largest drag on performance, resulting in a -4.75% variance versus the Russell 2000 Growth Index. Poor stock selection was the culprit as a number of our technology holdings posted large negative returns. One of the contributors to the underperformance in the sector was voxeljet, an early stage 3D printing company with significant exposure to automotive and industrial applications. While the company continues to grow rapidly and expand its footprint, investors’ appetite and willingness to pay higher multiples for these small cap growth stocks dipped during the past year as evidenced by the decline in this particular name. Despite the underperformance during the past year, we remain overweight the Technology sector given the focus on innovation lining up well with the Fund’s objectives of long-term growth of capital.
Other noteworthy contributors to the underperformance were the Consumer Discretionary and Consumer Staples sectors which caused -3.26% and -2.11% of relative shortfall, respectively, during the year. In the Consumer Discretionary sector, Black Diamond, a leading global equipment provider for climbing, skiing and mountaineering, posted disappointing results in their efforts to expand their brand into outdoor apparel. In the Consumer Staples category, Boulder Brands, a leading provider of gluten-free food brands, struggled with key input cost inflation along with slowing category growth of gluten free foods.
While the drag from the Healthcare sector was more modest at -0.97%, we were underweight the sector as it rose 28% during the fiscal year, leading all benchmark sectors. Healthcare now represents close to 25% of the Russell 2000 Growth Index with 15% of the index being the biotech and pharmaceuticals industries. Record volumes of mergers and acquisitions combined with a wave of innovative new drugs as well as a more streamlined Food and Drug Administration (FDA) approval process has caused a “melt up” in the majority of these type of healthcare companies. The broad-based, multi-year outperformance of this area of the market has drawn comparisons to the late 90’s tech boom given that many are high-risk, single product companies that have business models that are cash flow and earnings negative. Not every drug can generate $500 million-$1 billion in sales and given that so many of these companies are valued as such, then it stands to reason that market forces will correct these imbalances over time. As a reminder, our investment process typically avoids these types of companies due to the binary nature of the outcomes. For example, if company A does not get approval of a particular drug then the value of the company can quite literally be less than half of
5
Portfolio Management Review
(Continued)
what it was the previous day, which is not a risk we think is worth taking when running a more concentrated portfolio of 45-65 small-cap companies.
The collapse in oil prices, a surging United States dollar, the West Coast port strike and harsh winter weather have taken a toll on U.S. economic results to begin calendar 2015. However, during the current bull market that dates back to March 2009, economic metrics have disappointed in some fashion during the first quarter over the past five years only to yield to stronger results in the summer and fall months. Time will tell if this occurs again in 2015, but early indicators point to stronger data in the second quarter.
By many metrics, valuations for small caps are above historical averages; however, we believe this data point is somewhat mitigated by the fact that investors remain decidedly unenthusiastic towards the asset class based on mutual fund flows, which have been negative for four straight quarters. Small cap equity fund outflows in the December 2014 quarter even exceeded the worst quarter of outflows from the 2008 financial crisis!
After a strong five-year run for the Fund, the past year clearly fell short of our expectations. We continue to work diligently to attempt to best position the Fund going forward. As the economic outlook and investor sentiment ebbs and flows, our job remains the same in terms of identifying attractively valued, early-stage growth companies that have robust structural growth potential and defensible business models. We will use upward and downward market volatility to attempt to best position the Fund for long-term capital appreciation.
As a reminder, the Fund initiated a soft-close in November 2013 that remains in effect today. The Fund remains open to additional investments from existing investors, all clients of existing Advisors, Consultants, and Employer Sponsored Retirement Plans (401k, etc.). Please visit www.buffalofunds.com for more information.
Buffalo Flexible Income Fund
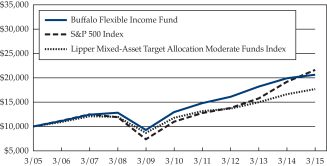
For the twelve months ended March 31, 2015, the Buffalo Flexible Income Fund returned 3.33%. During the same time period, the S&P 500 returned 12.73% and the Bank of America Merrill Lynch High Yield Master II Index returned 2.05%.
Equity
| • | For the fiscal year ended March 31, 2015, the equity portion of the portfolio returned 6.19% compared to 12.73% for the S&P 500 Index. The Flexible Income Fund’s equity component is primarily focused on large cap dividend payers which we believe possess significant competitive advantages. The primary sectors that led to the underperformance were Healthcare, Energy and |
Information Technology. The underperformance in Healthcare was due to both security selection and sector allocation. The Fund was roughly 350bps underweight the best performing sector in the S&P. Security selection also contributed to the underperformance in the sector as the fund is focused on dividend paying stocks and consequently did not have exposure to some non-dividend paying healthcare stocks that generated strong returns such as Actavis, Celgene and Gilead. Additionally, some of the dividend paying stocks the Fund owned did not perform as well as the sector including GlaxoSmithKline (GSK) and Baxter. GSK underperformed due to anemic sales growth and margin pressure which reflect increased competition and underwhelming new product launches and pipeline development. The deteriorating financials ultimately led the company to suspend its share repurchases and the market also became nervous about the sustainability of the dividend. However, we continue to believe in the Company’s prospects and expect new products to drive improved financial performance over the coming years. Baxter underperformed due to poor strategic execution in plasma, competition to key products and uncertainty over the upcoming company spin-off. The negative performance within Energy was due entirely to its overweight position as Energy was the worst performing sector over the past 12 months. The underperformance in IT was due to an underweight position and security selection. The Fund was roughly 700bps underweight the sector and the sector was one of the better performing sectors over the past 12 months. As it relates to security selection, the Fund was underweight Apple and did not have exposure to some non-dividend paying stocks such as Facebook that performed well over the past 12 months. |
Fixed income
| • | The fixed income portion of the Buffalo Flexible Income Fund generated a return of 3.56% over the past 12 months which compares favorably to the 2.05% return for the Bank of America Merrill Lynch Master II Index. The outperformance was primarily due to security selection within the Consumer Discretionary sector while the Energy and Health Care sectors also positively contributed to returns over the past twelve months. Within the Consumer Discretionary segment, the Lions Gate Entertainment (LGF) convertible notes were the top performer. LGF continues to execute on its growth strategy and there has also been speculation that LGF could potentially be acquired due its growing TV and film content. The outperformance in the Energy sector was driven by a modest underweight in one of |
6
the worst performing sectors while Healthcare outperformance was driven by an overweight in one of the better performing sectors. |
As we look ahead, we remain focused on finding attractive yield opportunities that we believe have favorable risk reward outlooks. Within the equity space we remain focused on large cap dividend payers as well as select MLPs. Within fixed income, we are primarily focused on three asset classes, high yield bonds, convertible bonds and floating rate bank debt.
Buffalo Growth Fund
The Buffalo Growth Fund invests in high quality growth companies with an emphasis on large capitalization stocks. We seek to invest in companies that have benefited from long-term secular growth trends that comprise our premier universe. Then we perform bottoms-up fundamental analysis that culminates in a valuation that incorporates both an upside target and downside risk exposure. The Growth Fund owns a portfolio of companies where we believe the upside potential exceeds downside risk exposure. Our belief is the market frequently overreacts to short term news providing what we view as attractive opportunities to purchase companies with long term growth opportunities. We use these opportunities to build a portfolio of high quality growth companies with the potential for competitive returns.
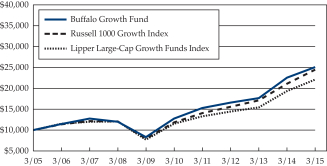
For the fiscal year ending March 31, 2015, the Buffalo Growth Fund returned 11.32% compared to 16.09% for the benchmark Russell 1000 Growth Index. The underperformance relative to the index was most significant in the Consumer Discretionary and Industrials sectors, which was offset by outperformance within the Information Technology sector.
The performance of our holdings within the Industrial sector was most impacted by the decline in oil prices. The most notable detractor was Chart Industries, where lower oil prices contributed to slower than anticipated adoption of liquefied natural gas (LNG) for use in industrial transportation within the U.S. and China. The decline in oil prices has compressed the economic advantage of using LNG as an alternative to diesel. However, we believe more stringent emissions standards and low natural gas prices will catalyze LNG adoption over the long-term. As a result, we used weakness in shares as an opportunity to increase our ownership.
Within the Consumer Discretionary sector, performance was most impacted by Coach and Discovery Communications. With Coach we believed that a good management team combined with a strong brand would enable it to execute a product refresh that would rejuvenate sales growth. However, sales growth proved elusive and
management determined it needed to embark on a more significant turnaround. Discovery Communications we believed had an advantaged content cost structure with the potential for increased distribution globally that would yield competitive returns. The thesis was challenged by the secular shift towards video on demand offerings, like Netflix, that has surpassed expectations and created more competition for audiences than anticipated. This will be a long-term headwind that could dilute returns on capital by impacting both distribution and advertising revenues. We exited our positions in Coach and Discovery as our long term outlook for each company was impaired during the year.
Turning to the top contributors in the Fund, Allergan benefitted from consolidation in the Health Care sector. The company owns a strong global franchise in aesthetic medicine and ophthalmology, where it has several products with unmatched brand equity. Given these strong and sustainable fundamentals, the company became an acquisition target with Actavis ultimately winning a competitive bidding process.
Within the Information Technology sector, Apple and Facebook, were also top contributors. Apple, which has built a strong competitive position in the mobile device market, produced a strong product cycle with the introduction of the iPhone 6 that resulted in market share gains. In addition, Apple introduced a watch that marked its first new product category since the iPad. Facebook shares climbed as it continued to rapidly grow sales and market share in digital advertising, particularly on mobile devices. It has built a suite of applications including the flagship Facebook app, Messenger, Instagram, and WhatsApp that have each successfully signed up between 300 million to over a billion users. The suite of apps provides it with a strong competitive advantage in audience reach that has proved attractive to advertisers.
While we are disappointed to have trailed the benchmark index for the fiscal year period, we recognize that periods of underperformance are an inevitable risk associated with seeking differentiated returns. However, we believe over the long-term our approach of seeking out high quality growth companies with the patience to buy at prices attractive for long-term capital returns have the potential to win out.
Buffalo High Yield Fund
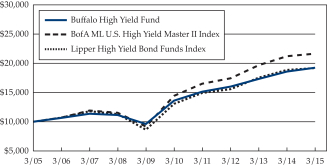
The Buffalo High Yield Fund returned 3.58% for the fiscal year ended March 31, 2015. During the period, the Fund outperformed by 153 basis points (bps) our primary benchmark, the BofA Merrill Lynch High Yield Master II Index (the “Index”) which had a return of 2.05% during the comparable period. Our outperformance relative to the Index can largely be attributed the Fund’s strategy of owning higher credit quality issues with shorter durations,
7
Portfolio Management Review
(Continued)
significant underweight in the Energy sector compared to the Index, and strong returns from the Fund’s common stock holdings. In fiscal 2015, higher returns in the high yield universe were directly correlated with higher credit quality as the “BB” rated sector returned 4.6% versus the “CCC”* sector losing -3.4%. According to JP Morgan, the Energy sector was the worst performing industry losing -8.0% in fiscal 2015 which benefited the Fund relative to the Index as the Fund’s Energy allocation was 5.2% compared to the Index’s 13.0% weighting. From an asset class perspective, contributions from our holdings of straight corporate bonds, bank loans, convertible preferred and common stocks all outperformed the Index. Our convertible bonds and cash holdings underperformed the Index.
A more detailed look at the portfolio demonstrates how the performance was generated during the fiscal year 2015:
| APPROXIMATE WEIGHTING RANGE | APPROXIMATE ASSET CLASS RETURN | |||||||||||
| LOW | HIGH | |||||||||||
Straight Corporates Bonds | 61 | % | 69 | % | 5 | % | ||||||
Convertibles Bonds | 16 | 17 | 1 | |||||||||
Bank Loans | 1 | 2 | 2 | |||||||||
Convertible Preferred Stocks | 2 | 2 | 10 | |||||||||
Common Stocks | 5 | 6 | 19 | |||||||||
Cash | 5 | 15 | 0 | |||||||||
|
| |||||||||||
Total | 4 | |||||||||||
Primary contributors to the straight corporate bond portfolio included Lions Gate 5.25% ‘18, Philips VanHeusen 7.75% ‘23, AAR Corp 7.25% ‘22 and FTI Consulting 6% ‘22. These bonds were relatively large weights within the portfolio, offered high credit quality with short duration, and performed well as lower quality and longer duration bonds declined. Securities that underperformed in this asset class included Kratos Defense & Security 7% ‘19, Hornbeck Offshore Services 5.875% ‘20 and Rent-a-Center 4.75% ‘21.
Two of the Fund’s largest convertible bond holdings, Lions Gate 1.25% ‘18 and Lions Gate 4% ‘17 generated strong returns. Fully offsetting these gains though, were losses sustained in General Cable 4.5% ‘29, Dealertrack 1.5% ‘17 and Servicesource 1.5% ‘18. As an asset class, convertible bonds contributed the least to the Fund’s total returns in fiscal 2015.
The Fund only owned two convertible preferred stock positions during the fiscal year 2015. HealthSouth 6.5% was a strong contributor as the underlying stock gained more than 25% during the year. The other convertible preferred, AMG Capital 5.15%, had virtually no impact on the Fund’s returns.
Within the common stock segment of the portfolio, names that contributed most positively to performance include FirstService Corproration, AbbVie, and Abbott Laboratories.
All of the common stock positions contributed positive returns to the Fund performance during the fiscal year.
The same factors that affected the high yield market during the 2014 fiscal year persisted throughout fiscal year 2015. Fixed income products, including high yield, continued to trade at relatively elevated levels driven by factors such as: (i) continued accommodative monetary policies from the Fed and uncertainty about the timing of interest rate increases; (ii) strong demand for yield securities outweighing supply; (iii) generally strong corporate earnings and a muted default environment; and (iv) investor complacency about the potential impact of geopolitical risks (such as turmoil in the Middle East and default risk in Greece). However, the precipitous drop in the price of crude oil during the second half of calendar year 2014 was a new significant factor that negatively influenced high yield returns as the Energy sector has the largest weighting in the Index. This weakness in high yield energy names caused spreads and yields to end the fiscal year higher than the near all-time lows when the year started, but still well below historical average levels. The spread to worst and yield to worst for the Index on March 31, 2015 were 494 bps and 6.2%, respectively, compared to 394 bps and 5.3% on March 31, 2014 and the 582 bps and 9.4% historical twenty year averages.
Within this environment, we have been managing the Fund cautiously. We believe that many bonds are not trading at levels that offer appealing risk/reward tradeoffs, and that the potential for a rising rate environment would lead to increased market volatility and more appealing investment opportunities. Our allocation of a portion of the Fund into common stocks and convertible securities reflects our belief that these securities offer better return opportunity relative to highly-speculative and richly valued CCC-rated bonds. We believe many CCC-rated and long duration bonds could underperform materially in a deteriorating market environment while offering minimal upside at current levels. We will continue to deploy cash to the opportunities that we believe offer the most appealing risk/reward tradeoffs with a bias toward high credit quality, relatively short duration, and attractive relative values.
Buffalo International Fund
Markets tend to lead economies but the latest economic data suggests global economies are slowly responding as the conductors increase their tempo, with Japanese inflation coming in at 2.2% for the most recent month, Europe posting positive and accelerating GDP growth (off of a very low base) helped in part by Euro depreciation, and China’s official Purchasing Managers’ Index (PMI) landing in expansionary territory after suggesting contraction in manufacturing earlier in the year. With Europe, Japan and
8
China looking somewhat better, the mood in emerging markets has also seemingly turned the corner.
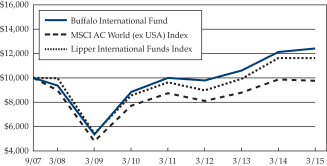
European, Japan and Hong Kong markets have responded very favorably, especially in the past few months, most posting solid returns on a local currency basis. On a U.S. dollar adjusted basis, the MSCI AC World (ex USA) Index posted a negative 1.01% return for the trailing twelve months ending March 31, 2015. Comparatively, the Buffalo International Fund posted a positive 2.32% return for the last twelve months, beating our benchmark.
Our emphasis on long-term growth through our weightings in Healthcare and Information Technology and our underweighting in Energy provided a positive boost to performance for the trailing twelve months, offset somewhat by our weighting and selection in Consumer Staples.
Notable significant positive performers for the year included Avago Technologies, Kuka AG, and Actavis PLC. Avago, a maker of RF signal filters has benefited from increasing penetration of 4G smartphones with increasing RF band connectivity. Kuka is a robotics manufacturer which has benefited from a switch of capital for labor as total labor costs continue to rise sharply in developing markets, and Actavis benefited from the resiliency of healthcare spending along with increased visibility on the synergies captured from recent acquisition activity.
All was not completely rosy, however, and we did have our fair share of laggards. Technip and Vallourec were the bigger detractors from performance – both being impacted by the significant slowdown in energy development spending. While each has secular growth aspects within the industry, they weren’t able to overcome the dramatic drop in all things energy in the fourth quarter of 2014. The Fund’s performance was also held back by holding cash due to our inclination to buy when stocks are down, not up. We ended the year with our cash balance at approximately 10%, above our longer-term goal of less than 5%.
With the European Central Bank baton pass, we’re happy to see international markets coming back in vogue with market participants. We’re also mindful that recent performance can change as markets rotate in and out of industries, as they sell winners and bid up under-performers. Our investment process favors a long-term secular growth perspective coupled within the context of our country specific macro analyses. We don’t fancy ourselves as global macro traders. While we don’t subscribe to the “buy anything and everything” approach in this environment, we continue to believe there are ample opportunities across the globe for investors. Our process remains unchanged. We look for companies that are exposed to secular growth trends, have improving balance sheets and sustainable
business models and whose valuation has the potential to provide appropriate prospective returns relative to their risks.
Buffalo Large Cap Fund
While growth slowed in the first quarter of 2015, over the past year the United States economy outperformed other developed markets delivering relatively consistent and modest expansion. Growth in U.S. gross domestic product (GDP) reached 2.2% in 2014, consistent with 2013. The first quarter 2015 initial measurement of GDP growth came in at 0.2% for a myriad of reasons. A harsh winter in the northeast and the west coast port closures arising from the dock workers’ strike contributed to the deceleration. The strength of the U.S. dollar relative to other developed and developing market currencies has negatively impacted U.S. exports, as these economies provide stimulus to drive economic expansion. In addition, the drop in oil prices had an impact on GDP, reducing corporate profits from the Energy sector. The offset is reduced manufacturing input costs resulting in increased corporate profit from the Industrial sector and increased Consumer Discretionary income driving retail sales growth, yet these positive effects typically lag. So the economy faced some headwinds in the first quarter of 2015, and consequently expectations for first quarter earnings have come down.
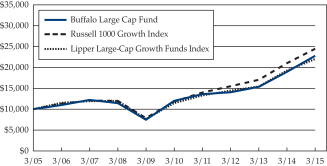
However, despite a relatively slow start to 2015 in terms of domestic economic growth, the equity market has continued its ascent with the Russell 1000 Growth Index returning 3.8% in the most recent quarter, and 16.1% for the twelve months ending March 31, 2015. The strength of the dollar has led some foreign investors to the U.S. capital markets as a perceived safe haven. Fixed income yields remain depressed and equities offer an attractive alternative. The moderating pace of U.S. economic growth is likely to delay the inevitable interest rate hikes expected from the Federal Reserve to late-2015 from mid-2015. Expectations remain high for U.S. economic growth to accelerate for the remainder of the calendar year. These factors present a favorable backdrop for U.S. equities.
While we are cognizant of the macroeconomic environment, our top down process is driven by the Buffalo secular trends rather than predictions related to global economic factors. By focusing on bottom up stock and company analysis, we believe that we can add more value to the investment process and Fund returns. The decision to buy, trim or exit a holding is driven by the investment thesis and valuation. The Buffalo Large Cap Fund holds the equity of secular growth companies which are beneficiaries of one of the Buffalo long term growth trends, and possess the following four characteristics:
| • | The company has a leadership position (a market share taker) in an attractive market with limited competition |
9
Portfolio Management Review
(Continued)
| • | The company’s products or services are value added |
| • | The company has a growth opportunity in North America |
| • | The company has a history of delivering a compelling return on invested capital and that pattern is expected to continue into the future. |
Our investment horizon is long term and we strive for low turnover. The focus on high quality companies, and the valuation discipline, is designed to position the Buffalo Large Cap Fund to potentially outperform its peers, particularly in a down market.
In the fiscal year 2015, the Buffalo Large Cap Fund returned 20.29% outperforming its benchmark, the Russell 1000 Growth Index, by 420 basis points, which returned 16.09%. The relative outperformance was driven by stock selection within the Consumer and Healthcare sectors. In fact, the top two contributors to the Fund for the year were healthcare holdings.
More specifically, the top three contributors to the Fund in fiscal year 2015 were Hospira, Biomarin and Apple. Hospira, a maker of lower cost injectable drugs, was the Fund’s largest holding entering fiscal 2015 given the company’s focus on containing health care costs and the attractive valuation of the equity. In February 2015, Pfizer announced plans to acquire Hospira for cash consideration of $90 per share, a significant premium to where the equity was trading. BioMarin, develops, manufactures and commercializes biologic drugs to treat rare diseases. The stock appreciated in anticipation of the FDA approval of a pipeline asset, drisapersen for Duchenne’s muscular dystrophy, which is currently under review at the agency. Duchenne’s muscular dystrophy is a debilitating disorder that affects male children starting at around age three and reduces life expectancy to about 30 years of age. Currently no drugs are available to treat this disease. Apple’s stock appreciated in response to the iPhone 6 launch which exceeded expectations and drove upward earnings revisions.
The three top detractors in the period were Precision Castparts, Discovery Communications and Qualcomm. Precision Castparts (PCP) is primarily a commercial aerospace supplier, but also has some modest exposure to oil and gas end markets. Precision Castparts had multiple earnings misses over the past year. The misses are attributable to the oversupply fundamentals in the oil/gas industry, as well as weak commercial aerospace product demand, which is not consistent with that end market’s strong growth dynamics. Since the commercial aerospace end market is strong, we believe that growth should return in the near-term in PCP’s commercial aerospace product offerings which should be a positive catalyst for the stock. Discovery Communications,
which owns and operates a number of cable networks in the U.S. and internationally, disappointed as U.S. advertising revenue growth was slower than investors expected while costs were higher than expected. Advertising growth has slowed in the U.S. as companies divert ad dollars from traditional venues to online and mobile internet properties. We believe this shift creates a significant headwind for Discovery Communications threatening its secular growth. As a result we exited the position during the year. Qualcomm was a detractor for several reasons. Chinese semiconductor manufacturers have failed to pay the licenses fees Qualcomm is owed based on the company’s intellectual property. These disputes are near a resolution and the license fees should be recovered over the next one to two years. In addition, a key customer did not use a Qualcomm processor in its latest generation handset. This issue will impact Qualcomm’s growth this year, but we are optimistic that Qualcomm can regain the business in future product cycles.
The Buffalo Large Cap Fund ended fiscal 2015 holding the equity of 46 companies up from 42 at the end of fiscal 2014. During the year ten new positions were added to the Fund (excluding the Google share split), and seven eliminated. The majority of the turnover was in the Healthcare and Consumer holdings. In Healthcare, several stocks reached extreme valuations and we reallocated those funds to equities that offered a more compelling risk reward. In the Consumer sector, we made a conscious effort to increase the Fund’s exposure to take advantage of growth in the automobile and healthy living end markets. Cash at the end of the fiscal year was 5.3% of net assets, modestly above the normal range for the Fund of 2-5%.
We are optimistic U.S. economic growth will accelerate in fiscal 2016. The harsh winter is behind us, the west coast ports are working through backlogs, employment and wage growth are improving and residential housing continues its recovery. We believe that the U.S. economy can deliver modest growth this year consistent with the last several years. The upside case would be that global GDP growth accelerates driven by economic stimulus emanating from the Europe and Asia. In the most recent quarter equity markets outside the U.S., specifically in Europe, China and Japan, outperformed the U.S. equity markets. Given this, the Buffalo Large Cap Fund remains committed to holding high quality companies with a growth opportunity in North America. We look for companies that are beneficiaries of the Buffalo secular growth trends. Frequently, growth opportunities in the U.S. translate into opportunities in the international markets. Therefore, the Fund has modest exposure to accelerating global economic growth, if that scenario materializes. Yet the Buffalo Large Cap Fund has greater leverage to growth companies in North America because we believe these companies are among the most
10
innovative, and have the potential to deliver strong, predictable and profitable growth over the intermediate and long term.
Buffalo Mid Cap Fund
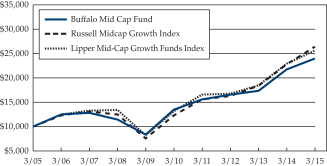
The Buffalo Mid Cap Fund advanced 10.43% for the fiscal year ending March 31, 2015. This result, while fairly strong on an absolute basis, underperformed the Russell Midcap Growth Index return of 15.56% over the same timeframe. Strong stock selection from the portfolio’s consumer stocks helped contribute to the 10%+ portfolio return during the period and included gains from WhiteWave Foods, LifeTime Fitness, and Under Armour which advanced by 55.06%, 47.42%, and 40.40% respectively. WhiteWave Foods which manufactures, markets, distributes, and sells branded plant-based foods and beverages, coffee creamers, premium dairy products and organic produce across North America and Europe advanced throughout the year as the company generated a strong organic net sales increases within North America and Europe. LifeTime Fitness, which develops and operates resort-like fitness and recreational centers, was acquired by a private equity firm for a nice premium. While Under Armour, the high-tech sporting equipment and apparel company, generated strong sales growth and gross margin expansion over the year in all product areas including international, footwear, women’s, youth and direct-to-consumer. The company continued to benefit from its strong brand awareness translating into significant market share gains.
The top contributor to the Fund’s performance during the period was the health care-related company Hospira, Inc. Hospira, a maker of lower cost injectable drugs, was the Fund’s largest holding given the company’s focus on containing health care costs and the attractive valuation of the equity. In February 2015, Pfizer announced plans to acquire Hospira for cash consideration of $90 per share, a significant premium to where the equity was trading and helped contribute to the stock’s 103.03% return during the period. Unfortunately, despite Hospira’s strong contribution to the portfolio the Healthcare sector overall was an area of relative weakness for the portfolio due to an underweight position in biotechnology, an area which produced very strong performance for the index. Most of the companies operating in the biotech industry do not meet our quality parameters due to their ongoing reliance on external capital raises to fund their business rather than from internal cash flow and so it has been difficult to participate in this sector. While it is frustrating to not fully participate in the party that has been going on within biotech, we feel the prudent decision long term is to stick to our process.
Other areas of weakness for the portfolio which led to the performance shortfall compared to the index occurred within our energy-related positions due to plunging oil
prices during the past 12 months. For example, CARBO Ceramics, a supplier of ceramic and resin-coated proppant for fracturing oil and gas wells, declined significantly after management reported disappointing results throughout the year and offered weak future guidance. The company has continued to lower guidance due to a decline in demand as operators experiment with utilizing more sand versus ceramic proppant. The company is also experiencing an increase in competition from imports and domestic players. We believe that the movement by operators into different completion methods will eventually result in a reversion back to ceramic or a mixture of sand/ceramic proppant to optimize well productivity and economic return over the life of the well. With that said, this reversion may take some time to materialize, therefore we’ve made the decision to exit the position for better potential risk/reward opportunities in the near term.
The Industrial area also experienced poor selection effect relative to the index with Chart Industries contributing to almost half of the underperformance. The company is a leading manufacturer of equipment used in the liquefied natural gas (LNG) supply chain and declined over 55% during the past year as sentiment surrounding slow adoption of LNG within the transportation sector and decelerating growth in China contributed to the stock’s sell off. We continue to believe LNG will be integrated into transportation vehicles in both China and the U.S., driven by stringent emissions regulations and the prospect of long-term low natural gas prices in North America. Chart Industries remains favorably positioned to attempt to benefit from this adoption through the supply chain of LNG to the end markets.
Idea generation has been strong and we feel good about the portfolio’s current positioning. Relative performance versus the benchmark and peers so far this year (2015) has been solid, which is encouraging. Regarding portfolio changes, we added five new securities during the period, eliminated two, and one was acquired. We are currently overweight Consumer Discretionary and Financials and are monitoring these exposures closely. The portfolio ended the period with 54 positions, a number that may continue to expand as we use market volatility as an opportunity to establish new ideas.
Looking ahead we believe the U.S. economy is on a self-sustaining path. Rising real wages, more plentiful job opportunities, better access to credit, low inflation and dramatically lower oil prices should lead to higher consumer confidence. The decline of oil prices and sizable movements in the currency markets can create volatility in the capital markets as the impact works its way through the financial system. A stronger U.S. dollar creates a headwind for U.S. multinational company earnings and margins, while mid
11
Portfolio Management Review
(Continued)
cap companies have more limited exposure to currency headwinds and typically sell more of their products and services into the domestic market, which currently has a more favorable macroeconomic backdrop. As always, we are diligently searching for those premier mid cap growth companies that have benefited from secular growth tailwinds, trading at reasonable valuations, with the potential to deliver significant capital appreciation over the long term.
Buffalo Small Cap Fund
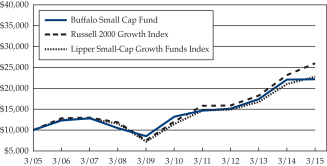
The Buffalo Small Cap Fund produced a return 0.56% for the fiscal year ending March 31, 2015. This result was obviously disappointing on an absolute and benchmark relative basis as the Russell 2000 Growth Index produced a return of 12.06% over the same timeframe.
Healthcare drove over half of the index’s return during the period as biotechnology and pharmaceutical shares rocketed on continued merger and acquisition activity in the sector. Record volumes of mergers and acquisitions combined with a wave of innovative new drugs as well as a more streamlined FDA approval process has caused a tremendous amount of investor speculation toward future earnings potential of many of these companies, in our opinion. The multi-year advance of stock prices in this area is reminiscent of the late 90’s tech boom given that many are high-risk, single product companies that have negative cash flow and no earnings. We don’t believe every new drug can generate a $1 billion in sales, so while many of these companies are valued as such, it stands to reason that market forces will find price multiple equilibrium over time. Most of the companies operating in the biotech industry do not meet our quality parameters due to their ongoing reliance on external capital raises to fund their business rather than from internal cash flow and so it has been difficult to participate in this sector. While our more established pharmaceutical and contract research holdings such as Akorn and ICON enjoyed substantial returns during the period, our underweight position to healthcare, and biotech in particular, hampered our relative return. While it is frustrating to not fully participate in the party that has been going on within biotech, we feel the prudent decision long term is to stick to our process.
Outside of Health Care the relative shortfall of the Fund during the past year was the result of poor stock performance among the portfolio’s Consumer and Technology stocks. Consumer stocks cost the portfolio over 350 basis points in relative performance. While we had a couple of solid performers in that area like LifeTime Fitness, which was acquired by a private equity firm for a nice premium, they were more than offset by the weakness from Pandora and Lumber Liquidators, which accounted for most of the underperformance in the sector. Lumber Liquidators, the specialty
retailer of hardwood flooring, declined by over 67% the past year exacerbated by a 60 Minutes story on the company claiming their laminate flooring sourced in China emits dangerous levels of formaldehyde. Although we believe the 60 Minutes analysis was flawed due to an improper testing technique that is not used by anyone in the industry or regulatory boards that ultimately decide appropriate levels of emissions, the report undoubtedly did some damage to the company’s brand. It will likely take some time for Lumber Liquidators to repair this damage and therefore we have trimmed the position as we believe the stock will tread water until the company sorts out the situation and reestablishes confidence in their products with consumers.
The Information Technology sector was also a major detractor during the past year and amounted to over 500 basis points of the relative performance shortfall when compared to the benchmark. Stratasys Ltd., a leader in 3D printing technology, was responsible for a large part of the underperformance, declining by over 50% during the period due to a reduction in earnings from most estimates from increased investments and weaker revenue growth due to a product issue with their desktop 3D printer line, Makerbot. While most investors expected increased investments, the product issue was a disappointing surprise and we have trimmed the position accordingly. Among the portfolio’s software as a service holdings, there was weakness in Cornerstone Ondemand which declined by about 40%. Cornerstone, a leading provider of talent management tools for recruiting, employee training and development, and other services declined due to lower than expected new business booking trends. This position has been trimmed due to execution issues and slowing growth. Overall we have been evaluating several new technology ideas for the portfolio and are monitoring ideal entry points based on what we view as attractive valuations.
Other areas of weakness for the portfolio which led to the performance shortfall compared to the index occurred within our energy-related positions due to plunging oil prices during the past 12 months. For example, CARBO Ceramics, a supplier of ceramic and resin-coated proppant for fracturing oil and gas wells, declined significantly after management reported disappointing results throughout the year and offered weak future guidance. The company has continued to lower guidance due to a decline in demand as operators experiment with utilizing more sand versus ceramic proppant. The company is also experiencing an increase in competition from imports and domestic players. We believe that the movement by operators into different completion methods will eventually result in a reversion back to ceramic or a mixture of sand/ceramic proppant to optimize well productivity and economic return over the life of the well. With that said, this reversion may take some
12
time to materialize, therefore we’ve made the decision to exit the position for better potential risk/reward opportunities in the near term.
The Industrial area also experienced poor selection effect relative to the index with Chart Industries contributing to the underperformance. The company is a leading manufacturer of equipment used in the liquefied natural gas (LNG) supply chain and declined over 55% during the past year as sentiment surrounding slow adoption of LNG within the transportation sector and decelerating growth in China contributed to the stock’s sell off. We continue to believe LNG will be integrated into transportation vehicles in both China and the U.S., driven by stringent emissions regulations and the prospect of long-term low natural gas prices in North America. Chart Industries remains favorably positioned to potentially benefit from this adoption through the supply chain of LNG to the end markets.
On a positive note, the Financial Services sector continues to provide solid relative performance. The portfolio’s investment in Wisdomtree, an innovator in exchange traded funds (ETFs), led our positive stock selection results within financials overall. Wisdomtree’s stock advanced over 63% during the year as strength in the U.S. dollar and a positive backdrop for global equities has led to continued growth in asset flows into the company’s currency hedged equity products. Overall our exposure to financials is now nearly 15% of portfolio assets, an overweight position of 700 basis points. As always, stocks come into the portfolio from the bottom up on their own merits and we are not trying to make any sector call here. However, as with any significant bet we make in the portfolio, we will continue to monitor this risk exposure closely.
We ended the period with 59 stocks in the portfolio up from 52 at year end, and while new idea generation remains strong, we remain steadfast in our quality and valuation parameters. The number of holdings in the portfolio will
likely tick up over the coming quarters but remain within our target range of 50 – 70 stocks. More new ideas have the added benefit of squeezing out old portfolio positions that have limited or no upside to our fair value estimates, and also stocks where our investment thesis has not played out or the company has failed to execute.
Outlook
Looking ahead we believe the U.S. economy is on a self-sustaining path. Rising real wages, more plentiful job opportunities, better access to credit, low inflation and dramatically lower oil prices should lead to higher consumer confidence. The decline in oil prices and sizable movements in the currency markets can create volatility in the capital markets as the impact works its way through the financial system. A stronger U.S. dollar creates a headwind for U.S. multinational company earnings and margins, while small-cap companies have more limited exposure to currency headwinds and typically sell more of their products and services into the domestic market, which currently has a more favorable macroeconomic backdrop. As always, we are diligently searching for those premier small cap growth companies that have benefited from secular growth tailwinds, trading at reasonable valuations, with the potential to deliver significant capital appreciation over the long term. We appreciate the continued confidence in our process and are laser focused on seeking to achieve outstanding performance relative to our benchmark and peers.
Sincerely,
 | ||
John C. Kornitzer President, KCM |
A basis point is one hundredth of a percentage point (0.01%)
Free Cash Flow is revenue less operating expenses including interest expense and maintenance capital spending. It is the discretionary cash that a company has after all expenses and is available for purposes such as dividend payments, investing back into the business, or share repurchases.
Return of Capital is a return from an investment that is not considered income. The return of capital is when some or all of the money an investor has in an investment is paid back to him or her, thus decreasing the value of the investment.
Return on Invested Capital is used to assess a company’s efficiency at allocating the capital under its control to profitable investments. The return on invested capital measure gives a sense of how well a company is using its money to generate returns.
Spread to worst is the difference in overall returns between two different classes of securities, or returns from the same class, but different representative securities. It measures the difference from the worst performing security to the best, and can be seen as a measure of dispersion of returns within a given market or between markets.
Yield to worst is the lowest potential yield that can be received on a bond without the issuer actually defaulting.
| * | According to S&P, an obligation rated ‘CCC’ is currently vulnerable and dependent on favorable business, financial and economic conditions to meet financial commitments. |
13
Investment Results
Total Returns as of March 31, 2015
| AVERAGE ANNUAL | ||||||||||||||||||||||||
| GROSS EXPENSE RATIO* | THREE MONTHS | ONE YEAR | FIVE YEARS | TEN YEARS | SINCE INCEPTION | |||||||||||||||||||
Buffalo Discovery Fund (inception date 4/16/01) | 1.01% | 7.50% | 15.56% | 16.94% | 12.33% | 9.24% | ||||||||||||||||||
Russell 3000 Growth Index | N/A | 4.05% | 15.76% | 15.71% | 9.41% | 4.83% | ||||||||||||||||||
Lipper Multi-Cap Growth Funds Index | N/A | 4.61% | 14.25% | 14.93% | 9.13% | 6.01% | ||||||||||||||||||
Buffalo Dividend Focus Fund (inception date 12/03/12) | 0.94% | 1.93% | 18.86% | N/A | N/A | 20.01% | ||||||||||||||||||
S&P 500 Index | N/A | 0.95% | 12.73% | N/A | N/A | 20.44% | ||||||||||||||||||
Lipper Equity Income Funds Index | N/A | -0.01% | 8.46% | N/A | N/A | 17.22% | ||||||||||||||||||
Buffalo Emerging Opportunities Fund (inception date 5/21/04) | 1.49% | 3.66% | -0.71% | 18.63% | 8.78% | 8.66% | ||||||||||||||||||
Russell 2000 Growth Index | N/A | 6.63% | 12.06% | 16.58% | 10.02% | 10.01% | ||||||||||||||||||
Lipper Small-Cap Growth Funds Index | N/A | 5.74% | 8.34% | 14.74% | 8.56% | 8.73% | ||||||||||||||||||
Buffalo Flexible Income Fund (inception date 8/12/94) | 1.03% | 0.86% | 3.33% | 9.79% | 7.49% | 7.48% | ||||||||||||||||||
S&P 500 Index | N/A | 0.95% | 12.73% | 14.47% | 8.01% | 9.61% | ||||||||||||||||||
Lipper Mixed-Asset Target Allocation Moderate Funds Index | N/A | 1.83% | 6.06% | 8.44% | 5.85% | 7.22% | ||||||||||||||||||
Buffalo Growth Fund (inception date 5/19/95) | 0.91% | 4.00% | 11.32% | 14.56% | 9.63% | 10.16% | ||||||||||||||||||
Russell 1000 Growth Index | N/A | 3.84% | 16.09% | 15.63% | 9.36% | 8.63% | ||||||||||||||||||
Lipper Large-Cap Growth Funds Index | N/A | 3.44% | 14.26% | 13.94% | 8.24% | 7.62% | ||||||||||||||||||
Buffalo High Yield Fund (inception date 5/19/95) | 1.02% | 2.74% | 3.58% | 7.19% | 6.79% | 7.61% | ||||||||||||||||||
Bank of America Merrill Lynch U.S. High Yield Master II Index | N/A | 2.54% | 2.05% | 8.40% | 8.04% | 7.55% | ||||||||||||||||||
Lipper High Yield Bond Funds Index | N/A | 2.47% | 1.80% | 8.01% | 6.76% | 6.20% | ||||||||||||||||||
Buffalo International Fund (inception date 9/28/07) | 1.08% | 4.37% | 2.32% | 7.01% | N/A | 2.92% | ||||||||||||||||||
MSCI AC World (ex USA) Index | N/A | 3.49% | -1.01% | 4.82% | N/A | -0.22% | ||||||||||||||||||
Lipper International Funds Index | N/A | 5.07% | 0.19% | 6.35% | N/A | 0.61% | ||||||||||||||||||
Buffalo Large Cap Fund (inception date 5/19/95) | 0.97% | 6.27% | 20.29% | 13.67% | 8.60% | 9.41% | ||||||||||||||||||
Russell 1000 Growth Index | N/A | 3.84% | 16.09% | 15.63% | 9.36% | 8.63% | ||||||||||||||||||
Lipper Large-Cap Growth Funds Index | N/A | 3.44% | 14.26% | 13.94% | 8.24% | 7.62% | ||||||||||||||||||
Buffalo Mid Cap Fund (inception date 12/17/01) | 1.01% | 7.05% | 10.43% | 12.28% | 9.15% | 8.75% | ||||||||||||||||||
Russell Midcap Growth Index | N/A | 5.38% | 15.56% | 16.43% | 10.19% | 9.01% | ||||||||||||||||||
Lipper Mid-Cap Growth Funds Index | N/A | 5.07% | 11.85% | 14.27% | 9.87% | 7.98% | ||||||||||||||||||
Buffalo Small Cap Fund (inception date 4/14/98) | 1.00% | 3.86% | 0.56% | 10.98% | 8.29% | 12.13% | ||||||||||||||||||
Russell 2000 Growth Index | N/A | 6.63% | 12.06% | 16.58% | 10.02% | 5.79% | ||||||||||||||||||
Lipper Small-Cap Growth Funds Index | N/A | 5.74% | 8.34% | 14.74% | 8.56% | 6.46% | ||||||||||||||||||
| * | As reported in the Funds’ Prospectus dated July 29, 2014. |
| Performance data quoted represents past performance; past performance does not guarantee future results. The investment return and principal value of an investment will fluctuate so that an investor’s shares, when redeemed, may be worth more or less than their original cost. Current performance of the Funds may be lower or higher than the performance quoted. Performance data current as of the most recent month-end may be obtained by calling 1-800-49-BUFFALO or by visiting the website at www.buffalofunds.com. |
| The Buffalo Discovery, Dividend Focus, Flexible Income, International, Large Cap, Mid Cap, and Growth Funds impose a 2.00% redemption fee on shares held for less than 60 days and the Buffalo High Yield, Emerging Opportunities and Small Cap Funds impose a 2.00% redemption fee on shares held less than 180 days. |
14
The Funds’ returns shown do not reflect the deduction of taxes that a shareholder would pay on distributions or the redemption of shares. The benchmark returns shown, excluding the Lipper Indices, reflect the reinvestment of dividends and capital gains but do not reflect the deduction of any investment management fees, other expenses or taxes. The performance of the Lipper Indices is presented net of the Funds’ fees and expenses; however, applicable sales charges are not taken into consideration. One cannot invest directly in an index.
The Russell 3000 Growth Index measures the performance of the broad growth segment of the U.S. equity universe. It includes those Russell 3000 Index companies with higher price-to-book ratios and higher forecasted growth values. The Lipper Multi-Cap Growth Funds Index is an unmanaged index that reflects the net asset value weighted return of 30 of the largest multi-cap growth funds tracked by Lipper. Its returns include net reinvested dividends. The S&P 500 Index is a capitalization weighted index of 500 large capitalization stocks which is designed to measure broad domestic securities markets. The Lipper Mixed-Asset Target Allocation Moderate Funds Index is an average of funds that, by portfolio practice, maintain a mix of between 40%-60% equity securities, with the remainder invested in bonds, cash, and cash equivalents. The total return of the Lipper Average does not include the effect of sales charges. You cannot invest directly in a Lipper Average. The Russell 1000 Growth Index measures the performance of those Russell 1000 Index companies with higher price-to-book ratios and higher forecasted growth values. The Lipper Large-Cap Growth Funds Index is an unmanaged, equally weighted performance index of the 30 largest qualifying mutual funds (based on net assets) in the Lipper Large-Cap classification. The Bank of America Merrill Lynch U.S. High Yield Master II Index tracks the performance of below investment grade U.S. dollar-denominated corporate bonds publicly issued in the U.S. domestic market. The Lipper High Yield Bond Funds Index is a widely recognized index of the 30 largest mutual funds that invest primarily in high yield bonds. The MSCI AC World (ex USA) Index is a free float-adjusted market capitalization index that is designed to measure equity market performance in the global developed and emerging markets, excluding the U.S. The Lipper International Funds Index is an unmanaged, equally weighted performance index of the 30 largest qualifying mutual funds (based on net assets) in the Lipper International classifications. The Russell Midcap Growth Index measures the performance of those Russell Midcap companies with higher price-to-book ratios and higher forecasted growth values. The Lipper Mid-Cap Growth Funds Index is an unmanaged, equally weighted performance index of the 30 largest qualifying mutual funds (based on net assets) in the Lipper Mid-Cap classification. The Russell 2000 Growth Index measures the performance of those Russell 2000 Index companies with higher price-to-book ratios and higher forecasted growth values. The Lipper Small-Cap Growth Funds Index is an unmanaged, equally weighted performance index of the 30 largest qualifying mutual funds (based on net assets) in the Lipper Small-Cap classification. Lipper Equity Income Funds Index tracks funds that seek relatively high current income and growth of income by investing at least 65% of their portfolio in dividend-paying equity securities. These funds’ gross or net yield must be at least 125% of the average gross or net yield of the U.S. diversified equity fund universe. The Russell 2000 Index measures the performance of the small-cap segment of the U.S. equity universe. The Russell 2000 Index is a subset of the Russell 3000® Index representing approximately 10% of the total market capitalization of that index.
Please refer to the prospectus for special risks associated with investing in the Buffalo Funds, including, but not limited to, risks involved with investments in science and technology, foreign, debt, lower- or non-rated securities and smaller companies.
Fund holdings and sector allocations are subject to change at any time and should not be considered a recommendation to buy or sell any security. Please refer to the Schedule of Investments for a complete list of Fund holdings.
15
Buffalo Discovery Fund
Growth of a $10,000 Investment
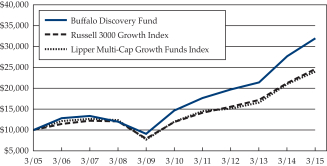
Buffalo Dividend Focus Fund
Growth of a $10,000 Investment
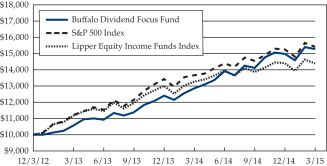
Buffalo Emerging Opportunities Fund
Growth of a $10,000 Investment
Buffalo Flexible Income Fund
Growth of a $10,000 Investment
Buffalo Growth Fund
Growth of a $10,000 Investment
Buffalo High Yield Fund
Growth of a $10,000 Investment
Buffalo International Fund
Growth of a $10,000 Investment
Buffalo Large Cap Fund
Growth of a $10,000 Investment
16
Buffalo Mid Cap Fund
Growth of a $10,000 Investment
Buffalo Small Cap Fund
Growth of a $10,000 Investment
17
Expense Example
As a shareholder of the Funds, you incur two types of costs: (1) transaction costs (including redemption fees) and (2) ongoing costs, including management fees and other Fund specific expenses. The examples below are intended to help you understand your ongoing costs (in dollars) of investing in the Funds and to compare these costs with the ongoing costs of investing in other mutual funds. The example is based on an investment of $1,000 invested at the beginning of the period and held for the entire period (October 1, 2014 – March 31, 2015).
ACTUAL EXPENSES
The first line of the tables below provides information about actual account values and actual expenses. You may use the information in this line, together with the amount you invested, to estimate the expenses that you paid over the period. Simply divide your account by $1,000 (for example, an $8,600 account value divided by $1,000 = 8.6), then multiply the result by the number in the first line under the heading entitled “Expenses Paid During the Period” to estimate the expenses you paid on your account during the period. Although the Funds charge no sales load or transaction fees, you will be assessed fees for outgoing wire transfers, returned checks and stop payment orders at prevailing rates charged by U.S. Bancorp Fund Services, LLC, the Funds’ transfer agent. If you request that a redemption be made by wire transfer, currently a $15.00 fee is charged by the Funds’ transfer agent. You will be charged a redemption fee equal to 2.00% of the net amount of the redemption if you redeem your shares of the Buffalo Flexible Income, Dividend Focus, International, Large Cap, Mid Cap, Discovery and Growth Funds within 60 days of purchase. The Buffalo High Yield, Emerging Opportunities and Small Cap Funds will charge a redemption fee equal to 2.00% of the net amount of the redemption if you redeem your shares
within 180 days of purchase. To the extent a Fund invests in shares of other investment companies as part of its investment strategy, you will indirectly bear your proportionate share of any fees and expenses charged by the underlying funds in which the Fund invests in addition to the expenses of the Fund. Actual expenses of the underlying funds are expected to vary among the various underlying funds. These expenses are not included in the examples below. The examples below include management fees, registration fees and other expenses. However, the examples below do not include portfolio trading commissions and related expenses and other extraordinary expenses as determined under U.S. generally accepted accounting principles.
HYPOTHETICAL EXAMPLE FOR COMPARISON PURPOSES
The second line of each table below provides information about hypothetical account values and hypothetical expenses based on the Funds’ actual expense ratios and an assumed rate of return of 5% per year before expenses, which are not the Funds’ actual returns. The hypothetical account values and expenses may not be used to estimate the actual ending account balance or expenses you paid for the period. You may use this information to compare the ongoing costs of investing in our Funds and other funds. To do so, compare this 5% hypothetical example with the 5% hypothetical examples that appear in the shareholder reports of the other funds. Please note that the expenses shown in the tables are meant to highlight your ongoing costs only and do not reflect any transactional costs, such as redemption fees. Therefore, the second line of the tables is useful in comparing ongoing costs only, and will not help you determine the relative total costs of owning different funds. In addition, if these transactional costs were included, your costs would have been higher.
| BUFFALO DISCOVERY FUND | BEGINNING ACCOUNT VALUE OCTOBER 1, 2014 | ENDING ACCOUNT VALUE MARCH 31, 2015 | EXPENSES PAID DURING PERIOD OCTOBER 1, 2014 - MARCH 31, 2015* | |||||||||
Actual | $ | 1,000.00 | $ | 1,136.80 | $ | 5.36 | ||||||
Hypothetical (5% return before expenses) | $ | 1,000.00 | $ | 1,014.83 | $ | 5.07 | ||||||
| * | Expenses are equal to the Fund’s annualized expense ratio of 1.01%, multiplied by the average account value over the period, multiplied by 182/365 to reflect the one-half year period. |
| BUFFALO DIVIDEND FOCUS FUND | BEGINNING | ENDING | EXPENSES PAID DURING | |||||||||
Actual | $ | 1,000.00 | $ | 1,082.50 | $ | 4.69 | ||||||
Hypothetical (5% return before expenses) | $ | 1,000.00 | $ | 1,015.93 | $ | 4.52 | ||||||
| * | Expenses are equal to the Fund’s annualized expense ratio of 0.90%, multiplied by the average account value over the period, multiplied by 182/365 to reflect the one-half year period. |
| BUFFALO EMERGING OPPORTUNITIES FUND | BEGINNING | ENDING | EXPENSES PAID DURING | |||||||||
Actual | $ | 1,000.00 | $ | 1,140.60 | $ | 7.83 | ||||||
Hypothetical (5% return before expenses) | $ | 1,000.00 | $ | 1,010.23 | $ | 7.37 | ||||||
| * | Expenses are equal to the Fund’s annualized expense ratio of 1.47%, multiplied by the average account value over the period, multiplied by 182/365 to reflect the one-half year period. |
18
| BUFFALO FLEXIBLE INCOME FUND | BEGINNING | ENDING | EXPENSES PAID DURING | |||||||||
Actual | $ | 1,000.00 | $ | 997.10 | $ | 5.01 | ||||||
Hypothetical (5% return before expenses) | $ | 1,000.00 | $ | 1,014.83 | $ | 5.07 | ||||||
| * | Expenses are equal to the Fund’s annualized expense ratio of 1.01%, multiplied by the average account value over the period, multiplied by 182/365 to reflect the one-half year period. |
| BUFFALO GROWTH FUND | BEGINNING | ENDING | EXPENSES PAID DURING | |||||||||
Actual | $ | 1,000.00 | $ | 1,083.30 | $ | 4.72 | ||||||
Hypothetical (5% return before expenses) | $ | 1,000.00 | $ | 1,015.83 | $ | 4.57 | ||||||
| * | Expenses are equal to the Fund’s annualized expense ratio of 0.91%, multiplied by the average account value over the period, multiplied by 182/365 to reflect the one-half year period. |
| BUFFALO HIGH YIELD FUND | BEGINNING | ENDING | EXPENSES PAID DURING | |||||||||
Actual | $ | 1,000.00 | $ | 1,032.50 | $ | 5.15 | ||||||
Hypothetical (5% return before expenses) | $ | 1,000.00 | $ | 1,014.73 | $ | 5.12 | ||||||
| * | Expenses are equal to the Fund’s annualized expense ratio of 1.02%, multiplied by the average account value over the period, multiplied by 182/365 to reflect the one-half year period. |
| BUFFALO INTERNATIONAL FUND | BEGINNING | ENDING | EXPENSES PAID DURING | |||||||||
Actual | $ | 1,000.00 | $ | 1,076.20 | $ | 5.40 | ||||||
Hypothetical (5% return before expenses) | $ | 1,000.00 | $ | 1,014.53 | $ | 5.22 | ||||||
| * | Expenses are equal to the Fund’s annualized expense ratio of 1.04%, multiplied by the average account value over the period, multiplied by 182/365 to reflect the one-half year period. |
| BUFFALO LARGE CAP FUND | BEGINNING | ENDING | EXPENSES PAID DURING | |||||||||
Actual | $ | 1,000.00 | $ | 1,144.00 | $ | 5.08 | ||||||
Hypothetical (5% return before expenses) | $ | 1,000.00 | $ | 1,015.43 | $ | 4.77 | ||||||
| * | Expenses are equal to the Fund’s annualized expense ratio of 0.95%, multiplied by the average account value over the period, multiplied by 182/365 to reflect the one-half year period. |
| BUFFALO MID CAP FUND | BEGINNING | ENDING | EXPENSES PAID DURING | |||||||||
Actual | $ | 1,000.00 | $ | 1,111.80 | $ | 5.31 | ||||||
Hypothetical (5% return before expenses) | $ | 1,000.00 | $ | 1,014.83 | $ | 5.07 | ||||||
| * | Expenses are equal to the Fund’s annualized expense ratio of 1.01%, multiplied by the average account value over the period, multiplied by 182/365 to reflect the one-half year period. |
| BUFFALO SMALL CAP FUND | BEGINNING | ENDING | EXPENSES PAID DURING | |||||||||
Actual | $ | 1,000.00 | $ | 1,091.40 | $ | 5.23 | ||||||
Hypothetical (5% return before expenses) | $ | 1,000.00 | $ | 1,014.93 | $ | 5.02 | ||||||
| * | Expenses are equal to the Fund’s annualized expense ratio of 1.00%, multiplied by the average account value over the period, multiplied by 182/365 to reflect the one-half year period. |
19
Allocation of Portfolio Holdings
Percentages represent market value as a percentage of total investments as of March 31, 2015.
BUFFALO DISCOVERY FUND
| Information Technology | 23.45% | |||
| Health Care | 22.44% | |||
| Industrials | 18.13% | |||
| Consumer Discretionary | 11.03% | |||
| Short-Term Investments | 9.63% | |||
| Materials | 5.57% | |||
| Consumer Staples | 3.38% | |||
| Energy | 3.25% | |||
| Financials | 3.12% | |||
|
| |||
| 100.00% |
BUFFALO DIVIDEND FOCUS FUND
| Information Technology | 16.85% | |||
| Health Care | 14.06% | |||
| Financials | 13.44% | |||
| Consumer Discretionary | 13.31% | |||
| Energy | 11.14% | |||
| Industrials | 9.08% | |||
| Consumer Staples | 8.94% | |||
| Short-Term Investments | 7.29% | |||
| Utilities | 3.21% | |||
| Telecommunication Services | 2.14% | |||
| Materials | 0.54% | |||
|
| |||
| 100.00% |
BUFFALO EMERGING OPPORTUNITIES FUND
| Information Technology | 40.18% | |||
| Health Care | 17.02% | |||
| Industrials | 15.13% | |||
| Consumer Discretionary | 12.69% | |||
| Telecommunication Services | 3.33% | |||
| Consumer Staples | 3.16% | |||
| Short-Term Investments | 2.84% | |||
| Energy | 2.83% | |||
| Materials | 2.82% | |||
|
| |||
| 100.00% |
BUFFALO FLEXIBLE INCOME FUND

| Common Stocks | 67.43% | |||
| Corporate Bonds | 19.06% | |||
| Convertible Bonds | 6.16% | |||
| Short-Term Investments | 2.83% | |||
| U.S. Government Note | 1.86% | |||
| REITS | 1.52% | |||
| Bank Loans | 1.14% | |||
|
| |||
| 100.00% |
BUFFALO GROWTH FUND
| Information Technology | 22.20% | |||
| Consumer Discretionary | 17.96% | |||
| Industrials | 17.13% | |||
| Financials | 12.56% | |||
| Consumer Staples | 7.99% | |||
| Health Care | 7.55% | |||
| Energy | 5.64% | |||
| Materials | 4.34% | |||
| Short-Term Investments | 2.88% | |||
| Telecommunication Services | 1.75% | |||
|
| |||
| 100.00% |
BUFFALO HIGH YIELD FUND

| Corporate Bonds | 70.38% | |||
| Convertible Bonds | 16.09% | |||
| Common Stocks | 5.23% | |||
| Short-Term Investments | 4.08% | |||
| Bank Loans | 1.77% | |||
| Convertible Preferred Stocks | 1.48% | |||
| Preffered Stocks | 0.97% | |||
|
| |||
| 100.00% |
20
BUFFALO INTERNATIONAL FUND

| Europe | 69.11% | |||
| Asia | 18.40% | |||
| Short-Term Investments | 7.28% | |||
| The Americas | 3.98% | |||
| Middle East | 1.23% | |||
|
| |||
| 100.00% |
BUFFALO LARGE CAP FUND
| Consumer Discretionary | 21.47% | |||
| Information Technology | 19.98% | |||
| Health Care | 16.99% | |||
| Industrials | 11.52% | |||
| Financials | 9.97% | |||
| Consumer Staples | 6.51% | |||
| Short-Term Investments | 6.20% | |||
| Materials | 4.40% | |||
| Energy | 2.96% | |||
|
| |||
| 100.00% |
BUFFALO MID CAP FUND
| Consumer Discretionary | 28.69% | |||
| Industrials | 18.17% | |||
| Information Technology | 16.65% | |||
| Financials | 14.52% | |||
| Health Care | 12.72% | |||
| Consumer Staples | 4.45% | |||
| Energy | 1.93% | |||
| Materials | 1.63% | |||
| Short-Term Investments | 1.24% | |||
|
| |||
| 100.00% |
BUFFALO SMALL CAP FUND
| Information Technology | 24.44% | |||
| Consumer Discretionary | 20.36% | |||
| Industrials | 18.10% | |||
| Health Care | 15.53% | |||
| Financials | 14.44% | |||
| Short-Term Investments | 4.71% | |||
| Consumer Staples | 2.13% | |||
| Telecommunication Services | 0.29% | |||
|
| |||
| 100.00% |
21
Buffalo Discovery Fund
SCHEDULE OF INVESTMENTS
March 31, 2015
| SHARES OR FACE AMOUNT | FAIR VALUE* | |||||||
| COMMON STOCKS — 90.78% |
| ||||||
| CONSUMER DISCRETIONARY — 11.28% |
| ||||||
Auto Components — 2.78% |
| |||||||
| 222,748 | BorgWarner, Inc. | $ | 13,471,799 | |||||
| 159,671 | Gentherm Inc.(a) | 8,064,982 | ||||||
|
| |||||||
| 21,536,781 | ||||||||
|
| |||||||
Distributors — 1.30% | ||||||||
| 392,700 | LKQ Corp.(a) | 10,037,412 | ||||||
|
| |||||||
Internet & Catalog Retail — 1.38% | ||||||||
| 113,000 | Expedia, Inc. | 10,636,690 | ||||||
|
| |||||||
Internet Software & Services — 1.39% | ||||||||
| 665,174 | Pandora Media Inc.(a) | 10,782,470 | ||||||
|
| |||||||
Media — 1.78% | ||||||||
| 407,127 | Lions Gate Entertainment Corp.(b) | 13,809,748 | ||||||
|
| |||||||
Specialty Retail — 1.67% | ||||||||
| 162,000 | Williams-Sonoma, Inc. | 12,913,020 | ||||||
|
| |||||||
Textiles, Apparel & Luxury Goods — 0.98% | ||||||||
| 118,400 | lululemon athletica, Inc.(a) | 7,579,968 | ||||||
Total Consumer Discretionary (Cost $67,356,330) | 87,296,089 | |||||||
|
| |||||||
| CONSUMER STAPLES — 3.45% |
| ||||||
Food & Staples Retailing — 3.45% | ||||||||
| 121,400 | CVS Health Corp. | 12,529,694 | ||||||
| 272,400 | Whole Foods Market, Inc. | 14,186,592 | ||||||
Total Consumer Staples (Cost $21,290,436) | 26,716,286 | |||||||
|
| |||||||
| Energy — 3.33% |
| ||||||
Energy Equipment & Services — 3.33% | ||||||||
| 205,300 | Baker Hughes, Inc. | 13,052,974 | ||||||
| 647,713 | Forum Energy Technologies Inc.(a) | 12,695,175 | ||||||
Total Energy (Cost $22,388,324) | 25,748,149 | |||||||
|
| |||||||
| FINANCIALS — 3.19% | |||||||
Capital Markets — 1.58% | ||||||||
| 77,825 | Financial Engines Inc. | 3,255,420 | ||||||
| 420,100 | WisdomTree Investments, Inc. | 9,015,346 | ||||||
|
| |||||||
| 12,270,766 | ||||||||
|
| |||||||
Diversified Financial Services — 1.61% | ||||||||
| 53,300 | Intercontinental Exchange Group, Inc. | 12,433,291 | ||||||
Total Financials (Cost $16,190,657) | 24,704,057 | |||||||
|
| |||||||
| HEALTH CARE — 22.94% | |||||||
Biotechnology — 2.58% | ||||||||
| 38,784 | Alnylam Pharmaceuticals Inc.(a) | 4,049,825 | ||||||
| 175,600 | Cepheid, Inc.(a) | 9,991,640 | ||||||
| 78,897 | KYTHERA Biopharmaceuticals, Inc.(a) | 3,956,685 | ||||||
| 149,400 | Sarepta Therapeutics, Inc.(a) | 1,984,032 | ||||||
|
| |||||||
| 19,982,182 | ||||||||
|
| |||||||
Health Care Equipment & Supplies — 8.24% | ||||||||
| 1,428,400 | Accuray Inc.(a) | 13,284,120 | ||||||
| 240,657 | Align Technology, Inc.(a) | 12,943,737 | ||||||
22
| SHARES OR FACE AMOUNT | FAIR VALUE* | |||||||
| HEALTH CARE (Continued) | |||||||
| 93,263 | Baxter International Inc. | $ | 6,388,515 | |||||
| 55,000 | Edwards Lifesciences Corp.(a) | 7,835,300 | ||||||
| 469,400 | Endologix, Inc.(a) | 8,012,658 | ||||||
| 191,485 | Inogen Inc.(a) | 6,125,605 | ||||||
| 123,250 | Nevro Corp.(a) | 5,907,372 | ||||||
| 235,982 | Oxford Immunotec Global PLC(a)(b) | 3,322,627 | ||||||
|
| |||||||
| 63,819,934 | ||||||||
|
| |||||||
Health Care Technology — 1.92% | ||||||||
| 124,725 | athenahealth Inc.(a) | 14,890,918 | ||||||
|
| |||||||
Life Sciences Tools & Services — 2.99% | ||||||||
| 240,200 | Agilent Technologies, Inc. | 9,980,310 | ||||||
| 165,500 | Charles River Laboratories International, Inc.(a) | 13,122,495 | ||||||
|
| |||||||
| 23,102,805 | ||||||||
|
| |||||||
Pharmaceuticals — 7.21% | ||||||||
| 17,222 | Actavis plc(a)(b) | 5,125,634 | ||||||
| 92,800 | Akorn, Inc.(a) | 4,408,928 | ||||||
| 134,200 | Hospira, Inc.(a) | 11,788,128 | ||||||
| 225,800 | Impax Laboratories, Inc.(a) | 10,583,246 | ||||||
| 292,000 | The Medicines Co.(a) | 8,181,840 | ||||||
| 94,900 | Perrigo Co. PLC(b) | 15,710,695 | ||||||
|
| |||||||
| 55,798,471 | ||||||||
Total Health Care (Cost $119,460,864) | 177,594,310 | |||||||
|
| |||||||
| INDUSTRIALS — 18.53% | |||||||
Aerospace & Defense — 1.93% | ||||||||
| 290,400 | Hexcel Corp. | 14,932,368 | ||||||
|
| |||||||
Commercial Services & Supplies — 1.28% | ||||||||
| 70,805 | Stericycle, Inc.(a) | 9,943,146 | ||||||
|
| |||||||
Construction & Engineering — 1.18% | ||||||||
| 319,600 | Quanta Services, Inc.(a) | 9,118,188 | ||||||
|
| |||||||
Electrical Equipment — 5.23% | ||||||||
| 63,500 | Acuity Brands, Inc. | 10,678,160 | ||||||
| 197,200 | AMETEK, Inc. | 10,360,888 | ||||||
| 94,000 | Rockwell Automation, Inc. | 10,903,060 | ||||||
| 49,500 | Roper Industries, Inc. | 8,514,000 | ||||||
|
| |||||||
| 40,456,108 | ||||||||
|
| |||||||
Machinery — 4.64% | ||||||||
| 429,839 | Chart Industries, Inc.(a) | 15,076,603 | ||||||
| 109,400 | Pall Corp. | 10,982,666 | ||||||
| 83,100 | Parker-Hannifin Corp. | 9,870,618 | ||||||
|
| |||||||
| 35,929,887 | ||||||||
|
| |||||||
Professional Services — 4.27% | ||||||||
| 105,490 | IHS Inc. — Class A(a) | 12,000,543 | ||||||
| 196,800 | Nielsen NV.(b) | 8,771,376 | ||||||
| 172,358 | Verisk Analytics, Inc — Class A(a) | 12,306,361 | ||||||
|
| |||||||
| 33,078,280 | ||||||||
Total Industrials (Cost $121,035,597) | 143,457,977 | |||||||
|
| |||||||
23
Buffalo Discovery Fund
SCHEDULE OF INVESTMENTS
March 31, 2015
(Continued)
| SHARES OR FACE AMOUNT | FAIR VALUE* | |||||||
| INFORMATION TECHNOLOGY — 22.37% | |||||||
Communications Equipment — 4.42% | ||||||||
| 208,320 | ADTRAN, Inc. | $ | 3,889,335 | |||||
| 100,000 | F5 Networks, Inc.(a) | 11,494,000 | ||||||
| 404,300 | Juniper Networks, Inc. | 9,129,094 | ||||||
| 140,100 | QUALCOMM, Inc. | 9,714,534 | ||||||
|
| |||||||
| 34,226,963 | ||||||||
|
| |||||||
Electronic Equipment, Instruments & Components — 0.68% | ||||||||
| 164,005 | National Instruments Corp. | 5,254,720 | ||||||
|
| |||||||
Internet Software & Services — 4.64% | ||||||||
| 90,013 | Akamai Technologies, Inc.(a) | 6,394,974 | ||||||
| 178,475 | Facebook Inc. — Class A(a) | 14,673,322 | ||||||
| 26,800 | Google Inc. — Class A(a) | 14,865,960 | ||||||
|
| |||||||
| 35,934,256 | ||||||||
|
| |||||||
IT Services — 1.16% | ||||||||
| 202,645 | Teradata Corp.(a) | 8,944,750 | ||||||
|
| |||||||
Semiconductors & Semiconductor Equipment — 0.70% | ||||||||
| 203,935 | Semtech Corp.(a) | 5,433,848 | ||||||
|
| |||||||
Software — 5.74% | ||||||||
| 189,000 | ACI Worldwide, Inc.(a) | 4,093,740 | ||||||
| 20,900 | ANSYS, Inc.(a) | 1,843,171 | ||||||
| 183,090 | BroadSoft Inc.(a) | 6,126,191 | ||||||
| 195,891 | Citrix Systems, Inc.(a) | 12,511,558 | ||||||
| 255,510 | Fortinet Inc.(a) | 8,930,075 | ||||||
| 144,100 | Red Hat, Inc.(a) | 10,915,575 | ||||||
|
| |||||||
| 44,420,310 | ||||||||
|
| |||||||
Technology Hardware, Storage & Peripherals — 5.03% | ||||||||
| 211,300 | Apple Inc. | 26,292,059 | ||||||
| 496,000 | EMC Corp. | 12,677,760 | ||||||
|
| |||||||
| 38,969,819 | ||||||||
Total Information Technology (Cost $118,406,852) | 173,184,666 | |||||||
|
| |||||||
| MATERIALS — 5.69% | |||||||
Chemicals — 5.69% | ||||||||
| 101,435 | Airgas, Inc. | 10,763,268 | ||||||
| 93,200 | Ecolab Inc. | 10,660,216 | ||||||
| 99,963 | FMC Corp. | 5,722,881 | ||||||
| 32,200 | International Flavors & Fragrances Inc. | 3,780,280 | ||||||
| 117,000 | Monsanto Co. | 13,167,180 | ||||||
Total Materials (Cost $34,831,172) | 44,093,825 | |||||||
|
| |||||||
| TOTAL COMMON STOCKS | 702,795,359 | ||||||
| (COST $520,960,232) | |||||||
24
| SHARES OR FACE AMOUNT | FAIR VALUE* | |||||||
| REITS — 1.59% | |||||||
| INFORMATION TECHNOLOGY — 1.59% | |||||||
Internet Software & Services — 1.59% | ||||||||
| 53,134 | Equinix Inc. | $ | 12,372,252 | |||||
Total Information Technology (Cost $9,114,197) | 12,372,252 | |||||||
|
| |||||||
| TOTAL REITS | 12,372,252 | ||||||
| (COST $9,114,197) | |||||||
| SHORT TERM INVESTMENTS — 9.85% | |||||||
| INVESTMENT COMPANIES — 9.85% | |||||||
| 70,000,000 | Fidelity Institutional Money Market Fund — Government Portfolio — 0.01%(c) | 70,000,000 | ||||||
| 6,237,125 | The STIT-Treasury Portfolio — 0.01%(c) | 6,237,125 | ||||||
Total Investment Company | 76,237,125 | |||||||
|
| |||||||
| TOTAL SHORT TERM INVESTMENTS | 76,237,125 | ||||||
| (COST $76,237,125) | |||||||
| TOTAL INVESTMENTS — 102.22% | 791,404,736 | ||||||
| (COST $606,311,554) | |||||||
| Liabilities in Excess of Other Assets — (2.22)% | (17,217,352 | ) | |||||
|
| |||||||
| TOTAL NET ASSETS — 100.00% | $ | 774,187,384 | |||||
|
| |||||||
PLC — Public Limited Company
| (a) | Non Income Producing |
| (b) | Foreign Issued Security. The total value of these securities amounted to $46,740,080 (6.04% of net assets) at March 31, 2015. |
| (c) | 7-day yield |
| * | See Note 1A of accompanying Notes to Financial Statements regarding valuation of securities. |
The Global Industry Classification Standard (GICS) was developed by and/or is the exclusive property of MSCI, Inc. and Standard & Poor’s Financial Services LLC (“S&P”). GICS is a service mark of MSCI and S&P and has been licensed for use by U.S. Bancorp Fund Services, LLC.
The accompanying notes are an integral part of these financial statements.
25
Buffalo Dividend Focus Fund
SCHEDULE OF INVESTMENTS
March 31, 2015
| SHARES OR FACE AMOUNT | FAIR VALUE* | |||||||
| COMMON STOCKS — 92.24% |
| ||||||
| CONSUMER DISCRETIONARY — 13.24% | |||||||
Automobiles — 2.00% | ||||||||
| 21,950 | General Motors Co. | $ | 823,125 | |||||
|
| |||||||
Hotels, Restaurants & Leisure — 4.13% | ||||||||
| 9,700 | Carnival Corp.(b) | 464,048 | ||||||
| 6,350 | Cedar Fair, L.P. | 364,490 | ||||||
| 5,500 | Marriott International, Inc. — Class A | 441,760 | ||||||
| 4,400 | McDonald’s Corp. | 428,736 | ||||||
|
| |||||||
| 1,699,034 | ||||||||
|
| |||||||
Media — 3.96% | ||||||||
| 7,050 | Comcast Corp. — Class A | 398,113 | ||||||
| 12,900 | MDC Partners Inc. — Class A(b) | 365,715 | ||||||
| 12,200 | Twenty-First Century Fox, Inc. | 412,848 | ||||||
| 4,300 | The Walt Disney Co. | 451,027 | ||||||
|
| |||||||
| 1,627,703 | ||||||||
|
| |||||||
Multiline Retail — 0.99% | ||||||||
| 6,250 | Macy’s, Inc. | 405,688 | ||||||
|
| |||||||
Specialty Retail — 2.16% | ||||||||
| 6,900 | Foot Locker, Inc. | 434,700 | �� | |||||
| 10,500 | The Gap, Inc. | 454,965 | ||||||
|
| |||||||
| 889,665 | ||||||||
Total Consumer Discretionary (Cost $4,761,113) | 5,445,215 | |||||||
|
| |||||||
| CONSUMER STAPLES — 8.90% | |||||||
Beverages — 0.99% | ||||||||
| 10,000 | The Coca Cola Co. | 405,500 | ||||||
|
| |||||||
Food Products — 5.56% | ||||||||
| 7,200 | General Mills, Inc. | 407,520 | ||||||
| 5,250 | Kraft Foods Group, Inc. — Class A | 457,354 | ||||||
| 6,100 | Mccormick & Co, Inc. | 470,371 | ||||||
| 14,000 | Pinnacle Foods Inc. | 571,340 | ||||||
| 9,100 | Unilever N.V. NY Shares — ADR(b) | 380,016 | ||||||
|
| |||||||
| 2,286,601 | ||||||||
|
| |||||||
Household Products — 2.35% | ||||||||
| 3,850 | The Clorox Co. | 425,001 | ||||||
| 6,600 | The Procter & Gamble Co. | 540,804 | ||||||
|
| |||||||
| 965,805 | ||||||||
Total Consumer Staples (Cost $2,908,615) | 3,657,906 | |||||||
|
| |||||||
| ENERGY — 11.09% | |||||||
Energy Equipment & Services — 1.97% | ||||||||
| 2,800 | Helmerich & Payne, Inc. | 190,596 | ||||||
| 13,900 | RPC, Inc. | 178,059 | ||||||
| 2,550 | Schlumberger Ltd.(b) | 212,772 | ||||||
| 18,700 | Transocean Partners LLC(b) | 229,075 | ||||||
|
| |||||||
| 810,502 | ||||||||
|
| |||||||
Oil, Gas & Consumable Fuels — 9.12% | ||||||||
| 3,525 | Chevron Corp. | 370,054 | ||||||
| 24,000 | Columbia Pipeline Partners LP(a) | 664,560 | ||||||
| 10,300 | Dominion Midstream Partners, LP | 427,553 | ||||||
26
| SHARES OR FACE AMOUNT | FAIR VALUE* | |||||||
| ENERGY (Continued) |
| ||||||
| 5,725 | EQT Midstream Partners LP. | $ | 444,604 | |||||
| 7,950 | Exxon Mobil Corp. | 675,750 | ||||||
| 28,650 | Rice Midstream Partners LP | 404,252 | ||||||
| 11,900 | Shell Midstream Partners LP | 464,100 | ||||||
| 5,800 | Sunoco LP | 297,830 | ||||||
|
| |||||||
| 3,748,703 | ||||||||
Total Energy (Cost $4,249,447) | 4,559,205 | |||||||
|
| |||||||
| FINANCIALS — 13.38% | |||||||
Capital Markets — 0.80% | ||||||||
| 900 | BlackRock, Inc. | 329,256 | ||||||
|
| |||||||
Commercial Banks — 2.36% | ||||||||
| 9,200 | BB&T Corp. | 358,708 | ||||||
| 11,250 | Wells Fargo & Co. | 612,000 | ||||||
|
| |||||||
| 970,708 | ||||||||
|
| |||||||
Consumer Finance — 1.41% | ||||||||
| 7,350 | Capital One Financial Corp. | 579,327 | ||||||
|
| |||||||
Diversified Financial Services — 6.99% | ||||||||
| 4,900 | American Express Co. | 382,788 | ||||||
| 27,050 | Bank of America Corp. | 416,299 | ||||||
| 4,400 | Berkshire Hathaway Inc.(a) | 635,008 | ||||||
| 4,850 | CME Group Inc. | 459,344 | ||||||
| 8,850 | JPMorgan Chase & Co. | 536,133 | ||||||
| 4,300 | McGraw Hill Financial, Inc. | 444,620 | ||||||
|
| |||||||
| 2,874,192 | ||||||||
|
| |||||||
Insurance — 1.82% | ||||||||
| 9,050 | Arthur J. Gallagher & Co. | 423,087 | ||||||
| 6,400 | MetLife, Inc. | 323,520 | ||||||
|
| |||||||
| 746,607 | ||||||||
Total Financials (Cost $5,009,268) | 5,500,090 | |||||||
|
| |||||||
| HEALTH CARE — 13.99% | |||||||
Biotechnology — 2.62% | ||||||||
| 2,950 | Amgen Inc. | 471,557 | ||||||
| 550 | Biogen Idec Inc.(a) | 232,232 | ||||||
| 3,800 | Gilead Sciences, Inc.(a) | 372,894 | ||||||
|
| |||||||
| 1,076,683 | ||||||||
|
| |||||||
Health Care Equipment & Supplies — 0.80% | ||||||||
| 4,200 | Medtronic, PLC(b) | 327,558 | ||||||
|
| |||||||
Health Care Providers & Services — 2.87% | ||||||||
| 2,300 | Anthem, Inc. | 355,143 | ||||||
| 5,300 | Cardinal Health, Inc. | 478,431 | ||||||
| 2,950 | UnitedHealth Group Inc. | 348,956 | ||||||
|
| |||||||
| 1,182,530 | ||||||||
|
| |||||||
Pharmaceuticals — 7.70% | ||||||||
| 9,400 | AbbVie Inc. | 550,276 | ||||||
| 6,800 | Johnson & Johnson | 684,080 | ||||||
| 8,600 | Merck & Co., Inc. | 494,328 | ||||||
| 4,850 | Novartis AG — ADR(b) | 478,258 | ||||||
| 14,950 | Pfizer Inc. | 520,111 | ||||||
27
Buffalo Dividend Focus Fund
SCHEDULE OF INVESTMENTS
March 31, 2015
(Continued)
| SHARES OR FACE AMOUNT | FAIR VALUE* | |||||||
| HEALTH CARE (Continued) |
| ||||||
| 8,850 | Sanofi — ADR(b) | $ | 437,544 | |||||
|
| |||||||
| 3,164,597 | ||||||||
Total Health Care (Cost $5,101,373) | 5,751,368 | |||||||
|
| |||||||
| INDUSTRIALS — 9.04% | |||||||
Aerospace & Defense — 1.96% | ||||||||
| 2,700 | The Boeing Co. | 405,216 | ||||||
| 3,400 | United Technologies Corp. | 398,480 | ||||||
|
| |||||||
| 803,696 | ||||||||
|
| |||||||
Airlines — 1.39% | ||||||||
| 6,650 | Delta Air Lines, Inc. | 298,984 | ||||||
| 6,100 | Southwest Airlines Co. | 270,230 | ||||||
|
| |||||||
| 569,214 | ||||||||
|
| |||||||
Commercial Services & Supplies — 1.89% | ||||||||
| 14,400 | Pitney Bowes Inc. | 335,808 | ||||||
| 8,150 | Waste Management, Inc. | 441,974 | ||||||
|
| |||||||
| 777,782 | ||||||||
|
| |||||||
Industrial Conglomerates — 1.42% | ||||||||
| 23,600 | General Electric Co. | 585,516 | ||||||
|
| |||||||
Professional Services — 1.12% | ||||||||
| 7,600 | Robert Half International, Inc. | 459,952 | ||||||
|
| |||||||
Road & Rail — 1.26% | ||||||||
| 5,050 | Norfolk Southern Corp. | 519,746 | ||||||
Total Industrials (Cost $3,030,734) | 3,715,906 | |||||||
|
| |||||||
| INFORMATION TECHNOLOGY — 16.76% | |||||||
Communications Equipment — 2.09% | ||||||||
| 15,400 | Cisco Systems, Inc. | 423,885 | ||||||
| 6,300 | QUALCOMM, Inc. | 436,842 | ||||||
|
| |||||||
| 860,727 | ||||||||
|
| |||||||
IT Services — 2.16% | ||||||||
| 8,950 | Paychex, Inc. | 444,054 | ||||||
| 6,800 | Visa Inc. — Class A | 444,788 | ||||||
|
| |||||||
| 888,842 | ||||||||
|
| |||||||
Semiconductors & Semiconductor Equipment — 3.60% | ||||||||
| 8,300 | Broadcom Corp. — Class A | 359,349 | ||||||
| 21,150 | Intel Corp. | 661,361 | ||||||
| 8,050 | Texas Instruments, Inc. | 460,339 | ||||||
|
| |||||||
| 1,481,049 | ||||||||
|
| |||||||
Software — 3.78% | ||||||||
| 16,300 | Activision Blizzard, Inc. | 370,417 | ||||||
| 19,500 | Microsoft Corp. | 792,773 | ||||||
| 9,000 | Oracle Corp. | 388,350 | ||||||
|
| |||||||
| 1,551,540 | ||||||||
|
| |||||||
Technology Hardware, Storage & Peripherals — 5.13% | ||||||||
| 14,170 | Apple Inc. | 1,763,173 | ||||||
| 13,550 | EMC Corp. | 346,338 | ||||||
|
| |||||||
| 2,109,511 | ||||||||
Total Information Technology (Cost $5,608,050) | 6,891,669 | |||||||
|
| |||||||
28
| SHARES OR FACE AMOUNT | FAIR VALUE* | |||||||
| MATERIALS — 0.53% | |||||||
Metals & Mining — 0.53% | ||||||||
| 10,325 | SunCoke Energy Partners LP. | $ | 219,819 | |||||
Total Materials (Cost $219,071) | 219,819 | |||||||
|
| |||||||
| TELECOMMUNICATION SERVICES — 2.12% | |||||||
Diversified Telecommunications — 2.12% | ||||||||
| 12,250 | AT&T Inc. | 399,962 | ||||||
| 9,750 | Verizon Communications Inc. | 474,143 | ||||||
Total Telecommunication Services (Cost $882,400) | 874,105 | |||||||
|
| |||||||
| UTILITIES — 3.19% | |||||||
Electric Utilities — 1.57% | ||||||||
| 10,150 | ITC Holdings Corp. | 379,914 | ||||||
| 5,250 | NRG Yield, Inc. | 266,333 | ||||||
|
| |||||||
| 646,247 | ||||||||
|
| |||||||
Independent Power and Renewable Electricity Producers — 1.62% | ||||||||
| 19,715 | Abengoa Yield plc(b) | 665,973 | ||||||
Total Utilities (Cost $1,068,162) | 1,312,220 | |||||||
|
| |||||||
| TOTAL COMMON STOCKS | 37,927,503 | ||||||
| (COST $32,838,233) | |||||||
| SHORT TERM INVESTMENT — 7.26% | |||||||
| INVESTMENT COMPANY — 7.26% | |||||||
| 2,983,829 | Fidelity Institutional Money Market Fund — Government Portfolio — 0.01%(c) | 2,983,829 | ||||||
Total Investment Company | 2,983,829 | |||||||
|
| |||||||
| TOTAL SHORT TERM INVESTMENT | 2,983,829 | ||||||
| (COST $2,983,829) | |||||||
| TOTAL INVESTMENTS — 99.50% | 40,911,332 | ||||||
| (COST $35,822,062) | |||||||
| Other Assets in Excess of Liabilities — 0.50% | 205,015 | ||||||
|
| |||||||
| TOTAL NET ASSETS — 100.00% | $ | 41,116,347 | |||||
|
| |||||||
ADR — American Depositary Receipt
PLC — Public Limited Company
| (a) | Non Income Producing |
| (b) | Foreign Issued Securities. The total value of these securites amounted to $3,560,959 (8.66% of net assets) at March 31, 2015. |
| (c) | 7-day yield |
| * | See Note 1A of accompanying Notes to Financial Statements regarding valuation of securities. |
The Global Industry Classification Standard (GICS) was developed by and/or is the exclusive property of MSCI, Inc. and Standard & Poor’s Financial Services LLC (“S&P”). GICS is a service mark of MSCI and S&P and has been licensed for use by U.S. Bancorp Fund Services, LLC.
The accompanying notes are an integral part of these financial statements.
29
Buffalo Emerging Opportunities Fund
SCHEDULE OF INVESTMENTS
March 31, 2015
| SHARES OR FACE AMOUNT | FAIR VALUE* | |||||||
| COMMON STOCKS — 97.94% | |||||||
| CONSUMER DISCRETIONARY — 12.80% | |||||||
Auto Components — 1.02% | ||||||||
| 110,000 | Remy International, Inc. | $ | 2,443,100 | |||||
|
| |||||||
Hotels, Restaurants & Leisure — 2.84% | ||||||||
| 67,000 | Fiesta Restaurant Group, Inc.(a) | 4,087,000 | ||||||
| 196,900 | Potbelly Corp.(a) | 2,697,530 | ||||||
|
| |||||||
| 6,784,530 | ||||||||
|
| |||||||
Media — 1.36% | ||||||||
| 58,500 | Rentrak Corp.(a) | 3,250,260 | ||||||
|
| |||||||
Specialty Retail — 4.23% | ||||||||
| 130,335 | The Container Store Group, Inc.(a) | 2,482,882 | ||||||
| 628,101 | The Tile Shop Holdings, Inc.(a) | 7,606,303 | ||||||
|
| |||||||
| 10,089,185 | ||||||||
|
| |||||||
Textiles, Apparel & Luxury Goods — 3.35% | ||||||||
| 71,700 | Oxford Industries, Inc. | 5,409,765 | ||||||
| 139,385 | Vince Holding Corp.(a) | 2,585,592 | ||||||
|
| |||||||
| 7,995,357 | ||||||||
Total Consumer Discretionary (Cost $29,944,120) | 30,562,432 | |||||||
|
| |||||||
| CONSUMER STAPLES — 3.19% | |||||||
Food & Staples Retailing — 0.82% | ||||||||
| 87,641 | Chefs’ Warehouse Inc.(a) | 1,965,787 | ||||||
|
| |||||||
Food Products — 2.37% | ||||||||
| 592,975 | Boulder Brands Inc.(a) | 5,651,052 | ||||||
Total Consumer Staples (Cost $8,951,469) | 7,616,839 | |||||||
|
| |||||||
| ENERGY — 2.86% | |||||||
Energy Equipment & Services — 2.86% | ||||||||
| 100,000 | CARBO Ceramics, Inc. | 3,051,000 | ||||||
| 114,381 | Natural Gas Services Group Inc.(a) | 2,198,403 | ||||||
| 55,000 | RigNet Inc.(a) | 1,572,450 | ||||||
Total Energy (Cost $8,354,141) | 6,821,853 | |||||||
|
| |||||||
| HEALTH CARE — 17.15% | |||||||
Health Care Equipment & Supplies — 9.50% | ||||||||
| 40,400 | Abaxis, Inc. | 2,590,044 | ||||||
| 642,800 | Accuray Inc.(a) | 5,978,040 | ||||||
| 90,600 | ICU Medical, Inc.(a) | 8,438,484 | ||||||
| 37,600 | Inogen Inc.(a) | 1,202,824 | ||||||
| 95,675 | Neogen Corp.(a) | 4,470,893 | ||||||
|
| |||||||
| 22,680,285 | ||||||||
|
| |||||||
Health Care Providers & Services — 1.25% | ||||||||
| 207,261 | National Research Corp.(a)(c) | 2,984,558 | ||||||
|
| |||||||
Health Care Technology — 3.57% | ||||||||
| 243,103 | Omnicell, Inc.(a) | 8,532,915 | ||||||
|
| |||||||
Pharmaceuticals — 2.83% | ||||||||
| 156,400 | Aratana Therapeutics, Inc.(a) | 2,503,964 | ||||||
| 165,300 | Intersect ENT, Inc.(a) | 4,269,699 | ||||||
|
| |||||||
| 6,773,663 | ||||||||
Total Health Care (Cost $24,877,374) | 40,971,421 | |||||||
|
| |||||||
30
| SHARES OR FACE AMOUNT | FAIR VALUE* | |||||||
| INDUSTRIALS — 15.25% | |||||||
Building Products — 2.82% | ||||||||
| 155,900 | Apogee Enterprises, Inc. | $ | 6,734,880 | |||||
|
| |||||||
Construction & Engineering — 2.24% | ||||||||
| 170,600 | MYR Group Inc.(a) | 5,346,604 | ||||||
|
| |||||||
Electrical Equipment — 3.51% | ||||||||
| 86,373 | Power Solutions International, Inc.(a) | 5,552,920 | ||||||
| 118,100 | Thermon Group Holdings Inc.(a) | 2,842,667 | ||||||
|
| |||||||
| 8,395,587 | ||||||||
|
| |||||||
Machinery — 2.79% | ||||||||
| 64,700 | Proto Labs, Inc.(a) | 4,529,000 | ||||||
| 269,300 | voxeljet AG — ADR(a)(b) | 2,130,163 | ||||||
|
| |||||||
| 6,659,163 | ||||||||
|
| |||||||
Professional Services — 3.89% | ||||||||
| 50,200 | Exponent, Inc. | 4,462,780 | ||||||
| 90,500 | WageWorks, Inc.(a) | 4,826,365 | ||||||
|
| |||||||
| 9,289,145 | ||||||||
Total Industrials (Cost $25,556,937) | 36,425,379 | |||||||
|
| |||||||
| INFORMATION TECHNOLOGY — 40.49% | |||||||
Communications Equipment — 2.07% | ||||||||
| 384,000 | Ruckus Wireless Inc.(a) | 4,942,080 | ||||||
|
| |||||||
Electronic Equipment, Instruments & Components — 1.89% | ||||||||
| 72,514 | FARO Technologies, Inc.(a) | 4,505,295 | ||||||
|
| |||||||
Internet Software & Services — 22.76% | ||||||||
| 386,800 | Amber Road Inc.(a)(c) | 3,577,900 | ||||||
| 71,700 | Benefitfocus, Inc.(a) | 2,637,843 | ||||||
| 122,400 | comScore Inc.(a) | 6,266,880 | ||||||
| 171,600 | Cornerstone OnDemand, Inc.(a) | 4,957,524 | ||||||
| 85,005 | Envestnet, Inc.(a) | 4,767,080 | ||||||
| 878,200 | Internap Network Services Corp.(a)(c) | 8,983,986 | ||||||
| 161,500 | LogMeIn, Inc.(a) | 9,042,385 | ||||||
| 121,650 | SPS Commerce Inc.(a) | 8,162,715 | ||||||
| 1,517,200 | Zix Corp.(a)(c) | 5,962,596 | ||||||
|
| |||||||
| 54,358,909 | ||||||||
|
| |||||||
Semiconductors & Semiconductor Equipment — 5.07% | ||||||||
| 75,644 | NVE Corp.(c) | 5,213,385 | ||||||
| 385,350 | PDF Solutions, Inc.(a) | 6,905,472 | ||||||
|
| |||||||
| 12,118,857 | ||||||||
|
| |||||||
Software — 8.70% | ||||||||
| 225,060 | Exa Corp.(a)(c) | 2,673,713 | ||||||
| 116,900 | Imperva Inc.(a) | 4,991,630 | ||||||
| 400,000 | Materialise NV — ADR(a)(b)(c) | 2,796,000 | ||||||
| 72,528 | Proofpoint, Inc.(a) | 4,295,108 | ||||||
| 243,733 | PROS Holdings, Inc.(a) | 6,022,642 | ||||||
|
| |||||||
| 20,779,093 | ||||||||
Total Information Technology (Cost $72,588,455) | 96,704,234 | |||||||
|
| |||||||
| MATERIALS — 2.84% | |||||||
Metals & Mining — 2.84% | ||||||||
| 536,760 | Horsehead Holding Corp.(a) | 6,795,382 | ||||||
Total Materials (Cost $6,285,789) | 6,795,382 | |||||||
|
| |||||||
31
Buffalo Emerging Opportunities Fund
SCHEDULE OF INVESTMENTS
March 31, 2015
(Continued)
| SHARES OR FACE AMOUNT | FAIR VALUE* | |||||||
| TELECOMMUNICATION SERVICES — 3.36% |
| ||||||
Diversified Telecommunication Services — 3.36% | ||||||||
| 954,799 | 8x8, Inc.(a) | $ | 8,020,311 | |||||
Total Telecommunication Services (Cost $8,278,108) | 8,020,311 | |||||||
|
| |||||||
| TOTAL COMMON STOCKS | 233,917,851 | ||||||
| (COST $184,836,393) | |||||||
| SHORT TERM INVESTMENT — 2.86% |
| ||||||
| INVESTMENT COMPANY — 2.86% | |||||||
| 6,829,635 | Fidelity Institutional Money Market Fund — Government Portfolio — 0.01%(d) | 6,829,635 | ||||||
Total Investment Company | 6,829,635 | |||||||
|
| |||||||
| TOTAL SHORT TERM INVESTMENT | 6,829,635 | ||||||
| (COST $6,829,635) | |||||||
| TOTAL INVESTMENTS — 100.80% | 240,747,486 | ||||||
| (COST $191,666,028) | |||||||
| Liabilities in Excess of Other Assets — (0.80)% | (1,919,552 | ) | |||||
|
| |||||||
| TOTAL NET ASSETS — 100.00% | $ | 238,827,934 | |||||
|
| |||||||
ADR — American Depositary Receipt
| (a) | Non Income Producing |
| (b) | Foreign Issued Securities. The total value of these securities amounted to $4,926,163 (2.06% of net assets) at March 31, 2015. |
| (c) | A portion of these securities is deemed illiquid. The total value of the illiquid portions of these securities amounted to $11,463,741 (4.80% of net assets) at March 31, 2015. |
| (d) | 7-day yield |
| * | See Note 1A of accompanying Notes to Financial Statements regarding valuation of securities. |
The Global Industry Classification Standard (GICS) was developed by and/or is the exclusive property of MSCI, Inc. and Standard & Poor’s Financial Services LLC (“S&P”). GICS is a service mark of MSCI and S&P and has been licensed for use by U.S. Bancorp Fund Services, LLC.
The accompanying notes are an integral part of these financial statements.
32
Buffalo Flexible Income Fund
SCHEDULE OF INVESTMENTS
March 31, 2015
| SHARES OR FACE AMOUNT | FAIR VALUE* | |||||||
| COMMON STOCKS — 67.19% | |||||||
| CONSUMER DISCRETIONARY — 5.26% | |||||||
Automobiles — 1.08% | ||||||||
| 900,000 | Ford Motor Co.(d) | $ | 14,526,000 | |||||
|
| |||||||
Hotels, Restaurants & Leisure — 2.16% | ||||||||
| 300,100 | McDonald’s Corp. | 29,241,744 | ||||||
|
| |||||||
Media — 2.02% | ||||||||
| 805,000 | Lions Gate Entertainment Corp.(d)(e) | 27,305,600 | ||||||
Total Consumer Discretionary (Cost $66,331,045) | 71,073,344 | |||||||
|
| |||||||
| CONSUMER STAPLES — 13.26% | |||||||
Beverages — 3.22% | ||||||||
| 440,000 | The Coca Cola Co.(d) | 17,842,000 | ||||||
| 40,000 | Diageo PLC — ADR(e) | 4,422,800 | ||||||
| 100,000 | Dr. Pepper Snapple Group, Inc. | 7,848,000 | ||||||
| 140,000 | PepsiCo, Inc. | 13,386,800 | ||||||
|
| |||||||
| 43,499,600 | ||||||||
|
| |||||||
Food & Staples Retailing — 1.04% | ||||||||
| 50,000 | Costco Wholesale Corp. | 7,574,750 | ||||||
| 125,000 | Sysco Corp. | 4,716,250 | ||||||
| 21,000 | Wal-Mart Stores, Inc. | 1,727,250 | ||||||
|
| |||||||
| 14,018,250 | ||||||||
|
| |||||||
Food Products — 4.60% | ||||||||
| 100,000 | Campbell Soup Co. | 4,655,000 | ||||||
| 185,000 | ConAgra Foods, Inc. | 6,758,050 | ||||||
| 350,000 | General Mills, Inc. | 19,810,000 | ||||||
| 85,000 | Kellogg Co. | 5,605,750 | ||||||
| 200,000 | Kraft Foods Group, Inc. — Class A(d) | 17,423,000 | ||||||
| 115,000 | Mondelez International Inc. — Class A | 4,150,350 | ||||||
| 90,000 | Unilever PLC — ADR(e) | 3,753,900 | ||||||
|
| |||||||
| 62,156,050 | ||||||||
|
| |||||||
Household Products — 4.40% | ||||||||
| 160,000 | The Clorox Co. | 17,662,400 | ||||||
| 30,000 | Colgate-Palmolive Co. | 2,080,200 | ||||||
| 152,800 | Kimberly-Clark Corp. | 16,366,408 | ||||||
| 285,000 | The Procter & Gamble Co. | 23,352,900 | ||||||
|
| |||||||
| 59,461,908 | ||||||||
Total Consumer Staples (Cost $129,901,583) | 179,135,808 | |||||||
|
| |||||||
| ENERGY — 17.11% | |||||||
Energy Equipment & Services — 2.31% | ||||||||
| 210,000 | Baker Hughes, Inc.(d) | 13,351,800 | ||||||
| 55,000 | CARBO Ceramics, Inc.(d) | 1,678,050 | ||||||
| 80,000 | Helmerich & Payne, Inc.(d) | 5,445,600 | ||||||
| 120,000 | Schlumberger Ltd.(e) | 10,012,800 | ||||||
| 33,900 | Tidewater Inc. | 648,846 | ||||||
|
| |||||||
| 31,137,096 | ||||||||
|
| |||||||
Oil, Gas & Consumable Fuels — 14.80% | ||||||||
| 400,000 | BP PLC — ADR(d)(e) | 15,644,000 | ||||||
| 170,000 | Chevron Corp. | 17,846,600 | ||||||
| 370,000 | ConocoPhillips | 23,036,200 | ||||||
33
Buffalo Flexible Income Fund
SCHEDULE OF INVESTMENTS
March 31, 2015
(Continued)
| SHARES OR FACE AMOUNT | FAIR VALUE* | |||||||
| ENERGY (Continued) | |||||||
| 140,000 | Delek Logistics Partners LP | $ | 6,094,200 | |||||
| 185,350 | EQT Midstream Partners LP. | 14,394,281 | ||||||
| 252,900 | Exxon Mobil Corp. | 21,496,500 | ||||||
| 100,000 | Hess Corp. | 6,787,000 | ||||||
| 433,400 | HollyFrontier Corp.(d) | 17,453,018 | ||||||
| 500,000 | Kinder Morgan Inc. | 21,030,000 | ||||||
| 215,000 | Marathon Oil Corp. | 5,613,650 | ||||||
| 50,000 | Marathon Petroleum Corp. | 5,119,500 | ||||||
| 137,000 | Midcoast Energy Partners LP | 1,896,080 | ||||||
| 50,000 | Phillips 66 | 3,930,000 | ||||||
| 300,000 | Royal Dutch Shell PLC. — ADR(e) | 17,895,000 | ||||||
| 200,000 | Suncor Energy, Inc.(e) | 5,850,000 | ||||||
| 310,000 | Sunoco LP | 15,918,500 | ||||||
|
| |||||||
| 200,004,529 | ||||||||
Total Energy (Cost $194,726,158) | 231,141,625 | |||||||
|
| |||||||
| FINANCIALS — 3.03% | |||||||
Commercial Banks — 1.24% | ||||||||
| 430,400 | BB&T Corp. | 16,781,296 | ||||||
|
| |||||||
Insurance — 1.79% | ||||||||
| 200,000 | The Allstate Corp. | 14,234,000 | ||||||
| 50,000 | Arthur J. Gallagher & Co. | 2,337,500 | ||||||
| 65,000 | The Chubb Corp. | 6,571,500 | ||||||
| 20,000 | Cincinnati Financial Corp. | 1,065,600 | ||||||
|
| |||||||
| 24,208,600 | ||||||||
Total Financials (Cost $29,649,310) | 40,989,896 | |||||||
|
| |||||||
| HEALTH CARE — 7.36% | |||||||
Biotechnology — 0.04% | ||||||||
| 5,000 | Celgene Corp.(a)(d) | 576,400 | ||||||
|
| |||||||
Health Care Equipment & Supplies — 2.01% | ||||||||
| 95,000 | Abbott Laboratories | 4,401,350 | ||||||
| 331,150 | Baxter International, Inc. | 22,683,775 | ||||||
|
| |||||||
| 27,085,125 | ||||||||
|
| |||||||
Pharmaceuticals — 5.31% | ||||||||
| 80,000 | Eli Lilly & Co. | 5,812,000 | ||||||
| 500,000 | GlaxoSmithKline PLC — ADR(e) | 23,075,000 | ||||||
| 200,000 | Johnson & Johnson | 20,120,000 | ||||||
| 180,000 | Merck & Co., Inc. | 10,346,400 | ||||||
| 250,000 | Pfizer Inc. | 8,697,500 | ||||||
| 60,000 | Teva Pharmaceutical Industries Ltd. — ADR(e) | 3,738,000 | ||||||
|
| |||||||
| 71,788,900 | ||||||||
Total Health Care (Cost $78,346,100) | 99,450,425 | |||||||
|
| |||||||
| INDUSTRIALS — 6.57% | |||||||
Aerospace & Defense — 1.22% | ||||||||
| 110,000 | The Boeing Co.(d) | 16,508,800 | ||||||
|
| |||||||
Commercial Services & Supplies — 3.02% | ||||||||
| 1,000,500 | Pitney Bowes Inc.(d) | 23,331,660 | ||||||
| 90,000 | Republic Services, Inc. | 3,650,400 | ||||||
| 255,000 | Waste Management, Inc. | 13,828,650 | ||||||
|
| |||||||
| 40,810,710 | ||||||||
|
| |||||||
34
| SHARES OR FACE AMOUNT | FAIR VALUE* | |||||||
| INDUSTRIALS (Continued) | |||||||
Industrial Conglomerates — 1.98% | ||||||||
| 1,075,000 | General Electric Co. | $ | 26,670,750 | |||||
|
| |||||||
Machinery — 0.10% | ||||||||
| 10,000 | Cummins Inc. | 1,386,400 | ||||||
|
| |||||||
Road & Rail — 0.25% | ||||||||
| 100,000 | CSX Corp. | 3,312,000 | ||||||
Total Industrials (Cost $62,089,823) | 88,688,660 | |||||||
|
| |||||||
| INFORMATION TECHNOLOGY — 6.19% | |||||||
Communications Equipment — 1.02% | ||||||||
| 500,000 | Cisco Systems, Inc. | 13,762,500 | ||||||
|
| |||||||
IT Services — 1.49% | ||||||||
| 125,000 | International Business Machines Corp. (IBM) | 20,062,500 | ||||||
|
| |||||||
Semiconductors & Semiconductor Equipment — 1.71% | ||||||||
| 740,000 | Intel Corp. | 23,139,800 | ||||||
|
| |||||||
Software — 1.97% | ||||||||
| 655,000 | Microsoft Corp. | 26,629,025 | ||||||
Total Information Technology (Cost $68,952,838) | 83,593,825 | |||||||
|
| |||||||
| MATERIALS — 3.43% | |||||||
Chemicals — 2.24% | ||||||||
| 350,000 | The Dow Chemical Co.(d) | 16,793,000 | ||||||
| 125,000 | E.I. du Pont de Nemours and Co. | 8,933,750 | ||||||
| 65,000 | Eastman Chemical Co.(d) | 4,501,900 | ||||||
|
| |||||||
| 30,228,650 | ||||||||
|
| |||||||
Metals & Mining — 1.19% | ||||||||
| 120,000 | Barrick Gold Corp.(e) | 1,315,200 | ||||||
| 85,000 | BHP Billiton Ltd. — ADR(d)(e) | 3,949,950 | ||||||
| 60,000 | Freeport-McMoRan Inc. | 1,137,000 | ||||||
| 349,900 | Newmont Mining Corp.(d) | 7,596,329 | ||||||
| 50,000 | Rio Tinto PLC — ADR(e) | 2,070,000 | ||||||
|
| |||||||
| 16,068,479 | ||||||||
Total Materials (Cost $41,376,164) | 46,297,129 | |||||||
|
| |||||||
| TELECOMMUNICATION SERVICES — 3.54% | |||||||
Diversified Telecommunications — 3.54% | ||||||||
| 825,000 | AT&T Inc.(d) | 26,936,250 | ||||||
| 430,000 | Verizon Communications, Inc.(d) | 20,910,900 | ||||||
Total Telecommunication Services (Cost $49,528,157) | 47,847,150 | |||||||
|
| |||||||
| UTILITIES — 1.44% | |||||||
Gas Utilities — 0.55% | ||||||||
| 315,000 | Questar Corp. | 7,515,900 | ||||||
|
| |||||||
Independent Power and Renewable Electricity Producers — 0.77% | ||||||||
| 307,835 | Abengoa Yield plc(e) | 10,398,666 | ||||||
|
| |||||||
Multi-Utilities — 0.12% | ||||||||
| 50,000 | OGE Energy Corp. | 1,580,500 | ||||||
Total Utilities (Cost $16,826,470) | 19,495,066 | |||||||
|
| |||||||
| TOTAL COMMON STOCKS | 907,712,928 | ||||||
| (COST $737,727,648) | |||||||
35
Buffalo Flexible Income Fund
SCHEDULE OF INVESTMENTS
March 31, 2015
(Continued)
| SHARES OR FACE AMOUNT | FAIR VALUE* | |||||||
| REITS — 1.51% |
| ||||||
| FINANCIALS — 1.51% | |||||||
Real Estate Investment Trusts (REITs) — 1.51% | ||||||||
| 185,000 | Digital Realty Trust, Inc. | $ | 12,202,600 | |||||
| 25,000 | Plum Creek Timber Co, Inc. | 1,086,250 | ||||||
| 215,000 | Weyerhaeuser Co. | 7,127,250 | ||||||
Total Financials (Cost $18,522,711) | 20,416,100 | |||||||
|
| |||||||
| TOTAL REITS | 20,416,100 | ||||||
| (COST $18,522,711) | |||||||
| CONVERTIBLE BONDS — 6.14% |
| ||||||
| CONSUMER DISCRETIONARY — 3.48% | |||||||
Media — 3.48% | ||||||||
| $ 2,000,000 | Lions Gate Entertainment Inc. | 6,470,000 | ||||||
| 30,000,000 | 1.250%, 04/15/2018(b) | 40,575,000 | ||||||
Total Consumer Discretionary (Cost $32,000,000) | 47,045,000 | |||||||
|
| |||||||
| HEALTH CARE — 0.57% | |||||||
Health Care Equipment & Supplies — 0.20% | ||||||||
| 2,250,000 | Alere, Inc. | 2,663,438 | ||||||
|
| |||||||
Health Care Providers & Services — 0.37% | ||||||||
| 4,500,000 | Omnicare Inc. | 4,938,750 | ||||||
Total Health Care (Cost $6,777,099) | 7,602,188 | |||||||
|
| |||||||
| INDUSTRIALS — 0.71% | |||||||
Air Freight & Logistics — 0.71% | ||||||||
| 8,500,000 | UTi Worldwide, Inc.(e) | 9,573,125 | ||||||
Total Industrials (Cost $8,799,678) | 9,573,125 | |||||||
|
| |||||||
| INFORMATION TECHNOLOGY — 1.33% | |||||||
Internet Software & Services — 0.34% | ||||||||
| 4,750,000 | Cornerstone OnDemand, Inc. | 4,634,219 | ||||||
|
| |||||||
Software — 0.99% | ||||||||
| 5,500,000 | BroadSoft, Inc. | 5,860,937 | ||||||
| 7,500,000 | Nuance Communications, Inc. | 7,481,250 | ||||||
|
| |||||||
| 13,342,187 | ||||||||
Total Information Technology (Cost $17,268,908) | 17,976,406 | |||||||
|
| |||||||
| MATERIALS — 0.05% |
| ||||||
Metals & Mining — 0.05% | ||||||||
| 7,500,000 | Molycorp Inc. | 675,000 | ||||||
Total Materials (Cost $7,500,000) | 675,000 | |||||||
|
| |||||||
| TOTAL CONVERTIBLE BONDS | 82,871,719 | ||||||
| (COST $72,345,685) | |||||||
36
| SHARES OR FACE AMOUNT | FAIR VALUE* | |||||||
| CORPORATE BONDS — 18.99% |
| ||||||
| CONSUMER DISCRETIONARY — 3.69% |
| ||||||
Hotels, Restaurants & Leisure — 0.15% | ||||||||
| $ 2,000,000 | Marina District Finance Co., Inc. | $ | 2,102,500 | |||||
|
| |||||||
Leisure Equipment & Products — 0.18% | ||||||||
| 2,200,000 | Brunswick Corp. | 2,409,000 | ||||||
|
| |||||||
Media — 3.15% | ||||||||
| 30,000,000 | Lions Gate Entertainment Corp. | 31,275,000 | ||||||
| 1,800,000 | Live Nation Entertainment Inc. | 1,926,000 | ||||||
| 2,000,000 | Sirius XM Radio, Inc.: | 1,985,000 | ||||||
| 7,000,000 | 5.875%, 10/01/2020 (Acquired Various Dates, Cost $7,050,000)(c)(f) | 7,315,000 | ||||||
|
| |||||||
| 42,501,000 | ||||||||
|
| |||||||
Specialty Retail — 0.21% | ||||||||
| 3,000,000 | Rent-A-Center Inc. | 2,835,000 | ||||||
Total Consumer Discretionary (Cost $47,986,781) | 49,847,500 | |||||||
|
| |||||||
| CONSUMER STAPLES — 0.68% | |||||||
Food & Staples Retailing — 0.68% | ||||||||
| 800,000 | Family Tree Escrow LLC. | 842,000 | ||||||
| 6,650,000 | The Pantry, Inc. | 7,564,375 | ||||||
| 800,000 | Spectrum Brands Holdings, Inc. | 846,000 | ||||||
Total Consumer Staples (Cost $8,422,752) | 9,252,375 | |||||||
|
| |||||||
| ENERGY — 3.41% | |||||||
Energy Equipment & Services — 0.35% | ||||||||
| 5,000,000 | Forum Energy Technologies Inc. | 4,712,500 | ||||||
|
| |||||||
Oil, Gas & Consumable Fuels — 3.06% | ||||||||
| 12,000,000 | Alpha Natural Resources, Inc. | 4,980,000 | ||||||
| 3,000,000 | Approach Resources, Inc. | 2,700,000 | ||||||
| 15,200,000 | Gulfport Energy Corp. | 15,656,000 | ||||||
| 4,500,000 | Kodiak Oil & Gas Corp.(e) | 4,736,250 | ||||||
| 11,000,000 | Swift Energy Co. | 6,435,000 | ||||||
| 6,492,000 | United Refining Co. | 6,849,060 | ||||||
|
| |||||||
| 41,356,310 | ||||||||
Total Energy (Cost $56,419,218) | 46,068,810 | |||||||
37
Buffalo Flexible Income Fund
SCHEDULE OF INVESTMENTS
March 31, 2015
(Continued)
| SHARES OR FACE AMOUNT | FAIR VALUE* | |||||||
| HEALTH CARE — 4.82% | |||||||
Health Care Equipment & Services — 0.29% | ||||||||
| $ 4,000,000 | Mallinckrodt International Finance S.A.(e) | $ | 3,960,000 | |||||
|
| |||||||
Health Care Providers & Services — 1.42% | ||||||||
| 1,948,000 | Acadia Healthcare Co., Inc. | 2,191,500 | ||||||
| 3,000,000 | CHS / Community Health Systems, Inc. | 3,221,250 | ||||||
| 13,000,000 | ExamWorks Group, Inc. | 13,812,500 | ||||||
|
| |||||||
| 19,225,250 | ||||||||
|
| |||||||
Health Care Technology — 0.39% | ||||||||
| 5,000,000 | Medassets, Inc. | 5,237,500 | ||||||
|
| |||||||
Pharmaceuticals — 2.72% | ||||||||
| 4,900,000 | Endo International PLC | 5,126,625 | ||||||
| 10,800,000 | Salix Pharmaceuticals, Ltd. | 12,001,500 | ||||||
| 4,050,000 | Valeant Pharmaceuticals International, Inc.: | 4,277,812 | ||||||
| 13,000,000 | 6.375%, 10/15/2020 (Acquired Various Dates, Cost $13,491,606)(c)(f) | 13,552,500 | ||||||
| 1,800,000 | VRX Escrow Corp. | 1,820,250 | ||||||
|
| |||||||
| 36,778,687 | ||||||||
Total Health Care (Cost $62,526,406) | 65,201,437 | |||||||
|
| |||||||
| INDUSTRIALS — 1.37% | |||||||
Aerospace & Defense — 0.41% | ||||||||
| 2,500,000 | DigitalGlobe Inc. | 2,512,500 | ||||||
| 3,000,000 | TransDigm, Inc. | 2,977,500 | ||||||
|
| |||||||
| 5,490,000 | ||||||||
|
| |||||||
Commercial Services & Supplies — 0.32% | ||||||||
| 4,000,000 | R.R. Donnelley & Sons Co. | 4,355,000 | ||||||
|
| |||||||
Construction & Engineering — 0.43% | ||||||||
| 5,575,000 | Tutor Perini Corp. | 5,811,938 | ||||||
|
| |||||||
Road & Rail — 0.21% | ||||||||
| 2,645,000 | Quality Distribution LLC / QD Capital Corp. | 2,783,862 | ||||||
Total Industrials (Cost $17,671,917) | 18,440,800 | |||||||
|
| |||||||
| INFORMATION TECHNOLOGY — 4.22% | |||||||
Cable & Satellite TV — 0.59% | ||||||||
| 2,000,000 | CCO Holdings LLC / CCO Holdings Capital Corp.: | 2,085,000 | ||||||
| 3,706,000 | 5.250%, 03/15/2021 | 3,807,915 | ||||||
| 2,000,000 | 6.625%, 01/31/2022 | 2,145,000 | ||||||
|
| |||||||
| 8,037,915 | ||||||||
|
| |||||||
38
| SHARES OR FACE AMOUNT | FAIR VALUE* | |||||||
| INFORMATION TECHNOLOGY (Continued) | |||||||
Internet Software & Services — 1.62% | ||||||||
| $22,000,000 | Bankrate Inc. | $ | 21,835,000 | |||||
|
| |||||||
IT Services — 0.77% | ||||||||
| 6,000,000 | iGATE Corp. | 6,067,500 | ||||||
| 5,000,000 | NeuStar, Inc. | 4,325,000 | ||||||
|
| |||||||
| 10,392,500 | ||||||||
|
| |||||||
Software — 1.24% | ||||||||
| 3,750,000 | ACI Worldwide, Inc. | 3,932,813 | ||||||
| 6,000,000 | Audatex North America, Inc. | 6,375,000 | ||||||
| 6,400,000 | Nuance Communications, Inc. | 6,496,000 | ||||||
|
| |||||||
| 16,803,813 | ||||||||
Total Information Technology (Cost $56,275,404) | 57,069,228 | |||||||
|
| |||||||
| MATERIALS — 0.39% | |||||||
Chemicals — 0.15% | ||||||||
| 2,008,000 | OMNOVA Solutions, Inc. | 2,045,650 | ||||||
|
| |||||||
Construction Materials — 0.24% | ||||||||
| 3,000,000 | Headwaters, Inc. | 3,157,500 | ||||||
Total Materials (Cost $5,141,169) | 5,203,150 | |||||||
|
| |||||||
| TELECOMMUNICATION SERVICES — 0.41% | |||||||
Diversified Telecommunications — 0.41% | ||||||||
| 2,600,000 | Consolidated Communications Finance Co. | 2,947,750 | ||||||
| 2,500,000 | 6.500%, 10/01/2022 (Acquired 09/04/14 Cost $2,500,000)(c)(f) | 2,537,500 | ||||||
Total Telecommunication Services (Cost $5,268,057) | 5,485,250 | |||||||
|
| |||||||
| TOTAL CORPORATE BONDS | 256,568,550 | ||||||
| (COST $259,711,704) | |||||||
| U.S. GOVERNMENT NOTE — 1.85% |
| ||||||
| U.S TREASURY OBLIGATIONS — 1.85% |
| ||||||
| 25,000,000 | United States Treasury Notes 0.500%, 01/31/2017 | 25,003,900 | ||||||
Total Public Administration (Cost $24,940,429) | 25,003,900 | |||||||
|
| |||||||
| TOTAL U.S. GOVERNMENT NOTE | 25,003,900 | ||||||
| (COST $24,940,429) | |||||||
39
Buffalo Flexible Income Fund
SCHEDULE OF INVESTMENTS
March 31, 2015
(Continued)
| SHARES OR FACE AMOUNT | FAIR VALUE* | |||||||
| BANK LOANS — 1.14% | |||||||
Diversified Telecommunications — 0.07% | ||||||||
| $ 992,462 | Consolidated Communications Finance Co. — Term Loan B 4.250%, 12/23/2020 | $ | 997,891 | |||||
|
| |||||||
Food & Staples Retailing — 0.03% | ||||||||
| 400,000 | Dollar Tree, Inc. 4.250%, 02/28/2020 | 404,694 | ||||||
|
| |||||||
Hotels, Restaurants & Leisure — 0.13% | ||||||||
| 1,747,748 | Hilton Worldwide — Term Loan 3.500%, 10/26/2020 | 1,752,117 | ||||||
|
| |||||||
Pharmaceuticals — 0.76% | ||||||||
| 10,177,323 | Salix Pharmaceuticals, Ltb. — Term Loan B 4.250%, 12/12/2019 | 10,194,166 | ||||||
|
| |||||||
Pharmaceuticals, Biotechnology & Life Sciences — 0.15% | ||||||||
| 1,984,962 | Grifols S.A. — Term Loan First Lien 3.178%, 02/26/2021 | 1,985,300 | ||||||
|
| |||||||
| TOTAL BANK LOANS | 15,334,168 | ||||||
| (COST $15,251,265) | |||||||
| SHORT TERM INVESTMENT — 2.82% |
| ||||||
| INVESTMENT COMPANY — 2.82% |
| ||||||
| 38,154,981 | Fidelity Institutional Money Market Fund — Government Portfolio — 0.01%(g) | 38,154,981 | ||||||
Total Investment Company | 38,154,981 | |||||||
|
| |||||||
| TOTAL SHORT TERM INVESTMENT | 38,154,981 | ||||||
| (COST $38,154,981) | |||||||
| Total Investments | 1,346,062,346 | ||||||
| (COST $1,166,654,423) — 99.64% | |||||||
| Other Assets in Excess of Liabilities — 0.36% | 4,882,996 | ||||||
|
| |||||||
| TOTAL NET ASSETS — 100.00% | $ | 1,350,945,342 | |||||
|
| |||||||
ADR — American Depositary Receipt
PLC — Public Limited Company
| (a) | Non Income Producing |
| (b) | These securities are deemed illiquid. The total value of the illiquid securities amounted to $78,320,000 (5.79% of net assets) at March 31, 2015. |
| (c) | Restricted security deemed liquid. The total value of restricted securities is $93,244,250 (6.90% of net assets) at March 31, 2015. |
| (d) | A portion of these investments are segregated as collateral for open written option contracts. |
| (e) | Foreign Issued Securities. The total value of these securities amounted to $185,073,353 (13.70% of net assets) at March 31, 2015. |
| (f) | 144A Securities. The total value of restricted securities is $90,023,000 (6.66% of net assets) at March 31, 2015. |
| (g) | 7-day yield |
| * | See Note 1A of accompanying Notes to Financial Statements regarding valuation of securities. |
40
SCHEDULE OF OPTIONS WRITTEN
March 31, 2015
| CONTRACTS | VALUE | |||||||
| CALL OPTIONS |
| ||||||
| 1,000 | AT&T, Inc. | $ | 9,000 | |||||
| 1,100 | Baker Hughes, Inc. | 176,000 | ||||||
| 25 | BHP Billiton Ltd: | 1,775 | ||||||
| 222 | Expiration: May 2015, Exercise Price: $52.50 | 6,438 | ||||||
| 450 | BP PLC | 15,300 | ||||||
| 100 | The Boeing Co. | 74,300 | ||||||
| 100 | CARBO Ceramics, Inc.: | 15,800 | ||||||
| 450 | Expiration: June 2015, Exercise Price: $45.00 | 12,375 | ||||||
| 50 | Celgene Corp. | 7,250 | ||||||
| 200 | The Coca Cola Co. | 5,300 | ||||||
| 100 | The Dow Chemical Co. | 26,250 | ||||||
| 100 | Eastman Chemical Co.: | 4,250 | ||||||
| 200 | Expiration: June 2015, Exercise Price: $80.00 | 3,000 | ||||||
| 200 | Expiration: June 2015, Exercise Price: $87.50 | 500 | ||||||
| 50 | Expiration: September 2015, Exercise Price: $85.00 | 1,625 | ||||||
| 7,000 | Ford Motor Co. | 175,000 | ||||||
| 800 | Helmerich & Payne, Inc. | 64,000 | ||||||
| 42 | HollyFrontier Corp.: | 1,890 | ||||||
| 300 | Expiration: June 2015, Exercise Price: $49.50 | 8,100 | ||||||
| 134 | Kraft Foods Group, Inc. | 36,850 | ||||||
| 50 | Lions Gate Entertainment Corp. | 2,250 | ||||||
| 500 | Newmont Mining Corp.: | 1,250 | ||||||
| 100 | Expiration: April 2015, Exercise Price: $28.00 | 100 | ||||||
| 250 | Pitney Bowes Inc. | 6,250 | ||||||
| 1,000 | Verizon Communications, Inc.: | 17,000 | ||||||
| 174 | Expiration: October 2015, Exercise Price: $52.50 | 7,830 | ||||||
Total Written Options (Premiums received $820,912) | $ | 679,683 | ||||||
|
| |||||||
The Global Industry Classification Standard (GICS) was developed by and/or is the exclusive property of MSCI, Inc. and Standard & Poor’s Financial Services LLC (“S&P”). GICS is a service mark of MSCI and S&P and has been licensed for use by U.S. Bancorp Fund Services, LLC.
The accompanying notes are an integral part of these financial statements.
41
Buffalo Growth Fund
SCHEDULE OF INVESTMENTS
March 31, 2015
| SHARES OR FACE AMOUNT | FAIR VALUE* | |||||||
| COMMON STOCKS — 95.10% | |||||||
| CONSUMER DISCRETIONARY — 17.87% | |||||||
Hotels, Restaurants & Leisure — 3.28% | ||||||||
| 163,500 | Dunkin’ Brands Group Inc. | $ | 7,776,060 | |||||
| 88,500 | Starwood Hotels & Resorts Worldwide, Inc. | 7,389,750 | ||||||
|
| |||||||
| 15,165,810 | ||||||||
|
| |||||||
Internet & Catalog Retail — 4.28% | ||||||||
| 24,600 | Amazon.com, Inc.(a) | 9,153,660 | ||||||
| 5,500 | Netflix Inc.(a) | 2,291,795 | ||||||
| 7,200 | The Priceline Group Inc.(a) | 8,381,880 | ||||||
|
| |||||||
| 19,827,335 | ||||||||
|
| |||||||
Internet Software & Services — 1.25% | ||||||||
| 356,400 | Pandora Media Inc.(a) | 5,777,244 | ||||||
|
| |||||||
Media — 2.84% | ||||||||
| 75,100 | AMC Networks, Inc.(a) | 5,755,664 | ||||||
| 70,640 | The Walt Disney Co. | 7,409,430 | ||||||
|
| |||||||
| 13,165,094 | ||||||||
|
| |||||||
Textiles, Apparel & Luxury Goods — 6.22% | ||||||||
| 122,600 | lululemon athletica, Inc.(a) | 7,848,852 | ||||||
| 80,600 | Michael Kors Holdings Ltd(a)(b) | 5,299,450 | ||||||
| 86,900 | NIKE, Inc. — Class B | 8,718,677 | ||||||
| 34,800 | Ralph Lauren Corp. | 4,576,200 | ||||||
| 29,500 | Under Armour, Inc. — Class A(a) | 2,382,125 | ||||||
|
| |||||||
| 28,825,304 | ||||||||
Total Consumer Discretionary (Cost $67,486,491) | 82,760,787 | |||||||
|
| |||||||
| CONSUMER STAPLES — 7.95% | |||||||
Beverages — 1.91% | ||||||||
| 72,600 | Anheuser-Busch InBev NV — ADR(b) | 8,850,666 | ||||||
|
| |||||||
Food & Staples Retailing — 3.28% | ||||||||
| 57,400 | Costco Wholesale Corp. | 8,695,813 | ||||||
| 124,641 | Whole Foods Market, Inc. | 6,491,303 | ||||||
|
| |||||||
| 15,187,116 | ||||||||
|
| |||||||
Food Products — 1.09% | ||||||||
| 140,200 | Mondelez International Inc. — Class A | 5,059,818 | ||||||
|
| |||||||
Household Products — 1.67% | ||||||||
| 72,200 | Kimberly-Clark Corp. | 7,733,342 | ||||||
Total Consumer Staples (Cost $31,521,759) | 36,830,942 | |||||||
|
| |||||||
| ENERGY — 5.61% | |||||||
Energy Equipment & Services — 5.61% | ||||||||
| 170,020 | Baker Hughes, Inc. | 10,809,871 | ||||||
| 89,464 | Dril-Quip, Inc.(a) | 6,118,443 | ||||||
| 108,450 | Schlumberger Ltd.(b) | 9,049,068 | ||||||
Total Energy (Cost $24,154,228) | 25,977,382 | |||||||
|
| |||||||
| FINANCIALS — 12.50% | |||||||
Capital Markets — 2.61% | ||||||||
| 32,500 | Affiliated Managers Group, Inc.(a) | 6,980,350 | ||||||
| 73,410 | Northern Trust Corp. | 5,113,006 | ||||||
|
| |||||||
| 12,093,356 | ||||||||
|
| |||||||
42
| SHARES OR FACE AMOUNT | FAIR VALUE* | |||||||
| FINANCIALS (Continued) | |||||||
Diversified Financial Services — 8.66% | ||||||||
| 122,800 | CME Group Inc. | $ | 11,630,388 | |||||
| 44,000 | Intercontinental Exchange Group, Inc. | 10,263,880 | ||||||
| 151,599 | JPMorgan Chase & Co. | 9,183,868 | ||||||
| 87,298 | McGraw Hill Financial, Inc. | 9,026,613 | ||||||
|
| |||||||
| 40,104,749 | ||||||||
|
| |||||||
Insurance — 1.23% | ||||||||
| 51,202 | ACE Ltd.(b) | 5,708,511 | ||||||
Total Financials (Cost $38,163,398) | 57,906,616 | |||||||
|
| |||||||
| HEALTH CARE — 7.51% | |||||||
Health Care Equipment & Supplies — 5.27% | ||||||||
| 212,800 | Abbott Laboratories | 9,859,024 | ||||||
| 124,666 | Align Technology, Inc.(a) | 6,705,161 | ||||||
| 114,800 | Baxter International, Inc. | 7,863,800 | ||||||
|
| |||||||
| 24,427,985 | ||||||||
|
| |||||||
Life Sciences Tools & Services — 1.61% | ||||||||
| 111,275 | Quintiles Transnational Holdings Inc.(a) | 7,452,087 | ||||||
|
| |||||||
Pharmaceuticals — 0.63% | ||||||||
| 9,750 | Actavis plc(a)(b) | 2,901,906 | ||||||
Total Health Care (Cost $20,379,456) | 34,781,978 | |||||||
|
| |||||||
| INDUSTRIALS — 17.05% | |||||||
Aerospace & Defense — 1.88% | ||||||||
| 57,942 | The Boeing Co. | 8,695,935 | ||||||
|
| |||||||
Air Freight & Logistics — 1.84% | ||||||||
| 51,400 | FedEx Corp. | 8,504,130 | ||||||
|
| |||||||
Commercial Services & Supplies — 2.98% | ||||||||
| 174,900 | Copart, Inc.(a) | 6,570,993 | ||||||
| 51,695 | Stericycle, Inc.(a) | 7,259,529 | ||||||
|
| |||||||
| 13,830,522 | ||||||||
|
| |||||||
Electrical Equipment — 0.91% | ||||||||
| 74,500 | Emerson Electric Co. | 4,218,190 | ||||||
|
| |||||||
Industrial Conglomerates — 4.82% | ||||||||
| 56,240 | 3M Co. | 9,276,788 | ||||||
| 97,200 | Danaher Corp. | 8,252,280 | ||||||
| 192,700 | General Electric Co. | 4,780,887 | ||||||
|
| |||||||
| 22,309,955 | ||||||||
|
| |||||||
Machinery — 2.90% | ||||||||
| 219,578 | Chart Industries, Inc.(a) | 7,701,698 | ||||||
| 91,400 | Pentair PLC(b) | 5,748,146 | ||||||
|
| |||||||
| 13,449,844 | ||||||||
|
| |||||||
Professional Services — 1.72% | ||||||||
| 60,242 | Towers Watson & Co. — Class A | 7,963,089 | ||||||
Total Industrials (Cost $56,685,324) | 78,971,665 | |||||||
|
| |||||||
43
Buffalo Growth Fund
SCHEDULE OF INVESTMENTS
March 31, 2015
(Continued)
| SHARES OR FACE AMOUNT | FAIR VALUE* | |||||||
| INFORMATION TECHNOLOGY — 20.55% | |||||||
Communications Equipment — 3.08% | ||||||||
| 240,500 | Cisco Systems, Inc. | $ | 6,619,763 | |||||
| 110,201 | QUALCOMM, Inc. | 7,641,337 | ||||||
|
| |||||||
| 14,261,100 | ||||||||
|
| |||||||
Internet Software & Services — 5.88% | ||||||||
| 69,800 | Akamai Technologies, Inc.(a) | 4,958,941 | ||||||
| 119,497 | Facebook Inc. — Class A(a) | 9,824,446 | ||||||
| 11,000 | Google Inc. — Class A(a) | 6,101,700 | ||||||
| 11,600 | Google Inc. — Class C(a) | 6,356,800 | ||||||
|
| |||||||
| 27,241,887 | ||||||||
|
| |||||||
IT Services — 2.29% | ||||||||
| 161,688 | Visa Inc. — Class A | 10,576,012 | ||||||
|
| |||||||
Semiconductors & Semiconductor Equipment — 1.06% | ||||||||
| 114,600 | Altera Corp. | 4,917,486 | ||||||
|
| |||||||
Software — 1.17% | ||||||||
| 125,200 | Oracle Corp. | 5,402,380 | ||||||
|
| |||||||
Technology Hardware, Storage & Peripherals — 7.07% | ||||||||
| 188,500 | Apple Inc. | 23,455,055 | ||||||
| 364,000 | EMC Corp. | 9,303,840 | ||||||
|
| |||||||
| 32,758,895 | ||||||||
Total Information Technology (Cost $46,706,135) | 95,157,760 | |||||||
|
| |||||||
| MATERIALS — 4.32% | |||||||
Chemicals — 4.32% | ||||||||
| 57,400 | Ecolab Inc. | 6,565,412 | ||||||
| 50,500 | Monsanto Co. | 5,683,270 | ||||||
| 64,200 | Praxair, Inc. | 7,751,508 | ||||||
Total Materials (Cost $13,625,873) | 20,000,190 | |||||||
|
| |||||||
| TELECOMMUNICATION SERVICES — 1.74% | |||||||
Wireless Telecommunication Services — 1.74% | ||||||||
| 124,200 | China Mobile Limited — ADR(b) | 8,076,726 | ||||||
Total Telecommunication Services (Cost $7,397,820) | 8,076,726 | |||||||
|
| |||||||
| TOTAL COMMON STOCKS | 440,464,046 | ||||||
| (COST $306,120,484) | |||||||
| REITS — 1.54% | |||||||
| INFORMATION TECHNOLOGY — 1.54% | |||||||
Internet Software & Services — 1.54% | ||||||||
| 30,656 | Equinix Inc. | 7,138,250 | ||||||
Total Information Technology (Cost $5,135,209) | 7,138,250 | |||||||
|
| |||||||
| TOTAL REITS | 7,138,250 | ||||||
| (COST $5,135,209) | |||||||
44
| SHARES OR FACE AMOUNT | FAIR VALUE* | |||||||
| SHORT TERM INVESTMENT — 2.87% | |||||||
| INVESTMENT COMPANY — 2.87% |
| ||||||
| 13,288,533 | Fidelity Institutional Money Market Fund — Government Portfolio — 0.01%(c) | $ | 13,288,533 | |||||
Total Investment Company | 13,288,533 | |||||||
|
| |||||||
| TOTAL SHORT TERM INVESTMENT | 13,288,533 | ||||||
| (COST $13,288,533) | |||||||
| TOTAL INVESTMENTS | 460,890,829 | ||||||
| (COST $324,544,226) — 99.51% | |||||||
| Other Assets in Excess of Liabilities — 0.49% | 2,276,562 | ||||||
|
| |||||||
| TOTAL NET ASSETS — 100.00% | $ | 463,167,391 | |||||
|
| |||||||
| (a) | Non Income Producing |
| (b) | Foreign Issued Securities. The total value of these securities amounted to $45,634,473 (9.85% of net assets) at March 31, 2015. |
| (c) | 7-day yield. |
| * | See Note 1A of accompanying Notes to Financial Statements regarding valuation of securities. |
The Global Industry Classification Standard (GICS) was developed by and/or is the exclusive property of MSCI, Inc. and Standard & Poor’s Financial Services LLC (“S&P”). GICS is a service mark of MSCI and S&P and has been licensed for use by U.S. Bancorp Fund Services, LLC.
The accompanying notes are an integral part of these financial statements.
45
Buffalo High Yield Fund
SCHEDULE OF INVESTMENTS
March 31, 2015
| SHARES OR FACE AMOUNT | FAIR VALUE* | |||||||
| COMMON STOCKS — 5.13% |
| ||||||
| CONSUMER STAPLES — 0.50% |
| ||||||
Food Products — 0.50% | ||||||||
| 35,000 | Mondelez International Inc. — Class A | $ | 1,263,150 | |||||
Total Consumer Staples (Cost $701,974) | 1,263,150 | |||||||
|
| |||||||
| FINANCIALS — 2.08% |
| ||||||
Diversified Financial Services — 0.83% | ||||||||
| 35,000 | JPMorgan Chase & Co. | 2,120,300 | ||||||
|
| |||||||
Real Estate Management & Development — 1.25% | ||||||||
| 49,501 | FirstService Corp.(e) | 3,203,705 | ||||||
Total Financials (Cost $2,928,411) | 5,324,005 | |||||||
|
| |||||||
| HEALTH CARE — 2.55% |
| ||||||
Health Care Equipment & Supplies — 0.87% | ||||||||
| 48,000 | Abbott Laboratories | 2,223,840 | ||||||
|
| |||||||
Pharmaceuticals — 1.68% | ||||||||
| 41,000 | AbbVie Inc. | 2,400,140 | ||||||
| 19,000 | Johnson & Johnson | 1,911,400 | ||||||
|
| |||||||
| 4,311,540 | ||||||||
Total Health Care (Cost $3,173,047) | 6,535,380 | |||||||
|
| |||||||
| SPECIAL PURPOSE ENTITY 0.00% |
| ||||||
Broadcasting (except Internet) 0.00% | ||||||||
| 725,000 | Adelphia Recovery Trust(a)(b)(d) | — | ||||||
Total Special Purpose Entity (Cost $712,005) | — | |||||||
|
| |||||||
| TOTAL COMMON STOCKS | 13,122,535 | ||||||
| (COST $7,515,437) | |||||||
| CONVERTIBLE PREFERRED STOCKS — 1.45% | |||||||
| HEALTH CARE — 1.45% | |||||||
Health Care Providers & Services — 1.45% | ||||||||
| 2,500 | HealthSouth Corp. | 3,724,062 | ||||||
Total Health Care (Cost $2,563,619) | 3,724,062 | |||||||
|
| |||||||
| TOTAL CONVERTIBLE PREFERRED STOCKS | 3,724,062 | ||||||
| (COST $2,563,619) | |||||||
| PREFERRED STOCKS — 0.96% | |||||||
| FINANCIALS — 0.96% | |||||||
Capital Markets — 0.96% | ||||||||
| 40,000 | AMG Capital Trust I | 2,447,500 | ||||||
Total Financials (Cost $2,535,000) | 2,447,500 | |||||||
|
| |||||||
| TOTAL PREFERRED STOCKS | 2,447,500 | ||||||
| (COST $2,535,000) | |||||||
46
| SHARES OR FACE AMOUNT | FAIR VALUE* | |||||||
| CONVERTIBLE BONDS — 15.78% |
| ||||||
| CONSUMER DISCRETIONARY — 4.37% |
| ||||||
Diversified Consumer Services — 0.47% | ||||||||
| $1,000,000 | Carriage Services, Inc. | $ | 1,202,505 | |||||
|
| |||||||
Media — 3.90% | ||||||||
| 1,000,000 | Lions Gate Entertainment Inc.;(b) | 3,235,000 | ||||||
| 5,000,000 | 1.250%, 04/15/2018 | 6,762,500 | ||||||
|
| |||||||
| 9,997,500 | ||||||||
Total Consumer Discretionary (Cost $7,000,000) | 11,200,005 | |||||||
|
| |||||||
| ENERGY — 0.36% |
| ||||||
Oil, Gas & Consumable Fuels — 0.36% | ||||||||
| 1,000,000 | Chesapeake Energy Corp. | 912,500 | ||||||
Total Energy (Cost $906,988) | 912,500 | |||||||
|
| |||||||
| HEALTH CARE — 2.86% |
| ||||||
Biotechnology — 0.44% | ||||||||
| 1,000,000 | Cepheid 1.250%, 02/01/2021 | 1,114,375 | ||||||
|
| |||||||
Health Care Equipment & Supplies — 2.00% | ||||||||
| 500,000 | Accuray, Inc.; | 556,875 | ||||||
| 1,500,000 | 3.500%, 02/01/2018 | 2,675,625 | ||||||
| 750,000 | Alere, Inc. | 887,812 | ||||||
| 1,000,000 | Endologix, Inc. | 1,002,500 | ||||||
|
| |||||||
| 5,122,812 | ||||||||
|
| |||||||
Pharmaceuticals — 0.42% | ||||||||
| 1,000,000 | The Medicines Co. | 1,081,875 | ||||||
Total Health Care (Cost $5,816,735) | 7,319,062 | |||||||
|
| |||||||
| INDUSTRIALS — 3.06% |
| ||||||
Air Freight & Logistics — 0.88% | ||||||||
| 2,000,000 | UTi Worldwide, Inc. | 2,252,500 | ||||||
|
| |||||||
Electrical Equipment — 0.31% | ||||||||
| 1,000,000 | General Cable Corp. | 796,875 | ||||||
|
| |||||||
Machinery — 1.18% | ||||||||
| 2,000,000 | The Greenbrier Companies, Inc. | 3,037,500 | ||||||
|
| |||||||
Trading Companies & Distributors — 0.69% | ||||||||
| 710,000 | WESCO International, Inc. | 1,757,694 | ||||||
Total Industrials (Cost $5,623,175) | 7,844,569 | |||||||
|
| |||||||
47
Buffalo High Yield Fund
SCHEDULE OF INVESTMENTS
March 31, 2015
(Continued)
| SHARES OR FACE AMOUNT | FAIR VALUE* | |||||||
| INFORMATION TECHNOLOGY — 5.13% |
| ||||||
Internet Software & Services — 3.31% | ||||||||
| $3,000,000 | Cornerstone OnDemand, Inc. | $ | 2,926,875 | |||||
| 3,000,000 | Dealertrack Technologies Inc. | 3,573,750 | ||||||
| 1,000,000 | Homeaway, Inc. | 951,875 | ||||||
| 1,000,000 | WebMD Health Corp. | 1,021,250 | ||||||
|
| |||||||
| 8,473,750 | ||||||||
|
| |||||||
Software — 1.82% | ||||||||
| 2,500,000 | BroadSoft, Inc. | 2,664,063 | ||||||
| 2,000,000 | Nuance Communications, Inc. | 1,995,000 | ||||||
|
| |||||||
| 4,659,063 | ||||||||
Total Information Technology (Cost $12,221,745) | 13,132,813 | |||||||
|
| |||||||
| TOTAL CONVERTIBLE BONDS | 40,408,949 | ||||||
| (COST $31,568,643) | |||||||
| CORPORATE BONDS — 69.03% |
| ||||||
| CONSUMER DISCRETIONARY — 20.84% |
| ||||||
Distributors — 0.48% | ||||||||
| 1,250,000 | LKQ Corp. | 1,231,250 | ||||||
|
| |||||||
Diversified Consumer Services — 1.55% | ||||||||
| 3,000,000 | Monitronics International Inc. | 2,951,250 | ||||||
| 1,000,000 | Service Corp International | 1,020,000 | ||||||
|
| |||||||
| 3,971,250 | ||||||||
|
| |||||||
Hotels, Restaurants & Leisure — 1.38% | ||||||||
| 1,000,000 | Marina District Finance Co., Inc. | 1,051,250 | ||||||
| 1,615,000 | Royal Caribbean Cruises Ltd. | 1,913,775 | ||||||
| 548,000 | Vail Resorts, Inc. | 568,208 | ||||||
|
| |||||||
| 3,533,233 | ||||||||
|
| |||||||
Household Durables — 0.87% | ||||||||
| 2,000,000 | Jarden Corp. | 2,215,000 | ||||||
|
| |||||||
Internet & Catalog Retail — 0.50% | ||||||||
| 250,000 | Netflix, Inc.: | 256,875 | ||||||
| 1,000,000 | 5.750%, 03/01/2024 (Acquired 02/04/2014 Cost $1,000,000)(c)(f) | 1,023,750 | ||||||
|
| |||||||
| 1,280,625 | ||||||||
|
| |||||||
Leisure Equipment & Products — 1.28% | ||||||||
| 3,000,000 | Brunswick Corp. | 3,285,000 | ||||||
|
| |||||||
48
| SHARES OR FACE AMOUNT | FAIR VALUE* | |||||||
| CONSUMER DISCRETIONARY (Continued) |
| ||||||
Media — 7.30% | ||||||||
| $ 250,000 | Lamar Media Corp.: | $ | 264,375 | |||||
| 250,000 | 5.000%, 05/01/2023 | 256,875 | ||||||
| 250,000 | 5.375%, 01/15/2024 | 261,875 | ||||||
| 7,000,000 | Lions Gate Entertainment Corp.(b)(e) | 7,297,500 | ||||||
| 1,250,000 | Live Nation Entertainment Inc.: | 1,337,500 | ||||||
| 2,100,000 | 5.375%, 06/15/2022 (Acquired Various Dates, Cost $2,107,500)(c)(f) | 2,152,500 | ||||||
| 250,000 | MDC Partners Inc. | 264,375 | ||||||
| 2,600,000 | Regal Entertainment Group | 2,639,000 | ||||||
| 3,095,000 | Sirius XM Radio, Inc.: | 3,071,787 | ||||||
| 1,000,000 | 5.875%, 10/01/2020 (Acquired Various Dates, Cost $1,000,000)(c)(f) | 1,045,000 | ||||||
| 100,000 | Townsquare Media, Inc. | 100,875 | ||||||
|
| |||||||
| 18,691,662 | ||||||||
|
| |||||||
Specialty Retail — 3.31% | ||||||||
| 1,000,000 | Outerwall, Inc. | 975,000 | ||||||
| 2,500,000 | Penske Automotive Group, Inc. | 2,637,500 | ||||||
| 1,750,000 | Rent-A-Center Inc.: | 1,653,750 | ||||||
| 2,000,000 | 4.750%, 05/01/2021 | 1,710,000 | ||||||
| 1,500,000 | Sonic Automotive, Inc. | 1,492,500 | ||||||
|
| |||||||
| 8,468,750 | ||||||||
|
| |||||||
Textiles, Apparel & Luxury Goods — 4.17% | ||||||||
| 4,500,000 | Perry Ellis International, Inc. | 4,668,750 | ||||||
| 3,120,000 | PVH Corp. | 3,862,460 | ||||||
| 2,000,000 | Wolverine World Wide, Inc. | 2,145,000 | ||||||
|
| |||||||
| 10,676,210 | ||||||||
Total Consumer Discretionary (Cost $50,563,813) | 53,352,980 | |||||||
|
| |||||||
| CONSUMER STAPLES — 4.07% |
| ||||||
Beverages — 0.93% | ||||||||
| 2,000,000 | Cott Beverages, Inc.: | 2,075,000 | ||||||
| 300,000 | 5.375%, 07/01/2022 (Acquired 06/10/2014 Cost $300,000)(c)(f) | 289,875 | ||||||
|
| |||||||
| 2,364,875 | ||||||||
|
| |||||||
Food & Staples Retailing — 1.05% | ||||||||
| 200,000 | Family Tree Escrow LLC. | 210,500 | ||||||
| 2,000,000 | The Pantry, Inc. | 2,275,000 | ||||||
49
Buffalo High Yield Fund
SCHEDULE OF INVESTMENTS
March 31, 2015
(Continued)
| SHARES OR FACE AMOUNT | FAIR VALUE* | |||||||
| CONSUMER STAPLES (Continued) |
| ||||||
| $ 200,000 | Spectrum Brands Holdings, Inc. | $ | 211,500 | |||||
|
| |||||||
| 2,697,000 | ||||||||
|
| |||||||
Food Products — 2.09% | ||||||||
| 100,000 | Darling Ingredients, Inc. | 101,125 | ||||||
| 125,000 | Post Holdings, Inc. | 129,688 | ||||||
| 2,750,000 | Smithfield Foods, Inc. | 3,073,125 | ||||||
| 2,000,000 | TreeHouse Foods, Inc. | 2,045,000 | ||||||
|
| |||||||
| 5,348,938 | ||||||||
Total Consumer Staples (Cost $9,679,459) | 10,410,813 | |||||||
|
| |||||||
| ENERGY — 6.37% |
| ||||||
Energy Equipment & Services — 0.47% | ||||||||
| 1,000,000 | Forum Energy Technologies Inc. | 942,500 | ||||||
| 250,000 | SESI LLC | 253,750 | ||||||
|
| |||||||
| 1,196,250 | ||||||||
|
| |||||||
Oil, Gas & Consumable Fuels — 5.90% | ||||||||
| 550,000 | Concho Resources, Inc. | 578,875 | ||||||
| 2,000,000 | Crestwood Midstream Partners LP/ Crestwood Midstream Finance Corp. | 2,020,000 | ||||||
| 1,000,000 | Frontier Oil Corp. | 1,031,250 | ||||||
| 4,000,000 | Gulfport Energy Corp. | 4,120,000 | ||||||
| 1,000,000 | Laredo Petroleum, Inc. | 1,047,500 | ||||||
| 1,000,000 | Newfield Exploration Co. | 1,035,450 | ||||||
| 1,861,000 | Suburban Propane Partners, L.P. / Suburban Energy Finance Corp.: | 2,009,880 | ||||||
| 500,000 | 5.500%, 06/01/2024 | 513,750 | ||||||
| 2,609,000 | United Refining Co. | 2,752,495 | ||||||
|
| |||||||
| 15,109,200 | ||||||||
Total Energy (Cost $15,857,532) | 16,305,450 | |||||||
|
| |||||||
| FINANCIALS — 2.52% |
| ||||||
Capital Markets — 1.15% | ||||||||
| 3,000,000 | KCG Holdings, Inc. | 2,934,000 | ||||||
|
| |||||||
Diversified Financial Services—1.37% | ||||||||
| 2,000,000 | Cogent Communications Finance Inc. | 1,965,000 | ||||||
50
| SHARES OR FACE AMOUNT | FAIR VALUE* | |||||||
| FINANCIALS (Continued) |
| ||||||
| $1,500,000 | MSCI Inc. | $ | 1,554,375 | |||||
|
| |||||||
| 3,519,375 | ||||||||
Total Financials (Cost $6,451,360) | 6,453,375 | |||||||
|
| |||||||
| HEALTH CARE — 7.69% |
| ||||||
Health Care Equipment & Services — 1.16% | ||||||||
| 3,000,000 | Mallinckrodt International Finance S.A. | 2,970,000 | ||||||
|
| |||||||
Health Care Equipment & Supplies — 0.25% | ||||||||
| 600,000 | Teleflex, Inc. | 628,500 | ||||||
|
| |||||||
Health Care Providers & Services — 3.85% | ||||||||
| 1,947,000 | Acadia Healthcare Co., Inc. | 2,190,375 | ||||||
| 1,000,000 | CHS / Community Health Systems, Inc.: | 1,065,000 | ||||||
| 2,200,000 | 7.125%, 07/15/2020 | 2,334,750 | ||||||
| 100,000 | 6.875%, 02/01/2022 (Acquired 01/15/2014 Cost $100,000)(c) | 107,375 | ||||||
| 3,825,000 | ExamWorks Group, Inc. | 4,064,062 | ||||||
| 100,000 | Tenet Healthcare Corp. | 106,250 | ||||||
|
| |||||||
| 9,867,812 | ||||||||
|
| |||||||
Pharmaceuticals — 2.43% | ||||||||
| 800,000 | Endo International PLC | 837,000 | ||||||
| 1,200,000 | Salix Pharmaceuticals, Ltd. | 1,333,500 | ||||||
| 450,000 | Valeant Pharmaceuticals International, Inc.: | 475,312 | ||||||
| 3,000,000 | 6.375%, 10/15/2020 (Acquired 06/27/2013 Cost $3,110,820)(c)(f) | 3,127,500 | ||||||
| 450,000 | VRX Escrow Corp. | 455,063 | ||||||
|
| |||||||
| 6,228,375 | ||||||||
Total Health Care (Cost $18,776,986) | 19,694,687 | |||||||
|
| |||||||
| INDUSTRIALS — 15.92% |
| ||||||
Aerospace & Defense — 6.89% | ||||||||
| 3,000,000 | AAR Corp. | 3,405,375 | ||||||
| 3,450,000 | DigitalGlobe Inc. | 3,467,250 | ||||||
| 2,000,000 | KLX Inc. | 2,000,000 | ||||||
| 1,000,000 | LMI Aerospace, Inc. | 1,012,500 | ||||||
| 250,000 | Moog, Inc. | 258,125 | ||||||
| 2,000,000 | TransDigm, Inc.: | 1,985,000 | ||||||
| 1,000,000 | 7.500%, 07/15/2021 | 1,080,000 | ||||||
51
Buffalo High Yield Fund
SCHEDULE OF INVESTMENTS
March 31, 2015
(Continued)
| SHARES OR FACE AMOUNT | FAIR VALUE* | |||||||
| INDUSTRIALS (Continued) |
| ||||||
| $ 250,000 | 6.000%, 07/15/2022 | $ | 251,250 | |||||
| 4,000,000 | Triumph Group Inc.: | 3,930,000 | ||||||
| 250,000 | 5.250%, 06/01/2022 | 246,875 | ||||||
|
| |||||||
| 17,636,375 | ||||||||
|
| |||||||
Commercial Services & Supplies — 3.17% | ||||||||
| 3,410,000 | Casella Waste Systems, Inc. | 3,427,050 | ||||||
| 100,000 | Clean Harbors, Inc. | 102,750 | ||||||
| 1,000,000 | Covanta Holding Corp.: | 1,067,500 | ||||||
| 250,000 | 5.875%, 03/01/2024 | 260,000 | ||||||
| 3,000,000 | R.R. Donnelley & Sons Co. | 3,266,250 | ||||||
|
| |||||||
| 8,123,550 | ||||||||
|
| |||||||
Construction & Engineering — 1.51% | ||||||||
| 3,700,000 | Tutor Perini Corp. | 3,857,250 | ||||||
|
| |||||||
Professional Services — 1.54% | ||||||||
| 3,625,000 | FTI Consulting, Inc. | 3,828,979 | ||||||
| 100,000 | IHS Inc. | 100,940 | ||||||
|
| |||||||
| 3,929,919 | ||||||||
|
| |||||||
Road & Rail — 0.94% | ||||||||
| 2,284,000 | Quality Distribution LLC / QD Capital Corp. | 2,403,910 | ||||||
|
| |||||||
Trading Companies & Distributors — 1.87% | ||||||||
| 2,000,000 | Fly Leasing Ltd.:(e) | 2,047,500 | ||||||
| 2,000,000 | 6.375%, 10/15/2021 | 1,985,000 | ||||||
| 750,000 | WESCO Distribution Inc. 5.375%, 12/15/2021 | 766,875 | ||||||
|
| |||||||
| 4,799,375 | ||||||||
Total Industrials (Cost $39,316,794) | 40,750,379 | |||||||
|
| |||||||
| INFORMATION TECHNOLOGY — 8.72% |
| ||||||
Cable & Satellite TV — 0.88% | ||||||||
| 2,200,000 | CCO Holdings LLC / CCO Holdings Capital Corp. | 2,260,500 | ||||||
|
| |||||||
Electronic Equipment, Instruments & Components — 0.81% | ||||||||
| 500,000 | Anixter Inc.: | 540,000 | ||||||
| 500,000 | 5.125%, 10/01/2021 | 515,625 | ||||||
| 1,000,000 | Cinemark USA, Inc. | 1,020,000 | ||||||
|
| |||||||
| 2,075,625 | ||||||||
|
| |||||||
Internet Software & Services — 2.50% | ||||||||
| 5,250,000 | Bankrate Inc. | 5,210,625 | ||||||
52
| SHARES OR FACE AMOUNT | FAIR VALUE* | |||||||
| INFORMATION TECHNOLOGY (Continued) |
| ||||||
| $1,100,000 | j2 Global, Inc. | $ | 1,193,500 | |||||
|
| |||||||
| 6,404,125 | ||||||||
|
| |||||||
IT Services — 2.52% | ||||||||
| 1,500,000 | iGATE Corp. | 1,516,875 | ||||||
| 4,000,000 | NeuStar, Inc. | 3,460,000 | ||||||
| 2,000,000 | ServiceSource International Inc. | 1,481,250 | ||||||
|
| |||||||
| 6,458,125 | ||||||||
|
| |||||||
Semiconductors & Semiconductor Equipment — 0.66% | ||||||||
| 1,500,000 | National Semiconductor Corp. 6.600%, 06/15/2017 | 1,679,106 | ||||||
|
| |||||||
Software — 1.35% | ||||||||
| 1,250,000 | ACI Worldwide, Inc. | 1,310,937 | ||||||
| 500,000 | Activision Blizzard, Inc. | 533,750 | ||||||
| 1,500,000 | Audatex North America, Inc. | 1,593,750 | ||||||
|
| |||||||
| 3,438,437 | ||||||||
Total Information Technology (Cost $22,156,762) | 22,315,918 | |||||||
|
| |||||||
| MATERIALS — 1.78% |
| ||||||
Construction Materials — 1.44% | ||||||||
| 2,000,000 | Headwaters, Inc.: | 2,105,000 | ||||||
| 1,500,000 | 7.625%, 04/01/2019 | 1,566,300 | ||||||
|
| |||||||
| 3,671,300 | ||||||||
|
| |||||||
Metals & Mining — 0.34% | ||||||||
| 250,000 | Steel Dynamics, Inc.: | 267,500 | ||||||
| 100,000 | 5.125%, 10/01/2021 (Acquired 09/04/2014 Cost $100,000)(c)(f) | 101,125 | ||||||
| 500,000 | 5.250%, 04/15/2023 | 508,750 | ||||||
|
| |||||||
| 877,375 | ||||||||
Total Materials (Cost $4,427,195) | 4,548,675 | |||||||
|
| |||||||
| REAL ESTATE — 0.08% |
| ||||||
Real Estate — 0.08% | ||||||||
| 200,000 | Outfront Media Capital LLC / Outfront Media Capital Corp | 210,000 | ||||||
Total Real Estate (Cost $199,000) | 210,000 | |||||||
|
| |||||||
| TELECOMMUNICATION SERVICES — 1.04% |
| ||||||
Broadcast Media — 0.40% | ||||||||
| 1,000,000 | Nexstar Broadcasting, Inc. | 1,027,500 | ||||||
|
| |||||||
Diversified Telecommunications — 0.64% | ||||||||
| 1,000,000 | Consolidated Communications Finance Co.: | 1,133,750 | ||||||
53
Buffalo High Yield Fund
SCHEDULE OF INVESTMENTS
March 31, 2015
(Continued)
| SHARES OR FACE AMOUNT | FAIR VALUE* | |||||||
| TELECOMMUNICATION SERVICES (Continued) |
| ||||||
| $ 500,000 | 6.500%, 10/01/2022 (Acquired 09/04/2014 Cost $500,000)(c)(f) | $ | 507,500 | |||||
|
| |||||||
| 1,641,250 | ||||||||
Total Telecommunication Services (Cost $2,563,393) | 2,668,750 | |||||||
|
| |||||||
| TOTAL CORPORATE BONDS | 176,711,027 | ||||||
| (COST $169,992,294) | |||||||
| BANK LOANS — 1.73% |
| ||||||
Diversified Telecommunications — 0.18% | ||||||||
| 452,620 | Consolidated Communications Finance Co. — Term Loan B 4.250%, 12/23/2020 | 455,096 | ||||||
|
| |||||||
Food & Staples Retailing — 0.04% | ||||||||
| 100,000 | Dollar Tree, Inc. 4.250%, 02/28/2020 | 101,173 | ||||||
|
| |||||||
Health Care Equipment & Services — 0.38% | ||||||||
| 990,000 | Mallinckrodt International Finance S.A. — Term Load B 3.250%, 03/19/2021 | 989,198 | ||||||
|
| |||||||
Internet Software & Services — 0.37% | ||||||||
| 954,022 | Dealertrack Technologies Inc. — Term Loan B 3.250%, 02/26/2021 | 952,634 | ||||||
|
| |||||||
Pharmaceuticals — 0.76% | ||||||||
| 1,935,564 | Salix Pharmaceuticals, Ltb. — Term Loan B 4.250%, 12/12/2019 | 1,938,768 | ||||||
|
| |||||||
| TOTAL BANK LOANS | 4,436,869 | ||||||
| (COST $4,415,132) | |||||||
| SHORT TERM INVESTMENT — 4.01% |
| ||||||
| INVESTMENT COMPANY — 4.01% |
| ||||||
| 10,257,581 | Fidelity Institutional Money Market Fund — Government Portfolio — 0.01%(g) | 10,257,581 | ||||||
Total Investment Company | 10,257,581 | |||||||
|
| |||||||
| TOTAL SHORT TERM INVESTMENT | 10,257,581 | ||||||
| (COST $10,257,581) | |||||||
| TOTAL INVESTMENTS — 98.09% | 251,108,523 | ||||||
| (COST $228,847,706) | |||||||
| Other Assets in Excess of Liabilities — 1.91% | 4,878,601 | ||||||
|
| |||||||
| TOTAL NET ASSETS — 100.00% | $ | 255,987,124 | |||||
|
| |||||||
| (a) | Non Income Producing |
| (b) | These securities are deemed illiquid. The total value of the illiquid securities amounted to $17,295,000 (6.75% of net assets) at March 31, 2015. |
| (c) | Restricted security deemed liquid. The total value of restricted securities is $41,253,294 (16.12% of net assets) at March 31, 2015. |
| (d) | Fair Valued Securities. The total value of these securities amounted to $0 (0.00% of net assets) at March 31, 2015. |
| (e) | Foreign Issued Securities. The total value of these securities amounted to $22,864,730 (8.93% of net assets) at March 31, 2015. |
| (f) | 144A Securities. The total value of these securities is $41,145,919 (16.07% of net assets) at March 31, 2015. |
| (g) | 7-day yield. |
| * | See Note 1A of accompanying Notes to Financial Statements regarding valuation of securities. |
The Global Industry Classification Standard (GICS) was developed by and/or is the exclusive property of MSCI, Inc. and Standard & Poor’s Financial Services LLC (“S&P”). GICS is a service mark of MSCI and S&P and has been licensed for use by U.S. Bancorp Fund Services, LLC.
The accompanying notes are an integral part of these financial statements.
54
Buffalo International Fund
SCHEDULE OF INVESTMENTS
March 31, 2015
| SHARES OR FACE AMOUNT | FAIR VALUE* | |||||||
| COMMON STOCKS — 88.51% |
| ||||||
| BELGIUM — 1.33% |
| ||||||
Beverages — 1.33% | ||||||||
| 28,000 | Anheuser-Busch InBev N.V. | $ | 3,420,617 | |||||
Total Belgium (Cost $2,878,358) | 3,420,617 | |||||||
|
| |||||||
| BRAZIL — 1.25% |
| ||||||
Beverages — 0.85% | ||||||||
| 380,000 | Ambev SA — ADR | 2,188,800 | ||||||
|
| |||||||
Wireless Telecommunication Services — 0.40% | ||||||||
| 62,130 | Tim Participacoes SA — ADR | 1,030,116 | ||||||
Total Brazil (Cost $3,650,307) | 3,218,916 | |||||||
|
| |||||||
| CANADA — 1.30% |
| ||||||
Road & Rail — 1.30% | ||||||||
| 30,000 | Canadian National Railway Co. | 2,006,100 | ||||||
| 7,300 | Canadian Pacific Railway Ltd. | 1,333,710 | ||||||
Total Canada (Cost $2,893,354) | 3,339,810 | |||||||
|
| |||||||
| CHILE — 0.75% |
| ||||||
Beverages — 0.75% | ||||||||
| 92,507 | Cia Cervecerias Unidas SA — ADR | 1,920,445 | ||||||
Total Chile (Cost $2,062,489) | 1,920,445 | |||||||
|
| |||||||
| CHINA — 1.14% |
| ||||||
Automobiles — 0.44% | ||||||||
| 160,000 | Great Wall Motor Company Ltd. — Class H | 1,127,943 | ||||||
|
| |||||||
Gas Utilities — 0.20% | ||||||||
| 86,000 | ENN Energy Holdings Ltd. | 528,072 | ||||||
|
| |||||||
Pharmaceuticals — 0.50% | ||||||||
| 2,250,000 | Sihuan Pharmaceutical Holdings Group Ltd.(c)(d) | 1,279,885 | ||||||
Total China (Cost $1,520,531) | 2,935,900 | |||||||
|
| |||||||
| FRANCE — 12.47% |
| ||||||
Air Freight & Logistics — 1.42% | ||||||||
| 686,400 | Bollore | 3,657,278 | ||||||
|
| |||||||
Beverages — 1.13% | ||||||||
| 24,500 | Pernod-Ricard SA | 2,896,911 | ||||||
|
| |||||||
Chemicals — 1.37% | ||||||||
| 27,320 | Air Liquide SA | 3,517,147 | ||||||
|
| |||||||
Electrical Equipment — 1.03% | ||||||||
| 34,000 | Schneider Electric | 2,645,828 | ||||||
|
| |||||||
Food Products — 1.10% | ||||||||
| 24,503 | Naturex | 1,336,210 | ||||||
| 18,280 | Vilmorin & Cie S.A. | 1,483,467 | ||||||
|
| |||||||
| 2,819,677 | ||||||||
|
| |||||||
Hotels, Restaurants & Leisure — 1.26% | ||||||||
| 62,000 | Accor SA | 3,233,044 | ||||||
|
| |||||||
Internet Software & Services — 0.95% | ||||||||
| 62,000 | Criteo SA — ADR(a) | 2,449,000 | ||||||
|
| |||||||
55
Buffalo International Fund
SCHEDULE OF INVESTMENTS
March 31, 2015
(Continued)
| SHARES OR FACE AMOUNT | FAIR VALUE* | |||||||
| FRANCE (Continued) |
| ||||||
Media — 0.60% | ||||||||
| 20,000 | Publicis Groupe SA | $ | 1,543,126 | |||||
|
| |||||||
Software — 1.19% | ||||||||
| 45,000 | Dassault Systemes S.A. | 3,045,337 | ||||||
|
| |||||||
Textiles, Apparel & Luxury Goods — 2.42% | ||||||||
| 634 | Hermes International | 223,855 | ||||||
| 18,000 | Kering | 3,513,926 | ||||||
| 14,000 | LVMH Moet Hennessy Louis Vuitton SA | 2,463,753 | ||||||
|
| |||||||
| 6,201,534 | ||||||||
Total France (Cost $30,731,276) | 32,008,882 | |||||||
|
| |||||||
| GERMANY — 19.24% |
| ||||||
Chemicals — 3.32% | ||||||||
| 24,800 | Linde A.G. | 5,043,043 | ||||||
| 55,000 | Symrise AG | 3,467,935 | ||||||
|
| |||||||
| 8,510,978 | ||||||||
|
| |||||||
Electronic Equipment, Instruments & Components — 0.75% | ||||||||
| 143,711 | Jenoptik AG | 1,934,874 | ||||||
|
| |||||||
Food Products — 0.31% | ||||||||
| 2,700 | KWS Saat AG | 788,209 | ||||||
|
| |||||||
Health Care Equipment & Supplies — 0.51% | ||||||||
| 50,000 | Carl Zeiss Meditec AG | 1,309,337 | ||||||
|
| |||||||
Health Care Providers & Services — 2.32% | ||||||||
| 100,000 | Fresenius SE & Co. KGaA | 5,961,626 | ||||||
|
| |||||||
Household Products — 1.48% | ||||||||
| 36,900 | Henkel AG & Co. KGaA | 3,807,801 | ||||||
|
| |||||||
Industrial Conglomerates — 1.25% | ||||||||
| 29,700 | Siemens A.G. — ADR | 3,212,166 | ||||||
|
| |||||||
Insurance — 1.53% | ||||||||
| 18,200 | Muenchener Rueckversicherungs-Gesellschaft AG. | 3,910,841 | ||||||
|
| |||||||
IT Services — 1.23% | ||||||||
| 75,000 | Wirecard AG | 3,160,876 | ||||||
|
| |||||||
Machinery — 2.09% | ||||||||
| 69,900 | KUKA AG | 5,356,439 | ||||||
|
| |||||||
Pharmaceuticals — 2.16% | ||||||||
| 28,000 | Bayer AG | 4,189,228 | ||||||
| 9,000 | Bayer AG — ADR | 1,352,385 | ||||||
|
| |||||||
| 5,541,613 | ||||||||
|
| |||||||
Software — 1.70% | ||||||||
| 60,300 | SAP AG — ADR | 4,351,851 | ||||||
|
| |||||||
Textiles, Apparel & Luxury Goods — 0.59% | ||||||||
| 19,200 | Adidas AG | 1,516,089 | ||||||
Total Germany (Cost $40,334,848) | 49,362,700 | |||||||
|
| |||||||
| HONG KONG — 4.48% |
| ||||||
Gas Utilities — 0.51% | ||||||||
| 420,000 | China Resources Gas Group Ltd. | 1,306,706 | ||||||
|
| |||||||
56
| SHARES OR FACE AMOUNT | FAIR VALUE* | |||||||
| HONG KONG (Continued) |
| ||||||
Industrial Conglomerates — 2.87% | ||||||||
| 330,000 | Beijing Enterprise Holdings Ltd. | $ | 2,592,609 | |||||
| 44,184 | Jardine Matheson Holding Ltd. | 2,792,042 | ||||||
| 56,695 | Jardine Strategic Holdings Ltd. | 1,980,383 | ||||||
|
| |||||||
| 7,365,034 | ||||||||
|
| |||||||
Oil, Gas & Consumable Fuels — 0.23% | ||||||||
| 615,000 | Kunlun Energy Company Ltd. | 597,323 | ||||||
|
| |||||||
Pharmaceuticals — 0.28% | ||||||||
| 700,000 | Sino Biopharmaceutical Ltd. | 708,178 | ||||||
|
| |||||||
Specialty Retail — 0.59% | ||||||||
| 530,750 | L’occitane International | 1,512,976 | ||||||
Total Hong Kong (Cost $9,463,002) | 11,490,217 | |||||||
|
| |||||||
| INDIA — 2.99% |
| ||||||
Commercial Banks — 1.21% | ||||||||
| 300,000 | ICICI Bank Ltd. — ADR | 3,108,000 | ||||||
|
| |||||||
Pharmaceuticals — 1.78% | ||||||||
| 80,000 | Dr. Reddy’s Laboratories Ltd. — ADR | 4,568,000 | ||||||
Total India (Cost $6,165,066) | 7,676,000 | |||||||
|
| |||||||
| IRELAND — 2.32% |
| ||||||
Pharmaceuticals — 2.32% | ||||||||
| 20,000 | Actavis plc(a) | 5,952,400 | ||||||
Total Ireland (Cost $3,723,891) | 5,952,400 | |||||||
|
| |||||||
| ISRAEL — 1.18% |
| ||||||
Pharmaceuticals — 1.18% | ||||||||
| 48,600 | Teva Pharmaceutical Industries Ltd. — ADR | 3,027,780 | ||||||
Total Israel (Cost $2,371,498) | 3,027,780 | |||||||
|
| |||||||
| ITALY — 0.90% |
| ||||||
Beverages — 0.90% | ||||||||
| 330,000 | Davide Campari-Milano SpA | 2,302,199 | ||||||
Total Italy (Cost $2,542,077) | 2,302,199 | |||||||
|
| |||||||
| JAPAN — 4.76% |
| ||||||
Beverages — 0.40% | ||||||||
| 32,000 | Asahi Group Holdings Ltd. | 1,014,670 | ||||||
|
| |||||||
Electronic Equipment, Instruments & Components — 2.65% | ||||||||
| 25,000 | Murata Manufacturing Co., Ltd. | 3,433,480 | ||||||
| 75,000 | Omron Corp. | 3,378,687 | ||||||
|
| |||||||
| 6,812,167 | ||||||||
|
| |||||||
Machinery — 1.46% | ||||||||
| 14,000 | FANUC Corp. | 3,056,393 | ||||||
| 35,000 | Komatsu Ltd. | 686,094 | ||||||
|
| |||||||
| 3,742,487 | ||||||||
|
| |||||||
Wireless Telecommunication Services — 0.25% | ||||||||
| 11,200 | SoftBank Corp. | 652,282 | ||||||
Total Japan (Cost $10,345,425) | 12,221,606 | |||||||
|
| |||||||
57
Buffalo International Fund
SCHEDULE OF INVESTMENTS
March 31, 2015
(Continued)
| SHARES OR FACE AMOUNT | FAIR VALUE* | |||||||
| NETHERLANDS — 3.92% |
| ||||||
Food Products — 1.05% | ||||||||
| 64,700 | Unilever N.V. NY Shares — ADR | $ | 2,701,872 | |||||
|
| |||||||
IT Services — 1.68% | ||||||||
| 152,499 | InterXion Holding NV(a) | 4,300,472 | ||||||
|
| |||||||
Semiconductors & Semiconductor Equipment — 1.19% | ||||||||
| 30,241 | ASML Holding NV NY Shares — ADR | 3,055,248 | ||||||
Total Netherlands (Cost $8,101,597) | 10,057,592 | |||||||
|
| |||||||
| NORWAY — 1.83% |
| ||||||
Commercial Services & Supplies — 0.57% | ||||||||
| 172,000 | Tomra Systems ASA | 1,446,554 | ||||||
|
| |||||||
Diversified Telecommunication Services — 0.87% | ||||||||
| 111,000 | Telenor ASA | 2,240,023 | ||||||
|
| |||||||
Internet Software & Services — 0.39% | ||||||||
| 124,681 | Opera Software ASA | 999,582 | ||||||
Total Norway (Cost $5,338,006) | 4,686,159 | |||||||
|
| |||||||
| REPUBLIC OF KOREA — 0.40% |
| ||||||
Semiconductors & Semiconductor Equipment — 0.40% | ||||||||
| 800 | Samsung Electronic Co., Ltd. | 1,037,403 | ||||||
Total Republic of Korea (Cost $894,090) | 1,037,403 | |||||||
|
| |||||||
| SINGAPORE — 2.41% |
| ||||||
Semiconductors & Semiconductor Equipment — 2.41% | ||||||||
| 48,770 | Avago Technologies Ltd. | 6,192,815 | ||||||
Total Singapore (Cost $1,750,829) | 6,192,815 | |||||||
|
| |||||||
| SPAIN — 0.85% |
| ||||||
Specialty Retail — 0.85% | ||||||||
| 67,500 | Inditex SA | 2,167,125 | ||||||
Total Spain (Cost $1,360,312) | 2,167,125 | |||||||
|
| |||||||
| SWEDEN — 1.03% |
| ||||||
Communications Equipment — 1.03% | ||||||||
| 210,000 | Telefonaktirbolaget LM Ericsson — ADR | 2,635,500 | ||||||
Total Sweden (Cost $2,417,870) | 2,635,500 | |||||||
|
| |||||||
| SWITZERLAND — 9.22% |
| ||||||
Capital Markets — 2.19% | ||||||||
| 141,900 | GAM Holding AG | 2,942,909 | ||||||
| 53,337 | Julius Baer Group Ltd. | 2,665,989 | ||||||
|
| |||||||
| 5,608,898 | ||||||||
|
| |||||||
Chemicals — 0.91% | ||||||||
| 34,500 | Syngenta AG — ADR | 2,339,445 | ||||||
|
| |||||||
Construction Materials — 1.37% | ||||||||
| 47,000 | Holcim Ltd. | 3,501,616 | ||||||
|
| |||||||
Insurance — 1.65% | ||||||||
| 44,000 | Swiss Re AG | 4,244,150 | ||||||
|
| |||||||
58
| SHARES OR FACE AMOUNT | FAIR VALUE* | |||||||
| SWITZERLAND (Continued) |
| ||||||
Pharmaceuticals — 1.11% | ||||||||
| 5,000 | Roche Holding AG | $ | 1,373,961 | |||||
| 43,000 | Roche Holding AG — ADR | 1,478,340 | ||||||
|
| |||||||
| 2,852,301 | ||||||||
|
| |||||||
Specialty Retail — 1.99% | ||||||||
| 34,500 | Dufry AG(a) | 5,100,672 | ||||||
Total Switzerland (Cost $21,402,828) | 23,647,082 | |||||||
|
| |||||||
| TAIWAN, PROVINCE OF CHINA — 1.48% | |||||||
Semiconductors & Semiconductor Equipment — 1.48% | ||||||||
| 161,281 | Taiwan Semiconductor Manufacturing Co. Ltd. — ADR | 3,786,878 | ||||||
Total Taiwan, Province of China (Cost $2,178,768) | 3,786,878 | |||||||
|
| |||||||
| UNITED KINGDOM — 13.26% | |||||||
Beverages — 2.31% | ||||||||
| 31,800 | Diageo PLC — ADR | 3,516,126 | ||||||
| 46,000 | SABMiller PLC. | 2,409,551 | ||||||
|
| |||||||
| 5,925,677 | ||||||||
|
| |||||||
Capital Markets — 2.33% | ||||||||
| 401,250 | Aberdeen Asset Management PLC | 2,729,813 | ||||||
| 36,500 | Schroders PLC | 1,729,051 | ||||||
| 42,164 | Schroders PLC — Non Voting | 1,514,354 | ||||||
|
| |||||||
| 5,973,218 | ||||||||
|
| |||||||
Health Care Equipment & Supplies — 1.17% | ||||||||
| 88,000 | Smith & Nephew PLC. — ADR | 3,006,960 | ||||||
|
| |||||||
Hotels, Restaurants & Leisure — 2.01% | ||||||||
| 87,692 | InterContinental Hotels Group PLC | 3,420,294 | ||||||
| 205,085 | Millennium & Copthorne Hotels PLC | 1,746,233 | ||||||
|
| |||||||
| 5,166,527 | ||||||||
|
| |||||||
Insurance — 1.20% | ||||||||
| 32,000 | Aon PLC | 3,075,840 | ||||||
|
| |||||||
Internet Software & Services — 0.87% | ||||||||
| 172,600 | Telecity Group PLC | 2,234,323 | ||||||
|
| |||||||
Media — 2.38% | ||||||||
| 122,600 | Liberty Global PLC — Serices C(a) | 6,106,706 | ||||||
|
| |||||||
Textiles, Apparel & Luxury Goods — 0.99% | ||||||||
| 99,000 | Burberry Group PLC | 2,542,358 | ||||||
Total United Kingdom (Cost $28,949,084) | 34,031,609 | |||||||
|
| |||||||
| TOTAL COMMON STOCKS | 227,119,635 | ||||||
| (COST $191,075,506) | |||||||
59
Buffalo International Fund
SCHEDULE OF INVESTMENTS
March 31, 2015
(Continued)
| SHARES OR FACE AMOUNT | FAIR VALUE* | |||||||
| EXCHANGE TRADED FUND — 0.52% |
| ||||||
| UNITED STATES — 0.52% |
| ||||||
| 20,000 | WisdomTree Europe Hedged Equity | $ | 1,322,800 | |||||
Total United States (Cost $1,111,800) | 1,322,800 | |||||||
|
| |||||||
| TOTAL EXCHANGE TRADED FUND | 1,322,800 | ||||||
| (COST $1,111,800) | |||||||
| SHORT TERM INVESTMENT — 6.99% |
| ||||||
| INVESTMENT COMPANY — 6.99% |
| ||||||
| 17,941,900 | Fidelity Institutional Money Market Fund — Government Portfolio — 0.01%(b) | 17,941,900 | ||||||
Total Investment Company | 17,941,900 | |||||||
|
| |||||||
| TOTAL SHORT TERM INVESTMENT | 17,941,900 | ||||||
| (COST $17,941,900) | |||||||
| TOTAL INVESTMENTS — 96.02% | 246,384,335 | ||||||
| (COST $210,129,206) | |||||||
| Other Assets in Excess of Liabilities — 3.98% | 10,223,249 | ||||||
|
| |||||||
| TOTAL NET ASSETS — 100.00% | $ | 256,607,584 | |||||
|
| |||||||
ADR — American Depositary Receipt
PLC — Public Limited Company
| (a) | Non Income Producing |
| (b) | 7-day yield |
| (c) | Fair Valued Security. The total value of the security amounted to $1,279,885 (0.50% of net assets) at March 31, 2015. |
| (d) | Security deemed illiquid. Total value of illiquid security amounted to $1,279,885 (0.50% of net assets) at March 31, 2015. |
| * | See Note 1A of accompanying Notes to Financial Statements regarding valuation of securities. |
60
As of March 31, 2015, the industry diversification was as follows:
| FAIR VALUE* | PERCENTAGE | |||||||
Common Stocks | ||||||||
Air Freight & Logistics | $ | 3,657,278 | 1.43% | |||||
Automobiles | 1,127,943 | 0.44% | ||||||
Beverages | 19,669,321 | 7.67% | ||||||
Capital Markets | 11,582,116 | 4.51% | ||||||
Chemicals | 14,367,570 | 5.60% | ||||||
Commercial Banks | 3,108,000 | 1.21% | ||||||
Commercial Services & Supplies | 1,446,553 | 0.56% | ||||||
Communications Equipment | 2,635,500 | 1.03% | ||||||
Construction Materials | 3,501,616 | 1.36% | ||||||
Diversified Telecommunication Services | 2,240,023 | 0.87% | ||||||
Electrical Equipment | 2,645,828 | 1.03% | ||||||
Electronic Equipment, Instruments & Components | 8,747,042 | 3.41% | ||||||
Food Products | 6,309,758 | 2.46% | ||||||
Gas Utilities | 1,834,778 | 0.72% | ||||||
Health Care Equipment & Supplies | 4,316,297 | 1.68% | ||||||
Health Care Providers & Services | 5,961,626 | 2.32% | ||||||
Hotels, Restaurants & Leisure | 8,399,572 | 3.27% | ||||||
Household Products | 3,807,801 | 1.48% | ||||||
Industrial Conglomerates | 10,577,199 | 4.12% | ||||||
Insurance | 11,230,831 | 4.38% | ||||||
Internet Software & Services | 5,682,905 | 2.21% | ||||||
IT Services | 7,461,348 | 2.91% | ||||||
Machinery | 9,098,926 | 3.55% | ||||||
Media | 7,649,832 | 2.98% | ||||||
Oil, Gas & Consumable Fuels | 597,323 | 0.23% | ||||||
Pharmaceuticals | 23,930,157 | 9.33% | ||||||
Road & Rail | 3,339,810 | 1.30% | ||||||
Semiconductors & Semiconductor Equipment | 14,072,343 | 5.48% | ||||||
Software | 7,397,188 | 2.88% | ||||||
Specialty Retail | 8,780,773 | 3.42% | ||||||
Textiles, Apparel & Luxury Goods | 10,259,981 | 4.00% | ||||||
Wireless Telecommunication Services | 1,682,397 | 0.66% | ||||||
|
|
|
| |||||
Total Common Stocks | 227,119,635 | 88.51% | ||||||
Exchange Traded Fund | ||||||||
Investment Company | 1,322,800 | 0.52% | ||||||
|
|
|
| |||||
Total Exchange Traded Fund | 1,322,800 | 0.52% | ||||||
Short Term Investment | ||||||||
Investment Company | 17,941,900 | 6.99% | ||||||
|
|
|
| |||||
Total Short Term Investment | 17,941,900 | 6.99% | ||||||
Total Investments | 246,384,335 | 96.02% | ||||||
Other Assets in Excess of Liabilities | 10,223,249 | 3.98% | ||||||
|
|
|
| |||||
TOTAL NET ASSETS | $ | 256,607,584 | 100.00% | |||||
|
|
|
| |||||
The Global Industry Classification Standard (GICS) was developed by and/or is the exclusive property of MSCI, Inc. and Standard & Poor’s Financial Services LLC (“S&P”). GICS is a service mark of MSCI and S&P and has been licensed for use by U.S. Bancorp Fund Services, LLC.
The accompanying notes are an integral part of these financial statements.
61
Buffalo Large Cap Fund
SCHEDULE OF INVESTMENTS
March 31, 2015
| SHARES OR FACE AMOUNT | FAIR VALUE* | |||||||
| COMMON STOCKS — 92.52% |
| ||||||
| CONSUMER DISCRETIONARY — 21.67% |
| ||||||
Auto Components — 1.48% | ||||||||
| 10,800 | BorgWarner, Inc. | $ | 653,184 | |||||
|
| |||||||
Hotels, Restaurants & Leisure — 1.36% | ||||||||
| 7,450 | Marriott International, Inc. — Class A | 598,384 | ||||||
|
| |||||||
Internet & Catalog Retail — 5.58% | ||||||||
| 3,625 | Amazon.com, Inc.(a) | 1,348,862 | ||||||
| 950 | The Priceline Group Inc.(a) | 1,105,943 | ||||||
|
| |||||||
| 2,454,805 | ||||||||
|
| |||||||
Media — 2.24% | ||||||||
| 5,100 | Charter Communications, Inc. — Class A(a) | 984,861 | ||||||
|
| |||||||
Specialty Retail — 5.27% | ||||||||
| 12,230 | Restoration Hardware Holdings Inc.(a) | 1,213,094 | ||||||
| 15,800 | TJX Companies, Inc. | 1,106,790 | ||||||
|
| |||||||
| 2,319,884 | ||||||||
|
| |||||||
Textiles, Apparel & Luxury Goods — 5.74% | ||||||||
| 16,700 | Coach, Inc. | 691,881 | ||||||
| 15,250 | lululemon athletica, Inc.(a) | 976,305 | ||||||
| 8,550 | NIKE, Inc. — Class B | 857,821 | ||||||
|
| |||||||
| 2,526,007 | ||||||||
Total Consumer Discretionary (Cost $7,231,695) | 9,537,125 | |||||||
|
| |||||||
| CONSUMER STAPLES — 6.57% |
| ||||||
Food & Staples Retailing — 6.57% | ||||||||
| 6,600 | Costco Wholesale Corp. | 999,867 | ||||||
| 8,700 | CVS Health Corp. | 897,927 | ||||||
| 19,100 | Whole Foods Market, Inc. | 994,728 | ||||||
Total Consumer Staples (Cost $1,928,524) | 2,892,522 | |||||||
|
| |||||||
| ENERGY — 2.99% |
| ||||||
Energy Equipment & Services — 2.99% | ||||||||
| 9,300 | National Oilwell Varco Inc. | 464,907 | ||||||
| 10,179 | Schlumberger Ltd.(b) | 849,336 | ||||||
Total Energy (Cost $1,054,455) | 1,314,243 | |||||||
|
| |||||||
| FINANCIALS — 10.07% |
| ||||||
Capital Markets — 2.10% | ||||||||
| 11,400 | T. Rowe Price Group Inc. | 923,172 | ||||||
|
| |||||||
Diversified Financial Services — 7.97% | ||||||||
| 10,675 | American Express Co. | 833,931 | ||||||
| 8,600 | CME Group Inc. | 814,506 | ||||||
| 3,575 | Intercontinental Exchange Group, Inc. | 833,940 | ||||||
| 9,900 | McGraw Hill Financial, Inc. | 1,023,660 | ||||||
|
| |||||||
| 3,506,037 | ||||||||
Total Financials (Cost $3,284,384) | 4,429,209 | |||||||
|
| |||||||
| HEALTH CARE — 17.15% |
| ||||||
Biotechnology — 2.69% | ||||||||
| 1,750 | Biogen Idec Inc.(a) | 738,920 | ||||||
| 7,800 | Cepheid, Inc.(a) | 443,820 | ||||||
|
| |||||||
| 1,182,740 | ||||||||
|
| |||||||
62
| SHARES OR FACE AMOUNT | FAIR VALUE* | |||||||
| HEALTH CARE (Continued) |
| ||||||
Health Care Equipment & Supplies — 1.04% | ||||||||
| 3,200 | Edwards Lifesciences Corp.(a) | $ | 455,872 | |||||
|
| |||||||
Health Care Technology — 4.42% | ||||||||
| 8,950 | athenahealth Inc.(a) | 1,068,540 | ||||||
| 12,000 | Cerner Corp.(a) | 879,120 | ||||||
|
| |||||||
| 1,947,660 | ||||||||
|
| |||||||
Pharmaceuticals — 9.00% | ||||||||
| 23,725 | Hospira, Inc.(a) | 2,084,004 | ||||||
| 19,500 | The Medicines Co.(a) | 546,390 | ||||||
| 8,050 | Perrigo Co. PLC(b) | 1,332,678 | ||||||
|
| |||||||
| 3,963,072 | ||||||||
Total Health Care (Cost $5,648,730) | 7,549,344 | |||||||
|
| |||||||
| INDUSTRIALS — 11.62% |
| ||||||
Aerospace & Defense — 4.56% | ||||||||
| 8,750 | The Boeing Co. | 1,313,200 | ||||||
| 3,300 | Precision Castparts Corp. | 693,000 | ||||||
|
| |||||||
| 2,006,200 | ||||||||
|
| |||||||
Air Freight & Logistics — 2.55% | ||||||||
| 6,800 | FedEx Corp. | 1,125,060 | ||||||
|
| |||||||
Commercial Services & Supplies — 1.15% | ||||||||
| 3,600 | Stericycle, Inc.(a) | 505,548 | ||||||
|
| |||||||
Professional Services — 1.81% | ||||||||
| 7,000 | IHS Inc. — Class A(a) | 796,320 | ||||||
|
| |||||||
Road & Rail — 1.55% | ||||||||
| 6,300 | Union Pacific Corp. | 682,353 | ||||||
Total Industrials (Cost $3,403,711) | 5,115,481 | |||||||
|
| |||||||
| INFORMATION TECHNOLOGY — 18.01% |
| ||||||
Communications Equipment — 4.10% | ||||||||
| 25,900 | Juniper Networks, Inc. | 584,822 | ||||||
| 17,600 | QUALCOMM, Inc. | 1,220,384 | ||||||
|
| |||||||
| 1,805,206 | ||||||||
|
| |||||||
Internet Software & Services — 5.57% | ||||||||
| 7,000 | Facebook Inc. — Class A(a) | 575,505 | ||||||
| 2,245 | Google Inc. — Class A(a) | 1,245,302 | ||||||
| 1,145 | Google Inc. — Class C(a) | 627,460 | ||||||
|
| |||||||
| 2,448,267 | ||||||||
|
| |||||||
IT Services — 1.90% | ||||||||
| 12,800 | Visa Inc. — Class A | 837,248 | ||||||
|
| |||||||
Semiconductors & Semiconductor Equipment — 2.44% | ||||||||
| 25,050 | Altera Corp. | 1,074,895 | ||||||
|
| |||||||
Software — 1.74% | ||||||||
| 17,740 | Oracle Corp. | 765,481 | ||||||
|
| |||||||
Technology Hardware, Storage & Peripherals — 2.26% | ||||||||
| 7,995 | Apple Inc. | 994,818 | ||||||
Total Information Technology (Cost $5,142,589) | 7,925,915 | |||||||
|
| |||||||
63
Buffalo Large Cap Fund
SCHEDULE OF INVESTMENTS
March 31, 2015
(Continued)
| SHARES OR FACE AMOUNT | FAIR VALUE* | |||||||
| MATERIALS — 4.44% |
| ||||||
Chemicals — 4.44% | ||||||||
| 7,700 | Monsanto Co. | $ | 866,558 | |||||
| 9,000 | Praxair, Inc. | 1,086,660 | ||||||
Total Materials (Cost $1,549,841) | 1,953,218 | |||||||
|
| |||||||
| TOTAL COMMON STOCKS | 40,717,057 | ||||||
| (COST $29,243,929) | |||||||
| REITS — 2.16% |
| ||||||
| INFORMATION TECHNOLOGY — 2.16% |
| ||||||
Internet Software & Services — 2.16% | ||||||||
| 4,083 | Equinix Inc. | 950,727 | ||||||
Total Information Technology (Cost $698,184) | 950,727 | |||||||
|
| |||||||
| TOTAL REITS | 950,727 | ||||||
| (COST $698,184) | |||||||
| SHORT TERM INVESTMENT — 6.26% |
| ||||||
| INVESTMENT COMPANY — 6.26% |
| ||||||
| 2,756,305 | Fidelity Institutional Money Market Fund — Government Portfolio — 0.01%(c) | 2,756,305 | ||||||
Total Investment Company | 2,756,305 | |||||||
|
| |||||||
| TOTAL SHORT TERM INVESTMENT | 2,756,305 | ||||||
| (COST $2,756,305) | |||||||
| TOTAL INVESTMENTS — 100.94% | 44,424,089 | ||||||
| (COST $32,698,418) | |||||||
| Liabilities in Excess of Other Assets — (0.94)% | (411,548 | ) | |||||
|
| |||||||
| TOTAL NET ASSETS — 100.00% | $ | 44,012,541 | |||||
|
| |||||||
| (a) | Non Income Producing |
| (b) | Foreign Issued Securities. The total value of these securities amounted to $2,182,014 (4.96% of net assets) at March 31, 2015. |
| (c) | 7-day yield |
| * | See Note 1A of accompanying Notes to Financial Statements regarding valuation of securities. |
The Global Industry Classification Standard (GICS) was developed by and/or is the exclusive property of MSCI, Inc. and Standard & Poor’s Financial Services LLC (“S&P”). GICS is a service mark of MSCI and S&P and has been licensed for use by U.S. Bancorp Fund Services, LLC.
The accompanying notes are an integral part of these financial statements.
64
Buffalo Mid Cap Fund
SCHEDULE OF INVESTMENTS
March 31, 2015
| SHARES OR FACE AMOUNT | FAIR VALUE* | |||||||
| COMMON STOCKS — 96.33% |
| ||||||
| CONSUMER DISCRETIONARY — 28.66% |
| ||||||
Auto Components — 4.40% | ||||||||
| 99,575 | Autoliv, Inc. | $ | 11,726,948 | |||||
| 218,175 | BorgWarner, Inc. | 13,195,224 | ||||||
|
| |||||||
| 24,922,172 | ||||||||
|
| |||||||
Distributors — 1.80% | ||||||||
| 398,375 | LKQ Corp.(a) | 10,182,465 | ||||||
|
| |||||||
Hotels, Restaurants & Leisure — 2.81% | ||||||||
| 178,675 | Dunkin’ Brands Group Inc. | 8,497,783 | ||||||
| 104,710 | Life Time Fitness, Inc.(a) | 7,430,222 | ||||||
|
| |||||||
| 15,928,005 | ||||||||
|
| |||||||
Household Durables — 1.93% | ||||||||
| 81,950 | Harman International Industries, Inc. | 10,950,978 | ||||||
|
| |||||||
Internet & Catalog Retail — 1.99% | ||||||||
| 119,475 | Expedia, Inc. | 11,246,182 | ||||||
|
| |||||||
Leisure Equipment & Products — 1.63% | ||||||||
| 65,325 | Polaris Industries Inc. | 9,217,357 | ||||||
|
| |||||||
Media — 5.00% | ||||||||
| 156,100 | AMC Networks, Inc.(a) | 11,963,504 | ||||||
| 482,575 | Lions Gate Entertainment Corp.(b) | 16,368,944 | ||||||
|
| |||||||
| 28,332,448 | ||||||||
|
| |||||||
Specialty Retail — 5.67% | ||||||||
| 107,675 | Restoration Hardware Holdings Inc.(a) | 10,680,283 | ||||||
| 125,050 | Tractor Supply Co. | 10,636,753 | ||||||
| 135,525 | Williams-Sonoma, Inc. | 10,802,698 | ||||||
|
| |||||||
| 32,119,734 | ||||||||
|
| |||||||
Textiles, Apparel & Luxury Goods — 3.43% | ||||||||
| 111,750 | Michael Kors Holdings Ltd(a)(b) | 7,347,563 | ||||||
| 149,655 | Under Armour, Inc. — Class A(a) | 12,084,641 | ||||||
|
| |||||||
| 19,432,204 | ||||||||
Total Consumer Discretionary (Cost $100,341,578) | 162,331,545 | |||||||
|
| |||||||
| CONSUMER STAPLES — 4.44% |
| ||||||
Beverages — 1.83% | ||||||||
| 38,705 | The Boston Beer Co, Inc. — Class A(a) | 10,349,717 | ||||||
|
| |||||||
Food Products — 2.61% | ||||||||
| 333,790 | WhiteWave Foods Co.(a) | 14,800,249 | ||||||
Total Consumer Staples (Cost $15,217,993) | 25,149,966 | |||||||
|
| |||||||
| ENERGY — 1.93% |
| ||||||
Energy Equipment & Services — 1.93% | ||||||||
| 557,550 | Forum Energy Technologies Inc.(a) | 10,927,980 | ||||||
Total Energy (Cost $11,965,351) | 10,927,980 | |||||||
|
| |||||||
| FINANCIALS — 14.50% |
| ||||||
Capital Markets — 5.59% | ||||||||
| 66,625 | Affiliated Managers Group, Inc.(a) | 14,309,717 | ||||||
| 255,625 | Financial Engines Inc. | 10,692,794 | ||||||
65
Buffalo Mid Cap Fund
SCHEDULE OF INVESTMENTS
March 31, 2015
(Continued)
| SHARES OR FACE AMOUNT | FAIR VALUE* | |||||||
| FINANCIALS (Continued) |
| ||||||
| 95,750 | Northern Trust Corp. | $ | 6,668,987 | |||||
|
| |||||||
| 31,671,498 | ||||||||
|
| |||||||
Diversified Financial Services — 8.91% | ||||||||
| 153,075 | CME Group Inc. | 14,497,733 | ||||||
| 112,725 | MarketAxess Holdings, Inc. | 9,344,903 | ||||||
| 132,650 | Moody’s Corp. | 13,769,070 | ||||||
| 209,700 | MSCI, Inc. | 12,856,707 | ||||||
|
| |||||||
| 50,468,413 | ||||||||
Total Financials (Cost $46,197,272) | 82,139,911 | |||||||
|
| |||||||
| HEALTH CARE — 12.71% |
| ||||||
Health Care Equipment & Supplies — 2.99% | ||||||||
| 155,750 | Align Technology, Inc.(a) | 8,377,014 | ||||||
| 91,000 | Varian Medical Systems, Inc.(a) | 8,562,190 | ||||||
|
| |||||||
| 16,939,204 | ||||||||
|
| |||||||
Health Care Technology — 1.53% | ||||||||
| 118,475 | Cerner Corp.(a) | 8,679,479 | ||||||
|
| |||||||
Life Sciences Tools & Services — 2.27% | ||||||||
| 76,725 | Bio-Techne Corp. | 7,694,750 | ||||||
| 27,625 | Illumina, Inc.(a) | 5,128,305 | ||||||
|
| |||||||
| 12,823,055 | ||||||||
|
| |||||||
Pharmaceuticals — 5.92% | ||||||||
| 227,750 | Hospira, Inc.(a) | 20,005,560 | ||||||
| 81,755 | Perrigo Co. PLC(b) | 13,534,540 | ||||||
|
| |||||||
| 33,540,100 | ||||||||
Total Health Care (Cost $48,188,307) | 71,981,838 | |||||||
|
| |||||||
| INDUSTRIALS — 18.16% |
| ||||||
Construction & Engineering — 1.70% | ||||||||
| 337,800 | Quanta Services, Inc.(a) | 9,637,434 | ||||||
|
| |||||||
Electrical Equipment — 2.61% | ||||||||
| 87,872 | Acuity Brands, Inc. | 14,776,556 | ||||||
|
| |||||||
Machinery — 2.88% | ||||||||
| 235,925 | Chart Industries, Inc.(a) | 8,275,069 | ||||||
| 114,615 | Proto Labs, Inc.(a) | 8,023,050 | ||||||
|
| |||||||
| 16,298,119 | ||||||||
|
| |||||||
Professional Services — 5.04% | ||||||||
| 173,450 | The Advisory Board Co.(a) | 9,241,416 | ||||||
| 68,050 | Towers Watson & Co. — Class A | 8,995,189 | ||||||
| 144,475 | Verisk Analytics, Inc — Class A(a) | 10,315,515 | ||||||
|
| |||||||
| 28,552,120 | ||||||||
|
| |||||||
Road & Rail — 4.25% | ||||||||
| 148,325 | Genesee & Wyoming Inc. — Class A(a) | 14,304,463 | ||||||
| 95,475 | Kansas City Southern | 9,746,088 | ||||||
|
| |||||||
| 24,050,551 | ||||||||
|
| |||||||
66
| SHARES OR FACE AMOUNT | FAIR VALUE* | |||||||
| INDUSTRIALS (Continued) |
| ||||||
Trading Companies & Distributors — 1.68% | ||||||||
| 131,800 | MSC Industrial Direct Co., Inc. — Class A | $ | 9,515,960 | |||||
Total Industrials (Cost $85,304,633) | 102,830,740 | |||||||
|
| |||||||
| INFORMATION TECHNOLOGY — 14.30% |
| ||||||
Communications Equipment — 1.35% | ||||||||
| 66,700 | F5 Networks, Inc.(a) | 7,666,498 | ||||||
|
| |||||||
Electronic Equipment, Instruments & Components — 1.32% | ||||||||
| 233,475 | National Instruments Corp. | 7,480,539 | ||||||
|
| |||||||
Internet Software & Services — 3.33% | ||||||||
| 187,550 | Akamai Technologies, Inc.(a) | 13,324,490 | ||||||
| 182,845 | HomeAway Inc.(a) | 5,516,433 | ||||||
|
| |||||||
| 18,840,923 | ||||||||
|
| |||||||
Software — 7.28% | ||||||||
| 74,725 | ANSYS, Inc.(a) | 6,589,998 | ||||||
| 218,510 | Fortinet Inc.(a) | 7,636,924 | ||||||
| 320,175 | RealPage, Inc.(a) | 6,448,325 | ||||||
| 121,600 | Red Hat, Inc.(a) | 9,211,200 | ||||||
| 219,350 | Solera Holdings Inc. | 11,331,621 | ||||||
|
| |||||||
| 41,218,068 | ||||||||
|
| |||||||
Technology Hardware, Storage & Peripherals — 1.02% | ||||||||
| 109,045 | Stratasys Ltd.(a)(b) | 5,755,395 | ||||||
Total Information Technology (Cost $56,292,741) | 80,961,423 | |||||||
|
| |||||||
| MATERIALS — 1.63% |
| ||||||
Chemicals — 1.63% | ||||||||
| 161,025 | FMC Corp. | 9,218,681 | ||||||
Total Materials (Cost $4,498,125) | 9,218,681 | |||||||
|
| |||||||
| TOTAL COMMON STOCKS | 545,542,084 | ||||||
| (COST $368,006,000) | |||||||
| REITS — 2.34% |
| ||||||
| INFORMATION TECHNOLOGY — 2.34% |
| ||||||
Internet Software & Services — 2.34% | ||||||||
| 56,830 | Equinix Inc. | 13,232,866 | ||||||
Total Information Technology (Cost $9,613,391) | 13,232,866 | |||||||
|
| |||||||
| TOTAL REITS | 13,232,866 | ||||||
| (COST $9,613,391) | |||||||
67
Buffalo Mid Cap Fund
SCHEDULE OF INVESTMENTS
March 31, 2015
(Continued)
| SHARES OR FACE AMOUNT | FAIR VALUE* | |||||||
| SHORT TERM INVESTMENT — 1.24% |
| ||||||
| INVESTMENT COMPANY — 1.24% |
| ||||||
| 7,007,994 | Fidelity Institutional Money Market Fund — Government Portfolio — 0.01%(c) | $ | 7,007,994 | |||||
Total Investment Company | 7,007,994 | |||||||
|
| |||||||
| TOTAL SHORT TERM INVESTMENT | 7,007,994 | ||||||
| (COST $7,007,994) | |||||||
| TOTAL INVESTMENTS — 99.91% | 565,782,944 | ||||||
| (COST $384,627,385) | |||||||
| Other Assets in Excess of Liabilities — 0.09% | 518,579 | ||||||
|
| |||||||
| TOTAL NET ASSETS — 100.00% | $ | 566,301,523 | |||||
|
| |||||||
| (a) | Non Income Producing |
| (b) | Foreign Issued Securities. The total value of these securities amounted to $43,006,442 (7.59% of net assets) at March 31, 2015. |
| (c) | 7-day yield |
| * | See Note 1A of accompanying Notes to Financial Statements regarding valuation of securities. |
The Global Industry Classification Standard (GICS) was developed by and/or is the exclusive property of MSCI, Inc. and Standard & Poor’s Financial Services LLC (“S&P”). GICS is a service mark of MSCI and S&P and has been licensed for use by U.S. Bancorp Fund Services, LLC.
The accompanying notes are an integral part of these financial statements.
68
Buffalo Small Cap Fund
SCHEDULE OF INVESTMENTS
March 31, 2015
| SHARES OR FACE AMOUNT | FAIR VALUE* | |||||||
| COMMON STOCKS — 95.16% |
| ||||||
| Consumer Discretionary — 20.33% |
| ||||||
Auto Components — 2.19% | ||||||||
| 220,275 | Dorman Products, Inc.(a) | $ | 10,958,681 | |||||
| 2,973,258 | Gentex Corp. | 54,410,622 | ||||||
| 11,720 | Gentherm Inc.(a) | 591,977 | ||||||
|
| |||||||
| 65,961,280 | ||||||||
|
| |||||||
Hotels, Restaurants & Leisure — 3.37% | ||||||||
| 1,028,705 | Life Time Fitness, Inc.(a) | 72,996,907 | ||||||
| 890,110 | Sonic Corp. | 28,216,487 | ||||||
|
| |||||||
| 101,213,394 | ||||||||
|
| |||||||
Internet Software & Services — 1.16% | ||||||||
| 2,146,595 | Pandora Media Inc.(a) | 34,796,305 | ||||||
|
| |||||||
Media — 2.59% | ||||||||
| 3,840,115 | The New York Times Co. — Class A(c) | 52,839,982 | ||||||
| 450,185 | Rentrak Corp.(a) | 25,012,279 | ||||||
|
| |||||||
| 77,852,261 | ||||||||
|
| |||||||
Specialty Retail — 4.47% | ||||||||
| 855,975 | Hibbett Sports Inc.(a) | 41,994,133 | ||||||
| 823,660 | Lumber Liquidators Holdgings, Inc.(a) | 25,352,255 | ||||||
| 675,250 | Restoration Hardware Holdings Inc.(a) | 66,978,048 | ||||||
|
| |||||||
| 134,324,436 | ||||||||
|
| |||||||
Textiles, Apparel & Luxury Goods — 6.55% | ||||||||
| 722,205 | Deckers Outdoor Corp.(a) | 52,627,078 | ||||||
| 1,077,992 | Oxford Industries, Inc.(c)(d) | 81,334,496 | ||||||
| 2,574,295 | Tumi Holdings Inc.(a)(c) | 62,967,256 | ||||||
|
| |||||||
| 196,928,830 | ||||||||
Total Consumer Discretionary (Cost $437,378,804) | 611,076,506 | |||||||
|
| |||||||
| CONSUMER STAPLES — 2.13% | |||||||
Beverages — 1.77% | ||||||||
| 198,539 | The Boston Beer Co, Inc. — Class A(a) | 53,089,329 | ||||||
|
| |||||||
Food & Staples Retailing — 0.36% | ||||||||
| 142,450 | United Natural Foods, Inc.(a) | 10,974,348 | ||||||
Total Consumer Staples (Cost $48,017,577) | 64,063,677 | |||||||
|
| |||||||
| FINANCIALS — 14.42% | |||||||
Capital Markets — 8.53% | ||||||||
| 1,932,110 | Financial Engines Inc.(c) | 80,820,161 | ||||||
| 1,520,510 | Stifel Financial Corp.(a) | 84,768,432 | ||||||
| 4,237,275 | WisdomTree Investments, Inc. | 90,931,922 | ||||||
|
| |||||||
| 256,520,515 | ||||||||
|
| |||||||
Diversified Financial Services — 3.66% | ||||||||
| 1,325,771 | MarketAxess Holdings, Inc.(c) | 109,906,416 | ||||||
|
| |||||||
Real Estate Management & Development — 2.23% | ||||||||
| 1,036,375 | FirstService Corp.(b)(c) | 67,074,190 | ||||||
Total Financials (Cost $162,024,276) | 433,501,121 | |||||||
|
| |||||||
69
Buffalo Small Cap Fund
SCHEDULE OF INVESTMENTS
March 31, 2015
(Continued)
| SHARES OR FACE AMOUNT | FAIR VALUE* | |||||||
| HEALTH CARE — 15.51% |
| ||||||
Biotechnology — 0.70% | ||||||||
| 420,600 | KYTHERA Biopharmaceuticals, Inc.(a) | $ | 21,093,090 | |||||
|
| |||||||
Health Care Equipment & Supplies — 3.11% | ||||||||
| 2,095,600 | Accuray Inc.(a) | 19,489,080 | ||||||
| 1,227,209 | Align Technology, Inc.(a) | 66,005,436 | ||||||
| 270,410 | Endologix, Inc.(a) | 4,615,899 | ||||||
| 95,180 | Insulet Corp.(a) | 3,174,253 | ||||||
|
| |||||||
| 93,284,668 | ||||||||
|
| |||||||
Health Care Technology — 4.11% | ||||||||
| 427,485 | athenahealth Inc.(a) | 51,037,434 | ||||||
| 1,480,575 | Medidata Solutions, Inc.(a) | 72,607,398 | ||||||
|
| |||||||
| 123,644,832 | ||||||||
|
| |||||||
Life Sciences Tools & Services — 4.07% | ||||||||
| 601,175 | Bio-Techne Corp. | 60,291,841 | ||||||
| 880,227 | ICON PLC.(a)(b) | 62,082,410 | ||||||
|
| |||||||
| 122,374,251 | ||||||||
|
| |||||||
Pharmaceuticals — 3.52% | ||||||||
| 1,171,825 | Akorn, Inc.(a) | 55,673,406 | ||||||
| 762,835 | Impax Laboratories, Inc.(a) | 35,754,076 | ||||||
| 513,485 | The Medicines Co.(a) | 14,387,850 | ||||||
|
| |||||||
| 105,815,332 | ||||||||
Total Health Care (Cost $240,250,307) | 466,212,173 | |||||||
|
| |||||||
| INDUSTRIALS — 18.07% | |||||||
Aerospace & Defense — 4.42% | ||||||||
| 882,995 | DigitalGlobe Inc.(a) | 30,083,639 | ||||||
| 1,999,085 | Hexcel Corp. | 102,792,951 | ||||||
|
| |||||||
| 132,876,590 | ||||||||
|
| |||||||
Commercial Services & Supplies — 0.83% | ||||||||
| 777,575 | Healthcare Servics Group, Inc. | 24,983,485 | ||||||
|
| |||||||
Machinery — 3.27% | ||||||||
| 1,065,800 | Chart Industries, Inc.(a) | 37,382,935 | ||||||
| 869,835 | Proto Labs, Inc.(a) | 60,888,450 | ||||||
|
| |||||||
| 98,271,385 | ||||||||
|
| |||||||
Professional Services — 8.50% | ||||||||
| 1,138,790 | The Corporate Executive Board Co.(c) | 90,943,769 | ||||||
| 491,500 | Costar Group, Inc.(a) | 97,233,445 | ||||||
| 1,264,405 | WageWorks, Inc.(a)(c) | 67,430,719 | ||||||
|
| |||||||
| 255,607,933 | ||||||||
|
| |||||||
Road & Rail — 1.05% | ||||||||
| 327,420 | Genesee & Wyoming Inc. — Class A(a) | 31,576,385 | ||||||
Total Industrials (Cost $304,827,632) | 543,315,778 | |||||||
|
| |||||||
| INFORMATION TECHNOLOGY — 24.41% |
| ||||||
Communications Equipment — 1.69% | ||||||||
| 2,393,044 | ADTRAN, Inc. | 44,678,132 | ||||||
| 307,320 | Infinera Corp.(a) | 6,044,984 | ||||||
|
| |||||||
| 50,723,116 | ||||||||
|
| |||||||
70
| SHARES OR FACE AMOUNT | FAIR VALUE* | |||||||
| INFORMATION TECHNOLOGY (Continued) | |||||||
Internet Software & Services — 10.91% | ||||||||
| 352,432 | comScore Inc.(a) | $ | 18,044,519 | |||||
| 1,298,540 | Cornerstone OnDemand, Inc.(a) | 37,514,821 | ||||||
| 1,809,750 | DealerTrack Holdings Inc.(a) | 69,711,570 | ||||||
| 707,900 | Envestnet, Inc.(a) | 39,699,032 | ||||||
| 976,700 | HomeAway Inc.(a) | 29,467,039 | ||||||
| 2,539,988 | Internap Network Services Corp.(a)(c) | 25,984,077 | ||||||
| 1,920,170 | LogMeIn, Inc.(a)(c)(d) | 107,510,318 | ||||||
|
| |||||||
| 327,931,376 | ||||||||
|
| |||||||
IT Services — 2.00% | ||||||||
| 2,132,006 | InterXion Holding NV(a)(b)(c) | 60,122,569 | ||||||
|
| |||||||
Semiconductors & Semiconductor Equipment — 1.25% | ||||||||
| 1,407,208 | Semtech Corp.(a) | 37,495,057 | ||||||
|
| |||||||
Software — 7.21% | ||||||||
| 3,128,703 | ACI Worldwide, Inc.(a)(c) | 67,767,707 | ||||||
| 1,158,475 | BroadSoft Inc.(a)(c) | 38,762,573 | ||||||
| 1,832,075 | RealPage, Inc.(a)(c) | 36,897,991 | ||||||
| 430,865 | The Ultimate Software Group, Inc.(a) | 73,227,661 | ||||||
|
| |||||||
| 216,655,932 | ||||||||
|
| |||||||
Technology Hardware, Storage & Peripherals — 1.35% | ||||||||
| 771,540 | Stratasys Ltd.(a)(b) | 40,721,881 | ||||||
Total Information Technology (Cost $498,028,052) | 733,649,931 | |||||||
|
| |||||||
| TELECOMMUNICATION SERVICES — 0.29% | |||||||
Diversified Telecommunication Services — 0.29% | ||||||||
| 245,780 | Cogent Communications Holdings Inc. | 8,683,407 | ||||||
Total Telecommunication Services (Cost $8,667,912) | 8,683,407 | |||||||
|
| |||||||
| TOTAL COMMON STOCKS | 2,860,502,593 | ||||||
| (COST $1,699,194,560) | |||||||
| SHORT TERM INVESTMENT — 4.70% |
| ||||||
| INVESTMENT COMPANY — 4.70% | |||||||
| 141,363,012 | Fidelity Institutional Money Market Fund — Government Portfolio — 0.01%(e) | 141,363,012 | ||||||
Total Investment Company | 141,363,012 | |||||||
|
| |||||||
| TOTAL SHORT TERM INVESTMENT | 141,363,012 | ||||||
| (COST $141,363,012) | |||||||
| TOTAL INVESTMENTS — 99.86% | 3,001,865,605 | ||||||
| (COST $1,840,557,572) | |||||||
| Other Assets in Excess of Liabilities — 0.14% | 4,114,497 | ||||||
|
| |||||||
| TOTAL NET ASSETS — 100.00% | $ | 3,005,980,102 | |||||
|
| |||||||
| (a) | Non Income Producing |
| (b) | Foreign Issued Securities. The total value of these securities amounted to $230,001,050 (7.65% of net assets) at March 31, 2015. |
| (c) | A portion of these securities is deemed illiquid. The total value of the illiquid portion of these securities amounted to $344,485,320 (11.46% of net assets) at March 31, 2015 |
| (d) | Affiliated company; the Fund owns 5% or more of the outstanding voting securities of the issuer. The total values of these securities amounted to $188,844,814 (6.28% of net assets) on March 31, 2015. |
| (e) | 7-day yield |
| * | See Note 1A of accompanying Notes to Financial Statements regarding valuation of securities. |
The Global Industry Classification Standard (GICS) was developed by and/or is the exclusive property of MSCI, Inc. and Standard & Poor’s Financial Services LLC (“S&P”). GICS is a service mark of MSCI and S&P and has been licensed for use by U.S. Bancorp Fund Services, LLC.
The accompanying notes are an integral part of these financial statements.
71
Statements of Assets and Liabilities
March 31, 2015
| BUFFALO DISCOVERY FUND | BUFFALO DIVIDEND FOCUS FUND | BUFFALO EMERGING OPPORTUNITIES FUND | ||||||||||
ASSETS: | ||||||||||||
Investments in securities, at cost: | ||||||||||||
Investments in securities of unaffiliated issuers | $ | 606,311,554 | $ | 35,822,062 | $ | 191,666,028 | ||||||
Investments in securities of affiliated issuers (Note 7) | — | — | — | |||||||||
|
|
|
|
|
| |||||||
Total investments, at cost | $ | 606,311,554 | $ | 35,822,062 | $ | 191,666,028 | ||||||
|
|
|
|
|
| |||||||
Investments in securities, at fair value: | ||||||||||||
Investments in securities of unaffiliated issuers | $ | 791,404,736 | $ | 40,911,332 | $ | 240,747,486 | ||||||
Investments in securities of affiliated issuers (Note 7) | — | — | — | |||||||||
|
|
|
|
|
| |||||||
Total investments, at fair value | 791,404,736 | 40,911,332 | 240,747,486 | |||||||||
Cash: | — | — | — | |||||||||
Cash denominated in foreign currency, at value:(1) | — | — | — | |||||||||
Receivables: | ||||||||||||
Investments sold | — | 105,970 | 4,140 | |||||||||
Fund shares sold | 5,283,245 | 107,372 | 92,644 | |||||||||
Dividends | 281,825 | 48,888 | 12,436 | |||||||||
Interest | 370 | 28 | 50 | |||||||||
Other assets | 35,973 | 19,086 | 15,296 | |||||||||
|
|
|
|
|
| |||||||
Total assets | 797,006,149 | 41,192,676 | 240,872,052 | |||||||||
|
|
|
|
|
| |||||||
LIABILITIES: | ||||||||||||
Payables: | ||||||||||||
Investments purchased | 21,698,729 | 19,812 | 1,551,720 | |||||||||
Written options, at value(2) (Note 8) | — | — | — | |||||||||
Fund shares purchased | 478,900 | 19,823 | 189,363 | |||||||||
Management fees | 635,681 | 31,981 | 294,572 | |||||||||
Custodian (Note 7) | — | — | — | |||||||||
Accrued expenses | 5,455 | 4,713 | 8,463 | |||||||||
|
|
|
|
|
| |||||||
Total liabilities | 22,818,765 | 76,329 | 2,044,118 | |||||||||
|
|
|
|
|
| |||||||
NET ASSETS | $ | 774,187,384 | $ | 41,116,347 | $ | 238,827,934 | ||||||
|
|
|
|
|
| |||||||
NET ASSETS CONSIST OF: | ||||||||||||
Capital (capital stock and paid-in capital) | $ | 539,310,996 | $ | 35,481,695 | $ | 194,235,128 | ||||||
Undistributed (distribution in excess of) net investment income | — | 20,318 | (658,944 | ) | ||||||||
Accumulated net realized gain (loss) from investment and foreign currency transactions | 49,783,206 | 525,064 | (3,829,708 | ) | ||||||||
Net unrealized appreciation from: | ||||||||||||
Investments and translation of assets and liabilities in foreign currency | 185,093,182 | 5,089,270 | 49,081,458 | |||||||||
|
|
|
|
|
| |||||||
NET ASSETS APPLICABLE TO OUTSTANDING SHARES | $ | 774,187,384 | $ | 41,116,347 | $ | 238,827,934 | ||||||
|
|
|
|
|
| |||||||
Capital shares, $1.00 par value: | ||||||||||||
Authorized | Unlimited | Unlimited | Unlimited | |||||||||
|
|
|
|
|
| |||||||
Outstanding | 36,012,352 | 2,987,095 | 13,381,717 | |||||||||
|
|
|
|
|
| |||||||
NET ASSET VALUE PER SHARE | $ | 21.50 | $ | 13.76 | $ | 17.85 | ||||||
|
|
|
|
|
| |||||||
(1) Cash denominated in foreign currency, at cost | — | — | — | |||||||||
(2) Written options, premiums received | — | — | — | |||||||||
The accompanying notes are an integral part of these financial statements.
72
BUFFALO | BUFFALO GROWTH FUND | BUFFALO HIGH YIELD FUND | BUFFALO INTERNATIONAL FUND | BUFFALO LARGE CAP FUND | BUFFALO MID CAP FUND | BUFFALO SMALL CAP FUND | ||||||||||||||||||||
| $ | 1,166,654,423 | $ | 324,544,226 | $ | 228,847,706 | $ | 210,129,206 | $ | 32,698,418 | $ | 384,627,385 | $ | 1,754,708,317 | |||||||||||||
| — | — | — | — | — | — | 85,849,255 | ||||||||||||||||||||
|
|
|
|
|
|
|
|
|
|
|
|
|
| |||||||||||||
| $ | 1,166,654,423 | $ | 324,544,226 | $ | 228,847,706 | $ | 210,129,206 | $ | 32,698,418 | $ | 384,627,385 | $ | 1,840,557,572 | |||||||||||||
|
|
|
|
|
|
|
|
|
|
|
|
|
| |||||||||||||
| $ | 1,346,062,346 | $ | 460,890,829 | $ | 251,108,523 | $ | 246,384,335 | $ | 44,424,089 | $ | 565,782,944 | $ | 2,813,020,791 | |||||||||||||
| — | — | — | — | — | — | 188,844,814 | ||||||||||||||||||||
|
|
|
|
|
|
|
|
|
|
|
|
|
| |||||||||||||
| 1,346,062,346 | 460,890,829 | 251,108,523 | 246,384,335 | 44,424,089 | 565,782,944 | 3,001,865,605 | ||||||||||||||||||||
| 89,590 | — | — | 18,533 | — | — | — | ||||||||||||||||||||
| — | — | — | 9,815,481 | — | — | — | ||||||||||||||||||||
| 299,577 | 2,615,205 | 1,508,472 | — | — | 1,667,906 | 20,594,739 | ||||||||||||||||||||
| 455,629 | 175,956 | 384,621 | 48,617 | 9,144 | 670,951 | 2,529,295 | ||||||||||||||||||||
| 1,889,366 | 521,814 | 86,214 | 603,064 | 14,202 | 154,382 | 321,179 | ||||||||||||||||||||
| 5,501,297 | 106 | 3,509,768 | 167 | 26 | 70 | 809 | ||||||||||||||||||||
| 35,777 | 20,432 | 15,369 | 11,684 | 12,959 | 24,162 | 70,325 | ||||||||||||||||||||
|
|
|
|
|
|
|
|
|
|
|
|
|
| |||||||||||||
| 1,354,333,582 | 464,224,342 | 256,612,967 | 256,881,881 | 44,460,420 | 568,300,415 | 3,025,381,952 | ||||||||||||||||||||
|
|
|
|
|
|
|
|
|
|
|
|
|
| |||||||||||||
| — | — | 100,000 | — | 411,260 | — | 11,621,985 | ||||||||||||||||||||
| 679,683 | — | — | — | — | — | — | ||||||||||||||||||||
| 1,485,146 | 675,049 | 306,404 | 15,500 | 2,694 | 1,498,897 | 5,203,303 | ||||||||||||||||||||
| 1,161,456 | 359,029 | 216,502 | 217,651 | 33,364 | 482,269 | 2,554,741 | ||||||||||||||||||||
| — | — | — | 11,594 | — | — | — | ||||||||||||||||||||
| 61,955 | 22,873 | 2,937 | 29,552 | 561 | 17,726 | 21,821 | ||||||||||||||||||||
|
|
|
|
|
|
|
|
|
|
|
|
|
| |||||||||||||
| 3,388,240 | 1,056,951 | 625,843 | 274,297 | 447,879 | 1,998,892 | 19,401,850 | ||||||||||||||||||||
|
|
|
|
|
|
|
|
|
|
|
|
|
| |||||||||||||
| $ | 1,350,945,342 | $ | 463,167,391 | $ | 255,987,124 | $ | 256,607,584 | $ | 44,012,541 | $ | 566,301,523 | $ | 3,005,980,102 | |||||||||||||
|
|
|
|
|
|
|
|
|
|
|
|
|
| |||||||||||||
| $ | 1,171,564,118 | $ | 276,838,231 | $ | 232,566,323 | $ | 226,126,220 | $ | 30,033,245 | $ | 355,837,797 | $ | 1,651,342,369 | |||||||||||||
| 812,155 | 411,811 | (68,594 | ) | 384,024 | 78,804 | (446,881 | ) | (4,238,994 | ) | |||||||||||||||||
| (980,083 | ) | 49,570,746 | 1,228,578 | (5,789,655 | ) | 2,174,821 | 29,755,048 | 197,568,694 | |||||||||||||||||
| 179,549,152 | 136,346,603 | 22,260,817 | 35,886,995 | 11,725,671 | 181,155,559 | 1,161,308,033 | ||||||||||||||||||||
|
|
|
|
|
|
|
|
|
|
|
|
|
| |||||||||||||
| $ | 1,350,945,342 | $ | 463,167,391 | $ | 255,987,124 | $ | 256,607,584 | $ | 44,012,541 | $ | 566,301,523 | $ | 3,005,980,102 | |||||||||||||
|
|
|
|
|
|
|
|
|
|
|
|
|
| |||||||||||||
| Unlimited | Unlimited | Unlimited | Unlimited | Unlimited | Unlimited | Unlimited | ||||||||||||||||||||
|
|
|
|
|
|
|
|
|
|
|
|
|
| |||||||||||||
| 92,956,746 | 13,386,814 | 21,865,723 | 21,505,134 | 1,754,060 | 30,312,899 | 91,559,026 | ||||||||||||||||||||
|
|
|
|
|
|
|
|
|
|
|
|
|
| |||||||||||||
| $ | 14.53 | $ | 34.60 | $ | 11.71 | $ | 11.93 | $ | 25.09 | $ | 18.68 | $ | 32.83 | |||||||||||||
|
|
|
|
|
|
|
|
|
|
|
|
|
| |||||||||||||
| — | — | — | 10,183,615 | — | — | — | ||||||||||||||||||||
| 820,912 | — | — | — | — | — | — | ||||||||||||||||||||
73
Statements of Operations
For the Year Ended March 31, 2015
| BUFFALO DISCOVERY FUND | BUFFALO DIVIDEND FOCUS FUND | BUFFALO EMERGING OPPORTUNIES FUND | ||||||||||
INVESTMENT INCOME: | ||||||||||||
Interest | $ | 2,859 | $ | 364 | $ | 599 | ||||||
Dividends: | ||||||||||||
Dividends from securities of unaffiliated issuers | 4,821,500 | 617,271 | 580,249 | |||||||||
Dividends from securities of affiliated issuers (Note 7) | — | — | — | |||||||||
Foreign tax withheld | (23,258 | ) | (6,993 | ) | — | |||||||
|
|
|
|
|
| |||||||
Total investment income | 4,801,101 | 610,642 | 580,848 | |||||||||
|
|
|
|
|
| |||||||
EXPENSES: | ||||||||||||
Management fees (Note 3) | 6,645,545 | 279,463 | 4,624,950 | |||||||||
Custody fees (Note 7) | — | — | — | |||||||||
Registration fees | 35,384 | 9,563 | 49,758 | |||||||||
Other | 11,266 | 1,466 | 9,090 | |||||||||
|
|
|
|
|
| |||||||
Total expenses | 6,692,195 | 290,492 | 4,683,798 | |||||||||
|
|
|
|
|
| |||||||
Net investment income (loss) | (1,891,094 | ) | 320,150 | (4,102,950 | ) | |||||||
|
|
|
|
|
| |||||||
NET REALIZED AND UNREALIZED GAIN (LOSS) ON INVESTMENTS: | ||||||||||||
Net realized gain (loss) from: | ||||||||||||
Investment transactions of unaffiliated issuers | 80,193,349 | 2,182,795 | (3,829,788 | ) | ||||||||
Investment transactions of affiliated issuers (Note 7) | — | — | — | |||||||||
Options written (Note 8) | — | — | — | |||||||||
Net unrealized appreciation/depreciation during the period on: | ||||||||||||
Investments | 18,800,661 | �� | 2,273,927 | (21,049,812 | ) | |||||||
Options written (Note 8) | — | — | — | |||||||||
|
|
|
|
|
| |||||||
Net realized and unrealized gain (loss) on investments | 98,994,010 | 4,456,722 | (24,879,520 | ) | ||||||||
|
|
|
|
|
| |||||||
Net increase (decrease) in net assets resulting from operations | $ | 97,102,916 | $ | 4,776,872 | $ | (28,982,470 | ) | |||||
|
|
|
|
|
| |||||||
The accompanying notes are an integral part of these financial statements.
74
| BUFFALO FLEXIBLE INCOME FUND | BUFFALO GROWTH FUND | BUFFALO HIGH YIELD FUND | BUFFALO INTERNATIONAL FUND | BUFFALO LARGE CAP FUND | BUFFALO MID CAP FUND | BUFFALO SMALL CAP FUND | ||||||||||||||||||||
| $ | 18,579,362 | $ | 1,713 | $ | 11,927,178 | $ | 1,817 | $ | 133 | $ | 782 | $ | 8,478 | |||||||||||||
| 27,418,711 | 7,859,780 | 569,997 | 4,818,339 | 408,242 | 4,773,064 | 9,895,377 | ||||||||||||||||||||
| — | — | — | — | — | — | 2,288,087 | ||||||||||||||||||||
| (290,099 | ) | (14,493 | ) | (3,870 | ) | (537,905 | ) | — | (18,820 | ) | (65,101 | ) | ||||||||||||||
|
|
|
|
|
|
|
|
|
|
|
|
|
| |||||||||||||
| 45,707,974 | 7,847,000 | 12,493,305 | 4,282,251 | 408,375 | 4,755,026 | 12,126,841 | ||||||||||||||||||||
|
|
|
|
|
|
|
|
|
|
|
|
|
| |||||||||||||
| 14,947,564 | 5,096,622 | 2,645,334 | 2,356,236 | 310,398 | 5,762,712 | 32,804,111 | ||||||||||||||||||||
| — | — | — | 88,340 | — | — | — | ||||||||||||||||||||
| 77,005 | 40,131 | 34,142 | 19,665 | 17,864 | 41,660 | 78,609 | ||||||||||||||||||||
| 21,232 | 7,771 | 6,426 | 4,657 | 1,309 | 7,947 | 46,362 | ||||||||||||||||||||
|
|
|
|
|
|
|
|
|
|
|
|
|
| |||||||||||||
| 15,045,801 | 5,144,524 | 2,685,902 | 2,468,898 | 329,571 | 5,812,319 | 32,929,082 | ||||||||||||||||||||
|
|
|
|
|
|
|
|
|
|
|
|
|
| |||||||||||||
| 30,662,173 | 2,702,476 | 9,807,403 | 1,813,353 | 78,804 | (1,057,293 | ) | (20,802,241 | ) | ||||||||||||||||||
|
|
|
|
|
|
|
|
|
|
|
|
|
| |||||||||||||
| (607,986 | ) | 91,305,329 | 1,407,640 | (1,524,661 | ) | 3,334,563 | 56,675,267 | 310,863,343 | ||||||||||||||||||
| — | — | — | — | — | — | (3,975,139 | ) | |||||||||||||||||||
| 624,574 | — | — | — | — | — | — | ||||||||||||||||||||
| 14,629,753 | (35,502,624 | ) | (2,045,967 | ) | 5,428,647 | 3,016,822 | (98,863 | ) | (310,233,283 | ) | ||||||||||||||||
| 283,266 | — | — | — | — | — | — | ||||||||||||||||||||
|
|
|
|
|
|
|
|
|
|
|
|
|
| |||||||||||||
| 14,929,607 | 55,802,705 | (638,327 | ) | 3,903,986 | 6,351,385 | 56,576,404 | (3,345,079 | ) | ||||||||||||||||||
|
|
|
|
|
|
|
|
|
|
|
|
|
| |||||||||||||
| $ | 45,591,780 | $ | 58,505,181 | $ | 9,169,076 | $ | 5,717,339 | $ | 6,430,189 | $ | 55,519,111 | $ | (24,147,320 | ) | ||||||||||||
|
|
|
|
|
|
|
|
|
|
|
|
|
| |||||||||||||
75
Statements of Changes in Net Assets
| BUFFALO DISCOVERY FUND | ||||||||
| YEAR ENDED MARCH 31, 2015 | YEAR ENDED MARCH 31, 2014 | |||||||
OPERATIONS: | ||||||||
Net investment income (loss) | $ | (1,891,094 | ) | $ | (2,608,113 | ) | ||
Net realized gain (loss) from investment transactions | 80,193,349 | 76,049,385 | ||||||
Net unrealized appreciation/depreciation during the year on investments and translation of assets and liabilities in foreign currencies | 18,800,661 | 66,538,230 | ||||||
|
|
|
| |||||
Net increase/(decrease) in net assets resulting from operations | 97,102,916 | 139,979,502 | ||||||
DISTRIBUTIONS TO SHAREHOLDERS: | ||||||||
Net investment income | — | — | ||||||
Net realized gain from investment transactions | (65,032,196 | ) | (42,280,594 | ) | ||||
|
|
|
| |||||
Total distributions to shareholders | (65,032,196 | ) | (42,280,594 | ) | ||||
CAPITAL SHARE TRANSACTIONS: | ||||||||
Shares sold | 251,810,031 | 172,012,059 | ||||||
Reinvested dividends and distributions | 63,266,179 | 40,932,376 | ||||||
|
|
|
| |||||
Shares issued | 315,076,210 | 212,944,435 | ||||||
Redemptions | (222,553,064 | ) | (176,568,358 | ) | ||||
Redemption fees (Note 5) | 57,478 | 32,236 | ||||||
|
|
|
| |||||
Shares repurchased | (222,495,586 | ) | (176,536,122 | ) | ||||
|
|
|
| |||||
Net increase (decrease) from capital share transactions | 92,580,624 | 36,408,313 | ||||||
|
|
|
| |||||
Total increase (decrease) in net assets | 124,651,344 | 134,107,221 | ||||||
NET ASSETS: | ||||||||
Beginning of period | 649,536,040 | 515,428,819 | ||||||
|
|
|
| |||||
End of period | $ | 774,187,384 | $ | 649,536,040 | ||||
|
|
|
| |||||
Undistributed (distribution in excess of) net investment income at end of year | $ | — | $ | — | ||||
|
|
|
| |||||
Fund share transactions: | ||||||||
Shares sold | 12,036,161 | 8,865,819 | ||||||
Reinvested dividends and distributions | 3,185,608 | 2,105,575 | ||||||
|
|
|
| |||||
| 15,221,769 | 10,971,394 | |||||||
Shares repurchased | (10,853,352 | ) | (9,505,843 | ) | ||||
|
|
|
| |||||
Net increase (decrease) in fund shares | 4,368,417 | 1,465,551 | ||||||
|
|
|
| |||||
| (1) | Effective June 3, 2013, the Fund name was changed to Buffalo Emerging Opportunities Fund. Prior to June 3, 2013, the Fund was known as the Buffalo Micro Cap Fund. |
The accompanying notes are an integral part of these financial statements.
76
| BUFFALO DIVIDEND FOCUS FUND | BUFFALO EMERGING OPPORTUNIES FUND | BUFFALO FLEXIBLE INCOME FUND | BUFFALO GROWTH FUND | |||||||||||||||||||||||||||
| YEAR ENDED MARCH 31, 2015 | YEAR ENDED MARCH 31, 2014 | YEAR ENDED MARCH 31, 2015 | YEAR ENDED MARCH 31, 2014 (1) | YEAR ENDED MARCH 31, 2015 | YEAR ENDED MARCH 31, 2014 | YEAR ENDED MARCH 31, 2015 | YEAR ENDED MARCH 31, 2014 | |||||||||||||||||||||||
| $ | 320,150 | $ | 222,061 | $ | (4,102,950 | ) | $ | (4,441,697 | ) | $ | 30,662,173 | $ | 24,179,477 | $ | 2,702,476 | $ | 2,439,253 | |||||||||||||
| 2,182,795 | 569,021 | (3,829,708 | ) | 27,026,586 | 16,588 | 16,180,658 | 91,305,329 | 50,488,452 | ||||||||||||||||||||||
| 2,273,927 |
| 2,234,064 | (21,049,812 | ) | 48,164,700 | 14,913,019 | 66,196,088 | (35,502,624 | ) | 83,160,262 | |||||||||||||||||||
|
|
|
|
|
|
|
|
|
|
|
|
|
|
|
| |||||||||||||||
| 4,776,872 | 3,025,146 | (28,982,470 | ) | 70,749,589 | 45,591,780 | 106,556,223 | 58,505,181 | 136,087,967 | ||||||||||||||||||||||
| (320,954 | ) | (220,213 | ) | — | — | (29,873,271 | ) | (24,064,687 | ) | (2,601,493 | ) | (3,648,495 | ) | |||||||||||||||||
| (1,761,094 | ) | (509,817 | ) | (18,880,842 | ) | (1,262,443 | ) | (6,589,756 | ) | (11,338,077 | ) | (65,581,683 | ) | (33,125,754 | ) | |||||||||||||||
|
|
|
|
|
|
|
|
|
|
|
|
|
|
|
| |||||||||||||||
| (2,082,048 | ) | (730,030 | ) | (18,880,842 | ) | (1,262,443 | ) | (36,463,027 | ) | (35,402,764 | ) | (68,183,176 | ) | (36,774,249 | ) | |||||||||||||||
| 32,321,321 | 4,519,089 | 51,764,222 | 482,250,309 | 367,530,181 | 734,666,145 | 62,397,903 | 132,278,831 | |||||||||||||||||||||||
| 1,873,070 | 629,139 | 18,306,236 | 1,194,073 | 35,520,956 | 34,111,420 | 65,878,238 | 35,162,786 | |||||||||||||||||||||||
|
|
|
|
|
|
|
|
|
|
|
|
|
|
|
| |||||||||||||||
| 34,194,391 | 5,148,228 | 70,070,458 | 483,444,382 | 403,051,137 | 768,777,565 | 128,276,141 | 167,441,617 | |||||||||||||||||||||||
| (14,482,153 | ) | (2,543,710 | ) | (309,917,957 | ) | (120,841,945 | ) | (459,148,434 | ) | (304,868,806 | ) | (271,502,922 | ) | (144,422,481 | ) | |||||||||||||||
| 7,826 | 130 | 683,127 | 807,260 | 57,154 | 113,722 | 28,798 | 51,252 | |||||||||||||||||||||||
|
|
|
|
|
|
|
|
|
|
|
|
|
|
|
| |||||||||||||||
| (14,474,327 | ) | (2,543,580 | ) | (309,234,830 | ) | (120,034,685 | ) | (459,091,280 | ) | (304,755,084 | ) | (271,474,124 | ) | (144,371,229 | ) | |||||||||||||||
|
|
|
|
|
|
|
|
|
|
|
|
|
|
|
| |||||||||||||||
| 19,720,064 | 2,604,648 | (239,164,372 | ) | 363,409,697 | (56,040,143 | ) | 464,022,481 | (143,197,983 | ) | 23,070,388 | ||||||||||||||||||||
|
|
|
|
|
|
|
|
|
|
|
|
|
|
|
| |||||||||||||||
| 22,414,888 | 4,899,764 | (287,027,684 | ) | 432,896,843 | (46,911,390 | ) | 535,175,940 | (152,875,978 | ) | 122,384,106 | ||||||||||||||||||||
| 18,701,459 | 13,801,695 | 525,855,618 | 92,958,775 | 1,397,856,732 | 862,680,792 | 616,043,369 | 493,659,263 | |||||||||||||||||||||||
|
|
|
|
|
|
|
|
|
|
|
|
|
|
|
| |||||||||||||||
| $ | 41,116,347 | $ | 18,701,459 | $ | 238,827,934 | $ | 525,855,618 | $ | 1,350,945,342 | $ | 1,397,856,732 | $ | 463,167,391 | $ | 616,043,369 | |||||||||||||||
|
|
|
|
|
|
|
|
|
|
|
|
|
|
|
| |||||||||||||||
| $ | 20,318 | $ | 17,951 | $ | (658,944 | ) | $ | — | $ | 812,155 | $ | (376,316 | ) | $ | 411,811 | $ | 310,828 | |||||||||||||
|
|
|
|
|
|
|
|
|
|
|
|
|
|
|
| |||||||||||||||
| 2,398,935 | 391,526 | 2,963,614 | 26,901,242 | 24,905,990 | 52,671,874 | 1,766,396 | 3,968,429 | |||||||||||||||||||||||
| 138,360 | 54,403 | 1,081,929 | 61,998 | 2,425,849 | 2,427,737 | 1,981,896 | 1,032,681 | |||||||||||||||||||||||
|
|
|
|
|
|
|
|
|
|
|
|
|
|
|
| |||||||||||||||
| 2,537,295 | 445,929 | 4,045,543 | 26,963,240 | 27,331,839 | 55,099,611 | 3,748,292 | 5,001,110 | |||||||||||||||||||||||
| (1,077,127 | ) | (227,675 | ) | (17,892,242 | ) | (6,442,090 | ) | (31,410,658 | ) | (21,772,931 | ) | (7,739,324 | ) | (4,342,702 | ) | |||||||||||||||
|
|
|
|
|
|
|
|
|
|
|
|
|
|
|
| |||||||||||||||
| 1,460,168 | 218,254 | (13,846,699 | ) | 20,521,150 | (4,078,819 | ) | 33,326,680 | (3,991,032 | ) | 658,408 | ||||||||||||||||||||
|
|
|
|
|
|
|
|
|
|
|
|
|
|
|
| |||||||||||||||
77
Statements of Changes in Net Assets
| BUFFALO HIGH YIELD FUND | ||||||||
| YEAR ENDED MARCH 31, 2015 | YEAR ENDED MARCH 31, 2014 | |||||||
OPERATIONS: | ||||||||
Net investment income (loss) | $ | 9,807,403 | $ | 10,237,997 | ||||
Net realized gain (loss) from investment transactions | 1,407,640 | 6,817,140 | ||||||
Net unrealized appreciation/depreciation during the year on investments and translation of assets and liabilities in foreign currencies | (2,045,967 | ) | 1,594,871 | |||||
|
|
|
| |||||
Net increase (decrease) in net assets resulting from operations | 9,169,076 | 18,650,008 | ||||||
DISTRIBUTIONS TO SHAREHOLDERS: | ||||||||
Net investment income | (9,369,546 | ) | (10,656,681 | ) | ||||
Net realized gain from investment transactions | (2,535,676 | ) | (4,322,504 | ) | ||||
|
|
|
| |||||
Total distributions to shareholders | (11,905,222 | ) | (14,979,185 | ) | ||||
CAPITAL SHARE TRANSACTIONS: | ||||||||
Shares sold | 37,616,927 | 80,843,340 | ||||||
Reinvested dividends and distributions | 11,121,539 | 10,027,287 | ||||||
|
|
|
| |||||
Shares issued | 48,738,466 | 90,870,627 | ||||||
Redemptions | (80,576,926 | ) | (65,240,591 | ) | ||||
Redemption fees (Note 5) | 23,475 | 125,147 | ||||||
|
|
|
| |||||
Shares repurchased | (80,553,451 | ) | (65,115,444 | ) | ||||
|
|
|
| |||||
Net increase (decrease) from capital share transactions | (31,814,985 | ) | 25,755,183 | |||||
|
|
|
| |||||
Total increase (decrease) in net assets | (34,551,131 | ) | 29,426,006 | |||||
NET ASSETS: | ||||||||
Beginning of period | 290,538,255 | 261,112,249 | ||||||
|
|
|
| |||||
End of period | $ | 255,987,124 | $ | 290,538,255 | ||||
|
|
|
| |||||
Undistributed (distribution in excess of) net investment income at end of year | $ | (68,594 | ) | $ | (685,435 | ) | ||
|
|
|
| |||||
Fund share transactions: | ||||||||
Shares sold | 3,217,854 | 6,835,542 | ||||||
Reinvested dividends and distributions | 957,498 | 850,824 | ||||||
|
|
|
| |||||
| 4,175,352 | 7,686,366 | |||||||
Shares repurchased | (6,850,163 | ) | (5,522,888 | ) | ||||
|
|
|
| |||||
Net increase (decrease) in fund shares | (2,674,811 | ) | 2,163,478 | |||||
|
|
|
| |||||
The accompanying notes are an integral part of these financial statements.
78
| BUFFALO INTERNATIONAL FUND | BUFFALO LARGE CAP FUND | BUFFALO MID CAP FUND | BUFFALO SMALL CAP FUND | |||||||||||||||||||||||||||
| YEAR ENDED MARCH 31, 2015 | YEAR ENDED MARCH 31, 2014 | YEAR ENDED MARCH 31, 2015 | YEAR ENDED MARCH 31, 2014 | YEAR ENDED MARCH 31, 2015 | YEAR ENDED MARCH 31, 2014 | YEAR ENDED MARCH 31, 2015 | YEAR ENDED MARCH 31, 2014 | |||||||||||||||||||||||
| $ | 1,813,353 | $ | 602,193 | $ | 78,804 | $ | 63,285 | $ | (1,057,293 | ) | $ | (1,235,491 | ) | $ | (20,802,241 | ) | $ | (16,492,516 | ) | |||||||||||
| (1,524,661 | ) | 5,585,567 | 3,334,563 | 4,872,447 | 56,675,267 | 114,339,882 | 306,888,204 | 358,038,527 | ||||||||||||||||||||||
| 5,428,647 |
| 15,589,979 | 3,016,822 | 1,371,961 | (98,863 | ) | 27,165,516 | (310,233,283 | ) | 476,762,877 | |||||||||||||||||||
|
|
|
|
|
|
|
|
|
|
|
|
|
|
|
| |||||||||||||||
| 5,717,339 | 21,777,739 | 6,430,189 | 6,307,693 | 55,519,111 | 140,269,907 | (24,147,320 | ) | 818,308,888 | ||||||||||||||||||||||
| (1,409,119 | ) | (354,812 | ) | (63,281 | ) | (101,488 | ) | — | — | — | — | |||||||||||||||||||
| — | — | (3,614,276 | ) | (4,186,123 | ) | (69,353,806 | ) | (88,592,833 | ) | (301,093,346 | ) | (313,081,084 | ) | |||||||||||||||||
|
|
|
|
|
|
|
|
|
|
|
|
|
|
|
| |||||||||||||||
| (1,409,119 | ) | (354,812 | ) | (3,677,557 | ) | (4,287,611 | ) | (69,353,806 | ) | (88,592,833 | ) | (301,093,346 | ) | (313,081,084 | ) | |||||||||||||||
| 41,149,210 | 107,987,877 | 10,156,163 | 3,946,253 | 91,731,038 | 101,725,184 | 484,135,925 | 693,673,158 | |||||||||||||||||||||||
| 1,344,943 | 335,818 | 3,558,114 | 4,234,300 | 68,086,243 | 86,531,993 | 287,667,722 | 296,310,794 | |||||||||||||||||||||||
|
|
|
|
|
|
|
|
|
|
|
|
|
|
|
| |||||||||||||||
| 42,494,153 | 108,323,695 | 13,714,277 | 8,180,553 | 159,817,281 | 188,257,177 | 771,803,647 | 989,983,952 | |||||||||||||||||||||||
| (15,494,625 | ) | (10,949,623 | ) | (4,565,485 | ) | (6,442,585 | ) | (199,946,710 | ) | (244,868,075 | ) | (1,244,026,272 | ) | (836,079,584 | ) | |||||||||||||||
| 650 | 2,006 | 82 | 924 | 10,583 | 10,690 | 62,286 | 69,745 | |||||||||||||||||||||||
|
|
|
|
|
|
|
|
|
|
|
|
|
|
|
| |||||||||||||||
| (15,493,975 | ) | (10,947,617 | ) | (4,565,403 | ) | (6,441,661 | ) | (199,936,127 | ) | (244,857,385 | ) | (1,243,963,986 | ) | (836,009,839 | ) | |||||||||||||||
|
|
|
|
|
|
|
|
|
|
|
|
|
|
|
| |||||||||||||||
| 27,000,178 | 97,376,078 | 9,148,874 | 1,738,892 | (40,118,846 | ) | (56,600,208 | ) | (472,160,339 | ) | 153,974,113 | ||||||||||||||||||||
|
|
|
|
|
|
|
|
|
|
|
|
|
|
|
| |||||||||||||||
| 31,308,398 | 118,799,005 | 11,901,506 | 3,758,974 | (53,953,541 | ) | (4,923,134 | ) | (797,401,005 | ) | 659,201,917 | ||||||||||||||||||||
| 225,299,186 | 106,500,181 | 32,111,035 | 28,352,061 | 620,255,064 | 625,178,198 | 3,803,381,107 | 3,144,179,190 | |||||||||||||||||||||||
|
|
|
|
|
|
|
|
|
|
|
|
|
|
|
| |||||||||||||||
| $ | 256,607,584 | $ | 225,299,186 | $ | 44,012,541 | $ | 32,111,035 | $ | 566,301,523 | $ | 620,255,064 | $ | 3,005,980,102 | $ | 3,803,381,107 | |||||||||||||||
|
|
|
|
|
|
|
|
|
|
|
|
|
|
|
| |||||||||||||||
| $ | 384,024 | $ | (58,796 | ) | $ | 78,804 | $ | 63,285 | $ | (446,881 | ) | $ | (626,345 | ) | $ | (4,238,994 | ) | $ | (6,562,140 | ) | ||||||||||
|
|
|
|
|
|
|
|
|
|
|
|
|
|
|
| |||||||||||||||
| 3,507,208 | 9,822,283 | 416,848 | 165,127 | 4,884,778 | 5,247,674 | 14,523,805 | 19,220,936 | |||||||||||||||||||||||
| 117,008 | 29,406 | 150,831 | 184,662 | 3,917,505 | 4,718,211 | 9,114,947 | 8,160,584 | |||||||||||||||||||||||
|
|
|
|
|
|
|
|
|
|
|
|
|
|
|
| |||||||||||||||
| 3,624,216 | 9,851,689 | 567,679 | 349,789 | 8,802,283 | 9,965,885 | 23,638,752 | 27,381,520 | |||||||||||||||||||||||
| (1,323,795 | ) | (1,004,580 | ) | (189,383 | ) | (269,012 | ) | (10,681,027 | ) | (12,618,838 | ) | (37,661,473 | ) | (23,459,118 | ) | |||||||||||||||
|
|
|
|
|
|
|
|
|
|
|
|
|
|
|
| |||||||||||||||
| 2,300,421 | 8,847,109 | 378,296 | 80,777 | (1,878,744 | ) | (2,652,953 | ) | (14,022,721 | ) | 3,922,402 | ||||||||||||||||||||
|
|
|
|
|
|
|
|
|
|
|
|
|
|
|
| |||||||||||||||
79
Financial Highlights
The following tables are intended to help you understand the Fund’s financial performance. The information reflects financial results for the Fund held for the periods shown. Total returns assume reinvestment of all dividends and distributions. Total returns do not reflect payment of sales charges, if any, and are not annualized for periods of less than one year.
BUFFALO DISCOVERY FUND
Condensed data for a share of capital stock outstanding throughout the year. | YEARS ENDED MARCH 31, | |||||||||||||||||||
| 2015 | 2014 | 2013(3) | 2012 | 2011 | ||||||||||||||||
Net asset value, beginning of year | $ | 20.53 | $ | 17.08 | $ | 16.96 | $ | 16.28 | $ | 13.76 | ||||||||||
|
|
|
|
|
|
|
|
|
| |||||||||||
Income from investment operations: | ||||||||||||||||||||
Net investment income (loss) | (0.05 | ) | (0.08 | ) | 0.02 | (0.07 | ) | (0.05 | )(1) | |||||||||||
Net gains on securities (both realized and unrealized) | 3.08 | 5.04 | 1.32 | 1.74 | 2.89 | |||||||||||||||
|
|
|
|
|
|
|
|
|
| |||||||||||
Total from investment operations | 3.03 | 4.96 | 1.34 | 1.67 | 2.84 | |||||||||||||||
|
|
|
|
|
|
|
|
|
| |||||||||||
Less distributions: | ||||||||||||||||||||
Dividends from net investment income | — | — | (0.03 | ) | — | — | ||||||||||||||
Distributions from capital gains | (2.06 | ) | (1.51 | ) | (1.19 | ) | (0.99 | ) | (0.32 | ) | ||||||||||
|
|
|
|
|
|
|
|
|
| |||||||||||
Total distributions | (2.06 | ) | (1.51 | ) | (1.22 | ) | (0.99 | ) | (0.32 | ) | ||||||||||
|
|
|
|
|
|
|
|
|
| |||||||||||
Paid-in capital from redemption fees(2) (Note 5) | — | — | — | — | — | |||||||||||||||
|
|
|
|
|
|
|
|
|
| |||||||||||
Net asset value, end of year | $ | 21.50 | $ | 20.53 | $ | 17.08 | $ | 16.96 | $ | 16.28 | ||||||||||
|
|
|
|
|
|
|
|
|
| |||||||||||
Total return | 15.56% | 29.54% | 8.46% | 11.50% | 20.77% | |||||||||||||||
|
|
|
|
|
|
|
|
|
| |||||||||||
Ratios/Supplemental Data | ||||||||||||||||||||
Net assets, end of year (in thousands) | $ | 774,187 | $ | 649,536 | $ | 515,429 | $ | 416,772 | $ | 364,188 | ||||||||||
Ratio of expenses to average net assets | 1.01% | 1.01% | 1.01% | 1.01% | 1.02% | |||||||||||||||
Ratio of net investment income (loss) to average net assets | (0.28% | ) | (0.47% | ) | 0.09% | (0.46% | ) | (0.33% | ) | |||||||||||
Portfolio turnover rate | 52% | 48% | 53% | 52% | 38% | |||||||||||||||
| (1) | Net investment loss per share calculated using average shares outstanding. |
| (2) | Less than $0.01 per share. |
| (3) | Effective June 29, 2012, the Fund name was changed to Buffalo Discovery Fund. Prior to June 29, 2012, the Fund was known as the Buffalo Science & Technology Fund. |
The accompanying notes are an integral part of these financial statements.
80
Financial Highlights
The following tables are intended to help you understand the Fund’s financial performance. The information reflects financial results for the Fund held for the periods shown. Total returns assume reinvestment of all dividends and distributions. Total returns do not reflect payment of sales charges, if any, and are not annualized for periods of less than one year.
BUFFALO DIVIDEND FOCUS FUND
Condensed data for a share of capital stock outstanding throughout the period. | FOR THE YEAR ENDED MARCH 31, | FOR THE PERIOD FROM DECEMBER 3, 2012 (COMMENCEMENT OF OPERATIONS) TO MARCH 31, 2013 | ||||||||||
| 2015 | 2014 | |||||||||||
Net asset value, beginning of period | $ | 12.25 | $ | 10.55 | $ | 10.00 | ||||||
|
|
|
|
|
| |||||||
Income from investment operations: | ||||||||||||
Net investment income | 0.13 | 0.16 | 0.01 | |||||||||
Net gains on securities (both realized and unrealized) | 2.16 | 2.08 | 0.55 | |||||||||
|
|
|
|
|
| |||||||
Total from investment operations | 2.29 | 2.24 | 0.56 | |||||||||
|
|
|
|
|
| |||||||
Less distributions: | ||||||||||||
Dividends from net investment income | (0.13 | ) | (0.16 | ) | (0.01 | ) | ||||||
Distributions from capital gains | (0.65 | ) | (0.38 | ) | — | |||||||
|
|
|
|
|
| |||||||
Total distributions | (0.78 | ) | (0.54 | ) | (0.01 | ) | ||||||
|
|
|
|
|
| |||||||
Paid-in capital from redemption fees (Note 5)(1) | — | — | — | |||||||||
|
|
|
|
|
| |||||||
Net asset value, end of period | $ | 13.76 | $ | 12.25 | $ | 10.55 | ||||||
|
|
|
|
|
| |||||||
Total return* | 18.86% | 21.65% | 5.65% | |||||||||
|
|
|
|
|
| |||||||
Ratios/Supplemental Data | ||||||||||||
Net assets, end of period (in thousands) | $ | 41,116 | $ | 18,701 | $ | 13,802 | ||||||
Ratio of expenses to average net assets** | 0.94% | 0.93% | 1.61% | |||||||||
Ratio of net investment income to average net assets** | 1.04% | 1.47% | 0.59% | |||||||||
Portfolio turnover rate* | 62% | 77% | 8% | |||||||||
| * | Not annualized for periods less than one full year. |
| ** | Annualized for periods less than one full year. |
| (1) | Less than $0.01 per share. |
The accompanying notes are an integral part of these financial statements.
81
Financial Highlights
The following tables are intended to help you understand the Fund’s financial performance. The information reflects financial results for the Fund held for the periods shown. Total returns assume reinvestment of all dividends and distributions. Total returns do not reflect payment of sales charges, if any, and are not annualized for periods of less than one year.
BUFFALO EMERGING OPPORTUNITIES FUND
Condensed data for a share of capital stock outstanding throughout the year. | YEARS ENDED MARCH 31, | |||||||||||||||||||
| 2015 | 2014(3) | 2013 | 2012 | 2011 | ||||||||||||||||
Net asset value, beginning of year | $ | 19.31 | $ | 13.86 | $ | 11.71 | $ | 10.24 | $ | 8.18 | ||||||||||
|
|
|
|
|
|
|
|
|
| |||||||||||
Income from investment operations: | ||||||||||||||||||||
Net investment loss | (0.31 | ) | (0.14 | ) | (0.05 | ) | (0.09 | ) | (0.07 | )(1) | ||||||||||
Net gains on securities (both realized and unrealized) | 0.06 | 5.59 | 2.20 | 1.56 | 2.13 | |||||||||||||||
|
|
|
|
|
|
|
|
|
| |||||||||||
Total from investment operations | (0.25 | ) | 5.45 | 2.15 | 1.47 | 2.06 | ||||||||||||||
|
|
|
|
|
|
|
|
|
| |||||||||||
Less distributions from capital gains | (1.25 | ) | (0.05 | ) | — | — | — | |||||||||||||
|
|
|
|
|
|
|
|
|
| |||||||||||
Paid-in capital from redemption fees (Note 5) | 0.04 | 0.05 | — | (2) | — | (2) | — | (2) | ||||||||||||
|
|
|
|
|
|
|
|
|
| |||||||||||
Net asset value, end of year | $ | 17.85 | $ | 19.31 | $ | 13.86 | $ | 11.71 | $ | 10.24 | ||||||||||
|
|
|
|
|
|
|
|
|
| |||||||||||
Total return | (0.71% | ) | 39.66% | 18.36% | 14.36% | 25.18% | ||||||||||||||
|
|
|
|
|
|
|
|
|
| |||||||||||
Ratios/Supplemental Data | ||||||||||||||||||||
Net assets, end of year (in thousands) | $ | 238,828 | $ | 525,856 | $ | 92,959 | $ | 40,981 | $ | 31,319 | ||||||||||
Ratio of expenses to average net assets | 1.47% | 1.48% | 1.50% | 1.51% | 1.53% | |||||||||||||||
Ratio of net investment loss to average net assets | (1.29% | ) | (1.36% | ) | (0.69% | ) | (0.99% | ) | (0.82% | ) | ||||||||||
Portfolio turnover rate | 19% | 23% | 21% | 31% | 30% | |||||||||||||||
| (1) | Net investment loss per share calculated using average shares outstanding. |
| (2) | Less than $0.01 per share. |
| (3) | Effective June 3, 2013, the Fund name was changed to Buffalo Emerging Opportunities Fund. Prior to June 3, 2013 the Fund was known as the Buffalo Micro Cap Fund. |
The accompanying notes are an integral part of these financial statements.
82
Financial Highlights
The following tables are intended to help you understand the Fund’s financial performance. The information reflects financial results for the Fund held for the periods shown. Total returns assume reinvestment of all dividends and distributions. Total returns do not reflect payment of sales charges, if any, and are not annualized for periods of less than one year.
BUFFALO FLEXIBLE INCOME FUND
Condensed data for a share of capital stock outstanding throughout the year. | YEARS ENDED MARCH 31, | |||||||||||||||||||
| 2015 | 2014 | 2013 | 2012(2) | 2011 | ||||||||||||||||
Net asset value, beginning of year | $ | 14.41 | $ | 13.54 | $ | 12.39 | $ | 11.76 | $ | 10.61 | ||||||||||
|
|
|
|
|
|
|
|
|
| |||||||||||
Income from investment operations: | ||||||||||||||||||||
Net investment income | 0.30 | 0.29 | 0.37 | 0.41 | 0.33 | |||||||||||||||
Net gains on securities (both realized and unrealized) | 0.18 | 0.99 | 1.20 | 0.63 | 1.15 | |||||||||||||||
|
|
|
|
|
|
|
|
|
| |||||||||||
Total from investment operations | 0.48 | 1.28 | 1.57 | 1.04 | 1.48 | |||||||||||||||
|
|
|
|
|
|
|
|
|
| |||||||||||
Less distributions: | ||||||||||||||||||||
Dividends from net investment income | (0.30 | ) | (0.28 | ) | (0.42 | ) | (0.41 | ) | (0.33 | ) | ||||||||||
Distributions from capital gains | (0.06 | ) | (0.13 | ) | — | — | — | |||||||||||||
|
|
|
|
|
|
|
|
|
| |||||||||||
Total distributions | (0.36 | ) | (0.41 | ) | (0.42 | ) | (0.41 | ) | (0.33 | ) | ||||||||||
|
|
|
|
|
|
|
|
|
| |||||||||||
Paid-in capital from redemption fees(1) (Note 5) | — | — | — | — | — | |||||||||||||||
|
|
|
|
|
|
|
|
|
| |||||||||||
Net asset value, end of year | $ | 14.53 | $ | 14.41 | $ | 13.54 | $ | 12.39 | $ | 11.76 | ||||||||||
|
|
|
|
|
|
|
|
|
| |||||||||||
Total return | 3.33% | 9.56% | 12.96% | 9.15% | 14.27% | |||||||||||||||
|
|
|
|
|
|
|
|
|
| |||||||||||
Ratios/Supplemental Data | ||||||||||||||||||||
Net assets, end of year (in thousands) | $ | 1,350,945 | $ | 1,397,857 | $ | 862,681 | $ | 377,851 | $ | 184,454 | ||||||||||
Ratio of expenses to average net assets | 1.01% | 1.01% | 1.02% | 1.01% | 1.02% | |||||||||||||||
Ratio of net investment income to average net assets | 2.05% | 2.06% | 2.89% | 3.49% | 2.98% | |||||||||||||||
Portfolio turnover rate | 42% | 13% | 25% | 19% | 26% | |||||||||||||||
| (1) | Less than $0.01 per share. |
| (2) | Effective July 29, 2011, the Fund name was changed to Buffalo Flexible Income Fund. Prior to July 29, 2011, the Fund was known as the Buffalo Balanced Fund. |
The accompanying notes are an integral part of these financial statements.
83
Financial Highlights
The following tables are intended to help you understand the Fund’s financial performance. The information reflects financial results for the Fund held for the periods shown. Total returns assume reinvestment of all dividends and distributions. Total returns do not reflect payment of sales charges, if any, and are not annualized for periods of less than one year.
BUFFALO GROWTH FUND
| Condensed data for a share of capital stock outstanding throughout the year. | YEARS ENDED MARCH 31, | |||||||||||||||||||
| 2015 | 2014 | 2013 | 2012 | 2011 | ||||||||||||||||
Net asset value, beginning of year | $ | 35.45 | $ | 29.53 | $ | 27.93 | $ | 26.15 | $ | 21.87 | ||||||||||
|
|
|
|
|
|
|
|
|
| |||||||||||
Income from investment operations: | ||||||||||||||||||||
Net investment income | 0.19 | 0.15 | 0.15 | 0.06 | 0.07 | |||||||||||||||
Net gains on securities (both realized and unrealized) | 3.63 | 8.02 | 1.57 | 2.17 | 4.28 | |||||||||||||||
|
|
|
|
|
|
|
|
|
| |||||||||||
Total from investment operations | 3.82 | 8.17 | 1.72 | 2.23 | 4.35 | |||||||||||||||
|
|
|
|
|
|
|
|
|
| |||||||||||
Less distributions: | ||||||||||||||||||||
Dividends from net investment income | (0.18 | ) | (0.22 | ) | (0.12 | ) | (0.01 | ) | (0.06 | ) | ||||||||||
Distributions from capital gains | (4.49 | ) | (2.03 | ) | — | (0.44 | ) | (0.01 | ) | |||||||||||
|
|
|
|
|
|
|
|
|
| |||||||||||
Total distributions | (4.67 | ) | (2.25 | ) | (0.12 | ) | (0.45 | ) | (0.07 | ) | ||||||||||
|
|
|
|
|
|
|
|
|
| |||||||||||
Paid-in capital from redemption fees(1) (Note 5) | — | — | — | — | — | |||||||||||||||
|
|
|
|
|
|
|
|
|
| |||||||||||
Net asset value, end of year | $ | 34.60 | $ | 35.45 | $ | 29.53 | $ | 27.93 | $ | 26.15 | ||||||||||
|
|
|
|
|
|
|
|
|
| |||||||||||
Total return | 11.32% | 27.98% | 6.20% | 8.78% | 19.88% | |||||||||||||||
|
|
|
|
|
|
|
|
|
| |||||||||||
Ratios/Supplemental Data | ||||||||||||||||||||
Net assets, end of year (in thousands) | $ | 463,167 | $ | 616,043 | $ | 493,659 | $ | 507,136 | $ | 320,113 | ||||||||||
Ratio of expenses to average net assets | 0.91% | 0.91% | 0.91% | 0.92% | 0.99% | |||||||||||||||
Ratio of net investment income to average net assets | 0.48% | 0.44% | 0.51% | 0.27% | 0.27% | |||||||||||||||
Portfolio turnover rate | 30% | 37% | 44% | 46% | 47% | |||||||||||||||
| (1) | Less than $0.01 per share. |
The accompanying notes are an integral part of these financial statements.
84
Financial Highlights
The following tables are intended to help you understand the Fund’s financial performance. The information reflects financial results for the Fund held for the periods shown. Total returns assume reinvestment of all dividends and distributions. Total returns do not reflect payment of sales charges, if any, and are not annualized for periods of less than one year.
BUFFALO HIGH YIELD FUND
Condensed data for a share of capital stock outstanding throughout the year. | YEARS ENDED MARCH 31, | |||||||||||||||||||
| 2015 | 2014 | 2013 | 2012 | 2011 | ||||||||||||||||
Net asset value, beginning of year | $ | 11.84 | $ | 11.67 | $ | 11.40 | $ | 11.45 | $ | 10.88 | ||||||||||
|
|
|
|
|
|
|
|
|
| |||||||||||
Income from investment operations: | ||||||||||||||||||||
Net investment income | 0.44 | 0.44 | 0.55 | 0.66 | 0.64 | |||||||||||||||
Net gains (losses) on securities (both realized and unrealized) | (0.03 | ) | 0.37 | 0.35 | (0.03 | ) | 0.56 | |||||||||||||
|
|
|
|
|
|
|
|
|
| |||||||||||
Total from investment operations | 0.41 | 0.81 | 0.90 | 0.63 | 1.20 | |||||||||||||||
|
|
|
|
|
|
|
|
|
| |||||||||||
Less distributions: | ||||||||||||||||||||
Dividends from net investment income | (0.42 | ) | (0.46 | ) | (0.62 | ) | (0.68 | ) | (0.63 | ) | ||||||||||
Distributions from capital gains | (0.12 | ) | (0.18 | ) | (0.01 | ) | — | — | ||||||||||||
|
|
|
|
|
|
|
|
|
| |||||||||||
Total distributions | (0.54 | ) | (0.64 | ) | (0.63 | ) | (0.68 | ) | (0.63 | ) | ||||||||||
|
|
|
|
|
|
|
|
|
| |||||||||||
Paid-in capital from redemption fees(1) (Note 5) | — | — | — | — | — | |||||||||||||||
|
|
|
|
|
|
|
|
|
| |||||||||||
Net asset value, end of year | $ | 11.71 | $ | 11.84 | $ | 11.67 | $ | 11.40 | $ | 11.45 | ||||||||||
|
|
|
|
|
|
|
|
|
| |||||||||||
Total return | 3.58% | 7.12% | 8.20% | 5.86% | 11.35% | |||||||||||||||
|
|
|
|
|
|
|
|
|
| |||||||||||
Ratios/Supplemental Data | ||||||||||||||||||||
Net assets, end of year (in thousands) | $ | 255,987 | $ | 290,538 | $ | 261,112 | $ | 255,771 | $ | 228,976 | ||||||||||
Ratio of expenses to average net assets | 1.02% | 1.01% | 1.01% | 1.02% | 1.02% | |||||||||||||||
Ratio of net investment income to average net assets | 3.71% | 3.72% | 4.85% | 5.89% | 5.75% | |||||||||||||||
Portfolio turnover rate | 25% | 39% | 32% | 21% | 25% | |||||||||||||||
| (1) | Less than $0.01 per share. |
The accompanying notes are an integral part of these financial statements.
85
Financial Highlights
The following tables are intended to help you understand the Fund’s financial performance. The information reflects financial results for the Fund held for the periods shown. Total returns assume reinvestment of all dividends and distributions. Total returns do not reflect payment of sales charges, if any, and are not annualized for periods of less than one year.
BUFFALO INTERNATIONAL FUND
Condensed data for a share of capital stock outstanding throughout the period. | YEARS ENDED MARCH 31, | |||||||||||||||||||
| 2015 | 2014 | 2013(1)(3) | 2012 | 2011 | ||||||||||||||||
Net asset value, beginning of period | $ | 11.73 | $ | 10.28 | $ | 9.52 | $ | 9.79 | $ | 8.70 | ||||||||||
|
|
|
|
|
|
|
|
|
| |||||||||||
Income from investment operations: | ||||||||||||||||||||
Net investment income | 0.09 | 0.04 | 0.04 | 0.05 | 0.06 | |||||||||||||||
Net gains (losses) on securities (both realized and unrealized) | 0.18 | 1.43 | 0.76 | (0.27 | ) | 1.08 | ||||||||||||||
|
|
|
|
|
|
|
|
|
| |||||||||||
Total from investment operations | 0.27 | 1.47 | 0.80 | (0.22 | ) | 1.14 | ||||||||||||||
|
|
|
|
|
|
|
|
|
| |||||||||||
Less distributions: | ||||||||||||||||||||
Dividends from net investment income | (0.07 | ) | (0.02 | ) | (0.04 | ) | (0.05 | ) | (0.05 | ) | ||||||||||
|
|
|
|
|
|
|
|
|
| |||||||||||
Total distributions | (0.07 | ) | (0.02 | ) | (0.04 | ) | (0.05 | ) | (0.05 | ) | ||||||||||
|
|
|
|
|
|
|
|
|
| |||||||||||
Paid-in capital from redemption fees(2) (Note 5) | — | — | — | — | — | |||||||||||||||
|
|
|
|
|
|
|
|
|
| |||||||||||
Net asset value, end of period | $ | 11.93 | $ | 11.73 | $ | 10.28 | $ | 9.52 | $ | 9.79 | ||||||||||
|
|
|
|
|
|
|
|
|
| |||||||||||
Total return | 2.32% | 14.31% | 8.44% | (2.20% | ) | 13.09% | ||||||||||||||
|
|
|
|
|
|
|
|
|
| |||||||||||
Ratios/Supplemental Data | ||||||||||||||||||||
Net assets, end of period (in thousands) | $ | 256,608 | $ | 225,299 | $ | 106,500 | $ | 70,805 | $ | 54,735 | ||||||||||
Ratio of expenses to average net assets | 1.05% | 1.07% | 1.09% | 1.14% | 1.17% | |||||||||||||||
Ratio of net investment income to average net assets | 0.77% | 0.38% | 0.42% | 0.58% | 0.38% | |||||||||||||||
Portfolio turnover rate | 21% | 15% | 23% | 29% | 35% | |||||||||||||||
| (1) | Effective end of business January 25, 2013, the Buffalo China Fund was reorganized into the Buffalo International Fund. |
| (2) | Less than $0.01 per share. |
| (3) | During the year ended March 31, 2013, the Fund incurred $17.3 million in purchases associated with the transfer of assets of the Buffalo China Fund, which merged into the Fund on January 25, 2013. The purchases were excluded from portfolio turnover calculation. Activity after January 25, 2013 reflects the Funds’ combined operations. |
The accompanying notes are an integral part of these financial statements.
86
Financial Highlights
The following tables are intended to help you understand the Fund’s financial performance. The information reflects financial results for the Fund held for the periods shown. Total returns assume reinvestment of all dividends and distributions. Total returns do not reflect payment of sales charges, if any, and are not annualized for periods of less than one year.
BUFFALO LARGE CAP FUND
Condensed data for a share of capital stock outstanding throughout the year. | YEARS ENDED MARCH 31, | |||||||||||||||||||
| 2015 | 2014 | 2013 | 2012 | 2011 | ||||||||||||||||
Net asset value, beginning of year | $ | 23.34 | $ | 21.89 | $ | 21.58 | $ | 20.96 | $ | 18.60 | ||||||||||
|
|
|
|
|
|
|
|
|
| |||||||||||
Income from investment operations: | ||||||||||||||||||||
Net investment income (loss) | 0.05 | 0.06 | 0.08 | 0.04 | 0.04 | |||||||||||||||
Net gains on securities (both realized and unrealized) | 4.51 | 4.94 | 1.79 | 0.74 | 2.38 | |||||||||||||||
|
|
|
|
|
|
|
|
|
| |||||||||||
Total from investment operations | 4.56 | 5.00 | 1.87 | 0.78 | 2.42 | |||||||||||||||
|
|
|
|
|
|
|
|
|
| |||||||||||
Less distributions: | ||||||||||||||||||||
Dividends from net investment income | (0.05 | ) | (0.08 | ) | (0.15 | ) | (0.04 | ) | (0.06 | ) | ||||||||||
Distributions from capital gains | (2.76 | ) | (3.47 | ) | (1.41 | ) | (0.12 | ) | — | |||||||||||
|
|
|
|
|
|
|
|
|
| |||||||||||
Total distributions | (2.81 | ) | (3.55 | ) | (1.56 | ) | (0.16 | ) | (0.06 | ) | ||||||||||
|
|
|
|
|
|
|
|
|
| |||||||||||
Paid-in capital from redemption fees(1) (Note 5) | — | — | — | — | — | |||||||||||||||
|
|
|
|
|
|
|
|
|
| |||||||||||
Net asset value, end of year | $ | 25.09 | $ | 23.34 | $ | 21.89 | $ | 21.58 | $ | 20.96 | ||||||||||
|
|
|
|
|
|
|
|
|
| |||||||||||
Total return | 20.29% | 23.13% | 9.17% | 3.84% | 13.04% | |||||||||||||||
|
|
|
|
|
|
|
|
|
| |||||||||||
Ratios/Supplemental Data | ||||||||||||||||||||
Net assets, end of year (in thousands) | $ | 44,013 | $ | 32,111 | $ | 28,352 | $ | 37,990 | $ | 36,072 | ||||||||||
Ratio of expenses to average net assets | 0.96% | 0.97% | 0.97% | 0.96% | 1.04% | |||||||||||||||
Ratio of net investment income to average net assets | 0.23% | 0.21% | 0.33% | 0.17% | 0.19% | |||||||||||||||
Portfolio turnover rate | 30% | 45% | 49% | 59% | 28% | |||||||||||||||
| (1) | Less than $0.01 per share. |
The accompanying notes are an integral part of these financial statements.
87
Financial Highlights
The following tables are intended to help you understand the Fund’s financial performance. The information reflects financial results for the Fund held for the periods shown. Total returns assume reinvestment of all dividends and distributions. Total returns do not reflect payment of sales charges, if any, and are not annualized for periods of less than one year.
BUFFALO MID CAP FUND
Condensed data for a share of capital stock outstanding throughout the year. | YEARS ENDED MARCH 31, | |||||||||||||||||||
| 2015 | 2014 | 2013 | 2012 | 2011 | ||||||||||||||||
Net asset value, beginning of year | $ | 19.27 | $ | 17.94 | $ | 17.95 | $ | 17.25 | $ | 14.89 | ||||||||||
|
|
|
|
|
|
|
|
|
| |||||||||||
Income from investment operations: | ||||||||||||||||||||
Net investment income (loss) | (0.04 | ) | (0.04 | ) | 0.01 | (0.06 | ) | (0.04 | )(1) | |||||||||||
Net gains on securities (both realized and unrealized) | 1.87 | 4.45 | 0.78 | 1.08 | 2.40 | |||||||||||||||
|
|
|
|
|
|
|
|
|
| |||||||||||
Total from investment operations | 1.83 | 4.41 | 0.79 | 1.02 | 2.36 | |||||||||||||||
|
|
|
|
|
|
|
|
|
| |||||||||||
Less distributions: | ||||||||||||||||||||
Dividends from net investment income | — | — | (0.01 | ) | — | — | ||||||||||||||
Distributions from capital gains | (2.42 | ) | (3.08 | ) | (0.79 | ) | (0.32 | ) | — | |||||||||||
|
|
|
|
|
|
|
|
|
| |||||||||||
Total distributions | (2.42 | ) | (3.08 | ) | (0.80 | ) | (0.32 | ) | — | |||||||||||
|
|
|
|
|
|
|
|
|
| |||||||||||
Paid-in capital from redemption fees(2) (Note 5) | — | — | — | — | — | |||||||||||||||
|
|
|
|
|
|
|
|
|
| |||||||||||
Net asset value, end of year | $ | 18.68 | $ | 19.27 | $ | 17.94 | $ | 17.95 | $ | 17.25 | ||||||||||
|
|
|
|
|
|
|
|
|
| |||||||||||
Total return | 10.43% | 25.46% | 4.67% | 6.22% | 15.85% | |||||||||||||||
|
|
|
|
|
|
|
|
|
| |||||||||||
Ratios/Supplemental Data | ||||||||||||||||||||
Net assets, end of year (in thousands) | $ | 566,302 | $ | 620,255 | $ | 625,178 | $ | 734,567 | $ | 754,587 | ||||||||||
Ratio of expenses to average net assets | 1.01% | 1.01% | 1.01% | 1.01% | 1.02% | |||||||||||||||
Ratio of net investment income (loss) to average net assets | (0.18% | ) | (0.20% | ) | 0.07% | (0.34% | ) | (0.23% | ) | |||||||||||
Portfolio turnover rate | 12% | 45% | 31% | 31% | 21% | |||||||||||||||
| (1) | Net investment loss per share calculated using average shares outstanding. |
| (2) | Less than $0.01 per share. |
The accompanying notes are an integral part of these financial statements.
88
Financial Highlights
The following tables are intended to help you understand the Fund’s financial performance. The information reflects financial results for the Fund held for the periods shown. Total returns assume reinvestment of all dividends and distributions. Total returns do not reflect payment of sales charges, if any, and are not annualized for periods of less than one year.
BUFFALO SMALL CAP FUND
Condensed data for a share of capital stock outstanding throughout the year. | YEARS ENDED MARCH 31, | |||||||||||||||||||
| 2015 | 2014 | 2013 | 2012 | 2011 | ||||||||||||||||
Net asset value, beginning of year | $ | 36.02 | $ | 30.93 | $ | 28.54 | $ | 27.69 | $ | 24.90 | ||||||||||
|
|
|
|
|
|
|
|
|
| |||||||||||
Income from investment operations: | ||||||||||||||||||||
Net investment loss | (0.24 | ) | (0.16 | ) | (0.09 | ) | (0.00 | )(2) | (0.10 | )(1) | ||||||||||
Net gains on securities (both realized and unrealized) | 0.31 | 8.44 | 4.20 | 0.91 | 2.89 | |||||||||||||||
|
|
|
|
|
|
|
|
|
| |||||||||||
Total from investment operations | 0.07 | 8.28 | 4.11 | 0.91 | 2.79 | |||||||||||||||
|
|
|
|
|
|
|
|
|
| |||||||||||
Less distributions: | ||||||||||||||||||||
Distributions from capital gains | (3.26 | ) | (3.19 | ) | (1.72 | ) | (0.06 | ) | — | |||||||||||
|
|
|
|
|
|
|
|
|
| |||||||||||
Total dividends and distributions | (3.26 | ) | (3.19 | ) | (1.72 | ) | (0.06 | ) | — | |||||||||||
|
|
|
|
|
|
|
|
|
| |||||||||||
Paid-in capital from redemption fees(2) (Note 5) | — | — | — | — | — | |||||||||||||||
|
|
|
|
|
|
|
|
|
| |||||||||||
Net asset value, end of year | $ | 32.83 | $ | 36.02 | $ | 30.93 | $ | 28.54 | $ | 27.69 | ||||||||||
|
|
|
|
|
|
|
|
|
| |||||||||||
Total return | 0.56% | 26.71% | 15.02% | 3.31% | 11.20% | |||||||||||||||
|
|
|
|
|
|
|
|
|
| |||||||||||
Ratios/Supplemental Data | ||||||||||||||||||||
Net assets, end of year (in thousands) | $ | 3,005,980 | $ | 3,803,381 | $ | 3,144,179 | $ | 2,768,696 | $ | 3,157,445 | ||||||||||
Ratio of expenses to average net assets | 1.00% | 1.00% | 1.00% | 1.00% | 1.01% | |||||||||||||||
Ratio of net investment loss to average net assets | (0.63% | ) | (0.45% | ) | (0.31% | ) | (0.00% | )(3) | (0.40% | ) | ||||||||||
Portfolio turnover rate | 17% | 22% | 34% | 24% | 16% | |||||||||||||||
| (1) | Net investment loss per share calculated using average shares outstanding. |
| (2) | Less than $0.01 per share. |
| (3) | Less than 0.01%. |
The accompanying notes are an integral part of these financial statements.
89
Notes to Financial Statements
March 31, 2015
1. SIGNIFICANT ACCOUNTING POLICIES:
The Buffalo Funds (comprised of the Buffalo Discovery Fund, Buffalo Dividend Focus Fund, Buffalo Emerging Opportunities Fund, Buffalo Flexible Income Fund, Buffalo Growth Fund, Buffalo High Yield Fund, Buffalo International Fund, Buffalo Large Cap Fund, Buffalo Mid Cap Fund, and Buffalo Small Cap Fund) (the “Funds”), is registered under the Investment Company Act of 1940, as amended (the “1940 Act”), as a diversified open-end management investment company. The shares of the Buffalo Funds are issued in multiple series, with each series, in effect, representing a separate fund.
The investment objective of the Buffalo Discovery Fund, Buffalo Emerging Opportunities Fund, Buffalo Growth Fund, Buffalo International Fund, Buffalo Large Cap Fund, Buffalo Mid Cap Fund and Buffalo Small Cap Fund is long-term growth of capital.
The investment objectives of the Buffalo Dividend Focus Fund and the Buffalo Flexible Income Fund are the generation of high current income and, as a secondary objective, the long-term growth of capital.
The investment objective of the Buffalo High Yield Fund is current income, with long-term growth of capital as a secondary objective.
Each Fund is an investment company and accordingly follows the investment company accounting and reporting guidance of the Financial Accounting Standards Board (“FASB”) Accounting Standard Codification Topic 946 “Financial Services — Investment Companies.”
The following is a summary of significant accounting policies consistently followed by the Funds in the preparation of their financial statements.
A. INVESTMENT VALUATION — Equity securities and debt securities traded on a national securities exchange or national market, except those traded using the National Association of Securities Dealers’ Automated Quotation System (“NASDAQ”), are valued at the latest sales price thereof, or if no sale was reported on that date, the mean between the most recent quoted bid and ask price is used. All equity securities that are traded using NASDAQ are valued using the NASDAQ Official Closing Price (“NOCP”), which may not necessarily represent the last sales price. If there has been no sale on such exchange or on NASDAQ on such day, the security is valued at the mean between the most recent quoted bid and ask price.
When market quotations are not readily available, any security or other asset is valued at its fair value as determined in good faith under procedures approved by the Board of Trustees (the “Board”). If events occur that will affect the value of a Fund’s portfolio securities before the net asset value (“NAV”) has been calculated (a “significant event”), the security will generally be priced using a fair value procedure. The Board has adopted specific procedures for valuing portfolio securities and delegated the responsibility of fair value determinations to the Valuation Committee. Some of the factors that may be considered by the Valuation Committee in determining fair value are fundamental analytical data relating to the investment; the nature and duration of any restriction on the disposition; trading in similar securities of the same issuer or comparable companies; information from broker-dealers; and an evaluation of the forces that influence the market in which the securities are purchased or sold. As of March 31, 2015, the Buffalo High Yield Fund and Buffalo International Fund each held one fair valued security, with a market value of $0 or 0.00% and $1,279,885 or 0.50% of total net assets, respectively. In addition, with respect to the valuation of securities principally traded on foreign markets, the Buffalo International Fund uses a fair value pricing service approved by the Funds’ Board which employs quantitative models to adjust for “stale” prices caused by the movement of other markets and other factors occurring after the close of the foreign markets, but before the close of the New York Stock Exchange (“NYSE”).
Debt securities with remaining maturities of 60 days or less are normally valued at amortized cost, unless the Board determines that amortized cost does not represent fair value.
Restricted securities include securities that have not been registered under the Securities Act of 1933, as amended, and securities that are subject to restrictions on resale. The Funds may invest in restricted securities that are consistent with the Funds’ investment objective and investment strategies. In some cases, the issuer of restricted securities has agreed to register such securities for resale, at the issuer’s expense either upon demand by the Funds or in connection with another registered offering of the securities. Investments in restricted securities are valued utilizing the Funds’ corporate bond valuation policies.
In accordance with Financial Accounting Standards Board (“FASB”) Accounting Standards Codifications (“ASC”) 820, Fair Value Measurements “ASC 820”, fair value is defined as the price that a Fund would receive to sell an investment or pay to transfer a liability in an orderly transaction with an independent buyer in the principal market, or in the absence of a principal market, the most advantageous market for the investment or liability. ASC 820 establishes a three-tier hierarchy to distinguish between (1) inputs that reflect the assumptions market participants would use in pricing an asset or liability developed based on market data obtained from sources independent of the reporting entity (observable inputs) and (2) inputs that reflect the reporting entity’s own assumptions about the assumptions market participants would use in pricing an asset or liability developed based on the best information available in the circumstances (unobservable inputs) and to establish classification of fair value measurements for disclosure purposes. Various inputs are used in determining the value of the Funds’ investments. The inputs are summarized in the three broad levels listed below:
Level 1 — Valuations based on quoted prices for investments in active markets that a Fund has the ability to access at the measurement date. Valuation adjustments are not applied to Level 1 investments.
Level 2 — Valuations based on other significant observable inputs (including quoted prices for similar securities, interest rates, prepayment speeds, credit risks, etc.).
Level 3 — Valuations based on significant unobservable inputs (including a Fund’s own assumptions and judgment in determining the fair value of investments).
90
Inputs that are used in determining fair value of an investment may include price information, credit data, volatility statistics, and other factors. These inputs can be either observable or unobservable. The availability of observable inputs can vary between investments, and is affected by various factors such as the type of investment, and the volume and level of activity for that investment or similar investments in the market place. The inputs will be considered by the Adviser, along with any other relevant factors in the calculation of an investment’s fair value. The Funds use prices and inputs that are current as of the measurement date, which may include periods of market dislocations. During these periods, the availability of prices and inputs may be reduced for many investments. This condition could cause an investment to be reclassified between the various levels within the hierarchy.
Non-U.S. equity securities actively traded in foreign markets may be reflected in Level 2 despite the availability of closing prices, because the Funds evaluate and determine whether those closing prices reflect fair value at the close of the NYSE or require adjustment, as described above and in Note 9 — Foreign Investment Risk, to the financial statements.
Investments falling into the Level 3 category are primarily supported by quoted prices from brokers and dealers participating in the market for those investments. However, these may be classified as Level 3 investments due to lack of market transparency and corroboration to support these quoted prices. Additionally, valuation models may be used as the pricing source for any remaining investments classified as Level 3. These models rely on one or more significant unobservable inputs and/or significant assumptions by the Valuation Committee. Inputs used in valuations may include, but are not limited to, financial statement analysis, capital account balances, discount rates and estimated cash flows, and comparable company data.
The inputs or methodology used for valuing securities are not necessarily an indication of the risk associated with investing in those securities.
The following table provides the fair value measurement of applicable Fund assets and liabilities by level within the fair value hierarchy as of March 31, 2015. These assets are measured on a recurring basis.
| BUFFALO DISCOVERY FUND | ||||||||||||||||
| Level 1 | Level 2 | Level 3 | Total | |||||||||||||
Common Stocks | $ | 702,795,359 | — | — | $ | 702,795,359 | ||||||||||
REITS | 12,372,252 | — | — | 12,372,252 | ||||||||||||
Short Term Investments | 76,237,125 | — | — | 76,237,125 | ||||||||||||
|
|
|
|
|
|
|
| |||||||||
Total* | $ | 791,404,736 | — | — | $ | 791,404,736 | ||||||||||
|
|
|
|
|
|
|
| |||||||||
| BUFFALO DIVIDEND FOCUS FUND | ||||||||||||||||
| Level 1 | Level 2 | Level 3 | Total | |||||||||||||
Common Stocks | $ | 37,927,503 | — | — | $ | 37,927,503 | ||||||||||
Short Term Investment | 2,983,829 | — | — | 2,983,829 | ||||||||||||
|
|
|
|
|
|
|
| |||||||||
Total* | $ | 40,911,332 | — | — | $ | 40,911,332 | ||||||||||
|
|
|
|
|
|
|
| |||||||||
| BUFFALO EMERGING OPPORTUNITIES FUND | ||||||||||||||||
| Level 1 | Level 2 | Level 3 | Total | |||||||||||||
Common Stocks | $ | 233,917,851 | — | — | $ | 233,917,851 | ||||||||||
Short Term Investment | 6,829,635 | — | — | 6,829,635 | ||||||||||||
|
|
|
|
|
|
|
| |||||||||
Total* | $ | 240,747,486 | — | — | $ | 240,747,486 | ||||||||||
|
|
|
|
|
|
|
| |||||||||
| BUFFALO FLEXIBLE INCOME FUND | ||||||||||||||||
| Level 1 | Level 2 | Level 3 | Total | |||||||||||||
Common Stocks | $ | 907,712,928 | — | — | $ | 907,712,928 | ||||||||||
REITS | 20,416,100 | — | — | 20,416,100 | ||||||||||||
Convertible Bonds | — | 82,871,719 | — | 82,871,719 | ||||||||||||
Corporate Bonds | — | 256,568,550 | — | 256,568,550 | ||||||||||||
U.S. Government Note | 25,003,900 | — | — | 25,003,900 | ||||||||||||
Bank Loans | — | 15,334,168 | — | 15,334,168 | ||||||||||||
Short Term Investment | 38,154,981 | — | — | 38,154,981 | ||||||||||||
|
|
|
|
|
|
|
| |||||||||
Total* | $ | 991,287,909 | 354,774,437 | — | $ | 1,346,062,346 | ||||||||||
|
|
|
|
|
|
|
| |||||||||
Written Options | $ | (381,783 | ) | (297,900 | ) | — | $ | (679,683 | ) | |||||||
|
|
|
|
|
|
|
| |||||||||
| BUFFALO GROWTH FUND | ||||||||||||||||
| Level 1 | Level 2 | Level 3 | Total | |||||||||||||
Common Stocks | $ | 440,464,046 | — | — | $ | 440,464,046 | ||||||||||
REITS | 7,138,250 | — | — | 7,138,250 | ||||||||||||
Short Term Investment | 13,288,533 | — | — | 13,288,533 | ||||||||||||
|
|
|
|
|
|
|
| |||||||||
Total* | $ | 460,890,829 | — | — | $ | 460,890,829 | ||||||||||
|
|
|
|
|
|
|
| |||||||||
91
Notes to Financial Statements
March 31, 2015
(Continued)
| BUFFALO HIGH YIELD FUND | ||||||||||||||||
| Level 1 | Level 2 | Level 3 | Total | |||||||||||||
Common Stocks | $ | 13,122,535 | — | — | $ | 13,122,535 | ||||||||||
Convertible Preferred Stocks | — | 3,724,062 | — | 3,724,062 | ||||||||||||
Preferred Stocks | — | 2,447,500 | — | 2,447,500 | ||||||||||||
Convertible Bonds | — | 40,408,949 | — | 40,408,949 | ||||||||||||
Corporate Bonds | — | 176,711,027 | — | 176,711,027 | ||||||||||||
Bank Loans | — | 4,436,869 | — | 4,436,869 | ||||||||||||
Short Term Investment | 10,257,581 | — | — | 10,257,581 | ||||||||||||
|
|
|
|
|
|
|
| |||||||||
Total* | $ | 23,380,116 | 227,728,407 | — | $ | 251,108,523 | ||||||||||
|
|
|
|
|
|
|
| |||||||||
| BUFFALO INTERNATIONAL FUND | ||||||||||||||||
| Level 1 | Level 2 | Level 3 | Total | |||||||||||||
Common Stocks | $ | 80,978,759 | 144,860,990 | 1,279,885 | $ | 227,119,635 | ||||||||||
Exchange Traded Fund | 1,322,800 | — | — | 1,322,800 | ||||||||||||
Short Term Investment | 17,941,900 | — | — | 17,941,900 | ||||||||||||
|
|
|
|
|
|
|
| |||||||||
Total* | $ | 100,243,459 | 144,860,990 | 1,279,885 | $ | 246,384,335 | ||||||||||
|
|
|
|
|
|
|
| |||||||||
| BUFFALO LARGE CAP FUND | ||||||||||||||||
| Level 1 | Level 2 | Level 3 | Total | |||||||||||||
Common Stocks | $ | 40,717,057 | — | — | $ | 40,717,057 | ||||||||||
REITS | 950,727 | — | — | 950,727 | ||||||||||||
Short Term Investment | 2,756,305 | — | — | 2,756,305 | ||||||||||||
|
|
|
|
|
|
|
| |||||||||
Total* | $ | 44,424,089 | — | — | $ | 44,424,089 | ||||||||||
|
|
|
|
|
|
|
| |||||||||
| BUFFALO MID CAP FUND | ||||||||||||||||
| Level 1 | Level 2 | Level 3 | Total | |||||||||||||
Common Stocks | $ | 545,542,084 | — | — | $ | 545,542,084 | ||||||||||
REITS | 13,232,866 | — | — | 13,232,866 | ||||||||||||
Short Term Investment | 7,007,994 | — | — | 7,007,994 | ||||||||||||
|
|
|
|
|
|
|
| |||||||||
Total* | $ | 565,782,944 | — | — | $ | 565,782,944 | ||||||||||
|
|
|
|
|
|
|
| |||||||||
| BUFFALO SMALL CAP FUND | ||||||||||||||||
| Level 1 | Level 2 | Level 3 | Total | |||||||||||||
Common Stocks | $ | 2,860,502,593 | — | — | $ | 2,860,502,593 | ||||||||||
Short Term Investment | 141,363,012 | — | — | 141,363,012 | ||||||||||||
|
|
|
|
|
|
|
| |||||||||
Total* | $ | 3,001,865,605 | — | — | $ | 3,001,865,605 | ||||||||||
|
|
|
|
|
|
|
| |||||||||
| * | Additional information regarding the industry and/or geographical classification of these investments is disclosed in the schedule of investments. |
The following is a reconciliation of the Buffalo High Yield Fund Level 3 assets for which significant unobservable inputs were used to determine fair value for the year ended March 31, 2015:
| FAIR VALUE MEASUREMENT USING SIGNIFICANT UNOBSERVABLE INPUTS (LEVEL 3) | INVESTMENTS IN SECURITIES YEAR ENDED MARCH 31, 2015 | |||
Fair Value as of 3/31/2014** | $ | — | ||
|
| |||
Fair Value as of 3/31/2015** | $ | — | ||
|
| |||
The amount of total gains or losses for the period included in net increase (decrease) in net assets applicable to outstanding shares attributed to the change in unrealized gains or losses relating to assets still held at the reporting date | $ | — | ||
|
| |||
| ** | Includes a security that was valued at $0 based on unobservable inputs as of March 31, 2014. There was no change in value in the investment(s) during the period ended March 31, 2015. |
92
The following is a reconciliation of the Buffalo International Fund Level 3 assets for which significant unobservable inputs were used to determine fair value for the year ended March 31, 2015:
| FAIR VALUE MEASUREMENT USING SIGNIFICANT UNOBSERVABLE INPUTS (LEVEL 3) | INVESTMENTS IN SECURITIES YEAR ENDED MARCH 31, 2015 | |||
Fair Value as of 3/31/2014 | $ | — | ||
Total unrealized losses included in earnings | (1,033,184 | ) | ||
Realized gain included in earnings | 526,716 | |||
Sales | (506,395 | ) | ||
Transfer into Level 3*** | 2,292,748 | |||
|
| |||
Fair Value as of 3/31/2015 | $ | 1,279,885 | ||
|
| |||
The amount of total gains or losses for the period included in net increase (decrease) in net assets applicable to outstanding shares attributed to the change in unrealized gains or losses relating to assets still held at the reporting date | $ | (1,033,184 | ) | |
|
| |||
| *** | The basis for recognizing and valuing transfers is as of the beginning of the period in which transfers occur. |
This Level 3 asset was priced at year-end using a recent trade price without any adjustments.
There were no transfers into or out of Level 1, Level 2 or Level 3 fair value measurements during the reporting period for the Buffalo Discovery Fund, Buffalo Dividend Focus Fund, Buffalo Emerging Opportunities Fund, Buffalo Flexible Income Fund, Buffalo Growth Fund, Buffalo High Yield Fund, Buffalo Large Cap Fund, Buffalo Mid Cap Fund and Buffalo Small Cap Fund. The Buffalo International Fund had transfers from Level 1 into Level 2. The market value of the securities was $107,841,629. The transfer into Level 2 was due to the securities being priced using the fair valuation price provided by the pricing service during the period ended March 31, 2015. The Buffalo International Fund had transfers from Level 1 into Level 3 in the amount of $2,292,748. The transfer into Level 3 was due to the security being priced using the fair valuation price provided by the Valuation Committee during the period ended March 31, 2015. The basis for recognizing and valuing transfers is as of the beginning of the period in which transfers occur.
B. FEDERAL INCOME TAXES — Each Fund complies with the requirements of Subchapter M of the Internal Revenue Code necessary to qualify as a regulated investment company and makes the requisite distributions of income and capital gains to its shareholders sufficient to relieve it from all or substantially all federal income and excise taxes. Therefore, no federal income tax provision has been provided.
At March 31, 2015, the Funds did not have any tax positions that did not meet the “more likely-than-not” threshold of being sustained by the applicable tax authority. The Funds recognize interest and penalties, if any, related to unrecognized tax benefits as other expense in the Statement of Operations. During the period, the Funds did not incur any interest or penalties.
The Funds have analyzed all open tax years, as defined by the Statute of Limitations, for all major jurisdictions. Open tax years are those that are open for exam by taxing authorities. Open tax years include the tax years ended March 31, 2012 through March 31, 2015. The Funds have no examinations in progress.
C. INVESTMENT TRANSACTIONS AND INVESTMENT INCOME — Investment transactions are accounted for on the date the securities are purchased or sold (trade date). Dividend income is recorded on the ex-dividend date except that certain dividends for foreign securities where the ex-dividend date may have passed are recorded as soon as the Fund is informed of the dividend in the exercise of reasonable diligence. Interest income is recognized on the accrual basis. Realized gains and losses from investment transactions are reported on the identified cost basis. All discounts/premiums are accreted/amortized for financial reporting purposes and are included in interest income.
D. DISTRIBUTIONS TO SHAREHOLDERS — Distributions to shareholders are recorded on the ex-dividend date. Distributions are determined in accordance with income tax regulations, which may differ from U.S. Generally Accepted Accounting Principles (GAAP). These differences are primarily due to differing treatments for premium amortization on debt securities, deferral of late year and wash sale losses, and partnership investment income.
E. USE OF ESTIMATES — The preparation of financial statements in conformity with GAAP requires management to make estimates and assumptions that affect the amounts reported in the financial statements and accompanying notes. Actual results could differ from such estimates.
F. FOREIGN CURRENCY TRANSLATION — Values of investments denominated in foreign currencies are converted into U.S. dollars using a spot market rate of exchange on the day of valuation. Purchases and sales of investments and dividend and interest income are translated to U.S. dollars using a spot market rate of exchange prevailing on the respective dates of such transactions. The portion of security gains or losses resulting from changes in foreign exchange rates is included with net realized and unrealized gain or loss from investments, as appropriate, for both financial reporting and tax purposes.
G. PURCHASED AND WRITTEN OPTION CONTRACTS — Certain of the Funds may purchase and write call or put options on securities and indices and enter into related closing transactions. As a holder of a call option, a Fund has the right, but not the obligation, to purchase a security at the exercise price during the exercise period. As the writer of a call option, a Fund has the obligation to sell the security at the exercise price during the exercise period. As a holder of a put option, a Fund has the right, but
93
Notes to Financial Statements
March 31, 2015
(Continued)
not the obligation, to sell a security at the exercise price during the exercise period. As the writer of a put option, a Fund has the obligation to buy the underlying security at the exercise price during the exercise period.
The premium that a Fund pays when purchasing a call option or receives when writing a call option will reflect, among other things, the market price of the security, the relationship of the exercise price to the market price of the security, the relationship of the exercise price to the volatility of the security, the length of the option period and supply and demand factors. The premium is the market value of an option.
A purchaser (holder) of a put option pays a non-refundable premium to the seller (writer) of a put option to obtain the right to sell a specified amount of a security at a fixed price (the exercise price) during a specified period (exercise period). Conversely, the seller (writer) of a put option, upon payment by the holder of the premium, has the obligation to buy the security from the holder of the put option at the exercise price during the exercise period.
Exchange traded options are valued at the composite price, using the National Best Bid and Offer quotes (“NBBO”). NBBO consists of the highest bid prices and lowest ask prices across any of the exchanges on which an option is quoted, thus providing a view across the entire U.S. options marketplace. Specifically, composite pricing looks at the last trades on the exchanges where the options are traded. If there are no trades for the option on a given business day, composite option pricing calculates the mean of the highest bid price and lowest ask price across the exchanges where the option is traded. Non-exchange traded options also will be valued at the mean between the last bid and asked quotations. For options where market quotations are not readily available, a fair value shall be determined as set forth in the Funds’ fair valuation guidelines. The Funds may use options to generate income and to hedge against losses caused by declines in the prices of stocks in its portfolio or for any other permissible purpose consistent with the Funds’ investment objectives. A risk of using derivatives is that the counterparty to a derivative may fail to comply with their obligation to the Funds. See Note 8 for written option activity.
H. INDEMNIFICATIONS — Under the Funds’ organizational documents, officers and trustees are indemnified against certain liabilities arising out of the performance of their duties to the Funds. In addition, in the normal course of business, the Funds enter into contracts that provide general indemnification to other parties. The Funds’ maximum exposure under these arrangements is unknown as this would involve future claims that may be made against the Funds that have not yet occurred, and may not occur. However, the Funds have not had prior claims or losses pursuant to these contracts and expect the risk of loss to be remote.
I. RECENT ACCOUNTING PRONOUNCEMENT — In June 2013, the FASB issued Accounting Standards Update 2013-08 Financial Services — Investment Companies (Topic 946) Amendments to the Scope, Measurement, and Disclosure Requirements (“ASU 2013-08”). ASU 2013-08 clarifies the characteristics of an investment company and requires reporting entities to disclose information about the following items: (i) the type and amount of financial support provided to investee companies, including situations in which the Funds assisted an investee in obtaining financial support, (ii) the primary reasons for providing the financial support, (iii) the type and amount of financial support the Funds are contractually required to provide to an investee, but has not yet provided, and (iv) the primary reasons for the contractual requirement to provide the financial support. The Funds adopted ASU 2013-08 effective April 1, 2014. Adoption of ASU 2013-08 did not result in any changes to the financial statements of the funds but did result in new disclosures.
2. FEDERAL TAX MATTERS:
The tax character of distributions paid during the years ended March 31, 2015 and March 31, 2014 was as follows:
| YEAR ENDED MARCH 31, 2015 | YEAR ENDED MARCH 31, 2014 | |||||||||||||||
| ORDINARY INCOME | LONG-TERM CAPITAL GAINS* | ORDINARY INCOME | LONG-TERM CAPITAL GAINS* | |||||||||||||
Buffalo Discovery Fund | $ | 9,580,402 | $ | 55,451,794 | $ | 14,601,107 | $ | 27,679,487 | ||||||||
Buffalo Dividend Focus Fund | 1,808,334 | 273,714 | 730,030 | — | ||||||||||||
Buffalo Emerging Opportunities Fund | 10,778,684 | 8,102,158 | — | 1,262,443 | ||||||||||||
Buffalo Flexible Income Fund | 32,513,778 | 3,949,249 | 31,097,108 | 4,305,656 | ||||||||||||
Buffalo Growth Fund | 6,702,957 | 61,480,219 | 14,635,618 | 22,138,631 | ||||||||||||
Buffalo High Yield Fund | 9,708,836 | 2,196,386 | 11,409,791 | 3,569,394 | ||||||||||||
Buffalo International Fund | 1,409,119 | — | 354,812 | — | ||||||||||||
Buffalo Large Cap Fund | 1,048,611 | 2,846,024 | 111,066 | 4,176,545 | ||||||||||||
Buffalo Mid Cap Fund | — | 69,353,806 | 4,380,399 | 84,212,434 | ||||||||||||
Buffalo Small Cap Fund | — | 301,093,346 | 38,722,736 | 274,358,348 | ||||||||||||
| * | The Funds designate as long-term capital gain dividends, pursuant to Internal Revenue Code Section 852(b)(3)(C), the amounts necessary to reduce the earnings and profits of the Funds related to net capital gain to zero. |
Distributions paid differ from the Statements of Changes in Net Assets due primarily to the recharacterization of short-term capital gain distributions to ordinary distributions for tax purposes.
94
Additionally, GAAP requires that certain components of net assets relating to permanent differences be reclassified between financial and tax reporting. These reclassifications have no effect on net assets or net asset value per share. For the year ended March 31, 2015, the following table shows the reclassifications made:
| UNDISTRIBUTED NET INVESTMENT INCOME/(LOSS) | ACCUMULATED NET REALIZED GAIN/(LOSS) | PAID IN CAPITAL | ||||||||||
Buffalo Discovery Fund | $ | 1,891,094 | $ | (1,891,094 | ) | $ | — | |||||
Buffalo Dividend Focus Fund | 3,171 | (3,053 | ) | (118 | ) | |||||||
Buffalo Emerging Opportunities Fund | 3,444,006 | 190 | (3,444,196 | ) | ||||||||
Buffalo Flexible Income Fund | 399,569 | (399,569 | ) | — | ||||||||
Buffalo Growth Fund | — | — | — | |||||||||
Buffalo High Yield Fund | 178,984 | (178,984 | ) | — | ||||||||
Buffalo International Fund | 38,586 | (38,585 | ) | (1 | ) | |||||||
Buffalo Large Cap Fund | (4 | ) | (217,074 | ) | 217,078 | |||||||
Buffalo Mid Cap Fund | 1,236,757 | (217,440 | ) | (1,019,317 | ) | |||||||
Buffalo Small Cap Fund | 23,125,387 | — | (23,125,387 | ) | ||||||||
The permanent differences primarily relate to foreign currency adjustments, sale of discount bonds/contingent payment debt instruments, partnership adjustments and net operating losses.
As of March 31, 2015, the components of accumulated earnings (losses) for income tax purposes were as follows:
| BUFFALO DISCOVERY FUND | BUFFALO DIVIDEND FOCUS FUND | BUFFALO EMERGING OPPORTUNITIES FUND | BUFFALO FLEXIBLE INCOME FUND | BUFFALO GROWTH FUND | ||||||||||||||||
Tax cost of Investments(a) | $ | 607,437,805 | $ | 35,883,265 | $ | 191,796,105 | $ | 1,169,229,670 | $ | 325,322,853 | ||||||||||
|
|
|
|
|
|
|
|
|
| |||||||||||
Unrealized Appreciation | 195,427,703 | 5,866,093 | 66,418,026 | 225,216,690 | 142,314,151 | |||||||||||||||
Unrealized Depreciation | (11,460,772 | ) | (838,026 | ) | (17,466,645 | ) | (48,384,014 | ) | (6,746,175 | ) | ||||||||||
|
|
|
|
|
|
|
|
|
| |||||||||||
Net unrealized appreciation | 183,966,931 | 5,028,067 | 48,951,381 | 176,832,676 | 135,567,976 | |||||||||||||||
|
|
|
|
|
|
|
|
|
| |||||||||||
Undistributed Ordinary Income | 10,904,620 | 281,276 | — | 2,697,317 | 1,687,590 | |||||||||||||||
Undistributed Long Term Capital Gain | 40,004,837 | 325,309 | — | — | 49,073,594 | |||||||||||||||
|
|
|
|
|
|
|
|
|
| |||||||||||
Distributable earnings | 50,909,457 | 606,585 | — | 2,697,317 | 50,761,184 | |||||||||||||||
|
|
|
|
|
|
|
|
|
| |||||||||||
Other accumulated loss | — | — | (4,358,575 | ) | (148,769 | ) | — | |||||||||||||
|
|
|
|
|
|
|
|
|
| |||||||||||
Total accumulated gain | 234,876,388 | 5,634,652 | 44,592,806 | 179,381,224 | 186,329,160 | |||||||||||||||
|
|
|
|
|
|
|
|
|
| |||||||||||
| BUFFALO HIGH YIELD FUND | BUFFALO INTERNATIONAL FUND | BUFFALO LARGE CAP FUND | BUFFALO MID CAP FUND | BUFFALO SMALL CAP FUND | ||||||||||||||||
Tax cost of Investments(a) | $ | 229,826,572 | $ | 210,201,401 | $ | 32,738,756 | $ | 384,721,490 | $ | 1,841,081,722 | ||||||||||
|
|
|
|
|
|
|
|
|
| |||||||||||
Unrealized Appreciation | 24,510,891 | 42,844,395 | 12,155,990 | 196,850,586 | 1,266,815,734 | |||||||||||||||
Unrealized Depreciation | (3,228,940 | ) | (6,661,461 | ) | (470,657 | ) | (15,789,132 | ) | (106,031,851 | ) | ||||||||||
|
|
|
|
|
|
|
|
|
| |||||||||||
Net unrealized appreciation | 21,281,951 | 36,182,934 | 11,685,333 | 181,061,454 | 1,160,783,883 | |||||||||||||||
|
|
|
|
|
|
|
|
|
| |||||||||||
Undistributed Ordinary Income | 910,272 | 384,024 | 814,789 | — | — | |||||||||||||||
Undistributed Long Term Capital Gain | 1,228,578 | — | 1,479,174 | 29,849,153 | 198,092,844 | |||||||||||||||
|
|
|
|
|
|
|
|
|
| |||||||||||
Distributable earnings | 2,138,850 | 384,024 | 2,293,963 | 29,849,153 | 198,092,844 | |||||||||||||||
|
|
|
|
|
|
|
|
|
| |||||||||||
Other accumulated loss | — | (6,085,594 | ) | — | (446,881 | ) | (4,238,994 | ) | ||||||||||||
|
|
|
|
|
|
|
|
|
| |||||||||||
Total accumulated gain | 23,420,801 | 30,481,364 | 13,979,296 | 210,463,726 | 1,354,637,733 | |||||||||||||||
|
|
|
|
|
|
|
|
|
| |||||||||||
The differences between book-basis and tax-basis unrealized appreciation are attributable primarily to the tax deferral of losses on wash sales, premium amortization, trust preferred instrument and contingent payment debt instrument adjustments and publicly traded partnership investments.
Other accumulated gain/(loss) is generally comprised of capital loss carryforwards, qualified late-year loss deferrals and/or unrealized gain/(loss) on derivative positions.
| (a) | Represents cost for federal income tax purposes and may differ from the cost for financial reporting purposes. |
The following Funds utilized the amounts below of prior year capital loss carryover in the current year.
Buffalo International Fund | 609,409 |
95
Notes to Financial Statements
March 31, 2015
(Continued)
As of March 31, 2015, the accumulated net realized loss on sales of investments and losses deferred for federal income tax purposes which are available to offset future taxable gains are as follows:
| BUFFALO FLEXIBLE INCOME FUND | ||||||||||||
| MONTH/YEAR REALIZED | MONTH/YEAR EXPIRING | ST | LT | |||||||||
March-15 | Unlimited | — | 273,198 | |||||||||
|
|
|
| |||||||||
Totals | — | 273,198 | ||||||||||
|
|
|
| |||||||||
| BUFFALO INTERNATIONAL FUND | ||||||||||||
| MONTH/YEAR REALIZED | MONTH/YEAR EXPIRING | ST | LT | |||||||||
March-09 | March-17 | 2,530,333 | N/A | |||||||||
March-10 | March-18 | 1,076,190 | N/A | |||||||||
March-15 | Unlimited | 786,906 | 1,281,662 | |||||||||
|
|
|
| |||||||||
Totals | 4,393,429 | 1,281,662 | ||||||||||
|
|
|
| |||||||||
The utilization of certain capital loss carryovers are subject to annual limitations of $652,599, pursuant to IRC Sec. 382 as a result of acquisition of the Buffalo China Fund on January 25, 2013.
|
| |||||||||||
| BUFFALO EMERGING OPPORTUNITIES FUND | ||||||||||||
| MONTH/YEAR REALIZED | MONTH/YEAR EXPIRING | ST | LT | |||||||||
March-15 | Unlimited | 3,553,218 | — | |||||||||
|
|
|
| |||||||||
Totals | 3,553,218 | — | ||||||||||
|
|
|
| |||||||||
RIC Modernization Act — On December 22, 2010, the Regulated Investment Company Modernization Act of 2010 (the “Act”) was enacted, which changed various technical rules governing the tax treatment of regulated investment companies. The changes are generally effective for taxable years beginning after the date of enactment. One of the more prominent changes addresses capital loss carryforwards. Under the Act, each Fund will be permitted to carry forward losses incurred in taxable years beginning after the date of enactment for an unlimited period. However, any losses incurred during those future years will be required to be utilized prior to the losses incurred in pre-enactment years, which carry an expiration date. As a result of this ordering rule, pre-enactment capital loss carryforwards may be more likely to expire unused. Additionally, post-enactment capital loss carryforward will retain their characteristics as either short-term or long-term capital losses rather than being considered all short-term as permitted under previous regulations.
At March 31, 2015, the following Funds deferred, on a tax basis, qualified late year losses, consisting of ordinary late year losses and post-October capital losses, as follows:
| ORDINARY LATE-YEAR LOSSES | POST-OCTOBER CAPITAL LOSSES | |||||||
Buffalo Emerging Opportunities Fund | $ | 658,944 | $ | 146,413 | ||||
Buffalo Mid Cap Fund | $ | 446,881 | $ | — | ||||
Buffalo Small Cap Fund | $ | 4,238,994 | $ | — | ||||
For the year ended March 31, 2015, the Buffalo International Fund earned foreign source income and paid foreign taxes which it intends to pass through to its shareholders pursuant to Section 853 of the Internal Revenue Code as follows:
| BUFFALO INTERNATIONAL FUND | ||||||||
| COUNTRY | GROSS DIVIDEND | TAXES WITHHELD | ||||||
Belgium | $ | 84,368 | $ | 12,655 | ||||
Bermuda | 92,115 | — | ||||||
Brazil | 307,799 | 14,967 | ||||||
Canada | 23,504 | 3,526 | ||||||
Switzerland | 666,534 | 29,720 | ||||||
Chile | 65,861 | 21,998 | ||||||
China | 40,754 | 4,075 | ||||||
Germany | 773,012 | 110,103 | ||||||
Spain | 43,066 | 6,460 | ||||||
France | 756,694 | 145,452 | ||||||
Hong Kong | 116,861 | 2,122 | ||||||
Israel | 58,340 | 8,751 | ||||||
India | 23,324 | — | ||||||
Italy | 28,516 | 4,277 | ||||||
Japan | 157,855 | 16,701 | ||||||
South Korea | 14,606 | 2,410 | ||||||
96
| COUNTRY | GROSS DIVIDEND | TAXES WITHHELD | ||||||
Cayman Islands | 31,067 | — | ||||||
Mexico | 4,843 | — | ||||||
Netherlands | 149,676 | 22,451 | ||||||
Norway | $ | 160,957 | $ | 24,144 | ||||
Sweden | 132,648 | 19,897 | ||||||
Taiwan | 80,552 | 16,111 | ||||||
|
|
|
| |||||
| $ | 3,812,952 | $ | 465,820 | |||||
3. RELATED PARTY TRANSACTIONS:
Management fees are paid to Kornitzer Capital Management, Inc. (“KCM”) at the rate of 1.00% per annum of the average daily net asset values of the Funds, except for the Buffalo Emerging Opportunities Fund, Buffalo Dividend Focus Fund, Buffalo Growth Fund and Buffalo Large Cap Fund which have a management fee rate of 1.45%, 0.90%, 0.90% and 0.90%, respectively. The management fees are for services which include the costs of all management, supervisory and administrative services required in the normal operation of the Funds. This includes investment management and supervision; fees of the custodian (except for the additional cost of maintaining custody of assets in foreign jurisdictions, when compared to domestic custody costs), independent registered public accounting firm and legal counsel; fees and expenses of officers, trustees and other personnel; rent; shareholder services; and other items incidental to corporate administration. Pursuant to a Master Services Agreement with U.S. Bancorp Fund Services, LLC (“USBFS”), KCM pays USBFS a fee of 30/100 of 1% (0.30%) of each Fund’s average daily net assets out of the fees KCM receives from the Funds, except for the Buffalo Dividend Focus Fund, Buffalo Growth Fund and the Buffalo Large Cap Fund, where USBFS receives 25/100 of 1% (0.25%). USBFS provides or obtains various operational services required by the Funds, pays various Fund expenses and acts as paying agent to compensate other Fund service providers. Some of the other Fund service providers are affiliates of USBFS.
With respect to the Buffalo Small Cap Fund only, the annual management fee rate of one percent (1.00%) of the Buffalo Small Cap Fund’s average daily net assets is a base fee paid to KCM that is subject to reduced fees paid on assets in excess of certain levels (breakpoints). The fee paid by KCM to USBFS is also subject to breakpoints on assets in excess of certain levels. The breakpoint schedules for the management fees paid by the Buffalo Small Cap Fund to KCM and the fees paid by KCM to USBFS are set forth in the following table:
| BUFFALO SMALL CAP FUND FEE BREAKPOINTS | ||||||||
| (AS A % OF AVERAGE DAILY NET ASSETS) | ||||||||
| ASSET LEVEL | MANAGEMENT FEE | USBFS FEE | ||||||
Assets up to $6 billion | 1.00 | % | 0.300 | % | ||||
Assets over $6 billion up to $7 billion | 0.95 | % | 0.275 | % | ||||
Assets over $7 billion up to $8 billion | 0.90 | % | 0.250 | % | ||||
Assets over $8 billion up to $9 billion | 0.85 | % | 0.225 | % | ||||
Assets over $9 billion | 0.80 | % | 0.200 | % | ||||
The management fees do not include the cost of acquiring and disposing of portfolio securities, taxes, if any, imposed directly on the Funds and their shares, insurance, certain trustee expenses and the cost of qualifying the Funds’ shares for sale in any jurisdiction. Certain officers and a trustee of the Funds are also officers and/or directors of KCM.
A trustee of the Funds is affiliated with USBFS and U.S. Bank, N.A., which provide accounting, administration, transfer agency and custodian services to the Funds, as described above.
4. AGGREGATE COMPENSATION TO TRUSTEES:
The Funds do not directly compensate any of their trustees. USBFS pays trustee fees to non-interested Board members from its share of the management fee that it receives from KCM. The aggregate compensation paid to the Funds’ non-interested trustees for their service on the Funds’ Board for the year ended March 31, 2015 was $125,000. Interested trustees who are affiliated with either KCM or the Funds’ service providers do not receive any compensation from the Funds, but are compensated directly by the advisor or service provider in connection with their employment with those entities.
5. REDEMPTION FEE:
Shares of the Buffalo Discovery Fund, Buffalo Dividend Focus Fund, Buffalo Flexible Income Fund, Buffalo Growth Fund, Buffalo International Fund, Buffalo Large Cap Fund and Buffalo Mid Cap Fund, sold or exchanged within 60 days of their purchase and shares of the Buffalo Emerging Opportunities Fund, Buffalo High Yield Fund and Buffalo Small Cap Fund sold or exchanged within 180 days of their purchase are subject to a redemption fee of 2.00% of the value of the shares sold or exchanged. The Funds will employ the “first in, first out” method to calculate the 60-day or 180-day holding period. The redemption fee is retained by the Funds and will help pay transaction and tax costs that long-term investors may bear when the Funds realize capital gains as a result of selling securities to meet investor redemptions.
97
Notes to Financial Statements
March 31, 2015
(Continued)
6. INVESTMENT TRANSACTIONS:
The aggregate purchases and sales of securities, excluding short-term investments and U.S. government securities, for the Funds for the year ended March 31, 2015, were as follows:
| BUFFALO DISCOVERY FUND | BUFFALO DIVIDEND FOCUS FUND | BUFFALO EMERGING OPPORTUNITIES FUND | BUFFALO FLEXIBLE INCOME FUND | BUFFALO GROWTH FUND | ||||||||||||||||
Purchases | $ | 338,777,263 | $ | 33,313,365 | $ | 59,643,884 | $ | 728,696,755 | $ | 163,165,269 | ||||||||||
Proceeds from Sales | $ | 335,016,851 | $ | 17,008,848 | $ | 320,497,421 | $ | 522,322,955 | $ | 359,533,724 | ||||||||||
| BUFFALO HIGH YIELD FUND | BUFFALO INTERNATIONAL FUND | BUFFALO LARGE CAP FUND | BUFFALO MID CAP FUND | BUFFALO SMALL CAP FUND | ||||||||||||||||
Purchases | $65,988,906 | $ | 62,863,822 | $ | 14,416,685 | $ | 65,753,333 | $ | 538,435,775 | |||||||||||
Proceeds from Sales | $57,103,129 | $ | 45,082,252 | $ | 10,101,111 | $ | 175,675,900 | $ | 1,422,061,077 | |||||||||||
There were no purchases or sales of long-term U.S. government securities for any Funds, except for the Buffalo Flexible Income Fund, during the year ended March 31, 2015. The Buffalo Flexible Income Fund purchased and sold $374,706,054 and $350,383,001 in long-term U.S. government securities, respectively, for period ended March 31, 2015.
7. TRANSACTIONS WITH AFFILIATES:*
Investments representing 5% or more of the outstanding voting securities of a portfolio company result in that company being considered an affiliated company, as defined in the 1940 Act. The aggregate fair value of all securities of affiliated companies held the Buffalo Small Cap Fund as of March 31, 2015 amounted to $188,844,814, respectively, representing and 6.28% of net assets, respectively. There were no affiliated companies held in any other Funds. A summary of affiliated transactions for each company which is an affiliate at March 31, 2015 or was an affiliate during the year ended March 31, 2015 is as follows:
| BUFFALO SMALL CAP FUND | ||||||||||||||||||||||||||||||||
| ADTRAN, INC. | DEALERTRACK HOLDINGS INC. (1) | INTERNAP NETWORK SERVICES CORP. | LOGMEIN, INC. | OXFORD INDUSTRIES, INC. | PROTO LABS, INC. | VITAMIN SHOPPE, INC. | TOTAL | |||||||||||||||||||||||||
March 31, 2014 Balance | ||||||||||||||||||||||||||||||||
Shares | 4,759,333 | 2,490,350 | 3,398,450 | 2,028,450 | 1,063,637 | 1,380,900 | 1,434,400 | — | ||||||||||||||||||||||||
Cost | $ | 98,692,325 | $ | 40,110,168 | $ | 47,327,405 | $ | 59,092,612 | $ | 29,899,197 | $ | 92,154,514 | $ | 68,832,621 | $ | 436,108,842 | ||||||||||||||||
Gross Additions | ||||||||||||||||||||||||||||||||
Shares | — | — | — | — | 59,125 | — | — | — | ||||||||||||||||||||||||
Cost | $ | — | $ | — | $ | — | $ | — | $ | 3,719,485 | $ | — | $ | — | $ | 3,719,485 | ||||||||||||||||
Gross Deductions | ||||||||||||||||||||||||||||||||
Shares | 2,366,289 | 680,600 | 858,462 | 108,280 | 44,770 | 511,065 | 1,434,400 | — | ||||||||||||||||||||||||
Cost | $ | 55,096,512 | $ | 12,260,877 | $ | 14,359,786 | $ | 3,785,133 | $ | 3,076,906 | $ | 37,496,032 | $ | 68,832,621 | $ | 194,907,867 | ||||||||||||||||
March 31, 2015 Balance | ||||||||||||||||||||||||||||||||
Shares | — | — | — | 1,920,170 | 1,077,992 | — | — | — | ||||||||||||||||||||||||
Cost | $ | — | $ | — | $ | — | $ | 55,307,479 | $ | 30,541,776 | $ | — | $ | — | $ | 85,849,255 | ||||||||||||||||
|
|
|
|
|
|
|
|
|
|
|
|
|
|
|
| |||||||||||||||||
Realized gain (loss) | $ | (3,674,498 | ) | $ | 18,107,049 | $ | (6,987,425 | ) | $ | 1,202,912 | $ | (380,013 | ) | $ | (4,048,356 | ) | $ | (8,194,808 | ) | $ | (3,975,139 | ) | ||||||||||
|
|
|
|
|
|
|
|
|
|
|
|
|
|
|
| |||||||||||||||||
Investment income | $ | 1,387,391 | $ | — | $ | — | $ | — | $ | 900,696 | $ | — | $ | — | $ | 2,288,087 | ||||||||||||||||
|
|
|
|
|
|
|
|
|
|
|
|
|
|
|
| |||||||||||||||||
| * | As a result of the Fund’s beneficial ownership of common stock of these companies, regulators require that the Fund state that it may be deemed an affiliate of the respective issuer. The Fund disclaims that the “affiliated persons” are affiliates of the Distributor, Advisor, Funds or any other client of the Advisor. |
| (1) | Security no longer an affiliate due to an increase in the outstanding shares of issuing company |
A Trustee of the Buffalo Funds affiliated with U.S. Bank, N.A., which provides Custody services to the Funds. For the year ended March 31, 2015, the Buffalo International Fund incurred $88,340 and $11,594 in Custody fees and Custodian fees payable, respectively.
8. OPTIONS WRITTEN:
FASB ASC 815, Derivatives and Hedging (“ASC 815”) is intended to improve financial reporting about derivative instruments by requiring enhanced disclosures to enable investors to better understand how and why the Funds use derivative instruments, how these derivative instruments are accounted for and their effects on the Funds’ financial position and results of operations. The Buffalo Flexible Income Fund is the only Fund that has maintained any positions in derivative instruments or engaged in hedging activities during the year ended March 31, 2015.
For additional information regarding derivative instruments and hedging activities of the Buffalo Flexible Income Fund please refer to Note 1.G to understand how and why the Buffalo Flexible Income Fund uses derivatives.
98
The number of option contracts written and the premiums received by the Buffalo Flexible Income Fund during the year ended March 31, 2015 were as follows:
| BUFFALO FLEXIBLE INCOME FUND | ||||||||
| CALL OPTIONS WRITTEN | ||||||||
| CONTRACTS | PREMIUMS | |||||||
Outstanding, March 31, 2014. | 10,086 | 447,629 | ||||||
Options written | 35,883 | 1,714,380 | ||||||
Corporate actions | 60 | — | ||||||
Options terminated in closing transaction | (70 | ) | (7,075 | ) | ||||
Options exercised | (16,383 | ) | (709,449 | ) | ||||
Options expired | (14,879 | ) | (624,573 | ) | ||||
|
|
|
| |||||
Outstanding, March 31, 2015 | 14,697 | 820,912 | ||||||
|
|
|
| |||||
The following is a summary of the location of derivative investments on the Buffalo Flexible Income Fund’s Statement of Assets and Liabilities as of March 31, 2015:
| DERIVATIVE INVESTMENT TYPE | VALUE | |
Liability Derivatives | ||
Buffalo Flexible Income Fund | $679,683 |
The following is a summary of the effect of derivative investments on Realized Gain (loss) and Change in Unrealized Appreciation/Depreciation on Options in the Funds as of March 31, 2015:
| DERIVATIVE INVESTMENT TYPE | REALIZED GAIN (LOSS) ON OPTIONS | |
Liability Derivatives | ||
Buffalo Flexible Income Fund | $624,574 | |
| DERIVATIVE INVESTMENT TYPE | CHANGE IN UNREALIZED APPRECIATION/DEPRECIATION ON OPTIONS | |
Liability Derivatives | ||
Buffalo Flexible Income Fund | $283,266 |
The following tables present derivative assets and liabilities net of amounts available for offset under a master netting arrangement (MNA) and net of related collateral received or pledged, if any, as of March 31, 2015:
| GROSS AMOUNTS NOT OFFSET IN THE STATEMENT OF ASSETS AND LIABILITIES AND SUBJECT TO MASTER NETTING AGREEMENTS (MNA) | ||||||||||||||||||||||||
| DESCRIPTION | GROSS AMOUNTS OF RECOGNIZED LIABILITIES | GROSS AMOUNTS OFFSET IN THE STATEMENT OF ASSETS AND LIABILITIES | NET AMOUNTS PRESENTED IN THE STATEMENT OF ASSETS AND LIABILITIES | GROSS AMOUNTS NOT OFFSET IN THE STATEMENT OF ASSETS AND LIABILITIES | NET AMOUNT | |||||||||||||||||||
| FINANCIAL INSTRUMENTS | COLLATERAL PLEDGED/ RECEIVED | |||||||||||||||||||||||
LIABILITIES: | ||||||||||||||||||||||||
Written Options | $ | 679,683 | $ | — | $ | 679,683 | $ | 679,683 | $ | — | $ | — | ||||||||||||
|
|
|
|
|
|
|
|
|
|
|
| |||||||||||||
| $ | 679,683 | $ | — | $ | 679,683 | $ | 679,683 | $ | — | $ | — | |||||||||||||
|
|
|
|
|
|
|
|
|
|
|
| |||||||||||||
9. FOREIGN INVESTMENT RISK:
When the Buffalo International Fund buys or sells securities on a foreign stock exchange, the transaction is undertaken in the local currency rather than in U.S. dollars. In purchasing or selling local currency to execute transactions on foreign exchanges, the Buffalo International Fund will be exposed to the risk that the value of the foreign currency will increase or decrease, which may impact the value of the portfolio holdings. China has, and may continue to adopt, internal economic policies that affect its currency valuations in a manner that may be disadvantageous for U.S. investors or U.S. companies seeking to do business in China. In addition, a country may impose formal or informal currency exchange controls (or “capital controls”). These types of controls may restrict or prohibit the Buffalo International Fund’s ability to repatriate both investment capital and income, which could undermine the value of the portfolio holdings and potentially place the Buffalo International Fund’s assets at risk of total loss.
Investing in securities of foreign corporations and governments involves additional risks relating to: political, social, religious and economic developments abroad; market instability; fluctuations in foreign exchange rates; different regulatory requirements, market practices, accounting standards and practices; and less publicly available information about foreign issuers. Additionally, these investments may be less liquid, carry higher brokerage commissions and other fees, and procedures and regulations governing transactions and custody in foreign markets also may involve delays in payment, delivery or recovery of money or investments. Investments in common stocks of U.S. companies with international operations, and the purchase of sponsored or unsponsored
99
Notes to Financial Statements
March 31, 2015
(Continued)
ADRs (American Depositary Receipt) carry similar risks. In addition to risks associated with investing in foreign securities, there are special risks associated with investments in China and Hong Kong, including exposure to currency fluctuations, less liquidity, expropriation, confiscatory taxation, nationalization, exchange control regulations, differing legal standards and rapid fluctuations in inflation and interest rates. The Chinese government could, at any time, alter or discontinue economic reform programs implemented since 1978.
10. SUBSEQUENT EVENTS:
Management has evaluated the events and transactions that have occurred after March 31, 2015 and through the date the financial statements were issued. On April 2, 2015, the Board of Trustees of Buffalo Funds accepted the resignation of Mr. Barry Koster from his role as Chief Compliance Officer of the Trust effective as of April 2, 2015. The Board appointed Mr. Clay E. Brethour as the Trust’s Interim Chief Compliance Officer effective as of the same date. On May 22, 2015, the Board of Trustees of Buffalo Funds accepted the resignation of Mr. Clay E. Brethour as the Trust’s Interim Chief Compliance Officer effective as of May 22, 2015. The Board appointed Mr. Fred Coats as the Trust’s Chief Compliance Officer effective as of the same date. On May 22, 2015, the Board of Trustees of Buffalo Funds accepted the resignation of Mrs. Rachel Spearo from her role as Secretary of the Trust effective as of May 22, 2015. The Board appointed Mr. Edward Paz as the Trust’s Secretary effective as of the same date. On May 22, 2015, Mr. Thomas Case retired as a Trustee of the Trust effective immediately. No other events were identified requiring additional disclosure in these financial statements.
100
Report of Independent Registered Public Accounting Firm
The Board of Trustees and Shareholders of
Buffalo Funds
We have audited the accompanying statements of assets and liabilities, including the schedules of investments, of the Buffalo Funds (comprising, respectively, the Buffalo Discovery Fund, Buffalo Dividend Focus Fund, Buffalo Emerging Opportunities Fund, Buffalo Flexible Income Fund, Buffalo Growth Fund, Buffalo High Yield Fund, Buffalo International Fund, Buffalo Large Cap Fund, Buffalo Mid Cap Fund, and Buffalo Small Cap Fund) (collectively referred to herein as the Funds), as of March 31, 2015, and the related statements of operations for the year then ended, the statements of changes in net assets for each of the two years in the period then ended and the financial highlights for each period indicated therein. These financial statements and financial highlights are the responsibility of the Funds’ management. Our responsibility is to express an opinion on these financial statements and financial highlights based on our audits.
We conducted our audits in accordance with the standards of the Public Company Accounting Oversight Board (United States). Those standards require that we plan and perform the audit to obtain reasonable assurance about whether the financial statements and financial highlights are free of material misstatement. We were not engaged to perform an audit of the Funds’ internal control over financial reporting. Our audits included consideration of internal control over financial reporting as a basis for designing audit procedures that are appropriate in the circumstances, but not for the purpose of expressing an opinion on the effectiveness of the Funds’ internal control over financial reporting. Accordingly, we express no such opinion. An audit also
includes examining, on a test basis, evidence supporting the amounts and disclosures in the financial statements and financial highlights, assessing the accounting principles used and significant estimates made by management, and evaluating the overall financial statement presentation. Our procedures included confirmation of securities owned as of March 31, 2015, by correspondence with the custodian, agent banks and brokers or by other appropriate auditing procedures where replies from agent banks and brokers were not received. We believe that our audits provide a reasonable basis for our opinion.
In our opinion, the financial statements and financial highlights referred to above present fairly, in all material respects, the financial position of each of the respective funds constituting the Buffalo Funds at March 31, 2015, the results of their operations for the year then ended, the changes in their net assets for each of the two years in the period then ended and the financial highlights for the periods indicated therein in conformity with U.S. generally accepted accounting principles.

Kansas City, Missouri
May 28, 2015
101
Notice to Shareholders
March 31, 2015
TAX INFORMATION
For the fiscal year ended March 31, 2015, certain dividends paid by the Funds may be subject to a maximum tax rate of 15%, as provided for by the Jobs and Growth Tax Relief Reconciliation Act of 2003. The percentage of dividends declared from ordinary income designated as qualified dividend income was as follows (unaudited):
Buffalo Discovery Fund | 22.04% | |||
Buffalo Dividend Focus Fund | 31.29% | |||
Buffalo Emerging Opportunities Fund | 3.54% | |||
Buffalo Flexible Income Fund | 81.94% | |||
Buffalo Growth Fund | 87.84% |
Buffalo High Yield Fund | 5.75% | |||
Buffalo International Fund | 100.00% | |||
Buffalo Large Cap Fund | 33.99% | |||
Buffalo Mid Cap Fund | 0.00% | |||
Buffalo Small Cap Fund | 0.00% |
For corporate shareholders, the percent of ordinary income distributions qualifying for the corporate dividends received deduction for the fiscal year ended March 31, 2015 was as follows (unaudited):
Buffalo Discovery Fund | 15.90% | |||
Buffalo Dividend Focus Fund | 27.72% | |||
Buffalo Emerging Opportunities Fund | 3.54% | |||
Buffalo Flexible Income Fund | 68.43% | |||
Buffalo Growth Fund | 87.62% |
Buffalo High Yield Fund | 5.49% | |||
Buffalo International Fund | 1.32% | |||
Buffalo Large Cap Fund | 36.10% | |||
Buffalo Mid Cap Fund | 0.00% | |||
Buffalo Small Cap Fund | 0.00% |
FOREIGN SHAREHOLDERS: The percentage of ordinary income distributions that are designated as interest-related dividends under Internal Revenue Code Section 871(k)(1)(C) for the year ended March 31, 2015 was as follows (unaudited):
Buffalo Discovery Fund | 0.00% | |||
Buffalo Dividend Focus Fund | 0.00% | |||
Buffalo Emerging Opportunities Fund | 0.00% | |||
Buffalo Flexible Income Fund | 40.89% | |||
Buffalo Growth Fund | 0.00% |
Buffalo High Yield Fund | 96.38% | |||
Buffalo International Fund | 0.00% | |||
Buffalo Large Cap Fund | 0.00% | |||
Buffalo Mid Cap Fund | 0.00% | |||
Buffalo Small Cap Fund | 0.00% |
FOREIGN SHAREHOLDERS: The percentage of taxable ordinary income distributions that are designated as short-term capital gain distributions under Internal Revenue Section 871(k)(2)(C) for the year ended March 31, 2015 was as follows (unaudited).
Buffalo Discovery Fund | 100.00% | |||
Buffalo Dividend Focus Fund | 82.25% | |||
Buffalo Emerging Opportunities Fund | 100.00% | |||
Buffalo Flexible Income Fund | 8.12% | |||
Buffalo Growth Fund | 61.19% |
Buffalo High Yield Fund | 3.49% | |||
Buffalo International Fund | 0.00% | |||
Buffalo Large Cap Fund | 93.96% | |||
Buffalo Mid Cap Fund | 0.00% | |||
Buffalo Small Cap Fund | 0.00% |
102
Trustees and Officers of the Funds (unaudited)
The management and affairs for the Funds are supervised by the Trustees (“Trustees”) under the laws of the State of Delaware. The Trustees and executive officers of the Funds and their principal occupations for the last five years are set forth below. Each may have held other positions with the named companies during that period. The Funds’ Statement of Additional Information includes additional information about the Trustees and is available without charge, upon request, by calling the Funds toll-free at 1-800-49-BUFFALO.
| NAME, AGE AND ADDRESS | POSITION(S) HELD WITH FUNDS | TERM OF OFFICE AND LENGTH OF TIME SERVED | PRINCIPAL OCCUPATION(S) DURING PAST 5 YEARS | NUMBER OF FUNDS IN COMPLEX OVERSEEN BY DIRECTOR | OTHER DIRECTORSHIPS HELD BY DIRECTOR | |||||
| INTERESTED TRUSTEES(1) | ||||||||||
Joseph C. Neuberger (53) 615 E. Michigan Streets Milwaukee, WI 53202 | Trustee
Chairman | Indefinite term and served since May 2003.
One year term and served since May 2003. | Executive Vice President, U.S. Bancorp Fund Services, LLC (1994-present). | Ten | Trustee, USAMUTUALS (an open-end investment company with three portfolios); Trustee, Trust for Professional Managers (an open-end investment company with 37 portfolios). | |||||
Clay E. Brethour (46) 5420 West 61st Place Shawnee Mission, KS 66205 | Trustee
President and Treasurer
Interim Chief Compliance Officer | Indefinite term and served since August 2013
One year term and served since September 2014.
Indefinite term and served from April 2015 to May 2015. | Portfolio Manager, Kornitzer Capital Management, Inc. (management company) 2000-present. | Ten | None | |||||
| NON-INTERESTED TRUSTEES | ||||||||||
Thomas S. Case (73) 515 Piney Creek Road Reno, NV 89511 | Trustee | Indefinite term and served from May 1995 to May 2015. | Retired. | Ten | None | |||||
J. Gary Gradinger (72) Golden Star Inc. 6445 Metcalf Ave. Overland Park, KS 66202 | Trustee | Indefinite term and served since February 2001 | Chairman and Chief Executive Officer, Golden Star Inc. (manufacturer of textile cleaning products). 1969-present. | Ten | Director, MGP Ingredients, Inc. (a food ingredients company) | |||||
Philip J. Kennedy (70) 116 Hermitage Hills Boulevard Hermitage, PA 16148 | Trustee | Indefinite term and served since May 1995. | Business Consultant and C.PA. Finance and Accounting Professor, Penn State Shenango (2001-2011). | Ten | None | |||||
| OFFICERS OF THE FUNDS | ||||||||||
Edward L Paz (43) 777 E. Wisconsin Ave. Milwaukee, WI 53202 | Secretary | One year term and served since May 2015 | Vice President, U.S. Bancorp Fund Services, LLC since July 2007. | N/A | N/A | |||||
Rachel A. Spearo (35) 777 E. Wisconsin Ave. Milwaukee, WI 53202 | Secretary | One year term and served from August 2006 to May 2015 | Vice President, U.S. Bancorp Fund Services, LLC since September 2004. | N/A | N/A | |||||
Barry Koster (54) 5420 West 61st Place Shawnee Mission, KS 66205 | Chief Compliance Officer | Indefinite term and served from October 2004 to April 2015 | Chief Compliance Officer since October 2004 and Chief Financial Officer since May 2002, Kornitzer Capital Management, Inc. (management company). | N/A | N/A | |||||
Fred Coats (50) 5420 West 61st Place Shawnee Mission, KS 66205 | Chief Compliance Officer | Indefinite term and served since May 2015 | Chief Compliance Officer, Kornitzer Capital Management, Inc. (management company), May 2015 to present; Private Practice Attorney, May 1993 to present. | N/A | N/A | |||||
| 1 | Each of these Trustees may be deemed to be an “interested person” of the Funds as that term is defined in the Investment Company Act of 1940, as amended. Messrs. Neuberger and Brethour are interested Trustees due to their employment by U.S. Bancorp Fund Services, LLC and Kornitzer Capital Management, Inc., respectively. U.S. Bancorp Fund Services, LLC is the Funds’ Administrator and Registered Transfer Agent. Kornitzer Capital Management, Inc. is the Funds’ Advisor. |
103
Notice to Shareholders
March 31, 2015
(Continued)
A NOTE ON FORWARD-LOOKING STATEMENTS
Except for historical information contained in this annual report for the Funds, the matters discussed in this report may constitute forward-looking statements made pursuant to the safe harbor provisions of the Securities Litigation Reform Act of 1995. These include any advisor and/or portfolio manager predictions, assessments, analyses or outlooks for individual securities, industries, market sectors and/or markets. These statements involve risks and uncertainties. In addition to the general risks described for the Funds in the current Prospectus, other factors bearing on these reports include the accuracy of the advisor’s or portfolio managers’ forecasts and predictions, and the appropriateness of the investment programs designed by the advisor or portfolio manager to implement their strategies efficiently and effectively. Any one or more of these factors, as well as other risks affecting the securities markets and investment instruments generally, could cause the actual results of the Funds to differ materially as compared to benchmarks associated with the Funds.
ADDITIONAL INFORMATION
The Buffalo Funds have adopted proxy voting policies and procedures that delegate to Kornitzer Capital Management, Inc., the Funds’ investment advisor, the authority to vote proxies. A description of the Buffalo Funds’ proxy voting policies and procedures is available without charge, upon request, by calling the Funds toll free at 1-800-49-BUFFALO. A description of these policies and procedures is also included in the Funds’ Statement of Additional Information, which is available on the SEC’s website at http://www.sec.gov.
The actual voting records relating to portfolio securities during the most recent twelve month period ended June 30 (as filed with the SEC on Form N-PX) are available without charge, upon request, by calling the Funds toll free at 1-800-49-BUFFALO or by accessing the SEC’s website at http://www.sec.gov.
The Funds file their complete schedule of portfolio holdings with the SEC four times each fiscal year at quarter-ends. The Funds file the Schedule of Portfolio Holdings with the SEC on Form N-CSR (second and fourth quarters) and on Form N-Q (first and third quarters). Shareholders may view the Funds’ Forms N-CSR and N-Q on the SEC’s website at http://www.sec.gov. Forms N-CSR and N-Q may also be reviewed and copied at the SEC’s Public Reference Room in Washington, D.C. Information on the SEC’s Public Reference Room may be obtained by calling 1-202-551-8090 (direct) or 1-800-SEC-0330 (general SEC number).
104
APPROVAL OF INVESTMENT ADVISORY CONTRACTS
The Board of Trustees (the “Trustees”) of Buffalo Funds, a Delaware statutory trust, on behalf of its series, Buffalo Flexible Income Fund, Buffalo High Yield Fund, Buffalo Large Cap Fund, Buffalo Small Cap Fund, Buffalo Growth Fund, Buffalo Discovery Fund, Buffalo Mid Cap Fund, Buffalo Emerging Opportunities Fund, Buffalo International Fund and Buffalo Dividend Focus Fund (all such funds referred to collectively as the “Funds”) met on November 20, 2014, to consider the renewal of the Amended and Restated Management Agreements (the “Agreements”) between the Trust, on behalf of the Funds, and Kornitzer Capital Management, Inc., the Funds’ investment adviser (the “Adviser”). In advance of the meeting, the Trustees requested and received materials to assist them in considering the renewal of the Agreements. The materials provided contained information with respect to the factors enumerated below, including the Agreements, a memorandum prepared by the Trustees’ independent legal counsel discussing in detail the Trustees’ fiduciary obligations and the factors they should assess in considering the approval of the Agreements, detailed comparative information relating to the advisory fees, overall expenses and performance of the Funds, due diligence materials relating to the Adviser (including the Adviser’s Form ADV, information regarding key personnel, information relating to the Adviser’s and the Funds’ compliance programs, including risk management, and the Code of Ethics), information that the Adviser regularly provides to the Trustees in connection with reports on its activities and the activities of the Funds at the Trustees’ periodic Board meetings, and other pertinent information. In addition, the Independent Trustees, as defined below, met in executive session with their independent counsel on November 19, 2014 and immediately prior to the Board meeting held on November 20, 2014, to review and discuss the information provided to them and their duties and responsibilities in connection with the renewal of the Agreements. Based on their evaluation of information provided by the Adviser, in conjunction with the Funds’ other service providers, the Trustees, by a unanimous vote (including a separate vote of the Trustees who are not “interested persons,” as that term is defined in the Investment Company Act of 1940, as amended (the “Independent Trustees”)), approved the renewal of the Agreements for an additional term of one year ending November 30, 2015.
DISCUSSION OF FACTORS CONSIDERED
In considering the renewal of the Agreements between the Trust, on behalf of the Funds, and the Adviser, the Trustees reviewed and analyzed various factors that they determined were relevant, including the factors enumerated below.
1. Nature, Extent and Quality of Services Provided to the Funds
The Trustees considered the nature, extent and quality of services provided by the Adviser to the Funds and the amount of time devoted to the Funds’ affairs by the Adviser’s staff. The Trustees considered the Adviser’s specific responsibilities in all aspects of day-to-day management of the Funds, including the investment strategies implemented by the Adviser, as well as the qualifications, experience and responsibilities of the Funds’ portfolio managers and other key personnel at the Adviser involved in the day-to-day activities of the Funds. In executive session the Independent Trustees reviewed information provided by the Adviser in response to the Board’s 15(c) request, including the structure of the Adviser’s compliance program and the Adviser’s marketing activity and goals and its continuing commitment to the growth of the Funds’ assets. The Trustees noted that during the course of the prior year they had met with representatives of the Adviser in person to discuss the Funds’ performance and outlook, along with the marketing and compliance efforts made by the Adviser throughout the year. The Trustees also noted any services that extended beyond portfolio management, and they considered the trading capability of the Adviser. The Trustees discussed in detail the Adviser’s handling of compliance matters, including the quarterly and annual reports of the Trust’s chief compliance officer to the Trustees on the effectiveness of the Adviser’s compliance program. The Trustees concluded that the Adviser had sufficient quality and depth of personnel, resources, investment methods and compliance policies and procedures essential to performing its duties under the Agreements and that the nature, overall quality and extent of the management services provided to the Funds, as well as the Adviser’s compliance program, were satisfactory and reliable.
2. Investment Performance of the Funds and the Adviser
In assessing the quality of the portfolio management services delivered by the Adviser, the Trustees compared the short term and longer-term performance of each Fund on both an absolute basis and in comparison to a benchmark index and in comparison to a peer group as constructed by data presented by Morningstar, Inc. (each a “Morningstar Peer Group”).
105
Notice to Shareholders
March 31, 2015
(Continued)
Buffalo Discovery Fund. The Trustees noted that the Buffalo Discovery Fund’s performance for the year-to-date, three year, five year and ten year periods ended September 30, 2014 was above the median for the Morningstar Peer Group of U.S. open-end mid cap growth funds, falling within the first quartile of the Morningstar Peer Group for all periods. The Trustees noted the Fund’s performance for the ten year period ended September 30, 2014 was the best of its Morningstar Peer Group. The Trustees further noted that for the three year, five year, ten year and since inception periods ended September 30, 2014, the Buffalo Discovery Fund outperformed the Lipper Science & Technology Index, the Lipper Multi Cap Growth Index, the Russell 3000 Growth Index and the Lipper Large Cap Growth Index. The Trustees also compared the performance of the Buffalo Discovery Fund to that of other accounts managed by KCM using investment strategies substantially similar to that of the Fund, and noted that for all periods the performance of the Fund was comparable to that of the other accounts.
Buffalo Dividend Focus Fund. The Trustees noted that the Dividend Focus Fund’s performance for the year-to-date and one year periods ended September 30, 2014 was above the median for the Morningstar Peer Group of U.S. open-end large value category funds, falling within the first quartile for each period. The Trustees also noted the Fund’s performance for the year-to-date period ended September 30, 2014 was the best of its Morningstar Peer Group. The Trustees further noted that for the one year period ended September 30, 2014, the Buffalo Dividend Focus Fund outperformed the Russell 1000 Value Total Return Index, the Lipper Equity Income Funds Index and the S&P 500 Index.
Buffalo Emerging Opportunities Fund. The Trustees noted that the Buffalo Emerging Opportunities Fund’s performance for the year-to-date and one year periods ended September 30, 2014 was below the median for the Morningstar Peer Group of U.S. open-end small growth funds, falling at the bottom of the fourth quartile of the Morningstar Peer Group as the worst performance for each period. The Trustees further noted that the Buffalo Emerging Opportunities Fund’s performance for the three year and five year periods ended September 30, 2014 was above the Morningstar Peer Group median for each period, falling into the first quartile for each period, and that the performance for the three year period was the best of the Morningstar Peer Group. The Trustees also noted that the Fund’s performance for the ten year period ended September 30, 2014 was only 0.01% below the Morningstar Peer Group median, falling into the top of the third quartile. The Trustees further noted that for the three year and five year periods ended September 30, 2014, the Buffalo Emerging Opportunities Fund outperformed the
Russell 2000 Total Return Index, the Russell Microcap Total Return Index, the Russell 2000 Growth Total Return Index, the Russell Microcap Growth Total Return Index, the Lipper Micro Cap Funds Index and the Lipper Small Cap Growth Funds Index.
Buffalo Flexible Income Fund. The Trustees noted that the Buffalo Flexible Income Fund’s performance for the year-to-date, five year and ten year periods ended September 30, 2014 was above the median for the Morningstar Peer Group of U.S. open-end moderate allocation funds, falling within the first quartile of the Morningstar Peer Group for the five year and ten year periods and within the second quartile of the Morningstar Peer Group for the year-to-date period. The Trustees also noted the Buffalo Flexible Income Fund’s performance was only slightly below the Morningstar Peer Group median for the one year and three year periods ended September 30, 2014, falling at the top of the third quartile for each period. The Trustees further noted that for the fifteen year period ended September 30, 2014, the Buffalo Flexible Income Fund outperformed the S&P 500 Index, and for all other periods the Fund had trailed the S&P 500 Index. The Trustees also noted for the one year, three year, five year, ten year, fifteen year and since inception periods ended September 30, 2014, the Buffalo Flexible Income Fund either outperformed or was closely aligned with the performance of the Lipper Mixed-Asset Target Allocation Moderate Funds Index and the Bank of America Merrill Lynch High Yield Master Funds II Index.
Buffalo Growth Fund. The Trustees noted that the Buffalo Growth Fund’s performance for the five year and ten year periods ended September 30, 2014 was above the median for the Morningstar Peer Group of U.S. open-end large growth funds, falling within the first quartile of the Morningstar Peer Group for the ten year period and within the second quartile of the Morningstar Peer Group for the five year period. The Trustees further noted that for the ten year, fifteen year and since inception periods ended September 30, 2014, the Buffalo Growth Fund outperformed the Russell 1000 Growth Total Return Index, the Lipper Large Cap Growth Funds Index, and the S&P 500 Index, and for the five year period ended September 30, 2014 the Buffalo Growth Fund outperformed the Lipper Large Cap Growth Funds Index, but lagged the Russell 1000 Growth Index and S&P 500 Index. The Trustees also compared the performance of the Buffalo Growth Fund to that of other accounts managed by KCM using investment strategies substantially similar to that of the Fund, and noted that for all periods the performance of the Fund was comparable to that of the other accounts.
Buffalo High Yield Fund. The Trustees noted that the Buffalo High Yield Fund’s performance for the year-to-date, one
106
year, three year, five year and ten year periods ended September 30, 2014 was below the median for the Morningstar Peer Group of U.S. open-end high yield bond funds, falling within the fourth quartile of the Morningstar Peer Group for all periods. The Trustees further noted that for the fifteen year and since inception periods ended September 30, 2014, the Buffalo High Yield Fund either outperformed or was in close alignment with the performance of the Bank of America Merrill Lynch High Yield Master Index, the Bank of America Merrill Lynch High Yield Master II Index and the Lipper High Yield Bond Funds Index.
Buffalo International Fund. The Trustees noted that the Buffalo International Fund’s performance for the one year, three year and five year periods ended September 30, 2014 was above the median for the Morningstar Peer Group of U.S. open-end foreign large growth funds, falling within the second quartile for each period. The Trustees further noted the Buffalo International Fund’s performance was at the Morningstar Peer Group median for the year-to-date period ended September 30, 2014. The Trustees further noted that for the one year, five year and since inception periods ended September 30, 2014, the Buffalo International Fund outperformed the MSCI All World Index ex USA Net, the MSCI EAFE Net Index and the Lipper International Funds Index. The Trustees also compared the performance of the Buffalo International Fund to that of other accounts managed by KCM using investment strategies substantially similar to that of the Fund, and noted that for all periods the performance of the Fund was comparable to that of the other accounts.
Buffalo Large Cap Fund. The Trustees noted that the Buffalo Large Cap Fund’s performance for the three year and ten year periods ended September 30, 2014 was above the median for the Morningstar Peer Group of U.S. open-end large growth funds, falling within the second quartile for each period. The Trustees further noted the Buffalo Large Cap Fund’s performance was only slightly below the Morningstar Peer Group median for the five year period ended September 30, 2014, falling at the top of the third quartile. The Trustees further noted that for the fifteen year and since inception periods ended September 30, 2014, the Buffalo Large Cap Fund outperformed the Russell 1000 Growth Total Return Index and the Lipper Large Cap Growth Funds Index, and had also outperformed the S&P 500 for the fifteen year period ended September 30, 2014. The Trustees also compared the performance of the Buffalo Large Cap Fund to that of other accounts managed by KCM using investment strategies substantially similar to that of the Fund, and noted that for all periods the performance of the Fund was comparable to that of the other accounts.
Buffalo Mid Cap Fund. The Trustees noted that the Buffalo Mid Cap Fund’s performance for the year-to-date and ten year periods ended September 30, 2014 was above the median for the Morningstar Peer Group of U.S. open-end mid-cap growth funds, falling within the second quartile of the Morningstar Peer Group for each period. The Trustees further noted the Buffalo Mid Cap Fund’s performance for the one year period ended September 30, 2014 was at the Morningstar Peer Group median. The Trustees also noted that for the one year, three year, five year, ten year and since inception periods ended September 30, 2014, the Buffalo Mid Cap Fund’s performance underperformed the Lipper Mid Cap Growth Funds Index, but outperformed the Index for the since inception period ended September 30, 2014. The Trustees further noted the Buffalo Mid Cap Fund underperformed the Russell Midcap Growth Index and the Russell Midcap Total Return Index for the one year, three year, five year, ten year and since inception periods ended September 30, 2014. The Trustees also compared the performance of the Buffalo Mid Cap Fund to that of other accounts managed by KCM using investment strategies substantially similar to that of the Fund, and noted that for all periods the performance of the Fund was comparable to that of the other accounts.
Buffalo Small Cap Fund. The Trustees noted that the Buffalo Small Cap Fund’s performance for the three year period ended September 30, 2014 was above the median for the Morningstar Peer Group of U.S. open-end small growth funds, falling within the second quartile but lagged the median over all other time periods presented. The Trustees further noted that for the three year, ten year, fifteen year and since inception periods ended September 30, 2014, the Buffalo Small Cap Fund outperformed the Russell 2000 Total Return Index and the Lipper Small Cap Growth Funds Index, and for the three year, fifteen year and since inception periods ended September 30, 2014, the Buffalo Small Cap Fund had outperformed the Russell 2000 Growth Total Return Index. The Trustees also compared the performance of the Buffalo Small Cap Fund to that of other accounts managed by KCM using investment strategies substantially similar to that of the Fund, and noted that for all periods the performance of the Fund was comparable to that of the other accounts.
After considering all of the information, the Trustees concluded that the performance obtained by the Adviser for the Funds was satisfactory under current market conditions and in light of each Fund’s track record. Although past performance is not a guarantee or indication of future results, the Trustees determined that the Funds and their shareholders were likely to benefit from the Adviser’s continued management.
107
Notice to Shareholders
March 31, 2015
(Continued)
3. Costs of Services Provided and Profits Realized by the Adviser
The Trustees considered the cost of services and the structure of the Adviser’s fees, including a review of the expense analyses and other pertinent material with respect to the Funds. The Trustees reviewed related statistical information, including the comparative expenses, expense components and peer group selections. The Trustees considered the cost structure of each Fund relative to its Morningstar Peer Group.
The Trustees also considered the overall profitability of the Adviser, as reviewed by the Independent Trustees during executive session. The Trustees also examined the level of profits that could be expected to accrue to the Adviser from the fees payable under the Agreements, as well as the Funds’ brokerage commissions and use of soft dollars by the Adviser. These considerations were based on materials requested by the Trustees specifically for the meeting, as well as the presentations made by the Adviser over the course of the year.
In reviewing the Morningstar 15(c) materials, the Board noted that unlike the mutual funds comprising the Peer Groups, the Buffalo Funds operate under a unitary fee structure whereby many of the Funds’ ordinary operating expenses are paid by the Adviser out of its advisory fee rather than paid directly by the Funds. The Board noted the difficulty of comparing the Buffalo Funds’ to non-unitary fee funds and observed that the contractual management fees in the materials and as discussed below, exclude the fees paid by the Adviser to U.S. Bancorp Fund Services, LLC under a master servicing agreement.
Buffalo Discovery Fund. The Trustees noted that the Buffalo Discovery Fund’s net management fee of 0.70% fell within the second quartile and was below the Morningstar Peer Group average of 0.78%, which fell in the third quartile. The Trustees further noted that the net expense ratio of 1.01% for the Buffalo Discovery Fund fell at the bottom of the second quartile, below the Morningstar Peer Group average of 1.10%, which fell into the upper second quartile.
Buffalo Dividend Focus Fund. The Trustees noted that the Buffalo Dividend Focus Fund’s net management fee of 0.65% fell within the first quartile, below the Morningstar Peer Group average of 0.86%. The Trustees further noted that the net expense ratio of 1.00% for the Buffalo Dividend Focus Fund fell within the second quartile, below the Morningstar Peer Group average of 1.16%, which fell into the third quartile.
Buffalo Emerging Opportunities Fund. The Trustees noted that the Buffalo Emerging Opportunities Fund’s net management
fee of 1.15% fell within the fourth quartile and was above the Morningstar Peer Group average of 0.86%, which fell in the second quartile. The Trustees further noted that the net expense ratio of 1.47% for the Buffalo Emerging Opportunities Fund fell within the fourth quartile, above the Morningstar Peer Group average of 1.19%, which fell into the second quartile. The Adviser noted the challenges in providing a comparable peer group in evaluating the management fees and expense ratio for the Emerging Opportunities Fund. He explained the Morningstar Peer Group for the Emerging Opportunities Fund is composed of a majority of small cap funds, versus micro cap funds, as Morningstar does not have a peer group category specifically for micro cap funds. The Adviser explained that the Emerging Opportunities Fund may be better compared to a peer group composed only of micro cap funds, as small cap funds in general have lower management fees and overall expense ratios because of their scalability and less research intensity compared to micro cap funds.
Buffalo Flexible Income Fund. The Trustees noted that the Buffalo Flexible Income Fund’s net management fee of 0.70% fell at the top of the third quartile and was above the Morningstar Peer Group average of 0.49%, which fell within the second quartile. The Trustees further noted that the net expense ratio of 1.01% for the Buffalo Flexible Income Fund fell within the fourth quartile, above the Morningstar Peer Group average of 0.63%, which fell within the second quartile. The Adviser noted the challenges in providing a comparable peer group in evaluating the management fees and expense ratio for the Flexible Income Fund. The Adviser explained the Morningstar Peer Group for the Flexible Income Fund is composed of funds that incorporate government treasuries within their fixed income portion of assets, versus high yield corporate bonds, as used by the Flexible Income Fund. The Adviser explained that funds that use corporate debt tend to have higher management fees and total expense ratios than those funds that use government treasuries.
Buffalo Growth Fund. The Trustees noted that the Buffalo Growth Fund’s net management fee of 0.65% fell at the top of the first quartile, below the Morningstar Peer Group average of 0.76%, which fell at the bottom of the third quartile. The Trustees further noted that the net expense ratio of 0.91% for the Buffalo Growth Fund fell within the second quartile, below the Morningstar Peer Group average of 0.99%, which fell at the top of the second quartile.
Buffalo High Yield Fund. The Trustees noted that the Buffalo High Yield Fund’s net management fee of 0.70% fell at the top of the third quartile, above the Morningstar Peer Group average of 0.60%, which fell at the top of the second quartile.
108
The Trustees further noted that the net expense ratio of 1.02% for the Buffalo High Yield Fund fell within the fourth quartile, above the Morningstar Peer Group average of 0.87%, which fell within the second quartile.
Buffalo International Fund. The Trustees noted that the Buffalo International Fund’s net management fee of 0.70% fell at the bottom of the first quartile, below the Morningstar Peer Group average of 0.85%, which fell at the top of the second quartile. The Trustees further noted that the net expense ratio of 1.05% for the Buffalo International Fund fell within the first quartile, below the Morningstar Peer Group average of 1.19%, which fell at the top of the second quartile.
Buffalo Large Cap Fund. The Trustees noted that the Buffalo Large Cap Fund’s net management fee of 0.65% fell within the first quartile, below the Morningstar Peer Group average of 0.82%, which fell within the third quartile. The Trustees further noted that the net expense ratio of 0.96% for the Buffalo Large Cap Fund fell within the first quartile, below the Morningstar Peer Group average of 1.12%, which fell within the third quartile.
Buffalo Mid Cap Fund. The Trustees noted that the Buffalo Mid Cap Fund’s net management fee of 0.70% fell within the second quartile, below the Morningstar Peer Group average of 0.76%, which fell within the third quartile. The Trustees further noted that the net expense ratio of 1.01% for the Buffalo Mid Cap Fund fell in the second quartile, below the Morningstar Peer Group average of 1.06%, which fell at the bottom of the third quartile.
Buffalo Small Cap Fund. The Trustees noted that the Buffalo Small Cap Fund’s net management fee of 0.70% fell within the second quartile and was below the Morningstar Peer Group average of 0.77%, which fell in the third quartile. The Trustees further noted that the net expense ratio of 1.00% for the Buffalo Small Cap Fund fell within the second quartile, and was only 0.01% above the Morningstar Peer Group average of 0.99%, which also fell within the second quartile.
The Trustees concluded that the Funds’ expenses and the management fees paid to the Adviser were fair and reasonable in light of the comparative performance, expense and management fee information. The Trustees further concluded that the Adviser’s profit from sponsoring the Funds had not been, and currently was not, excessive and that the Adviser maintained adequate profit levels to support the services to the Funds.
4. Extent of Economies of Scale as the Funds Grow
The Trustees compared each Fund’s expenses relative to its peer group and discussed realized and potential economies
of scale. The Trustees also reviewed the structure of each Fund’s management fee and whether each Fund was large enough to generate economies of scale for shareholders or whether economies of scale would be expected to be realized as Fund assets grow (and if so, how those economies of scale were being or would be shared with shareholders). The Trustees noted that, with the exception of the breakpoint management fee schedule proposed for the Buffalo Small Cap Fund, the Funds’ management fee structures did not contain any breakpoint reductions as the Funds’ assets grow in size, but that the feasibility of incorporating breakpoints would continue to be reviewed on a regular basis. The Trustees further noted that the breakpoint fee schedule proposed for the Buffalo Small Cap Fund would allow additional sharing of economies of scale with the Buffalo Small Cap Fund’s shareholders as the Fund’s assets grow beyond $6 billion. With respect to the Adviser’s fee structure, the Trustees concluded that the current fee structure was reasonable and reflected a sharing of economies of scale between the Adviser and the Funds at the Funds’ current asset levels.
5. Benefits Derived from the Relationship with the Funds
The Trustees considered the direct and indirect benefits that could be received by the Adviser from its association with the Funds. The Trustees examined the brokerage and commissions of the Adviser with respect to the Funds. The Trustees concluded that the benefits the Adviser may receive, such as greater name recognition, growth in separate account management services, greater exposure to press coverage, or increased ability to obtain research or brokerage services, appear to be reasonable, and in many cases may benefit the Funds through growth in assets.
CONCLUSIONS
The Trustees considered all of the foregoing factors. In considering the Agreements, the Trustees did not identify any one factor as all-important, but rather considered these factors collectively in light of the Funds’ surrounding circumstances and concluded that the Funds and their shareholders would continue to benefit from the Adviser’s continued management. Based on this review, the Trustees, including a majority of the Independent Trustees, approved the renewal of the Agreements with the Funds as being in the best interests of the Funds and their shareholders.
109
Privacy Policy
This Privacy Policy has been adopted by the Buffalo Funds. The Funds are each an open-end diversified management investment company registered under the Investment Company Act of 1940 (the “1940 Act”).
This Privacy Policy has also been adopted by KCM, an investment advisor registered with the Securities and Exchange Commission that serves as the investment advisor and manager of the Funds.
The Funds and the Advisor are collectively referred to as the “Companies,” “we,” “our” or “us.”
As a part of providing you services and products we collect non-public personally identifiable information (“Personal Information”) about you. Some of this is information you provide and some is obtained from other sources. In some circumstances, a necessary part of providing products and services to you requires that we disclose Personal Information about you to third parties.
We want you to understand how we handle your Personal Information. Please read the Privacy Policy carefully. It has information about our policies for the collection, use, disclosure, and protection of your Personal Information. If you have any questions, you can obtain additional information from the following:
Buffalo Funds
c/o U.S. Bancorp Fund Services, LLC
P.O. Box 701
Milwaukee, Wisconsin 53201-0701
www.buffalofunds.com
1-800-492-8332
Please be aware that we periodically update or revise the Privacy Policy. As methods of doing business change, we reflect any applicable changes in our Privacy Policy. If you are our customer, we will send you an update as and when it occurs.
SALE/DISCLOSURE OF YOUR PERSONAL INFORMATION
We promise that we will not sell your Personal Information to any person.
Also, we will not disclose your Personal Information to any third person aside from the disclosures described below. These disclosures generally relate to marketing or maintaining products or services provided to you.
WHAT INFORMATION DO WE COLLECT?
Personal, Financial and Product Information
To be able to offer, provide and maintain these products and services, the Companies collect a variety of Personal Information about you. The Personal Information we collect will vary depending upon the product or service you select.
The following is a general list of the Personal Information. Not all of the Personal Information will be collected every time you do business with us.
Personal Information
| • | Name |
| • | Address |
| • | Birthdate |
| • | Phone number |
| • | Social Security Number |
| • | E-mail address |
| • | Product-Related Personal Information |
| • | Product Activity History (things you have done with your mutual funds such as deposits, transfers, redemptions, etc.) |
GENERAL PRIVACY PROCESSES
How do we collect Personal Information?
We use a variety of methods to collect Personal Information. We collect Personal Information directly from you with paper forms (for example, new account and other administrative forms), over the phone or through facsimile transmissions. We also collect Personal Information from our web site and through other electronic means. We collect some Personal Information through joint marketing programs where we offer a product or service through another financial institution. In some of these instances, you may be considered a customer of both entities.
Who has access to this Personal Information?
Generally, only the Companies’ staff and certain companies working on the Companies’ behalf have access to this Personal Information.
Those Working on Our Behalf
Depending on the product or service you select, there may be a number of third parties that will have access to your Personal Information since they are working on our behalf. This access is necessary because these third parties perform a task or provide administrative services for the product you seek or have purchased from us. If we do not share the Personal Information, we cannot provide you the product or service you requested. In certain cases, affiliates are the entities performing such services on our behalf.
When we share Personal Information with non-affiliated companies working on our behalf, we protect your Personal Information by requiring such companies to adopt our privacy policy or have a policy providing protection similar to ours.
110
Required Disclosures
Certain Personal Information may also be disclosed to third parties without your consent if disclosure is necessary to comply with: 1) legal processes; 2) to protect the rights, property, or personal safety of the Funds, their shareholders or the public; 3) as part of inspections or examinations conducted by our regulatory agencies; and 4) in other situations required by law.
Joint Marketing
In certain circumstances, the Companies may jointly market a product or service with another financial institution. In these circumstances, we have arranged to offer our products through these entities and their representatives or through electronic systems (for example, the Internet).
The Companies may make other disclosures authorized by law.
Requested Disclosures
We will disclose your Personal Information if you request it to those persons that you designate. Examples of this are to: members of your family; registered investment advisors, attorneys and CPAs who you have retained to advise you in a transaction; and persons whom you have designated to represent you in dealings with us.
What do we do with the Personal Information?
The Companies make use of the Personal Information to provide you with the financial products and services that we offer.
At the point that you cease being a customer, we will maintain your Personal Information and handle it just the same as our current customers.
The Companies restrict access to the Personal Information to those who need to know it for ordinary business purposes. We also maintain physical, electronic, and procedural safeguards that comply with federal standards to guard your Personal Information.
What are your options regarding corrections of Personal Information?
Generally, upon your written request, we will make available Personal Information for your review. Please note, Personal Information collected that relates to a disputed claim or legal proceeding will not be made available. If you notify us that the Personal Information is incorrect, we will review it and if we agree, correct our records. If we do not agree, you may submit a short comment, which we will include in future third party disclosures, if any occur, of Personal Information.
111

Item 2. Code of Ethics.
The Registrant has adopted a code of ethics that applies to the Registrant’s principal executive officer and principal financial officer. The Registrant has not made any amendments to its code of ethics during the period covered by this report. The Registrant has not granted any waivers from any provisions of the code of ethics during the period covered by this report. A copy of the Registrant’s Code of Ethics is incorporated by reference to the Registrant’s Form N-CSR filed on June 3, 2011.
Item 3. Audit Committee Financial Expert.
The Registrant’s Board of Trustees has determined that there is at least one audit committee financial expert serving on its audit committee. The name of the audit committee financial expert is Philip J. Kennedy. Mr. Kennedy is “independent” as defined in Item 3(a)(2) of Form N-CSR.
Item 4. Principal Accountant Fees and Services.
(1) (a) – (d) Aggregate fees billed to the Registrant for each of the last two fiscal years for professional services rendered by the Registrant’s Independent Registered Public Accounting Firm were as follows:
| FYE 03/31/2015 | FYE 03/31/2014 | |||||||
Audit Fees | $ | 206,000 | $ | 198,190 | ||||
Audit-Related Fees | $ | 7,000 | $ | 6,445 | ||||
Tax Fees | $ | 33,720 | $ | 30,315 | ||||
All Other Fees | $ | 0 | $ | 0 | ||||
Audit fees include amounts related to the audit of the Registrant’s annual financial statements and services normally provided by the Independent Registered Public Accounting Firm in connection with statutory and regulatory filings, including registration statements. Audit-related fees refer to the reading and commenting on the Registrant’s semi-annual reports. Tax fees include amounts related to tax compliance, tax planning, and tax advice, including specifically tax return review and excise tax distribution review services. There were no fees billed for services rendered to the Registrant’s investment adviser or any entity controlling, controlled by or under common control with the investment adviser that provides ongoing services to the Registrant that were required to be approved pursuant to paragraph (c)(7)(ii) of Rule 2-01 of Regulation S-X.
(e) (1) The Registrant’s audit committee charter requires pre-approval in advance of (i) audit and non-audit services performed by the Registrant’s Independent Registered Public Accounting Firm for the Registrant; and (ii) audit and non-audit services relating directly to the operations and financial reporting of the Registrant performed by the Registrant’s principal accounting officer for the Registrant’s investment adviser, and any entity controlling, controlled by, or under common control with the investment adviser that provides ongoing services to the Registrant.
1
(2) None of the services described in (b) – (d) above were approved by the audit committee specifically pursuant to paragraph (c)(7)(i)(C) of Rule 2-01 of Regulation S-X.
(f) Not applicable.
(g) The aggregate non-audit fees were for audit-related and tax services rendered to the Registrant. As disclosed above, the amount of fees billed for such services were $33,720 and $30,315 for the 2015 and 2014 fiscal years, respectively.
(h) The aggregate fees billed for non-audit services rendered to the Registrant’s investment advisor related to surprise security count procedures were $11,400 and $11,000 for the 2015 and 2014 fiscal years respectively. These fees were not required to be pre-approved pursuant to paragraph (c)(7)(ii) of Rule 2-01 of Regulation S-X.
Item 5. Audit Committee of Listed Registrants.
Not applicable because the Registrant is not a listed issuer.
Item 6. Investments.
Schedule of Investments is included as part of the report to shareholders filed under Item 1 of this Form.
Item 7. Disclosure of Proxy Voting Policies and Procedures for Closed-End Management Investment Companies.
Not applicable because the Registrant is an open-end investment company.
Item 8. Portfolio Managers of Closed-End Management Investment Companies.
Not applicable because the Registrant is an open-end investment company.
Item 9. Purchases of Equity Securities by Closed-End Management Investment Company and Affiliated Purchasers.
Not applicable because the Registrant is an open-end investment company.
Item 10. Submission of Matters to a Vote of Security Holders.
There have been no material changes to the procedures by which shareholders may recommend nominees to the Registrant’s Board of Trustees.
Item 11. Controls and Procedures.
| (a) | The Registrant’s Principal Executive Officer and Principal Financial Officer has reviewed and evaluated the Registrant’s disclosure controls and procedures (as defined in Rule 30a-3(c) under the Investment Company Act of 1940 (the “Act”)) as of a date within 90 days of the |
2
filing of this report, as required by Rule 30a-3(b) under the Act and Rules 13a-15(b) or 15d-15(b) under the Securities Exchange Act of 1934. Based on his review, the Principal Executive Office and Principal Financial Officer has concluded that the disclosure controls and procedures are effective in ensuring that information required to be disclosed in this report is appropriately recorded, processed, summarized and reported and made known to him by others within the Registrant and by the Registrant’s service provider.
| (b) | There were no changes in the Registrant’s internal control over financial reporting that occurred during the Registrant’s second fiscal quarter of the period covered by this report that have materially affected, are is reasonably likely to materially affect, the Registrant’s internal control over financial reporting. |
Item 12. Exhibits.
| (a) | (1) Code of Ethics. Incorporated by reference to the Registrant’s Form N-CSR filed on June 3, 2011. |
| (2) | Certifications pursuant to Section 302(a) of the Sarbanes-Oxley Act of 2002 are filed herewith. |
| (3) | Not applicable to open-end investment companies. |
| (b) | Certifications pursuant to Section 906 of the Sarbanes-Oxley Act of 2002. Furnished herewith. |
3
SIGNATURES
Pursuant to the requirements of the Securities Exchange Act of 1934 and the Investment Company Act of 1940, the registrant has duly caused this report to be signed on its behalf by the undersigned, thereunto duly authorized.
| Buffalo Funds | ||
| By | /s/ Clay E. Brethour | |
| Clay E. Brethour | ||
| President and Treasurer | ||
| Date | June 3, 2015 | |
Pursuant to the requirements of the Securities Exchange Act of 1934 and the Investment Company Act of 1940, this report has been signed below by the following persons on behalf of the registrant and in the capacities and on the dates indicated.
| Buffalo Funds | ||
| By | /s/ Clay E. Brethour | |
| Clay E. Brethour | ||
| President and Treasurer | ||
| Date | June 3, 2015 | |
4