UNITED STATES
SECURITIES AND EXCHANGE COMMISSION
Washington, D.C. 20549
FORM N-CSR
CERTIFIED SHAREHOLDER REPORT OF REGISTERED
MANAGEMENT INVESTMENT COMPANIES
Investment Company Act file number 811-10303
Buffalo Funds
(Exact name of Registrant as specified in charter)
5420 W. 61st Place
Shawnee Mission, KS 66205
(Address of principal executive offices) (Zip code)
Kent W. Gasaway
5420 W. 61st Place
Shawnee Mission, KS 66205
(Name and address of agent for service)
(913) 677-7778
Registrant’s telephone number, including area code
Date of fiscal year end: March 31, 2012
Date of reporting period: March 31, 2012
Item 1. Reports to Stockholders.
 Message to Our Shareholders
T
he past 12 months have proven extremely volatile for investors. While returns for the market and the Buffalo Funds have been positive, they have been held back by concerns over a return to recession throughout Europe, the ability of certain European countries to fund their government debts, higher oil prices and a possible economic slowdown in China. Offsetting positives have included a recent slight pick-up in economic and job growth in the U.S., still strong corporate profits and near-zero interest rates.
Similar to 2011, equity returns in the first three months of 2012 have been double-digit as measured by the S&P 500 Index. Yet the mood is decidedly cautious as investors fear a replay of the mid-year swoon in 2011. We are more upbeat. At this point we think the chances favor more calm this summer. Europe remains the biggest risk, but debt yields are down substantially from last year. If we are correct, the U.S. market could have another leg upward to new highs for this cycle. Investors continue to tire of earning negative real returns in money market vehicles and short-term bonds. We may be very near the tipping point toward equities.
While we are optimistic in the short term, the outlook for our markets in the intermediate term is more uncertain. We believe this uncertainty is mostly tied to Washington’s inability to make real progress on our budget deficit. While our Treasury securities remain a safe haven for the world, this may not always be the case.
We are currently benefiting from being the most liquid and among the “least worst” government credits. However, without a serious long-term deficit reduction plan, another U.S. government debt downgrade may not be far in the future. The next battle on this subject will be after the presidential election when the U.S. government will likely again reach its
allowable debt ceiling. Debate will likely be divisive and highly partisan, yet the outcome could set the tone for market returns in 2013 and beyond. A budget ceiling increase that includes substantial bi-partisan deficit reduction legislation (similar to the proposed Simpson-Bowles plan) would be extremely positive for U.S. financial markets. We fear a ceiling increase with no plan would yield the opposite results. We again encourage everyone to write their congressional representatives and emphasize the importance of coming to a real agreement on this subject.
Regardless of the outcome, your investment team at the Buffalo Funds will continue its search for great growth companies. This is a particularly exciting time for new idea generation as more and more companies are coming public for the first time. The upcoming offering of Facebook shares will likely foster even more IPOs (Initial Public Offerings). In anticipation of future growth, we continue to add depth to our research staff. We now have 25 full-time investment professionals on staff and our assets under management are near an all-time high.
We are excited about the prospects for 2012 and look forward to updating you on all the above this fall. We are truly appreciative of your trust and your investments with the Buffalo Funds.
Sincerely,

Kent W. Gasaway
President
Past performance does not guarantee future results. Mutual fund investing involves risk; loss of principal is possible. Opinions expressed are subject to change, are not guaranteed and should not be considered investment advice.
2
Portfolio Management Review
Buffalo China Fund
The past 12 months were a difficult yet critical period for the Chinese economy. Slowing growth and rising inflation pressured the government to adjust monetary policy and manage expectations, both at home and abroad as China was widely expected to be one of the main drivers of global growth. A pending change in leadership added to uncertainty despite the government’s efforts to ensure a smooth transition of power.
Most markets found it difficult to generate positive returns in this challenging environment. The Buffalo China Fund returned -18.89% for fiscal year ending March 31, 2012. The MSCI China Free Net (USD) Index returned -12.83% for the same time period.
Almost all sectors had negative returns for the trailing 12 months, with the exception of Telecommunication. China Mobile, a provider of wireless communication, was the top contributor to the Fund during this period as it continued to grow its subscriber base. Chinese consumers have displayed a voracious appetite for wireless technology, especially as the middle class expands and deploys its disposable income, and the telecommunication industry has benefited from the trend.
Another key contributor is premium pediatric nutrition and baby care producer Biostime. As Chinese parents become more willing to spend on their single child’s health and growth, premium baby care and formula manufacturers continue to benefit from the trend. Biostime is well-positioned in the industry with a business model that can respond to consumer needs.
Boasting the second largest GDP in the world, China’s growing economy has a huge demand for energy, making up about 10% of total GDP. In the long term, we believe this will not be sustainable without a strategic change away from heavy dependency on coal, currently 70% of total energy usage. The downstream air pollution, human health and environmental impact will require China to seek alternative energy. We have identified natural gas development, exploration, and distribution as a major trend in China for the next 10 years, as China increases its natural gas consumption. We strategically added selected names in the sector, such as ENN and Kunlun early this year.
During the past 12 months, due to rising labor and raw materials costs, some of our Consumer sector stocks suffered losses, including long-time holding Asian Citrus. Intensified competition and a glut in supply dragged the performance of sports apparel and shoes manufacturer Anta. Finally, China’s transition away from a fixed asset investment-driven economy to a consumption-driven economy negatively impacted construction materials and commodity producers, such as cement producers Anhui Conch and Jiangxi Copper.
In a recent study sponsored by China’s policy makers entitled “China 2030: Building a Modern, Harmonious, and Creative High-Income Society,” the roles of the state and the private sector were examined in order to encourage increased competition in the economy. State Owned Enterprises’ (SOEs’) current monopolistic position may prove less effective and even detrimental to China’s long-term prosperity and more private sector businesses are encouraged to participate in currently exclusive sectors such as natural gas exploration and private banking. We view the gradual and slowly downsizing of SOEs as a trend and seek private companies that can emerge and benefit from the trend.
During the trailing 12 months, we reallocated the Fund into more consumer-related stocks as China moved to enhance disposable income for the growing middle class. We also increased the Fund’s exposure to commodity-dependent companies such as utilities as commodity prices eased. These moves resulted in a larger than normal turnover for the portfolio during the period. We believe broad trends will stabilize and we expect a more normal turnover rate going forward.
Buffalo Flexible Income Fund
The Buffalo Flexible Income Fund returned 9.15% in fiscal 2012 (FYE: 3/31) which compared favorably to the S&P 500 equity index and the Bank of America/Merrill Lynch High Yield Master II Index which returned 8.54% and 5.64% respectively over the same time period.
Fiscal 2012 was a tale of two halves as the first half was negatively impacted by various geopolitical events while the second half saw risk assets rally as some of these events were resolved in a favorable manner. Specifically, in the first six months of 2012 markets were negatively impacted by the European sovereign debt crisis with a primary focus on Greece, the supply chain disruption from the tsunami in Japan, the end of monetary easing (QEII) and the congressional debacle surrounding the U.S. debt ceiling which ultimately resulted in the first ever downgrade of U.S. sovereign debt by the S&P ratings agency. As a result of these numerous market uncertainties and risks experienced in the first half of fiscal 2012, the S&P 500 index and the BofA Merrill Lynch High Yield Master II Index declined nearly 13.87% and 6.31%, respectively.
In contrast to the first half of 2012, the second half of fiscal 2012 saw extremely strong returns in risk assets as the S&P 500 and the BofA Merrill Lynch High Yield Master II Index returned approximately 26% and 12%, respectively. Some of the factors that drove the second half rally in risk assets included calming of the European sovereign debt crises as the European Central Bank’s LTRO (long term refinancing
3
Portfolio Management Review
(Continued)
operation) was received favorably by the market, improved U.S. domestic data, and a resolution to the Greek debt crisis as its sovereign debt was restructured in a manner which did not disrupt the global financial system.
The Fund’s positive relative performance in equities was primarily driven by security selection. Flexible Income’s equity portfolio ended the fiscal year at a 55% weighting and generated a return of 10.49% versus the S&P 500 at 8.5%. Consumer Staples, Health Care, and Information Technology were the best-performing sectors on an absolute basis. Relatively speaking, the Fund generated a majority of its outperformance in Consumer Staples, Financials, and Health Care. In Consumer Staples, an overweight position in a sector that outperformed the broader index positively impacted performance. In Financials, an underweight position in a sector that underperformed the benchmark coupled with superior stock selection by the Fund contributed positively. Lastly, Health Care helped the Fund’s relative performance due to both an overweight position and positive security selection.
Some of the biggest individual contributors to equity Fund performance included Intel, Microsoft, and HollyFrontier Corporation. Intel’s stock was up 40% driven by a series of quarters where the company beat consensus estimates and raised guidance driven by strong personal computer demand in emerging markets coupled with strength in enterprise demand. Microsoft’s stock saw a 29% return for the Fund in 2012, almost all of which came in fiscal 4Q with the stock up 25% in that quarter alone. The company’s fiscal 4Q performance was driven by an earnings beat as well as anticipation of the release of Windows 8 and Office 15 in the company’s fiscal 2013. Lastly, HollyFrontier’s contribution to Fund performance can be attributed to nimble trading by the Fund team which sold the shares near its highs in July of 2011 due to valuation and repurchased the shares at much lower prices starting in November of 2011. After the Fund’s purchase, the shares benefited from a substantial increase in crack spreads (i.e. the gross margin related to buying crude oil and processing it into refined products) driven by the company’s access to relatively cheaper crude oil feedstock.
The biggest drag on equity performance for the fiscal year came from Pitney Bowes, Hess Corp, and Schlumberger which all declined between 24% and 30% for the Fund. Pitney Bowes continues to struggle with declines in their installed base and weak mail growth. Hess Corporation saw most of its detrimental performance in the first half of the fiscal year due to a material decline in oil prices of approximately 25% coupled with earnings that missed consensus expectations, disappointing production guidance, and increased costs. Schlumberger also performed weakly, primarily in the first half of the fiscal year, on declining oil prices and macroeconomic concerns.
The Fund’s positive relative performance in fixed income was driven by both security selection and asset allocation. Flexible Income’s fixed income portfolio ended the fiscal year at a 33% weighting and generated a return of 11.25% vs. the BofA Merrill Lynch High Yield Master II Index at 5.6%. Services, Energy, and Consumer Non-Cyclical’s were the biggest contributors to absolute as well as relative performance. In both Services and Energy an overweight position coupled with superior security selection helped drive relative outperformance. In Consumer Non-Cyclical’s, positive relative performance was driven primarily by security selection. Top individual contributors in the fixed income portfolio included Lions Gate 10.25% due 11/01/2016, United Refining 10.5% due 2/28/2018, and Warner Chilcott 7.75% due 9/15/2018. The biggest detractors from fixed income performance were Goodrich Petroleum 8.875% due 3/15/2019, Acadia Healthcare 12.875% due 11/1/2018, and Triumph Group 8.0% due 11/15/2017.
During fiscal 2012, the Buffalo Balanced Fund was renamed the Buffalo Flexible Income Fund. The primary rationale for changing the name was to enhance the flexibility of the Fund as it relates both to the universe of fixed income and equity securities and the asset allocation within the Fund. The strategy of the Fund was also changed slightly to focus on generating income first with a secondary focus on capital appreciation. In connection with the name change, the Fund’s prospectus was amended such that the Fund could invest in additional equity classes such as real estate investment trusts (REITs) and master limited partnerships (MLPs) as well as an expanded opportunity set within the fixed income universe (bank loans, convertible bonds, high yield bonds, mortgage and sovereign debt). The Fund has historically been run with a 60% equity allocation and a 40% fixed income allocation and the new mandate provides the managers with the ability to deviate from these prior percentages. However, it should be noted that while we have increased the flexibility of the Fund managers as it relates to both security selection and asset allocation, the Fund’s composition and allocation have not changed significantly since we announced the change last year.
While risk markets have appreciated significantly over the past six months, we continue to look for investment opportunities that have positive risk/reward tradeoffs. Furthermore, the new investment mandate enables us to look at additional investment opportunities. It should also be emphasized that we will continue to pursue the same disciplined strategy of employing rigorous fundamental analysis in finding high yielding securities that generate income, have limited downside based on our analysis, and increase purchasing power over the long run.
4
Buffalo Growth Fund
During fiscal 2012, which ended March 31, 2012, equity investors were treated to a full range of offerings over the last 12 months, and many of them headed for the exit. During the second and third quarters of fiscal 2012, stocks swung wildly on alternating positive and negative news reports. Supply line disruptions in Japan and oil supply delays in the Middle East followed by improved jobs outlook in the U.S. and hopes for debt relief in Greece. In short, fear and uncertainty ruled market sentiment until a degree of stability returned in the fourth quarter. This positive trend took hold and by the end of the first quarter 2012, most stock indexes had returned to their pre-recessionary levels.
The Buffalo Growth Fund was buffeted in this stormy market as its U.S. stocks have exposure to global markets and their various challenges. The Fund had a positive return of 8.78% for the trailing 12 months, but lagged the benchmark Russell 1000 Growth Index, which returned 11.02%. During bouts of turbulence, the Fund employs its strategy of turning market overreactions to our advantage as opportunities to purchase stocks from our “wish list” of premier companies when market downturns bring them into our target valuation range.
The Fund’s underperformance relative to the benchmark during the fiscal year was primarily driven by poor stock selection in the Consumer Discretionary sector. Companies such as WMS Industries, a maker of gambling machines, and Electronic Arts, maker of electronic games, and Ancestry.com, an on-line genealogy search service, failed to generate the revenues we had hoped to see in the period.
Underperformance was somewhat offset by strong performance from the Healthcare sector, driven by stand-out performers Pharmaceutical Product Development and Align Technologies. Pharmaceutical Product Development was acquired during the year and taken private, while Align Technologies continued to rapidly grow its Invisalign product in all geographies, whether developed or developing economies.
Ironically, the strongest contributor to the Fund, Apple, hurt relative performance because of its underweighting relative to the benchmark. We do not align the Fund’s weightings with those of the benchmark. Our stock selection and asset allocation are driven by price-to-growth attractiveness of companies we consider premier companies whose rapid and sustained growth prospects are propelled by long-term trends and international expansion. Apple, though one of the largest weightings within the Fund at an average 2.78%, couldn’t provide the punch of the 5.56% weighting in the benchmark.
We maintain our belief that U.S. based companies with large or growing global markets will be significant drivers of investment growth. In this interconnected, complex world, market cycles fluctuate at different rates from country to country. We believe the companies that can compete and excel are the ones that can derive profits from more than one market so that if one area of the globe is flagging, the company can draw on its other locations to boost revenues. Strong and innovative U.S. companies that can expand their brand into different countries should be well-positioned to benefit as markets and consumers continue to regain their strength at various paces. We continue to search for these companies and construct the portfolio with high-quality stocks that have the potential to generate returns for long-term investors.
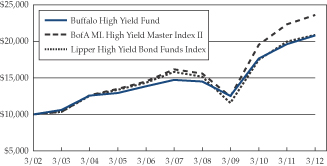
Buffalo High Yield Fund
The Buffalo High Yield Fund returned 5.86% for the fiscal year ended March 31, 2012. During the period, the Fund outperformed by 22 basis points our primary benchmark, the BofA Merrill Lynch High Yield Master II Index, which had a return of 5.64%. The primary reasons for our outperformance include contributions from our holdings of straight corporate bonds, preferreds’, and convertible preferreds. Our holdings of convertibles and common equities underperformed our primary index.
A more detailed look at the portfolio demonstrates how the performance was generated:
| • | The corporate bond portion of the portfolio returned roughly 11% during the year and represented roughly 68%-72% of assets during the year. |
| • | The convertible bond portion of the portfolio returned roughly 3% during the year and represented roughly 10%-13% of assets during the year. |
| • | The convertible preferred and preferred stock portion of the portfolio returned roughly 11% during the year and accounted for between 5%-6% of assets during the year. |
| • | The common equity component of the Fund returned roughly -10% during the year and accounted for between 4%-7% of assets during the year. |
| • | The cash component of the portfolio did not generate a material return to the portfolio and represented between 7%-10% of the Fund’s assets during the year. |
Primary contributors to the straight corporate bond portfolio included Lions Gate 10.25%, United Refining 10.5%, Prestige Brands 8.25%, and iGATE 9%. These bonds were among the larger weightings in the portfolio, and all generated significant interest income and capital appreciation.
5
Portfolio Management Review
(Continued)
Within the convertible bond portfolio, Sonosite 3.75%, Hornbeck 1.625%, Amylin 3% and Hornbeck Offshore were the largest contributors to the class’s return. Ciena 4%, and General Cable 3.25% served as a drag on the performance of this asset class. The underlying equities of the many of our holdings in this class are concurrently owned in the Buffalo equity Funds.
Within the preferred and convertible preferred portfolio, Boston Private Financial 4.875% and FirstService 7% generated strong positive returns.
The common equity portion of the portfolio consisted of six companies at fiscal year-end, down from nine at year end 3/31/11. All but one of these holdings are dividend-paying stocks. Within this segment, Abbott Labs and Kraft Foods were the top performers. Our holdings of WMS and Lincoln Educational Services served as a drag on performance.
Our allocation of a portion of the Fund into common stocks and other securities with equity-like exposure reflects our belief that these stocks are undervalued relative to lower quality high yield debt investments, and offer a more attractive risk/reward trade-off. We believe these securities could contribute meaningfully to performance in coming periods.
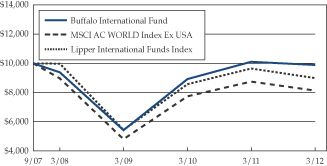
Buffalo International Fund
In a fickle world, where triple-digit market swings can be driven by fear as much as reality, it can be hard to maintain steady footing. The Buffalo International Fund has tried to do just that over the last 12 months, focusing less on macroeconomic tremors and more on company-specific business fundamentals. We believe this is a sound basis for investing for long-term growth.
Although negative returns are disappointing, we are pleased that in such a dramatically down market, the International Fund was able to outperform our benchmark, the MSCI AC World Index ex. USA. During fiscal year, ended March 31, 2012, the Fund had returns of -2.20%, while the index returned -7.17%. We feel it is just as important, perhaps more important, to protect the Fund against dramatic losses in a down market as it is to generate strong positive returns in an up market. For the period, the Fund provided relatively good protection for a number of reasons.
Our belief in the power of the consumer in growing middle-class economies helped performance as we overweighted Consumer sectors, which performed well during the period. Our top two performers for the trailing 12 months were Consumer Staples companies Companhia de Bebidas das Americas ADS and Compania Cervecerias Unidas S.A. ADS. Both of these beverage companies have operations focused on the growing beer markets in Latin America, with both stocks benefiting from strong and steady revenue growth and a stable and growing dividend policy.
The Fund also benefited from a relatively low weighting in Financials. The upheaval in financial markets, led by debt and solvency fears in Europe, reverberated around the world and the sector in general was hit. Our limited exposure had negative returns but, again, much less so than in the benchmark which had close to one quarter of its holdings in Financials.
The Fund also found some positive returns in the Telecommunication sector, where TIM Participacoes, the number two Brazilian wireless provider, continued to grow its subscriber base. We believe this is still a solid long-term trend as the world’s consumers seem to have an endless appetite for wireless communication and new applications and products are hitting the market at a furious pace. We maintain a position in this company and feel it still has room to grow.
While our average cash position during the trailing 12 months was higher, at 8.31%, than our normal target range, it was actually a benefit to the Fund in a down market. We are looking to deploy some of that cash into high-conviction stocks, or to purchase additional shares of stocks in the portfolio when they experience a market decline and come within our valuation range.
While the European fiscal situation is still unresolved, and growth in China is expected to be slower than originally hoped, we still believe there are ample opportunities across the globe for investors to find growth. We stick with our fundamental strategy of selecting companies with trend-based, secular growth potential, screen for sound business practices and balance sheets, and then purchase when the stock is fairly valued. The Fund will reach its 5-year anniversary this December, and we hope to report favorable results that support our investment philosophy.
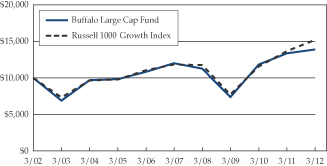
Buffalo Large Cap Fund
Over the last 12 months, investors were exposed to a wide array of market conditions. In the second quarter of calendar 2011, what had appeared to be a market on the way to strong recovery, took a turn when a devastating earthquake hit Japan, triggering a deadly tsunami, and a prolonged disruption of industrial supply lines out of that country. Toward the end of the summer, national politics fueled investor dismay as the U.S. Congress debated raising the debt ceiling. Additional challenges that contributed to the capital market jitters included: rising tensions in the Middle East, slowing growth in China, and the seemingly insurmountable issues of debt and insolvency in peripheral European countries. Yet, strong fourth quarter earnings for U.S. companies, as well as better than expected U.S. economic growth in late 2011 and early 2012, helped equities mount a strong ascent in the first calendar quarter of 2012. Sadly, many investors failed to capture this
6
momentum as they remained too fearful to participate in equity markets.
The Buffalo Large Cap Fund had positive performance of 3.84% during fiscal 2012, underperforming the benchmark Russell 1000 Growth Index, which returned 11.02%. The Fund substantially underperformed in the back half of calendar 2011, July through December. In reflecting on the key factor that generated the underperformance, we concluded that our efforts to own names with valuation support based on free cash flow generation had led to a significant weighting in more contrarian or controversial stocks. As the market became more risk-averse, these equities sold off and meaningfully underperformed. Going forward, our priority is refocused on investing in secular growth companies. We aim to enter or add to these equities at attractive valuations. So while valuation remains important, the top priority is sustainable and profitable growth.
In further evaluating the annual performance relative to the benchmark, the Large Cap Fund had strong relative performance with regard to sector allocation. The underperformance was entirely driven by stock selection. In particular the stock selection was weakest in the Information Technology sector followed by the Energy sector. Over the past six to nine months, we made substantial efforts to reposition the Fund’s Technology investments. We exited Yahoo and Corning, both of which are highly cyclical and structurally challenged companies, and we added Oracle and Google, both of which are market leaders with sustainable growth profiles, strong operating margins, and reasonable valuations. Our poor relative performance in Information Technology was also affected by what we do not own versus the benchmark. For example, the Fund owned no shares of Apple during the period, a stock that appreciated over 70% since last April and has a substantial weighting in the benchmark.
Within the Energy sector, the Fund invests in more value-added, innovative industries as opposed to pure-play energy exploration and production companies. Entering the fiscal year, Schlumberger was our only exposure to the sector. Schlumberger underperformed the market during the year, driven by the oversupply of natural gas in North America given the plethora of drilling in shale formations as well as the weak demand resulting from warm winter. As natural gas pricing declined, margins came under pressure in North America and drilling activity declined. We viewed this situation as relatively short term, and increased the Fund’s Energy exposure late in the year, given the long-term growth prospects for these businesses globally and the attractive valuations.
Top contributors in the period were Qualcomm and eBay. Qualcomm is a key supplier to Apple and has benefited
from the proliferation of mobile digital devices. eBay has had growth exceeding expectations as the company evolves into a leader in online and mobile payments. Key detractors in the period were Hospira and Schlumberger. Hospira, a generic drug manufacturer, was added to the Fund in the second calendar quarter of 2011. Subsequent to building a position in this stock, the operating performance was impacted by manufacturing compliance issues at several important plants, which led to a sell-off in the equity. We believe the issues at Hospira are addressable over the near to intermediate term and that over the long term generic injectable drugs and follow-on biologic drugs will have significant growth potential. We continue to hold the stock. Schlumberger detracted from performance for the reasons highlighted previously.
While the equity markets may trade sideways in the near term, digesting the gains achieved in the first quarter of calendar year 2012, we expect the Buffalo Large Cap Fund, which invests in large companies that address global markets, to appreciate over the intermediate to long term. We maintain the opinion that equities will provide more favorable returns for long-term investors than other asset classes like fixed income investments. We used last year’s volatility to upgrade the growth profile of the portfolio. While we do not anticipate the same level of volatility in 2012 as in 2011, given the more upbeat macroeconomic data, we remain focused on the long term and will use any short-term market dislocations as opportunities to add to our highest-conviction holdings at attractive valuations.
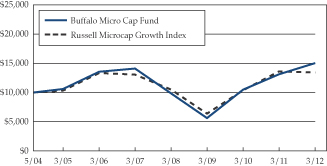
Buffalo Micro Cap Fund
At this time last year, equity markets were setting up for disappointment due to the growing optimism over improving economic conditions and signs that the recovery was becoming self-sustaining. That feeling quickly disappeared with a sequence of negative events that no one could have predicted. Japan was hit with a devastating earthquake and tsunami that threatened a nuclear disaster and disrupted manufacturing supply lines for months to come. Debt problems emerged in Europe, U.S. debt was downgraded by Standard & Poor’s, Washington DC was embroiled in political gridlock, and the Arab Spring created heightened tensions in the Middle East. Needless to say, most investors sought lower risk options as equity markets went on a dizzying ride of exaggerated swings. Despite all this negativity, U.S. equity markets rebounded strongly in the second half of the fiscal year due to stable economic growth rather than the collapse that many had expected.
Fortunately, the Buffalo Micro Cap Fund was able to successfully navigate the tremendous volatility over the past 12 months. As a result, the Fund was up 14.36%, which
7
Portfolio Management Review
(Continued)
outpaced the Russell Microcap Growth Index’s return of -1.31% for the period.
The primary reason for such outperformance lies mainly with strong stock selection. While the Fund had good stock performers in every sector, Information Technology provided the biggest boost. The Fund was heavily overweight in this sector relative to the benchmark, where Information Technology produced negative returns. The Fund’s strong positive returns are due to a few stand-out companies such as Guidewire Software, SPS Commerce, and Deltek. Guidewire, which makes software for the global property and casualty insurance industry, delivered exceptionally strong results in its first quarter as a public company. SPS Commerce, a provider of on-demand supply chain management solutions, continued to experience accelerating demand for its productivity enhancing suite of software products. Deltek, a supplier of software to project-based businesses, continued to make steady progress towards improving margins and renewed revenue growth.
The Financials sector also helped performance as well with our overweight position and good returns from MarketAxess Holdings, a company which facilitates online trading of fixed income securities. The company benefited in the period from growing fixed income volumes, an expanded network trading partners and increase market share.
While the Fund had negative performance from the Materials and Telecommunications sectors, the weighting in those two sectors was minimal so it had very little impact on the Fund overall. Due to our investment style and strategy, we tend to stay away from cyclical industries because of the inherent volatility in the business model — something we saw plenty of over the past 12 months. We continue to rely on the Firm’s trend-based analysis framework to help identify companies with strong secular growth drivers. This in turn helps identify business models that can perform in a variety of any market conditions.
While we are gratified by the outstanding performance of the Fund over the trailing 12 months, we continue to “expect the unexpected” and remain diligent in our management of the portfolio. Our objective, just as it has been in the past, is to continue to use volatility to the Fund’s advantage by proactively preparing for downturns in the market. One of the primary ways we do this is by using our in-house research capabilities. This not only helps us identify premier early-stage growth companies, but also prices that, in our opinion, provide shareholders an appropriate risk/reward profile. In terms of the investment landscape, the pace of technological innovation and product development for smaller companies continues at a rapid rate, and we believe that businesses in our investment universe have the potential
to become the large cap companies of tomorrow. Our job is to go uncover those opportunities.
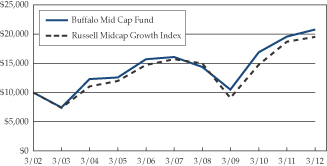
Buffalo Mid Cap Fund
Long-term investors have to learn that market cycles come and go, and economic headwinds can turn to tailwinds overnight. To succeed, we believe investors need to focus on strategy, fundamentals, and the quality and valuation of the stocks in their portfolio. The past 12 months have clearly demonstrated that, and many equity investors decided they were not up to a long-term commitment and headed for lower-risk bond alternatives. The wild volatility of the second and third quarters in 2011 shook the faint of heart out of the equity markets. Unfortunately, the risk-averse also missed the tremendous run-up stocks have enjoyed in the past two quarters.
The Buffalo Mid Cap Fund was knocked about during the choppy middle of 2011, but managed to finish the fiscal year ending 3/31/2012 with positive returns of 6.22%, beating the benchmark Russell Midcap Growth Index which returned 4.43% in the period.
The Fund’s outperformance during the trailing 12 months is mostly due to our allocation among sectors. The Fund was overweight the Consumer Discretionary sector relative to the benchmark, where this sector provided some of the strongest returns. Consumers began to spend more freely over the last few quarters, and stocks like UnderArmour, which continues to expand its global marketing reach, provided strong returns for the Fund.
We also benefited from our limited exposure to the Energy sector during the period, with this sector being the hardest hit in the benchmark. This was a particularly volatile time for oil and gas industries, and our avoidance of these volatile, cyclical stocks paid off well for the Fund.
A few holdings provided stand-out returns during the past year, helping to boost the Fund’s overall performance. Information Technology stocks Equinix and National Semiconductor had stellar returns, even in a sector that performed well overall. Equinix saw strong growth in data center spending and it was revealed that it was considering becoming a Real Estate Investment Trust (REIT) to enable it to enjoy a more favorable tax status and provide regular cash dividends to shareholders. National Semiconductor was acquired during the period by Texas Instruments. Healthcare stock Amylin had a breakthrough when its once-weekly injectable drug for Type II diabetes was approved by the FDA and a rumor of a buyout offer sent the stock soaring.
During the past 12 months, the Buffalo Mid Cap Fund passed its 10-year anniversary. This is a significant milestone
8
for any mutual fund, and we were happy with the 10-year returns. We believe the Fund has great potential for performance as economies both in the U.S. and abroad continue to recover and expand. We feel that mid-sized companies should fare well as they can benefit from both well-established business models and broader market reach.
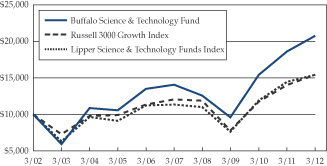
Buffalo Science & Technology Fund
We are pleased, as we look back over the past 12 months, to report that shareholders of the Buffalo Science and Technology Fund were rewarded for their trust in our investment process and strategy. Despite more than a little turbulence in equity markets over that period of time, the Fund generated positive returns in three of the four quarters of this past fiscal year, outperforming our benchmark for three of those quarters. For the fiscal year ended March 31, 2012, the Fund was up 11.50%.
Challenges were many during 2011, including supply line disruptions from the Japanese earthquake and tsunami, which delayed electronic manufacturing and sales globally. Unrest in the Middle East drove oil prices higher, affecting almost all segments of the market. Political gridlock in the U.S. and debt resolution gridlock in Europe created a general queasy feeling in the markets and left investors dazed and confused, wondering where to find returns.
The Buffalo Science and Technology Fund managed to find returns by investing in a strategic mix of sectors and companies with good business fundamentals and promising growth prospects. The Fund’s largest boost came from the Healthcare sector, where we are overweight relative to the Russell 3000 Growth Index and solid stock selection worked in our favor. Three of the top six contributors to the Fund were Healthcare stocks. Topping the list was Amylin Pharmaceuticals, which won FDA approval for its once-weekly injectable treatment for Type II diabetes. This news lifted the stock, as did strong execution on the launch of the drug as well as speculation regarding a takeover bid from Bristol-Myers Squibb. Our conviction in this company as it worked through the rigorous FDA testing phases was handsomely rewarded.
Investors in this Fund typically understand that we venture outside of typical technology sectors to look for growth through innovation and smart idea-generation. During the fiscal year, that strategy paid off as strong returns came from the Industrials and Telecommunication sectors. One example is Chart Industries, a provider of key equipment for the process of liquefaction of natural gas, which was strong throughout the year as the globalization of natural gas continued to grow.
The biggest drag on performance for the period was the Fund’s underweight in Apple, which had a breathtaking run
over the last few quarters, up over 70%. While it was the second highest contributor to the Fund, our weighting is below the 5.11% weighting in the Russell 3000 Growth Index. We believe our smaller position was and is justified as a prudent move to control risk.
Overall, we are pleased with the performance of the Science and Technology Fund over the trailing 12 months. While some uncertainty remains for stocks for the balance of 2012, we continue to watch our portfolio closely and populate it with high-quality stocks with an eye toward long-term growth. We believe that innovation and discovery are creating exciting opportunities for companies to make newer and better products and services that improve life. The Fund is keen to find those companies and share their success with you, our investors.
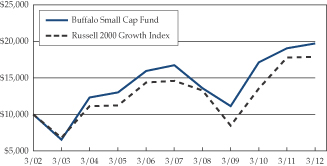
Buffalo Small Cap Fund
A tale of two markets: It was the best of times. It was the worst of times. With apologies to Charles Dickens, we feel the past 12 months have demonstrated everything investors love and hate about stocks. The second and third quarters of 2011 were nauseatingly volatile, with global headlines driving wild market swings almost daily. Once the volatility subsided in the fourth quarter, investors discovered that, for all of the activity, the markets had ended the year virtually flat. Then, to reward those whose patience was not exhausted, equities surged in the first quarter of 2012, returning almost all stock indexes to their pre-recessionary levels and generating double-digit returns, to the delight of the true believers.
At Buffalo Funds, we are true believers in equities as a valuable long-term investment. Our conviction resulted in positive performance for the Buffalo Small Cap Fund, both absolute and relative to our benchmark, the Russell 2000 Growth Index. For the trailing 12-month period, the Fund returned 3.31% versus 0.68% for the Index.
The Fund enjoyed its biggest boost from the Healthcare sector, where strong stock picking led to outsized performance. In fact, three of the top five performers during the past fiscal year were Healthcare companies. Amylin Pharmaceuticals topped the list, with its signature diabetes drug Bydureon finally receiving FDA approval and rumors of a buyout offer for the company giving the stock a sizable run-up in the first quarter of this year. Athenahealth was the number two performer in the Fund as strong earnings paid off after the company had given disappointing guidance in the previous quarter. Align Technology, the maker of clear tooth alignment devices, continued to grow market share and increase revenues throughout the period.
In a volatile environment, the Fund fared well by its underweight in the cyclical Energy and Materials sectors.
9
Portfolio Management Review
(Continued)
We typically limit our exposure to these sectors as we prefer to select companies and industries that, over the long term, are less likely to be affected by unit pricing and market fluctuations.
The biggest drag on performance came from the Industrials sector where two long-term holdings, Career Education Corporation and Monster Worldwide, could not seem to recover from the economic downturn. Neither company saw strong enough growth off the recessionary bottom due to company-specific factors. Accordingly, we have exited both positions.
Overall, we are pleased that the Small Cap Fund was able to outperform our benchmark for the trailing 12 months. We feel that our diligent efforts to reshape the portfolio with stocks of higher conviction have begun to bear fruit. While last year’s market contortions were certainly troubling for investors, we were able to use downturns to our advantage and purchase shares when they came into our target price range. We continue to look for these opportunities as they arise. We are grateful to our shareholders who have maintained their trust in our management style and philosophy and we hope to reward your trust with continued solid performance.
Sincerely,
 | | |
John C. Kornitzer President, KCM | Kent W. Gasaway Sr. Vice President, KCM | |
 |  | |
Robert Male Sr. Vice President, KCM | Grant P. Sarris Sr. Vice President, KCM | |
 | ||
William J. Kornitzer III Sr. Vice President, KCM | ||
A basis point is one hundredth of a percentage point (0.01%)
10
Investment Results
Total Returns as of March 31, 2012
| AVERAGE ANNUAL | ||||||||||||||||||||||||
| GROSS EXPENSE RATIO* | THREE MONTHS | ONE YEAR | FIVE YEARS | TEN YEARS | SINCE INCEPTION | |||||||||||||||||||
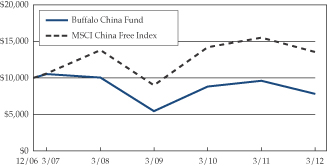
Buffalo China Fund (inception date 12/18/06) | 1.75% | 7.13% | -18.89% | -5.87% | N/A | -4.55% | ||||||||||||||||||
MSCI China Free Index | N/A | 9.92% | -12.83% | 4.96% | N/A | 5.91% | ||||||||||||||||||
Hang Seng Index | N/A | 11.51% | -12.63% | 0.75% | N/A | 1.31% | ||||||||||||||||||
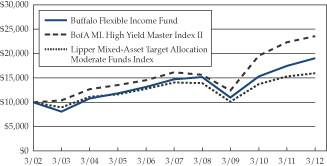
Buffalo Flexible Income Fund (inception date 8/12/94) | 1.05% | 5.16% | 9.15% | 5.32% | 6.65% | 7.30% | ||||||||||||||||||
BofA Merrill Lynch High Yield Master Index II | N/A | 5.15% | 5.64% | 7.84% | 8.95% | 7.95% | ||||||||||||||||||
Lipper Mixed-Asset Target Allocation Moderate Funds Index | N/A | 7.54% | 4.07% | 2.53% | 4.76% | 6.94% | ||||||||||||||||||
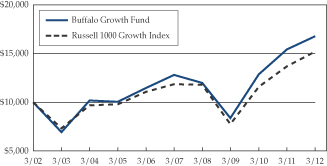
Buffalo Growth Fund (inception date 5/19/95) | 1.00% | 13.35% | 8.78% | 5.38% | 5.24% | 9.36% | ||||||||||||||||||
Russell 1000 Growth Index | N/A | 14.69% | 11.02% | 5.10% | 4.28% | 7.32% | ||||||||||||||||||
Lipper Large Cap Growth Funds Index | N/A | 17.15% | 8.55% | 3.88% | 3.31% | 6.33% | ||||||||||||||||||
Buffalo High Yield Fund (inception date 5/19/95) | 1.04% | 5.33% | 5.86% | 7.16% | 7.59% | 7.85% | ||||||||||||||||||
BofA Merrill Lynch High Yield Master Index II | N/A | 5.15% | 5.64% | 7.84% | 8.95% | 7.56% | ||||||||||||||||||
Lipper High Yield Bond Funds Index | N/A | 5.74% | 4.62% | 5.74% | 7.64% | 6.03% | ||||||||||||||||||
Buffalo International Fund (inception date 9/28/07) | 1.18% | 14.42% | -2.20% | N/A | N/A | -0.47% | ||||||||||||||||||
MSCI AC World (ex U.S.) Index | N/A | 11.23% | -7.17% | N/A | N/A | -4.39% | ||||||||||||||||||
Lipper International Funds Index | N/A | 12.56% | -6.81% | N/A | N/A | -4.64% | ||||||||||||||||||
Buffalo Large Cap Fund (inception date 5/19/95) | 1.04% | 15.34% | 3.84% | 2.92% | 3.35% | 8.05% | ||||||||||||||||||
Russell 1000 Growth Index | N/A | 14.69% | 11.02% | 5.10% | 4.28% | 7.32% | ||||||||||||||||||
Lipper Large-Cap Growth Funds Index | N/A | 17.15% | 8.55% | 3.88% | 3.31% | 6.33% | ||||||||||||||||||
Buffalo Micro Cap Fund (inception date 5/21/04) | 1.55% | 17.57% | 14.36% | 1.27% | N/A | 5.31% | ||||||||||||||||||
Russell Microcap Growth Index | N/A | 16.34% | -1.31% | 0.55% | N/A | 3.82% | ||||||||||||||||||
Lipper Micro-Cap Funds Index | N/A | 13.89% | -0.33% | 1.25% | N/A | 5.62% | ||||||||||||||||||
Buffalo Mid Cap Fund (inception date 12/17/01) | 1.04% | 15.06% | 6.22% | 5.24% | 7.58% | 7.49% | ||||||||||||||||||
Russell Midcap Growth Index | N/A | 14.52% | 4.43% | 4.44% | 6.92% | 6.67% | ||||||||||||||||||
Lipper Mid-Cap Growth Funds Index | N/A | 14.99% | 1.19% | 4.83% | 6.25% | 5.98% | ||||||||||||||||||
Buffalo Science & Technology Fund (inception date 4/16/01) | 1.03% | 19.86% | 11.50% | 8.10% | 7.58% | 7.07% | ||||||||||||||||||
Russell 3000 Growth Index | N/A | 14.58% | 10.14% | 5.02% | 4.42% | 3.65% | ||||||||||||||||||
Lipper Science & Technology Funds Index | N/A | 20.55% | 6.89% | 6.34% | 4.43% | 2.26% | ||||||||||||||||||
Buffalo Small Cap Fund (inception date 4/14/98) | 1.01% | 14.48% | 3.31% | 3.32% | 7.02% | 11.82% | ||||||||||||||||||
Russell 2000 Growth Index | N/A | 13.28% | 0.68% | 4.15% | 6.00% | 3.38% | ||||||||||||||||||
Lipper Small-Cap Growth Funds Index | N/A | 14.16% | 1.35% | 3.16% | 5.19% | 4.66% | ||||||||||||||||||
| * | As reported in the Funds’ Prospectus dated July 29, 2011 |
| Performance data quoted represents past performance; past performance does not guarantee future results. The investment return and principal value of an investment will fluctuate so that an investor’s shares, when redeemed, may be worth more or less than their original cost. Current performance of the Funds may be lower or higher than the performance quoted. Performance data current of the most recent month-end may be obtained by calling 1-800-49-BUFFALO or by visiting the website at www.buffalofunds.com. |
| The Buffalo Flexible Income, International, China, Large Cap, Mid Cap, Science & Technology and Growth Funds impose a 2.00% redemption fee on shares held for less than 60 days and the Buffalo High Yield, Micro Cap and Small Cap Funds impose a 2.00% redemption fee on shares held less than 180 days. |
11
The Funds’ returns shown do not reflect the deduction of taxes that a shareholder would pay on distributions or the redemption of shares. The benchmark returns shown, excluding the Lipper Indices, reflect the reinvestment of dividends and capital gains but do not reflect the deduction of any investment management fees, other expenses or taxes. The performance of the Lipper Indices is presented net of the Funds’ fees and expenses; however, applicable sales charges are not taken into consideration. One cannot invest directly in an index.
The MSCI China Free Index is a capitalization weighted index that measures the performance of stocks from the country of China. The Hang Seng Index is a free-float capitalization-weighted index of selection of companies from the Stock Exchange of Hong Kong. The components of the index are divided into four subindexes: Commerce and Industry, Finance, Utilities, and Properties. The index was developed with a base level of 100 as of July 31, 1964. BofA Merrill Lynch High Yield Master Index II tracks the performance of below investment grade U.S. dollar-denominated corporate bonds publicly issued in the U.S. domestic market. The Lipper Mixed-Asset Target Allocation Moderate Funds Index is an average of funds that, by portfolio practice, maintain a mix of between 40%-60% equity securities, with the remainder invested in bonds, cash, and cash equivalents. The total return of the Lipper Average does not include the effect of sales charges. You cannot invest directly in a Lipper Average. The Russell 1000 Growth Index measures the performance of those Russell 1000 Index companies with higher price-to-book ratios and higher forecasted growth values. The Lipper Large-Cap Growth Funds Index is an unmanaged, equally weighted performance index of the 30 largest qualifying mutual funds (based on net assets) in the Lipper Large-Cap classification. The Lipper High Yield Bond Funds Index is a widely recognized index of the 30 largest mutual funds that invest primarily in high yield bonds. The MSCI AC World (ex U.S.) Index is a free float-adjusted market capitalization index that is designed to measure equity market performance in the global developed and emerging markets, excluding the U.S. The Lipper International Funds Index is an unmanaged, equally weighted performance index of the 30 largest qualifying mutual funds (based on net assets) in the Lipper International classifications. The Russell Microcap Growth Index measures the performance of those Russell Microcap companies with higher price-to-book ratios and higher forecasted growth values. The Lipper Micro-Cap Funds Index is an unmanaged equally weighted performance index of the 30 largest qualifying mutual funds (based on net assets) in the Lipper Micro-Cap classification. The Russell Midcap Growth Index measures the performance of those Russell Midcap companies with higher price-to-book ratios and higher forecasted growth values. The Lipper Mid-Cap Growth Funds Index is an unmanaged, equally weighted performance index of the 30 largest qualifying mutual funds (based on net assets) in the Lipper Mid-Cap classification. The Russell 3000 Growth Index measures the performance of the broad growth segment of the U.S. equity universe. It includes those Russell 3000 Index companies with higher price-to-book ratios and higher forecasted growth values. The Lipper Science & Technology Funds Index is an unmanaged, equally weighted performance index of the 30 largest qualifying mutual funds (based on net assets) in the Lipper Science and Technology classification. The Russell 2000 Growth Index measures the performance of those Russell 2000 Index companies with higher price-to-book ratios and higher forecasted growth values. The Lipper Small-Cap Growth Funds Index is an unmanaged, equally weighted performance index of the 30 largest qualifying mutual funds (based on net assets) in the Lipper Small-Cap classification.
Divided yield is a ratio providing an estimate of the return per share on a stock investment based on the market price at the end of the reporting period.
Please refer to the prospectus for special risks associated with investing in the Buffalo Funds, including, but not limited to, risks involved with investments in science and technology, foreign, debt, lower- or non-rated securities and smaller companies.
12
Buffalo China Fund
Growth of a $10,000 Investment
Buffalo Flexible Income Fund
Growth of a $10,000 Investment
Buffalo Growth Fund
Growth of a $10,000 Investment
Buffalo High Yield Fund
Growth of a $10,000 Investment
Buffalo International Fund
Growth of a $10,000 Investment
Buffalo Large Cap Fund
Growth of a $10,000 Investment
Buffalo Micro Cap Fund
Growth of a $10,000 Investment
Buffalo Mid Cap Fund
Growth of a $10,000 Investment
13
Buffalo Science & Technology Fund
Growth of a $10,000 Investment
Buffalo Small Cap Fund
Growth of a $10,000 Investment
14
Expense Example
As a shareholder of the Funds, you incur two types of costs: (1) transaction costs (including redemption fees) and (2) ongoing costs, including management fees and other Fund specific expenses. The examples below are intended to help you understand your ongoing costs (in dollars) of investing in the Funds and to compare these costs with the ongoing costs of investing in other mutual funds. The example is based on an investment of $1,000 invested at the beginning of the period and held for the entire period (10/1/11 – 3/31/12). This information is unaudited.
ACTUAL EXPENSES
The first line of the tables below provides information about actual account values and actual expenses. You may use the information in this line, together with the amount you invested, to estimate the expenses that you paid over the period. Simply divide your account by $1,000 (for example, an $8,600 account value divided by $1,000 = 8.6), then multiply the result by the number in the first line under the heading entitled “Expenses Paid During the Period” to estimate the expenses you paid on your account during the period. Although the Funds charge no sales load or transaction fees, you will be assessed fees for outgoing wire transfers, returned checks and stop payment orders at prevailing rates charged by U.S. Bancorp Fund Services, LLC, the Funds’ transfer agent. If you request that a redemption be made by wire transfer, currently a $15.00 fee is charged by the Funds’ transfer agent. You will be charged a redemption fee equal to 2.00% of the net amount of the redemption if you redeem your shares of the Buffalo Flexible Income, China, International, Large Cap, Mid Cap, Science & Technology and Growth Funds within 60 days of purchase. The Buffalo High Yield, Micro Cap and Small Cap Funds will charge a redemption fee equal to 2.00% of the net amount of the redemption if you redeem your shares within 180 days of
purchase. To the extent a Fund invests in shares of other investment companies as part of its investment strategy, you will indirectly bear your proportionate share of any fees and expenses charged by the underlying funds in which the Fund invests in addition to the expenses of the Fund. Actual expenses of the underlying funds are expected to vary among the various underlying funds. These expenses are not included in the examples below. The examples below include management fees, registration fees and other expenses. However, the examples below do not include portfolio trading commissions and related expenses and other extraordinary expenses as determined under U.S. generally accepted accounting principles.
HYPOTHETICAL EXAMPLE FOR COMPARISON PURPOSES
The second line of each table below provides information about hypothetical account values and hypothetical expenses based on the Funds’ actual expense ratios and an assumed rate of return of 5% per year before expenses, which are not the Funds’ actual returns. The hypothetical account values and expenses may not be used to estimate the actual ending account balance or expenses you paid for the period. You may use this information to compare the ongoing costs of investing in our Funds and other funds. To do so, compare this 5% hypothetical example with the 5% hypothetical examples that appear in the shareholder reports of the other funds. Please note that the expenses shown in the tables are meant to highlight your ongoing costs only and do not reflect any transactional costs, such as redemption fees. Therefore, the second line of the tables is useful in comparing ongoing costs only, and will not help you determine the relative total costs of owning different funds. In addition, if these transactional costs were included, your costs would have been higher.
| BUFFALO CHINA FUND | BEGINNING ACCOUNT VALUE OCTOBER 1, 2011 | ENDING ACCOUNT VALUE MARCH 31, 2012 | EXPENSES PAID DURING PERIOD OCTOBER 1, 2011 - MARCH 31, 2012* | |||||||||
Actual | $ | 1,000.00 | $ | 1,117.80 | $ | 9.74 | ||||||
Hypothetical (5% return before expenses) | $ | 1,000.00 | $ | 1,006.60 | $ | 9.23 | ||||||
| * | Expenses are equal to the Fund’s annualized expense ratio of 1.84%, multiplied by the average account value over the period, multiplied by 183/366 to reflect the one-half year period. |
| BUFFALO FLEXIBLE INCOME FUND | BEGINNING ACCOUNT VALUE OCTOBER 1, 2011 | ENDING ACCOUNT VALUE MARCH 31, 2012 | EXPENSES PAID DURING PERIOD OCTOBER 1, 2011 - MARCH 31, 2012* | |||||||||
Actual | $ | 1,000.00 | $ | 1,142.60 | $ | 5.41 | ||||||
Hypothetical (5% return before expenses) | $ | 1,000.00 | $ | 1,014.90 | $ | 5.09 | ||||||
| * | Expenses are equal to the Fund’s annualized expense ratio of 1.01%, multiplied by the average account value over the period, multiplied by 183/366 to reflect the one-half year period. |
| BUFFALO GROWTH FUND | BEGINNING ACCOUNT VALUE OCTOBER 1, 2011 | ENDING ACCOUNT VALUE MARCH 31, 2012 | EXPENSES PAID DURING PERIOD OCTOBER 1, 2011 - MARCH 31, 2012* | |||||||||
Actual | $ | 1,000.00 | $ | 1,278.50 | $ | 5.18 | ||||||
Hypothetical (5% return before expenses) | $ | 1,000.00 | $ | 1,015.90 | $ | 4.59 | ||||||
| * | Expenses are equal to the Fund’s annualized expense ratio of 0.91%, multiplied by the average account value over the period, multiplied by 183/366 to reflect the one-half year period. |
15
| BUFFALO HIGH YIELD FUND | BEGINNING ACCOUNT VALUE OCTOBER 1, 2011 | ENDING ACCOUNT VALUE MARCH 31, 2012 | EXPENSES PAID DURING PERIOD OCTOBER 1, 2011 - MARCH 31, 2012* | |||||||||
Actual | $ | 1,000.00 | $ | 1,105.10 | $ | 5.37 | ||||||
Hypothetical (5% return before expenses) | $ | 1,000.00 | $ | 1,014.80 | $ | 5.14 | ||||||
| * | Expenses are equal to the Fund’s annualized expense ratio of 1.02%, multiplied by the average account value over the period, multiplied by 183/366 to reflect the one-half year period. |
| BUFFALO INTERNATIONAL FUND | BEGINNING ACCOUNT VALUE OCTOBER 1, 2011 | ENDING ACCOUNT VALUE MARCH 31, 2012 | EXPENSES PAID DURING PERIOD OCTOBER 1, 2011 - MARCH 31, 2012* | |||||||||
Actual | $ | 1,000.00 | $ | 1,210.50 | $ | 6.36 | ||||||
Hypothetical (5% return before expenses) | $ | 1,000.00 | $ | 1,013.50 | $ | 5.79 | ||||||
| * | Expenses are equal to the Fund’s annualized expense ratio of 1.15%, multiplied by the average account value over the period, multiplied by 183/366 to reflect the one-half year period. |
| BUFFALO LARGE CAP FUND | BEGINNING ACCOUNT VALUE OCTOBER 1, 2011 | ENDING ACCOUNT VALUE MARCH 31, 2012 | EXPENSES PAID DURING PERIOD OCTOBER 1, 2011 - MARCH 31, 2012* | |||||||||
Actual | $ | 1,000.00 | $ | 1,249.40 | $ | 5.45 | ||||||
Hypothetical (5% return before expenses) | $ | 1,000.00 | $ | 1,015.30 | $ | 4.89 | ||||||
| * | Expenses are equal to the Fund’s annualized expense ratio of 0.97%, multiplied by the average account value over the period, multiplied by 183/366 to reflect the one-half year period. |
| BUFFALO MICRO CAP FUND | BEGINNING ACCOUNT VALUE OCTOBER 1, 2011 | ENDING ACCOUNT VALUE MARCH 31, 2012 | EXPENSES PAID DURING PERIOD OCTOBER 1, 2011 - MARCH 31, 2012* | |||||||||
Actual | $ | 1,000.00 | $ | 1,397.40 | $ | 9.05 | ||||||
Hypothetical (5% return before expenses) | $ | 1,000.00 | $ | 1,009.90 | $ | 7.59 | ||||||
| * | Expenses are equal to the Fund’s annualized expense ratio of 1.51%, multiplied by the average account value over the period, multiplied by 183/366 to reflect the one-half year period. |
| BUFFALO MID CAP FUND | BEGINNING ACCOUNT VALUE OCTOBER 1, 2011 | ENDING ACCOUNT VALUE MARCH 31, 2012 | EXPENSES PAID DURING PERIOD OCTOBER 1, 2011 - MARCH 31, 2012* | |||||||||
Actual | $ | 1,000.00 | $ | 1,267.20 | $ | 5.72 | ||||||
Hypothetical (5% return before expenses) | $ | 1,000.00 | $ | 1,014.90 | $ | 5.09 | ||||||
| * | Expenses are equal to the Fund’s annualized expense ratio of 1.01%, multiplied by the average account value over the period, multiplied by 183/366 to reflect the one-half year period. |
| BUFFALO SCIENCE & TECHNOLOGY FUND | BEGINNING ACCOUNT VALUE OCTOBER 1, 2011 | ENDING ACCOUNT VALUE MARCH 31, 2012 | EXPENSES PAID DURING PERIOD OCTOBER 1, 2011 - MARCH 31, 2012* | |||||||||
Actual | $ | 1,000.00 | $ | 1,326.00 | $ | 5.87 | ||||||
Hypothetical (5% return before expenses) | $ | 1,000.00 | $ | 1,014.90 | $ | 5.09 | ||||||
| * | Expenses are equal to the Fund’s annualized expense ratio of 1.01%, multiplied by the average account value over the period, multiplied by 183/366 to reflect the one-half year period. |
| BUFFALO SMALL CAP FUND | BEGINNING ACCOUNT VALUE OCTOBER 1, 2011 | ENDING ACCOUNT VALUE MARCH 31, 2012 | EXPENSES PAID DURING PERIOD OCTOBER 1, 2011 - MARCH 31, 2012* | |||||||||
Actual | $ | 1,000.00 | $ | 1,350.60 | $ | 5.88 | ||||||
Hypothetical (5% return before expenses) | $ | 1,000.00 | $ | 1,015.00 | $ | 5.04 | ||||||
| * | Expenses are equal to the Fund’s annualized expense ratio of 1.00%, multiplied by the average account value over the period, multiplied by 183/366 to reflect the one-half year period. |
16
Allocation of Portfolio Holdings
Percentages represent market value as a percentage of total investments as of March 31, 2012.
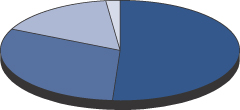
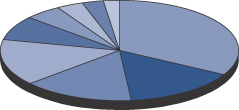
BUFFALO CHINA FUND
| Financials | 27.44% | |||
| Energy | 26.63% | |||
| Consumer Discretionary | 19.57% | |||
| Utilities | 7.31% | |||
| Consumer Staples | 7.03% | |||
| Information Technology | 6.36% | |||
| Health Care | 2.54% | |||
| Materials | 1.50% | |||
| Short-Term Investments | 1.27% | |||
| Telecommunication Services | 0.35% | |||
|
| |||
| 100.00% |
BUFFALO FLEXIBLE INCOME FUND
| Common Stocks | 51.02% | |||
| Corporate Bonds | 31.01% | |||
| Short-Term Investments | 16.06% | |||
| Convertible Bonds | 1.91% | |||
|
| |||
| 100.00% |
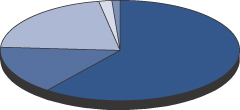
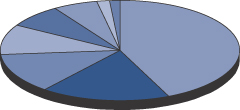
BUFFALO GROWTH FUND
| Information Technology | 36.66% | |||
| Health Care | 12.69% | |||
| Consumer Discretionary | 11.80% | |||
| Industrials | 11.61% | |||
| Financials | 9.87% | |||
| Materials | 5.63% | |||
| Energy | 5.17% | |||
| Short-Term Investments | 4.78% | |||
| Consumer Staples | 1.79% | |||
|
| |||
| 100.00% |
BUFFALO HIGH YIELD FUND
| Corporate Bonds | 70.58% | |||
| Convertible Bonds | 10.55% | |||
| Short-Term Investments | 8.89% | |||
| Common Stocks | 4.38% | |||
| Convertible Preferred Stocks | 3.34% | |||
| Preferred Stocks | 2.26% | |||
|
| |||
| 100.00% |
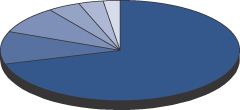
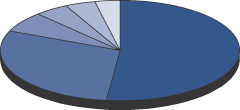
BUFFALO INTERNATIONAL FUND
| Europe | 60.36% | |||
| The Americas | 15.67% | |||
| Asia | 21.09% | |||
| Short-Term Investments | 1.80% | |||
| Middle East | 1.08% | |||
|
| |||
| 100.00% |
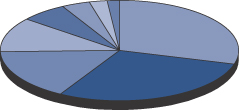
BUFFALO LARGE CAP FUND
| Information Technology | 32.98% | |||
| Consumer Discretionary | 15.43% | |||
| Financials | 15.10% | |||
| Health Care | 15.04% | |||
| Industrials | 7.80% | |||
| Energy | 5.00% | |||
| Materials | 3.61% | |||
| Short-Term Investments | 2.89% | |||
| Consumer Staples | 2.15% | |||
|
| |||
| 100.00% |
17
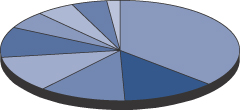
BUFFALO MICRO CAP FUND
| Information Technology | 43.31% | |||
| Health Care | 17.52% | |||
| Industrials | 12.91% | |||
| Financials | 9.72% | |||
| Consumer Discretionary | 7.38% | |||
| Short-Term Investments | 6.02% | |||
| Materials | 1.75% | |||
| Consumer Staples | 1.39% | |||
|
| |||
| 100.00% |
BUFFALO MID CAP FUND
| Information Technology | 29.34% | |||
| Consumer Discretionary | 28.89% | |||
| Financials | 16.35% | |||
| Health Care | 11.21% | |||
| Industrials | 6.29% | |||
| Short-Term Investments | 3.82% | |||
| Materials | 2.43% | |||
| Consumer Staples | 1.67% | |||
|
| |||
| 100.00% |
BUFFALO SCIENCE & TECHNOLOGY FUND
| Information Technology | 51.84% | |||
| Health Care | 29.53% | |||
| Industrial | 6.62% | |||
| Short-Term Investments | 4.57% | |||
| Materials | 4.07% | |||
| Energy | 3.37% | |||
|
| |||
| 100.00% |
BUFFALO SMALL CAP FUND

| Information Technology | 31.03% | |||
| Consumer Discretionary | 20.27% | |||
| Health Care | 17.34% | |||
| Industrials | 13.49% | |||
| Financials | 11.44% | |||
| Short-Term Investments | 3.52% | |||
| Consumer Staples | 1.86% | |||
| Energy | 1.05% | |||
|
| |||
| 100.00% |
18
Buffalo China Fund
SCHEDULE OF INVESTMENTS
March 31, 2012
| SHARES OR FACE AMOUNT | FAIR VALUE* | |||||||
| COMMON STOCKS — 88.84% |
| ||||||
| CONSUMER DISCRETIONARY — 17.61% |
| ||||||
Automobiles — 7.34% | ||||||||
| 706,000 | Dongfeng Motor Group Co. Ltd. — Class H | $ | 1,274,620 | |||||
| 180,000 | Great Wall Motor Company Ltd. — Class H | 350,007 | ||||||
|
| |||||||
| 1,624,627 | ||||||||
|
| |||||||
Specialty Retail — 9.06% | ||||||||
| 450,000 | China ZhengTong Auto Services Holdings Ltd.(a) | 450,837 | ||||||
| 3,320,000 | Emperor Watch & Jewellery Ltd. | 525,861 | ||||||
| 122,076 | Lentuo International Inc. — ADR(a) | 461,448 | ||||||
| 1,330,000 | Oriental Watch Holdings Ltd. | 566,901 | ||||||
|
| |||||||
| 2,005,047 | ||||||||
|
| |||||||
Textiles, Apparel & Luxury Goods — 1.21% | ||||||||
| 110,000 | Stella International Holdings Ltd. | 266,871 | ||||||
Total Consumer Discretionary (Cost $4,683,779) | 3,896,545 | |||||||
|
| |||||||
| CONSUMER STAPLES — 6.32% |
| ||||||
Food Products — 3.15% | ||||||||
| 271,000 | Biostime International Holdings Ltd. | 697,256 | ||||||
|
| |||||||
Personal Products — 3.17% | ||||||||
| 1,900,000 | Prince Frog International Holdings Ltd. | 702,204 | ||||||
Total Consumer Staples (Cost $1,195,001) | 1,399,460 | |||||||
|
| |||||||
| ENERGY — 23.97% |
| ||||||
Oil, Gas & Consumable Fuels — 23.97% | ||||||||
| 1,500 | China Petroleum & Chemical Corp. — ADR | 163,080 | ||||||
| 762,000 | China Petroleum & Chemical Corp. — Class H | 830,143 | ||||||
| 710,000 | CNOOC Ltd. | 1,459,214 | ||||||
| 1,200 | CNOOC Ltd. — ADR | 245,148 | ||||||
| 500,000 | Kunlun Energy Company Ltd. | 901,417 | ||||||
| 1,036,000 | PetroChina Company Ltd. | 1,464,840 | ||||||
| 1,700 | PetroChina Company Ltd. — ADR | 238,901 | ||||||
Total Energy (Cost $4,171,208) | 5,302,743 | |||||||
|
| |||||||
| FINANCIALS — 24.69% |
| ||||||
Commercial Banks — 8.35% | ||||||||
| 1,380,000 | Agricultural Bank of China Ltd. — Class H | 591,767 | ||||||
| 800,000 | Bank of China Ltd. — Class H | 322,450 | ||||||
| 393,000 | China Construction Bank — Class H | 303,649 | ||||||
| 977,500 | Industrial & Commercial Bank of China Ltd. — Class H | 630,641 | ||||||
|
| |||||||
| 1,848,507 | ||||||||
|
| |||||||
Insurance — 16.34% | ||||||||
| 325,000 | AIA Group Ltd. | 1,190,675 | ||||||
| 12,000 | China Life Insurance Co., Ltd — ADR | 466,440 | ||||||
| 415,000 | China Life Insurance Co., Ltd. — Class H | 1,076,839 | ||||||
| 741,800 | PICC Property and Casuality Co. Ltd. — Class H(a) | 882,646 | ||||||
|
| |||||||
| 3,616,600 | ||||||||
Total Financials (Cost $5,815,032) | 5,465,107 | |||||||
|
| |||||||
| HEALTH CARE — 2.29% |
| ||||||
Biotechnology — 2.29% | ||||||||
| 34,200 | 3SBio, Inc. — ADR(a) | 506,160 | ||||||
Total Health Care (Cost $370,724) | 506,160 | |||||||
|
| |||||||
19
Buffalo China Fund
SCHEDULE OF INVESTMENTS
March 31, 2012
(Continued)
| SHARES OR FACE AMOUNT | FAIR VALUE* | |||||||
| INFORMATION TECHNOLOGY — 5.73% |
| ||||||
Communications Equipment — 1.92% | ||||||||
| 156,000 | AAC Technologies Holdings Inc. | $ | 423,872 | |||||
|
| |||||||
Internet Software & Services — 3.81% | ||||||||
| 30,000 | 21Vianet Group Inc. — ADR(a) | 340,500 | ||||||
| 18,000 | Tencent Holdings Ltd | 502,064 | ||||||
|
| |||||||
| 842,564 | ||||||||
Total Information Technology (Cost $1,266,622) | 1,266,436 | |||||||
|
| |||||||
| MATERIALS — 1.35% |
| ||||||
Chemicals — 1.35% | ||||||||
| 394,000 | China BlueChemical Ltd. — Class H | 298,333 | ||||||
Total Materials (Cost $251,077) | 298,333 | |||||||
|
| |||||||
| TELECOMMUNICATION SERVICES — 0.31% |
| ||||||
Diversified Telecommunication Services — 0.31% | ||||||||
| 144,000 | China Communications Services Corp. Ltd. — Class H | 69,538 | ||||||
Total Telecommunication Services (Cost $76,533) | 69,538 | |||||||
|
| |||||||
| UTILITIES — 6.57% |
| ||||||
Gas Utilities — 4.59% | ||||||||
| 120,000 | China Resources Gas Group Ltd. | 229,630 | ||||||
| 165,000 | ENN Energy Holdings Ltd. | 569,438 | ||||||
| 300,000 | Towngas China Company Ltd. | 217,499 | ||||||
|
| |||||||
| 1,016,567 | ||||||||
|
| |||||||
Independent Power Producers & Energy Traders — 1.98% | ||||||||
| 120,000 | China Resources Power Holdings Company Ltd. | 222,212 | ||||||
| 400,000 | Huaneng Power International, Inc. — Class H | 217,370 | ||||||
|
| |||||||
| 439,582 | ||||||||
Total Utilities (Cost $1,427,696) | 1,456,149 | |||||||
|
| |||||||
| TOTAL COMMON STOCKS | 19,660,471 | ||||||
| (COST $19,257,672) | |||||||
| SHORT TERM INVESTMENTS — 1.14% |
| ||||||
| Investment Company — 1.14% |
| ||||||
| 252,184 | Fidelity Institutional Government Portfolio — 0.01%(b) | 252,184 | ||||||
Total Investment Company | 252,184 | |||||||
|
| |||||||
| TOTAL SHORT TERM INVESTMENTS | 252,184 | ||||||
| (COST $252,184) | |||||||
| TOTAL INVESTMENTS — 89.98% | 19,912,655 | ||||||
| (COST $19,509,856) | |||||||
| Other Assets in Excess of Liabilities — 10.02% | 2,217,067 | ||||||
|
| |||||||
| TOTAL NET ASSETS — 100.00% | $ | 22,129,722 | |||||
|
| |||||||
20
ADR — American Depositary Receipt
| (a) | Non Income Producing |
| (b) | 7-day yield. |
| * | See Note 1A of accompanying Notes to Financial Statements regarding valuation of securities. |
As of March 31, 2012, the country diversification was as follows:
| FAIR VALUE | PERCENTAGE | |||||||
China | 15,539,405 | 70.22% | ||||||
Hong Kong | 4,121,066 | 18.62% | ||||||
|
|
|
| |||||
Total Common Stock | 19,660,471 | 88.84% | ||||||
Total Short Term Investment | 252,184 | 1.14% | ||||||
|
|
|
| |||||
Total Investments | 19,912,655 | 89.98% | ||||||
Other Assets in Excess of Liabilities | 2,217,067 | 10.02% | ||||||
|
|
|
| |||||
TOTAL NET ASSETS | $ | 22,129,722 | 100.00% | |||||
|
|
|
| |||||
The Global Industry Classification Standard (GICS®) was developed by and/or is the exclusive property of MSCI, Inc. and Standard & Poor Financial Services LLC (“S&P”). GICS is a service mark of MSCI and S&P and has been licensed for use by U.S. Bancorp Fund Services, LLC.
The accompanying notes are an integral part of these financial statements.
21
Buffalo Flexible Income Fund
SCHEDULE OF INVESTMENTS
March 31, 2012
| SHARES OR FACE AMOUNT | FAIR VALUE* | |||||||
| COMMON STOCKS — 50.43% |
| ||||||
| CONSUMER DISCRETIONARY — 0.52% |
| ||||||
Hotels, Restaurants & Leisure — 0.52% | ||||||||
| 20,000 | McDonald’s Corp. | $ | 1,962,000 | |||||
Total Consumer Discretionary (Cost $1,457,184) | 1,962,000 | |||||||
|
| |||||||
| CONSUMER STAPLES — 14.33% |
| ||||||
Beverages — 3.76% | ||||||||
| 60,000 | The Coca Cola Co. | 4,440,600 | ||||||
| 15,000 | Diageo plc — ADR(d) | 1,447,500 | ||||||
| 100,000 | Dr. Pepper Snapple Group, Inc. | 4,021,000 | ||||||
| 65,000 | PepsiCo, Inc. | 4,312,750 | ||||||
|
| |||||||
| 14,221,850 | ||||||||
|
| |||||||
Food & Staples Retailing — 3.37% | ||||||||
| 40,000 | Costco Wholesale Corp. | 3,632,000 | ||||||
| 255,000 | Roundy’s, Inc.(a) | 2,728,500 | ||||||
| 70,000 | Sysco Corp. | 2,090,200 | ||||||
| 70,000 | Wal-Mart Stores, Inc.(b) | 4,284,000 | ||||||
|
| |||||||
| 12,734,700 | ||||||||
|
| |||||||
Food Products — 3.31% | ||||||||
| 95,000 | Campbell Soup Co. | 3,215,750 | ||||||
| 45,000 | ConAgra Foods, Inc. | 1,181,700 | ||||||
| 20,000 | General Mills, Inc. | 789,000 | ||||||
| 26,000 | H.J. Heinz Co.(b) | 1,392,300 | ||||||
| 40,000 | Kellogg Co. | 2,145,200 | ||||||
| 100,000 | Kraft Foods Inc. — Class A | 3,801,000 | ||||||
|
| |||||||
| 12,524,950 | ||||||||
|
| |||||||
Household Products — 3.89% | ||||||||
| 72,000 | The Clorox Co.(b) | 4,949,999 | ||||||
| 25,000 | Colgate-Palmolive Co.(b) | 2,444,500 | ||||||
| 40,000 | Kimberly-Clark Corp.(b) | 2,955,600 | ||||||
| 65,000 | The Procter & Gamble Co. | 4,368,650 | ||||||
|
| |||||||
| 14,718,749 | ||||||||
Total Consumer Staples (Cost $44,297,992) | 54,200,249 | |||||||
|
| |||||||
| ENERGY — 13.87% |
| ||||||
Energy Equipment & Services — 2.90% | ||||||||
| 120,000 | Baker Hughes, Inc.(b) | 5,032,800 | ||||||
| 100,000 | Patterson-UTI Energy, Inc.(b) | 1,729,000 | ||||||
| 60,000 | Schlumberger Ltd.(b)(d) | 4,195,800 | ||||||
|
| |||||||
| 10,957,600 | ||||||||
|
| |||||||
Oil, Gas & Consumable Fuels — 10.97% | ||||||||
| 50,100 | BP plc — ADR(d) | 2,254,500 | ||||||
| 70,000 | Chevron Corp. | 7,506,800 | ||||||
| 100,000 | ConocoPhillips | 7,601,000 | ||||||
| 100,000 | Exxon Mobil Corp. | 8,673,000 | ||||||
| 20,000 | Hess Corp.(b) | 1,179,000 | ||||||
| 85,000 | HollyFrontier Corp.(b) | 2,732,750 | ||||||
| 10,000 | Kinder Morgan Inc. | 386,500 | ||||||
| 70,000 | Marathon Oil Corp. | 2,219,000 | ||||||
| 35,000 | Marathon Petroleum Corp. | 1,517,600 | ||||||
22
| SHARES OR FACE AMOUNT | FAIR VALUE* | |||||||
| ENERGY (Continued) |
| ||||||
| 105,100 | Royal Dutch Shell PLC — ADR(b)(d) | $ | 7,370,663 | |||||
|
| |||||||
| 41,440,813 | ||||||||
Total Energy (Cost $39,154,412) | 52,398,413 | |||||||
|
| |||||||
| FINANCIALS — 2.60% |
| ||||||
Insurance — 2.60% | ||||||||
| 110,000 | The Allstate Corp. | 3,621,200 | ||||||
| 60,000 | Chubb Corp. | 4,146,600 | ||||||
| 60,000 | Cincinnati Financial Corp.(b) | 2,070,600 | ||||||
Total Financials (Cost $7,661,692) | 9,838,400 | |||||||
|
| |||||||
| HEALTH CARE — 6.95% |
| ||||||
Health Care Equipment & Supplies — 0.40% | ||||||||
| 25,000 | Baxter International, Inc. | 1,494,500 | ||||||
|
| |||||||
Pharmaceuticals — 6.55% | ||||||||
| 75,000 | Abbott Laboratories(b) | 4,596,750 | ||||||
| 50,000 | Eli Lilly & Co. | 2,013,500 | ||||||
| 60,000 | GlaxoSmithKline, PLC — ADR(d) | 2,694,600 | ||||||
| 125,000 | Johnson & Johnson(b) | 8,245,000 | ||||||
| 70,000 | Merck & Co., Inc.(b) | 2,688,000 | ||||||
| 200,000 | Pfizer, Inc. | 4,532,000 | ||||||
|
| |||||||
| 24,769,850 | ||||||||
Total Health Care (Cost $22,540,974) | 26,264,350 | |||||||
|
| |||||||
| INDUSTRIALS — 5.91% |
| ||||||
Aerospace & Defense — 1.18% | ||||||||
| 60,000 | The Boeing Co.(b) | 4,462,200 | ||||||
|
| |||||||
Commercial Services & Supplies — 1.95% | ||||||||
| 200,000 | Pitney Bowes, Inc. | 3,516,000 | ||||||
| 110,000 | Waste Management Inc. | 3,845,600 | ||||||
|
| |||||||
| 7,361,600 | ||||||||
|
| |||||||
Industrial Conglomerates — 2.70% | ||||||||
| 24,400 | 3M Co.(b) | 2,176,724 | ||||||
| 400,000 | General Electric Co. | 8,028,000 | ||||||
|
| |||||||
| 10,204,724 | ||||||||
|
| |||||||
Machinery — 0.08% | ||||||||
| 5,000 | Illinois Tool Works Inc. | 285,600 | ||||||
Total Industrials (Cost $20,416,140) | 22,314,124 | |||||||
|
| |||||||
| INFORMATION TECHNOLOGY — 2.61% |
| ||||||
Semiconductors & Semiconductor Equipment — 1.33% | ||||||||
| 100,000 | Applied Materials, Inc. | 1,244,000 | ||||||
| 135,000 | Intel Corp. | 3,794,850 | ||||||
|
| |||||||
| 5,038,850 | ||||||||
|
| |||||||
Software — 1.28% | ||||||||
| 150,000 | Microsoft Corp. | 4,837,500 | ||||||
Total Information Technology (Cost $7,248,997) | 9,876,350 | |||||||
|
| |||||||
23
Buffalo Flexible Income Fund
SCHEDULE OF INVESTMENTS
March 31, 2012
(Continued)
| SHARES OR FACE AMOUNT | FAIR VALUE* | |||||||
| MATERIALS — 2.49% |
| ||||||
Chemicals — 0.86% | ||||||||
| 25,000 | The Dow Chemical Co. | $ | 866,000 | |||||
| 45,000 | E.I. du Pont de Nemours & Co.(b) | 2,380,500 | ||||||
|
| |||||||
| 3,246,500 | ||||||||
|
| |||||||
Metals & Mining — 1.63% | ||||||||
| 120,000 | Newmont Mining Corp.(b) | 6,152,400 | ||||||
Total Materials (Cost $9,518,119) | 9,398,900 | |||||||
|
| |||||||
| TELECOMMUNICATION SERVICES — 0.26% |
| ||||||
Diversified Telecommunication Services — 0.26% | ||||||||
| 25,000 | CenturyLink Inc.(b) | 966,250 | ||||||
Total Telecommunication Services (Cost $903,834) | 966,250 | |||||||
|
| |||||||
| UTILITIES — 0.89% |
| ||||||
Gas Utilities — 0.54% | ||||||||
| 105,000 | Questar Corp. | 2,022,300 | ||||||
|
| |||||||
Multi-Utilities — 0.35% | ||||||||
| 25,000 | OGE Energy Corp. | 1,337,500 | ||||||
Total Utilities (Cost $2,832,494) | 3,359,800 | |||||||
|
| |||||||
| TOTAL COMMON STOCKS | 190,578,836 | ||||||
| (COST $156,031,838) | |||||||
| CONVERTIBLE BONDS — 1.89% |
| ||||||
| CONSUMER DISCRETIONARY — 0.97% |
| ||||||
Media — 0.97% | ||||||||
| $3,795,000 | Live Nation Entertainment Inc. | 3,647,944 | ||||||
Total Consumer Discretionary (Cost $3,489,723) | 3,647,944 | |||||||
|
| |||||||
| HEALTH CARE — 0.92% |
| ||||||
Biotechnology — 0.92% | ||||||||
| 3,500,000 | Amylin Pharmaceuticals, Inc. | 3,486,875 | ||||||
Total Health Care (Cost $3,253,234) | 3,486,875 | |||||||
|
| |||||||
| TOTAL CONVERTIBLE BONDS | 7,134,819 | ||||||
| (COST $6,742,957) | |||||||
| CORPORATE BONDS — 30.66% |
| ||||||
| CONSUMER DISCRETIONARY — 7.60% |
| ||||||
Diversified Consumer Services — 0.80% | ||||||||
| 3,000,000 | Carriage Services, Inc. | 3,037,500 | ||||||
|
| |||||||
Hotels, Restaurants & Leisure — 1.84% | ||||||||
| 3,400,000 | Gaylord Entertainment Co. | 3,434,000 | ||||||
| 3,500,000 | Isle of Capri Casinos | 3,500,000 | ||||||
|
| |||||||
| 6,934,000 | ||||||||
|
| |||||||
24
| SHARES OR FACE AMOUNT | FAIR VALUE* | |||||||
| CONSUMER DISCRETIONARY (Continued) |
| ||||||
Leisure Equipment & Products — 0.57% | ||||||||
| $2,200,000 | Brunswick Corp. | $ | 2,167,000 | |||||
|
| |||||||
Media — 3.69% | ||||||||
| 9,500,000 | Lions Gate Entertainment Inc.: | 10,509,375 | ||||||
| 2,500,000 | 4.000%, 01/11/2017 (Acquired 01/11/2012, Cost $2,500,000)(c)(d)(e)(f) | 3,425,650 | ||||||
|
| |||||||
| 13,935,025 | ||||||||
|
| |||||||
Specialty Retail — 0.70% | ||||||||
| 1,000,000 | Sonic Automotive, Inc. | 1,087,500 | ||||||
| 1,500,000 | United Auto Group, Inc. | 1,565,640 | ||||||
|
| |||||||
| 2,653,140 | ||||||||
Total Consumer Discretionary (Cost $26,487,372) | 28,726,665 | |||||||
|
| |||||||
| CONSUMER STAPLES — 2.00% |
| ||||||
Food & Staples Retailing — 1.06% | ||||||||
| 4,000,000 | The Pantry, Inc. | 4,015,000 | ||||||
|
| |||||||
Food Products — 0.94% | ||||||||
| 125,000 | Post Holdings, Inc. | 131,250 | ||||||
| 3,000,000 | Smithfield Foods, Inc. | 3,405,000 | ||||||
| �� |
|
| ||||||
| 3,536,250 | ||||||||
Total Consumer Staples (Cost $7,054,034) | 7,551,250 | |||||||
|
| |||||||
| ENERGY — 7.94% |
| ||||||
Energy Equipment & Services — 0.14% | ||||||||
| 350,000 | Hornbeck Offshore Services, Inc.: | 369,250 | ||||||
| 150,000 | 5.875%, 04/01/2020 (Acquired 03/02/2012, Cost $150,000)(c)(f) | 151,125 | ||||||
|
| |||||||
| 520,375 | ||||||||
|
| |||||||
Oil, Gas & Consumable Fuels — 7.80% | ||||||||
| 3,000,000 | Berry Petroleum Co. | 3,131,250 | ||||||
| 2,000,000 | Frontier Oil Corp.: | 2,135,000 | ||||||
| 600,000 | 6.875%, 11/15/2018 | 627,000 | ||||||
| 5,470,000 | Goodrich Petroleum Corp. | 5,333,250 | ||||||
| 2,500,000 | Kodiak Oil & Gas Corp. | 2,646,875 | ||||||
| 5,000,000 | Swift Energy Co. | 5,212,500 | ||||||
| 10,000,000 | United Refining Co. | 10,374,999 | ||||||
|
| |||||||
| 29,460,874 | ||||||||
Total Energy (Cost $28,530,995) | 29,981,249 | |||||||
|
| |||||||
25
Buffalo Flexible Income Fund
SCHEDULE OF INVESTMENTS
March 31, 2012
(Continued)
| SHARES OR FACE AMOUNT | FAIR VALUE* | |||||||
| FINANCIALS — 0.28% | |||||||
Capital Markets — 0.28% | ||||||||
| $40,000 | Stifel Financial Corp. Senior Note | $ | 1,061,000 | |||||
Total Financials (Cost $1,002,400) | 1,061,000 | |||||||
|
| |||||||
| HEALTH CARE — 3.71% |
| ||||||
Health Care Providers & Services — 2.81% | ||||||||
| 3,000,000 | Acadia Healthcare Co., Inc. | 3,210,000 | ||||||
| 887,000 | CHS/Community Health Systems, Inc. | 920,263 | ||||||
| 6,500,000 | ExamWorks Group, Inc. | 6,500,000 | ||||||
|
| |||||||
| 10,630,263 | ||||||||
|
| |||||||
Pharmaceuticals — 0.90% | ||||||||
| 3,250,000 | Warner Chilcott Corp. | 3,404,375 | ||||||
Total Health Care (Cost $13,209,430) | 14,034,638 | |||||||
|
| |||||||
| INDUSTRIALS — 5.87% |
| ||||||
Commercial Services & Supplies — 1.36% | ||||||||
| 3,000,000 | Iron Mountain, Inc. | 3,007,500 | ||||||
| 2,000,000 | RR Donnelley & Sons Co. | 2,130,000 | ||||||
|
| |||||||
| 5,137,500 | ||||||||
|
| |||||||
Construction & Engineering — 1.13% | ||||||||
| 4,200,000 | Tutor Perini Corp. | 4,263,000 | ||||||
|
| |||||||
Consumer Services & Supplies — 0.65% | ||||||||
| 2,445,000 | Interface, Inc. | 2,449,597 | ||||||
|
| |||||||
Electrical Equipment — 1.12% | ||||||||
| 4,000,000 | Polypore International, Inc. | 4,240,000 | ||||||
|
| |||||||
Road & Rail — 1.61% | ||||||||
| 2,000,000 | Kansas City Southern de Mexico SA de CV | 2,240,000 | ||||||
| 3,500,000 | Quality Distribution LLC/QD Capital Corp. | 3,858,750 | ||||||
|
| |||||||
| 6,098,750 | ||||||||
Total Industrials (Cost $21,209,201) | 22,188,847 | |||||||
|
| |||||||
| INFORMATION TECHNOLOGY — 3.26% |
| ||||||
Electronic Equipment, Instruments & Components — 1.83% | ||||||||
| 4,000,000 | Kemet Corp.: | 4,320,000 | ||||||
| 2,375,000 | 10.500%, 05/01/2018 | 2,576,875 | ||||||
|
| |||||||
| 6,896,875 | ||||||||
|
| |||||||
26
| SHARES OR FACE AMOUNT | FAIR VALUE* | |||||||
| INFORMATION TECHNOLOGY (Continued) |
| ||||||
IT Services — 0.87% | ||||||||
| $3,000,000 | iGATE Corp. | $ | 3,273,750 | |||||
|
| |||||||
Software — 0.56% | ||||||||
| 2,000,000 | Audatex North America, Inc. | 2,110,000 | ||||||
Total Information Technology (Cost $11,802,113) | 12,280,625 | |||||||
|
| |||||||
| TOTAL CORPORATE BONDS | 115,824,274 | ||||||
| (COST $109,295,545) | |||||||
| SHORT TERM INVESTMENTS — 15.87% |
| ||||||
Investment Company — 15.87% | ||||||||
| 36,000,000 | Fidelity Institutional Government Portfolio — 0.01%(g) | 36,000,000 | ||||||
| 23,976,772 | The STIT-Treasury Portfolio — 0.02%(g) | 23,976,772 | ||||||
Total Investment Company | 59,976,772 | |||||||
|
| |||||||
| TOTAL SHORT TERM INVESTMENTS | 59,976,772 | ||||||
| (COST $59,976,772) | |||||||
| TOTAL INVESTMENTS | 373,514,701 | ||||||
| (COST $332,047,112) — 98.85% | |||||||
| Other Assets in Excess of Liabilities — 1.15% | 4,336,659 | ||||||
|
| |||||||
| TOTAL NET ASSETS — 100.00% | $ | 377,851,360 | |||||
|
| |||||||
ADR — American Depositary Receipt
PLC — Public Limited Company
| (a) | Non Income Producing |
| (b) | Portions of these investments are segregated as collateral for open written option contracts. |
| (c) | Restricted security deemed liquid. The total value of restricted securities is $19,284,900 (5.10% of net assets) at March 31, 2012. |
| (d) | Foreign Issued Security. The total value of these securities amounted to $40,189,338 (10.64% of net assets) at March 31, 2012. |
| (e) | Fair valued security. The total value of these securities amounted to $5,875,247 (1.55% of net assets) at March 31, 2012. |
| (f) | 144A Security. The total value of these securities is $19,284,900 (5.10% of net assets) at March 31, 2012. |
| (g) | 7-day yield. |
| * | See Note 1A of accompanying Notes to Financial Statements regarding valuation of securities. |
27
Buffalo Flexible Income Fund
SCHEDULE OF OPTIONS WRITTEN
March 31, 2012
| CONTRACTS | VALUE | |||||||
| CALL OPTIONS |
| ||||||
| 50 | 3M Co.: | $ | 3,750 | |||||
| 50 | Expiration: May 2012, Exercise Price: $92.50 | 3,550 | ||||||
| 50 | Abbott Laboratories | 19,000 | ||||||
| 100 | Baker Hughes, Inc. | 1,500 | ||||||
| 200 | The Boeing Co. | 4,200 | ||||||
| 50 | CenturyLink Inc. | 250 | ||||||
| 200 | Cincinnati Financial Corp. | 18,000 | ||||||
| 250 | The Clorox Co. | 625 | ||||||
| 75 | Colgate-Palmolive Co. | 12,900 | ||||||
| 50 | E.I. du Pont de Nemours & Co. | 12,550 | ||||||
| 150 | H.J. Heinz Co. | 9,750 | ||||||
| 200 | Hess Corp. | 3,200 | ||||||
| 300 | HollyFrontier Corp. | 16,500 | ||||||
| 450 | Johnson & Johnson | 8,100 | ||||||
| 50 | Kimberly-Clark Corp. | 5,550 | ||||||
| 100 | Merck & Co., Inc. | 6,000 | ||||||
| 250 | Newmont Mining Corp. | 10,750 | ||||||
| 400 | Patterson-UTI Energy, Inc. | 1,000 | ||||||
| 51 | Royal Dutch Shell PLC | 1,530 | ||||||
| 100 | Schlumberger Ltd. | 800 | ||||||
| 400 | Wal-Mart Stores, Inc. | 31,200 | ||||||
Total Written Option (Premium received $209,626) | $ | 170,705 | ||||||
|
| |||||||
The Global Industry Classification Standard (GICS®) was developed by and/or is the exclusive property of MSCI, Inc. and Standard & Poor Financial Services LLC (“S&P”). GICS is a service mark of MSCI and S&P and has been licensed for use by U.S. Bancorp Fund Services, LLC.
The accompanying notes are an integral part of these financial statements.
28
Buffalo Growth Fund
SCHEDULE OF INVESTMENTS
March 31, 2012
| SHARES OR FACE AMOUNT | FAIR VALUE* | |||||||
| COMMON STOCKS — 95.52% |
| ||||||
| CONSUMER DISCRETIONARY — 11.84% |
| ||||||
Auto Components — 2.75% | ||||||||
| 234,700 | Gentex Corp. | $ | 5,750,150 | |||||
| 252,300 | Johnson Controls, Inc. | 8,194,704 | ||||||
|
| |||||||
| 13,944,854 | ||||||||
|
| |||||||
Hotels, Restaurants & Leisure — 4.23% | ||||||||
| 75,500 | McDonald’s Corp. | 7,406,550 | ||||||
| 152,900 | Starwood Hotels & Resorts Worldwide, Inc. | 8,625,089 | ||||||
| 75,400 | Yum! Brands, Inc. | 5,366,972 | ||||||
|
| |||||||
| 21,398,611 | ||||||||
|
| |||||||
Household Durables — 2.25% | ||||||||
| 244,000 | Harman International Industries, Inc. | 11,421,640 | ||||||
|
| |||||||
Specialty Retail — 1.75% | ||||||||
| 179,400 | Abercrombie & Fitch Co. — Class A | 8,900,034 | ||||||
|
| |||||||
Textiles, Apparel & Luxury Goods — 0.86% | ||||||||
| 25,000 | Ralph Lauren Corp. | 4,358,250 | ||||||
Total Consumer Discretionary (Cost $51,006,658) | 60,023,389 | |||||||
|
| |||||||
| CONSUMER STAPLES — 1.79% | |||||||
Beverages — 1.79% | ||||||||
| 122,700 | The Coca Cola Co. | 9,081,027 | ||||||
Total Consumer Staples (Cost $7,687,999) | 9,081,027 | |||||||
|
| |||||||
| ENERGY — 5.19% | |||||||
Energy Equipment & Services — 5.19% | ||||||||
| 202,200 | Baker Hughes, Inc. | 8,480,268 | ||||||
| 106,200 | Lufkin Industries, Inc. | 8,565,030 | ||||||
| 132,600 | Schlumberger Ltd.(b) | 9,272,718 | ||||||
Total Energy (Cost $30,252,136) | 26,318,016 | |||||||
|
| |||||||
| FINANCIALS — 9.90% | |||||||
Capital Markets — 5.87% | ||||||||
| 69,300 | Affiliated Managers Group, Inc.(a) | 7,748,433 | ||||||
| 48,400 | The Goldman Sachs Group, Inc. | 6,019,508 | ||||||
| 219,700 | Northern Trust Corp. | 10,424,765 | ||||||
| 85,700 | T. Rowe Price Group Inc. | 5,596,210 | ||||||
|
| |||||||
| 29,788,916 | ||||||||
|
| |||||||
Diversified Financial Services — 4.03% | ||||||||
| 342,700 | JPMorgan Chase & Co. | 15,757,346 | ||||||
| 126,700 | MSCI, Inc.(a) | 4,663,827 | ||||||
|
| |||||||
| 20,421,173 | ||||||||
Total Financials (Cost $43,703,738) | 50,210,089 | |||||||
|
| |||||||
| HEALTH CARE — 12.73% | |||||||
Health Care Equipment & Supplies — 4.81% | ||||||||
| 357,100 | Align Technology, Inc.(a) | 9,838,105 | ||||||
| 138,500 | Baxter International, Inc. | 8,279,530 | ||||||
| 90,400 | Haemonetics Corp.(a) | 6,299,072 | ||||||
|
| |||||||
| 24,416,707 | ||||||||
|
| |||||||
29
Buffalo Growth Fund
SCHEDULE OF INVESTMENTS
March 31, 2012
(Continued)
| SHARES OR FACE AMOUNT | FAIR VALUE* | |||||||
| HEALTH CARE (Continued) | |||||||
Life Sciences Tools & Services — 2.94% | ||||||||
| 224,600 | Agilent Technologies, Inc.(a) | $ | 9,996,946 | |||||
| 136,200 | Charles River Laboratories International, Inc.(a) | 4,915,458 | ||||||
|
| |||||||
| 14,912,404 | ||||||||
|
| |||||||
Pharmaceuticals — 4.98% | ||||||||
| 165,600 | Abbott Laboratories | 10,149,624 | ||||||
| 93,300 | Allergan, Inc. | 8,903,619 | ||||||
| 93,900 | Johnson & Johnson | 6,193,644 | ||||||
|
| |||||||
| 25,246,887 | ||||||||
Total Health Care (Cost $49,127,473) | 64,575,998 | |||||||
|
| |||||||
| INDUSTRIALS — 11.65% | |||||||
Aerospace & Defense — 1.98% | ||||||||
| 135,300 | The Boeing Co. | 10,062,261 | ||||||
|
| |||||||
Air Freight & Logistics — 1.91% | ||||||||
| 105,500 | FedEx Corp. | 9,701,780 | ||||||
|
| |||||||
Electrical Equipment — 1.91% | ||||||||
| 185,300 | Emerson Electric Co. | 9,668,954 | ||||||
|
| |||||||
Industrial Conglomerates — 3.51% | ||||||||
| 84,900 | 3M Co. | 7,573,929 | ||||||
| 508,800 | General Electric Co. | 10,211,616 | ||||||
|
| |||||||
| 17,785,545 | ||||||||
|
| |||||||
Machinery — 2.34% | ||||||||
| 98,100 | Chart Industries, Inc.(a) | 7,193,673 | ||||||
| 91,700 | The Timken Co. | 4,652,858 | ||||||
|
| |||||||
| 11,846,531 | ||||||||
Total Industrials (Cost $52,283,476) | 59,065,071 | |||||||
|
| |||||||
| INFORMATION TECHNOLOGY — 36.77% | |||||||
Communications Equipment — 9.33% | ||||||||
| 638,800 | Cisco Systems, Inc. | 13,510,620 | ||||||
| 571,800 | Juniper Networks, Inc.(a) | 13,082,784 | ||||||
| 125,200 | Motorola Solutions, Inc. | 6,363,916 | ||||||
| 210,500 | QUALCOMM Inc. | 14,318,211 | ||||||
|
| |||||||
| 47,275,531 | ||||||||
|
| |||||||
Computers & Peripherals — 6.79% | ||||||||
| 34,600 | Apple Inc.(a) | 20,741,662 | ||||||
| 305,800 | NetApp, Inc.(a) | 13,690,666 | ||||||
|
| |||||||
| 34,432,328 | ||||||||
|
| |||||||
Electronic Equipment, Instruments & Components — 1.37% | ||||||||
| 243,700 | National Instruments Corp. | 6,950,324 | ||||||
|
| |||||||
Internet Software & Services — 7.04% | ||||||||
| 217,200 | Akamai Technologies, Inc.(a) | 7,971,240 | ||||||
| 249,900 | Ancestry.com, Inc.(a) | 5,682,726 | ||||||
| 297,000 | eBay Inc.(a) | 10,956,330 | ||||||
| 17,300 | Google Inc. — Class A(a) | 11,093,452 | ||||||
|
| |||||||
| 35,703,748 | ||||||||
|
| |||||||
IT Services — 1.52% | ||||||||
| 65,500 | Visa Inc. | 7,729,000 | ||||||
|
| |||||||
30
| SHARES OR FACE AMOUNT | FAIR VALUE* | |||||||
| INFORMATION TECHNOLOGY (Continued) | |||||||
Semiconductors & Semiconductor Equipment — 6.57% | ||||||||
| 183,100 | Altera Corp. | $ | 7,291,042 | |||||
| 599,900 | Applied Materials, Inc. | 7,462,756 | ||||||
| 317,200 | Broadcom Corp. — Class A | 12,465,960 | ||||||
| 112,300 | KLA-Tencor Corp. | 6,111,366 | ||||||
|
| |||||||
| 33,331,124 | ||||||||
|
| |||||||
Software — 4.15% | ||||||||
| 520,340 | Electronic Arts Inc.(a) | 8,575,203 | ||||||
| 427,900 | Oracle Corp. | 12,477,564 | ||||||
|
| |||||||
| 21,052,767 | ||||||||
Total Information Technology (Cost $154,828,362) | 186,474,822 | |||||||
|
| |||||||
| MATERIALS — 5.65% | |||||||
Chemicals — 5.65% | ||||||||
| 141,400 | E.I. du Pont de Nemours & Co. | 7,480,060 | ||||||
| 57,700 | FMC Corp. | 6,108,122 | ||||||
| 123,600 | Monsanto Co. | 9,858,336 | ||||||
| 45,300 | Praxair, Inc. | 5,193,192 | ||||||
Total Materials (Cost $24,119,101) | 28,639,710 | |||||||
|
| |||||||
| TOTAL COMMON STOCKS | 484,388,122 | ||||||
| (COST $413,008,943) | |||||||
| SHORT TERM INVESTMENTS — 4.79% |
| ||||||
| INVESTMENT COMPANY — 4.79% |
| ||||||
| 24,295,994 | Fidelity Institutional Government Portfolio — 0.01%(c) | 24,295,994 | ||||||
Total Investment Company | 24,295,994 | |||||||
|
| |||||||
| TOTAL SHORT TERM INVESTMENTS | 24,295,994 | ||||||
| (COST $24,295,994) | |||||||
| TOTAL INVESTMENTS | 508,684,116 | ||||||
| (COST $437,304,937) — 100.31% | |||||||
| Liabilities in Excess of Other Assets — (0.31)% | (1,547,779 | ) | |||||
|
| |||||||
| TOTAL NET ASSETS — 100.00% | $ | 507,136,337 | |||||
|
| |||||||
| (a) | Non Income Producing |
| (b) | Foreign Issued Security. The total value of these securities amounted to $9,272,718 (1.83% of net assets) at March 31, 2012. |
| (c) | 7-day yield. |
| * | See Note 1A of accompanying Notes to Financial Statements regarding valuation of securities. |
The Global Industry Classification Standard (GICS®) was developed by and/or is the exclusive property of MSCI, Inc. and Standard & Poor Financial Services LLC (“S&P”). GICS is a service mark of MSCI and S&P and has been licensed for use by U.S. Bancorp Fund Services, LLC.
The accompanying notes are an integral part of these financial statements.
31
Buffalo High Yield Fund
SCHEDULE OF INVESTMENTS
March 31, 2012
| SHARES OR FACE AMOUNT | FAIR VALUE* | |||||||
| COMMON STOCKS — 4.31% |
| ||||||
| CONSUMER DISCRETIONARY — 1.13% |
| ||||||
Hotels, Restaurants & Leisure — 1.13% | ||||||||
| 121,334 | WMS Industries Inc.(a) | $ | 2,879,256 | |||||
Total Consumer Discretionary (Cost $1,600,188) | 2,879,256 | |||||||
|
| |||||||
| CONSUMER STAPLES — 0.92% | |||||||
Food & Staples Retailing — 0.40% | ||||||||
| 95,000 | Roundy’s, Inc.(a) | 1,016,500 | ||||||
|
| |||||||
Food Products — 0.52% | ||||||||
| 35,000 | Kraft Foods Inc. — Class A | 1,330,350 | ||||||
Total Consumer Staples (Cost $1,880,394) | 2,346,850 | |||||||
|
| |||||||
| FINANCIALS — 0.63% | |||||||
Diversified Financial Services — 0.63% | ||||||||
| 35,000 | JPMorgan Chase & Co. | 1,609,300 | ||||||
Total Financials (Cost $1,604,106) | 1,609,300 | |||||||
|
| |||||||
| HEALTH CARE — 1.63% | |||||||
Pharmaceuticals — 1.63% | ||||||||
| 48,000 | Abbott Laboratories | 2,941,920 | ||||||
| 19,000 | Johnson & Johnson | 1,253,240 | ||||||
Total Health Care (Cost $3,344,228) | 4,195,160 | |||||||
|
| |||||||
| SPECIAL PURPOSE ENTITY — 0.00% | |||||||
Broadcasting (except Internet) — 0.00% | ||||||||
| 725,000 | Adelphia Recovery Trust(a)(b)(d) | — | ||||||
Total Special Purpose Entity (Cost $712,005) | — | |||||||
|
| |||||||
| TOTAL COMMON STOCKS | 11,030,566 | ||||||
| (COST $9,140,921) | |||||||
| CONVERTIBLE PREFERRED STOCKS — 3.28% |
| ||||||
| CONSUMER DISCRETIONARY — 0.81% |
| ||||||
Media — 0.81% | ||||||||
| 2,005 | The Interpublic Group of Companies, Inc. | 2,080,689 | ||||||
Total Consumer Discretionary (Cost $2,015,050) | 2,080,689 | |||||||
|
| |||||||
| FINANCIALS — 1.51% | |||||||
Commercial Banks — 1.51% | ||||||||
| 108,200 | Boston Private Capital Trust I(a) | 3,854,625 | ||||||
Total Financials (Cost $5,342,000) | 3,854,625 | |||||||
|
| |||||||
| HEALTH CARE — 0.96% | |||||||
Health Care Providers & Services — 0.96% | ||||||||
| 2,500 | HealthSouth Corp. | 2,463,125 | ||||||
Total Health Care (Cost $2,563,619) | 2,463,125 | |||||||
|
| |||||||
| TOTAL CONVERTIBLE PREFERRED STOCKS | 8,398,439 | ||||||
| (COST $9,920,669) | |||||||
32
| SHARES OR FACE AMOUNT | FAIR VALUE* | |||||||
| PREFERRED STOCKS — 2.22% |
| ||||||
| FINANCIALS — 2.22% |
| ||||||
Capital Markets — 0.97% | ||||||||
| 50,000 | AMG Capital Trust I(a) | $ | 2,490,625 | |||||
|
| |||||||
Real Estate Management & Development — 1.25% | ||||||||
| 125,000 | Firstservice Corp.(e) | 3,193,750 | ||||||
Total Financials (Cost $5,032,681) | 5,684,375 | |||||||
|
| |||||||
| TOTAL PREFERRED STOCKS | 5,684,375 | ||||||
| (COST $5,032,681) | |||||||
| CONVERTIBLE BONDS — 11.37% |
| ||||||
| CONSUMER DISCRETIONARY — 0.99% |
| ||||||
Media — 0.99% | ||||||||
| $1,000,000 | The Interpublic Group of Companies, Inc. | 1,148,750 | ||||||
| 1,000,000 | Lions Gate Entertainment Inc. | 1,370,260 | ||||||
Total Consumer Discretionary (Cost $1,990,00) | 2,519,010 | |||||||
|
| |||||||
| CONSUMER STAPLES — 0.12% | |||||||
Food & Staples Retailing — 0.12% | ||||||||
| 300,000 | The Pantry, Inc. | 301,875 | ||||||
Total Consumer Staples (Cost $286,094) | 301,875 | |||||||
|
| |||||||
| ENERGY — 1.91% | |||||||
Energy Equipment & Services — 1.91% | ||||||||
| 4,500,000 | Hornbeck Offshore Services, Inc. | 4,874,400 | ||||||
Total Energy (Cost $4,058,326) | 4,874,400 | |||||||
|
| |||||||
| FINANCIALS — 0.54% | |||||||
Capital Markets — 0.54% | ||||||||
| 1,300,000 | Janus Capital Group, Inc. | 1,387,750 | ||||||
Total Financials (Cost $1,304,378) | 1,387,750 | |||||||
|
| |||||||
| HEALTH CARE — 4.40% | |||||||
Biotechnology — 1.17% | ||||||||
| 3,000,000 | Amylin Pharmaceuticals, Inc. | 2,988,750 | ||||||
|
| |||||||
Health Care Equipment & Supplies — 1.94% | ||||||||
| 2,000,000 | NuVasive, Inc.: | 1,985,000 | ||||||
| 500,000 | 2.750%, 07/01/2017 | 428,750 | ||||||
| 1,800,000 | SonoSite, Inc. | 2,553,750 | ||||||
|
| |||||||
| 4,967,500 | ||||||||
|
| |||||||
Life Sciences Tools & Services — 1.29% | ||||||||
| 3,250,000 | Charles River Laboratories International, Inc. | 3,290,625 | ||||||
Total Health Care (Cost $10,190,891) | 11,246,875 | |||||||
|
| |||||||
33
Buffalo High Yield Fund
SCHEDULE OF INVESTMENTS
March 31, 2012
(Continued)
| SHARES OR FACE AMOUNT | FAIR VALUE* | |||||||
| INDUSTRIALS — 2.07% | |||||||
Commercial Services & Supplies — 0.45% | ||||||||
| $1,000,000 | Covanta Holding Corp. | $ | 1,153,750 | |||||
|
| |||||||
Electrical Equipment — 0.83% | ||||||||
| 2,000,000 | General Cable Corp. | 2,117,500 | ||||||
|
| |||||||
Machinery — 0.12% | ||||||||
| 250,000 | Chart Industries, Inc. | 321,250 | ||||||
|
| |||||||
Trading Companies & Distributors — 0.67% | ||||||||
| 710,000 | WESCO International, Inc. | 1,716,425 | ||||||
Total Industrials (Cost $3,837,631) | 5,308,925 | |||||||
|
| |||||||
| INFORMATION TECHNOLOGY — 1.25% | |||||||
Internet Software & Services — 1.25% | ||||||||
| 3,000,000 | DealerTrack Holdings, Inc. | 3,210,000 | ||||||
Total Information Technology (Cost $3,000,000) | 3,210,000 | |||||||
|
| |||||||
| MATERIALS — 0.09% | |||||||
Metals & Mining — 0.09% | ||||||||
| 200,000 | Steel Dynamics, Inc. | 227,750 | ||||||
Total Materials (Cost $200,000) | 227,750 | |||||||
|
| |||||||
| TOTAL CONVERTIBLE BONDS | 29,076,585 | ||||||
| (COST $24,867,320) | |||||||
| CORPORATE BONDS — 68.45% |
| ||||||
| CONSUMER DISCRETIONARY — 26.22% |
| ||||||
Diversified Consumer Services — 3.40% | ||||||||
| 3,000,000 | Carriage Services, Inc. | 3,037,500 | ||||||
| 4,800,000 | Education Management LLC | 4,632,000 | ||||||
| 1,000,000 | Monitronics International Inc. | 1,017,500 | ||||||
|
| |||||||
| 8,687,000 | ||||||||
|
| |||||||
Hotels, Restaurants & Leisure — 5.04% | ||||||||
| 600,000 | Cedar Fair L.P. | 676,500 | ||||||
| 3,000,000 | Gaylord Entertainment Co. | 3,030,000 | ||||||
| 1,178,000 | Isle of Capri Casinos | 1,178,000 | ||||||
| 1,600,000 | Penn National Gaming, Inc. | 1,804,000 | ||||||
| 1,450,000 | Royal Caribbean Cruises Ltd.: | 1,522,500 | ||||||
| 1,615,000 | 7.500%, 10/15/2027(e) | 1,631,150 | ||||||
34
| SHARES OR FACE AMOUNT | FAIR VALUE* | |||||||
| CONSUMER DISCRETIONARY (Continued) |
| ||||||
| $350,000 | Scientific Games International Inc. | $ | 366,625 | |||||
| 1,000,000 | Speedway Motorsports, Inc.: | 1,100,000 | ||||||
| 500,000 | 6.750%, 02/01/2019 | 522,500 | ||||||
| 1,000,000 | Vail Resorts, Inc. | 1,055,000 | ||||||
|
| |||||||
| 12,886,275 | ||||||||
|
| |||||||
Household Durables — 0.90% | ||||||||
| 2,000,000 | Jarden Corp. | 2,210,000 | ||||||
| 85,000 | Sealy Mattress Co. | 92,438 | ||||||
|
| |||||||
| 2,302,438 | ||||||||
|
| |||||||
Internet & Catalog Retail — 0.43% | ||||||||
| 1,000,000 | HSN, Inc. | 1,090,010 | ||||||
|
| |||||||
Leisure Equipment & Products — 1.15% | ||||||||
| 3,000,000 | Brunswick Corp. | 2,955,000 | ||||||
|
| |||||||
Media — 7.50% | ||||||||
| 500,000 | Interactive Data Corp. | 568,750 | ||||||
| 1,750,000 | Lamar Media Corp.: | 1,798,125 | ||||||
| 1,000,000 | 6.625%, 08/15/2015 | 1,027,500 | ||||||
| 250,000 | 5.875%, 02/01/2022 (Acquired 01/26/2012, Cost $250,000)(c)(f) | 255,625 | ||||||
| 8,000,000 | Lions Gate Entertainment Inc. | 8,849,999 | ||||||
| 2,500,000 | MDC Partners Inc. | 2,737,500 | ||||||
| 2,300,000 | Regal Entertainment Group | 2,530,000 | ||||||
| 1,325,000 | Ticketmaster Entertainment, Inc. | 1,432,656 | ||||||
|
| |||||||
| 19,200,155 | ||||||||
|
| |||||||
Specialty Retail — 4.50% | ||||||||
| 700,000 | Asbury Automotive Group, Inc. | 728,875 | ||||||
| 2,000,000 | AutoNation, Inc. | 2,007,520 | ||||||
| 3,525,000 | Sonic Automotive, Inc. | 3,833,438 | ||||||
| 4,725,000 | United Auto Group, Inc. | 4,931,766 | ||||||
|
| |||||||
| 11,501,599 | ||||||||
|
| |||||||
Textiles, Apparel & Luxury Goods — 3.30% | ||||||||
| 4,500,000 | Oxford Industries, Inc. | 4,876,875 | ||||||
| 3,120,000 | Phillips Van-Heusen | 3,557,580 | ||||||
|
| |||||||
| 8,434,455 | ||||||||
Total Consumer Discretionary (Cost $64,625,758) | 67,056,932 | |||||||
|
| |||||||
35
Buffalo High Yield Fund
SCHEDULE OF INVESTMENTS
March 31, 2012
(Continued)
| SHARES OR FACE AMOUNT | FAIR VALUE* | |||||||
| CONSUMER STAPLES — 7.24% | |||||||
Food & Staples Retailing — 2.95% | ||||||||
| $4,750,000 | The Pantry, Inc. | $ | 4,767,813 | |||||
| 2,000,000 | SUPERVALU Inc. | 2,105,000 | ||||||
| 600,000 | Susser Holdings LLC / Susser Finance Corp. | 661,500 | ||||||
|
| |||||||
| 7,534,313 | ||||||||
|
| |||||||
Food Products — 1.31% | ||||||||
| 100,000 | Darling International, Inc. | 112,000 | ||||||
| 125,000 | Post Holdings, Inc. | 131,250 | ||||||
| 2,750,000 | Smithfield Foods, Inc. | 3,121,250 | ||||||
|
| |||||||
| 3,364,500 | ||||||||
|
| |||||||
Personal Products — 2.98% | ||||||||
| 4,000,000 | Prestige Brands Inc. | 4,390,000 | ||||||
| 3,000,000 | Revlon Consumer Products Corp. | 3,240,000 | ||||||
|
| |||||||
| 7,630,000 | ||||||||
Total Consumer Staples (Cost $17,371,190) | 18,528,813 | |||||||
|
| |||||||
| ENERGY — 7.67% | |||||||
Energy Equipment & Services — 0.76% | ||||||||
| 600,000 | Hornbeck Offshore Services, Inc. | 604,500 | ||||||
| 1,000,000 | Parker Drilling Co. | 1,065,000 | ||||||
| 250,000 | SESI, LLC | 271,250 | ||||||
|
| |||||||
| 1,940,750 | ||||||||
|
| |||||||
Oil, Gas & Consumable Fuels — 6.91% | ||||||||
| 665,000 | Berry Petroleum Co.: | 771,400 | ||||||
| 2,000,000 | 8.250%, 11/01/2016 | 2,087,500 | ||||||
| 1,750,000 | Concho Resources, Inc.: | 1,925,000 | ||||||
| 550,000 | 6.500%, 01/15/2022 | 583,000 | ||||||
| 100,000 | Continental Resources, Inc. | 112,250 | ||||||
| 1,000,000 | Frontier Oil Corp. | 1,045,000 | ||||||
| 4,200,000 | Goodrich Petroleum Corp. | 4,095,000 | ||||||
| 3,000,000 | Inergy LP/Inergy Finance Corp. | 2,902,500 | ||||||
| 4,000,000 | United Refining Co. | 4,150,000 | ||||||
|
| |||||||
| 17,671,650 | ||||||||
Total Energy (Cost $18,961,410) | 19,612,400 | |||||||
|
| |||||||
36
| SHARES OR FACE AMOUNT | FAIR VALUE* | |||||||
| HEALTH CARE — 4.54% | |||||||
Health Care Providers & Services — 3.10% | ||||||||
Acadia Healthcare Co., Inc. | ||||||||
| $3,000,000 | 12.875%, 11/01/2018 | $ | 3,210,000 | |||||
CHS/Community Health Systems, Inc. | ||||||||
| 1,183,000 | 8.875%, 07/15/2015 | 1,227,363 | ||||||
ExamWorks Group, Inc. | ||||||||
| 3,500,000 | 9.000%, 07/15/2019 (Acquired 07/14/2011 through 02/29/2012, Cost $3,290,411)(c)(f) | 3,500,000 | ||||||
|
| |||||||
| 7,937,363 | ||||||||
|
| |||||||
Pharmaceuticals — 1.44% | ||||||||
Warner Chilcott Corp. | ||||||||
| 3,500,000 | 7.750%, 09/15/2018(e) | 3,666,250 | ||||||
Total Health Care (Cost $10,975,282) | 11,603,613 | |||||||
|
| |||||||
| INDUSTRIALS — 16.41% | |||||||
Aerospace & Defense — 4.47% | ||||||||
AAR Corp. | ||||||||
| 3,000,000 | 7.250%, 01/15/2022 (Acquired 01/13/2012, Cost $2,948,040)(c)(f) | 3,067,500 | ||||||
Kratos Defense & Security Solutions, Inc. | ||||||||
| 2,500,000 | 10.000%, 06/01/2017 | 2,718,750 | ||||||
TransDigm, Inc. | ||||||||
| 2,000,000 | 7.750%, 12/15/2018 | 2,175,000 | ||||||
Triumph Group Inc.: | ||||||||
| 2,150,000 | 8.000%, 11/15/2017 | 2,354,250 | ||||||
| 1,000,000 | 8.625%, 07/15/2018 | 1,125,000 | ||||||
|
| |||||||
| 11,440,500 | ||||||||
|
| |||||||
Commercial Services & Supplies — 3.79% | ||||||||
Casella Waste Systems, Inc. | ||||||||
| 2,410,000 | 7.750%, 02/15/2019 | 2,397,950 | ||||||
Cenveo Corp. | ||||||||
| 792,000 | 7.875%, 12/01/2013 | 760,320 | ||||||
Covanta Holding Corp. | ||||||||
| 1,000,000 | 7.250%, 12/01/2020 | 1,080,859 | ||||||
Interface, Inc. | ||||||||
| 2,909,000 | 9.500%, 02/01/2014(d) | 2,914,469 | ||||||
Mobile Mini, Inc. | ||||||||
| 2,500,000 | 6.875%, 05/01/2015 | 2,537,500 | ||||||
|
| |||||||
| 9,691,098 | ||||||||
|
| |||||||
Construction & Engineering — 1.47% | ||||||||
Tutor Perini Corp. | ||||||||
| 3,700,000 | 7.625%, 11/01/2018 | 3,755,500 | ||||||
|
| |||||||
Electrical Equipment — 0.41% | ||||||||
Polypore International, Inc. | ||||||||
| 1,000,000 | 7.500%, 11/15/2017 | 1,060,000 | ||||||
|
| |||||||
Machinery — 1.51% | ||||||||
Altra Holdings, Inc. | ||||||||
| 1,500,000 | 8.125%, 12/01/2016 | 1,620,000 | ||||||
American Railcar Industries, Inc. | ||||||||
| 2,200,000 | 7.500%, 03/01/2014 | 2,233,000 | ||||||
|
| |||||||
| 3,853,000 | ||||||||
|
| |||||||
37
Buffalo High Yield Fund
SCHEDULE OF INVESTMENTS
March 31, 2012
(Continued)
| SHARES OR FACE AMOUNT | FAIR VALUE* | |||||||
| INDUSTRIALS (Continued) | |||||||
Road & Rail — 4.76% | ||||||||
Kansas City Southern de Mexico SA de CV(e): | ||||||||
| $4,000,000 | 8.000%, 02/01/2018 | $ | 4,479,999 | |||||
| 2,000,000 | 6.625%, 12/15/2020 | 2,180,000 | ||||||
| 2,000,000 | 6.125%, 06/15/2021 | 2,172,500 | ||||||
Quality Distribution LLC/QD Capital Corp. | ||||||||
| 3,025,000 | 9.875%, 11/01/2018 | 3,335,063 | ||||||
|
| |||||||
| 12,167,562 | ||||||||
Total Industrials (Cost $39,312,879) | 41,967,660 | |||||||
|
| |||||||
| INFORMATION TECHNOLOGY — 5.73% | |||||||
Electronic Equipment, Instruments & Components — 1.91% | ||||||||
Kemet Corp. | ||||||||
| 4,500,000 | 10.500%, 05/01/2018 | 4,882,500 | ||||||
|
| |||||||
Internet Software & Services — 0.11% | ||||||||
Equinix, Inc. | ||||||||
| 250,000 | 7.000%, 07/15/2021 | 275,000 | ||||||
|
| |||||||
IT Services — 2.13% | ||||||||
iGATE Corp. | ||||||||
| 5,000,000 | 9.000%, 05/01/2016 | 5,456,250 | ||||||
|
| |||||||
Semiconductors & Semiconductor Equipment — 0.96% | ||||||||
KLA-Tencor Corp. | ||||||||
| 500,000 | 6.900%, 05/01/2018 | 596,910 | ||||||
National Semiconductor Corp. | ||||||||
| 1,500,000 | 6.600%, 06/15/2017 | 1,852,547 | ||||||
|
| |||||||
| 2,449,457 | ||||||||
|
| |||||||
Software — 0.62% | ||||||||
Audatex North America, Inc. | ||||||||
| 1,500,000 | 6.750%, 06/15/2018 (Acquired 6/10/2011, Cost $1,500,000)(c)(f) | 1,582,500 | ||||||
Total Information Technology (Cost $13,257,776) | 14,645,707 | |||||||
|
| |||||||
| MATERIALS — 0.21% | |||||||
Metals & Mining — 0.21% | ||||||||
Steel Dynamics, Inc. | ||||||||
| 500,000 | 7.625%, 03/15/2020 | 543,750 | ||||||
Total Materials (Cost $500,000) | 543,750 | |||||||
|
| |||||||
| TELECOMMUNICATION SERVICES — 0.43% | |||||||
Diversified Telecommunications — 0.43% | ||||||||
Level 3 Financing, Inc. | ||||||||
| 1,000,000 | 10.000%, 02/01/2018 | 1,100,000 | ||||||
Total Telecommunication Services (Cost $1,069,105) | 1,100,000 | |||||||
|
| |||||||
| TOTAL CORPORATE BONDS | 175,058,875 | ||||||
| (COST $164,073,400) | |||||||
38
| SHARES OR FACE AMOUNT | FAIR VALUE* | |||||||
| SHORT TERM INVESTMENTS — 8.74% |
| ||||||
| INVESTMENT COMPANY — 8.74% | |||||||
| 22,355,590 | Fidelity Institutional Government Portfolio — 0.01%(g) | $ | 22,355,590 | |||||
Total Investment Company | 22,355,590 | |||||||
|
| |||||||
| TOTAL SHORT TERM INVESTMENTS | 22,355,590 | ||||||
| (COST $22,355,590) | |||||||
| TOTAL INVESTMENTS — 98.37% | 251,604,430 | ||||||
| (COST $235,390,581) | |||||||
| Other Assets in Excess of Liabilities — 1.63% | 4,166,172 | ||||||
|
| |||||||
| TOTAL NET ASSETS — 100.00% | $ | 255,770,602 | |||||
|
| |||||||
| (a) | Non Income Producing |
| (b) | Illiquid Security. The total value of these securities amounted to $0 (0.00% of net assets) at March 31, 2012. |
| (c) | Restricted security deemed liquid. The total value of restricted securities is $15,469,448 (6.05% of net assets) at March 31, 2012. |
| (d) | Fair valued security. The total value of these securities amounted to $4,284,729 (1.68% of net assets) at March 31, 2012. |
| (e) | Foreign issued security. The total value of these securities amounted to $31,803,908 (12.43% of net assets) at March 31, 2012. |
| (f) | 144A Security. The total value of these securities is $15,469,448 (6.05% of net assets) at March 31, 2012. |
| (g) | 7-day yield. |
| * | See Note 1A of accompanying Notes to Financial Statements regarding valuation of securities. |
The Global Industry Classification Standard (GICS®) was developed by and/or is the exclusive property of MSCI, Inc. and Standard & Poor Financial Services LLC (“S&P”). GICS is a service mark of MSCI and S&P and has been licensed for use by U.S. Bancorp Fund Services, LLC.
The accompanying notes are an integral part of these financial statements.
39
Buffalo International Fund
SCHEDULE OF INVESTMENTS
March 31, 2012
| SHARES OR FACE AMOUNT | FAIR VALUE* | |||||||
| COMMON STOCKS — 86.82% |
| ||||||
| AUSTRALIA — 0.61% |
| ||||||
Metals & Mining — 0.61% | ||||||||
| 6,000 | BHP Billiton Ltd. — ADR | $ | 434,400 | |||||
Total Australia (Cost $437,098) | 434,400 | |||||||
|
| |||||||
| BRAZIL — 7.15% |
| ||||||
Diversified Financial Services — 1.60% | ||||||||
| 184,320 | BM&F Bovespa SA | 1,129,881 | ||||||
|
| |||||||
Health Care Providers & Services — 1.94% | ||||||||
| 58,200 | Diagnosticos da America SA | 447,312 | ||||||
| 70,000 | Fleury SA | 925,690 | ||||||
|
| |||||||
| 1,373,002 | ||||||||
|
| |||||||
Real Estate Management & Development — 1.17% | ||||||||
| 36,000 | BR Properties SA | 459,897 | ||||||
| 16,000 | Iguatemi Empresa de Shopping Centers SA | 367,252 | ||||||
|
| |||||||
| 827,149 | ||||||||
|
| |||||||
Wireless Telecommunication Services — 2.44% | ||||||||
| 53,630 | Tim Participacoes SA — ADR | 1,730,104 | ||||||
Total Brazil (Cost $4,749,978) | 5,060,136 | |||||||
|
| |||||||
| CANADA — 0.42% |
| ||||||
Metals & Mining — 0.42% | ||||||||
| 8,400 | Teck Resources Ltd. — Class B | 299,544 | ||||||
Total Canada (Cost $300,015) | 299,544 | |||||||
|
| |||||||
| CHILE — 1.80% |
| ||||||
Beverages — 1.80% | ||||||||
| 16,200 | Compania Cervecerias Unidas S.A. — ADR | 1,274,778 | ||||||
Total Chile (Cost $794,327) | 1,274,778 | |||||||
|
| |||||||
| CHINA — 4.61% |
| ||||||
Automobiles — 0.76% | ||||||||
| 300,000 | Dongfeng Motor Group Co. Ltd. — Class H | 541,623 | ||||||
|
| |||||||
Biotechnology — 1.19% | ||||||||
| 57,000 | 3SBio, Inc. — ADR(a) | 843,600 | ||||||
|
| |||||||
Food Products — 0.31% | ||||||||
| 84,500 | Biostime International Holdings Ltd. | 217,410 | ||||||
|
| |||||||
Health Care Equipment & Supplies — 0.79% | ||||||||
| 17,000 | Mindray Medical International Ltd. — ADR | 560,490 | ||||||
|
| |||||||
IT Services — 0.26% | ||||||||
| 347,000 | Travelsky Technology Ltd. — Class H | 181,866 | ||||||
|
| |||||||
Specialty Retail — 1.30% | ||||||||
| 100,000 | China ZhengTong Auto Services Holdings Ltd.(a) | 100,186 | ||||||
| 217,500 | Lentuo International Inc. — ADR(a) | 822,150 | ||||||
|
| |||||||
| 922,336 | ||||||||
Total China (Cost $3,218,096) | 3,267,325 | |||||||
|
| |||||||
40
| SHARES OR FACE AMOUNT | FAIR VALUE* | |||||||
| FRANCE — 12.27% |
| ||||||
Beverages — 2.62% | ||||||||
| 9,000 | Pernod Ricard SA | $ | 941,064 | |||||
| 9,000 | Remy Cointreau SA | 914,656 | ||||||
|
| |||||||
| 1,855,720 | ||||||||
|
| |||||||
Chemicals — 1.32% | ||||||||
| 7,000 | Air Liquide SA | 933,221 | ||||||
|
| |||||||
Electrical Equipment — 1.57% | ||||||||
| 17,000 | Schneider Electric | 1,110,751 | ||||||
|
| |||||||
Energy Equipment & Services — 1.91% | ||||||||
| 11,500 | Technip SA | 1,354,773 | ||||||
|
| |||||||
Food Products — 1.78% | ||||||||
| 18,100 | DANONE S.A. | 1,262,527 | ||||||
|
| |||||||
Multiline Retail — 0.49% | ||||||||
| 2,000 | PPR | 344,096 | ||||||
|
| |||||||
Software — 1.51% | ||||||||
| 11,600 | Dassault Systemes S.A. | 1,067,344 | ||||||
|
| |||||||
Textiles, Apparel & Luxury Goods — 1.07% | ||||||||
| 4,400 | LVMH Moet Hennessy Louis Vuitton SA | 756,132 | ||||||
Total France (Cost $7,621,399) | 8,684,564 | |||||||
|
| |||||||
| GERMANY — 14.24% |
| ||||||
Automobiles — 0.57% | ||||||||
| 7,500 | Bayerische Motoren Werke (BMW) AG — ADR | 224,400 | ||||||
| 2,000 | Bayerische Motoren Werke (BMW) AG | 179,864 | ||||||
|
| |||||||
| 404,264 | ||||||||
|
| |||||||
Chemicals — 1.01% | ||||||||
| 4,000 | Linde AG | 717,801 | ||||||
|
| |||||||
Food Products — 0.70% | ||||||||
| 2,200 | KWS Saat AG | 495,872 | ||||||
|
| |||||||
Health Care Equipment & Supplies — 1.98% | ||||||||
| 13,700 | Fresenius SE | 1,404,917 | ||||||
|
| |||||||
Household Products — 2.15% | ||||||||
| 24,400 | Henkel AG & Co. KGaA | 1,522,986 | ||||||
|
| |||||||
Industrial Conglomerates — 0.64% | ||||||||
| 4,500 | Siemens AG — ADR | 453,780 | ||||||
|
| |||||||
Pharmaceuticals — 1.90% | ||||||||
| 3,000 | Bayer AG — ADR | 210,870 | ||||||
| 16,100 | Bayer AG | 1,132,469 | ||||||
|
| |||||||
| 1,343,339 | ||||||||
|
| |||||||
Software — 1.72% | ||||||||
| 17,400 | SAP AG — ADR | 1,214,868 | ||||||
|
| |||||||
Textiles, Apparel & Luxury Goods — 3.57% | ||||||||
| 17,700 | Adidas AG | 1,381,931 | ||||||
| 3,200 | Puma AG Rudolf Dassler Sport | 1,142,933 | ||||||
|
| |||||||
| 2,524,864 | ||||||||
Total Germany (Cost $8,575,055) | 10,082,691 | |||||||
|
| |||||||
41
Buffalo International Fund
SCHEDULE OF INVESTMENTS
March 31, 2012
(Continued)
| SHARES OR FACE AMOUNT | FAIR VALUE* | |||||||
| HONG KONG — 6.07% |
| ||||||
Hotels, Restaurants & Leisure — 0.27% | ||||||||
| 120,000 | Mandarin Oriental International Ltd. | $ | 193,800 | |||||
|
| |||||||
Industrial Conglomerates — 4.00% | ||||||||
| 28,184 | Jardine Matheson Holding Ltd. | 1,409,200 | ||||||
| 46,695 | Jardine Strategic Holdings Ltd.(a) | 1,424,664 | ||||||
|
| |||||||
| 2,833,864 | ||||||||
|
| |||||||
Specialty Retail — 0.87% | ||||||||
| 235,000 | Belle International Holdings Ltd. | 421,850 | ||||||
| 450,000 | Oriental Watch Holdings Ltd. | 191,809 | ||||||
|
| |||||||
| 613,659 | ||||||||
|
| |||||||
Textiles, Apparel & Luxury Goods — 0.93% | ||||||||
| 270,000 | Stella International Holdings Ltd. | 655,047 | ||||||
Total Hong Kong (Cost $4,016,094) | 4,296,370 | |||||||
|
| |||||||
| INDIA — 1.38% |
| ||||||
Pharmaceuticals — 1.38% | ||||||||
| 28,300 | Dr. Reddy’s Laboratories Ltd. — ADR | 978,048 | ||||||
Total India (Cost $721,953) | 978,048 | |||||||
|
| |||||||
| ISRAEL — 0.99% |
| ||||||
Pharmaceuticals — 0.99% | ||||||||
| 15,600 | Teva Pharmaceutical Industries Ltd. — ADR | 702,936 | ||||||
Total Israel (Cost $656,068) | 702,936 | |||||||
|
| |||||||
| ITALY — 0.29% |
| ||||||
Textiles, Apparel & Luxury Goods — 0.29% | ||||||||
| 10,000 | Salvatore Ferragamo Italia SpA(a) | 207,258 | ||||||
Total Italy (Cost $205,283) | 207,258 | |||||||
|
| |||||||
| JAPAN — 2.07% |
| ||||||
Electronic Equipment, Instruments & Components — 0.42% | ||||||||
| 34,000 | Nippon Electric Glass Co., Ltd. | 295,349 | ||||||
|
| |||||||
Machinery — 1.25% | ||||||||
| 5,000 | FANUC CORP. | 886,794 | ||||||
|
| |||||||
Tobacco — 0.40% | ||||||||
| 50 | JAPAN TOBACCO INC. | 281,503 | ||||||
Total Japan (Cost $1,527,945) | 1,463,646 | |||||||
|
| |||||||
| LUXEMBOURG — 1.91% |
| ||||||
Wireless Telecommunication Services — 1.91% | ||||||||
| 11,900 | Millicom International Cellular SA(a) | 1,349,043 | ||||||
Total Luxembourg (Cost $890,509) | 1,349,043 | |||||||
|
| |||||||
| MALAYSIA — 1.97% |
| ||||||
Airlines — 1.67% | ||||||||
| 1,055,000 | AirAsia BHD | 1,188,102 | ||||||
|
| |||||||
Hotels, Restaurants & Leisure — 0.30% | ||||||||
| 100,000 | QSR Brands Bhd | 208,911 | ||||||
Total Malaysia (Cost $673,270) | 1,397,013 | |||||||
|
| |||||||
42
| SHARES OR FACE AMOUNT | FAIR VALUE* | |||||||
| MEXICO — 1.47% |
| ||||||
Food & Staples Retailing — 0.75% | ||||||||
| 15,800 | Wal-Mart de Mexico SAB de CV — ADR | $ | 530,406 | |||||
|
| |||||||
Wireless Telecommunication Services — 0.72% | ||||||||
| 20,600 | America Movil SAB de CV — ADR | 511,498 | ||||||
Total Mexico (Cost $910,366) | 1,041,904 | |||||||
|
| |||||||
| NETHERLANDS — 2.81% |
| ||||||
Food Products — 1.78% | ||||||||
| 37,000 | Unilever NV — NY Shares — ADR | 1,259,110 | ||||||
|
| |||||||
Semiconductors & Semiconductor Equipment — 1.03% | ||||||||
| 14,500 | ASML Holding N.V. — NY Shares — ADR | 727,030 | ||||||
Total Netherlands (Cost $1,730,479) | 1,986,140 | |||||||
|
| |||||||
| NORWAY — 0.83% |
| ||||||
Commercial Services & Supplies — 0.83% | ||||||||
| 72,000 | Tomra Systems Asa | 587,910 | ||||||
Total Norway (Cost $437,067) | 587,910 | |||||||
|
| |||||||
| SINGAPORE — 0.88% |
| ||||||
Semiconductors & Semiconductor Equipment — 0.88% | ||||||||
| 16,070 | Avago Technologies Ltd. | 626,248 | ||||||
Total Singapore (Cost $545,220) | 626,248 | |||||||
|
| |||||||
| SPAIN — 1.35% |
| ||||||
Specialty Retail — 1.35% | ||||||||
| 10,000 | Industria de Diseno Textil, S.A. (Inditex) | 957,868 | ||||||
Total Spain (Cost $844,268) | 957,868 | |||||||
|
| |||||||
| SWEDEN — 0.74% |
| ||||||
Communications Equipment — 0.74% | ||||||||
| 50,500 | Telefonaktirbolaget LM Ericsson — ADR | 520,655 | ||||||
Total Sweden (Cost $655,166) | 520,655 | |||||||
|
| |||||||
| SWITZERLAND — 11.21% |
| ||||||
Capital Markets — 3.53% | ||||||||
| 92,900 | GAM Holding AG | 1,353,313 | ||||||
| 28,400 | Julius Baer Group Ltd. | 1,146,445 | ||||||
|
| |||||||
| 2,499,758 | ||||||||
|
| |||||||
Chemicals — 1.83% | ||||||||
| 18,800 | Syngenta Ag — ADR | 1,294,004 | ||||||
|
| |||||||
Electrical Equipment — 1.65% | ||||||||
| 57,400 | ABB Ltd. — ADR | 1,171,534 | ||||||
|
| |||||||
Food Products — 1.93% | ||||||||
| 800 | Barry Callebaut Ag | 801,595 | ||||||
| 9,000 | Nestle SA | 566,301 | ||||||
|
| |||||||
| 1,367,896 | ||||||||
|
| |||||||
Marine — 0.29% | ||||||||
| 1,500 | Kuehne + Nagel International AG | 202,891 | ||||||
|
| |||||||
43
Buffalo International Fund
SCHEDULE OF INVESTMENTS
March 31, 2012
(Continued)
| SHARES OR FACE AMOUNT | FAIR VALUE* | |||||||
| SWITZERLAND (Continued) |
| ||||||
Textiles, Apparel & Luxury Goods — 1.98% | ||||||||
| 16,500 | Compagnie Financiere Richemont SA — Class BR A | $ | 1,034,563 | |||||
| 800 | The Swatch Group AG | 368,229 | ||||||
|
| |||||||
| 1,402,792 | ||||||||
Total Switzerland (Cost $6,939,650) | 7,938,875 | |||||||
|
| |||||||
| TAIWAN, PROVINCE OF CHINA — 1.82% |
| ||||||
Semiconductors & Semiconductor Equipment — 1.82% | ||||||||
| 84,281 | Taiwan Semiconductor Manufacturing Company Ltd. — ADR | 1,287,814 | ||||||
Total Taiwan, Province of China (Cost $858,239) | 1,287,814 | |||||||
|
| |||||||
| UNITED KINGDOM — 9.93% |
| ||||||
Beverages — 2.28% | ||||||||
| 12,600 | Diageo plc — ADR | 1,215,900 | ||||||
| 10,000 | SABMiller plc | 401,392 | ||||||
|
| |||||||
| 1,617,292 | ||||||||
|
| |||||||
Capital Markets — 2.48% | ||||||||
| 41,500 | Schroders PLC | 1,048,784 | ||||||
| 35,500 | Schroders PLC | 704,095 | ||||||
|
| |||||||
| 1,752,879 | ||||||||
|
| |||||||
Energy Equipment & Services — 0.86% | ||||||||
| 22,000 | Petrofac Ltd. | 612,284 | ||||||
|
| |||||||
Health Care Equipment & Supplies — 1.06% | ||||||||
| 14,900 | Smith & Nephew PLC — ADR | 752,450 | ||||||
|
| |||||||
Hotels, Restaurants & Leisure — 1.75% | ||||||||
| 161,085 | Millennium & Copthorne Hotels PLC | 1,238,025 | ||||||
|
| |||||||
Internet Software & Services — 1.50% | ||||||||
| 90,000 | Telecity Group PLC(a) | 1,060,941 | ||||||
Total United Kingdom (Cost $6,203,172) | 7,033,871 | |||||||
|
| |||||||
| TOTAL COMMON STOCKS | 61,479,037 | ||||||
| (COST $53,510,717) | |||||||
| PREFERRED STOCKS — 3.59% |
| ||||||
| BRAZIL — 3.59% |
| ||||||
Beverages — 2.23% | ||||||||
| 38,100 | Companhia de Bebidas das Americas (AMBEV) — ADR | 1,574,292 | ||||||
|
| |||||||
Oil, Gas & Consumable Fuels — 1.36% | ||||||||
| 37,800 | Petroleo Brasileiro S.A. — ADR | 966,168 | ||||||
Total Brazil (Cost $2,094,368) | 2,540,460 | |||||||
|
| |||||||
| TOTAL PREFERRED STOCKS | 2,540,460 | ||||||
| (COST $2,094,368) | |||||||
44
| SHARES OR FACE AMOUNT | FAIR VALUE* | |||||||
| SHORT TERM INVESTMENTS — 1.66% |
| ||||||
| INVESTMENT COMPANY — 1.66% | |||||||
| 1,173,200 | Fidelity Institutional Government Portfolio — 0.01%(b) | $ | 1,173,200 | |||||
Total Investment Company | 1,173,200 | |||||||
|
| |||||||
| TOTAL SHORT TERM INVESTMENTS | 1,173,200 | ||||||
| (COST $1,173,200) | |||||||
| TOTAL INVESTMENTS — 92.07% | 65,192,697 | ||||||
| (COST $56,778,285) | |||||||
| Other Assets in Excess of Liabilities — 7.93% | 5,612,187 | ||||||
|
| |||||||
| TOTAL NET ASSETS — 100.00% | $ | 70,804,884 | |||||
|
| |||||||
ADR — American Depositary Receipt
PLC — Public Limited Company
| (a) | Non Income Producing |
| (b) | 7-day yield. |
| * | See Note 1A of accompanying Notes to Financial Statements regarding valuation of securities. |
The accompanying notes are an integral part of these financial statements.
45
Buffalo International Fund
SCHEDULE OF INVESTMENTS
March 31, 2012
(Continued)
As of March 31, 2012, the industry diversification was as follows:
| FAIR VALUE | PERCENTAGE | |||||||
Common Stocks | ||||||||
Airlines | $ | 1,188,102 | 1.67% | |||||
Automobiles | 945,887 | 1.33% | ||||||
Beverages | 4,747,790 | 6.70% | ||||||
Biotechnology | 843,600 | 1.19% | ||||||
Capital Markets | 4,252,637 | 6.01% | ||||||
Chemicals | 2,945,026 | 4.16% | ||||||
Commercial Services & Supplies | 587,910 | 0.83% | ||||||
Communications Equipment | 520,655 | 0.74% | ||||||
Diversified Financial Services | 1,129,881 | 1.60% | ||||||
Electrical Equipment | 2,282,285 | 3.22% | ||||||
Electronic Equipment, Instruments & Components | 295,349 | 0.42% | ||||||
Energy Equipment & Services | 1,967,057 | 2.77% | ||||||
Food & Staples Retailing | 530,406 | 0.75% | ||||||
Food Products | 4,602,815 | 6.50% | ||||||
Health Care Equipment & Supplies | 2,717,857 | 3.84% | ||||||
Health Care Providers & Services | 1,373,002 | 1.94% | ||||||
Hotels, Restaurants & Leisure | 1,640,736 | 2.32% | ||||||
Household Products | 1,522,986 | 2.15% | ||||||
Industrial Conglomerates | 3,287,644 | 4.64% | ||||||
Internet Software & Services | 1,060,941 | 1.50% | ||||||
IT Services | 181,866 | 0.26% | ||||||
Machinery | 886,794 | 1.25% | ||||||
Marine | 202,891 | 0.29% | ||||||
Metals & Mining | 733,944 | 1.04% | ||||||
Multiline Retail | 344,096 | 0.49% | ||||||
Pharmaceuticals | 3,024,323 | 4.27% | ||||||
Real Estate Management & Development | 827,149 | 1.17% | ||||||
Semiconductors & Semiconductor Equipment | 2,641,092 | 3.73% | ||||||
Software | 2,282,212 | 3.22% | ||||||
Specialty Retail | 2,493,863 | 3.52% | ||||||
Textiles, Apparel & Luxury Goods | 5,546,093 | 7.83% | ||||||
Tobacco | 281,503 | 0.40% | ||||||
Wireless Telecommunication Services | 3,590,645 | 5.07% | ||||||
|
|
|
| |||||
Total Common Stocks | 61,479,037 | 86.82% | ||||||
Preferred Stocks | ||||||||
Beverages | 1,574,292 | 2.23% | ||||||
Oil, Gas & Consumable Fuels | 966,168 | 1.36% | ||||||
|
|
|
| |||||
Total Preferred Stocks | 2,540,460 | 3.59% | ||||||
Short Term Investments | ||||||||
Investment Company | 1,173,200 | 1.66% | ||||||
|
|
|
| |||||
Total Short Term Investments | 1,173,200 | 1.66% | ||||||
Total Investments | 65,192,697 | 92.07% | ||||||
Other Assets in Excess of Liabilities | 5,612,187 | 7.93% | ||||||
|
|
|
| |||||
TOTAL NET ASSETS | $ | 70,804,884 | 100.00% | |||||
|
|
|
| |||||
The Global Industry Classification Standard (GICS®) was developed by and/or is the exclusive property of MSCI, Inc. and Standard & Poor Financial Services LLC (“S&P”). GICS is a service mark of MSCI and S&P and has been licensed for use by U.S. Bancorp Fund Services, LLC.
The accompanying notes are an integral part of these financial statements.
46
Buffalo Large Cap Fund
SCHEDULE OF INVESTMENTS
March 31, 2012
| SHARES OR FACE AMOUNT | FAIR VALUE* | |||||||
| COMMON STOCKS — 97.07% |
| ||||||
| CONSUMER DISCRETIONARY — 15.42% |
| ||||||
Auto Components — 1.50% | ||||||||
| 17,500 | Johnson Controls, Inc. | $ | 568,400 | |||||
|
| |||||||
Automobiles — 3.43% | ||||||||
| 15,000 | TOYOTA MOTOR CORP. — ADR(b) | 1,302,300 | ||||||
|
| |||||||
Hotels, Restaurants & Leisure — 2.06% | ||||||||
| 20,700 | Marriott International, Inc. — Class A | 783,495 | ||||||
|
| |||||||
Media — 3.55% | ||||||||
| 30,900 | The Walt Disney Co. | 1,352,802 | ||||||
|
| |||||||
Specialty Retail — 1.65% | ||||||||
| 12,600 | Abercrombie & Fitch Co. — Class A | 625,086 | ||||||
|
| |||||||
Textiles, Apparel & Luxury Goods — 3.23% | ||||||||
| 8,700 | Deckers Outdoor Corp.(a) | 548,535 | ||||||
| 18,800 | Luxottica Group S.p.A. — ADR(b) | 678,116 | ||||||
|
| |||||||
| 1,226,651 | ||||||||
Total Consumer Discretionary (Cost $4,932,070) | 5,858,734 | |||||||
|
| |||||||
| CONSUMER STAPLES — 2.15% |
| ||||||
Food & Staples Retailing — 2.15% | ||||||||
| 9,000 | Costco Wholesale Corp. | 817,200 | ||||||
Total Consumer Staples (Cost $517,843) | 817,200 | |||||||
|
| |||||||
| ENERGY — 5.00% |
| ||||||
Energy Equipment & Services — 5.00% | ||||||||
| 22,800 | Baker Hughes, Inc. | 956,232 | ||||||
| 13,479 | Schlumberger Ltd.(b) | 942,586 | ||||||
Total Energy (Cost $1,793,874) | 1,898,818 | |||||||
|
| |||||||
| FINANCIALS — 15.09% |
| ||||||
Capital Markets — 5.59% | ||||||||
| 3,500 | The Goldman Sachs Group, Inc. | 435,295 | ||||||
| 20,300 | Northern Trust Corp. | 963,235 | ||||||
| 11,100 | T. Rowe Price Group Inc. | 724,830 | ||||||
|
| |||||||
| 2,123,360 | ||||||||
|
| |||||||
Diversified Financial Services — 9.50% | ||||||||
| 14,250 | American Express Co. | 824,505 | ||||||
| 9,100 | Franklin Resources, Inc. | 1,128,673 | ||||||
| 36,000 | JPMorgan Chase & Co. | 1,655,280 | ||||||
|
| |||||||
| 3,608,458 | ||||||||
Total Financials (Cost $4,058,775) | 5,731,818 | |||||||
|
| |||||||
| HEALTH CARE — 15.03% |
| ||||||
Biotechnology — 3.82% | ||||||||
| 29,700 | Gilead Sciences, Inc.(a) | 1,450,845 | ||||||
|
| |||||||
Health Care Providers & Services — 2.30% | ||||||||
| 42,700 | HEALTHSOUTH Corp.(a) | 874,496 | ||||||
|
| |||||||
Life Sciences Tools & Services — 2.85% | ||||||||
| 24,300 | Agilent Technologies, Inc.(a) | 1,081,593 | ||||||
|
| |||||||
47
Buffalo Large Cap Fund
SCHEDULE OF INVESTMENTS
March 31, 2012
(Continued)
| SHARES OR FACE AMOUNT | FAIR VALUE* | |||||||
| HEALTH CARE (Continued) |
| ||||||
Pharmaceuticals — 6.06% | ||||||||
| 40,200 | Forest Laboratories, Inc.(a) | $ | 1,394,538 | |||||
| 24,300 | Hospira, Inc.(a) | 908,577 | ||||||
|
| |||||||
| 2,303,115 | ||||||||
Total Health Care (Cost $4,943,051) | 5,710,049 | |||||||
|
| |||||||
| INDUSTRIALS — 7.80% |
| ||||||
Aerospace & Defense — 3.31% | ||||||||
| 16,900 | The Boeing Co. | 1,256,853 | ||||||
|
| |||||||
Air Freight & Logistics — 2.64% | ||||||||
| 10,900 | FedEx Corp. | 1,002,364 | ||||||
|
| |||||||
Construction & Engineering — 1.85% | ||||||||
| 11,700 | Fluor Corp. | 702,468 | ||||||
Total Industrials (Cost $1,820,711) | 2,961,685 | |||||||
|
| |||||||
| INFORMATION TECHNOLOGY — 32.97% |
| ||||||
Communications Equipment — 9.14% | ||||||||
| 59,500 | Juniper Networks, Inc.(a) | 1,361,360 | ||||||
| 14,200 | Motorola Solutions, Inc. | 721,786 | ||||||
| 20,400 | QUALCOMM Inc. | 1,387,608 | ||||||
|
| |||||||
| 3,470,754 | ||||||||
|
| |||||||
Computers & Peripherals — 3.50% | ||||||||
| 29,700 | NetApp, Inc.(a) | 1,329,669 | ||||||
|
| |||||||
Internet Software & Services — 5.87% | ||||||||
| 32,200 | eBay Inc.(a) | 1,187,858 | ||||||
| 1,625 | Google Inc. — Class A(a) | 1,042,015 | ||||||
|
| |||||||
| 2,229,873 | ||||||||
|
| |||||||
IT Services — 1.27% | ||||||||
| 4,100 | Visa Inc. | 483,800 | ||||||
|
| |||||||
Semiconductors & Semiconductor Equipment — 7.56% | ||||||||
| 22,700 | Altera Corp. | 903,914 | ||||||
| 46,600 | Applied Materials, Inc. | 579,704 | ||||||
| 35,300 | Broadcom Corp. — Class A | 1,387,290 | ||||||
|
| |||||||
| 2,870,908 | ||||||||
|
| |||||||
Software — 5.63% | ||||||||
| 70,700 | Electronic Arts Inc.(a) | 1,165,136 | ||||||
| 33,400 | Oracle Corp. | 973,944 | ||||||
|
| |||||||
| 2,139,080 | ||||||||
Total Information Technology (Cost $10,141,938) | 12,524,084 | |||||||
|
| |||||||
| MATERIALS — 3.61% |
| ||||||
Chemicals — 3.61% | ||||||||
| 17,200 | Monsanto Co. | 1,371,872 | ||||||
Total Materials (Cost $1,064,843) | 1,371,872 | |||||||
|
| |||||||
| TOTAL COMMON STOCKS | 36,874,260 | ||||||
| (COST $29,273,105) | |||||||
48
| SHARES OR FACE AMOUNT | FAIR VALUE* | |||||||
| SHORT TERM INVESTMENTS — 2.88% |
| ||||||
| INVESTMENT COMPANY — 2.88% |
| ||||||
| 1,095,810 | Fidelity Institutional Government Portfolio — 0.01%(c) | $ | 1,095,810 | |||||
Total Investment Company | 1,095,810 | |||||||
|
| |||||||
| TOTAL SHORT TERM INVESTMENTS | 1,095,810 | ||||||
| (COST $1,095,810) | |||||||
| TOTAL INVESTMENTS — 99.95% | 37,970,070 | ||||||
| (COST $30,368,915) | |||||||
| Other Assets in Excess of Liabilities — 0.05% | 19,832 | ||||||
|
| |||||||
| TOTAL NET ASSETS — 100.00% | $ | 37,989,902 | |||||
|
| |||||||
ADR — American Depositary Receipt
| (a) | Non Income Producing |
| (b) | Foreign Issued Security. The total value of these securities amounted to $2,923,002 (7.69% of net assets) at March 31, 2012. |
| (c) | 7-day yield. |
| * | See Note 1A of accompanying Notes to Financial Statements regarding valuation of securities. |
The Global Industry Classification Standard (GICS®) was developed by and/or is the exclusive property of MSCI, Inc. and Standard & Poor Financial Services LLC (“S&P”). GICS is a service mark of MSCI and S&P and has been licensed for use by U.S. Bancorp Fund Services, LLC.
The accompanying notes are an integral part of these financial statements.
49
Buffalo Micro Cap Fund
SCHEDULE OF INVESTMENTS
March 31, 2012
| SHARES OR FACE AMOUNT | FAIR VALUE* | |||||||
| COMMON STOCKS — 93.51% |
| ||||||
| CONSUMER DISCRETIONARY — 7.34% |
| ||||||
Diversified Consumer Services — 2.02% | ||||||||
| 75,500 | National American University Holdings, Inc. | $ | 475,650 | |||||
| 7,200 | Steiner Leisure Ltd.(a)(b) | 351,576 | ||||||
|
| |||||||
| 827,226 | ||||||||
|
| |||||||
Hotels, Restaurants & Leisure — 2.52% | ||||||||
| 58,700 | Shuffle Master, Inc.(a) | 1,033,120 | ||||||
|
| |||||||
Textiles, Apparel & Luxury Goods — 2.80% | ||||||||
| 22,600 | Oxford Industries, Inc. | 1,148,532 | ||||||
Total Consumer Discretionary (Cost $1,761,524) | 3,008,878 | |||||||
|
| |||||||
| CONSUMER STAPLES — 1.38% |
| ||||||
Food Products — 1.38% | ||||||||
| 85,600 | Smart Balance, Inc.(a) | 565,816 | ||||||
Total Consumer Staples (Cost $481,820) | 565,816 | |||||||
|
| |||||||
| FINANCIALS — 9.67% |
| ||||||
Capital Markets — 2.43% | ||||||||
| 12,800 | Cohen & Steers, Inc. | 408,320 | ||||||
| 88,800 | Edelman Financial Group Inc. | 586,968 | ||||||
|
| |||||||
| 995,288 | ||||||||
|
| |||||||
Diversified Financial Services — 7.24% | ||||||||
| 60,000 | FX Alliance Inc.(a) | 940,800 | ||||||
| 54,400 | MarketAxess Holdings, Inc. | 2,028,576 | ||||||
|
| |||||||
| 2,969,376 | ||||||||
Total Financials (Cost $2,378,144) | 3,964,664 | |||||||
|
| |||||||
| HEALTH CARE — 17.43% |
| ||||||
Health Care Equipment & Supplies — 8.38% | ||||||||
| 50,200 | Align Technology, Inc.(a) | 1,383,009 | ||||||
| 16,400 | ICU Medical, Inc.(a) | 806,224 | ||||||
| 41,925 | Meridian Bioscience, Inc. | 812,507 | ||||||
| 11,050 | Neogen Corp.(a) | 431,724 | ||||||
|
| |||||||
| 3,433,464 | ||||||||
|
| |||||||
Health Care Providers & Services — 3.48% | ||||||||
| 11,000 | Landauer, Inc. | 583,220 | ||||||
| 19,600 | National Research Corp. | 841,624 | ||||||
|
| |||||||
| 1,424,844 | ||||||||
|
| |||||||
Health Care Technology — 5.57% | ||||||||
| 10,200 | Computer Programs and Systems, Inc. | 576,504 | ||||||
| 29,700 | Medidata Solutions, Inc.(a) | 791,208 | ||||||
| 54,100 | Omnicell, Inc.(a) | 822,861 | ||||||
| 4,000 | Vocera Communications Inc.(a) | 93,600 | ||||||
|
| |||||||
| 2,284,173 | ||||||||
Total Health Care (Cost $4,346,242) | 7,142,481 | |||||||
|
| |||||||
| INDUSTRIALS — 12.85% |
| ||||||
Building Products — 1.40% | ||||||||
| 42,400 | Ameresco, Inc. — Class A(a) | 574,520 | ||||||
|
| |||||||
50
| SHARES OR FACE AMOUNT | FAIR VALUE* | |||||||
| INDUSTRIALS (Continued) |
| ||||||
Construction & Engineering — 2.00% | ||||||||
| 45,900 | MYR Group Inc.(a) | $ | 819,774 | |||||
|
| |||||||
Electrical Equipment — 2.99% | ||||||||
| 60,000 | Thermon Group Holdings Inc.(a) | 1,227,000 | ||||||
|
| |||||||
Machinery — 4.81% | ||||||||
| 22,200 | Chart Industries, Inc.(a) | 1,627,926 | ||||||
| 10,000 | Proto Labs, Inc.(a) | 340,900 | ||||||
|
| |||||||
| 1,968,826 | ||||||||
|
| |||||||
Professional Services — 1.65% | ||||||||
| 13,900 | Exponent, Inc.(a) | 674,428 | ||||||
Total Industrials (Cost $2,986,934) | 5,264,548 | |||||||
|
| |||||||
| INFORMATION TECHNOLOGY — 43.09% |
| ||||||
Communications Equipment — 1.41% | ||||||||
| 81,600 | EXFO, Inc.(a)(b) | 576,096 | ||||||
|
| |||||||
Computers & Peripherals — 3.09% | ||||||||
| 27,492 | Rimage Corp. | 275,195 | ||||||
| 27,100 | Stratasys, Inc.(a) | 989,692 | ||||||
|
| |||||||
| 1,264,887 | ||||||||
|
| |||||||
Electronic Equipment, Instruments & Components — 2.78% | ||||||||
| 20,000 | DTS, Inc.(a) | 604,400 | ||||||
| 35,500 | Electro Scientific Industries, Inc. | 532,855 | ||||||
|
| |||||||
| 1,137,255 | ||||||||
|
| |||||||
Internet Software & Services — 16.39% | ||||||||
| 40,000 | comScore Inc.(a) | 855,600 | ||||||
| 55,500 | Cornerstone OnDemand, Inc.(a) | 1,212,120 | ||||||
| 35,000 | Envestnet, Inc.(a) | 438,200 | ||||||
| 158,500 | Internap Network Services Corp.(a) | 1,163,390 | ||||||
| 24,300 | Keynote Systems, Inc. | 480,168 | ||||||
| 50,800 | SciQuest, Inc.(a) | 774,192 | ||||||
| 36,000 | SPS Commerce Inc.(a) | 967,680 | ||||||
| 40,900 | XO Group, Inc.(a) | 384,051 | ||||||
| 153,000 | Zix Corp.(a) | 445,230 | ||||||
|
| |||||||
| 6,720,631 | ||||||||
|
| |||||||
Semiconductors & Semiconductor Equipment — 3.20% | ||||||||
| 8,500 | NVE Corp.(a) | 450,500 | ||||||
| 102,350 | PDF Solutions, Inc.(a) | 862,811 | ||||||
|
| |||||||
| 1,313,311 | ||||||||
|
| |||||||
Software — 16.22% | ||||||||
| 16,500 | ACI Worldwide, Inc.(a) | 664,455 | ||||||
| 15,000 | Bottomline Techologies, Inc.(a) | 419,100 | ||||||
| 84,178 | Deltek, Inc.(a) | 897,337 | ||||||
| 25,000 | EPIQ Systems, Inc. | 302,500 | ||||||
| 48,000 | Guidewire Software Inc.(a) | 1,477,440 | ||||||
| 10,000 | Imperva Inc.(a) | 391,500 | ||||||
| 56,800 | PROS Holdings, Inc.(a) | 1,062,160 | ||||||
| 35,500 | Tangoe, Inc.(a) | 667,755 | ||||||
| 56,500 | Velti PLC(a)(b) | 765,575 | ||||||
|
| |||||||
| 6,647,822 | ||||||||
Total Information Technology (Cost $13,231,219) | 17,660,002 | |||||||
|
| |||||||
51
Buffalo Micro Cap Fund
SCHEDULE OF INVESTMENTS
March 31, 2012
(Continued)
| SHARES OR FACE AMOUNT | FAIR VALUE* | |||||||
| MATERIALS — 1.75% |
| ||||||
Chemicals — 0.43% | ||||||||
| 36,600 | STR Holdings Inc.(a) | $ | 177,144 | |||||
|
| |||||||
Metals & Mining — 1.32% | ||||||||
| 47,300 | Horsehead Holding Corp.(a) | 538,747 | ||||||
Total Materials (Cost $858,699) | 715,891 | |||||||
|
| |||||||
| TOTAL COMMON STOCKS | 38,322,280 | ||||||
| (COST $26,044,582) | |||||||
| SHORT TERM INVESTMENTS — 5.99% |
| ||||||
| INVESTMENT COMPANY — 5.99% |
| ||||||
| 2,454,840 | Fidelity Institutional Government Portfolio — 0.01%(c) | 2,454,840 | ||||||
Total Investment Company | 2,454,840 | |||||||
|
| |||||||
| TOTAL SHORT TERM INVESTMENTS | 2,454,840 | ||||||
| (COST $2,454,840) | |||||||
| TOTAL INVESTMENTS — 99.50% | 40,777,120 | ||||||
| (COST $28,499,422) | |||||||
| Other Assets in Excess of Liabilities — 0.50% | 204,044 | ||||||
|
| |||||||
| TOTAL NET ASSETS — 100.00% | $ | 40,981,164 | |||||
|
| |||||||
PLC — Public Limited Company
| (a) | Non Income Producing |
| (b) | Foreign Issued Security. The total value of these securities amounted to $1,693,247 (4.13% of net assets) at March 31, 2012. |
| (c) | 7-day yield. |
| * | See Note 1A of accompanying Notes to Financial Statements regarding valuation of securities. |
The Global Industry Classification Standard (GICS®) was developed by and/or is the exclusive property of MSCI, Inc. and Standard & Poor Financial Services LLC (“S&P”). GICS is a service mark of MSCI and S&P and has been licensed for use by U.S. Bancorp Fund Services, LLC.
The accompanying notes are an integral part of these financial statements.
52
Buffalo Mid Cap Fund
SCHEDULE OF INVESTMENTS
March 31, 2012
SHARES OR FACE AMOUNT | FAIR VALUE* | |||||||
| COMMON STOCKS — 96.55% |
| ||||||
| CONSUMER DISCRETIONARY — 29.00% |
| ||||||
Auto Components — 4.87% | ||||||||
| 296,200 | Autoliv, Inc. | $ | 19,860,210 | |||||
| 650,700 | Gentex Corp. | 15,942,150 | ||||||
|
| |||||||
| 35,802,360 | ||||||||
|
| |||||||
Distributors — 0.87% | ||||||||
| 206,100 | LKQ Corp.(a) | 6,424,137 | ||||||
|
| |||||||
Diversified Consumer Services — 2.14% | ||||||||
| 464,250 | DeVry, Inc. | 15,724,148 | ||||||
|
| |||||||
Hotels, Restaurants & Leisure — 5.80% | ||||||||
| 18,300 | Chipotle Mexican Grill, Inc.(a) | 7,649,400 | ||||||
| 1,032,850 | International Game Technology | 17,341,552 | ||||||
| 347,675 | Life Time Fitness, Inc.(a) | 17,581,924 | ||||||
|
| |||||||
| 42,572,876 | ||||||||
|
| |||||||
Household Durables — 3.22% | ||||||||
| 505,650 | Harman International Industries, Inc. | 23,669,477 | ||||||
|
| |||||||
Specialty Retail — 6.96% | ||||||||
| 415,700 | Abercrombie & Fitch Co. — Class A | 20,622,876 | ||||||
| 219,725 | PETsMART, Inc. | 12,572,665 | ||||||
| 614,500 | Urban Outfitters, Inc.(a) | 17,888,095 | ||||||
|
| |||||||
| 51,083,636 | ||||||||
|
| |||||||
Textiles, Apparel & Luxury Goods — 5.14% | ||||||||
| 136,125 | Deckers Outdoor Corp.(a) | 8,582,681 | ||||||
| 49,875 | Ralph Lauren Corp. | 8,694,709 | ||||||
| 218,000 | Under Armour, Inc. — Class A(a) | 20,492,000 | ||||||
|
| |||||||
| 37,769,390 | ||||||||
Total Consumer Discretionary (Cost $165,709,339) | 213,046,024 | |||||||
|
| |||||||
| CONSUMER STAPLES — 1.67% |
| ||||||
Food & Staples Retailing — 1.67% | ||||||||
| 147,725 | Whole Foods Market, Inc. | 12,290,720 | ||||||
Total Consumer Staples (Cost $5,111,461) | 12,290,720 | |||||||
|
| |||||||
| FINANCIALS — 16.41% |
| ||||||
Capital Markets — 6.45% | ||||||||
| 139,000 | Affiliated Managers Group, Inc.(a) | 15,541,590 | ||||||
| 442,900 | Eaton Vance Corp. | 12,658,082 | ||||||
| 403,800 | Northern Trust Corp. | 19,160,310 | ||||||
|
| |||||||
| 47,359,982 | ||||||||
|
| |||||||
Diversified Financial Services — 9.96% | ||||||||
| 309,500 | Global Payments Inc. | 14,691,965 | ||||||
| 478,300 | Moody’s Corp. | 20,136,430 | ||||||
| 360,800 | Morningstar, Inc. | 22,748,440 | ||||||
| 424,100 | MSCI, Inc.(a) | 15,611,121 | ||||||
|
| |||||||
| 73,187,956 | ||||||||
Total Financials (Cost $99,489,883) | 120,547,938 | |||||||
|
| |||||||
| HEALTH CARE — 11.25% |
| ||||||
Biotechnology — 2.36% | ||||||||
| 694,600 | Amylin Pharmaceuticals, Inc.(a) | 17,337,216 | ||||||
|
| |||||||
53
Buffalo Mid Cap Fund
SCHEDULE OF INVESTMENTS
March 31, 2012
(Continued)
SHARES OR FACE AMOUNT | FAIR VALUE* | |||||||
| HEALTH CARE (Continued) |
| ||||||
Health Care Equipment & Supplies — 1.80% | ||||||||
| 329,400 | DENTSPLY International, Inc. | $ | 13,218,822 | |||||
|
| |||||||
Life Sciences Tools & Services — 3.57% | ||||||||
| 204,925 | Charles River Laboratories International, Inc.(a) | 7,395,743 | ||||||
| 357,775 | Illumina, Inc.(a) | 18,822,543 | ||||||
|
| |||||||
| 26,218,286 | ||||||||
|
| |||||||
Pharmaceuticals — 3.52% | ||||||||
| 470,650 | Forest Laboratories, Inc.(a) | 16,326,848 | ||||||
| 255,650 | Hospira, Inc.(a) | 9,558,754 | ||||||
|
| |||||||
| 25,885,602 | ||||||||
Total Health Care (Cost $65,214,396) | 82,659,926 | |||||||
|
| |||||||
| INDUSTRIALS — 6.32% |
| ||||||
Air Freight & Logistics — 0.98% | ||||||||
| 419,100 | UTI Worldwide, Inc.(b) | 7,221,093 | ||||||
|
| |||||||
Commercial Services & Supplies — 1.61% | ||||||||
| 726,600 | Covanta Holding Corp. | 11,792,718 | ||||||
|
| |||||||
Construction & Engineering — 2.27% | ||||||||
| 795,700 | Quanta Services, Inc.(a) | 16,630,130 | ||||||
|
| |||||||
Professional Services — 1.46% | ||||||||
| 228,900 | Verisk Analytics, Inc — Class A(a) | 10,751,433 | ||||||
Total Industrials (Cost $43,733,278) | 46,395,374 | |||||||
|
| |||||||
| INFORMATION TECHNOLOGY — 29.46% |
| ||||||
Communications Equipment — 2.68% | ||||||||
| 860,000 | Juniper Networks, Inc.(a) | 19,676,800 | ||||||
|
| |||||||
Electronic Equipment, Instruments & Components — 3.33% | ||||||||
| 641,825 | Dolby Laboratories, Inc. — Class A(a) | 24,427,860 | ||||||
|
| |||||||
Internet Software & Services — 5.92% | ||||||||
| 451,900 | Akamai Technologies, Inc.(a) | 16,584,730 | ||||||
| 170,850 | Equinix, Inc.(a) | 26,900,333 | ||||||
|
| |||||||
| 43,485,063 | ||||||||
|
| |||||||
IT Services — 6.50% | ||||||||
| 129,500 | Fiserv, Inc.(a) | 8,986,005 | ||||||
| 634,000 | NeuStar, Inc.(a) | 23,616,499 | ||||||
| 291,950 | VeriFone Systems, Inc.(a) | 15,143,447 | ||||||
|
| |||||||
| 47,745,951 | ||||||||
|
| |||||||
Semiconductors & Semiconductor Equipment — 2.92% | ||||||||
| 394,225 | KLA-Tencor Corp. | 21,453,725 | ||||||
|
| |||||||
Software — 8.11% | ||||||||
| 131,600 | ANSYS, Inc.(a) | 8,556,632 | ||||||
| 1,247,100 | Electronic Arts Inc.(a) | 20,552,207 | ||||||
| 308,150 | Fortinet Inc.(a) | 8,520,348 | ||||||
| 210,400 | Red Hat, Inc.(a) | 12,600,856 | ||||||
| 204,400 | Solera Holdings Inc. | 9,379,916 | ||||||
|
| |||||||
| 59,609,959 | ||||||||
Total Information Technology (Cost $157,890,778) | 216,399,358 | |||||||
|
| |||||||
54
SHARES OR FACE AMOUNT | FAIR VALUE* | |||||||
| MATERIALS — 2.44% |
| ||||||
Chemicals — 2.44% | ||||||||
| 169,200 | FMC Corp. | $ | 17,911,512 | |||||
Total Materials (Cost $9,605,756) | 17,911,512 | |||||||
|
| |||||||
| TOTAL COMMON STOCKS | 709,250,852 | ||||||
| (COST $546,754,891) | |||||||
| SHORT TERM INVESTMENTS — 3.84% |
| ||||||
| INVESTMENT COMPANY — 3.84% | |||||||
| 28,188,159 | Fidelity Institutional Government Portfolio — 0.01%(c) | 28,188,159 | ||||||
Total Investment Company | 28,188,159 | |||||||
|
| |||||||
| TOTAL SHORT TERM INVESTMENTS | 28,188,159 | ||||||
| (COST $28,188,159) | |||||||
| TOTAL INVESTMENTS — 100.39% | 737,439,011 | ||||||
| (COST $574,943,050) | |||||||
| Liabilities in Excess of Other Assets — (0.39)% | (2,872,312 | ) | |||||
|
| |||||||
| TOTAL NET ASSETS — 100.00% | $ | 734,566,699 | |||||
|
| |||||||
| (a) | Non Income Producing |
| (b) | Foreign Issued Security. The total value of these securities amounted to $7,221,093 (0.98% of net assets) at March 31, 2012. |
| (c) | 7-day yield. |
| * | See Note 1A of accompanying Notes to Financial Statements regarding valuation of securities. |
The Global Industry Classification Standard (GICS®) was developed by and/or is the exclusive property of MSCI, Inc. and Standard & Poor Financial Services LLC (“S&P”). GICS is a service mark of MSCI and S&P and has been licensed for use by U.S. Bancorp Fund Services, LLC.
The accompanying notes are an integral part of these financial statements.
55
Buffalo Science & Technology Fund
SCHEDULE OF INVESTMENTS
March 31, 2012
| SHARES OR FACE AMOUNT | FAIR VALUE* | |||||||
| COMMON STOCKS — 95.85% |
| ||||||
| ENERGY — 3.38% |
| ||||||
Energy Equipment & Services — 3.38% | ||||||||
| 162,800 | Baker Hughes, Inc. | $ | 6,827,832 | |||||
| 103,825 | Schlumberger Ltd.(b) | 7,260,482 | ||||||
Total Energy (Cost $13,260,301) | 14,088,314 | |||||||
|
| |||||||
| HEALTH CARE — 29.66% |
| ||||||
Biotechnology — 6.67% | ||||||||
| 680,600 | Amylin Pharmaceuticals, Inc.(a) | 16,987,776 | ||||||
| 221,700 | Gilead Sciences, Inc.(a) | 10,830,045 | ||||||
|
| |||||||
| 27,817,821 | ||||||||
|
| |||||||
Health Care Equipment & Supplies — 5.76% | ||||||||
| 533,000 | Align Technology, Inc.(a) | 14,684,149 | ||||||
| 111,400 | Baxter International Inc. | 6,659,492 | ||||||
| 131,200 | NuVasive, Inc.(a) | 2,209,408 | ||||||
| 37,800 | OraSure Technologies, Inc.(a) | 434,322 | ||||||
|
| |||||||
| 23,987,371 | ||||||||
|
| |||||||
Health Care Providers & Services — 1.57% | ||||||||
| 319,700 | HealthSouth Corp.(a) | 6,547,456 | ||||||
|
| |||||||
Health Care Technology — 1.94% | ||||||||
| 54,950 | athenahealth Inc.(a) | 4,072,894 | ||||||
| 56,900 | Computer Programs and Systems, Inc. | 3,215,988 | ||||||
| 33,400 | Vocera Communications Inc.(a) | 781,560 | ||||||
|
| |||||||
| 8,070,442 | ||||||||
|
| |||||||
Life Sciences Tools & Services — 5.71% | ||||||||
| 152,800 | Agilent Technologies, Inc.(a) | 6,801,128 | ||||||
| 205,100 | Charles River Laboratories International, Inc.(a) | 7,402,059 | ||||||
| 114,400 | Illumina, Inc.(a) | 6,018,584 | ||||||
| 51,200 | Techne Corp. | 3,589,120 | ||||||
|
| |||||||
| 23,810,891 | ||||||||
|
| |||||||
Pharmaceuticals — 8.01% | ||||||||
| 79,100 | Allergan, Inc. | 7,548,513 | ||||||
| 317,400 | Forest Laboratories, Inc.(a) | 11,010,606 | ||||||
| 213,900 | Hospira, Inc.(a) | 7,997,721 | ||||||
| 405,000 | Warner Chilcott PLC — Class A(a)(b) | 6,808,050 | ||||||
|
| |||||||
| 33,364,890 | ||||||||
Total Health Care (Cost $95,839,487) | 123,598,871 | |||||||
|
| |||||||
| INDUSTRIALS — 6.65% |
| ||||||
Aerospace & Defense — 1.33% | ||||||||
| 169,700 | Ceradyne, Inc.(a) | 5,525,432 | ||||||
|
| |||||||
Construction & Engineering — 1.89% | ||||||||
| 376,000 | Quanta Services, Inc.(a) | 7,858,400 | ||||||
|
| |||||||
Electrical Equipment — 1.92% | ||||||||
| 80,900 | Roper Industries, Inc. | 8,022,044 | ||||||
|
| |||||||
Machinery — 1.51% | ||||||||
| 86,100 | Chart Industries, Inc.(a) | 6,313,713 | ||||||
Total Industrials (Cost $20,247,059) | 27,719,589 | |||||||
|
| |||||||
56
| SHARES OR FACE AMOUNT | FAIR VALUE* | |||||||
| INFORMATION TECHNOLOGY — 52.07% |
| ||||||
Communications Equipment — 12.77% | ||||||||
| 293,000 | ADTRAN, Inc. | $ | 9,138,670 | |||||
| 567,000 | Cisco Systems, Inc. | 11,992,051 | ||||||
| 21,100 | F5 Networks, Inc.(a) | 2,847,656 | ||||||
| 483,400 | Juniper Networks, Inc.(a) | 11,060,192 | ||||||
| 113,000 | Motorola Solutions, Inc. | 5,743,790 | ||||||
| 153,900 | QUALCOMM Inc. | 10,468,278 | ||||||
| 69,900 | Riverbed Technology, Inc.(a) | 1,962,792 | ||||||
|
| |||||||
| 53,213,429 | ||||||||
|
| |||||||
Computers & Peripherals — 8.85% | ||||||||
| 27,200 | Apple Inc.(a) | 16,305,584 | ||||||
| 331,000 | EMC Corp.(a) | 9,890,280 | ||||||
| 238,900 | NetApp, Inc.(a) | 10,695,553 | ||||||
|
| |||||||
| 36,891,417 | ||||||||
|
| |||||||
Electronic Equipment, Instruments & Components — 1.37% | ||||||||
| 117,800 | Dolby Laboratories, Inc. — Class A(a) | 4,483,468 | ||||||
| 20,200 | OSI Systems, Inc.(a) | 1,238,260 | ||||||
|
| |||||||
| 5,721,728 | ||||||||
|
| |||||||
Internet Software & Services — 9.32% | ||||||||
| 186,600 | Akamai Technologies, Inc.(a) | 6,848,220 | ||||||
| 285,400 | Ancestry.com, Inc.(a) | 6,489,996 | ||||||
| 237,600 | eBay Inc.(a) | 8,765,064 | ||||||
| 49,100 | Equinix, Inc.(a) | 7,730,795 | ||||||
| 13,700 | Google Inc. — Class A(a) | 8,784,988 | ||||||
| 8,700 | Millennial Media Inc.(a) | 204,450 | ||||||
|
| |||||||
| 38,823,513 | ||||||||
|
| |||||||
IT Services — 3.35% | ||||||||
| 43,800 | International Business Machines Corp. (IBM) | 9,138,870 | ||||||
| 129,766 | NeuStar, Inc.(a) | 4,833,784 | ||||||
|
| |||||||
| 13,972,654 | ||||||||
|
| |||||||
Semiconductors & Semiconductor Equipment — 5.15% | ||||||||
| 481,800 | Applied Materials, Inc. | 5,993,592 | ||||||
| 255,400 | Broadcom Corp. — Class A | 10,037,220 | ||||||
| 190,400 | Semtech Corp.(a) | 5,418,784 | ||||||
|
| |||||||
| 21,449,596 | ||||||||
|
| |||||||
Software — 11.26% | ||||||||
| 111,600 | ACI Worldwide, Inc.(a) | 4,494,132 | ||||||
| 74,700 | ANSYS, Inc.(a) | 4,856,994 | ||||||
| 139,300 | Bottomline Techologies, Inc.(a) | 3,892,042 | ||||||
| 65,300 | Citrix Systems, Inc.(a) | 5,152,823 | ||||||
| 432,900 | Electronic Arts Inc.(a) | 7,134,192 | ||||||
| 242,400 | Fortinet Inc.(a) | 6,702,360 | ||||||
| 324,900 | Oracle Corp. | 9,474,084 | ||||||
| 160,800 | Rovi Corp.(a) | 5,234,040 | ||||||
|
| |||||||
| 46,940,667 | ||||||||
Total Information Technology (Cost $172,811,271) | 217,013,004 | |||||||
|
| |||||||
57
Buffalo Science & Technology Fund
SCHEDULE OF INVESTMENTS
March 31, 2012
(Continued)
| SHARES OR FACE AMOUNT | FAIR VALUE* | |||||||
| MATERIALS — 4.09% | |||||||
Chemicals — 4.09% | ||||||||
| 60,200 | FMC Corp. | $ | 6,372,772 | |||||
| 133,900 | Monsanto Co. | 10,679,864 | ||||||
Total Materials (Cost $12,516,411) | 17,052,636 | |||||||
|
| |||||||
| TOTAL COMMON STOCKS | 399,472,414 | ||||||
| (COST $314,674,529) | |||||||
| SHORT TERM INVESTMENTS — 4.59% | |||||||
| INVESTMENT COMPANY — 4.59% |
| ||||||
| 19,135,718 | Fidelity Institutional Government Portfolio — 0.01%(c) | 19,135,718 | ||||||
Total Investment Company | 19,135,718 | |||||||
|
| |||||||
| TOTAL SHORT TERM INVESTMENTS | 19,135,718 | ||||||
| (COST $19,135,718) | |||||||
| TOTAL INVESTMENTS — 100.44% | 418,608,132 | ||||||
| (COST $333,810,247) | |||||||
| Liabilities in Excess of Other Assets — (0.44)% | (1,835,785 | ) | |||||
|
| |||||||
| TOTAL NET ASSETS — 100.00% | $ | 416,772,347 | |||||
|
| |||||||
PLC — Public Limited Company
| (a) | Non Income Producing |
| (b) | Foreign Issued Security. The total value of these securities amounted to $14,068,532 (3.38% of net assets) at March 31, 2012. |
| (c) | 7-day yield. |
| * | See Note 1A of accompanying Notes to Financial Statements regarding valuation of securities. |
The Global Industry Classification Standard (GICS®) was developed by and/or is the exclusive property of MSCI, Inc. and Standard & Poor Financial Services LLC (“S&P”). GICS is a service mark of MSCI and S&P and has been licensed for use by U.S. Bancorp Fund Services, LLC.
The accompanying notes are an integral part of these financial statements.
58
Buffalo Small Cap Fund
SCHEDULE OF INVESTMENTS
March 31, 2012
| SHARES OR FACE AMOUNT | FAIR VALUE* | |||||||
| COMMON STOCKS — 97.40% |
| ||||||
| CONSUMER DISCRETIONARY — 20.46% |
| ||||||
Auto Components — 1.76% | ||||||||
| 1,992,764 | Gentex Corp. | $ | 48,822,718 | |||||
|
| |||||||
Diversified Consumer Services — 1.99% | ||||||||
| 676,200 | Capella Education Co.(a) | 24,309,390 | ||||||
| 905,983 | DeVry, Inc. | 30,685,644 | ||||||
|
| |||||||
| 54,995,034 | ||||||||
|
| |||||||
Hotels, Restaurants & Leisure — 11.28% | ||||||||
| 78,525 | Ameristar Casinos, Inc. | 1,462,921 | ||||||
| 2,014,200 | Life Time Fitness, Inc.(a) | 101,858,094 | ||||||
| 1,918,000 | P.F. Chang’s China Bistro, Inc.(d) | 75,799,360 | ||||||
| 339,175 | Panera Bread Co.(a) | 54,580,041 | ||||||
| 3,304,525 | WMS Industries, Inc.(a)(d) | 78,416,378 | ||||||
|
| |||||||
| 312,116,794 | ||||||||
|
| |||||||
Household Durables — 2.50% | ||||||||
| 1,480,800 | Harman International Industries, Inc. | 69,316,248 | ||||||
|
| |||||||
Internet & Catalog Retail — 0.43% | ||||||||
| 362,200 | Blue Nile, Inc.(a) | 11,945,356 | ||||||
|
| |||||||
Textiles, Apparel & Luxury Goods — 2.50% | ||||||||
| 955,825 | Oxford Industries, Inc.(d) | 48,575,027 | ||||||
| 220,200 | Under Armour, Inc. — Class A(a) | 20,698,800 | ||||||
|
| |||||||
| 69,273,827 | ||||||||
Total Consumer Discretionary (Cost $351,514,798) | 566,469,977 | |||||||
|
| |||||||
| CONSUMER STAPLES — 1.88% | |||||||
Food & Staples Retailing — 1.88% | ||||||||
| 1,083,700 | The Fresh Market, Inc.(a) | 51,963,415 | ||||||
Total Consumer Staples (Cost $44,587,752) | 51,963,415 | |||||||
|
| |||||||
| ENERGY — 1.06% | |||||||
Energy Equipment & Services — 1.06% | ||||||||
| 363,900 | Lufkin Industries, Inc. | 29,348,535 | ||||||
Total Energy (Cost $26,922,470) | 29,348,535 | |||||||
|
| |||||||
| FINANCIALS — 11.55% | |||||||
Capital Markets — 5.36% | ||||||||
| 1,383,800 | Financial Engines Inc.(a) | 30,941,768 | ||||||
| 878,100 | Stifel Financial Corp.(a) | 33,227,304 | ||||||
| 2,594,650 | Waddell & Reed Financial, Inc. — Class A | 84,092,606 | ||||||
|
| |||||||
| 148,261,678 | ||||||||
|
| |||||||
Diversified Financial Services — 4.73% | ||||||||
| 779,350 | FX Alliance Inc.(a)(c) | 12,220,208 | ||||||
| 1,736,706 | MarketAxess Holdings, Inc. | 64,761,767 | ||||||
| 854,900 | Morningstar, Inc.(c) | 53,901,445 | ||||||
|
| |||||||
| 130,883,420 | ||||||||
|
| |||||||
Real Estate Management & Development — 1.46% | ||||||||
| 1,323,100 | FirstService Corp.(a)(b)(c) | 40,539,784 | ||||||
Total Financials (Cost $165,698,256) | 319,684,882 | |||||||
|
| |||||||
59
Buffalo Small Cap Fund
SCHEDULE OF INVESTMENTS
March 31, 2012
(Continued)
| SHARES OR FACE AMOUNT | FAIR VALUE* | |||||||
| HEALTH CARE — 17.51% | |||||||
Biotechnology — 3.47% | ||||||||
| 3,849,800 | Amylin Pharmaceuticals, Inc.(a) | $ | 96,091,008 | |||||
|
| |||||||
Health Care Equipment & Services — 1.09% | ||||||||
| 1,186,800 | PSS World Medical, Inc.(a) | 30,073,512 | ||||||
|
| |||||||
Health Care Equipment & Supplies — 6.07% | ||||||||
| 4,294,425 | Align Technology, Inc.(a)(d) | 118,311,409 | ||||||
| 715,400 | Haemonetics Corp.(a) | 49,849,072 | ||||||
|
| |||||||
| 168,160,481 | ||||||||
|
| |||||||
Health Care Technology — 3.22% | ||||||||
| 1,202,700 | athenahealth Inc.(a) | 89,144,124 | ||||||
|
| |||||||
Life Sciences Tools & Services — 3.66% | ||||||||
| 2,040,900 | ICON PLC — ADR(a)(b)(c) | 43,307,898 | ||||||
| 827,400 | Techne Corp. | 58,000,740 | ||||||
|
| |||||||
| 101,308,638 | ||||||||
Total Health Care (Cost $288,430,554) | 484,777,763 | |||||||
|
| |||||||
| INDUSTRIALS — 13.61% | |||||||
Aerospace & Defense — 3.83% | ||||||||
| 682,300 | Ceradyne, Inc.(a) | 22,215,688 | ||||||
| 3,496,500 | Hexcel Corp.(a) | 83,950,965 | ||||||
|
| |||||||
| 106,166,653 | ||||||||
|
| |||||||
Electrical Equipment — 0.90% | ||||||||
| 705,050 | Polypore International, Inc.(a) | 24,789,558 | ||||||
|
| |||||||
Machinery — 3.01% | ||||||||
| 326,150 | Chart Industries, Inc.(a) | 23,916,580 | ||||||
| 505,319 | Valmont Industries, Inc. | 59,329,503 | ||||||
|
| |||||||
| 83,246,083 | ||||||||
|
| |||||||
Professional Services — 5.87% | ||||||||
| 2,393,210 | The Corporate Executive Board Co.(c)(d) | 102,931,962 | ||||||
| 866,150 | Costar Group, Inc.(a) | 59,807,658 | ||||||
|
| |||||||
| 162,739,620 | ||||||||
Total Industrials (Cost $218,706,523) | 376,941,914 | |||||||
|
| |||||||
| INFORMATION TECHNOLOGY — 31.33% | |||||||
Communications Equipment — 3.13% | ||||||||
| 2,776,108 | ADTRAN, Inc. | 86,586,809 | ||||||
|
| |||||||
Computers & Peripherals — 1.75% | ||||||||
| 1,323,750 | Stratasys, Inc.(a)(c)(d) | 48,343,350 | ||||||
|
| |||||||
Electronic Equipment, Instruments & Components — 3.14% | ||||||||
| 502,392 | Dolby Laboratories, Inc. — Class A(a) | 19,121,040 | ||||||
| 572,800 | DTS, Inc.(a) | 17,310,016 | ||||||
| 1,774,462 | National Instruments Corp. | 50,607,656 | ||||||
|
| |||||||
| 87,038,712 | ||||||||
|
| |||||||
Internet Software & Services — 7.33% | ||||||||
| 1,124,400 | Ancestry.com, Inc.(a) | 25,568,856 | ||||||
| 523,150 | Cornerstone OnDemand, Inc.(a) | 11,425,596 | ||||||
| 2,787,050 | DealerTrack Holdings Inc.(a)(c)(d) | 84,336,133 | ||||||
| 3,299,725 | Dice Holdings Inc.(a)(d) | 30,786,434 | ||||||
| 3,130,500 | Internap Network Services Corp.(a)(c)(d) | 22,977,870 | ||||||
60
| SHARES OR FACE AMOUNT | FAIR VALUE* | |||||||
| INFORMATION TECHNOLOGY (Continued) | |||||||
| 753,300 | LogMeIn, Inc.(a) | $ | 26,538,759 | |||||
| 59,700 | Millennial Media Inc.(a) | 1,402,950 | ||||||
|
| |||||||
| 203,036,598 | ||||||||
|
| |||||||
IT Services — 2.43% | ||||||||
| 1,804,000 | NeuStar, Inc.(a) | 67,199,000 | ||||||
|
| |||||||
Semiconductors & Semiconductor Equipment — 6.04% | ||||||||
| 765,596 | Cabot Microelectronics Corp.(a) | 29,766,372 | ||||||
| 2,397,718 | MKS Instruments, Inc.(c) | 70,804,613 | ||||||
| 2,342,958 | Semtech Corp.(a) | 66,680,585 | ||||||
|
| |||||||
| 167,251,570 | ||||||||
|
| |||||||
Software — 7.51% | ||||||||
| 988,700 | ACI Worldwide, Inc.(a) | 39,814,949 | ||||||
| 941,300 | Ariba, Inc.(a) | 30,789,923 | ||||||
| 1,022,742 | Manhattan Associates, Inc.(a) | 48,610,926 | ||||||
| 950,100 | OPNET Technologies, Inc. | 27,552,900 | ||||||
| 1,797,950 | RealD Inc.(a) | 24,272,325 | ||||||
| 502,300 | The Ultimate Software Group, Inc.(a) | 36,808,544 | ||||||
|
| |||||||
| 207,849,567 | ||||||||
Total Information Technology (Cost $630,627,397) | 867,305,606 | |||||||
|
| |||||||
| TOTAL COMMON STOCKS | 2,696,492,092 | ||||||
| (COST $1,726,487,750) | |||||||
| SHORT TERM INVESTMENTS — 3.55% | |||||||
| INVESTMENT COMPANY — 3.55% | |||||||
| 98,370,701 | Fidelity Institutional Government Portfolio — 0.01%(e) | 98,370,701 | ||||||
Total Investment Company | 98,370,701 | |||||||
|
| |||||||
| TOTAL SHORT TERM INVESTMENTS | 98,370,701 | ||||||
| (COST $98,370,701) | |||||||
| TOTAL INVESTMENTS — 100.95% | 2,794,862,793 | ||||||
| (COST $1,824,858,451) | |||||||
| Liabilities in Excess of Other Assets — (0.95)% | (26,167,099 | ) | |||||
|
| |||||||
| TOTAL NET ASSETS — 100.00% | $ | 2,768,695,694 | |||||
|
| |||||||
ADR — American Depositary Receipt
PLC — Public Limited Company
| (a) | Non Income Producing |
| (b) | Foreign Issued Security. The total value of these securities amounted to $83,847,682 (3.03% of net assets) at March 31, 2012. |
| (c) | Portion or all of these securities deemed illiquid. The total value of these portions amounted to $111,855,306 (4.04% of net assets) at March 31, 2012. |
| (d) | Affiliated company; the Fund owns 5% or more of the outstanding voting securities of the issuer. The total value of these securities amounted to $610,477,923 (22.05% of net assets) at March 31, 2012. Please see Note 7 for details on affiliate transactions |
| (e) | 7-day yield. |
| * | See Note 1A of accompanying Notes to Financial Statements regarding valuation of securities. |
The Global Industry Classification Standard (GICS®) was developed by and/or is the exclusive property of MSCI, Inc. and Standard & Poor Financial Services LLC (“S&P”). GICS is a service mark of MSCI and S&P and has been licensed for use by U.S. Bancorp Fund Services, LLC.
The accompanying notes are an integral part of these financial statements.
61
Statements of Assets and Liabilities
March 31, 2012
CHINA FUND | BUFFALO FLEXIBLE INCOME | BUFFALO GROWTH FUND | ||||||||||
ASSETS: | ||||||||||||
Investments in securities, at cost: | ||||||||||||
Investments in securities of unaffiliated issuers | $ | 19,509,856 | $ | 332,047,112 | $ | 437,304,937 | ||||||
Investments in securities of affiliated issuers (Note 7) | — | — | — | |||||||||
|
|
|
|
|
| |||||||
Total investments, at cost | $ | 19,509,856 | $ | 332,047,112 | $ | 437,304,937 | ||||||
|
|
|
|
|
| |||||||
Investments in securities, at value: | ||||||||||||
Investments in securities of unaffiliated issuers | $ | 19,912,655 | $ | 373,514,701 | $ | 508,684,116 | ||||||
Investments in securities of affiliated issuers (Note 7) | — | — | — | |||||||||
|
|
|
|
|
| |||||||
Total investments, at value | 19,912,655 | 373,514,701 | 508,684,116 | |||||||||
Cash: | — | 31,536 | — | |||||||||
Cash denominated in foreign currency, at value:(1) | 1,879,783 | — | — | |||||||||
Receivables: | ||||||||||||
Investments sold | 1,575,721 | — | — | |||||||||
Fund shares sold | 575 | 2,007,609 | 788,969 | |||||||||
Dividends | 64 | 431,233 | 399,601 | |||||||||
Interest | 1 | 2,500,081 | 157 | |||||||||
Other assets | 8,865 | 25,104 | 34,271 | |||||||||
|
|
|
|
|
| |||||||
Total assets | 23,377,664 | 378,510,264 | 509,907,114 | |||||||||
|
|
|
|
|
| |||||||
LIABILITIES: | ||||||||||||
Payables: | ||||||||||||
Investments purchased | 1,175,035 | — | 2,037,768 | |||||||||
Written options, at value(2) (Note 8) | — | 170,705 | — | |||||||||
Fund shares purchased | 12,932 | 179,575 | 336,889 | |||||||||
Management fees | 29,072 | 308,129 | 377,936 | |||||||||
Custodian | 9,042 | — | — | |||||||||
Accrued expenses | 21,861 | 495 | 18,184 | |||||||||
|
|
|
|
|
| |||||||
Total liabilities | 1,247,942 | 658,904 | 2,770,777 | |||||||||
|
|
|
|
|
| |||||||
NET ASSETS | $ | 22,129,722 | $ | 377,851,360 | $ | 507,136,337 | ||||||
|
|
|
|
|
| |||||||
NET ASSETS CONSIST OF: | ||||||||||||
Capital (capital stock and paid-in capital) | $ | 33,741,839 | $ | 338,950,106 | $ | 437,114,955 | ||||||
Undistributed (distribution in excess of) net investment income (loss) | 18,567 | 251,602 | 1,165,383 | |||||||||
Accumulated net realized gain (loss) from investment and foreign currency transactions | (12,033,152 | ) | (2,856,858 | ) | (2,523,180 | ) | ||||||
Net unrealized appreciation from: | ||||||||||||
Investments and translation of assets and liabilities in foreign currency | 402,468 | 41,506,510 | 71,379,179 | |||||||||
|
|
|
|
|
| |||||||
NET ASSETS APPLICABLE TO OUTSTANDING SHARES | $ | 22,129,722 | $ | 377,851,360 | $ | 507,136,337 | ||||||
|
|
|
|
|
| |||||||
Capital shares, $1.00 par value: | ||||||||||||
Authorized | Unlimited | Unlimited | Unlimited | |||||||||
|
|
|
|
|
| |||||||
Outstanding | 3,135,379 | 30,484,773 | 18,157,444 | |||||||||
|
|
|
|
|
| |||||||
NET ASSET VALUE PER SHARE | $ | 7.06 | $ | 12.39 | $ | 27.93 | ||||||
|
|
|
|
|
| |||||||
(1) Cash denominated in foreign currencies, at cost | 1,880,114 | — | — | |||||||||
(2) Written options, premiums received | — | 209,626 | — | |||||||||
The accompanying notes are an integral part of these financial statements.
62
BUFFALO HIGH YIELD FUND | BUFFALO INTERNATIONAL FUND | BUFFALO LARGE CAP FUND | BUFFALO MICRO CAP FUND | BUFFALO MID CAP FUND | BUFFALO SCIENCE & TECHNOLOGY FUND | BUFFALO SMALL CAP FUND | ||||||||||||||||||||
| $ | 235,390,581 | $ | 56,778,285 | $ | 30,368,915 | $ | 28,499,422 | $ | 574,943,050 | $ | 333,810,247 | $ | 1,416,969,862 | |||||||||||||
| — | — | — | — | — | — | 407,888,589 | ||||||||||||||||||||
|
|
|
|
|
|
|
|
|
|
|
|
|
| |||||||||||||
| $ | 235,390,581 | $ | 56,778,285 | $ | 30,368,915 | $ | 28,499,422 | $ | 574,943,050 | $ | 333,810,247 | $ | 1,824,858,451 | |||||||||||||
|
|
|
|
|
|
|
|
|
|
|
|
|
| |||||||||||||
| $ | 251,604,430 | $ | 65,192,697 | $ | 37,970,070 | $ | 40,777,120 | $ | 737,439,011 | $ | 418,608,132 | $ | 2,184,384,870 | |||||||||||||
| — | — | — | — | — | — | 610,477,923 | ||||||||||||||||||||
|
|
|
|
|
|
|
|
|
|
|
|
|
| |||||||||||||
| 251,604,430 | 65,192,697 | 37,970,070 | 40,777,120 | 737,439,011 | 418,608,132 | 2,794,862,793 | ||||||||||||||||||||
| 46,484 | 2,089 | — | — | — | — | — | ||||||||||||||||||||
| — | 5,615,637 | — | — | — | — | — | ||||||||||||||||||||
| 102,828 | 376,160 | — | 577,075 | — | 3,858,535 | 5,028,578 | ||||||||||||||||||||
| 364,477 | 23,597 | 17,331 | 45,716 | 1,182,470 | 731,513 | 3,388,849 | ||||||||||||||||||||
| 108,966 | 226,660 | 20,690 | 10,808 | 342,573 | 112,722 | 90,958 | ||||||||||||||||||||
| 4,117,337 | 8 | 9 | 13 | 175 | 194 | 788 | ||||||||||||||||||||
| 17,939 | 10,600 | 12,557 | 15,496 | 30,611 | 25,097 | 68,450 | ||||||||||||||||||||
|
|
|
|
|
|
|
|
|
|
|
|
|
| |||||||||||||
| 256,362,461 | 71,447,448 | 38,020,657 | 41,426,228 | 738,994,840 | 423,336,193 | 2,803,440,416 | ||||||||||||||||||||
|
|
|
|
|
|
|
|
|
|
|
|
|
| |||||||||||||
| — | 548,792 | — | 349,000 | — | 5,852,692 | 1,095,055 | ||||||||||||||||||||
| — | — | — | — | — | — | — | ||||||||||||||||||||
| 373,515 | 6,956 | 1,323 | 46,842 | 3,803,015 | 371,140 | 31,305,533 | ||||||||||||||||||||
| 215,486 | 59,122 | 28,778 | 48,307 | 614,653 | 336,827 | 2,329,373 | ||||||||||||||||||||
| — | 14,999 | — | — | — | — | — | ||||||||||||||||||||
| 2,858 | 12,695 | 654 | 915 | 10,473 | 3,187 | 14,761 | ||||||||||||||||||||
|
|
|
|
|
|
|
|
|
|
|
|
|
| |||||||||||||
| 591,859 | 642,564 | 30,755 | 445,064 | 4,428,141 | 6,563,846 | 34,744,722 | ||||||||||||||||||||
|
|
|
|
|
|
|
|
|
|
|
|
|
| |||||||||||||
| $ | 255,770,602 | $ | 70,804,884 | $ | 37,989,902 | $ | 40,981,164 | $ | 734,566,699 | $ | 416,772,347 | $ | 2,768,695,694 | |||||||||||||
|
|
|
|
|
|
|
|
|
|
|
|
|
| |||||||||||||
| $ | 239,653,595 | $ | 69,572,343 | $ | 28,731,935 | $ | 33,546,557 | $ | 557,051,984 | $ | 318,201,699 | $ | 1,856,579,400 | |||||||||||||
| 737,022 | (35,470 | ) | 58,772 | (93,238 | ) | (648,266 | ) | (91,015 | ) | — | ||||||||||||||||
| (833,864 | ) | (7,143,694 | ) | 1,598,040 | (4,749,853 | ) | 15,667,020 | 13,863,778 | (57,888,048 | ) | ||||||||||||||||
| 16,213,849 | 8,411,705 | 7,601,155 | 12,277,698 | 162,495,961 | 84,797,885 | 970,004,342 | ||||||||||||||||||||
|
|
|
|
|
|
|
|
|
|
|
|
|
| |||||||||||||
| $ | 255,770,602 | $ | 70,804,884 | $ | 37,989,902 | $ | 40,981,164 | $ | 734,566,699 | $ | 416,772,347 | $ | 2,768,695,694 | |||||||||||||
|
|
|
|
|
|
|
|
|
|
|
|
|
| |||||||||||||
| Unlimited | Unlimited | Unlimited | Unlimited | Unlimited | Unlimited | Unlimited | ||||||||||||||||||||
|
|
|
|
|
|
|
|
|
|
|
|
|
| |||||||||||||
| 22,443,889 | 7,437,637 | 1,760,221 | 3,499,842 | 40,924,962 | 24,579,458 | 96,994,568 | ||||||||||||||||||||
|
|
|
|
|
|
|
|
|
|
|
|
|
| |||||||||||||
| $ | 11.40 | $ | 9.52 | $ | 21.58 | $ | 11.71 | �� | $ | 17.95 | $ | 16.96 | $ | 28.54 | ||||||||||||
|
|
|
|
|
|
|
|
|
|
|
|
|
| |||||||||||||
| — | 5,618,344 | — | — | — | — | — | ||||||||||||||||||||
| — | — | — | — | — | — | — | ||||||||||||||||||||
63
Statements of Operations
For the Year Ended March 31, 2012
| BUFFALO CHINA FUND | BUFFALO FLEXIBLE | BUFFALO | ||||||||||
INVESTMENT INCOME: | ||||||||||||
Interest | $ | 72 | $ | 6,252,414 | $ | 2,571 | ||||||
Dividends: | ||||||||||||
Dividends from securities of unaffiliated issuers | 485,356 | 4,054,954 | 5,176,356 | |||||||||
Dividends from securities of affiliated issuers (Note 7) | — | — | — | |||||||||
Foreign tax withheld | (36,820 | ) | (29,232 | ) | — | |||||||
|
|
|
|
|
| |||||||
Total investment income | 448,608 | 10,278,136 | 5,178,927 | |||||||||
|
|
|
|
|
| |||||||
EXPENSES: | ||||||||||||
Management fees | 355,749 | 2,282,849 | 3,939,442 | |||||||||
Custody fees | 51,792 | — | — | |||||||||
Registration fees | 18,682 | 27,170 | 56,623 | |||||||||
Other | 1,548 | 4,331 | 21,191 | |||||||||
|
|
|
|
|
| |||||||
Total expenses | 427,771 | 2,314,350 | 4,017,256 | |||||||||
|
|
|
|
|
| |||||||
Net investment income (loss) | 20,837 | 7,963,786 | 1,161,671 | |||||||||
|
|
|
|
|
| |||||||
NET REALIZED AND UNREALIZED GAIN (LOSS) ON INVESTMENTS: | ||||||||||||
Net realized gain (loss) from: | ||||||||||||
Investment transactions of unaffiliated issuers | (1,929,705 | ) | (579,137 | ) | (2,464,048 | ) | ||||||
Investment transactions of affiliated issuers (Note 7) | — | — | — | |||||||||
Options written (Note 8) | — | 397,395 | — | |||||||||
Net unrealized appreciation/depreciation during the period on: | ||||||||||||
Investments | (3,296,500 | ) | 15,917,089 | 44,671,784 | ||||||||
Options written (Note 8) | — | 47,701 | — | |||||||||
|
|
|
|
|
| |||||||
Net realized and unrealized gain (loss) on investments | (5,226,205 | ) | 15,783,048 | 42,207,736 | ||||||||
|
|
|
|
|
| |||||||
Net increase (decrease) in net assets resulting from operations | $ | (5,205,368 | ) | $ | 23,746,834 | $ | 43,369,407 | |||||
|
|
|
|
|
| |||||||
The accompanying notes are an integral part of these financial statements.
64
| BUFFALO HIGH YIELD FUND | BUFFALO INTERNATIONAL FUND | BUFFALO LARGE CAP FUND | BUFFALO MICRO CAP FUND | BUFFALO Mid Cap | BUFFALO SCIENCE & TECHNOLOGY FUND | BUFFALO SMALL CAP | ||||||||||||||||||||
| $ | 15,226,339 | $ | 272 | $ | 134 | $ | 125 | $ | 2,968 | $ | 1,731 | $ | 9,182 | |||||||||||||
| 1,136,953 | 1,227,190 | 394,980 | 167,857 | 4,857,136 | 1,979,795 | 21,400,429 | ||||||||||||||||||||
| — | — | — | — | — | — | 6,014,363 | ||||||||||||||||||||
| (36,213 | ) | (115,333 | ) | (4,381 | ) | — | — | — | (19,038 | ) | ||||||||||||||||
|
|
|
|
|
|
|
|
|
|
|
|
|
| |||||||||||||
| 16,327,079 | 1,112,129 | 390,733 | 167,982 | 4,860,104 | 1,981,526 | 27,404,936 | ||||||||||||||||||||
|
|
|
|
|
|
|
|
|
|
|
|
|
| |||||||||||||
| 2,361,240 | 638,984 | 311,433 | 473,889 | 7,196,453 | 3,564,072 | 27,396,428 | ||||||||||||||||||||
| — | 63,972 | — | — | — | — | — | ||||||||||||||||||||
| 41,025 | 19,937 | 19,090 | 17,266 | 58,646 | 35,496 | 57,050 | ||||||||||||||||||||
| 6,476 | 3,657 | 1,438 | 1,499 | 16,206 | 7,400 | 53,532 | ||||||||||||||||||||
|
|
|
|
|
|
|
|
|
|
|
|
|
| |||||||||||||
| 2,408,741 | 726,550 | 331,961 | 492,654 | 7,271,305 | 3,606,968 | 27,507,010 | ||||||||||||||||||||
|
|
|
|
|
|
|
|
|
|
|
|
|
| |||||||||||||
| 13,918,338 | 385,579 | 58,772 | (324,672 | ) | (2,411,201 | ) | (1,625,442 | ) | (102,074 | ) | ||||||||||||||||
|
|
|
|
|
|
|
|
|
|
|
|
|
| |||||||||||||
| 298,745 | (3,168,401 | ) | 1,831,151 | 1,777,933 | 16,985,345 | 22,793,819 | (4,634,778 | ) | ||||||||||||||||||
| — | — | — | — | — | — | (43,314,010 | ) | |||||||||||||||||||
| — | — | — | — | — | — | — | ||||||||||||||||||||
| 24,117 | 1,615,542 | (628,450 | ) | 4,063,821 | 26,505,163 | 20,000,119 | 104,205,404 | |||||||||||||||||||
| — | — | — | — | — | — | — | ||||||||||||||||||||
|
|
|
|
|
|
|
|
|
|
|
|
|
| |||||||||||||
| 322,862 | (1,552,859 | ) | 1,202,701 | 5,841,754 | 43,490,508 | 42,793,938 | 56,256,516 | |||||||||||||||||||
|
|
|
|
|
|
|
|
|
|
|
|
|
| |||||||||||||
| $ | 14,241,200 | $ | (1,167,280 | ) | $ | 1,261,473 | $ | 5,517,082 | $ | 41,079,307 | $ | 41,168,496 | $ | 56,154,442 | ||||||||||||
|
|
|
|
|
|
|
|
|
|
|
|
|
| |||||||||||||
65
Statements of Changes in Net Assets
BUFFALO CHINA FUND | ||||||||
| YEAR ENDED MARCH 31, 2012 | YEAR ENDED MARCH 31, 2011 | |||||||
OPERATIONS: | ||||||||
Net investment income | $ | 20,837 | $ | 21,363 | ||||
Net realized gain (loss) from investment transactions | (1,929,705 | ) | 624,194 | |||||
Net unrealized appreciation/depreciation during the period on investments and translation of assets and liabilities in foreign currencies | (3,296,500 | ) | 1,537,040 | |||||
|
|
|
| |||||
Net increase (decrease) in net assets resulting from operations | (5,205,368 | ) | 2,182,597 | |||||
DISTRIBUTIONS TO SHAREHOLDERS: | ||||||||
Net investment income | (13,344 | ) | — | |||||
Net realized gain from investment transactions | — | — | ||||||
|
|
|
| |||||
Total distributions to shareholders | (13,344 | ) | — | |||||
CAPITAL SHARE TRANSACTIONS: | ||||||||
Shares sold | 5,161,698 | 2,258,637 | ||||||
Reinvested dividends and distributions | 12,891 | — | ||||||
|
|
|
| |||||
Shares issued | 5,174,589 | 2,258,637 | ||||||
Redemptions | (2,664,009 | ) | (3,469,263 | ) | ||||
Redemption fees (Note 5) | 766 | 1,232 | ||||||
|
|
|
| |||||
Shares repurchased | (2,663,243 | ) | (3,468,031 | ) | ||||
|
|
|
| |||||
Net increase (decrease) from capital share transactions | 2,511,346 | (1,209,394 | ) | |||||
|
|
|
| |||||
Total increase (decrease) in net assets | (2,707,366 | ) | 973,203 | |||||
NET ASSETS: | ||||||||
Beginning of period | 24,837,088 | 23,863,885 | ||||||
|
|
|
| |||||
End of period | $ | 22,129,722 | $ | 24,837,088 | ||||
|
|
|
| |||||
Undistributed (distribution in excess of) net investment income (loss) at end of year | $ | 18,567 | $ | 12,214 | ||||
|
|
|
| |||||
Fund share transactions: | ||||||||
Shares sold | 643,594 | 273,555 | ||||||
Reinvested dividends and distributions | 1,971 | — | ||||||
|
|
|
| |||||
| 645,565 | 273,555 | |||||||
Shares repurchased | (360,923 | ) | (421,593 | ) | ||||
|
|
|
| |||||
Net increase (decrease) in fund shares | 284,642 | (148,038 | ) | |||||
|
|
|
| |||||
The accompanying notes are an integral part of these financial statements.
66
BUFFALO FLEXIBLE INCOME FUND | BUFFALO GROWTH FUND | BUFFALO HIGH YIELD FUND | BUFFALO INTERNATIONAL FUND | |||||||||||||||||||||||||||
| YEAR ENDED MARCH 31, 2012 | YEAR ENDED MARCH 31, 2011 | YEAR ENDED MARCH 31, 2012 | YEAR ENDED MARCH 31, 2011 | YEAR ENDED MARCH 31, 2012 | YEAR ENDED MARCH 31, 2011 | YEAR ENDED MARCH 31, 2012 | YEAR ENDED MARCH 31, 2011 | |||||||||||||||||||||||
| $ | 7,963,786 | $ | 4,713,249 | $ | 1,161,671 | $ | 370,069 | $ | 13,918,338 | $ | 11,449,046 | $ | 385,579 | $ | 134,415 | |||||||||||||||
| (181,742 | ) | (2,167,113 | ) | (2,464,048 | ) | 8,318,636 | 298,745 | 1,462,810 | (3,168,401 | ) | 942,040 | |||||||||||||||||||
| 15,964,790 | 18,975,341 | 44,671,784 | 14,368,383 | 24,117 | 8,775,851 | 1,615,542 | 3,874,500 | |||||||||||||||||||||||
|
|
|
|
|
|
|
|
|
|
|
|
|
|
|
| |||||||||||||||
| 23,746,834 | 21,521,477 | 43,369,407 | 23,057,088 | 14,241,200 | 21,687,707 | (1,167,280 | ) | 4,950,955 | ||||||||||||||||||||||
| (7,871,498 | ) | (4,753,325 | ) | (69,262 | ) | (300,984 | ) | (14,274,625 | ) | (11,432,171 | ) | (344,354 | ) | (191,360 | ) | |||||||||||||||
| — | — | (7,937,395 | ) | (33,240 | ) | — | — | — | — | |||||||||||||||||||||
|
|
|
|
|
|
|
|
|
|
|
|
|
|
|
| |||||||||||||||
| (7,871,498 | ) | (4,753,325 | ) | (8,006,657 | ) | (334,224 | ) | (14,274,625 | ) | (11,432,171 | ) | (344,354 | ) | (191,360 | ) | |||||||||||||||
| 234,722,990 | 48,443,139 | 294,658,152 | 217,381,671 | 87,708,544 | 100,154,279 | 23,048,370 | 24,914,244 | |||||||||||||||||||||||
| 7,129,106 | 4,023,966 | 7,794,818 | 329,292 | 10,532,596 | 9,443,498 | 311,460 | 186,402 | |||||||||||||||||||||||
|
|
|
|
|
|
|
|
|
|
|
|
|
|
|
| |||||||||||||||
| 241,852,096 | 52,467,105 | 302,452,970 | 217,710,963 | 98,241,140 | 109,597,777 | 23,359,830 | 25,100,646 | |||||||||||||||||||||||
| (64,414,428 | ) | (39,101,323 | ) | (150,860,547 | ) | (25,428,214 | ) | (71,614,907 | ) | (63,187,731 | ) | (5,779,246 | ) | (5,086,965 | ) | |||||||||||||||
| 84,284 | 8,091 | 67,978 | 20,531 | 202,036 | 69,779 | 740 | 1,575 | |||||||||||||||||||||||
|
|
|
|
|
|
|
|
|
|
|
|
|
|
|
| |||||||||||||||
| (64,330,144 | ) | (39,093,232 | ) | (150,792,569 | ) | (25,407,683 | ) | (71,412,871 | ) | (63,117,952 | ) | (5,778,506 | ) | (5,085,390 | ) | |||||||||||||||
|
|
|
|
|
|
|
|
|
|
|
|
|
|
|
| |||||||||||||||
| 177,521,952 | 13,373,873 | 151,660,401 | 192,303,280 | 26,828,269 | 46,479,825 | 17,581,324 | 20,015,256 | |||||||||||||||||||||||
|
|
|
|
|
|
|
|
|
|
|
|
|
|
|
| |||||||||||||||
| 193,397,288 | 30,142,025 | 187,023,151 | 215,026,144 | 26,794,844 | 56,735,361 | 16,069,690 | 24,774,851 | |||||||||||||||||||||||
| 184,454,072 | 154,312,047 | 320,113,186 | 105,087,042 | 228,975,758 | 172,240,397 | 54,735,194 | 29,960,343 | |||||||||||||||||||||||
|
|
|
|
|
|
|
|
|
|
|
|
|
|
|
| |||||||||||||||
| $ | 377,851,360 | $ | 184,454,072 | $ | 507,136,337 | $ | 320,113,186 | $ | 255,770,602 | $ | 228,975,758 | $ | 70,804,884 | $ | 54,735,194 | |||||||||||||||
|
|
|
|
|
|
|
|
|
|
|
|
|
|
|
| |||||||||||||||
| $ | 251,602 | $ | 126,776 | $ | 1,165,383 | $ | 69,085 | $ | 737,022 | $ | 271,360 | $ | (35,470 | ) | $ | 9,687 | ||||||||||||||
|
|
|
|
|
|
|
|
|
|
|
|
|
|
|
| |||||||||||||||
| 19,681,141 | 4,405,997 | 11,506,939 | 8,522,208 | 7,903,466 | 8,974,477 | 2,445,859 | 2,689,245 | |||||||||||||||||||||||
| 609,411 | 374,026 | 318,546 | 13,198 | 956,505 | 852,143 | 37,890 | 19,580 | |||||||||||||||||||||||
|
|
|
|
|
|
|
|
|
|
|
|
|
|
|
| |||||||||||||||
| 20,290,552 | 4,780,023 | 11,825,485 | 8,535,406 | 8,859,971 | 9,826,620 | 2,483,749 | 2,708,825 | |||||||||||||||||||||||
| (5,494,502 | ) | (3,636,753 | ) | (5,909,785 | ) | (1,098,068 | ) | (6,414,869 | ) | (5,658,433 | ) | (638,423 | ) | (561,381 | ) | |||||||||||||||
|
|
|
|
|
|
|
|
|
|
|
|
|
|
|
| |||||||||||||||
| 14,796,050 | 1,143,270 | 5,915,700 | 7,437,338 | 2,445,102 | 4,168,187 | 1,845,326 | 2,147,444 | |||||||||||||||||||||||
|
|
|
|
|
|
|
|
|
|
|
|
|
|
|
| |||||||||||||||
67
Statements of Changes in Net Assets
BUFFALO LARGE CAP FUND | ||||||||
| YEAR ENDED MARCH 31, 2012 | YEAR ENDED MARCH 31, 2011 | |||||||
OPERATIONS: | ||||||||
Net investment income (loss) | $ | 58,772 | $ | 62,988 | ||||
Net realized gain (loss) from investment transactions | 1,831,151 | 1,592,150 | ||||||
Net unrealized appreciation/depreciation during the period on investments and translation of assets and liabilities in foreign currencies | (628,450 | ) | 2,221,397 | |||||
|
|
|
| |||||
Net increase in net assets resulting from operations | 1,261,473 | 3,876,535 | ||||||
DISTRIBUTIONS TO SHAREHOLDERS: | ||||||||
Net investment income | (62,922 | ) | (105,420 | ) | ||||
Net realized gain from investment transactions | (201,892 | ) | — | |||||
|
|
|
| |||||
Total distributions to shareholders | (264,814 | ) | (105,420 | ) | ||||
CAPITAL SHARE TRANSACTIONS: | ||||||||
Shares sold | 7,850,317 | 6,388,589 | ||||||
Reinvested dividends and distributions | 260,214 | 102,763 | ||||||
|
|
|
| |||||
Shares issued | 8,110,531 | 6,491,352 | ||||||
Redemptions | (7,189,908 | ) | (10,965,044 | ) | ||||
Redemption fees (Note 5) | 447 | 9,344 | ||||||
|
|
|
| |||||
Shares repurchased | (7,189,461 | ) | (10,955,700 | ) | ||||
|
|
|
| |||||
Net increase (decrease) from capital share transactions | 921,070 | (4,464,348 | ) | |||||
|
|
|
| |||||
Total increase (decrease) in net assets | 1,917,729 | (693,233 | ) | |||||
NET ASSETS: | ||||||||
Beginning of period | 36,072,173 | 36,765,406 | ||||||
|
|
|
| |||||
End of period | $ | 37,989,902 | $ | 36,072,173 | ||||
|
|
|
| |||||
Undistributed (distribution in excess of) net investment income (loss) at end of year | $ | 58,772 | $ | 62,922 | ||||
|
|
|
| |||||
Fund share transactions: | ||||||||
Shares sold | 381,672 | 347,239 | ||||||
Reinvested dividends and distributions | 14,089 | 5,180 | ||||||
|
|
|
| |||||
| 395,761 | 352,419 | |||||||
Shares repurchased | (356,182 | ) | (608,096 | ) | ||||
|
|
|
| |||||
Net increase (decrease) in fund shares | 39,579 | (255,677 | ) | |||||
|
|
|
| |||||
The accompanying notes are an integral part of these financial statements.
68
BUFFALO MICRO CAP FUND | BUFFALO MID CAP FUND | BUFFALO SCIENCE & TECHNOLOGY FUND | BUFFALO SMALL CAP FUND | |||||||||||||||||||||||||||
| YEAR ENDED MARCH 31, 2012 | PERIOD ENDED MARCH 31, 2011 | YEAR ENDED MARCH 31, 2012 | YEAR ENDED MARCH 31, 2011 | YEAR ENDED MARCH 31, 2012 | YEAR ENDED MARCH 31, 2011 | YEAR ENDED MARCH 31, 2012 | YEAR ENDED MARCH 31, 2011 | |||||||||||||||||||||||
| $ | (324,672 | ) | $ | (207,250 | ) | $ | (2,411,201 | ) | $ | (1,387,440 | ) | $ | (1,625,442 | ) | $ | (928,200 | ) | $ | (102,074 | ) | $ | (11,552,024 | ) | |||||||
| 1,777,933 | 1,609,334 | 16,985,345 | 49,571,485 | 22,793,819 | 26,128,477 | (47,948,888 | ) | 33,411,198 | ||||||||||||||||||||||
| 4,063,821 | 4,849,150 | 26,505,163 | 54,610,692 | 20,000,119 | 29,274,027 | 104,205,404 | 291,989,378 | |||||||||||||||||||||||
|
|
|
|
|
|
|
|
|
|
|
|
|
|
|
| |||||||||||||||
| 5,517,082 | 6,251,234 | 41,079,307 | 102,794,737 | 41,168,496 | 54,474,304 | 56,154,442 | 313,848,552 | |||||||||||||||||||||||
| — | — | — | — | — | — | — | — | |||||||||||||||||||||||
| — | — | (13,548,232 | ) | — | (21,747,641 | ) | | (6,266,862 | ) | (5,878,612 | ) | — | ||||||||||||||||||
|
|
|
|
|
|
|
|
|
|
|
|
|
|
|
| |||||||||||||||
| — | — | (13,548,232 | ) | — | (21,747,641 | ) | (6,266,862 | ) | (5,878,612 | ) | — | |||||||||||||||||||
| 9,590,701 | 8,090,040 | 180,540,562 | 351,595,180 | 135,265,084 | 148,397,436 | 382,125,538 | 655,390,547 | |||||||||||||||||||||||
| — | — | 12,958,850 | — | 21,444,054 | 6,178,654 | 5,588,302 | — | |||||||||||||||||||||||
|
|
|
|
|
|
|
|
|
|
|
|
|
|
|
| |||||||||||||||
| 9,590,701 | 8,090,040 | 193,499,412 | 351,595,180 | 156,709,138 | 154,576,090 | 387,713,840 | 655,390,547 | |||||||||||||||||||||||
| (5,450,819 | ) | (5,718,596 | ) | (241,074,842 | ) | (169,807,424 | ) | (123,587,768 | ) | (68,464,417 | ) | (826,854,018 | ) | (743,987,259 | ) | |||||||||||||||
| 4,711 | 17,511 | 23,680 | 75,456 | 42,093 | 54,835 | 115,316 | 356,932 | |||||||||||||||||||||||
|
|
|
|
|
|
|
|
|
|
|
|
|
|
|
| |||||||||||||||
| (5,446,108 | ) | (5,701,085 | ) | (241,051,162 | ) | (169,731,968 | ) | (123,545,675 | ) | (68,409,582 | ) | (826,738,702 | ) | (743,630,327 | ) | |||||||||||||||
|
|
|
|
|
|
|
|
|
|
|
|
|
|
|
| |||||||||||||||
| 4,144,593 | 2,388,955 | (47,551,750 | ) | 181,863,212 | 33,163,463 | 86,166,508 | (439,024,862 | ) | (88,239,780 | ) | ||||||||||||||||||||
|
|
|
|
|
|
|
|
|
|
|
|
|
|
|
| |||||||||||||||
| 9,661,675 | 8,640,189 | (20,020,675 | ) | 284,657,949 | 52,584,318 | 134,373,950 | (388,749,032 | ) | 225,608,772 | |||||||||||||||||||||
| 31,319,489 | 22,679,300 | 754,587,374 | 469,929,425 | 364,188,029 | 229,814,079 | 3,157,444,726 | 2,931,835,954 | |||||||||||||||||||||||
|
|
|
|
|
|
|
|
|
|
|
|
|
|
|
| |||||||||||||||
| $ | 40,981,164 | $ | 31,319,489 | $ | 734,566,699 | $ | 754,587,374 | $ | 416,772,347 | $ | 364,188,029 | $ | 2,768,695,694 | $ | 3,157,444,726 | |||||||||||||||
|
|
|
|
|
|
|
|
|
|
|
|
|
|
|
| |||||||||||||||
| $ | (93,238 | ) | $ | — | $ | (648,266 | ) | $ | — | $ | (91,015 | ) | $ | — | $ | — | $ | — | ||||||||||||
|
|
|
|
|
|
|
|
|
|
|
|
|
|
|
| |||||||||||||||
| 981,904 | 963,524 | 10,838,407 | 23,074,130 | 8,607,620 | 10,133,391 | 14,842,433 | 26,450,201 | |||||||||||||||||||||||
| — | — | 843,675 | — | 1,523,015 | 405,165 | 223,711 | — | |||||||||||||||||||||||
|
|
|
|
|
|
|
|
|
|
|
|
|
|
|
| |||||||||||||||
| 981,904 | 963,524 | 11,682,082 | 23,074,130 | 10,130,635 | 10,538,556 | 15,066,144 | 26,450,201 | |||||||||||||||||||||||
| (541,112 | ) | (675,683 | ) | (14,500,886 | ) | (10,894,969 | ) | (7,916,853 | ) | (4,877,586 | ) | (32,118,874 | ) | (30,154,945 | ) | |||||||||||||||
|
|
|
|
|
|
|
|
|
|
|
|
|
|
|
| |||||||||||||||
| 440,792 | 287,841 | (2,818,804 | ) | 12,179,161 | 2,213,782 | 5,660,970 | (17,052,730 | ) | (3,704,744 | ) | ||||||||||||||||||||
|
|
|
|
|
|
|
|
|
|
|
|
|
|
|
| |||||||||||||||
69
Financial Highlights
The following tables are intended to help you understand the Fund’s financial performance. The information reflects financial results for the Fund held for the periods shown. Total returns assume reinvestment of all dividends and distributions. Total returns do not reflect payment of sales charges, if any, and are not annualized for periods of less than one year.
BUFFALO CHINA FUND
Condensed data for a share of capital stock outstanding throughout the period. | YEARS ENDED MARCH 31, | |||||||||||||||||||
| 2012 | 2011 | 2010 | 2009(2)(3) | 2008 | ||||||||||||||||
Net asset value, beginning of period | $ | 8.71 | $ | 7.96 | $ | 4.92 | $ | 9.35 | $ | 10.53 | ||||||||||
|
|
|
|
|
|
|
|
|
| |||||||||||
Income from investment operations: | ||||||||||||||||||||
Net investment income (loss) | 0.01 | 0.01 | (0.02 | )(4) | 0.02 | 0.02 | ||||||||||||||
Net gains (losses) on securities (both realized and unrealized) | (1.65 | ) | 0.74 | 3.07 | (4.17 | ) | (0.29 | ) | ||||||||||||
|
|
|
|
|
|
|
|
|
| |||||||||||
Total from investment operations | (1.64 | ) | 0.75 | 3.05 | (4.15 | ) | (0.27 | ) | ||||||||||||
|
|
|
|
|
|
|
|
|
| |||||||||||
Less distributions: | ||||||||||||||||||||
Dividends from net investment income | (0.01 | ) | — | (0.01 | ) | (0.02 | ) | (0.05 | ) | |||||||||||
Distributions from capital gains | — | — | — | (0.26 | ) | (0.87 | ) | |||||||||||||
|
|
|
|
|
|
|
|
|
| |||||||||||
Total distributions | (0.01 | ) | — | (0.01 | ) | (0.28 | ) | (0.92 | ) | |||||||||||
|
|
|
|
|
|
|
|
|
| |||||||||||
Paid-in capital from redemption fees (Note 5) | — | (1) | — | (1) | — | (1) | — | (1) | 0.01 | |||||||||||
|
|
|
|
|
|
|
|
|
| |||||||||||
Net asset value, end of period | $ | 7.06 | $ | 8.71 | $ | 7.96 | $ | 4.92 | $ | 9.35 | ||||||||||
|
|
|
|
|
|
|
|
|
| |||||||||||
Total return | (18.89% | ) | 9.42% | 61.88% | (45.89% | ) | (4.47% | ) | ||||||||||||
|
|
|
|
|
|
|
|
|
| |||||||||||
Ratios/Supplemental Data | ||||||||||||||||||||
Net assets, end of period (in thousands) | $ | 22,130 | $ | 24,837 | $ | 23,864 | $ | 14,313 | $ | 29,413 | ||||||||||
Ratio of expenses to average net assets | 1.80% | 1.75% | 1.78% | 1.83% | 1.72% | |||||||||||||||
Ratio of net investment income (loss) to average net assets | 0.09% | 0.09% | (0.26% | ) | 0.24% | 0.10% | ||||||||||||||
Portfolio turnover rate | 94% | 12% | 22% | 54% | 75% | |||||||||||||||
| (1) | Less than $0.01 per share. |
| (2) | Kornitzer Capital Management, Inc. assumed sole management advisory responsibility for Buffalo China Fund effective November 17, 2008. Prior to November 17, 2008, Jayhawk Capital Management, LLC provided sub-advisory services. |
| (3) | Effective November 17, 2008, the Fund name was changed to Buffalo China Fund. Prior to November 17, 2008, the Fund was known as the Buffalo Jayhawk China Fund. |
| (4) | Net investment loss per share calculated using average shares outstanding. |
The accompanying notes are an integral part of these financial statements.
70
Financial Highlights
The following tables are intended to help you understand the Fund’s financial performance. The information reflects financial results for the Fund held for the periods shown. Total returns assume reinvestment of all dividends and distributions. Total returns do not reflect payment of sales charges, if any.
BUFFALO FLEXIBLE INCOME FUND
| Condensed data for a share of capital | YEARS ENDED MARCH 31, | |||||||||||||||||||
| stock outstanding throughout the year. | 2012(2) | 2011 | 2010 | 2009 | 2008 | |||||||||||||||
Net asset value, beginning of year | $ | 11.76 | $ | 10.61 | $ | 7.89 | $ | 11.38 | $ | 11.71 | ||||||||||
|
|
|
|
|
|
|
|
|
| |||||||||||
Income from investment operations: | ||||||||||||||||||||
Net investment income | 0.41 | 0.33 | 0.35 | 0.38 | 0.36 | |||||||||||||||
Net gains (losses) on securities (both realized and unrealized) | 0.63 | 1.15 | 2.72 | (3.49 | ) | 0.05 | ||||||||||||||
|
|
|
|
|
|
|
|
|
| |||||||||||
Total from investment operations | 1.04 | 1.48 | 3.07 | (3.11 | ) | 0.41 | ||||||||||||||
|
|
|
|
|
|
|
|
|
| |||||||||||
Less distributions: | ||||||||||||||||||||
Dividends from net investment income | (0.41 | ) | (0.33 | ) | (0.35 | ) | (0.38 | ) | (0.36 | ) | ||||||||||
Distributions from capital gains | — | — | — | — | (0.38 | ) | ||||||||||||||
|
|
|
|
|
|
|
|
|
| |||||||||||
Total distributions | (0.41 | ) | (0.33 | ) | (0.35 | ) | (0.38 | ) | (0.74 | ) | ||||||||||
|
|
|
|
|
|
|
|
|
| |||||||||||
Paid-in capital from redemption fees(1) (Note 5) | — | — | — | — | — | |||||||||||||||
|
|
|
|
|
|
|
|
|
| |||||||||||
Net asset value, end of year | $ | 12.39 | $ | 11.76 | $ | 10.61 | $ | 7.89 | $ | 11.38 | ||||||||||
|
|
|
|
|
|
|
|
|
| |||||||||||
Total return | 9.15% | 14.27% | 39.32% | (27.75% | ) | 3.23% | ||||||||||||||
|
|
|
|
|
|
|
|
|
| |||||||||||
Ratios/Supplemental Data | ||||||||||||||||||||
Net assets, end of year (in thousands) | $ | 377,851 | $ | 184,454 | $ | 154,312 | $ | 113,692 | $ | 166,661 | ||||||||||
Ratio of expenses to average net assets | 1.01% | 1.02% | 1.03% | 1.03% | 1.02% | |||||||||||||||
Ratio of net investment income to average net assets | 3.49% | 2.98% | 3.55% | 3.85% | 2.99% | |||||||||||||||
Portfolio turnover rate | 19% | 26% | 12% | 14% | 17% | |||||||||||||||
| (1) | Less than $0.01 per share. |
| (2) | Effective July 29, 2011, the Fund name was changed to Buffalo Flexible Income Fund. Prior to July 29, 2011, the Fund was known as the Buffalo Balanced Fund. |
The accompanying notes are an integral part of these financial statements.
71
Financial Highlights
The following tables are intended to help you understand the Fund’s financial performance. The information reflects financial results for the Fund held for the periods shown. Total returns assume reinvestment of all dividends and distributions. Total returns do not reflect payment of sales charges, if any, and are not annualized for periods of less than one year.
BUFFALO GROWTH FUND
| Condensed data for a share of capital | YEARS ENDED MARCH 31, | |||||||||||||||||||
| stock outstanding throughout the year. | 2012 | 2011 | 2010(1) | 2009 | 2008 | |||||||||||||||
Net asset value, beginning of year | $ | 26.15 | $ | 21.87 | $ | 14.29 | $ | 20.85 | $ | 23.15 | ||||||||||
|
|
|
|
|
|
|
|
|
| |||||||||||
Income from investment operations: | ||||||||||||||||||||
Net investment income | 0.06 | 0.07 | 0.10 | 0.10 | 0.08 | |||||||||||||||
Net gains (losses) on securities (both realized and unrealized) | 2.17 | 4.28 | 7.58 | (6.48 | ) | (1.48 | ) | |||||||||||||
|
|
|
|
|
|
|
|
|
| |||||||||||
Total from investment operations | 2.23 | 4.35 | 7.68 | (6.38 | ) | (1.40 | ) | |||||||||||||
|
|
|
|
|
|
|
|
|
| |||||||||||
Less distributions: | ||||||||||||||||||||
Dividends from net investment income | (0.01 | ) | (0.06 | ) | (0.10 | ) | (0.11 | ) | (0.08 | ) | ||||||||||
Distributions from capital gains | (0.44 | ) | (0.01 | ) | — | (0.07 | ) | (0.82 | ) | |||||||||||
Return of capital | — | — | — | (2) | — | — | ||||||||||||||
|
|
|
|
|
|
|
|
|
| |||||||||||
Total distributions | (0.45 | ) | (0.07 | ) | (0.10 | ) | (0.18 | ) | (0.90 | ) | ||||||||||
|
|
|
|
|
|
|
|
|
| |||||||||||
Paid-in capital from redemption fees(2) (Note 5) | — | — | — | — | — | |||||||||||||||
|
|
|
|
|
|
|
|
|
| |||||||||||
Net asset value, end of year | $ | 27.93 | $ | 26.15 | $ | 21.87 | $ | 14.29 | $ | 20.85 | ||||||||||
|
|
|
|
|
|
|
|
|
| |||||||||||
Total return | 8.78% | 19.88% | 53.80% | (30.70% | ) | (6.51% | ) | |||||||||||||
|
|
|
|
|
|
|
|
|
| |||||||||||
Ratios/Supplemental Data | ||||||||||||||||||||
Net assets, end of year (in thousands) | $ | 507,136 | $ | 320,113 | $ | 105,087 | $ | 68,221 | $ | 109,792 | ||||||||||
Ratio of expenses to average net assets | 0.92% | 0.99% | 1.03% | 1.05% | 1.03% | |||||||||||||||
Ratio of net investment income to average net assets | 0.27% | 0.27% | 0.51% | 0.53% | 0.37% | |||||||||||||||
Portfolio turnover rate | 46% | 47% | 30% | 51% | 31% | |||||||||||||||
| (1) | Effective July 31, 2009, the Fund name was changed to Buffalo Growth Fund. Prior to July 31, 2009, the Fund was known as the Buffalo USA Global Fund. |
| (2) | Less than $0.01 per share. |
The accompanying notes are an integral part of these financial statements.
72
Financial Highlights
The following tables are intended to help you understand the Fund’s financial performance. The information reflects financial results for the Fund held for the periods shown. Total returns assume reinvestment of all dividends and distributions. Total returns do not reflect payment of sales charges, if any, and are not annualized for periods of less than one year.
BUFFALO HIGH YIELD FUND
| Condensed data for a share of capital | YEARS ENDED MARCH 31, | |||||||||||||||||||
| stock outstanding throughout the year. | 2012 | 2011 | 2010 | 2009 | 2008 | |||||||||||||||
Net asset value, beginning of year | $ | 11.45 | $ | 10.88 | $ | 8.20 | $ | 10.40 | $ | 11.26 | ||||||||||
|
|
|
|
|
|
|
|
|
| |||||||||||
Income from investment operations: | ||||||||||||||||||||
Net investment income | 0.66 | 0.64 | 0.63 | 0.70 | 0.65 | |||||||||||||||
Net gains (losses) on securities (both realized and unrealized) | (0.03 | ) | 0.56 | 2.68 | (2.10 | ) | (0.81 | ) | ||||||||||||
|
|
|
|
|
|
|
|
|
| |||||||||||
Total from investment operations | 0.63 | 1.20 | 3.31 | (1.40 | ) | (0.16 | ) | |||||||||||||
|
|
|
|
|
|
|
|
|
| |||||||||||
Less distributions: | ||||||||||||||||||||
Dividends from net investment income | (0.68 | ) | (0.63 | ) | (0.63 | ) | (0.72 | ) | (0.67 | ) | ||||||||||
Distributions from capital gains | — | — | — | (0.08 | ) | (0.03 | ) | |||||||||||||
|
|
|
|
|
|
|
|
|
| |||||||||||
Total distributions | (0.68 | ) | (0.63 | ) | (0.63 | ) | (0.80 | ) | (0.70 | ) | ||||||||||
|
|
|
|
|
|
|
|
|
| |||||||||||
Paid-in capital from redemption fees(1) (Note 5) | — | — | — | — | — | |||||||||||||||
|
|
|
|
|
|
|
|
|
| |||||||||||
Net asset value, end of year | $ | 11.40 | $ | 11.45 | $ | 10.88 | $ | 8.20 | $ | 10.40 | ||||||||||
|
|
|
|
|
|
|
|
|
| |||||||||||
Total return | 5.86% | 11.35% | 40.96% | (13.64% | ) | (1.52% | ) | |||||||||||||
|
|
|
|
|
|
|
|
|
| |||||||||||
Ratios/Supplemental Data | ||||||||||||||||||||
Net assets, end of year (in thousands) | $ | 255,771 | $ | 228,976 | $ | 172,240 | $ | 95,346 | $ | 151,176 | ||||||||||
Ratio of expenses to average net assets | 1.02% | 1.02% | 1.02% | 1.03% | 1.02% | |||||||||||||||
Ratio of net investment income to average net assets | 5.89% | 5.75% | 6.31% | 7.08% | 5.71% | |||||||||||||||
Portfolio turnover rate | 21% | 25% | 41% | 7% | 22% | |||||||||||||||
| (1) | Less than $0.01 per share. |
The accompanying notes are an integral part of these financial statements.
73
Financial Highlights
The following tables are intended to help you understand the Fund’s financial performance. The information reflects financial results for the Fund held for the periods shown. Total returns assume reinvestment of all dividends and distributions. Total returns do not reflect payment of sales charges, if any, and are not annualized for periods of less than one year.
BUFFALO INTERNATIONAL FUND
| Condensed data for a share of capital | YEARS ENDED MARCH 31, | FOR THE PERIOD FROM SEPTEMBER 28, 2007 (COMMENCEMENT OF OPERATIONS) TO | ||||||||||||||||||
| stock outstanding throughout the period. | 2012 | 2011 | 2010 | 2009 | MARCH 31, 2008 | |||||||||||||||
Net asset value, beginning of period | $ | 9.79 | $ | 8.70 | $ | 5.31 | $ | 9.37 | $ | 10.00 | ||||||||||
|
|
|
|
|
|
|
|
|
| |||||||||||
Income from investment operations: | ||||||||||||||||||||
Net investment income | 0.05 | 0.06 | 0.05 | 0.08 | 0.02 | |||||||||||||||
Net gains (losses) on securities (both realized and unrealized) | (0.27 | ) | 1.08 | 3.40 | (4.04 | ) | (0.65 | ) | ||||||||||||
|
|
|
|
|
|
|
|
|
| |||||||||||
Total from investment operations | (0.22 | ) | 1.14 | 3.45 | (3.96 | ) | (0.63 | ) | ||||||||||||
|
|
|
|
|
|
|
|
|
| |||||||||||
Less distributions: | ||||||||||||||||||||
Dividends from net investment income | (0.05 | ) | (0.05 | ) | (0.05 | ) | (0.06 | ) | — | |||||||||||
Distributions from capital gains | — | — | — | (0.01 | ) | — | ||||||||||||||
Return of capital | — | — | (0.01 | ) | (0.03 | ) | — | |||||||||||||
|
|
|
|
|
|
|
|
|
| |||||||||||
Total distributions | (0.05 | ) | (0.05 | ) | (0.06 | ) | (0.10 | ) | — | |||||||||||
|
|
|
|
|
|
|
|
|
| |||||||||||
Paid-in capital from redemption fees(1) (Note 5) | — | — | — | — | — | |||||||||||||||
|
|
|
|
|
|
|
|
|
| |||||||||||
Net asset value, end of period | $ | 9.52 | $ | 9.79 | $ | 8.70 | $ | 5.31 | $ | 9.37 | ||||||||||
|
|
|
|
|
|
|
|
|
| |||||||||||
Total return* | (2.20% | ) | 13.09% | 65.00% | (42.76% | ) | (6.30% | ) | ||||||||||||
|
|
|
|
|
|
|
|
|
| |||||||||||
Ratios/Supplemental Data | ||||||||||||||||||||
Net assets, end of period (in thousands) | $ | 70,805 | $ | 54,735 | $ | 29,960 | $ | 13,632 | $ | 22,038 | ||||||||||
Ratio of expenses to average net assets** | 1.14% | 1.17% | 1.22% | 1.20% | 1.29% | |||||||||||||||
Ratio of net investment income to average net assets** | 0.58% | 0.38% | 0.61% | 0.97% | 0.39% | |||||||||||||||
Portfolio turnover rate* | 29% | 35% | 38% | 26% | 11% | |||||||||||||||
| * | Not annualized for periods less than one full year. |
| ** | Annualized for periods less than one full year. |
| (1) | Less than $0.01 per share. |
The accompanying notes are an integral part of these financial statements.
74
Financial Highlights
The following tables are intended to help you understand the Fund’s financial performance. The information reflects financial results for the Fund held for the periods shown. Total returns assume reinvestment of all dividends and distributions. Total returns do not reflect payment of sales charges, if any, and are not annualized for periods of less than one year.
BUFFALO LARGE CAP FUND
| Condensed data for a share of capital | YEARS ENDED MARCH 31, | |||||||||||||||||||
| stock outstanding throughout the year. | 2012 | 2011 | 2010 | 2009 | 2008 | |||||||||||||||
Net asset value, beginning of year | $ | 20.96 | $ | 18.60 | $ | 11.66 | $ | 19.68 | $ | 21.59 | ||||||||||
|
|
|
|
|
|
|
|
|
| |||||||||||
Income from investment operations: | ||||||||||||||||||||
Net investment income | 0.04 | 0.04 | 0.05 | 0.04 | 0.02 | |||||||||||||||
Net gains (losses) on securities (both realized and unrealized) | 0.74 | 2.38 | 6.93 | (6.14 | ) | (1.30 | ) | |||||||||||||
|
|
|
|
|
|
|
|
|
| |||||||||||
Total from investment operations | 0.78 | 2.42 | 6.98 | (6.10 | ) | (1.28 | ) | |||||||||||||
|
|
|
|
|
|
|
|
|
| |||||||||||
Less distributions: | ||||||||||||||||||||
Dividends from net investment income. | (0.04 | ) | (0.06 | ) | (0.04 | ) | — | (0.02 | ) | |||||||||||
Distributions from capital gains | (0.12 | ) | — | — | (1.92 | ) | (0.61 | ) | ||||||||||||
|
|
|
|
|
|
|
|
|
| |||||||||||
Total distributions | (0.16 | ) | (0.06 | ) | (0.04 | ) | (1.92 | ) | (0.63 | ) | ||||||||||
|
|
|
|
|
|
|
|
|
| |||||||||||
Paid-in capital from redemption fees(1) (Note 5) | — | — | — | — | — | |||||||||||||||
|
|
|
|
|
|
|
|
|
| |||||||||||
Net asset value, end of year | $ | 21.58 | $ | 20.96 | $ | 18.60 | $ | 11.66 | $ | 19.68 | ||||||||||
|
|
|
|
|
|
|
|
|
| |||||||||||
Total return | 3.84% | 13.04% | 59.85% | (34.35% | ) | (6.25% | ) | |||||||||||||
|
|
|
|
|
|
|
|
|
| |||||||||||
Ratios/Supplemental Data | ||||||||||||||||||||
Net assets, end of year (in thousands) | $ | 37,990 | $ | 36,072 | $ | 36,765 | $ | 21,320 | $ | 41,513 | ||||||||||
Ratio of expenses to average net assets | 0.96% | 1.04% | 1.08% | 1.09% | 1.05% | |||||||||||||||
Ratio of net investment income (loss) to average net assets | 0.17% | 0.19% | 0.35% | 0.23% | 0.11% | |||||||||||||||
Portfolio turnover rate | 59% | 28% | 35% | 27% | 32% | |||||||||||||||
| (1) | Less than $0.01 per share. |
The accompanying notes are an integral part of these financial statements.
75
Financial Highlights
The following tables are intended to help you understand the Fund’s financial performance. The information reflects financial results for the Fund held for the periods shown. Total returns assume reinvestment of all dividends and distributions. Total returns do not reflect payment of sales charges, if any, and are not annualized for periods of less than one year.
BUFFALO MICRO CAP FUND
Condensed data for a share of capital stock outstanding throughout the year. | YEARS ENDED MARCH 31, | |||||||||||||||||||
| 2012 | 2011 | 2010 | 2009 | 2008 | ||||||||||||||||
Net asset value, beginning of year | $ | 10.24 | $ | 8.18 | $ | 4.40 | $ | 8.45 | $ | 13.32 | ||||||||||
|
|
|
|
|
|
|
|
|
| |||||||||||
Income from investment operations: | ||||||||||||||||||||
Net investment loss | (0.09 | ) | (0.07 | )(1) | — | (0.07 | ) | (0.16 | ) | |||||||||||
Net gains (losses) on securities (both realized and unrealized) | 1.56 | 2.13 | 3.78 | (3.49 | ) | (3.69 | ) | |||||||||||||
|
|
|
|
|
|
|
|
|
| |||||||||||
Total from investment operations | 1.47 | 2.06 | 3.78 | (3.56 | ) | (3.85 | ) | |||||||||||||
|
|
|
|
|
|
|
|
|
| |||||||||||
Less distributions from capital gains | — | — | — | (0.49 | ) | (1.02 | ) | |||||||||||||
|
|
|
|
|
|
|
|
|
| |||||||||||
Paid-in capital from redemption fees(2) (Note 5) | — | — | — | — | — | |||||||||||||||
|
|
|
|
|
|
|
|
|
| |||||||||||
Net asset value, end of year | $ | 11.71 | $ | 10.24 | $ | 8.18 | $ | 4.40 | $ | 8.45 | ||||||||||
|
|
|
|
|
|
|
|
|
| |||||||||||
Total return | 14.36% | 25.18% | 85.91% | (42.64% | ) | (30.23% | ) | |||||||||||||
|
|
|
|
|
|
|
|
|
| |||||||||||
Ratios/Supplemental Data | ||||||||||||||||||||
Net assets, end of year (in thousands) | $ | 40,981 | $ | 31,319 | $ | 22,679 | $ | 14,017 | $ | 27,383 | ||||||||||
Ratio of expenses to average net assets | 1.51% | 1.53% | 1.54% | 1.55% | 1.50% | |||||||||||||||
Ratio of net investment loss to average net assets | (0.99% | ) | (0.82% | ) | (1.10% | ) | (1.01% | ) | (1.08% | ) | ||||||||||
Portfolio turnover rate | 31% | 30% | 28% | 31% | 34% | |||||||||||||||
| (1) | Net investment loss per share calculated using average shares outstanding. |
| (2) | Less than $0.01 per share. |
The accompanying notes are an integral part of these financial statements.
76
Financial Highlights
The following tables are intended to help you understand the Fund’s financial performance. The information reflects financial results for the Fund held for the periods shown. Total returns assume reinvestment of all dividends and distributions. Total returns do not reflect payment of sales charges, if any, and are not annualized for periods of less than one year.
BUFFALO MID CAP FUND
Condensed data for a share of capital stock outstanding throughout the year. | YEARS ENDED MARCH 31, | |||||||||||||||||||
| 2012 | 2011 | 2010 | 2009 | 2008 | ||||||||||||||||
Net asset value, beginning of year | $ | 17.25 | $ | 14.89 | $ | 9.27 | $ | 12.86 | $ | 15.53 | ||||||||||
|
|
|
|
|
|
|
|
|
| |||||||||||
Income from investment operations: | ||||||||||||||||||||
Net investment loss | (0.06 | ) | (0.04 | )(1) | (0.05 | )(1) | (0.03 | ) | (0.03 | ) | ||||||||||
Net gains (losses) on securities (both realized and unrealized) | 1.08 | 2.40 | 5.67 | (3.38 | ) | (1.42 | ) | |||||||||||||
|
|
|
|
|
|
|
|
|
| |||||||||||
Total from investment operations | 1.02 | 2.36 | 5.62 | (3.41 | ) | (1.45 | ) | |||||||||||||
|
|
|
|
|
|
|
|
|
| |||||||||||
Less distributions from capital gains | (0.32 | ) | — | — | (0.18 | ) | (1.22 | ) | ||||||||||||
|
|
|
|
|
|
|
|
|
| |||||||||||
Paid-in capital from redemption fees(2) (Note 5) | — | — | — | — | — | |||||||||||||||
|
|
|
|
|
|
|
|
|
| |||||||||||
Net asset value, end of year | $ | 17.95 | $ | 17.25 | $ | 14.89 | $ | 9.27 | $ | 12.86 | ||||||||||
|
|
|
|
|
|
|
|
|
| |||||||||||
Total return | 6.22% | 15.85% | 60.63% | (26.96% | ) | (10.60% | ) | |||||||||||||
|
|
|
|
|
|
|
|
|
| |||||||||||
Ratios/Supplemental Data | ||||||||||||||||||||
Net assets, end of year (in thousands) | $ | 734,567 | $ | 754,587 | $ | 469,929 | $ | 193,720 | $ | 380,008 | ||||||||||
Ratio of expenses to average net assets | 1.01% | 1.02% | 1.02% | 1.02% | 1.01% | |||||||||||||||
Ratio of net investment loss to average net assets | (0.34% | ) | (0.23% | ) | (0.43% | ) | (0.26% | ) | (0.23% | ) | ||||||||||
Portfolio turnover rate | 31% | 21% | 12% | 17% | 34% | |||||||||||||||
| (1) | Net investment loss per share calculated using average shares outstanding. |
| (2) | Less than $0.01 per share. |
The accompanying notes are an integral part of these financial statements.
77
Financial Highlights
The following tables are intended to help you understand the Fund’s financial performance. The information reflects financial results for the Fund held for the periods shown. Total returns assume reinvestment of all dividends and distributions. Total returns do not reflect payment of sales charges, if any, and are not annualized for periods of less than one year.
BUFFALO SCIENCE & TECHNOLOGY FUND
Condensed data for a share of capital stock outstanding throughout the year. | YEARS ENDED MARCH 31, | |||||||||||||||||||
| 2012 | 2011 | 2010 | 2009 | 2008 | ||||||||||||||||
Net asset value, beginning of year | $ | 16.28 | $ | 13.76 | $ | 8.55 | $ | 11.41 | $ | 13.48 | ||||||||||
|
|
|
|
|
|
|
|
|
| |||||||||||
Income from investment operations: | ||||||||||||||||||||
Net investment loss | (0.07 | ) | (0.05 | )(1) | (0.03 | )(1) | (0.02 | ) | (0.06 | ) | ||||||||||
Net gains (losses) on securities (both realized and unrealized) | 1.74 | 2.89 | 5.24 | (2.64 | ) | (1.26 | ) | |||||||||||||
|
|
|
|
|
|
|
|
|
| |||||||||||
Total from investment operations | 1.67 | 2.84 | 5.21 | (2.66 | ) | (1.32 | ) | |||||||||||||
|
|
|
|
|
|
|
|
|
| |||||||||||
Less distributions from capital gains | (0.99 | ) | (0.32 | ) | — | (0.20 | ) | (0.75 | ) | |||||||||||
|
|
|
|
|
|
|
|
|
| |||||||||||
Paid-in capital from redemption fees(2) (Note 5) | — | — | — | — | — | |||||||||||||||
|
|
|
|
|
|
|
|
|
| |||||||||||
Net asset value, end of year | $ | 16.96 | $ | 16.28 | $ | 13.76 | $ | 8.55 | $ | 11.41 | ||||||||||
|
|
|
|
|
|
|
|
|
| |||||||||||
Total return | 11.50% | 20.77% | 60.94% | (23.85% | ) | (10.57% | ) | |||||||||||||
|
|
|
|
|
|
|
|
|
| |||||||||||
Ratios/Supplemental Data | ||||||||||||||||||||
Net assets, end of year (in thousands) | $ | 416,772 | $ | 364,188 | $ | 229,814 | $ | 102,480 | $ | 144,851 | ||||||||||
Ratio of expenses to average net assets | 1.01% | 1.02% | 1.02% | 1.03% | 1.02% | |||||||||||||||
Ratio of net investment loss to average net assets | (0.46% | ) | (0.33% | ) | (0.22% | ) | (0.24% | ) | (0.39% | ) | ||||||||||
Portfolio turnover rate | 52% | 38% | 35% | 51% | 52% | |||||||||||||||
| (1) | Net investment loss per share calculated using average shares outstanding. |
| (2) | Less than $0.01 per share. |
The accompanying notes are an integral part of these financial statements.
78
Financial Highlights
The following tables are intended to help you understand the Fund’s financial performance. The information reflects financial results for the Fund held for the periods shown. Total returns assume reinvestment of all dividends and distributions. Total returns do not reflect payment of sales charges, if any, and are not annualized for periods of less than one year.
BUFFALO SMALL CAP FUND
Condensed data for a share of capital stock outstanding throughout the year. | YEARS ENDED MARCH 31, | |||||||||||||||||||
| 2012 | 2011 | 2010 | 2009 | 2008 | ||||||||||||||||
Net asset value, beginning of year | $ | 27.69 | $ | 24.90 | $ | 16.21 | $ | 20.48 | $ | 28.00 | ||||||||||
|
|
|
|
|
|
|
|
|
| |||||||||||
Income from investment operations: | ||||||||||||||||||||
Net investment income (loss) | — | (2) | (0.10 | )(1) | (0.01 | ) | 0.04 | (0.11 | ) | |||||||||||
Net gains (losses) on securities (both realized and unrealized) | 0.91 | 2.89 | 8.73 | (3.55 | ) | (4.75 | ) | |||||||||||||
|
|
|
|
|
|
|
|
|
| |||||||||||
Total from investment operations | 0.91 | 2.79 | 8.72 | (3.51 | ) | (4.86 | ) | |||||||||||||
|
|
|
|
|
|
|
|
|
| |||||||||||
Less dividends and distributions: | ||||||||||||||||||||
Dividends from net investment income | — | — | (0.03 | ) | — | — | ||||||||||||||
Distributions from capital gains | (0.06 | ) | — | — | (0.76 | ) | (2.66 | ) | ||||||||||||
Return of capital | — | — | — | (2) | — | — | ||||||||||||||
|
|
|
|
|
|
|
|
|
| |||||||||||
Total dividends and distributions | (0.06 | ) | — | (0.03 | ) | (0.76 | ) | (2.66 | ) | |||||||||||
|
|
|
|
|
|
|
|
|
| |||||||||||
Paid-in capital from redemption fees(2) (Note 5) | — | — | — | — | — | |||||||||||||||
|
|
|
|
|
|
|
|
|
| |||||||||||
Net asset value, end of year | $ | 28.54 | $ | 27.69 | $ | 24.90 | $ | 16.21 | $ | 20.48 | ||||||||||
|
|
|
|
|
|
|
|
|
| |||||||||||
Total return | 3.31% | 11.20% | 53.80% | (18.00% | ) | (18.74% | ) | |||||||||||||
|
|
|
|
|
|
|
|
|
| |||||||||||
Ratios/Supplemental Data | ||||||||||||||||||||
Net assets, end of year (in thousands) | $ | 2,768,696 | $ | 3,157,445 | $ | 2,931,836 | $ | 1,257,265 | $ | 1,602,315 | ||||||||||
Ratio of expenses to average net assets | 1.00% | 1.01% | 1.01% | 1.01% | 1.00% | |||||||||||||||
Ratio of net investment income (loss) to average net assets | (0.00% | )(3) | (0.40% | ) | (0.51% | ) | 0.22% | (0.41% | ) | |||||||||||
Portfolio turnover rate | 24% | 16% | 9% | 15% | 37% | |||||||||||||||
| (1) | Net investment loss per share calculated using average shares outstanding. |
| (2) | Less than $0.01 per share. |
| (3) | Less than 0.01%. |
The accompanying notes are an integral part of these financial statements.
79
Notes to Financial Statements
March 31, 2012
1. SIGNIFICANT ACCOUNTING POLICIES:
The Buffalo Funds (comprised of the Buffalo China Fund, Buffalo Flexible Income Fund (formerly Buffalo Balanced Fund), Buffalo Growth Fund, Buffalo High Yield Fund, Buffalo International Fund, Buffalo Large Cap Fund, Buffalo Micro Cap Fund, Buffalo Mid Cap Fund, Buffalo Science & Technology Fund and Buffalo Small Cap Fund) (the “Funds”), are registered under the Investment Company Act of 1940, as amended, as diversified open-end management investment companies. The shares of the Buffalo Funds are issued in multiple series, with each series, in effect, representing a separate fund. The following is a summary of significant accounting policies consistently followed by the Funds in the preparation of their financial statements.
A. INVESTMENT VALUATION — Corporate stocks and bonds traded on a national securities exchange or national market, except those traded using the National Association of Securities Dealers’ Automated Quotation System (“NASDAQ”), are valued at the latest sales price thereof, or if no sale was reported on that date, the mean between the most recent quoted bid and asked price is used. All equity securities that are traded using NASDAQ are valued using the NASDAQ Official Closing Price (“NOCP”), which may not necessarily represent the last sales price. If there has been no sale on such exchange or on NASDAQ on such day, the security is valued at the mean between the most recent quoted bid and ask price.
When market quotations are not readily available, any security or other asset is valued at its fair value as determined in good faith under procedures approved by the Board of Trustees (the “Board”). If events occur that will affect the value of a Fund’s portfolio securities before the net asset value (NAV) has been calculated (a “significant event”), the security will generally be priced using a fair value procedure. The Board has adopted specific procedures for valuing portfolio securities and delegated the responsibility of fair value determinations to the Valuation Committee. Some of the factors that may be considered by the Valuation Committee in determining fair value are fundamental analytical data relating to the investment; the nature and duration of any restriction on the disposition; trading in similar securities of the same issuer or comparable companies; information from broker-dealers; and an evaluation of the forces that influence the market in which the securities are purchased or sold. As of March 31, 2012, the Buffalo Flexible Income Fund and Buffalo High Yield Fund held two and three fair valued securities, respectively, with a market value of $5,875,247 or 1.55% and $4,284,729 or 1.68%, respectively of total net assets. In addition, with respect to the valuation of securities principally traded on foreign markets, the Buffalo China Fund and the Buffalo International Fund use a fair value pricing service approved by the Funds’ Board which employs quantitative models to adjust for “stale” prices caused by the movement of other markets and other factors occurring after the close of the foreign markets, but before the close of the New York Stock Exchange (NYSE).
Debt securities with remaining maturities of 60 days or less are normally valued at amortized cost, unless the Board determines that amortized cost does not represent fair value.
In accordance with Financial Accounting Standards Board (FASB) Accounting Standards Codifications (ASC) 820, Fair Value Measurements and Disclosure (ASC 820), fair value is defined as the price that a Fund would receive to sell an investment or pay to transfer a liability in an orderly transaction with an independent buyer in the principal market, or in the absence of a principal market, the most advantageous market for the investment or liability. ASC 820 establishes a three-tier hierarchy to distinguish between (1) inputs that reflect the assumptions market participants would use in pricing an asset or liability developed based on market data obtained from sources independent of the reporting entity (observable inputs) and (2) inputs that reflect the reporting entity’s own assumptions about the assumptions market participants would use in pricing an asset or liability developed based on the best information available in the circumstances (unobservable inputs) and to establish classification of fair value measurements for disclosure purposes. Various inputs are used in determining the value of the Funds’ investments. The inputs are summarized in the three broad levels listed below:
Level 1 — Valuations based on quoted prices for investments in active markets that a Fund has the ability to access at the measurement date. Valuation adjustments are not applied to Level 1 investments.
Level 2 — Valuations based on other significant observable inputs (including quoted prices for similar securities, interest rates, prepayment speeds, credit risks, etc.).
Level 3 — Valuations based on significant unobservable inputs (including a Fund’s own assumptions and judgment in determining the fair value of investments).
In January 2010, the FASB issued ASU No. 2010-06, “Improving Disclosures about Fair Valued Measurements,” which amends the disclosure requirements related to recurring and nonrecurring fair value measurements. The guidance requires new disclosures on the transfers of assets and liabilities between Level 1 (quoted prices in active market for identical assets or liabilities) and Level 2 (significant other observable inputs) of the fair value measurement hierarchy, including the reasons and the timing of the transfers, Additionally, the guidance requires a rollforward of activities on purchases, sales, issuance and settlements of assets al liabilities measured using significant unobservable inputs (Level 3 fair value measurements). Other than requiring additional disclosures, the adoption of this new guidance did not have material impact on the financial statements.
Inputs that are used in determining fair value of an investment may include price information, credit data, volatility statistics, and other factors. These inputs can be either observable or unobservable. The availability of observable inputs can vary between investments, and is affected by various factors such as the type of investment, and the volume and level of activity for that investment or similar investments in the market place. The inputs will be considered by the Adviser, along with any other relevant factors in the calculation of an investment’s fair value. The Funds use prices and inputs that are current as of the measurement date, which may include periods of market dislocations. During these periods, the availability of prices and inputs may be reduced for many investments. This condition could cause an investment to be reclassified between the various levels within the hierarchy.
80
Non-U.S. equity securities actively traded in foreign markets may be reflected in Level 2 despite the availability of closing prices, because the Funds evaluate and determine whether those closing prices reflect fair value at the close of the NYSE or require adjustment, as described above and in Note 9 — Foreign Investment Risks, to the financial statements.
Investments falling into the Level 3 category are primarily supported by quoted prices from brokers and dealers participating in the market for those investments. However, these may be classified as Level 3 investments due to lack of market transparency and corroboration to support these quoted prices. Additionally, valuation models may be used as the pricing source for any remaining investments classified as Level 3. These models rely on one or more significant unobservable inputs and/or significant assumptions by the Valuation Committee. Inputs used in valuations may include, but are not limited to, financial statement analysis, capital account balances, discount rates and estimated cash flows, and comparable company data.
The inputs or methodology used for valuing securities are not necessarily an indication of the risk associated with investing in those securities.
The following table provides the fair value measurement of applicable Fund assets and liabilities by level within the fair value hierarchy as of March 31, 2012. These assets are measured on a recurring basis.
| BUFFALO CHINA FUND | ||||||||||||||||
| LEVEL 1 | LEVEL 2 | LEVEL 3 | TOTAL | |||||||||||||
Common Stocks | $ | 19,660,471 | $ | — | $ | — | $ | 19,660,471 | ||||||||
Short Term Investment | 252,184 | — | — | 252,184 | ||||||||||||
|
|
|
|
|
|
|
| |||||||||
Total* | $ | 19,912,655 | $ | — | $ | — | $ | 19,912,655 | ||||||||
|
|
|
|
|
|
|
| |||||||||
| THE BUFFALO FLEXIBLE INCOME FUND | ||||||||||||||||
| LEVEL 1 | LEVEL 2 | LEVEL 3 | TOTAL | |||||||||||||
Common Stocks | $ | 190,578,836 | $ | — | $ | — | $ | 190,578,836 | ||||||||
Convertible Bonds | — | 7,134,819 | — | 7,134,819 | ||||||||||||
Corporate Bonds | ||||||||||||||||
Consumer Discretionary | — | 25,301,015 | 3,425,650 | 28,726,665 | ||||||||||||
Consumer Staples | — | 7,551,250 | — | 7,551,250 | ||||||||||||
Energy | — | 29,981,249 | — | 29,981,249 | ||||||||||||
Financials | — | 1,061,000 | — | 1,061,000 | ||||||||||||
Health Care | — | 14,034,638 | — | 14,034,638 | ||||||||||||
Industrials | — | 19,739,250 | 2,449,597 | 22,188,847 | ||||||||||||
Information Technology | — | 12,280,625 | — | 12,280,625 | ||||||||||||
Short Term Investments | 59,976,772 | — | — | 59,976,772 | ||||||||||||
|
|
|
|
|
|
|
| |||||||||
Total* | $ | 250,555,608 | $ | 117,083,846 | $ | 5,875,247 | $ | 373,514,701 | ||||||||
|
|
|
|
|
|
|
| |||||||||
Written Options | $ | (170,705 | ) | — | — | $ | (170,705 | ) | ||||||||
|
|
|
|
|
|
|
| |||||||||
| THE BUFFALO GROWTH FUND | ||||||||||||||||
| LEVEL 1 | LEVEL 2 | LEVEL 3 | TOTAL | |||||||||||||
Common Stocks | $ | 484,388,122 | $ | — | $ | — | $ | 484,388,122 | ||||||||
Short Term Investment | 24,295,994 | — | — | 24,295,994 | ||||||||||||
|
|
|
|
|
|
|
| |||||||||
Total* | $ | 508,684,116 | $ | — | $ | — | $ | 508,684,116 | ||||||||
|
|
|
|
|
|
|
| |||||||||
| THE BUFFALO HIGH YIELD FUND | ||||||||||||||||
| LEVEL 1 | LEVEL 2 | LEVEL 3 | TOTAL | |||||||||||||
Common Stocks | $ | 11,030,566 | $ | — | $ | — | $ | 11,030,566 | ||||||||
Convertible Preferred Stocks | ||||||||||||||||
Consumer Discretionary | 2,080,689 | — | — | 2,080,689 | ||||||||||||
Financials | — | 3,854,625 | — | 3,854,625 | ||||||||||||
Health Care | — | 2,463,125 | — | 2,463,125 | ||||||||||||
Preferred Stocks | ||||||||||||||||
Financials | 3,193,750 | 2,490,625 | — | 5,684,375 | ||||||||||||
Convertible Bonds | — | 27,706,325 | 1,370,260 | 29,076,585 | ||||||||||||
Corporate Bonds | ||||||||||||||||
Consumer Discretionary | — | 67,056,932 | — | 67,056,932 | ||||||||||||
Consumer Staples | — | 18,528,813 | — | 18,528,813 | ||||||||||||
Energy | — | 19,612,400 | — | 19,612,400 | ||||||||||||
Health Care | — | 11,603,613 | — | 11,603,613 | ||||||||||||
Industrials | — | 39,053,191 | 2,914,469 | 41,967,660 | ||||||||||||
Information Technology | — | 14,645,707 | — | 14,645,707 | ||||||||||||
Materials | — | 543,750 | — | 543,750 | ||||||||||||
Telecommunication Services | — | 1,100,000 | — | 1,100,000 | ||||||||||||
Short Term Investment | 22,355,590 | — | — | 22,355,590 | ||||||||||||
|
|
|
|
|
|
|
| |||||||||
Total* | $ | 38,660,595 | $ | 208,659,106 | $ | 4,284,729 | $ | 251,604,430 | ||||||||
|
|
|
|
|
|
|
| |||||||||
81
Notes to Financial Statements
March 31, 2012
(Continued)
| THE BUFFALO INTERNATIONAL FUND | ||||||||||||||||
| LEVEL 1 | LEVEL 2 | LEVEL 3 | TOTAL | |||||||||||||
Common Stocks | ||||||||||||||||
Australia | $ | 434,400 | $ | — | $ | — | $ | 434,400 | ||||||||
Brazil | 5,060,136 | — | — | 5,060,136 | ||||||||||||
Canada | 299,544 | — | — | 299,544 | ||||||||||||
Chile | 1,274,778 | — | — | 1,274,778 | ||||||||||||
China | 3,267,325 | — | — | 3,267,325 | ||||||||||||
France | 8,684,564 | — | — | 8,684,564 | ||||||||||||
Germany | 10,082,691 | — | — | 10,082,691 | ||||||||||||
Hong Kong | 4,296,370 | — | — | 4,296,370 | ||||||||||||
India | 978,048 | — | — | 978,048 | ||||||||||||
Israel | 702,936 | — | — | 702,936 | ||||||||||||
Italy | 207,258 | — | — | 207,258 | ||||||||||||
Japan | 1,463,646 | — | — | 1,463,646 | ||||||||||||
Luxembourg | 1,349,043 | — | — | 1,349,043 | ||||||||||||
Malaysia | 1,397,013 | — | — | 1,397,013 | ||||||||||||
Mexico | 1,041,904 | — | — | 1,041,904 | ||||||||||||
Netherlands | 1,986,140 | — | — | 1,986,140 | ||||||||||||
Norway | 587,910 | — | — | 587,910 | ||||||||||||
Singapore | 626,248 | — | — | 626,248 | ||||||||||||
Spain | 957,868 | — | — | 957,868 | ||||||||||||
Sweden | 520,655 | — | — | 520,655 | ||||||||||||
Switzerland | 7,938,875 | — | — | 7,938,875 | ||||||||||||
Taiwan | 1,287,814 | — | — | 1,287,814 | ||||||||||||
United Kingdom | 7,033,871 | — | — | 7,033,871 | ||||||||||||
Preferred Stocks | 2,540,460 | — | — | 2,540,460 | ||||||||||||
Short Term Investment | 1,173,200 | — | — | 1,173,200 | ||||||||||||
|
|
|
|
|
|
|
| |||||||||
Total* | $ | 65,192,697 | $ | — | $ | — | $ | 65,192,697 | ||||||||
|
|
|
|
|
|
|
| |||||||||
| THE LARGE CAP FUND | ||||||||||||||||
| LEVEL 1 | LEVEL 2 | LEVEL 3 | TOTAL | |||||||||||||
Common Stocks | $ | 36,874,260 | $ | 36,874,260 | ||||||||||||
Short Term Investment | 1,095,810 | — | — | 1,095,810 | ||||||||||||
|
|
|
|
|
|
|
| |||||||||
Total* | $ | 37,970,070 | $ | — | $ | — | $ | 37,970,070 | ||||||||
|
|
|
|
|
|
|
| |||||||||
| THE BUFFALO MICRO CAP FUND | ||||||||||||||||
| LEVEL 1 | LEVEL 2 | LEVEL 3 | TOTAL | |||||||||||||
Common Stocks | $ | 38,322,280 | $ | — | $ | — | $ | 38,322,280 | ||||||||
Short Term Investment | 2,454,840 | — | — | 2,454,840 | ||||||||||||
|
|
|
|
|
|
|
| |||||||||
Total* | $ | 40,777,120 | $ | — | $ | — | $ | 40,777,120 | ||||||||
|
|
|
|
|
|
|
| |||||||||
| THE BUFFALO MID CAP FUND | ||||||||||||||||
| LEVEL 1 | LEVEL 2 | LEVEL 3 | TOTAL | |||||||||||||
Common Stocks | $ | 709,250,852 | $ | — | $ | — | $ | 709,250,852 | ||||||||
Short Term Investment | 28,188,159 | — | — | 28,188,159 | ||||||||||||
|
|
|
|
|
|
|
| |||||||||
Total* | $ | 737,439,011 | $ | — | $ | — | $ | 737,439,011 | ||||||||
|
|
|
|
|
|
|
| |||||||||
| THE BUFFALO SCIENCE & TECHNOLOGY FUND | ||||||||||||||||
| LEVEL 1 | LEVEL 2 | LEVEL 3 | TOTAL | |||||||||||||
Common Stocks | $ | 399,472,414 | $ | — | $ | — | $ | 399,472,414 | ||||||||
Short Term Investment | 19,135,718 | — | — | 19,135,718 | ||||||||||||
|
|
|
|
|
|
|
| |||||||||
Total* | $ | 418,608,132 | $ | — | $ | — | $ | 418,608,132 | ||||||||
|
|
|
|
|
|
|
| |||||||||
| THE BUFFALO SMALL CAP FUND | ||||||||||||||||
| LEVEL 1 | LEVEL 2 | LEVEL 3 | TOTAL | |||||||||||||
Common Stocks | $ | 2,696,492,092 | $ | — | $ | — | $ | 2,696,492,092 | ||||||||
Short Term Investment | 98,370,701 | — | — | 98,370,701 | ||||||||||||
|
|
|
|
|
|
|
| |||||||||
Total* | $ | 2,794,862,793 | $ | — | $ | — | $ | 2,794,862,793 | ||||||||
|
|
|
|
|
|
|
| |||||||||
| * | Additional information regarding the industry and/or geographical classification of these investments is disclosed in the schedule of investments. |
82
The following is a reconciliation of the Buffalo China Fund Level 3 assets for which significant unobservable inputs were used to determine fair value for the year ended March 31, 2012:
| FAIR VALUE MEASUREMENT USING SIGNIFICANT UNOBSERVABLE INPUTS (LEVEL 3) | INVESTMENTS IN SECURITIES PERIOD ENDED MARCH 31, 2012 | |||
Fair Value as of 3/31/2011** | $ | — | ||
Total unrealized gain included in earnings | 3,573,630 | |||
Realized gain included in earnings | — | |||
Realized losses included in earnings | (3,565,820 | ) | ||
Purchases | — | |||
Sales | — | |||
Issuance | — | |||
Settlements | (7,810 | ) | ||
Transfer into Level 3** | — | |||
|
| |||
| $ | — | |||
|
| |||
The amount of total gains or losses for the period included in net increase (decrease) in net asset applicable to outstanding shares attributed to the change in unrealized gains or losses relating to assets still held at the reporting date | $ | 3,573,630 | ||
|
| |||
| ** | Investment was valued at $0 based on unobservable inputs as of March 31, 2011. The investment was written off the books during the fiscal year. There was no change in value in the investment(s) during the period ended March 31, 2012. |
The following is a reconciliation of the Buffalo Flexible Income Fund Level 3 assets for which significant unobservable inputs were used to determine fair value for the year ended March 31, 2012:
| FAIR VALUE MEASUREMENT USING SIGNIFICANT UNOBSERVABLE INPUTS (LEVEL 3) | INVESTMENTS IN SECURITIES PERIOD ENDED MARCH 31, 2012 | |||
Fair Value as of 3/31/2011 | $ | — | ||
Total unrealized gain included in earnings | 905,797 | |||
Realized gain included in earnings | — | |||
Realized losses included in earnings | — | |||
Purchases | 2,500,000 | |||
Sales | — | |||
Issuance | — | |||
Settlements | — | |||
Transfer into Level 3* | 2,469,450 | |||
|
| |||
Fair Value as of 3/31/2012 | $ | 5,875,247 | ||
|
| |||
The amount of total gains or losses for the period included in net increase (decrease) in net asset applicable to outstanding shares attributed to the change in unrealized gains or losses relating to assets still held at the reporting date | $ | 905,797 | ||
|
| |||
| * | The security transferred into Level 3 as the security was fair valued by the Valuation Committee due to a halt in trading on March 30, 2012. The basis for recognizing and valuing transfers is as of the beginning of the period in which transfers occur. |
The following is a reconciliation of the Buffalo High Yield Fund Level 3 assets for which significant unobservable inputs were used to determine fair value for the year ended March 31, 2012:
| FAIR VALUE MEASUREMENT USING SIGNIFICANT UNOBSERVABLE INPUTS (LEVEL 3) | INVESTMENTS IN SECURITIES PERIOD ENDED MARCH 31, 2012 | |||
Fair Value as of 3/31/2011** | $ | — | ||
Total unrealized gain included in earnings | 346,639 | |||
Realized gain included in earnings | — | |||
Realized losses included in earnings | — | |||
Purchases | 1,000,000 | |||
Sales | — | |||
Issuance | — | |||
Settlements | — | |||
Transfer into Level 3* | 2,938,090 | |||
|
| |||
Fair Value as of 3/31/2012 | $ | 4,284,729 | ||
|
| |||
The amount of total gains or losses for the period included in net increase (decrease) in net asset applicable to outstanding shares attributed to the change in unrealized gains or losses relating to assets still held at the reporting date | $ | 346,369 | ||
|
| |||
| * | The security transferred into Level 3 as the security was fair valued by the Valuation Committee due to a halt in trading on March 30, 2012. The basis for recognizing and valuing transfers is as of the beginning of the period in which transfers occur. |
| ** | Investment was valued at $0 based on unobservable inputs as of March 31, 2011. There was no change in value in the investment(s) during the period ended March 31, 2012. |
83
Notes to Financial Statements
March 31, 2012
(Continued)
There were no significant transfers during the year into or out of Level 1, Level 2 or Level 3 fair value measurements during the reporting period for the Buffalo China Fund, Buffalo Growth Fund, Buffalo International Fund, Buffalo Large Cap Fund, Buffalo Micro Cap Fund, Buffalo Mid Cap Fund, Buffalo Science & Technology Fund and Buffalo Small Cap Fund. During the year, there were the following transfers between Levels 1, Level 2 and Level 3:
| FUND | MARKET VALUE LEVEL 1 TO LEVEL 2 | MARKET VALUE LEVEL 2 TO LEVEL 3 | ||||||
Buffalo Flexible Income Fund* | — | 2,469,450 | ||||||
Buffalo High Yield Fund* | — | 2,938,090 | ||||||
| * | Transfer into Level 3 is due to the securities not being priced by the pricing service. The securities were fair valued under procedures approved by the Board of Trustees. |
B. FEDERAL INCOME TAXES — Each Fund complies with the requirements of Subchapter M of the Internal Revenue Code necessary to qualify as a regulated investment company and makes the requisite distributions of income and capital gains to its shareholders sufficient to relieve it from all or substantially all federal income and excise taxes. Therefore, no federal income tax provision has been provided.
The Funds have analyzed all open tax years, as defined by the Statute of Limitations, for all major jurisdictions. Open tax years are those that are open for exam by taxing authorities. Open tax years include the tax years ended March 31, 2009 through March 31, 2012. The Funds have no examinations in progress.
At March 31, 2012, the Funds did not have any tax positions that did not meet the “more likely-than-not” threshold of being sustained by the applicable tax authority.
The Funds recognize interest and penalties, if any, related to unrecognized tax benefits as income tax expense in the Statement of Operations. During the period, the Funds did not incur any interest or penalties.
C. INVESTMENT TRANSACTIONS AND INVESTMENT INCOME — Investment transactions are accounted for on the date the securities are purchased or sold (trade date). Dividend income is recorded on the ex-dividend date except that certain dividends for foreign securities where the ex-dividend date may have passed are recorded as soon as the Fund is informed of the dividend in the exercise of reasonable diligence. Interest income is recognized on the accrual basis. Realized gains and losses from investment transactions are reported on the identified cost basis. All discounts/premiums are accreted/amortized for financial reporting purposes and are included in interest income.
D. DISTRIBUTIONS TO SHAREHOLDERS — Distributions to shareholders are recorded on the ex-dividend date. Distributions are determined in accordance with income tax regulations, which may differ from U.S. Generally Accepted Accounting Principles (GAAP). These differences are primarily due to differing treatments for premium amortization on debt securities and deferral of late year and wash sale losses.
E. USE OF ESTIMATES — The preparation of financial statements in conformity with GAAP requires management to make estimates and assumptions that affect the amounts reported in the financial statements and accompanying notes. Actual results could differ from such estimates.
F. FOREIGN CURRENCY TRANSLATION — Values of investments denominated in foreign currencies are converted into U.S. dollars using a spot market rate of exchange on the day of valuation. Purchases and sales of investments and dividend and interest income are translated to U.S. dollars using a spot market rate of exchange prevailing on the respective dates of such transactions. The portion of security gains or losses resulting from changes in foreign exchange rates is included with net realized and unrealized gain or loss from investments, as appropriate, for both financial reporting and tax purposes.
G. PURCHASED AND WRITTEN OPTION CONTRACTS — Certain of the Funds may purchase and write call or put options on securities and indices and enter into related closing transactions. As a holder of a call option, a Fund has the right, but not the obligation, to purchase a security at the exercise price during the exercise period. As the writer of a call option, a Fund has the obligation to sell the security at the exercise price during the exercise period. As a holder of a put option, a Fund has the right, but not the obligation, to sell a security at the exercise price during the exercise period. As the writer of a put option, a Fund has the obligation to buy the underlying security at the exercise price during the exercise period.
The premium that a Fund pays when purchasing a call option or receives when writing a call option will reflect, among other things, the market price of the security, the relationship of the exercise price to the market price of the security, the relationship of the exercise price to the volatility of the security, the length of the option period and supply and demand factors. The premium is the market value of an option.
A purchaser (holder) of a put option pays a non-refundable premium to the seller (writer) of a put option to obtain the right to sell a specified amount of a security at a fixed price (the exercise price) during a specified period (exercise period). Conversely, the seller (writer) of a put option, upon payment by the holder of the premium, has the obligation to buy the security from the holder of the put option at the exercise price during the exercise period.
An option that is written by a Fund is generally valued at the last sale price or, in the absence of the last sale price, the average of the quoted bid and asked prices. An option that is purchased by a Fund is generally valued at the last sale price or, in the absence of the last sale price, the average of the quoted bid and asked prices. If an options exchange closes after the time at which a Fund’s net asset value is calculated, the last sale or last bid and asked prices as of that time will be used to calculate the net asset value. The Funds may use options to generate income and to hedge against losses caused by declines in the prices of stocks in its portfolio or for any other permissible purpose consistent with the Funds’ investment objectives. A risk of using derivatives is that the counterparty to a derivative may fail to comply with their obligation to the Funds. See Note 8 for written option activity.
84
H. INDEMNIFICATIONS — Under the Funds’ organizational documents, officers and trustees are indemnified against certain liabilities arising out of the performance of their duties to the Funds. In addition, in the normal course of business, the Funds enter into contracts that provide general indemnification to other parties. The Funds’ maximum exposure under these arrangements is unknown as this would involve future claims that may be made against the Funds that have not yet occurred, and may not occur. However, the Funds have not had prior claims or losses pursuant to these contracts and expect the risk of loss to be remote.
I. RECENT ACCOUNTING PRONOUNCEMENT — In May 2011, the FASB issued ASU No. 2011-04 “Amendments to Achieve Common Fair Value Measurement and Disclosure Requirements” in GAAP and the International Financial Reporting Standards (“IFRS”), ASU No. 2011-04 amends FASB ASC Topic 820, “Fair Value Measurement and Disclosures” to establish common requirement for measuring fair value and disclosing information about fair value measurement in accordance with GAAP and IFRS, ASU 2011-04 is effective for fiscal years beginning after December 15, 2011 and for interim periods within those fiscal years. Management is currently evaluating the impact of these amendments to the financial statements.
2. FEDERAL TAX MATTERS:
The tax character of distributions paid during the year ended March 31, 2012 and the year ended March 31, 2011 was as follows:
| YEAR ENDED MARCH 31, 2012 | YEAR ENDED MARCH 31, 2011 | |||||||||||||||||||
| ORDINARY INCOME | RETURN OF CAPITAL | LONG-TERM CAPITAL GAINS* | ORDINARY INCOME | LONG-TERM CAPITAL GAINS* | ||||||||||||||||
Buffalo China Fund | 13,344 | — | — | — | — | |||||||||||||||
Buffalo Flexible Income Fund | 7,871,498 | — | — | 4,753,325 | — | |||||||||||||||
Buffalo Growth Fund | 1,721,915 | — | 6,284,742 | 300,984 | 33,240 | |||||||||||||||
Buffalo High Yield Fund | 14,274,625 | — | — | 11,432,171 | — | |||||||||||||||
Buffalo International Fund | 344,354 | — | — | 191,360 | — | |||||||||||||||
Buffalo Large Cap Fund | 62,922 | — | 201,892 | 105,420 | — | |||||||||||||||
Buffalo Micro Cap Fund | — | — | — | — | — | |||||||||||||||
Buffalo Mid Cap Fund | — | — | 13,548,232 | — | — | |||||||||||||||
Buffalo Science & Technology Fund | 2,035,668 | — | 19,711,973 | — | 6,266,862 | |||||||||||||||
Buffalo Small Cap Fund | — | 648 | 5,877,964 | — | — | |||||||||||||||
| * | The Funds designate as long-term capital gain dividends, pursuant to Internal Revenue Code Section 852(b)(3)(C), the amounts necessary to reduce the earnings and profits of the Funds related to net capital gain to zero. |
Total distributions paid differ from the Statements of Changes in Net Assets due primarily to the recharacterization of short-term capital gain distributions to ordinary distributions for tax purposes.
Additionally, U.S. generally accepted accounting principles require that certain components of net assets relating to permanent differences be reclassified between financial and tax reporting. These reclassifications have no effect on net assets or net asset value per share. For the year ended March 31, 2012, the following table shows the reclassifications made:
| UNDISTRIBUTED NET INVESTMENT INCOME/(LOSS) | ACCUMULATED NET REALIZED GAIN/(LOSS) | PAID IN CAPITAL | ||||||||||
Buffalo China Fund | $ | (1,140 | ) | $ | 1,140 | $ | — | |||||
Buffalo Flexible Income Fund | 32,538 | (32,538 | ) | — | ||||||||
Buffalo Growth Fund | 3,889 | (1,225 | ) | (2,664 | ) | |||||||
Buffalo High Yield Fund | 821,949 | (821,949 | ) | — | ||||||||
Buffalo International Fund | (86,382 | ) | 86,382 | — | ||||||||
Buffalo Large Cap Fund | — | (423 | ) | 423 | ||||||||
Buffalo Micro Cap Fund | 231,434 | — | (231,434 | ) | ||||||||
Buffalo Mid Cap Fund | 1,762,935 | — | (1,762,935 | ) | ||||||||
Buffalo Science & Technology Fund | 1,534,427 | (1,526,515 | ) | (7,912 | ) | |||||||
Buffalo Small Cap Fund | 102,074 | 648 | (102,722 | ) | ||||||||
The permanent differences primarily relate to foreign currency realized gain/loss, sale of premium bonds and net operating losses.
85
Notes to Financial Statements
March 31, 2012
(Continued)
As of March 31, 2012, the components of accumulated earnings (losses) for income tax purposes were as follows:
| BUFFALO CHINA FUND | BUFFALO FLEXIBLE INCOME FUND | BUFFALO GROWTH FUND | BUFFALO HIGH YIELD FUND | BUFFALO INTERNATIONAL FUND | ||||||||||||||||
Tax cost of Investments(a) | $ | 19,538,122 | $ | 332,224,777 | $ | 437,906,416 | $ | 236,200,459 | $ | 56,782,412 | ||||||||||
|
|
|
|
|
|
|
|
|
| |||||||||||
Unrealized Appreciation | 1,939,297 | 44,323,788 | 84,212,929 | 19,016,542 | 11,231,635 | |||||||||||||||
Unrealized Depreciation | (1,564,764 | ) | (3,033,864 | ) | (13,435,229 | ) | (3,612,571 | ) | (2,821,350 | ) | ||||||||||
|
|
|
|
|
|
|
|
|
| |||||||||||
Net unrealized appreciation | 374,533 | 41,289,924 | 70,777,700 | 15,403,971 | 8,410,285 | |||||||||||||||
|
|
|
|
|
|
|
|
|
| |||||||||||
Undistributed Ordinary Income | 18,567 | 309,621 | 1,165,383 | 1,546,900 | — | |||||||||||||||
Undistributed Long Term Capital Gain | — | — | — | — | — | |||||||||||||||
|
|
|
|
|
|
|
|
|
| |||||||||||
Distributable earnings | 18,567 | 309,621 | 1,165,383 | 1,546,900 | — | |||||||||||||||
|
|
|
|
|
|
|
|
|
| |||||||||||
Other accumulated loss | (12,005,217 | ) | (2,698,291 | ) | (1,921,701 | ) | (833,864 | ) | (7,177,744 | ) | ||||||||||
|
|
|
|
|
|
|
|
|
| |||||||||||
Total accumulated gain/(loss) | (11,612,117 | ) | 38,901,254 | 70,021,382 | 16,117,007 | 1,232,541 | ||||||||||||||
|
|
|
|
|
|
|
|
|
| |||||||||||
| BUFFALO LARGE CAP FUND | BUFFALO MICRO CAP FUND | BUFFALO MID CAP FUND | BUFFALO SCIENCE & TECHNOLOGY FUND | BUFFALO SMALL CAP FUND | ||||||||||||||||
Tax cost of Investments(a) | $ | 30,398,270 | $ | 28,499,422 | $ | 574,943,050 | $ | 335,195,243 | $ | 1,824,990,395 | ||||||||||
|
|
|
|
|
|
|
|
|
| |||||||||||
Unrealized Appreciation | 8,390,689 | 13,659,537 | 184,020,664 | 95,859,484 | 1,063,301,391 | |||||||||||||||
Unrealized Depreciation | (818,889 | ) | (1,381,839 | ) | (21,524,703 | ) | (12,446,595 | ) | (93,428,993 | ) | ||||||||||
|
|
|
|
|
|
|
|
|
| |||||||||||
Net unrealized appreciation | 7,571,800 | 12,277,698 | 162,495,961 | 83,412,889 | 969,872,398 | |||||||||||||||
|
|
|
|
|
|
|
|
|
| |||||||||||
Undistributed Ordinary Income | 58,772 | — | — | — | — | |||||||||||||||
Undistributed Long Term Capital Gain | 1,627,395 | — | 15,667,020 | 15,248,774 | — | |||||||||||||||
|
|
|
|
|
|
|
|
|
| |||||||||||
Distributable earnings | 1,686,167 | — | 15,667,020 | 15,248,774 | — | |||||||||||||||
|
|
|
|
|
|
|
|
|
| |||||||||||
Other accumulated loss | — | (4,843,091 | ) | (648,266 | ) | (91,015 | ) | (57,756,104 | ) | |||||||||||
|
|
|
|
|
|
|
|
|
| |||||||||||
Total accumulated gain | 9,257,967 | 7,434,607 | 177,514,715 | 98,570,648 | 912,116,294 | |||||||||||||||
|
|
|
|
|
|
|
|
|
| |||||||||||
The difference between book-basis and tax-basis unrealized appreciation is attributable primarily to the tax deferral of losses on wash sales, premium amortization and Trust Preferred Instrument & Contingent Payment Debt Instrument adjustments.
| (a) | Represents cost for federal income tax purposes and may differ from the cost for financial reporting purposes. |
The Buffalo Micro Cap Fund utilized $1,748,789 of prior year capital loss carryover in the current year. As of March 31, 2012, the accumulated net realized loss on sales of investments and losses deferred for federal income tax purposes which are available to offset future taxable gains are as follows:
| BUFFALO CHINA FUND | ||||||||||||||||
| MONTH/ YEAR REALIZED | MONTH/ YEAR EXPIRING | ST | LT | |||||||||||||
| March-09 | March-17 | 1,307,508 | — | |||||||||||||
| March-10 | March-18 | 7,794,631 | — | |||||||||||||
| March-11 | March-19 | 843,515 | — | |||||||||||||
| March-12 | Unlimited | 919,459 | 664,542 | |||||||||||||
|
|
|
| |||||||||||||
| Totals | 10,865,113 | 664,542 | ||||||||||||||
|
|
|
| |||||||||||||
| BUFFALO FLEXIBLE INCOME FUND | ||||||||||||||||
| MONTH/ YEAR REALIZED | MONTH/ YEAR EXPIRING | ST | LT | |||||||||||||
| March-09 | March-17 | 261,035 | — | |||||||||||||
| March-10 | March-18 | 57,091 | — | |||||||||||||
| March-11 | March-19 | 428,749 | — | |||||||||||||
| March-12 | Unlimited | — | 1,346,654 | |||||||||||||
|
|
|
| |||||||||||||
| Totals | 746,875 | 1,346,654 | ||||||||||||||
|
|
|
| |||||||||||||
86
| BUFFALO GROWTH FUND | ||||||||||||||||
| MONTH/ YEAR REALIZED | MONTH/ YEAR EXPIRING | ST | LT | |||||||||||||
| March-12 | Unlimited | 1,921,701 | — | |||||||||||||
|
|
|
| |||||||||||||
| Totals | 1,921,701 | — | ||||||||||||||
|
|
|
| |||||||||||||
| BUFFALO HIGH YIELD FUND | ||||||||||||||||
| MONTH/ YEAR REALIZED | MONTH/ YEAR EXPIRING | ST | LT | |||||||||||||
| March-10 | March-18 | 310,660 | — | |||||||||||||
| March-12 | Unlimited | 460,435 | — | |||||||||||||
|
|
|
| |||||||||||||
| Totals | 771,095 | — | ||||||||||||||
|
|
|
| |||||||||||||
| BUFFALO INTERNATIONAL FUND | ||||||||||||||||
| MONTH/ YEAR REALIZED | MONTH/ YEAR EXPIRING | ST | LT | |||||||||||||
| March-09 | March-17 | 970,960 | — | |||||||||||||
| March-10 | March-18 | 2,976,289 | — | |||||||||||||
| March-12 | Unlimited | 735,535 | 809,320 | |||||||||||||
|
|
|
| |||||||||||||
| Totals | 4,682,784 | 809,320 | ||||||||||||||
|
|
|
| |||||||||||||
| BUFFALO LARGE CAP FUND | ||||||||||||||||
| MONTH/ YEAR REALIZED | MONTH/ YEAR EXPIRING | ST | LT | |||||||||||||
| March-12 | Unlimited | — | — | |||||||||||||
|
|
|
| |||||||||||||
| Totals | — | — | ||||||||||||||
|
|
|
| |||||||||||||
| BUFFALO MICRO CAP FUND | ||||||||||||||||
| MONTH/ YEAR REALIZED | MONTH/ YEAR EXPIRING | ST | LT | |||||||||||||
| March-10 | March-18 | 4,749,853 | — | |||||||||||||
| March-12 | Unlimited | — | — | |||||||||||||
|
|
|
| |||||||||||||
| Totals | 4,749,853 | — | ||||||||||||||
|
|
|
| |||||||||||||
| BUFFALO MID CAP FUND | ||||||||||||||||
| MONTH/ YEAR REALIZED | MONTH/ YEAR EXPIRING | ST | LT | |||||||||||||
| March-12 | Unlimited | — | — | |||||||||||||
|
|
|
| |||||||||||||
| Totals | — | — | ||||||||||||||
|
|
|
| |||||||||||||
| BUFFALO SCIENCE & TECHNOLOGY FUND | ||||||||||||||||
| MONTH/ YEAR REALIZED | MONTH/ YEAR EXPIRING | ST | LT | |||||||||||||
| March-12 | Unlimited | — | — | |||||||||||||
|
|
|
| |||||||||||||
| Totals | — | — | ||||||||||||||
|
|
|
| |||||||||||||
| BUFFALO SMALL CAP FUND | ||||||||||||||||
| MONTH/ YEAR REALIZED | MONTH/ YEAR EXPIRING | ST | LT | |||||||||||||
| March-12 | Unlimited | — | 57,756,104 | |||||||||||||
|
|
|
| |||||||||||||
| Totals | — | 57,756,104 | ||||||||||||||
|
|
|
| |||||||||||||
87
Notes to Financial Statements
March 31, 2012
(Continued)
RIC Modernization Act — On December 22, 2010, the Regulated Investment Company Modernization Act of 2010 (the “Act”) was enacted, which changed various technical rules governing the tax treatment of regulated investment companies. The changes are generally effective for taxable years beginning after the date of enactment. One of the more prominent changes addresses capital loss carryforwards. Under the Act, each Fund will be permitted to carry forward losses incurred in taxable years beginning after the date of enactment for an unlimited period. However, any losses incurred during those future years will be required to be utilized prior to the losses incurred in pre-enactment years, which carry an expiration date. As a result of this ordering rule, pre-enactment capital loss carryforwards may be more likely to expire unused. Additionally, post-enactment capital loss carryforward will retain their characteristics as either short-term or long-term capital losses rather than being considered all short-term as permitted under previous regulations.
At March 31, 2012, the following Funds deferred, on a tax basis, qualified late year losses, consisting of ordinary late year losses and post-October losses, as follows:
| LATE YEAR ORDINARY LOSSES | POST OCTOBER CAPITAL LOSSES | |||||||
Buffalo China Fund | $ | — | $ | 475,148 | ||||
Buffalo Flexible Income Fund | $ | — | $ | 643,683 | ||||
Buffalo High Yield Fund | $ | — | $ | 62,769 | ||||
Buffalo International Fund | $ | 35,470 | $ | 1,649,383 | ||||
Buffalo Micro Cap Fund | $ | 93,238 | $ | — | ||||
Buffalo Mid Cap Fund | $ | 648,266 | $ | — | ||||
Buffalo Science & Technology Fund | $ | 91,015 | $ | — | ||||
For the year ended March 31, 2012, the Buffalo International Fund and the Buffalo China Fund earned foreign source income and paid foreign taxes which they intend to pass through to their shareholders pursuant to Section 853 of the Internal Revenue Code as follows:
| Buffalo China Fund | ||||||||
| Country | Gross Dividend Per Share | Taxes Withheld Per Share | ||||||
Bermuda | $ | 13,582 | $ | — | ||||
China | 218,770 | 21,877 | ||||||
Hong Kong | 222,515 | 14,943 | ||||||
Cayman Islands | 38,149 | — | ||||||
|
|
|
| |||||
Total | $ | 493,016 | $ | 36,820 | ||||
| Buffalo International Fund | ||||||||
| Country | Gross Dividend Per Share | Taxes Withheld Per Share | ||||||
Austria | $ | 6,600 | $ | — | ||||
Bermuda | 84,389 | — | ||||||
Brazil | 213,973 | 10,475 | ||||||
Canada | 3,276 | 491 | ||||||
Switzerland | 60,707 | 5,102 | ||||||
Chile | 27,061 | 9,471 | ||||||
Germany | 128,640 | 21,106 | ||||||
Spain | 2,747 | 522 | ||||||
France | 138,564 | 21,457 | ||||||
United Kingdom | 136,611 | — | ||||||
Hong Kong | 106,646 | 4,449 | ||||||
Israel | 17,914 | 3,163 | ||||||
India | 23,513 | — | ||||||
Japan | 27,301 | 1,911 | ||||||
Cayman Islands | 47,890 | — | ||||||
Luxembourg | 57,120 | 8,568 | ||||||
Mexico | 5,886 | — | ||||||
Malaysia | 10,439 | — | ||||||
Netherlands | 70,728 | 7,116 | ||||||
Norway | 8,235 | 1,235 | ||||||
Sweden | 25,773 | 3,866 | ||||||
Singapore | 7,558 | — | ||||||
Taiwan | 31,968 | 6,394 | ||||||
|
|
|
| |||||
Total | $ | 1,243,539 | $ | 105,326 | ||||
3. RELATED PARTY TRANSACTIONS:
Management fees are paid to Kornitzer Capital Management, Inc. (“KCM”) at the rate of 1.00% per annum of the average daily net asset values of the Funds, except for the Buffalo China Fund, Buffalo Micro Cap Fund, Buffalo Growth Fund and Buffalo Large Cap Fund which have a management fee rate of 1.50%, 1.45%, 0.90% and 0.90%, respectively. The management fees are for services which include the costs of all management, supervisory and administrative services required in the normal operation of the Funds. This includes investment management and supervision; fees of the custodian (except for the additional cost of maintaining custody of assets in foreign jurisdictions, when compared to domestic custody costs), independent registered public accounting firm and
88
legal counsel; fees and expenses of officers, trustees and other personnel; rent; shareholder services; and other items incidental to corporate administration. Pursuant to a Master Services Agreement with U.S. Bancorp Fund Services, LLC (“U.S. Bancorp”), KCM pays U.S. Bancorp a fee of 30/100 of 1% (0.30%) of each Fund’s average daily net assets out of the fees KCM receives from the Funds, except for the Buffalo Growth Fund and the Buffalo Large Cap Fund, where U.S. Bancorp receives 25/100 of 1% (0.25%). U.S. Bancorp provides or obtains various operational services required by the Funds, pays various Fund expenses and acts as paying agent to compensate other Fund service providers. Some of the other Fund service providers are affiliates of U.S. Bancorp.
The management fees do not include the cost of acquiring and disposing of portfolio securities, taxes, if any, imposed directly on the Funds and their shares, insurance, certain trustee expenses and the cost of qualifying the Funds’ shares for sale in any jurisdiction. Certain officers and a trustee of the Funds are also officers and/or directors of KCM.
A trustee of the Funds is affiliated with U.S. Bancorp and U.S. Bank, N.A., which provide accounting, administration, transfer agency and custodian services to the Funds, as described above.
4. AGGREGATE COMPENSATION TO TRUSTEES:
The Funds do not directly compensate any of their trustees. U.S. Bancorp pays trustee fees to non-interested Board members from its share of the management fee that it receives from KCM. The aggregate compensation paid to the Funds’ non-interested trustees for their service on the Funds’ Boards for the year ended March 31, 2012 was $125,500. Interested trustees who are affiliated with either KCM or the Funds’ service providers do not receive any compensation from the Funds, but are compensated directly by the advisor or service provider in connection with their employment with those entities.
5. REDEMPTION FEE:
Shares of the Buffalo Flexible Income Fund, Buffalo International Fund, Buffalo China Fund, Buffalo Large Cap Fund, Buffalo Mid Cap Fund, Buffalo Science & Technology Fund and Buffalo Growth Fund sold or exchanged within 60 days of their purchase and shares of the Buffalo High Yield Fund, Buffalo Micro Cap Fund and Buffalo Small Cap Fund sold or exchanged within 180 days of their purchase are subject to a redemption fee of 2.00% of the value of the shares sold or exchanged. The Funds will employ the “first in, first out” method to calculate the 60-day or 180-day holding period. The redemption fee is retained by the Funds and will help pay transaction and tax costs that long-term investors may bear when the Funds realize capital gains as a result of selling securities to meet investor redemptions.
6. INVESTMENT TRANSACTIONS:
The aggregate purchases and sales of securities, excluding short-term investments and U.S. government securities, for the Funds for the year ended March 31, 2012, were as follows:
| BUFFALO CHINA FUND | BUFFALO FLEXIBLE INCOME FUND | BUFFALO GROWTH FUND | BUFFALO HIGH YIELD FUND | BUFFALO INTERNATIONAL FUND | ||||||||||||||||
Purchases | $ | 21,850,457 | $ | 188,861,661 | $ | 329,613,350 | $ | 67,467,471 | $ | 30,215,624 | ||||||||||
Proceeds from sales | $ | 21,072,088 | $ | 37,886,537 | $ | 191,865,993 | $ | 45,752,371 | $ | 17,151,927 | ||||||||||
| BUFFALO LARGE CAP FUND | BUFFALO MICRO CAP FUND | BUFFALO MID CAP FUND | BUFFALO SCIENCE & TECHNOLOGY FUND | BUFFALO SMALL CAP FUND | ||||||||||||||||
Purchases | $ | 20,831,100 | $ | 11,937,678 | $ | 216,357,550 | $ | 196,497,062 | $ | 631,055,641 | ||||||||||
Proceeds from Sales | $ | 19,786,832 | $ | 9,890,872 | $ | 232,989,956 | $ | 178,817,442 | $ | 917,961,681 | ||||||||||
There were no purchases or sales of long-term U.S. government securities for any Funds during the year ended March 31, 2012.
89
Notes to Financial Statements
March 31, 2012
(Continued)
7. TRANSACTIONS WITH AFFILIATES:*
Investments representing 5% or more of the outstanding voting securities of a portfolio company result in that company being considered an affiliated company, as defined in the 1940 Act. The aggregate fair value of all securities of affiliated companies held in the Buffalo Small Cap Fund as of March 31, 2012 amounted to $610,477,923, representing 22.05% of net assets. There were no affiliated companies held in any other Funds. A summary of affiliated transactions for each company which is an affiliate at March 31, 2012 or was an affiliate during the period ended March 31, 2012 is as follows:
| ALIGN TECHNOLOGY, INC. | AMERISTAR CASINOS, INC.(1) | ATHENAHEALTH INC. | CABOT MICROELECTRONICS CORP. | CAREER EDUCATION CORP.(1) | COLDWATER CREEK, INC. | CORINTHIAN COLLEGES, INC. | THE CORPORATE EXECUTIVE BOARD CO. | |||||||||||||||||||||||||
March 31, 2011 Balance | ||||||||||||||||||||||||||||||||
Shares | 5,344,525 | — | 1,863,300 | 1,359,346 | — | 6,937,300 | 7,117,865 | 2,582,860 | ||||||||||||||||||||||||
Cost | $ | 66,543,681 | $ | — | $ | 54,878,782 | $ | 39,829,631 | $ | — | $ | 53,634,537 | $ | 94,852,258 | $ | 50,126,033 | ||||||||||||||||
Gross Additions | ||||||||||||||||||||||||||||||||
Shares | — | — | — | — | — | — | — | — | ||||||||||||||||||||||||
Cost | $ | — | $ | — | $ | — | $ | — | $ | — | $ | — | $ | — | $ | — | ||||||||||||||||
Gross Deductions | ||||||||||||||||||||||||||||||||
Shares | 1,050,100 | 1,232,444 | 113,950 | 197,096 | 2,750 | 2,310,250 | 2,878,515 | 189,650 | ||||||||||||||||||||||||
Cost | $ | 20,537,553 | $ | 21,789,647 | $ | 4,252,226 | $ | 6,071,788 | $ | 64,907 | $ | 27,072,826 | $ | 43,147,718 | $ | 4,627,620 | ||||||||||||||||
March 31, 2012 Balance | ||||||||||||||||||||||||||||||||
Shares | 4,294,425 | — | — | — | — | — | — | 2,393,210 | ||||||||||||||||||||||||
Cost | $ | 46,006,128 | $ | — | $ | — | $ | — | $ | — | $ | — | $ | — | $ | 45,498,413 | ||||||||||||||||
|
|
|
|
|
|
|
|
|
|
|
|
|
|
|
| |||||||||||||||||
Realized gain (loss) | $ | 5,477,657 | $ | 49,176 | $ | 2,251,368 | $ | 3,728,734 | $ | (39,845 | ) | $ | (23,504,925 | ) | $ | (37,768,279 | ) | $ | 2,922,437 | |||||||||||||
|
|
|
|
|
|
|
|
|
|
|
|
|
|
|
| |||||||||||||||||
Investment income | $ | — | $ | 571,587 | $ | — | $ | — | $ | — | $ | — | $ | — | $ | 1,581,099 | ||||||||||||||||
|
|
|
|
|
|
|
|
|
|
|
|
|
|
|
| |||||||||||||||||
| DEALERTRACK HOLDINGS INC. | DICE HOLDINGS INC.(1) | FORMFACTOR, INC. | INTERNAP NETWORK SERVICES CORP. | LIFE TIME FITNESS, INC. | MANHATTAN ASSOCIATES, INC. | MKS INSTRUMENTS, INC. | OXFORD INDUSTRIES, INC. | |||||||||||||||||||||||||
March 31, 2011 Balance | ||||||||||||||||||||||||||||||||
Shares | 3,342,000 | — | 3,215,725 | 2,767,000 | 2,593,950 | 1,854,492 | 3,266,068 | 1,008,225 | ||||||||||||||||||||||||
Cost | $ | 55,972,808 | $ | — | $ | 53,967,198 | $ | 42,868,707 | $ | 54,203,086 | $ | 36,681,449 | $ | 60,490,590 | $ | 26,636,601 | ||||||||||||||||
Gross Additions | ||||||||||||||||||||||||||||||||
Shares | — | — | — | 363,500 | — | — | — | — | ||||||||||||||||||||||||
Cost | $ | — | $ | — | $ | — | $ | 2,557,387 | $ | — | $ | — | $ | — | $ | — | ||||||||||||||||
Gross Deductions | ||||||||||||||||||||||||||||||||
Shares | 554,950 | — | 683,325 | — | 476,850 | 826,692 | 643,918 | 52,400 | ||||||||||||||||||||||||
Cost | $ | 10,382,146 | $ | — | $ | 17,730,640 | $ | — | $ | 18,852,584 | $ | 18,110,300 | $ | 14,594,356 | $ | 2,338,786 | ||||||||||||||||
March 31, 2012 Balance | ||||||||||||||||||||||||||||||||
Shares | 2,787,050 | 3,299,725 | — | 3,130,500 | — | — | — | 955,825 | ||||||||||||||||||||||||
Cost | $ | 45,590,662 | $ | 38,056,552 | $ | — | $ | 45,426,094 | $ | — | $ | — | $ | — | $ | 24,297,815 | ||||||||||||||||
|
|
|
|
|
|
|
|
|
|
|
|
|
|
|
| |||||||||||||||||
Realized gain (loss) | $ | 5,635,702 | $ | — | $ | (11,694,422 | ) | $ | — | $ | (434,341 | ) | $ | 17,810,136 | $ | 4,709,163 | $ | 214,920 | ||||||||||||||
|
|
|
|
|
|
|
|
|
|
|
|
|
|
|
| |||||||||||||||||
Investment income | $ | — | $ | — | $ | — | $ | — | $ | — | $ | — | $ | 1,295,220 | $ | 524,277 | ||||||||||||||||
|
|
|
|
|
|
|
|
|
|
|
|
|
|
|
| |||||||||||||||||
| * | As a result of the Buffalo Small Cap Fund’s beneficial ownership of common stock of these companies, regulators require that the Fund state that it may be deemed an affiliate of the respective issuer. The Fund disclaims that the “affiliated persons” are affiliates of the Distributors, Advisor, Funds or any other client of the Advisor. |
90
| P.F. CHANG’S CHINA BISTRO, INC. | STRATASYS INC | UNIVERSAL TECHNICAL INSTITUTE, INC.(2) | WMS INDUSTRIES, INC.(1) | WRIGHT MEDICAL GROUP, INC.(1)(2) | XO GROUP, INC.(3) | TOTAL | ||||||||||||||||||||||||
March 31, 2011 Balance | ||||||||||||||||||||||||||||||
Shares | 2,250,500 | — | 1,240,000 | — | — | 2,037,600 | ||||||||||||||||||||||||
Cost | $ | 78,881,641 | $ | — | $ | 18,091,918 | $ | — | $ | — | $ | 33,497,552 | $ | 821,156,472 | ||||||||||||||||
Gross Additions | ||||||||||||||||||||||||||||||
Shares | — | 211,300 | — | 388,000 | — | — | ||||||||||||||||||||||||
Cost | $ | — | $ | 4,972,382 | $ | — | $ | 12,352,507 | $ | — | $ | — | $ | 19,882,276 | ||||||||||||||||
Gross Deductions | ||||||||||||||||||||||||||||||
Shares | 332,500 | — | — | — | — | 605,000 | ||||||||||||||||||||||||
Cost | $ | 14,933,520 | $ | — | $ | — | $ | — | $ | — | $ | 11,683,898 | $ | 214,400,869 | ||||||||||||||||
March 31, 2012 Balance | ||||||||||||||||||||||||||||||
Shares | 1,918,000 | 1,323,750 | — | 3,304,525 | — | — | ||||||||||||||||||||||||
Cost | $ | 63,948,120 | $ | 38,322,219 | $ | — | $ | 60,742,586 | $ | — | $ | — | $ | 407,888,589 | ||||||||||||||||
|
|
|
|
|
|
|
|
|
|
|
|
|
| |||||||||||||||||
Realized gain (loss) | $ | (5,467,123 | ) | $ | — | $ | — | $ | — | $ | — | $ | (7,204,368 | ) | $ | (43,314,010 | ) | |||||||||||||
|
|
|
|
|
|
|
|
|
|
|
|
|
| |||||||||||||||||
Investment income | $ | 2,042,180 | $ | — | $ | — | $ | — | $ | — | $ | — | $ | 6,014,363 | ||||||||||||||||
|
|
|
|
|
|
|
|
|
|
|
|
|
| |||||||||||||||||
| * | As a result of the Buffalo Small Cap Fund’s beneficial ownership of common stock of these companies, regulators require that the Fund state that it may be deemed an affiliate of the respective issuer. The Fund disclaims that the “affiliated persons” are affiliates of the Distributors, Advisor, Funds or any other client of the Advisor. |
| (1) | Security is an affiliate due to decrease in the outstanding shares of the issuing company |
| (2) | Security no longer an affiliate due to an increase in the outstanding shares of issuing company |
| (3) | The Knot, Inc. became XO Group, Inc. on 6/28/2011 |
Note: Schedule may not roll forward, as the schedule only reflects activity during the time the Fund was deemed an affiliate (held more than 5% of a Stock’s outstanding securities).
8. OPTIONS WRITTEN:
FASB ASC 815, Derivatives and Hedging (ASC 815) is intended to improve financial reporting about derivative instruments by requiring enhanced disclosures to enable investors to better understand how and why the Funds use derivative instruments, how these derivative instruments are accounted for and their effects on the Funds’ financial position and results of operations. The Buffalo Flexible Income Fund is the only Fund that has maintained any positions in derivative instruments or engaged in hedging activities during the year ended March 31, 2012.
For additional information regarding derivative instruments and hedging activities of the Buffalo Flexible Income Fund please refer to Note 1.G to understand how and why the Buffalo Flexible Income Fund uses derivatives.
The number of option contracts written and the premiums received by the Buffalo Flexible Income Fund during the year ended March 31, 2012 were as follows:
| CALL OPTIONS WRITTEN | ||||||||
| CONTRACTS | PREMIUMS | |||||||
Outstanding, March 31, 2011 | 350 | $ | 8,970 | |||||
Options written | 21,343 | 855,865 | ||||||
Options terminated in closing transaction | — | — | ||||||
Options exercised | (6,924 | ) | (257,814 | ) | ||||
Options expired | (11,243 | ) | (397,395 | ) | ||||
|
|
|
| |||||
Outstanding, March 31, 2012 | 3,526 | $ | 209,626 | |||||
|
|
|
| |||||
The following is a summary of the location of derivative investments on the Buffalo Flexible Income Fund’s Statement of Assets and Liabilities as of March 31, 2012:
| LOCATION ON THE STATEMENT OF ASSETS AND LIABILITIES | ||||
| DERIVATIVE INVESTMENT TYPE | LIABILITY DERIVATIVES | FAIR VALUE | ||
Options — equity contracts | Written options, at value | $170,705 | ||
The following is a summary of the location of derivative investments, realized gain (loss) on derivative instruments recognized and change in unrealized gain (loss) on derivative instruments recognized on the Buffalo Flexible Income Fund’s Statement of Operations for the year ended March 31, 2012:
| DERIVATIVE INVESTMENT TYPE | LOCATION OF GAIN (LOSS) ON DERIVATIVES | REALIZED GAIN ON DERIVATIVE INVESTMENTS | UNREALIZED GAIN ON DERIVATIVE INVESTMENTS | |||
Options — equity contracts | Net realized gain (loss) from options written | $397,395 | $47,701 |
91
Notes to Financial Statements
March 31, 2012
(Continued)
9. FOREIGN INVESTMENT RISK:
When the Buffalo China Fund or the Buffalo International Fund buys or sells securities on a foreign stock exchange, the transaction is undertaken in the local currency rather than in U.S. dollars. In purchasing or selling local currency to execute transactions on foreign exchanges, the Buffalo China Fund and the Buffalo International Fund will be exposed to the risk that the value of the foreign currency will increase or decrease, which may impact the value of the portfolio holdings and your investment. China has, and may continue to adopt, internal economic policies that affect its currency valuations in a manner that may be disadvantageous for U.S. investors or U.S. companies seeking to do business in China. In addition, a country may impose formal or informal currency exchange controls (or “capital controls”). These types of controls may restrict or prohibit the Buffalo China Fund’s ability to repatriate both investment capital and income, which could undermine the value of the portfolio holdings and potentially place the Buffalo China Fund’s assets at risk of total loss.
Investing in securities of foreign corporations and governments involves additional risks relating to: political, social, religious and economic developments abroad; market instability; fluctuations in foreign exchange rates; different regulatory requirements, market practices, accounting standards and practices; and less publicly available information about foreign issuers. Additionally, these investments maybe less liquid, carry higher brokerage commissions and other fees, and procedures and regulations governing transactions and custody in foreign markets also may involve delays in payment, delivery or recovery of money or investments. Investments in common stocks of U.S. companies with international operations, and the purchase of sponsored or unsponsored ADRs (American Depositary Receipt) carry similar risks. In addition to risks associated with investing in foreign securities, there are special risks associated with investments in China and Hong Kong, including exposure to currency fluctuations, less liquidity, expropriation, confiscatory taxation, nationalization, exchange control regulations, differing legal standards and rapid fluctuations in inflation and interest rates. The Chinese government could, at any time, alter or discontinue economic reform programs implemented since 1978.
10. SUBSEQUENT EVENTS:
Management has evaluated the events and transactions that have occurred after March 31, 2012 and through the date the financial statements were issued. Effective May 23, 2012, Ms. Shelly Ma, a co-portfolio manager of the Buffalo China Fund and the Buffalo International Fund has resigned from Kornitzer Capital Management. The Buffalo China Fund continues to be co-managed by Mr. William Kornitzer, Ms. Nicole Kornitzer and Mr. Yulin Li. The Buffalo International Fund continues to be co-managed by Mr. William Kornitzer and Ms. Nicole Kornitzer.
The Board of Trustees of Buffalo Funds approved a change to the name of the Buffalo Science & Technology Fund. Effective June 29, 2012, the Science & Technology Fund’s name will be changed to Buffalo Discovery Fund.
This report has been prepared for the information of the shareholders of the Funds, and is not to be construed as an offering of the shares of the Funds. Shares of the Funds are offered only by the Prospectus, a copy of which may be obtained from Buffalo Funds c/o U.S. Bancorp Fund Services, LLC, 1-800-49-BUFFALO or at www.buffalofunds.com.
92
Report of Independent Registered Public Accounting Firm
The Board of Trustees and Shareholders
Buffalo Funds
We have audited the accompanying statements of assets and liabilities of the Buffalo Funds (comprised of Buffalo Flexible Income Fund, Buffalo Growth Fund, Buffalo High Yield Fund, Buffalo International Fund, Buffalo China Fund, Buffalo Large Cap Fund, Buffalo Micro Cap Fund, Buffalo Mid Cap Fund, Buffalo Science & Technology Fund and Buffalo Small Cap Fund) (collectively referred to herein as “the Funds”), including the schedule of investments, as of March 31, 2012, and the related statements of operations for the year then ended, the statements of changes in net assets for each of the two years in the period then ended, and financial highlights for the periods indicated therein. These financial statements and financial highlights are the responsibility of the Funds’ management. Our responsibility is to express an opinion on these financial statements and financial highlights based on our audits.
We conducted our audits in accordance with the standards of the Public Company Accounting Oversight Board (United States). Those standards require that we plan and perform the audit to obtain reasonable assurance about whether the financial statements and financial highlights are free of material misstatement. We were not engaged to perform an audit of the Funds’ internal control over financial reporting. Our audits included consideration of internal control over financial reporting as a basis for designing audit procedures that are appropriate in the circumstances, but not for the purpose of expressing an
opinion on the effectiveness of the Funds’ internal control over financial reporting. Accordingly, we express no such opinion. An audit also includes examining, on a test basis, evidence supporting the amounts and disclosures in the financial statements and financial highlights, assessing the accounting principles used and significant estimates made by management, and evaluating the overall financial statement presentation. Our procedures included confirmation of securities owned as of March 31, 2012, by correspondence with the custodian and brokers or by other appropriate auditing procedures where replies from brokers were not received. We believe that our audits provide a reasonable basis for our opinion.
In our opinion, the financial statements and financial highlights referred to above present fairly, in all material respects, the financial position of each of the portfolios constituting the Buffalo Funds at March 31, 2012, the results of their operations for the year then ended, the changes in their net assets for each of the two years in the period then ended, and financial highlights for the periods indicated therein, in conformity with U.S. generally accepted accounting principles.

Kansas City, Missouri
May 29, 2012
93
Notice to Shareholders
March 31, 2012
TAX INFORMATION
For the fiscal year ended March 31, 2012, certain dividends paid by the Funds may be subject to a maximum tax rate of 15%, as provided for by the Jobs and Growth Tax Relief Reconciliation Act of 2003. The percentage of dividends declared from ordinary income designated as qualified dividend income was as follows (unaudited):
Buffalo Flexible Income Fund | 50.52% | |||
Buffalo China Fund | 100.00% | |||
Buffalo Growth Fund | 85.60% | |||
Buffalo High Yield Fund | 7.48% | |||
Buffalo International Fund | 100.00% |
Buffalo Large Cap Fund | 100.00% | |||
Buffalo Micro Cap Fund | 0.00% | |||
Buffalo Mid Cap Fund | 0.00% | |||
Buffalo Science & Technology Fund | 93.91% | |||
Buffalo Small Cap Fund | 0.00% |
For corporate shareholders, the percent of ordinary income distributions qualifying for the corporate dividends received deduction for the fiscal year ended March 31, 2012 was as follows (unaudited):
Buffalo Flexible Income Fund | 45.56% | |||
Buffalo China Fund | 0.00% | |||
Buffalo Growth Fund | 84.47% | |||
Buffalo High Yield Fund | 5.85% | |||
Buffalo International Fund | 0.00% |
Buffalo Large Cap Fund | 100.00% | |||
Buffalo Micro Cap Fund | 0.00% | |||
Buffalo Mid Cap Fund | 0.00% | |||
Buffalo Science & Technology Fund | 91.10% | |||
Buffalo Small Cap Fund | 0.00% |
FOREIGN SHAREHOLDERS: The percentage of ordinary income distributions that are designated as interest-related dividends under Internal Revenue Code Section 871(k)(1)(C) for the year ended March 31, 2012 was as follows (unaudited):
Buffalo Flexible Income Fund | 53.73% | |||
Buffalo China Fund | 0.00% | |||
Buffalo Growth Fund | 0.00% | |||
Buffalo High Yield Fund | 80.90% | |||
Buffalo International Fund | 0.00% |
Buffalo Large Cap Fund | 0.00% | |||
Buffalo Micro Cap Fund | 0.00% | |||
Buffalo Mid Cap Fund | 0.00% | |||
Buffalo Science & Technology Fund | 0.00% | |||
Buffalo Small Cap Fund | 0.00% |
FOREIGN SHAREHOLDERS: The percentage of taxable ordinary income distributions that are designated as short-term capital gain distributions under Internal Revenue Section 871(k)(2)(C) for the year ended March 31, 2012 was as follows (unaudited).
Buffalo Flexible Income Fund | 0.00% | |||
Buffalo China Fund | 0.00% | |||
Buffalo Growth Fund | 95.98% | |||
Buffalo High Yield Fund | 0.00% | |||
Buffalo International Fund | 0.00% |
Buffalo Large Cap Fund | 0.00% | |||
Buffalo Micro Cap Fund | 0.00% | |||
Buffalo Mid Cap Fund | 0.00% | |||
Buffalo Science & Technology Fund | 100.00% | |||
Buffalo Small Cap Fund | 0.00% |
94
Trustees and Officers of the Funds (unaudited)
The management and affairs for the Funds are supervised by the Trustees (“Trustees”) under the laws of the particular Fund’s state of organization. The Trustees and executive officers of the Funds and their principal occupations for the last five years are set forth below. Each may have held other positions with the named companies during that period. The Funds’ Statement of Additional Information includes additional information about the Trustees and is available without charge, upon request, by calling the Funds toll-free at 1-800-49-BUFFALO.
| NAME, AGE AND ADDRESS | POSITION(S) HELD WITH FUNDS | TERM OF OFFICE AND LENGTH OF TIME SERVED | PRINCIPAL OCCUPATION(S) DURING PAST 5 YEARS | NUMBER OF FUNDS IN COMPLEX OVERSEEN BY DIRECTOR | OTHER DIRECTORSHIPS HELD BY DIRECTOR | |||||
| INTERESTED TRUSTEES(1) | ||||||||||
Joseph C. Neuberger (50) 777 E. Wisconsin Ave. Milwaukee, WI 53202 | Trustee
Chairman | Indefinite term and served since May 2003.
One year term and served since May 2003. | Executive Vice President, U.S. Bancorp Fund Services, LLC (1994-present). | Ten | Trustee, USA MUTUALS (an open-end investment company with two portfolios); Trustee, Trust for Professional Managers (an open-end investment company with 24 portfolios). | |||||
Grant P. Sarris (44) 5420 West 61st Place Shawnee Mission, KS 66205 | Trustee | Indefinite term and served since July 2008. | Portfolio Manager, Kornitzer Capital Management, Inc. 2003-present. | Ten | None | |||||
| NON-INTERESTED TRUSTEES | ||||||||||
Thomas S. Case (70) 515 Piney Creek Road Reno, NV 89511 | Trustee | Indefinite term and served since inception. | Retired. | Ten | None | |||||
J. Gary Gradinger (69) Golden Star Inc. 400 East 10th Avenue North Kansas City, MO 64116 | Trustee | Indefinite term and served since February 2001. | Chairman, President and Chief Executive Officer, Golden Star Inc. (manufacturer of textile cleaning products). | Ten | Director, MGP Ingredients, Inc. | |||||
Philip J. Kennedy (66) Department of Business Administration Penn State Shenango 147 Shenango Avenue Sharon, PA 16146 | Trustee | Indefinite term and served since May 1995. | Internship Coordinator and Instructor for the Department of Business Administration, Penn State Shenango, 2002-present. | Ten | None | |||||
| OFFICERS OF THE FUNDS | ||||||||||
Kent W. Gasaway (52) 5420 West 61st Place Shawnee Mission, KS 66205 | President and Treasurer | Indefinite term and served since inception. One year term and served since May 2003. | Senior Vice President/Portfolio Manager, Kornitzer Capital Management, Inc. (management company) 1991-present. | N/A | N/A | |||||
Rachel A. Spearo (32) 777 E. Wisconsin Ave. Milwaukee, WI 53202 | Secretary | One year term and served since August 2006. | Vice President, U.S. Bancorp Fund Services, LLC since September 2004. | N/A | N/A | |||||
Barry Koster (51) 5420 West 61st Place Shawnee Mission, KS 66205 | Chief Compliance Officer | Indefinite term and served since October 2004. | Chief Compliance Officer since October 2004 and Chief Financial Officer since May 2002, Kornitzer Capital Management, Inc. (management company). | N/A | N/A | |||||
| 1 | Each of these Trustees may be deemed to be an “interested person” of the Funds as that term is defined in the Investment Company Act of 1940, as amended. Messrs. Neuberger and Sarris are interested Trustees due to their employment by U.S. Bancorp Fund Services, LLC and Kornitzer Capital Management, Inc., respectively. U.S. Bancorp Fund Services, LLC is the Funds’ Administrator and Registered Transfer Agent. Kornitzer Capital Management, Inc. is the Funds’ Advisor. |
95
Notice to Shareholders
March 31, 2012
(Continued)
A NOTE ON FORWARD-LOOKING STATEMENTS
Except for historical information contained in this annual report for the Funds, the matters discussed in this report may constitute forward-looking statements made pursuant to the safe harbor provisions of the Securities Litigation Reform Act of 1995. These include any advisor and/or portfolio manager predictions, assessments, analyses or outlooks for individual securities, industries, market sectors and/or markets. These statements involve risks and uncertainties. In addition to the general risks described for the Funds in the current Prospectus, other factors bearing on these reports include the accuracy of the advisor’s or portfolio managers’ forecasts and predictions, and the appropriateness of the investment programs designed by the advisor or portfolio manager to implement their strategies efficiently and effectively. Any one or more of these factors, as well as other risks affecting the securities markets and investment instruments generally, could cause the actual results of the Funds to differ materially as compared to benchmarks associated with the Funds.
ADDITIONAL INFORMATION
The Buffalo Funds have adopted proxy voting policies and procedures that delegate to Kornitzer Capital Management, Inc., the Funds’ investment advisor, the authority to vote proxies. A description of the Buffalo Funds’ proxy voting policies and procedures is available without charge, upon request, by calling the Funds toll free at 1-800-49-BUFFALO. A description of these policies and procedures is also included in the Funds’ Statement of Additional Information, which is available on the SEC’s website at http://www.sec.gov.
The actual voting records relating to portfolio securities during the most recent twelve month period ended June 30 (as filed with the SEC on Form N-PX) are available without charge, upon request, by calling the Funds toll free at 1-800-49-BUFFALO or by accessing the SEC’s website at http://www.sec.gov.
The Funds file their complete schedule of portfolio holdings with the SEC four times each fiscal year at quarter-ends. The Funds file the Schedule of Portfolio Holdings with the SEC on Form N-CSR (second and fourth quarters) and on Form N-Q (first and third quarters). Shareholders may view the Funds’ Forms N-CSR and N-Q on the SEC’s website at http://www.sec.gov. Forms N-CSR and N-Q may also be reviewed and copied at the SEC’s Public Reference Room in Washington, D.C. Information on the SEC’s Public Reference Room may be obtained by calling 1-202-551-8090 (direct) or 1-800-SEC-0330 (general SEC number).
96
APPROVAL OF INVESTMENT ADVISORY CONTRACTS
The Board of Trustees (the “Trustees”) of Buffalo Funds, a Delaware statutory trust, on behalf of its series, Buffalo Flexible Income Fund, Buffalo High Yield Fund, Buffalo Large Cap Fund, Buffalo Small Cap Fund, Buffalo Growth Fund, Buffalo Science & Technology Fund, Buffalo Mid Cap Fund, Buffalo Micro Cap Fund, Buffalo China Fund and Buffalo International Fund (all such funds referred to collectively as the “Funds”) met on November 17, 2011, to consider the renewal of the Amended and Restated Management Agreements (the “Agreements”) between the Funds and Kornitzer Capital Management, Inc., the Funds’ investment adviser (the “Adviser”). In advance of the meeting, the Trustees requested and received materials to assist them in considering the renewal of the Agreements. The materials provided contained information with respect to the factors enumerated below, including the Agreements, a memorandum prepared by the Trustees’ independent legal counsel discussing in detail the Trustees’ fiduciary obligations and the factors they should assess in considering the approval of the Agreements, detailed comparative information relating to the advisory fees, overall expenses and performance of the Funds, due diligence materials relating to the Adviser (including the Adviser’s Form ADV and financial information, information regarding key personnel, information relating to the Adviser’s and the Funds’ compliance programs, including risk management, and the Code of Ethics), information that the Adviser regularly provides to the Trustees in connection with reports on its activities and the activities of the Funds at the Trustees’ periodic Board meetings, and other pertinent information. In addition, the Independent Trustees, as defined below, met in executive session with their independent counsel immediately prior to the Board meeting held on November 17, 2011, to review and discuss the information provided to them and their duties and responsibilities in connection with the renewal of the Agreements. Based on their evaluation of information provided by the Adviser, in conjunction with the Funds’ other service providers, the Trustees, by a unanimous vote (including a separate vote of the Trustees who are not “interested persons,” as that term is defined in the Investment Company Act of 1940, as amended (the “Independent Trustees”)), approved the renewal of the Agreements for an additional term of one year ending November 30, 2012.
DISCUSSION OF FACTORS CONSIDERED
In considering the Agreements and reaching their conclusions, the Trustees reviewed and analyzed various factors that they determined were relevant, including the factors enumerated below.
1. Nature, Extent and Quality of Services Provided to the Funds.
The Trustees considered the nature, extent and quality of services provided by the Adviser to the Funds. The Trustees considered the Adviser’s specific responsibilities in all aspects of day-to-day management of the Funds, as well as the qualifications, experience and responsibilities of the portfolio management teams and other key personnel of the Adviser involved in the day-to-day activities of the Funds. The Trustees considered the Adviser’s emphasis on long-term results and the quality of the Adviser’s reports throughout the course of the year as well as in connection with the contract renewal process. The Trustees noted the services that extended beyond portfolio management, including operations and compliance, and they considered the overall capability of the Adviser, including its continuing commitment to enhance distribution of the Funds. The Trustees concluded that the Adviser had sufficient quality and depth of personnel, resources, investment methods and compliance policies and procedures essential to performing its duties under the Agreements and that the nature, overall quality and extent of the management services provided to the Funds were appropriate.
2. Investment Performance of the Adviser and the Funds.
In assessing the portfolio management services provided by the Adviser, the Trustees considered information provided to them prior to their meeting on November 17, 2011, including, without limitation, materials prepared by Lipper, Inc. with respect to the fees, expenses and performance of each of the Funds compared with similar funds managed by other investment advisers, comparable information with respect to other investment vehicles managed by the Adviser as well as other information presented to them by the Adviser at the meeting and throughout the preceding year. The Trustees considered the relevant peer group and index comparisons in the materials provided and concluded that while certain Funds performed better against their peer group and relevant benchmarks than others, the overall performance of each Fund, with the exception of the Buffalo China Fund, Buffalo International Fund and Buffalo Small Cap Fund, compared favorably with its benchmark and peer group. With respect to the Buffalo China Fund, the Trustees noted that while the Buffalo China Fund was in the fourth quartile for the three-year performance time period
97
Notice to Shareholders
March 31, 2012
(Continued)
compared to its relevant peer group, the Fund had improved to the third quartile for the one-year performance time period. With respect to the Buffalo International Fund, the Trustees noted that the Fund fell into the fourth quartile for the one-year time period, but was ranked in the third quartile for the three-year time period. With respect to the Buffalo Small Cap Fund, the Trustees focused on the longer term performance noting that the Fund fell into the second quartile for the ten-year performance period; the third quartile for the five-year period performance period and the fourth quartile for the three-year and one-year performance periods. The Trustees expressed confidence in the Adviser’s portfolio management teams, including certain portfolio management changes made during the year. After considering all of the information presented, the Trustees concluded that the Funds and their shareholders would continue to benefit from the Adviser’s continued management.
3. Costs of Services and Profits Realized by the Adviser.
The Trustees considered the cost structure of the Funds relative to their peer groups based on the Lipper, Inc. analysis provided to the Trustees prior to their meeting. The Trustees also examined the level of profits that could be expected to accrue to the Adviser from the fees payable under the Agreements. The Trustees specifically considered the fee structure for the Funds as well as the Funds’ overall expense ratios. In light of the comparative expense and advisory fee information and the investment management services provided by the Adviser, the Trustees concluded that the Funds’ expenses and the fees paid to the Adviser were competitive and, therefore, fair and reasonable. The Trustees further concluded that the Adviser’s profit from sponsoring the Funds had not been and would not be excessive and would enable the Adviser to maintain adequate profit levels to support its provision of advisory services to the Funds.
4. Extent of Economies of Scale as the Funds Grow.
The Trustees reviewed the structure of the Adviser’s advisory fees and discussed potential economies of scale based on the Funds’ current size and as they grow (and if such economies are realized, how they would be shared with shareholders). The Trustees concluded that the potential economies of scale that the Funds might realize would be achievable under the structure of the Adviser’s advisory fees and the Funds’ expenses, particularly in light of the Adviser’s proposal to consider fee breakpoints in the future as the Funds grow. The Trustees specifically reviewed fee schedules for other funds with asset levels and investment objectives similar to the Small Cap Fund, noting that while the Small Cap Fund did not have a breakpoint in its fee schedule, the Small Cap Fund’s advisory fee was in line with comparable funds at comparable asset levels. The Trustees therefore concluded that the Adviser’s fee structure was acceptable based on the potential economies of scale that may be achieved by the Funds as they grow combined with the Adviser’s commitment to consider breakpoints in the future.
5. Benefits Derived from the Relationship with the Funds.
The Trustees considered the direct and indirect benefits that could be received by the Adviser from its association with the Funds. The Trustees examined the brokerage arrangements of the Adviser with respect to the Funds. The Trustees concluded that the benefits the Adviser may receive, such as greater name recognition and/or increased ability to obtain research or brokerage services, appear to be reasonable, and in many cases may benefit the Funds.
CONCLUSIONS
The Trustees considered all of the foregoing factors. In considering the Agreements, the Trustees did not identify any one factor as all-important, but rather considered these factors collectively in light of the Funds’ surrounding circumstances. Based on this review, the Trustees, including a majority of the Independent Trustees, approved the renewal of the Agreements with the Funds as being in the best interests of the Funds and their shareholders.
98
Privacy Policy
This Privacy Policy has been adopted by the Buffalo Funds. The Funds are each an open-end diversified management investment company registered under the Investment Company Act of 1940 (the “1940 Act”).
This Privacy Policy has also been adopted by KCM, an investment advisor registered with the Securities and Exchange Commission that serves as the investment advisor and manager of the Funds.
The Funds and the Advisor are collectively referred to as the “Companies,” “we,” “our” or “us.”
As a part of providing you services and products we collect non-public personally identifiable information (“Personal Information”) about you. Some of this is information you provide and some is obtained from other sources. In some circumstances, a necessary part of providing products and services to you requires that we disclose Personal Information about you to third parties.
We want you to understand how we handle your Personal Information. Please read the Privacy Policy carefully. It has information about our policies for the collection, use, disclosure, and protection of your Personal Information. If you have any questions, you can obtain additional information from the following:
Buffalo Funds
c/o U.S. Bancorp Fund Services, LLC
P.O. Box 701
Milwaukee, Wisconsin 53201-0701 1-800-492-8332
www.buffalofunds.com
Please be aware that we periodically update or revise the Privacy Policy. As methods of doing business change, we reflect any applicable changes in our Privacy Policy. If you are our customer, we will send you an update as and when it occurs.
SALE/DISCLOSURE OF YOUR PERSONAL INFORMATION
We promise that we will not sell your Personal Information to any person.
Also, we will not disclose your Personal Information to any third person aside from the disclosures described below. These disclosures generally relate to marketing or maintaining products or services provided to you.
WHAT INFORMATION DO WE COLLECT?
Personal, Financial and Product Information
To be able to offer, provide and maintain these products and services, the Companies collect a variety of Personal Information about you. The Personal Information we collect will vary depending upon the product or service you select.
The following is a general list of the Personal Information. Not all of the Personal Information will be collected every time you do business with us.
Personal Information
| • | Name |
| • | Address |
| • | Birthdate |
| • | Phone number |
| • | Social Security Number |
| • | E-mail address |
| • | Product-Related Personal Information |
| • | Product Activity History (things you have done with your mutual funds such as deposits, transfers, redemptions, etc.) |
GENERAL PRIVACY PROCESSES
How do we collect Personal Information?
We use a variety of methods to collect Personal Information. We collect Personal Information directly from you with paper forms (for example, new account and other administrative forms), over the phone or through facsimile transmissions. We also collect Personal Information from our web site and through other electronic means. We collect some Personal Information through joint marketing programs where we offer a product or service through another financial institution. In some of these instances, you may be considered a customer of both entities.
Who has access to this Personal Information?
Generally, only the Companies’ staff and certain companies working on the Companies’ behalf have access to this Personal Information.
Those Working on Our Behalf
Depending on the product or service you select, there may be a number of third parties that will have access to your Personal Information since they are working on our behalf. This access is necessary because these third parties perform a task or provide administrative services for the product you seek or have purchased from us. If we do not share the Personal Information, we cannot provide you the product or service you requested. In certain cases, affiliates are the entities performing such services on our behalf.
When we share Personal Information with non-affiliated companies working on our behalf, we protect your Personal Information by requiring such companies to adopt our privacy policy or have a policy providing protection similar to ours.
99
Privacy Policy
(Continued)
Required Disclosures
Certain Personal Information may also be disclosed to third parties without your consent if disclosure is necessary to comply with: 1) legal processes; 2) to protect the rights, property, or personal safety of the Funds, their shareholders or the public; 3) as part of inspections or examinations conducted by our regulatory agencies; and 4) in other situations required by law.
Joint Marketing
In certain circumstances, the Companies may jointly market a product or service with another financial institution. In these circumstances, we have arranged to offer our products through these entities and their representatives or through electronic systems (for example, the Internet).
The Companies may make other disclosures authorized by law.
Requested Disclosures
We will disclose your Personal Information if you request it to those persons that you designate. Examples of this are to: members of your family; registered investment advisors, attorneys and CPAs who you have retained to advise you in a transaction; and persons whom you have designated to represent you in dealings with us.
What do we do with the Personal Information?
The Companies make use of the Personal Information to provide you with the financial products and services that we offer.
At the point that you cease being a customer, we will maintain your Personal Information and handle it just the same as our current customers.
The Companies restrict access to the Personal Information to those who need to know it for ordinary business purposes. We also maintain physical, electronic, and procedural safeguards that comply with federal standards to guard your Personal Information.
What are your options regarding corrections of Personal Information?
Generally, upon your written request, we will make available Personal Information for your review. Please note, Personal Information collected that relates to a disputed claim or legal proceeding will not be made available. If you notify us that the Personal Information is incorrect, we will review it and if we agree, correct our records. If we do not agree, you may submit a short comment, which we will include in future third party disclosures, if any occur, of Personal Information.
100

Item 2. Code of Ethics.
The Registrant has adopted a code of ethics that applies to the Registrant’s principal executive officer and principal financial officer. The Registrant has not made any amendments to its code of ethics during the period covered by this report. The Registrant has not granted any waivers from any provisions of the code of ethics during the period covered by this report. A copy of the Registrant’s Code of Ethics is incorporated by reference to the Registrant’s Form N-CSR filed on June 3, 2011.
Item 3. Audit Committee Financial Expert.
The Registrant’s Board of Trustees has determined that there is at least one audit committee financial expert serving on its audit committee. The name of the audit committee financial expert is Philip J. Kennedy. Mr. Kennedy is “independent” as defined in Item 3(a)(2) of Form N-CSR.
Item 4. Principal Accountant Fees and Services.
(a) – (d) Aggregate fees billed to the Registrant for each of the last two fiscal years for professional services rendered by the Registrant’s Independent Registered Public Accounting Firm were as follows:
| FYE 03/31/2012 | FYE 03/31/2011 | |||||||
Audit Fees | $ | 181,530 | $ | 174,550 | ||||
Audit-Related Fees | $ | 5,900 | $ | 5,700 | ||||
Tax Fees | $ | 27,750 | $ | 26,600 | ||||
All Other Fees | $ | 0 | $ | 0 | ||||
Audit fees include amounts related to the audit of the Registrant’s annual financial statements and services normally provided by the Independent Registered Public Accounting Firm in connection with statutory and regulatory filings, including registration statements. Audit-related fees refer to the reading and commenting on the Registrant’s semi-annual reports. Tax fees include amounts related to tax compliance, tax planning, and tax advice, including specifically tax return review and excise tax distribution review services. There were no fees billed for services rendered to the Registrant’s investment adviser or any entity controlling, controlled by or under common control with the investment adviser that provides ongoing services to the Registrant that were required to be approved pursuant to paragraph (c)(7)(ii) of Rule 2-01 of Regulation S-X.
(e) (1) The Registrant’s audit committee charter requires pre-approval in advance of (i) audit and non-audit services performed by the Registrant’s Independent Registered Public Accounting Firm for the Registrant; and (ii) audit and non-audit services relating directly to the operations and financial reporting of the Registrant performed by the Registrant’s principal accounting officer for the Registrant’s investment adviser, and any entity controlling, controlled by, or under common control with the investment adviser that provides ongoing services to the Registrant.
(2) None of the services described in (b) – (d) above were approved by the audit committee specifically pursuant to paragraph (c)(7)(i)(C) of Rule 2-01 of Regulation S-X.
(f) Not applicable.
(g) The aggregate non-audit fees were for audit-related and tax services rendered to the Registrant. As disclosed above, the amount of fees billed for such services were $33,650 and $32,300 for the 2012 and 2011 fiscal years, respectively.
(h) The aggregate fees billed for non-audit services rendered to the Registrant’s investment advisor related to surprise security count procedures were $10,000 and $10,000 for the 2012 and 2011 fiscal years respectively. These fees were not required to be pre-approved pursuant to paragraph (c)(7)(ii) of Rule 2-01 of Regulation S-X.
Item 5. Audit Committee of Listed Registrants.
Not applicable because the Registrant is not a listed issuer.
Item 6. Investments.
Schedule of Investments is included as part of the report to shareholders filed under Item 1 of this Form.
Item 7. Disclosure of Proxy Voting Policies and Procedures for Closed-End Management Investment Companies.
Not applicable because the Registrant is an open-end investment company.
Item 8. Portfolio Managers of Closed-End Management Investment Companies.
Not applicable because the Registrant is an open-end investment company.
Item 9. Purchases of Equity Securities by Closed-End Management Investment Company and Affiliated Purchasers.
Not applicable because the Registrant is an open-end investment company.
Item 10. Submission of Matters to a Vote of Security Holders.
There have been no material changes to the procedures by which shareholders may recommend nominees to the Registrant’s Board of Trustees.
Item 11. Controls and Procedures.
| (a) | The Registrant’s Principal Executive Officer and Principal Financial Officer has reviewed and evaluated the Registrant’s disclosure controls and procedures (as defined in Rule 30a-3(c) under the Investment Company Act of 1940 (the “Act”)) as of a date within 90 days of the |
| filing of this report, as required by Rule 30a-3(b) under the Act and Rules 13a-15(b) or 15d-15(b) under the Securities Exchange Act of 1934. Based on his review, the Principal Executive Office and Principal Financial Officer has concluded that the disclosure controls and procedures are effective in ensuring that information required to be disclosed in this report is appropriately recorded, processed, summarized and reported and made known to him by others within the Registrant and by the Registrant’s service provider. |
| (b) | There were no changes in the Registrant’s internal control over financial reporting that occurred during the Registrant’s second fiscal quarter of the period covered by this report that have materially affected, are is reasonably likely to materially affect, the Registrant’s internal control over financial reporting. |
Item 12. Exhibits.
| (a) | (1) Code of Ethics. Incorporated by reference to the Registrant’s Form N-CSR filed on June 3, 2011. |
(2) Certifications pursuant to Section 302(a) of the Sarbanes-Oxley Act of 2002 are filed herewith.
(3) Not applicable to open-end investment companies.
| (b) | Certifications pursuant to Section 906 of the Sarbanes-Oxley Act of 2002. Furnished herewith. |
SIGNATURES
Pursuant to the requirements of the Securities Exchange Act of 1934 and the Investment Company Act of 1940, the Registrant has duly caused this report to be signed on its behalf by the undersigned, thereunto duly authorized.
| Buffalo Funds | ||||
| By | /s/ Kent W. Gasaway | |||
| Kent W. Gasaway | ||||
| President and Treasurer | ||||
| Date | 6/6/2012 | |||
Pursuant to the requirements of the Securities Exchange Act of 1934 and the Investment Company Act of 1940, this report has been signed below by the following person on behalf of the Registrant and in the capacities and on the date indicated.
| By | /s/ Kent W. Gasaway | |||
| Kent W. Gasaway | ||||
| President and Treasurer | ||||
| Date | 6/6/2012 | |||