UNITED STATES
SECURITIES AND EXCHANGE COMMISSION
Washington, D.C. 20549
FORM N-CSR
CERTIFIED SHAREHOLDER REPORT OF REGISTERED
MANAGEMENT INVESTMENT COMPANIES
Investment Company Act file number 811-10303
Buffalo Funds
(Exact name of registrant as specified in charter)
5420 W. 61st Place
Shawnee Mission, KS 66205
(Address of principal executive offices) (Zip code)
Kent W. Gasaway
5420 W. 61st Place
Shawnee Mission, KS 66205
(Name and address of agent for service)
(913) 677-7778
Registrant’s telephone number, including area code
Date of fiscal year end: March 31, 2013
Date of reporting period: March 31, 2013
Item 1. Reports to Stockholders.
 Message to Our Shareholders
W
ith considerable help from the Federal Reserve, the equity market has climbed a wall of worry over the past 12 months. Fed chairman Ben Bernanke would never admit it, but the target of their zero interest rate policy and quantitative easing was not only housing, but the stock market as well. For the average American household, their home and retirement savings are their largest assets. When they are appreciating, consumers feel better about spending. When consumers are spending, businesses feel better about hiring. It’s a virtuous cycle that has taken a long time to rekindle, but it appears to us that it is finally working. Leading indicators such as initial unemployment claims and continuing claims have fallen substantially and are nearing levels that in 2004 (the last “jobless” recovery) foretold a much improved job market. Other reasons for optimism on the U.S. economy include a housing recovery that is really gaining steam, a budding U.S. manufacturing renaissance, growing U.S. energy production, strong auto sales, a healthy agricultural market and a continuing boom in technology entrepreneurship.
As a result, the stock market appears to have entered a period that we might describe as the “perfect storm”. The market has picked up on the potential stronger U.S. economy and therefore is willing to pay forward for higher potential earnings to come. At the same time the Fed has made bonds so unattractive that many stocks appear to be superior investments based on dividends.
Conversely, we believe the long bull run for bonds is about to end. If we get better job growth the next six months the unemployment rate could drop below 7%. The Fed has targeted a 6.5% unemployment rate as the level they will pull
back on quantitative easing. However, we believe the bond market will move well ahead of the Federal Reserve. As this takes place the bond market may hit an air pocket with rates rising quicker and higher than investors expect. We believe 3-30 year Treasury rates could rise 150 basis points in a short period of time as the bond market transitions from artificial (Fed induced) to true market based levels. This could cause some short term consternation in the stock market, but we believe it would be short lived. Unless we see a meaningful pick-up in inflation (particularly in wages), Fed tightening is likely to be gradual and subdued. We believe this would increase the likelihood of an extended economic cycle and further appreciation in stocks in coming years.
Thus, we are excited about the prospects for stocks and the Buffalo Funds in 2013 and beyond. Our assets under management are at an all-time high (over $6 billion at 03/31/13). We are adding to our research staff and continue to find great new growth and income ideas for our various Funds. As always, we appreciate your trust in our management teams and our organization. We will continue to work diligently to meet your needs and goals.
Sincerely,

Kent W. Gasaway
President
The Funds’ investment objectives, risks, charges and expenses must be considered carefully before investing. The Prospectus contains this and other important information about the investment company, and it may be obtained by calling 1-800-49-BUFFALO or visiting www.buffalofunds. com. Read it carefully before investing.
Past performance does not guarantee future results. Mutual fund investing involves risk. Principal loss is possible.
The opinions expressed above are those of the author, are subject to change and are not guaranteed and should not be considered investment advice.
The Buffalo Funds are distributed by Quasar Distributors, LLC.
2
Portfolio Management Review
Buffalo Discovery Fund
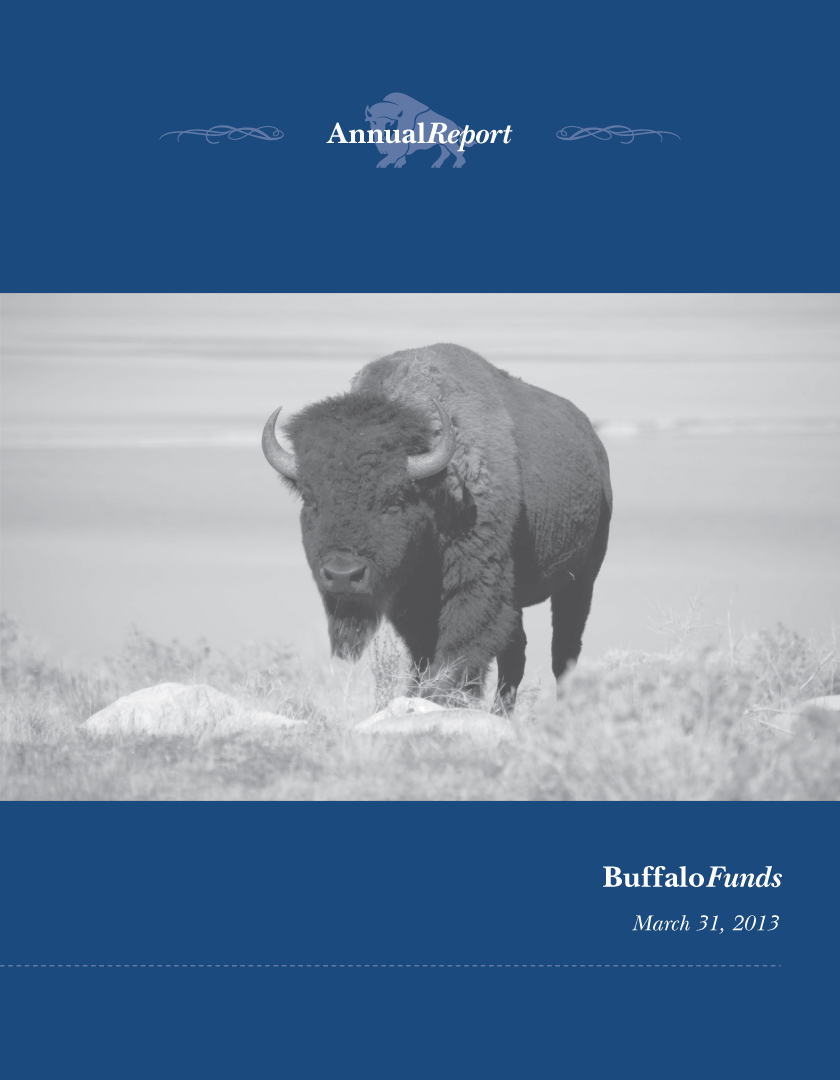
In our quest for companies that can generate growth through innovative business products, ideas and solutions, we look to every sector and market capitalization for contenders. Over the trailing 12 months ending March 31, 2013, the Buffalo Discovery Fund did a good job of finding those companies and returning a positive 8.46% for our investors. It is a little disappointing that we underperformed the benchmark Russell 3000 Growth Index during that period as it returned 10.42%, but we would remind investors that a benchmark is not our guide to portfolio construction, it is simply a tool. As active managers with a highly focused strategy and mandate, we are typically indifferent to benchmark construction and allocation.
Not surprisingly, the biggest return for the Fund came from the Healthcare sector which generally led the market during the period. We have long found this sector to be rich in innovative companies, so we typically overweight the sector, in this period by over 100%. The top contributor for the trailing 12 months was Healthcare stock Gilead Sciences. The company continues to attract attention due to its differentiated Hepatitis C drug pipeline which we anticipate could drive earnings growth in excess of expectations starting in 2014. Align Technology and athenahealth also contributed to the strong Healthcare returns as both companies continued to grow market share with their unique product offerings in a hot healthcare environment.
While the Fund is generally overweight in Information Technology sector stocks owing to the innovative nature of those companies, the last four quarters were a difficult period for tech stocks in general as it was the only sector in the benchmark with negative returns, and our overweight dragged on performance. This is a sector with sizeable international exposure, something that was shunned in the period, and it is largely a discretionary expenditure that consumers can adjust up or down depending on their confidence in macroeconomic conditions. Meanwhile, the market preferred stable cash generation that’s paid out as dividends in a growth-challenged world.
Two companies accounted for the entire underperformance in that sector: Rovi and Apple. Rovi became tangled in patent disputes and failed to live up to our investment thesis. We exited the position when we lost faith in management’s ability to right the ship. Apple’s famous growth story has become more challenging to sustain and grow and the stock suffers if investors see anything short of stellar revenue. We believe the company is a poster-child for innovation and, despite its size, still holds the potential for further market expansion. Despite its negative returns in the period, the underweight of Apple relative to the benchmark actually contributed to positive allocation effect for the Fund.
We are optimistic that our investment approach, finding companies that benefit from the development, advancement, or commercial application of innovative strategies, will continue to lead us to growth opportunities grounded in the Buffalo Funds long-term trends. While we anticipate that growth will continue at a subdued rate, we believe there are companies positioned to grow through competitive advantage and creative directions. We continue to seek out these companies to add to our portfolio when market conditions create buying opportunities.
Buffalo Dividend Focus Fund
The Buffalo Dividend Focus Fund was launched on 12/03/2012. The following is a review of the first quarter performance for the Fund since the Fund was not open for a full twelve months as of 3/31/2013.
While we are not proud of underperforming the benchmark by over five percentage points in the first quarter, we would like to mention that we see investing as a marathon – not a sprint. The underperformance had little to do with stock picking and more to do with a cash position that averaged 42% during the quarter. The cash position has since been whittled down materially and we don’t expect to see cash that high again. It was purely a function of the Fund being new and getting the money invested.
From a stock picking perspective, we did fairly well in the first quarter relative to the benchmark. Our top relative sector contributors to Fund performance included Information Technology, Consumer Staples, and Financials while top relative sector detractors were Energy, Health Care, and Materials.
Information Technology: In the IT space we were significantly underweight a sector that was the worst performing sector in the benchmark. Coupling the underweight with superior relative stock selection in the sector and the Information Technology space was kind to us in the first quarter relative to the benchmark. Notable contributors included Paychex, Microsoft, and Intel.
Consumer Staples: In Consumer Staples we were slightly underweight the second best performing sector in the bench-mark. However, we had superior relative stock selection. Notable contributors included Pinnacle Foods, General Mills, and Clorox.
Financials: In Financials we were significantly underweight a sector that performed roughly in line with the broader S&P 500 benchmark. However, once again, we exhibited superior relative stock selection in the sector. Notable contributors included Arthur J. Gallagher, AllianceBernstein Holdings, and Artisan Partners Management.
3
Portfolio Management Review
(Continued)
Buffalo Flexible Income Fund
For the twelve months ended 3/31/13, the Buffalo Flexible Income Fund returned 12.96%. During the same time period the S&P 500 returned 13.96% and the Bank of America Merrill Lynch High Yield Master II returned 13.05%. Additionally, the fund’s peer group, the Lipper Mixed Asset Target Allocation Moderate Funds Index returned 9.27% during the 12 months ended 3/31/13.
Equity
During the fiscal year ended March 31, 2013, the equity portion of the portfolio returned 20.00% compared to 13.96% for the S&P 500 Index. The primary sectors that led to the outperformance were the energy and consumer staples sectors. The energy sector positively impacted performance primarily due to security selection. Within the energy sector, refiners and MLPs were the primary drivers behind the outperformance. The outperformance within the consumer staples segment reflects the Funds overweight position in the sector relative to the benchmark as well as security selection. The consumer staples segment has been positively impacted by the arrival of income investors searching for low volatility business models that have exhibited reliable dividends.
Fixed income
For the fiscal year March 31, 2013, the fixed income portion of the portfolio returned 12.20% compared to 13.05% for the Bank of America Merrill Lynch High Yield Master II Index. The underperformance primarily reflects the conservative nature of the portfolio. The portfolio is primarily focused on the higher quality credits within the High Yield space which we define as Single B and better. Over the past 12 months the CCC part of the market, which we view as the riskiest, has performed the best as more and more investors reach for yield. The sector with the largest contribution to fixed income returns over the past 12 months was media and the largest driver behind that was security selection (Lions Gate Entertainment converts). The sector that provided the largest detraction from returns was basic industry which was primarily due to poor security selection (Molycorp converts).
Buffalo Growth Fund
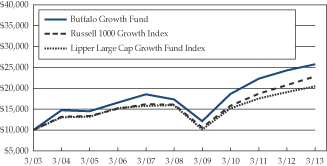
The first quarter of 2013 saw limited growth in international markets while U.S. markets showed signs of continuing recovery and strength. With the Buffalo Growth Fund focused on U.S. companies that can generate substantial revenue from expansion into international markets, this economic backdrop was not ideal for strong returns. For the trailing 12-month period ending March 31, 2013 the Fund did generate positive absolute returns of 6.20%, but underperformed the benchmark Russell 1000 Growth Index which returned 10.09%.
The stronger growth domestically was an acute headwind for the Growth Fund in the Consumer Discretionary sector. Many of the best performing components of the sector, such as homebuilders and cable & media companies, have limited to no exposure to international growth. In addition, Abercrombie & Fitch, Electronic Arts, and Gentex each had specific issues that added to the underperformance. Abercrombie & Fitch reduced international store growth expectations in the face of weakening comparable store sales and announced plans to reduce domestic stores. Electronic Arts rollout of Star Wars, a multiplayer online game, saw disappointing uptake. Gentex’s growth stalled when auto makers shifted away from placing rear camera displays inside the rearview mirror in favor of placement in the center console. In each case, these companies held an attractive risk/reward payoff when we initiated positions. We believe that this discipline will yield positive results over long term time horizons, but the Fund is not immune to unlucky outcomes of uncertain events and the havoc those outcomes play on short term results.
On an absolute basis, the Healthcare sector was the standout in the trailing 12 months. Long-time holding Align Technology overcame a brief downturn in the fourth quarter of 2012 to come in as the third highest contributor for the Fund during the period. The company continues to capture market share for its proprietary Invisalign dental appliances. This company has been a strong secular grower for the Fund and we believe it will continue to capture growth through international expansion.
Apple, the most heavily weighted stock in the portfolio, continued to be a drag on performance as the stock slipped throughout the period. Perhaps the most closely watched stock in the Information Technology sector, Apple’s growth slowed during the period, but only relative to its 46% compound annual growth rate of the previous two years. We believe that Apple remains a premier company and an innovation leader. We believe the stock’s decline in the last few months has de-risked the story and set up a very attractive price for its growth prospects. As of the end of the first quarter, Apple was a top-five holding in the Fund.
As we look ahead, we continue to see stable but subdued growth prospects. The sluggish global growth environment has led us to favor companies where international growth is in the earlier stages and less dependent on the cyclicality of global growth. These companies are more dependent upon expanding international penetration than global GDP growth. As always, we are looking for companies growing both domestically and internationally and we feel confident in the long-term growth prospects of our holdings. We believe these companies have come through the U.S. recession stronger, leaner, and more productive, positioning them to penetrate foreign markets wherever and
4
whenever they see opportunity. As global markets continue to expand, we believe the Buffalo Growth Fund should benefit from the growth of these U.S. companies.
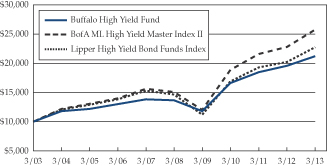
Buffalo High Yield Fund
The Buffalo High Yield Fund returned 8.20% for the fiscal year ended March 31, 2013. During the period, the Fund underperformed by 485 basis points our primary benchmark, the BofA Merrill Lynch High Yield Master II Index, which had a return of 13.05% during the comparable period. The primary reasons for our underperformance relative to the index include: include contributions from our holdings of straight corporate bonds, preferreds, convertibles, common stocks, and our cash holdings. The Fund’s holdings of convertible preferreds outperformed the Index.
A more detailed look at the portfolio demonstrates how the performance was generated:
| APPROXIMATE WEIGHTING RANGE | APPROXIMATE ASSET CLASS RETURN | |||||||||||
| LOW | HIGH | |||||||||||
Straight corporates | 60 | % | 70 | % | 9 | |||||||
Convertibles | 9 | 13 | 11 | |||||||||
Preferred stock | 1 | 1 | 5 | |||||||||
Convertible preferreds | 3 | 4 | 30 | |||||||||
Common stocks | 3 | 4 | 9 | |||||||||
Cash | 9 | 24 | 0 | |||||||||
|
| |||||||||||
Total | 8 | |||||||||||
Primary contributors to the straight corporate bond portfolio included United Refining 10.5%, Lions Gate Entertainment 10.25%, Acadia Healthcare 12.875%, and Suburban Propane 7.375%. These bonds were among the larger weightings in the portfolio, and all generated significant interest income and capital appreciation in the midst of the strong overall upward movement of the high yield market. Securities that underperformed in this asset class include Education Management 8.75% and Supervalu 8%.
Within the convertible bond portfolio, Lions Gate 4%, General Cable 4.5%, Amylin 3%, and Wesco 6% were the largest contributors to the class’s return. The underlying equities of many of our holdings in this class are concurrently owned in the Buffalo equity Funds. There were no securities in this asset class that detracted meaningfully from the Fund’s performance.
Within the preferred and convertible preferred portfolio, Boston Private Financial 4.875%, AMG Capital 5.1%, and Healthsouth 6.5% generated positive returns, as this asset class generated returns well above the Index. There were no securities in this asset class that detracted meaningfully from the Fund’s performance.
Within the common stock segment of the portfolio, names that contributed most positively to performance include
Abbott Labs and Kraft Foods (both of which split into separately-traded public companies during the year. Our holdings of WMS and Roundy’s served as a drag on performance.
In the midst of investor appetite for yield in the low-rate environment, the high yield market has been trading at elevated levels for much of the past three years. This dynamic continued to persist at the end of the fiscal year. Much of the Fund’s underperformance relative to its Index reflects our cautious stance in the midst of these inflated market levels, combined with significant uncertainty in global markets around factors such as: (i) continued mixed signs about the health of the U.S. economy and job market; (ii) the direction of U.S. fiscal policy in the current Congress; (iii) the ultimate duration of the Fed’s accommodative monetary policies; and (iv) the ongoing sovereign debt crisis in Europe. Our allocation of a portion of the Fund into common stocks and other securities with equity-like exposure reflects our belief that equities are undervalued relative to highly-speculative and richly valued CCC-rated bonds, and offer a more attractive risk/reward trade-off. We believe these securities could contribute meaningfully to performance in coming periods.
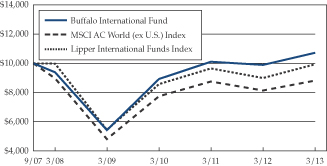
Buffalo International Fund
Looking at global markets over the past 12 months, it was quite a fun and wild ride. Europe swung between risk on and risk off throughout the period with no clear resolution to its underlying fiscal issues. China, though it maintained an enviable GDP growth rate, slowed considerably, causing ripples of fear and consternation among its vast network of trading partners. Toward the end of the period, quantitative easing in Japan and fresh bail-out talks for Cyprus provided reminders that global economies remain fragile and central banks are doing what they can to encourage “animal spirits.”
Despite a fair amount of uncertainty, the Buffalo International Fund posted a respectable 8.44% return for the 12 months ending March 31, 2013, slightly besting our benchmark MSCI AC World (ex. U.S.) Index which ended the period up 8.36%.
The Fund’s gains were broadly based, ranging from strong Consumer Staples to Financials to Healthcare sectors. The Consumer Staples sector, the most heavily weighted in the Fund, generated close to 400 basis points of returns in the period. Stocks of particular interest in that sector included Diageo, Henkel AG, and KWS Saat. While none of these companies had unusual positive surprises, they represented companies with growth and stability characteristics that investors seemed to crave in this environment.
The leading contributor for the 12-month period was Bayer AG. Bayer benefited not only from an attractive valuation and dividend yield, but also from a few positives with
5
Portfolio Management Review
(Continued)
its drug pipeline: Xarelto was approved in Europe for pulmonary embolism and deep vein thrombosis, Eylea was launched for wet age-related macular degeneration, Stivarga was launched for advanced colorectal cancer, and Riociguat and Alpharadin were submitted for approval.
The Fund was also held back by the unusually high cash weighting during the period as it merged with the Buffalo China Fund in the first quarter. We have been trimming our China exposure as well as experiencing inflows into the Fund, resulting in higher cash levels. We continue to look for appropriate stocks to put that money to work.
While the world is still beset by slow growth, central banks are continuing with their easy money policies, and with little overt inflation, we feel this easy and cheap money should continue to benefit all asset classes. While we don’t subscribe to the “buy anything and everything” approach in this environment, we will continue to look for stocks that we think represent the best risk/reward opportunities.
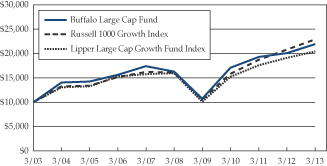
Buffalo Large Cap Fund
For some time we have communicated our belief that equities offer the opportunity for better returns than fixed income investments given the low bond yields. Nevertheless, since the Great Recession, equity mutual funds have seen outflows every year, driven by domestic equities, while fixed income mutual funds have seen inflows every year. In the first quarter of 2013 equity mutual funds, including domestic as well as world equity funds, saw inflows on par with fixed income mutual funds. We are encouraged by this data and believe that valuation supports a rotation into equities. We also see the U.S economy as a leader of global economic acceleration, with the U.S. housing market and labor market as two areas of strength, both with the potential for a ripple effect.
During 2012, we refined our process in an effort to improve the quality of the holdings, help limited the downside and reduced the volatility of the Fund. The four key characteristics of the names in the Buffalo Large Cap Fund are as follows:
| 1. | The company has a leadership position (a market share taker) in an attractive market with limited competition. |
| 2. | The company’s products or services are value added. |
| 3. | The company has a growth opportunity in North America. |
| 4. | The company has a history of delivering a compelling return on invested capital and that pattern is expected to continue into the future. |
While the Fund is still early in this transition, we believe that the adjustments we made are having their intended effect.
The Russell 1000 Growth Index returned 10.09% in the trailing 12 months ending March 31, 2013 while the Buffalo Large Cap Fund appreciated 9.17%. The majority of the underperformance relative to the benchmark was driven by stock selection, primarily in the Consumer Discretionary sector, and to a lesser extent the Financial and Energy sectors. This negative stock selection effect was partially offset with strong stock selection in the Materials sector and positive allocation effect in the Financial and Healthcare holdings, two sectors that returned over 20% in the year and both of which the Fund is overweight.
Looking closer at stock selection, the Fund’s performance within the Consumer Discretionary sector was hurt by two mid-size retailers, Abercrombie & Fitch and Deckers. The Fund exited both names mid year as they did not meet the criteria outlined above. Namely, neither company was felt to have a compelling growth opportunity in North America nor did we endorse their ability to deliver compelling returns on invested capital. Within the Energy sector, our exposure to oil and gas equipment and services providers, specifically Schlumberger and Baker Hughes hurt performance as these companies had downward earnings revision as a result of weak performance in North America driven by historically low natural gas prices. We did exit Baker Hughes in the year and added to Schlumberger. Although Baker Hughes traded at a lower multiple, we have concerns about management’s ability to execute and consequently to gain share. Schlumberger on the other hand is a top operator in the industry and we believe the company is more than likely to outgrow its peers over the long term both in North America and internationally. Finally, our Financial stock selection was hurt by JP Morgan which underperformed other Financials as a result of a large trading loss during the year. We continue to like the name and believe the company is well positioned to benefit from accelerating global economic growth as well as rising interest rates. The offsetting positive stock selection effect was from the overweighting of Monsanto. Many Materials companies were hurt by slowing growth in China; however Monsanto was propelled higher by its innovation in crop science. This technology has enabled the company to take share and raise prices as result of the value their seed delivers to the farmer. Monsanto was a top-three contributor to the Fund during the year.
Two other top contributors in the year were Gilead and eBay. Gilead continues to attract attention due to its differentiated Hepatitis C drug pipeline which should drive earnings growth in excess of expectations starting in 2014. eBay saw growth ahead of expectations in both its online
6
marketplace and payment businesses. The top detractors in the period were two technology names NetApp and Juniper, as well as the Consumer Discretionary holding, Deckers which was previously discussed. NetApp, a storage solution provider, saw growth slow as a result of increasing competition from EMC as well as slower overall growth in enterprise spending. With a strong management, new product cycle, and attractive valuation we continue to hold the name. Juniper was hurt by less than expected investment in communication infrastructure by service providers as well as a loss of share in security due to heightened competition. While the stock has been challenging, the company is a key beneficiary of the proliferation of mobile digital devices, a long-term growth trend with much potential still ahead and we continue to hold the name.
We ended fiscal 2013 with 41 names in the Fund, exiting ten of the Fund’s positions and adding 14 new equities during the course of the year. The overall impetus behind the changes was to improve the quality of the holdings, focus on less cyclical companies with sustainable growth stories that include growth in North America, and buy these companies at attractive valuations. While we still believe that emerging markets offer great potential in the intermediate to long term, we prefer to access this potential by investing in companies that also offer a growth opportunity in North America, the market we are most familiar with and also the region that is likely to lead an overall acceleration of global GDP. In addition, these geographically diverse companies should deliver more consistent returns over the long term, in my opinion. The Buffalo Growth Funds were founded on the historical observation that secular growth companies deliver superior returns over the intermediate to long term. The Buffalo Large Cap Fund is comprised of what we consider high-quality, secular growth companies with reasonable valuations.
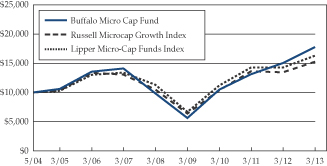
Buffalo Micro Cap Fund
For the 12-month period ending March 31, 2013, the Buffalo Micro Cap Fund returned a very respectable 18.36%, easily outperforming the benchmark Russell Microcap Growth Index which had a return of 13.80%.
While a number of things went right for the Fund during the period, with only the Materials sector posting negative returns, by far the biggest contributor to both absolute and relative performance was the Information Technology sector where the Fund has a material overweight position versus the benchmark. We have found a number of strong, early-stage growth opportunities in this sector, and they have paid off handsomely for the Fund. Four of the Fund’s top five contributors over the past year have been Information Technology constituents. Chief among these was Stratasys, a stock we have held for some time, which benefited from
increasing awareness and demand for 3D printing. The company also benefited from its transformational combination with privately held 3D printer manufacturer Objet.
While the Healthcare and Consumer Staples sectors provided nice returns for the Fund, our underweight to the benchmark held back relative performance. Nonetheless, Healthcare stocks such as Align Technology and National Research Corporation reported strong results during the year in a in a sector that generally led the market during this time period. Align, the leading manufacturer of clear aligners for straightening teeth, continued to benefit from the global adoption of their patented solution instead of traditional wire and bracket braces. In terms of National Research, the company has been transitioning to more of a subscription-based business model, which enables better revenue and earnings visibility. Additionally, and perhaps more importantly, the company witnessed increasing demand for its patient survey products due to increasing data requirements from the Affordable Care Act.
Another significant contribution to relative performance came from the Fund’s lack of exposure to the Energy sector, the only sector to post negative returns for the benchmark. We typically avoid investing in the type of cyclical stocks found in this sector and during a rough period for Energy stocks such as the one we have seen, the strategy paid off for the Fund.
The Fund posted strong absolute and relative returns for the year and as we look forward it looks as if the market could be poised for further gains. The Federal Reserve’s open ended quantitative easing program appears to be stimulating the equity markets at the same time housing, employment, manufacturing and domestic energy production are also improving and/or enhancing domestic economic growth. Despite our optimistic outlook, we also expect periods of downside volatility that are similar to what we have experienced over the past several years. Additionally, we will continue to be proactive in our discovery and research of early-stage growth companies in order to take advantage of any market weakness. We remain excited about the growth potential of the companies in the portfolio, as well as potential new investments we are evaluating, and will continue to work diligently to provide our investors with an opportunity for attractive rates of long-term capital appreciation.
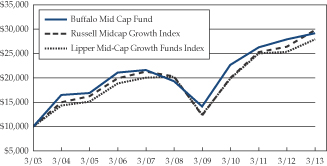
Buffalo Mid Cap Fund
The 12 months ended March 31, 2013 were a disappointing period for the Buffalo Mid Cap Fund. The Fund returned 4.67% in the period compared to 12.76% for the Russell Midcap Growth Index. The Fund outperformed the benchmark in only one quarter out of the last four. While we
7
Portfolio Management Review
(Continued)
believe that our strategy remains sound, we have to admit disappointment and frustration with the recent returns. At a time when the markets were so strong, we basically missed on many of our stocks, which generated positive returns, but not to the extent of those in the benchmark. At times we had very strong performance from some of our stocks, but they always seemed to be held back by equally strong — or stronger — negative returns from a few stocks. With few exceptions, we continue to maintain our conviction in our holdings and are patiently waiting for them to generate the returns that we believe they are capable of.
Most of the poor stock selection in the past 12 months was concentrated in the Information Technology and Consumer Discretionary sectors. Four of the five worst-performing stocks in the Fund were from one of these sectors. Rovi Corporation resulted in nearly 200 basis points of underperformance. The company was plagued by patent disputes that affected critical technology agreements and threatened the basics of their business model. We sold it out of the portfolio, but not before it exacted a toll. VeriFone, another technology stock, slipped in the first quarter of 2013 when earnings missed badly and the company’s management came into question, ultimately resulting in the replacement of its CEO. We believe the long-term outlook for the company is favorable and we continue to hold the stock.
Underperformers in the Consumer Discretionary sector included Deckers Outdoor (maker of iconic Uggs footwear) and Gentex Corporation, a manufacturer of mirror-embedded rear-view cameras. The former was hurt in the period by a slowing of demand for its products. Gentex stock, which we have held in the Fund because of the increasing safety and electronics content in vehicles, suffered as the company lost customers to competitor products in one application. The stock has started to recover and is up 26% calendar year to date.
Adding to the performance woes, the Fund underweighted the Healthcare sector, one of the strongest sectors in the period, and over-weighted the Information Technology sector, the only sector to generate negative returns for the 12-month period.
We continue to believe in our investment process and in the fundamentals of the companies in the portfolio. We are diligently analyzing the quality and growth prospects of each stock we own in the Fund and searching for additional high-quality mid-cap stocks to add. We understand the frustration our shareholders feel because we feel it keenly ourselves. We are grateful for your trust in our management and hope that when we report to you next year it will be with news of benchmark-beating returns.
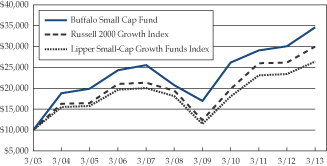
Buffalo Small Cap Fund
Following some rough periods of underperformance for the Buffalo Small Cap Fund, it is with great satisfaction that we report that for the 12 months ending March 31, 2013 the Fund outperformed its benchmark, the Russell 2000 Growth Index. The Fund returned 15.02% in the period and the Index returned 14.52%. As managers, we feel that our diligent efforts to hone the quality and growth prospects of the Fund were right on target and give us confidence in our strategy and trend-based selection process.
The Healthcare sector gets most of the credit for the strong performance with Align Technology and athenahealth contributing most of the gains in that sector. Align Technology has been held by the Fund for years and has consistently shown capacity for long-term growth with its unique Invisalign clear orthodontic appliances. The company continues to capture market share with teens and clear aligners are still in their infancy stage for adoption and growth outside the U.S. For athenahealth, a provider of medical practice management software, overall increased physician subscription for their products and greater penetration of new products within existing customer practices helped drive near 30% revenue growth.
Close behind the Healthcare sector was Information Technology, which contributed 270 basis points of outperformance during the trailing 12 months. One of the top contributors in this space during the period was Stratasys, which benefited from the growing demand for 3D printing. The company also saw a boost when it acquired privately held competitor Objet.
8
On the margin we have been positioning the Fund to benefit from a stronger U.S. economy in the latter half of 2013 and 2014. Therefore, we have tilted a bit more domestic and/or a bit more growth cyclical in our new purchases. We are excited about the new names added to the Fund and look forward to giving you more information about them in future reports.
Sincerely,
 | | |
John C. Kornitzer President, KCM | Kent W. Gasaway Sr. Vice President, KCM | |
 |  | |
Robert Male Sr. Vice President, KCM | Grant P. Sarris Sr. Vice President, KCM | |
 | ||
William J. Kornitzer III Sr. Vice President, KCM | ||
9
| GDP | = Gross Domestic Product |
A basis point is one hundredth of a percentage point (0.01%)
Investment Results
Total Returns as of March 31, 2013
| AVERAGE ANNUAL | ||||||||||||||||||||||||
| GROSS EXPENSE RATIO* | THREE MONTHS | ONE YEAR | FIVE YEARS | TEN YEARS | SINCE INCEPTION | |||||||||||||||||||
Buffalo Discovery Fund (inception date 4/16/01) | 1.02% | 8.58% | 8.46% | 12.35% | 14.32% | 7.18% | ||||||||||||||||||
Russell 3000 Growth Index | N/A | 9.82% | 10.42% | 7.44% | 8.84% | 4.20% | ||||||||||||||||||
Lipper Multi-Cap Growth Funds Index | N/A | 9.77% | 9.65% | 6.04% | 9.16% | 3.81% | ||||||||||||||||||
Buffalo Dividend Focus Fund (inception date 12/03/12) | 0.97% | 5.55% | N/A | N/A | N/A | 5.65% | *** | |||||||||||||||||
S&P 500 Index | N/A | 10.61% | N/A | N/A | N/A | 12.14% | *** | |||||||||||||||||
Buffalo Flexible Income Fund (inception date 8/12/94) | 1.03% | 7.69% | 12.96% | 7.24% | 10.30% | 7.59% | ||||||||||||||||||
S&P 500 Index** | N/A | 10.61% | 13.96% | 5.81% | 8.53% | 8.83% | ||||||||||||||||||
Bank of America Merrill Lynch High Yield Master Index II | N/A | 2.87% | 13.05% | 11.19% | 9.81% | 7.95% | ||||||||||||||||||
Lipper Mixed-Asset Target Allocation Moderate Funds Index | N/A | 5.16% | 9.27% | 4.62% | 6.90% | 7.07% | ||||||||||||||||||
Buffalo Growth Fund (inception date 5/19/95) | 0.93% | 7.62% | 6.20% | 8.10% | 9.84% | 9.18% | ||||||||||||||||||
Russell 1000 Growth Index | N/A | 9.54% | 10.09% | 7.30% | 8.62% | 7.47% | ||||||||||||||||||
Lipper Large Cap Growth Funds Index | N/A | 8.17% | 7.04% | 5.09% | 7.40% | 6.37% | ||||||||||||||||||
Buffalo High Yield Fund (inception date 5/19/95) | 1.03% | 3.28% | 8.20% | 9.20% | 7.81% | 7.87% | ||||||||||||||||||
Bank of America Merrill Lynch High Yield Master Index II | N/A | 2.87% | 13.05% | 11.19% | 9.81% | 7.95% | ||||||||||||||||||
Lipper High Yield Bond Funds Index | N/A | 3.08% | 12.50% | 9.16% | 8.57% | 6.38% | ||||||||||||||||||
Buffalo International Fund (inception date 9/28/07) | 1.15% | 4.26% | 8.44% | 2.53% | N/A | 1.09% | ||||||||||||||||||
MSCI AC World (ex U.S.) Index | N/A | 3.17% | 8.36% | -0.39% | N/A | -2.20% | ||||||||||||||||||
Lipper International Funds Index | N/A | 3.85% | 10.44% | -0.12% | N/A | -2.07% | ||||||||||||||||||
Buffalo Large Cap Fund (inception date 5/19/95) | 0.97% | 7.41% | 9.17% | 6.10% | 8.15% | 8.11% | ||||||||||||||||||
Russell 1000 Growth Index | N/A | 9.54% | 10.09% | 7.30% | 8.62% | 7.47% | ||||||||||||||||||
Lipper Large-Cap Growth Funds Index | N/A | 8.17% | 7.04% | 5.09% | 7.40% | 6.37% | ||||||||||||||||||
Buffalo Micro Cap Fund (inception date 5/21/04) | 1.52% | 11.95% | 18.36% | 12.56% | N/A | 6.70% | ||||||||||||||||||
Russell Microcap Growth Index | N/A | 14.96% | 13.80% | 7.81% | N/A | 4.90% | ||||||||||||||||||
Lipper Micro-Cap Funds Index | N/A | 12.64% | 14.42% | 7.56% | N/A | 6.57% | ||||||||||||||||||
Buffalo Mid Cap Fund (inception date 12/17/01) | 1.02% | 5.72% | 4.67% | 8.61% | 11.31% | 7.24% | ||||||||||||||||||
Russell Midcap Growth Index | N/A | 11.51% | 12.76% | 7.98% | 11.53% | 7.20% | ||||||||||||||||||
Lipper Mid-Cap Growth Funds Index | N/A | 11.62% | 10.05% | 6.63% | 10.79% | 6.33% | ||||||||||||||||||
Buffalo Small Cap Fund (inception date 4/14/98) | 1.00% | 9.80% | 15.02% | 10.75% | 13.22% | 12.03% | ||||||||||||||||||
Russell 2000 Growth Index | N/A | 13.21% | 14.52% | 9.04% | 11.61% | 4.09% | ||||||||||||||||||
Lipper Small-Cap Growth Funds Index | N/A | 11.73% | 12.51% | 7.75% | 10.19% | 5.17% | ||||||||||||||||||
| * | As reported in the Funds’ Prospectus dated June 29, 2012, except for the Buffalo Dividend Focus Fund, with a prospectus dated 12/3/2013. |
| ** | The Buffalo Flexible Income Fund replaced the Bank of America Merrill Lynch High Yield Master II Index® with the S&P 500® Index as the primary benchmark index of the Fund to more accurately represent the Fund’s investment approach. |
| *** | Cumulative since inception dated 12/3/2012. |
| Performance data quoted represents past performance; past performance does not guarantee future results. The investment return and principal value of an investment will fluctuate so that an investor’s shares, when redeemed, may be worth more or less than their original cost. Current performance of the Funds may be lower or higher than the performance quoted. Performance data current of the most recent month-end may be obtained by calling 1-800-49-BUFFALO or by visiting the website at www.buffalofunds.com. |
| The Buffalo Discovery, Dividend Focus, Flexible Income, International, Large Cap, Mid Cap, and Growth Funds impose a 2.00% redemption fee on shares held for less than 60 days and the Buffalo High Yield, Micro Cap and Small Cap Funds impose a 2.00% redemption fee on shares held less than 180 days. |
10
The Funds’ returns shown do not reflect the deduction of taxes that a shareholder would pay on distributions or the redemption of shares. The benchmark returns shown, excluding the Lipper Indices, reflect the reinvestment of dividends and capital gains but do not reflect the deduction of any investment management fees, other expenses or taxes. The performance of the Lipper Indices is presented net of the Funds’ fees and expenses; however, applicable sales charges are not taken into consideration. One cannot invest directly in an index.
The Russell 3000 Growth Index measures the performance of the broad growth segment of the U.S. equity universe. It includes those Russell 3000 Index companies with higher price-to-book ratios and higher forecasted growth values. The Lipper Multi-Cap Growth Funds Index is an unmanaged index that reflects the net asset value weighted return of 30 of the largest multi-cap growth funds tracked by Lipper. Its returns include net reinvested dividends. The S&P 500 Index is a capitalization weighted index of 500 large capitalization stocks which is designed to measure broad domestic securities markets. The Lipper Mixed-Asset Target Allocation Moderate Funds Index is an average of funds that, by portfolio practice, maintain a mix of between 40%-60% equity securities, with the remainder invested in bonds, cash, and cash equivalents. The total return of the Lipper Average does not include the effect of sales charges. You cannot invest directly in a Lipper Average. The Russell 1000 Growth Index measures the performance of those Russell 1000 Index companies with higher price-to-book ratios and higher forecasted growth values. The Lipper Large-Cap Growth Funds Index is an unmanaged, equally weighted performance index of the 30 largest qualifying mutual funds (based on net assets) in the Lipper Large-Cap classification. Bank of America Merrill Lynch High Yield Master Index II tracks the performance of below investment grade U.S. dollar-denominated corporate bonds publicly issued in the U.S. domestic market. The Lipper High Yield Bond Funds Index is a widely recognized index of the 30 largest mutual funds that invest primarily in high yield bonds. The MSCI AC World (ex U.S.) Index is a free float-adjusted market capitalization index that is designed to measure equity market performance in the global developed and emerging markets, excluding the U.S. The Lipper International Funds Index is an unmanaged, equally weighted performance index of the 30 largest qualifying mutual funds (based on net assets) in the Lipper International classifications. The Russell Microcap Growth Index measures the performance of those Russell Microcap companies with higher price-to-book ratios and higher forecasted growth values. The Lipper Micro-Cap Funds Index is an unmanaged equally weighted performance index of the 30 largest qualifying mutual funds (based on net assets) in the Lipper Micro-Cap classification. The Russell Midcap Growth Index measures the performance of those Russell Midcap companies with higher price-to-book ratios and higher forecasted growth values. The Lipper Mid-Cap Growth Funds Index is an unmanaged, equally weighted performance index of the 30 largest qualifying mutual funds (based on net assets) in the Lipper Mid-Cap classification. The Russell 2000 Growth Index measures the performance of those Russell 2000 Index companies with higher price-to-book ratios and higher forecasted growth values. The Lipper Small-Cap Growth Funds Index is an unmanaged, equally weighted performance index of the 30 largest qualifying mutual funds (based on net assets) in the Lipper Small-Cap classification.
Please refer to the prospectus for special risks associated with investing in the Buffalo Funds, including, but not limited to, risks involved with investments in science and technology, foreign, debt, lower- or non-rated securities and smaller companies.
Fund holdings and sector allocations are subject to change at any time and should not be considered a recommendation to buy or sell any security. Please refer to the Schedule of Investments for a complete list of fund holdings.
11
Buffalo Discovery Fund
Growth of a $10,000 Investment
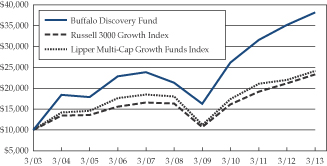
Buffalo Dividend Focus Fund
Growth of a $10,000 Investment
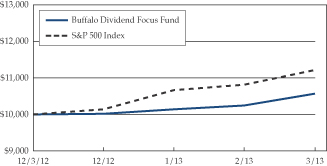
Buffalo Flexible Income Fund
Growth of a $10,000 Investment
Buffalo Growth Fund
Growth of a $10,000 Investment
Buffalo High Yield Fund
Growth of a $10,000 Investment
Buffalo International Fund
Growth of a $10,000 Investment
Buffalo Large Cap Fund
Growth of a $10,000 Investment
Buffalo Micro Cap Fund
Growth of a $10,000 Investment
12
Buffalo Mid Cap Fund
Growth of a $10,000 Investment
Buffalo Small Cap Fund
Growth of a $10,000 Investment
13
Expense Example
As a shareholder of the Funds, you incur two types of costs: (1) transaction costs (including redemption fees) and (2) ongoing costs, including management fees and other Fund specific expenses. The examples below are intended to help you understand your ongoing costs (in dollars) of investing in the Funds and to compare these costs with the ongoing costs of investing in other mutual funds. The example is based on an investment of $1,000 invested at the beginning of the period and held for the entire period (10/1/12 – 3/31/13) except for the Buffalo Dividend Focus Fund, which is based on the period 12/4/12 – 3/31/13. This information is unaudited.
ACTUAL EXPENSES
The first line of the tables below provides information about actual account values and actual expenses. You may use the information in this line, together with the amount you invested, to estimate the expenses that you paid over the period. Simply divide your account by $1,000 (for example, an $8,600 account value divided by $1,000 = 8.6), then multiply the result by the number in the first line under the heading entitled “Expenses Paid During the Period” to estimate the expenses you paid on your account during the period. Although the Funds charge no sales load or transaction fees, you will be assessed fees for outgoing wire transfers, returned checks and stop payment orders at prevailing rates charged by U.S. Bancorp Fund Services, LLC, the Funds’ transfer agent. If you request that a redemption be made by wire transfer, currently a $15.00 fee is charged by the Funds’ transfer agent. You will be charged a redemption fee equal to 2.00% of the net amount of the redemption if you redeem your shares of the Buffalo Flexible Income, Dividend Focus, International, Large Cap, Mid Cap, Discovery and Growth Funds within 60 days of purchase. The Buffalo High Yield, Micro Cap and Small Cap Funds will charge a redemption fee equal to 2.00% of the net amount of the redemption if you
redeem your shares within 180 days of purchase. To the extent a Fund invests in shares of other investment companies as part of its investment strategy, you will indirectly bear your proportionate share of any fees and expenses charged by the underlying funds in which the Fund invests in addition to the expenses of the Fund. Actual expenses of the underlying funds are expected to vary among the various underlying funds. These expenses are not included in the examples below. The examples below include management fees, registration fees and other expenses. However, the examples below do not include portfolio trading commissions and related expenses and other extraordinary expenses as determined under U.S. generally accepted accounting principles.
HYPOTHETICAL EXAMPLE FOR COMPARISON PURPOSES
The second line of each table below provides information about hypothetical account values and hypothetical expenses based on the Funds’ actual expense ratios and an assumed rate of return of 5% per year before expenses, which are not the Funds’ actual returns. The hypothetical account values and expenses may not be used to estimate the actual ending account balance or expenses you paid for the period. You may use this information to compare the ongoing costs of investing in our Funds and other funds. To do so, compare this 5% hypothetical example with the 5% hypothetical examples that appear in the shareholder reports of the other funds. Please note that the expenses shown in the tables are meant to highlight your ongoing costs only and do not reflect any transactional costs, such as redemption fees. Therefore, the second line of the tables is useful in comparing ongoing costs only, and will not help you determine the relative total costs of owning different funds. In addition, if these transactional costs were included, your costs would have been higher.
| BUFFALO DISCOVERY FUND | BEGINNING ACCOUNT VALUE OCTOBER 1, 2012 | ENDING ACCOUNT VALUE MARCH 31, 2013 | EXPENSES PAID DURING PERIOD OCTOBER 1, 2012 MARCH 31, 2013* | |||||||||
Actual | $ | 1,000.00 | $ | 1,073.90 | $ | 5.22 | ||||||
Hypothetical (5% return before expenses) | $ | 1,000.00 | $ | 1,014.83 | $ | 5.07 | ||||||
| * | Expenses are equal to the Fund’s annualized expense ratio of 1.01%, multiplied by the average account value over the period, multiplied by 182/365 to reflect the one-half year period. |
| BUFFALO DIVIDEND FOCUS FUND | BEGINNING ACCOUNT VALUE DECEMBER 3, 2012 | ENDING ACCOUNT VALUE MARCH 31, 2013 | EXPENSES PAID DURING PERIOD DECEMBER 3, 2012 - MARCH 31, 2013* | |||||||||
Actual | $ | 1,000.00 | $ | 1,056.50 | $ | 5.35 | ||||||
Hypothetical (5% return before expenses) | $ | 1,000.00 | $ | 1,000.06 | $ | 5.21 | ||||||
| * | Expenses are equal to the Fund’s annualized expense ratio of 1.61%, multiplied by the average account value over the period, multiplied by 118/365 to reflect the one-half year period. |
14
| BUFFALO FLEXIBLE INCOME FUND | BEGINNING ACCOUNT VALUE OCTOBER 1, 2012 | ENDING ACCOUNT VALUE MARCH 31, 2013 | EXPENSES PAID DURING PERIOD OCTOBER 1, 2012 MARCH 31, 2013* | |||||||||
Actual | $ | 1,000.00 | $ | 1,076.90 | $ | 5.28 | ||||||
Hypothetical (5% return before expenses) | $ | 1,000.00 | $ | 1,014.73 | $ | 5.12 | ||||||
| * | Expenses are equal to the Fund’s annualized expense ratio of 1.02%, multiplied by the average account value over the period, multiplied by 182/365 to reflect the one-half year period. |
| BUFFALO GROWTH FUND | BEGINNING ACCOUNT VALUE OCTOBER 1, 2012 | ENDING ACCOUNT VALUE MARCH 31, 2013 | EXPENSES PAID DURING MARCH 31, 2013* | |||||||||
Actual | $ | 1,000.00 | $ | 1,079.00 | $ | 4.72 | ||||||
Hypothetical (5% return before expenses) | $ | 1,000.00 | $ | 1,015.83 | $ | 4.57 | ||||||
| * | Expenses are equal to the Fund’s annualized expense ratio of 0.91%, multiplied by the average account value over the period, multiplied by 182/365 to reflect the one-half year period. |
| BUFFALO HIGH YIELD FUND | BEGINNING ACCOUNT VALUE OCTOBER 1, 2012 | ENDING ACCOUNT VALUE MARCH 31, 2013 | EXPENSES PAID DURING PERIOD OCTOBER 1, 2012 MARCH 31, 2013* | |||||||||
Actual | $ | 1,000.00 | $ | 1,048.30 | $ | 5.16 | ||||||
Hypothetical (5% return before expenses) | $ | 1,000.00 | $ | 1,014.83 | $ | 5.07 | ||||||
| * | Expenses are equal to the Fund’s annualized expense ratio of 1.01%, multiplied by the average account value over the period, multiplied by 182/365 to reflect the one-half year period. |
| BUFFALO INTERNATIONAL FUND | BEGINNING ACCOUNT VALUE OCTOBER 1, 2012 | ENDING ACCOUNT VALUE MARCH 31, 2013 | EXPENSES PAID DURING PERIOD OCTOBER 1, 2012 MARCH 31, 2013* | |||||||||
Actual | $ | 1,000.00 | $ | 1,102.90 | $ | 5.66 | ||||||
Hypothetical (5% return before expenses) | $ | 1,000.00 | $ | 1,014.13 | $ | 5.42 | ||||||
| * | Expenses are equal to the Fund’s annualized expense ratio of 1.08%, multiplied by the average account value over the period, multiplied by 182/365 to reflect the one-half year period. |
| BUFFALO LARGE CAP FUND | BEGINNING ACCOUNT VALUE OCTOBER 1, 2012 | ENDING ACCOUNT VALUE MARCH 31, 2013 | EXPENSES PAID DURING PERIOD OCTOBER 1, 2012 MARCH 31, 2013* | |||||||||
Actual | $ | 1,000.00 | $ | 1,125.60 | $ | 5.14 | ||||||
Hypothetical (5% return before expenses) | $ | 1,000.00 | $ | 1,015.23 | $ | 4.87 | ||||||
| * | Expenses are equal to the Fund’s annualized expense ratio of 0.97%, multiplied by the average account value over the period, multiplied by 182/365 to reflect the one-half year period. |
| BUFFALO MICRO CAP FUND | BEGINNING ACCOUNT VALUE OCTOBER 1, 2012 | ENDING ACCOUNT VALUE MARCH 31, 2013 | EXPENSES PAID DURING PERIOD OCTOBER 1, 2012 MARCH 31, 2013* | |||||||||
Actual | $ | 1,000.00 | $ | 1,097.40 | $ | 7.79 | ||||||
Hypothetical (5% return before expenses) | $ | 1,000.00 | $ | 1,010.03 | $ | 7.47 | ||||||
| * | Expenses are equal to the Fund’s annualized expense ratio of 1.49%, multiplied by the average account value over the period, multiplied by 182/365 to reflect the one-half year period. |
| BUFFALO MID CAP FUND | BEGINNING ACCOUNT VALUE OCTOBER 1, 2012 | ENDING ACCOUNT VALUE MARCH 31, 2013 | EXPENSES PAID DURING PERIOD OCTOBER 1, 2012 MARCH 31, 2013* | |||||||||
Actual | $ | 1,000.00 | $ | 1,108.50 | $ | 5.31 | ||||||
Hypothetical (5% return before expenses) | $ | 1,000.00 | $ | 1,014.83 | $ | 5.07 | ||||||
| * | Expenses are equal to the Fund’s annualized expense ratio of 1.01%, multiplied by the average account value over the period, multiplied by 182/365 to reflect the one-half year period. |
| BUFFALO SMALL CAP FUND | BEGINNING ACCOUNT VALUE OCTOBER 1, 2012 | ENDING ACCOUNT VALUE MARCH 31, 2013 | EXPENSES PAID DURING PERIOD OCTOBER 1, 2012 MARCH 31, 2013* | |||||||||
Actual | $ | 1,000.00 | $ | 1,118.50 | $ | 5.28 | ||||||
Hypothetical (5% return before expenses) | $ | 1,000.00 | $ | 1,014.93 | $ | 5.02 | ||||||
| * | Expenses are equal to the Fund’s annualized expense ratio of 1.00%, multiplied by the average account value over the period, multiplied by 182/365 to reflect the one-half year period. |
15
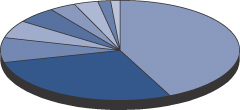
Allocation of Portfolio Holdings
Percentages represent market value as a percentage of total investments as of March 31, 2013.
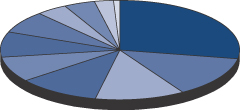
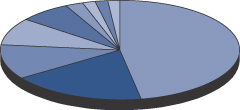
BUFFALO DISCOVERY FUND
| Information Technology | 43.10% | |||
| Health Care | 27.95% | |||
| Industrials | 8.02% | |||
| Consumer Discretionary | 5.83% | |||
| Energy | 5.33% | |||
| Consumer Staples | 3.52% | |||
| Materials | 3.26% | |||
| Short-Term Investments | 1.72% | |||
| Financials | 1.27% | |||
|
| |||
| 100.00% |
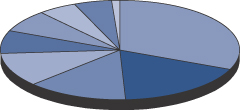
BUFFALO DIVIDEND FOCUS FUND
| Short-Term Investments | 27.84% | |||
| Consumer Staples | 13.35% | |||
| Energy | 12.13% | |||
| Industrials | 11.16% | |||
| Information Technology | 8.24% | |||
| Materials | 8.20% | |||
| Health Care | 7.28% | |||
| Telecommunication Services | 4.20% | |||
| Financials | 4.15% | |||
| Consumer Discretionary | 2.58% | |||
| Utilities | 0.87% | |||
|
| |||
| 100.00% |
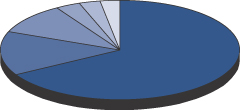
BUFFALO FLEXIBLE INCOME FUND

| Common Stocks | 53.44% | |||
| Short-Term Investments | 24.94% | |||
| Corporate Bonds | 17.96% | |||
| Convertible Bonds | 3.51% | |||
| REITS | 0.15% | |||
|
| |||
| 100.00% |
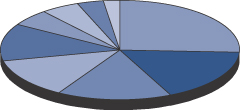
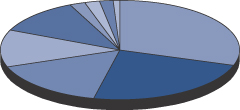
BUFFALO GROWTH FUND
| Information Technology | 31.38% | |||
| Industrials | 17.86% | |||
| Health Care | 13.66% | |||
| Consumer Discretionary | 10.99% | |||
| Energy | 7.46% | |||
| Financials | 7.23% | |||
| Consumer Staples | 5.22% | |||
| Materials | 5.10% | |||
| Short-Term Investments | 1.10% | |||
|
| |||
| 100.00% |
BUFFALO HIGH YIELD FUND
| Corporate Bonds | 66.75% | |||
| Short-Term Investments | 14.26% | |||
| Convertible Bonds | 10.14% | |||
| Common Stocks | 3.32% | |||
| Convertible Preferred Stocks | 2.85% | |||
| Preffered Stocks | 2.68% | |||
|
| |||
| 100.00% |
BUFFALO INTERNATIONAL FUND

| Europe | 58.63% | |||
| Asia | 29.32% | |||
| The Americas | 10.02% | |||
| Short-Term Investments | 1.37% | |||
| Middle East | 0.66% | |||
|
| |||
| 100.00% |
16
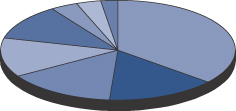
BUFFALO LARGE CAP FUND
| Information Technology | 25.74% | |||
| Health Care | 17.31% | |||
| Consumer Discretionary | 15.51% | |||
| Industrials | 12.91% | |||
| Financials | 12.17% | |||
| Consumer Staples | 5.36% | |||
| Materials | 5.21% | |||
| Energy | 3.56% | |||
| Short-Term Investments | 2.23% | |||
|
| |||
| 100.00% |
BUFFALO MICRO CAP FUND
| Information Technology | 47.13% | |||
| Health Care | 18.26% | |||
| Industrials | 11.33% | |||
| Consumer Discretionary | 8.85% | |||
| Short-Term Investments | 6.95% | |||
| Financials | 2.40% | |||
| Materials | 1.72% | |||
| Telecommunication Services | 1.71% | |||
| Consumer Staples | 1.65% | |||
|
| |||
| 100.00% |
BUFFALO MID CAP FUND
| Information Technology | 30.01% | |||
| Consumer Discretionary | 23.50% | |||
| Financials | 16.02% | |||
| Health Care | 12.00% | |||
| Industrials | 11.63% | |||
| Materials | 2.10% | |||
| Energy | 2.00% | |||
| Short-Term Investments | 1.83% | |||
| Consumer Staples | 0.91% | |||
|
| |||
| 100.00% |
BUFFALO SMALL CAP FUND
| Information Technology | 36.04% | |||
| Consumer Discretionary | 15.14% | |||
| Industrials | 15.09% | |||
| Health Care | 12.67% | |||
| Financials | 11.55% | |||
| Energy | 3.74% | |||
| Short-Term Investments | 3.39% | |||
| Consumer Staples | 2.38% | |||
|
| |||
| 100.00% |
17
Buffalo Discovery Fund
SCHEDULE OF INVESTMENTS
March 31, 2013
| SHARES OR FACE AMOUNT | FAIR VALUE* | |||||||
| COMMON STOCKS — 98.12% |
| ||||||
| CONSUMER DISCRETIONARY — 5.82% |
| ||||||
Auto Components — 1.26% |
| |||||||
| 83,900 | BorgWarner, Inc.(a) | $ | 6,488,826 | |||||
|
| |||||||
Diversified Consumer Services — 0.53% | ||||||||
| 285,150 | LifeLock, Inc.(a) | 2,745,995 | ||||||
|
| |||||||
Media — 1.54% | ||||||||
| 560,600 | Pandora Media Inc.(a) | 7,938,096 | ||||||
|
| |||||||
Specialty Retail — 2.49% | ||||||||
| 95,000 | Vitamin Shoppe, Inc.(a) | 4,640,750 | ||||||
| 158,800 | Williams-Sonoma, Inc. | 8,181,376 | ||||||
|
| |||||||
| 12,822,126 | ||||||||
Total Consumer Discretionary (Cost $25,970,100) | 29,995,043 | |||||||
|
| |||||||
| CONSUMER STAPLES — 3.51% | |||||||
Food & Staples Retailing — 2.67% | ||||||||
| 171,000 | The Fresh Market, Inc.(a) | 7,313,670 | ||||||
| 74,200 | Whole Foods Market, Inc. | 6,436,850 | ||||||
|
| |||||||
| 13,750,520 | ||||||||
|
| |||||||
Personal Products — 0.84% | ||||||||
| 116,000 | Herbalife Ltd.(b) | 4,344,200 | ||||||
Total Consumer Staples (Cost $18,513,572) | 18,094,720 | |||||||
|
| |||||||
| ENERGY — 5.32% | |||||||
Energy Equipment & Services — 5.32% | ||||||||
| 215,100 | Baker Hughes, Inc. | 9,982,791 | ||||||
| 91,000 | CARBO Ceramics, Inc. | 8,287,370 | ||||||
| 318,600 | Forum Energy Technologies Inc.(a) | 9,162,936 | ||||||
Total Energy (Cost $25,211,195) | 27,433,097 | |||||||
|
| |||||||
| FINANCIALS — 1.27% | |||||||
Capital Markets — 1.27% | ||||||||
| 180,300 | Financial Engines Inc.(a) | 6,530,466 | ||||||
Total Financials (Cost $3,410,400) | 6,530,466 | |||||||
|
| |||||||
| HEALTH CARE — 27.90% | |||||||
Biotechnology — 2.79% | ||||||||
| 807,925 | Dyax Corp.(a) | 3,522,553 | ||||||
| 222,400 | Gilead Sciences, Inc.(a) | 10,882,032 | ||||||
|
| |||||||
| 14,404,585 | ||||||||
|
| |||||||
Health Care Equipment & Services — 1.60% | ||||||||
| 347,500 | Quidel Corp.(a) | 8,253,125 | ||||||
|
| |||||||
Health Care Equipment & Supplies — 6.34% | ||||||||
| 1,076,200 | Accuray Inc.(a) | 4,993,568 | ||||||
| 417,013 | Align Technology, Inc.(a) | 13,974,106 | ||||||
| 110,500 | Baxter International Inc. | 8,026,720 | ||||||
| 219,600 | Insulet Corp.(a) | 5,678,856 | ||||||
|
| |||||||
| 32,673,250 | ||||||||
|
| |||||||
Health Care Technology — 1.82% | ||||||||
| 96,750 | athenahealth Inc.(a) | 9,388,620 | ||||||
|
| |||||||
18
| SHARES OR FACE AMOUNT | FAIR VALUE* | |||||||
| HEALTH CARE (Continued) |
| ||||||
Life Sciences Tools & Services — 5.43% | ||||||||
| 131,800 | Agilent Technologies, Inc. | $ | 5,531,646 | |||||
| 173,500 | Charles River Laboratories International, Inc.(a) | 7,680,845 | ||||||
| 120,300 | Illumina, Inc.(a) | 6,496,200 | ||||||
| 246,500 | PerkinElmer, Inc. | 8,292,260 | ||||||
|
| |||||||
| 28,000,951 | ||||||||
|
| |||||||
Pharmaceuticals — 9.92% | ||||||||
| 650,000 | Akorn, Inc.(a) | 8,989,500 | ||||||
| 79,100 | Allergan, Inc. | 8,829,933 | ||||||
| 156,100 | Eli Lilly & Co. | 8,864,919 | ||||||
| 184,300 | Forest Laboratories, Inc.(a) | 7,010,772 | ||||||
| 363,500 | Hospira, Inc.(a) | 11,933,705 | ||||||
| 405,000 | Warner Chilcott PLC — Class A(b) | 5,487,750 | ||||||
|
| |||||||
| 51,116,579 | ||||||||
Total Health Care (Cost $108,464,473) | 143,837,110 | |||||||
|
| |||||||
| INDUSTRIALS — 8.01% | |||||||
Aerospace & Defense — 0.64% | ||||||||
| 113,700 | Hexcel Corp.(a) | 3,298,437 | ||||||
|
| |||||||
Commercial Services and Supplies — 1.07% | ||||||||
| 51,800 | Stericycle, Inc.(a) | 5,500,124 | ||||||
|
| |||||||
Construction & Engineering — 1.64% | ||||||||
| 296,000 | Quanta Services, Inc.(a) | 8,459,680 | ||||||
|
| |||||||
Electrical Equipment — 1.28% | ||||||||
| 51,900 | Roper Industries, Inc. | 6,607,389 | ||||||
|
| |||||||
Machinery — 2.37% | ||||||||
| 152,700 | Chart Industries, Inc.(a) | 12,217,527 | ||||||
|
| |||||||
Professional Services — 1.01% | ||||||||
| 98,700 | The Advisory Board Co.(a) | 5,183,724 | ||||||
Total Industrials (Cost $26,336,444) | 41,266,881 | |||||||
|
| |||||||
| INFORMATION TECHNOLOGY — 43.03% | |||||||
Communications Equipment — 8.69% | ||||||||
| 623,900 | ADTRAN, Inc. | 12,259,635 | ||||||
| 210,607 | Aruba Networks Inc.(a) | 5,210,417 | ||||||
| 56,800 | F5 Networks, Inc.(a) | 5,059,744 | ||||||
| 443,500 | Juniper Networks, Inc.(a) | 8,222,490 | ||||||
| 80,200 | Motorola Solutions, Inc. | 5,135,206 | ||||||
| 133,300 | QUALCOMM Inc. | 8,924,435 | ||||||
|
| |||||||
| 44,811,927 | ||||||||
|
| |||||||
Computers & Peripherals — 5.80% | ||||||||
| 29,800 | Apple Inc. | 13,190,374 | ||||||
| 301,700 | EMC Corp.(a) | 7,207,613 | ||||||
| 278,500 | NetApp, Inc.(a) | 9,513,560 | ||||||
|
| |||||||
| 29,911,547 | ||||||||
|
| |||||||
Electronic Equipment, Instruments & Components — 3.92% | ||||||||
| 74,000 | Dolby Laboratories, Inc. — Class A | 2,483,440 | ||||||
| 188,304 | FARO Technologies, Inc.(a) | 8,170,511 | ||||||
| 290,700 | National Instruments Corp. | 9,520,425 | ||||||
|
| |||||||
| 20,174,376 | ||||||||
|
| |||||||
19
Buffalo Discovery Fund
SCHEDULE OF INVESTMENTS
March 31, 2013
(Continued)
| SHARES OR FACE AMOUNT | FAIR VALUE* | |||||||
| INFORMATION TECHNOLOGY (Continued) |
| ||||||
Internet Software & Services — 6.18% | ||||||||
| 291,200 | Akamai Technologies, Inc.(a) | $ | 10,276,448 | |||||
| 19,200 | Equinix, Inc.(a) | 4,153,152 | ||||||
| 325,000 | Facebook Inc.(a) | 8,313,500 | ||||||
| 9,000 | Google Inc. — Class A(a) | 7,146,270 | ||||||
| 309,000 | Millennial Media Inc.(a) | 1,962,150 | ||||||
|
| |||||||
| 31,851,520 | ||||||||
|
| |||||||
IT Services — 2.33% | ||||||||
| 193,966 | NeuStar, Inc.(a) | 9,025,238 | ||||||
| 421,800 | ServiceSource International Inc.(a) | 2,982,126 | ||||||
|
| |||||||
| 12,007,364 | ||||||||
|
| |||||||
Semiconductors & Semiconductor Equipment — 4.39% | ||||||||
| 245,400 | Broadcom Corp. — Class A | 8,508,018 | ||||||
| 181,800 | Microchip Technology Inc. | 6,682,968 | ||||||
| 210,400 | Semtech Corp.(a) | 7,446,056 | ||||||
|
| |||||||
| 22,637,042 | ||||||||
|
| |||||||
Software — 11.72% | ||||||||
| 184,300 | ACI Worldwide, Inc.(a) | 9,004,897 | ||||||
| 32,700 | ANSYS, Inc.(a) | 2,662,434 | ||||||
| 173,000 | Broadsoft Inc.(a) | 4,579,310 | ||||||
| 184,300 | Check Point Software Technologies Ltd.(a)(b) | 8,660,257 | ||||||
| 102,100 | Citrix Systems, Inc.(a) | 7,367,536 | ||||||
| 287,800 | Fortinet Inc.(a) | 6,815,104 | ||||||
| 155,400 | MICROS Systems, Inc.(a) | 7,072,254 | ||||||
| 162,100 | Red Hat, Inc.(a) | 8,195,776 | ||||||
| 76,100 | VMware, Inc.(a) | 6,002,768 | ||||||
|
| |||||||
| 60,360,336 | ||||||||
Total Information Technology (Cost $188,547,522) | 221,754,112 | |||||||
|
| |||||||
| MATERIALS — 3.26% | |||||||
Chemicals — 3.26% | ||||||||
| 81,100 | FMC Corp. | 4,625,133 | ||||||
| 115,200 | Monsanto Co. | 12,168,576 | ||||||
Total Materials (Cost $9,497,141) | 16,793,709 | |||||||
|
| |||||||
| TOTAL COMMON STOCKS | 505,705,138 | ||||||
| (COST $405,950,847) | |||||||
| SHORT TERM INVESTMENTS — 1.71% |
| ||||||
| INVESTMENT COMPANY — 1.71% |
| ||||||
| 8,830,653 | Fidelity Institutional — Government Portfolio — 0.01%(c) | 8,830,653 | ||||||
Total Investment Company | 8,830,653 | |||||||
|
| |||||||
| TOTAL SHORT TERM INVESTMENTS | 8,830,653 | ||||||
| (COST $8,830,653) | |||||||
| TOTAL INVESTMENTS — 99.83% | 514,535,791 | ||||||
| (COST $414,781,500) | |||||||
| Other Assets in Excess of Liabilities — 0.17% | 893,028 | ||||||
|
| |||||||
| TOTAL NET ASSETS — 100.00% | $ | 515,428,819 | |||||
|
| |||||||
20
PLC — Public Limited Company
| (a) | Non Income Producing |
| (b) | Foreign Issued Security. The total value of these securities amounted to $18,492,207 (3.59% of net assets) at March 31, 2013. |
| (c) | 7-day yield |
| * | See Note 1A of accompanying Notes to Financial Statements regarding valuation of securities. |
The Global Industry Classification Standard (GICS) was developed by and/or is the exclusive property of MSCI, Inc. and Standard & Poor Financial Services LLC (“S&P”). GICS is a service mark of MSCI and S&P and has been licensed for use by U.S. Bancorp Fund Services, LLC.
21
Buffalo Dividend Focus Fund
SCHEDULE OF INVESTMENTS
March 31, 2013
| SHARES OR FACE AMOUNT | FAIR VALUE* | |||||||
| COMMON STOCKS — 73.19% |
| ||||||
| CONSUMER DISCRETIONARY — 2.62% | |||||||
Hotels, Restaurants & Leisure — 2.62% | ||||||||
| 1,200 | Darden Restaurants, Inc.(c) | $ | 62,016 | |||||
| 3,000 | McDonald’s Corp. | 299,070 | ||||||
Total Consumer Discretionary (Cost $331,393) | 361,086 | |||||||
|
| |||||||
| CONSUMER STAPLES — 13.53% | |||||||
Beverages — 2.05% | ||||||||
| 7,000 | The Coca Cola Co. | 283,080 | ||||||
|
| |||||||
Food Products — 7.32% | ||||||||
| 3,000 | Campbell Soup Co. | 136,080 | ||||||
| 6,000 | General Mills, Inc. | 295,860 | ||||||
| 6,000 | Kraft Foods Group, Inc. — Class A | 309,180 | ||||||
| 12,200 | Pinnacle Foods Inc.(a) | 270,962 | ||||||
|
| |||||||
| 1,012,082 | ||||||||
|
| |||||||
Household Products — 4.16% | ||||||||
| 3,000 | The Clorox Co. | 265,590 | ||||||
| 4,000 | The Procter & Gamble Co. | 308,240 | ||||||
|
| |||||||
| 573,830 | ||||||||
Total Consumer Staples (Cost $1,667,341) | 1,868,992 | |||||||
|
| |||||||
| ENERGY — 12.31% | |||||||
Energy Equipment & Services — 0.54% | ||||||||
| 1,000 | Schlumberger Ltd.(b)(c) | 74,890 | ||||||
|
| |||||||
Oil, Gas & Consumable Fuels — 11.77% | ||||||||
| 6,000 | BP plc — ADR(b)(c) | 254,100 | ||||||
| 4,500 | ConocoPhillips | 270,450 | ||||||
| 2,000 | Dorchester Minerals LP. | 46,400 | ||||||
| 10,000 | Kinder Morgan Inc. | 386,800 | ||||||
| 7,000 | LinnCo LLC | 273,350 | ||||||
| 1,500 | MPLX LP | 56,175 | ||||||
| 4,000 | Royal Dutch Shell PLC — ADR(b) | 260,640 | ||||||
| 1,400 | Tesoro Logistics LP. | 75,558 | ||||||
|
| |||||||
| 1,623,473 | ||||||||
Total Energy (Cost $1,663,278) | 1,698,363 | |||||||
|
| |||||||
| FINANCIALS — 4.21% | |||||||
Capital Markets — 1.90% | ||||||||
| 10,000 | AllianceBernstein Holding LP | 219,000 | ||||||
| 1,100 | Artisan Partners Asset Management, Inc.(a) | 43,395 | ||||||
|
| |||||||
| 262,395 | ||||||||
|
| |||||||
Insurance — 2.31% | ||||||||
| 6,000 | Arthur J. Gallagher & Co. | 247,860 | ||||||
| 1,500 | Cincinnati Financial Corp. | 70,785 | ||||||
|
| |||||||
| 318,645 | ||||||||
Total Financials (Cost $507,303) | 581,040 | |||||||
|
| |||||||
| HEALTH CARE — 7.38% | |||||||
Health Care Equipment & Supplies — 0.25% | ||||||||
| 1,500 | Meridian Bioscience, Inc. | 34,230 | ||||||
|
| |||||||
22
| SHARES OR FACE AMOUNT | FAIR VALUE* | |||||||
| HEALTH CARE (Continued) | |||||||
Health Care Providers & Services — 0.57% | ||||||||
| 1,400 | Landauer, Inc. | $ | 78,932 | |||||
|
| |||||||
Health Care Technology — 0.24% | ||||||||
| 600 | Computer Programs and Systems, Inc. | 32,466 | ||||||
|
| |||||||
Pharmaceuticals — 6.32% | ||||||||
| 6,000 | GlaxoSmithKline PLC — ADR(b) | 281,460 | ||||||
| 4,000 | Johnson & Johnson | 326,120 | ||||||
| 6,000 | Merck & Co., Inc. | 265,380 | ||||||
|
| |||||||
| 872,960 | ||||||||
Total Health Care (Cost $958,703) | 1,018,588 | |||||||
|
| |||||||
| INDUSTRIALS — 11.32% | |||||||
Aerospace & Defense — 1.58% | ||||||||
| 20,000 | Exelis Inc. | 217,800 | ||||||
|
| |||||||
Commercial Services & Supplies — 4.87% | ||||||||
| 20,000 | Pitney Bowes Inc. | 297,200 | ||||||
| 3,000 | Republic Services, Inc. | 99,000 | ||||||
| 7,000 | Waste Management, Inc. | 274,470 | ||||||
|
| |||||||
| 670,670 | ||||||||
|
| |||||||
Electrical Equipment — 0.41% | ||||||||
| 2,500 | ABB Ltd. — ADR(b) | 56,900 | ||||||
|
| |||||||
Industrial Conglomerates — 2.51% | ||||||||
| 15,000 | General Electric Co. | 346,800 | ||||||
|
| |||||||
Road & Rail — 1.95% | ||||||||
| 3,500 | Norfolk Southern Corp. | 269,780 | ||||||
Total Industrials (Cost $1,455,681) | 1,561,950 | |||||||
|
| |||||||
| INFORMATION TECHNOLOGY — 8.36% | |||||||
Electronic Equipment & Instruments — 0.42% | ||||||||
| 2,000 | Molex Inc. | 58,560 | ||||||
|
| |||||||
IT Services — 2.03% | ||||||||
| 8,000 | Paychex, Inc. | 280,560 | ||||||
|
| |||||||
Semiconductors & Semiconductor Equipment — 3.29% | ||||||||
| 14,000 | Intel Corp. | 305,900 | ||||||
| 4,000 | Microchip Technology Inc. | 147,040 | ||||||
|
| |||||||
| 452,940 | ||||||||
|
| |||||||
Software — 2.62% | ||||||||
| 3,000 | CA, Inc. | 75,510 | ||||||
| 10,000 | Microsoft Corp. | 286,100 | ||||||
|
| |||||||
| 361,610 | ||||||||
Total Information Technology (Cost $1,074,484) | 1,153,670 | |||||||
|
| |||||||
| MATERIALS — 8.32% | |||||||
Chemicals — 3.31% | ||||||||
| 5,000 | The Dow Chemical Co. | 159,200 | ||||||
| 5,000 | E.I. du Pont de Nemours and Co. | 245,800 | ||||||
| 2,600 | Tronox Limited(b) | 51,506 | ||||||
|
| |||||||
| 456,506 | ||||||||
|
| |||||||
23
Buffalo Dividend Focus Fund
SCHEDULE OF INVESTMENTS
March 31, 2013
(Continued)
| SHARES OR FACE AMOUNT | FAIR VALUE* | |||||||
| MATERIALS (Continued) | |||||||
Containers & Packaging — 1.84% | ||||||||
| 7,000 | MeadWestvaco Corp. | $ | 254,100 | |||||
|
| |||||||
Metals & Mining — 3.17% | ||||||||
| 6,500 | Cliffs Natural Resources Inc.(c) | 123,565 | ||||||
| 5,000 | Newmont Mining Corp. | 209,450 | ||||||
| 5,000 | SunCoke Energy Partners LP(a) | 104,500 | ||||||
|
| |||||||
| 437,515 | ||||||||
Total Materials (Cost $1,215,637) | 1,148,121 | |||||||
|
| |||||||
| TELECOMMUNICATION SERVICES — 4.26% | |||||||
Diversified Telecommunications — 4.26% | ||||||||
| 8,000 | AT&T Inc. | 293,520 | ||||||
| 6,000 | Verizon Communications Inc. | 294,900 | ||||||
Total Telecommunication Services (Cost $537,623) | 588,420 | |||||||
|
| |||||||
| UTILITIES — 0.88% | |||||||
Gas Utilities — 0.88% | ||||||||
| 5,000 | Questar Corp. | 121,650 | ||||||
Total Utilities (Cost $113,440) | 121,650 | |||||||
|
| |||||||
| TOTAL COMMON STOCKS | 10,101,880 | ||||||
| (COST $9,524,883) | |||||||
| SHORT TERM INVESTMENTS — 28.25% |
| ||||||
| INVESTMENT COMPANIES — 28.25% |
| ||||||
| 1,300,000 | Fidelity Institutional — Government Portfolio — 0.01%(d) | 1,300,000 | ||||||
| 1,298,334 | SEI Daily Income Treasury II — Class B — 0.01%(d) | 1,298,334 | ||||||
| 1,300,000 | The STIT-Treasury Portfolio — 0.02%(d) | 1,300,000 | ||||||
Total Investment Companies | 3,898,334 | |||||||
|
| |||||||
| TOTAL SHORT TERM INVESTMENTS | 3,898,334 | ||||||
| (COST $3,898,334) | |||||||
| TOTAL INVESTMENTS — 101.44% | 14,000,214 | ||||||
| (COST $13,423,217) | |||||||
| Liabilities in Excess of Other Assets — (1.44)% | (198,519 | ) | |||||
|
| |||||||
| TOTAL NET ASSETS — 100.00% | $ | 13,801,695 | |||||
|
| |||||||
ADR — American Depositary Receipt
| (a) | Non Income Producing |
| (b) | Foreign Issued Securities. The total value of these securities amounted to $979,496 (7.10% of net assets) at March 31, 2013. |
| (c) | Portions of these investments are segregated as collateral for open written option contacts. |
| (d) | 7-day yield |
| * | See Note 1A of accompanying Notes to Financial Statements regarding valuation of securities. |
24
SCHEDULE OF OPTIONS WRITTEN
March 31, 2013
| CONTRACTS | VALUE | |||||||
| CALL OPTIONS | |||||||
| 40 | BP plc: | $ | 160 | |||||
| 20 | Cliffs Natural Resources Inc.: | 70 | ||||||
| 30 | Expiration: July 2013, Exercise Price: $43.00 | 90 | ||||||
| 12 | Darden Resaurants, Inc.: | 6,600 | ||||||
| 10 | Schlumberger Ltd.: | 4,050 | ||||||
Total Written Options (Premium received 15,252) | $ | 10,970 | ||||||
|
| |||||||
The Global Industry Classification Standard (GICS) was developed by and/or is the exclusive property of MSCI, Inc. and Standard & Poor Financial Services LLC (“S&P”). GICS is a service mark of MSCI and S&P and has been licensed for use by U.S. Bancorp Fund Services, LLC.
The accompanying notes are an integral part of these financial statements.
25
Buffalo Flexible Income Fund
SCHEDULE OF INVESTMENTS
March 31, 2013
| SHARES OR FACE AMOUNT | FAIR VALUE* | |||||||
| COMMON STOCKS — 52.97% | |||||||
| CONSUMER DISCRETIONARY — 1.21% | |||||||
Hotels, Restaurants & Leisure — 1.21% | ||||||||
| 105,000 | McDonald’s Corp. | $ | 10,467,450 | |||||
Total Consumer Discretionary (Cost $9,002,904) | 10,467,450 | |||||||
|
| |||||||
| CONSUMER STAPLES — 11.45% | |||||||
Beverages — 3.19% | ||||||||
| 300,000 | The Coca Cola Co. | 12,132,000 | ||||||
| 22,000 | Diageo PLC — ADR(d)(f) | 2,768,480 | ||||||
| 100,000 | Dr. Pepper Snapple Group, Inc. | 4,695,000 | ||||||
| 100,000 | PepsiCo, Inc. | 7,911,000 | ||||||
|
| |||||||
| 27,506,480 | ||||||||
|
| |||||||
Food & Staples Retailing — 1.14% | ||||||||
| 40,000 | Costco Wholesale Corp. | 4,244,400 | ||||||
| 95,000 | Sysco Corp.(f) | 3,341,150 | ||||||
| 30,000 | Wal-Mart Stores, Inc. | 2,244,900 | ||||||
|
| |||||||
| 9,830,450 | ||||||||
|
| |||||||
Food Products — 3.96% | ||||||||
| 100,000 | Campbell Soup Co. | 4,536,000 | ||||||
| 100,000 | ConAgra Foods, Inc. | 3,581,000 | ||||||
| 170,000 | General Mills, Inc. | 8,382,700 | ||||||
| 30,000 | H.J. Heinz Co. | 2,168,100 | ||||||
| 70,000 | Kellogg Co. | 4,510,100 | ||||||
| 155,000 | Kraft Foods Group, Inc. — Class A | 7,987,150 | ||||||
| 100,000 | Mondelez International Inc. | 3,061,000 | ||||||
|
| |||||||
| 34,226,050 | ||||||||
|
| |||||||
Household Products — 3.16% | ||||||||
| 75,000 | The Clorox Co. | 6,639,750 | ||||||
| 15,000 | Colgate-Palmolive Co. | 1,770,450 | ||||||
| 35,000 | Kimberly-Clark Corp. | 3,429,300 | ||||||
| 200,000 | The Procter & Gamble Co. | 15,412,000 | ||||||
|
| |||||||
| 27,251,500 | ||||||||
Total Consumer Staples (Cost $75,169,279) | 98,814,480 | |||||||
|
| |||||||
| ENERGY — 16.05% | |||||||
Energy Equipment & Services — 2.53% | ||||||||
| 200,000 | Baker Hughes, Inc. | 9,282,000 | ||||||
| 121,000 | Patterson-UTI Energy, Inc.(f) | 2,884,640 | ||||||
| 105,000 | Schlumberger Ltd.(d)(f) | 7,863,450 | ||||||
| 35,000 | Tidewater Inc. | 1,767,500 | ||||||
|
| |||||||
| 21,797,590 | ||||||||
|
| |||||||
Oil, Gas & Consumable Fuels — 13.52% | ||||||||
| 225,000 | BP plc — ADR(d)(f) | 9,528,750 | ||||||
| 75,000 | Chevron Corp. | 8,911,500 | ||||||
| 169,000 | ConocoPhillips | 10,156,900 | ||||||
| 140,000 | Delek Logistics Partners LP | 4,366,600 | ||||||
| 125,000 | EQT Midstream Partners LP | 4,850,000 | ||||||
| 148,500 | Exxon Mobil Corp.(f) | 13,381,335 | ||||||
| 60,000 | Hess Corp. | 4,296,600 | ||||||
| 206,000 | HollyFrontier Corp. | 10,598,700 | ||||||
| 50,000 | Kinder Morgan Inc. | 1,934,000 | ||||||
26
| SHARES OR FACE AMOUNT | FAIR VALUE* | |||||||
| ENERGY (Continued) | |||||||
| 107,000 | Linn Energy LLC | $ | 4,055,300 | |||||
| 80,000 | Marathon Oil Corp. | 2,697,600 | ||||||
| 35,000 | Marathon Petroleum Corp. | 3,136,000 | ||||||
| 75,000 | MPLX LP | 2,808,750 | ||||||
| 50,000 | Phillips 66 | 3,498,500 | ||||||
| 240,000 | Royal Dutch Shell PLC. — ADR(d) | 15,638,400 | ||||||
| 360,000 | Susser Petroleum Partners LP | 11,700,000 | ||||||
| 93,600 | Tesoro Logistics LP. | 5,051,592 | ||||||
|
| |||||||
| 116,610,527 | ||||||||
Total Energy (Cost $104,559,516) | 138,408,117 | |||||||
|
| |||||||
| FINANCIALS — 1.74% | |||||||
Capital Markets — 0.40% | ||||||||
| 66,150 | Artisan Partners Asset Management, Inc.(a) | 2,609,618 | ||||||
| 15,000 | Northern Trust Corp. | 818,400 | ||||||
|
| |||||||
| 3,428,018 | ||||||||
|
| |||||||
Insurance — 1.34% | ||||||||
| 48,000 | The Allstate Corp. | 2,355,360 | ||||||
| 50,000 | Arthur J. Gallagher & Co. | 2,065,500 | ||||||
| 60,000 | Chubb Corp. | 5,251,800 | ||||||
| 40,000 | Cincinnati Financial Corp.(f) | 1,887,600 | ||||||
|
| |||||||
| 11,560,260 | ||||||||
Total Financials (Cost $9,574,993) | 14,988,278 | |||||||
|
| |||||||
| HEALTH CARE — 5.87% | |||||||
Health Care Equipment & Supplies — 0.84% | ||||||||
| 100,000 | Baxter International, Inc. | 7,264,000 | ||||||
|
| |||||||
Pharmaceuticals — 5.03% | ||||||||
| 70,000 | Abbott Laboratories | 2,472,400 | ||||||
| 50,000 | Eli Lilly & Co. | 2,839,500 | ||||||
| 240,000 | GlaxoSmithKline PLC — ADR(d) | 11,258,400 | ||||||
| 150,000 | Johnson & Johnson | 12,229,500 | ||||||
| 200,000 | Merck & Co., Inc. | 8,846,000 | ||||||
| 200,000 | Pfizer, Inc. | 5,772,000 | ||||||
|
| |||||||
| 43,417,800 | ||||||||
Total Health Care (Cost $40,231,112) | 50,681,800 | |||||||
|
| |||||||
| INDUSTRIALS — 5.81% | |||||||
Aerospace & Defense — 1.30% | ||||||||
| 125,000 | The Boeing Co.(f) | 10,731,250 | ||||||
| 45,000 | Exelis Inc. | 490,050 | ||||||
|
| |||||||
| 11,221,300 | ||||||||
|
| |||||||
Commercial Services & Supplies — 2.32% | ||||||||
| 800,000 | Pitney Bowes Inc.(f) | 11,888,000 | ||||||
| 10,000 | Republic Services, Inc. | 330,000 | ||||||
| 200,000 | Waste Management, Inc. | 7,842,000 | ||||||
|
| |||||||
| 20,060,000 | ||||||||
|
| |||||||
Industrial Conglomerates — 1.88% | ||||||||
| 700,000 | General Electric Co. | 16,184,000 | ||||||
|
| |||||||
27
Buffalo Flexible Income Fund
SCHEDULE OF INVESTMENTS
March 31, 2013
(Continued)
| SHARES OR FACE AMOUNT | FAIR VALUE* | |||||||
| INDUSTRIALS (Continued) | |||||||
Machinery — 0.11% | ||||||||
| 15,000 | Illinois Tool Works Inc. | $ | 914,100 | |||||
|
| |||||||
Road & Rail — 0.20% | ||||||||
| 70,000 | CSX Corp. | 1,724,100 | ||||||
Total Industrials (Cost $43,179,008) | 50,103,500 | |||||||
|
| |||||||
| INFORMATION TECHNOLOGY — 5.50% | |||||||
Communications Equipment — 0.73% | ||||||||
| 300,000 | Cisco Systems, Inc. | 6,273,000 | ||||||
|
| |||||||
IT Services — 1.50% | ||||||||
| 54,000 | International Business Machines Corp. (IBM) | 11,518,200 | ||||||
| 40,000 | Paychex, Inc. | 1,402,800 | ||||||
|
| |||||||
| 12,921,000 | ||||||||
|
| |||||||
Semiconductors & Semiconductor Equipment — 1.53% | ||||||||
| 605,000 | Intel Corp. | 13,219,250 | ||||||
|
| |||||||
Software — 1.74% | ||||||||
| 525,000 | Microsoft Corp. | 15,020,250 | ||||||
Total Information Technology (Cost $45,174,126) | 47,433,500 | |||||||
|
| |||||||
| MATERIALS — 3.21% | |||||||
Chemicals — 1.36% | ||||||||
| 215,000 | The Dow Chemical Co.(f) | 6,845,600 | ||||||
| 100,000 | E.I. du Pont de Nemours and Co. | 4,916,000 | ||||||
|
| |||||||
| 11,761,600 | ||||||||
|
| |||||||
Metals & Mining — 1.85% | ||||||||
| 282,211 | Newmont Mining Corp. | 11,821,819 | ||||||
| 195,000 | SunCoke Energy Partners LP.(a) | 4,075,500 | ||||||
|
| |||||||
| 15,897,319 | ||||||||
Total Materials (Cost $28,390,930) | 27,658,919 | |||||||
|
| |||||||
| TELECOMMUNICATION SERVICES — 1.42% | |||||||
Diversified Telecommunications — 1.42% | ||||||||
| 200,000 | AT&T Inc. | 7,338,000 | ||||||
| 100,000 | Verizon Communications Inc. | 4,915,000 | ||||||
Total Telecommunication Services (Cost $11,260,223) | 12,253,000 | |||||||
|
| |||||||
| UTILITIES — 0.56% | |||||||
Gas Utilities — 0.36% | ||||||||
| 125,000 | Questar Corp. | 3,041,250 | ||||||
|
| |||||||
Multi-Utilities — 0.20% | ||||||||
| 25,000 | OGE Energy Corp. | 1,749,500 | ||||||
Total Utilities (Cost $3,231,721) | 4,790,750 | |||||||
|
| |||||||
| TOTAL COMMON STOCKS | 455,599,794 | ||||||
| (COST $369,773,811) | |||||||
28
| SHARES OR FACE AMOUNT | FAIR VALUE* | |||||||
| REITS — 0.15% |
| ||||||
| FINANCIALS — 0.15% |
| ||||||
Real Estate Investment Trusts (REITs) — 0.15% | ||||||||
| 25,000 | Plum Creek Timber Co, Inc. | $ | 1,305,000 | |||||
Total Financials (Cost $938,063) | 1,305,000 | |||||||
|
| |||||||
| TOTAL REITS | 1,305,000 | ||||||
| (COST $938,063) | |||||||
| CONVERTIBLE BONDS — 3.47% |
| ||||||
| CONSUMER DISCRETIONARY — 0.76% |
| ||||||
Media — 0.76% | ||||||||
| $ 6,500,000 | Live Nation Entertainment Inc. | 6,548,750 | ||||||
Total Consumer Discretionary (Cost $6,296,705) | 6,548,750 | |||||||
|
| |||||||
| HEALTH CARE — 0.85% | |||||||
Health Care Providers & Services — 0.85% | ||||||||
| 4,500,000 | Omnicare Inc.: | 4,516,875 | ||||||
| 2,500,000 | 3.750%, 04/01/2042 | 2,804,688 | ||||||
Total Health Care (Cost $7,010,951) | 7,321,563 | |||||||
|
| |||||||
| INFORMATION TECHNOLOGY — 1.24% | |||||||
Software — 1.24% | ||||||||
| 3,500,000 | BroadSoft, Inc. | 3,594,063 | ||||||
| 7,000,000 | Rovi Corp. | 7,153,124 | ||||||
Total Information Technology (Cost $10,240,293) | 10,747,187 | |||||||
|
| |||||||
| MATERIALS — 0.62% | |||||||
Metals & Mining — 0.62% | ||||||||
| 7,500,000 | Molycorp Inc. | 5,353,125 | ||||||
Total Materials (Cost $7,500,000) | 5,353,125 | |||||||
|
| |||||||
| TOTAL CONVERTIBLE BONDS | 29,970,625 | ||||||
| (COST $31,047,949) | |||||||
| CORPORATE BONDS — 17.80% |
| ||||||
| CONSUMER DISCRETIONARY — 3.48% |
| ||||||
Hotels, Restaurants & Leisure — 0.26% | ||||||||
| 125,000 | Ameristar Casinos, Inc. | 137,656 | ||||||
| 2,000,000 | Marina District Finance Co., Inc. | 2,070,000 | ||||||
|
| |||||||
| 2,207,656 | ||||||||
|
| |||||||
Leisure Equipment & Products — 0.27% | ||||||||
| 2,200,000 | Brunswick Corp. | 2,365,000 | ||||||
|
| |||||||
29
Buffalo Flexible Income Fund
SCHEDULE OF INVESTMENTS
March 31, 2013
(Continued)
| SHARES OR FACE AMOUNT | FAIR VALUE* | |||||||
| CONSUMER DISCRETIONARY (Continued) |
| ||||||
Media — 2.52% | ||||||||
| $ 9,500,000 | Lions Gate Entertainment Inc.:(d) | $ | 10,414,375 | |||||
| 2,500,000 | 4.000%, 01/11/2017(e) | 5,764,063 | ||||||
| 1,500,000 | Live Nation Entertainment Inc. | 1,620,000 | ||||||
| 3,500,000 | MDC Partners Inc.(d) | 3,902,500 | ||||||
|
| |||||||
| 21,700,938 | ||||||||
|
| |||||||
Specialty Retail — 0.43% | ||||||||
| 2,500,000 | Penske Automotive Group Inc | 2,618,750 | ||||||
| 1,000,000 | Sonic Automotive, Inc. | 1,105,000 | ||||||
|
| |||||||
| 3,723,750 | ||||||||
Total Consumer Discretionary (Cost $25,048,428) | 29,997,344 | |||||||
|
| |||||||
| CONSUMER STAPLES — 0.83% |
| ||||||
Food & Staples Retailing — 0.83% | ||||||||
| 6,650,000 | The Pantry, Inc. | 7,165,375 | ||||||
Total Consumer Staples (Cost $6,809,492) | 7,165,375 | |||||||
|
| |||||||
| ENERGY — 5.45% | |||||||
Energy Equipment & Services — 0.16% | ||||||||
| 1,300,000 | Heckmann Corp. | 1,395,875 | ||||||
|
| |||||||
Oil, Gas & Consumable Fuels — 5.29% | ||||||||
| 12,000,000 | Alpha Natural Resources, Inc. | 12,929,999 | ||||||
| 2,500,000 | Cloud Peak Energy Resources LLC/Cloud Peak Energy Finance Co. | 2,687,500 | ||||||
| 8,000,000 | Gulfport Energy Corp. | 8,480,000 | ||||||
| 4,500,000 | Kodiak Oil & Gas Corp.(d) | 5,107,500 | ||||||
| 5,000,000 | Swift Energy Co. | 5,150,000 | ||||||
| 10,000,000 | United Refining Co. | 11,350,000 | ||||||
|
| |||||||
| 45,704,999 | ||||||||
Total Energy (Cost $43,005,570) | 47,100,874 | |||||||
|
| |||||||
| FINANCIALS — 0.12% |
| ||||||
Capital Markets — 0.12% | ||||||||
| 40,000 | Stifel Financial Corp. | 1,069,600 | ||||||
Total Financials (Cost $1,002,400) | 1,069,600 | |||||||
|
| |||||||
| HEALTH CARE — 1.76% |
| ||||||
Health Care Providers & Services — 1.14% | ||||||||
| 1,948,000 | Acadia Healthcare Co., Inc. | 2,396,040 | ||||||
30
| SHARES OR FACE AMOUNT | FAIR VALUE* | |||||||
| HEALTH CARE (Continued) |
| ||||||
| $ 6,825,000 | Examworks Group, Inc. | $ | 7,439,250 | |||||
|
| |||||||
| 9,835,290 | ||||||||
|
| |||||||
Pharmaceuticals — 0.62% | ||||||||
| 5,000,000 | Warner Chilcott Corp.(d) | 5,368,750 | ||||||
Total Health Care (Cost $13,520,903) | 15,204,040 | |||||||
|
| |||||||
| INDUSTRIALS — 3.43% |
| ||||||
Aerospace & Defense — 1.12% | ||||||||
| 4,500,000 | Kratos Defense & Security Solutions, Inc. | 4,972,500 | ||||||
|
| |||||||
Commercial Services & Supplies — 0.54% | ||||||||
| 4,000,000 | R. R. Donnelley & Sons Co. | 4,620,000 | ||||||
|
| |||||||
Construction & Engineering — 0.68% | ||||||||
| 5,575,000 | Tutor Perini Corp. | 5,881,625 | ||||||
|
| |||||||
Electrical Equipment — 0.50% | ||||||||
| 4,000,000 | Polypore International, Inc. | 4,310,000 | ||||||
|
| |||||||
Machinery — 0.43% | ||||||||
| 3,570,000 | Mueller Water Products Inc. | 3,690,488 | ||||||
|
| |||||||
Road & Rail — 0.70% | ||||||||
| 2,000,000 | Kansas City Southern de Mexico SA de CV(d) | 2,205,000 | ||||||
| 3,500,000 | Quality Distribution LLC/QD Capital Corp. | 3,867,500 | ||||||
|
| |||||||
| 6,072,500 | ||||||||
Total Industrials (Cost $27,768,013) | 29,547,113 | |||||||
|
| |||||||
| INFORMATION TECHNOLOGY — 1.51% | |||||||
Electronic Equipment, Instruments & Components — 0.44% | ||||||||
| 3,625,000 | Kemet Corp. | 3,797,188 | ||||||
|
| |||||||
IT Services — 0.63% | ||||||||
| 5,000,000 | iGATE Corp. | 5,468,750 | ||||||
|
| |||||||
Software — 0.44% | ||||||||
| 3,500,000 | Audatex North America, Inc. | 3,771,250 | ||||||
Total Information Technology (Cost $12,535,227) | 13,037,188 | |||||||
|
| |||||||
| MATERIALS — 0.87% | |||||||
Chemicals — 0.64% | ||||||||
| 1,510,000 | Omnova Solutions, Inc. | 1,615,700 | ||||||
| 4,000,000 | Tronox Finance LLC | 3,895,000 | ||||||
|
| |||||||
| 5,510,700 | ||||||||
|
| |||||||
31
Buffalo Flexible Income Fund
SCHEDULE OF INVESTMENTS
March 31, 2013
(Continued)
| SHARES OR FACE AMOUNT | FAIR VALUE* | |||||||
| MATERIALS (Continued) | |||||||
Metals & Mining — 0.23% | ||||||||
| $ 2,000,000 | Molycorp Inc. | $ | 1,980,000 | |||||
Total Materials (Cost $7,597,278) | 7,490,700 | |||||||
|
| |||||||
| TELECOMMUNICATION SERVICES — 0.35% | |||||||
Diversified Telecommunications — 0.35% | ||||||||
| 2,600,000 | Consolidated Communications Finance Co. | 2,977,000 | ||||||
Total Telecommunication Services (Cost $2,807,221) | 2,977,000 | |||||||
|
| |||||||
| TOTAL CORPORATE BONDS | 153,589,234 | ||||||
| (COST $140,094,532) | |||||||
| SHORT TERM INVESTMENTS — 24.72% |
| ||||||
| INVESTMENT COMPANIES — 24.72% |
| ||||||
| 84,500,000 | Fidelity Institutional — Government Portfolio — 0.01%(g) | 84,500,000 | ||||||
| 44,265,511 | SEI Daily Income Treasury II — Class B — 0.01%(g) | 44,265,511 | ||||||
| 84,500,000 | The STIT-Treasury Portfolio — 0.02%(g) | 84,500,000 | ||||||
Total Investment Companies | 213,265,511 | |||||||
|
| |||||||
| TOTAL SHORT TERM INVESTMENTS | 213,265,511 | ||||||
| (COST $213,265,511) | |||||||
| TOTAL INVESTMENTS — 99.11% | 853,730,164 | ||||||
| (COST $755,119,866) | |||||||
| Other Assets in Excess of Liabilities — 1.04% | 8,950,628 | ||||||
|
| |||||||
| TOTAL NET ASSETS — 100.00% | $ | 862,680,792 | |||||
|
| |||||||
ADR — American Depositary Receipt
PLC — Public Limited Company
| (a) | Non Income Producing |
| (b) | 144A Security. The total value of these securities is $30,527,375 (3.54% of net assets) at March 31, 2013. |
| (c) | Restricted Security Deemed Liquid. The total value of restricted securities is $30,527,357 (3.54% of net assets) at March 31, 2013. |
| (d) | Foreign Issued Securities. The total value of these securities amounted to $79,819,668 (9.25% of net assets) at March 31, 2013. |
| (e) | Illiquid Security. The total value of these securities amounted to $5,764,063 (0.67% of net assets) at March 31, 2013. |
| (f) | Portions of these investments are segregated as collateral for open written option contacts. |
| (g) | 7-day yield |
| * | See Note 1A of accompanying Notes to Financial Statements regarding valuation of securities. |
The accompanying notes are an integral part of these financial statements.
32
SCHEDULE OF OPTIONS WRITTEN
March 31, 2013
| CONTRACTS | VALUE | |||||||
| CALL OPTIONS |
| ||||||
| 250 | The Boeing Co: | $ | 110,750 | |||||
| 1,000 | BP plc: | 4,000 | ||||||
| 250 | Expiration: April 2013, Exercise Price: $42.00 | 21,500 | ||||||
| 380 | Cincinnati Financial Corp.: | 114,950 | ||||||
| 50 | Diageo PLC: | 30,450 | ||||||
| 300 | The Dow Chemical Co.: | 6,300 | ||||||
| 150 | Expiration: April 2013, Exercise Price: $34.00 | 900 | ||||||
| 300 | Expiration: June 2013, Exercise Price: $37.00 | 3,000 | ||||||
| 100 | Exxon Mobil Corp.: | 11,100 | ||||||
| 153 | Patterson-UTI Energy, Inc.: | 36,338 | ||||||
| 250 | Expiration: August 2013, Exercise Price: $26.00 | 26,875 | ||||||
| 500 | Pitney Bowes Inc.: | 10,000 | ||||||
| 250 | Schlumberger Ltd.: | 3,750 | ||||||
| 250 | Sysco Corp.: | 13,000 | ||||||
Total Written Options (Premium received 222,660) | $ | 392,913 | ||||||
|
| |||||||
The Global Industry Classification Standard (GICS) was developed by and/or is the exclusive property of MSCI, Inc. and Standard & Poor Financial Services LLC (“S&P”). GICS is a service mark of MSCI and S&P and has been licensed for use by U.S. Bancorp Fund Services, LLC.
The accompanying notes are an integral part of these financial statements.
33
Buffalo Growth Fund
SCHEDULE OF INVESTMENTS
March 31, 2013
| SHARES OR FACE AMOUNT | FAIR VALUE* | |||||||
| COMMON STOCKS — 98.85% |
| ||||||
| CONSUMER DISCRETIONARY — 10.98% |
| ||||||
Auto Components — 1.02% | ||||||||
| 252,300 | Gentex Corp. | $ | 5,048,523 | |||||
|
| |||||||
Hotels, Restaurants & Leisure — 3.24% | ||||||||
| 92,000 | McDonald’s Corp. | 9,171,480 | ||||||
| 106,900 | Starwood Hotels & Resorts Worldwide, Inc. | 6,812,737 | ||||||
|
| |||||||
| 15,984,217 | ||||||||
|
| |||||||
Household Durables — 1.83% | ||||||||
| 202,100 | Harman International Industries, Inc. | 9,019,723 | ||||||
|
| |||||||
Textiles, Apparel & Luxury Goods — 4.89% | ||||||||
| 152,900 | Coach, Inc. | 7,643,471 | ||||||
| 183,400 | NIKE, Inc. | 10,822,434 | ||||||
| 111,000 | Under Armour, Inc. — Class A(a) | 5,683,200 | ||||||
|
| |||||||
| 24,149,105 | ||||||||
Total Consumer Discretionary (Cost $47,085,571) | 54,201,568 | |||||||
|
| |||||||
| CONSUMER STAPLES — 5.22% |
| ||||||
Beverages — 1.91% | ||||||||
| 232,900 | The Coca Cola Co. | 9,418,476 | ||||||
|
| |||||||
Food & Staples Retailing — 3.31% | ||||||||
| 211,900 | Walgreen Co. | 10,103,392 | ||||||
| 72,000 | Whole Foods Market, Inc. | 6,246,000 | ||||||
|
| |||||||
| 16,349,392 | ||||||||
Total Consumer Staples (Cost $21,344,443) | 25,767,868 | |||||||
|
| |||||||
| ENERGY — 7.46% |
| ||||||
Energy Equipment & Services — 7.46% | ||||||||
| 252,500 | Baker Hughes, Inc. | 11,718,525 | ||||||
| 207,500 | Lufkin Industries, Inc. | 13,775,925 | ||||||
| 151,100 | Schlumberger Ltd.(b) | 11,315,879 | ||||||
Total Energy (Cost $39,199,812) | 36,810,329 | |||||||
|
| |||||||
| FINANCIALS — 7.23% |
| ||||||
Capital Markets — 4.97% | ||||||||
| 44,300 | Affiliated Managers Group, Inc.(a) | 6,803,151 | ||||||
| 38,850 | Artisan Partners Asset Management, Inc.(a) | 1,532,633 | ||||||
| 47,500 | The Goldman Sachs Group, Inc. | 6,989,625 | ||||||
| 168,900 | Northern Trust Corp. | 9,215,184 | ||||||
|
| |||||||
| 24,540,593 | ||||||||
|
| |||||||
Diversified Financial Services — 2.26% | ||||||||
| 234,600 | JPMorgan Chase & Co. | 11,134,116 | ||||||
Total Financials (Cost $26,503,248) | 35,674,709 | |||||||
|
| |||||||
| HEALTH CARE — 13.65% |
| ||||||
Health Care Equipment & Supplies — 5.70% | ||||||||
| 397,000 | Align Technology, Inc.(a) | 13,303,470 | ||||||
| 138,800 | Baxter International, Inc. | 10,082,432 | ||||||
| 114,400 | Haemonetics Corp.(a) | 4,765,904 | ||||||
|
| |||||||
| 28,151,806 | ||||||||
|
| |||||||
34
| SHARES OR FACE AMOUNT | FAIR VALUE* | |||||||
| HEALTH CARE (Continued) |
| ||||||
Life Sciences Tools & Services — 2.28% | ||||||||
| 140,900 | Agilent Technologies, Inc. | $ | 5,913,573 | |||||
| 120,700 | Charles River Laboratories International, Inc.(a) | 5,343,389 | ||||||
|
| |||||||
| 11,256,962 | ||||||||
|
| |||||||
Pharmaceuticals — 5.67% | ||||||||
| 257,300 | Abbott Laboratories | 9,087,836 | ||||||
| 99,600 | Allergan, Inc. | 11,118,348 | ||||||
| 137,100 | Eli Lilly and Co. | 7,785,909 | ||||||
|
| |||||||
| 27,992,093 | ||||||||
Total Health Care (Cost $46,357,355) | 67,400,861 | |||||||
|
| |||||||
| INDUSTRIALS — 17.85% |
| ||||||
Aerospace & Defense — 2.14% | ||||||||
| 123,200 | The Boeing Co. | 10,576,720 | ||||||
|
| |||||||
Air Freight & Logistics — 1.24% | ||||||||
| 62,200 | FedEx Corp. | 6,108,040 | ||||||
|
| |||||||
Building Products — 1.18% | ||||||||
| 155,200 | Fortune Brands Home & Security, Inc.(a) | 5,809,136 | ||||||
|
| |||||||
Commercial Services and Supplies — 1.39% | ||||||||
| 64,600 | Stericycle, Inc.(a) | 6,859,228 | ||||||
|
| |||||||
Electrical Equipment — 2.00% | ||||||||
| 176,500 | Emerson Electric Co. | 9,861,055 | ||||||
|
| |||||||
Industrial Conglomerates — 3.21% | ||||||||
| 80,200 | 3M Co. | 8,526,062 | ||||||
| 317,100 | General Electric Co. | 7,331,352 | ||||||
|
| |||||||
| 15,857,414 | ||||||||
|
| |||||||
Machinery — 5.11% | ||||||||
| 122,000 | Chart Industries, Inc.(a) | 9,761,220 | ||||||
| 167,600 | Pentair Ltd.(b) | 8,840,900 | ||||||
| 42,100 | Valmont Industries, Inc. | 6,621,067 | ||||||
|
| |||||||
| 25,223,187 | ||||||||
|
| |||||||
Trading Companies & Distributors — 1.58% | ||||||||
| 34,700 | W.W. Grainger, Inc. | 7,806,806 | ||||||
Total Industrials (Cost $70,704,173) | 88,101,586 | |||||||
|
| |||||||
| INFORMATION TECHNOLOGY — 31.36% |
| ||||||
Communications Equipment — 6.99% | ||||||||
| 388,600 | ADTRAN, Inc. | 7,635,990 | ||||||
| 397,400 | Cisco Systems, Inc. | 8,309,634 | ||||||
| 467,600 | Juniper Networks, Inc.(a) | 8,669,304 | ||||||
| 148,100 | QUALCOMM Inc. | 9,915,295 | ||||||
|
| |||||||
| 34,530,223 | ||||||||
|
| |||||||
Computers & Peripherals — 7.75% | ||||||||
| 42,900 | Apple Inc. | 18,988,826 | ||||||
| 454,400 | EMC Corp.(a) | 10,855,616 | ||||||
| 245,600 | NetApp, Inc.(a) | 8,389,696 | ||||||
|
| |||||||
| 38,234,138 | ||||||||
|
| |||||||
Electronic Equipment, Instruments & Components — 1.57% | ||||||||
| 236,600 | National Instruments Corp. | 7,748,650 | ||||||
|
| |||||||
35
Buffalo Growth Fund
SCHEDULE OF INVESTMENTS
March 31, 2013
(Continued)
| SHARES OR FACE AMOUNT | FAIR VALUE* | |||||||
| INFORMATION TECHNOLOGY (Continued) |
| ||||||
Internet Software & Services — 6.89% | ||||||||
| 292,600 | Akamai Technologies, Inc.(a) | $ | 10,325,854 | |||||
| 131,300 | eBay Inc.(a) | 7,119,086 | ||||||
| 350,500 | Facebook Inc.(a) | 8,965,790 | ||||||
| 9,600 | Google Inc. — Class A(a) | 7,622,688 | ||||||
|
| |||||||
| 34,033,418 | ||||||||
|
| |||||||
IT Services — 1.35% | ||||||||
| 39,200 | Visa Inc. | 6,657,728 | ||||||
|
| |||||||
Semiconductors & Semiconductor Equipment — 4.98% | ||||||||
| 246,300 | Altera Corp. | 8,736,261 | ||||||
| 279,200 | Broadcom Corp. — Class A | 9,679,864 | ||||||
| 283,200 | Intel Corp. | 6,187,920 | ||||||
|
| |||||||
| 24,604,045 | ||||||||
|
| |||||||
Software — 1.83% | ||||||||
| 279,700 | Oracle Corp. | 9,045,498 | ||||||
Total Information Technology (Cost $126,977,459) | 154,853,700 | |||||||
|
| |||||||
| MATERIALS — 5.10% |
| ||||||
Chemicals — 5.10% | ||||||||
| 217,200 | E.I. du Pont de Nemours and Co. | 10,677,552 | ||||||
| 75,900 | Monsanto Co. | 8,017,317 | ||||||
| 58,100 | Praxair, Inc. | 6,480,474 | ||||||
Total Materials (Cost $21,124,938) | 25,175,343 | |||||||
|
| |||||||
| TOTAL COMMON STOCKS | 487,985,964 | ||||||
| (COST $399,296,999) | |||||||
| SHORT TERM INVESTMENTS — 1.10% |
| ||||||
| INVESTMENT COMPANY — 1.10% |
| ||||||
| 5,411,652 | Fidelity Institutional — Government Portfolio — 0.01%(c) | 5,411,652 | ||||||
Total Investment Company | 5,411,652 | |||||||
|
| |||||||
| TOTAL SHORT TERM INVESTMENTS | 5,411,652 | ||||||
| (COST $5,411,652) | |||||||
| TOTAL INVESTMENTS | 493,397,616 | ||||||
| (COST $404,708,651) — 99.95% | |||||||
| Other Assets in Excess of Liabilities — 0.05% | 261,647 | ||||||
|
| |||||||
| TOTAL NET ASSETS — 100.00% | $ | 493,659,263 | |||||
|
| |||||||
| (a) | Non Income Producing |
| (b) | Foreign Issued Security. The total value of these securities amounted to $20,156,799 (4.08% of net assets) at March 31, 2013. |
| (c) | 7-day yield. |
| * | See Note 1A of accompanying Notes to Financial Statements regarding valuation of securities. |
The Global Industry Classification Standard (GICS) was developed by and/or is the exclusive property of MSCI, Inc. and Standard & Poor Financial Services LLC (“S&P”). GICS is a service mark of MSCI and S&P and has been licensed for use by U.S. Bancorp Fund Services, LLC.
The accompanying notes are an integral part of these financial statements.
36
Buffalo High Yield Fund
SCHEDULE OF INVESTMENTS
March 31, 2013
| SHARES OR FACE AMOUNT | FAIR VALUE* | |||||||
| COMMON STOCKS — 3.27% |
| ||||||
| CONSUMER STAPLES — 0.64% |
| ||||||
Food Products — 0.64% | ||||||||
| 11,666 | Kraft Foods Group, Inc. — Class A | $ | 601,149 | |||||
| 35,000 | Mondelez International Inc. | 1,071,350 | ||||||
Total Consumer Staples (Cost $1,072,872) | 1,672,499 | |||||||
|
| |||||||
| FINANCIALS — 0.64% | |||||||
Diversified Financial Services — 0.64% | ||||||||
| 35,000 | JPMorgan Chase & Co. | 1,661,100 | ||||||
Total Financials (Cost $1,604,106) | 1,661,100 | |||||||
|
| |||||||
| HEALTH CARE — 1.99% | |||||||
Pharmaceuticals — 1.99% | ||||||||
| 48,000 | Abbott Laboratories | 1,695,360 | ||||||
| 48,000 | AbbVie, Inc. | 1,957,440 | ||||||
| 19,000 | Johnson & Johnson | 1,549,070 | ||||||
Total Health Care (Cost $3,344,229) | 5,201,870 | |||||||
|
| |||||||
| SPECIAL PURPOSE ENTITY — 0.00% | |||||||
Broadcasting (except Internet) — 0.00% | ||||||||
| 725,000 | Adelphia Recovery Trust(a)(b)(d) | — | ||||||
Total Special Purpose Entity (Cost $712,005) | — | |||||||
|
| |||||||
| TOTAL COMMON STOCKS | 8,535,469 | ||||||
| (COST $6,733,212) | |||||||
| CONVERTIBLE PREFERRED STOCKS — 2.81% |
| ||||||
| CONSUMER DISCRETIONARY — 0.95% |
| ||||||
Media — 0.95% | ||||||||
| 2,005 | The Interpublic Group of Companies, Inc. | 2,484,195 | ||||||
Total Consumer Discretionary (Cost $2,015,050) | 2,484,195 | |||||||
|
| |||||||
| HEALTH CARE — 1.85% | |||||||
Health Care Providers & Services — 1.85% | ||||||||
| 2,500 | HealthSouth Corp. | 2,938,125 | ||||||
| 37,000 | Omnicare Capital Trust II | 1,905,500 | ||||||
Total Health Care (Cost $4,334,677) | 4,843,625 | |||||||
|
| |||||||
| TOTAL CONVERTIBLE PREFERRED STOCKS | 7,327,820 | ||||||
| (COST $6,349,727) | |||||||
| PREFERRED STOCKS — 2.64% |
| ||||||
| FINANCIALS — 2.64% |
| ||||||
Capital Markets — 1.43% | ||||||||
| 60,785 | AMG Capital Trust I | 3,730,679 | ||||||
|
| |||||||
Real Estate Management & Development — 1.21% | ||||||||
| 125,000 | Firstservice Corp.(a)(e) | 3,150,000 | ||||||
Total Financials (Cost $5,617,357) | 6,880,679 | |||||||
|
| |||||||
| TOTAL PREFERRED STOCKS | 6,880,679 | ||||||
| (COST $5,617,357) | |||||||
37
Buffalo High Yield Fund
SCHEDULE OF INVESTMENTS
March 31, 2013
(Continued)
| SHARES OR FACE AMOUNT | FAIR VALUE* | |||||||
| CONVERTIBLE BONDS — 10.48% |
| ||||||
| ENERGY — 1.85% |
| ||||||
Energy Equipment & Services — 1.85% | ||||||||
| $4,500,000 | Hornbeck Offshore Services, Inc. | $ | 4,839,300 | |||||
Total Energy (Cost $4,323,888) | 4,839,300 | |||||||
|
| |||||||
| FINANCIALS — 0.52% | |||||||
Capital Markets — 0.52% | ||||||||
| 1,300,000 | Janus Capital Group, Inc. | 1,369,875 | ||||||
Total Financials (Cost $1,302,504) | 1,369,875 | |||||||
|
| |||||||
| HEALTH CARE — 3.18% | |||||||
Health Care Equipment & Services — 0.88% | ||||||||
| 2,100,000 | Accuray, Inc. | 2,291,625 | ||||||
|
| |||||||
Health Care Equipment & Supplies — 1.04% | ||||||||
| 2,700,000 | Hologic, Inc. | 2,715,201 | ||||||
|
| |||||||
Life Sciences Tools & Services — 1.26% | ||||||||
| 3,250,000 | Charles River Laboratories International, Inc. | 3,284,531 | ||||||
Total Health Care (Cost $8,104,378) | 8,291,357 | |||||||
|
| |||||||
| INDUSTRIALS — 3.07% | |||||||
Commercial Services & Supplies — 0.50% | ||||||||
| 1,000,000 | Covanta Holding Corp. | 1,293,125 | ||||||
|
| |||||||
Electrical Equipment — 0.95% | ||||||||
| 2,000,000 | General Cable Corp. | 2,502,500 | ||||||
|
| |||||||
Machinery — 0.90% | ||||||||
| 250,000 | Chart Industries, Inc. | 339,688 | ||||||
| 2,000,000 | The Greenbrier Companies, Inc. | 2,011,250 | ||||||
|
| |||||||
| 2,350,938 | ||||||||
|
| |||||||
Trading Companies & Distributors — 0.72% | ||||||||
| 710,000 | WESCO International, Inc. | 1,868,631 | ||||||
Total Industrials (Cost $5,722,901) | 8,015,194 | |||||||
|
| |||||||
| INFORMATION TECHNOLOGY — 1.76% |
| ||||||
Software — 1.76% | ||||||||
| 1,500,000 | BroadSoft, Inc. | 1,540,313 | ||||||
| 3,000,000 | Rovi Corp. | 3,065,625 | ||||||
Total Information Technology (Cost $4,364,193) | 4,605,938 | |||||||
|
| |||||||
38
| SHARES OR FACE AMOUNT | FAIR VALUE* | |||||||
| MATERIALS — 0.09% |
| ||||||
Metals & Mining — 0.09% | ||||||||
| $ 200,000 | Steel Dynamics, Inc. | $ | 225,500 | |||||
Total Materials (Cost $200,000) | 225,500 | |||||||
|
| |||||||
| TOTAL CONVERTIBLE BONDS | 27,347,164 | ||||||
| (COST $24,017,864) | |||||||
| CORPORATE BONDS — 65.17% |
| ||||||
| CONSUMER DISCRETIONARY — 22.05% | |||||||
Diversified Consumer Services — 1.61% | ||||||||
| 1,000,000 | Coinstar, Inc. | 1,025,000 | ||||||
| 3,000,000 | Monitronics International Inc. | 3,187,500 | ||||||
|
| |||||||
| 4,212,500 | ||||||||
|
| |||||||
Hotels, Restaurants & Leisure — 3.69% | ||||||||
| 125,000 | Ameristar Casinos, Inc. | 137,656 | ||||||
| 600,000 | Cedar Fair L.P. | 675,000 | ||||||
| 1,000,000 | Marina District Finance Co., Inc. | 1,035,000 | ||||||
| 1,600,000 | Penn National Gaming, Inc. | 1,816,000 | ||||||
| 1,450,000 | Royal Caribbean Cruises Ltd.:(e) | 1,466,313 | ||||||
| 1,615,000 | 7.500%, 10/15/2027 | 1,841,100 | ||||||
| 1,000,000 | Speedway Motorsports, Inc.: | 1,060,000 | ||||||
| 500,000 | 6.750%, 02/01/2019 | 536,250 | ||||||
| 1,000,000 | Vail Resorts, Inc. | 1,078,125 | ||||||
|
| |||||||
| 9,645,444 | ||||||||
|
| |||||||
Household Durables — 1.00% | ||||||||
| 2,000,000 | Jarden Corp. | 2,272,500 | ||||||
| 250,000 | Libbey Glass, Inc. | 270,938 | ||||||
| 68,000 | Sealy Mattress Co. | 71,996 | ||||||
|
| |||||||
| 2,615,434 | ||||||||
|
| |||||||
Leisure Equipment & Products — 1.24% | ||||||||
| 3,000,000 | Brunswick Corp. | 3,225,000 | ||||||
|
| |||||||
Media — 7.65% | ||||||||
| 500,000 | Interactive Data Corp. | 570,000 | ||||||
| 250,000 | Lamar Media Corp.: | 271,875 | ||||||
| 250,000 | 5.000%, 05/01/2023 | 251,250 | ||||||
39
Buffalo High Yield Fund
SCHEDULE OF INVESTMENTS
March 31, 2013
(Continued)
| SHARES OR FACE AMOUNT | FAIR VALUE* | |||||||
| CONSUMER DISCRETIONARY (Continued) | |||||||
| $8,000,000 | Lions Gate Entertainment Inc.:(e) | $ | 8,769,999 | |||||
| 1,000,000 | 4.000%, 01/11/2017(b) | 2,305,625 | ||||||
| 1,000,000 | Live Nation Entertainment Inc. | 1,080,000 | ||||||
| 3,500,000 | MDC Partners Inc.:(e) | 3,902,500 | ||||||
| 250,000 | 6.750%, 04/01/2020 (Acquired 03/15/2013, Cost $250,000)(c)(f) | 253,750 | ||||||
| 2,300,000 | Regal Entertainment Group | 2,593,250 | ||||||
|
| |||||||
| 19,998,249 | ||||||||
|
| |||||||
Specialty Retail — 3.76% | ||||||||
| 3,200,000 | Asbury Automotive Group, Inc. | 3,300,032 | ||||||
| 2,500,000 | Penske Automotive Group, Inc. | 2,618,750 | ||||||
| 3,525,000 | Sonic Automotive, Inc. | 3,895,125 | ||||||
|
| |||||||
| 9,813,907 | ||||||||
|
| |||||||
Textiles, Apparel & Luxury Goods — 3.09% | ||||||||
| 4,000,000 | Perry Ellis International, Inc. | 4,220,000 | ||||||
| 3,120,000 | Phillips Van-Heusen | 3,835,500 | ||||||
|
| |||||||
| 8,055,500 | ||||||||
Total Consumer Discretionary (Cost $51,322,865) | 57,566,034 | |||||||
|
| |||||||
| CONSUMER STAPLES — 4.07% |
| ||||||
Food & Staples Retailing — 1.07% | ||||||||
| 2,000,000 | The Pantry, Inc. | 2,155,000 | ||||||
| 600,000 | Susser Holdings LLC / Susser Finance Corp. | 631,125 | ||||||
|
| |||||||
| 2,786,125 | ||||||||
|
| |||||||
Food Products — 1.32% | ||||||||
| 100,000 | Darling International, Inc. | 114,000 | ||||||
| 125,000 | Post Holdings, Inc. | 137,344 | ||||||
| 2,750,000 | Smithfield Foods, Inc. | 3,200,312 | ||||||
|
| |||||||
| 3,451,656 | ||||||||
|
| |||||||
Personal Products — 1.68% | ||||||||
| 4,000,000 | Prestige Brands Inc. | 4,380,000 | ||||||
Total Consumer Staples (Cost $9,504,648) | 10,617,781 | |||||||
|
| |||||||
| ENERGY — 10.17% | |||||||
Energy Equipment & Services — 0.97% | ||||||||
| 500,000 | Heckmann Corp. | 536,875 | ||||||
40
| SHARES OR FACE AMOUNT | FAIR VALUE* | |||||||
| ENERGY (Continued) | |||||||
| $ 600,000 | Hornbeck Offshore Services, Inc. | $ | 624,000 | |||||
| 1,000,000 | Parker Drilling Co. | 1,095,000 | ||||||
| 250,000 | SESI LLC | 280,938 | ||||||
|
| |||||||
| 2,536,813 | ||||||||
|
| |||||||
Oil, Gas & Consumable Fuels — 8.40% | ||||||||
| 3,000,000 | Alpha Natural Resources, Inc. | 3,232,500 | ||||||
| 665,000 | Berry Petroleum Co. | 728,175 | ||||||
| 2,500,000 | Cloud Peak Energy Resources LLC/Cloud Peak Energy Finance Co. | 2,687,500 | ||||||
| 1,750,000 | Concho Resources, Inc.: | 1,885,625 | ||||||
| 550,000 | 6.500%, 01/15/2022 | 602,250 | ||||||
| 100,000 | Continental Resources, Inc. | 111,750 | ||||||
| 1,000,000 | Frontier Oil Corp. | 1,087,500 | ||||||
| 4,000,000 | Gulfport Energy Corp. | 4,240,000 | ||||||
| 2,533,000 | Suburban Propane Partners L. P. | 2,805,298 | ||||||
| 4,000,000 | United Refining Co. | 4,539,999 | ||||||
|
| |||||||
| 21,920,597 | ||||||||
|
| |||||||
Pipelines — 0.80% | ||||||||
| 2,000,000 | Inergy Midstream LLC 6.000%, 12/15/2020 (Acquired 11/27/2012, Cost $2,000,000)(c)(f) | 2,090,000 | ||||||
Total Energy (Cost $24,822,149) | 26,547,410 | |||||||
|
| |||||||
| HEALTH CARE — 4.04% | |||||||
Health Care Providers & Services — 2.60% | ||||||||
| 1,947,000 | Acadia Healthcare Co., Inc. | 2,394,810 | ||||||
| 200,000 | CHS/Community Health Systems Inc. | 217,250 | ||||||
| 3,825,000 | Examworks Group, Inc. | 4,169,250 | ||||||
|
| |||||||
| 6,781,310 | ||||||||
|
| |||||||
Pharmaceuticals — 1.44% | ||||||||
| 3,500,000 | Warner Chilcott Corp.(e) | 3,758,125 | ||||||
Total Health Care (Cost $9,305,740) | 10,539,435 | |||||||
|
| |||||||
| INDUSTRIALS — 16.89% | |||||||
Aerospace & Defense — 5.45% | ||||||||
| 3,000,000 | AAR Corp. | 3,270,000 | ||||||
| 3,500,000 | Kratos Defense & Security Solutions, Inc. | 3,867,500 | ||||||
41
Buffalo High Yield Fund
SCHEDULE OF INVESTMENTS
March 31, 2013
(Continued)
| SHARES OR FACE AMOUNT | FAIR VALUE* | |||||||
| INDUSTRIALS (Continued) | |||||||
| $2,000,000 | Transdigm, Inc. | $ | 2,205,000 | |||||
| 1,000,000 | 5.500%, 10/15/2020(c)(f) | 1,047,500 | ||||||
| 2,150,000 | Triumph Group Inc. | 2,316,625 | ||||||
| 1,000,000 | 8.625%, 07/15/2018 | 1,116,250 | ||||||
| 400,000 | 4.875%, 04/01/2021 (Acquired 02/11/2013, Cost $400,000)(c)(f) | 405,000 | ||||||
|
| |||||||
| 14,227,875 | ||||||||
|
| |||||||
Commercial Services & Supplies — 3.04% | ||||||||
| 3,410,000 | Casella Waste Systems, Inc. | 3,265,075 | ||||||
| 100,000 | Clean Harbors, Inc. | 103,750 | ||||||
| 1,000,000 | Covanta Holding Corp. | 1,106,458 | ||||||
| 3,000,000 | R. R. Donnelley & Sons Co. | 3,465,000 | ||||||
|
| |||||||
| 7,940,283 | ||||||||
|
| |||||||
Construction & Engineering — 1.68% | ||||||||
| 500,000 | MasTec, Inc. | 496,250 | ||||||
| 3,700,000 | Tutor Perini Corp. | 3,903,500 | ||||||
|
| |||||||
| 4,399,750 | ||||||||
|
| |||||||
Electrical Equipment — 0.41% | ||||||||
| 1,000,000 | Polypore International, Inc. | 1,077,500 | ||||||
|
| |||||||
Machinery — 0.79% | ||||||||
| 2,000,000 | Mueller Water Products Inc. | 2,067,500 | ||||||
|
| |||||||
Professional Services — 0.31% | ||||||||
| 750,000 | FTI Consulting, Inc. | 796,875 | ||||||
|
| |||||||
Road & Rail — 4.71% | ||||||||
| 4,000,000 | Kansas City Southern de Mexico SA de CV:(e) | 4,410,000 | ||||||
| 2,000,000 | 6.625%, 12/15/2020 | 2,280,000 | ||||||
| 2,000,000 | 6.125%, 06/15/2021 | 2,270,000 | ||||||
| 3,025,000 | Quality Distribution LLC/QD Capital Corp. | 3,342,625 | ||||||
|
| |||||||
| 12,302,625 | ||||||||
Total Industrials (Cost $39,546,810) | 42,812,408 | |||||||
|
| |||||||
| INFORMATION TECHNOLOGY — 6.34% | |||||||
Electronic Equipment, Instruments & Components — 0.90% | ||||||||
| 500,000 | Anixter Inc. | 533,750 | ||||||
| 1,750,000 | Kemet Corp. | 1,833,125 | ||||||
|
| |||||||
| 2,366,875 | ||||||||
|
| |||||||
42
| SHARES OR FACE AMOUNT | FAIR VALUE* | |||||||
| INFORMATION TECHNOLOGY (Continued) | |||||||
Internet Software & Services — 1.79% | ||||||||
| $3,000,000 | Dealertrack Technologies Inc. | $ | 3,213,750 | |||||
| 250,000 | Equinix, Inc. | 278,438 | ||||||
| 1,100,000 | j2 Global, Inc. | 1,177,000 | ||||||
|
| |||||||
| 4,669,188 | ||||||||
|
| |||||||
IT Services — 2.10% | ||||||||
| 5,000,000 | iGATE Corp. | 5,468,750 | ||||||
|
| |||||||
Semiconductors & Semiconductor Equipment — 0.93% | ||||||||
| 500,000 | KLA-Tencor Corp. | 600,060 | ||||||
| 1,500,000 | National Semiconductor Corp. | 1,821,828 | ||||||
|
| |||||||
| 2,421,888 | ||||||||
|
| |||||||
Software — 0.62% | ||||||||
| 1,500,000 | Audatex North America, Inc. | 1,616,250 | ||||||
Total Information Technology (Cost $14,973,379) | 16,542,951 | |||||||
|
| |||||||
| MATERIALS — 1.27% | |||||||
Metals & Mining — 1.27% | ||||||||
| 2,000,000 | Molycorp Inc. | 1,980,000 | ||||||
| 250,000 | Steel Dynamics, Inc.: | 271,250 | ||||||
| 500,000 | 7.625%, 03/15/2020 | 557,500 | ||||||
| 500,000 | 5.250%, 04/15/2023 (Acquired 08/02/2012, Cost $500,000)(c)(f) | 508,125 | ||||||
|
| |||||||
| 3,316,875 | ||||||||
Total Materials (Cost $3,247,719) | 3,316,875 | |||||||
|
| |||||||
| TELECOMMUNICATION SERVICES — 0.86% |
| ||||||
Diversified Telecommunications — 0.86% | ||||||||
| 1,000,000 | Consolidated Communications Finance Co. | 1,145,000 | ||||||
| 1,000,000 | Level 3 Financing, Inc. | 1,110,000 | ||||||
Total Telecommunication Services (Cost $2,135,643) | 2,255,000 | |||||||
|
| |||||||
| TOTAL CORPORATE BONDS | 170,197,894 | ||||||
| (COST $154,858,953) | |||||||
43
Buffalo High Yield Fund
SCHEDULE OF INVESTMENTS
March 31, 2013
(Continued)
| SHARES OR FACE AMOUNT | FAIR VALUE* | |||||||
| SHORT TERM INVESTMENTS — 14.03% |
| ||||||
| INVESTMENT COMPANY — 14.03% | |||||||
| 25,000,000 | Fidelity Institutional — Government Portfolio — 0.01%(g) | $ | 25,000,000 | |||||
| 11,637,130 | The STIT-Treasury Portfolio — 0.02%(g) | 11,637,130 | ||||||
Total Investment Company | 36,637,130 | |||||||
|
| |||||||
| TOTAL SHORT TERM INVESTMENTS | 36,637,130 | ||||||
| (COST $36,637,130) | |||||||
| TOTAL INVESTMENTS — 98.40% | 256,926,156 | ||||||
| (COST $234,214,243) | |||||||
| Other Assets in Excess of Liabilities — 1.60% | 4,186,093 | ||||||
|
| |||||||
| TOTAL NET ASSETS — 100.00% | $ | 261,112,249 | |||||
|
| |||||||
| (a) | Non Income Producing |
| (b) | Illiquid Security. The total value of these securities amounted to $2,305,625 (0.88% of net assets) at March 31, 2013. |
| (c) | Restricted security deemed liquid. The total value of restricted securities is $21,616,121 (8.28% of net assets) at March 31, 2013. |
| (d) | Fair Valued Security. The total value of these securities amounted to $0 (0.00% of net assets) at March 31, 2013. |
| (e) | Foreign Issued Security. The total value of these securities amounted to $34,407,412 (13.18% of net assets) at March 31, 2013. |
| (f) | 144A Security. The total value of these securities is $21,616,121 (8.28% of net assets) at March 31, 2013. |
| (g) | 7-day yield. |
| * | See Note 1A of accompanying Notes to Financial Statements regarding valuation of securities. |
The Global Industry Classification Standard (GICS) was developed by and/or is the exclusive property of MSCI, Inc. and Standard & Poor Financial Services LLC (“S&P”). GICS is a service mark of MSCI and S&P and has been licensed for use by U.S. Bancorp Fund Services, LLC.
The accompanying notes are an integral part of these financial statements.
44
Buffalo International Fund
SCHEDULE OF INVESTMENTS
March 31, 2013
| SHARES OR FACE AMOUNT | FAIR VALUE* | |||||||
| COMMON STOCKS — 85.16% |
| ||||||
| BRAZIL — 4.26% |
| ||||||
Diversified Financial Services — 1.16% | ||||||||
| 184,320 | BM&F Bovespa SA | $ | 1,239,594 | |||||
|
| |||||||
Health Care Providers & Services — 1.06% | ||||||||
| 83,200 | Diagnosticos da America SA | 477,605 | ||||||
| 70,000 | Fleury SA | 656,439 | ||||||
|
| |||||||
| 1,134,044 | ||||||||
|
| |||||||
Real Estate Management & Development — 0.75% | ||||||||
| 36,000 | BR Properties SA | 400,485 | ||||||
| 32,000 | Iguatemi Empresa de Shopping Centers SA | 402,860 | ||||||
|
| |||||||
| 803,345 | ||||||||
|
| |||||||
Wireless Telecommunication Services — 1.29% | ||||||||
| 62,130 | Tim Participacoes SA — ADR | 1,359,405 | ||||||
Total Brazil (Cost $5,103,079) | 4,536,388 | |||||||
|
| |||||||
| CANADA — 0.71% |
| ||||||
Metals & Mining — 0.22% | ||||||||
| 8,400 | Teck Resources Ltd. — Class B | 236,544 | ||||||
|
| |||||||
Road & Rail — 0.49% | ||||||||
| 4,000 | Canadian Pacific Railway Ltd. | 521,880 | ||||||
Total Canada (Cost $586,042) | 758,424 | |||||||
|
| |||||||
| CHILE — 1.26% |
| ||||||
Beverages — 1.26% | ||||||||
Cie Cervecerias Unidas S.A. — ADR | 1,339,740 | |||||||
Total Chile (Cost $794,327) | 1,339,740 | |||||||
|
| |||||||
| CHINA — 11.04% |
| ||||||
Automobiles — 0.99% | ||||||||
| 310,000 | Great Wall Motor Company Ltd. — Class H | 1,050,299 | ||||||
|
| |||||||
Biotechnology — 1.53% | ||||||||
| 107,200 | 3SBio, Inc. — ADR(a) | 1,629,440 | ||||||
|
| |||||||
Communications Equipment — 1.37% | ||||||||
| 304,000 | AAC Technologies Holdings Inc. | 1,460,757 | ||||||
|
| |||||||
Food Products — 0.98% | ||||||||
| 200,000 | Biostime International Holdings Ltd. | 1,042,183 | ||||||
|
| |||||||
Gas Utilities — 0.78% | ||||||||
| 150,000 | ENN Energy Holdings Ltd. | 830,913 | ||||||
|
| |||||||
Health Care Equipment & Supplies — 1.08% | ||||||||
| 28,700 | Mindray Medical International Ltd. — ADR | 1,146,278 | ||||||
|
| |||||||
Health Care Providers & Services — 0.69% | ||||||||
| 228,400 | Sinopharm Group Co. | 737,054 | ||||||
|
| |||||||
Insurance — 1.91% | ||||||||
| 801,800 | PICC Property and Casuality Co. Ltd. — Class H(a) | 1,029,809 | ||||||
| 130,000 | Ping An Insurance (Group) Co. of China Ltd. — Class H | 1,008,174 | ||||||
|
| |||||||
| 2,037,983 | ||||||||
|
| |||||||
Personal Products — 1.22% | ||||||||
| 2,526,000 | Prince Frog International Holdings Ltd. | 1,301,634 | ||||||
|
| |||||||
45
Buffalo International Fund
SCHEDULE OF INVESTMENTS
March 31, 2013
(Continued)
| SHARES OR FACE AMOUNT | FAIR VALUE* | |||||||
| CHINA (Continued) |
| ||||||
Specialty Retail — 0.49% | ||||||||
| 358,910 | Lentuo International Inc. — ADR(a)(b) | $ | 520,420 | |||||
Total China (Cost $10,773,940) | 11,756,961 | |||||||
|
| |||||||
| FRANCE — 9.72% |
| ||||||
Beverages — 1.05% | ||||||||
| 9,000 | Pernod-Ricard SA | 1,121,481 | ||||||
|
| |||||||
Chemicals — 0.88% | ||||||||
| 7,700 | Air Liquide SA | 935,505 | ||||||
|
| |||||||
Electrical Equipment — 1.17% | ||||||||
| 17,000 | Schneider Electric | 1,242,117 | ||||||
|
| |||||||
Energy Equipment & Services — 1.11% | ||||||||
| 11,500 | Technip SA | 1,179,011 | ||||||
|
| |||||||
Food Products — 1.77% | ||||||||
| 27,100 | Danonne S.A. | 1,885,591 | ||||||
|
| |||||||
Media — 0.74% | ||||||||
| 125,000 | Havas SA | 791,385 | ||||||
|
| |||||||
Multiline Retail — 1.03% | ||||||||
| 5,000 | PPR | 1,098,549 | ||||||
|
| |||||||
Software — 1.26% | ||||||||
| 11,600 | Dassault Systemes S.A. | 1,340,932 | ||||||
|
| |||||||
Textiles, Apparel & Luxury Goods — 0.71% | ||||||||
| 4,400 | LVMH Moet Hennessy Louis Vuitton SA | 755,217 | ||||||
Total France (Cost $9,001,689) | 10,349,788 | |||||||
|
| |||||||
| GERMANY — 14.07% |
| ||||||
Automobiles — 0.37% | ||||||||
| 2,000 | Bayerische Motoren Werke AG | 172,563 | ||||||
| 7,500 | Bayerische Motoren Werke AG — ADR | 216,375 | ||||||
|
| |||||||
| 388,938 | ||||||||
|
| |||||||
Chemicals — 1.22% | ||||||||
| 7,000 | Linde AG | 1,301,531 | ||||||
|
| |||||||
Food Products — 0.74% | ||||||||
| 2,200 | KWS Saat AG | 783,982 | ||||||
|
| |||||||
Health Care Equipment & Supplies — 1.59% | ||||||||
| 13,700 | Fresenius SE & Co. KGaA | 1,690,987 | ||||||
|
| |||||||
Household Products — 1.81% | ||||||||
| 24,400 | Henkel AG & Co. KGaA | 1,926,678 | ||||||
|
| |||||||
Industrial Conglomerates — 0.46% | ||||||||
| 4,500 | Siemens AG — ADR | 485,100 | ||||||
|
| |||||||
Insurance — 0.97% | ||||||||
| 5,500 | Muenchener Rueckversicherungs-Gesellschaft AG. | 1,028,624 | ||||||
|
| |||||||
Machinery — 0.61% | ||||||||
| 15,000 | KUKA AG(a) | 654,322 | ||||||
|
| |||||||
Pharmaceuticals — 1.84% | ||||||||
| 16,100 | Bayer AG | 1,660,728 | ||||||
| 3,000 | Bayer AG — ADR | 310,650 | ||||||
|
| |||||||
| 1,971,378 | ||||||||
|
| |||||||
46
| SHARES OR FACE AMOUNT | FAIR VALUE* | |||||||
| GERMANY (Continued) |
| ||||||
Software — 1.81% | ||||||||
| 23,900 | SAP AG — ADR | $ | 1,924,906 | |||||
|
| |||||||
Textiles, Apparel & Luxury Goods — 2.65% | ||||||||
| 17,700 | Adidas AG | 1,836,434 | ||||||
| 3,200 | Puma SE | 998,821 | ||||||
|
| |||||||
| 2,835,255 | ||||||||
Total Germany (Cost $11,086,822) | 14,991,701 | |||||||
|
| |||||||
| HONG KONG — 10.52% |
| ||||||
Commercial Banks — 1.20% | ||||||||
| 384,000 | BOC Hong Kong Holdings Ltd. | 1,281,228 | ||||||
|
| |||||||
Gas Utilities — 1.02% | ||||||||
| 290,000 | China Resources Gas Group Ltd. | 805,083 | ||||||
| 300,000 | Towngas China Company Ltd. | 277,100 | ||||||
|
| |||||||
| 1,082,183 | ||||||||
|
| |||||||
Industrial Conglomerates — 4.68% | ||||||||
| 170,000 | Beijing Enterprise Holdings Ltd. | 1,309,621 | ||||||
| 28,184 | Jardine Matheson Holdings Ltd. | 1,834,779 | ||||||
| 46,695 | Jardine Strategic Holdings Ltd. | 1,848,189 | ||||||
|
| |||||||
| 4,992,589 | ||||||||
|
| |||||||
Insurance — 1.34% | ||||||||
| 325,000 | AIA Group Ltd. | 1,423,501 | ||||||
|
| |||||||
Oil, Gas & Consumable Fuels — 1.49% | ||||||||
| 746,000 | Kunlun Energy Company Ltd. | 1,585,690 | ||||||
|
| |||||||
Pharmaceuticals — 0.79% | ||||||||
| 1,200,000 | Sino Biopharmaceutical Ltd. | 837,869 | ||||||
Total Hong Kong (Cost $8,985,664) | 11,203,060 | |||||||
|
| |||||||
| INDIA — 0.86% |
| ||||||
Pharmaceuticals — 0.86% | ||||||||
| 28,300 | Dr. Reddy’s Laboratories Ltd. — ADR | 915,505 | ||||||
Total India (Cost $721,953) | 915,505 | |||||||
|
| |||||||
| ISRAEL — 0.58% |
| ||||||
Pharmaceuticals — 0.58% | ||||||||
| 15,600 | Teva Pharmaceutical Industries Ltd. — ADR | 619,008 | ||||||
Total Israel (Cost $656,068) | 619,008 | |||||||
|
| |||||||
| ITALY — 1.00% |
| ||||||
Beverages — 0.51% | ||||||||
| 70,000 | Davide Campari-Milano SpA | 544,660 | ||||||
|
| |||||||
Health Care Equipment & Supplies — 0.49% | ||||||||
| 15,000 | DiaSorin SpA | 524,919 | ||||||
Total Italy (Cost $1,127,020) | 1,069,579 | |||||||
|
| |||||||
| JAPAN — 1.14% |
| ||||||
Machinery — 0.72% | ||||||||
| 5,000 | FANUC CORP. | 764,328 | ||||||
|
| |||||||
47
Buffalo International Fund
SCHEDULE OF INVESTMENTS
March 31, 2013
(Continued)
| SHARES OR FACE AMOUNT | FAIR VALUE* | |||||||
| JAPAN (Continued) |
| ||||||
Office Electronics — 0.42% | ||||||||
| 12,200 | CANON INC. — ADR | $ | 447,618 | |||||
Total Japan (Cost $1,316,475) | 1,211,946 | |||||||
|
| |||||||
| LUXEMBOURG — 0.89% |
| ||||||
Wireless Telecommunication Services — 0.89% | ||||||||
| 11,900 | Millicom Internationall Cellular SA | 950,495 | ||||||
Total Luxembourg (Cost $890,509) | 950,495 | |||||||
|
| |||||||
| MEXICO — 0.49% |
| ||||||
Food & Staples Retailing — 0.49% | ||||||||
| 15,800 | Wal-Mart de Mexico SAB de CV — ADR | 517,450 | ||||||
Total Mexico (Cost $414,747) | 517,450 | |||||||
|
| |||||||
| NETHERLANDS — 3.87% |
| ||||||
Air Freight & Logistics — 0.52% | ||||||||
| 75,000 | TNT Express NV | 549,723 | ||||||
|
| |||||||
Computers & Peripherals — 0.49% | ||||||||
| 6,000 | Gemalto NV | 523,381 | ||||||
|
| |||||||
Food Products — 1.42% | ||||||||
| 37,000 | Unilever NV — NY Shares — ADR | 1,517,001 | ||||||
|
| |||||||
IT Services — 0.79% | ||||||||
| 34,600 | InterXion Holding NV(a) | 838,012 | ||||||
|
| |||||||
Semiconductors & Semiconductor Equipment — 0.65% | ||||||||
| 10,241 | ASML Holding NV — NY Shares — ADR | 696,490 | ||||||
Total Netherlands (Cost $3,282,469) | 4,124,607 | |||||||
|
| |||||||
| NORWAY — 2.10% | |||||||
Commercial Services & Supplies — 0.66% | ||||||||
| 72,000 | Tomra Systems ASA | 702,649 | ||||||
|
| |||||||
Diversified Telecommunication Services — 1.44% | ||||||||
| 70,000 | Telenor ASA | 1,530,455 | ||||||
Total Norway (Cost $1,993,433) | 2,233,104 | |||||||
|
| |||||||
| SINGAPORE — 1.04% | |||||||
Semiconductors & Semiconductor Equipment — 1.04% | ||||||||
| 30,770 | Avago Technologies Ltd. | 1,105,258 | ||||||
Total Singapore (Cost $1,046,363) | 1,105,258 | |||||||
|
| |||||||
| SPAIN — 1.24% | |||||||
Specialty Retail — 1.24% | ||||||||
| 10,000 | Inditex S.A. | 1,325,437 | ||||||
Total Spain (Cost $844,268) | 1,325,437 | |||||||
|
| |||||||
| SWEDEN — 1.47% | |||||||
Communications Equipment — 1.47% | ||||||||
| 124,000 | Telefonaktirbolaget LM Ericsson — ADR(a) | 1,562,400 | ||||||
Total Sweden (Cost $1,477,278) | 1,562,400 | |||||||
|
| |||||||
48
| SHARES OR FACE AMOUNT | FAIR VALUE* | |||||||
| SWITZERLAND — 8.74% | |||||||
Capital Markets — 2.61% | ||||||||
| 92,900 | GAM Holding AG | $ | 1,570,677 | |||||
| 31,337 | Julius Baer Group Ltd. | 1,218,423 | ||||||
|
| |||||||
| 2,789,100 | ||||||||
|
| |||||||
Chemicals — 1.18% | ||||||||
| 15,000 | Syngenta AG — ADR | 1,256,250 | ||||||
|
| |||||||
Electrical Equipment — 1.33% | ||||||||
| 62,400 | ABB Ltd. — ADR | 1,420,224 | ||||||
|
| |||||||
Food Products — 0.28% | ||||||||
| 304 | Barry Callebaut AG | 293,176 | ||||||
|
| |||||||
Insurance — 0.95% | ||||||||
| 12,500 | Swiss Re AG | 1,016,539 | ||||||
|
| |||||||
Specialty Retail — 1.17% | ||||||||
| 10,000 | Dufry AG(a) | 1,240,914 | ||||||
|
| |||||||
Textiles, Apparel & Luxury Goods — 1.22% | ||||||||
| 16,500 | Cie Financiere Richemont SA — Class BR A | 1,294,902 | ||||||
Total Switzerland (Cost $7,849,213) | 9,311,105 | |||||||
|
| |||||||
| TAIWAN, PROVINCE OF CHINA — 1.36% | |||||||
Semiconductors & Semiconductor Equipment — 1.36% | ||||||||
| 84,281 | Taiwan Semiconductor Manufacturing Co. Ltd. — ADR | 1,448,790 | ||||||
Total Taiwan, Province of China (Cost $858,239) | 1,448,790 | |||||||
|
| |||||||
| UNITED KINGDOM — 8.80% | |||||||
Beverages — 1.98% | ||||||||
| 12,600 | Diageo PLC — ADR | 1,585,584 | ||||||
| 10,000 | SABMiller PLC | 526,340 | ||||||
|
| |||||||
| 2,111,924 | ||||||||
|
| |||||||
Capital Markets — 2.87% | ||||||||
| 121,250 | Aberdeen Asset Management PLC | 790,733 | ||||||
| 35,500 | Schroders PLC | 931,017 | ||||||
| 41,500 | Schroders PLC | 1,329,250 | ||||||
|
| |||||||
| 3,051,000 | ||||||||
|
| |||||||
Energy Equipment & Services — 0.67% | ||||||||
| 33,000 | Petrofac Ltd. | 718,536 | ||||||
|
| |||||||
Health Care Equipment & Supplies — 0.81% | ||||||||
| 14,900 | Smith & Nephew PLC — ADR | 860,177 | ||||||
|
| |||||||
Hotels, Restaurants & Leisure — 1.31% | ||||||||
| 161,085 | Millennium & Copthorne Hotels PLC | 1,392,694 | ||||||
|
| |||||||
Internet Software & Services — 1.16% | ||||||||
| 90,000 | Telecity Group PLC | 1,235,546 | ||||||
Total United Kingdom (Cost $7,208,450) | 9,369,877 | |||||||
|
| |||||||
| TOTAL COMMON STOCKS | 90,700,623 | ||||||
| (COST $76,018,048) | |||||||
49
Buffalo International Fund
SCHEDULE OF INVESTMENTS
March 31, 2013
(Continued)
| SHARES OR FACE AMOUNT | FAIR VALUE* | |||||||
| PREFERRED STOCKS — 2.16% |
| ||||||
| BRAZIL — 2.16% |
| ||||||
Beverages — 1.52% | ||||||||
| 38,100 | Cie de Bebidas das Americas (AMBEV) — ADR | $ | 1,612,773 | |||||
|
| |||||||
Oil, Gas & Consumable Fuels — 0.64% | ||||||||
| 37,800 | Petroleo Brasileiro S.A. — ADR | 686,070 | ||||||
Total Brazil (Cost $2,094,368) | 2,298,843 | |||||||
|
| |||||||
| TOTAL PREFERRED STOCKS | 2,298,843 | ||||||
| (COST $2,094,368) | |||||||
| SHORT TERM INVESTMENTS — 1.21% |
| ||||||
| INVESTMENT COMPANY — 1.21% |
| ||||||
| 1,289,166 | Fidelity Institutional — Government Portfolio — 0.01%(c) | 1,289,166 | ||||||
Total Investment Company | 1,289,166 | |||||||
|
| |||||||
| TOTAL SHORT TERM INVESTMENTS | 1,289,166 | ||||||
| (COST $1,289,166) | |||||||
| TOTAL INVESTMENTS — 88.53% | 94,288,632 | ||||||
| (COST $79,401,582) | |||||||
| Other Assets in Excess of Liabilities — 11.47% | 12,211,549 | ||||||
|
| |||||||
| TOTAL NET ASSETS — 100.00% | $ | 106,500,181 | |||||
|
| |||||||
ADR — American Depository Receipt
PLC — Public Limited Company
| (a) | Non Income Producing |
| (b) | Portion of this security deemed illiquid. The total value of this portion amounted to $335,923 (0.32% of net assets) at March 31, 2013. |
| (c) | 7-day yeild |
| * | See Note 1A of accompanying Notes to Financial Statements regarding valuation of securities. |
50
As of March 31, 2013, the industry diversification was as follows:
| FAIR VALUE | PERCENTAGE | |||||||
Common Stocks | ||||||||
Air Freight & Logistics | $ | 549,723 | 0.52% | |||||
Automobiles | 1,439,237 | 1.35% | ||||||
Beverages | 5,117,805 | 4.81% | ||||||
Biotechnology | 1,629,440 | 1.53% | ||||||
Capital Markets | 5,840,100 | 5.48% | ||||||
Chemicals | 3,493,286 | 3.28% | ||||||
Commercial Banks | 1,281,228 | 1.20% | ||||||
Commercial Services & Supplies | 702,649 | 0.66% | ||||||
Communications Equipment | 3,023,157 | 2.84% | ||||||
Computers & Peripherals | 523,381 | 0.49% | ||||||
Diversified Financial Services | 1,239,594 | 1.16% | ||||||
Diversified Telecommunication Services | 1,530,455 | 1.44% | ||||||
Electrical Equipment | 2,662,341 | 2.50% | ||||||
Energy Equipment & Services | 1,897,547 | 1.78% | ||||||
Food & Staples Retailing | 517,450 | 0.49% | ||||||
Food Products | 5,521,933 | 5.18% | ||||||
Gas Utilities | 1,913,096 | 1.80% | ||||||
Health Care Equipment & Supplies | 4,222,361 | 3.96% | ||||||
Health Care Providers & Services | 1,871,098 | 1.76% | ||||||
Hotels, Restaurants & Leisure | 1,392,694 | 1.31% | ||||||
Household Products | 1,926,678 | 1.81% | ||||||
Industrial Conglomerates | 5,477,689 | 5.14% | ||||||
Insurance | 5,506,647 | 5.17% | ||||||
Internet Software & Services | 1,235,546 | 1.16% | ||||||
IT Services | 838,012 | 0.79% | ||||||
Machinery | 1,418,650 | 1.33% | ||||||
Media | 791,385 | 0.74% | ||||||
Metals & Mining | 236,544 | 0.22% | ||||||
Multiline Retail | 1,098,549 | 1.03% | ||||||
Office Electronics | 447,618 | 0.42% | ||||||
Oil, Gas & Consumable Fuels | 1,585,690 | 1.49% | ||||||
Personal Products | 1,301,634 | 1.22% | ||||||
Pharmaceuticals | 4,343,760 | 4.08% | ||||||
Real Estate Management & Development | 803,345 | 0.75% | ||||||
Road & Rail | 521,880 | 0.49% | ||||||
Semiconductors & Semiconductor Equipment | 3,250,538 | 3.05% | ||||||
Software | 3,265,838 | 3.07% | ||||||
Specialty Retail | 3,086,771 | 2.90% | ||||||
Textiles, Apparel & Luxury Goods | 4,885,374 | 4.59% | ||||||
Wireless Telecommunication Services | 2,309,900 | 2.17% | ||||||
|
|
|
| |||||
Total Common Stocks | 90,700,623 | 85.16% | ||||||
Preferred Stocks | ||||||||
Beverages | 1,612,773 | 1.52% | ||||||
Oil, Gas & Consumable Fuels | 686,070 | 0.64% | ||||||
|
|
|
| |||||
Total Preferred Stocks | 2,298,843 | 2.16% | ||||||
Short Term Investments | ||||||||
Investment Company | 1,289,166 | 1.21% | ||||||
|
|
|
| |||||
Total Short Term Investments | 1,289,166 | 1.21% | ||||||
Total Investments | 94,288,632 | 88.53% | ||||||
Other Assets in Excess of Liabilities | 12,211,549 | 11.47% | ||||||
|
|
|
| |||||
TOTAL NET ASSETS | $ | 106,500,181 | 100.00% | |||||
|
|
|
| |||||
The Global Industry Classification Standard (GICS) was developed by and/or is the exclusive property of MSCI, Inc. and Standard & Poor Financial Services LLC (“S&P”). GICS is a service mark of MSCI and S&P and has been licensed for use by U.S. Bancorp Fund Services, LLC.
The accompanying notes are an integral part of these financial statements.
51
Buffalo Large Cap Fund
SCHEDULE OF INVESTMENTS
March 31, 2013
| SHARES OR FACE AMOUNT | FAIR VALUE* | |||||||
| COMMON STOCKS — 101.36% |
| ||||||
| CONSUMER DISCRETIONARY — 16.07% |
| ||||||
Automobiles — 3.22% | ||||||||
| 8,900 | TOYOTA MOTOR CORP. — ADR(b) | $ | 913,496 | |||||
|
| |||||||
Hotels, Restaurants & Leisure — 2.79% | ||||||||
| 18,750 | Marriott International, Inc. — Class A | 791,813 | ||||||
|
| |||||||
Media — 1.36% | ||||||||
| 6,800 | The Walt Disney Co. | 386,240 | ||||||
|
| |||||||
Specialty Retail — 1.73% | ||||||||
| 10,500 | TJX Companies, Inc. | 490,875 | ||||||
|
| |||||||
Textiles, Apparel & Luxury Goods — 6.97% | ||||||||
| 15,700 | Coach, Inc. | 784,842 | ||||||
| 9,400 | Luxottica Group S.p.A. — ADR(b) | 472,726 | ||||||
| 12,150 | NIKE, Inc. | 716,972 | ||||||
|
| |||||||
| 1,974,540 | ||||||||
Total Consumer Discretionary (Cost $3,627,943) | 4,556,964 | |||||||
|
| |||||||
| CONSUMER STAPLES — 5.56% | |||||||
Food & Staples Retailing — 5.56% | ||||||||
| 6,800 | Costco Wholesale Corp. | 721,548 | ||||||
| 9,850 | Whole Foods Market, Inc. | 854,488 | ||||||
Total Consumer Staples (Cost $1,252,059) | 1,576,036 | |||||||
|
| |||||||
| ENERGY — 3.69% | |||||||
Energy Equipment & Services — 3.69% | ||||||||
| 13,979 | Schlumberger Ltd.(b) | 1,046,887 | ||||||
Total Energy (Cost $703,429) | 1,046,887 | |||||||
|
| |||||||
| FINANCIALS — 12.61% | |||||||
Capital Markets — 4.21% | ||||||||
| 4,900 | The Goldman Sachs Group, Inc. | 721,035 | ||||||
| 6,300 | T. Rowe Price Group Inc. | 471,681 | ||||||
|
| |||||||
| 1,192,716 | ||||||||
|
| |||||||
Diversified Financial Services — 8.40% | ||||||||
| 10,275 | American Express Co. | 693,152 | ||||||
| 6,000 | Franklin Resources, Inc. | 904,860 | ||||||
| 16,550 | JPMorgan Chase & Co. | 785,463 | ||||||
|
| |||||||
| 2,383,475 | ||||||||
Total Financials (Cost $2,332,374) | 3,576,191 | |||||||
|
| |||||||
| HEALTH CARE — 17.94% | |||||||
Biotechnology — 3.18% | ||||||||
| 18,400 | Gilead Sciences, Inc.(a) | 900,312 | ||||||
|
| |||||||
Health Care Technology — 2.91% | ||||||||
| 8,700 | Cerner Corp.(a) | 824,325 | ||||||
|
| |||||||
Life Science Tools & Services — 1.98% | ||||||||
| 16,700 | PerkinElmer, Inc. | 561,788 | ||||||
|
| |||||||
Pharmaceuticals — 9.87% | ||||||||
| 10,800 | Eli Lilly and Co. | 613,332 | ||||||
| 19,400 | Forest Laboratories, Inc.(a) | 737,976 | ||||||
52
| SHARES OR FACE AMOUNT | FAIR VALUE* | |||||||
| HEALTH CARE (Continued) | |||||||
| 25,325 | Hospira, Inc.(a) | $ | 831,419 | |||||
| 5,200 | Perrigo Co. | 617,396 | ||||||
|
| |||||||
| 2,800,123 | ||||||||
Total Health Care (Cost $3,849,201) | 5,086,548 | |||||||
|
| |||||||
| INDUSTRIALS — 13.39% | |||||||
Aerospace & Defense — 5.72% | ||||||||
| 10,900 | The Boeing Co. | 935,765 | ||||||
| 3,600 | Precision Castparts Corp. | 682,632 | ||||||
|
| |||||||
| 1,618,397 | ||||||||
|
| |||||||
Air Freight & Logistics — 1.59% | ||||||||
| 4,600 | FedEx Corp. | 451,720 | ||||||
|
| |||||||
Construction & Engineering — 2.30% | ||||||||
| 9,850 | Fluor Corp. | 653,351 | ||||||
|
| |||||||
Road & Rail — 2.23% | ||||||||
| 4,450 | Union Pacific Corp. | 633,725 | ||||||
|
| |||||||
Trading Companies & Distributors — 1.55% | ||||||||
| 1,950 | W.W. Grainger, Inc. | 438,711 | ||||||
Total Industrials (Cost $2,701,988) | 3,795,904 | |||||||
|
| |||||||
| INFORMATION TECHNOLOGY — 26.69% | |||||||
Communications Equipment — 5.14% | ||||||||
| 37,400 | Juniper Networks, Inc.(a) | 693,396 | ||||||
| 11,400 | QUALCOMM Inc. | 763,229 | ||||||
|
| |||||||
| 1,456,625 | ||||||||
|
| |||||||
Computers & Peripherals — 4.62% | ||||||||
| 1,685 | Apple Inc. | 745,832 | ||||||
| 16,550 | NetApp, Inc.(a) | 565,348 | ||||||
|
| |||||||
| 1,311,180 | ||||||||
|
| |||||||
Internet Software & Services — 7.27% | ||||||||
| 14,300 | eBay Inc.(a) | 775,346 | ||||||
| 18,600 | Facebook Inc.(a) | 475,788 | ||||||
| 1,020 | Google Inc. — Class A(a) | 809,910 | ||||||
|
| |||||||
| 2,061,044 | ||||||||
|
| |||||||
IT Services — 1.92% | ||||||||
| 3,200 | Visa Inc. | 543,488 | ||||||
|
| |||||||
Semiconductors & Semiconductor Equipment — 5.12% | ||||||||
| 23,300 | Altera Corp. | 826,451 | ||||||
| 18,000 | Broadcom Corp. — Class A | 624,060 | ||||||
|
| |||||||
| 1,450,511 | ||||||||
|
| |||||||
Software — 2.62% | ||||||||
| 22,950 | Oracle Corp. | 742,203 | ||||||
Total Information Technology (Cost $5,850,518) | 7,565,051 | |||||||
|
| |||||||
53
Buffalo Large Cap Fund
SCHEDULE OF INVESTMENTS
March 31, 2013
(Continued)
| SHARES OR FACE AMOUNT | FAIR VALUE* | |||||||
| MATERIALS — 5.41% |
| ||||||
Chemicals — 5.41% | ||||||||
| 8,700 | Monsanto Co. | $ | 918,981 | |||||
| 5,500 | Praxair, Inc. | 613,470 | ||||||
Total Materials (Cost $1,081,632) | 1,532,451 | |||||||
|
| |||||||
| TOTAL COMMON STOCKS | 28,736,032 | ||||||
| (COST $21,399,144) | |||||||
| SHORT TERM INVESTMENTS — 2.31% |
| ||||||
| INVESTMENT COMPANY — 2.31% |
| ||||||
| 655,471 | Fidelity Institutional — Government Portfolio — 0.01%(c) | 655,471 | ||||||
Total Investment Company | 655,471 | |||||||
|
| |||||||
| TOTAL SHORT TERM INVESTMENTS | 655,471 | ||||||
| (COST $655,471) | |||||||
| TOTAL INVESTMENTS — 103.67% | 29,391,503 | ||||||
| (COST $22,054,615) | |||||||
| Liabilities in Excess of Other Assets — (3.67)% | (1,039,442 | ) | |||||
|
| |||||||
| TOTAL NET ASSETS — 100.00% | $ | 28,352,061 | |||||
|
| |||||||
ADR — American Depositary Receipt
| (a) | Non Income Producing |
| (b) | Foreign Issued Security. The total value of these securities amounted to $2,433,109 (8.58% of net assets) at March 31, 2013. |
| (c) | 7-day yield |
| * | See Note 1A of accompanying Notes to Financial Statements regarding valuation of securities. |
The Global Industry Classification Standard (GICS) was developed by and/or is the exclusive property of MSCI, Inc. and Standard & Poor Financial Services LLC (“S&P”). GICS is a service mark of MSCI and S&P and has been licensed for use by U.S. Bancorp Fund Services, LLC.
The accompanying notes are an integral part of these financial statements.
54
Buffalo Micro Cap Fund
SCHEDULE OF INVESTMENTS
March 31, 2013
| SHARES OR FACE AMOUNT | FAIR VALUE* | |||||||
| COMMON STOCKS — 93.90% |
| ||||||
| CONSUMER DISCRETIONARY — 8.93% |
| ||||||
Diversified Consumer Services — 1.80% | ||||||||
| 173,600 | LifeLock, Inc.(a) | $ | 1,671,768 | |||||
|
| |||||||
Hotels, Restaurants & Leisure — 1.86% | ||||||||
| 104,200 | SHFL Entertainment, Inc.(a) | 1,726,594 | ||||||
|
| |||||||
Household Durables — 3.31% | ||||||||
| 61,900 | iRobot Corp.(a) | 1,588,354 | ||||||
| 74,000 | TRI Pointe Homes, Inc.(a) | 1,491,100 | ||||||
|
| |||||||
| 3,079,454 | ||||||||
|
| |||||||
Textiles, Apparel & Luxury Goods — 1.96% | ||||||||
| 34,300 | Oxford Industries, Inc. | 1,821,330 | ||||||
Total Consumer Discretionary (Cost $6,317,775) | 8,299,146 | |||||||
|
| |||||||
| CONSUMER STAPLES — 1.67% | |||||||
Food Products — 1.67% | ||||||||
| 172,400 | Boulder Brands, Inc.(a) | 1,548,152 | ||||||
Total Consumer Staples (Cost $1,298,380) | 1,548,152 | |||||||
|
| |||||||
| FINANCIALS — 2.42% | |||||||
Diversified Financial Services — 2.42% | ||||||||
| 60,400 | MarketAxess Holdings, Inc. | 2,252,920 | ||||||
Total Financials (Cost $763,950) | 2,252,920 | |||||||
|
| |||||||
| HEALTH CARE — 18.43% | |||||||
Health Care Equipment & Services — 1.55% | ||||||||
| 60,800 | Quidel Corp.(a) | 1,444,000 | ||||||
|
| |||||||
Health Care Equipment & Supplies — 7.10% | ||||||||
| 259,000 | Accuray Inc.(a) | 1,201,760 | ||||||
| 50,200 | Align Technology, Inc.(a) | 1,682,201 | ||||||
| 26,500 | ICU Medical, Inc.(a) | 1,562,175 | ||||||
| 46,625 | Meridian Bioscience, Inc. | 1,063,983 | ||||||
| 21,950 | Neogen Corp.(a) | 1,088,062 | ||||||
|
| |||||||
| 6,598,181 | ||||||||
|
| |||||||
Health Care Providers & Services — 2.96% | ||||||||
| 23,900 | Landauer, Inc. | 1,347,482 | ||||||
| 24,200 | National Research Corp. | 1,404,568 | ||||||
|
| |||||||
| 2,752,050 | ||||||||
|
| |||||||
Health Care Technology — 6.82% | ||||||||
| 20,000 | Computer Programs and Systems, Inc. | 1,082,200 | ||||||
| 69,100 | HealthStream, Inc.(a) | 1,585,154 | ||||||
| 29,700 | Medidata Solutions, Inc.(a) | 1,722,006 | ||||||
| 103,000 | Omnicell, Inc.(a) | 1,944,640 | ||||||
|
| |||||||
| 6,334,000 | ||||||||
Total Health Care (Cost $11,426,948) | 17,128,231 | |||||||
|
| |||||||
| INDUSTRIALS — 11.44% | |||||||
Building Products — 0.45% | ||||||||
| 56,500 | Ameresco, Inc. — Class A(a) | 418,100 | ||||||
|
| |||||||
55
Buffalo Micro Cap Fund
SCHEDULE OF INVESTMENTS
March 31, 2013
(Continued)
| SHARES OR FACE AMOUNT | FAIR VALUE* | |||||||
| INDUSTRIALS (Continued) | |||||||
Commercial Services & Supplies — 1.65% | ||||||||
| 101,500 | Heritage-Crystal Clean, Inc.(a) | $ | 1,532,650 | |||||
|
| |||||||
Construction & Engineering — 1.97% | ||||||||
| 74,600 | MYR Group Inc.(a) | 1,832,176 | ||||||
|
| |||||||
Electrical Equipment — 1.86% | ||||||||
| 77,700 | Thermon Group Holdings Inc.(a) | 1,725,717 | ||||||
|
| |||||||
Machinery — 2.46% | ||||||||
| 11,000 | Chart Industries, Inc.(a) | 880,110 | ||||||
| 28,700 | Proto Labs, Inc.(a) | 1,409,170 | ||||||
|
| |||||||
| 2,289,280 | ||||||||
|
| |||||||
Professional Services — 3.05% | ||||||||
| 24,700 | Exponent, Inc.(a) | 1,332,318 | ||||||
| 60,000 | WageWorks, Inc.(a) | 1,501,800 | ||||||
|
| |||||||
| 2,834,118 | ||||||||
Total Industrials (Cost $7,910,653) | 10,632,041 | |||||||
|
| |||||||
| INFORMATION TECHNOLOGY — 47.55% | |||||||
Communications Equipment — 3.44% | ||||||||
| 267,300 | EXFO, Inc.(a)(b)(c) | 1,360,557 | ||||||
| 154,900 | Procera Networks, Inc.(a) | 1,841,761 | ||||||
|
| |||||||
| 3,202,318 | ||||||||
|
| |||||||
Computers & Peripherals — 0.83% | ||||||||
| 10,400 | Stratasys Ltd.(a)(b) | 771,888 | ||||||
|
| |||||||
Electronic Equipment, Instruments & Components — 3.89% | ||||||||
| 54,200 | DTS, Inc.(a) | 901,346 | ||||||
| 81,400 | Electro Scientific Industries, Inc. | 899,470 | ||||||
| 41,714 | FARO Technologies, Inc.(a) | 1,809,970 | ||||||
|
| |||||||
| 3,610,786 | ||||||||
|
| |||||||
Internet Software & Services — 18.08% | ||||||||
| 89,700 | comScore Inc.(a) | 1,505,166 | ||||||
| 55,500 | Cornerstone OnDemand, Inc.(a) | 1,892,550 | ||||||
| 63,500 | E2open, Inc.(a) | 1,266,190 | ||||||
| 60,800 | Envestnet, Inc.(a) | 1,064,608 | ||||||
| 232,200 | Internap Network Services Corp.(a) | 2,171,070 | ||||||
| 111,900 | Keynote Systems, Inc. | 1,562,124 | ||||||
| 84,000 | LogMeIn, Inc.(a) | 1,614,480 | ||||||
| 91,200 | SciQuest, Inc.(a) | 2,192,448 | ||||||
| 51,400 | SPS Commerce Inc.(a) | 2,193,238 | ||||||
| 377,600 | Zix Corp.(a) | 1,351,808 | ||||||
|
| |||||||
| 16,813,682 | ||||||||
|
| |||||||
Semiconductors & Semiconductor Equipment — 3.32% | ||||||||
| 24,500 | NVE Corp.(a) | 1,382,290 | ||||||
| 106,450 | PDF Solutions, Inc.(a) | 1,705,329 | ||||||
|
| |||||||
| 3,087,619 | ||||||||
|
| |||||||
Software — 17.99% | ||||||||
| 16,500 | ACI Worldwide, Inc.(a) | 806,190 | ||||||
| 41,500 | Bottomline Techologies, Inc.(a) | 1,183,165 | ||||||
| 62,700 | Ellie Mae, Inc.(a) | 1,507,935 | ||||||
| 118,100 | Exa Corp.(a) | 1,124,312 | ||||||
56
| SHARES OR FACE AMOUNT | FAIR VALUE* | |||||||
| INFORMATION TECHNOLOGY (Continued) | |||||||
| 50,100 | FleetMatics Group PLC(a)(b) | $ | 1,214,925 | |||||
| 48,000 | Guidewire Software Inc.(a) | 1,845,120 | ||||||
| 34,500 | Imperva Inc.(a) | 1,328,250 | ||||||
| 137,100 | Mitek Systems, Inc.(a) | 641,628 | ||||||
| 30,000 | Model N, Inc.(a) | �� | 594,600 | |||||
| 98,628 | Proofpoint, Inc.(a) | 1,662,868 | ||||||
| 72,200 | PROS Holdings, Inc.(a) | 1,961,674 | ||||||
| 46,000 | Synchronoss Technologies, Inc.(a) | 1,427,380 | ||||||
| 115,000 | Tangoe, Inc.(a) | 1,424,850 | ||||||
|
| |||||||
| 16,722,897 | ||||||||
Total Information Technology (Cost $34,824,596) | 44,209,190 | |||||||
|
| |||||||
| MATERIALS — 1.74% | |||||||
Metals & Mining — 1.74% | ||||||||
| 148,700 | Horsehead Holding Corp.(a) | 1,617,856 | ||||||
Total Materials (Cost $1,490,185) | 1,617,856 | |||||||
|
| |||||||
| TELECOMMUNICATION SERVICES — 1.72% | |||||||
Diversified Telecommunication Services — 1.72% | ||||||||
| 233,600 | 8x8, Inc.(a) | 1,600,160 | ||||||
Total Telecommunication Services (Cost $1,288,639) | 1,600,160 | |||||||
|
| |||||||
| TOTAL COMMON STOCKS | 87,287,696 | ||||||
| (COST $65,321,126) | |||||||
| SHORT TERM INVESTMENTS — 7.01% |
| ||||||
| INVESTMENT COMPANY — 7.01% |
| ||||||
| 6,515,203 | Fidelity Institutional — Government Portfolio — 0.01%(d) | 6,515,203 | ||||||
Total Investment Company | 6,515,203 | |||||||
|
| |||||||
| TOTAL SHORT TERM INVESTMENTS | 6,515,203 | ||||||
| (COST $6,515,203) | |||||||
| TOTAL INVESTMENTS — 100.91% | 93,802,899 | ||||||
| (COST $71,836,329) | |||||||
| Liabilities in Excess of Other Assets — (0.91)% | (844,124 | ) | |||||
|
| |||||||
| TOTAL NET ASSETS — 100.00% | $ | 92,958,775 | |||||
|
| |||||||
PLC — Public Limited Company
| (a) | Non Income Producing |
| (b) | Foreign Issued Security. The total value of these securities amounted to $3,347,370 (3.60% of net assets) at March 31, 2013. |
| (c) | Portion of this security deemed illiquid. The total value of this portion amounted to $600,452 (0.65% of net assets) at March 31, 2013. |
| (d) | 7-day yield |
| * | See Note 1A of accompanying Notes to Financial Statements regarding valuation of securities. |
The Global Industry Classification Standard (GICS) was developed by and/or is the exclusive property of MSCI, Inc. and Standard & Poor Financial Services LLC (“S&P”). GICS is a service mark of MSCI and S&P and has been licensed for use by U.S. Bancorp Fund Services, LLC.
The accompanying notes are an integral part of these financial statements.
57
Buffalo Mid Cap Fund
SCHEDULE OF INVESTMENTS
March 31, 2013
| SHARES OR FACE AMOUNT | FAIR VALUE* | |||||||
| COMMON STOCKS — 98.15% |
| ||||||
| CONSUMER DISCRETIONARY — 23.50% |
| ||||||
Auto Components — 6.46% | ||||||||
| 230,100 | Autoliv, Inc. | $ | 15,909,113 | |||||
| 146,450 | BorgWarner, Inc.(a) | 11,326,443 | ||||||
| 658,671 | Gentex Corp. | 13,180,007 | ||||||
|
| |||||||
| 40,415,563 | ||||||||
|
| |||||||
Distributors — 1.61% | ||||||||
| 461,300 | LKQ Corp.(a) | 10,037,888 | ||||||
|
| |||||||
Hotels, Restaurants & Leisure — 4.00% | ||||||||
| 726,700 | International Game Technology | 11,990,550 | ||||||
| 303,825 | Life Time Fitness, Inc.(a) | 12,997,634 | ||||||
|
| |||||||
| 24,988,184 | ||||||||
|
| |||||||
Household Durables — 1.55% | ||||||||
| 217,200 | Harman International Industries, Inc. | 9,693,636 | ||||||
|
| |||||||
Specialty Retail — 7.16% | ||||||||
| 255,325 | Abercrombie & Fitch Co. — Class A | 11,796,015 | ||||||
| 86,925 | PetSmart, Inc. | 5,398,043 | ||||||
| 441,475 | Urban Outfitters, Inc.(a) | 17,102,741 | ||||||
| 202,775 | Williams-Sonoma, Inc. | 10,446,968 | ||||||
|
| |||||||
| 44,743,767 | ||||||||
|
| |||||||
Textiles, Apparel & Luxury Goods — 2.72% | ||||||||
| 332,550 | Under Armour, Inc. — Class A(a) | 17,026,560 | ||||||
Total Consumer Discretionary (Cost $105,557,076) | 146,905,598 | |||||||
|
| |||||||
| CONSUMER STAPLES — 0.91% | |||||||
Food & Staples Retailing — 0.91% | ||||||||
| 65,575 | Whole Foods Market, Inc. | 5,688,631 | ||||||
Total Consumer Staples (Cost $1,996,600) | 5,688,631 | |||||||
|
| |||||||
| ENERGY — 2.00% | |||||||
Energy Equipment & Services — 2.00% | ||||||||
| 434,300 | Forum Energy Technologies Inc.(a) | 12,490,468 | ||||||
Total Energy (Cost $10,027,622) | 12,490,468 | |||||||
|
| |||||||
| FINANCIALS — 16.02% | |||||||
Capital Markets — 8.21% | ||||||||
| 111,200 | Affiliated Managers Group, Inc.(a) | 17,076,984 | ||||||
| 318,175 | Eaton Vance Corp. | 13,309,260 | ||||||
| 384,025 | Northern Trust Corp. | 20,952,404 | ||||||
|
| |||||||
| 51,338,648 | ||||||||
|
| |||||||
Diversified Financial Services — 7.81% | ||||||||
| 233,375 | �� | Moody’s Corp. | 12,443,555 | |||||
| 314,375 | Morningstar, Inc. | 21,981,100 | ||||||
| 424,100 | MSCI, Inc.(a) | 14,389,713 | ||||||
|
| |||||||
| 48,814,368 | ||||||||
Total Financials (Cost $69,407,655) | 100,153,016 | |||||||
|
| |||||||
58
| SHARES OR FACE AMOUNT | FAIR VALUE* | |||||||
| HEALTH CARE — 12.00% | |||||||
Health Care Technology — 1.32% | ||||||||
| 87,050 | Cerner Corp.(a) | $ | 8,247,988 | |||||
|
| |||||||
Life Sciences Tools & Services — 4.43% | ||||||||
| 372,725 | Illumina, Inc.(a) | 20,127,150 | ||||||
| 224,100 | PerkinElmer, Inc. | 7,538,724 | ||||||
|
| |||||||
| 27,665,874 | ||||||||
|
| |||||||
Pharmaceuticals — 6.25% | ||||||||
| 343,400 | Forest Laboratories, Inc.(a) | 13,062,936 | ||||||
| 504,850 | Hospira, Inc.(a) | 16,574,225 | ||||||
| 79,700 | Perrigo Co. | 9,462,781 | ||||||
|
| |||||||
| 39,099,942 | ||||||||
Total Health Care (Cost $62,462,570) | 75,013,804 | |||||||
|
| |||||||
| INDUSTRIALS — 11.63% | |||||||
Commercial Services & Supplies — 1.92% | ||||||||
| 594,400 | Covanta Holding Corp. | 11,977,160 | ||||||
|
| |||||||
Construction & Engineering — 2.58% | ||||||||
| 564,975 | Quanta Services, Inc.(a) | 16,146,986 | ||||||
|
| |||||||
Professional Services — 3.57% | ||||||||
| 189,100 | The Advisory Board Co.(a) | 9,931,532 | ||||||
| 200,450 | Verisk Analytics, Inc — Class A(a) | 12,353,733 | ||||||
|
| |||||||
| 22,285,265 | ||||||||
|
| |||||||
Road & Rail — 2.44% | ||||||||
| 164,050 | Genesee & Wyoming Inc.(a) | 15,274,696 | ||||||
|
| |||||||
Trading Companies & Distributors — 1.12% | ||||||||
| 81,500 | MSC Industrial Direct Co., Inc. | 6,991,070 | ||||||
Total Industrials (Cost $52,033,816) | 72,675,177 | |||||||
|
| |||||||
| INFORMATION TECHNOLOGY — 29.99% | |||||||
Communications Equipment — 2.82% | ||||||||
| 952,200 | Juniper Networks, Inc.(a) | 17,653,788 | ||||||
|
| |||||||
Electronic Equipment, Instruments & Components — 4.30% | ||||||||
| 498,375 | Dolby Laboratories, Inc. — Class A | 16,725,465 | ||||||
| 309,950 | National Instruments Corp. | 10,150,863 | ||||||
|
| |||||||
| 26,876,328 | ||||||||
|
| |||||||
Internet Software & Services — 6.13% | ||||||||
| 549,800 | Akamai Technologies, Inc.(a) | 19,402,442 | ||||||
| 44,400 | Equinix, Inc.(a) | 9,604,164 | ||||||
| 185,150 | Rackspace Hosting, Inc.(a) | 9,346,372 | ||||||
|
| |||||||
| 38,352,978 | ||||||||
|
| |||||||
IT Services — 3.28% | ||||||||
| 274,800 | NeuStar, Inc.(a) | 12,786,444 | ||||||
| 371,975 | VeriFone Systems, Inc.(a) | 7,692,443 | ||||||
|
| |||||||
| 20,478,887 | ||||||||
|
| |||||||
Semiconductors & Semiconductor Equipment — 3.97% | ||||||||
| 290,300 | Altera Corp. | 10,296,941 | ||||||
| 275,175 | KLA-Tencor Corp. | 14,512,730 | ||||||
|
| |||||||
| 24,809,671 | ||||||||
|
| |||||||
59
Buffalo Mid Cap Fund
SCHEDULE OF INVESTMENTS
March 31, 2013
(Continued)
| SHARES OR FACE AMOUNT | FAIR VALUE* | |||||||
| INFORMATION TECHNOLOGY (Continued) | |||||||
Software — 9.49% | ||||||||
| 117,100 | ANSYS, Inc.(a) | $ | 9,534,282 | |||||
| 506,350 | Electronic Arts Inc.(a) | 8,962,395 | ||||||
| 587,600 | Fortinet Inc.(a) | 13,914,367 | ||||||
| 140,925 | MICROS Systems, Inc.(a) | 6,413,497 | ||||||
| 118,500 | Red Hat, Inc.(a) | 5,991,360 | ||||||
| 249,450 | Solera Holdings Inc. | 14,550,418 | ||||||
|
| |||||||
| 59,366,319 | ||||||||
Total Information Technology (Cost $151,572,432) | 187,537,971 | |||||||
|
| |||||||
| MATERIALS — 2.10% |
| ||||||
Chemicals — 2.10% | ||||||||
| 229,850 | FMC Corp. | 13,108,346 | ||||||
Total Materials (Cost $6,426,334) | 13,108,346 | |||||||
|
| |||||||
| TOTAL COMMON STOCKS | 613,573,011 | ||||||
| (COST $459,484,105) | |||||||
| SHORT TERM INVESTMENTS — 1.83% |
| ||||||
| INVESTMENT COMPANY — 1.83% |
| ||||||
| 11,453,895 | Fidelity Institutional — Government Portfolio — 0.01%(b) | 11,453,895 | ||||||
Total Investment Company | 11,453,895 | |||||||
|
| |||||||
| TOTAL SHORT TERM INVESTMENTS | 11,453,895 | ||||||
| (COST $11,453,895) | |||||||
| TOTAL INVESTMENTS — 99.98% | 625,026,906 | ||||||
| (COST $470,938,000) | |||||||
| Other Assets in Excess of Liabilities — 0.02% | 151,292 | ||||||
|
| |||||||
| TOTAL NET ASSETS — 100.00% | $ | 625,178,198 | |||||
|
| |||||||
| (a) | Non Income Producing |
| (b) | 7-day yield |
| * | See Note 1A of accompanying Notes to Financial Statements regarding valuation of securities. |
The Global Industry Classification Standard (GICS) was developed by and/or is the exclusive property of MSCI, Inc. and Standard & Poor Financial Services LLC (“S&P”). GICS is a service mark of MSCI and S&P and has been licensed for use by U.S. Bancorp Fund Services, LLC.
The accompanying notes are an integral part of these financial statements.
60
Buffalo Small Cap Fund
SCHEDULE OF INVESTMENTS
March 31, 2013
| SHARES OR FACE AMOUNT | FAIR VALUE* | |||||||
| COMMON STOCKS — 97.32% |
| ||||||
| CONSUMER DISCRETIONARY — 15.26% |
| ||||||
Auto Components — 1.33% | ||||||||
| 2,090,514 | Gentex Corp. | $ | 41,831,185 | |||||
|
| |||||||
Hotels, Restaurants & Leisure — 2.59% | ||||||||
| 1,906,550 | Life Time Fitness, Inc.(a) | 81,562,209 | ||||||
|
| |||||||
Household Durables — 1.88% | ||||||||
| 1,323,400 | Harman International Industries, Inc. | 59,063,342 | ||||||
|
| |||||||
Media — 1.99% | ||||||||
| 4,428,700 | Pandora Media Inc.(a) | 62,710,392 | ||||||
|
| |||||||
Specialty Retail — 2.17% | ||||||||
| 680,950 | Hibbett Sports Inc.(a) | 38,317,057 | ||||||
| 610,000 | Vitamin Shoppe, Inc.(a) | 29,798,500 | ||||||
|
| |||||||
| 68,115,557 | ||||||||
|
| |||||||
Textiles, Apparel & Luxury Goods — 5.30% | ||||||||
| 787,550 | Deckers Outdoor Corp.(a) | 43,858,659 | ||||||
| 1,039,975 | Oxford Industries, Inc.(c)(d) | 55,222,672 | ||||||
| 1,341,625 | Tumi Holdings Inc.(a) | 28,093,628 | ||||||
| 1,662,250 | Vera Bradley, Inc.(a) | 39,278,968 | ||||||
|
| |||||||
| 166,453,927 | ||||||||
Total Consumer Discretionary (Cost $338,276,605) | 479,736,612 | |||||||
|
| |||||||
| CONSUMER STAPLES — 2.40% |
| ||||||
Food & Staples Retailing — 2.40% | ||||||||
| 1,760,925 | The Fresh Market, Inc.(a) | 75,314,762 | ||||||
Total Consumer Staples (Cost $75,765,984) | 75,314,762 | |||||||
|
| |||||||
| ENERGY — 3.76% |
| ||||||
Energy Equipment & Services — 3.76% | ||||||||
| 256,650 | CARBO Ceramics, Inc. | 23,373,116 | ||||||
| 1,430,700 | Lufkin Industries, Inc. | 94,984,173 | ||||||
Total Energy (Cost $110,842,818) | 118,357,289 | |||||||
|
| |||||||
| FINANCIALS — 11.61% |
| ||||||
Capital Markets — 6.39% | ||||||||
| 202,700 | Artisan Partners Asset Management, Inc.(a) | 7,996,515 | ||||||
| 1,657,375 | Financial Engines Inc.(a) | 60,030,123 | ||||||
| 1,606,650 | Stifel Financial Corp.(a) | 55,702,556 | ||||||
| 1,497,800 | Waddell & Reed Financial, Inc. — Class A | 65,573,683 | ||||||
| 1,118,725 | WisdomTree Investments, Inc.(a) | 11,634,740 | ||||||
|
| |||||||
| 200,937,617 | ||||||||
|
| |||||||
Diversified Financial Services — 3.92% | ||||||||
| 1,675,281 | MarketAxess Holdings, Inc. | 62,487,981 | ||||||
| 868,150 | Morningstar, Inc.(c) | 60,701,048 | ||||||
|
| |||||||
| 123,189,029 | ||||||||
|
| |||||||
Real Estate Management & Development — 1.30% | ||||||||
| 1,231,425 | FirstService Corp.(a)(b)(c) | 40,932,567 | ||||||
Total Financials (Cost $179,274,030) | 365,059,213 | |||||||
|
| |||||||
61
Buffalo Small Cap Fund
SCHEDULE OF INVESTMENTS
March 31, 2013
(Continued)
| SHARES OR FACE AMOUNT | FAIR VALUE* | |||||||
| HEALTH CARE — 12.77% | |||||||
Health Care Equipment & Supplies — 6.49% | ||||||||
| 3,712,757 | Align Technology, Inc.(a) | $ | 124,414,487 | |||||
| 1,283,425 | Haemonetics Corp.(a) | 53,467,486 | ||||||
| 1,009,300 | Insulet Corp.(a) | 26,100,498 | ||||||
|
| |||||||
| 203,982,471 | ||||||||
|
| |||||||
Health Care Technology — 2.49% | ||||||||
| 807,750 | athenahealth Inc.(a) | 78,384,060 | ||||||
|
| |||||||
Life Sciences Tools & Services — 3.05% | ||||||||
| 1,575,725 | ICON PLC.(a)(b) | 50,880,160 | ||||||
| 664,000 | Techne Corp. | 45,052,400 | ||||||
|
| |||||||
| 95,932,560 | ||||||||
|
| |||||||
Pharmaceuticals — 0.74% | ||||||||
| 1,677,275 | Akorn, Inc.(a) | 23,196,713 | ||||||
Total Health Care (Cost $217,716,308) | 401,495,804 | |||||||
|
| |||||||
| INDUSTRIALS — 15.20% | |||||||
Aerospace & Defense — 3.15% | ||||||||
| 3,413,550 | Hexcel Corp.(a) | 99,027,086 | ||||||
|
| |||||||
Electrical Equipment — 2.17% | ||||||||
| 1,700,750 | Polypore International, Inc.(a) | 68,336,135 | ||||||
|
| |||||||
Machinery — 3.58% | ||||||||
| 691,950 | Chart Industries, Inc.(a) | 55,362,920 | ||||||
| 363,519 | Valmont Industries, Inc. | 57,170,632 | ||||||
|
| |||||||
| 112,533,552 | ||||||||
|
| |||||||
Professional Services — 5.48% | ||||||||
| 1,593,460 | The Corporate Executive Board Co.(c) | 92,675,633 | ||||||
| 726,900 | Costar Group, Inc.(a) | 79,566,474 | ||||||
|
| |||||||
| 172,242,107 | ||||||||
|
| |||||||
Road & Rail — 0.82% | ||||||||
| 278,160 | Genesee & Wyoming Inc.(a) | 25,899,478 | ||||||
Total Industrials (Cost $229,956,693) | 478,038,358 | |||||||
|
| |||||||
| INFORMATION TECHNOLOGY — 36.32% | |||||||
Communications Equipment — 4.68% | ||||||||
| 4,855,908 | ADTRAN, Inc.(d) | 95,418,592 | ||||||
| 2,092,900 | Aruba Networks Inc.(a) | 51,778,346 | ||||||
|
| |||||||
| 147,196,938 | ||||||||
|
| |||||||
Computers & Peripherals — 2.64% | ||||||||
| 1,118,725 | Stratasys Ltd.(a)(b) | 83,031,770 | ||||||
|
| |||||||
Electronic Equipment, Instruments & Components — 2.13% | ||||||||
| 734,650 | DTS, Inc.(a)(c) | 12,217,230 | ||||||
| 1,674,462 | National Instruments Corp. | 54,838,630 | ||||||
|
| |||||||
| 67,055,860 | ||||||||
|
| |||||||
Internet Software & Services — 9.21% | ||||||||
| 1,604,300 | Angie’s List Inc.(a) | 31,700,968 | ||||||
| 1,044,850 | Cornerstone OnDemand, Inc.(a) | 35,629,385 | ||||||
| 2,490,350 | DealerTrack Holdings Inc.(a)(c)(d) | 73,166,482 | ||||||
| 3,299,725 | Dice Holdings Inc.(a)(c)(d) | 33,426,214 | ||||||
62
| SHARES OR FACE AMOUNT | FAIR VALUE* | |||||||
| INFORMATION TECHNOLOGY (Continued) | |||||||
| 3,398,450 | Internap Network Services Corp.(a)(c)(d) | $ | 31,775,508 | |||||
| 1,263,600 | Liquidity Services Inc.(a) | 37,667,916 | ||||||
| 1,893,450 | LogMeIn, Inc.(a)(d) | 36,392,109 | ||||||
| 1,505,000 | Millennial Media Inc.(a) | 9,556,750 | ||||||
|
| |||||||
| 289,315,332 | ||||||||
|
| |||||||
IT Services — 3.94% | ||||||||
| 1,303,300 | InterXion Holding NV(a)(b) | 31,565,926 | ||||||
| 1,667,000 | NeuStar, Inc.(a) | 77,565,510 | ||||||
| 2,100,000 | ServiceSource International Inc.(a) | 14,847,000 | ||||||
|
| |||||||
| 123,978,436 | ||||||||
|
| |||||||
Semiconductors & Semiconductor Equipment — 5.58% | ||||||||
| 830,946 | Cabot Microelectronics Corp.(a) | 28,875,374 | ||||||
| 2,253,443 | MKS Instruments, Inc.(c) | 61,293,650 | ||||||
| 2,407,958 | Semtech Corp.(a) | 85,217,633 | ||||||
|
| |||||||
| 175,386,657 | ||||||||
|
| |||||||
Software — 8.14% | ||||||||
| 1,467,450 | ACI Worldwide, Inc.(a) | 71,699,607 | ||||||
| 769,850 | Advent Software, Inc.(a) | 21,532,705 | ||||||
| 843,275 | Broadsoft Inc.(a) | 22,321,489 | ||||||
| 1,141,775 | Infoblox, Inc.(a) | 24,776,518 | ||||||
| 238,953 | Manhattan Associates, Inc.(a) | 17,751,818 | ||||||
| 2,549,300 | RealD Inc.(a)(d) | 33,140,900 | ||||||
| 593,269 | RealPage, Inc.(a) | 12,286,601 | ||||||
| 502,300 | The Ultimate Software Group, Inc.(a) | 52,319,568 | ||||||
|
| |||||||
| 255,829,206 | ||||||||
Total Information Technology (Cost $913,310,160) | 1,141,794,199 | |||||||
|
| |||||||
| TOTAL COMMON STOCKS | 3,059,796,237 | ||||||
| (COST $2,065,142,598) | |||||||
| REITS — 0.02% |
| ||||||
| FINANCIALS — 0.02% |
| ||||||
Real Estate Investment Trusts — 0.02% | ||||||||
| 32,500 | CyrusOne Inc.(a) | 742,300 | ||||||
Total Financials (Cost $617,500) | 742,300 | |||||||
|
| |||||||
| TOTAL REITS | 742,300 | ||||||
| (COST $617,500) | |||||||
63
Buffalo Small Cap Fund
SCHEDULE OF INVESTMENTS
March 31, 2013
(Continued)
| SHARES OR FACE AMOUNT | FAIR VALUE* | |||||||
| SHORT TERM INVESTMENTS — 3.42% |
| ||||||
| INVESTMENT COMPANY — 3.42% | |||||||
| 107,579,472 | Fidelity Institutional — Government Portfolio — 0.01%(e) | $ | 107,579,472 | |||||
Total Investment Company | 107,579,472 | |||||||
|
| |||||||
| TOTAL SHORT TERM INVESTMENTS | 107,579,472 | ||||||
| (COST $107,579,472) | |||||||
| TOTAL INVESTMENTS — 100.76% | 3,168,118,009 | ||||||
| (COST $2,173,339,570) | |||||||
| Liabilities in Excess of Other Assets — (0.76)% | (23,938,819 | ) | |||||
|
| |||||||
| TOTAL NET ASSETS — 100.00% | $ | 3,144,179,190 | |||||
|
| |||||||
| (a) | Non Income Producing |
| (b) | Foreign Issued Security. The total value of these securities amounted to $206,410,423 (6.56% of net assets) at March 31, 2013. |
| (c) | Portion or all of these securities deemed illiquid. The total value of these portions amounted to $140,230,392 (4.46% of net assets) at March 31, 2013 |
| (d) | Affliated company; the Fund owns 5% or more of the outstanding voting securites of the issuer. The total values of these securities amounted to $358,542,477 (11.40% of net assets) on March 31, 2013. |
| (e) | 7-day yield |
| * | See Note 1A of accompanying Notes to Financial Statements regarding valuation of securities. |
The Global Industry Classification Standard (GICS) was developed by and/or is the exclusive property of MSCI, Inc. and Standard & Poor Financial Services LLC (“S&P”). GICS is a service mark of MSCI and S&P and has been licensed for use by U.S. Bancorp Fund Services, LLC.
The accompanying notes are an integral part of these financial statements.
64
This page intentionally left blank.
65
Statements of Assets and Liabilities
March 31, 2013
| BUFFALO DISCOVERY FUND | BUFFALO DIVIDEND FOCUS FUND | BUFFALO FLEXIBLE INCOME FUND | ||||||||||
ASSETS: | ||||||||||||
Investments in securities, at cost: | ||||||||||||
Investments in securities of unaffiliated issuers | $ | 414,781,500 | $ | 13,423,217 | $ | 755,119,866 | ||||||
Investments in securities of affiliated issuers (Note 7) | — | — | — | |||||||||
|
|
|
|
|
| |||||||
Total investments, at cost | $ | 414,781,500 | $ | 13,423,217 | $ | 755,119,866 | ||||||
|
|
|
|
|
| |||||||
Investments in securities, at value: | ||||||||||||
Investments in securities of unaffiliated issuers | $ | 514,535,791 | $ | 14,000,214 | $ | 853,730,164 | ||||||
Investments in securities of affiliated issuers (Note 7) | — | — | — | |||||||||
|
|
|
|
|
| |||||||
Total investments, at value | 514,535,791 | 14,000,214 | 853,730,164 | |||||||||
Cash: | — | 6,164 | 236,455 | |||||||||
Cash denominated in foreign currency, at value:(1) | — | — | — | |||||||||
Receivables: | ||||||||||||
Investments sold | 8,416,466 | 495,244 | 1,619,473 | |||||||||
Fund shares sold | 903,335 | 3,164 | 5,412,247 | |||||||||
Dividends | 139,427 | 21,032 | 944,206 | |||||||||
Interest | 106 | 42 | 3,963,721 | |||||||||
Other assets | 37,510 | 187 | 41,742 | |||||||||
|
|
|
|
|
| |||||||
Total assets | 524,032,635 | 14,526,047 | 865,948,008 | |||||||||
|
|
|
|
|
| |||||||
LIABILITIES: | ||||||||||||
Payables: | ||||||||||||
Investments purchased | 7,924,258 | 682,000 | 1,775,151 | |||||||||
Written options, at value(2) (Note 8) | — | 10,970 | 392,913 | |||||||||
Fund shares purchased | 237,666 | — | 359,829 | |||||||||
Management fees | 433,178 | 10,234 | 702,445 | |||||||||
Custodian | — | — | — | |||||||||
Accrued expenses | 8,714 | 21,148 | 36,878 | |||||||||
|
|
|
|
|
| |||||||
Total liabilities | 8,603,816 | 724,352 | 3,267,216 | |||||||||
|
|
|
|
|
| |||||||
NET ASSETS | $ | 515,428,819 | $ | 13,801,695 | $ | 862,680,792 | ||||||
|
|
|
|
|
| |||||||
NET ASSETS CONSIST OF: | ||||||||||||
Capital (capital stock and paid-in capital) | $ | 410,322,059 | $ | 13,158,589 | $ | 763,582,990 | ||||||
Undistributed (distribution in excess of) net investment income (loss) | (236,044 | ) | 827 | (527,417 | ) | |||||||
Accumulated net realized gain (loss) from investment and foreign currency transactions | 5,588,513 | 61,000 | 1,185,174 | |||||||||
Net unrealized appreciation from: | ||||||||||||
Investments and translation of assets and liabilities in foreign currency | 99,754,291 | 581,279 | 98,440,045 | |||||||||
|
|
|
|
|
| |||||||
NET ASSETS APPLICABLE TO OUTSTANDING SHARES | $ | 515,428,819 | $ | 13,801,695 | $ | 862,680,792 | ||||||
|
|
|
|
|
| |||||||
Capital shares, $1.00 par value: | ||||||||||||
Authorized | Unlimited | Unlimited | Unlimited | |||||||||
|
|
|
|
|
| |||||||
Outstanding | 30,178,384 | 1,308,673 | 63,708,885 | |||||||||
|
|
|
|
|
| |||||||
NET ASSET VALUE PER SHARE | $ | 17.08 | $ | 10.55 | $ | 13.54 | ||||||
|
|
|
|
|
| |||||||
(1) Cash denominated in foreign currency, at cost | — | — | — | |||||||||
(2) Written options, premiums received | — | 15,252 | 222,660 | |||||||||
The accompanying notes are an integral part of these financial statements.
66
| BUFFALO GROWTH FUND | BUFFALO HIGH YIELD FUND | BUFFALO INTERNATIONAL FUND | BUFFALO LARGE CAP FUND | BUFFALO MICRO CAP FUND | BUFFALO MID CAP FUND | BUFFALO SMALL CAP FUND | ||||||||||||||||||||
| $ | 404,708,651 | $ | 234,214,243 | $ | 79,401,582 | $ | 22,054,615 | $ | 71,836,329 | $ | 470,938,000 | $ | 1,821,138,617 | |||||||||||||
| — | — | — | — | — | — | 352,200,953 | ||||||||||||||||||||
|
|
|
|
|
|
|
|
|
|
|
|
|
| |||||||||||||
| $ | 404,708,651 | $ | 234,214,243 | $ | 79,401,582 | $ | 22,054,615 | $ | 71,836,329 | $ | 470,938,000 | $ | 2,173,339,570 | |||||||||||||
|
|
|
|
|
|
|
|
|
|
|
|
|
| |||||||||||||
| $ | 493,397,616 | $ | 256,926,156 | $ | 94,288,632 | $ | 29,391,503 | $ | 93,802,899 | $ | 625,026,906 | $ | 2,809,575,532 | |||||||||||||
| — | — | — | — | — | — | 358,542,477 | ||||||||||||||||||||
|
|
|
|
|
|
|
|
|
|
|
|
|
| |||||||||||||
| 493,397,616 | 256,926,156 | 94,288,632 | 29,391,503 | 93,802,899 | 625,026,906 | 3,168,118,009 | ||||||||||||||||||||
| — | — | 1,970,637 | — | — | — | — | ||||||||||||||||||||
| — | — | 9,002,763 | — | — | — | — | ||||||||||||||||||||
| — | — | 2,150,373 | 258,368 | — | — | 7,226,238 | ||||||||||||||||||||
| 643,302 | 369,324 | 26,399 | 1,550 | 578,887 | 1,423,467 | 6,395,243 | ||||||||||||||||||||
| 405,282 | 170,762 | 209,489 | 21,458 | 21,247 | 302,449 | 542,637 | ||||||||||||||||||||
| 86 | 4,022,458 | 18 | 9 | 59 | 130 | 670 | ||||||||||||||||||||
| 23,703 | 18,423 | 20,352 | 11,070 | 15,391 | 26,854 | 73,844 | ||||||||||||||||||||
|
|
|
|
|
|
|
|
|
|
|
|
|
| |||||||||||||
| 494,469,989 | 261,507,123 | 107,668,663 | 29,683,958 | 94,418,483 | 626,779,806 | 3,182,356,641 | ||||||||||||||||||||
|
|
|
|
|
|
|
|
|
|
|
|
|
| |||||||||||||
| — | — | 998,792 | 70,774 | 1,328,106 | — | 33,559,089 | ||||||||||||||||||||
| — | — | — | — | — | — | — | ||||||||||||||||||||
| 413,626 | 161,986 | 5,262 | 1,237,928 | 17,380 | 1,060,004 | 1,969,635 | ||||||||||||||||||||
| 377,201 | 220,349 | 90,084 | 22,698 | 110,574 | 529,934 | 2,630,895 | ||||||||||||||||||||
| — | — | 39,905 | — | — | — | — | ||||||||||||||||||||
| 19,899 | 12,539 | 34,439 | 497 | 3,648 | 11,670 | 17,832 | ||||||||||||||||||||
|
|
|
|
|
|
|
|
|
|
|
|
|
| |||||||||||||
| 810,726 | 394,874 | 1,168,482 | 1,331,897 | 1,459,708 | 1,601,608 | 38,177,451 | ||||||||||||||||||||
|
|
|
|
|
|
|
|
|
|
|
|
|
| |||||||||||||
| $ | 493,659,263 | $ | 261,112,249 | $ | 106,500,181 | $ | 28,352,061 | $ | 92,958,775 | $ | 625,178,198 | $ | 3,144,179,190 | |||||||||||||
|
|
|
|
|
|
|
|
|
|
|
|
|
| |||||||||||||
| $ | 396,965,826 | $ | 238,626,125 | $ | 101,807,982 | $ | 18,928,401 | $ | 73,433,999 | $ | 453,576,168 | $ | 1,992,653,982 | |||||||||||||
| 1,520,070 | (474,311 | ) | (97,616 | ) | 72 | (250,055 | ) | (650,311 | ) | — | ||||||||||||||||
| | 6,484,402 | | 248,522 | (10,078,554 | ) | 2,086,700 | (2,191,739 | ) | 18,163,435 | 156,746,769 | ||||||||||||||||
| | 88,688,965 | | 22,711,913 | 14,868,369 | 7,336,888 | 21,966,570 | 154,088,906 | 994,778,439 | ||||||||||||||||||
|
|
|
|
|
|
|
|
|
|
|
|
|
| |||||||||||||
| $ | 493,659,263 | $ | 261,112,249 | $ | 106,500,181 | $ | 28,352,061 | $ | 92,958,775 | $ | 625,178,198 | $ | 3,144,179,190 | |||||||||||||
|
|
|
|
|
|
|
|
|
|
|
|
|
| |||||||||||||
| Unlimited | Unlimited | Unlimited | Unlimited | Unlimited | Unlimited | Unlimited | ||||||||||||||||||||
|
|
|
|
|
|
|
|
|
|
|
|
|
| |||||||||||||
| 16,719,438 | 22,377,056 | 10,357,604 | 1,294,987 | 6,707,266 | 34,844,596 | 101,659,345 | ||||||||||||||||||||
|
|
|
|
|
|
|
|
|
|
|
|
|
| |||||||||||||
| $ | 29.53 | $ | 11.67 | $ | 10.28 | $ | 21.89 | $ | 13.86 | $ | 17.94 | $ | 30.93 | |||||||||||||
|
|
|
|
|
|
|
|
|
|
|
|
|
| |||||||||||||
| — | — | 9,021,444 | — | — | — | — | ||||||||||||||||||||
| — | — | — | — | — | — | — | ||||||||||||||||||||
67
Statements of Operations
For the Period Ended March 31, 2013
| BUFFALO DISCOVERY FUND | BUFFALO DIVIDEND FOCUS FUND(1) | BUFFALO FLEXIBLE INCOME FUND | ||||||||||
INVESTMENT INCOME: | ||||||||||||
Interest | $ | 1,739 | $ | 92 | $ | 12,285,464 | ||||||
Dividends: | ||||||||||||
Dividends from securities of unaffiliated issuers | 4,804,851 | 75,434 | 10,358,039 | |||||||||
Dividends from securities of affiliated issuers (Note 7) | — | — | — | |||||||||
Foreign tax withheld | — | (516 | ) | (74,024 | ) | |||||||
|
|
|
|
|
| |||||||
Total investment income | 4,806,590 | 75,010 | 22,569,479 | |||||||||
|
|
|
|
|
| |||||||
EXPENSES: | ||||||||||||
Management fees (Note 3) | 4,375,358 | 30,567 | 5,770,208 | |||||||||
Custody fees | — | — | — | |||||||||
Registration fees | 37,891 | 20,887 | 63,334 | |||||||||
Other | 13,909 | 3,379 | 41,071 | |||||||||
|
|
|
|
|
| |||||||
Total expenses | 4,427,158 | 54,833 | 5,874,613 | |||||||||
|
|
|
|
|
| |||||||
Net investment income (loss) | 379,432 | 20,177 | 16,694,866 | |||||||||
|
|
|
|
|
| |||||||
NET REALIZED AND UNREALIZED GAIN (LOSS) ON INVESTMENTS: | ||||||||||||
Net realized gain from: | ||||||||||||
Investment transactions of unaffiliated issuers | 23,697,166 | 61,000 | 5,458,477 | |||||||||
Investment transactions of affiliated issuers (Note 7) | — | — | — | |||||||||
Options written (Note 8) | — | — | 753,430 | |||||||||
Net unrealized appreciation/depreciation during the period on: | ||||||||||||
Investments | 14,956,406 | 576,997 | 57,142,709 | |||||||||
Options written (Note 8) | — | 4,282 | (209,174 | ) | ||||||||
|
|
|
|
|
| |||||||
Net realized and unrealized gain on investments | 38,653,572 | 642,279 | 63,145,442 | |||||||||
|
|
|
|
|
| |||||||
Net increase in net assets resulting from operations | $ | 39,033,004 | $ | 662,456 | $ | 79,840,308 | ||||||
|
|
|
|
|
| |||||||
| (1) | For the period from December 3, 2012 (commencement of operations) to March 31, 2013. |
The accompanying notes are an integral part of these financial statements.
68
| BUFFALO GROWTH FUND | BUFFALO HIGH YIELD FUND | BUFFALO INTERNATIONAL FUND | BUFFALO LARGE CAP FUND | BUFFALO MICRO CAP FUND | BUFFALO MID CAP FUND | BUFFALO SMALL CAP FUND | ||||||||||||||||||||
| $ | 1,674 | $ | 14,664,287 | $ | 219 | $ | 133 | $ | 532 | $ | 2,196 | $ | 11,558 | |||||||||||||
| 7,010,068 | 1,024,833 | 1,312,735 | 400,126 | 474,380 | 7,007,715 | 16,117,732 | ||||||||||||||||||||
| — | — | — | — | — | — | 3,395,066 | ||||||||||||||||||||
| — | (32,813 | ) | (145,027 | ) | (3,623 | ) | — | — | — | |||||||||||||||||
|
|
|
|
|
|
|
|
|
|
|
|
|
| |||||||||||||
| 7,011,742 | 15,656,307 | 1,167,927 | 396,636 | 474,912 | 7,009,911 | 19,524,356 | ||||||||||||||||||||
|
|
|
|
|
|
|
|
|
|
|
|
|
| |||||||||||||
| 4,428,205 | 2,670,579 | 774,055 | 274,085 | 855,273 | 6,514,517 | 28,033,885 | ||||||||||||||||||||
| — | — | 41,721 | — | — | — | — | ||||||||||||||||||||
| 57,963 | 29,329 | 21,947 | 19,712 | 22,623 | 44,343 | 55,562 | ||||||||||||||||||||
| 11,161 | 6,501 | 2,397 | 1,351 | 4,250 | 13,915 | 49,048 | ||||||||||||||||||||
|
|
|
|
|
|
|
|
|
|
|
|
|
| |||||||||||||
| 4,497,329 | 2,706,409 | 840,120 | 295,148 | 882,146 | 6,572,775 | 28,138,495 | ||||||||||||||||||||
|
|
|
|
|
|
|
|
|
|
|
|
|
| |||||||||||||
| 2,514,413 | 12,949,898 | 327,807 | 101,488 | (407,234 | ) | 437,136 | (8,614,139 | ) | ||||||||||||||||||
|
|
|
|
|
|
|
|
|
|
|
|
|
| |||||||||||||
| 9,007,582 | 1,637,852 | 1,738,698 | 2,510,577 | 2,558,114 | 30,259,276 | 354,973,015 | ||||||||||||||||||||
| — | — | — | — | — | — | 36,449,591 | ||||||||||||||||||||
| — | — | — | — | — | — | — | ||||||||||||||||||||
| 17,309,786 | 6,498,064 | 4,383,091 | (264,267 | ) | 9,688,872 | (8,407,055 | ) | 24,774,097 | ||||||||||||||||||
| — | — | — | — | — | — | — | ||||||||||||||||||||
|
|
|
|
|
|
|
|
|
|
|
|
|
| |||||||||||||
| 26,317,368 | 8,135,916 | 6,121,789 | 2,246,310 | 12,246,986 | 21,852,221 | 416,196,703 | ||||||||||||||||||||
|
|
|
|
|
|
|
|
|
|
|
|
|
| |||||||||||||
| $ | 28,831,781 | $ | 21,085,814 | $ | 6,449,596 | $ | 2,347,798 | $ | 11,839,752 | $ | 22,289,357 | $ | 407,582,564 | |||||||||||||
|
|
|
|
|
|
|
|
|
|
|
|
|
| |||||||||||||
69
Statements of Changes in Net Assets
| BUFFALO DISCOVERY FUND | ||||||||
| YEAR ENDED MARCH 31, 2013(2) | YEAR ENDED MARCH 31, 2012 | |||||||
OPERATIONS: | ||||||||
Net investment income (loss) | $ | 379,432 | $ | (1,625,442 | ) | |||
Net realized gain (loss) from investment transactions | 23,697,166 | 22,793,819 | ||||||
Net unrealized appreciation/depreciation during the period on investments and translation of assets and liabilities in foreign currencies | 14,956,406 | 20,000,119 | ||||||
|
|
|
| |||||
Net increase in net assets resulting from operations | 39,033,004 | 41,168,496 | ||||||
DISTRIBUTIONS TO SHAREHOLDERS: | ||||||||
Net investment income | (849,449 | ) | — | |||||
Net realized gain from investment transactions | (31,647,443 | ) | (21,747,641 | ) | ||||
|
|
|
| |||||
Total distributions to shareholders | (32,496,892 | ) | (21,747,641 | ) | ||||
CAPITAL SHARE TRANSACTIONS: | ||||||||
Shares sold | 189,146,492 | 135,265,084 | ||||||
Reinvested dividends and distributions | 31,879,357 | 21,444,054 | ||||||
|
|
|
| |||||
Shares issued | 221,025,849 | 156,709,138 | ||||||
Redemptions | (128,944,136 | ) | (123,587,768 | ) | ||||
Redemption fees (Note 5) | 38,647 | 42,093 | ||||||
|
|
|
| |||||
Shares repurchased | (128,905,489 | ) | (123,545,675 | ) | ||||
|
|
|
| |||||
Net increase (decrease) from capital share transactions | 92,120,360 | 33,163,463 | ||||||
|
|
|
| |||||
Total increase (decrease) in net assets | 98,656,472 | 52,584,318 | ||||||
NET ASSETS: | ||||||||
Beginning of period | 416,772,347 | 364,188,029 | ||||||
|
|
|
| |||||
End of period | $ | 515,428,819 | $ | 416,772,347 | ||||
|
|
|
| |||||
Undistributed (distribution in excess of) net investment income (loss) at end of year | $ | (236,044 | ) | $ | (91,015 | ) | ||
|
|
|
| |||||
Fund share transactions: | ||||||||
Shares sold | 11,466,234 | 8,607,620 | ||||||
Reinvested dividends and distributions | 2,008,781 | 1,523,015 | ||||||
|
|
|
| |||||
| 13,475,015 | 10,130,635 | |||||||
Shares repurchased | (7,876,089 | ) | (7,916,853 | ) | ||||
|
|
|
| |||||
Net increase (decrease) in fund shares | 5,598,926 | 2,213,782 | ||||||
|
|
|
| |||||
| (1) | For the period from December 3, 2012 (commencement of operations) to March 31, 2013. |
| (2) | Effective June 29, 2012, the Fund name was changed to Buffalo Discovery Fund. Prior to June 29, 2012, the Fund was known as the Buffalo Science & Technology Fund. |
The accompanying notes are an integral part of these financial statements.
70
| BUFFALO DIVIDEND FOCUS FUND | BUFFALO FLEXIBLE INCOME FUND | BUFFALO GROWTH FUND | BUFFALO HIGH YIELD FUND | |||||||||||||||||||||||
| PERIOD ENDED MARCH 31, 2013(1) | YEAR ENDED MARCH 31, 2013 | YEAR ENDED MARCH 31, 2012 | YEAR ENDED MARCH 31, 2013 | YEAR ENDED MARCH 31, 2012 | YEAR ENDED MARCH 31, 2013 | YEAR ENDED MARCH 31, 2012 | ||||||||||||||||||||
| $ | 20,177 | $ | 16,694,866 | $ | 7,963,786 | $ | 2,514,413 | $ | 1,161,671 | $ | 12,949,898 | $ | 13,918,338 | |||||||||||||
| 61,000 | 6,211,907 | (181,742 | ) | 9,007,582 | (2,464,048 | ) | 1,637,852 | 298,745 | ||||||||||||||||||
| 581,279 |
| 56,933,535 | 15,964,790 | 17,309,786 | 44,671,784 | 6,498,064 | 24,117 | ||||||||||||||||||
|
|
|
|
|
|
|
|
|
|
|
|
|
| |||||||||||||
| 662,456 | 79,840,308 | 23,746,834 | 28,831,781 | 43,369,407 | 21,085,814 | 14,241,200 | ||||||||||||||||||||
| (19,350 | ) | (19,644,122 | ) | (7,871,498 | ) | (2,159,726 | ) | (69,262 | ) | (14,510,847 | ) | (14,274,625 | ) | |||||||||||||
| — | — | — | — | (7,937,395 | ) | (205,850 | ) | — | ||||||||||||||||||
|
|
|
|
|
|
|
|
|
|
|
|
|
| |||||||||||||
| (19,350 | ) | (19,644,122 | ) | (7,871,498 | ) | (2,159,726 | ) | (8,006,657 | ) | (14,716,697 | ) | (14,274,625 | ) | |||||||||||||
| 13,194,653 | 581,393,467 | 234,722,990 | 139,307,266 | 294,658,152 | 128,956,078 | 87,708,544 | ||||||||||||||||||||
| 18,453 | 18,463,013 | 7,129,106 | 2,055,684 | 7,794,818 | 9,918,863 | 10,532,596 | ||||||||||||||||||||
|
|
|
|
|
|
|
|
|
|
|
|
|
| |||||||||||||
| 13,213,106 | 599,856,480 | 241,852,096 | 141,362,950 | 302,452,970 | 138,874,941 | 98,241,140 | ||||||||||||||||||||
| (54,673 | ) | (175,279,273 | ) | (64,414,428 | ) | (181,537,693 | ) | (150,860,547 | ) | (139,957,614 | ) | (71,614,907 | ) | |||||||||||||
| 156 | 56,039 | 84,284 | 25,614 | 67,978 | 55,203 | 202,036 | ||||||||||||||||||||
|
|
|
|
|
|
|
|
|
|
|
|
|
| |||||||||||||
| (54,517 | ) | (175,223,234 | ) | (64,330,144 | ) | (181,512,079 | ) | (150,792,569 | ) | (139,902,411 | ) | (71,412,871 | ) | |||||||||||||
|
|
|
|
|
|
|
|
|
|
|
|
|
| |||||||||||||
| 13,158,589 | 424,633,246 | 177,521,952 | (40,149,129 | ) | 151,660,401 | (1,027,470 | ) | 26,828,269 | ||||||||||||||||||
|
|
|
|
|
|
|
|
|
|
|
|
|
| |||||||||||||
| 13,801,695 | 484,829,432 | 193,397,288 | (13,477,074 | ) | 187,023,151 | 5,341,647 | 26,794,844 | |||||||||||||||||||
| — | 377,851,360 | 184,454,072 | 507,136,337 | 320,113,186 | 255,770,602 | 228,975,758 | ||||||||||||||||||||
|
|
|
|
|
|
|
|
|
|
|
|
|
| |||||||||||||
| $ | 13,801,695 | $ | 862,680,792 | $ | 377,851,360 | $ | 493,659,263 | $ | 507,136,337 | $ | 261,112,249 | $ | 255,770,602 | |||||||||||||
|
|
|
|
|
|
|
|
|
|
|
|
|
| |||||||||||||
| $ | 827 | $ | (527,417 | ) | $ | 251,602 | $ | 1,520,070 | $ | 1,163,383 | $ | (474,311 | ) | $ | 737,022 | |||||||||||
|
|
|
|
|
|
|
|
|
|
|
|
|
| |||||||||||||
| 1,312,221 | 45,535,243 | 19,681,141 | 5,135,775 | 11,506,939 | 11,344,939 | 7,903,466 | ||||||||||||||||||||
| 1,781 | 1,446,468 | 609,411 | 74,320 | 318,546 | 871,759 | 956,505 | ||||||||||||||||||||
|
|
|
|
|
|
|
|
|
|
|
|
|
| |||||||||||||
| 1,314,002 | 46,981,711 | 20,290,552 | 5,210,095 | 11,825,485 | 12,216,698 | 8,859,971 | ||||||||||||||||||||
| (5,329 | ) | (13,757,599 | ) | (5,494,502 | ) | (6,648,101 | ) | (5,909,785 | ) | (12,283,531 | ) | (6,414,869 | ) | |||||||||||||
|
|
|
|
|
|
|
|
|
|
|
|
|
| |||||||||||||
| 1,308,673 | 33,224,112 | 14,796,050 | (1,438,006 | ) | 5,915,700 | (66,833 | ) | 2,445,102 | ||||||||||||||||||
|
|
|
|
|
|
|
|
|
|
|
|
|
| |||||||||||||
71
Statements of Changes in Net Assets
| BUFFALO INTERNATIONAL FUND | ||||||||
| YEAR ENDED MARCH 31, 2013(1) | YEAR ENDED MARCH 31, 2012 | |||||||
OPERATIONS: | ||||||||
Net investment income (loss) | $ | 327,807 | $ | 385,579 | ||||
Net realized gain (loss) from investment transactions | 1,738,698 | (3,168,401 | ) | |||||
Net unrealized appreciation/depreciation during the period on investments and translation of assets and liabilities in foreign currencies | 4,383,091 | 1,615,542 | ||||||
|
|
|
| |||||
Net increase (decrease) in net assets resulting from operations | 6,449,596 | (1,167,280 | ) | |||||
DISTRIBUTIONS TO SHAREHOLDERS: | ||||||||
Net investment income | (322,407 | ) | (344,354 | ) | ||||
Net realized gain from investment transactions | — | — | ||||||
|
|
|
| |||||
Total distributions to shareholders | (322,407 | ) | (344,354 | ) | ||||
CAPITAL SHARE TRANSACTIONS: | ||||||||
Shares sold | 10,883,059 | 23,048,370 | ||||||
Shares issued in merger | 22,978,843 | — | ||||||
Reinvested dividends and distributions | 291,324 | 311,460 | ||||||
|
|
|
| |||||
Shares issued | 34,153,226 | 23,359,830 | ||||||
Redemptions | (4,585,714 | ) | (5,779,246 | ) | ||||
Redemption fees (Note 5) | 596 | 740 | ||||||
|
|
|
| |||||
Shares repurchased | (4,585,118 | ) | (5,778,506 | ) | ||||
|
|
|
| |||||
Net increase (decrease) from capital share transactions | 29,568,108 | 17,581,324 | ||||||
|
|
|
| |||||
Total increase (decrease) in net assets | 35,695,297 | 16,069,690 | ||||||
NET ASSETS: | ||||||||
Beginning of period | 70,804,884 | 54,735,194 | ||||||
|
|
|
| |||||
End of period | $ | 106,500,181 | $ | 70,804,884 | ||||
|
|
|
| |||||
Undistributed (distribution in excess of) net investment income (loss) at end of year | $ | (97,616 | ) | $ | (35,470 | ) | ||
|
|
|
| |||||
Fund share transactions: | ||||||||
Shares sold | 1,139,649 | 2,445,859 | ||||||
Shares issued in merger | 2,230,956 | — | ||||||
Reinvested dividends and distributions | 29,576 | 37,890 | ||||||
|
|
|
| |||||
| 3,400,181 | 2,483,749 | |||||||
Shares repurchased | (480,214 | ) | (638,423 | ) | ||||
|
|
|
| |||||
Net increase (decrease) in fund shares | 2,919,967 | 1,845,326 | ||||||
|
|
|
| |||||
| (1) | Effective end of business January 25, 2013, the Buffalo China Fund was reorganized into the Buffalo International Fund. See Note 10 for more information. |
The accompanying notes are an integral part of these financial statements.
72
| BUFFALO LARGE CAP FUND | BUFFALO MICRO CAP FUND | BUFFALO MID CAP FUND | BUFFALO SMALL CAP FUND | |||||||||||||||||||||||||||
| YEAR ENDED MARCH 31, 2013 | YEAR ENDED MARCH 31, 2012 | YEAR ENDED MARCH 31, 2013 | YEAR ENDED MARCH 31, 2012 | YEAR ENDED MARCH 31, 2013 | YEAR ENDED MARCH 31, 2012 | YEAR ENDED MARCH 31, 2013 | YEAR ENDED MARCH 31, 2012 | |||||||||||||||||||||||
| $ | 101,488 | $ | 58,772 | $ | (407,234 | ) | $ | (324,672 | ) | $ | 437,136 | $ | (2,411,201 | ) | $ | (8,614,139 | ) | $ | (102,074 | ) | ||||||||||
| 2,510,577 | 1,831,151 | 2,558,114 | 1,777,933 | 30,259,276 | 16,985,345 | 391,422,606 | (47,948,888 | ) | ||||||||||||||||||||||
| (264,267 | ) | (628,450 | ) | 9,688,872 | 4,063,821 | (8,407,055 | ) | 26,505,163 | 24,774,097 | 104,205,404 | |||||||||||||||||||
|
|
|
|
|
|
|
|
|
|
|
|
|
|
|
| |||||||||||||||
| 2,347,798 | 1,261,473 | 11,839,752 | 5,517,082 | 22,289,357 | 41,079,307 | 407,582,564 | 56,154,442 | |||||||||||||||||||||||
| (205,803 | ) | (62,922 | ) | — | — | (461,541 | ) | — | — | — | ||||||||||||||||||||
| (1,976,302 | ) | (201,892 | ) | — | — | (27,740,501 | ) | (13,548,232 | ) | (168,173,650 | ) | (5,878,612 | ) | |||||||||||||||||
|
|
|
|
|
|
|
|
|
|
|
|
|
|
|
| |||||||||||||||
| (2,182,105 | ) | (264,814 | ) | — | — | (28,202,042 | ) | (13,548,232 | ) | (168,173,650 | ) | (5,878,612 | ) | |||||||||||||||||
| 3,747,644 | 7,850,317 | 53,609,883 | 9,590,701 | 128,061,614 | 180,540,562 | 671,192,316 | 382,125,538 | |||||||||||||||||||||||
| — | — | — | — | — | — | — | — | |||||||||||||||||||||||
| 2,158,669 | 260,214 | — | — | 27,422,379 | 12,958,850 | 159,693,624 | 5,588,302 | |||||||||||||||||||||||
|
|
|
|
|
|
|
|
|
|
|
|
|
|
|
| |||||||||||||||
| 5,906,313 | 8,110,531 | 53,609,883 | 9,590,701 | 155,483,993 | 193,499,412 | 830,885,940 | 387,713,840 | |||||||||||||||||||||||
| (15,715,438 | ) | (7,189,908 | ) | (13,552,662 | ) | (5,450,819 | ) | (258,976,997 | ) | (241,074,842 | ) | (694,844,702 | ) | (826,854,018 | ) | |||||||||||||||
| 5,591 | 447 | 80,638 | 4,711 | 17,188 | 23,680 | 33,344 | 115,316 | |||||||||||||||||||||||
|
|
|
|
|
|
|
|
|
|
|
|
|
|
|
| |||||||||||||||
| (15,709,847 | ) | (7,189,461 | ) | (13,472,024 | ) | (5,446,108 | ) | (258,959,809 | ) | (241,051,162 | ) | (694,811,358 | ) | (826,738,702 | ) | |||||||||||||||
|
|
|
|
|
|
|
|
|
|
|
|
|
|
|
| |||||||||||||||
| (9,803,534 | ) | 921,070 | 40,137,859 | 4,144,593 | (103,475,816 | ) | (47,551,750 | ) | 136,074,582 | (439,024,862 | ) | |||||||||||||||||||
|
|
|
|
|
|
|
|
|
|
|
|
|
|
|
| |||||||||||||||
| (9,637,841 | ) | 1,917,729 | 51,977,611 | 9,661,675 | (109,388,501 | ) | (20,020,675 | ) | 375,483,496 | (388,749,032 | ) | |||||||||||||||||||
| 37,989,902 | 36,072,173 | 40,981,164 | 31,319,489 | 734,566,699 | 754,587,374 | 2,768,695,694 | 3,157,444,726 | |||||||||||||||||||||||
|
|
|
|
|
|
|
|
|
|
|
|
|
|
|
| |||||||||||||||
| $ | 28,352,061 | $ | 37,989,902 | $ | 92,958,775 | $ | 40,981,164 | $ | 625,178,198 | $ | 734,566,699 | $ | 3,144,179,190 | $ | 2,768,695,694 | |||||||||||||||
|
|
|
|
|
|
|
|
|
|
|
|
|
|
|
| |||||||||||||||
| $ | 72 | $ | 58,772 | $ | (250,055 | ) | $ | (93,238 | ) | $ | (650,311 | ) | $ | (648,266 | ) | $ | — | $ | — | |||||||||||
|
|
|
|
|
|
|
|
|
|
|
|
|
|
|
| |||||||||||||||
| 181,399 | 381,672 | 4,319,638 | 981,904 | 7,540,213 | 10,838,407 | 23,292,680 | 14,842,433 | |||||||||||||||||||||||
| — | — | — | — | — | — | — | — | |||||||||||||||||||||||
| 105,404 | 14,089 | — | — | 1,608,350 | 843,675 | 5,689,121 | 223,711 | |||||||||||||||||||||||
|
|
|
|
|
|
|
|
|
|
|
|
|
|
|
| |||||||||||||||
| 286,803 | 395,761 | 4,319,638 | 981,904 | 9,148,564 | 11,682,082 | 28,981,801 | 15,066,144 | |||||||||||||||||||||||
| (752,037 | ) | (356,182 | ) | (1,112,214 | ) | (541,112 | ) | (15,228,929 | ) | (14,500,886 | ) | (24,317,024 | ) | (32,118,874 | ) | |||||||||||||||
|
|
|
|
|
|
|
|
|
|
|
|
|
|
|
| |||||||||||||||
| (465,234 | ) | 39,579 | 3,207,424 | 440,792 | (6,080,366 | ) | (2,818,804 | ) | 4,664,777 | (17,052,730 | ) | |||||||||||||||||||
|
|
|
|
|
|
|
|
|
|
|
|
|
|
|
| |||||||||||||||
73
Financial Highlights
The following tables are intended to help you understand the Fund’s financial performance. The information reflects financial results for the Fund held for the periods shown. Total returns assume reinvestement of all dividends and distributions. Total returns do not reflect payment of sales charges, if any, and are not annualized for periods of less than one year.
BUFFALO DISCOVERY FUND
Condensed data for a share of capital stock outstanding throughout the year. | YEARS ENDED MARCH 31, | |||||||||||||||||||
| 2013(3) | 2012 | 2011 | 2010 | 2009 | ||||||||||||||||
Net asset value, beginning of year | $ | 16.96 | $ | 16.28 | $ | 13.76 | $ | 8.55 | $ | 11.41 | ||||||||||
|
|
|
|
|
|
|
|
|
| |||||||||||
Income from investment operations: | ||||||||||||||||||||
Net investment income (loss) | 0.02 | (0.07 | ) | (0.05 | )(1) | (0.03 | )(1) | (0.02 | ) | |||||||||||
Net gains (losses) on securities (both realized and unrealized) | 1.32 | 1.74 | 2.89 | 5.24 | (2.64 | ) | ||||||||||||||
|
|
|
|
|
|
|
|
|
| |||||||||||
Total from investment operations | 1.34 | 1.67 | 2.84 | 5.21 | (2.66 | ) | ||||||||||||||
|
|
|
|
|
|
|
|
|
| |||||||||||
Less distributions: | ||||||||||||||||||||
Dividends from net investment income | (0.03 | ) | — | — | — | — | ||||||||||||||
Distributions from capital gains | (1.19 | ) | (0.99 | ) | (0.32 | ) | — | (0.20 | ) | |||||||||||
|
|
|
|
|
|
|
|
|
| |||||||||||
Total distributions | (1.22 | ) | (0.99 | ) | (0.32 | ) | — | (0.20 | ) | |||||||||||
|
|
|
|
|
|
|
|
|
| |||||||||||
Paid-in capital from redemption fees(2) (Note 5) | — | — | — | — | — | |||||||||||||||
|
|
|
|
|
|
|
|
|
| |||||||||||
Net asset value, end of year | $ | 17.08 | $ | 16.96 | $ | 16.28 | $ | 13.76 | $ | 8.55 | ||||||||||
|
|
|
|
|
|
|
|
|
| |||||||||||
Total return | 8.46% | 11.50% | 20.77% | 60.94% | (23.85% | ) | ||||||||||||||
|
|
|
|
|
|
|
|
|
| |||||||||||
Ratios/Supplemental Data | ||||||||||||||||||||
Net assets, end of year (in thousands) | $ | 515,429 | $ | 416,772 | $ | 364,188 | $ | 229,814 | $ | 102,480 | ||||||||||
Ratio of expenses to average net assets | 1.01% | 1.01% | 1.02% | 1.02% | 1.03% | |||||||||||||||
Ratio of net investment income (loss) to average net assets | 0.09% | (0.46% | ) | (0.33% | ) | (0.22% | ) | (0.24% | ) | |||||||||||
Portfolio turnover rate | 53% | 52% | 38% | 35% | 51% | |||||||||||||||
| (1) | Net investment loss per share calculated using average shares outstanding. |
| (2) | Less than $0.01 per share. |
| (3) | Effective June 29, 2012, the Fund name was changed to Buffalo Discovery Fund. Prior to June 29, 2012, the Fund was known as the Buffalo Science & Technology Fund. |
The accompanying notes are an integral part of these financial statements.
74
Financial Highlights
The following tables are intended to help you understand the Fund’s financial performance. The information reflects financial results for the Fund held for the periods shown. Total returns assume reinvestement of all dividends and distributions. Total returns do not reflect payment of sales charges, if any, and are not annualized for periods of less than one year.
BUFFALO DIVIDEND FOCUS FUND
Condensed data for a share of capital stock outstanding throughout the period. | FOR THE PERIOD FROM | |||
Net asset value, beginning of period | $ | 10.00 | ||
|
| |||
Income from investment operations: | ||||
Net investment income | 0.01 | |||
Net gains on securities (both realized and unrealized) | 0.55 | |||
|
| |||
Total from investment operations | 0.56 | |||
|
| |||
Less distributions: | ||||
Dividends from net investment income | (0.01 | ) | ||
Distributions from capital gains | — | |||
|
| |||
Total distributions | (0.01 | ) | ||
|
| |||
Paid-in capital from redemption fees (Note 5)(1) | — | |||
|
| |||
Net asset value, end of period | $ | 10.55 | ||
|
| |||
Total return* | 5.65% | * | ||
|
| |||
Ratios/Supplemental Data | ||||
Net assets, end of period (in thousands) | $ | 13,802 | ||
Ratio of expenses to average net assets** | 1.61% | |||
Ratio of net investment income to average net assets** | 0.59% | |||
Portfolio turnover rate* | 8% | |||
| * | Not annualized for periods less than one full year. |
| ** | Annualized for periods less than one full year. |
| (1) | Less than $0.01 per share. |
The accompanying notes are an integral part of these financial statements.
75
Financial Highlights
The following tables are intended to help you understand the Fund’s financial performance. The information reflects financial results for the Fund held for the periods shown. Total returns assume reinvestement of all dividends and distributions. Total returns do not reflect payment of sales charges, if any, and are not annualized for periods of less than one year.
BUFFALO FLEXIBLE INCOME FUND
Condensed data for a share of capital stock outstanding throughout the year. | YEARS ENDED MARCH 31, | |||||||||||||||||||
| 2013 | 2012(2) | 2011 | 2010 | 2009 | ||||||||||||||||
Net asset value, beginning of year | $ | 12.39 | $ | 11.76 | $ | 10.61 | $ | 7.89 | $ | 11.38 | ||||||||||
|
|
|
|
|
|
|
|
|
| |||||||||||
Income from investment operations: | ||||||||||||||||||||
Net investment income | 0.37 | 0.41 | 0.33 | 0.35 | 0.38 | |||||||||||||||
Net gains (losses) on securities (both realized and unrealized) | 1.20 | 0.63 | 1.15 | 2.72 | (3.49 | ) | ||||||||||||||
|
|
|
|
|
|
|
|
|
| |||||||||||
Total from investment operations | 1.57 | 1.04 | 1.48 | 3.07 | (3.11 | ) | ||||||||||||||
|
|
|
|
|
|
|
|
|
| |||||||||||
Less distributions: | ||||||||||||||||||||
Dividends from net investment income | (0.42 | ) | (0.41 | ) | (0.33 | ) | (0.35 | ) | (0.38 | ) | ||||||||||
Distributions from capital gains | — | — | — | — | — | |||||||||||||||
|
|
|
|
|
|
|
|
|
| |||||||||||
Total distributions | (0.42 | ) | (0.41 | ) | (0.33 | ) | (0.35 | ) | (0.38 | ) | ||||||||||
|
|
|
|
|
|
|
|
|
| |||||||||||
Paid-in capital from redemption fees(1) (Note 5) | — | — | — | — | — | |||||||||||||||
|
|
|
|
|
|
|
|
|
| |||||||||||
Net asset value, end of year | $ | 13.54 | $ | 12.39 | $ | 11.76 | $ | 10.61 | $ | 7.89 | ||||||||||
|
|
|
|
|
|
|
|
|
| |||||||||||
Total return | 12.96% | 9.15% | 14.27% | 39.32% | (27.75% | ) | ||||||||||||||
|
|
|
|
|
|
|
|
|
| |||||||||||
Ratios/Supplemental Data | ||||||||||||||||||||
Net assets, end of year (in thousands) | $ | 862,681 | $ | 377,851 | $ | 184,454 | $ | 154,312 | $ | 113,692 | ||||||||||
Ratio of expenses to average net assets | 1.02% | 1.01% | 1.02% | 1.03% | 1.03% | |||||||||||||||
Ratio of net investment income to average net assets | 2.89% | 3.49% | 2.98% | 3.55% | 3.85% | |||||||||||||||
Portfolio turnover rate | 25% | 19% | 26% | 12% | 14% | |||||||||||||||
| (1) | Less than $0.01 per share. |
| (2) | Effective July 29, 2011, the Fund name was changed to Buffalo Flexible Income Fund. Prior to July 29, 2011, the Fund was known as the Buffalo Balanced Fund. |
The accompanying notes are an integral part of these financial statements.
76
Financial Highlights
The following tables are intended to help you understand the Fund’s financial performance. The information reflects financial results for the Fund held for the periods shown. Total returns assume reinvestement of all dividends and distributions. Total returns do not reflect payment of sales charges, if any, and are not annualized for periods of less than one year.
BUFFALO GROWTH FUND
| Condensed data for a share of capital stock outstanding throughout the year. | YEARS ENDED MARCH 31, | |||||||||||||||||||
| 2013 | 2012 | 2011 | 2010(1) | 2009 | ||||||||||||||||
Net asset value, beginning of year | $ | 27.93 | $ | 26.15 | $ | 21.87 | $ | 14.29 | $ | 20.85 | ||||||||||
|
|
|
|
|
|
|
|
|
| |||||||||||
Income from investment operations: | ||||||||||||||||||||
Net investment income | 0.15 | 0.06 | 0.07 | 0.10 | 0.10 | |||||||||||||||
Net gains (losses) on securities (both realized and unrealized) | 1.57 | 2.17 | 4.28 | 7.58 | (6.48 | ) | ||||||||||||||
|
|
|
|
|
|
|
|
|
| |||||||||||
Total from investment operations | 1.72 | 2.23 | 4.35 | 7.68 | (6.38 | ) | ||||||||||||||
|
|
|
|
|
|
|
|
|
| |||||||||||
Less distributions: | ||||||||||||||||||||
Dividends from net investment income | (0.12 | ) | (0.01 | ) | (0.06 | ) | (0.10 | ) | (0.11 | ) | ||||||||||
Distributions from capital gains | — | (0.44 | ) | (0.01 | ) | — | (0.07 | ) | ||||||||||||
Return of capital | — | — | — | — | (2) | — | ||||||||||||||
|
|
|
|
|
|
|
|
|
| |||||||||||
Total distributions | (0.12 | ) | (0.45 | ) | (0.07 | ) | (0.10 | ) | (0.18 | ) | ||||||||||
|
|
|
|
|
|
|
|
|
| |||||||||||
Paid-in capital from redemption fees(2) (Note 5) | — | — | — | — | — | |||||||||||||||
|
|
|
|
|
|
|
|
|
| |||||||||||
Net asset value, end of year | $ | 29.53 | $ | 27.93 | $ | 26.15 | $ | 21.87 | $ | 14.29 | ||||||||||
|
|
|
|
|
|
|
|
|
| |||||||||||
Total return | 6.20% | 8.78% | 19.88% | 53.80% | (30.70% | ) | ||||||||||||||
|
|
|
|
|
|
|
|
|
| |||||||||||
Ratios/Supplemental Data | ||||||||||||||||||||
Net assets, end of year (in thousands) | $ | 493,659 | $ | 507,136 | $ | 320,113 | $ | 105,087 | $ | 68,221 | ||||||||||
Ratio of expenses to average net assets | 0.91% | 0.92% | 0.99% | 1.03% | 1.05% | |||||||||||||||
Ratio of net investment income to average net assets | 0.51% | 0.27% | 0.27% | 0.51% | 0.53% | |||||||||||||||
Portfolio turnover rate | 44% | 46% | 47% | 30% | 51% | |||||||||||||||
| (1) | Effective July 31, 2009, the Fund name was changed to Buffalo Growth Fund. Prior to July 31, 2009, the Fund was known as the Buffalo USA Global Fund. |
| (2) | Less than $0.01 per share. |
The accompanying notes are an integral part of these financial statements.
77
Financial Highlights
The following tables are intended to help you understand the Fund’s financial performance. The information reflects financial results for the Fund held for the periods shown. Total returns assume reinvestement of all dividends and distributions. Total returns do not reflect payment of sales charges, if any, and are not annualized for periods of less than one year.
BUFFALO HIGH YIELD FUND
Condensed data for a share of capital stock outstanding throughout the year. | YEARS ENDED MARCH 31, | |||||||||||||||||||
| 2013 | 2012 | 2011 | 2010 | 2009 | ||||||||||||||||
Net asset value, beginning of year | $ | 11.40 | $ | 11.45 | $ | 10.88 | $ | 8.20 | $ | 10.40 | ||||||||||
|
|
|
|
|
|
|
|
|
| |||||||||||
Income from investment operations: | ||||||||||||||||||||
Net investment income | 0.55 | 0.66 | 0.64 | 0.63 | 0.70 | |||||||||||||||
Net gains (losses) on securities (both realized and unrealized) | 0.35 | (0.03 | ) | 0.56 | 2.68 | (2.10 | ) | |||||||||||||
|
|
|
|
|
|
|
|
|
| |||||||||||
Total from investment operations | 0.90 | 0.63 | 1.20 | 3.31 | (1.40 | ) | ||||||||||||||
|
|
|
|
|
|
|
|
|
| |||||||||||
Less distributions: | ||||||||||||||||||||
Dividends from net investment income | (0.62 | ) | (0.68 | ) | (0.63 | ) | (0.63 | ) | (0.72 | ) | ||||||||||
Distributions from capital gains | (0.01 | ) | — | — | — | (0.08 | ) | |||||||||||||
|
|
|
|
|
|
|
|
|
| |||||||||||
Total distributions | (0.63 | ) | (0.68 | ) | (0.63 | ) | (0.63 | ) | (0.80 | ) | ||||||||||
|
|
|
|
|
|
|
|
|
| |||||||||||
Paid-in capital from redemption fees(1) (Note 5) | — | — | — | — | — | |||||||||||||||
|
|
|
|
|
|
|
|
|
| |||||||||||
Net asset value, end of year | $ | 11.67 | $ | 11.40 | $ | 11.45 | $ | 10.88 | $ | 8.20 | ||||||||||
|
|
|
|
|
|
|
|
|
| |||||||||||
Total return | 8.20% | 5.86% | 11.35% | 40.96% | (13.64% | ) | ||||||||||||||
|
|
|
|
|
|
|
|
|
| |||||||||||
Ratios/Supplemental Data | ||||||||||||||||||||
Net assets, end of year (in thousands) | $ | 261,112 | $ | 255,771 | $ | 228,976 | $ | 172,240 | $ | 95,346 | ||||||||||
Ratio of expenses to average net assets | 1.01% | 1.02% | 1.02% | 1.02% | 1.03% | |||||||||||||||
Ratio of net investment income to average net assets | 4.85% | 5.89% | 5.75% | 6.31% | 7.08% | |||||||||||||||
Portfolio turnover rate | 32% | 21% | 25% | 41% | 7% | |||||||||||||||
| (1) | Less than $0.01 per share. |
The accompanying notes are an integral part of these financial statements.
78
Financial Highlights
The following tables are intended to help you understand the Fund’s financial performance. The information reflects financial results for the Fund held for the periods shown. Total returns assume reinvestement of all dividends and distributions. Total returns do not reflect payment of sales charges, if any, and are not annualized for periods of less than one year.
BUFFALO INTERNATIONAL FUND
Condensed data for a share of capital stock outstanding throughout the period. | YEARS ENDED MARCH 31, | |||||||||||||||||||
| 2013(1)(3) | 2012 | 2011 | 2010 | 2009 | ||||||||||||||||
Net asset value, beginning of period | $ | 9.52 | $ | 9.79 | $ | 8.70 | $ | 5.31 | $ | 9.37 | ||||||||||
|
|
|
|
|
|
|
|
|
| |||||||||||
Income from investment operations: | ||||||||||||||||||||
Net investment income | 0.04 | 0.05 | 0.06 | 0.05 | 0.08 | |||||||||||||||
Net gains (losses) on securities (both realized and unrealized) | 0.76 | (0.27 | ) | 1.08 | 3.40 | (4.04 | ) | |||||||||||||
|
|
|
|
|
|
|
|
|
| |||||||||||
Total from investment operations | 0.80 | (0.22 | ) | 1.14 | 3.45 | (3.96 | ) | |||||||||||||
|
|
|
|
|
|
|
|
|
| |||||||||||
Less distributions: | ||||||||||||||||||||
Dividends from net investment income | (0.04 | ) | (0.05 | ) | (0.05 | ) | (0.05 | ) | (0.06 | ) | ||||||||||
Distributions from capital gains | — | — | — | — | (0.01 | ) | ||||||||||||||
Return of capital | — | — | — | (0.01 | ) | (0.03 | ) | |||||||||||||
|
|
|
|
|
|
|
|
|
| |||||||||||
Total distributions | (0.04 | ) | (0.05 | ) | (0.05 | ) | (0.06 | ) | (0.10 | ) | ||||||||||
|
|
|
|
|
|
|
|
|
| |||||||||||
Paid-in capital from redemption fees(2) (Note 5) | — | — | — | — | — | |||||||||||||||
|
|
|
|
|
|
|
|
|
| |||||||||||
Net asset value, end of period | $ | 10.28 | $ | 9.52 | $ | 9.79 | $ | 8.70 | $ | 5.31 | ||||||||||
|
|
|
|
|
|
|
|
|
| |||||||||||
Total return | 8.44% | (2.20% | ) | 13.09% | 65.00% | (42.76% | ) | |||||||||||||
|
|
|
|
|
|
|
|
|
| |||||||||||
Ratios/Supplemental Data | ||||||||||||||||||||
Net assets, end of period (in thousands) | $ | 106,500 | $ | 70,805 | $ | 54,735 | $ | 29,960 | $ | 13,632 | ||||||||||
Ratio of expenses to average net assets | 1.09% | 1.14% | 1.17% | 1.22% | 1.20% | |||||||||||||||
Ratio of net investment income to average net assets | 0.42% | 0.58% | 0.38% | 0.61% | 0.97% | |||||||||||||||
Portfolio turnover rate | 23% | 29% | 35% | 38% | 26% | |||||||||||||||
| (1) | Effective end of business January 25, 2013, the Buffalo China Fund was reorganized into the Buffalo International Fund. See Note 10 for more information. |
| (2) | Less than $0.01 per share. |
| (3) | During the year ended March 31, 2013, the Fund incurred $17.3 million in purchases associated with the transfer of assets of the Buffalo China Fund, which merged into the Fund on January 25, 2013. The purchases were excluded from portfolio turnover calculation. Activity after January 25, 2013 reflects the Funds’ combined operations. See Note 10. |
The accompanying notes are an integral part of these financial statements.
79
Financial Highlights
The following tables are intended to help you understand the Fund’s financial performance. The information reflects financial results for the Fund held for the periods shown. Total returns assume reinvestement of all dividends and distributions. Total returns do not reflect payment of sales charges, if any, and are not annualized for periods of less than one year.
BUFFALO LARGE CAP FUND
Condensed data for a share of capital stock outstanding throughout the year. | YEARS ENDED MARCH 31, | |||||||||||||||||||
| 2013 | 2012 | 2011 | 2010 | 2009 | ||||||||||||||||
Net asset value, beginning of year | $ | 21.58 | $ | 20.96 | $ | 18.60 | $ | 11.66 | $ | 19.68 | ||||||||||
|
|
|
|
|
|
|
|
|
| |||||||||||
Income from investment operations: | ||||||||||||||||||||
Net investment income | 0.08 | 0.04 | 0.04 | 0.05 | 0.04 | |||||||||||||||
Net gains (losses) on securities (both realized and unrealized) | 1.79 | 0.74 | 2.38 | 6.93 | (6.14 | ) | ||||||||||||||
|
|
|
|
|
|
|
|
|
| |||||||||||
Total from investment operations | 1.87 | 0.78 | 2.42 | 6.98 | (6.10 | ) | ||||||||||||||
|
|
|
|
|
|
|
|
|
| |||||||||||
Less distributions: | ||||||||||||||||||||
Dividends from net investment income | (0.15 | ) | (0.04 | ) | (0.06 | ) | (0.04 | ) | — | |||||||||||
Distributions from capital gains | (1.41 | ) | (0.12 | ) | — | — | (1.92 | ) | ||||||||||||
|
|
|
|
|
|
|
|
|
| |||||||||||
Total distributions | (1.56 | ) | (0.16 | ) | (0.06 | ) | (0.04 | ) | (1.92 | ) | ||||||||||
|
|
|
|
|
|
|
|
|
| |||||||||||
Paid-in capital from redemption fees(1) (Note 5) | — | — | — | — | — | |||||||||||||||
|
|
|
|
|
|
|
|
|
| |||||||||||
Net asset value, end of year | $ | 21.89 | $ | 21.58 | $ | 20.96 | $ | 18.60 | $ | 11.66 | ||||||||||
|
|
|
|
|
|
|
|
|
| |||||||||||
Total return | 9.17% | 3.84% | 13.04% | 59.85% | (34.35% | ) | ||||||||||||||
|
|
|
|
|
|
|
|
|
| |||||||||||
Ratios/Supplemental Data | ||||||||||||||||||||
Net assets, end of year (in thousands) | $ | 28,352 | $ | 37,990 | $ | 36,072 | $ | 36,765 | $ | 21,320 | ||||||||||
Ratio of expenses to average net assets | 0.97% | 0.96% | 1.04% | 1.08% | 1.09% | |||||||||||||||
Ratio of net investment income to average net assets | 0.33% | 0.17% | 0.19% | 0.35% | 0.23% | |||||||||||||||
Portfolio turnover rate | 49% | 59% | 28% | 35% | 27% | |||||||||||||||
| (1) | Less than $0.01 per share. |
The accompanying notes are an integral part of these financial statements.
80
Financial Highlights
The following tables are intended to help you understand the Fund’s financial performance. The information reflects financial results for the Fund held for the periods shown. Total returns assume reinvestement of all dividends and distributions. Total returns do not reflect payment of sales charges, if any, and are not annualized for periods of less than one year.
BUFFALO MICRO CAP FUND
Condensed data for a share of capital stock outstanding throughout the year. | YEARS ENDED MARCH 31, | |||||||||||||||||||
| 2013 | 2012 | 2011 | 2010 | 2009 | ||||||||||||||||
Net asset value, beginning of year | $ | 11.71 | $ | 10.24 | $ | 8.18 | $ | 4.40 | $ | 8.45 | ||||||||||
|
|
|
|
|
|
|
|
|
| |||||||||||
Income from investment operations: | ||||||||||||||||||||
Net investment loss | (0.05 | ) | (0.09 | ) | (0.07 | )(1) | — | (0.07 | ) | |||||||||||
Net gains (losses) on securities (both realized and unrealized) | 2.20 | 1.56 | 2.13 | 3.78 | (3.49 | ) | ||||||||||||||
|
|
|
|
|
|
|
|
|
| |||||||||||
Total from investment operations | 2.15 | 1.47 | 2.06 | 3.78 | (3.56 | ) | ||||||||||||||
|
|
|
|
|
|
|
|
|
| |||||||||||
Less distributions from capital gains | — | — | — | — | (0.49 | ) | ||||||||||||||
|
|
|
|
|
|
|
|
|
| |||||||||||
Paid-in capital from redemption fees(2) (Note 5) | — | — | — | — | — | |||||||||||||||
|
|
|
|
|
|
|
|
|
| |||||||||||
Net asset value, end of year | $ | 13.86 | $ | 11.71 | $ | 10.24 | $ | 8.18 | $ | 4.40 | ||||||||||
|
|
|
|
|
|
|
|
|
| |||||||||||
Total return | 18.36% | 14.36% | 25.18% | 85.91% | (42.64% | ) | ||||||||||||||
|
|
|
|
|
|
|
|
|
| |||||||||||
Ratios/Supplemental Data | ||||||||||||||||||||
Net assets, end of year (in thousands) | $ | 92,959 | $ | 40,981 | $ | 31,319 | $ | 22,679 | $ | 14,017 | ||||||||||
Ratio of expenses to average net assets | 1.50% | 1.51% | 1.53% | 1.54% | 1.55% | |||||||||||||||
Ratio of net investment loss to average net assets | (0.69% | ) | (0.99% | ) | (0.82% | ) | (1.10% | ) | (1.01% | ) | ||||||||||
Portfolio turnover rate | 21% | 31% | 30% | 28% | 31% | |||||||||||||||
| (1) | Net investment loss per share calculated using average shares outstanding. |
| (2) | Less than $0.01 per share. |
The accompanying notes are an integral part of these financial statements.
81
Financial Highlights
The following tables are intended to help you understand the Fund’s financial performance. The information reflects financial results for the Fund held for the periods shown. Total returns assume reinvestement of all dividends and distributions. Total returns do not reflect payment of sales charges, if any, and are not annualized for periods of less than one year.
BUFFALO MID CAP FUND
Condensed data for a share of capital stock outstanding throughout the year. | YEARS ENDED MARCH 31, | |||||||||||||||||||
| 2013 | 2012 | 2011 | 2010 | 2009 | ||||||||||||||||
Net asset value, beginning of year | $ | 17.95 | $ | 17.25 | $ | 14.89 | $ | 9.27 | $ | 12.86 | ||||||||||
|
|
|
|
|
|
|
|
|
| |||||||||||
Income from investment operations: | ||||||||||||||||||||
Net investment loss | 0.01 | (0.06 | ) | (0.04 | )(1) | (0.05 | )(1) | (0.03 | ) | |||||||||||
Net gains (losses) on securities (both realized and unrealized) | 0.78 | 1.08 | 2.40 | 5.67 | (3.38 | ) | ||||||||||||||
|
|
|
|
|
|
|
|
|
| |||||||||||
Total from investment operations | 0.79 | 1.02 | 2.36 | 5.62 | (3.41 | ) | ||||||||||||||
|
|
|
|
|
|
|
|
|
| |||||||||||
Less distributions: | ||||||||||||||||||||
Dividends from net investment income | (0.01 | ) | — | — | — | — | ||||||||||||||
Distributions from capital gains | (0.79 | ) | (0.32 | ) | — | — | (0.18 | ) | ||||||||||||
|
|
|
|
|
|
|
|
|
| |||||||||||
Total distributions | (0.80 | ) | (0.32 | ) | — | — | (0.18 | ) | ||||||||||||
|
|
|
|
|
|
|
|
|
| |||||||||||
Paid-in capital from redemption fees(2) (Note 5) | — | — | — | — | — | |||||||||||||||
|
|
|
|
|
|
|
|
|
| |||||||||||
Net asset value, end of year | $ | 17.94 | $ | 17.95 | $ | 17.25 | $ | 14.89 | $ | 9.27 | ||||||||||
|
|
|
|
|
|
|
|
|
| |||||||||||
Total return | 4.67% | 6.22% | 15.85% | 60.63% | (26.96% | ) | ||||||||||||||
|
|
|
|
|
|
|
|
|
| |||||||||||
Ratios/Supplemental Data | ||||||||||||||||||||
Net assets, end of year (in thousands) | $ | 625,178 | $ | 734,567 | $ | 754,587 | $ | 469,929 | $ | 193,720 | ||||||||||
Ratio of expenses to average net assets | 1.01% | 1.01% | 1.02% | 1.02% | 1.02% | |||||||||||||||
Ratio of net investment income (loss) to average net assets | 0.07% | (0.34% | ) | (0.23% | ) | (0.43% | ) | (0.26% | ) | |||||||||||
Portfolio turnover rate | 31% | 31% | 21% | 12% | 17% | |||||||||||||||
| (1) | Net investment loss per share calculated using average shares outstanding. |
| (2) | Less than $0.01 per share. |
The accompanying notes are an integral part of these financial statements.
82
Financial Highlights
The following tables are intended to help you understand the Fund’s financial performance. The information reflects financial results for the Fund held for the periods shown. Total returns assume reinvestement of all dividends and distributions. Total returns do not reflect payment of sales charges, if any, and are not annualized for periods of less than one year.
BUFFALO SMALL CAP FUND
Condensed data for a share of capital stock outstanding throughout the year. | YEARS ENDED MARCH 31, | |||||||||||||||||||
| 2013 | 2012 | 2011 | 2010 | 2009 | ||||||||||||||||
Net asset value, beginning of year | $ | 28.54 | $ | 27.69 | $ | 24.90 | $ | 16.21 | $ | 20.48 | ||||||||||
|
|
|
|
|
|
|
|
|
| |||||||||||
Income from investment operations: | ||||||||||||||||||||
Net investment income (loss) | (0.09 | ) | — | (2) | (0.10 | )(1) | (0.01 | ) | 0.04 | |||||||||||
Net gains (losses) on securities (both realized and unrealized) | 4.20 | 0.91 | 2.89 | 8.73 | (3.55 | ) | ||||||||||||||
|
|
|
|
|
|
|
|
|
| |||||||||||
Total from investment operations | 4.11 | 0.91 | 2.79 | 8.72 | (3.51 | ) | ||||||||||||||
|
|
|
|
|
|
|
|
|
| |||||||||||
Less distributions: | ||||||||||||||||||||
Dividends from net investment income | — | — | — | (0.03 | ) | — | ||||||||||||||
Distributions from capital gains | (1.72 | ) | (0.06 | ) | — | — | (0.76 | ) | ||||||||||||
Return of capital | — | — | — | — | (2) | — | ||||||||||||||
|
|
|
|
|
|
|
|
|
| |||||||||||
Total dividends and distributions | (1.72 | ) | (0.06 | ) | — | (0.03 | ) | (0.76 | ) | |||||||||||
|
|
|
|
|
|
|
|
|
| |||||||||||
Paid-in capital from redemption fees(2) (Note 5) | — | — | — | — | — | |||||||||||||||
|
|
|
|
|
|
|
|
|
| |||||||||||
Net asset value, end of year | $ | 30.93 | $ | 28.54 | $ | 27.69 | $ | 24.90 | $ | 16.21 | ||||||||||
|
|
|
|
|
|
|
|
|
| |||||||||||
Total return | 15.02% | 3.31% | 11.20% | 53.80% | (18.00% | ) | ||||||||||||||
|
|
|
|
|
|
|
|
|
| |||||||||||
Ratios/Supplemental Data | ||||||||||||||||||||
Net assets, end of year (in thousands) | $ | 3,144,179 | $ | 2,768,696 | $ | 3,157,445 | $ | 2,931,836 | $ | 1,257,265 | ||||||||||
Ratio of expenses to average net assets | 1.00% | 1.00% | 1.01% | 1.01% | 1.01% | |||||||||||||||
Ratio of net investment income (loss) to average net assets | (0.31% | ) | (0.00% | )(3) | (0.40% | ) | (0.51% | ) | 0.22% | |||||||||||
Portfolio turnover rate | 34% | 24% | 16% | 9% | 15% | |||||||||||||||
| (1) | Net investment loss per share calculated using average shares outstanding. |
| (2) | Less than $0.01 per share. |
| (3) | Less than 0.01%. |
The accompanying notes are an integral part of these financial statements.
83
Notes to Financial Statements
March 31, 2013
1. SIGNIFICANT ACCOUNTING POLICIES:
The Buffalo Funds (comprised of the Buffalo Discovery Fund, Buffalo Dividend Focus Fund, Buffalo Flexible Income Fund, Buffalo Growth Fund, Buffalo High Yield Fund, Buffalo International Fund, Buffalo Large Cap Fund, Buffalo Micro Cap Fund, Buffalo Mid Cap Fund, and Buffalo Small Cap Fund) (the “Funds”), are registered under the Investment Company Act of 1940, as amended (the “1940 Act”), as diversified open-end management investment companies. The shares of the Buffalo Funds are issued in multiple series, with each series, in effect, representing a separate fund.
The investment objective of the Buffalo Discovery Fund, Buffalo Growth Fund, Buffalo International Fund, Buffalo Large Cap Fund, Buffalo Micro Cap Fund, Buffalo Mid Cap Fund and Buffalo Small Cap Fund is long-term growth of capital.
The investment objectives of the Buffalo Flexible Income Fund and Buffalo Dividend Focus Fund are the generation of high current income and, as a secondary objective, the long-term growth of capital.
The investment objective of the Buffalo High Yield Fund is current income, with long-term growth of capital as a secondary objective.
The following is a summary of significant accounting policies consistently followed by the Funds in the preparation of their financial statements.
A. INVESTMENT VALUATION — Corporate stocks and bonds traded on a national securities exchange or national market, except those traded using the National Association of Securities Dealers’ Automated Quotation System (“NASDAQ”), are valued at the latest sales price thereof, or if no sale was reported on that date, the mean between the most recent quoted bid and asked price is used. All equity securities that are traded using NASDAQ are valued using the NASDAQ Official Closing Price (“NOCP”), which may not necessarily represent the last sales price. If there has been no sale on such exchange or on NASDAQ on such day, the security is valued at the mean between the most recent quoted bid and ask price.
When market quotations are not readily available, any security or other asset is valued at its fair value as determined in good faith under procedures approved by the Board of Trustees (the “Board”). If events occur that will affect the value of a Fund’s portfolio securities before the net asset value (NAV) has been calculated (a “significant event”), the security will generally be priced using a fair value procedure. The Board has adopted specific procedures for valuing portfolio securities and delegated the responsibility of fair value determinations to the Valuation Committee. Some of the factors that may be considered by the Valuation Committee in determining fair value are fundamental analytical data relating to the investment; the nature and duration of any restriction on the disposition; trading in similar securities of the same issuer or comparable companies; information from broker-dealers; and an evaluation of the forces that influence the market in which the securities are purchased or sold. As of March 31, 2013, the Buffalo High Yield Fund held one fair valued security, with a market value of $0 or 0.00% of total net assets. In addition, with respect to the valuation of securities principally traded on foreign markets, the Buffalo International Fund uses a fair value pricing service approved by the Funds’ Board which employs quantitative models to adjust for “stale” prices caused by the movement of other markets and other factors occurring after the close of the foreign markets, but before the close of the New York Stock Exchange (NYSE).
Debt securities with remaining maturities of 60 days or less are normally valued at amortized cost, unless the Board determines that amortized cost does not represent fair value.
Restricted securities include securities that have not been registered under the Securities Act of 1933, as amended, and securities that are subject to restrictions on resale. The Fund may invest in restricted securities that are consistent with the Fund’s investment objective and investment strategies. In some cases, the issuer of restricted securities has agreed to register such securities for resale, at the issuer’s expense either upon demand by the Fund or in connection with another registered offering of the securities. Investments in restricted securities are valued utilizing the Funds’ corporate bond valuation policies.
In accordance with Financial Accounting Standards Board (FASB) Accounting Standards Codifications (ASC) 820, Fair Value Measurements and Disclosure (ASC 820), fair value is defined as the price that a Fund would receive to sell an investment or pay to transfer a liability in an orderly transaction with an independent buyer in the principal market, or in the absence of a principal market, the most advantageous market for the investment or liability. ASC 820 establishes a three-tier hierarchy to distinguish between (1) inputs that reflect the assumptions market participants would use in pricing an asset or liability developed based on market data obtained from sources independent of the reporting entity (observable inputs) and (2) inputs that reflect the reporting entity’s own assumptions about the assumptions market participants would use in pricing an asset or liability developed based on the best information available in the circumstances (unobservable inputs) and to establish classification of fair value measurements for disclosure purposes. Various inputs are used in determining the value of the Funds’ investments. The inputs are summarized in the three broad levels listed below:
Level 1 — Valuations based on quoted prices for investments in active markets that a Fund has the ability to access at the measurement date. Valuation adjustments are not applied to Level 1 investments.
Level 2 — Valuations based on other significant observable inputs (including quoted prices for similar securities, interest rates, prepayment speeds, credit risks, etc.).
Level 3 — Valuations based on significant unobservable inputs (including a Fund’s own assumptions and judgment in determining the fair value of investments).
On May 12, 2011, the FASB issued an Accounting Standard Update (ASU) No. 2011-04, modifying ASC 820. At the same time, the International Accounting Standards Board (IASB) issued International Financial Reporting Standard (IFRS) 13, Fair Value
84
Measurement. The objective by the FASB and IASB is convergence of their guidance on fair value measurements and disclosures. Specifically, the ASU requires reporting entities to disclose i) the amounts of any transfers between Level 1 and Level 2, and the reasons for the transfers, ii) for Level 3 fair value measurements, a) quantitative information about significant unobservable inputs used, b) a description of the valuation processes used by the reporting entity and c) a narrative description of the sensitivity of the fair value measurement to change in unobservable inputs if a change in those inputs might result in a significantly higher or lower fair value measurement. The effective date of the ASU is for interim and annual periods beginning after December 15, 2011. Other than requiring additional disclosures, the adoption of this guidance did not have material impact on the financial statements of the Funds.
Inputs that are used in determining fair value of an investment may include price information, credit data, volatility statistics, and other factors. These inputs can be either observable or unobservable. The availability of observable inputs can vary between investments, and is affected by various factors such as the type of investment, and the volume and level of activity for that investment or similar investments in the market place. The inputs will be considered by the Adviser, along with any other relevant factors in the calculation of an investment’s fair value. The Funds use prices and inputs that are current as of the measurement date, which may include periods of market dislocations. During these periods, the availability of prices and inputs may be reduced for many investments. This condition could cause an investment to be reclassified between the various levels within the hierarchy.
Non-U.S. equity securities actively traded in foreign markets may be reflected in Level 2 despite the availability of closing prices, because the Funds evaluate and determine whether those closing prices reflect fair value at the close of the NYSE or require adjustment, as described above and in Note 9 — Foreign Investment Risk, to the financial statements.
Investments falling into the Level 3 category are primarily supported by quoted prices from brokers and dealers participating in the market for those investments. However, these may be classified as Level 3 investments due to lack of market transparency and corroboration to support these quoted prices. Additionally, valuation models may be used as the pricing source for any remaining investments classified as Level 3. These models rely on one or more significant unobservable inputs and/or significant assumptions by the Valuation Committee. Inputs used in valuations may include, but are not limited to, financial statement analysis, capital account balances, discount rates and estimated cash flows, and comparable company data.
The inputs or methodology used for valuing securities are not necessarily an indication of the risk associated with investing in those securities.
The following table provides the fair value measurement of applicable Fund assets and liabilities by level within the fair value hierarchy as of March 31, 2013. These assets are measured on a recurring basis.
| BUFFALO DISCOVERY FUND | ||||||||||||||||
| Level 1 | Level 2 | Level 3 | Total | |||||||||||||
Common Stocks | $ | 505,705,138 | $ | — | $ | — | $ | 505,705,138 | ||||||||
Short Term Investment | 8,830,653 | — | — | 8,830,653 | ||||||||||||
|
|
|
|
|
|
|
| |||||||||
Total* | $ | 514,535,791 | $ | — | $ | — | $ | 514,535,791 | ||||||||
|
|
|
|
|
|
|
| |||||||||
| BUFFALO DIVIDEND FOCUS FUND | ||||||||||||||||
| Level 1 | Level 2 | Level 3 | Total | |||||||||||||
Common Stocks | $ | 10,101,880 | $ | — | $ | — | $ | 10,101,880 | ||||||||
Short Term Investments | 3,898,334 | — | — | 3,898,334 | ||||||||||||
|
|
|
|
|
|
|
| |||||||||
Total* | $ | 14,000,214 | $ | — | $ | — | $ | 14,000,214 | ||||||||
|
|
|
|
|
|
|
| |||||||||
Written Options | (10,970 | ) | — | — | (10,970 | ) | ||||||||||
|
|
|
|
|
|
|
| |||||||||
| BUFFALO FLEXIBLE INCOME FUND | ||||||||||||||||
| Level 1 | Level 2 | Level 3 | Total | |||||||||||||
Common Stocks | $ | 455,599,794 | $ | — | $ | — | $ | 455,599,794 | ||||||||
REITS | 1,305,000 | — | — | 1,305,000 | ||||||||||||
Convertible Bonds | — | 29,970,625 | — | 29,970,625 | ||||||||||||
Corporate Bonds | — | 153,589,234 | — | 153,589,234 | ||||||||||||
Short Term Investments | 213,265,511 | — | — | 213,265,511 | ||||||||||||
|
|
|
|
|
|
|
| |||||||||
Total* | $ | 670,170,305 | $ | 183,559,859 | $ | — | $ | 853,730,164 | ||||||||
|
|
|
|
|
|
|
| |||||||||
Written Options | (392,913 | ) | — | — | (392,913 | ) | ||||||||||
|
|
|
|
|
|
|
| |||||||||
| BUFFALO GROWTH FUND | ||||||||||||||||
| Level 1 | Level 2 | Level 3 | Total | |||||||||||||
Common Stocks | $ | 487,985,964 | $ | — | $ | — | $ | 487,985,964 | ||||||||
Short Term Investment | 5,411,652 | — | — | 5,411,652 | ||||||||||||
|
|
|
|
|
|
|
| |||||||||
Total* | $ | 493,397,616 | $ | — | $ | — | $ | 493,397,616 | ||||||||
|
|
|
|
|
|
|
| |||||||||
| * | Additional information regarding the industry and/or geographical classification of these investments is disclosed in the schedule of investments. |
85
Notes to Financial Statements
March 31, 2013
(Continued)
| BUFFALO HIGH YIELD FUND | ||||||||||||||||
| Level 1 | Level 2 | Level 3 | Total | |||||||||||||
Common Stocks | $ | 8,535,469 | $ | — | $ | — | $ | 8,535,469 | ||||||||
Convertible Preferred Stocks | 4,389,695 | 2,938,125 | — | 7,327,820 | ||||||||||||
Preferred Stocks | 3,150,000 | 3,730,679 | — | 6,880,679 | ||||||||||||
Convertible Bonds | — | 27,347,164 | — | 27,347,164 | ||||||||||||
Corporate Bonds | — | 170,197,894 | — | 170,197,894 | ||||||||||||
Short Term Investments | 36,637,130 | — | — | 36,637,130 | ||||||||||||
|
|
|
|
|
|
|
| |||||||||
Total* | $ | 52,712,294 | $ | 204,213,862 | $ | — | $ | 256,926,156 | ||||||||
|
|
|
|
|
|
|
| |||||||||
| BUFFALO INTERNATIONAL FUND | ||||||||||||||||
| Level 1 | Level 2 | Level 3 | Total | |||||||||||||
Common Stocks | $ | 90,700,623 | $ | — | $ | — | $ | 90,700,623 | ||||||||
Preferred Stocks | 2,298,843 | — | — | 2,298,843 | ||||||||||||
Short Term Investment | 1,289,166 | — | — | 1,289,166 | ||||||||||||
|
|
|
|
|
|
|
| |||||||||
Total* | $ | 94,288,632 | $ | — | $ | — | $ | 94,288,632 | ||||||||
|
|
|
|
|
|
|
| |||||||||
| BUFFALO LARGE CAP FUND | ||||||||||||||||
| Level 1 | Level 2 | Level 3 | Total | |||||||||||||
Common Stocks | $ | 28,736,032 | $ | $ | $ | 28,736,032 | ||||||||||
Short Term Investment | 655,471 | — | — | 655,471 | ||||||||||||
|
|
|
|
|
|
|
| |||||||||
Total* | $ | 29,391,503 | $ | — | $ | — | $ | 29,391,503 | ||||||||
|
|
|
|
|
|
|
| |||||||||
| BUFFALO MICRO CAP FUND | ||||||||||||||||
| Level 1 | Level 2 | Level 3 | Total | |||||||||||||
Common Stocks | $ | 87,287,696 | $ | — | $ | — | $ | 87,287,696 | ||||||||
Short Term Investment | 6,515,203 | — | — | 6,515,203 | ||||||||||||
|
|
|
|
|
|
|
| |||||||||
Total* | $ | 93,802,899 | $ | — | $ | — | $ | 93,802,899 | ||||||||
|
|
|
|
|
|
|
| |||||||||
| BUFFALO MID CAP FUND | ||||||||||||||||
| Level 1 | Level 2 | Level 3 | Total | |||||||||||||
Common Stocks | $ | 613,573,011 | $ | — | $ | — | $ | 613,573,011 | ||||||||
Short Term Investment | 11,453,895 | — | — | 11,453,895 | ||||||||||||
|
|
|
|
|
|
|
| |||||||||
Total* | $ | 625,026,906 | $ | — | $ | — | $ | 625,026,906 | ||||||||
|
|
|
|
|
|
|
| |||||||||
| BUFFALO SMALL CAP FUND | ||||||||||||||||
| Level 1 | Level 2 | Level 3 | Total | |||||||||||||
Common Stocks | $ | 3,059,796,237 | $ | — | $ | — | $ | 3,059,796,237 | ||||||||
REITS | 742,300 | — | — | 742,300 | ||||||||||||
Short Term Investment | 107,579,472 | — | — | 107,579,472 | ||||||||||||
|
|
|
|
|
|
|
| |||||||||
Total* | $ | 3,168,118,009 | $ | — | $ | — | $ | 3,168,118,009 | ||||||||
|
|
|
|
|
|
|
| |||||||||
| * | Additional information regarding the industry and/or geographical classification of these investments is disclosed in the schedule of investments. |
The following is a reconciliation of the Buffalo Flexible Income Fund Level 3 assets for which significant unobservable inputs were used to determine fair value for the period ended March 31, 2013:
| FAIR VALUE MEASUREMENT USING SIGNIFICANT UNOBSERVABLE INPUTS (LEVEL 3) | INVESTMENTS IN SECURITIES PERIOD ENDED MARCH 31, 2013 | |||
Fair Value as of 3/31/2012 | $ | 5,875,247 | ||
Total unrealized gain included in earnings | (18,808 | ) | ||
Realized gain included in earnings | 14,211 | |||
Sales | (2,445,000 | ) | ||
Transfer out of Level 3* | (3,425,650 | ) | ||
|
| |||
Fair Value as of 3/31/2013 | $ | — | ||
|
| |||
The amount of total gains or losses for the period included in net increase (decrease) in net asset applicable to outstanding shares attributed to the change in unrealized gains or losses relating to assets still held at the reporting date | $ | — | ||
|
| |||
| * | The basis for recognizing and valuing transfers is as of the beginning of the period in which transfers occur. |
86
The following is a reconciliation of the Buffalo High Yield Income Fund Level 3 assets for which significant unobservable inputs were used to determine fair value for the period ended March 31, 2013:
| FAIR VALUE MEASUREMENT USING SIGNIFICANT UNOBSERVABLE INPUTS (LEVEL 3) | INVESTMENTS IN SECURITIES PERIOD ENDED MARCH 31, 2013 | |||
Fair Value as of 3/31/2012** | $ | 4,284,729 | ||
Total unrealized losses included in earnings | (5,469 | ) | ||
Sales | (2,909,000 | ) | ||
Transfer out of Level 3* | (1,370,260 | ) | ||
|
| |||
Fair Value as of 3/31/2013** | $ | — | ||
|
| |||
The amount of total gains or losses for the period included in net increase (decrease) in net asset applicable to outstanding shares attributed to the change in unrealized gains or losses relating to assets still held at the reporting date | ||||
|
| |||
| * | The basis for recognizing and valuing transfers is as of the beginning of the period in which transfers occur. |
| ** | Includes a security that was valued at $0 based on unobservable inputs as of March 31, 2013. There was no change in value in the investment(s) during the year ended March 31, 2013. |
There were no transfers into or out of Level 1, Level 2 or Level 3 fair value measurements during the reporting period for the Buffalo Discovery, Buffalo Dividend Focus Fund, Buffalo Growth Fund, Buffalo International, Buffalo Large Cap Fund, Buffalo Micro Cap Fund, Buffalo Mid Cap Fund and Buffalo Small Cap Fund. During the year, there were the following transfers between Levels 1, Level 2 and Level 3:
| MARKET VALUE TRANSFERRED BETWEEN | ||||||||
| FUND | LEVEL 1 & LEVEL 2 | LEVEL 2 & LEVEL 3 | ||||||
Buffalo Flexible Income Fund* | — | 3,425,650 | ||||||
Buffalo High Yield Fund* | — | 1,370,260 | ||||||
| * | Transfer out of Level 3 is due to one security being priced by the pricing service. The security was previously fair valued under procedures approved by the Board of Trustees. |
B. FEDERAL INCOME TAXES — Each Fund complies with the requirements of Subchapter M of the Internal Revenue Code necessary to qualify as a regulated investment company and makes the requisite distributions of income and capital gains to its shareholders sufficient to relieve it from all or substantially all federal income and excise taxes. Therefore, no federal income tax provision has been provided.
The Funds have analyzed all open tax years, as defined by the Statute of Limitations, for all major jurisdictions. Open tax years are those that are open for exam by taxing authorities. Open tax years include the tax years ended March 31, 2010 through March 31, 2013. The Funds have no examinations in progress. At March 31, 2013, the Funds did not have any tax positions that did not meet the “more likely-than-not” threshold of being sustained by the applicable tax authority. The Funds recognize interest and penalties, if any, related to unrecognized tax benefits as other expense in the Statement of Operations. During the period, the Funds did not incur any interest or penalties.
C. INVESTMENT TRANSACTIONS AND INVESTMENT INCOME — Investment transactions are accounted for on the date the securities are purchased or sold (trade date). Dividend income is recorded on the ex-dividend date except that certain dividends for foreign securities where the ex-dividend date may have passed are recorded as soon as the Fund is informed of the dividend in the exercise of reasonable diligence. Interest income is recognized on the accrual basis. Realized gains and losses from investment transactions are reported on the identified cost basis. All discounts/premiums are accreted/amortized for financial reporting purposes and are included in interest income.
D. DISTRIBUTIONS TO SHAREHOLDERS — Distributions to shareholders are recorded on the ex-dividend date. Distributions are determined in accordance with income tax regulations, which may differ from U.S. Generally Accepted Accounting Principles (GAAP). These differences are primarily due to differing treatments for premium amortization on debt securities and deferral of late year and wash sale losses.
E. USE OF ESTIMATES — The preparation of financial statements in conformity with GAAP requires management to make estimates and assumptions that affect the amounts reported in the financial statements and accompanying notes. Actual results could differ from such estimates.
F. FOREIGN CURRENCY TRANSLATION — Values of investments denominated in foreign currencies are converted into U.S. dollars using a spot market rate of exchange on the day of valuation. Purchases and sales of investments and dividend and interest income are translated to U.S. dollars using a spot market rate of exchange prevailing on the respective dates of such transactions. The portion of security gains or losses resulting from changes in foreign exchange rates is included with net realized and unrealized gain or loss from investments, as appropriate, for both financial reporting and tax purposes.
G. PURCHASED AND WRITTEN OPTION CONTRACTS — Certain of the Funds may purchase and write call or put options on securities and indices and enter into related closing transactions. As a holder of a call option, a Fund has the right, but not the obligation, to purchase a security at the exercise price during the exercise period. As the writer of a call option, a Fund has the obligation to sell the security at the exercise price during the exercise period. As a holder of a put option, a Fund has the right, but
87
Notes to Financial Statements
March 31, 2013
(Continued)
not the obligation, to sell a security at the exercise price during the exercise period. As the writer of a put option, a Fund has the obligation to buy the underlying security at the exercise price during the exercise period.
The premium that a Fund pays when purchasing a call option or receives when writing a call option will reflect, among other things, the market price of the security, the relationship of the exercise price to the market price of the security, the relationship of the exercise price to the volatility of the security, the length of the option period and supply and demand factors. The premium is the market value of an option.
A purchaser (holder) of a put option pays a non-refundable premium to the seller (writer) of a put option to obtain the right to sell a specified amount of a security at a fixed price (the exercise price) during a specified period (exercise period). Conversely, the seller (writer) of a put option, upon payment by the holder of the premium, has the obligation to buy the security from the holder of the put option at the exercise price during the exercise period.
An option that is written by a Fund is generally valued at the last sale price or, in the absence of the last sale price, the average of the quoted bid and asked prices. An option that is purchased by a Fund is generally valued at the last sale price or, in the absence of the last sale price, the average of the quoted bid and asked prices. If an options exchange closes after the time at which a Fund’s net asset value is calculated, the last sale or last bid and asked prices as of that time will be used to calculate the net asset value. The Funds may use options to generate income and to hedge against losses caused by declines in the prices of stocks in its portfolio or for any other permissible purpose consistent with the Funds’ investment objectives. A risk of using derivatives is that the counterparty to a derivative may fail to comply with their obligation to the Funds. See Note 8 for written option activity.
H. INDEMNIFICATIONS — Under the Funds’ organizational documents, officers and trustees are indemnified against certain liabilities arising out of the performance of their duties to the Funds. In addition, in the normal course of business, the Funds enter into contracts that provide general indemnification to other parties. The Funds’ maximum exposure under these arrangements is unknown as this would involve future claims that may be made against the Funds that have not yet occurred, and may not occur. However, the Funds have not had prior claims or losses pursuant to these contracts and expect the risk of loss to be remote.
2. FEDERAL TAX MATTERS:
The tax character of distributions paid during the year ended March 31, 2013 and the year ended March 31, 2012 was as follows:
| YEAR ENDED MARCH 31, 2013 | YEAR ENDED MARCH 31, 2012 | |||||||||||||||||||
| ORDINARY INCOME | LONG-TERM CAPITAL GAINS* | ORDINARY INCOME | RETURN OF CAPITAL | LONG-TERM CAPITAL GAINS* | ||||||||||||||||
Buffalo Discovery Fund | 849,449 | 31,647,443 | 2,035,668 | — | 19,711,973 | |||||||||||||||
Buffalo Dividend Focus Fund | 19,350 | — | — | — | — | |||||||||||||||
Buffalo Flexible Income Fund | 19,534,086 | 110,036 | 7,871,498 | — | — | |||||||||||||||
Buffalo Growth Fund | 2,159,726 | — | 1,721,915 | — | 6,284,742 | |||||||||||||||
Buffalo High Yield Fund | 14,510,847 | 205,850 | 14,274,625 | — | — | |||||||||||||||
Buffalo International Fund | 322,407 | — | 344,354 | — | — | |||||||||||||||
Buffalo Large Cap Fund | 205,803 | 1,976,302 | 62,922 | — | 201,892 | |||||||||||||||
Buffalo Micro Cap Fund | — | — | — | — | — | |||||||||||||||
Buffalo Mid Cap Fund | 439,181 | 27,762,861 | — | — | 13,548,232 | |||||||||||||||
Buffalo Small Cap Fund | 25,955,358 | 142,218,292 | — | 648 | 5,877,964 | |||||||||||||||
| * | The Funds designate as long-term capital gain dividends, pursuant to Internal Revenue Code Section 852(b)(3)(C), the amounts necessary to reduce the earnings and profits of the Funds related to net capital gain to zero. |
Total distributions paid differ from the Statements of Changes in Net Assets due primarily to the recharacterization of short-term capital gain distributions to ordinary distributions for tax purposes.
Additionally, U.S. Generally Accepted Accounting Principles require that certain components of net assets relating to permanent differences be reclassified between financial and tax reporting. These reclassifications have no effect on net assets or net asset value per share. For the year ended March 31, 2013, the following table shows the reclassifications made:
| UNDISTRIBUTED NET INVESTMENT INCOME/(LOSS) | ACCUMULATED NET REALIZED GAIN/(LOSS) | PAID IN CAPITAL | ||||||||||
Buffalo Discovery Fund | $ | 324,988 | $ | (324,988 | ) | $ | — | |||||
Buffalo Dividend Focus Fund | — | — | — | |||||||||
Buffalo Flexible Income Fund | 2,170,237 | (2,169,875 | ) | (362 | ) | |||||||
Buffalo Growth Fund | — | — | — | |||||||||
Buffalo High Yield Fund | 349,616 | (349,616 | ) | — | ||||||||
Buffalo International Fund | (67,546 | ) | (4,673,558 | ) | 4,741,104 | |||||||
Buffalo Large Cap Fund | 45,615 | (45,615 | ) | — | ||||||||
Buffalo Micro Cap Fund | 250,417 | — | (250,417 | ) | ||||||||
Buffalo Mid Cap Fund | 22,360 | (22,360 | ) | — | ||||||||
Buffalo Small Cap Fund | 8,614,139 | (8,614,139 | ) | — | ||||||||
The permanent differences primarily relate to foreign currency adjustments, sale on discount bonds/CPDIs, net operating losses.
88
As of March 31, 2013, the components of accumulated earnings (losses) for income tax purposes were as follows:
| BUFFALO DISCOVERY FUND | BUFFALO DIVIDEND FOCUS FUND | BUFFALO FLEXIBLE INCOME FUND | BUFFALO GROWTH FUND | BUFFALO HIGH YIELD | ||||||||||||||||
Tax cost of Investments(a) | $ | 416,004,232 | $ | 13,423,217 | $ | 756,150,502 | $ | 405,991,183 | $ | 235,144,667 | ||||||||||
|
|
|
|
|
|
|
|
|
| |||||||||||
Unrealized Appreciation | 115,612,217 | 745,552 | 106,598,826 | 97,813,603 | 23,674,655 | |||||||||||||||
Unrealized Depreciation | (17,080,658 | ) | (168,555 | ) | (9,019,164 | ) | (10,407,170 | ) | (1,893,166 | ) | ||||||||||
|
|
|
|
|
|
|
|
|
| |||||||||||
Net unrealized appreciation | 98,531,559 | 576,997 | 97,579,662 | 87,406,433 | 21,781,489 | |||||||||||||||
|
|
|
|
|
|
|
|
|
| |||||||||||
Undistributed Ordinary Income | — | 61,827 | — | 1,520,070 | 456,113 | |||||||||||||||
Undistributed Long Term Capital Gain | 6,811,245 | — | 1,703,025 | 7,766,934 | 248,522 | |||||||||||||||
|
|
|
|
|
|
|
|
|
| |||||||||||
Distributable earnings | 6,811,245 | 61,827 | 1,703,025 | 9,287,004 | 704,635 | |||||||||||||||
|
|
|
|
|
|
|
|
|
| |||||||||||
Other accumulated gain/(loss) | (236,044 | ) | 4,282 | (184,885 | ) | — | — | |||||||||||||
|
|
|
|
|
|
|
|
|
| |||||||||||
Total accumulated gain/(loss) | 105,106,760 | 643,106 | 99,097,802 | 96,693,437 | 22,486,124 | |||||||||||||||
|
|
|
|
|
|
|
|
|
| |||||||||||
| BUFFALO INTERNATIONAL FUND | BUFFALO LARGE CAP FUND | BUFFALO MICRO CAP FUND | BUFFALO MID CAP FUND | BUFFALO SMALL CAP FUND | ||||||||||||||||
Tax cost of Investments(a) | $ | 79,456,871 | $ | 22,168,349 | $ | 71,836,329 | $ | 471,712,219 | $ | 2,173,471,514 | ||||||||||
|
|
|
|
|
|
|
|
|
| |||||||||||
Unrealized Appreciation | 18,863,036 | 7,786,457 | 24,570,341 | 163,191,695 | 1,104,403,974 | |||||||||||||||
Unrealized Depreciation | (4,031,275 | ) | (563,303 | ) | (2,603,771 | ) | (9,877,008 | ) | (109,757,479 | ) | ||||||||||
|
|
|
|
|
|
|
|
|
| |||||||||||
Net unrealized appreciation | 14,831,761 | 7,223,154 | 21,966,570 | 153,314,687 | 994,646,495 | |||||||||||||||
|
|
|
|
|
|
|
|
|
| |||||||||||
Undistributed Ordinary Income | — | 101,488 | — | — | 5,368,830 | |||||||||||||||
Undistributed Long Term Capital Gain | — | 2,127,285 | — | 18,937,654 | 151,509,883 | |||||||||||||||
|
|
|
|
|
|
|
|
|
| |||||||||||
Distributable earnings | — | 2,228,773 | — | 18,937,654 | 156,878,713 | |||||||||||||||
|
|
|
|
|
|
|
|
|
| |||||||||||
Other accumulated gain/(loss) | (10,139,562 | ) | (28,267 | ) | (2,441,794 | ) | (650,311 | ) | — | |||||||||||
|
|
|
|
|
|
|
|
|
| |||||||||||
Total accumulated gain/(loss) | 4,692,199 | 9,423,660 | 19,524,776 | 171,602,030 | 1,151,525,208 | |||||||||||||||
|
|
|
|
|
|
|
|
|
| |||||||||||
The differences between book-basis and tax-basis unrealized appreciation are attributable primarily to the tax deferral of losses on wash sales, premium amortization, Trust Preferred Instrument & Contingent Payment Debt Instrument adjustments and publicly traded partnership investments.
| (a) | Represents cost for federal income tax purposes and may differ from the cost for financial reporting purposes. |
The following Funds utilized the amounts below of prior year capital loss carryover in the current year.
Buffalo Flexible Income Fund | 2,093,529 | |||
Buffalo Growth Fund | 1,921,701 | |||
Buffalo High Yield Fund | 771,095 | |||
Buffalo International Fund | 1,655,707 | |||
Buffalo Micro Cap Fund | 2,558,114 | |||
Buffalo Small Cap Fund | 57,756,104 |
The Buffalo International Fund had capital loss carryover of $6,571,806 expire in the current year.
As of March 31, 2013, the accumulated net realized loss on sales of investments and losses deferred for federal income tax purposes which are available to offset future taxable gains are as follows:
| BUFFALO INTERNATIONAL FUND | ||||||||||||
| MONTH/ YEAR REALIZED | MONTH/ YEAR EXPIRING | ST | LT | |||||||||
| March-09 | March-17 | 3,501,293 | N/A | |||||||||
| March-10 | March-18 | 3,819,804 | N/A | |||||||||
| March-13 | Unlimited | 2,716,450 | 36,063 | |||||||||
|
|
|
| |||||||||
| Totals | 10,037,547 | 36,063 | ||||||||||
|
|
|
| |||||||||
| BUFFALO MICRO CAP FUND | ||||||||||||
| MONTH/ YEAR REALIZED | MONTH/ YEAR EXPIRING | ST | LT | |||||||||
| March-10 | March-18 | 2,191,739 | N/A | |||||||||
|
|
|
| |||||||||
| Totals | 2,191,739 | — | ||||||||||
|
|
|
| |||||||||
RIC Modernization Act — On December 22, 2010, the Regulated Investment Company Modernization Act of 2010 (the “Act”) was enacted, which changed various technical rules governing the tax treatment of regulated investment companies. The changes
89
Notes to Financial Statements
March 31, 2013
(Continued)
are generally effective for taxable years beginning after the date of enactment. One of the more prominent changes addresses capital loss carryforwards. Under the Act, each Fund will be permitted to carry forward losses incurred in taxable years beginning after the date of enactment for an unlimited period. However, any losses incurred during those future years will be required to be utilized prior to the losses incurred in pre-enactment years, which carry an expiration date. As a result of this ordering rule, pre-enactment capital loss carryforwards may be more likely to expire unused. Additionally, post-enactment capital loss carryforward will retain their characteristics as either short-term or long-term capital losses rather than being considered all short-term as permitted under previous regulations.
At March 31, 2013, the following Funds deferred, on a tax basis, qualified late year losses, consisting of ordinary late year losses and post-October capital losses, as follows:
| LATE YEAR ORDINARY LOSSES | POST OCTOBER CAPITAL LOSSES | |||||||
Buffalo Discovery Fund | $ | 236,044 | $ | — | ||||
Buffalo International Fund | $ | 49,449 | $ | — | ||||
Buffalo Micro Cap Fund | $ | 250,055 | $ | — | ||||
Buffalo Mid Cap Fund | $ | 650,311 | $ | — | ||||
For the year ended March 31, 2013, the Buffalo International Fund earned foreign source income and paid foreign taxes which they intend to pass through to their shareholders pursuant to Section 853 of the Internal Revenue Code as follows:
| BUFFALO INTERNATIONAL FUND | ||||||||
| COUNTRY | GROSS DIVIDEND PER SHARE | TAXES WITHHELD PER SHARE | ||||||
Bermuda | $ | 51,655 | $ | — | ||||
Brazil | 134,259 | 3,533 | ||||||
Canada | 11,674 | 1,751 | ||||||
Switzerland | 112,859 | 10,877 | ||||||
Chile | 34,236 | 11,437 | ||||||
Germany | 197,372 | 29,606 | ||||||
Spain | 35,562 | 5,334 | ||||||
France | 204,119 | 30,468 | ||||||
Hong Kong | 20,963 | 1,503 | ||||||
Israel | 16,825 | 3,197 | ||||||
India | 7,008 | — | ||||||
Italy | 3,589 | 538 | ||||||
Jersey | 15,114 | — | ||||||
Japan | 25,790 | 1,811 | ||||||
Cayman Islands | 43,594 | — | ||||||
Luxembourg | 64,260 | 9,639 | ||||||
Mexico | 12,560 | — | ||||||
Netherlands | 55,210 | 8,281 | ||||||
Norway | 13,188 | 1,978 | ||||||
Sweden | 25,098 | 3,765 | ||||||
Taiwan | 41,918 | 8,385 | ||||||
|
|
|
| |||||
Total | $ | 1,126,853 | $ | 132,103 | ||||
3. RELATED PARTY TRANSACTIONS:
Management fees are paid to Kornitzer Capital Management, Inc. (“KCM”) at the rate of 1.00% per annum of the average daily net asset values of the Funds, except for the Buffalo Micro Cap Fund, Buffalo Dividend Focus Fund, Buffalo Growth Fund and Buffalo Large Cap Fund which have a management fee rate of 1.45%, 0.90%, 0.90% and 0.90%, respectively. The management fees are for services which include the costs of all management, supervisory and administrative services required in the normal operation of the Funds. This includes investment management and supervision; fees of the custodian (except for the additional cost of maintaining custody of assets in foreign jurisdictions, when compared to domestic custody costs), independent registered public accounting firm and legal counsel; fees and expenses of officers, trustees and other personnel; rent; shareholder services; and other items incidental to corporate administration. Pursuant to a Master Services Agreement with U.S. Bancorp Fund Services, LLC (“U.S. Bancorp”), KCM pays U.S. Bancorp a fee of 30/100 of 1% (0.30%) of each Fund’s average daily net assets out of the fees KCM receives from the Funds, except for the Buffalo Growth Fund and the Buffalo Large Cap Fund, where U.S. Bancorp receives 25/100 of 1% (0.25%). U.S. Bancorp provides or obtains various operational services required by the Funds, pays various Fund expenses and acts as paying agent to compensate other Fund service providers. Some of the other Fund service providers are affiliates of U.S. Bancorp.
The management fees do not include the cost of acquiring and disposing of portfolio securities, taxes, if any, imposed directly on the Funds and their shares, insurance, certain trustee expenses and the cost of qualifying the Funds’ shares for sale in any jurisdiction. Certain officers and a trustee of the Funds are also officers and/or directors of KCM.
A trustee of the Funds is affiliated with U.S. Bancorp and U.S. Bank, N.A., which provide accounting, administration, transfer agency and custodian services to the Funds, as described above.
90
4. AGGREGATE COMPENSATION TO TRUSTEES:
The Funds do not directly compensate any of their trustees. U.S. Bancorp pays trustee fees to non-interested Board members from its share of the management fee that it receives from KCM. The aggregate compensation paid to the Funds’ non-interested trustees for their service on the Funds’ Boards for the year ended March 31, 2013 was $98,500. Interested trustees who are affiliated with either KCM or the Funds’ service providers do not receive any compensation from the Funds, but are compensated directly by the advisor or service provider in connection with their employment with those entities.
5. REDEMPTION FEE:
Shares of the Buffalo Flexible Income Fund, Buffalo International Fund, Buffalo Dividend Focus Fund, Buffalo Large Cap Fund, Buffalo Mid Cap Fund, Buffalo Discovery Fund and Buffalo Growth Fund sold or exchanged within 60 days of their purchase and shares of the Buffalo High Yield Fund, Buffalo Micro Cap Fund and Buffalo Small Cap Fund sold or exchanged within 180 days of their purchase are subject to a redemption fee of 2.00% of the value of the shares sold or exchanged. The Funds will employ the “first in, first out” method to calculate the 60-day or 180-day holding period. The redemption fee is retained by the Funds and will help pay transaction and tax costs that long-term investors may bear when the Funds realize capital gains as a result of selling securities to meet investor redemptions.
6. INVESTMENT TRANSACTIONS:
The aggregate purchases and sales of securities, excluding short-term investments and U.S. government securities, for the Funds for the year ended March 31, 2013, were as follows:
| BUFFALO DISCOVERY FUND | BUFFALO DIVIDEND FOCUS FUND | BUFFALO FLEXIBLE INCOME FUND | BUFFALO GROWTH FUND | BUFFALO HIGH YIELD FUND | ||||||||||||||||
Purchases | $ | 297,443,357 | $ | 10,033,490 | $ | 381,317,495 | $ | 210,353,073 | $ | 71,025,553 | ||||||||||
Proceeds from Sales | $ | 225,336,597 | $ | 562,714 | $ | 116,165,227 | $ | 233,102,383 | $ | 88,521,206 | ||||||||||
| BUFFALO INTERNATIONAL FUND | BUFFALO LARGE CAP FUND | BUFFALO MICRO CAP FUND | BUFFALO MID CAP FUND | BUFFALO SMALL CAP FUND | ||||||||||||||||
Purchases | $ | 37,063,816 | $ | 14,592,810 | $ | 49,825,855 | $ | 194,434,169 | $ | 1,047,751,610 | ||||||||||
Proceeds from Sales | $ | 16,185,586 | $ | 24,980,879 | $ | 11,787,424 | $ | 304,005,128 | $ | 911,049,747 | ||||||||||
There were no purchases or sales of long-term U.S. government securities for any Funds during the year ended March 31, 2013.
7. TRANSACTIONS WITH AFFILIATES:*
Investments representing 5% or more of the outstanding voting securities of a portfolio company result in that company being considered an affiliated company, as defined in the 1940 Act. The aggregate fair value of all securities of affiliated companies held in the Buffalo Small Cap Fund as of March 31, 2013 amounted to $358,542,477, representing 11.40% of net assets. There were no affiliates companies held in any other Funds. A summary of affiliated transactions from each company which is an affiliate at March 31, 2013 or was an affiliate during the year ended March 31, 2013 is as follows:
| ADTRAN, INC. | ALIGN TECHNOLOGY, INC. | CAPELLA EDUCATION CO.(1) | THE CORPORATE EXECUTIVE BOARD CO. | DEALERTRACK HOLDINGS INC. | DICE HOLDINGS INC. | INTERNAP NETWORK SERVICES CORP. | ||||||||||||||||||||||||
March 31, 2012 Balance | ||||||||||||||||||||||||||||||
Shares | — | 4,294,425 | — | 2,393,210 | 2,787,050 | 3,299,725 | 3,130,500 | |||||||||||||||||||||||
Cost | $ | — | $ | 46,006,128 | $ | — | $ | 45,498,413 | $ | 45,590,662 | $ | 38,056,552 | $ | 45,426,094 | ||||||||||||||||
Gross Additions | ||||||||||||||||||||||||||||||
Shares | 1,715,808 | 555,000 | — | — | — | — | 267,950 | |||||||||||||||||||||||
Cost | $ | 31,677,384 | $ | 15,296,460 | $ | — | $ | — | $ | — | $ | — | $ | 1,901,311 | ||||||||||||||||
Gross Deductions | ||||||||||||||||||||||||||||||
Shares | — | 761,525 | 40,600 | 724,410 | 296,700 | — | — | |||||||||||||||||||||||
Cost | $ | — | $ | 10,856,152 | $ | 2,450,144 | $ | 16,225,934 | $ | 5,480,494 | $ | — | $ | — | ||||||||||||||||
March 31, 2013 Balance | ||||||||||||||||||||||||||||||
Shares | 4,855,908 | — | — | — | 2,490,350 | 3,299,725 | 3,398,450 | |||||||||||||||||||||||
Cost | $ | 101,810,587 | $ | — | $ | — | $ | — | $ | 40,110,168 | $ | 38,056,552 | $ | 47,327,405 | ||||||||||||||||
|
|
|
|
|
|
|
|
|
|
|
|
|
| |||||||||||||||||
Realized gain (loss) | $ | — | $ | 12,650,073 | $ | (1,162,205 | ) | $ | 20,368,277 | $ | 3,662,945 | $ | — | $ | — | |||||||||||||||
|
|
|
|
|
|
|
|
|
|
|
|
|
| |||||||||||||||||
Investment income | $ | 890,128 | $ | — | $ | — | $ | 1,125,894 | $ | — | $ | — | $ | — | ||||||||||||||||
|
|
|
|
|
|
|
|
|
|
|
|
|
| |||||||||||||||||
91
Notes to Financial Statements
March 31, 2013
(Continued)
| LOGMEIN, INC. | OPNET TECHNOLOGIES, INC.(2) | OXFORD INDUSTRIES, INC. | P.F. CHANG’S CHINA BISTRO, INC. | REALD INC.(1) | STRATASYS LTD.(3) | WMS INDUSTRIES, INC. | TOTAL | |||||||||||||||||||||||||
March 31, 2012 Balance | ||||||||||||||||||||||||||||||||
Shares | — | — | 955,825 | 1,918,000 | — | 1,323,750 | 3,304,525 | — | ||||||||||||||||||||||||
Cost | $ | — | $ | — | $ | 24,297,815 | $ | 63,948,120 | $ | — | $ | 38,322,219 | $ | 60,742,586 | $ | 407,888,589 | ||||||||||||||||
Gross Additions | ||||||||||||||||||||||||||||||||
Shares | 662,000 | 277,500 | 84,150 | — | — | — | — | — | ||||||||||||||||||||||||
Cost | $ | 16,588,927 | $ | 7,172,266 | $ | 3,877,246 | $ | — | $ | — | $ | — | $ | — | $ | 76,513,594 | ||||||||||||||||
Gross Deductions | ||||||||||||||||||||||||||||||||
Shares | — | 3,000 | — | 678,950 | — | 26,100 | 550,475 | — | ||||||||||||||||||||||||
Cost | $ | — | $ | 108,072 | $ | — | $ | 26,054,992 | $ | — | $ | 913,046 | $ | 19,782,828 | $ | 81,871,662 | ||||||||||||||||
March 31, 2013 Balance | ||||||||||||||||||||||||||||||||
Shares | 1,893,450 | — | 1,039,975 | — | 2,549,300 | — | — | — | ||||||||||||||||||||||||
Cost | $ | 56,650,303 | $ | — | $ | 28,175,061 | $ | — | $ | 40,070,877 | $ | — | $ | — | $ | 352,200,953 | ||||||||||||||||
|
|
|
|
|
|
|
|
|
|
|
|
|
|
|
| |||||||||||||||||
Realized gain (loss) | $ | — | $ | 17,756 | $ | — | $ | 8,797,061 | $ | — | $ | 962,578 | $ | (8,846,894 | ) | $ | 36,449,591 | |||||||||||||||
|
|
|
|
|
|
|
|
|
|
|
|
|
|
|
| |||||||||||||||||
Investment income | $ | — | $ | 417,188 | $ | 591,060 | $ | 370,796 | $ | — | $ | — | $ | — | $ | 3,395,066 | ||||||||||||||||
|
|
|
|
|
|
|
|
|
|
|
|
|
|
|
| |||||||||||||||||
| * | As a result of the Buffalo Small Cap Fund’s beneficial ownership of common stock of these companies, regulators require that the Fund state that it may be deemed an affiliate of the respective issuer. The Fund disclaims that the “affiliated persons” are affiliates of the Distributors, Advisor, Funds or any other client of the Advisor. |
| (1) | Security became an affiliate due to decrease in the outstanding shares of the issuing company |
| (2) | Security no longer an affiliate due to an increase in the outstanding shares of issuing company |
| (3) | Security no longer an affiliate due to the dilution of its outstanding share through a merger with Objet Ltd. to form a new company, Stratasys Ltd., which the Fund now holds. |
Note: Schedule may not roll forward, as the schedule only reflects activity during the time the Fund was deemed an affiliate (held more than 5% of a Stock’s outstanding securities).
8. OPTIONS WRITTEN:
FASB ASC 815, Derivatives and Hedging (ASC 815) is intended to improve financial reporting about derivative instruments by requiring enhanced disclosures to enable investors to better understand how and why the Funds use derivative instruments, how these derivative instruments are accounted for and their effects on the Funds’ financial position and results of operations. The Buffalo Dividend Focus Fund and the Buffalo Flexible Income Fund are the only Funds that have maintained any positions in derivative instruments or engaged in hedging activities during the year ended March 31, 2013.
For additional information regarding derivative instruments and hedging activities of the Buffalo Dividend Focus Fund and Buffalo Flexible Income Fund please refer to Note 1.G to understand how and why the Buffalo Flexible Income Fund uses derivatives.
The number of option contracts written and the premiums received by the Buffalo Dividend Focus Fund and Buffalo Flexible Income Fund during the year ended March 31, 2013 were as follows:
| BUFFALO DIVIDEND FOCUS FUND | ||||||||
| CALL OPTIONS WRITTEN | ||||||||
| CONTRACTS | PREMIUMS | |||||||
Options written | 112 | $ | 15,252 | |||||
Options terminated in closing transaction | — | — | ||||||
Options exercised | — | — | ||||||
Options expired | — | — | ||||||
|
|
|
| |||||
Outstanding, March 31, 2013 | 112 | $ | 15,252 | |||||
|
|
|
| |||||
| BUFFALO FLEXIBLE INCOME FUND | ||||||||
| CALL OPTIONS WRITTEN | ||||||||
| CONTRACTS | PREMIUMS | |||||||
Outstanding, March 31, 2012 | 3,526 | $ | 209,626 | |||||
Options written | 25,702 | 1,139,229 | ||||||
Options terminated in closing transaction | (500 | ) | (44,890 | ) | ||||
Options exercised | (9,369 | ) | (319,350 | ) | ||||
Options expired | (15,176 | ) | (761,955 | ) | ||||
|
|
|
| |||||
Outstanding, March 31, 2013 | 4,183 | $ | 222,660 | |||||
|
|
|
| |||||
92
The following is a summary of the location of derivative investments on the Buffalo Dividend Focus Fund and Buffalo Flexible Income Fund’s Statement of Assets and Liabilities as of March 31, 2013:
| DERIVATIVE INVESTMENT TYPE | VALUE | |
Liability Derivatives | ||
Buffalo Dividend Focus Fund | $ 10,970 | |
Buffalo Flexible Income Fund | $ 392,913 |
The following is a summary of the effect of derivative investments on Realized Gain (loss) and Change in Unrealized Appreciation/Depreciation on Options in the Funds as of March 31, 2013:
| DERIVATIVE INVESTMENT TYPE | REALIZED GAIN (LOSS) ON OPTIONS | |
Liability Derivatives | ||
Buffalo Dividend Focus Fund | $ — | |
Buffalo Flexible Income Fund | $ 753,430 |
| DERIVATIVE INVESTMENT TYPE | CHANGE IN UNREALIZED APPRECIATION/DEPRECIATION ON OPTIONS | |
Liability Derivatives | ||
Buffalo Dividend Focus Fund | $ 4,282 | |
Buffalo Flexible Income Fund | $ (209,174) |
9. FOREIGN INVESTMENT RISK:
When the Buffalo International Fund buys or sells securities on a foreign stock exchange, the transaction is undertaken in the local currency rather than in U.S. dollars. In purchasing or selling local currency to execute transactions on foreign exchanges, the Buffalo International Fund will be exposed to the risk that the value of the foreign currency will increase or decrease, which may impact the value of the portfolio holdings and your investment. China has, and may continue to adopt, internal economic policies that affect its currency valuations in a manner that may be disadvantageous for U.S. investors or U.S. companies seeking to do business in China. In addition, a country may impose formal or informal currency exchange controls (or “capital controls”). These types of controls may restrict or prohibit the Buffalo International Fund’s ability to repatriate both investment capital and income, which could undermine the value of the portfolio holdings and potentially place the Buffalo International Fund’s assets at risk of total loss.
Investing in securities of foreign corporations and governments involves additional risks relating to: political, social, religious and economic developments abroad; market instability; fluctuations in foreign exchange rates; different regulatory requirements, market practices, accounting standards and practices; and less publicly available information about foreign issuers. Additionally, these investments may be less liquid, carry higher brokerage commissions and other fees, and procedures and regulations governing transactions and custody in foreign markets also may involve delays in payment, delivery or recovery of money or investments. Investments in common stocks of U.S. companies with international operations, and the purchase of sponsored or unsponsored ADRs (American Depositary Receipt) carry similar risks. In addition to risks associated with investing in foreign securities, there are special risks associated with investments in China and Hong Kong, including exposure to currency fluctuations, less liquidity, expropriation, confiscatory taxation, nationalization, exchange control regulations, differing legal standards and rapid fluctuations in inflation and interest rates. The Chinese government could, at any time, alter or discontinue economic reform programs implemented since 1978.
10. FUND REORGANIZATION:
Reorganization of the Buffalo China Fund into the Buffalo International Fund: At a meeting held on November 16, 2012, the Board of Trustees of the Buffalo Funds approved a Form of Agreement and Plan of Reorganization (“Reorganization Agreement”) that provided for the reorganization of a series of the Fund, Buffalo China Fund (“Target Fund”), into another series of the Fund, Buffalo International Fund (“Acquiring Fund”) (the “Reorganization”). The reorganization did not require shareholder approval by the shareholders of the Target Fund or Acquiring Fund.
Pursuant to the Reorganization Agreement, on January 25, 2013 (merger date), each holder of the Target Fund became the owner of full and fractional shares of the Acquiring Fund having an equal aggregate value.
The merger was accomplished by tax free exchange as detailed below:
Net assets of Target Fund on Merger Date | Net assets of before merger | Net assets of Acquiring Fund immediately after merger | Target Fund shares exchanged | Acquiring Fund the Target Fund’s | ||||
$ 22,978,843 | $82,828,215 | $105,807,058 | 2,915,254 | 2,230,956 |
93
Notes to Financial Statements
March 31, 2013
(Continued)
The Target Fund had the following undistributed income, unrealized appreciation, accumulated net realized losses and capital stock as of January 25, 2013, (amounts are presented in accordance with GAAP).
| Undistributed Income | Unrealized Appreciation (Depreciation) | Accumulated Net Realized Gains (Losses) | Capital Stock | Total | ||||
$ — | $2,073,573 | $(11,321,509) | $32,226,779 | $22,978,843 |
Because the combined investment portfolios have been managed as a single integrated portfolio since the acquisition was completed, it is not practical to separate the amounts of revenue and earnings of the Target Fund that have been included in the Acquiring Fund’s statement of operations since January 25, 2013.
The Target Fund had capital loss carryforwards, which were combined with those of the Acquiring Fund and Subject to IRS regulations, the Acquiring Fund may use short-term capital loss carryforwards of $11,318,514 from the Target Fund.
11. SUBSEQUENT EVENTS:
Management has evaluated the events and transactions that have occurred after March 31, 2013 and through the date the financial statements were issued. Effective May 23, 2013, Mr. Grant P. Sarris, a Trustee of the Buffalo Funds has resigned as a Trustee of the Funds. Effective May 31, 2013, Mr. Sarris, a portfolio manager of the Buffalo Funds will resign from the Advisor and as a portfolio manager. On January 15, 2013 the Board of Trustees approved a change in the name of the Buffalo Micro Cap Fund to the Buffalo Emerging Opportunities Fund, and related changes to the Fund’s principal investment strategies, to be effective June 3, 2013.
This report has been prepared for the information of the shareholders of the Funds, and is not to be construed as an offering of the shares of the Funds. Shares of the Funds are offered only by the Prospectus, a copy of which may be obtained from Buffalo Funds c/o U.S. Bancorp Fund Services, LLC, 1-800-49-BUFFALO or at www.buffalofunds.com.
94
Report of Independent Registered Public Accounting Firm
The Board of Trustees and Shareholders of
Buffalo Funds:
We have audited the accompanying statement of assets and liabilities of Buffalo Funds (comprised of Buffalo Discovery Fund, Buffalo Dividend Focus Fund, Buffalo Flexible Income Fund, Buffalo Growth Fund, Buffalo High Yield Fund, Buffalo International Fund, Buffalo Large Cap Fund, Buffalo Micro Cap Fund, Buffalo Mid Cap Fund and Buffalo Small Cap Fund) (collectively referred to herein as “the Funds”) including the schedule of investments, as of March, 31, 2013, and the related statements of operations, the statements of changes in net assets, and the financial highlights for each period indicated therein. These financial statements and financial highlights are the responsibility of the Funds’ management. Our responsibility is to express an opinion on these financial statements and financial highlights based on our audits.
We conducted our audits in accordance with the standards of the Public Company Accounting Oversight Board (United States). Those standards require that we plan and perform the audit to obtain reasonable assurance about whether the financial statements and financial highlights are free of material misstatement. We were not engaged to perform an audit of the Funds’ internal control over financial reporting. Our audits included consideration of internal control over financial reporting as a basis for designing audit procedures that are appropriate in the circumstances, but not for the purpose of
expressing an opinion on the effectiveness of the Funds’ internal control over financial reporting. Accordingly, we express no such opinion. An audit also includes examining, on a test basis, evidence supporting the amounts and disclosures in the financial statements and financial highlights, assessing the accounting principles used and significant estimates made by management, and evaluating the overall financial statement presentation. Our procedures included confirmation of securities owned as of March 31, 2013, by correspondence with the custodian, transfer agent, and brokers or by other appropriate auditing procedures where replies from brokers were not received. We believe that our audits provide a reasonable basis for our opinion.
In our opinion, the financial statements and financial highlights referred to above present fairly, in all material respects, the financial position of Buffalo Funds at March 31, 2013, the results of its operations, the changes in its net assets, and the financial highlights for each of the periods indicated therein, in conformity with U.S. generally accepted accounting principles.

Kansas City, Missouri
May 30, 2013
95
Notice to Shareholders
March 31, 2013
TAX INFORMATION
For the fiscal year ended March 31, 2013, certain dividends paid by the Funds may be subject to a maximum tax rate of 15%, as provided for by the Jobs and Growth Tax Relief Reconciliation Act of 2003. The percentage of dividends declared from ordinary income designated as qualified dividend income was as follows (unaudited):
Buffalo Discovery Fund | 100.00% | |||
Buffalo Dividend Focus Fund | 100.00% | |||
Buffalo Flexible Income Fund | 52.92% | |||
Buffalo Growth Fund | 85.60% | |||
Buffalo High Yield Fund | 7.63% |
Buffalo International Fund | 100.00% | |||
Buffalo Large Cap Fund | 100.00% | |||
Buffalo Micro Cap Fund | 0.00% | |||
Buffalo Mid Cap Fund | 100.00% | |||
Buffalo Small Cap Fund | 62.29% |
For corporate shareholders, the percent of ordinary income distributions qualifying for the corporate dividends received deduction for the fiscal year ended March 31, 2013 was as follows (unaudited):
Buffalo Discovery Fund | 100.00% | |||
Buffalo Dividend Focus Fund | 100.00% | |||
Buffalo Flexible Income Fund | 46.82% | |||
Buffalo Growth Fund | 84.47% | |||
Buffalo High Yield Fund | 6.08% |
Buffalo International Fund | 0.00% | |||
Buffalo Large Cap Fund | 100.00% | |||
Buffalo Micro Cap Fund | 0.00% | |||
Buffalo Mid Cap Fund | 100.00% | |||
Buffalo Small Cap Fund | 62.29% |
FOREIGN SHAREHOLDERS: The percentage of ordinary income distributions that are designated as interest-related dividends under Internal Revenue Code Section 871(k)(1)(C) for the year ended March 31, 2013 was as follows (unaudited):
Buffalo Discovery Fund | 0.03% | |||
Buffalo Dividend Focus Fund | 0.00% | |||
Buffalo Flexible Income Fund | 49.76% | |||
Buffalo Growth Fund | 0.00% | |||
Buffalo High Yield Fund | 91.00% |
Buffalo International Fund | 0.00% | |||
Buffalo Large Cap Fund | 0.00% | |||
Buffalo Micro Cap Fund | 0.00% | |||
Buffalo Mid Cap Fund | 0.00% | |||
Buffalo Small Cap Fund | 0.02% |
FOREIGN SHAREHOLDERS: The percentage of taxable ordinary income distributions that are designated as short-term capital gain distributions under Internal Revenue Section 871(k)(2)(C) for the year ended March 31, 2013 was as follows (unaudited).
Buffalo Discovery Fund | 38.26% | |||
Buffalo Dividend Focus Fund | 0.00% | |||
Buffalo Flexible Income Fund | 11.00% | |||
Buffalo Growth Fund | 0.00% | |||
Buffalo High Yield Fund | 0.00% |
Buffalo International Fund | 0.00% | |||
Buffalo Large Cap Fund | 0.00% | |||
Buffalo Micro Cap Fund | 0.00% | |||
Buffalo Mid Cap Fund | 0.00% | |||
Buffalo Small Cap Fund | 100.00% |
96
Trustees and Officers of the Funds (unaudited)
The management and affairs for the Funds are supervised by the Trustees (“Trustees”) under the laws of the particular Fund’s state of organization. The Trustees and executive officers of the Funds and their principal occupations for the last five years are set forth below. Each may have held other positions with the named companies during that period. The Funds’ Statement of Additional Information includes additional information about the Trustees and is available without charge, upon request, by calling the Funds toll-free at 1-800-49-BUFFALO.
| NAME, AGE AND ADDRESS | POSITION(S) HELD WITH FUNDS | TERM OF OFFICE AND LENGTH OF TIME SERVED | PRINCIPAL OCCUPATION(S) DURING PAST 5 YEARS | NUMBER OF FUNDS IN COMPLEX OVERSEEN BY DIRECTOR | OTHER DIRECTORSHIPS HELD BY DIRECTOR | |||||
| INTERESTED TRUSTEES(1) | ||||||||||
Joseph C. Neuberger (51) 615 E. Michigan Streets Milwaukee, WI 53202 | Trustee
Chairman | Indefinite term and served since May 2003.
One year term and served since May 2003. | Executive Vice President, U.S. Bancorp Fund Services, LLC (1994-present). | Ten | Trustee, USA MUTUALS (an open-end investment company with two portfolios); Trustee, Trust for Professional Managers (an open-end investment company with 28 portfolios). | |||||
| NON-INTERESTED TRUSTEES | ||||||||||
Thomas S. Case (71) 515 Piney Creek Road Reno, NV 89511 | Trustee | Indefinite term and served since May 1995. | Retired. | Ten | None | |||||
J. Gary Gradinger (70) Golden Star Inc. 4770 North Belleview Avenue Kansas City, MO 64116 | Trustee | Indefinite term and served since February 2001. | Chairman, President and Chief Executive Officer, Golden Star Inc. (manufacturer of textile cleaning products). 1969-present. | Ten | Director, MGP Ingredients, Inc. (a food ingredients company) | |||||
Philip J. Kennedy (68) 116 Hermitage Hills Boulevard Hermitage, PA 16148 | Trustee | Indefinite term and served since May 1995. | Business Consultant and C.PA. Finance and Accounting Professor, Penn State Shenango (2007-2011). | Ten | None | |||||
| OFFICERS OF THE FUNDS | ||||||||||
Kent W. Gasaway (53) 5420 West 61st Place Shawnee Mission, KS 66205 | President and Treasurer | Indefinite term and served since inception. One year term and served since May 2003. | Senior Vice President/Portfolio Manager, Kornitzer Capital Management, Inc. (management company) 1991-present. | N/A | N/A | |||||
Rachel A. Spearo (33) 777 E. Wisconsin Ave. Milwaukee, WI 53202 | Secretary | One year term and served since August 2006. | Vice President, U.S. Bancorp Fund Services, LLC since September 2004. | N/A | N/A | |||||
Barry Koster (52) 5420 West 61st Place Shawnee Mission, KS 66205 | Chief Compliance Officer | Indefinite term and served since October 2004. | Chief Compliance Officer since October 2004 and Chief Financial Officer since May 2002, Kornitzer Capital Management, Inc. (management company). | N/A | N/A | |||||
| 1 | Each of these Trustees may be deemed to be an “interested person” of the Funds as that term is defined in the Investment Company Act of 1940, as amended. Messrs. Neuberger and Sarris are interested Trustees due to their employment by U.S. Bancorp Fund Services, LLC and Kornitzer Capital Management, Inc., respectively. U.S. Bancorp Fund Services, LLC is the Funds’ Administrator and Registered Transfer Agent. Kornitzer Capital Management, Inc. is the Funds’ Advisor. |
97
Notice to Shareholders
March 31, 2013
(Continued)
A NOTE ON FORWARD-LOOKING STATEMENTS
Except for historical information contained in this annual report for the Funds, the matters discussed in this report may constitute forward-looking statements made pursuant to the safe harbor provisions of the Securities Litigation Reform Act of 1995. These include any advisor and/or portfolio manager predictions, assessments, analyses or outlooks for individual securities, industries, market sectors and/or markets. These statements involve risks and uncertainties. In addition to the general risks described for the Funds in the current Prospectus, other factors bearing on these reports include the accuracy of the advisor’s or portfolio managers’ forecasts and predictions, and the appropriateness of the investment programs designed by the advisor or portfolio manager to implement their strategies efficiently and effectively. Any one or more of these factors, as well as other risks affecting the securities markets and investment instruments generally, could cause the actual results of the Funds to differ materially as compared to benchmarks associated with the Funds.
ADDITIONAL INFORMATION
The Buffalo Funds have adopted proxy voting policies and procedures that delegate to Kornitzer Capital Management, Inc., the Funds’ investment advisor, the authority to vote proxies. A description of the Buffalo Funds’ proxy voting policies and procedures is available without charge, upon request, by calling the Funds toll free at 1-800-49-BUFFALO. A description of these policies and procedures is also included in the Funds’ Statement of Additional Information, which is available on the SEC’s website at http://www.sec.gov.
The actual voting records relating to portfolio securities during the most recent twelve month period ended June 30 (as filed with the SEC on Form N-PX) are available without charge, upon request, by calling the Funds toll free at 1-800-49-BUFFALO or by accessing the SEC’s website at http://www.sec.gov.
The Funds file their complete schedule of portfolio holdings with the SEC four times each fiscal year at quarter-ends. The Funds file the Schedule of Portfolio Holdings with the SEC on Form N-CSR (second and fourth quarters) and on Form N-Q (first and third quarters). Shareholders may view the Funds’ Forms N-CSR and N-Q on the SEC’s website at http://www.sec.gov. Forms N-CSR and N-Q may also be reviewed and copied at the SEC’s Public Reference Room in Washington, D.C. Information on the SEC’s Public Reference Room may be obtained by calling 1-202-551-8090 (direct) or 1-800-SEC-0330 (general SEC number).
98
APPROVAL OF INVESTMENT ADVISORY CONTRACTS
The Board of Trustees (the “Trustees”) of Buffalo Funds, a Delaware statutory trust, on behalf of its series, Buffalo Flexible Income Fund, Buffalo High Yield Fund, Buffalo Large Cap Fund, Buffalo Small Cap Fund, Buffalo Growth Fund, Buffalo Discovery Fund, Buffalo Mid Cap Fund, Buffalo Micro Cap Fund, Buffalo China Fund and Buffalo International Fund (all such funds referred to collectively as the “Funds”) met on November 16, 2012, to consider the renewal of the Amended and Restated Management Agreements (the “Agreements”) between the Funds and Kornitzer Capital Management, Inc., the Funds’ investment adviser (the “Adviser”). In advance of the meeting, the Trustees requested and received materials to assist them in considering the renewal of the Agreements. The materials provided contained information with respect to the factors enumerated below, including the Agreements, a memorandum prepared by the Trustees’ independent legal counsel discussing in detail the Trustees’ fiduciary obligations and the factors they should assess in considering the approval of the Agreements, detailed comparative information relating to the advisory fees, overall expenses and performance of the Funds, due diligence materials relating to the Adviser (including the Adviser’s Form ADV and financial information, information regarding key personnel, information relating to the Adviser’s and the Funds’ compliance programs, including risk management, and the Code of Ethics), information that the Adviser regularly provides to the Trustees in connection with reports on its activities and the activities of the Funds at the Trustees’ periodic Board meetings, and other pertinent information. In addition, the Independent Trustees, as defined below, met in executive session with their independent counsel immediately prior to the Board meeting held on November 16, 2012, to review and discuss the information provided to them and their duties and responsibilities in connection with the renewal of the Agreements. Based on their evaluation of information provided by the Adviser, in conjunction with the Funds’ other service providers, the Trustees, by a unanimous vote (including a separate vote of the Trustees who are not “interested persons,” as that term is defined in the Investment Company Act of 1940, as amended (the “Independent Trustees”)), approved the renewal of the Agreements for an additional term of one year ending November 30, 2013, noting that the Board was on the same date approving a plan of reorganization to merge the Buffalo China Fund into the Buffalo International Fund.
DISCUSSION OF FACTORS CONSIDERED
In considering the Agreements and reaching their conclusions, the Trustees reviewed and analyzed various factors that they determined were relevant, including the factors enumerated below.
1. Nature, Extent and Quality of Services Provided to the Funds.
The Trustees considered the nature, extent and quality of services provided by the Adviser to the Funds. The Trustees considered the Adviser’s specific responsibilities in all aspects of day-to-day management of the Funds, as well as the qualifications, experience and responsibilities of the portfolio management teams and other key personnel of the Adviser involved in the day-to-day activities of the Funds. The Trustees considered the Adviser’s emphasis on long-term results and the quality of the Adviser’s reports throughout the course of the year as well as in connection with the contract renewal process. The Trustees noted the services that extended beyond portfolio management, including operations and compliance, and they considered the overall capability of the Adviser, including its continuing commitment to enhance the marketing and distribution of the Funds. The Trustees concluded that the Adviser had sufficient quality and depth of personnel, resources, investment methods and compliance policies and procedures essential to performing its duties under the Agreements and that the nature, overall quality and extent of the management services provided to the Funds were appropriate.
2. Investment Performance of the Adviser and the Funds.
In assessing the portfolio management services provided by the Adviser, the Trustees considered information provided to them prior to their meeting on November 16, 2012, including, without limitation, materials prepared by U.S. Bancorp Fund Services, LLC (the “Administrator”) using information provided by Morningstar Direct (“Morningstar”) with respect to the fees, expenses and performance of each of the Funds compared with similar funds managed by other investment advisers, comparable information with respect to other investment vehicles managed by the Adviser as well as other information presented to them by the Adviser at the meeting and throughout the preceding year.
The Trustees considered the relevant Morningstar peer group and category comparisons in the materials provided and discussed each Fund. The performance periods compared were as of September 30, 2012. With respect to the Buffalo (i) China Fund, the Trustees noted the poor performance of the Fund and the relatively higher fees and expenses and discussed the Adviser’s recommendation that
99
Notice to Shareholders
March 31, 2013
(Continued)
the China Fund be merged with and into the Buffalo International Fund which would provide China Fund shareholders with continued exposure to China at a lower cost; (ii) Discovery Fund, the Trustees noted that Fund’s performance had exceeded both the peer group median and average for the one, three, five and ten year time periods; (iii) Flexible Income Fund, the Trustees noted that while the Fund’s one year performance had slightly lagged the peer median and average, its three, five and ten year performance numbers exceeded both the median and average; (iv) Growth Fund, the Trustees noted that while the Fund’s one year and three performance lagged the median and the average, its five and ten year performance exceeded both measurements; (v) High Yield Fund, the Trustees noted that while the Fund had underperformed both the peer median and the average in all instances except one over the one, three, five and ten year time periods, the Fund was conservatively managed with a very low beta; (vi) International Fund, the Trustees noted that the Fund had met or exceeded both the peer median and average over the one, three and five year time periods; (vii) Large Cap Fund, the Trustees noted that while the Fund had underperformed the peer median and averages over all time periods noted, its fees and expenses were among the lowest in the category; (viii) Micro Cap Fund, the Trustees noted that the Fund had significantly outperformed its peer median and averages for the one and three year periods and also outperformed, although to a lesser extent its peer median and averages over the five year time period; (ix) Mid Cap Fund, the Trustees noted that while the Fund had underperformed both the peer median and the average in all instances except one over the one, three, five and ten year time periods, the Adviser continued to focus on the Fund’s portfolio management team and process and would do so going forward; and the (x) Small Cap Fund, the Trustees noted that the Fund had significantly outperformed the peer median and average for the one year period, had exceeded its peer median and average for the five and ten year periods, although to a lesser extent, and had only underperformed in the three year period. The Trustees expressed confidence in the Adviser’s portfolio management teams, including certain portfolio management changes made during the prior year.
3. Costs of Services and Profits Realized by the Adviser.
The Trustees considered the cost structure of the Funds relative to their peer groups based on the Morningstar analysis provided to the Trustees prior to their meeting. The Trustees also examined the level of profits that could be expected to accrue to the Adviser from the fees payable under the Agreements based on the analysis provided by the Adviser.
The Trustees specifically considered the fee structure for the Funds as well as the Funds’ net expenses. With respect to the Buffalo (i) China Fund, the Trustees considered the relatively higher fees and expenses and discussed the Adviser’s recommendation that the China Fund be merged with and into the Buffalo International Fund which has a lower advisory fee and net expenses than those of the China Fund; (ii) Discovery Fund, the Trustees noted that Fund’s advisory fee and net expenses were lower than both the peer group median and average; (iii) Flexible Income Fund, the Trustees noted that while the Fund’s advisory fee and net expenses were higher than both the peer median and average, its three, five and ten year performance numbers were very favorable; (iv) Growth Fund, the Trustees noted that the Fund’s advisory fee was lower than both the peer group median and the average, although the net expenses were higher than both; (v) High Yield Fund, the Trustees noted that while the Fund’s advisory fee and net expenses were higher than both the peer median and average, the fees were still well within the range of fees and expenses for the Morningstar category; (vi) International Fund, the Trustees noted that the advisory fee was among the lowest in its category, significantly below the median and the average, although the net expense was slightly above both the median and average; (vii) Large Cap Fund, the Trustees noted that both the advisory fee and the net expenses were lower than the peer median and average; (viii) Micro Cap Fund, the Trustees noted that while both the advisory fee and the net expenses were above both the peer median and the average, the Fund’s performance was strong over all time periods; (ix) Mid Cap Fund, the Trustees noted that the advisory fee was below both the peer median and the average while the net expenses were slightly above both; and the (x) Small Cap Fund, the Trustees noted that advisory fee was below the peer median and average and the net expenses were at the peer median and slightly above the peer average. In light of the comparative expense and advisory fee information and the investment management services provided by the Adviser, the Trustees concluded that the Funds’ expenses and the fees paid to the Adviser were competitive and, therefore, fair and reasonable. The Trustees further concluded that the Adviser’s profit from sponsoring the Funds had not been and would not be excessive and would enable the Adviser to maintain adequate profit levels to support its provision of advisory services to the Funds.
4. Extent of Economies of Scale as the Funds Grow.
The Trustees reviewed the structure of the Adviser’s advisory fees and discussed potential economies of scale based on the Funds’ current size and as they grow (and if such economies are realized, how they would be shared with shareholders). The Trustees concluded that the potential
100
economies of scale that the Funds might realize would be achievable under the structure of the Adviser’s advisory fees and the Funds’ expenses, particularly in light of the Adviser’s proposal to consider fee breakpoints in the future as the Funds grow, and acknowledging that the largest of the Funds, the Small Cap Fund, is currently closed to new investors. The Trustees therefore concluded that the Adviser’s fee structure was acceptable based on the potential economies of scale that may be achieved by the Funds as they grow combined with the Adviser’s commitment to consider breakpoints in the future.
5. Benefits Derived from the Relationship with the Funds.
The Trustees considered the direct and indirect benefits that could be received by the Adviser from its association with the Funds. The Trustees examined the brokerage arrangements of the Adviser with respect to the Funds. The Trustees
concluded that the benefits the Adviser may receive, such as greater name recognition and/or increased ability to obtain research or brokerage services, appeared to be reasonable, and in many cases may benefit the Funds.
CONCLUSIONS
The Trustees considered all of the foregoing factors. In considering the Agreements, the Trustees did not identify any one factor as all-important, but rather considered these factors collectively in light of the Funds’ surrounding circumstances and concluded that the Funds and their shareholders would continue to benefit from the Adviser’s continued management. Based on this review, the Trustees, including a majority of the Independent Trustees, approved the renewal of the Agreements with the Funds as being in the best interests of the Funds and their shareholders.
101
Privacy Policy
This Privacy Policy has been adopted by the Buffalo Funds. The Funds are each an open-end diversified management investment company registered under the Investment Company Act of 1940 (the “1940 Act”).
This Privacy Policy has also been adopted by KCM, an investment advisor registered with the Securities and Exchange Commission that serves as the investment advisor and manager of the Funds.
The Funds and the Advisor are collectively referred to as the “Companies,” “we,” “our” or “us.”
As a part of providing you services and products we collect non-public personally identifiable information (“Personal Information”) about you. Some of this is information you provide and some is obtained from other sources. In some circumstances, a necessary part of providing products and services to you requires that we disclose Personal Information about you to third parties.
We want you to understand how we handle your Personal Information. Please read the Privacy Policy carefully. It has information about our policies for the collection, use, disclosure, and protection of your Personal Information. If you have any questions, you can obtain additional information from the following:
Buffalo Funds
c/o U.S. Bancorp Fund Services, LLC
P.O. Box 701
Milwaukee, Wisconsin 53201-0701 1-800-492-8332
www.buffalofunds.com
Please be aware that we periodically update or revise the Privacy Policy. As methods of doing business change, we reflect any applicable changes in our Privacy Policy. If you are our customer, we will send you an update as and when it occurs.
SALE/DISCLOSURE OF YOUR PERSONAL INFORMATION
We promise that we will not sell your Personal Information to any person.
Also, we will not disclose your Personal Information to any third person aside from the disclosures described below. These disclosures generally relate to marketing or maintaining products or services provided to you.
WHAT INFORMATION DO WE COLLECT?
Personal, Financial and Product Information
To be able to offer, provide and maintain these products and services, the Companies collect a variety of Personal Information about you. The Personal Information we collect will vary depending upon the product or service you select.
The following is a general list of the Personal Information. Not all of the Personal Information will be collected every time you do business with us.
Personal Information
| • | Name |
| • | Address |
| • | Birthdate |
| • | Phone number |
| • | Social Security Number |
| • | E-mail address |
| • | Product-Related Personal Information |
| • | Product Activity History (things you have done with your mutual funds such as deposits, transfers, redemptions, etc.) |
GENERAL PRIVACY PROCESSES
How do we collect Personal Information?
We use a variety of methods to collect Personal Information. We collect Personal Information directly from you with paper forms (for example, new account and other administrative forms), over the phone or through facsimile transmissions. We also collect Personal Information from our web site and through other electronic means. We collect some Personal Information through joint marketing programs where we offer a product or service through another financial institution. In some of these instances, you may be considered a customer of both entities.
Who has access to this Personal Information?
Generally, only the Companies’ staff and certain companies working on the Companies’ behalf have access to this Personal Information.
Those Working on Our Behalf
Depending on the product or service you select, there may be a number of third parties that will have access to your Personal Information since they are working on our behalf. This access is necessary because these third parties perform a task or provide administrative services for the product you seek or have purchased from us. If we do not share the Personal Information, we cannot provide you the product or service you requested. In certain cases, affiliates are the entities performing such services on our behalf.
When we share Personal Information with non-affiliated companies working on our behalf, we protect your Personal Information by requiring such companies to adopt our privacy policy or have a policy providing protection similar to ours.
102
Required Disclosures
Certain Personal Information may also be disclosed to third parties without your consent if disclosure is necessary to comply with: 1) legal processes; 2) to protect the rights, property, or personal safety of the Funds, their shareholders or the public; 3) as part of inspections or examinations conducted by our regulatory agencies; and 4) in other situations required by law.
Joint Marketing
In certain circumstances, the Companies may jointly market a product or service with another financial institution. In these circumstances, we have arranged to offer our products through these entities and their representatives or through electronic systems (for example, the Internet).
The Companies may make other disclosures authorized by law.
Requested Disclosures
We will disclose your Personal Information if you request it to those persons that you designate. Examples of this are to: members of your family; registered investment advisors, attorneys and CPAs who you have retained to advise you in a transaction; and persons whom you have designated to represent you in dealings with us.
What do we do with the Personal Information?
The Companies make use of the Personal Information to provide you with the financial products and services that we offer.
At the point that you cease being a customer, we will maintain your Personal Information and handle it just the same as our current customers.
The Companies restrict access to the Personal Information to those who need to know it for ordinary business purposes. We also maintain physical, electronic, and procedural safeguards that comply with federal standards to guard your Personal Information.
What are your options regarding corrections of Personal Information?
Generally, upon your written request, we will make available Personal Information for your review. Please note, Personal Information collected that relates to a disputed claim or legal proceeding will not be made available. If you notify us that the Personal Information is incorrect, we will review it and if we agree, correct our records. If we do not agree, you may submit a short comment, which we will include in future third party disclosures, if any occur, of Personal Information.
103

Item 2. Code of Ethics.
The Registrant has adopted a code of ethics that applies to the Registrant’s principal executive officer and principal financial officer. The Registrant has not made any amendments to its code of ethics during the period covered by this report. The Registrant has not granted any waivers from any provisions of the code of ethics during the period covered by this report. A copy of the Registrant’s Code of Ethics is incorporated by reference to the Registrant’s Form N-CSR filed on June 3, 2011.
Item 3. Audit Committee Financial Expert.
The Registrant’s Board of Trustees has determined that there is at least one audit committee financial expert serving on its audit committee. The name of the audit committee financial expert is Philip J. Kennedy. Mr. Kennedy is “independent” as defined in Item 3(a)(2) of Form N-CSR.
Item 4. Principal Accountant Fees and Services.
(1) (a) – (d) Aggregate fees billed to the Registrant for each of the last two fiscal years for professional services rendered by the Registrant’s Independent Registered Public Accounting Firm were as follows:
| FYE 03/31/2013 | FYE 03/31/2012 | |||||||
Audit Fees | $ | 193,975 | $ | 181,530 | ||||
Audit-Related Fees | $ | 6,080 | $ | 5,900 | ||||
Tax Fees | $ | 31,625 | $ | 27,750 | ||||
All Other Fees | $ | 0 | $ | 0 | ||||
Audit fees include amounts related to the audit of the Registrant’s annual financial statements and services normally provided by the Independent Registered Public Accounting Firm in connection with statutory and regulatory filings, including registration statements. Audit-related fees refer to the reading and commenting on the Registrant’s semi-annual reports. Tax fees include amounts related to tax compliance, tax planning, and tax advice, including specifically tax return review and excise tax distribution review services. There were no fees billed for services rendered to the Registrant’s investment adviser or any entity controlling, controlled by or under common control with the investment adviser that provides ongoing services to the Registrant that were required to be approved pursuant to paragraph (c)(7)(ii) of Rule 2-01 of Regulation S-X.
(e) (1) The Registrant’s audit committee charter requires pre-approval in advance of (i) audit and non-audit services performed by the Registrant’s Independent Registered Public Accounting Firm for the Registrant; and (ii) audit and non-audit services relating directly to the operations and financial reporting of the Registrant performed by the Registrant’s principal accounting officer for the Registrant’s investment adviser, and any entity controlling, controlled by, or under common control with the investment adviser that provides ongoing services to the Registrant.
(2) None of the services described in (b) – (d) above were approved by the audit committee specifically pursuant to paragraph (c)(7)(i)(C) of Rule 2-01 of Regulation S-X.
(f) Not applicable.
(g) The aggregate non-audit fees were for audit-related and tax services rendered to the Registrant. As disclosed above, the amount of fees billed for such services were $37,705 and $33,650 for the 2013 and 2012 fiscal years, respectively.
(h) The aggregate fees billed for non-audit services rendered to the Registrant’s investment advisor related to surprise security count procedures were $10,000 and $10,000 for the 2013 and 2012 fiscal years respectively. These fees were not required to be pre-approved pursuant to paragraph (c)(7)(ii) of Rule 2-01 of Regulation S-X.
Item 5. Audit Committee of Listed Registrants.
Not applicable because the Registrant is not a listed issuer.
Item 6. Investments.
Schedule of Investments is included as part of the report to shareholders filed under Item 1 of this Form.
Item 7. Disclosure of Proxy Voting Policies and Procedures for Closed-End Management Investment Companies.
Not applicable because the Registrant is an open-end investment company.
Item 8. Portfolio Managers of Closed-End Management Investment Companies.
Not applicable because the Registrant is an open-end investment company.
Item 9. Purchases of Equity Securities by Closed-End Management Investment Company and Affiliated Purchasers.
Not applicable because the Registrant is an open-end investment company.
Item 10. Submission of Matters to a Vote of Security Holders.
There have been no material changes to the procedures by which shareholders may recommend nominees to the Registrant’s Board of Trustees.
Item 11. Controls and Procedures.
| (a) | The Registrant’s Principal Executive Officer and Principal Financial Officer has reviewed and evaluated the Registrant’s disclosure controls and procedures (as defined in Rule 30a-3(c) under the Investment Company Act of 1940 (the “Act”)) as of a date within 90 days of the |
| filing of this report, as required by Rule 30a-3(b) under the Act and Rules 13a-15(b) or 15d-15(b) under the Securities Exchange Act of 1934. Based on his review, the Principal Executive Office and Principal Financial Officer has concluded that the disclosure controls and procedures are effective in ensuring that information required to be disclosed in this report is appropriately recorded, processed, summarized and reported and made known to him by others within the Registrant and by the Registrant’s service provider. |
| (b) | There were no changes in the Registrant’s internal control over financial reporting that occurred during the Registrant’s second fiscal quarter of the period covered by this report that have materially affected, are is reasonably likely to materially affect, the Registrant’s internal control over financial reporting. |
Item 12. Exhibits.
| (a) | (1) Code of Ethics. Incorporated by reference to the Registrant’s Form N-CSR filed on June 3, 2011. |
(2) Certifications pursuant to Section 302(a) of the Sarbanes-Oxley Act of 2002 are filed herewith.
(3) Not applicable to open-end investment companies.
| (b) | Certifications pursuant to Section 906 of the Sarbanes-Oxley Act of 2002. Furnished herewith. |
SIGNATURES
Pursuant to the requirements of the Securities Exchange Act of 1934 and the Investment Company Act of 1940, the registrant has duly caused this report to be signed on its behalf by the undersigned, thereunto duly authorized.
| Buffalo Funds | ||||
| By | /s/ Kent W. Gasaway | |||
| Kent W. Gasaway | ||||
| President and Treasurer | ||||
| Date | 6/6/2013 | |||
Pursuant to the requirements of the Securities Exchange Act of 1934 and the Investment Company Act of 1940, this report has been signed below by the following persons on behalf of the registrant and in the capacities and on the dates indicated.
| Buffalo Funds | ||||
| By | /s/ Kent W. Gasaway | |||
| Kent W. Gasaway | ||||
| President and Treasurer | ||||
| Date | 6/6/2013 | |||