UNITED STATES
SECURITIES AND EXCHANGE COMMISSION
Washington, D.C. 20549
FORM N-CSR
CERTIFIED SHAREHOLDER REPORT OF REGISTERED
MANAGEMENT INVESTMENT COMPANIES
Investment Company Act file number 811-10303
Buffalo Funds
(Exact name of registrant as specified in charter)
5420 W. 61st Place,
Shawnee Mission, KS 66025
(Address of principal executive offices) (Zip code)
Kent Gasaway
5420 W. 61st Place,
Shawnee Mission, KS 66025
(Name and address of agent for service)
913-677-7778
Registrant's telephone number, including area code
Date of fiscal year end: March 31
Date of reporting period: September 30, 2020
Item 1. Reports to Stockholders.


SEMI-ANNUAL
REPORT
September 30, 2020
Beginning on January 1, 2021, as permitted by regulations adopted by the U.S. Securities and Exchange Commission, paper copies of the Funds' annual and semi-annual shareholder reports will no longer be sent by mail, unless you specifically request paper copies of the reports from the Funds or from your financial intermediary, such as a broker-dealer or bank if you hold your shares through such an institution. Instead, the reports will be made available on the Funds' website (buffalofunds.com/our-funds/performance/#literature), and you will be notified by mail each time a report is posted and provided with a website link to access the report.
If you already elected to receive shareholder reports electronically, you will not be affected by this change and you need not take any action. You may elect to receive shareholder reports and other communications from the Funds electronically anytime by contacting your financial intermediary or, if you hold your shares directly with the Funds, by calling (800) 492-8332.
You may elect to receive all future reports in paper free of charge. If you invest through a financial intermediary, you can contact your financial intermediary to request that you continue to receive paper copies of your shareholder reports. If you invest directly with the Funds, you can call (800) 492-8332 to let the Funds know you wish to continue receiving paper copies of your shareholder reports. Your election to receive shareholder reports in paper will apply to all funds that you hold through the financial intermediary or directly with the Funds.
TABLE OF CONTENTS
Portfolio Management Review | | | 4 | | |
Investment Results | | | 14 | | |
Expense Example | | | 17 | | |
Allocation of Portfolio Holdings | | | 21 | | |
Schedules of Investments or Options Written | | | 23 | | |
Buffalo Discovery Fund (BUFTX) | | | 23 | | |
Buffalo Dividend Focus Fund (BUFDX) | | | 29 | | |
Buffalo Emerging Opportunities Fund (BUFOX) | | | 36 | | |
Buffalo Flexible Income Fund (BUFBX) | | | 42 | | |
Buffalo Growth Fund (BUFGX) | | | 48 | | |
Buffalo High Yield Fund (BUFHX) | | | 53 | | |
Buffalo International Fund (BUFIX) | | | 66 | | |
Buffalo Large Cap Fund (BUFEX) | | | 75 | | |
Buffalo Mid Cap Fund (BUFMX) | | | 80 | | |
Buffalo Small Cap Fund (BUFSX) | | | 86 | | |
Statements of Assets and Liabilities | | | 92 | | |
Statements of Operations | | | 94 | | |
Statements of Changes in Net Assets | | | 96 | | |
Financial Highlights | | | 100 | | |
Notes to Financial Statements | | | 120 | | |
Statement Regarding Liquidity Risk Management Program | | | 133 | | |
Privacy Policy | | | 135 | | |
PORTFOLIO MANAGEMENT REVIEW (UNAUDITED)
BUFFALO DISCOVERY FUND
The Buffalo Discovery Fund rose 36.37% for the six-month period ending September 30, 2020 but underperformed the Morningstar US Mid Growth Index's, the fund's benchmark, return of 47.53%. Index results were largely driven by technology stocks, as the sector was one of the best performing sectors and drove over 44% of the index's return while representing about 39% of the index's weight. High growth software stocks in which the portfolio is underweight, led returns. Furthermore, the fund did not own Square and Zoom Video Communications, two of the benchmark's more significant performers, which advanced nearly 210% and 93%, respectively, and were relatively large index positions.
Some of the fund's relative underperformance during the period is explained by the first quarter's outperformance, as the fund's holdings declined less than the index and experienced less of a rebound during the subsequent six months. Furthermore, it was difficult to keep pace with the index in the Technology sector as it was largely driven by meaningful appreciation of already expensive high growth software stocks, many of which do not meet our valuation parameters. While we did have some high growth software stocks in the portfolio, we did not have enough of them to maintain pace with the index.
Etsy, Inc. was the best performing position during the six month period, with a gain of almost 220%. With the spread of COVID-19, the shift to e-commerce is clearly a trend that has witnessed increased momentum, and Etsy, as a leading online arts and crafts marketplace, benefited disproportionally. The company did an excellent job during the pandemic of driving new customers to the platform and becoming the "go to" site for handmade masks and Personal Protective Equipment (PPE) for consumers.
Twillio, Inc. was also a top performer for the fund in the period gaining just over 171%. Despite having some exposure to weaker industries like travel, which concerned some investors early in the six-month period, Twilio's communication volumes have been excellent during the pandemic, led by messaging and video. The company remains the leader in Communications Platform as a Service (CPaaS), which we believe, is still in the early stages of growth.
eHealth (EHTH) operates a direct to consumer, online health insurance marketplace that offers consumers a broad choice of insurance solutions from over 180 health insurance carriers. Its shares weakened during the period as investors grew concerned about a higher than expected level of customer churn and the potential negative effect on customer acquisition costs and the lifetime value of customer contracts. The company has prioritized growing enrollment over retention the last couple of years, but has recently taken corrective action to improve retention. Despite the higher churn, the company raised its full year guidance for sales and profitability and raised its expected five-year annual revenue growth rate to 27% from 23% prior. The company remained a prime beneficiary of the secular shift from offline agent assisted sales to online digital sales channels where broader choice and the option to get coverage entirely through an online experience can potentially cut out the middle-man and lead to lower costs for the consumer and disruptive share gain for the company.
The first nine months of 2020 has been an extremely volatile period for the market, and given the market's quick rebound despite a slower economy, lower earnings, political uncertainty and continued COVID-19 concerns, a lot rests on the trajectory of earnings recovery in 2021. Volatility is likely to remain in place but it should ease once we get a clearer picture of fiscal stimulus plans and the policy biases of the next administration. Investors will then likely continue to focus on the trajectory of COVID-19 cases, the progression of additional treatments and vaccines, and ongoing company commentary on business trends. We believe there will be a meaningful amount of data on vaccine and treatment options over the next few months that could be quite positive for those willing to look beyond near-term case numbers. Furthermore, fiscal and monetary policy remain extremely accommodative worldwide with activity levels rebounding across countries and sectors. The economy is mending. Consumer and business confidence is rising too as the world has found innovative ways to adapt, progress and grow despite the one-hundred-year pandemic in our midst.

4
Due to a reduction in growth opportunities in the last six to nine months, we are mindful that investors may have bid up certain high growth stocks to unsustainable valuations, and we continue to focus on the downside risk relative to upside opportunity for stocks in the portfolio. The disparity in returns between growth and value has been extreme this year, and at some point, there could be a meaningful reversion to the mean, likely triggered by lower political uncertainty post-election and successful clinical results from a potential vaccine. Going forward, we think lower political uncertainty and a probable COVID-19 vaccine could steepen the yield curve and should be good for more economically sensitive areas at the expense of over-priced growth stocks and are adjusting the portfolio accordingly.
We stand poised to capitalize when and where we see an opportunity to improve risk-adjusted return potential within the portfolio. Economic conditions may ebb and flow, but our focus is steady: to invest in attractively priced, financially strong, well-managed companies whose innovative strategies should fuel secular growth opportunities. We seek those opportunities where thoughtful management teams are in a favorable position to use innovation for market advantage, durable growth, and sustained shareholder value creation. Successful innovation may often lead to share gains in large existing markets, or the creation of large new market opportunities, a strategy which we believe is less dependent on the overall macro environment for growth.
BUFFALO DIVIDEND FOCUS FUND
The Buffalo Dividend Focus Fund posted a return of 27.77% for the semi-annual period, underperforming the Morningstar US Large-Mid Cap Index, the fund's benchmark, return of 33.41% and the S&P 500 Index return of 31.31%. All of the sectors in the fund and benchmark posted positive returns. The fund's sectors with the highest weightings had mixed performance relative to the benchmark. Health Care and Financials posted favorable relative performance compared to the performance of the benchmark's health care and financials sectors, while Information Technology experienced lagging relative returns. The fund's Energy, Real Estate, and Utilities sectors delivered constructive performance relative to the benchmark. The fund's Consumer Discretionary, Consumer Staples, Industrials, Materials, and Telecommunication Services holdings detracted from relative performance.
Specific securities that contributed most positively to the fund's performance during the period include Apple Inc., Microsoft Corp. and Horizon Therapeutics PLC. Apple advanced on solid quarterly results, anticipated growth from 5G iPhone sales, and announcement of a stock split. Microsoft improved on growing momentum from its cloud services and enterprise products which boosted results above analysts' estimates, and expansion in the company's valuation metrics. The biopharmaceuticals company Horizon Therapeutics rose on strong quarterly results driven by the launch of Tepezza for thyroid eye disease treatment and favorable study data on Krystexxa in combination with immunomodulation (methotrexate).
Delta Air Lines, Elanco Animal Health, and Edison International diminished the fund's performance during the period. Delta declined on the reduced demand for airline travel due to COVID-19. Elanco fell on poor quarterly results due to distributor inventory destocking. Edison, an electric power generation and distribution company, has been hurt by the threat of wild fires and the spending to mitigate them, which has created pressure on the balance sheet and earnings.
The stock market reached a record high during the period on the expectations that the economy can recover from the COVID-19 Pandemic. The market fell from the peak, during the period, as investors became concerned regarding a second wave of COVID-19 cases, the prospects for passage of a fiscal stimulus having been bogged down by partisan politics, anxiety around the presidential election, lack of an agreement on Britain's exit from the European Union (Brexit), and rhetoric around new anti-trust regulation regarding the large technology companies. Brexit deadlines will force decisions on an agreement for Britain's exit from the European Union, or cause further delays. As the current quarter unfolds, the market will likely be impacted as some of these issues play out. Resolution of these issues will likely influence the prospects, timing, and size of additional fiscal stimulus measures needed to support the economy over the intermediate term and sustainable growth over the longer term. Monetary policy continues to remain accommodative, as Central Banks reiterate their policies of not raising interest rates, continue debt-buying programs, and expand inflation tolerance levels.
Despite the uncertainty created by pandemic, we remain focused on wide moat, large capitalization companies trading at reasonable valuations, in our view. As always, the fund will continue to emphasize on competitively

5
advantaged companies that can be purchased at a fair value, in our opinion. As stock market volatility spikes, we will look for opportunities to find companies that fit our investment criteria, as we continue to follow our process of finding new investment ideas and to be ready when market declines provide better entry points.
BUFFALO EMERGING OPPORTUNITIES FUND
Effective October 16, 2020, the Buffalo Emerging Opportunities Fund changed its name to the Buffalo Early Stage Growth Fund. We believe this name better captures the spirit of the fund, seeking holdings that are generally smaller than the median market capitalization of the benchmark, the Morningstar US Small Growth Index, and are bringing innovation to their industries through new products and/or services.
The fund posted a positive return of 51.52% for the six-month period ending September 30, 2020. This compares to the Morningstar US Small Growth Index's return of 42.60%. These historically strong returns followed the sell-off in February and March related to the onset of the global pandemic caused by the spread of COVID-19.
The fund's outperformance compared to the index during the semi-annual period was led by the investments within Information Technology and Financials. The fund maintained an overweight to the Financials sector and produced a return of 84.4%, on average, compared to the benchmark's average return of -18.5% for the sector. The fund also outperformed in Information Technology, our largest sector weighting. The fund's Information Technology holdings returned 68.2%, on average, versus the benchmark's average return of 42.5%.
While COVID-19 appears to be surging into the winter months, most industries (outside of travel, hospitality, select retail, among others) have staged a strong rebound. With recent vaccine trial data for COVID-19 showing promising outcomes, we look for the market to persevere through these next several months until a vaccine(s) become more widely accessible.
We operate on the small end of the small cap growth spectrum and will continue to seek investment opportunities that can sustain growth due to secular trends and from the innovation and disruption they are introducing to an industry. We believe less investor interest in our segment of the market creates opportunities for us to uncover value. The fund ended
September 30, 2020 with 65 holdings. As always, we will be paying close attention to the valuations of portfolio holdings and we will utilize market volatility to trim or add to positions as risk/reward profiles improve or degrade.
The Buffalo Early Stage Growth Fund is primarily focused on identifying innovation within U.S. companies with North American revenue bases. We continue to look for prudent ways to deploy cash and remain long-term focused, aiming to be shrewd when the market environment presents opportunity and more cautious when it does not. With an active share of greater than 95%, the fund will continue to offer a distinct offering from the index and category peers.
BUFFALO FLEXIBLE INCOME FUND
The Buffalo Flexible Income Fund produced a return of 17.18% for the semi-annual period compared to 22.95% for the Morningstar Moderately Aggressive Target Risk Index. The top contributors to fund performance were Microsoft, Qualcomm, and Nuance convertible bonds. Microsoft continues to benefit from its leading positions in key category verticals such as cloud computing, applications (Office, Teams, and Linked-In) as well as gaming. Qualcomm increased in value during the quarter due to the favorable settlement of a long-standing legal dispute with Huawei. Nuance benefitted from positive earnings and guidance as it showed continued momentum with its cloud transition and incremental positive signs on the adoption of another one its software platforms, Dragon Ambient Experience (DAX). The top three detractors over the semi-annual review period were BP, HollyFrontier and Kinder Morgan. All three of these companies are in the energy sector and have been negatively impacted by depressed oil and gas prices.
The stock market reached a record high during the second half of the semi-annual period on the expectations that the economy can recover from the COVID-19 Pandemic. The market fell from the peak, during the period, as investors became concerned regarding a second wave of COVID-19 cases, the prospects for passage of a fiscal stimulus having been bogged down by partisan politics, anxiety around the presidential election, lack of an agreement on Britain's exit from the European Union (Brexit), and rhetoric around new anti-trust regulation regarding the large technology companies. As the remainder of the year

6
unfolds, the market will likely be impacted as some of these issues play out. Studies on vaccines and drug therapies to treat COVID-19 are likely to be released. Resolution of these issues will likely influence the prospects, timing, and size of additional fiscal stimulus measures needed to support the economy over the intermediate term and sustainable growth over the longer term. Monetary policy continues to remain accommodative, as Central Banks reiterate their policies of not raising interest rates, continue debt-buying programs, and expand inflation tolerance levels.
BUFFALO GROWTH FUND
The Buffalo Growth Fund gained 36.27% in the six-month period ending September 30, 2020 versus the Morningstar US Growth Index's, the fund's benchmark, gain of 45.08%. Stock selection in the Consumer Discretionary sector and the drag from un-invested cash were the leading causes of relative underperformance. Within the Consumer Discretionary sector, most of the underperformance was driven by not owning Tesla, a relatively large benchmark position, which was up over 300% in the period. Across the entire portfolio, underexposure to companies with no earnings and stocks, with what we believe to be unsustainable valuation multiples, hurt relative performance. With interest rates expected to be "lower for longer", sales growth was rewarded over profitability and valuation-sensitivity in the quarter. Regarding our un-invested cash, while not a level we consider elevated, cash averaged 3.17% of fund assets, and any allocation to cash holds back performance when the market is up over 45%.
Apple Inc. shares increased over 83% during the semi-annual review period making it a significant contributor to the fund's return. The company experienced better than expected demand improvement driven by the work/learn from home trend and a rebound in international sales as global markets begin to reopen. Apple's handset sales growth is likely to benefit from the upcoming 5G iPhone introduction which should mark the beginning of a 2-year handset upgrade cycle for the company.
Amazon.com, Inc. was another top contributor, with shares up over 61% during the period. The ongoing shift to ecommerce continued as consumers avoided brick-and-mortar stores during the pandemic. Furthermore, the company's web services division was also well positioned to benefit from the growing need for
cloud computing in a world with more people working from home.
Wells Fargo was a victim of the low interest rate environment and sluggish economic activity and detracted from fund performance during the period. Without a sharp rebound in economic activity, with the potential to drive interest rates higher, the outlook for banks is uninspiring. As a result, we eliminated the position from the fund to invest in more attractive near-term opportunities, by our analysis.
RealPage, Inc. is a leading provider of hosted software and data analytics to the real estate industry. Its solutions enable the rental real estate industry to manage property operations more efficiently. The stock did not keep pace with the rest of the market as investors feared the negative effects of higher unemployment and de-urbanization may weigh on occupancy rates and yield at rental properties. However, lower occupancy rates may help drive increased sales for RealPage as property managers have to invest in marketing and operational solutions that aid in attracting new tenants.
The first nine months of 2020 has been an extremely volatile period for the market, and given the market's quick rebound despite a slower economy, lower earnings, political uncertainty and continued COVID-19 concerns, a lot rests on the trajectory of earnings recovery in 2021. Volatility is likely to remain in place but it should ease once we get a clearer picture of fiscal stimulus plans and the policy biases of the next administration. Investors will then likely continue to focus on the trajectory of COVID-19 cases, the progression of additional treatments and vaccines, and ongoing company commentary on business trends. We believe there will be a meaningful amount of data on vaccine and treatment options over the next few months that could be quite positive for those willing to look beyond near-term case numbers. Furthermore, fiscal and monetary policy remain extremely accommodative worldwide with activity levels rebounding across countries and sectors. The economy is mending. Consumer and business confidence is rising too as the world has found innovative ways to adapt, progress and grow despite the one-hundred-year pandemic in our midst.
Due to a reduction in growth opportunities in the last six to nine months, we are mindful that investors may have bid up certain high growth stocks to unsustainable valuations, and we continue to focus on the downside

7
risk relative to upside opportunity for stocks in the portfolio. The disparity in returns between growth and value has been extreme this year, and at some point, there could be a meaningful reversion to the mean, likely triggered by lower political uncertainty and successful clinical results from a potential vaccine. Going forward, we think lower political uncertainty and a probable COVID-19 vaccine could steepen the yield curve and should be good for more economically sensitive areas at the expense of over-priced growth stocks and are adjusting the portfolio accordingly.
We will continue to invest in businesses with solid growth opportunities, durable competitive advantages, scalable business models, and good management teams, when they are trading at attractive valuations, in our opinion.
BUFFALO HIGH YIELD FUND
The Buffalo High Yield Fund increased 16.13% for the six months ending September 30, 2020, and outperformed the ICE BofAML US High Yield Master II Index, which gained 14.76% for the same period. The fund also outperformed the Lipper High Yield Bond Funds Index's return of 13.85%.
The U.S. high yield sector continued its rally in the period after posting its strongest performance since the third quarter of 2009 in the second quarter of 2020. High yield bond prices continued their recovery through July and August before reversing course in September. The first two months advanced on positive vaccine news, better than expected earnings and a dovish stance from the Federal Reserve. The high yield market declined in September amid uncertainty over a new economic stimulus package, the pending US elections and rising cases of COVID-19 in Europe.
Following a record $47.3 billion inflow in the second quarter, high yield funds saw $10.7 billion of cash inflows in the third quarter. While July and August continued the trend of inflows, September posted the first monthly outflows (-$4.3 billion) since the mass exodus in March of this year. During the third quarter, high yield issuers brought $131.9 billion in new bonds to market driven primarily by refinancing. In the first nine months of 2020, new issuance volume totaled $350.3 billion, up 68% from the $208.2 billion in the first nine months of 2019.
During the six month period, the 10-year Treasury bond yield increased only two basis points to 0.68% and remains near record lows. Every industrial sector in the U.S. high yield universe and every credit rating silo
produced positive returns during the six month review period. According to data from JP Morgan, the lower quality end of the high yield credit spectrum, i.e., split B/CCC, non-rated and defaulted issues, performed better than the higher end of the quality spectrum. The non-rated segment produced the largest gain of 19.5% while the split BBB segment was the worst performer with a still solid 11.8% gain.
According to data from JP Morgan, the U.S. high yield market's spread to worst at the end of September was 603 basis points, 108 bps tighter than the 495 bps spread at the end of March 2020 and 6 bps tighter than its 20-year historical average of 609 bps. The yield to worst for the high yield market at period end was 6.32%, below the 8.55% 20-year average, and below the yield of 10.00% at the end of March 2020.
During the semi-annual period 129 out of the 137 issues in the Buffalo High Yield fund produced positive returns. The three top contributors were Nuance Communications 1.5% convertible bonds, Cerence 3% convertible bonds, and Diebold Nixdorf 8.5% corporate bonds. Nuance and Cerence are technology driven enterprises that reported better than expected earnings or guidance during the period and the underlying stocks benefited from the strong demand from investors to own the Technology sector. Over the six month period, Diebold Nixdorf bonds steadily and fully recouped the 30 points lost in March.
Specific securities that detracted the most from the fund's performance include Turning Point Brands 2.5% convertible bonds, Delek Logistics 6.75% corporate bonds and K12 Inc. 1.125% convertible bonds. Turning Point Brands underlying common stock declined in September along with the other major tobacco stocks despite positive sentiment from sell-side analysts. Delek Logistics provides crude oil logistic services and like most securities in the energy space, Delek's bonds declined amid continued fossil fuels demand concerns. K12 Inc. convertible bonds declined in September after Miami-Dade school board decided to stop using K12's services. The contract was 1% of revenue and not related to the company's core online business, but the stock sold off regardless.
Until March 2020, the United States had been enjoying a growing economy with modest inflation that had created a favorable environment for risky assets. However, near the end of February/early March, the COVID-19 pandemic and plummeting crude oil prices wreaked havoc on the markets. The U.S. high yield default rate increased to a

8
three year high of 3.54% in March, which was up 91 bps from the 2.63% level in December 2019, and above the 3.44% long-term average. The trend continued through July, peaking around 6.2% before declining to 5.8% through August and September. During the six month period, 73 companies defaulted on $101.5 billion of debt. We are concerned first and foremost about the ongoing COVID-19 pandemic and the fallout on global economies. We are managing the fund cautiously yet actively, focusing on higher quality, non-investment grade issuers with defensive business models and manageable credit metrics. We will continue to deploy cash in opportunities that we believe offer the most appealing risk/reward tradeoff with a bias toward shorter durations and less leveraged credits. Additionally, we believe bank loans offer a more defensive position as they provide senior positioning in the capital structure. Finally, we continue to look for opportunities in convertible bonds and preferred stocks. We ended the period with 137 positions, essentially unchanged from the previous quarter's level (excluding cash).
BUFFALO INTERNATIONAL FUND
Global equity markets surged ahead in the semi-annual period with the MSCI ACWI Index returning +28.91%. Macro data continued to improve in the second half of the semi-annul review period and companies broadly reported earnings that proved to be more resilient than expectations. While the world experienced another increase in COVID-19 cases this fall, positive news flow on vaccines and therapy fronts continued to provide hope for investors and optimism for the possibility of a V-shaped recovery drove markets higher. Nearly all industry sectors rose during the period with the exception of Energy, which was hurt by lingering weakness in oil demand. While the international stock market advance was not quite as robust as in the U.S. markets, the MSCI ACWI ex-US Index rose 23.38%, and the MSCI EAFE Index rose 20.39%. Meanwhile emerging market indexes continued their strong rebound during the period with a return of 29.37%, as measured by the MSCI Emerging Markets Index.
PERFORMANCE COMMENTARY
The Buffalo International Fund produced a return of +31.29% for the period, outperforming the Morningstar Global Markets ex-US Index's return of +24.73%. Stock selection was the main driver of performance during the period; however, the sector allocation impact was also supportive due to an underweight to Energy and
Financials, weaker performing sectors of the Morningstar US Large Growth Index, the fund's benchmark. The fund's allocation to cash detracted from relative results during the market's strong advance.
CONTRIBUTORS
Top contributors in the period included Taiwan Semiconductor Manufacturing Co., Sartorius Stedim Biotech SA, and Hexagon. Taiwan Semiconductor, the largest contract semiconductor manufacturer in the world, recovered faster than expected from the pandemic and forecasted better future sales from 5G smartphone demand. Sartorius Stedim, a manufacturer of equipment for the production of biologic drugs, continued to benefit from the growing demand for its products by the pharmaceutical industry, as well as some incremental demand for the increased production of vaccines. Hexagon, a technology and software provider in the fields of geosystems and metrology, continues to benefit from organic growth in its software business related to the increased digitalization of industry.
DETRACTORS
Partially offsetting the contributions from above included lagging results from Grifols S.A., Jardine Matheson, and Hannover Rueck. Grifols, a pharmaceutical company focused on the plasma derivatives business, had a weak stock performance due to concerns around the collection of plasma from human donors in the face of the circulating virus, as well as positive data from a potential future competitor in one business area. While we think the pandemic presents some challenges and will add to costs, the long-term growth of the business continues to be attractive in our view, for a company operating in an industry with high barriers to entry. Jardine Matheson, a conglomerate of consumer-driven businesses in the Asia-Pacific region, reported results that were pressured by pandemic-related declines in consumption. As a result, we have made a decision to eliminate Jardine from the portfolio to explore more attractive risk/reward opportunities. Meanwhile Hannover Re, the 3rd largest global reinsurance company, reported disappointing earnings in the period due to impacts from the virus, but the outlook for price increases into 2021 remains positive for this best-in-class reinsurer.
OUTLOOK
The prospects of a quick and complete bounce back from the economic pain induced by the lockdowns is proving too optimistic. The pandemic continues to sweep its way across the world, flaring up here and there, and

9
European countries have once again implemented various kinds of lockdown measures to control its spread, which is negatively effecting freedom of personal movement and business potential. We expect to see continued market volatility over the next few quarters, as we will likely be in a period of economic uncertainty where most companies have limited visibility into the near-term future of their businesses. We do not yet know exactly in what enduring ways this pandemic might weigh on global economies, nor how behaviors might change for the longer term. Social unrest has been on the rise, and the continued pandemic and ensuing economic stress could cause further turmoil. Given the damage to trade that the pandemic has caused, the rising tensions between the U.S. and China will also be a factor to monitor. Finally, medical advances or failures with respect to a treatment or a vaccine for COVID will have an impact on the outlook for markets. All of these factors create uncertainty and may contribute to market choppiness.
As always, we believe volatility offers opportunity for those investors who take a longer-term view. We will seek out those companies who can survive during this exceptional time and grow throughout the economic cycle beyond. As usual, our focus remains steadfast on investing in attractively priced, financially stable, well-managed companies with innovative strategies fueled by secular growth attributes. We believe this discipline should lead to superior risk-adjusted returns over the long term.
BUFFALO LARGE CAP FUND
The Buffalo Large Cap Fund (the "Fund") returned 38.23% during the 6-month period ending September 30, 2020, but underperformed its primary benchmark, the Morningstar US Large Growth Index, which returned 44.12% during the same period. During the 6-month review period, large cap stocks experienced a sharp rally off their March lows, but continued to see volatility driven by factors including the evolving COVID-19 pandemic, pace of the economic recovery in the U.S., and the November elections. For the semi-annual period, the fund's largest source of underperformance was from stock selection in the Consumer Discretionary sector. This underperformance was offset, in part, by relatively strong stock selection in Industrials and the fund's underweight position in the Telecommunications sector.
Amazon was the top contributor to the fund's performance, with shares increasing by 61% during the
period. Demand for Amazon's delivery services remained strong in the fiscal period as consumers continued to avoid brick-and-mortar stores in the pandemic environment to shift spending online. The company's web services division was also well positioned for continued growth, driven by the need for cloud computing in an increased remote work environment.
Apple was the next top-contributing stock for the fund during the six-month review period, with the stock returning 82%. Demand for the company's devices has remained strong in the downturn, and the upcoming launch of the iPhone 12 with 5G technology appears poised to generate strong growth. The company is also continuing its favorable mix shift to high margin digital services products, which should help drive significant earnings growth in 2021 and beyond.
Microsoft was also among the top contributors for the fund during the fiscal period, with the stock returning 33%. The company's business has been insulated from COVID-19 slowdowns, amidst the increase in remote work and learning. Growth in its cloud services and Office 365 products also remained strong. We believe the company's growth outlook in the December quarter and into 2021 should remain solid regardless of the trajectory of the COVID-19 pandemic and pace of economic recovery.
Marriott was the weakest-performing name for the fund during the six-month period. Like many travel-related consumer companies, this stock experienced a large contraction in demand in its business due to the global evaporation of the travel industry in the 2nd half of the first quarter. Global travel remains far below pre-pandemic levels, and the path of the company's recovery remains uncertain.
Looking forward into the second half of the fiscal year, we believe volatility for large caps is likely to remain in place in the near term. While the rate of job gains has slowed in recent months, the September unemployment rate in the U.S. declined to 7.9% (down from 14.7% in April) and any further slowdown in the recovery could pressure large cap shares. Many of the FAANGMT (Facebook, Apple, Amazon, Netflix, Alphabet — formerly Google, Microsoft and Tesla) stocks which are large positions in the fund have performed well in the "stay and work from home" environment of 2020, and these stocks appear poised to report strong earnings in the September quarter. At the same time, this earnings season will reveal more about how companies with more cyclical business models are performing. Many companies in industries such as bricks-

10
and-mortar retail and travel will likely continue to report very weak results, with an uncertain path to return to pre-pandemic levels. At this point in mid-October, many areas in the U.S. continue to report growth in infections, and signs are emerging that we may be entering a "third wave" of this pandemic. While improved testing and treatments will likely help many states avoid further lockdowns, a surge in infections would be a clear negative for large cap stocks and the overall market. At the same time, we believe that positive data on a vaccine could help the stock market rerate and value names that have suffered the most in 2020, and they would strongly outperform the broad market in this scenario. While we believe that the Federal Reserve and Congress's aggressive policy response to the virus earlier in 2020 helped to prevent a deeper recession, future stimulus agreement appears uncertain in the political environment. We believe that individual consumers could suffer if no deal is reached, which could have widespread impacts on many market sectors.
The larger cap Russell 1000 Growth Index and the smaller cap Russell 2000 Growth Index generated comparable returns in the 6-month period of 44.74% and 39.93%, respectively. However, value-oriented stocks trailed growth stocks during the period, as the Russell 1000 Value Index and the smaller cap Russell 2000 Value Index produced returns of 18.45% and 21.58%, respectively. In an environment of continued job growth, positive vaccine data, and increased clarity on the election, we believe more cyclical companies could start to outperform the higher growth stocks that have led large cap returns this fiscal year. We are prepared to make some slight adjustments to our portfolio in this scenario. We continue to be diligent in our process of finding growth companies that benefit from long-term trends while still trading at reasonable valuations and appreciate your confidence in our process.
BUFFALO MID CAP FUND
The Buffalo Mid Cap Fund returned 31.57% during the period. While we would normally be happy with those returns in most six-month periods, we trailed the Morningstar US Mid Growth Index's return of 47.53%. Stock selection in the Technology and Health Care sectors, along with a drag from cash, drove most of the relative underperformance.
Veeva Systems was the leading contributor to performance, rising 80% in the period after reporting strong earnings and benefiting from the general preference among investors for rapidly growing software
companies this year. Their Vault product has strong momentum in the marketplace, and fears of declining customer relationship management market share seem to have been addressed. They also announced a new consumer facing application that could expand their addressable market.
CoStar Group was another top contributor. The company reported 2nd quarter earnings that were much better than investors expected led by the Apartments.com business which is proving to be somewhat counter-cyclical. Sales for their core CoStar Suite also recovered from coronavirus induced weakness quicker than anticipated.
After a turbulent start to the year, the focus remains on the trajectory of the COVID-19 pandemic and the associated economic fallout. Unfortunately, the gradual reopening of the economy has led to a surge in virus cases. We expect state and local governments to resist shutting down economies again with strict shelter in place orders. On the positive side, several vaccines appear to show promise in immunizing people from the virus. The availability of a vaccine or cure would, obviously, be a welcome development and lead to more rapid and broader economic growth.
Two underperforming companies during the fiscal period were Western Digital and TripAdvisor. After being impacted by the spring shutdown, both companies were positioned to benefit from a reopening of the economy. However, that theme met resistance as the U.S. experienced a 2nd surge in virus cases during the summer.
Western Digital is broadly tied to computing demand across enterprise and consumer markets through its data storage technologies. While there were pockets of strong demand from cloud and consumer computing, these were more than offset by weakness in enterprise storage and mobile device sales. In addition, new management surprised investors by eliminating its dividend in favor of investing in growth. This is perhaps a good long-term decision, but created a shock to the cohort of investors historically drawn to the stock due to the company's dividend payments which led to a turnover in the shareholder base.
TripAdvisor is tied to travel activity, which increased after lockdown restrictions were lifted. However, the impact remained marginal on its core travel advertising business and experiences booking business. Advertising for travel businesses will likely only fully recover once there is more certainty that the virus has been contained. At that point, TripAdvisor's customers can more confidently spend to attract travelers without the fear of cancellations.

11
While the timing and trajectory are unclear, the pandemic will end and the economy will eventually recover. When that happens, economic growth will broaden and the scarcity value of growth in equity markets will diminish. The recent outperformance of "growth at any price" cannot continue forever, and a reversal in market leadership is likely to be painful for investors that ignored valuations. While we expect volatility to remain high, it will not change our investment philosophy. We will continue to invest in businesses with solid growth opportunities, durable competitive advantages, scalable business models, and good management teams, when they are trading at attractive valuations. Thank you for your continued support.
BUFFALO SMALL CAP FUND
During the 6-month period ending September 30, 2020, the Buffalo Small Cap Fund (the "Fund") returned 58.14% outperforming its primary benchmark, the Morningstar US Small Growth Index (the "Index"), which returned 42.60% during the same period. During the 6-month period, small cap stocks experienced a sharp rally off their March bottoms, and continued to experience volatility driven by factors including the evolving COVID-19 pandemic, pace of the economic recovery in the U.S., and the November elections. In the first fiscal quarter ending June 30, the Fund returned 44.02% compared to the Index's return of 32.84%, while in the second fiscal quarter, the Fund returned 9.91% compared to the Index's return of 7.35%. For the semi-annual period, the fund's largest sources of outperformance were from strong stock selection in Information Technology ("IT") and Consumer Discretionary. Notably, the fund experienced broad outperformance across all sectors except Energy and Consumer Staples where results were in -line with the Index.
In spite of generally strong stock selection in the Health Care sector, eHealth was the largest detractor from performance during the semi-annual period. The company is a market leader in helping seniors select the best Medicare Advantage, Supplemental Medicare, and/or Part D health care insurance options. The company's share price has taken a step back due, in part, to investor concerns about increased churn or lower lifetime value of their customers. However, we believe the long-term outlook for the company and its business model remains strong and the company has taken the appropriate steps to reduce customer churn.
Livongo Health was the fund's largest contributor to performance in the 6-month period returning 391%. The
company is a leading provider of technology solutions for remote monitoring of patients with chronic medical conditions. In the current environment of COVID-19 quarantines, demand for the company's solutions remains solid. Strong operating performance along with increased investor willingness to pay higher multiples for companies with solutions that benefit from the pandemic, helped drive the stock to all-time highs. During the 3rd quarter Livongo and Teladoc Health announced plans to merge and we exited the position as the combined company has graduated beyond the portfolio's target capitalization range.
Penn National Gaming, Inc. was the next largest contributor for the fund as the stock rose 475% during the period. The company sold off sharply in the 1st quarter along with other companies that would suffer from a pandemic-driven shutdown, but has since rallied strongly. The company is an owner and manager of gaming and racing properties, sports betting operations, and video gaming terminals, including 41 properties in 19 states. Additionally, the company recently purchased a 36% equity interest in Barstool Sports, Inc., a leading digital sports, entertainment and media platform. The combination of the Barstool's audience, brand and marketing engine along with Penn's large geographic footprint create an unrivaled omni-channel offering. The company launched an online sports betting app called Barstool Sports in the third quarter with great success. Penn's stock performance has been driven by better-than-expected preannounced 3rd quarter margins and revenue growth, as well as the large opportunity in the company's omni-channel offering created by the Barstool Sports partnership.
Bandwidth was another top contributor to performance in the 6-month period returning 159%. The company provides communications services and software to enterprises and many of the cloud based communications companies that are gaining share and experiencing accelerated growth during the pandemic, such as Zoom and Ring Central. The company recently completed a large acquisition to expand its international business, which we believe offers significant opportunities for growth similar to the U.S. market.
Looking forward into the second half of the fiscal year, we believe volatility for small caps is likely to remain in place in the near term, but many factors point to optimism for the holdings in the Fund and the overall markets later this quarter and beyond. While the rate of job gains has slowed in recent months, the September unemployment rate in the U.S. declined to 7.9% (down from 14.7% in April) and we are optimistic the job market will continue to mend

12
in coming months. Given the market's rapid recovery from March lows, future returns will depend significantly on the trajectory of corporate earnings into 2021. While "work from home" companies and sectors with exposure to housing have fared well this year, we believe that many companies have adapted their businesses, and are poised to report encouraging results in this environment of improving business spending and consumer confidence. Positive information flow on new COVID-19 treatment options, vaccine progress and increased testing capacity could continue to allow the market to grind higher allowing investors to look beyond near-term infection numbers. Fiscal and monetary policy remain extremely accommodative worldwide, and we believe both political parties have strong interest in passing stimulus that will help consumers before year end.
In an environment of continued job growth, positive vaccine data, and increased clarity on the election results,
we believe more cyclical companies could start to outperform the high growth companies that have led small cap returns thus far this fiscal year. We have slightly increased our cyclical growth weighting in the portfolio as we have trimmed or sold some high growth stocks that have either graduated into the mid cap range or have reached full valuation. We continue to be diligent in our process of finding growth companies that benefit from long-term trends while still trading at reasonable valuations and appreciate your confidence in our process.
Sincerely,

John C. Kornitzer
President, KCM
The Funds' investment objectives, risks, charges and expenses must be considered carefully before investing. The summary and statutory prospectus contains this and other important information about the investment company, and it may be obtained by calling 1-800-49-BUFFALO or visiting www.buffalofunds.com. Read it carefully before investing.
Past performance does not guarantee future results. Mutual fund investing involves risk. Principal loss is possible.
Kornitzer Capital Management, Inc. is the Advisor to the Buffalo Funds which are distributed by Quasar Distributors, LLC.
An outbreak of an infectious respiratory illness caused by a novel coronavirus known as COVID-19 has affected the worldwide economy, as well as the economies of individual countries, the financial health of individual companies and the market in general in significant and unforeseen ways. The future impact of COVID-19 is currently unknown, and it may exacerbate other risks that apply to the Funds. Any such impact could affect the Funds' performance, the performance of the securities in which the Funds invest and may lead to losses on your investment in the Funds.
The opinions expressed are those of the Portfolio Manager(s) and are subject to change, are not guaranteed and should not be considered recommendations to buy or sell any security.
Bond ratings are grades given to bonds that indicate their credit quality as determined by a private independent rating service such as Standard & Poor's. The firm evaluates a bond issuer's financial strength, or its ability to pay a bond's principal and interest in a timely fashion. Ratings are expressed as letters ranging from 'AAA', which is the highest grade, to 'D', which is the lowest grade. In limited situations when the rating agency has not issued a formal rating, the Advisor will classify the security as nonrated.
Earnings growth is not representative of a fund's future performance.
A basis point is one hundredth of a percentage point (0.01%) Yield is the income return on an investment.
Yield to worst is the lowest potential yield that can be received on a bond without the issuer actually defaulting. A Spread is the difference between the bid and the ask price of a security.
Spread to worst is the difference between the yield to worst of a bond and the yield to worst of a U.S. Treasury security with similar duration.
Duration is a commonly used measure of the potential volatility of the price of a debt security, or the aggregate market value of a portfolio of debt securities, prior to maturity. Securities with a longer duration generally have more volatile prices than securities of comparable quality with a shorter duration.
Active share is a measure of the percentage of stock holdings in a manager's portfolio that differs from the benchmark index.
Yield curve is the curve on a graph in which the yield of fixed-interest securities is plotted against the length of time they have to run to maturity.
The MSCI ACWI Index is a free float-adjusted market capitalization weighted index that is designed to measure the equity market performance of developed and emerging markets.
The MSCI ACWI ex US Index captures large an dmid cap representation across 22 of 23 developed market countries (excluding the US) and 26 emerging markets countries.
The MSCI Emerging Markets Index is a free float-adjusted market capitalization index that is designed to measure equity market performance of emerging markets.
The Russell 1000 Growth Index refers to a composite that includes large and mid-cap companies located in the U.S. that also exhibit a growth probability.
The Russell 2000 Growth Index refers to a composite that includes small-cap companies located in the U.S. that also exhibit a growth probability.
The Russell 1000 Value Index refers to a composite of large and mid-cap companies located in the U.S. that also exhibit a value probability.
The Russell 2000 Value Index refers to a composite that includes small-cap companies located in the U.S. that also exhibit a value probability.

13
INVESTMENT RESULTS (UNAUDITED)
Total Returns as of September 30, 2020 (Unaudited)
| | | | | | Average Annual | |
| | Gross Expense
Ratio* | | Six
Months | | One Year | | Five Years | | Ten Years | | Investor
Class
Since
Inception | | Institutional
Class
Since
Inception | |
Buffalo Discovery Fund — Investor Class
(inception date 4/16/01) | | | 1.01 | % | | | 36.37 | % | | | 16.76 | % | | | 13.89 | % | | | 14.41 | % | | | 9.78 | % | | | N/A | | |
Buffalo Discovery Fund — Institutional Class
(inception date 7/1/19)1 | | | 0.86 | % | | | 36.46 | % | | | 16.96 | % | | | 14.06 | % | | | 14.58 | % | | | N/A | | | | 12.02 | % | |
Morningstar US Mid Growth Index | | | N/A | | | | 47.53 | % | | | 32.62 | % | | | 17.20 | % | | | 15.09 | % | | | 9.16 | % | | | 21.42 | % | |
Lipper Multi-Cap Growth Funds Index | | | N/A | | | | 48.34 | % | | | 36.56 | % | | | 17.67 | % | | | 15.37 | % | | | 8.32 | % | | | 26.19 | % | |
Buffalo Dividend Focus Fund — Investor Class
(inception date 12/03/12) | | | 0.95 | % | | | 27.77 | % | | | 9.80 | % | | | 11.63 | % | | | N/A | | | | 12.12 | % | | | N/A | | |
Buffalo Dividend Focus Fund —
Institutional Class (inception date 7/1/19)1 | | | 0.80 | % | | | 27.86 | % | | | 9.91 | % | | | 11.79 | % | | | N/A | | | | N/A | | | | 9.56 | % | |
Morningstar US Large-Mid Cap Index | | | N/A | | | | 33.41 | % | | | 16.71 | % | | | 14.21 | % | | | N/A | | | | 14.19 | % | | | 13.82 | % | |
S&P 500 Index | | | N/A | | | | 31.31 | % | | | 15.15 | % | | | 14.15 | % | | | N/A | | | | 14.07 | % | | | 12.78 | % | |
Lipper Equity Income Funds Index | | | N/A | | | | 20.46 | % | | | -1.35 | % | | | 8.91 | % | | | N/A | | | | 9.56 | % | | | 0.49 | % | |
Buffalo Emerging Opportunities Fund —
Investor Class (inception date 5/21/04) | | | 1.49 | % | | | 51.52 | % | | | 27.41 | % | | | 16.15 | % | | | 15.71 | % | | | 9.52 | % | | | N/A | | |
Buffalo Emerging Opportunities Fund —
Institutional Class (inception date 7/1/19)1 | | | 1.35 | % | | | 51.72 | % | | | 27.59 | % | | | 16.33 | % | | | 15.89 | % | | | N/A | | | | 16.47 | % | |
Morningstar US Small Growth Index | | | N/A | | | | 42.60 | % | | | 22.23 | % | | | 13.79 | % | | | 13.39 | % | | | 9.81 | % | | | 12.81 | % | |
Lipper Small-Cap Growth Funds Index | | | N/A | | | | 45.75 | % | | | 20.08 | % | | | 14.15 | % | | | 13.07 | % | | | 9.39 | % | | | 11.71 | % | |
Buffalo Flexible Income Fund —
Investor Class (inception date 8/12/94) | | | 1.01 | % | | | 17.18 | % | | | -7.20 | % | | | 4.93 | % | | | 6.39 | % | | | 6.55 | % | | | N/A | | |
Buffalo Flexible Income Fund —
Institutional Class (inception date 7/1/19)1 | | | 0.86 | % | | | 17.21 | % | | | -7.11 | % | | | 5.08 | % | | | 6.55 | % | | | N/A | | | | -5.22 | % | |
Morningstar Moderately Aggressive
Target Risk Index** | | | N/A | | | | 22.95 | % | | | 6.97 | % | | | 9.19 | % | | | 8.48 | % | | | N/A | | | | 5.64 | % | |
60% Morningstar US Large Cap Index/
40% ICE BofAML US High Yield Master II Index | | | N/A | | | | 25.60 | % | | | 12.72 | % | | | 11.87 | % | | | 11.14 | % | | | 9.04 | % | | | 10.95 | % | |
Lipper Mixed-Asset Target Allocation
Moderate Funds Index | | | N/A | | | | 18.20 | % | | | 7.32 | % | | | 7.48 | % | | | 7.12 | % | | | 6.89 | % | | | 6.36 | % | |
Buffalo Growth Fund — Investor Class
(inception date 5/19/95) | | | 0.92 | % | | | 36.27 | % | | | 22.88 | % | | | 15.54 | % | | | 14.15 | % | | | 10.71 | % | | | N/A | | |
Buffalo Growth Fund — Institutional Class
(inception date 7/1/19)1 | | | 0.78 | % | | | 36.42 | % | | | 23.06 | % | | | 15.71 | % | | | 14.32 | % | | | N/A | | | | 16.88 | % | |
Morningstar US Growth Index*** | | | N/A | | | | 45.08 | % | | | 41.39 | % | | | 19.94 | % | | | 17.30 | % | | | N/A | | | | 29.93 | % | |
Lipper Large Cap Growth Funds Index | | | N/A | | | | 44.07 | % | | | 37.42 | % | | | 18.91 | % | | | 15.90 | % | | | 9.35 | % | | | 27.61 | % | |

14
| | | | | | Average Annual | |
| | Gross Expense
Ratio* | | Six
Months | | One Year | | Five Years | | Ten Years | | Investor
Class
Since
Inception | | Institutional
Class
Since
Inception | |
Buffalo High Yield Fund — Investor Class
(inception date 5/19/95) | | | 1.02 | % | | | 16.13 | % | | | 4.54 | % | | | 4.78 | % | | | 5.39 | % | | | 6.85 | % | | | N/A | | |
Buffalo High Yield Fund — Institutional Class
(inception date 7/1/19)1 | | | 0.88 | % | | | 16.19 | % | | | 4.57 | % | | | 4.91 | % | | | 5.54 | % | | | N/A | | | | 4.62 | % | |
ICE BofAML US High Yield Master II Index | | | N/A | | | | 14.76 | % | | | 2.30 | % | | | 6.61 | % | | | 6.28 | % | | | 7.00 | % | | | 2.69 | % | |
Lipper High Yield Bond Funds Index | | | N/A | | | | 13.85 | % | | | 0.29 | % | | | 5.35 | % | | | 5.57 | % | | | 5.71 | % | | | 0.91 | % | |
Buffalo International Fund — Investor Class
(inception date 9/28/07) | | | 1.03 | % | | | 31.29 | % | | | 15.51 | % | | | 11.30 | % | | | 7.61 | % | | | 5.24 | % | | | N/A | | |
Buffalo International Fund —
Institutional Class (inception date 7/1/19)1 | | | 0.88 | % | | | 31.44 | % | | | 15.65 | % | | | 11.46 | % | | | 7.77 | % | | | N/A | | | | 10.35 | % | |
Morningstar Global Markets ex-US Index | | | N/A | | | | 24.73 | % | | | 3.49 | % | | | 6.67 | % | | | 4.51 | % | | | 1.87 | % | | | 1.02 | % | |
Lipper International Funds Index | | | N/A | | | | 25.86 | % | | | 5.28 | % | | | 6.23 | % | | | 5.09 | % | | | 1.93 | % | | | 2.71 | % | |
Buffalo Large Cap Fund — Investor Class
(inception date 5/19/95) | | | 0.94 | % | | | 38.23 | % | | | 26.21 | % | | | 16.30 | % | | | 14.95 | % | | | 10.34 | % | | | N/A | | |
Buffalo Large Cap Fund — Institutional Class
(inception date 7/1/19)1 | | | 0.80 | % | | | 38.40 | % | | | 26.41 | % | | | 16.48 | % | | | 15.12 | % | | | N/A | | | | 20.75 | % | |
Morningstar US Large Growth Index**** | | | N/A | | | | 44.12 | % | | | 40.45 | % | | | 20.34 | % | | | 17.79 | % | | | N/A | | | | 30.18 | % | |
Lipper Large Cap Growth Funds Index | | | N/A | | | | 44.07 | % | | | 37.42 | % | | | 18.91 | % | | | 15.90 | % | | | 9.35 | % | | | 27.61 | % | |
Buffalo Mid Cap Fund — Investor Class
(inception date 12/17/01) | | | 1.02 | % | | | 31.57 | % | | | 17.87 | % | | | 11.48 | % | | | 10.88 | % | | | 8.77 | % | | | N/A | | |
Buffalo Mid Cap Fund — Institutional Class
(inception date 7/1/19)1 | | | 0.89 | % | | | 31.77 | % | | | 18.06 | % | | | 11.66 | % | | | 11.05 | % | | | N/A | | | | 14.91 | % | |
Morningstar US Mid Growth Index | | | N/A | | | | 47.53 | % | | | 32.62 | % | | | 17.20 | % | | | 15.09 | % | | | 9.82 | % | | | 21.42 | % | |
Lipper Mid-Cap Growth Funds Index | | | N/A | | | | 42.72 | % | | | 23.13 | % | | | 15.38 | % | | | 13.44 | % | | | 9.14 | % | | | 15.95 | % | |
Buffalo Small Cap Fund — Investor Class
(inception date 4/14/98) | | | 1.01 | % | | | 58.14 | % | | | 43.10 | % | | | 18.90 | % | | | 13.93 | % | | | 12.67 | % | | | N/A | | |
Buffalo Small Cap Fund — Institutional Class
(inception date 7/1/19)1 | | | 0.86 | % | | | 58.36 | % | | | 43.31 | % | | | 19.08 | % | | | 14.11 | % | | | N/A | | | | 28.95 | % | |
Morningstar US Small Growth Index | | | N/A | | | | 42.60 | % | | | 22.23 | % | | | 13.79 | % | | | 13.39 | % | | | 6.61 | % | | | 12.81 | % | |
Lipper Small-Cap Growth Funds Index | | | N/A | | | | 45.75 | % | | | 20.08 | % | | | 14.15 | % | | | 13.07 | % | | | 7.51 | % | | | 11.71 | % | |
1 The Institutional Class commenced operations on 7/1/2019. Performance for periods prior to 7/1/2019 is based on the performance of the Investor Class adjusted for the Shareholder Servicing fee of up to 0.15% of the Investor Class.
* As reported in the Funds' Prospectus dated July 29, 2020. Current period gross expense ratio for each Fund can be found on the Financial Highlights, beginning on page 100.
** The inception date of the Morningstar Moderately Aggressive Target Risk Index is February 18, 2009. The annualized return since inception as of September 30, 2020 is 11.09%.
*** The inception date of the Morningstar US Growth Index is July 3, 2002. The annualized return since inception as of September 30, 2020 is 7.93%.
**** The inception date of the Morningstar US Large Growth Index is July 3, 2002. The annualized return since inception as of September 30, 2020 is 7.36%.
Performance data quoted represents past performance; past performance does not guarantee future results. The investment return and principal value of an investment will fluctuate so that an investor's shares, when redeemed, may be worth more or less than their original cost. Current performance of the Funds may be lower or higher than the performance quoted. Performance data current as of the most recent month-end may be obtained by calling 1-800-49-BUFFALO or by visiting the website at www.buffalofunds.com.
The returns shown were achieved during a period of generally rising market values. This past performance is not indicative of an investor's future results.

15
The Funds' returns shown do not reflect the deduction of taxes that a shareholder would pay on distributions or the redemption of shares. The benchmark returns shown, excluding the Lipper Indices, reflect the reinvestment of dividends and capital gains but do not reflect the deduction of any investment management fees, other expenses or taxes. The performance of the Lipper Indices is presented net of the funds' fees and expenses; however, applicable sales charges are not taken into consideration. One cannot invest directly in an index.
The Morningstar US Mid Growth Index measures the performance of US mid-cap stocks that are expected to grow at a faster pace than the rest of the market as measured by forward earnings, historical earnings, book value, cash flow and sales. The Lipper Multi-Cap Growth Funds Index is an unmanaged index that reflects the net asset value weighted return of 30 of the largest multi-cap growth funds tracked by Lipper. Its returns include net reinvested dividends. The Morningstar US Large-Mid Cap Index measures the performance of the US equity market targeting the top 90% of stocks by market capitalization. The Lipper Equity Income Funds Index tracks funds that seek relatively high current income and growth of income by investing at least 65% of their portfolio in dividend-paying equity securities. These funds' gross or net yield must be at least 125% of the average gross or net yield of the U.S. diversified equity fund universe. The Morningstar US Small Growth Index measures the performance of US small-cap stocks that are expected to grow at a faster pace than the rest of the market as measured by forward earnings, historical earnings, book value, cash flows and sales. The Lipper Small-Cap Growth Funds Index is an unmanaged, equally weighted performance index of the 30 largest qualifying mutual funds (based on net assets) in the Lipper Small-Cap classification. The Morningstar Moderately Aggressive Target Risk Index represents a portfolio of global equities, bonds and traditional inflation hedges, and seeks approximately 80% exposure to global equity markets. The Morningstar US Large Cap Index measures the performance of the US equity market targeting the top 70% of stocks by market capitalization. The ICE BofAML US High Yield Master II Index tracks the performance of below investment grade U.S. dollar-denominated corporate bonds publicly issued in the U.S. domestic market. The Lipper Mixed-Asset Target Allocation Moderate Funds Index is an average of funds that, by portfolio practice, maintain a mix of between 40%-60% equity securities, with the remainder invested in bonds, cash, and cash equivalents. The total return of the Lipper Average does not include the effect of sales charges. The Morningstar US Growth Index measures the performance of US stocks that are expected to grow at a faster pace than the rest of the market as measured by forward earnings, historical earnings, book value, cash flow and sales. The Lipper Large Cap Growth Funds Index is an unmanaged, equally weighted performance index of the 30 largest qualifying mutual funds (based on net assets) in the Lipper Large-Cap classification. The Lipper High Yield Bond Funds Index is a widely recognized index of the 30 largest mutual funds that invest primarily in high yield bonds. The Morningstar Global Market ex-US Index is designed to provide exposure to the top 97% market capitalization in each of two market segments, developed markets, excluding the United States, and emerging markets. The Lipper International Funds Index is an unmanaged, equally weighted performance index of the 30 largest qualifying mutual funds (based on net assets) in the Lipper International classification. The Morningstar US Large Growth Index measures the performance of US large-cap stocks that are expected to grow at a faster pace than the rest of the market as measured by forward earnings, historical earnings, book value, cash flow and sales. The Morningstar US Mid Growth Index uses a 10-factor style box methodology that categorizes stocks by their growth and value orientations. The Lipper Mid-Cap Growth Funds Index is an unmanaged, equally weighted performance index of the 30 largest qualifying mutual funds (based on net assets) in the Lipper Mid-Cap classification. The S&P 500 Index is a capitalization weighted index of 500 large capitalization stocks which is designed to measure broad domestic securities markets.
Please refer to the prospectus for special risks associated with investing in the Buffalo Funds, including, but not limited to, risks involved with investments in healthcare and information technology companies, foreign securities, debt securities, lower- or unrated securities and medium and small companies. Fund holdings and sector allocations are subject to change at any time and should not be considered a recommendation to buy or sell any security. Please refer to the Schedule of Investments or Options Written for a complete list of Fund holdings.

16
EXPENSE EXAMPLE (UNAUDITED)
As a shareholder of the Funds, you incur two types of costs: (1) transaction costs (including redemption fees) and (2) ongoing costs, including management fees, shareholder servicing fees (Investor Class only) and other Fund specific expenses. The examples below are intended to help you understand your ongoing costs (in dollars) of investing in the Funds and to compare these costs with the ongoing costs of investing in other mutual funds. The example is based on an investment of $1,000 invested at the beginning of the period and held for the entire period (April 1, 2020 – September 30, 2020).
ACTUAL EXPENSES
The first line of the tables below provides information about actual account values and actual expenses. You may use the information in this line, together with the amount you invested, to estimate the expenses that you paid over the period. Simply divide your account by $1,000 (for example, an $8,600 account value divided by $1,000 = 8.6), then multiply the result by the number in the first line under the heading entitled "Expenses Paid During the Period" to estimate the expenses you paid on your account during the period. Although the Funds charge no sales load or transaction fees, you will be assessed fees for outgoing wire transfers, returned checks and stop payment orders at prevailing rates charged by U.S. Bancorp Fund Services, LLC, the Funds' transfer agent. If you request that a redemption be made by wire transfer, currently a $15.00 fee is charged by the Funds' transfer agent. To the extent a Fund invests in shares of other investment companies as part of its investment strategy, you will indirectly bear your proportionate share of any fees and expenses charged by
the underlying funds in which the Fund invests in addition to the expenses of the Fund. Actual expenses of the underlying funds are expected to vary among the various underlying funds. These expenses are not included in the examples below. The examples below include management fees, registration fees and other expenses. However, the examples below do not include portfolio trading commissions and related expenses and other extraordinary expenses as determined under U.S. generally accepted accounting principles.
HYPOTHETICAL EXAMPLE FOR COMPARISON PURPOSES
The second line of each table below provides information about hypothetical account values and hypothetical expenses based on the Funds' actual expense ratios and an assumed rate of return of 5% per year before expenses, which are not the Funds' actual returns. The hypothetical account values and expenses may not be used to estimate the actual ending account balance or expenses you paid for the period. You may use this information to compare the ongoing costs of investing in our Funds and other funds. To do so, compare this 5% hypothetical example with the 5% hypothetical examples that appear in the shareholder reports of the other funds. Please note that the expenses shown in the tables are meant to highlight your ongoing costs only and do not reflect any transactional costs. Therefore, the second line of the tables is useful in comparing ongoing costs only, and will not help you determine the relative total costs of owning different funds. In addition, if these transactional costs were included, your costs would have been higher.
BUFFALO DISCOVERY FUND | | Beginning
Account Value
April 1, 2020 | | Ending
Account Value
September 30, 2020 | | Expenses Paid During
Period April 1, 2020 -
September 30, 2020* | |
Investor Class | |
Actual | | $ | 1,000.00 | | | $ | 1,363.70 | | | $ | 5.98 | | |
Hypothetical (5% return before expenses) | | $ | 1,000.00 | | | $ | 1,020.00 | | | $ | 5.11 | | |
Institutional Class | |
Actual | | $ | 1,000.00 | | | $ | 1,364.60 | | | $ | 5.10 | | |
Hypothetical (5% return before expenses) | | $ | 1,000.00 | | | $ | 1,020.76 | | | $ | 4.36 | | |
* Expenses for the Investor Class are equal to the Fund's annualized expense ratio of 1.01%, multiplied by the average account value over the period, multiplied by 183/365 to reflect the one-half year period. Expenses for the Institutional Class are equal to the Fund's annualized expense ratio of 0.86%, multiplied by the average account value over the period, multiplied by 183/365 to reflect a one-half year period.

17
BUFFALO DIVIDEND FOCUS FUND | | Beginning
Account Value
April 1, 2020 | | Ending
Account Value
September 30, 2020 | | Expenses Paid During
Period April 1, 2020 -
September 30, 2020* | |
Investor Class | |
Actual | | $ | 1,000.00 | | | $ | 1,277.70 | | | $ | 5.48 | | |
Hypothetical (5% return before expenses) | | $ | 1,000.00 | | | $ | 1,020.26 | | | $ | 4.86 | | |
Institutional Class | |
Actual | | $ | 1,000.00 | | | $ | 1,278.60 | | | $ | 4.63 | | |
Hypothetical (5% return before expenses) | | $ | 1,000.00 | | | $ | 1,021.01 | | | $ | 4.10 | | |
* Expenses for the Investor Class are equal to the Fund's annualized expense ratio of 0.96%, multiplied by the average account value over the period, multiplied by 183/365 to reflect the one-half year period. Expenses for the Institutional Class are equal to the Fund's annualized expense ratio of 0.81%, multiplied by the average account value over the period, multiplied by 183/365 to reflect a one-half year period.
BUFFALO EMERGING OPPORTUNITIES FUND | | Beginning
Account Value
April 1, 2020 | | Ending
Account Value
September 30, 2020 | | Expenses Paid During
Period April 1, 2020 -
September 30, 2020* | |
Investor Class | |
Actual | | $ | 1,000.00 | | | $ | 1,515.20 | | | $ | 9.52 | | |
Hypothetical (5% return before expenses) | | $ | 1,000.00 | | | $ | 1,017.50 | | | $ | 7.64 | | |
Institutional Class | |
Actual | | $ | 1,000.00 | | | $ | 1,517.20 | | | $ | 8.58 | | |
Hypothetical (5% return before expenses) | | $ | 1,000.00 | | | $ | 1,018.25 | | | $ | 6.88 | | |
* Expenses for the Investor Class are equal to the Fund's annualized expense ratio of 1.51%, multiplied by the average account value over the period, multiplied by 183/365 to reflect the one-half year period. Expenses for the Institutional Class are equal to the Fund's annualized expense ratio of 1.36%, multiplied by the average account value over the period, multiplied by 183/365 to reflect a one-half year period.
BUFFALO FLEXIBLE INCOME FUND | | Beginning
Account Value
April 1, 2020 | | Ending
Account Value
September 30, 2020 | | Expenses Paid During
Period April 1, 2020 -
September 30, 2020* | |
Investor Class | |
Actual | | $ | 1,000.00 | | | $ | 1,171.80 | | | $ | 5.50 | | |
Hypothetical (5% return before expenses) | | $ | 1,000.00 | | | $ | 1,020.00 | | | $ | 5.11 | | |
Institutional Class | |
Actual | | $ | 1,000.00 | | | $ | 1,172.10 | | | $ | 4.68 | | |
Hypothetical (5% return before expenses) | | $ | 1,000.00 | | | $ | 1,020.76 | | | $ | 4.36 | | |
* Expenses for the Investor Class are equal to the Fund's annualized expense ratio of 1.01%, multiplied by the average account value over the period, multiplied by 183/365 to reflect the one-half year period. Expenses for the Institutional Class are equal to the Fund's annualized expense ratio of 0.86%, multiplied by the average account value over the period, multiplied by 183/365 to reflect a one-half year period.
BUFFALO GROWTH FUND | | Beginning
Account Value
April 1, 2020 | | Ending
Account Value
September 30, 2020 | | Expenses Paid During
Period April 1, 2020 -
September 30, 2020* | |
Investor Class | |
Actual | | $ | 1,000.00 | | | $ | 1,362.70 | | | $ | 5.51 | | |
Hypothetical (5% return before expenses) | | $ | 1,000.00 | | | $ | 1,020.41 | | | $ | 4.71 | | |
Institutional Class | |
Actual | | $ | 1,000.00 | | | $ | 1,364.20 | | | $ | 4.62 | | |
Hypothetical (5% return before expenses) | | $ | 1,000.00 | | | $ | 1,021.16 | | | $ | 3.95 | | |
* Expenses for the Investor Class are equal to the Fund's annualized expense ratio of 0.93%, multiplied by the average account value over the period, multiplied by 183/365 to reflect the one-half year period. Expenses for the Institutional Class are equal to the Fund's annualized expense ratio of 0.78%, multiplied by the average account value over the period, multiplied by 183/365 to reflect a one-half year period.

18
BUFFALO HIGH YIELD FUND | | Beginning
Account Value
April 1, 2020 | | Ending
Account Value
September 30, 2020 | | Expenses Paid During
Period April 1, 2020 -
September 30, 2020* | |
Investor Class | |
Actual | | $ | 1,000.00 | | | $ | 1,161.30 | | | $ | 5.47 | | |
Hypothetical (5% return before expenses) | | $ | 1,000.00 | | | $ | 1,020.00 | | | $ | 5.11 | | |
Institutional Class | |
Actual | | $ | 1,000.00 | | | $ | 1,161.90 | | | $ | 4.66 | | |
Hypothetical (5% return before expenses) | | $ | 1,000.00 | | | $ | 1,020.76 | | | $ | 4.36 | | |
* Expenses for the Investor Class are equal to the Fund's annualized expense ratio of 1.01%, multiplied by the average account value over the period, multiplied by 183/365 to reflect the one-half year period. Expenses for the Institutional Class are equal to the Fund's annualized expense ratio of 0.86%, multiplied by the average account value over the period, multiplied by 183/365 to reflect a one-half year period.
BUFFALO INTERNATIONAL FUND | | Beginning
Account Value
April 1, 2020 | | Ending
Account Value
September 30, 2020 | | Expenses Paid During
Period April 1, 2020 -
September 30, 2020* | |
Investor Class | |
Actual | | $ | 1,000.00 | | | $ | 1,312.90 | | | $ | 5.97 | | |
Hypothetical (5% return before expenses) | | $ | 1,000.00 | | | $ | 1,019.90 | | | $ | 5.22 | | |
Institutional Class | |
Actual | | $ | 1,000.00 | | | $ | 1,314.40 | | | $ | 5.11 | | |
Hypothetical (5% return before expenses) | | $ | 1,000.00 | | | $ | 1,020.66 | | | $ | 4.46 | | |
* Expenses for the Investor Class are equal to the Fund's annualized expense ratio of 1.03%, multiplied by the average account value over the period, multiplied by 183/365 to reflect the one-half year period. Expenses for the Institutional Class are equal to the Fund's annualized expense ratio of 0.88%, multiplied by the average account value over the period, multiplied by 183/365 to reflect a one-half year period.
BUFFALO LARGE CAP FUND | | Beginning
Account Value
April 1, 2020 | | Ending
Account Value
September 30, 2020 | | Expenses Paid During
Period April 1, 2020 -
September 30, 2020* | |
Investor Class | |
Actual | | $ | 1,000.00 | | | $ | 1,382.30 | | | $ | 5.67 | | |
Hypothetical (5% return before expenses) | | $ | 1,000.00 | | | $ | 1,020.31 | | | $ | 4.81 | | |
Institutional Class | |
Actual | | $ | 1,000.00 | | | $ | 1,384.00 | | | $ | 4.78 | | |
Hypothetical (5% return before expenses) | | $ | 1,000.00 | | | $ | 1,021.06 | | | $ | 4.05 | | |
* Expenses for the Investor Class are equal to the Fund's annualized expense ratio of 0.95%, multiplied by the average account value over the period, multiplied by 183/365 to reflect the one-half year period. Expenses for the Institutional Class are equal to the Fund's annualized expense ratio of 0.80%, multiplied by the average account value over the period, multiplied by 183/365 to reflect a one-half year period.
BUFFALO MID CAP FUND | | Beginning
Account Value
April 1, 2020 | | Ending
Account Value
September 30, 2020 | | Expenses Paid During
Period April 1, 2020 -
September 30, 2020* | |
Investor Class | |
Actual | | $ | 1,000.00 | | | $ | 1,315.70 | | | $ | 6.04 | | |
Hypothetical (5% return before expenses) | | $ | 1,000.00 | | | $ | 1,019.85 | | | $ | 5.27 | | |
Institutional Class | |
Actual | | $ | 1,000.00 | | | $ | 1,317.70 | | | $ | 5.17 | | |
Hypothetical (5% return before expenses) | | $ | 1,000.00 | | | $ | 1,020.61 | | | $ | 4.51 | | |
* Expenses for the Investor Class are equal to the Fund's annualized expense ratio of 1.04%, multiplied by the average account value over the period, multiplied by 183/365 to reflect the one-half year period. Expenses for the Institutional Class are equal to the Fund's annualized expense ratio of 0.89%, multiplied by the average account value over the period, multiplied by 183/365 to reflect a one-half year period.

19
BUFFALO SMALL CAP FUND | | Beginning
Account Value
April 1, 2020 | | Ending
Account Value
September 30, 2020 | | Expenses Paid During
Period April 1, 2020 -
September 30, 2020* | |
Investor Class | |
Actual | | $ | 1,000.00 | | | $ | 1,581.40 | | | $ | 6.54 | | |
Hypothetical (5% return before expenses) | | $ | 1,000.00 | | | $ | 1,020.00 | | | $ | 5.11 | | |
Institutional Class | |
Actual | | $ | 1,000.00 | | | $ | 1,583.60 | | | $ | 5.57 | | |
Hypothetical (5% return before expenses) | | $ | 1,000.00 | | | $ | 1,020.76 | | | $ | 4.36 | | |
* Expenses for the Investor Class are equal to the Fund's annualized expense ratio of 1.01%, multiplied by the average account value over the period, multiplied by 183/365 to reflect the one-half year period. Expenses for the Institutional Class are equal to the Fund's annualized expense ratio of 0.86%, multiplied by the average account value over the period, multiplied by 183/365 to reflect a one-half year period.

20
ALLOCATION OF PORTFOLIO HOLDINGS
(UNAUDITED)
Percentages represent market value as a percentage of investments as of September 30, 2020.
BUFFALO DISCOVERY
FUND
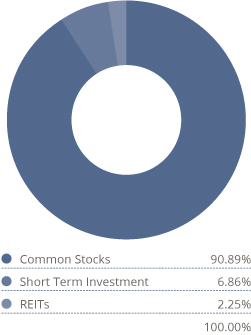
BUFFALO DIVIDEND
FOCUS FUND
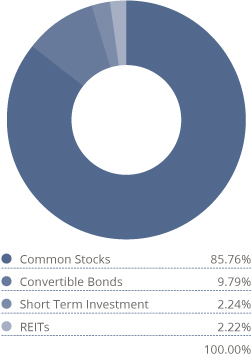
BUFFALO EMERGING
OPPORTUNITIES FUND

BUFFALO FLEXIBLE
INCOME FUND

BUFFALO GROWTH
FUND
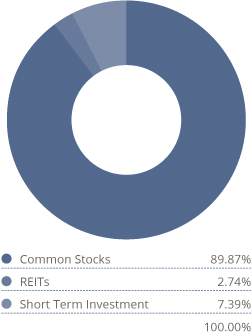
BUFFALO HIGH YIELD
FUND
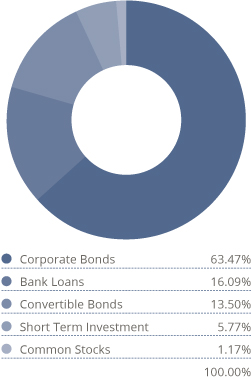

21
Percentages represent market value as a percentage of investments as of September 30, 2020.
BUFFALO
INTERNATIONAL FUND

BUFFALO LARGE CAP
FUND

BUFFALO MID CAP
FUND

BUFFALO SMALL CAP
FUND


22
BUFFALO DISCOVERY FUND
(UNAUDITED)
SCHEDULE OF INVESTMENTS
SEPTEMBER 30, 2020
Shares or Face Amount | | | | $ Fair Value* | |
Common Stocks | | | 92.82 | % | |
Communication Services | | | 4.69 | % | |
| | | | | Diversified Telecommunication Services | | | 1.67 | % | |
| | 155,199 | | | Bandwidth, Inc.(a) | | | 27,093,089 | | |
| | | | | Entertainment | | | 2.36 | % | |
| | 155,744 | | | Activision Blizzard, Inc. | | | 12,607,477 | | |
| | 154,693 | | | Take-Two Interactive Software, Inc.(a) | | | 25,558,377 | | |
| | | | 38,165,854 | | |
| | | | | Media | | | 0.66 | % | |
| | 152,085 | | | Cardlytics, Inc.(a) | | | 10,732,639 | | |
| Total Communication Services (Cost $57,428,279) | | | 75,991,582 | | |
Consumer Discretionary | | | 11.19 | % | |
| | | | | Diversified Consumer Services | | | 0.70 | % | |
| | 157,799 | | | Chegg, Inc.(a) | | | 11,273,161 | | |
| | | | | Hotels, Restaurants & Leisure | | | 5.61 | % | |
| | 16,065 | | | Chipotle Mexican Grill, Inc.(a) | | | 19,980,201 | | |
| | 236,443 | | | Darden Restaurants, Inc. | | | 23,819,268 | | |
| | 504,375 | | | Penn National Gaming, Inc.(a) | | | 36,668,062 | | |
| | 48,710 | | | Vail Resorts, Inc. | | | 10,422,479 | | |
| | | | 90,890,010 | | |
| | | | | Internet & Direct Marketing Retail | | | 1.92 | % | |
| | 120,807 | | | Etsy, Inc.(a) | | | 14,693,755 | | |
| | 179,830 | | | Expedia Group, Inc. | | | 16,488,613 | | |
| | | | 31,182,368 | | |
| | | | | Specialty Retail | | | 2.96 | % | |
| | 111,650 | | | Five Below, Inc.(a) | | | 14,179,550 | | |
| | 165,634 | | | Ross Stores, Inc. | | | 15,456,965 | | |
| | 127,425 | | | Tractor Supply Co. | | | 18,265,099 | | |
| | | | 47,901,614 | | |
| Total Consumer Discretionary (Cost $123,120,835) | | | 181,247,153 | | |

The accompanying notes are an integral part of these financial statements.
23
BUFFALO DISCOVERY FUND
(UNAUDITED)
SCHEDULE OF INVESTMENTS
SEPTEMBER 30, 2020 Continued
Shares or Face Amount | | | | $ Fair Value* | |
Consumer Staples | | | 0.55 | % | |
| | | | | Personal Products | | | 0.55 | % | |
| | 41,013 | | | The Estee Lauder Companies Inc. — Class A | | | 8,951,087 | | |
| Total Consumer Staples (Cost $6,363,368) | | | 8,951,087 | | |
Financials | | | 7.25 | % | |
| | | | | Capital Markets | | | 4.40 | % | |
| | 232,590 | | | Intercontinental Exchange, Inc. | | | 23,270,630 | | |
| | 83,526 | | | Moody's Corp. | | | 24,210,011 | | |
| | 66,495 | | | MSCI, Inc. | | | 23,724,086 | | |
| | | | 71,204,727 | | |
| | | | | Diversified Financial Services | | | 1.48 | % | |
| | 134,572 | | | Global Payments Inc. | | | 23,897,296 | | |
| | | | | Insurance | | | 1.37 | % | |
| | 281,850 | | | eHealth, Inc.(a) | | | 22,266,150 | | |
| Total Financials (Cost $88,975,089) | | | 117,368,173 | | |
Health Care | | | 18.68 | % | |
| | | | | Biotechnology | | | 4.03 | % | |
| | 88,520 | | | Alnylam Pharmaceuticals, Inc.(a) | | | 12,888,512 | | |
| | 253,130 | | | Ligand Pharmaceuticals, Inc.(a) | | | 24,128,352 | | |
| | 389,880 | | | Natera, Inc.(a) | | | 28,164,931 | | |
| | | | 65,181,795 | | |
| | | | | Health Care Equipment & Supplies | | | 7.46 | % | |
| | 163,200 | | | Alcon, Inc.(a) (b) | | | 9,294,240 | | |
| | 321,400 | | | Boston Scientific Corp.(a) | | | 12,280,694 | | |
| | 361,920 | | | Hologic, Inc.(a) | | | 24,056,822 | | |
| | 24,237 | | | IDEXX Laboratories, Inc.(a) | | | 9,527,807 | | |
| | 82,485 | | | Insulet Corporation(a) | | | 19,515,126 | | |
| | 81,615 | | | Novocure Ltd.(a) (b) | | | 9,084,566 | | |
| | 74,755 | | | Quidel Corp.(a) | | | 16,399,752 | | |
| | 152,299 | | | Zimmer Biomet Holdings, Inc. | | | 20,733,986 | | |
| | | | 120,892,993 | | |

The accompanying notes are an integral part of these financial statements.
24
BUFFALO DISCOVERY FUND
(UNAUDITED)
SCHEDULE OF INVESTMENTS
SEPTEMBER 30, 2020 Continued
Shares or Face Amount | | | | $ Fair Value* | |
| | | | | Health Care Providers & Services | | | 1.19 | % | |
| | 92,345 | | | Guardant Health, Inc.(a) | | | 10,322,324 | | |
| | 47,464 | | | Laboratory Corporation of America Holdings(a) | | | 8,936,047 | | |
| | | | 19,258,371 | | |
| | | | | Health Care Technology | | | 0.67 | % | |
| | 38,380 | | | Veeva Systems, Inc.(a) | | | 10,792,072 | | |
| | | | | Life Sciences Tools & Services | | | 4.35 | % | |
| | 331,365 | | | Adaptive Biotechnologies Corporation(a) | | | 16,114,280 | | |
| | 140,815 | | | Agilent Technologies, Inc. | | | 14,213,866 | | |
| | 588,000 | | | Avantor, Inc.(a) | | | 13,224,120 | | |
| | 21,380 | | | Bio-Rad Laboratories, Inc.(a) | | | 11,020,535 | | |
| | 83,366 | | | ICON PLC.(a) (b) | | | 15,930,409 | | |
| | | | 70,503,210 | | |
| | | | | Pharmaceuticals | | | 0.98 | % | |
| | 185,525 | | | Catalent, Inc.(a) | | | 15,892,072 | | |
| Total Health Care (Cost $246,172,020) | | | 302,520,513 | | |
Industrials | | | 18.66 | % | |
| | | | | Aerospace & Defense | | | 0.95 | % | |
| | 90,600 | | | L3Harris Technologies, Inc. | | | 15,387,504 | | |
| | | | | Commercial Services & Supplies | | | 4.80 | % | |
| | 211,816 | | | Copart, Inc.(a) | | | 22,274,571 | | |
| | 483,163 | | | IAA Inc.(a) | | | 25,158,297 | | |
| | 790,025 | | | KAR Auction Services, Inc. | | | 11,376,360 | | |
| | 203,501 | | | Republic Services, Inc. | | | 18,996,818 | | |
| | | | 77,806,046 | | |
| | | | | Construction & Engineering | | | 0.72 | % | |
| | 277,250 | | | MasTec, Inc.(a) | | | 11,699,950 | | |
| | | | | Electrical Equipment | | | 3.08 | % | |
| | 253,430 | | | AMETEK, Inc. | | | 25,190,942 | | |
| | 127,967 | | | Generac Holdings, Inc.(a) | | | 24,779,530 | | |
| | | | 49,970,472 | | |

The accompanying notes are an integral part of these financial statements.
25
BUFFALO DISCOVERY FUND
(UNAUDITED)
SCHEDULE OF INVESTMENTS
SEPTEMBER 30, 2020 Continued
Shares or Face Amount | | | | $ Fair Value* | |
| | | | | Professional Services | | | 6.77 | % | |
| | 31,966 | | | CoStar Group, Inc.(a) | | | 27,123,471 | | |
| | 356,495 | | | IHS Markit Ltd.(b) | | | 27,988,422 | | |
| | 230,664 | | | TransUnion | | | 19,405,762 | | |
| | 893,795 | | | Upwork, Inc.(a) | | | 15,587,785 | | |
| | 105,164 | | | Verisk Analytics, Inc. | | | 19,487,941 | | |
| | | | 109,593,381 | | |
| | | | | Road & Rail | | | 1.62 | % | |
| | 144,790 | | | Kansas City Southern | | | 26,182,376 | | |
| | | | | Trading Companies & Distributors | | | 0.72 | % | |
| | 257,320 | | | Fastenal Co. | | | 11,602,559 | | |
| Total Industrials (Cost $194,138,397) | | | 302,242,288 | | |
Information Technology | | | 29.52 | % | |
| | | | | Communications Equipment | | | 2.57 | % | |
| | 34,688 | | | Arista Networks Inc.(a) | | | 7,177,988 | | |
| | 398,917 | | | Ciena Corp.(a) | | | 15,833,016 | | |
| | 246,261 | | | Lumentum Holdings, Inc.(a) | | | 18,501,589 | | |
| | | | 41,512,593 | | |
| | | | | Electronic Equipment, Instruments & Components | | | 3.50 | % | |
| | 158,637 | | | Amphenol Corp. — Class A | | | 17,175,628 | | |
| | 213,930 | | | Keysight Technologies, Inc.(a) | | | 21,132,005 | | |
| | 514,953 | | | National Instruments Corp. | | | 18,383,822 | | |
| | | | 56,691,455 | | |
| | | | | Internet Software & Services | | | 1.21 | % | |
| | 1,799,700 | | | Cloudera, Inc.(a) | | | 19,598,733 | | |
| | | | | IT Services | | | 4.59 | % | |
| | 144,005 | | | Akamai Technologies, Inc.(a) | | | 15,918,313 | | |
| | 61,084 | | | EPAM Systems, Inc.(a) | | | 19,747,235 | | |
| | 61,926 | | | FleetCor Technologies, Inc.(a) | | | 14,744,581 | | |
| | 35,506 | | | Twilio Inc. — Class A(a) | | | 8,773,178 | | |
| | 74,070 | | | VeriSign, Inc.(a) | | | 15,173,239 | | |
| | | | 74,356,546 | | |

The accompanying notes are an integral part of these financial statements.
26
BUFFALO DISCOVERY FUND
(UNAUDITED)
SCHEDULE OF INVESTMENTS
SEPTEMBER 30, 2020 Continued
Shares or Face Amount | | | | $ Fair Value* | |
| | | | | Semiconductors & Semiconductor Equipment | | | 4.72 | % | |
| | 139,810 | | | Inphi Corporation(a) | | | 15,693,672 | | |
| | 90,000 | | | KLA-Tencor Corporation | | | 17,436,600 | | |
| | 214,178 | | | Marvell Technology Group Ltd.(b) | | | 8,502,867 | | |
| | 164,611 | | | Micron Technology, Inc.(a) | | | 7,730,132 | | |
| | 19,246 | | | Monolithic Power Systems, Inc. | | | 5,381,374 | | |
| | 120,024 | | | Universal Display Corp. | | | 21,693,138 | | |
| | | | 76,437,783 | | |
| | | | | Software | | | 12.93 | % | |
| | 663,745 | | | 8x8, Inc.(a) | | | 10,321,235 | | |
| | 90,539 | | | Aspen Technology, Inc.(a) | | | 11,461,332 | | |
| | 107,884 | | | DocuSign, Inc.(a) | | | 23,220,952 | | |
| | 114,698 | | | Guidewire Software, Inc.(a) | | | 11,959,561 | | |
| | 33,753 | | | HubSpot, Inc.(a) | | | 9,863,639 | | |
| | 42,827 | | | Palo Alto Networks, Inc.(a) | | | 10,481,908 | | |
| | 952,648 | | | Pluralsight, Inc.(a) | | | 16,318,860 | | |
| | 174,774 | | | RealPage, Inc.(a) | | | 10,073,973 | | |
| | 22,696 | | | ServiceNow, Inc.(a) | | | 11,007,560 | | |
| | 73,681 | | | Splunk, Inc.(a) | | | 13,861,607 | | |
| | 92,330 | | | Synopsys, Inc.(a) | | | 19,756,773 | | |
| | 36,774 | | | Tyler Technologies, Inc.(a) | | | 12,817,946 | | |
| | 158,850 | | | Varonis Systems, Inc.(a) | | | 18,334,467 | | |
| | 106,983 | | | VMware, Inc. — Class A(a) | | | 15,370,248 | | |
| | 141,807 | | | Zendesk, Inc.(a) | | | 14,594,776 | | |
| | | | 209,444,837 | | |
| Total Information Technology (Cost $388,372,992) | | | 478,041,947 | | |
Materials | | | 2.28 | % | |
| | | | | Construction Materials | | | 1.27 | % | |
| | 87,298 | | | Martin Marietta Materials, Inc. | | | 20,546,457 | | |
| | | | | Containers & Packaging | | | 1.01 | % | |
| | 144,300 | | | AptarGroup, Inc. | | | 16,334,760 | | |
| Total Materials (Cost $39,655,337) | | | 36,881,217 | | |
| Total Common Stocks (Cost $1,144,226,317) | | | 1,503,243,960 | | |

The accompanying notes are an integral part of these financial statements.
27
BUFFALO DISCOVERY FUND
(UNAUDITED)
SCHEDULE OF INVESTMENTS
SEPTEMBER 30, 2020 Continued
Shares or Face Amount | | | | $ Fair Value* | |
REITS | | | 3.37 | % | |
Real Estate | | | 3.37 | % | |
| | | | | Equity Real Estate Investment Trusts (REITs) | | | 3.37 | % | |
| | 277,429 | | | CyrusOne, Inc. | | | 19,428,353 | | |
| | 22,655 | | | Equinix Inc. | | | 17,220,745 | | |
| | 56,515 | | | SBA Communications Corp. | | | 17,998,897 | | |
| Total Real Estate (Cost $37,382,486) | | | 54,647,995 | | |
| Total REITS (Cost $37,382,486) | | | 54,647,995 | | |
Short Term Investments | | | 4.56 | % | |
Investment Company | | | 4.56 | % | |
| | 73,829,389 | | | Fidelity Investments Money Market Funds — Government Portfolio — Class I — 0.10%(c) | | | 73,829,389 | | |
Total Investment Company | | | 73,829,389 | | |
| Total Short Term Investments (Cost $73,829,389) | | | 73,829,389 | | |
Total Investments (Cost $1,255,438,192)
| | | 100.75
1,631,721,344 | % | |
Liabilities in Excess of Other Assets
| | | (0.75
(12,101,400) | )% | |
Total Net Assets
| | | 100.00
1,619,619,944 | % | |
PLC Public Limited Company
(a) Non Income Producing.
(b) Foreign Issued Security. The total value of these securities amounted to $70,800,504 (4.37% of net assets) at September 30, 2020.
(c) The rate quoted is the annualized seven-day effective yield as of September 30, 2020.
* See Note 1A of the accompanying Notes to Financial Statements regarding valuation of securities.
The Global Industry Classification Standard (GICS) was developed by and/or is the exclusive property of MSCI, Inc. and Standard & Poor's Financial Services LLC ("S&P"). GICS is a service mark of MSCI and S&P and has been licensed for use by U.S. Bancorp Fund Services, LLC.

The accompanying notes are an integral part of these financial statements.
28
BUFFALO DIVIDEND FOCUS FUND
(UNAUDITED)
SCHEDULE OF INVESTMENTS
SEPTEMBER 30, 2020
Shares or Face Amount | | | | $ Fair Value* | |
Common Stocks | | | 78.99 | % | |
Communication Services | | | 7.92 | % | |
| | | | | Diversified Telecommunication Services | | | 0.79 | % | |
| | 10,625 | | | Verizon Communications, Inc. | | | 632,081 | | |
| | | | | Entertainment | | | 2.45 | % | |
| | 10,750 | | | Activision Blizzard, Inc. | | | 870,213 | | |
| | 8,705 | | | The Walt Disney Co. | | | 1,080,116 | | |
| | | | 1,950,329 | | |
| | | | | Interactive Media & Services | | | 3.37 | % | |
| | 630 | | | Alphabet, Inc. — Class A(a) | | | 923,328 | | |
| | 650 | | | Alphabet, Inc. — Class C(a) | | | 955,240 | | |
| | 3,100 | | | Facebook, Inc. — Class A(a) | | | 811,890 | | |
| | | | 2,690,458 | | |
| | | | | Media | | | 1.31 | % | |
| | 22,500 | | | Comcast Corp. — Class A | | | 1,040,850 | | |
| Total Communication Services (Cost $3,383,757) | | | 6,313,718 | | |
Consumer Discretionary | | | 5.81 | % | |
| | | | | Hotels, Restaurants & Leisure | | | 2.17 | % | |
| | 6,775 | | | Cedar Fair, L.P. | | | 190,174 | | |
| | 5,000 | | | Las Vegas Sands Corp | | | 233,300 | | |
| | 9,500 | | | Starbucks Corp. | | | 816,240 | | |
| | 2,300 | | | Vail Resorts, Inc. | | | 492,131 | | |
| | | | 1,731,845 | | |
| | | | | Internet & Direct Marketing Retail | | | 2.17 | % | |
| | 550 | | | Amazon.com, Inc.(a) | | | 1,731,801 | | |
| | | | | Specialty Retail | | | 1.47 | % | |
| | 4,225 | | | The Home Depot, Inc. | | | 1,173,325 | | |
| Total Consumer Discretionary (Cost $2,329,751) | | | 4,636,971 | | |
Consumer Staples | | | 3.34 | % | |
| | | | | Beverages | | | 0.96 | % | |
| | 5,550 | | | PepsiCo, Inc. | | | 769,230 | | |
| | | | | Food & Staples Retailing | | | 0.61 | % | |
| | 3,450 | | | Walmart, Inc. | | | 482,689 | | |

The accompanying notes are an integral part of these financial statements.
29
BUFFALO DIVIDEND FOCUS FUND
(UNAUDITED)
SCHEDULE OF INVESTMENTS
SEPTEMBER 30, 2020 Continued
Shares or Face Amount | | | | $ Fair Value* | |
| | | | | Food Products | | | 0.77 | % | |
| | 10,300 | | | Tyson Foods, Inc. | | | 612,644 | | |
| | | | | Household Products | | | 1.00 | % | |
| | 5,725 | | | The Procter & Gamble Co. | | | 795,718 | | |
| Total Consumer Staples (Cost $1,763,336) | | | 2,660,281 | | |
Energy | | | 3.63 | % | |
| | | | | Oil, Gas & Consumable Fuels | | | 3.63 | % | |
| | 46,650 | | | Enterprise Products Partners L.P. | | | 736,603 | | |
| | 17,200 | | | Enviva Partners LP | | | 692,472 | | |
| | 9,875 | | | Hess Corp. | | | 404,184 | | |
| | 9,526 | | | Marathon Petroleum Corp. | | | 279,493 | | |
| | 4,200 | | | Valero Energy Corp. | | | 181,944 | | |
| | 80,000 | | | Viper Energy Partners LP | | | 601,600 | | |
| Total Energy (Cost $3,831,409) | | | 2,896,296 | | |
Financials | | | 12.80 | % | |
| | | | | Banks | | | 5.69 | % | |
| | 46,100 | | | Bank of America Corp. | | | 1,110,549 | | |
| | 8,550 | | | Citigroup, Inc. | | | 368,590 | | |
| | 32,500 | | | Citizens Financial Group, Inc. | | | 821,600 | | |
| | 11,000 | | | JPMorgan Chase & Co. | | | 1,058,970 | | |
| | 31,000 | | | Truist Financial Corp. | | | 1,179,550 | | |
| | | | 4,539,259 | | |
| | | | | Capital Markets | | | 3.95 | % | |
| | 1,100 | | | BlackRock, Inc. | | | 619,905 | | |
| | 4,025 | | | CME Group, Inc. | | | 673,423 | | |
| | 5,150 | | | S&P Global, Inc. | | | 1,857,090 | | |
| | | | 3,150,418 | | |
| | | | | Diversified Financial Services | | | 1.63 | % | |
| | 27,000 | | | Compass Diversified Holdings | | | 514,620 | | |
| | 4,400 | | | Global Payments Inc. | | | 781,352 | | |
| | | | 1,295,972 | | |
| | | | | Insurance | | | 1.53 | % | |
| | 11,575 | | | Arthur J. Gallagher & Co. | | | 1,222,089 | | |
| Total Financials (Cost $6,509,886) | | | 10,207,738 | | |

The accompanying notes are an integral part of these financial statements.
30
BUFFALO DIVIDEND FOCUS FUND
(UNAUDITED)
SCHEDULE OF INVESTMENTS
SEPTEMBER 30, 2020 Continued
Shares or Face Amount | | | | $ Fair Value* | |
Health Care | | | 15.50 | % | |
| | | | | Biotechnology | | | 1.28 | % | |
| | 4,000 | | | Amgen Inc. | | | 1,016,640 | | |
| | | | | Health Care Equipment & Supplies | | | 3.16 | % | |
| | 11,600 | | | Baxter International, Inc. | | | 932,872 | | |
| | 7,400 | | | Medtronic, PLC(b) | | | 769,008 | | |
| | 6,000 | | | Zimmer Biomet Holdings, Inc. | | | 816,840 | | |
| | | | 2,518,720 | | |
| | | | | Health Care Providers & Services | | | 6.18 | % | |
| | 3,375 | | | Anthem, Inc. | | | 906,491 | | |
| | 15,300 | | | CVS Health Corp. | | | 893,520 | | |
| | 8,100 | | | HCA Healthcare, Inc. | | | 1,009,908 | | |
| | 2,500 | | | McKesson Corp. | | | 372,325 | | |
| | 5,600 | | | UnitedHealth Group, Inc. | | | 1,745,912 | | |
| | | | 4,928,156 | | |
| | | | | Pharmaceuticals | | | 4.88 | % | |
| | 3,150 | | | Eli Lilly & Co. | | | 466,263 | | |
| | 20,000 | | | Horizon Therapeutics Plc(a) (b) | | | 1,553,600 | | |
| | 7,125 | | | Johnson & Johnson | | | 1,060,770 | | |
| | 9,800 | | | Merck & Co., Inc. | | | 812,910 | | |
| | | | 3,893,543 | | |
| Total Health Care (Cost $8,877,593) | | | 12,357,059 | | |
Industrials | | | 5.72 | % | |
| | | | | Aerospace & Defense | | | 0.63 | % | |
| | 3,025 | | | The Boeing Co. | | | 499,911 | | |
| | | | | Commercial Services & Supplies | | | 1.17 | % | |
| | 2,800 | | | Cintas Corp. | | | 931,924 | | |
| | | | | Electrical Equipment | | | 0.31 | % | |
| | 2,500 | | | AMETEK, Inc. | | | 248,500 | | |
| | | | | Industrial Conglomerates | | | 0.71 | % | |
| | 3,450 | | | Honeywell International, Inc. | | | 567,905 | | |
| | | | | Machinery | | | 1.00 | % | |
| | 3,950 | | | Parker-Hannifin Corp. | | | 799,243 | | |

The accompanying notes are an integral part of these financial statements.
31
BUFFALO DIVIDEND FOCUS FUND
(UNAUDITED)
SCHEDULE OF INVESTMENTS
SEPTEMBER 30, 2020 Continued
Shares or Face Amount | | | | $ Fair Value* | |
| | | | | Professional Services | | | 1.32 | % | |
| | 3,200 | | | Equifax, Inc. | | | 502,080 | | |
| | 7,000 | | | IHS Markit Ltd.(b) | | | 549,570 | | |
| | | | 1,051,650 | | |
| | | | | Trading Companies & Distributors | | | 0.58 | % | |
| | 10,300 | | | Fastenal Co. | | | 464,427 | | |
| Total Industrials (Cost $3,430,116) | | | 4,563,560 | | |
Information Technology | | | 18.60 | % | |
| | | | | Communications Equipment | | | 0.88 | % | |
| | 17,750 | | | Cisco Systems, Inc. | | | 699,172 | | |
| | | | | IT Services | | | 4.94 | % | |
| | 4,000 | | | MasterCard, Inc. — Class A | | | 1,352,680 | | |
| | 12,925 | | | Visa Inc. — Class A | | | 2,584,612 | | |
| | | | 3,937,292 | | |
| | | | | Semiconductors & Semiconductor Equipment | | | 1.87 | % | |
| | 9,075 | | | QUALCOMM, Inc. | | | 1,067,946 | | |
| | 2,950 | | | Texas Instruments, Inc. | | | 421,231 | | |
| | | | 1,489,177 | | |
| | | | | Software | | | 5.79 | % | |
| | 19,750 | | | Microsoft Corp. | | | 4,154,018 | | |
| | 7,700 | | | SS&C Technologies Holdings, Inc. | | | 466,004 | | |
| | | | 4,620,022 | | |
| | | | | Technology Hardware, Storage & Peripherals | | | 5.12 | % | |
| | 35,280 | | | Apple Inc. | | | 4,085,777 | | |
| Total Information Technology (Cost $4,986,421) | | | 14,831,440 | | |
Materials | | | 1.21 | % | |
| | | | | Construction Materials | | | 0.44 | % | |
| | 1,500 | | | Martin Marietta Materials, Inc. | | | 353,040 | | |
| | | | | Containers & Packaging | | | 0.77 | % | |
| | 43,700 | | | Graphic Packaging Holding Co. | | | 615,733 | | |
| Total Materials (Cost $1,045,888) | | | 968,773 | | |

The accompanying notes are an integral part of these financial statements.
32
BUFFALO DIVIDEND FOCUS FUND
(UNAUDITED)
SCHEDULE OF INVESTMENTS
SEPTEMBER 30, 2020 Continued
Shares or Face Amount | | | | $ Fair Value* | |
Utilities | | | 4.46 | % | |
| | | | | Electric Utilities | | | 3.56 | % | |
| | 15,700 | | | American Electric Power Co., Inc. | | | 1,283,161 | | |
| | 30,550 | | | Edison International | | | 1,553,162 | | |
| | | | 2,836,323 | | |
| | | | | Multi-Utilities | | | 0.90 | % | |
| | 6,100 | | | Sempra Energy | | | 721,996 | | |
| Total Utilities (Cost $3,582,309) | | | 3,558,319 | | |
| Total Common Stocks (Cost $39,740,466) | | | 62,994,155 | | |
REITS | | | 4.94 | % | |
Real Estate | | | 4.94 | % | |
| | | | | Equity Real Estate Investment Trusts (REITs) | | | 4.94 | % | |
| | 3,200 | | | American Tower Corp. | | | 773,536 | | |
| | 19,106 | | | Community Healthcare Trust, Inc. | | | 893,397 | | |
| | 10,000 | | | CyrusOne, Inc. | | | 700,300 | | |
| | 5,000 | | | Digital Realty Trust, Inc. | | | 733,800 | | |
| | 1,100 | | | Equinix Inc. | | | 836,143 | | |
| Total Real Estate (Cost $2,673,741) | | | 3,937,176 | | |
| Total REITS (Cost $2,673,741) | | | 3,937,176 | | |
Preferred Stocks | | | 0.46 | % | |
Financials | | | 0.46 | % | |
| | | | | Diversified Financial Services | | | 0.46 | % | |
| | 15,000 | | | Compass Diversified Holdings | | | 364,200 | | |
| Total Financials (Cost $379,031) | | | 364,200 | | |
| Total Preferred Stocks (Cost $379,031) | | | 364,200 | | |
Convertible Bonds | | | 11.85 | % | |
Communication Services | | | 1.45 | % | |
| | | | | Entertainment | | | 0.80 | % | |
| | | | | Zynga, Inc. | | | |
| | 500,000 | | | 0.250%, 06/01/2024 | | | 635,312 | | |

The accompanying notes are an integral part of these financial statements.
33
BUFFALO DIVIDEND FOCUS FUND
(UNAUDITED)
SCHEDULE OF INVESTMENTS
SEPTEMBER 30, 2020 Continued
Shares or Face Amount | | | | $ Fair Value* | |
| | | | | Interactive Media & Services | | | 0.65 | % | |
| | | | | Zillow Group, Inc. | | | |
| | 300,000 | | | 2.750%, 05/15/2025 | | | 519,835 | | |
| Total Communication Services (Cost $809,711) | | | 1,155,147 | | |
Health Care | | | 4.10 | % | |
| | | | | Biotechnology | | | 3.48 | % | |
| | | | | Apellis Pharmaceuticals, Inc. | | | |
| | 300,000 | | | 3.500%, 09/15/2026 | | | 322,125 | | |
| | | | | BioMarin Pharmaceutical, Inc. | | | |
| | 800,000 | | | 0.599%, 08/01/2024 | | | 841,482 | | |
| | | | | Exact Sciences Corp. | | | |
| | 100,000 | | | 0.375%, 03/15/2027 | | | 117,539 | | |
| | 750,000 | | | 0.375%, 03/01/2028 | | | 813,571 | | |
| | | | | PTC Therapeutics, Inc. | | | |
| | 600,000 | | | 1.500%, 09/15/2026(c) | | | 679,266 | | |
| | | | 2,773,983 | | |
| | | | | Pharmaceuticals | | | 0.62 | % | |
| | | | | Collegium Pharmaceutical, Inc. | | | |
| | 500,000 | | | 2.625%, 02/15/2026 | | | 497,500 | | |
| Total Health Care (Cost $3,113,396) | | | 3,271,483 | | |
Industrials | | | 1.23 | % | |
| | | | | Airlines | | | 1.23 | % | |
| | | | | Southwest Airlines Co. | | | |
| | 750,000 | | | 1.250%, 05/01/2025 | | | 982,500 | | |
| Total Industrials (Cost $750,000) | | | 982,500 | | |
Information Technology | | | 5.07 | % | |
| | | | | Communications Equipment | | | 1.01 | % | |
| | | | | Lumentum Holdings, Inc. | | | |
| | 750,000 | | | 0.500%, 12/15/2026(c) | | | 800,106 | | |

The accompanying notes are an integral part of these financial statements.
34
BUFFALO DIVIDEND FOCUS FUND
(UNAUDITED)
SCHEDULE OF INVESTMENTS
SEPTEMBER 30, 2020 Continued
Shares or Face Amount | | | | $ Fair Value* | |
| | | | | Software | | | 4.06 | % | |
| | | | | Cerence, Inc. | | | |
| | 925,000 | | | 3.000%, 06/01/2025(c) | | | 1,426,688 | | |
| | | | | Guidewire Software, Inc. | | | |
| | 500,000 | | | 1.250%, 03/15/2025 | | | 575,978 | | |
| | | | | Nuance Communications, Inc. | | | |
| | 750,000 | | | 1.500%, 11/01/2035 | | | 1,236,538 | | |
| | | | 3,239,204 | | |
| Total Information Technology (Cost $2,923,231) | | | 4,039,310 | | |
| Total Convertible Bonds (Cost $7,596,338) | | | 9,448,440 | | |
Short Term Investments | | | 3.76 | % | |
| | | | | Investment Company | | | 3.76 | % | |
| | 3,000,833 | | | Fidelity Investments Money Market Funds — Government Portfolio — Class I — 0.10%(d) | | | 3,000,833 | | |
Total Investment Company | | | 3,000,833 | | |
| Total Short Term Investments (Cost $3,000,833) | | | 3,000,833 | | |
Total Investments (Cost $53,390,409)
| | | 100.00
79,744,804 | % | |
Liabilities in Excess of Other Assets
| | | 0.00
(902) | % | |
Total Net Assets
| | | 100.00
79,743,902 | % | |
PLC Public Limited Company
(a) Non Income Producing
(b) Foreign Issued Security. The total value of these securities amounted to $2,872,178 (3.60% of net assets) at September 30, 2020.
(c) Restricted security deemed liquid. The total value of restricted securities is $2,906,060 (3.64% of net assets) at September 30, 2020.
(d) The rate quoted is the annualized seven-day effective yield as of September 30, 2020.
* See Note 1A of the accompanying Notes to Financial Statements regarding valuation of securities.
The Global Industry Classification Standard (GICS) was developed by and/or is the exclusive property of MSCI, Inc. and Standard & Poor's Financial Services LLC ("S&P"). GICS is a service mark of MSCI and S&P and has been licensed for use by U.S. Bancorp Fund Services, LLC.

The accompanying notes are an integral part of these financial statements.
35
BUFFALO EMERGING OPPORTUNITIES FUND (UNAUDITED)
SCHEDULE OF INVESTMENTS
SEPTEMBER 30, 2020
Shares or Face Amount | | | | $ Fair Value* | |
Common Stocks | | | 88.55 | % | |
Administrative and Support and Waste Management and Remediation Services | | | 0.97 | % | |
| | | | | Business Support Services | | | 0.97 | % | |
| | 70,000 | | | dMY Technology Group, Inc.(a) | | | 893,200 | | |
| Total Administrative and Support and Waste Management and Remediation Services (Cost $751,793) | | | 893,200 | | |
Communication Services | | | 1.94 | % | |
| | | | | Interactive Media & Services | | | 0.96 | % | |
| | 15,000 | | | EverQuote, Inc.(a) | | | 579,600 | | |
| | 197,000 | | | Trivago N.V. — ADR(a) (b) | | | 305,350 | | |
| | | | 884,950 | | |
| | | | | Media | | | 0.98 | % | |
| | 42,800 | | | Liberty Media Corp-Liberty Braves(a) | | | 899,228 | | |
| Total Communication Services (Cost $2,108,666) | | | 1,784,178 | | |
Consumer Discretionary | | | 12.48 | % | |
| | | | | Auto Components | | | 1.08 | % | |
| | 64,100 | | | Motorcar Parts of America, Inc.(a) | | | 997,396 | | |
| | | | | Hotels, Restaurants & Leisure | | | 2.75 | % | |
| | 125,000 | | | Accel Entertainment, Inc.(a) | | | 1,338,750 | | |
| | 145,100 | | | Del Taco Restaurants, Inc.(a) | | | 1,189,820 | | |
| | | | 2,528,570 | | |
| | | | | Household Durables | | | 5.62 | % | |
| | 13,000 | | | LGI Homes, Inc.(a) | | | 1,510,210 | | |
| | 68,000 | | | Lovesac Co/The(a) | | | 1,884,280 | | |
| | 130,000 | | | Mohawk Group Holdings, Inc.(a) | | | 1,072,500 | | |
| | 18,700 | | | Universal Electronics, Inc.(a) | | | 705,738 | | |
| | | | 5,172,728 | | |
| | | | | Internet & Direct Marketing Retail | | | 1.95 | % | |
| | 34,500 | | | Shutterstock, Inc. | | | 1,795,380 | | |
| | | | | Leisure Products | | | 1.08 | % | |
| | 20,000 | | | Malibu Boats, Inc. — Class A(a) | | | 991,200 | | |
| Total Consumer Discretionary (Cost $9,963,983) | | | 11,485,274 | | |

The accompanying notes are an integral part of these financial statements.
36
BUFFALO EMERGING OPPORTUNITIES
FUND (UNAUDITED)
SCHEDULE OF INVESTMENTS
SEPTEMBER 30, 2020 Continued
Shares or Face Amount | | | | $ Fair Value* | |
Consumer Staples | | | 1.69 | % | |
| | | | | Beverages | | | 1.69 | % | |
| | 39,200 | | | MGP Ingredients, Inc. | | | 1,557,808 | | |
| Total Consumer Staples (Cost $1,473,246) | | | 1,557,808 | | |
Finance and Insurance | | | 2.04 | % | |
| | | | | Holding Companies-Divers | | | 1.12 | % | |
| | 100,000 | | | FinTech Acquisition Corp III(a) | | | 1,031,000 | | |
| | | | | Other Financial Investment Activities | | | 0.92 | % | |
| | 36,000 | | | Forum Merger II Corp.(a) | | | 851,040 | | |
| Total Finance and Insurance (Cost $1,675,924) | | | 1,882,040 | | |
Financials | | | 8.83 | % | |
| | | | | Capital Markets | | | 4.34 | % | |
| | 20,585 | | | Hamilton Lane Inc. — Class A | | | 1,329,585 | | |
| | 104,400 | | | Open Lending Corp.(a) | | | 2,662,200 | | |
| | | | 3,991,785 | | |
| | | | | Consumer Finance | | | 1.27 | % | |
| | 3,800 | | | LendingTree, Inc.(a) | | | 1,166,182 | | |
| | | | | Diversified Financial Services | | | 1.96 | % | |
| | 94,800 | | | Compass Diversified Holdings | | | 1,806,888 | | |
| | | | | Insurance | | | 1.26 | % | |
| | 6,100 | | | Kinsale Capital Group, Inc. | | | 1,160,098 | | |
| Total Financials (Cost $3,426,650) | | | 8,124,953 | | |
Health Care | | | 17.88 | % | |
| | | | | Biotechnology | | | 2.12 | % | |
| | 20,700 | | | Castle Biosciences, Inc.(a) | | | 1,065,015 | | |
| | 17,400 | | | Deciphera Pharmaceuticals, Inc.(a) | | | 892,620 | | |
| | | | 1,957,635 | | |

The accompanying notes are an integral part of these financial statements.
37
BUFFALO EMERGING OPPORTUNITIES
FUND (UNAUDITED)
SCHEDULE OF INVESTMENTS
SEPTEMBER 30, 2020 Continued
Shares or Face Amount | | | | $ Fair Value* | |
| | | | | Health Care Equipment & Supplies | | | 8.39 | % | |
| | 64,300 | | | Establishment Labs Holdings, Inc.(a) (b) | | | 1,191,479 | | |
| | 100,200 | | | GenMark Diagnostics, Inc.(a) | | | 1,422,840 | | |
| | 26,590 | | | OrthoPediatrics Corp.(a) | | | 1,221,013 | | |
| | 113,400 | | | Oxford Immunotec Global PLC(a) (b) | | | 1,326,780 | | |
| | 125,000 | | | Repro-Med Systems, Inc.(a) | | | 902,500 | | |
| | 153,600 | | | Sientra, Inc.(a) | | | 522,240 | | |
| | 20,075 | | | STAAR Surgical Co.(a) | | | 1,135,442 | | |
| | | | 7,722,294 | | |
| | | | | Health Care Providers & Services | | | 1.34 | % | |
| | 5,800 | | | LHC Group, Inc.(a) | | | 1,232,848 | | |
| | | | | Health Care Technology | | | 4.22 | % | |
| | 50,000 | | | HealthStream, Inc.(a) | | | 1,003,500 | | |
| | 8,785 | | | Inspire Medical Systems, Inc.(a) | | | 1,133,704 | | |
| | 23,400 | | | Omnicell, Inc.(a) | | | 1,747,044 | | |
| | | | 3,884,248 | | |
| | | | | Pharmaceuticals | | | 1.81 | % | |
| | 89,900 | | | Optinose, Inc.(a) | | | 350,610 | | |
| | 51,100 | | | Urovant Sciences Ltd.(a) (b) | | | 477,274 | | |
| | 108,651 | | | Verrica Pharmaceuticals, Inc.(a) | | | 840,959 | | |
| | | | 1,668,843 | | |
| Total Health Care (Cost $13,443,468) | | | 16,465,868 | | |
Industrials | | | 18.21 | % | |
| | | | | Aerospace & Defense | | | 1.41 | % | |
| | 67,400 | | | Kratos Defense & Security Solutions, Inc.(a) | | | 1,299,472 | | |
| | | | | Air Freight & Logistics | | | 2.39 | % | |
| | 87,900 | | | Air Transport Services Group, Inc.(a) | | | 2,202,774 | | |
| | | | | Building Products | | | 4.73 | % | |
| | 32,700 | | | Advanced Drainage Systems, Inc. | | | 2,041,788 | | |
| | 27,500 | | | Apogee Enterprises, Inc. | | | 587,675 | | |
| | 30,000 | | | Patrick Industries, Inc. | | | 1,725,600 | | |
| | | | 4,355,063 | | |

The accompanying notes are an integral part of these financial statements.
38
BUFFALO EMERGING OPPORTUNITIES
FUND (UNAUDITED)
SCHEDULE OF INVESTMENTS
SEPTEMBER 30, 2020 Continued
Shares or Face Amount | | | | $ Fair Value* | |
| | | | | Construction & Engineering | | | 1.52 | % | |
| | 26,500 | | | NV5 Global, Inc.(a) | | | 1,398,405 | | |
| | | | | Machinery | | | 3.21 | % | |
| | 56,500 | | | Federal Signal Corporation | | | 1,652,625 | | |
| | 20,000 | | | Kornit Digital Ltd.(a) (b) | | | 1,297,400 | | |
| | | | 2,950,025 | | |
| | | | | Professional Services | | | 2.94 | % | |
| | 19,700 | | | ICF International, Inc. | | | 1,212,141 | | |
| | 58,600 | | | Willdan Group, Inc.(a) | | | 1,494,886 | | |
| | | | 2,707,027 | | |
| | | | | Trading Companies & Distributors | | | 2.01 | % | |
| | 60,200 | | | Foundation Building Materials, Inc.(a) | | | 946,344 | | |
| | 53,710 | | | Univar Inc.(a) | | | 906,625 | | |
| | | | 1,852,969 | | |
| Total Industrials (Cost $14,713,940) | | | 16,765,735 | | |
Information Technology | | | 24.51 | % | |
| | | | | Communications Equipment | | | 1.46 | % | |
| | 75,500 | | | Calix, Inc.(a) | | | 1,342,390 | | |
| | | | | Electronic Equipment, Instruments & Components | | | 1.02 | % | |
| | 40,000 | | | nLight, Inc.(a) | | | 939,200 | | |
| | | | | Internet Software & Services | | | 1.15 | % | |
| | 54,000 | | | NIC, Inc. | | | 1,063,800 | | |
| | | | | IT Services | | | 4.19 | % | |
| | 57,800 | | | i3 Verticals, Inc. — Class A(a) | | | 1,459,450 | | |
| | 152,600 | | | Paysign, Inc.(a) | | | 866,768 | | |
| | 31,100 | | | Virtusa Corp.(a) | | | 1,528,876 | | |
| | | | 3,855,094 | | |
| | | | | Semiconductors & Semiconductor Equipment | | | 1.14 | % | |
| | 45,000 | | | MaxLinear, Inc.(a) | | | 1,045,800 | | |

The accompanying notes are an integral part of these financial statements.
39
BUFFALO EMERGING OPPORTUNITIES
FUND (UNAUDITED)
SCHEDULE OF INVESTMENTS
SEPTEMBER 30, 2020 Continued
Shares or Face Amount | | | | $ Fair Value* | |
| | | | | Software | | | 15.55 | % | |
| | 159,500 | | | 8x8, Inc.(a) | | | 2,480,225 | | |
| | 55,000 | | | Cerence, Inc.(a) | | | 2,687,850 | | |
| | 11,900 | | | CyberArk Software Ltd.(a) (b) | | | 1,230,698 | | |
| | 17,905 | | | Envestnet, Inc.(a) | | | 1,381,550 | | |
| | 25,900 | | | Materialise NV — ADR(a) (b) | | | 955,969 | | |
| | 56,720 | | | Mimecast Ltd.(a) (b) | | | 2,661,302 | | |
| | 19,800 | | | Varonis Systems, Inc.(a) | | | 2,285,316 | | |
| | 42,000 | | | Yext, Inc.(a) | | | 637,560 | | |
| | | | 14,320,470 | | |
| Total Information Technology (Cost $12,471,842) | | | 22,566,754 | | |
| Total Common Stocks (Cost $60,029,512) | | | 81,525,810 | | |
REITS | | | 2.55 | % | |
Real Estate | | | 2.55 | % | |
| | | | | Equity Real Estate Investment Trusts (REITs) | | | 2.55 | % | |
| | 50,100 | | | Community Healthcare Trust, Inc. | | | 2,342,676 | | |
| Total Real Estate (Cost $1,184,990) | | | 2,342,676 | | |
| Total REITS (Cost $1,184,990) | | | 2,342,676 | | |
Short Term Investments | | | 8.82 | % | |
Investment Company | | | 8.82 | % | |
| | 8,116,664 | | | Fidelity Investments Money Market Funds — Government Portfolio — Class I — 0.10%(c) | | | 8,116,664 | | |
Total Investment Company | | | 8,116,664 | | |
| Total Short Term Investments (Cost $8,116,664) | | | 8,116,664 | | |
Total Investments (Cost $69,331,166)
| | | 99.92
91,985,150 | % | |
Other Assets in Excess of Liabilities
| | | 0.08
77,936 | % | |
Total Net Assets
| | | 100.00
92,063,084 | % | |

The accompanying notes are an integral part of these financial statements.
40
BUFFALO EMERGING OPPORTUNITIES
FUND (UNAUDITED)
SCHEDULE OF INVESTMENTS
SEPTEMBER 30, 2020 Continued
ADR American Depositary Receipt
PLC Public Limited Company
(a) Non Income Producing.
(b) Foreign Issued Security. The total value of these securities amounted to $9,446,252 (10.26% of net assets) at September 30, 2020.
(c) The rate quoted is the annualized seven-day effective yield as of September 30, 2020.
* See Note 1A of the accompanying Notes to Financial Statements regarding valuation of securities.
The Global Industry Classification Standard (GICS) was developed by and/or is the exclusive property of MSCI, Inc. and Standard & Poor's Financial Services LLC ("S&P"). GICS is a service mark of MSCI and S&P and has been licensed for use by U.S. Bancorp Fund Services, LLC.

The accompanying notes are an integral part of these financial statements.
41
BUFFALO FLEXIBLE INCOME FUND (UNAUDITED)
SCHEDULE OF INVESTMENTS
SEPTEMBER 30, 2020
Shares or Face Amount | | | | $ Fair Value* | |
Common Stocks | | | 92.78 | % | |
Communication Services | | | 6.42 | % | |
| | | | | Diversified Telecommunication Services | | | 5.29 | % | |
| | 310,000 | | | AT&T, Inc. | | | 8,838,100 | | |
| | 215,000 | | | Verizon Communications, Inc. | | | 12,790,350 | | |
| | | | 21,628,450 | | |
| | | | | Entertainment | | | 1.13 | % | |
| | 255,000 | | | Lions Gate Entertainment Corp. — Class A(a) (b) | | | 2,417,400 | | |
| | 255,000 | | | Lions Gate Entertainment Corp. — Class B(a) (b) | | | 2,223,600 | | |
| | | | 4,641,000 | | |
| Total Communication Services (Cost $31,423,304) | | | 26,269,450 | | |
Consumer Staples | | | 22.55 | % | |
| | | | | Beverages | | | 5.62 | % | |
| | 185,000 | | | The Coca Cola Co.(c) | | | 9,133,450 | | |
| | 50,000 | | | Keurig Dr Pepper, Inc. | | | 1,380,000 | | |
| | 90,000 | | | PepsiCo, Inc. | | | 12,474,000 | | |
| | | | 22,987,450 | | |
| | | | | Food & Staples Retailing | | | 4.08 | % | |
| | 40,000 | | | Costco Wholesale Corp. | | | 14,200,000 | | |
| | 40,000 | | | Sysco Corp. | | | 2,488,800 | | |
| | | | 16,688,800 | | |
| | | | | Food Products | | | 4.14 | % | |
| | 160,000 | | | B&G Foods, Inc. | | | 4,443,200 | | |
| | 150,000 | | | General Mills, Inc. | | | 9,252,000 | | |
| | 50,000 | | | Kellogg Co. | | | 3,229,500 | | |
| | | | 16,924,700 | | |
| | | | | Household Products | | | 8.71 | % | |
| | 55,000 | | | The Clorox Co. | | | 11,559,350 | | |
| | 25,000 | | | Colgate-Palmolive Co. | | | 1,928,750 | | |
| | 70,000 | | | Kimberly-Clark Corp. | | | 10,336,200 | | |
| | 85,000 | | | The Procter & Gamble Co. | | | 11,814,150 | | |
| | | | 35,638,450 | | |
| Total Consumer Staples (Cost $39,886,724) | | | 92,239,400 | | |

The accompanying notes are an integral part of these financial statements.
42
BUFFALO FLEXIBLE INCOME FUND (UNAUDITED)
SCHEDULE OF INVESTMENTS
SEPTEMBER 30, 2020 Continued
Shares or Face Amount | | | | $ Fair Value* | |
Energy | | | 15.52 | % | |
| | | | | Energy Equipment & Services | | | 0.76 | % | |
| | 199,300 | | | Schlumberger Ltd.(b) | | | 3,101,108 | | |
| | | | | Oil, Gas & Consumable Fuels | | | 14.76 | % | |
| | 435,000 | | | Apache Corp. | | | 4,119,450 | | |
| | 315,200 | | | BP PLC — ADR(b) | | | 5,503,392 | | |
| | 150,000 | | | Chevron Corp. | | | 10,800,000 | | |
| | 220,000 | | | ConocoPhillips | | | 7,224,800 | | |
| | 140,000 | | | Delek Logistics Partners LP | | | 3,970,400 | | |
| | 164,700 | | | Exxon Mobil Corp. | | | 5,654,151 | | |
| | 195,000 | | | Hess Corp.(c) | | | 7,981,350 | | |
| | 260,000 | | | HollyFrontier Corp. | | | 5,124,600 | | |
| | 525,000 | | | Kinder Morgan, Inc. | | | 6,473,250 | | |
| | 85,000 | | | Marathon Petroleum Corp. | | | 2,493,900 | | |
| | 20,000 | | | Phillips 66 | | | 1,036,800 | | |
| | | | 60,382,093 | | |
| Total Energy (Cost $99,925,322) | | | 63,483,201 | | |
Financials | | | 6.95 | % | |
| | | | | Banks | | | 2.33 | % | |
| | 250,000 | | | Truist Financial Corp. | | | 9,512,500 | | |
| | | | | Insurance | | | 4.62 | % | |
| | 100,000 | | | The Allstate Corp. | | | 9,414,000 | | |
| | 90,000 | | | Arthur J. Gallagher & Co. | | | 9,502,200 | | |
| | | | 18,916,200 | | |
| Total Financials (Cost $16,001,517) | | | 28,428,700 | | |
Health Care | | | 17.74 | % | |
| | | | | Biotechnology | | | 0.85 | % | |
| | 55,000 | | | Gilead Sciences, Inc. | | | 3,475,450 | | |
| | | | | Health Care Equipment & Supplies | | | 4.09 | % | |
| | 80,000 | | | Abbott Laboratories | | | 8,706,400 | | |
| | 100,000 | | | Baxter International, Inc. | | | 8,042,000 | | |
| | | | 16,748,400 | | |

The accompanying notes are an integral part of these financial statements.
43
BUFFALO FLEXIBLE INCOME FUND (UNAUDITED)
SCHEDULE OF INVESTMENTS
SEPTEMBER 30, 2020 Continued
Shares or Face Amount | | | | $ Fair Value* | |
| | | | | Pharmaceuticals | | | 12.80 | % | |
| | 25,000 | | | Bristol-Myers Squibb Co. | | | 1,507,250 | | |
| | 70,000 | | | Eli Lilly & Co. | | | 10,361,400 | | |
| | 260,000 | | | GlaxoSmithKline PLC — ADR(b) | | | 9,786,400 | | |
| | 95,000 | | | Johnson & Johnson(c) | | | 14,143,600 | | |
| | 80,000 | | | Merck & Co., Inc. | | | 6,636,000 | | |
| | 270,000 | | | Pfizer Inc. | | | 9,909,000 | | |
| | | | 52,343,650 | | |
| Total Health Care (Cost $38,173,275) | | | 72,567,500 | | |
Industrials | | | 3.54 | % | |
| | | | | Commercial Services & Supplies | | | 3.54 | % | |
| | 490,000 | | | Pitney Bowes Inc. | | | 2,601,900 | | |
| | 105,000 | | | Waste Management, Inc. | | | 11,882,850 | | |
| Total Industrials (Cost $5,451,794) | | | 14,484,750 | | |
Information Technology | | | 17.83 | % | |
| | | | | Communications Equipment | | | 1.93 | % | |
| | 200,000 | | | Cisco Systems, Inc. | | | 7,878,000 | | |
| | | | | IT Services | | | 1.78 | % | |
| | 60,000 | | | International Business Machines Corp. | | | 7,300,200 | | |
| | | | | Semiconductors & Semiconductor Equipment | | | 6.15 | % | |
| | 270,000 | | | Intel Corp. | | | 13,980,600 | | |
| | 95,000 | | | QUALCOMM, Inc. | | | 11,179,600 | | |
| | | | 25,160,200 | | |
| | | | | Software | | | 7.97 | % | |
| | 155,000 | | | Microsoft Corp. | | | 32,601,150 | | |
| Total Information Technology (Cost $26,234,705) | | | 72,939,550 | | |
Materials | | | 2.23 | % | |
| | | | | Chemicals | | | 1.49 | % | |
| | 65,500 | | | Dow Inc. | | | 3,081,775 | | |
| | 54,900 | | | DuPont de Nemours Inc. | | | 3,045,852 | | |
| | | | 6,127,627 | | |

The accompanying notes are an integral part of these financial statements.
44
BUFFALO FLEXIBLE INCOME FUND (UNAUDITED)
SCHEDULE OF INVESTMENTS
SEPTEMBER 30, 2020 Continued
Shares or Face Amount | | | | $ Fair Value* | |
| | | | | Metals & Mining | | | 0.74 | % | |
| | 50,000 | | | Rio Tinto PLC — ADR(b) | | | 3,019,500 | | |
| Total Materials (Cost $6,257,108) | | | 9,147,127 | | |
| Total Common Stocks (Cost $263,353,749) | | | 379,559,678 | | |
Real Estate Investment Trust (REITs) | | | 3.06 | % | |
| | | | | Real Estate | | | 3.06 | % | |
| | 85,300 | | | Digital Realty Trust, Inc. | | | 12,518,628 | | |
| Total Real Estate (Cost $4,909,414) | | | 12,518,628 | | |
| Total REITs (Cost $4,909,414) | | | 12,518,628 | | |
Convertible Bonds | | | 3.11 | % | |
Information Technology | | | 3.11 | % | |
| | | | | Software | | | 3.11 | % | |
| | | | | Nuance Communications, Inc. | | | |
| | 7,725,000 | | | 1.500%, 11/01/2035 | | | 12,736,343 | | |
| Total Information Technology (Cost $7,517,671) | | | 12,736,343 | | |
| Total Convertible Bonds (Cost $7,517,671) | | | 12,736,343 | | |
Corporate Bonds | | | 0.47 | % | |
Financials | | | 0.47 | % | |
| | | | | Diversified Financial Services | | | 0.47 | % | |
| | | | | Everi Payments, Inc. | | | |
| | 1,938,000 | | | 7.500%, 12/15/2025(d) | | | 1,906,304 | | |
| Total Financials (Cost $1,938,000) | | | 1,906,304 | | |
| Total Corporate Bonds (Cost $1,938,000) | | | 1,906,304 | | |

The accompanying notes are an integral part of these financial statements.
45
BUFFALO FLEXIBLE INCOME FUND (UNAUDITED)
SCHEDULE OF INVESTMENTS
SEPTEMBER 30, 2020 Continued
Shares or Face Amount | | | | $ Fair Value* | |
Short Term Investments | | | 0.70 | % | |
Investment Company | | | 0.70 | % | |
| | 2,880,589 | | | Fidelity Investments Money Market Funds — Government Portfolio — Class I — 0.10%(e) | | | 2,880,589 | | |
Total Investment Company | | | 2,880,589 | | |
| Total Short Term Investments (Cost $2,880,589) | | | 2,880,589 | | |
Total Investments (Cost $280,599,423)
| | | 100.12
409,601,542 | % | |
Liabilities in Excess of Other Assets
| | | (0.12
(503,560) | )% | |
Total Net Assets
| | | 100.00
409,097,982 | % | |
ADR American Depository Receipt
PLC Public Limited Company
(a) Non Income Producing.
(b) Foreign Issued Security. The total value of these securities amounted to $26,051,100 (6.37% of net assets) at September 30, 2020.
(c) A portion of these investments are segregated as collateral for open written option contracts.
(d) Restricted security deemed liquid. The total value of this security is $1,906,304 (0.47% of net assets) at September 30, 2020.
(e) The rate quoted is the annualized seven-day effective yield as of September 30, 2020.
* See Note 1A of the accompanying Notes to Financial Statements regarding valuation of securities.
The Global Industry Classification Standard (GICS) was developed by and/or is the exclusive property of MSCI, Inc. and Standard & Poor's Financial Services LLC ("S&P"). GICS is a service mark of MSCI and S&P and has been licensed for use by U.S. Bancorp Fund Services, LLC.

The accompanying notes are an integral part of these financial statements.
46
BUFFALO FLEXIBLE INCOME FUND (UNAUDITED)
SCHEDULE OF OPTIONS WRITTEN
SEPTEMBER 30, 2020 Continued
Contracts | | | | $ Notional Amount | | $ Value | |
Call Options | | | |
| | | | | Coca-Cola Co/The | | | | | |
| | 300 | | | Expiration: November 2020, Exercise Price: $55.00 | | | 1,481,100 | | | | 9,000 | | |
| | | | | Hess Corp. | | | | | |
| | 150 | | | Expiration: November 2020, Exercise Price: $70.00 | | | 613,950 | | | | 675 | | |
| | | | | Johnson & Johnson | | | | | |
| | 100 | | | Expiration: October 2020, Exercise Price: $165.00 | | | 1,488,800 | | | | 1,000 | | |
| | | Total Written Options (Premiums received $33,112) | | | | | | | 10,675 | | |

The accompanying notes are an integral part of these financial statements.
47
BUFFALO GROWTH FUND (UNAUDITED)
SCHEDULE OF INVESTMENTS
SEPTEMBER 30, 2020
Shares or Face Amount | | | | $ Fair Value* | |
Common Stocks | | | 95.19 | % | |
Communication Services | | | 13.96 | % | |
| | | | | Entertainment | | | 2.82 | % | |
| | 13,441 | | | Electronic Arts, Inc.(a) | | | 1,752,841 | | |
| | 28,457 | | | The Walt Disney Co. | | | 3,530,944 | | |
| | | | 5,283,785 | | |
| | | | | Interactive Media & Services | | | 9.54 | % | |
| | 3,195 | | | Alphabet, Inc. — Class A(a) | | | 4,682,592 | | |
| | 3,822 | | | Alphabet, Inc. — Class C(a) | | | 5,616,811 | | |
| | 21,281 | | | Facebook, Inc. — Class A(a) | | | 5,573,494 | | |
| | 18,147 | | | Match Group, Inc.(a) | | | 2,007,966 | | |
| | | | 17,880,863 | | |
| | | | | Media | | | 1.60 | % | |
| | 65,000 | | | Comcast Corp. — Class A | | | 3,006,900 | | |
| Total Communication Services (Cost $11,951,685) | | | 26,171,548 | | |
Consumer Discretionary | | | 14.75 | % | |
| | | | | Hotels, Restaurants & Leisure | | | 1.52 | % | |
| | 19,928 | | | Starbucks Corp. | | | 1,712,214 | | |
| | 5,317 | | | Vail Resorts, Inc. | | | 1,137,678 | | |
| | | | 2,849,892 | | |
| | | | | Internet & Direct Marketing Retail | | | 8.02 | % | |
| | 4,125 | | | Amazon.com, Inc.(a) | | | 12,988,511 | | |
| | 1,199 | | | Booking Holdings, Inc.(a) | | | 2,051,106 | | |
| | | | 15,039,617 | | |
| | | | | Specialty Retail | | | 2.82 | % | |
| | 19,018 | | | The Home Depot, Inc. | | | 5,281,489 | | |
| | | | | Textiles, Apparel & Luxury Goods | | | 2.39 | % | |
| | 35,612 | | | NIKE, Inc. — Class B | | | 4,470,730 | | |
| Total Consumer Discretionary (Cost $9,624,811) | | | 27,641,728 | | |
Consumer Staples | | | 0.89 | % | |
| | | | | Personal Products | | | 0.89 | % | |
| | 7,641 | | | The Estee Lauder Companies Inc. — Class A | | | 1,667,648 | | |
| Total Consumer Staples (Cost $1,550,354) | | | 1,667,648 | | |

The accompanying notes are an integral part of these financial statements.
48
BUFFALO GROWTH FUND (UNAUDITED)
SCHEDULE OF INVESTMENTS
SEPTEMBER 30, 2020 Continued
Shares or Face Amount | | | | $ Fair Value* | |
Financials | | | 5.72 | % | |
| | | | | Capital Markets | | | 4.53 | % | |
| | 11,550 | | | CME Group, Inc. | | | 1,932,430 | | |
| | 27,056 | | | Intercontinental Exchange, Inc. | | | 2,706,953 | | |
| | 10,702 | | | S&P Global, Inc. | | | 3,859,141 | | |
| | | | 8,498,524 | | |
| | | | | Diversified Financial Services | | | 1.19 | % | |
| | 12,522 | | | Global Payments Inc. | | | 2,223,657 | | |
| Total Financials (Cost $4,429,429) | | | 10,722,181 | | |
Health Care | | | 12.90 | % | |
| | | | | Health Care Equipment & Supplies | | | 7.21 | % | |
| | 8,682 | | | Becton Dickinson and Co. | | | 2,020,128 | | |
| | 18,039 | | | Danaher Corp. | | | 3,884,338 | | |
| | 25,005 | | | Edwards Lifesciences Corp.(a) | | | 1,995,899 | | |
| | 7,152 | | | IDEXX Laboratories, Inc.(a) | | | 2,811,523 | | |
| | 3,950 | | | Intuitive Surgical, Inc.(a) | | | 2,802,683 | | |
| | | | 13,514,571 | | |
| | | | | Health Care Providers & Services | | | 1.50 | % | |
| | 9,000 | | | UnitedHealth Group, Inc. | | | 2,805,930 | | |
| | | | | Health Care Technology | | | 1.25 | % | |
| | 8,323 | | | Veeva Systems, Inc.(a) | | | 2,340,344 | | |
| | | | | Life Sciences Tools & Services | | | 2.94 | % | |
| | 8,056 | | | Illumina, Inc.(a) | | | 2,489,948 | | |
| | 6,859 | | | Thermo Fisher Scientific, Inc. | | | 3,028,386 | | |
| | | | 5,518,334 | | |
| Total Health Care (Cost $16,820,127) | | | 24,179,179 | | |
Industrials | | | 6.56 | % | |
| | | | | Commercial Services & Supplies | | | 0.72 | % | |
| | 93,925 | | | KAR Auction Services, Inc. | | | 1,352,520 | | |
| | | | | Industrial Conglomerates | | | 1.66 | % | |
| | 18,916 | | | Honeywell International, Inc. | | | 3,113,763 | | |

The accompanying notes are an integral part of these financial statements.
49
BUFFALO GROWTH FUND (UNAUDITED)
SCHEDULE OF INVESTMENTS
SEPTEMBER 30, 2020 Continued
Shares or Face Amount | | | | $ Fair Value* | |
| | | | | Professional Services | | | 3.04 | % | |
| | 47,457 | | | IHS Markit Ltd.(b) | | | 3,725,849 | | |
| | 23,414 | | | TransUnion | | | 1,969,820 | | |
| | | | 5,695,669 | | |
| | | | | Road & Rail | | | 1.14 | % | |
| | 10,822 | | | Union Pacific Corp. | | | 2,130,527 | | |
| Total Industrials (Cost $9,541,763) | | | 12,292,479 | | |
Information Technology | | | 35.93 | % | |
| | | | | IT Services | | | 6.42 | % | |
| | 13,965 | | | Broadridge Financial Solutions, Inc. | | | 1,843,380 | | |
| | 18,310 | | | MasterCard, Inc. — Class A | | | 6,191,893 | | |
| | 20,007 | | | Visa Inc. — Class A | | | 4,000,800 | | |
| | | | 12,036,073 | | |
| | | | | Semiconductors & Semiconductor Equipment | | | 3.10 | % | |
| | 19,815 | | | Analog Devices, Inc. | | | 2,313,203 | | |
| | 9,615 | | | Broadcom Inc. | | | 3,502,937 | | |
| | | | 5,816,140 | | |
| | | | | Software | | | 20.56 | % | |
| | 6,845 | | | Adobe, Inc.(a) | | | 3,356,993 | | |
| | 4,570 | | | Fair Isaac Corp.(a) | | | 1,943,987 | | |
| | 5,850 | | | Intuit, Inc. | | | 1,908,328 | | |
| | 90,533 | | | Microsoft Corp. | | | 19,041,806 | | |
| | 7,066 | | | Palo Alto Networks, Inc.(a) | | | 1,729,404 | | |
| | 28,000 | | | RealPage, Inc.(a) | | | 1,613,920 | | |
| | 14,222 | | | salesforce.com, Inc.(a) | | | 3,574,273 | | |
| | 6,703 | | | ServiceNow, Inc.(a) | | | 3,250,955 | | |
| | 14,739 | | | VMware, Inc. — Class A(a) | | | 2,117,552 | | |
| | | | 38,537,218 | | |
| | | | | Technology Hardware, Storage & Peripherals | | | 5.85 | % | |
| | 94,716 | | | Apple Inc. | | | 10,969,060 | | |
| Total Information Technology (Cost $33,752,132) | | | 67,358,491 | | |
Materials | | | 3.46 | % | |
| | | | | Chemicals | | | 3.46 | % | |
| | 11,000 | | | Ecolab Inc. | | | 2,198,240 | | |
| | 18,025 | | | Linde PLC(b) | | | 4,292,293 | | |
| Total Materials (Cost $3,817,526) | | | 6,490,533 | | |

The accompanying notes are an integral part of these financial statements.
50
BUFFALO GROWTH FUND (UNAUDITED)
SCHEDULE OF INVESTMENTS
SEPTEMBER 30, 2020 Continued
Shares or Face Amount | | | | $ Fair Value* | |
Real Estate | | | 1.02 | % | |
| | | | | Real Estate Management & Development | | | 1.02 | % | |
| | 40,700 | | | CBRE Group, Inc. — Class A(a) | | | 1,911,679 | | |
| Total Real Estate (Cost $1,666,669) | | | 1,911,679 | | |
| Total Common Stocks (Cost $93,154,496) | | | 178,435,466 | | |
REITs | | | 3.21 | % | |
Real Estate | | | 3.21 | % | |
| | | | | Equity Real Estate Investment Trusts (REITs) | | | 3.21 | % | |
| | 8,395 | | | American Tower Corp. | | | 2,029,324 | | |
| | 5,237 | | | Equinix Inc. | | | 3,980,801 | | |
| Total Real Estate (Cost $2,164,198) | | | 6,010,125 | | |
| Total REITs (Cost $2,164,198) | | | 6,010,125 | | |
Short Term Investments | | | 1.72 | % | |
Investment Company | | | 1.72 | % | |
| | 3,230,112 | | | Fidelity Investments Money Market Funds — Government Portfolio — Class I — 0.10%(c) | | | 3,230,112 | | |
Total Investment Company | | | 3,230,112 | | |
| Total Short Term Investments (Cost $3,230,112) | | | 3,230,112 | | |
Total Investments (Cost $98,548,806)
| | | 100.12
187,675,703 | % | |
Liabilities in Excess of Other Assets
| | | (0.12
(224,898) | )% | |
Total Net Assets
| | | 100.00
187,450,805 | % | |

The accompanying notes are an integral part of these financial statements.
51
BUFFALO GROWTH FUND (UNAUDITED)
SCHEDULE OF INVESTMENTS
SEPTEMBER 30, 2020 Continued
ADR American Depositary Receipt
PLC Public Limited Company
(a) Non Income Producing.
(b) Foreign Issued Security. The total value of these securities amounted to $8,018,142 (4.28% of net assets) at September 30, 2020.
(c) The rate quoted is the annualized seven-day effective yield as of September 30, 2020.
* See Note 1A of the accompanying Notes to Financial Statements regarding valuation of securities.
The Global Industry Classification Standard (GICS) was developed by and/or is the exclusive property of MSCI, Inc. and Standard & Poor's Financial Services LLC ("S&P"). GICS is a service mark of MSCI and S&P and has been licensed for use by U.S. Bancorp Fund Services, LLC.

The accompanying notes are an integral part of these financial statements.
52
BUFFALO HIGH YIELD FUND
(UNAUDITED)
SCHEDULE OF INVESTMENTS
SEPTEMBER 30, 2020
Shares or Face Amount | | | | $ Fair Value* | |
Preferred Stocks | | | 1.49 | % | |
Energy | | | 0.49 | % | |
| | | | | Oil, Gas & Consumable Fuels | | | 0.49 | % | |
| | 50,000 | | | Targa Resources Partners LP (1 Month LIBOR USD + 7.710%) | | | 1,200,000 | | |
| Total Energy (Cost $1,217,095) | | | 1,200,000 | | |
Financials | | | 1.00 | % | |
| | | | | Diversified Financial Services | | | 1.00 | % | |
| | 100,000 | | | Compass Diversified Holdings | | | 2,428,000 | | |
| Total Financials (Cost $2,484,285) | | | 2,428,000 | | |
| Total Preferred Stocks (Cost $3,701,380) | | | 3,628,000 | | |
Common Stocks | | | 0.41 | % | |
Communication Services | | | 0.18 | % | |
| | | | | Entertainment | | | 0.18 | % | |
| | 24,485 | | | Lions Gate Entertainment Corp. — Class A(a) | | | 232,118 | | |
| | 24,485 | | | Lions Gate Entertainment Corp. — Class B(a) | | | 213,508 | | |
| Total Communication Services (Cost $499,984) | | | 445,626 | | |
Industrials | | | 0.23 | % | |
| | | | | Machinery | | | 0.23 | % | |
| | 19,000 | | | The Greenbrier Companies, Inc. | | | 558,600 | | |
| Total Industrials (Cost $673,855) | | | 558,600 | | |
| Total Common Stocks (Cost $1,173,839) | | | 1,004,226 | | |
Convertible Bonds | | | 17.59 | % | |
Communication Services | | | 0.57 | % | |
| | | | | Interactive Media & Services | | | 0.57 | % | |
| | | | | Zillow Group, Inc. | | | |
| | 800,000 | | | 2.750%, 05/15/2025 | | | 1,386,226 | | |
| Total Communication Services (Cost $800,000) | | | 1,386,226 | | |

The accompanying notes are an integral part of these financial statements.
53
BUFFALO HIGH YIELD FUND
(UNAUDITED)
SCHEDULE OF INVESTMENTS
SEPTEMBER 30, 2020 Continued
Shares or Face Amount | | | | $ Fair Value* | |
Consumer Discretionary | | | 0.69 | % | |
| | | | | Diversified Consumer Services | | | 0.69 | % | |
| | | | | K12, Inc. | | | |
| | 2,000,000 | | | 1.125%, 09/01/2027(b) | | | 1,677,856 | | |
| Total Consumer Discretionary (Cost $1,910,428) | | | 1,677,856 | | |
Consumer Staples | | | 0.73 | % | |
| | | | | Tobacco | | | 0.73 | % | |
| | | | | Turning Point Brands, Inc. | | | |
| | 2,000,000 | | | 2.500%, 07/15/2024 | | | 1,785,000 | | |
| Total Consumer Staples (Cost $1,736,054) | | | 1,785,000 | | |
Financials | | | 0.90 | % | |
| | | | | Consumer Finance | | | 0.90 | % | |
| | | | | PRA Group, Inc. | | | |
| | 2,000,000 | | | 3.500%, 06/01/2023 | | | 2,202,144 | | |
| Total Financials (Cost $2,027,334) | | | 2,202,144 | | |
Health Care | | | 2.90 | % | |
| | | | | Biotechnology | | | 1.40 | % | |
| | | | | Flexion Therapeutics, Inc. | | | |
| | 2,000,000 | | | 3.375%, 05/01/2024 | | | 1,591,927 | | |
| | | | | Ligand Pharmaceuticals, Inc. | | | |
| | 2,000,000 | | | 0.750%, 05/15/2023 | | | 1,818,691 | | |
| | | | 3,410,618 | | |
| | | | | Pharmaceuticals | | | 1.50 | % | |
| | | | | Dermira, Inc. | | | |
| | 1,000,000 | | | 3.000%, 05/15/2022 | | | 1,013,750 | | |
| | | | | Revance Therapeutics, Inc. | | | |
| | 2,500,000 | | | 1.750%, 02/15/2027(b) | | | 2,647,331 | | |
| | | | 3,661,081 | | |
| Total Health Care (Cost $7,132,571) | | | 7,071,699 | | |

The accompanying notes are an integral part of these financial statements.
54
BUFFALO HIGH YIELD FUND
(UNAUDITED)
SCHEDULE OF INVESTMENTS
SEPTEMBER 30, 2020 Continued
Shares or Face Amount | | | | $ Fair Value* | |
Industrials | | | 2.41 | % | |
| | | | | Air Freight & Logistics | | | 1.09 | % | |
| | | | | Air Transport Services Group, Inc. | | | |
| | 2,500,000 | | | 1.125%, 10/15/2024 | | | 2,659,087 | | |
| | | | | Airlines | | | 0.94 | % | |
| | | | | Southwest Airlines Co. | | | |
| | 1,750,000 | | | 1.250%, 05/01/2025 | | | 2,292,500 | | |
| | | | | Machinery | | | 0.38 | % | |
| | | | | The Greenbrier Companies, Inc. | | | |
| | 1,000,000 | | | 2.875%, 02/01/2024 | | | 918,492 | | |
| Total Industrials (Cost $5,224,185) | | | 5,870,079 | | |
Information Technology | | | 9.39 | % | |
| | | | | Communications Equipment | | | 0.77 | % | |
| | | | | Lumentum Holdings, Inc. | | | |
| | 1,750,000 | | | 0.500%, 12/15/2026(b) | | | 1,866,914 | | |
| | | | | IT Services | | | 1.62 | % | |
| | | | | Cardtronics plc | | | |
| | 2,000,000 | | | 1.000%, 12/01/2020(a) | | | 1,999,916 | | |
| | | | | MongoDB, Inc. | | | |
| | 1,500,000 | | | 0.250%, 01/15/2026(b) | | | 1,962,869 | | |
| | | | 3,962,785 | | |
| | | | | Software | | | 7.00 | % | |
| | | | | Avaya Holdings Corp. | | | |
| | 1,000,000 | | | 2.250%, 06/15/2023 | | | 949,000 | | |
| | | | | Cerence, Inc. | | | |
| | 2,400,000 | | | 3.000%, 06/01/2025(b) | | | 3,701,677 | | |
| | | | | Guidewire Software, Inc. | | | |
| | 2,000,000 | | | 1.250%, 03/15/2025 | | | 2,303,912 | | |
| | | | | J2 Global, Inc. | | | |
| | 4,250,000 | | | 1.750%, 11/01/2026(b) | | | 3,779,196 | | |
| | | | | Nuance Communications, Inc. | | | |
| | 3,310,000 | | | 1.500%, 11/01/2035 | | | 5,457,255 | | |
| | | | | Pluralsight, Inc. | | | |
| | 1,000,000 | | | 0.375%, 03/01/2024 | | | 888,000 | | |
| | | | 17,079,040 | | |
| Total Information Technology (Cost $18,520,220) | | | 22,908,739 | | |
| Total Convertible Bonds (Cost $37,350,792) | | | 42,901,743 | | |

The accompanying notes are an integral part of these financial statements.
55
BUFFALO HIGH YIELD FUND
(UNAUDITED)
SCHEDULE OF INVESTMENTS
SEPTEMBER 30, 2020 Continued
Shares or Face Amount | | | | $ Fair Value* | |
Corporate Bonds | | | 59.44 | % | |
Administrative and Support and Waste Management and Remediation Services | | | 0.21 | % | |
| | | | | Office Administrative Services | | | 0.21 | % | |
| | | | | Cargo Aircraft Management, Inc. | | | |
| | 500,000 | | | 4.750%, 02/01/2028(b) | | | 506,175 | | |
| Total Administrative and Support and Waste Management and Remediation Services (Cost $500,000) | | | 506,175 | | |
Agriculture, Forestry, Fishing and Hunting | | | 0.87 | % | |
| | | | | Forest Nurseries and Gathering of Forest Products | | | 0.87 | % | |
| | | | | Enviva Partners LP / Enviva Partners Finance Corp. | | | |
| | 2,000,000 | | | 6.500%, 01/15/2026(b) | | | 2,111,250 | | |
| Total Agriculture, Forestry, Fishing and Hunting (Cost $2,018,370) | | | 2,111,250 | | |
Basic Materials | | | 0.82 | % | |
| | | | | Basic Chemical Manufacturing | | | 0.82 | % | |
| | | | | Tronox, Inc. | | | |
| | 2,000,000 | | | 6.500%, 04/15/2026(b) | | | 2,003,750 | | |
| Total Basic Materials (Cost $2,002,500) | | | 2,003,750 | | |
Communication Services | | | 7.78 | % | |
| | | | | Diversified Telecommunication Services | | | 2.05 | % | |
| | | | | Consolidated Communications, Inc. | | | |
| | 5,000,000 | | | 6.500%, 10/01/2022 | | | 5,006,625 | | |
| | | | | Entertainment | | | 1.25 | % | |
| | | | | Live Nation Entertainment, Inc. | | | |
| | 1,000,000 | | | 4.875%, 11/01/2024(b) | | | 969,375 | | |
| | 500,000 | | | 5.625%, 03/15/2026(b) | | | 483,750 | | |
| | 250,000 | | | 4.750%, 10/15/2027(b) | | | 234,531 | | |
| | | | | Netflix, Inc. | | | |
| | 250,000 | | | 5.500%, 02/15/2022 | | | 262,500 | | |
| | 1,000,000 | | | 5.750%, 03/01/2024 | | | 1,104,375 | | |
| | | | 3,054,531 | | |

The accompanying notes are an integral part of these financial statements.
56
BUFFALO HIGH YIELD FUND
(UNAUDITED)
SCHEDULE OF INVESTMENTS
SEPTEMBER 30, 2020 Continued
Shares or Face Amount | | | | $ Fair Value* | |
| | | | | Interactive Media & Services | | | 1.29 | % | |
| | | | | Match Group, Inc. | | | |
| | 1,000,000 | | | 5.000%, 12/15/2027(b) | | | 1,058,560 | | |
| | | | | TripAdvisor, Inc. | | | |
| | 2,000,000 | | | 7.000%, 07/15/2025(b) | | | 2,088,750 | | |
| | | | 3,147,310 | | |
| | | | | Media | | | 3.19 | % | |
| | | | | AMC Networks, Inc. | | | |
| | 1,500,000 | | | 5.000%, 04/01/2024 | | | 1,535,625 | | |
| | | | | Cinemark USA, Inc. | | | |
| | 1,000,000 | | | 5.125%, 12/15/2022 | | | 890,625 | | |
| | | | | The E.W. Scripps Co. | | | |
| | 250,000 | | | 5.125%, 05/15/2025(b) | | | 245,000 | | |
| | | | | Gray Television, Inc. | | | |
| | 2,060,000 | | | 5.875%, 07/15/2026(b) | | | 2,141,112 | | |
| | | | | National CineMedia LLC | | | |
| | 1,500,000 | | | 5.750%, 08/15/2026 | | | 1,025,340 | | |
| | | | | Townsquare Media, Inc. | | | |
| | 2,100,000 | | | 6.500%, 04/01/2023(b) | | | 1,931,780 | | |
| | | | 7,769,482 | | |
| Total Communication Services (Cost $19,398,186) | | | 18,977,948 | | |
Consumer Staples | | | 1.27 | % | |
| | | | | Food Products | | | 1.27 | % | |
| | | | | Performance Food Group, Inc. | | | |
| | 3,000,000 | | | 5.500%, 10/15/2027(b) | | | 3,095,490 | | |
| Total Consumer Staples (Cost $3,000,000) | | | 3,095,490 | | |
Consumer Discretionary | | | 7.64 | % | |
| | | | | Auto Components | | | 0.42 | % | |
| | | | | Allison Transmission, Inc. | | | |
| | 1,000,000 | | | 5.000%, 10/01/2024(b) | | | 1,011,935 | | |
| | | | | Commercial Services | | | 1.29 | % | |
| | | | | Compass Group Diversified Holdings LLC | | | |
| | 2,000,000 | | | 8.000%, 05/01/2026(b) | | | 2,107,120 | | |
| | | | | The ServiceMaster Co. LLC | | | |
| | 1,000,000 | | | 5.125%, 11/15/2024(b) | | | 1,025,000 | | |
| | | | 3,132,120 | | |

The accompanying notes are an integral part of these financial statements.
57
BUFFALO HIGH YIELD FUND
(UNAUDITED)
SCHEDULE OF INVESTMENTS
SEPTEMBER 30, 2020 Continued
Shares or Face Amount | | | | $ Fair Value* | |
| | | | | Hotels, Restaurants & Leisure | | | 1.79 | % | |
| | | | | Nathan's Famous, Inc. | | | |
| | 1,500,000 | | | 6.625%, 11/01/2025(b) | | | 1,530,000 | | |
| | | | | Royal Caribbean Cruises Ltd. | | | |
| | 1,615,000 | | | 7.500%, 10/15/2027(a) | | | 1,421,200 | | |
| | | | | Six Flags Entertainment Corp. | | | |
| | 1,500,000 | | | 5.500%, 04/15/2027(b) | | | 1,424,325 | | |
| | | | 4,375,525 | | |
| | | | | Leisure Products | | | 1.42 | % | |
| | | | | Brunswick Corp. | | | |
| | 3,000,000 | | | 7.375%, 09/01/2023 | | | 3,470,872 | | |
| | | | | Specialty Retail | | | 1.25 | % | |
| | | | | At Home Holding III, Inc. | | | |
| | 1,000,000 | | | 8.750%, 09/01/2025(b) | | | 1,046,880 | | |
| | | | | Penske Automotive Group, Inc. | | | |
| | 2,000,000 | | | 5.750%, 10/01/2022 | | | 2,000,000 | | |
| | | | 3,046,880 | | |
| | | | | Textiles, Apparel & Luxury Goods | | | 1.47 | % | |
| | | | | PVH Corp. | | | |
| | 3,120,000 | | | 7.750%, 11/15/2023 | | | 3,591,539 | | |
| Total Consumer Discretionary (Cost $17,356,446) | | | 18,628,871 | | |
Consumer Staples | | | 3.35 | % | |
| | | | | Food Products | | | 3.35 | % | |
| | | | | Pilgrim's Pride Corp. | | | |
| | 1,000,000 | | | 5.750%, 03/15/2025(b) | | | 1,020,000 | | |
| | | | | TreeHouse Foods, Inc. | | | |
| | 3,000,000 | | | 6.000%, 02/15/2024(b) | | | 3,082,815 | | |
| | 4,000,000 | | | 4.000%, 09/01/2028 | | | 4,053,020 | | |
| Total Consumer Staples (Cost $7,982,972) | | | 8,155,835 | | |
Energy | | | 8.40 | % | |
| | | | | Energy Equipment & Services | | | 0.20 | % | |
| | | | | Bristow Group, Inc. | | | |
| | 500,000 | | | 7.750%, 12/15/2022 | | | 480,050 | | |

The accompanying notes are an integral part of these financial statements.
58
BUFFALO HIGH YIELD FUND
(UNAUDITED)
SCHEDULE OF INVESTMENTS
SEPTEMBER 30, 2020 Continued
Shares or Face Amount | | | | $ Fair Value* | |
| | | | | Oil, Gas & Consumable Fuels | | | 8.20 | % | |
| | | | | CNX Resources Corp. | | | |
| | 3,000,000 | | | 7.250%, 03/14/2027(b) | | | 3,063,810 | | |
| | | | | Comstock Resources, Inc. | | | |
| | 2,500,000 | | | 9.750%, 08/15/2026 | | | 2,578,000 | | |
| | | | | Delek Logistics Partners LP / Delek Logistics Finance Corp. | | | |
| | 2,000,000 | | | 6.750%, 05/15/2025 | | | 1,822,290 | | |
| | | | | Energy Transfer Operating LP | | | |
| | 1,000,000 | | | 7.125% (5 Year CMT Rate + 5.306%), 11/15/2165 | | | 791,250 | | |
| | | | | MEG Energy Corp. | | | |
| | 2,000,000 | | | 7.125%, 02/01/2027(a) (b) | | | 1,798,660 | | |
| | | | | MPLX LP | | | |
| | 5,500,000 | | | 6.875% (3 Month LIBOR USD + 4.652%), 08/15/2023 | | | 4,537,212 | | |
| | | | | Parsley Energy LLC / Parsley Finance Corp. | | | |
| | 1,000,000 | | | 5.375%, 01/15/2025(b) | | | 1,000,000 | | |
| | | | | Seven Generations Energy Ltd. | | | |
| | 1,275,000 | | | 6.750%, 05/01/2023(a) (b) | | | 1,249,092 | | |
| | 1,500,000 | | | 5.375%, 09/30/2025(a) (b) | | | 1,425,922 | | |
| | | | | Viper Energy Partners LP | | | |
| | 1,750,000 | | | 5.375%, 11/01/2027(b) | | | 1,726,708 | | |
| | | | 19,992,944 | | |
| Total Energy (Cost $21,986,352) | | | 20,472,994 | | |
Finance and Insurance | | | 1.07 | % | |
| | | | | Other Financial Investment Activities | | | 1.07 | % | |
| | | | | EIG Investors Corp. | | | |
| | 2,500,000 | | | 10.875%, 02/01/2024 | | | 2,609,113 | | |
| Total Finance and Insurance (Cost $2,572,580) | | | 2,609,113 | | |
Financials | | | 2.11 | % | |
| | | | | Capital Markets | | | 1.08 | % | |
| | | | | Donnelley Financial Solutions, Inc. | | | |
| | 2,500,000 | | | 8.250%, 10/15/2024 | | | 2,627,862 | | |
| | | | | Consumer Finance | | | 0.04 | % | |
| | | | | PRA Group, Inc. | | | |
| | 100,000 | | | 7.375%, 09/01/2025(b) | | | 104,538 | | |

The accompanying notes are an integral part of these financial statements.
59
BUFFALO HIGH YIELD FUND
(UNAUDITED)
SCHEDULE OF INVESTMENTS
SEPTEMBER 30, 2020 Continued
Shares or Face Amount | | | | $ Fair Value* | |
| | | | | Diversified Financial Services | | | 0.99 | % | |
| | | | | Cott Holdings, Inc. | | | |
| | 1,250,000 | | | 5.500%, 04/01/2025(b) | | | 1,282,813 | | |
| | | | | Everi Payments, Inc. | | | |
| | 1,160,000 | | | 7.500%, 12/15/2025(b) | | | 1,141,028 | | |
| | | | 2,423,841 | | |
| Total Financials (Cost $4,993,121) | | | 5,156,241 | | |
Health Care | | | 4.16 | % | |
| | | | | Health Care Equipment & Supplies | | | 0.42 | % | |
| | | | | Catalent Pharma Solutions, Inc. | | | |
| | 1,000,000 | | | 4.875%, 01/15/2026(b) | | | 1,023,560 | | |
| | | | | Pharmaceuticals | | | 3.74 | % | |
| | | | | Bausch Health Americas, Inc. | | | |
| | 1,000,000 | | | 9.250%, 04/01/2026(a) (b) | | | 1,101,300 | | |
| | | | | Bausch Health Companies Inc. | | | |
| | 1,500,000 | | | 5.500%, 11/01/2025(a) (b) | | | 1,540,875 | | |
| | 500,000 | | | 9.000%, 12/15/2025(a) (b) | | | 545,150 | | |
| | | | | Horizon Therapeutics USA, Inc. | | | |
| | 1,000,000 | | | 5.500%, 08/01/2027(b) | | | 1,062,940 | | |
| | | | | Mylan NV | | | |
| | 2,000,000 | | | 3.950%, 06/15/2026(a) | | | 2,252,849 | | |
| | | | | Teva Pharmaceutical Industries Ltd. | | | |
| | 2,500,000 | | | 6.750%, 03/01/2028(a) | | | 2,617,063 | | |
| | | | 9,120,177 | | |
| Total Health Care (Cost $9,239,537) | | | 10,143,737 | | |
Industrials | | | 10.26 | % | |
| | | | | Aerospace & Defense | | | 0.59 | % | |
| | | | | TransDigm, Inc. | | | |
| | 500,000 | | | 6.250%, 03/15/2026(b) | | | 522,775 | | |
| | 500,000 | | | 6.375%, 06/15/2026 | | | 503,125 | | |
| | | | | Triumph Group, Inc. | | | |
| | 500,000 | | | 6.250%, 09/15/2024(b) | | | 426,510 | | |
| | | | 1,452,410 | | |

The accompanying notes are an integral part of these financial statements.
60
BUFFALO HIGH YIELD FUND
(UNAUDITED)
SCHEDULE OF INVESTMENTS
SEPTEMBER 30, 2020 Continued
Shares or Face Amount | | | | $ Fair Value* | |
| | | | | Building Products | | | 1.90 | % | |
| | | | | Builders FirstSource, Inc. | | | |
| | 450,000 | | | 6.750%, 06/01/2027(b) | | | 482,625 | | |
| | 4,000,000 | | | 5.000%, 03/01/2030(b) | | | 4,147,500 | | |
| | | | 4,630,125 | | |
| | | | | Commercial Services & Supplies | | | 4.88 | % | |
| | | | | Cimpress NV | | | |
| | 2,000,000 | | | 7.000%, 06/15/2026(a) (b) | | | 1,907,120 | | |
| | | | | Covanta Holding Corp. | | | |
| | 1,500,000 | | | 5.875%, 07/01/2025 | | | 1,556,092 | | |
| | 250,000 | | | 5.000%, 09/01/2030 | | | 252,638 | | |
| | | | | KAR Auction Services, Inc. | | | |
| | 2,500,000 | | | 5.125%, 06/01/2025(b) | | | 2,503,075 | | |
| | | | | Matthews International Corp. | | | |
| | 2,260,000 | | | 5.250%, 12/01/2025(b) | | | 2,143,938 | | |
| | | | | Quad Graphics, Inc. | | | |
| | 4,000,000 | | | 7.000%, 05/01/2022 | | | 3,534,060 | | |
| | | | 11,896,923 | | |
| | | | | Construction & Engineering | | | 1.39 | % | |
| | | | | Great Lakes Dredge & Dock Corp. | | | |
| | 1,500,000 | | | 8.000%, 05/15/2022 | | | 1,543,477 | | |
| | | | | Tutor Perini Corp. | | | |
| | 2,000,000 | | | 6.875%, 05/01/2025(b) | | | 1,843,750 | | |
| | | | 3,387,227 | | |
| | | | | Trading Companies & Distributors | | | 1.50 | % | |
| | | | | Fly Leasing Ltd. | | | |
| | 2,000,000 | | | 6.375%, 10/15/2021(a) | | | 2,004,690 | | |
| | 2,000,000 | | | 5.250%, 10/15/2024(a) | | | 1,653,750 | | |
| | | | 3,658,440 | | |
| Total Industrials (Cost $25,909,945) | | | 25,025,125 | | |
Information | | | 2.63 | % | |
| | | | | Other Telecommunications | | | 1.57 | % | |
| | | | | Avaya, Inc. | | | |
| | 1,500,000 | | | 6.125%, 09/15/2028(b) | | | 1,535,025 | | |
| | | | | Consolidated Communications, Inc. | | | |
| | 2,250,000 | | | 6.500%, 10/01/2028(b) | | | 2,300,625 | | |
| | | | 3,835,650 | | |

The accompanying notes are an integral part of these financial statements.
61
BUFFALO HIGH YIELD FUND
(UNAUDITED)
SCHEDULE OF INVESTMENTS
SEPTEMBER 30, 2020 Continued
Shares or Face Amount | | | | $ Fair Value* | |
| | | | | Radio and Television Broadcasting | | | 1.06 | % | |
| | | | | iHeartCommunications, Inc. | | | |
| | 2,000,000 | | | 8.375%, 05/01/2027 | | | 1,973,630 | | |
| | 100,000 | | | 5.250%, 08/15/2027(b) | | | 97,669 | | |
| | | | | Nexstar Broadcasting, Inc. | | | |
| | 500,000 | | | 4.750%, 11/01/2028(b) | | | 510,525 | | |
| | | | 2,581,824 | | |
| Total Information (Cost $6,497,771) | | | 6,417,474 | | |
Information Technology | | | 3.69 | % | |
| | | | | Electronic Equipment, Instruments & Components | | | 1.05 | % | |
| | | | | Itron, Inc. | | | |
| | 2,500,000 | | | 5.000%, 01/15/2026(b) | | | 2,570,313 | | |
| | | | | IT Services | | | 0.92 | % | |
| | | | | Cardtronics Inc / Cardtronics USA, Inc. | | | |
| | 1,000,000 | | | 5.500%, 05/01/2025(a) (b) | | | 1,003,645 | | |
| | | | | j2 Cloud Services LLC / j2 Global Co-Obligor, Inc. | | | |
| | 1,200,000 | | | 6.000%, 07/15/2025(b) | | | 1,249,560 | | |
| | | | 2,253,205 | | |
| | | | | Technology Hardware, Storage & Peripherals | | | 1.72 | % | |
| | | | | Diebold Nixdorf, Inc. | | | |
| | 4,000,000 | | | 8.500%, 04/15/2024 | | | 3,651,600 | | |
| | 500,000 | | | 9.375%, 07/15/2025(b) | | | 528,750 | | |
| | | | 4,180,350 | | |
| Total Information Technology (Cost $9,152,570) | | | 9,003,868 | | |
Materials | | | 0.96 | % | |
| | | | | Chemicals | | | 0.42 | % | |
| | | | | OCI NV | | | |
| | 1,000,000 | | | 6.625%, 04/15/2023(a) (b) | | | 1,035,250 | | |
| | | | | Metals & Mining | | | 0.54 | % | |
| | | | | Commercial Metals Co. | | | |
| | 1,000,000 | | | 5.750%, 04/15/2026 | | | 1,042,965 | | |
| | 250,000 | | | 5.375%, 07/15/2027 | | | 264,565 | | |
| | | | 1,307,530 | | |
| Total Materials (Cost $2,261,250) | | | 2,342,780 | | |

The accompanying notes are an integral part of these financial statements.
62
BUFFALO HIGH YIELD FUND
(UNAUDITED)
SCHEDULE OF INVESTMENTS
SEPTEMBER 30, 2020 Continued
Shares or Face Amount | | | | $ Fair Value* | |
Professional, Scientific, and Technical Services | | | 0.62 | % | |
| | | | | Other Professional, Scientific, and Technical Services | | | 0.62 | % | |
| | | | | Sabre GLBL, Inc. | | | |
| | 1,500,000 | | | 7.375%, 09/01/2025(b) | | | 1,517,250 | | |
| Total Professional, Scientific, and Technical Services (Cost $1,519,089) | | | 1,517,250 | | |
Retail Trade | | | 1.72 | % | |
| | | | | Sporting Goods, Hobby, and Musical Instrument Stores | | | 1.72 | % | |
| | | | | Michaels Stores, Inc. | | | |
| | 4,000,000 | | | 8.000%, 07/15/2027(b) | | | 4,186,760 | | |
| Total Retail Trade (Cost $3,968,951) | | | 4,186,760 | | |
Wholesale Trade | | | 1.88 | % | |
| | | | | Drugs and Druggists' Sundries Merchant Wholesalers | | | 1.49 | % | |
| | | | | Herbalife Nutrition Ltd / HLF Financing, Inc. | | | |
| | 500,000 | | | 7.875%, 09/01/2025(a) (b) | | | 537,500 | | |
| | | | | HLF Financing Sarl LLC / Herbalife International, Inc. | | | |
| | 3,000,000 | | | 7.250%, 08/15/2026(b) | | | 3,087,195 | | |
| | | | 3,624,695 | | |
| | | | | Machinery, Equipment, and Supplies Merchant Wholesalers | | | 0.39 | % | |
| | | | | TransDigm, Inc. | | | |
| | 1,000,000 | | | 5.500%, 11/15/2027 | | | 962,950 | | |
| Total Wholesale Trade (Cost $4,552,500) | | | 4,587,645 | | |
| Total Corporate Bonds (Cost $144,912,140) | | | 144,942,306 | | |
Bank Loans | | | 16.29 | % | |
| | | | | Aerospace & Defense | | | 1.43 | % | |
| | 3,609,671 | | | Maxar Technologies Ltd., Senior Secured First Lien Term Loan (1 Month LIBOR USD + 2.750%) | | | 3,482,214 | | |
| | | | | Aerospace/Defense | | | 0.75 | % | |
| | 1,935,574 | | | TransDigm, Inc. Senior Secured First Lien Term Loan (1 Month LIBOR USD + 2.250%) | | | 1,836,704 | | |
| | | | | Broadcasting | | | 0.19 | % | |
| | 480,313 | | | Nexstar Media Group, Inc., Senior Secured First Lien Term Loan (1 Month LIBOR USD + 2.750%) | | | 470,807 | | |
| | | | | Building Products | | | 0.14 | % | |
| | 334,142 | | | Builders FirstSource, Inc., Senior Secured First Lien Term Loan (1 Month LIBOR USD + 3.000%) | | | 330,209 | | |

The accompanying notes are an integral part of these financial statements.
63
BUFFALO HIGH YIELD FUND
(UNAUDITED)
SCHEDULE OF INVESTMENTS
SEPTEMBER 30, 2020 Continued
Shares or Face Amount | | | | $ Fair Value* | |
| | | | | Capital Goods | | | 0.53 | % | |
| | 1,311,242 | | | SiteOne Landscape Supply Holding, Llc, Senior Secured First Lien Term Loan
(1 Month LIBOR USD + 2.750%) | | | 1,304,686 | | |
| | | | | Construction & Engineering | | | 1.22 | % | |
| | 3,000,000 | | | Tutor Perini Corp., Senior Secured First Lien Term Loan (1 Month LIBOR USD + 4.750%) | | | 2,970,000 | | |
| | | | | Diversified Consumer Services | | | 0.82 | % | |
| | 1,993,912 | | | Weight Watchers International, Inc., Senior Secured First Lien Term Loan
(1 Month LIBOR USD + 4.750%) | | | 1,993,912 | | |
| | | | | Financial Services | | | 2.83 | % | |
| | 6,931,211 | | | Open Lending LLC, Senior Secured First Lien Term Loan (1 Month LIBOR USD + 6.500%) | | | 6,896,555 | | |
| | | | | Food Products | | | 1.54 | % | |
| | 1,829,678 | | | Atkins Nutritionals, Inc., Senior Secured First Lien Term Loan (1 Month LIBOR USD + 3.750%)(c) | | | 1,836,548 | | |
| | 1,925,000 | | | Bellring Brands LLC, Senior Secured First Lien Term Loan (1 Month LIBOR USD + 5.000%)(c) | | | 1,931,824 | | |
| | | | | Health Care Equipment & Services | | | 0.74 | % | |
| | 1,828,571 | | | RadNet, Inc. , Senior Secured First Lien Term Loan (1 Month LIBOR USD + 3.750%) | | | 1,809,143 | | |
| | | | | Machinery | | | 0.36 | % | |
| | 950,000 | | | Welbilt, Inc., Senior Secured First Lien Term Loan (1 Month LIBOR USD + 2.500%) | | | 870,290 | | |
| | | | | Media | | | 1.02 | % | |
| | 624,468 | | | Entercom Media Corp., Senior Secured First Lien Term Loan (1 Month LIBOR USD + 2.500%) | | | 588,820 | | |
| | 985,050 | | | The E.W. Scripps Co., Senior Secured First Lien Term Loan (1 Month LIBOR USD + 2.500%) | | | 962,734 | | |
| | 970,000 | | | The E.W. Scripps Co., Senior Secured First Lien Term Loan (1 Month LIBOR USD + 2.750%) | | | 939,993 | | |
| | | | | Metals & Mining | | | 0.84 | % | |
| | 2,420,900 | | | U.S. Silica Co., Senior Secured First Lien Term Loan (1 Month LIBOR USD + 4.000%) | | | 2,041,871 | | |
| | | | | Oil, Gas & Consumable Fuels | | | 0.36 | % | |
| | 977,500 | | | Keane Group Holdings, LLC, Senior Secured First Lien Term Loan (1 Month LIBOR USD + 3.500%) | | | 873,641 | | |
| | | | | Pharmaceuticals | | | 0.77 | % | |
| | 1,900,398 | | | Lannett Co, Inc., Senior Secured First Lien Term Loan (1 Month LIBOR USD + 5.375%) | | | 1,871,892 | | |
| | | | | Software | | | 1.35 | % | |
| | 1,899,278 | | | Avaya, Inc., Senior Secured First Lien Term Loan (1 Month LIBOR USD + 4.250%) | | | 1,892,460 | | |
| | 271,997 | | | SS&C Technologies Holdings, Inc., Senior Secured First Lien Term Loan
(1 Month LIBOR USD + 1.750%)(c) | | | 264,177 | | |
| | 191,097 | | | SS&C Technologies Holdings, Inc., Senior Secured First Lien Term Loan
(1 Month USD + 1.750%)(c) | | | 185,602 | | |
| | 979,744 | | | SS&C Technologies Holdings, Inc., Senior Secured First Lien Term Loan
(1 Month LIBOR USD + 1.750%)(c) | | | 952,120 | | |
| | | | | Transportation | | | .80 | % | |
| | 1,994,872 | | | Daseke Cos, Inc., Senior Secured First Lien Term Loan (1 Month LIBOR USD + 5.000%) | | | 1,961,837 | | |

The accompanying notes are an integral part of these financial statements.
64
BUFFALO HIGH YIELD FUND
(UNAUDITED)
SCHEDULE OF INVESTMENTS
SEPTEMBER 30, 2020 Continued
Shares or Face Amount | | | | $ Fair Value* | |
| | | | | Telecommunications | | | 0.20 | % | |
| | 500,000 | | | Consolidated Communications, Inc., Senior Secured First Lien Term Loan
(1 Month LIBOR USD + 2.500%) | | | 495,938 | | |
| | | | | Trading Companies & Distributors | | | 0.40 | % | |
| | 982,500 | | | Foundation Building Materials Holding Company LLC, Senior Secured First Lien Term Loan
(1 Month LIBOR USD + 3.000%) | | | 971,447 | | |
| Total Bank Loans (Cost $40,611,053) | | | 39,735,424 | | |
Short Term Investments | | | 5.84 | % | |
Investment Company | | | 5.84 | % | |
| | 14,240,384 | | | Fidelity Investments Money Market Funds — Government Portfolio — Class I — 0.10%(d) | | | 14,240,384 | | |
Total Investment Company | | | 14,240,384 | | |
| Total Short Term Investments (Cost $14,240,384) | | | 14,240,384 | | |
Total Investments (Cost $241,989,588)
| | | 101.06
246,452,083 | % | |
Liabilities in Excess of Other Assets
| | | (1.06
(2,594,053) | )% | |
Total Net Assets
| | | 100.00
243,858,030 | % | |
(a) Foreign Issued Securities. The total value of these securities amounted to $24,539,609 (10.06% if net assets) at September 30, 2020.
(b) Restricted securities deemed liquid. The total value of these securities amounted to $96,957,197 (39.76% of net assets) at September 30, 2020.
(c) Illiquid Security. The total value of these securities amounted to $5,170,271 (2.12% of net assets) at September 30, 2020.
(d) The rate quoted is the annualized seven-day effective yield as of September 30, 2020.
* See Note 1A of the accompanying Notes to Financial Statements regarding valuation of securities.
The Global Industry Classification Standard (GICS) was developed by and/or is the exclusive property of MSCI, Inc. and Standard & Poor's Financial Services LLC ("S&P"). GICS is a service mark of MSCI and S&P and has been licensed for use by U.S. Bancorp Fund Services, LLC.

The accompanying notes are an integral part of these financial statements.
65
BUFFALO INTERNATIONAL FUND
(UNAUDITED)
SCHEDULE OF INVESTMENTS
SEPTEMBER 30, 2020
Shares or Face Amount | | | | $ Fair Value* | |
Common Stocks | | | 90.16 | % | |
Belgium | | | 1.39 | % | |
| | | | | Beverages | | | 1.39 | % | |
| | 83,500 | | | Anheuser-Busch InBev SA/NV | | | 4,495,703 | | |
| | 41,500 | | | Anheuser-Busch InBev SA/NV — ADR | | | 2,236,020 | | |
| | | | 6,731,723 | | |
| Total Belgium (Cost $8,039,001) | | | 6,731,723 | | |
Canada | | | 1.48 | % | |
| | | | | Road & Rail | | | 1.48 | % | |
| | 67,000 | | | Canadian National Railway Co. | | | 7,132,820 | | |
| Total Canada (Cost $4,822,925) | | | 7,132,820 | | |
Cayman Islands | | | 1.47 | % | |
| | | | | Interactive Media & Services | | | 1.47 | % | |
| | 105,000 | | | Tencent Holdings Ltd. — ADR | | | 7,103,250 | | |
| Total Cayman Islands (Cost $4,497,658) | | | 7,103,250 | | |
Denmark | | | 1.31 | % | |
| | | | | Pharmaceuticals | | | 1.31 | % | |
| | 15,000 | | | Novo Nordisk A/S | | | 1,039,269 | | |
| | 76,000 | | | Novo Nordisk A/S — ADR | | | 5,276,680 | | |
| | | | 6,315,949 | | |
| Total Denmark (Cost $5,103,075) | | | 6,315,949 | | |
France | | | 16.06 | % | |
| | | | | Aerospace & Defense | | | 0.70 | % | |
| | 45,000 | | | Thales SA | | | 3,372,667 | | |
| | | | | Beverages | | | 1.24 | % | |
| | 37,500 | | | Pernod Ricard SA | | | 5,978,882 | | |
| | | | | Chemicals | | | 1.68 | % | |
| | 51,062 | | | Air Liquide SA | | | 8,093,870 | | |

The accompanying notes are an integral part of these financial statements.
66
BUFFALO INTERNATIONAL FUND
(UNAUDITED)
SCHEDULE OF INVESTMENTS
SEPTEMBER 30, 2020 Continued
Shares or Face Amount | | | | $ Fair Value* | |
| | | | | Construction & Engineering | | | 0.97 | % | |
| | 56,000 | | | Vinci SA | | | 4,679,195 | | |
| | | | | Electrical Equipment | | | 2.29 | % | |
| | 89,000 | | | Schneider Electric SE | | | 11,062,668 | | |
| | | | | Hotels, Restaurants & Leisure | | | 0.38 | % | |
| | 50,000 | | | La Francaise des Jeux SAEM | | | 1,834,333 | | |
| | | | | Life Sciences Tools & Services | | | 2.36 | % | |
| | 33,000 | | | Sartorius Stedim Biotech | | | 11,390,442 | | |
| | | | | Media (discontinued effective close of September 28, 2018) | | | 0.32 | % | |
| | 88,000 | | | JCDecaux SA(a) | | | 1,521,370 | | |
| | | | | Pharmaceuticals | | | 1.03 | % | |
| | 99,587 | | | Sanofi — ADR | | | 4,996,280 | | |
| | | | | Professional Services | | | 1.32 | % | |
| | 283,000 | | | Bureau Veritas SA(a) | | | 6,379,232 | | |
| | | | | Software | | | 1.08 | % | |
| | 28,000 | | | Dassault Systemes SE | | | 5,224,329 | | |
| | | | | Textiles, Apparel & Luxury Goods | | | 2.69 | % | |
| | 10,300 | | | Kering SA | | | 6,832,469 | | |
| | 13,100 | | | LVMH Moet Hennessy Louis Vuitton SE | | | 6,129,535 | | |
| | | | 12,962,004 | | |
| Total France (Cost $49,308,263) | | | 77,495,272 | | |
Germany | | | 20.91 | % | |
| | | | | Capital Markets | | | 1.02 | % | |
| | 142,000 | | | DWS Group GmbH & Co KGaA | | | 4,893,940 | | |
| | | | | Chemicals | | | 1.60 | % | |
| | 56,000 | | | Symrise AG | | | 7,734,906 | | |
| | | | | Electric | | | 0.18 | % | |
| | 32,600 | | | Siemens Energy AG(a) | | | 879,108 | | |
| | | | | Electronic Equipment, Instruments & Components | | | 0.74 | % | |
| | 133,711 | | | Jenoptik AG | | | 3,585,197 | | |
| | | | | Health Care Equipment & Supplies | | | 1.72 | % | |
| | 65,525 | | | Carl Zeiss Meditec AG(a) | | | 8,275,892 | | |

The accompanying notes are an integral part of these financial statements.
67
BUFFALO INTERNATIONAL FUND
(UNAUDITED)
SCHEDULE OF INVESTMENTS
SEPTEMBER 30, 2020 Continued
Shares or Face Amount | | | | $ Fair Value* | |
| | | | | Health Care Providers & Services | | | 1.57 | % | |
| | 167,000 | | | Fresenius SE & Co. KGaA | | | 7,594,256 | | |
| | | | | Household Products | | | 0.46 | % | |
| | 23,900 | | | Henkel AG & Co. KGaA | | | 2,235,336 | | |
| | | | | Industrial Conglomerates | | | 1.71 | % | |
| | 65,200 | | | Siemens A.G. — ADR | | | 8,234,096 | | |
| | | | | Insurance | | | 2.51 | % | |
| | 34,000 | | | Hannover Rueck SE | | | 5,263,599 | | |
| | 26,900 | | | Muenchener Rueckversicherungs-Gesellschaft AG in Muenchen | | | 6,838,487 | | |
| | | | 12,102,086 | | |
| | | | | Pharmaceuticals | | | 1.96 | % | |
| | 12,000 | | | Bayer AG — ADR | | | 179,400 | | |
| | 63,500 | | | Merck KGaA | | | 9,257,868 | | |
| | | | 9,437,268 | | |
| | | | | Semiconductors & Semiconductor Equipment | | | 1.48 | % | |
| | 254,000 | | | Infineon Technologies AG | | | 7,159,233 | | |
| | | | | Software | | | 2.09 | % | |
| | 64,800 | | | SAP SE — ADR | | | 10,096,488 | | |
| | | | | Textiles, Apparel & Luxury Goods | | | 2.38 | % | |
| | 19,700 | | | adidas AG(a) | | | 6,361,998 | | |
| | 57,160 | | | Puma SE(a) | | | 5,138,436 | | |
| | | | 11,500,434 | | |
| | | | | Trading Companies & Distributors | | | 1.49 | % | |
| | 113,000 | | | Brenntag AG | | | 7,184,792 | | |
| Total Germany (Cost $65,136,673) | | | 100,913,032 | | |
India | | | 1.46 | % | |
| | | | | Banks | | | 1.46 | % | |
| | 27,500 | | | HDFC Bank Ltd. — ADR(a) | | | 1,373,900 | | |
| | 577,480 | | | ICICI Bank Ltd. — ADR(a) | | | 5,676,628 | | |
| | | | 7,050,528 | | |
| Total India (Cost $6,904,141) | | | 7,050,528 | | |

The accompanying notes are an integral part of these financial statements.
68
BUFFALO INTERNATIONAL FUND
(UNAUDITED)
SCHEDULE OF INVESTMENTS
SEPTEMBER 30, 2020 Continued
Shares or Face Amount | | | | $ Fair Value* | |
Ireland | | | 8.18 | % | |
| | | | | Chemicals | | | 2.29 | % | |
| | 46,760 | | | Linde PLC | | | 11,055,567 | | |
| | | | | Construction Materials | | | 1.45 | % | |
| | 78,000 | | | CRH PLC — ADR | | | 2,815,020 | | |
| | 5,000 | | | CRH PLC | | | 180,323 | | |
| | 110,000 | | | CRH public limited company | | | 3,988,769 | | |
| | | | 6,984,112 | | |
| | | | | Food Products | | | 0.45 | % | |
| | 17,000 | | | Kerry Group Plc | | | 2,177,469 | | |
| | | | | Health Care Equipment & Supplies | | | 1.67 | % | |
| | 77,400 | | | Medtronic, PLC | | | 8,043,408 | | |
| | | | | Hotels, Restaurants & Leisure | | | 0.27 | % | |
| | 450,015 | | | Dalata Hotel Group PLC(a) | | | 1,304,797 | | |
| | | | | Insurance | | | 2.05 | % | |
| | 48,000 | | | Aon Plc | | | 9,902,400 | | |
| Total Ireland (Cost $29,828,761) | | | 39,467,753 | | |
Japan | | | 4.56 | % | |
| | | | | Beverages | | | 0.85 | % | |
| | 117,000 | | | Asahi Group Holdings Ltd. | | | 4,077,757 | | |
| | | | | Electronic Equipment, Instruments & Components | | | 3.08 | % | |
| | 3,500 | | | KEYENCE CORP. | | | 1,636,177 | | |
| | 75,000 | | | Murata Manufacturing Co., Ltd. | | | 4,877,038 | | |
| | 107,000 | | | Omron Corp. | | | 8,365,915 | | |
| | | | 14,879,130 | | |
| | | | | Machinery | | | 0.63 | % | |
| | 14,000 | | | FANUC Corp. | | | 2,686,818 | | |
| | 18,000 | | | FANUC Corp. — ADR(a) | | | 344,880 | | |
| | | | 3,031,698 | | |
| Total Japan (Cost $15,440,558) | | | 21,988,585 | | |

The accompanying notes are an integral part of these financial statements.
69
BUFFALO INTERNATIONAL FUND
(UNAUDITED)
SCHEDULE OF INVESTMENTS
SEPTEMBER 30, 2020 Continued
Shares or Face Amount | | | | $ Fair Value* | |
Luxembourg | | | 2.58 | % | |
| | | | | Life Sciences Tools & Services | | | 2.28 | % | |
| | 13,900 | | | Eurofins Scientific SE(a) | | | 11,011,183 | | |
| | | | | Personal Products | | | 0.30 | % | |
| | 830,750 | | | L'Occitane International SA | | | 1,453,881 | | |
| Total Luxembourg (Cost $7,860,761) | | | 12,465,064 | | |
Netherlands | | | 8.89 | % | |
| | | | | Beverages | | | 1.61 | % | |
| | 710,000 | | | Davide Campari-Milano NV | | | 7,749,294 | | |
| | | | | IT Services | | | 1.22 | % | |
| | 3,200 | | | Adyen NV(a) | | | 5,902,383 | | |
| | | | | Personal Products | | | 1.32 | % | |
| | 97,200 | | | Unilever N.V. — NY Shares — ADR | | | 5,870,880 | | |
| | 8,000 | | | Unilever NV | | | 485,822 | | |
| | | | 6,356,702 | | |
| | | | | Semiconductors & Semiconductor Equipment | | | 2.89 | % | |
| | 25,741 | | | ASML Holding NV — NY Shares — ADR | | | 9,505,379 | | |
| | 65,000 | | | STMicroelectronics N.V. | | | 1,993,562 | | |
| | 80,600 | | | STMicroelectronics N.V. — NY Shares — ADR | | | 2,473,614 | | |
| | | | 13,972,555 | | |
| | | | | Trading Companies & Distributors | | | 1.85 | % | |
| | 75,000 | | | IMCD N.V. | | | 8,920,163 | | |
| Total Netherlands (Cost $19,660,750) | | | 42,901,097 | | |
Norway | | | 2.05 | % | |
| | | | | Commercial Services & Supplies | | | 2.05 | % | |
| | 228,000 | | | Tomra Systems ASA(a) | | | 9,877,001 | | |
| Total Norway (Cost $2,498,870) | | | 9,877,001 | | |

The accompanying notes are an integral part of these financial statements.
70
BUFFALO INTERNATIONAL FUND
(UNAUDITED)
SCHEDULE OF INVESTMENTS
SEPTEMBER 30, 2020 Continued
Shares or Face Amount | | | | $ Fair Value* | |
Republic of Korea | | | 0.41 | % | |
| | | | | Semiconductors & Semiconductor Equipment | | | 0.41 | % | |
| | 40,000 | | | Samsung Electronic Co., Ltd. | | | 1,985,767 | | |
| Total Republic of Korea (Cost $894,090) | | | 1,985,767 | | |
Spain | | | 1.70 | % | |
| | | | | Biotechnology | | | 1.28 | % | |
| | 357,200 | | | Grifols SA — ADR | | | 6,197,420 | | |
| | | | | Specialty Retail | | | 0.42 | % | |
| | 73,500 | | | Industria de Diseno Textil, S.A. | | | 2,033,344 | | |
| Total Spain (Cost $8,930,521) | | | 8,230,764 | | |
Sweden | | | 2.33 | % | |
| | | | | Electronic Equipment, Instruments & Components | | | 2.16 | % | |
| | 138,000 | | | Hexagon AB — B Shares(a) | | | 10,423,557 | | |
| | | | | Software | | | 0.17 | % | |
| | 10,000 | | | Sinch AB(a) | | | 815,482 | | |
| Total Sweden (Cost $7,672,596) | | | 11,239,039 | | |
Switzerland | | | 6.68 | % | |
| | | | | Capital Markets | | | 0.45 | % | |
| | 51,037 | | | Julius Baer Group Ltd. | | | 2,167,664 | | |
| | | | | Construction Materials | | | 0.66 | % | |
| | 70,000 | | | LafargeHolcim Ltd. | | | 3,186,369 | | |
| | | | | Electrical Equipment | | | 1.17 | % | |
| | 222,500 | | | ABB Ltd. — ADR | | | 5,662,625 | | |
| | | | | Health Care Equipment & Supplies | | | 0.54 | % | |
| | 46,000 | | | Alcon, Inc.(a) | | | 2,608,003 | | |
| | | | | Life Sciences Tools & Services | | | 2.62 | % | |
| | 20,500 | | | Lonza Group AG | | | 12,651,279 | | |

The accompanying notes are an integral part of these financial statements.
71
BUFFALO INTERNATIONAL FUND
(UNAUDITED)
SCHEDULE OF INVESTMENTS
SEPTEMBER 30, 2020 Continued
Shares or Face Amount | | | | $ Fair Value* | |
| | | | | Pharmaceuticals | | | 1.24 | % | |
| | 11,800 | | | Roche Holding AG | | | 4,041,978 | | |
| | 45,400 | | | Roche Holding AG — ADR | | | 1,943,574 | | |
| | | | 5,985,552 | | |
| Total Switzerland (Cost $22,986,514) | | | 32,261,492 | | |
Taiwan, Province of China | | | 2.42 | % | |
| | | | | Semiconductors & Semiconductor Equipment | | | 2.42 | % | |
| | 144,281 | | | Taiwan Semiconductor Manufacturing Co. Ltd. — ADR | | | 11,696,861 | | |
| Total Taiwan, Province of China (Cost $1,869,696) | | | 11,696,861 | | |
United Kingdom | | | 6.28 | % | |
| | | | | Aerospace & Defense | | | 0.57 | % | |
| | 440,000 | | | BAE Systems Plc | | | 2,732,639 | | |
| | | | | Beverages | | | 1.15 | % | |
| | 40,300 | | | Diageo PLC — ADR | | | 5,547,698 | | |
| | | | | Health Care Equipment & Supplies | | | 1.19 | % | |
| | 147,000 | | | Smith & Nephew Plc — ADR | | | 5,747,700 | | |
| | | | | Hotels, Restaurants & Leisure | | | 0.52 | % | |
| | 48,100 | | | InterContinental Hotels Group PLC(a) | | | 2,524,802 | | |
| | | | | Pharmaceuticals | | | 1.27 | % | |
| | 94,000 | | | AstraZeneca PLC — ADR | | | 5,151,200 | | |
| | 9,000 | | | AstraZeneca PLC | | | 983,385 | | |
| | | | 6,134,585 | | |
| | | | | Trading Companies & Distributors | | | 1.58 | % | |
| | 212,000 | | | Ashtead Group Plc | | | 7,634,453 | | |
| Total United Kingdom (Cost $23,750,781) | | | 30,321,877 | | |
| Total Common Stocks (Cost $285,205,634) | | | 435,177,874 | | |

The accompanying notes are an integral part of these financial statements.
72
BUFFALO INTERNATIONAL FUND
(UNAUDITED)
SCHEDULE OF INVESTMENTS
SEPTEMBER 30, 2020 Continued
Shares or Face Amount | | | | $ Fair Value* | |
Short Term Investments | | | 8.75 | % | |
Investment Company | | | 8.75 | % | |
| | 42,234,763 | | | Fidelity Investments Money Market Funds — Government Portfolio — Class I — 0.10%(b) | | | 42,234,763 | | |
Total Investment Company | | | 42,234,763 | | |
| Total Short Term Investments (Cost $42,234,763) | | | 42,234,763 | | |
| Total Investments (Cost $327,440,397) | | | 98.91
477,412,637 | % | |
Other Assets in Excess of Liabilities | | | 1.09
5,240,643 | % | |
Total Net Assets | | | 100.00
482,653,280 | % | |
ADR American Depositary Receipt
PLC Public Limited Company
(a) Non Income Producing.
(b) The rate quoted is the annualized seven-day effective yield as of September 30, 2020.
* See Note 1A of the accompanying Notes to Financial Statements regarding valuation of securities.
The Global Industry Classification Standard (GICS) was developed by and/or is the exclusive property of MSCI, Inc. and Standard & Poor's Financial Services LLC ("S&P"). GICS is a service mark of MSCI and S&P and has been licensed for use by U.S. Bancorp Fund Services, LLC.

The accompanying notes are an integral part of these financial statements.
73
BUFFALO INTERNATIONAL FUND
(UNAUDITED)
SCHEDULE OF INVESTMENTS
SEPTEMBER 30, 2020 Continued
As of September 30, 2020, the industry diversification was as follows:
| | | $ Fair Value | | Percentage | |
Common Stocks | |
Aerospace & Defense | | | 6,105,306 | | | | 1.26 | % | |
Banks | | | 7,050,528 | | | | 1.46 | % | |
Beverages | | | 30,085,355 | | | | 6.23 | % | |
Biotechnology | | | 6,197,420 | | | | 1.28 | % | |
Capital Markets | | | 7,061,603 | | | | 1.46 | % | |
Chemicals | | | 26,884,343 | | | | 5.57 | % | |
Commercial Services & Supplies | | | 9,877,001 | | | | 2.05 | % | |
Construction & Engineering | | | 4,679,195 | | | | 0.97 | % | |
Construction Materials | | | 10,170,481 | | | | 2.11 | % | |
Electric | | | 879,108 | | | | 0.18 | % | |
Electrical Equipment | | | 16,725,293 | | | | 3.47 | % | |
Electronic Equipment, Instruments & Components | | | 28,887,884 | | | | 5.99 | % | |
Food Products | | | 2,177,469 | | | | 0.45 | % | |
Health Care Equipment & Supplies | | | 24,675,002 | | | | 5.11 | % | |
Health Care Providers & Services | | | 7,594,256 | | | | 1.57 | % | |
Hotels, Restaurants & Leisure | | | 5,663,933 | | | | 1.17 | % | |
Household Products | | | 2,235,336 | | | | 0.46 | % | |
Industrial Conglomerates | | | 8,234,096 | | | | 1.71 | % | |
Insurance | | | 22,004,486 | | | | 4.56 | % | |
Interactive Media & Services | | | 7,103,250 | | | | 1.47 | % | |
IT Services | | | 5,902,383 | | | | 1.22 | % | |
Life Sciences Tools & Services | | | 35,052,905 | | | | 7.26 | % | |
Machinery | | | 3,031,698 | | | | 0.63 | % | |
Media (discontinued effective close of September 28, 2018) | | | 1,521,370 | | | | 0.32 | % | |
Personal Products | | | 7,810,582 | | | | 1.62 | % | |
Pharmaceuticals | | | 32,869,634 | | | | 6.81 | % | |
Professional Services | | | 6,379,232 | | | | 1.32 | % | |
Road & Rail | | | 7,132,820 | | | | 1.48 | % | |
Semiconductors & Semiconductor Equipment | | | 34,814,416 | | | | 7.21 | % | |
Software | | | 16,136,299 | | | | 3.34 | % | |
Specialty Retail | | | 2,033,344 | | | | 0.42 | % | |
Textiles, Apparel & Luxury Goods | | | 24,462,438 | | | | 5.07 | % | |
Trading Companies & Distributors | | | 23,739,408 | | | | 4.92 | % | |
Total Common Stocks | | | 435,177,874 | | | | 90.16 | % | |
Short Term Investments | |
Investment Company | | | 42,234,763 | | | | 8.75 | % | |
Total Short Term Investments | | | 42,234,763 | | | | 8.75 | % | |
Total Investments | | | 477,412,637 | | | | 98.91 | % | |
Other Assets in Excess of Liabilities | | | 5,240,643 | | | | 1.09 | % | |
TOTAL NET ASSETS | | | 482,653,280 | | | | 100.00 | % | |

The accompanying notes are an integral part of these financial statements.
74
BUFFALO LARGE CAP FUND
(UNAUDITED)
SCHEDULE OF INVESTMENTS
SEPTEMBER 30, 2020
Shares or Face Amount | | | | $ Fair Value* | |
Common Stocks | | | 93.14 | % | |
Communication Services | | | 9.54 | % | |
| | | | | Entertainment | | | 2.60 | % | |
| | 12,510 | | | Electronic Arts, Inc.(a) | | | 1,631,429 | | |
| | 8,000 | | | The Walt Disney Co. | | | 992,640 | | |
| | | | 2,624,069 | | |
| | | | | Interactive Media & Services | | | 6.94 | % | |
| | 2,845 | | | Alphabet, Inc. — Class A(a) | | | 4,169,632 | | |
| | 1,148 | | | Alphabet, Inc. — Class C(a) | | | 1,687,101 | | |
| | 4,450 | | | Facebook, Inc. — Class A(a) | | | 1,165,455 | | |
| | | | 7,022,188 | | |
| Total Communication Services (Cost $4,239,331) | | | 9,646,257 | | |
Consumer Discretionary | | | 16.60 | % | |
| | | | | Hotels, Restaurants & Leisure | | | 2.19 | % | |
| | 26,555 | | | Las Vegas Sands Corp | | | 1,239,056 | | |
| | 10,740 | | | Yum! Brands, Inc. | | | 980,562 | | |
| | | | 2,219,618 | | |
| | | | | Internet & Direct Marketing Retail | | | 8.79 | % | |
| | 2,485 | | | Amazon.com, Inc.(a) | | | 7,824,594 | | |
| | 625 | | | Booking Holdings, Inc.(a) | | | 1,069,175 | | |
| | | | 8,893,769 | | |
| | | | | Specialty Retail | | | 3.97 | % | |
| | 11,455 | | | Lowe's Companies, Inc. | | | 1,899,927 | | |
| | 2,350 | | | O'Reilly Automotive, Inc.(a) | | | 1,083,538 | | |
| | 18,645 | | | The TJX Companies, Inc. | | | 1,037,594 | | |
| | | | 4,021,059 | | |
| | | | | Textiles, Apparel & Luxury Goods | | | 1.65 | % | |
| | 13,260 | | | NIKE, Inc. — Class B | | | 1,664,660 | | |
| Total Consumer Discretionary (Cost $6,965,766) | | | 16,799,106 | | |
Consumer Staples | | | 1.33 | % | |
| | | | | Personal Products | | | 1.33 | % | |
| | 6,180 | | | The Estee Lauder Companies Inc. — Class A | | | 1,348,785 | | |
| Total Consumer Staples (Cost $665,699) | | | 1,348,785 | | |

The accompanying notes are an integral part of these financial statements.
75
BUFFALO LARGE CAP FUND
(UNAUDITED)
SCHEDULE OF INVESTMENTS
SEPTEMBER 30, 2020 Continued
Shares or Face Amount | | | | $ Fair Value* | |
Energy | | | 0.33 | % | |
| | | | | Energy Equipment & Services | | | 0.33 | % | |
| | 21,579 | | | Schlumberger Ltd.(b) | | | 335,769 | | |
| Total Energy (Cost $1,286,750) | | | 335,769 | | |
Financials | | | 6.89 | % | |
| | | | | Capital Markets | | | 6.48 | % | |
| | 10,125 | | | CME Group, Inc. | | | 1,694,014 | | |
| | 17,850 | | | Intercontinental Exchange, Inc. | | | 1,785,892 | | |
| | 6,475 | | | S&P Global, Inc. | | | 2,334,885 | | |
| | 5,800 | | | T Rowe Price Group, Inc. | | | 743,676 | | |
| | | | 6,558,467 | | |
| | | | | Thrifts & Mortgage Finance | | | 0.41 | % | |
| | 20,460 | | | Rocket Cos, Inc.(a) | | | 407,768 | | |
| Total Financials (Cost $2,814,740) | | | 6,966,235 | | |
Health Care | | | 17.24 | % | |
| | | | | Biotechnology | | | 1.39 | % | |
| | 5,760 | | | Alnylam Pharmaceuticals, Inc.(a) | | | 838,656 | | |
| | 2,000 | | | Biogen Idec Inc.(a) | | | 567,360 | | |
| | | | 1,406,016 | | |
| | | | | Health Care Equipment & Supplies | | | 7.81 | % | |
| | 13,890 | | | Abbott Laboratories | | | 1,511,649 | | |
| | 12,150 | | | Danaher Corp. | | | 2,616,260 | | |
| | 13,200 | | | Medtronic, PLC(b) | | | 1,371,744 | | |
| | 2,995 | | | The Cooper Companies, Inc. | | | 1,009,674 | | |
| | 10,210 | | | Zimmer Biomet Holdings, Inc. | | | 1,389,989 | | |
| | | | 7,899,316 | | |
| | | | | Health Care Providers & Services | | | 2.47 | % | |
| | 6,460 | | | Laboratory Corporation of America Holdings(a) | | | 1,216,224 | | |
| | 4,125 | | | UnitedHealth Group, Inc. | | | 1,286,051 | | |
| | | | 2,502,275 | | |
| | | | | Health Care Technology | | | 1.47 | % | |
| | 20,545 | | | Cerner Corp. | | | 1,485,198 | | |
| | | | | Life Sciences Tools & Services | | | 1.00 | % | |
| | 3,260 | | | Illumina, Inc.(a) | | | 1,007,601 | | |

The accompanying notes are an integral part of these financial statements.
76
BUFFALO LARGE CAP FUND
(UNAUDITED)
SCHEDULE OF INVESTMENTS
SEPTEMBER 30, 2020 Continued
Shares or Face Amount | | | | $ Fair Value* | |
| | | | | Pharmaceuticals | | | 3.10 | % | |
| | 15,160 | | | Catalent, Inc.(a) | | | 1,298,606 | | |
| | 25,000 | | | Mylan NV(a) (b) | | | 370,750 | | |
| | 34,285 | | | Roche Holding AG — ADR(b) | | | 1,467,741 | | |
| | | | 3,137,097 | | |
| Total Health Care (Cost $13,723,075) | | | 17,437,503 | | |
Industrials | | | 8.48 | % | |
| | | | | Air Freight & Logistics | | | 2.03 | % | |
| | 8,150 | | | FedEx Corp. | | | 2,049,888 | | |
| | | | | Airlines | | | 0.46 | % | |
| | 15,340 | | | Delta Air Lines, Inc. | | | 469,097 | | |
| | | | | Building Products | | | 1.51 | % | |
| | 27,660 | | | Masco Corp. | | | 1,524,896 | | |
| | | | | Commercial Services & Supplies | | | 1.54 | % | |
| | 13,800 | | | Waste Management, Inc. | | | 1,561,746 | | |
| | | | | Industrial Conglomerates | | | 1.15 | % | |
| | 7,100 | | | Honeywell International, Inc. | | | 1,168,731 | | |
| | | | | Road & Rail | | | 1.79 | % | |
| | 10,000 | | | Kansas City Southern | | | 1,808,300 | | |
| Total Industrials (Cost $6,086,155) | | | 8,582,658 | | |
Information Technology | | | 31.00 | % | |
| | | | | Electronic Equipment, Instruments & Components | | | 1.04 | % | |
| | 21,600 | | | Trimble, Inc.(a) | | | 1,051,920 | | |
| | | | | IT Services | | | 6.30 | % | |
| | 16,270 | | | Black Knight, Inc.(a) | | | 1,416,303 | | |
| | 11,380 | | | PayPal Holdings, Inc.(a) | | | 2,242,201 | | |
| | 13,615 | | | Visa Inc. — Class A | | | 2,722,592 | | |
| | | | 6,381,096 | | |
| | | | | Semiconductors & Semiconductor Equipment | | | 3.84 | % | |
| | 15,320 | | | QUALCOMM, Inc. | | | 1,802,858 | | |
| | 7,370 | | | Texas Instruments, Inc. | | | 1,052,362 | | |
| | 9,870 | | | Xilinx, Inc. | | | 1,028,849 | | |
| | | | 3,884,069 | | |

The accompanying notes are an integral part of these financial statements.
77
BUFFALO LARGE CAP FUND
(UNAUDITED)
SCHEDULE OF INVESTMENTS
SEPTEMBER 30, 2020 Continued
Shares or Face Amount | | | | $ Fair Value* | |
| | | | | Software | | | 13.87 | % | |
| | 4,775 | | | DocuSign, Inc.(a) | | | 1,027,771 | | |
| | 3,825 | | | Intuit, Inc. | | | 1,247,753 | | |
| | 43,800 | | | Microsoft Corp. | | | 9,212,454 | | |
| | 10,115 | | | salesforce.com, Inc.(a) | | | 2,542,102 | | |
| | | | 14,030,080 | | |
| | | | | Technology Hardware, Storage & Peripherals | | | 5.95 | % | |
| | 51,980 | | | Apple Inc. | | | 6,019,804 | | |
| Total Information Technology (Cost $11,492,019) | | | 31,366,969 | | |
Materials | | | 1.73 | % | |
| | | | | Chemicals | | | 1.73 | % | |
| | 7,355 | | | Linde PLC(b) | | | 1,751,446 | | |
| Total Materials (Cost $1,202,211) | | | 1,751,446 | | |
| Total Common Stocks (Cost $48,475,746) | | | 94,234,728 | | |
REITS | | | 2.57 | % | |
Real Estate | | | 2.57 | % | |
| | | | | Equity Real Estate Investment Trusts (REITs) | | | 2.57 | % | |
| | 3,411 | | | Equinix Inc. | | | 2,592,803 | | |
| Total Real Estate (Cost $713,694) | | | 2,592,803 | | |
| Total REITS (Cost $713,694) | | | 2,592,803 | | |
Short Term Investments | | | 4.32 | % | |
Investment Company | | | 4.32 | % | |
| | 4,373,530 | | | Fidelity Investments Money Market Funds — Government Portfolio — Class I — 0.10%(c) | | | 4,373,530 | | |
Total Investment Company | | | 4,373,530 | | |
| Total Short Term Investments (Cost $4,373,530) | | | 4,373,530 | | |

The accompanying notes are an integral part of these financial statements.
78
BUFFALO LARGE CAP FUND
(UNAUDITED)
SCHEDULE OF INVESTMENTS
SEPTEMBER 30, 2020 Continued
Shares or Face Amount | | $ Fair Value* | |
| Total Investments (Cost $53,562,970) | | | 100.03
101,201,061 | % | |
Liabilities in Excess of Other Assets | | | (0.03
(25,813) | )% | |
Total Net Assets | | | 100.00
101,175,248 | % | |
ADR American Depositary Receipt
PLC Public Limited Company
(a) Non Income Producing.
(b) Foreign Issued Security. The total value of these securities amounted to $5,297,450 (5.24% of net assets) at September 30, 2020.
(c) The rate quoted is the annualized seven-day effective yield as of September 30, 2020.
* See Note 1A of the accompanying Notes to Financial Statements regarding valuation of securities.
The Global Industry Classification Standard (GICS) was developed by and/or is the exclusive property of MSCI, Inc. and Standard & Poor's Financial Services LLC ("S&P"). GICS is a service mark of MSCI and S&P and has been licensed for use by U.S. Bancorp Fund Services, LLC.

The accompanying notes are an integral part of these financial statements.
79
BUFFALO MID CAP FUND (UNAUDITED)
SCHEDULE OF INVESTMENTS
SEPTEMBER 30, 2020
Shares or Face Amount | | | | $ Fair Value* | |
Common Stocks | | | 96.45 | % | |
Communication Services | | | 4.59 | % | |
| | | | | Entertainment | | | 2.78 | % | |
| | 23,537 | | | Live Nation Entertainment, Inc.(a) | | | 1,268,173 | | |
| | 18,900 | | | Take-Two Interactive Software, Inc.(a) | | | 3,122,658 | | |
| | | | 4,390,831 | | |
| | | | | Interactive Media & Services | | | 1.34 | % | |
| | 69,040 | | | TripAdvisor, Inc. | | | 1,352,494 | | |
| | 37,660 | | | Yelp, Inc.(a) | | | 756,589 | | |
| | | | 2,109,083 | | |
| | | | | Media | | | 0.47 | % | |
| | 22,329 | | | Liberty Media Corp-Liberty Formula One(a) | | | 748,245 | | |
| Total Communication Services (Cost $6,094,974) | | | 7,248,159 | | |
Consumer Discretionary | | | 7.52 | % | |
| | | | | Distributors | | | 0.34 | % | |
| | 19,223 | | | LKQ Corp.(a) | | | 533,054 | | |
| | | | | Diversified Consumer Services | | | 3.24 | % | |
| | 13,970 | | | Bright Horizons Family Solutions, Inc.(a) | | | 2,123,999 | | |
| | 15,010 | | | Chegg, Inc.(a) | | | 1,072,314 | | |
| | 48,500 | | | ServiceMaster Global Holdings, Inc.(a) | | | 1,934,180 | | |
| | | | 5,130,493 | | |
| | | | | Hotels, Restaurants & Leisure | | | 0.81 | % | |
| | 5,956 | | | Vail Resorts, Inc. | | | 1,274,405 | | |
| | | | | Internet & Direct Marketing Retail | | | 1.13 | % | |
| | 32,580 | | | Chewy, Inc.(a) | | | 1,786,362 | | |
| | | | | Specialty Retail | | | 1.44 | % | |
| | 24,835 | | | CarMax, Inc.(a) | | | 2,282,585 | | |
| | | | | Textiles, Apparel & Luxury Goods | | | 0.56 | % | |
| | 65,570 | | | Levi Strauss & Co. | | | 878,638 | | |
| Total Consumer Discretionary (Cost $8,414,037) | | | 11,885,537 | | |

The accompanying notes are an integral part of these financial statements.
80
BUFFALO MID CAP FUND (UNAUDITED)
SCHEDULE OF INVESTMENTS
SEPTEMBER 30, 2020 Continued
Shares or Face Amount | | | | $ Fair Value* | |
Consumer Staples | | | 1.22 | % | |
| | | | | Beverages | | | 0.54 | % | |
| | 960 | | | The Boston Beer Co, Inc. — Class A(a) | | | 848,025 | | |
| | | | | Food Products | | | 0.68 | % | |
| | 7,570 | | | The Hershey Company | | | 1,085,084 | | |
| Total Consumer Staples (Cost $1,298,105) | | | 1,933,109 | | |
Financials | | | 7.09 | % | |
| | | | | Capital Markets | | | 7.09 | % | |
| | 6,225 | | | MarketAxess Holdings, Inc. | | | 2,997,898 | | |
| | 10,974 | | | Moody's Corp. | | | 3,180,814 | | |
| | 14,116 | | | MSCI, Inc. | | | 5,036,306 | | |
| Total Financials (Cost $944,003) | | | 11,215,018 | | |
Health Care | | | 22.79 | % | |
| | | | | Aerospace & Defense | | | 1.01 | % | |
| | 4,700 | | | Teleflex, Inc. | | | 1,599,974 | | |
| | | | | Biotechnology | | | 0.90 | % | |
| | 13,950 | | | Exact Sciences Corp.(a) | | | 1,422,203 | | |
| | | | | Health Care Equipment & Supplies | | | 5.32 | % | |
| | 19,630 | | | Cantel Medical Corp. | | | 862,542 | | |
| | 75,810 | | | Envista Holdings Corp.(a) | | | 1,870,991 | | |
| | 17,420 | | | Hill-Rom Holdings, Inc. | | | 1,454,744 | | |
| | 9,820 | | | Masimo Corp.(a) | | | 2,318,109 | | |
| | 5,650 | | | The Cooper Companies, Inc. | | | 1,904,728 | | |
| | | | 8,411,114 | | |
| | | | | Health Care Providers & Services | | | 4.15 | % | |
| | 20,470 | | | AmerisourceBergen Corp. | | | 1,983,952 | | |
| | 4,440 | | | Chemed Corp. | | | 2,132,754 | | |
| | 37,720 | | | Encompass Health Corp. | | | 2,451,046 | | |
| | | | 6,567,752 | | |
| | | | | Health Care Technology | | | 3.96 | % | |
| | 13,250 | | | Cerner Corp. | | | 957,842 | | |
| | 18,850 | | | Veeva Systems, Inc.(a) | | | 5,300,432 | | |
| | | | 6,258,274 | | |

The accompanying notes are an integral part of these financial statements.
81
BUFFALO MID CAP FUND (UNAUDITED)
SCHEDULE OF INVESTMENTS
SEPTEMBER 30, 2020 Continued
Shares or Face Amount | | | | $ Fair Value* | |
| | | | | Life Sciences Tools & Services | | | 6.02 | % | |
| | 9,500 | | | Agilent Technologies, Inc. | | | 958,930 | | |
| | 6,560 | | | Bio-Rad Laboratories, Inc.(a) | | | 3,381,418 | | |
| | 13,320 | | | Bio-Techne Corp. | | | 3,299,764 | | |
| | 6,055 | | | Illumina, Inc.(a) | | | 1,871,479 | | |
| | | | 9,511,591 | | |
| | | | | Pharmaceuticals | | | 1.43 | % | |
| | 13,692 | | | Zoetis, Inc. | | | 2,264,246 | | |
| Total Health Care (Cost $23,593,248) | | | 36,035,154 | | |
Industrials | | | 21.87 | % | |
| | | | | Aerospace & Defense | | | 0.99 | % | |
| | 27,760 | | | BWX Technologies, Inc. | | | 1,563,166 | | |
| | | | | Building Products | | | 1.15 | % | |
| | 25,402 | | | Trex Co., Inc.(a) | | | 1,818,783 | | |
| | | | | Commercial Services & Supplies | | | 3.75 | % | |
| | 25,041 | | | Copart, Inc.(a) | | | 2,633,311 | | |
| | 52,666 | | | IAA Inc.(a) | | | 2,742,319 | | |
| | 38,599 | | | KAR Auction Services, Inc. | | | 555,826 | | |
| | | | 5,931,456 | | |
| | | | | Electrical Equipment | | | 2.22 | % | |
| | 35,255 | | | AMETEK, Inc. | | | 3,504,347 | | |
| | | | | Professional Services | | | 10.82 | % | |
| | 6,155 | | | CoStar Group, Inc.(a) | | | 5,222,579 | | |
| | 12,483 | | | Equifax, Inc. | | | 1,958,582 | | |
| | 64,388 | | | IHS Markit Ltd.(b) | | | 5,055,102 | | |
| | 26,303 | | | Verisk Analytics, Inc. | | | 4,874,209 | | |
| | | | 17,110,472 | | |
| | | | | Road & Rail | | | 1.66 | % | |
| | 14,508 | | | Kansas City Southern | | | 2,623,482 | | |
| | | | | Trading Companies & Distributors | | | 1.28 | % | |
| | 49,225 | | | HD Supply Holdings, Inc.(a) | | | 2,030,039 | | |
| Total Industrials (Cost $16,864,343) | | | 34,581,745 | | |

The accompanying notes are an integral part of these financial statements.
82
BUFFALO MID CAP FUND (UNAUDITED)
SCHEDULE OF INVESTMENTS
SEPTEMBER 30, 2020 Continued
Shares or Face Amount | | | | $ Fair Value* | |
Information Technology | | | 25.94 | % | |
| | | | | Communications Equipment | | | 1.29 | % | |
| | 16,570 | | | F5 Networks, Inc.(a) | | | 2,034,299 | | |
| | | | | IT Services | | | 3.39 | % | |
| | 8,680 | | | EPAM Systems, Inc.(a) | | | 2,806,070 | | |
| | 11,320 | | | Euronet Worldwide, Inc.(a) | | | 1,031,252 | | |
| | 7,400 | | | VeriSign, Inc.(a) | | | 1,515,890 | | |
| | | | 5,353,212 | | |
| | | | | Semiconductors & Semiconductor Equipment | | | 3.95 | % | |
| | 32,745 | | | Maxim Integrated Products, Inc. | | | 2,213,889 | | |
| | 31,310 | | | ON Semiconductor Corp.(a) | | | 679,114 | | |
| | 9,140 | | | Universal Display Corp. | | | 1,651,964 | | |
| | 16,330 | | | Xilinx, Inc. | | | 1,702,239 | | |
| | | | 6,247,206 | | |
| | | | | Software | | | 16.27 | % | |
| | 23,235 | | | Aspen Technology, Inc.(a) | | | 2,941,318 | | |
| | 25,462 | | | Guidewire Software, Inc.(a) | | | 2,654,923 | | |
| | 10,630 | | | Palo Alto Networks, Inc.(a) | | | 2,601,692 | | |
| | 13,730 | | | Proofpoint, Inc.(a) | | | 1,449,202 | | |
| | 56,350 | | | RealPage, Inc.(a) | | | 3,248,014 | | |
| | 5,440 | | | ServiceNow, Inc.(a) | | | 2,638,400 | | |
| | 14,600 | | | Splunk, Inc.(a) | | | 2,746,698 | | |
| | 40,989 | | | SS&C Technologies Holdings, Inc. | | | 2,480,654 | | |
| | 6,640 | | | Tyler Technologies, Inc.(a) | | | 2,314,438 | | |
| | 11,293 | | | VMware, Inc. — Class A(a) | | | 1,622,465 | | |
| | 4,790 | | | Workday, Inc.(a) | | | 1,030,473 | | |
| | | | 25,728,277 | | |
| | | | | Technology Hardware, Storage & Peripherals | | | 1.04 | % | |
| | 44,950 | | | Western Digital Corp. | | | 1,642,923 | | |
| Total Information Technology (Cost $26,741,117) | | | 41,005,917 | | |
Materials | | | 3.35 | % | |
| | | | | Chemicals | | | 2.02 | % | |
| | 30,110 | | | FMC Corp. | | | 3,188,950 | | |
| | | | | Construction Materials | | | 1.33 | % | |
| | 8,937 | | | Martin Marietta Materials, Inc. | | | 2,103,413 | | |
| Total Materials (Cost $2,617,659) | | | 5,292,363 | | |

The accompanying notes are an integral part of these financial statements.
83
BUFFALO MID CAP FUND (UNAUDITED)
SCHEDULE OF INVESTMENTS
SEPTEMBER 30, 2020 Continued
Shares or Face Amount | | | | $ Fair Value* | |
Real Estate | | | 2.08 | % | |
| | | | | Real Estate Management & Development | | | 2.08 | % | |
| | 70,022 | | | CBRE Group, Inc. — Class A(a) | | | 3,288,933 | | |
| Total Real Estate (Cost $3,186,459) | | | 3,288,933 | | |
| Total Common Stocks (Cost $89,753,945) | | | 152,485,935 | | |
REITS | | | 2.03 | % | |
Real Estate | | | 2.03 | % | |
| | | | | Equity Real Estate Investment Trusts (REITs) | | | 2.03 | % | |
| | 4,234 | | | Equinix Inc. | | | 3,218,390 | | |
| Total Real Estate (Cost $706,650) | | | 3,218,390 | | |
| Total REITS (Cost $706,650) | | | 3,218,390 | | |
Short Term Investments | | | 1.56 | % | |
Investment Company | | | 1.56 | % | |
| | 2,464,464 | | | Fidelity Investments Money Market Funds — Government Portfolio — Class I — 0.10%(c) | | | 2,464,464 | | |
Total Investment Company | | | 2,464,464 | | |
| Total Short Term Investments (Cost $2,464,464) | | | 2,464,464 | | |
| Total Investments (Cost $92,925,059) | | | 100.04
158,168,789 | % | |
Liabilities in Excess of Other Assets | | | (0.04
(67,663) | )% | |
Total Net Assets | | | 100.00
158,101,126 | % | |

The accompanying notes are an integral part of these financial statements.
84
BUFFALO MID CAP FUND (UNAUDITED)
SCHEDULE OF INVESTMENTS
SEPTEMBER 30, 2020 Continued
(a) Non Income Producing.
(b) Foreign Issued Security. The total value of this security amounted to $5,055,102 (3.19% of net assets) at September 30, 2020.
(c) The rate quoted is the annualized seven-day effective yield as of September 30, 2020.
* See Note 1A of the accompanying Notes to Financial Statements regarding valuation of securities.
The Global Industry Classification Standard (GICS) was developed by and/or is the exclusive property of MSCI, Inc. and Standard & Poor's Financial Services LLC ("S&P"). GICS is a service mark of MSCI and S&P and has been licensed for use by U.S. Bancorp Fund Services, LLC.

The accompanying notes are an integral part of these financial statements.
85
BUFFALO SMALL CAP FUND
(UNAUDITED)
SCHEDULE OF INVESTMENTS
SEPTEMBER 30, 2020
Shares or Face Amount | | | | $ Fair Value* | |
Common Stocks | | | 95.05 | % | |
Communication Services | | | 5.56 | % | |
| | | | | Diversified Telecommunication Services | | | 2.94 | % | |
| | 115,410 | | | Bandwidth, Inc.(a) | | | 20,147,124 | | |
| | | | | Interactive Media & Services | | | 2.00 | % | |
| | 215,865 | | | CarGurus, Inc.(a) | | | 4,669,160 | | |
| | 131,295 | | | EverQuote, Inc.(a) | | | 5,073,239 | | |
| | 201,655 | | | TripAdvisor, Inc. | | | 3,950,421 | | |
| | | | 13,692,820 | | |
| | | | | Media | | | 0.62 | % | |
| | 60,160 | | | Cardlytics, Inc.(a) | | | 4,245,491 | | |
| Total Communication Services (Cost $25,953,808) | | | 38,085,435 | | |
Consumer Discretionary | | | 12.85 | % | |
| | | | | Diversified Consumer Services | | | 0.73 | % | |
| | 69,715 | | | Chegg, Inc.(a) | | | 4,980,440 | | |
| | | | | Hotels, Restaurants & Leisure | | | 6.15 | % | |
| | 941,320 | | | Everi Holdings Inc.(a) | | | 7,765,890 | | |
| | 235,055 | | | Penn National Gaming, Inc.(a) | | | 17,088,498 | | |
| | 121,130 | | | Texas Roadhouse, Inc. | | | 7,363,493 | | |
| | 21,810 | | | Vail Resorts, Inc. | | | 4,666,686 | | |
| | 38,105 | | | Wingstop, Inc. | | | 5,207,048 | | |
| | | | 42,091,615 | | |
| | | | | Household Durables | | | 1.84 | % | |
| | 454,620 | | | Lovesac Co/The(a) | | | 12,597,520 | | |
| | | | | Internet & Direct Marketing Retail | | | 1.97 | % | |
| | 566,365 | | | RealReal Inc/The(a) | | | 8,195,301 | | |
| | 101,995 | | | Shutterstock, Inc. | | | 5,307,820 | | |
| | | | 13,503,121 | | |
| | | | | Specialty Retail | | | 1.65 | % | |
| | 42,120 | | | Five Below, Inc.(a) | | | 5,349,240 | | |
| | 513,615 | | | Guess?, Inc. | | | 5,968,206 | | |
| | | | 11,317,446 | | |
| | | | | Textiles, Apparel & Luxury Goods | | | 0.51 | % | |
| | 179,237 | | | Steven Madden Ltd. | | | 3,495,122 | | |
| Total Consumer Discretionary (Cost $56,756,676) | | | 87,985,264 | | |

The accompanying notes are an integral part of these financial statements.
86
BUFFALO SMALL CAP FUND
(UNAUDITED)
SCHEDULE OF INVESTMENTS
SEPTEMBER 30, 2020 Continued
Shares or Face Amount | | | | $ Fair Value* | |
Consumer Staples | | | 0.86 | % | |
| | | | | Beverages | | | 0.86 | % | |
| | 148,065 | | | MGP Ingredients, Inc. | | | 5,884,103 | | |
| Total Consumer Staples (Cost $4,771,239) | | | 5,884,103 | | |
Finance and Insurance | | | 0.96 | % | |
| | 637,105 | | | FinTech Acquisition Corp III(a) | | | 6,568,553 | | |
| Total Finance and Insurance (Cost $6,554,345) | | | 6,568,553 | | |
Financials | | | 7.45 | % | |
| | | | | Capital Markets | | | 2.74 | % | |
| | 151,195 | | | Hamilton Lane Inc. — Class A | | | 9,765,685 | | |
| | 351,595 | | | Open Lending Corp.(a) | | | 8,965,672 | | |
| | | | 18,731,357 | | |
| | | | | Consumer Finance | | | 1.47 | % | |
| | 199,000 | | | Green Dot Corp.(a) | | | 10,071,390 | | |
| | | | | Insurance | | | 3.24 | % | |
| | 110,560 | | | eHealth, Inc.(a) | | | 8,734,240 | | |
| | 129,165 | | | Palomar Holdings, Inc.(a) | | | 13,464,160 | | |
| | | | 22,198,400 | | |
| Total Financials (Cost $21,474,539) | | | 51,001,147 | | |
Health Care | | | 28.46 | % | |
| | | | | Biotechnology | | | 14.47 | % | |
| | 108,935 | | | ACADIA Pharmaceuticals, Inc.(a) | | | 4,493,569 | | |
| | 454,945 | | | CareDx, Inc.(a) | | | 17,260,613 | | |
| | 137,995 | | | Castle Biosciences, Inc.(a) | | | 7,099,843 | | |
| | 196,790 | | | Deciphera Pharmaceuticals, Inc.(a) | | | 10,095,327 | | |
| | 456,745 | | | Halozyme Therapeutics, Inc.(a) | | | 12,003,259 | | |
| | 148,160 | | | Ligand Pharmaceuticals, Inc.(a) | | | 14,122,611 | | |
| | 351,030 | | | Natera, Inc.(a) | | | 25,358,407 | | |
| | 58,760 | | | Repligen Corp.(a) | | | 8,669,450 | | |
| | | | 99,103,079 | | |

The accompanying notes are an integral part of these financial statements.
87
BUFFALO SMALL CAP FUND
(UNAUDITED)
SCHEDULE OF INVESTMENTS
SEPTEMBER 30, 2020 Continued
Shares or Face Amount | | | | $ Fair Value* | |
| | | | | Health Care Equipment & Supplies | | | 4.65 | % | |
| | 91,310 | | | Novocure Ltd.(a) (b) | | | 10,163,716 | | |
| | 467,625 | | | OraSure Technologies, Inc.(a) | | | 5,690,997 | | |
| | 31,600 | | | Quidel Corp.(a) | | | 6,932,408 | | |
| | 160,395 | | | STAAR Surgical Co.(a) | | | 9,071,941 | | |
| | | | 31,859,062 | | |
| | | | | Health Care Providers & Services | | | 1.93 | % | |
| | 130,893 | | | HealthEquity, Inc.(a) | | | 6,723,973 | | |
| | 219,855 | | | Progyny, Inc.(a) | | | 6,470,333 | | |
| | | | 13,194,306 | | |
| | | | | Health Care Technology | | | 1.10 | % | |
| | 235,744 | | | Phreesia, Inc.(a) | | | 7,574,455 | | |
| | | | | Life Sciences Tools & Services | | | 5.30 | % | |
| | 237,735 | | | Adaptive Biotechnologies Corporation(a) | | | 11,561,053 | | |
| | 30,765 | | | Bio-Techne Corp. | | | 7,621,413 | | |
| | 283,580 | | | Quanterix Corp.(a) | | | 9,567,989 | | |
| | 141,760 | | | Syneos Health, Inc.(a) | | | 7,535,962 | | |
| | | | 36,286,417 | | |
| | | | | Pharmaceuticals | | | 1.01 | % | |
| | 74,070 | | | Compass Pathways Plc — ADR(a) (b) | | | 2,585,043 | | |
| | 556,860 | | | Verrica Pharmaceuticals, Inc.(a) | | | 4,310,096 | | |
| | | | 6,895,139 | | |
| Total Health Care (Cost $120,324,625) | | | 194,912,458 | | |
Industrials | | | 20.97 | % | |
| | | | | Air Freight & Logistics | | | 1.95 | % | |
| | 532,020 | | | Air Transport Services Group, Inc.(a) | | | 13,332,421 | | |
| | | | | Building Products | | | 4.07 | % | |
| | 176,920 | | | Advanced Drainage Systems, Inc. | | | 11,046,885 | | |
| | 527,625 | | | PGT Innovations, Inc.(a) | | | 9,243,990 | | |
| | 105,820 | | | Trex Co., Inc.(a) | | | 7,576,712 | | |
| | | | 27,867,587 | | |
| | | | | Commercial Services & Supplies | | | 2.66 | % | |
| | 183,105 | | | IAA Inc.(a) | | | 9,534,277 | | |
| | 605,385 | | | KAR Auction Services, Inc. | | | 8,717,544 | | |
| | | | 18,251,821 | | |

The accompanying notes are an integral part of these financial statements.
88
BUFFALO SMALL CAP FUND
(UNAUDITED)
SCHEDULE OF INVESTMENTS
SEPTEMBER 30, 2020 Continued
Shares or Face Amount | | | | $ Fair Value* | |
| | | | | Construction & Engineering | | | 0.68 | % | |
| | 110,485 | | | MasTec, Inc.(a) | | | 4,662,467 | | |
| | | | | Electrical Equipment | | | 2.37 | % | |
| | 39,090 | | | Generac Holdings, Inc.(a) | | | 7,569,387 | | |
| | 111,120 | | | Vicor Corp.(a) | | | 8,637,358 | | |
| | | | 16,206,745 | | |
| | | | | Machinery | | | 3.58 | % | |
| | 95,555 | | | John Bean Technologies Corp. | | | 8,780,549 | | |
| | 242,805 | | | Kornit Digital Ltd.(a) (b) | | | 15,750,760 | | |
| | | | 24,531,309 | | |
| | | | | Professional Services | | | 4.78 | % | |
| | 94,570 | | | FTI Consulting, Inc.(a) | | | 10,021,583 | | |
| | 205,728 | | | ICF International, Inc. | | | 12,658,444 | | |
| | 577,795 | | | Upwork, Inc.(a) | | | 10,076,745 | | |
| | | | 32,756,772 | | |
| | | | | Trading Companies & Distributors | | | 0.88 | % | |
| | 49,390 | | | SiteOne Landscape Supply, Inc.(a) | | | 6,023,111 | | |
| Total Industrials (Cost $105,879,591) | | | 143,632,233 | | |
Information Technology | | | 16.82 | % | |
| | | | | Communications Equipment | | | 4.22 | % | |
| | 696,100 | | | ADTRAN, Inc. | | | 7,138,505 | | |
| | 463,750 | | | Calix, Inc.(a) | | | 8,245,475 | | |
| | 148,090 | | | Ciena Corp.(a) | | | 5,877,692 | | |
| | 101,585 | | | Lumentum Holdings, Inc.(a) | | | 7,632,081 | | |
| | | | 28,893,753 | | |
| | | | | Internet Software & Services | | | 1.20 | % | |
| | 753,875 | | | Cloudera, Inc.(a) | | | 8,209,699 | | |
| | | | | IT Services | | | 1.85 | % | |
| | 120,230 | | | Endava Plc — ADR(a) (b) | | | 7,592,525 | | |
| | 893,155 | | | Paysign, Inc.(a) | | | 5,073,120 | | |
| | | | 12,665,645 | | |
| | | | | Semiconductors & Semiconductor Equipment | | | 2.76 | % | |
| | 96,195 | | | Inphi Corporation(a) | | | 10,797,889 | | |
| | 83,225 | | | Silicon Laboratories, Inc.(a) | | | 8,143,566 | | |
| | | | 18,941,455 | | |

The accompanying notes are an integral part of these financial statements.
89
BUFFALO SMALL CAP FUND
(UNAUDITED)
SCHEDULE OF INVESTMENTS
SEPTEMBER 30, 2020 Continued
Shares or Face Amount | | | | $ Fair Value* | |
| | | | | Software | | | 6.79 | % | |
| | 397,540 | | | 8x8, Inc.(a) | | | 6,181,747 | | |
| | 198,881 | | | Mimecast Ltd.(a) (b) | | | 9,331,496 | | |
| | 592,060 | | | Pluralsight, Inc.(a) | | | 10,141,988 | | |
| | 244,605 | | | Tenable Holdings, Inc.(a) | | | 9,233,839 | | |
| | 100,700 | | | Varonis Systems, Inc.(a) | | | 11,622,794 | | |
| | | | 46,511,864 | | |
| Total Information Technology (Cost $89,109,716) | | | 115,222,416 | | |
Materials | | | 1.12 | % | |
| | | | | Construction Materials | | | 1.12 | % | |
| | 463,433 | | | Summit Materials, Inc. — Class A(a) | | | 7,665,182 | | |
| Total Materials (Cost $7,412,638) | | | 7,665,182 | | |
| Total Common Stocks (Cost $438,237,177) | | | 650,956,791 | | |
REITS | | | 2.70 | % | |
Real Estate | | | 2.70 | % | |
| | | | | Equity Real Estate Investment Trusts (REITs) | | | 2.70 | % | |
| | 169,360 | | | CyrusOne, Inc. | | | 11,860,281 | | |
| | 105,090 | | | QTS Realty Trust, Inc. | | | 6,622,772 | | |
| Total Real Estate (Cost $12,574,133) | | | 18,483,053 | | |
| Total REITS (Cost $12,574,133) | | | 18,483,053 | | |
Short Term Investments | | | 2.35 | % | |
Investment Company | | | 2.35 | % | |
| | 16,084,902 | | | Fidelity Investments Money Market Funds — Government Portfolio — Class I — 0.10%(c) | | | 16,084,902 | | |
Total Investment Company | | | 16,084,902 | | |
| Total Short Term Investments (Cost $16,084,902) | | | 16,084,902 | | |

The accompanying notes are an integral part of these financial statements.
90
BUFFALO SMALL CAP FUND
(UNAUDITED)
SCHEDULE OF INVESTMENTS
SEPTEMBER 30, 2020 Continued
Shares or Face Amount | | $ Fair Value* | |
| Total Investments (Cost $466,896,212) | | | 100.10
685,524,746 | % | |
Liabilities in Excess of Other Assets | | | (0.10
(692,674) | )% | |
Total Net Assets | | | 100.00
684,832,072 | % | |
ADR American Depositary Receipt
PLC Public Limited Company
(a) Non Income Producing.
(b) Foreign Issued Security. The total value of these securities amounted to $45,423,540 (6.63% of net assets) at September 30, 2020.
(c) The rate quoted is the annualized seven-day effective yield as of September 30, 2020.
* See Note 1A of the accompanying Notes to Financial Statements regarding valuation of securities.
The Global Industry Classification Standard (GICS) was developed by and/or is the exclusive property of MSCI, Inc. and Standard & Poor's Financial Services LLC ("S&P"). GICS is a service mark of MSCI and S&P and has been licensed for use by U.S. Bancorp Fund Services, LLC.

The accompanying notes are an integral part of these financial statements.
91
STATEMENTS OF ASSETS AND
LIABILITIES
SEPTEMBER 30, 2020 (UNAUDITED)
| | Buffalo
Discovery
Fund | | Buffalo
Dividend Focus
Fund | | Buffalo
Emerging
Opportunities
Fund | | Buffalo
Flexible Income
Fund | | Buffalo
Growth
Fund | |
ASSETS: | |
Investments in securities, at cost: | | $ | 1,255,438,192 | | | $ | 53,390,409 | | | $ | 69,331,166 | | | $ | 280,599,423 | | | $ | 98,548,806 | | |
Investments in securities, at value: | | | 1,631,721,344 | | | | 79,744,804 | | | | 91,985,150 | | | | 409,601,542 | | | | 187,675,703 | | |
Cash | | | — | | | | — | | | | — | | | | — | | | | — | | |
Cash denominated in foreign currency, at value(1) | | | — | | | | — | | | | — | | | | — | | | | — | | |
Receivables: | |
Investments sold | | | — | | | | — | | | | 256,717 | | | | — | | | | — | | |
Fund shares sold | | | 2,022,181 | | | | 15,366 | | | | 34,207 | | | | 11,903 | | | | 121,812 | | |
Dividends | | | 372,348 | | | | 53,478 | | | | 9,245 | | | | 568,368 | | | | 36,284 | | |
Interest | | | — | | | | 26,300 | | | | — | | | | 91,101 | | | | — | | |
Other assets | | | 38,396 | | | | 10,055 | | | | 16,755 | | | | 22,836 | | | | 16,601 | | |
Total assets | | | 1,634,154,269 | | | | 79,850,003 | | | | 92,302,074 | | | | 410,295,750 | | | | 187,850,400 | | |
LIABILITIES: | |
Payables: | |
Investments purchased | | | 11,495,722 | | | | — | | | | — | | | | — | | | | — | | |
Written options, at value(2) (Note 8) | | | — | | | | — | | | | — | | | | 10,675 | | | | — | | |
Fund shares purchased | | | 1,420,210 | | | | 50,172 | | | | 106,007 | | | | 750,217 | | | | 223,272 | | |
Management fees (Note 3) | | | 1,108,006 | | | | 49,262 | | | | 97,456 | | | | 293,899 | | | | 116,036 | | |
Custodian fees (Note 3) | | | — | | | | — | | | | — | | | | — | | | | — | | |
Accrued shareholder service fees — Investor Class (Note 7) | | | 509,347 | | | | 3,962 | | | | 27,490 | | | | 90,160 | | | | 42,720 | | |
Accrued expenses | | | 1,040 | | | | 2,705 | | | | 8,037 | | | | 52,817 | | | | 17,567 | | |
Total liabilities | | | 14,534,325 | | | | 106,101 | | | | 238,990 | | | | 1,197,768 | | | | 399,595 | | |
NET ASSETS | | $ | 1,619,619,944 | | | $ | 79,743,902 | | | $ | 92,063,084 | | | $ | 409,097,982 | | | $ | 187,450,805 | | |
NET ASSETS CONSIST OF: | |
Capital (capital stock and paid-in capital) | | $ | 1,109,276,447 | | | $ | 54,673,976 | | | $ | 58,370,907 | | | $ | 281,304,351 | | | $ | 88,433,645 | | |
Total distributable earnings | | | 510,343,497 | | | | 25,069,926 | | | | 33,692,177 | | | | 127,793,631 | | | | 99,017,160 | | |
NET ASSETS APPLICABLE TO OUTSTANDING SHARES | | $ | 1,619,619,944 | | | $ | 79,743,902 | | | $ | 92,063,084 | | | $ | 409,097,982 | | | $ | 187,450,805 | | |
Net Assets — Investor Class | | $ | 1,370,950,554 | | | $ | 26,862,572 | | | $ | 59,056,800 | | | $ | 273,014,385 | | | $ | 109,993,670 | | |
Outstanding Shares — Investor Class | | | 50,562,022 | | | | 1,397,202 | | | | 3,118,622 | | | | 19,727,337 | | | | 3,807,869 | | |
NET ASSET VALUE PER SHARE — Investor Class | | $ | 27.11 | | | $ | 19.23 | | | $ | 18.94 | | | $ | 13.84 | | | $ | 28.89 | | |
Net Assets — Institutional Class | | $ | 248,669,390 | | | $ | 52,881,330 | | | $ | 33,006,284 | | | $ | 136,083,597 | | | $ | 77,457,135 | | |
Outstanding Shares — Institutional Class | | | 9,152,360 | | | | 2,750,540 | | | | 1,739,444 | | | | 9,838,572 | | | | 2,678,548 | | |
NET ASSET VALUE PER SHARE — Institutional Class | | $ | 27.17 | | | $ | 19.23 | | | $ | 18.98 | | | $ | 13.83 | | | $ | 28.92 | | |
Capital shares, $1.00 par value: | |
Authorized | | | Unlimited | | | | Unlimited | | | | Unlimited | | | | Unlimited | | | | Unlimited | | |
| (1) Cash denominated in foreign currencies, at cost | | | — | | | | — | | | | — | | | | — | | | | — | | |
| (2) Written options, premiums received | | | — | | | | — | | | | — | | | | 33,112 | | | | — | | |

The accompanying notes are an integral part of these financial statements.
92
| | Buffalo
High Yield
Fund | | Buffalo
International
Fund | | Buffalo
Large Cap
Fund | | Buffalo
Mid Cap
Fund | | Buffalo
Small Cap
Fund | |
ASSETS: | |
Investments in securities, at cost: | | $ | 241,989,588 | | | $ | 327,440,397 | | | $ | 53,562,970 | | | $ | 92,925,059 | | | $ | 466,896,212 | | |
Investments in securities, at value: | | | 246,452,083 | | | | 477,412,637 | | | | 101,201,061 | | | | 158,168,789 | | | | 685,524,746 | | |
Cash | | | 728,871 | | | | 24,065 | | | | — | | | | — | | | | — | | |
Cash denominated in foreign currency, at value(1) | | | — | | | | 3,601,020 | | | | — | | | | — | | | | — | | |
Receivables: | |
Investments sold | | | 1,042,404 | | | | 3,596,938 | | | | — | | | | — | | | | 1,662,151 | | |
Fund shares sold | | | 99,267 | | | | 1,139,028 | | | | 100,467 | | | | 127,993 | | | | 1,000,707 | | |
Dividends | | | 9,375 | | | | 1,300,609 | | | | 31,272 | | | | 32,862 | | | | 269,764 | | |
Interest | | | 3,088,719 | | | | — | | | | — | | | | — | | | | — | | |
Other assets | | | 25,189 | | | | 42,743 | | | | 15,907 | | | | 11,060 | | | | 21,306 | | |
Total assets | | | 251,445,908 | | | | 487,117,040 | | | | 101,348,707 | | | | 158,340,704 | | | | 688,478,674 | | |
LIABILITIES: | |
Payables: | |
Investments purchased | | | 7,287,243 | | | | 3,601,020 | | | | — | | | | — | | | | 2,343,887 | | |
Written options, at value(2) (Note 8) | | | — | | | | — | | | | — | | | | — | | | | — | | |
Fund shares purchased | | | 127,736 | | | | 431,841 | | | | 101,965 | | | | 79,071 | | | | 514,135 | | |
Management fees (Note 3) | | | 170,307 | | | | 335,380 | | | | 62,284 | | | | 110,391 | | | | 465,051 | | |
Custodian fees (Note 3) | | | — | | | | 14,257 | | | | — | | | | — | | | | — | | |
Accrued shareholder service fees — Investor Class (Note 7) | | | — | | | | 57,240 | | | | 8,378 | | | | 37,059 | | | | 317,527 | | |
Accrued expenses | | | 2,592 | | | | 24,022 | | | | 832 | | | | 13,057 | | | | 6,002 | | |
Total liabilities | | | 7,587,878 | | | | 4,463,760 | | | | 173,459 | | | | 239,578 | | | | 3,646,602 | | |
NET ASSETS | | $ | 243,858,030 | | | $ | 482,653,280 | | | $ | 101,175,248 | | | $ | 158,101,126 | | | $ | 684,832,072 | | |
NET ASSETS CONSIST OF: | |
Capital (capital stock and paid-in capital) | | $ | 238,865,678 | | | $ | 329,736,071 | | | $ | 52,082,991 | | | $ | 81,824,638 | | | $ | 382,473,160 | | |
Total distributable earnings | | | 4,992,352 | | | | 152,917,209 | | | | 49,092,257 | | | | 76,276,488 | | | | 302,358,912 | | |
NET ASSETS APPLICABLE TO OUTSTANDING SHARES | | $ | 243,858,030 | | | $ | 482,653,280 | | | $ | 101,175,248 | | | $ | 158,101,126 | | | $ | 684,832,072 | | |
Net Assets — Investor Class | | $ | 48,195,923 | | | $ | 251,102,535 | | | $ | 37,173,215 | | | $ | 91,771,226 | | | $ | 529,638,268 | | |
Outstanding Shares — Investor Class | | | 4,362,343 | | | | 14,115,504 | | | | 910,556 | | | | 5,356,002 | | | | 30,608,167 | | |
NET ASSET VALUE PER SHARE — Investor Class | | $ | 11.05 | | | $ | 17.79 | | | $ | 40.82 | | | $ | 17.13 | | | $ | 17.30 | | |
Net Assets — Institutional Class | | $ | 195,662,107 | | | $ | 231,550,743 | | | $ | 64,024,883 | | | $ | 66,329,900 | | | $ | 155,193,804 | | |
Outstanding Shares — Institutional Class | | | 17,734,026 | | | | 13,001,981 | | | | 1,565,201 | | | | 3,863,832 | | | | 8,951,576 | | |
NET ASSET VALUE PER SHARE — Institutional Class | | $ | 11.03 | | | $ | 17.81 | | | $ | 40.91 | | | $ | 17.17 | | | $ | 17.34 | | |
Capital shares, $1.00 par value: | |
Authorized | | | Unlimited | | | | Unlimited | | | | Unlimited | | | | Unlimited | | | | Unlimited | | |
| (1) Cash denominated in foreign currencies, at cost | | | — | | | | (15,225 | ) | | | — | | | | — | | | | — | | |
| (2) Written options, premiums received | | | — | | | | — | | | | — | | | | — | | | | — | | |

93
STATEMENTS OF OPERATIONS
FOR THE SIX MONTHS ENDED SEPTEMBER 30, 2020 (UNAUDITED)
| | Buffalo
Discovery
Fund | | Buffalo
Dividend Focus
Fund | | Buffalo
Emerging
Opportunities
Fund | | Buffalo
Flexible Income
Fund | | Buffalo
Growth
Fund | |
INVESTMENT INCOME: | |
Interest | | $ | — | | | $ | 46,870 | | | $ | — | | | $ | 297,276 | | | $ | — | | |
Dividends from securities | | | 3,214,342 | | | | 593,422 | | | | 137,953 | | | | 6,298,947 | | | | 697,747 | | |
Foreign tax withheld | | | — | | | | — | | | | — | | | | (12,891 | ) | | | (1,168 | ) | |
Total investment income | | | 3,214,342 | | | | 640,292 | | | | 137,953 | | | | 6,583,332 | | | | 696,579 | | |
EXPENSES: | |
Management fees (Note 3) | | | 6,606,702 | | | | 285,062 | | | | 553,639 | | | | 1,865,757 | | | | 660,410 | | |
Shareholder Service Fees — Investor Class (Note 7) | | | 985,669 | | | | 20,002 | | | | 41,463 | | | | 220,841 | | | | 78,698 | | |
Registration fees | | | 41,339 | | | | 20,943 | | | | 22,783 | | | | 22,686 | | | | 22,678 | | |
Custody fees | | | — | | | | — | | | | — | | | | — | | | | — | | |
Trustees' fees and related expenses | | | 262 | | | | 262 | | | | 262 | | | | 262 | | | | 262 | | |
Other expenses | | | 14,294 | | | | 662 | | | | 701 | | | | 4,462 | | | | 1,561 | | |
Total expenses | | | 7,648,266 | | | | 326,931 | | | | 618,848 | | | | 2,114,008 | | | | 763,609 | | |
Net investment income (loss) | | | (4,433,924 | ) | | | 313,361 | | | | (480,895 | ) | | | 4,469,324 | | | | (67,030 | ) | |
NET REALIZED AND UNREALIZED GAIN (LOSS): | |
Net realized gain (loss) from: | |
Investment transactions | | | 153,282,815 | | | | 396,329 | | | | 11,579,775 | | | | (6,809,623 | ) | | | 11,456,381 | | |
Options written (Note 8) | | | — | | | | — | | | | — | | | | 672,440 | | | | — | | |
Net unrealized appreciation / depreciation during the period on: | |
Investments | | | 316,976,703 | | | | 17,109,238 | | | | 21,837,870 | | | | 70,934,798 | | | | 40,433,841 | | |
Options written (Note 8) | | | — | | | | — | | | | — | | | | 64,664 | | | | — | | |
Net realized and unrealized gain (loss) | | | 470,259,518 | | | | 17,505,567 | | | | 33,417,645 | | | | 64,862,279 | | | | 51,890,222 | | |
Net decrease in net assets resulting from operations | | $ | 465,825,594 | | | $ | 17,818,928 | | | $ | 32,936,750 | | | $ | 69,331,603 | | | $ | 51,823,192 | | |

The accompanying notes are an integral part of these financial statements.
94
| | Buffalo
High Yield
Fund | | Buffalo
International
Fund | | Buffalo
Large Cap
Fund | | Buffalo
Mid Cap
Fund | | Buffalo
Small Cap
Fund | |
INVESTMENT INCOME: | |
Interest | | $ | 5,694,484 | | | $ | — | | | $ | — | | | $ | — | | | $ | — | | |
Dividends from securities | | | 111,760 | | | | 3,801,174 | | | | 351,888 | | | | 372,525 | | | | 609,635 | | |
Foreign tax withheld | | | — | | | | (432,690 | ) | | | (576 | ) | | | — | | | | — | | |
Total investment income | | | 5,806,244 | | | | 3,368,484 | | | | 351,312 | | | | 372,525 | | | | 609,635 | | |
EXPENSES: | |
Management fees (Note 3) | | | 918,957 | | | | 1,857,713 | | | | 342,768 | | | | 670,010 | | | | 2,532,174 | | |
Shareholder Service Fees — Investor Class (Note 7) | | | 36,457 | | | | 170,403 | | | | 25,838 | | | | 71,829 | | | | 346,971 | | |
Registration fees | | | 23,042 | | | | 20,160 | | | | 22,040 | | | | 26,588 | | | | 24,132 | | |
Custody fees | | | — | | | | 36,714 | | | | — | | | | — | | | | — | | |
Trustees' fees and related expenses | | | 262 | | | | 170 | | | | 262 | | | | 262 | | | | 262 | | |
Other expenses | | | 2,214 | | | | 3,878 | | | | 800 | | | | 1,477 | | | | 4,574 | | |
Total expenses | | | 980,932 | | | | 2,089,038 | | | | 391,708 | | | | 770,166 | | | | 2,908,113 | | |
Net investment income (loss) | | | 4,825,312 | | | | 1,279,446 | | | | (40,396 | ) | | | (397,641 | ) | | | (2,298,478 | ) | |
NET REALIZED AND UNREALIZED GAIN (LOSS): | |
Net realized gain (loss) from: | |
Investment transactions | | | 392,542 | | | | 2,630,675 | | | | 1,405,726 | | | | 11,051,491 | | | | 94,907,566 | | |
Options written (Note 8) | | | — | | | | — | | | | — | | | | — | | | | — | | |
Net unrealized appreciation / depreciation during the period on: | |
Investments | | | 25,764,649 | | | | 110,094,669 | | | | 26,557,919 | | | | 31,405,380 | | | | 156,822,543 | | |
Options written (Note 8) | | | — | | | | — | | | | — | | | | — | | | | — | | |
Net realized and unrealized gain (loss) | | | 26,157,191 | | | | 112,725,344 | | | | 27,963,645 | | | | 42,456,871 | | | | 251,730,109 | | |
Net decrease in net assets resulting from operations | | $ | 30,982,503 | | | $ | 114,004,790 | | | $ | 27,923,249 | | | $ | 42,059,230 | | | $ | 249,431,631 | | |

95
STATEMENTS OF CHANGES IN
NET ASSETS
| | Buffalo
Discovery Fund | | Buffalo
Dividend Focus Fund | | Buffalo
Emerging Opportunities Fund | |
| | Six Months Ended
September 30, 2020
(UNAUDITED) | | Year Ended
March 31, 2020 | | Six Months Ended
September 30, 2020
(UNAUDITED) | | Year Ended
March 31, 2020 | | Six Months Ended
September 30, 2020
(UNAUDITED) | | Year Ended
March 31, 2020 | |
OPERATIONS: | |
Net investment income (loss) | | $ | (4,433,924 | ) | | $ | (5,147,410 | ) | | $ | 313,361 | | | $ | 682,638 | | | $ | (480,895 | ) | | $ | (898,309 | ) | |
Net realized gain on investment transactions | | | 153,282,815 | | | | 239,791,313 | | | | 396,329 | | | | (1,235,429 | ) | | | 11,579,775 | | | | 4,967,396 | | |
Net unrealized appreciation / depreciation during the year on investments and translation of
assets and liabilities in foreign currencies | | | 316,976,703 | | | | (372,840,225 | ) | | | 17,109,238 | | | | (6,938,944 | ) | | | 21,837,870 | | | | (14,748,717 | ) | |
Net increase (decrease) in net assets resulting from operations | | | 465,825,594 | | | | (138,196,322 | ) | | | 17,818,928 | | | | (7,491,735 | ) | | | 32,936,750 | | | | (10,679,630 | ) | |
DISTRIBUTIONS TO SHAREHOLDERS: | |
Distributable earnings | | | — | | | | (236,305,302 | ) | | | (294,097 | ) | | | (708,148 | ) | | | — | | | | (4,253,755 | ) | |
Return of capital | | | — | | | | — | | | | — | | | | (42,916 | ) | | | — | | | | — | | |
Total distributions | | | — | | | | (236,305,302 | ) | | | (294,097 | ) | | | (751,064 | ) | | | — | | | | (4,253,755 | ) | |
CAPITAL SHARE TRANSACTIONS: | |
Shares sold | |
Investor Class | | | 70,701,426 | | | | 206,300,631 | | | | 1,523,525 | | | | 6,815,282 | | | | 1,976,584 | | | | 6,245,478 | | |
Institutional Class | | | 23,293,964 | | | | 322,701,272 | | | | 5,070,483 | | | | 52,078,530 | | | | 834,506 | | | | 31,935,871 | | |
Reinvested dividends and distributions | |
Investor Class | | | — | | | | 197,048,623 | | | | 88,033 | | | | 414,171 | | | | — | | | | 2,727,174 | | |
Institutional Class | | | — | | | | 32,726,500 | | | | 195,816 | | | | 312,479 | | | | — | | | | 1,395,082 | | |
Shares Issued | | | 93,995,390 | | | | 758,777,026 | | | | 6,877,857 | | | | 59,620,462 | | | | 2,811,090 | | | | 42,303,605 | | |
Redemptions | |
Investor Class | | | (225,858,419 | ) | | | (716,838,812 | ) | | | (4,833,227 | ) | | | (40,365,885 | ) | | | (6,981,871 | ) | | | (42,636,704 | ) | |
Institutional Class | | | (52,009,729 | ) | | | (74,031,084 | ) | | | (4,533,135 | ) | | | (4,602,812 | ) | | | (2,437,836 | ) | | | (3,031,053 | ) | |
Shares repurchased | | | (277,868,148 | ) | | | (790,869,896 | ) | | | (9,366,362 | ) | | | (44,968,697 | ) | | | (9,419,707 | ) | | | (45,667,757 | ) | |
Net increase (decrease) from capital share transactions | | | (183,872,758 | ) | | | (32,092,870 | ) | | | (2,488,505 | ) | | | 14,651,765 | | | | (6,608,617 | ) | | | (3,364,152 | ) | |
Total increase (decrease) in net assets | | | 281,952,836 | | | | (406,594,494 | ) | | | 15,036,326 | | | | 6,408,966 | | | | 26,328,133 | | | | (18,297,537 | ) | |
NET ASSETS: | |
Beginning of period | | | 1,337,667,108 | | | | 1,744,261,602 | | | | 64,707,576 | | | | 58,298,610 | | | | 65,734,951 | | | | 84,032,488 | | |
End of period | | $ | 1,619,619,944 | | | $ | 1,337,667,108 | | | $ | 79,743,902 | | | $ | 64,707,576 | | | $ | 92,063,084 | | | $ | 65,734,951 | | |
Fund share transactions: | |
Shares issued | |
Investor Class | | | 2,898,003 | | | | 8,114,121 | | | | 82,301 | | | | 383,278 | | | | 118,481 | | | | 395,510 | | |
Institutional Class | | | 962,198 | | | | 12,059,154 | | | | 282,734 | | | | 2,957,318 | | | | 46,977 | | | | 1,950,037 | | |
| | | 3,860,201 | | | | 20,173,275 | | | | 365,035 | | | | 3,340,596 | | | | 165,458 | | | | 2,345,547 | | |
Reinvested dividends and distributions | |
Investor Class | | | — | | | | 8,210,360 | | | | 4,713 | | | | 24,235 | | | | — | | | | 164,090 | | |
Institutional Class | | | — | | | | 1,362,469 | | | | 10,467 | | | | 18,699 | | | | — | | | | 83,839 | | |
| | | — | | | | 9,572,829 | | | | 15,180 | | | | 42,934 | | | | — | | | | 247,929 | | |
Shares Issued | | | 3,860,201 | | | | 29,746,104 | | | | 380,215 | | | | 3,383,530 | | | | 165,458 | | | | 2,593,476 | | |
Shares repurchased | |
Investor Class | | | (9,279,457 | ) | | | (28,341,179 | ) | | | (267,377 | ) | | | (2,332,103 | ) | | | (411,318 | ) | | | (2,639,316 | ) | |
Institutional Class | | | (2,128,023 | ) | | | (3,103,438 | ) | | | (250,618 | ) | | | (268,060 | ) | | | (153,766 | ) | | | (187,644 | ) | |
Total Shares Repurchased | | | (11,407,480 | ) | | | (31,444,617 | ) | | | (517,995 | ) | | | (2,600,163 | ) | | | (565,084 | ) | | | (2,826,960 | ) | |
Net increase (decrease) in fund shares | | | (7,547,279 | ) | | | (1,698,513 | ) | | | (137,780 | ) | | | 783,367 | | | | (399,626 | ) | | | (233,484 | ) | |

The accompanying notes are an integral part of these financial statements.
96
| | Buffalo
Flexible Income Fund | | Buffalo
Growth Fund | |
| | Six Months Ended
September 30, 2020
(UNAUDITED) | | Year Ended
March 31, 2020 | | Six Months Ended
September 30, 2020
(UNAUDITED) | | Year Ended
March 31, 2020 | |
OPERATIONS: | |
Net investment income (loss) | | $ | 4,469,324 | | | $ | 12,513,985 | | | $ | (67,030 | ) | | $ | 276,759 | | |
Net realized gain on investment transactions | | | (6,137,183 | ) | | | 9,291,793 | | | | 11,456,381 | | | | 17,594,269 | | |
Net unrealized appreciation / depreciation during the year on investments and translation of
assets and liabilities in foreign currencies | | | 70,999,462 | | | | (124,907,483 | ) | | | 40,433,841 | | | | (22,605,705 | ) | |
Net increase (decrease) in net assets resulting from operations | | | 69,331,603 | | | | (103,101,705 | ) | | | 51,823,192 | | | | (4,734,677 | ) | |
DISTRIBUTIONS TO SHAREHOLDERS: | |
Distributable earnings | | | (4,529,518 | ) | | | (16,305,324 | ) | | | — | | | | (22,442,337 | ) | |
Return of capital | | | — | | | | — | | | | — | | | | — | | |
Total distributions | | | (4,529,518 | ) | | | (16,305,324 | ) | | | — | | | | (22,442,337 | ) | |
CAPITAL SHARE TRANSACTIONS: | |
Shares sold | |
Investor Class | | | 2,737,576 | | | | 8,349,603 | | | | 3,695,340 | | | | 6,138,725 | | |
Institutional Class | | | 1,958,646 | | | | 192,711,625 | | | | 5,625,487 | | | | 72,785,092 | | |
Reinvested dividends and distributions | |
Investor Class | | | 2,906,325 | | | | 11,940,056 | | | | — | | | | 13,954,602 | | |
Institutional Class | | | 1,395,374 | | | | 3,679,342 | | | | — | | | | 8,131,987 | | |
Shares Issued | | | 8,997,921 | | | | 216,680,626 | | | | 9,320,827 | | | | 101,010,406 | | |
Redemptions | |
Investor Class | | | (49,517,032 | ) | | | (291,492,747 | ) | | | (12,761,889 | ) | | | (94,869,871 | ) | |
Institutional Class | | | (22,443,386 | ) | | | (23,871,195 | ) | | | (7,290,052 | ) | | | (7,174,880 | ) | |
Shares repurchased | | | (71,960,418 | ) | | | (315,363,942 | ) | | | (20,051,941 | ) | | | (102,044,751 | ) | |
Net increase (decrease) from capital share transactions | | | (62,962,497 | ) | | | (98,683,316 | ) | | | (10,731,114 | ) | | | (1,034,345 | ) | |
Total increase (decrease) in net assets | | | 1,839,588 | | | | (218,090,345 | ) | | | 41,092,078 | | | | (28,211,359 | ) | |
NET ASSETS: | |
Beginning of period | | | 407,258,394 | | | | 625,348,739 | | | | 146,358,727 | | | | 174,570,086 | | |
End of period | | $ | 409,097,982 | | | $ | 407,258,394 | | | $ | 187,450,805 | | | $ | 146,358,727 | | |
Fund share transactions: | |
Shares issued | |
Investor Class | | | 201,146 | | | | 559,738 | | | | 139,560 | | | | 239,496 | | |
Institutional Class | | | 140,201 | | | | 12,609,730 | | | | 208,530 | | | | 2,703,466 | | |
| | | 341,347 | | | | 13,169,468 | | | | 348,090 | | | | 2,942,962 | | |
Reinvested dividends and distributions | |
Investor Class | | | 209,217 | | | | 793,912 | | | | — | | | | 560,201 | | |
Institutional Class | | | 100,535 | | | | 245,232 | | | | — | | | | 326,455 | | |
| | | 309,752 | | | | 1,039,144 | | | | — | | | | 886,656 | | |
Shares Issued | | | 651,099 | | | | 14,208,612 | | | | 348,090 | | | | 3,829,618 | | |
Shares repurchased | |
Investor Class | | | (3,599,674 | ) | | | (19,385,727 | ) | | | (486,002 | ) | | | (3,600,122 | ) | |
Institutional Class | | | (1,624,526 | ) | | | (1,632,600 | ) | | | (279,982 | ) | | | (279,922 | ) | |
Total Shares Repurchased | | | (5,224,200 | ) | | | (21,018,327 | ) | | | (765,984 | ) | | | (3,880,044 | ) | |
Net increase (decrease) in fund shares | | | (4,573,101 | ) | | | (6,809,715 | ) | | | (417,894 | ) | | | (50,426 | ) | |

97
STATEMENTS OF CHANGES IN
NET ASSETS
| | Buffalo
High Yield Fund | | Buffalo
International Fund | | Buffalo
Large Cap Fund | |
| | Six Months Ended
September 30, 2020
(UNAUDITED) | | Year Ended
March 31, 2020 | | Six Months Ended
September 30, 2020
(UNAUDITED) | | Year Ended
March 31, 2020 | | Six Months Ended
September 30, 2020
(UNAUDITED) | | Year Ended
March 31, 2020 | |
OPERATIONS: | |
Net investment income (loss) | | $ | 4,825,312 | | | $ | 8,734,875 | | | $ | 1,279,446 | | | $ | 2,552,346 | | | $ | (40,396 | ) | | $ | 226,506 | | |
Net realized gain on investment transactions | | | 392,542 | | | | 545,930 | | | | 2,630,675 | | | | 46,628 | | | | 1,405,726 | | | | 116,976 | | |
Net unrealized appreciation / depreciation during the year on investments and translation of
assets and liabilities in foreign currencies | | | 25,764,649 | | | | (24,152,200 | ) | | | 110,094,669 | | | | (34,252,460 | ) | | | 26,557,919 | | | | (3,183,801 | ) | |
Net increase (decrease) in net assets resulting from operations | | | 30,982,503 | | | | (14,871,395 | ) | | | 114,004,790 | | | | (31,653,486 | ) | | | 27,923,249 | | | | (2,840,319 | ) | |
DISTRIBUTIONS TO SHAREHOLDERS: | |
Distributable earnings | | | (4,799,949 | ) | | | (8,705,714 | ) | | | — | | | | (2,604,701 | ) | | | — | | | | (1,260,297 | ) | |
Return of capital | | | — | | | | — | | | | — | | | | — | | | | — | | | | — | | |
Total distributions | | | (4,799,949 | ) | | | (8,705,714 | ) | | | — | | | | (2,604,701 | ) | | | — | | | | (1,260,297 | ) | |
CAPITAL SHARE TRANSACTIONS: | |
Shares sold | |
Investor Class | | | 3,134,002 | | | | 16,651,157 | | | | 43,638,761 | | | | 89,387,217 | | | | 2,024,830 | | | | 5,577,768 | | |
Institutional Class | | | 38,581,266 | | | | 181,490,562 | | | | 28,923,907 | | | | 261,186,092 | | | | 5,419,873 | | | | 54,591,180 | | |
Reinvested dividends and distributions | |
Investor Class | | | 1,003,451 | | | | 3,844,464 | | | | — | | | | 1,202,548 | | | | — | | | | 472,165 | | |
Institutional Class | | | 3,316,301 | | | | 4,078,662 | | | | — | | | | 1,214,800 | | | | — | | | | 739,158 | | |
Shares Issued | | | 46,035,020 | | | | 206,064,845 | | | | 72,562,668 | | | | 352,990,657 | | | | 7,444,703 | | | | 61,380,271 | | |
Redemptions | |
Investor Class | | | (8,129,527 | ) | | | (162,179,247 | ) | | | (35,436,252 | ) | | | (244,307,743 | ) | | | (3,364,819 | ) | | | (48,314,639 | ) | |
Institutional Class | | | (8,000,913 | ) | | | (23,988,189 | ) | | | (28,571,406 | ) | | | (55,210,922 | ) | | | (3,943,868 | ) | | | (4,851,305 | ) | |
Shares repurchased | | | (16,130,440 | ) | | | (186,167,436 | ) | | | (64,007,658 | ) | | | (299,518,665 | ) | | | (7,308,687 | ) | | | (53,165,944 | ) | |
Net increase (decrease) from capital share transactions | | | 29,904,580 | | | | 19,897,409 | | | | 8,555,010 | | | | 53,471,992 | | | | 136,016 | | | | 8,214,327 | | |
Total increase (decrease) in net assets | | | 56,087,134 | | | | (3,679,700 | ) | | | 122,559,800 | | | | 19,213,805 | | | | 28,059,265 | | | | 4,113,711 | | |
NET ASSETS: | |
Beginning of period | | | 187,770,896 | | | | 191,450,596 | | | | 360,093,480 | | | | 340,879,675 | | | | 73,115,983 | | | | 69,002,272 | | |
End of period | | $ | 243,858,030 | | | $ | 187,770,896 | | | $ | 482,653,280 | | | $ | 360,093,480 | | | $ | 101,175,248 | | | $ | 73,115,983 | | |
Fund share transactions: | |
Shares issued | |
Investor Class | | | 298,485 | | | | 1,516,951 | | | | 2,765,817 | | | | 6,008,278 | | | | 55,761 | | | | 172,360 | | |
Institutional Class | | | 3,581,643 | | | | 16,458,266 | | | | 1,756,931 | | | | 16,486,606 | | | | 141,464 | | | | 1,655,235 | | |
| | | 3,880,128 | | | | 17,975,217 | | | | 4,522,748 | | | | 22,494,884 | | | | 197,225 | | | | 1,827,595 | | |
Reinvested dividends and distributions | |
Investor Class | | | 94,777 | | | | 350,903 | | | | — | | | | 71,966 | | | | — | | | | 13,678 | | |
Institutional Class | | | 312,635 | | | | 372,852 | | | | — | | | | 72,699 | | | | — | | | | 21,394 | | |
| | | 407,412 | | | | 723,755 | | | | — | | | | 144,665 | | | | — | | | | 35,072 | | |
Shares Issued | | | 4,287,540 | | | | 18,698,972 | | | | 4,522,748 | | | | 22,639,549 | | | | 197,225 | | | | 1,862,667 | | |
Shares repurchased | |
Investor Class | | | (767,728 | ) | | | (14,764,965 | ) | | | (2,221,082 | ) | | | (15,607,068 | ) | | | (89,988 | ) | | | (1,466,945 | ) | |
Institutional Class | | | (756,605 | ) | | | (2,234,765 | ) | | | (1,765,353 | ) | | | (3,548,902 | ) | | | (106,538 | ) | | | (146,127 | ) | |
Total Shares Repurchased | | | (1,524,333 | ) | | | (16,999,730 | ) | | | (3,986,435 | ) | | | (19,155,970 | ) | | | (196,526 | ) | | | (1,613,072 | ) | |
Net increase (decrease) in fund shares | | | 2,763,207 | | | | 1,699,241 | | | | 536,313 | | | | 3,483,579 | | | | 699 | | | | 249,595 | | |

The accompanying notes are an integral part of these financial statements.
98
| | Buffalo
Mid Cap Fund | | Buffalo
Small Cap Fund | |
| | Six Months Ended
September 30, 2020
(UNAUDITED) | | Year Ended
March 31, 2020 | | Six Months Ended
September 30, 2020
(UNAUDITED) | | Year Ended
March 31, 2020 | |
OPERATIONS: | |
Net investment income (loss) | | $ | (397,641 | ) | | $ | (634,332 | ) | | $ | (2,298,478 | ) | | $ | (3,460,299 | ) | |
Net realized gain on investment transactions | | | 11,051,491 | | | | 11,862,668 | | | | 94,907,566 | | | | 22,298,931 | | |
Net unrealized appreciation / depreciation during the year on investments and translation of
assets and liabilities in foreign currencies | | | 31,405,380 | | | | (15,719,274 | ) | | | 156,822,543 | | | | (51,267,065 | ) | |
Net increase (decrease) in net assets resulting from operations | | | 42,059,230 | | | | (4,490,938 | ) | | | 249,431,631 | | | | (32,428,433 | ) | |
DISTRIBUTIONS TO SHAREHOLDERS: | |
Distributable earnings | | | — | | | | (13,465,597 | ) | | | — | | | | (46,863,860 | ) | |
Return of capital | | | — | | | | — | | | | — | | | | — | | |
Total distributions | | | — | | | | (13,465,597 | ) | | | — | | | | (46,863,860 | ) | |
CAPITAL SHARE TRANSACTIONS: | |
Shares sold | |
Investor Class | | | 1,845,648 | | | | 46,767,088 | | | | 30,525,254 | | | | 26,007,306 | | |
Institutional Class | | | 4,490,521 | | | | 63,911,053 | | | | 17,434,707 | | | | 120,044,991 | | |
Reinvested dividends and distributions | |
Investor Class | | | — | | | | 8,843,404 | | | | — | | | | 37,817,344 | | |
Institutional Class | | | — | | | | 4,461,718 | | | | — | | | | 8,235,789 | | |
Shares Issued | | | 6,336,169 | | | | 123,983,263 | | | | 47,959,961 | | | | 192,105,430 | | |
Redemptions | |
Investor Class | | | (22,079,859 | ) | | | (97,399,541 | ) | | | (33,010,451 | ) | | | (181,346,811 | ) | |
Institutional Class | | | (5,567,865 | ) | | | (6,535,831 | ) | | | (12,448,723 | ) | | | (8,976,585 | ) | |
Shares repurchased | | | (27,647,724 | ) | | | (103,935,372 | ) | | | (45,459,174 | ) | | | (190,323,396 | ) | |
Net increase (decrease) from capital share transactions | | | (21,311,555 | ) | | | 20,047,891 | | | | 2,500,787 | | | | 1,782,034 | | |
Total increase (decrease) in net assets | | | 20,747,675 | | | | 2,091,356 | | | | 251,932,418 | | | | (77,510,259 | ) | |
NET ASSETS: | |
Beginning of period | | | 137,353,451 | | | | 135,262,095 | | | | 432,899,654 | | | | 510,409,913 | | |
End of period | | $ | 158,101,126 | | | $ | 137,353,451 | | | $ | 684,832,072 | | | $ | 432,899,654 | | |
Fund share transactions: | |
Shares issued | |
Investor Class | | | 121,647 | | | | 3,071,189 | | | | 1,917,693 | | | | 1,964,337 | | |
Institutional Class | | | 275,722 | | | | 4,082,600 | | | | 1,117,065 | | | | 8,772,669 | | |
| | | 397,369 | | | | 7,153,789 | | | | 3,034,758 | | | | 10,737,006 | | |
Reinvested dividends and distributions | |
Investor Class | | | — | | | | 581,420 | | | | — | | | | 2,782,733 | | |
Institutional Class | | | — | | | | 293,149 | | | | — | | | | 605,573 | | |
| | | — | | | | 874,569 | | | | — | | | | 3,388,306 | | |
Shares Issued | | | 397,369 | | | | 8,028,358 | | | | 3,034,758 | | | | 14,125,312 | | |
Shares repurchased | |
Investor Class | | | (1,375,007 | ) | | | (6,358,182 | ) | | | (2,181,369 | ) | | | (13,476,585 | ) | |
Institutional Class | | | (350,502 | ) | | | (437,136 | ) | | | (845,679 | ) | | | (698,052 | ) | |
Total Shares Repurchased | | | (1,725,509 | ) | | | (6,795,318 | ) | | | (3,027,048 | ) | | | (14,174,637 | ) | |
Net increase (decrease) in fund shares | | | (1,328,140 | ) | | | 1,233,040 | | | | 7,710 | | | | (49,325 | ) | |

99
FINANCIAL HIGHLIGHTS
BUFFALO DISCOVERY FUND INVESTOR CLASS
The following tables are intended to help you understand the Fund's financial performance for the periods shown. Certain information reflects financial results for a single Fund share. Total returns in the table represent the rate that an investor would have earned (or lost) on an investment in the Fund. Total returns assume reinvestment of all dividends and distributions. Total returns do not reflect payment of sales charges, if any, and are not annualized for periods of less than one year.
| | | For the Six Months
Ended September 30,
2020 | | Years Ended March 31, | |
Condensed data for a share of capital stock
outstanding throughout the period. | | (UNAUDITED) | | 2020 | | 2019 | | 2018 | | 2017 | | 2016 | |
Net asset value, beginning of period | | $ | 19.88 | | | $ | 25.29 | | | $ | 24.52 | | | $ | 21.86 | | | $ | 19.30 | | | $ | 21.50 | | |
Income from investment operations: | |
Net investment loss | | | 0.01 | | | | (0.06 | ) | | | (0.06 | ) | | | (0.04 | ) | | | (0.02 | ) | | | (0.03 | ) | |
Net gains (losses) on securities (both
realized and unrealized) | | | 7.22 | | | | (1.76 | ) | | | 2.31 | | | | 3.82 | | | | 3.10 | | | | (0.69 | ) | |
Total from investment operations | | | 7.23 | | | | (1.82 | ) | | | 2.25 | | | | 3.78 | | | | 3.08 | | | | (0.72 | ) | |
Less distributions: | |
Distributions from capital gains | | | — | | | | (3.59 | ) | | | (1.48 | ) | | | (1.12 | ) | | | (0.52 | ) | | | (1.48 | ) | |
Total distributions | | | — | | | | (3.59 | ) | | | (1.48 | ) | | | (1.12 | ) | | | (0.52 | ) | | | (1.48 | ) | |
Paid-in capital from redemption fees(1) | | | — | | | | — | | | | — | | | | — | | | | — | (2) | | | — | (2) | |
Net asset value, end of period | | $ | 27.11 | | | $ | 19.88 | | | $ | 25.29 | | | $ | 24.52 | | | $ | 21.86 | | | $ | 19.30 | | |
Total return* | | | 36.37 | % | | | (9.64 | %) | | | 10.34 | % | | | 17.35 | % | | | 16.07 | % | | | (3.30 | %) | |
Ratios/Supplemental Data | |
Net assets, end of period (in thousands) | | $ | 1,370,951 | | | $ | 1,132,237 | | | $ | 1,744,262 | | | $ | 1,896,950 | | | $ | 1,254,238 | | | $ | 1,010,583 | | |
Ratio of expenses to average net assets** | | | 1.01 | % | | | 1.01 | % | | | 1.01 | % | | | 1.01 | % | | | 1.01 | % | | | 1.01 | % | |
Ratio of net investment income (loss) to average
net assets** | | | (0.59 | %) | | | (0.30 | %) | | | (0.21 | %) | | | (0.20 | %) | | | (0.11 | %) | | | (0.18 | %) | |
Portfolio turnover rate* | | | 59 | % | | | 123 | % | | | 77 | % | | | 42 | % | | | 51 | % | | | 59 | % | |
* Not annualized for periods less than one year.
** Annualized for periods less than one year.
(1) Effective December 1, 2016, the Board of Trustees approved the elimination of redemption fees on shares of the Funds.
(2) Less than $0.01 per share.

100
FINANCIAL HIGHLIGHTS
BUFFALO DISCOVERY FUND INSTITUTIONAL CLASS
The following tables are intended to help you understand the Fund's financial performance for the periods shown. Certain information reflects financial results for a single Fund share. Total returns in the table represent the rate that an investor would have earned (or lost) on an investment in the Fund. Total returns assume reinvestment of all dividends and distributions. Total returns do not reflect payment of sales charges, if any, and are not annualized for periods of less than one year.
Condensed data for a share of capital stock
outstanding throughout the period. | | For the Six Months
Ended September 30,
2020
(UNAUDITED) | | For the period
July 1, 2019*
through
March 31, 2020 | |
Net asset value, beginning of period | | $ | 19.91 | | | $ | 27.10 | | |
Income from investment operations: | |
Net investment loss | | | 0.03 | | | | (0.04 | ) | |
Net gains (losses) on securities (both realized and unrealized) | | | 7.23 | | | | (3.56 | ) | |
Total from investment operations | | | 7.26 | | | | (3.60 | ) | |
Less distributions: | |
Distributions from capital gains | | | — | | | | (3.59 | ) | |
Total distributions | | | — | | | | (3.59 | ) | |
Net asset value, end of period | | $ | 27.17 | | | $ | 19.91 | | |
Total return** | | | 36.46 | % | | | (15.55 | %) | |
Ratios/Supplemental Data | |
Net assets, end of period (in thousands) | | $ | 248,669 | | | $ | 205,430 | | |
Ratio of expenses to average net assets*** | | | 0.86 | % | | | 0.86 | % | |
Ratio of net investment income (loss) to average net assets*** | | | (0.30 | %) | | | (0.25 | %) | |
Portfolio turnover rate** | | | 59 | % | | | 123 | % | |
* Inception date
** Not annualized.
*** Annualized.

101
FINANCIAL HIGHLIGHTS
BUFFALO DIVIDEND FOCUS FUND INVESTOR CLASS
The following tables are intended to help you understand the Fund's financial performance for the periods shown. Certain information reflects financial results for a single Fund share. Total returns in the table represent the rate that an investor would have earned (or lost) on an investment in the Fund. Total returns assume reinvestment of all dividends and distributions. Total returns do not reflect payment of sales charges, if any, and are not annualized for periods of less than one year.
| | | For the Six Months
Ended September 30,
2020 | | Years Ended March 31, | |
Condensed data for a share of capital stock
outstanding throughout the period. | | (UNAUDITED) | | 2020 | | 2019 | | 2018 | | 2017 | | 2016 | |
Net asset value, beginning of period | | $ | 15.10 | | | $ | 16.65 | | | $ | 16.28 | | | $ | 15.32 | | | $ | 13.20 | | | $ | 13.76 | | |
Income from investment operations: | |
Net investment gain | | | 0.02 | | | | 0.44 | | | | 0.25 | | | | 0.19 | | | | 0.18 | | | | 0.16 | | |
Net gains (losses) on securities (both realized
and unrealized) | | | 4.17 | | | | (1.81 | ) | | | 0.91 | | | | 1.11 | | | | 2.22 | | | | (0.30 | ) | |
Total from investment operations | | | 4.19 | | | | (1.37 | ) | | | 1.16 | | | | 1.30 | | | | 2.40 | | | | (0.14 | ) | |
Less distributions: | |
Distributions from investment Income | | | (0.06 | ) | | | (0.17 | ) | | | (0.25 | ) | | | (0.19 | ) | | | (0.18 | ) | | | (0.17 | ) | |
Distributions from capital gains | | | — | | | | — | | | | (0.54 | ) | | | (0.15 | ) | | | (0.10 | ) | | | (0.26 | ) | |
Distributions from return of capital | | | — | | | | (0.01 | ) | | | — | | | | — | | | | — | | | | — | | |
Total distributions | | | (0.06 | ) | | | (0.18 | ) | | | (0.79 | ) | | | (0.34 | ) | | | (0.28 | ) | | | (0.43 | ) | |
Paid-in capital from redemption fees(1) | | | — | | | | — | | | | — | | | | — | | | | — | (2) | | | 0.01 | | |
Net asset value, end of period | | $ | 19.23 | | | $ | 15.10 | | | $ | 16.65 | | | $ | 16.28 | | | $ | 15.32 | | | $ | 13.20 | | |
Total return* | | | 27.77 | % | | | (8.32 | %) | | | 7.48 | % | | | 8.51 | % | | | 18.35 | % | | | (0.88 | %) | |
Ratios/Supplemental Data | |
Net assets, end of period (in thousands) | | $ | 26,863 | | | $ | 23,821 | | | $ | 58,299 | | | $ | 59,364 | | | $ | 59,795 | | | $ | 38,222 | | |
Ratio of expenses to average net assets** | | | 0.96 | % | | | 0.95 | % | | | 0.94 | % | | | 0.94 | % | | | 0.95 | % | | | 0.97 | % | |
Ratio of net investment income (loss) to average
net assets** | | | 0.73 | % | | | 0.84 | % | | | 1.45 | % | | | 1.16 | % | | | 1.34 | % | | | 1.21 | % | |
Portfolio turnover rate* | | | 7 | % | | | 31 | % | | | 20 | % | | | 21 | % | | | 26 | % | | | 65 | % | |
* Not annualized for periods less than one year.
** Annualized for periods less than one year.
(1) Effective December 1, 2016, the Board of Trustees approved the elimination of redemption fees on shares of the Funds.
(2) Less than $0.01 per share.

102
FINANCIAL HIGHLIGHTS
BUFFALO DIVIDEND FOCUS FUND INSTITUTIONAL CLASS
The following tables are intended to help you understand the Fund's financial performance for the periods shown. Certain information reflects financial results for a single Fund share. Total returns in the table represent the rate that an investor would have earned (or lost) on an investment in the Fund. Total returns assume reinvestment of all dividends and distributions. Total returns do not reflect payment of sales charges, if any, and are not annualized for periods of less than one year.
Condensed data for a share of capital stock
outstanding throughout the period. | | For the Six Months
Ended September 30,
2020
(UNAUDITED) | | For the period
July 1, 2019*
through
March 31, 2020 | |
Net asset value, beginning of period | | $ | 15.10 | | | $ | 17.37 | | |
Income from investment operations: | |
Net investment income | | | 0.06 | | | | 0.28 | | |
Net gains (losses) on securities (both realized and unrealized) | | | 4.15 | | | | (2.41 | ) | |
Total from investment operations | | | 4.21 | | | | (2.13 | ) | |
Less distributions: | |
Distributions from investment Income | | | (0.08 | ) | | | (0.13 | ) | |
Distributions from capital gains | | | — | | | | — | | |
Distributions from return of capital | | | — | | | | (0.01 | ) | |
Total distributions | | | (0.08 | ) | | | (0.14 | ) | |
Net asset value, end of period | | $ | 19.23 | | | $ | 15.10 | | |
Total return** | | | 27.86 | % | | | (12.34 | %) | |
Ratios/Supplemental Data | |
Net assets, end of period (in thousands) | | $ | 52,881 | | | $ | 40,887 | | |
Ratio of expenses to average net assets*** | | | 0.81 | % | | | 0.80 | % | |
Ratio of net investment income (loss) to average net assets*** | | | 0.88 | % | | | 1.23 | % | |
Portfolio turnover rate** | | | 7 | % | | | 31 | % | |
* Inception date
** Not annualized.
*** Annualized.

103
FINANCIAL HIGHLIGHTS
BUFFALO EMERGING OPPORTUNITIES FUND INVESTOR CLASS
The following tables are intended to help you understand the Fund's financial performance for the periods shown. Certain information reflects financial results for a single Fund share. Total returns in the table represent the rate that an investor would have earned (or lost) on an investment in the Fund. Total returns assume reinvestment of all dividends and distributions. Total returns do not reflect payment of sales charges, if any, and are not annualized for periods of less than one year.
| | | For the Six Months
Ended September 30,
2020 | | Years Ended March 31, | |
Condensed data for a share of capital stock
outstanding throughout the period. | | (UNAUDITED) | | 2020 | | 2019 | | 2018 | | 2017 | | 2016 | |
Net asset value, beginning of period | | $ | 12.50 | | | $ | 15.30 | | | $ | 16.03 | | | $ | 15.78 | | | $ | 13.89 | | | $ | 17.85 | | |
Income from investment operations: | |
Net investment loss | | | 0.04 | | | | (0.15 | ) | | | (0.15 | ) | | | (0.18 | ) | | | (0.13 | ) | | | (0.28 | ) | |
Net gains (losses) on securities (both realized
and unrealized) | | | 6.40 | | | | (1.85 | ) | | | 1.32 | | | | 3.55 | | | | 3.25 | | | | (2.45 | ) | |
Total from investment operations | | | 6.44 | | | | (2.00 | ) | | | 1.17 | | | | 3.37 | | | | 3.12 | | | | (2.73 | ) | |
Less distributions: | |
Distributions from capital gains | | | — | | | | (0.80 | ) | | | (1.90 | ) | | | (3.12 | ) | | | (1.23 | ) | | | (1.23 | ) | |
Paid-in capital from redemption fees(1) | | | — | | | | — | | | | — | | | | — | | | | — | (2) | | | — | (2) | |
Net asset value, end of period | | $ | 18.94 | | | $ | 12.50 | | | $ | 15.30 | | | $ | 16.03 | | | $ | 15.78 | | | $ | 13.89 | | |
Total return* | | | 51.52 | % | | | (14.38 | %) | | | 9.39 | % | | | 21.84 | % | | | 22.99 | % | | | (15.47 | %) | |
Ratios/Supplemental Data | |
Net assets, end of period (in thousands) | | $ | 59,057 | | | $ | 42,633 | | | $ | 84,032 | | | $ | 87,969 | | | $ | 85,336 | | | $ | 114,270 | | |
Ratio of expenses to average net assets** | | | 1.51 | % | | | 1.49 | % | | | 1.48 | % | | | 1.48 | % | | | 1.48 | % | | | 1.47 | % | |
Ratio of net investment income (loss) to average
net assets** | | | (1.18 | %) | | | (1.00 | %) | | | (0.94 | %) | | | (1.10 | %) | | | (0.62 | %) | | | (1.19 | %) | |
Portfolio turnover rate* | | | 22 | % | | | 22 | % | | | 40 | % | | | 48 | % | | | 95 | % | | | 70 | % | |
* Not annualized for periods less than one year.
** Annualized for periods less than one year.
(1) Effective December 1, 2016, the Board of Trustees approved the elimination of redemption fees on shares of the Funds.
(2) Less than $0.01 per share.

104
FINANCIAL HIGHLIGHTS
BUFFALO EMERGING OPPORTUNITIES FUND INSTITUTIONAL CLASS
The following tables are intended to help you understand the Fund's financial performance for the periods shown. Certain information reflects financial results for a single Fund share. Total returns in the table represent the rate that an investor would have earned (or lost) on an investment in the Fund. Total returns assume reinvestment of all dividends and distributions. Total returns do not reflect payment of sales charges, if any, and are not annualized for periods of less than one year.
Condensed data for a share of capital stock
outstanding throughout the period. | | For the Six Months
Ended September 30,
2020
(UNAUDITED) | | For the period
July 1, 2019*
through
March 31, 2020 | |
Net asset value, beginning of period | | $ | 12.51 | | | $ | 16.44 | | |
Income from investment operations: | |
Net investment loss | | | 0.07 | | | | (0.14 | ) | |
Net gains (losses) on securities (both realized and unrealized) | | | 6.40 | | | | (2.99 | ) | |
Total from investment operations | | | 6.47 | | | | (3.13 | ) | |
Less distributions: | |
Distributions from investment Income | | | — | | | | — | | |
Distributions from capital gains | | | — | | | | (0.80 | ) | |
Total distributions | | | — | | | | (0.80 | ) | |
Net asset value, end of period | | $ | 18.98 | | | $ | 12.51 | | |
Total return** | | | 51.72 | % | | | (20.25 | %) | |
Ratios/Supplemental Data | |
Net assets, end of period (in thousands) | | $ | 33,006 | | | $ | 23,102 | | |
Ratio of expenses to average net assets*** | | | 1.36 | % | | | 1.35 | % | |
Ratio of net investment income (loss) to average net assets*** | | | (1.03 | %) | | | (1.19 | %) | |
Portfolio turnover rate** | | | 22 | % | | | 22 | % | |
* Inception date
** Not annualized.
*** Annualized.

105
FINANCIAL HIGHLIGHTS
BUFFALO FLEXIBLE INCOME FUND INVESTOR CLASS
The following tables are intended to help you understand the Fund's financial performance for the periods shown. Certain information reflects financial results for a single Fund share. Total returns in the table represent the rate that an investor would have earned (or lost) on an investment in the Fund. Total returns assume reinvestment of all dividends and distributions. Total returns do not reflect payment of sales charges, if any, and are not annualized for periods of less than one year.
| | | For the Six Months
Ended September 30,
2020 | | Years Ended March 31, | |
Condensed data for a share of capital stock
outstanding throughout the period. | | (UNAUDITED) | | 2020 | | 2019 | | 2018 | | 2017 | | 2016 | |
Net asset value, beginning of period | | $ | 11.93 | | | $ | 15.27 | | | $ | 15.00 | | | $ | 14.74 | | | $ | 13.70 | | | $ | 14.53 | | |
Income from investment operations: | |
Net investment income | | | 0.12 | | | | 0.72 | | | | 0.39 | | | | 0.34 | | | | 0.35 | | | | 0.38 | | |
Net gains (losses) on securities (both realized
and unrealized) | | | 1.93 | | | | (3.63 | ) | | | 0.71 | | | | 0.77 | | | | 1.14 | | | | (0.70 | ) | |
Total from investment operations | | | 2.05 | | | | (2.91 | ) | | | 1.10 | | | | 1.11 | | | | 1.49 | | | | (0.32 | ) | |
Less distributions: | |
Distributions from investment Income | | | (0.14 | ) | | | (0.32 | ) | | | (0.39 | ) | | | (0.36 | ) | | | (0.38 | ) | | | (0.41 | ) | |
Distributions from capital gains | | | — | | | | (0.11 | ) | | | (0.44 | ) | | | (0.49 | ) | | | (0.07 | ) | | | (0.10 | ) | |
Total distributions | | | (0.14 | ) | | | (0.43 | ) | | | (0.83 | ) | | | (0.85 | ) | | | (0.45 | ) | | | (0.51 | ) | |
Paid-in capital from redemption fees(1) | | | | | | | — | | | | — | | | | — | | | | — | (2) | | | — | (2) | |
Net asset value, end of period | | $ | 13.84 | | | $ | 11.93 | | | $ | 15.27 | | | $ | 15.00 | | | $ | 14.74 | | | $ | 13.70 | | |
Total return* | | | 17.18 | % | | | (19.63 | %) | | | 7.73 | % | | | 7.57 | % | | | 11.02 | % | | | (2.24 | %) | |
Ratios/Supplemental Data | |
Net assets, end of period (in thousands) | | $ | 273,014 | | | $ | 273,416 | | | $ | 625,349 | | | $ | 698,084 | | | $ | 797,453 | | | $ | 899,246 | | |
Ratio of expenses to average net assets** | | | 1.01 | % | | | 1.01 | % | | | 1.01 | % | | | 1.01 | % | | | 1.01 | % | | | 1.01 | % | |
Ratio of net investment income (loss) to average
net assets** | | | 1.99 | % | | | 1.99 | % | | | 2.57 | % | | | 2.27 | % | | | 2.45 | % | | | 2.72 | % | |
Portfolio turnover rate* | | | 1 | % | | | 5 | % | | | 6 | % | | | 2 | % | | | 1 | % | | | 5 | % | |
* Not annualized for periods less than one year.
** Annualized for periods less than one year.
(1) Effective December 1, 2016, the Board of Trustees approved the elimination of redemption fees on shares of the Funds.
(2) Less than $0.01 per share.

106
FINANCIAL HIGHLIGHTS
BUFFALO FLEXIBLE INCOME FUND INSTITUTIONAL CLASS
The following tables are intended to help you understand the Fund's financial performance for the periods shown. Certain information reflects financial results for a single Fund share. Total returns in the table represent the rate that an investor would have earned (or lost) on an investment in the Fund. Total returns assume reinvestment of all dividends and distributions. Total returns do not reflect payment of sales charges, if any, and are not annualized for periods of less than one year.
Condensed data for a share of capital stock
outstanding throughout the period. | | For the Six Months
Ended September 30,
2020
(UNAUDITED) | | For the period
July 1, 2019*
through
March 31, 2020 | |
Net asset value, beginning of period | | $ | 11.93 | | | $ | 15.31 | | |
Income from investment operations: | |
Net investment income | | | 0.15 | | | | 0.57 | | |
Net gains (losses) on securities (both realized and unrealized) | | | 1.90 | | | | (3.60 | ) | |
Total from investment operations | | | 2.05 | | | | (3.03 | ) | |
Less distributions: | |
Distributions from investment Income | | | (0.15 | ) | | | (0.25 | ) | |
Distributions from capital gains | | | — | | | | (0.10 | ) | |
Total distributions | | | (0.15 | ) | | | (0.35 | ) | |
Net asset value, end of period | | $ | 13.83 | | | $ | 11.93 | | |
Total return** | | | 17.21 | % | | | (20.20 | %) | |
Ratios/Supplemental Data | |
Net assets, end of period (in thousands) | | $ | 136,084 | | | $ | 133,843 | | |
Ratio of expenses to average net assets*** | | | 0.86 | % | | | 0.86 | % | |
Ratio of net investment income (loss) to average net assets*** | | | 2.14 | % | | | 2.79 | % | |
Portfolio turnover rate** | | | 1 | % | | | 5 | % | |
* Inception date
** Not annualized.
*** Annualized.

107
FINANCIAL HIGHLIGHTS
BUFFALO GROWTH FUND INVESTOR CLASS
The following tables are intended to help you understand the Fund's financial performance for the periods shown. Certain information reflects financial results for a single Fund share. Total returns in the table represent the rate that an investor would have earned (or lost) on an investment in the Fund. Total returns assume reinvestment of all dividends and distributions. Total returns do not reflect payment of sales charges, if any, and are not annualized for periods of less than one year.
| | | For the Six Months
Ended September 30,
2020 | | Years Ended March 31, | |
Condensed data for a share of capital stock
outstanding throughout the period. | | (UNAUDITED) | | 2020 | | 2019 | | 2018 | | 2017 | | 2016 | |
Net asset value, beginning of period | | $ | 21.20 | | | $ | 25.10 | | | $ | 29.83 | | | $ | 30.83 | | | $ | 28.86 | | | $ | 34.60 | | |
Income from investment operations: | |
Net investment loss | | | (0.01 | ) | | | 0.08 | | | | 0.05 | | | | 0.39 | | | | 0.23 | | | | 0.18 | | |
Net gains (losses) on securities (both realized
and unrealized) | | | 7.70 | | | | (0.55 | ) | | | 2.76 | | | | 4.58 | | | | 3.36 | | | | (0.61 | ) | |
Total from investment operations | | | 7.69 | | | | (0.47 | ) | | | 2.81 | | | | 4.97 | | | | 3.59 | | | | (0.43 | ) | |
Less distributions: | |
Distributions from investment Income | | | — | | | | (0.08 | ) | | | (0.01 | ) | | | (0.45 | ) | | | (0.22 | ) | | | (0.19 | ) | |
Distributions from capital gains | | | — | | | | (3.35 | ) | | | (7.53 | ) | | | (5.52 | ) | | | (1.40 | ) | | | (5.12 | ) | |
Total distributions | | | — | | | | (3.43 | ) | | | (7.54 | ) | | | (5.97 | ) | | | (1.62 | ) | | | (5.31 | ) | |
Paid-in capital from redemption fees(1) | | | | | | | — | | | | — | | | | — | | | | — | (2) | | | — | (2) | |
Net asset value, end of period | | $ | 28.89 | | | $ | 21.20 | | | $ | 25.10 | | | $ | 29.83 | | | $ | 30.83 | | | $ | 28.86 | | |
Total return* | | | 36.27 | % | | | (3.90 | %) | | | 13.17 | % | | | 16.42 | % | | | 12.88 | % | | | (0.96 | %) | |
Ratios/Supplemental Data | |
Net assets, end of period (in thousands) | | $ | 109,994 | | | $ | 88,051 | | | $ | 174,570 | | | $ | 204,251 | | | $ | 326,944 | | | $ | 395,511 | | |
Ratio of expenses to average net assets** | | | 0.93 | % | | | 0.92 | % | | | 0.91 | % | | | 0.91 | % | | | 0.91 | % | | | 0.91 | % | |
Ratio of net investment income (loss) to average
net assets** | | | (0.14 | %) | | | 0.11 | % | | | 0.17 | % | | | 0.90 | % | | | 0.70 | % | | | 0.52 | % | |
Portfolio turnover rate* | | | 15 | % | | | 33 | % | | | 16 | % | | | 32 | % | | | 18 | % | | | 42 | % | |
* Not annualized for periods less than one year.
** Annualized for periods less than one year.
(1) Effective December 1, 2016, the Board of Trustees approved the elimination of redemption fees on shares of the Funds.
(2) Less than $0.01 per share.

108
FINANCIAL HIGHLIGHTS
BUFFALO GROWTH FUND INSTITUTIONAL CLASS
The following tables are intended to help you understand the Fund's financial performance for the periods shown. Certain information reflects financial results for a single Fund share. Total returns in the table represent the rate that an investor would have earned (or lost) on an investment in the Fund. Total returns assume reinvestment of all dividends and distributions. Total returns do not reflect payment of sales charges, if any, and are not annualized for periods of less than one year.
Condensed data for a share of capital stock
outstanding throughout the period. | | For the Six Months
Ended September 30,
2020
(UNAUDITED) | | For the period
July 1, 2019*
through
March 31, 2020 | |
Net asset value, beginning of period | | $ | 21.20 | | | $ | 27.10 | | |
Income from investment operations: | |
Net investment loss | | | 0.01 | | | | 0.15 | | |
Net gains (losses) on securities (both realized and unrealized) | | | 7.71 | | | | (2.59 | ) | |
Total from investment operations | | | 7.72 | | | | (2.44 | ) | |
Less distributions: | |
Distributions from investment Income | | | — | | | | (0.10 | ) | |
Distributions from capital gains | | | — | | | | (3.36 | ) | |
Total distributions | | | — | | | | (3.46 | ) | |
Net asset value, end of period | | $ | 28.92 | | | $ | 21.20 | | |
Total return** | | | 36.42 | % | | | (10.92 | %) | |
Ratios/Supplemental Data | |
Net assets, end of period (in thousands) | | $ | 77,457 | | | $ | 58,307 | | |
Ratio of expenses to average net assets*** | | | 0.78 | % | | | 0.78 | % | |
Ratio of net investment income (loss) to average net assets*** | | | 0.01 | % | | | 0.28 | % | |
Portfolio turnover rate** | | | 15 | % | | | 33 | % | |
* Inception date
** Not annualized.
*** Annualized.

109
FINANCIAL HIGHLIGHTS
BUFFALO HIGH YIELD FUND INVESTOR CLASS
The following tables are intended to help you understand the Fund's financial performance for the periods shown. Certain information reflects financial results for a single Fund share. Total returns in the table represent the rate that an investor would have earned (or lost) on an investment in the Fund. Total returns assume reinvestment of all dividends and distributions. Total returns do not reflect payment of sales charges, if any, and are not annualized for periods of less than one year.
| | | For the Six Months
Ended September 30,
2020 | | Years Ended March 31, | |
Condensed data for a share of capital stock
outstanding throughout the period. | | (UNAUDITED) | | 2020 | | 2019 | | 2018 | | 2017 | | 2016 | |
Net asset value, beginning of period | | $ | 9.72 | | | $ | 10.86 | | | $ | 11.04 | | | $ | 11.21 | | | $ | 11.04 | | | $ | 11.71 | | |
Income from investment operations: | |
Net investment income | | | 0.22 | | | | 1.17 | | | | 0.51 | | | | 0.50 | | | | 0.48 | | | | 0.44 | | |
Net gains (losses) on securities (both realized
and unrealized) | | | 1.34 | | | | (1.85 | ) | | | (0.15 | ) | | | (0.15 | ) | | | 0.42 | | | | (0.48 | ) | |
Total from investment operations | | | 1.56 | | | | (0.68 | ) | | | 0.36 | | | | 0.35 | | | | 0.90 | | | | (0.04 | ) | |
Less distributions: | |
Distributions from investment Income | | | (0.23 | ) | | | (0.46 | ) | | | (0.51 | ) | | | (0.47 | ) | | | (0.47 | ) | | | (0.46 | ) | |
Distributions from capital gains | | | — | | | | — | | | | (0.03 | ) | | | (0.05 | ) | | | (0.26 | ) | | | (0.17 | ) | |
Total distributions | | | (0.23 | ) | | | (0.46 | ) | | | (0.54 | ) | | | (0.52 | ) | | | (0.73 | ) | | | (0.63 | ) | |
Paid-in capital from redemption fees(1) | | | — | | | | — | | | | — | | | | — | | | | — | (2) | | | — | (2) | |
Net asset value, end of period | | $ | 11.05 | | | $ | 9.72 | | | $ | 10.86 | | | $ | 11.04 | | | $ | 11.21 | | | $ | 11.04 | | |
Total return* | | | 16.13 | % | | | (6.67 | %) | | | 3.46 | % | | | 3.20 | % | | | 8.37 | % | | | (0.41 | %) | |
Ratios/Supplemental Data | |
Net assets, end of period (in thousands) | | $ | 48,196 | | | $ | 46,036 | | | $ | 191,451 | | | $ | 231,295 | | | $ | 236,006 | | | $ | 282,385 | | |
Ratio of expenses to average net assets** | | | 1.01 | % | | | 1.02 | % | | | 1.02 | % | | | 1.02 | % | | | 1.02 | % | | | 1.01 | % | |
Ratio of net investment income (loss) to average
net assets** | | | 4.35 | % | | | 3.60 | % | | | 4.68 | % | | | 4.06 | % | | | 4.27 | % | | | 3.79 | % | |
Portfolio turnover rate* | | | 25 | % | | | 36 | % | | | 22 | % | | | 41 | % | | | 40 | % | | | 44 | % | |
* Not annualized for periods less than one year.
** Annualized for periods less than one year.
(1) Effective December 1, 2016, the Board of Trustees approved the elimination of redemption fees on shares of the Funds.
(2) Less than $0.01 per share.

110
FINANCIAL HIGHLIGHTS
BUFFALO HIGH YIELD FUND INSTITUTIONAL CLASS
The following tables are intended to help you understand the Fund's financial performance for the periods shown. Certain information reflects financial results for a single Fund share. Total returns in the table represent the rate that an investor would have earned (or lost) on an investment in the Fund. Total returns assume reinvestment of all dividends and distributions. Total returns do not reflect payment of sales charges, if any, and are not annualized for periods of less than one year.
Condensed data for a share of capital stock
outstanding throughout the period. | | For the Six Months
Ended September 30,
2020
(UNAUDITED) | | For the period
July 1, 2019*
through
March 31, 2020 | |
Net asset value, beginning of period | | $ | 9.71 | | | $ | 11.01 | | |
Income from investment operations: | |
Net investment loss | | | 0.24 | | | | 0.71 | | |
Net gains (losses) on securities (both realized and unrealized) | | | 1.32 | | | | (1.66 | ) | |
Total from investment operations | | | 1.56 | | | | (0.95 | ) | |
Less distributions: | |
Distributions from investment Income | | | (0.24 | ) | | | (0.35 | ) | |
Distributions from capital gains | | | — | | | | — | | |
Total distributions | | | (0.24 | ) | | | (0.35 | ) | |
Net asset value, end of period | | $ | 11.03 | | | $ | 9.71 | | |
Total return** | | | 16.19 | % | | | (8.94 | %) | |
Ratios/Supplemental Data | |
Net assets, end of period (in thousands) | | $ | 195,662 | | | $ | 141,735 | | |
Ratio of expenses to average net assets*** | | | 0.86 | % | | | 0.88 | % | |
Ratio of net investment income (loss) to average net assets*** | | | 4.50 | % | | | 4.90 | % | |
Portfolio turnover rate** | | | 25 | % | | | 36 | % | |
* Inception date
** Not annualized.
*** Annualized.

111
FINANCIAL HIGHLIGHTS
BUFFALO INTERNATIONAL FUND INVESTOR CLASS
The following tables are intended to help you understand the Fund's financial performance for the periods shown. Certain information reflects financial results for a single Fund share. Total returns in the table represent the rate that an investor would have earned (or lost) on an investment in the Fund. Total returns assume reinvestment of all dividends and distributions. Total returns do not reflect payment of sales charges, if any, and are not annualized for periods of less than one year.
| | | For the Six Months
Ended September 30,
2020 | | Years Ended March 31, | |
Condensed data for a share of capital stock
outstanding throughout the period. | | (UNAUDITED) | | 2020 | | 2019 | | 2018 | | 2017 | | 2016 | |
Net asset value, beginning of period | | $ | 13.54 | | | $ | 14.76 | | | $ | 15.10 | | | $ | 12.80 | | | $ | 11.40 | | | $ | 11.93 | | |
Income from investment operations: | |
Net investment income | | | 0.04 | | | | 0.19 | | | | 0.09 | | | | 0.06 | | | | 0.13 | | | | 0.06 | | |
Net gains (losses) on securities (both realized
and unrealized) | | | 4.21 | | | | (1.31 | ) | | | (0.11 | ) | | | 2.29 | | | | 1.39 | | | | (0.54 | ) | |
Total from investment operations | | | 4.25 | | | | (1.12 | ) | | | (0.02 | ) | | | 2.35 | | | | 1.52 | | | | (0.48 | ) | |
Less distributions: | |
Distributions from investment Income | | | — | | | | (0.10 | ) | | | (0.08 | ) | | | (0.04 | ) | | | (0.12 | ) | | | (0.05 | ) | |
Distributions from capital gains | | | — | | | | — | | | | (0.24 | ) | | | (0.01 | ) | | | — | | | | — | | |
Total distributions | | | — | | | | (0.10 | ) | | | (0.32 | ) | | | (0.05 | ) | | | (0.12 | ) | | | (0.05 | ) | |
Paid-in capital from redemption fees(1) | | | — | | | | — | | | | — | | | | — | | | | — | (2) | | | — | (2) | |
Net asset value, end of period | | $ | 17.79 | | | $ | 13.54 | | | $ | 14.76 | | | $ | 15.10 | | | $ | 12.80 | | | $ | 11.40 | | |
Total return* | | | 31.29 | % | | | (7.67 | %) | | | 0.11 | % | | | 18.40 | % | | | 13.46 | % | | | (4.02 | %) | |
Ratios/Supplemental Data | |
Net assets, end of period (in thousands) | | $ | 251,103 | | | $ | 183,809 | | | $ | 340,880 | | | $ | 277,865 | | | $ | 203,276 | | | $ | 234,446 | | |
Ratio of expenses to average net assets** | | | 1.03 | % | | | 1.03 | % | | | 1.04 | % | | | 1.03 | % | | | 1.04 | % | | | 1.04 | % | |
Ratio of net investment income (loss) to average
net assets** | | | 0.51 | % | | | 0.55 | % | | | 0.64 | % | | | 0.42 | % | | | 1.02 | % | | | 0.52 | % | |
Portfolio turnover rate* | | | 10 | % | | | 13 | % | | | 16 | % | | | 13 | % | | | 4 | % | | | 7 | % | |
* Not annualized for periods less than one year.
** Annualized for periods less than one year.
(1) Effective December 1, 2016, the Board of Trustees approved the elimination of redemption fees on shares of the Funds.
(2) Less than $0.01 per share.

112
FINANCIAL HIGHLIGHTS
BUFFALO INTERNATIONAL FUND INSTITUTIONAL CLASS
The following tables are intended to help you understand the Fund's financial performance for the periods shown. Certain information reflects financial results for a single Fund share. Total returns in the table represent the rate that an investor would have earned (or lost) on an investment in the Fund. Total returns assume reinvestment of all dividends and distributions. Total returns do not reflect payment of sales charges, if any, and are not annualized for periods of less than one year.
Condensed data for a share of capital stock
outstanding throughout the period. | | For the Six Months
Ended September 30,
2020
(UNAUDITED) | | For the period
July 1, 2019*
through
March 31, 2020 | |
Net asset value, beginning of period | | $ | 13.55 | | | $ | 15.85 | | |
Income from investment operations: | |
Net investment loss | | | 0.05 | | | | 0.20 | | |
Net gains (losses) on securities (both realized and unrealized) | | | 4.21 | | | | (2.39 | ) | |
Total from investment operations | | | 4.26 | | | | (2.19 | ) | |
Less distributions: | |
Distributions from investment Income | | | — | | | | (0.11 | ) | |
Distributions from capital gains | | | — | | | | — | | |
Total distributions | | | — | | | | (0.11 | ) | |
Net asset value, end of period | | $ | 17.81 | | | $ | 13.55 | | |
Total return** | | | 31.44 | % | | | (13.95 | %) | |
Ratios/Supplemental Data | |
Net assets, end of period (in thousands) | | $ | 231,551 | | | $ | 176,285 | | |
Ratio of expenses to average net assets*** | | | 0.88 | % | | | 0.88 | % | |
Ratio of net investment income (loss) to average net assets*** | | | 0.66 | % | | | 0.86 | % | |
Portfolio turnover rate** | | | 10 | % | | | 13 | % | |
* Inception date
** Not annualized.
*** Annualized.

113
FINANCIAL HIGHLIGHTS
BUFFALO LARGE CAP FUND INVESTOR CLASS
The following tables are intended to help you understand the Fund's financial performance for the periods shown. Certain information reflects financial results for a single Fund share. Total returns in the table represent the rate that an investor would have earned (or lost) on an investment in the Fund. Total returns assume reinvestment of all dividends and distributions. Total returns do not reflect payment of sales charges, if any, and are not annualized for periods of less than one year.
| | | For the Six Months
Ended September 30,
2020 | | Years Ended March 31, | |
Condensed data for a share of capital stock
outstanding throughout the period. | | (UNAUDITED) | | 2020 | | 2019 | | 2018 | | 2017 | | 2016 | |
Net asset value, beginning of period | | $ | 29.53 | | | $ | 31.01 | | | $ | 29.08 | | | $ | 26.53 | | | $ | 23.09 | | | $ | 25.09 | | |
Income from investment operations: | |
Net investment loss | | | (0.03 | ) | | | 0.09 | | | | 0.09 | | | | 0.09 | | | | 0.08 | | | | 0.09 | | |
Net gains (losses) on securities (both realized
and unrealized) | | | 11.32 | | | | (1.07 | ) | | | 3.46 | | | | 4.01 | | | | 4.18 | | | | (0.47 | ) | |
Total from investment operations | | | 11.29 | | | | (0.98 | ) | | | 3.55 | | | | 4.10 | | | | 4.26 | | | | (0.38 | ) | |
Less distributions: | |
Distributions from investment Income | | | — | | | | (0.07 | ) | | | (0.11 | ) | | | (0.04 | ) | | | (0.13 | ) | | | (0.04 | ) | |
Distributions from capital gains | | | — | | | | (0.43 | ) | | | (1.51 | ) | | | (1.51 | ) | | | (0.69 | ) | | | (1.58 | ) | |
Total distributions | | | — | | | | (0.50 | ) | | | (1.62 | ) | | | (1.55 | ) | | | (0.82 | ) | | | (1.62 | ) | |
Paid-in capital from redemption fees(1) | | | | | | | — | | | | — | | | | — | | | | — | (2) | | | — | (2) | |
Net asset value, end of period | | $ | 40.82 | | | $ | 29.53 | | | $ | 31.01 | | | $ | 29.08 | | | $ | 26.53 | | | $ | 23.09 | | |
Total return* | | | 38.23 | % | | | (3.40 | %) | | | 12.96 | % | | | 15.41 | % | | | 18.67 | % | | | (1.56 | %) | |
Ratios/Supplemental Data | |
Net assets, end of period (in thousands) | | $ | 37,173 | | | $ | 27,872 | | | $ | 69,002 | | | $ | 69,024 | | | $ | 57,881 | | | $ | 47,794 | | |
Ratio of expenses to average net assets** | | | 0.95 | % | | | 0.94 | % | | | 0.93 | % | | | 0.93 | % | | | 0.95 | % | | | 0.94 | % | |
Ratio of net investment income (loss) to average
net assets** | | | (0.18 | %) | | | 0.21 | % | | | 0.27 | % | | | 0.33 | % | | | 0.34 | % | | | 0.41 | % | |
Portfolio turnover rate* | | | 6 | % | | | 6 | % | | | 10 | % | | | 40 | % | | | 41 | % | | | 62 | % | |
* Not annualized for periods less than one year.
** Annualized for periods less than one year.
(1) Effective December 1, 2016, the Board of Trustees approved the elimination of redemption fees on shares of the Funds.
(2) Less than $0.01 per share.

114
FINANCIAL HIGHLIGHTS
BUFFALO LARGE CAP FUND INSTITUTIONAL CLASS
The following tables are intended to help you understand the Fund's financial performance for the periods shown. Certain information reflects financial results for a single Fund share. Total returns in the table represent the rate that an investor would have earned (or lost) on an investment in the Fund. Total returns assume reinvestment of all dividends and distributions. Total returns do not reflect payment of sales charges, if any, and are not annualized for periods of less than one year.
Condensed data for a share of capital stock
outstanding throughout the period. | | For the Six Months
Ended September 30,
2020
(UNAUDITED) | | For the period
July 1, 2019*
through
March 31, 2020 | |
Net asset value, beginning of period | | $ | 29.56 | | | $ | 32.79 | | |
Income from investment operations: | |
Net investment loss | | | (0.01 | ) | | | 0.16 | | |
Net gains (losses) on securities (both realized and unrealized) | | | 11.36 | | | | (2.89 | ) | |
Total from investment operations | | | 11.35 | | | | (2.73 | ) | |
Less distributions: | |
Distributions from investment Income | | | — | | | | (0.07 | ) | |
Distributions from capital gains | | | — | | | | (0.43 | ) | |
Total distributions | | | — | | | | (0.50 | ) | |
Net asset value, end of period | | $ | 40.91 | | | $ | 29.56 | | |
Total return** | | | 38.40 | % | | | (8.55 | %) | |
Ratios/Supplemental Data | |
Net assets, end of period (in thousands) | | $ | 64,025 | | | $ | 45,244 | | |
Ratio of expenses to average net assets*** | | | 0.80 | % | | | 0.80 | % | |
Ratio of net investment income (loss) to average net assets*** | | | (0.03 | %) | | | 0.40 | % | |
Portfolio turnover rate** | | | 6 | % | | | 6 | % | |
* Inception date
** Not annualized.
*** Annualized.

115
FINANCIAL HIGHLIGHTS
BUFFALO MID CAP FUND INVESTOR CLASS
The following tables are intended to help you understand the Fund's financial performance for the periods shown. Certain information reflects financial results for a single Fund share. Total returns in the table represent the rate that an investor would have earned (or lost) on an investment in the Fund. Total returns assume reinvestment of all dividends and distributions. Total returns do not reflect payment of sales charges, if any, and are not annualized for periods of less than one year.
| | | For the Six Months
Ended September 30,
2020 | | Years Ended March 31, | |
Condensed data for a share of capital stock
outstanding throughout the period. | | (UNAUDITED) | | 2020 | | 2019 | | 2018 | | 2017 | | 2016 | |
Net asset value, beginning of period | | $ | 13.02 | | | $ | 14.52 | | | $ | 13.99 | | | $ | 15.68 | | | $ | 15.04 | | | $ | 18.68 | | |
Income from investment operations: | |
Net investment loss | | | 0.01 | | | | (0.05 | ) | | | (0.04 | ) | | | (0.03 | ) | | | (0.01 | ) | | | (0.02 | ) | |
Net gains (losses) on securities (both realized
and unrealized) | | | 4.10 | | | | (0.19 | ) | | | 1.11 | | | | 1.77 | | | | 1.85 | | | | (1.62 | ) | |
Total from investment operations | | | 4.11 | | | | (0.24 | ) | | | 1.07 | | | | 1.74 | | | | 1.84 | | | | (1.64 | ) | |
Less distributions: | |
Distributions from investment Income | | | — | | | | — | | | | — | | | | — | | | | — | | | | — | (1) | |
Distributions from capital gains | | | — | | | | (1.26 | ) | | | (0.54 | ) | | | (3.43 | ) | | | (1.20 | ) | | | (2.00 | ) | |
Total distributions | | | — | | | | (1.26 | ) | | | (0.54 | ) | | | (3.43 | ) | | | (1.20 | ) | | | (2.00 | ) | |
Paid-in capital from redemption fees(2) | | | — | | | | — | | | | — | | | | — | | | | — | (1) | | | — | (1) | |
Net asset value, end of period | | $ | 17.13 | | | $ | 13.02 | | | $ | 14.52 | | | $ | 13.99 | | | $ | 15.68 | | | $ | 15.04 | | |
Total return* | | | 31.57 | % | | | (2.89 | %) | | | 8.40 | % | | | 11.69 | % | | | 12.94 | % | | | (8.83 | %) | |
Ratios/Supplemental Data | |
Net assets, end of period (in thousands) | | $ | 91,771 | | | $ | 86,030 | | | $ | 135,262 | | | $ | 155,587 | | | $ | 395,413 | | | $ | 458,635 | | |
Ratio of expenses to average net assets** | | | 1.04 | % | | | 1.02 | % | | | 1.02 | % | | | 1.01 | % | | | 1.01 | % | | | 1.01 | % | |
Ratio of net investment income (loss) to average
net assets** | | | (0.56 | %) | | | (0.39 | %) | | | (0.27 | %) | | | (0.13 | %) | | | (0.09 | %) | | | (0.10 | %) | |
Portfolio turnover rate* | | | 22 | % | | | 52 | % | | | 36 | % | | | 51 | % | | | 51 | % | | | 46 | % | |
* Not annualized for periods less than one year.
** Annualized for periods less than one year.
(1) Less than $0.01 per share.
(2) Effective December 1, 2016, the Board of Trustees approved the elimination of redemption fees on shares of the Funds.

116
FINANCIAL HIGHLIGHTS
BUFFALO MID CAP FUND INSTITUTIONAL CLASS
The following tables are intended to help you understand the Fund's financial performance for the periods shown. Certain information reflects financial results for a single Fund share. Total returns in the table represent the rate that an investor would have earned (or lost) on an investment in the Fund. Total returns assume reinvestment of all dividends and distributions. Total returns do not reflect payment of sales charges, if any, and are not annualized for periods of less than one year.
Condensed data for a share of capital stock
outstanding throughout the period. | | For the Six Months
Ended September 30,
2020
(UNAUDITED) | | For the period
July 1, 2019*
through
March 31, 2020 | |
Net asset value, beginning of period | | $ | 13.03 | | | $ | 15.63 | | |
Income from investment operations: | |
Net investment loss | | | 0.03 | | | | (0.04 | ) | |
Net gains (losses) on securities (both realized and unrealized) | | | 4.11 | | | | (1.30 | ) | |
Total from investment operations | | | 4.14 | | | | (1.34 | ) | |
Less distributions: | |
Distributions from capital gains | | | — | | | | (1.26 | ) | |
Net asset value, end of period | | $ | 17.17 | | | $ | 13.03 | | |
Total return** | | | 31.77 | % | | | (9.72 | %) | |
Ratios/Supplemental Data | |
Net assets, end of period (in thousands) | | $ | 66,330 | | | $ | 51,324 | | |
Ratio of expenses to average net assets*** | | | 0.89 | % | | | 0.89 | % | |
Ratio of net investment income (loss) to average net assets*** | | | (0.41 | %) | | | (0.38 | %) | |
Portfolio turnover rate** | | | 22 | % | | | 52 | % | |
* Inception date
** Not annualized.
*** Annualized.

117
FINANCIAL HIGHLIGHTS
BUFFALO SMALL CAP FUND INVESTOR CLASS
The following tables are intended to help you understand the Fund's financial performance for the periods shown. Certain information reflects financial results for a single Fund share. Total returns in the table represent the rate that an investor would have earned (or lost) on an investment in the Fund. Total returns assume reinvestment of all dividends and distributions. Total returns do not reflect payment of sales charges, if any, and are not annualized for periods of less than one year.
| | | For the Six Months
Ended September 30,
2020 | | Years Ended March 31, | |
Condensed data for a share of capital stock
outstanding throughout the period. | | (UNAUDITED) | | 2020 | | 2019 | | 2018 | | 2017 | | 2016 | |
Net asset value, beginning of period | | $ | 10.94 | | | $ | 12.89 | | | $ | 15.00 | | | $ | 16.61 | | | $ | 16.64 | | | $ | 32.83 | | |
Income from investment operations: | |
Net investment loss | | | 0.01 | | | | (0.08 | ) | | | (0.08 | ) | | | (0.09 | ) | | | (0.13 | ) | | | (0.20 | ) | |
Net gains (losses) on securities (both realized
and unrealized) | | | 6.35 | | | | (0.62 | ) | | | 1.25 | | | | 2.92 | | | | 3.19 | | | | (3.60 | ) | |
Total from investment operations | | | 6.36 | | | | (0.70 | ) | | | 1.17 | | | | 2.83 | | | | 3.06 | | | | (3.80 | ) | |
Less distributions: | |
Distributions from capital gains | | | — | | | | (1.25 | ) | | | (3.28 | ) | | | (4.44 | ) | | | (3.09 | ) | | | (12.39 | ) | |
Paid-in capital from redemption fees(1) | | | | | | | — | | | | — | | | | — | | | | — | (2) | | | — | (2) | |
Net asset value, end of period | | $ | 17.30 | | | $ | 10.94 | | | $ | 12.89 | | | $ | 15.00 | | | $ | 16.61 | | | $ | 16.64 | | |
Total return* | | | 58.14 | % | | | (7.33 | %) | | | 12.19 | % | | | 17.65 | % | | | 24.51 | % | | | (13.28 | %) | |
Ratios/Supplemental Data | |
Net assets, end of period (in thousands) | | $ | 529,638 | | | $ | 337,804 | | | $ | 510,410 | | | $ | 535,820 | | | $ | 563,002 | | | $ | 961,411 | | |
Ratio of expenses to average net assets** | | | 1.01 | % | | | 1.01 | % | | | 1.01 | % | | | 1.01 | % | | | 1.01 | % | | | 1.01 | % | |
Ratio of net investment income (loss) to average
net assets** | | | (0.81 | %) | | | (0.65 | %) | | | (0.55 | %) | | | (0.64 | %) | | | (0.52 | %) | | | (0.61 | %) | |
Portfolio turnover rate* | | | 34 | % | | | 67 | % | | | 57 | % | | | 49 | % | | | 45 | % | | | 41 | % | |
* Not annualized for periods less than one year.
** Annualized for periods less than one year.
(1) Effective December 1, 2016, the Board of Trustees approved the elimination of redemption fees on shares of the Funds.
(2) Less than $0.01 per share.

118
FINANCIAL HIGHLIGHTS
BUFFALO SMALL CAP FUND INSTITUTIONAL CLASS
The following tables are intended to help you understand the Fund's financial performance for the periods shown. Certain information reflects financial results for a single Fund share. Total returns in the table represent the rate that an investor would have earned (or lost) on an investment in the Fund. Total returns assume reinvestment of all dividends and distributions. Total returns do not reflect payment of sales charges, if any, and are not annualized for periods of less than one year.
Condensed data for a share of capital stock
outstanding throughout the period. | | For the Six Months
Ended September 30,
2020
(UNAUDITED) | | For the period
July 1, 2019*
through
March 31, 2020 | |
Net asset value, beginning of period | | $ | 10.96 | | | $ | 13.78 | | |
Income from investment operations: | |
Net investment loss | | | 0.03 | | | | (0.06 | ) | |
Net gains (losses) on securities (both realized and unrealized) | | | 6.35 | | | | (1.51 | ) | |
Total from investment operations | | | 6.38 | | | | (1.57 | ) | |
Less distributions: | |
Distributions from capital gains | | | — | | | | (1.25 | ) | |
Net asset value, end of period | | $ | 17.34 | | | $ | 10.96 | | |
Total return** | | | 58.36 | % | | | (13.24 | %) | |
Ratios/Supplemental Data | |
Net assets, end of period (in thousands) | | $ | 155,194 | | | $ | 95,095 | | |
Ratio of expenses to average net assets*** | | | 0.86 | % | | | 0.86 | % | |
Ratio of net investment income (loss) to average net assets*** | | | (0.66 | %) | | | (0.73 | %) | |
Portfolio turnover rate** | | | 34 | % | | | 67 | % | |
* Inception date
** Not annualized.
***Annualized.

119
NOTES TO FINANCIAL STATEMENTS
September 30, 2020 (Unaudited)
1. SIGNIFICANT ACCOUNTING POLICIES:
The Buffalo Funds (comprised of the Buffalo Discovery Fund, Buffalo Dividend Focus Fund, Buffalo Emerging Opportunities Fund, Buffalo Flexible Income Fund, Buffalo Growth Fund, Buffalo High Yield Fund, Buffalo International Fund, Buffalo Large Cap Fund, Buffalo Mid Cap Fund, and Buffalo Small Cap Fund) (the "Funds") are registered under the Investment Company Act of 1940, as amended (the "1940 Act"), as a diversified open-end management investment company. The shares of the Buffalo Funds are issued in multiple series, with each series, in effect, representing a separate fund.
Each of the Funds offers two classes of shares, Investor Class and Institutional Class. Each class of share represents an equal interest in the Fund, except the difference of class specific expenses, which reflects the difference in the range of services provided to each class. The shareholder servicing fees for the Investor Class represent the class specific expenses. See Note 7 for more information regarding shareholder servicing fees for the Investor Class. Income, expenses (other than class specific), and realized and unrealized gains and losses on investments are allocated daily to each class based on relative net assets.
The investment objective of the Buffalo Discovery Fund, Buffalo Emerging Opportunities Fund, Buffalo Growth Fund, Buffalo International Fund, Buffalo Large Cap Fund, Buffalo Mid Cap Fund and Buffalo Small Cap Fund is long-term growth of capital. The investment objective of the Buffalo Flexible Income Fund is high current income, with long-term growth of capital as a secondary objective. The investment objectives of the Buffalo Dividend Focus Fund and Buffalo High Yield Fund are current income, with long-term growth of capital as a secondary objective.
Each Fund is an investment company and accordingly follows the investment company accounting and reporting guidance of the Financial Accounting Standards Board ("FASB") Accounting Standard Codification ("ASC") Topic 946 "Financial Services — Investment Companies."
The following is a summary of significant accounting policies consistently followed by the Funds in the preparation of their financial statements.
A. INVESTMENT VALUATION — In accordance with FASB ASC 820, Fair Value Measurements ("ASC 820"), fair value is defined as the price that a Fund would receive to sell an investment or pay to transfer a liability in an orderly transaction with an independent buyer in the principal market, or in the absence of a principal market, the most advantageous market for the investment or liability.
Equity securities and debt securities traded on a national securities exchange or national market, except those traded using the National Association of Securities Dealers' Automated Quotation System ("NASDAQ"), are valued at the latest sales price thereof, or if no sale was reported on that date, the mean between the most recent quoted bid and ask price is used. All equity securities that are traded using NASDAQ are valued using the NASDAQ Official Closing Price ("NOCP"), which may not necessarily represent the last sales price. If there has been no sale on such exchange or on NASDAQ on such day, the security is valued at the mean between the most recent quoted bid and ask price.
When market quotations are not readily available, any security or other asset is valued at its fair value as determined in good faith under procedures approved by the Board of Trustees (the "Board"). If events occur that will affect the value of a Fund's portfolio securities before the net asset value ("NAV") has been calculated (a "significant event"), the security will generally be priced using a fair value procedure. The Board has adopted specific procedures for valuing portfolio securities and delegated the responsibility of fair value determinations to the Valuation Committee. Some of the factors that may be considered by the Valuation Committee in determining fair value are fundamental analytical data relating to the investment; the nature and duration of any restriction on disposition; trading in similar securities of the same issuer or comparable companies; information from broker-dealers; and an evaluation of the forces that influence the market in which the securities are purchased or sold. As of September 30, 2020, none of the Funds held

120
fair valued securities. In addition, with respect to the valuation of securities principally traded on foreign markets, the Buffalo International Fund uses a fair value pricing service approved by the Funds' Board which employs quantitative models to adjust for "stale" prices caused by the movement of other markets and other factors occurring after the close of the foreign markets, but before the close of the New York Stock Exchange ("NYSE"). As of September 30, 2020, the Buffalo International Fund held 58 securities where a foreign fair value factor was applied, with a market value of $304,430,701 or 63.07% of total net assets.
Debt securities, including treasury bills, commercial paper, corporate and convertible bonds, bank loans, etc., with remaining maturities of 60 days or less are normally valued at the last reported sale price. If there is no trade on the valuation date, then the security will be priced at the mean between the most recent bid and ask prices.
Restricted securities include securities that have not been registered under the Securities Act of 1933, as amended, and securities that are subject to restrictions on resale. The Funds may invest in restricted securities that are consistent with the Funds' investment objectives and investment strategies. In some cases, the issuer of restricted securities has agreed to register such securities for resale, at the issuer's expense either upon demand by the Funds or in connection with another registered offering of the securities. Investments in restricted securities are valued utilizing the Funds' valuation policies.
ASC 820 establishes a three-tier hierarchy to distinguish between (1) inputs that reflect the assumptions market participants would use in pricing an asset or liability developed based on market data obtained from sources independent of the reporting entity (observable inputs) and (2) inputs that reflect the reporting entity's own assumptions about the assumptions market participants would use in pricing an asset or liability developed based on the best information available in the circumstances (unobservable inputs) and to establish classification of fair value measurements for disclosure purposes. Various inputs are used in determining the value of the Funds' investments. The inputs are summarized in the three broad levels listed below:
Level 1 — Valuations based on quoted prices for investments in active markets that a Fund has the ability to access at the measurement date. Valuation adjustments are not applied to Level 1 investments.
Level 2 — Valuations based on other significant observable inputs (including quoted prices for similar securities, interest rates, prepayment speeds, credit risks, etc.).
Level 3 — Valuations based on significant unobservable inputs (including a Fund's own assumptions and judgment in determining the fair value of investments).
Inputs that are used in determining fair value of an investment may include price information, credit data, volatility statistics, and other factors. These inputs can be either observable or unobservable. The availability of observable inputs can vary between investments, and is affected by various factors such as the type of investment, and the volume and level of activity for that investment or similar investments in the market place. The inputs will be considered by Kornitzer Capital Management, Inc. ("Advisor" or "KCM"), the Funds' investment advisor, along with any other relevant factors in the calculation of an investment's fair value. The Funds use prices and inputs that are current as of the measurement date, which may include periods of market dislocations. During these periods, the availability of prices and inputs may be reduced for many investments. This condition could cause an investment to be reclassified between the various levels within the hierarchy.
Non-U.S. equity securities actively traded in foreign markets may be reflected in Level 2 despite the availability of closing prices, because the Funds evaluate and determine whether those closing prices reflect fair value at the close of the NYSE or require adjustment, as described above and in Note 9 — Foreign Investment Risk.
Investments falling into the Level 3 category are primarily supported by quoted prices from brokers and dealers participating in the market for those investments. However, these may be classified as Level 3 investments due to lack of market transparency and corroboration to support these quoted prices. Additionally, valuation models may be used as the pricing source for any remaining investments classified as Level 3. These models rely on one or more significant unobservable inputs and/or significant assumptions made by the Valuation Committee. Inputs used in valuations may include, but are not limited to, financial statement analysis, capital account balances, discount rates and estimated cash flows, and comparable company data.
The inputs or methodology used for valuing securities are not necessarily an indication of the risk associated with investing in those securities.

121
The following table provides the fair value measurement of applicable Fund assets and liabilities by level within the fair value hierarchy as of September 30, 2020. These assets are measured on a recurring basis.
BUFFALO DISCOVERY FUND
| | Level 1 | | Level 2 | | Level 3 | | Total | |
Common Stocks | | $ | 1,503,243,960 | | | $ | — | | | $ | — | | | $ | 1,503,243,960 | | |
REITS | | | 54,647,995 | | | | — | | | | — | | | | 54,647,995 | | |
Short Term Investment | | | 73,829,389 | | | | — | | | | — | | | | 73,829,389 | | |
Total* | | $ | 1,631,721,344 | | | $ | — | | | $ | — | | | $ | 1,631,721,344 | | |
BUFFALO DIVIDEND FOCUS FUND
| | Level 1 | | Level 2 | | Level 3 | | Total | |
Common Stocks | | $ | 62,994,155 | | | $ | — | | | $ | — | | | $ | 62,994,155 | | |
REITS | | | 3,937,176 | | | | — | | | | — | | | | 3,937,176 | | |
Preferred Stocks | | | 364,200 | | | | — | | | | — | | | | 364,200 | | |
Convertible Bonds | | | — | | | | 9,448,440 | | | | — | | | | 9,448,440 | | |
Short Term Investment | | | 3,000,833 | | | | — | | | | — | | | | 3,000,833 | | |
Total* | | $ | 70,296,364 | | | $ | 9,448,440 | | | $ | — | | | $ | 79,744,804 | | |
BUFFALO EMERGING OPPORTUNITIES FUND
| | Level 1 | | Level 2 | | Level 3 | | Total | |
Common Stocks | | $ | 81,525,810 | | | $ | — | | | $ | — | | | $ | 81,525,810 | | |
REITS | | | 2,342,676 | | | | — | | | | — | | | | 2,342,676 | | |
Short Term Investments | | | 8,116,664 | | | | — | | | | — | | | | 8,116,664 | | |
Total* | | $ | 91,985,150 | | | $ | — | | | $ | — | | | $ | 91,985,150 | | |
BUFFALO FLEXIBLE INCOME FUND
| | Level 1 | | Level 2 | | Level 3 | | Total | |
Common Stocks | | $ | 379,559,678 | | | $ | — | | | $ | — | | | $ | 379,559,678 | | |
REITS | | | 12,518,628 | | | | — | | | | — | | | | 12,518,628 | | |
Convertible Bonds | | | — | | | | 12,736,343 | | | | — | | | | 12,736,343 | | |
Corporate Bonds | | | — | | | | 1,906,304 | | | | — | | | | 1,906,304 | | |
Short Term Investment | | | 2,880,589 | | | | — | | | | — | | | | 2,880,589 | | |
Total* | | $ | 394,958,895 | | | $ | 14,642,647 | | | $ | — | | | $ | 409,601,542 | | |
Written Options | | $ | 10,675 | | | $ | — | | | $ | — | | | $ | 10,675 | | |
BUFFALO GROWTH FUND
| | Level 1 | | Level 2 | | Level 3 | | Total | |
Common Stocks | | $ | 178,435,466 | | | $ | — | | | $ | — | | | $ | 178,435,466 | | |
REITS | | | 6,010,125 | | | | — | | | | — | | | | 6,010,125 | | |
Short Term Investment | | | 3,230,112 | | | | — | | | | — | | | | 3,230,112 | | |
Total* | | $ | 187,675,703 | | | $ | — | | | $ | — | | | $ | 187,675,703 | | |
BUFFALO HIGH YIELD FUND
| | Level 1 | | Level 2 | | Level 3 | | Total | |
Common Stocks | | $ | 1,004,226 | | | $ | — | | | $ | — | | | $ | 1,004,226 | | |
Preferred Stocks | | | 3,628,000 | | | | — | | | | — | | | | 3,628,000 | | |
Convertible Bonds | | | — | | | | 42,901,743 | | | | — | | | | 42,901,743 | | |
Corporate Bonds | | | — | | | | 144,942,306 | | | | — | | | | 144,942,306 | | |
Bank Loans | | | — | | | | 39,735,424 | | | | — | | | | 39,735,424 | | |
Short Term Investment | | | 14,240,384 | | | | — | | | | — | | | | 14,240,384 | | |
Total* | | $ | 18,872,610 | | | $ | 227,579,473 | | | $ | — | | | $ | 246,452,083 | | |

122
BUFFALO INTERNATIONAL FUND
| | Level 1 | | Level 2 | | Level 3 | | Total | |
Common Stocks | | $ | 130,747,173 | | | $ | 304,430,701 | | | $ | — | | | $ | 435,177,874 | | |
Short Term Investment | | | 42,234,763 | | | | — | | | | — | | | | 42,234,763 | | |
Total* | | $ | 172,981,936 | | | $ | 304,430,701 | | | $ | — | | | $ | 477,412,637 | | |
BUFFALO LARGE CAP FUND
| | Level 1 | | Level 2 | | Level 3 | | Total | |
Common Stocks | | $ | 94,234,728 | | | $ | — | | | $ | — | | | $ | 94,234,728 | | |
REITS | | | 2,592,803 | | | | — | | | | — | | | | 2,592,803 | | |
Short Term Investment | | | 4,373,530 | | | | — | | | | — | | | | 4,373,530 | | |
Total* | | $ | 101,201,061 | | | $ | — | | | $ | — | | | $ | 101,201,061 | | |
BUFFALO MID CAP FUND
| | Level 1 | | Level 2 | | Level 3 | | Total | |
Common Stocks | | $ | 152,485,935 | | | $ | — | | | $ | — | | | $ | 152,485,935 | | |
REITS | | | 3,218,390 | | | | — | | | | — | | | | 3,218,390 | | |
Short Term Investment | | | 2,464,464 | | | | — | | | | — | | | | 2,464,464 | | |
Total* | | $ | 158,168,789 | | | $ | — | | | $ | — | | | $ | 158,168,789 | | |
BUFFALO SMALL CAP FUND
| | Level 1 | | Level 2 | | Level 3 | | Total | |
Common Stocks | | $ | 650,956,791 | | | $ | — | | | $ | — | | | $ | 650,956,791 | | |
REITS | | | 18,483,053 | | | | — | | | | | | 18,483,053 | | |
Short Term Investment | | | 16,084,902 | | | | — | | | | — | | | | 16,084,902 | | |
Total* | | $ | 685,524,746 | | | $ | — | | | $ | — | | | $ | 685,524,746 | | |
* Additional information regarding the industry and/or geographical classification of these investments is disclosed in the schedule of investments.
There were no transfers into or out of Level 1, Level 2 or Level 3 fair value measurements during the reporting period. The basis for recognizing and valuing transfers is as of the beginning of the year in which transfers occur.
B. FEDERAL INCOME TAXES — Each Fund complies with the requirements of Subchapter M of the Internal Revenue Code necessary to qualify as a regulated investment company and makes the requisite distributions of income and capital gains to its shareholders sufficient to relieve it from all or substantially all federal income and excise taxes. Therefore, no federal income tax provision has been provided.
At March 31, 2020, the Funds did not have any tax positions that did not meet the "more likely-than-not" threshold of being sustained by the applicable tax authority. The Funds recognize interest and penalties, if any, related to unrecognized tax benefits as other expense in the Statement of Operations. During the year, the Funds did not incur any interest or penalties.
The Funds have analyzed all open tax years, as defined by the statute of limitations, for all major jurisdictions. Open tax years are those that are open for exam by taxing authorities. Open tax years include the tax years ended March 31, 2017 through March 31, 2020. The Funds have no examinations in progress.
C. INVESTMENT TRANSACTIONS AND INVESTMENT INCOME — Investment transactions are accounted for on the date the securities are purchased or sold (trade date). Dividend income is recorded on the ex-dividend date except that certain dividends for foreign securities where the ex-dividend date may have passed are recorded as soon as the Fund is informed of the dividend in the exercise of reasonable diligence. Interest income is recognized on the accrual basis. Realized gains and losses from investment transactions are reported on the identified cost basis. All discounts/premiums are accreted/amortized for financial reporting purposes and are included in interest income.
D. DISTRIBUTIONS TO SHAREHOLDERS — Distributions to shareholders are recorded on the ex-dividend date. Distributions are determined in accordance with income tax regulations, which may differ from U.S. generally accepted accounting principles ("GAAP"). These differences are primarily due to differing treatments for premium amortization on debt securities, deferral of late year and wash sale losses, and partnership investment income.

123
E. USE OF ESTIMATES — The preparation of financial statements in conformity with GAAP requires management to make estimates and assumptions that affect the amounts reported in the financial statements and accompanying notes. Actual results could differ from such estimates.
F. FOREIGN CURRENCY TRANSLATION — Values of investments denominated in foreign currencies are converted into U.S. dollars using a spot market rate of exchange on the day of valuation. Purchases and sales of investments and dividend and interest income are translated to U.S. dollars using a spot market rate of exchange prevailing on the respective dates of such transactions. The portion of security gains or losses resulting from changes in foreign exchange rates is included with net realized and unrealized gain or loss from investments, as appropriate, for both financial reporting and tax purposes.
G. PURCHASED AND WRITTEN OPTION CONTRACTS — Certain Funds may purchase and write call or put options on securities and indices and enter into related closing transactions. As a holder of a call option, a Fund has the right, but not the obligation, to purchase a security at the exercise price during the exercise period. As the writer of a call option, a Fund has the obligation to sell the security at the exercise price during the exercise period. The Fund's maximum payout in the case of written call option contracts cannot be determined. As a holder of a put option, a Fund has the right, but not the obligation, to sell a security at the exercise price during the exercise period. As the writer of a put option, a Fund has the obligation to buy the underlying security at the exercise price during the exercise period. The Funds did not hold any written put options as of September 30, 2020.
The premium that a Fund pays when purchasing an option or receives when writing an option will reflect, among other things, the market price of the security, the relationship of the exercise price to the market price of the security, the relationship of the exercise price to the volatility of the security, the length of the option period and supply and demand factors. The premium is the market value of an option at the time of purchase.
A purchaser (holder) of a put option pays a non-refundable premium to the seller (writer) of a put option to obtain the right to sell a specified amount of a security at a fixed price (the exercise price) during a specified period (exercise period). Conversely, the seller (writer) of a put option, upon payment by the holder of the premium, has the obligation to buy the security from the holder of the put option at the exercise price during the exercise period.
Exchange traded options are valued at the composite price, using the National Best Bid and Offer quotes ("NBBO"). NBBO consists of the highest bid prices and lowest ask prices across any of the exchanges on which an option is quoted, thus providing a view across the entire U.S. options marketplace. Specifically, composite pricing looks at the last trades on the exchanges where the options are traded. If there are no trades for the option on a given business day, composite option pricing calculates the mean of the highest bid price and lowest ask price across the exchanges where the option is traded. Non exchange traded options also will be valued at the mean between the last bid and ask quotations. For options where market quotations are not readily available, a fair value shall be determined as set forth in the Funds' fair valuation guidelines.
The Funds may use options with the objective to generate income as a non-principal investment strategy. Currently, the Buffalo Flexible Income Fund makes use of the options strategy to a greater extent than the other Funds because high income generation is a primary investment objective of the Buffalo Flexible Income Fund. The primary strategy used by Buffalo Flexible Income Fund to achieve income generation through the use of options is to write covered calls with the strike price above the cost basis and the value the portfolio managers believe will be achieved before the expiration of the option and also at a value that the portfolio managers are willing to sell if the option is exercised. The collected premiums generate income for the Fund, and if the option is exercised, a gain will also be achieved. A risk of using derivatives is that the counterparty to a derivative may fail to comply with their obligation to the Funds. See Note 7 for written option activity.
H. INDEMNIFICATIONS — Under the Funds' organizational documents, officers and trustees are indemnified against certain liabilities arising out of the performance of their duties to the Funds. In addition, in the normal course of business, the Funds enter into contracts that provide general indemnification to other parties. The Funds' maximum exposure under these arrangements is unknown as this would involve future claims that may be made against the Funds that have not yet occurred, and may not occur. However, the Funds have not had prior claims or losses pursuant to these contracts and expect the risk of loss to be remote.

124
I. RECENT ACCOUNTING PRONOUNCEMENTS — In March 2020, FASB issued Accounting Standards Update 2020-04, Reference Rate Reform: Facilitation of the Effects of Reference Rate Reform on Financial Reporting ("ASU 2020-04"). The main objective of ASU 2020-04 is to provide relief to companies that will be impacted by the expected change in benchmark interest rates at the end of 2021, when participating banks will no longer be required to submit London Inter-bank Offered Rate ("LIBOR") quotes by the UK Financial Conduct Authority. ASU 2020-04 allows companies to, provided the only change to existing contracts are a change to an approved benchmark interest rate, account for modifications as a continuance of the existing contract without additional analysis. In addition, derivative contracts that qualified for hedge accounting prior to modification, will be allowed to continue to receive such treatment, even if critical terms change due to a change in the benchmark interest rate. For new and existing contracts, the Funds may elect to apply the amendments as of March 12, 2020 through December 31, 2022. Management is currently assessing the impact of the adoption of ASU 2020-04 to the Funds' financial statements and various filings.
In August 2018, FASB issued ASU 2018-13, Fair Value Measurement (Topic 820): Disclosure Framework — Changes to the Disclosure Requirements for Fair Value Measurement ("ASU 2018-13"). The primary focus of ASU 2018-13 is to improve the effectiveness of the disclosure requirements for fair value measurements. The changes affect all companies that are required to include fair value measurement disclosures. In general, the amendments in ASU 2018-13 are effective for all entities for fiscal years and interim periods within those fiscal years, beginning after December 15, 2019. An entity is permitted to early adopt the removed or modified disclosures upon the issuance of ASU 2018-13 and may delay adoption of the additional disclosures, which are required for public companies only, until their effective date. These updates have been incorporated in the Funds' financial statements and have no impact on each of the Fund's net assets or results of operations. The Funds adopted the removed and modified disclosures in the Funds' financial statements.
2. FEDERAL TAX MATTERS:
The tax character of distributions paid during the six months ended September 30, 2020 and the year ended March 31, 2020 were as follows:
| | Six Months Ended
September 30, 2020 | | Year Ended March 31, 2020 | |
| | Ordinary
Income | | Long-Term
Capital Gains | | Ordinary
Income | | Long-Term
Capital Gains* | | | |
Buffalo Discovery Fund | | $ | — | | | $ | — | | | $ | 44,023,909 | | | $ | — | | | $ | — | | |
Buffalo Dividend Focus Fund | | | 294,097 | | | | — | | | | 708,148 | | | | 42,916 | | | | — | | |
Buffalo Emerging Opportunities Fund | | | — | | | | — | | | | — | | | | — | | | | 4,253,755 | | |
Buffalo Flexible Income Fund | | | 4,529,518 | | | | — | | | | 13,493,126 | | | | — | | | | 2,812,198 | | |
Buffalo Growth Fund | | | — | | | | — | | | | 1,002,914 | | | | — | | | | 21,439,423 | | |
Buffalo High Yield Fund | | | 4,799,949 | | | | — | | | | 8,705,714 | | | | — | | | | — | | |
Buffalo International Fund | | | — | | | | — | | | | 2,604,701 | | | | — | | | | — | | |
Buffalo Large Cap Fund | | | — | | | | — | | | | 657,920 | | | | — | | | | 602,377 | | |
Buffalo Mid Cap Fund | | | — | | | | — | | | | — | | | | — | | | | 13,465,597 | | |
Buffalo Small Cap Fund | | | — | | | | — | | | | — | | | | — | | | | 46,863,860 | | |
* The Funds designate as long-term capital gain dividends, pursuant to Internal Revenue Code Section 852(b)(3)(C), the amounts necessary to reduce the earnings and profits of the Funds related to net capital gain to zero for the tax period ended March 31, 2020.
For tax purposes, distributions from short-term capital gain distributions are included in ordinary income distributions.

125
Additionally, GAAP requires that certain components of net assets relating to permanent differences be reclassified between financial and tax reporting. These reclassifications have no effect on net assets or net asset value per share. For the year ended March 31, 2020, the following table shows the reclassifications made:
| | | Distributable
Earnings | | Paid In
Capital | |
Buffalo Discovery Fund | | $ | (29,628,441 | ) | | $ | 29,628,441 | | |
Buffalo Dividend Focus Fund | | | — | | | | — | | |
Buffalo Emerging Opportunities Fund | | | 832,932 | | | | (832,932 | ) | |
Buffalo Flexible Income Fund | | | (1,530,114 | ) | | | 1,530,114 | | |
Buffalo Growth Fund | | | (2,498,540 | ) | | | 2,498,540 | | |
Buffalo High Yield Fund | | | (23,643 | ) | | | 23,643 | | |
Buffalo International Fund | | | — | | | | — | | |
Buffalo Large Cap Fund | | | (167,234 | ) | | | 167,234 | | |
Buffalo Mid Cap Fund | | | (1,130,214 | ) | | | 1,130,214 | | |
Buffalo Small Cap Fund | | | (2,968,770 | ) | | | 2,968,770 | | |
The permanent differences primarily relate to net operating losses and utilization of earnings and profit distributions to shareholders on redemption of shares.
As of March 31, 2020, the components of distributable earnings (losses) for income tax purposes were as follows:
| | | Buffalo
Discovery
Fund | | Buffalo
Dividend Focus
Fund | | Buffalo
Emerging
Opportunities
Fund | | Buffalo
Flexible Income
Fund | | Buffalo
Growth
Fund | |
Tax cost of Investments(a) | | $ | 1,272,846,659 | | | $ | 55,731,230 | | | $ | 66,150,429 | | | $ | 349,109,770 | | | $ | 97,688,804 | | |
Unrealized Appreciation | | | 183,618,498 | | | | 15,129,360 | | | | 14,447,040 | | | | 148,500,597 | | | | 58,005,638 | | |
Unrealized Depreciation | | | (133,357,665 | ) | | | (5,955,961 | ) | | | (14,180,964 | ) | | | (90,849,345 | ) | | | (9,312,581 | ) | |
Net unrealized appreciation | | | 50,260,833 | | | | 9,173,399 | | | | 266,076 | | | | 57,651,252 | | | | 48,693,057 | | |
Undistributed Ordinary Income | | | — | | | | — | | | | — | | | | 921,499 | | | | — | | |
Undistributed Long Term
Capital Gain | | | 13,952,573 | | | | — | | | | 711,300 | | | | 4,920,429 | | | | 1,606,859 | | |
Distributable earnings | | | 13,952,573 | | | | — | | | | 711,300 | | | | 5,841,928 | | | | 1,606,859 | | |
Other accumulated gain/(loss) | | | (19,695,503 | ) | | | (1,628,304 | ) | | | (221,948 | ) | | | (501,634 | ) | | | (3,105,947 | ) | |
Total distributable earnings | | | 44,517,903 | | | | 7,545,095 | | | | 755,428 | | | | 62,991,546 | | | | 47,193,969 | | |
| | | Buffalo
High Yield
Fund | | Buffalo
International
Fund | | Buffalo
Large Cap
Fund | | Buffalo
Mid Cap
Fund | | Buffalo
Small Cap
Fund | |
Tax cost of Investments(a) | | $ | 207,025,369 | | | $ | 319,522,275 | | | $ | 51,913,749 | | | $ | 104,035,962 | | | $ | 369,136,916 | | |
Unrealized Appreciation | | | 2,007,204 | | | | 74,222,506 | | | | 26,510,265 | | | | 39,795,833 | | | | 108,251,047 | | |
Unrealized Depreciation | | | (23,397,755 | ) | | | (34,399,493 | ) | | | (5,458,879 | ) | | | (5,957,483 | ) | | | (47,934,039 | ) | |
Net unrealized appreciation/
depreciation | | | (21,390,551 | ) | | | 39,823,013 | | | | 21,051,386 | | | | 33,838,350 | | | | 60,317,008 | | |
Undistributed Ordinary Income | | | 382,214 | | | | 43,181 | | | | 226,492 | | | | — | | | | — | | |
Undistributed Long Term
Capital Gain | | | — | | | | — | | | | — | | | | 551,872 | | | | — | | |
Distributable earnings | | | 382,214 | | | | 43,181 | | | | 226,492 | | | | 551,872 | | | | — | | |
Other accumulated gain/(loss) | | | (181,865 | ) | | | (953,775 | ) | | | (108,870 | ) | | | (172,964 | ) | | | (7,389,727 | ) | |
Total distributable earnings | | | (21,190,202 | ) | | | 38,912,419 | | | | 21,169,008 | | | | 34,217,258 | | | | 52,927,281 | | |
The differences between book-basis and tax-basis unrealized appreciation/depreciation are attributable primarily to the tax deferral of losses on wash sales, premium amortization, and publicly traded partnership investments.
Other accumulated gain/(loss) is generally comprised of capital loss carryforwards, qualified late year losses and/or straddle loss deferrals.
(a) Represents cost for federal income tax purposes and may differ from the cost for financial reporting purposes.

126
As of March 31, 2020, the Buffalo Funds had the following capital loss carryovers available to offset future taxable gains:
| | | Short Term
Capital Loss
Carryover | | Long Term
Capital Loss
Carryover | | Total
Capital Loss
Carryover | | Expires | |
Buffalo Discovery Fund | | | — | | | | — | | | | — | | | | — | | |
Buffalo Dividend Focus Fund | | | 912,402 | | | | 715,902 | | | | 1,628,304 | | | | unlimited | | |
Buffalo Emerging Opportunities Fund | | | — | | | | — | | | | — | | | | — | | |
Buffalo Flexible Income Fund | | | — | | | | — | | | | — | | | | — | | |
Buffalo Growth Fund | | | — | | | | — | | | | — | | | | — | | |
Buffalo High Yield Fund | | | 181,865 | | | | — | | | | 181,865 | | | | unlimited | | |
Buffalo International Fund | | | 953,775 | | | | — | | | | 953,775 | | | | unlimited | | |
Buffalo Large Cap Fund | | | — | | | | — | | | | — | | | | — | | |
Buffalo Mid Cap Fund | | | — | | | | — | | | | — | | | | — | | |
Buffalo Small Cap Fund | | | — | | | | — | | | | — | | | | — | | |
In order to meet certain excise tax distribution requirements, the Funds are required to measure and distribute annually net capital gains realized during a twelve month period ending October 31 and net investment income earned during a twelve month period ending December 31. In connection with this, the Funds are permitted for tax purposes to defer into their next fiscal year qualified late year losses. Qualified late year capital losses are any net capital losses incurred between November 1 and the end of their fiscal year, March 31, 2020. Qualified late year ordinary losses are generally losses incurred between January 1 and the end of their fiscal year, March 31, 2020.
At March 31, 2020, the following Funds deferred, on a tax basis, qualified late year losses, consisting of ordinary and capital losses, as follows:
| | | Qualified Late Year
Ordinary Losses | | Qualified Late Year
Capital Losses | |
Buffalo Discovery Fund | | | — | | | | 19,695,503 | | |
Buffalo Dividend Focus Fund | | | — | | | | — | | |
Buffalo Emerging Opportunities Fund | | | 221,948 | | | | — | | |
Buffalo Flexible Income Fund | | | — | | | | — | | |
Buffalo Growth Fund | | | — | | | | 3,105,947 | | |
Buffalo High Yield Fund | | | — | | | | — | | |
Buffalo International Fund | | | — | | | | — | | |
Buffalo Large Cap Fund | | | — | | | | 108,870 | | |
Buffalo Mid Cap Fund | | | 172,964 | | | | — | | |
Buffalo Small Cap Fund | | | 974,554 | | | | 6,415,173 | | |
For the year ended March 31, 2020, the Buffalo International Fund earned foreign source income and paid foreign taxes, as noted below, which it intends to pass through to its shareholders pursuant to Section 853 of the Internal Revenue Code.
| | | Gross Foreign
Income | | Foreign Tax
Paid | |
Buffalo International Fund | | | 6,656,837 | | | | 849,512 | | |
| | | | 6,656,837 | | | | 849,512 | | |
3. RELATED PARTY TRANSACTIONS:
Management fees are paid to KCM at the rate of 0.85% per annum of the average daily net asset values of the Funds, except for the Buffalo Emerging Opportunities Fund, Buffalo Dividend Focus Fund, Buffalo Growth Fund and Buffalo Large Cap Fund which have a management fee rate of 1.30%, 0.75%, 0.75% and 0.75%, respectively. The management fees are for services which include the costs of all management, supervisory and administrative services required in the normal operation of the Funds. This includes investment management and supervision; fees of the custodian (except for the additional cost of maintaining custody of assets in foreign jurisdictions, when compared to domestic custody costs), independent registered public accounting firm and legal counsel; fees and expenses of officers,

127
trustees and other personnel; rent; and other items incidental to corporate administration. Pursuant to a Master Services Agreement with U.S. Bancorp Fund Services, LLC, doing business as U.S. Bank Global Fund Services ("GFS"), KCM pays GFS a fee of 30/100 of 1% (0.30%) of each Funds' average daily net assets out of the fees KCM receives from the Funds, except for the Buffalo Dividend Focus Fund, Buffalo Growth Fund and the Buffalo Large Cap Fund, where GFS receives 25/100 of 1% (0.25%) of such Funds' average daily net assets. GFS provides or obtains various operational services required by the Funds, pays various Fund expenses and acts as paying agent to compensate other Fund service providers. Some of the other Fund service providers are affiliates of GFS.
With respect to the Buffalo Small Cap Fund only, the annual management fee rate of 0.85% of the Buffalo Small Cap Fund's average daily net assets is a base fee paid to KCM that is subject to reduced fees paid on assets in excess of certain levels (breakpoints). The fee paid by KCM to GFS is also subject to breakpoints on assets in excess of certain levels. The breakpoint schedules for the management fees paid by the Buffalo Small Cap Fund to KCM and the fees paid by KCM to GFS are set forth in the following table:
BUFFALO SMALL CAP FUND FEE BREAKPOINTS
| | | (As a % Of Average Daily Net Assets) | |
Asset Level | | Management Fee | | GFS Fee | |
Assets up to $6 billion | | | 0.85 | % | | | 0.300 | % | |
Assets over $6 billion up to $7 billion | | | 0.80 | % | | | 0.275 | % | |
Assets over $7 billion up to $8 billion | | | 0.75 | % | | | 0.250 | % | |
Assets over $8 billion up to $9 billion | | | 0.70 | % | | | 0.225 | % | |
Assets over $9 billion | | | 0.65 | % | | | 0.200 | % | |
The management fees do not include the cost of acquiring and disposing of portfolio securities, taxes, if any, imposed directly on the Funds and their shares, insurance, certain trustee expenses and the cost of qualifying the Funds' shares for sale in any jurisdiction. Certain officers of the Funds are also officers and/or directors of KCM. With respect to each Fund's Investor Class, the management fees do not include the shareholder servicing fees.
The Buffalo International Fund incurred $36,714 in custody fees during the period ended September 30, 2020, and owed $14,257 for custody fees as of September 30, 2020.
4. AGGREGATE COMPENSATION TO TRUSTEES:
The Funds do not directly compensate any of their trustees. GFS pays trustee fees to non-interested Board members from its share of the management fee that it receives from KCM. The aggregate compensation paid to the Funds' non-interested trustees for their service on the Funds' Board for the period ended September 30, 2020 was $144,000. Interested trustees who are affiliated with KCM do not receive any compensation from the Funds, but are compensated directly by KCM in connection with their employment with KCM.
5. INVESTMENT TRANSACTIONS:
The aggregate purchases and sales of securities, excluding short-term investments and U.S. government securities, for the Funds for the year ended September 30, 2020, were as follows:
| | Buffalo
Discovery
Fund | | Buffalo
Dividend Focus
Fund | | Buffalo
Emerging
Opportunities
Fund | | Buffalo
Flexible Income
Fund | | Buffalo
Growth
Fund | |
Purchases | | $ | 903,328,945 | | | $ | 5,549,820 | | | $ | 17,314,062 | | | $ | 2,616,139 | | | $ | 25,980,996 | | |
Proceeds from Sales | | $ | 1,072,453,304 | | | $ | 9,181,041 | | | $ | 22,998,380 | | | $ | 62,396,849 | | | $ | 36,067,024 | | |
| | Buffalo
High Yield
Fund | | Buffalo
International
Fund | | Buffalo
Large Cap
Fund | | Buffalo
Mid Cap
Fund | | Buffalo
Small Cap
Fund | |
Purchases | | $ | 77,105,161 | | | $ | 40,495,587 | | | $ | 5,551,311 | | | $ | 35,081,554 | | | $ | 206,948,916 | | |
Proceeds from Sales | | $ | 52,913,344 | | | $ | 42,143,109 | | | $ | 5,509,951 | | | $ | 49,829,329 | | | $ | 214,870,268 | | |
There were no purchases or sales of long-term U.S. government securities for any Funds during the period ended September 30, 2020.

128
6. TRANSACTIONS WITH AFFILIATES:
Investments representing 5% or more of the outstanding voting securities of a portfolio company result in that company being considered an affiliated company, as defined in the 1940 Act. There were no affiliated companies held in any of the Funds during the period ended September 30, 2020.
7. SHAREHOLDER SERVICING PLAN:
The Trust, on behalf of the Funds, has adopted a Shareholder Servicing Plan, to pay a fee at an annual rate of up to 0.15% of average daily net assets of the Investor Class shares serviced by shareholder servicing agents who provide administrative and support services to their customers. No shareholder servicing fees are charged to the Institutional Class. For the period ended September 30, 2020, Investor Class shareholder servicing fees were as follows:
| Fund: | | Investor Class
Shareholder
Servicing Fee | |
Buffalo Discovery Fund | | $ | 985,669 | | |
Buffalo Dividend Focus Fund | | | 20,002 | | |
Buffalo Emerging Opportunities Fund | | | 41,463 | | |
Buffalo Flexible Income Fund | | | 220,841 | | |
Buffalo Growth Fund | | | 78,698 | | |
Buffalo High Yield Fund | | | 36,457 | | |
Buffalo International Fund | | | 170,403 | | |
Buffalo Large Cap Fund | | | 25,838 | | |
Buffalo Mid Cap Fund | | | 71,829 | | |
Buffalo Small Cap Fund | | | 346,971 | | |
8. OPTIONS WRITTEN:
FASB ASC 815, Derivatives and Hedging (ASC 815) requires disclosures to enable investors to better understand how and why the Funds use derivative instruments, how these derivative instruments are accounted for and their effects on the Funds' financial position and results of operations. The Buffalo Flexible Income Fund is the only Fund that has maintained any positions in derivative instruments or engaged in hedging activities during the six months ended September 30, 2020. For the six months ended September 30, 2020, the quarterly average gross notional amount of derivatives held by the Fund was $10,007,539 representing holdings in written options. The Fund utilizes these written options as a substitute for a comparable market position in the respective underlying security of the written options.
As of September 30, 2020, the Buffalo Flexible Income Fund was invested in written option contracts.
The following is a summary of the location of derivative investments on the Fund's Statement of Assets and Liabilities as of September 30, 2020:
Derivative Investment Type | | Value | |
Liability Derivatives | |
Buffalo Flexible Income Fund | | | |
Written Options — equity contracts | | $ | 10,675 | | |
The following is a summary of the effect of derivative investments on Realized Gain (loss) and Change in Unrealized Appreciation/Depreciation on Options in the Fund as of September 30, 2020:
Derivative Investment Type | | Realized Gain (Loss) on Options | |
Liability Derivatives | |
Buffalo Flexible Income Fund | | | |
Written Options — equity contracts | | $ | 672,440 | | |
Derivative Investment Type | | Change in Unrealized Appreciation/Depreciation on Options | |
Liability Derivatives | |
Buffalo Flexible Income Fund | | | |
Written Options — equity contracts | | $ | 64,664 | | |

129
The following table presents derivative assets and liabilities net of amounts available for offset under Master Netting Agreements (MNA) and net of related collateral received or pledged, if any, as of September 30, 2020:
GROSS AMOUNTS NOT OFFSET IN THE STATEMENT OF ASSETS AND LIABILITIES AND SUBJECT TO MNAs
| | | Gross | | Gross
Amounts
Offset In The | | Net Amounts
Presented In | | Gross Amounts Not Offset
In The Statement Of
Financial Position | | | |
Liabilities: | | Amounts Of
Recognized
Liabilities | | Statement
Of Financial
Position | | The Statement
Of Financial
Position | | Financial
Instruments | | Collateral
Pledged/
(Received)* | | Net
Amount | |
Description | |
Written Options | | $ | 10,675 | | | $ | — | | | $ | 10,675 | | | $ | 10,675 | | | $ | 10,675 | | | $ | — | | |
| | | $ | 10,675 | | | $ | — | | | $ | 10,675 | | | $ | 10,675 | | | $ | 10,675 | | | $ | — | | |
* Any over-collateralization of total financial instruments or cash is not shown.
9. FOREIGN INVESTMENT RISK:
When the Buffalo International Fund buys or sells securities on a foreign stock exchange, the transaction is undertaken in the local currency rather than in U.S. dollars. In purchasing or selling local currency to execute transactions on foreign exchanges, the Buffalo International Fund will be exposed to the risk that the value of the foreign currency will increase or decrease, which may impact the value of the portfolio holdings. China has, and may continue to adopt, internal economic policies that affect its currency valuations in a manner that may be disadvantageous for U.S. investors or U.S. companies seeking to do business in China. In addition, a country may impose formal or informal currency exchange controls (or "capital controls"). These types of controls may restrict or prohibit the Buffalo International Fund's ability to repatriate both investment capital and income, which could undermine the value of the portfolio holdings and potentially place the Buffalo International Fund's assets at risk of total loss.
Investing in securities of foreign corporations and governments involves additional risks relating to: political, social, religious and economic developments abroad; market instability; fluctuations in foreign exchange rates; different regulatory requirements, market practices, accounting standards and practices; and less publicly available information about foreign issuers. Additionally, these investments may be less liquid, carry higher brokerage commissions and other fees, and procedures and regulations governing transactions and custody in foreign markets also may involve delays in payment, delivery or recovery of money or investments. Investments in common stocks of U.S. companies with international operations, and the purchase of sponsored or unsponsored ADRs (American Depositary Receipt) carry similar risks. In addition to risks associated with investing in foreign securities, there are special risks associated with investments in China and Hong Kong, including exposure to currency fluctuations, less liquidity, expropriation, confiscatory taxation, nationalization, exchange control regulations, differing legal standards and rapid fluctuations in inflation and interest rates. The Chinese government could, at any time, alter or discontinue economic reform programs implemented since 1978.
10. LINE OF CREDIT:
U.S. Bank, N.A. has made available to the Funds an unsecured line of credit pursuant to a Loan Agreement for the Funds which matures, unless renewed, on July 30, 2021. The line of credit is intended to provide short-term financing, if necessary, subject to certain restrictions, in connection with shareholder redemptions. The Funds may borrow up to the lesser of $50,000,000 or certain percentage amounts based on the net assets of the Funds.
The interest rate paid by the Funds on outstanding borrowings is equal to the Prime Rate. As of September 30, 2020, the Prime Rate was 3.25%. During the six months ended September 30, 2020, the Buffalo Flexible Income Fund had average outstanding borrowings of $5,803 under the credit facility and paid a weighted average interest rate of 3.25%, totaling $96 which is included in the other expenses on the Statement of Operations. During the six months ended September 30, 2020, the Buffalo Mid Cap Fund had average outstanding borrowings of $18,738 under the credit facility and paid a weighted average interest rate of 3.25%, totaling $310 which is included in the other expenses on the Statement of Operations. The July 6, 2020 balance of $3,429,000 for the Buffalo Mid Cap Fund was the maximum

130
borrowing during the six months ended September 30, 2020. None of the other Buffalo Funds had borrowings under the credit facility during the period ended September 30, 2020.
11. Impact of COVID-19:
The global outbreak of COVID-19 has disrupted economic markets and the prolonged economic impact is uncertain. The operational and financial performance of the issuers of securities in which the Funds invest depends on future developments, including the duration and spread of the outbreak, and such uncertainty may in turn impact the value of a Fund's investments. The rapid development and fluidity of this situation precludes any prediction as to the ultimate adverse impact of COVID-19. Nevertheless, COVID-19 presents material uncertainty and risk with respect to the Funds' performance and financial results.
12. SUBSEQUENT EVENTS:
Management has evaluated the events and transactions that have occurred after September 30, 2020 and through the date the financial statements were issued.
On August 13, 2020, the Board approved a change to the name of the Buffalo Emerging Opportunities Fund. Effective October 15, 2020, the Emerging Opportunities Fund's name was changed to Buffalo Early Stage Growth Fund.

131
A NOTE ON FORWARD-LOOKING STATEMENTS
Except for historical information contained in this semi-annual report for the Funds, the matters discussed in this report may constitute forward-looking statements made pursuant to the safe harbor provisions of the Securities Litigation Reform Act of 1995. These include any advisor and/or portfolio manager predictions, assessments, analyses or outlooks for individual securities, industries, market sectors and/or markets. These statements involve risks and uncertainties. In addition to the general risks described for the Funds in the current Prospectus, other factors bearing on these reports include the accuracy of the advisor's or portfolio managers' forecasts and predictions, and the appropriateness of the investment programs designed by the advisor or portfolio manager to implement their strategies efficiently and effectively. Any one or more of these factors, as well as other risks affecting the securities markets and investment instruments generally, could cause the actual results of the Funds to differ materially as compared to benchmarks associated with the Funds.
ADDITIONAL INFORMATION
The Buffalo Funds have adopted proxy voting policies and procedures that delegate to Kornitzer Capital Management, Inc., the Funds' investment advisor, the authority to vote proxies. A description of the Buffalo Funds' proxy voting policies and procedures is available without charge, upon request, by calling the Funds toll free at 1-800-49-BUFFALO. A description of these policies and procedures is also included in the Funds' Statement of Additional Information, which is available on the SEC's website at http://www.sec.gov.
The actual voting records relating to portfolio securities during the most recent twelve month period ended June 30 (as filed with the SEC on Form N-PX) are available without charge, upon request, by calling the Funds toll free at 1-800-49-BUFFALO or by accessing the SEC's website at http://www.sec.gov.
The Funds file their complete schedule of portfolio holdings with the SEC four times each fiscal year at quarter-ends. The Trust files the Schedule of Portfolio Holdings with the SEC on Form N-CSR (second and fourth quarters) and as an exhibit to its reports on Form N-PORT (first and third quarters). Shareholders may view the Funds' Forms N-CSR and N-PORT on the SEC's website at http://www.sec.gov.

132
STATEMENT REGARDING LIQUIDITY RISK MANAGEMENT PROGRAM (UNAUDITED)
The Securities and Exchange Commission adopted Rule 22e-4 under the Investment Company Act of 1940, as amended (the "Liquidity Rule") to promote effective liquidity risk management throughout the open-end investment company industry, thereby reducing the risk that open-end investment companies ("funds") will be unable to meet their redemption obligations and mitigating dilution of the interests of fund shareholders. The Liquidity Rule requires funds to establish and implement written liquidity risk management programs ("LRMPs")
The Buffalo Funds (individually, a "Fund" or collectively, the "Funds") have established and implemented the Buffalo Funds' LRMP (the "Program") applicable to all of the Funds. The Board of Trustees of the Funds (the "Board") met on August 20, 2020 (the "Meeting") to review the Program pursuant to the Liquidity Rule. The Board has designated the Funds' adviser, Kornitzer Capital Management, Inc. (the "Adviser"), as the administrator of the Program, and the Adviser has appointed a committee to fulfill the responsibilities set forth under the Program (the "Program Administrator"). At the Meeting, the Adviser's Chief Compliance Officer ("CCO"), on behalf of the Program Administrator, made a presentation to the Board that addressed the operation of the Program and assessed its adequacy and effectiveness of implementation, including any material changes to the Program (the "Presentation"). The Presentation covered the period from July 1, 2019 through June 30, 2020 (the "Reporting Period").
The Presentation noted that the Program complied with the key factors for consideration under the Liquidity Rule for assessing, managing, and periodically reviewing a Fund's "liquidity risk" (as defined under the Liquidity Rule), including the following points.
Liquidity Classification — The Presentation described the Program's liquidity classification methodology for categorizing the Funds' investments into one of four liquidity buckets. Specifically, the Program Administration noted that it relied on liquidity classifications provided by ICE Data Services, its third party data service that provides liquidity classification services, and that each Fund predominantly held investments that were classified as highly liquid during the Reporting Period.
Highly Liquid Investment Minimum ("HLIM") — The Program Administrator noted that each Fund's portfolio is expected to continue to primarily hold highly liquid investments and each Fund will be considered a "primarily highly liquid fund" (as defined in the Program) and can therefore continue to rely on the exclusion in the Liquidity Rule from the requirements to determine and review a HLIM for each Fund and to adopt policies and procedures for responding to a HLIM shortfall.
Liquidity Risk. In concluding that each Fund's liquidity risk was low, the Program Administrator considered the following:
• The Funds' investment strategy and liquidity of portfolio investments during normal and reasonably foreseeable stressed market conditions — During the Reporting Period, the Program Administrator reviewed whether each Fund's investment strategy is appropriate for an open-end fund structure with a focus on Funds with holdings of less liquid and illiquid assets and factored a Fund's concentration in an issuer into the liquidity classification methodology by taking issuer position sizes into account.
• Short-term and long-term cash flow projections during normal and reasonably foreseeable stressed market conditions — During the Reporting Period, the Program Administrator reviewed historical redemption activity and used this information as a component to establish each Fund's reasonably anticipated trading size. The Program Administrator also took into consideration other factors such as shareholder ownership concentration, applicable distribution channels, and the degree of certainty associated with a Fund's short-term and long-term cash flow projections.
• Holdings of cash and cash equivalents — The Program Administrator considered the degree to which each Fund held cash and cash equivalents as a component of each Fund's ability to meet redemption requests.

133
Conclusion. The Presentation provided that the Program Administrator was not proposing any material changes to the Program after reviewing the adequacy of the Program and the effectiveness of the Program's implementation. The Presentation stated that the Program Administrator concluded that, based on the operation of the Program during the Reporting Period, the Program is operating as intended and is effective in implementing the requirements of the Liquidity Rule.

134
PRIVACY POLICY (UNAUDITED)
This Privacy Policy has been adopted by the Buffalo Funds. The Funds are each an open-end diversified management investment company registered under the Investment Company Act of 1940 (the "1940 Act").
This Privacy Policy has also been adopted by KCM, an investment advisor registered with the Securities and Exchange Commission that serves as the investment advisor and manager of the Funds.
The Funds and the Adviser are collectively referred to as the "Companies," "we," "our" or "us."
As a part of providing you services and products we collect non-public personally identifiable information ("Personal Information") about you. Some of this is information you provide and some is obtained from other sources. In some circumstances, a necessary part of providing products and services to you requires that we disclose Personal Information about you to third parties.
We want you to understand how we handle your Personal Information. Please read the Privacy Policy carefully. It has information about our policies for the collection, use, disclosure, and protection of your Personal Information. If you have any questions, you can obtain additional information from the following:
Buffalo Funds
c/o U.S. Bancorp Fund Services, LLC
P.O. Box 701
Milwaukee, Wisconsin 53201-0701
www.buffalofunds.com
1-800-492-8332
Please be aware that we periodically update or revise the Privacy Policy. As methods of doing business change, we reflect any applicable changes in our Privacy Policy. If you are our customer, we will send you an update as and when it occurs.
SALE/DISCLOSURE OF YOUR PERSONAL INFORMATION
We promise that we will not sell your Personal Information to any person.
Also, we will not disclose your Personal Information to any third person aside from the disclosures described below. These disclosures generally relate to marketing or maintaining products or services provided to you.
WHAT INFORMATION DO WE COLLECT?
Personal, Financial and Product Information
To be able to offer, provide and maintain these products and services, the Companies collect a variety of Personal Information about you. The Personal Information we collect will vary depending upon the product or service you select.
The following is a general list of the Personal Information. Not all of the Personal Information will be collected every time you do business with us.
Personal Information
• Name
• Address
• Birthdate
• Phone number
• Social Security Number
• E-mail address
• Product-Related Personal Information
• Product Activity History (things you have done with your mutual funds such as deposits, transfers, redemptions, etc.)
GENERAL PRIVACY PROCESSES
How do we collect Personal Information?
We use a variety of methods to collect Personal Information. We collect Personal Information directly from you with paper forms (for example, new account and other administrative forms), over the phone or through facsimile transmissions. We also collect Personal Information from our web site and through other electronic means. We collect some Personal Information through joint marketing programs where we offer a product or service through another financial institution. In some of these instances, you may be considered a customer of both entities.
Who has access to this Personal Information?
Generally, only the Companies' staff and certain companies working on the Companies' behalf have access to this Personal Information.

135
Those Working on Our Behalf
Depending on the product or service you select, there may be a number of third parties that will have access to your Personal Information since they are working on our behalf. This access is necessary because these third parties perform a task or provide administrative services for the product you seek or have purchased from us. If we do not share the Personal Information, we cannot provide you the product or service you requested. In certain cases, affiliates are the entities performing such services on our behalf.
When we share Personal Information with non-affiliated companies working on our behalf, we protect your Personal Information by requiring such companies to adopt our privacy policy or have a policy providing protection similar to ours.
Required Disclosures
Certain Personal Information may also be disclosed to third parties without your consent if disclosure is necessary to comply with: 1) legal processes; 2) to protect the rights, property, or personal safety of the Funds, their shareholders or the public; 3) as part of inspections or examinations conducted by our regulatory agencies; and 4) in other situations required by law.
Joint Marketing
In certain circumstances, the Companies may jointly market a product or service with another financial institution. In these circumstances, we have arranged to offer our products through these entities and their representatives or through electronic systems (for example, the Internet).
The Companies may make other disclosures authorized by law.
Requested Disclosures
We will disclose your Personal Information if you request it to those persons that you designate. Examples of this are to: members of your family; registered investment advisors, attorneys and CPAs who you have retained to advise you in a transaction; and persons whom you have designated to represent you in dealings with us.
What do we do with the Personal Information?
The Companies make use of the Personal Information to provide you with the financial products and services that we offer.
At the point that you cease being a customer, we will maintain your Personal Information and handle it just the same as our current customers.
The Companies restrict access to the Personal Information to those who need to know it for ordinary business purposes. We also maintain physical, electronic, and procedural safeguards that comply with federal standards to guard your Personal Information.
What are your options regarding corrections of Personal Information?
Generally, upon your written request, we will make available Personal Information for your review. Please note, Personal Information collected that relates to a disputed claim or legal proceeding will not be made available. If you notify us that the Personal Information is incorrect, we will review it and if we agree, correct our records. If we do not agree, you may submit a short comment, which we will include in future third party disclosures, if any occur, of Personal Information.

136


1-800-49-BUFFALO
(1-800-492-8332)
Buffalo Funds
c/o U.S. Bancorp Fund Services, LLC
P.O. Box 701
Milwaukee, WI 53201-0701
www.buffalofunds.com
Buffalofundannual
Item 2. Code of Ethics.
Not applicable for semi-annual reports
Item 3. Audit Committee Financial Expert.
Not applicable for semi-annual reports
Item 4. Principal Accountant Fees and Services.
Not applicable for semi-annual reports
Item 5. Audit Committee of Listed Registrants.
Not applicable.
Item 6. Investments.
Schedule of Investments is included as part of the report to shareholders filed under Item 1 of this Form.
Item 7. Disclosure of Proxy Voting Policies and Procedures for Closed-End Management Investment Companies.
Not applicable to open-end investment companies.
Item 8. Portfolio Managers of Closed-End Management Investment Companies.
Not applicable to open-end investment companies.
Item 9. Purchases of Equity Securities by Closed-End Management Investment Company and Affiliated Purchasers.
Not applicable to open-end investment companies.
Item 10. Submission of Matters to a Vote of Security Holders.
There have been no material changes to the procedures by which shareholders may recommend nominees to the registrant’s Board of Trustees.
Item 11. Controls and Procedures.
| (a) | The registrant’s Principal Executive Officer and Principal Financial Officer has reviewed and evaluated the registrant’s disclosure controls and procedures (as defined in Rule 30a-3(c) under the 1940 Act) as of a date within 90 days of the filing of this report as required by Rule 30a-3(b) under the 1940 Act and Rules 13a-15(b) or 15d-15(b) under the Securities Exchange Act of 1934. Based on his review, the Principal Executive Officer and Principal Financial Officer has concluded that the disclosure controls and procedures are effective in ensuring that information required to be disclosed in this report is appropriately recorded, processed, summarized and reported and made known to him by others within the registrant and by the registrant’s service providers. |
| (b) | There were no changes in the registrant’s internal controls over financial reporting that occurred during the registrant’s second fiscal quarter of the period covered by this report that have materially affected, or are reasonably likely to materially affect, registrant’s internal control over financial reporting. |
Item 12. Disclosure of Securities Lending Activities for Closed-End Management Investment Companies
Not applicable to open-end investment companies.
Item 13. Exhibits.
| (a) | (1) Any code of ethics or amendment thereto, that is the subject of the disclosure required by Item 2, to the extent that the registrant intends to satisfy Item 2 requirements through filing an exhibit. Not Applicable for Semi-Annual Report. |
| (3) | Not applicable to open-end investment companies. |
SIGNATURES
Pursuant to the requirements of the Securities Exchange Act of 1934 and the Investment Company Act of 1940, the registrant has duly caused this report to be signed on its behalf by the undersigned, thereunto duly authorized.
| Buffalo Funds | |
| | |
| By | /S/ Kent W. Gasaway | |
| | Kent W. Gasaway | |
| | President and Treasurer | |
| | |
| Date | 12/8/2020 | |
Pursuant to the requirements of the Securities Exchange Act of 1934 and the Investment Company Act of 1940, this report has been signed below by the following person on behalf of the registrant and in the capacities and on the date indicated.
| Buffalo Funds | |
| | |
| | |
| By | /S/ Kent W. Gasaway | |
| | Kent W. Gasaway, | |
| | President and Treasurer | |
| | |
| Date | 12/8/2020 | |