UNITED STATES
SECURITIES AND EXCHANGE COMMISSION
Washington, D.C. 20549
FORM N-CSR
CERTIFIED SHAREHOLDER REPORT OF REGISTERED
MANAGEMENT INVESTMENT COMPANIES
Investment Company Act file number 811-10303
Buffalo Funds
(Exact name of registrant as specified in charter)
5420 W. 61st Place,
Mission, KS 66205
(Address of principal executive offices) (Zip code)
Laura Symon Browne
5420 W. 61st Place,
Mission, KS 66205
(Name and address of agent for service)
913-677-7778
Registrant's telephone number, including area code
Date of fiscal year end: March 31
Date of reporting period: September 30, 2022
Item 1. Reports to Stockholders.


SEMI-ANNUAL REPORT
September 30, 2022
This page intentionally left blank.
TABLE OF CONTENTS
Investment Results (unaudited) | | | 4 | | |
Portfolio Management Review (unaudited) | | | 8 | | |
Expense Example (unaudited) | | | 19 | | |
Allocation of Portfolio Holdings (unaudited) | | | 23 | | |
Schedules of Investments or Options Written | | | 25 | | |
Buffalo Discovery Fund (BUFTX) | | | 25 | | |
Buffalo Dividend Focus Fund (BUFDX) | | | 31 | | |
Buffalo Early Stage Growth Fund (BUFOX) | | | 39 | | |
Buffalo Flexible Income Fund (BUFBX) | | | 44 | | |
Buffalo Growth Fund (BUFGX) | | | 50 | | |
Buffalo High Yield Fund (BUFHX) | | | 54 | | |
Buffalo International Fund (BUFIX) | | | 68 | | |
Buffalo Large Cap Fund (BUFEX) | | | 77 | | |
Buffalo Mid Cap Fund (BUFMX) | | | 83 | | |
Buffalo Small Cap Fund (BUFSX) | | | 88 | | |
Statements of Assets and Liabilities | | | 94 | | |
Statements of Operations | | | 96 | | |
Statements of Changes in Net Assets | | | 98 | | |
Financial Highlights | | | 102 | | |
Notes to Financial Statements | | | 122 | | |
Statement Regarding Liquidity Risk Management Program (unaudited) | | | 135 | | |
Privacy Policy (unaudited) | | | 137 | | |
INVESTMENT RESULTS (UNAUDITED)
Total Returns as of September 30, 2022
| | | | | | Average Annual | |
| | Gross Expense
Ratio** | | Six
Months | | One Year | | Five Years | | Ten Years | | Investor
Class
Since
Inception | | Institutional
Class
Since
Inception2 | |
Buffalo Discovery Fund — Investor Class
(inception date 4/16/01) | | | 1.00 | % | | | -23.23 | % | | | -30.12 | % | | | 5.28 | % | | | 9.99 | % | | | 8.30 | % | | | N/A | | |
Buffalo Discovery Fund — Institutional Class
(inception date 7/1/19)1 | | | 0.86 | % | | | -23.15 | % | | | -30.00 | % | | | 5.45 | % | | | 10.15 | % | | | N/A | | | | 8.46 | % | |
Russell Mid Cap Growth Index | | | N/A | | | | -21.59 | % | | | -29.50 | % | | | 7.62 | % | | | 10.85 | % | | | 8.27 | % | | | 8.27 | % | |
Morningstar US Mid Growth Index* | | | N/A | | | | -23.19 | % | | | -32.42 | % | | | 8.76 | % | | | 10.93 | % | | | N/A | | | | N/A | | |
Lipper Mid-Cap Growth Funds Index | | | N/A | | | | -22.77 | % | | | -31.45 | % | | | 6.85 | % | | | 9.99 | % | | | 7.62 | % | | | 7.62 | % | |
Buffalo Dividend Focus Fund — Investor Class
(inception date 12/03/12) | | | 0.93 | % | | | -14.94 | % | | | -10.29 | % | | | 8.87 | % | | | N/A | | | | 11.25 | % | | | N/A | | |
Buffalo Dividend Focus Fund —
Institutional Class (inception date 7/1/19)1 | | | 0.78 | % | | | -14.84 | % | | | -10.16 | % | | | 9.04 | % | | | N/A | | | | N/A | | | | 11.42 | % | |
Russell 1000 Index | | | N/A | | | | -20.51 | % | | | -17.22 | % | | | 9.00 | % | | | N/A | | | | 11.98 | % | | | 11.98 | % | |
Morningstar US Large-Mid Cap Index | | | N/A | | | | -20.73 | % | | | -17.51 | % | | | 9.01 | % | | | N/A | | | | 11.96 | % | | | 11.96 | % | |
Lipper Equity Income Funds Index | | | N/A | | | | -15.26 | % | | | -8.18 | % | | | 6.42 | % | | | N/A | | | | 9.40 | % | | | 9.40 | % | |
Buffalo Early Stage Growth Fund —
Investor Class (inception date 5/21/04) | | | 1.46 | % | | | -22.31 | % | | | -34.58 | % | | | 6.90 | % | | | 9.98 | % | | | 8.12 | % | | | N/A | | |
Buffalo Early Stage Growth Fund —
Institutional Class (inception date 7/1/19)1 | | | 1.33 | % | | | -22.20 | % | | | -34.40 | % | | | 7.07 | % | | | 10.15 | % | | | N/A | | | | 8.28 | % | |
Russell 2000 Growth Index | | | N/A | | | | -19.06 | % | | | -29.27 | % | | | 3.60 | % | | | 8.81 | % | | | 7.91 | % | | | 7.91 | % | |
Morningstar US Small Growth Index | | | N/A | | | | -24.34 | % | | | -34.89 | % | | | 3.35 | % | | | 8.24 | % | | | 7.61 | % | | | 7.61 | % | |
Lipper Small-Cap Growth Funds Index | | | N/A | | | | -20.70 | % | | | -28.70 | % | | | 7.29 | % | | | 9.91 | % | | | 8.12 | % | | | 8.12 | % | |
Buffalo Flexible Income Fund — Investor Class
(inception date 8/12/94) | | | 1.01 | % | | | -11.93 | % | | | 1.76 | % | | | 6.27 | % | | | 6.60 | % | | | 7.10 | % | | | N/A | | |
Buffalo Flexible Income Fund —
Institutional Class (inception date 7/1/19)1 | | | 0.86 | % | | | -11.92 | % | | | 1.85 | % | | | 6.42 | % | | | 6.75 | % | | | N/A | | | | 7.25 | % | |
Russell 3000 Index | | | N/A | | | | -20.42 | % | | | -17.63 | % | | | 8.62 | % | | | 11.39 | % | | | 9.57 | % | | | 9.57 | % | |
Morningstar Moderately Aggressive
Target Risk Index* | | | N/A | | | | -18.70 | % | | | -19.38 | % | | | 3.74 | % | | | 6.53 | % | | | N/A | | | | N/A | | |
Lipper Mixed-Asset Target Allocation
Moderate Funds Index | | | N/A | | | | -14.82 | % | | | -15.47 | % | | | 3.43 | % | | | 5.46 | % | | | 6.38 | % | | | 6.38 | % | |
Buffalo Growth Fund — Investor Class
(inception date 5/19/95) | | | 0.92 | % | | | -26.37 | % | | | -27.98 | % | | | 7.99 | % | | | 10.45 | % | | | 9.51 | % | | | N/A | | |
Buffalo Growth Fund — Institutional Class
(inception date 7/1/19)1 | | | 0.77 | % | | | -26.33 | % | | | -27.89 | % | | | 8.15 | % | | | 10.62 | % | | | N/A | | | | 9.68 | % | |
Russell 3000 Growth Index | | | N/A | | | | -23.49 | % | | | -23.01 | % | | | 11.57 | % | | | 13.36 | % | | | 9.37 | % | | | 9.37 | % | |
Morningstar US Growth Index* | | | N/A | | | | -28.19 | % | | | -32.18 | % | | | 10.66 | % | | | 12.43 | % | | | N/A | | | | N/A | | |
Lipper Large Cap Growth Funds Index | | | N/A | | | | -25.46 | % | | | -29.14 | % | | | 9.66 | % | | | 11.95 | % | | | 8.22 | % | | | 8.22 | % | |

4
| | | | | | Average Annual | |
| | Gross Expense
Ratio** | | Six
Months | | One Year | | Five Years | | Ten Years | | Investor
Class
Since
Inception | | Institutional
Class
Since
Inception2 | |
Buffalo High Yield Fund — Investor Class
(inception date 5/19/95) | | | 1.02 | % | | | -7.57 | % | | | -8.74 | % | | | 2.96 | % | | | 4.13 | % | | | 6.45 | % | | | N/A | | |
Buffalo High Yield Fund — Institutional Class
(inception date 7/1/19)1 | | | 0.87 | % | | | -7.51 | % | | | -8.61 | % | | | 3.09 | % | | | 4.27 | % | | | N/A | | | | 6.61 | % | |
ICE BofAML US High Yield Master II Index | | | N/A | | | | -10.56 | % | | | -14.04 | % | | | 1.41 | % | | | 3.87 | % | | | 6.30 | % | | | 6.30 | % | |
Lipper High Yield Bond Funds Index | | | N/A | | | | -10.20 | % | | | -13.11 | % | | | 1.34 | % | | | 3.53 | % | | | 5.21 | % | | | 5.21 | % | |
Buffalo International Fund — Investor Class
(inception date 9/28/07) | | | 1.03 | % | | | -23.29 | % | | | -29.04 | % | | | 2.63 | % | | | 6.20 | % | | | 3.82 | % | | | N/A | | |
Buffalo International Fund —
Institutional Class (inception date 7/1/19)1 | | | 0.88 | % | | | -23.22 | % | | | -28.90 | % | | | 2.79 | % | | | 6.36 | % | | | N/A | | | | 3.98 | % | |
FTSE All-World ex-US Index | | | N/A | | | | -21.90 | % | | | -24.52 | % | | | -0.08 | % | | | 3.71 | % | | | 1.28 | % | | | 1.28 | % | |
Morningstar Global Markets ex-US Index* | | | N/A | | | | -22.28 | % | | | -25.34 | % | | | -0.55 | % | | | 3.50 | % | | | N/A | | | | N/A | | |
Lipper International Funds Index | | | N/A | | | | -22.06 | % | | | -26.34 | % | | | -0.45 | % | | | 4.02 | % | | | 1.19 | % | | | 1.19 | % | |
Buffalo Large Cap Fund — Investor Class
(inception date 5/19/95) | | | 0.93 | % | | | -22.83 | % | | | -24.20 | % | | | 9.20 | % | | | 12.58 | % | | | 9.41 | % | | | N/A | | |
Buffalo Large Cap Fund — Institutional Class
(inception date 7/1/19)1 | | | 0.78 | % | | | -22.79 | % | | | -24.10 | % | | | 9.37 | % | | | 12.75 | % | | | N/A | | | | 9.57 | % | |
Russell 1000 Growth Index | | | N/A | | | | -23.77 | % | | | -22.59 | % | | | 12.17 | % | | | 13.70 | % | | | 9.54 | % | | | 9.54 | % | |
Morningstar US Large Growth Index* | | | N/A | | | | -31.74 | % | | | -38.87 | % | | | 8.02 | % | | | 11.26 | % | | | N/A | | | | N/A | | |
Lipper Large-Cap Growth Funds Index | | | N/A | | | | -25.46 | % | | | -29.14 | % | | | 9.66 | % | | | 11.95 | % | | | 8.22 | % | | | 8.22 | % | |
Buffalo Mid Cap Fund — Investor Class
(inception date 12/17/01) | | | 1.02 | % | | | -24.27 | % | | | -28.32 | % | | | 6.82 | % | | | 8.69 | % | | | 7.58 | % | | | N/A | | |
Buffalo Mid Cap Fund — Institutional Class
(inception date 7/1/19)1 | | | 0.87 | % | | | -24.26 | % | | | -28.25 | % | | | 6.97 | % | | | 8.84 | % | | | N/A | | | | 7.74 | % | |
Russell Mid Cap Growth Index | | | N/A | | | | -21.59 | % | | | -29.50 | % | | | 7.62 | % | | | 10.85 | % | | | 8.46 | % | | | 8.46 | % | |
Morningstar US Mid Growth Index* | | | N/A | | | | -23.19 | % | | | -32.42 | % | | | 8.76 | % | | | 10.93 | % | | | N/A | | | | N/A | | |
Lipper Mid-Cap Growth Funds Index | | | N/A | | | | -22.77 | % | | | -31.45 | % | | | 6.85 | % | | | 9.99 | % | | | 7.62 | % | | | 7.62 | % | |
Buffalo Small Cap Fund — Investor Class
(inception date 4/14/98) | | | 1.01 | % | | | -16.33 | % | | | -31.85 | % | | | 11.12 | % | | | 11.19 | % | | | 11.44 | % | | | N/A | | |
Buffalo Small Cap Fund — Institutional Class
(inception date 7/1/19)1 | | | 0.86 | % | | | -16.24 | % | | | -31.72 | % | | | 11.30 | % | | | 11.36 | % | | | N/A | | | | 11.60 | % | |
Russell 2000 Growth Index | | | N/A | | | | -19.06 | % | | | -29.27 | % | | | 3.60 | % | | | 8.81 | % | | | 5.52 | % | | | 5.52 | % | |
Morningstar US Small Growth Index* | | | N/A | | | | -24.34 | % | | | -34.89 | % | | | 3.35 | % | | | 8.24 | % | | | N/A | | | | N/A | | |
Lipper Small-Cap Growth Funds Index | | | N/A | | | | -20.70 | % | | | -28.70 | % | | | 7.29 | % | | | 9.91 | % | | | 6.72 | % | | | 6.72 | % | |
1 The Institutional Class commenced operations on 7/1/2019. Performance for periods prior to 7/1/2019 is based on the performance of the Investor Class adjusted for the Shareholder Services fee of the Investor Class.
2 For performance of the Institutional Class benchmarks prior to 7/1/2019 (Inception Date of Institutional Class), performance of the Investor Class benchmarks is used.
* The inception date of this index is after the inception date of the Fund.
** As reported in the Funds' Prospectus dated July 1, 2021. Current period gross expense ratio for each Fund can be found on the Financial Highlights, beginning on page 96.

5
Performance data quoted represents past performance; past performance does not guarantee future results. The investment return and principal value of an investment will fluctuate so that an investor's shares, when redeemed, may be worth more or less than their original cost. Current performance of the Funds may be lower or higher than the performance quoted. Performance data current as of the most recent month-end may be obtained by calling 1-800-49-BUFFALO or by visiting the website at www.buffalofunds.com.
The Russell Midcap® Growth Index has replaced the Morningstar US Mid Growth Index as the Buffalo Discovery Fund's primary benchmark. The Russell 1000 Index has replaced the Morningstar US Large-Mid Cap Index as the Buffalo Dividend Focus Fund's primary benchmark. The Russell 2000® Growth Index has replaced the Morningstar US Small Growth Index as the Buffalo Early Stage Growth Fund's primary benchmark. The Russell 3000 Index has replaced the Morningstar Moderately Aggressive Target Risk Index as the Buffalo Flexible Income Fund's primary benchmark. The Russell 3000® Growth Index has replaced the Morningstar US Growth Index as the Buffalo Growth Fund's primary benchmark. The FTSE All-World ex-US Index has replaced the Morningstar Global Markets ex-US Index as the Buffalo International Fund's primary benchmark. The Russell 1000® Growth Index has replaced the Morningstar US Large Growth Index as the Buffalo Large Cap Fund's primary benchmark. The Russell Midcap® Growth Index has replaced the Morningstar US Mid Growth Index as the Buffalo Mid Cap Fund's primary benchmark. The Russell 2000® Growth Index has replaced the Morningstar US Small Growth Index as the Buffalo Small Cap Fund's primary benchmark. The Advisor believes that each of the new indices is more appropriate given each Fund's holdings.
The Funds' returns shown do not reflect the deduction of taxes that a shareholder would pay on distributions or the redemption of shares. The benchmark returns shown, excluding the Lipper Indices, reflect the reinvestment of dividends and capital gains but do not reflect the deduction of any investment management fees, other expenses or taxes. The performance of the Lipper Indices is presented net of fees and expenses; however, applicable sales charges are not taken into consideration. One cannot invest directly in an index.
The Russell 1000 Growth Index measures the performance of those Russell 1000 Index companies with higher price-to-book ratios and higher forecasted growth values. The Russell 2000 Growth Index is a small-cap stock market index of the bottom 2,000 stocks in the Russell 3000 Index. The Russell Mid Cap Growth Index measures the performance of those Russell Midcap companies with higher price-to-book ratios and higher forecasted growth values. The Russell 1000 Index represents the 1,000 companies by market capitalization in the USA. The Russell 3000 Index is a market-capitalization-weighted equity index that tracks the performance of the 3,000 largest US-traded stocks. The Russell 3000 Growth Index is a market-capitalization index that is comprised of companies that display signs of above-average growth. The FTSE All-World ex-US Index is part of the FTSE All-World Index, a global index covering approximately 4,000 mid cap and large cap stocks in 47 countries, excluding the USA. The Morningstar US Mid Growth Index measures the performance of US mid-cap stocks that are expected to grow at a faster pace than the rest of the market as measured by forward earnings, historical earnings, book value, cash flow and sales. The Morningstar US Large-Mid Cap Index measures the performance of the US equity market targeting the top 90% of stocks by market capitalization. The Lipper Equity Income Funds Index tracks funds that seek relatively high current income and growth of income by investing at least 65% of their portfolio in dividend-paying equity securities. These funds' gross or net yield must be at least 125% of the average gross or net yield of the U.S. diversified equity fund universe. The Morningstar US Small Growth Index measures the performance of US small-cap stocks that are expected to grow at a faster pace than the rest of the market as measured by forward earnings, historical earnings, book value, cash flows and sales. The Lipper Small-Cap Growth Funds Index is an unmanaged, equally weighted performance index of the 30 largest qualifying mutual funds (based on net assets) in the Lipper Small-Cap classification. The ICE BofAML US High Yield Master II Index tracks the performance of below investment grade U.S. dollar-denominated corporate bonds publicly issued in the U.S. domestic market. The Lipper Mixed-Asset Target Allocation Moderate Funds Index is an average of funds that, by portfolio practice, maintain a mix of between 40%-60% equity securities, with the remainder invested in bonds, cash, and cash equivalents. The total return of the Lipper Average does not include the effect of sales charges. The Morningstar US Growth Index measures the performance of US stocks that are expected to grow at a faster pace than the rest of the market as measured by forward earnings, historical earnings, book value, cash flow and sales. The Lipper Large Cap Growth Funds Index is an unmanaged, equally weighted performance index of the 30 largest qualifying mutual funds (based on net assets) in

6
the Lipper Large-Cap classification. The Lipper High Yield Bond Funds Index is a widely recognized index of the 30 largest mutual funds that invest primarily in high yield bonds. The Morningstar Global Market ex-US Index is designed to provide exposure to the top 97% market capitalization in each of two market segments, developed markets, excluding the United States, and emerging markets. The Lipper International Funds Index is an unmanaged, equally weighted performance index of the 30 largest qualifying mutual funds (based on net assets) in the Lipper International classification. The Morningstar US Large Growth Index measures the performance of US large-cap stocks that are expected to grow at a faster pace than the rest of the market as measured by forward earnings, historical earnings, book value, cash flow and sales. The Lipper Mid-Cap Growth Funds Index is an unmanaged, equally weighted performance index of the 30 largest qualifying mutual funds (based on net assets) in the Lipper Mid-Cap classification. The Morningstar Moderately Aggressive Target Risk Index is designed to meet the needs of investors who would like to maintain a target level of equity exposure through a portfolio diversified across equities, bonds and inflation-hedged instruments.
Please refer to the prospectus for special risks associated with investing in the Buffalo Funds, including, but not limited to, risks involved with investments in healthcare and information technology companies, foreign securities, debt securities, lower- or unrated securities and medium and small companies. Fund holdings and sector allocations are subject to change at any time and should not be considered a recommendation to buy or sell any security. Please refer to the Schedule of Investments for a complete list of Fund holdings.

7
PORTFOLIO MANAGEMENT REVIEW (UNAUDITED)
BUFFALO DISCOVERY FUND
The Buffalo Discovery Fund declined 23.23% for the six-month period ending September 30, 2022, versus a decline of 21.59% for the Russell Midcap Growth Index. Stubbornly high inflation, aggressive interest-rate increases, rising fear of a recession, and expectations for softer corporate earnings were the main headwinds leading to significant market declines during the semi-annual reporting period.
The Fund's relative underperformance came from weak stock selection, primarily in the Healthcare and Consumer Discretionary sectors, which more than offset strong performance in the Technology sector.
This has clearly been a challenging year for investors. Between war, supply chain disruption, inflation, European recession, and higher interest rates, the market has digested a lot of bad news. We expect innovative, competitively advantaged growth companies to outperform their peers in such an environment, leading to attractive risk-adjusted returns over a full economic cycle. We remain steadfast in our mission to invest in innovative growth companies while maintaining a consistent discipline around valuation and risk.
Calix was the largest contributor to performance during the semi-annual reporting period. The company develops and markets communications software, systems, and services to smaller broadband service providers. The Fund initiated a position earlier this year following a pullback in the stock despite no negative change in the company's fundamentals. Calix continued to see strong demand for its products and has successfully transformed its business into a higher margin platform company from a legacy hardware provider.
Expedia was the leading detractor to Fund performance. Expedia is an online travel agency (OTA) with brands that include Expedia, Hotels.com, Vrbo, and Travelocity. There has been a strong recovery in demand for consumer travel coming out of the COVID pandemic, but investors are increasingly concerned that fundamentals have peaked ahead of a potential recession, and that Expedia has ceded some market share in hotels to Booking.com. However, we believe the company is well positioned to benefit from a multiyear recovery in services spending
that we expect to play out, and that share loss concerns have been overstated due to the divestment of a subsidiary in Europe. We view the company's current valuation compelling given the recent pullback.
TaskUs was also among the larger detractors from performance during the semi-annual reporting period. TaskUs is a Business Process Outsourcing (BPO) company that primarily provides outsourced services to technology companies. The company reported better-than-expected results for the March quarter but failed to raise full-year estimates due to an offshore transition from its largest customer. This lowered revenues in the near term and the stock was punished by the market. However, we believe TaskUs' offering can help companies looking to lower their costs and should eventually garner more attention due to the weaker macroeconomic environment. We believe the stock is undervalued at these levels and the company's shares remain in the portfolio.
Regarding our outlook for the markets, we expect companies to provide cautious earnings guidance for the next few quarters due to slowing economic activity, currency headwinds, increased promotional activity, and inflationary cost pressures. On a positive note, we are seeing signs that the Federal Reserve's aggressive efforts to combat inflation are working. We have seen prices peak for gasoline, shipping containers, used cars, and numerous commodities. Unfortunately, however, it typically takes several quarters before this cost relief flows through to consumer prices. With headline inflation expected to remain elevated and labor markets tight, it seems unlikely the Fed will waver from its plan for two more outsized interest rate hikes this cycle.
Our strategy is to take a long-term, risk-aware view and build positions in our highest conviction companies as the risk/reward tradeoff improves. Recessions don't last forever — the average recession since 1950 has lasted 10 months with the longest at 18 months — and stocks typically move higher before the economic downturn ends. We expect interest rates to remain elevated for some time, therefore we are leaning into dominant companies with strong balance sheets generating attractive returns on capital investment. We're also

8
holding slightly more cash in the near term to take advantage of opportunities where heightened investor fear and market volatility leads to stock price overreactions. We believe investing in innovative, well-managed companies with durable competitive advantages trading at attractive valuations will continue to generate outsized multiyear returns. Thank you for your continued trust and support.
BUFFALO DIVIDEND FOCUS FUND
The Buffalo Dividend Focus Fund posted a return of -14.94% for the six-month period ending September 30, 2022, a result that outperformed the Russell 1000 Index return of -20.51%. Stubbornly high inflation, aggressive interest-rate increases, rising fear of a recession, and expectations for softer corporate earnings were the main headwinds leading to significant market declines during the semi-annual reporting period. Absolute performance was disappointing as only one sector, Energy, generated positive absolute returns for the portfolio during the period; however, the Fund's sector allocation impact and stock selection effect benefited performance overall compared to the benchmark. The Fund's exposure to Communication Services, Consumer Discretionary, Energy, Health Care, Information Technology, Materials, Real Estate and Utilities delivered constructive performance relative to the benchmark.
Specific securities that contributed most positively to performance during the semi-annual review period included Absolute Software, Lamb Weston Holdings and Eli Lilly. Absolute Software (which develops, markets, and distributes cloud-based software that supports the management and security of devices, applications, data and networks for enterprises) gained on better than expected earnings combined with management's increase in forward guidance; demand remains robust for the company's Cyber Defense and Resilience security solutions. Lamb Weston, a producer of frozen potato products, gained on strong quarterly results with margins expected to rise as price increases are implemented and the potato crop normalizes. Eli Lilly, a manufacturer and marketer of pharmaceutical products, climbed as investors reacted favorably to its robust new product cycle outlook over the next few years across large end markets such as diabetes, obesity, Alzheimer's, cancer and immunology.
Microsoft Corporation, Apple, and Horizon Therapeutics PLC were the top detractors from the Fund's
performance. Microsoft Corporation, the software and computer services company, declined on foreign exchange headwinds, soft personal computer demand, and general macro-economic weakness. Shares of Apple declined reflecting the higher interest rate environment (tech stock valuations inversely correlated to rates) and consumer macro concerns, specifically around iPhone sales and recent lockdowns in China where most of the iPhone production resides. Horizon Therapeutics slumped on weak financial results and a lowered outlook due to generic competition in its inflammation segment and slower expected growth for its thyroid eye treatment (Tepezza).
Despite the uncertainty created by a hawkish Fed and geo-political tensions, we remain focused on "wide moat", large capitalization dividend-paying companies trading at reasonable valuations, in our view. As always, the Fund will continue to emphasize competitively advantaged companies that can be purchased at a fair value. As stock market volatility spikes, we will look for opportunities to find companies that align with our investment criteria; we continue to follow our process of finding new investment ideas and poise to be ready when market declines provide better entry points.
BUFFALO EARLY STAGE GROWTH FUND
The Buffalo Early Stage Growth Fund generated a return of -22.31% for the six-month period ending September 30, 2022, a result that underperformed the Russell 2000 Growth Index return of -19.06%. Most of the underperformance was due to stock selection, however, the portfolio's sector allocation impact was also negative due to the Fund's underweight in Health Care, one of the benchmark's less negative sectors during the semi-annual review period. The portfolio is underweight Health Care, specifically Biotechnology, from our philosophy of avoiding binary event risk due to the unpredictable nature of drug approvals/failures by the FDA within the industry.
Regarding stock selection, all sectors declined during the period; however, on a relative basis the Fund underperformed in the Consumer Discretionary and Health Care but outperformed in Information Technology. One of the largest contributors to performance during the review period was Calix, a leading provider of hardware and software that enables broadband service providers to manage and optimize

9
their networks. Strong second quarter results, a positive outlook by management, and a new stock buyback announcement drove the shares higher. The digital divide between urban and rural and work-from-home trends has created a strong demand set-up for small- and mid- size broadband service providers to continue to build out and optimize their networks. Calix has created a more stable model with recurring software revenue along with a focus on smaller providers, eliminating the lumpiness and volatility from large customers. Broadband access should remain somewhat insulated from upcoming macro weakness as Calix is a prime beneficiary of federal government stimulus funds from legislative acts; this should provide a strong tailwind over the next several years as over $100 billion in stimulus funds will be spent on broadband access.
One of the largest detractors in the period was Open Lending Corporation. Open Lending is a provider of automated decisioning technology for credit unions and banks who are underwriting near prime auto loans. Investors' lack of experience with Open Lending through a consumer credit cycle that is deteriorating has pushed the share price down to multi-year lows. Credit unions and banks use the Open Lending platform to protect their credit risk; the company has paired its underwriting technology with three insurance carriers that offer auto loan default coverage. Open Lending is not taking on balance sheet risk but does earn a profit share split with the insurance partners so the performance (repayment) of these auto loans is important. To date, there have been no issues with loan performance, rather the lack of inventory of both new and used cars has pushed down volumes of loans coming through their platform as near-prime consumers have been priced out of the market. With a gradual easing of used car prices and a return of new vehicle production numbers, the environment for Open Lending should improve. The company provides a solution that benefits the consumer (lower rates), benefits the loan provider (default protection and increased loan volumes) and benefits insurance carriers (high margin offering). We look forward to Open Lending proving their durability to investors in various credit cycles.
The Russell 2000 Growth Index has now seen a 38% drawdown from November 2021 levels. Declines of this magnitude historically would suggest that much of the pain is behind us. Many of our consumer discretionary holdings are now trading below 6 times annual EBITDA (Earnings Before Interest, Taxes, Depreciation and
Amortization; a cash flow-like metric), multiples which would have been virtually unheard of in years past. Similarly, many recurring revenue software companies have seen their valuations compress by 60-70% or more. However, many of these companies have not yet cut their earnings expectations, a change that we believe is coming as companies look toward 2023 and the macro environment they face. We believe some of the decline in valuation multiples already anticipates these coming revisions.
Regardless of the macroeconomic headwinds, our job remains to find attractive small cap companies that have not been fully appreciated by the market or are mispriced due to recent results or events. We believe less investor interest in the early stage segment of the market creates an opportunity for us to uncover value. With an active share of greater than 90%, the Fund will continue to offer a distinct offering from the Index and category peers.
BUFFALO FLEXIBLE INCOME FUND
The Buffalo Flexible Income Fund generated a return of -11.93% for the six months ended September 30, 2022, compared to a return of -20.42% for the Russell 3000 Index. Stubbornly high inflation, aggressive interest-rate increases, rising fear of a recession, and expectations for softer corporate earnings were the main headwinds leading to significant market declines during the semi-annual reporting period.
While absolute performance was negative, the Fund's significant outperformance compared to the benchmark was aided by the sector allocation and stock selection. The portfolio is overweight Energy and Consumer Staples, two of the best performing areas of the market overall during the semi-annual review period.
The top three stock contributors to the Fund's performance during the semi-annual reporting period were Eli Lilly, General Mills and Marathon Petroleum. Lilly continued to benefit from one of the best drug pipelines in the industry. General Mills reported strong earnings and has benefited from a consumer shift to eating more food at home, the company's pricing power, and market share gains. Marathon benefitted from extremely favorable refining margins and throughput volumes which have resulted in record cash flow generation.
The top three detractors were Microsoft, Intel, and APA Corporation. Microsoft shares declined about 24% in the period on continued weakness across the technology and

10
software complex owing to the Fed's ongoing effort to raise short term interest rates; to a lesser effect, there was also pressure on the company's top-line from the strength of the U.S. dollar which diluted international revenues. Microsoft's fundamentals remain positive as they continued to take share in cloud hosting/software stack and their core MS Office productivity and gaming franchises, global leaders in their respective categories. APA, which operates in the oil and gas industry, benefited earlier this year from rising commodities prices; however, shares pulled back during the semi-annual review period due to weaker than expected earnings as production volumes missed estimates and costs, were elevated during the period.
It appears that much of the bad news has been priced into market valuations, but volatility could remain elevated. We believe the direction of the market will depend on inflation's trajectory, the Federal Reserve's actions to tame inflation, and the amount of economic damage caused by higher interest rates. The inflation picture continues to ebb and flow. We are seeing a decline in logistics costs, shipping rates, and some commodity prices, however component shortages continue to persist. Generally, it seems price increases are moderating but the sustainability of this moderation is questionable. While the Fed has already increased interest rates by 375 basis points, market expectations forecast additional hikes in this tightening cycle. In response, there has been a growing chorus for the Fed to slow its pace of tightening and allow previous hikes to make their way through the economy. Meanwhile, global economies continue to slow, especially in Europe where energy prices remain high. While many companies have already lowered financial guidance for the year, we could be bracing for another earnings season of decreasing estimates.
Despite the uncertainty, we remain focused on "wide moat", large capitalization dividend-paying companies trading at reasonable valuations, in our view. As always, the Fund will continue to emphasize competitively advantaged companies that can be purchased at a fair value. We will be ready to take advantage of opportunities created by stock market volatility using market declines as attractive entry points for long-term investors.
BUFFALO GROWTH FUND
The Buffalo Growth Fund declined 26.37% during the six-months ending September 30, 2022, trailing the
benchmark Russell 3000 Growth Index return of -23.49%. Stubbornly high inflation, aggressive interest-rate increases, rising fear of a recession, and expectations for softer corporate earnings were the main headwinds leading to significant market declines during the semi-annual reporting period. Relative underperformance was primarily due to weak stock selection; however, the sector allocation impact was also negative due to a portfolio overweight to Communication Services, the weakest performing sector, and due to a portfolio underweight within Consumer Staples, a top performing sector during the semi-annual review period. Regarding stock selection, the portfolio underperformed in Health Care and Financials and outperformed within Technology.
The top detractors from performance during the semi-annual review period were Microsoft and Alphabet. Microsoft shares declined about 24% in the six-month period on continued weakness across the Technology and Software sector owing to the Fed's ongoing effort to raise short term interest rates; to a lesser effect, there was also pressure on the company's top-line from the strength of the U.S dollar, which diluted international revenues. Microsoft's fundamentals remain positive as they continued to take share in cloud hosting/software stack and their core MS Office productivity and gaming franchises, global leaders in their respective categories.
Alphabet's shares declined by about 30% during the semi-annual review period as advertisers slowed their spend. Google is the market share leader in internet driven paid advertising and paid search. While digital advertising continues to take share, the company is not immune to overall advertising spend which has moderated in the near term as global growth expectations recede.
Partially offsetting above were the top contributors to performance during the semi-annual review period which was led by DoubleVerify and Progyny. Progyny, Inc., a leading fertility benefits management company, gained about 25% in the period. The company continued to grow rapidly as more employers offer the benefit to gain an edge in the war for talent, improve employee retention, and control medical costs. In our view, they have a long runway for growth, with a total addressable market (TAM) that is only 3-4% penetrated.
DoubleVerify Holdings gained about 33% in the semi-annual review period after they beat and raised earnings expectations. Producing accelerating revenue growth was a rare occurrence in this uncertain macro environment.

11
DoubleVerify is an advertising technology company which provides digital media measurement. They monitor and measure online advertising campaigns to assure that ads are being viewed by actual people (not bots or fraud) and that the ads are not being placed on sites or next to content that could be harmful to their brand. We expect the company to grow faster than peers and benefit as digital advertising continues to take share from offline advertising.
Stock market multiples have largely adjusted to rising interest rates, but earnings still need to adjust downward. We expect companies to provide cautious earnings guidance due to slowing economic activity, currency headwinds, increased promotional activity, and inflationary cost pressures. On a positive note, we are seeing signs that the Federal Reserve's aggressive efforts to combat inflation is working. We have seen prices peak for gasoline, shipping containers, used cars, and numerous commodities. Unfortunately, however, it typically takes several quarters before this cost relief flows through to consumer prices. With headline inflation expected to remain elevated and labor markets tight, it seems unlikely the Fed will waver from its plan for more interest rate hikes.
Our strategy is to take a long-term, risk aware view and build positions in premier growth companies as risk/reward improves. Recessions don't last forever — the average recession since 1950 has lasted 10 months with the longest at 18 months — and stocks are beginning to discount the downturn. We expect interest rates will remain elevated for some time, so we are leaning into dominant companies with strong balance sheets generating attractive returns on capital investment. As we move through this more tumultuous part of the economic cycle, we're seeking opportunities where heightened investor fear and market volatility lead to stock price over-reactions. We believe investing in well-managed companies with durable competitive advantages, trading at attractive valuations, will continue to generate outsized multiyear returns. Thank you for your continued trust and support.
BUFFALO HIGH YIELD FUND
The Buffalo High Yield Fund produced a return of -7.57% for the six months ending September 30, 2022, a result that outperformed the ICE BofA High Yield Index by 299 basis points which lost -10.56%. The Fund also
outperformed the Lipper High Yield Bond Funds Index return of -10.20%.
The U.S. high yield sector posted its third consecutive declining quarter of 2022 as domestic inflation and global recession fears continued to weigh on investor sentiment. During the six-month period, the Federal Reserve issued two separate 50bp hikes followed by two 75bp increases in the Federal Funds rate. These hikes accompanied by continued hawkish commentary from the FOMC (Federal Open Market Committee) caused significant upward pressure on treasury yields, and energy prices remained elevated as the Ukraine invasion persisted. High yield bonds ended the six months period at 9.86% yield to worst, up 355 bps from the beginning of the period and compared to the record low of 4.22% in July 2021. The 10-year Treasury yield rose 148bps to 3.82% and lost over 11% during the six-month period while the S&P 500 stock index posted a loss of -20.20% over the same period.
High yield funds continued the streak of quarterly cash outflows that began in the first calendar quarter of 2021, posting an $8.7 billion outflow in the 3rd quarter 2022. High yield fund outflows for the six months period were -$26.4 billion which compares to -$1.9 billion outflow in the first half of fiscal 2022. Not surprisingly, high yield new issuance remained muted during the quarter with only $18.9 billion coming to market, which was the lightest volume since the March 2009 quarter and compares to the quarterly average of $117 billion over the last two years. According to JP Morgan, single B-rated or higher issues accounted for most of the activity in the six-month period and was tilted heavily toward Technology (17.5%), Energy (15.1%), and Automotive (11.6%). Every sector in the U.S. high yield universe and every credit rating silo produced negative returns during the six months ending in September 2022. According to data from JP Morgan, the Split B rated tier outperformed both the higher and lower quality ends of the high yield credit spectrum.
The U.S. high yield market's spread to worst for the period end was 574bps, 175bps wider than the March quarter end and only 3bps wider than its 20-year historical average of 571 basis points. The yield to worst for the high yield market at period end was 9.86%, above the 7.88% 20-year average, and above the 6.31% yield at the end of the March 2022 quarter.

12
The Fund's composition by asset class at quarter end was as follows:
| | | 9/30/2021 | | 12/31/2021 | | 3/31/2022 | | 6/30/2022 | | 9/30/2022 | |
Straight
Corporates | | | 65.3 | % | | | 67.8 | % | | | 68.3 | % | | | 69.4 | % | | | 69.6 | % | |
Convertibles | | | 16.1 | % | | | 7.1 | % | | | 6.3 | % | | | 4.6 | % | | | 4.3 | % | |
Bank Loans | | | 13.5 | % | | | 16.7 | % | | | 18.5 | % | | | 18.9 | % | | | 19.1 | % | |
Preferred
Stocks | | | 2.2 | % | | | 2.6 | % | | | 2.7 | % | | | 2.9 | % | | | 2.5 | % | |
Convertible
Preferreds | | | 0.0 | % | | | 0.0 | % | | | 0.0 | % | | | 0.0 | % | | | 0.0 | % | |
Common
Stocks | | | 0.0 | % | | | 1.3 | % | | | 0.0 | % | | | 0.0 | % | | | 0.0 | % | |
Cash | | | 2.9 | % | | | 4.5 | % | | | 4.1 | % | | | 4.1 | % | | | 4.6 | % | |
Total | | | 100.0 | % | | | 100.0 | % | | | 100.0 | % | | | 100.0 | % | | | 100.0 | % | |
The approximate contribution of return from the various asset classes in the Fund during the semi-annual period is as follows:
| | | Approximate
Contribution
to Return | |
Straight Corporates | | | -5.84 | % | |
Convertibles | | | -0.78 | % | |
Bank Loans | | | -0.27 | % | |
Preferred Stocks | | | -0.25 | % | |
Convertible Preferreds | | | N/A | | |
Common Stocks | | | N/A | | |
Total | | | -7.57 | % | |
During the six months period ending September 30, 2022, the three top contributors were MPLX 6.875% corporate bonds, Consol Energy 11% corporate bonds, and Portillo's bank debt. The coupon on the MPLX bonds converts from a fixed rate to a floating rate in early 2023 which made the issue attractive as the Fed raised short term rates during the period. MPLX is also midstream energy operator and the Energy sector performed better than any other sector during the back half of the period. Consol Energy is a coal mining company and benefitted from very strong coal prices driven by higher natural gas prices and the Ukranian conflict. Portillo's is a fast casual restaurant chain whose bank loans outperformed merely by maintaining its price near par while the rest of the high yield market declined.
The Diebold Nixdorf 8.5% corporate bonds, Entercom Media 6.75% corporate bonds, and Energy Transfer 7.125% corporate bonds detracted the most from performance during the period. Diebold Nixdorf reported weaker than expected earnings and the Fund liquidated its position during the June quarter. Entercom (now called Audacy) sold off with the rest of the broadcasting sector
over concerns a slowing economy would lead to less ad spending. Energy Transfer drifted lower with the overall market and its lower liquidity may have exacerbated the downward move despite generating significant free cash flow.
We are focused first and foremost on the Federal Reserve's balancing act between taming inflation while avoiding a recession, global economic weakness, continued supply chain disruptions, and the geopolitical uncertainty caused by the ongoing conflict in Ukraine. We are managing the portfolio cautiously yet actively, focusing on higher-quality issuers with defensive business models and manageable credit metrics. We will continue to deploy cash in opportunities that we believe offer the most appealing risk/reward tradeoff with a bias toward shorter durations and less levered credits. Additionally, we believe bank loans offer a more defensive position as they provide senior positioning in the capital structure and less interest rate sensitivity due to their floating rate structures. Finally, while we continue to look for opportunities in convertible bonds and preferred stocks, the increased level of bond yields for traditional bonds/loans in conjunction with the increased volatility of the underlying equities makes these types of securities less appealing to us currently. The Fund ended the quarter with 131 investment positions, down from 138 (excluding cash) at the beginning of our semi-annual period.
BUFFALO INTERNATIONAL FUND
The Buffalo International Fund produced a return of -23.29% for the semi-annual reporting period ending September 30, 2022, a result that underperformed the FTSE All-World ex US Index return of -21.90%. Global equity markets declined significantly during the period, as continuing high inflation, interest-rate hikes, and signs of a global economic downturn weighed on the markets. Despite a decline in many commodity prices, the data releases showed continuing increases in inflation; The Federal Reserve, European Central Bank, and the Bank of England have all raised interest rates.
The Buffalo International Fund's relative underperformance was due to stock selection, particularly within the Health Care, Technology, and Consumer Discretionary segments of the portfolio while the Fund's cash position helped to cushion the decline. The top contributor in the period was ICICI Bank. ICICI Bank, India's second-largest private bank, continued to

13
benefit from the trend of private banks taking share from public banks. Management's efforts to restructure and digitalize are paying off as business normalizes post-pandemic. The top detractor in the semi-annual period was Taiwan Semiconductor Manufacturing Co. (TSM). TSM, the largest contract semiconductor manufacturer in the world, saw its stock decline due to signs of slowing end-market demand in certain sectors, as well as geopolitical tensions between the U.S. and China. The company continued to benefit, however, from its technological leadership and dominant market share with higher growth and improving margins.
It appears the world economy is weakening; many countries, particularly in Europe and the UK, are facing the probability of recession. China's economic indicators continue to disappoint, and meeting growth targets becomes ever more out of reach. It's clear that with the continuation of the COVID zero policy, it would be difficult to imagine that China could be an engine of global growth. We will monitor the changes that may arise from the upcoming Communist Party Congress. Meanwhile, in the U.S., with interest rates rising and inflation continuing, it is equally difficult to imagine that the U.S. will not also see some sort of a downturn.
We continue to be overweight in Europe and have more comfort around the potential for the region to make it through the winter without energy rationing. Regardless, we see an economic slowdown as likely, and have therefore been mindful of deploying cash at valuations that we believe have already "priced in" the potential downside.
Despite the dour economic outlook, we also look for the positives. There are still short-term positives that we believe will continue to benefit many of our companies, such as the easing of prior pressures on supply chains and the drop in the price of many commodities. As inflation pressures continue to ease, businesses and investors will be more focused on making adjustments to manage through any downturn. It is impossible to know where the bottom of this bear market may be, but we continue our long-term focused investment strategy. We seek out high quality companies that have sound, sustainable business models; competitive advantages; and benefit from secular growth drivers that will continue beyond any short-term economic downturn. We prefer businesses that have strong balance sheets and generate strong free cash flow. In this inflationary environment we also favor the companies that have the means of passing off cost pressures, such as companies with high recurring
revenues or companies whose products make up a small cost of a larger product. And faced with a potential recession, we seek out and focus on companies that can preserve margins even in a weaker environment. This may include businesses that are "asset light", have low fixed costs, or have the means to drive efficiency improvements through a downturn.
BUFFALO LARGE CAP FUND
The Buffalo Large Cap Fund produced a return of -22.83% for the six-month period ending September 30, 2022, outperforming the Russell 1000 Growth's return of -23.77%. Stubbornly high inflation, aggressive interest-rate increases, rising fear of a recession, and expectations for softer corporate earnings were the main headwinds leading to significant market declines during the semi-annual reporting period.
While absolute performance was disappointing, relative performance compared to the benchmark was aided by the Fund's sector allocation and stock selection. Overweight positions in Consumer Staples, Health Care, and other more defensive sectors with a particular focus on dividend paying companies with strong balance sheets, buffered losses. Also, the cash position in the Fund was defensively elevated, ranging from 6.5% to 7.5% — more than double the long-term normalized level of 2% to 3%. Regarding stock selection, the Fund outperformed in Health Care and Industrials, which was partially offset by underperformance within Technology.
Overall, the top contributors to Fund performance for the semi-annual reporting period were Enphase Energy and Vertex Pharmaceuticals. Enphase Energy is a novel solar energy company which has rapidly become one the leading global manufacturers of microinverters for solar panels used for residential and small commercial businesses. Key to the company's leading market share has been its own proprietary integrated circuit, which has resulted in lower energy costs and increased solar energy features for homeowners. Beyond seeing sharp accelerating demand in Europe for residential and small business solar panel installations related to the Russia invasion into Ukraine, we're equally positive on the company's entrance into the important solar battery storage segment. Having the ability to store, rather than lose excess solar energy to the grid, we believe provides a compelling holistic energy management system for customers while increasing the company's revenue potential from $2,500 to $8,500 per home. Akin to last

14
quarter, Enphase's shares appreciated well ahead of the market rising a 42% during the third quarter.
Vertex Pharmaceuticals is in the large cap pharma category and represents one of the best growth profiles in the biotechnology sector. Vertex shares rose over 11% % in the six-month period reflecting its favorable growth profile, reasonable valuation, and the shift to more defensive positions for growth investors in the current market environment.
Meanwhile, the top detractors from Fund results for the quarter were Microsoft and Alphabet. Microsoft shares declined about 24% in the period on continued weakness across the Technology and Software sectors owing to the Fed's ongoing effort to raise short term interest rates; to a lesser effect, pressure on the company's top-line from the strength of the U.S. dollar diluted international revenues. Microsoft's fundamentals remain positive as they continued to take share in cloud hosting/software stack and their core MS Office productivity and gaming franchises, global leaders in their respective categories.
Not dissimilar to Microsoft, and other large tech companies, Google's shares continued to decline in the six-month review period, falling more than 30%. Google is the market share leader in internet-driven paid advertising and paid search related to eCommerce retail goods and services. Retailers for the last year have been struggling through supply chain headwinds and now face a more challenged consumer both at the low- and mid- to high-end due to ongoing inflation and creeping economic softness. Partially offsetting the slower retail/eComm issues for the company is travel, which remains the second largest contributor to their large paid-advertising platform and is seeing a renaissance of sorts with solid underlying demand. Moving forward, we will continue to monitor the slope of eComm growth (consensus is for a 10% increase from 2021) to see if Google's operating environment becomes less favorable.
Looking ahead we maintain a close eye on the Ukraine/Russia conflict, the economic and energy situation in Europe, and the on-going trade/geo-political tensions between the U.S and China, as well as remaining cognizant of the upcoming winter season and any unexpected indications of increased severity of COVID-19 infection levels that might impact the pace of an economic rebound.
While there is no shortage of macro and global challenges to ponder, we remain deeply engaged talking to analysts and companies every week making sure we're
owning the best, high-growth investment opportunities that will help change the world in a durable way over the long run while risk-managing sector and individual company position exposures. We believe the market will remain choppy with further downside risk to 2023 earnings estimates. However, we also recognize that when market valuations do eventually bottom out, high-quality, high-growth companies could most likely lead the equity markets higher. Historically, the gains that occur in the subsequent 12 months after the market reaches its lows are substantial and can have a significant impact on returns if missed.
As always, we appreciate your continued confidence in our investment strategy and approach. It's one that has historically demonstrated a track record of long-term outperformance through various market challenges and opportunities.
BUFFALO MID CAP FUND
The Buffalo Mid Cap Fund declined 24.27% for the six-month period ending September 30, 2022, a result that underperformed the Russell Midcap Growth Index's return of -21.59%. Stubbornly high inflation, aggressive interest-rate increases, rising fear of a recession, and expectations for softer corporate earnings were the main headwinds leading to significant market declines for the semi-annual period.
Most of the Fund's relative shortfall was due to weak stock selection, primarily within the Health Care and Industrials segments of the portfolio. Weak results in those areas were partially offset by stronger stock selection in Information Technology.
Top contributors for the semi-annual period included Aspen Technology and DoubleVerify. Investors have taken note of Aspen as its merger with Emerson is off to a good start with the potential for accelerating growth due to synergies in industrials and oil and gas. The combination of Aspen's process simulation and manufacturing software with Emerson's industrial automation controls and salesforce looks promising for the industrials division. Additionally, Emerson's geological simulation has provided Aspen's oil and gas franchise with new business opportunities benefitting thatunit.
DoubleVerify is an advertising technology company which provides digital media measurement. They monitor and measure online advertising campaigns to ensure that ads are being viewed by actual people (not bots or fraud) and

15
that ads aren't being placed on sites or next to content that could be harmful to their brand. We expect DoubleVerify to benefit from digital continuing to gain share of ad budgets and an increasing focus on return on investment (ROI) and brand safety.
Lyft, Inc. was the top detractor during the review period. Despite a better than expected first quarter, the company's guidance for the remainder of the year was very disappointing. Revenue guidance was positive, but margins are expected to decline meaningfully. Lyft is increasing spending to attract drivers to their platform, which is calling into question the long-term economics of the business.
Financial conditions have continued to tighten substantially throughout the year. The Fed Funds rate has risen from 0.0-0.25% to 3.75-4.00% with additional increases expected. 10-year Treasury yields have increased from 1.5% to nearly 4.0%, but the curve has recently begun inverting signaling expectations for declining economic growth. As a result, equity valuations generally remain under pressure.
While these are undoubtedly challenging economic times, we will continue to look for attractively-valued businesses with solid growth opportunities, durable competitive advantages, scalable business models, and exceptional management teams.
BUFFALO SMALL CAP FUND
The Buffalo Small Cap Fund produced a return of -16.33% for the six-month period ending September 30, 2022, outperforming the Russell 2000 Growth's return of -19.06%. Stubbornly high inflation, aggressive interest-rate increases, rising fear of a recession, and expectations for softer corporate earnings were the main headwinds leading to significant market declines during the semi-annual reporting period.
While absolute performance was disappointing, the Fund's sector allocation and stock selection benefited performance compared to the benchmark. Outperformance in Industrials, Financials and Technology offset relative underperformance within Consumer Discretionary. Calix was the greatest contributor to performance during the period. After considerable outperformance in 2021, the stock sold off initially in 2022 despite stable fundamentals. The Fund increased its position on the pullback and was rewarded as the stock rallied over 42% during the semi-annual period as the
company continued to see strong demand for its broadband communications systems and software for smaller broadband service provider customers. The company has managed a difficult supply chain environment exceptionally well and has successfully transformed its business into a higher-margin platform company from a legacy hardware company.
TransMedics, a transplant medical devices company, was also among the top contributors to Fund performance during the period. The company's innovative Organ Containment System ("OCS") and National OCS Program ("NOP") continued to see rapid uptake translating to accelerating revenue growth of over 150% in the second quarter, as reported in early August. Despite the very weak capital markets environment this year, the company was able to raise over $100 million in an upsized public offering, further bolstering their balance sheet.
The largest detractor from performance was TaskUs, a Business Process Outsource (BPO) company which provides outsourced services largely for other technology companies. The company reported better than expected results for the March quarter but failed to raise full-year estimates due to an offshore transition from its largest customer which lowers revenues in the near term. We believe the TaskUs offering can help companies looking to lower their costs by moving these functions offshore and should eventually garner more attention due to the weaker macroeconomic environment. As a result of the share price pullback, we believe the stock is undervalued and remains in the portfolio.
Codexis was also among the large detractors as a surprise reduction in financial guidance in July sent the stock lower. Codexis saw decreased demand for its enzymes from Pfizer used in the production of Paxlovid, a treatment for COVID-19. Additionally, the weak capital markets backdrop and a reduced funding environment delayed additional projects by smaller customers. We believe Codexis technology remains sound and recent management changes should benefit the company.
We believe small cap stocks have already rerated for a considerable slowdown in economic growth. We continue to believe much of the bad news has been priced in, but markets will remain volatile. We believe the direction of the market will continue to depend on inflation's trajectory, how aggressive the Federal Reserve must be to rein in inflation, and the amount of economic damage caused by higher interest rates.

16
The inflation picture continues to ebb and flow. While we are seeing a decline in logistics costs, shipping rates, and some commodity prices, component shortages continue to persist. Generally, it seems price increases are moderating but the sustainability of this moderation is questionable. While the Fed has already increased interest rates by 375 basis points, market expectations forecast additional hikes in this tightening cycle. In response, there has been a growing chorus for the Fed to slow its pace of tightening and allow previous hikes to make their way through the economy. Meanwhile, global economies continue to slow, especially in Europe where energy prices remain high. While many companies have already lowered financial guidance for the year, we could be entering another earnings season of decreasing estimates which could bring more market volatility.
At the portfolio level, we are taking advantage of market volatility by increasing positions in stocks that are oversold and trimming those that are fully valued or have exceeded our market capitalization guidelines. We are cautious with unfamiliar management teams and their ability to navigate a less predictable economy and market volatility. Portfolio turnover has remained consistent with prior years, even slightly lower year-to-date. New positions have been initiated in a few companies we've owned previously such as Natera and Kornit Digital, which are currently trading at more attractive valuation levels. Despite trimming some gains in Health Care, we remain overweight in the sector as these companies are generally less sensitive to a slowing economy. Portfolio positioning is fairly defensive within Technology with a focus on a steadier IT Services industry and the Communications Equipment industry which has unique demand drivers due to government subsidies. On the other hand, the portfolio is underweight Semiconductors and Software relative to the benchmark. A few higher-quality energy-related stocks corrected meaningfully in the third quarter which allowed us to increase energy sector exposure at a more favorable risk/reward, although the portfolio remains underweight relative to the benchmark. Larger positions within the portfolio continue to be companies with recurring revenue streams or those with strong demand and good visibility into future earnings. And as always, all holdings should benefit from long-term growth trends and we seek to trade at attractive valuations — the cornerstone of our investment process. We thank you for your continued support.

17
Bond ratings are grades given to bonds that indicate their credit quality as determined by a private independent rating service such as Standard & Poor's. The firm evaluates a bond issuer's financial strength, or its ability to pay a bond's principal and interest in a timely fashion. Ratings are expressed as letters ranging from 'AAA', which is the highest grade, to 'D', which is the lowest grade. In limited situations when the rating agency has not issued a formal rating, the Advisor will classify the security as nonrated.
Earnings growth is not representative of a Fund's future performance.
A basis point is one hundredth of a percentage point (0.01%).
Yield is the income return on an investment.
Yield to worst is the lowest potential yield that can be received on a bond without the issuer actually defaulting. A Spread is the difference between the bid and the ask price of a security.
Spread to worst is the difference between the yield to worst of a bond and the yield to worst of a U.S. Treasury security with similar duration.
The London Interbank Offered Rate (LIBOR) is a benchmark interest rate at which major global banks lend to one another in the international interbank market for short-term loans.
Duration is a commonly used measure of the potential volatility of the price of a debt security, or the aggregate market value of a portfolio of debt securities, prior to maturity. Securities with a longer duration generally have more volatile prices than securities of comparable quality with a shorter duration.
Active share is a measure of the percentage of stock holdings in a manager's portfolio that differs from the benchmark index.
Cash flow is the net amount of cash and cash-equivalents being transferred into and out of a business.
Free Cash Flow is revenue less operating expenses including interest expense and maintenance capital spending. It is the discretionary cash that a company has after all expenses and is available for purposes such as dividend payments, investing back into the business, or share repurchases.
NASDAQ or National Association of Securities Dealers Automated Quotations is a global electronic marketplace for buying and selling securities.

18
EXPENSE EXAMPLE (UNAUDITED)
As a shareholder of the Funds, you incur two types of costs: (1) transaction costs and (2) ongoing costs, including management fees, shareholder servicing fees (Investor Class only) and other Fund specific expenses. The examples below are intended to help you understand your ongoing costs (in dollars) of investing in the Funds and to compare these costs with the ongoing costs of investing in other mutual funds. The example is based on an investment of $1,000 invested at the beginning of the period and held for the entire period (April 1, 2022 – September 30, 2022).
ACTUAL EXPENSES
The first line of the tables below provides information about actual account values and actual expenses. You may use the information in this line, together with the amount you invested, to estimate the expenses that you paid over the period. Simply divide your account by $1,000 (for example, an $8,600 account value divided by $1,000 = 8.6), then multiply the result by the number in the first line under the heading entitled "Expenses Paid During the Period" to estimate the expenses you paid on your account during the period. Although the Funds charge no sales load or transaction fees, you will be assessed fees for outgoing wire transfers, returned checks and stop payment orders at prevailing rates charged by U.S. Bancorp Fund Services, LLC, the Funds' transfer agent. If you request that a redemption be made by wire transfer, currently a $15.00 fee is charged by the Funds' transfer agent. To the extent a Fund invests in shares of other investment companies as part of its investment strategy, you will indirectly bear your proportionate share of any fees and expenses charged by
the underlying funds in which the Fund invests in addition to the expenses of the Fund. Actual expenses of the underlying funds are expected to vary among the various underlying funds. These expenses are not included in the examples below. The examples below include management fees, registration fees and other expenses. However, the examples below do not include portfolio trading commissions and related expenses and other extraordinary expenses as determined under U.S. generally accepted accounting principles.
HYPOTHETICAL EXAMPLE FOR COMPARISON PURPOSES
The second line of each table below provides information about hypothetical account values and hypothetical expenses based on the Funds' actual expense ratios and an assumed rate of return of 5% per year before expenses, which are not the Funds' actual returns. The hypothetical account values and expenses may not be used to estimate the actual ending account balance or expenses you paid for the period. You may use this information to compare the ongoing costs of investing in our Funds and other funds. To do so, compare this 5% hypothetical example with the 5% hypothetical examples that appear in the shareholder reports of the other funds. Please note that the expenses shown in the tables are meant to highlight your ongoing costs only and do not reflect any transactional costs. Therefore, the second line of the tables is useful in comparing ongoing costs only, and will not help you determine the relative total costs of owning different funds. In addition, if these transactional costs were included, your costs would have been higher.
BUFFALO DISCOVERY FUND | | Beginning
Account Value
April 1, 2022 | | Ending
Account Value
September 30, 2022 | | Expenses Paid During
Period April 1, 2022 -
September 30, 2022* | |
Investor Class | | | | | | | |
Actual | | $ | 1,000.00 | | | $ | 767.70 | | | $ | 4.48 | | |
Hypothetical (5% return before expenses) | | $ | 1,000.00 | | | $ | 1,020.00 | | | $ | 5.11 | | |
Institutional Class | | | | | | | |
Actual | | $ | 1,000.00 | | | $ | 768.50 | | | $ | 3.81 | | |
Hypothetical (5% return before expenses) | | $ | 1,000.00 | | | $ | 1,020.76 | | | $ | 4.36 | | |
* Expenses for the Investor Class are equal to the Fund's annualized expense ratio of 1.01%, multiplied by the average account value over the period, multiplied by 183/365 to reflect the one-half year period. Expenses for the Institutional Class are equal to the Fund's annualized expense ratio of 0.86%, multiplied by the average account value over the period, multiplied by 183/365 to project a one-half year period.

19
BUFFALO DIVIDEND FOCUS FUND | | Beginning
Account Value
April 1, 2022 | | Ending
Account Value
September 30, 2022 | | Expenses Paid During
Period April 1, 2022 -
September 30, 2022* | |
Investor Class | | | | | | | |
Actual | | $ | 1,000.00 | | | $ | 850.60 | | | $ | 4.31 | | |
Hypothetical (5% return before expenses) | | $ | 1,000.00 | | | $ | 1,020.41 | | | $ | 4.71 | | |
Institutional Class | | | | | | | |
Actual | | $ | 1,000.00 | | | $ | 851.60 | | | $ | 3.62 | | |
Hypothetical (5% return before expenses) | | $ | 1,000.00 | | | $ | 1,021.16 | | | $ | 3.95 | | |
* Expenses for the Investor Class are equal to the Fund's annualized expense ratio of 0.93%, multiplied by the average account value over the period, multiplied by 183/365 to reflect the one-half year period. Expenses for the Institutional Class are equal to the Fund's annualized expense ratio of 0.78%, multiplied by the average account value over the period, multiplied by 183/365 to project a one-half year period.
BUFFALO EARLY STAGE GROWTH FUND | | Beginning
Account Value
April 1, 2022 | | Ending
Account Value
September 30, 2022 | | Expenses Paid During
Period April 1, 2022 -
September 30, 2022* | |
Investor Class | | | | | | | |
Actual | | $ | 1,000.00 | | | $ | 776.90 | | | $ | 6.64 | | |
Hypothetical (5% return before expenses) | | $ | 1,000.00 | | | $ | 1,017.60 | | | $ | 7.54 | | |
Institutional Class | | | | | | | |
Actual | | $ | 1,000.00 | | | $ | 778.00 | | | $ | 5.97 | | |
Hypothetical (5% return before expenses) | | $ | 1,000.00 | | | $ | 1,018.35 | | | $ | 6.78 | | |
* Expenses for the Investor Class are equal to the Fund's annualized expense ratio of 1.49%, multiplied by the average account value over the period, multiplied by 183/365 to reflect the one-half year period. Expenses for the Institutional Class are equal to the Fund's annualized expense ratio of 1.34%, multiplied by the average account value over the period, multiplied by 183/365 to project a one-half year period.
BUFFALO FLEXIBLE INCOME FUND | | Beginning
Account Value
April 1, 2022 | | Ending
Account Value
September 30, 2022 | | Expenses Paid During
Period April 1, 2022 -
September 30, 2022* | |
Investor Class | | | | | | | |
Actual | | $ | 1,000.00 | | | $ | 880.70 | | | $ | 4.76 | | |
Hypothetical (5% return before expenses) | | $ | 1,000.00 | | | $ | 1,020.00 | | | $ | 5.11 | | |
Institutional Class | | | | | | | |
Actual | | $ | 1,000.00 | | | $ | 880.80 | | | $ | 4.05 | | |
Hypothetical (5% return before expenses) | | $ | 1,000.00 | | | $ | 1,020.76 | | | $ | 4.36 | | |
* Expenses for the Investor Class are equal to the Fund's annualized expense ratio of 1.01%, multiplied by the average account value over the period, multiplied by 183/365 to reflect the one-half year period. Expenses for the Institutional Class are equal to the Fund's annualized expense ratio of 0.86%, multiplied by the average account value over the period, multiplied by 183/365 to project a one-half year period.
BUFFALO GROWTH FUND | | Beginning
Account Value
April 1, 2022 | | Ending
Account Value
September 30, 2022 | | Expenses Paid During
Period April 1, 2022 -
September 30, 2022* | |
Investor Class | | | | | | | |
Actual | | $ | 1,000.00 | | | $ | 736.30 | | | $ | 4.01 | | |
Hypothetical (5% return before expenses) | | $ | 1,000.00 | | | $ | 1,020.45 | | | $ | 4.66 | | |
Institutional Class | | | | | | | |
Actual | | $ | 1,000.00 | | | $ | 736.70 | | | $ | 3.35 | | |
Hypothetical (5% return before expenses) | | $ | 1,000.00 | | | $ | 1,021.21 | | | $ | 3.90 | | |
* Expenses for the Investor Class are equal to the Fund's annualized expense ratio of 0.92%, multiplied by the average account value over the period, multiplied by 183/365 to reflect the one-half year period. Expenses for the Institutional Class are equal to the Fund's annualized expense ratio of 0.77%, multiplied by the average account value over the period, multiplied by 183/365 to project a one-half year period.

20
BUFFALO HIGH YIELD FUND | | Beginning
Account Value
April 1, 2022 | | Ending
Account Value
September 30, 2022 | | Expenses Paid During
Period April 1, 2022 -
September 30, 2022* | |
Investor Class | | | | | | | |
Actual | | $ | 1,000.00 | | | $ | 924.30 | | | $ | 4.92 | | |
Hypothetical (5% return before expenses) | | $ | 1,000.00 | | | $ | 1,019.95 | | | $ | 5.16 | | |
Institutional Class | | | | | | | |
Actual | | $ | 1,000.00 | | | $ | 924.90 | | | $ | 4.20 | | |
Hypothetical (5% return before expenses) | | $ | 1,000.00 | | | $ | 1,020.71 | | | $ | 4.41 | | |
* Expenses for the Investor Class are equal to the Fund's annualized expense ratio of 1.02%, multiplied by the average account value over the period, multiplied by 183/365 to reflect the one-half year period. Expenses for the Institutional Class are equal to the Fund's annualized expense ratio of 0.87%, multiplied by the average account value over the period, multiplied by 183/365 to project a one-half year period.
BUFFALO INTERNATIONAL FUND | | Beginning
Account Value
April 1, 2022 | | Ending
Account Value
September 30, 2022 | | Expenses Paid During
Period April 1, 2022 -
September 30, 2022* | |
Investor Class | | | | | | | |
Actual | | $ | 1,000.00 | | | $ | 767.10 | | | $ | 4.56 | | |
Hypothetical (5% return before expenses) | | $ | 1,000.00 | | | $ | 1,019.90 | | | $ | 5.22 | | |
Institutional Class | | | | | | | |
Actual | | $ | 1,000.00 | | | $ | 767.80 | | | $ | 3.90 | | |
Hypothetical (5% return before expenses) | | $ | 1,000.00 | | | $ | 1,020.66 | | | $ | 4.46 | | |
* Expenses for the Investor Class are equal to the Fund's annualized expense ratio of 1.03%, multiplied by the average account value over the period, multiplied by 183/365 to reflect the one-half year period. Expenses for the Institutional Class are equal to the Fund's annualized expense ratio of 0.88%, multiplied by the average account value over the period, multiplied by 183/365 to project a one-half year period.
BUFFALO LARGE CAP FUND | | Beginning
Account Value
April 1, 2022 | | Ending
Account Value
September 30, 2022 | | Expenses Paid During
Period April 1, 2022 -
September 30, 2022* | |
Investor Class | | | | | | | |
Actual | | $ | 1,000.00 | | | $ | 771.70 | | | $ | 4.22 | | |
Hypothetical (5% return before expenses) | | $ | 1,000.00 | | | $ | 1,020.31 | | | $ | 4.81 | | |
Institutional Class | | | | | | | |
Actual | | $ | 1,000.00 | | | $ | 772.10 | | | $ | 3.55 | | |
Hypothetical (5% return before expenses) | | $ | 1,000.00 | | | $ | 1,021.06 | | | $ | 4.05 | | |
* Expenses for the Investor Class are equal to the Fund's annualized expense ratio of 0.95%, multiplied by the average account value over the period, multiplied by 183/365 to reflect the one-half year period. Expenses for the Institutional Class are equal to the Fund's annualized expense ratio of 0.80%, multiplied by the average account value over the period, multiplied by 183/365 to project a one-half year period.
BUFFALO MID CAP FUND | | Beginning
Account Value
April 1, 2022 | | Ending
Account Value
September 30, 2022 | | Expenses Paid During
Period April 1, 2022 -
September 30, 2022* | |
Investor Class | | | | | | | |
Actual | | $ | 1,000.00 | | | $ | 757.30 | | | $ | 4.54 | | |
Hypothetical (5% return before expenses) | | $ | 1,000.00 | | | $ | 1,019.90 | | | $ | 5.22 | | |
Institutional Class | | | | | | | |
Actual | | $ | 1,000.00 | | | $ | 757.40 | | | $ | 3.88 | | |
Hypothetical (5% return before expenses) | | $ | 1,000.00 | | | $ | 1,020.66 | | | $ | 4.46 | | |
* Expenses for the Investor Class are equal to the Fund's annualized expense ratio of 1.03%, multiplied by the average account value over the period, multiplied by 183/365 to reflect the one-half year period. Expenses for the Institutional Class are equal to the Fund's annualized expense ratio of 0.88%, multiplied by the average account value over the period, multiplied by 183/365 to project a one-half year period.

21
BUFFALO SMALL CAP FUND | | Beginning
Account Value
April 1, 2022 | | Ending
Account Value
September 30, 2022 | | Expenses Paid During
Period April 1, 2022 -
September 30, 2022* | |
Investor Class | | | | | | | |
Actual | | $ | 1,000.00 | | | $ | 836.70 | | | $ | 4.60 | | |
Hypothetical (5% return before expenses) | | $ | 1,000.00 | | | $ | 1,020.05 | | | $ | 5.06 | | |
Institutional Class | | | | | | | |
Actual | | $ | 1,000.00 | | | $ | 837.60 | | | $ | 3.96 | | |
Hypothetical (5% return before expenses) | | $ | 1,000.00 | | | $ | 1,020.76 | | | $ | 4.36 | | |
* Expenses for the Investor Class are equal to the Fund's annualized expense ratio of 1.00%, multiplied by the average account value over the period, multiplied by 183/365 to reflect the one-half year period. Expenses for the Institutional Class are equal to the Fund's annualized expense ratio of 0.86%, multiplied by the average account value over the period, multiplied by 183/365 to project a one-half year period.

22
ALLOCATION OF PORTFOLIO HOLDINGS
(UNAUDITED)
Percentages represent market value as a percentage of investments as of September 30, 2022.
BUFFALO DISCOVERY
FUND
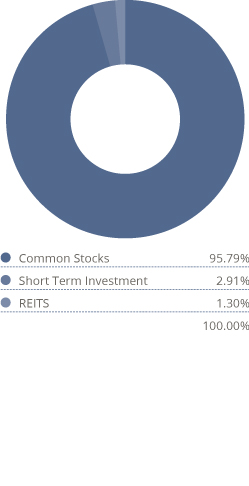
BUFFALO DIVIDEND
FOCUS FUND
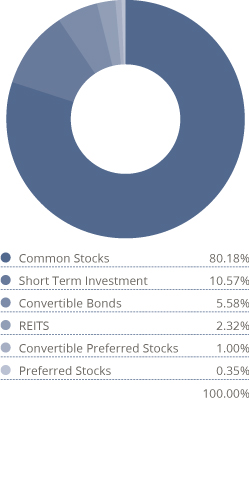
BUFFALO EARLY STAGE GROWTH FUND
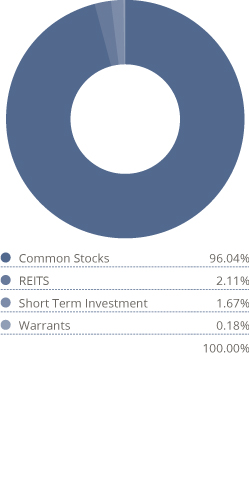
BUFFALO FLEXIBLE
INCOME FUND

BUFFALO GROWTH
FUND

BUFFALO HIGH YIELD
FUND
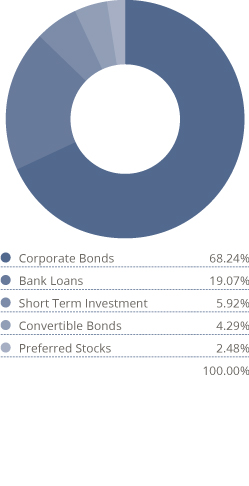

23
Percentages represent market value as a percentage of investments as of September 30, 2022.
BUFFALO
INTERNATIONAL FUND

BUFFALO LARGE CAP
FUND

BUFFALO MID CAP
FUND

BUFFALO SMALL CAP
FUND
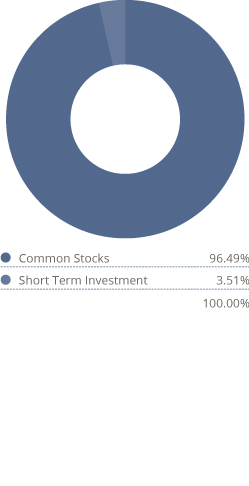

24
BUFFALO DISCOVERY FUND (UNAUDITED)
SCHEDULE OF INVESTMENTS
SEPTEMBER 30, 2022
Shares or Face Amount | | | | $ Fair Value* | |
Common Stocks | | | 95.77 | % | |
Communication Services | | | 2.39 | % | |
| | | | | Entertainment | | | 1.49 | % | |
| | 127,928 | | | Take-Two Interactive Software, Inc.(a) | | | 13,944,152 | | |
| | | | | Interactive Media & Services | | | 0.90 | % | |
| | 233,846 | | | CarGurus, Inc.(a) | | | 3,313,598 | | |
| | 457,271 | | | Eventbrite, Inc.(a) | | | 2,780,208 | | |
| | 48,206 | | | Match Group, Inc.(a) | | | 2,301,836 | | |
| | | | 8,395,642 | | |
| Total Communication Services (Cost $39,772,094) | | | 22,339,794 | | |
Consumer Discretionary | | | 12.92 | % | |
| | | | | Auto Components | | | 1.28 | % | |
| | 152,736 | | | Aptiv PLC — ADR(a) (b) | | | 11,945,482 | | |
| | | | | Hotels, Restaurants & Leisure | | | 5.38 | % | |
| | 6,034 | | | Chipotle Mexican Grill, Inc.(a) | | | 9,067,654 | | |
| | 73,291 | | | Darden Restaurants, Inc. | | | 9,258,119 | | |
| | 591,386 | | | Everi Holdings Inc.(a) | | | 9,592,281 | | |
| | 461,700 | | | MGM Resorts International | | | 13,721,724 | | |
| | 312,076 | | | Penn National Gaming, Inc.(a) | | | 8,585,211 | | |
| | | | 50,224,989 | | |
| | | | | Internet & Direct Marketing Retail | | | 1.39 | % | |
| | 138,862 | | | Expedia Group, Inc.(a) | | | 13,009,981 | | |
| | | | | Leisure Products | | | 1.10 | % | |
| | 535,085 | | | Callaway Golf Co.(a) | | | 10,305,737 | | |
| | | | | Specialty Retail | | | 2.73 | % | |
| | 106,358 | | | Five Below, Inc.(a) | | | 14,642,306 | | |
| | 58,309 | | | Tractor Supply Co. | | | 10,838,477 | | |
| | | | 25,480,783 | | |
| | | | | Textiles, Apparel & Luxury Goods | | | 1.04 | % | |
| | 30,957 | | | Deckers Outdoor Corp.(a) | | | 9,677,468 | | |
| Total Consumer Discretionary (Cost $130,066,374) | | | 120,644,440 | | |

The accompanying notes are an integral part of these financial statements.
25
BUFFALO DISCOVERY FUND
(UNAUDITED)
SCHEDULE OF INVESTMENTS
SEPTEMBER 30, 2022 Continued
Shares or Face Amount | | | | $ Fair Value* | |
Energy | | | 1.17 | % | |
| | | | | Energy Equipment & Services | | | 1.17 | % | |
| | 303,428 | | | Schlumberger Ltd. — ADR(b) | | | 10,893,065 | | |
| Total Energy (Cost $10,225,948) | | | 10,893,065 | | |
Financials | | | 7.40 | % | |
| | | | | Banks | | | 0.67 | % | |
| | 18,745 | | | SVB Financial Group(a) | | | 6,294,196 | | |
| | | | | Capital Markets | | | 5.14 | % | |
| | 82,438 | | | Intercontinental Exchange, Inc. | | | 7,448,273 | | |
| | 55,940 | | | MSCI, Inc. | | | 23,594,932 | | |
| | 46,751 | | | S&P Global, Inc. | | | 14,275,418 | | |
| | 94,821 | | | TPG, Inc. | | | 2,639,817 | | |
| | | | 47,958,440 | | |
| | | | | Diversified Financial Services | | | 1.59 | % | |
| | 137,708 | | | Global Payments Inc. | | | 14,879,350 | | |
| Total Financials (Cost $42,198,264) | | | 69,131,986 | | |
Health Care | | | 17.63 | % | |
| | | | | Biotechnology | | | 3.35 | % | |
| | 227,396 | | | Horizon Therapeutics Plc — ADR(a) (b) | | | 14,073,538 | | |
| | 391,835 | | | Natera, Inc.(a) | | | 17,170,210 | | |
| | | | 31,243,748 | | |
| | | | | Health Care Equipment & Supplies | | | 4.17 | % | |
| | 146,641 | | | Alcon, Inc. — ADR(b) | | | 8,531,573 | | |
| | 382,064 | | | Boston Scientific Corp.(a) | | | 14,797,339 | | |
| | 109,330 | | | Edwards Lifesciences Corp.(a) | | | 9,033,938 | | |
| | 20,299 | | | IDEXX Laboratories, Inc.(a) | | | 6,613,414 | | |
| | | | 38,976,264 | | |
| | | | | Health Care Providers & Services | | | 2.10 | % | |
| | 291,851 | | | HealthEquity, Inc.(a) | | | 19,603,632 | | |
| | | | | Health Care Technology | | | 2.02 | % | |
| | 140,076 | | | Doximity, Inc.(a) | | | 4,233,097 | | |
| | 107,376 | | | Evolent Health, Inc. — Class A(a) | | | 3,858,019 | | |
| | 65,534 | | | Veeva Systems, Inc.(a) | | | 10,805,246 | | |
| | | | 18,896,362 | | |

The accompanying notes are an integral part of these financial statements.
26
BUFFALO DISCOVERY FUND
(UNAUDITED)
SCHEDULE OF INVESTMENTS
SEPTEMBER 30, 2022 Continued
Shares or Face Amount | | | | $ Fair Value* | |
| | | | | Life Sciences Tools & Services | | | 5.50 | % | |
| | 87,972 | | | Agilent Technologies, Inc. | | | 10,692,996 | | |
| | 559,073 | | | Avantor, Inc.(a) | | | 10,957,831 | | |
| | 20,273 | | | Bio-Rad Laboratories, Inc.(a) | | | 8,456,679 | | |
| | 62,976 | | | Charles River Laboratories International, Inc.(a) | | | 12,393,677 | | |
| | 48,662 | | | IQVIA Holdings, Inc.(a) | | | 8,814,635 | | |
| | | | 51,315,818 | | |
| | | | | Pharmaceuticals | | | 0.49 | % | |
| | 63,246 | | | Catalent, Inc.(a) | | | 4,576,481 | | |
| Total Health Care (Cost $167,712,961) | | | 164,612,305 | | |
Industrials | | | 17.51 | % | |
| | | | | Building Products | | | 0.96 | % | |
| | 152,068 | | | Builders FirstSource, Inc.(a) | | | 8,959,846 | | |
| | | | | Commercial Services & Supplies | | | 1.75 | % | |
| | 153,522 | | | Copart, Inc.(a) | | | 16,334,741 | | |
| | | | | Construction & Engineering | | | 1.42 | % | |
| | 208,114 | | | MasTec, Inc.(a) | | | 13,215,239 | | |
| | | | | Electrical Equipment | | | 3.67 | % | |
| | 172,526 | | | AMETEK, Inc. | | | 19,566,173 | | |
| | 24,262 | | | Generac Holdings, Inc.(a) | | | 4,322,033 | | |
| | 484,078 | | | Shoals Technologies Group, Inc.(a) | | | 10,431,881 | | |
| | | | 34,320,087 | | |
| | | | | Machinery | | | 1.27 | % | |
| | 274,314 | | | Ingersoll Rand, Inc. | | | 11,866,824 | | |
| | | | | Professional Services | | | 5.14 | % | |
| | 260,436 | | | CoStar Group, Inc.(a) | | | 18,139,368 | | |
| | 197,512 | | | TransUnion | | | 11,749,989 | | |
| | 416,057 | | | Upwork, Inc.(a) | | | 5,666,696 | | |
| | 73,123 | | | Verisk Analytics, Inc. | | | 12,469,665 | | |
| | | | 48,025,718 | | |
| | | | | Road & Rail | | | 0.74 | % | |
| | 260,759 | | | Uber Technologies, Inc.(a) | | | 6,910,113 | | |

The accompanying notes are an integral part of these financial statements.
27
BUFFALO DISCOVERY FUND
(UNAUDITED)
SCHEDULE OF INVESTMENTS
SEPTEMBER 30, 2022 Continued
Shares or Face Amount | | | | $ Fair Value* | |
| | | | | Trading Companies & Distributors | | | 2.56 | % | |
| | 229,853 | | | Fastenal Co. | | | 10,582,432 | | |
| | 111,573 | | | WESCO International, Inc.(a) | | | 13,319,585 | | |
| | | | 23,902,017 | | |
| Total Industrials (Cost $125,257,978) | | | 163,534,585 | | |
Information Technology | | | 33.17 | % | |
| | | | | Communications Equipment | | | 6.26 | % | |
| | 51,817 | | | Arista Networks Inc.(a) | | | 5,849,621 | | |
| | 407,054 | | | Calix, Inc.(a) | | | 24,887,282 | | |
| | 243,191 | | | Ciena Corp.(a) | | | 9,832,212 | | |
| | 68,945 | | | F5 Networks, Inc.(a) | | | 9,978,410 | | |
| | 115,607 | | | Lumentum Holdings, Inc.(a) | | | 7,927,172 | | |
| | | | 58,474,697 | | |
| | | | | Electronic Equipment, Instruments & Components | | | 4.62 | % | |
| | 159,301 | | | Amphenol Corp. — Class A | | | 10,666,795 | | |
| | 112,444 | | | Keysight Technologies, Inc.(a) | | | 17,694,188 | | |
| | 393,334 | | | National Instruments Corp. | | | 14,844,425 | | |
| | | | 43,205,408 | | |
| | | | | IT Services | | | 5.07 | % | |
| | 26,382 | | | EPAM Systems, Inc.(a) | | | 9,555,297 | | |
| | 48,691 | | | FleetCor Technologies, Inc.(a) | | | 8,577,893 | | |
| | 214,672 | | | GoDaddy, Inc. — Class A(a) | | | 15,215,951 | | |
| | 132,692 | | | Shift4 Payments, Inc.(a) | | | 5,919,390 | | |
| | 500,090 | | | TaskUS, Inc.(a) | | | 8,051,449 | | |
| | | | 47,319,980 | | |
| | | | | Semiconductors & Semiconductor Equipment | | | 3.43 | % | |
| | 221,821 | | | Azenta, Inc. | | | 9,507,248 | | |
| | 81,466 | | | Micron Technology, Inc. | | | 4,081,447 | | |
| | 27,366 | | | SolarEdge Technologies, Inc.(a) | | | 6,334,134 | | |
| | 128,492 | | | Universal Display Corp. | | | 12,123,220 | | |
| | | | 32,046,049 | | |

The accompanying notes are an integral part of these financial statements.
28
BUFFALO DISCOVERY FUND
(UNAUDITED)
SCHEDULE OF INVESTMENTS
SEPTEMBER 30, 2022 Continued
Shares or Face Amount | | | | $ Fair Value* | |
| | | | | Software | | | 13.79 | % | |
| | 34,070 | | | Aspen Technology, Inc.(a) | | | 8,115,474 | | |
| | 58,902 | | | Autodesk, Inc.(a) | | | 11,002,894 | | |
| | 572,329 | | | DoubleVerify Holdings, Inc.(a) | | | 15,653,198 | | |
| | 73,870 | | | Guidewire Software, Inc.(a) | | | 4,548,915 | | |
| | 63,978 | | | Palo Alto Networks, Inc.(a) | | | 10,478,957 | | |
| | 137,491 | | | RingCentral, Inc.(a) | | | 5,494,140 | | |
| | 144,504 | | | Splunk, Inc.(a) | | | 10,866,701 | | |
| | 45,310 | | | Synopsys, Inc.(a) | | | 13,842,658 | | |
| | 349,284 | | | Tenable Holdings, Inc.(a) | | | 12,155,083 | | |
| | 223,614 | | | The Trade Desk, Inc. — Class A(a) | | | 13,360,936 | | |
| | 33,113 | | | Tyler Technologies, Inc.(a) | | | 11,506,767 | | |
| | 443,078 | | | Varonis Systems, Inc.(a) | | | 11,750,429 | | |
| | | | 128,776,152 | | |
| Total Information Technology (Cost $317,936,946) | | | 309,822,286 | | |
Materials | | | 3.58 | % | |
| | | | | Chemicals | | | 1.66 | % | |
| | 61,184 | | | Ecolab Inc. | | | 8,836,193 | | |
| | 24,639 | | | Linde PLC — ADR(b) | | | 6,642,428 | | |
| | | | 15,478,621 | | |
| | | | | Construction Materials | | | 1.92 | % | |
| | 55,815 | | | Martin Marietta Materials, Inc. | | | 17,977,454 | | |
| Total Materials (Cost $32,632,983) | | | 33,456,075 | | |
| Total Common Stocks (Cost $865,803,548) | | | 894,434,536 | | |
REITS | | | 1.31 | % | |
Real Estate | | | 1.31 | % | |
| | | | | Equity Real Estate Investment Trusts (REITs) | | | 1.31 | % | |
| | 13,256 | | | Equinix Inc. | | | 7,540,543 | | |
| | 16,295 | | | SBA Communications Corp. | | | 4,638,372 | | |
| Total Real Estate (Cost $13,418,413) | | | 12,178,915 | | |
| Total REITS (Cost $13,418,413) | | | 12,178,915 | | |

The accompanying notes are an integral part of these financial statements.
29
BUFFALO DISCOVERY FUND
(UNAUDITED)
SCHEDULE OF INVESTMENTS
SEPTEMBER 30, 2022 Continued
Shares or Face Amount | | | | $ Fair Value* | |
Short Term Investments | | | 2.91 | % | |
Investment Company | | | 2.91 | % | |
| | 27,195,183 | | | Fidelity Investments Money Market Funds — Government Portfolio — Class I — 2.73%(c) | | | 27,195,183 | | |
Total Investment Company | | | 27,195,183 | | |
| Total Short Term Investments (Cost $27,195,183) | | | 27,195,183 | | |
Total Investments (Cost $906,417,144)
| | | 99.99
933,808,634 | % | |
Other Assets in Excess of Liabilities
| | | 0.01
129,751 | % | |
Total Net Assets
| | | 100.00
933,938,385 | % | |
ADR American Depositary Receipt
PLC Public Limited Company
(a) Non Income Producing.
(b) Foreign Issued Security. The total value of these securities amounted to $52,086,087 (5.58% of net assets) at September 30, 2022.
(c) The rate quoted is the annualized seven-day effective yield as of September 30, 2022.
* See Note 1A of the accompanying Notes to Financial Statements regarding valuation of securities.
The Global Industry Classification Standard (GICS) was developed by and/or is the exclusive property of MSCI, Inc. and Standard & Poor's Financial Services LLC ("S&P"). GICS is a service mark of MSCI and S&P and has been licensed for use by U.S. Bancorp Fund Services, LLC.

The accompanying notes are an integral part of these financial statements.
30
BUFFALO DIVIDEND FOCUS FUND (UNAUDITED)
SCHEDULE OF INVESTMENTS
SEPTEMBER 30, 2022
Shares or Face Amount | | | | $ Fair Value* | |
Common Stocks | | | 80.15 | % | |
Communication Services | | | 5.19 | % | |
| | | | | Diversified Telecommunication Services | | | 0.38 | % | |
| | 10,625 | | | Verizon Communications, Inc. | | | 403,431 | | |
| | | | | Entertainment | | | 1.44 | % | |
| | 10,750 | | | Activision Blizzard, Inc. | | | 799,155 | | |
| | 7,605 | | | The Walt Disney Co.(a) | | | 717,380 | | |
| | | | 1,516,535 | | |
| | | | | Interactive Media & Services | | | 2.74 | % | |
| | 12,600 | | | Alphabet, Inc. — Class A(a) | | | 1,205,190 | | |
| | 13,000 | | | Alphabet, Inc. — Class C(a) | | | 1,249,950 | | |
| | 3,100 | | | Facebook, Inc. — Class A(a) | | | 420,608 | | |
| | | | 2,875,748 | | |
| | | | | Media | | | 0.63 | % | |
| | 22,500 | | | Comcast Corp. — Class A | | | 659,925 | | |
| Total Communication Services (Cost $3,286,636) | | | 5,455,639 | | |
Consumer Discretionary | | | 3.23 | % | |
| | | | | Hotels, Restaurants & Leisure | | | 0.94 | % | |
| | 5,000 | | | Las Vegas Sands Corp(a) | | | 187,600 | | |
| | 9,500 | | | Starbucks Corp. | | | 800,470 | | |
| | | | 988,070 | | |
| | | | | Internet & Direct Marketing Retail | | | 1.18 | % | |
| | 11,000 | | | Amazon.com, Inc.(a) | | | 1,243,000 | | |
| | | | | Specialty Retail | | | 1.11 | % | |
| | 4,225 | | | The Home Depot, Inc. | | | 1,165,847 | | |
| Total Consumer Discretionary (Cost $1,757,399) | | | 3,396,917 | | |
Consumer Staples | | | 4.14 | % | |
| | | | | Beverages | | | 1.61 | % | |
| | 5,550 | | | PepsiCo, Inc. | | | 906,093 | | |
| | 63,000 | | | Primo Water Corporation — ADR(b) | | | 790,650 | | |
| | | | 1,696,743 | | |
| | | | | Food & Staples Retailing | | | 0.43 | % | |
| | 3,450 | | | Walmart, Inc. | | | 447,465 | | |

The accompanying notes are an integral part of these financial statements.
31
BUFFALO DIVIDEND FOCUS FUND (UNAUDITED)
SCHEDULE OF INVESTMENTS
SEPTEMBER 30, 2022 Continued
Shares or Face Amount | | | | $ Fair Value* | |
| | | | | Food Products | | | 1.41 | % | |
| | 9,000 | | | Lamb Weston Holdings, Inc. | | | 696,420 | | |
| | 11,900 | | | Tyson Foods, Inc. | | | 784,567 | | |
| | | | 1,480,987 | | |
| | | | | Household Products | | | 0.69 | % | |
| | 5,725 | | | The Procter & Gamble Co. | | | 722,781 | | |
| Total Consumer Staples (Cost $3,419,962) | | | 4,347,976 | | |
Energy | | | 12.46 | % | |
| | | | | Oil, Gas & Consumable Fuels | | | 12.46 | % | |
| | 162,600 | | | Energy Transfer Equity, L.P. | | | 1,793,478 | | |
| | 46,650 | | | Enterprise Products Partners L.P. | | | 1,109,337 | | |
| | 17,200 | | | Enviva, Inc. | | | 1,033,032 | | |
| | 9,875 | | | Hess Corp. | | | 1,076,276 | | |
| | 12,126 | | | Marathon Petroleum Corp. | | | 1,204,476 | | |
| | 63,400 | | | Northern Oil and Gas, Inc. | | | 1,737,794 | | |
| | 7,900 | | | Valero Energy Corp. | | | 844,115 | | |
| | 150,000 | | | Viper Energy Partners LP | | | 4,299,000 | | |
| Total Energy (Cost $6,644,759) | | | 13,097,508 | | |
Financials | | | 13.04 | % | |
| | | | | Banks | | | 6.06 | % | |
| | 52,200 | | | Bank of America Corp. | | | 1,576,440 | | |
| | 24,375 | | | Citigroup, Inc. | | | 1,015,706 | | |
| | 40,750 | | | Citizens Financial Group, Inc. | | | 1,400,170 | | |
| | 10,825 | | | JPMorgan Chase & Co. | | | 1,131,213 | | |
| | 28,600 | | | Truist Financial Corp. | | | 1,245,244 | | |
| | | | 6,368,773 | | |
| | | | | Capital Markets | | | 3.33 | % | |
| | 1,100 | | | BlackRock, Inc. | | | 605,308 | | |
| | 4,025 | | | CME Group, Inc. | | | 712,948 | | |
| | 7,136 | | | S&P Global, Inc. | | | 2,178,978 | | |
| | | | 3,497,234 | | |
| | | | | Diversified Financial Services | | | 1.76 | % | |
| | 118,100 | | | Burford Capital Ltd. — ADR(b) | | | 885,750 | | |
| | 27,000 | | | Compass Diversified Holdings | | | 487,620 | | |
| | 4,400 | | | Global Payments Inc. | | | 475,420 | | |
| | | | 1,848,790 | | |

The accompanying notes are an integral part of these financial statements.
32
BUFFALO DIVIDEND FOCUS FUND (UNAUDITED)
SCHEDULE OF INVESTMENTS
SEPTEMBER 30, 2022 Continued
Shares or Face Amount | | | | $ Fair Value* | |
| | | | | Insurance | | | 1.89 | % | |
| | 11,575 | | | Arthur J. Gallagher & Co. | | | 1,981,871 | | |
| Total Financials (Cost $9,276,471) | | | 13,696,668 | | |
Health Care | | | 15.78 | % | |
| | | | | Biotechnology | | | 1.46 | % | |
| | 24,700 | | | Horizon Therapeutics Plc — ADR(a) (b) | | | 1,528,683 | | |
| | | | | Health Care Equipment & Supplies | | | 2.08 | % | |
| | 10,000 | | | Abbott Laboratories | | | 967,600 | | |
| | 11,600 | | | Baxter International, Inc. | | | 624,776 | | |
| | 7,400 | | | Medtronic, PLC — ADR(b) | | | 597,550 | | |
| | | | 2,189,926 | | |
| | | | | Health Care Providers & Services | | | 9.36 | % | |
| | 3,375 | | | Anthem, Inc. | | | 1,533,060 | | |
| | 32,900 | | | CVS Health Corp. | | | 3,137,673 | | |
| | 8,100 | | | HCA Healthcare, Inc. | | | 1,488,699 | | |
| | 2,500 | | | McKesson Corp. | | | 849,675 | | |
| | 5,600 | | | UnitedHealth Group, Inc. | | | 2,828,224 | | |
| | | | 9,837,331 | | |
| | | | | Pharmaceuticals | | | 2.88 | % | |
| | 3,150 | | | Eli Lilly & Co. | | | 1,018,552 | | |
| | 7,125 | | | Johnson & Johnson | | | 1,163,940 | | |
| | 9,800 | | | Merck & Co., Inc. | | | 843,976 | | |
| | | | 3,026,468 | | |
| Total Health Care (Cost $10,043,378) | | | 16,582,408 | | |
Industrials | | | 4.09 | % | |
| | | | | Aerospace & Defense | | | 0.35 | % | |
| | 3,025 | | | The Boeing Co.(a) | | | 366,267 | | |
| | | | | Commercial Services & Supplies | | | 1.04 | % | |
| | 2,800 | | | Cintas Corp. | | | 1,086,932 | | |
| | | | | Electrical Equipment | | | 0.27 | % | |
| | 2,500 | | | AMETEK, Inc. | | | 283,525 | | |
| | | | | Industrial Conglomerates | | | 0.55 | % | |
| | 3,450 | | | Honeywell International, Inc. | | | 576,046 | | |

The accompanying notes are an integral part of these financial statements.
33
BUFFALO DIVIDEND FOCUS FUND (UNAUDITED)
SCHEDULE OF INVESTMENTS
SEPTEMBER 30, 2022 Continued
Shares or Face Amount | | | | $ Fair Value* | |
| | | | | Machinery | | | 0.91 | % | |
| | 3,950 | | | Parker-Hannifin Corp. | | | 957,125 | | |
| | | | | Professional Services | | | 0.52 | % | |
| | 3,200 | | | Equifax, Inc. | | | 548,576 | | |
| | | | | Trading Companies & Distributors | | | 0.45 | % | |
| | 10,300 | | | Fastenal Co. | | | 474,212 | | |
| Total Industrials (Cost $2,943,278) | | | 4,292,683 | | |
Information Technology | | | 15.46 | % | |
| | | | | Communications Equipment | | | 0.67 | % | |
| | 17,750 | | | Cisco Systems, Inc. | | | 710,000 | | |
| | | | | IT Services | | | 4.25 | % | |
| | 7,700 | | | International Business Machines Corp. | | | 914,837 | | |
| | 4,400 | | | MasterCard, Inc. — Class A | | | 1,251,096 | | |
| | 12,925 | | | Visa Inc. — Class A | | | 2,296,126 | | |
| | | | 4,462,059 | | |
| | | | | Semiconductors & Semiconductor Equipment | | | 1.41 | % | |
| | 9,075 | | | QUALCOMM, Inc. | | | 1,025,294 | | |
| | 2,950 | | | Texas Instruments, Inc. | | | 456,601 | | |
| | | | 1,481,895 | | |
| | | | | Software | | | 5.04 | % | |
| | 50,100 | | | Absolute Software Corp. — ADR(b) | | | 581,661 | | |
| | 18,650 | | | Microsoft Corp. | | | 4,343,585 | | |
| | 7,700 | | | SS&C Technologies Holdings, Inc. | | | 367,675 | | |
| | | | 5,292,921 | | |
| | | | | Technology Hardware, Storage & Peripherals | | | 4.09 | % | |
| | 31,080 | | | Apple Inc. | | | 4,295,256 | | |
| Total Information Technology (Cost $6,766,084) | | | 16,242,131 | | |
Materials | | | 1.59 | % | |
| | | | | Construction Materials | | | 0.77 | % | |
| | 10,000 | | | CRH PLC — ADR(b) | | | 322,300 | | |
| | 1,500 | | | Martin Marietta Materials, Inc. | | | 483,135 | | |
| | | | 805,435 | | |

The accompanying notes are an integral part of these financial statements.
34
BUFFALO DIVIDEND FOCUS FUND (UNAUDITED)
SCHEDULE OF INVESTMENTS
SEPTEMBER 30, 2022 Continued
Shares or Face Amount | | | | $ Fair Value* | |
| | | | | Containers & Packaging | | | 0.82 | % | |
| | 43,700 | | | Graphic Packaging Holding Co. | | | 862,638 | | |
| Total Materials (Cost $1,579,696) | | | 1,668,073 | | |
Utilities | | | 5.17 | % | |
| | | | | Electric Utilities | | | 3.52 | % | |
| | 15,700 | | | American Electric Power Co., Inc. | | | 1,357,265 | | |
| | 30,550 | | | Edison International | | | 1,728,519 | | |
| | 49,300 | | | PG&E Corp.(a) | | | 616,250 | | |
| | | | 3,702,034 | | |
| | | | | Independent Power and Renewable Electricity Producers | | | 0.78 | % | |
| | 39,000 | | | Vistra Corp. | | | 819,000 | | |
| | | | | Multi-Utilities | | | 0.87 | % | |
| | 6,100 | | | Sempra Energy | | | 914,634 | | |
| Total Utilities (Cost $5,098,787) | | | 5,435,668 | | |
| Total Common Stocks (Cost $50,816,450) | | | 84,215,671 | | |
REITS | | | 2.32 | % | |
Real Estate | | | 2.32 | % | |
| | | | | Equity Real Estate Investment Trusts (REITs) | | | 2.32 | % | |
| | 3,200 | | | American Tower Corp. | | | 687,040 | | |
| | 19,106 | | | Community Healthcare Trust, Inc. | | | 625,721 | | |
| | 5,000 | | | Digital Realty Trust, Inc. | | | 495,900 | | |
| | 1,100 | | | Equinix Inc. | | | 625,724 | | |
| Total Real Estate (Cost $2,014,132) | | | 2,434,385 | | |
| Total REITS (Cost $2,014,132) | | | 2,434,385 | | |
Convertible Preferred Stocks | | | 0.99 | % | |
Health Care | | | 0.99 | % | |
| | | | | Pharmaceuticals | | | 0.99 | % | |
| | 50,000 | | | Elanco Animal Health, Inc.
5.000%, 02/01/2023 | | | 1,045,500 | | |
| Total Health Care (Cost $2,429,605) | | | 1,045,500 | | |
| Total Convertible Preferred Stocks (Cost $2,429,605) | | | 1,045,500 | | |

The accompanying notes are an integral part of these financial statements.
35
BUFFALO DIVIDEND FOCUS FUND (UNAUDITED)
SCHEDULE OF INVESTMENTS
SEPTEMBER 30, 2022 Continued
Shares or Face Amount | | | | $ Fair Value* | |
Preferred Stocks | | | 0.35 | % | |
Financials | | | 0.35 | % | |
| | | | | Diversified Financial Services | | | 0.35 | % | |
| | 15,000 | | | Compass Diversified Holdings
7.875%, 01/30/2025(e) | | | 370,200 | | |
| Total Financials (Cost $349,499) | | | 370,200 | | |
| Total Preferred Stocks (Cost $349,499) | | | 370,200 | | |
Convertible Bonds | | | 5.58 | % | |
Consumer Discretionary | | | 1.01 | % | |
| | | | | Hotels, Restaurants & Leisure | | | 1.01 | % | �� |
| | 1,000,000 | | | Royal Caribbean Cruises Ltd.
6.000%, 08/15/2025(b) (c) | | | 1,058,500 | | |
| Total Consumer Discretionary (Cost $1,000,000) | | | 1,058,500 | | |
Health Care | | | 2.24 | % | |
| | | | | Biotechnology | | | 2.24 | % | |
| | 300,000 | | | Apellis Pharmaceuticals, Inc.
3.500%, 09/15/2026 | | | 586,206 | | |
| | 100,000 | | | Exact Sciences Corp.
0.375%, 03/15/2027 | | | 69,685 | | |
| | 750,000 | | | 0.375%, 03/01/2028 | | | 478,125 | | |
| | 600,000 | | | PTC Therapeutics, Inc.
1.500%, 09/15/2026 | | | 705,900 | | |
| | 500,000 | | | Travere Therapeutics, Inc.
2.250%, 03/01/2029 | | | 511,250 | | |
| Total Health Care (Cost $2,253,565) | | | 2,351,166 | | |
Industrials | | | 0.82 | % | |
| | | | | Airlines | | | 0.82 | % | |
| | 750,000 | | | Southwest Airlines Co.
1.250%, 05/01/2025 | | | 858,938 | | |
| Total Industrials (Cost $750,000) | | | 858,938 | | |

The accompanying notes are an integral part of these financial statements.
36
BUFFALO DIVIDEND FOCUS FUND (UNAUDITED)
SCHEDULE OF INVESTMENTS
SEPTEMBER 30, 2022 Continued
Shares or Face Amount | | | | $ Fair Value* | |
Information Technology | | | 1.51 | % | |
| | | | | Communications Equipment | | | 0.67 | % | |
| | 750,000 | | | Lumentum Holdings, Inc.
0.500%, 12/15/2026 | | | 703,125 | | |
| | | | | Software | | | 0.84 | % | |
| | 500,000 | | | Cerence, Inc.
3.000%, 06/01/2025 | | | 436,936 | | |
| | 500,000 | | | Guidewire Software, Inc.
1.250%, 03/15/2025 | | | 451,000 | | |
| | | | 887,936 | | |
| Total Information Technology (Cost $1,759,991) | | | 1,591,061 | | |
| Total Convertible Bonds (Cost $5,763,556) | | | 5,859,665 | | |
Short Term Investments | | | 10.56 | % | |
Investment Companies | | | 10.56 | % | |
| | 10,593,068 | | | Fidelity Investments Money Market Funds — Government Portfolio — Class I — 2.73%(d) | | | 10,593,068 | | |
| | 505,547 | | | Invesco Treasury Portfolio | | | 505,547 | | |
Total Investment Companies | | | 11,098,615 | | |
| Total Short Term Investments (Cost $11,098,615) | | | 11,098,615 | | |
Total Investments (Cost $72,471,857)
| | | 99.95
105,024,036 | % | |
Other Assets in Excess of Liabilities
| | | 0.05
52,475 | % | |
Total Net Assets
| | | 100.00
105,076,511 | % | |

The accompanying notes are an integral part of these financial statements.
37
BUFFALO DIVIDEND FOCUS FUND (UNAUDITED)
SCHEDULE OF INVESTMENTS
SEPTEMBER 30, 2022 Continued
ADR American Depositary Receipt
PLC Public Limited Company
(a) Non Income Producing
(b) Foreign Issued Security. The total value of these securities amounted to $5,765,094 (5.49% of net assets) at September 30, 2022.
(c) Illiquid Security. The total value of these securities amounted to $1,058,500 (1.01% of net assets) at September 30, 2022.
(d) The rate quoted is the annualized seven-day effective yield as of September 30, 2022.
(e) Callable at any dividend payment date on or after date disclosed.
* See Note 1A of the accompanying Notes to Financial Statements regarding valuation of securities.
The Global Industry Classification Standard (GICS) was developed by and/or is the exclusive property of MSCI, Inc. and Standard & Poor's Financial Services LLC ("S&P"). GICS is a service mark of MSCI and S&P and has been licensed for use by U.S. Bancorp Fund Services, LLC.

The accompanying notes are an integral part of these financial statements.
38
BUFFALO EARLY STAGE GROWTH FUND (UNAUDITED)
SCHEDULE OF INVESTMENTS
SEPTEMBER 30, 2022
Shares or Face Amount | | | | $ Fair Value* | |
Common Stocks | | | 96.13 | % | |
Consumer Discretionary | | | 14.26 | % | |
| | | | | Auto Components | | | 0.54 | % | |
| | 110,000 | | | Holley, Inc.(a) | | | 445,500 | | |
| | | | | Diversified Consumer Services | | | 1.21 | % | |
| | 120,300 | | | OneSpaWorld Holdings Ltd. — ADR(a) (b) | | | 1,010,520 | | |
| | | | | Hotels, Restaurants & Leisure | | | 5.10 | % | |
| | 187,800 | | | Accel Entertainment, Inc.(a) | | | 1,466,718 | | |
| | 247,200 | | | Playa Hotels & Resorts N.V. — ADR(a) (b) | | | 1,438,704 | | |
| | 140,300 | | | Rush Street Interactive, Inc.(a) | | | 516,304 | | |
| | 65,374 | | | Target Hospitality Corp.(a) | | | 825,020 | | |
| | | | 4,246,746 | | |
| | | | | Household Durables | | | 2.17 | % | |
| | 13,900 | | | LGI Homes, Inc.(a) | | | 1,131,043 | | |
| | 33,100 | | | Lovesac Co/The(a) | | | 674,578 | | |
| | | | 1,805,621 | | |
| | | | | Internet & Direct Marketing Retail | | | 2.89 | % | |
| | 65,950 | | | Lulu's Fashion Lounge Holdings, Inc.(a) | | | 307,327 | | |
| | 36,900 | | | Overstock.com, Inc.(a) | | | 898,515 | | |
| | 23,900 | | | Shutterstock, Inc. | | | 1,199,063 | | |
| | | | 2,404,905 | | |
| | | | | Leisure Products | | | 1.53 | % | |
| | 26,600 | | | Malibu Boats, Inc. — Class A(a) | | | 1,276,534 | | |
| | | | | Specialty Retail | | | 0.82 | % | |
| | 20,100 | | | Sleep Number Corp.(a) | | | 679,581 | | |
| Total Consumer Discretionary (Cost $16,576,498) | | | 11,869,407 | | |
Consumer Staples | | | 2.98 | % | |
| | | | | Food Products | | | 2.98 | % | |
| | 130,000 | | | Real Good Food Co Inc/The(a) | | | 839,800 | | |
| | 180,000 | | | SunOpta, Inc. — ADR(a) (b) | | | 1,638,000 | | |
| Total Consumer Staples (Cost $3,507,704) | | | 2,477,800 | | |

The accompanying notes are an integral part of these financial statements.
39
BUFFALO EARLY STAGE GROWTH FUND
(UNAUDITED)
SCHEDULE OF INVESTMENTS
SEPTEMBER 30, 2022 Continued
Shares or Face Amount | | | | $ Fair Value* | |
Financials | | | 8.98 | % | |
| | | | | Capital Markets | | | 3.14 | % | |
| | 21,985 | | | Hamilton Lane Inc. — Class A | | | 1,310,526 | | |
| | 162,100 | | | Open Lending Corp.(a) | | | 1,303,284 | | |
| | | | 2,613,810 | | |
| | | | | Diversified Financial Services | | | 2.47 | % | |
| | 113,700 | | | Compass Diversified Holdings | | | 2,053,422 | | |
| | | | | Insurance | | | 3.37 | % | |
| | 11,000 | | | Kinsale Capital Group, Inc. | | | 2,809,620 | | |
| Total Financials (Cost $4,960,087) | | | 7,476,852 | | |
Health Care | | | 16.88 | % | |
| | | | | Biotechnology | | | 1.26 | % | |
| | 40,100 | | | Castle Biosciences, Inc.(a) | | | 1,045,808 | | |
| | | | | Health Care Equipment & Supplies | | | 7.66 | % | |
| | 58,800 | | | BioLife Solutions, Inc.(a) | | | 1,337,700 | | |
| | 29,700 | | | Establishment Labs Holdings, Inc. — ADR(a) (b) | | | 1,621,917 | | |
| | 133,000 | | | Lucid Diagnostics, Inc.(a) | | | 203,490 | | |
| | 28,490 | | | OrthoPediatrics Corp.(a) | | | 1,314,529 | | |
| | 33,610 | | | Paragon 28, Inc.(a) | | | 598,930 | | |
| | 18,375 | | | STAAR Surgical Co.(a) | | | 1,296,356 | | |
| | | | 6,372,922 | | |
| | | | | Health Care Providers & Services | | | 1.80 | % | |
| | 85,000 | | | AirSculpt Technologies, Inc.(a) | | | 546,550 | | |
| | 5,800 | | | LHC Group, Inc.(a) | | | 949,228 | | |
| | | | 1,495,778 | | |
| | | | | Health Care Technology | | | 4.36 | % | |
| | 67,100 | | | HealthStream, Inc.(a) | | | 1,426,546 | | |
| | 5,200 | | | Inspire Medical Systems, Inc.(a) | | | 922,324 | | |
| | 14,700 | | | Omnicell, Inc.(a) | | | 1,279,341 | | |
| | | | 3,628,211 | | |
| | | | | Pharmaceuticals | | | 1.80 | % | |
| | 690,000 | | | Societal CDMO, Inc.(a) | | | 1,124,700 | | |
| | 129,251 | | | Verrica Pharmaceuticals, Inc.(a) | | | 377,413 | | |
| | | | 1,502,113 | | |
| Total Health Care (Cost $13,109,432) | | | 14,044,832 | | |

The accompanying notes are an integral part of these financial statements.
40
BUFFALO EARLY STAGE GROWTH FUND
(UNAUDITED)
SCHEDULE OF INVESTMENTS
SEPTEMBER 30, 2022 Continued
Shares or Face Amount | | | | $ Fair Value* | |
Industrials | | | 29.20 | % | |
| | | | | Aerospace & Defense | | | 2.80 | % | |
| | 80,000 | | | Cadre Holdings, Inc. | | | 1,924,800 | | |
| | 40,000 | | | Kratos Defense & Security Solutions, Inc.(a) | | | 406,400 | | |
| | | | 2,331,200 | | |
| | | | | Air Freight & Logistics | | | 2.29 | % | |
| | 79,100 | | | Air Transport Services Group, Inc.(a) | | | 1,905,519 | | |
| | | | | Building Products | | | 4.98 | % | |
| | 13,000 | | | Advanced Drainage Systems, Inc. | | | 1,616,810 | | |
| | 29,400 | | | Apogee Enterprises, Inc. | | | 1,123,668 | | |
| | 32,100 | | | Patrick Industries, Inc. | | | 1,407,264 | | |
| | | | 4,147,742 | | |
| | | | | Construction & Engineering | | | 4.97 | % | |
| | 95,000 | | | Bowman Consulting Group Ltd.(a) | | | 1,387,000 | | |
| | 22,200 | | | NV5 Global, Inc.(a) | | | 2,748,804 | | |
| | | | 4,135,804 | | |
| | | | | Machinery | | | 5.63 | % | |
| | 60,400 | | | Federal Signal Corporation | | | 2,254,128 | | |
| | 160,000 | | | Hillman Solutions Corp.(a) | | | 1,206,400 | | |
| | 46,000 | | | Kornit Digital Ltd. — ADR(a) (b) | | | 1,224,060 | | |
| | | | 4,684,588 | | |
| | | | | Professional Services | | | 4.18 | % | |
| | 21,100 | | | ICF International, Inc. | | | 2,300,322 | | |
| | 79,400 | | | Willdan Group, Inc.(a) | | | 1,175,914 | | |
| | | | 3,476,236 | | |
| | | | | Trading Companies & Distributors | | | 4.35 | % | |
| | 30,600 | | | Transcat, Inc.(a) | | | 2,316,114 | | |
| | 57,510 | | | Univar Inc.(a) | | | 1,307,777 | | |
| | | | 3,623,891 | | |
| Total Industrials (Cost $21,009,966) | | | 24,304,980 | | |
Information Technology | | | 22.95 | % | |
| | | | | Communications Equipment | | | 2.74 | % | |
| | 37,300 | | | Calix, Inc.(a) | | | 2,280,522 | | |
| | | | | Electronic Equipment, Instruments & Components | | | 0.48 | % | |
| | 42,800 | | | nLight, Inc.(a) | | | 404,460 | | |

The accompanying notes are an integral part of these financial statements.
41
BUFFALO EARLY STAGE GROWTH FUND
(UNAUDITED)
SCHEDULE OF INVESTMENTS
SEPTEMBER 30, 2022 Continued
Shares or Face Amount | | | | $ Fair Value* | |
| | | | | IT Services | | | 9.09 | % | |
| | 59,700 | | | BigCommerce Holdings, Inc.(a) | | | 883,560 | | |
| | 101,900 | | | i3 Verticals, Inc. — Class A(a) | | | 2,041,057 | | |
| | 348,600 | | | Paya Holdings, Inc.(a) | | | 2,129,946 | | |
| | 29,000 | | | Teradata Corp.(a) | | | 900,740 | | |
| | 104,600 | | | Verra Mobility Corp.(a) | | | 1,607,702 | | |
| | | | 7,563,005 | | |
| | | | | Semiconductors & Semiconductor Equipment | | | 1.37 | % | |
| | 35,000 | | | MaxLinear, Inc.(a) | | | 1,141,700 | | |
| | | | | Software | | | 9.27 | % | |
| | 175,900 | | | 8x8, Inc.(a) | | | 606,855 | | |
| | 190,100 | | | Absolute Software Corp. — ADR(b) | | | 2,207,061 | | |
| | 45,900 | | | Cerence, Inc.(a) | | | 722,925 | | |
| | 28,500 | | | CoreCard Corp.(a) | | | 620,445 | | |
| | 7,100 | | | CyberArk Software Ltd. — ADR(a) (b) | | | 1,064,574 | | |
| | 27,005 | | | Envestnet, Inc.(a) | | | 1,199,022 | | |
| | 48,700 | | | Varonis Systems, Inc.(a) | | | 1,291,524 | | |
| | | | 7,712,406 | | |
| Total Information Technology (Cost $21,769,578) | | | 19,102,093 | | |
Materials | | | 0.88 | % | |
| | | | | Chemicals | | | 0.88 | % | |
| | 45,000 | | | Element Solutions, Inc. | | | 732,150 | | |
| Total Materials (Cost $921,425) | | | 732,150 | | |
| Total Common Stocks (Cost $81,854,690) | | | 80,008,114 | | |
REITS | | | 2.11 | % | |
Real Estate | | | 2.11 | % | |
| | | | | Equity Real Estate Investment Trusts (REITs) | | | 2.11 | % | |
| | 53,600 | | | Community Healthcare Trust, Inc. | | | 1,755,400 | | |
| Total Real Estate (Cost $1,340,664) | | | 1,755,400 | | |
| Total REITS (Cost $1,340,664) | | | 1,755,400 | | |

The accompanying notes are an integral part of these financial statements.
42
BUFFALO EARLY STAGE GROWTH FUND
(UNAUDITED)
SCHEDULE OF INVESTMENTS
SEPTEMBER 30, 2022 Continued
Shares or Face Amount | | | | $ Fair Value* | |
Warrants | | | 0.18 | % | |
| | | Internet & Direct Marketing Retail | | | 0.18 | % | |
| | 1,200,000 | | | 1847 Goedeker, Inc.(a) (c) | | | 150,000 | | |
| Total Warrants (Cost $577,170) | | | 150,000 | | |
Short Term Investments | | | 1.68 | % | |
Investment Company | | | 1.68 | % | |
| | 1,395,348 | | | Fidelity Investments Money Market Funds — Government Portfolio — Class I — 2.73%(d) | | | 1,395,348 | | |
Total Investment Company | | | 1,395,348 | | |
| Total Short Term Investments (Cost $1,395,348) | | | 1,395,348 | | |
| Total Investments (Cost $85,167,872) | | | 100.10
83,308,862 | % | |
Liabilities in Excess of Other Assets | | | (0.10
(87,018) | )% | |
Total Net Assets | | | 100.00
83,221,844 | % | |
ADR American Depositary Receipt
PLC Public Limited Company
(a) Non Income Producing.
(b) Foreign Issued Securities. The total value of these securities amounted to $10,204,836 (12.26% of net assets) at September 30, 2022.
(c) Illiquid Security. The total value of these securities amounted to $150,000 (0.18% of net assets) at September 30, 2022.
(d) The rate quoted is the annualized seven-day effective yield as of September 30, 2022.
* See Note 1A of the accompanying Notes to Financial Statements regarding valuation of securities.
The Global Industry Classification Standard (GICS) was developed by and/or is the exclusive property of MSCI, Inc. and Standard & Poor's Financial Services LLC ("S&P"). GICS is a service mark of MSCI and S&P and has been licensed for use by U.S. Bancorp Fund Services, LLC.

The accompanying notes are an integral part of these financial statements.
43
BUFFALO FLEXIBLE INCOME FUND (UNAUDITED)
SCHEDULE OF INVESTMENTS
SEPTEMBER 30, 2022
Shares or Face Amount | | | | $ Fair Value | |
Common Stocks | | | 96.65 | % | |
Communication Services | | | 3.47 | % | |
| | | | | Diversified Telecommunication Services | | | 2.64 | % | |
| | 303,000 | | | AT&T, Inc. | | | 4,648,020 | | |
| | 175,000 | | | Verizon Communications, Inc. | | | 6,644,750 | | |
| | | | 11,292,770 | | |
| | | | | Entertainment | | | 0.83 | % | |
| | 140,000 | | | Lions Gate Entertainment Corp. — Class A — ADR(a) (b) | | | 1,040,200 | | |
| | 230,000 | | | Lions Gate Entertainment Corp. — Class B — ADR(a) (b) | | | 1,598,500 | | |
| | 80,000 | | | Warner Bros Discovery, Inc.(a) | | | 920,000 | | |
| | | | 3,558,700 | | |
| Total Communication Services (Cost $23,392,985) | | | 14,851,470 | | |
Consumer Staples | | | 19.87 | % | |
| | | | | Beverages | | | 5.02 | % | |
| | 80,000 | | | PepsiCo, Inc. | | | 13,060,800 | | |
| | 150,000 | | | The Coca Cola Co.(c) | | | 8,403,000 | | |
| | | | 21,463,800 | | |
| | | | | Food & Staples Retailing | | | 3.31 | % | |
| | 30,000 | | | Costco Wholesale Corp. | | | 14,168,100 | | |
| | | | | Food Products | | | 5.23 | % | |
| | 150,000 | | | B&G Foods, Inc. | | | 2,473,500 | | |
| | 89,000 | | | ConAgra Foods, Inc. | | | 2,904,070 | | |
| | 150,000 | | | General Mills, Inc. | | | 11,491,500 | | |
| | 60,000 | | | Kellogg Co. | | | 4,179,600 | | |
| | 40,000 | | | The Kraft Heinz Co. | | | 1,334,000 | | |
| | | | 22,382,670 | | |
| | | | | Household Products | | | 5.97 | % | |
| | 25,000 | | | Colgate-Palmolive Co. | | | 1,756,250 | | |
| | 70,000 | | | Kimberly-Clark Corp. | | | 7,877,800 | | |
| | 50,000 | | | The Clorox Co. | | | 6,419,500 | | |
| | 75,000 | | | The Procter & Gamble Co. | | | 9,468,750 | | |
| | | | 25,522,300 | | |
| | | | | Personal Products | | | 0.34 | % | |
| | 235,000 | | | Haleon Plc — ADR(b) | | | 1,431,150 | | |
| Total Consumer Staples (Cost $41,435,393) | | | 84,968,020 | | |

The accompanying notes are an integral part of these financial statements.
44
BUFFALO FLEXIBLE INCOME FUND (UNAUDITED)
SCHEDULE OF INVESTMENTS
SEPTEMBER 30, 2022 Continued
Shares or Face Amount | | | | $ Fair Value | |
Energy | | | 27.86 | % | |
| | | | | Energy Equipment & Services | | | 1.68 | % | |
| | 200,000 | | | Schlumberger Ltd. — ADR(b) | | | 7,180,000 | | |
| | | | | Oil, Gas & Consumable Fuels | | | 26.18 | % | |
| | 400,000 | | | APA Corp. | | | 13,676,000 | | |
| | 125,000 | | | Chevron Corp. | | | 17,958,750 | | |
| | 175,000 | | | ConocoPhillips | | | 17,909,500 | | |
| | 140,000 | | | Delek Logistics Partners LP | | | 7,131,600 | | |
| | 165,000 | | | Exxon Mobil Corp. | | | 14,406,150 | | |
| | 155,000 | | | Hess Corp. | | | 16,893,450 | | |
| | 70,000 | | | HF Sinclair Corp. | | | 3,768,800 | | |
| | 560,000 | | | Kinder Morgan, Inc. | | | 9,318,400 | | |
| | 85,000 | | | Marathon Petroleum Corp. | | | 8,443,050 | | |
| | 88,000 | | | Suncor Energy, Inc. — ADR(b) | | | 2,477,200 | | |
| | | | 111,982,900 | | |
| Total Energy (Cost $70,465,152) | | | 119,162,900 | | |
Financials | | | 8.78 | % | |
| | | | | Banks | | | 3.01 | % | |
| | 108,850 | | | Citizens Financial Group, Inc. | | | 3,740,086 | | |
| | 209,720 | | | Truist Financial Corp. | | | 9,131,208 | | |
| | | | 12,871,294 | | |
| | | | | Insurance | | | 5.77 | % | |
| | 75,000 | | | Arthur J. Gallagher & Co. | | | 12,841,500 | | |
| | 95,000 | | | The Allstate Corp. | | | 11,830,350 | | |
| | | | 24,671,850 | | |
| Total Financials (Cost $18,683,162) | | | 37,543,144 | | |
Health Care | | | 16.51 | % | |
| | | | | Biotechnology | | | 1.44 | % | |
| | 100,000 | | | Gilead Sciences, Inc. | | | 6,169,000 | | |
| | | | | Health Care Equipment & Supplies | | | 2.83 | % | |
| | 75,000 | | | Abbott Laboratories | | | 7,257,000 | | |
| | 90,000 | | | Baxter International, Inc. | | | 4,847,400 | | |
| | | | 12,104,400 | | |

The accompanying notes are an integral part of these financial statements.
45
BUFFALO FLEXIBLE INCOME FUND (UNAUDITED)
SCHEDULE OF INVESTMENTS
SEPTEMBER 30, 2022 Continued
Shares or Face Amount | | | | $ Fair Value | |
| | | | | Pharmaceuticals | | | 12.24 | % | |
| | 15,000 | | | Bristol-Myers Squibb Co. | | | 1,066,350 | | |
| | 45,000 | | | Eli Lilly & Co. | | | 14,550,750 | | |
| | 182,000 | | | GlaxoSmithKline PLC — ADR(b) | | | 5,356,260 | | |
| | 75,000 | | | Johnson & Johnson | | | 12,252,000 | | |
| | 80,000 | | | Merck & Co., Inc. | | | 6,889,600 | | |
| | 270,000 | | | Pfizer Inc. | | | 11,815,200 | | |
| | 50,000 | | | Viatris, Inc. | | | 426,000 | | |
| | | | 52,356,160 | | |
| Total Health Care (Cost $34,226,613) | | | 70,629,560 | | |
Industrials | | | 3.45 | % | |
| | | | | Commercial Services & Supplies | | | 2.85 | % | |
| | 429,000 | | | Pitney Bowes Inc. | | | 999,570 | | |
| | 70,000 | | | Waste Management, Inc. | | | 11,214,700 | | |
| | | | 12,214,270 | | |
| | | | | Electrical Equipment | | | 0.60 | % | |
| | 100,000 | | | ABB Ltd. — ADR(b) | | | 2,566,000 | | |
| Total Industrials (Cost $6,985,590) | | | 14,780,270 | | |
Information Technology | | | 14.36 | % | |
| | | | | Communications Equipment | | | 1.64 | % | |
| | 175,000 | | | Cisco Systems, Inc. | | | 7,000,000 | | |
| | | | | IT Services | | | 1.97 | % | |
| | 70,000 | | | International Business Machines Corp. | | | 8,316,700 | | |
| | 12,000 | | | Kyndryl Holdings, Inc.(a) | | | 99,240 | | |
| | | | 8,415,940 | | |
| | | | | Semiconductors & Semiconductor Equipment | | | 3.40 | % | |
| | 170,000 | | | Intel Corp. | | | 4,380,900 | | |
| | 90,000 | | | QUALCOMM, Inc. | | | 10,168,200 | | |
| | | | 14,549,100 | | |
| | | | | Software | | | 7.35 | % | |
| | 135,000 | | | Microsoft Corp. | | | 31,441,500 | | |
| Total Information Technology (Cost $24,137,848) | | | 61,406,540 | | |

The accompanying notes are an integral part of these financial statements.
46
BUFFALO FLEXIBLE INCOME FUND (UNAUDITED)
SCHEDULE OF INVESTMENTS
SEPTEMBER 30, 2022 Continued
Shares or Face Amount | | | | $ Fair Value | |
Materials | | | 2.35 | % | |
| | | | | Chemicals | | | 1.18 | % | |
| | 115,000 | | | Dow Inc. | | | 5,051,950 | | |
| | | | | Metals & Mining | | | 1.17 | % | |
| | 15,000 | | | BHP Billiton Ltd. — ADR(b) | | | 750,600 | | |
| | 110,000 | | | Cleveland-Cliffs, Inc.(a) | | | 1,481,700 | | |
| | 50,000 | | | Rio Tinto PLC — ADR(b) | | | 2,753,000 | | |
| | | | 4,985,300 | | |
| Total Materials (Cost $9,666,711) | | | 10,037,250 | | |
| Total Common Stocks (Cost $228,993,454) | | | 413,379,154 | | |
REITS | | | 1.98 | % | |
Real Estate | | | 1.98 | % | |
| | | | | Equity Real Estate Investment Trusts (REITs) | | | 1.98 | % | |
| | 85,300 | | | Digital Realty Trust, Inc. | | | 8,460,054 | | |
| Total Real Estate (Cost $4,977,727) | | | 8,460,054 | | |
| Total REITS (Cost $4,977,727) | | | 8,460,054 | | |
Short Term Investments | | | 1.12 | % | |
Investment Company | | | 1.12 | % | |
| | 4,786,089 | | | Fidelity Investments Money Market Funds — Government Portfolio — Class I — 2.73%(d) | | | 4,786,089 | | |
Total Investment Company | | | 4,786,089 | | |
| Total Short Term Investments (Cost $4,786,089) | | | 4,786,089 | | |
Total Investments (Cost $238,757,270)
| | | 99.75
426,625,297 | % | |

The accompanying notes are an integral part of these financial statements.
47
BUFFALO FLEXIBLE INCOME FUND (UNAUDITED)
SCHEDULE OF INVESTMENTS
SEPTEMBER 30, 2022 Continued
Shares or Face Amount | | $ Fair Value | |
Other Assets in Excess of Liabilities
| | | 0.25
1,053,305 | % | |
Total Net Assets
| | | 100.00
427,678,602 | % | |
ADR American Depositary Receipt
PLC Public Limited Company
(a) Non Income Producing.
(b) Foreign Issued Security. The total value of these securities amounted to $25,152,910 (5.87% of net assets) at September 30, 2022.
(c) A portion of this investment is segregated as collateral for open written option contracts.
(d) The rate quoted is the annualized seven-day effective yield as of September 30, 2022.
* See Note 1A of the accompanying Notes to Financial Statements regarding valuation of securities.
The Global Industry Classification Standard (GICS) was developed by and/or is the exclusive property of MSCI, Inc. and Standard & Poor's Financial Services LLC ("S&P"). GICS is a service mark of MSCI and S&P and has been licensed for use by U.S. Bancorp Fund Services, LLC.

The accompanying notes are an integral part of these financial statements.
48
BUFFALO FLEXIBLE INCOME FUND (UNAUDITED)
SCHEDULE OF OPTIONS WRITTEN
SEPTEMBER 30, 2022 Continued
Contracts | | | | $ Notional Amount | | $ Value | |
Call Options | |
| | The Coca Cola Co. | | | | | |
| | (250 | ) | | Expiration: November 2022, Exercise Price: $70.00 | | | 8,000 | | | | 1,000 | | |
| | | Total Written Option (Premium received $9,000) | | | | | 1,000 | | |

The accompanying notes are an integral part of these financial statements.
49
BUFFALO GROWTH FUND
(UNAUDITED)
SCHEDULE OF INVESTMENTS
SEPTEMBER 30, 2022
Shares or Face Amount | | | | $ Fair Value* | |
Common Stocks | | | 98.57 | % | |
Communication Services | | | 12.68 | % | |
| | | | | Interactive Media & Services | | | 12.68 | % | |
| | 63,900 | | | Alphabet, Inc. — Class A(a) | | | 6,112,035 | | |
| | 76,440 | | | Alphabet, Inc. — Class C(a) | | | 7,349,706 | | |
| | 21,281 | | | Facebook, Inc. — Class A(a) | | | 2,887,406 | | |
| | 18,147 | | | Match Group, Inc.(a) | | | 866,519 | | |
| Total Communication Services (Cost $5,290,362) | | | 17,215,666 | | |
Consumer Discretionary | | | 11.14 | % | |
| | | | | Internet & Direct Marketing Retail | | | 8.60 | % | |
| | 82,500 | | | Amazon.com, Inc.(a) | | | 9,322,500 | | |
| | 1,429 | | | Booking Holdings, Inc.(a) | | | 2,348,147 | | |
| | | | 11,670,647 | | |
| | | | | Specialty Retail | | | 1.40 | % | |
| | 6,896 | | | The Home Depot, Inc. | | | 1,902,882 | | |
| | | | | Textiles, Apparel & Luxury Goods | | | 1.14 | % | |
| | 18,639 | | | NIKE, Inc. — Class B | | | 1,549,274 | | |
| Total Consumer Discretionary (Cost $5,533,034) | | | 15,122,803 | | |
Energy | | | 1.50 | % | |
| | | | | Energy Equipment & Services | | | 1.50 | % | |
| | 56,633 | | | Schlumberger Ltd. — ADR(b) | | | 2,033,125 | | |
| Total Energy (Cost $2,045,465) | | | 2,033,125 | | |
Financials | | | 4.91 | % | |
| | | | | Capital Markets | | | 3.20 | % | |
| | 201,786 | | | Open Lending Corp.(a) | | | 1,622,360 | | |
| | 8,889 | | | S&P Global, Inc. | | | 2,714,256 | | |
| | | | 4,336,616 | | |
| | | | | Diversified Financial Services | | | 1.71 | % | |
| | 21,526 | | | Global Payments Inc. | | | 2,325,884 | | |
| Total Financials (Cost $8,907,338) | | | 6,662,500 | | |

The accompanying notes are an integral part of these financial statements.
50
BUFFALO GROWTH FUND
(UNAUDITED)
SCHEDULE OF INVESTMENTS
SEPTEMBER 30, 2022 Continued
Shares or Face Amount | | | | $ Fair Value* | |
Health Care | | | 15.51 | % | |
| | | | | Health Care Equipment & Supplies | | | 6.12 | % | |
| | 8,870 | | | Danaher Corp. | | | 2,291,032 | | |
| | 21,475 | | | Edwards Lifesciences Corp.(a) | | | 1,774,479 | | |
| | 25,335 | | | Establishment Labs Holdings, Inc. — ADR(a) (b) | | | 1,383,544 | | |
| | 3,297 | | | IDEXX Laboratories, Inc.(a) | | | 1,074,163 | | |
| | 9,522 | | | Intuitive Surgical, Inc.(a) | | | 1,784,804 | | |
| | | | 8,308,022 | | |
| | | | | Health Care Providers & Services | | | 3.88 | % | |
| | 57,024 | | | Progyny, Inc.(a) | | | 2,113,310 | | |
| | 6,226 | | | UnitedHealth Group, Inc. | | | 3,144,379 | | |
| | | | 5,257,689 | | |
| | | | | Health Care Technology | | | 1.51 | % | |
| | 12,459 | | | Veeva Systems, Inc.(a) | | | 2,054,240 | | |
| | | | | Life Sciences Tools & Services | | | 3.06 | % | |
| | 7,766 | | | Illumina, Inc.(a) | | | 1,481,675 | | |
| | 5,259 | | | Thermo Fisher Scientific, Inc. | | | 2,667,312 | | |
| | | | 4,148,987 | | |
| | | | | Pharmaceuticals | | | 0.94 | % | |
| | 9,600 | | | Jazz Pharmaceuticals Public Limited Company — ADR(a) (b) | | | 1,279,584 | | |
| Total Health Care (Cost $16,692,162) | | | 21,048,522 | | |
Industrials | | | 6.39 | % | |
| | | | | Commercial Services & Supplies | | | 1.53 | % | |
| | 19,500 | | | Copart, Inc.(a) | | | 2,074,800 | | |
| | | | | Professional Services | | | 2.71 | % | |
| | 23,414 | | | TransUnion | | | 1,392,899 | | |
| | 13,400 | | | Verisk Analytics, Inc. | | | 2,285,102 | | |
| | | | 3,678,001 | | |
| | | | | Road & Rail | | | 2.15 | % | |
| | 57,278 | | | Uber Technologies, Inc.(a) | | | 1,517,867 | | |
| | 7,206 | | | Union Pacific Corp. | | | 1,403,873 | | |
| | | | 2,921,740 | | |
| Total Industrials (Cost $9,027,939) | | | 8,674,541 | | |

The accompanying notes are an integral part of these financial statements.
51
BUFFALO GROWTH FUND
(UNAUDITED)
SCHEDULE OF INVESTMENTS
SEPTEMBER 30, 2022 Continued
Shares or Face Amount | | | | $ Fair Value* | |
Information Technology | | | 42.71 | % | |
| | | | | IT Services | | | 6.74 | % | |
| | 16,115 | | | MasterCard, Inc. — Class A | | | 4,582,139 | | |
| | 17,149 | | | PayPal Holdings, Inc.(a) | | | 1,476,014 | | |
| | 17,358 | | | Visa Inc. — Class A | | | 3,083,649 | | |
| | | | 9,141,802 | | |
| | | | | Semiconductors & Semiconductor Equipment | | | 3.60 | % | |
| | 16,162 | | | Applied Materials, Inc. | | | 1,324,153 | | |
| | 27,665 | | | Azenta, Inc. | | | 1,185,722 | | |
| | 2,856 | | | Broadcom Inc. | | | 1,268,092 | | |
| | 9,100 | | | NVIDIA Corp. | | | 1,104,649 | | |
| | | | 4,882,616 | | |
| | | | | Software | | | 23.39 | % | |
| | 6,845 | | | Adobe, Inc.(a) | | | 1,883,744 | | |
| | 91,255 | | | DoubleVerify Holdings, Inc.(a) | | | 2,495,824 | | |
| | 4,570 | | | Fair Isaac Corp.(a) | | | 1,882,886 | | |
| | 4,012 | | | Intuit, Inc. | | | 1,553,928 | | |
| | 79,809 | | | Microsoft Corp. | | | 18,587,516 | | |
| | 10,842 | | | Palo Alto Networks, Inc.(a) | | | 1,775,811 | | |
| | 14,222 | | | salesforce.com, Inc.(a) | | | 2,045,692 | | |
| | 4,034 | | | ServiceNow, Inc.(a) | | | 1,523,279 | | |
| | | | 31,748,680 | | |
| | | | | Technology Hardware, Storage & Peripherals | | | 8.98 | % | |
| | 88,208 | | | Apple Inc. | | | 12,190,346 | | |
| Total Information Technology (Cost $31,058,864) | | | 57,963,444 | | |
Materials | | | 2.00 | % | |
| | | | | Chemicals | | | 2.00 | % | |
| | 10,044 | | | Linde PLC — ADR(b) | | | 2,707,762 | | |
| Total Materials (Cost $1,641,742) | | | 2,707,762 | | |
Real Estate | | | 1.73 | % | |
| | | | | Real Estate Management & Development | | | 1.73 | % | |
| | 34,850 | | | CBRE Group, Inc. — Class A(a) | | | 2,352,724 | | |
| Total Real Estate (Cost $1,427,111) | | | 2,352,724 | | |
| Total Common Stocks (Cost $81,624,017) | | | 133,781,087 | | |

The accompanying notes are an integral part of these financial statements.
52
BUFFALO GROWTH FUND
(UNAUDITED)
SCHEDULE OF INVESTMENTS
SEPTEMBER 30, 2022 Continued
Shares or Face Amount | | | | $ Fair Value* | |
Short Term Investments | | | 1.48 | % | |
Investment Company | | | 1.48 | % | |
| | 2,004,616 | | | Fidelity Investments Money Market Funds — Government Portfolio — Class I — 2.73%(c) | | | 2,004,616 | | |
Total Investment Company | | | 2,004,616 | | |
| Total Short Term Investments (Cost $2,004,616) | | | 2,004,616 | | |
| Total Investments (Cost $83,628,633) | | | 100.05
135,785,703 | % | |
Liabilities in Excess of Other Assets
| | | (0.05
(68,550) | )% | |
Total Net Assets
| | | 100.00
135,717,153 | % | |
ADR American Depositary Receipt
PLC Public Limited Company
(a) Non Income Producing.
(b) Foreign Issued Securities. The total value of these securities amounted to $7,404,015 (5.46% of net assets) at September 30, 2022.
(c) The rate quoted is the annualized seven-day effective yield as of September 30, 2022.
* See Note 1A of the accompanying Notes to Financial Statements regarding valuation of securities.
The Global Industry Classification Standard (GICS) was developed by and/or is the exclusive property of MSCI, Inc. and Standard & Poor's Financial Services LLC ("S&P"). GICS is a service mark of MSCI and S&P and has been licensed for use by U.S. Bancorp Fund Services, LLC.

The accompanying notes are an integral part of these financial statements.
53
BUFFALO HIGH YIELD FUND (UNAUDITED)
SCHEDULE OF INVESTMENTS
SEPTEMBER 30, 2022
Shares or Face Amount | | | | $ Fair Value* | |
Preferred Stocks | | | 2.47 | % | |
Consumer Discretionary | | | 0.13 | % | |
| | | | | Textiles, Apparel & Luxury Goods | | | 0.13 | % | |
| | | | | Fossil Group, Inc. | | | |
| | 20,998 | | | 7.000%, 11/30/2026(d) | | | 346,467 | | |
| Total Consumer Discretionary (Cost $522,692) | | | 346,467 | | |
Energy | | | 1.22 | % | |
| | | | | Oil, Gas & Consumable Fuels | | | 1.22 | % | |
| | | | | NuStar Energy LP (3 Month LIBOR USD + 6.880%) | | | |
| | 150,000 | | | 9.000%, (effective 12/15/2022, 3 Month LIBOR USD + 6.880%), 12/15/2022(d) (f) | | | 3,319,500 | | |
| Total Energy (Cost $3,135,472) | | | 3,319,500 | | |
Financials | | | 1.12 | % | |
| | | | | Diversified Financial Services | | | 1.12 | % | |
| | | | | Compass Diversified Holdings | | | |
| | 25,000 | | | 7.250%, 07/30/2022(d) | | | 596,000 | | |
| | 100,000 | | | 7.875%, 01/30/2025(d) | | | 2,468,000 | | |
| Total Financials (Cost $2,852,111) | | | 3,064,000 | | |
| Total Preferred Stocks (Cost $6,510,275) | | | 6,729,967 | | |
Convertible Bonds | | | 4.29 | % | |
Consumer Discretionary | | | 1.37 | % | |
| | | | | Auto Components | | | 0.33 | % | |
| | | | | Patrick Industries, Inc. | | | |
| | 1,250,000 | | | 1.750%, 12/01/2028(b) | | | 910,937 | | |
| | | | | Diversified Consumer Services | | | 0.75 | % | |
| | | | | Stride, Inc. | | | |
| | 2,000,000 | | | 1.125%, 09/01/2027 | | | 2,039,000 | | |
| | | | | Internet & Direct Marketing Retail | | | 0.29 | % | |
| | | | | Etsy, Inc. | | | |
| | 1,000,000 | | | 0.250%, 06/15/2028 | | | 778,500 | | |
| Total Consumer Discretionary (Cost $4,194,749) | | | 3,728,437 | | |

The accompanying notes are an integral part of these financial statements.
54
BUFFALO HIGH YIELD FUND
(UNAUDITED)
SCHEDULE OF INVESTMENTS
SEPTEMBER 30, 2022 Continued
Shares or Face Amount | | | | $ Fair Value* | |
Industrials | | | 2.07 | % | |
| | | | | Air Freight & Logistics | | | 0.70 | % | |
| | | | | Air Transport Services Group, Inc. | | | |
| | 1,900,000 | | | 1.125%, 10/15/2024 | | | 1,904,750 | | |
| | | | | Airlines | | | 0.42 | % | |
| | | | | Southwest Airlines Co. | | | |
| | 1,000,000 | | | 1.250%, 05/01/2025 | | | 1,145,250 | | |
| | | | | Electrical Equipment | | | 0.33 | % | |
| | | | | Array Technologies, Inc. | | | |
| | 1,000,000 | | | 1.000%, 12/01/2028(b) | | | 892,020 | | |
| | | | | Machinery | | | 0.62 | % | |
| | | | | Greenbrier Cos Inc/The | | | |
| | 1,000,000 | | | 2.875%, 04/15/2028 | | | 789,500 | | |
| | | | | The Greenbrier Companies, Inc. | | | |
| | 1,000,000 | | | 2.875%, 02/01/2024 | | | 904,500 | | |
| | | | 1,694,000 | | |
| Total Industrials (Cost $5,800,297) | | | 5,636,020 | | |
Information Technology | | | 0.85 | % | |
| | | | | Communications Equipment | | | 0.18 | % | |
| | | | | Lumentum Holdings, Inc. | | | |
| | 500,000 | | | 0.500%, 12/15/2026 | | | 468,750 | | |
| | | | | Software | | | 0.67 | % | |
| | | | | Mitek Systems, Inc. | | | |
| | 2,250,000 | | | 0.750%, 02/01/2026 | | | 1,825,496 | | |
| Total Information Technology (Cost $2,803,242) | | | 2,294,246 | | |
| Total Convertible Bonds (Cost $12,798,288) | | | 11,658,703 | | |
Corporate Bonds | | | 68.24 | % | |
Accommodation and Food Services | | | 0.54 | % | |
| | | | | Restaurants and Other Eating Places | | | 0.54 | % | |
| | | | | Dave & Buster's, Inc. | | | |
| | 1,500,000 | | | 7.625%, 11/01/2025(b) | | | 1,479,142 | | |
| Total Accommodation and Food Services (Cost $1,508,532) | | | 1,479,142 | | |

The accompanying notes are an integral part of these financial statements.
55
BUFFALO HIGH YIELD FUND
(UNAUDITED)
SCHEDULE OF INVESTMENTS
SEPTEMBER 30, 2022 Continued
Shares or Face Amount | | | | $ Fair Value* | |
Administrative and Support and Waste Management and Remediation Services | | | 0.48 | % | |
| | | | | Business Support Services | | | 0.16 | % | |
| | | | | Burford Capital Global Finance LLC | | | |
| | 500,000 | | | 6.250%, 04/15/2028(b) | | | 439,060 | | |
| | | | | Office Administrative Services | | | 0.32 | % | |
| | | | | Cargo Aircraft Management, Inc. | | | |
| | 1,000,000 | | | 4.750%, 02/01/2028(b) | | | 862,970 | | |
| Total Administrative and Support and Waste Management and Remediation Services (Cost $1,457,473) | | | 1,302,030 | | |
Agriculture, Forestry, Fishing and Hunting | | | 0.70 | % | |
| | | | | Forest Nurseries and Gathering of Forest Products | | | 0.70 | % | |
| | | | | Enviva Partners LP / Enviva Partners Finance Corp. | | | |
| | 2,000,000 | | | 6.500%, 01/15/2026(b) | | | 1,893,900 | | |
| Total Agriculture, Forestry, Fishing and Hunting (Cost $2,007,790) | | | 1,893,900 | | |
Communication Services | | | 4.07 | % | |
| | | | | Entertainment | | | 0.61 | % | |
| | | | | Live Nation Entertainment, Inc. | | | |
| | 1,000,000 | | | 4.875%, 11/01/2024(b) | | | 966,545 | | |
| | 500,000 | | | 5.625%, 03/15/2026(b) | | | 476,094 | | |
| | 250,000 | | | 4.750%, 10/15/2027(b) | | | 217,557 | | |
| | | | 1,660,196 | | |
| | | | | Interactive Media & Services | | | 1.99 | % | |
| | | | | Cars.com, Inc. | | | |
| | 3,000,000 | | | 6.375%, 11/01/2028(b) | | | 2,563,170 | | |
| | | | | Match Group, Inc. | | | |
| | 1,000,000 | | | 5.000%, 12/15/2027(b) | | | 894,075 | | |
| | | | | TripAdvisor, Inc. | | | |
| | 2,000,000 | | | 7.000%, 07/15/2025(b) | | | 1,947,441 | | |
| | | | 5,404,686 | | |

The accompanying notes are an integral part of these financial statements.
56
BUFFALO HIGH YIELD FUND
(UNAUDITED)
SCHEDULE OF INVESTMENTS
SEPTEMBER 30, 2022 Continued
Shares or Face Amount | | | | $ Fair Value* | |
| | | | | Media | | | 1.47 | % | |
| | | | | AMC Networks, Inc. | | | |
| | 596,000 | | | 5.000%, 04/01/2024 | | | 571,180 | | |
| | | | | Gray Television, Inc. | | | |
| | 2,060,000 | | | 5.875%, 07/15/2026(b) | | | 1,903,224 | | |
| | 500,000 | | | 4.750%, 10/15/2030(b) | | | 375,459 | | |
| | | | | Townsquare Media, Inc. | | | |
| | 1,250,000 | | | 6.875%, 02/01/2026(b) | | | 1,144,113 | | |
| | | | 3,993,976 | | |
| Total Communication Services (Cost $12,087,269) | | | 11,058,858 | | |
Consumer Staples | | | 1.01 | % | |
| | | | | Food Products | | | 1.01 | % | |
| | | | | Performance Food Group, Inc. | | | |
| | 3,000,000 | | | 5.500%, 10/15/2027(b) | | | 2,733,600 | | |
| Total Consumer Staples (Cost $3,000,000) | | | 2,733,600 | | |
Consumer Discretionary | | | 4.72 | % | |
| | | | | Auto Components | | | 0.83 | % | |
| | | | | Patrick Industries, Inc. | | | |
| | 3,000,000 | | | 4.750%, 05/01/2029(b) | | | 2,239,740 | | |
| | | | | Hotels, Restaurants & Leisure | | | 1.93 | % | |
| | | | | Golden Entertainment, Inc. | | | |
| | 1,000,000 | | | 7.625%, 04/15/2026(b) | | | 987,350 | | |
| | | | | Nathan's Famous, Inc. | | | |
| | 1,100,000 | | | 6.625%, 11/01/2025(b) | | | 1,095,248 | | |
| | | | | Royal Caribbean Cruises Ltd. | | | |
| | 2,000,000 | | | 11.625%, 08/15/2027(a) (b) | | | 1,823,750 | | |
| | | | | Six Flags Entertainment Corp. | | | |
| | 1,500,000 | | | 5.500%, 04/15/2027(b) | | | 1,335,739 | | |
| | | | 5,242,087 | | |
| | | | | Leisure Products | | | 0.78 | % | |
| | | | | Vista Outdoor, Inc. | | | |
| | 3,000,000 | | | 4.500%, 03/15/2029(b) | | | 2,123,820 | | |

The accompanying notes are an integral part of these financial statements.
57
BUFFALO HIGH YIELD FUND
(UNAUDITED)
SCHEDULE OF INVESTMENTS
SEPTEMBER 30, 2022 Continued
Shares or Face Amount | | | | $ Fair Value* | |
| | | | | Textiles, Apparel & Luxury Goods | | | 1.18 | % | |
| | | | | PVH Corp. | | | |
| | 3,120,000 | | | 7.750%, 11/15/2023 | | | 3,217,556 | | |
| Total Consumer Discretionary (Cost $13,723,783) | | | 12,823,203 | | |
Consumer Staples | | | 2.16 | % | |
| | | | | Food Products | | | 1.48 | % | |
| | | | | Lamb Weston Holdings, Inc. | | | |
| | 1,000,000 | | | 4.125%, 01/31/2030(b) | | | 847,915 | | |
| | | | | TreeHouse Foods, Inc. | | | |
| | 4,000,000 | | | 4.000%, 09/01/2028 | | | 3,183,520 | | |
| | | | 4,031,435 | | |
| | | | | Personal Products | | | 0.68 | % | |
| | | | | BellRing Brands, Inc. | | | |
| | 2,000,000 | | | 7.000%, 03/15/2030(b) | | | 1,833,700 | | |
| Total Consumer Staples (Cost $6,966,451) | | | 5,865,135 | | |
Consumer, Cyclical | | | 0.62 | % | |
| | | | | Motion Picture and Video Industries | | | 0.62 | % | |
| | | | | Cinemark USA, Inc. | | | |
| | 2,000,000 | | | 5.875%, 03/15/2026(b) | | | 1,674,597 | | |
| Total Consumer, Cyclical (Cost $1,984,328) | | | 1,674,597 | | |
Energy | | | 19.09 | % | |
| | | | | Energy Equipment & Services | | | 0.73 | % | |
| | | | | Bristow Group, Inc. | | | |
| | 2,250,000 | | | 6.875%, 03/01/2028(b) | | | 1,991,801 | | |

The accompanying notes are an integral part of these financial statements.
58
BUFFALO HIGH YIELD FUND
(UNAUDITED)
SCHEDULE OF INVESTMENTS
SEPTEMBER 30, 2022 Continued
Shares or Face Amount | | | | $ Fair Value* | |
| | | | | Oil, Gas & Consumable Fuels | | | 18.36 | % | |
| | | | | Antero Resources Corp. | | | |
| | 245,000 | | | 7.625%, 02/01/2029(b) | | | 245,533 | | |
| | 1,000,000 | | | 5.375%, 03/01/2030(b) | | | 902,225 | | |
| | | | | Athabasca Oil Corp. | | | |
| | 2,550,000 | | | 9.750%, 11/01/2026(a) (b) | | | 2,708,458 | | |
| | | | | California Resources Corp. | | | |
| | 4,000,000 | | | 7.125%, 02/01/2026(b) | | | 3,766,060 | | |
| | | | | CNX Resources Corp. | | | |
| | 4,000,000 | | | 7.250%, 03/14/2027(b) | | | 3,899,240 | | |
| | 100,000 | | | 6.000%, 01/15/2029(b) | | | 91,227 | | |
| | 500,000 | | | 7.375%, 01/15/2031(b) | | | 491,588 | | |
| | | | | CONSOL Energy, Inc. | | | |
| | 6,000,000 | | | 11.000%, 11/15/2025(b) | | | 6,178,920 | | |
| | | | | Delek Logistics Partners LP / Delek Logistics Finance Corp. | | | |
| | 3,000,000 | | | 6.750%, 05/15/2025 | | | 2,835,394 | | |
| | | | | Energy Transfer LP | | | |
| | 5,600,000 | | | 7.125% (5 Year CMT Rate + 5.306%), 11/15/2165 | | | 4,614,240 | | |
| | | | | Matador Resources Co. | | | |
| | 5,500,000 | | | 5.875%, 09/15/2026 | | | 5,315,283 | | |
| | | | | MPLX LP | | | |
| | 8,800,000 | | | 6.875% (3 Month LIBOR USD + 4.652%), 08/15/2023 | | | 8,690,000 | | |
| | | | | Northern Oil and Gas, Inc. | | | |
| | 9,100,000 | | | 8.125%, 03/01/2028(b) | | | 8,549,996 | | |
| | | | | Viper Energy Partners LP | | | |
| | 1,750,000 | | | 5.375%, 11/01/2027(b) | | | 1,615,900 | | |
| | | | 49,904,064 | | |
| Total Energy (Cost $54,524,538) | | | 51,895,865 | | |
Finance and Insurance | | | 1.29 | % | |
| | | | | Activities Related to Credit Intermediation | | | 0.56 | % | |
| | | | | Scripps Escrow II, Inc. | | | |
| | 2,000,000 | | | 5.375%, 01/15/2031(b) | | | 1,517,499 | | |
| | | | | Other Financial Investment Activities | | | 0.73 | % | |
| | | | | Arrow Bidco LLC | | | |
| | 2,000,000 | | | 9.500%, 03/15/2024 (b) | | | 2,002,375 | | |
| Total Finance and Insurance (Cost $4,003,623) | | | 3,519,874 | | |

The accompanying notes are an integral part of these financial statements.
59
BUFFALO HIGH YIELD FUND
(UNAUDITED)
SCHEDULE OF INVESTMENTS
SEPTEMBER 30, 2022 Continued
Shares or Face Amount | | | | $ Fair Value* | |
Financial | | | 0.96 | % | |
| | | | | Business Support Services | | | 0.96 | % | |
| | | | | Burford Capital Global Finance LLC | | | |
| | 3,000,000 | | | 6.875%, 04/15/2030(b) | | | 2,622,390 | | |
| Total Financial (Cost $2,985,994) | | | 2,622,390 | | |
Financials | | | 0.54 | % | |
| | | | | Consumer Finance | | | 0.54 | % | |
| | | | | PRA Group, Inc. | | | |
| | 1,100,000 | | | 7.375%, 09/01/2025(b) | | | 1,062,137 | | |
| | 500,000 | | | 5.000%, 10/01/2029(b) | | | 406,109 | | |
| Total Financials (Cost $1,584,081) | | | 1,468,246 | | |
Health Care | | | 1.19 | % | |
| | | | | Pharmaceuticals | | | 1.19 | % | |
| | | | | Horizon Therapeutics USA, Inc. | | | |
| | 1,000,000 | | | 5.500%, 08/01/2027(b) | | | 938,450 | | |
| | | | | Teva Pharmaceutical Industries Ltd. | | | |
| | 2,500,000 | | | 6.750%, 03/01/2028(a) | | | 2,294,701 | | |
| Total Health Care (Cost $3,376,542) | | | 3,233,151 | | |
Industrials | | | 9.47 | % | |
| | | | | Aerospace & Defense | | | 0.35 | % | |
| | | | | TransDigm, Inc. | | | |
| | 500,000 | | | 6.250%, 03/15/2026(b) | | | 485,845 | | |
| | 500,000 | | | 6.375%, 06/15/2026 | | | 472,979 | | |
| | | | 958,824 | | |
| | | | | Building Products | | | 1.98 | % | |
| | | | | Advanced Drainage Systems, Inc. | | | |
| | 1,250,000 | | | 6.375%, 06/15/2030(b) | | | 1,214,038 | | |
| | | | | Builders FirstSource, Inc. | | | |
| | 4,000,000 | | | 5.000%, 03/01/2030(b) | | | 3,386,555 | | |
| | 1,000,000 | | | 4.250%, 02/01/2032(b) | | | 769,300 | | |
| | | | 5,369,893 | | |

The accompanying notes are an integral part of these financial statements.
60
BUFFALO HIGH YIELD FUND
(UNAUDITED)
SCHEDULE OF INVESTMENTS
SEPTEMBER 30, 2022 Continued
Shares or Face Amount | | | | $ Fair Value* | |
| | | | | Commercial Services & Supplies | | | 4.04 | % | |
| | | | | Cimpress NV | | | |
| | 2,000,000 | | | 7.000%, 06/15/2026(a) (b) | | | 1,363,860 | | |
| | | | | CoreCivic, Inc. | | | |
| | 6,000,000 | | | 8.250%, 04/15/2026 | | | 5,973,600 | | |
| | | | | Deluxe Corp. | | | |
| | 2,500,000 | | | 8.000%, 06/01/2029(b) | | | 2,015,412 | | |
| | | | | GEO Group Inc/The | | | |
| | 2,000,000 | | | 6.000%, 04/15/2026 | | | 1,638,501 | | |
| | | | 10,991,373 | | |
| | | | | Construction & Engineering | | | 0.83 | % | |
| | | | | Tutor Perini Corp. | | | |
| | 3,000,000 | | | 6.875%, 05/01/2025(b) | | | 2,247,869 | | |
| | | | | Trading Companies & Distributors | | | 2.27 | % | |
| | | | | Alta Equipment Group, Inc. | | | |
| | 2,750,000 | | | 5.625%, 04/15/2026(b) | | | 2,309,367 | | |
| | | | | BlueLinx Holdings, Inc. | | | |
| | 3,000,000 | | | 6.000%, 11/15/2029(b) | | | 2,361,351 | | |
| | | | | Fly Leasing Ltd. | | | |
| | 2,000,000 | | | 7.000%, 10/15/2024(a) (b) | | | 1,503,860 | | |
| | | | 6,174,578 | | |
| Total Industrials (Cost $30,164,345) | | | 25,742,537 | | |
Information | | | 3.18 | % | |
| | | | | Data Processing, Hosting, and Related Services | | | 0.63 | % | |
| | | | | VM Consolidated, Inc. | | | |
| | 2,000,000 | | | 5.500%, 04/15/2029(b) | | | 1,723,656 | | |
| | | | | Motion Picture and Video Industries | | | 0.55 | % | |
| | | | | Lions Gate Capital Holdings LLC | | | |
| | 2,000,000 | | | 5.500%, 04/15/2029(b) | | | 1,493,920 | | |
| | | | | Other Telecommunications | | | 0.55 | % | |
| | | | | Consolidated Communications, Inc. | | | |
| | 2,000,000 | | | 6.500%, 10/01/2028(b) | | | 1,500,440 | | |

The accompanying notes are an integral part of these financial statements.
61
BUFFALO HIGH YIELD FUND
(UNAUDITED)
SCHEDULE OF INVESTMENTS
SEPTEMBER 30, 2022 Continued
Shares or Face Amount | | | | $ Fair Value* | |
| | | | | Radio and Television Broadcasting | | | 1.45 | % | |
| | | | | Audacy Capital Corp. | | | |
| | 2,200,000 | | | 6.750%, 03/31/2029(b) | | | 534,176 | | |
| | | | | Gray Escrow II, Inc. | | | |
| | 1,000,000 | | | 5.375%, 11/15/2031(b) | | | 786,560 | | |
| | | | | iHeartCommunications, Inc. | | | |
| | 2,000,000 | | | 8.375%, 05/01/2027 | | | 1,691,875 | | |
| | 100,000 | | | 5.250%, 08/15/2027(b) | | | 85,691 | | |
| | | | | Nexstar Media, Inc. | | | |
| | 500,000 | | | 4.750%, 11/01/2028(b) | | | 428,650 | | |
| | | | | Scripps Escrow II, Inc. | | | |
| | 500,000 | | | 3.875%, 01/15/2029(b) | | | 402,395 | | |
| | | | 3,929,347 | | |
| Total Information (Cost $12,248,536) | | | 8,647,363 | | |
Information Technology | | | 1.47 | % | |
| | | | | Software | | | 1.47 | % | |
| | | | | Consensus Cloud Solutions, Inc. | | | |
| | 4,500,000 | | | 6.000%, 10/15/2026 (b) | | | 3,989,993 | | |
| Total Information Technology (Cost $4,459,352) | | | 3,989,993 | | |
Management of Companies and Enterprises | | | 0.54 | % | |
| | | | | Management of Companies and Enterprises | | | 0.54 | % | |
| | | | | Teva Pharmaceutical Finance Netherlands III BV | | | |
| | 1,500,000 | | | 7.125%, 01/31/2025(a) | | | 1,462,568 | | |
| Total Management of Companies and Enterprises (Cost $1,500,867) | | | 1,462,568 | | |
Manufacturing | | | 1.01 | % | |
| | | | | Aerospace Product and Parts Manufacturing | | | 0.59 | % | |
| | | | | TransDigm, Inc. | | | |
| | 1,000,000 | | | 4.625%, 01/15/2029 | | | 807,515 | | |
| | 1,000,000 | | | 4.875%, 05/01/2029 | | | 810,000 | | |
| | | | 1,617,515 | | |

The accompanying notes are an integral part of these financial statements.
62
BUFFALO HIGH YIELD FUND
(UNAUDITED)
SCHEDULE OF INVESTMENTS
SEPTEMBER 30, 2022 Continued
Shares or Face Amount | | | | $ Fair Value* | |
| | | | | Other Chemical Product and Preparation Manufacturing | | | 0.42 | % | |
| | | | | Garden Spinco Corp. | | | |
| | 1,100,000 | | | 8.625%, 07/20/2030(b) | | | 1,138,847 | | |
| Total Manufacturing (Cost $3,115,901) | | | 2,756,362 | | |
Materials | | | 2.62 | % | |
| | | | | Chemicals | | | 0.61 | % | |
| | | | | Chemours Co/The | | | |
| | 2,000,000 | | | 5.750%, 11/15/2028(b) | | | 1,640,420 | | |
| | | | | Metals & Mining | | | 1.38 | % | |
| | | | | Commercial Metals Co. | | | |
| | 500,000 | | | 3.875%, 02/15/2031 | | | 393,359 | | |
| | | | | Taseko Mines Ltd. | | | |
| | 3,000,000 | | | 7.000%, 02/15/2026(a) (b) | | | 2,390,460 | | |
| | | | | Warrior Met Coal, Inc. | | | |
| | 1,000,000 | | | 7.875%, 12/01/2028(b) | | | 973,256 | | |
| | | | 3,757,075 | | |
| | | | | Paper & Forest Products | | | 0.63 | % | |
| | | | | Sylvamo Corp. | | | |
| | 2,000,000 | | | 7.000%, 09/01/2029(b) | | | 1,711,239 | | |
| Total Materials (Cost $8,525,851) | | | 7,108,734 | | |
Mining, Quarrying, and Oil and Gas Extraction | | | 5.72 | % | |
| | | | | Coal Mining | | | 1.17 | % | |
| | | | | Alliance Resource Operating Partners LP / Alliance Resource Finance Corp. | | | |
| | 3,250,000 | | | 7.500%, 05/01/2025(b) | | | 3,170,261 | | |
| | | | | Oil and Gas Extraction | | | 2.25 | % | |
| | | | | Penn Virginia Holdings LLC | | | |
| | 6,500,000 | | | 9.250%, 08/15/2026(b) | | | 6,118,125 | | |
| | | | | Support Activities for Mining | | | 2.30 | % | |
| | | | | Talos Production, Inc. | | | |
| | 6,000,000 | | | 12.000%, 01/15/2026 | | | 6,265,620 | | |
| Total Mining, Quarrying, and Oil and Gas Extraction (Cost $16,100,789) | | | 15,554,006 | | |

The accompanying notes are an integral part of these financial statements.
63
BUFFALO HIGH YIELD FUND
(UNAUDITED)
SCHEDULE OF INVESTMENTS
SEPTEMBER 30, 2022 Continued
Shares or Face Amount | | | | $ Fair Value* | |
Professional, Scientific, and Technical Services | | | 0.78 | % | |
| | | | | Advertising, Public Relations, and Related Services | | | 0.29 | % | |
| | | | | Outfront Media Capital LLC / Outfront Media Capital Corp. | | | |
| | 1,000,000 | | | 4.625%, 03/15/2030(b) | | | 780,188 | | |
| | | | | Other Professional, Scientific, and Technical Services | | | 0.49 | % | |
| | | | | Sabre GLBL, Inc. | | | |
| | 1,500,000 | | | 7.375%, 09/01/2025(b) | | | 1,345,514 | | |
| Total Professional, Scientific, and Technical Services (Cost $2,498,750) | | | 2,125,702 | | |
Real Estate and Rental and Leasing | | | 1.58 | % | |
| | | | | Lessors of Real Estate | | | 1.58 | % | |
| | | | | IIP Operating Partnership LP | | | |
| | 3,000,000 | | | 5.500%, 05/25/2026 | | | 2,683,786 | | |
| | | | | Uniti Group LP / Uniti Group Finance Inc / CSL Capital LLC | | | |
| | 1,000,000 | | | 4.750%, 04/15/2028(b) | | | 792,320 | | |
| | 1,200,000 | | | 6.500%, 02/15/2029(b) | | | 806,800 | | |
| | | | 1,599,120 | | |
| Total Real Estate and Rental and Leasing (Cost $5,186,370) | | | 4,282,906 | | |
Transportation and Warehousing | | | 1.06 | % | |
| | | | | Pipeline Transportation of Crude Oil | | | 0.32 | % | |
| | | | | Delek Logistics Partners LP / Delek Logistics Finance Corp. | | | |
| | 1,000,000 | | | 7.125%, 06/01/2028(b) | | | 880,620 | | |
| | | | | Pipeline Transportation of Natural Gas | | | 0.74 | % | |
| | | | | Antero Midstream Partners LP / Antero Midstream Finance Corp. | | | |
| | 2,000,000 | | | 7.875%, 05/15/2026(b) | | | 2,012,660 | | |
| Total Transportation and Warehousing (Cost $3,001,348) | | | 2,893,280 | | |
Utilities | | | 2.21 | % | |
| | | | | Electric Power Generation, Transmission and Distribution | | | 1.08 | % | |
| | | | | IEA Energy Services LLC | | | |
| | 3,000,000 | | | 6.625%, 08/15/2029(b) | | | 2,943,105 | | |

The accompanying notes are an integral part of these financial statements.
64
BUFFALO HIGH YIELD FUND
(UNAUDITED)
SCHEDULE OF INVESTMENTS
SEPTEMBER 30, 2022 Continued
Shares or Face Amount | | | | $ Fair Value* | |
| | | | | Independent Power and Renewable Electricity Producers | | | 1.13 | % | |
| | | | | Vistra Corp. | | | |
| | 3,500,000 | | | 7.000% (5 Year CMT Rate + 5.740%), 06/15/2027 | | | 3,063,393 | | |
| Total Utilities (Cost $6,402,222) | | | 6,006,498 | | |
Wholesale Trade | | | 1.23 | % | |
| | | | | Grocery and Related Product Merchant Wholesalers | | | 0.91 | % | |
| | | | | Performance Food Group, Inc. | | | |
| | 1,000,000 | | | 4.250%, 08/01/2029(b) | | | 834,570 | | |
| | | | | Primo Water Holdings, Inc. | | | |
| | 2,000,000 | | | 4.375%, 04/30/2029(b) | | | 1,629,782 | | |
| | | | 2,464,352 | | |
| | | | | Machinery, Equipment, and Supplies Merchant Wholesalers | | | 0.32 | % | |
| | | | | TransDigm, Inc. | | | |
| | 1,000,000 | | | 5.500%, 11/15/2027 | | | 871,965 | | |
| Total Wholesale Trade (Cost $4,000,461) | | | 3,336,317 | | |
| Total Corporate Bonds (Cost $206,415,196) | | | 185,476,257 | | |
Bank Loans | | | 19.07 | % | |
| | | | | Aerospace & Defense | | | 2.41 | % | |
| | 4,987,500 | | | Maxar Technologies Ltd., Senior Secured First Lien Term Loan (1 Month SOFR USD + 4.250%) | | | 4,698,649 | | |
| | 1,896,570 | | | TransDigm, Inc., Senior Secured First Lien Term Loan (3 Month LIBOR USD + 2.250%) | | | 1,853,622 | | |
| | | | 6,552,271 | | |
| | | | | Broadcasting | | | 0.10 | % | |
| | 518,692 | | | CBS Radio, Senior Secured First Lien Term Loan (1 Month LIBOR USD + 2.500%) | | | 433,108 | | |
| | 280,473 | | | Nexstar Media Group, Inc., Senior Secured First Lien Term Loan (1 Month LIBOR USD + 2.500%) | | | 277,318 | | |
| | | | 710,426 | | |
| | | | | Commercial Services & Supplies | | | 1.46 | % | |
| | 3,000,000 | | | GEO Group Inc/The | | | 2,976,255 | | |
| | 1,000,000 | | | GEO Group Inc/The | | | 988,750 | | |
| | | | 3,965,005 | | |
| | | | | Construction & Engineering | | | 1.01 | % | |
| | 2,941,234 | | | Tutor Perini Corp., Senior Secured First Lien Term Loan (1 Month LIBOR USD + 4.750%)(g) | | | 2,739,024 | | |
| | | | | Internet & Direct Marketing Retail | | | 1.57 | % | |
| | 4,443,750 | | | Magnite, Inc., Senior Secured First Lien Term Loan (6 Month LIBOR USD + 5.000%)(g) | | | 4,254,891 | | |

The accompanying notes are an integral part of these financial statements.
65
BUFFALO HIGH YIELD FUND
(UNAUDITED)
SCHEDULE OF INVESTMENTS
SEPTEMBER 30, 2022 Continued
Shares or Face Amount | | | | $ Fair Value* | |
| | | | | IT Services | | | 1.03 | % | |
| | 2,857,500 | | | MoneyGram International, Inc., Senior Secured First Lien Term Loan (6 Month LIBOR USD + 4.500%) | | | 2,806,294 | | |
| | | | | Media | | | 0.76 | % | |
| | 8,698,882 | | | Directv Financing LLC., Senior Secured First Lien Term Loan (1 Month LIBOR USD + 5.000%) | | | 8,125,321 | | |
| | 965,150 | | | The E.W. Scripps Co., Senior Secured First Lien Term Loan (1 Month LIBOR USD + 2.562%) | | | 935,341 | | |
| | 198,750 | | | The E.W. Scripps Co., Senior Secured First Lien Term Loan (1 Month LIBOR USD + 2.750%) | | | 192,699 | | |
| | 950,000 | | | The E.W. Scripps Co., Senior Secured First Lien Term Loan (1 Month LIBOR USD + 2.000%) | | | 940,144 | | |
| | | | 10,193,505 | | |
| | | | | Oil, Gas & Consumable Fuels | | | 1.03 | % | |
| | 2,823,899 | | | Consolidated Energy, Inc., Senior Secured First Lien Term Loan (1 Month LIBOR USD + 3.500%) | | | 2,796,987 | | |
| | | | | Pharmaceuticals | | | 0.79 | % | |
| | 2,230,180 | | | Jazz Pharmaceuticals., Senior Secured First Lien Term Loan (1 Month LIBOR USD + 3.500%) | | | 2,159,885 | | |
| | 4,937,500 | | | PetIQ Holdings LLC, Senior Secured First Lien Term Loan (1 Month LIBOR USD + 4.250%)(g) | | | 4,567,188 | | |
| | | | 6,727,073 | | |
| | | | | Retailers (other than Food/Drug) | | | 0.48 | % | |
| | 1,972,481 | | | Jo-Ann Stores LLC., Senior Secured First Lien Term Loan (3 Month LIBOR USD + 4.750%) | | | 1,314,165 | | |
| | 6,007,577 | | | Portillo's Holdings LLC., Senior Secured First Lien Term Loan (1 Month LIBOR USD + 5.500%) | | | 5,977,539 | | |
| | | | 7,291,704 | | |
| | | | | Software | | | 0.46 | % | |
| | 188,611 | | | SS&C Technologies Holdings, Inc., Senior Secured First Lien Term Loan
(1 Month LIBOR USD + 1.750%)(c) | | | 183,037 | | |
| | 153,114 | | | SS&C Technologies Holdings, Inc., Senior Secured First Lien Term Loan
(1 Month LIBOR USD + 1.750%)(c) | | | 148,589 | | |
| | 947,400 | | | SS&C Technologies Holdings, Inc., Senior Secured First Lien Term Loan
(1 Month LIBOR USD + 1.750%)(c) | | | 922,867 | | |
| | | | 1,254,493 | | |
| | | | | Telecommunication Services — Diversified | | | 0.94 | % | |
| | 2,928,009 | | | Consolidated Communications, Inc., Senior Secured First Lien Term Loan
(1 Month LIBOR USD + 3.500%)(c) | | | 2,547,368 | | |
| Total Bank Loans (Cost $54,409,091) | | | 51,839,041 | | |
Short Term Investments | | | 5.92 | % | |
Investment Company | | | 5.92 | % | |
| | 16,089,487 | | | Fidelity Investments Money Market Funds — Government Portfolio — Class I — 2.73%(e) | | | 16,089,487 | | |
Total Investment Company | | | 16,089,487 | | |
| Total Short Term Investments (Cost $16,089,487) | | | 16,089,487 | | |

The accompanying notes are an integral part of these financial statements.
66
BUFFALO HIGH YIELD FUND
(UNAUDITED)
SCHEDULE OF INVESTMENTS
SEPTEMBER 30, 2022 Continued
Shares or Face Amount | | | | $ Fair Value* | |
Total Investments (Cost $296,222,337)
| | | | | 99.99
271,793,455 | % | |
Other Assets in Excess of Liabilities
| | | 0.01
15,588 | % | |
Total Net Assets
| | | 100.00
271,809,043 | % | |
(a) Foreign Issued Securities. The total value of these securities amounted to $13,547,657 (4.98% of net assets) at September 30, 2022.
(b) 144A securities. The total value of these securities amounted to $130,422,180 (47.98% of net assets) at September 30, 2022.
(c) Illiquid Security. The total value of these securities amounted to $3,801,861 (1.40% of net assets) at September 30, 2022.
(d) Callable at any dividend payment date on or after date disclosed.
(e) The rate quoted is the annualized seven-day effective yield as of September 30, 2022.
(f) Fixed to floating rate. Effective date of change and formula disclosed. Rate disclosed as of March 31, 2021.
(g) Level 3 security. See the accompanying Notes to the Financial Statements for information regarding Level 3 securities.
* See Note 1A of the accompanying Notes to Financial Statements regarding valuation of securities.
The Global Industry Classification Standard (GICS) was developed by and/or is the exclusive property of MSCI, Inc. and Standard & Poor's Financial Services LLC ("S&P"). GICS is a service mark of MSCI and S&P and has been licensed for use by U.S. Bancorp Fund Services, LLC.

The accompanying notes are an integral part of these financial statements.
67
BUFFALO INTERNATIONAL FUND (UNAUDITED)
SCHEDULE OF INVESTMENTS
SEPTEMBER 30, 2022
Shares or Face Amount | | | | $ Fair Value* | |
Common Stocks | | | 90.63 | % | |
Belgium | | | 0.45 | % | |
| | | | | Beverages | | | 0.45 | % | |
| | 45,000 | | | Anheuser-Busch InBev SA/NV | | | 2,038,341 | | |
| Total Belgium (Cost $2,291,611) | | | 2,038,341 | | |
Bermuda | | | 0.12 | % | |
| | | | | Machinery | | | 0.12 | % | |
| | 500,000 | | | AutoStore Holdings Ltd.(a) | | | 549,051 | | |
| Total Bermuda (Cost $2,021,588) | | | 549,051 | | |
Canada | | | 3.95 | % | |
| | | | | Commercial Services & Supplies | | | 1.12 | % | |
| | 200,000 | | | GFL Environmental, Inc. — ADR | | | 5,058,000 | | |
| | | | | Road & Rail | | | 1.60 | % | |
| | 67,000 | | | Canadian National Railway Co. — ADR | | | 7,235,330 | | |
| | | | | Software | | | 1.23 | % | |
| | 4,000 | | | Constellation Software Inc/Canada(a) | | | 5,565,830 | | |
| Total Canada (Cost $16,817,611) | | | 17,859,160 | | |
Cayman Islands | | | 0.10 | % | |
| | | | | Diversified Telecommunication Services | | | 0.10 | % | |
| | 80,000 | | | IHS Holding Ltd. — ADR(a) | | | 446,400 | | |
| Total Cayman Islands (Cost $1,680,000) | | | 446,400 | | |
China | | | 0.31 | % | |
| | | | | Commercial Banks | | | 0.31 | % | |
| | 300,000 | | | China Merchants Bank Co., Ltd. | | | 1,388,358 | | |
| Total China (Cost $1,973,642) | | | 1,388,358 | | |

The accompanying notes are an integral part of these financial statements.
68
BUFFALO INTERNATIONAL FUND
(UNAUDITED)
SCHEDULE OF INVESTMENTS
SEPTEMBER 30, 2022 Continued
Shares or Face Amount | | | | $ Fair Value* | |
Denmark | | | 2.00 | % | |
| | | | | Pharmaceuticals | | | 2.00 | % | |
| | 15,000 | | | Novo Nordisk A/S | | | 1,494,267 | | |
| | 76,000 | | | Novo Nordisk A/S — ADR | | | 7,571,880 | | |
| | | | 9,066,147 | | |
| Total Denmark (Cost $5,103,075) | | | 9,066,147 | | |
France | | | 16.48 | % | |
| | | | | Aerospace & Defense | | | 1.95 | % | |
| | 80,000 | | | Thales SA | | | 8,815,485 | | |
| | | | | Beverages | | | 1.52 | % | |
| | 37,500 | | | Pernod Ricard SA | | | 6,879,503 | | |
| | | | | Chemicals | | | 1.42 | % | |
| | 56,168 | | | Air Liquide SA | | | 6,419,928 | | |
| | | | | Construction & Engineering | | | 1.32 | % | |
| | 74,000 | | | Vinci SA | | | 5,983,675 | | |
| | | | | Electrical Equipment | | | 2.22 | % | |
| | 89,000 | | | Schneider Electric SE | | | 10,052,581 | | |
| | | | | Life Sciences Tools & Services | | | 1.56 | % | |
| | 23,000 | | | Sartorius Stedim Biotech | | | 7,054,919 | | |
| | | | | Pharmaceuticals | | | 1.26 | % | |
| | 149,587 | | | Sanofi — ADR | | | 5,687,298 | | |
| | | | | Professional Services | | | 1.25 | % | |
| | 253,000 | | | Bureau Veritas SA | | | 5,661,496 | | |
| | | | | Software | | | 1.07 | % | |
| | 140,000 | | | Dassault Systemes SE | | | 4,833,492 | | |
| | | | | Textiles, Apparel & Luxury Goods | | | 2.91 | % | |
| | 12,300 | | | Kering SA | | | 5,455,629 | | |
| | 13,100 | | | LVMH Moet Hennessy Louis Vuitton SE | | | 7,723,400 | | |
| | | | 13,179,029 | | |
| Total France (Cost $53,477,459) | | | 74,567,406 | | |

The accompanying notes are an integral part of these financial statements.
69
BUFFALO INTERNATIONAL FUND
(UNAUDITED)
SCHEDULE OF INVESTMENTS
SEPTEMBER 30, 2022 Continued
Shares or Face Amount | | | | $ Fair Value* | |
Germany | | | 14.58 | % | |
| | | | | Capital Markets | | | 0.75 | % | |
| | 142,000 | | | DWS Group GmbH & Co KGaA | | | 3,380,198 | | |
| | | | | Chemicals | | | 0.99 | % | |
| | 46,000 | | | Symrise AG | | | 4,485,553 | | |
| | | | | Electrical Equipment | | | 0.15 | % | |
| | 62,600 | | | Siemens Energy AG | | | 689,271 | | |
| | | | | Electronic Equipment, Instruments & Components | | | 0.81 | % | |
| | 185,211 | | | Jenoptik AG | | | 3,645,991 | | |
| | | | | Health Care Equipment & Supplies | | | 1.28 | % | |
| | 55,525 | | | Carl Zeiss Meditec AG | | | 5,767,593 | | |
| | | | | Health Care Providers & Services | | | 0.37 | % | |
| | 78,900 | | | Fresenius SE & Co. KGaA | | | 1,681,763 | | |
| | | | | Household Products | | | 0.17 | % | |
| | 13,900 | | | Henkel AG & Co. KGaA | | | 787,754 | | |
| | | | | Industrial Conglomerates | | | 1.69 | % | |
| | 78,200 | | | Siemens A.G. — ADR | | | 7,643,464 | | |
| | | | | Insurance | | | 1.93 | % | |
| | 15,000 | | | Hannover Rueck SE | | | 2,248,571 | | |
| | 26,900 | | | Muenchener Rueckversicherungs-Gesellschaft AG in Muenchen | | | 6,475,361 | | |
| | | | 8,723,932 | | |
| | | | | Pharmaceuticals | | | 2.27 | % | |
| | 63,500 | | | Merck KGaA | | | 10,279,390 | | |
| | | | | Semiconductors & Semiconductor Equipment | | | 0.26 | % | |
| | 54,000 | | | Infineon Technologies AG | | | 1,181,733 | | |
| | | | | Software | | | 1.16 | % | |
| | 64,800 | | | SAP SE — ADR | | | 5,265,000 | | |
| | | | | Textiles, Apparel & Luxury Goods | | | 1.24 | % | |
| | 19,700 | | | adidas AG | | | 2,264,728 | | |
| | 72,160 | | | Puma SE | | | 3,338,118 | | |
| | | | 5,602,846 | | |
| | | | | Trading Companies & Distributors | | | 1.51 | % | |
| | 113,000 | | | Brenntag AG | | | 6,831,049 | | |
| Total Germany (Cost $57,767,398) | | | 65,965,537 | | |

The accompanying notes are an integral part of these financial statements.
70
BUFFALO INTERNATIONAL FUND
(UNAUDITED)
SCHEDULE OF INVESTMENTS
SEPTEMBER 30, 2022 Continued
Shares or Face Amount | | | | $ Fair Value* | |
Hong Kong | | | 0.30 | % | |
| | | | | Capital Markets | | | 0.30 | % | |
| | 40,000 | | | Hong Kong Exchanges & Clearing Ltd. | | | 1,367,297 | | |
| Total Hong Kong (Cost $1,935,676) | | | 1,367,297 | | |
India | | | 2.69 | % | |
| | | | | Banks | | | 2.69 | % | |
| | 55,000 | | | HDFC Bank Ltd. — ADR | | | 3,213,100 | | |
| | 427,480 | | | ICICI Bank Ltd. — ADR | | | 8,964,256 | | |
| | | | 12,177,356 | | |
| Total India (Cost $6,778,180) | | | 12,177,356 | | |
Ireland | | | 9.67 | % | |
| | | | | Chemicals | | | 2.80 | % | |
| | 46,760 | | | Linde PLC | | | 12,659,409 | | |
| | | | | Construction Materials | | | 1.37 | % | |
| | 78,000 | | | CRH PLC — ADR | | | 2,513,940 | | |
| | 5,000 | | | CRH PLC | | | 160,383 | | |
| | 110,000 | | | CRH public limited company | | | 3,536,692 | | |
| | | | 6,211,015 | | |
| | | | | Food Products | | | 0.53 | % | |
| | 27,000 | | | Kerry Group Plc | | | 2,406,564 | | |
| | | | | Health Care Equipment & Supplies | | | 1.38 | % | |
| | 77,400 | | | Medtronic, PLC — ADR | | | 6,250,050 | | |
| | | | | Insurance | | | 2.37 | % | |
| | 40,000 | | | Aon Plc — ADR | | | 10,714,800 | | |
| | | | | Life Sciences Tools & Services | | | 1.22 | % | |
| | 30,000 | | | ICON PLC. — ADR(a) | | | 5,513,400 | | |
| Total Ireland (Cost $34,165,399) | | | 43,755,238 | | |
Japan | | | 8.10 | % | |
| | | | | Beverages | | | 0.81 | % | |
| | 117,000 | | | Asahi Group Holdings Ltd. | | | 3,647,601 | | |

The accompanying notes are an integral part of these financial statements.
71
BUFFALO INTERNATIONAL FUND
(UNAUDITED)
SCHEDULE OF INVESTMENTS
SEPTEMBER 30, 2022 Continued
Shares or Face Amount | | | | $ Fair Value* | |
| | | | | Electronic Equipment, Instruments & Components | | | 2.52 | % | |
| | 16,100 | | | KEYENCE CORP. | | | 5,322,025 | | |
| | 75,000 | | | Murata Manufacturing Co., Ltd. | | | 3,452,038 | | |
| | 57,000 | | | Omron Corp. | | | 2,611,584 | | |
| | | | 11,385,647 | | |
| | | | | Entertainment | | | 0.93 | % | |
| | 105,000 | | | Nintendo Co Ltd. | | | 4,235,102 | | |
| | | | | Machinery | | | 0.63 | % | |
| | 18,500 | | | FANUC Corp. | | | 2,597,665 | | |
| | 18,000 | | | FANUC Corp. — ADR(a) | | | 252,000 | | |
| | | | 2,849,665 | | |
| | | | | Professional Services | | | 1.15 | % | |
| | 20,000 | | | BayCurrent Consulting, Inc. | | | 5,188,670 | | |
| | | | | Semiconductors & Semiconductor Equipment | | | 2.06 | % | |
| | 10,000 | | | Disco Corp. | | | 2,204,518 | | |
| | 850,000 | | | Renesas Electronics Corp.(a) | | | 7,125,754 | | |
| | | | 9,330,272 | | |
| Total Japan (Cost $44,249,819) | | | 36,636,957 | | |
Luxembourg | | | 1.52 | % | |
| | | | | Life Sciences Tools & Services | | | 1.03 | % | |
| | 79,000 | | | EUROFINS SCIENTIFI | | | 4,689,764 | | |
| | | | | Personal Products | | | 0.49 | % | |
| | 730,750 | | | L'Occitane International SA | | | 2,203,013 | | |
| Total Luxembourg (Cost $4,301,530) | | | 6,892,777 | | |
Netherlands | | | 6.20 | % | |
| | | | | Beverages | | | 1.19 | % | |
| | 610,000 | | | Davide Campari-Milano NV | | | 5,396,990 | | |
| | | | | IT Services | | | 1.30 | % | |
| | 4,700 | | | Adyen NV(a) | | | 5,861,640 | | |
| | | | | Semiconductors & Semiconductor Equipment | | | 2.53 | % | |
| | 16,741 | | | ASML Holding NV — NY Shares — ADR | | | 6,953,374 | | |
| | 65,000 | | | STMicroelectronics N.V. | | | 2,020,015 | | |
| | 80,600 | | | STMicroelectronics N.V. — NY Shares — ADR | | | 2,493,764 | | |
| | | | 11,467,153 | | |

The accompanying notes are an integral part of these financial statements.
72
BUFFALO INTERNATIONAL FUND
(UNAUDITED)
SCHEDULE OF INVESTMENTS
SEPTEMBER 30, 2022 Continued
Shares or Face Amount | | | | $ Fair Value* | |
| | | | | Trading Companies & Distributors | | | 1.18 | % | |
| | 45,000 | | | IMCD N.V. | | | 5,335,251 | | |
| Total Netherlands (Cost $13,686,197) | | | 28,061,034 | | |
Norway | | | 1.89 | % | |
| | | | | Commercial Services & Supplies | | | 1.12 | % | |
| | 286,000 | | | TOMRA Systems ASA | | | 5,046,028 | | |
| | | | | Semiconductors & Semiconductor Equipment | | | 0.77 | % | |
| | 265,459 | | | Nordic Semiconductor ASA(a) | | | 3,506,272 | | |
| Total Norway (Cost $7,364,883) | | | 8,552,300 | | |
Republic of Korea | | | 0.33 | % | |
| | | | | Semiconductors & Semiconductor Equipment | | | 0.33 | % | |
| | 40,000 | | | Samsung Electronic Co., Ltd. | | | 1,468,770 | | |
| Total Republic of Korea (Cost $894,090) | | | 1,468,770 | | |
Sweden | | | 2.43 | % | |
| | | | | Electronic Equipment, Instruments & Components | | | 1.99 | % | |
| | 966,000 | | | HEXAGON AB | | | 9,021,604 | | |
| | | | | Hotels, Restaurants & Leisure | | | 0.44 | % | |
| | 25,000 | | | Evolution AB | | | 1,976,189 | | |
| Total Sweden (Cost $9,818,401) | | | 10,997,793 | | |
Switzerland | | | 6.58 | % | |
| | | | | Capital Markets | | | 0.74 | % | |
| | 76,937 | | | Julius Baer Group Ltd. | | | 3,357,459 | | |
| | | | | Construction Materials | | | 0.63 | % | |
| | 70,000 | | | LafargeHolcim Ltd. | | | 2,868,639 | | |
| | | | | Electrical Equipment | | | 1.26 | % | |
| | 222,500 | | | ABB Ltd. — ADR | | | 5,709,350 | | |
| | | | | Food Products | | | 0.48 | % | |
| | 20,000 | | | Nestle SA | | | 2,163,146 | | |

The accompanying notes are an integral part of these financial statements.
73
BUFFALO INTERNATIONAL FUND
(UNAUDITED)
SCHEDULE OF INVESTMENTS
SEPTEMBER 30, 2022 Continued
Shares or Face Amount | | | | $ Fair Value* | |
| | | | | Health Care Equipment & Supplies | | | 0.59 | % | |
| | 46,000 | | | Alcon, Inc. | | | 2,671,930 | | |
| | | | | Life Sciences Tools & Services | | | 1.62 | % | |
| | 15,000 | | | Lonza Group AG | | | 7,303,369 | | |
| | | | | Pharmaceuticals | | | 1.26 | % | |
| | 11,800 | | | Roche Holding AG | | | 3,841,287 | | |
| | 45,400 | | | Roche Holding AG — ADR | | | 1,844,148 | | |
| | | | 5,685,435 | | |
| Total Switzerland (Cost $24,338,000) | | | 29,759,328 | | |
Taiwan, Province of China | | | 1.96 | % | |
| | | | | Semiconductors & Semiconductor Equipment | | | 1.96 | % | |
| | 129,281 | | | Taiwan Semiconductor Manufacturing Co. Ltd. — ADR | | | 8,863,505 | | |
| Total Taiwan, Province of China (Cost $1,607,687) | | | 8,863,505 | | |
United Kingdom | | | 9.87 | % | |
| | | | | Aerospace & Defense | | | 0.86 | % | |
| | 440,000 | | | BAE Systems Plc | | | 3,866,009 | | |
| | | | | Beverages | | | 1.51 | % | |
| | 40,300 | | | Diageo PLC — ADR | | | 6,843,343 | | |
| | | | | Food Products | | | 0.63 | % | |
| | 64,700 | | | Unilever PLC — ADR | | | 2,836,448 | | |
| | | | | Health Care Equipment & Supplies | | | 0.65 | % | |
| | 127,000 | | | Smith & Nephew Plc — ADR | | | 2,948,940 | | |
| | | | | Hotels, Restaurants & Leisure | | | 0.78 | % | |
| | 73,100 | | | InterContinental Hotels Group PLC | | | 3,520,617 | | |
| | | | | Oil, Gas & Consumable Fuels | | | 1.38 | % | |
| | 200,000 | | | Shell Plc | | | 4,988,606 | | |
| | 25,000 | | | Shell Plc — ADR | | | 1,244,000 | | |
| | | | 6,232,606 | | |
| | | | | Pharmaceuticals | | | 1.96 | % | |
| | 144,000 | | | AstraZeneca PLC — ADR | | | 7,896,960 | | |
| | 9,000 | | | AstraZeneca PLC | | | 989,361 | | |
| | | | 8,886,321 | | |

The accompanying notes are an integral part of these financial statements.
74
BUFFALO INTERNATIONAL FUND
(UNAUDITED)
SCHEDULE OF INVESTMENTS
SEPTEMBER 30, 2022 Continued
Shares or Face Amount | | | | $ Fair Value* | |
| | | | | Trading Companies & Distributors | | | 2.10 | % | |
| | 212,000 | | | Ashtead Group Plc | | | 9,520,840 | | |
| Total United Kingdom (Cost $36,384,148) | | | 44,655,124 | | |
United States | | | 1.10 | % | |
| | | | | Internet & Direct Marketing Retail | | | 1.10 | % | |
| | 6,000 | | | MercadoLibre, Inc.(a) | | | 4,966,680 | | |
| Total United States (Cost $6,274,753) | | | 4,966,680 | | |
| Total Common Stocks (Cost $332,931,147) | | | 410,034,559 | | |
Short Term Investments | | | 8.94 | % | |
Investment Company | | | 8.94 | % | |
| | 40,429,638 | | | Fidelity Investments Money Market Funds — Government Portfolio — Class I — 2.73%(b) | | | 40,429,638 | | |
Total Investment Company | | | 40,429,638 | | |
| Total Short Term Investments (Cost $40,429,638) | | | 40,429,638 | | |
Total Investments (Cost $373,360,785)
| | | 99.57
450,464,197 | % | |
Other Assets in Excess of Liabilities
| | | 0.43
1,931,868 | % | |
Total Net Assets
| | | 100.00
452,396,065 | % | |
ADR American Depositary Receipt
PLC Public Limited Company
(a) Non Income Producing.
(b) The rate quoted is the annualized seven-day effective yield as of September 30, 2022.
* See Note 1A of the accompanying Notes to Financial Statements regarding valuation of securities.
The Global Industry Classification Standard (GICS) was developed by and/or is the exclusive property of MSCI, Inc. and Standard & Poor's Financial Services LLC ("S&P"). GICS is a service mark of MSCI and S&P and has been licensed for use by U.S. Bancorp Fund Services, LLC.

The accompanying notes are an integral part of these financial statements.
75
BUFFALO INTERNATIONAL FUND
(UNAUDITED)
SCHEDULE OF INVESTMENTS
SEPTEMBER 30, 2022 Continued
As of September 30, 2022, the industry diversification was as follows:
| | | $ Fair Value | | Percentage | |
Common Stocks | |
Aerospace & Defense | | | 12,681,494 | | | | 2.80 | % | |
Banks | | | 12,177,356 | | | | 2.69 | % | |
Beverages | | | 24,805,779 | | | | 5.48 | % | |
Capital Markets | | | 8,104,953 | | | | 1.79 | % | |
Chemicals | | | 23,564,890 | | | | 5.21 | % | |
Commercial Banks | | | 1,388,358 | | | | 0.31 | % | |
Commercial Services & Supplies | | | 10,104,028 | | | | 2.23 | % | |
Construction & Engineering | | | 5,983,674 | | | | 1.32 | % | |
Construction Materials | | | 9,079,654 | | | | 2.01 | % | |
Diversified Telecommunication Services | | | 446,400 | | | | 0.10 | % | |
Electrical Equipment | | | 16,451,202 | | | | 3.64 | % | |
Electronic Equipment, Instruments & Components | | | 24,053,242 | | | | 5.32 | % | |
Entertainment | | | 4,235,102 | | | | 0.94 | % | |
Food Products | | | 7,406,158 | | | | 1.64 | % | |
Health Care Equipment & Supplies | | | 17,638,513 | | | | 3.90 | % | |
Health Care Providers & Services | | | 1,681,763 | | | | 0.37 | % | |
Hotels, Restaurants & Leisure | | | 5,496,805 | | | | 1.22 | % | |
Household Products | | | 787,755 | | | | 0.17 | % | |
Industrial Conglomerates | | | 7,643,464 | | | | 1.69 | % | |
Insurance | | | 19,438,732 | | | | 4.30 | % | |
Internet & Direct Marketing Retail | | | 4,966,680 | | | | 1.10 | % | |
IT Services | | | 5,861,640 | | | | 1.30 | % | |
Life Sciences Tools & Services | | | 24,561,452 | | | | 5.43 | % | |
Machinery | | | 3,398,717 | | | | 0.75 | % | |
Oil, Gas & Consumable Fuels | | | 6,232,606 | | | | 1.38 | % | |
Personal Products | | | 2,203,013 | | | | 0.49 | % | |
Pharmaceuticals | | | 39,604,590 | | | | 8.75 | % | |
Professional Services | | | 10,850,166 | | | | 2.40 | % | |
Road & Rail | | | 7,235,330 | | | | 1.60 | % | |
Semiconductors & Semiconductor Equipment | | | 35,817,705 | | | | 7.92 | % | |
Software | | | 15,664,322 | | | | 3.46 | % | |
Textiles, Apparel & Luxury Goods | | | 18,781,875 | | | | 4.15 | % | |
Trading Companies & Distributors | | | 21,687,141 | | | | 4.79 | % | |
Total Common Stocks | | | 410,034,559 | | | | 90.64 | % | |
Short Term Investments | |
Investment Company | | | 40,429,638 | | | | 8.94 | % | |
Total Short Term Investments | | | 40,429,638 | | | | 8.94 | % | |
Total Investments | | | 450,464,197 | | | | 99.57 | % | |
Other Assets in Excess of Liabilities | | | 1,931,868 | | | | 0.43 | % | |
TOTAL NET ASSETS | | | 452,396,065 | | | | 100.00 | % | |

The accompanying notes are an integral part of these financial statements.
76
BUFFALO LARGE CAP FUND
(UNAUDITED)
SCHEDULE OF INVESTMENTS
SEPTEMBER 30, 2022
Shares or Face Amount | | | | $ Fair Value* | |
Common Stocks | | | 92.51 | % | |
Communication Services | | | 7.20 | % | |
| | | | | Interactive Media & Services | | | 7.20 | % | |
| | 56,900 | | | Alphabet, Inc. — Class A(a) | | | 5,442,485 | | |
| | 6,460 | | | Alphabet, Inc. — Class C(a) | | | 621,129 | | |
| Total Communication Services (Cost $1,690,168) | | | 6,063,614 | | |
Consumer Discretionary | | | 14.35 | % | |
| | | | | Automobiles | | | 1.83 | % | |
| | 5,820 | | | Tesla, Inc.(a) | | | 1,543,755 | | |
| | | | | Hotels, Restaurants & Leisure | | | 2.34 | % | |
| | 4,825 | | | Airbnb, Inc.(a) | | | 506,818 | | |
| | 2,950 | | | McDonald's Corp. | | | 680,683 | | |
| | 7,390 | | | Yum! Brands, Inc. | | | 785,853 | | |
| | | | 1,973,354 | | |
| | | | | Internet & Direct Marketing Retail | | | 6.66 | % | |
| | 49,700 | | | Amazon.com, Inc.(a) | | | 5,616,100 | | |
| | | | | Specialty Retail | | | 2.79 | % | |
| | 1,100 | | | O'Reilly Automotive, Inc.(a) | | | 773,685 | | |
| | 3,950 | | | The Home Depot, Inc. | | | 1,089,963 | | |
| | 7,795 | | | The TJX Companies, Inc. | | | 484,225 | | |
| | | | 2,347,873 | | |
| | | | | Textiles, Apparel & Luxury Goods | | | 0.73 | % | |
| | 5,260 | | | NIKE, Inc. — Class B | | | 437,211 | | |
| | 10,900 | | | On Holding AG — ADR(a) (b) | | | 174,945 | | |
| | | | 612,156 | | |
| Total Consumer Discretionary (Cost $7,463,061) | | | 12,093,238 | | |
Consumer Staples | | | 4.34 | % | |
| | | | | Beverages | | | 0.54 | % | |
| | 8,025 | | | The Coca Cola Co. | | | 449,560 | | |
| | | | | Food & Staples Retailing | | | 2.41 | % | |
| | 3,500 | | | Costco Wholesale Corp. | | | 1,652,945 | | |
| | 5,350 | | | Sysco Corp. | | | 378,299 | | |
| | | | 2,031,244 | | |

The accompanying notes are an integral part of these financial statements.
77
BUFFALO LARGE CAP FUND
(UNAUDITED)
SCHEDULE OF INVESTMENTS
SEPTEMBER 30, 2022 Continued
Shares or Face Amount | | | | $ Fair Value* | |
| | | | | Household Products | | | 0.67 | % | |
| | 4,475 | | | The Procter & Gamble Co. | | | 564,969 | | |
| | | | | Personal Products | | | 0.72 | % | |
| | 2,810 | | | The Estee Lauder Companies Inc. — Class A | | | 606,679 | | |
| Total Consumer Staples (Cost $3,426,494) | | | 3,652,452 | | |
Energy | | | 1.59 | % | |
| | | | | Energy Equipment & Services | | | 0.45 | % | |
| | 10,700 | | | Schlumberger Ltd. — ADR(b) | | | 384,130 | | |
| | | | | Oil, Gas & Consumable Fuels | | | 1.14 | % | |
| | 4,550 | | | EOG Resources, Inc. | | | 508,371 | | |
| | 4,125 | | | Hess Corp. | | | 449,584 | | |
| | | | 957,955 | | |
| Total Energy (Cost $1,540,365) | | | 1,342,085 | | |
Financials | | | 3.22 | % | |
| | | | | Capital Markets | | | 1.35 | % | |
| | 1,025 | | | MSCI, Inc. | | | 432,335 | | |
| | 2,325 | | | S&P Global, Inc. | | | 709,939 | | |
| | | | 1,142,274 | | |
| | | | | Insurance | | | 1.87 | % | |
| | 3,200 | | | Aon PLC — ADR(b) | | | 857,184 | | |
| | 4,175 | | | Arthur J. Gallagher & Co. | | | 714,843 | | |
| | | | 1,572,027 | | |
| Total Financials (Cost $2,225,647) | | | 2,714,301 | | |
Health Care | | | 15.13 | % | |
| | | | | Biotechnology | | | 1.47 | % | |
| | 1,080 | | | Alnylam Pharmaceuticals, Inc.(a) | | | 216,173 | | |
| | 3,525 | | | Vertex Pharmaceuticals Inc.(a) | | | 1,020,628 | | |
| | | | 1,236,801 | | |

The accompanying notes are an integral part of these financial statements.
78
BUFFALO LARGE CAP FUND
(UNAUDITED)
SCHEDULE OF INVESTMENTS
SEPTEMBER 30, 2022 Continued
Shares or Face Amount | | | | $ Fair Value* | |
| | | | | Health Care Equipment & Supplies | | | 4.88 | % | |
| | 16,825 | | | Boston Scientific Corp.(a) | | | 651,632 | | |
| | 3,475 | | | Danaher Corp. | | | 897,558 | | |
| | 11,075 | | | Edwards Lifesciences Corp.(a) | | | 915,127 | | |
| | 2,275 | | | Insulet Corporation(a) | | | 521,885 | | |
| | 5,325 | | | Medtronic, PLC — ADR(b) | | | 429,994 | | |
| | 3,450 | | | Stryker Corp. | | | 698,763 | | |
| | | | 4,114,959 | | |
| | | | | Health Care Providers & Services | | | 4.55 | % | |
| | 3,750 | | | HCA Healthcare, Inc. | | | 689,212 | | |
| | 6,220 | | | UnitedHealth Group, Inc. | | | 3,141,349 | | |
| | | | 3,830,561 | | |
| | | | | Life Sciences Tools & Services | | | 1.90 | % | |
| | 2,275 | | | ICON PLC. — ADR(a) (b) | | | 418,100 | | |
| | 22,615 | | | Stevanato Group SpA — ADR(a) (b) | | | 383,098 | | |
| | 1,575 | | | Thermo Fisher Scientific, Inc. | | | 798,824 | | |
| | | | 1,600,022 | | |
| | | | | Pharmaceuticals | | | 2.33 | % | |
| | 8,350 | | | AstraZeneca PLC — ADR(b) | | | 457,914 | | |
| | 2,650 | | | Eli Lilly & Co. | | | 856,878 | | |
| | 4,400 | | | Zoetis, Inc. | | | 652,476 | | |
| | | | 1,967,268 | | |
| Total Health Care (Cost $12,112,476) | | | 12,749,611 | | |
Industrials | | | 6.15 | % | |
| | | | | Aerospace & Defense | | | 1.85 | % | |
| | 1,150 | | | Lockheed Martin Corp. | | | 444,234 | | |
| | 2,375 | | | Northrop Grumman Corp. | | | 1,117,010 | | |
| | | | 1,561,244 | | |
| | | | | Commercial Services & Supplies | | | 0.81 | % | |
| | 4,250 | | | Waste Management, Inc. | | | 680,893 | | |
| | | | | Electrical Equipment | | | 0.54 | % | |
| | 3,425 | | | Eaton Corp Plc — ADR(b) | | | 456,758 | | |
| | | | | Industrial Conglomerates | | | 1.10 | % | |
| | 5,525 | | | Honeywell International, Inc. | | | 922,509 | | |
| | | | | Machinery | | | 0.55 | % | |
| | 10,800 | | | Ingersoll Rand, Inc. | | | 467,208 | | |

The accompanying notes are an integral part of these financial statements.
79
BUFFALO LARGE CAP FUND
(UNAUDITED)
SCHEDULE OF INVESTMENTS
SEPTEMBER 30, 2022 Continued
Shares or Face Amount | | | | $ Fair Value* | |
| | | | | Professional Services | | | 0.81 | % | |
| | 15,775 | | | KBR, Inc. | | | 681,795 | | |
| | | | | Trading Companies & Distributors | | | 0.49 | % | |
| | 1,525 | | | United Rentals, Inc.(a) | | | 411,933 | | |
| Total Industrials (Cost $5,027,071) | | | 5,182,340 | | |
Information Technology | | | 37.41 | % | |
| | | | | Communications Equipment | | | 0.98 | % | |
| | 7,325 | | | Arista Networks Inc.(a) | | | 826,919 | | |
| | | | | IT Services | | | 4.44 | % | |
| | 2,750 | | | Accenture Plc — ADR(b) | | | 707,575 | | |
| | 1,700 | | | MasterCard, Inc. — Class A | | | 483,378 | | |
| | 1,550 | | | MongoDB, Inc.(a) | | | 307,768 | | |
| | 12,640 | | | Visa Inc. — Class A | | | 2,245,496 | | |
| | | | 3,744,217 | | |
| | | | | Semiconductors & Semiconductor Equipment | | | 5.35 | % | |
| | 4,650 | | | Advanced Micro Devices, Inc.(a) | | | 294,624 | | |
| | 6,675 | | | Applied Materials, Inc. | | | 546,883 | | |
| | 1,975 | | | ASML Holding NV — NY Shares — ADR(b) | | | 820,316 | | |
| | 1,375 | | | Enphase Energy, Inc.(a) | | | 381,521 | | |
| | 10,175 | | | Entegris, Inc. | | | 844,728 | | |
| | 9,175 | | | NVIDIA Corp. | | | 1,113,753 | | |
| | 16,275 | | | STMicroelectronics N.V. — NY Shares — ADR(b) | | | 503,549 | | |
| | | | 4,505,374 | | |
| | | | | Software | | | 18.11 | % | |
| | 3,445 | | | Adobe, Inc.(a) | | | 948,064 | | |
| | 1,450 | | | Atlassian Corp Plc — ADR(a) (b) | | | 305,356 | | |
| | 3,000 | | | CrowdStrike Holdings, Inc.(a) | | | 494,430 | | |
| | 850 | | | HubSpot, Inc.(a) | | | 229,602 | | |
| | 1,560 | | | Intuit, Inc. | | | 604,219 | | |
| | 5,650 | | | Manhattan Associates, Inc.(a) | | | 751,619 | | |
| | 37,200 | | | Microsoft Corp. | | | 8,663,880 | | |
| | 6,150 | | | Palo Alto Networks, Inc.(a) | | | 1,007,308 | | |
| | 5,290 | | | salesforce.com, Inc.(a) | | | 760,914 | | |
| | 1,720 | | | ServiceNow, Inc.(a) | | | 649,489 | | |
| | 1,550 | | | Synopsys, Inc.(a) | | | 473,541 | | |
| | 2,435 | | | Workday, Inc.(a) | | | 370,656 | | |
| | | | 15,259,078 | | |

The accompanying notes are an integral part of these financial statements.
80
BUFFALO LARGE CAP FUND
(UNAUDITED)
SCHEDULE OF INVESTMENTS
SEPTEMBER 30, 2022 Continued
Shares or Face Amount | | | | $ Fair Value* | |
| | | | | Technology Hardware, Storage & Peripherals | | | 8.53 | % | |
| | 51,980 | | | Apple Inc. | | | 7,183,636 | | |
| Total Information Technology (Cost $20,424,408) | | | 31,519,224 | | |
Materials | | | 3.12 | % | |
| | | | | Chemicals | | | 2.58 | % | |
| | 1,475 | | | Albemarle Corp. | | | 390,049 | | |
| | 14,170 | | | Corteva, Inc. | | | 809,815 | | |
| | 3,630 | | | Linde PLC — ADR(b) | | | 978,612 | | |
| | | | 2,178,476 | | |
| | | | | Construction Materials | | | 0.54 | % | |
| | 14,000 | | | CRH PLC — ADR(b) | | | 451,220 | | |
| Total Materials (Cost $2,492,089) | | | 2,629,696 | | |
| Total Common Stocks (Cost $56,401,779) | | | 77,946,561 | | |
REITS | | | 0.36 | % | |
Real Estate | | | 0.36 | % | |
| | | | | Equity Real Estate Investment Trusts (REITs) | | | 0.36 | % | |
| | 3,000 | | | Prologis, Inc. | | | 304,800 | | |
| Total Real Estate (Cost $390,613) | | | 304,800 | | |
| Total REITS (Cost $390,613) | | | 304,800 | | |
Exchange Traded Funds | | | 0.34 | % | |
| | | | | Other Investment Pools and Funds | | | 0.34 | % | |
| | 6,725 | | | SPDR S&P Metals & Mining ETF | | | 285,745 | | |
| Total Exchange Traded Funds (Cost $391,398) | | | 285,745 | | |

The accompanying notes are an integral part of these financial statements.
81
BUFFALO LARGE CAP FUND
(UNAUDITED)
SCHEDULE OF INVESTMENTS
SEPTEMBER 30, 2022 Continued
Shares or Face Amount | | | | $ Fair Value* | |
Short Term Investments | | | 7.38 | % | |
Investment Company | | | 7.38 | % | |
| | 6,218,503 | | | Fidelity Investments Money Market Funds — Government Portfolio — Class I — 2.73%(c) | | | 6,218,503 | | |
Total Investment Company | | | 6,218,503 | | |
| Total Short Term Investments (Cost $6,218,503) | | | 6,218,503 | | |
Total Investments (Cost $63,402,293)
| | | 100.59
84,755,609 | % | |
Liabilities in Excess of Other Assets
| | | (0.59
(496,538) | )% | |
Total Net Assets
| | | 100.00
84,259,071 | % | |
ADR American Depositary Receipt
PLC Public Limited Company
(a) Non Income Producing.
(b) Foreign Issued Securities. The total value of these securities amounted to $7,328,751 (8.70% of net assets) at September 30, 2022.
(c) The rate quoted is the annualized seven-day effective yield as of September 30, 2022.
* See Note 1A of the accompanying Notes to Financial Statements regarding valuation of securities.
The Global Industry Classification Standard (GICS) was developed by and/or is the exclusive property of MSCI, Inc. and Standard & Poor's Financial Services LLC ("S&P"). GICS is a service mark of MSCI and S&P and has been licensed for use by U.S. Bancorp Fund Services, LLC.

The accompanying notes are an integral part of these financial statements.
82
BUFFALO MID CAP FUND
(UNAUDITED)
SCHEDULE OF INVESTMENTS
SEPTEMBER 30, 2022
Shares or Face Amount | | | | $ Fair Value | |
Common Stocks | | | 95.92 | % | |
Communication Services | | | 5.02 | % | |
| | | | | Entertainment | | | 2.46 | % | |
| | 23,537 | | | Live Nation Entertainment, Inc.(a) | | | 1,789,754 | | |
| | 12,500 | | | Take-Two Interactive Software, Inc.(a) | | | 1,362,500 | | |
| | | | 3,152,254 | | |
| | | | | Interactive Media & Services | | | 1.64 | % | |
| | 90,300 | | | Pinterest, Inc.(a) | | | 2,103,990 | | |
| | | | | Media | | | 0.92 | % | |
| | 22,329 | | | Liberty Media Corp-Liberty Formula One(a) | | | 1,172,719 | | |
| Total Communication Services (Cost $6,228,075) | | | 6,428,963 | | |
Consumer Discretionary | | | 7.45 | % | |
| | | | | Hotels, Restaurants & Leisure | | | 1.20 | % | |
| | 7,106 | | | Vail Resorts, Inc. | | | 1,532,338 | | |
| | | | | Internet & Direct Marketing Retail | | | 1.33 | % | |
| | 18,200 | | | Expedia Group, Inc.(a) | | | 1,705,158 | | |
| | | | | Specialty Retail | | | 3.48 | % | |
| | 24,835 | | | CarMax, Inc.(a) | | | 1,639,607 | | |
| | 20,800 | | | Floor & Decor Holdings, Inc. — Class A(a) | | | 1,461,408 | | |
| | 5,500 | | | RH(a) | | | 1,353,385 | | |
| | | | 4,454,400 | | |
| | | | | Textiles, Apparel & Luxury Goods | | | 1.44 | % | |
| | 6,600 | | | lululemon athletica, Inc.(a) | | | 1,845,096 | | |
| Total Consumer Discretionary (Cost $12,476,523) | | | 9,536,992 | | |
Financials | | | 10.95 | % | |
| | | | | Capital Markets | | | 6.39 | % | |
| | 6,225 | | | MarketAxess Holdings, Inc. | | | 1,385,000 | | |
| | 8,074 | | | Moody's Corp. | | | 1,962,870 | | |
| | 11,466 | | | MSCI, Inc. | | | 4,836,244 | | |
| | | | 8,184,114 | | |
| | | | | Diversified Financial Services | | | 2.59 | % | |
| | 30,700 | | | Global Payments Inc. | | | 3,317,135 | | |

The accompanying notes are an integral part of these financial statements.
83
BUFFALO MID CAP FUND
(UNAUDITED)
SCHEDULE OF INVESTMENTS
SEPTEMBER 30, 2022 Continued
Shares or Face Amount | | | | $ Fair Value | |
| | | | | Insurance | | | 1.97 | % | |
| | 9,900 | | | Kinsale Capital Group, Inc. | | | 2,528,658 | | |
| Total Financials (Cost $7,034,514) | | | 14,029,907 | | |
Health Care | | | 16.14 | % | |
| | | | | Aerospace & Defense | | | 0.85 | % | |
| | 5,400 | | | Teleflex, Inc. | | | 1,087,884 | | |
| | | | | Health Care Equipment & Supplies | | | 3.44 | % | |
| | 6,700 | | | ABIOMED, Inc.(a) | | | 1,645,922 | | |
| | 38,810 | | | Envista Holdings Corp.(a) | | | 1,273,356 | | |
| | 5,650 | | | The Cooper Companies, Inc. | | | 1,491,035 | | |
| | | | 4,410,313 | | |
| | | | | Health Care Providers & Services | | | 2.37 | % | |
| | 24,550 | | | Encompass Health Corp. | | | 1,110,396 | | |
| | 52,000 | | | Progyny, Inc.(a) | | | 1,927,120 | | |
| | | | 3,037,516 | | |
| | | | | Health Care Technology | | | 2.59 | % | |
| | 19,500 | | | Doximity, Inc.(a) | | | 589,290 | | |
| | 16,550 | | | Veeva Systems, Inc.(a) | | | 2,728,764 | | |
| | | | 3,318,054 | | |
| | | | | Life Sciences Tools & Services | | | 5.95 | % | |
| | 4,530 | | | Bio-Rad Laboratories, Inc.(a) | | | 1,889,644 | | |
| | 8,700 | | | Bio-Techne Corp. | | | 2,470,800 | | |
| | 7,555 | | | Illumina, Inc.(a) | | | 1,441,419 | | |
| | 10,000 | | | IQVIA Holdings, Inc.(a) | | | 1,811,400 | | |
| | | | 7,613,263 | | |
| | | | | Pharmaceuticals | | | 0.94 | % | |
| | 9,000 | | | Jazz Pharmaceuticals Public Limited Company — ADR(a) (b) | | | 1,199,610 | | |
| Total Health Care (Cost $18,261,607) | | | 20,666,640 | | |
Industrials | | | 19.01 | % | |
| | | | | Aerospace & Defense | | | 1.64 | % | |
| | 4,000 | | | TransDigm Group, Inc. | | | 2,099,280 | | |
| | | | | Building Products | | | 0.89 | % | |
| | 26,002 | | | Trex Co., Inc.(a) | | | 1,142,528 | | |

The accompanying notes are an integral part of these financial statements.
84
BUFFALO MID CAP FUND
(UNAUDITED)
SCHEDULE OF INVESTMENTS
SEPTEMBER 30, 2022 Continued
Shares or Face Amount | | | | $ Fair Value | |
| | | | | Commercial Services & Supplies | | | 3.39 | % | |
| | 25,041 | | | Copart, Inc.(a) | | | 2,664,362 | | |
| | 52,666 | | | IAA Inc.(a) | | | 1,677,412 | | |
| | | | 4,341,774 | | |
| | | | | Electrical Equipment | | | 3.12 | % | |
| | 35,255 | | | AMETEK, Inc. | | | 3,998,270 | | |
| | | | | Professional Services | | | 9.26 | % | |
| | 136,000 | | | Clarivate Plc — ADR(a) (b) | | | 1,277,040 | | |
| | 61,550 | | | CoStar Group, Inc.(a) | | | 4,286,957 | | |
| | 12,483 | | | Equifax, Inc. | | | 2,139,961 | | |
| | 24,353 | | | Verisk Analytics, Inc. | | | 4,152,917 | | |
| | | | 11,856,875 | | |
| | | | | Road & Rail | | | 0.71 | % | |
| | 69,000 | | | Lyft, Inc.(a) | | | 908,730 | | |
| Total Industrials (Cost $15,301,059) | | | 24,347,457 | | |
Information Technology | | | 29.53 | % | |
| | | | | Communications Equipment | | | 1.87 | % | |
| | 16,570 | | | F5 Networks, Inc.(a) | | | 2,398,176 | | |
| | | | | IT Services | | | 8.07 | % | |
| | 6,680 | | | EPAM Systems, Inc.(a) | | | 2,419,429 | | |
| | 22,600 | | | Euronet Worldwide, Inc.(a) | | | 1,712,176 | | |
| | 17,500 | | | Gartner, Inc.(a) | | | 4,842,075 | | |
| | 44,000 | | | Teradata Corp.(a) | | | 1,366,640 | | |
| | | | 10,340,320 | | |
| | | | | Semiconductors & Semiconductor Equipment | | | 3.75 | % | |
| | 18,300 | | | Micron Technology, Inc. | | | 916,830 | | |
| | 43,310 | | | ON Semiconductor Corp.(a) | | | 2,699,512 | | |
| | 12,540 | | | Universal Display Corp. | | | 1,183,149 | | |
| | | | 4,799,491 | | |

The accompanying notes are an integral part of these financial statements.
85
BUFFALO MID CAP FUND
(UNAUDITED)
SCHEDULE OF INVESTMENTS
SEPTEMBER 30, 2022 Continued
Shares or Face Amount | | | | $ Fair Value | |
| | | | | Software | | | 15.84 | % | |
| | 11,480 | | | Aspen Technology, Inc.(a) | | | 2,734,536 | | |
| | 82,000 | | | DoubleVerify Holdings, Inc.(a) | | | 2,242,700 | | |
| | 21,862 | | | Guidewire Software, Inc.(a) | | | 1,346,262 | | |
| | 24,090 | | | Palo Alto Networks, Inc.(a) | | | 3,945,701 | | |
| | 28,000 | | | Procore Technologies, Inc.(a) | | | 1,385,440 | | |
| | 19,400 | | | Splunk, Inc.(a) | | | 1,458,880 | | |
| | 34,289 | | | SS&C Technologies Holdings, Inc. | | | 1,637,300 | | |
| | 6,640 | | | Tyler Technologies, Inc.(a) | | | 2,307,400 | | |
| | 67,000 | | | Varonis Systems, Inc.(a) | | | 1,776,840 | | |
| | 9,540 | | | Workday, Inc.(a) | | | 1,452,179 | | |
| | | | 20,287,238 | | |
| Total Information Technology (Cost $31,027,336) | | | 37,825,225 | | |
Materials | | | 4.01 | % | |
| | | | | Chemicals | | | 2.75 | % | |
| | 92,500 | | | Element Solutions, Inc. | | | 1,504,975 | | |
| | 19,110 | | | FMC Corp. | | | 2,019,927 | | |
| | | | 3,524,902 | | |
| | | | | Construction Materials | | | 1.26 | % | |
| | 5,000 | | | Martin Marietta Materials, Inc. | | | 1,610,450 | | |
| Total Materials (Cost $3,148,170) | | | 5,135,352 | | |
Real Estate | | | 3.81 | % | |
| | | | | Real Estate Management & Development | | | 3.81 | % | |
| | 56,522 | | | CBRE Group, Inc. — Class A(a) | | | 3,815,800 | | |
| | 37,000 | | | Zillow Group, Inc.(a) | | | 1,058,570 | | |
| Total Real Estate (Cost $4,632,590) | | | 4,874,370 | | |
| Total Common Stocks (Cost $98,109,874) | | | 122,844,906 | | |

The accompanying notes are an integral part of these financial statements.
86
BUFFALO MID CAP FUND
(UNAUDITED)
SCHEDULE OF INVESTMENTS
SEPTEMBER 30, 2022 Continued
Shares or Face Amount | | | | $ Fair Value | |
REITS | | | 1.85 | % | |
Real Estate | | | 1.85 | % | |
| | | Equity Real Estate Investment Trusts (REITs) | | | 1.85 | % | |
| | 36,790 | | | Welltower, Inc. | | | 2,366,333 | | |
| Total Real Estate (Cost $2,689,550) | | | 2,366,333 | | |
| Total REITS (Cost $2,689,550) | | | 2,366,333 | | |
Short Term Investments | | | 1.60 | % | |
Investment Company | | | 1.60 | % | |
| | 2,046,176 | | | Fidelity Investments Money Market Funds — Government Portfolio — Class I — 2.73%(c) | | | 2,046,176 | | |
Total Investment Company | | | 2,046,176 | | |
| Total Short Term Investments (Cost $2,046,176) | | | 2,046,176 | | |
Total Investments (Cost $102,845,600)
| | | 99.37
127,257,415 | % | |
Other Assets in Excess of Liabilities
| | | 0.63
812,852 | % | |
Total Net Assets
| | | 100.00
128,070,267 | % | |
ADR American Depositary Receipt
PLC Public Limited Company
(a) Non Income Producing.
(b) Foreign Issued Security. The total value of these securities amounted to $2,476,650 (1.93% of net assets) at September 30, 2022.
(c) The rate quoted is the annualized seven-day effective yield as of September 30, 2022.
* See Note 1A of the accompanying Notes to Financial Statements regarding valuation of securities.
The Global Industry Classification Standard (GICS) was developed by and/or is the exclusive property of MSCI, Inc. and Standard & Poor's Financial Services LLC ("S&P"). GICS is a service mark of MSCI and S&P and has been licensed for use by U.S. Bancorp Fund Services, LLC.

The accompanying notes are an integral part of these financial statements.
87
BUFFALO SMALL CAP FUND
(UNAUDITED)
SCHEDULE OF INVESTMENTS
SEPTEMBER 30, 2022
Shares or Face Amount | | | | $ Fair Value* | |
Common Stocks | | | 96.43 | % | |
Communication Services | | | 0.61 | % | |
| | | | | Interactive Media & Services | | | 0.61 | % | |
| | 811,824 | | | Eventbrite, Inc.(a) | | | 4,935,890 | | |
| Total Communication Services (Cost $15,253,617) | | | 4,935,890 | | |
Consumer Discretionary | | | 11.92 | % | |
| | | | | Diversified Consumer Services | | | 0.88 | % | |
| | 383,065 | | | European Wax Center, Inc. | | | 7,067,549 | | |
| | | | | Hotels, Restaurants & Leisure | | | 6.27 | % | |
| | 973,015 | | | Everi Holdings Inc.(a) | | | 15,782,303 | | |
| | 531,202 | | | First Watch Restaurant Group, Inc.(a) | | | 7,691,805 | | |
| | 1,060,075 | | | Rush Street Interactive, Inc.(a) | | | 3,901,076 | | |
| | 568,620 | | | Target Hospitality Corp.(a) | | | 7,175,985 | | |
| | 59,355 | | | Texas Roadhouse, Inc. | | | 5,179,317 | | |
| | 87,090 | | | Wingstop, Inc. | | | 10,922,828 | | |
| | | | 50,653,314 | | |
| | | | | Household Durables | | | 0.60 | % | |
| | 239,147 | | | Lovesac Co/The(a) | | | 4,873,816 | | |
| | | | | Internet & Direct Marketing Retail | | | 0.60 | % | |
| | 628,156 | | | Vivid Seats, Inc. | | | 4,811,675 | | |
| | | | | Multiline Retail | | | 1.41 | % | |
| | 220,070 | | | Ollie's Bargain Outlet Holdings, Inc.(a) | | | 11,355,612 | | |
| | | | | Specialty Retail | | | 0.95 | % | |
| | 523,996 | | | Guess?, Inc. | | | 7,687,021 | | |
| | | | | Textiles, Apparel & Luxury Goods | | | 1.21 | % | |
| | 367,162 | | | Steven Madden Ltd. | | | 9,792,210 | | |
| Total Consumer Discretionary (Cost $94,605,000) | | | 96,241,197 | | |
Consumer Staples | | | 2.43 | % | |
| | | | | Beverages | | | 2.43 | % | |
| | 185,025 | | | MGP Ingredients, Inc. | | | 19,642,254 | | |
| Total Consumer Staples (Cost $7,519,455) | | | 19,642,254 | | |

The accompanying notes are an integral part of these financial statements.
88
BUFFALO SMALL CAP FUND
(UNAUDITED)
SCHEDULE OF INVESTMENTS
SEPTEMBER 30, 2022 Continued
Shares or Face Amount | | | | $ Fair Value* | |
Energy | | | 2.72 | % | |
| | | | | Energy Equipment & Services | | | 2.72 | % | |
| | 288,905 | | | Cactus, Inc. | | | 11,102,619 | | |
| | 555,115 | | | ChampionX Corp. | | | 10,863,601 | | |
| Total Energy (Cost $22,160,328) | | | 21,966,220 | | |
Financials | | | 7.33 | % | |
| | | | | Banks | | | 2.48 | % | |
| | 445,170 | | | Bancorp Inc/The(a) | | | 9,784,836 | | |
| | 245,635 | | | Customers Bancorp, Inc.(a) | | | 7,241,320 | | |
| | 39,845 | | | Silvergate Capital Corp.(a) | | | 3,002,321 | | |
| | | | 20,028,477 | | |
| | | | | Capital Markets | | | 1.83 | % | |
| | 151,195 | | | Hamilton Lane Inc. — Class A | | | 9,012,734 | | |
| | 716,455 | | | Open Lending Corp.(a) | | | 5,760,298 | | |
| | | | 14,773,032 | | |
| | | | | Insurance | | | 3.02 | % | |
| | 348,515 | | | BRP Group, Inc.(a) | | | 9,183,370 | | |
| | 181,773 | | | Palomar Holdings, Inc.(a) | | | 15,218,036 | | |
| | | | 24,401,406 | | |
| Total Financials (Cost $63,445,852) | | | 59,202,915 | | |
Health Care | | | 26.15 | % | |
| | | | | Biotechnology | | | 8.91 | % | |
| | 767,712 | | | Avid Bioservices, Inc.(a) | | | 14,678,653 | | |
| | 584,096 | | | Castle Biosciences, Inc.(a) | | | 15,233,224 | | |
| | 447,914 | | | Halozyme Therapeutics, Inc.(a) | | | 17,710,520 | | |
| | 125,092 | | | Ligand Pharmaceuticals, Inc.(a) | | | 10,771,672 | | |
| | 309,165 | | | Natera, Inc.(a) | | | 13,547,610 | | |
| | | | 71,941,679 | | |

The accompanying notes are an integral part of these financial statements.
89
BUFFALO SMALL CAP FUND
(UNAUDITED)
SCHEDULE OF INVESTMENTS
SEPTEMBER 30, 2022 Continued
Shares or Face Amount | | | | $ Fair Value* | |
| | | | | Health Care Equipment & Supplies | | | 8.27 | % | |
| | 248,295 | | | Establishment Labs Holdings, Inc. — ADR(a) (b) | | | 13,559,390 | | |
| | 425,744 | | | Paragon 28, Inc.(a) | | | 7,586,758 | | |
| | 76,710 | | | QuidelOrtho Corp.(a) | | | 5,483,231 | | |
| | 182,000 | | | STAAR Surgical Co.(a) | | | 12,840,100 | | |
| | 392,926 | | | TransMedics Group, Inc.(a) | | | 16,400,731 | | |
| | 494,223 | | | Treace Medical Concepts, Inc.(a) | | | 10,907,502 | | |
| | | | 66,777,712 | | |
| | | | | Health Care Providers & Services | | | 4.81 | % | |
| | 269,388 | | | HealthEquity, Inc.(a) | | | 18,094,792 | | |
| | 608,765 | | | Privia Health Group, Inc.(a) | | | 20,734,536 | | |
| | | | 38,829,328 | | |
| | | | | Health Care Technology | | | 3.19 | % | |
| | 464,930 | | | Evolent Health, Inc. — Class A(a) | | | 16,704,935 | | |
| | 31,960 | | | Inspire Medical Systems, Inc.(a) | | | 5,668,745 | | |
| | 230,364 | | | OptimizeRx Corp.(a) | | | 3,413,994 | | |
| | | | 25,787,674 | | |
| | | | | Life Sciences Tools & Services | | | 0.97 | % | |
| | 751,264 | | | Codexis, Inc.(a) | | | 4,552,660 | | |
| | 69,595 | | | Syneos Health, Inc.(a) | | | 3,281,404 | | |
| | | | 7,834,064 | | |
| Total Health Care (Cost $213,550,334) | | | 211,170,457 | | |
Industrials | | | 21.86 | % | |
| | | | | Air Freight & Logistics | | | 1.03 | % | |
| | 345,437 | | | Air Transport Services Group, Inc.(a) | | | 8,321,577 | | |
| | | | | Building Products | | | 4.30 | % | |
| | 85,030 | | | Advanced Drainage Systems, Inc. | | | 10,575,181 | | |
| | 299,030 | | | AZEK Co Inc/The(a) | | | 4,969,879 | | |
| | 836,435 | | | Janus International Group, Inc.(a) | | | 7,461,000 | | |
| | 556,970 | | | PGT Innovations, Inc.(a) | | | 11,674,091 | | |
| | | | 34,680,151 | | |
| | | | | Construction & Engineering | | | 3.20 | % | |
| | 149,185 | �� | | MasTec, Inc.(a) | | | 9,473,248 | | |
| | 132,360 | | | NV5 Global, Inc.(a) | | | 16,388,815 | | |
| | | | 25,862,063 | | |

The accompanying notes are an integral part of these financial statements.
90
BUFFALO SMALL CAP FUND
(UNAUDITED)
SCHEDULE OF INVESTMENTS
SEPTEMBER 30, 2022 Continued
Shares or Face Amount | | | | $ Fair Value* | |
| | | | | Electrical Equipment | | | 2.44 | % | |
| | 384,860 | | | Array Technologies, Inc.(a) | | | 6,380,979 | | |
| | 473,177 | | | Shoals Technologies Group, Inc.(a) | | | 10,196,964 | | |
| | 52,532 | | | Vicor Corp.(a) | | | 3,106,743 | | |
| | | | 19,684,686 | | |
| | | | | Machinery | | | 3.81 | % | |
| | 68,530 | | | Chart Industries, Inc.(a) | | | 12,633,505 | | |
| | 119,870 | | | John Bean Technologies Corp. | | | 10,308,820 | | |
| | 293,965 | | | Kornit Digital Ltd. — ADR(a) (b) | | | 7,822,409 | | |
| | | | 30,764,734 | | |
| | | | | Professional Services | | | 7.08 | % | |
| | 486,135 | | | First Advantage Corp.(a) | | | 6,237,112 | | |
| | 82,670 | | | FTI Consulting, Inc.(a) | | | 13,699,246 | | |
| | 224,100 | | | ICF International, Inc. | | | 24,431,382 | | |
| | 469,140 | | | Sterling Check Corp.(a) | | | 8,275,629 | | |
| | 332,885 | | | Upwork, Inc.(a) | | | 4,533,894 | | |
| | | | 57,177,263 | | |
| Total Industrials (Cost $151,650,220) | | | 176,490,474 | | |
Information Technology | | | 21.43 | % | |
| | | | | Communications Equipment | | | 6.44 | % | |
| | 678,930 | | | ADTRAN Holdings, Inc. | | | 13,293,449 | | |
| | 412,600 | | | Calix, Inc.(a) | | | 25,226,364 | | |
| | 427,075 | | | Cambium Networks Corp. — ADR(a) (b) | | | 7,226,109 | | |
| | 153,920 | | | Ciena Corp.(a) | | | 6,222,986 | | |
| | | | 51,968,908 | | |
| | | | | IT Services | | | 6.67 | % | |
| | 436,070 | | | BigCommerce Holdings, Inc.(a) | | | 6,453,836 | | |
| | 127,505 | | | Endava Plc — ADR(a) (b) | | | 10,280,728 | | |
| | 486,795 | | | Grid Dynamics Holdings, Inc.(a) | | | 9,117,670 | | |
| | 1,714,490 | | | Paya Holdings, Inc.(a) | | | 10,475,534 | | |
| | 104,460 | | | Shift4 Payments, Inc.(a) | | | 4,659,961 | | |
| | 800,579 | | | TaskUS, Inc.(a) | | | 12,889,322 | | |
| | | | 53,877,051 | | |

The accompanying notes are an integral part of these financial statements.
91
BUFFALO SMALL CAP FUND
(UNAUDITED)
SCHEDULE OF INVESTMENTS
SEPTEMBER 30, 2022 Continued
Shares or Face Amount | | | | $ Fair Value* | |
| | | | | Semiconductors & Semiconductor Equipment | | | 3.00 | % | |
| | 267,945 | | | MaxLinear, Inc.(a) | | | 8,740,366 | | |
| | 58,335 | | | Silicon Laboratories, Inc.(a) | | | 7,200,872 | | |
| | 87,950 | | | Universal Display Corp. | | | 8,298,083 | | |
| | | | 24,239,321 | | |
| | | | | Software | | | 5.32 | % | |
| | 672,859 | | | DoubleVerify Holdings, Inc.(a) | | | 18,402,693 | | |
| | 273,700 | | | Tenable Holdings, Inc.(a) | | | 9,524,760 | | |
| | 278,665 | | | Varonis Systems, Inc.(a) | | | 7,390,196 | | |
| | 1,038,410 | | | Zuora, Inc.(a) | | | 7,663,466 | | |
| | | | 42,981,115 | | |
| Total Information Technology (Cost $174,567,926) | | | 173,066,395 | | |
Materials | | | 1.98 | % | |
| | | | | Construction Materials | | | 1.38 | % | |
| | 463,433 | | | Summit Materials, Inc. — Class A(a) | | | 11,103,855 | | |
| | | | | Containers & Packaging | | | 0.60 | % | |
| | 302,997 | | | Karat Packaging, Inc.(a) | | | 4,844,922 | | |
| Total Materials (Cost $12,354,782) | | | 15,948,777 | | |
| Total Common Stocks (Cost $755,107,514) | | | 778,664,579 | | |
Short Term Investments | | | 3.50 | % | |
Investment Company | | | 3.50 | % | |
| | 28,264,250 | | | Fidelity Investments Money Market Funds — Government Portfolio — Class I — 2.73%(c) | | | 28,264,250 | | |
Total Investment Company | | | 28,264,250 | | |
| Total Short Term Investments (Cost $28,264,250) | | | 28,264,250 | | |

The accompanying notes are an integral part of these financial statements.
92
BUFFALO SMALL CAP FUND
(UNAUDITED)
SCHEDULE OF INVESTMENTS
SEPTEMBER 30, 2022 Continued
Shares or Face Amount | | $ Fair Value* | |
Total Investments (Cost $783,371,764)
| | | 99.93
806,928,829 | % | |
Other Assets in Excess of Liabilities
| | | 0.07
540,619 | % | |
Total Net Assets
| | | 100.00
807,469,448 | % | |
ADR American Depositary Receipt
PLC Public Limited Company
(a) Non Income Producing.
(b) Foreign Issued Securities. The total value of these securities amounted to $38,888,636 (4.82% of net assets) at September 30, 2022.
(c) The rate quoted is the annualized seven-day effective yield as of September 30, 2022.
* See Note 1A of the accompanying Notes to Financial Statements regarding valuation of securities.
The Global Industry Classification Standard (GICS) was developed by and/or is the exclusive property of MSCI, Inc. and Standard & Poor's Financial Services LLC ("S&P"). GICS is a service mark of MSCI and S&P and has been licensed for use by U.S. Bancorp Fund Services, LLC.

The accompanying notes are an integral part of these financial statements.
93
STATEMENTS OF ASSETS AND
LIABILITIES
SEPTEMBER 30, 2022 (UNAUDITED)
| | | Buffalo
Discovery
Fund | | Buffalo
Dividend Focus
Fund | | Buffalo
Early
Stage Growth
Fund | | Buffalo
Flexible Income
Fund | | Buffalo
Growth
Fund | |
ASSETS: | |
Investments in securities, at cost: | | $ | 906,417,144 | | | $ | 72,471,857 | | | $ | 85,167,872 | | | $ | 238,757,270 | | | $ | 83,628,633 | | |
Cash denominated in foreign currencies, at cost: | | | — | | | | — | | | | — | | | | — | | | | — | | |
Investments in securities, at value: | | | 933,808,634 | | | | 105,024,036 | | | | 83,308,862 | | | | 426,625,297 | | | | 135,785,703 | | |
Cash: | | | — | | | | — | | | | — | | | | — | | | | — | | |
Cash denominated in foreign currency, at value:(1) | | | — | | | | — | | | | — | | | | — | | | | — | | |
Receivables: | |
Investments sold | | | 2,056,025 | | | | — | | | | — | | | | 438,490 | | | | — | | |
Fund shares sold | | | 197,513 | | | | 8,873 | | | | 37,038 | | | | 280,482 | | | | 82,835 | | |
Dividends | | | 179,405 | | | | 66,404 | | | | 16,105 | | | | 782,982 | | | | 23,992 | | |
Interest | | | — | | | | 44,150 | | | | — | | | | — | | | | — | | |
Other receivables | | | — | | | | — | | | | — | | | | — | | | | — | | |
Other assets | | | 32,177 | | | | 14,533 | | | | 21,662 | | | | 32,317 | | | | 19,450 | | |
Total assets | | | 936,273,754 | | | | 105,157,996 | | | | 83,383,667 | | | | 428,159,568 | | | | 135,911,980 | | |
LIABILITIES: | |
Payables: | |
Investments purchased | | | 603,296 | | | | — | | | | — | | | | — | | | | — | | |
Written options, at value(1) (Note 8) | | | — | | | | — | | | | — | | | | 1,000 | | | | — | | |
Fund shares purchased | | | 658,999 | | | | 250 | | | | 600 | | | | 13,981 | | | | 17,322 | | |
Management fees (Note 3) | | | 707,270 | | | | 69,251 | | | | 95,920 | | | | 318,122 | | | | 91,656 | | |
Custodian fees (Note 3) | | | — | | | | — | | | | — | | | | — | | | | — | | |
Accrued shareholder service fees — Investor Class (Note 7) | | | 364,343 | | | | 9,175 | | | | 57,007 | | | | 94,590 | | | | 67,838 | | |
Other payables | | | — | | | | — | | | | — | | | | — | | | | — | | |
Accrued expenses | | | 1,461 | | | | 2,809 | | | | 8,296 | | | | 53,273 | | | | 18,011 | | |
Total liabilities | | | 2,335,369 | | | | 81,485 | | | | 161,823 | | | | 480,966 | | | | 194,827 | | |
NET ASSETS | | $ | 933,938,385 | | | $ | 105,076,511 | | | $ | 83,221,844 | | | $ | 427,678,602 | | | $ | 135,717,153 | | |
NET ASSETS CONSIST OF: | |
Capital (capital stock and paid-in capital) | | $ | 878,543,427 | | | $ | 70,773,031 | | | $ | 87,781,296 | | | $ | 226,165,862 | | | $ | 75,631,241 | | |
Total distributable earnings | | | 55,394,958 | | | | 34,303,480 | | | | (4,559,452 | ) | | | 201,512,740 | | | | 60,085,912 | | |
NET ASSETS APPLICABLE TO OUTSTANDING SHARES | | $ | 933,938,385 | | | $ | 105,076,511 | | | $ | 83,221,844 | | | $ | 427,678,602 | | | $ | 135,717,153 | | |
Net Assets — Investor Class | | $ | 740,936,638 | | | $ | 26,393,019 | | | $ | 50,086,050 | | | $ | 278,352,905 | | | $ | 70,903,068 | | |
Outstanding Shares — Investor Class | | | 38,125,361 | | | | 1,208,819 | | | | 3,630,940 | | | | 16,749,141 | | | | 3,123,217 | | |
NET ASSET VALUE PER SHARE — Investor Class | | $ | 19.43 | | | $ | 21.83 | | | $ | 13.79 | | | $ | 16.62 | | | $ | 22.70 | | |
Net Assets — Institutional Class | | $ | 193,001,747 | | | $ | 78,683,522 | | | $ | 33,135,794 | | | $ | 149,325,697 | | | $ | 64,814,085 | | |
Outstanding Shares — Institutional Class | | | 9,871,932 | | | | 3,603,873 | | | | 2,387,729 | | | | 8,988,463 | | | | 2,842,285 | | |
NET ASSET VALUE PER SHARE — Institutional Class | | $ | 19.55 | | | $ | 21.83 | | | $ | 13.88 | | | $ | 16.61 | | | $ | 22.80 | | |
Capital shares, $1.00 par value: | |
Authorized | | | Unlimited | | | | Unlimited | | | | Unlimited | | | | Unlimited | | | | Unlimited | | |
| (1) Written options, premiums received | | | — | | | | — | | | | — | | | | 9,000 | | | | — | | |

The accompanying notes are an integral part of these financial statements.
94

| | | Buffalo
High Yield
Fund | | Buffalo
International
Fund | | Buffalo
Large Cap
Fund | | Buffalo
Mid Cap
Fund | | Buffalo
Small Cap
Fund | |
ASSETS: | |
Investments in securities, at cost: | | $ | 296,222,337 | | | $ | 373,360,785 | | | $ | 63,402,293 | | | $ | 102,845,600 | | | $ | 783,371,764 | | |
Cash denominated in foreign currencies, at cost: | | | — | | | | — | | | | — | | | | — | | | | — | | |
Investments in securities, at value: | | | 271,793,455 | | | | 450,464,197 | | | | 84,755,609 | | | | 127,257,415 | | | | 806,928,829 | | |
Cash: | | | 134,998 | | | | 30,534 | | | | — | | | | — | | | | — | | |
Cash denominated in foreign currency, at value:(1) | | | — | | | | — | | | | — | | | | — | | | | — | | |
Receivables: | |
Investments sold | | | 1,376,693 | | | | — | | | | — | | | | 938,122 | | | | 1,719,883 | | |
Fund shares sold | | | 57,175 | | | | 410,022 | | | | 12,370 | | | | 16,201 | | | | 688,888 | | |
Dividends | | | — | | | | 2,062,360 | | | | 34,415 | | | | 17,603 | | | | 121,501 | | |
Interest | | | 4,024,457 | | | | — | | | | — | | | | — | | | | — | | |
Other receivables | | | — | | | | — | | | | — | | | | — | | | | — | | |
Other assets | | | 24,760 | | | | 47,756 | | | | 14,886 | | | | 11,005 | | | | 38,210 | | |
Total assets | | | 277,411,538 | | | | 453,014,869 | | | | 84,817,280 | | | | 128,240,346 | | | | 809,497,311 | | |
LIABILITIES: | |
Payables: | |
Investments purchased | | | 5,299,783 | | | | — | | | | 471,750 | | | | — | | | | — | | |
Written options, at value(1) (Note 8) | | | — | | | | — | | | | — | | | | — | | | | — | | |
Fund shares purchased | | | 106,974 | | | | 204,187 | | | | 8,823 | | | | 4,825 | | | | 674,964 | | |
Management fees (Note 3) | | | 192,663 | | | | 337,228 | | | | 56,404 | | | | 97,669 | | | | 598,152 | | |
Custodian fees (Note 3) | | | — | | | | 19,298 | | | | — | | | | — | | | | — | | |
Accrued shareholder service fees — Investor Class (Note 7) | | | — | | | | 16,371 | | | | 19,768 | | | | 53,899 | | | | 748,116 | | |
Other payables | | | — | | | | — | | | | — | | | | — | | | | — | | |
Accrued expenses | | | 3,075 | | | | 41,720 | | | | 1,464 | | | | 13,686 | | | | 6,631 | | |
Total liabilities | | | 5,602,495 | | | | 618,804 | | | | 558,209 | | | | 170,079 | | | | 2,027,863 | | |
NET ASSETS | | $ | 271,809,043 | | | $ | 452,396,065 | | | $ | 84,259,071 | | | $ | 128,070,267 | | | $ | 807,469,448 | | |
NET ASSETS CONSIST OF: | |
Capital (capital stock and paid-in capital) | | $ | 296,457,701 | | | $ | 364,041,809 | | | $ | 64,112,367 | | | $ | 90,827,511 | | | $ | 856,750,000 | | |
Total distributable earnings | | | (24,648,658 | ) | | | 88,354,256 | | | | 20,146,704 | | | | 37,242,756 | | | | (49,280,552 | ) | |
NET ASSETS APPLICABLE TO OUTSTANDING SHARES | | $ | 271,809,043 | | | $ | 452,396,065 | | | $ | 84,259,071 | | | $ | 128,070,267 | | | $ | 807,469,448 | | |
Net Assets — Investor Class | | $ | 46,110,255 | | | $ | 191,997,445 | | | $ | 25,761,067 | | | $ | 67,887,833 | | | $ | 566,275,015 | | |
Outstanding Shares — Investor Class | | | 4,578,458 | | | | 12,119,213 | | | | 830,272 | | | | 5,060,040 | | | | 42,001,087 | | |
NET ASSET VALUE PER SHARE — Investor Class | | $ | 10.07 | | | $ | 15.84 | | | $ | 31.03 | | | $ | 13.42 | | | $ | 13.48 | | |
Net Assets — Institutional Class | | $ | 225,698,788 | | | $ | 260,398,620 | | | $ | 58,497,004 | | | $ | 60,182,434 | | | $ | 241,194,433 | | |
Outstanding Shares — Institutional Class | | | 22,429,142 | | | | 16,410,995 | | | | 1,876,630 | | | | 4,460,917 | | | | 17,789,295 | | |
NET ASSET VALUE PER SHARE — Institutional Class | | $ | 10.06 | | | $ | 15.87 | | | $ | 31.17 | | | $ | 13.49 | | | $ | 13.56 | | |
Capital shares, $1.00 par value: | |
Authorized | | | Unlimited | | | | Unlimited | | | | Unlimited | | | | Unlimited | | | | Unlimited | | |
| (1) Written options, premiums received | | | — | | | | — | | | | — | | | | — | | | | — | | |
95
STATEMENTS OF OPERATIONS
FOR THE SIX MONTHS ENDED SEPTEMBER 30, 2022 (UNAUDITED)
| | | Buffalo
Discovery
Fund | | Buffalo
Dividend Focus
Fund | | Buffalo
Early
Stage Growth
Fund | | Buffalo
Flexible Income
Fund | | Buffalo
Growth
Fund | |
INVESTMENT INCOME: | |
Interest | | $ | — | | | $ | 119,133 | | | $ | — | | | $ | — | | | $ | — | | |
Dividends from securities | | | 2,369,091 | | | | 991,287 | | | | 239,035 | | | | 6,527,491 | | | | 479,547 | | |
Foreign tax withheld | | | (5,804 | ) | | | (1,957 | ) | | | (3,522 | ) | | | (9,444 | ) | | | — | | |
Total investment income | | | 2,363,287 | | | | 1,108,463 | | | | 235,513 | | | | 6,518,047 | | | | 479,547 | | |
EXPENSES: | |
Management fees (Note 3) | | | 4,924,940 | | | | 428,325 | | | | 630,606 | | | | 2,026,088 | | | | 610,797 | | |
Shareholder Service Fees — Investor Class (Note 7) | | | 664,984 | | | | 21,736 | | | | 43,744 | | | | 232,097 | | | | 64,094 | | |
Registration fees | | | 25,341 | | | | 16,105 | | | | 17,665 | | | | 19,492 | | | | 17,567 | | |
Custody fees | | | — | | | | — | | | | — | | | | — | | | | — | | |
Other expenses | | | 9,898 | | | | 914 | | | | 921 | | | | 3,257 | | | | 1,434 | | |
Total expenses | | | 5,625,163 | | | | 467,080 | | | | 692,936 | | | | 2,280,934 | | | | 693,892 | | |
Net investment income (loss) | | | (3,261,876 | ) | | | 641,383 | | | | (457,423 | ) | | | 4,237,113 | | | | (214,345 | ) | |
NET REALIZED AND UNREALIZED GAIN (LOSS): | |
Net realized gain (loss) from: | |
Investment transactions | | | 26,218,388 | | | | (90,599 | ) | | | (1,118,282 | ) | | | 1,428,357 | | | | 4,221,635 | | |
Options written (Note 8) | | | — | | | | — | | | | — | | | | 125,162 | | | | — | | |
Net unrealized appreciation/depreciation during the year on: | |
Investments | | | (340,482,604 | ) | | | (18,646,915 | ) | | | (23,033,525 | ) | | | (64,640,958 | ) | | | (54,251,593 | ) | |
Options written (Note 8) | | | — | | | | — | | | | — | | | | 77,235 | | | | — | | |
Net realized and unrealized gain (loss) | | | (314,264,216 | ) | | | (18,737,514 | ) | | | (24,151,807 | ) | | | (63,010,204 | ) | | | (50,029,958 | ) | |
Net increase (decrease) in net assets resulting from operations | | $ | (317,526,092 | ) | | $ | (18,096,131 | ) | | $ | (24,609,230 | ) | | $ | (58,773,091 | ) | | $ | (50,244,303 | ) | |

The accompanying notes are an integral part of these financial statements.
96

| | | Buffalo
High Yield
Fund | | Buffalo
International
Fund | | Buffalo
Large Cap
Fund | | Buffalo
Mid Cap
Fund | | Buffalo
Small Cap
Fund | |
INVESTMENT INCOME: | |
Interest | | $ | 8,649,070 | | | $ | — | | | $ | — | | | $ | — | | | $ | — | | |
Dividends from securities | | | 339,973 | | | | 5,963,342 | | | | 369,310 | | | | 428,511 | | | | 2,401,957 | | |
Foreign tax withheld | | | — | | | | (638,419 | ) | | | (2,642 | ) | | | — | | | | — | | |
Total investment income | | | 8,989,043 | | | | 5,324,923 | | | | 366,668 | | | | 428,511 | | | | 2,401,957 | | |
EXPENSES: | |
Management fees (Note 3) | | | 1,196,619 | | | | 2,181,453 | | | | 364,718 | | | | 643,164 | | | | 3,648,744 | | |
Shareholder Service Fees — Investor Class (Note 7) | | | 35,328 | | | | 167,844 | | | | 22,187 | | | | 60,834 | | | | 419,833 | | |
Registration fees | | | 18,030 | | | | 16,618 | | | | 21,907 | | | | 22,637 | | | | 42,737 | | |
Custody fees | | | — | | | | 55,731 | | | | — | | | | — | | | | — | | |
Other expenses | | | 5,208 | | | | 4,029 | | | | 896 | | | | 1,342 | | | | 6,616 | | |
Total expenses | | | 1,255,185 | | | | 2,425,675 | | | | 409,708 | | | | 727,977 | | | | 4,117,930 | | |
Net investment income (loss) | | | 7,733,858 | | | | 2,899,248 | | | | (43,040 | ) | | | (299,466 | ) | | | (1,715,973 | ) | |
NET REALIZED AND UNREALIZED GAIN (LOSS): | |
Net realized gain (loss) from: | |
Investment transactions | | | (5,022,738 | ) | | | 940,574 | | | | (1,201,617 | ) | | | 8,445,802 | | | | (65,081,108 | ) | |
Options written (Note 8) | | | — | | | | — | | | | — | | | | — | | | | — | | |
Net unrealized appreciation/depreciation during the year on: | |
Investments | | | (24,875,728 | ) | | | (139,338,847 | ) | | | (24,265,180 | ) | | | (50,845,062 | ) | | | (92,280,992 | ) | |
Options written (Note 8) | | | — | | | | — | | | | — | | | | — | | | | — | | |
Net realized and unrealized gain (loss) | | | (29,898,466 | ) | | | (138,398,273 | ) | | | (25,466,797 | ) | | | (42,399,260 | ) | | | (157,362,100 | ) | |
Net increase (decrease) in net assets resulting from operations | | $ | (22,164,608 | ) | | $ | (135,499,025 | ) | | $ | (25,509,837 | ) | | $ | (42,698,726 | ) | | $ | (159,078,073 | ) | |
97
STATEMENTS OF CHANGES IN
NET ASSETS
| | | Buffalo
Discovery Fund | | Buffalo
Dividend Focus Fund | | Buffalo
Early Stage Growth Fund | |
| | | Six-Months Ended
September 30, 2022
(UNAUDITED) | | Year Ended
March 31, 2022 | | Six-Months Ended
September 30, 2022
(UNAUDITED) | | Year Ended
March 31, 2022 | | Six-Months Ended
September 30, 2022
(UNAUDITED) | | Year Ended
March 31, 2022 | |
OPERATIONS: | |
Net investment income (loss) | | $ | (3,261,876 | ) | | $ | (11,567,931 | ) | | $ | 641,383 | | | $ | 753,476 | | | $ | (457,423 | ) | | $ | (1,582,051 | ) | |
Net realized gain (loss) on investment transactions | | | 26,218,388 | | | | 145,261,973 | | | | (90,599 | ) | | | 2,299,786 | | | | (1,118,282 | ) | | | 10,248,601 | | |
Net unrealized appreciation/depreciation during the year on investments and translation of
assets and liabilities in foreign currencies | | | (340,482,604 | ) | | | (200,818,345 | ) | | | (18,646,915 | ) | | | 10,781,502 | | | | (23,033,525 | ) | | | (26,331,028 | ) | |
Net increase (decrease) in net assets resulting from operations | | | (317,526,092 | ) | | | (67,124,303 | ) | | | (18,096,131 | ) | | | 13,834,764 | | | | (24,609,230 | ) | | | (17,664,478 | ) | |
DISTRIBUTIONS TO SHAREHOLDERS: | |
Distributable earnings | | | — | | | | (236,211,778 | ) | | | (598,682 | ) | | | (2,146,892 | ) | | | — | | | | (18,199,094 | ) | |
Total distributions | | | — | | | | (236,211,778 | ) | | | (598,682 | ) | | | (2,146,892 | ) | | | — | | | | (18,199,094 | ) | |
CAPITAL SHARE TRANSACTIONS: | |
Shares sold | |
Investor Class | | | 22,299,921 | | | | 90,702,153 | | | | 1,731,034 | | | | 2,561,338 | | | | 1,678,072 | | | | 16,837,991 | | |
Institutional Class | | | 15,129,934 | | | | 112,094,624 | | | | 9,900,747 | | | | 9,515,807 | | | | 1,088,054 | | | | 7,269,326 | | |
Reinvested dividends and distributions | |
Investor Class | | | — | | | | 175,336,317 | | | | 133,967 | | | | 544,419 | | | | — | | | | 10,901,467 | | |
Institutional Class | | | — | | | | 54,999,105 | | | | 448,184 | | | | 1,544,679 | | | | — | | | | 6,790,444 | | |
Shares Issued | | | 37,429,855 | | | | 433,132,199 | | | | 12,213,932 | | | | 14,166,243 | | | | 2,766,126 | | | | 41,799,228 | | |
Redemptions | |
Investor Class | | | (137,954,350 | ) | | | (383,826,469 | ) | | | (1,594,373 | ) | | | (4,057,708 | ) | | | (4,941,917 | ) | | | (20,264,115 | ) | |
Institutional Class | | | (110,637,256 | ) | | | (63,487,663 | ) | | | (3,689,387 | ) | | | (5,965,203 | ) | | | (2,682,492 | ) | | | (4,828,538 | ) | |
Shares repurchased | | | (248,591,606 | ) | | | (447,314,132 | ) | | | (5,283,760 | ) | | | (10,022,911 | ) | | | (7,624,409 | ) | | | (25,092,653 | ) | |
Net increase (decrease) from capital share transactions | | | (211,161,751 | ) | | | (14,181,933 | ) | | | 6,930,172 | | | | 4,143,332 | | | | (4,858,283 | ) | | | 16,706,575 | | |
Total increase (decrease) in net assets | | | (528,687,843 | ) | | | (317,518,014 | ) | | | (11,764,641 | ) | | | 15,831,204 | | | | (29,467,513 | ) | | | (19,156,997 | ) | |
NET ASSETS: | |
Beginning of period | | | 1,462,626,228 | | | | 1,780,144,242 | | | | 116,841,152 | | | | 101,009,948 | | | | 112,689,357 | | | | 131,846,354 | | |
End of period | | $ | 933,938,385 | | | $ | 1,462,626,228 | | | $ | 105,076,511 | | | $ | 116,841,152 | | | $ | 83,221,844 | | | $ | 112,689,357 | | |
Fund share transactions: | |
Shares issued | |
Investor Class | | | 1,027,568 | | | | 5,500,653 | | | | 71,316 | | | | 141,111 | | | | 109,265 | | | | 707,214 | | |
Institutional Class | | | 697,690 | | | | 3,308,615 | | | | 405,391 | | | | 832,698 | | | | 69,657 | | | | 321,214 | | |
| | | | 1,725,258 | | | | 8,809,268 | | | | 476,707 | | | | 973,809 | | | | 178,922 | | | | 1,028,428 | | |
Reinvested dividends and distributions | |
Investor Class | | | — | | | | 3,704,344 | | | | 5,832 | | | | 7,919 | | | | — | | | | 555,914 | | |
Institutional Class | | | — | | | | 714,717 | | | | 19,506 | | | | 20,360 | | | | — | | | | 344,518 | | |
| | | | — | | | | 4,419,061 | | | | 25,338 | | | | 28,279 | | | | — | | | | 900,432 | | |
Shares Issued | | | 1,725,258 | | | | 13,228,329 | | | | 502,045 | | | | 1,002,088 | | | | 178,922 | | | | 1,928,860 | | |
Shares repurchased | |
Investor Class | | | (6,341,037 | ) | | | (19,361,212 | ) | | | (66,459 | ) | | | (491,618 | ) | | | (323,083 | ) | | | (886,300 | ) | |
Institutional Class | | | (5,110,534 | ) | | | (3,408,874 | ) | | | (154,283 | ) | | | (435,000 | ) | | | (173,912 | ) | | | (220,133 | ) | |
Total Shares Repurchased | | | (11,451,571 | ) | | | (22,770,086 | ) | | | (220,742 | ) | | | (926,618 | ) | | | (496,995 | ) | | | (1,106,433 | ) | |
Net increase (decrease) in fund shares | | | (9,726,313 | ) | | | (9,541,757 | ) | | | 281,303 | | | | 75,470 | | | | (318,073 | ) | | | 822,427 | | |

The accompanying notes are an integral part of these financial statements.
98

| | | Buffalo
Flexible Income Fund | | Buffalo
Growth Fund | |
| | | Six-Months Ended
September 30, 2022
(UNAUDITED) | | Year Ended
March 31, 2022 | | Six-Months Ended
September 30, 2022
(UNAUDITED) | | Year Ended
March 31, 2022 | |
OPERATIONS: | |
Net investment income (loss) | | $ | 4,237,113 | | | $ | 7,460,791 | | | $ | (214,345 | ) | | $ | (696,471 | ) | |
Net realized gain (loss) on investment transactions | | | 1,553,519 | | | | 19,116,133 | | | | 4,221,635 | | | | 18,127,016 | | |
Net unrealized appreciation/depreciation during the year on investments and translation of
assets and liabilities in foreign currencies | | | (64,563,723 | ) | | | 69,725,547 | | | | (54,251,593 | ) | | | 2,161,487 | | |
Net increase (decrease) in net assets resulting from operations | | | (58,773,091 | ) | | | 96,302,471 | | | | (50,244,303 | ) | | | 19,592,032 | | |
DISTRIBUTIONS TO SHAREHOLDERS: | |
Distributable earnings | | | (4,043,916 | ) | | | (24,455,226 | ) | | | — | | | | (20,046,380 | ) | |
Total distributions | | | (4,043,916 | ) | | | (24,455,226 | ) | | | — | | | | (20,046,380 | ) | |
CAPITAL SHARE TRANSACTIONS: | |
Shares sold | |
Investor Class | | | 34,544,966 | | | | 35,446,475 | | | | 834,606 | | | | 5,085,586 | | |
Institutional Class | | | 5,702,704 | | | | 11,411,527 | | | | 1,110,011 | | | | 6,760,777 | | |
Reinvested dividends and distributions | |
Investor Class | | | 2,518,282 | | | | 15,186,659 | | | | — | | | | 10,701,157 | | |
Institutional Class | | | 1,195,987 | | | | 7,689,399 | | | | — | | | | 9,126,988 | | |
Shares Issued | | | 43,961,939 | | | | 69,734,060 | | | | 1,944,617 | | | | 31,674,508 | | |
Redemptions | |
Investor Class | | | (31,678,876 | ) | | | (60,688,616 | ) | | | (6,778,480 | ) | | | (25,149,748 | ) | |
Institutional Class | | | (11,812,398 | ) | | | (16,575,934 | ) | | | (4,537,415 | ) | | | (9,182,096 | ) | |
Shares repurchased | | | (43,491,274 | ) | | | (77,264,550 | ) | | | (11,315,895 | ) | | | (34,331,844 | ) | |
Net increase (decrease) from capital share transactions | | | 470,665 | | | | (7,530,490 | ) | | | (9,371,278 | ) | | | (2,657,336 | ) | |
Total increase (decrease) in net assets | | | (62,346,342 | ) | | | 64,316,755 | | | | (59,615,581 | ) | | | (3,111,684 | ) | |
NET ASSETS: | |
Beginning of period | | | 490,024,944 | | | | 425,708,189 | | | | 195,332,734 | | | | 198,444,418 | | |
End of period | | $ | 427,678,602 | | | $ | 490,024,944 | | | $ | 135,717,153 | | | $ | 195,332,734 | | |
Fund share transactions: | |
Shares issued | |
Investor Class | | | 1,850,299 | | | | 1,953,183 | | | | 31,640 | | | | 152,848 | | |
Institutional Class | | | 313,819 | | | | 639,999 | | | | 42,681 | | | | 199,782 | | |
| | | | 2,164,118 | | | | 2,593,182 | | | | 74,321 | | | | 352,630 | | |
Reinvested dividends and distributions | |
Investor Class | | | 139,531 | | | | 866,665 | | | | — | | | | 331,305 | | |
Institutional Class | | | 66,241 | | | | 438,889 | | | | — | | | | 281,697 | | |
| | | | 205,772 | | | | 1,305,554 | | | | — | | | | 613,002 | | |
Shares Issued | | | 2,369,890 | | | | 3,898,736 | | | | 74,321 | | | | 965,632 | | |
Shares repurchased | |
Investor Class | | | (1,745,637 | ) | | | (3,423,944 | ) | | | (259,915 | ) | | | (750,535 | ) | |
Institutional Class | | | (636,670 | ) | | | (936,487 | ) | | | (173,076 | ) | | | (273,115 | ) | |
Total Shares Repurchased | | | (2,382,307 | ) | | | (4,360,431 | ) | | | (432,991 | ) | | | (1,023,650 | ) | |
Net increase (decrease) in fund shares | | | (12,417 | ) | | | (461,695 | ) | | | (358,670 | ) | | | (58,018 | ) | |
99
STATEMENTS OF CHANGES IN
NET ASSETS
| | | Buffalo
High Yield Fund | | Buffalo
International Fund | | Buffalo
Large Cap Fund | |
| | | Six-Months Ended
September 30, 2022
(UNAUDITED) | | Year Ended
March 31, 2022 | | Six-Months Ended
September 30, 2022
(UNAUDITED) | | Year Ended
March 31, 2022 | | Six-Months Ended
September 30, 2022
(UNAUDITED) | | Year Ended
March 31, 2022 | |
OPERATIONS: | |
Net investment income (loss) | | $ | 7,733,858 | | | $ | 12,350,271 | | | $ | 2,899,248 | | | $ | 1,338,822 | | | $ | (43,040 | ) | | $ | (286,638 | ) | |
Net realized gain (loss) on investment transactions | | | (5,022,738 | ) | | | 8,337,574 | | | | 940,574 | | | | 15,739,005 | | | | (1,201,617 | ) | | | 27,125,565 | | |
Net unrealized appreciation/depreciation during the year on investments and translation of
assets and liabilities in foreign currencies | | | (24,875,728 | ) | | | (15,061,629 | ) | | | (139,338,847 | ) | | | (9,582,271 | ) | | | (24,265,180 | ) | | | (15,249,591 | ) | |
Net increase (decrease) in net assets resulting from operations | | | (22,164,608 | ) | | | 5,626,216 | | | | (135,499,025 | ) | | | 7,495,556 | | | | (25,509,837 | ) | | | 11,589,336 | | |
DISTRIBUTIONS TO SHAREHOLDERS: | |
Distributable earnings | | | (8,619,195 | ) | | | (21,107,564 | ) | | | — | | | | (8,250,348 | ) | | | — | | | | (26,204,398 | ) | |
Total distributions | | | (8,619,195 | ) | | | (21,107,564 | ) | | | — | | | | (8,250,348 | ) | | | — | | | | (26,204,398 | ) | |
CAPITAL SHARE TRANSACTIONS: | |
Shares sold | |
Investor Class | | | 6,047,804 | | | | 16,978,308 | | | | 28,668,951 | | | | 74,628,662 | | | | 717,570 | | | | 4,233,701 | | |
Institutional Class | | | 19,293,741 | | | | 37,510,763 | | | | 40,874,596 | | | | 65,919,686 | | | | 2,147,156 | | | | 8,024,389 | | |
Reinvested dividends and distributions | |
Investor Class | | | 1,369,940 | | | | 3,835,831 | | | | — | | | | 3,539,520 | | | | — | | | | 8,131,619 | | |
Institutional Class | | | 6,338,142 | | | | 15,198,835 | | | | — | | | | 4,474,207 | | | | — | | | | 17,150,974 | | |
Shares Issued | | | 33,049,627 | | | | 73,523,737 | | | | 69,543,547 | | | | 148,562,075 | | | | 2,864,726 | | | | 37,540,683 | | |
Redemptions | |
Investor Class | | | (6,746,622 | ) | | | (17,482,430 | ) | | | (40,628,716 | ) | | | (75,011,332 | ) | | | (2,485,355 | ) | | | (9,924,225 | ) | |
Institutional Class | | | (20,148,748 | ) | | | (19,946,518 | ) | | | (20,742,142 | ) | | | (38,713,002 | ) | | | (4,084,009 | ) | | | (8,334,709 | ) | |
Shares repurchased | | | (26,895,370 | ) | | | (37,428,948 | ) | | | (61,370,858 | ) | | | (113,724,334 | ) | | | (6,569,364 | ) | | | (18,258,934 | ) | |
Net increase (decrease) from capital share transactions | | | 6,154,257 | | | | 36,094,789 | | | | 8,172,689 | | | | 34,837,741 | | | | (3,704,638 | ) | | | 19,281,749 | | |
Total increase (decrease) in net assets | | | (24,629,546 | ) | | | 20,613,441 | | | | (127,326,336 | ) | | | 34,082,949 | | | | (29,214,475 | ) | | | 4,666,687 | | |
NET ASSETS: | |
Beginning of period | | | 296,438,589 | | | | 275,825,148 | | | | 579,722,401 | | | | 545,639,452 | | | | 113,473,546 | | | | 108,806,859 | | |
End of period | | $ | 271,809,043 | | | $ | 296,438,589 | | | $ | 452,396,065 | | | $ | 579,722,401 | | | $ | 84,259,071 | | | $ | 113,473,546 | | |
Fund share transactions: | |
Shares issued | |
Investor Class | | | 576,303 | | | | 1,444,631 | | | | 1,582,014 | | | | 3,362,322 | | | | 20,698 | | | | 87,396 | | |
Institutional Class | | | 1,810,448 | | | | 3,219,662 | | | | 2,229,400 | | | | 2,960,156 | | | | 60,674 | | | | 168,409 | | |
| | | | 2,386,751 | | | | 4,664,293 | | | | 3,811,414 | | | | 6,322,478 | | | | 81,372 | | | | 255,805 | | |
Reinvested dividends and distributions | |
Investor Class | | | 130,935 | | | | 330,686 | | | | — | | | | 157,413 | | | | — | | | | 189,902 | | |
Institutional Class | | | 606,298 | | | | 1,311,808 | | | | — | | | | 198,604 | | | | — | | | | 399,138 | | |
| | | | 737,233 | | | | 1,642,494 | | | | — | | | | 356,017 | | | | — | | | | 589,040 | | |
Shares Issued | | | 3,123,984 | | | | 6,306,787 | | | | 3,811,414 | | | | 6,678,495 | | | | 81,372 | | | | 844,845 | | |
Shares repurchased | |
Investor Class | | | (634,606 | ) | | | (1,507,734 | ) | | | (2,204,274 | ) | | | (3,455,367 | ) | | | (70,584 | ) | | | (206,465 | ) | |
Institutional Class | | | (1,906,772 | ) | | | (1,717,947 | ) | | | (1,137,416 | ) | | | (1,752,736 | ) | | | (118,344 | ) | | | (175,089 | ) | |
Total Shares Repurchased | | | (2,541,378 | ) | | | (3,225,681 | ) | | | (3,341,690 | ) | | | (5,208,103 | ) | | | (188,928 | ) | | | (381,554 | ) | |
Net increase (decrease) in fund shares | | | 582,606 | | | | 3,081,106 | | | | 469,724 | | | | 1,470,392 | | | | (107,556 | ) | | | 463,291 | | |

The accompanying notes are an integral part of these financial statements.
100

| | | Buffalo
Mid Cap Fund | | Buffalo
Small Cap Fund | |
| | | Six-Months Ended
September 30, 2022
(UNAUDITED) | | Year Ended
March 31, 2022 | | Six-Months Ended
September 30, 2022
(UNAUDITED) | | Year Ended
March 31, 2022 | |
OPERATIONS: | |
Net investment income (loss) | | $ | (299,466 | ) | | $ | (955,603 | ) | | $ | (1,715,973 | ) | | $ | (9,042,676 | ) | |
Net realized gain (loss) on investment transactions | | | 8,445,802 | | | | 14,348,950 | | | | (65,081,108 | ) | | | 52,166,078 | | |
Net unrealized appreciation/depreciation during the year on investments and translation of
assets and liabilities in foreign currencies | | | (50,845,062 | ) | | | (15,622,847 | ) | | | (92,280,992 | ) | | | (254,440,168 | ) | |
Net increase (decrease) in net assets resulting from operations | | | (42,698,726 | ) | | | (2,229,500 | ) | | | (159,078,073 | ) | | | (211,316,766 | ) | |
DISTRIBUTIONS TO SHAREHOLDERS: | |
Distributable earnings | | | — | | | | (20,762,447 | ) | | | — | | | | (142,049,821 | ) | |
Total distributions | | | — | | | | (20,762,447 | ) | | | — | | | | (142,049,821 | ) | |
CAPITAL SHARE TRANSACTIONS: | |
Shares sold | |
Investor Class | | | 814,852 | | | | 5,257,376 | | | | 47,366,994 | | | | 291,257,479 | | |
Institutional Class | | | 2,040,434 | | | | 6,656,550 | | | | 53,008,607 | | | | 174,193,990 | | |
Reinvested dividends and distributions | |
Investor Class | | | — | | | | 11,369,480 | | | | — | | | | 101,656,595 | | |
Institutional Class | | | — | | | | 9,147,691 | | | | — | | | | 37,625,245 | | |
Shares Issued | | | 2,855,286 | | | | 32,431,097 | | | | 100,375,601 | | | | 604,733,309 | | |
Redemptions | |
Investor Class | | | (6,931,072 | ) | | | (14,115,769 | ) | | | (65,561,181 | ) | | | (241,646,741 | ) | |
Institutional Class | | | (4,978,214 | ) | | | (6,203,747 | ) | | | (47,189,375 | ) | | | (160,773,145 | ) | |
Shares repurchased | | | (11,909,286 | ) | | | (20,319,516 | ) | | | (112,750,556 | ) | | | (402,419,886 | ) | |
Net increase (decrease) from capital share transactions | | | (9,054,000 | ) | | | 12,111,581 | | | | (12,374,955 | ) | | | 202,313,423 | | |
Total increase (decrease) in net assets | | | (51,752,726 | ) | | | (10,880,366 | ) | | | (171,453,028 | ) | | | (151,053,164 | ) | |
NET ASSETS: | |
Beginning of period | | | 179,822,993 | | | | 190,703,359 | | | | 978,922,476 | | | | 1,129,975,640 | | |
End of period | | $ | 128,070,267 | | | $ | 179,822,993 | | | $ | 807,469,448 | | | $ | 978,922,476 | | |
Fund share transactions: | |
Shares issued | |
Investor Class | | | 52,308 | | | | 263,645 | | | | 3,296,161 | | | | 13,531,321 | | |
Institutional Class | | | 135,856 | | | | 336,084 | | | | 3,724,986 | | | | 8,315,660 | | |
| | | | 188,164 | | | | 599,729 | | | | 7,021,147 | | | | 21,846,981 | | |
Reinvested dividends and distributions | |
Investor Class | | | — | | | | 612,910 | | | | — | | | | 5,564,127 | | |
Institutional Class | | | — | | | | 491,019 | | | | — | | | | 2,050,422 | | |
| | | | — | | | | 1,103,929 | | | | — | | | | 7,614,549 | | |
Shares Issued | | | 188,164 | | | | 1,703,658 | | | | 7,021,147 | | | | 29,461,530 | | |
Shares repurchased | |
Investor Class | | | (464,400 | ) | | | (708,224 | ) | | | (4,605,982 | ) | | | (11,981,132 | ) | |
Institutional Class | | | (325,814 | ) | | | (308,223 | ) | | | (3,312,061 | ) | | | (7,788,562 | ) | |
Total Shares Repurchased | | | (790,214 | ) | | | (1,016,447 | ) | | | (7,918,043 | ) | | | (19,769,694 | ) | |
Net increase (decrease) in fund shares | | | (602,050 | ) | | | 687,211 | | | | (896,896 | ) | | | 9,691,836 | | |
101
FINANCIAL HIGHLIGHTS
BUFFALO DISCOVERY FUND INVESTOR CLASS
The following tables are intended to help you understand the Fund's financial performance for the periods shown. Certain information reflects financial results for a single Fund share. Total returns in the table represent the rate that an investor would have earned (or lost) on an investment in the Fund. Total returns assume reinvestment of all dividends and distributions. Total returns do not reflect payment of sales charges, if any, and are not annualized for periods of less than one year.
| | | For the Six Months
Ended September 30,
2022 | | For the Years Ended March 31, | |
Condensed data for a share of capital stock
outstanding throughout the period. | | (UNAUDITED) | | 2022 | | 2021 | | 2020 | | 2019 | | 2018 | |
Net asset value, beginning of period | | $ | 25.31 | | | $ | 30.82 | | | $ | 19.88 | | | $ | 25.29 | | | $ | 24.52 | | | $ | 21.86 | | |
Income from investment operations: | |
Net investment loss | | | (0.07 | )(1) | | | (0.21 | )(1) | | | (0.18 | )(1) | | | (0.06 | ) | | | (0.06 | ) | | | (0.04 | ) | |
Net gains (losses) on securities (both realized
and unrealized) | | | (5.81 | ) | | | (0.93 | ) | | | 13.51 | | | | (1.76 | ) | | | 2.31 | | | | 3.82 | | |
Total from investment operations | | | (5.88 | ) | | | (1.14 | ) | | | 13.33 | | | | (1.82 | ) | | | 2.25 | | | | 3.78 | | |
Less distributions: | |
Distributions from capital gains | | | — | | | | (4.37 | ) | | | (2.39 | ) | | | (3.59 | ) | | | (1.48 | ) | | | (1.12 | ) | |
Total distributions | | | — | | | | (4.37 | ) | | | (2.39 | ) | | | (3.59 | ) | | | (1.48 | ) | | | (1.12 | ) | |
Net asset value, end of period | | $ | 19.43 | | | $ | 25.31 | | | $ | 30.82 | | | $ | 19.88 | | | $ | 25.29 | | | $ | 24.52 | | |
Total return* | | | (23.23 | %) | | | (4.58 | %) | | | 67.49 | % | | | (9.64 | %) | | | 10.34 | % | | | 17.35 | % | |
Ratios/Supplemental Data | |
Net assets, end of period (in thousands) | | $ | 740,937 | | | $ | 1,099,258 | | | $ | 1,442,145 | | | $ | 1,132,237 | | | $ | 1,744,262 | | | $ | 1,896,950 | | |
Ratio of expenses to average net assets** | | | 1.01 | % | | | 1.00 | % | | | 1.01 | % | | | 1.01 | % | | | 1.01 | % | | | 1.01 | % | |
Ratio of net investment income (loss) to average
net assets** | | | (0.60 | %) | | | (0.70 | %) | | | (0.64 | %) | | | (0.30 | %) | | | (0.21 | %) | | | (0.20 | %) | |
Portfolio turnover rate* | | | 14 | % | | | 41 | % | | | 84 | % | | | 123 | % | | | 77 | % | | | 42 | % | |
* Not annualized for periods less than one year.
** Annualized for periods less than one year.
(1) Per share amounts have been calculated using the average shares method.

102
FINANCIAL HIGHLIGHTS
BUFFALO DISCOVERY FUND INSTITUTIONAL CLASS
The following tables are intended to help you understand the Fund's financial performance for the periods shown. Certain information reflects financial results for a single Fund share. Total returns in the table represent the rate that an investor would have earned (or lost) on an investment in the Fund. Total returns assume reinvestment of all dividends and distributions. Total returns do not reflect payment of sales charges, if any, and are not annualized for periods of less than one year.
| | | For the Six Months
Ended September 30,
2022 | | For the Years Ended
March 31, | | For the period
July 1, 2019*
through | |
Condensed data for a share of capital stock
outstanding throughout the period. | | (UNAUDITED) | | 2022 | | 2021 | | March 31, 2020 | |
Net asset value, beginning of period | | $ | 25.44 | | | $ | 30.92 | | | $ | 19.91 | | | $ | 27.10 | | |
Income from investment operations: | |
Net investment loss | | | (0.05 | )(1) | | | (0.17 | )(1) | | | (0.14 | )(1) | | | (0.04 | ) | |
Net gains (losses) on securities (both realized and unrealized) | | | (5.84 | ) | | | (0.94 | ) | | | 13.54 | | | | (3.56 | ) | |
Total from investment operations | | | (5.89 | ) | | | (1.11 | ) | | | 13.40 | | | | (3.60 | ) | |
Less distributions: | |
Distributions from capital gains | | | — | | | | (4.37 | ) | | | (2.39 | ) | | | (3.59 | ) | |
Total distributions | | | — | | | | (4.37 | ) | | | (2.39 | ) | | | (3.59 | ) | |
Net asset value, end of period | | $ | 19.55 | | | $ | 25.44 | | | $ | 30.92 | | | $ | 19.91 | | |
Total return** | | | (23.15 | %) | | | (4.46 | %) | | | 67.75 | % | | | (15.55 | %) | |
Ratios/Supplemental Data | |
Net assets, end of period (in thousands) | | $ | 193,002 | | | $ | 363,369 | | | $ | 337,999 | | | $ | 205,430 | | |
Ratio of expenses to average net assets*** | | | 0.86 | % | | | 0.86 | % | | | 0.86 | % | | | 0.86 | % | |
Ratio of net investment income (loss) to average net assets*** | | | (0.45 | %) | | | (0.55 | %) | | | (0.50 | %) | | | (0.25 | %) | |
Portfolio turnover rate** | | | 14 | % | | | 41 | % | | | 84 | % | | | 123 | % | |
* Inception date
** Not annualized for periods less than one year.
*** Annualized for periods less than one year.
(1) Per share amounts have been calculated using the average shares method.

103
FINANCIAL HIGHLIGHTS
BUFFALO DIVIDEND FOCUS FUND INVESTOR CLASS
The following tables are intended to help you understand the Fund's financial performance for the periods shown. Certain information reflects financial results for a single Fund share. Total returns in the table represent the rate that an investor would have earned (or lost) on an investment in the Fund. Total returns assume reinvestment of all dividends and distributions. Total returns do not reflect payment of sales charges, if any, and are not annualized for periods of less than one year.
| | | For the Six Months
Ended September 30,
2022 | | For the Years Ended March 31, | |
Condensed data for a share of capital stock
outstanding throughout the period. | | (UNAUDITED) | | 2022 | | 2021 | | 2020 | | 2019 | | 2018 | |
Net asset value, beginning of period | | $ | 25.79 | | | $ | 23.16 | | | $ | 15.10 | | | $ | 16.65 | | | $ | 16.28 | | | $ | 15.32 | | |
Income from investment operations: | |
Net investment gain | | | 0.12 | (1) | | | 0.14 | (1) | | | 0.12 | (1) | | | 0.44 | | | | 0.25 | | | | 0.19 | | |
Net gains (losses) on securities (both realized
and unrealized) | | | (3.97 | ) | | | 2.94 | | | | 8.06 | | | | (1.81 | ) | | | 0.91 | | | | 1.11 | | |
Total from investment operations | | | (3.85 | ) | | | 3.08 | | | | 8.18 | | | | (1.37 | ) | | | 1.16 | | | | 1.30 | | |
Less distributions: | |
Distributions from investment Income | | | (0.11 | ) | | | (0.14 | ) | | | (0.12 | ) | | | (0.17 | ) | | | (0.25 | ) | | | (0.19 | ) | |
Distributions from capital gains | | | — | | | | (0.31 | ) | | | — | | | | — | | | | (0.54 | ) | | | (0.15 | ) | |
Distributions from return of capital | | | — | | | | — | | | | — | | | | (0.01 | ) | | | — | | | | — | | |
Total distributions | | | (0.11 | ) | | | (0.45 | ) | | | (0.12 | ) | | | (0.18 | ) | | | (0.79 | ) | | | (0.34 | ) | |
Net asset value, end of period | | $ | 21.83 | | | $ | 25.79 | | | $ | 23.16 | | | $ | 15.10 | | | $ | 16.65 | | | $ | 16.28 | | |
Total return* | | | (14.94 | %) | | | 13.39 | % | | | 54.29 | % | | | (8.32 | %) | | | 7.48 | % | | | 8.51 | % | |
Ratios/Supplemental Data | |
Net assets, end of period (in thousands) | | $ | 26,393 | | | $ | 30,895 | | | $ | 28,605 | | | $ | 23,821 | | | $ | 58,299 | | | $ | 59,364 | | |
Ratio of expenses to average net assets** | | | 0.93 | % | | | 0.93 | % | | | 0.94 | % | | | 0.95 | % | | | 0.94 | % | | | 0.94 | % | |
Ratio of net investment income (loss) to average
net assets** | | | 1.01 | % | | | 0.56 | % | | | 0.63 | % | | | 0.84 | % | | | 1.45 | % | | | 1.16 | % | |
Portfolio turnover rate* | | | 2 | % | | | 4 | % | | | 20 | % | | | 31 | % | | | 20 | % | | | 21 | % | |
* Not annualized for periods less than one year.
** Annualized for periods less than one year.
(1) Per share amounts have been calculated using the average shares method.

104
FINANCIAL HIGHLIGHTS
BUFFALO DIVIDEND FOCUS FUND INSTITUTIONAL CLASS
The following tables are intended to help you understand the Fund's financial performance for the periods shown. Certain information reflects financial results for a single Fund share. Total returns in the table represent the rate that an investor would have earned (or lost) on an investment in the Fund. Total returns assume reinvestment of all dividends and distributions. Total returns do not reflect payment of sales charges, if any, and are not annualized for periods of less than one year.
| | | For the Six Months
Ended September 30,
2022 | | For the Years Ended
March 31, | | For the period
July 1, 2019*
through | |
Condensed data for a share of capital stock
outstanding throughout the period. | | (UNAUDITED) | | 2022 | | 2021 | | March 31, 2020 | |
Net asset value, beginning of period | | $ | 25.78 | | | $ | 23.16 | | | $ | 15.10 | | | $ | 17.37 | | |
Income from investment operations: | |
Net investment income | | | 0.14 | (1) | | | 0.18 | (1) | | | 0.15 | (1) | | | 0.28 | | |
Net gains (losses) on securities (both realized and unrealized) | | | (3.96 | ) | | | 2.93 | | | | 8.06 | | | | (2.41 | ) | |
Total from investment operations | | | (3.82 | ) | | | 3.11 | | | | 8.21 | | | | (2.13 | ) | |
Less distributions: | |
Distributions from investment Income | | | (0.13 | ) | | | (0.18 | ) | | | (0.15 | ) | | | (0.13 | ) | |
Distributions from capital gains | | | — | | | | (0.31 | ) | | | — | | | | — | | |
Distributions from return of capital | | | — | | | | — | | | | — | | | | (0.01 | ) | |
Total distributions | | | (0.13 | ) | | | (0.49 | ) | | | (0.15 | ) | | | (0.14 | ) | |
Net asset value, end of period | | $ | 21.83 | | | $ | 25.78 | | | $ | 23.16 | | | $ | 15.10 | | |
Total return** | | | (14.84 | %) | | | 13.51 | % | | | 54.52 | % | | | (12.34 | %) | |
Ratios/Supplemental Data | |
Net assets, end of period (in thousands) | | $ | 78,684 | | | $ | 85,946 | | | $ | 72,405 | | | $ | 40,887 | | |
Ratio of expenses to average net assets*** | | | 0.78 | % | | | 0.78 | % | | | 0.79 | % | | | 0.80 | % | |
Ratio of net investment income (loss) to average net assets*** | | | 1.16 | % | | | 0.71 | % | | | 0.78 | % | | | 1.23 | % | |
Portfolio turnover rate** | | | 2 | % | | | 4 | % | | | 20 | % | | | 31 | % | |
* Inception date
** Not annualized for periods less than one year.
*** Annualized for periods less than one year.
(1) Per share amounts have been calculated using the average shares method.

105
FINANCIAL HIGHLIGHTS
BUFFALO EARLY STAGE GROWTH FUND INVESTOR CLASS
The following tables are intended to help you understand the Fund's financial performance for the periods shown. Certain information reflects financial results for a single Fund share. Total returns in the table represent the rate that an investor would have earned (or lost) on an investment in the Fund. Total returns assume reinvestment of all dividends and distributions. Total returns do not reflect payment of sales charges, if any, and are not annualized for periods of less than one year.
| | | For the Six Months
Ended September 30,
2022 | | For the Years Ended March 31, | |
Condensed data for a share of capital stock
outstanding throughout the period. | | (UNAUDITED) | | 2022 | | 2021 | | 2020 | | 2019 | | 2018 | |
Net asset value, beginning of period | | $ | 17.75 | | | $ | 23.88 | | | $ | 12.50 | | | $ | 15.30 | | | $ | 16.03 | | | $ | 15.78 | | |
Income from investment operations: | |
Net investment loss | | | (0.08 | )(1) | | | (0.28 | )(1) | | | (0.25 | )(1) | | | (0.15 | ) | | | (0.15 | ) | | | (0.18 | ) | |
Net gains (losses) on securities (both realized
and unrealized) | | | (3.88 | ) | | | (2.60 | ) | | | 14.11 | | | | (1.85 | ) | | | 1.32 | | | | 3.55 | | |
Total from investment operations | | | (3.96 | ) | | | (2.88 | ) | | | 13.86 | | | | (2.00 | ) | | | 1.17 | | | | 3.37 | | |
Less distributions: | |
Distributions from capital gains | | | — | | | | (3.25 | ) | | | (2.48 | ) | | | (0.80 | ) | | | (1.90 | ) | | | (3.12 | ) | |
Total distributions | | | — | | | | (3.25 | ) | | | (2.48 | ) | | | (0.80 | ) | | | (0.79 | ) | | | (0.34 | ) | |
Net asset value, end of period | | $ | 13.79 | | | $ | 17.75 | | | $ | 23.88 | | | $ | 12.50 | | | $ | 15.30 | | | $ | 16.03 | | |
Total return* | | | (22.31 | %) | | | (13.32 | %) | | | 112.86 | % | | | (14.38 | %) | | | 9.39 | % | | | 21.84 | % | |
Ratios/Supplemental Data | |
Net assets, end of period (in thousands) | | $ | 80,086 | | | $ | 68,232 | | | $ | 82,824 | | | $ | 42,633 | | | $ | 84,032 | | | $ | 87,969 | | |
Ratio of expenses to average net assets** | | | 1.49 | % | | | 1.45 | % | | | 1.50 | % | | | 1.49 | % | | | 1.48 | % | | | 1.48 | % | |
Ratio of net investment income (loss) to average
net assets** | | | (1.00 | %) | | | (1.22 | %) | | | (1.24 | %) | | | (1.00 | %) | | | (0.94 | %) | | | (1.10 | %) | |
Portfolio turnover rate* | | | 4 | % | | | 34 | % | | | 54 | % | | | 22 | % | | | 40 | % | | | 48 | % | |
* Not annualized for periods less than one year.
** Annualized for periods less than one year.
(1) Per share amounts have been calculated using the average shares method.

106
FINANCIAL HIGHLIGHTS
BUFFALO EARLY STAGE GROWTH FUND INSTITUTIONAL CLASS
The following tables are intended to help you understand the Fund's financial performance for the periods shown. Certain information reflects financial results for a single Fund share. Total returns in the table represent the rate that an investor would have earned (or lost) on an investment in the Fund. Total returns assume reinvestment of all dividends and distributions. Total returns do not reflect payment of sales charges, if any, and are not annualized for periods of less than one year.
| | | For the Six Months
Ended September 30,
2022 | | For the Years Ended
March 31, | | For the period
July 1, 2019*
through | |
Condensed data for a share of capital stock
outstanding throughout the period. | | (UNAUDITED) | | 2022 | | 2021 | | March 31, 2020 | |
Net asset value, beginning of period | | $ | 17.84 | | | $ | 23.96 | | | $ | 12.51 | | | $ | 16.44 | | |
Income from investment operations: | |
Net investment loss | | | (0.07 | )(1) | | | (0.24 | )(1) | | | (0.22 | )(1) | | | (0.14 | ) | |
Net gains (losses) on securities (both realized and unrealized) | | | (3.89 | ) | | | (2.63 | ) | | | 14.15 | | | | (2.99 | ) | |
Total from investment operations | | | (3.96 | ) | | | (2.87 | ) | | | 13.93 | | | | (3.13 | ) | |
Less distributions: | |
Distributions from investment Income | | | — | | | | — | | | | — | | | | — | | |
Distributions from capital gains | | | — | | | | (3.25 | ) | | | (2.48 | ) | | | (0.80 | ) | |
Total distributions | | | — | | | | (3.25 | ) | | | (2.48 | ) | | | (0.80 | ) | |
Net asset value, end of period | | $ | 13.88 | | | $ | 17.84 | | | $ | 23.96 | | | $ | 12.51 | | |
Total return** | | | (22.20 | %) | | | (13.20 | %) | | | 113.25 | % | | | (20.25 | %) | |
Ratios/Supplemental Data | |
Net assets, end of period (in thousands) | | $ | 33,136 | | | $ | 44,458 | | | $ | 49,023 | | | $ | 23,102 | | |
Ratio of expenses to average net assets*** | | | 1.34 | % | | | 1.32 | % | | | 1.35 | % | | | 1.35 | % | |
Ratio of net investment income (loss) to average net assets*** | | | (0.85 | %) | | | (1.07 | %) | | | (1.09 | %) | | | (1.19 | %) | |
Portfolio turnover rate** | | | 4 | % | | | 34 | % | | | 54 | % | | | 22 | % | |
* Inception date
** Not annualized for periods less than one year.
*** Annualized for periods less than one year.
(1) Per share amounts have been calculated using the average shares method.

107
FINANCIAL HIGHLIGHTS
BUFFALO FLEXIBLE INCOME FUND INVESTOR CLASS
The following tables are intended to help you understand the Fund's financial performance for the periods shown. Certain information reflects financial results for a single Fund share. Total returns in the table represent the rate that an investor would have earned (or lost) on an investment in the Fund. Total returns assume reinvestment of all dividends and distributions. Total returns do not reflect payment of sales charges, if any, and are not annualized for periods of less than one year.
| | | For the Six Months
Ended September 30,
2022 | | For the Years Ended March 31, | |
Condensed data for a share of capital stock
outstanding throughout the period. | | (UNAUDITED) | | 2022 | | 2021 | | 2020 | | 2019 | | 2018 | |
Net asset value, beginning of period | | $ | 19.03 | | | $ | 16.24 | | | $ | 11.93 | | | $ | 15.27 | | | $ | 15.00 | | | $ | 14.74 | | |
Income from investment operations: | |
Net investment income | | | 0.16 | (1) | | | 0.29 | (1) | | | 0.29 | (1) | | | 0.72 | | | | 0.39 | | | | 0.34 | | |
Net gains (losses) on securities (both realized
and unrealized) | | | (2.42 | ) | | | 3.48 | | | | 4.53 | | | | (3.63 | ) | | | 0.71 | | | | 0.77 | | |
Total from investment operations | | | (2.26 | ) | | | 3.77 | | | | 4.82 | | | | (2.91 | ) | | | 1.10 | | | | 1.11 | | |
Less distributions: | |
Distributions from investment Income | | | (0.15 | ) | | | (0.29 | ) | | | (0.30 | ) | | | (0.32 | ) | | | (0.39 | ) | | | (0.36 | ) | |
Distributions from capital gains | | | — | | | | (0.69 | ) | | | (0.21 | ) | | | (0.11 | ) | | | (0.44 | ) | | | (0.49 | ) | |
Total distributions | | | (0.15 | ) | | | (0.98 | ) | | | (0.51 | ) | | | (0.43 | ) | | | (0.83 | ) | | | (0.85 | ) | |
Net asset value, end of period | | $ | 16.62 | | | $ | 19.03 | | | $ | 16.24 | | | $ | 11.93 | | | $ | 15.27 | | | $ | 15.00 | | |
Total return* | | | (11.93 | %) | | | 23.81 | % | | | 40.94 | % | | | (19.63 | %) | | | 7.73 | % | | | 7.57 | % | |
Ratios/Supplemental Data | |
Net assets, end of period (in thousands) | | $ | 278,353 | | | $ | 314,134 | | | $ | 277,906 | | | $ | 273,416 | | | $ | 625,349 | | | $ | 698,084 | | |
Ratio of expenses to average net assets** | | | 1.01 | % | | | 1.01 | % | | | 1.01 | % | | | 1.01 | % | | | 1.01 | % | | | 1.01 | % | |
Ratio of net investment income (loss) to average
net assets** | | | 1.73 | % | | | 1.60 | % | | | 2.04 | % | | | 1.99 | % | | | 2.57 | % | | | 2.27 | % | |
Portfolio turnover rate* | | | 1 | % | | | 4 | % | | | 1 | % | | | 5 | % | | | 6 | % | | | 2 | % | |
* Not annualized for periods less than one year.
** Annualized for periods less than one year.
(1) Per share amounts have been calculated using the average shares method.

108
FINANCIAL HIGHLIGHTS
BUFFALO FLEXIBLE INCOME FUND INSTITUTIONAL CLASS
The following tables are intended to help you understand the Fund's financial performance for the periods shown. Certain information reflects financial results for a single Fund share. Total returns in the table represent the rate that an investor would have earned (or lost) on an investment in the Fund. Total returns assume reinvestment of all dividends and distributions. Total returns do not reflect payment of sales charges, if any, and are not annualized for periods of less than one year.
| | | For the Six Months
Ended September 30,
2022 | | For the Years Ended
March 31, | | For the period
July 1, 2019*
through | |
Condensed data for a share of capital stock
outstanding throughout the period. | | (UNAUDITED) | | 2022 | | 2021 | | March 31, 2020 | |
Net asset value, beginning of period | | $ | 19.03 | | | $ | 16.24 | | | $ | 11.93 | | | $ | 15.31 | | |
Income from investment operations: | |
Net investment income | | | 0.17 | (1) | | | 0.32 | (1) | | | 0.31 | (1) | | | 0.57 | | |
Net gains (losses) on securities (both realized and unrealized) | | | (2.43 | ) | | | 3.48 | | | | 4.53 | | | | (3.60 | ) | |
Total from investment operations | | | (2.25 | ) | | | 3.80 | | | | 4.84 | | | | (3.03 | ) | |
Less distributions: | |
Distributions from investment Income | | | (0.17 | ) | | | (0.31 | ) | | | (0.32 | ) | | | (0.25 | ) | |
Distributions from capital gains | | | — | | | | (0.69 | ) | | | (0.21 | ) | | | (0.10 | ) | |
Total distributions | | | (0.17 | ) | | | (1.01 | ) | | | (0.53 | ) | | | (0.35 | ) | |
Net asset value, end of period | | $ | 16.61 | | | $ | 19.03 | | | $ | 16.24 | | | $ | 11.93 | | |
Total return** | | | (11.92 | %) | | | 24.00 | % | | | 41.15 | % | | | (20.20 | %) | |
Ratios/Supplemental Data | |
Net assets, end of period (in thousands) | | $ | 149,326 | | | $ | 175,891 | | | $ | 147,802 | | | $ | 133,843 | | |
Ratio of expenses to average net assets*** | | | 0.86 | % | | | 0.86 | % | | | 0.86 | % | | | 0.86 | % | |
Ratio of net investment income (loss) to average net assets*** | | | 1.87 | % | | | 1.75 | % | | | 2.19 | % | | | 2.79 | % | |
Portfolio turnover rate** | | | 1 | % | | | 4 | % | | | 1 | % | | | 5 | % | |
* Inception date
** Not annualized for periods less than one year.
*** Annualized for periods less than one year.
(1) Per share amounts have been calculated using the average shares method.

109
FINANCIAL HIGHLIGHTS
BUFFALO GROWTH FUND INVESTOR CLASS
The following tables are intended to help you understand the Fund's financial performance for the periods shown. Certain information reflects financial results for a single Fund share. Total returns in the table represent the rate that an investor would have earned (or lost) on an investment in the Fund. Total returns assume reinvestment of all dividends and distributions. Total returns do not reflect payment of sales charges, if any, and are not annualized for periods of less than one year.
| | | For the Six Months
Ended September 30,
2022 | | For the Years Ended March 31, | |
Condensed data for a share of capital stock
outstanding throughout the period. | | (UNAUDITED) | | 2022 | | 2021 | | 2020 | | 2019 | | 2018 | |
Net asset value, beginning of period | | $ | 30.83 | | | $ | 31.07 | | | $ | 21.20 | | | $ | 25.10 | | | $ | 29.83 | | | $ | 30.83 | | |
Income from investment operations: | |
Net investment loss | | | (0.04 | )(1) | | | (0.13 | )(1) | | | (0.05 | )(1) | | | 0.08 | | | | 0.05 | | | | 0.39 | | |
Net gains (losses) on securities (both realized
and unrealized) | | | (8.09 | ) | | | 3.25 | | | | 11.46 | | | | (0.55 | ) | | | 2.76 | | | | 4.58 | | |
Total from investment operations | | | (8.13 | ) | | | 3.12 | | | | 11.41 | | | | (0.47 | ) | | | 2.81 | | | | 4.97 | | |
Less distributions: | |
Distributions from investment Income | | | — | | | | — | | | | — | | | | (0.08 | ) | | | (0.01 | ) | | | (0.45 | ) | |
Distributions from capital gains | | | — | | | | (3.36 | ) | | | (1.53 | ) | | | (3.35 | ) | | | (7.53 | ) | | | (5.52 | ) | |
Total distributions | | | — | | | | (3.36 | ) | | | (1.53 | ) | | | (3.43 | ) | | | (7.54 | ) | | | (5.97 | ) | |
Net asset value, end of period | | $ | 22.70 | | | $ | 30.83 | | | $ | 31.07 | | | $ | 21.20 | | | $ | 25.10 | | | $ | 29.83 | | |
Total return* | | | (26.37 | %) | | | 9.56 | % | | | 53.98 | % | | | (3.90 | %) | | | 13.17 | % | | | 16.42 | % | |
Ratios/Supplemental Data | |
Net assets, end of period (in thousands) | | $ | 70,903,068 | | | $ | 103,336 | | | $ | 112,399 | | | $ | 88,051 | | | $ | 174,570 | | | $ | 204,251 | | |
Ratio of expenses to average net assets** | | | 0.92 | % | | | 0.92 | % | | | 0.92 | % | | | 0.92 | % | | | 0.91 | % | | | 0.91 | % | |
Ratio of net investment income (loss) to average
net assets** | | | (0.33 | %) | | | (0.40 | %) | | | (0.19 | %) | | | 0.11 | % | | | 0.17 | % | | | 0.90 | % | |
Portfolio turnover rate* | | | 7 | % | | | 13 | % | | | 21 | % | | | 33 | % | | | 16 | % | | | 32 | % | |
* Not annualized for periods less than one year.
** Annualized for periods less than one year.
(1) Per share amounts have been calculated using the average shares method.

110
FINANCIAL HIGHLIGHTS
BUFFALO GROWTH FUND INSTITUTIONAL CLASS
The following tables are intended to help you understand the Fund's financial performance for the periods shown. Certain information reflects financial results for a single Fund share. Total returns in the table represent the rate that an investor would have earned (or lost) on an investment in the Fund. Total returns assume reinvestment of all dividends and distributions. Total returns do not reflect payment of sales charges, if any, and are not annualized for periods of less than one year.
| | | For the Six Months
Ended September 30,
2022 | | For the Years Ended
March 31, | | For the period
July 1, 2019*
through | |
Condensed data for a share of capital stock
outstanding throughout the period. | | (UNAUDITED) | | 2022 | | 2021 | | March 31, 2020 | |
Net asset value, beginning of period | | $ | 30.95 | | | $ | 31.13 | | | $ | 21.20 | | | $ | 27.10 | | |
Income from investment operations: | |
Net investment loss | | | (0.02 | )(1) | | | (0.08 | )(1) | | | (0.01 | )(1) | | | 0.15 | | |
Net gains (losses) on securities (both realized and unrealized) | | | (8.13 | ) | | | 3.28 | | | | 11.47 | | | | (2.59 | ) | |
Total from investment operations | | | (8.15 | ) | | | 3.18 | | | | 11.46 | | | | (2.44 | ) | |
Less distributions: | |
Distributions from investment Income | | | — | | | | — | | | | — | | | | (0.10 | ) | |
Distributions from capital gains | | | — | | | | (3.36 | ) | | | (1.53 | ) | | | (3.36 | ) | |
Total distributions | | | — | | | | (3.36 | ) | | | (1.53 | ) | | | (3.46 | ) | |
Net asset value, end of period | | $ | 22.80 | | | $ | 30.95 | | | $ | 31.13 | | | $ | 21.20 | | |
Total return** | | | (26.33 | %) | | | 9.74 | % | | | 54.26 | % | | | (10.92 | %) | |
Ratios/Supplemental Data | |
Net assets, end of period (in thousands) | | $ | 64,814 | | | $ | 91,997 | | | $ | 86,046 | | | $ | 58,307 | | |
Ratio of expenses to average net assets*** | | | 0.77 | % | | | 0.77 | % | | | 0.77 | % | | | 0.78 | % | |
Ratio of net investment income (loss) to average net assets*** | | | (0.18 | %) | | | (0.25 | %) | | | (0.04 | %) | | | 0.28 | % | |
Portfolio turnover rate** | | | 7 | % | | | 13 | % | | | 21 | % | | | 33 | % | |
* Inception date
** Not annualized for periods less than one year.
*** Annualized for periods less than one year.
(1) Per share amounts have been calculated using the average shares method.

111
FINANCIAL HIGHLIGHTS
BUFFALO HIGH YIELD FUND INVESTOR CLASS
The following tables are intended to help you understand the Fund's financial performance for the periods shown. Certain information reflects financial results for a single Fund share. Total returns in the table represent the rate that an investor would have earned (or lost) on an investment in the Fund. Total returns assume reinvestment of all dividends and distributions. Total returns do not reflect payment of sales charges, if any, and are not annualized for periods of less than one year.
| | | For the Six Months
Ended September 30,
2022 | | For the Years Ended March 31, | |
Condensed data for a share of capital stock
outstanding throughout the period. | | (UNAUDITED) | | 2022 | | 2021 | | 2020 | | 2019 | | 2018 | |
Net asset value, beginning of period | | $ | 11.23 | | | $ | 11.82 | | | $ | 9.72 | | | $ | 10.86 | | | $ | 11.04 | | | $ | 11.21 | | |
Income from investment operations: | |
Net investment income | | | 0.28 | (1) | | | 0.48 | (1) | | | 0.48 | (1) | | | 1.17 | | | | 0.51 | | | | 0.50 | | |
Net gains (losses) on securities (both realized
and unrealized) | | | (1.13 | ) | | | (0.24 | ) | | | 2.10 | | | | (1.85 | ) | | | (0.15 | ) | | | (0.15 | ) | |
Total from investment operations | | | (0.84 | ) | | | 0.24 | | | | 2.59 | | | | (0.68 | ) | | | 0.36 | | | | 0.35 | | |
Less distributions: | |
Distributions from investment Income | | | (0.32 | ) | | | (0.48 | ) | | | (0.49 | ) | | | (0.46 | ) | | | (0.51 | ) | | | (0.47 | ) | |
Distributions from capital gains | | | — | | | | (0.34 | ) | | | — | (2) | | | — | | | | (0.03 | ) | | | (0.05 | ) | |
Total distributions | | | (0.32 | ) | | | (0.83 | ) | | | (0.49 | ) | | | (0.46 | ) | | | (0.54 | ) | | | (0.52 | ) | |
Net asset value, end of period | | $ | 10.07 | | | $ | 11.23 | | | $ | 11.82 | | | $ | 9.72 | | | $ | 10.86 | | | $ | 11.04 | | |
Total return* | | | (7.57 | %) | | | 1.97 | % | | | 27.07 | % | | | (6.67 | %) | | | 3.46 | % | | | 3.20 | % | |
Ratios/Supplemental Data | |
Net assets, end of period (in thousands) | | $ | 46,110 | | | $ | 50,581 | | | $ | 50,110 | | | $ | 46,036 | | | $ | 191,451 | | | $ | 231,295 | | |
Ratio of expenses to average net assets** | | | 1.02 | % | | | 1.02 | % | | | 1.02 | % | | | 1.02 | % | | | 1.02 | % | | | 1.02 | % | |
Ratio of net investment income (loss) to average
net assets** | | | 5.37 | % | | | 4.09 | % | | | 4.38 | % | | | 3.60 | % | | | 4.68 | % | | | 4.06 | % | |
Portfolio turnover rate* | | | 13 | % | | | 41 | % | | | 66 | % | | | 36 | % | | | 22 | % | | | 41 | % | |
* Not annualized for periods less than one year.
** Annualized for periods less than one year.
(1) Per share amounts have been calculated using the average shares method.

112
FINANCIAL HIGHLIGHTS
BUFFALO HIGH YIELD FUND INSTITUTIONAL CLASS
The following tables are intended to help you understand the Fund's financial performance for the periods shown. Certain information reflects financial results for a single Fund share. Total returns in the table represent the rate that an investor would have earned (or lost) on an investment in the Fund. Total returns assume reinvestment of all dividends and distributions. Total returns do not reflect payment of sales charges, if any, and are not annualized for periods of less than one year.
| | | For the Six Months
Ended September 30,
2022 | | For the Years Ended
March 31, | | For the period
July 1, 2019*
through | |
Condensed data for a share of capital stock
outstanding throughout the period. | | (UNAUDITED) | | 2022 | | 2021 | | March 31, 2020 | |
Net asset value, beginning of period | | $ | 11.22 | | | $ | 11.81 | | | $ | 9.71 | | | $ | 11.01 | | |
Income from investment operations: | |
Net investment loss | | | 0.29 | (1) | | | 0.50 | (1) | | | 0.50 | (1) | | | 0.71 | | |
Net gains (losses) on securities (both realized and unrealized) | | | (1.13 | ) | | | (0.24 | ) | | | 2.10 | | | | (1.66 | ) | |
Total from investment operations | | | (0.83 | ) | | | 0.26 | | | | 2.60 | | | | (0.95 | ) | |
Less distributions: | |
Distributions from investment Income | | | (0.33 | ) | | | (0.50 | ) | | | (0.50 | ) | | | (0.35 | ) | |
Distributions from capital gains | | | — | | | | (0.35 | ) | | | — | (2) | | | — | | |
Total distributions | | | (0.33 | ) | | | (0.85 | ) | | | (0.50 | ) | | | (0.35 | ) | |
Net asset value, end of period | | $ | 10.06 | | | $ | 11.22 | | | $ | 11.81 | | | $ | 9.71 | | |
Total return** | | | (7.51 | %) | | | 2.12 | % | | | 27.28 | % | | | (8.94 | %) | |
Ratios/Supplemental Data | |
Net assets, end of period (in thousands) | | $ | 225,699 | | | $ | 245,858 | | | $ | 225,715 | | | $ | 141,735 | | |
Ratio of expenses to average net assets*** | | | 0.87 | % | | | 0.87 | % | | | 0.86 | % | | | 0.88 | % | |
Ratio of net investment income (loss) to average net assets*** | | | 5.52 | % | | | 4.24 | % | | | 4.51 | % | | | 4.90 | % | |
Portfolio turnover rate** | | | 13 | % | | | 41 | % | | | 66 | % | | | 36 | % | |
* Inception date
** Not annualized for periods less than one year.
*** Annualized for periods less than one year.
(1) Per share amounts have been calculated using the average shares method.
(2) Less than $0.01 per share.

113
FINANCIAL HIGHLIGHTS
BUFFALO INTERNATIONAL FUND INVESTOR CLASS
The following tables are intended to help you understand the Fund's financial performance for the periods shown. Certain information reflects financial results for a single Fund share. Total returns in the table represent the rate that an investor would have earned (or lost) on an investment in the Fund. Total returns assume reinvestment of all dividends and distributions. Total returns do not reflect payment of sales charges, if any, and are not annualized for periods of less than one year.
| | | For the Six Months
Ended September 30,
2022 | | For the Years Ended March 31, | |
Condensed data for a share of capital stock
outstanding throughout the period. | | (UNAUDITED) | | 2022 | | 2021 | | 2020 | | 2019 | | 2018 | |
Net asset value, beginning of period | | $ | 20.67 | | | $ | 20.51 | | | $ | 13.54 | | | $ | 14.76 | | | $ | 15.10 | | | $ | 12.80 | | |
Income from investment operations: | |
Net investment income | | | 0.10 | (1) | | | 0.03 | (1) | | | 0.04 | (1) | | | 0.19 | | | | 0.09 | | | | 0.06 | | |
Net gains (losses) on securities (both realized
and unrealized) | | | (4.93 | ) | | | 0.39 | | | | 6.98 | | | | (1.31 | ) | | | (0.11 | ) | | | 2.29 | | |
Total from investment operations | | | (4.83 | ) | | | 0.42 | | | | 7.02 | | | | (1.12 | ) | | | (0.02 | ) | | | 2.35 | | |
Less distributions: | |
Distributions from investment Income | | | — | | | | (0.02 | ) | | | (0.05 | ) | | | (0.10 | ) | | | (0.08 | ) | | | (0.04 | ) | |
Distributions from capital gains | | | — | | | | (0.26 | ) | | | — | (2) | | | — | | | | (0.24 | ) | | | (0.01 | ) | |
Total distributions | | | — | | | | (0.28 | ) | | | (0.05 | ) | | | (0.10 | ) | | | (0.32 | ) | | | (0.05 | ) | |
Net asset value, end of period | | $ | 15.84 | | | $ | 20.65 | | | $ | 20.51 | | | $ | 13.54 | | | $ | 14.76 | | | $ | 15.10 | | |
Total return* | | | (23.29 | %) | | | 1.94 | % | | | 51.79 | % | | | (7.67 | %) | | | 0.11 | % | | | 18.40 | % | |
Ratios/Supplemental Data | |
Net assets, end of period (in thousands) | | $ | 191,997 | | | $ | 263,120 | | | $ | 260,044 | | | $ | 183,809 | | | $ | 340,880 | | | $ | 277,865 | | |
Ratio of expenses to average net assets** | | | 1.03 | % | | | 1.03 | % | | | 1.03 | % | | | 1.03 | % | | | 1.04 | % | | | 1.03 | % | |
Ratio of net investment income (loss) to average
net assets** | | | 1.05 | % | | | 0.14 | % | | | 0.22 | % | | | 0.55 | % | | | 0.64 | % | | | 0.42 | % | |
Portfolio turnover rate* | | | 5 | % | | | 13 | % | | | 14 | % | | | 13 | % | | | 16 | % | | | 13 | % | |
* Not annualized for periods less than one year.
** Annualized for periods less than one year.
(1) Per share amounts have been calculated using the average shares method.

114
FINANCIAL HIGHLIGHTS
BUFFALO INTERNATIONAL FUND INSTITUTIONAL CLASS
The following tables are intended to help you understand the Fund's financial performance for the periods shown. Certain information reflects financial results for a single Fund share. Total returns in the table represent the rate that an investor would have earned (or lost) on an investment in the Fund. Total returns assume reinvestment of all dividends and distributions. Total returns do not reflect payment of sales charges, if any, and are not annualized for periods of less than one year.
| | | For the Six Months
Ended September 30,
2022 | | For the Years Ended
March 31, | | For the period
July 1, 2019*
through | |
Condensed data for a share of capital stock
outstanding throughout the period. | | (UNAUDITED) | | 2022 | | 2021 | | March 31, 2020 | |
Net asset value, beginning of period | | $ | 20.65 | | | $ | 20.53 | | | $ | 13.55 | | | $ | 15.85 | | |
Income from investment operations: | |
Net investment loss | | | 0.11 | (1) | | | 0.06 | (1) | | | 0.07 | (1) | | | 0.20 | | |
Net gains (losses) on securities (both realized and unrealized) | | | (4.89 | ) | | | 0.39 | | | | 6.99 | | | | (2.39 | ) | |
Total from investment operations | | | (4.78 | ) | | | 0.45 | | | | 7.06 | | | | (2.19 | ) | |
Less distributions: | |
Distributions from investment Income | | | — | | | | (0.05 | ) | | | (0.08 | ) | | | (0.11 | ) | |
Distributions from capital gains | | | — | | | | (0.26 | ) | | | — | (2) | | | — | | |
Total distributions | | | — | | | | (0.31 | ) | | | (0.08 | ) | | | (0.11 | ) | |
Net asset value, end of period | | $ | 15.87 | | | $ | 20.67 | | | $ | 20.53 | | | $ | 13.55 | | |
Total return** | | | (23.22 | %) | | | 2.08 | % | | | 52.12 | % | | | (13.95 | %) | |
Ratios/Supplemental Data | |
Net assets, end of period (in thousands) | | $ | 260,399 | | | $ | 316,602 | | | $ | 285,595 | | | $ | 176,285 | | |
Ratio of expenses to average net assets*** | | | 0.88 | % | | | 0.88 | % | | | 0.88 | % | | | 0.88 | % | |
Ratio of net investment income (loss) to average net assets*** | | | 1.20 | % | | | 0.29 | % | | | 0.37 | % | | | 0.86 | % | |
Portfolio turnover rate** | | | 5 | % | | | 13 | % | | | 14 | % | | | 13 | % | |
* Inception date
** Not annualized for periods less than one year.
*** Annualized for periods less than one year.
(1) Per share amounts have been calculated using the average shares method.
(2) Less than $0.01 per share.

115
FINANCIAL HIGHLIGHTS
BUFFALO LARGE CAP FUND INVESTOR CLASS
The following tables are intended to help you understand the Fund's financial performance for the periods shown. Certain information reflects financial results for a single Fund share. Total returns in the table represent the rate that an investor would have earned (or lost) on an investment in the Fund. Total returns assume reinvestment of all dividends and distributions. Total returns do not reflect payment of sales charges, if any, and are not annualized for periods of less than one year.
| | | For the Six Months
Ended September 30,
2022 | | For the Years Ended March 31, | |
Condensed data for a share of capital stock
outstanding throughout the period. | | (UNAUDITED) | | 2022 | | 2021 | | 2020 | | 2019 | | 2018 | |
Net asset value, beginning of period | | $ | 40.21 | | | $ | 46.23 | | | $ | 29.53 | | | $ | 31.01 | | | $ | 29.08 | | | $ | 26.53 | | |
Income from investment operations: | |
Net investment loss | | | (0.03 | )(1) | | | (0.16 | )(1) | | | (0.07 | )(1) | | | 0.09 | | | | 0.09 | | | | 0.09 | | |
Net gains (losses) on securities (both realized
and unrealized) | | | (9.15 | ) | | | 5.59 | | | | 16.83 | | | | (1.07 | ) | | | 3.46 | | | | 4.01 | | |
Total from investment operations | | | (9.18 | ) | | | 5.43 | | | | 16.76 | | | | (0.98 | ) | | | 3.55 | | | | 4.10 | | |
Less distributions: | |
Distributions from investment Income | | | — | | | | — | | | | (0.06 | ) | | | (0.07 | ) | | | (0.11 | ) | | | (0.04 | ) | |
Distributions from capital gains | | | — | | | | (11.45 | ) | | | — | | | | (0.43 | ) | | | (1.51 | ) | | | (1.51 | ) | |
Total distributions | | | — | | | | (11.45 | ) | | | (0.06 | ) | | | (0.50 | ) | | | (1.62 | ) | | | (1.55 | ) | |
Net asset value, end of period | | $ | 31.03 | | | $ | 40.21 | | | $ | 46.23 | | | $ | 29.53 | | | $ | 31.01 | | | $ | 29.08 | | |
Total return* | | | (22.83 | %) | | | 10.23 | % | | | 56.78 | % | | | (3.40 | %) | | | 12.96 | % | | | 15.41 | % | |
Ratios/Supplemental Data | |
Net assets, end of period (in thousands) | | $ | 25,761 | | | $ | 35,391 | | | $ | 37,413 | | | $ | 27,872 | | | $ | 69,002 | | | $ | 69,024 | | |
Ratio of expenses to average net assets** | | | 0.95 | % | | | 0.93 | % | | | 0.94 | % | | | 0.94 | % | | | 0.93 | % | | | 0.93 | % | |
Ratio of net investment income (loss) to average
net assets** | | | (0.19 | %) | | | (0.34 | %) | | | (0.16 | %) | | | 0.21 | % | | | 0.27 | % | | | 0.33 | % | |
Portfolio turnover rate* | | | 25 | % | | | 83 | % | | | 7 | % | | | 6 | % | | | 10 | % | | | 40 | % | |
* Not annualized for periods less than one year.
** Annualized for periods less than one year.
(1) Per share amounts have been calculated using the average shares method.

116
FINANCIAL HIGHLIGHTS
BUFFALO LARGE CAP FUND INSTITUTIONAL CLASS
The following tables are intended to help you understand the Fund's financial performance for the periods shown. Certain information reflects financial results for a single Fund share. Total returns in the table represent the rate that an investor would have earned (or lost) on an investment in the Fund. Total returns assume reinvestment of all dividends and distributions. Total returns do not reflect payment of sales charges, if any, and are not annualized for periods of less than one year.
| | | For the Six Months
Ended September 30,
2022 | | For the Years Ended
March 31, | | For the period
July 1, 2019*
through | |
Condensed data for a share of capital stock
outstanding throughout the period. | | (UNAUDITED) | | 2022 | | 2021 | | March 31, 2020 | |
Net asset value, beginning of period | | $ | 40.37 | | | $ | 46.30 | | | $ | 29.56 | | | $ | 32.79 | | |
Income from investment operations: | |
Net investment loss | | | (0.01 | )(1) | | | (0.09 | )(1) | | | — | (1)(2) | | | 0.16 | | |
Net gains (losses) on securities (both realized and unrealized) | | | (9.19 | ) | | | 5.61 | | | | 16.85 | | | | (2.89 | ) | |
Total from investment operations | | | (9.20 | ) | | | 5.52 | | | | 16.85 | | | | (2.73 | ) | |
Less distributions: | |
Distributions from investment Income | | | — | | | | — | | | | (0.11 | ) | | | (0.07 | ) | |
Distributions from capital gains | | | — | | | | (11.45 | ) | | | — | | | | (0.43 | ) | |
Total distributions | | | — | | | | (11.45 | ) | | | (0.11 | ) | | | (0.50 | ) | |
Net asset value, end of period | | $ | 31.17 | | | $ | 40.37 | | | $ | 46.30 | | | $ | 29.56 | | |
Total return** | | | (22.79 | %) | | | 10.42 | % | | | 57.02 | % | | | (8.55 | %) | |
Ratios/Supplemental Data | |
Net assets, end of period (in thousands) | | $ | 58,497 | | | $ | 78,082 | | | $ | 71,394 | | | $ | 45,244 | | |
Ratio of expenses to average net assets*** | | | 0.80 | % | | | 0.78 | % | | | 0.79 | % | | | 0.80 | % | |
Ratio of net investment income (loss) to average net assets*** | | | (0.04 | %) | | | (0.19 | %) | | | (0.01 | %) | | | 0.40 | % | |
Portfolio turnover rate** | | | 25 | % | | | 83 | % | | | 7 | % | | | 6 | % | |
* Inception date
** Not annualized for periods less than one year.
*** Annualized for periods less than one year.
(1) Per share amounts have been calculated using the average shares method.
(2) Less than $0.01 per share.

117
FINANCIAL HIGHLIGHTS
BUFFALO MID CAP FUND INVESTOR CLASS
The following tables are intended to help you understand the Fund's financial performance for the periods shown. Certain information reflects financial results for a single Fund share. Total returns in the table represent the rate that an investor would have earned (or lost) on an investment in the Fund. Total returns assume reinvestment of all dividends and distributions. Total returns do not reflect payment of sales charges, if any, and are not annualized for periods of less than one year.
| | | For the Six Months
Ended September 30,
2022 | | For the Years Ended March 31, | |
Condensed data for a share of capital stock
outstanding throughout the period. | | (UNAUDITED) | | 2022 | | 2021 | | 2020 | | 2019 | | 2018 | |
Net asset value, beginning of period | | $ | 17.72 | | | $ | 20.19 | | | $ | 13.02 | | | $ | 14.52 | | | $ | 13.99 | | | $ | 15.68 | | |
Income from investment operations: | |
Net investment loss | | | (0.04 | )(1) | | | (0.11 | )(1) | | | (0.11 | )(1) | | | (0.05 | ) | | | (0.04 | ) | | | (0.03 | ) | |
Net gains (losses) on securities (both realized
and unrealized) | | | (4.26 | ) | | | (0.10 | ) | | | 8.61 | | | | (0.19 | ) | | | 1.11 | | | | 1.77 | | |
Total from investment operations | | | (4.30 | ) | | | (0.21 | ) | | | 8.50 | | | | (0.24 | ) | | | 1.07 | | | | 1.74 | | |
Less distributions: | |
Distributions from investment Income | | | — | | | | — | | | | — | | | | — | | | | — | | | | — | | |
Distributions from capital gains | | | — | | | | (2.26 | ) | | | (1.33 | ) | | | (1.26 | ) | | | (0.54 | ) | | | (3.43 | ) | |
Total distributions | | | — | | | | (2.26 | ) | | | (1.33 | ) | | | (1.26 | ) | | | (0.54 | ) | | | (3.43 | ) | |
Net asset value, end of period | | $ | 13.42 | | | $ | 17.72 | | | $ | 20.19 | | | $ | 13.02 | | | $ | 14.52 | | | $ | 13.99 | | |
Total return* | | | (24.27 | %) | | | (1.55 | %) | | | 65.92 | % | | | (2.89 | %) | | | 8.40 | % | | | 11.69 | % | |
Ratios/Supplemental Data | |
Net assets, end of period (in thousands) | | $ | 67,888 | | | $ | 96,992 | | | $ | 107,061 | | | $ | 86,030 | | | $ | 135,262 | | | $ | 155,587 | | |
Ratio of expenses to average net assets*** | | | 1.03 | % | | | 1.02 | % | | | 1.03 | % | | | 1.02 | % | | | 1.02 | % | | | 1.01 | % | |
Ratio of net investment income (loss) to average
net assets*** | | | (0.47 | %) | | | (0.56 | %) | | | (0.63 | %) | | | (0.39 | %) | | | (0.27 | %) | | | (0.13 | %) | |
Portfolio turnover rate** | | | 14 | % | | | 19 | % | | | 41 | % | | | 52 | % | | | 36 | % | | | 51 | % | |
* Not annualized for periods less than one year.
** Annualized for periods less than one year.
(1) Per share amounts have been calculated using the average shares method.

118
FINANCIAL HIGHLIGHTS
BUFFALO MID CAP FUND INSTITUTIONAL CLASS
The following tables are intended to help you understand the Fund's financial performance for the periods shown. Certain information reflects financial results for a single Fund share. Total returns in the table represent the rate that an investor would have earned (or lost) on an investment in the Fund. Total returns assume reinvestment of all dividends and distributions. Total returns do not reflect payment of sales charges, if any, and are not annualized for periods of less than one year.
| | | For the Six Months
Ended September 30,
2022 | | For the Years Ended
March 31, | | For the period
July 1, 2019*
through | |
Condensed data for a share of capital stock
outstanding throughout the period. | | (UNAUDITED) | | 2022 | | 2021 | | March 31, 2020 | |
Net asset value, beginning of period | | $ | 17.81 | | | $ | 20.24 | | | $ | 13.03 | | | $ | 15.63 | | |
Income from investment operations: | |
Net investment loss | | | (0.02 | )(1) | | | (0.08 | )(1) | | | (0.09 | )(1) | | | (0.04 | ) | |
Net gains (losses) on securities (both realized and unrealized) | | | (4.30 | ) | | | (0.09 | ) | | | 8.63 | | | | (1.30 | ) | |
Total from investment operations | | | (4.32 | ) | | | (0.17 | ) | | | 8.54 | | | | (1.34 | ) | |
Less distributions: | |
Distributions from investment Income | | | — | | | | — | | | | — | | | | — | | |
Distributions from capital gains | | | — | | | | (2.26 | ) | | | (1.33 | ) | | | (1.26 | ) | |
Total distributions | | | — | | | | (2.26 | ) | | | (1.33 | ) | | | (1.26 | ) | |
Net asset value, end of period | | $ | 13.49 | | | $ | 17.81 | | | $ | 20.24 | | | $ | 13.03 | | |
Total return** | | | (24.26 | %) | | | (1.34 | %) | | | 66.18 | % | | | (9.72 | %) | |
Ratios/Supplemental Data | |
Net assets, end of period (in thousands) | | $ | 60,182 | | | $ | 82,831 | | | $ | 83,642 | | | $ | 51,324 | | |
Ratio of expenses to average net assets*** | | | 0.88 | % | | | 0.87 | % | | | 0.88 | % | | | 0.89 | % | |
Ratio of net investment income (loss) to average net assets*** | | | (0.32 | %) | | | (0.41 | %) | | | (0.48 | %) | | | (0.38 | %) | |
Portfolio turnover rate** | | | 14 | % | | | 19 | % | | | 41 | % | | | 52 | % | |
* Inception date
** Not annualized for periods less than one year.
*** Annualized for periods less than one year.
(1) Per share amounts have been calculated using the average shares method.

119
FINANCIAL HIGHLIGHTS
BUFFALO SMALL CAP FUND INVESTOR CLASS
The following tables are intended to help you understand the Fund's financial performance for the periods shown. Certain information reflects financial results for a single Fund share. Total returns in the table represent the rate that an investor would have earned (or lost) on an investment in the Fund. Total returns assume reinvestment of all dividends and distributions. Total returns do not reflect payment of sales charges, if any, and are not annualized for periods of less than one year.
| | | For the Six Months
Ended September 30,
2022 | | For the Years Ended March 31, | |
Condensed data for a share of capital stock
outstanding throughout the period. | | (UNAUDITED) | | 2022 | | 2021 | | 2020 | | 2019 | | 2018 | |
Net asset value, beginning of period | | $ | 16.11 | | | $ | 22.14 | | | $ | 10.94 | | | $ | 12.89 | | | $ | 15.00 | | | $ | 16.61 | | |
Income from investment operations: | |
Net investment loss | | | (0.03 | )(1) | | | (0.17 | )(1) | | | (0.15 | )(1) | | | (0.08 | ) | | | (0.08 | ) | | | (0.09 | ) | |
Net gains (losses) on securities (both realized
and unrealized) | | | (2.60 | ) | | | (3.27 | ) | | | 13.23 | | | | (0.62 | ) | | | 1.25 | | | | 2.92 | | |
Total from investment operations | | | (2.63 | ) | | | (3.44 | ) | | | 13.08 | | | | (0.70 | ) | | | 1.17 | | | | 2.83 | | |
Less distributions: | |
Distributions from investment Income | | | — | | | | — | | | | — | | | | — | | | | — | | | | — | | |
Distributions from capital gains | | | — | | | | (2.59 | ) | | | (1.88 | ) | | | (1.25 | ) | | | (3.28 | ) | | | (4.44 | ) | |
Total distributions | | | — | | | | (2.59 | ) | | | (1.88 | ) | | | (1.25 | ) | | | (3.28 | ) | | | (4.44 | ) | |
Net asset value, end of period | | $ | 13.48 | | | $ | 16.11 | | | $ | 22.14 | | | $ | 10.94 | | | $ | 12.89 | | | $ | 15.00 | | |
Total return* | | | (16.33 | %) | | | (16.93 | %) | | | 120.78 | % | | | (7.33 | %) | | | 12.19 | % | | | 17.65 | % | |
Ratios/Supplemental Data | |
Net assets, end of period (in thousands) | | $ | 566,275 | | | $ | 697,647 | | | $ | 801,388 | | | $ | 337,804 | | | $ | 510,410 | | | $ | 535,820 | | |
Ratio of expenses to average net assets** | | | 1.00 | % | | | 1.01 | % | | | 1.01 | % | | | 1.01 | % | | | 1.01 | % | | | 1.01 | % | |
Ratio of net investment income (loss) to average
net assets** | | | (0.44 | %) | | | (0.83 | %) | | | (0.81 | %) | | | (0.65 | %) | | | (0.55 | %) | | | (0.64 | %) | |
Portfolio turnover rate* | | | 22 | % | | | 59 | % | | | 63 | % | | | 67 | % | | | 57 | % | | | 49 | % | |
* Not annualized for periods less than one year.
** Annualized for periods less than one year.
(1) Per share amounts have been calculated using the average shares method.

120
FINANCIAL HIGHLIGHTS
BUFFALO SMALL CAP FUND INSTITUTIONAL CLASS
The following tables are intended to help you understand the Fund's financial performance for the periods shown. Certain information reflects financial results for a single Fund share. Total returns in the table represent the rate that an investor would have earned (or lost) on an investment in the Fund. Total returns assume reinvestment of all dividends and distributions. Total returns do not reflect payment of sales charges, if any, and are not annualized for periods of less than one year.
| | | For the Six Months
Ended September 30,
2022 | | For the Years Ended
March 31, | | For the period
July 1, 2019*
through | |
Condensed data for a share of capital stock
outstanding throughout the period. | | (UNAUDITED) | | 2022 | | 2021 | | March 31, 2020 | |
Net asset value, beginning of period | | $ | 16.19 | | | $ | 22.20 | | | $ | 10.96 | | | $ | 13.78 | | |
Income from investment operations: | |
Net investment loss | | | (0.02 | )(1) | | | (0.14 | )(1) | | | (0.13 | )(1) | | | (0.06 | ) | |
Net gains (losses) on securities (both realized and unrealized) | | | (2.61 | ) | | | (3.28 | ) | | | 13.24 | | | | (1.51 | ) | |
Total from investment operations | | | (2.63 | ) | | | (3.42 | ) | | | 13.11 | | | | (1.57 | ) | |
Less distributions: | |
Distributions from investment Income | | | — | | | | — | | | | — | | | | — | | |
Distributions from capital gains | | | — | | | | (2.59 | ) | | | (1.88 | ) | | | (1.25 | ) | |
Total distributions | | | — | | | | (2.59 | ) | | | (1.88 | ) | | | (1.25 | ) | |
Net asset value, end of period | | $ | 13.56 | | | $ | 16.19 | | | $ | 22.20 | | | $ | 10.96 | | |
Total return** | | | (16.24 | %) | | | (16.79 | %) | | | 121.14 | % | | | (13.24 | %) | |
Ratios/Supplemental Data | |
Net assets, end of period (in thousands) | | $ | 241,194 | | | $ | 281,276 | | | $ | 328,588 | | | $ | 95,095 | | |
Ratio of expenses to average net assets*** | | | 0.86 | % | | | 0.86 | % | | | 0.86 | % | | | 0.86 | % | |
Ratio of net investment income (loss) to average net assets*** | | | (0.30 | %) | | | (0.68 | %) | | | (0.67 | %) | | | (0.73 | %) | |
Portfolio turnover rate** | | | 22 | % | | | 59 | % | | | 63 | % | | | 67 | % | |
* Inception date
** Not annualized for periods less than one year.
*** Annualized for periods less than one year.
(1) Per share amounts have been calculated using the average shares method.

121
NOTES TO FINANCIAL STATEMENTS (UNAUDITED)
SEPTEMBER 30, 2022
1. SIGNIFICANT ACCOUNTING POLICIES:
The Buffalo Funds (comprised of the Buffalo Discovery Fund, Buffalo Dividend Focus Fund, Buffalo Early Stage Growth Fund, Buffalo Flexible Income Fund, Buffalo Growth Fund, Buffalo High Yield Fund, Buffalo International Fund, Buffalo Large Cap Fund, Buffalo Mid Cap Fund, and Buffalo Small Cap Fund) (the "Funds") are registered under the Investment Company Act of 1940, as amended (the "1940 Act"), each as a diversified open-end management investment company. The shares of the Buffalo Funds are issued in multiple series, with each series, in effect, representing a separate fund. Kornitzer Capital Management, Inc. ("Advisor" or "KCM") is the Funds' investment advisor.
Each of the Funds offers two classes of shares, Investor Class and Institutional Class. Each class of shares represents an equal interest in the Fund, except the difference of class specific expenses, which reflects the difference in the range of services provided to each class. The shareholder servicing fees for the Investor Class represent the class specific expenses. See Note 7 for more information regarding shareholder servicing fees for the Investor Class. Income, expenses (other than class specific), and realized and unrealized gains and losses on investments are allocated daily to each class based on relative net assets.
The investment objective of the Buffalo Discovery Fund, Buffalo Early Stage Growth Fund, Buffalo Growth Fund, Buffalo International Fund, Buffalo Large Cap Fund, Buffalo Mid Cap Fund and Buffalo Small Cap Fund is long-term growth of capital. The investment objective of the Buffalo Flexible Income Fund is high current income, with long-term growth of capital as a secondary objective. The investment objectives of the Buffalo Dividend Focus Fund and Buffalo High Yield Fund are current income, with long-term growth of capital as a secondary objective.
Each Fund is an investment company and accordingly follows the investment company accounting and reporting guidance of the Financial Accounting Standards Board ("FASB") Accounting Standard Codification ("ASC") Topic 946 "Financial Services — Investment Companies."
The following is a summary of significant accounting policies consistently followed by the Funds in the preparation of their financial statements.
A. INVESTMENT VALUATION — In accordance with FASB ASC 820, Fair Value Measurements ("ASC 820"), fair value is defined as the price that a Fund would receive to sell an investment or pay to transfer a liability in an orderly transaction with an independent buyer in the principal market, or in the absence of a principal market, the most advantageous market for the investment or liability.
Equity securities and debt securities traded on a national securities exchange or national market, except those traded using the National Association of Securities Dealers' Automated Quotation System ("NASDAQ"), are valued at the latest sales price thereof, or if no sale was reported on that date, the mean between the most recent quoted bid and ask price is used. All equity securities that are traded using NASDAQ are valued using the NASDAQ Official Closing Price ("NOCP"), which may not necessarily represent the last sales price. If there has been no sale on such exchange or on NASDAQ on such day, the security is valued at the mean between the most recent quoted bid and ask price.
When market quotations are not readily available, any security or other asset is valued at its fair value as determined in good faith under procedures approved by the Board of Trustees (the "Board"). If events occur that will affect the value of a Fund's portfolio securities before the net asset value ("NAV") has been calculated (a "significant event"), the security will generally be priced using a fair value procedure. The Board has adopted specific procedures for valuing portfolio securities and delegated the responsibility of fair value determinations to the Valuation Committee for the period of April 1, 2022 to September 7, 2022 and to KCM, as the Funds' valuation designee in accordance with new Rule 2a-5 of the 1940 Act, starting on September 8, 2022. Some of the factors that have been or may be considered by the Valuation Committee or KCM, as applicable in determining fair value are fundamental analytical data relating to the investment; the nature and duration of any restriction on disposition; trading in similar securities of the same

122
issuer or comparable companies; information from broker-dealers; and an evaluation of the forces that influence the market in which the securities are purchased or sold. As of September 30, 2022, none of the Funds held securities valued at fair value as determined in good faith by the KCM, as valuation designee at such time. In addition, with respect to the valuation of securities principally traded on foreign markets, the Buffalo International Fund uses a fair value pricing service which employs quantitative models to adjust for "stale" prices caused by the movement of other markets and other factors occurring after the close of the foreign markets, but before the close of the New York Stock Exchange ("NYSE"). As of September 30, 2022, the Buffalo International Fund held 65 securities where a foreign fair value factor was applied, with a market value of $283,182,762 or 62.60% of total net assets.
Debt securities, including treasury bills, commercial paper, corporate and convertible bonds, bank loans, etc., with remaining maturities of 60 days or less are normally valued at the last reported sale price. If there is no trade on the valuation date, then the security will be priced at the mean between the most recent bid and ask prices.
Restricted securities include securities that have not been registered under the Securities Act of 1933, as amended, and securities that are subject to restrictions on resale. The Funds may invest in restricted securities that are consistent with the Funds' investment objectives and investment strategies. In some cases, the issuer of restricted securities has agreed to register such securities for resale, at the issuer's expense either upon demand by the Funds or in connection with another registered offering of the securities. Investments in restricted securities are valued utilizing the Funds' valuation policies.
ASC 820 establishes a three-tier hierarchy to distinguish between (1) inputs that reflect the assumptions market participants would use in pricing an asset or liability developed based on market data obtained from sources independent of the reporting entity (observable inputs) and (2) inputs that reflect the reporting entity's own assumptions about the assumptions market participants would use in pricing an asset or liability developed based on the best information available in the circumstances (unobservable inputs) and to establish classification of fair value measurements for disclosure purposes. Various inputs are used in determining the value of the Funds' investments. The inputs are summarized in the three broad levels listed below:
Level 1 — Valuations based on quoted prices for investments in active markets that a Fund has the ability to access at the measurement date. Valuation adjustments are not applied to Level 1 investments.
Level 2 — Valuations based on other significant observable inputs (including quoted prices for similar securities, interest rates, prepayment speeds, credit risks, etc.).
Level 3 — Valuations based on significant unobservable inputs (including a Fund's own assumptions and judgment in determining the fair value of investments).
Inputs that are used in determining fair value of an investment may include price information, credit data, volatility statistics, and other factors. These inputs can be either observable or unobservable. The availability of observable inputs can vary between investments, and is affected by various factors such as the type of investment, and the volume and level of activity for that investment or similar investments in the market place. The inputs will be considered by KCM, along with any other relevant factors in the calculation of an investment's fair value. The Funds use prices and inputs that are current as of the measurement date, which may include periods of market dislocations. During these periods, the availability of prices and inputs may be reduced for many investments. This condition could cause an investment to be reclassified between the various levels within the hierarchy.
Non-U.S. equity securities actively traded in foreign markets may be reflected in Level 2 despite the availability of closing prices, because the Funds evaluate and determine whether those closing prices reflect fair value at the close of the NYSE or require adjustment, as described above and in Note 9 — Foreign Investment Risk.
Investments falling into the Level 3 category are primarily supported by quoted prices from brokers and dealers participating in the market for those investments. However, these may be classified as Level 3 investments due to lack of market transparency and corroboration to support these quoted prices. Additionally, valuation models may be used as the pricing source for any remaining investments classified as Level 3. These models rely on one or more significant unobservable inputs and/or significant assumptions made by the Advisor. Inputs used in valuations may include, but are not limited to, financial statement analysis, capital account balances, discount rates and estimated cash flows, and comparable company data.

123
The inputs or methodology used for valuing securities are not necessarily an indication of the risk associated with investing in those securities.
The following table provides the fair value measurement of applicable Fund assets and liabilities by level within the fair value hierarchy as of September 30, 2022. These assets are measured on a recurring basis.
BUFFALO DISCOVERY FUND
| | Level 1 | | Level 2 | | Level 3 | | Total | |
Common Stocks | | $ | 894,434,536 | | | $ | — | | | $ | — | | | $ | 894,434,536 | | |
REITS | | | 12,178,915 | | | | — | | | | — | | | | 12,178,915 | | |
Short Term Investments | | | 27,195,183 | | | | — | | | | — | | | | 27,195,183 | | |
Total* | | $ | 933,808,634 | | | $ | — | | | $ | — | | | $ | 933,808,634 | | |
BUFFALO DIVIDEND FOCUS FUND
| | Level 1 | | Level 2 | | Level 3 | | Total | |
Common Stocks | | $ | 84,215,671 | | | $ | — | | | $ | — | | | $ | 84,215,671 | | |
REITS | | | 2,434,385 | | | | — | | | | — | | | | 2,434,385 | | |
Convertible Preferred Stocks | | | 1,045,500 | | | | — | | | | — | | | | 1,045,500 | | |
Preferred Stocks | | | 370,200 | | | | — | | | | — | | | | 370,200 | | |
Convertible Bonds | | | — | | | | 5,859,665 | | | | — | | | | 5,859,665 | | |
Short Term Investments | | | 11,098,615 | | | | — | | | | — | | | | 11,098,615 | | |
Total* | | $ | 99,164,371 | | | $ | 5,859,665 | | | $ | — | | | $ | 105,024,036 | | |
BUFFALO EARLY STAGE GROWTH FUND
| | Level 1 | | Level 2 | | Level 3 | | Total | |
Common Stocks | | $ | 80,008,114 | | | $ | — | | | $ | — | | | $ | 80,008,114 | | |
REITS | | | 1,755,400 | | | | — | | | | — | | | | 1,755,400 | | |
Warrants | | | 150,000 | | | | — | | | | — | | | | 150,000 | | |
Short Term Investments | | | 1,395,348 | | | | — | | | | — | | | | 1,395,348 | | |
Total* | | $ | 83,308,862 | | | $ | — | | | $ | — | | | $ | 83,308,862 | | |
BUFFALO FLEXIBLE INCOME FUND
| | Level 1 | | Level 2 | | Level 3 | | Total | |
Common Stocks | | $ | 413,379,154 | | | $ | — | | | $ | — | | | $ | 413,379,154 | | |
REITS | | | 8,460,054 | | | | — | | | | — | | | | 8,460,054 | | |
Short Term Investments | | | 4,786,089 | | | | — | | | | — | | | | 4,786,089 | | |
Total* | | $ | 426,625,297 | | | $ | — | | | $ | — | | | $ | 426,625,297 | | |
Written Options | | $ | 1,000 | | | $ | — | | | $ | — | | | $ | 1,000 | | |
BUFFALO GROWTH FUND
| | Level 1 | | Level 2 | | Level 3 | | Total | |
Common Stocks | | $ | 133,781,087 | | | $ | — | | | $ | — | | | $ | 133,781,087 | | |
Short Term Investments | | | 2,004,616 | | | | — | | | | — | | | | 2,004,616 | | |
Total* | | $ | 135,785,703 | | | $ | — | | | $ | — | | | $ | 135,785,703 | | |
BUFFALO HIGH YIELD FUND
| | Level 1 | | Level 2 | | Level 3 | | Total | |
Preferred Stocks | | $ | 6,729,967 | | | $ | — | | | $ | — | | | $ | 6,729,967 | | |
Convertible Bonds | | | — | | | | 11,658,703 | | | | — | | | | 11,658,703 | | |
Corporate Bonds | | | — | | | | 185,476,257 | | | | — | | | | 185,476,257 | | |
Bank Loans | | | — | | | | 40,277,938 | | | | 11,561,103 | | | | 51,839,041 | | |
Short Term Investments | | | 16,089,487 | | | | — | | | | — | | | | 16,089,487 | | |
Total* | | $ | 22,819,454 | | | $ | 248,974,001 | | | $ | — | | | $ | 271,793,455 | | |

124
BUFFALO INTERNATIONAL FUND
| | Level 1 | | Level 2 | | Level 3 | | Total | |
Common Stocks | | $ | 410,034,559 | | | $ | — | | | $ | — | | | $ | 410,034,559 | | |
Short Term Investments | | | 40,429,638 | | | | — | | | | — | | | | 40,429,638 | | |
Total* | | $ | 450,464,197 | | | $ | — | | | $ | — | | | $ | 450,464,197 | | |
BUFFALO LARGE CAP FUND
| | Level 1 | | Level 2 | | Level 3 | | Total | |
Common Stocks | | $ | 77,946,561 | | | $ | — | | | $ | — | | | $ | 77,946,561 | | |
REITS | | | 304,800 | | | | — | | | | — | | | | 304,800 | | |
Exchange Traded Funds | | | 285,745 | | | | — | | | | — | | | | 285,745 | | |
Short Term Investments | | | 6,218,503 | | | | — | | | | — | | | | 6,218,503 | | |
Total* | | $ | 84,755,609 | | | $ | — | | | $ | — | | | $ | 84,755,609 | | |
BUFFALO MID CAP FUND
| | Level 1 | | Level 2 | | Level 3 | | Total | |
Common Stocks | | $ | 122,844,906 | | | $ | — | | | $ | — | | | $ | 122,844,906 | | |
REITS | | | 2,366,333 | | | | — | | | | — | | | | 2,366,333 | | |
Short Term Investments | | | 2,046,176 | | | | — | | | | — | | | | 2,046,176 | | |
Total* | | $ | 127,257,415 | | | $ | — | | | $ | — | | | $ | 127,257,415 | | |
BUFFALO SMALL CAP FUND
| | Level 1 | | Level 2 | | Level 3 | | Total | |
Common Stocks | | $ | 778,664,579 | | | $ | — | | | $ | — | | | $ | 778,664,579 | | |
Short Term Investments | | | 28,264,250 | | | | — | | | | — | | | | 28,264,250 | | |
Total* | | $ | 806,928,829 | | | $ | — | | | $ | — | | | $ | 806,928,829 | | |
* Additional information regarding the industry and/or geographical classification of these investments is disclosed in the schedule of investments.
There were no transfers into or out of Level 1, Level 2 or Level 3 fair value measurements during the reporting year. The basis for recognizing and valuing transfers is as of the beginning of the year in which transfers occur.
The following is a reconciliation of the Buffalo High Yield Fund Level 3 assets for which significant unobservable inputs were used to determine fair value for the period ended September 30, 2022:
| Fair Value Measurement Using Significant Unobservable Inputs (Level 3) | | Investments
in Securities
Period Ended
September 30, 2022 | |
Fair Value as of 3/31/2022 | | $ | 14,060,826 | | |
Total unrealized losses included in earnings | | | (725,877 | ) | |
Realized gain included in earnings | | | 57,829 | | |
Sales | | | (1,838,497 | ) | |
Amortization/Accretion | | | 6,822 | | |
Fair Value as of 9/30/2022* | | $ | 11,561,103 | | |
* Securities valued as Level 3 during the period were due to uncertainty regarding the valuation of certain securities with thinly traded markets. All Level 3 securities in the Buffalo High Yield Fund were priced by an approved pricing vendor as of September 30, 2022. The basis for recognizing and valuing transfers is as of the beginning of the period in which transfers occur.
B. FEDERAL INCOME TAXES — Each Fund complies with the requirements of Subchapter M of the Internal Revenue Code necessary to qualify as a regulated investment company and makes the requisite distributions of income and capital gains to its shareholders sufficient to relieve it from all or substantially all federal income and excise taxes. Therefore, no federal income tax provision has been provided.

125
At September 30, 2022, the Funds did not have any tax positions that did not meet the "more likely-than-not" threshold of being sustained by the applicable tax authority. The Funds recognize interest and penalties, if any, related to unrecognized tax benefits as other expense in the Statement of Operations. During the year, the Funds did not incur any interest or penalties.
The Funds have analyzed all open tax years, as defined by the statute of limitations, for all major jurisdictions. Open tax years are those that are open for exam by taxing authorities. Open tax years include the tax years ended March 31, 2019 through March 31, 2022. The Funds have no examinations in progress.
C. INVESTMENT TRANSACTIONS AND INVESTMENT INCOME — Investment transactions are accounted for on the date the securities are purchased or sold (trade date). Dividend income is recorded on the ex-dividend date except that certain dividends for foreign securities where the ex-dividend date may have passed are recorded as soon as the Fund is informed of the dividend in the exercise of reasonable diligence. Interest income is recognized on the accrual basis. Realized gains and losses from investment transactions are reported on the identified cost basis. All discounts/premiums are accreted/amortized for financial reporting purposes and are included in interest income.
D. DISTRIBUTIONS TO SHAREHOLDERS — Distributions to shareholders are recorded on the ex-dividend date. Distributions are determined in accordance with income tax regulations, which may differ from U.S. generally accepted accounting principles ("GAAP"). These differences are primarily due to differing treatments for premium amortization on debt securities, deferral of late year and wash sale losses, and partnership investment income.
E. USE OF ESTIMATES — The preparation of financial statements in conformity with GAAP requires management to make estimates and assumptions that affect the amounts reported in the financial statements and accompanying notes. Actual results could differ from such estimates.
F. FOREIGN CURRENCY TRANSLATION — Values of investments denominated in foreign currencies are converted into U.S. dollars using a spot market rate of exchange on the day of valuation. Purchases and sales of investments and dividend and interest income are translated to U.S. dollars using a spot market rate of exchange prevailing on the respective dates of such transactions. The portion of security gains or losses resulting from changes in foreign exchange rates is included with net realized and unrealized gain or loss from investments, as appropriate, for both financial reporting and tax purposes.
G. PURCHASED AND WRITTEN OPTION CONTRACTS — Certain Funds may purchase and write call or put options on securities and indices and enter into related closing transactions. As a holder of a call option, a Fund has the right, but not the obligation, to purchase a security at the exercise price during the exercise period. As the writer of a call option, a Fund has the obligation to sell the security at the exercise price during the exercise period. The Fund's maximum payout in the case of written call option contracts cannot be determined. As a holder of a put option, a Fund has the right, but not the obligation, to sell a security at the exercise price during the exercise period. As the writer of a put option, a Fund has the obligation to buy the underlying security at the exercise price during the exercise period. The Funds did not hold any written put options as of September 30, 2022.
The premium that a Fund pays when purchasing an option or receives when writing an option will reflect, among other things, the market price of the security, the relationship of the exercise price to the market price of the security, the relationship of the exercise price to the volatility of the security, the length of the option period and supply and demand factors. The premium is the market value of an option at the time of purchase.
A purchaser (holder) of a put option pays a non-refundable premium to the seller (writer) of a put option to obtain the right to sell a specified amount of a security at a fixed price (the exercise price) during a specified period (exercise period). Conversely, the seller (writer) of a put option, upon payment by the holder of the premium, has the obligation to buy the security from the holder of the put option at the exercise price during the exercise period.
Exchange traded options are valued at the composite price, using the National Best Bid and Offer quotes ("NBBO"). NBBO consists of the highest bid prices and lowest ask prices across any of the exchanges on which an option is quoted, thus providing a view across the entire U.S. options marketplace. Specifically, composite pricing looks at the last trades on the exchanges where the options are traded. If there are no trades for the option on a given business day, composite option pricing calculates the mean of the highest bid price and lowest ask price across the exchanges where the option is traded. Non exchange traded options also will be valued at the mean between the last bid and ask

126
quotations. For options where market quotations are not readily available, a fair value shall be determined as set forth in the Funds' fair valuation guidelines.
The Funds may use options with the objective to generate income as a non-principal investment strategy. Currently, the Buffalo Flexible Income Fund makes use of the options strategy to a greater extent than the other Funds because high income generation is a primary investment objective of the Buffalo Flexible Income Fund. The primary strategy used by Buffalo Flexible Income Fund to achieve income generation through the use of options is to write covered calls with the strike price above the cost basis and the value the portfolio managers believe will be achieved before the expiration of the option and also at a value that the portfolio managers are willing to sell if the option is exercised. The collected premiums generate income for the Fund, and if the option is exercised, a gain will also be achieved. A risk of using derivatives is that the counterparty to a derivative may fail to comply with their obligation to the Funds. See Note 8 for written option activity.
H. INDEMNIFICATIONS — Under the Funds' organizational documents, officers and trustees are indemnified against certain liabilities arising out of the performance of their duties to the Funds. In addition, in the normal course of business, the Funds enter into contracts that provide general indemnification to other parties. The Funds' maximum exposure under these arrangements is unknown as this would involve future claims that may be made against the Funds that have not yet occurred, and may not occur. However, the Funds have not had prior claims or losses pursuant to these contracts and expect the risk of loss to be remote.
I. RECENT ACCOUNTING PRONOUNCEMENTS — In March 2020, FASB issued Accounting Standards Update 2020-04, Reference Rate Reform: Facilitation of the Effects of Reference Rate Reform on Financial Reporting ("ASU 2020-04"). The main objective of ASU 2020-04 is to provide relief to companies that will be impacted by the expected change in benchmark interest rates at the end of 2021, when participating banks will no longer be required to submit London Inter-bank Offered Rate ("LIBOR") quotes by the UK Financial Conduct Authority. ASU 2020-04 allows companies to, provided the only change to existing contracts are a change to an approved benchmark interest rate, account for modifications as a continuance of the existing contract without additional analysis. In addition, derivative contracts that qualified for hedge accounting prior to modification, will be allowed to continue to receive such treatment, even if critical terms change due to a change in the benchmark interest rate. For new and existing contracts, the Funds may elect to apply the amendments as of March 12, 2020 through December 31, 2022. Management is currently assessing the impact of the adoption of ASU 2020-04 to the Funds' financial statements and various filings.
2. FEDERAL TAX MATTERS:
The tax character of distributions paid during the period ended September 30, 2022 and the year ended March 31, 2022 were as follows:
| | Six Months Ended
September 30, 2022 | | Year Ended March 31, 2022 | |
| | Ordinary
Income | | Long-Term
Capital Gains | | Ordinary
Income | | Long-Term
Capital Gains* | |
Buffalo Discovery Fund | | $ | — | | | $ | — | | | $ | 112,318,729 | | | $ | — | | |
Buffalo Dividend Focus Fund | | | 598,682 | | | | — | | | | 986,883 | | | | 42,916 | | |
Buffalo Early Stage Growth Fund | | | — | | | | — | | | | 5,875,169 | | | | — | | |
Buffalo Flexible Income Fund | | | 4,043,916 | | | | — | | | | 8,766,704 | | | | — | | |
Buffalo Growth Fund | | | — | | | | — | | | | 132,540 | | | | — | | |
Buffalo High Yield Fund | | | 8,619,195 | | | | — | | | | 17,440,640 | | | | — | | |
Buffalo International Fund | | | — | | | | — | | | | 1,022,952 | | | | — | | |
Buffalo Large Cap Fund | | | — | | | | — | | | | 1,335,634 | | | | — | | |
Buffalo Mid Cap Fund | | | — | | | | — | | | | 3,986,617 | | | | — | | |
Buffalo Small Cap Fund | | | — | | | | — | | | | 52,124,491 | | | | — | | |
* The Funds designate as long-term capital gain dividends, pursuant to Internal Revenue Code Section 852(b)(3)(C), the amounts necessary to reduce the earnings and profits of the Funds related to net capital gain to zero for the tax period ended March 31, 2022.

127
For tax purposes, distributions from short-term capital gain distributions are included in ordinary income distributions.
Additionally, GAAP requires that certain components of net assets relating to permanent differences be reclassified between financial and tax reporting. These reclassifications have no effect on net assets or net asset value per share. For the year ended March 31, 2022, the following table shows the reclassifications made:
Funds | | Distributable
Earnings | | Paid In
Capital | |
Buffalo Discovery Fund | | $ | (28,498,234 | ) | | $ | 28,498,234 | | |
Buffalo Dividend Focus Fund | | | (80,638 | ) | | | 80,638 | | |
Buffalo Early Stage Growth Fund | | | (1,907,036 | ) | | | 1,907,036 | | |
Buffalo Flexible Income Fund | | | (1,477,994 | ) | | | 1,477,994 | | |
Buffalo Growth Fund | | | (1,377,738 | ) | | | 1,377,738 | | |
Buffalo High Yield Fund | | | (628,998 | ) | | | 628,998 | | |
Buffalo International Fund | | | (960,089 | ) | | | 960,089 | | |
Buffalo Large Cap Fund | | | (1,696,615 | ) | | | 1,696,615 | | |
Buffalo Mid Cap Fund | | | (162,886 | ) | | | 162,886 | | |
Buffalo Small Cap Fund | | | (26,891,803 | ) | | | 26,891,803 | | |
The permanent differences primarily relate to net operating losses and utilization of earnings and profit distributions to shareholders on redemption of shares.
As of March 31, 2022, the components of distributable earnings (losses) for income tax purposes were as follows:
| | | Buffalo
Discovery
Fund | | Buffalo
Dividend Focus
Fund | | Buffalo
Early
Stage Growth
Fund | | Buffalo
Flexible Income
Fund | | Buffalo
Growth
Fund | |
Tax cost of Investments(a) | | $ | 1,097,903,658 | | | $ | 65,709,828 | | | $ | 91,181,258 | | | $ | 237,239,090 | | | $ | 89,178,884 | | |
Unrealized Appreciation | | | 424,315,793 | | | | 52,802,414 | | | | 35,755,718 | | | | 259,461,399 | | | | 110,300,602 | | |
Unrealized Depreciation | | | (59,444,807 | ) | | | (1,626,676 | ) | | | (14,807,994 | ) | | | (7,074,906 | ) | | | (3,892,864 | ) | |
Net unrealized appreciation | | | 364,870,986 | | | | 51,175,738 | | | | 20,947,724 | | | | 252,386,493 | | | | 106,407,738 | | |
Undistributed Ordinary Income | | | — | | | | — | | | | — | | | | — | | | | — | | |
Undistributed Long Term
Capital Gain | | | 61,661,360 | | | | 1,828,124 | | | | 991,522 | | | | 11,966,545 | | | | 6,058,234 | | |
Distributable earnings | | | 61,661,360 | | | | 1,828,124 | | | | 991,522 | | | | 11,966,545 | | | | 6,058,234 | | |
Other accumulated gain/(loss) | | | (53,611,296 | ) | | | (5,539 | ) | | | (1,889,468 | ) | | | (24,933 | ) | | | (2,135,757 | ) | |
Total distributable earnings | | | 372,921,050 | | | | 52,998,323 | | | | 20,049,778 | | | | 264,328,105 | | | | 110,330,215 | | |
| | | Buffalo
High Yield
Fund | | Buffalo
International
Fund | | Buffalo
Large Cap
Fund | | Buffalo
Mid Cap
Fund | | Buffalo
Small Cap
Fund | |
Tax cost of Investments(a) | | $ | 293,543,757 | | | $ | 361,079,925 | | | $ | 68,731,116 | | | $ | 104,678,464 | | | $ | 861,016,916 | | |
Unrealized Appreciation | | | 6,787,035 | | | | 223,670,021 | | | | 47,997,454 | | | | 78,209,934 | | | | 229,018,671 | | |
Unrealized Depreciation | | | (7,024,552 | ) | | | (7,471,565 | ) | | | (2,491,360 | ) | | | (2,953,057 | ) | | | (113,440,213 | ) | |
Net unrealized appreciation | | | (237,517 | ) | | | 216,198,456 | | | | 45,506,094 | | | | 75,256,877 | | | | 115,578,458 | | |
Undistributed Ordinary Income | | | 1,369,487 | | | | 234,266 | | | | — | | | | — | | | | — | | |
Undistributed Long Term
Capital Gain | | | 5,003,175 | | | | 7,420,560 | | | | 2,521,272 | | | | 4,892,444 | | | | — | | |
Distributable earnings | | | 6,372,662 | | | | 7,654,826 | | | | 2,521,272 | | | | 4,892,444 | | | | — | | |
Other accumulated gain/(loss) | | | — | | | | — | | | | (2,370,825 | ) | | | (207,839 | ) | | | (5,780,937 | ) | |
Total distributable earnings | | | 6,135,145 | | | | 223,853,282 | | | | 45,656,541 | | | | 79,941,482 | | | | 109,797,521 | | |
The differences between book-basis and tax-basis unrealized appreciation/depreciation are attributable primarily to the tax deferral of losses on wash sales, premium amortization, and publicly traded partnership investments.
Other accumulated gain/(loss) is generally comprised of qualified late year losses and/or straddle loss deferrals.
(a) Represents cost for federal income tax purposes and may differ from the cost for financial reporting purposes.

128
As of March 31, 2022, the Buffalo Funds had no capital loss carryovers available to offset future taxable gains.
In order to meet certain excise tax distribution requirements, the Funds are required to measure and distribute annually net capital gains realized during a twelve month period ending October 31 and net investment income earned during a twelve month period ending December 31. In connection with this, the Funds are permitted for tax purposes to defer into their next fiscal year qualified late year losses. Qualified late year capital losses are any net capital losses incurred between November 1 and the end of their fiscal year, March 31, 2022. Qualified late year ordinary losses are generally losses incurred between January 1 and the end of their fiscal year, March 31, 2022.
At March 31, 2022, the following Funds deferred, on a tax basis, qualified late year losses, consisting of ordinary and capital losses, as follows:
Funds | | Qualified Late Year
Ordinary Losses | | Qualified Late Year
Capital Losses | |
Buffalo Discovery Fund | | $ | — | | | $ | 53,611,296 | | |
Buffalo Dividend Focus Fund | | | 5,539 | | | | — | | |
Buffalo Early Stage Growth Fund | | | 252,011 | | | | 1,637,457 | | |
Buffalo Flexible Income Fund | | | — | | | | — | | |
Buffalo Growth Fund | | | 133,391 | | | | 2,002,366 | | |
Buffalo High Yield Fund | | | — | | | | — | | |
Buffalo International Fund | | | — | | | | — | | |
Buffalo Large Cap Fund | | | — | | | | 2,370,825 | | |
Buffalo Mid Cap Fund | | | 207,839 | | | | — | | |
Buffalo Small Cap Fund | | | 1,872,293 | | | | 3,908,644 | | |
For the year ended March 31, 2022, the Buffalo International Fund earned foreign source income and paid foreign taxes, as noted below, which it intends to pass through to its shareholders pursuant to Section 853 of the Internal Revenue Code.
| | | Gross Foreign
Income | | Foreign Tax
Paid | |
Buffalo International Fund | | $ | 8,144,918 | | | $ | (956,967 | ) | |
3. RELATED PARTY TRANSACTIONS:
Management fees are paid to KCM at the rate of 0.85% per annum of the average daily net asset values of the Funds, except for the Buffalo Early Stage Growth Fund, Buffalo Dividend Focus Fund, Buffalo Growth Fund and Buffalo Large Cap Fund which have a management fee rate of 1.30%, 0.75%, 0.75% and 0.75%, respectively. The management fees are for services which include the costs of all management, supervisory and administrative services required in the normal operation of the Funds. This includes investment management and supervision; fees of the custodian (except for the additional cost of maintaining custody of assets in foreign jurisdictions, when compared to domestic custody costs), independent registered public accounting firm and legal counsel; fees and expenses of officers, trustees and other personnel; rent; and other items incidental to corporate administration. Pursuant to a Master Services Agreement with U.S. Bancorp Fund Services, LLC, doing business as U.S. Bank Global Fund Services ("GFS"), KCM pays GFS a fee of 30/100 of 1% (0.30%) of each Funds' average daily net assets out of the fees KCM receives from the Funds, except for the Buffalo Dividend Focus Fund, Buffalo Growth Fund and the Buffalo Large Cap Fund, where GFS receives 25/100 of 1% (0.25%). GFS provides or obtains various operational services required by the Funds, pays various Fund expenses and acts as paying agent to compensate other Fund service providers. Some of the other Fund service providers are affiliates of GFS.
With respect to the Buffalo Small Cap Fund only, the annual management fee rate of 0.85% of the Buffalo Small Cap Fund's average daily net assets is a base fee paid to KCM that is subject to reduced fees paid on assets in excess of certain levels (breakpoints). The fee paid by KCM to GFS is also subject to breakpoints on assets in excess of certain

129
levels. The breakpoint schedules for the management fees paid by the Buffalo Small Cap Fund to KCM and the fees paid by KCM to GFS are set forth in the following table:
BUFFALO SMALL CAP FUND FEE BREAKPOINTS
| | | (As a % Of Average Daily Net Assets) | |
Asset Level | | Management Fee | | GFS Fee | |
Assets up to $6 billion | | | 0.85 | % | | | 0.300 | % | |
Assets over $6 billion up to $7 billion | | | 0.80 | % | | | 0.275 | % | |
Assets over $7 billion up to $8 billion | | | 0.75 | % | | | 0.250 | % | |
Assets over $8 billion up to $9 billion | | | 0.70 | % | | | 0.225 | % | |
Assets over $9 billion | | | 0.65 | % | | | 0.200 | % | |
The management fees do not include the cost of acquiring and disposing of portfolio securities, taxes, if any, imposed directly on the Funds and their shares, insurance, certain trustee expenses and the cost of qualifying the Funds' shares for sale in any jurisdiction. Certain officers of the Funds are also officers and/or directors of KCM. With respect to each Fund's Investor Class, the management fees do not include the shareholder servicing fees.
The Buffalo International Fund incurred $55,731 in custody fees during the period ended September 30, 2022, and owed $19,298 for custody fees as of September 30, 2022.
4. AGGREGATE COMPENSATION TO TRUSTEES:
The Funds do not directly compensate any of their trustees. GFS pays trustee fees to non-interested Board members from its share of the management fee that it receives from KCM. The aggregate compensation paid to the Funds' non-interested trustees for their service on the Funds' Board for the period ended September 30, 2022 was $224,000. Interested trustees who are affiliated with KCM do not receive any compensation from the Funds, but are compensated directly by KCM in connection with their employment with KCM.
5. INVESTMENT TRANSACTIONS:
The aggregate purchases and sales of securities, excluding short-term investments and U.S. government securities, for the Funds for the six months ended September 30, 2022, were as follows:
| | Buffalo
Discovery
Fund | | Buffalo
Dividend Focus
Fund | | Buffalo
Early
Stage Growth
Fund | | Buffalo
Flexible Income
Fund | | Buffalo
Growth
Fund | |
Purchases | | $ | 166,215,187 | | | $ | 6,161,936 | | | $ | 7,155,556 | | | $ | 15,352,826 | | | $ | 10,551,455 | | |
Proceeds from Sales | | | 391,830,025 | | | | 1,941,417 | | | | 3,438,028 | | | | 5,879,925 | | | | 17,893,999 | | |
| | Buffalo
High Yield
Fund | | Buffalo
International
Fund | | Buffalo
Large Cap
Fund | | Buffalo
Mid Cap
Fund | | Buffalo
Small Cap
Fund | |
Purchases | | $ | 41,233,546 | | | $ | 26,045,423 | | | $ | 24,508,486 | | | $ | 21,752,079 | | | $ | 193,905,737 | | |
Proceeds from Sales | | | 36,935,248 | | | | 23,644,812 | | | | 27,732,284 | | | | 27,580,929 | | | | 189,868,534 | | |
There were no purchases or sales of long-term U.S. government securities for any Funds during the period ended September 30, 2022.
6. TRANSACTIONS WITH AFFILIATES:
Investments representing 5% or more of the outstanding voting securities of a portfolio company result in that company being considered an affiliated company, as defined in the 1940 Act. There were no affiliated companies held in any of the Funds during the period ended September 30, 2022.

130
7. SHAREHOLDER SERVICING PLAN:
The Trust, on behalf of the Funds, has adopted a Shareholder Servicing Plan, to pay a fee at an annual rate of up to 0.15% of average daily net assets of the Investor Class shares serviced by shareholder servicing agents who provide administrative and support services to their customers. No shareholder servicing fees are charged to the Institutional Class. For the period ended September 30, 2022, Investor Class shareholder servicing fees were as follows:
| Fund: | | Investor Class
Shareholder
Servicing Fee | |
Buffalo Discovery Fund | | $ | 664,984 | | |
Buffalo Dividend Focus Fund | | | 21,736 | | |
Buffalo Early Stage Growth Fund | | | 43,744 | | |
Buffalo Flexible Income Fund | | | 232,097 | | |
Buffalo Growth Fund | | | 64,094 | | |
Buffalo High Yield Fund | | | 35,328 | | |
Buffalo International Fund | | | 167,844 | | |
Buffalo Large Cap Fund | | | 22,187 | | |
Buffalo Mid Cap Fund | | | 60,834 | | |
Buffalo Small Cap Fund | | | 419,833 | | |
8. OPTIONS WRITTEN:
FASB ASC 815, Derivatives and Hedging (ASC 815) requires disclosures to enable investors to better understand how and why the Funds use derivative instruments, how these derivative instruments are accounted for and their effects on the Funds' financial position and results of operations. The Buffalo Flexible Income Fund is the only Fund that has maintained any positions in derivative instruments or engaged in hedging activities during the six months ended September 30, 2022. For the six months ended September 30, 2022, the quarterly average gross notional amount of derivatives held by the Fund was $1,205,700, representing holdings in written options. The Fund utilizes these written options as a substitute for a comparable market position in the respective underlying security of the written options.
As of September 30, 2022, the Buffalo Flexible Income Fund was invested in written option contracts.
The following is a summary of the location of derivative investments on the Buffalo Flexible Income Fund's Statement of Assets and Liabilities as of September 30, 2022:
Derivative Investment Type | | Value | |
Liability Derivatives | |
Buffalo Flexible Income Fund | | | |
Written Options — equity contracts | | $ | 1,000 | | |
The following is a summary of the effect of derivative investments on Realized Gain (loss) and Change in Unrealized Appreciation/Depreciation on Options in the Fund as of September 30, 2022:
Derivative Investment Type | | Realized Gain (Loss) on Options | |
Liability Derivatives | |
Buffalo Flexible Income Fund | | | |
Written Options — equity contracts | | $ | 125,162 | | |
Derivative Investment Type | | Change in Unrealized Appreciation/Depreciation on Options | |
Liability Derivatives | |
Buffalo Flexible Income Fund | | | |
Written Options — equity contracts | | $ | 77,235 | | |

131
The following table presents derivative assets and liabilities net of amounts available for offset under Master Netting Agreements (MNA) and net of related collateral received or pledged, if any, as of September 30, 2022:
GROSS AMOUNTS NOT OFFSET IN THE STATEMENT OF ASSETS AND LIABILITIES AND SUBJECT TO MNAs
| | | Gross | | Gross
Amounts
Offset In The | | Net Amounts
Presented In | | Gross Amounts Not Offset
In The Statement Of
Financial Position | | | |
Liabilities: | | Amounts Of
Recognized
Liabilities | | Statement
Of Financial
Position | | The Statement
Of Financial
Position | | Financial
Instruments | | Collateral
Pledged/
(Received)* | | Net
Amount | |
Description | |
Written Options | | $ | 1,000 | | | $ | 1,000 | | | $ | 1,000 | | | $ | 1,000 | | | $ | 1,000 | | | $ | 1,000 | | |
| | | $ | 1,000 | | | $ | 1,000 | | | $ | 1,000 | | | $ | 1,000 | | | $ | 1,000 | | | $ | 1,000 | | |
* Any over-collateralization of total financial instruments or cash is not shown.
9. FOREIGN INVESTMENT RISK:
When the Buffalo International Fund buys or sells securities on a foreign stock exchange, the transaction is undertaken in the local currency rather than in U.S. dollars. In purchasing or selling local currency to execute transactions on foreign exchanges, the Buffalo International Fund will be exposed to the risk that the value of the foreign currency will increase or decrease, which may impact the value of the portfolio holdings. China has, and may continue to adopt, internal economic policies that affect its currency valuations in a manner that may be disadvantageous for U.S. investors or U.S. companies seeking to do business in China. In addition, a country may impose formal or informal currency exchange controls (or "capital controls"). These types of controls may restrict or prohibit the Buffalo International Fund's ability to repatriate both investment capital and income, which could undermine the value of the portfolio holdings and potentially place the Buffalo International Fund's assets at risk of total loss.
Investing in securities of foreign corporations and governments involves additional risks relating to: political, social, religious and economic developments abroad; market instability; fluctuations in foreign exchange rates; different regulatory requirements, market practices, accounting standards and practices; and less publicly available information about foreign issuers. Additionally, these investments may be less liquid, carry higher brokerage commissions and other fees, and procedures and regulations governing transactions and custody in foreign markets also may involve delays in payment, delivery or recovery of money or investments. Investments in common stocks of U.S. companies with international operations, and the purchase of sponsored or unsponsored ADRs (American Depositary Receipt) carry similar risks. In addition to risks associated with investing in foreign securities, there are special risks associated with investments in China and Hong Kong, including exposure to currency fluctuations, less liquidity, expropriation, confiscatory taxation, nationalization, exchange control regulations, differing legal standards and rapid fluctuations in inflation and interest rates. The Chinese government could, at any time, alter or discontinue economic reform programs implemented since 1978.
10. LINE OF CREDIT:
U.S. Bank, N.A. has made available to the Funds an unsecured line of credit pursuant to a Loan Agreement for the Funds which matures, unless renewed, on July 30, 2023. The line of credit is intended to provide short-term financing, if necessary, subject to certain restrictions, in connection with shareholder redemptions. The Funds may borrow up to the lesser of $50,000,000 or certain percentage amounts based on the net assets of the Funds.
The interest rate paid by the Funds on outstanding borrowings is equal to the Prime Rate. As of September 30, 2022, the Prime Rate was 6.25%. None of the Buffalo Funds had borrowings under the credit facility during the six months ended September 30, 2022.
11. RECENT MARKET EVENTS:
U.S. and international markets have experienced significant periods of volatility in recent years and months due to a number of economic, political and global macros factors including the impact of COVID-19 as a global pandemic and related public health crisis, growth concerns in the U.S. and overseas, uncertainties regarding interest rates, rising

132
inflation, trade tensions, and the threat of tariffs imposed by the U.S. and other countries. In particular, the global spread of COVID-19 has resulted in disruptions to business operations and supply chains, stress on the global healthcare system, growth concerns in the U.S. and overseas, staffing shortages and the inability to meet consumer demand, and widespread concern and uncertainty. The global recovery from COVID-19 is proceeding at slower than expected rates due to the emergence of variant strains and may last for an extended period of time. Health crises and related political, social and economic disruptions caused by the spread of COVID-19 may also exacerbate other pre-existing political, social and economic risks in certain countries. As a result of continuing political tensions and armed conflicts, including the war between Ukraine and Russia, the U.S. and the European Union imposed sanctions on certain Russian individual and companies, including certain financial institutions, and have limited certain exports and imports to and from Russia. The war has contributed to recent market volatility and may continue to do so. These developments, as well as other events, could result in further market volatility and negatively affect financial asset prices, the liquidity of certain securities and the normal operations of securities exchange and other markets, despite government efforts to address market disruptions. Continuing market volatility as a result of recent market conditions or other events may have adverse effects on your account.
12. LIBOR:
The London Interbank Offered Rate ("LIBOR") is an interest-rate average calculated from estimates submitted by the leading banks in London. LIBOR represents the rate which banks may obtain short-term borrowings from each other. It is the primary interest rate benchmark for short-term interest rates around the world. The regulator of the LIBOR administrator phased out the use of LIBOR on December 30, 2021 such that the one-week and 2-month USD LIBOR settings ceased to be published or will no longer be representative. The remaining USD LIBOR settings will cease to be published or will no longer be representative after June 30, 2023. Because the usefulness of LIBOR as a reference rate could deteriorate during the transition from LIBOR to an alternative reference rate, these effects could occur prior to June 30, 2023. The expected discontinuation of LIBOR could have a significant impact on the financial markets, and may present a risk for certain market participants, including the risk that the transition from LIBOR to an alternative interest rate will not be orderly, will occur over various time periods or will have unintended consequences.
13. SUBSEQUENT EVENTS:
Management has evaluated the events and transactions that have occurred after September 30, 2022 and through the date the financial statements were issued. On November 17, 2022, the Board accepted the resignation of Mr. Kent Gasaway as President and Treasurer of the Trust and approved the appointment of Ms. Laura Symon Browne as President and Treasurer of the Trust.

133
A NOTE ON FORWARD-LOOKING STATEMENTS
Except for historical information contained in this annual report for the Funds, the matters discussed in this report may constitute forward-looking statements made pursuant to the safe harbor provisions of the Securities Litigation Reform Act of 1995. These include any advisor and/or portfolio manager predictions, assessments, analyses or outlooks for individual securities, industries, market sectors and/or markets. These statements involve risks and uncertainties. In addition to the general risks described for the Funds in the current Prospectus, other factors bearing on these reports include the accuracy of the Advisor's or portfolio managers' forecasts and predictions, and the appropriateness of the investment programs designed by the Advisor or portfolio manager to implement their strategies efficiently and effectively. Any one or more of these factors, as well as other risks affecting the securities markets and investment instruments generally, could cause the actual results of the Funds to differ materially as compared to benchmarks associated with the Funds.
ADDITIONAL INFORMATION
The Buffalo Funds have adopted proxy voting policies and procedures that delegate to Kornitzer Capital Management, Inc., the Funds' investment advisor, the authority to vote proxies. A description of the Buffalo Funds' proxy voting policies and procedures is available without charge, upon request, by calling the Funds toll free at 1-800-49-BUFFALO. A description of these policies and procedures is also included in the Funds' Statement of Additional Information, which is available on the SEC's website at http://www.sec.gov.
The actual voting records relating to portfolio securities during the most recent twelve month period ended June 30 (as filed with the SEC on Form N-PX) are available without charge, upon request, by calling the Funds toll free at 1-800-49-BUFFALO or by accessing the SEC's website at http://www.sec.gov.
The Funds file their complete schedule of portfolio holdings with the SEC four times each fiscal year at quarter-ends. The Trust files the Schedule of Portfolio Holdings with the SEC on Form N-CSR (second and fourth quarters) and as an exhibit to its reports on Form N-PORT (first and third quarters). Shareholders may view the Funds' Forms N-CSR and N-PORT on the SEC's website at http://www.sec.gov.

134
STATEMENT REGARDING LIQUIDITY RISK MANAGEMENT PROGRAM
(UNAUDITED)
The Securities and Exchange Commission adopted Rule 22e-4 under the Investment Company Act of 1940, as amended (the "Liquidity Rule"), to promote effective liquidity risk management throughout the open-end investment company industry, thereby reducing the risk that open-end investment companies ("funds") will be unable to meet their redemption obligations and mitigating dilution of the interests of fund shareholders. The Liquidity Rule requires funds to establish and implement written liquidity risk management programs ("LRMPs")
The Buffalo Funds (individually, a "Fund" or collectively, the "Funds") have established and implemented the Buffalo Funds' LRMP (the "Program") applicable to all of the Funds. The Board of Trustees of the Funds (the "Board") met on August 18, 2022 (the "Meeting") to review the Program pursuant to the Liquidity Rule. The Board has designated the Funds' adviser, Kornitzer Capital Management, Inc. (the "Adviser"), as the administrator of the Program, and the Adviser has appointed a committee to fulfill the responsibilities set forth under the Program (the "Program Administrator"). At the Meeting, the Adviser's Chief Compliance Officer ("CCO"), on behalf of the Program Administrator, made a presentation to the Board that addressed the operation of the Program and assessed its adequacy and effectiveness, including any material changes to the Program (the "Presentation"). The Presentation covered the period from July 1, 2021 through June 30, 2022 (the "Reporting Period").
The Presentation noted that the Program complied with the key factors for consideration under the Liquidity Rule for assessing, managing, and periodically reviewing a Fund's "liquidity risk" (as defined under the Liquidity Rule), including the following points.
Liquidity Classification — The Presentation described the Program's liquidity classification methodology for categorizing the Funds' investments into one of four liquidity buckets. Specifically, the Program Administrator noted that it relied on liquidity classifications provided by ICE Data Services, its third party data service that provides liquidity classification services, and that each Fund predominantly held investments that were classified as highly liquid during the Reporting Period.
Highly Liquid Investment Minimum ("HLIM") — The Program Administrator noted that each Fund's portfolio is expected to continue to primarily hold highly liquid investments and each Fund will be considered a "primarily highly liquid fund" (as defined in the Program) and can therefore continue to rely on the exclusion in the Liquidity Rule from the requirements to determine and review a HLIM for each Fund and to adopt policies and procedures for responding to a HLIM shortfall.
Liquidity Risk — In concluding that each Fund's liquidity risk was low, the Program Administrator considered the following:
• The Funds' investment strategy and liquidity of portfolio investments during normal and reasonably foreseeable stressed market conditions — During the Reporting Period, the Program Administrator reviewed whether each Fund's investment strategy is appropriate for an open-end fund structure with a focus on Funds with holdings of less liquid and illiquid assets and factored a Fund's concentration in an issuer into the liquidity classification methodology by taking issuer position sizes into account.
• Short-term and long-term cash flow projections during normal and reasonably foreseeable stressed market conditions — During the Reporting Period, the Program Administrator reviewed historical redemption activity and used this information as a component to establish each Fund's reasonably anticipated trading size. The Program Administrator also took into consideration other factors such as shareholder ownership concentration, applicable distribution channels, and the degree of certainty associated with a Fund's short-term and long-term cash flow projections.
• Holdings of cash and cash equivalents — The Program Administrator considered the degree to which each Fund held cash and cash equivalents as a component of each Fund's ability to meet redemption requests.

135
• Lines of Credit — The Program Administrator considered the existence of lines of credit available to each Fund as a source of temporary liquidity to meet redemption requests.
Conclusion — The Presentation provided that the Program Administrator was not proposing any material changes to the Program after reviewing the adequacy of the Program and the effectiveness of the Program's implementation. The Presentation stated that the Program Administrator concluded that, based the review of the design and on the operation of the Program's current policies and procedures during the Reporting Period, the Program is operating as intended and is effective in implementing the requirements of the Liquidity Rule.

136
PRIVACY POLICY (UNAUDITED)
This Privacy Policy has been adopted by the Buffalo Funds. The Funds are each an open-end diversified management investment company registered under the Investment Company Act of 1940 (the "1940 Act").
This Privacy Policy has also been adopted by KCM, an investment advisor registered with the Securities and Exchange Commission that serves as the investment advisor and manager of the Funds.
The Funds and the Adviser are collectively referred to as the "Companies," "we," "our" or "us."
As a part of providing you services and products we collect non-public personally identifiable information ("Personal Information") about you. Some of this is information you provide and some is obtained from other sources. In some circumstances, a necessary part of providing products and services to you requires that we disclose Personal Information about you to third parties.
We want you to understand how we handle your Personal Information. Please read the Privacy Policy carefully. It has information about our policies for the collection, use, disclosure, and protection of your Personal Information. If you have any questions, you can obtain additional information from the following:
Buffalo Funds
c/o U.S. Bancorp Fund Services, LLC
P.O. Box 701
Milwaukee, Wisconsin 53201-0701
www.buffalofunds.com
1-800-492-8332
Please be aware that we periodically update or revise the Privacy Policy. As methods of doing business change, we reflect any applicable changes in our Privacy Policy. If you are our customer, we will send you an update as and when it occurs.
SALE/DISCLOSURE OF YOUR PERSONAL INFORMATION
We promise that we will not sell your Personal Information to any person.
Also, we will not disclose your Personal Information to any third person aside from the disclosures described below. These disclosures generally relate to marketing or maintaining products or services provided to you.
WHAT INFORMATION DO WE COLLECT?
Personal, Financial and Product Information
To be able to offer, provide and maintain these products and services, the Companies collect a variety of Personal Information about you. The Personal Information we collect will vary depending upon the product or service you select.
The following is a general list of the Personal Information. Not all of the Personal Information will be collected every time you do business with us.
Personal Information
• Name
• Address
• Birthdate
• Phone number
• Social Security Number
• E-mail address
• Product-Related Personal Information
• Product Activity History (things you have done with your mutual funds such as deposits, transfers, redemptions, etc.)
GENERAL PRIVACY PROCESSES
How do we collect Personal Information?
We use a variety of methods to collect Personal Information. We collect Personal Information directly from you with paper forms (for example, new account and other administrative forms), over the phone or through facsimile transmissions. We also collect Personal Information from our web site and through other electronic means. We collect some Personal Information through joint marketing programs where we offer a product or service through another financial institution. In some of these instances, you may be considered a customer of both entities.
Who has access to this Personal Information?
Generally, only the Companies' staff and certain companies working on the Companies' behalf have access to this Personal Information.

137
Those Working on Our Behalf
Depending on the product or service you select, there may be a number of third parties that will have access to your Personal Information since they are working on our behalf. This access is necessary because these third parties perform a task or provide administrative services for the product you seek or have purchased from us. If we do not share the Personal Information, we cannot provide you the product or service you requested. In certain cases, affiliates are the entities performing such services on our behalf.
When we share Personal Information with non-affiliated companies working on our behalf, we protect your Personal Information by requiring such companies to adopt our privacy policy or have a policy providing protection similar to ours.
Required Disclosures
Certain Personal Information may also be disclosed to third parties without your consent if disclosure is necessary to comply with: 1) legal processes; 2) to protect the rights, property, or personal safety of the Funds, their shareholders or the public; 3) as part of inspections or examinations conducted by our regulatory agencies; and 4) in other situations required by law.
Joint Marketing
In certain circumstances, the Companies may jointly market a product or service with another financial institution. In these circumstances, we have arranged to offer our products through these entities and their representatives or through electronic systems (for example, the Internet).
The Companies may make other disclosures authorized by law.
Requested Disclosures
We will disclose your Personal Information if you request it to those persons that you designate. Examples of this are to: members of your family; registered investment advisors, attorneys and CPAs who you have retained to advise you in a transaction; and persons whom you have designated to represent you in dealings with us.
What do we do with the Personal Information?
The Companies make use of the Personal Information to provide you with the financial products and services that we offer.
At the point that you cease being a customer, we will maintain your Personal Information and handle it just the same as our current customers.
The Companies restrict access to the Personal Information to those who need to know it for ordinary business purposes. We also maintain physical, electronic, and procedural safeguards that comply with federal standards to guard your Personal Information.
What are your options regarding corrections of Personal Information?
Generally, upon your written request, we will make available Personal Information for your review. Please note, Personal Information collected that relates to a disputed claim or legal proceeding will not be made available. If you notify us that the Personal Information is incorrect, we will review it and if we agree, correct our records. If we do not agree, you may submit a short comment, which we will include in future third party disclosures, if any occur, of Personal Information.

138


1-800-49-BUFFALO
(1-800-492-8332)
Buffalo Funds
c/o U.S. Bancorp Fund Services, LLC
P.O. Box 701
Milwaukee, WI 53201-0701
www.buffalofunds.com
Buffalofundannual
Item 2. Code of Ethics.
Not applicable for semi-annual reports
Item 3. Audit Committee Financial Expert.
Not applicable for semi-annual reports
Item 4. Principal Accountant Fees and Services.
Not applicable for semi-annual reports
Item 5. Audit Committee of Listed Registrants.
Not applicable.
Item 6. Investments.
Schedule of Investments is included as part of the report to shareholders filed under Item 1 of this Form.
Item 7. Disclosure of Proxy Voting Policies and Procedures for Closed-End Management Investment Companies.
Not applicable to open-end investment companies.
Item 8. Portfolio Managers of Closed-End Management Investment Companies.
Not applicable to open-end investment companies.
Item 9. Purchases of Equity Securities by Closed-End Management Investment Company and Affiliated Purchasers.
Not applicable to open-end investment companies.
Item 10. Submission of Matters to a Vote of Security Holders.
There have been no material changes to the procedures by which shareholders may recommend nominees to the registrant’s Board of Trustees.
Item 11. Controls and Procedures.
| (a) | The registrant’s Principal Executive Officer and Principal Financial Officer has reviewed and evaluated the registrant’s disclosure controls and procedures (as defined in Rule 30a-3(c) under the 1940 Act) as of a date within 90 days of the filing of this report as required by Rule 30a-3(b) under the 1940 Act and Rules 13a-15(b) or 15d-15(b) under the Securities Exchange Act of 1934. Based on his review, the Principal Executive Officer and Principal Financial Officer has concluded that the disclosure controls and procedures are effective in ensuring that information required to be disclosed in this report is appropriately recorded, processed, summarized and reported and made known to him by others within the registrant and by the registrant’s service providers. |
| (b) | There were no changes in the registrant’s internal controls over financial reporting that occurred during the registrant’s second fiscal quarter of the period covered by this report that have materially affected, or are reasonably likely to materially affect, registrant’s internal control over financial reporting. |
Item 12. Disclosure of Securities Lending Activities for Closed-End Management Investment Companies
Not applicable to open-end investment companies.
Item 13. Exhibits.
| (a) | (1) Any code of ethics or amendment thereto, that is the subject of the disclosure required by Item 2, to the extent that the registrant intends to satisfy Item 2 requirements through filing an exhibit. “Not Applicable” for semi-annual reports. |
(2) A separate certification for each principal executive officer and principal financial officer pursuant to Section 302 of the Sarbanes-Oxley Act of 2002. Filed herewith.
(3) Any written solicitation to purchase securities under Rule 23c-1 under the Act sent or given during the period covered by the report by or on behalf of the registrant to 10 or more persons. Not applicable to open-end investment companies.
(4) Change in the registrant’s independent public accountant. There was no change in the registrant’s independent public accountant for the period covered by this report.
SIGNATURES
Pursuant to the requirements of the Securities Exchange Act of 1934 and the Investment Company Act of 1940, the registrant has duly caused this report to be signed on its behalf by the undersigned, thereunto duly authorized.
| Buffalo Funds | |
| | | |
| By | /s/ Laura Symon Browne | |
| Laura Symon Browne | |
| President and Treasurer | |
| | | |
| Date | December 7, 2022 | |
Pursuant to the requirements of the Securities Exchange Act of 1934 and the Investment Company Act of 1940, this report has been signed below by the following person on behalf of the registrant and in the capacities and on the date indicated.
| Buffalo Funds | |
| | | |
| By | /s/ Laura Symon Browne | |
| Laura Symon Browne | |
| President and Treasurer | |
| | | |
| Date | December 7, 2022 | |