UNITED STATES
SECURITIES AND EXCHANGE COMMISSION
Washington, D.C. 20549
FORM N-CSR
CERTIFIED SHAREHOLDER REPORT OF REGISTERED
MANAGEMENT INVESTMENT COMPANIES
Investment Company Act file number 811-10303
Buffalo Funds
(Exact name of registrant as specified in charter)
5420 W. 61st Place,
Shawnee Mission, KS 66025
(Address of principal executive offices) (Zip code)
Kent Gasaway
5420 W. 61st Place,
Shawnee Mission, KS 66025
(Name and address of agent for service)
913-677-7778
Registrant's telephone number, including area code
Date of fiscal year end: March 31
Date of reporting period: September 30, 2021
Item 1. Reports to Stockholders.


SEMI-ANNUAL
REPORT
September 30, 2021
TABLE OF CONTENTS
Portfolio Management Review | | | 4 | | |
Investment Results | | | 14 | | |
Expense Example | | | 17 | | |
Allocation of Portfolio Holdings | | | 21 | | |
Schedules of Investments or Options Written | | | 23 | | |
Buffalo Discovery Fund (BUFTX) | | | 23 | | |
Buffalo Dividend Focus Fund (BUFDX) | | | 29 | | |
Buffalo Early Stage Growth Fund (BUFOX) | | | 37 | | |
Buffalo Flexible Income Fund (BUFBX) | | | 43 | | |
Buffalo Growth Fund (BUFGX) | | | 49 | | |
Buffalo High Yield Fund (BUFHX) | | | 54 | | |
Buffalo International Fund (BUFIX) | | | 68 | | |
Buffalo Large Cap Fund (BUFEX) | | | 77 | | |
Buffalo Mid Cap Fund (BUFMX) | | | 82 | | |
Buffalo Small Cap Fund (BUFSX) | | | 88 | | |
Statements of Assets and Liabilities | | | 94 | | |
Statements of Operations | | | 96 | | |
Statements of Changes in Net Assets | | | 98 | | |
Financial Highlights | | | 102 | | |
Notes to Financial Statements | | | 122 | | |
Statement Regarding Liquidity Risk Management Program | | | 135 | | |
Privacy Policy | | | 137 | | |
PORTFOLIO MANAGEMENT REVIEW (UNAUDITED)
BUFFALO DISCOVERY FUND
The Buffalo Discovery Fund Investor Class gained 4.83% during the period but trailed the Morningstar US Mid Growth Index's gain of 11.55%. Strong stock selection in the Consumer Staples and Industrials holdings was offset by weak selection in the Fund's Consumer Discretionary, Health Care and Information Technology holdings. In short, our valuation discipline was the root of the relative underperformance in the period. Economic gains stalled as Covid fears reignited while long-term Treasury yields declined following jobs reports that surprised to the downside, inflation reports surprised to the upside, and Federal Reserve communications turned slightly more hawkish. Within equity markets, the main beneficiaries of lower long-term interest rates were long-duration (high valuation) growth stocks, where the Fund was underweight relative to the index.
The Fund continues to invest in disruptive and innovative growth companies with relatively attractive valuations, a strategy we believe should be a key driver of above-index risk-adjusted returns over the long term.
Top contributors to portfolio results in the period included MSCI, an Index and ETF provider, which rallied as strong flows to passive products and its leverage to a rising market and asset-based fees supported continued strong growth prospects. Additionally, prior investments in building out a core competency in ESG ratings is proving successful with strong uptake and a bright future for this large new growth segment. Overall, retention rates continue to rebound providing confidence that COVID-19 driven cancelations were indeed a one-time occurrence.
Palo Alto Networks, Inc, (PANW) a leading network security solutions provider, was another strong contributor in the period. Investors cheered better than expected billing guidance for fiscal year 2022 driven by a robust spending environment and strong adoption of next generation products. Security spending remains strong following numerous high profile cyber-attacks in recent years while at the same time the work from home trend has expanded the threat landscape beyond the corporation.
On the other hand, Bandwidth (BAND) was the largest detractor during the period. The stock was weak for a
couple of reasons, namely consolidation and vertical integration within the Communications Platform as a Service (CPaaS) group that brought fears of Bandwidth having a competitive disadvantage, and continued tough compares throughout the rest of 2021, especially in the upcoming fourth quarter where Bandwidth benefitted from additional political traffic in 2021. We believe the latter is a short term phenomenon that will anniversary next quarter, and the Street is failing to give credit for Bandwidth's own acquisition activity, namely the acquisition of Voxbone which accelerates Bandwidth's entry into Europe.
Penn National Gaming, Inc. was also a detractor during the period following a strong run since the pandemic lows in 2020. Profit taking was driven by fears of peaking growth rates as we begin to lap the easy comparisons of last year. The company is an owner and manager of gaming and racing properties, sports betting operations, and video gaming terminals, including 41 properties in 19 states. Additionally, the company recently purchased a 36% equity interest in Barstool Sports, Inc., a leading digital sports, entertainment and media platform that transformed their secular growth opportunity. The combination of the Barstool's audience, brand and marketing engine along with Penn's large geographic footprint create an unrivaled omni-channel offering that we believe could produce more durable growth than investors' currently anticipate.
OUTLOOK
The market environment remains constructive for equity investing. Corporate earnings are recovering and interest rates remain relatively low by historical standards providing a healthy backdrop for investors' allocation to equities. Vaccination rates are increasing worldwide contributing to increased mobility, improved business and consumer confidence and rapidly improving economic activity. Supply constraints, labor shortages, shipping bottlenecks and a slow return to work are causing transitory inflation and holding back the economy in the near term but as these things ease robust corporate earnings growth is poised to follow suit in our opinion.

4
As we move deeper into economic recovery, concerns about high debt levels, rising tax rates, decelerating growth, virus mutations, and a more hawkish Fed could begin to affect equity valuations. Inflation, and the Fed's response to it, will be of vigorous interest throughout the remainder of the year. In its latest public messaging, we think the Fed has already passed the threshold from "dovish" to "hawkish" regarding its messaging on inflation. As the drum-beat for Fed tapering grows louder we think the market could transition incrementally away from speculative and early cycle stocks and rotate increasingly to growth and quality as tapering begins to reduce liquidity while peaking growth rates cause investors to be more discerning about cyclically-oriented equities.
As always, we seek opportunities where thoughtful management teams are in a favorable position to use innovation for market advantage, durable growth, and sustained shareholder value creation. We remain ever mindful of valuations as there are still signs of excess in areas like high growth software. We continue to focus on attractive risk / reward equity opportunities in companies that are financially strong, well-managed and are benefitting from innovative strategies and disruptive megatrends. Thank you for your support.
BUFFALO DIVIDEND FOCUS FUND
The Buffalo Dividend Focus Fund Investor Class posted a return of 7.52% in the semi-annual period, underperforming the Morningstar US Large-Mid Index return of 9.04% and the S&P 500 Index return of 9.18%. With the exception of Consumer Discretionary (for the Fund) and Telecommunication Services, all sectors in the Fund and benchmark posted positive returns. The Fund's sectors with the highest weightings (Information Technology, Health Care, and Financials) had mixed performance relative to the index. Financials had favorable performance, while Information Technology and Health Care underperformed. The Fund's Consumer Staples, Energy, Industrials, Materials, and Utilities sectors delivered constructive performance relative to the benchmark. The Fund's sectors including Real Estate and Telecommunication Services detracted.
Specific securities that contributed most positively to performance included Viper Energy Partners LP (VNOM), Microsoft Corporation (MSFT), and Apple Inc. (AAPL). Viper Energy Partners LP, an owner of oil and natural gas properties, climbed as energy prices moved higher as
supply/demand drivers improved as the economy rebounded from the Covid-19 slowdown. Microsoft advanced on anticipated enterprise IT spending growth, which should lead to robust sales and margin expansion. Apple gained on continued healthy demand for high margin products and services and increased stock buybacks.
Global Payments Inc. (GPN), Southwest Airlines Co. (LUV) and Exact Sciences Corp. (EXAS) detracted from the Fund's performance the most. Global Payments, which is involved in electronic transaction processing, declined during the period despite reporting results ahead of expectations as management's outlook missed lofty investor expectations and concerns regarding competition. Southwest Airlines Co. fell during the period giving back some of its robust gains in the 1st quarter due to anticipated weaker yields caused by higher fuel and operating expenses, as well as, the rise in Covid-19 cases in late summer. Exact Sciences Corp., which is involved in non-invasive medical testing, dropped as opportunities for testing declined due to patient wellness office visits that continue to lag a full recovery from the Covid-19 slowdown.
The stock market experienced a solid advance during the first five months of the semi-annual period reaching record highs every month; however, in September the market traded off and gave up some of its earlier gains. The rise in the early months of the time-period was attributed to the economy's continued recovery from the Covid-19 Pandemic. New Covid-19 infections, hospitalizations and deaths began to decline in spring into early summer as vaccines have been approved and injected into arms. Life was on the cusp of returning to normal. However, with the delta variant advance the momentum to a return to normal waned. The late summer surge in Covid-19 cases coincided with severe weather events (hurricanes, flooding, fires, etc.), supply chain logistics issues, key parts shortages, unemployment insurance plans ending, and inflation pressures leading to reduced estimates for economic growth. Investors are also watching Washington as Congress works on the budget, infrastructure plans, and raising the debt ceiling, with all parties indicating an unwillingness to compromise. The Fed continues to indicate that it views the current elevated levels of inflation as transitory, and that they are not likely to raise interest rates in the near term. However they are likely to curtail (or taper) their bond buying activity in near term, with a modest monthly decline in purchases.

5
Despite the uncertainty from the number of events listed above, we remain focused on wide moat, large capitalization companies trading at reasonable valuations, in our view. As always, the Fund will continue to emphasize competitively advantaged companies that can be purchased at a fair value, in our opinion. As stock market volatility spikes, we will look for opportunities to find companies that fit our investment criteria, as we continue to follow our process of finding new investment ideas and to be ready when market declines provide better entry points.
BUFFALO EARLY STAGE GROWTH FUND
The Buffalo Emerging Opportunities Fund, effective October 16, 2020, changed its name to the Buffalo Early Stage Growth Fund. We believe this name better captures the spirit of the Fund, seeking holdings that are generally smaller than the median market capitalization of the benchmark and are bringing innovation to their industries through new products and/or services.
The Fund's Investor Class posted a return of 2.93% for the six-month period ending September 30, 2021 compared to the Morningstar US Small Growth Index return of 0.07%. These more subdued returns follow the historic rebound and strong market returns in calendar 2020.
The Fund's outperformance compared to the index during the semi-annual period was led by Consumer Discretionary and Healthcare sector holdings. The Fund maintained an overweight in the Consumer Discretionary sector which produced a return of 12.5%, on average, compared to the benchmark return of -2.6% for the sector. The Fund also generated superior stock selection in the Healthcare sector during the period, with the Fund's average return in the sector coming in at 2.1% versus -7.9% on average for the index.
The current market concerns are primarily focused on supply chain issues across sectors along with inflation not appearing to be as transitory as the Federal Reserve would like us to believe. This leads to market concerns over the Federal Reserve pulling off the gas and starting to apply pressure to the brake pedal. While lack of monetary stimulus is of concern, more fiscal stimulus seems possible. Overall we continue to point to the U.S. consumer balance sheet as one of the most important data points in providing positive direction for the economy and financial markets. In particular, personal
incomes are well above pre-Covid levels, the M2 money supply is at record levels at $21 trillion, and household net worth is also at record levels. Thus, while the market might become unsettled from time to time, we believe there remains a strong backstop given the excess funds held by U.S. households.
Regardless of all the headlines we are presented with, our job remains to find attractive small cap companies that have not been fully appreciated by the market or are mispriced due to recent results or events. We believe less investor interest in our segment of the market creates opportunity for us to uncover value.
The Fund typically invests at the smaller end of the small cap growth spectrum and the managers continue to seek companies with sustainable growth due to secular growth trends or innovative or disruptive products.
The Buffalo Early Stage Growth Fund is focused primarily on identifying innovation within U.S. companies with primarily North American revenue bases. With an active share of greater than 90%, a lower turnover strategy with 50-70 holdings, the Fund will continue to offer a distinct offering from the Index and category peers.
BUFFALO FLEXIBLE INCOME FUND
The Buffalo Flexible Income Fund Investor Class returned 7.16% for the six-months ending September 30, 2021, compared to a return of 4.89% for the Morningstar Moderately Aggressive Target Risk Index. The top three contributors to the Fund's performance during the quarter were Microsoft, Nuance and ConocoPhillips. Microsoft reported strong earnings results with all segments reporting above the higher end of the prior guidance range. ConocoPhillips share price appreciation reflects improved commodity prices, its acquisition of Shell's Permian acreage and higher cash returns to shareholders while Nuance advanced when it announced that it had agreed to be acquired by Microsoft for a premium valuation.
The top detractors from results for the period were Intel and Clorox. Intel's decline reflects weak sales growth, concerns about PC competition, weaker gross margins, slower data center growth and an announced expansion into foundry. Clorox shares declined due to tougher comparisons as cleaning products saw strong demand in 2020 due to pandemic. Clorox is also contending with higher raw material prices which compressed margins.

6
The stock market continued to advance through July reaching record highs, however September traded off and gave up a lot of the semi-annual period's earlier gains. The early rise was due to expectations that the economy would continue to recover from the pandemic. At the time, new Covid-19 infections, hospitalizations and deaths were declining. However, a late summer surge in cases coincided with severe weather events (hurricanes, flooding, fires, etc.), supply chain delays, key parts shortages, and inflation pressures which led to reduced estimates for economic growth. Investors are also watching politics in Washington as Congress works on the budget, an infrastructure plan, and the debt ceiling. The Federal Reserve continued to indicate that it views elevated levels of inflation as transitory, and not likely to trigger interest rates increases in the near term. However, they did forecast a taper in their bond buying activity with a modest monthly decline in purchases. As always, we remain focused on wide moat, large capitalization dividend paying companies trading at reasonable valuations, in our view. As stock market volatility spikes, we will look for opportunities to find companies that fit our investment criteria, as we continue to follow our process of finding new investment ideas and to be ready when market declines provide better entry points.
BUFFALO GROWTH FUND
The Buffalo Growth Fund Investor Class produced a return of 12.01% during the semi-annual period but trailed the Morningstar US Growth Index's return of 15.61%. Strong stock selection in the Industrials and Real Estate sectors was offset by underperformance in the Fund's Information Technology and Consumer Discretionary holdings. In short, our valuation discipline was the root of the relative underperformance in the period. Economic gains stalled as Covid fears reignited, meanwhile long-term Treasury yields fell early in the period after jobs reports surprised to the downside, inflation reports surprised to the upside, and Federal Reserve communications turned slightly more hawkish. Within equity markets, the main beneficiaries of lower long-term interest rates were long-duration (high valuation) growth stocks, where the Fund was underweight relative to the index.
TOP CONTRIBUTORS
Microsoft Corporation was the top contributor to performance in the period. The company is a prime beneficiary of workplace digital transformation and the
move from on premise IT infrastructure to the cloud. As the economy emerges from the pandemic Microsoft appears well positioned to gain a share of rising IT budgets.
Alphabet Inc. was also a top contributor in the period. The company experienced improving growth in its leading digital advertising businesses following a relatively cautious ad budget environment through most of last year. Alphabet is poised to benefit in 2021 as digital advertising budgets expand alongside improving economic conditions.
TOP DETRACTORS
TripAdvisor Inc. was caught up in general travel industry weakness. The rise of the delta variant drove some countries to reinstate previously abandoned lockdown measures, causing investors to push out their projections for a broad travel recovery. Additionally, their promising new Trip Advisor Plus subscription business experienced some early stage growing pains after it tweaked its offering to ensure rate-parity across the various platforms. We believe the changes will drive new partners onto the platform. TripAdvisor stands to benefit as travel demand, dining and entertainment rebound.
Global Payments also detracted from the Fund's performance. Despite reporting strong financial results, investors were concerned that the company didn't raise annual guidance by the amount of the beat, implying a slowdown in the second half of the year. Additionally, investors responded to changing interest rates by rotating from payment stocks to banks and/or faster growing "fintech" companies.
OUTLOOK
The market environment remains constructive for equity investing. Corporate earnings are recovering and interest rates remain relatively low by historical standards providing a healthy backdrop for equities. Vaccination rates are increasing worldwide contributing to increased mobility, improved business and consumer confidence and rapidly improving economic activity. Supply constraints, labor shortages, shipping bottlenecks and a slow return to work are contributing to inflation and holding back the economy in the near term, but as these things ease, robust corporate earnings growth is poised to follow suit in our opinion. We believe that the global reopening has been delayed and that as these supply side bottlenecks ease, economic expansion will continue.
As we get further along into the recovery, concerns about high debt levels, corporate profit margins, decelerating

7
growth, virus mutations, and a more hawkish Fed could affect equity valuations. Inflation, and the Fed's response to it, will be of vigorous interest throughout the remainder of the year. In its latest public messaging, we think the Fed has already passed the threshold from Dovish to Hawkish regarding its messaging on inflation given the persistence of supply chain constraints and rising prices. As the drum-beat for Fed tapering grows louder we think the market could transition incrementally away from speculative and early cycle stocks and rotate increasingly to growth and quality as tapering begins to reduce liquidity while peaking growth rates cause investors to be more discerning about cyclically oriented equities.
We believe the portfolio is well positioned for an environment of increased economic optimism and higher long-term interest rates. But this is a result of our bottom-up process, not the implementation of any top-down view. We are under-exposed to hyper-growth companies with sky high valuation multiples because we don't think they currently present us with an attractive risk/reward profile. While we are mindful of macroeconomic fluctuations, they do not drive our investment process. We will continue to invest in businesses with solid growth opportunities, durable competitive advantages, scalable business models, and good management teams, when they are trading at attractive valuations, in our opinion. Thank you for your continued support.
BUFFALO HIGH YIELD FUND
The Buffalo High Yield Fund Investor Class increased 3.28% for the six months ending September 30, 2021, underperforming the ICE BofAML High Yield Master II Index which gained 3.74% for the same period.
The U.S. high yield sector continued its positive return streak in both the June and September quarters, posting six consecutive positive quarters after suffering the significant COVID-19 correction in the March 2020 quarter. In fact, high yield bond yields posted record lows in July hitting 4.22% as investors seemed to accept the Fed's claim that current inflation will prove transitory. However, from that point forward, high yield returns were more muted as investors weighed strong corporate earnings and economic data versus a potential pivot towards tapering by the Federal Reserve, uncertainty regarding the spread of delta variant and a potential fallout from China's Evergrande default. The 10-Year
Treasury Bond returned 2.98% during the six month period while the S&P 500 Index logged a 9.18% return.
High yield funds experienced outflows of $1.3 billion during the semi-annual period. This compares to a robust $58 billion cash inflow during the same period last year. During the six-month period, high yield primary market activity produced $250 billion of new issuance which almost matched the $277 billion issued in the same 2021 timeframe. Both periods were driven largely by refinancing activities. According to JP Morgan, the middle and upper credit quality tiers each accounted for roughly 42% of the new issuance with the lower tier producing roughly 15% of new bonds. By sector, the heaviest volume came from Healthcare (11.1%), Energy (10.8%), and Financials (10.3%).
During the six month period, the 10-year Treasury Bond's yield decreased 21 basis points to 1.53% after dropping as low as 1.17% in early August. Every sector in the U.S. high yield universe and every credit rating silo produced positive returns during the six months ending in September. According to data from JP Morgan, the higher and lower quality ends of the high yield credit spectrum outperformed the split BB/B rated middle tier credits with the lower split B/CCC segment performing the best.
According to data from JP Morgan, the U.S. high yield market's spread to worst at the end of September was 385 basis points, 218 bps tighter than the 603 bps spread at the end of September 2020 and 204 bps tighter than its 20-year historical average of 589 bps. After touching a record low of 4.22% in July, the yield to worst for the high yield market at period end was 4.51%, below the 6.32% yield last September and still well below the 8.14% 20-year average.
During the semi-annual period the top contributors to Fund performance were Nuance Communications 1.5% convertible bonds, Northern Oil & Gas 8.125% corporate bonds, and Cerence 3% convertible bonds. In early April 2021, Microsoft announced the acquisition of Nuance for a 23% premium, driving the strong performance in Nuance convertible bonds. The Northern Oil & Gas bonds, along with the energy sector as a whole, improved on the back of surging natural gas and crude oil prices during the six month period as the Covid-19 vaccinations roll-out increased economic activity and global supplies fell short of demand. Cerence is a technology driven enterprise that reported better than expected earnings and guidance during the period and the underlying stocks benefited from the strong demand

8
from investors to own the technology sector early in the period.
The Invacare 4.25% convertible bonds, Smile Direct Club 0.0% convertible bonds, and the Avaya 2.25% convertible bonds detracted the most from performance during the period. Invacare convertible bonds were negatively impacted by a disappointing earnings announcement that were driven by global supply chain disruptions. Smile Direct Club convertible bonds declined after posting weaker than expected earnings. Despite meeting analysts' estimates, Avaya convertible bonds declined after the company provided guidance for the rest of 2021 that missed expectations.
We ended the first half of fiscal 2022 with 147 positions, basically unchanged from the previous quarter's level of 148 (excluding cash). We are focused first and foremost on the ongoing recovery from the COVID-19 pandemic, the supply chain disruptions that have occurred as a result, and the Federal Reserve's balancing act between growth and inflation. The potential for new regulatory changes to various industries from the Biden administration is a secondary focus. We are managing the Fund cautiously yet actively, focusing on high-quality issuers with defensive business models and manageable credit metrics. We will continue to deploy cash in opportunities that we believe offer the most appealing risk/reward tradeoff, with a bias toward shorter durations and less levered credits. Additionally, we believe bank loans offer a more defensive position as they provide senior positioning in the capital structure and less interest rate sensitivity due to their floating rate structures. Finally, we continue to look for opportunities in convertible bonds and preferred stocks.
BUFFALO INTERNATIONAL FUND
Equity markets outside the U.S. advanced during the 6-month period ending September 30, 2021, driven by European markets, as vaccine rollouts accelerated and European countries began to recover from the pandemic. The momentum began to taper towards the end of the period, however, as concerns around inflation, global supply chains, and a failing property developer in China weighed on markets. The Japanese market was flat during the period, while the Hong Kong market sold off considerably. The S&P 5OO Index advanced 9.18% for the period while the MSCI All-Country World ex-USA Index advanced just 2.19%.
The Buffalo International Fund Investor Class produced a return of 10.19% for the semi-annual period, outperforming the MSCI All-Country World ex-USA Growth Index and the broader Morningstar Global Markets ex-US Index, which posted returns of 2.60% and 2.98%, respectively. Compared to the Morningstar index, outperformance was mostly due to stock selection as sector allocation was a small drag on relative results. Our lack of Energy, a strong performing benchmark sector in the period, weighed on the sector allocation effect.
Top contributors in the 6-month period included Sartorius Stedim Biotech SA, IMCD N.V., and ASML Holding NV. Sartorius Stedim, a global provider of equipment used in manufacturing biologic drugs, reported better results than expected and raised its guidance for the year on a record 80% increase in orders. Biologic drugs are in ever higher demand due to increases in biosimilars, new treatment modalities, and emerging markets. IMCD, a global distributor of specialty chemicals, continued to benefit from the growing market for outsourcing by chemical companies. While chemical companies rationalize the number of distributors for efficiency gains, large players like IMCD are able to gain market share. Meanwhile, ASML , the sole provider of certain equipment for semiconductor manufacturing, has seen increased demand for its equipment as semiconductor manufacturers have been building capacity. Investors also believe the company will be a key beneficiary of some longer-term trends such as spend on elevated logic and memory equipment for AI.
Top detractors during the 6-month period were Tencent Holdings, TeamViewer AG and Nintendo. Tencent, a social networking payment and mobile games company in China, saw continued pressure on its stock price as China announced policy intentions surrounding restricting video games for minors, breaking down "walled gardens", state ownership of data and a need for internet companies to no longer focus solely on profitability. We decided to sell our position until there is clearer visibility on the outlook and future prospects for the internet giant. TeamViewer, which offers software solutions for remote access and connectivity, declined after a disappointing quarterly report. Increased customer churn showed that the customers acquired during the earlier part of the pandemic were not staying and it seems the company does not have a strong enough competitive advantage in the face of competition. Therefore, we decided to sell our position. Finally, Nintendo, the well-known Japanese video game company, had poor

9
performance during the period, as delays related to anticipated new product launches weighed on the stock. We continue to believe that over the long-term the company's business model will be less volatile and less reliant on new hardware, as digital software sales increase.
Going forward, market volatility is likely to continue in our view. On the one hand, global economies continue to recover, as vaccination rates rise, and mobility and overall economic activity improves. On the other hand, however, uncertainty around future growth and inflation will most likely continue to weigh on the market. Supply chain bottlenecks continue around the globe, with shortages of semiconductors affecting the automotive and technology industries, while Covid-related factory closures and delays at ports wreak havoc on retailers. Companies in nearly every industry are now reporting cost inflation, whether it be from labor costs, raw materials, transportation or energy. Recent worries related to China's slowing economic growth and the secondary effects have become a global concern, as the country is dealing with regulatory measures that have now affected most industries.
Despite these storm clouds, we will continue to seek high quality companies that have sound business models, competitive advantage, that are backed by secular growth drivers that can lead to long-term growth. Targeted companies should be attractively priced, financially stable, and well-managed with innovative strategies. We believe this discipline should lead to superior risk-adjusted returns over the long term.
BUFFALO LARGE CAP FUND
The Buffalo Large Cap Fund Investor Class produced a return of 12.22% for the 6-month period ending September 30, 2021, a result that outperformed the S&P 500 Index and the Morningstar Large Cap Growth Category average, but underperformed the prospectus benchmark Morningstar US Large Growth Index return of 18.13% in the period.
While the Fund's total return on an absolute basis was solid, stock selection in Healthcare, Consumer Discretionary and Financials led to the relative shortfall against the benchmark. We point out that not owning several strong performing benchmark holdings including Tesla and Moderna negatively impacted our relative performance.
Overall the top contributors to portfolio performance for the period were Microsoft, Alphabet, and Apple Inc. Microsoft Corporation was the top contributor to performance in the period. The company is a prime beneficiary of workplace digital transformation and the move from on premise IT infrastructure to the cloud. As the economy emerges from the pandemic, Microsoft appears well positioned to gain a share of rising IT budgets.
Alphabet is the parent company of Google and several former Google subsidiaries. Shares appreciated on the back of a strong, across the board financial performance with both Search, YouTube, and Cloud. We continue to have a large position in Alphabet based on our expectation the company will continue to drive strong growth from its leading franchises in online search and digital video advertising, while also gaining share in the large and fast growing public cloud computing sector on the strength of its highly differentiated machine learning tool-kit.
Apple gained on continued healthy demand for high margin products and services and increased stock buybacks.
Meanwhile the top detractors from portfolio performance for the period were Cigna, Twilio, and FedEx. Shares of health insurer Cigna declined during the period as the company reported a disappointing Medical Loss Ratio (MLR). MLR within the U.S. Medical segment was much higher than estimates which management attributed to higher COVID-19-related costs and a quicker return of non-COVID-19 utilization than originally expected.
Twilio, a leading communications-platform-as-a-service, or CPaaS, firm that integrates communications capabilities such as messaging, voice, and video into client-facing products, reported a slowdown in organic growth and reduced profitability. Although the company experienced an uptick in revenue it was offset by higher costs, resulting in depressed profitability. The higher loss compared with previous guidance was a result of accelerating investments in the platform and growth-supporting areas such as research and development and sales and marketing.
FedEx is a leading multination transportation and package delivery company highly leveraged to growth of e-commerce and business services such as overnight delivery. FedEx shares declined stemming from revenues and expenses being negatively impacted from a material labor shortage in package handlers at facilities around the U.S. The corollary has been late deliveries and extra

10
overtime pay for current workers. We own a moderately weighted position in FedEX as the company should continue to benefit from the acceleration of e-commerce globally owing to its broad, global network of linked aircraft and ground transportation. We also see a three to four year margin recovery theme, as certain aircraft are retired coupled with TNT acquisition synergies and increased pricing power. We expect some modest relief with stronger than normal seasonal shipping rate increases and some improvement on the labor front as we exit past supplemental unemployment benefits.
From a sector perspective, healthcare and financials remain slight relative over-weights due to our conviction in growth cyclicals/defensives heading into 2022. However, we would stress that information technology and consumer discretionary remain, by a large margin, the largest weightings in our Fund. There are a myriad of possible outcomes for the remaining weeks of 2021 with no real certainty from several different outcomes. We've mentioned to colleagues over the last several months that we don't recall ever having so many low probability events all occurring at the same time. From Covid-19, climate change, debates around the durability of the most significant increase in material, shelter and wage prices we have seen in 40 plus years resulting mostly from supply chains and product shortages. Add to this array of uncertainties is the increasingly tenuous relations between the U.S. and China and China's own overt intentions around reunification with Taiwan.
We attempt to risk mitigate from an overall portfolio level but acknowledge in an imperfect world there are multiple possible outcomes from a macro level.
BUFFALO MID CAP FUND
The Buffalo Mid Cap Fund Investor Class returned 4.01% for the six-month period ended September 30, 2021. Over the same period, the Morningstar US Mid Growth Index returned 11.55%. The Fund underperformed as the Covid 19 Delta variant spread and interest rates fell, causing weakness in reopening beneficiaries and strength in high-multiple, long-duration growth companies. We continue to believe that the valuations being assigned to unprofitable technology companies are unsustainable. We maintain less exposure to the most expensive stocks in the index, and that was the primary drag on relative performance.
POSITIVES
MSCI reported two strong quarters during the period. Index revenue came in ahead of expectations, and their ESG and climate offerings drove accelerating revenue growth. The strong revenue performance led the company to increase free cash flow guidance. MSCI should benefit from the growth of international investing, increasing use of passive investments, and ESG driven investing for years to come.
Gartner, a technology focused research and advisory company, reported earnings with significant upside across all metrics. Contract value growth accelerated sharply in both business segments. Expense growth remained controlled, and earnings and cash flow forecasts were materially increased after the quarter. While research and consulting are both growing nicely, their conferences' business could provide further upside with a return to in-person events.
Palo Alto Networks shares advanced driven by accelerating growth and a better than expected outlook for fiscal 2022. The company appears to be at the end of an investment cycle, and it has adapted its product portfolio to prosper from a network security market driven by cloud computing use cases. This pivot by the company to embrace cloud security should continue to support revenue growth as investment levels normalize and boost profit growth.
NEGATIVES
The top three detractors from Fund performance were TripAdvisor, Lyft, and Vroom. TripAdvisor shares were under pressure as spread of the Covid 19 Delta variant delayed a rebound in the travel industry. Also, TripAdvisor announced a change to their new TripAdvisor Plus offering, leading investors to question how the rollout was going and what the total opportunity could be.
Lyft shares were negatively impacted by renewed fears over Covid-19 driven by the Delta variant. Despite reporting results that exceeded expectations and a better than expected profit outlook, shares traded off on guidance for less robust sales growth.
Next, Vroom, an online dealership for used cars, was negatively impacted by a mixed outlook for the September quarter. Used car prices have seen unprecedented appreciation driven by scarce new car availability resulting from component shortages. Expectations for a return to normal price depreciation

11
drove a decline in gross profit margin per unit and was a catalyst that sent shares lower.
OUTLOOK
Consensus thinking is coming around to the fact that inflation may not be completely transitory and the Federal Reserve will likely have to dial back its support for the economy. The current debate centers on whether or not the economy can continue to grow in the face of higher inflation and less fiscal stimulus. This can lead in two directions, stagflation or robust economic growth. Judging by the flattening yield curve and the outperformance of high-multiple, long-duration growth equities, stagflation appears to be the more popular view. We take the other view.
The Delta variant has clearly hampered the economic reopening, but we believe it has only delayed a more robust recovery. We don't foresee weak consumer demand and high employment as problems anytime soon. Consumer wallets are in good shape, helped by government support during the pandemic. To some extent, this has reduced incentives to work, at least at pre-Covid wage levels. Job growth has been disappointing recently, but with vaccination rates up, the possibility of a pharmaceutical treatment, declining Covid cases, and reduced unemployment benefits, we would expect this to improve. Improving labor supply, along with fewer factory and port closures, should alleviate widespread supply chain problems and boost economic growth.
We believe the portfolio is well positioned for an environment of increased economic optimism and higher long-term interest rates. But this is a result of our bottom-up process, not the implementation of any top-down view. We are under-exposed to hyper-growth companies with sky high valuation multiples because we don't think they currently present us with an attractive risk/reward profile. While we are mindful of macroeconomic fluctuations, they do not drive our investment process. We will continue to invest in businesses with solid growth opportunities, durable competitive advantages, scalable business models, and good management teams, when they are trading at attractive valuations, in our opinion. Thank you for your continued support.
BUFFALO SMALL CAP FUND
The Buffalo Small Cap Fund Investor Class produced a return of 1.99% for the semi-annual period,
outperforming the Morningstar US Small Cap Growth Index return of 0.07%. During the 6-month period, small cap stocks performed well in the first half of the period, but sold off in the second half as inflation concerns and more persistent supply chain complications weighed on stock performance. Index performance was led by Energy, Technology, Real Estate and Industrials, but offset by weakness in Telecom Services, Utilities and Healthcare.
The Fund's outperformance relative to the benchmark was driven by solid stock selection in Technology, Consumer Discretionary, and Financials that was slightly offset by underperformance in Telecom Services, Industrials and Healthcare.
TaskUs was a meaningful contributor to performance during the period. A recent Initial Public Offering (IPO), we believe TaskUs is a unique Business Process Outsourcer (BPO) in that it has high growth, a great vertical end-market in Technology with fast growing customers, high recurring revenue, and no meaningful legacy services that weigh on future growth. The company got off to a fast start meaningfully beating consensus estimates and taking growth expectations higher on their first reporting period and the stock responded well.
Everi was another meaningful contributor during the period. Everi's casino customers continued to experience gradual improvement in operating results despite an increase in Covid cases due to the delta variant allowing the company's slot and fintech placements to experience solid results. Furthermore, Everi is experiencing further acceptance of its mobile wallet solution as it announced Penn National Gaming as a customer during the period. The product remains early in its life cycle and its further acceptance could drive additional investors into the stock.
Viant Technology was an underperformer during the period. A provider of an alternative Demand Side Platform (DSP) that is not reliant on traditional cookies in web browsers to appropriately identify suitable programmatic ad targets struggled during the period. Google, maker of the popular Chrome browser, delayed the timeframe for when it would no longer use cookies to identify users thereby pushing out a key catalyst for the stock. We believe that advertisers will continue to look for other DSP alternatives knowing that the cookie's days are numbered and that Viant will continue to gain share in this fast growing market.

12
The outlook for small caps remains somewhat mixed, in our view. Investor concerns over rising inflation, a planned reduction in the Fed's purchase of bonds, higher interest rates, a looming debt ceiling vote, uncertainty in Washington, continued economic headwinds from supply chain disruptions, and ongoing fears of additional Covid outbreaks weighs on market sentiment and has driven investors to the relative safety of larger cap companies or less risky assets. As one can surmise from the length of the list of concerns, there is definitely a decently sized wall of worry impacting investors. We believe that many of these concerns are already "baked into the cake," noting that small cap growth stocks have experienced a significant amount of relative underperformance this year. Furthermore, small cap stocks tend to outperform as the economy accelerates and with the worst of the delta variant seemingly behind us, most economists have fourth quarter GDP picking back up after ratcheting down third quarter growth expectations due to Covid. We also note that small caps tend to outperform in periods of rising interest rates as this is generally a sign of an
improving economy. The yield on 10-year U.S. Treasury Bonds has started rising after bottoming in July.
While growth stocks may continue to lag value if the economy experiences an acceleration due to supply chain improvements or as Covid fears wane, we remain confident in the outlook for growth stocks in the medium- to long-term as high government debt levels may eventually weigh on outsized GDP growth giving growth companies premium positioning with investors. We are cognizant of the negative impact rising interest rates typically have on long duration assets characterized by high valuations and significant operating losses, and are positioning the portfolio accordingly.
Sincerely,

John C. Kornitzer
President, KCM
The Funds' investment objectives, risks, charges and expenses must be considered carefully before investing. The summary and statutory prospectus contains this and other important information about the investment company, and it may be obtained by calling 1-800-49-BUFFALO or visiting www.buffalofunds.com. Read it carefully before investing.
Past performance does not guarantee future results. Mutual fund investing involves risk. Principal loss is possible.
Kornitzer Capital Management, Inc. is the Advisor to the Buffalo Funds which are distributed by Quasar Distributors, LLC.
An outbreak of an infectious respiratory illness caused by a novel coronavirus known as COVID-19 has affected the worldwide economy, as well as the economies of individual countries, the financial health of individual companies and the market in general in significant and unforeseen ways. The future impact of COVID-19 is currently unknown, and it may exacerbate other risks that apply to the Funds. Any such impact could affect the Funds' performance, the performance of the securities in which the Funds invest and may lead to losses on your investment in the Funds.
The opinions expressed are those of the Portfolio Manager(s) and are subject to change, are not guaranteed and should not be considered recommendations to buy or sell any security.
Bond ratings are grades given to bonds that indicate their credit quality as determined by a private independent rating service such as Standard & Poor's. The firm evaluates a bond issuer's financial strength, or its ability to pay a bond's principal and interest in a timely fashion. Ratings are expressed as letters ranging from 'AAA', which is the highest grade, to 'D', which is the lowest grade. In limited situations when the rating agency has not issued a formal rating, the Advisor will classify the security as nonrated.
Earnings growth is not representative of a fund's future performance.
A basis point is one hundredth of a percentage point (0.01%) Yield is the income return on an investment.
Yield to worst is the lowest potential yield that can be received on a bond without the issuer actually defaulting. A Spread is the difference between the bid and the ask price of a security.
Spread to worst is the difference between the yield to worst of a bond and the yield to worst of a U.S. Treasury security with similar duration.
Duration is a commonly used measure of the potential volatility of the price of a debt security, or the aggregate market value of a portfolio of debt securities, prior to maturity. Securities with a longer duration generally have more volatile prices than securities of comparable quality with a shorter duration.
Active share is a measure of the percentage of stock holdings in a manager's portfolio that differs from the benchmark index.
Yield curve is the curve on a graph in which the yield of fixed-interest securities is plotted against the length of time they have to run to maturity.
The MSCI All-Country World Index is a free float-adjusted market capitalization weighted index that is designed to measure the equity market performance of developed and emerging markets.
The MSCI All-Country World ex US Index captures large and mid cap representation across 22 of 23 developed market countries (excluding the US) and 26 emerging markets countries.

13
INVESTMENT RESULTS (UNAUDITED)
Total Returns as of September 30, 2021
| | | | | | | Average Annual | |
| | | Gross Expense
Ratio**** | | Six
Months | | One Year | | Five Years | | Ten Years | | Investor
Class
Since
Inception | | Institutional
Class
Since
Inception | |
Buffalo Discovery Fund — Investor Class
(inception date 4/16/01) | | | 1.01 | % | | | 4.83 | % | | | 28.76 | % | | | 17.23 | % | | | 17.38 | % | | | 10.64 | % | | | N/A | | |
Buffalo Discovery Fund — Institutional Class
(inception date 7/1/19)1 | | | 0.86 | % | | | 4.88 | % | | | 28.93 | % | | | 17.40 | % | | | 17.56 | % | | | N/A | | | | 19.25 | % | |
Morningstar US Mid Growth Index | | | N/A | | | | 11.55 | % | | | 31.01 | % | | | 21.55 | % | | | 17.91 | % | | | 10.14 | % | | | 25.59 | % | |
Lipper Multi-Cap Growth Funds Index | | | N/A | | | | 9.67 | % | | | 28.04 | % | | | 21.39 | % | | | 18.17 | % | | | 9.21 | % | | | 27.01 | % | |
Buffalo Dividend Focus Fund — Investor Class
(inception date 12/03/12) | | | 0.94 | % | | | 7.52 | % | | | 29.83 | % | | | 14.56 | % | | | N/A | | | | 14.00 | % | | | N/A | | |
Buffalo Dividend Focus Fund —
Institutional Class (inception date 7/1/19)1 | | | 0.79 | % | | | 7.60 | % | | | 30.03 | % | | | 14.73 | % | | | N/A | | | | N/A | | | | 18.23 | % | |
Morningstar US Large-Mid Cap Index | | | N/A | | | | 9.04 | % | | | 30.20 | % | | | 17.18 | % | | | N/A | | | | 15.90 | % | | | 20.83 | % | |
S&P 500 Index | | | N/A | | | | 9.18 | % | | | 30.00 | % | | | 16.90 | % | | | N/A | | | | 15.77 | % | | | 20.14 | % | |
Lipper Equity Income Funds Index | | | N/A | | | | 5.30 | % | | | 28.86 | % | | | 11.49 | % | | | N/A | | | | 11.60 | % | | | 12.62 | % | |
Buffalo Early Stage Growth Fund —
Investor Class (inception date 5/21/04) | | | 1.51 | % | | | 2.93 | % | | | 44.60 | % | | | 22.04 | % | | | 19.55 | % | | | 11.29 | % | | | N/A | | |
Buffalo Early Stage Growth Fund —
Institutional Class (inception date 7/1/19)1 | | | 1.36 | % | | | 3.01 | % | | | 44.79 | % | | | 24.66 | % | | | 19.73 | % | | | N/A | | | | 28.30 | % | |
Morningstar US Small Growth Index | | | N/A | | | | 0.07 | % | | | 27.66 | % | | | 16.67 | % | | | 15.98 | % | | | 10.77 | % | | | 19.19 | % | |
Lipper Small-Cap Growth Funds Index | | | N/A | | | | 3.89 | % | | | 35.39 | % | | | 18.78 | % | | | 16.67 | % | | | 10.74 | % | | | 21.68 | % | |
Buffalo Flexible Income Fund —
Investor Class (inception date 8/12/94) | | | 1.01 | % | | | 7.16 | % | | | 28.89 | % | | | 8.32 | % | | | 8.35 | % | | | 7.30 | % | | | N/A | | |
Buffalo Flexible Income Fund —
Institutional Class (inception date 7/1/19)1 | | | 0.86 | % | | | 7.24 | % | | | 29.15 | % | | | 8.48 | % | | | 8.52 | % | | | N/A | | | | 8.76 | % | |
Morningstar Moderately Aggressive
Target Risk Index* | | | N/A | | | | 4.89 | % | | | 23.81 | % | | | 11.36 | % | | | 10.89 | % | | | N/A | | | | 13.36 | % | |
60% Morningstar US Large Cap Index/
40% ICE BofAML US High Yield Master II Index | | | N/A | | | | 7.38 | % | | | 21.40 | % | | | 13.25 | % | | | 13.14 | % | | | 9.47 | % | | | 15.48 | % | |
Bank of America Merrill Combined Index
(60% S&P 500® Index/40% ICE BofAML
US High Yield Master II Index) | | | N/A | | | | 7.04 | % | | | 22.43 | % | | | 12.71 | % | | | 12.93 | % | | | 9.54 | % | | | 14.68 | % | |
Lipper Mixed-Asset Target Allocation
Moderate Funds Index | | | N/A | | | | 4.48 | % | | | 18.12 | % | | | 9.16 | % | | | 8.96 | % | | | 7.28 | % | | | 11.44 | % | |
Buffalo Growth Fund — Investor Class
(inception date 5/19/95) | | | 0.92 | % | | | 12.01 | % | | | 26.56 | % | | | 18.43 | % | | | 16.79 | % | | | 11.27 | % | | | N/A | | |
Buffalo Growth Fund — Institutional Class
(inception date 7/1/19)1 | | | 0.77 | % | | | 12.11 | % | | | 26.78 | % | | | 18.61 | % | | | 16.97 | % | | | N/A | | | | 21.18 | % | |
Morningstar US Growth Index** | | | N/A | | | | 15.61 | % | | | 31.05 | % | | | 24.23 | % | | | 20.12 | % | | | N/A | | | | 30.43 | % | |
Lipper Large Cap Growth Funds Index | | | N/A | | | | 12.34 | % | | | 26.86 | % | | | 22.14 | % | | | 18.70 | % | | | 9.97 | % | | | 27.28 | % | |

14
| | | | | | | Average Annual | |
| | | Gross Expense
Ratio**** | | Six
Months | | One Year | | Five Years | | Ten Years | | Investor
Class
Since
Inception | | Institutional
Class
Since
Inception | |
Buffalo High Yield Fund — Investor Class
(inception date 5/19/95) | | | 1.03 | % | | | 3.28 | % | | | 13.00 | % | | | 6.09 | % | | | 6.48 | % | | | 7.07 | % | | | N/A | | |
Buffalo High Yield Fund — Institutional Class
(inception date 7/1/19)1 | | | 0.87 | % | | | 3.36 | % | | | 13.22 | % | | | 6.24 | % | | | 6.63 | % | | | N/A | | | | 8.36 | % | |
ICE BofAML High Yield Master II Index | | | N/A | | | | 3.74 | % | | | 11.46 | % | | | 6.35 | % | | | 7.30 | % | | | 7.16 | % | | | 6.50 | % | |
Lipper High Yield Bond Funds Index | | | N/A | | | | 3.67 | % | | | 11.97 | % | | | 6.02 | % | | | 6.77 | % | | | 5.98 | % | | | 6.11 | % | |
Buffalo International Fund — Investor Class
(inception date 9/28/07) | | | 1.04 | % | | | 10.19 | % | | | 27.39 | % | | | 14.24 | % | | | 11.84 | % | | | 6.68 | % | | | N/A | | |
Buffalo International Fund —
Institutional Class (inception date 7/1/19)1 | | | 0.89 | % | | | 10.23 | % | | | 27.57 | % | | | 14.40 | % | | | 12.00 | % | | | N/A | | | | 17.70 | % | |
Morningstar Global Markets ex-US Index | | | N/A | | | | 2.98 | % | | | 25.11 | % | | | 9.21 | % | | | 8.05 | % | | | 3.38 | % | | | 11.09 | % | |
Lipper International Funds Index | | | N/A | | | | 3.20 | % | | | 26.32 | % | | | 9.66 | % | | | 8.95 | % | | | 3.51 | % | | | 12.61 | % | |
Buffalo Large Cap Fund — Investor Class
(inception date 5/19/95) | | | 0.95 | % | | | 12.22 | % | | | 27.28 | % | | | 19.00 | % | | | 17.99 | % | | | 10.94 | % | | | N/A | | |
Buffalo Large Cap Fund — Institutional Class
(inception date 7/1/19)1 | | | 0.80 | % | | | 12.33 | % | | | 27.45 | % | | | 19.18 | % | | | 18.17 | % | | | N/A | | | | 23.68 | % | |
Morningstar US Large Growth Index*** | | | N/A | | | | 18.13 | % | | | 27.69 | % | | | 24.01 | % | | | 20.29 | % | | | N/A | | | | 29.07 | % | |
Lipper Large-Cap Growth Funds Index | | | N/A | | | | 12.34 | % | | | 26.86 | % | | | 22.14 | % | | | 18.70 | % | | | 9.97 | % | | | 27.28 | % | |
Buffalo Mid Cap Fund — Investor Class
(inception date 12/17/01) | | | 1.03 | % | | | 4.01 | % | | | 31.17 | % | | | 16.50 | % | | | 14.40 | % | | | 9.81 | % | | | N/A | | |
Buffalo Mid Cap Fund — Institutional Class
(inception date 7/1/19)1 | | | 0.88 | % | | | 4.15 | % | | | 31.34 | % | | | 16.68 | % | | | 14.57 | % | | | N/A | | | | 21.95 | % | |
Morningstar US Mid Growth Index | | | N/A | | | | 11.55 | % | | | 31.01 | % | | | 21.55 | % | | | 17.91 | % | | | 10.81 | % | | | 25.59 | % | |
Lipper Mid-Cap Growth Funds Index | | | N/A | | | | 7.58 | % | | | 29.93 | % | | | 19.47 | % | | | 16.71 | % | | | 10.10 | % | | | 21.97 | % | |
Buffalo Small Cap Fund — Investor Class
(inception date 4/14/98) | | | 1.01 | % | | | 1.99 | % | | | 42.39 | % | | | 24.86 | % | | | 19.40 | % | | | 13.80 | % | | | N/A | | |
Buffalo Small Cap Fund — Institutional Class
(inception date 7/1/19)1 | | | 0.86 | % | | | 2.07 | % | | | 42.54 | % | | | 25.05 | % | | | 19.57 | % | | | N/A | | | | 34.82 | % | |
Morningstar US Small Growth Index | | | N/A | | | | 0.07 | % | | | 27.66 | % | | | 16.67 | % | | | 15.98 | % | | | 7.43 | % | | | 19.19 | % | |
Lipper Small-Cap Growth Funds Index | | | N/A | | | | 3.89 | % | | | 35.39 | % | | | 18.78 | % | | | 16.67 | % | | | 8.57 | % | | | 21.68 | % | |
1 The Institutional Class commenced operations on 7/1/2019. Performance for periods prior to 7/1/2019 is based on the performance of the Investor Class adjusted for the Shareholder Services fee of the Investor Class.
* The inception date of the Morningstar Moderately Aggressive Target Risk Index is February 18, 2009. The annualized return since inception as of September 30, 2021 is 12.05%.
** The inception date of the Morningstar US Growth Index is July 3, 2002. The annualized return since inception as of September 30, 2021 is 12.34%.
*** The inception date of the Morningstar US Large Growth Index is July 3, 2002. The annualized return since inception as of September 30, 2021 is 11.67%.
**** As reported in the Funds' Prospectus dated July 1, 2021. Current period gross expense ratio for each Fund can be found on the Financial Highlights, beginning on page 102.
Performance data quoted represents past performance; past performance does not guarantee future results. The investment return and principal value of an investment will fluctuate so that an investor's shares, when redeemed, may be worth more or less than their original cost. Current performance of the Funds may be lower or higher than the performance quoted. Performance data current as of the most recent month-end may be obtained by calling 1-800-49-BUFFALO or by visiting the website at www.buffalofunds.com.

15
The Funds' returns shown do not reflect the deduction of taxes that a shareholder would pay on distributions or the redemption of shares. The benchmark returns shown, excluding the Lipper Indices, reflect the reinvestment of dividends and capital gains but do not reflect the deduction of any investment management fees, other expenses or taxes. The performance of the Lipper Indices is presented net of fees and expenses; however, applicable sales charges are not taken into consideration. One cannot invest directly in an index.
The Morningstar US Mid Growth Index measures the performance of US mid-cap stocks that are expected to grow at a faster pace than the rest of the market as measured by forward earnings, historical earnings, book value, cash flow and sales. The Lipper Multi-Cap Growth Funds Index is an unmanaged index that reflects the net asset value weighted return of 30 of the largest multi-cap growth funds tracked by Lipper. Its returns include net reinvested dividends. The Morningstar US Large-Mid Cap Index measures the performance of the US equity market targeting the top 90% of stocks by market capitalization. Lipper Equity Income Funds Index tracks funds that seek relatively high current income and growth of income by investing at least 65% of their portfolio in dividend-paying equity securities. These funds' gross or net yield must be at least 125% of the average gross or net yield of the U.S. diversified equity fund universe. The Morningstar US Small Growth Index measures the performance of US small-cap stocks that are expected to grow at a faster pace than the rest of the market as measured by forward earnings, historical earnings, book value, cash flows and sales. The Lipper Small-Cap Growth Funds Index is an unmanaged, equally weighted performance index of the 30 largest qualifying mutual funds (based on net assets) in the Lipper Small-Cap classification. The Morningstar US Large Cap Index measures the performance of the US equity market targeting the top 70% of stocks by market capitalization. The ICE BofAML US High Yield Master II Index tracks the performance of below investment grade U.S. dollar-denominated corporate bonds publicly issued in the U.S. domestic market. The Lipper Mixed-Asset Target Allocation Moderate Funds Index is an average of funds that, by portfolio practice, maintain a mix of between 40%-60% equity securities, with the remainder invested in bonds, cash, and cash equivalents. The total return of the Lipper Average does not include the effect of sales charges. The Morningstar US Growth Index measures the performance of US stocks that are expected to grow at a faster pace than the rest of the market as measured by forward earnings, historical earnings, book value, cash flow and sales. The Lipper Large Cap Growth Funds Index is an unmanaged, equally weighted performance index of the 30 largest qualifying mutual funds (based on net assets) in the Lipper Large-Cap classification. The Lipper High Yield Bond Funds Index is a widely recognized index of the 30 largest mutual funds that invest primarily in high yield bonds. The Morningstar Global Market ex-US Index is designed to provide exposure to the top 97% market capitalization in each of two market segments, developed markets, excluding the United States, and emerging markets. The Lipper International Funds Index is an unmanaged, equally weighted performance index of the 30 largest qualifying mutual funds (based on net assets) in the Lipper International classification. The Morningstar US Large Growth Index measures the performance of US large-cap stocks that are expected to grow at a faster pace than the rest of the market as measured by forward earnings, historical earnings, book value, cash flow and sales. The Lipper Mid-Cap Growth Funds Index is an unmanaged, equally weighted performance index of the 30 largest qualifying mutual funds (based on net assets) in the Lipper Mid-Cap classification. The S&P 500 Index is a capitalization weighted index of 500 large capitalization stocks which is designed to measure broad domestic securities markets. The Morningstar Moderately Aggressive Target Risk Index is designed to meet the needs of investors who would like to maintain a target level of equity exposure through a portfolio diversified across equities, bonds and inflation-hedged instruments.
Please refer to the prospectus for special risks associated with investing in the Buffalo Funds, including, but not limited to, risks involved with investments in healthcare and information technology companies, foreign securities, debt securities, lower- or unrated securities and medium and small companies. Fund holdings and sector allocations are subject to change at any time and should not be considered a recommendation to buy or sell any security. Please refer to the Schedule of Investments for a complete list of Fund holdings.

16
EXPENSE EXAMPLE (UNAUDITED)
As a shareholder of the Funds, you incur two types of costs: (1) transaction costs (including redemption fees) and (2) ongoing costs, including management fees, shareholder servicing fees (Investor Class only) and other Fund specific expenses. The examples below are intended to help you understand your ongoing costs (in dollars) of investing in the Funds and to compare these costs with the ongoing costs of investing in other mutual funds. The example is based on an investment of $1,000 invested at the beginning of the period and held for the entire period (April 1, 2021 – September 30, 2021).
ACTUAL EXPENSES
The first line of the tables below provides information about actual account values and actual expenses. You may use the information in this line, together with the amount you invested, to estimate the expenses that you paid over the period. Simply divide your account by $1,000 (for example, an $8,600 account value divided by $1,000 = 8.6), then multiply the result by the number in the first line under the heading entitled "Expenses Paid During the Period" to estimate the expenses you paid on your account during the period. Although the Funds charge no sales load or transaction fees, you will be assessed fees for outgoing wire transfers, returned checks and stop payment orders at prevailing rates charged by U.S. Bancorp Fund Services, LLC, the Funds' transfer agent. If you request that a redemption be made by wire transfer, currently a $15.00 fee is charged by the Funds' transfer agent. To the extent a Fund invests in shares of other investment companies as part of its investment strategy, you will indirectly bear your proportionate share of any fees and expenses charged by
the underlying funds in which the Fund invests in addition to the expenses of the Fund. Actual expenses of the underlying funds are expected to vary among the various underlying funds. These expenses are not included in the examples below. The examples below include management fees, registration fees and other expenses. However, the examples below do not include portfolio trading commissions and related expenses and other extraordinary expenses as determined under U.S. generally accepted accounting principles.
HYPOTHETICAL EXAMPLE FOR COMPARISON PURPOSES
The second line of each table below provides information about hypothetical account values and hypothetical expenses based on the Funds' actual expense ratios and an assumed rate of return of 5% per year before expenses, which are not the Funds' actual returns. The hypothetical account values and expenses may not be used to estimate the actual ending account balance or expenses you paid for the period. You may use this information to compare the ongoing costs of investing in our Funds and other funds. To do so, compare this 5% hypothetical example with the 5% hypothetical examples that appear in the shareholder reports of the other funds. Please note that the expenses shown in the tables are meant to highlight your ongoing costs only and do not reflect any transactional costs. Therefore, the second line of the tables is useful in comparing ongoing costs only, and will not help you determine the relative total costs of owning different Funds. In addition, if these transactional costs were included, your costs would have been higher.
BUFFALO DISCOVERY FUND | | Beginning
Account Value
April 1, 2021 | | Ending
Account Value
September 30, 2021 | | Expenses Paid During
Period April 1, 2021 -
September 30, 2021* | |
Investor Class | | | | | | | |
Actual | | $ | 1,000.00 | | | $ | 1,048.30 | | | $ | 5.13 | | |
Hypothetical (5% return before expenses) | | $ | 1,000.00 | | | $ | 1,020.05 | | | $ | 5.06 | | |
Institutional Class | |
Actual | | $ | 1,000.00 | | | $ | 1,048.80 | | | $ | 4.37 | | |
Hypothetical (5% return before expenses) | | $ | 1,000.00 | | | $ | 1,020.81 | | | $ | 4.31 | | |
* Expenses for the Investor Class are equal to the Fund's annualized expense ratio of 1.00%, multiplied by the average account value over the period, multiplied by 183/365 to reflect the one-half year period. Expenses for the Institutional Class are equal to the Fund's annualized expense ratio of 0.85%, multiplied by the average account value over the period, multiplied by 183/365 to project a one-half year period.

17
BUFFALO DIVIDEND FOCUS FUND | | Beginning
Account Value
April 1, 2021 | | Ending
Account Value
September 30, 2021 | | Expenses Paid During
Period April 1, 2021 -
September 30, 2021* | |
Investor Class | |
Actual | | $ | 1,000.00 | | | $ | 1,075.20 | | | $ | 4.84 | | |
Hypothetical (5% return before expenses) | | $ | 1,000.00 | | | $ | 1,020.41 | | | $ | 4.71 | | |
Institutional Class | |
Actual | | $ | 1,000.00 | | | $ | 1,076.00 | | | $ | 4.06 | | |
Hypothetical (5% return before expenses) | | $ | 1,000.00 | | | $ | 1,021.16 | | | $ | 3.95 | | |
* Expenses for the Investor Class are equal to the Fund's annualized expense ratio of 0.93%, multiplied by the average account value over the period, multiplied by 183/365 to reflect the one-half year period. Expenses for the Institutional Class are equal to the Fund's annualized expense ratio of 0.78%, multiplied by the average account value over the period, multiplied by 183/365 to project a one-half year period.
BUFFALO EARLY STAGE GROWTH FUND | | Beginning
Account Value
April 1, 2021 | | Ending
Account Value
September 30, 2021 | | Expenses Paid During
Period April 1, 2021 -
September 30, 2021* | |
Investor Class | |
Actual | | $ | 1,000.00 | | | $ | 1,029.30 | | | $ | 7.68 | | |
Hypothetical (5% return before expenses) | | $ | 1,000.00 | | | $ | 1,017.50 | | | $ | 7.64 | | |
Institutional Class | |
Actual | | $ | 1,000.00 | | | $ | 1,030.10 | | | $ | 7.18 | | |
Hypothetical (5% return before expenses) | | $ | 1,000.00 | | | $ | 1,018.00 | | | $ | 7.13 | | |
* Expenses for the Investor Class are equal to the Fund's annualized expense ratio of 1.51%, multiplied by the average account value over the period, multiplied by 183/365 to reflect the one-half year period. Expenses for the Institutional Class are equal to the Fund's annualized expense ratio of 1.41%, multiplied by the average account value over the period, multiplied by 183/365 to project a one-half year period.
BUFFALO FLEXIBLE INCOME FUND | | Beginning
Account Value
April 1, 2021 | | Ending
Account Value
September 30, 2021 | | Expenses Paid During
Period April 1, 2021 -
September 30, 2021* | |
Investor Class | |
Actual | | $ | 1,000.00 | | | $ | 1,071.60 | | | $ | 5.25 | | |
Hypothetical (5% return before expenses) | | $ | 1,000.00 | | | $ | 1,020.00 | | | $ | 5.11 | | |
Institutional Class | |
Actual | | $ | 1,000.00 | | | $ | 1,072.40 | | | $ | 4.47 | | |
Hypothetical (5% return before expenses) | | $ | 1,000.00 | | | $ | 1,020.76 | | | $ | 4.36 | | |
* Expenses for the Investor Class are equal to the Fund's annualized expense ratio of 1.01%, multiplied by the average account value over the period, multiplied by 183/365 to reflect the one-half year period. Expenses for the Institutional Class are equal to the Fund's annualized expense ratio of 0.86%, multiplied by the average account value over the period, multiplied by 183/365 to project a one-half year period.
BUFFALO GROWTH FUND | | Beginning
Account Value
April 1, 2021 | | Ending
Account Value
September 30, 2021 | | Expenses Paid During
Period April 1, 2021 -
September 30, 2021* | |
Investor Class | |
Actual | | $ | 1,000.00 | | | $ | 1,120.10 | | | $ | 4.89 | | |
Hypothetical (5% return before expenses) | | $ | 1,000.00 | | | $ | 1,020.45 | | | $ | 4.66 | | |
Institutional Class | |
Actual | | $ | 1,000.00 | | | $ | 1,121.10 | | | $ | 4.09 | | |
Hypothetical (5% return before expenses) | | $ | 1,000.00 | | | $ | 1,021.21 | | | $ | 3.90 | | |
* Expenses for the Investor Class are equal to the Fund's annualized expense ratio of 0.92%, multiplied by the average account value over the period, multiplied by 183/365 to reflect the one-half year period. Expenses for the Institutional Class are equal to the Fund's annualized expense ratio of 0.77%, multiplied by the average account value over the period, multiplied by 183/365 to project a one-half year period.

18
BUFFALO HIGH YIELD FUND | | Beginning
Account Value
April 1, 2021 | | Ending
Account Value
September 30, 2021 | | Expenses Paid During
Period April 1, 2021 -
September 30, 2021* | |
Investor Class | |
Actual | | $ | 1,000.00 | | | $ | 1,032.80 | | | $ | 5.15 | | |
Hypothetical (5% return before expenses) | | $ | 1,000.00 | | | $ | 1,020.00 | | | $ | 5.11 | | |
Institutional Class | |
Actual | | $ | 1,000.00 | | | $ | 1,033.60 | | | $ | 4.38 | | |
Hypothetical (5% return before expenses) | | $ | 1,000.00 | | | $ | 1,020.76 | | | $ | 4.36 | | |
* Expenses for the Investor Class are equal to the Fund's annualized expense ratio of 1.01%, multiplied by the average account value over the period, multiplied by 183/365 to reflect the one-half year period. Expenses for the Institutional Class are equal to the Fund's annualized expense ratio of 0.86%, multiplied by the average account value over the period, multiplied by 183/365 to project a one-half year period.
BUFFALO INTERNATIONAL FUND | | Beginning
Account Value
April 1, 2021 | | Ending
Account Value
September 30, 2021 | | Expenses Paid During
Period April 1, 2021 -
September 30, 2021* | |
Investor Class | |
Actual | | $ | 1,000.00 | | | $ | 1,101.90 | | | $ | 5.64 | | |
Hypothetical (5% return before expenses) | | $ | 1,000.00 | | | $ | 1,019.70 | | | $ | 5.42 | | |
Institutional Class | |
Actual | | $ | 1,000.00 | | | $ | 1,102.30 | | | $ | 4.85 | | |
Hypothetical (5% return before expenses) | | $ | 1,000.00 | | | $ | 1,020.46 | | | $ | 4.66 | | |
* Expenses for the Investor Class are equal to the Fund's annualized expense ratio of 1.07%, multiplied by the average account value over the period, multiplied by 183/365 to reflect the one-half year period. Expenses for the Institutional Class are equal to the Fund's annualized expense ratio of 0.92%, multiplied by the average account value over the period, multiplied by 183/365 to project a one-half year period.
BUFFALO LARGE CAP FUND | | Beginning
Account Value
April 1, 2021 | | Ending
Account Value
September 30, 2021 | | Expenses Paid During
Period April 1, 2021 -
September 30, 2021* | |
Investor Class | |
Actual | | $ | 1,000.00 | | | $ | 1,122.20 | | | $ | 4.95 | | |
Hypothetical (5% return before expenses) | | $ | 1,000.00 | | | $ | 1,020.41 | | | $ | 4.71 | | |
Institutional Class | |
Actual | | $ | 1,000.00 | | | $ | 1,123.30 | | | $ | 4.15 | | |
Hypothetical (5% return before expenses) | | $ | 1,000.00 | | | $ | 1,021.16 | | | $ | 3.95 | | |
* Expenses for the Investor Class are equal to the Fund's annualized expense ratio of 0.93%, multiplied by the average account value over the period, multiplied by 183/365 to reflect the one-half year period. Expenses for the Institutional Class are equal to the Fund's annualized expense ratio of 0.78%, multiplied by the average account value over the period, multiplied by 183/365 to project a one-half year period.
BUFFALO MID CAP FUND | | Beginning
Account Value
April 1, 2021 | | Ending
Account Value
September 30, 2021 | | Expenses Paid During
Period April 1, 2021 -
September 30, 2021* | |
Investor Class | |
Actual | | $ | 1,000.00 | | | $ | 1,040.10 | | | $ | 5.17 | | |
Hypothetical (5% return before expenses) | | $ | 1,000.00 | | | $ | 1,020.00 | | | $ | 5.11 | | |
Institutional Class | |
Actual | | $ | 1,000.00 | | | $ | 1,041.50 | | | $ | 4.40 | | |
Hypothetical (5% return before expenses) | | $ | 1,000.00 | | | $ | 1,020.76 | | | $ | 4.36 | | |
* Expenses for the Investor Class are equal to the Fund's annualized expense ratio of 1.01%, multiplied by the average account value over the period, multiplied by 183/365 to reflect the one-half year period. Expenses for the Institutional Class are equal to the Fund's annualized expense ratio of 0.86%, multiplied by the average account value over the period, multiplied by 183/365 to project a one-half year period.

19
BUFFALO SMALL CAP FUND | | Beginning
Account Value
April 1, 2021 | | Ending
Account Value
September 30, 2021 | | Expenses Paid During
Period April 1, 2021 -
September 30, 2021* | |
Investor Class | |
Actual | | $ | 1,000.00 | | | $ | 1,019.90 | | | $ | 5.11 | | |
Hypothetical (5% return before expenses) | | $ | 1,000.00 | | | $ | 1,020.00 | | | $ | 5.11 | | |
Institutional Class | |
Actual | | $ | 1,000.00 | | | $ | 1,020.70 | | | $ | 4.31 | | |
Hypothetical (5% return before expenses) | | $ | 1,000.00 | | | $ | 1,020.81 | | | $ | 4.31 | | |
* Expenses for the Investor Class are equal to the Fund's annualized expense ratio of 1.01%, multiplied by the average account value over the period, multiplied by 183/365 to reflect the one-half year period. Expenses for the Institutional Class are equal to the Fund's annualized expense ratio of 0.85%, multiplied by the average account value over the period, multiplied by 183/365 to project a one-half year period.

20
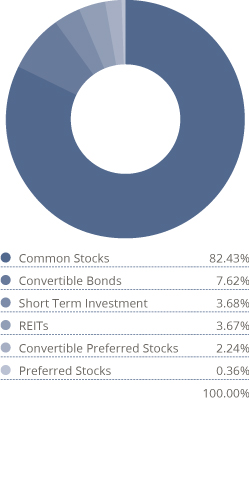
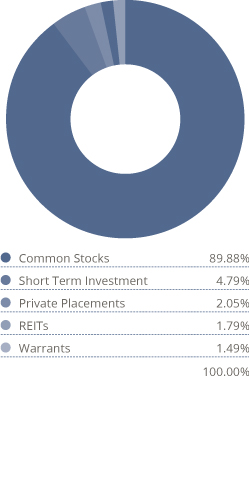
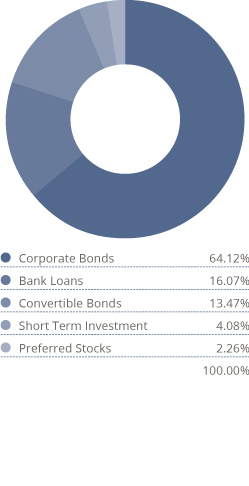
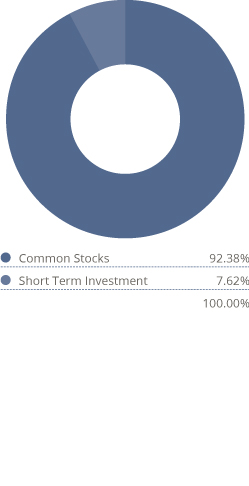
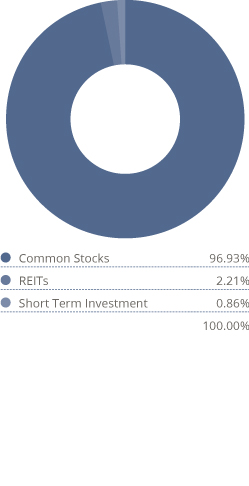
ALLOCATION OF PORTFOLIO HOLDINGS
(UNAUDITED)
Percentages represent market value as a percentage of investments as of September 30, 2021.
BUFFALO DISCOVERY
FUND

BUFFALO DIVIDEND
FOCUS FUND
BUFFALO EARLY STAGE GROWTH FUND
BUFFALO FLEXIBLE
INCOME FUND

BUFFALO GROWTH
FUND

BUFFALO HIGH YIELD
FUND

21
Percentages represent market value as a percentage of investments as of September 30, 2021.
BUFFALO
INTERNATIONAL FUND
BUFFALO LARGE CAP
FUND

BUFFALO MID CAP
FUND
BUFFALO SMALL CAP
FUND


22
BUFFALO DISCOVERY FUND
(UNAUDITED)
SCHEDULE OF INVESTMENTS
SEPTEMBER 30, 2021
Shares or Face Amount | | | | $ Fair Value* | |
Common Stocks | | | 96.08 | % | |
Communication Services | | | 4.32 | % | |
| | | | | Diversified Telecommunication Services | | | 1.29 | % | |
| | 253,879 | | | Bandwidth, Inc.(a) | | | 22,920,196 | | |
| | | | | Entertainment | | | 1.91 | % | |
| | 50,514 | | | Roku, Inc.(a) | | | 15,828,562 | | |
| | 118,415 | | | Take-Two Interactive Software, Inc.(a) | | | 18,244,199 | | |
| | | | 34,072,761 | | |
| | | | | Interactive Media & Services | | | 1.12 | % | |
| | 1,052,780 | | | Eventbrite, Inc.(a) | | | 19,908,070 | | |
| Total Communication Services (Cost $90,720,347) | | | 76,901,027 | | |
Consumer Discretionary | | | 14.49 | % | |
| | | | | Hotels, Restaurants & Leisure | | | 6.57 | % | |
| | 9,093 | | | Chipotle Mexican Grill, Inc.(a) | | | 16,526,709 | | |
| | 183,069 | | | Darden Restaurants, Inc. | | | 27,729,462 | | |
| | 623,684 | | | Everi Holdings Inc.(a) | | | 15,080,679 | | |
| | 526,645 | | | MGM Resorts International | | | 22,724,732 | | |
| | 329,120 | | | Penn National Gaming, Inc.(a) | | | 23,848,035 | | |
| | 489,494 | | | Sportradar Holding AG — ADR(a) (b) | | | 11,077,249 | | |
| | | | 116,986,866 | | |
| | | | | Internet & Direct Marketing Retail | | | 1.93 | % | |
| | 209,630 | | | Expedia Group, Inc.(a) | | | 34,358,357 | | |
| | | | | Leisure Products | | | 1.73 | % | |
| | 644,925 | | | Callaway Golf Co.(a) | | | 17,819,278 | | |
| | 149,104 | | | Peloton Interactive, Inc.(a) | | | 12,979,503 | | |
| | | | 30,798,781 | | |
| | | | | Specialty Retail | | | 3.16 | % | |
| | 75,255 | | | Five Below, Inc.(a) | | | 13,305,837 | | |
| | 361,803 | | | Olaplex Holdings, Inc.(a) | | | 8,864,173 | | |
| | 106,059 | | | Ross Stores, Inc. | | | 11,544,522 | | |
| | 110,651 | | | Tractor Supply Co. | | | 22,418,999 | | |
| | | | 56,133,531 | | |
| | | | | Textiles, Apparel & Luxury Goods | | | 1.10 | % | |
| | 292,381 | | | VF Corp. | | | 19,586,603 | | |
| Total Consumer Discretionary (Cost $197,118,112) | | | 257,864,138 | | |

The accompanying notes are an integral part of these financial statements.
23
BUFFALO DISCOVERY FUND
(UNAUDITED)
SCHEDULE OF INVESTMENTS
SEPTEMBER 30, 2021 Continued
Shares or Face Amount | | | | $ Fair Value* | |
Financials | | | 4.52 | % | |
| | | | | Capital Markets | | | 3.25 | % | |
| | 151,540 | | | Intercontinental Exchange, Inc. | | | 17,399,823 | | |
| | 66,495 | | | MSCI, Inc. | | | 40,451,568 | | |
| | | | 57,851,391 | | |
| | | | | Diversified Financial Services | | | 1.27 | % | |
| | 143,274 | | | Global Payments Inc. | | | 22,577,117 | | |
| Total Financials (Cost $36,172,910) | | | 80,428,508 | | |
Health Care | | | 21.24 | % | |
| | | | | Biotechnology | | | 4.61 | % | |
| | 239,815 | | | Horizon Therapeutics Plc — ADR(a) (b) | | | 26,269,335 | | |
| | 168,835 | | | Ligand Pharmaceuticals, Inc.(a) | | | 23,522,092 | | |
| | 289,495 | | | Natera, Inc.(a) | | | 32,261,323 | | |
| | | | 82,052,750 | | |
| | | | | Health Care Equipment & Supplies | | | 4.36 | % | |
| | 188,200 | | | Alcon, Inc. — ADR(b) | | | 15,144,454 | | |
| | 579,200 | | | Boston Scientific Corp.(a) | | | 25,131,488 | | |
| | 24,237 | | | IDEXX Laboratories, Inc.(a) | | | 15,072,990 | | |
| | 152,299 | | | Zimmer Biomet Holdings, Inc. | | | 22,290,482 | | |
| | | | 77,639,414 | | |
| | | | | Health Care Providers & Services | | | 2.43 | % | |
| | 127,930 | | | Guardant Health, Inc.(a) | | | 15,992,530 | | |
| | 420,050 | | | HealthEquity, Inc.(a) | | | 27,202,438 | | |
| | | | 43,194,968 | | |
| | | | | Life Sciences Tools & Services | | | 8.30 | % | |
| | 131,444 | | | Agilent Technologies, Inc. | | | 20,706,373 | | |
| | 766,870 | | | Avantor, Inc.(a) | | | 31,364,983 | | |
| | 21,380 | | | Bio-Rad Laboratories, Inc.(a) | | | 15,948,411 | | |
| | 66,415 | | | Charles River Laboratories International, Inc.(a) | | | 27,407,478 | | |
| | 115,506 | | | ICON PLC. — ADR(a) (b) | | | 30,264,882 | | |
| | 875,560 | | | Stevanato Group SpA — ADR(a) (b) | | | 22,160,424 | | |
| | | | 147,852,551 | | |
| | | | | Pharmaceuticals | | | 1.54 | % | |
| | 205,860 | | | Catalent, Inc.(a) | | | 27,393,790 | | |
| Total Health Care (Cost $251,623,591) | | | 378,133,473 | | |

The accompanying notes are an integral part of these financial statements.
24
BUFFALO DISCOVERY FUND
(UNAUDITED)
SCHEDULE OF INVESTMENTS
SEPTEMBER 30, 2021 Continued
Shares or Face Amount | | | | $ Fair Value* | |
Industrials | | | 20.00 | % | |
| | | | | Building Products | | | 1.22 | % | |
| | 419,837 | | | Builders FirstSource, Inc.(a) | | | 21,722,366 | | |
| | | | | Commercial Services & Supplies | | | 1.65 | % | |
| | 211,816 | | | Copart, Inc.(a) | | | 29,383,116 | | |
| | | | | Construction & Engineering | | | 1.46 | % | |
| | 300,765 | | | MasTec, Inc.(a) | | | 25,950,004 | | |
| | | | | Electrical Equipment | | | 3.57 | % | |
| | 230,015 | | | AMETEK, Inc. | | | 28,524,160 | | |
| | 85,952 | | | Generac Holdings, Inc.(a) | | | 35,126,004 | | |
| | | | 63,650,164 | | |
| | | | | Machinery | | | 1.02 | % | |
| | 358,709 | | | Ingersoll Rand, Inc.(a) | | | 18,082,521 | | |
| | | | | Professional Services | | | 8.09 | % | |
| | 319,660 | | | CoStar Group, Inc.(a) | | | 27,509,939 | | |
| | 356,495 | | | IHS Markit Ltd. — ADR(b) | | | 41,574,447 | | |
| | 230,664 | | | TransUnion | | | 25,905,874 | | |
| | 408,265 | | | Upwork, Inc.(a) | | | 18,384,173 | | |
| | 152,795 | | | Verisk Analytics, Inc. | | | 30,600,255 | | |
| | | | 143,974,688 | | |
| | | | | Road & Rail | | | 0.96 | % | |
| | 319,073 | | | Lyft, Inc.(a) | | | 17,099,122 | | |
| | | | | Trading Companies & Distributors | | | 2.03 | % | |
| | 392,325 | | | Fastenal Co. | | | 20,247,893 | | |
| | 138,431 | | | WESCO International, Inc.(a) | | | 15,963,863 | | |
| | | | 36,211,756 | | |
| Total Industrials (Cost $195,733,718) | | | 356,073,737 | | |
Information Technology | | | 29.21 | % | |
| | | | | Communications Equipment | | | 3.79 | % | |
| | 36,078 | | | Arista Networks Inc.(a) | | | 12,397,844 | | |
| | 343,785 | | | Ciena Corp.(a) | | | 17,653,360 | | |
| | 121,464 | | | F5 Networks, Inc.(a) | | | 24,144,614 | | |
| | 158,156 | | | Lumentum Holdings, Inc.(a) | | | 13,212,352 | | |
| | | | 67,408,170 | | |

The accompanying notes are an integral part of these financial statements.
25
BUFFALO DISCOVERY FUND
(UNAUDITED)
SCHEDULE OF INVESTMENTS
SEPTEMBER 30, 2021 Continued
Shares or Face Amount | | | | $ Fair Value* | |
| | | | | Electronic Equipment, Instruments & Components | | | 4.07 | % | |
| | 307,274 | | | Amphenol Corp. — Class A | | | 22,501,675 | | |
| | 193,390 | | | Keysight Technologies, Inc.(a) | | | 31,772,043 | | |
| | 463,933 | | | National Instruments Corp. | | | 18,200,092 | | |
| | | | 72,473,810 | | |
| | | | | IT Services | | | 4.00 | % | |
| | 87,140 | | | Akamai Technologies, Inc.(a) | | | 9,113,972 | | |
| | 30,540 | | | EPAM Systems, Inc.(a) | | | 17,422,459 | | |
| | 91,566 | | | FleetCor Technologies, Inc.(a) | | | 23,923,449 | | |
| | 296,630 | | | GoDaddy, Inc. — Class A(a) | | | 20,675,111 | | |
| | | | 71,134,991 | | |
| | | | | Semiconductors & Semiconductor Equipment | | | 3.07 | % | |
| | 39,877 | | | KLA-Tencor Corporation | | | 13,339,255 | | |
| | 257,096 | | | Micron Technology, Inc.(a) | | | 18,248,674 | | |
| | 135,509 | | | Universal Display Corp. | | | 23,166,619 | | |
| | | | 54,754,548 | | |
| | | | | Software | | | 14.28 | % | |
| | 532,000 | | | 8x8, Inc.(a) | | | 12,443,480 | | |
| | 90,539 | | | Aspen Technology, Inc.(a) | | | 11,118,189 | | |
| | 65,200 | | | Autodesk, Inc.(a) | | | 18,593,084 | | |
| | 324,484 | | | Digital Turbine, Inc.(a) | | | 22,308,275 | | |
| | 431,066 | | | DoubleVerify Holdings, Inc.(a) | | | 14,725,215 | | |
| | 161,605 | | | Guidewire Software, Inc.(a) | | | 19,209,986 | | |
| | 767,765 | | | Momentive Global, Inc.(a) | | | 15,048,194 | | |
| | 55,000 | | | Palo Alto Networks, Inc.(a) | | | 26,345,000 | | |
| | 526,490 | | | Riskified Ltd. — ADR(a) (b) | | | 12,009,237 | | |
| | 87,396 | | | Splunk, Inc.(a) | | | 12,647,075 | | |
| | 58,058 | | | Synopsys, Inc.(a) | | | 17,383,146 | | |
| | 721,710 | | | Tenable Holdings, Inc.(a) | | | 33,299,700 | | |
| | 41,191 | | | Tyler Technologies, Inc.(a) | | | 18,892,252 | | |
| | 331,105 | | | Varonis Systems, Inc.(a) | | | 20,147,739 | | |
| | | | 254,170,572 | | |
| Total Information Technology (Cost $395,720,905) | | | 519,942,091 | | |

The accompanying notes are an integral part of these financial statements.
26
BUFFALO DISCOVERY FUND
(UNAUDITED)
SCHEDULE OF INVESTMENTS
SEPTEMBER 30, 2021 Continued
Shares or Face Amount | | | | $ Fair Value* | |
Materials | | | 2.30 | % | |
| | | | | Construction Materials | | | 1.45 | % | |
| | 75,798 | | | Martin Marietta Materials, Inc. | | | 25,898,661 | | |
| | | | | Metals & Mining | | | 0.85 | % | |
| | 762,524 | | | Cleveland-Cliffs, Inc.(a) | | | 15,105,600 | | |
| Total Materials (Cost $37,727,095) | | | 41,004,261 | | |
| Total Common Stocks (Cost $1,204,816,678) | | | 1,710,347,235 | | |
REITS | | | 1.45 | % | |
Real Estate | | | 1.45 | % | |
| | | | | Equity Real Estate Investment Trusts (REITs) | | | 1.45 | % | |
| | 16,558 | | | Equinix Inc. | | | 13,082,973 | | |
| | 38,514 | | | SBA Communications Corp. | | | 12,731,573 | | |
| Total Real Estate (Cost $12,259,663) | | | 25,814,546 | | |
| Total REITS (Cost $12,366,279) | | | 25,814,546 | | |
Short Term Investments | | | 3.63 | % | |
Investment Company | | | 3.63 | % | |
| | 64,706,143 | | | Fidelity Investments Money Market Funds — Government Portfolio — Class I — 0.01%(c) | | | 64,706,143 | | |
Total Investment Company | | | 64,706,143 | | |
| Total Short Term Investments (Cost $64,706,143) | | | 64,706,143 | | |
Total Investments (Cost $1,281,782,484)
| | | 101.16
1,800,867,924 | % | |
Liabilities in Excess of Other Assets
| | | (1.16
(20,722,894) | )% | |
Total Net Assets
| | | 100.00
1,780,145,031 | % | |

The accompanying notes are an integral part of these financial statements.
27
BUFFALO DISCOVERY FUND
(UNAUDITED)
SCHEDULE OF INVESTMENTS
SEPTEMBER 30, 2021 Continued
ADR American Depositary Receipt
PLC Public Limited Company
(a) Non Income Producing.
(b) Foreign Issued Security. The total value of these securities amounted to $157,356,357 (8.84% of net assets) at September 30, 2021.
(c) The rate quoted is the annualized seven-day effective yield as of September 30, 2021.
* See Note 1A of the accompanying Notes to Financial Statements regarding valuation of securities.
The Global Industry Classification Standard (GICS) was developed by and/or is the exclusive property of MSCI, Inc. and Standard & Poor's Financial Services LLC ("S&P"). GICS is a service mark of MSCI and S&P and has been licensed for use by U.S. Bancorp Fund Services, LLC.

The accompanying notes are an integral part of these financial statements.
28
BUFFALO DIVIDEND FOCUS FUND
(UNAUDITED)
SCHEDULE OF INVESTMENTS
SEPTEMBER 30, 2021
Shares or Face Amount | | | | $ Fair Value* | |
Common Stocks | | | 82.42 | % | |
Communication Services | | | 7.58 | % | |
| | | | | Diversified Telecommunication Services | | | 0.52 | % | |
| | 10,625 | | | Verizon Communications, Inc. | | | 573,856 | | |
| | | | | Entertainment | | | 1.91 | % | |
| | 10,750 | | | Activision Blizzard, Inc. | | | 831,943 | | |
| | 7,605 | | | The Walt Disney Co.(a) | | | 1,286,538 | | |
| | | | 2,118,481 | | |
| | | | | Interactive Media & Services | | | 4.02 | % | |
| | 630 | | | Alphabet, Inc. — Class A(a) | | | 1,684,318 | | |
| | 650 | | | Alphabet, Inc. — Class C(a) | | | 1,732,451 | | |
| | 3,100 | | | Facebook, Inc. — Class A(a) | | | 1,052,109 | | |
| | | | 4,468,878 | | |
| | | | | Media | | | 1.13 | % | |
| | 22,500 | | | Comcast Corp. — Class A | | | 1,258,425 | | |
| Total Communication Services (Cost $3,286,636) | | | 8,419,640 | | |
Consumer Discretionary | | | 4.27 | % | |
| | | | | Hotels, Restaurants & Leisure | | | 1.39 | % | |
| | 6,775 | | | Cedar Fair, L.P.(a) | | | 314,224 | | |
| | 5,000 | | | Las Vegas Sands Corp(a) | | | 183,000 | | |
| | 9,500 | | | Starbucks Corp. | | | 1,047,945 | | |
| | | | 1,545,169 | | |
| | | | | Internet & Direct Marketing Retail | | | 1.63 | % | |
| | 550 | | | Amazon.com, Inc.(a) | | | 1,806,772 | | |
| | | | | Specialty Retail | | | 1.25 | % | |
| | 4,225 | | | The Home Depot, Inc. | | | 1,386,899 | | |
| Total Consumer Discretionary (Cost $1,974,064) | | | 4,738,840 | | |
Consumer Staples | | | 3.74 | % | |
| | | | | Beverages | | | 1.25 | % | |
| | 5,550 | | | PepsiCo, Inc. | | | 834,776 | | |
| | 35,000 | | | PRIMO WATER CORPORATION — ADR(b) | | | 550,200 | | |
| | | | 1,384,976 | | |

The accompanying notes are an integral part of these financial statements.
29
BUFFALO DIVIDEND FOCUS FUND
(UNAUDITED)
SCHEDULE OF INVESTMENTS
SEPTEMBER 30, 2021 Continued
Shares or Face Amount | | | | $ Fair Value* | |
| | | | | Food & Staples Retailing | | | 0.43 | % | |
| | 3,450 | | | Walmart, Inc. | | | 480,861 | | |
| | | | | Food Products | | | 1.34 | % | |
| | 9,000 | | | Lamb Weston Holdings, Inc. | | | 552,330 | | |
| | 11,900 | | | Tyson Foods, Inc. | | | 939,386 | | |
| | | | 1,491,716 | | |
| | | | | Household Products | | | 0.72 | % | |
| | 5,725 | | | The Procter & Gamble Co. | | | 800,355 | | |
| Total Consumer Staples (Cost $3,022,908) | | | 4,157,908 | | |
Energy | | | 9.19 | % | |
| | | | | Oil, Gas & Consumable Fuels | | | 9.19 | % | |
| | 116,900 | | | Energy Transfer Equity, L.P. | | | 1,119,902 | | |
| | 46,650 | | | Enterprise Products Partners L.P. | | | 1,009,506 | | |
| | 17,200 | | | Enviva Partners LP | | | 930,348 | | |
| | 9,875 | | | Hess Corp. | | | 771,336 | | |
| | 12,126 | | | Marathon Petroleum Corp. | | | 749,508 | | |
| | 63,400 | | | Northern Oil and Gas, Inc. | | | 1,356,760 | | |
| | 7,900 | | | Valero Energy Corp. | | | 557,503 | | |
| | 170,000 | | | Viper Energy Partners LP | | | 3,714,500 | | |
| Total Energy (Cost $7,011,586) | | | 10,209,363 | | |
Financials | | | 16.00 | % | |
| | | | | Banks | | | 9.64 | % | |
| | 59,000 | | | Bank of America Corp. | | | 2,504,550 | | |
| | 29,000 | | | Citigroup, Inc. | | | 2,035,220 | | |
| | 46,500 | | | Citizens Financial Group, Inc. | | | 2,184,570 | | |
| | 12,500 | | | JPMorgan Chase & Co. | | | 2,046,125 | | |
| | 33,000 | | | Truist Financial Corp. | | | 1,935,450 | | |
| | | | 10,705,915 | | |
| | | | | Capital Markets | | | 3.50 | % | |
| | 1,100 | | | BlackRock, Inc. | | | 922,526 | | |
| | 4,025 | | | CME Group, Inc. | | | 778,354 | | |
| | 5,150 | | | S&P Global, Inc. | | | 2,188,184 | | |
| | | | 3,889,064 | | |

The accompanying notes are an integral part of these financial statements.
30
BUFFALO DIVIDEND FOCUS FUND
(UNAUDITED)
SCHEDULE OF INVESTMENTS
SEPTEMBER 30, 2021 Continued
Shares or Face Amount | | | | $ Fair Value* | |
| | | | | Diversified Financial Services | | | 1.31 | % | |
| | 27,000 | | | Compass Diversified Holdings | | | 760,590 | | |
| | 4,400 | | | Global Payments Inc. | | | 693,352 | | |
| | | | 1,453,942 | | |
| | | | | Insurance | | | 1.55 | % | |
| | 11,575 | | | Arthur J. Gallagher & Co. | | | 1,720,624 | | |
| Total Financials (Cost $8,797,277) | | | 17,769,545 | | |
Health Care | | | 15.12 | % | |
| | | | | Biotechnology | | | 2.44 | % | |
| | 24,700 | | | Horizon Therapeutics Plc — ADR(a) (b) | | | 2,705,638 | | |
| | | | | Health Care Equipment & Supplies | | | 2.46 | % | |
| | 11,600 | | | Baxter International, Inc. | | | 932,988 | | |
| | 7,400 | | | Medtronic, PLC — (b) | | | 927,590 | | |
| | 6,000 | | | Zimmer Biomet Holdings, Inc. | | | 878,160 | | |
| | | | 2,738,738 | | |
| | | | | Health Care Providers & Services | | | 7.84 | % | |
| | 3,375 | | | Anthem, Inc. | | | 1,258,200 | | |
| | 32,900 | | | CVS Health Corp. | | | 2,791,894 | | |
| | 8,100 | | | HCA Healthcare, Inc. | | | 1,966,032 | | |
| | 2,500 | | | McKesson Corp. | | | 498,450 | | |
| | 5,600 | | | UnitedHealth Group, Inc. | | | 2,188,144 | | |
| | | | 8,702,720 | | |
| | | | | Pharmaceuticals | | | 2.38 | % | |
| | 3,150 | | | Eli Lilly & Co. | | | 727,808 | | |
| | 7,125 | | | Johnson & Johnson | | | 1,150,687 | | |
| | 9,800 | | | Merck & Co., Inc. | | | 736,078 | | |
| | 980 | | | Organon & Co. | | | 32,134 | | |
| | | | 2,646,707 | | |
| Total Health Care (Cost $9,849,004) | | | 16,793,803 | | |
Industrials | | | 5.44 | % | |
| | | | | Aerospace & Defense | | | 0.60 | % | |
| | 3,025 | | | The Boeing Co.(a) | | | 665,319 | | |
| | | | | Commercial Services & Supplies | | | 0.96 | % | |
| | 2,800 | | | Cintas Corp. | | | 1,065,848 | | |

The accompanying notes are an integral part of these financial statements.
31
BUFFALO DIVIDEND FOCUS FUND
(UNAUDITED)
SCHEDULE OF INVESTMENTS
SEPTEMBER 30, 2021 Continued
Shares or Face Amount | | | | $ Fair Value* | |
| | | | | Electrical Equipment | | | 0.28 | % | |
| | 2,500 | | | AMETEK, Inc. | | | 310,025 | | |
| | | | | Industrial Conglomerates | | | 0.66 | % | |
| | 3,450 | | | Honeywell International, Inc. | | | 732,366 | | |
| | | | | Machinery | | | 0.99 | % | |
| | 3,950 | | | Parker-Hannifin Corp. | | | 1,104,499 | | |
| | | | | Professional Services | | | 1.47 | % | |
| | 3,200 | | | Equifax, Inc. | | | 810,944 | | |
| | 7,000 | | | IHS Markit Ltd. — (b) | | | 816,340 | | |
| | | | 1,627,284 | | |
| | | | | Trading Companies & Distributors | | | 0.48 | % | |
| | 10,300 | | | Fastenal Co. | | | 531,583 | | |
| Total Industrials (Cost $3,430,116) | | | 6,036,924 | | |
Information Technology | | | 16.08 | % | |
| | | | | Communications Equipment | | | 0.87 | % | |
| | 17,750 | | | Cisco Systems, Inc. | | | 966,132 | | |
| | | | | IT Services | | | 3.97 | % | |
| | 4,400 | | | MasterCard, Inc. — Class A | | | 1,529,792 | | |
| | 12,925 | | | Visa Inc. — Class A | | | 2,879,044 | | |
| | | | 4,408,836 | | |
| | | | | Semiconductors & Semiconductor Equipment | | | 1.57 | % | |
| | 9,075 | | | QUALCOMM, Inc. | | | 1,170,493 | | |
| | 2,950 | | | Texas Instruments, Inc. | | | 567,020 | | |
| | | | 1,737,513 | | |
| | | | | Software | | | 5.71 | % | |
| | 50,100 | | | Absolute Software Corp. — ADR(b) | | | 550,599 | | |
| | 18,650 | | | Microsoft Corp. | | | 5,257,808 | | |
| | 7,700 | | | SS&C Technologies Holdings, Inc. | | | 534,380 | | |
| | | | 6,342,787 | | |
| | | | | Technology Hardware, Storage & Peripherals | | | 3.96 | % | |
| | 31,080 | | | Apple Inc. | | | 4,397,820 | | |
| Total Information Technology (Cost $5,663,134) | | | 17,853,088 | | |

The accompanying notes are an integral part of these financial statements.
32
BUFFALO DIVIDEND FOCUS FUND
(UNAUDITED)
SCHEDULE OF INVESTMENTS
SEPTEMBER 30, 2021 Continued
Shares or Face Amount | | | | $ Fair Value* | |
Materials | | | 1.63 | % | |
| | | | | Construction Materials | | | 0.88 | % | |
| | 10,000 | | | CRH PLC — ADR(b) | | | 467,400 | | |
| | 1,500 | | | Martin Marietta Materials, Inc. | | | 512,520 | | |
| | | | 979,920 | | |
| | | | | Containers & Packaging | | | 0.75 | % | |
| | 43,700 | | | Graphic Packaging Holding Co. | | | 832,048 | | |
| Total Materials (Cost $1,579,696) | | | 1,811,968 | | |
Utilities | | | 3.37 | % | |
| | | | | Electric Utilities | | | 2.67 | % | |
| | 15,700 | | | American Electric Power Co., Inc. | | | 1,274,526 | | |
| | 30,550 | | | Edison International | | | 1,694,608 | | |
| | | | 2,969,134 | | |
| | | | | Multi-Utilities | | | 0.70 | % | |
| | 6,100 | | | Sempra Energy | | | 771,650 | | |
| Total Utilities (Cost $3,582,309) | | | 3,740,784 | | |
| Total Common Stocks (Cost $48,196,730) | | | 91,531,863 | | |
REITS | | | 3.67 | % | |
Real Estate | | | 3.67 | % | |
| | | | | Equity Real Estate Investment Trusts (REITs) | | | 3.67 | % | |
| | 3,200 | | | American Tower Corp. | | | 849,312 | | |
| | 19,106 | | | Community Healthcare Trust, Inc. | | | 863,400 | | |
| | 10,000 | | | CyrusOne, Inc. | | | 774,100 | | |
| | 5,000 | | | Digital Realty Trust, Inc. | | | 722,250 | | |
| | 1,100 | | | Equinix Inc. | | | 869,143 | | |
| Total Real Estate (Cost $2,663,061) | | | 4,078,205 | | |
| Total REITS (Cost $2,663,061) | | | 4,078,205 | | |

The accompanying notes are an integral part of these financial statements.
33
BUFFALO DIVIDEND FOCUS FUND
(UNAUDITED)
SCHEDULE OF INVESTMENTS
SEPTEMBER 30, 2021 Continued
Shares or Face Amount | | | | $ Fair Value* | |
Convertible Preferred Stocks | | | 2.25 | % | |
Health Care | | | 2.25 | % | |
| | | | | Pharmaceuticals | | | 2.25 | % | |
| | 50,000 | | | Elanco Animal Health, Inc. | | | 2,493,500 | | |
| Total Health Care (Cost $2,429,605) | | | 2,493,500 | | |
| Total Convertible Preferred Stocks (Cost $2,429,605) | | | 2,493,500 | | |
Preferred Stocks | | | 0.36 | % | |
Financials | | | 0.36 | % | |
| | | | | Diversified Financial Services | | | 0.36 | % | |
| | 15,000 | | | Compass Diversified Holdings | | | 402,000 | | |
| Total Financials (Cost $379,031) | | | 402,000 | | |
| Total Preferred Stocks (Cost $379,031) | | | 402,000 | | |
Convertible Bonds | | | 7.62 | % | |
Communication Services | | | 0.51 | % | |
| | | | | Entertainment | | | 0.51 | % | |
| | | | | Zynga, Inc. | | | |
| | 500,000 | | | 0.250%, 06/01/2024 | | | 569,322 | | |
| Total Communication Services (Cost $507,054) | | | 569,322 | | |
Health Care | | | 2.41 | % | |
| | | | | Biotechnology | | | 2.41 | % | |
| | | | | Apellis Pharmaceuticals, Inc. | | | |
| | 300,000 | | | 3.500%, 09/15/2026 | | | 372,375 | | |
| | | | | Avadel Finance Cayman Ltd. | | | |
| | 650,000 | | | 4.500%, 02/01/2023(b) (c) | | | 751,400 | | |
| | | | | Exact Sciences Corp. | | | |
| | 100,000 | | | 0.375%, 03/15/2027 | | | 113,750 | | |
| | 750,000 | | | 0.375%, 03/01/2028 | | | 808,920 | | |
| | | | | PTC Therapeutics, Inc. | | | |
| | 600,000 | | | 1.500%, 09/15/2026(c) | | | 620,100 | | |
| Total Health Care (Cost $2,439,558) | | | 2,666,545 | | |

The accompanying notes are an integral part of these financial statements.
34
BUFFALO DIVIDEND FOCUS FUND
(UNAUDITED)
SCHEDULE OF INVESTMENTS
SEPTEMBER 30, 2021 Continued
Shares or Face Amount | | | | $ Fair Value* | |
Industrials | | | 1.01 | % | |
| | | | | Airlines | | | 1.01 | % | |
| | | | | Southwest Airlines Co. | | | |
| | 750,000 | | | 1.250%, 05/01/2025 | | | 1,123,125 | | |
| Total Industrials (Cost $750,000) | | | 1,123,125 | | |
Information Technology | | | 3.69 | % | |
| | | | | Communications Equipment | | | 0.74 | % | |
| | | | | Lumentum Holdings, Inc. | | | |
| | 750,000 | | | 0.500%, 12/15/2026 | | | 827,510 | | |
| | | | | Software | | | 2.95 | % | |
| | | | | Cerence, Inc. | | | |
| | 250,000 | | | 3.000%, 06/01/2025(c) | | | 667,773 | | |
| | | | | Guidewire Software, Inc. | | | |
| | 500,000 | | | 1.250%, 03/15/2025 | | | 602,188 | | |
| | | | | Nuance Communications, Inc. | | | |
| | 750,000 | | | 1.500%, 11/01/2035 | | | 2,002,996 | | |
| | | | 3,272,957 | | |
| Total Information Technology (Cost $2,242,193) | | | 4,100,467 | | |
| Total Convertible Bonds (Cost $5,938,805) | | | 8,459,459 | | |
Short Term Investments | | | 3.68 | % | |
Investment Company | | | 3.68 | % | |
| | 4,082,750 | | | Fidelity Investments Money Market Funds — Government Portfolio — Class I — 0.10%(d) | | | 4,082,750 | | |
Total Investment Company | | | 4,082,750 | | |
| Total Short Term Investments (Cost $4,082,750) | | | 4,082,750 | | |

The accompanying notes are an integral part of these financial statements.
35
BUFFALO DIVIDEND FOCUS FUND
(UNAUDITED)
SCHEDULE OF INVESTMENTS
SEPTEMBER 30, 2021 Continued
Shares or Face Amount | | | | $ Fair Value* | |
Total Investments (Cost $63,689,982)
| | | 100.00
111,047,777 | % | |
Other Assets in Excess of Liabilities
| | | 0.00
4,279 | % | |
Total Net Assets
| | | 100.00
111,052,056 | % | |
ADR American Depositary Receipt
PLC Public Limited Company
(a) Non Income Producing
(b) Foreign Issued Security. The total value of these securities amounted to $6,769,167 (6.10% of net assets) at September 30, 2021.
(c) 144A Securities. The total value of these securities is $2,039,273 (1.84% of net assets) at September 30, 2021.
(d) The rate quoted is the annualized seven-day effective yield as of September 30, 2021.
* See Note 1A of the accompanying Notes to Financial Statements regarding valuation of securities.
The Global Industry Classification Standard (GICS) was developed by and/or is the exclusive property of MSCI, Inc. and Standard & Poor's Financial Services LLC ("S&P"). GICS is a service mark of MSCI and S&P and has been licensed for use by U.S. Bancorp Fund Services, LLC.

The accompanying notes are an integral part of these financial statements.
36
BUFFALO EARLY STAGE GROWTH
FUND (UNAUDITED)
SCHEDULE OF INVESTMENTS
SEPTEMBER 30, 2021
Shares or Face Amount | | | | $ Fair Value | |
Common Stocks | | | 88.62 | % | |
Communication Services | | | 3.07 | % | |
| | | | | Entertainment | | | 0.85 | % | |
| | 84,000 | | | Motorsport Games, Inc.(a) | | | 1,197,840 | | |
| | | | | Interactive Media & Services | | | 2.22 | % | |
| | 49,900 | | | EverQuote, Inc.(a) | | | 929,637 | | |
| | 117,700 | | | Genius Sports Ltd. — ADR(a) (b) | | | 2,196,282 | | |
| | | | 3,125,919 | | |
| Total Communication Services (Cost $4,543,807) | | | 4,323,759 | | |
Consumer Discretionary | | | 17.65 | % | |
| | | | | Auto Components | | | 0.92 | % | |
| | 25,000 | | | Holley, Inc.(a) | | | 298,500 | | |
| | 51,196 | | | Motorcar Parts of America, Inc.(a) | | | 998,322 | | |
| | | | 1,296,822 | | |
| | | | | Diversified Consumer Services | | | 1.23 | % | |
| | 173,300 | | | OneSpaWorld Holdings Ltd. — ADR(a) (b) | | | 1,727,801 | | |
| | | | | Hotels, Restaurants & Leisure | | | 5.43 | % | |
| | 187,800 | | | Accel Entertainment, Inc.(a) | | | 2,279,892 | | |
| | 155,200 | | | Del Taco Restaurants, Inc. | | | 1,354,896 | | |
| | 247,200 | | | Playa Hotels & Resorts N.V. — ADR(a) (b) | | | 2,049,288 | | |
| | 101,600 | | | Rush Street Interactive, Inc.(a) | | | 1,951,736 | | |
| | | | 7,635,812 | | |
| | | | | Household Durables | | | 3.05 | % | |
| | 13,900 | | | LGI Homes, Inc.(a) | | | 1,972,549 | | |
| | 20,100 | | | Lovesac Co/The(a) | | | 1,328,409 | | |
| | 20,000 | | | Universal Electronics, Inc.(a) | | | 985,000 | | |
| | | | 4,285,958 | | |
| | | | | Internet & Direct Marketing Retail | | | 4.36 | % | |
| | 43,900 | | | Overstock.com, Inc.(a) | | | 3,420,688 | | |
| | 23,900 | | | Shutterstock, Inc. | | | 2,708,348 | | |
| | | | 6,129,036 | | |
| | | | | Leisure Products | | | 1.32 | % | |
| | 26,600 | | | Malibu Boats, Inc. — Class A(a) | | | 1,861,468 | | |

The accompanying notes are an integral part of these financial statements.
37
BUFFALO EARLY STAGE GROWTH
FUND (UNAUDITED)
SCHEDULE OF INVESTMENTS
SEPTEMBER 30, 2021 Continued
Shares or Face Amount | | | | $ Fair Value | |
| | | | | Specialty Retail | | | 1.34 | % | |
| | 20,100 | | | Sleep Number Corp.(a) | | | 1,878,948 | | |
| Total Consumer Discretionary (Cost $16,797,474) | | | 24,815,845 | | |
Consumer Staples | | | 2.65 | % | |
| | | | | Food Products | | | 2.65 | % | |
| | 162,238 | | | Stryve Foods, Inc.(a) | | | 867,973 | | |
| | 240,000 | | | SunOpta, Inc. — ADR(a) (b) | | | 2,143,200 | | |
| | 38,500 | | | Tattooed Chef, Inc.(a) | | | 709,555 | | |
| Total Consumer Staples (Cost $5,051,786) | | | 3,720,728 | | |
Financials | | | 8.19 | % | |
| | | | | Capital Markets | | | 4.50 | % | |
| | 21,985 | | | Hamilton Lane Inc. — Class A | | | 1,864,768 | | |
| | 89,900 | | | MarketWise, Inc.(a) | | | 742,574 | | |
| | | | 2,607,342 | | |
| | 103,100 | | | Open Lending Corp.(a) | | | 3,718,817 | | |
| | | | | Diversified Financial Services | | | 2.28 | % | |
| | 113,700 | | | Compass Diversified Holdings | | | 3,202,929 | | |
| | | | | Insurance | | | 1.41 | % | |
| | 12,300 | | | Kinsale Capital Group, Inc. | | | 1,988,910 | | |
| Total Financials (Cost $4,105,322) | | | 11,517,998 | | |
Health Care | | | 15.34 | % | |
| | | | | Biotechnology | | | 1.73 | % | |
| | 22,100 | | | Castle Biosciences, Inc.(a) | | | 1,469,650 | | |
| | 28,600 | | | Deciphera Pharmaceuticals, Inc.(a) | | | 971,828 | | |
| | | | 2,441,478 | | |

The accompanying notes are an integral part of these financial statements.
38
BUFFALO EARLY STAGE GROWTH
FUND (UNAUDITED)
SCHEDULE OF INVESTMENTS
SEPTEMBER 30, 2021 Continued
Shares or Face Amount | | | | $ Fair Value | |
| | | | | Health Care Equipment & Supplies | | | 6.61 | % | |
| | 36,700 | | | Establishment Labs Holdings, Inc. — ADR(a) (b) | | | 2,626,986 | | |
| | 28,490 | | | OrthoPediatrics Corp.(a) | | | 1,866,380 | | |
| | 165,000 | | | PAVmed, Inc.(a) | | | 1,409,100 | | |
| | 189,152 | | | Repro-Med Systems, Inc.(a) | | | 539,083 | | |
| | 164,300 | | | Sientra, Inc.(a) | | | 941,439 | | |
| | 14,875 | | | STAAR Surgical Co.(a) | | | 1,911,884 | | |
| | | | 9,294,872 | | |
| | | | | Health Care Providers & Services | | | 0.65 | % | |
| | 5,800 | | | LHC Group, Inc.(a) | | | 910,078 | | |
| | | | | Health Care Technology | | | 4.46 | % | |
| | 67,100 | | | HealthStream, Inc.(a) | | | 1,917,718 | | |
| | 6,785 | | | Inspire Medical Systems, Inc.(a) | | | 1,580,091 | | |
| | 18,700 | | | Omnicell, Inc.(a) | | | 2,775,641 | | |
| | | | 6,273,450 | | |
| | | | | Pharmaceuticals | | | 1.89 | % | |
| | 505,000 | | | Recro Pharma, Inc.(a) | | | 1,040,300 | | |
| | 129,251 | | | Verrica Pharmaceuticals, Inc.(a) | | | 1,615,637 | | |
| | | | 2,655,937 | | |
| Total Health Care (Cost $12,522,850) | | | 21,575,815 | | |
Industrials | | | 16.13 | % | |
| | | | | Aerospace & Defense | | | 0.64 | % | |
| | 40,000 | | | Kratos Defense & Security Solutions, Inc.(a) | | | 892,400 | | |
| | | | | Air Freight & Logistics | | | 1.45 | % | |
| | 79,100 | | | Air Transport Services Group, Inc.(a) | | | 2,041,571 | | |
| | | | | Building Products | | | 3.69 | % | |
| | 13,000 | | | Advanced Drainage Systems, Inc. | | | 1,406,210 | | |
| | 29,400 | | | Apogee Enterprises, Inc. | | | 1,110,144 | | |
| | 32,100 | | | Patrick Industries, Inc. | | | 2,673,930 | | |
| | | | 5,190,284 | | |
| | | | | Construction & Engineering | | | 2.96 | % | |
| | 70,000 | | | Bowman Consulting Group Ltd.(a) | | | 962,500 | | |
| | 32,500 | | | NV5 Global, Inc.(a) | | | 3,203,525 | | |
| | | | 4,166,025 | | |
| | | | | Machinery | | | 1.66 | % | |
| | 60,400 | | | Federal Signal Corporation | | | 2,332,648 | | |

The accompanying notes are an integral part of these financial statements.
39
BUFFALO EARLY STAGE GROWTH
FUND (UNAUDITED)
SCHEDULE OF INVESTMENTS
SEPTEMBER 30, 2021 Continued
Shares or Face Amount | | | | $ Fair Value | |
| | | | | Professional Services | | | 3.35 | % | |
| | 21,100 | | | ICF International, Inc. | | | 1,884,019 | | |
| | 79,400 | | | Willdan Group, Inc.(a) | | | 2,825,846 | | |
| | | | 4,709,865 | | |
| | | | | Trading Companies & Distributors | | | 2.38 | % | |
| | 30,600 | | | Transcat, Inc.(a) | | | 1,973,088 | | |
| | 57,510 | | | Univar Inc.(a) | | | 1,369,888 | | |
| | | | 3,342,976 | | |
| Total Industrials (Cost $16,662,272) | | | 22,675,769 | | |
Information Technology | | | 23.61 | % | |
| | | | | Communications Equipment | | | 2.00 | % | |
| | 57,000 | | | Calix, Inc.(a) | | | 2,817,510 | | |
| | | | | Electronic Equipment, Instruments & Components | | | 0.86 | % | |
| | 42,800 | | | nLight, Inc.(a) | | | 1,206,532 | | |
| | | | | IT Services | | | 5.01 | % | |
| | 89,900 | | | i3 Verticals, Inc. — Class A(a) | | | 2,176,479 | | |
| | 253,600 | | | Paya Holdings, Inc.(a) | | | 2,756,632 | | |
| | 139,600 | | | Verra Mobility Corp.(a) | | | 2,103,772 | | |
| | | | 7,036,883 | | |
| | | | | Semiconductors & Semiconductor Equipment | | | 1.98 | % | |
| | 56,600 | | | MaxLinear, Inc.(a) | | | 2,787,550 | | |
| | | | | Software | | | 13.76 | % | |
| | 157,900 | | | 8x8, Inc.(a) | | | 3,693,281 | | |
| | 190,100 | | | Absolute Software Corp. — ADR(b) | | | 2,089,199 | | |
| | 26,900 | | | Cerence, Inc.(a) | | | 2,585,359 | | |
| | 7,100 | | | CyberArk Software Ltd. — ADR(a) (b) | | | 1,120,522 | | |
| | 27,005 | | | Envestnet, Inc.(a) | | | 2,166,881 | | |
| | 53,500 | | | Intelligent Systems Corp.(a) | | | 2,172,635 | | |
| | 46,920 | | | Mimecast Ltd. — ADR(a) (b) | | | 2,984,112 | | |
| | 41,700 | | | Varonis Systems, Inc.(a) | | | 2,537,445 | | |
| | | | 19,349,434 | | |
| Total Information Technology (Cost $19,944,959) | | | 33,197,909 | | |
| Total Common Stocks (Cost $84,758,470) | | | 121,827,823 | | |

The accompanying notes are an integral part of these financial statements.
40
BUFFALO EARLY STAGE GROWTH
FUND (UNAUDITED)
SCHEDULE OF INVESTMENTS
SEPTEMBER 30, 2021 Continued
Shares or Face Amount | | | | $ Fair Value | |
Private Placements | | | 1.97 | % | |
| | | | | Auto Components | | | 1.27 | % | |
| | 150,000 | | | Holley, Inc.(a) (d) | | | 1,791,000 | | |
| Total Software (Cost $1,500,000) | | | 1,791,000 | | |
| | | | | Capital Markets | | | 0.70 | % | |
| | 120,000 | | | MarketWise, Inc. — Class A(a) (d) | | | 991,200 | | |
| Total Capital Markets (Cost $1,200,000) | | | 991,200 | | |
| Total Private Placements (Cost $2,700,000) | | | 2,782,200 | | |
REITS | | | 1.72 | % | |
Real Estate | | | 1.72 | % | |
| | | | | Equity Real Estate Investment Trusts (REITs) | | | 1.72 | % | |
| | 53,600 | | | Community Healthcare Trust, Inc. | | | 2,422,184 | | |
| Total Real Estate (Cost $1,437,562) | | | 2,422,184 | | |
| Total REITS (Cost $1,437,562) | | | 2,422,184 | | |
Warrants | | | 1.43 | % | |
| | | | | Internet & Direct Marketing Retail | | | 1.43 | % | |
| | 1,200,000 | | | 1847 Goedeker, Inc.(a) (c) | | | 2,016,000 | | |
| Total Internet & Direct Marketing Retail (Cost $577,170) | | | 2,016,000 | | |
| Total Warrants (Cost $577,170) | | | 2,016,000 | | |
Short Term Investments | | | 4.62 | % | |
Investment Company | | | 4.62 | % | |
| | 6,489,082 | | | Fidelity Investments Money Market Funds — Government Portfolio — Class I — 0.010%(e) | | | 6,489,082 | | |
Total Investment Company | | | 6,489,082 | | |
| Total Short Term Investments (Cost $6,489,082) | | | 6,489,082 | | |

The accompanying notes are an integral part of these financial statements.
41
BUFFALO EARLY STAGE GROWTH
FUND (UNAUDITED)
SCHEDULE OF INVESTMENTS
SEPTEMBER 30, 2021 Continued
Shares or Face Amount | | | | $ Fair Value | |
Total Investments (Cost $93,172,068)
| | | 96.39
135,537,289 | % | |
Other Assets in Excess of Liabilities
| | | 3.61
5,069,923 | % | |
Total Net Assets
| | | 100.00
140,607,212 | % | |
ADR American Depositary Receipt
(a) Non Income Producing.
(b) Foreign Issued Securities. The total value of these securities amounted to $18,300,190 (13.00% of net assets) at September 30, 2021.
(c) Illiquid Security. The total value of these securities amounted to $4,635,590 (1.55% of net assets) at September 30, 2021.
(d) Security is restricted from resale and considered illiquid.
(e) The rate quoted is the annualized seven-day effective yield as of September 30, 2021.
* See Note 1A of the accompanying Notes to Financial Statements regarding valuation of securities.
The Global Industry Classification Standard (GICS) was developed by and/or is the exclusive property of MSCI, Inc. and Standard & Poor's Financial Services LLC ("S&P"). GICS is a service mark of MSCI and S&P and has been licensed for use by U.S. Bancorp Fund Services, LLC.

The accompanying notes are an integral part of these financial statements.
42
BUFFALO FLEXIBLE INCOME FUND (UNAUDITED)
SCHEDULE OF INVESTMENTS
SEPTEMBER 30, 2021
Shares or Face Amount | | | | $ Fair Value* | |
Common Stocks | | | 93.48 | % | |
Communication Services | | | 5.00 | % | |
| | | | | Diversified Telecommunication Services | | | 3.78 | % | |
| | 300,000 | | | AT&T, Inc. | | | 8,103,000 | | |
| | 150,000 | | | Verizon Communications, Inc. | | | 8,101,500 | | |
| | | | 16,204,500 | | |
| | | | | Entertainment | | | 1.22 | % | |
| | 140,000 | | | Lions Gate Entertainment Corp. — Class A(a) (b) | | | 1,986,600 | | |
| | 250,000 | | | Lions Gate Entertainment Corp. — Class B(a) (b) | | | 3,250,000 | | |
| | | | 5,236,600 | | |
| Total Communication Services (Cost $24,322,364) | | | 21,441,100 | | |
Consumer Staples | | | 19.32 | % | |
| | | | | Beverages | | | 4.64 | % | |
| | 150,000 | | | The Coca Cola Co. | | | 7,870,500 | | |
| | 80,000 | | | PepsiCo, Inc. | | | 12,032,800 | | |
| | | | 19,903,300 | | |
| | | | | Food & Staples Retailing | | | 3.67 | % | |
| | 35,000 | | | Costco Wholesale Corp.(c) | | | 15,727,250 | | |
| | | | | Food Products | | | 4.03 | % | |
| | 150,000 | | | B&G Foods, Inc. | | | 4,483,500 | | |
| | 150,000 | | | General Mills, Inc. | | | 8,973,000 | | |
| | 59,800 | | | Kellogg Co. | | | 3,822,416 | | |
| | | | 17,278,916 | | |
| | | | | Household Products | | | 6.98 | % | |
| | 50,000 | | | The Clorox Co. | | | 8,280,500 | | |
| | 25,000 | | | Colgate-Palmolive Co. | | | 1,889,500 | | |
| | 70,000 | | | Kimberly-Clark Corp. | | | 9,270,800 | | |
| | 75,000 | | | The Procter & Gamble Co. | | | 10,485,000 | | |
| | | | 29,925,800 | | |
| Total Consumer Staples (Cost $35,723,090) | | | 82,835,266 | | |

The accompanying notes are an integral part of these financial statements.
43
BUFFALO FLEXIBLE INCOME FUND (UNAUDITED)
SCHEDULE OF INVESTMENTS
SEPTEMBER 30, 2021 Continued
Shares or Face Amount | | | | $ Fair Value* | |
Energy | | | 21.10 | % | |
| | | | | Energy Equipment & Services | | | 0.90 | % | |
| | 130,000 | | | Schlumberger Ltd. — ADR(b) | | | 3,853,200 | | |
| | | | | Oil, Gas & Consumable Fuels | | | 20.20 | % | |
| | 425,000 | | | APA Corp. | | | 9,107,750 | | |
| | 145,000 | | | Chevron Corp. | | | 14,710,250 | | |
| | 219,000 | | | ConocoPhillips(c) | | | 14,841,630 | | |
| | 140,000 | | | Delek Logistics Partners LP | | | 6,332,200 | | |
| | 165,000 | | | Exxon Mobil Corp. | | | 9,705,300 | | |
| | 165,000 | | | Hess Corp. | | | 12,888,150 | | |
| | 150,000 | | | HollyFrontier Corp.(c) | | | 4,969,500 | | |
| | 525,000 | | | Kinder Morgan, Inc. | | | 8,783,250 | | |
| | 85,000 | | | Marathon Petroleum Corp.(c) | | | 5,253,850 | | |
| | | | 86,591,880 | | |
| Total Energy (Cost $73,548,423) | | | 90,445,080 | | |
Financials | | | 7.82 | % | |
| | | | | Banks | | | 2.40 | % | |
| | 175,000 | | | Truist Financial Corp. | | | 10,263,750 | | |
| | | | | Insurance | | | 5.42 | % | |
| | 75,000 | | | Arthur J. Gallagher & Co. | | | 11,148,750 | | |
| | 95,000 | | | The Allstate Corp.(c) | | | 12,094,450 | | |
| | | | 23,243,200 | | |
| Total Financials (Cost $12,486,126) | | | 33,506,950 | | |
Health Care | | | 17.10 | % | |
| | | | | Biotechnology | | | 1.14 | % | |
| | 70,000 | | | Gilead Sciences, Inc. | | | 4,889,500 | | |
| | | | | Health Care Equipment & Supplies | | | 3.75 | % | |
| | 75,000 | | | Abbott Laboratories | | | 8,859,750 | | |
| | 90,000 | | | Baxter International, Inc. | | | 7,238,700 | | |
| | | | 16,098,450 | | |

The accompanying notes are an integral part of these financial statements.
44
BUFFALO FLEXIBLE INCOME FUND (UNAUDITED)
SCHEDULE OF INVESTMENTS
SEPTEMBER 30, 2021 Continued
Shares or Face Amount | | | | $ Fair Value* | |
| | | | | Pharmaceuticals | | | 12.21 | % | |
| | 15,000 | | | Bristol-Myers Squibb Co. | | | 887,550 | | |
| | 52,000 | | | Eli Lilly & Co.(c) | | | 12,014,600 | | |
| | 235,000 | | | GlaxoSmithKline PLC — ADR(b) | | | 8,979,350 | | |
| | 75,000 | | | Johnson & Johnson(c) | | | 12,112,500 | | |
| | 80,000 | | | Merck & Co., Inc. | | | 6,008,800 | | |
| | 8,000 | | | Organon & Co. | | | 262,320 | | |
| | 270,000 | | | Pfizer Inc.(c) | | | 11,612,700 | | |
| | 33,501 | | | Viatris, Inc.(a) | | | 453,939 | | |
| | | | 52,331,759 | | |
| Total Health Care (Cost $34,742,023) | | | 73,319,709 | | |
Industrials | | | 3.30 | % | |
| | | | | Commercial Services & Supplies | | | 3.30 | % | |
| | 427,300 | | | Pitney Bowes Inc. | | | 3,080,833 | | |
| | 74,000 | | | Waste Management, Inc.(c) | | | 11,052,640 | | |
| Total Industrials (Cost $3,990,385) | | | 14,133,473 | | |
Information Technology | | | 18.18 | % | |
| | | | | Communications Equipment | | | 2.54 | % | |
| | 200,000 | | | Cisco Systems, Inc. | | | 10,886,000 | | |
| | | | | IT Services | | | 1.94 | % | |
| | 60,000 | | | International Business Machines Corp. | | | 8,335,800 | | |
| | | | | Semiconductors & Semiconductor Equipment | | | 4.82 | % | |
| | 170,000 | | | Intel Corp. | | | 9,057,600 | | |
| | 90,000 | | | QUALCOMM, Inc. | | | 11,608,200 | | |
| | | | 20,665,800 | | |
| | | | | Software | | | 8.88 | % | |
| | 135,000 | | | Microsoft Corp. | | | 38,059,200 | | |
| Total Information Technology (Cost $23,334,143) | | | 77,946,800 | | |

The accompanying notes are an integral part of these financial statements.
45
BUFFALO FLEXIBLE INCOME FUND (UNAUDITED)
SCHEDULE OF INVESTMENTS
SEPTEMBER 30, 2021 Continued
Shares or Face Amount | | | | $ Fair Value* | |
Materials | | | 1.66 | % | |
| | | | | Chemicals | | | 0.88 | % | |
| | 65,500 | | | Dow Inc. | | | 3,770,180 | | |
| | | | | Metals & Mining | | | 0.78 | % | |
| | 50,000 | | | Rio Tinto PLC — ADR(b) | | | 3,341,000 | | |
| Total Materials (Cost $3,842,134) | | | 7,111,180 | | |
| Total Common Stocks (Cost $211,988,688) | | | 400,739,558 | | |
REITS | | | 2.87 | % | |
Real Estate | | | 2.87 | % | |
| | | | | Equity Real Estate Investment Trusts (REITs) | | | 2.87 | % | |
| | 85,300 | | | Digital Realty Trust, Inc. | | | 12,321,585 | | |
| Total Real Estate (Cost $4,877,395) | | | 12,321,585 | | |
| Total REITS (Cost $4,877,395) | | | 12,321,585 | | |
Convertible Bonds | | | 3.12 | % | |
Information Technology | | | 3.12 | % | |
| | | | | Software | | | 3.12 | % | |
| | | | | Nuance Communications, Inc. | | | |
| | 5,000,000 | | | 1.500%, 11/01/2035 | | | 13,353,307 | | |
| Total Information Technology (Cost $4,862,941) | | | 13,353,307 | | |
| Total Convertible Bonds (Cost $4,862,941) | | | 13,353,307 | | |
Short Term Investments | | | 0.51 | % | |
Investment Company | | | 0.51 | % | |
| | 2,202,304 | | | Fidelity Investments Money Market Funds — Government Portfolio — Class I — 0.010%(d) | | | 2,202,304 | | |
Total Investment Company | | | 2,202,304 | | |
| Total Short Term Investments (Cost $2,202,304) | | | 2,202,304 | | |

The accompanying notes are an integral part of these financial statements.
46
BUFFALO FLEXIBLE INCOME FUND (UNAUDITED)
SCHEDULE OF INVESTMENTS
SEPTEMBER 30, 2021 Continued
Shares or Face Amount | | | | $ Fair Value* | |
Total Investments (Cost $223,931,328)
| | | 99.98
428,616,754 | % | |
Other Assets in Excess of Liabilities
| | | 0.02
77,966 | % | |
Total Net Assets
| | | 100.00
428,694,720 | % | |
ADR American Depository Receipt
(a) Non Income Producing.
(b) Foreign Issued Security. The total value of these securities amounted to $21,410,150 (4.99% of net assets) at September 30, 2021.
(c) A portion of this investment is segregated as collateral for open written option contracts.
(d) The rate quoted is the annualized seven-day effective yield as of September 30, 2021.
* See Note 1A of the accompanying Notes to Financial Statements regarding valuation of securities.
The Global Industry Classification Standard (GICS) was developed by and/or is the exclusive property of MSCI, Inc. and Standard & Poor's Financial Services LLC ("S&P"). GICS is a service mark of MSCI and S&P and has been licensed for use by U.S. Bancorp Fund Services, LLC.

The accompanying notes are an integral part of these financial statements.
47
BUFFALO FLEXIBLE INCOME FUND (UNAUDITED)
SCHEDULE OF OPTIONS WRITTEN
SEPTEMBER 30, 2021 Continued
Contracts | | | | $ Notional Amount | | $ Value | |
Call Options | | | |
| | | | | The Allstate Corp. | | | | | |
| | 100 | | | Expiration: October 2021, Exercise Price: $150.00 | | | 1,273,100 | | | | 400 | | |
| | | | | ConocoPhillips | | | | | |
| | 250 | | | Expiration: October 2021, Exercise Price: $80.00 | | | 1,694,250 | | | | 2,500 | | |
| | | | | Costco Wholesale Corp. | | | | | |
| | 50 | | | Expiration: October 2021, Exercise Price: $500.00 | | | 2,246,750 | | | | 1,200 | | |
| | | | | Eli Lilly & Co. | | | | | |
| | 20 | | | Expiration: October 2021, Exercise Price: $255.00 | | | 462,100 | | | | 500 | | |
| | | | | HollyFrontier Corp. | | | | | |
| | 100 | | | Expiration: October 2021, Exercise Price: $33.00 | | | 331,300 | | | | 8,500 | | |
| | 500 | | | Expiration: October 2021, Exercise Price: $34.00 | | | 1,656,500 | | | | 42,500 | | |
| | 33 | | | Expiration: November 2021, Exercise Price: $37.00 | | | 109,329 | | | | 2,063 | | |
| | | | | Johnson & Johnson | | | | | |
| | 50 | | | Expiration: November 2021, Exercise Price: $175.00 | | | 807,500 | | | | 3,950 | | |
| | | | | Marathon Petroleum Corp. | | | | | |
| | 350 | | | Expiration: October 2021, Exercise Price: $85.00 | | | 2,163,350 | | | | 875 | | |
| | | | | Pfizer Inc. | | | | | |
| | 450 | | | Expiration: October 2021, Exercise Price: $50.00 | | | 1,935,450 | | | | 450 | | |
| | | | | Waste Management, Inc. | | | | | |
| | 50 | | | Expiration: October 2021, Exercise Price: $160.00 | | | 746,800 | | | | 750 | | |
| | | Total Written Options (Premium received $117,142) | | | | | | | 63,688 | | |

The accompanying notes are an integral part of these financial statements.
48
BUFFALO GROWTH FUND
(UNAUDITED)
SCHEDULE OF INVESTMENTS
SEPTEMBER 30, 2021
Shares or Face Amount | | | | $ Fair Value | |
Common Stocks | | | 97.35 | % | |
Communication Services | | | 18.20 | % | |
| | | | | Entertainment | | | 1.89 | % | |
| | 13,441 | | | Electronic Arts, Inc. | | | 1,911,982 | | |
| | 12,368 | | | The Walt Disney Co.(a) | | | 2,092,295 | | |
| | | | 4,004,277 | | |
| | | | | Interactive Media & Services | | | 14.99 | % | |
| | 3,195 | | | Alphabet, Inc. — Class A(a) | | | 8,541,896 | | |
| | 3,822 | | | Alphabet, Inc. — Class C(a) | | | 10,186,815 | | |
| | 21,281 | | | Facebook, Inc. — Class A(a) | | | 7,222,559 | | |
| | 18,147 | | | Match Group, Inc.(a) | | | 2,848,897 | | |
| | 85,000 | | | TripAdvisor, Inc.(a) | | | 2,877,250 | | |
| | | | 31,677,417 | | |
| | | | | Media | | | 1.32 | % | |
| | 50,000 | | | Comcast Corp. — Class A | | | 2,796,500 | | |
| Total Communication Services (Cost $13,729,010) | | | 38,478,194 | | |
Consumer Discretionary | | | 12.17 | % | |
| | | | | Hotels, Restaurants & Leisure | | | 1.43 | % | |
| | 36,840 | | | Sportradar Holding AG — ADR(a) (b) | | | 833,689 | | |
| | 19,928 | | | Starbucks Corp. | | | 2,198,258 | | |
| | | | 3,031,947 | | |
| | | | | Internet & Direct Marketing Retail | | | 8.02 | % | |
| | 4,125 | | | Amazon.com, Inc.(a) | | | 13,550,790 | | |
| | 1,429 | | | Booking Holdings, Inc.(a) | | | 3,392,260 | | |
| | | | 16,943,050 | | |
| | | | | Soap Cleaning Compound and Toilet Preparation | | | 0.37 | % | |
| | 31,800 | | | OLAPLEX HLDGS, Inc.(a) | | | 779,100 | | |
| | | | | Specialty Retail | | | 1.07 | % | |
| | 6,896 | | | The Home Depot, Inc. | | | 2,263,681 | | |
| | | | | Textiles, Apparel & Luxury Goods | | | 1.28 | % | |
| | 18,639 | | | NIKE, Inc. — Class B | | | 2,706,942 | | |
| Total Consumer Discretionary (Cost $8,712,105) | | | 25,724,720 | | |

The accompanying notes are an integral part of these financial statements.
49
BUFFALO GROWTH FUND
(UNAUDITED)
SCHEDULE OF INVESTMENTS
SEPTEMBER 30, 2021 Continued
Shares or Face Amount | | | | $ Fair Value | |
Financials | | | 4.68 | % | |
| | | | | Capital Markets | | | 3.53 | % | |
| | 80,592 | | | Open Lending Corp.(a) | | | 2,906,953 | | |
| | 10,702 | | | S&P Global, Inc. | | | 4,547,173 | | |
| | | | 7,454,126 | | |
| | | | | Diversified Financial Services | | | 1.15 | % | |
| | 15,440 | | | Global Payments Inc. | | | 2,433,035 | | |
| Total Financials (Cost $6,223,444) | | | 9,887,161 | | |
Health Care | | | 11.44 | % | |
| | | | | Health Care Equipment & Supplies | | | 6.04 | % | |
| | 8,870 | | | Danaher Corp. | | | 2,700,383 | | |
| | 21,475 | | | Edwards Lifesciences Corp.(a) | | | 2,431,185 | | |
| | 3,297 | | | IDEXX Laboratories, Inc.(a) | | | 2,050,404 | | |
| | 3,174 | | | Intuitive Surgical, Inc.(a) | | | 3,155,432 | | |
| | 16,594 | | | Zimmer Biomet Holdings, Inc. | | | 2,428,698 | | |
| | | | 12,766,102 | | |
| | | | | Health Care Providers & Services | | | 1.15 | % | |
| | 6,226 | | | UnitedHealth Group, Inc. | | | 2,432,747 | | |
| | | | | Health Care Technology | | | 1.14 | % | |
| | 8,323 | | | Veeva Systems, Inc.(a) | | | 2,398,439 | | |
| | | | | Life Sciences Tools & Services | | | 2.52 | % | |
| | 5,026 | | | Illumina, Inc.(a) | | | 2,038,596 | | |
| | 5,759 | | | Thermo Fisher Scientific, Inc. | | | 3,290,289 | | |
| | | | 5,328,885 | | |
| | | | | Pharmaceuticals | | | 0.59 | % | |
| | 9,600 | | | Jazz Pharmaceuticals Public Limited Company — ADR(a) (b) | | | 1,250,016 | | |
| Total Health Care (Cost $14,824,213) | | | 24,176,189 | | |
Industrials | | | 8.11 | % | |
| | | | | Commercial Services & Supplies | | | 1.28 | % | |
| | 19,500 | | | Copart, Inc.(a) | | | 2,705,040 | | |
| | | | | Machinery | | | 0.80 | % | |
| | 44,820 | | | Evoqua Water Technologies Corp.(a) | | | 1,683,439 | | |

The accompanying notes are an integral part of these financial statements.
50
BUFFALO GROWTH FUND
(UNAUDITED)
SCHEDULE OF INVESTMENTS
SEPTEMBER 30, 2021 Continued
Shares or Face Amount | | | | $ Fair Value | |
| | | | | Professional Services | | | 4.00 | % | |
| | 26,957 | | | IHS Markit Ltd. — ADR(b) | | | 3,143,725 | | |
| | 23,414 | | | TransUnion | | | 2,629,627 | | |
| | 13,400 | | | Verisk Analytics, Inc. | | | 2,683,618 | | |
| | | | 8,456,970 | | |
| | | | | Road & Rail | | | 2.03 | % | |
| | 48,535 | | | Uber Technologies, Inc.(a) | | | 2,174,368 | | |
| | 10,822 | | | Union Pacific Corp. | | | 2,121,220 | | |
| | | | 4,295,588 | | |
| Total Industrials (Cost $12,098,667) | | | 17,141,037 | | |
Information Technology | | | 38.46 | % | |
| | | | | IT Services | | | 6.36 | % | |
| | 18,310 | | | MasterCard, Inc. — Class A | | | 6,366,021 | | |
| | 10,022 | | | PayPal Holdings, Inc.(a) | | | 2,607,825 | | |
| | 20,007 | | | Visa Inc. — Class A | | | 4,456,559 | | |
| | | | 13,430,405 | | |
| | | | | Semiconductors & Semiconductor Equipment | | | 4.72 | % | |
| | 19,815 | | | Analog Devices, Inc. | | | 3,318,616 | | |
| | 8,415 | | | Broadcom Inc. | | | 4,080,686 | | |
| | 12,440 | | | NVIDIA Corp. | | | 2,577,070 | | |
| | | | 9,976,372 | | |
| | | | | Software | | | 21.04 | % | |
| | 6,845 | | | Adobe, Inc.(a) | | | 3,940,803 | | |
| | 4,570 | | | Fair Isaac Corp.(a) | | | 1,818,540 | | |
| | 5,850 | | | Intuit, Inc. | | | 3,156,134 | | |
| | 90,533 | | | Microsoft Corp. | | | 25,523,063 | | |
| | 6,066 | | | Palo Alto Networks, Inc.(a) | | | 2,905,614 | | |
| | 14,222 | | | salesforce.com, Inc.(a) | | | 3,857,291 | | |
| | 5,261 | | | ServiceNow, Inc.(a) | | | 3,273,763 | | |
| | | | 44,475,208 | | |
| | | | | Technology Hardware, Storage & Peripherals | | | 6.34 | % | |
| | 94,716 | | | Apple Inc. | | | 13,402,314 | | |
| Total Information Technology (Cost $32,635,281) | | | 81,284,299 | | |

The accompanying notes are an integral part of these financial statements.
51
BUFFALO GROWTH FUND
(UNAUDITED)
SCHEDULE OF INVESTMENTS
SEPTEMBER 30, 2021 Continued
Shares or Face Amount | | | | $ Fair Value | |
Materials | | | 2.42 | % | |
| | | | | Chemicals | | | 2.42 | % | |
| | 9,500 | | | Ecolab Inc. | | | 1,981,890 | | |
| | 10,654 | | | Linde PLC — ADR(b) | | | 3,125,671 | | |
| Total Materials (Cost $2,493,892) | | | 5,107,561 | | |
Real Estate | | | 1.87 | % | |
| | | | | Real Estate Management & Development | | | 1.87 | % | |
| | 40,700 | | | CBRE Group, Inc. — Class A(a) | | | 3,962,552 | | |
| Total Real Estate (Cost $1,666,669) | | | 3,962,552 | | |
| Total Common Stocks (Cost $92,383,281) | | | 205,761,713 | | |
REITS | | | 2.14 | % | |
Real Estate | | | 2.14 | % | |
| | | | | Equity Real Estate Investment Trusts (REITs) | | | 2.14 | % | |
| | 8,395 | | | American Tower Corp. | | | 2,228,117 | | |
| | 2,914 | | | Equinix Inc. | | | 2,302,439 | | |
| Total Real Estate (Cost $1,775,276) | | | 4,530,556 | | |
| Total REITS (Cost $1,775,276) | | | 4,530,556 | | |
Short Term Investments | | | 1.07 | % | |
Investment Company | | | 1.07 | % | |
| | 2,264,445 | | | Fidelity Investments Money Market Funds — Government Portfolio — Class I — 0.010%(c) | | | 2,264,445 | | |
Total Investment Company | | | 2,264,445 | | |
| Total Short Term Investments (Cost $2,264,445) | | | 2,264,445 | | |

The accompanying notes are an integral part of these financial statements.
52
BUFFALO GROWTH FUND
(UNAUDITED)
SCHEDULE OF INVESTMENTS
SEPTEMBER 30, 2021 Continued
Shares or Face Amount | | | | $ Fair Value | |
Total Investments (Cost $96,423,002)
| | | 100.56
212,556,714 | % | |
Liabilities in Excess of Other Assets
| | | (0.56
(1,193,267) | )% | |
Total Net Assets
| | | 100.00
211,363,447 | % | |
ADR American Depositary Receipt
PLC Public Limited Company
(a) Non Income Producing.
(b) Foreign Issued Security. The total value of these securities amounted to $8,353,101 (3.95% of net assets) at September 30, 2021.
(c) The rate quoted is the annualized seven-day effective yield as of September 30, 2021
* See Note 1A of accompanying Notes to Financial Statements regarding valuation of securities.
The Global Industry Classification Standard (GICS) was developed by and/or is the exclusive property of MSCI, Inc. and Standard & Poor's Financial Services LLC ("S&P"). GICS is a service mark of MSCI and S&P and has been licensed for use by U.S. Bancorp Fund Services, LLC.

The accompanying notes are an integral part of these financial statements.
53
BUFFALO HIGH YIELD FUND
(UNAUDITED)
SCHEDULE OF INVESTMENTS
SEPTEMBER 30, 2021
Shares or Face Amount | | | | $ Fair Value* | |
Preferred Stocks | | | 2.25 | % | |
Energy | | | 1.14 | % | |
| | | | | Oil, Gas & Consumable Fuels | | | 1.14 | % | |
| | 137,482 | | | NuStar Energy LP (3 Month LIBOR USD + 6.880%) | | | 3,419,178 | | |
| Total Energy (Cost $2,899,914) | | | 3,419,178 | | |
Financials | | | 1.11 | % | |
| | | | | Diversified Financial Services | | | 1.11 | % | |
| | 100,000 | | | Compass Diversified Holdings | | | 2,680,000 | | |
| | 25,000 | | | Compass Diversified Holdings | | | 646,250 | | |
| Total Financials (Cost $3,094,299) | | | 3,326,250 | | |
| Total Preferred Stocks (Cost $5,994,213) | | | 6,745,428 | | |
Convertible Bonds | | | 13.46 | % | |
Communication Services | | | 0.31 | % | |
| | | | | Interactive Media & Services | | | 0.31 | % | |
| | | | | TripAdvisor, Inc. | | | |
| | 1,000,000 | | | 0.250%, 04/01/2026(b) | | | 909,000 | | |
| Total Communication Services (Cost $963,304) | | | 909,000 | | |
Consumer Discretionary | | | 1.05 | % | |
| | | | | Diversified Consumer Services | | | 0.67 | % | |
| | | | | Stride, Inc. | | | |
| | 2,000,000 | | | 1.125%, 09/01/2027 | | | 1,997,200 | | |
| | | | | Internet & Direct Marketing Retail | | | 0.38 | % | |
| | | | | Etsy, Inc. | | | |
| | 1,000,000 | | | 0.250%, 06/15/2028(b) | | | 1,139,500 | | |
| Total Consumer Discretionary (Cost $2,922,421) | | | 3,136,700 | | |

The accompanying notes are an integral part of these financial statements.
54
BUFFALO HIGH YIELD FUND
(UNAUDITED)
SCHEDULE OF INVESTMENTS
SEPTEMBER 30, 2021 Continued
Shares or Face Amount | | | | $ Fair Value* | |
Financials | | | 0.74 | % | |
| | | | | Consumer Finance | | | 0.74 | % | |
| | | | | PRA Group, Inc. | | | |
| | 2,000,000 | | | 3.500%, 06/01/2023 | | | 2,220,474 | | |
| Total Financials (Cost $2,017,364) | | | 2,220,474 | | |
Health Care | | | 2.82 | % | |
| | | | | Biotechnology | | | 0.60 | % | |
| | | | | Flexion Therapeutics, Inc. | | | |
| | 2,000,000 | | | 3.375%, 05/01/2024 | | | 1,790,000 | | |
| | | | | Health Care Equipment & Supplies | | | 0.85 | % | |
| | | | | Invacare Corp. | | | |
| | 3,000,000 | | | 4.250%, 03/15/2026(b) | | | 2,544,438 | | |
| | | | | Pharmaceuticals | | | 1.37 | % | |
| | | | | Avadel Finance Cayman Ltd. | | | |
| | 550,000 | | | 4.500%, 02/01/2023(a) (b) | | | 635,800 | | |
| | | | | Revance Therapeutics, Inc. | | | |
| | 3,000,000 | | | 1.750%, 02/15/2027 | | | 3,460,200 | | |
| | | | 4,096,000 | | |
| Total Health Care (Cost $8,547,033) | | | 8,430,438 | | |
Industrials | | | 2.25 | % | |
| | | | | Air Freight & Logistics | | | 0.90 | % | |
| | | | | Air Transport Services Group, Inc. | | | |
| | 2,500,000 | | | 1.125%, 10/15/2024 | | | 2,703,973 | | |
| | | | | Airlines | | | 0.65 | % | |
| | | | | Southwest Airlines Co. | | | |
| | 1,300,000 | | | 1.250%, 05/01/2025 | | | 1,946,750 | | |
| | | | | Machinery | | | 0.70 | % | |
| | | | | The Greenbrier Companies, Inc. | | | |
| | 1,000,000 | | | 2.875%, 04/15/2028(b) | | | 1,046,000 | | |
| | | | | The Greenbrier Companies, Inc. | | | |
| | 1,000,000 | | | 2.875%, 02/01/2024 | | | 1,038,125 | | |
| | | | 2,084,125 | | |
| Total Industrials (Cost $5,786,512) | | | 6,734,848 | | |

The accompanying notes are an integral part of these financial statements.
55
BUFFALO HIGH YIELD FUND
(UNAUDITED)
SCHEDULE OF INVESTMENTS
SEPTEMBER 30, 2021 Continued
Shares or Face Amount | | | | $ Fair Value* | |
Information Technology | | | 6.29 | % | |
| | | | | Communications Equipment | | | 0.65 | % | |
| | | | | Lumentum Holdings, Inc. | | | |
| | 1,750,000 | | | 0.500%, 12/15/2026 | | | 1,930,856 | | |
| | | | | Software | | | 5.64 | % | |
| | | | | Avaya Holdings Corp. | | | |
| | 2,000,000 | | | 2.250%, 06/15/2023 | | | 2,105,000 | | |
| | | | | Guidewire Software, Inc. | | | |
| | 1,100,000 | | | 1.250%, 03/15/2025 | | | 1,324,812 | | |
| | | | | J2 Global, Inc. | | | |
| | 2,500,000 | | | 1.750%, 11/01/2026(b) | | | 3,141,306 | | |
| | | | | Mitek Systems, Inc. | | | |
| | 2,500,000 | | | 0.750%, 02/01/2026(b) | | | 2,807,253 | | |
| | | | | Nuance Communications, Inc. | | | |
| | 2,810,000 | | | 1.500%, 11/01/2035 | | | 7,504,559 | | |
| | | | 16,882,930 | | |
| Total Information Technology (Cost $12,310,860) | | | 18,813,786 | | |
| Total Convertible Bonds (Cost $32,547,494) | | | 40,245,246 | | |
Corporate Bonds | | | 64.08 | % | |
Administrative and Support and Waste Management and Remediation Services | | | 0.35 | % | |
| | | | | Office Administrative Services | | | 0.35 | % | |
| | | | | Cargo Aircraft Management, Inc. | | | |
| | 1,000,000 | | | 4.750%, 02/01/2028(b) | | | 1,035,250 | | |
| Total Administrative and Support and Waste Management and Remediation Services (Cost $1,012,194) | | | 1,035,250 | | |
Agriculture, Forestry, Fishing and Hunting | | | 0.69 | % | |
| | | | | Forest Nurseries and Gathering of Forest Products | | | 0.69 | % | |
| | | | | Enviva Partners LP / Enviva Partners Finance Corp. | | | |
| | 2,000,000 | | | 6.500%, 01/15/2026(b) | | | 2,071,250 | | |
| Total Agriculture, Forestry, Fishing and Hunting (Cost $2,014,349) | | | 2,071,250 | | |

The accompanying notes are an integral part of these financial statements.
56
BUFFALO HIGH YIELD FUND
(UNAUDITED)
SCHEDULE OF INVESTMENTS
SEPTEMBER 30, 2021 Continued
Shares or Face Amount | | | | $ Fair Value* | |
Communication Services | | | 4.16 | % | |
| | | | | Entertainment | | | 1.05 | % | |
| | | | | Live Nation Entertainment, Inc. | | | |
| | 1,000,000 | | | 4.875%, 11/01/2024(b) | | | 1,012,420 | | |
| | 500,000 | | | 5.625%, 03/15/2026(b) | | | 518,307 | | |
| | 250,000 | | | 4.750%, 10/15/2027(b) | | | 254,375 | | |
| | | | | Netflix, Inc. | | | |
| | 250,000 | | | 5.500%, 02/15/2022 | | | 254,363 | | |
| | 1,000,000 | | | 5.750%, 03/01/2024 | | | 1,105,940 | | |
| | | | 3,145,405 | | |
| | | | | Interactive Media & Services | | | 1.94 | % | |
| | | | | Cars.com, Inc. | | | |
| | 2,500,000 | | | 6.375%, 11/01/2028(b) | | | 2,640,675 | | |
| | | | | Match Group, Inc. | | | |
| | 1,000,000 | | | 5.000%, 12/15/2027(b) | | | 1,045,000 | | |
| | | | | TripAdvisor, Inc. | | | |
| | 2,000,000 | | | 7.000%, 07/15/2025(b) | | | 2,122,500 | | |
| | | | 5,808,175 | | |
| | | | | Media | | | 1.17 | % | |
| | | | | AMC Networks, Inc. | | | |
| | 596,000 | | | 5.000%, 04/01/2024 | | | 604,484 | | |
| | | | | Gray Television, Inc. | | | |
| | 2,060,000 | | | 5.875%, 07/15/2026(b) | | | 2,129,010 | | |
| | 500,000 | | | 4.750%, 10/15/2030(b) | | | 491,985 | | |
| | | | | Townsquare Media, Inc. | | | |
| | 250,000 | | | 6.875%, 02/01/2026(b) | | | 263,438 | | |
| | | | 3,488,917 | | |
| Total Communication Services (Cost $11,927,190) | | | 12,442,497 | | |
Consumer Staples | | | 1.05 | % | |
| | | | | Food Products | | | 1.05 | % | |
| | | | | Performance Food Group, Inc. | | | |
| | 3,000,000 | | | 5.500%, 10/15/2027(b) | | | 3,144,930 | | |
| Total Consumer Staples (Cost $3,000,000) | | | 3,144,930 | | |

The accompanying notes are an integral part of these financial statements.
57
BUFFALO HIGH YIELD FUND
(UNAUDITED)
SCHEDULE OF INVESTMENTS
SEPTEMBER 30, 2021 Continued
Shares or Face Amount | | | | $ Fair Value* | |
Consumer Discretionary | | | 4.97 | % | |
| | | | | Auto Components | | | 0.68 | % | |
| | | | | Patrick Industries, Inc. | | | |
| | 2,000,000 | | | 4.750%, 05/01/2029(b) | | | 2,042,500 | | |
| | | | | Hotels, Restaurants & Leisure | | | 3.11 | % | |
| | | | | Carrols Restaurant Group, Inc. | | | |
| | 3,500,000 | | | 5.875%, 07/01/2029(b) | | | 3,299,083 | | |
| | | | | Everi Holdings, Inc. | | | |
| | 1,000,000 | | | 5.000%, 07/15/2029(b) | | | 1,025,930 | | |
| | | | | Nathan's Famous, Inc. | | | |
| | 1,500,000 | | | 6.625%, 11/01/2025(b) | | | 1,534,530 | | |
| | | | | Royal Caribbean Cruises Ltd. | | | |
| | 1,615,000 | | | 7.500%, 10/15/2027(a) | | | 1,880,231 | | |
| | | | | Six Flags Entertainment Corp. | | | |
| | 1,500,000 | | | 5.500%, 04/15/2027(b) | | | 1,550,625 | | |
| | | | 9,290,399 | | |
| | | | | Textiles, Apparel & Luxury Goods | | | 1.18 | % | |
| | | | | PVH Corp. | | | |
| | 3,120,000 | | | 7.750%, 11/15/2023 | | | 3,522,230 | | |
| Total Consumer Discretionary (Cost $13,942,082) | | | 14,855,129 | | |
Consumer Staples | | | 1.31 | % | |
| | | | | Food Products | | | 1.31 | % | |
| | | | | TreeHouse Foods, Inc. | | | |
| | 4,000,000 | | | 4.000%, 09/01/2028 | | | 3,919,960 | | |
| Total Consumer Staples (Cost $4,000,000) | | | 3,919,960 | | |
Consumer, Cyclical | | | 0.68 | % | |
| | | | | Theaters | | | 0.68 | % | |
| | | | | Cinemark USA, Inc. | | | |
| | 2,000,000 | | | 5.875%, 03/15/2026(b) | | | 2,022,670 | | |
| Total Consumer, Cyclical (Cost $1,980,369) | | | 2,022,670 | | |

The accompanying notes are an integral part of these financial statements.
58
BUFFALO HIGH YIELD FUND
(UNAUDITED)
SCHEDULE OF INVESTMENTS
SEPTEMBER 30, 2021 Continued
Shares or Face Amount | | | | $ Fair Value* | |
Energy | | | 20.33 | % | |
| | | | | Energy Equipment & Services | | | 1.31 | % | |
| | | | | Bristow Group, Inc. | | | |
| | 2,250,000 | | | 6.875%, 03/01/2028(b) | | | 2,344,500 | | |
| | | | | Precision Drilling Corp. | | | |
| | 1,500,000 | | | 6.875%, 01/15/2029(a) (b) | | | 1,569,000 | | |
| | | | 3,913,500 | | |
| | | | | Oil, Gas & Consumable Fuels | | | 19.02 | % | |
| | | | | Antero Midstream Partners LP / Antero Midstream Finance Corp. | | | |
| | 2,000,000 | | | 7.875%, 05/15/2026(b) | | | 2,193,140 | | |
| | | | | Antero Resources Corp. | | | |
| | 658,000 | | | 8.375%, 07/15/2026(b) | | | 746,159 | | |
| | 500,000 | | | 7.625%, 02/01/2029(b) | | | 559,625 | | |
| | 1,000,000 | | | 5.375%, 03/01/2030(b) | | | 1,054,400 | | |
| | | | | California Resources Corp. | | | |
| | 4,000,000 | | | 7.125%, 02/01/2026(b) | | | 4,226,320 | | |
| | | | | CNX Midstream Partners LP | | | |
| | 750,000 | | | 4.750%, 04/15/2030(b) | | | 761,265 | | |
| | | | | CNX Resources Corp. | | | |
| | 4,000,000 | | | 7.250%, 03/14/2027(b) | | | 4,263,800 | | |
| | 100,000 | | | 6.000%, 01/15/2029(b) | | | 105,875 | | |
| | | | | Comstock Resources, Inc. | | | |
| | 600,000 | | | 6.750%, 03/01/2029(b) | | | 648,750 | | |
| | | | | CONSOL Energy, Inc. | | | |
| | 6,000,000 | | | 11.000%, 11/15/2025(b) | | | 6,189,630 | | |
| | | | | Delek Logistics Partners LP / Delek Logistics Finance Corp. | | | |
| | 3,000,000 | | | 6.750%, 05/15/2025 | | | 3,081,375 | | |
| | 1,000,000 | | | 7.125%, 06/01/2028(b) | | | 1,066,385 | | |
| | | | | Energy Transfer LP | | | |
| | 5,000,000 | | | 7.125% (5 Year CMT Rate + 5.306%), 11/15/2165 | | | 5,218,750 | | |
| | | | | Matador Resources Co. | | | |
| | 5,500,000 | | | 5.875%, 09/15/2026 | | | 5,686,065 | | |
| | | | | MPLX LP | | | |
| | 7,000,000 | | | 6.875% (3 Month LIBOR USD + 4.652%), 08/15/2023 | | | 7,140,000 | | |
| | | | | Northern Oil and Gas, Inc. | | | |
| | 6,600,000 | | | 8.125%, 03/01/2028(b) | | | 7,061,340 | | |
| | | | | Penn Virginia Escrow LLC | | | |
| | 5,000,000 | | | 9.250%, 08/15/2026(b) | | | 5,054,000 | | |
| | | | | Viper Energy Partners LP | | | |
| | 1,750,000 | | | 5.375%, 11/01/2027(b) | | | 1,828,094 | | |
| | | | 56,884,973 | | |
| Total Energy (Cost $58,278,919) | | | 60,798,473 | | |

The accompanying notes are an integral part of these financial statements.
59
BUFFALO HIGH YIELD FUND
(UNAUDITED)
SCHEDULE OF INVESTMENTS
SEPTEMBER 30, 2021 Continued
Shares or Face Amount | | | | $ Fair Value* | |
Finance and Insurance | | | 0.66 | % | |
| | | | | Activities Related to Credit Intermediation | | | 0.66 | % | |
| | | | | Scripps Escrow II, Inc. | | | |
| | 2,000,000 | | | 5.375%, 01/15/2031(b) | | | 1,969,250 | | |
| Total Finance and Insurance (Cost $1,995,900) | | | 1,969,250 | | |
Financials | | | 3.14 | % | |
| | | | | Capital Markets | | | 0.86 | % | |
| | | | | Donnelley Financial Solutions, Inc. | | | |
| | 2,500,000 | | | 8.250%, 10/15/2024 | | | 2,570,088 | | |
| | | | | Consumer Finance | | | 0.20 | % | |
| | | | | PRA Group, Inc. | | | |
| | 100,000 | | | 7.375%, 09/01/2025(b) | | | 107,125 | | |
| | 500,000 | | | 5.000%, 10/01/2029(b) | | | 501,635 | | |
| | | | 608,760 | | |
| | | | | Other Telecommunications | | | 1.03 | % | |
| | | | | Uniti Group LP / Uniti Fiber Holdings Inc / CSL Capital LLC | | | |
| | 2,000,000 | | | 7.125%, 12/15/2024(b) | | | 2,045,000 | | |
| | 1,000,000 | | | 4.750%, 04/15/2028(b) | | | 1,022,500 | | |
| | | | 3,067,500 | | |
| | | | | REITS | | | 1.05 | % | |
| | | | | IIP Operating Partnership LP | | | |
| | 3,000,000 | | | 5.500%, 05/25/2026(b) | | | 3,146,562 | | |
| Total Financials (Cost $9,105,189) | | | 9,392,910 | | |
Health Care | | | 2.35 | % | |
| | | | | Pharmaceuticals | | | 2.35 | % | |
| | | | | Bausch Health Americas, Inc. | | | |
| | 1,000,000 | | | 9.250%, 04/01/2026(a) (b) | | | 1,067,500 | | |
| | | | | Bausch Health Companies Inc. | | | |
| | 1,500,000 | | | 5.500%, 11/01/2025(a) (b) | | | 1,524,375 | | |
| | 500,000 | | | 9.000%, 12/15/2025(a) (b) | | | 530,000 | | |
| | | | | Horizon Therapeutics USA, Inc. | | | |
| | 1,000,000 | | | 5.500%, 08/01/2027(b) | | | 1,061,250 | | |
| | | | | Teva Pharmaceutical Industries Ltd. | | | |
| | 2,500,000 | | | 6.750%, 03/01/2028(a) | | | 2,859,375 | | |
| Total Health Care (Cost $6,357,159) | | | 7,042,500 | | |

The accompanying notes are an integral part of these financial statements.
60
BUFFALO HIGH YIELD FUND
(UNAUDITED)
SCHEDULE OF INVESTMENTS
SEPTEMBER 30, 2021 Continued
Shares or Face Amount | | | | $ Fair Value* | |
Industrials | | | 9.72 | % | |
| | | | | Aerospace & Defense | | | 0.35 | % | |
| | | | | TransDigm, Inc. | | | |
| | 500,000 | | | 6.250%, 03/15/2026(b) | | | 523,810 | | |
| | 500,000 | | | 6.375%, 06/15/2026 | | | 516,455 | | |
| | | | 1,040,265 | | |
| | | | | Building Products | | | 1.92 | % | |
| | | | | Builders FirstSource, Inc. | | | |
| | 402,000 | | | 6.750%, 06/01/2027(b) | | | 426,622 | | |
| | 4,000,000 | | | 5.000%, 03/01/2030(b) | | | 4,285,000 | | |
| | 1,000,000 | | | 4.250%, 02/01/2032(b) | | | 1,022,528 | | |
| | | | 5,734,150 | | |
| | | | | Commercial Services & Supplies | | | 5.16 | % | |
| | | | | Cimpress NV | | | |
| | 2,000,000 | | | 7.000%, 06/15/2026(a) (b) | | | 2,088,400 | | |
| | | | | Covanta Holding Corp. | | | |
| | 1,500,000 | | | 5.875%, 07/01/2025 | | | 1,550,625 | | |
| | 250,000 | | | 5.000%, 09/01/2030 | | | 252,823 | | |
| | | | | Deluxe Corp. | | | |
| | 2,500,000 | | | 8.000%, 06/01/2029(b) | | | 2,615,625 | | |
| | | | | KAR Auction Services, Inc. | | | |
| | 2,500,000 | | | 5.125%, 06/01/2025(b) | | | 2,531,250 | | |
| | | | | Matthews International Corp. | | | |
| | 2,260,000 | | | 5.250%, 12/01/2025(b) | | | 2,332,365 | | |
| | | | | Quad Graphics, Inc. | | | |
| | 4,000,000 | | | 7.000%, 05/01/2022 | | | 4,060,000 | | |
| | | | 15,431,088 | | |
| | | | | Construction & Engineering | | | 1.02 | % | |
| | | | | Tutor Perini Corp. | | | |
| | 3,000,000 | | | 6.875%, 05/01/2025(b) | | | 3,071,250 | | |
| | | | | Trading Companies & Distributors | | | 1.27 | % | |
| | | | | Alta Equipment Group, Inc. | | | |
| | 1,750,000 | | | 5.625%, 04/15/2026(b) | | | 1,800,312 | | |
| | | | | Fly Leasing Ltd. | | | |
| | 2,000,000 | | | 7.000%, 10/15/2024(a) (b) | | | 1,993,320 | | |
| | | | 3,793,632 | | |
| Total Industrials (Cost $28,204,971) | | | 29,070,385 | | |

The accompanying notes are an integral part of these financial statements.
61
BUFFALO HIGH YIELD FUND
(UNAUDITED)
SCHEDULE OF INVESTMENTS
SEPTEMBER 30, 2021 Continued
Shares or Face Amount | | | | $ Fair Value* | |
Information | | | 4.99 | % | |
| | | | | Data Processing, Hosting, and Related Services | | | 0.34 | % | |
| | | | | VM Consolidated, Inc. | | | |
| | 1,000,000 | | | 5.500%, 04/15/2029(b) | | | 1,018,495 | | |
| | | | | Motion Picture and Video Industries | | | 0.69 | % | |
| | | | | Lions Gate Capital Holdings LLC | | | |
| | 2,000,000 | | | 5.500%, 04/15/2029(b) | | | 2,070,040 | | |
| | | | | Other Telecommunications | | | 1.35 | % | |
| | | | | Avaya, Inc. | | | |
| | 1,500,000 | | | 6.125%, 09/15/2028(b) | | | 1,579,080 | | |
| | | | | Consolidated Communications, Inc. | | | |
| | 2,250,000 | | | 6.500%, 10/01/2028(b) | | | 2,446,920 | | |
| | | | 4,026,000 | | |
| | | | | Radio and Television Broadcasting | | | 1.83 | % | |
| | | | | Audacy Capital Corp. | | | |
| | 2,200,000 | | | 6.750%, 03/31/2029(b) | | | 2,220,240 | | |
| | | | | iHeartCommunications, Inc. | | | |
| | 2,000,000 | | | 8.375%, 05/01/2027 | | | 2,140,000 | | |
| | 100,000 | | | 5.250%, 08/15/2027(b) | | | 104,125 | | |
| | | | | Nexstar Media, Inc. | | | |
| | 500,000 | | | 4.750%, 11/01/2028(b) | | | 519,317 | | |
| | | | | Scripps Escrow II, Inc. | | | |
| | 500,000 | | | 3.875%, 01/15/2029(b) | | | 502,370 | | |
| | | | 5,486,052 | | |
| | | | | Software Publishers | | | 0.78 | % | |
| | | | | Consensus Cloud Solutions, Inc. | | | |
| | 2,250,000 | | | 6.000%, 10/15/2026(b) | | | 2,317,500 | | |
| Total Information (Cost $14,438,791) | | | 14,918,087 | | |
Information Technology | | | 1.55 | % | |
| | | | | Technology Hardware, Storage & Peripherals | | | 1.55 | % | |
| | | | | Diebold Nixdorf, Inc. | | | |
| | 4,000,000 | | | 8.500%, 04/15/2024 | | | 4,091,940 | | |
| | 500,000 | | | 9.375%, 07/15/2025(b) | | | 547,815 | | |
| Total Information Technology (Cost $4,476,928) | | | 4,639,755 | | |

The accompanying notes are an integral part of these financial statements.
62
BUFFALO HIGH YIELD FUND
(UNAUDITED)
SCHEDULE OF INVESTMENTS
SEPTEMBER 30, 2021 Continued
Shares or Face Amount | | | | $ Fair Value* | |
Manufacturing | | | 1.07 | % | |
| | | | | Petroleum and Coal Products Manufacturing | | | 0.33 | % | |
| | | | | Calumet Specialty Products Partners LP / Calumet Finance Corp. | | | |
| | 1,000,000 | | | 7.750%, 04/15/2023 | | | 992,500 | | |
| | | | | Resin, Synthetic Rubber, and Artificial Synthetic Fibers and Filaments Manufacturing | | | 0.74 | % | |
| | | | | Rayonier AM Products, Inc. | | | |
| | 2,100,000 | | | 7.625%, 01/15/2026(b) | | | 2,222,062 | | |
| Total Manufacturing (Cost $3,142,539) | | | 3,214,562 | | |
Materials | | | 2.40 | % | |
| | | | | Chemicals | | | 0.70 | % | |
| | | | | Chemours Co/The | | | |
| | 2,000,000 | | | 5.750%, 11/15/2028(b) | | | 2,100,000 | | |
| | | | | Metals & Mining | | | 1.70 | % | |
| | | | | Commercial Metals Co. | | | |
| | 250,000 | | | 5.375%, 07/15/2027 | | | 262,812 | | |
| | 500,000 | | | 3.875%, 02/15/2031 | | | 503,390 | | |
| | | | | Taseko Mines Ltd. | | | |
| | 3,000,000 | | | 7.000%, 02/15/2026(a) (b) | | | 3,045,000 | | |
| | | | | Warrior Met Coal, Inc. | | | |
| | 1,250,000 | | | 8.000%, 11/01/2024(a) (b) | | | 1,270,313 | | |
| | | | 5,081,515 | | |
| Total Materials (Cost $7,046,307) | | | 7,181,515 | | |
Mining, Quarrying, and Oil and Gas Extraction | | | 0.77 | % | |
| | | | | Coal Mining | | | 0.77 | % | |
| | | | | Alliance Resource Operating Partners LP / Alliance Resource Finance Corp. | | | |
| | 2,250,000 | | | 7.500%, 05/01/2025(b) | | | 2,289,375 | | |
| Total Mining, Quarrying, and Oil and Gas Extraction (Cost $2,280,181) | | | 2,289,375 | | |
Professional, Scientific, and Technical Services | | | 0.87 | % | |
| | | | | Advertising, Public Relations, and Related Services | | | 0.33 | % | |
| | | | | Outfront Media Capital LLC / Outfront Media Capital Corp. | | | |
| | 1,000,000 | | | 4.625%, 03/15/2030(b) | | | 1,003,373 | | |

The accompanying notes are an integral part of these financial statements.
63
BUFFALO HIGH YIELD FUND
(UNAUDITED)
SCHEDULE OF INVESTMENTS
SEPTEMBER 30, 2021 Continued
Shares or Face Amount | | | | $ Fair Value* | |
| | | | | Other Professional, Scientific, and Technical Services | | | 0.54 | % | |
| | | | | Sabre GLBL, Inc. | | | |
| | 1,500,000 | | | 7.375%, 09/01/2025(b) | | | 1,603,050 | | |
| Total Professional, Scientific, and Technical Services (Cost $2,508,232) | | | 2,606,423 | | |
Real Estate and Rental and Leasing | | | 0.07 | % | |
| | | | | Lessors of Real Estate | | | 0.07 | % | |
| | | | | Uniti Group LP / Uniti Group Finance Inc / CSL Capital LLC | | | |
| | 200,000 | | | 6.500%, 02/15/2029(b) | | | 206,000 | | |
| Total Real Estate and Rental and Leasing (Cost $200,000) | | | 206,000 | | |
Technology | | | 0.09 | % | |
| | | | | Technology | | | 0.09 | % | |
| | | | | Consensus Cloud Solutions, Inc. | | | |
| | 250,000 | | | 6.500%, 10/15/2028(b) | | | 260,063 | | |
| Total Technology (Cost $250,000) | | | 260,063 | | |
Utilities | | | 0.66 | % | |
| | | | | Electric Power Generation, Transmission and Distribution | | | 0.66 | % | |
| | | | | IEA Energy Services LLC | | | |
| | 2,000,000 | | | 6.625%, 08/15/2029(b) | | | 1,983,960 | | |
| Total Utilities (Cost $1,969,660) | | | 1,983,960 | | |
Wholesale Trade | | | 2.20 | % | |
| | | | | Drugs and Druggists' Sundries Merchant Wholesalers | | | 0.18 | % | |
| | | | | Herbalife Nutrition Ltd / HLF Financing, Inc. | | | |
| | 500,000 | | | 7.875%, 09/01/2025(a) (b) | | | 536,875 | | |
| | | | | Grocery and Related Product Merchant Wholesalers | | | 1.00 | % | |
| | | | | Performance Food Group, Inc. | | | |
| | 1,000,000 | | | 4.250%, 08/01/2029(b) | | | 1,003,760 | | |
| | | | | Primo Water Holdings, Inc. | | | |
| | 2,000,000 | | | 4.375%, 04/30/2029(b) | | | 2,001,960 | | |
| | | | 3,005,720 | | |

The accompanying notes are an integral part of these financial statements.
64
BUFFALO HIGH YIELD FUND
(UNAUDITED)
SCHEDULE OF INVESTMENTS
SEPTEMBER 30, 2021 Continued
Shares or Face Amount | | | | $ Fair Value* | |
| | | | | Machinery, Equipment, and Supplies Merchant Wholesalers | | | 1.01 | % | |
| | | | | TransDigm, Inc. | | | |
| | 1,000,000 | | | 5.500%, 11/15/2027 | | | 1,035,060 | | |
| | 1,000,000 | | | 4.625%, 01/15/2029 | | | 996,745 | | |
| | 1,000,000 | | | 4.875%, 05/01/2029 | | | 1,003,570 | | |
| | | | 3,035,375 | | |
| Total Wholesale Trade (Cost $6,500,578) | | | 6,577,970 | | |
| Total Corporate Bonds (Cost $184,631,538) | | | 191,642,914 | | |
Bank Loans | | | 16.06 | % | |
| | | | | Aerospace & Defense | | | 1.84 | % | |
| | 3,609,671 | | | Maxar Technologies Ltd., Senior Secured First Lien Term Loan (1 Month LIBOR USD + 2.750%) | | | 3,585,432 | | |
| | 1,916,072 | | | TransDigm, Inc., Senior Secured First Lien Term Loan (1 Month LIBOR USD + 2.250%) | | | 1,897,907 | | |
| | | | 5,483,339 | | |
| | | | | Broadcasting | | | 0.33 | % | |
| | 559,678 | | | CBS Radio, Senior Secured First Lien Term Loan (1 Month LIBOR USD + 2.500%) | | | 552,772 | | |
| | 431,373 | | | Nexstar Media Group, Inc., Senior Secured First Lien Term Loan (1 Month LIBOR USD + 2.500%) | | | 431,509 | | |
| | | | 984,281 | | |
| | | | | Cable/Satellite TV | | | 2.01 | % | |
| | 6,000,000 | | | DIRECTV Financing LLC, Senior Secured First Lien Term Loan (1 Month LIBOR USD + 5.000%) | | | 6,010,620 | | |
| | | | | Construction & Engineering | | | 1.00 | % | |
| | 2,971,247 | | | Tutor Perini Corp., Senior Secured First Lien Term Loan (3 Month LIBOR USD + 4.750%) | | | 2,984,246 | | |
| | | | | Diversified Consumer Services | | | 0.33 | % | |
| | 997,500 | | | Weight Watchers International, Inc., Senior Secured First Lien Term Loan
(1 Month LIBOR USD + 3.500%) | | | 997,605 | | |
| | | | | Financial | | | 0.65 | % | |
| | 1,925,000 | | | Fly Willow Funding Ltd., Senior Secured First Lien Term Loan (3 Month LIBOR USD + 6.000%) | | | 1,934,625 | | |
| | | | | Food Products | | | 0.46 | % | |
| | 1,377,161 | | | Atkins Nutritionals, Inc., Senior Secured First Lien Term Loan (1 Month LIBOR USD + 3.750%)(c) | | | 1,383,310 | | |
| | | | | Healthcare | | | 0.67 | % | |
| | 1,995,000 | | | RadNet, Inc., Senior Secured First Lien Term Loan (3 Month LIBOR USD + 3.000%) | | | 1,994,381 | | |
| | | | | Internet & Direct Marketing Retail | | | 1.51 | % | |
| | 4,493,750 | | | Magnite, Inc., Senior Secured First Lien Term Loan (6 Month LIBOR USD + 5.000%) | | | 4,504,984 | | |
| | | | | IT Services | | | 1.01 | % | |
| | 3,000,000 | | | MoneyGram International, Inc., Senior Secured First Lien Term Loan (3 Month LIBOR USD + 4.250%) | | | 3,003,750 | | |

The accompanying notes are an integral part of these financial statements.
65
BUFFALO HIGH YIELD FUND
(UNAUDITED)
SCHEDULE OF INVESTMENTS
SEPTEMBER 30, 2021 Continued
Shares or Face Amount | | | | $ Fair Value* | |
| | | | | Media | | | 0.72 | % | |
| | 975,100 | | | The E.W. Scripps Co., Senior Secured First Lien Term Loan (1 Month LIBOR USD + 2.562%) | | | 973,359 | | |
| | 216,875 | | | The E.W. Scripps Co., Senior Secured First Lien Term Loan (1 Month LIBOR USD + 3.000%) | | | 217,568 | | |
| | 960,000 | | | The E.W. Scripps Co., Senior Secured First Lien Term Loan (1 Month LIBOR USD + 2.000%) | | | 954,000 | | |
| | | | 2,144,927 | | |
| | | | | Oil, Gas & Consumable Fuels | | | 0.64 | % | |
| | 1,994,791 | | | Consolidated Energy, Inc., Senior Secured First Lien Term Loan (3 Month LIBOR USD + 2.500%) | | | 1,921,413 | | |
| | | | | Pharmaceuticals | | | 2.33 | % | |
| | 1,995,000 | | | Jazz Pharmaceuticals., Senior Secured First Lien Term Loan (1 Month LIBOR USD + 3.500%) | | | 1,999,997 | | |
| | 4,987,500 | | | PetIQ Holdings LLC, Senior Secured First Lien Term Loan (3 Month LIBOR USD + 4.250%) | | | 4,968,797 | | |
| | | | 6,968,794 | | |
| | | | | Retailers (other than Food/Drug) | | | 0.65 | % | |
| | 2,000,000 | | | Jo-Ann Stores LLC., Senior Secured First Lien Term Loan (1 Month LIBOR USD + 4.750%) | | | 1,950,000 | | |
| | | | | Software | | | 0.44 | % | |
| | 207,770 | | | SS&C Technologies Holdings, Inc., Senior Secured First Lien Term Loan
(1 Month LIBOR USD + 1.750%)(c) | | | 205,992 | | |
| | 157,332 | | | SS&C Technologies Holdings, Inc., Senior Secured First Lien Term Loan
(1 Month LIBOR USD + 1.750%)(c) | | | 155,985 | | |
| | 969,113 | | | SS&C Technologies Holdings, Inc., Senior Secured First Lien Term Loan
(1 Month LIBOR USD + 1.750%)(c) | | | 961,442 | | |
| | | | 1,323,419 | | |
| | | | | Telecommunications | | | 1.48 | % | |
| | 1,500,000 | | | Avaya, Inc., Senior Secured First Lien Term Loan (1 Month LIBOR USD + 4.000%) | | | 1,503,645 | | |
| | 2,928,009 | | | Consolidated Communications, Inc., Senior Secured First Lien Term Loan
(1 Month LIBOR USD + 4.7500%) | | | 2,935,564 | | |
| | | | 4,439,209 | | |
| Total Bank Loans (Cost $47,801,081) | | | 48,028,903 | | |
Short Term Investments | | | 4.08 | % | |
Investment Company | | | 4.08 | % | |
| | 12,207,166 | | | Fidelity Investments Money Market Funds — Government Portfolio — Class I — 0.010%(d) | | | 12,207,166 | | |
Total Investment Company | | | 12,207,166 | | |
| Total Short Term Investments (Cost $12,207,166) | | | 12,207,166 | | |

The accompanying notes are an integral part of these financial statements.
66
BUFFALO HIGH YIELD FUND
(UNAUDITED)
SCHEDULE OF INVESTMENTS
SEPTEMBER 30, 2021 Continued
Shares or Face Amount | | | | $ Fair Value* | |
Total Investments (Cost $283,181,493)
| | | 99.93
298,869,657 | % | |
Other Assets in Excess of Liabilities
| | | 0.07
200,659 | % | |
Total Net Assets
| | | 100.00
299,070,316 | % | |
(a) Foreign Issued Securities. The total value of these securities amounted to $17,729,876 (5.93% of net assets) at September 30, 2021.
(b) 144A securities. The total value of these securities amounted to $148,617,429 (49.69% of net assets) at September 30, 2021
(c) Illiquid Security. The total value of these securities amounted to $4,635,590 (1.55% of net assets) at September 30, 2021.
(d) The rate quoted is the annualized seven-day effective yield as of September 30, 2021.
* See Note 1A of the accompanying Notes to Financial Statements regarding valuation of securities.
The Global Industry Classification Standard (GICS) was developed by and/or is the exclusive property of MSCI, Inc. and Standard & Poor's Financial Services LLC ("S&P"). GICS is a service mark of MSCI and S&P and has been licensed for use by U.S. Bancorp Fund Services, LLC.

The accompanying notes are an integral part of these financial statements.
67
BUFFALO INTERNATIONAL FUND
(UNAUDITED)
SCHEDULE OF INVESTMENTS
SEPTEMBER 30, 2021
Shares or Face Amount | | | | $ Fair Value* | |
Common Stocks | | | 93.24 | % | |
Belgium | | | 1.14 | % | |
| | | | | Beverages | | | 1.14 | % | |
| | 83,500 | | | Anheuser-Busch InBev SA/NV | | | 4,735,887 | | |
| | 41,500 | | | Anheuser-Busch InBev SA/NV — ADR | | | 2,339,770 | | |
| | | | 7,075,657 | | |
| Total Belgium (Cost $8,039,001) | | | 7,075,657 | | |
Canada | | | 1.25 | % | |
| | | | | Road & Rail | | | 1.25 | % | |
| | 67,000 | | | Canadian National Railway Co. — ADR | | | 7,748,550 | | |
| Total Canada (Cost $4,822,925) | | | 7,748,550 | | |
Cayman Islands | | | 0.18 | % | |
| | | | | Interactive Media & Services | | | 0.18 | % | |
| | 55,000 | | | VTEX — ADR(a) | | | 1,131,350 | | |
| Total Cayman Islands (Cost $1,131,756) | | | 1,131,350 | | |
Denmark | | | 1.41 | % | |
| | | | | Pharmaceuticals | | | 1.41 | % | |
| | 15,000 | | | Novo Nordisk A/S | | | 1,445,844 | | |
| | 76,000 | | | Novo Nordisk A/S — ADR | | | 7,296,760 | | |
| | | | 8,742,604 | | |
| Total Denmark (Cost $5,103,075) | | | 8,742,604 | | |
France | | | 16.81 | % | |
| | | | | Aerospace & Defense | | | 1.10 | % | |
| | 70,000 | | | Thales SA | | | 6,786,866 | | |
| | | | | Beverages | | | 1.33 | % | |
| | 37,500 | | | Pernod Ricard SA | | | 8,267,340 | | |
| | | | | Chemicals | | | 1.32 | % | |
| | 51,062 | | | Air Liquide SA | | | 8,178,069 | | |

The accompanying notes are an integral part of these financial statements.
68
BUFFALO INTERNATIONAL FUND
(UNAUDITED)
SCHEDULE OF INVESTMENTS
SEPTEMBER 30, 2021 Continued
Shares or Face Amount | | | | $ Fair Value* | |
| | | | | Construction & Engineering | | | 1.28 | % | |
| | 76,000 | | | Vinci SA | | | 7,904,648 | | |
| | | | | Electrical Equipment | | | 2.39 | % | |
| | 89,000 | | | Schneider Electric SE | | | 14,823,256 | | |
| | | | | Hotels, Restaurants & Leisure | | | 0.42 | % | |
| | 50,000 | | | La Francaise des Jeux SAEM | | | 2,570,851 | | |
| | | | | Life Sciences Tools & Services | | | 2.53 | % | |
| | 28,000 | | | Sartorius Stedim Biotech | | | 15,646,482 | | |
| | | | | Pharmaceuticals | | | 0.77 | % | |
| | 99,587 | | | Sanofi — ADR | | | 4,801,089 | | |
| | | | | Professional Services | | | 1.56 | % | |
| | 313,000 | | | Bureau Veritas SA | | | 9,659,541 | | |
| | | | | Software | | | 1.19 | % | |
| | 140,000 | | | Dassault Systemes SE | | | 7,367,547 | | |
| | | | | Textiles, Apparel & Luxury Goods | | | 2.92 | % | |
| | 12,300 | | | Kering SA | | | 8,736,181 | | |
| | 13,100 | | | LVMH Moet Hennessy Louis Vuitton SE | | | 9,383,028 | | |
| | | | 18,119,209 | | |
| Total France (Cost $53,572,724) | | | 104,124,898 | | |
Germany | | | 19.79 | % | |
| | | | | Capital Markets | | | 1.17 | % | |
| | 172,000 | | | DWS Group GmbH & Co KGaA | | | 7,224,662 | | |
| | | | | Chemicals | | | 1.18 | % | |
| | 56,000 | | | Symrise AG | | | 7,339,959 | | |
| | | | | Electrical Equipment | | | 0.27 | % | |
| | 62,600 | | | Siemens Energy AG(a) | | | 1,674,512 | | |
| | | | | Electronic Equipment, Instruments & Components | | | 0.84 | % | |
| | 153,711 | | | Jenoptik AG | | | 5,180,051 | | |
| | | | | Health Care Equipment & Supplies | | | 1.72 | % | |
| | 55,525 | | | Carl Zeiss Meditec AG | | | 10,635,899 | | |
| | | | | Health Care Providers & Services | | | 0.90 | % | |
| | 117,000 | | | Fresenius SE & Co. KGaA | | | 5,600,206 | | |
| | | | | Household Products | | | 0.33 | % | |
| | 23,900 | | | Henkel AG & Co. KGaA | | | 2,055,994 | | |

The accompanying notes are an integral part of these financial statements.
69
BUFFALO INTERNATIONAL FUND
(UNAUDITED)
SCHEDULE OF INVESTMENTS
SEPTEMBER 30, 2021 Continued
Shares or Face Amount | | | | $ Fair Value* | |
| | | | | Industrial Conglomerates | | | 1.85 | % | |
| | 70,200 | | | Siemens A.G. — ADR | | | 11,481,242 | | |
| | | | | Insurance | | | 2.14 | % | |
| | 34,000 | | | Hannover Rueck SE | | | 5,920,779 | | |
| | 26,900 | | | Muenchener Rueckversicherungs-Gesellschaft AG in Muenchen | | | 7,340,159 | | |
| | | | 13,260,938 | | |
| | | | | Pharmaceuticals | | | 2.22 | % | |
| | 63,500 | | | Merck KGaA | | | 13,743,877 | | |
| | | | | Semiconductors & Semiconductor Equipment | | | 1.35 | % | |
| | 204,000 | | | Infineon Technologies AG | | | 8,343,205 | | |
| | | | | Software | | | 1.96 | % | |
| | 64,800 | | | SAP SE — ADR | | | 8,750,592 | | |
| | 115,000 | | | TeamViewer AG(a) | | | 3,364,382 | | |
| | | | 12,114,974 | | |
| | | | | Textiles, Apparel & Luxury Goods | | | 2.02 | % | |
| | 19,700 | | | adidas AG | | | 6,190,832 | | |
| | 57,160 | | | Puma SE | | | 6,354,178 | | |
| | | | 12,545,010 | | |
| | | | | Trading Companies & Distributors | | | 1.84 | % | |
| | 123,000 | | | Brenntag AG | | | 11,426,005 | | |
| Total Germany (Cost $69,971,835) | | | 122,626,534 | | |
India | | | 2.08 | % | |
| | | | | Banks | | | 2.08 | % | |
| | 27,500 | | | HDFC Bank Ltd. — ADR | | | 2,009,975 | | |
| | 577,480 | | | ICICI Bank Ltd. — ADR | | | 10,897,047 | | |
| | | | 12,907,022 | | |
| Total India (Cost $6,904,141) | | | 12,907,022 | | |
Ireland | | | 9.13 | % | |
| | | | | Chemicals | | | 2.22 | % | |
| | 46,760 | | | Linde PLC | | | 13,751,068 | | |
| | | | | Construction Materials | | | 1.46 | % | |
| | 78,000 | | | CRH PLC — ADR | | | 3,645,720 | | |
| | 5,000 | | | CRH PLC | | | 234,630 | | |
| | 110,000 | | | CRH public limited company | | | 5,191,418 | | |
| | | | 9,071,768 | | |

The accompanying notes are an integral part of these financial statements.
70
BUFFALO INTERNATIONAL FUND
(UNAUDITED)
SCHEDULE OF INVESTMENTS
SEPTEMBER 30, 2021 Continued
Shares or Face Amount | | | | $ Fair Value* | |
| | | | | Food Products | | | 0.59 | % | |
| | 27,000 | | | Kerry Group Plc | | | 3,627,939 | | |
| | | | | Health Care Equipment & Supplies | | | 1.57 | % | |
| | 77,400 | | | Medtronic, PLC — ADR | | | 9,702,090 | | |
| | | | | Hotels, Restaurants & Leisure | | | 0.23 | % | |
| | 300,015 | | | Dalata Hotel Group PLC(a) | | | 1,424,837 | | |
| | | | | Insurance | | | 2.21 | % | |
| | 48,000 | | | Aon Plc — ADR | | | 13,716,960 | | |
| | | | | Life Sciences Tools & Services | | | 0.85 | % | |
| | 20,000 | | | ICON PLC. — ADR(a) | | | 5,240,400 | | |
| Total Ireland (Cost $34,558,070) | | | 56,535,062 | | |
Italy | | | 0.44 | % | |
| | | | | Life Sciences Tools & Services | | | 0.44 | % | |
| | 108,050 | | | Stevanato Group SpA — ADR(a) | | | 2,734,745 | | |
| Total Italy (Cost $2,269,050) | | | 2,734,745 | | |
Japan | | | 6.39 | % | |
| | | | | Beverages | | | 0.91 | % | |
| | 117,000 | | | Asahi Group Holdings Ltd. | | | 5,645,880 | | |
| | | | | Electronic Equipment, Instruments & Components | | | 3.45 | % | |
| | 7,000 | | | KEYENCE CORP. | | | 4,178,098 | | |
| | 75,000 | | | Murata Manufacturing Co., Ltd. | | | 6,633,936 | | |
| | 107,000 | | | Omron Corp. | | | 10,587,928 | | |
| | | | 21,399,962 | | |
| | | | | Entertainment | | | 0.81 | % | |
| | 10,500 | | | Nintendo Co Ltd. | | | 5,017,770 | | |
| | | | | Machinery | | | 0.72 | % | |
| | 18,500 | | | FANUC Corp. | | | 4,056,346 | | |
| | 18,000 | | | FANUC Corp. — ADR(a) | | | 396,900 | | |
| | | | 4,453,246 | | |
| | | | | Semiconductors & Semiconductor Equipment | | | 0.50 | % | |
| | 250,000 | | | Renesas Electronics Corp.(a) | | | 3,076,840 | | |
| Total Japan (Cost $27,114,936) | | | 39,593,698 | | |

The accompanying notes are an integral part of these financial statements.
71
BUFFALO INTERNATIONAL FUND
(UNAUDITED)
SCHEDULE OF INVESTMENTS
SEPTEMBER 30, 2021 Continued
Shares or Face Amount | | | | $ Fair Value* | |
Luxembourg | | | 2.55 | % | |
| | | | | Life Sciences Tools & Services | | | 2.16 | % | |
| | 104,000 | | | EUROFINS SCIENTIFI(a) | | | 13,352,670 | | |
| | | | | Personal Products | | | 0.39 | % | |
| | 730,750 | | | L'Occitane International SA | | | 2,436,928 | | |
| Total Luxembourg (Cost $5,449,304) | | | 15,789,598 | | |
Netherlands | | | 9.01 | % | |
| | | | | Beverages | | | 1.61 | % | |
| | 710,000 | | | Davide Campari-Milano NV | | | 9,973,490 | | |
| | | | | IT Services | | | 1.44 | % | |
| | 3,200 | | | Adyen NV(a) | | | 8,945,133 | | |
| | | | | Semiconductors & Semiconductor Equipment | | | 3.64 | % | |
| | 21,741 | | | ASML Holding NV — NY Shares — ADR | | | 16,199,437 | | |
| | 65,000 | | | STMicroelectronics N.V. | | | 2,838,003 | | |
| | 80,600 | | | STMicroelectronics N.V. — NY Shares — ADR | | | 3,516,578 | | |
| | | | 22,554,018 | | |
| | | | | Trading Companies & Distributors | | | 2.32 | % | |
| | 75,000 | | | IMCD N.V. | | | 14,353,454 | | |
| Total Netherlands (Cost $14,504,366) | | | 55,826,095 | | |
Norway | | | 1.42 | % | |
| | | | | Commercial Services & Supplies | | | 1.42 | % | |
| | 168,000 | | | Tomra Systems ASA | | | 8,788,446 | | |
| Total Norway (Cost $1,282,872) | | | 8,788,446 | | |
Republic of Korea | | | 0.60 | % | |
| | | | | Semiconductors & Semiconductor Equipment | | | 0.60 | % | |
| | 60,000 | | | Samsung Electronic Co., Ltd. | | | 3,719,676 | | |
| Total Republic of Korea (Cost $2,338,574) | | | 3,719,676 | | |

The accompanying notes are an integral part of these financial statements.
72
BUFFALO INTERNATIONAL FUND
(UNAUDITED)
SCHEDULE OF INVESTMENTS
SEPTEMBER 30, 2021 Continued
Shares or Face Amount | | | | $ Fair Value* | |
Spain | | | 1.04 | % | |
| | | | | Biotechnology | | | 0.61 | % | |
| | 257,200 | | | Grifols SA — ADR | | | 3,757,692 | | |
| | | | | Specialty Retail | | | 0.43 | % | |
| | 73,500 | | | Industria de Diseno Textil, S.A. | | | 2,704,478 | | |
| Total Spain (Cost $6,652,736) | | | 6,462,170 | | |
Sweden | | | 3.18 | % | |
| | | | | Communications Equipment | | | 0.45 | % | |
| | 250,000 | | | Telefonaktirbolaget LM Ericsson — ADR | | | 2,800,000 | | |
| | | | | Electronic Equipment, Instruments & Components | | | 2.41 | % | |
| | 966,000 | | | Hexagon AB — B Shares | | | 14,942,083 | | |
| | | | | Software Publishers | | | 0.32 | % | |
| | 100,000 | | | Sinch AB(a) | | | 1,939,199 | | |
| Total Sweden (Cost $11,050,671) | | | 19,681,282 | | |
Switzerland | | | 6.69 | % | |
| | | | | Capital Markets | | | 1.08 | % | |
| | 101,037 | | | Julius Baer Group Ltd. | | | 6,712,869 | | |
| | | | | Construction Materials | | | 0.54 | % | |
| | 70,000 | | | LafargeHolcim Ltd. | | | 3,372,951 | | |
| | | | | Electrical Equipment | | | 1.20 | % | |
| | 222,500 | | | ABB Ltd. — ADR | | | 7,422,600 | | |
| | | | | Food Products | | | 0.39 | % | |
| | 20,000 | | | Nestle SA | | | 2,409,801 | | |
| | | | | Health Care Equipment & Supplies | | | 0.60 | % | |
| | 46,000 | | | Alcon, Inc. | | | 3,724,655 | | |
| | | | | Life Sciences Tools & Services | | | 1.82 | % | |
| | 15,000 | | | Lonza Group AG | | | 11,251,647 | | |
| | | | | Pharmaceuticals | | | 1.03 | % | |
| | 11,800 | | | Roche Holding AG | | | 4,306,646 | | |
| | 45,400 | | | Roche Holding AG — ADR | | | 2,064,338 | | |
| | | | 6,370,984 | | |

The accompanying notes are an integral part of these financial statements.
73
BUFFALO INTERNATIONAL FUND
(UNAUDITED)
SCHEDULE OF INVESTMENTS
SEPTEMBER 30, 2021 Continued
Shares or Face Amount | | | | $ Fair Value* | |
| | | | | Textiles, Apparel & Luxury Goods | | | 0.03 | % | |
| | 6,500 | | | On Holding AG — ADR(a) | | | 195,845 | | |
| Total Switzerland (Cost $26,526,090) | | | 41,461,352 | | |
Taiwan, Province of China | | | 2.33 | % | |
| | | | | Semiconductors & Semiconductor Equipment | | | 2.33 | % | |
| | 129,281 | | | Taiwan Semiconductor Manufacturing Co. Ltd. — ADR | | | 14,434,224 | | |
| Total Taiwan, Province of China (Cost $1,607,687) | | | 14,434,224 | | |
United Kingdom | | | 7.77 | % | |
| | | | | Aerospace & Defense | | | 0.54 | % | |
| | 440,000 | | | BAE Systems Plc | | | 3,332,585 | | |
| | | | | Beverages | | | 1.25 | % | |
| | 40,300 | | | Diageo PLC — ADR | | | 7,777,900 | | |
| | | | | Food Products | | | 0.85 | % | |
| | 97,200 | | | Unilever PLC — ADR | | | 5,270,184 | | |
| | | | | Health Care Equipment & Supplies | | | 0.70 | % | |
| | 127,000 | | | Smith & Nephew Plc — ADR | | | 4,361,180 | | |
| | | | | Hotels, Restaurants & Leisure | | | 0.75 | % | |
| | 73,100 | | | InterContinental Hotels Group PLC(a) | | | 4,667,549 | | |
| | | | | Pharmaceuticals | | | 1.09 | % | |
| | 94,000 | | | AstraZeneca PLC — ADR | | | 5,645,640 | | |
| | 9,000 | | | AstraZeneca PLC | | | 1,084,660 | | |
| | | | 6,730,300 | | |
| | | | | Trading Companies & Distributors | | | 2.59 | % | |
| | 212,000 | | | Ashtead Group Plc | | | 16,025,803 | | |
| Total United Kingdom (Cost $28,609,661) | | | 48,165,501 | | |
United States | | | 0.03 | % | |
| | | | | Software | | | 0.03 | % | |
| | 3,630 | | | Freshworks, Inc.(a) | | | 154,965 | | |
| Total United States (Cost $130,680) | | | 154,965 | | |
| Total Common Stocks (Cost $311,640,154) | | | 577,703,429 | | |

The accompanying notes are an integral part of these financial statements.
74
BUFFALO INTERNATIONAL FUND
(UNAUDITED)
SCHEDULE OF INVESTMENTS
SEPTEMBER 30, 2021 Continued
Shares or Face Amount | | | | $ Fair Value* | |
Short Term Investments | | | 7.70 | % | |
Investment Company | | | 7.70 | % | |
| | 47,680,669 | | | Fidelity Investments Money Market Funds — Government Portfolio — Class I — 0.010%(b) | | | 47,680,669 | | |
Total Investment Company | | | 47,680,669 | | |
| Total Short Term Investments (Cost $47,680,669) | | | 47,680,669 | | |
Total Investments (Cost $359,320,823)
| | | 100.94
625,384,098 | % | |
Liabilities in Excess of Other Assets
| | | (0.94
(5,852,810) | )% | |
Total Net Assets
| | | 100.00
619,531,288 | % | |
ADR American Depositary Receipt
PLC Public Limited Company
(a) Non Income Producing.
(b) The rate quoted is the annualized seven-day effective yield as of September 30, 2021.
* See Note 1A of the accompanying Notes to Financial Statements regarding valuation of securities.
The Global Industry Classification Standard (GICS) was developed by and/or is the exclusive property of MSCI, Inc. and Standard & Poor's Financial Services LLC ("S&P"). GICS is a service mark of MSCI and S&P and has been licensed for use by U.S. Bancorp Fund Services, LLC.

The accompanying notes are an integral part of these financial statements.
75
BUFFALO INTERNATIONAL FUND
(UNAUDITED)
SCHEDULE OF INVESTMENTS
SEPTEMBER 30, 2021 Continued
As of September 30, 2021, the industry diversification was as follows:
| | | $ Fair Value | | Percentage | |
Common Stocks | |
Aerospace & Defense | | | 3,332,585 | | | | 0.54 | % | |
Banks | | | 12,907,022 | | | | 2.08 | % | |
Beverages | | | 38,740,267 | | | | 6.25 | % | |
Biotechnology | | | 3,757,692 | | | | 0.61 | % | |
Capital Markets | | | 13,937,531 | | | | 2.25 | % | |
Chemicals | | | 29,269,096 | | | | 4.72 | % | |
Commercial Services & Supplies | | | 8,788,446 | | | | 1.42 | % | |
Communications Equipment | | | 2,800,000 | | | | 0.45 | % | |
Construction & Engineering | | | 7,904,648 | | | | 1.28 | % | |
Construction Materials | | | 12,444,719 | | | | 2.01 | % | |
Electrical Equipment | | | 23,920,368 | | | | 3.86 | % | |
Electronic Equipment, Instruments & Components | | | 41,522,096 | | | | 6.70 | % | |
Entertainment | | | 5,017,770 | | | | 0.81 | % | |
Food Products | | | 11,307,924 | | | | 1.83 | % | |
Health Care Equipment & Supplies | | | 28,423,824 | | | | 4.59 | % | |
Health Care Providers & Services | | | 5,600,206 | | | | 0.90 | % | |
Hotels, Restaurants & Leisure | | | 8,663,237 | | | | 1.40 | % | |
Household Products | | | 2,055,994 | | | | 0.33 | % | |
Industrial Conglomerates | | | 11,481,242 | | | | 1.85 | % | |
Insurance | | | 26,977,898 | | | | 4.35 | % | |
Interactive Media & Services | | | 1,131,350 | | | | 0.18 | % | |
IT Services | | | 8,945,133 | | | | 1.44 | % | |
Life Sciences Tools & Services | | | 48,225,944 | | | | 7.78 | % | |
Machinery | | | 4,453,246 | | | | 0.72 | % | |
Personal Products | | | 2,436,928 | | | | 0.39 | % | |
Pharmaceuticals | | | 47,175,720 | | | | 7.61 | % | |
Professional Services | | | 9,659,541 | | | | 1.56 | % | |
Road & Rail | | | 7,748,550 | | | | 1.25 | % | |
Semiconductors & Semiconductor Equipment | | | 64,242,937 | | | | 10.37 | % | |
Software | | | 7,522,512 | | | | 1.21 | % | |
Software Publishers | | | 1,939,199 | | | | 0.31 | % | |
Specialty Retail | | | 2,704,478 | | | | 0.44 | % | |
Textiles, Apparel & Luxury Goods | | | 30,860,064 | | | | 4.98 | % | |
Trading Companies & Distributors | | | 41,805,262 | | | | 6.75 | % | |
Total Common Stocks | | | 577,703,429 | | | | 93.25 | % | |
Short Term Investment | |
Investment Company | | | 47,680,669 | | | | 7.70 | % | |
Total Short Term Investment | | | 47,680,669 | | | | 7.70 | % | |
Total Investments | | | 625,384,098 | | | | 100.94 | % | |
Liabilities in Excess of Other Assets | | | (5,852,810 | ) | | | (1.15 | )% | |
TOTAL NET ASSETS | | | 619,531,288 | | | | 100.00 | % | |

The accompanying notes are an integral part of these financial statements.
76
BUFFALO LARGE CAP FUND (UNAUDITED)
SCHEDULE OF INVESTMENTS
SEPTEMBER 30, 2021
Shares or Face Amount | | | | $ Fair Value | |
Common Stocks | | | 95.65 | % | |
Communication Services | | | 13.22 | % | |
| | | | | Entertainment | | | 1.62 | % | |
| | 5,960 | | | Electronic Arts, Inc. | | | 847,810 | | |
| | 1,500 | | | Sea Ltd. — ADR(a) (b) | | | 478,095 | | |
| | 3,850 | | | The Walt Disney Co.(a) | | | 651,305 | | |
| | | | 1,977,210 | | |
| | | | | Interactive Media & Services | | | 11.60 | % | |
| | 2,845 | | | Alphabet, Inc. — Class A(a) | | | 7,606,165 | | |
| | 498 | | | Alphabet, Inc. — Class C(a) | | | 1,327,324 | | |
| | 15,475 | | | Facebook, Inc. — Class A(a) | | | 5,252,060 | | |
| | | | 14,185,549 | | |
| Total Communication Services (Cost $6,868,461) | | | 16,162,759 | | |
Consumer Discretionary | | | 16.21 | % | |
| | | | | Auto Components | | | 0.70 | % | |
| | 5,700 | | | Aptiv PLC — ADR(a) (b) | | | 849,129 | | |
| | | | | Automobiles | | | 0.71 | % | |
| | 1,125 | | | Tesla, Inc.(a) | | | 872,415 | | |
| | | | | Hotels, Restaurants & Leisure | | | 2.63 | % | |
| | 3,250 | | | Airbnb, Inc.(a) | | | 545,188 | | |
| | 5,600 | | | McDonald's Corp. | | | 1,350,216 | | |
| | 10,740 | | | Yum! Brands, Inc. | | | 1,313,609 | | |
| | | | 3,209,013 | | |
| | | | | Internet & Catalog Retail | | | 1.42 | % | |
| | 2,850 | | | Netflix Inc.(a) | | | 1,739,469 | | |
| | | | | Internet & Direct Marketing Retail | | | 7.10 | % | |
| | 2,485 | | | Amazon.com, Inc.(a) | | | 8,163,325 | | |
| | 2,500 | | | Etsy, Inc.(a) | | | 519,900 | | |
| | | | 8,683,225 | | |
| | | | | Specialty Retai | | | 2.47 | % | |
| | 7,425 | | | Lowe's Companies, Inc. | | | 1,506,235 | | |
| | 775 | | | RH(a) | | | 516,855 | | |
| | 15,170 | | | The TJX Companies, Inc. | | | 1,000,917 | | |
| | | | 3,024,007 | | |
| | | | | Textiles, Apparel & Luxury Goods | | | 1.18 | % | |
| | 9,935 | | | NIKE, Inc. — Class B | | | 1,442,860 | | |
| Total Consumer Discretionary (Cost $9,484,429) | | | 19,820,118 | | |

The accompanying notes are an integral part of these financial statements.
77
BUFFALO LARGE CAP FUND
(UNAUDITED)
SCHEDULE OF INVESTMENTS
SEPTEMBER 30, 2021 Continued
Shares or Face Amount | | | | $ Fair Value | |
Consumer Staples | | | 2.73 | % | |
| | | | | Food & Staples Retailing | | | 2.04 | % | |
| | 3,225 | | | Costco Wholesale Corp. | | | 1,449,154 | | |
| | 13,350 | | | Sysco Corp. | | | 1,047,975 | | |
| | | | 2,497,129 | | |
| | | | | Personal Products | | | 0.69 | % | |
| | 2,810 | | | The Estee Lauder Companies Inc. — Class A | | | 842,803 | | |
| Total Consumer Staples (Cost $2,806,625) | | | 3,339,932 | | |
Financials | | | 3.99 | % | |
| | | | | Banks | | | 0.72 | % | |
| | 5,375 | | | JPMorgan Chase & Co. | | | 879,834 | | |
| | | | | Capital Markets | | | 2.66 | % | |
| | 1,700 | | | BlackRock, Inc. | | | 1,425,722 | | |
| | 4,300 | | | S&P Global, Inc. | | | 1,827,027 | | |
| | | | 3,252,749 | | |
| | | | | Insurance | | | 0.61 | % | |
| | 2,625 | | | Aon Plc — ADR(b) | | | 750,146 | | |
| Total Financials (Cost $3,345,262) | | | 4,882,729 | | |
Health Care | | | 12.88 | % | |
| | | | | Biotechnology | | | 0.52 | % | |
| | 3,360 | | | Alnylam Pharmaceuticals, Inc.(a) | | | 634,401 | | |
| | | | | Health Care Equipment & Supplies | | | 3.65 | % | |
| | 11,765 | | | Abbott Laboratories | | | 1,389,800 | | |
| | 4,900 | | | Danaher Corp. | | | 1,491,756 | | |
| | 1,275 | | | Insulet Corporation(a) | | | 362,393 | | |
| | 4,625 | | | Stryker Corp. | | | 1,219,705 | | |
| | | | 4,463,654 | | |
| | | | | Health Care Providers & Services | | | 1.57 | % | |
| | 3,825 | | | Cigna Corp. | | | 765,612 | | |
| | 2,950 | | | UnitedHealth Group, Inc. | | | 1,152,683 | | |
| | | | 1,918,295 | | |

The accompanying notes are an integral part of these financial statements.
78
BUFFALO LARGE CAP FUND
(UNAUDITED)
SCHEDULE OF INVESTMENTS
SEPTEMBER 30, 2021 Continued
Shares or Face Amount | | | | $ Fair Value | |
| | | | | Life Sciences Tools & Services | | | 4.22 | % | |
| | 5,075 | | | ICON PLC — ADR(a) (b) | | | 1,329,751 | | |
| | 1,935 | | | Illumina, Inc.(a) | | | 784,855 | | |
| | 4,675 | | | PerkinElmer, Inc. | | | 810,131 | | |
| | 22,615 | | | Stevanato Group SpA — ADR(a) (b) | | | 572,386 | | |
| | 2,900 | | | Thermo Fisher Scientific, Inc. | | | 1,656,857 | | |
| | | | 5,153,980 | | |
| | | | | Pharmaceuticals | | | 2.92 | % | |
| | 7,810 | | | Catalent, Inc.(a) | | | 1,039,277 | | |
| | 2,650 | | | Eli Lilly & Co. | | | 612,283 | | |
| | 6,625 | | | Johnson & Johnson | | | 1,069,937 | | |
| | 4,400 | | | Zoetis, Inc. | | | 854,216 | | |
| | | | 3,575,713 | | |
| Total Health Care (Cost $11,946,584) | | | 15,746,043 | | |
Industrials | | | 3.77 | % | |
| | | | | Aerospace & Defense | | | 1.30 | % | |
| | 2,200 | | | Northrop Grumman Corp. | | | 792,330 | | |
| | 9,300 | | | Raytheon Technologies Corp. | | | 799,428 | | |
| | | | 1,591,758 | | |
| | | | | Air Freight & Logistics | | | 0.59 | % | |
| | 3,300 | | | FedEx Corp. | | | 723,657 | | |
| | | | | Industrial Conglomerates | | | 1.88 | % | |
| | 4,625 | | | Honeywell International, Inc. | | | 981,795 | | |
| | 16,025 | | | Siemens A.G. — ADR(b) | | | 1,316,293 | | |
| | | | 2,298,088 | | |
| Total Industrials (Cost $4,032,505) | | | 4,613,503 | | |
Information Technology | | | 40.82 | % | |
| | | | | Communications Equipment | | | 1.12 | % | |
| | 4,000 | | | Arista Networks Inc.(a) | | | 1,374,560 | | |
| | | | | Electronic Equipment, Instruments & Components | | | 0.75 | % | |
| | 11,170 | | | Trimble, Inc.(a) | | | 918,733 | | |
| | | | | Internet Software & Service | | | 0.32 | % | |
| | 1,625 | | | Okta, Inc.(a) | | | 385,678 | | |

The accompanying notes are an integral part of these financial statements.
79
BUFFALO LARGE CAP FUND
(UNAUDITED)
SCHEDULE OF INVESTMENTS
SEPTEMBER 30, 2021 Continued
Shares or Face Amount | | | | $ Fair Value | |
| | | | | IT Services | | | 5.52 | % | |
| | 27,500 | | | Adyen NV — ADR(a) (b) | | | 771,100 | | |
| | 9,525 | | | PayPal Holdings, Inc.(a) | | | 2,478,500 | | |
| | 2,500 | | | Twilio Inc. — Class A(a) | | | 797,625 | | |
| | 12,115 | | | Visa Inc. — Class A | | | 2,698,616 | | |
| | | | 6,745,841 | | |
| | | | | Semiconductors & Semiconductor Equipment | | | 7.43 | % | |
| | 11,500 | | | Applied Materials, Inc. | | | 1,480,395 | | |
| | 2,300 | | | ASML Holding NV — NY Shares — ADR(b) | | | 1,713,753 | | |
| | 2,500 | | | Enphase Energy, Inc.(a) | | | 374,925 | | |
| | 12,850 | | | Entegris, Inc. | | | 1,617,815 | | |
| | 2,225 | | | Lam Research Corporation | | | 1,266,359 | | |
| | 10,650 | | | Micron Technology, Inc.(a) | | | 755,937 | | |
| | 4,575 | | | NXP Semiconductors NV — ADR(b) | | | 896,105 | | |
| | 5,120 | | | Texas Instruments, Inc. | | | 984,115 | | |
| | | | 9,089,404 | | |
| | | | | Software | | | 19.67 | % | |
| | 3,500 | | | Adobe, Inc.(a) | | | 2,015,020 | | |
| | 17,250 | | | Dassault Systemes SE — ADR(b) | | | 909,075 | | |
| | 6,200 | | | Fortinet Inc.(a) | | | 1,810,648 | | |
| | 1,325 | | | HubSpot, Inc.(a) | | | 895,819 | | |
| | 4,525 | | | Intuit, Inc. | | | 2,441,283 | | |
| | 37,200 | | | Microsoft Corp. | | | 10,487,424 | | |
| | 2,775 | | | Palo Alto Networks, Inc.(a) | | | 1,329,225 | | |
| | 6,115 | | | salesforce.com, Inc.(a) | | | 1,658,510 | | |
| | 2,250 | | | ServiceNow, Inc.(a) | | | 1,400,108 | | |
| | 9,200 | | | Snap Inc. — Class A(a) | | | 679,604 | | |
| | 1,725 | | | Workday, Inc.(a) | | | 431,060 | | |
| | | | 24,057,776 | | |
| | | | | Technology Hardware, Storage & Peripherals | | | 6.01 | % | |
| | 51,980 | | | Apple Inc. | | | 7,355,170 | | |
| Total Information Technology (Cost $27,509,300) | | | 49,927,162 | | |
Materials | | | 2.03 | % | |
| | | | | Chemicals | | | 1.25 | % | |
| | 5,230 | | | Linde PLC — ADR(b) | | | 1,534,377 | | |

The accompanying notes are an integral part of these financial statements.
80
BUFFALO LARGE CAP FUND
(UNAUDITED)
SCHEDULE OF INVESTMENTS
SEPTEMBER 30, 2021 Continued
Shares or Face Amount | | | | $ Fair Value | |
| | | | | Construction Materials | | | 0.78 | % | |
| | 20,275 | | | CRH PLC — ADR(b) | | | 947,654 | | |
| Total Materials (Cost $1,913,209) | | | 2,482,031 | | |
| Total Common Stocks (Cost $67,906,375) | | | 116,974,277 | | |
REITS | | | 1.04 | % | |
Real Estate | | | 1.04 | % | |
| | | | | Equity Real Estate Investment Trusts (REITs) | | | 1.04 | % | |
| | 1,611 | | | Equinix Inc. | | | 1,272,899 | | |
| Total Real Estate (Cost $269,645) | | | 1,272,899 | | |
| Total REITS (Cost $269,645) | | | 1,272,899 | | |
Short Term Investments | | | 5.73 | % | |
Investment Company | | | 5.73 | % | |
| | 7,012,932 | | | Fidelity Investments Money Market Funds — Government Portfolio — Class I — 0.010%(c) | | | 7,012,932 | | |
Total Investment Company | | | 7,012,932 | | |
| Total Short Term Investments (Cost $7,012,932) | | | 7,012,932 | | |
Total Investments (Cost $75,188,952)
| | | 102.42
125,260,108 | % | |
Liabilities in Excess of Other Assets
| | | (2.42
(2,961,745) | )% | |
Total Net Assets
| | | 100.00
122,298,363 | % | |
ADR American Depositary Receipt
(a) Non Income Producing.
(b) Foreign Issued Security. The total value of these securities amounted to $12,067,865 (9.87% of net assets) at September 30, 2021.
(c) The rate quoted is the annualized seven-day effective yield as of September 30, 2021
* See Note 1A of accompanying Notes to Financial Statements regarding valuation of securities.
The Global Industry Classification Standard (GICS) was developed by and/or is the exclusive property of MSCI, Inc. and Standard & Poor's Financial Services LLC ("S&P"). GICS is a service mark of MSCI and S&P and has been licensed for use by U.S. Bancorp Fund Services, LLC.

The accompanying notes are an integral part of these financial statements.
81
BUFFALO MID CAP FUND
(UNAUDITED)
SCHEDULE OF INVESTMENTS
SEPTEMBER 30, 2021
Shares or Face Amount | | | | $ Fair Value | |
Common Stocks | | | 97.26 | % | |
Communication Services | | | 6.26 | % | |
| | | | | Entertainment | | | 1.92 | % | |
| | 23,537 | | | Live Nation Entertainment, Inc.(a) | | | 2,144,927 | | |
| | 10,260 | | | Take-Two Interactive Software, Inc.(a) | | | 1,580,758 | | |
| | | | 3,725,685 | | |
| | | | | Interactive Media & Services | | | 3.80 | % | |
| | 22,590 | | | IAC/InterActiveCorp(a) | | | 2,943,251 | | |
| | 99,540 | | | TripAdvisor, Inc.(a) | | | 3,369,429 | | |
| | 36,674 | | | Vimeo, Inc.(a) | | | 1,077,116 | | |
| | | | 7,389,796 | | |
| | | | | Media | | | 0.54 | % | |
| | 22,329 | | | Liberty Media Corp-Liberty Formula One(a) | | | 1,050,579 | | |
| Total Communication Services (Cost $8,569,190) | | | 12,166,060 | | |
Consumer Discretionary | | | 6.08 | % | |
| | | | | Distributors | | | 0.50 | % | |
| | 19,223 | | | LKQ Corp.(a) | | | 967,301 | | |
| | | | | Diversified Consumer Services | | | 1.04 | % | |
| | 48,500 | | | Terminix Global Holdings, Inc.(a) | | | 2,020,995 | | |
| | | | | Hotels, Restaurants & Leisure | | | 1.02 | % | |
| | 5,956 | | | Vail Resorts, Inc.(a) | | | 1,989,602 | | |
| | | | | Specialty Retail | | | 2.10 | % | |
| | 24,835 | | | CarMax, Inc.(a) | | | 3,177,886 | | |
| | 40,930 | | | Vroom, Inc.(a) | | | 903,325 | | |
| | | | 4,081,211 | | |
| | | | | Soap Cleaning Compound and Toilet Preparation | | | 0.36 | % | |
| | 28,915 | | | OLAPLEX HLDGS, Inc.(a) | | | 708,417 | | |
| | | | | Textiles, Apparel & Luxury Goods | | | 1.06 | % | |
| | 83,570 | | | Levi Strauss & Co. | | | 2,048,301 | | |
| Total Consumer Discretionary (Cost $8,102,046) | | | 11,815,827 | | |

The accompanying notes are an integral part of these financial statements.
82
BUFFALO MID CAP FUND
(UNAUDITED)
SCHEDULE OF INVESTMENTS
SEPTEMBER 30, 2021 Continued
Shares or Face Amount | | | | $ Fair Value | |
Consumer Staples | | | 0.25 | % | |
| | | | | Beverages | | | 0.25 | % | |
| | 960 | | | The Boston Beer Co, Inc. — Class A(a) | | | 489,360 | | |
| Total Consumer Staples (Cost $347,494) | | | 489,360 | | |
Energy | | | 3.13 | % | |
| | | | | Energy Equipment & Services | | | 1.56 | % | |
| | 102,140 | | | Schlumberger Ltd. — ADR(b) | | | 3,027,430 | | |
| | | | | Oil, Gas & Consumable Fuels | | | 1.57 | % | |
| | 38,000 | | | EOG Resources, Inc. | | | 3,050,260 | | |
| Total Energy (Cost $4,095,057) | | | 6,077,690 | | |
Financials | | | 7.01 | % | |
| | | | | Capital Markets | | | 7.01 | % | |
| | 6,225 | | | MarketAxess Holdings, Inc. | | | 2,618,795 | | |
| | 8,074 | | | Moody's Corp. | | | 2,867,158 | | |
| | 13,366 | | | MSCI, Inc. | | | 8,131,073 | | |
| Total Financials (Cost $851,533) | | | 13,617,026 | | |
Health Care | | | 18.32 | % | |
| | | | | Aerospace & Defense | | | 1.05 | % | |
| | 5,400 | | | Teleflex, Inc. | | | 2,033,370 | | |
| | | | | Biotechnology | | | 0.69 | % | |
| | 13,950 | | | Exact Sciences Corp.(a) | | | 1,331,527 | | |
| | | | | Health Care Equipment & Supplies | | | 5.03 | % | |
| | 6,700 | | | ABIOMED, Inc.(a) | | | 2,180,984 | | |
| | 75,810 | | | Envista Holdings Corp.(a) | | | 3,169,616 | | |
| | 7,720 | | | Masimo Corp.(a) | | | 2,089,881 | | |
| | 5,650 | | | The Cooper Companies, Inc. | | | 2,335,202 | | |
| | | | 9,775,683 | | |
| | | | | Health Care Providers & Services | | | 2.23 | % | |
| | 5,360 | | | Chemed Corp. | | | 2,493,043 | | |
| | 24,550 | | | Encompass Health Corp. | | | 1,842,232 | | |
| | | | 4,335,275 | | |

The accompanying notes are an integral part of these financial statements.
83
BUFFALO MID CAP FUND
(UNAUDITED)
SCHEDULE OF INVESTMENTS
SEPTEMBER 30, 2021 Continued
Shares or Face Amount | | | | $ Fair Value | |
| | | | | Health Care Technology | | | 2.45 | % | |
| | 16,550 | | | Veeva Systems, Inc.(a) | | | 4,769,214 | | |
| | | | | Life Sciences Tools & Services | | | 5.87 | % | |
| | 4,530 | | | Bio-Rad Laboratories, Inc.(a) | | | 3,379,153 | | |
| | 11,500 | | | Bio-Techne Corp. | | | 5,572,555 | | |
| | 6,055 | | | Illumina, Inc.(a) | | | 2,455,969 | | |
| | | | 11,407,677 | | |
| | | | | Pharmaceuticals | | | 1.00 | % | |
| | 14,880 | | | Jazz Pharmaceuticals Public Limited Company — ADR(a) (b) | | | 1,937,525 | | |
| Total Health Care (Cost $20,071,832) | | | 35,590,271 | | |
Industrials | | | 26.64 | % | |
| | | | | Aerospace & Defense | | | 2.05 | % | |
| | 27,760 | | | BWX Technologies, Inc. | | | 1,495,154 | | |
| | 4,000 | | | TransDigm Group, Inc.(a) | | | 2,498,280 | | |
| | | | 3,993,434 | | |
| | | | | Building Products | | | 1.10 | % | |
| | 21,002 | | | Trex Co., Inc.(a) | | | 2,140,734 | | |
| | | | | Commercial Services & Supplies | | | 3.27 | % | |
| | 25,041 | | | Copart, Inc.(a) | | | 3,473,687 | | |
| | 52,666 | | | IAA Inc.(a) | | | 2,873,984 | | |
| | | | 6,347,671 | | |
| | | | | Electrical Equipment | | | 2.25 | % | |
| | 35,255 | | | AMETEK, Inc. | | | 4,371,972 | | |
| | | | | Professional Services | | | 10.93 | % | |
| | 61,550 | | | CoStar Group, Inc.(a) | | | 5,296,993 | | |
| | 12,483 | | | Equifax, Inc. | | | 3,163,442 | | |
| | 64,388 | | | IHS Markit Ltd. — ADR(b) | | | 7,508,928 | | |
| | 26,303 | | | Verisk Analytics, Inc. | | | 5,267,702 | | |
| | | | 21,237,065 | | |
| | | | | Road & Rail | | | 7.04 | % | |
| | 10,658 | | | Kansas City Southern | | | 2,884,481 | | |
| | 121,000 | | | Lyft, Inc.(a) | | | 6,484,390 | | |
| | 96,020 | | | Uber Technologies, Inc.(a) | | | 4,301,696 | | |
| | | | 13,670,567 | | |
| Total Industrials (Cost $24,372,676) | | | 51,761,443 | | |

The accompanying notes are an integral part of these financial statements.
84
BUFFALO MID CAP FUND
(UNAUDITED)
SCHEDULE OF INVESTMENTS
SEPTEMBER 30, 2021 Continued
Shares or Face Amount | | | | $ Fair Value | |
Information Technology | | | 23.89 | % | |
| | | | | Communications Equipment | | | 1.69 | % | |
| | 16,570 | | | F5 Networks, Inc.(a) | | | 3,293,785 | | |
| | | | | IT Services | | | 6.18 | % | |
| | 6,680 | | | EPAM Systems, Inc.(a) | | | 3,810,806 | | |
| | 22,600 | | | Euronet Worldwide, Inc.(a) | | | 2,876,528 | | |
| | 17,500 | | | Gartner, Inc.(a) | | | 5,317,900 | | |
| | | | 12,005,234 | | |
| | | | | Semiconductors & Semiconductor Equipment | | | 4.84 | % | |
| | 19,186 | | | Analog Devices, Inc. | | | 3,213,271 | | |
| | 37,300 | | | Micron Technology, Inc.(a) | | | 2,647,554 | | |
| | 43,310 | | | ON Semiconductor Corp.(a) | | | 1,982,299 | | |
| | 9,140 | | | Universal Display Corp. | | | 1,562,574 | | |
| | | | 9,405,698 | | |
| | | | | Software | | | 11.18 | % | |
| | 27,335 | | | Aspen Technology, Inc.(a) | | | 3,356,738 | | |
| | 21,862 | | | Guidewire Software, Inc.(a) | | | 2,598,736 | | |
| | 28,170 | | | Nutanix, Inc.(a) | | | 1,062,009 | | |
| | 10,030 | | | Palo Alto Networks, Inc.(a) | | | 4,804,370 | | |
| | 9,700 | | | Splunk, Inc.(a) | | | 1,403,687 | | |
| | 34,289 | | | SS&C Technologies Holdings, Inc. | | | 2,379,657 | | |
| | 6,640 | | | Tyler Technologies, Inc.(a) | | | 3,045,436 | | |
| | 12,300 | | | Workday, Inc.(a) | | | 3,073,647 | | |
| | | | 21,724,280 | | |
| Total Information Technology (Cost $27,054,601) | | | 46,428,997 | | |
Materials | | | 2.42 | % | |
| | | | | Chemicals | | | 1.10 | % | |
| | 23,310 | | | FMC Corp. | | | 2,134,264 | | |
| | | | | Construction Materials | | | 1.32 | % | |
| | 7,500 | | | Martin Marietta Materials, Inc. | | | 2,562,600 | | |
| Total Materials (Cost $1,847,509) | | | 4,696,864 | | |

The accompanying notes are an integral part of these financial statements.
85
BUFFALO MID CAP FUND
(UNAUDITED)
SCHEDULE OF INVESTMENTS
SEPTEMBER 30, 2021 Continued
Shares or Face Amount | | | | $ Fair Value | |
Real Estate | | | 3.26 | % | |
| | | | | Real Estate Management & Development | | | 3.26 | % | |
| | 65,022 | | | CBRE Group, Inc. — Class A(a) | | | 6,330,542 | | |
| Total Real Estate (Cost $2,929,009) | | | 6,330,542 | | |
| Total Common Stocks (Cost $98,240,947) | | | 188,974,080 | | |
REITS | | | 2.22 | % | |
Real Estate | | | 2.22 | % | |
| | | | | Equity Real Estate Investment Trusts (REITs) | | | 2.22 | % | |
| | 1,624 | | | Equinix Inc. | | | 1,283,171 | | |
| | 36,790 | | | Welltower, Inc. | | | 3,031,496 | | |
| Total Real Estate (Cost $2,978,683) | | | 4,314,667 | | |
| Total REITS (Cost $2,978,683) | | | 4,314,667 | | |
Short Term Investments | | | 0.86 | % | |
Investment Company | | | 0.86 | % | |
| | 1,667,124 | | | Fidelity Investments Money Market Funds — Government Portfolio — Class I — 0.010%(c) | | | 1,667,124 | | |
Total Investment Company | | | 1,667,124 | | |
| Total Short Term Investments (Cost $1,667,124) | | | 1,667,124 | | |
Total Investments (Cost $102,886,754)
| | | 100.34
194,955,871 | % | |
Liabilities in Excess of Other Assets
| | | (0.34
(661,428) | )% | |
Total Net Assets
| | | 100.00
194,294,443 | % | |

The accompanying notes are an integral part of these financial statements.
86
BUFFALO MID CAP FUND
(UNAUDITED)
SCHEDULE OF INVESTMENTS
SEPTEMBER 30, 2021 Continued
ADR American Depositary Receipt
(a) Non Income Producing.
(b) Foreign Issued Securities. The total value of these securities amounted to $12,473,883 (6.42% of net assets) at September 30, 2021.
(c) The rate quoted is the annualized seven-day effective yield as of September 30, 2021
* See Note 1A of accompanying Notes to Financial Statements regarding valuation of securities.
The Global Industry Classification Standard (GICS) was developed by and/or is the exclusive property of MSCI, Inc. and Standard & Poor's Financial Services LLC ("S&P"). GICS is a service mark of MSCI and S&P and has been licensed for use by U.S. Bancorp Fund Services, LLC.

The accompanying notes are an integral part of these financial statements.
87
BUFFALO SMALL CAP FUND
(UNAUDITED)
SCHEDULE OF INVESTMENTS
SEPTEMBER 30, 2021
Shares or Face Amount | | | | $ Fair Value | |
Common Stocks | | | 97.12 | % | |
Communication Services | | | 5.00 | % | |
| | | | | Diversified Telecommunication Services | | | 1.24 | % | |
| | 164,485 | | | Bandwidth, Inc.(a) | | | 14,849,706 | | |
| | | | | Interactive Media & Services | | | 3.76 | % | |
| | 940,835 | | | Eventbrite, Inc.(a) | | | 17,791,190 | | |
| | 571,090 | | | EverQuote, Inc.(a) | | | 10,639,406 | | |
| | 888,730 | | | Genius Sports Ltd. — ADR(a) (b) | | | 16,583,702 | | |
| | | | 45,014,298 | | |
| Total Communication Services (Cost $60,717,056) | | | 59,864,004 | | |
Consumer Discretionary | | | 17.19 | % | |
| | | | | Diversified Consumer Services | | | 1.35 | % | |
| | 577,840 | | | European Wax Center, Inc.(a) | | | 16,185,298 | | |
| | | | | Hotels, Restaurants & Leisure | | | 7.40 | % | |
| | 349,040 | | | Bally's Corp.(a) | | | 17,500,866 | | |
| | 1,067,610 | | | Everi Holdings Inc.(a) | | | 25,814,810 | | |
| | 1,286,245 | | | Rush Street Interactive, Inc.(a) | | | 24,708,766 | | |
| | 121,130 | | | Texas Roadhouse, Inc. | | | 11,062,803 | | |
| | 58,290 | | | Wingstop, Inc. | | | 9,555,480 | | |
| | | | 88,642,725 | | |
| | | | | Household Durables | | | 2.26 | % | |
| | 206,632 | | | Lovesac Co/The(a) | | | 13,656,309 | | |
| | 636,060 | | | Purple Innovation, Inc.(a) | | | 13,369,981 | | |
| | | | 27,026,290 | | |
| | | | | Internet & Direct Marketing Retail | | | 2.75 | % | |
| | 187,635 | | | Overstock.com, Inc.(a) | | | 14,620,519 | | |
| | 513,020 | | | RealReal Inc/The(a) | | | 6,761,604 | | |
| | 101,995 | | | Shutterstock, Inc. | | | 11,558,073 | | |
| | | | 32,940,196 | | |
| | | | | Specialty Retail | | | 2.06 | % | |
| | 837,551 | | | Guess?, Inc. | | | 17,596,946 | | |
| | 1,013,190 | | | Shift Technologies, Inc.(a) | | | 7,031,539 | | |
| | | | 24,628,485 | | |

The accompanying notes are an integral part of these financial statements.
88
BUFFALO SMALL CAP FUND
(UNAUDITED)
SCHEDULE OF INVESTMENTS
SEPTEMBER 30, 2021 Continued
Shares or Face Amount | | | | $ Fair Value | |
| | | | | Textiles, Apparel & Luxury Goods | | | 1.37 | % | |
| | 407,487 | | | Steven Madden Ltd. | | | 16,364,678 | | |
| Total Consumer Discretionary (Cost $152,144,960) | | | 205,787,672 | | |
Consumer Staples | | | 0.80 | % | |
| | | | | Beverages | | | 0.80 | % | |
| | 148,065 | | | MGP Ingredients, Inc. | | | 9,639,032 | | |
| Total Consumer Staples (Cost $4,771,239) | | | 9,639,032 | | |
Financials | | | 6.14 | % | |
| | | | | Capital Markets | | | 3.10 | % | |
| | 151,195 | | | Hamilton Lane Inc. — Class A | | | 12,824,360 | | |
| | 578,343 | | | MarketWise, Inc.(a) | | | 4,777,113 | | |
| | 540,875 | | | Open Lending Corp.(a) | | | 19,509,361 | | |
| | | | 37,110,834 | | |
| | | | | Insurance | | | 3.04 | % | |
| | 487,670 | | | BRP Group, Inc.(a) | | | 16,234,534 | | |
| | 249,078 | | | Palomar Holdings, Inc.(a) | | | 20,132,975 | | |
| | | | 36,367,509 | | |
| Total Financials (Cost $38,037,748) | | | 73,478,343 | | |
Health Care | | | 22.61 | % | |
| | | | | Biotechnology | | | 8.75 | % | |
| | 657,383 | | | Avid Bioservices, Inc.(a) | | | 14,179,751 | | |
| | 186,324 | | | CareDx, Inc.(a) | | | 11,807,352 | | |
| | 321,717 | | | Castle Biosciences, Inc.(a) | | | 21,394,181 | | |
| | 327,360 | | | Deciphera Pharmaceuticals, Inc.(a) | | | 11,123,693 | | |
| | 268,610 | | | DermTech, Inc.(a) | | | 8,625,067 | | |
| | 464,930 | | | Halozyme Therapeutics, Inc.(a) | | | 18,913,352 | | |
| | 133,987 | | | Ligand Pharmaceuticals, Inc.(a) | | | 18,667,069 | | |
| | | | 104,710,465 | | |

The accompanying notes are an integral part of these financial statements.
89
BUFFALO SMALL CAP FUND
(UNAUDITED)
SCHEDULE OF INVESTMENTS
SEPTEMBER 30, 2021 Continued
Shares or Face Amount | | | | $ Fair Value | |
| | | | | Health Care Equipment & Supplies | | | 4.33 | % | |
| | 230,420 | | | CVRx, Inc.(a) | | | 3,811,147 | | |
| | 194,830 | | | Establishment Labs Holdings, Inc. — ADR(a) (b) | | | 13,945,931 | | |
| | 453,012 | | | NeuroPace, Inc.(a) | | | 7,180,240 | | |
| | 1,188,610 | | | OraSure Technologies, Inc.(a) | | | 13,443,179 | | |
| | 104,315 | | | STAAR Surgical Co.(a) | | | 13,407,607 | | |
| | | | 51,788,104 | | |
| | | | | Health Care Providers & Services | | | 2.13 | % | |
| | 259,963 | | | HealthEquity, Inc.(a) | | | 16,835,204 | | |
| | 368,610 | | | Privia Health Group, Inc.(a) | | | 8,684,451 | | |
| | | | 25,519,655 | | |
| | | | | Health Care Technology | | | 1.67 | % | |
| | 631,725 | | | iCAD, Inc.(a) | | | 6,791,044 | | |
| | 213,444 | | | Phreesia, Inc.(a) | | | 13,169,495 | | |
| | | | 19,960,539 | | |
| | | | | Life Sciences Tools & Services | | | 4.54 | % | |
| | 192,695 | | | Adaptive Biotechnologies Corporation(a) | | | 6,549,703 | | |
| | 342,045 | | | Quanterix Corp.(a) | | | 17,030,420 | | |
| | 464,805 | | | Sotera Health Co.(a) | | | 12,154,651 | | |
| | 213,560 | | | Syneos Health, Inc.(a) | | | 18,682,229 | | |
| | | | 54,417,003 | | |
| | | | | Pharmaceuticals | | | 1.19 | % | |
| | 678,385 | | | Ocular Therapeutix, Inc.(a) | | | 6,783,850 | | |
| | 598,985 | | | Verrica Pharmaceuticals, Inc.(a) | | | 7,487,313 | | |
| | | | 14,271,163 | | |
| Total Health Care (Cost $210,287,331) | | | 270,666,929 | | |
Industrials | | | 21.99 | % | |
| | | | | Air Freight & Logistics | | | 1.61 | % | |
| | 746,900 | | | Air Transport Services Group, Inc.(a) | | | 19,277,489 | | |
| | | | | Building Products | | | 3.47 | % | |
| | 159,415 | | | Advanced Drainage Systems, Inc. | | | 17,243,921 | | |
| | 747,550 | | | Janus International Group, Inc.(a) | | | 9,150,012 | | |
| | 796,425 | | | PGT Innovations, Inc.(a) | | | 15,211,717 | | |
| | | | 41,605,650 | | |

The accompanying notes are an integral part of these financial statements.
90
BUFFALO SMALL CAP FUND
(UNAUDITED)
SCHEDULE OF INVESTMENTS
SEPTEMBER 30, 2021 Continued
Shares or Face Amount | | | | $ Fair Value | |
| | | | | Construction & Engineering | | | 2.83 | % | |
| | 201,510 | | | MasTec, Inc.(a) | | | 17,386,283 | | |
| | 166,825 | | | NV5 Global, Inc.(a) | | | 16,443,940 | | |
| | | | 33,830,223 | | |
| | | | | Electrical Equipment | | | 3.49 | % | |
| | 1,063,500 | | | Array Technologies, Inc.(a) | | | 19,696,020 | | |
| | 164,370 | | | Vicor Corp.(a) | | | 22,051,879 | | |
| | | | 41,747,899 | | |
| | | | | Machinery | | | 4.20 | % | |
| | 406,305 | | | Hydrofarm Holdings Group, Inc.(a) | | | 15,378,644 | | |
| | 119,870 | | | John Bean Technologies Corp. | | | 16,847,729 | | |
| | 124,992 | | | Kornit Digital Ltd. — ADR(a) (b) | | | 18,091,342 | | |
| | | | 50,317,715 | | |
| | | | | Professional Services | | | 5.57 | % | |
| | 413,235 | | | First Advantage Corp.(a) | | | 7,872,127 | | |
| | 124,710 | | | FTI Consulting, Inc.(a) | | | 16,798,437 | | |
| | 271,658 | | | ICF International, Inc. | | | 24,256,343 | | |
| | 215,000 | | | Sterling Check Corp.(a) | | | 5,581,400 | | |
| | 271,080 | | | Upwork, Inc.(a) | | | 12,206,732 | | |
| | | | 66,715,039 | | |
| | | | | Trading Companies & Distributors | | | 0.82 | % | |
| | 49,390 | | | SiteOne Landscape Supply, Inc.(a) | | | 9,851,823 | | |
| Total Industrials (Cost $201,267,322) | | | 263,345,838 | | |
Information Technology | | | 20.53 | % | |
| | | | | Communications Equipment | | | 4.69 | % | |
| | 845,458 | | | ADTRAN, Inc. | | | 15,860,792 | | |
| | 386,575 | | | Calix, Inc.(a) | | | 19,108,402 | | |
| | 584,150 | | | Cambium Networks Corp. — ADR(a) (b) | | | 21,140,389 | | |
| | | | 56,109,583 | | |
| | | | | IT Services | | | 3.31 | % | |
| | 93,220 | | | Endava PLC — ADR(a) (b) | | | 12,663,937 | | |
| | 1,662,785 | | | Paya Holdings, Inc.(a) | | | 18,074,473 | | |
| | 134,520 | | | TaskUS, Inc.(a) | | | 8,928,092 | | |
| | | | 39,666,502 | | |

The accompanying notes are an integral part of these financial statements.
91
BUFFALO SMALL CAP FUND
(UNAUDITED)
SCHEDULE OF INVESTMENTS
SEPTEMBER 30, 2021 Continued
Shares or Face Amount | | | | $ Fair Value | |
| | | | | Semiconductors & Semiconductor Equipment | | | 2.70 | % | |
| | 385,455 | | | MaxLinear, Inc.(a) | | | 18,983,659 | | |
| | 95,345 | | | Silicon Laboratories, Inc.(a) | | | 13,363,555 | | |
| | | | 32,347,214 | | |
| | | | | Software | | | 9.83 | % | |
| | 350,385 | | | 8x8, Inc.(a) | | | 8,195,505 | | |
| | 240,665 | | | Digital Turbine, Inc.(a) | | | 16,545,719 | | |
| | 277,074 | | | DoubleVerify Holdings, Inc.(a) | | | 9,464,848 | | |
| | 259,641 | | | Mimecast Ltd. — ADR(a) (b) | | | 16,513,168 | | |
| | 774,379 | | | Momentive Global, Inc.(a) | | | 15,177,829 | | |
| | 347,367 | | | Riskified Ltd. — ADR(a) (b) | | | 7,923,441 | | |
| | 458,695 | | | Tenable Holdings, Inc.(a) | | | 21,164,187 | | |
| | 206,705 | | | Varonis Systems, Inc.(a) | | | 12,577,999 | | |
| | 827,745 | | | Viant Technology, Inc.(a) | | | 10,115,044 | | |
| | | | 117,677,740 | | |
| Total Information Technology (Cost $172,843,789) | | | 245,801,039 | | |
Materials | | | 1.77 | % | |
| | | | | Construction Materials | | | 1.24 | % | |
| | 463,433 | | | Summit Materials, Inc. — Class A(a) | | | 14,815,953 | | |
| | | | | Containers & Packaging | | | 0.53 | % | |
| | 302,997 | | | Karat Packaging, Inc.(a) | | | 6,372,027 | | |
| Total Materials (Cost $12,354,782) | | | 21,187,980 | | |
| Total Common Stocks (Cost $878,976,047) | | | 1,149,770,837 | | |
Private Placements | | | 1.09 | % | |
| | | | | Software | | | 0.45 | % | |
| | 800,000 | | | Airspan Networks Holdings, Inc.(a) (c) | | | 5,344,000 | | |
| Total Software (Cost $8,000,000) | | | 5,344,000 | | |
| | | | | Capital Markets | | | 0.64 | % | |
| | 930,000 | | | MarketWise, Inc. — Class A(a) (c) | | | 7,681,800 | | |
| Total Capital Markets (Cost $9,300,000) | | | 7,681,800 | | |
| Total Private Placements (Cost $17,300,000) | | | 13,025,800 | | |

The accompanying notes are an integral part of these financial statements.
92
BUFFALO SMALL CAP FUND
(UNAUDITED)
SCHEDULE OF INVESTMENTS
SEPTEMBER 30, 2021 Continued
Shares or Face Amount | | | | $ Fair Value | |
Short Term Investments | | | 3.16 | % | |
Investment Company | | | 3.16 | % | |
| | 37,819,132 | | | Fidelity Investments Money Market Funds — Government Portfolio — Class I — 0.010%(d) | | | 37,819,132 | | |
Total Investment Company | | | 37,819,132 | | |
| Total Short Term Investments (Cost $37,819,132) | | | 37,819,132 | | |
Total Investments (Cost $915,913,359)
| | | 100.28
1,200,615,769 | % | |
Liabilities in Excess of Other Assets
| | | (0.28
(3,340,294) | )% | |
Total Net Assets
| | | 100.00
1,197,275,475 | % | |
ADR American Depositary Receipt
PLC Public Limited Company
(a) Non Income Producing.
(b) Foreign Issued Securities. The total value of these securities amounted to $106,105,918 (8.87% of net assets) at September 30, 2021.
(c) Security is restricted from resale and considered illiquid.
(d) The rate quoted is the annualized seven-day effective yield as of September 30, 2021.
* See Note 1A of the accompanying Notes to Financial Statements regarding valuation of securities.
The Global Industry Classification Standard (GICS) was developed by and/or is the exclusive property of MSCI, Inc. and Standard & Poor's Financial Services LLC ("S&P"). GICS is a service mark of MSCI and S&P and has been licensed for use by U.S. Bancorp Fund Services, LLC.

The accompanying notes are an integral part of these financial statements.
93
STATEMENTS OF ASSETS AND
LIABILITIES
SEPTEMBER 30, 2021 (UNAUDITED)
| | | Buffalo
Discovery
Fund | | Buffalo
Dividend Focus
Fund | | Buffalo
Early
Stage Growth
Fund | | Buffalo
Flexible Income
Fund | | Buffalo
Growth
Fund | |
ASSETS: | |
Investments in securities, at cost: | | $ | 1,281,782,484 | | | $ | 63,689,982 | | | $ | 93,172,068 | | | $ | 223,931,328 | | | $ | 96,423,002 | | |
Cash denominated in foreign currencies, at cost: | | | — | | | | — | | | | — | | | | — | | | | — | | |
Investments in securities, at value: | | | 1,800,867,924 | | | | 111,047,777 | | | | 135,537,289 | | | | 428,616,754 | | | | 212,556,714 | | |
Cash: | | | — | | | | — | | | | — | | | | — | | | | — | | |
Cash denominated in foreign currency, at value: | | | — | | | | — | | | | — | | | | — | | | | — | | |
Receivables: | |
Investments sold | | | — | | | | — | | | | 9,321,859 | | | | — | | | | — | | |
Fund shares sold | | | 468,095 | | | | 9,858 | | | | 32,385 | | | | 3,490 | | | | 44,432 | | |
Dividends | | | 111,187 | | | | 61,667 | | | | 10,723 | | | | 578,182 | | | | 28,050 | | |
Interest | | | — | | | | 18,919 | | | | — | | | | 31,267 | | | | — | | |
Other receivables | | | — | | | | — | | | | — | | | | — | | | | — | | |
Other assets | | | 47,749 | | | | 15,103 | | | | 752 | | | | 32,068 | | | | 22,652 | | |
Total assets | | | 1,801,494,955 | | | | 111,153,324 | | | | 144,903,008 | | | | 429,261,761 | | | | 212,651,848 | | |
LIABILITIES: | |
Payables: | |
Investments purchased | | | 18,255,070 | | | | — | | | | 3,873,484 | | | | — | | | | 667,800 | | |
Written options, at value(1) (Note 8) | | | — | | | | — | | | | — | | | | 63,688 | | | | — | | |
Fund shares purchased | | | 1,334,309 | | | | 22,853 | | | | 162,228 | | | | 72,985 | | | | 408,210 | | |
Management fees (Note 3) | | | 1,289,080 | | | | 69,685 | | | | 156,192 | | | | 303,510 | | | | 137,058 | | |
Custodian fees (Note 3) | | | — | | | | — | | | | — | | | | — | | | | — | | |
Accrued shareholder service fees — Investor Class (Note 7) | | | 470,269 | | | | 5,934 | | | | 47,870 | | | | 73,699 | | | | 57,425 | | |
Other payables | | | — | | | | — | | | | — | | | | — | | | | — | | |
Accrued expenses | | | 1,196 | | | | 2,796 | | | | 56,022 | | | | 53,159 | | | | 17,908 | | |
Total liabilities | | | 21,349,924 | | | | 101,268 | | | | 4,295,796 | | | | 567,041 | | | | 1,288,401 | | |
NET ASSETS | | $ | 1,780,145,031 | | | $ | 111,052,056 | | | $ | 140,607,212 | | | $ | 428,694,720 | | | $ | 211,363,447 | | |
NET ASSETS CONSIST OF: | |
Capital (capital stock and paid-in capital) | | $ | 989,827,660 | | | $ | 62,308,544 | | | $ | 78,997,109 | | | $ | 208,251,554 | | | $ | 75,269,208 | | |
Total distributable earnings | | | 790,317,371 | | | | 48,743,512 | | | | 61,610,103 | | | | 220,443,166 | | | | 136,094,239 | | |
NET ASSETS APPLICABLE TO OUTSTANDING SHARES | | $ | 1,780,145,031 | | | $ | 111,052,056 | | | $ | 140,607,212 | | | $ | 428,694,720 | | | $ | 211,363,447 | | |
Net Assets — Investor Class | | $ | 1,374,457,527 | | | $ | 30,596,249 | | | $ | 87,999,089 | | | $ | 275,782,426 | | | $ | 115,310,710 | | |
Outstanding Shares — Investor Class | | | 42,519,775 | | | | 1,231,789 | | | | 3,583,851 | | | | 15,980,712 | | | | 3,311,383 | | |
NET ASSET VALUE PER SHARE — Investor Class | | $ | 32.33 | | | $ | 24.84 | | | $ | 24.55 | | | $ | 17.26 | | | $ | 34.82 | | |
Net Assets — Institutional Class | | $ | 405,687,504 | | | $ | 80,455,807 | | | $ | 52,608,124 | | | $ | 152,912,294 | | | $ | 96,052,736 | | |
Outstanding Shares — Institutional Class | | | 12,503,022 | | | | 3,239,254 | | | | 2,134,410 | | | | 8,864,165 | | | | 2,750,993 | | |
NET ASSET VALUE PER SHARE — Institutional Class | | $ | 32.45 | | | $ | 24.84 | | | $ | 24.65 | | | $ | 17.25 | | | $ | 34.92 | | |
Capital shares, $1.00 par value: | |
Authorized | | | Unlimited | | | | Unlimited | | | | Unlimited | | | | Unlimited | | | | Unlimited | | |
| (1) Written options, premiums received | | | — | | | | — | | | | — | | | | 117,142 | | | | — | | |

The accompanying notes are an integral part of these financial statements.
94
| | | Buffalo
High Yield
Fund | | Buffalo
International
Fund | | Buffalo
Large Cap
Fund | | Buffalo
Mid Cap
Fund | | Buffalo
Small Cap
Fund | |
ASSETS: | |
Investments in securities, at cost: | | $ | 283,181,493 | | | $ | 359,320,823 | | | $ | 75,188,952 | | | $ | 102,886,754 | | | $ | 915,913,359 | | |
Cash denominated in foreign currencies, at cost: | | | — | | | | 27,633 | | | | — | | | | — | | | | — | | |
Investments in securities, at value: | | | 298,869,657 | | | | 625,384,098 | | | | 125,260,108 | | | | 194,955,871 | | | | 1,200,615,769 | | |
Cash: | | | 117,992 | | | | — | | | | — | | | | — | | | | 35,004 | | |
Cash denominated in foreign currency, at value: | | | — | | | | 27,652 | | | | — | | | | — | | | | — | | |
Receivables: | |
Investments sold | | | 1,455,675 | | | | 1,219 | | | | — | | | | 70,874 | | | | 6,159,698 | | |
Fund shares sold | | | 302,798 | | | | 630,773 | | | | 12,325 | | | | 104,357 | | | | 1,772,876 | | |
Dividends | | | — | | | | 1,953,515 | | | | 27,876 | | | | 40,327 | | | | 91,238 | | |
Interest | | | 3,591,328 | | | | — | | | | — | | | | — | | | | — | | |
Other receivables | | | — | | | | — | | | | — | | | | — | | | | — | | |
Other assets | | | 61,956 | | | | 19,715 | | | | 18,406 | | | | 17,636 | | | | 71,624 | | |
Total assets | | | 304,399,406 | | | | 628,016,972 | | | | 125,318,715 | | | | 195,189,065 | | | | 1,208,746,209 | | |
LIABILITIES: | |
Payables: | |
Investments purchased | | | 5,025,000 | | | | 7,082,737 | | | | 2,924,177 | | | | 607,215 | | | | 9,249,201 | | |
Written options, at value(1) (Note 8) | | | — | | | | — | | | | — | | | | — | | | | — | | |
Fund shares purchased | | | 92,486 | | | | 724,235 | | | | 1,229 | | | | 72,814 | | | | 711,775 | | |
Management fees (Note 3) | | | 208,670 | | | | 456,348 | | | | 79,026 | | | | 140,417 | | | | 857,632 | | |
Custodian fees (Note 3) | | | — | | | | 138,088 | | | | — | | | | — | | | | — | | |
Accrued shareholder service fees — Investor Class (Note 7) | | | — | | | | 42,892 | | | | 14,559 | | | | 47,539 | | | | 645,783 | | |
Other payables | | | — | | | | — | | | | — | | | | — | | | | — | | |
Accrued expenses | | | 2,934 | | | | 41,384 | | | | 1,361 | | | | 26,637 | | | | 6,343 | | |
Total liabilities | | | 5,329,090 | | | | 8,485,684 | | | | 3,020,352 | | | | 894,622 | | | | 11,470,734 | | |
NET ASSETS | | $ | 299,070,316 | | | $ | 619,531,288 | | | $ | 122,298,363 | | | $ | 194,294,443 | | | $ | 1,197,275,475 | | |
NET ASSETS CONSIST OF: | |
Capital (capital stock and paid-in capital) | | $ | 273,512,159 | | | $ | 338,926,626 | | | $ | 47,012,261 | | | $ | 83,258,255 | | | $ | 689,536,986 | | |
Total distributable earnings | | | 25,558,157 | | | | 280,604,662 | | | | 75,286,102 | | | | 111,036,188 | | | | 507,738,489 | | |
NET ASSETS APPLICABLE TO OUTSTANDING SHARES | | $ | 299,070,316 | | | $ | 619,531,288 | | | $ | 122,298,363 | | | $ | 194,294,443 | | | $ | 1,197,275,475 | | |
Net Assets — Investor Class | | $ | 57,988,385 | | | $ | 289,318,148 | | | $ | 41,959,879 | | | $ | 107,194,024 | | | $ | 887,476,547 | | |
Outstanding Shares — Investor Class | | | 4,846,283 | | | | 12,801,631 | | | | 808,769 | | | | 5,100,646 | | | | 39,287,866 | | |
NET ASSET VALUE PER SHARE — Investor Class | | $ | 11.97 | | | $ | 22.60 | | | $ | 51.88 | | | $ | 21.02 | | | $ | 22.59 | | |
Net Assets — Institutional Class | | $ | 241,081,931 | | | $ | 330,213,140 | | | $ | 80,338,484 | | | $ | 87,100,420 | | | $ | 309,798,927 | | |
Outstanding Shares — Institutional Class | | | 20,164,027 | | | | 14,590,024 | | | | 1,544,769 | | | | 4,129,766 | | | | 13,664,717 | | |
NET ASSET VALUE PER SHARE — Institutional Class | | $ | 11.96 | | | $ | 22.63 | | | $ | 52.01 | | | $ | 21.09 | | | $ | 22.67 | | |
Capital shares, $1.00 par value: | |
Authorized | | | Unlimited | | | | Unlimited | | | | Unlimited | | | | Unlimited | | | | Unlimited | | |
| (1) Written options, premiums received | | | — | | | | — | | | | — | | | | — | | | | — | | |

95
STATEMENTS OF OPERATIONS
FOR THE SIX MONTHS ENDED SEPTEMBER 30, 2021 (UNAUDITED)
| | | Buffalo
Discovery
Fund | | Buffalo
Dividend Focus
Fund | | Buffalo
Early
Stage Growth
Fund | | Buffalo
Flexible Income
Fund | | Buffalo
Growth
Fund | |
INVESTMENT INCOME: | |
Interest | | $ | — | | | $ | 29,513 | | | $ | — | | | $ | 98,329 | | | $ | — | | |
Dividends from securities | | | 2,811,658 | | | | 763,951 | | | | 167,826 | | | | 5,874,393 | | | | 593,138 | | |
Foreign tax withheld | | | — | | | | (1,289 | ) | | | (3,695 | ) | | | (1,512 | ) | | | — | | |
Total investment income | | | 2,811,658 | | | | 792,175 | | | | 164,131 | | | | 5,971,210 | | | | 593,138 | | |
EXPENSES: | |
Management fees (Note 3) | | | 7,703,092 | | | | 412,971 | | | | 942,698 | | | | 1,870,433 | | | | 807,302 | | |
Shareholder Service Fees — Investor Class (Note 7) | | | 1,084,535 | | | | 22,987 | | | | 69,401 | | | | 213,982 | | | | 89,578 | | |
Registration fees | | | 17,296 | | | | 14,840 | | | | 75,910 | | | | 9,752 | | | | 15,389 | | |
Custody fees | | | — | | | | — | | | | — | | | | — | | | | — | | |
Other expenses | | | 11,824 | | | | 630 | | | | 898 | | | | 2,617 | | | | 1,285 | | |
Total expenses | | | 8,816,747 | | | | 451,428 | | | | 1,088,907 | | | | 2,096,784 | | | | 913,554 | | |
Net investment income (loss) | | | (6,005,089 | ) | | | 340,747 | | | | (924,776 | ) | | | 3,874,426 | | | | (320,416 | ) | |
NET REALIZED AND UNREALIZED GAIN (LOSS): | |
Net realized gain (loss) from: | |
Investment transactions | | | 141,207,403 | | | | 397,879 | | | | 9,854,815 | | | | 4,175,218 | | | | 12,365,818 | | |
Options written (Note 8) | | | — | | | | — | | | | — | | | | 450,799 | | | | — | | |
Net unrealized appreciation/depreciation during the year on: | |
Investments | | | (49,606,999 | ) | | | 6,940,204 | | | | (5,140,322 | ) | | | 21,870,889 | | | | 11,886,536 | | |
Options written (Note 8) | | | — | | | | — | | | | — | | | | 53,454 | | | | — | | |
Net realized and unrealized gain (loss) | | | 91,600,404 | | | | 7,338,083 | | | | 4,714,493 | | | | 26,550,360 | | | | 24,252,354 | | |
Net increase in net assets resulting from operations | | $ | 85,595,315 | | | $ | 7,678,830 | | | $ | 3,789,717 | | | $ | 30,424,786 | | | $ | 23,931,938 | | |

The accompanying notes are an integral part of these financial statements.
96
| | | Buffalo
High Yield
Fund | | Buffalo
International
Fund | | Buffalo
Large Cap
Fund | | Buffalo
Mid Cap
Fund | | Buffalo
Small Cap
Fund | |
INVESTMENT INCOME: | |
Interest | | $ | 6,891,229 | | | $ | — | | | $ | — | | | $ | — | | | $ | — | | |
Dividends from securities | | | 121,094 | | | | 5,260,037 | | | | 374,475 | | | | 387,888 | | | | 972,020 | | |
Foreign tax withheld | | | — | | | | (645,555 | ) | | | (659 | ) | | | — | | | | — | | |
Total investment income | | | 7,012,323 | | | | 4,614,482 | | | | 373,816 | | | | 387,888 | | | | 972,020 | | |
EXPENSES: | |
Management fees (Note 3) | | | 1,231,878 | | | | 2,577,464 | | | | 453,890 | | | | 846,083 | | | | 5,114,891 | | |
Shareholder Service Fees — Investor Class (Note 7) | | | 41,234 | | | | 214,244 | | | | 30,976 | | | | 83,241 | | | | 660,052 | | |
Registration fees | | | 13,119 | | | | 40,661 | | | | 16,835 | | | | 13,209 | | | | 25,561 | | |
Custody fees | | | — | | | | 173,220 | | | | — | | | | — | | | | — | | |
Other expenses | | | 2,633 | | | | 3,532 | | | | 886 | | | | 1,241 | | | | 7,492 | | |
Total expenses | | | 1,288,864 | | | | 3,009,121 | | | | 502,587 | | | | 943,774 | | | | 5,807,996 | | |
Net investment income (loss) | | | 5,723,459 | | | | 1,605,361 | | | | (128,771 | ) | | | (555,886 | ) | | | (4,835,976 | ) | |
NET REALIZED AND UNREALIZED GAIN (LOSS): | |
Net realized gain (loss) from: | |
Investment transactions | | | 3,262,713 | | | | 13,214,446 | | | | 24,243,586 | | | | 7,306,366 | | | | 108,094,369 | | |
Options written (Note 8) | | | — | | | | — | | | | — | | | | — | | | | — | | |
Net unrealized appreciation/depreciation during the year on: | |
Investments | | | 179,689 | | | | 40,216,692 | | | | (10,796,931 | ) | | | 1,202,749 | | | | (85,575,815 | ) | |
Options written (Note 8) | | | — | | | | — | | | | — | | | | — | | | | — | | |
Net realized and unrealized gain (loss) | | | 3,442,402 | | | | 53,431,138 | | | | 13,446,655 | | | | 8,509,115 | | | | 22,518,554 | | |
Net increase in net assets resulting from operations | | $ | 9,165,861 | | | $ | 55,036,499 | | | $ | 13,317,884 | | | $ | 7,953,229 | | | $ | 17,682,578 | | |

97
STATEMENTS OF CHANGES IN
NET ASSETS
| | | Buffalo
Discovery Fund | | Buffalo
Dividend Focus Fund | | Buffalo
Early Stage Growth Fund | |
| | | Six Months Ended
September 30, 2021
(UNAUDITED) | | Year Ended
March 31, 2021 | | Six Months Ended
September 30, 2021
(UNAUDITED) | | Year Ended
March 31, 2021 | | Six Months Ended
September 30, 2021
(UNAUDITED) | | Year Ended
March 31, 2021 | |
OPERATIONS: | |
Net investment income (loss) | | $ | (6,005,089 | ) | | $ | (10,326,642 | ) | | $ | 340,747 | | | $ | 606,964 | | | $ | (924,776 | ) | | $ | (1,200,578 | ) | |
Net realized gain on investment transactions | | | 141,207,403 | | | | 322,324,905 | | | | 397,879 | | | | 2,703,910 | | | | 9,854,815 | | | | 24,524,120 | | |
Net unrealized appreciation / depreciation during the year on investments and translation of
assets and liabilities in foreign currencies | | | (49,606,999 | ) | | | 509,250,181 | | | | 6,940,204 | | | | 31,172,434 | | | | (5,140,322 | ) | | | 46,689,428 | | |
Net increase (decrease) in net assets resulting from operations | | | 85,595,315 | | | | 821,248,444 | | | | 7,678,830 | | | | 34,483,308 | | | | 3,789,717 | | | | 70,012,970 | | |
DISTRIBUTIONS TO SHAREHOLDERS: | |
Distributable earnings | | | — | | | | (135,340,074 | ) | | | (326,407 | ) | | | (603,921 | ) | | | — | | | | (11,977,369 | ) | |
Total distributions | | | — | | | | (135,340,074 | ) | | | (326,407 | ) | | | (603,921 | ) | | | — | | | | (11,977,369 | ) | |
CAPITAL SHARE TRANSACTIONS: | |
Shares sold | |
Investor Class | | | 47,124,095 | | | | 149,611,384 | | | | 1,369,802 | | | | 2,831,032 | | | | 12,989,434 | | | | 12,452,018 | | |
Institutional Class | | | 76,527,133 | | | | 96,646,218 | | | | 5,006,075 | | | | 17,170,546 | | | | 4,350,348 | | | | 6,151,289 | | |
Reinvested dividends and distributions | |
Investor Class | | �� | — | | | | 110,352,380 | | | | 72,775 | | | | 161,501 | | | | — | | | | 7,394,722 | | |
Institutional Class | | | — | | | | 21,348,611 | | | | 243,647 | | | | 421,740 | | | | — | | | | 4,253,752 | | |
Shares Issued | | | 123,651,228 | | | | 377,958,593 | | | | 6,692,299 | | | | 20,584,819 | | | | 17,339,782 | | | | 30,251,781 | | |
Redemptions | |
Investor Class | | | (185,303,125 | ) | | | (530,764,960 | ) | | | (1,522,759 | ) | | | (9,627,763 | ) | | | (10,222,180 | ) | | | (17,078,266 | ) | |
Institutional Class | | | (23,942,629 | ) | | | (90,624,869 | ) | | | (2,479,855 | ) | | | (8,534,071 | ) | | | (2,146,461 | ) | | | (5,097,713 | ) | |
Shares repurchased | | | (209,245,754 | ) | | | (621,389,829 | ) | | | (4,002,614 | ) | | | (18,161,834 | ) | | | (12,368,641 | ) | | | (22,175,979 | ) | |
Net increase (decrease) from capital share transactions | | | (85,594,526 | ) | | | (243,431,236 | ) | | | 2,689,685 | | | | 2,422,985 | | | | 4,971,141 | | | | 8,075,802 | | |
Total increase (decrease) in net assets | | | 789 | | | | 442,477,134 | | | | 10,042,108 | | | | 36,302,372 | | | | 8,760,858 | | | | 66,111,403 | | |
NET ASSETS: | |
Beginning of period | | | 1,780,144,242 | | | | 1,337,667,108 | | | | 101,009,948 | | | | 64,707,576 | | | | 131,846,354 | | | | 65,734,951 | | |
End of period | | $ | 1,780,145,031 | | | $ | 1,780,144,242 | | | $ | 111,052,056 | | | $ | 101,009,948 | | | $ | 140,607,212 | | | $ | 131,846,354 | | |
Fund share transactions: | |
Shares issued | |
Investor Class | | | 1,467,297 | | | | 5,500,653 | | | | 55,337 | | | | 141,111 | | | | 528,240 | | | | 567,291 | | |
Institutional Class | | | 2,312,134 | | | | 3,308,615 | | | | 203,259 | | | | 832,698 | | | | 175,417 | | | | 273,406 | | |
| | | | 3,779,431 | | | | 8,809,268 | | | | 258,596 | | | | 973,809 | | | | 703,657 | | | | 840,697 | | |
Reinvested dividends and distributions | |
Investor Class | | | — | | | | 3,704,344 | | | | 2,967 | | | | 7,919 | | | | — | | | | 341,558 | | |
Institutional Class | | | — | | | | 714,717 | | | | 9,933 | | | | 20,360 | | | | — | | | | 195,935 | | |
| | | | — | | | | 4,419,061 | | | | 12,900 | | | | 28,279 | | | | — | | | | 537,493 | | |
Shares Issued | | | 3,779,431 | | | | 13,228,329 | | | | 271,496 | | | | 1,002,088 | | | | 703,657 | | | | 1,378,190 | | |
Shares repurchased | |
Investor Class | | | (5,734,783 | ) | | | (19,361,212 | ) | | | (61,493 | ) | | | (491,618 | ) | | | (412,319 | ) | | | (852,378 | ) | |
Institutional Class | | | (741,755 | ) | | | (3,408,874 | ) | | | (99,952 | ) | | | (435,000 | ) | | | (87,392 | ) | | | (269,189 | ) | |
Total Shares Repurchased | | | (6,476,538 | ) | | | (22,770,086 | ) | | | (161,445 | ) | | | (926,618 | ) | | | (499,711 | ) | | | (1,121,567 | ) | |
Net increase (decrease) in fund shares | | | (2,697,107 | ) | | | (9,541,757 | ) | | | 110,051 | | | | 75,470 | | | | 203,946 | | | | 256,623 | | |

The accompanying notes are an integral part of these financial statements.
98
| | Buffalo
Flexible Income Fund | | Buffalo
Growth Fund | |
| | | Six Months Ended
September 30, 2021
(UNAUDITED) | | Year Ended
March 31, 2021 | | Six Months Ended
September 30, 2021
(UNAUDITED) | | Year Ended
March 31, 2021 | |
OPERATIONS: | |
Net investment income (loss) | | $ | 3,874,426 | | | $ | 8,932,524 | | | $ | (320,416 | ) | | $ | (241,834 | ) | |
Net realized gain on investment transactions | | | 4,626,017 | | | | 12,766,430 | | | | 12,365,818 | | | | 20,363,885 | | |
Net unrealized appreciation / depreciation during the year on investments and translation of
assets and liabilities in foreign currencies | | | 21,924,343 | | | | 124,757,423 | | | | 11,886,536 | | | | 55,554,120 | | |
Net increase (decrease) in net assets resulting from operations | | | 30,424,786 | | | | 146,456,377 | | | | 23,931,938 | | | | 75,676,171 | | |
DISTRIBUTIONS TO SHAREHOLDERS: | |
Distributable earnings | | | (3,940,474 | ) | | | (14,924,358 | ) | | | — | | | | (9,555,575 | ) | |
Total distributions | | | (3,940,474 | ) | | | (14,924,358 | ) | | | — | | | | (9,555,575 | ) | |
CAPITAL SHARE TRANSACTIONS: | |
Shares sold | |
Investor Class | | | 4,878,682 | | | | 5,998,019 | | | | 3,283,770 | | | | 8,115,877 | | |
Institutional Class | | | 3,150,070 | | | | 6,056,964 | | | | 4,226,178 | | | | 8,440,623 | | |
Reinvested dividends and distributions | |
Investor Class | | | 2,446,032 | | | | 9,615,886 | | | | — | | | | 5,431,116 | | |
Institutional Class | | | 1,286,363 | | | | 4,671,983 | | | | — | | | | 4,021,245 | | |
Shares Issued | | | 11,761,147 | | | | 26,342,852 | | | | 7,509,948 | | | | 26,008,861 | | |
Redemptions | |
Investor Class | | | (26,722,260 | ) | | | (98,594,572 | ) | | | (13,819,191 | ) | | | (28,516,879 | ) | |
Institutional Class | | | (8,536,668 | ) | | | (40,830,504 | ) | | | (4,703,666 | ) | | | (11,526,887 | ) | |
Shares repurchased | | | (35,258,928 | ) | | | (139,425,076 | ) | | | (18,522,857 | ) | | | (40,043,766 | ) | |
Net increase (decrease) from capital share transactions | | | (23,497,781 | ) | | | (113,082,224 | ) | | | (11,012,909 | ) | | | (14,034,905 | ) | |
Total increase (decrease) in net assets | | | 2,986,531 | | | | 18,449,795 | | | | 12,919,029 | | | | 52,085,691 | | |
NET ASSETS: | |
Beginning of period | | | 425,708,189 | | | | 407,258,394 | | | | 198,444,418 | | | | 146,358,727 | | |
End of period | | $ | 428,694,720 | | | $ | 425,708,189 | | | $ | 211,363,447 | | | $ | 198,444,418 | | |
Fund share transactions: | |
Shares issued | |
Investor Class | | | 416,984 | | | | 416,984 | | | | 98,660 | | | | 284,229 | | |
Institutional Class | | | 407,263 | | | | 407,263 | | | | 122,936 | | | | 300,559 | | |
| | | | 824,247 | | | | 824,247 | | | | 221,596 | | | | 584,788 | | |
Reinvested dividends and distributions | |
Investor Class | | | 656,101 | | | | 656,101 | | | | — | | | | 179,600 | | |
Institutional Class | | | 318,733 | | | | 318,733 | | | | — | | | | 132,758 | | |
| | | | 974,834 | | | | 974,834 | | | | — | | | | 312,358 | | |
Shares Issued | | | 1,799,081 | | | | 1,799,081 | | | | 221,596 | | | | 897,146 | | |
Shares repurchased | |
Investor Class | | | (6,880,691 | ) | | | (6,880,691 | ) | | | (405,150 | ) | | | (1,000,266 | ) | |
Institutional Class | | | (2,845,684 | ) | | | (2,845,684 | ) | | | (136,260 | ) | | | (419,001 | ) | |
Total Shares Repurchased | | | (9,726,375 | ) | | | (9,726,375 | ) | | | (541,410 | ) | | | (1,419,267 | ) | |
Net increase (decrease) in fund shares | | | (7,927,294 | ) | | | (7,927,294 | ) | | | (319,814 | ) | | | (522,121 | ) | |

99
STATEMENTS OF CHANGES IN
NET ASSETS
| | | Buffalo
High Yield Fund | | Buffalo
International Fund | | Buffalo
Large Cap Fund | |
| | | Six Months Ended
September 30, 2021
(UNAUDITED) | | Year Ended
March 31, 2021 | | Six Months Ended
September 30, 2021
(UNAUDITED) | | Year Ended
March 31, 2021 | | Six Months Ended
September 30, 2021
(UNAUDITED) | | Year Ended
March 31, 2021 | |
OPERATIONS: | |
Net investment income (loss) | | $ | 5,723,459 | | | $ | 10,724,695 | | | $ | 1,605,361 | | | $ | 1,433,999 | | | $ | (128,771 | ) | | $ | (62,605 | ) | |
Net realized gain on investment transactions | | | 3,262,713 | | | | 6,896,478 | | | | 13,214,446 | | | | 1,772,922 | | | | 24,243,586 | | | | 1,438,010 | | |
Net unrealized appreciation / depreciation during the year on investments and translation of
assets and liabilities in foreign currencies | | | 179,689 | | | | 36,810,629 | | | | 40,216,692 | | | | 185,957,714 | | | | (10,796,931 | ) | | | 39,787,915 | | |
Net increase (decrease) in net assets resulting from operations | | | 9,165,861 | | | | 54,431,802 | | | | 55,036,499 | | | | 189,164,635 | | | | 13,317,884 | | | | 41,163,320 | | |
DISTRIBUTIONS TO SHAREHOLDERS: | |
Distributable earnings | | | (5,853,195 | ) | | | (10,791,072 | ) | | | — | | | | (1,810,577 | ) | | | — | | | | (226,492 | ) | |
Total distributions | | | (5,853,195 | ) | | | (10,791,072 | ) | | | — | | | | (1,810,577 | ) | | | — | | | | (226,492 | ) | |
CAPITAL SHARE TRANSACTIONS: | |
Shares sold | |
Investor Class | | | 10,481,295 | | | | 7,659,688 | | | | 35,276,975 | | | | 76,610,305 | | | | 2,310,644 | | | | 4,685,305 | | |
Institutional Class | | | 14,806,274 | | | | 58,665,709 | | | | 31,607,362 | | | | 68,195,319 | | | | 4,767,436 | | | | 9,245,163 | | |
Reinvested dividends and distributions | |
Investor Class | | | 1,047,730 | | | | 2,076,991 | | | | — | | | | 705,246 | | | | — | | | | 46,663 | | |
Institutional Class | | | 4,167,567 | | | | 7,577,783 | | | | — | | | | 1,027,962 | | | | — | | | | 171,050 | | |
Shares Issued | | | 30,502,866 | | | | 75,980,171 | | | | 66,884,337 | | | | 146,538,832 | | | | 7,078,080 | | | | 14,148,181 | | |
Redemptions | |
Investor Class | | | (4,242,001 | ) | | | (15,115,408 | ) | | | (32,059,296 | ) | | | (97,166,871 | ) | | | (2,288,184 | ) | | | (10,383,103 | ) | |
Institutional Class | | | (6,328,363 | ) | | | (16,448,241 | ) | | | (15,969,704 | ) | | | (51,180,047 | ) | | | (4,616,276 | ) | | | (9,011,030 | ) | |
Shares repurchased | | | (10,570,364 | ) | | | (31,563,649 | ) | | | (48,029,000 | ) | | | (148,346,918 | ) | | | (6,904,460 | ) | | | (19,394,133 | ) | |
Net increase (decrease) from capital share transactions | | | 19,932,502 | | | | 44,416,522 | | | | 18,855,337 | | | | (1,808,086 | ) | | | 173,620 | | | | (5,245,952 | ) | |
Total increase (decrease) in net assets | | | 23,245,168 | | | | 88,057,252 | | | | 73,891,836 | | | | 185,545,972 | | | | 13,491,504 | | | | 35,690,876 | | |
NET ASSETS: | |
Beginning of period | | | 275,828,148 | | | | 187,770,896 | | | | 545,639,452 | | | | 360,093,480 | | | | 108,806,859 | | | | 73,115,983 | | |
End of period | | $ | 299,073,316 | | | $ | 275,828,148 | | | $ | 619,531,288 | | | $ | 545,639,452 | | | $ | 122,298,363 | | | $ | 108,806,859 | | |
Fund share transactions: | |
Shares issued | |
Investor Class | | | 875,262 | | | | 685,046 | | | | 1,563,939 | | | | 4,425,494 | | | | 44,572 | | | | 115,539 | | |
Institutional Class | | | 1,238,499 | | | | 5,312,364 | | | | 1,388,854 | | | | 3,747,339 | | | | 93,801 | | | | 227,459 | | |
| | | | 2,113,761 | | | | 5,997,410 | | | | 2,952,793 | | | | 8,172,833 | | | | 138,373 | | | | 342,998 | | |
Reinvested dividends and distributions | |
Investor Class | | | 87,913 | | | | 187,338 | | | | — | | | | 35,368 | | | | — | | | | 1,051 | | |
Institutional Class | | | 349,985 | | | | 680,140 | | | | — | | | | 51,553 | | | | — | | | | 3,848 | | |
| | | | 437,898 | | | | 867,478 | | | | — | | | | 86,921 | | | | — | | | | 4,899 | | |
Shares Issued | | | 2,551,659 | | | | 6,864,888 | | | | 2,952,793 | | | | 8,259,754 | | | | 138,373 | | | | 347,897 | | |
Shares repurchased | |
Investor Class | | | (355,135 | ) | | | (1,370,951 | ) | | | (1,439,413 | ) | | | (5,354,527 | ) | | | (45,130 | ) | | | (251,260 | ) | |
Institutional Class | | | (530,102 | ) | | | (1,483,211 | ) | | | (711,818 | ) | | | (2,896,307 | ) | | | (90,872 | ) | | | (219,968 | ) | |
Total Shares Repurchased | | | (885,237 | ) | | | (2,854,162 | ) | | | (2,151,231 | ) | | | (8,250,834 | ) | | | (136,002 | ) | | | (471,228 | ) | |
Net increase (decrease) in fund shares | | | 1,666,422 | | | | 4,010,725 | | | | 801,562 | | | | 8,920 | | | | 2,371 | | | | (123,331 | ) | |

The accompanying notes are an integral part of these financial statements.
100
| | | Buffalo
Mid Cap Fund | | Buffalo
Small Cap Fund | |
| | | Six Months Ended
September 30, 2021
(UNAUDITED) | | Year Ended
March 31, 2021 | | Six Months Ended
September 30, 2021
(UNAUDITED) | | Year Ended
March 31, 2021 | |
OPERATIONS: | |
Net investment income (loss) | | $ | (555,886 | ) | | $ | (953,118 | ) | | $ | (4,835,976 | ) | | $ | (5,997,480 | ) | |
Net realized gain on investment transactions | | | 7,306,366 | | | | 26,399,637 | | | | 108,094,369 | | | | 219,482,041 | | |
Net unrealized appreciation / depreciation during the year on investments and translation of
assets and liabilities in foreign currencies | | | 1,202,749 | | | | 57,028,018 | | | | (85,575,815 | ) | | | 308,472,234 | | |
Net increase (decrease) in net assets resulting from operations | | | 7,953,229 | | | | 82,474,537 | | | | 17,682,578 | | | | 521,956,795 | | |
DISTRIBUTIONS TO SHAREHOLDERS: | |
Distributable earnings | | | — | | | | (12,015,139 | ) | | | — | | | | (76,101,843 | ) | |
Total distributions | | | — | | | | (12,015,139 | ) | | | — | | | | (76,101,843 | ) | |
CAPITAL SHARE TRANSACTIONS: | |
Shares sold | |
Investor Class | | | 2,243,185 | | | | 3,660,618 | | | | 179,102,116 | | | | 177,161,629 | | |
Institutional Class | | | 3,156,571 | | | | 8,501,585 | | | | 86,104,351 | | | | 157,633,634 | | |
Reinvested dividends and distributions | |
Investor Class | | | — | | | | 6,861,738 | | | | — | | | | 58,109,075 | | |
Institutional Class | | | — | | | | 5,016,695 | | | | — | | | | 16,517,003 | | |
Shares Issued | | | 5,399,756 | | | | 24,040,636 | | | | 265,206,467 | | | | 409,421,341 | | |
Redemptions | |
Investor Class | | | (6,546,545 | ) | | | (31,736,812 | ) | | | (106,211,233 | ) | | | (117,827,412 | ) | |
Institutional Class | | | (3,215,356 | ) | | | (9,413,314 | ) | | | (109,377,977 | ) | | | (40,372,895 | ) | |
Shares repurchased | | | (9,761,901 | ) | | | (41,150,126 | ) | | | (215,589,210 | ) | | | (158,200,307 | ) | |
Net increase (decrease) from capital share transactions | | | (4,362,145 | ) | | | (17,109,490 | ) | | | 49,617,257 | | | | 251,221,034 | | |
Total increase (decrease) in net assets | | | 3,591,084 | | | | 53,349,908 | | | | 67,299,835 | | | | 697,075,986 | | |
NET ASSETS: | |
Beginning of period | | | 190,703,359 | | | | 137,353,451 | | | | 1,129,975,640 | | | | 432,899,654 | | |
End of period | | $ | 194,294,443 | | | $ | 190,703,359 | | | $ | 1,197,275,475 | | | $ | 1,129,975,640 | | |
Fund share transactions: | |
Shares issued | |
Investor Class | | | 44,571 | | | | 214,506 | | | | 7,744,207 | | | | 8,586,112 | | |
Institutional Class | | | 93,801 | | | | 483,763 | | | | 3,719,362 | | | | 7,457,256 | | |
| | | | 138,372 | | | | 698,269 | | | | 11,463,569 | | | | 16,043,368 | | |
Reinvested dividends and distributions | |
Investor Class | | | — | | | | 360,385 | | | | — | | | | 2,816,727 | | |
Institutional Class | | | — | | | | 262,792 | | | | — | | | | 798,695 | | |
| | | | — | | | | 623,177 | | | | — | | | | 3,615,422 | | |
Shares Issued | | | 138,372 | | | | 1,321,446 | | | | 11,463,569 | | | | 19,658,790 | | |
Shares repurchased | |
Investor Class | | | (45,130 | ) | | | (1,880,452 | ) | | | (4,652,931 | ) | | | (6,078,091 | ) | |
Institutional Class | | | (90,872 | ) | | | (553,172 | ) | | | (4,853,496 | ) | | | (2,137,290 | ) | |
Total Shares Repurchased | | | (136,002 | ) | | | (2,433,624 | ) | | | (9,506,427 | ) | | | (8,215,381 | ) | |
Net increase (decrease) in fund shares | | | 2,370 | | | | (1,112,178 | ) | | | 1,957,142 | | | | 11,443,409 | | |

101
FINANCIAL HIGHLIGHTS
BUFFALO DISCOVERY FUND INVESTOR CLASS
The following tables are intended to help you understand the Fund's financial performance for the periods shown. Certain information reflects financial results for a single Fund share. Total returns in the table represent the rate that an investor would have earned (or lost) on an investment in the Fund. Total returns assume reinvestment of all dividends and distributions. Total returns do not reflect payment of sales charges, if any, and are not annualized for periods of less than one year.
| | | For the Six Months
Ended September 30,
2021 | | For the Years Ended March 31, | |
Condensed data for a share of capital stock
outstanding throughout the period. | | (UNAUDITED) | | 2021 | | 2020 | | 2019 | | 2018 | | 2017 | |
Net asset value, beginning of period | | $ | 30.82 | | | $ | 19.88 | | | $ | 25.29 | | | $ | 24.52 | | | $ | 21.86 | | | $ | 19.30 | | |
Income from investment operations: | |
Net investment loss | | | (0.11 | )(1) | | | (0.18 | )(1) | | | (0.06 | ) | | | (0.06 | ) | | | (0.04 | ) | | | (0.02 | ) | |
Net gains (losses) on securities (both realized
and unrealized) | | | 1.62 | | | | 13.51 | | | | (1.76 | ) | | | 2.31 | | | | 3.82 | | | | 3.10 | | |
Total from investment operations | | | 1.51 | | | | 13.33 | | | | (1.82 | ) | | | 2.25 | | | | 3.78 | | | | 3.08 | | |
Less distributions: | |
Distributions from capital gains | | | — | | | | (2.39 | ) | | | (3.59 | ) | | | (1.48 | ) | | | (1.12 | ) | | | (0.52 | ) | |
Total distributions | | | — | | | | (2.39 | ) | | | (3.59 | ) | | | (1.48 | ) | | | (1.12 | ) | | | (0.52 | ) | |
Paid-in capital from redemption fees(2) | | | — | | | | — | | | | — | | | | — | | | | — | | | | — | (3) | |
Net asset value, end of period | | $ | 32.33 | | | $ | 30.82 | | | $ | 19.88 | | | $ | 25.29 | | | $ | 24.52 | | | $ | 21.86 | | |
Total return* | | | 4.83 | % | | | 67.49 | % | | | (9.64 | %) | | | 10.34 | % | | | 17.35 | % | | | 16.07 | % | |
Ratios/Supplemental Data | |
Net assets, end of period (in thousands) | | $ | 1,374,458 | | | $ | 1,442,145 | | | $ | 1,132,237 | | | $ | 1,744,262 | | | $ | 1,896,950 | | | $ | 1,254,238 | | |
Ratio of expenses to average net assets** | | | 1.00 | % | | | 1.01 | % | | | 1.01 | % | | | 1.01 | % | | | 1.01 | % | | | 1.01 | % | |
Ratio of net investment income (loss) to average
net assets** | | | (0.70 | %) | | | (0.64 | %) | | | (0.30 | %) | | | (0.21 | %) | | | (0.20 | %) | | | (0.11 | %) | |
Portfolio turnover rate* | | | 22 | % | | | 84 | % | | | 123 | % | | | 77 | % | | | 42 | % | | | 51 | % | |
* Not annualized for periods less than one year.
** Annualized for periods less than one year.
(1) Per share amounts have been calculated using the average shares method.
(2) Effective December 1, 2016, the Board of Trustees approved the elimination of redemption fees on shares of the Funds.
(3) Less than $0.01 per share.

102
FINANCIAL HIGHLIGHTS
BUFFALO DISCOVERY FUND INSTITUTIONAL CLASS
The following tables are intended to help you understand the Fund's financial performance for the periods shown. Certain information reflects financial results for a single Fund share. Total returns in the table represent the rate that an investor would have earned (or lost) on an investment in the Fund. Total returns assume reinvestment of all dividends and distributions. Total returns do not reflect payment of sales charges, if any, and are not annualized for periods of less than one year.
| | | For the Six Months
Ended September 30,
2021 | | For the Year Ended
March 31, | | For the period
July 1, 2019*
through | |
Condensed data for a share of capital stock
outstanding throughout the period. | | (UNAUDITED) | | 2021 | | March 31, 2020 | |
Net asset value, beginning of period | | $ | 30.92 | | | $ | 19.91 | | | $ | 27.10 | | |
Income from investment operations: | |
Net investment loss | | | (0.09 | )(1) | | | (0.14 | )(1) | | | (0.04 | ) | |
Net gains (losses) on securities (both realized and unrealized) | | | 1.62 | | | | 13.54 | | | | (3.56 | ) | |
Total from investment operations | | | 1.53 | | | | 13.40 | | | | (3.60 | ) | |
Less distributions: | |
Distributions from capital gains | | | — | | | | (2.39 | ) | | | (3.59 | ) | |
Total distributions | | | — | | | | (2.39 | ) | | | (3.59 | ) | |
Net asset value, end of period | | $ | 32.45 | | | $ | 30.92 | | | $ | 19.91 | | |
Total return** | | | 4.88 | % | | | 67.75 | % | | | (15.55 | %)(2) | |
Ratios/Supplemental Data | |
Net assets, end of period (in thousands) | | $ | 405,688 | | | $ | 337,999 | | | $ | 205,430 | | |
Ratio of expenses to average net assets*** | | | 0.85 | % | | | 0.86 | % | | | 0.86 | % | |
Ratio of net investment income (loss) to average net assets*** | | | (0.55 | %) | | | (0.50 | %) | | | (0.25 | %) | |
Portfolio turnover rate** | | | 22 | % | | | 84 | % | | | 123 | % | |
* Inception date
** Not annualized for periods less than one year.
*** Annualized for periods less than one year.
(1) Per share amounts have been calculated using the average shares method.
(2) The return listed is the non-annualized return for the Institutional Class from inception date through March 31, 2020.

103
FINANCIAL HIGHLIGHTS
BUFFALO DIVIDEND FOCUS FUND INVESTOR CLASS
The following tables are intended to help you understand the Fund's financial performance for the periods shown. Certain information reflects financial results for a single Fund share. Total returns in the table represent the rate that an investor would have earned (or lost) on an investment in the Fund. Total returns assume reinvestment of all dividends and distributions. Total returns do not reflect payment of sales charges, if any, and are not annualized for periods of less than one year.
| | | For the Six Months
Ended September 30,
2021 | | For the Years Ended March 31, | |
Condensed data for a share of capital stock
outstanding throughout the period. | | (UNAUDITED) | | 2021 | | 2020 | | 2019 | �� | 2018 | | 2017 | |
Net asset value, beginning of period | | $ | 23.16 | | | $ | 15.10 | | | $ | 16.65 | | | $ | 16.28 | | | $ | 15.32 | | | $ | 13.20 | | |
Income from investment operations: | |
Net investment gain | | | (0.06 | )(1) | | | 0.12 | (1) | | | 0.44 | | | | 0.25 | | | | 0.19 | | | | 0.18 | | |
Net gains (losses) on securities (both realized
and unrealized) | | | 1.80 | | | | 8.06 | | | | (1.81 | ) | | | 0.91 | | | | 1.11 | | | | 2.22 | | |
Total from investment operations | | | 1.74 | | | | 8.18 | | | | (1.37 | ) | | | 1.16 | | | | 1.30 | | | | 2.40 | | |
Less distributions: | |
Distributions from investment Income | | | (0.06 | ) | | | (0.12 | ) | | | (0.17 | ) | | | (0.25 | ) | | | (0.19 | ) | | | (0.18 | ) | |
Distributions from capital gains | | | — | | | | — | | | | — | | | | (0.54 | ) | | | (0.15 | ) | | | (0.10 | ) | |
Distributions from return of capital | | | — | | | | — | | | | (0.01 | ) | | | — | | | | — | | | | — | | |
Total distributions | | | (0.06 | ) | | | (0.12 | ) | | | (0.18 | ) | | | (0.79 | ) | | | (0.34 | ) | | | (0.28 | ) | |
Paid-in capital from redemption fees(2) | | | — | | | | — | | | | — | | | | — | | | | — | | | | — | (3) | |
Net asset value, end of period | | $ | 24.84 | | | $ | 23.16 | | | $ | 15.10 | | | $ | 16.65 | | | $ | 16.28 | | | $ | 15.32 | | |
Total return* | | | 7.52 | % | | | 54.29 | % | | | (8.32 | %) | | | 7.48 | % | | | 8.51 | % | | | 18.35 | % | |
Ratios/Supplemental Data | |
Net assets, end of period (in thousands) | | $ | 30,596 | | | $ | 28,605 | | | $ | 23,821 | | | $ | 58,299 | | | $ | 59,364 | | | $ | 59,795 | | |
Ratio of expenses to average net assets** | | | 0.93 | % | | | 0.94 | % | | | 0.95 | % | | | 0.94 | % | | | 0.94 | % | | | 0.95 | % | |
Ratio of net investment income (loss) to average
net assets** | | | (0.96 | %) | | | 0.63 | % | | | 0.84 | % | | | 1.45 | % | | | 1.16 | % | | | 1.34 | % | |
Portfolio turnover rate* | | | 1 | % | | | 20 | % | | | 31 | % | | | 20 | % | | | 21 | % | | | 26 | % | |
* Not annualized for periods less than one year.
** Annualized for periods less than one year.
(1) Per share amounts have been calculated using the average shares method.
(2) Effective December 1, 2016, the Board of Trustees approved the elimination of redemption fees on shares of the Funds.
(3) Less than $0.01 per share.

104
FINANCIAL HIGHLIGHTS
BUFFALO DIVIDEND FOCUS FUND INSTITUTIONAL CLASS
The following tables are intended to help you understand the Fund's financial performance for the periods shown. Certain information reflects financial results for a single Fund share. Total returns in the table represent the rate that an investor would have earned (or lost) on an investment in the Fund. Total returns assume reinvestment of all dividends and distributions. Total returns do not reflect payment of sales charges, if any, and are not annualized for periods of less than one year.
| | | For the Six Months
Ended September 30,
2021 | | For the Year Ended
March 31, | | For the period
July 1, 2019*
through | |
Condensed data for a share of capital stock
outstanding throughout the period. | | (UNAUDITED) | | 2021 | | March 31, 2020 | |
Net asset value, beginning of period | | $ | 23.16 | | | $ | 15.10 | | | $ | 17.37 | | |
Income from investment operations: | |
Net investment income | | | (0.02 | )(1) | | | 0.15 | (1) | | | 0.28 | | |
Net gains (losses) on securities (both realized and unrealized) | | | 1.78 | | | | 8.06 | | | | (2.41 | ) | |
Total from investment operations | | | 1.76 | | | | 8.21 | | | | (2.13 | ) | |
Less distributions: | |
Distributions from investment Income | | | (0.08 | ) | | | (0.15 | ) | | | (0.13 | ) | |
Distributions from capital gains | | | — | | | | — | | | | — | | |
Distributions from return of capital | | | — | | | | — | | | | (0.01 | ) | |
Total distributions | | | (0.08 | ) | | | (0.15 | ) | | | (0.14 | ) | |
Net asset value, end of period | | $ | 24.84 | | | $ | 23.16 | | | $ | 15.10 | | |
Total return** | | | 7.60 | % | | | 54.52 | % | | | (12.34 | %)(2) | |
Ratios/Supplemental Data | |
Net assets, end of period (in thousands) | | $ | 80,456 | | | $ | 72,405 | | | $ | 40,887 | | |
Ratio of expenses to average net assets*** | | | 0.78 | % | | | 0.79 | % | | | 0.80 | % | |
Ratio of net investment income (loss) to average net assets*** | | | (0.81 | %) | | | 0.78 | % | | | 1.23 | % | |
Portfolio turnover rate** | | | 1 | % | | | 20 | % | | | 31 | % | |
* Inception date
** Not annualized for periods less than one year.
*** Annualized for periods less than one year.
(1) Per share amounts have been calculated using the average shares method.
(2) The return listed is the non-annualized return for the Institutional Class from inception date through March 31, 2020.

105
FINANCIAL HIGHLIGHTS
BUFFALO EARLY STAGE GROWTH FUND INVESTOR CLASS
The following tables are intended to help you understand the Fund's financial performance for the periods shown. Certain information reflects financial results for a single Fund share. Total returns in the table represent the rate that an investor would have earned (or lost) on an investment in the Fund. Total returns assume reinvestment of all dividends and distributions. Total returns do not reflect payment of sales charges, if any, and are not annualized for periods of less than one year.
| | | For the Six Months
Ended September 30,
2021 | | For the Years Ended March 31, | |
Condensed data for a share of capital stock
outstanding throughout the period. | | (UNAUDITED) | | 2021 | | 2020 | | 2019 | | 2018 | | 2017 | |
Net asset value, beginning of period | | $ | 23.88 | | | $ | 12.50 | | | $ | 15.30 | | | $ | 16.03 | | | $ | 15.78 | | | $ | 13.89 | | |
Income from investment operations: | |
Net investment loss | | | (0.17 | )(1) | | | (0.25 | )(1) | | | (0.15 | ) | | | (0.15 | ) | | | (0.18 | ) | | | (0.13 | ) | |
Net gains (losses) on securities (both realized
and unrealized) | | | 0.84 | | | | 14.11 | | | | (1.85 | ) | | | 1.32 | | | | 3.55 | | | | 3.25 | | |
Total from investment operations | | | 0.67 | | | | 13.86 | | | | (2.00 | ) | | | 1.17 | | | | 3.37 | | | | 3.12 | | |
Less distributions: | |
Distributions from capital gains | | | — | | | | (2.48 | ) | | | (0.80 | ) | | | (1.90 | ) | | | (3.12 | ) | | | (1.23 | ) | |
Total distributions | | | — | | | | (2.48 | ) | | | (0.80 | ) | | | (0.79 | ) | | | (0.34 | ) | | | (0.28 | ) | |
Paid-in capital from redemption fees(2) | | | — | | | | — | | | | — | | | | — | | | | — | | | | — | (3) | |
Net asset value, end of period | | $ | 24.55 | | | $ | 23.88 | | | $ | 12.50 | | | $ | 15.30 | | | $ | 16.03 | | | $ | 15.78 | | |
Total return* | | | 2.93 | % | | | 112.86 | % | | | (14.38 | %) | | | 9.39 | % | | | 21.84 | % | | | 22.99 | % | |
Ratios/Supplemental Data | |
Net assets, end of period (in thousands) | | $ | 87,999 | | | $ | 82,824 | | | $ | 42,633 | | | $ | 84,032 | | | $ | 87,969 | | | $ | 85,336 | | |
Ratio of expenses to average net assets** | | | 1.51 | % | | | 1.50 | % | | | 1.49 | % | | | 1.48 | % | | | 1.48 | % | | | 1.48 | % | |
Ratio of net investment income (loss) to average
net assets** | | | (1.33 | %) | | | (1.24 | %) | | | (1.00 | %) | | | (0.94 | %) | | | (1.10 | %) | | | (0.62 | %) | |
Portfolio turnover rate* | | | 20 | % | | | 54 | % | | | 22 | % | | | 40 | % | | | 48 | % | | | 95 | % | |
* Not annualized for periods less than one year.
** Annualized for periods less than one year.
(1) Per share amounts have been calculated using the average shares method.
(2) Effective December 1, 2016, the Board of Trustees approved the elimination of redemption fees on shares of the Funds.
(3) Less than $0.01 per share.

106
FINANCIAL HIGHLIGHTS
BUFFALO EARLY STAGE GROWTH FUND INSTITUTIONAL CLASS
The following tables are intended to help you understand the Fund's financial performance for the periods shown. Certain information reflects financial results for a single Fund share. Total returns in the table represent the rate that an investor would have earned (or lost) on an investment in the Fund. Total returns assume reinvestment of all dividends and distributions. Total returns do not reflect payment of sales charges, if any, and are not annualized for periods of less than one year.
| | | For the Period
Ended September 30,
2021 | | For the Year Ended
March 31, | | For the period
July 1, 2019*
through | |
Condensed data for a share of capital stock
outstanding throughout the period. | | (UNAUDITED) | | 2021 | | March 31, 2020 | |
Net asset value, beginning of period | | $ | 23.96 | | | $ | 12.51 | | | $ | 16.44 | | |
Income from investment operations: | |
Net investment loss | | | (0.15 | )(1) | | | (0.22 | )(1) | | | (0.14 | ) | |
Net gains (losses) on securities (both realized and unrealized) | | | 0.84 | | | | 14.15 | | | | (2.99 | ) | |
Total from investment operations | | | 0.69 | | | | 13.93 | | | | (3.13 | ) | |
Less distributions: | |
Distributions from investment Income | | | — | | | | — | | | | — | | |
Distributions from capital gains | | | — | | | | (2.48 | ) | | | (0.80 | ) | |
Total distributions | | | — | | | | (2.48 | ) | | | (0.80 | ) | |
Net asset value, end of period | | $ | 24.65 | | | $ | 23.96 | | | $ | 12.51 | | |
Total return** | | | 3.01 | % | | | 113.25 | % | | | (20.25 | %)(2) | |
Ratios/Supplemental Data | |
Net assets, end of period (in thousands) | | $ | 52,608 | | | $ | 49,023 | | | $ | 23,102 | | |
Ratio of expenses to average net assets*** | | | 1.41 | % | | | 1.35 | % | | | 1.35 | % | |
Ratio of net investment income (loss) to average net assets*** | | | (1.18 | %) | | | (1.09 | %) | | | (1.19 | %) | |
Portfolio turnover rate** | | | 20 | % | | | 54 | % | | | 22 | % | |
* Inception date
** Not annualized for periods less than one year.
*** Annualized for periods less than one year.
(1) Per share amounts have been calculated using the average shares method.
(2) The return listed is the non-annualized return for the Institutional Class from inception date through March 31, 2020.

107
FINANCIAL HIGHLIGHTS
BUFFALO FLEXIBLE INCOME FUND INVESTOR CLASS
The following tables are intended to help you understand the Fund's financial performance for the periods shown. Certain information reflects financial results for a single Fund share. Total returns in the table represent the rate that an investor would have earned (or lost) on an investment in the Fund. Total returns assume reinvestment of all dividends and distributions. Total returns do not reflect payment of sales charges, if any, and are not annualized for periods of less than one year.
| | | For the Six Months
Ended September 30,
2021 | | For the Years Ended March 31, | |
Condensed data for a share of capital stock
outstanding throughout the period. | | (UNAUDITED) | | 2021 | | 2020 | | 2019 | | 2018 | | 2017 | |
Net asset value, beginning of period | | $ | 16.24 | | | $ | 11.93 | | | $ | 15.27 | | | $ | 15.00 | | | $ | 14.74 | | | $ | 13.70 | | |
Income from investment operations: | |
Net investment income | | | 0.14 | (1) | | | 0.29 | (1) | | | 0.72 | | | | 0.39 | | | | 0.34 | | | | 0.35 | | |
Net gains (losses) on securities (both realized
and unrealized) | | | 1.04 | | | | 4.53 | | | | (3.63 | ) | | | 0.71 | | | | 0.77 | | | | 1.14 | | |
Total from investment operations | | | 1.17 | | | | 4.82 | | | | (2.91 | ) | | | 1.10 | | | | 1.11 | | | | 1.49 | | |
Less distributions: | |
Distributions from investment Income | | | (0.15 | ) | | | (0.30 | ) | | | (0.32 | ) | | | (0.39 | ) | | | (0.36 | ) | | | (0.38 | ) | |
Distributions from capital gains | | | — | | | | (0.21 | ) | | | (0.11 | ) | | | (0.44 | ) | | | (0.49 | ) | | | (0.07 | ) | |
Total distributions | | | (0.15 | ) | | | (0.51 | ) | | | (0.43 | ) | | | (0.83 | ) | | | (0.85 | ) | | | (0.45 | ) | |
Paid-in capital from redemption fees(2) | | | — | | | | — | | | | — | | | | — | | | | — | | | | — | (3) | |
Net asset value, end of period | | $ | 17.26 | | | $ | 16.24 | | | $ | 11.93 | | | $ | 15.27 | | | $ | 15.00 | | | $ | 14.74 | | |
Total return* | | | 7.16 | % | | | 40.94 | % | | | (19.63 | %) | | | 7.73 | % | | | 7.57 | % | | | 11.02 | % | |
Ratios/Supplemental Data | |
Net assets, end of period (in thousands) | | $ | 275,782 | | | $ | 277,906 | | | $ | 273,416 | | | $ | 625,349 | | | $ | 698,084 | | | $ | 797,453 | | |
Ratio of expenses to average net assets** | | | 1.01 | % | | | 1.01 | % | | | 1.01 | % | | | 1.01 | % | | | 1.01 | % | | | 1.01 | % | |
Ratio of net investment income (loss) to average
net assets** | | | (0.18 | %) | | | 2.04 | % | | | 1.99 | % | | | 2.57 | % | | | 2.27 | % | | | 2.45 | % | |
Portfolio turnover rate* | | | 0 | % | | | 1 | % | | | 5 | % | | | 6 | % | | | 2 | % | | | 1 | % | |
* Not annualized for periods less than one year.
** Annualized for periods less than one year.
(1) Per share amounts have been calculated using the average shares method.
(2) Effective December 1, 2016, the Board of Trustees approved the elimination of redemption fees on shares of the Funds.
(3) Less than $0.01 per share.

108
FINANCIAL HIGHLIGHTS
BUFFALO FLEXIBLE INCOME FUND INSTITUTIONAL CLASS
The following tables are intended to help you understand the Fund's financial performance for the periods shown. Certain information reflects financial results for a single Fund share. Total returns in the table represent the rate that an investor would have earned (or lost) on an investment in the Fund. Total returns assume reinvestment of all dividends and distributions. Total returns do not reflect payment of sales charges, if any, and are not annualized for periods of less than one year.
| | | For the Six Months
Ended September 30,
2021 | | For the Year Ended
March 31, | | For the period
July 1, 2019*
through | |
Condensed data for a share of capital stock
outstanding throughout the period. | | (UNAUDITED) | | 2021 | | March 31, 2020 | |
Net asset value, beginning of period | | $ | 16.24 | | | $ | 11.93 | | | $ | 15.31 | | |
Income from investment operations: | |
Net investment income | | | 0.16 | (1) | | | 0.31 | (1) | | | 0.57 | | |
Net gains (losses) on securities (both realized and unrealized) | | | 1.01 | | | | 4.53 | | | | (3.60 | ) | |
Total from investment operations | | | 1.17 | | | | 4.84 | | | | (3.03 | ) | |
Less distributions: | |
Distributions from investment Income | | | (0.16 | ) | | | (0.32 | ) | | | (0.25 | ) | |
Distributions from capital gains | | | — | | | | (0.21 | ) | | | (0.10 | ) | |
Total distributions | | | (0.16 | ) | | | (0.53 | ) | | | (0.35 | ) | |
Net asset value, end of period | | $ | 17.25 | | | $ | 16.24 | | | $ | 11.93 | | |
Total return** | | | 7.24 | % | | | 41.15 | % | | | (20.20 | %)(2) | |
Ratios/Supplemental Data | |
Net assets, end of period (in thousands) | | $ | 152,912 | | | $ | 147,802 | | | $ | 133,843 | | |
Ratio of expenses to average net assets*** | | | 0.86 | % | | | 0.86 | % | | | 0.86 | % | |
Ratio of net investment income (loss) to average net assets*** | | | (0.03 | %) | | | 2.19 | % | | | 2.79 | % | |
Portfolio turnover rate** | | | 0 | % | | | 1 | % | | | 5 | % | |
* Inception date
** Not annualized for periods less than one year.
*** Annualized for periods less than one year.
(1) Per share amounts have been calculated using the average shares method.
(2) The return listed is the non-annualized return for the Institutional Class from inception date through March 31, 2020.

109
FINANCIAL HIGHLIGHTS
BUFFALO GROWTH FUND INVESTOR CLASS
The following tables are intended to help you understand the Fund's financial performance for the periods shown. Certain information reflects financial results for a single Fund share. Total returns in the table represent the rate that an investor would have earned (or lost) on an investment in the Fund. Total returns assume reinvestment of all dividends and distributions. Total returns do not reflect payment of sales charges, if any, and are not annualized for periods of less than one year.
| | | For the Six Months
Ended September 30,
2021 | | For the Years Ended March 31, | |
Condensed data for a share of capital stock
outstanding throughout the period. | | (UNAUDITED) | | 2021 | | 2020 | | 2019 | | 2018 | | 2017 | |
Net asset value, beginning of period | | $ | 31.07 | | | $ | 21.20 | | | $ | 25.10 | | | $ | 29.83 | | | $ | 30.83 | | | $ | 28.86 | | |
Income from investment operations: | |
Net investment loss | | | (0.08 | )(1) | | | (0.05 | )(1) | | | 0.08 | | | | 0.05 | | | | 0.39 | | | | 0.23 | | |
Net gains (losses) on securities (both realized
and unrealized) | | | 3.83 | | | | 11.46 | | | | (0.55 | ) | | | 2.76 | | | | 4.58 | | | | 3.36 | | |
Total from investment operations | | | 3.75 | | | | 11.41 | | | | (0.47 | ) | | | 2.81 | | | | 4.97 | | | | 3.59 | | |
Less distributions: | |
Distributions from investment Income | | | — | | | | — | | | | (0.08 | ) | | | (0.01 | ) | | | (0.45 | ) | | | (0.22 | ) | |
Distributions from capital gains | | | — | | | | (1.53 | ) | | | (3.35 | ) | | | (7.53 | ) | | | (5.52 | ) | | | (1.40 | ) | |
Total distributions | | | — | | | | (1.53 | ) | | | (3.43 | ) | | | (7.54 | ) | | | (5.97 | ) | | | (1.62 | ) | |
Paid-in capital from redemption fees(2) | | | — | | | | — | | | | — | | | | — | | | | — | | | | — | (3) | |
Net asset value, end of period | | $ | 34.82 | | | $ | 31.07 | | | $ | 21.20 | | | $ | 25.10 | | | $ | 29.83 | | | $ | 30.83 | | |
Total return* | | | 12.01 | % | | | 53.98 | % | | | (3.90 | %) | | | 13.17 | % | | | 16.42 | % | | | 12.88 | % | |
Ratios/Supplemental Data | |
Net assets, end of period (in thousands) | | $ | 115,311 | | | $ | 112,399 | | | $ | 88,051 | | | $ | 174,570 | | | $ | 204,251 | | | $ | 326,944 | | |
Ratio of expenses to average net assets** | | | 0.92 | % | | | 0.92 | % | | | 0.92 | % | | | 0.91 | % | | | 0.91 | % | | | 0.91 | % | |
Ratio of net investment income (loss) to average
net assets** | | | (0.47 | %) | | | (0.19 | %) | | | 0.11 | % | | | 0.17 | % | | | 0.90 | % | | | 0.70 | % | |
Portfolio turnover rate* | | | 8 | % | | | 21 | % | | | 33 | % | | | 16 | % | | | 32 | % | | | 18 | % | |
* Not annualized for periods less than one year.
** Annualized for periods less than one year.
(1) Per share amounts have been calculated using the average shares method.
(2) Effective December 1, 2016, the Board of Trustees approved the elimination of redemption fees on shares of the Funds.
(3) Less than $0.01 per share.

110
FINANCIAL HIGHLIGHTS
BUFFALO GROWTH FUND INSTITUTIONAL CLASS
The following tables are intended to help you understand the Fund's financial performance for the periods shown. Certain information reflects financial results for a single Fund share. Total returns in the table represent the rate that an investor would have earned (or lost) on an investment in the Fund. Total returns assume reinvestment of all dividends and distributions. Total returns do not reflect payment of sales charges, if any, and are not annualized for periods of less than one year.
| | | For the Six Months
Ended September 30,
2021 | | For the Year Ended
March 31, | | For the period
July 1, 2019*
through | |
Condensed data for a share of capital stock
outstanding throughout the period. | | (UNAUDITED) | | 2021 | | March 31, 2020 | |
Net asset value, beginning of period | | $ | 31.13 | | | $ | 21.20 | | | $ | 27.10 | | |
Income from investment operations: | |
Net investment loss | | | (0.05 | )(1) | | | (0.01 | )(1) | | | 0.15 | | |
Net gains (losses) on securities (both realized and unrealized) | | | 3.84 | | | | 11.47 | | | | (2.59 | ) | |
Total from investment operations | | | 3.79 | | | | 11.46 | | | | (2.44 | ) | |
Less distributions: | |
Distributions from investment Income | | | — | | | | — | | | | (0.10 | ) | |
Distributions from capital gains | | | — | | | | (1.53 | ) | | | (3.36 | ) | |
Total distributions | | | — | | | | (1.53 | ) | | | (3.46 | ) | |
Net asset value, end of period | | $ | 34.92 | | | $ | 31.13 | | | $ | 21.20 | | |
Total return** | | | 12.11 | % | | | 54.26 | % | | | (10.92 | %)(2) | |
Ratios/Supplemental Data | |
Net assets, end of period (in thousands) | | $ | 96,053 | | | $ | 86,046 | | | $ | 58,307 | | |
Ratio of expenses to average net assets*** | | | 0.77 | % | | | 0.77 | % | | | 0.78 | % | |
Ratio of net investment income (loss) to average net assets*** | | | (0.32 | %) | | | (0.04 | %) | | | 0.28 | % | |
Portfolio turnover rate** | | | 8 | % | | | 21 | % | | | 33 | % | |
* Inception date
** Not annualized for periods less than one year.
*** Annualized for periods less than one year.
(1) Per share amounts have been calculated using the average shares method.
(2) The return listed is the non-annualized return for the Institutional Class from inception date through March 31, 2020.

111
FINANCIAL HIGHLIGHTS
BUFFALO HIGH YIELD FUND INVESTOR CLASS
The following tables are intended to help you understand the Fund's financial performance for the periods shown. Certain information reflects financial results for a single Fund share. Total returns in the table represent the rate that an investor would have earned (or lost) on an investment in the Fund. Total returns assume reinvestment of all dividends and distributions. Total returns do not reflect payment of sales charges, if any, and are not annualized for periods of less than one year.
| | | For the Six Months
Ended September 30,
2021 | | For the Years Ended March 31, | |
Condensed data for a share of capital stock
outstanding throughout the period. | | (UNAUDITED) | | 2021 | | 2020 | | 2019 | | 2018 | | 2017 | |
Net asset value, beginning of period | | $ | 11.82 | | | $ | 9.72 | | | $ | 10.86 | | | $ | 11.04 | | | $ | 11.21 | | | $ | 11.04 | | |
Income from investment operations: | |
Net investment income | | | 0.24 | (1) | | | 0.48 | (1) | | | 1.17 | | | | 0.51 | | | | 0.50 | | | | 0.48 | | |
Net gains (losses) on securities (both realized
and unrealized) | | | 0.15 | | | | 2.10 | | | | (1.85 | ) | | | (0.15 | ) | | | (0.15 | ) | | | 0.42 | | |
Total from investment operations | | | 0.38 | | | | 2.59 | | | | (0.68 | ) | | | 0.36 | | | | 0.35 | | | | 0.90 | | |
Less distributions: | |
Distributions from investment Income | | | (0.23 | ) | | | (0.49 | ) | | | (0.46 | ) | | | (0.51 | ) | | | (0.47 | ) | | | (0.47 | ) | |
Distributions from capital gains | | | — | | | | — | (2) | | | — | | | | (0.03 | ) | | | (0.05 | ) | | | (0.26 | ) | |
Total distributions | | | (0.23 | ) | | | (0.49 | ) | | | (0.46 | ) | | | (0.54 | ) | | | (0.52 | ) | | | (0.73 | ) | |
Paid-in capital from redemption fees(3) | | | — | | | | — | | | | — | | | | — | | | | — | | | | — | (2) | |
Net asset value, end of period | | $ | 11.97 | | | $ | 11.82 | | | $ | 9.72 | | | $ | 10.86 | | | $ | 11.04 | | | $ | 11.21 | | |
Total return* | | | 3.28 | % | | | 27.07 | % | | | (6.67 | %) | | | 3.46 | % | | | 3.20 | % | | | 8.37 | % | |
Ratios/Supplemental Data | |
Net assets, end of period (in thousands) | | $ | 57,988 | | | $ | 50,110 | | | $ | 46,036 | | | $ | 191,451 | | | $ | 231,295 | | | $ | 236,006 | | |
Ratio of expenses to average net assets** | | | 1.01 | % | | | 1.02 | % | | | 1.02 | % | | | 1.02 | % | | | 1.02 | % | | | 1.02 | % | |
Ratio of net investment income (loss) to average
net assets** | | | 0.08 | % | | | 4.38 | % | | | 3.60 | % | | | 4.68 | % | | | 4.06 | % | | | 4.27 | % | |
Portfolio turnover rate* | | | 26 | % | | | 66 | % | | | 36 | % | | | 22 | % | | | 41 | % | | | 40 | % | |
(1) Per share amounts have been calculated using the average shares method.
(2) Less than $0.01 per share.
(3) Effective December 1, 2016, the Board of Trustees approved the elimination of redemption fees on shares of the Funds.

112
FINANCIAL HIGHLIGHTS
BUFFALO HIGH YIELD FUND INSTITUTIONAL CLASS
The following tables are intended to help you understand the Fund's financial performance for the periods shown. Certain information reflects financial results for a single Fund share. Total returns in the table represent the rate that an investor would have earned (or lost) on an investment in the Fund. Total returns assume reinvestment of all dividends and distributions. Total returns do not reflect payment of sales charges, if any, and are not annualized for periods of less than one year.
| | | For the Six Months
Ended September 30,
2021 | | For the Year Ended
March 31, | | For the period
July 1, 2019*
through | |
Condensed data for a share of capital stock
outstanding throughout the period. | | (UNAUDITED) | | 2021 | | March 31, 2020 | |
Net asset value, beginning of period | | $ | 11.81 | | | $ | 9.71 | | | $ | 11.01 | | |
Income from investment operations: | |
Net investment loss | | | 0.26 | (1) | | | 0.50 | (1) | | | 0.71 | | |
Net gains (losses) on securities (both realized and unrealized) | | | 0.14 | | | | 2.10 | | | | (1.66 | ) | |
Total from investment operations | | | 0.39 | | | | 2.60 | | | | (0.95 | ) | |
Less distributions: | |
Distributions from investment Income | | | (0.24 | ) | | | (0.50 | ) | | | (0.35 | ) | |
Distributions from capital gains | | | — | | | | — | (2) | | | — | | |
Total distributions | | | (0.24 | ) | | | (0.50 | ) | | | (0.35 | ) | |
Net asset value, end of period | | $ | 11.96 | | | $ | 11.81 | | | $ | 9.71 | | |
Total return** | | | 3.36 | % | | | 27.28 | % | | | (8.94 | %)(3) | |
Ratios/Supplemental Data | |
Net assets, end of period (in thousands) | | $ | 241,082 | | | $ | 225,715 | | | $ | 141,735 | | |
Ratio of expenses to average net assets*** | | | 0.86 | % | | | 0.86 | % | | | 0.88 | % | |
Ratio of net investment income (loss) to average net assets*** | | | 0.23 | % | | | 4.51 | % | | | 4.90 | % | |
Portfolio turnover rate** | | | 26 | % | | | 66 | % | | | 36 | % | |
* Inception date
** Not annualized for periods less than one year.
*** Annualized for periods less than one year.
(1) Per share amounts have been calculated using the average shares method.
(2) Less than $0.01 per share.
(3) The return listed is the non-annualized return for the Institutional Class from inception date through March 31, 2020.

113
FINANCIAL HIGHLIGHTS
BUFFALO INTERNATIONAL FUND INVESTOR CLASS
The following tables are intended to help you understand the Fund's financial performance for the periods shown. Certain information reflects financial results for a single Fund share. Total returns in the table represent the rate that an investor would have earned (or lost) on an investment in the Fund. Total returns assume reinvestment of all dividends and distributions. Total returns do not reflect payment of sales charges, if any, and are not annualized for periods of less than one year.
| | | For the Six Months
Ended September 30,
2021 | | For the Years Ended March 31, | |
Condensed data for a share of capital stock
outstanding throughout the period. | | (UNAUDITED) | | 2021 | | 2020 | | 2019 | | 2018 | | 2017 | |
Net asset value, beginning of period | | | $20.51 | | | | $13.54 | | | | $14.76 | | | | $15.10 | | | | $12.80 | | | | $11.40 | | |
Income from investment operations: | |
Net investment income | | | 0.06 | (1) | | | 0.04 | (1) | | | 0.19 | | | | 0.09 | | | | 0.06 | | | | 0.13 | | |
Net gains (losses) on securities (both realized
and unrealized) | | | 2.03 | | | | 6.98 | | | | (1.31 | ) | | | (0.11 | ) | | | 2.29 | | | | 1.39 | | |
Total from investment operations | | | 2.09 | | | | 7.02 | | | | (1.12 | ) | | | (0.02 | ) | | | 2.35 | | | | 1.52 | | |
Less distributions: | |
Distributions from investment Income | | | — | | | | (0.05 | ) | | | (0.10 | ) | | | (0.08 | ) | | | (0.04 | ) | | | (0.12 | ) | |
Distributions from capital gains | | | — | | | | — | (2) | | | — | | | | (0.24 | ) | | | (0.01 | ) | | | — | | |
Total distributions | | | — | | | | (0.05 | ) | | | (0.10 | ) | | | (0.32 | ) | | | (0.05 | ) | | | (0.12 | ) | |
Paid-in capital from redemption fees(3) | | | — | | | | — | | | | — | | | | — | | | | — | | | | — | (2) | |
Net asset value, end of period | | | $22.60 | | | | $20.51 | | | | $13.54 | | | | $14.76 | | | | $15.10 | | | | $12.80 | | |
Total return* | | | 10.19 | % | | | 51.79 | % | | | (7.67 | %) | | | 0.11 | % | | | 18.40 | % | | | 13.46 | % | |
Ratios/Supplemental Data | |
Net assets, end of period (in thousands) | | | $289,318 | | | | $260,044 | | | | $183,809 | | | | $340,880 | | | | $277,865 | | | | $203,276 | | |
Ratio of expenses to average net assets** | | | 1.07 | % | | | 1.03 | % | | | 1.03 | % | | | 1.04 | % | | | 1.03 | % | | | 1.04 | % | |
Ratio of net investment income (loss) to average
net assets** | | | 0.49 | % | | | 0.22 | % | | | 0.55 | % | | | 0.64 | % | | | 0.42 | % | | | 1.02 | % | |
Portfolio turnover rate* | | | 4 | % | | | 14 | % | | | 13 | % | | | 16 | % | | | 13 | % | | | 4 | % | |
* Not annualized for periods less than one year.
** Annualized for periods less than one year.
(1) Per share amounts have been calculated using the average shares method.
(2) Less than $0.01 per share.
(3) Effective December 1, 2016, the Board of Trustees approved the elimination of redemption fees on shares of the Funds.

114
FINANCIAL HIGHLIGHTS
BUFFALO INTERNATIONAL FUND INSTITUTIONAL CLASS
The following tables are intended to help you understand the Fund's financial performance for the periods shown. Certain information reflects financial results for a single Fund share. Total returns in the table represent the rate that an investor would have earned (or lost) on an investment in the Fund. Total returns assume reinvestment of all dividends and distributions. Total returns do not reflect payment of sales charges, if any, and are not annualized for periods of less than one year.
| | | For the Six Months
Ended September 30,
2021 | | For the Year Ended
March 31, | | For the period
July 1, 2019*
through | |
Condensed data for a share of capital stock
outstanding throughout the period. | | (UNAUDITED) | | 2021 | | March 31, 2020 | |
Net asset value, beginning of period | | | $20.53 | | | | $13.55 | | | | $15.85 | | |
Income from investment operations: | |
Net investment loss | | | 0.07 | (1) | | | 0.07 | (1) | | | 0.20 | | |
Net gains (losses) on securities (both realized and unrealized) | | | 2.03 | | | | 6.99 | | | | (2.39 | ) | |
Total from investment operations | | | 2.10 | | | | 7.06 | | | | (2.19 | ) | |
Less distributions: | |
Distributions from investment Income | | | — | | | | (0.08 | ) | | | (0.11 | ) | |
Distributions from capital gains | | | — | | | | — | (2) | | | — | | |
Total distributions | | | — | | | | (0.08 | ) | | | (0.11 | ) | |
Net asset value, end of period | | | $22.63 | | | | $20.53 | | | | $13.55 | | |
Total return** | | | 10.23 | % | | | 52.12 | % | | | (13.95 | %)(3) | |
Ratios/Supplemental Data | |
Net assets, end of period (in thousands) | | | $330,213 | | | | $285,595 | | | | $176,285 | | |
Ratio of expenses to average net assets*** | | | 0.92 | % | | | 0.88 | % | | | 0.88 | % | |
Ratio of net investment income (loss) to average net assets*** | | | 0.64 | % | | | 0.37 | % | | | 0.86 | % | |
Portfolio turnover rate** | | | 4 | % | | | 14 | % | | | 13 | % | |
* Inception date
** Not annualized for periods less than one year.
*** Annualized for periods less than one year.
(1) Per share amounts have been calculated using the average shares method.
(2) Less than $0.01 per share.
(3) The return listed is the non-annualized return for the Institutional Class from inception date through March 31, 2020.

115
FINANCIAL HIGHLIGHTS
BUFFALO LARGE CAP FUND INVESTOR CLASS
The following tables are intended to help you understand the Fund's financial performance for the periods shown. Certain information reflects financial results for a single Fund share. Total returns in the table represent the rate that an investor would have earned (or lost) on an investment in the Fund. Total returns assume reinvestment of all dividends and distributions. Total returns do not reflect payment of sales charges, if any, and are not annualized for periods of less than one year.
| | | For the Six Months
Ended September 30,
2021 | | For the Years Ended March 31, | |
Condensed data for a share of capital stock
outstanding throughout the period. | | (UNAUDITED) | | 2021 | | 2020 | | 2019 | | 2018 | | 2017 | |
Net asset value, beginning of period | | | $46.23 | | | | $29.53 | | | | $31.01 | | | | $29.08 | | | | $26.53 | | | | $23.09 | | |
Income from investment operations: | |
Net investment loss | | | (0.08 | )(1) | | | (0.07 | )(1) | | | 0.09 | | | | 0.09 | | | | 0.09 | | | | 0.08 | | |
Net gains (losses) on securities (both realized
and unrealized) | | | 5.73 | | | | 16.83 | | | | (1.07 | ) | | | 3.46 | | | | 4.01 | | | | 4.18 | | |
Total from investment operations | | | 5.65 | | | | 16.76 | | | | (0.98 | ) | | | 3.55 | | | | 4.10 | | | | 4.26 | | |
Less distributions: | |
Distributions from investment Income | | | — | | | | (0.06 | ) | | | (0.07 | ) | | | (0.11 | ) | | | (0.04 | ) | | | (0.13 | ) | |
Distributions from capital gains | | | — | | | | — | | | | (0.43 | ) | | | (1.51 | ) | | | (1.51 | ) | | | (0.69 | ) | |
Total distributions | | | — | | | | (0.06 | ) | | | (0.50 | ) | | | (1.62 | ) | | | (1.55 | ) | | | (0.82 | ) | |
Paid-in capital from redemption fees(2) | | | — | | | | — | | | | — | | | | — | | | | — | | | | — | (3) | |
Net asset value, end of period | | | $51.88 | | | | $46.23 | | | | $29.53 | | | | $31.01 | | | | $29.08 | | | | $26.53 | | |
Total return* | | | 12.22 | % | | | 56.78 | % | | | (3.40 | %) | | | 12.96 | % | | | 15.41 | % | | | 18.67 | % | |
Ratios/Supplemental Data | |
Net assets, end of period (in thousands) | | | $41,960 | | | | $37,413 | | | | $27,872 | | | | $69,002 | | | | $69,024 | | | | $57,881 | | |
Ratio of expenses to average net assets** | | | 0.93 | % | | | 0.94 | % | | | 0.94 | % | | | 0.93 | % | | | 0.93 | % | | | 0.95 | % | |
Ratio of net investment income (loss) to average
net assets** | | | (0.32 | %) | | | (0.16 | %) | | | 0.21 | % | | | 0.27 | % | | | 0.33 | % | | | 0.34 | % | |
Portfolio turnover rate* | | | 52 | % | | | 7 | % | | | 6 | % | | | 10 | % | | | 40 | % | | | 41 | % | |
* Not annualized for periods less than one year.
** Annualized for periods less than one year.
(1) Per share amounts have been calculated using the average shares method.
(2) Effective December 1, 2016, the Board of Trustees approved the elimination of redemption fees on shares of the Funds.
(3) Less than $0.01 per share.

116
FINANCIAL HIGHLIGHTS
BUFFALO LARGE CAP FUND INSTITUTIONAL CLASS
The following tables are intended to help you understand the Fund's financial performance for the periods shown. Certain information reflects financial results for a single Fund share. Total returns in the table represent the rate that an investor would have earned (or lost) on an investment in the Fund. Total returns assume reinvestment of all dividends and distributions. Total returns do not reflect payment of sales charges, if any, and are not annualized for periods of less than one year.
| | | For the Six Months
Ended September 30,
2021 | | For the Year Ended
March 31, | | For the period
July 1, 2019*
through | |
Condensed data for a share of capital stock
outstanding throughout the period. | | (UNAUDITED) | | 2021 | | March 31, 2020 | |
Net asset value, beginning of period | | | $46.30 | | | | $29.56 | | | | $32.79 | | |
Income from investment operations: | |
Net investment loss | | | (0.04 | )(1) | | | — | (1)(2) | | | 0.16 | | |
Net gains (losses) on securities (both realized and unrealized) | | | 5.75 | | | | 16.85 | | | | (2.89 | ) | |
Total from investment operations | | | 5.71 | | | | 16.85 | | | | (2.73 | ) | |
Less distributions: | |
Distributions from investment Income | | | — | | | | (0.11 | ) | | | (0.07 | ) | |
Distributions from capital gains | | | — | | | | — | | | | (0.43 | ) | |
Total distributions | | | — | | | | (0.11 | ) | | | (0.50 | ) | |
Net asset value, end of period | | | $52.01 | | | | $46.30 | | | | $29.56 | | |
Total return** | | | 12.33 | % | | | 57.02 | % | | | (8.55 | %)(3) | |
Ratios/Supplemental Data | |
Net assets, end of period (in thousands) | | | $80,338 | | | | $71,394 | | | | $45,244 | | |
Ratio of expenses to average net assets*** | | | 0.78 | % | | | 0.79 | % | | | 0.80 | % | |
Ratio of net investment income (loss) to average net assets*** | | | (0.17 | %) | | | (0.01 | %) | | | 0.40 | % | |
Portfolio turnover rate** | | | 52 | % | | | 7 | % | | | 6 | % | |
* Inception date
** Not annualized for periods less than one year.
*** Annualized for periods less than one year.
(1) Per share amounts have been calculated using the average shares method.
(2) Less than $0.01 per share.
(3) The return listed is the non-annualized return for the Institutional Class from inception date through March 31, 2020.

117
FINANCIAL HIGHLIGHTS
BUFFALO MID CAP FUND INVESTOR CLASS
The following tables are intended to help you understand the Fund's financial performance for the periods shown. Certain information reflects financial results for a single Fund share. Total returns in the table represent the rate that an investor would have earned (or lost) on an investment in the Fund. Total returns assume reinvestment of all dividends and distributions. Total returns do not reflect payment of sales charges, if any, and are not annualized for periods of less than one year.
| | | For the Six Months
Ended September 30,
2021 | | For the Years Ended March 31, | |
Condensed data for a share of capital stock
outstanding throughout the period. | | (UNAUDITED) | | 2021 | | 2020 | | 2019 | | 2018 | | 2017 | |
Net asset value, beginning of period | | $ | 20.19 | | | $ | 13.02 | | | $ | 14.52 | | | $ | 13.99 | | | $ | 15.68 | | | $ | 15.04 | | |
Income from investment operations: | |
Net investment loss | | | (0.07 | )(1) | | | (0.11 | )(1) | | | (0.05 | ) | | | (0.04 | ) | | | (0.03 | ) | | | (0.01 | ) | |
Net gains (losses) on securities (both realized
and unrealized) | | | 0.90 | | | | 8.61 | | | | (0.19 | ) | | | 1.11 | | | | 1.77 | | | | 1.85 | | |
Total from investment operations | | | 0.83 | | | | 8.50 | | | | (0.24 | ) | | | 1.07 | | | | 1.74 | | | | 1.84 | | |
Less distributions: | |
Distributions from investment Income | | | — | | | | — | | | | — | | | | — | | | | — | | | | — | | |
Distributions from capital gains | | | — | | | | (1.33 | ) | | | (1.26 | ) | | | (0.54 | ) | | | (3.43 | ) | | | (1.20 | ) | |
Total distributions | | | — | | | | (1.33 | ) | | | (1.26 | ) | | | (0.54 | ) | | | (3.43 | ) | | | (1.20 | ) | |
Paid-in capital from redemption fees(2) | | | — | | | | — | | | | — | | | | — | | | | — | | | | — | (3) | |
Net asset value, end of period | | $ | 21.02 | | | $ | 20.19 | | | $ | 13.02 | | | $ | 14.52 | | | $ | 13.99 | | | $ | 15.68 | | |
Total return* | | | 4.01 | % | | | 65.92 | % | | | (2.89 | %) | | | 8.40 | % | | | 11.69 | % | | | 12.94 | % | |
Ratios/Supplemental Data | |
Net assets, end of period (in thousands) | | $ | 107,194 | | | $ | 107,061 | | | $ | 86,030 | | | $ | 135,262 | | | $ | 155,587 | | | $ | 395,413 | | |
Ratio of expenses to average net assets** | | | 1.01 | % | | | 1.03 | % | | | 1.02 | % | | | 1.02 | % | | | 1.01 | % | | | 1.01 | % | |
Ratio of net investment income (loss) to average
net assets** | | | (0.62 | %) | | | (0.63 | %) | | | (0.39 | %) | | | (0.27 | %) | | | (0.13 | %) | | | (0.09 | %) | |
Portfolio turnover rate* | | | 6 | % | | | 41 | % | | | 52 | % | | | 36 | % | | | 51 | % | | | 51 | % | |
* Not annualized for periods less than one year.
** Annualized for periods less than one year.
(1) Per share amounts have been calculated using the average shares method.
(2) Effective December 1, 2016, the Board of Trustees approved the elimination of redemption fees on shares of the Funds.
(3) Less than $0.01 per share.

118
FINANCIAL HIGHLIGHTS
BUFFALO MID CAP FUND INSTITUTIONAL CLASS
The following tables are intended to help you understand the Fund's financial performance for the periods shown. Certain information reflects financial results for a single Fund share. Total returns in the table represent the rate that an investor would have earned (or lost) on an investment in the Fund. Total returns assume reinvestment of all dividends and distributions. Total returns do not reflect payment of sales charges, if any, and are not annualized for periods of less than one year.
| | | For the Six Months
Ended September 30,
2021 | | For the Year Ended
March 31, | | For the period
July 1, 2019*
through | |
Condensed data for a share of capital stock
outstanding throughout the period. | | (UNAUDITED) | | 2021 | | March 31, 2020 | |
Net asset value, beginning of period | | $ | 20.24 | | | $ | 13.03 | | | $ | 15.63 | | |
Income from investment operations: | |
Net investment loss | | | (0.05 | )(1) | | | (0.09 | )(1) | | | (0.04 | ) | |
Net gains (losses) on securities (both realized and unrealized) | | | 0.90 | | | | 8.63 | | | | (1.30 | ) | |
Total from investment operations | | | 0.85 | | | | 8.54 | | | | (1.34 | ) | |
Less distributions: | |
Distributions from investment Income | | | — | | | | — | | | | — | | |
Distributions from capital gains | | | — | | | | (1.33 | ) | | | (1.26 | ) | |
Total distributions | | | — | | | | (1.33 | ) | | | (1.26 | ) | |
Net asset value, end of period | | $ | 21.09 | | | $ | 20.24 | | | $ | 13.03 | | |
Total return** | | | 4.15 | % | | | 66.18 | % | | | (9.72 | %)(2) | |
Ratios/Supplemental Data | |
Net assets, end of period (in thousands) | | $ | 87,100 | | | $ | 83,642 | | | $ | 51,324 | | |
Ratio of expenses to average net assets*** | | | 0.86 | % | | | 0.88 | % | | | 0.89 | % | |
Ratio of net investment income (loss) to average net assets*** | | | (0.47 | %) | | | (0.48 | %) | | | (0.38 | %) | |
Portfolio turnover rate** | | | 6 | % | | | 41 | % | | | 52 | % | |
* Inception date
** Not annualized for periods less than one year.
*** Annualized for periods less than one year.
(1) Per share amounts have been calculated using the average shares method.
(2) The return listed is the non-annualized return for the Institutional Class from inception date through March 31, 2020.

119
FINANCIAL HIGHLIGHTS
BUFFALO SMALL CAP FUND INVESTOR CLASS
The following tables are intended to help you understand the Fund's financial performance for the periods shown. Certain information reflects financial results for a single Fund share. Total returns in the table represent the rate that an investor would have earned (or lost) on an investment in the Fund. Total returns assume reinvestment of all dividends and distributions. Total returns do not reflect payment of sales charges, if any, and are not annualized for periods of less than one year.
| | | For the Six Months
Ended September 30,
2021 | | For the Years Ended March 31, | |
Condensed data for a share of capital stock
outstanding throughout the period. | | (UNAUDITED) | | 2021 | | 2020 | | 2019 | | 2018 | | 2017 | |
Net asset value, beginning of period | | $ | 22.14 | | | $ | 10.94 | | | $ | 12.89 | | | $ | 15.00 | | | $ | 16.61 | | | $ | 16.64 | | |
Income from investment operations: | |
Net investment loss | | | (0.10 | )(1) | | | (0.15 | )(1) | | | (0.08 | ) | | | (0.08 | ) | | | (0.09 | ) | | | (0.13 | ) | |
Net gains (losses) on securities (both realized
and unrealized) | | | 0.10 | | | | 13.23 | | | | (0.62 | ) | | | 1.25 | | | | 2.92 | | | | 3.19 | | |
Total from investment operations | | | — | | | | 13.08 | | | | (0.70 | ) | | | 1.17 | | | | 2.83 | | | | 3.06 | | |
Less distributions: | |
Distributions from investment Income | | | — | | | | — | | | | — | | | | — | | | | — | | | | — | | |
Distributions from capital gains | | | — | | | | (1.88 | ) | | | (1.25 | ) | | | (3.28 | ) | | | (4.44 | ) | | | (3.09 | ) | |
Total distributions | | | — | | | | (1.88 | ) | | | (1.25 | ) | | | (0.54 | ) | | | (3.43 | ) | | | (1.20 | ) | |
Paid-in capital from redemption fees(2) | | | — | | | | — | | | | — | | | | — | | | | — | | | | — | (3) | |
Net asset value, end of period | | $ | 22.14 | | | $ | 22.14 | | | $ | 10.94 | | | $ | 12.89 | | | $ | 15.00 | | | $ | 16.61 | | |
Total return* | | | 1.99 | % | | | 120.78 | % | | | (7.33 | %) | | | 12.19 | % | | | 17.65 | % | | | 24.51 | % | |
Ratios/Supplemental Data | |
Net assets, end of period (in thousands) | | $ | 887,477 | | | $ | 801,388 | | | $ | 337,804 | | | $ | 510,410 | | | $ | 535,820 | | | $ | 563,002 | | |
Ratio of expenses to average net assets** | | | 1.01 | % | | | 1.01 | % | | | 1.01 | % | | | 1.01 | % | | | 1.01 | % | | | 1.01 | % | |
Ratio of net investment income (loss) to average
net assets** | | | (0.84 | %) | | | (0.81 | %) | | | (0.65 | %) | | | (0.55 | %) | | | (0.64 | %) | | | (0.52 | %) | |
Portfolio turnover rate* | | | 28 | % | | | 63 | % | | | 67 | % | | | 57 | % | | | 49 | % | | | 45 | % | |
* Not annualized for periods less than one year.
** Annualized for periods less than one year.
(1) Per share amounts have been calculated using the average shares method.
(2) Effective December 1, 2016, the Board of Trustees approved the elimination of redemption fees on shares of the Funds.
(3) Less than $0.01 per share.

120
FINANCIAL HIGHLIGHTS
BUFFALO SMALL CAP FUND INSTITUTIONAL CLASS
The following tables are intended to help you understand the Fund's financial performance for the periods shown. Certain information reflects financial results for a single Fund share. Total returns in the table represent the rate that an investor would have earned (or lost) on an investment in the Fund. Total returns assume reinvestment of all dividends and distributions. Total returns do not reflect payment of sales charges, if any, and are not annualized for periods of less than one year.
| | | For the Six Months
Ended September 30,
2021 | | For the Year Ended
March 31, | | For the period
July 1, 2019*
through | |
Condensed data for a share of capital stock
outstanding throughout the period. | | (UNAUDITED) | | 2021 | | March 31, 2020 | |
Net asset value, beginning of period | | $ | 22.20 | | | $ | 10.96 | | | $ | 13.78 | | |
Income from investment operations: | |
Net investment loss | | | (0.08 | )(1) | | | (0.13 | )(1) | | | (0.06 | ) | |
Net gains (losses) on securities (both realized and unrealized) | | | 0.08 | | | | 13.24 | | | | (1.51 | ) | |
Total from investment operations | | | — | | | | 13.11 | | | | (1.57 | ) | |
Less distributions: | |
Distributions from investment Income | | | | | | | — | | |
Distributions from capital gains | | | — | | | | (1.88 | ) | | | (1.25 | ) | |
Total distributions | | | — | | | | (1.88 | ) | | | (1.25 | ) | |
Net asset value, end of period | | $ | 22.20 | | | $ | 22.20 | | | $ | 10.96 | | |
Total return** | | | 2.07 | % | | | 121.14 | % | | | (13.24 | %)(2) | |
Ratios/Supplemental Data | |
Net assets, end of period (in thousands) | | $ | 309,799 | | | $ | 328,588 | | | $ | 95,095 | | |
Ratio of expenses to average net assets*** | | | 0.85 | % | | | 0.86 | % | | | 0.86 | % | |
Ratio of net investment income (loss) to average net assets*** | | | (0.69 | %) | | | (0.67 | %) | | | (0.73 | %) | |
Portfolio turnover rate** | | | 28 | % | | | 63 | % | | | 67 | % | |
* Inception date
** Not annualized for periods less than one year.
***Annualized for periods less than one year.
(1) Per share amounts have been calculated using the average shares method.
(2) The return listed is the non-annualized return for the Institutional Class from inception date through March 31, 2020.

121
NOTES TO FINANCIAL STATEMENTS
September 30, 2021
1. SIGNIFICANT ACCOUNTING POLICIES:
The Buffalo Funds (comprised of the Buffalo Discovery Fund, Buffalo Dividend Focus Fund, Buffalo Early Stage Growth Fund, Buffalo Flexible Income Fund, Buffalo Growth Fund, Buffalo High Yield Fund, Buffalo International Fund, Buffalo Large Cap Fund, Buffalo Mid Cap Fund, and Buffalo Small Cap Fund) (the "Funds") are registered under the Investment Company Act of 1940, as amended (the "1940 Act"), as a diversified open-end management investment company. The shares of the Buffalo Funds are issued in multiple series, with each series, in effect, representing a separate fund.
Each of the Funds offers two classes of shares, Investor Class and Institutional Class. Each class of share represents an equal interest in the Fund, except the difference of class specific expenses, which reflects the difference in the range of services provided to each class. The shareholder servicing fees for the Investor Class represent the class specific expenses. See Note 7 for more information regarding shareholder servicing fees for the Investor Class. Income, expenses (other than class specific), and realized and unrealized gains and losses on investments are allocated daily to each class based on relative net assets.
The investment objective of the Buffalo Discovery Fund, Buffalo Early Stage Growth Fund, Buffalo Growth Fund, Buffalo International Fund, Buffalo Large Cap Fund, Buffalo Mid Cap Fund and Buffalo Small Cap Fund is long-term growth of capital. The investment objective of the Buffalo Flexible Income Fund is high current income, with long-term growth of capital as a secondary objective. The investment objectives of the Buffalo Dividend Focus Fund and Buffalo High Yield Fund are current income, with long-term growth of capital as a secondary objective.
Each Fund is an investment company and accordingly follows the investment company accounting and reporting guidance of the Financial Accounting Standards Board ("FASB") Accounting Standard Codification ("ASC") Topic 946 "Financial Services — Investment Companies."
The following is a summary of significant accounting policies consistently followed by the Funds in the preparation of their financial statements.
A. INVESTMENT VALUATION — In accordance with FASB ASC 820, Fair Value Measurements ("ASC 820"), fair value is defined as the price that a Fund would receive to sell an investment or pay to transfer a liability in an orderly transaction with an independent buyer in the principal market, or in the absence of a principal market, the most advantageous market for the investment or liability.
All equity securities that are traded on a national securities exchange, except those listed on the NASDAQ Global Market, NASDAQ Global Select and NASDAQ Capital Market exchanges ("NASDAQ"), are valued at the last sale price on that exchange on the date as of which assets are valued. If the security is listed on more than one exchange, a Fund will use the price of the exchange that the Fund generally considers to be the principal exchange on which the security is traded. Securities traded on NASDAQ will be valued at the NASDAQ Official Closing Price, which may not necessarily represent the last sale price. If there has been no sale on such exchange or on NASDAQ on such day, then (i) the security shall be valued at the mean between the most recent quoted bid and ask prices at the close of the exchange on such day; or (ii) the security shall be valued at the latest sales price on the "Composite Market" for the day such security is being valued. "Composite Market" means a consolidation of the trade information provided by national securities and foreign exchanges and over-the-counter markets as published by a Pricing Service.
Debt securities, including short-term debt instruments having a maturity of 60 days or less, are valued at the mean in accordance with prices supplied by an approved Pricing Service. Pricing Services may use various valuation methodologies such as the mean between the bid and the ask prices, matrix pricing and other analytical pricing models, as well as market transactions and dealer quotations. If a price is not available from a Pricing Service, the most recent quotation obtained from one or more broker-dealers known to follow the issue will be obtained. Quotations will be valued at the mean between the bid and the offer.

122
Foreign securities will be priced in their local currencies as of the close of their primary exchange or market or as of the time a Fund calculates its net asset value ("NAV"), whichever is earlier. Foreign securities, currencies and other assets denominated in foreign currencies are then translated into U.S. dollars at the exchange rate of such currencies against the U.S. dollar, as provided by a Pricing. All assets denominated in foreign currencies will be converted into U.S. dollars using the applicable currency exchange rates as of the close of the New York Stock Exchange ("NYSE"), generally 4:00 p.m. Eastern Time.
Foreign securities listed on a foreign exchange are valued at the last sale price at the close of the exchange on which the security is primarily traded. In certain countries market maker prices are used since they are the most representative of the daily trading activity. Market maker prices are usually the mean between the bid and ask prices. Certain markets are not closed at the time that the Funds price portfolio securities. In these situations, snapshot prices are provided by the individual pricing services or other alternate sources at the close of the NYSE as appropriate. Securities not traded on a particular day are valued at the mean between the last reported bid and the asked quotes, or the last sale price when appropriate.
When market quotations are not readily available, any security or other asset is valued at its fair value as determined in good faith under procedures approved by the Board of Trustees (the "Board"). If events occur that will affect the value of a Fund's portfolio securities before the net asset value ("NAV") has been calculated (a "significant event"), the security will generally be priced using a fair value procedure. The Board has adopted specific procedures for valuing portfolio securities and delegated the responsibility of fair value determinations to the Valuation Committee. Some of the factors that may be considered by the Valuation Committee in determining fair value are fundamental analytical data relating to the investment; the nature and duration of any restriction on disposition; trading in similar securities of the same issuer or comparable companies; information from broker-dealers; and an evaluation of the forces that influence the market in which the securities are purchased or sold. As of September 30, 2021, none of the Funds held fair valued securities. In addition, with respect to the valuation of securities principally traded on foreign markets, the Buffalo International Fund uses a fair value pricing service approved by the Funds' Board which employs quantitative models to adjust for "stale" prices caused by the movement of other markets and other factors occurring after the close of the foreign markets, but before the close of the NYSE. As of September 30, 2021, the Buffalo International Fund held 58 securities where a foreign fair value factor was applied, with a market value of $396,497,006 or 64.00% of total net assets.
ASC 820 establishes a three-tier hierarchy to distinguish between (1) inputs that reflect the assumptions market participants would use in pricing an asset or liability developed based on market data obtained from sources independent of the reporting entity (observable inputs) and (2) inputs that reflect the reporting entity's own assumptions about the assumptions market participants would use in pricing an asset or liability developed based on the best information available in the circumstances (unobservable inputs) and to establish classification of fair value measurements for disclosure purposes. Various inputs are used in determining the value of the Funds' investments. The inputs are summarized in the three broad levels listed below:
Level 1 — Valuations based on quoted prices for investments in active markets that a Fund has the ability to access at the measurement date. Valuation adjustments are not applied to Level 1 investments.
Level 2 — Valuations based on other significant observable inputs (including quoted prices for similar securities, interest rates, prepayment speeds, credit risks, etc.).
Level 3 — Valuations based on significant unobservable inputs (including a Fund's own assumptions and judgment in determining the fair value of investments).
Inputs that are used in determining fair value of an investment may include price information, credit data, volatility statistics, and other factors. These inputs can be either observable or unobservable. The availability of observable inputs can vary between investments, and is affected by various factors such as the type of investment, and the volume and level of activity for that investment or similar investments in the market place. The inputs will be considered by Kornitzer Capital Management, Inc. ("Advisor" or "KCM"), the Funds' investment advisor, along with any other relevant factors in the calculation of an investment's fair value. The Funds use prices and inputs that are current as of the measurement date, which may include periods of market dislocations. During these periods, the availability of prices and inputs may be reduced for many investments. This condition could cause an investment to be reclassified between the various levels within the hierarchy.

123
Non-U.S. equity securities actively traded in foreign markets may be reflected in Level 2 despite the availability of closing prices, because the Funds evaluate and determine whether those closing prices reflect fair value at the close of the NYSE or require adjustment, as described above and in Note 9 — Foreign Investment Risk.
Investments falling into the Level 3 category are primarily supported by quoted prices from brokers and dealers participating in the market for those investments. However, these may be classified as Level 3 investments due to lack of market transparency and corroboration to support these quoted prices. Additionally, valuation models may be used as the pricing source for any remaining investments classified as Level 3. These models rely on one or more significant unobservable inputs and/or significant assumptions made by the Valuation Committee. Inputs used in valuations may include, but are not limited to, financial statement analysis, capital account balances, discount rates and estimated cash flows, and comparable company data.
The inputs or methodology used for valuing securities are not necessarily an indication of the risk associated with investing in those securities.
The following table provides the fair value measurement of applicable Fund assets and liabilities by level within the fair value hierarchy as of September 30, 2021. These assets are measured on a recurring basis.
BUFFALO DISCOVERY FUND
| | Level 1 | | Level 2 | | Level 3 | | Total | |
Common Stocks | | $ | 1,710,347,235 | | | $ | — | | | $ | — | | | $ | 1,710,347,235 | | |
REITS | | | 25,814,546 | | | | — | | | | — | | | | 25,814,546 | | |
Short Term Investments | | | 64,706,143 | | | | — | | | | — | | | | 64,706,143 | | |
Total* | | $ | 1,800,867,924 | | | $ | — | | | $ | — | | | $ | 1,800,867,924 | | |
BUFFALO DIVIDEND FOCUS FUND
| | Level 1 | | Level 2 | | Level 3 | | Total | |
Common Stocks | | $ | 91,531,863 | | | $ | — | | | $ | — | | | $ | 91,531,863 | | |
REITS | | | 4,078,205 | | | | — | | | | — | | | | 4,078,205 | | |
Convertible Preferred Stocks | | | 2,493,500 | | | | — | | | | — | | | | 2,493,500 | | |
Preferred Stocks | | | 402,000 | | | | — | | | | — | | | | 402,000 | | |
Convertible Bonds | | | — | | | | 8,459,459 | | | | — | | | | 8,459,459 | | |
Short Term Investments | | | 4,082,750 | | | | — | | | | — | | | | 4,082,750 | | |
Total* | | $ | 102,588,318 | | | $ | 8,459,459 | | | $ | — | | | $ | 111,047,777 | | |
BUFFALO EARLY STAGE GROWTH FUND
| | Level 1 | | Level 2 | | Level 3 | | Total | |
Common Stocks | | $ | 121,827,823 | | | $ | — | | | $ | — | | | $ | 121,827,823 | | |
Private Placements | | | 2,782,200 | | | | — | | | | — | | | | 2,782,200 | | |
REITS | | | 2,422,184 | | | | — | | | | — | | | | 2,422,184 | | |
Warrants | | | 2,016,000 | | | | — | | | | — | | | | 2,016,000 | | |
Short Term Investments | | | 6,489,082 | | | | — | | | | — | | | | 6,489,082 | | |
Total* | | $ | 135,537,289 | | | $ | — | | | $ | — | | | $ | 135,537,289 | | |
BUFFALO FLEXIBLE INCOME FUND
| | Level 1 | | Level 2 | | Level 3 | | Total | |
Common Stocks | | $ | 400,739,558 | | | $ | — | | | $ | — | | | $ | 400,739,558 | | |
REITS | | | 12,321,585 | | | | — | | | | — | | | | 12,321,585 | | |
Convertible Bonds | | | — | | | | 13,353,307 | | | | — | | | | 13,353,307 | | |
Short Term Investments | | | 2,202,304 | | | | — | | | | — | | | | 2,202,304 | | |
Total* | | $ | 415,263,447 | | | $ | 13,353,307 | | | $ | — | | | $ | 428,616,754 | | |
Written Options | | $ | 63,688 | | | $ | — | | | $ | — | | | $ | 63,688 | | |

124
BUFFALO GROWTH FUND
| | Level 1 | | Level 2 | | Level 3 | | Total | |
Common Stocks | | $ | 205,761,713 | | | $ | — | | | $ | — | | | $ | 205,761,713 | | |
REITS | | | 4,530,556 | | | | — | | | | — | | | | 4,530,556 | | |
Short Term Investments | | | 2,264,445 | | | | — | | | | — | | | | 2,264,445 | | |
Total* | | $ | 212,556,714 | | | $ | — | | | $ | — | | | $ | 212,556,714 | | |
BUFFALO HIGH YIELD FUND
| | Level 1 | | Level 2 | | Level 3 | | Total | |
Preferred Stocks | | $ | 6,745,428 | | | $ | — | | | $ | — | | | $ | 6,745,428 | | |
Convertible Bonds | | | — | | | | 40,245,246 | | | | — | | | | 40,245,246 | | |
Corporate Bonds | | | — | | | | 191,642,914 | | | | — | | | | 191,642,914 | | |
Bank Loans | | | — | | | | 48,028,903 | | | | — | | | | 48,028,903 | | |
Short Term Investments | | | 12,207,166 | | | | — | | | | — | | | | 12,207,166 | | |
Total* | | $ | 18,952,594 | | | $ | 279,917,063 | | | $ | — | | | $ | 298,869,657 | | |
BUFFALO INTERNATIONAL FUND
| | Level 1 | | Level 2 | | Level 3 | | Total | |
Common Stocks | | $ | 577,703,429 | | | | | $ | — | | | $ | 577,703,429 | | |
Short Term Investments | | | 47,680,669 | | | | — | | | | — | | | | 47,680,669 | | |
Total* | | $ | 625,384,098 | | | $ | — | | | $ | — | | | $ | 625,384,098 | | |
BUFFALO LARGE CAP FUND
| | Level 1 | | Level 2 | | Level 3 | | Total | |
Common Stocks | | $ | 116,974,277 | | | $ | — | | | $ | — | | | $ | 116,974,277 | | |
REITS | | | 1,272,899 | | | | — | | | | — | | | | 1,272,899 | | |
Short Term Investments | | | 7,012,932 | | | | — | | | | — | | | | 7,012,932 | | |
Total* | | $ | 125,260,108 | | | $ | — | | | $ | — | | | $ | 125,260,108 | | |
BUFFALO MID CAP FUND
| | Level 1 | | Level 2 | | Level 3 | | Total | |
Common Stocks | | $ | 188,974,080 | | | $ | — | | | $ | — | | | $ | 188,974,080 | | |
REITS | | | 4,314,667 | | | | — | | | | — | | | | 4,314,667 | | |
Short Term Investments | | | 1,667,124 | | | | — | | | | — | | | | 1,667,124 | | |
Total* | | $ | 194,955,871 | | | $ | — | | | $ | — | | | $ | 194,955,871 | | |
BUFFALO SMALL CAP FUND
| | Level 1 | | Level 2 | | Level 3 | | Total | |
Common Stocks | | $ | 1,149,770,837 | | | $ | — | | | $ | — | | | $ | 1,149,770,837 | | |
Private Placements | | | 13,025,800 | | | | — | | | | | | 13,025,800 | | |
Short Term Investments | | | 37,819,132 | | | | — | | | | — | | | | 37,819,132 | | |
Total* | | $ | 1,200,615,769 | | | $ | — | | | $ | — | | | $ | 1,200,615,769 | | |
* Additional information regarding the industry and/or geographical classification of these investments is disclosed in the schedule of investments.
There were no transfers into or out of Level 1, Level 2 or Level 3 fair value measurements during the reporting year. The basis for recognizing and valuing transfers is as of the beginning of the year in which transfers occur.
B. FEDERAL INCOME TAXES — Each Fund complies with the requirements of Subchapter M of the Internal Revenue Code necessary to qualify as a regulated investment company and makes the requisite distributions of income and capital gains to its shareholders sufficient to relieve it from all or substantially all federal income and excise taxes. Therefore, no federal income tax provision has been provided.

125
At September 30, 2021, the Funds did not have any tax positions that did not meet the "more likely-than-not" threshold of being sustained by the applicable tax authority. The Funds recognize interest and penalties, if any, related to unrecognized tax benefits as other expense in the Statement of Operations. During the year, the Funds did not incur any interest or penalties.
The Funds have analyzed all open tax years, as defined by the statute of limitations, for all major jurisdictions. Open tax years are those that are open for exam by taxing authorities. Open tax years include the tax years ended March 31, 2018 through March 31, 2021. The Funds have no examinations in progress.
C. INVESTMENT TRANSACTIONS AND INVESTMENT INCOME — Investment transactions are accounted for on the date the securities are purchased or sold (trade date). Dividend income is recorded on the ex-dividend date except that certain dividends for foreign securities where the ex-dividend date may have passed are recorded as soon as the Fund is informed of the dividend in the exercise of reasonable diligence. Interest income is recognized on the accrual basis. Realized gains and losses from investment transactions are reported on the identified cost basis. All discounts/premiums are accreted/amortized for financial reporting purposes and are included in interest income.
D. DISTRIBUTIONS TO SHAREHOLDERS — Distributions to shareholders are recorded on the ex-dividend date. Distributions are determined in accordance with income tax regulations, which may differ from U.S. generally accepted accounting principles ("GAAP"). These differences are primarily due to differing treatments for premium amortization on debt securities, deferral of late year and wash sale losses, and partnership investment income.
E. USE OF ESTIMATES — The preparation of financial statements in conformity with GAAP requires management to make estimates and assumptions that affect the amounts reported in the financial statements and accompanying notes. Actual results could differ from such estimates.
F. FOREIGN CURRENCY TRANSLATION — Values of investments denominated in foreign currencies are converted into U.S. dollars using a spot market rate of exchange on the day of valuation. Purchases and sales of investments and dividend and interest income are translated to U.S. dollars using a spot market rate of exchange prevailing on the respective dates of such transactions. The portion of security gains or losses resulting from changes in foreign exchange rates is included with net realized and unrealized gain or loss from investments, as appropriate, for both financial reporting and tax purposes.
G. PURCHASED AND WRITTEN OPTION CONTRACTS — Certain Funds may purchase and write call or put options on securities and indices and enter into related closing transactions. As a holder of a call option, a Fund has the right, but not the obligation, to purchase a security at the exercise price during the exercise period. As the writer of a call option, a Fund has the obligation to sell the security at the exercise price during the exercise period. The Fund's maximum payout in the case of written call option contracts cannot be determined. As a holder of a put option, a Fund has the right, but not the obligation, to sell a security at the exercise price during the exercise period. As the writer of a put option, a Fund has the obligation to buy the underlying security at the exercise price during the exercise period. The Funds did not hold any written put options as of September 30, 2021.
The premium that a Fund pays when purchasing an option or receives when writing an option will reflect, among other things, the market price of the security, the relationship of the exercise price to the market price of the security, the relationship of the exercise price to the volatility of the security, the length of the option period and supply and demand factors. The premium is the market value of an option at the time of purchase.
A purchaser (holder) of a put option pays a non-refundable premium to the seller (writer) of a put option to obtain the right to sell a specified amount of a security at a fixed price (the exercise price) during a specified period (exercise period). Conversely, the seller (writer) of a put option, upon payment by the holder of the premium, has the obligation to buy the security from the holder of the put option at the exercise price during the exercise period.
Exchange traded options are valued at the composite price, using the National Best Bid and Offer quotes ("NBBO"). NBBO consists of the highest bid prices and lowest ask prices across any of the exchanges on which an option is quoted, thus providing a view across the entire U.S. options marketplace. Specifically, composite pricing looks at the last trades on the exchanges where the options are traded. If there are no trades for the option on a given business day, composite option pricing calculates the mean of the highest bid price and lowest ask price across the exchanges

126
where the option is traded. Non exchange traded options also will be valued at the mean between the last bid and ask quotations. For options where market quotations are not readily available, a fair value shall be determined as set forth in the Funds' fair valuation guidelines.
The Funds may use options with the objective to generate income as a non-principal investment strategy. Currently, the Buffalo Flexible Income Fund makes use of the options strategy to a greater extent than the other Funds because high income generation is a primary investment objective of the Buffalo Flexible Income Fund. The primary strategy used by Buffalo Flexible Income Fund to achieve income generation through the use of options is to write covered calls with the strike price above the cost basis and the value the portfolio managers believe will be achieved before the expiration of the option and also at a value that the portfolio managers are willing to sell if the option is exercised. The collected premiums generate income for the Fund, and if the option is exercised, a gain will also be achieved. A risk of using derivatives is that the counterparty to a derivative may fail to comply with their obligation to the Funds. See Note 7 for written option activity.
H. INDEMNIFICATIONS — Under the Funds' organizational documents, officers and trustees are indemnified against certain liabilities arising out of the performance of their duties to the Funds. In addition, in the normal course of business, the Funds enter into contracts that provide general indemnification to other parties. The Funds' maximum exposure under these arrangements is unknown as this would involve future claims that may be made against the Funds that have not yet occurred, and may not occur. However, the Funds have not had prior claims or losses pursuant to these contracts and expect the risk of loss to be remote.
I. RECENT ACCOUNTING PRONOUNCEMENTS — In March 2020, FASB issued Accounting Standards Update 2020-04, Reference Rate Reform: Facilitation of the Effects of Reference Rate Reform on Financial Reporting ("ASU 2020-04"). The main objective of ASU 2020-04 is to provide relief to companies that will be impacted by the expected change in benchmark interest rates at the end of 2021, when participating banks will no longer be required to submit London Inter-bank Offered Rate ("LIBOR") quotes by the UK Financial Conduct Authority. ASU 2020-04 allows companies to, provided the only change to existing contracts are a change to an approved benchmark interest rate, account for modifications as a continuance of the existing contract without additional analysis. In addition, derivative contracts that qualified for hedge accounting prior to modification, will be allowed to continue to receive such treatment, even if critical terms change due to a change in the benchmark interest rate. For new and existing contracts, the Funds may elect to apply the amendments as of March 12, 2020 through December 31, 2022. Management is currently assessing the impact of the adoption of ASU 2020-04 to the Funds' financial statements and various filings.
In December 2020, the SEC adopted a new rule providing a framework for fund valuation practices ("Rule 2a-5"). Rule 2a-5 establishes requirements for determining fair value in good faith for purposes of the 1940 Act. Rule 2a-5 will permit fund boards to designate certain parties to perform fair value determinations, subject to board oversight and certain other conditions. Rule 2a-5 also defines when market quotations are "readily available" for purposes of the 1940 Act and the threshold for determining whether a fund must fair value a security. In connection with Rule 2a-5, the SEC also adopted related recordkeeping requirements and is rescinding previously issued guidance, including with respect to the role of a board in determining fair value and the accounting and auditing of fund investments. The Funds will be required to comply with the rules by September 8, 2022. Management is currently assessing the potential impact of the new rules on the Funds' financial statements.
2. FEDERAL TAX MATTERS:
The tax character of distributions paid during the six months ended September 30, 2021 and the year ended March 31, 2021 were as follows:
| | Six Months Ended
September 30, 2021 | | Year Ended March 31, 2021 | |
| | | Ordinary
Income | | Long-Term
Capital Gains | | Ordinary
Income | | Long-Term
Capital Gains* | |
Buffalo Discovery Fund | | $ | — | | | $ | — | | | $ | 38,071,743 | | | $ | 97,268,331 | | |
Buffalo Dividend Focus Fund | | | 326,407 | | | | — | | | | 603,921 | | | | — | | |
Buffalo Early Stage Growth Fund | | | — | | | | — | | | | 3,781,350 | | | | 8,196,019 | | |
Buffalo Flexible Income Fund | | | 3,940,474 | | | | — | | | | 10,003,773 | | | | 4,920,585 | | |

127
| | | Six Months Ended
September 30, 2021 | | Year Ended March 31, 2021 | |
| | | Ordinary
Income | | Long-Term
Capital Gains | | Ordinary
Income | | Long-Term
Capital Gains* | |
Buffalo Growth Fund | | $ | — | | | $ | — | | | $ | — | | | $ | 9,555,575 | | |
Buffalo High Yield Fund | | | 5,853,195 | | | | — | | | | 10,794,072 | | | | — | | |
Buffalo International Fund | | | — | | | | — | | | | 1,745,735 | | | | 64,842 | | |
Buffalo Large Cap Fund | | | — | | | | — | | | | 226,492 | | | | — | | |
Buffalo Mid Cap Fund | | | — | | | | — | | | | 1,244,192 | | | | 10,770,947 | | |
Buffalo Small Cap Fund | | | — | | | | — | | | | 40,701,261 | | | | 35,400,582 | | |
* The Funds designate as long-term capital gain dividends, pursuant to Internal Revenue Code Section 852(b)(3)(C), the amounts necessary to reduce the earnings and profits of the Funds related to net capital gain to zero for the tax period ended March 31, 2021.
For tax purposes, distributions from short-term capital gain distributions are included in ordinary income distributions.
Additionally, GAAP requires that certain components of net assets relating to permanent differences be reclassified between financial and tax reporting. These reclassifications have no effect on net assets or net asset value per share. For the year ended March 31, 2021, the following table shows the reclassifications made:
Funds | | Distributable
Earnings | | Paid In
Capital | |
Buffalo Discovery Fund | | $ | (25,670,908 | ) | | $ | 25,670,908 | | |
Buffalo Dividend Focus Fund | | | (33,393 | ) | | | 33,393 | | |
Buffalo Early Stage Growth Fund | | | (970,643 | ) | | | 970,643 | | |
Buffalo Flexible Income Fund | | | (596,731 | ) | | | 596,731 | | |
Buffalo Growth Fund | | | (1,152,264 | ) | | | 1,152,264 | | |
Buffalo High Yield Fund | | | (202,037 | ) | | | 202,037 | | |
Buffalo International Fund | | | (698,314 | ) | | | 698,314 | | |
Buffalo Large Cap Fund | | | (137,618 | ) | | | 137,618 | | |
Buffalo Mid Cap Fund | | | (1,593,697 | ) | | | 1,593,697 | | |
Buffalo Small Cap Fund | | | (7,812,394 | ) | | | 7,812,394 | | |
The permanent differences primarily relate to net operating losses and utilization of earnings and profit distributions to shareholders on redemption of shares.
As of March 31, 2021, the components of distributable earnings (losses) for income tax purposes were as follows:
| | | Buffalo
Discovery
Fund | | Buffalo
Dividend Focus
Fund | | Buffalo
Early
Stage Growth
Fund | | Buffalo
Flexible Income
Fund | | Buffalo
Growth
Fund | |
Tax cost of Investments(a) | | $ | 1,219,821,689 | | | $ | 60,583,938 | | | $ | 91,289,344 | | | $ | 242,962,436 | | | $ | 92,707,801 | | |
Unrealized Appreciation | | | 590,691,327 | | | | 41,258,235 | | | | 49,827,163 | | | | 206,901,667 | | | | 104,901,180 | | |
Unrealized Depreciation | | | (29,093,910 | ) | | | (902,825 | ) | | | (3,223,273 | ) | | | (24,395,110 | ) | | | (654,929 | ) | |
Net unrealized appreciation | | | 561,597,417 | | | | 40,355,410 | | | | 46,603,890 | | | | 182,506,557 | | | | 104,246,251 | | |
Undistributed Ordinary Income | | | 89,977,978 | | | | 459,514 | | | | 4,799,969 | | | | 674,486 | | | | — | | |
Undistributed Long Term
Capital Gain | | | 53,315,779 | | | | 576,165 | | | | 6,416,527 | | | | 10,802,744 | | | | 8,025,977 | | |
Distributable earnings | | | 143,293,757 | | | | 1,035,679 | | | | 11,216,496 | | | | 11,477,230 | | | | 8,025,977 | | |
Other accumulated gain/(loss) | | | (135,809 | ) | | | — | | | | — | | | | (24,933 | ) | | | (109,927 | ) | |
Total distributable earnings | | | 704,755,365 | | | | 41,391,089 | | | | 57,820,386 | | | | 193,958,854 | | | | 112,162,301 | | |

128
| | | Buffalo
High Yield
Fund | | Buffalo
International
Fund | | Buffalo
Large Cap
Fund | | Buffalo
Mid Cap
Fund | | Buffalo
Small Cap
Fund | |
Tax cost of Investments(a) | | $ | 262,378,986 | | | $ | 316,044,769 | | | $ | 48,048,034 | | | $ | 98,437,869 | | | $ | 769,607,747 | | |
Unrealized Appreciation | | | 16,554,615 | | | | 228,910,050 | | | | 61,143,895 | | | | 91,392,428 | | | | 394,821,486 | | |
Unrealized Depreciation | | | (1,159,311 | ) | | | (3,152,978 | ) | | | (304,594 | ) | | | (526,060 | ) | | | (25,800,096 | ) | |
Net unrealized appreciation | | | 15,395,304 | | | | 225,757,072 | | | | 60,839,301 | | | | 90,866,368 | | | | 369,021,390 | | |
Undistributed Ordinary Income | | | 5,595,425 | | | | 122,197 | | | | 693,994 | | | | 3,986,687 | | | | 52,124,491 | | |
Undistributed Long Term
Capital Gain | | | 1,254,762 | | | | — | | | | 439,170 | | | | 8,229,904 | | | | 68,910,030 | | |
Distributable earnings | | | 6,850,187 | | | | 122,197 | | | | 1,133,164 | | | | 12,216,591 | | | | 121,034,521 | | |
Other accumulated gain/(loss) | | | — | | | | (311,106 | ) | | | (4,247 | ) | | | — | | | | — | | |
Total distributable earnings | | | 22,245,491 | | | | 225,568,163 | | | | 61,968,218 | | | | 103,082,959 | | | | 490,055,911 | | |
The differences between book-basis and tax-basis unrealized appreciation/depreciation are attributable primarily to the tax deferral of losses on wash sales, premium amortization, and publicly traded partnership investments.
Other accumulated gain/(loss) is generally comprised of capital loss carryforwards, qualified late year losses and/or straddle loss deferrals.
(a) Represents cost for federal income tax purposes and may differ from the cost for financial reporting purposes.
As of March 31, 2021, the Buffalo Funds had no capital loss carryovers available to offset future taxable gains.
In order to meet certain excise tax distribution requirements, the Funds are required to measure and distribute annually net capital gains realized during a twelve month period ending October 31 and net investment income earned during a twelve month period ending December 31. In connection with this, the Funds are permitted for tax purposes to defer into their next fiscal year qualified late year losses. Qualified late year capital losses are any net capital losses incurred between November 1 and the end of their fiscal year, March 31, 2021. Qualified late year ordinary losses are generally losses incurred between January 1 and the end of their fiscal year, March 31, 2021.
At March 31, 2021, the following Funds deferred, on a tax basis, qualified late year losses, consisting of ordinary and capital losses, as follows:
Funds | | Qualified Late Year
Ordinary Losses | | Qualified Late Year
Capital Losses | |
Buffalo Discovery Fund | | $ | — | | | $ | — | | |
Buffalo Dividend Focus Fund | | | — | | | | — | | |
Buffalo Early Stage Growth Fund | | | — | | | | — | | |
Buffalo Flexible Income Fund | | | — | | | | — | | |
Buffalo Growth Fund | | | 109,927 | | | | — | | |
Buffalo High Yield Fund | | | — | | | | — | | |
Buffalo International Fund | | | — | | | | 334,761 | | |
Buffalo Large Cap Fund | | | 4,247 | | | | — | | |
Buffalo Mid Cap Fund | | | — | | | | — | | |
Buffalo Small Cap Fund | | | — | | | | — | | |
For the year ended March 31, 2021, the Buffalo International Fund earned foreign source income and paid foreign taxes, as noted below, which it intends to pass through to its shareholders pursuant to Section 853 of the Internal Revenue Code.
| | | Gross Foreign
Income | | Foreign Tax
Paid | |
Buffalo International Fund | | $ | 6,774,252 | | | $ | 783,546 | | |
3. RELATED PARTY TRANSACTIONS:
Management fees are paid to KCM at the rate of 0.85% per annum of the average daily net asset values of the Funds, except for the Buffalo Early Stage Growth Fund, Buffalo Dividend Focus Fund, Buffalo Growth Fund and Buffalo Large Cap Fund which have a management fee rate of 1.30%, 0.75%, 0.75% and 0.75%, respectively. The management fees

129
are for services which include the costs of all management, supervisory and administrative services required in the normal operation of the Funds. This includes investment management and supervision; fees of the custodian (except for the additional cost of maintaining custody of assets in foreign jurisdictions, when compared to domestic custody costs), independent registered public accounting firm and legal counsel; fees and expenses of officers, trustees and other personnel; rent; and other items incidental to corporate administration. Pursuant to a Master Services Agreement with U.S. Bancorp Fund Services, LLC, doing business as U.S. Bank Global Fund Services ("GFS"), KCM pays GFS a fee of 30/100 of 1% (0.30%) of each Funds' average daily net assets out of the fees KCM receives from the Funds, except for the Buffalo Dividend Focus Fund, Buffalo Growth Fund and the Buffalo Large Cap Fund, where GFS receives 25/100 of 1% (0.25%). GFS provides or obtains various operational services required by the Funds, pays various Fund expenses and acts as paying agent to compensate other Fund service providers. Some of the other Fund service providers are affiliates of GFS.
With respect to the Buffalo Small Cap Fund only, the annual management fee rate of 0.85% of the Buffalo Small Cap Fund's average daily net assets is a base fee paid to KCM that is subject to reduced fees paid on assets in excess of certain levels (breakpoints). The fee paid by KCM to GFS is also subject to breakpoints on assets in excess of certain levels. The breakpoint schedules for the management fees paid by the Buffalo Small Cap Fund to KCM and the fees paid by KCM to GFS are set forth in the following table:
BUFFALO SMALL CAP FUND FEE BREAKPOINTS
| | | (As a % Of Average Daily Net Assets) | |
Asset Level | | Management Fee | | GFS Fee | |
Assets up to $6 billion | | | 0.85 | % | | | 0.300 | % | |
Assets over $6 billion up to $7 billion | | | 0.80 | % | | | 0.275 | % | |
Assets over $7 billion up to $8 billion | | | 0.75 | % | | | 0.250 | % | |
Assets over $8 billion up to $9 billion | | | 0.70 | % | | | 0.225 | % | |
Assets over $9 billion | | | 0.65 | % | | | 0.200 | % | |
The management fees do not include the cost of acquiring and disposing of portfolio securities, taxes, if any, imposed directly on the Funds and their shares, insurance, certain trustee expenses and the cost of qualifying the Funds' shares for sale in any jurisdiction. Certain officers of the Funds are also officers and/or directors of KCM. With respect to each Fund's Investor Class, the management fees do not include the shareholder servicing fees.
The Buffalo International Fund incurred $173,220 in custody fees during the period ended September 30, 2021, and owed $138,088 for custody fees as of September 30, 2021.
4. AGGREGATE COMPENSATION TO TRUSTEES:
The Funds do not directly compensate any of their trustees. GFS pays trustee fees to non-interested Board members from its share of the management fee that it receives from KCM. The aggregate compensation paid to the Funds' non-interested trustees for their service on the Funds' Board for the period ended September 30, 2021 was $186,500. Interested trustees who are affiliated with KCM do not receive any compensation from the Funds, but are compensated directly by KCM in connection with their employment with KCM.
5. INVESTMENT TRANSACTIONS:
The aggregate purchases and sales of securities, excluding short-term investments and U.S. government securities, for the Funds for the year ended September 30, 2021, were as follows:
| | | Buffalo
Discovery
Fund | | Buffalo
Dividend Focus
Fund | | Buffalo
Early
Stage Growth
Fund | | Buffalo
Flexible Income
Fund | | Buffalo
Growth
Fund | |
Purchases | | $ | 369,184,950 | | | $ | 3,867,955 | | | $ | 31,764,335 | | | $ | 513,996 | | | $ | 16,811,593 | | |
Proceeds from Sales | | | 495,609,687 | | | | 1,034,502 | | | | 14,528,488 | | | | 21,855,787 | | | | 27,394,383 | | |

130
| | | Buffalo
High Yield
Fund | | Buffalo
International
Fund | | Buffalo
Large Cap
Fund | | Buffalo
Mid Cap
Fund | | Buffalo
Small Cap
Fund | |
Purchases | | $ | 102,824,780 | | | $ | 18,255,009 | | | $ | 57,085,171 | | | $ | 11,713,206 | | | $ | 385,224,209 | | |
Proceeds from Sales | | | 69,390,775 | | | | 24,335,800 | | | | 59,893,547 | | | | 17,228,200 | | | | 319,558,092 | | |
There were no purchases or sales of long-term U.S. government securities for any Funds during the period ended September 30, 2021.
6. TRANSACTIONS WITH AFFILIATES:
Investments representing 5% or more of the outstanding voting securities of a portfolio company result in that company being considered an affiliated company, as defined in the 1940 Act. There were no affiliated companies held in any of the Funds during the period ended September 30, 2021.
7. SHAREHOLDER SERVICING PLAN:
The Trust, on behalf of the Funds, has adopted a Shareholder Servicing Plan, to pay a fee at an annual rate of up to 0.15% of average daily net assets of the Investor Class shares serviced by shareholder servicing agents who provide administrative and support services to their customers. No shareholder servicing fees are charged to the Institutional Class. For the period ended September 30, 2021, Investor Class shareholder servicing fees were as follows:
Fund: | | Investor Class
Shareholder
Servicing Fee | |
Buffalo Discovery Fund | | $ | 1,084,535 | | |
Buffalo Dividend Focus Fund | | | 22,987 | | |
Buffalo Early Stage Growth Fund | | | 69,401 | | |
Buffalo Flexible Income Fund | | | 213,982 | | |
Buffalo Growth Fund | | | 89,578 | | |
Buffalo High Yield Fund | | | 41,234 | | |
Buffalo International Fund | | | 214,244 | | |
Buffalo Large Cap Fund | | | 30,976 | | |
Buffalo Mid Cap Fund | | | 83,241 | | |
Buffalo Small Cap Fund | | | 660,052 | | |
8. OPTIONS WRITTEN:
FASB ASC 815, Derivatives and Hedging (ASC 815) requires disclosures to enable investors to better understand how and why the Funds use derivative instruments, how these derivative instruments are accounted for and their effects on the Funds' financial position and results of operations. The Buffalo Flexible Income Fund is the only Fund that has maintained any positions in derivative instruments or engaged in hedging activities during the six months ended September 30, 2021. For the six months ended September 30, 2021, the quarterly average gross notional amount of derivatives held by the Fund was $9,575,361, representing holdings in written options. The Fund utilizes these written options as a substitute for a comparable market position in the respective underlying security of the written options.
As of September 30, 2021, the Buffalo Flexible Income Fund was invested in written option contracts.
The following is a summary of the location of derivative investments on the Fund's Statement of Assets and Liabilities as of September 30, 2021:
Derivative Investment Type | | Value | |
Liability Derivatives | |
Buffalo Flexible Income Fund | | | |
Written Options — equity contracts | | $ | 63,688 | | |

131
The following is a summary of the effect of derivative investments on Realized Gain (loss) and Change in Unrealized Appreciation/Depreciation on Options in the Fund as of September 30, 2021:
Derivative Investment Type | | Realized Gain (Loss) on Options | |
Liability Derivatives | |
Buffalo Flexible Income Fund | | | |
Written Options — equity contracts | | $ | 450,799 | | |
Derivative Investment Type | | Change in Unrealized Appreciation/Depreciation on Options | |
Liability Derivatives | |
Buffalo Flexible Income Fund | | | |
Written Options — equity contracts | | $ | 53,454 | | |
The following table presents derivative assets and liabilities net of amounts available for offset under Master Netting Agreements (MNA) and net of related collateral received or pledged, if any, as of September 30, 2021:
GROSS AMOUNTS NOT OFFSET IN THE STATEMENT OF ASSETS AND LIABILITIES AND SUBJECT TO MNAs
| | | Gross | | Gross
Amounts
Offset In The | | Net Amounts
Presented In | | Gross Amounts Not Offset
In The Statement Of
Financial Position | | | |
Liabilities: | | Amounts Of
Recognized
Liabilities | | Statement
Of Financial
Position | | The Statement
Of Financial
Position | | Financial
Instruments | | Collateral
Pledged/
(Received)* | | Net
Amount | |
Description | |
Written Options | | $ | 63,688 | | | $ | — | | | $ | 63,688 | | | $ | 63,688 | | | $ | 63,688 | | | $ | — | | |
| | | $ | 63,688 | | | $ | — | | | $ | 63,688 | | | $ | 63,688 | | | $ | 63,688 | | | $ | — | | |
* Any over-collateralization of total financial instruments or cash is not shown.
9. FOREIGN INVESTMENT RISK:
When the Buffalo International Fund buys or sells securities on a foreign stock exchange, the transaction is undertaken in the local currency rather than in U.S. dollars. In purchasing or selling local currency to execute transactions on foreign exchanges, the Buffalo International Fund will be exposed to the risk that the value of the foreign currency will increase or decrease, which may impact the value of the portfolio holdings. China has, and may continue to adopt, internal economic policies that affect its currency valuations in a manner that may be disadvantageous for U.S. investors or U.S. companies seeking to do business in China. In addition, a country may impose formal or informal currency exchange controls (or "capital controls"). These types of controls may restrict or prohibit the Buffalo International Fund's ability to repatriate both investment capital and income, which could undermine the value of the portfolio holdings and potentially place the Buffalo International Fund's assets at risk of total loss.
Investing in securities of foreign corporations and governments involves additional risks relating to: political, social, religious and economic developments abroad; market instability; fluctuations in foreign exchange rates; different regulatory requirements, market practices, accounting standards and practices; and less publicly available information about foreign issuers. Additionally, these investments may be less liquid, carry higher brokerage commissions and other fees, and procedures and regulations governing transactions and custody in foreign markets also may involve delays in payment, delivery or recovery of money or investments. Investments in common stocks of U.S. companies with international operations, and the purchase of sponsored or unsponsored ADRs (American Depositary Receipt) carry similar risks. In addition to risks associated with investing in foreign securities, there are special risks associated with investments in China and Hong Kong, including exposure to currency fluctuations, less liquidity, expropriation, confiscatory taxation, nationalization, exchange control regulations, differing legal standards and rapid fluctuations in inflation and interest rates. The Chinese government could, at any time, alter or discontinue economic reform programs implemented since 1978.

132
10. LINE OF CREDIT:
U.S. Bank, N.A. has made available to the Funds an unsecured line of credit pursuant to a Loan Agreement for the Funds which matures, unless renewed, on July 30, 2022. The line of credit is intended to provide short-term financing, if necessary, subject to certain restrictions, in connection with shareholder redemptions. The Funds may borrow up to the lesser of $50,000,000 or certain percentage amounts based on the net assets of the Funds.
The interest rate paid by the Funds on outstanding borrowings is equal to the Prime Rate. As of September 30, 2021, the Prime Rate was 3.25%. None of the Buffalo Funds had borrowings under the credit facility during the six months ended September 30, 2021.
11. IMPACT OF COVID-19:
The global outbreak of COVID-19 has disrupted economic markets and the prolonged economic impact is uncertain. The operational and financial performance of the issuers of securities in which the Funds invest depends on future developments, including the duration and spread of the outbreak, and such uncertainty may in turn impact the value of a Fund's investments. Events related to COVID-19 may result in further global economic disruption and market volatility, which in turn may impact the value of each Fund's investments.
12. SUBSEQUENT EVENTS:
Management has evaluated the events and transactions that have occurred after September 30, 2021 and through the date the financial statements were issued and determined that there were no significant subsequent events that would require adjustment of the financial statements or additional disclosures.

133
A NOTE ON FORWARD-LOOKING STATEMENTS
Except for historical information contained in this annual report for the Funds, the matters discussed in this report may constitute forward-looking statements made pursuant to the safe harbor provisions of the Securities Litigation Reform Act of 1995. These include any advisor and/or portfolio manager predictions, assessments, analyses or outlooks for individual securities, industries, market sectors and/or markets. These statements involve risks and uncertainties. In addition to the general risks described for the Funds in the current Prospectus, other factors bearing on these reports include the accuracy of the Advisor's or portfolio managers' forecasts and predictions, and the appropriateness of the investment programs designed by the Advisor or portfolio manager to implement their strategies efficiently and effectively. Any one or more of these factors, as well as other risks affecting the securities markets and investment instruments generally, could cause the actual results of the Funds to differ materially as compared to benchmarks associated with the Funds.
ADDITIONAL INFORMATION
The Buffalo Funds have adopted proxy voting policies and procedures that delegate to Kornitzer Capital Management, Inc., the Funds' investment advisor, the authority to vote proxies. A description of the Buffalo Funds' proxy voting policies and procedures is available without charge, upon request, by calling the Funds toll free at 1-800-49-BUFFALO. A description of these policies and procedures is also included in the Funds' Statement of Additional Information, which is available on the SEC's website at http://www.sec.gov.
The actual voting records relating to portfolio securities during the most recent twelve month period ended June 30 (as filed with the SEC on Form N-PX) are available without charge, upon request, by calling the Funds toll free at 1-800-49-BUFFALO or by accessing the SEC's website at http://www.sec.gov.
The Funds file their complete schedule of portfolio holdings with the SEC four times each fiscal year at quarter-ends. The Trust files the Schedule of Portfolio Holdings with the SEC on Form N-CSR (second and fourth quarters) and as an exhibit to its reports on Form N-PORT (first and third quarters). Shareholders may view the Funds' Forms N-CSR and N-PORT on the SEC's website at http://www.sec.gov.

134
STATEMENT REGARDING LIQUIDITY RISK MANAGEMENT PROGRAM (UNAUDITED)
The Securities and Exchange Commission adopted Rule 22e-4 under the Investment Company Act of 1940, as amended (the "Liquidity Rule") to promote effective liquidity risk management throughout the open-end investment company industry, thereby reducing the risk that open-end investment companies ("funds") will be unable to meet their redemption obligations and mitigating dilution of the interests of fund shareholders. The Liquidity Rule requires funds to establish and implement written liquidity risk management programs ("LRMPs")
The Buffalo Funds (individually, a "Fund" or collectively, the "Funds") have established and implemented the Buffalo Funds' LRMP (the "Program") applicable to all of the Funds. The Board of Trustees of the Funds (the "Board") met on August 19, 2021 (the "Meeting") to review the Program pursuant to the Liquidity Rule's requirements. The Board has designated the Funds' adviser, Kornitzer Capital Management, Inc. (the "Adviser"), as the administrator of the Program, and the Adviser has appointed a committee to fulfill the responsibilities set forth under the Program (the "Program Administrator"). At the Meeting, the Adviser's Chief Compliance Officer ("CCO"), on behalf of the Program Administrator, made a presentation to the Board that addressed the operation of the Program and assessed its adequacy and effectiveness of implementation, including any material changes to the Program (the "Presentation"). The Presentation covered the period from July 1, 2020 through June 30, 2021 (the "Reporting Period").
The Presentation noted that the Program complied with the key factors for consideration under the Liquidity Rule for assessing, managing, and periodically reviewing a Fund's "liquidity risk" (as defined under the Liquidity Rule), including the following points.
Liquidity Classification — The Presentation described the Program's liquidity classification methodology for categorizing the Funds' investments into one of four liquidity buckets. Specifically, the Program Administration noted that it relied on liquidity classifications provided by ICE Data Services, its third party data service provider that provides liquidity classification services, and that each Fund predominantly held investments that were classified as "highly liquid" during the Reporting Period.
Highly Liquid Investment Minimum ("HLIM") — The Program Administrator noted that each Fund's portfolio is expected to continue to hold primarily highly liquid investments and each Fund will be considered a "primarily highly liquid fund" (as defined in the Program) and can therefore continue to rely on the exclusion in the Liquidity Rule from the requirements to determine and review a HLIM for each Fund and to adopt policies and procedures for responding to a HLIM shortfall.
Liquidity Risk — In concluding that each Fund's liquidity risk was low, the Program Administrator considered the following:
• The Funds' investment strategy and liquidity of portfolio investments during normal and reasonably foreseeable stressed market conditions — During the Reporting Period, the Program Administrator reviewed whether each Fund's investment strategy is appropriate for an open-end fund structure with a focus on Funds with holdings of less liquid and illiquid assets and factored a Fund's concentration in an issuer into the liquidity classification methodology by taking issuer position sizes into account.
• Short-term and long-term cash flow projections during normal and reasonably foreseeable stressed market conditions — During the Reporting Period, the Program Administrator reviewed historical redemption activity and used this information as a component to establish each Fund's reasonably anticipated trading size. The Program Administrator also took into consideration other factors such as shareholder ownership concentration, applicable distribution channels, and the degree of certainty associated with a Fund's short-term and long-term cash flow projections.
• Holdings of cash and cash equivalents — The Program Administrator considered the degree to which each Fund held cash and cash equivalents as a component of each Fund's ability to meet redemption requests.

135
Conclusion — The Presentation provided that the Program Administrator was not proposing any material changes to the Program after reviewing the adequacy of the Program and the effectiveness of the Program's implementation. The Presentation stated that the Program Administrator concluded that, based on the operation of the Program during the Reporting Period, the Program is operating as intended and is effective in implementing the requirements of the Liquidity Rule.

136
PRIVACY POLICY (UNAUDITED)
This Privacy Policy has been adopted by the Buffalo Funds. The Funds are each an open-end diversified management investment company registered under the Investment Company Act of 1940 (the "1940 Act").
This Privacy Policy has also been adopted by KCM, an investment advisor registered with the Securities and Exchange Commission that serves as the investment advisor and manager of the Funds.
The Funds and the Adviser are collectively referred to as the "Companies," "we," "our" or "us."
As a part of providing you services and products we collect non-public personally identifiable information ("Personal Information") about you. Some of this is information you provide and some is obtained from other sources. In some circumstances, a necessary part of providing products and services to you requires that we disclose Personal Information about you to third parties.
We want you to understand how we handle your Personal Information. Please read the Privacy Policy carefully. It has information about our policies for the collection, use, disclosure, and protection of your Personal Information. If you have any questions, you can obtain additional information from the following:
Buffalo Funds
c/o U.S. Bancorp Fund Services, LLC
P.O. Box 701
Milwaukee, Wisconsin 53201-0701
www.buffalofunds.com
1-800-492-8332
Please be aware that we periodically update or revise the Privacy Policy. As methods of doing business change, we reflect any applicable changes in our Privacy Policy. If you are our customer, we will send you an update as and when it occurs.
SALE/DISCLOSURE OF YOUR PERSONAL INFORMATION
We promise that we will not sell your Personal Information to any person.
Also, we will not disclose your Personal Information to any third person aside from the disclosures described below. These disclosures generally relate to marketing or maintaining products or services provided to you.
WHAT INFORMATION DO WE COLLECT?
Personal, Financial and Product Information
To be able to offer, provide and maintain these products and services, the Companies collect a variety of Personal Information about you. The Personal Information we collect will vary depending upon the product or service you select.
The following is a general list of the Personal Information. Not all of the Personal Information will be collected every time you do business with us.
Personal Information
• Name
• Address
• Birthdate
• Phone number
• Social Security Number
• E-mail address
• Product-Related Personal Information
• Product Activity History (things you have done with your mutual funds such as deposits, transfers, redemptions, etc.)
GENERAL PRIVACY PROCESSES
How do we collect Personal Information?
We use a variety of methods to collect Personal Information. We collect Personal Information directly from you with paper forms (for example, new account and other administrative forms), over the phone or through facsimile transmissions. We also collect Personal Information from our web site and through other electronic means. We collect some Personal Information through joint marketing programs where we offer a product or service through another financial institution. In some of these instances, you may be considered a customer of both entities.
Who has access to this Personal Information?
Generally, only the Companies' staff and certain companies working on the Companies' behalf have access to this Personal Information.

137
Those Working on Our Behalf
Depending on the product or service you select, there may be a number of third parties that will have access to your Personal Information since they are working on our behalf. This access is necessary because these third parties perform a task or provide administrative services for the product you seek or have purchased from us. If we do not share the Personal Information, we cannot provide you the product or service you requested. In certain cases, affiliates are the entities performing such services on our behalf.
When we share Personal Information with non-affiliated companies working on our behalf, we protect your Personal Information by requiring such companies to adopt our privacy policy or have a policy providing protection similar to ours.
Required Disclosures
Certain Personal Information may also be disclosed to third parties without your consent if disclosure is necessary to comply with: 1) legal processes; 2) to protect the rights, property, or personal safety of the Funds, their shareholders or the public; 3) as part of inspections or examinations conducted by our regulatory agencies; and 4) in other situations required by law.
Joint Marketing
In certain circumstances, the Companies may jointly market a product or service with another financial institution. In these circumstances, we have arranged to offer our products through these entities and their representatives or through electronic systems (for example, the Internet).
The Companies may make other disclosures authorized by law.
Requested Disclosures
We will disclose your Personal Information if you request it to those persons that you designate. Examples of this are to: members of your family; registered investment advisors, attorneys and CPAs who you have retained to advise you in a transaction; and persons whom you have designated to represent you in dealings with us.
What do we do with the Personal Information?
The Companies make use of the Personal Information to provide you with the financial products and services that we offer.
At the point that you cease being a customer, we will maintain your Personal Information and handle it just the same as our current customers.
The Companies restrict access to the Personal Information to those who need to know it for ordinary business purposes. We also maintain physical, electronic, and procedural safeguards that comply with federal standards to guard your Personal Information.
What are your options regarding corrections of Personal Information?
Generally, upon your written request, we will make available Personal Information for your review. Please note, Personal Information collected that relates to a disputed claim or legal proceeding will not be made available. If you notify us that the Personal Information is incorrect, we will review it and if we agree, correct our records. If we do not agree, you may submit a short comment, which we will include in future third party disclosures, if any occur, of Personal Information.

138


1-800-49-BUFFALO
(1-800-492-8332)
Buffalo Funds
c/o U.S. Bancorp Fund Services, LLC
P.O. Box 701
Milwaukee, WI 53201-0701
www.buffalofunds.com
Buffalofundannual
Item 2. Code of Ethics.
Not applicable for semi-annual reports
Item 3. Audit Committee Financial Expert.
Not applicable for semi-annual reports
Item 4. Principal Accountant Fees and Services.
Not applicable for semi-annual reports
Item 5. Audit Committee of Listed Registrants.
Not applicable.
Item 6. Investments.
Schedule of Investments is included as part of the report to shareholders filed under Item 1 of this Form.
Item 7. Disclosure of Proxy Voting Policies and Procedures for Closed-End Management Investment Companies.
Not applicable to open-end investment companies.
Item 8. Portfolio Managers of Closed-End Management Investment Companies.
Not applicable to open-end investment companies.
Item 9. Purchases of Equity Securities by Closed-End Management Investment Company and Affiliated Purchasers.
Not applicable to open-end investment companies.
Item 10. Submission of Matters to a Vote of Security Holders.
There have been no material changes to the procedures by which shareholders may recommend nominees to the registrant’s Board of Trustees.
Item 11. Controls and Procedures.
| (a) | The registrant’s Principal Executive Officer and Principal Financial Officer has reviewed and evaluated the registrant’s disclosure controls and procedures (as defined in Rule 30a-3(c) under the 1940 Act) as of a date within 90 days of the filing of this report as required by Rule 30a-3(b) under the 1940 Act and Rules 13a-15(b) or 15d-15(b) under the Securities Exchange Act of 1934. Based on his review, the Principal Executive Officer and Principal Financial Officer has concluded that the disclosure controls and procedures are effective in ensuring that information required to be disclosed in this report is appropriately recorded, processed, summarized and reported and made known to him by others within the registrant and by the registrant’s service providers. |
| (b) | There were no changes in the registrant’s internal controls over financial reporting that occurred during the registrant’s second fiscal quarter of the period covered by this report that have materially affected, or are reasonably likely to materially affect, registrant’s internal control over financial reporting. |
Item 12. Disclosure of Securities Lending Activities for Closed-End Management Investment Companies
Not applicable to open-end investment companies.
Item 13. Exhibits.
| (a) | (1) Any code of ethics or amendment thereto, that is the subject of the disclosure required by Item 2, to the extent that the registrant intends to satisfy Item 2 requirements through filing an exhibit. “Not Applicable” for semi-annual reports. |
(2) A separate certification for each principal executive officer and principal financial officer pursuant to Section 302 of the Sarbanes-Oxley Act of 2002. Filed herewith.
(3) Any written solicitation to purchase securities under Rule 23c-1 under the Act sent or given during the period covered by the report by or on behalf of the registrant to 10 or more persons. Not applicable to open-end investment companies.
(4) Change in the registrant’s independent public accountant. There was no change in the registrant’s independent public accountant for the period covered by this report.
SIGNATURES
Pursuant to the requirements of the Securities Exchange Act of 1934 and the Investment Company Act of 1940, the registrant has duly caused this report to be signed on its behalf by the undersigned, thereunto duly authorized.
| | Buffalo Funds | |
| | | |
| | | | |
| | By | /s/ Kent W. Gasaway | |
| | | Kent W. Gasaway | |
| | | President and Treasurer | |
| | | |
| | | |
| | Date | 12/8/2021 | |
Pursuant to the requirements of the Securities Exchange Act of 1934 and the Investment Company Act of 1940, this report has been signed below by the following person on behalf of the registrant and in the capacities and on the date indicated.
| | Buffalo Funds | |
| | | |
| | | | |
| | By | /s/ Kent W. Gasaway | |
| | | Kent W. Gasaway, | |
| | | President and Treasurer | |
| | | |
| | | |
| | Date | 12/8/2021 | |