UNITED STATES
SECURITIES AND EXCHANGE COMMISSION
Washington, D.C. 20549
FORM N-CSR
CERTIFIED SHAREHOLDER REPORT OF REGISTERED MANAGEMENT
INVESTMENT COMPANIES
Investment Company Act file number 811-10325
VANECK ETF TRUST
(Exact name of registrant as specified in charter)
666 Third Avenue, New York, NY 10017
(Address of principal executive offices) (Zip code)
Van Eck Associates Corporation
666 THIRD AVENUE, NEW YORK, NY 10017
(Name and address of agent for service)
Registrant’s telephone number, including area code: (212) 293-2000
Date of fiscal year end: APRIL 30
Date of reporting period: APRIL 30, 2024
| Item 1. | Report to Shareholders |
 | ANNUAL REPORT
April 30, 2024 |
| CEF Muni Income ETF | XMPT |
| High Yield Muni ETF | HYD |
| HIP Sustainable Muni ETF | SMI |
| Intermediate Muni ETF | ITM |
| Long Muni ETF | MLN |
| Short High Yield Muni ETF | SHYD |
| Short Muni ETF | SMB |
Certain information contained in this report represents the opinion of the investment adviser which may change at any time. This information is not intended to be a forecast of future events, a guarantee of future results or investment advice. Current market conditions may not continue. Also, unless otherwise specifically noted, any discussion of the Funds’ holdings, the Funds’ performance, and the views of the investment adviser are as of April 30, 2024.
VANECK ETFs
PRESIDENT’S LETTER
April 30, 2024 (unaudited)
Dear Fellow Shareholders:
The 2025 Problem—The Fiscal Deficit Bell is Ringing
They say that no one rings the bell at market tops and bottoms, but some important bells are ringing. Most importantly, gold prices are hitting all-time highs despite outflows from U.S. gold bullion ETFs. Gold prices aren’t rallying in a small way. They are reaching, bitcoin-like, for the sky. The biggest change in our view from year-end 2023 is (a) that the markets are beginning to see fiscal spending as out of control and (b) global economic growth has turned positive, a good sign for commodity investors.
At the end of 2023, we suggested that the three major macro factors—monetary policy, government spending and global economic growth—would not change much in 2024. While a big market impact (with surging 10-year interest rates) from out of control fiscal spending may only rest at 10% probability, we repeat that investors should prepare for this with a gold/bitcoin/real assets allocation. These assets are already in a bull market, which means that healthy corrections can be expected (20%?).
Discussion of Major Macro Factors
Let’s review the three main factors that impact markets.
| 1. | Monetary Policy: Not Very Stimulative to Maybe Looser |
I feel like a broken record, but our favorite inflation measure is wage inflation, not food or gas prices. That is the kind of inflation which is endemic and hard to manage once it takes hold. And with wage inflation around 4.5%, not near the U.S. Federal Reserve’s (“Fed’s”) 2% target, we didn’t expect a big Fed loosening coming into 2024. And that was “correct”—the Fed has not cut interest rates yet this year.
Yet, the two most important central banks in the world have softened their language. First, the Fed said that it would reduce its selling schedule of bonds in Jerome Powell’s comments after the March meeting. And Powell said that the 2% inflation was always a “long-term” target, which suggests that the 2% target is less important in 2024. Therefore, the Fed might be looser (even though wage inflation continues). And while it’s probably false, there have been rumors in China of central bank bond-buying which they haven’t done in over a decade and never under Xi Jinping. So, maybe marginally looser monetary policy, but with high wage inflation, no major changes are expected.
| 2. | Government Spending: “Also Muted” to Out of Control |
We entered 2024 expecting that the Republicans, in control of the House of Representatives, would seek to slow government spending. While we probably didn’t sufficiently appreciate the amount of some of the Biden Administration’s spending, as with the environmental Inflation Reduction Act (“IRA”), we didn’t expect any upside surprises in government spending in 2024. But by focusing on the change in spending, we probably underappreciated how large the fiscal deficits continue to be. These deficits are keeping the economy hot—at full employment—and are also pressuring inflation higher.
Now let’s look at 2025, which I think the markets are beginning to do. 2025 is a very important policy year for fiscal discipline. The reason is that Social Security will go bankrupt in 2033. If major fiscal problems are only addressed the year after a Presidential election, then it has to be addressed in 2025, because 2029 is WAY too late to fix any entitlement problem. But in the first quarter, we just learned that the major parties have nominated the two most profligate “peacetime” spenders in U.S. history.
We have 7% budget deficits in the middle of an economic boom! We may look back on this the same way we now look back at 1% interest rates on 10 year debt—an amazing situation that shouldn’t be and can’t last. But timing markets is almost impossible.
Are there signals, besides gold, that the market is concerned about 2025? Are other bells ringing? Actually, yes. U.S. credit default swaps are at elevated levels after rising in 2023 during the budget standoff. And emerging market debt has actually been outperforming U.S. debt for the last three years. See my investment outlook1 on www.vaneck.com for the charts.
VANECK ETFs
PRESIDENT’S LETTER
(unaudited) (continued)
My last piece of evidence for the “out of control” scenario is an article from alternative media site, the Free Press. In an article mainly on social commentary, we suddenly see a chart on government spending.
Federal government current expenditures: Interest payments, Billions of Dollars, Quarterly, Seasonally Adjusted Annual Rate

Source: U.S. Bureau of Economic Analysis as of January 25, 2024. Shaded areas indicate U.S. recessions.
| 3. | Global Growth – from Low Levels to Expansion |
In the first quarter of 2024, the world economy moved into expansion mode, with good upwards momentum. As well, economic data from China in March was quite strong. For growth, my favorite statistics is PMI, partially because it shows a “yes or no” answer. If PMI is over 50, we are in expansion mode. And both global growth and China manufacturing moved into expansion mode in Q1. This is the reason commodity returns have been strong so far this year. And this data supports an allocation to commodities.
We thank you for investing in VanEck’s investment strategies. On the following pages, you will find financial statements for each of the funds for the twelve month period ended April 30, 2024. As always, we value your continued confidence in us and look forward to helping you meet your investment goals in the future.

Jan F. van Eck
CEO and President
VanEck ETF Trust
May 20, 2024
PS The investing outlook can change suddenly. To get our quarterly investment outlooks, please subscribe to “VanEck News & Insights”.2 Should you have any questions regarding fund performance, please contact us at 800.826.2333 or visit our website.
1 https://www.vaneck.com/us/en/insights/investment-outlook/
2 https://www.vaneck.com/us/en/subscribe/
VANECK ETFs
MANAGEMENT DISCUSSION
April 30, 2024 (unaudited)
CEF MUNI INCOME ETF
• Rising interest rates and higher short-term borrowing costs put pressure on municipal bond closed-end fund performance. The discount-to-net asset value generally widened for most of the Fund’s underlying holdings as the municipal curve remained inverted.
• Underlying closed-end fund holdings traded at a weighted average discount-to-net asset value of -12.29% over the reporting period, which is much wider than the since inception average discount of -5.66%.
• The Nuveen Municipal Credit Income Fund and the Nuveen AMT-Free Municipal Credit Income Fund were the largest contributors to the Fund’s performance for the fiscal year ended April 30, 2024. The Nuveen Municipal Credit Opportunities Fund and the Invesco Value Municipal income Trust were the largest detractors from the Fund’s performance for the reporting period.
HIGH YIELD MUNI ETF
• The broad high yield municipal bond market outperformed investment grade as credit spreads narrowed over the reporting period and benefitted from the segment’s longer duration and higher carry.
• Securities from Puerto Rico and California were the largest contributors to the Fund’s performance while securities from Alabama and Hawaii were the largest detractors.
• The Fund’s exposure to the industrial development revenue and tax sectors provided the largest contribution to performance over the reporting period, while exposure to pollution control and power bonds were the smallest contributors with no sectors in aggregate detracting from the Fund’s performance for the reporting period.
HIP SUSTAINABLE MUNI ETF
• On whole, most sustainable funds lagged their conventional peers by a small margin in 2023. Some of the macroeconomic pressures that contributed to their modest performance included high interest rates and persistent inflation.
• Securities from California and New York were the largest contributors to the Fund’s performance while securities from Massachusetts and Texas were the largest detractors.
• The Fund’s exposure to the tax and state general obligation sectors provided the largest contribution to performance over the reporting period while exposure to local general obligation sector was the largest detractor for the reporting period.
INTERMEDIATE MUNI ETF
• An inversion in the short end of the municipal yield curve and rising rates put pressure on intermediate maturity bonds.
• Securities from New York and California were the largest contributors to the Fund’s performance while securities from Montana and West Virginia were the largest detractors.
• The Fund’s exposure to the tax and local general obligation sectors provided the largest contribution to performance over the reporting period, while exposure to single family housing and pollution control were the smallest contributors, with no sectors in aggregate detracting from the Fund’s performance for the reporting period.
LONG MUNI ETF
• The long end of the investment grade municipal yield curve rose more modestly than any other segments of the curve, but the U.S. Federal Reserve’s monetary policy strategy still put pressure on longer maturity bonds.
• Securities from California and New York were the largest contributors to the Fund’s performance while securities from Wyoming and Virginia were the largest detractors.
• The Fund’s exposure to the hospital and local general obligation sectors provided the largest contribution to performance over the reporting period, while exposure to pollution control bonds were the largest detractors for the reporting period.
SHORT HIGH YIELD MUNI ETF
• The broad high yield municipal bond market outperformed the investment grade segment as credit spreads narrowed over the reporting period.
• The U.S. Federal Reserve’s monetary policy strategy was a drag on short maturity bonds, as short-term rates increased higher and faster than longer-term rates.
• Securities from Puerto Rico and Illinois were the largest contributors to the Fund’s performance while securities from Mississippi and Alabama were the largest detractors.
• The Fund’s exposure to the tax and local general obligation sectors provided the largest contribution to performance over the reporting period while exposure to pollution control bonds were the largest detractors.
SHORT MUNI ETF
• The U.S. Federal Reserve’s monetary policy strategy put pressure on short maturity bonds, as short-term rates increased higher and faster than longer-term rates.
• Securities from California and New York were the largest contributors to the Fund’s performance, while securities from Iowa and Guam were the smallest contributors.
• The Fund’s exposure to the state general obligation and the utilities sectors provided the largest contribution to performance over the reporting period, while exposure to industrial development revenue and tobacco bonds were the smallest contributors, with no sectors in aggregate detracting from the Fund’s performance for the reporting period.
VANECK CEF MUNI INCOME ETF
PERFORMANCE COMPARISON
April 30, 2024 (unaudited)
| Average Annual Total Return |
| | | Share Price | | NAV | | CEFMXTR1 | | US002 |
| One Year | | | 1.09 | % | | | 1.16 | % | | | 1.55 | % | | | (1.40 | )% |
| Five Year | | | (0.43 | )% | | | (0.42 | )% | | | (0.01 | )% | | | (0.14 | )% |
| Ten Year | | | 2.57 | % | | | 2.58 | % | | | 2.96 | % | | | 1.24 | % |
| 1 | S-Network Municipal Bond Closed-End Fund IndexSM (CEFMXTR) is a rules based index intended to serve as a benchmark for closed-end funds listed in the U.S. that are principally engaged in asset management processes designed to produce federally tax-exempt annual yield. The CEFMXTR employs a modified total net assets weighting methodology designed to provide investment exposure across the various business segments that together comprise the federally tax-exempt annual yield sector of the closed-end fund market. |
| | |
| 2 | The ICE BofA US Broad Market Index (US00) is a broad-based benchmark that measures the performance of U.S. dollar-denominated, investment grade debt securities, including U.S. Treasury notes and bonds, quasi-government securities, corporate securities, residential and commercial mortgage-backed securities and asset-backed securities. |
Hypothetical Growth of $10,000
| This chart shows the value of a hypothetical $10,000 investment in the Fund at NAV over the past 10 years. The result is compared with the Fund’s benchmark and a broad-based index. | | 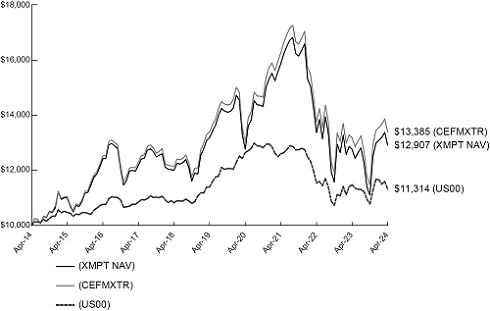 |
Past performance is no guarantee of future results. Performance results do not reflect the deduction of taxes that a shareholder would pay on fund distributions or on the redemption or sale of fund shares.
See “About Fund Performance” on page 13 for more information.
VANECK HIGH YIELD MUNI ETF
PERFORMANCE COMPARISON
April 30, 2024 (unaudited)
| Average Annual Total Return |
| | | Share Price | | NAV | | MHYX1 | | US002 |
| One Year | | | 3.59 | % | | | 4.04 | % | | | 5.57 | % | | | (1.40 | )% |
| Five Year | | | (0.16 | )% | | | (0.12 | )% | | | 2.46 | % | | | (0.14 | )% |
| Ten Year | | | 2.68 | % | | | 2.72 | % | | | 4.64 | % | | | 1.24 | % |
| 1 | ICE Broad High Yield Crossover Municipal Index (MHYX) is comprised of lower-rated and unrated U.S. dollar denominated tax-exempt debt publicly issued in the U.S. domestic market by U.S. states and territories as well as their political subdivisions. |
| | |
| | From December 1, 2022 forward, the index data reflects that of the Fund’s underlying index, MHYX.
Index data from March 1, 2022 to November 30, 2022 reflects that of the ICE High Yield Crossover Municipal Bond Transition Index (MXYT), an interim index that gradually increased exposure to securities based on their weightings in MHYX and proportionally reduced exposure to certain component securities of the Bloomberg Barclays Municipal Custom High Yield Composite Index (LMEHTR). Index data prior to March 1, 2022 reflects that of the LMEHTR. |
| | |
| 2 | The ICE BofA US Broad Market Index (US00) is a broad-based benchmark that measures the performance of U.S. dollar-denominated, investment grade debt securities, including U.S. Treasury notes and bonds, quasi-government securities, corporate securities, residential and commercial mortgage-backed securities and asset-backed securities. |
Hypothetical Growth of $10,000
| This chart shows the value of a hypothetical $10,000 investment in the Fund at NAV over the past 10 years. The result is compared with the Fund’s benchmark and a broad-based index. | |  |
Past performance is no guarantee of future results. Performance results do not reflect the deduction of taxes that a shareholder would pay on fund distributions or on the redemption or sale of fund shares.
See “About Fund Performance” on page 13 for more information.
VANECK HIP SUSTAINABLE MUNI ETF
PERFORMANCE COMPARISON
April 30, 2024 (unaudited)
| Average Annual Total Return |
| | | Share Price | | NAV | | MUNI1 |
| One Year | | | 1.92 | % | | | 2.14 | % | | | 2.12 | % |
| Life* | | | (1.89 | )% | | | (1.80 | )% | | | (1.41 | )% |
| * | Inception of Fund: 9/8/21; First Day of Secondary Market Trading: 9/9/21. |
| | |
| 1 | ICE US Broad Municipal Index (MUNI) tracks the performance of U.S. dollar denominated investment grade tax-exempt debt publicly issued by the United States and its territories, and their political subdivisions, in the U.S. domestic market. |
Hypothetical Growth of $10,000 (Since Inception)
| This chart shows the value of a hypothetical $10,000 investment in the Fund at NAV since inception. The result is compared with the Fund’s benchmark and a broad-based index. | |  |
Past performance is no guarantee of future results. Performance results do not reflect the deduction of taxes that a shareholder would pay on fund distributions or on the redemption or sale of fund shares.
See “About Fund Performance” on page 13 for more information.
VANECK INTERMEDIATE MUNI ETF
PERFORMANCE COMPARISON
April 30, 2024 (unaudited)
| Average Annual Total Return |
| | | Share Price | | NAV | | MBNI1 | | US002 |
| One Year | | | 1.52 | % | | | 1.48 | % | | | 1.73 | % | | | (1.40 | )% |
| Five Year | | | 0.83 | % | | | 0.83 | % | | | 1.31 | % | | | (0.14 | )% |
| Ten Year | | | 2.15 | % | | | 2.18 | % | | | 2.71 | % | | | 1.24 | % |
| 1 | ICE Intermediate AMT-Free Broad National Municipal Index (MBNI) is comprised of intermediate maturity U.S. dollar denominated investment grade tax exempt debt publicly issued in the U.S. domestic market by U.S. states and territories as well as their political subdivisions. |
| | |
| | From December 1, 2022 forward, the index data reflects that of the Fund’s underlying index, MBNI.
Index data from March 1, 2022 to November 30, 2022 reflects the ICE Intermediate AMT-Free Broad National Municipal Transition Index (MIBT), an interim index that gradually increased exposure to securities based on their weightings in MBNI and proportionally reduced exposure to certain component securities of the Bloomberg Barclays AMT-Free Intermediate Continuous Municipal Index (LMT2TR). Index data prior to March 1, 2022 reflects that of LMT2TR. |
| | |
| 2 | The ICE BofA US Broad Market Index (US00) is a broad-based benchmark that measures the performance of U.S. dollar-denominated, investment grade debt securities, including U.S. Treasury notes and bonds, quasi-government securities, corporate securities, residential and commercial mortgage-backed securities and asset-backed securities. |
Hypothetical Growth of $10,000
| This chart shows the value of a hypothetical $10,000 investment in the Fund at NAV over the past 10 years. The result is compared with the Fund’s benchmark and a broad-based index. | | 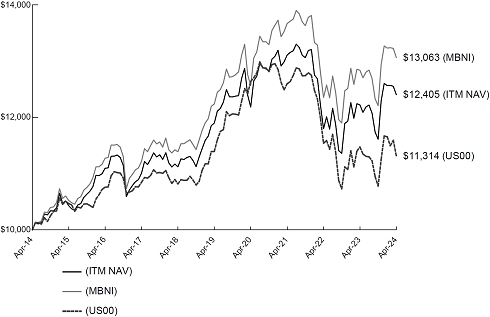 |
Past performance is no guarantee of future results. Performance results do not reflect the deduction of taxes that a shareholder would pay on fund distributions or on the redemption or sale of fund shares.
See “About Fund Performance” on page 13 for more information.
VANECK LONG MUNI ETF
PERFORMANCE COMPARISON
April 30, 2024 (unaudited)
| Average Annual Total Return |
| | | Share Price | | NAV | | MBNL1 | | US002 |
| One Year | | | 1.61 | % | | | 2.01 | % | | | 2.34 | % | | | (1.40 | )% |
| Five Year | | | (0.05 | )% | | | (0.06 | )% | | | 0.78 | % | | | (0.14 | )% |
| Ten Year | | | 2.36 | % | | | 2.34 | % | | | 3.11 | % | | | 1.24 | % |
| 1 | ICE Long AMT-Free Broad National Municipal Index (MBNL) is comprised of long maturity U.S. dollar denominated investment grade tax-exempt debt publicly issued in the U.S. domestic market by U.S. states and territories as well as their political subdivisions. |
| | |
| | From December 1, 2022 forward, the index data reflects that of the Fund’s underlying index, MBNL.
Index data from March 1, 2022 to November 30, 2022 reflects that of the ICE Long AMT-Free Broad National Municipal Transition Index (MLBT), an interim index that gradually increased exposure to securities based on their weightings in MBNL and proportionally reduced exposure to certain component securities of the Bloomberg Barclays AMT-Free Long Continuous Municipal Index (LMT3TR). Index data prior to March 1, 2022 reflects that of LMT3TR. |
| | |
| 2 | The ICE BofA US Broad Market Index (US00) is a broad-based benchmark that measures the performance of U.S. dollar-denominated, investment grade debt securities, including U.S. Treasury notes and bonds, quasi-government securities, corporate securities, residential and commercial mortgage-backed securities and asset-backed securities. |
Hypothetical Growth of $10,000
| This chart shows the value of a hypothetical $10,000 investment in the Fund at NAV over the past 10 years. The result is compared with the Fund’s benchmark and a broad-based index. | | 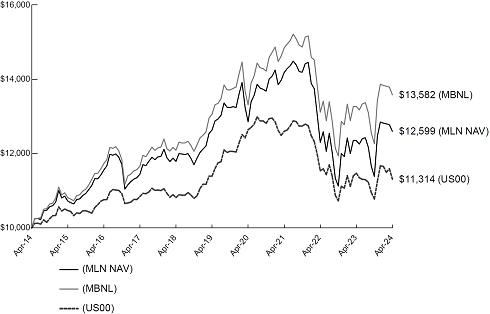 |
Past performance is no guarantee of future results. Performance results do not reflect the deduction of taxes that a shareholder would pay on fund distributions or on the redemption or sale of fund shares.
See “About Fund Performance” on page 13 for more information.
VANECK SHORT HIGH YIELD MUNI ETF
PERFORMANCE COMPARISON
April 30, 2024 (unaudited)
| Average Annual Total Return |
| | | Share Price | | NAV | | MIHX1 | | US002 |
| One Year | | | 2.03 | % | | | 2.82 | % | | | 4.29 | % | | | (1.40 | )% |
| Five Year | | | 0.84 | % | | | 0.83 | % | | | 2.71 | % | | | (0.14 | )% |
| Ten Year | | | 1.74 | % | | | 1.75 | % | | | 3.51 | % | | | 1.24 | % |
| 1 | ICE 1-12 Year Broad High Yield Crossover Municipal Index (MIHX) is comprised of lower-rated and unrated U.S. dollar denominated tax-exempt debt publicly issued in the U.S. domestic market by U.S. states and territories as well as their political subdivisions. |
| | |
| | From December 1, 2022 forward, the index data reflects that of the Fund’s underlying index, MIHX.
Index data from March 1, 2022 to November 30, 2022 reflects that of the ICE 1-12 Year Broad High Yield Crossover Municipal Bond Transition Index (MXIT), an interim index that gradually increased exposure to securities based on their weightings in MIHX and proportionally reduced exposure to certain component securities of the Bloomberg Barclays Municipal High Yield Short Duration Index (BMHYTR). Index data prior to March 1, 2022 reflects that of the BMHYTR. |
| | |
| 2 | The ICE BofA US Broad Market Index (US00) is a broad-based benchmark that measures the performance of U.S. dollar-denominated, investment grade debt securities, including U.S. Treasury notes and bonds, quasi-government securities, corporate securities, residential and commercial mortgage-backed securities and asset-backed securities. |
Hypothetical Growth of $10,000
| This chart shows the value of a hypothetical $10,000 investment in the Fund at NAV over the past 10 years. The result is compared with the Fund’s benchmark and a broad-based index. | | 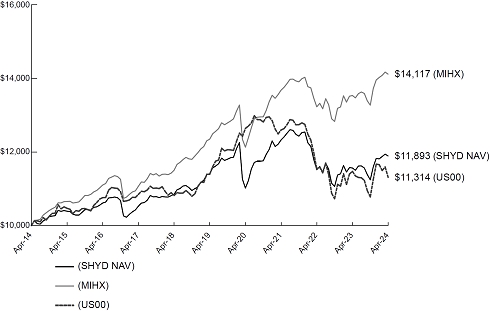 |
Past performance is no guarantee of future results. Performance results do not reflect the deduction of taxes that a shareholder would pay on fund distributions or on the redemption or sale of fund shares.
See “About Fund Performance” on page 13 for more information.
VANECK SHORT MUNI ETF
PERFORMANCE COMPARISON
April 30, 2024 (unaudited)
| Average Annual Total Return |
| | | Share Price | | NAV | | MBNS1 | | US002 |
| One Year | | | 2.62 | % | | | 2.12 | % | | | 2.15 | % | | | (1.40 | )% |
| Five Year | | | 0.89 | % | | | 0.87 | % | | | 1.07 | % | | | (0.14 | )% |
| Ten Year | | | 1.05 | % | | | 1.02 | % | | | 1.35 | % | | | 1.24 | % |
| 1 | ICE Short AMT-Free Broad National Municipal Index (MBNS) is comprised of short maturity U.S. dollar denominated investment grade tax exempt debt publicly issued in the U.S. domestic market by U.S. states and territories as well as their political subdivisions. |
| | |
| | From December 1, 2022 forward, the index data reflects that of the Fund’s underlying index, MBNS. Index data from March 1, 2022 to November 30, 2022 reflects the ICE Short AMT-Free Broad National Municipal Transition Index (MSBT), an interim index that gradually increased exposure to securities based on their weightings in MBNS and proportionally reduced exposure to certain component securities of the Bloomberg Barclays AMT-Free Short Continuous Municipal Index (LMT1TR). Index data prior to March 1, 2022 reflects that of LMT1TR. |
| | |
| 2 | The ICE BofA US Broad Market Index (US00) is a broad-based benchmark that measures the performance of U.S. dollar-denominated, investment grade debt securities, including U.S. Treasury notes and bonds, quasi-government securities, corporate securities, residential and commercial mortgage-backed securities and asset-backed securities. |
Hypothetical Growth of $10,000
| This chart shows the value of a hypothetical $10,000 investment in the Fund at NAV over the past 10 years. The result is compared with the Fund’s benchmark and a broad-based index. | |  |
Past performance is no guarantee of future results. Performance results do not reflect the deduction of taxes that a shareholder would pay on fund distributions or on the redemption or sale of fund shares.
See “About Fund Performance” on page 13 for more information.
VANECK ETF TRUST
ABOUT FUND PERFORMANCE
(unaudited)
The price used to calculate market return (Share Price) is determined by using the closing price listed on its primary listing exchange. Since the shares of each Fund did not trade in the secondary market until after each Fund’s commencement, for the period from commencement to the first day of secondary market trading in shares of each Fund, the NAV of each Fund is used as a proxy for the secondary market trading price to calculate market returns.
The performance data quoted represents past performance. Past performance is not a guarantee of future results. Performance information for each Fund reflects temporary waivers of expenses and/or fees, if any. Had each Fund incurred all expenses, investment returns would have been reduced. These returns do not reflect the deduction of taxes that a shareholder would pay on Fund dividends and distributions or the sale of Fund shares.
Investment return and value of the shares of each Fund will fluctuate so that an investor’s shares, when sold, may be worth more or less than their original cost. Performance may be lower or higher than performance data quoted. Fund returns reflect reinvestment of dividends and capital gains distributions. Performance current to the most recent month-end is available by calling 800.826.2333 or by visiting vaneck.com.
Index returns assume the reinvestment of all income and do not reflect any management fees or brokerage expenses associated with Fund returns. Certain indices may take into account withholding taxes. Investors cannot invest directly in the Index. Returns for actual Fund investors may differ from what is shown because of differences in timing, the amount invested and fees and expenses.
CEFMXTR is published by S-Network Global Indexes, LLC (“S-Network”). MHYX, MXYT, MBNI, MIBT, MBNL, MLBT, MIHX, MXIT, MBNS, MSBT, MUNI and US00 are published by ICE Data Indices, LLC (“ICE Data”) and its affiliates. LMEHTR, LMT2TR, LMT3TR, BMHYTR and LMT1TR are published by Bloomberg Finance L.P. and its affiliates (“Bloomberg”). Bloomberg, ICE Data and S-Network are referred to herein as the “Index Providers”. Index Providers do not sponsor, endorse, or promote the Funds and bear no liability with respect to the Funds or any security.
VANECK ETF TRUST
EXPLANATION OF EXPENSES
(unaudited)
Hypothetical $1,000 investment at beginning of period
As a shareholder of a Fund, you incur operating expenses, including management fees and other Fund expenses. This disclosure is intended to help you understand the ongoing costs (in dollars) of investing in your Fund and to compare these costs with the ongoing costs of investing in other mutual funds.
The disclosure is based on an investment of $1,000 invested at the beginning of the period and held for the entire period, November 1, 2023, to April 30, 2024.
Actual Expenses
The first line in the table below provides information about account values and actual expenses. You may use the information in this line, together with the amount you invested, to estimate the expenses that you paid over the period. Simply divide your account value by $1,000 (for example, an $8,600 account value divided by $1,000 = 8.6), then multiply the result by the number in the first line under the heading entitled “Expenses Paid During the Period.”
Hypothetical Example for Comparison Purposes
The second line in the table below provides information about hypothetical account values and hypothetical expenses based on the Fund’s actual expense ratio and an assumed rate of return of 5% per year before expenses, which is not the Fund’s actual return. The hypothetical account values and expenses may not be used to estimate the actual ending account balance or expenses you paid for the period. You may use this information to compare the ongoing costs of investing in your Fund and other funds. To do so, compare this 5% hypothetical example with the 5% hypothetical examples that appear in the shareholder reports of other funds.
Please note that the expenses shown in the table are meant to highlight your ongoing costs only and do not reflect any transactional costs, such as brokerage commissions paid on purchases and sales. Therefore, the second line of the table is useful in comparing ongoing costs only, and will not help you determine the relative costs of owning different funds. In addition, if these transactional costs were included, your costs would have been higher.
| | | Beginning
Account
Value
November 1, 2023 | | Ending
Account
Value
April 30, 2024 | | Annualized
Expense
Ratio
During Period | | Expenses Paid
During the Period
November 1, 2023 -
April 30, 2024(a) |
| CEF Muni Income ETF | | | | | | | | |
| Actual | | $1,000.00 | | $1,163.60 | | 0.41% | | $2.21 |
| Hypothetical (b) | | $1,000.00 | | $1,022.82 | | 0.41% | | $2.06 |
| High Yield Muni ETF | | | | | | | | |
| Actual | | $1,000.00 | | $1,100.40 | | 0.32% | | $1.67 |
| Hypothetical (b) | | $1,000.00 | | $1,023.27 | | 0.32% | | $1.61 |
| HIP Sustainable Muni ETF | | | | | | | | |
| Actual | | $1,000.00 | | $1,070.10 | | 0.24% | | $1.24 |
| Hypothetical (b) | | $1,000.00 | | $1,023.67 | | 0.24% | | $1.21 |
| Intermediate Muni ETF | | | | | | | | |
| Actual | | $1,000.00 | | $1,068.20 | | 0.22% | | $1.13 |
| Hypothetical (b) | | $1,000.00 | | $1,023.77 | | 0.22% | | $1.11 |
| Long Muni ETF | | | | | | | | |
| Actual | | $1,000.00 | | $1,106.60 | | 0.24% | | $1.26 |
| Hypothetical (b) | | $1,000.00 | | $1,023.67 | | 0.24% | | $1.21 |
| Short High Yield Muni ETF | | | | | | | | |
| Actual | | $1,000.00 | | $1,057.70 | | 0.35% | | $1.79 |
| Hypothetical (b) | | $1,000.00 | | $1,023.12 | | 0.35% | | $1.76 |
| | | Beginning
Account
Value
November 1, 2023 | | Ending
Account
Value
April 30, 2024 | | Annualized
Expense
Ratio
During Period | | Expenses Paid
During the Period
November 1, 2023 -
April 30, 2024(a) |
| Short Muni ETF | | | | | | | | |
| Actual | | $1,000.00 | | $1,028.80 | | 0.07% | | $0.35 |
| Hypothetical (b) | | $1,000.00 | | $1,024.52 | | 0.07% | | $0.35 |
| | |
| (a) | Expenses are equal to the Fund’s annualized expense ratio (for the six months ended April 30, 2024), multiplied by the average account value over the period, multiplied by the number of days in the most recent fiscal half year divided by the number of the days in the fiscal year (to reflect the one-half year period). |
| (b) | Assumes annual return of 5% before expenses |
VANECK CEF MUNI INCOME ETF
SCHEDULE OF INVESTMENTS
April 30, 2024
| | | Number
of Shares | | | Value | |
| CLOSED-END FUNDS: 100.2% (a) | | | | | | | | |
| abrdn National Municipal Income Fund | | | 105,120 | | | $ | 1,043,842 | |
| Alliance Bernstein National Municipal Income Fund, Inc. | | | 242,571 | | | | 2,544,570 | |
| BlackRock 2037 Municipal Target Term Trust | | | 36,733 | | | | 883,796 | |
| Blackrock Investment Quality Municipal Trust, Inc. | | | 100,779 | | | | 1,210,356 | |
| BlackRock Long-Term Municipal Advantage Trust | | | 59,875 | | | | 579,590 | |
| BlackRock MuniAssets Fund, Inc. | | | 167,953 | | | | 1,822,290 | |
| BlackRock Municipal 2030 Target Term Trust | | | 510,579 | | | | 10,456,658 | |
| BlackRock Municipal Income Fund, Inc. | | | 534,109 | | | | 6,142,253 | |
| BlackRock Municipal Income Quality Trust | | | 192,214 | | | | 2,095,133 | |
| BlackRock Municipal Income Trust | | | 326,481 | | | | 3,238,691 | |
| BlackRock Municipal Income Trust II | | | 359,174 | | | | 3,731,818 | |
| BlackRock MuniHoldings Fund, Inc. | | | 398,332 | | | | 4,560,901 | |
| BlackRock MuniHoldings Quality Fund II, Inc. | | | 184,321 | | | | 1,797,130 | |
| BlackRock MuniVest Fund II, Inc. | | | 159,691 | | | | 1,659,189 | |
| BlackRock MuniVest Fund, Inc. | | | 485,421 | | | | 3,310,571 | |
| BlackRock MuniYield Fund, Inc. | | | 340,547 | | | | 3,575,743 | |
| BlackRock MuniYield Quality Fund II, Inc. | | | 166,216 | | | | 1,630,579 | |
| BlackRock MuniYield Quality Fund III, Inc. | | | 404,225 | | | | 4,418,179 | |
| BlackRock MuniYield Quality Fund, Inc. | | | 423,802 | | | | 4,979,673 | |
| BNY Mellon Municipal Bond Infrastructure Fund, Inc. | | | 157,540 | | | | 1,573,825 | |
| BNY Mellon Municipal Income, Inc. | | | 159,166 | | | | 1,057,021 | |
| BNY Mellon Strategic Municipal Bond Fund, Inc. | | | 415,315 | | | | 2,334,070 | |
| BNY Mellon Strategic Municipals, Inc. | | | 526,366 | | | | 3,100,296 | |
| DWS Municipal Income Trust | | | 303,740 | | | | 2,827,819 | |
| Eaton Vance Municipal Bond Fund | | | 530,412 | | | | 5,272,295 | |
| | | Number
of Shares | | | Value | |
| Eaton Vance Municipal Income 2028 Term Trust | | | 54,734 | | | $ | 991,233 | |
| Eaton Vance Municipal Income Trust | | | 295,750 | | | | 2,904,265 | |
| Eaton Vance National Municipal Opportunities Trust | | | 95,650 | | | | 1,554,408 | |
| Invesco Advantage Municipal Income Trust II | | | 343,728 | | | | 2,842,631 | |
| Invesco Municipal Income Opportunities Trust | | | 197,174 | | | | 1,200,790 | |
| Invesco Municipal Opportunity Trust | | | 512,831 | | | | 4,759,072 | |
| Invesco Municipal Trust | | | 427,635 | | | | 3,977,005 | |
| Invesco Quality Municipal Income Trust | | | 444,621 | | | | 4,148,314 | |
| Invesco Trust for Investment Grade Municipals | | | 416,052 | | | | 3,973,297 | |
| Invesco Value Municipal Income Trust | | | 363,284 | | | | 4,123,273 | |
| MFS Municipal Income Trust | | | 316,315 | | | | 1,608,462 | |
| Neuberger Berman Municipal Fund, Inc. | | | 225,315 | | | | 2,273,428 | |
| Nuveen AMT-Free Municipal Credit Income Fund | | | 1,527,761 | | | | 17,645,640 | |
| Nuveen AMT-Free Municipal Value Fund | | | 111,773 | | | | 1,504,465 | |
| Nuveen AMT-Free Quality Municipal Income Fund | | | 1,670,557 | | | | 17,774,726 | |
| Nuveen Dynamic Municipal Opportunities Fund | | | 291,960 | | | | 3,118,133 | |
| Nuveen Municipal Credit Income Fund | | | 1,493,598 | | | | 17,460,161 | |
| Nuveen Municipal High Income Opportunity Fund | | | 652,928 | | | | 6,718,629 | |
| Nuveen Municipal Value Fund, Inc. | | | 1,097,394 | | | | 9,294,927 | |
| Nuveen Quality Municipal Income Fund | | | 1,626,285 | | | | 17,775,295 | |
| Nuveen Select Tax-Free Income Portfolio | | | 203,459 | | | | 2,854,530 | |
| PIMCO Municipal Income Fund | | | 113,591 | | | | 1,010,960 | |
| PIMCO Municipal Income Fund II | | | 342,747 | | | | 2,807,098 | |
| PIMCO Municipal Income Fund III | | | 197,292 | | | | 1,461,934 | |
See Notes to Financial Statements
| | | Number
of Shares | | | Value | |
| Pioneer Municipal High Income Advantage Fund, Inc. | | | 183,478 | | | $ | 1,432,963 | |
| Pioneer Municipal High Income Fund Trust | | | 174,188 | | | | 1,478,856 | |
| Pioneer Municipal High Income Opportunities Fund, Inc. | | | 129,246 | | | | 1,421,706 | |
| Putnam Managed Municipal Income Trust | | | 281,503 | | | | 1,646,793 | |
| Putnam Municipal Opportunities Trust | | | 196,908 | | | | 1,913,946 | |
| Western Asset Managed Municipals Fund, Inc. | | | 417,011 | | | | 4,132,579 | |
Total Closed-End Funds: 100.2%
(Cost: $258,686,899) | | | | | | | 221,655,807 | |
| Liabilities in excess of other assets: (0.2)% | | | | | | | (517,319) | |
| NET ASSETS: 100.0% | | | | | | $ | 221,138,488 | |
Footnotes:
| (a) | Each underlying fund’s shareholder reports and registration documents are available free of charge on the SEC’s website at https://www.sec.gov. |
| Summary of Investments by Asset Class | | % of
Investments | | Value | |
| Municipal Fixed Income | | | 100.0% | | | $ | 221,655,807 | |
The summary of inputs used to value the Fund’s investments as of April 30, 2024 is as follows:
| | | Level 1
Quoted
Prices | | | Level 2
Significant
Observable
Inputs | | | Level 3
Significant
Unobservable
Inputs | | | Value | |
| Closed-End Funds | | $ | 221,655,807 | | | $ | — | | | $ | — | | | $ | 221,655,807 | |
See Notes to Financial Statements
VANECK HIGH YIELD MUNI ETF
SCHEDULE OF INVESTMENTS
April 30, 2024
| | | Par
(000’s | ) | | Value | |
| MUNICIPAL BONDS: 98.1% | | | | | | | | |
| Alabama: 1.8% | | | | | | | | |
| Alabama Special Care Facilities Financing Authority, Methodist Home for Aging (RB) | | | | | | | | |
| 5.75%, 06/01/45 (c) | | $ | 2,000 | | | $ | 1,768,505 | |
| 5.75%, 06/01/35 (c) | | | 1,400 | | | | 1,356,491 | |
| 6.00%, 06/01/50 (c) | | | 5,900 | | | | 5,300,432 | |
| Alabama State Port Authority Docks Facilities, Series A (RB) (AGM) | | | | | | | | |
| 5.00%, 10/01/34 (c) | | | 1,000 | | | | 1,024,970 | |
| 5.00%, 10/01/29 (c) | | | 1,675 | | | | 1,719,632 | |
Black Belt Energy Gas District, Project No. 8, Series A (RB) 4.00%, 12/01/52 (c) (p) | | | 10,000 | | | | 9,807,300 | |
Black Belt Energy Gas District, Series A (RB) 5.25%, 01/01/54 (c) (p) | | | 5,000 | | | | 5,291,173 | |
County of Jefferson, Alabama Sewer Warrants (RB) 5.25%, 10/01/49 (c) | | | 1,000 | | | | 1,053,704 | |
Hoover Industrial Development Board, United States Steel Corp. Project (RB) 6.38%, 11/01/50 (p) | | | 1,180 | | | | 1,295,097 | |
Hoover Industrial Development Board, United States Steel Corp. Project (RB) (SD CRED PROG) 5.75%, 10/01/49 (c) | | | 8,540 | | | | 8,770,876 | |
Jefferson County, Alabama Sewer Revenue (RB) 5.25%, 10/01/45 (c) | | | 2,175 | | | | 2,332,222 | |
Montgomery Alabama Medical Clinic Board of Health Care Facility, Jackson Hospital and Clinic (RB) 5.00%, 03/01/33 (c) | | | 1,350 | | | | 1,025,068 | |
Southeast Alabama Gas Supply District, Project No. 2, Series B (RB) 5.00%, 06/01/49 (c) (p) | | | 2,600 | | | | 2,710,979 | |
| Tuscaloosa County Industrial Development Authority, Hunt Refining Project, Series A (RB) | | | | | | | | |
| 4.50%, 05/01/32 (c) | | | 2,914 | | | | 2,911,808 | |
| 5.25%, 05/01/44 (c) | | | 7,000 | | | | 7,015,216 | |
| | | | | | | | 53,383,473 | |
| Alaska: 0.0% | | | | | | | | |
Northern Tobacco Securitization Corp., Series B-2 (RB) 0.00%, 06/01/66 (c) ^ | | | 3,000 | | | | 367,854 | |
| | | Par
(000’s | ) | | Value | |
| American Samoa: 0.2% | | | | | | |
| American Samoa Economic Development Authority, Series A (RB) | | | | | | |
| 5.00%, 09/01/38 (c) | | $ | 4,250 | | | $ | 4,145,036 | |
| 6.50%, 09/01/28 | | | 250 | | | | 260,056 | |
| 6.62%, 09/01/35 (c) | | | 1,000 | | | | 1,028,884 | |
| | | | | | | | 5,433,976 | |
| Arizona: 2.6% | | | | | | | | |
| Arizona Industrial Development Authority (RB) | | | | | | | | |
| 5.00%, 07/01/54 (c) | | | 1,000 | | | | 898,335 | |
| 5.00%, 07/01/51 (c) | | | 2,420 | | | | 2,091,636 | |
| 5.00%, 07/01/51 (c) | | | 1,000 | | | | 864,312 | |
Arizona Industrial Development Authority Education Facility, Leman Academy of Excellence Projects, Series A (RB) 4.50%, 07/01/54 (c) | | | 1,000 | | | | 851,885 | |
Arizona Industrial Development Authority Education Facility, Leman Academy of Excellence, East and Central Tucson Projects, Series A (RB) 4.00%, 07/01/29 (c) | | | 500 | | | | 484,537 | |
Arizona Industrial Development Authority, Academies of Math and Science Projects (RB) 5.00%, 07/01/39 (c) | | | 1,000 | | | | 987,381 | |
Arizona Industrial Development Authority, Academies of Math and Science, Series B (RB) 5.00%, 07/01/29 (c) | | | 200 | | | | 202,272 | |
| Arizona Industrial Development Authority, American Charter School Foundation Project (RB) | | | | | | | | |
| 6.00%, 07/01/37 (c) | | | 1,270 | | | | 1,303,650 | |
| 6.00%, 07/01/47 (c) | | | 2,940 | | | | 2,982,746 | |
Arizona Industrial Development Authority, Arizona Agribusiness and Equine Center, Inc. Project, Series B (RB) 5.00%, 03/01/37 (c) | | | 1,545 | | | | 1,497,938 | |
| Arizona Industrial Development Authority, Basis School Project, Series A (RB) | | | | | | | | |
| 5.12%, 07/01/37 (c) | | | 250 | | | | 250,972 | |
| 5.25%, 07/01/47 (c) | | | 500 | | | | 486,252 | |
| Arizona Industrial Development Authority, Basis School Project, Series D (RB) | | | | | | | | |
| 5.00%, 07/01/47 (c) | | | 270 | | | | 253,762 | |
| 5.00%, 07/01/51 (c) | | | 515 | | | | 476,813 | |
Arizona Industrial Development Authority, Basis School Project, Series G (RB) (AGM) 5.00%, 07/01/47 (c) | | | 500 | | | | 469,930 | |
See Notes to Financial Statements
| | | Par
(000’s | ) | | Value | |
| Arizona (continued) | | | | | | |
Arizona Industrial Development Authority, Benjamin Franklin Charter School Projects, Series A (RB) 5.25%, 07/01/53 (c) | | $ | 1,000 | | | $ | 954,043 | |
| Arizona Industrial Development Authority, Education Facility, Series A (RB) | | | | | | | | |
| 5.25%, 07/01/37 (c) | | | 2,650 | | | | 2,652,858 | |
| 5.50%, 07/01/52 (c) | | | 2,100 | | | | 1,987,877 | |
Arizona Industrial Development Authority, Kaizen Education Project (RB) 5.70%, 07/01/47 (c) | | | 1,000 | | | | 1,009,418 | |
Arizona Industrial Development Authority, Pinecrest Academy of Northern Nevada Project, Series A (RB) 4.50%, 07/15/29 (c) | | | 500 | | | | 471,125 | |
Arizona Industrial Development Authority, Point 320 LLC, Series A (RB) 3.62%, 05/20/33 | | | 6,427 | | | | 5,937,290 | |
Arizona Industrial Development Authority, Somerset Academy of Las Vegas, Series A (RB) 4.00%, 12/15/51 (c) | | | 1,400 | | | | 1,066,031 | |
City of Phoenix Civic Improvement Corp., Series B (RB) (BAM) 5.00%, 07/01/44 (c) | | | 6,990 | | | | 7,180,636 | |
| Glendale Industrial Development Authority, Beatitudes Campus Project (RB) | | | | | | | | |
| 4.00%, 11/15/27 (c) | | | 250 | | | | 236,710 | |
| 5.00%, 11/15/40 (c) | | | 1,000 | | | | 856,583 | |
Glendale Industrial Development Authority, Royal Oaks Inspirata Pointe Project, Series A (RB) 5.00%, 05/15/56 (c) | | | 1,340 | | | | 1,153,620 | |
Industrial Development Authority of the City of Phoenix Arizona/The (RB) 6.75%, 07/01/44 (c) | | | 1,000 | | | | 1,002,444 | |
| Industrial Development Authority of the City of Phoenix, Basis Schools, Inc. Project, Series A (RB) | | | | | | | | |
| 4.00%, 07/01/25 | | | 200 | | | | 198,422 | |
| 5.00%, 07/01/46 (c) | | | 1,000 | | | | 947,243 | |
| 5.00%, 07/01/45 (c) | | | 500 | | | | 477,350 | |
| 5.00%, 07/01/35 (c) | | | 900 | | | | 902,865 | |
Industrial Development Authority of the City of Phoenix, Downtown Student Housing, Series A (RB) 5.00%, 07/01/42 (c) | | | 1,250 | | | | 1,236,400 | |
| | | Par
(000’s | ) | | Value | |
| Arizona (continued) | | | | | | |
Industrial Development Authority of the City of Phoenix, Legacy Traditional School Project (RB) 5.00%, 07/01/45 (c) | | $ | 4,435 | | | $ | 4,233,993 | |
Industrial Development Authority of the City of Phoenix, Legacy Traditional School Project, Series A (RB) 5.00%, 07/01/36 (c) | | | 750 | | | | 753,305 | |
Maricopa County Arizona Industrial Development Authority, Valley Christian Schools Project, Series A (RB) 6.38%, 07/01/58 (c) | | | 1,000 | | | | 1,014,873 | |
Maricopa County Industrial Development Authority, Benjamin Franklin Charter School Projects, Series A (RB) 6.00%, 07/01/52 (c) | | | 1,000 | | | | 1,016,066 | |
| Maricopa County Industrial Development Authority, Legacy Traditional Schools Projects, Series A (RB) (SD CRED PROG) | | | | | | | | |
| 5.00%, 07/01/54 (c) | | | 1,400 | | | | 1,405,438 | |
| 5.00%, 07/01/49 (c) | | | 1,300 | | | | 1,311,565 | |
| Maricopa County Industrial Development Authority, Legacy Traditional Schools Projects, Series B (RB) | | | | | | | | |
| 5.00%, 07/01/54 (c) | | | 500 | | | | 460,601 | |
| 5.00%, 07/01/49 (c) | | | 1,990 | | | | 1,860,264 | |
| 5.00%, 07/01/39 (c) | | | 500 | | | | 493,172 | |
Maricopa County Industrial Development Authority, Paradise School Project (RB) 5.00%, 07/01/47 (c) | | | 1,750 | | | | 1,696,191 | |
Phoenix Arizona Industrial Development Authority, Falcon Properties LLC, Project, Series A (RB) 4.15%, 12/01/57 (c) | | | 5,000 | | | | 3,568,801 | |
Phoenix Arizona Industrial Development Authority, Guam Facilities Foundation, Inc. Project (RB) 5.12%, 02/01/34 (c) | | | 1,000 | | | | 945,691 | |
Phoenix Arizona Industrial Development Authority, Provident Group - Falcon Properties LLC, Project, Series A (RB) 4.00%, 12/01/51 (c) | | | 1,000 | | | | 732,709 | |
Pima County Industrial Development Authority, American Leadership Academy Project (RB) 5.62%, 06/15/45 (c) | | | 1,250 | | | | 1,252,470 | |
See Notes to Financial Statements
VANECK HIGH YIELD MUNI ETF
SCHEDULE OF INVESTMENTS
(continued)
| | | Par
(000’s | ) | | Value | |
| Arizona (continued) | | | | | | |
| Pima County Industrial Development Authority, Edkey Charter Schools Project (RB) | | | | | | |
| 5.25%, 07/01/36 (c) | | $ | 250 | | | $ | 250,358 | |
| 5.38%, 07/01/46 (c) | | | 250 | | | | 240,399 | |
| 5.50%, 07/01/51 (c) | | | 250 | | | | 240,418 | |
Pima County, Industrial Development Authority, Edkey Charter School Project (RB) 5.00%, 07/01/30 (c) | | | 1,000 | | | | 1,011,888 | |
Sacramento County, Community Facilities District No. 2005-2 (RB) 5.00%, 12/01/32 | | | 2,000 | | | | 2,104,558 | |
| Salt Verde Financial Corp. (RB) | | | | | | | | |
| 5.00%, 12/01/37 | | | 7,105 | | | | 7,556,941 | |
| 5.25%, 12/01/25 | | | 265 | | | | 269,437 | |
| 5.25%, 12/01/27 | | | 215 | | | | 222,710 | |
| 5.25%, 12/01/28 | | | 245 | | | | 254,893 | |
Tempe Industrial Development Authority, Friendship Village of Tempe (RB) 5.00%, 12/01/54 (c) | | | 355 | | | | 316,392 | |
| Tempe Industrial Development Authority, Mirabella at ASU Project, Series A (RB) | | | | | | | | |
| 6.00%, 10/01/37 (c) | | | 1,200 | | | | 841,288 | |
| 6.12%, 10/01/52 (c) | | | 600 | | | | 356,660 | |
| | | | | | | | 76,784,417 | |
| Arkansas: 1.1% | | | | | | | | |
Arkansas Development Finance Authority, Big River Steel Project (RB) 4.50%, 09/01/49 (c) | | | 7,520 | | | | 7,363,662 | |
| Arkansas Development Finance Authority, Environmental Improvement, United States Steel Corporation Project (RB) | | | | | | | | |
| 5.45%, 09/01/52 (c) | | | 19,750 | | | | 20,001,181 | |
| 5.70%, 05/01/53 (c) | | | 3,205 | | | | 3,296,099 | |
| | | | | | | | 30,660,942 | |
| California: 12.0% | | | | | | | | |
| Alameda Corridor Transportation Authority, Second Subordinate Lien, Series B (RB) | | | | | | | | |
| 5.00%, 10/01/37 (c) | | | 5,535 | | | | 5,628,495 | |
| 5.00%, 10/01/36 (c) | | | 2,230 | | | | 2,270,726 | |
| 5.00%, 10/01/35 (c) | | | 1,650 | | | | 1,681,792 | |
| 5.00%, 10/01/34 (c) | | | 3,000 | | | | 3,062,317 | |
Alameda Corridor Transportation Authority, Series A (RB) (AGM) 0.00%, 10/01/53 (c) ^ | | | 1,905 | | | | 458,344 | |
Anaheim Community Facilities District No. 08-1 (ST) 4.00%, 09/01/46 (c) | | | 420 | | | | 365,495 | |
| | | Par
(000’s | ) | | Value | |
| California (continued) | | | | | | |
| 4.00%, 09/01/36 (c) | | $ | 160 | | | $ | 156,287 | |
| 4.00%, 09/01/41 (c) | | | 615 | | | | 561,701 | |
Anaheim Public Financing Authority, Anaheim Public Improvement Project, Series A (RB) (BAM) 5.00%, 09/01/36 (c) | | | 2,000 | | | | 2,080,890 | |
Antelope Valley Healthcare District, Series A (RB) 5.25%, 03/01/36 (c) | | | 1,480 | | | | 1,477,269 | |
California Community Choice Financing Authority, Clean Energy Project, Series C (RB) 5.25%, 01/01/54 (c) (p) | | | 10,970 | | | | 11,450,374 | |
California Community Choice Financing Authority, Clean Energy, Series B-1 (RB) 5.00%, 07/01/53 (c) (p) | | | 1,580 | | | | 1,656,886 | |
California Community Choice Financing Authority, Clean Energy, Series D (RB) 5.50%, 05/01/54 (c) (p) | | | 10,000 | | | | 10,619,301 | |
California Community College Financing Authority, Orange Coast College Project (RB) 5.25%, 05/01/53 (c) | | | 1,695 | | | | 1,714,459 | |
California Community Housing Agency Senior Essential Housing, Series A-1 (RB) (AGM) 3.00%, 02/01/57 (c) | | | 3,000 | | | | 1,835,245 | |
California Community Housing Agency, Essential Housing, Arbors, Series A (RB) 5.00%, 08/01/50 (c) | | | 3,100 | | | | 2,893,905 | |
California Community Housing Agency, Essential Housing, Glendale Properties, Series A-1 (RB) 4.00%, 02/01/56 (c) | | | 2,000 | | | | 1,642,159 | |
California Community Housing Agency, Essential Housing, Glendale Properties, Series A-2 (RB) 3.00%, 08/01/56 (c) | | | 4,000 | | | | 2,784,349 | |
California Community Housing Agency, Essential Housing, Mira Vista Hills Apartments, Series A (RB) 4.00%, 02/01/56 (c) | | | 2,000 | | | | 1,392,313 | |
California Community Housing Agency, Essential Housing, Serenity at Larkspur, Series A (RB) 5.00%, 02/01/50 (c) | | | 3,000 | | | | 2,097,995 | |
See Notes to Financial Statements
| | | Par
(000’s | ) | | Value | |
| California (continued) | | | | | | |
California Community Housing Agency, Essential Housing, Summit at Sausalito Apartments, Series A-2 (RB) 4.00%, 02/01/50 (c) | | $ | 2,000 | | | $ | 1,478,686 | |
California Community Housing Agency, Series A-1 (RB) 4.00%, 02/01/56 (c) | | | 4,500 | | | | 4,016,889 | |
California Community Housing Agency, Stoneridge Apartments, Series A (RB) 4.00%, 02/01/56 (c) | | | 6,000 | | | | 4,717,717 | |
California County Tobacco Securitization Agency, Alameda County Tobacco Asset Securitization Corp. (RB) 5.88%, 06/01/35 (c) | | | 5 | | | | 5,111 | |
California County Tobacco Securitization Agency, Golden Gate Tobacco, Series A (RB) 5.00%, 06/01/36 (c) | | | 15 | | | | 14,706 | |
California County Tobacco Securitization Agency, Series A (RB) 4.00%, 06/01/49 (c) | | | 3,050 | | | | 2,892,370 | |
| California Health Facilities Financing Authority, Children’s Hospital, Series A (RB) | | | | | | | | |
| 4.00%, 08/15/49 (c) | | | 250 | | | | 219,387 | |
| 4.20%, 08/15/42 (c) | | | 500 | | | | 467,423 | |
| 5.00%, 08/15/37 (c) | | | 460 | | | | 473,430 | |
| 5.00%, 08/15/42 (c) | | | 990 | | | | 1,008,777 | |
California Health Facilities Financing Authority, Sutter Health, Series A (RB) 5.00%, 11/15/48 (c) | | | 590 | | | | 604,618 | |
| California Housing Finance Agency (RB) | | | | | | | | |
| 3.25%, 08/20/36 | | | 1,925 | | | | 1,747,011 | |
| 3.50%, 11/20/35 | | | 2,384 | | | | 2,204,182 | |
California Housing Finance Agency, Series A (RB) 4.00%, 03/20/33 | | | 6,503 | | | | 6,476,962 | |
California Infrastructure & Economic Development Bank, California Science Center Phase III Project, Series A (RB) 4.00%, 05/01/55 (c) | | | 2,300 | | | | 2,093,230 | |
California Infrastructure & Economic Development Bank, California State Teachers Retirement System (RB) 5.00%, 08/01/32 (c) | | | 1,085 | | | | 1,192,337 | |
| | | Par
(000’s | ) | | Value | |
| California (continued) | | | | | | |
California Infrastructure & Economic Development Bank, Charter School Portfolio Project, Series A-1 (RB) 5.00%, 01/01/55 (c) | | $ | 1,000 | | | $ | 840,908 | |
| California Municipal Finance Authority, California Baptist University, Series A (RB) | | | | | | | | |
| 5.50%, 11/01/45 (c) | | | 500 | | | | 502,062 | |
| 6.12%, 11/01/33 (c) | | | 1,000 | | | | 1,001,772 | |
California Municipal Finance Authority, Charter School Santa Rosa Academy Project, (RB) 5.00%, 07/01/62 (c) | | | 1,000 | | | | 940,144 | |
California Municipal Finance Authority, CHF-Davis I, LLC - West Village Student Housing Project (RB) 5.00%, 05/15/38 (c) | | | 500 | | | | 517,530 | |
California Municipal Finance Authority, CHF-Davis I, LLC - West Village Student Housing Project (RB) (BAM) 4.00%, 05/15/48 (c) | | | 150 | | | | 138,832 | |
California Municipal Finance Authority, CHF-Davis II, LLC - Orchard Park Student Housing Project (RB) (BAM) 4.00%, 05/15/46 (c) | | | 5,000 | | | | 4,782,196 | |
California Municipal Finance Authority, CHF-Davis II, LLC - Orchard Park Student Housing Project, Series A (RB) (BAM) 4.00%, 05/15/41 (c) | | | 1,500 | | | | 1,464,032 | |
California Municipal Finance Authority, Community Medical Centers, Series A (RB) 4.00%, 02/01/42 (c) | | | 1,165 | | | | 1,087,663 | |
| California Municipal Finance Authority, Eisenhower Medical Center, Series A (RB) | | | | | | | | |
| 5.00%, 07/01/30 (c) | | | 200 | | | | 206,309 | |
| 5.00%, 07/01/31 (c) | | | 250 | | | | 257,755 | |
| California Municipal Finance Authority, John Adams Academies Lincoln Project, Series A (RB) | | | | | | | | |
| 5.00%, 10/01/49 (c) | | | 500 | | | | 467,265 | |
| 5.00%, 10/01/57 (c) | | | 500 | | | | 453,472 | |
| 5.00%, 10/01/39 (c) | | | 500 | | | | 493,632 | |
California Municipal Finance Authority, Julian Charter School Project, Series A (RB) 5.62%, 03/01/45 (c) | | | 2,390 | | | | 2,262,283 | |
See Notes to Financial Statements
VANECK HIGH YIELD MUNI ETF
SCHEDULE OF INVESTMENTS
(continued)
| | | Par
(000’s | ) | | Value | |
| California (continued) | | | | | | |
| California Municipal Finance Authority, LINXS APM Project, Series A (RB) | | | | | | |
| 5.00%, 12/31/29 (c) | | $ | 500 | | | $ | 497,703 | |
| 5.00%, 06/30/29 (c) | | | 600 | | | | 597,420 | |
| 5.00%, 12/31/43 (c) | | | 2,490 | | | | 2,449,413 | |
| 5.00%, 06/30/28 | | | 65 | | | | 64,762 | |
| California Municipal Finance Authority, LINXS APM Project, Series A (RB) (AGM) | | | | | | | | |
| 3.00%, 12/31/30 (c) | | | 1,950 | | | | 1,782,455 | |
| 5.00%, 12/31/37 (c) | | | 1,000 | | | | 986,987 | |
| 5.00%, 12/31/34 (c) | | | 700 | | | | 693,517 | |
| 5.00%, 06/30/31 (c) | | | 1,035 | | | | 1,029,048 | |
California Municipal Finance Authority, Northbay Healthcare Group, Series A (RB) 5.25%, 11/01/47 (c) | | | 230 | | | | 221,767 | |
| California Municipal Finance Authority, Palmdale Aerospace Academy, Series A (RB) | | | | | | | | |
| 5.00%, 07/01/41 (c) | | | 500 | | | | 488,147 | |
| 5.00%, 07/01/49 (c) | | | 1,000 | | | | 941,303 | |
| 5.00%, 07/01/38 (c) | | | 130 | | | | 129,170 | |
California Municipal Finance Authority, Social Bonds - Healthright 360, Series A (RB) 5.00%, 11/01/49 (c) | | | 3,000 | | | | 2,656,352 | |
California Municipal Finance Authority, UCR Dundee-Glasgow Student Housing Project (RB) (BAM) 4.00%, 05/15/48 (c) | | | 250 | | | | 231,387 | |
California Municipal Finance Authority, United Airlines, Inc., International Airport Project (RB) 4.00%, 07/15/29 | | | 19,000 | | | | 18,893,268 | |
California Pollution Control Financing Authority, Poseidon Resources LP Desalination Project (RB) (ACA) 5.00%, 07/01/37 (c) | | | 5,000 | | | | 5,002,459 | |
| California Pollution Control Financing Authority, Solid Waste Disposal, CalPlant I Project (RB) | | | | | | | | |
| 7.00%, 07/01/22 (d) * | | | 1,000 | | | | 13,500 | |
| 7.50%, 12/01/39 (c) (d) * | | | 6,863 | | | | 686 | |
| 7.50%, 07/01/32 (c) (d) * | | | 10,500 | | | | 141,750 | |
| 8.00%, 07/01/39 (c) (d) * | | | 6,635 | | | | 89,573 | |
California Pollution Control Financing Authority, Solid Waste Disposal, CalPlant I Project (RB) (SAW) 7.50%, 07/01/32 (d) * | | | 1,000 | | | | 13,500 | |
| | | Par
(000’s | ) | | Value | |
| California (continued) | | | | | | |
| California Pollution Control Financing Authority, Water Furnishing Poseidon Resources (Channelside) LP Desalination Project (RB) | | | | | | |
| 5.00%, 07/01/38 (c) | | $ | 1,000 | | | $ | 1,064,191 | |
| 5.00%, 07/01/37 (c) | | | 1,000 | | | | 1,070,490 | |
California Public Finance Authority, Enso Village Project, Series A (RB) 5.00%, 06/01/54 (c) | | | 400 | | | | 367,020 | |
California School Finance Authority, Charter School Facility, Grimmway School, Series A (RB) 5.00%, 07/01/36 (c) | | | 2,000 | | | | 2,015,355 | |
California School Finance Authority, Charter School, John Adams Academies, Series A (RB) 5.00%, 07/01/52 (c) | | | 1,000 | | | | 927,271 | |
California School Finance Authority, NCCD-Santa Rosa Properties LLC, Series A (RB) 4.00%, 11/01/51 (c) | | | 1,000 | | | | 823,939 | |
| California School Finance Authority, River Springs Charter School Project, Series A (RB) | | | | | | | | |
| 5.00%, 07/01/47 (c) | | | 2,000 | | | | 1,864,816 | |
| 6.38%, 07/01/46 (c) | | | 5,000 | | | | 5,152,370 | |
| California School Finance Authority, Rocketship Education, Series A (RB) | | | | | | | | |
| 5.12%, 06/01/47 (c) | | | 250 | | | | 244,202 | |
| 5.25%, 06/01/52 (c) | | | 250 | | | | 245,307 | |
| California Statewide Communities Development Authority, Baptist University, Series A (RB) | | | | | | | | |
| 3.50%, 11/01/27 | | | 1,210 | | | | 1,173,910 | |
| 5.00%, 11/01/41 (c) | | | 1,000 | | | | 994,234 | |
| 6.38%, 11/01/43 (c) | | | 1,000 | | | | 1,001,268 | |
California Statewide Communities Development Authority, College Housing (RB) 5.25%, 07/01/49 (c) | | | 250 | | | | 250,093 | |
| California Statewide Communities Development Authority, Daughters of Charity Health System, Series A (RB) | | | | | | | | |
| 5.50%, 07/01/39 (c) (d) * | | | 21 | | | | 19,561 | |
| 5.75%, 07/01/24 (c) (d) * | | | 4 | | | | 3,743 | |
See Notes to Financial Statements
| | | Par
(000’s | ) | | Value | |
| California (continued) | | | | | | |
California Statewide Communities Development Authority, Daughters of Charity Health System, Series H (RB) 5.75%, 07/01/25 (c) (d) * | | $ | 1 | | | $ | 549 | |
| California Statewide Communities Development Authority, Irvine East Campus Armaments, CHF-Irvine, LLC (RB) | | | | | | | | |
| 5.00%, 05/15/33 (c) | | | 545 | | | | 556,184 | |
| 5.00%, 05/15/30 (c) | | | 385 | | | | 394,065 | |
California Statewide Communities Development Authority, Lancer Educational Student Housing Project, Series A (RB) 5.00%, 06/01/39 (c) | | | 435 | | | | 438,474 | |
California Statewide Communities Development Authority, Lancer Plaza Project (RB) 5.62%, 11/01/33 (c) | | | 1,075 | | | | 1,076,286 | |
| California Statewide Communities Development Authority, Loma Linda University Medical Center, Series A (RB) | | | | | | | | |
| 5.00%, 12/01/41 (c) | | | 17,050 | | | | 17,150,155 | |
| 5.00%, 12/01/36 (c) | | | 3,595 | | | | 3,644,551 | |
| 5.25%, 12/01/44 (c) | | | 5,300 | | | | 5,315,306 | |
| 5.25%, 12/01/34 (c) | | | 1,740 | | | | 1,752,392 | |
| 5.25%, 12/01/56 (c) | | | 14,900 | | | | 14,971,378 | |
| 5.25%, 12/01/48 (c) | | | 1,000 | | | | 1,015,328 | |
| 5.50%, 12/01/54 (c) | | | 11,630 | | | | 11,666,137 | |
| 5.50%, 12/01/58 (c) | | | 3,500 | | | | 3,565,987 | |
California Statewide Communities Development Authority, Methodist Hospital of Southern California (RB) 5.00%, 01/01/33 (c) | | | 2,000 | | | | 2,137,998 | |
California Statewide Communities Development Authority, Provident Group Pomona Properties LLC, Series A (RB) 5.00%, 12/01/46 (c) | | | 4,730 | | | | 4,739,240 | |
California Statewide Communities Development Authority, University of California, Irvine East Campus Apartments (RB) 3.50%, 05/15/36 (c) | | | 615 | | | | 569,194 | |
California Statewide Communities Development Authority, University of California, Irvine East Campus Apartments, Phase IV-A (RB) 5.00%, 05/15/47 (c) | | | 3,170 | | | | 3,182,843 | |
| | | Par
(000’s | ) | | Value | |
| California (continued) | | | | | | |
California Statewide Financing Authority, Pooled Tobacco Securitization Program, Series C (RB) 6.00%, 05/01/43 (c) | | $ | 900 | | | $ | 919,896 | |
City & County of San Francisco, Special Tax District No 2020-1, Series A (ST) 4.00%, 09/01/41 (c) | | | 1,635 | | | | 1,435,032 | |
City of Fontana, Community Facilities District No. 90 (ST) 4.00%, 09/01/51 (c) | | | 500 | | | | 433,782 | |
City of Fremont, Community Facilities District No. 1 (ST) 5.00%, 09/01/40 (c) | | | 250 | | | | 251,648 | |
| City of Irvine, Community Facilities District No. 2013-3 (ST) | | | | | | | | |
| 4.00%, 09/01/33 (c) | | | 250 | | | | 250,425 | |
| 4.00%, 09/01/34 (c) | | | 250 | | | | 250,465 | |
| 4.00%, 09/01/32 (c) | | | 230 | | | | 230,532 | |
City of Irvine, Reassessment District No. 15-2 (SA) 5.00%, 09/02/42 (c) | | | 750 | | | | 755,896 | |
City of Rancho Cordova, Sunridge Anatolia community Facilities District No. 2003-1 (ST) 4.00%, 09/01/37 (c) | | | 180 | | | | 174,464 | |
City of Rocklin, Community Facilities District No. 10 (ST) 5.00%, 09/01/39 (c) | | | 810 | | | | 819,633 | |
| City of Roseville, Fiddyment Ranch Community Facilities District No. 1 (ST) | | | | | | | | |
| 3.75%, 09/01/36 (c) | | | 500 | | | | 463,537 | |
| 5.00%, 09/01/34 (c) | | | 155 | | | | 159,129 | |
City of Roseville, Fiddyment Ranch Community Facilities District No. 5 (ST) 5.00%, 09/01/47 (c) | | | 3,450 | | | | 3,472,483 | |
City of Roseville, Westpark Community Facility District No. 1 (ST) 5.00%, 09/01/37 (c) | | | 200 | | | | 202,180 | |
City of San Clemente, Facilities District No. 2006-1 (ST) 5.00%, 09/01/40 (c) | | | 1,045 | | | | 1,055,120 | |
CMFA Special Finance Agency VII Essential Housing, The Breakwater Apartments, Series A-1 (RB) 3.00%, 08/01/56 (c) | | | 4,000 | | | | 2,663,283 | |
CMFA Special Finance Agency VIII, Essential Housing, Series A-1 (RB) 3.00%, 08/01/56 (c) | | | 8,360 | | | | 5,556,395 | |
See Notes to Financial Statements
VANECK HIGH YIELD MUNI ETF
SCHEDULE OF INVESTMENTS
(continued)
| | | Par
(000’s | ) | | Value | |
| California (continued) | | | | | | |
CMFA Special Finance Agency XII, Essential Housing, Series A-2 (RB) 4.38%, 08/01/49 (c) | | $ | 1,000 | | | $ | 809,259 | |
CMFA Special Finance Agency, Essential Housing, Series A-1 (RB) 4.00%, 08/01/56 (c) | | | 2,500 | | | | 2,133,463 | |
| Compton Public Finance Authority (RB) | | | | | | | | |
| 4.00%, 09/01/27 (c) | | | 800 | | | | 793,077 | |
| 4.50%, 09/01/32 (c) | | | 1,585 | | | | 1,572,961 | |
County of Los Angeles Community Facilities District No 2021-01 (ST) 5.00%, 09/01/47 (c) | | | 1,000 | | | | 1,003,052 | |
| CSCDA Community Improvement Authority (RB) | | | | | | | | |
| 2.80%, 03/01/47 (c) | | | 1,935 | | | | 1,430,624 | |
| 3.12%, 07/01/56 (c) | | | 2,500 | | | | 1,650,457 | |
| 3.60%, 05/01/47 (c) | | | 2,000 | | | | 1,646,088 | |
CSCDA Community Improvement Authority, Atlanta-Glendale, Series A-1 (RB) 3.50%, 10/01/46 (c) | | | 1,000 | | | | 789,980 | |
CSCDA Community Improvement Authority, Atlanta-Glendale, Series A-2 (RB) 4.00%, 10/01/56 (c) | | | 7,750 | | | | 5,905,023 | |
| CSCDA Community Improvement Authority, City of Orange Portfolio, Series A-2 (RB) | | | | | | | | |
| 3.00%, 12/01/56 (c) | | | 2,000 | | | | 1,379,652 | |
| 3.00%, 03/01/57 (c) | | | 4,000 | | | | 2,696,737 | |
| CSCDA Community Improvement Authority, Essential Housing Mezzanine Lien, Series B (RB) | | | | | | | | |
| 4.00%, 04/01/57 (c) | | | 1,000 | | | | 714,249 | |
| 4.00%, 05/01/57 (c) | | | 1,500 | | | | 1,067,777 | |
CSCDA Community Improvement Authority, Essential Housing, Acacia on Santa Rosa Creek, Series A (RB) (NATL) 4.00%, 10/01/56 (c) | | | 2,500 | | | | 2,114,902 | |
CSCDA Community Improvement Authority, Essential Housing, The Link Glendale, Series A-1 (RB) 3.00%, 07/01/45 (c) | | | 1,000 | | | | 753,577 | |
| | | Par
(000’s | ) | | Value | |
| California (continued) | | | | | | |
CSCDA Community Improvement Authority, Essential Housing, Waterscape Apartments, Series A (RB) 3.00%, 09/01/56 (c) | | $ | 2,060 | | | $ | 1,402,835 | |
CSCDA Community Improvement Authority, Essential Housing, Westgate Phase, Series A-2 (RB) 3.12%, 06/01/57 (c) | | | 3,000 | | | | 1,757,139 | |
CSCDA Community Improvement Authority, Jefferson-Anaheim, Series A-2 (RB) 3.12%, 08/01/56 (c) | | | 4,205 | | | | 3,052,573 | |
CSCDA Community Improvement Authority, Link-Glendale, Series A-2 (RB) 4.00%, 07/01/56 (c) | | | 5,350 | | | | 3,880,222 | |
CSCDA Community Improvement Authority, Millennium South Bay-Hawthorne, Series A-1 (RB) 3.25%, 07/01/56 (c) | | | 2,000 | | | | 1,362,744 | |
CSCDA Community Improvement Authority, Monterey Station Apartments, Series A-1 (RB) 3.00%, 07/01/43 (c) | | | 2,500 | | | | 1,926,948 | |
CSCDA Community Improvement Authority, Park Crossing Apartments, Series B (RB) 4.00%, 12/01/48 (c) | | | 1,000 | | | | 730,247 | |
CSCDA Community Improvement Authority, Pasadena Portfolio, Series A-1 (RB) 2.65%, 12/01/46 (c) | | | 1,635 | | | | 1,249,624 | |
CSCDA Community Improvement Authority, Pasadena Portfolio, Series B (RB) 4.00%, 12/01/56 (c) | | | 1,000 | | | | 729,762 | |
CSCDA Community Improvement Authority, Vineyard Gardens Apartments, Series B (RB) 4.00%, 10/01/48 (c) | | | 500 | | | | 360,534 | |
CSCDA Community Improvement Authority, Wood Creek Apartments, Series A-2 (RB) 4.00%, 12/01/58 (c) | | | 3,000 | | | | 2,222,527 | |
| Dublin Community Facilities District No 2015-1 (ST) | | | | | | | | |
| 5.00%, 09/01/39 (c) | | | 500 | | | | 517,249 | |
| 5.00%, 09/01/44 (c) | | | 500 | | | | 511,643 | |
| 5.00%, 09/01/49 (c) | | | 500 | | | | 506,686 | |
See Notes to Financial Statements
| | | Par
(000’s | ) | | Value | |
| California (continued) | | | | | | |
| 5.00%, 09/01/37 (c) | | $ | 1,150 | | | $ | 1,184,192 | |
| 5.00%, 09/01/47 (c) | | | 485 | | | | 489,796 | |
| Folsom Ranch Financing Authority (ST) | | | | | | | | |
| 5.00%, 09/01/32 (c) | | | 1,100 | | | | 1,143,551 | |
| 5.00%, 09/01/37 (c) | | | 2,000 | | | | 2,058,208 | |
Foothill/Eastern Transportation Corridor Agency, Toll Road Revenue, Series B-1 (RB) 3.95%, 01/15/53 (c) | | | 100 | | | | 90,101 | |
Foothill/Eastern Transportation Corridor Agency, Toll Road Revenue, Series B-2 (RB) 3.50%, 01/15/53 (c) | | | 475 | | | | 391,362 | |
Golden State Tobacco Securitization Corp., California Tobacco Settlement, Series B-2 (RB) 0.00%, 06/01/66 (c) ^ | | | 101,000 | | | | 10,255,833 | |
Independent Cities Finance Authority, Mobil Home Park, Series A (RB) 3.75%, 10/15/46 (c) | | | 250 | | | | 210,206 | |
Inland Empire Tobacco Securitization Authority, Series C-2 (RB) 0.00%, 06/01/47 (c) ^ | | | 100,000 | | | | 21,120,050 | |
Irvine Unified School District (ST) 5.00%, 09/01/51 (c) | | | 1,075 | | | | 1,085,345 | |
Lake Elsinore Public Financing Authority, Local Agency (ST) 5.00%, 09/01/40 (c) | | | 405 | | | | 407,774 | |
Lincoln Public Financing Authority, Twelve Bridges, Series B (SA) 6.00%, 09/02/27 (c) | | | 27 | | | | 27,040 | |
MSR Energy Authority, Series A (RB) 6.12%, 11/01/29 | | | 420 | | | | 444,941 | |
| Orange County Community Facilities District No. 1, Series A (ST) | | | | | | | | |
| 4.25%, 08/15/38 (c) | | | 975 | | | | 967,393 | |
| 5.25%, 08/15/45 (c) | | | 455 | | | | 458,352 | |
Palm Desert California Improvement, Section 29 Assessment District No. 2004- 02 (SA) 4.00%, 09/02/37 (c) | | | 1,200 | | | | 1,134,985 | |
Palomar Health (RB) 5.00%, 11/01/31 (c) | | | 250 | | | | 242,663 | |
Palomar Pomerado Health, Series A (GO) (NATL) 0.00%, 08/01/25 ^ | | | 125 | | | | 118,409 | |
Perris Union High School District Financing Authority (ST) 5.00%, 09/01/41 (c) | | | 1,000 | | | | 1,003,983 | |
| | | Par
(000’s | ) | | Value | |
| California (continued) | | | | | | |
Poway Unified School District Public Financing Authority, Series A (ST) 5.00%, 09/01/34 (c) | | $ | 750 | | | $ | 761,885 | |
River Islands Public Financing Authority, Community Facilities District No. 2003-1, Series A-1 (ST) 5.00%, 09/01/38 (c) | | | 500 | | | | 510,356 | |
Romoland School District No. 2004-1 (ST) 5.00%, 09/01/48 (c) | | | 500 | | | | 505,970 | |
| Sacramento County, Community Facilities District No. 2005-2 (ST) | | | | | | | | |
| 5.00%, 09/01/45 (c) | | | 495 | | | | 498,457 | |
| 5.00%, 09/01/40 (c) | | | 345 | | | | 348,989 | |
San Diego County Regional Airport Authority, Series A (RB) 5.00%, 07/01/56 (c) | | | 745 | | | | 783,269 | |
San Diego County, California Regional Airport, Series A (RB) 4.00%, 07/01/46 (c) | | | 1,050 | | | | 1,029,061 | |
San Francisco California City & County Airport Commission International Airport, SFO Fuel Company LLC, Series A (RB) 5.00%, 01/01/47 (c) | | | 1,475 | | | | 1,507,878 | |
San Francisco City & County, International Airport, Series A (RB) (BAM-TCRS) 5.00%, 05/01/40 (c) | | | 2,750 | | | | 2,750,965 | |
San Jacinto Unified School District Financing Authority (ST) 5.00%, 09/01/49 (c) | | | 300 | | | | 302,464 | |
San Joaquin Hills Transportation Corridor Agency, Junior Lien Toll Road, Series B (RB) 5.25%, 01/15/49 (c) | | | 200 | | | | 201,203 | |
| San Joaquin Hills Transportation Corridor Agency, Toll Road, Series A (RB) (NATL) | | | | | | | | |
| 0.00%, 01/15/32 ^ | | | 145 | | | | 107,209 | |
| 0.00%, 01/15/36 ^ | | | 105 | | | | 65,312 | |
Saugus Hart School Facilities Financing Authority, Community Facilities District No. 2006-1 (ST) 5.00%, 09/01/41 (c) | | | 500 | | | | 503,630 | |
Successor Agency of Pttsburg, Los Medanos Community Development Project, Series A (TA) (AGM) 5.00%, 09/01/29 (c) | | | 1,020 | | | | 1,054,281 | |
See Notes to Financial Statements
VANECK HIGH YIELD MUNI ETF
SCHEDULE OF INVESTMENTS
(continued)
| | | Par
(000’s | ) | | Value | |
| California (continued) | | | | | | |
| Tustin Community Facilities District, Series A (ST) | | | | | | |
| 5.00%, 09/01/45 (c) | | $ | 100 | | | $ | 100,521 | |
| 5.00%, 09/01/40 (c) | | | 100 | | | | 100,775 | |
Val Verde Unified School District (ST) 5.00%, 09/01/37 (c) | | | 750 | | | | 755,505 | |
| Western Hills Water District, Diablo Grande Community Facilities District No. 1 (ST) | | | | | | | | |
| 4.00%, 09/01/21 (d) * | | | 850 | | | | 231,625 | |
| 5.30%, 09/01/31 (c) (d) * | | | 530 | | | | 144,425 | |
William S. Hart Union High School District No. 2015-1 (ST) 5.00%, 09/01/42 (c) | | | 445 | | | | 450,512 | |
| | | | | | | | 348,490,984 | |
| Colorado: 2.5% | | | | | | | | |
Aerotropolis Colorado Regional Transportation Authority (RB) 4.38%, 12/01/52 (c) | | | 2,000 | | | | 1,639,384 | |
Arkansas River Power Authority, Power Supply System, Series A (RB) 5.00%, 10/01/43 (c) | | | 2,010 | | | | 2,033,540 | |
Base Village Metropolitan District No. 2, Series A (GO) 5.75%, 12/01/46 (c) | | | 1,000 | | | | 996,829 | |
| Brighton Crossing Metropolitan District No. 6, Series A (GO) | | | | | | | | |
| 5.00%, 12/01/35 (c) | | | 500 | | | | 482,391 | |
| 5.00%, 12/01/40 (c) | | | 500 | | | | 452,802 | |
Broadway Station Metropolitan District No. 3, Series A (GO) 5.00%, 12/01/49 (c) | | | 1,425 | | | | 1,106,061 | |
Centerra Metropolitan District No 1 in Larimer County, Colorado, Series A (GO) 5.00%, 12/01/51 (c) | | | 1,000 | | | | 889,989 | |
| Centerra Metropolitan District No. 1 (TA) | | | | | | | | |
| 5.00%, 12/01/47 (c) | | | 500 | | | | 449,198 | |
| 5.00%, 12/01/29 (c) | | | 500 | | | | 494,336 | |
| 5.00%, 12/01/37 (c) | | | 500 | | | | 480,003 | |
City and County of Denver, United Airlines, Inc. Project (RB) 5.00%, 10/01/32 (c) | | | 10,195 | | | | 10,187,622 | |
City of Fruita, Colorado Healthcare Canyons Hospital and Medical Center, Series B (RB) 5.50%, 01/01/48 (c) | | | 2,250 | | | | 2,079,106 | |
Colorado Bridge Enterprise, Central 70 Project (RB) 4.00%, 06/30/51 (c) | | | 2,700 | | | | 2,266,240 | |
| | | Par
(000’s | ) | | Value | |
| Colorado (continued) | | | | | | |
Colorado Educational and Cultural Facilities Authority, Rocky Mountain Classical Academy Project (RB) 5.00%, 10/01/49 (c) | | $ | 500 | | | $ | 460,837 | |
Colorado Health Facilities Authority, CommonSpirit Health, Series A-1 (RB) 4.00%, 08/01/38 (c) | | | 510 | | | | 492,605 | |
| Colorado Health Facilities Authority, CommonSpirit Health, Series A-2 (RB) | | | | | | | | |
| 3.25%, 08/01/49 (c) | | | 5 | | | | 3,695 | |
| 4.00%, 08/01/49 (c) | | | 4,735 | | | | 4,306,828 | |
| 5.00%, 08/01/44 (c) | | | 2,000 | | | | 2,056,132 | |
Colorado Health Facilities Authority, Covenant Retirement Communities, Inc., Series A (RB) 5.00%, 12/01/35 (c) | | | 1,000 | | | | 1,001,240 | |
Colorado Health Facilities Authority, Senior Living Second Tier, American Eagle Portfolio Project Series B-1 (RB) 2.00%, 07/01/57 (c) | | | 536 | | | | 53,616 | |
Colorado High Performance Transportation Enterprise, C-470 Express Lanes (RB) 5.00%, 12/31/51 (c) | | | 350 | | | | 350,452 | |
| Creekwalk Marketplace Business Improvement District, Series A (RB) | | | | | | | | |
| 5.50%, 12/01/39 (c) | | | 500 | | | | 438,471 | |
| 5.75%, 12/01/49 (c) | | | 500 | | | | 426,083 | |
Crowfoot Valley Ranch Metropolitan District No. 2, Series A (GO) 5.62%, 12/01/38 (c) | | | 1,000 | | | | 972,165 | |
| Fountain Urban Renewal Authority, South Academy Highlands Project, Series A (TA) | | | | | | | | |
| 4.50%, 11/01/29 (c) | | | 720 | | | | 702,368 | |
| 5.25%, 11/01/37 (c) | | | 2,345 | | | | 2,287,670 | |
| 5.50%, 11/01/44 (c) | | | 1,865 | | | | 1,795,166 | |
Green Valley Ranch East Metropolitan District No. 6, Series A (GO) 5.88%, 12/01/50 (c) | | | 1,000 | | | | 977,757 | |
Jefferson Center Metropolitan District No. 1, Series A-2 (RB) 4.38%, 12/01/47 (c) | | | 1,000 | | | | 851,696 | |
Kinston Metropolitan District No. 5, Series A (GO) 5.12%, 12/01/50 (c) | | | 1,000 | | | | 956,800 | |
Painted Prairie Public Improvement Authority (RB) 5.00%, 12/01/39 (c) | | | 1,000 | | | | 935,009 | |
See Notes to Financial Statements
| | | Par
(000’s | ) | | Value | |
| Colorado (continued) | | | | | | |
Peak Metropolitan District No. 1, El Paco County, Series A (GO) 4.00%, 12/01/35 (c) | | $ | 540 | | | $ | 466,133 | |
Prairie Center Metropolitan District No. 3, Adams County, Series A (RB) 5.00%, 12/15/41 (c) | | | 4,000 | | | | 3,963,646 | |
Public Authority for Colorado Energy Natural Gas (RB) 6.50%, 11/15/38 | | | 2,000 | | | | 2,415,499 | |
Puerto Rico Sales Tax Financing Corp., Series A-2 (RB) 3.62%, 12/01/44 (c) | | | 960 | | | | 713,233 | |
Rampart Range Metropolitan District No. 5, Colorado Limited Tax Supported and Special Bonds (RB) 4.00%, 12/01/51 (c) | | | 3,000 | | | | 2,220,200 | |
Regional Transportation District, Denver Transit Partners Eagle P3 Project, Series A (RB) 4.00%, 07/15/39 | | | 1,500 | | | | 1,456,886 | |
Southglenn Metropolitan District (GO) 5.00%, 12/01/46 (c) | | | 1,000 | | | | 902,874 | |
Southlands Metropolitan District No. 1, Series A-1 (GO) 5.00%, 12/01/47 (c) | | | 1,200 | | | | 1,146,320 | |
| Sterling Ranch Community Authority Board, Colorado Limited Tax, Series A (RB) | | | | | | | | |
| 4.25%, 12/01/50 (c) | | | 1,000 | | | | 838,203 | |
| 6.50%, 12/01/54 (c) | | | 1,000 | | | | 1,017,352 | |
Sterling Ranch Community Authority Board, Douglas County, Colorado (SA) 5.62%, 12/01/43 (c) | | | 1,000 | | | | 1,014,422 | |
Trails at Crowfoot Metropolitan District No 3 (GO) 5.00%, 12/01/49 (c) | | | 1,000 | | | | 931,838 | |
| Transport Metropolitan District No. 3 (GO) | | | | | | | | |
| 5.00%, 12/01/51 (c) | | | 4,000 | | | | 3,160,471 | |
| 5.00%, 12/01/41 (c) | | | 2,000 | | | | 1,692,789 | |
Tree Farm Metropolitan District, Eagle County, Colorado (GO) 4.75%, 12/01/50 (c) | | | 2,000 | | | | 1,711,340 | |
| Velocity Metropolitan District No. 3 (GO) | | | | | | | | |
| 5.12%, 12/01/34 (c) | | | 500 | | | | 495,894 | |
| 5.38%, 12/01/39 (c) | | | 1,500 | | | | 1,455,810 | |
| Verve Metropolitan District No. 1 (GO) | | | | | | | | |
| 5.00%, 12/01/36 (c) | | | 1,025 | | | | 878,034 | |
| 5.75%, 12/01/33 (c) | | | 1,000 | | | | 942,441 | |
| | | Par
(000’s | ) | | Value | |
| Colorado (continued) | | | | | | |
Village Metropolitan District/The (GO) 5.00%, 12/01/49 (c) | | $ | 1,750 | | | $ | 1,649,023 | |
| Windler Public Improvement Authority, Series A-1 (RB) (BAM) | | | | | | | | |
| 4.00%, 12/01/36 (c) | | | 1,000 | | | | 863,042 | |
| 4.00%, 12/01/41 (c) | | | 1,000 | | | | 784,010 | |
| | | | | | | | 73,345,551 | |
| Connecticut: 0.7% | | | | | | | | |
Bridgeport Housing Authority, Energy Performance Equipment (RB) 5.60%, 06/01/26 (c) | | | 630 | | | | 627,242 | |
| Connecticut State Health and Educational Facilities Authority, Church Home of Harford, Series A (RB) | | | | | | | | |
| 5.00%, 09/01/46 (c) | | | 3,500 | | | | 2,991,786 | |
| 5.00%, 09/01/53 (c) | | | 1,200 | | | | 976,065 | |
| Connecticut State Health and Educational Facilities Authority, Griffin Hospital, Series G (RB) | | | | | | | | |
| 5.00%, 07/01/50 (c) | | | 2,630 | | | | 2,268,887 | |
| 5.00%, 07/01/44 (c) | | | 1,100 | | | | 992,166 | |
Connecticut State Health and Educational Facilities Authority, Mary Wade Home Issue, Series A-1 (RB) 5.00%, 10/01/54 (c) | | | 5,000 | | | | 3,808,031 | |
Connecticut State Health and Educational Facilities Authority, McLean Issue, Series A (RB) 5.00%, 01/01/55 (c) | | | 2,000 | | | | 1,551,126 | |
| Connecticut State Health and Educational Facilities Authority, Nuvance Health Issue, Series A (RB) | | | | | | | | |
| 4.00%, 07/01/38 (c) | | | 500 | | | | 466,352 | |
| 5.00%, 07/01/33 (c) | | | 1,000 | | | | 1,023,209 | |
Connecticut State Health and Educational Facilities Authority, University of Hartford, Series N (RB) 4.00%, 07/01/44 (c) | | | 250 | | | | 190,982 | |
Connecticut State Health and Educational Facilities Authority, University of Hartford, Series N (RB) (SD CRED PROG) 4.00%, 07/01/49 (c) | | | 250 | | | | 181,872 | |
| Steel Point Infrastructure Improvement District (TA) | | | | | | | | |
| 4.00%, 04/01/51 (c) | | | 2,000 | | | | 1,573,862 | |
| 4.00%, 04/01/41 (c) | | | 1,125 | | | | 953,645 | |
See Notes to Financial Statements
VANECK HIGH YIELD MUNI ETF
SCHEDULE OF INVESTMENTS
(continued)
| | | Par
(000’s | ) | | Value | |
| Connecticut (continued) | | | | | | |
Town of Hamden, Whitney Center Project (RB) 5.00%, 01/01/50 (c) | | $ | 3,000 | | | $ | 2,602,380 | |
| | | | | | | | 20,207,605 | |
| Delaware: 0.2% | | | | | | | | |
County of Kent, Delaware Student Housing and Dinning Facility, State University Project, Series A (RB) 5.00%, 07/01/48 (c) | | | 1,450 | | | | 1,439,846 | |
| Delaware Economic Development Authority, Aspira Chapter School, Series A (RB) | | | | | | | | |
| 4.00%, 06/01/52 (c) | | | 915 | | | | 676,873 | |
| 5.00%, 06/01/46 (c) | | | 1,000 | | | | 912,649 | |
| 5.00%, 06/01/36 (c) | | | 250 | | | | 247,313 | |
Delaware State Economic Development Authority (RB) 5.00%, 06/01/51 (c) | | | 1,100 | | | | 980,480 | |
| | | | | | | | 4,257,161 | |
| District of Columbia: 0.7% | | | | | | | | |
District of Columbia Tobacco Settlement Financing Corp. (RB) 0.00%, 06/15/46 (c) ^ | | | 7,500 | | | | 1,749,488 | |
District of Columbia, Federal Highway Grant Anticipation (RB) (SAW) 5.00%, 12/01/30 (c) | | | 1,225 | | | | 1,343,250 | |
| District of Columbia, Ingleside at Rock Creek Project, Series A (RB) | | | | | | | | |
| 5.00%, 07/01/32 (c) | | | 250 | | | | 251,727 | |
| 5.00%, 07/01/42 (c) | | | 1,180 | | | | 1,124,399 | |
| District of Columbia, Latin American Montessori Bilingual Public Charter School Issue (RB) | | | | | | | | |
| 5.00%, 06/01/50 (c) | | | 3,500 | | | | 3,263,528 | |
| 5.00%, 06/01/40 (c) | | | 500 | | | | 489,171 | |
Metropolitan Washington Airports Authority, Dulles Toll Road, Series A (RB) 0.00%, 10/01/37 ^ | | | 9,325 | | | | 4,866,841 | |
| Metropolitan Washington Airports Authority, Dulles Toll Road, Series B (RB) | | | | | | | | |
| 0.00%, 10/01/37 ^ | | | 1,020 | | | | 555,309 | |
| 4.00%, 10/01/44 (c) | | | 7,315 | | | | 6,939,857 | |
| 4.00%, 10/01/36 (c) | | | 250 | | | | 252,359 | |
| 6.50%, 10/01/44 (c) | | | 245 | | | | 267,451 | |
| | | | | | | | 21,103,380 | |
| | | Par
(000’s | ) | | Value | |
| Florida: 4.6% | | | | | | |
Alachua County, Health Facilities Authority, Shands Teaching Hospital and Clinics, Inc., at the University of Florida Project, Series B (RB) 5.00%, 12/01/34 (c) | | $ | 1,055 | | | $ | 1,061,152 | |
Brevard County, Florida Health Facilities Authority, Series A (RB) 5.00%, 04/01/52 (c) | | | 1,000 | | | | 1,032,210 | |
Broward County Florida Port Facilities, Series B (RB) 4.00%, 09/01/38 (c) | | | 2,150 | | | | 2,151,957 | |
Cape Coral Health Facilities Authority, Gulf Care, Inc. Project (RB) 6.00%, 07/01/50 (c) | | | 295 | | | | 207,561 | |
Capital Trust Agency, Education Growth Fund, Series A-1 (RB) 5.00%, 07/01/56 (c) | | | 7,200 | | | | 6,588,525 | |
Capital Trust Agency, Educational Facilities, Franklin Academy Projects (RB) 5.00%, 12/15/35 (c) | | | 1,335 | | | | 1,294,873 | |
Capital Trust Agency, Educational Facilities, Franklin Academy Projects (RB) (SD CRED PROG) 5.00%, 12/15/40 (c) | | | 500 | | | | 459,670 | |
| Capital Trust Agency, Educational Facilities, Pineapple Cove Classical Academy, Inc., Series A (RB) | | | | | | | | |
| 4.50%, 07/01/29 (c) | | | 400 | | | | 388,316 | |
| 5.12%, 07/01/39 (c) | | | 500 | | | | 480,844 | |
| 5.25%, 07/01/49 (c) | | | 500 | | | | 457,015 | |
| 5.38%, 07/01/54 (c) | | | 500 | | | | 455,337 | |
| Capital Trust Agency, Educational Facilities, Renaissance Charter School, Inc., Series A (RB) | | | | | | | | |
| 4.38%, 06/15/27 | | | 185 | | | | 182,213 | |
| 5.25%, 06/15/47 (c) | | | 500 | | | | 477,433 | |
Capital Trust Agency, Educational Facilities, Renaissance Charter School, Inc., Series A (RB) (SBG) 5.00%, 06/15/39 (c) | | | 1,000 | | | | 958,962 | |
| Capital Trust Agency, University Bridge, LLC Student Housing Project, Series A (RB) | | | | | | | | |
| 4.00%, 12/01/28 | | | 2,200 | | | | 2,130,960 | |
| 5.25%, 12/01/43 (c) | | | 2,000 | | | | 1,963,921 | |
| 5.25%, 12/01/58 (c) | | | 2,200 | | | | 2,097,749 | |
Capital Trust Agency, Wonderful Foundations Charter Schools Portfolio Projects, Series A (RB) 5.00%, 01/01/55 (c) | | | 2,250 | | | | 1,860,071 | |
See Notes to Financial Statements
| | | Par
(000’s | ) | | Value | |
| Florida (continued) | | | | | | |
Charlotte County Industrial Development Authority, Town & Country Utilities Project (RB) 5.00%, 10/01/49 (c) | | $ | 1,000 | | | $ | 985,522 | |
City of Orlando, Senior Tourist Development Tax, Series A (RB) (AGM) 5.00%, 11/01/31 (c) | | | 3,000 | | | | 3,140,110 | |
| City of Orlando, Tourist Development Tax, Series A (RB) (AGM) | | | | | | | | |
| 5.00%, 11/01/27 | | | 1,100 | | | | 1,147,202 | |
| 5.00%, 11/01/38 (c) | | | 500 | | | | 514,037 | |
| 5.00%, 11/01/32 (c) | | | 2,500 | | | | 2,608,633 | |
City Of South Miami Health Facilities Authority, Inc. (RB) 4.00%, 08/15/42 (c) | | | 2,040 | | | | 1,916,214 | |
| City of Tallahassee, Health Facilities Authority, Memorial Healthcare, Inc. Project (RB) | | | | | | | | |
| 4.00%, 12/01/35 (c) | | | 230 | | | | 215,183 | |
| 5.00%, 12/01/44 (c) | | | 1,305 | | | | 1,273,413 | |
| 5.00%, 12/01/40 (c) | | | 1,210 | | | | 1,210,463 | |
Clay County, Florida Sales Surtax (RB) 4.00%, 10/01/39 (c) | | | 1,100 | | | | 1,076,334 | |
| Collier County Industrial Development Authority, Arlington of Naples Project, Series A (RB) | | | | | | | | |
| 7.00%, 05/15/24 (d) * | | | 440 | | | | 11,879 | |
| 8.12%, 05/15/44 (c) (d) * | | | 343 | | | | 9,261 | |
County of Broward, Florida Airport System, Series A (RB) 5.00%, 10/01/29 (c) | | | 2,135 | | | | 2,168,884 | |
County of Broward, Florida Port Facilities, Series A (RB) 5.00%, 09/01/49 (c) | | | 1,645 | | | | 1,680,223 | |
County of Escambia, Health Facilities Authority, Baptist Health Care Corp., Series A (RB) (SAW) 5.00%, 08/15/31 (c) | | | 2,000 | | | | 2,088,997 | |
Escambia County Health Facilities Authority, Baptist Health Care Corp. Obligated Group, Series A (RB) (SAW) 4.00%, 08/15/45 (c) | | | 2,000 | | | | 1,769,112 | |
Florida Development Finance Corp., Brightline Florida Passenger Rail Project (RB) 5.50%, 07/01/53 (c) | | | 1,000 | | | | 1,036,944 | |
Florida Development Finance Corp., Central Charter School Project (RB) 5.88%, 08/15/52 (c) | | | 1,000 | | | | 960,650 | |
| | | Par
(000’s | ) | | Value | |
| Florida (continued) | | | | | | |
Florida Development Finance Corp., Educational Facilities, Mater Academy Project, Series A (RB) 5.00%, 06/15/47 (c) | | $ | 2,225 | | | $ | 2,173,063 | |
Florida Development Finance Corp., Glenridge on Palmer Ranch Project (RB) 5.00%, 06/01/35 (c) | | | 425 | | | | 406,843 | |
| Florida Development Finance Corp., Mayflower Retirement Community Project, Series A (RB) | | | | | | | | |
| 4.00%, 06/01/55 (c) | | | 2,000 | | | | 1,245,515 | |
| 5.25%, 06/01/50 (c) | | | 1,000 | | | | 831,929 | |
Florida Development Finance Corp., Renaissance Chapter School, Inc. Project, Series B (RB) 5.25%, 06/15/41 (c) | | | 1,000 | | | | 972,435 | |
| Florida Development Finance Corp., Renaissance Charter School, Inc. Project, Series A (RB) | | | | | | | | |
| 5.75%, 06/15/29 (c) | | | 1,000 | | | | 1,000,943 | |
| 6.00%, 06/15/35 (c) | | | 500 | | | | 505,507 | |
| 6.12%, 06/15/46 (c) | | | 685 | | | | 688,834 | |
| 6.62%, 06/15/43 (c) | | | 1,000 | | | | 1,089,635 | |
| 6.75%, 06/15/53 (c) | | | 1,000 | | | | 1,085,106 | |
Florida Development Finance Corp., UF Health Jacksonville Project, Series A (RB) 5.00%, 02/01/52 (c) | | | 1,000 | | | | 874,987 | |
| Florida Development Finance Corp., Virgin Trains USA Passenger Rail Project, Series A (RB) | | | | | | | | |
| 6.38%, 01/01/49 (c) (p) | | | 5,300 | | | | 5,359,787 | |
| 6.50%, 01/01/49 (c) (p) | | | 9,750 | | | | 9,860,945 | |
Florida Development Finance Corp., Waste Pro USA, Inc. Project (RB) 6.12%, 07/01/32 (c) (p) | | | 4,000 | | | | 4,083,270 | |
| FRERC Community Development District (SA) (AGM) | | | | | | | | |
| 5.38%, 11/01/40 (c) | | | 1,450 | | | | 1,355,911 | |
| 5.50%, 11/01/50 (c) | | | 2,450 | | | | 2,228,239 | |
Hillsborough County Industrial Development Authority, Tampa General Hospital Project, Series A (RB) 4.00%, 08/01/45 (c) | | | 6,500 | | | | 5,918,975 | |
Lake County, Florida Retirement Facility, Lakeside at Waterman Village Project, Series A (RB) 5.75%, 08/15/50 (c) | | | 2,000 | | | | 1,833,064 | |
See Notes to Financial Statements
VANECK HIGH YIELD MUNI ETF
SCHEDULE OF INVESTMENTS
(continued)
| | | Par
(000’s | ) | | Value | |
| Florida (continued) | | | | | | | | |
Lee County Industrial Development Authority, Community Charter Schools, LLC Projects, Series A (RB) 5.75%, 06/15/42 (c) | | $ | 500 | | | $ | 482,256 | |
Lee County Industrial Development Authority, Cypress Cove at HealthPark Florida, Inc. Project, Series A (RB) 5.25%, 10/01/57 (c) | | | 1,000 | | | | 832,663 | |
Miami Beach Florida Health Facilities Authority, Mount Sinai Medical Center, Series B (RB) (AGM) 4.00%, 11/15/46 (c) | | | 2,500 | | | | 2,296,496 | |
| Miami Beach Health Facilities Authority, Mount Sinai Medical Center (RB) | | | | | | | | |
| 5.00%, 11/15/39 (c) | | | 1,880 | | | | 1,883,721 | |
| 5.00%, 11/15/44 (c) | | | 3,000 | | | | 3,005,715 | |
| Miami World Center Community Development District (SA) | | | | | | | | |
| 5.12%, 11/01/39 (c) | | | 750 | | | | 759,207 | |
| 5.25%, 11/01/49 (c) | | | 250 | | | | 252,861 | |
Miami-Dade County Aviation, Series A (RB) (BAM-TCRS) 5.00%, 10/01/36 (c) | | | 3,000 | | | | 3,003,714 | |
Miami-Dade County Industrial Development Authority (RB) 5.50%, 07/01/61 (c) | | | 1,000 | | | | 968,049 | |
Miami-Date County, Florida Subordinate Special (RB) 5.00%, 10/01/28 (c) | | | 1,360 | | | | 1,405,653 | |
| Mid-Bay Bridge Authority, First Senior Lien, Series A (RB) | | | | | | | | |
| 5.00%, 10/01/40 (c) | | | 2,500 | | | | 2,508,372 | |
| 5.00%, 10/01/35 (c) | | | 500 | | | | 504,929 | |
Mid-Bay Bridge Authority, Second Senior Lien, Series C (RB) 5.00%, 10/01/40 (c) | | | 1,000 | | | | 1,003,349 | |
Midtown Miami Community Development District, Parking Garage Project, Series A (SA) 5.00%, 05/01/37 (c) | | | 85 | | | | 84,996 | |
North Broward Hospital District, Broward Health, Series B (RB) 5.00%, 01/01/48 (c) | | | 2,000 | | | | 2,028,556 | |
North Broward Hospital District, Series B (RB) 5.00%, 01/01/32 (c) | | | 155 | | | | 161,684 | |
| Northern Palm Beach County Improvement District, Unit of Development No. 2C (RB) | | | | | | | | |
| 5.00%, 08/01/37 (c) | | | 200 | | | | 201,617 | |
| 5.00%, 08/01/46 (c) | | | 200 | | | | 197,867 | |
| | | Par
(000’s | ) | | Value | |
| Florida (continued) | | | | | | | | |
Palm Beach County Health Facilities Authority, Toby & Leon Cooperman Sinai Residences of Boca Raton Expansion, Series A (RB) 5.00%, 06/01/55 (c) | | $ | 3,230 | | | $ | 2,932,765 | |
| Palm Beach County, Palm Beach Atlantic University Housing Project, Series A (RB) | | | | | | | | |
| 5.00%, 04/01/51 (c) | | | 2,500 | | | | 2,396,453 | |
| 5.00%, 04/01/39 (c) | | | 1,000 | | | | 1,004,277 | |
Palm Cost Park Community Development District (SA) 5.70%, 05/01/37 (c) | | | 140 | | | | 141,823 | |
Pinellas County Industrial Development Authority, Drs. Kiran & Pallavi Patel 2017 Foundation For Global Understaing Inc. Project (RB) 5.00%, 07/01/39 (c) | | | 1,900 | | | | 1,899,871 | |
Polk Country Industrial Development Authority, Florida Industrial Development (RB) 5.88%, 01/01/33 | | | 4,820 | | | | 4,611,984 | |
| Seminole County Industrial Development Authority, Retirement Facility, Legacy Pointe at UCF Project, Series A (RB) | | | | | | | | |
| 5.50%, 11/15/49 (c) | | | 500 | | | | 423,321 | |
| 5.75%, 11/15/54 (c) | | | 1,500 | | | | 1,283,129 | |
Seminole County Industrial Development Authority, Retirement Facility, Legacy Pointe at UCF Project, Series B-1 (RB) 4.25%, 11/15/26 (c) | | | 1,200 | | | | 1,174,606 | |
Tallahassee Florida Health Facilities, Tallahassee Memorial Healthcare, Inc. Project, Series A (RB) 5.00%, 12/01/55 (c) | | | 1,100 | | | | 1,039,581 | |
| Village Community Development District No. 12 (SA) | | | | | | | | |
| 3.25%, 05/01/26 | | | 150 | | | | 148,843 | |
| 3.62%, 05/01/31 (c) | | | 995 | | | | 985,305 | |
| 4.25%, 05/01/43 (c) | | | 905 | | | | 863,817 | |
| Village Community Development District No. 13 (SA) | | | | | | | | |
| 3.00%, 05/01/29 | | | 715 | | | | 688,509 | |
| 3.50%, 05/01/51 (c) | | | 1,500 | | | | 1,235,768 | |
| 3.55%, 05/01/39 (c) | | | 2,755 | | | | 2,520,175 | |
| | | | | | | | 134,508,750 | |
See Notes to Financial Statements
| | | Par
(000’s | ) | | Value | |
| Georgia: 1.4% | | | | | | | | |
Burke County Development Authority, Series C (RB) (SAW) 4.12%, 11/01/45 (c) | | $ | 6,525 | | | $ | 5,819,741 | |
Floyd County Development Authority, Spires at Berry College Project, Series A (RB) (SBG) 5.50%, 12/01/28 (c) | | | 1,250 | | | | 1,240,971 | |
Fulton County Residential Care Facilities for the Elderly Authority, Canterbury Court Project, Series A (RB) 4.00%, 04/01/41 (c) | | | 2,500 | | | | 2,019,022 | |
Gainesville & Hall County Hospital Authority (RB) 5.00%, 02/15/45 (c) | | | 3,575 | | | | 3,620,307 | |
Gainesville and Hall County Development Authority, Educational Facilities, Riverside Military Academy, Inc. Project (RB) (BAM) 5.00%, 03/01/37 (c) | | | 700 | | | | 551,444 | |
George L Smith II World Congress Center Authority, Series A (RB) 4.00%, 01/01/54 (c) | | | 4,750 | | | | 4,063,393 | |
Georgia Local Government, Grantor Trust, Series A (CP) (NATL) 4.75%, 06/01/28 | | | 416 | | | | 421,483 | |
Glynn-Brunswick Memorial Hospital Authority, Southeast Georgia Health System Project (RB) 5.00%, 08/01/47 (c) | | | 2,680 | | | | 2,589,082 | |
Macon-Bibb County Urban Development Authority, Academy for Classical Education, Inc., Series A (RB) 5.75%, 06/15/37 (c) | | | 250 | | | | 257,008 | |
Main Street Natural Gas, Inc., Series C (RB) 4.00%, 08/01/52 (c) (p) | | | 15,000 | | | | 14,565,030 | |
| Marietta Development Authority, Life University, Inc. Project, Series A (RB) | | | | | | | | |
| 5.00%, 11/01/37 (c) | | | 5,000 | | | | 4,851,981 | |
| 5.00%, 11/01/47 (c) | | | 1,000 | | | | 912,388 | |
Municipal Electric Authority of Georgia, Plant Vogtle Units 3 and 4, Series A (RB) 5.00%, 07/01/60 (c) | | | 375 | | | | 371,107 | |
| White County Development Authority, Truett McConnell University Project, Series A (RB) | | | | | | | | |
| 5.12%, 10/01/39 (c) | | | 500 | | | | 449,859 | |
| 5.25%, 10/01/49 (c) | | | 500 | | | | 423,284 | |
| | | | | | | | 42,156,100 | |
| | | Par
(000’s | ) | | Value | |
| Guam: 0.9% | | | | | | | | |
Guam Government (GO) 5.00%, 11/15/31 (c) | | $ | 1,055 | | | $ | 1,074,813 | |
| Guam Government, Business Privilege Tax, Series D (RB) | | | | | | | | |
| 4.00%, 11/15/39 (c) | | | 600 | | | | 555,407 | |
| 5.00%, 11/15/33 (c) | | | 5,805 | | | | 5,873,115 | |
| 5.00%, 11/15/39 (c) | | | 1,085 | | | | 1,089,776 | |
| 5.00%, 11/15/35 (c) | | | 1,100 | | | | 1,111,423 | |
| 5.00%, 11/15/34 (c) | | | 1,040 | | | | 1,051,780 | |
| Guam Government, Business Privilege Tax, Series F (RB) | | | | | | | | |
| 4.00%, 01/01/42 (c) | | | 7,000 | | | | 6,438,181 | |
| 4.00%, 01/01/36 (c) | | | 1,000 | | | | 983,047 | |
| Guam Government, Department of Education, John F. Kennedy High School Refunding and Energy Efficiency Project, Series A (CP) | | | | | | | | |
| 4.25%, 02/01/30 | | | 500 | | | | 484,848 | |
| 5.00%, 02/01/40 (c) | | | 500 | | | | 486,718 | |
| Guam Government, Limited Obligation, Series A (RB) | | | | | | | | |
| 5.00%, 12/01/34 (c) | | | 2,290 | | | | 2,332,007 | |
| 5.00%, 12/01/46 (c) | | | 3,120 | | | | 2,978,492 | |
Guam Power Authority, Series A (RB) 5.00%, 10/01/40 (c) | | | 500 | | | | 505,930 | |
| | | | | | | | 24,965,537 | |
| Hawaii: 0.2% | | | | | | | | |
Kuakini, Hawaii Health System, Series A (RB) 6.38%, 07/01/32 (c) | | | 1,645 | | | | 1,486,754 | |
| State of Hawaii, Department of Budget and Finance, Series A (RB) | | | | | | | | |
| 6.25%, 07/01/27 (c) | | | 1,400 | | | | 1,400,842 | |
| 6.62%, 07/01/33 (c) | | | 2,085 | | | | 2,087,176 | |
| | | | | | | | 4,974,772 | |
| Idaho: 0.1% | | | | | | | | |
Idaho Falls Auditorium District, Annual Appropriation Certificates of Participation (CP) 5.25%, 05/15/51 (c) | | | 2,000 | | | | 1,938,213 | |
| Idaho Health Facilities Authority, Madison Memorial Hospital Project (RB) | | | | | | | | |
| 3.50%, 09/01/33 (c) | | | 450 | | | | 396,097 | |
| 5.00%, 09/01/37 (c) | | | 1,135 | | | | 1,124,559 | |
Idaho Health Facilities Authority, Terraces of Boise, Series A (RB) 3.80%, 10/01/31 (c) | | | 100 | | | | 84,368 | |
| | | | | | | | 3,543,237 | |
| Illinois: 9.8% | | | | | | | | |
Chicago Board of Education (GO) 5.25%, 12/01/35 (c) | | | 3,000 | | | | 3,230,821 | |
See Notes to Financial Statements
VANECK HIGH YIELD MUNI ETF
SCHEDULE OF INVESTMENTS
(continued)
| | | Par
(000’s | ) | | Value | |
| Illinois (continued) | | | | | | | | |
Chicago Board of Education (GO) (AGM) 5.00%, 12/01/33 (c) | | $ | 1,250 | | | $ | 1,303,812 | |
| Chicago Board of Education, Series A (GO) | | | | | | | | |
| 5.00%, 12/01/30 (c) | | | 1,265 | | | | 1,300,144 | |
| 5.00%, 12/01/33 (c) | | | 250 | | | | 256,788 | |
| 5.00%, 12/01/30 (c) | | | 1,195 | | | | 1,241,234 | |
| 5.00%, 12/01/29 | | | 1,000 | | | | 1,047,927 | |
| 5.00%, 12/01/32 (c) | | | 5,575 | | | | 5,842,190 | |
| 5.00%, 12/01/39 (c) | | | 6,000 | | | | 6,128,240 | |
| 5.00%, 12/01/35 (c) | | | 2,400 | | | | 2,500,314 | |
| 5.00%, 12/01/33 (c) | | | 5,100 | | | | 5,341,500 | |
| 5.00%, 12/01/40 (c) | | | 6,350 | | | | 6,455,447 | |
| 5.00%, 12/01/36 (c) | | | 6,990 | | | | 7,233,290 | |
| 5.00%, 12/01/37 (c) | | | 3,610 | | | | 3,711,021 | |
| 5.00%, 12/01/34 (c) | | | 395 | | | | 413,056 | |
| 5.00%, 12/01/47 (c) | | | 10,000 | | | | 9,912,289 | |
| 5.00%, 12/01/42 (c) | | | 17,755 | | | | 17,645,299 | |
| 5.88%, 12/01/47 (c) | | | 2,600 | | | | 2,833,242 | |
| 7.00%, 12/01/44 (c) | | | 4,210 | | | | 4,358,221 | |
| 7.00%, 12/01/26 (c) | | | 5,200 | | | | 5,427,468 | |
| 7.00%, 12/01/46 (c) | | | 2,250 | | | | 2,423,290 | |
Chicago Board of Education, Series A (GO) (AGM) 5.00%, 12/01/34 (c) | | | 1,250 | | | | 1,302,836 | |
| Chicago Board of Education, Series A (GO) (AMBAC) | | | | | | | | |
| 5.50%, 12/01/25 | | | 145 | | | | 146,626 | |
| 5.50%, 12/01/26 | | | 175 | | | | 177,362 | |
| 5.50%, 12/01/31 | | | 1,285 | | | | 1,355,901 | |
| Chicago Board of Education, Series A (GO) (NATL) | | | | | | | | |
| 0.00%, 12/01/27 ^ | | | 760 | | | | 652,373 | |
| 0.00%, 12/01/28 ^ | | | 390 | | | | 320,238 | |
| 0.00%, 12/01/30 ^ | | | 55 | | | | 41,339 | |
| 5.50%, 12/01/26 | | | 355 | | | | 361,425 | |
| Chicago Board of Education, Series B (GO) | | | | | | | | |
| 4.00%, 12/01/39 (c) | | | 5,000 | | | | 4,667,536 | |
| 4.00%, 12/01/40 (c) | | | 5,000 | | | | 4,597,875 | |
| 5.00%, 12/01/27 | | | 1,500 | | | | 1,546,809 | |
| 5.00%, 12/01/33 (c) | | | 200 | | | | 207,586 | |
| 5.00%, 12/01/31 (c) | | | 3,600 | | | | 3,773,452 | |
| 5.00%, 12/01/33 (c) | | | 1,105 | | | | 1,102,458 | |
| 5.00%, 12/01/34 (c) | | | 1,680 | | | | 1,670,390 | |
| 6.50%, 12/01/46 (c) | | | 4,000 | | | | 4,156,248 | |
| Chicago Board of Education, Series C (GO) | | | | | | | | |
| 5.00%, 12/01/27 | | | 2,000 | | | | 2,062,413 | |
| 5.00%, 12/01/30 (c) | | | 2,000 | | | | 2,044,937 | |
| 5.00%, 12/01/34 (c) | | | 8,805 | | | | 8,958,463 | |
| 5.25%, 12/01/35 (c) | | | 11,015 | | | | 11,014,492 | |
| 5.25%, 12/01/39 (c) | | | 12,180 | | | | 12,153,766 | |
| 6.00%, 12/01/35 (c) | | | 1,160 | | | | 1,168,586 | |
Chicago Board of Education, Series C (GO) (AGM) 5.00%, 12/01/30 (c) | | | 500 | | | | 522,500 | |
| | | Par
(000’s | ) | | Value | |
| Illinois (continued) | | | | | | | | |
Chicago Board of Education, Series E (GO) 5.12%, 12/01/32 (c) | | $ | 3,640 | | | $ | 3,639,943 | |
Chicago Board of Education, Series G (GO) 5.00%, 12/01/44 (c) | | | 3,000 | | | | 2,971,192 | |
| Chicago Board of Education, Series H (GO) | | | | | | | | |
| 5.00%, 12/01/46 (c) | | | 12,710 | | | | 12,489,990 | |
| 5.00%, 12/01/36 (c) | | | 9,730 | | | | 9,844,346 | |
Chicago O’Hare International Airport, Series A (RB) (AGM) 5.25%, 01/01/45 (c) | | | 3,000 | | | | 3,178,737 | |
| Chicago School Reform Board of Trustees, Series A (GO) (NATL) | | | | | | | | |
| 0.00%, 12/01/25 ^ | | | 355 | | | | 331,748 | |
| 0.00%, 12/01/29 ^ | | | 1,460 | | | | 1,145,390 | |
| Chicago School Reform Board of Trustees, Series B-1 (GO) (NATL) | | | | | | | | |
| 0.00%, 12/01/25 ^ | | | 1,650 | | | | 1,541,927 | |
| 0.00%, 12/01/26 ^ | | | 1,630 | | | | 1,460,347 | |
| 0.00%, 12/01/27 ^ | | | 1,030 | | | | 884,137 | |
| 0.00%, 12/01/28 ^ | | | 690 | | | | 567,592 | |
| 0.00%, 12/01/29 ^ | | | 645 | | | | 506,011 | |
| 0.00%, 12/01/31 ^ | | | 520 | | | | 372,814 | |
Chicago Transit Authority, Federal Transit Administration Section 5307 Urbanized Area Formula (RB) 5.00%, 06/01/26 | | | 100 | | | | 102,216 | |
| City of Chicago, City Colleges (GO) (NATL) | | | | | | | | |
| 0.00%, 01/01/28 ^ | | | 345 | | | | 302,178 | |
| 0.00%, 01/01/30 ^ | | | 420 | | | | 332,583 | |
| 0.00%, 01/01/33 ^ | | | 985 | | | | 679,811 | |
| 0.00%, 01/01/34 ^ | | | 760 | | | | 499,873 | |
| City of Chicago, Series A (GO) | | | | | | | | |
| 5.00%, 01/01/27 | | | 725 | | | | 747,178 | |
| 5.00%, 01/01/27 | | | 200 | | | | 206,118 | |
| 5.00%, 01/01/33 (c) | | | 3,000 | | | | 3,227,209 | |
| 5.00%, 01/01/34 (c) | | | 3,000 | | | | 3,221,640 | |
| 5.00%, 01/01/32 (c) | | | 1,500 | | | | 1,615,277 | |
| 5.50%, 01/01/49 (c) | | | 3,000 | | | | 3,095,621 | |
| 5.50%, 01/01/41 (c) | | | 1,000 | | | | 1,058,919 | |
| 6.00%, 01/01/38 (c) | | | 5,000 | | | | 5,210,171 | |
City of Chicago, Series A (GO) (NATL) 0.00%, 01/01/29 ^ | | | 140 | | | | 115,521 | |
City of Chicago, Series A (GO) (SAW) 5.00%, 01/01/29 | | | 2,775 | | | | 2,939,075 | |
| City of Chicago, Series C (GO) | | | | | | | | |
| 0.00%, 01/01/32 ^ | | | 195 | | | | 138,665 | |
| 5.00%, 01/01/26 | | | 380 | | | | 386,965 | |
| 5.00%, 01/01/27 (c) | | | 250 | | | | 253,932 | |
City of Chicago, Series D (GO) 5.50%, 01/01/40 (c) | | | 5,000 | | | | 5,015,070 | |
See Notes to Financial Statements
| | | Par
(000’s | ) | | Value | |
| Illinois (continued) | | | | | | | | |
City of Chicago, Series F (GO) 5.50%, 01/01/42 (c) | | $ | 1,175 | | | $ | 1,177,753 | |
City of Chicago, Water Revenue, Second Lien (RB) (AMBAC) 5.75%, 11/01/30 | | | 880 | | | | 939,639 | |
City of Harvey, Series A (GO) 4.50%, 01/01/54 | | | 4,659 | | | | 3,528,253 | |
Cook County, Illinois, Series B (GO) 4.00%, 11/15/26 | | | 1,200 | | | | 1,216,998 | |
Illinois Finance Authority (RB) 7.38%, 09/01/42 (c) (p) | | | 2,500 | | | | 2,687,090 | |
Illinois Finance Authority Student Housing and Academic Facility, CHF - Chicago, L.L.C. - University of Illinois at Chicago Project, Series A (RB) 5.00%, 02/15/47 (c) | | | 4,125 | | | | 3,904,679 | |
Illinois Finance Authority, Acero Charter Schools, Inc. (RB) 4.00%, 10/01/42 (c) | | | 1,000 | | | | 821,593 | |
Illinois Finance Authority, Admiral Lake Project (RB) 5.12%, 05/15/38 (c) | | | 390 | | | | 339,803 | |
Illinois Finance Authority, Central Baptist Village (RB) 5.38%, 11/15/39 (c) | | | 35 | | | | 33,593 | |
Illinois Finance Authority, CHF - Cook, LLC - Northeastern Illinois University Project, Series A (RB) 5.00%, 07/01/30 (c) | | | 1,000 | | | | 954,966 | |
| Illinois Finance Authority, Friendship Village of Schaumburg (RB) | | | | | | | | |
| 5.00%, 02/15/27 (d) * | | | 3,000 | | | | 690,000 | |
| 5.00%, 02/15/37 (c) (d) * | | | 6,500 | | | | 1,495,000 | |
| 5.12%, 02/15/45 (c) (d) * | | | 6,130 | | | | 1,409,900 | |
Illinois Finance Authority, Greenfields of Geneva Project (RB) 7.10%, 11/01/52 (c) | | | 100 | | | | 82,657 | |
Illinois Finance Authority, Illinois Institute of Technology (RB) 5.00%, 09/01/40 (c) | | | 175 | | | | 159,303 | |
Illinois Finance Authority, Intrinsic School Project, Series A (RB) 6.00%, 12/01/45 (c) | | | 500 | | | | 501,685 | |
| Illinois Finance Authority, Lutheran Life Communities Obligated Group, Series A (RB) | | | | | | | | |
| 5.00%, 11/01/35 (c) | | | 5 | | | | 4,436 | |
| 5.00%, 11/01/30 (c) | | | 250 | | | | 234,790 | |
| 5.00%, 11/01/29 (c) | | | 500 | | | | 474,636 | |
| | | Par
(000’s | ) | | Value | |
| Illinois (continued) | | | | | | | | |
Illinois Finance Authority, Roosevelt University (RB) 5.50%, 04/01/32 (c) | | $ | 475 | | | $ | 463,681 | |
| Illinois Sports Facilities Authority (RB) | | | | | | | | |
| 5.00%, 06/15/28 | | | 1,000 | | | | 1,043,070 | |
| 5.00%, 06/15/30 (c) | | | 3,055 | | | | 3,215,103 | |
| 5.00%, 06/15/29 | | | 1,000 | | | | 1,054,314 | |
Illinois Sports Facilities Authority (RB) (AGM) 5.00%, 06/15/27 (c) | | | 3,000 | | | | 2,999,124 | |
Illinois Sports Facilities Authority (RB) (AMBAC) 0.00%, 06/15/26 ^ | | | 690 | | | | 628,905 | |
| Illinois State, Series A (GO) | | | | | | | | |
| 5.00%, 12/01/31 (c) | | | 500 | | | | 522,244 | |
| 5.00%, 05/01/43 (c) | | | 500 | | | | 509,317 | |
Metropolitan Pier & Exposition Authority (RB) 0.00%, 12/15/50 ^ | | | 35,755 | | | | 8,811,848 | |
Metropolitan Pier & Exposition Authority (RB) (NATL) 0.00%, 12/15/33 ^ | | | 1,500 | | | | 1,033,284 | |
Metropolitan Pier and Exposition Authority, Illinois McCormick Place Expansion Project, Series B (RB) 5.00%, 12/15/40 (c) | | | 1,000 | | | | 1,010,178 | |
| Metropolitan Pier and Exposition Authority, McCormick Place Expansion Project, Series A (RB) | | | | | | | | |
| 3.00%, 06/15/25 (c) | | | 2,000 | | | | 1,967,371 | |
| 5.00%, 06/15/50 (c) | | | 3,000 | | | | 3,061,452 | |
| Metropolitan Pier and Exposition Authority, McCormick Place Expansion Project, Series A (RB) (NATL) | | | | | | | | |
| 0.00%, 12/15/30 ^ | | | 475 | | | | 370,805 | |
| 0.00%, 12/15/34 ^ | | | 590 | | | | 388,979 | |
| 0.00%, 06/15/30 ^ | | | 745 | | | | 592,486 | |
| 0.00%, 06/15/31 ^ | | | 125 | | | | 95,377 | |
| 0.00%, 06/15/34 ^ | | | 190 | | | | 127,920 | |
| 0.00%, 06/15/39 ^ | | | 115 | | | | 58,521 | |
Northeastern Illinois University, Capital Improvement Project (CP) 4.00%, 10/01/38 (c) | | | 585 | | | | 470,222 | |
| Northern Illinois Municipal Power Agent Power Project, Prairie State Project, Series A (RB) | | | | | | | | |
| 4.00%, 12/01/31 (c) | | | 2,000 | | | | 2,012,759 | |
| State of Illinois (GO) | | | | | | | | |
| 3.50%, 06/01/31 (c) | | | 175 | | | | 164,973 | |
| 4.00%, 01/01/31 (c) | | | 610 | | | | 610,650 | |
| 4.00%, 06/01/35 (c) | | | 270 | | | | 266,325 | |
| 4.00%, 06/01/34 (c) | | | 360 | | | | 355,587 | |
| 4.00%, 06/01/37 (c) | | | 460 | | | | 446,451 | |
See Notes to Financial Statements
VANECK HIGH YIELD MUNI ETF
SCHEDULE OF INVESTMENTS
(continued)
| | | Par
(000’s | ) | | Value | |
| Illinois (continued) | | | | | | | | |
| 4.12%, 11/01/31 (c) | | $ | 600 | | | $ | 602,752 | |
| 5.00%, 11/01/24 | | | 200 | | | | 200,973 | |
| 5.00%, 02/01/27 | | | 500 | | | | 517,258 | |
| 5.00%, 05/01/35 (c) | | | 100 | | | | 100,086 | |
| 5.00%, 02/01/26 (c) | | | 375 | | | | 375,344 | |
| 5.00%, 05/01/34 (c) | | | 175 | | | | 175,223 | |
| 5.00%, 02/01/27 (c) | | | 350 | | | | 350,305 | |
| 5.00%, 06/01/26 | | | 125 | | | | 128,202 | |
State of Illinois (RB) 3.00%, 06/15/31 (c) | | | 100 | | | | 94,105 | |
| State of Illinois, Series A (GO) | | | | | | | | |
| 5.00%, 10/01/28 | | | 500 | | | | 529,300 | |
| 5.00%, 11/01/28 | | | 5 | | | | 5,301 | |
| 5.00%, 12/01/34 (c) | | | 100 | | | | 104,059 | |
| 5.00%, 03/01/46 (c) | | | 4,865 | | | | 5,007,721 | |
| 5.00%, 05/01/41 (c) | | | 365 | | | | 373,078 | |
State of Illinois, Series C (GO) 4.00%, 11/01/43 (c) | | | 1,425 | | | | 1,321,283 | |
State of Illinois, Series D (GO) 5.00%, 11/01/25 | | | 250 | | | | 254,360 | |
Upper Illinois River Valley Development Authority, Elgin Math and Science Academy Charter School Project, Series A (RB) 6.00%, 03/01/63 (c) | | | 1,000 | | | | 992,452 | |
Village of Bolingbrook, Special Service Area No. 1 (ST) 5.25%, 03/01/41 (c) | | | 500 | | | | 459,720 | |
Village of Bridgeview (GO) 5.00%, 12/01/42 (c) | | | 360 | | | | 328,946 | |
| Will County Community High School District No. 210, Series B (GO) | | | | | | | | |
| 0.00%, 01/01/29 ^ | | | 90 | | | | 74,433 | |
| 0.00%, 01/01/31 ^ | | | 245 | | | | 186,381 | |
| 0.00%, 01/01/33 ^ | | | 540 | | | | 374,907 | |
| | | | | | | | 286,187,309 | |
| Indiana: 1.0% | | | | | | | | |
City of Anderson, Indiana Economic Development, Anderson University (RB) 4.75%, 10/01/27 (c) | | | 175 | | | | 166,517 | |
Indiana Finance Authority Educational Facilities, Earlham College Project, Series A (RB) 5.00%, 10/01/32 (c) | | | 150 | | | | 150,035 | |
Indiana Finance Authority Midwestern Disaster Relief, Ohio Valley Electric Corp. Project, Series C (RB) 3.00%, 11/01/30 | | | 1,500 | | | | 1,376,303 | |
Indiana Finance Authority, Baptist Healthcare System, Series A (RB) 5.00%, 08/15/51 (c) | | | 4,000 | | | | 4,013,112 | |
| | | Par
(000’s | ) | | Value | |
| Indiana (continued) | | | | | | | | |
Indiana Finance Authority, Ohio Valley Electric Corp. Project, Series A (RB) 4.25%, 11/01/30 | | $ | 7,000 | | | $ | 6,950,266 | |
Indiana Finance Authority, Ohio Valley Electric Corp. Project, Series B (RB) 3.00%, 11/01/30 | | | 5,000 | | | | 4,587,675 | |
Indiana Finance Authority, United States Steel Corp. Project, Series A (RB) 4.12%, 12/01/26 | | | 5,500 | | | | 5,480,545 | |
| Indianapolis Local Public Improvement Bond Bank (RB) | | | | | | | | |
| 5.75%, 03/01/43 (c) | | | 2,340 | | | | 2,557,820 | |
| 6.00%, 03/01/53 (c) | | | 1,000 | | | | 1,085,289 | |
| 6.12%, 03/01/57 (c) | | | 3,135 | | | | 3,399,780 | |
| | | | | | | | 29,767,342 | |
| Iowa: 0.9% | | | | | | | | |
City of Coralville, Marriott Hotel and Convention Center, Series E (CP) 4.00%, 06/01/29 (c) | | | 1,025 | | | | 976,477 | |
| Iowa Finance Authority, Lifespace Communities, Inc., Series A (RB) | | | | | | | | |
| 5.00%, 05/15/43 (c) | | | 655 | | | | 597,881 | |
| 5.00%, 05/15/48 (c) | | | 4,000 | | | | 3,503,419 | |
Iowa Finance Authority, Midwestern Disaster Area, Alcoa Inc. Project (RB) 4.75%, 08/01/42 (c) | | | 14,000 | | | | 13,681,545 | |
Iowa Finance Authority, Midwestern Disaster Area, Iowa Fertilizer Co. Project, Series A (RB) 5.00%, 12/01/50 (c) (p) | | | 5,105 | | | | 5,299,463 | |
| Iowa Higher Education Loan Authority, Wartburg College Project (RB) | | | | | | | | |
| 4.00%, 10/01/25 | | | 1,170 | | | | 1,145,772 | |
| 5.00%, 10/01/37 (c) | | | 2,115 | | | | 1,936,490 | |
| | | | | | | | 27,141,047 | |
| Kansas: 0.3% | | | | | | | | |
City of Hutchinson, Regional Medical Center, Inc. (RB) 5.00%, 12/01/41 (c) | | | 250 | | | | 220,868 | |
City of Lenexa, Kansas Health Care Facility, Lakeview Village, Inc., Series A (RB) 5.00%, 05/15/43 (c) | | | 1,000 | | | | 949,347 | |
City of Manhattan, Kansas Health Care Facilities Authority, Meadowlark Hills Retirement Community, Series A (RB) 4.00%, 06/01/46 (c) | | | 3,000 | | | | 2,370,189 | |
See Notes to Financial Statements
| | | Par
(000’s | ) | | Value | |
| Kansas (continued) | | | | | | | | |
City of Manhattan, Kansas Sales Tax, Downtown Redevelopment Star Project Area (RB) 4.00%, 06/01/27 (c) | | $ | 500 | | | $ | 499,081 | |
City of Wichita, Health Care Facilities, Series I (RB) 5.00%, 05/15/38 (c) | | | 1,355 | | | | 1,137,676 | |
| City of Wichita, Health Care Facilities, Series III (RB) | | | | | | | | |
| 5.00%, 05/15/50 (c) | | | 500 | | | | 357,386 | |
| 5.00%, 05/15/34 (c) | | | 250 | | | | 223,853 | |
Manhattan Kansas Health Care Facilities, Meadowlark Hills, Series A (RB) 4.00%, 06/01/36 (c) | | | 1,000 | | | | 913,505 | |
| Topeka Kansas Health Care Facilities, Brewster Place, Series A (RB) | | | | | | | | |
| 6.25%, 12/01/42 (c) | | | 1,000 | | | | 1,006,527 | |
| 6.50%, 12/01/52 (c) | | | 1,000 | | | | 1,006,455 | |
| | | | | | | | 8,684,887 | |
| Kentucky: 1.0% | | | | | | | | |
Christian County School District Finance Corp. (RB) (AGM) 4.50%, 10/01/48 (c) | | | 1,000 | | | | 1,026,724 | |
Christian County, Jennie Stuart Medical Center (RB) 5.38%, 02/01/36 (c) | | | 100 | | | | 101,678 | |
City of Henderson, Kentucky Exempt Facilities, Pratt Paper, LLC Project, Series A (RB) 4.45%, 01/01/42 (c) | | | 2,250 | | | | 2,209,362 | |
| Kentucky Economic Development Finance Authority Hospital, Series A (RB) | | | | | | | | |
| 5.00%, 06/01/45 (c) | | | 1,720 | | | | 1,720,544 | |
| 5.00%, 06/01/31 (c) | | | 1,315 | | | | 1,346,003 | |
Kentucky Economic Development Finance Authority, Louisville Arena Authority, Inc., Series A (RB) (AGM) 5.00%, 12/01/47 (c) | | | 760 | | | | 750,243 | |
Kentucky Economic Development Finance Authority, Louisville Arena Project, Series A (RB) (AGM) 5.00%, 12/01/45 (c) | | | 4,655 | | | | 4,785,702 | |
| Kentucky Economic Development Finance Authority, Masonic Home Independent Living II, Inc., Series A (RB) | | | | | | | | |
| 5.00%, 05/15/31 (c) | | | 2,545 | | | | 2,345,595 | |
| 5.00%, 05/15/46 (c) | | | 250 | | | | 189,005 | |
| 5.00%, 05/15/36 (c) | | | 350 | | | | 301,099 | |
| | | Par
(000’s | ) | | Value | |
| Kentucky (continued) | | | | | | | | |
| Kentucky Economic Development Finance Authority, Masonic Homes of Kentucky, Inc. (RB) | | | | | | | | |
| 5.38%, 11/15/32 (c) | | $ | 400 | | | $ | 366,685 | |
| 5.50%, 11/15/45 (c) | | | 250 | | | | 198,547 | |
| Kentucky Economic Development Finance Authority, Owensboro Health System, Inc., Series A (RB) | | | | | | | | |
| 5.00%, 06/01/26 | | | 175 | | | | 176,472 | |
| 5.00%, 06/01/41 (c) | | | 990 | | | | 994,771 | |
| 5.25%, 06/01/41 (c) | | | 750 | | | | 756,359 | |
Kentucky Economic Development Finance Authority, Owensboro Health System, Inc., Series B (RB) 5.00%, 06/01/40 (c) | | | 500 | | | | 503,250 | |
Kentucky Public Energy Authority, Gas Supply, SeriesA-1 (RB) 5.00%, 05/01/55 (c) (p) | | | 2,500 | | | | 2,600,442 | |
| Louisville & Jefferson County, UOFL Health Project, Series A (RB) (AGM) | | | | | | | | |
| 5.00%, 05/15/52 (c) | | | 4,000 | | | | 4,119,036 | |
| 5.00%, 05/15/47 (c) | | | 3,170 | | | | 3,294,169 | |
Paducah Electric Plant Board, Series A (RB) (AGM) 5.00%, 10/01/29 (c) | | | 1,045 | | | | 1,076,902 | |
| | | | | | | | 28,862,588 | |
| Louisiana: 1.7% | | | | | | | | |
Calcasieu Parish Memorial Hospital Service District (RB) 5.00%, 12/01/39 (c) | | | 3,800 | | | | 3,569,279 | |
City of Shreveport, Water and Sewer Revenue, Series C (RB) (BAM) 5.00%, 12/01/25 | | | 100 | | | | 102,110 | |
Louisiana Local Government Environmental Facilities and Community Development Authority, CDF Healthcare of Louisiana, LLC Project, Series A (RB) 5.62%, 06/01/45 (c) | | | 925 | | | | 775,156 | |
Louisiana Local Government Environmental Facilities and Community Development Authority, City of New Orleans Gomesa Project (RB) 4.00%, 11/01/46 (c) | | | 2,850 | | | | 2,524,032 | |
Louisiana Local Government Environmental Facilities and Community Development Authority, Jefferson Parish Gomesa Project (RB) (NATL) 4.00%, 11/01/44 (c) | | | 1,900 | | | | 1,693,974 | |
See Notes to Financial Statements
VANECK HIGH YIELD MUNI ETF
SCHEDULE OF INVESTMENTS
(continued)
| | | Par
(000’s | ) | | Value | |
| Louisiana (continued) | | | | | | | | |
Louisiana Local Government Environmental Facilities and Community Development Authority, Parc Fontaine Apartments, Series A (RB) 4.25%, 12/01/35 (c) | | $ | 175 | | | $ | 127,206 | |
Louisiana Local Government Environmental Facilities and Community Development Authority, Westlake Chemical Corp. Project (RB) 3.50%, 11/01/32 (c) | | | 5,745 | | | | 5,424,656 | |
Louisiana Public Facilities Authority, Loyola University Project, (RB) 5.25%, 10/01/46 (c) | | | 1,500 | | | | 1,570,485 | |
Louisiana Public Facilities Authority, Solid Waste Disposal , Louisiana Pellets, Inc. Project, Series A (RB) 7.50%, 07/01/23 (d) * ∞ | | | 2,259 | | | | 23 | |
Louisiana Public Facilities Authority, Solid Waste Disposal Revenue, Louisiana Pellets, Inc. Project (RB) 7.75%, 07/01/39 (c) (d) * ∞ | | | 1,647 | | | | 17 | |
Louisiana Public Facilities Authority, Solid Waste Disposal Revenue, Louisiana Pellets, Inc. Project, Series A (RB) 8.38%, 07/01/39 (c) (d) * ∞ | | | 1,389 | | | | 14 | |
Louisiana Stadium and Exposition District, Series A (RB) 5.00%, 07/01/48 (c) | | | 5,000 | | | | 5,283,526 | |
New Orleans Aviation Board, North Terminal Project, Series A (RB) 5.00%, 01/01/40 (c) | | | 2,160 | | | | 2,160,003 | |
| Parish of St James, Nustar Logistics, LP Project (RB) | | | | | | | | |
| 5.85%, 08/01/41 (p) | | | 750 | | | | 761,005 | |
| 6.35%, 07/01/40 (c) | | | 11,355 | | | | 12,279,339 | |
Parish of St James, Nustar Logistics, LP Project, Series A (RB) 6.35%, 10/01/40 (c) | | | 6,000 | | | | 6,488,422 | |
Parish of St John the Baptist LA (RB) 2.20%, 06/01/37 (p) | | | 6,500 | | | | 6,190,969 | |
Tangipahoa Parish, Louisiana Hospital Service, District No.1, North Oaks Health System Project (RB) 4.00%, 02/01/37 (c) | | | 1,530 | | | | 1,489,322 | |
| | | | | | | | 50,439,538 | |
| | | Par
(000’s | ) | | Value | |
| Maine: 0.3% | | | | | | | | |
Maine Health & Higher Educational Facilities Authority (RB) (AGM) 4.75%, 07/01/53 (c) | | $ | 1,500 | | | $ | 1,523,782 | |
| Maine Health and Higher Educational Facilities Authority, Eastern Maine Medical Center Obligated Group Issue, Series A (RB) | | | | | | | | |
| 4.00%, 07/01/46 (c) | | | 1,695 | | | | 1,352,050 | |
| 5.00%, 07/01/41 (c) | | | 1,000 | | | | 937,421 | |
| 5.00%, 07/01/46 (c) | | | 5,345 | | | | 4,683,353 | |
| | | | | | | | 8,496,606 | |
| Maryland: 1.6% | | | | | | | | |
Baltimore Maryland, Special Obligation, Harbor Point Project (RB) 5.00%, 06/01/51 (c) | | | 1,000 | | | | 963,453 | |
| City of Baltimore, Convention Center Hotel (RB) | | | | | | | | |
| 5.00%, 09/01/39 (c) | | | 1,000 | | | | 961,775 | |
| 5.00%, 09/01/46 (c) | | | 2,000 | | | | 1,808,342 | |
| 5.00%, 09/01/30 (c) | | | 1,000 | | | | 1,007,323 | |
| 5.00%, 09/01/42 (c) | | | 2,250 | | | | 2,100,764 | |
City of Baltimore, East Baltimore Research Park Project, Series A (RB) 5.00%, 09/01/38 (c) | | | 500 | | | | 495,930 | |
City of Baltimore, Harbor Point Project (RB) 5.12%, 06/01/43 (c) | | | 250 | | | | 244,883 | |
County of Frederick, Maryland Educational Facilities Project, Mount Saunt Mary’s University, Series A (RB) 5.00%, 09/01/37 (c) | | | 1,000 | | | | 981,810 | |
Frederick County Maryland, Urban Community Development Authority, Series A (ST) 4.00%, 07/01/50 (c) | | | 1,995 | | | | 1,719,866 | |
Frederick County, Education Facilities Project, Series A (RB) 5.00%, 09/01/45 (c) | | | 6,470 | | | | 6,004,896 | |
Frederick County, Maryland Educational Facilities Project, Mount Saint Mary’s University, Series A (RB) 5.00%, 09/01/32 (c) | | | 2,000 | | | | 2,001,684 | |
Frederick County, Maryland, Jefferson Technology Park Project, Series B (TA) 4.62%, 07/01/43 (c) | | | 1,900 | | | | 1,785,771 | |
Howard County, Series A (TA) 4.50%, 02/15/47 (c) | | | 2,500 | | | | 2,244,804 | |
Maryland Economic Development Corp. (RB) 5.25%, 06/30/55 (c) | | | 2,000 | | | | 2,048,858 | |
See Notes to Financial Statements
| | | Par
(000’s | ) | | Value | |
| Maryland (continued) | | | | | | | | |
Maryland Economic Development Corp., CNX Marine Terminal, Inc. Port of Baltimore Facility (RB) 5.75%, 09/01/25 (c) | | $ | 6,785 | | | $ | 6,834,077 | |
| Maryland Economic Development Corp., Metro Centre at Owings Mills Project (TA) | | | | | | | | |
| 3.75%, 07/01/27 (c) | | | 100 | | | | 97,247 | |
| 4.38%, 07/01/36 (c) | | | 470 | | | | 450,003 | |
| 4.50%, 07/01/44 (c) | | | 530 | | | | 479,652 | |
| Maryland Economic Development Corp., Port Covington Project (TA) | | | | | | | | |
| 4.00%, 09/01/50 (c) | | | 3,250 | | | | 2,576,434 | |
| 4.00%, 09/01/40 (c) | | | 2,250 | | | | 1,979,524 | |
| Maryland Economic Development Corp., Purple Line Light Rail Project, Series B (RB) | | | | | | | | |
| 5.25%, 06/30/52 (c) | | | 1,085 | | | | 1,114,441 | |
| 5.25%, 06/30/47 (c) | | | 5,000 | | | | 5,152,219 | |
| Maryland Health and Higher Educational Facilities Authority, Mercy Medical Center, Series A (RB) | | | | | | | | |
| 4.00%, 07/01/42 (c) | | | 400 | | | | 359,146 | |
| 5.00%, 07/01/38 (c) | | | 250 | | | | 252,568 | |
| Maryland Health and Higher Educational Facilities Authority, Meritus Medical Center (RB) | | | | | | | | |
| 4.00%, 07/01/30 (c) | | | 210 | | | | 209,461 | |
| 4.25%, 07/01/35 (c) | | | 145 | | | | 145,040 | |
| 5.00%, 07/01/40 (c) | | | 500 | | | | 502,834 | |
| 5.00%, 07/01/33 (c) | | | 625 | | | | 633,119 | |
Maryland Health and Higher Educational Facilities Authority, Peninsula Regional Health System Issue, Series A (RB) 4.00%, 07/01/48 (c) | | | 1,435 | | | | 1,305,088 | |
Prince George County, Collington Episcopal Life Care Community, Inc. (RB) 5.25%, 04/01/37 (c) | | | 1,000 | | | | 968,077 | |
Prince George’s County, Suitland-Naylor Road Project (TA) 4.75%, 07/01/36 (c) | | | 500 | | | | 501,228 | |
| | | | | | | | 47,930,317 | |
| Massachusetts: 1.6% | | | | | | | | |
Collegiate Charter School of Lowell (RB) 5.00%, 06/15/39 (c) | | | 365 | | | | 365,925 | |
| | | Par
(000’s | ) | | Value | |
| Massachusetts (continued) | | | | | | | | |
Commonwealth of Massachusetts (RB) (BAM-TCRS NATL) 5.50%, 01/01/34 | | $ | 1,420 | | | $ | 1,649,917 | |
Massachusetts Development Finance Agency (RB) 5.00%, 07/01/34 (c) | | | 1,120 | | | | 1,151,939 | |
Massachusetts Development Finance Agency, Boston Medical Center Issue , Series D (RB) 4.00%, 07/01/45 (c) | | | 535 | | | | 463,242 | |
Massachusetts Development Finance Agency, Boston Medical Center Issue, Series D (RB) 5.00%, 07/01/44 (c) | | | 2,120 | | | | 2,082,216 | |
Massachusetts Development Finance Agency, Boston Medical Center Issue, Series G (RB) 5.25%, 07/01/52 (c) | | | 5,435 | | | | 5,717,152 | |
Massachusetts Development Finance Agency, Boston Student Housing Project (RB) 5.00%, 10/01/48 (c) | | | 1,000 | | | | 994,374 | |
Massachusetts Development Finance Agency, Emerson College (RB) 5.00%, 01/01/35 (c) | | | 500 | | | | 503,567 | |
Massachusetts Development Finance Agency, Emmanuel College, Series A (RB) 5.00%, 10/01/43 (c) | | | 1,035 | | | | 1,036,071 | |
Massachusetts Development Finance Agency, Lasell University (RB) 4.00%, 07/01/45 (c) | | | 2,400 | | | | 1,979,099 | |
Massachusetts Development Finance Agency, Lawrence General Hospital (RB) 5.00%, 07/01/34 (c) | | | 1,000 | | | | 901,130 | |
Massachusetts Development Finance Agency, Lawrence General Hospital, Series A (RB) 5.25%, 07/01/34 (c) | | | 350 | | | | 321,879 | |
| Massachusetts Development Finance Agency, Linden Ponds, Inc. Facility (RB) | | | | | | | | |
| 5.00%, 11/15/38 (c) | | | 500 | | | | 516,924 | |
| 5.12%, 11/15/46 (c) | | | 500 | | | | 511,490 | |
| Massachusetts Development Finance Agency, Newbridge on the Charles, Inc. (RB) | | | | | | | | |
| 4.00%, 10/01/32 (c) | | | 1,000 | | | | 984,524 | |
| 4.12%, 10/01/42 (c) | | | 2,500 | | | | 2,249,781 | |
| 5.00%, 10/01/47 (c) | | | 1,400 | | | | 1,399,939 | |
| 5.00%, 10/01/57 (c) | | | 14,550 | | | | 14,068,033 | |
See Notes to Financial Statements
VANECK HIGH YIELD MUNI ETF
SCHEDULE OF INVESTMENTS
(continued)
| | | Par
(000’s | ) | | Value | |
| Massachusetts (continued) | | | | | | | | |
Massachusetts Development Finance Agency, South Shore Hospital Issue, Series I (RB) 4.00%, 07/01/36 (c) | | $ | 1,500 | | | $ | 1,407,513 | |
Massachusetts Development Finance Agency, Springfield College Issue, Series A (RB) (AGM) 4.00%, 06/01/56 (c) | | | 5 | | | | 3,988 | |
Massachusetts Development Finance Agency, UMass Boston Student Housing Project (RB) 5.00%, 10/01/41 (c) | | | 1,930 | | | | 1,939,928 | |
Massachusetts Development Finance Agency, UMass Dartmouth Student Housing Project (RB) 5.00%, 10/01/48 (c) | | | 1,000 | | | | 963,109 | |
| Massachusetts Development Finance Agency, UMass Memorial Health Care Obligated Group Issue, Series I (RB) | | | | | | | | |
| 5.00%, 07/01/29 (c) | | | 190 | | | | 194,230 | |
| 5.00%, 07/01/46 (c) | | | 510 | | | | 511,437 | |
Massachusetts Development Finance Agency, Worcester Polytechnic Institute Issue (RB) 5.00%, 09/01/59 (c) | | | 2,000 | | | | 2,065,709 | |
Massachusetts State Development Finance Agency, Wellforce Issue, Series A (RB) 5.00%, 07/01/33 (c) | | | 1,250 | | | | 1,268,595 | |
| | | | | | | | 45,251,711 | |
| Michigan: 0.6% | | | | | | | | |
Calhoun County Hospital Finance Authority, Oaklawn Hospital (RB) 5.00%, 02/15/41 (c) | | | 290 | | | | 275,486 | |
City of Detroit, Michigan Unlimited Tax (GO) 5.50%, 04/01/45 (c) | | | 250 | | | | 260,246 | |
| City of Detroit, Michigan Unlimited Tax, Series A (GO) | | | | | | | | |
| 5.00%, 04/01/46 (c) | | | 135 | | | | 135,872 | |
| 5.00%, 04/01/50 (c) | | | 1,475 | | | | 1,476,527 | |
Detroit Service Learning Academy, Public School Academy (RB) (AGM) 4.00%, 07/01/41 (c) | | | 1,000 | | | | 833,702 | |
Flint Michigan Hospital Building Authority, Hurley Medical Center (RB) 4.00%, 07/01/41 (c) | | | 500 | | | | 419,885 | |
| | | Par
(000’s | ) | | Value | |
| Michigan (continued) | | | | | | | | |
Flint Michigan Hospital Building Authority, Series B (RB) 4.75%, 07/01/28 (c) | | $ | 395 | | | $ | 382,553 | |
Ivywood Classical Academy (RB) 6.25%, 01/01/59 (c) | | | 1,000 | | | | 997,782 | |
| Michigan Finance Authority, Presbyterian Villages of Michigan (RB) | | | | | | | | |
| 5.25%, 11/15/35 (c) | | | 250 | | | | 238,545 | |
| 5.50%, 11/15/45 (c) | | | 300 | | | | 269,635 | |
| Michigan Finance Authority, Public Lighting Authority Local Project, Series B (RB) | | | | | | | | |
| 5.00%, 07/01/39 (c) | | | 215 | | | | 215,174 | |
| 5.00%, 07/01/44 (c) | | | 3,575 | | | | 3,576,685 | |
Michigan Finance Authority, Thomas M. Cooley Law School Project (RB) 5.00%, 07/01/34 (c) | | | 795 | | | | 796,354 | |
Michigan Finance Authority, Tobacco Settlement Bonds, Series B-2 (RB) 0.00%, 06/01/65 (c) ^ | | | 15,500 | | | | 1,622,449 | |
Michigan State Building Authority, Series F (RB) 4.00%, 10/01/24 | | | 100 | | | | 99,837 | |
| Michigan Strategic Fund, Evangelical Homes Project (RB) | | | | | | | | |
| 5.25%, 06/01/32 (c) | | | 1,000 | | | | 961,749 | |
| 5.50%, 06/01/47 (c) | | | 1,900 | | | | 1,622,083 | |
| Michigan Strategic Fund, I-75 Improvement Project (RB) | | | | | | | | |
| 5.00%, 06/30/48 (c) | | | 1,250 | | | | 1,251,435 | |
| 5.00%, 12/31/32 (c) | | | 700 | | | | 724,768 | |
| 5.00%, 06/30/31 (c) | | | 600 | | | | 621,501 | |
Michigan Tobacco Settlement Finance Authority, Series B (RB) 0.00%, 06/01/52 (c) ^ | | | 260 | | | | 32,273 | |
Summit Academy North, Michigan Public School (RB) 4.00%, 11/01/41 (c) | | | 1,000 | | | | 846,819 | |
| | | | | | | | 17,661,360 | |
| Minnesota: 0.7% | | | | | | | | |
Chippewa County, Chippewa County-Montevideo Hospital Project (RB) 4.00%, 03/01/37 (c) | | | 135 | | | | 125,177 | |
City of Anoka, Homestead at Anoka, Inc. Project (RB) 4.25%, 11/01/27 (c) | | | 405 | | | | 390,460 | |
| City of Brooklyn Park, Charter School, Athlos Leadership Academy Project, Series A (RB) | | | | | | | | |
| 5.50%, 07/01/40 (c) | | | 245 | | | | 221,596 | |
| 5.50%, 07/01/35 (c) | | | 250 | | | | 239,129 | |
See Notes to Financial Statements
| | | Par
(000’s | ) | | Value | |
| Minnesota (continued) | | | | | | | | |
City of Crookston, Health Care Facilities, Riverview Health Project (RB) 5.00%, 05/01/34 (c) | | $ | 3,000 | | | $ | 2,513,371 | |
| City of Deephaven, Charter School, Eagle Ridge Academy Project, Series A (RB) | | | | | | | | |
| 5.25%, 07/01/40 (c) | | | 500 | | | | 500,856 | |
| 5.50%, 07/01/50 (c) | | | 2,860 | | | | 2,860,721 | |
City of Forest Lake, International Language Academy, Series A (RB) (SAW) 5.38%, 08/01/50 (c) | | | 500 | | | | 488,611 | |
City of Maple Grove, Minnesota Health Care Facilities (RB) 3.38%, 05/01/33 (c) | | | 115 | | | | 104,962 | |
City of St. Louis Park, Place Via Sol Project (RB) (AMBAC) 6.00%, 07/01/53 (d) (p) * | | | 1,927 | | | | 192,740 | |
| City of St. Paul, Housing and Redevelopment Authority, Series A (RB) | | | | | | | | |
| 4.00%, 07/01/35 (c) | | | 1,000 | | | | 987,429 | |
| 5.75%, 09/01/46 (c) | | | 325 | | | | 326,938 | |
Duluth Economic Development Authority (RB) 4.00%, 07/01/41 (c) | | | 2,255 | | | | 1,788,042 | |
Housing & Redevelopment Authority of The City of St Paul Minnesota (RB) 4.00%, 11/15/43 (c) | | | 2,000 | | | | 1,754,200 | |
Minneapolis Minnesota Heath Care System, Fairview Health Services, Series A (RB) 5.00%, 11/15/49 (c) | | | 2,000 | | | | 1,954,276 | |
Minnesota Higher Education Facilities Authority, Augsburg College, Series A (RB) 5.00%, 05/01/46 (c) | | | 3,730 | | | | 3,306,775 | |
Minnesota Higher Education Facilities Authority, Augsburg College, Series B (RB) 4.25%, 05/01/40 (c) | | | 940 | | | | 785,977 | |
Minnesota Higher Education Facilities Authority, Bethel University (RB) 5.00%, 05/01/47 (c) | | | 2,000 | | | | 1,756,775 | |
Township of Baytown, St. Croix Preparatory Academy Project, Series A (RB) 4.00%, 08/01/36 (c) | | | 250 | | | | 227,722 | |
Woodbury, Minnesota Charter School Lease, Woodbury Leadership Academy Project, Series A (RB) 4.00%, 07/01/56 (c) | | | 1,150 | | | | 790,731 | |
| | | | | | | | 21,316,488 | |
| | | Par
(000’s | ) | | Value | |
| Mississippi: 0.3% | | | | | | | | |
| Mississippi Development Bank, Magnolia Regional Health Center Project (RB) | | | | | | | | |
| 4.00%, 10/01/41 (c) | | $ | 3,500 | | | $ | 2,836,600 | |
| 5.00%, 10/01/32 (c) | | | 1,530 | | | | 1,557,044 | |
Mississippi Hospital Equipment and Facilities Authority, Baptist Memorial Health Corp., Series A (RB) 5.00%, 09/01/41 (c) | | | 3,000 | | | | 3,014,305 | |
| | | | | | | | 7,407,949 | |
| Missouri: 0.8% | | | | | | | | |
| Boone County, Boone Hospital Center (RB) | | | | | | | | |
| 3.00%, 08/01/34 (c) | | | 410 | | | | 280,776 | |
| 4.00%, 08/01/38 (c) | | | 565 | | | | 384,090 | |
City of Liberty, Liberty Commons Project, Series A (TA) 5.75%, 06/01/35 (c) | | | 500 | | | | 468,765 | |
City of Nevada, Regional Medical Center (RB) (ACA) 4.30%, 10/01/26 (c) | | | 40 | | | | 39,700 | |
City of St. Louis, Industrial Development Authority, Ballpark Village Development Project, Series A (RB) 4.38%, 11/15/35 (c) | | | 250 | | | | 204,732 | |
Health & Educational Facilities Authority of the State of Missouri (RB) 4.00%, 11/15/42 (c) | | | 1,150 | | | | 1,077,943 | |
Health and Educational Facilities Authority, Lutheran Senior Services Projects, Series C (RB) 4.00%, 02/01/42 (c) | | | 475 | | | | 413,929 | |
I-470 Western Gateway Transportation Development District, Series A (RB) 5.25%, 12/01/48 (c) | | | 1,100 | | | | 1,069,048 | |
Industrial Development Authority of the City of Lee’s Summit, Missouri, Series A (RB) 5.00%, 08/15/39 (c) | | | 1,000 | | | | 1,022,465 | |
Kansas City Industrial Development Authority, Methodist Retire Home, Series B (RB) 5.00%, 11/15/46 | | | 5,352 | | | | 3,747,445 | |
| Kirkwood Industrial Development Authority, Missouri Retirement Community, Series A (RB) | | | | | | | | |
| 5.25%, 05/15/50 (c) | | | 2,000 | | | | 1,585,303 | |
| 5.25%, 05/15/37 (c) | | | 1,500 | | | | 1,356,376 | |
See Notes to Financial Statements
VANECK HIGH YIELD MUNI ETF
SCHEDULE OF INVESTMENTS
(continued)
| | | Par
(000’s | ) | | Value | |
| Missouri (continued) | | | | | | | | |
| Lees Summit Industrial Development Authority, John Knox Village, Series A (RB) | | | | | | | | |
| 5.00%, 08/15/36 (c) | | $ | 1,550 | | | $ | 1,531,682 | |
| 5.00%, 08/15/32 (c) | | | 2,430 | | | | 2,430,744 | |
| 5.00%, 08/15/42 (c) | | | 2,000 | | | | 1,846,372 | |
| 5.62%, 08/15/54 (c) | | | 500 | | | | 503,629 | |
Missouri State Health and Educational Facilities Authority, Lutheran Senior Services Project, Series A (RB) 5.00%, 02/01/42 (c) | | | 3,000 | | | | 2,978,847 | |
St. Joseph Industrial Development Authority, Missouri Healthcare, Series A (RB) 5.00%, 01/01/50 (c) | | | 1,000 | | | | 737,615 | |
St. Louis County, Industrial Development Authority, Friendship Village St. Louis, Series A (RB) 5.00%, 09/01/38 (c) | | | 500 | | | | 500,930 | |
St. Louis County, Industrial Development Authority, St. Andrew’s Resources, Series A (RB) 5.00%, 12/01/35 (c) | | | 150 | | | | 143,508 | |
University City of Missouri Industrial Development Authority of University City, Missouri, Series A (RB) 4.88%, 06/15/36 (c) | | | 1,000 | | | | 1,002,871 | |
| | | | | | | | 23,326,770 | |
| Montana: 0.2% | | | | | | | | |
City of Forsyth, Rosebud County, Montana Pollution Control, Series A (RB) 3.90%, 03/01/31 (c) | | | 2,000 | | | | 1,894,271 | |
Montana Facility Finance Authority, Bozeman Deaconess Health Services, Series A (RB) 4.00%, 06/01/45 (c) | | | 415 | | | | 379,991 | |
Montana Facility Finance Authority, Health Care Facilities, Children’s Home & Hospital Project, Series A (RB) 4.00%, 07/01/50 (c) | | | 1,970 | | | | 1,276,820 | |
| Montana Facility Finance Authority, Kalispell Regional Medical Center, Series B (RB) | | | | | | | | |
| 4.12%, 07/01/38 (c) | | | 500 | | | | 480,730 | |
| 5.00%, 07/01/48 (c) | | | 1,270 | | | | 1,265,357 | |
| | | | | | | | 5,297,169 | |
| Nebraska: 0.1% | | | | | | | | |
Central Plains Energy Project, Gas Project Crossover No. 3, Series A (RB) 5.00%, 09/01/30 | | | 2,000 | | | | 2,104,202 | |
| | | Par
(000’s | ) | | Value | |
| Nebraska (continued) | | | | | | | | |
| 5.00%, 09/01/34 | | $ | 1,000 | | | $ | 1,054,958 | |
| 5.00%, 09/01/36 | | | 500 | | | | 520,392 | |
Central Plains Energy Project, Series G (RB) 5.00%, 05/01/53 (c) (p) | | | 235 | | | | 245,353 | |
| | | | | | | | 3,924,905 | |
| Nevada: 0.3% | | | | | | | | |
| City of Las Vegas, Special Improvement District No. 814 (SA) | | | | | | | | |
| 4.00%, 06/01/44 (c) | | | 230 | | | | 189,185 | |
| 4.00%, 06/01/49 (c) | | | 530 | | | | 415,581 | |
City of Reno, Tax Increment Senior Lien, Series C (TA) 5.40%, 06/01/27 (c) | | | 965 | | | | 948,098 | |
Clark County School District, Series A (GO) 5.00%, 06/15/26 | | | 2,000 | | | | 2,064,309 | |
Clark County, Special Improvement District No. 159 (SA) 5.00%, 08/01/35 (c) | | | 160 | | | | 160,856 | |
Director of the State of Nevada Department of Business and Industry, Brightline West Passenger Rail Project, Series A-3 (RB) 8.12%, 01/01/50 (c) (p) | | | 1,000 | | | | 1,026,572 | |
Henderson Local Improvement District No. T-18 (SA) 4.00%, 09/01/35 (c) | | | 610 | | | | 552,912 | |
North Las Vegas, Special Improvement District No. 64 (SA) 4.62%, 06/01/49 (c) | | | 225 | | | | 205,961 | |
North Las Vegas, Special Improvement District No. 64 (SA) (SAW) 4.62%, 06/01/43 (c) | | | 470 | | | | 443,151 | |
| State of Nevada, Department of Business and Industry, Somerset Academy, Series A (RB) | | | | | | | | |
| 5.00%, 12/15/38 (c) | | | 400 | | | | 394,674 | |
| 5.00%, 12/15/48 (c) | | | 500 | | | | 463,287 | |
| 5.00%, 12/15/35 (c) | | | 2,000 | | | | 2,006,363 | |
| 5.12%, 12/15/45 (c) | | | 1,000 | | | | 963,870 | |
| | | | | | | | 9,834,819 | |
| New Hampshire: 0.4% | | | | | | | | |
| National Finance Authority, Ascentria Care Alliance Project (RB) | | | | | | | | |
| 5.00%, 07/01/51 (c) | | | 1,220 | | | | 969,665 | |
| 5.00%, 07/01/56 (c) | | | 2,000 | | | | 1,553,287 | |
National Finance Authority, New Hampshire Resource Recovery, Covanta Project, Series C (RB) 4.88%, 11/01/42 (c) | | | 3,375 | | | | 3,044,943 | |
See Notes to Financial Statements
| | | Par
(000’s | ) | | Value | |
| New Hampshire (continued) | | | | | | | | |
National Finance Authority, New Hampshire, Presbyterian Senior Living Project, Series A (RB) 5.25%, 07/01/48 (c) | | $ | 1,000 | | | $ | 1,013,842 | |
National Finance Authority, Springpoints Living Project (RB) 4.00%, 01/01/41 (c) | | | 1,000 | | | | 838,604 | |
National Finance Authority, The Vista Project, Series A (RB) 5.62%, 07/01/46 (c) | | | 2,600 | | | | 2,368,551 | |
| New Hampshire Health and Education Facilities Authority, Hillside Village, Series A (RB) | | | | | | | | |
| 6.12%, 07/01/37 (c) (d) * | | | 1,212 | | | | 290,788 | |
| 6.12%, 07/01/52 (c) (d) * | | | 808 | | | | 193,859 | |
| 6.25%, 07/01/42 (c) (d) * | | | 404 | | | | 96,929 | |
| | | | | | | | 10,370,468 | |
| New Jersey: 2.9% | | | | | | | | |
Casino Reinvestment Development Authority (RB) 5.25%, 11/01/44 (c) | | | 8,450 | | | | 8,459,707 | |
Casino Reinvestment Development Authority, Luxury Tax (RB) 5.25%, 11/01/39 (c) | | | 1,410 | | | | 1,413,569 | |
New Jersey Economic Development Authority, Bancroft Neurohealth Project, Series A (RB) 5.00%, 06/01/36 (c) | | | 470 | | | | 451,037 | |
| New Jersey Economic Development Authority, Continental Airlines, Inc. Project (RB) | | | | | | | | |
| 5.25%, 09/15/29 (c) | | | 1,645 | | | | 1,647,436 | |
| 5.50%, 06/01/33 (c) | | | 60 | | | | 60,616 | |
| 5.62%, 11/15/30 (c) | | | 285 | | | | 287,529 | |
| 5.62%, 11/15/30 (c) | | | 2,035 | | | | 2,053,061 | |
| 5.75%, 09/15/27 (c) | | | 725 | | | | 725,438 | |
New Jersey Economic Development Authority, Kapkowski Road Landfill Reclamation Improvement District Project (SA) 5.75%, 04/01/31 | | | 55 | | | | 55,233 | |
| New Jersey Economic Development Authority, Lions Gate Project (RB) | | | | | | | | |
| 4.88%, 01/01/29 (c) | | | 655 | | | | 644,126 | |
| 5.00%, 01/01/34 (c) | | | 500 | | | | 491,327 | |
| New Jersey Economic Development Authority, Motor Vehicle Surcharges, Series A (RB) | | | | | | | | |
| 4.00%, 07/01/34 (c) | | | 2,000 | | | | 1,976,019 | |
| 4.00%, 07/01/32 (c) | | | 1,640 | | | | 1,650,372 | |
| 5.00%, 07/01/33 (c) | | | 4,640 | | | | 4,748,149 | |
| | | Par
(000’s | ) | | Value | |
| New Jersey (continued) | | | | | | | | |
New Jersey Economic Development Authority, Motor Vehicle Surcharges, Series A (RB) (BAM) 5.00%, 07/01/28 (c) | | $ | 2,500 | | | $ | 2,598,452 | |
New Jersey Economic Development Authority, Motor Vehicle Surcharges, Series B (RB) (XLCA) 0.00%, 07/01/26 ^ | | | 515 | | | | 471,246 | |
New Jersey Economic Development Authority, New Jersey Transit Corp. Project, Series B (RB) 4.00%, 11/01/25 | | | 120 | | | | 120,525 | |
New Jersey Economic Development Authority, Port Newark Container Terminal LLC Project (RB) 5.00%, 10/01/47 (c) | | | 3,300 | | | | 3,320,407 | |
| New Jersey Economic Development Authority, School Facilities Construction, Series AAA (RB) | | | | | | | | |
| 5.00%, 06/15/36 (c) | | | 305 | | | | 319,112 | |
| 5.00%, 06/15/35 (c) | | | 725 | | | | 758,544 | |
New Jersey Economic Development Authority, School Facilities Construction, Series BBB (RB) 5.50%, 06/15/29 (c) | | | 165 | | | | 174,693 | |
New Jersey Economic Development Authority, School Facilities Construction, Series EEE (RB) 5.00%, 06/15/48 (c) | | | 2,880 | | | | 2,940,600 | |
New Jersey Economic Development Authority, School Facilities Construction, Series LLL (RB) 5.00%, 06/15/38 (c) | | | 600 | | | | 638,271 | |
New Jersey Economic Development Authority, School Facilities Construction, Series MMM (RB) 4.00%, 06/15/35 (c) | | | 500 | | | | 506,121 | |
New Jersey Economic Development Authority, School Facilities Construction, Series PP (RB) 5.00%, 06/15/26 (c) | | | 100 | | | | 100,109 | |
| New Jersey Economic Development Authority, School Facilities Construction, Series QQQ (RB) | | | | | | | | |
| 4.00%, 06/15/49 (c) | | | 1,705 | | | | 1,597,940 | |
| 4.00%, 06/15/40 (c) | | | 600 | | | | 591,615 | |
| 4.00%, 06/15/35 (c) | | | 700 | | | | 712,798 | |
| 4.00%, 06/15/38 (c) | | | 600 | | | | 600,656 | |
See Notes to Financial Statements
VANECK HIGH YIELD MUNI ETF
SCHEDULE OF INVESTMENTS
(continued)
| | | Par
(000’s | ) | | Value | |
| New Jersey (continued) | | | | | | | | |
| New Jersey Economic Development Authority, School Facilities Construction, Series WW (RB) | | | | | | | | |
| 5.00%, 06/15/35 (c) | | $ | 680 | | | $ | 691,703 | |
| 5.00%, 06/15/37 (c) | | | 630 | | | | 640,842 | |
| 5.25%, 06/15/28 (c) | | | 435 | | | | 441,154 | |
| New Jersey Economic Development Authority, School Facilities Construction, Series XX (RB) | | | | | | | | |
| 4.38%, 06/15/27 (c) | | | 420 | | | | 421,575 | |
| 5.00%, 06/15/26 (c) | | | 105 | | | | 106,807 | |
| New Jersey Economic Development Authority, The Goethals Bridge Replacement Project (RB) | | | | | | | | |
| 5.12%, 01/01/34 (c) | | | 350 | | | | 350,145 | |
| 5.38%, 01/01/43 (c) | | | 2,900 | | | | 2,901,015 | |
| 5.50%, 01/01/27 (c) | | | 500 | | | | 500,471 | |
New Jersey Economic Development Authority, West Campus Housing, LLC, Series A (RB) 4.12%, 07/01/30 (c) | | | 150 | | | | 136,687 | |
New Jersey Educational Facilities Authority, Higher Educational Capital Improvement, Series A (RB) 5.00%, 09/01/26 (c) | | | 330 | | | | 331,221 | |
New Jersey Educational Facilities Authority, Rider University, Series F (RB) 5.00%, 07/01/47 (c) | | | 490 | | | | 377,935 | |
New Jersey Educational Facilities Authority, The College of saint Elizabeth Issue, Series D (RB) 5.00%, 07/01/46 (c) | | | 2,500 | | | | 2,234,902 | |
New Jersey Health Care Facilities Financing Authority, Hospital Asset Transformation Program (RB) 5.00%, 10/01/28 (c) | | | 500 | | | | 523,983 | |
| New Jersey Transportation Trust Fund Authority, Series A (RB) | | | | | | | | |
| 0.00%, 12/15/25 ^ | | | 270 | | | | 253,892 | |
| 0.00%, 12/15/25 ^ | | | 230 | | | | 216,279 | |
| 0.00%, 12/15/33 ^ | | | 5 | | | | 3,480 | |
| 4.25%, 06/15/44 (c) | | | 1,405 | | | | 1,373,109 | |
| 5.00%, 12/15/26 | | | 5 | | | | 5,187 | |
| 5.00%, 12/15/28 | | | 200 | | | | 214,374 | |
| 5.00%, 12/15/39 (c) | | | 385 | | | | 405,604 | |
| New Jersey Transportation Trust Fund Authority, Series AA (RB) | | | | | | | | |
| 4.75%, 06/15/35 (c) | | | 150 | | | | 151,450 | |
| 5.00%, 06/15/46 (c) | | | 340 | | | | 341,646 | |
| | | Par
(000’s | ) | | Value | |
| New Jersey (continued) | | | | | | | | |
| 5.25%, 06/15/41 (c) | | $ | 505 | | | $ | 510,445 | |
| New Jersey Transportation Trust Fund Authority, Series C (RB) (AMBAC) | | | | | | | | |
| 0.00%, 12/15/25 ^ | | | 250 | | | | 235,085 | |
| 0.00%, 12/15/28 ^ | | | 185 | | | | 155,991 | |
New Jersey Transportation Trust Fund Authority, Series C (RB) (NATL) 0.00%, 12/15/31 ^ | | | 365 | | | | 274,842 | |
Newark Housing Port Authority, Marine Terminal Redevelopment Project (RB) (NATL) 5.25%, 01/01/27 | | | 100 | | | | 103,429 | |
South Jersey Port Corp., Marine Terminal, Series B (RB) 5.00%, 01/01/34 (c) | | | 360 | | | | 376,869 | |
| Tobacco Settlement Financing Corp., Series A (RB) | | | | | | | | |
| 5.00%, 06/01/46 (c) | | | 18,290 | | | | 18,702,023 | |
| 5.25%, 06/01/46 (c) | | | 2,675 | | | | 2,770,097 | |
Tobacco Settlement Financing Corp., Series B (RB) 5.00%, 06/01/46 (c) | | | 8,530 | | | | 8,614,131 | |
| | | | | | | | 84,481,081 | |
| New Mexico: 0.1% | | | | | | | | |
New Mexico Hospital Equipment Loan Council, Haverland Carter Lifestyle Group -LA Vida Llena Expansion Project, Series A (RB) 5.00%, 07/01/49 (c) | | | 3,480 | | | | 2,811,566 | |
| New York: 11.5% | | | | | | | | |
| Brooklyn Arena Local Development Corp., Barclays Center (RB) | | | | | | | | |
| 0.00%, 07/15/32 ^ | | | 395 | | | | 282,013 | |
| 0.00%, 07/15/33 ^ | | | 370 | | | | 252,393 | |
| 0.00%, 07/15/47 ^ | | | 180 | | | | 56,715 | |
| Brooklyn Arena Local Development Corp., Barclays Center, Series A (RB) | | | | | | | | |
| 5.00%, 07/15/42 (c) | | | 9,515 | | | | 9,610,048 | |
| 5.00%, 07/15/26 | | | 345 | | | | 353,724 | |
Build NYC Resource Corp. (RB) 4.00%, 08/01/42 (c) | | | 1,310 | | | | 1,158,354 | |
Build NYC Resource Corp., Albert Einstein School of Medicine, Inc., Project (RB) 5.50%, 09/01/45 (c) | | | 4,820 | | | | 4,820,209 | |
| Build NYC Resource Corp., Brooklyn Navy Yard Cogeneration Partners, L.P. Project (RB) | | | | | | | | |
| 5.00%, 12/31/28 | | | 5,005 | | | | 4,737,402 | |
| 5.25%, 12/31/33 (c) | | | 9,700 | | | | 8,780,776 | |
See Notes to Financial Statements
| | | Par
(000’s | ) | | Value | |
| New York (continued) | | | | | | | | |
Build NYC Resource Corp., East Harlem Scholars Academy Charter School Project (RB) 5.75%, 06/01/42 (c) | | $ | 1,000 | | | $ | 1,037,800 | |
| Build NYC Resource Corp., Kipp NYC Public School Facilities - Canal West Project (RB) | | | | | | | | |
| 5.25%, 07/01/57 (c) | | | 1,000 | | | | 1,017,025 | |
| 5.25%, 07/01/52 (c) | | | 1,000 | | | | 1,020,381 | |
Build NYC Resource Corp., Richmond University Medical Center Project, Series A (RB) 5.62%, 12/01/50 (c) | | | 1,200 | | | | 1,056,737 | |
Build NYC Resource Corp., Shefa School Project, Series A (RB) (SAW) 5.00%, 06/15/51 (c) | | | 4,750 | | | | 4,348,404 | |
Build NYC Resource Corp., Unity Preparatory Charter School of Brooklyn Project, Series A (RB) 5.50%, 06/15/63 (c) | | | 1,000 | | | | 974,846 | |
City of Troy Capital Resource Corp., Series A (RB) 4.00%, 09/01/40 (c) | | | 1,250 | | | | 1,189,219 | |
County of Suffolk, Series D (GO) (BAM) 4.00%, 10/15/29 (c) | | | 1,000 | | | | 1,022,139 | |
| Dutchess County Local Development Corp., Bard College Project, Series A (RB) | | | | | | | | |
| 5.00%, 07/01/40 (c) | | | 1,500 | | | | 1,530,242 | |
| 5.00%, 07/01/51 (c) | | | 3,370 | | | | 3,329,071 | |
| 5.00%, 07/01/45 (c) | | | 1,000 | | | | 1,006,397 | |
| Erie Tobacco Asset Securitization Corp., Series A (RB) | | | | | | | | |
| 5.00%, 06/01/38 (c) | | | 5 | | | | 4,804 | |
| 5.00%, 06/01/45 (c) | | | 2,000 | | | | 1,876,020 | |
Metropolitan Transportation Authority (RB) 4.25%, 11/15/42 (c) | | | 990 | | | | 955,721 | |
Metropolitan Transportation Authority, Series D (RB) 4.00%, 11/15/42 (c) | | | 1,000 | | | | 930,448 | |
Monroe County Industrial Development Corp., Rochester regional Health Project, Series A (RB) 3.00%, 12/01/40 (c) | | | 5 | | | | 3,599 | |
| Monroe County Industrial Development Corp., Rochester Regional Health Project, Series A (RB) | | | | | | | | |
| 4.00%, 12/01/35 (c) | | | 2,100 | | | | 2,066,110 | |
| 5.00%, 12/01/31 (c) | | | 500 | | | | 519,915 | |
| | | Par
(000’s | ) | | Value | |
| New York (continued) | | | | | | | | |
Nassau County Tobacco Settlement Corp., Series A-3 (RB) 5.12%, 06/01/46 (c) | | $ | 2,905 | | | $ | 2,651,692 | |
New York City Housing Development Corp., Multi- Family Housing, Series F (RB) 4.50%, 02/15/48 (c) | | | 2,500 | | | | 2,489,872 | |
New York City Industrial Development Agency, Airport Facilities, Series A (RB) 5.00%, 07/01/28 (c) | | | 1,725 | | | | 1,724,427 | |
| New York Counties Tobacco Trust IV, Series A (RB) | | | | | | | | |
| 3.75%, 06/01/45 (c) | | | 500 | | | | 392,107 | |
| 5.00%, 06/01/42 (c) | | | 7,335 | | | | 6,826,020 | |
| 5.00%, 06/01/45 (c) | | | 785 | | | | 710,897 | |
New York Counties Tobacco Trust IV, Series E (RB) 0.00%, 06/01/55 (c) ^ | | | 5 | | | | 423 | |
| New York Counties Tobacco Trust VI, Series A-2B (RB) | | | | | | | | |
| 5.00%, 06/01/51 (c) | | | 5,000 | | | | 4,536,357 | |
| 5.00%, 06/01/45 (c) | | | 1,270 | | | | 1,185,270 | |
New York Liberty Development Corp., 3 World Trade Center Project (RB) 5.38%, 11/15/40 (c) | | | 10,000 | | | | 10,020,946 | |
New York Liberty Development Corp., 4 World Trade Center Project, Series A (RB) 2.50%, 11/15/36 (c) | | | 2,000 | | | | 1,643,749 | |
New York Liberty Development Corp., Bank of America Tower at One Bryant Park Project, Series 3 (RB) 2.80%, 09/15/69 (c) | | | 7,000 | | | | 6,217,643 | |
New York Liberty Development Corp., Goldman Sachs Headquarters LLC (RB) 5.25%, 10/01/35 | | | 5,000 | | | | 5,760,729 | |
New York State Dormitory Authority (RB) (AGM) 5.00%, 07/01/43 (c) | | | 2,375 | | | | 2,459,709 | |
New York State Dormitory Authority, CUNY Student Housing Project (RB) (AMBAC) 5.50%, 07/01/35 | | | 480 | | | | 515,712 | |
New York State Dormitory Authority, Fit Student Housing Corp. (RB) (NATL) 5.25%, 07/01/31 | | | 150 | | | | 153,586 | |
New York State Dormitory Authority, Fordham University, Series A (RB) 5.00%, 07/01/41 (c) | | | 1,550 | | | | 1,584,085 | |
See Notes to Financial Statements
VANECK HIGH YIELD MUNI ETF
SCHEDULE OF INVESTMENTS
(continued)
| | | Par
(000’s | ) | | Value | |
| New York (continued) | | | | | | | | |
New York State Dormitory Authority, Montefiore Obligated Group, Series A (RB) 5.00%, 08/01/27 | | $ | 1,000 | | | $ | 1,008,790 | |
New York State Dormitory Authority, New School, Series A (RB) 5.00%, 07/01/46 (c) | | | 2,500 | | | | 2,525,536 | |
New York State Dormitory Authority, Series A (RB) 5.00%, 07/01/31 (c) | | | 1,370 | | | | 1,413,988 | |
New York State Dormitory Authority, Yeshiva University, Series A (RB) 5.00%, 07/15/50 (c) | | | 1,000 | | | | 982,525 | |
New York Transportation Development Corp. (RB) 5.38%, 06/30/60 (c) | | | 10,000 | | | | 10,447,512 | |
New York Transportation Development Corp. (RB) (AGM) 5.00%, 12/01/32 | | | 6,080 | | | | 6,607,210 | |
| New York Transportation Development Corp., American Airlines, Inc. John F. Kennedy International Airport Project (RB) | | | | | | | | |
| 5.00%, 08/01/31 (c) | | | 9,640 | | | | 9,640,678 | |
| 5.00%, 08/01/26 (c) | | | 5,010 | | | | 5,011,512 | |
| 5.25%, 08/01/31 (c) | | | 8,005 | | | | 8,403,793 | |
| 5.38%, 08/01/36 (c) | | | 2,000 | | | | 2,105,769 | |
| New York Transportation Development Corp., Delta Air Lines, Inc. - LaGuardia Airport Terminals C&D Redevelopment Project (RB) | | | | | | | | |
| 4.00%, 01/01/36 (c) | | | 2,750 | | | | 2,727,100 | |
| 4.00%, 10/01/30 | | | 8,665 | | | | 8,645,966 | |
| 4.38%, 10/01/45 (c) | | | 20,000 | | | | 19,337,510 | |
| 5.00%, 01/01/33 (c) | | | 5,230 | | | | 5,384,793 | |
| 5.00%, 01/01/31 (c) | | | 610 | | | | 630,406 | |
| 5.00%, 01/01/32 (c) | | | 1,300 | | | | 1,341,044 | |
| 5.00%, 01/01/30 (c) | | | 4,600 | | | | 4,755,841 | |
| 5.00%, 10/01/35 (c) | | | 16,150 | | | | 17,070,124 | |
| 5.00%, 10/01/40 (c) | | | 13,300 | | | | 13,741,242 | |
| 5.62%, 04/01/40 (c) | | | 7,895 | | | | 8,585,033 | |
| 6.00%, 04/01/35 (c) | | | 6,000 | | | | 6,803,401 | |
New York Transportation Development Corp., John F. Kennedy International Airport New Terminal One Project (RB) 6.00%, 06/30/54 (c) | | | 3,475 | | | | 3,810,346 | |
New York Transportation Development Corp., John F. Kennedy International Airport Project (RB) 3.00%, 08/01/31 | | | 5,765 | | | | 5,407,798 | |
| | | Par
(000’s | ) | | Value | |
| New York (continued) | | | | | | | | |
| New York Transportation Development Corp., LaGuardia Airport Terminal B Redevelopment Project, Series A (RB) | | | | | | | | |
| 4.00%, 07/01/31 (c) | | $ | 1,000 | | | $ | 978,866 | |
| 5.00%, 07/01/30 (c) | | | 420 | | | | 420,201 | |
| 5.00%, 07/01/34 (c) | | | 4,230 | | | | 4,231,527 | |
| 5.00%, 07/01/46 (c) | | | 10,130 | | | | 9,880,157 | |
| 5.00%, 07/01/41 (c) | | | 11,445 | | | | 11,265,066 | |
| 5.25%, 01/01/50 (c) | | | 12,720 | | | | 12,592,771 | |
| New York Transportation Development Corp., Terminal 4 John F. Kennedy International Airport Project (RB) | | | | | | | | |
| 5.00%, 12/01/42 (c) | | | 1,000 | | | | 1,037,253 | |
| 5.00%, 12/01/41 (c) | | | 1,000 | | | | 1,041,130 | |
| 5.00%, 12/01/39 (c) | | | 1,000 | | | | 1,052,077 | |
New York Transportation Development Corp., Terminal 4 John F. Kennedy International Airport Project (RB) (AGM) 5.00%, 12/01/30 | | | 5,000 | | | | 5,353,366 | |
Niagara Area Development Corp., New York Solid Waste Disposal Facility, Series A (RB) 4.75%, 11/01/42 (c) | | | 2,250 | | | | 2,009,961 | |
Otsego County Capital Resource Corp., Hartwick College Project, Series A (RB) 5.00%, 10/01/45 (c) | | | 355 | | | | 261,099 | |
Suffolk Tobacco Asset Securitization Corp., Series B-2 (RB) 0.00%, 06/01/66 (c) ^ | | | 10,515 | | | | 1,012,301 | |
Troy Capital Resource Corp., Rensselaer Polytechnic Institute Project, Series A (RB) 5.00%, 09/01/36 (c) | | | 1,000 | | | | 1,074,481 | |
| TSASC, Inc., Tobacco Settlement Bonds, Series B (RB) | | | | | | | | |
| 5.00%, 06/01/48 (c) | | | 2,000 | | | | 1,779,433 | |
| 5.00%, 06/01/45 (c) | | | 18,780 | | | | 16,985,993 | |
| Ulster County Capital Resource Corp., Woodland Pond of New Paltz Project (RB) | | | | | | | | |
| 5.00%, 09/15/37 (c) | | | 400 | | | | 328,207 | |
| 5.25%, 09/15/53 (c) | | | 180 | | | | 130,063 | |
Westchester County Local Development Corp., Medical Center (RB) 5.00%, 11/01/46 (c) | | | 3,000 | | | | 2,841,797 | |
Westchester County Local Development Corp., Pace University, Series A (RB) 5.50%, 05/01/42 (c) | | | 5,000 | | | | 5,000,099 | |
See Notes to Financial Statements
| | | Par
(000’s | ) | | Value | |
| New York (continued) | | | | | | | | |
Westchester Tobacco Asset Securitization Corp., Series B (RB) 5.00%, 06/01/41 (c) | | $ | 200 | | | $ | 203,744 | |
Westchester Tobacco Asset Securitization Corp., Series C (RB) 5.00%, 06/01/45 (c) | | | 4,575 | | | | 4,470,829 | |
Yonkers Economic Development Corp., Charter School of Educational Excellence Project, Series A (RB) 5.00%, 10/15/54 (c) | | | 275 | | | | 261,001 | |
Yonkers Economic Development Corp., Charter School of Educational Excellence Project, Series A (RB) (AGM) 5.00%, 10/15/39 (c) | | | 315 | | | | 317,082 | |
| | | | | | | | 333,730,157 | |
| North Carolina: 0.8% | | | | | | | | |
North Carolina Department of Transportation,I-77 Hot Lanes Project (RB) 5.00%, 12/31/37 (c) | | | 1,000 | | | | 1,004,827 | |
| North Carolina Medical Care Commission Health Care Facilities First Mortgage, Pennybyrn at Maryfield (RB) | | | | | | | | |
| 5.00%, 10/01/30 (c) | | | 1,000 | | | | 992,387 | |
| 5.00%, 10/01/35 (c) | | | 1,770 | | | | 1,720,449 | |
North Carolina Medical Care Commission Health Care Facilities, Series A (RB) 4.00%, 07/01/49 (c) | | | 205 | | | | 190,318 | |
North Carolina Medical Care Commission, Pennybyrn at Maryfield (RB) 5.00%, 10/01/25 | | | 60 | | | | 60,003 | |
| North Carolina Medical Care Commission, Retirement Facilities (RB) | | | | | | | | |
| 4.70%, 07/01/37 (c) | | | 550 | | | | 462,833 | |
| 5.00%, 10/01/31 (c) | | | 3,530 | | | | 3,542,573 | |
| 5.00%, 10/01/37 (c) | | | 1,140 | | | | 1,118,125 | |
North Carolina Medical Care Commission, Retirement Facilities, Series A (RB) 5.00%, 10/01/30 (c) | | | 165 | | | | 161,454 | |
North Carolina Medical Care Commission, Retirement Facilities, Series A (RB) (AGM) 5.00%, 07/01/49 (c) | | | 385 | | | | 332,617 | |
North Carolina Medical Care Commission, Salemtowne Project (RB) 5.25%, 10/01/37 (c) | | | 465 | | | | 436,820 | |
| | | Par
(000’s | ) | | Value | |
| North Carolina (continued) | | | | | | | | |
North Carolina Turnpike Authority (RB) (AGM) 4.00%, 01/01/55 (c) | | $ | 3,625 | | | $ | 3,269,767 | |
North Carolina Turnpike Authority Triangle Expressway System Senior Lien (RB) 5.00%, 01/01/40 (c) | | | 5,000 | | | | 5,135,730 | |
| North Carolina Turnpike Authority, Triangle Expressway System (RB) | | | | | | | | |
| 5.00%, 01/01/30 (c) | | | 1,000 | | | | 1,031,284 | |
| 5.00%, 01/01/49 (c) | | | 1,430 | | | | 1,453,728 | |
| North Carolina Turnpike Authority, Triangle Expressway System (RB) (AGM) | | | | | | | | |
| 5.00%, 01/01/32 (c) | | | 100 | | | | 107,251 | |
| 5.00%, 01/01/58 (c) | | | 2,500 | | | | 2,640,604 | |
| | | | | | | | 23,660,770 | |
| North Dakota: 0.2% | | | | | | | | |
City of Grand Forks ND (RB) (AGM) 5.00%, 12/01/53 (c) | | | 2,000 | | | | 2,039,216 | |
City of Grand Forks, Altru Health System (RB) 5.00%, 12/01/32 (c) | | | 2,000 | | | | 2,071,933 | |
City of Grand Forks, Altru Health System (RB) (AGM) 4.00%, 12/01/41 (c) | | | 1,000 | | | | 884,085 | |
| City of Williston, Eagle Crest Apartments LLC Project (RB) | | | | | | | | |
| 6.25%, 09/01/23 (d) * | | | 607 | | | | 303,337 | |
| 7.75%, 09/01/38 (c) (d) * | | | 1,268 | | | | 633,802 | |
County of Grand Forks, Red River Biorefinery, LLC Project, Series A (RB) 7.00%, 12/15/43 (c) (d) * | | | 5,500 | | | | 165,000 | |
Ward County, North Dakota Health Care Facilities, Series C (RB) 5.00%, 06/01/43 (c) | | | 1,000 | | | | 901,728 | |
| | | | | | | | 6,999,101 | |
| Ohio: 3.6% | | | | | | | | |
| Akron Bath Copley Joint Township Hospital District, Summa Health System (RB) | | | | | | | | |
| 5.25%, 11/15/46 (c) | | | 5,000 | | | | 5,047,322 | |
| 5.25%, 11/15/41 (c) | | | 500 | | | | 507,587 | |
Brunswick City School District, Classroom Facilities and School Improvement (GO) (BAM) 5.25%, 12/01/53 (c) | | | 2,000 | | | | 2,118,085 | |
Buckeye Tobacco Settlement Financing Authority, Series B-2 (RB) 5.00%, 06/01/55 (c) | | | 31,075 | | | | 28,173,266 | |
See Notes to Financial Statements
VANECK HIGH YIELD MUNI ETF
SCHEDULE OF INVESTMENTS
(continued)
| | | Par
(000’s | ) | | Value | |
| Ohio (continued) | | | | | | | | |
Buckeye Tobacco Settlement Financing Authority, Series B-3 (RB) 0.00%, 06/01/57 (c) ^ | | $ | 120,500 | | | $ | 11,946,816 | |
Centerville Ohio Health Care, Graceworks Lutheran Services (RB) 5.25%, 11/01/47 (c) | | | 1,000 | | | | 901,514 | |
Cleveland Cuyahoga County, Port Authority Cultural Facility, Playhouse Square Foundation Project (RB) 5.00%, 12/01/28 | | | 700 | | | | 711,896 | |
Columbus-Franklin County Finance Authority, Ohio Dominican University Project (RB) (SBG) 6.50%, 03/01/48 (c) | | | 3,800 | | | | 2,679,564 | |
County of Allen OH Hospital Facilities Revenue (RB) 4.00%, 11/01/44 (c) | | | 2,160 | | | | 2,059,547 | |
County of Butler (RB) 5.00%, 11/15/32 (c) | | | 1,035 | | | | 1,045,150 | |
County of Cuyahoga, Ohio Convention Hotel Project (CP) 5.00%, 12/01/25 (c) | | | 1,805 | | | | 1,806,073 | |
| County of Cuyahoga, Ohio Hospital, The Metrohealth System (RB) | | | | | | | | |
| 4.75%, 02/15/47 (c) | | | 340 | | | | 326,090 | |
| 5.25%, 02/15/47 (c) | | | 10,000 | | | | 10,023,847 | |
| 5.50%, 02/15/52 (c) | | | 1,225 | | | | 1,240,248 | |
| 5.50%, 02/15/57 (c) | | | 3,000 | | | | 3,034,238 | |
County of Lukas, Ohio Hospital, Promedica Healthcare, Series A (RB) (AGM) 5.25%, 11/15/48 (c) | | | 2,000 | | | | 1,988,903 | |
| County of Montgomery, Premier Health Partners Obligated Group, Series A (RB) | | | | | | | | |
| 4.00%, 11/15/45 (c) | | | 2,250 | | | | 1,913,695 | |
| 4.00%, 11/15/42 (c) | | | 3,940 | | | | 3,457,889 | |
| Muskingum County, Ohio Hospital Facilities, Genesis HealthCare System Project (RB) | | | | | | | | |
| 5.00%, 02/15/44 (c) | | | 1,750 | | | | 1,612,936 | |
| 5.00%, 02/15/33 (c) | | | 490 | | | | 483,887 | |
Ohio Air Quality Development Authority, AMG Vanadium Project (RB) 5.00%, 07/01/49 (c) | | | 11,000 | | | | 10,128,103 | |
Ohio Air Quality Development Authority, Dayton Co. Project, Series B (RB) 4.25%, 11/01/40 (p) | | | 1,000 | | | | 987,946 | |
| | | Par
(000’s | ) | | Value | |
| Ohio (continued) | | | | | | | | |
Ohio Air Quality Development Authority, Duke Energy Corp. Project, Series B (RB) 4.25%, 11/01/39 (p) | | $ | 1,000 | | | $ | 1,002,160 | |
Ohio Air Quality Development Authority, Ohio Valley Electric Corp. Project, Series A (RB) 3.25%, 09/01/29 | | | 2,750 | | | | 2,601,427 | |
Ohio Airport Special Revenue, Continental Airlines, Inc. Project (RB) 5.38%, 09/15/27 (c) | | | 5,000 | | | | 5,000,970 | |
Ohio University, A State University of Ohio, Series A (RB) 5.00%, 12/01/45 (c) | | | 1,250 | | | | 1,276,601 | |
| Southeastern Ohio Port Authority, Hospital Facilities Revenue, Memorial Health System Obligated Group Project (RB) | | | | | | | | |
| 5.00%, 12/01/43 (c) | | | 1,240 | | | | 1,074,815 | |
| 5.00%, 12/01/35 (c) | | | 245 | | | | 230,063 | |
| 5.50%, 12/01/43 (c) | | | 70 | | | | 64,618 | |
Washington County, Ohio Hospital Facilities, Memorial Health System (RB) 6.75%, 12/01/52 (c) | | | 2,235 | | | | 2,406,118 | |
| | | | | | | | 105,851,374 | |
| Oklahoma: 1.3% | | | | | | | | |
Atoka Industrial Development Authority Solid Waste Disposal Facilities, Gladieux Metals Recycling Oklahoma, LLC Project (RB) 8.00%, 08/01/39 (c) | | | 1,000 | | | | 1,006,159 | |
| Norman Regional Hospital Authority (RB) | | | | | | | | |
| 3.25%, 09/01/38 (c) | | | 340 | | | | 250,497 | |
| 4.00%, 09/01/37 (c) | | | 2,365 | | | | 2,062,243 | |
| 4.00%, 09/01/45 (c) | | | 1,000 | | | | 802,471 | |
Oklahoma Development Finance Authority, Oklahoma City University Project (RB) 5.00%, 08/01/44 (c) | | | 4,305 | | | | 4,082,762 | |
| Oklahoma Development Finance Authority, OU Medicine Project, Series B (RB) | | | | | | | | |
| 5.00%, 08/15/33 (c) | | | 700 | | | | 720,586 | |
| 5.25%, 08/15/43 (c) | | | 2,900 | | | | 2,959,695 | |
| 5.25%, 08/15/48 (c) | | | 8,000 | | | | 8,087,823 | |
| Oklahoma Development Finance Authority, OU Medicine Project, Series B (RB) (AGM) | | | | | | | | |
| 5.50%, 08/15/52 (c) | | | 1,300 | | | | 1,322,060 | |
| 5.50%, 08/15/57 (c) | | | 6,290 | | | | 6,401,599 | |
See Notes to Financial Statements
| | | Par
(000’s | ) | | Value | |
| Oklahoma (continued) | | | | | | | | |
Rogers County Industrial Development Authority (RB) 3.62%, 04/01/40 (c) | | $ | 375 | | | $ | 338,249 | |
Tulsa Airports Improvement Trust (RB) 5.50%, 06/01/35 (c) | | | 5,000 | | | | 5,000,969 | |
Tulsa Municipal Airport Trust, American Airlines, Inc. (RB) 5.00%, 06/01/35 (c) (p) | | | 4,455 | | | | 4,483,680 | |
| | | | | | | | 37,518,793 | |
| Oregon: 0.1% | | | | | | | | |
Multnomah County, Oregon Hospital Facilities Authority, PArkview Project, Series A (RB) (AGM) 4.00%, 12/01/36 (c) | | | 1,000 | | | | 865,870 | |
Oregon State Facilities Authority (RB) 5.00%, 10/01/35 (c) | | | 2,260 | | | | 2,301,985 | |
Oregon State Facilities Authority, Samaritan Health Services Project (RB) 5.00%, 10/01/46 (c) | | | 1,000 | | | | 989,586 | |
| | | | | | | | 4,157,441 | |
| Pennsylvania: 4.4% | | | | | | | | |
Allegheny County Airport Authority, Pittsburgh International Airport, Series A (RB) (AGM) 5.50%, 01/01/48 (c) | | | 1,410 | | | | 1,523,755 | |
| Allentown Neighborhood Improvement Zone Development Authority (RB) | | | | | | | | |
| 5.00%, 05/01/42 (c) | | | 2,000 | | | | 1,973,821 | |
| 5.00%, 05/01/32 (c) | | | 250 | | | | 254,517 | |
| 5.00%, 05/01/33 (c) | | | 250 | | | | 254,076 | |
| 5.00%, 05/01/28 | | | 670 | | | | 672,442 | |
| 5.00%, 05/01/42 (c) | | | 2,245 | | | | 2,220,820 | |
| 5.00%, 05/01/28 | | | 1,000 | | | | 1,018,527 | |
| 5.38%, 05/01/42 (c) | | | 4,000 | | | | 3,893,413 | |
| Berks County Industrial Development Authority, Tower Health Project (RB) | | | | | | | | |
| 5.00%, 11/01/24 | | | 500 | | | | 416,791 | |
| 5.00%, 11/01/26 | | | 120 | | | | 79,150 | |
| 5.00%, 11/01/28 (c) | | | 470 | | | | 265,973 | |
| 5.00%, 11/01/34 (c) | | | 110 | | | | 57,238 | |
| 5.00%, 11/01/30 (c) | | | 1,000 | | | | 535,427 | |
Berks County Municipal Authority, Reading Hospital and Medical Center Project, Series A (RB) 5.00%, 11/01/44 (c) | | | 1,000 | | | | 516,391 | |
Berks County Municipal Authority, Tower Health Project (RB) 4.00%, 11/01/47 (c) | | | 3,425 | | | | 1,767,808 | |
| | | Par
(000’s | ) | | Value | |
| Pennsylvania (continued) | | | | | | | | |
| Berks County Municipal Authority, Tower Health Project, Series A (RB) | | | | | | | | |
| 5.00%, 02/01/27 | | $ | 1,000 | | | $ | 639,572 | |
| 5.00%, 02/01/30 | | | 860 | | | | 465,784 | |
Berks County Municipal Authority, Tower Health Project, Series B-2 (RB) 5.00%, 02/01/40 (c) (p) | | | 6,000 | | | | 3,837,430 | |
Butler County Hospital Authority, Butler Health System Project, Series A (RB) 5.00%, 07/01/39 (c) | | | 1,465 | | | | 1,391,897 | |
Central Texas Regional Mobility Authority, Subordinated Lien, Series G (RB) 6.00%, 10/01/48 (c) | | | 1,000 | | | | 979,867 | |
Chester County Health and Education Facilities Authority, Immaculata University Project (RB) 5.00%, 11/01/46 (c) | | | 430 | | | | 345,242 | |
Chester County Industrial Development Authority (RB) 5.25%, 10/15/47 (c) | | | 1,250 | | | | 1,151,925 | |
| Chester County Industrial Development Authority, Woodland at Greystone Project (SA) | | | | | | | | |
| 5.00%, 03/01/38 (c) | | | 1,200 | | | | 1,159,207 | |
| 5.12%, 03/01/48 (c) | | | 1,897 | | | | 1,743,027 | |
County of Cumberland, Diakon Lutheran Social Ministries (RB) 4.00%, 01/01/33 (c) | | | 185 | | | | 179,189 | |
| Crawford County Hospital Authority, Meadville Medical Center Project, Series A (RB) | | | | | | | | |
| 6.00%, 06/01/46 (c) | | | 440 | | | | 443,147 | |
| 6.00%, 06/01/51 (c) | | | 345 | | | | 345,763 | |
Cumberland County Municipal Authority (RB) 5.00%, 01/01/45 (c) | | | 3,000 | | | | 2,650,372 | |
Delaware County Industrial Development Authority, Chester Community Charter School Project, Series A (RB) 5.12%, 06/01/46 (c) | | | 395 | | | | 372,805 | |
Delaware Valley, Pennsylvania Regional Finance Authority, Series A (RB) (AMBAC) 5.50%, 08/01/28 | | | 2,880 | | | | 3,107,509 | |
Erie Pennsylvania Higher Education Building Authority, Mercyhurst University Project (RB) 5.00%, 09/15/37 (c) | | | 1,000 | | | | 940,404 | |
See Notes to Financial Statements
VANECK HIGH YIELD MUNI ETF
SCHEDULE OF INVESTMENTS
(continued)
| | | Par
(000’s | ) | | Value | |
| Pennsylvania (continued) | | | | | | | | |
| Franklin County Industrial Development Authority, Menno-Haven, Inc. Project (RB) | | | | | | | | |
| 5.00%, 12/01/49 (c) | | $ | 500 | | | $ | 407,054 | |
| 5.00%, 12/01/54 (c) | | | 215 | | | | 168,858 | |
Lancaster County Hospital Authority, Brethren Village Project (RB) 5.12%, 07/01/37 (c) | | | 1,000 | | | | 944,526 | |
| Lancaster County Hospital Authority, St. Anne’s Retirement Community, Inc. Project (RB) | | | | | | | | |
| 5.00%, 03/01/40 (c) | | | 425 | | | | 366,288 | |
| 5.00%, 03/01/45 (c) | | | 310 | | | | 254,555 | |
| 5.00%, 03/01/50 (c) | | | 425 | | | | 338,093 | |
McCandless Industrial Development Authority, LA Roche University Project, Series A (RB) 6.75%, 12/01/46 (c) | | | 1,000 | | | | 947,944 | |
Montgomery County Higher Education and Health Authority, Holy Redeemer Health System, Series A (RB) 5.00%, 10/01/40 (c) | | | 5,150 | | | | 4,707,504 | |
Montgomery County Higher Education and Health Authority, Presbytery Homes, Inc. Project (RB) 5.00%, 12/01/47 (c) | | | 2,000 | | | | 1,871,176 | |
Montgomery County Higher Education and Health Authority, Thomas Jefferson University, Series B (RB) 5.00%, 05/01/47 (c) | | | 4,800 | | | | 4,961,674 | |
Montgomery County Industrial Development Authority, Series A (RB) 4.10%, 04/01/53 (p) | | | 2,500 | | | | 2,549,839 | |
| Montgomery County Industrial Development Authority, Whitemarsh Continuing Care Retirement Community Project (RB) | | | | | | | | |
| 5.00%, 01/01/30 (c) | | | 150 | | | | 146,737 | |
| 5.25%, 01/01/40 (c) | | | 870 | | | | 795,173 | |
| Moon Industrial Development Authority, Baptist Homes Society (RB) | | | | | | | | |
| 5.62%, 07/01/30 (c) | | | 300 | | | | 268,779 | |
| 6.00%, 07/01/45 (c) | | | 590 | | | | 441,106 | |
Northampton County Industrial Development Authority, Morningstar Senior Living, Inc. Project (RB) 5.00%, 11/01/39 (c) | | | 1,000 | | | | 915,107 | |
| | | Par
(000’s | ) | | Value | |
| Pennsylvania (continued) | | | | | | | | |
Pennsylvania Economic Development Financing Authority, Solid Wast Disposal, Covanta Project, Series A (RB) 3.25%, 08/01/39 (c) | | $ | 2,750 | | | $ | 2,083,567 | |
| Pennsylvania Economic Development Financing Authority, Tapestry Moon Senior Housing Project, Series A (RB) | | | | | | | | |
| 6.50%, 12/01/38 (c) (d) * | | | 3,040 | | | | 1,159,000 | |
| 6.75%, 12/01/53 (c) (d) * | | | 6,470 | | | | 2,466,688 | |
| Pennsylvania Economic Development Financing Authority, The Penndot Major Bridges Package One Project (RB) | | | | | | | | |
| 5.25%, 06/30/53 (c) | | | 3,000 | | | | 3,115,153 | |
| 5.50%, 06/30/43 (c) | | | 2,500 | | | | 2,715,519 | |
| 5.50%, 06/30/40 (c) | | | 3,000 | | | | 3,298,594 | |
| 5.75%, 06/30/48 (c) | | | 6,000 | | | | 6,528,163 | |
| 6.00%, 06/30/61 (c) | | | 6,000 | | | | 6,592,586 | |
| Pennsylvania Economic Development Financing Authority, The Pennsylvania Rapid Bridge Replacement Project (RB) | | | | | | | | |
| 5.00%, 12/31/25 | | | 1,105 | | | | 1,113,756 | |
| 5.00%, 12/31/28 (c) | | | 575 | | | | 581,725 | |
| 5.00%, 12/31/26 (c) | | | 1,485 | | | | 1,497,588 | |
| 5.00%, 06/30/42 (c) | | | 6,945 | | | | 6,845,179 | |
| 5.00%, 12/31/30 (c) | | | 410 | | | | 415,196 | |
Pennsylvania Higher Educational Facilities Authority (RB) 5.00%, 11/01/42 (c) | | | 1,100 | | | | 1,073,814 | |
| Pennsylvania Higher Educational Facilities Authority, La Salle University (RB) | | | | | | | | |
| 5.00%, 05/01/37 (c) | | | 1,915 | | | | 1,629,399 | |
| 5.00%, 05/01/42 (c) | | | 1,000 | | | | 804,100 | |
Pennsylvania Turnpike Commission, Series B (RB) (BAM) 4.00%, 12/01/39 (c) | | | 2,840 | | | | 2,843,317 | |
Philadelphia Authority for Industrial Development, First Philadelphia Preparatory Charter School Project, Series A (RB) 7.25%, 06/15/43 (c) | | | 1,000 | | | | 1,003,499 | |
Philadelphia Authority for Industrial Development, Greater Philadelphia Health Action, Inc. Project, Series A (RB) 6.38%, 06/01/40 (c) | | | 440 | | | | 439,993 | |
See Notes to Financial Statements
| | | Par
(000’s | ) | | Value | |
| Pennsylvania (continued) | | | | | | | | |
| 6.50%, 06/01/45 (c) | | $ | 440 | | | $ | 439,944 | |
| 6.62%, 06/01/50 (c) | | | 415 | | | | 415,204 | |
Philadelphia Authority for Industrial Development, Independence Charter School West Project (RB) 5.00%, 06/15/39 (c) | | | 355 | | | | 337,965 | |
Philadelphia Authority for Industrial Development, KIPP Philadelphia Charter School Project, Series B (RB) (AGM) 5.00%, 04/01/46 (c) | | | 1,000 | | | | 912,980 | |
Philadelphia Authority for Industrial Development, LA Salle University (RB) 4.00%, 05/01/42 (c) | | | 2,000 | | | | 1,404,139 | |
| Philadelphia Authority for Industrial Development, Performing Arts, String Theory Charter School Project (RB) | | | | | | | | |
| 5.00%, 06/15/50 (c) | | | 1,000 | | | | 946,959 | |
| 5.00%, 06/15/40 (c) | | | 500 | | | | 495,605 | |
Philadelphia Authority for Industrial Development, Temple University (RB) 5.00%, 04/01/29 (c) | | | 3,000 | | | | 3,030,545 | |
Philadelphia Authority for Industrial Development, Temple University, First Series (RB) 5.00%, 04/01/40 (c) | | | 5,695 | | | | 5,719,908 | |
Philadelphia Authority for Industrial Development, Wesley Enhanced Living Obligation Group, Series A (RB) 5.00%, 07/01/32 (c) | | | 735 | | | | 692,114 | |
Philadelphia Hospitals and Higher Education Facilities Authority, Temple University Health System (RB) 5.00%, 07/01/33 (c) | | | 1,000 | | | | 1,015,413 | |
| Philadelphia Hospitals and Higher Education Facilities Authority, Temple University Health System, Series A (RB) | | | | | | | | |
| 5.00%, 07/01/31 (c) | | | 1,240 | | | | 1,259,638 | |
| 5.00%, 07/01/32 (c) | | | 220 | | | | 223,444 | |
Philadelphia, Pennsylvania Hospital & Higher Education Facilities Authority, Temple University Health System Obligation Group (RB) (AGM) 5.00%, 07/01/37 (c) | | | 2,470 | | | | 2,637,270 | |
Reading Pennsylvania School District (GO) (AGM) 5.00%, 03/01/37 (c) | | | 1,535 | | | | 1,581,738 | |
| | | Par
(000’s | ) | | Value | |
| Pennsylvania (continued) | | | | | | | | |
Scranton-Lackawanna, Pennsylvania Health and Welfare Authority (RB) 5.00%, 06/01/36 (c) | | $ | 1,500 | | | $ | 1,425,474 | |
The School District of Philadelphia, Se (GO) (SAW) 5.00%, 09/01/26 | | | 3,000 | | | | 3,089,067 | |
| | | | | | | | 127,121,945 | |
| Puerto Rico: 9.0% | | | | | | | | |
Children’s Trust Fund, Tobacco Settlement< Series A (RB) 0.00%, 05/15/57 (c) ^ | | | 200,000 | | | | 16,003,840 | |
Cofina Class 2 Trust (RB) (AMBAC) 0.00%, 08/01/47 ^ | | | 80 | | | | 23,464 | |
| Puerto Rico Commonwealth Aqueduct and Sewer Authority, Series A (RB) | | | | | | | | |
| 4.00%, 07/01/42 (c) | | | 7,365 | | | | 6,876,130 | |
| 5.00%, 07/01/47 (c) | | | 15,000 | | | | 15,197,312 | |
| 5.00%, 07/01/30 | | | 7,500 | | | | 7,939,336 | |
| 5.00%, 07/01/37 (c) | | | 6,290 | | | | 6,607,962 | |
| 6.12%, 07/01/24 | | | 55 | | | | 55,193 | |
| Puerto Rico Commonwealth Aqueduct and Sewer Authority, Series B (RB) | | | | | | | | |
| 5.00%, 07/01/29 | | | 3,000 | | | | 3,151,411 | |
| 5.00%, 07/01/37 (c) | | | 3,365 | | | | 3,517,252 | |
Puerto Rico Commonwealth, Series A-1 (GO) 4.00%, 07/01/41 (c) | | | 8,260 | | | | 7,685,080 | |
| Puerto Rico Commonwealth, Series A-1 (GO) (BAM-TCRS) | | | | | | | | |
| 4.00%, 07/01/35 (c) | | | 8,573 | | | | 8,316,841 | |
| 4.00%, 07/01/37 (c) | | | 9,500 | | | | 9,104,531 | |
| 4.00%, 07/01/33 (c) | | | 13,570 | | | | 13,374,844 | |
| 5.75%, 07/01/31 | | | 10,055 | | | | 11,227,099 | |
Puerto Rico Industrial, Tourist, Educational, Medical and Environmental Control Facilities Financing Authority, University Plaza Project, Series A (RB) (NATL) 5.00%, 07/01/33 (c) | | | 20 | | | | 19,590 | |
| Puerto Rico Sales Tax Financing Corp. Sales Tax Revenue (RB) | | | | | | | | |
| 4.75%, 07/01/53 (c) | | | 3,000 | | | | 2,935,368 | |
| 5.00%, 07/01/58 (c) | | | 3,000 | | | | 3,000,354 | |
| Puerto Rico Sales Tax Financing Corp., Series A-1 (RB) | | | | | | | | |
| 0.00%, 07/01/24 ^ | | | 2 | | | | 1,987 | |
| 4.50%, 07/01/34 (c) | | | 2,800 | | | | 2,810,881 | |
| 5.00%, 07/01/58 (c) | | | 36,645 | | | | 36,649,321 | |
Puerto Rico Sales Tax Financing Corp., Series A-1 (RB) (AGC) 4.55%, 07/01/40 (c) | | | 10,414 | | | | 10,429,071 | |
See Notes to Financial Statements
VANECK HIGH YIELD MUNI ETF
SCHEDULE OF INVESTMENTS
(continued)
| | | Par
(000’s | ) | | Value | |
| Puerto Rico (continued) | | | | | | | | |
Puerto Rico Sales Tax Financing Corp., Series A-1 (RB) (AMBAC) 4.75%, 07/01/53 (c) | | $ | 25,720 | | | $ | 25,165,888 | |
| Puerto Rico Sales Tax Financing Corp., Series A-2 (RB) | | | | | | | | |
| 4.33%, 07/01/40 (c) | | | 12,590 | | | | 12,329,779 | |
| 4.33%, 07/01/40 (c) | | | 26,145 | | | | 25,604,612 | |
| 4.55%, 07/01/40 (c) | | | 6,432 | | | | 6,441,308 | |
| 4.78%, 07/01/58 (c) | | | 5,000 | | | | 4,903,958 | |
Puerto Rico Sales Tax Rev Restructed BDS Cofina A-1 (RB) 0.00%, 07/01/51 (c) ^ | | | 100,246 | | | | 22,985,796 | |
| | | | | | | | 262,358,208 | |
| Rhode Island: 0.3% | | | | | | | | |
| Rhode Island Health and Educational Building Corp., Care New England Issue, Series B (RB) | | | | | | | | |
| 5.00%, 09/01/26 | | | 100 | | | | 99,026 | |
| 5.00%, 09/01/36 (c) | | | 3,750 | | | | 3,515,312 | |
Rhode Island Health and Educational Building Corp., Care New England, Series B (RB) 5.00%, 09/01/31 (c) | | | 500 | | | | 484,266 | |
| Rhode Island Health and Educational Building Corp., Lifespan Obligated Group Issue (RB) | | | | | | | | |
| 5.00%, 05/15/33 (c) | | | 1,000 | | | | 1,011,751 | |
| 5.00%, 05/15/39 (c) | | | 2,215 | | | | 2,221,397 | |
| | | | | | | | 7,331,752 | |
| South Carolina: 0.4% | | | | | | | | |
Berkeley County, South Carolina Nexton Improvement District (SA) 4.38%, 11/01/49 (c) | | | 800 | | | | 652,235 | |
Piedmont Municipal Power Agency, South Carolina Electric, Series C (RB) 5.00%, 01/01/34 (c) | | | 1,000 | | | | 1,025,418 | |
Scago Educational Facilities, School District of Pickens County Project (RB) 5.00%, 12/01/29 (c) | | | 1,425 | | | | 1,442,190 | |
| South Carolina Jobs-Economic Development Authority, Hampton Medical Center Project (RB) | | | | | | | | |
| 5.00%, 11/01/37 (c) | | | 650 | | | | 644,708 | |
| 5.00%, 11/01/33 (c) | | | 500 | | | | 505,559 | |
| South Carolina Jobs-Economic Development Authority, High Point Academy Project, Series A (RB) | | | | | | | | |
| 5.75%, 06/15/49 (c) | | | 500 | | | | 505,037 | |
| 5.75%, 06/15/39 (c) | | | 500 | | | | 507,965 | |
| | | Par
(000’s | ) | | Value | |
| South Carolina (continued) | | | | | | | | |
South Carolina Jobs-Economic Development Authority, South Carolina Episcopal Home at Still Hopes (RB) 5.00%, 04/01/47 (c) | | $ | 3,000 | | | $ | 2,556,005 | |
South Carolina Jobs-Economic Development Authority, The Lutheran Homes of South Carolina, Inc. (RB) 5.00%, 05/01/43 (c) | | | 320 | | | | 264,114 | |
| South Carolina Jobs-Economic Development Authority, The Woodlands at Furman (RB) | | | | | | | | |
| 4.00%, 11/15/27 (c) | | | 210 | | | | 205,593 | |
| 5.25%, 11/15/52 (c) | | | 2,000 | | | | 1,839,580 | |
| 5.25%, 11/15/37 (c) | | | 2,000 | | | | 2,008,909 | |
| | | | | | | | 12,157,313 | |
| South Dakota: 0.2% | | | | | | | | |
| City of Sioux Falls, Dow Rummel Village Project (RB) | | | | | | | | |
| 5.00%, 11/01/42 (c) | | | 750 | | | | 661,532 | |
| 5.00%, 11/01/46 (c) | | | 500 | | | | 423,976 | |
| County of Lincoln, South Dakota Economic Development, Augustana College Association Project, Series A (RB) | | | | | | | | |
| 4.00%, 08/01/51 (c) | | | 1,550 | | | | 1,241,670 | |
| 4.00%, 08/01/56 (c) | | | 1,000 | | | | 779,298 | |
Lincoln County, South Dakota Economic Development Bonds, The Augustana College Association Project, Series A (RB) 4.00%, 08/01/61 (c) | | | 1,300 | | | | 990,290 | |
South Dakota Health & Educational Facilities Authority (RB) 5.00%, 07/01/46 (c) | | | 2,000 | | | | 1,987,732 | |
| | | | | | | | 6,084,498 | |
| Tennessee: 0.8% | | | | | | | | |
Bristol Industrial Development Board, Pinnacle Project, Series A (RB) 5.00%, 12/01/35 (c) | | | 2,000 | | | | 1,834,661 | |
Chattanooga Health, Educational and Housing Facility Board, Series A-2 (RB) 5.00%, 08/01/44 (c) | | | 310 | | | | 318,701 | |
Chattanooga-Hamilton County Hospital, Erlanger Health System, Series A (RB) 5.00%, 10/01/44 (c) | | | 6,180 | | | | 6,023,498 | |
| Knox County Health Educational and Housing Facility Board (RB) | | | | | | | | |
| 4.00%, 09/01/40 (c) | | | 295 | | | | 261,242 | |
| 4.00%, 09/01/47 (c) | | | 290 | | | | 230,341 | |
| 5.00%, 04/01/36 (c) | | | 1,055 | | | | 1,068,695 | |
See Notes to Financial Statements
| | | Par
(000’s | ) | | Value | |
| Tennessee (continued) | | | | | | | | |
Metropolitan Government of Nashville and Davidson County, Health and Educational Facilities Board, Lipscomb University Project, Series A (RB) 5.25%, 10/01/58 (c) | | $ | 2,000 | | | $ | 2,014,654 | |
Tennessee Corp. Gas Supply, Series A (RB) 5.50%, 10/01/53 (c) (p) | | | 5,000 | | | | 5,257,912 | |
Tennessee Energy Acquisition Corp., Series B (RB) 5.62%, 09/01/26 | | | 5,000 | | | | 5,052,541 | |
The Health, Educational and Housing Facility Board of the City of Chattanooga, CommonSpirit Health, Series A-1 (RB) 4.00%, 08/01/37 (c) | | | 200 | | | | 196,689 | |
| | | | | | | | 22,258,934 | |
| Texas: 5.6% | | | | | | | | |
Angelina and Neches River Authority, Industrial Development Corp., Solid Waste Disposal and Wastewater Treatment Facilities, Series A (RB) 7.50%, 12/01/45 (c) | | | 1,500 | | | | 995,305 | |
| Arlington Higher Education Finance Corp. (RB) | | | | | | | | |
| 4.50%, 06/15/56 (c) (p) | | | 1,000 | | | | 998,694 | |
| 5.75%, 06/01/43 (c) | | | 1,000 | | | | 1,019,140 | |
| 6.00%, 06/01/53 (c) | | | 1,000 | | | | 1,012,579 | |
| 6.25%, 06/01/63 (c) | | | 1,000 | | | | 1,021,117 | |
| Arlington Higher Education Finance Corp., Legacy Traditional School - Texas Project, Series A (RB) | | | | | | | | |
| 4.38%, 02/15/51 (c) | | | 1,000 | | | | 711,061 | |
| 6.75%, 02/15/62 (c) | | | 5 | | | | 4,938 | |
Austin Convention Enterprises, Inc., Convention Center Hotel, First Tier, Series A (RB) 5.00%, 01/01/33 (c) | | | 500 | | | | 505,101 | |
Austin Convention Enterprises, Inc., Convention Center Hotel, First Tier, Series A (RB) (SAW) 5.00%, 01/01/27 | | | 280 | | | | 281,155 | |
| Austin Convention Enterprises, Inc., Convention Center Hotel, Second Tier, Series B (RB) | | | | | | | | |
| 5.00%, 01/01/26 | | | 715 | | | | 708,258 | |
| 5.00%, 01/01/34 (c) | | | 500 | | | | 492,343 | |
| Board of Managers, Joint Guadalupe County, City of Seguin Hospital (RB) | | | | | | | | |
| 5.00%, 12/01/40 (c) | | | 610 | | | | 559,703 | |
| 5.00%, 12/01/45 (c) | | | 215 | | | | 189,935 | |
| | | Par
(000’s | ) | | Value | |
| Texas (continued) | | | | | | | | |
Brazoria County Industrial Development Corp., Texas Solid Waste Disposal Facilities, Gladieux Recycling, LLC Project (RB) (SAW) 8.50%, 03/01/39 (c) | | $ | 5,010 | | | $ | 4,523,087 | |
Brazoria County Industrial Development Corp., Texas Solid Waste Disposal Facilities, Gladieux Recycling, LLC Project (RB) (SBG) 7.00%, 03/01/39 (c) | | | 1,785 | | | | 1,653,146 | |
Calhoun County Navigation Industrial Development Authority, Max Midstream Texas LLC Project, Series A (RB) 3.62%, 07/01/26 (c) | | | 2,700 | | | | 2,533,072 | |
Central Texas Regional Mobility Authority, Series C (RB) 5.00%, 01/01/27 (c) | | | 7,000 | | | | 7,140,593 | |
City of Houston, Texas Airport System Special Facilities, United Airlines, Inc., Series A (RB) 4.00%, 07/01/41 (c) | | | 7,500 | | | | 7,045,978 | |
City of Houston, Texas Airport System Special Facilities, United Airlines, Inc., Series B-1 (RB) 4.00%, 07/15/41 (c) | | | 18,855 | | | | 17,711,784 | |
| City of Houston, Texas Airport System Special Facilities, United Airlines, Inc., Series C (RB) | | | | | | | | |
| 5.00%, 07/15/27 | | | 5,590 | | | | 5,670,466 | |
| 5.00%, 07/15/28 | | | 2,500 | | | | 2,551,052 | |
City of Houston, Texas Airport System Special Facilities, United Airlines, Inc., Technical Operations Center Project (RB) 5.00%, 07/15/28 | | | 1,000 | | | | 1,020,421 | |
City of Houston, Texas Airport System Special Facilities, United Airlines, Inc., Terminal Improvement Projects, Series B-1 (RB) 5.00%, 07/15/30 (c) | | | 4,335 | | | | 4,346,716 | |
City of New Braunfels, Utility System (RB) 4.00%, 07/01/50 (c) | | | 445 | | | | 407,153 | |
| Clifton Higher Education Finance Corp., Series A (RB) | | | | | | | | |
| 5.12%, 08/15/30 (c) | | | 730 | | | | 742,606 | |
| 5.50%, 08/15/35 (c) | | | 610 | | | | 622,789 | |
| 6.00%, 06/15/48 (c) | | | 1,000 | | | | 1,001,639 | |
Clifton Higher Education Finance Corp., Series D (RB) 5.25%, 08/15/27 (c) | | | 1,000 | | | | 1,014,734 | |
See Notes to Financial Statements
VANECK HIGH YIELD MUNI ETF
SCHEDULE OF INVESTMENTS
(continued)
| | | Par
(000’s | ) | | Value | |
| Texas (continued) | | | | | | | | |
| 5.75%, 08/15/33 (c) | | $ | 500 | | | $ | 511,013 | |
| 6.00%, 08/15/38 (c) | | | 500 | | | | 511,348 | |
Conroe Local Government Corp., Conroe Convention Center Hotel, Series A (RB) 4.00%, 10/01/50 (c) | | | 2,035 | | | | 1,283,425 | |
Dallas County Flood Control District No. 1 (GO) 5.00%, 04/01/32 (c) | | | 850 | | | | 849,935 | |
Dallas Texas Housing Finance Corp. Residential Development, The Briscoe Apartments, Series A (RB) 6.00%, 12/01/62 (c) | | | 1,000 | | | | 970,739 | |
El Paso County Hospital District (GO) 5.00%, 08/15/43 (c) | | | 4,680 | | | | 4,477,516 | |
| Harris County, Houston Sports Authority, Junior Lien, Series H (RB) (NATL) | | | | | | | | |
| 0.00%, 11/15/25 ^ | | | 495 | | | | 463,475 | |
| 0.00%, 11/15/27 ^ | | | 590 | | | | 509,252 | |
| 0.00%, 11/15/29 ^ | | | 1,405 | | | | 1,119,333 | |
| 0.00%, 11/15/30 ^ | | | 115 | | | | 87,773 | |
| 0.00%, 11/15/41 (c) ^ | | | 1,140 | | | | 416,751 | |
| 0.00%, 11/15/35 (c) ^ | | | 120 | | | | 67,169 | |
| 0.00%, 11/15/40 (c) ^ | | | 170 | | | | 66,421 | |
| 0.00%, 11/15/32 (c) ^ | | | 705 | | | | 481,701 | |
| 0.00%, 11/15/37 (c) ^ | | | 350 | | | | 169,638 | |
| 0.00%, 11/15/39 (c) ^ | | | 145 | | | | 60,769 | |
| Harris County, Houston Sports Authority, Third Lien, Series A-3 (RB) (NATL) | | | | | | | | |
| 0.00%, 11/15/31 (c) ^ | | | 100 | | | | 64,920 | |
| 0.00%, 11/15/35 (c) ^ | | | 3,455 | | | | 1,766,879 | |
Matagorda County Navigation District No. 1, Series A (RB) (AMBAC) 4.40%, 05/01/30 | | | 1,035 | | | | 1,043,204 | |
Matagorda County, Navigation District 1 (RB) 4.00%, 06/01/30 (c) | | | 5,000 | | | | 4,933,884 | |
| Mesquite Health Facility Development Corp., Christian Care Centers, Inc. Project (RB) (NATL) | | | | | | | | |
| 5.12%, 02/15/30 (c) (d) * | | | 237 | | | | 2,369 | |
| 5.12%, 02/15/42 (c) (d) * | | | 907 | | | | 9,069 | |
Mission Economic Development Corp., Senior Lien, Natgasoline Project (RB) 4.62%, 10/01/31 (c) | | | 11,500 | | | | 11,382,307 | |
| Montgomery County Toll Road Authority (RB) | | | | | | | | |
| 5.00%, 09/15/48 (c) | | | 5,915 | | | | 5,941,799 | |
| 5.00%, 09/15/43 (c) | | | 3,310 | | | | 3,328,855 | |
| | | Par
(000’s | ) | | Value | |
| Texas (continued) | | | | | | | | |
New Hampshire Health and Education Facilities Authority, (RB) 4.00%, 08/15/41 (c) | | $ | 2,315 | | | $ | 1,935,195 | |
New Hope Cultural Education Facilities Finance Corp., 4-K Housing, Inc. Stoney Brook Project, Series B (RB) 5.00%, 07/01/52 (c) (d) * | | | 235 | | | | 94,000 | |
New Hope Cultural Education Facilities Finance Corp., Cardinal Bay, Inc., Series C (RB) 5.50%, 07/01/46 (c) (d) * | | | 1,595 | | | | 558,250 | |
New Hope Cultural Education Facilities Finance Corp., Carillon Lifecare Community Project (RB) 5.00%, 07/01/36 (c) | | | 230 | | | | 203,227 | |
New Hope Cultural Education Facilities Finance Corp., Legacy Preparatory Charter Academy, Series A (RB) 5.25%, 08/15/27 (c) | | | 150 | | | | 150,796 | |
New Hope Cultural Education Facilities Finance Corp., MRC Senior Living - The Langford Project, Series A (RB) 5.50%, 11/15/46 (c) | | | 750 | | | | 621,882 | |
| New Hope Cultural Education Facilities Finance Corp., NCCD-College Station Properties LLC, Series A (RB) | | | | | | | | |
| 5.00%, 07/01/47 (c) | | | 440 | | | | 408,100 | |
| 5.00%, 07/01/35 (c) | | | 100 | | | | 92,750 | |
New Hope Cultural Education Facilities Finance Corp., Presbyterian Village North Project (RB) 5.25%, 10/01/49 (c) | | | 1,000 | | | | 854,275 | |
New Hope Cultural Education Facilities Finance Corp., Presbyterian Village North Project, Series A (RB) 5.25%, 10/01/55 (c) | | | 1,500 | | | | 1,244,943 | |
| New Hope Cultural Education Facilities Finance Corp., Wesleyan Homes, Inc. Project (RB) | | | | | | | | |
| 5.00%, 01/01/50 (c) | | | 250 | | | | 185,557 | |
| 5.00%, 01/01/55 (c) | | | 250 | | | | 180,418 | |
| 5.50%, 01/01/35 (c) | | | 1,000 | | | | 936,246 | |
North East Texas Regional Mobility Authority, Series B (RB) 5.00%, 01/01/41 (c) | | | 400 | | | | 400,552 | |
Port Beaumont Navigation District, Allegiant Industrial Island Park Project (RB) 8.00%, 02/01/39 (c) | | | 2,725 | | | | 2,537,781 | |
See Notes to Financial Statements
| | | Par
(000’s | ) | | Value | |
| Texas (continued) | | | | | | | | |
| Pottsboro Higher Education Finance Corp., Imagine International Academy of North Texas LLC, Series A (RB) | | | | | | | | |
| 5.00%, 08/15/36 (c) | | $ | 1,055 | | | $ | 1,023,823 | |
| 5.00%, 08/15/46 (c) | | | 1,400 | | | | 1,275,439 | |
Reagan Hospital District, Series A (GO) 5.12%, 02/01/39 (c) | | | 1,000 | | | | 944,187 | |
Sanger Industrial Development Corp., Texas Pellets Project, Series B (RB) 8.00%, 07/01/38 (c) (d) * | | | 9,900 | | | | 990 | |
Tarrant County Cultural Education Facilities Finance Corp. (RB) 5.00%, 07/01/48 (c) | | | 2,500 | | | | 2,540,782 | |
Tarrant County Cultural Education Facilities Finance Corp., Air Force Villages Obligated Group Project (RB) 5.00%, 05/15/37 (c) | | | 125 | | | | 120,135 | |
Tarrant County Cultural Education Facilities Finance Corp., C.C. Young Memorial Home Project, Series A (RB) 6.38%, 02/15/48 (c) (d) * | | | 535 | | | | 294,250 | |
| Texas Municipal Gas Acquisition & Supply Corp. III (RB) | | | | | | | | |
| 5.00%, 12/15/29 | | | 1,375 | | | | 1,425,673 | |
| 5.00%, 12/15/32 | | | 3,425 | | | | 3,607,122 | |
Texas Municipal Gas Acquisition and Supply Corp. III (RB) 5.00%, 12/15/28 | | | 925 | | | | 953,132 | |
| Texas Private Activity Bond Surface Transportation Corp. (RB) | | | | | | | | |
| 4.00%, 12/31/39 (c) | | | 2,550 | | | | 2,541,566 | |
| 5.50%, 06/30/43 (c) | | | 1,000 | | | | 1,060,576 | |
| 5.50%, 06/30/42 (c) | | | 2,250 | | | | 2,390,539 | |
Texas Private Activity Bond Surface Transportation Corp., Blueridge Transportation Group LLC Project (RB) 5.00%, 12/31/40 (c) | | | 230 | | | | 230,314 | |
| Texas Private Activity Bond Surface Transportation Corp., Managed Lanes Project, Series A (RB) | | | | | | | | |
| 4.00%, 12/31/38 (c) | | | 3,175 | | | | 3,178,076 | |
| 4.00%, 06/30/39 (c) | | | 1,700 | | | | 1,694,508 | |
| | | Par
(000’s | ) | | Value | |
| Texas (continued) | | | | | | | | |
Texas Private Activity Bond Surface Transportation Corp., NTE Mobility Partners LLC North Tarrant Express Project (RB) 5.50%, 12/31/58 (c) | | $ | 1,000 | | | $ | 1,073,352 | |
Texas Private Activity Bond Surface Transportation Corp., NTE Mobility Partners LLC Project (RB) 5.00%, 06/30/58 (c) | | | 10,250 | | | | 10,328,097 | |
Texas Private Activity Bond Surface Transportation Corp., NTE Mobility Partners LLC Project, Series A (RB) 4.00%, 12/31/37 (c) | | | 500 | | | | 491,040 | |
| Texas Transportation Commission, Central Texas Turnpike System, Series C (RB) | | | | | | | | |
| 5.00%, 08/15/37 (c) | | | 6,735 | | | | 6,746,287 | |
| 5.00%, 08/15/32 (c) | | | 600 | | | | 601,534 | |
| Town of Westlake, Solana Public Improvement District (SA) | | | | | | | | |
| 6.12%, 09/01/35 (c) | | | 1,000 | | | | 1,000,630 | |
| 6.25%, 09/01/40 (c) | | | 1,000 | | | | 984,587 | |
| 6.38%, 09/01/45 (c) | | | 1,000 | | | | 984,324 | |
Woodloch Health Facilities Development Corp., Series A-1 (RB) 6.75%, 12/01/51 (c) (d) * | | | 3,645 | | | | 72,897 | |
| | | | | | | | 162,971,941 | |
| Utah: 0.3% | | | | | | | | |
Black Desert Public Infrastructure District (GO) 4.00%, 03/01/51 (c) | | | 3,100 | | | | 2,261,950 | |
Medical School Campus, Public Infrastructure District, Series A (GO) 5.50%, 02/01/50 (c) | | | 2,000 | | | | 1,623,384 | |
Mida Mountain Village Public Infrastructure District, Mountain Village Assessment Area, Series A (SA) 5.00%, 08/01/50 (c) | | | 2,000 | | | | 1,889,495 | |
| Utah Charter School Finance Authority, Freedom Academy Foundation Project (RB) | | | | | | | | |
| 5.25%, 06/15/37 (c) | | | 1,500 | | | | 1,436,951 | |
| 5.38%, 06/15/48 (c) | | | 2,195 | | | | 1,968,066 | |
| | | | | | | | 9,179,846 | |
| Vermont: 0.0% | | | | | | | | |
Vermont Economic Development Authority, Wake Robin Corp. Project, Series A (RB) 4.00%, 05/01/37 (c) | | | 500 | | | | 456,663 | |
See Notes to Financial Statements
VANECK HIGH YIELD MUNI ETF
SCHEDULE OF INVESTMENTS
(continued)
| | | Par
(000’s | ) | | Value | |
| Virgin Islands: 0.5% | | | | | | | | |
| Matching Fund Special Purpose Securitization Corp., Virgin Island, Series A (RB) | | | | | | | | |
| 5.00%, 10/01/28 | | $ | 1,000 | | | $ | 1,045,640 | |
| 5.00%, 10/01/39 (c) | | | 5,000 | | | | 5,219,458 | |
| 5.00%, 10/01/32 | | | 5,010 | | | | 5,383,703 | |
Virgin Islands Public Finance Authority, Virgin Islands Gross Receipts Taxes Loan Note (RB) (NATL) 4.25%, 10/01/29 (c) | | | 720 | | | | 727,700 | |
Virgin Islands Public Finance Authority, Virgin Islands Gross Receipts Taxes Loan Note, Series C (RB) 4.50%, 10/01/44 (c) | | | 550 | | | | 435,525 | |
Virgin Islands Public Finance Authority, Virgin Islands Gross Receipts Taxes, Series C (RB) 5.00%, 10/01/30 (c) | | | 1,000 | | | | 976,659 | |
| Virgin Islands Water & Power Authority, Series B (RB) | | | | | | | | |
| 5.00%, 07/01/24 (c) | | | 65 | | | | 64,672 | |
| 5.00%, 07/01/27 (c) | | | 170 | | | | 160,056 | |
| 5.00%, 07/01/25 (c) | | | 1,170 | | | | 1,136,335 | |
| | | | | | | | 15,149,748 | |
| Virginia: 2.1% | | | | | | | | |
Bristol Industrial Development Authority, Series B (RB) 6.35%, 11/01/44 (c) (d) * | | | 250 | | | | 140,864 | |
Cherry Hill Community Development Authority, Potomac Shores Project (SA) 5.15%, 03/01/35 (c) | | | 200 | | | | 201,351 | |
| Chesapeake Bay Bridge and Tunnel District, First Tier (RB) | | | | | | | | |
| 5.00%, 07/01/46 (c) | | | 8,000 | | | | 8,037,214 | |
| 5.00%, 07/01/51 (c) | | | 1,025 | | | | 1,026,335 | |
City of Chesapeake, Chesapeake Transportation System, Series A (RB) 5.00%, 07/15/47 (c) | | | 380 | | | | 380,029 | |
City of Hopewell, Sewer System, Series A (RB) 5.00%, 07/15/33 (c) | | | 240 | | | | 240,046 | |
Farms New Kent Community Development Authority, Series A (SA) 3.75%, 03/01/36 (c) | | | 3,715 | | | | 3,481,337 | |
| Farmville Industrial Development Authority, Educational Facilities, Longwood University Student Housing Projects, Series A (RB) | | | | | | | | |
| 5.00%, 01/01/50 (c) | | | 1,500 | | | | 1,362,709 | |
| 5.00%, 01/01/59 (c) | | | 1,000 | | | | 882,015 | |
| | | Par
(000’s | ) | | Value | |
| Virginia (continued) | | | | | | | | |
James City County Economic Development Authority (RB) 6.88%, 12/01/58 (c) | | $ | 1,000 | | | $ | 1,084,390 | |
Lynchburg Economic Development Authority, Central Health, Inc., Series A (RB) 5.00%, 01/01/47 (c) | | | 4,950 | | | | 4,973,687 | |
Roanoke County Economic Development Authority (RB) 5.00%, 09/01/34 (c) (d) * | | | 230 | | | | 210,065 | |
Roanoke County Economic Development Authority, Series B (RB) 4.62%, 09/01/54 (c) (d) (p) * | | | 455 | | | | 415,564 | |
Roanoke Economic Development Authority, Residential Care Facility, Series A (RB) 5.38%, 09/01/54 (c) (d) * | | | 1,595 | | | | 1,456,757 | |
Tobacco Settlement Financing Corp./VA (RB) 5.00%, 06/01/47 (c) | | | 5,000 | | | | 4,613,785 | |
| Virginia Beach Development Authority (RB) | | | | | | | | |
| 7.00%, 09/01/59 (c) | | | 1,000 | | | | 1,105,001 | |
| 7.00%, 09/01/53 (c) | | | 1,000 | | | | 1,108,997 | |
Virginia College Building Authority, Marymount University Project, Series B (RB) 5.25%, 07/01/30 (c) | | | 1,300 | | | | 1,305,434 | |
| Virginia Small Business Financing Authority (RB) | | | | | | | | |
| 4.00%, 01/01/38 (c) | | | 3,000 | | | | 2,949,309 | |
| 5.00%, 12/31/49 (c) | | | 1,000 | | | | 1,005,154 | |
Virginia Small Business Financing Authority, 95 Express Lanes LLC Project (RB) 5.00%, 01/01/34 (c) | | | 2,500 | | | | 2,669,832 | |
Virginia Small Business Financing Authority, Residential Care Facilities, Lifespire of Virginia (RB) (AGM) 4.00%, 12/01/36 (c) | | | 1,000 | | | | 973,901 | |
| Virginia Small Business Financing Authority, Senior Lien 95 Express Lanes, LLC Project (RB) | | | | | | | | |
| 4.00%, 01/01/40 (c) | | | 1,250 | | | | 1,156,412 | |
| 4.00%, 07/01/41 (c) | | | 1,000 | | | | 918,295 | |
| 4.00%, 01/01/48 (c) | | | 3,925 | | | | 3,463,034 | |
| 4.00%, 01/01/41 (c) | | | 1,000 | | | | 919,869 | |
| 5.00%, 01/01/33 (c) | | | 4,945 | | | | 5,286,462 | |
See Notes to Financial Statements
| | | Par
(000’s | ) | | Value | |
| Virginia (continued) | | | | | | | | |
Virginia Small Business Financing Authority, Senior Lien I-495 Hot Lanes Project (RB) 5.00%, 12/31/52 (c) | | $ | 2,000 | | | $ | 2,007,889 | |
Virginia Small Business Financing Authority, Senior Lien Transform 66 P3 Project (RB) 5.00%, 12/31/56 (c) | | | 5,520 | | | | 5,530,816 | |
Virginia Small Business Financing Authority, Senior Lien, 95 Express Lanes LLC Project (RB) 4.00%, 01/01/39 (c) | | | 2,810 | | | | 2,634,817 | |
Wise County Industrial Development Authority, Virginia Electric and Power Co. Project, Series A (RB) (AGC) 0.75%, 10/01/40 (p) | | | 1,000 | | | | 935,375 | |
| | | | | | | | 62,476,745 | |
| Washington: 1.0% | | | | | | | | |
| Kalispel Tribe Indians Priority, Series A (RB) | | | | | | | | |
| 5.00%, 01/01/32 (c) | | | 250 | | | | 254,346 | |
| 5.25%, 01/01/38 (c) | | | 250 | | | | 254,983 | |
| King County Public Hospital District No. 4, Snoqualmie Valley Hospital, Series A (RB) | | | | | | | | |
| 5.75%, 12/01/30 (c) | | | 500 | | | | 505,029 | |
| 6.00%, 12/01/35 (c) | | | 500 | | | | 507,659 | |
| 6.25%, 12/01/45 (c) | | | 250 | | | | 248,307 | |
Washington Health Care Facilities Authority, CommonSpirit Health, Series A-1 (RB) 4.00%, 08/01/44 (c) | | | 100 | | | | 93,982 | |
| Washington Health Care Facilities Authority, Virginia Mason Medical Center (RB) | | | | | | | | |
| 5.00%, 08/15/37 (c) | | | 3,000 | | | | 3,032,330 | |
| 5.00%, 08/15/34 (c) | | | 205 | | | | 209,388 | |
| Washington State Housing Finance Commission, Bayview Manor Senior Project, Series A (RB) | | | | | | | | |
| 5.00%, 07/01/36 (c) | | | 1,150 | | | | 1,060,964 | |
| 5.00%, 07/01/46 (c) | | | 2,150 | | | | 1,767,314 | |
Washington State Housing Finance Commission, Eliseo Project, Series A (RB) 4.00%, 01/01/41 (c) | | | 3,000 | | | | 2,373,195 | |
Washington State Housing Finance Commission, Presbyterian Retirement Communities Northwest Projects, Series A (RB) 5.00%, 01/01/51 (c) | | | 2,495 | | | | 1,920,309 | |
| | | Par
(000’s | ) | | Value | |
| Washington (continued) | | | | | | | | |
| 5.00%, 01/01/36 (c) | | $ | 2,125 | | | $ | 1,931,753 | |
| Washington State Housing Finance Commission, Radford Court and Nordheim Court Portfolio (RB) | | | | | | | | |
| 5.00%, 07/01/54 (c) | | | 500 | | | | 503,834 | |
| 5.50%, 07/01/59 (c) | | | 1,000 | | | | 1,043,243 | |
Washington State Housing Finance Commission, Series A (RB) 3.50%, 12/20/35 | | | 4,114 | | | | 3,742,642 | |
Washington State Housing Finance Commission, Transforming Age Projects, Series A (RB) 5.00%, 01/01/55 (c) | | | 6,000 | | | | 4,517,121 | |
| Washington State Housing Finance Commission, Wesley Homes at Lea Hill Project (RB) | | | | | | | | |
| 5.00%, 07/01/51 (c) | | | 1,250 | | | | 988,271 | |
| 5.00%, 07/01/46 (c) | | | 500 | | | | 408,486 | |
Washington State, Convention Center Public Facilities District (RB) 4.00%, 07/01/31 | | | 2,700 | | | | 2,639,686 | |
| | | | | | | | 28,002,842 | |
| West Virginia: 0.2% | | | | | | | | |
County of Ohio, Fort Henry Centre Tax Increment Financing District No. 1, The Highlands Project (TA) 4.00%, 06/01/34 (c) | | | 760 | | | | 701,069 | |
| Harrison County Building Commission, General Services Administration Building Project (RB) | | | | | | | | |
| 3.12%, 10/01/45 (c) | | | 700 | | | | 484,343 | |
| 3.25%, 10/01/50 (c) | | | 820 | | | | 555,742 | |
| 3.50%, 10/01/40 (c) | | | 1,000 | | | | 842,156 | |
West Virginia Economic Development Authority, Arch Resources Project (RB) 5.00%, 07/01/45 (c) (p) | | | 1,900 | | | | 1,905,288 | |
West Virginia Economic Development Authority, West Virginia Lottery (RB) 4.00%, 06/15/32 (c) | | | 1,600 | | | | 1,623,559 | |
| | | | | | | | 6,112,157 | |
| Wisconsin: 2.1% | | | | | | | | |
| Public Finance Authority (RB) | | | | | | | | |
| 5.00%, 06/15/54 (c) | | | 1,375 | | | | 1,278,114 | |
| 6.25%, 10/01/53 (c) | | | 1,000 | | | | 1,011,741 | |
Public Finance Authority Educational Facilities, Charter Day School, Inc. Project, Series A (RB) 5.00%, 12/01/55 (c) | | | 1,000 | | | | 825,045 | |
See Notes to Financial Statements
VANECK HIGH YIELD MUNI ETF
SCHEDULE OF INVESTMENTS
(continued)
| | | Par
(000’s | ) | | Value | |
| Wisconsin (continued) | | | | | | | | |
Public Finance Authority, Bancroft Neurohealth Project, Series A (RB) 5.12%, 06/01/48 (c) | | $ | 250 | | | $ | 222,601 | |
Public Finance Authority, Carson Valley Medical Center, Series A (RB) (SAW) 4.00%, 12/01/51 (c) | | | 5,250 | | | | 3,949,827 | |
| Public Finance Authority, Cornerstone Charter Academy, Series A (RB) | | | | | | | | |
| 5.00%, 02/01/36 (c) | | | 495 | | | | 478,736 | |
| 5.12%, 02/01/46 (c) | | | 550 | | | | 496,599 | |
| Public Finance Authority, Corvian Community School Project, Series A (RB) | | | | | | | | |
| 4.25%, 06/15/29 (c) | | | 400 | | | | 385,353 | |
| 5.00%, 06/15/49 (c) | | | 500 | | | | 426,886 | |
| 5.00%, 06/15/39 (c) | | | 500 | | | | 460,056 | |
| Public Finance Authority, Crossroads Health Project, Series A (RB) | | | | | | | | |
| 8.00%, 07/01/53 (c) | | | 1,000 | | | | 1,007,894 | |
| 8.12%, 07/01/58 (c) | | | 1,000 | | | | 1,008,207 | |
Public Finance Authority, Educational Facilities, Lake Erie College Project, Series A (RB) 5.88%, 10/01/54 (c) | | | 1,000 | | | | 665,536 | |
Public Finance Authority, Grand Hyatt San Antonio Hotel Acquisition Project, Series A (RB) 5.00%, 02/01/62 (c) | | | 960 | | | | 918,784 | |
| Public Finance Authority, Healthcare Facility Expansion, Church Home of Hartford, Inc. Project, Series A (RB) | | | | | | | | |
| 5.00%, 09/01/38 (c) | | | 1,500 | | | | 1,388,297 | |
| 5.00%, 09/01/25 | | | 50 | | | | 49,933 | |
| Public Finance Authority, Living Community First Mortgage (RB) | | | | | | | | |
| 4.25%, 05/01/29 (c) | | | 395 | | | | 359,004 | |
| 5.00%, 03/01/37 (c) | | | 1,250 | | | | 1,187,397 | |
Public Finance Authority, Lombard Conference and Hotel Center, Second-Tier (RB) (ACA) 3.75%, 07/01/51 (c) (d) * | | | 890 | | | | 619,374 | |
Public Finance Authority, Maryland Proton Treatment Center, Series A-1 (RB) 6.25%, 01/01/38 (c) | | | 500 | | | | 225,000 | |
Public Finance Authority, Marys Woods at Marylhurst Project, Series A (RB) 5.25%, 05/15/37 (c) | | | 1,350 | | | | 1,334,920 | |
| | | Par
(000’s | ) | | Value | |
| Wisconsin (continued) | | | | | | | | |
Public Finance Authority, Miami Worldcenter Project, Series A (TA) 5.00%, 06/01/41 (c) | | $ | 1,000 | | | $ | 996,524 | |
| Public Finance Authority, Penick Village (RB) | | | | | | | | |
| 4.00%, 09/01/29 (c) | | | 370 | | | | 344,796 | |
| 5.00%, 09/01/49 (c) | | | 500 | | | | 408,462 | |
| 5.00%, 09/01/39 (c) | | | 500 | | | | 450,293 | |
Public Finance Authority, Prime Healthcare Foundation, Inc., Series A (RB) 5.20%, 12/01/37 (c) | | | 1,405 | | | | 1,419,846 | |
Public Finance Authority, Roseman University of Health Sciences Project (RB) 5.88%, 04/01/45 (c) | | | 4,000 | | | | 4,037,449 | |
| Public Finance Authority, Sky Harbour Capital LLC, Aviation Facilities Project (RB) | | | | | | | | |
| 4.00%, 07/01/41 (c) | | | 500 | | | | 399,769 | |
| 4.00%, 09/01/51 (c) | | | 1,500 | | | | 1,084,631 | |
| 4.25%, 07/01/54 (c) | | | 4,765 | | | | 3,655,932 | |
Public Finance Authority, The Foundation of the University of North Carolina, Inc., Series A (RB) 4.00%, 09/01/56 (c) | | | 1,060 | | | | 741,366 | |
Public Finance Authority, Trinity Regional Hospital Sachse, Series A-1 (RB) 7.38%, 01/01/50 (c) (d) * | | | 4,265 | | | | 426 | |
| Public Finance Authority, Ultimate Medical Academy Project, Series A (RB) | | | | | | | | |
| 5.00%, 10/01/34 (c) | | | 2,000 | | | | 2,048,464 | |
| 5.00%, 10/01/39 (c) | | | 1,950 | | | | 1,960,011 | |
Public Finance Authority, University of North Carolina at Charlotte Inc., Series A (RB) 4.00%, 09/01/41 (c) | | | 1,000 | | | | 808,744 | |
Public Finance Authority, Wingate University, Series A (RB) 5.25%, 10/01/48 (c) | | | 2,255 | | | | 2,096,639 | |
Public Finance Authority, Wisconsin Senior Airport Facilities, Series B (RB) 5.00%, 07/01/42 (c) | | | 9,000 | | | | 8,944,249 | |
Public Finance Authority, Wonderful Foundation Charter School Portfolio Project, Series A-1 (RB) 5.00%, 01/01/55 (c) | | | 5,545 | | | | 4,584,042 | |
See Notes to Financial Statements
| | | Par
(000’s | ) | | Value | |
| Wisconsin (continued) | | | | | | | | |
Wisconsin Health and Educational Facilities Authority, Covenant Communities, Inc. Project, Series A-1 (RB) (SAW) 4.00%, 07/01/48 (c) | | $ | 105 | | | $ | 79,920 | |
Wisconsin Health and Educational Facilities Authority, Covenant Communities, Inc. Project, Series B (RB) 4.38%, 07/01/38 (c) | | | 850 | | | | 672,275 | |
| Wisconsin Health and Educational Facilities Authority, St. Camillus Health System, Inc., Series A (RB) | | | | | | | | |
| 5.00%, 11/01/39 (c) | | | 1,950 | | | | 1,765,980 | |
| 5.00%, 11/01/54 (c) | | | 500 | | | | 398,803 | |
Wisconsin Health and Educational Facilities Authority, Thedacare, Inc., (RB) 4.00%, 12/15/49 (c) | | | 260 | | | | 237,370 | |
Wisconsin Health and Educational Facilities Authority, Wheaton Franciscan Healthcare System, Series A (RB) 5.12%, 02/01/38 (c) | | | 3,950 | | | | 3,706,530 | |
Wisconsin State Health & Educational Facilities Authority, Marshfield Clinic Health System, Inc., Series A (RB) (AGM) 5.00%, 02/15/32 (c) | | | 1,500 | | | | 1,608,313 | |
| | | | | | | | 60,750,138 | |
| Wyoming: 0.1% | | | | | | | | |
County of Campbell, Wyoming Solid Waste Facilities, Series A (RB) (SBG) 3.62%, 07/15/39 (c) | | | 3,000 | | | | 2,643,154 | |
Total Municipal Bonds: 98.1%
(Cost: $3,044,946,805) | | | | | | | 2,860,351,179 | |
| Other assets less liabilities: 1.9% | | | | | | | 54,970,389 | |
| NET ASSETS: 100.0% | | | | | | $ | 2,915,321,568 | |
See Notes to Financial Statements
VANECK HIGH YIELD MUNI ETF
SCHEDULE OF INVESTMENTS
(continued)
Definitions:
| ACA | Credit Agricole SA |
| AGC | Assured Guaranty Corp. |
| AGM | Assured Guaranty Municipal Corp. |
| AMBAC | American Municipal Bond Assurance Corp. |
| BAM | Build America Assurance Co. |
| CP | Certificate of Participation |
| GO | General Obligation |
| NATL | National Public Finance Guarantee Corp. |
| RB | Revenue Bond |
| SA | Special Assessment |
| SAW | State Aid Withholding |
| SBG | School Board Guaranteed |
| SD CRED PROG | Special District Credit Enhancement Program |
| ST | Special Tax |
| TA | Tax Allocation |
| XLCA | Syncora Guarantee, Inc. |
Footnotes:
| (c) | Callable Security — the redemption date shown is the date the security may be redeemed by the issuer |
| (d) | Security in default |
| (p) | Putable Security — the redemption date shown is the date the security may be redeemed by the investor |
| * | Non-income producing |
| ^ | Zero Coupon Bond |
| ∞ | Security is valued using significant unobservable inputs that factor in discount for lack of marketability and is classified as Level 3 in the fair value hierarchy. |
| Summary of Investments by Sector | | % of
Investments | | Value | |
| Industrial Development Revenue | | | 15.6 | % | | $ | 447,109,195 | |
| Tax | | | 12.1 | | | | 347,117,541 | |
| Hospitals | | | 11.7 | | | | 334,997,202 | |
| Education | | | 9.8 | | | | 281,050,252 | |
| Local GO | | | 9.7 | | | | 276,196,900 | |
| Health | | | 6.6 | | | | 189,635,735 | |
| Tobacco | | | 6.0 | | | | 172,439,877 | |
| Leasing COPS & Appropriations | | | 4.4 | | | | 124,620,709 | |
| Toll & Turnpike | | | 4.3 | | | | 122,941,416 | |
| Multi-Family Housing | | | 3.4 | | | | 97,248,067 | |
| Utilities | | | 3.0 | | | | 85,146,309 | |
| Airport | | | 2.7 | | | | 77,986,797 | |
| Power | | | 2.4 | | | | 68,263,442 | |
| State GO | | | 2.2 | | | | 63,704,000 | |
| Water & Sewer | | | 1.6 | | | | 46,325,146 | |
| Miscellaneous | | | 1.3 | | | | 37,007,662 | |
| Transportation | | | 1.2 | | | | 32,887,783 | |
| Special Tax | | | 0.8 | | | | 22,985,796 | |
| Pollution Control | | | 0.8 | | | | 21,086,563 | |
| Refunded | | | 0.3 | | | | 8,146,248 | |
| Unassigned | | | 0.1 | | | | 3,454,539 | |
| | | | 100.0 | % | | $ | 2,860,351,179 | |
See Notes to Financial Statements
The summary of inputs used to value the Fund’s investments as of April 30, 2024 is as follows:
| | | Level 1
Quoted
Prices | | | Level 2
Significant
Observable
Inputs | | | Level 3
Significant
Unobservable
Inputs | | | Value | |
| Municipal Bonds | | | | | | | | | | | | | | | | |
| Alabama | | $ | — | | | $ | 53,383,473 | | | $ | — | | | $ | 53,383,473 | |
| Alaska | | | — | | | | 367,854 | | | | — | | | | 367,854 | |
| American Samoa | | | — | | | | 5,433,976 | | | | — | | | | 5,433,976 | |
| Arizona | | | — | | | | 76,784,417 | | | | — | | | | 76,784,417 | |
| Arkansas | | | — | | | | 30,660,942 | | | | — | | | | 30,660,942 | |
| California | | | — | | | | 348,490,984 | | | | — | | | | 348,490,984 | |
| Colorado | | | — | | | | 73,345,551 | | | | — | | | | 73,345,551 | |
| Connecticut | | | — | | | | 20,207,605 | | | | — | | | | 20,207,605 | |
| Delaware | | | — | | | | 4,257,161 | | | | — | | | | 4,257,161 | |
| District of Columbia | | | — | | | | 21,103,380 | | | | — | | | | 21,103,380 | |
| Florida | | | — | | | | 134,508,750 | | | | — | | | | 134,508,750 | |
| Georgia | | | — | | | | 42,156,100 | | | | — | | | | 42,156,100 | |
| Guam | | | — | | | | 24,965,537 | | | | — | | | | 24,965,537 | |
| Hawaii | | | — | | | | 4,974,772 | | | | — | | | | 4,974,772 | |
| Idaho | | | — | | | | 3,543,237 | | | | — | | | | 3,543,237 | |
| Illinois | | | — | | | | 286,187,309 | | | | — | | | | 286,187,309 | |
| Indiana | | | — | | | | 29,767,342 | | | | — | | | | 29,767,342 | |
| Iowa | | | — | | | | 27,141,047 | | | | — | | | | 27,141,047 | |
| Kansas | | | — | | | | 8,684,887 | | | | — | | | | 8,684,887 | |
| Kentucky | | | — | | | | 28,862,588 | | | | — | | | | 28,862,588 | |
| Louisiana | | | — | | | | 50,439,484 | | | | 54 | | | | 50,439,538 | |
| Maine | | | — | | | | 8,496,606 | | | | — | | | | 8,496,606 | |
| Maryland | | | — | | | | 47,930,317 | | | | — | | | | 47,930,317 | |
| Massachusetts | | | — | | | | 45,251,711 | | | | — | | | | 45,251,711 | |
| Michigan | | | — | | | | 17,661,360 | | | | — | | | | 17,661,360 | |
| Minnesota | | | — | | | | 21,316,488 | | | | — | | | | 21,316,488 | |
| Mississippi | | | — | | | | 7,407,949 | | | | — | | | | 7,407,949 | |
| Missouri | | | — | | | | 23,326,770 | | | | — | | | | 23,326,770 | |
| Montana | | | — | | | | 5,297,169 | | | | — | | | | 5,297,169 | |
| Nebraska | | | — | | | | 3,924,905 | | | | — | | | | 3,924,905 | |
| Nevada | | | — | | | | 9,834,819 | | | | — | | | | 9,834,819 | |
| New Hampshire | | | — | | | | 10,370,468 | | | | — | | | | 10,370,468 | |
| New Jersey | | | — | | | | 84,481,081 | | | | — | | | | 84,481,081 | |
| New Mexico | | | — | | | | 2,811,566 | | | | — | | | | 2,811,566 | |
| New York | | | — | | | | 333,730,157 | | | | — | | | | 333,730,157 | |
| North Carolina | | | — | | | | 23,660,770 | | | | — | | | | 23,660,770 | |
| North Dakota | | | — | | | | 6,999,101 | | | | — | | | | 6,999,101 | |
| Ohio | | | — | | | | 105,851,374 | | | | — | | | | 105,851,374 | |
| Oklahoma | | | — | | | | 37,518,793 | | | | — | | | | 37,518,793 | |
| Oregon | | | — | | | | 4,157,441 | | | | — | | | | 4,157,441 | |
| Pennsylvania | | | — | | | | 127,121,945 | | | | — | | | | 127,121,945 | |
| Puerto Rico | | | — | | | | 262,358,208 | | | | — | | | | 262,358,208 | |
| Rhode Island | | | — | | | | 7,331,752 | | | | — | | | | 7,331,752 | |
| South Carolina | | | — | | | | 12,157,313 | | | | — | | | | 12,157,313 | |
| South Dakota | | | — | | | | 6,084,498 | | | | — | | | | 6,084,498 | |
| Tennessee | | | — | | | | 22,258,934 | | | | — | | | | 22,258,934 | |
| Texas | | | — | | | | 162,971,941 | | | | — | | | | 162,971,941 | |
| Utah | | | — | | | | 9,179,846 | | | | — | | | | 9,179,846 | |
| Vermont | | | — | | | | 456,663 | | | | — | | | | 456,663 | |
| Virgin Islands | | | — | | | | 15,149,748 | | | | — | | | | 15,149,748 | |
| Virginia | | | — | | | | 62,476,745 | | | | — | | | | 62,476,745 | |
| Washington | | | — | | | | 28,002,842 | | | | — | | | | 28,002,842 | |
| West Virginia | | | — | | | | 6,112,157 | | | | — | | | | 6,112,157 | |
| Wisconsin | | | — | | | | 60,750,138 | | | | — | | | | 60,750,138 | |
| Wyoming | | | — | | | | 2,643,154 | | | | — | | | | 2,643,154 | |
See Notes to Financial Statements
VANECK HIGH YIELD MUNI ETF
SCHEDULE OF INVESTMENTS
(continued)
| Total | | $ | — | | | $ | 2,860,351,125 | | | $ | 54 | | | $ | 2,860,351,179 | |
See Notes to Financial Statements
VANECK HIP SUSTAINABLE MUNI ETF
SCHEDULE OF INVESTMENTS
April 30, 2024
| | | Par
(000’s | ) | | Value | |
| MUNICIPAL BONDS: 98.0% | | | | | | | | |
| Arizona: 1.8% | | | | | | | | |
Arizona Industrial Development Authority, Educational Facility, KIPP NYC Public Charter Schools - Macombs Facility Project, Series A (RB) 4.00%, 07/01/51 (c) | | $ | 400 | | | $ | 329,425 | |
| California: 30.8% | | | | | | | | |
California Health Facilities Financing Authority, Adventist Health System, Series A (RB) 3.00%, 03/01/39 (c) | | | 275 | | | | 228,006 | |
California Health Facilities Financing Authority, Sutter Health, Series A (RB) 4.00%, 11/15/42 (c) | | | 300 | | | | 290,268 | |
City of Los Angeles Department of Airports, Series A (RB) 5.00%, 05/15/51 (c) | | | 475 | | | | 487,667 | |
El Dorado Irrigation District, Series C (RB) 4.00%, 03/01/34 (c) | | | 250 | | | | 253,385 | |
Golden State Tobacco Securitization Corp., Enhanced Tobacco Settlement, Series A (RB) 5.00%, 06/01/40 (c) | | | 250 | | | | 254,611 | |
Los Angeles Unified School District, Series A (GO) 5.00%, 07/01/28 (c) | | | 250 | | | | 255,194 | |
Regents of University of California, Medical Center Pooled, Series P (RB) 4.00%, 05/15/53 (c) | | | 250 | | | | 245,638 | |
San Francisco City & County, International Airport, Series E (RB) 5.00%, 05/01/34 (c) | | | 370 | | | | 392,725 | |
| State of California, Various Purpose (GO) | | | | | | | | |
| 4.00%, 10/01/33 (c) | | | 370 | | | | 393,383 | |
| 5.00%, 10/01/29 (c) | | | 500 | | | | 540,748 | |
| 5.00%, 08/01/27 (c) | | | 410 | | | | 415,196 | |
| 5.00%, 04/01/27 | | | 250 | | | | 262,717 | |
| 5.00%, 08/01/27 | | | 300 | | | | 317,346 | |
State of California, Various Purpose (GO) (SAW) 5.00%, 12/01/46 (c) | | | 250 | | | | 267,344 | |
University of California, Series BB (RB) 5.00%, 05/15/49 (c) | | | 250 | | | | 263,489 | |
University of California, Series BH (RB) 4.00%, 05/15/46 (c) | | | 280 | | | | 281,363 | |
Val Verde Unified School District, Series A (GO) (BAM) 2.75%, 08/01/49 (c) | | | 720 | | | | 492,551 | |
| | | | | | | | 5,641,631 | |
| | | Par
(000’s | ) | | Value | |
| Colorado: 1.4% | | | | | | | | |
State of Colorado, Series A (CP) 4.00%, 12/15/40 (c) | | $ | 250 | | | $ | 250,929 | |
| Connecticut: 4.2% | | | | | | | | |
State of Connecticut, Series A (GO) 4.00%, 04/15/36 (c) | | | 250 | | | | 254,469 | |
State of Connecticut, Special Tax Obligation, Series A (RB) 5.00%, 08/01/28 (c) | | | 250 | | | | 254,274 | |
State of Connecticut, Special Tax Obligation, Series B (RB) 5.00%, 10/01/26 | | | 250 | | | | 259,877 | |
| | | | | | | | 768,620 | |
| Hawaii: 2.8% | | | | | | | | |
City and County of Honolulu, Wastewater System, Series A (RB) 4.00%, 07/01/33 (c) | | | 510 | | | | 515,108 | |
| Massachusetts: 3.3% | | | | | | | | |
Commonwealth of Massachusetts Federal Highway Grant Anticipation Notes, Series A (RB) 5.00%, 06/15/27 (c) | | | 250 | | | | 250,418 | |
Commonwealth of Massachusetts, Series B (GO) 5.00%, 11/01/24 | | | 360 | | | | 362,444 | |
| | | | | | | | 612,862 | |
| Michigan: 1.2% | | | | | | | | |
Michigan Finance Authority, Trinity Health Credit Group, Series A (RB) 4.00%, 12/01/49 (c) | | | 250 | | | | 229,361 | |
| Nevada: 1.3% | | | | | | | | |
Las Vegas Valley Water District, Series A (GO) 4.00%, 06/01/46 (c) | | | 250 | | | | 241,030 | |
| New York: 28.2% | | | | | | | | |
City of New York, Series B-1 (GO) 5.00%, 10/01/37 (c) | | | 250 | | | | 261,431 | |
Long Island Power Authority, Electric System, Series B (RB) 5.00%, 09/01/46 (c) | | | 500 | | | | 509,240 | |
Long Island Power Authority, Electric System, Series C (RB) 5.25%, 09/01/29 | | | 255 | | | | 280,381 | |
Metropolitan Transportation Authority (RB) 4.25%, 11/15/42 (c) | | | 325 | | | | 313,747 | |
Metropolitan Transportation Authority, Series B (RB) 4.25%, 11/15/39 (c) | | | 240 | | | | 240,066 | |
Nassau County Interim Finance Authority, Public Benefit Corp., Series A (RB) 5.00%, 11/15/24 | | | 250 | | | | 252,022 | |
See Notes to Financial Statements
VANECK HIP SUSTAINABLE MUNI ETF
SCHEDULE OF INVESTMENTS
(continued)
| | | Par
(000’s | ) | | Value | |
| New York (continued) | | | | | | | | |
New York City Municipal Water Finance Authority, Water & Sewer System, Series GG (RB) 5.00%, 06/15/39 (c) | | $ | 400 | | | $ | 404,438 | |
New York City Municipal Water Finance Authority, Water and Sewer System, Series BB (RB) 4.00%, 06/15/45 (c) | | | 250 | | | | 243,632 | |
New York City Transitional Finance Authority Future Tax, Series B-1 (RB) 5.00%, 08/01/42 (c) | | | 300 | | | | 299,972 | |
New York City Transitional Finance Authority Future Tax, Series E-1 (RB) 5.00%, 02/01/41 (c) | | | 250 | | | | 251,529 | |
New York State Dormitory Authority (RB) (BAM) 4.00%, 02/15/37 (c) | | | 280 | | | | 285,140 | |
New York State Dormitory Authority, New School, Series A (RB) 5.00%, 07/01/27 (c) | | | 250 | | | | 257,148 | |
New York State Dormitory Authority, Personal Income Tax, Series A (RB) 5.00%, 03/15/29 (c) | | | 250 | | | | 252,484 | |
New York State Dormitory Authority, State Sales Tax, Series A (RB) 5.00%, 03/15/38 (c) | | | 275 | | | | 284,512 | |
New York State Urban Development Corp., Personal Income Tax, Series A (RB) 5.00%, 03/15/42 (c) | | | 250 | | | | 267,521 | |
Port Authority of New York & New Jersey (RB) 5.00%, 11/15/42 (c) | | | 500 | | | | 507,232 | |
Triborough Bridge & Tunnel Authority, Payroll Mobility Tax, Series C (RB) 4.00%, 05/15/46 (c) | | | 250 | | | | 240,766 | |
| | | | | | | | 5,151,261 | |
| North Carolina: 1.6% | | | | | | | | |
University of North Carolina, Hospitals at Chapel Hill (RB) 5.00%, 02/01/45 | | | 265 | | | | 296,613 | |
| Ohio: 2.6% | | | | | | | | |
County of Franklin OH (RB) 4.12%, 05/15/45 (c) | | | 250 | | | | 240,657 | |
| | | Par
(000’s | ) | | Value | |
| Ohio (continued) | | | | | | | | |
County of Franklin, Hospital Facilities, Series A (RB) (XLCA) 4.00%, 05/15/47 (c) | | $ | 250 | | | $ | 238,206 | |
| | | | | | | | 478,863 | |
| Oregon: 1.4% | | | | | | | | |
Oregon State, Department of Administrative Services, State Lottery, Series D (RB) 5.00%, 04/01/29 (c) | | | 250 | | | | 253,062 | |
| Pennsylvania: 4.6% | | | | | | | | |
Commonwealth of Pennsylvania, 2nd Series (GO) (AGM) 4.00%, 08/15/29 (c) | | | 250 | | | | 251,255 | |
| Pennsylvania Turnpike Commission, Series B (RB) | | | | | | | | |
| 4.00%, 12/01/46 (c) | | | 250 | | | | 236,633 | |
| 5.00%, 12/01/51 (c) | | | 330 | | | | 346,133 | |
| | | | | | | | 834,021 | |
| South Dakota: 1.4% | | | | | | | | |
South Dakota Housing Development Authority, Series A (RB) 4.55%, 05/01/48 (c) | | | 250 | | | | 248,894 | |
| Texas: 3.1% | | | | | | | | |
Wylie Independent School District (GO) 5.00%, 08/15/39 (c) | | | 500 | | | | 559,912 | |
| Washington: 5.4% | | | | | | | | |
City of Seattle, City Light Department, Series A (RB) 4.00%, 07/01/51 (c) | | | 250 | | | | 233,632 | |
King County, Washington Public Hospital District No. 1 (GO) 5.00%, 12/01/32 (c) | | | 250 | | | | 255,496 | |
King County, Washington School District No. 414 (GO) (SBG) 4.00%, 12/01/30 (c) | | | 250 | | | | 253,205 | |
Port of Seattle, First Lien (RB) 5.00%, 09/01/24 | | | 250 | | | | 250,617 | |
| | | | | | | | 992,950 | |
| Wisconsin: 2.9% | | | | | | | | |
State of Wisconsin, Department of Transportation (RB) 5.00%, 07/01/28 (c) | | | 265 | | | | 279,488 | |
Wisconsin Health & Educational Facilities Authority, Aspipus, Inc. (RB) 4.00%, 08/15/38 (c) | | | 250 | | | | 245,098 | |
| | | | | | | | 524,586 | |
Total Municipal Bonds: 98.0%
(Cost: $19,059,224) | | | | | | | 17,929,128 | |
| Other assets less liabilities: 2.0% | | | | | | 363,070 | |
| NET ASSETS: 100.0% | | | | | | $ | 18,292,198 | |
See Notes to Financial Statements
| Definitions: |
| AGM | Assured Guaranty Municipal Corp. |
| BAM | Build America Assurance Co. |
| CP | Certificate of Participation |
| GO | General Obligation |
| RB | Revenue Bond |
| SAW | State Aid Withholding |
| SBG | School Board Guaranteed |
| XLCA | Syncora Guarantee, Inc. |
| Footnotes: |
| (c) | Callable Security — the redemption date shown is the date the security may be redeemed by the issuer |
| Summary of Investments by Sector | | % of
Investments | | Value | |
| State GO | | | 17.1 | % | | $ | 3,064,903 | |
| Tax | | | 16.3 | | | | 2,927,585 | |
| Local GO | | | 13.0 | | | | 2,318,818 | |
| Hospitals | | | 11.2 | | | | 2,013,847 | |
| Transportation | | | 7.3 | | | | 1,311,662 | |
| Water & Sewer | | | 6.5 | | | | 1,163,178 | |
| Education | | | 6.3 | | | | 1,131,425 | |
| Power | | | 5.7 | | | | 1,023,253 | |
| Airport | | | 4.9 | | | | 880,392 | |
| Toll & Turnpike | | | 3.3 | | | | 582,766 | |
| Leasing COPS & Appropriations | | | 2.8 | | | | 501,347 | |
| Refunded | | | 1.4 | | | | 254,611 | |
| Utilities | | | 1.4 | | | | 253,385 | |
| Miscellaneous | | | 1.4 | | | | 253,062 | |
| Single Family Housing | | | 1.4 | | | | 248,894 | |
| | | | 100.0 | % | | $ | 17,929,128 | |
The summary of inputs used to value the Fund’s investments as of April 30, 2024 is as follows:
| | | Level 1
Quoted
Prices | | | Level 2
Significant
Observable
Inputs | | | Level 3
Significant
Unobservable
Inputs | | | Value | |
| Municipal Bonds * | | $ | — | | | $ | 17,929,128 | | | $ | — | | | $ | 17,929,128 | |
| * | See Schedule of Investments for geographic sector breakouts. |
See Notes to Financial Statements
VANECK INTERMEDIATE MUNI ETF
SCHEDULE OF INVESTMENTS
April 30, 2024
| | | Par
(000’s | ) | | Value | |
| MUNICIPAL BONDS: 98.3% | | | | | | | | |
| Alabama: 1.5% | | | | | | | | |
| Alabama Public School and College Authority, Series A (RB) | | | | | | | | |
| 4.00%, 11/01/36 (c) | | $ | 2,000 | | | $ | 2,060,392 | |
| 5.00%, 11/01/31 (c) | | | 525 | | | | 588,621 | |
| 5.00%, 11/01/34 (c) | | | 2,015 | | | | 2,255,298 | |
| Black Belt Energy Gas District, Series A (RB) | | | | | | | | |
| 4.00%, 06/01/51 (c) (p) | | | 5,065 | | | | 4,992,406 | |
| 5.25%, 01/01/54 (c) (p) | | | 2,000 | | | | 2,116,469 | |
Black Belt Energy Gas District, Series B (RB) 5.25%, 12/01/53 (c) (p) | | | 1,000 | | | | 1,068,534 | |
Board of Trustees of the University of Alabama, Series B (RB) 3.00%, 07/01/33 (c) | | | 860 | | | | 801,487 | |
| County of Jefferson, Alabama Sewer Warrants (RB) | | | | | | | | |
| 5.00%, 10/01/38 (c) | | | 2,000 | | | | 2,173,026 | |
| 5.00%, 10/01/37 (c) | | | 1,000 | | | | 1,096,299 | |
| 5.25%, 10/01/40 (c) | | | 1,000 | | | | 1,096,462 | |
Lower Alabama Gas District, Series A (RB) 5.00%, 09/01/34 | | | 2,500 | | | | 2,626,759 | |
Southeast Alabama Gas Supply District, Project No. 1, Series A (RB) 5.00%, 08/01/54 (c) (p) | | | 1,000 | | | | 1,056,636 | |
Southeast Alabama Gas Supply District, Project No. 2, Series B (RB) 5.00%, 06/01/49 (c) (p) | | | 2,000 | | | | 2,085,368 | |
Southeast Energy Authority, Cooperative District Commodity Supply, Project No.2, Series B (RB) 4.00%, 12/01/51 (c) (p) | | | 3,000 | | | | 2,937,945 | |
University of Alabama, Board of Trustee, Series A (RB) 4.00%, 07/01/35 (c) | | | 820 | | | | 839,525 | |
| | | | | | | | 27,795,227 | |
| Alaska: 0.1% | | | | | | | | |
Alaska Housing Finance Corp., Series B (RB) 2.15%, 06/01/36 (c) | | | 1,040 | | | | 824,852 | |
State of Alaska, International Airports System, Series A (RB) 5.00%, 10/01/31 (c) | | | 305 | | | | 310,668 | |
State of Alaska, International Airports System, Series B (RB) 5.00%, 10/01/35 (c) | | | 635 | | | | 646,063 | |
| | | | | | | | 1,781,583 | |
| Arizona: 1.5% | | | | | | | | |
Arizona Industrial Development Authority, Point 320 LLC, Series A (RB) 3.62%, 05/20/33 | | | 1,836 | | | | 1,696,368 | |
| | | Par
(000’s | ) | | Value | |
| Arizona (continued) | | | | | | | | |
| Arizona Transportation Board, Highway (RB) | | | | | | | | |
| 5.00%, 07/01/30 (c) | | $ | 835 | | | $ | 862,951 | |
| 5.00%, 07/01/31 (c) | | | 1,050 | | | | 1,085,147 | |
City of Mesa, Arizona Utility System (RB) 4.00%, 07/01/31 (c) | | | 1,550 | | | | 1,569,754 | |
City of Phoenix Civic Improvement Corp., Excise Tax, Series A (RB) 5.00%, 07/01/35 (c) | | | 1,785 | | | | 1,812,946 | |
City of Phoenix Civic Improvement Corp., Junior Lien Water System (RB) 5.00%, 07/01/40 (c) | | | 1,895 | | | | 2,102,117 | |
| City of Phoenix Civic Improvement Corp., Rental Car Facility Charge, Series A (RB) | | | | | | | | |
| 5.00%, 07/01/32 (c) | | | 1,000 | | | | 1,072,847 | |
| 5.00%, 07/01/34 (c) | | | 1,275 | | | | 1,363,072 | |
City of Phoenix Civic Improvement Corp., Senior Lien Airport, Series D (RB) 5.00%, 07/01/33 (c) | | | 550 | | | | 578,016 | |
Maricopa County, Arizona Pollution Control, Southern California Edison Company, Series A (RB) 2.40%, 06/01/35 (c) | | | 1,150 | | | | 920,079 | |
Maricopa County, Arizona Pollution Control, Southern California Edison Company, Series B (RB) 2.40%, 06/01/35 (c) | | | 1,500 | | | | 1,200,103 | |
| Maricopa County, Industrial Development Authority, Banner Health, Series A (RB) | | | | | | | | |
| 4.00%, 01/01/38 (c) | | | 1,500 | | | | 1,485,962 | |
| 4.00%, 01/01/41 (c) | | | 2,000 | | | | 1,959,647 | |
| 5.00%, 01/01/38 (c) | | | 605 | | | | 620,733 | |
| Salt River Project Agricultural Improvement and Power District, Series A (RB) | | | | | | | | |
| 5.00%, 01/01/32 (c) | | | 2,380 | | | | 2,534,372 | |
| 5.00%, 01/01/32 | | | 1,000 | | | | 1,141,243 | |
| 5.00%, 12/01/32 (c) | | | 1,000 | | | | 1,014,263 | |
Salt Verde Financial Corp. (RB) 5.00%, 12/01/37 | | | 4,600 | | | | 4,892,601 | |
| | | | | | | | 27,912,221 | |
| Arkansas: 0.1% | | | | | | | | |
City of Fort Worth, Water and Sewer Construction (RB) 5.00%, 10/01/34 (c) | | | 1,000 | | | | 1,066,788 | |
See Notes to Financial Statements
| | | Par
(000’s | ) | | Value | |
| California: 16.9% | | | | | | | | |
Anaheim Housing and Public Improvements Authority, Electric Utility Distribution Improvements, Series A (RB) 5.00%, 10/01/35 (c) | | $ | 1,000 | | | $ | 1,063,562 | |
| Bay Area Toll Authority, Series S-7 (RB) | | | | | | | | |
| 3.25%, 04/01/36 (c) | | | 1,270 | | | | 1,186,105 | |
| 4.00%, 04/01/33 (c) | | | 2,905 | | | | 2,950,728 | |
Beverly Hills Unified School District (GO) 0.00%, 08/01/30 ^ | | | 1,000 | | | | 827,004 | |
California Community Choice Financing Authority, Clean Energy Project, Series C (RB) 5.25%, 01/01/54 (c) (p) | | | 6,065 | | | | 6,330,585 | |
California Community Choice, Financing Authority Clean Energy Project, Series B-1 (RB) 4.00%, 02/01/52 (c) (p) | | | 7,000 | | | | 6,920,470 | |
California Health Facilities Financing Authority, Adventist Health System, Series A (RB) 3.00%, 03/01/39 (c) | | | 1,000 | | | | 829,111 | |
California Health Facilities Financing Authority, Cedars-Sinai Medical Center, Series A (RB) 5.00%, 08/15/31 (c) | | | 310 | | | | 322,176 | |
California Health Facilities Financing Authority, Cedars-Sinai Medical Center, Series B (RB) 3.00%, 08/15/34 (c) | | | 400 | | | | 374,130 | |
| California Health Facilities Financing Authority, CommonSpirit Health, Series A (RB) | | | | | | | | |
| 4.00%, 04/01/37 (c) | | | 1,060 | | | | 1,068,126 | |
| 4.00%, 04/01/38 (c) | | | 500 | | | | 498,460 | |
California Health Facilities Financing Authority, Stanford Health Care, Series A (RB) 5.00%, 11/15/31 (c) | | | 750 | | | | 802,597 | |
California Health Facilities Financing Authority, Sutter Health, Series A (RB) 5.00%, 11/15/35 (c) | | | 1,575 | | | | 1,661,047 | |
| California Housing Finance Agency (RB) | | | | | | | | |
| 3.25%, 08/20/36 | | | 1,925 | | | | 1,747,012 | |
| 3.50%, 11/20/35 | | | 1,192 | | | | 1,102,091 | |
| 3.75%, 03/25/35 | | | 6,137 | | | | 5,926,792 | |
California State Public Works Board, Department of Corrections and Rehabilitation, Series A (RB) 5.00%, 09/01/31 (c) | | | 2,200 | | | | 2,208,630 | |
| | | Par
(000’s | ) | | Value | |
| California (continued) | | | | | | | | |
| California State Public Works Board, Department of Corrections and Rehabilitation, Series D (RB) | | | | | | | | |
| 3.00%, 09/01/32 (c) | | $ | 360 | | | $ | 341,480 | |
| 3.00%, 09/01/31 (c) | | | 500 | | | | 476,838 | |
| California State Public Works Board, May Lee State Office Complex, Series A (RB) | | | | | | | | |
| 5.00%, 04/01/41 (c) | | | 1,920 | | | | 2,134,215 | |
| 5.00%, 04/01/40 (c) | | | 1,000 | | | | 1,121,217 | |
California State Public Works Board, New Natural Resources Headquarters, Series C (RB) 5.00%, 11/01/40 (c) | | | 2,650 | | | | 2,902,957 | |
California State Public Works Board, Various Capital Projects, Series A (RB) 5.00%, 08/01/35 (c) | | | 2,000 | | | | 2,248,225 | |
| California State Public Works Board, Various Capital Projects, Series B (RB) | | | | | | | | |
| 5.00%, 12/01/35 (c) | | | 1,845 | | | | 2,106,264 | |
| 5.00%, 12/01/34 (c) | | | 2,000 | | | | 2,305,390 | |
| California State Public Works Board, Various Capital Projects, Series C (RB) | | | | | | | | |
| 4.00%, 11/01/31 (c) | | | 1,000 | | | | 1,010,243 | |
| 4.00%, 08/01/37 (c) | | | 2,000 | | | | 2,076,980 | |
| 5.00%, 08/01/34 (c) | | | 1,000 | | | | 1,132,044 | |
| California State University, Series A (RB) | | | | | | | | |
| 5.00%, 11/01/31 (c) | | | 2,035 | | | | 2,087,605 | |
| 5.00%, 11/01/31 (c) | | | 1,510 | | | | 1,565,218 | |
California Statewide Communities Development Authority, Front Porch Communities and Services, Series A (RB) 3.00%, 04/01/37 (c) | | | 1,000 | | | | 899,349 | |
| City and County of San Francisco, Moscone Convention Center Expansion Project, Series B (CP) | | | | | | | | |
| 4.00%, 04/01/36 (c) | | | 2,000 | | | | 2,005,499 | |
| 4.00%, 04/01/30 (c) | | | 1,000 | | | | 1,003,820 | |
| City of Los Angeles, Department of Airports, Los Angeles International Airport, Series B (RB) | | | | | | | | |
| 4.00%, 05/15/36 (c) | | | 1,000 | | | | 1,049,092 | |
| 5.00%, 05/15/37 (c) | | | 1,400 | | | | 1,572,442 | |
City of San Jose, California Airport, Series B (RB) (BAM) 4.00%, 03/01/34 (c) | | | 325 | | | | 343,208 | |
See Notes to Financial Statements
VANECK INTERMEDIATE MUNI ETF
SCHEDULE OF INVESTMENTS
(continued)
| | | Par
(000’s | ) | | Value | |
| California (continued) | | | | | | | | |
County of Los Angeles, Long Beach Unified School District, Series D-1 (GO) 0.00%, 08/01/39 (c) ^ | | $ | 1,250 | | | $ | 617,024 | |
County of Sacramento, Regional County Sanitation District, Series A (RB) 5.00%, 12/01/33 (c) | | | 3,000 | | | | 3,001,570 | |
County of Santa Clara, Series C (GO) 5.00%, 08/01/33 (c) | | | 525 | | | | 559,068 | |
East Bay Municipal Utility District, Water System, Series A (RB) 5.00%, 06/01/32 (c) | | | 1,000 | | | | 1,017,959 | |
East Side Union High School District, Series B (GO) (AGM) 3.00%, 08/01/35 (c) | | | 2,590 | | | | 2,404,034 | |
Eastern Municipal Water District, Financing Authority, Water and Wastewater, Series B (RB) (BAM-TCRS) 4.00%, 07/01/35 (c) | | | 1,150 | | | | 1,167,811 | |
Fontana Redevelopment Agency Successor Agency, Series A (TA) 5.00%, 10/01/32 (c) | | | 760 | | | | 805,049 | |
Fremont Union High School District (GO) 4.00%, 08/01/40 (c) | | | 2,350 | | | | 2,332,078 | |
| Kern High School District, Series C (GO) (AGM) | | | | | | | | |
| 2.00%, 08/01/31 (c) | | | 1,600 | | | | 1,399,943 | |
| 2.00%, 08/01/32 (c) | | | 3,000 | | | | 2,570,497 | |
| Los Angeles Community College District, Series J (GO) | | | | | | | | |
| 4.00%, 08/01/32 (c) | | | 400 | | | | 409,995 | |
| 4.00%, 08/01/33 (c) | | | 750 | | | | 766,984 | |
Los Angeles Community College District, Series L (GO) 5.00%, 08/01/36 (c) | | | 1,000 | | | | 1,164,660 | |
| Los Angeles County Metropolitan Transportation Authority, Sales Tax, Series A (RB) | | | | | | | | |
| 4.00%, 06/01/35 (c) | | | 1,000 | | | | 1,061,942 | |
| 4.00%, 06/01/36 (c) | | | 1,045 | | | | 1,103,888 | |
| 4.00%, 06/01/38 (c) | | | 1,460 | | | | 1,524,219 | |
| 4.00%, 06/01/39 (c) | | | 1,000 | | | | 1,037,645 | |
| 5.00%, 06/01/35 (c) | | | 1,000 | | | | 1,126,310 | |
| 5.00%, 07/01/31 (c) | | | 795 | | | | 845,901 | |
| 5.00%, 07/01/36 (c) | | | 900 | | | | 1,030,117 | |
| 5.00%, 07/01/37 (c) | | | 1,060 | | | | 1,202,683 | |
| 5.00%, 07/01/38 (c) | | | 2,530 | | | | 2,853,281 | |
| | | Par
(000’s | ) | | Value | |
| California (continued) | | | | | | | | |
Los Angeles County Public Works Financing Authority, Lakma Bulding for Permanent Collection Project, Series A (RB) 4.00%, 12/01/38 (c) | | $ | 1,500 | | | $ | 1,545,317 | |
Los Angeles Department of International Airport, Series B (RB) 4.00%, 05/15/39 (c) | | | 1,900 | | | | 1,951,444 | |
Los Angeles Department of Water and Power, Series A (RB) 5.00%, 07/01/40 (c) | | | 2,000 | | | | 2,214,021 | |
Los Angeles Department of Water and Power, Series B (RB) 5.00%, 07/01/40 (c) | | | 1,380 | | | | 1,545,670 | |
| Los Angeles Department of Water and Power, Series C (RB) | | | | | | | | |
| 5.00%, 07/01/34 (c) | | | 1,125 | | | | 1,275,826 | |
| 5.00%, 07/01/36 (c) | | | 1,500 | | | | 1,683,809 | |
| Los Angeles Department of Water and Power, Series D (RB) | | | | | | | | |
| 5.00%, 07/01/32 (c) | | | 790 | | | | 791,415 | |
| 5.00%, 07/01/32 (c) | | | 1,210 | | | | 1,211,686 | |
| 5.00%, 07/01/38 (c) | | | 2,000 | | | | 2,127,684 | |
| 5.00%, 07/01/39 (c) | | | 1,000 | | | | 1,135,435 | |
Los Angeles Municipal Improvement Corp., Series B (RB) 4.00%, 11/01/35 (c) | | | 2,000 | | | | 2,021,843 | |
| Los Angeles Unified School District, AD Valorem Property Tax, Series C (GO) | | | | | | | | |
| 4.00%, 07/01/38 (c) | | | 1,605 | | | | 1,664,999 | |
| 4.00%, 07/01/37 (c) | | | 2,000 | | | | 2,089,970 | |
| Los Angeles Unified School District, AD Valorem Property Tax, Series RYRR (GO) | | | | | | | | |
| 4.00%, 07/01/37 (c) | | | 1,500 | | | | 1,582,880 | |
| 5.00%, 07/01/35 (c) | | | 1,300 | | | | 1,481,760 | |
| Los Angeles Unified School District, Series A (GO) | | | | | | | | |
| 4.00%, 07/01/33 (c) | | | 1,580 | | | | 1,658,606 | |
| 5.00%, 07/01/30 (c) | | | 1,720 | | | | 1,891,149 | |
| 5.00%, 07/01/30 | | | 500 | | | | 559,211 | |
Los Angeles Unified School District, Series B (GO) 5.00%, 07/01/30 (c) | | | 915 | | | | 950,072 | |
| Los Angeles Unified School District, Series C (GO) | | | | | | | | |
| 3.00%, 07/01/35 (c) | | | 1,880 | | | | 1,763,275 | |
| 4.00%, 07/01/36 (c) | | | 2,000 | | | | 2,105,621 | |
Los Angeles Unified School District, Series RYQ (GO) 4.00%, 07/01/37 (c) | | | 1,000 | | | | 1,044,985 | |
See Notes to Financial Statements
| | | Par
(000’s | ) | | Value | |
| California (continued) | | | | | | | | |
Mount Diablo Unified School District, Series B (GO) 4.00%, 08/01/35 (c) | | $ | 1,000 | | | $ | 1,067,976 | |
Mountain House Public Financing Authority, California Utility System, Series B (RB) (BAM) 4.00%, 12/01/40 (c) | | | 500 | | | | 505,479 | |
Oakland Unified School District, Series A (GO) (BAM) 4.00%, 08/01/39 (c) | | | 1,055 | | | | 1,079,203 | |
Orange County, Local Transportation Authority Sales Tax (RB) 4.00%, 02/15/38 (c) | | | 1,500 | | | | 1,525,873 | |
Palomar Health, Series B (GO) 4.00%, 08/01/35 (c) | | | 1,000 | | | | 973,351 | |
Peralta Community College District, Series D (GO) 4.00%, 08/01/39 (c) | | | 2,000 | | | | 1,968,189 | |
Public Utilities Commission of the City and County of San Francisco Water, Series D (RB) 5.00%, 11/01/34 (c) | | | 785 | | | | 832,514 | |
Regents of the University of California Medical Center Pooled, Series L (RB) 5.00%, 05/15/33 (c) | | | 650 | | | | 677,182 | |
Riverside County Transportation Commission, Series B (RB) 5.00%, 06/01/37 (c) | | | 560 | | | | 592,708 | |
Riverside County Transportation Commission, Series B-1 (RB) 4.00%, 06/01/41 (c) | | | 1,425 | | | | 1,429,472 | |
Sacramento County Sanitation Districts Financing Authority, Series A (RB) 5.00%, 12/01/31 (c) | | | 1,000 | | | | 1,000,712 | |
San Diego County Regional Airport Authority, Series A (RB) 5.00%, 07/01/34 (c) | | | 535 | | | | 590,687 | |
San Diego County Regional Airport Authority, Series B (RB) 5.00%, 07/01/34 (c) | | | 2,075 | | | | 2,336,835 | |
San Diego County Water Authority, Series B (RB) 4.00%, 05/01/35 (c) | | | 2,000 | | | | 2,151,239 | |
| San Diego Unified School District, Series I (GO) | | | | | | | | |
| 0.00%, 07/01/35 (c) ^ | | | 1,000 | | | | 640,118 | |
| 5.00%, 07/01/32 (c) | | | 650 | | | | 689,705 | |
| | | Par
(000’s | ) | | Value | |
| California (continued) | | | | | | | | |
San Francisco City & County, Airport Commission, San Francisco International Airport, Series B (RB) 4.00%, 05/01/37 (c) | | $ | 1,010 | | | $ | 1,046,101 | |
| San Francisco City & County, Public Utilities Commission Wastewater, Series A (RB) | | | | | | | | |
| 5.00%, 10/01/36 (c) | | | 1,000 | | | | 1,159,411 | |
| 5.00%, 10/01/39 (c) | | | 1,500 | | | | 1,711,010 | |
San Francisco City & County, Public Utilities Commission Wastewater, Series B (RB) 5.00%, 10/01/39 (c) | | | 1,000 | | | | 1,140,673 | |
San Francisco County Transportation Authority (RB) 3.00%, 02/01/34 (c) | | | 500 | | | | 473,156 | |
San Francisco Unified School District, Series B (GO) 4.00%, 06/15/34 (c) | | | 2,000 | | | | 2,068,132 | |
San Joquin Hills Transportation Corridor Agency, Series A (RB) 4.00%, 01/15/34 (c) | | | 1,000 | | | | 1,043,569 | |
San Marcos Unified School District (GO) 4.00%, 08/01/33 (c) | | | 400 | | | | 410,332 | |
| Santa Clara County Financing Authority, Capital Facilities, Series A (RB) | | | | | | | | |
| 4.00%, 05/01/36 (c) | | | 840 | | | | 883,659 | |
| 5.00%, 05/01/34 (c) | | | 1,855 | | | | 2,133,728 | |
| Santa Clara County Financing Authority, Multiple Facilities Projects, Series Q (RB) | | | | | | | | |
| 3.00%, 05/15/35 (c) | | | 1,000 | | | | 919,137 | |
| 4.00%, 05/15/32 (c) | | | 1,510 | | | | 1,512,547 | |
Santa Clara County, Mountain View, Los Altos Union High School, Series A (GO) 3.35%, 08/01/36 (c) | | | 1,520 | | | | 1,478,315 | |
| Santa Clara Unified School District (GO) | | | | | | | | |
| 3.00%, 07/01/35 (c) | | | 1,535 | | | | 1,422,818 | |
| 3.00%, 07/01/34 (c) | | | 395 | | | | 373,493 | |
| 3.00%, 07/01/34 (c) | | | 2,000 | | | | 1,882,120 | |
| Santa Monica-Malibu Unified School District, Series C (GO) | | | | | | | | |
| 5.00%, 08/01/39 (c) | | | 1,000 | | | | 1,127,011 | |
| 5.00%, 08/01/40 (c) | | | 1,000 | | | | 1,121,282 | |
State of California (GO) 4.00%, 10/01/34 (c) | | | 2,000 | | | | 2,124,517 | |
State of California (GO) (AGM) 5.25%, 08/01/32 | | | 5,750 | | | | 6,628,576 | |
State of California, Department of Water Resources, Central Valley Project, Series AX (RB) 5.00%, 12/01/31 (c) | | | 915 | | | | 980,400 | |
See Notes to Financial Statements
VANECK INTERMEDIATE MUNI ETF
SCHEDULE OF INVESTMENTS
(continued)
| | | Par
(000’s | ) | | Value | |
| California (continued) | | | | | | | | |
| State of California, Various Purpose (GO) | | | | | | | | |
| 3.00%, 10/01/33 (c) | | $ | 2,000 | | | $ | 1,959,474 | |
| 3.00%, 10/01/36 (c) | | | 350 | | | | 327,990 | |
| 3.12%, 04/01/35 (c) | | | 1,575 | | | | 1,545,657 | |
| 4.00%, 11/01/34 (c) | | | 2,945 | | | | 3,117,983 | |
| 4.00%, 11/01/35 (c) | | | 1,310 | | | | 1,375,821 | |
| 4.00%, 11/01/38 (c) | | | 2,000 | | | | 2,047,193 | |
| 4.00%, 03/01/36 (c) | | | 9,500 | | | | 9,854,718 | |
| 4.00%, 03/01/37 (c) | | | 5,020 | | | | 5,179,540 | |
| 4.00%, 09/01/37 (c) | | | 2,000 | | | | 2,090,093 | |
| 4.00%, 10/01/39 (c) | | | 2,300 | | | | 2,351,806 | |
| 4.00%, 10/01/33 (c) | | | 1,795 | | | | 1,908,439 | |
| 4.00%, 08/01/33 (c) | | | 700 | | | | 704,599 | |
| 4.00%, 09/01/32 (c) | | | 1,815 | | | | 1,827,650 | |
| 4.00%, 09/01/34 (c) | | | 1,500 | | | | 1,509,776 | |
| 5.00%, 10/01/30 (c) | | | 1,065 | | | | 1,152,090 | |
| 5.00%, 10/01/31 (c) | | | 5,050 | | | | 5,565,155 | |
| 5.00%, 10/01/30 (c) | | | 2,340 | | | | 2,578,700 | |
| 5.00%, 10/01/31 | | | 4,000 | | | | 4,554,626 | |
| 5.00%, 11/01/31 (c) | | | 2,645 | | | | 2,809,665 | |
| 5.00%, 11/01/30 (c) | | | 1,020 | | | | 1,083,527 | |
| 5.00%, 11/01/34 (c) | | | 1,610 | | | | 1,803,009 | |
| 5.00%, 12/01/36 (c) | | | 2,000 | | | | 2,214,730 | |
| 5.00%, 03/01/35 (c) | | | 2,330 | | | | 2,577,805 | |
| 5.00%, 04/01/32 (c) | | | 2,500 | | | | 2,732,789 | |
| 5.00%, 04/01/35 (c) | | | 3,500 | | | | 3,805,879 | |
| 5.00%, 04/01/36 (c) | | | 3,000 | | | | 3,242,513 | |
| 5.00%, 04/01/30 | | | 2,910 | | | | 3,236,115 | |
| 5.00%, 04/01/32 | | | 4,270 | | | | 4,896,711 | |
| 5.00%, 10/01/39 (c) | | | 2,615 | | | | 2,938,990 | |
| 5.00%, 10/01/36 (c) | | | 2,000 | | | | 2,284,729 | |
| 5.00%, 05/01/31 (c) | | | 2,480 | | | | 2,484,649 | |
| 5.00%, 10/01/33 (c) | | | 500 | | | | 500,937 | |
| 5.00%, 08/01/32 (c) | | | 1,000 | | | | 1,001,839 | |
| 5.00%, 08/01/33 (c) | | | 1,000 | | | | 1,001,814 | |
| 5.00%, 08/01/35 (c) | | | 490 | | | | 507,060 | |
| 5.00%, 08/01/30 (c) | | | 2,250 | | | | 2,380,430 | |
| 5.00%, 08/01/36 (c) | | | 3,245 | | | | 3,473,568 | |
| 5.00%, 09/01/30 (c) | | | 1,095 | | | | 1,138,691 | |
| 5.00%, 09/01/35 (c) | | | 2,250 | | | | 2,573,467 | |
| 5.00%, 09/01/36 (c) | | | 2,000 | | | | 2,298,219 | |
State of California, Various Purpose (GO) (SAW) 5.00%, 12/01/34 (c) | | | 1,000 | | | | 1,033,058 | |
| State Public Works Board, Various Capital Projects, Series B (RB) | | | | | | | | |
| 4.00%, 05/01/38 (c) | | | 1,500 | | | | 1,543,312 | |
| 4.00%, 05/01/37 (c) | | | 2,000 | | | | 2,078,287 | |
University of California, Series AM (RB) 4.00%, 05/15/34 (c) | | | 3,000 | | | | 3,000,074 | |
University of California, Series BE (RB) 5.00%, 05/15/36 (c) | | | 1,500 | | | | 1,667,843 | |
| | | Par
(000’s | ) | | Value | |
| California (continued) | | | | | | | | |
University of California, Series BM (RB) 5.00%, 05/15/35 (c) | | $ | 1,000 | | | $ | 1,165,347 | |
| University of California, Series BN (RB) | | | | | | | | |
| 5.00%, 05/15/37 (c) | | | 1,000 | | | | 1,151,963 | |
| 5.00%, 05/15/35 (c) | | | 2,000 | | | | 2,330,695 | |
| 5.00%, 05/15/36 (c) | | | 1,000 | | | | 1,160,548 | |
University of California, Series BQ (RB) 5.00%, 05/15/35 (c) | | | 1,000 | | | | 1,165,347 | |
| University of California, Series BV (RB) | | | | | | | | |
| 5.00%, 05/15/38 (c) | | | 2,000 | | | | 2,311,797 | |
| 5.00%, 05/15/40 (c) | | | 1,000 | | | | 1,135,144 | |
University of California, Series I (RB) 4.00%, 05/15/35 (c) | | | 2,160 | | | | 2,165,042 | |
University of California, Series O (RB) 5.00%, 05/15/36 (c) | | | 1,170 | | | | 1,256,393 | |
University of California, Series Q (RB) 4.00%, 05/15/39 (c) | | | 2,500 | | | | 2,578,425 | |
| | | | | | | | 304,582,999 | |
| Colorado: 1.9% | | | | | | | | |
Adams and Arapahoe Joint School District No. 28J, Series A (GO) (SAW) 5.00%, 12/01/30 (c) | | | 540 | | | | 561,671 | |
Cherry Creek School District No. 5 (GO) (SAW) 5.00%, 12/15/30 (c) | | | 1,000 | | | | 1,023,071 | |
City and County of Denver, Series A-2 (RB) 0.00%, 08/01/36 (c) ^ | | | 1,200 | | | | 704,069 | |
Colorado Health Facilities Authority, Advenhealth, Series A (RB) 4.00%, 11/15/38 (c) | | | 2,000 | | | | 1,992,806 | |
| Colorado Health Facilities Authority, CommonSpirit Health, Series A (RB) | | | | | | | | |
| 5.00%, 12/01/34 | | | 2,000 | | | | 2,268,886 | |
| 5.00%, 12/01/39 (c) | | | 1,000 | | | | 1,103,072 | |
Colorado Health Facilities Authority, CommonSpirit Health, Series A-1 (RB) 4.00%, 08/01/38 (c) | | | 2,350 | | | | 2,269,845 | |
Colorado Health Facilities Authority, Sanford, Series A (RB) 4.00%, 11/01/39 (c) | | | 2,000 | | | | 1,937,246 | |
| Denver City and County School District No. 1 (GO) (SAW) | | | | | | | | |
| 3.00%, 12/01/36 (c) | | | 1,430 | | | | 1,293,855 | |
| 5.00%, 12/01/39 (c) | | | 1,000 | | | | 1,085,777 | |
See Notes to Financial Statements
| | | Par
(000’s | ) | | Value | |
| Colorado (continued) | | | | | | | | |
Denver City and County School, Board of Water Commissioners, Series A (RB) 3.00%, 12/15/37 (c) | | $ | 1,000 | | | $ | 891,523 | |
Jefferson County School District R-1 (GO) 5.00%, 12/15/30 (c) | | | 1,110 | | | | 1,199,956 | |
| Pueblo City, Schools District No. 60 (GO) (SAW) | | | | | | | | |
| 3.00%, 12/15/37 (c) | | | 500 | | | | 434,326 | |
| 5.00%, 12/15/34 (c) | | | 1,010 | | | | 1,103,444 | |
| 5.00%, 12/15/38 (c) | | | 1,625 | | | | 1,741,522 | |
Regional Transportation District, Fastracks Project, Series A (RB) 5.00%, 11/01/36 (c) | | | 1,820 | | | | 1,875,773 | |
| Regional Transportation District, Fastracks Project, Series B (RB) | | | | | | | | |
| 5.00%, 11/01/34 (c) | | | 1,995 | | | | 2,094,304 | |
| 5.00%, 11/01/33 (c) | | | 530 | | | | 557,273 | |
| State of Colorado, Series A (CP) | | | | | | | | |
| 4.00%, 12/15/36 (c) | | | 1,315 | | | | 1,334,540 | |
| 4.00%, 12/15/39 (c) | | | 1,540 | | | | 1,552,260 | |
| 4.00%, 12/15/36 (c) | | | 1,750 | | | | 1,794,995 | |
| 5.00%, 12/15/34 (c) | | | 1,000 | | | | 1,123,125 | |
State of Colorado, Series A (CP) (SAW) 4.00%, 12/15/37 (c) | | | 2,000 | | | | 2,031,716 | |
University of Colorado, Series A-2 (RB) 3.00%, 06/01/33 (c) | | | 800 | | | | 718,053 | |
Weld County School District No. 6 (GO) (SAW) 5.00%, 12/01/36 (c) | | | 2,165 | | | | 2,344,890 | |
| | | | | | | | 35,037,998 | |
| Connecticut: 2.2% | | | | | | | | |
Connecticut Housing Finance Authority Housing Mortgage Finance Program, Series A (RB) 4.40%, 11/15/38 (c) | | | 1,530 | | | | 1,543,831 | |
Connecticut Housing Finance Authority Housing Mortgage Finance Program, Series A-1 (RB) (SAW) 1.70%, 05/15/34 (c) | | | 1,290 | | | | 1,017,503 | |
Connecticut Housing Finance Authority Housing Mortgage Finance Program, Series D-1 (RB) 3.20%, 11/15/32 (c) | | | 260 | | | | 241,241 | |
Connecticut State Health and Educational Facilities Authority, Hartford Health Issue, Series A (RB) (SD CRED PROG) 5.00%, 07/01/34 (c) | | | 335 | | | | 358,393 | |
| | | Par
(000’s |
) | | Value | |
| Connecticut (continued) | | | | | | | | |
Connecticut State Health and Educational Facilities Authority, Nuvance Health Issue, Series A (RB) 5.00%, 07/01/32 (c) | | $ | 1,700 | | | $ | 1,740,103 | |
Connecticut State, Transportation Infrastructure Purposes, Series A (RB) 5.00%, 09/01/33 (c) | | | 1,000 | | | | 1,003,512 | |
| State of Connecticut, Series A (GO) | | | | | | | | |
| 3.00%, 01/15/32 (c) | | | 2,200 | | | | 2,102,332 | |
| 3.00%, 01/15/35 (c) | | | 2,500 | | | | 2,329,023 | |
| 3.00%, 01/15/34 (c) | | | 1,000 | | | | 937,377 | |
| 3.00%, 01/15/36 (c) | | | 1,000 | | | | 918,291 | |
| 4.00%, 01/15/37 (c) | | | 2,000 | | | | 2,051,622 | |
| 4.00%, 01/15/31 | | | 1,780 | | | | 1,884,411 | |
| 5.00%, 01/15/37 (c) | | | 1,000 | | | | 1,144,942 | |
| State of Connecticut, Series C (GO) | | | | | | | | |
| 4.00%, 06/01/34 (c) | | | 1,950 | | | | 2,035,891 | |
| 4.00%, 06/01/36 (c) | | | 850 | | | | 877,415 | |
| State of Connecticut, Series E (GO) | | | | | | | | |
| 5.00%, 11/15/32 | | | 1,000 | | | | 1,152,453 | |
| 5.00%, 09/15/30 (c) | | | 1,665 | | | | 1,791,798 | |
| State of Connecticut, Series F (GO) | | | | | | | | |
| 5.00%, 11/15/32 (c) | | | 1,525 | | | | 1,553,618 | |
| 5.00%, 11/15/31 (c) | | | 1,550 | | | | 1,580,061 | |
| State of Connecticut, Special Tax, Series A (RB) | | | | | | | | |
| 5.00%, 05/01/31 | | | 1,650 | | | | 1,861,912 | |
| 5.00%, 05/01/35 (c) | | | 1,500 | | | | 1,682,824 | |
| 5.00%, 09/01/31 (c) | | | 1,250 | | | | 1,254,655 | |
| 5.00%, 09/01/30 (c) | | | 1,300 | | | | 1,304,838 | |
| 5.00%, 09/01/32 (c) | | | 475 | | | | 489,358 | |
State of Connecticut, Special Tax, Series A (ST) 5.00%, 05/01/37 (c) | | | 2,500 | | | | 2,731,326 | |
| State of Connecticut, Special Tax, Transportation Infrastructure Purposes, Series A (RB) | | | | | | | | |
| 4.00%, 05/01/36 (c) | | | 1,225 | | | | 1,269,960 | |
| 5.00%, 05/01/33 (c) | | | 1,025 | | | | 1,152,199 | |
State of Connecticut, Transportation Infrustructure Purposes, Series D (RB) 4.00%, 11/01/38 (c) | | | 2,000 | | | | 2,035,740 | |
| | | | | | | | 40,046,629 | |
| Delaware: 0.2% | | | | | | | | |
Delaware Health Facilities Authority, Bayhealth Medical Center Project, Series A (RB) 4.00%, 07/01/40 (c) | | | 1,000 | | | | 973,308 | |
State of Delaware (GO) 2.00%, 02/01/35 (c) | | | 1,000 | | | | 807,596 | |
See Notes to Financial Statements
VANECK INTERMEDIATE MUNI ETF
SCHEDULE OF INVESTMENTS
(continued)
| | | Par
(000’s | ) | | Value | |
| Delaware (continued) | | | | | | | | |
| State of Delaware, Series A (GO) | | | | | | | | |
| 2.00%, 01/01/36 (c) | | $ | 650 | | | $ | 516,886 | |
| 5.00%, 05/01/36 (c) | | | 1,000 | | | | 1,158,732 | |
| | | | | | | | 3,456,522 | |
| District of Columbia: 1.7% | | | | | | | | |
District of Columbia Water & Sewer Authority (RB) 4.00%, 10/01/33 (c) | | | 1,000 | | | | 1,000,844 | |
District of Columbia, Federal Highway Grant Anticipation (RB) (SAW) 5.00%, 12/01/34 (c) | | | 2,250 | | | | 2,457,052 | |
District of Columbia, Georgetown University Issue (RB) 5.00%, 04/01/30 (c) | | | 645 | | | | 672,109 | |
District of Columbia, Income Tax, Series A (RB) 4.00%, 03/01/40 (c) | | | 2,000 | | | | 2,011,916 | |
| District of Columbia, Series A (GO) | | | | | | | | |
| 5.00%, 01/01/37 (c) | | | 1,000 | | | | 1,140,333 | |
| 5.00%, 06/01/33 (c) | | | 580 | | | | 608,995 | |
| 5.00%, 06/01/34 (c) | | | 1,000 | | | | 1,049,777 | |
| 5.00%, 06/01/35 (c) | | | 750 | | | | 803,908 | |
District of Columbia, Series A (RB) 5.00%, 03/01/36 (c) | | | 1,000 | | | | 1,089,048 | |
District of Columbia, Series C (GO) 5.00%, 06/01/38 (c) | | | 1,980 | | | | 1,981,442 | |
District of Columbia, Series C (RB) 5.00%, 05/01/36 (c) | | | 1,000 | | | | 1,101,759 | |
District of Columbia, Series D (GO) 5.00%, 06/01/32 (c) | | | 1,350 | | | | 1,350,983 | |
Washington Convention & Sports Authority, Series A (RB) 5.00%, 10/01/30 (c) | | | 1,000 | | | | 1,056,708 | |
Washington Metropolitan Area Transit Authority (RB) 5.00%, 07/01/36 (c) | | | 1,000 | | | | 1,040,513 | |
| Washington Metropolitan Area Transit Authority, Series A (RB) | | | | | | | | |
| 4.00%, 07/15/34 (c) | | | 4,000 | | | | 4,166,469 | |
| 5.00%, 07/15/37 (c) | | | 1,400 | | | | 1,516,680 | |
| 5.00%, 07/15/37 (c) | | | 2,000 | | | | 2,195,720 | |
| Washington Metropolitan Area Transit Authority, Series A-2 (RB) | | | | | | | | |
| 5.00%, 07/01/34 (c) | | | 810 | | | | 849,253 | |
| 5.00%, 07/01/33 (c) | | | 550 | | | | 578,495 | |
| | | Par
(000’s | ) | | Value | |
| District of Columbia (continued) | | | |
| Washington Metropolitan Area Transit Authority, Series B (RB) | | | | | | | | |
| 5.00%, 07/01/31 (c) | | $ | 650 | | | $ | 684,129 | |
| 5.00%, 07/01/30 (c) | | | 555 | | | | 584,299 | |
| 5.00%, 07/01/37 (c) | | | 1,140 | | | | 1,181,464 | |
| 5.00%, 07/01/34 (c) | | | 1,880 | | | | 1,971,106 | |
| | | | | | | | 31,093,002 | |
| Florida: 2.8% | | | | | | | | |
Broward County, Florida Tourist Development, Convention Center Expansion Project (RB) 4.00%, 09/01/36 (c) | | | 2,000 | | | | 2,032,150 | |
Central Florida Expressway Authority (RB) (BAM) 3.00%, 07/01/34 (c) | | | 520 | | | | 481,384 | |
Central Florida Expressway Authority, Series A (RB) 4.00%, 07/01/31 (c) | | | 1,250 | | | | 1,260,941 | |
Central Florida Expressway Authority, Series A (RB) (BAM) 5.00%, 07/01/38 (c) | | | 2,000 | | | | 2,081,390 | |
Central Florida Expressway Authority, Series B (RB) 4.00%, 07/01/39 (c) | | | 2,000 | | | | 1,943,629 | |
City of Gainesville, Utilities System, Series A (RB) 5.00%, 10/01/34 (c) | | | 1,045 | | | | 1,100,841 | |
City of Jacksonville, Series A (RB) 5.00%, 10/01/32 (c) | | | 1,095 | | | | 1,192,572 | |
| City of Orlando, Senior Tourist Development Tax, Series A (RB) (AGM) | | | | | | | | |
| 5.00%, 11/01/31 (c) | | | 2,000 | | | | 2,093,406 | |
| 5.00%, 11/01/37 (c) | | | 560 | | | | 577,755 | |
County of Leon, Tallahassee City, Blueprint Intergovernmental Agency (RB) 5.00%, 10/01/38 (c) | | | 1,000 | | | | 1,116,734 | |
| County of Miami-Dade (RB) | | | | | | | | |
| 0.00%, 10/01/31 (c) ^ | | | 565 | | | | 416,457 | |
| 0.00%, 10/01/32 (c) ^ | | | 400 | | | | 281,626 | |
| 5.00%, 10/01/34 (c) | | | 2,005 | | | | 2,059,670 | |
| County of Miami-Dade, Building Better Communities Program, Series A (GO) | | | | | | | | |
| 5.00%, 07/01/30 (c) | | | 520 | | | | 535,650 | |
| 5.00%, 07/01/34 (c) | | | 555 | | | | 570,187 | |
County of Miami-Dade, Building Better Communities Program, Series A (GO) (SAW) 4.00%, 07/01/36 (c) | | | 1,600 | | | | 1,657,159 | |
County of Miami-Dade, Expressway Authority Toll System, Series A (RB) 5.00%, 07/01/39 (c) | | | 2,000 | | | | 1,909,977 | |
See Notes to Financial Statements
| | | Par
(000’s | ) | | Value | |
| Florida (continued) | | | | | | | | |
County of Miami-Dade, Florida Aviation, Series A (RB) 4.00%, 10/01/39 (c) | | $ | 1,500 | | | $ | 1,464,784 | |
County of Miami-Dade, Florida Transit System (RB) 4.00%, 07/01/34 (c) | | | 865 | | | | 870,449 | |
County of Miami-Dade, Water and Sewer System (RB) 5.00%, 10/01/32 (c) | | | 3,500 | | | | 3,933,118 | |
County of Miami-Dade, Water and Sewer System, Series A (RB) 5.00%, 10/01/32 (c) | | | 1,500 | | | | 1,522,644 | |
| County of Miami-Dade, Water and Sewer System, Series B (RB) | | | | | | | | |
| 3.00%, 10/01/34 (c) | | | 370 | | | | 343,354 | |
| 5.00%, 10/01/33 (c) | | | 605 | | | | 613,883 | |
Florida Development Finance Corp., Lakeland Regional Health Systems (RB) 4.00%, 11/15/35 (c) | | | 2,000 | | | | 2,032,626 | |
Florida Housing Finance Corp., Homeowner Mortgage (RB) 2.10%, 07/01/35 (c) | | | 950 | | | | 776,276 | |
JEA Electric System, Series A (RB) 5.00%, 10/01/39 (c) | | | 2,000 | | | | 1,909,302 | |
| JEA Electric System, Series B (RB) | | | | | | | | |
| 3.38%, 10/01/34 (c) | | | 520 | | | | 491,519 | |
| 5.00%, 10/01/32 (c) | | | 885 | | | | 926,567 | |
| 5.00%, 10/01/30 (c) | | | 850 | | | | 894,872 | |
Lee Memorial Health System, Series A-1 (RB) 5.00%, 04/01/34 (c) | | | 605 | | | | 642,471 | |
Orange County Health Facilities Authority (RB) 5.00%, 10/01/39 (c) | | | 1,000 | | | | 1,019,840 | |
Orange County, Health Facilities Authority, Series A (RB) 5.00%, 10/01/36 (c) | | | 1,325 | | | | 1,360,581 | |
Orange County, Tourist Development Tax (RB) 5.00%, 10/01/30 | | | 490 | | | | 543,848 | |
Polk County, School District (RB) (SAW) 5.00%, 10/01/30 (c) | | | 1,000 | | | | 1,094,452 | |
| Reedy Creek Improvement District, Series A (GO) | | | | | | | | |
| 4.00%, 06/01/31 (c) | | | 1,000 | | | | 1,017,475 | |
| 5.00%, 06/01/35 (c) | | | 1,000 | | | | 1,019,496 | |
South Miami Health Facilities Authority, Baptist Health (RB) 5.00%, 08/15/32 (c) | | | 800 | | | | 833,798 | |
| | | Par
(000’s | ) | | Value | |
| Florida (continued) | | | | | | | | |
State of Florida, Board of Education, Public Education Capital Outlay, Series C (GO) (AMBAC) 3.00%, 06/01/35 (c) | | $ | 510 | | | $ | 475,145 | |
| State of Florida, Board of Education, Public Education Capital Outlay, Series E (GO) | | | | | | | | |
| 2.38%, 06/01/31 (c) | | | 590 | | | | 529,990 | |
| 3.00%, 06/01/30 (c) | | | 1,000 | | | | 964,900 | |
| State of Florida, Department of Transportation Financing Corp. (RB) | | | | | | | | |
| 3.00%, 07/01/35 (c) | | | 1,000 | | | | 929,927 | |
| 3.00%, 07/01/31 (c) | | | 1,000 | | | | 961,984 | |
State of Florida, Department of Transportation, Federal Highway Reimbursement, Series A (RB) 5.00%, 07/01/30 | | | 880 | | | | 975,300 | |
Volusia County, School Board, Master Lease Program, Series B (CP) 5.00%, 08/01/30 (c) | | | 1,320 | | | | 1,323,916 | |
| | | | | | | | 50,784,045 | |
| Georgia: 2.6% | | | | | | | | |
Athens-Clarke County, Georgia Water and Sewerage (RB) 4.00%, 01/01/32 (c) | | | 1,450 | | | | 1,451,554 | |
| City of Atlanta, Airport Passenger Facility Charge, Series C (RB) | | | | | | | | |
| 5.00%, 07/01/35 (c) | | | 800 | | | | 870,873 | |
| 5.00%, 07/01/38 (c) | | | 2,275 | | | | 2,436,648 | |
City of Atlanta, Water and Wastewater (RB) 5.00%, 11/01/32 (c) | | | 1,000 | | | | 1,015,313 | |
County of Fulton (GO) 4.00%, 07/01/40 (c) | | | 1,500 | | | | 1,484,217 | |
Dekalb County, Water and Sewerage, Series B (RB) (AGM) 5.00%, 10/01/35 (c) | | | 1,530 | | | | 1,583,666 | |
Fulton County, Georgia Water and Sewerage, Series A (RB) 3.00%, 01/01/37 (c) | | | 3,000 | | | | 2,725,934 | |
Georgia Housing and Finance Authority, Single Family Mortgage, Series B-1 (RB) 2.90%, 12/01/31 (c) | | | 925 | | | | 833,837 | |
| Main Street Natural Gas, Inc., Gas Supply, Series A (RB) | | | | | | | | |
| 5.00%, 05/15/35 | | | 2,000 | | | | 2,093,993 | |
| 5.00%, 05/15/37 | | | 2,000 | | | | 2,099,397 | |
| 5.00%, 05/15/38 | | | 1,000 | | | | 1,033,285 | |
| 5.00%, 05/01/54 (c) (p) | | | 2,000 | | | | 2,118,961 | |
Main Street Natural Gas, Inc., Gas Supply, Series C (RB) 5.00%, 09/01/53 (c) (p) | | | 1,000 | | | | 1,053,443 | |
See Notes to Financial Statements
VANECK INTERMEDIATE MUNI ETF
SCHEDULE OF INVESTMENTS
(continued)
| | | Par
(000’s | ) | | Value | |
| Georgia (continued) | | | | | | | | |
Main Street Natural Gas, Inc., Gas Supply, Series E (RB) 5.00%, 12/01/53 (c) (p) | | $ | 2,000 | | | $ | 2,113,229 | |
| Private Colleges and Universities Authority, Emory University, Series B (RB) | | | | | | | | |
| 4.00%, 10/01/38 (c) | | | 2,000 | | | | 2,002,084 | |
| 4.00%, 09/01/40 (c) | | | 2,000 | | | | 2,012,256 | |
| 4.00%, 09/01/36 (c) | | | 2,175 | | | | 2,246,193 | |
| 5.00%, 09/01/33 | | | 1,000 | | | | 1,160,712 | |
| State of Georgia, Road and Tollway Authority (RB) | | | | | | | | |
| 5.00%, 06/01/31 (c) | | | 2,550 | | | | 2,842,700 | |
| 5.00%, 06/01/32 (c) | | | 2,000 | | | | 2,228,875 | |
State of Georgia, Road and Tollway Authority, Series A (RB) 4.00%, 07/15/35 (c) | | | 3,255 | | | | 3,433,725 | |
| State of Georgia, Series A (GO) | | | | | | | | |
| 4.00%, 08/01/34 (c) | | | 935 | | | | 983,979 | |
| 5.00%, 02/01/32 (c) | | | 2,000 | | | | 2,101,453 | |
| 5.00%, 02/01/33 (c) | | | 1,200 | | | | 1,260,612 | |
State of Georgia, Series C (GO) 5.00%, 07/01/30 (c) | | | 3,000 | | | | 3,183,596 | |
| | | | | | | | 46,370,535 | |
| Hawaii: 0.6% | | | | | | | | |
City and County of Honolulu, Rail Transit Project, Series B (GO) 5.00%, 03/01/31 (c) | | | 1,930 | | | | 2,135,667 | |
City and County of Honolulu, Series B (GO) 5.00%, 09/01/32 (c) | | | 1,015 | | | | 1,065,182 | |
City and County of Honolulu, Wastewater System, Series A (RB) 4.00%, 07/01/33 (c) | | | 970 | | | | 979,714 | |
City and County of Honolulu, Wastewater System, Series B (RB) 5.00%, 07/01/36 (c) | | | 875 | | | | 948,459 | |
State of Hawaii (RB) 5.00%, 01/01/36 (c) | | | 1,000 | | | | 1,111,353 | |
State of Hawaii, Department of Transportation Airports Division, Series D (RB) (BAM) 5.00%, 07/01/34 (c) | | | 2,000 | | | | 2,214,113 | |
| State of Hawaii, Series FK (GO) | | | | | | | | |
| 3.25%, 05/01/33 (c) | | | 1,000 | | | | 958,832 | |
| 5.00%, 05/01/34 (c) | | | 690 | | | | 720,926 | |
| | | | | | | | 10,134,246 | |
| Illinois: 4.8% | | | | | | | | |
Chicago O’Hare International Airport, Series A (RB) 5.00%, 01/01/35 (c) | | | 1,000 | | | | 1,092,371 | |
Chicago O’Hare International Airport, Series A (RB) (AGM) 4.00%, 01/01/37 (c) | | | 1,000 | | | | 1,017,194 | |
| | | Par
(000’s | ) | | Value | |
| Illinois (continued) | | | | | | | | |
| Chicago O’Hare International Airport, Series B (RB) | | | | | | | | |
| 5.00%, 01/01/41 (c) | | $ | 2,120 | | | $ | 2,144,877 | |
| 5.00%, 01/01/39 (c) | | | 2,000 | | | | 2,053,606 | |
| 5.00%, 01/01/34 (c) | | | 365 | | | | 379,051 | |
Chicago O’Hare International Airport, Series D (RB) 4.12%, 01/01/40 (c) | | | 1,150 | | | | 1,141,525 | |
| City of Chicago, Second Lien Water (RB) (AGM) | | | | | | | | |
| 5.00%, 11/01/36 (c) | | | 1,500 | | | | 1,569,344 | |
| 5.00%, 11/01/34 (c) | | | 1,420 | | | | 1,488,905 | |
| City of Chicago, Series A (GO) | | | | | | | | |
| 5.00%, 01/01/30 | | | 1,000 | | | | 1,069,149 | |
| 5.00%, 01/01/33 (c) | | | 2,455 | | | | 2,640,932 | |
| 5.00%, 01/01/32 (c) | | | 1,000 | | | | 1,076,852 | |
City of Chicago, Series B (GO) 4.00%, 01/01/40 (c) | | | 1,064 | | | | 1,008,856 | |
City of Chicago, Series C (GO) 5.00%, 01/01/38 (c) | | | 1,150 | | | | 1,152,814 | |
City of Chicago, Wastewater Transmission, Series A (RB) (BAM) 5.00%, 01/01/40 (c) | | | 1,000 | | | | 1,100,571 | |
City of Chicago, Wastewater Transmission, Series B (RB) 5.00%, 01/01/36 (c) | | | 750 | | | | 772,404 | |
City of Chicago, Wastewater Transmission, Series B (RB) (AGM) 5.00%, 01/01/37 (c) | | | 1,000 | | | | 1,112,403 | |
| Illinois Finance Authority, Carle Foundation, Series A (RB) | | | | | | | | |
| 4.00%, 08/15/38 (c) | | | 1,500 | | | | 1,497,309 | |
| 4.00%, 08/15/37 (c) | | | 1,500 | | | | 1,511,344 | |
| 5.00%, 08/15/35 (c) | | | 1,000 | | | | 1,103,838 | |
| Illinois Finance Authority, Clean Water Initiative (RB) | | | | | | | | |
| 4.00%, 07/01/35 (c) | | | 1,600 | | | | 1,673,155 | |
| 4.00%, 07/01/37 (c) | | | 1,000 | | | | 1,032,578 | |
| 5.00%, 07/01/33 (c) | | | 700 | | | | 729,501 | |
| 5.00%, 07/01/36 (c) | | | 2,560 | | | | 2,780,213 | |
Illinois Finance Authority, Clean Water Initiative (RB) (AGM) 5.00%, 07/01/34 (c) | | | 1,400 | | | | 1,529,529 | |
Illinois Finance Authority, Memorial Health System (RB) 5.00%, 04/01/34 (c) | | | 1,435 | | | | 1,515,934 | |
| Illinois Finance Authority, NorthShore University HealthSystem, Series A (RB) | | | | | | | | |
| 4.00%, 08/15/40 (c) | | | 1,625 | | | | 1,589,385 | |
| 5.00%, 08/15/33 (c) | | | 1,000 | | | | 1,100,300 | |
| 5.00%, 08/15/34 (c) | | | 1,295 | | | | 1,420,117 | |
| 5.00%, 08/15/32 (c) | | | 1,365 | | | | 1,506,870 | |
Illinois Finance Authority, Silver Cross Hospital and Medical Centers, Series C (RB) 4.12%, 08/15/37 (c) | | | 2,145 | | | | 2,041,109 | |
See Notes to Financial Statements
| | | Par
(000’s | ) | | Value | |
| Illinois (continued) | | | | | | | | |
Illinois Housing Development Authority, Series B (RB) 3.45%, 10/01/33 (c) | | $ | 420 | | | $ | 394,154 | |
Illinois Municipal Electric Agency Power Supply System, Series A (RB) 4.00%, 02/01/34 (c) | | | 1,500 | | | | 1,483,730 | |
Illinois State Finance Authority, Ann & Robert H. Lurie Children’s Hospital (RB) 4.00%, 08/15/37 (c) | | | 1,000 | | | | 1,002,514 | |
Illinois State Finance Authority, University of Chicago, Series A (RB) 5.00%, 10/01/33 | | | 1,000 | | | | 1,163,713 | |
Illinois State Municipal Electric Agency, Power Supply, Series A (RB) 4.00%, 02/01/35 (c) | | | 2,000 | | | | 1,966,382 | |
| Illinois State Toll Highway Authority, Series A (RB) | | | | | | | | |
| 5.00%, 01/01/40 (c) | | | 2,000 | | | | 2,021,828 | |
| 5.00%, 01/01/37 (c) | | | 3,000 | | | | 3,451,114 | |
| Illinois State Toll Highway Authority, Series B (RB) | | | | | | | | |
| 5.00%, 01/01/37 (c) | | | 1,500 | | | | 1,531,835 | |
| 5.00%, 01/01/40 (c) | | | 1,000 | | | | 1,017,893 | |
Illinois State, Series C (GO) 4.00%, 10/01/40 (c) | | | 1,000 | | | | 946,574 | |
Metropolitan Water Reclamation District of Greater Chicago (GO) (NATL-IBC FGIC) 5.25%, 12/01/35 | | | 1,000 | | | | 1,199,533 | |
| Northern Illinois Municipal Power Agency, Series A (RB) | | | | | | | | |
| 4.00%, 12/01/32 (c) | | | 1,235 | | | | 1,242,652 | |
| 4.00%, 12/01/36 (c) | | | 1,500 | | | | 1,485,894 | |
| 5.00%, 12/01/30 (c) | | | 990 | | | | 1,022,053 | |
| Sales Tax Securitization Corp., Series A (RB) | | | | | | | | |
| 5.00%, 01/01/34 (c) | | | 570 | | | | 599,281 | |
| 5.00%, 01/01/34 (c) | | | 1,000 | | | | 1,132,034 | |
| State of Illinois (GO) | | | | | | | | |
| 4.00%, 10/01/34 (c) | | | 2,000 | | | | 2,004,709 | |
| 4.00%, 06/01/33 (c) | | | 2,155 | | | | 2,137,769 | |
| 4.00%, 07/01/37 (c) | | | 1,000 | | | | 985,462 | |
| 5.00%, 05/01/36 (c) | | | 1,000 | | | | 1,088,356 | |
| 5.00%, 07/01/36 (c) | | | 1,000 | | | | 1,088,627 | |
State of Illinois (RB) 3.00%, 06/15/32 (c) | | | 680 | | | | 633,944 | |
State of Illinois, Sales Tax, Series A (RB) (BAM) 3.00%, 06/15/32 (c) | | | 3,000 | | | | 2,796,810 | |
State of Illinois, Sales Tax, Series C (RB) 5.00%, 06/15/30 | | | 1,000 | | | | 1,095,764 | |
State of Illinois, Series A (GO) 4.00%, 03/01/40 (c) | | | 2,460 | | | | 2,347,586 | |
| | | Par
(000’s | ) | | Value | |
| Illinois (continued) | | | | | | | | |
| 5.00%, 10/01/33 (c) | | $ | 2,500 | | | $ | 2,631,127 | |
| 5.00%, 12/01/35 (c) | | | 1,000 | | | | 1,038,559 | |
| 5.00%, 03/01/34 (c) | | | 1,000 | | | | 1,084,813 | |
| 5.00%, 05/01/35 (c) | | | 2,250 | | | | 2,343,419 | |
| 5.25%, 12/01/30 (c) | | | 1,200 | | | | 1,263,835 | |
State of Illinois, Series B (GO) 5.00%, 11/01/30 (c) | | | 1,000 | | | | 1,074,383 | |
| | | | | | | | 87,128,383 | |
| Indiana: 0.7% | | | | | | | | |
Avon Indiana Community School Building Corp., AD Valorem Property Tax First Mortgage (RB) 5.25%, 07/15/39 (c) | | | 1,000 | | | | 1,123,369 | |
City of Indianapolis, Indiana Water System, Series A (RB) 5.00%, 10/01/36 (c) | | | 1,720 | | | | 1,826,851 | |
Indiana Finance Authority, First Lien Wastewater Utility (RB) 4.00%, 10/01/35 (c) | | | 2,500 | | | | 2,602,561 | |
Indiana Finance Authority, Indiana University Health Inc., Series B (RB) 5.00%, 10/01/55 (c) (p) | | | 1,000 | | | | 1,107,031 | |
Indiana Finance Authority, Ohio Valley Electric Corp. Project, Series A (RB) 4.25%, 11/01/30 | | | 1,545 | | | | 1,534,023 | |
Indianapolis Local Public Improvement Bond Bank, Courhouse and Jail Project, Series A (RB) 5.00%, 02/01/31 (c) | | | 1,715 | | | | 1,855,115 | |
Indianapolis Local Public Improvement Bond Bank, Indiana Convention Center Hotel, Series E (RB) 5.50%, 03/01/38 (c) | | | 1,000 | | | | 1,097,980 | |
Indianapolis Local Public Improvement Bond Bank, Series A (RB) (AGM) 4.00%, 06/01/39 (c) | | | 1,000 | | | | 1,005,626 | |
| | | | | | | | 12,152,556 | |
| Iowa: 0.4% | | | | | | | | |
Iowa Finance Authority (RB) 5.00%, 08/01/31 (c) | | | 1,000 | | | | 1,052,248 | |
Iowa Finance Authority, Midwestern Disaster Area, Iowa Fertilizer Company Project (RB) 4.00%, 12/01/50 (c) (p) | | | 3,210 | | | | 3,303,985 | |
| Iowa Finance Authority, Series A (RB) | | | | | | | | |
| 5.00%, 08/01/37 (c) | | | 1,000 | | | | 1,116,024 | |
| 5.00%, 08/01/36 (c) | | | 1,000 | | | | 1,151,577 | |
| 5.00%, 08/01/37 (c) | | | 1,000 | | | | 1,139,981 | |
| | | | | | | | 7,763,815 | |
See Notes to Financial Statements
VANECK INTERMEDIATE MUNI ETF
SCHEDULE OF INVESTMENTS
(continued)
| | | Par
(000’s | ) | | Value | |
| Kansas: 0.4% | | | | | | | | |
County of Butler, Unified School District No. 385 (GO) 4.00%, 09/01/30 (c) | | $ | 500 | | | $ | 509,233 | |
County of Johnson, Internal Improvement, Series A (GO) 4.00%, 09/01/34 (c) | | | 750 | | | | 758,983 | |
Kansas Development Finance Authority, Adventhealth Hospital, Series B (RB) 5.00%, 11/15/54 (p) | | | 2,450 | | | | 2,698,754 | |
State of Kansas, Department of Transportation, Series A (RB) 5.00%, 09/01/32 (c) | | | 1,165 | | | | 1,224,926 | |
University of Kansas Hospital Authority (RB) 4.00%, 09/01/40 (c) | | | 2,000 | | | | 1,909,859 | |
| | | | | | | | 7,101,755 | |
| Kentucky: 0.6% | | | | | | | | |
| Kentucky Public Energy Authority, Gas Supply, Series A-1 (RB) | | | | | | | | |
| 4.00%, 08/01/52 (c) (p) | | | 1,200 | | | | 1,186,057 | |
| 5.25%, 04/01/54 (c) (p) | | | 3,000 | | | | 3,172,576 | |
Kentucky State Property and Building Commission, Project No. 119 (RB) (BAM) 5.00%, 05/01/34 (c) | | | 3,285 | | | | 3,495,756 | |
| Louisville and Jefferson County, Metro Government, Norton Healthcare, Inc., Series A (RB) | | | | | | | | |
| 4.00%, 10/01/36 (c) | | | 1,000 | | | | 973,453 | |
| 5.00%, 10/01/31 (c) | | | 290 | | | | 296,736 | |
| University of Kentucky, Series A (RB) | | | | | | | | |
| 3.00%, 10/01/35 (c) | | | 770 | | | | 694,333 | |
| 4.00%, 10/01/30 (c) | | | 500 | | | | 504,079 | |
| | | | | | | | 10,322,990 | |
| Louisiana: 0.9% | | | | | | | | |
| Jefferson Sales Tax District, Parish of Jefferson, Series B (RB) (AGM) | | | | | | | | |
| 4.00%, 12/01/37 (c) | | | 1,300 | | | | 1,314,547 | |
| 5.00%, 12/01/33 (c) | | | 615 | | | | 665,004 | |
Jefferson Sales Tax District, Series B (RB) (AGM) 4.00%, 12/01/35 (c) | | | 500 | | | | 513,364 | |
Louisiana Local Government Environmental Facilities and Community Development Authority, Series B (RB) 2.50%, 04/01/36 (c) | | | 1,455 | | | | 1,164,549 | |
Louisiana Local Government Environmental Facilities and Community Development Authority, Westlake Chemical Corp. Project (RB) 3.50%, 11/01/32 (c) | | | 5,040 | | | | 4,758,967 | |
| | | Par
(000’s | ) | | Value | |
| Louisiana (continued) | | | | | | | | |
Louisville Public Facilities Authority, Tulane University, Series A (RB) 5.00%, 10/15/36 (c) | | $ | 1,000 | | | $ | 1,115,129 | |
| State of Louisiana, Series A (GO) | | | | | | | | |
| 5.00%, 03/01/33 (c) | | | 930 | | | | 1,027,848 | |
| 5.00%, 03/01/38 (c) | | | 1,000 | | | | 1,095,460 | |
| 5.00%, 03/01/32 (c) | | | 750 | | | | 842,099 | |
| 5.00%, 04/01/35 (c) | | | 1,000 | | | | 1,149,502 | |
| 5.00%, 04/01/36 (c) | | | 1,000 | | | | 1,141,270 | |
State of Louisiana, Series A (GO) (BAM) 5.00%, 03/01/34 (c) | | | 910 | | | | 1,005,018 | |
| | | | | | | | 15,792,757 | |
| Maryland: 1.7% | | | | | | | | |
City of Baltimore, Wastewater Project, Series C (RB) 5.00%, 07/01/39 (c) | | | 1,500 | | | | 1,508,392 | |
County of Baltimore (GO) 4.00%, 03/01/34 (c) | | | 890 | | | | 929,323 | |
County of Baltimore (GO) (AGC) 4.00%, 03/01/34 (c) | | | 1,925 | | | | 1,988,684 | |
County of Baltimore (GO) (CA MTG INS) 4.00%, 03/01/36 (c) | | | 2,420 | | | | 2,488,410 | |
County of Montgomery, Series A (GO) 3.00%, 08/01/32 (c) | | | 750 | | | | 719,945 | |
Maryland Department of Transportation (RB) 3.00%, 09/01/31 (c) | | | 500 | | | | 479,397 | |
| Prince George’s County, Public Improvement, Series A (GO) | | | | | | | | |
| 5.00%, 07/15/36 (c) | | | 2,500 | | | | 2,672,961 | |
| 5.00%, 08/01/35 (c) | | | 2,500 | | | | 2,915,178 | |
| 5.00%, 08/01/34 (c) | | | 1,500 | | | | 1,754,974 | |
Prince George’s County, Public Improvement, Series A (GO) (SAW) 4.00%, 07/15/30 (c) | | | 1,000 | | | | 1,034,055 | |
State of Maryland (GO) 4.00%, 06/01/30 (c) | | | 1,500 | | | | 1,497,673 | |
| State of Maryland, Department of Transportation (RB) | | | | | | | | |
| 3.00%, 11/01/30 (c) | | | 520 | | | | 502,173 | |
| 3.12%, 05/01/31 (c) | | | 855 | | | | 830,293 | |
State of Maryland, Department of Transportation (RB) (SAW) 2.12%, 10/01/31 (c) | | | 2,340 | | | | 2,011,791 | |
State of Maryland, Department of Transportation, Series B (RB) 4.00%, 05/01/30 (c) | | | 750 | | | | 773,800 | |
| State of Maryland, State and Local Facilities Loan (GO) | | | | | | | | |
| 4.00%, 08/01/32 (c) | | | 530 | | | | 545,787 | |
| 5.00%, 03/15/32 (c) | | | 3,000 | | | | 3,279,851 | |
| 5.00%, 08/01/30 (c) | | | 1,000 | | | | 1,082,149 | |
See Notes to Financial Statements
| | | Par
(000’s | ) | | Value | |
| Maryland (continued) | | | | | | | | |
| State of Maryland, State and Local Facilities Loan, Series A (GO) | | | | | | | | |
| 3.00%, 08/01/31 (c) | | $ | 1,000 | | | $ | 964,309 | |
| 5.00%, 03/15/31 (c) | | | 1,500 | | | | 1,671,813 | |
Washington Suburban Sanitary District, Maryland Consolidated Public Improvement (GO) 5.00%, 06/01/34 (c) | | | 1,650 | | | | 1,710,061 | |
| | | | | | | | 31,361,019 | |
| Massachusetts: 3.3% | | | | | | | | |
City of Boston, Series A (GO) 5.00%, 11/01/39 (c) | | | 2,000 | | | | 2,266,260 | |
Commonwealth of Massachusetts (RB) (BAM-TCRS NATL) 5.50%, 01/01/34 | | | 3,000 | | | | 3,485,739 | |
Commonwealth of Massachusetts (RB) (NATL) 5.50%, 01/01/34 | | | 1,000 | | | | 1,139,428 | |
Commonwealth of Massachusetts Transportation Fund, Series A (RB) 5.00%, 06/01/33 (c) | | | 1,275 | | | | 1,276,577 | |
Commonwealth of Massachusetts, Accelerated Bridge Program, Series A (RB) 5.00%, 06/01/35 (c) | | | 980 | | | | 981,179 | |
| Commonwealth of Massachusetts, Series A (GO) | | | | | | | | |
| 5.00%, 01/01/40 (c) | | | 1,500 | | | | 1,683,170 | |
| 5.00%, 10/01/31 | | | 3,000 | | | | 3,420,262 | |
| Commonwealth of Massachusetts, Series B (GO) | | | | | | | | |
| 5.00%, 07/01/31 (c) | | | 600 | | | | 622,308 | |
| 5.00%, 07/01/34 (c) | | | 1,860 | | | | 1,928,230 | |
Commonwealth of Massachusetts, Series C (GO) 5.00%, 05/01/30 | | | 1,000 | | | | 1,116,653 | |
Commonwealth of Massachusetts, Series C (GO) (AGM) 5.00%, 05/01/31 | | | 2,665 | | | | 3,019,873 | |
| Commonwealth of Massachusetts, Series D (GO) | | | | | | | | |
| 4.00%, 11/01/37 (c) | | | 2,000 | | | | 2,051,336 | |
| 4.00%, 05/01/35 (c) | | | 1,165 | | | | 1,187,761 | |
| 5.00%, 07/01/36 (c) | | | 365 | | | | 402,771 | |
Commonwealth of Massachusetts, Series D (GO) (SBG) 5.00%, 07/01/38 (c) | | | 2,000 | | | | 2,178,410 | |
| Commonwealth of Massachusetts, Series E (GO) | | | | | | | | |
| 3.00%, 11/01/33 (c) | | | 1,275 | | | | 1,195,996 | |
| 4.00%, 04/01/33 (c) | | | 1,000 | | | | 1,001,856 | |
| 4.00%, 04/01/38 (c) | | | 1,000 | | | | 989,312 | |
| | | Par
(000’s | ) | | Value | |
| Massachusetts (continued) | | | | | | | | |
| 4.00%, 09/01/39 (c) | | $ | 3,000 | | | $ | 2,966,542 | |
| 5.00%, 11/01/32 (c) | | | 1,000 | | | | 1,121,985 | |
| 5.00%, 09/01/37 (c) | | | 1,010 | | | | 1,075,977 | |
Commonwealth of Massachusetts, Series E (GO) (AGM) 5.00%, 05/01/31 (c) | | | 1,100 | | | | 1,100,218 | |
Commonwealth of Massachusetts, Transportation Fund, Series A (GO) 5.00%, 12/01/33 (c) | | | 500 | | | | 521,828 | |
Commonwealth of Massachusetts, Transportation Fund, Series A (RB) 5.00%, 06/01/37 (c) | | | 800 | | | | 892,885 | |
| Massachusetts Bay Transportation Authority Sales Tax, Series A-1 (RB) | | | | | | | | |
| 4.00%, 07/01/38 (c) | | | 2,000 | | | | 2,045,775 | |
| 5.00%, 07/01/40 (c) | | | 1,000 | | | | 1,115,916 | |
Massachusetts Development Finance Agency, Beth Israel Lahey Health Issue, Series K (RB) 5.00%, 07/01/35 (c) | | | 255 | | | | 272,920 | |
Massachusetts Development Finance Agency, Children’s Hospital, Series T (RB) 5.00%, 03/01/34 (c) | | | 1,000 | | | | 1,166,024 | |
Massachusetts Development Finance Agency, Harvard University Issue, Series A (RB) 4.00%, 07/15/36 (c) | | | 1,035 | | | | 1,046,067 | |
| Massachusetts Development Finance Agency, Harvard University Issue, Series B (RB) | | | | | | | | |
| 4.00%, 02/15/36 | | | 1,000 | | | | 1,093,786 | |
| 5.00%, 02/15/33 | | | 2,000 | | | | 2,339,267 | |
Massachusetts Development Finance Agency, Partners Healthcare System, Series S (RB) 4.00%, 07/01/35 (c) | | | 1,500 | | | | 1,513,112 | |
Massachusetts Development Finance Agency, Suffolk University (RB) 5.00%, 07/01/35 (c) | | | 500 | | | | 512,931 | |
Massachusetts School Building Authority, Dedicated Sales Tax, Series C (RB) 5.00%, 08/15/37 (c) | | | 1,150 | | | | 1,169,121 | |
Massachusetts Water Resources Authority, Series B (RB) (AGM) 5.25%, 08/01/30 | | | 2,000 | | | | 2,289,092 | |
See Notes to Financial Statements
VANECK INTERMEDIATE MUNI ETF
SCHEDULE OF INVESTMENTS
(continued)
| | | Par
(000’s | ) | | Value | |
| Massachusetts (continued) | | | | | | | | |
Massachusetts Water Resources Authority, Series C (RB) 5.00%, 08/01/31 (c) | | $ | 2,115 | | | $ | 2,247,811 | |
The Commonwealth of Massachusetts, Series A (GO) 5.00%, 03/01/36 (c) | | | 1,000 | | | | 1,167,260 | |
| University of Massachusetts Building Authority (RB) | | | | | | | | |
| 5.00%, 11/01/30 (c) | | | 1,020 | | | | 1,087,186 | |
| 5.00%, 11/01/34 (c) | | | 750 | | | | 819,403 | |
| 5.00%, 05/01/34 (c) | | | 1,220 | | | | 1,333,962 | |
University of Massachusetts Building Authority (RB) (SD CRED PROG) 5.00%, 11/01/32 (c) | | | 500 | | | | 547,022 | |
| | | | | | | | 59,393,211 | |
| Michigan: 1.5% | | | | | | | | |
Detroit City School District, Series A (GO) (AGM) 5.25%, 05/01/32 | | | 2,220 | | | | 2,505,706 | |
Great Lakes Water Authority, Sewage Disposal System, Senior Lien, Series A (RB) 5.00%, 07/01/37 (c) | | | 3,000 | | | | 3,414,598 | |
| Great Lakes Water Authority, Sewage Disposal System, Senior Lien, Series B (RB) | | | | | | | | |
| 5.00%, 07/01/30 (c) | | | 500 | | | | 516,515 | |
| 5.00%, 07/01/31 (c) | | | 570 | | | | 588,495 | |
Great Lakes Water Authority, Sewage Disposal System, Senior Lien, Series C (RB) 5.00%, 07/01/33 (c) | | | 1,025 | | | | 1,058,164 | |
Kalamazoo Michigan Hospital Facilities, Bronson Healthcare Group (RB) 4.00%, 05/15/36 (c) | | | 2,000 | | | | 2,003,736 | |
Michigan Finance Authority Hospital, McLaren Health Care, Series A (RB) 5.00%, 05/15/38 (c) | | | 1,500 | | | | 1,509,841 | |
Michigan Finance Authority, Henry Ford Health System (RB) 3.00%, 11/15/33 (c) | | | 355 | | | | 335,167 | |
Michigan Finance Authority, Local Government Loan Program, Series H-1 (RB) 5.00%, 10/01/34 (c) | | | 725 | | | | 727,390 | |
| Michigan Finance Authority, Trinity Health Credit Group, Series A (RB) | | | | | | | | |
| 4.00%, 12/01/40 (c) | | | 1,000 | | | | 967,676 | |
| 5.00%, 12/01/35 (c) | | | 585 | | | | 609,614 | |
| 5.00%, 12/01/34 (c) | | | 2,000 | | | | 2,090,040 | |
| | | Par
(000’s | ) | | Value | |
| Michigan (continued) | | | | | | | | |
Michigan State Housing Development Authority, Series A (RB) 4.30%, 10/01/40 (c) | | $ | 725 | | | $ | 724,971 | |
Michigan State Housing Development Authority, Series B (RB) 4.50%, 12/01/38 (c) | | | 1,500 | | | | 1,526,919 | |
Michigan State University, Series A (RB) 5.00%, 08/15/40 (c) | | | 2,000 | | | | 2,015,748 | |
State of Michigan, Building Authority, Series I (RB) 5.00%, 10/15/32 (c) | | | 570 | | | | 590,068 | |
State of Michigan, Environmental Program (GO) 3.00%, 05/01/30 (c) | | | 410 | | | | 393,767 | |
State of Michigan, Environmental Program, Series A (GO) 3.00%, 05/15/36 (c) | | | 750 | | | | 685,316 | |
State of Michigan, Housing Development Authority, Single-Family Mortgage, Series B (RB) 3.10%, 12/01/31 (c) | | | 1,370 | | | | 1,274,217 | |
State of Michigan, Trunk Line Fund (RB) 5.00%, 11/15/36 (c) | | | 1,000 | | | | 1,154,683 | |
State of Michigan, Trunk Line Fund, Series A (RB) 5.00%, 11/15/35 (c) | | | 1,900 | | | | 2,144,613 | |
| | | | | | | | 26,837,244 | |
| Minnesota: 0.8% | | | | | | | | |
County of Hennepin, Minnesota First Lien Sales Tax, Series A (RB) 5.00%, 12/15/31 (c) | | | 1,000 | | | | 1,036,076 | |
Minneapolis-St. Paul Metropolitan Airports Commission, Series B (RB) 5.00%, 01/01/31 (c) | | | 325 | | | | 340,013 | |
Minnesota Agricultural & Economic Development Board (RB) 5.00%, 01/01/38 (c) | | | 1,000 | | | | 1,111,956 | |
| Minnesota Public Facilities Authority, Series A (RB) | | | | | | | | |
| 5.00%, 03/01/33 (c) | | | 1,500 | | | | 1,546,085 | |
| 5.00%, 03/01/31 | | | 1,000 | | | | 1,128,883 | |
Regents of the University of Minnesota, Series B (RB) 5.00%, 12/01/31 (c) | | | 1,000 | | | | 1,059,379 | |
| State of Minnesota, Various Purpose, Series A (GO) | | | | | | | | |
| 5.00%, 08/01/33 (c) | | | 1,000 | | | | 1,101,978 | |
| 5.00%, 08/01/36 (c) | | | 1,000 | | | | 1,093,777 | |
| 5.00%, 08/01/37 (c) | | | 2,000 | | | | 2,204,287 | |
| 5.00%, 08/01/36 (c) | | | 2,000 | | | | 2,220,055 | |
See Notes to Financial Statements
| | | Par
(000’s | ) | | Value | |
| Minnesota (continued) | | | | | | | | |
State of Minnesota, Various Purpose, Series D (GO) 3.00%, 10/01/30 (c) | | $ | 1,000 | | | $ | 971,851 | |
White Bear Lake, independent School District No. 624, Series A (GO) (SD CRED PROG) 3.00%, 02/01/33 (c) | | | 1,000 | | | | 958,132 | |
| | | | | | | | 14,772,472 | |
| Mississippi: 0.1% | | | | | | | | |
| State of Mississippi, Series A (RB) | | | | | | | | |
| 5.00%, 10/15/36 (c) | | | 550 | | | | 566,323 | |
| 5.00%, 10/15/34 (c) | | | 1,000 | | | | 1,038,039 | |
| | | | | | | | 1,604,362 | |
| Missouri: 0.5% | | | | | | | | |
City of Springfield, Public Utility (RB) 4.00%, 08/01/31 (c) | | | 1,000 | | | | 1,000,719 | |
County of St. Louis, Hazewood School District, Series A (GO) (BAM) 5.00%, 03/01/38 (c) | | | 1,000 | | | | 1,101,901 | |
Curators of the University of Missouri, Series B (RB) 5.00%, 11/01/30 | | | 1,400 | | | | 1,570,603 | |
Missouri Joint Municipal Electric Utility Commission, Prairie State Project, Series A (RB) 4.00%, 12/01/32 (c) | | | 685 | | | | 691,321 | |
Springfield School District No. R-12 (GO) 4.00%, 03/01/34 (c) | | | 650 | | | | 671,894 | |
| Springfield School District No. R-12 (GO) (SAW) | | | | | | | | |
| 4.00%, 03/01/35 (c) | | | 2,415 | | | | 2,489,546 | |
| 5.00%, 03/01/36 (c) | | | 450 | | | | 486,206 | |
St. Louis School District, Board of Education (GO) (AGM) 5.00%, 04/01/37 (c) | | | 1,000 | | | | 1,111,222 | |
| | | | | | | | 9,123,412 | |
| Nebraska: 0.6% | | | | | | | | |
| Central Plains Energy Project, Gas Project Crossover No. 3, Series A (RB) | | | | | | | | |
| 5.00%, 09/01/31 | | | 1,215 | | | | 1,279,112 | |
| 5.00%, 09/01/32 | | | 1,280 | | | | 1,346,379 | |
| 5.00%, 09/01/34 | | | 4,300 | | | | 4,536,319 | |
| 5.00%, 09/01/35 | | | 2,000 | | | | 2,099,946 | |
Nebraska Public Power District, Series B (RB) 5.00%, 01/01/37 (c) | | | 1,000 | | | | 1,012,838 | |
| | | | | | | | 10,274,594 | |
| Nevada: 0.9% | | | | | | | | |
Clark County School District, Limited Tax, Series A (GO) 5.00%, 06/15/40 (c) | | | 1,000 | | | | 1,100,684 | |
Clark County, Nevada Airport System, Series A-2 (RB) 5.00%, 07/01/30 (c) | | | 1,000 | | | | 1,001,626 | |
| | | Par
(000’s | ) | | Value | |
| Nevada (continued) | | | | | | | | |
| 5.00%, 07/01/35 (c) | | $ | 1,500 | | | $ | 1,502,438 | |
Clark County, Nevada Limited Tax, Flood Control (GO) 4.00%, 11/01/33 (c) | | | 1,675 | | | | 1,681,473 | |
Clark County, Nevada McCarran International Airport, Passenger Facility, Series E (RB) 5.00%, 07/01/32 (c) | | | 470 | | | | 512,013 | |
Clark County, School District, Series A (GO) 4.00%, 06/15/41 (c) | | | 1,000 | | | | 988,177 | |
| Clark County, School District, Series A (GO) (AGM) | | | | | | | | |
| 5.00%, 06/15/34 (c) | | | 915 | | | | 1,003,221 | |
| 5.00%, 06/15/32 (c) | | | 1,000 | | | | 1,097,448 | |
Clark County, School District, Series B (GO) (BAM) 3.00%, 06/15/38 (c) | | | 1,500 | | | | 1,279,201 | |
Clark County, School District, Series C (GO) 5.00%, 06/15/32 (c) | | | 1,050 | | | | 1,104,829 | |
Clark County, Transportation Improvement, Limited Tax, Series B (GO) 4.00%, 12/01/39 (c) | | | 2,245 | | | | 2,259,200 | |
County of Clark, Motor Vehicle Fuel Tax (RB) (AGM) 4.00%, 07/01/40 (c) | | | 1,105 | | | | 1,099,621 | |
Las Vegas Valley Water District, Series C (GO) 3.00%, 06/01/32 (c) | | | 1,000 | | | | 951,094 | |
| State of Nevada, Highway Improvement, Motor Vehicle Fuel Tax (RB) (AGM) | | | | | | | | |
| 4.00%, 12/01/33 (c) | | | 760 | | | | 777,225 | |
| 4.00%, 12/01/32 (c) | | | 760 | | | | 779,000 | |
| | | | | | | | 17,137,250 | |
| New Jersey: 3.8% | | | | | | | | |
Casino Reinvestment Development Authority, Luxury Tax (RB) 5.25%, 11/01/39 (c) | | | 1,210 | | | | 1,213,063 | |
County of Camden, Board of Education of Township of Cherry Hill (GO) 4.00%, 08/01/35 (c) | | | 1,000 | | | | 1,032,423 | |
| County of Hudson (GO) | | | | | | | | |
| 2.00%, 11/15/34 (c) | | | 2,000 | | | | 1,608,020 | |
| 2.00%, 11/15/35 (c) | | | 685 | | | | 539,690 | |
New Jersey Economic Development Authority, Motor Vehicle Surcharges, Series A (RB) (BAM) 3.12%, 07/01/31 (c) | | | 755 | | | | 727,222 | |
See Notes to Financial Statements
VANECK INTERMEDIATE MUNI ETF
SCHEDULE OF INVESTMENTS
(continued)
| | | Par
(000’s | ) | | Value | |
| New Jersey (continued) | | | | | | | | |
New Jersey Economic Development Authority, New Jersey Transit Transportation Project, Series A (RB) (AGM) 5.00%, 11/01/33 (c) | | $ | 1,000 | | | $ | 1,085,591 | |
| New Jersey Economic Development Authority, School Facilities Construction, Series LLL (RB) | | | | | | | | |
| 5.00%, 06/15/37 (c) | | | 1,970 | | | | 2,106,156 | |
| 5.00%, 06/15/36 (c) | | | 1,250 | | | | 1,346,370 | |
New Jersey Economic Development Authority, School Facilities Construction, Series MMM (RB) 4.00%, 06/15/36 (c) | | | 1,080 | | | | 1,088,240 | |
| New Jersey Economic Development Authority, School Facilities Construction, Series QQQ (RB) | | | | | | | | |
| 4.00%, 06/15/36 (c) | | | 2,455 | | | | 2,486,713 | |
| 4.00%, 06/15/39 (c) | | | 1,000 | | | | 992,377 | |
New Jersey Economic Development Authority, School Facilities Construction, Series SSS (RB) 5.00%, 06/15/34 | | | 1,500 | | | | 1,721,677 | |
New Jersey Educational Facilities Authority, Princeton University, Series A-2 (RB) 5.00%, 03/01/41 (c) | | | 2,500 | | | | 2,812,114 | |
| New Jersey Educational Facilities Authority, Princeton University, Series C (RB) | | | | | | | | |
| 2.00%, 03/01/37 (c) | | | 1,975 | | | | 1,483,974 | |
| 2.00%, 03/01/36 (c) | | | 1,000 | | | | 777,463 | |
| 2.00%, 03/01/38 (c) | | | 2,000 | | | | 1,439,451 | |
New Jersey Educational Facilities Authority, Princeton University, Series I (RB) 5.00%, 07/01/32 (c) | | | 500 | | | | 529,455 | |
New Jersey Health Care Facilities Financing Authority, Inspira Health, Series A (RB) 3.38%, 07/01/34 (c) | | | 360 | | | | 348,095 | |
New Jersey Health Care Facilities Financing Authority, Valley Health System (RB) 5.00%, 07/01/31 (c) | | | 1,000 | | | | 1,076,580 | |
| New Jersey State Turnpike Authority, Series B (RB) | | | | | | | | |
| 5.00%, 01/01/34 (c) | | | 2,900 | | | | 3,081,122 | |
| 5.00%, 01/01/33 (c) | | | 1,080 | | | | 1,147,957 | |
| New Jersey Transportation Trust Fund Authority, Series A (RB) | | | | | | | | |
| 4.00%, 12/15/31 (c) | | | 2,830 | | | | 2,892,951 | |
| 4.00%, 06/15/40 (c) | | | 1,000 | | | | 986,025 | |
| 4.25%, 06/15/40 (c) | | | 3,045 | | | | 3,072,601 | |
| | | Par
(000’s | ) | | Value | |
| New Jersey (continued) | | | | | | | | |
| 5.00%, 12/15/36 (c) | | $ | 1,000 | | | $ | 1,056,261 | |
| 5.00%, 12/15/33 (c) | | | 1,395 | | | | 1,490,863 | |
| 5.00%, 12/15/34 (c) | | | 1,100 | | | | 1,172,298 | |
| 5.00%, 06/15/30 (c) | | | 435 | | | | 446,220 | |
New Jersey Transportation Trust Fund Authority, Series A-1 (RB) 4.10%, 06/15/31 (c) | | | 780 | | | | 785,859 | |
| New Jersey Transportation Trust Fund Authority, Series AA (RB) | | | | | | | | |
| 4.00%, 06/15/39 (c) | | | 1,000 | | | | 993,493 | |
| 4.12%, 06/15/39 (c) | | | 1,000 | | | | 992,993 | |
| 4.75%, 06/15/38 (c) | | | 2,950 | | | | 2,972,238 | |
| 5.00%, 06/15/40 (c) | | | 1,000 | | | | 1,090,170 | |
New Jersey Transportation Trust Fund Authority, Series BB (RB) 4.00%, 06/15/36 (c) | | | 1,045 | | | | 1,058,740 | |
New Jersey Transportation Trust Fund Authority, Series D (RB) 5.00%, 06/15/32 (c) | | | 1,720 | | | | 1,729,882 | |
New Jersey Turnpike Authority, Series A (RB) 5.00%, 01/01/34 (c) | | | 4,000 | | | | 4,005,195 | |
New Jersey Turnpike Authority, Series G (RB) 5.00%, 01/01/36 (c) | | | 3,000 | | | | 3,175,433 | |
New Jersey Turnpike Authority, Series G (RB) (AGM) 4.00%, 01/01/33 (c) | | | 2,130 | | | | 2,180,268 | |
| State of New Jersey, Various Purposes (GO) | | | | | | | | |
| 2.00%, 06/01/30 (c) | | | 3,000 | | | | 2,632,212 | |
| 2.00%, 06/01/34 (c) | | | 3,000 | | | | 2,410,922 | |
| 5.00%, 06/01/38 (c) | | | 2,000 | | | | 2,144,752 | |
| Tobacco Settlement Financing Corp., Series A (RB) | | | | | | | | |
| 5.00%, 06/01/31 (c) | | | 500 | | | | 528,471 | |
| 5.00%, 06/01/32 (c) | | | 2,755 | | | | 2,910,998 | |
| | | | | | | | 69,372,598 | |
| New Mexico: 0.1% | | | | | | | | |
State of New Mexico (GO) 5.00%, 03/01/33 | | | 1,000 | | | | 1,157,655 | |
| New York: 18.5% | | | | | | | | |
Battery Park City Authorization, Series B (RB) 5.00%, 11/01/36 (c) | | | 1,000 | | | | 1,167,211 | |
City of New York Trust for Cultural Resources, Lincoln Center for Performing Arts Inc., Series A (RB) 4.00%, 12/01/34 (c) | | | 3,000 | | | | 3,126,869 | |
City of New York, Housing Development Corp., Series G-1 (RB) 3.10%, 11/01/32 (c) | | | 500 | | | | 461,187 | |
See Notes to Financial Statements
| | | Par
(000’s | ) | | Value | |
| New York (continued) | | | | | | | | |
| City of New York, Series A (GO) | | | | | | | | |
| 4.00%, 08/01/34 (c) | | $ | 485 | | | $ | 488,490 | |
| 4.00%, 08/01/38 (c) | | | 600 | | | | 601,091 | |
| 5.00%, 08/01/37 (c) | | | 1,000 | | | | 1,123,819 | |
| 5.00%, 09/01/34 (c) | | | 2,170 | | | | 2,471,650 | |
City of New York, Series A-1 (GO) 5.00%, 09/01/37 (c) | | | 2,000 | | | | 2,224,969 | |
| City of New York, Series B-1 (GO) | | | | | | | | |
| 5.00%, 10/01/31 (c) | | | 500 | | | | 546,554 | |
| 5.00%, 10/01/32 (c) | | | 1,125 | | | | 1,228,753 | |
| 5.00%, 11/01/30 | | | 1,000 | | | | 1,111,233 | |
| 5.25%, 10/01/40 (c) | | | 1,575 | | | | 1,759,825 | |
City of New York, Series C (GO) 5.00%, 08/01/33 (c) | | | 1,165 | | | | 1,175,293 | |
City of New York, Series D (GO) 4.00%, 04/01/41 (c) | | | 1,000 | | | | 982,069 | |
City of New York, Series D-1 (GO) (BAM) 5.00%, 03/01/37 (c) | | | 1,565 | | | | 1,698,605 | |
| City of New York, Series E (GO) | | | | | | | | |
| 5.00%, 04/01/37 (c) | | | 1,000 | | | | 1,123,291 | |
| 5.00%, 08/01/30 (c) | | | 540 | | | | 557,580 | |
| City of New York, Series E-1 (GO) | | | | | | | | |
| 5.00%, 03/01/39 (c) | | | 2,000 | | | | 2,098,651 | |
| 5.00%, 03/01/32 (c) | | | 1,015 | | | | 1,079,597 | |
| 5.25%, 03/01/34 (c) | | | 1,000 | | | | 1,071,683 | |
| 5.25%, 03/01/31 (c) | | | 1,500 | | | | 1,610,218 | |
| City of New York, Series F-1 (GO) | | | | | | | | |
| 5.00%, 08/01/38 (c) | | | 1,000 | | | | 1,118,405 | |
| 5.00%, 08/01/39 (c) | | | 1,330 | | | | 1,481,006 | |
| 5.00%, 08/01/37 (c) | | | 1,000 | | | | 1,123,819 | |
| 5.00%, 08/01/36 (c) | | | 1,000 | | | | 1,136,928 | |
City of New York, Series I-1 (GO) 4.25%, 03/01/35 (c) | | | 1,000 | | | | 1,000,080 | |
City of New York, Series L (GO) 5.00%, 04/01/32 (c) | | | 655 | | | | 710,373 | |
City of New York, Series L-5 (GO) 5.00%, 04/01/34 (c) | | | 1,865 | | | | 2,085,920 | |
City of New York, Series L-6 (GO) 5.00%, 04/01/30 (c) | | | 1,000 | | | | 1,085,374 | |
County of Broome, Local Development Corp., United Health Services Hospitals, In. Project (RB) (AGM) 4.00%, 04/01/40 (c) | | | 925 | | | | 899,354 | |
County of Monroe, Industrial Development Corp., Rochester Regional Health Project, Series A (RB) 3.00%, 12/01/37 (c) | | | 865 | | | | 666,799 | |
| | | Par
(000’s | ) | | Value | |
| New York (continued) | | | | | | | | |
| County of Nassau, Interim Finance Authority, Public Benefit Corp., Series A (RB) | | | | | | | | |
| 4.00%, 11/15/35 (c) | | $ | 1,000 | | | $ | 1,060,789 | |
| 5.00%, 11/15/35 (c) | | | 1,500 | | | | 1,709,663 | |
County of Suffolk, New York Water System, Series A (RB) 5.00%, 06/01/36 (c) | | | 1,515 | | | | 1,628,242 | |
| County of Suffolk, Public Improvement, Series C (GO) | | | | | | | | |
| 4.00%, 09/01/36 (c) | | | 1,000 | | | | 1,031,389 | |
| 5.00%, 09/01/35 (c) | | | 1,500 | | | | 1,660,484 | |
| Hudson Yards Infrastructure Corp., Series A (RB) | | | | | | | | |
| 5.00%, 02/15/31 (c) | | | 1,400 | | | | 1,464,477 | |
| 5.00%, 02/15/33 (c) | | | 460 | | | | 481,038 | |
| 5.00%, 02/15/32 (c) | | | 1,700 | | | | 1,778,127 | |
| Long Island Power Authority, Electric System (RB) | | | | | | | | |
| 5.00%, 09/01/33 (c) | | | 750 | | | | 796,419 | |
| 5.00%, 09/01/31 (c) | | | 305 | | | | 324,119 | |
| 5.00%, 09/01/32 (c) | | | 500 | | | | 531,070 | |
| Long Island Power Authority, Electric System, Series A (RB) | | | | | | | | |
| 3.00%, 09/01/36 (c) | | | 450 | | | | 421,732 | |
| 5.00%, 09/01/36 (c) | | | 1,500 | | | | 1,658,697 | |
Long Island Power Authority, Electric System, Series B (RB) 5.00%, 09/01/36 (c) | | | 2,000 | | | | 2,063,894 | |
| Metropolitan Transportation Authority, Series A (RB) | | | | | | | | |
| 4.00%, 11/15/33 (c) | | | 340 | | | | 337,768 | |
| 5.00%, 11/15/40 (c) | | | 1,000 | | | | 1,090,743 | |
Metropolitan Transportation Authority, Series A-1 (RB) 4.00%, 11/15/40 (c) | | | 1,000 | | | | 981,160 | |
Metropolitan Transportation Authority, Series A-2 (RB) 5.00%, 11/15/45 (p) | | | 1,935 | | | | 2,074,553 | |
| Metropolitan Transportation Authority, Series C-1 (RB) | | | | | | | | |
| 4.00%, 11/15/32 (c) | | | 1,980 | | | | 1,994,850 | |
| 4.00%, 11/15/34 (c) | | | 395 | | | | 397,191 | |
| 5.00%, 11/15/31 (c) | | | 1,445 | | | | 1,529,813 | |
| 5.00%, 11/15/33 (c) | | | 2,540 | | | | 2,685,426 | |
| 5.00%, 11/15/30 (c) | | | 1,540 | | | | 1,629,766 | |
| 5.00%, 11/15/34 (c) | | | 810 | | | | 855,569 | |
Metropolitan Transportation Authority, Series C-2 (RB) 0.00%, 11/15/33 ^ | | | 1,035 | | | | 717,310 | |
| Metropolitan Transportation Authority, Series D (RB) | | | | | | | | |
| 3.12%, 11/15/35 (c) | | | 265 | | | | 234,974 | |
| 4.00%, 11/15/32 (c) | | | 400 | | | | 400,950 | |
| 5.00%, 11/15/30 (c) | | | 1,085 | | | | 1,148,244 | |
| 5.00%, 11/15/32 (c) | | | 1,570 | | | | 1,660,908 | |
| 5.00%, 11/15/33 (c) | | | 535 | | | | 565,631 | |
See Notes to Financial Statements
VANECK INTERMEDIATE MUNI ETF
SCHEDULE OF INVESTMENTS
(continued)
| | | Par
(000’s | ) | | Value | |
| New York (continued) | | | | | | | | |
Metropolitan Transportation Authority, Series D-1 (RB) (BAM) 5.00%, 11/15/33 (c) | | $ | 2,000 | | | $ | 2,039,067 | |
Metropolitan Transportation Authority, Series E (RB) 5.00%, 11/15/30 | | | 1,000 | | | | 1,108,596 | |
New York City Housing Development Corp., Multi-Family Housing, Series A (RB) (AGC) 2.90%, 11/01/37 (c) | | | 1,000 | | | | 849,354 | |
New York City Housing Development Corp., Multi-Family Housing, Series A-1-C (RB) 2.35%, 11/01/35 (c) | | | 1,100 | | | | 890,132 | |
New York City Housing Development Corp., Multi-Family Housing, Series I-1 (RB) 2.35%, 11/01/40 (c) | | | 525 | | | | 377,428 | |
| New York City Industrial Development Agency, Queens Baseball Stadium Project, Series A (RB) (AGM) | | | | | | | | |
| 4.00%, 01/01/32 (c) | | | 500 | | | | 517,377 | |
| 5.00%, 01/01/31 | | | 2,700 | | | | 2,973,109 | |
| New York City Industrial Development Agency, Yankee Stadium Project, Series A (RB) (AGM) | | | | | | | | |
| 4.00%, 03/01/32 (c) | | | 2,500 | | | | 2,572,315 | |
| 4.00%, 03/01/31 (c) | | | 2,765 | | | | 2,845,876 | |
New York City Municipal Water Finance Authority, Series AA (RB) 5.00%, 06/15/32 (c) | | | 1,000 | | | | 1,099,349 | |
New York City Municipal Water Finance Authority, Series CC-1 (RB) 5.00%, 06/15/38 (c) | | | 1,000 | | | | 1,029,695 | |
| New York City Municipal Water Finance Authority, Series DD (RB) | | | | | | | | |
| 5.00%, 06/15/34 (c) | | | 3,685 | | | | 4,288,911 | |
| 5.00%, 06/15/34 | | | 5,360 | | | | 6,311,024 | |
New York City Municipal Water Finance Authority, Series FF-2 (RB) 5.00%, 06/15/33 (c) | | | 500 | | | | 545,134 | |
| New York City Transitional Finance Authority Building Aid, Series S (RB) (SAW) | | | | | | | | |
| 4.00%, 07/15/35 (c) | | | 1,015 | | | | 1,061,117 | |
| 5.00%, 07/15/40 (c) | | | 1,305 | | | | 1,312,599 | |
| | | Par
(000’s | ) | | Value | |
| New York (continued) | | | | | | | | |
| New York City Transitional Finance Authority Future Tax, Series A-1 (RB) | | | | | | | | |
| 5.00%, 05/01/37 (c) | | $ | 1,000 | | | $ | 1,135,790 | |
| 5.00%, 05/01/36 (c) | | | 1,000 | | | | 1,145,984 | |
New York City Transitional Finance Authority Future Tax, Series F-1 (RB) 5.00%, 02/01/39 (c) | | | 1,000 | | | | 1,116,203 | |
New York City Transitional Finance Authority, Building Aid, Series S-1 (RB) (SAW) 4.00%, 07/15/36 (c) | | | 1,375 | | | | 1,427,491 | |
New York City Transitional Finance Authority, Building Aid, Series S-2 (RB) (SAW) 5.00%, 07/15/31 (c) | | | 1,010 | | | | 1,079,269 | |
| New York City Transitional Finance Authority, Building Aid, Series S-3 (RB) (SAW) | | | | | | | | |
| 5.00%, 07/15/33 (c) | | | 1,605 | | | | 1,712,326 | |
| 5.00%, 07/15/35 (c) | | | 1,000 | | | | 1,065,196 | |
New York City Transitional Finance Authority, Building Aid, Series S-4 (RB) (SAW) 5.00%, 07/15/33 (c) | | | 500 | | | | 533,435 | |
| New York City Transitional Finance Authority, Future Tax Secured Subordinate, Series A (RB) | | | | | | | | |
| 3.00%, 11/01/37 (c) | | | 2,000 | | | | 1,776,786 | |
| 5.00%, 11/01/36 (c) | | | 3,000 | | | | 3,315,120 | |
| New York City Transitional Finance Authority, Future Tax Secured Subordinate, Series A-1 (RB) | | | | | | | | |
| 4.00%, 05/01/31 (c) | | | 630 | | | | 634,876 | |
| 5.00%, 11/01/32 (c) | | | 1,000 | | | | 1,135,197 | |
| 5.00%, 05/01/33 (c) | | | 450 | | | | 462,178 | |
| 5.00%, 05/01/35 (c) | | | 655 | | | | 672,216 | |
| 5.00%, 05/01/34 (c) | | | 880 | | | | 903,472 | |
| New York City Transitional Finance Authority, Future Tax Secured Subordinate, Series B (RB) | | | | | | | | |
| 4.00%, 08/01/35 (c) | | | 2,000 | | | | 2,010,127 | |
| 5.00%, 05/01/36 (c) | | | 1,000 | | | | 1,152,963 | |
| New York City Transitional Finance Authority, Future Tax Secured Subordinate, Series B-1 (RB) | | | | | | | | |
| 4.00%, 08/01/39 (c) | | | 1,190 | | | | 1,197,108 | |
| 5.00%, 11/01/32 (c) | | | 1,065 | | | | 1,119,535 | |
| 5.00%, 11/01/34 (c) | | | 2,980 | | | | 2,981,413 | |
| 5.00%, 08/01/32 (c) | | | 1,345 | | | | 1,347,340 | |
| 5.00%, 08/01/33 (c) | | | 895 | | | | 922,865 | |
| 5.00%, 08/01/31 (c) | | | 690 | | | | 712,086 | |
| 5.00%, 08/01/32 (c) | | | 540 | | | | 557,049 | |
| 5.00%, 08/01/32 (c) | | | 1,000 | | | | 1,056,233 | |
See Notes to Financial Statements
| | | Par
(000’s | ) | | Value | |
| New York (continued) | | | | | | | | |
| 5.00%, 08/01/34 (c) | | $ | 780 | | | $ | 827,934 | |
| 5.00%, 08/01/31 (c) | | | 1,000 | | | | 1,115,763 | |
| 5.00%, 08/01/34 (c) | | | 1,000 | | | | 1,129,260 | |
| New York City Transitional Finance Authority, Future Tax Secured Subordinate, Series C (RB) | | | | | | | | |
| 5.00%, 11/01/30 (c) | | | 2,280 | | | | 2,397,951 | |
| 5.00%, 11/01/33 (c) | | | 900 | | | | 945,901 | |
| New York City Transitional Finance Authority, Future Tax Secured Subordinate, Series C-1 (RB) | | | | | | | | |
| 4.00%, 05/01/40 (c) | | | 775 | | | | 773,236 | |
| 4.00%, 05/01/39 (c) | | | 1,690 | | | | 1,698,789 | |
| 5.00%, 05/01/37 (c) | | | 2,500 | | | | 2,754,793 | |
New York City Transitional Finance Authority, Future Tax Secured Subordinate, Series D-1 (RB) 4.00%, 11/01/38 (c) | | | 1,500 | | | | 1,519,012 | |
| New York City Transitional Finance Authority, Future Tax Secured Subordinate, Series E-1 (RB) | | | | | | | | |
| 5.00%, 02/01/35 (c) | | | 1,195 | | | | 1,205,822 | |
| 5.00%, 02/01/31 (c) | | | 1,500 | | | | 1,535,412 | |
| 5.00%, 02/01/39 (c) | | | 1,710 | | | | 1,767,092 | |
New York City Transitional Finance Authority, Future Tax Secured Subordinate, Series G-1 (RB) 4.00%, 11/01/30 | | | 6,000 | | | | 6,345,700 | |
New York City Transitional Finance Authority, Series C (RB) 5.00%, 05/01/33 | | | 1,000 | | | | 1,158,459 | |
| New York City Transitional Finance Authority, Series D (RB) | | | | | | | | |
| 5.00%, 11/01/39 (c) | | | 4,300 | | | | 4,860,180 | |
| 5.00%, 11/01/36 (c) | | | 1,000 | | | | 1,153,269 | |
New York City Water and Sewer System, Series AA-2 (RB) 3.00%, 06/15/40 (c) | | | 660 | | | | 557,880 | |
New York City Water and Sewer System, Series EE (RB) (AGC) 5.00%, 06/15/40 (c) | | | 800 | | | | 850,015 | |
New York Liberty Development Corp., Goldman Sachs Headquarters LLC (RB) 5.25%, 10/01/35 | | | 1,000 | | | | 1,152,146 | |
New York State Dormitory Authority, Memorial Sloan- Kettering Cancer Center, Series 1 (RB) 4.00%, 07/01/37 (c) | | | 1,000 | | | | 1,016,784 | |
| | | Par
(000’s | ) | | Value | |
| New York (continued) | | | | | | | | |
New York State Dormitory Authority, Montefiore Medical Center, Series A (RB) 5.00%, 08/01/30 (c) | | $ | 1,000 | | | $ | 1,024,978 | |
| New York State Dormitory Authority, New York University, Series A (RB) | | | | | | | | |
| 5.00%, 07/01/30 (c) | | | 3,000 | | | | 3,047,422 | |
| 5.00%, 07/01/33 (c) | | | 1,140 | | | | 1,199,121 | |
| 5.00%, 07/01/32 (c) | | | 385 | | | | 414,573 | |
| 5.00%, 07/01/40 (c) | | | 400 | | | | 421,943 | |
New York State Dormitory Authority, New York University, Series A (RB) (AGC) 5.00%, 03/15/38 (c) | | | 1,250 | | | | 1,311,011 | |
| New York State Dormitory Authority, Sales Tax, Series A (RB) | | | | | | | | |
| 5.00%, 03/15/40 (c) | | | 1,500 | | | | 1,658,570 | |
| 5.00%, 03/15/36 (c) | | | 2,000 | | | | 2,283,628 | |
| 5.00%, 03/15/37 (c) | | | 1,000 | | | | 1,130,613 | |
| 5.00%, 03/15/34 (c) | | | 2,150 | | | | 2,152,436 | |
| 5.00%, 03/15/38 (c) | | | 1,310 | | | | 1,311,484 | |
New York State Dormitory Authority, School Districts Bond Financing Program, Series A (RB) (AGM) 4.00%, 10/01/35 (c) | | | 1,315 | | | | 1,350,429 | |
| New York State Dormitory Authority, School Districts Bond Financing Program, Series A (RB) | | | | | | | | |
| 5.00%, 10/01/35 (c) | | | 2,040 | | | | 2,294,738 | |
| 5.00%, 10/01/36 (c) | | | 1,000 | | | | 1,116,194 | |
| New York State Dormitory Authority, School Districts Bond Financing Program, Series A (RB) (SAW) | | | | | | | | |
| 5.00%, 10/01/30 (c) | | | 1,325 | | | | 1,367,927 | |
| 5.00%, 10/01/32 (c) | | | 1,200 | | | | 1,238,316 | |
| New York State Dormitory Authority, State Personal Income Tax, Series A (RB) | | | | | | | | |
| 3.00%, 03/15/38 (c) | | | 3,120 | | | | 2,759,071 | |
| 4.00%, 02/15/33 (c) | | | 1,000 | | | | 1,020,176 | |
| 4.00%, 02/15/36 (c) | | | 1,235 | | | | 1,254,080 | |
| 4.00%, 02/15/35 (c) | | | 2,475 | | | | 2,520,501 | |
| 4.00%, 03/15/37 (c) | | | 1,075 | | | | 1,097,093 | |
| 4.00%, 03/15/38 (c) | | | 2,795 | | | | 2,838,107 | |
| 4.00%, 03/15/37 (c) | | | 1,135 | | | | 1,156,894 | |
| 5.00%, 02/15/32 (c) | | | 595 | | | | 621,537 | |
| 5.00%, 02/15/31 (c) | | | 2,115 | | | | 2,208,961 | |
| 5.00%, 03/15/36 (c) | | | 3,910 | | | | 4,207,909 | |
| 5.00%, 03/15/35 (c) | | | 1,950 | | | | 2,106,360 | |
| 5.00%, 03/15/34 (c) | | | 2,370 | | | | 2,562,797 | |
| 5.00%, 03/15/37 (c) | | | 1,000 | | | | 1,143,110 | |
| 5.00%, 03/15/38 (c) | | | 1,000 | | | | 1,132,581 | |
| 5.00%, 03/15/41 (c) | | | 2,000 | | | | 2,217,036 | |
| 5.00%, 02/15/39 (c) | | | 2,000 | | | | 2,033,827 | |
See Notes to Financial Statements
VANECK INTERMEDIATE MUNI ETF
SCHEDULE OF INVESTMENTS
(continued)
| | | Par
(000’s | ) | | Value | |
| New York (continued) | | | | | | | | |
| 5.00%, 03/15/39 (c) | | $ | 2,000 | | | $ | 2,223,874 | |
| 5.25%, 03/15/38 (c) | | | 1,305 | | | | 1,396,996 | |
| New York State Dormitory Authority, State Personal Income Tax, Series B (RB) | | | | | | | | |
| 5.00%, 02/15/34 (c) | | | 1,095 | | | | 1,104,158 | |
| 5.00%, 02/15/37 (c) | | | 2,270 | | | | 2,371,238 | |
| 5.00%, 02/15/31 (c) | | | 2,000 | | | | 2,108,437 | |
| New York State Dormitory Authority, State Personal Income Tax, Series D (RB) | | | | | | | | |
| 5.00%, 02/15/33 (c) | | | 2,000 | | | | 2,210,105 | |
| 5.00%, 02/15/32 (c) | | | 940 | | | | 963,941 | |
| New York State Dormitory Authority, State Personal Income Tax, Series E (RB) | | | | | | | | |
| 4.00%, 03/15/38 (c) | | | 1,500 | | | | 1,526,044 | |
| 4.00%, 03/15/37 (c) | | | 2,000 | | | | 2,046,286 | |
| New York State Dormitory Authority, State Sales Tax, Series A (RB) | | | | | | | | |
| 5.00%, 03/15/33 (c) | | | 1,000 | | | | 1,046,473 | |
| 5.00%, 03/15/34 (c) | | | 2,110 | | | | 2,203,014 | |
| 5.00%, 03/15/31 (c) | | | 515 | | | | 541,139 | |
| New York State Dormitory Authority, State Sales Tax, Series C (RB) | | | | | | | | |
| 5.00%, 03/15/31 (c) | | | 520 | | | | 554,275 | |
| 5.00%, 03/15/35 (c) | | | 1,970 | | | | 2,089,278 | |
New York State Environmental Facilities Corp., Clean Water and Drinking Water, Series A (RB) 5.00%, 06/15/40 (c) | | | 1,000 | | | | 1,129,661 | |
| New York State Environmental Facilities Corp., Municipal Water Finance Authority Projects, Series A (RB) | | | | | | | | |
| 5.00%, 06/15/32 (c) | | | 415 | | | | 425,766 | |
| 5.00%, 06/15/30 (c) | | | 765 | | | | 785,474 | |
| 5.00%, 06/15/33 (c) | | | 2,000 | | | | 2,002,883 | |
| New York State Environmental Facilities Corp., Municipal Water Finance Authority Projects, Series B (RB) | | | | | | | | |
| 4.00%, 06/15/37 (c) | | | 1,530 | | | | 1,554,546 | |
| 5.00%, 06/15/36 (c) | | | 1,250 | | | | 1,363,216 | |
New York State Environmental Facilities Corp., Municipal Water Finance Authority Projects, Series E (RB) 5.00%, 06/15/33 (c) | | | 1,000 | | | | 1,059,107 | |
New York State Housing Finance Agency, Series H (RB) (AGM) 2.10%, 11/01/35 (c) | | | 835 | | | | 666,168 | |
| | | Par
(000’s | ) | | Value | |
| New York (continued) | | | | | | | | |
New York State Thruway Authority, Personal Income Tax, Series A-1 (RB) 4.00%, 03/15/40 (c) | | $ | 525 | | | $ | 525,433 | |
| New York State Thruway Authority, Series A (RB) | | | | | | | | |
| 5.00%, 01/01/41 (c) | | | 1,000 | | | | 1,011,554 | |
| 5.00%, 01/01/33 (c) | | | 600 | | | | 611,573 | |
| 5.00%, 01/01/31 (c) | | | 650 | | | | 662,749 | |
New York State Thruway Authority, Series B (RB) (AGM) 4.00%, 01/01/37 (c) | | | 800 | | | | 815,805 | |
| New York State Thruway Authority, Series K (RB) | | | | | | | | |
| 5.00%, 01/01/31 (c) | | | 2,500 | | | | 2,520,476 | |
| 5.00%, 01/01/32 (c) | | | 4,335 | | | | 4,370,220 | |
| New York State Thruway Authority, Series L (RB) | | | | | | | | |
| 3.50%, 01/01/37 (c) | | | 1,120 | | | | 1,094,469 | |
| 4.00%, 01/01/36 (c) | | | 2,500 | | | | 2,558,844 | |
New York State Thruway Authority, Series P (RB) 5.00%, 01/01/38 (c) | | | 1,000 | | | | 1,129,367 | |
| New York State Thruway Authority, State Personal Income, Series A-1 (RB) | | | | | | | | |
| 5.00%, 03/15/34 (c) | | | 2,000 | | | | 2,247,566 | |
| 5.00%, 03/15/35 (c) | | | 800 | | | | 896,661 | |
New York State Urban Development Corp., State Personal Income, Series A (RB) 5.00%, 03/15/37 (c) | | | 1,475 | | | | 1,617,965 | |
| New York State Urban Development Corp., State Personal Income, Series C (RB) | | | | | | | | |
| 4.00%, 03/15/34 (c) | | | 1,000 | | | | 1,042,146 | |
| 4.00%, 03/15/37 (c) | | | 1,000 | | | | 1,021,002 | |
| 5.00%, 03/15/31 (c) | | | 350 | | | | 368,297 | |
| 5.00%, 03/15/32 (c) | | | 4,295 | | | | 4,517,508 | |
| New York State Urban Development Corp., State Sales Tax, Series A (RB) | | | | | | | | |
| 5.00%, 03/15/35 (c) | | | 1,000 | | | | 1,094,389 | |
| 5.00%, 03/15/36 (c) | | | 4,500 | | | | 5,067,471 | |
New York State, Urban Development Coporation, Series B (RB) 5.00%, 03/15/36 (c) | | | 1,000 | | | | 1,147,823 | |
| New York Transportation Development Corp., Terminal 4 John F. Kennedy International Airport Project, Series C (RB) | | | | | | | | |
| 5.00%, 12/01/30 | | | 1,150 | | | | 1,255,771 | |
| 5.00%, 12/01/37 (c) | | | 1,000 | | | | 1,068,446 | |
| 5.00%, 12/01/35 (c) | | | 750 | | | | 812,527 | |
See Notes to Financial Statements
| | | Par
(000’s | ) | | Value | |
| New York (continued) | | | | | | | | |
Port Authority of New York and New Jersey, Series 184 (RB) 5.00%, 09/01/30 (c) | | $ | 2,000 | | | $ | 2,007,151 | |
Port Authority of New York and New Jersey, Series 209 (RB) 5.00%, 07/15/36 (c) | | | 500 | | | | 531,919 | |
Port Authority of New York and New Jersey, Series 211 (RB) 5.00%, 09/01/34 (c) | | | 500 | | | | 535,330 | |
Port Authority of New York and New Jersey, Series 217 (RB) 5.00%, 11/01/36 (c) | | | 500 | | | | 545,124 | |
| Port Authority of New York and New Jersey, Series 222 (RB) | | | | | | | | |
| 4.00%, 07/15/37 (c) | | | 3,975 | | | | 4,070,283 | |
| 4.00%, 07/15/36 (c) | | | 2,600 | | | | 2,692,442 | |
| 5.00%, 07/15/35 (c) | | | 1,000 | | | | 1,108,705 | |
| 5.00%, 07/15/34 (c) | | | 1,000 | | | | 1,111,179 | |
State of New York, Mortgage Agency, Series 195 (RB) 3.00%, 10/01/31 (c) | | | 615 | | | | 571,994 | |
State of New York, Mortgage Agency, Series 205 (RB) 3.12%, 10/01/32 (c) | | | 460 | | | | 431,270 | |
| Triborough Bridge and Tunnel Authority, Payroll Mobility Tax, Series A (RB) | | | | | | | | |
| 5.00%, 11/15/31 | | | 1,000 | | | | 1,145,033 | |
| 5.00%, 11/15/34 (c) | | | 1,000 | | | | 1,157,309 | |
Triborough Bridge and Tunnel Authority, Payroll Mobility Tax, Series B (RB) 5.00%, 05/15/31 | | | 1,130 | | | | 1,284,278 | |
| Triborough Bridge and Tunnel Authority, Payroll Mobility Tax, Series C (RB) | | | | | | | | |
| 5.00%, 05/15/37 (c) | | | 1,225 | | | | 1,366,220 | |
| 5.00%, 11/15/36 (c) | | | 3,000 | | | | 3,442,705 | |
Triborough Bridge and Tunnel Authority, Series A (RB) 5.00%, 05/15/40 (c) | | | 750 | | | | 842,535 | |
| Triborough Bridge and Tunnel Authority, Series B (RB) | | | | | | | | |
| 5.00%, 11/15/31 | | | 1,000 | | | | 1,140,666 | |
| 5.00%, 11/15/32 (c) | | | 1,070 | | | | 1,121,649 | |
| 5.00%, 11/15/33 (c) | | | 1,255 | | | | 1,315,325 | |
| 5.00%, 11/15/37 (c) | | | 1,000 | | | | 1,043,458 | |
| Troy Capital Resource Corp., Rensselaer Polytechnic Institute Project, Series A (RB) | | | | | | | | |
| 5.00%, 09/01/31 (c) | | | 1,795 | | | | 1,948,028 | |
| 5.00%, 09/01/37 (c) | | | 500 | | | | 532,529 | |
| TSASC, Inc., Tobacco Settlement Bonds, Series A (RB) | | | | | | | | |
| 5.00%, 06/01/35 (c) | | | 845 | | | | 874,018 | |
| 5.00%, 06/01/33 (c) | | | 500 | | | | 518,746 | |
Utility Debt Securitization Authority (RB) 5.00%, 12/15/36 (c) | | | 2,830 | | | | 2,878,975 | |
| | | Par
(000’s | ) | | Value | |
| New York (continued) | | | | | | | | |
| 5.00%, 12/15/38 (c) | | $ | 2,000 | | | $ | 2,106,702 | |
| Utility Debt Securitization Authority, Series A (RB) | | | | | | | | |
| 5.00%, 12/15/32 (c) | | | 610 | | | | 630,230 | |
| 5.00%, 12/15/33 (c) | | | 2,000 | | | | 2,065,914 | |
| 5.00%, 12/15/35 (c) | | | 500 | | | | 515,650 | |
Utility Debt Securitization Authority, Series E (RB) 5.00%, 12/15/35 (c) | | | 2,000 | | | | 2,326,401 | |
| | | | | | | | 334,585,763 | |
| North Carolina: 1.3% | | | | | | | | |
Charlotte-Mecklenburg Hospital Authority, Atrium Health Care, Series D (RB) 5.00%, 01/15/49 (p) | | | 3,000 | | | | 3,316,609 | |
Charlotte-Mecklenburg Hospital Authority, Carolinas Healthcare System, Series A (RB) 4.00%, 01/15/35 (c) | | | 1,925 | | | | 1,937,899 | |
County of Mecklenburg, Series A (GO) 4.00%, 04/01/30 (c) | | | 900 | | | | 917,790 | |
County of Mecklenburg, Series B (GO) 2.00%, 12/01/30 (c) | | | 250 | | | | 219,748 | |
County of Wake (RB) 3.00%, 03/01/35 (c) | | | 1,500 | | | | 1,408,632 | |
| North Carolina Charlotte Douglas International Airport, Series A (RB) | | | | | | | | |
| 4.00%, 07/01/38 (c) | | | 1,000 | | | | 1,010,295 | |
| 4.00%, 07/01/39 (c) | | | 1,670 | | | | 1,660,853 | |
North Carolina Housing Finance Agency Home Ownership (RB) 4.60%, 07/01/37 (c) | | | 1,000 | | | | 1,030,004 | |
North Carolina Municipal Power Agency No. 1, Series A (RB) 5.00%, 01/01/32 (c) | | | 1,000 | | | | 1,093,150 | |
North Carolina Turnpike Authority, Triangle Expressway System (RB) 5.00%, 01/01/32 (c) | | | 500 | | | | 515,443 | |
| North Carolina Turnpike Authority, Triangle Expressway System, Series A (RB) | | | | | | | | |
| 4.00%, 01/01/35 (c) | | | 800 | | | | 819,902 | |
| 4.00%, 01/01/33 (c) | | | 890 | | | | 912,966 | |
| 4.00%, 01/01/34 (c) | | | 360 | | | | 369,209 | |
State of North Carolina, Department of State Treasurer, Series B (GO) 2.12%, 06/01/36 (c) | | | 625 | | | | 498,524 | |
State of North Carolina, Series A (GO) 3.00%, 06/01/34 (c) | | | 380 | | | | 364,071 | |
See Notes to Financial Statements
VANECK INTERMEDIATE MUNI ETF
SCHEDULE OF INVESTMENTS
(continued)
| | | Par
(000’s | ) | | Value | |
| North Carolina (continued) | | | | | | | | |
| 5.00%, 06/01/30 (c) | | $ | 1,140 | | | $ | 1,232,916 | |
| 5.00%, 06/01/31 (c) | | | 1,100 | | | | 1,231,465 | |
| State of North Carolina, Series A (RB) | | | | | | | | |
| 5.00%, 05/01/31 (c) | | | 1,000 | | | | 1,095,831 | |
| 5.00%, 05/01/34 (c) | | | 1,000 | | | | 1,145,515 | |
State of North Carolina, Series B (RB) 3.00%, 05/01/31 (c) | | | 800 | | | | 766,399 | |
University of North Carolina at Chapel Hill, Series B (RB) 5.00%, 12/01/37 (c) | | | 1,000 | | | | 1,128,347 | |
| | | | | | | | 22,675,568 | |
| Ohio: 1.7% | | | | | | | | |
| Akron Bath Copley Joint Township Hospital District, Summa Health (RB) | | | | | | | | |
| 4.00%, 11/15/35 (c) | | | 1,000 | | | | 949,060 | |
| 4.00%, 11/15/36 (c) | | | 1,000 | | | | 936,709 | |
American Municipal Power, Inc., Spairie State Campus Project, Series A (RB) 5.00%, 02/15/37 (c) | | | 1,000 | | | | 1,120,311 | |
American Municipal Power, Inc., Spairie State Campus Project, Series A (RB) 4.00%, 02/15/34 (c) | | | 1,520 | | | | 1,582,948 | |
| Buckeye Tobacco Settlement Financing Authority, Series A-2 (RB) | | | | | | | | |
| 5.00%, 06/01/32 (c) | | | 500 | | | | 537,184 | |
| 5.00%, 06/01/33 (c) | | | 500 | | | | 536,507 | |
| 5.00%, 06/01/34 (c) | | | 3,000 | | | | 3,212,220 | |
City of Columbus, Various Purpose, Series A (GO) 5.00%, 04/01/30 | | | 1,000 | | | | 1,114,366 | |
City of Columbus, Various Purpose, Series B (GO) 5.00%, 04/01/31 (c) | | | 1,245 | | | | 1,362,457 | |
| County of Allen, Ohio Hospital Facilities, Mercy Health, Series A (RB) | | | | | | | | |
| 5.00%, 08/01/30 (c) | | | 1,030 | | | | 1,091,737 | |
| 5.00%, 12/01/30 (c) | | | 1,000 | | | | 1,095,015 | |
County of Butler, Ohio Hospital Facilities, UC Health (RB) 4.00%, 11/15/37 (c) | | | 500 | | | | 445,392 | |
County of Hamilton, Series A (RB) 4.00%, 12/01/31 (c) | | | 1,000 | | | | 1,011,682 | |
Northeast Ohio Regional Sewer District (RB) 3.00%, 11/15/35 (c) | | | 1,000 | | | | 923,293 | |
| Ohio Turnpike and Infrastructure Commission, Series A (RB) | | | | | | | | |
| 5.00%, 02/15/31 (c) | | | 500 | | | | 532,314 | |
| 5.00%, 02/15/32 (c) | | | 500 | | | | 532,102 | |
| | | Par
(000’s | ) | | Value | |
| Ohio (continued) | | | | | | | | |
Ohio Water Development Authority, Drinking Water, Series A (RB) 5.00%, 12/01/36 (c) | | $ | 1,335 | | | $ | 1,491,119 | |
Ohio Water Development Authority, Fresh Water (RB) 5.00%, 12/01/37 (c) | | | 1,760 | | | | 1,904,074 | |
| Ohio Water Development Authority, Water Pollution Control, Series A (RB) | | | | | | | | |
| 5.00%, 12/01/31 (c) | | | 2,065 | | | | 2,172,274 | |
| 5.00%, 12/01/37 (c) | | | 1,970 | | | | 2,155,630 | |
| 5.00%, 06/01/33 (c) | | | 1,000 | | | | 1,113,935 | |
| 5.00%, 12/01/40 (c) | | | 1,000 | | | | 1,127,439 | |
State of Ohio Hospital, Cleveland Clinic Health System, Series A (RB) 4.00%, 01/01/34 (c) | | | 760 | | | | 776,186 | |
State of Ohio, Cleveland Clinic System, Series B (RB) (BAM) 4.00%, 01/01/41 (c) | | | 835 | | | | 821,109 | |
State of Ohio, Highway Capital Improvement, Series T (GO) 5.00%, 05/01/33 (c) | | | 1,000 | | | | 1,048,893 | |
State of Ohio, Major New Infrastructure Project (RB) 5.00%, 12/15/31 | | | 1,225 | | | | 1,392,675 | |
| | | | | | | | 30,986,631 | |
| Oklahoma: 0.2% | | | | | | | | |
| Grand River Dam Authority, Series A (RB) | | | | | | | | |
| 4.00%, 06/01/33 (c) | | | 2,000 | | | | 2,015,503 | |
| 5.00%, 06/01/31 (c) | | | 515 | | | | 531,289 | |
Oklahoma Turnpike Authority, Series C (RB) 5.00%, 01/01/35 (c) | | | 565 | | | | 589,283 | |
| | | | | | | | 3,136,075 | |
| Oregon: 1.3% | | | | | | | | |
Asante Health System, Hospital Facilities Authority of the City of Medford, Asante Projects, Series A (RB) 5.00%, 08/15/33 (c) | | | 720 | | | | 781,845 | |
Asante Health System, Hospital Facilities Authority of the City of Medford, Asante Projects, Series A (RB) (AGM) 5.00%, 08/15/34 (c) | | | 700 | | | | 757,877 | |
City of Portland Oregon, Sewer System, Series A (RB) 3.00%, 03/01/37 (c) | | | 2,350 | | | | 2,096,925 | |
Corvallis School District No. 509J, Series B (GO) (SBG) 5.00%, 06/15/35 (c) | | | 1,285 | | | | 1,371,246 | |
| Hillsboro School District No. 1J (GO) (SBG) | | | | | | | | |
| 5.00%, 06/15/35 (c) | | | 590 | | | | 614,860 | |
| 5.00%, 06/15/31 (c) | | | 1,000 | | | | 1,049,373 | |
See Notes to Financial Statements
| | | Par
(000’s | ) | | Value | |
| Oregon (continued) | | | | | | | | |
| Marion and Polk County, Salem-Keizer School District No. 24J, Series B (GO) (SBG) | | | | | | | | |
| 4.00%, 06/15/35 (c) | | $ | 740 | | | $ | 757,010 | |
| 5.00%, 06/15/32 (c) | | | 545 | | | | 584,488 | |
Marion and Polk County, Salem-Keizer School District No. 24J, Series C (GO) (SBG) 4.00%, 06/15/38 (c) | | | 2,000 | | | | 2,024,821 | |
| Multnomah and Clackamas Counties, School District No. 10JT, Series B (GO) (SBG) | | | | | | | | |
| 0.01%, 06/15/33 (c) | | | 1,010 | | | | 687,056 | |
| 0.01%, 06/15/32 (c) | | | 1,215 | | | | 866,187 | |
Multnomah County School District No. 1J, Series B (GO) (SBG) 3.00%, 06/15/33 (c) | | | 1,280 | | | | 1,213,545 | |
Multnomah County, School District No. 1J (GO) (SBG) 5.00%, 06/15/35 (c) | | | 1,000 | | | | 1,159,889 | |
Portland Community College District (GO) 5.00%, 06/15/36 (c) | | | 1,000 | | | | 1,142,746 | |
| State of Oregon, Department of Transportation, Highway User Tax, Series A (RB) | | | | | | | | |
| 4.00%, 11/15/38 (c) | | | 3,000 | | | | 3,053,842 | |
| 5.00%, 11/15/36 (c) | | | 1,650 | | | | 1,802,361 | |
| 5.00%, 11/15/36 (c) | | | 1,000 | | | | 1,106,470 | |
State of Oregon, Series A (GO) 5.00%, 05/01/36 (c) | | | 1,000 | | | | 1,151,064 | |
Tri-County Metropolitan Transportation District of Oregon, Series A (RB) 3.25%, 10/01/34 (c) | | | 570 | | | | 549,847 | |
| | | | | | | | 22,771,452 | |
| Pennsylvania: 3.8% | | | | | | | | |
| Allegheny County Hospital Development Authority, Series A (RB) | | | | | | | | |
| 5.00%, 04/01/33 (c) | | | 1,120 | | | | 1,172,728 | |
| 5.00%, 07/15/30 (c) | | | 360 | | | | 388,587 | |
| 5.00%, 07/15/33 (c) | | | 810 | | | | 869,506 | |
Allegheny County Sanitary Authority Sewer (RB) 5.00%, 12/01/35 (c) | | | 1,000 | | | | 1,012,148 | |
| City of Philadelphia, Gas Works (RB) | | | | | | | | |
| 5.00%, 10/01/33 (c) | | | 680 | | | | 697,436 | |
| 5.00%, 10/01/32 (c) | | | 970 | | | | 995,772 | |
| 5.00%, 10/01/30 (c) | | | 880 | | | | 905,019 | |
| 5.00%, 10/01/31 (c) | | | 735 | | | | 755,212 | |
City of Philadelphia, Series A (RB) (AGC) 4.00%, 07/01/36 (c) | | | 1,000 | | | | 1,009,236 | |
City of Philadelphia, Series B (GO) 5.00%, 02/01/37 (c) | | | 1,500 | | | | 1,601,942 | |
| | | Par
(000’s | ) | | Value | |
| Pennsylvania (continued) | | | | | | | | |
Commonwealth Financing Authority, Series A (RB) 5.00%, 06/01/33 (c) | | $ | 1,595 | | | $ | 1,611,361 | |
| Commonwealth of Pennsylvania (GO) | | | | | | | | |
| 3.00%, 01/01/31 (c) | | | 510 | | | | 490,259 | |
| 3.00%, 09/15/35 (c) | | | 1,055 | | | | 983,325 | |
| 4.00%, 02/01/32 (c) | | | 1,500 | | | | 1,512,056 | |
| 4.00%, 05/15/32 (c) | | | 2,000 | | | | 2,110,190 | |
| 4.00%, 08/15/34 (c) | | | 1,500 | | | | 1,503,880 | |
| 5.00%, 09/01/32 | | | 2,000 | | | | 2,303,446 | |
| 5.00%, 09/01/37 (c) | | | 1,000 | | | | 1,135,080 | |
| Geisinger Authority Health System, Series A (RB) | | | | | | | | |
| 4.00%, 04/01/39 (c) | | | 1,000 | | | | 977,751 | |
| 5.00%, 02/15/39 (c) | | | 3,100 | | | | 3,174,652 | |
Geisinger Authority Health System, Series C (RB) 5.00%, 04/01/43 (c) (p) | | | 2,000 | | | | 2,142,288 | |
Lancaster County, Hospital Authority, Penn State Health (RB) 5.00%, 11/01/38 (c) | | | 1,100 | | | | 1,152,994 | |
Pennsylvania Economic Development Financing Authority, UPMC, Series A (RB) 3.38%, 11/15/33 (c) | | | 1,000 | | | | 979,648 | |
Pennsylvania Higher Educational Facilities Authority, Trustee of University, Series A (RB) 4.00%, 08/15/31 (c) | | | 1,000 | | | | 1,010,015 | |
Pennsylvania Higher Educational Facilities Authority, Trustee of University, Series B (RB) 5.00%, 10/01/34 (c) | | | 2,675 | | | | 2,722,397 | |
| Pennsylvania Housing Finance Agency, Single Family Mortgage (RB) | | | | | | | | |
| 2.80%, 10/01/31 (c) | | | 700 | | | | 638,581 | |
| 3.20%, 10/01/31 (c) | | | 425 | | | | 399,851 | |
| 3.65%, 10/01/32 (c) | | | 315 | | | | 304,129 | |
| Pennsylvania Housing Finance Agency, Single Family Mortgage, Series B (RB) | | | | | | | | |
| 3.20%, 10/01/32 (c) | | | 300 | | | | 278,237 | |
| 3.45%, 10/01/32 (c) | | | 620 | | | | 585,767 | |
Pennsylvania State System of Higher Education, Series AT-1 (RB) 4.00%, 06/15/34 (c) | | | 765 | | | | 767,938 | |
Pennsylvania Turnpike Commission (RB) 5.00%, 12/01/32 (c) | | | 1,000 | | | | 1,004,312 | |
See Notes to Financial Statements
VANECK INTERMEDIATE MUNI ETF
SCHEDULE OF INVESTMENTS
(continued)
| | | Par
(000’s | ) | | Value | |
| Pennsylvania (continued) | | | | | | | | |
Pennsylvania Turnpike Commission, Motor License (RB) 4.00%, 12/01/37 (c) | | $ | 2,000 | | | $ | 2,009,820 | |
| Pennsylvania Turnpike Commission, Series A (RB) | | | | | | | | |
| 5.00%, 12/01/32 (c) | | | 750 | | | | 776,918 | |
| 5.00%, 12/01/37 (c) | | | 1,250 | | | | 1,331,442 | |
| 5.00%, 12/01/30 (c) | | | 500 | | | | 546,611 | |
| 5.00%, 12/01/37 (c) | | | 1,000 | | | | 1,070,214 | |
| 5.00%, 12/01/33 (c) | | | 1,000 | | | | 1,134,255 | |
| Pennsylvania Turnpike Commission, Series B (RB) | | | | | | | | |
| 4.00%, 12/01/38 (c) | | | 1,000 | | | | 1,008,319 | |
| 4.00%, 12/01/37 (c) | | | 1,025 | | | | 1,046,144 | |
| 4.00%, 12/01/36 (c) | | | 1,000 | | | | 1,029,245 | |
| 5.00%, 12/01/34 (c) | | | 1,010 | | | | 1,030,626 | |
| 5.00%, 06/01/36 (c) | | | 2,650 | | | | 2,712,448 | |
| 5.00%, 12/01/34 (c) | | | 700 | | | | 783,177 | |
| Pennsylvania Turnpike Commission, Series B (RB) (AGM) | | | | | | | | |
| 5.00%, 06/01/34 (c) | | | 510 | | | | 539,362 | |
| 5.00%, 06/01/33 (c) | | | 1,735 | | | | 1,814,432 | |
| Pittsburgh Water and Sewer Authority, Series B (RB) (AGM) | | | | | | | | |
| 5.00%, 09/01/31 | | | 1,460 | | | | 1,649,107 | |
| 5.00%, 09/01/32 | | | 2,000 | | | | 2,289,134 | |
| 5.00%, 09/01/33 | | | 2,000 | | | | 2,317,896 | |
| School District of Philadelphia, Series F (GO) (SAW) | | | | | | | | |
| 5.00%, 09/01/38 (c) | | | 1,570 | | | | 1,585,453 | |
| 5.00%, 09/01/37 (c) | | | 1,000 | | | | 1,011,166 | |
| 5.00%, 09/01/32 (c) | | | 485 | | | | 492,992 | |
State of Pennsylvania (GO) 5.00%, 09/01/31 | | | 2,000 | | | | 2,271,723 | |
| State Public School Building Authority, School District of Philadelphia Project, Series A (RB) (AGM) | | | | | | | | |
| 5.00%, 06/01/33 (c) | | | 1,225 | | | | 1,258,276 | |
| 5.00%, 06/01/32 (c) | | | 1,750 | | | | 1,797,536 | |
| | | | | | | | 68,702,039 | |
| Rhode Island: 0.3% | | | | | | | | |
Rhode Island Health and Educational Building Corp., Financing Program, Series F (RB) 4.00%, 05/15/39 (c) | | | 1,000 | | | | 1,000,408 | |
Rhode Island Health and Educational Building Corp., Hospital Financing (RB) 5.00%, 05/15/34 | | | 1,000 | | | | 1,108,535 | |
Rhode Island Housing and Mortgage Finance Corp., Series A (RB) (AGM) 2.10%, 10/01/35 (c) | | | 1,000 | | | | 811,903 | |
| | | Par
(000’s | ) | | Value | |
| Rhode Island (continued) | | | | | | | | |
State of Rhode Island, Series A (GO) 5.00%, 08/01/39 (c) | | $ | 2,000 | | | $ | 2,226,255 | |
Tobacco Settlement Financing Corp., Series A (RB) 5.00%, 06/01/40 (c) | | | 1,000 | | | | 1,007,401 | |
| | | | | | | | 6,154,502 | |
| South Carolina: 0.7% | | | | | | | | |
City of Columbia, Waterworks and Sewer System, Series B (RB) 4.00%, 02/01/41 (c) | | | 1,000 | | | | 984,544 | |
| Lancaster County, School District (GO) | | | | | | | | |
| 3.25%, 03/01/32 (c) | | | 325 | | | | 315,384 | |
| 4.00%, 03/01/35 (c) | | | 1,000 | | | | 1,014,201 | |
Patriots Energy Group Financing Agency, Gas Supply, Series A (RB) 5.25%, 10/01/54 (c) (p) | | | 5,000 | | | | 5,261,449 | |
Piedmont Municipal Power Agency, Series B (RB) 5.00%, 01/01/32 (c) | | | 1,000 | | | | 1,083,570 | |
South Carolina Transportation Infrastructure Bank, Series A (RB) 5.00%, 10/01/37 (c) | | | 1,000 | | | | 1,044,415 | |
| South Carolina, Public Service Authority, Series A (RB) | | | | | | | | |
| 4.00%, 12/01/33 (c) | | | 1,115 | | | | 1,131,579 | |
| 5.00%, 12/01/37 (c) | | | 1,500 | | | | 1,523,811 | |
Town of Mount Pleasant, South Carolina Water and Sewer System, Series A (RB) 4.00%, 06/01/39 (c) | | | 1,000 | | | | 1,000,022 | |
| | | | | | | | 13,358,975 | |
| South Dakota: 0.2% | | | | | | | | |
| South Dakota Health and Educational Facilities Authority (RB) | | | | | | | | |
| 5.00%, 09/01/40 (c) | | | 2,750 | | | | 2,812,198 | |
| 5.00%, 09/01/30 (c) | | | 255 | | | | 267,098 | |
| | | | | | | | 3,079,296 | |
| Tennessee: 1.1% | | | | | | | | |
County of Shelby, Public Improvement, Series B (GO) 4.00%, 04/01/40 (c) | | | 1,000 | | | | 1,006,301 | |
| Metropolitan Government of Nashville and Davidson County (GO) | | | | | | | | |
| 4.00%, 01/01/31 (c) | | | 545 | | | | 550,882 | |
| 4.00%, 01/01/32 (c) | | | 580 | | | | 585,024 | |
| Metropolitan Government of Nashville and Davidson County, Vanderbilt University Medical Center, Series A (RB) | | | | | | | | |
| 5.00%, 07/01/31 (c) | | | 1,000 | | | | 1,099,081 | |
| 5.00%, 07/01/40 (c) | | | 3,050 | | | | 3,085,363 | |
See Notes to Financial Statements
| | | Par
(000’s | ) | | Value | |
| Tennessee (continued) | | | | | | | | |
| Shelby County, Public Improvement, Series B (GO) | | | | | | | | |
| 4.00%, 04/01/34 (c) | | $ | 1,000 | | | $ | 1,046,947 | |
| 4.00%, 04/01/35 (c) | | | 1,000 | | | | 1,041,687 | |
| 4.00%, 04/01/33 (c) | | | 3,000 | | | | 3,146,713 | |
State of Tennessee, Series A (GO) 5.00%, 05/01/35 (c) | | | 1,000 | | | | 1,163,340 | |
Tennessee Corp. Gas Supply, Series A (RB) 5.50%, 10/01/53 (c) (p) | | | 2,000 | | | | 2,103,164 | |
Tennessee Energy Acquisition Corp., Commodity Project, Series A (RB) 5.00%, 05/01/52 (c) (p) | | | 4,000 | | | | 4,205,955 | |
| | | | | | | | 19,034,457 | |
| Texas: 8.7% | | | | | | | | |
| Aldine Independent School District, Series A (GO) | | | | | | | | |
| 4.00%, 02/15/34 (c) | | | 675 | | | | 685,341 | |
| 4.00%, 02/15/33 (c) | | | 910 | | | | 924,328 | |
| Arlington Independent School District, Unlimited Tax School Building (GO) | | | | | | | | |
| 4.00%, 02/15/35 (c) | | | 500 | | | | 513,565 | |
| 4.00%, 02/15/34 (c) | | | 1,000 | | | | 1,029,052 | |
Austin Independent School District, Unlimited Tax School Building (GO) 5.00%, 08/01/36 (c) | | | 1,500 | | | | 1,708,943 | |
Bexar County Hospital District, Limited Tax (GO) 4.00%, 02/15/35 (c) | | | 1,000 | | | | 1,013,630 | |
Board of Regents of the University of Texas System, Series A (RB) 5.00%, 08/15/30 | | | 2,950 | | | | 3,300,353 | |
Board of Regents of the University of Texas System, Series A (RB) (AGM) 5.00%, 08/15/31 (c) | | | 850 | | | | 929,043 | |
City of Austin, Water and Wastewater System (RB) 5.00%, 11/15/30 (c) | | | 1,065 | | | | 1,065,907 | |
City of Dallas, Series A (GO) 3.00%, 02/15/36 (c) | | | 600 | | | | 536,949 | |
| City of Dallas, Waterworks and Sewer System, Series A (RB) | | | | | | | | |
| 5.00%, 10/01/30 (c) | | | 565 | | | | 583,548 | |
| 5.00%, 10/01/31 (c) | | | 600 | | | | 619,697 | |
City of Dallas, Waterworks and Sewer System, Series C (RB) 5.00%, 10/01/33 (c) | | | 1,500 | | | | 1,675,934 | |
City of Denton, Utility System (RB) 5.00%, 12/01/31 (c) | | | 965 | | | | 999,051 | |
City of Houston, Airport System, Series D (RB) 5.00%, 07/01/36 (c) | | | 1,000 | | | | 1,061,205 | |
| | | Par
(000’s | ) | | Value | |
| Texas (continued) | | | | | | | | |
| City of Houston, Combined Utility System, First Lien, Series A (RB) | | | | | | | | |
| 5.00%, 11/15/33 (c) | | $ | 4,500 | | | $ | 5,017,097 | |
| 5.00%, 11/15/36 (c) | | | 1,000 | | | | 1,144,505 | |
City of Houston, Combined Utility System, First Lien, Series C (RB) 4.00%, 11/15/36 (c) | | | 1,500 | | | | 1,538,337 | |
| City of Houston, Combined Utility System, First Lien, Series D (RB) | | | | | | | | |
| 5.00%, 11/15/33 (c) | | | 1,000 | | | | 1,077,728 | |
| 5.00%, 11/15/35 (c) | | | 750 | | | | 804,330 | |
City of Houston, Public Improvement, Series A (GO) 5.00%, 03/01/32 (c) | | | 1,000 | | | | 1,079,642 | |
| City of Houston, Series A (GO) | | | | | | | | |
| 5.00%, 03/01/32 (c) | | | 520 | | | | 543,448 | |
| 5.00%, 03/01/31 (c) | | | 500 | | | | 522,578 | |
City of Houston, Texas Public Improvement, Series A (GO) 5.00%, 03/01/34 (c) | | | 1,000 | | | | 1,141,445 | |
City of San Antonio, Electric and Gas Systems (RB) 5.00%, 02/01/33 (c) | | | 1,000 | | | | 1,130,874 | |
| City of San Antonio, Electric and Gas Systems, Series B (RB) | | | | | | | | |
| 4.00%, 02/01/33 | | | 1,000 | | | | 1,048,348 | |
| 5.00%, 02/01/39 (c) | | | 1,000 | | | | 1,106,888 | |
Conroe Independent School District (GO) 5.00%, 02/15/31 (c) | | | 1,430 | | | | 1,444,508 | |
Corpus Christi Independent School District (GO) 4.00%, 08/15/32 (c) | | | 320 | | | | 326,756 | |
County of Bexar, Alamo Community College District (GO) 4.00%, 08/15/32 (c) | | | 1,000 | | | | 1,038,561 | |
| County of Collin, Community College District (GO) | | | | | | | | |
| 3.25%, 08/15/33 (c) | | | 500 | | | | 495,809 | |
| 4.00%, 08/15/31 (c) | | | 925 | | | | 945,111 | |
County of Dallas, Garland Independent School District, Series A (GO) 5.00%, 02/15/37 (c) | | | 500 | | | | 565,634 | |
County of Dallas, Highland Park Independent School District (GO) 3.00%, 02/15/35 (c) | | | 1,540 | | | | 1,414,715 | |
| County of Harris, Cultural Education Facilities Finance Corp., TECO Project (RB) | | | | | | | | |
| 4.00%, 11/15/32 (c) | | | 950 | | | | 956,343 | |
| 5.00%, 11/15/30 (c) | | | 850 | | | | 891,990 | |
See Notes to Financial Statements
VANECK INTERMEDIATE MUNI ETF
SCHEDULE OF INVESTMENTS
(continued)
| | | Par
(000’s | ) | | Value | |
| Texas (continued) | | | | | | | | |
County of Harris, Toll Road, Senior Lien, Series A (RB) 5.00%, 08/15/33 (c) | | $ | 675 | | | $ | 696,675 | |
| Cypress-Fairbanks Independent School District (GO) | | | | | | | | |
| 4.00%, 02/15/31 (c) | | | 1,735 | | | | 1,736,226 | |
| 4.00%, 02/15/38 (c) | | | 1,275 | | | | 1,295,006 | |
| Cypress-Fairbanks Independent School District, Series A (GO) | | | | | | | | |
| 3.00%, 02/15/34 (c) | | | 500 | | | | 471,897 | |
| 4.00%, 02/15/37 (c) | | | 1,500 | | | | 1,540,838 | |
| 5.00%, 02/15/31 (c) | | | 1,805 | | | | 1,956,911 | |
Dallas Area Rapid Transit, Senior Lien (RB) 5.00%, 12/01/33 (c) | | | 1,835 | | | | 2,015,508 | |
| Dallas Independent School District, Unlimited Tax School Building (GO) | | | | | | | | |
| 4.00%, 02/15/31 (c) | | | 1,000 | | | | 1,052,857 | |
| 5.00%, 02/15/40 (c) | | | 1,500 | | | | 1,646,679 | |
| 5.00%, 02/15/36 (c) | | | 1,000 | | | | 1,132,082 | |
| 5.00%, 02/15/35 (c) | | | 1,000 | | | | 1,138,176 | |
Eagle Mountain and Saginaw Independent School District (GO) 4.00%, 08/15/32 (c) | | | 335 | | | | 338,141 | |
EP Tuscany Zaragosa PFC Residential Development, Tuscany at Mega hills and Villas (RB) 4.00%, 12/01/33 (c) | | | 2,000 | | | | 1,904,480 | |
Fort Bend Independent School District (GO) 5.00%, 08/15/30 (c) | | | 2,000 | | | | 2,098,562 | |
| Frisco Independent School District (GO) | | | | | | | | |
| 4.00%, 02/15/36 (c) | | | 1,345 | | | | 1,387,167 | |
| 4.00%, 02/15/32 (c) | | | 1,350 | | | | 1,402,181 | |
| 5.00%, 08/15/36 (c) | | | 2,000 | | | | 2,163,369 | |
Harris County Flood Control District Improvement, Series A (GO) 4.00%, 10/01/35 (c) | | | 1,000 | | | | 1,030,238 | |
Harris County, Cultural Education Facilities Finance Corp., Texas Children's Hospital, Series A (RB) 3.00%, 10/01/40 (c) | | | 1,145 | | | | 960,182 | |
Hays Consolidated Independent School District (GO) 5.00%, 02/15/40 (c) | | | 1,000 | | | | 1,092,097 | |
| Houston Independent School District, Limited Tax School House (GO) | | | | | | | | |
| 4.00%, 02/15/39 (c) | | | 1,000 | | | | 991,080 | |
| 5.00%, 02/15/34 (c) | | | 540 | | | | 565,373 | |
| | | Par
(000’s | ) | | Value | |
| Texas (continued) | | | | | | | | |
Houston Independent School District, Maintenance Tax Notes (GO) 5.00%, 07/15/32 (c) | | $ | 605 | | | $ | 646,932 | |
Hurst Euless Bedford Independent School District (GO) 4.00%, 08/15/40 (c) | | | 1,000 | | | | 1,011,542 | |
Katy Independent School District, Fort Bend, Harris and Waller Counties (GO) 5.00%, 02/15/38 (c) | | | 2,510 | | | | 2,591,629 | |
| Lone Star College System (GO) | | | | | | | | |
| 4.00%, 02/15/32 (c) | | | 1,500 | | | | 1,506,841 | |
| 5.00%, 02/15/33 (c) | | | 400 | | | | 409,846 | |
Lower Colorado River Authority (RB) (AGM) 5.00%, 05/15/32 (c) | | | 1,000 | | | | 1,115,877 | |
Lower Colorado River Authority, LCRA Transmission Services Corp. Project (RB) 5.00%, 05/15/37 (c) | | | 1,250 | | | | 1,345,373 | |
Lower Colorado River Authority, LCRA Transmission Services Corp. Project, Series A (RB) (AGM) 5.00%, 05/15/36 (c) | | | 1,000 | | | | 1,127,574 | |
Midland Independent School District, Unlimited School Building (GO) 4.00%, 02/15/39 (c) | | | 2,555 | | | | 2,587,353 | |
| New Hope Cultural Education Facilities Finance Corp. Hospital, Children’s Healthcare, Series A (RB) | | | | | | | | |
| 4.00%, 08/15/36 (c) | | | 1,005 | | | | 1,003,699 | |
| 4.00%, 08/15/40 (c) | | | 555 | | | | 537,098 | |
North Texas Municipal Water District, Water System (RB) 5.00%, 09/01/35 (c) | | | 715 | | | | 735,206 | |
| North Texas Tollway Authority System, Series B (RB) | | | | | | | | |
| 4.00%, 01/01/38 (c) | | | 2,250 | | | | 2,258,227 | |
| 4.00%, 01/01/33 (c) | | | 1,975 | | | | 2,041,119 | |
| 4.00%, 01/01/36 (c) | | | 2,000 | | | | 2,041,619 | |
| 5.00%, 01/01/39 (c) | | | 1,000 | | | | 1,023,896 | |
| North Texas Tollway Authority, First Tier, Series A (RB) | | | | | | | | |
| 4.12%, 01/01/40 (c) | | | 2,000 | | | | 2,018,568 | |
| 5.00%, 01/01/33 (c) | | | 500 | | | | 510,834 | |
| 5.00%, 01/01/31 (c) | | | 1,675 | | | | 1,713,840 | |
North Texas Tollway Authority, Second Tier, Series B (RB) (AGM) 4.00%, 01/01/35 (c) | | | 450 | | | | 454,330 | |
Northside Independent School District, Unlimited Tax (GO) 5.00%, 08/15/32 (c) | | | 880 | | | | 923,861 | |
See Notes to Financial Statements
| | | Par
(000’s | ) | | Value | |
| Texas (continued) | | | | | | | | |
Permanent University Fund, University of Texas System (RB) 5.00%, 07/01/33 (c) | | $ | 1,180 | | | $ | 1,352,626 | |
| Pflugerville Independent School District, Unlimited Tax, Series A (GO) | | | | | | | | |
| 5.00%, 02/15/34 (c) | | | 1,875 | | | | 2,123,656 | |
| 5.00%, 02/15/37 (c) | | | 1,000 | | | | 1,110,877 | |
| Plano Independent School District, Unlimited Tax (GO) | | | | | | | | |
| 5.00%, 02/15/36 (c) | | | 1,000 | | | | 1,131,726 | |
| 5.00%, 02/15/35 (c) | | | 1,000 | | | | 1,138,139 | |
Port of Houston Authority of Harris County, Series A-2 (GO) 5.00%, 10/01/34 (c) | | | 1,000 | | | | 1,108,125 | |
San Antonio Independent School District, Unlimited Tax School Building (GO) 4.00%, 08/15/34 (c) | | | 500 | | | | 511,625 | |
State of Texas, Conroe Independent School Disrict (GO) 5.00%, 02/15/38 (c) | | | 1,000 | | | | 1,133,313 | |
State of Texas, Tarrant County College District (GO) 5.00%, 08/15/40 (c) | | | 2,020 | | | | 2,206,342 | |
State of Texas, Transportation Commission (GO) 4.00%, 10/01/32 (c) | | | 1,525 | | | | 1,508,415 | |
State of Texas, Transportation Commission, Highway Improvement, Series A (GO) 5.00%, 04/01/30 (c) | | | 500 | | | | 516,102 | |
Texas Department of Housing & Community Affairs, Series A (RB) (GNMA/FNMA) 3.80%, 07/01/39 (c) | | | 1,670 | | | | 1,549,263 | |
| Texas Municipal Gas Acquisition & Supply Corp. III (RB) | | | | | | | | |
| 5.00%, 12/15/31 | | | 1,475 | | | | 1,545,485 | |
| 5.00%, 12/15/32 | | | 1,000 | | | | 1,053,174 | |
Texas Municipal Gas Acquisition & Supply Corp. IV, Series B (RB) 5.50%, 01/01/54 (c) (p) | | | 3,000 | | | | 3,310,157 | |
Texas Private Activity Bond Surface Transportation Corp., LBJ Infrastructure Group LLC I-635 Managed Lanes Project, Series A (RB) 4.00%, 06/30/36 (c) | | | 1,390 | | | | 1,407,842 | |
Texas Private Activity Bond Surface Transportation Corp., NTE Mobility Partners LLC Project, Series A (RB) 4.00%, 12/31/37 (c) | | | 1,000 | | | | 982,080 | |
| | | Par
(000’s | ) | | Value | |
| Texas (continued) | | | | | | | | |
Texas Transportation Commission, Central Texas Turnpike System, Series C (RB) 5.00%, 08/15/34 (c) | | $ | 1,570 | | | $ | 1,573,970 | |
Texas Transportation Commission, Highway Improvement (GO) 5.00%, 04/01/40 (c) | | | 2,500 | | | | 2,788,027 | |
Texas Transportation Commission, Highway Improvement, Series A (GO) 5.00%, 04/01/38 (c) | | | 1,000 | | | | 1,024,905 | |
| Texas Water Development Board (RB) | | | | | | | | |
| 3.00%, 10/15/35 (c) | | | 750 | | | | 683,991 | |
| 3.00%, 10/15/36 (c) | | | 950 | | | | 848,747 | |
| 3.00%, 10/15/34 (c) | | | 500 | | | | 462,823 | |
| 4.00%, 10/15/35 (c) | | | 2,000 | | | | 2,007,658 | |
| 4.00%, 10/15/31 (c) | | | 2,000 | | | | 2,101,989 | |
| Texas Water Development Board, Series A (RB) | | | | | | | | |
| 3.00%, 10/15/35 (c) | | | 2,650 | | | | 2,403,558 | |
| 4.00%, 10/15/34 (c) | | | 1,000 | | | | 1,001,791 | |
| 4.00%, 10/15/33 (c) | | | 400 | | | | 406,506 | |
| 4.00%, 10/15/34 (c) | | | 1,000 | | | | 1,014,783 | |
| 4.00%, 10/15/33 (c) | | | 600 | | | | 612,413 | |
| 4.60%, 10/15/39 (c) | | | 1,000 | | | | 1,072,553 | |
| 4.65%, 10/15/40 (c) | | | 2,000 | | | | 2,136,271 | |
| 5.00%, 04/15/30 (c) | | | 250 | | | | 263,920 | |
| Texas Water Development Board, Series B (RB) | | | | | | | | |
| 4.00%, 10/15/37 (c) | | | 3,000 | | | | 3,028,755 | |
| 4.00%, 10/15/34 (c) | | | 1,000 | | | | 1,022,886 | |
| 5.00%, 10/15/32 (c) | | | 1,500 | | | | 1,615,435 | |
Texas Water Development Board, Series D (RB) 3.00%, 10/15/37 (c) | | | 500 | | | | 436,336 | |
| Tomball Independent School District, Unlimited Tax (GO) | | | | | | | | |
| 5.00%, 02/15/38 (c) | | | 1,000 | | | | 1,121,443 | |
| 5.00%, 02/15/37 (c) | | | 1,100 | | | | 1,247,274 | |
Travis County, Permanent Improvements, Limited Tax (GO) 5.00%, 03/01/40 (c) | | | 1,000 | | | | 1,114,738 | |
Trinity River Authority, Regional Wastewater System (RB) 5.00%, 08/01/30 (c) | | | 670 | | | | 705,605 | |
University of Houston, Board of Regents, Series A (RB) 5.00%, 02/15/35 (c) | | | 1,500 | | | | 1,693,045 | |
| University of Texas, Board of Regents, Series A (RB) | | | | | | | | |
| 5.00%, 07/01/40 (c) | | | 1,000 | | | | 1,111,774 | |
| 5.00%, 08/15/34 (c) | | | 2,000 | | | | 2,284,747 | |
| | | | | | | | 156,577,072 | |
See Notes to Financial Statements
VANECK INTERMEDIATE MUNI ETF
SCHEDULE OF INVESTMENTS
(continued)
| | | Par
(000’s | ) | | Value | |
| Utah: 0.4% | | | | | | | | |
Central Utah Water Conservancy District, Series B (RB) 4.00%, 10/01/34 (c) | | $ | 395 | | | $ | 401,439 | |
Intermountain Power Agency, Utah Power Supply, Series A (RB) 4.00%, 07/01/36 (c) | | | 2,000 | | | | 2,094,942 | |
University of Utah, Series A (RB) 5.00%, 08/01/31 (c) | | | 365 | | | | 385,541 | |
University of Utah, Series B (RB) 5.00%, 08/01/38 (c) | | | 2,220 | | | | 2,467,135 | |
Utah Transit Authority, Subordinated Sales Tax (RB) 4.00%, 12/15/31 (c) | | | 2,000 | | | | 2,018,021 | |
| | | | | | | | 7,367,078 | |
| Vermont: 0.2% | | | | | | | | |
University of Vermont & State Agricultural College (RB) 4.00%, 10/01/40 (c) | | | 2,000 | | | | 1,951,912 | |
Vermont Educational & Health Buildings Financing Agency, Series A (RB) 5.00%, 12/01/31 (c) | | | 1,000 | | | | 1,025,861 | |
| | | | | | | | 2,977,773 | |
| Virginia: 1.6% | | | | | | | | |
Arlington County, Public Improvement (GO) 5.00%, 06/15/34 (c) | | | 2,000 | | | | 2,302,162 | |
County of Fairfax, Public Improvement, Series A (GO) 2.00%, 10/01/34 (c) | | | 375 | | | | 304,765 | |
| County of Fairfax, Public Improvement, Series A (GO) (SAW) | | | | | | | | |
| 4.00%, 10/01/35 (c) | | | 1,000 | | | | 1,064,181 | |
| 4.00%, 10/01/36 (c) | | | 1,000 | | | | 1,055,995 | |
| 5.00%, 10/01/31 (c) | | | 750 | | | | 806,096 | |
| 5.00%, 10/01/32 (c) | | | 1,755 | | | | 1,921,432 | |
County of Loudoun, Economic Development Authority, Public Facility, Series A (RB) 3.00%, 12/01/36 (c) | | | 1,500 | | | | 1,358,234 | |
Hampton Roads Transportation Accountability Commission, Series A (RB) 4.00%, 07/01/40 (c) | | | 665 | | | | 670,791 | |
| Virginia College Building Authority, 21st Century College and Equipment Programs Educational Facilities, Series A (RB) | | | | | | | | |
| 3.00%, 02/01/36 (c) | | | 2,750 | | | | 2,545,197 | |
| 4.00%, 02/01/38 (c) | | | 2,095 | | | | 2,116,627 | |
| 4.00%, 02/01/36 (c) | | | 1,500 | | | | 1,535,726 | |
| 4.00%, 02/01/41 (c) | | | 1,000 | | | | 991,662 | |
| 5.00%, 02/01/35 (c) | | | 1,950 | | | | 2,147,604 | |
| | | Par
(000’s | ) | | Value | |
| Virginia (continued) | | | | | | | | |
Virginia College Building Authority, 21st Century College and Equipment Programs Educational Facilities, Series E (RB) 5.00%, 02/01/31 (c) | | $ | 2,180 | | | $ | 2,325,106 | |
| Virginia Commonwealth Transportation Board, Series A (RB) | | | | | | | | |
| 4.00%, 05/15/36 (c) | | | 1,000 | | | | 1,019,401 | |
| 4.00%, 05/15/31 (c) | | | 500 | | | | 506,274 | |
| 5.00%, 05/15/32 (c) | | | 800 | | | | 848,028 | |
| Virginia Public Building Authority, Series A (RB) | | | | | | | | |
| 3.00%, 08/01/32 (c) | | | 695 | | | | 655,978 | |
| 3.12%, 08/01/34 (c) | | | 1,050 | | | | 1,013,310 | |
| 5.00%, 08/01/33 (c) | | | 1,000 | | | | 1,116,556 | |
| Virginia Public Building Authority, Series A-2 (RB) | | | | | | | | |
| 4.00%, 08/01/35 (c) | | | 1,000 | | | | 1,054,606 | |
| 4.00%, 08/01/37 (c) | | | 1,000 | | | | 1,037,344 | |
| | | | | | | | 28,397,075 | |
| Washington: 3.9% | | | | | | | | |
| City of Seattle, Municipal Light and Power Improvement, Series A (RB) | | | | | | | | |
| 4.00%, 07/01/36 (c) | | | 1,000 | | | | 1,034,527 | |
| 4.00%, 07/01/37 (c) | | | 1,000 | | | | 1,023,664 | |
County of King, Limited Tax (GO) 4.00%, 07/01/30 (c) | | | 2,110 | | | | 2,150,771 | |
| Energy Northwest, Colombia Generating Station Electric, Series A (RB) | | | | | | | | |
| 5.00%, 07/01/33 (c) | | | 400 | | | | 419,704 | |
| 5.00%, 07/01/32 (c) | | | 695 | | | | 746,693 | |
| 5.00%, 07/01/33 (c) | | | 1,930 | | | | 2,146,619 | |
| 5.00%, 07/01/35 (c) | | | 2,000 | | | | 2,306,576 | |
| 5.00%, 07/01/36 (c) | | | 1,000 | | | | 1,144,545 | |
| Energy Northwest, Colombia Generating Station Electric, Series A (RB) (AGM) | | | | | | | | |
| 5.00%, 07/01/36 (c) | | | 1,000 | | | | 1,082,964 | |
| 5.00%, 07/01/38 (c) | | | 500 | | | | 535,527 | |
| 5.00%, 07/01/36 (c) | | | 2,605 | | | | 2,869,709 | |
| Energy Northwest, Colombia Generating Station Electric, Series C (RB) | | | | | | | | |
| 5.00%, 07/01/30 (c) | | | 1,250 | | | | 1,268,902 | |
| 5.00%, 07/01/34 (c) | | | 1,000 | | | | 1,071,592 | |
Everett Housing Authority, Hunting Park Apartments Project (RB) 4.00%, 07/01/37 (c) | | | 3,845 | | | | 3,706,766 | |
King County, School District No. 210 Federal Way (GO) (SBG) 4.00%, 12/01/33 (c) | | | 880 | | | | 897,048 | |
See Notes to Financial Statements
| | | Par
(000’s | ) | | Value | |
| Washington (continued) | | | | | | | | |
| King County, School District No. 401 Highline (GO) (SBG) | | | | | | | | |
| 3.12%, 12/01/32 (c) | | $ | 690 | | | $ | 654,052 | |
| 5.00%, 12/01/30 (c) | | | 700 | | | | 728,826 | |
King County, School District No. 411 Issaquah (GO) (SBG) 4.00%, 12/01/31 (c) | | | 635 | | | | 642,048 | |
King County, School District No. 414 Lake Washington (GO) (SBG) 5.00%, 12/01/31 (c) | | | 980 | | | | 1,025,046 | |
King County, Washington Sewer, Series B (RB) 4.00%, 07/01/35 (c) | | | 1,000 | | | | 987,727 | |
| Kitsap County, School District No. 401 Central Kitsap (GO) (SBG) | | | | | | | | |
| 4.00%, 12/01/34 (c) | | | 1,000 | | | | 1,006,764 | |
| 4.00%, 12/01/32 (c) | | | 1,425 | | | | 1,436,489 | |
| 4.00%, 12/01/33 (c) | | | 1,250 | | | | 1,260,161 | |
Pierce County, School District No. 403 Bethel (GO) (SBG) 5.00%, 12/01/32 (c) | | | 500 | | | | 545,911 | |
State of Washington, Motor Vehicle Fuel Tax, Series R-A (GO) 5.00%, 08/01/31 (c) | | | 825 | | | | 853,577 | |
State of Washington, Motor Vehicle Fuel Tax, Series R-A (GO) (SBG) 5.00%, 06/01/31 (c) | | | 1,000 | | | | 1,111,790 | |
State of Washington, Series A (GO) 5.00%, 08/01/33 (c) | | | 755 | | | | 778,342 | |
State of Washington, Series C (GO) 5.00%, 08/01/32 (c) | | | 880 | | | | 926,635 | |
State of Washington, Series D (GO) 5.00%, 08/01/31 (c) | | | 880 | | | | 928,024 | |
State of Washington, Various Purpose, Series A (GO) 5.00%, 08/01/34 (c) | | | 500 | | | | 525,394 | |
| State of Washington, Various Purpose, Series C (GO) | | | | | | | | |
| 5.00%, 02/01/40 (c) | | | 2,165 | | | | 2,267,212 | |
| 5.00%, 02/01/35 (c) | | | 2,175 | | | | 2,440,914 | |
State of Washington, Various Purpose, Series D (GO) 5.00%, 02/01/40 (c) | | | 735 | | | | 756,138 | |
State of Washington, Various Purpose, Series R-C (GO) 5.00%, 08/01/34 (c) | | | 880 | | | | 924,693 | |
| Washington Health Care Facilities Authority, Multicare Health System, Series B (RB) | | | | | | | | |
| 5.00%, 08/15/36 (c) | | | 1,815 | | | | 1,876,595 | |
| 5.00%, 08/15/37 (c) | | | 2,000 | | | | 2,057,731 | |
| | | Par
(000’s | ) | | Value | |
| Washington (continued) | | | | | | | | |
Washington Health Care Facilities Authority, Providence St. Joseph Health, Series A (RB) 4.00%, 10/01/34 (c) | | $ | 1,820 | | | $ | 1,758,761 | |
Washington Health Care Facilities Authority, Providence St. Joseph Health, Series B (RB) 4.00%, 10/01/42 (p) | | | 1,595 | | | | 1,567,751 | |
Washington Health Care Facilities Authority, Providence St. Joseph Health, Series D (RB) 5.00%, 10/01/38 (c) | | | 2,270 | | | | 2,214,565 | |
Washington State Housing Finance Commission, Series A (RB) 3.50%, 12/20/35 | | | 1,655 | | | | 1,505,761 | |
Washington State, Motor Vehicle Fuel Tax, Series A (GO) 5.00%, 06/01/36 (c) | | | 1,050 | | | | 1,154,398 | |
Washington State, Motor Vehicle Fuel Tax, Series F (GO) 5.00%, 06/01/39 (c) | | | 2,000 | | | | 2,195,046 | |
Washington State, Shoreline School District No. 412 (GO) (SBG) 4.00%, 12/01/36 (c) | | | 1,000 | | | | 1,004,293 | |
| Washington State, Various Purpose, Series A (GO) | | | | | | | | |
| 5.00%, 08/01/38 (c) | | | 1,000 | | | | 1,087,116 | |
| 5.00%, 08/01/37 (c) | | | 1,250 | | | | 1,389,049 | |
| 5.00%, 08/01/38 (c) | | | 2,000 | | | | 2,253,658 | |
Washington State, Various Purpose, Series A-1 (GO) 5.00%, 08/01/30 (c) | | | 1,500 | | | | 1,504,189 | |
| Washington State, Various Purpose, Series C (GO) | | | | | | | | |
| 5.00%, 07/01/31 (c) | | | 1,575 | | | | 1,588,623 | |
| 5.00%, 02/01/38 (c) | | | 1,145 | | | | 1,207,036 | |
| 5.00%, 02/01/35 (c) | | | 1,000 | | | | 1,064,306 | |
| 5.00%, 02/01/39 (c) | | | 1,080 | | | | 1,149,673 | |
| 5.00%, 02/01/36 (c) | | | 1,000 | | | | 1,096,377 | |
| | | | | | | | 69,880,278 | |
| West Virginia: 0.2% | | | | | | | | |
| State of West Virginia, Series A (GO) | | | | | | | | |
| 5.00%, 06/01/36 (c) | | | 500 | | | | 542,645 | |
| 5.00%, 12/01/31 (c) | | | 1,000 | | | | 1,095,066 | |
State of West Virginia, Series B (GO) 5.00%, 12/01/30 (c) | | | 675 | | | | 723,993 | |
West Virginia, Parkways Authority, Senior Lien Turnpike Toll (RB) 5.00%, 06/01/36 (c) | | | 1,320 | | | | 1,466,982 | |
| | | | | | | | 3,828,686 | |
See Notes to Financial Statements
VANECK INTERMEDIATE MUNI ETF
SCHEDULE OF INVESTMENTS
(continued)
| | | Par
(000’s | ) | | Value | |
| Wisconsin: 0.8% | | | | | | | | |
Middleton-Cross Plains Area School District, Series A (GO) 3.25%, 03/01/36 (c) | | $ | 350 | | | $ | 333,821 | |
Public Finance Authority, Providence St. Joseph Health, Series C (RB) 4.00%, 10/01/41 (p) | | | 1,335 | | | | 1,312,193 | |
State of Wisconsin (GO) 5.00%, 11/01/31 (c) | | | 450 | | | | 472,086 | |
| State of Wisconsin, Series A (GO) | | | | | | | | |
| 5.00%, 05/01/35 (c) | | | 890 | | | | 902,777 | |
| 5.00%, 05/01/36 (c) | | | 1,000 | | | | 1,130,942 | |
| 5.00%, 05/01/35 (c) | | | 1,000 | | | | 1,135,767 | |
Wisconsin Department of Transportation, Series A (RB) 5.00%, 07/01/31 (c) | | | 940 | | | | 941,061 | |
| Wisconsin Health and Educational Facilities Authority, Ascension Senior Credit Group, Series A (RB) | | | | | | | | |
| 4.00%, 11/15/39 (c) | | | 1,875 | | | | 1,816,296 | |
| 4.00%, 11/15/35 (c) | | | 1,500 | | | | 1,491,226 | |
| | | Par
(000’s | ) | | Value | |
| Wisconsin (continued) | | | | | | | | |
| 5.00%, 11/15/36 (c) | | $ | 1,000 | | | $ | 1,021,460 | |
Wisconsin Health and Educational Facilities Authority, Children's Hospital of Wisconsin, Inc. (RB) 4.00%, 08/15/31 (c) | | | 500 | | | | 501,776 | |
Wisconsin Health and Educational Facilities Authority, Prohealth Care, Inc. (RB) 5.00%, 08/15/31 (c) | | | 2,500 | | | | 2,505,443 | |
Wisconsin Housing and Economic Development Authority, Home Ownership, Series A (RB) 4.12%, 09/01/35 (c) | | | 1,000 | | | | 1,000,988 | |
| | | | | | | | 14,565,836 | |
| Wyoming: 0.2% | | | | | | | | |
County of Campbell, Wyoming Solid Waste Facilities, Series A (RB) (SBG) 3.62%, 07/15/39 (c) | | | 4,500 | | | | 3,964,730 | |
Total Municipal Bonds: 98.3%
(Cost: $1,839,732,180) | | | | 1,773,401,154 | |
| Other assets less liabilities: 1.7% | | | | 31,264,415 | |
| NET ASSETS: 100.0% | | | | | | $ | 1,804,665,569 | |
Definitions:
| AGC | Assured Guaranty Corp. |
| AGM | Assured Guaranty Municipal Corp. |
| AMBAC | American Municipal Bond Assurance Corp. |
| BAM | Build America Assurance Co. |
| CP | Certificate of Participation |
| GO | General Obligation |
| NATL | National Public Finance Guarantee Corp. |
| RB | Revenue Bond |
| SAW | State Aid Withholding |
| SBG | School Board Guaranteed |
| SD CRED PROG | Special District Credit Enhancement Program |
| TA | Tax Allocation |
Footnotes:
| (c) | Callable Security — the redemption date shown is the date the security may be redeemed by the issuer |
| (p) | Putable Security — the redemption date shown is the date the security may be redeemed by the investor |
| ^ | Zero Coupon Bond |
See Notes to Financial Statements
| Summary of Investments by Sector | | % of
Investments | | Value |
| State GO | | | 16.0 | % | | $ | 284,174,503 | |
| Local GO | | | 15.4 | | | | 272,474,250 | |
| Tax | | | 14.8 | | | | 262,539,129 | |
| Water & Sewer | | | 7.7 | | | | 136,408,976 | |
| Hospitals | | | 6.8 | | | | 120,509,880 | |
| Education | | | 6.7 | | | | 119,374,915 | |
| Transportation | | | 5.6 | | | | 100,152,568 | |
| Toll & Turnpike | | | 5.4 | | | | 96,254,203 | |
| Power | | | 5.1 | | | | 90,555,080 | |
| Utilities | | | 4.4 | | | | 77,354,102 | |
| Leasing COPS & Appropriations | | | 4.1 | | | | 72,182,174 | |
| Miscellaneous | | | 2.0 | | | | 35,904,408 | |
| Airport | | | 2.0 | | | | 35,773,195 | |
| Multi-Family Housing | | | 1.4 | | | | 25,185,938 | |
| Single Family Housing | | | 0.7 | | | | 12,407,391 | |
| Industrial Development Revenue | | | 0.7 | | | | 12,351,842 | |
| Tobacco | | | 0.6 | | | | 10,125,545 | |
| Pollution Control | | | 0.4 | | | | 7,562,020 | |
| Unassigned | | | 0.1 | | | | 1,211,686 | |
| Health | | | 0.1 | | | | 899,349 | |
| | | | 100.0 | % | | $ | 1,773,401,154 | |
The summary of inputs used to value the Fund's investments as of April 30, 2024 is as follows:
| | | Level 1
Quoted
Prices | | | Level 2
Significant
Observable
Inputs | | | Level 3
Significant
Unobservable
Inputs | | | Value | |
| Municipal Bonds * | | $ | — | | | $ | 1,773,401,154 | | | $ | — | | | $ | 1,773,401,154 | |
| * | See Schedule of Investments for geographic sector breakouts. |
See Notes to Financial Statements
VANECK LONG MUNI ETF
SCHEDULE OF INVESTMENTS
April 30, 2024
| | | Par
(000’s | ) | | Value | |
| MUNICIPAL BONDS: 98.2% | | | | | | | | |
| Alabama: 0.7% | | | | | | | | |
Alabama Corrections Institution Finance Authority, Series A (RB) 5.25%, 07/01/47 (c) | | $ | 1,000 | | | $ | 1,073,034 | |
City of Huntsville, Alabama Scholl, Series D (GO) 5.00%, 03/01/53 (c) | | | 1,000 | | | | 1,068,167 | |
County of Jefferson, Alabama Sewer Warrants (RB) 5.25%, 10/01/49 (c) | | | 1,000 | | | | 1,053,704 | |
| | | | | | | | 3,194,905 | |
| Arizona: 1.5% | | | | | | | | |
Arizona Industrial Development Authority Student Housing, North Carolina Central University Project, Series A (RB) (BAM) 4.00%, 06/01/44 (c) | | | 500 | | | | 475,657 | |
| City of Phoenix Civic Improvement Corp., Series A (RB) | | | | | | | | |
| 4.00%, 07/01/44 (c) | | | 1,500 | | | | 1,450,971 | |
| 5.00%, 07/01/49 (c) | | | 1,000 | | | | 1,036,643 | |
City of Phoenix Civic Improvement Corp., Water System, Series A (RB) 5.00%, 07/01/44 (c) | | | 750 | | | | 798,931 | |
Pima County, Industrial Development Authority, Tucson Medical Center, Series A (RB) 4.00%, 04/01/46 (c) | | | 750 | | | | 691,699 | |
| Salt River Project Agricultural Improvement & Power District, Electric Project, Series A (RB) | | | | | | | | |
| 5.00%, 01/01/50 (c) | | | 1,000 | | | | 1,064,146 | |
| 5.00%, 01/01/47 (c) | | | 1,000 | | | | 1,072,910 | |
| | | | | | | | 6,590,957 | |
| Arkansas: 0.2% | | | | | | | | |
City of Springdale, Arkansas Sales and Use Tax, Series B (RB) (BAM) 4.25%, 08/01/53 (c) | | | 1,000 | | | | 973,788 | |
| California: 16.6% | | | | | | | | |
Airport Commission of the City and County of San Francisco, International Airport, Series E (RB) 5.00%, 05/01/48 (c) | | | 995 | | | | 1,032,519 | |
Airport Commission of the City and County of San Francisco, International Airport, Series F (RB) 5.00%, 05/01/50 (c) | | | 1,000 | | | | 1,045,287 | |
| | | Par
(000’s | ) | | Value | |
| California (continued) | | | | | | | | |
Alameda County, Pleasanton United School District (GO) 4.00%, 08/01/52 (c) | | $ | 1,500 | | | $ | 1,465,739 | |
Anaheim Housing & Public Improvements Authority, Electric Utility Distribution System improvements, Series C (RB) (NATL) 5.00%, 10/01/45 (c) | | | 500 | | | | 508,551 | |
Austin Independent School District, Unlimited Tax (RB) 3.00%, 08/15/51 (c) | | | 1,000 | | | | 768,436 | |
Bay Area Toll Authority, Toll Bridge, Series S (RB) 4.00%, 04/01/47 (c) | | | 1,000 | | | | 977,908 | |
California County Tobacco Securitization Agency, Series A (RB) 4.00%, 06/01/49 (c) | | | 850 | | | | 806,070 | |
California Health Facilities Financing Authority, Children’s Hospital, Series A (RB) 5.00%, 08/15/47 (c) | | | 1,000 | | | | 1,013,407 | |
California Health Facilities Financing Authority, City of Hope (RB) 5.00%, 11/15/49 (c) | | | 750 | | | | 759,454 | |
| California Health Facilities Financing Authority, Commonspririt Health, Series A (RB) | | | | | | | | |
| 4.00%, 04/01/45 (c) | | | 1,000 | | | | 954,379 | |
| 5.00%, 12/01/45 (c) | | | 1,000 | | | | 1,075,282 | |
| California Health Facilities Financing Authority, Kaiser Permanente, Series A (RB) | | | | | | | | |
| 4.00%, 11/01/51 (c) | | | 1,000 | | | | 956,156 | |
| 4.00%, 11/01/44 (c) | | | 1,000 | | | | 978,750 | |
California Health Facilities Financing Authority, Pin Health, Series A (RB) 4.00%, 06/01/50 (c) | | | 750 | | | | 703,357 | |
California Health Facilities Financing Authority, Providence St. Joseph Health, Series A (RB) 3.00%, 10/01/41 (c) | | | 680 | | | | 545,303 | |
California Health Facilities Financing Authority, Series A (RB) 4.00%, 03/01/43 (c) | | | 1,000 | | | | 905,887 | |
California Health Facilities Financing Authority, Series B (RB) 4.00%, 11/15/41 (c) | | | 1,000 | | | | 969,598 | |
See Notes to Financial Statements
| | | Par
(000’s | ) | | Value | |
| California (continued) | | | | | | | | |
California Infrastructure & Economic Development Bank (RB) 5.00%, 05/15/47 (c) | | $ | 500 | | | $ | 520,997 | |
California State Public Works Board, Series A (RB) 5.00%, 04/01/49 (c) | | | 1,500 | | | | 1,621,467 | |
California Statewide Communities Development Authority, Montage Health, Series A (RB) 4.00%, 06/01/46 (c) | | | 1,055 | | | | 1,018,612 | |
Chabot-Las Positas Community College District, Series C (GO) 5.25%, 08/01/48 (c) | | | 1,000 | | | | 1,116,204 | |
Chaffey Joint Union High School District, Series C (GO) 5.25%, 08/01/47 (c) | | | 500 | | | | 518,243 | |
Chaffey Joint Union High School District, Series G (GO) 5.25%, 08/01/52 (c) | | | 1,000 | | | | 1,094,546 | |
Chino Valley Unified School District, Series B (GO) (SBG) 5.00%, 08/01/55 (c) | | | 620 | | | | 652,100 | |
City and County of San Francisco, Public Utilities Commission Water, Series D (RB) 3.00%, 11/01/50 (c) | | | 500 | | | | 380,999 | |
City of Los Angeles, Department of Airports, Series D (RB) 4.00%, 05/15/48 (c) | | | 750 | | | | 730,700 | |
County of Bernardino, Raito Unified School District (GO) (BAM) 5.00%, 08/01/52 (c) | | | 1,000 | | | | 1,069,514 | |
East Bay Municipal Utility District, Water System, Series A (RB) 4.00%, 06/01/45 (c) | | | 1,210 | | | | 1,191,181 | |
El Dorado Irrigation District, Series A (CP) (AGM) 4.00%, 03/01/45 (c) | | | 630 | | | | 616,881 | |
Fremont Union High School District, Series A (GO) 4.00%, 08/01/46 (c) | | | 500 | | | | 496,362 | |
Glendale Community College District, Series B (GO) 3.00%, 08/01/47 (c) | | | 325 | | | | 249,001 | |
Hayward Unified School District (GO) (BAM) 4.00%, 08/01/43 (c) | | | 1,000 | | | | 1,000,638 | |
Irvin Facilities Financing Authority, Irvine Great Park Infrastructure Project, Series A (ST) 5.00%, 09/01/43 (c) | | | 500 | | | | 552,862 | |
| | | Par
(000’s | ) | | Value | |
| California (continued) | | | | | | | | |
| Los Angeles Department of Water and Power, Series A (RB) | | | | | | | | |
| 5.00%, 07/01/44 (c) | | $ | 500 | | | $ | 500,225 | |
| 5.00%, 07/01/49 (c) | | | 800 | | | | 872,242 | |
Los Angeles Department of Water and Power, Series B (RB) 5.25%, 07/01/53 (c) | | | 500 | | | | 549,102 | |
| Los Angeles Department of Water and Power, Series D (RB) | | | | | | | | |
| 5.00%, 07/01/47 (c) | | | 500 | | | | 544,173 | |
| 5.00%, 07/01/52 (c) | | | 750 | | | | 808,121 | |
Los Angeles Department of Water and Power, Series E (RB) 5.00%, 07/01/53 (c) | | | 1,000 | | | | 1,080,626 | |
Los Angeles Unified School District, Unlimited and Valorem Property Tax (GO) 5.25%, 07/01/47 (c) | | | 1,000 | | | | 1,110,680 | |
| Metropolitan Water District of Southern California, Series A (RB) | | | | | | | | |
| 5.00%, 04/01/53 (c) | | | 1,000 | | | | 1,082,714 | |
| 5.00%, 04/01/48 (c) | | | 1,500 | | | | 1,643,236 | |
Miracosta Community College District, Series A (GO) 4.00%, 08/01/42 (c) | | | 530 | | | | 530,020 | |
Regents of University of California, Medical Center Pooled, Series L (RB) 4.00%, 05/15/44 (c) | | | 1,015 | | | | 1,012,987 | |
Regents of University of California, Medical Center Pooled, Series P (RB) 4.00%, 05/15/53 (c) | | | 1,000 | | | | 982,553 | |
Riverside County, Perris Union High School District, Series A (GO) (AGM) 4.00%, 09/01/43 (c) | | | 570 | | | | 570,093 | |
Sacramento Area Flood Control Agency, Series A (SA) 5.00%, 10/01/47 (c) | | | 1,500 | | | | 1,536,103 | |
Sacramento City Unified School District, Series G (GO) (AGM) 4.00%, 08/01/49 (c) | | | 500 | | | | 480,778 | |
San Diego Association of Governments South Bay Expressway Toll, Series A (RB) 5.00%, 07/01/42 (c) | | | 610 | | | | 631,006 | |
San Diego County Regional Airport Authority, Series A (RB) 5.00%, 07/01/44 (c) | | | 750 | | | | 792,433 | |
See Notes to Financial Statements
VANECK LONG MUNI ETF
SCHEDULE OF INVESTMENTS
(continued)
| | | Par
(000’s | ) | | Value | |
| California (continued) | | | | | | | | |
San Diego Public Facilities Financing Authority, Series A (RB) 5.25%, 08/01/48 (c) | | $ | 1,000 | | | $ | 1,118,691 | |
San Diego Unified School District, Series I (GO) 4.00%, 07/01/47 (c) | | | 595 | | | | 582,636 | |
San Francisco Bay Area Rapid Transit District, Series B-1 (GO) 3.00%, 08/01/49 (c) | | | 600 | | | | 460,967 | |
San Francisco Bay Area Rapid Transit District, Series C-1 (GO) 4.00%, 08/01/45 (c) | | | 610 | | | | 601,577 | |
| San Francisco City and County, International Airport, Series B (RB) | | | | | | | | |
| 4.00%, 05/01/52 (c) | | | 1,000 | | | | 960,482 | |
| 5.00%, 05/01/47 (c) | | | 700 | | | | 720,308 | |
| 5.00%, 05/01/52 (c) | | | 1,000 | | | | 1,066,985 | |
San Francisco City and County, Public Utilities Commission Wastewater, Series A (RB) 4.00%, 10/01/48 (c) | | | 885 | | | | 873,597 | |
San Francisco Municipal Transportation Agency (RB) 4.00%, 03/01/46 (c) | | | 750 | | | | 735,888 | |
San Jacinto County, Transportation Authority, Limited Tax (RB) 4.00%, 03/01/41 (c) | | | 1,000 | | | | 994,060 | |
San Jose Evergreen Community College District, Series B (GO) 3.00%, 09/01/41 (c) | | | 825 | | | | 697,745 | |
San Mateo County Community College District, Series B (GO) 5.00%, 09/01/45 (c) | | | 820 | | | | 867,942 | |
San Mateo Foster City Public Financing Authority, Clean Water Program (RB) (SAW) 4.00%, 08/01/44 (c) | | | 500 | | | | 500,121 | |
Saugus Union School District School Facilities Improvement District No.1, Series C (GO) 2.38%, 08/01/44 (c) | | | 1,000 | | | | 688,313 | |
Southern California Public Power Authority, Southern Transmission System (RB) 5.25%, 07/01/53 (c) | | | 500 | | | | 550,252 | |
Southwestern Community College District, Series A (GO) 4.00%, 08/01/47 (c) | | | 750 | | | | 740,663 | |
| State of California, Various Purpose (GO) | | | | | | | | |
| 3.00%, 12/01/43 (c) | | | 400 | | | | 337,823 | |
| 3.62%, 10/01/47 (c) | | | 645 | | | | 571,687 | |
| 4.00%, 10/01/44 (c) | | | 500 | | | | 493,629 | |
| | | Par
(000’s | ) | | Value | |
| California (continued) | | | | | | | | |
| 5.00%, 10/01/48 (c) | | $ | 935 | | | $ | 974,360 | |
| 5.00%, 11/01/47 (c) | | | 515 | | | | 532,097 | |
| 5.00%, 09/01/48 (c) | | | 2,000 | | | | 2,181,445 | |
| 5.00%, 04/01/49 (c) | | | 1,000 | | | | 1,049,090 | |
| 5.00%, 10/01/42 (c) | | | 1,500 | | | | 1,656,230 | |
State of California, Various Purpose (GO) (SAW) 5.00%, 12/01/46 (c) | | | 625 | | | | 668,361 | |
Sunnyvale Financing Authority, Civic Center Project (RB) (AGM) 4.00%, 04/01/45 (c) | | | 695 | | | | 682,054 | |
University of California, Series BK (RB) 5.00%, 05/15/52 (c) | | | 2,000 | | | | 2,152,992 | |
| University of California, Series BN (RB) | | | | | | | | |
| 5.00%, 05/15/41 (c) | | | 1,000 | | | | 1,118,754 | |
| 5.00%, 05/15/42 (c) | | | 1,000 | | | | 1,115,172 | |
University of California, Series EE (RB) 5.00%, 05/15/43 (c) | | | 500 | | | | 538,734 | |
University of California, Series M (RB) 5.00%, 05/15/42 (c) | | | 1,950 | | | | 2,037,999 | |
University of California, Series O (RB) 5.00%, 05/15/58 (c) | | | 1,000 | | | | 1,039,090 | |
University of California, Series Q (RB) 5.00%, 05/15/46 (c) | | | 500 | | | | 538,716 | |
Ventura Unified School District, Series A (GO) 4.00%, 08/01/52 (c) | | | 500 | | | | 486,953 | |
| | | | | | | | 73,358,895 | |
| Colorado: 1.9% | | | | | | | | |
Board of Governors of Colorado State University System, Series C (RB) 4.00%, 03/01/47 (c) | | | 1,050 | | | | 997,632 | |
Boulder Valley School District No. Re-2 Boulder (GO) (SAW) 5.00%, 12/01/41 (c) | | | 500 | | | | 505,490 | |
City of Colorado Springs, Utilities System, Series C (RB) 5.00%, 11/15/50 (c) | | | 600 | | | | 631,632 | |
Colorado Bridge and Tunnel Enterprise, Series A (RB) (AGM) 5.25%, 12/01/49 (c) | | | 500 | | | | 546,158 | |
Colorado Health Facilities Authority Hospital, Series A (RB) (SBG) 4.00%, 11/15/43 (c) | | | 685 | | | | 670,067 | |
Colorado Health Facilities Authority, CommonSpirit Health, Series A (RB) 5.50%, 11/01/47 (c) | | | 1,000 | | | | 1,089,693 | |
See Notes to Financial Statements
| | | Par
(000’s | ) | | Value | |
| Colorado (continued) | | | | | | | | |
| Colorado Health Facilities Authority, CommonSpirit Health, Series A-2 (RB) | | | | | | | | |
| 3.25%, 08/01/49 (c) | | $ | 500 | | | $ | 369,496 | |
| 4.00%, 08/01/49 (c) | | | 745 | | | | 677,632 | |
Colorado Health Facilities Authority, Sanford, Series A (RB) 5.00%, 11/01/44 (c) | | | 500 | | | | 519,826 | |
Colorado High Performance Transportation Enterprise, C-470 Express Lanes (RB) 5.00%, 12/31/51 (c) | | | 250 | | | | 250,323 | |
Regional Transportation District, Fastracks Project, Series B (RB) 2.00%, 11/01/41 (c) | | | 850 | | | | 564,187 | |
Weld County School District No. 5J (GO) (SAW) 4.00%, 12/01/45 (c) | | | 1,000 | | | | 970,228 | |
Weld County School District No. 6 (GO) (SAW) 4.00%, 12/01/45 (c) | | | 800 | | | | 786,210 | |
| | | | | | | | 8,578,574 | |
| Connecticut: 0.5% | | | | | | | | |
| Connecticut Housing Finance Authority, Housing Mortgage Finance Program, Series A (RB) | | | | | | | | |
| 4.60%, 11/15/49 (c) | | | 1,000 | | | | 992,260 | |
| 4.70%, 11/15/43 (c) | | | 500 | | | | 503,478 | |
Connecticut State Health and Educational Facilities Authority, Trinity Health Credit Group (RB) 5.00%, 12/01/45 (c) | | | 750 | | | | 759,107 | |
| | | | | | | | 2,254,845 | |
| Delaware: 0.3% | | | | | | | | |
| State of Delaware, Series A (GO) | | | | | | | | |
| 4.00%, 05/01/41 (c) | | | 1,000 | | | | 1,008,395 | |
| 4.00%, 05/01/42 (c) | | | 500 | | | | 502,174 | |
| | | | | | | | 1,510,569 | |
| District of Columbia: 1.5% | | | | | | | | |
District of Columbia, Children’s Hospital (RB) 5.00%, 07/15/44 (c) | | | 500 | | | | 505,067 | |
District of Columbia, Income Tax, Series C (RB) 4.00%, 05/01/45 (c) | | | 805 | | | | 790,686 | |
District of Columbia, Series A (RB) 2.62%, 03/01/45 (c) | | | 575 | | | | 410,830 | |
Metropolitan Washington Airports Authority, Dulles Toll Road, Dulles Metrorail and Capital Improvements Projects, Series A (RB) (AGM) 4.00%, 10/01/52 (c) | | | 1,000 | | | | 943,063 | |
| | | Par
(000’s | ) | | Value | |
| District of Columbia (continued) | | | | | | | | |
Metropolitan Washington Airports Authority, Dulles Toll Road, Dulles Metrorail and Capital Improvements Projects, Series B (RB) 4.00%, 10/01/49 (c) | | $ | 1,250 | | | $ | 1,141,396 | |
| Washington Metropolitan Area Transit Authority, Series A (RB) | | | | | | | | |
| 3.00%, 07/15/43 (c) | | | 750 | | | | 599,208 | |
| 4.00%, 07/15/46 (c) | | | 1,000 | | | | 952,132 | |
| 5.00%, 07/15/48 (c) | | | 1,000 | | | | 1,069,110 | |
| | | | | | | | 6,411,492 | |
| Florida: 4.6% | | | | | | | | |
Brevard County, Florida Health Facilities Authority, Series A (RB) 5.00%, 04/01/52 (c) | | | 1,055 | | | | 1,088,982 | |
Cape Coral Florida Water and Sewer (RB) (BAM) 5.25%, 10/01/53 (c) | | | 1,000 | | | | 1,088,964 | |
Central Florida Expressway Authority (RB) (BAM) 4.00%, 07/01/41 (c) | | | 845 | | | | 810,698 | |
| City of Jacksonville, Health Care Facilities, Brooks Rehabilitation (RB) | | | | | | | | |
| 4.00%, 11/01/45 (c) | | | 1,000 | | | | 886,347 | |
| 5.00%, 11/01/50 (c) | | | 1,000 | | | | 1,014,289 | |
City of Lakeland, Florida Hospital, Regional Health Systems (RB) 5.00%, 11/15/45 (c) | | | 1,000 | | | | 1,003,287 | |
City of Tampa, Florida Water & Wastewater System, Series A (RB) (BAM-TCRS) 5.00%, 10/01/47 (c) | | | 500 | | | | 534,331 | |
County of Broward, Florida Port Facilities, Series A (RB) 5.00%, 09/01/49 (c) | | | 500 | | | | 510,706 | |
| County of Broward, Florida Tourist Development, Convention Center Expansion Project (RB) | | | | | | | | |
| 4.00%, 09/01/47 (c) | | | 1,000 | | | | 950,925 | |
| 4.00%, 09/01/51 (c) | | | 1,010 | | | | 944,675 | |
County of Miami-Dade, Florida Seaport, Series A (RB) (AGM) 4.00%, 10/01/49 (c) | | | 2,000 | | | | 1,933,476 | |
County of Miami-Dade, Florida Water and Sewer System (RB) 4.00%, 10/01/48 (c) | | | 1,000 | | | | 963,145 | |
County of Miami-Dade, Health Facilities Authority Hospital, Nicklaus Children’s Hospital Project, Series A (RB) 4.00%, 08/01/51 (c) | | | 500 | | | | 459,649 | |
See Notes to Financial Statements
VANECK LONG MUNI ETF
SCHEDULE OF INVESTMENTS
(continued)
| | | Par
(000’s | ) | | Value | |
| Florida (continued) | | | | | | | | |
County of Palm Beach, Health Facilities Authority, Lifespace Communities, Inc., Series B (RB) 4.00%, 05/15/53 (c) | | $ | 330 | | | $ | 231,426 | |
County of Saint Luce, School Board, Series A (CP) (AGM) 5.00%, 07/01/48 (c) | | | 1,000 | | | | 1,054,013 | |
County of Sarasota, Florida Utility System, Series A (RB) 5.00%, 10/01/50 (c) | | | 500 | | | | 525,418 | |
Florida Higher Educational Facilities Financial Authority, Rollins College Project, Series A (RB) 4.00%, 12/01/50 (c) | | | 750 | | | | 682,381 | |
Fort Pierce Utilities Authority, Series A (RB) (AGM) 4.00%, 10/01/52 (c) | | | 1,000 | | | | 915,606 | |
Halifax Hospital Medical Center (RB) 4.00%, 06/01/46 (c) | | | 525 | | | | 480,776 | |
Hillsborough County, Florida Capital Improvement Non-Ad Valorem (RB) 2.25%, 08/01/51 (c) | | | 500 | | | | 293,214 | |
Jea Water and Sewer System, Series A (RB) 5.25%, 10/01/49 (c) | | | 1,000 | | | | 1,100,353 | |
North Broward Hospital District, Broward Health, Series B (RB) 5.00%, 01/01/48 (c) | | | 1,000 | | | | 1,014,278 | |
Orange County Health Facilities Authority, Series A (RB) 5.00%, 10/01/47 (c) | | | 1,000 | | | | 1,022,705 | |
South Broward Hospital District, Series A (RB) 3.00%, 05/01/46 (c) | | | 750 | | | | 572,228 | |
| | | | | | | | 20,081,872 | |
| Georgia: 1.8% | | | | | | | | |
Brookhaven Development Authority, Children’s Healthcare of Atlanta, Inc., Series A (RB) 4.00%, 07/01/44 (c) | | | 660 | | | | 641,253 | |
County of Burke, Development Authority, Series D (RB) 4.12%, 11/01/45 (c) | | | 260 | | | | 231,898 | |
County of Clarke, Hospital Authority, Piedmont Healthcare, Inc., Series A (RB) 4.00%, 07/01/41 (c) | | | 500 | | | | 485,009 | |
County of Fulton, Georgia Water and Sewerage, Series A (RB) 2.25%, 01/01/43 (c) | | | 500 | | | | 345,202 | |
| | | Par
(000’s | ) | | Value | |
| Georgia (continued) | | | | | | | | |
| Gainesville and Hall County Hospital Authority, Northeast Georgia Health System, Series A (RB) | | | | | | | | |
| 4.00%, 02/15/42 (c) | | $ | 1,000 | | | $ | 960,381 | |
| 4.00%, 02/15/45 (c) | | | 1,295 | | | | 1,230,229 | |
Georgia Housing and Finance Authority, Single Family Mortgage, Series B-1 (RB) 3.35%, 12/01/41 (c) | | | 215 | | | | 182,228 | |
Georgia State Road and Tollway Authority, Managed Lane System, Series A (RB) 3.00%, 07/15/51 (c) | | | 500 | | | | 367,135 | |
Main Street Natural Gas, Inc., Series C (RB) 5.00%, 05/15/49 | | | 990 | | | | 1,009,950 | |
Metropolitan Atlanta Rapid Transit Authority Sales Tax, Series A (RB) 3.00%, 07/01/47 (c) | | | 1,000 | | | | 766,348 | |
Municipal Electric Authority of Georgia, Plant Vogtle Units 3 & 4 Project, Series A (RB) 4.50%, 07/01/63 (c) | | | 500 | | | | 476,779 | |
Municipal Electric Authority of Georgia, Series A (RB) 5.00%, 01/01/63 (c) | | | 500 | | | | 506,101 | |
Private Colleges & Universities Authority, Emory University, Series B (RB) 4.00%, 09/01/41 (c) | | | 855 | | | | 857,510 | |
| | | | | | | | 8,060,023 | |
| Hawaii: 0.2% | | | | | | | | |
City and County of Honolulu, Series C (GO) 4.00%, 08/01/43 (c) | | | 750 | | | | 747,740 | |
| Idaho: 0.3% | | | | | | | | |
Idaho Health Facilities Authority, St. Luke’s Health System Project, Series A (RB) 5.00%, 03/01/44 (c) | | | 500 | | | | 498,565 | |
Idaho Housing and Finance Association, Single Family Mortgage. Series A (RB) 4.60%, 01/01/49 (c) | | | 750 | | | | 744,271 | |
| | | | | | | | 1,242,836 | |
| Illinois: 3.8% | | | | | | | | |
City of Chicago, Second Lien Water Project, Series A (RB) (AGM) 5.25%, 11/01/53 (c) | | | 500 | | | | 535,808 | |
City of Chicago, Series A (GO) 5.50%, 01/01/43 (c) | | | 750 | | | | 789,620 | |
| City of Chicago, Wastewater Transmission Project, Series A (RB) (AGM) | | | | | | | | |
| 5.25%, 01/01/53 (c) | | | 500 | | | | 533,976 | |
| 5.50%, 01/01/62 (c) | | | 1,550 | | | | 1,678,266 | |
See Notes to Financial Statements
| | | Par
(000’s | ) | | Value | |
| Illinois (continued) | | | | | | | | |
Illinois Finance Authority, Silver Cross Hospital and Medical Center, Series C (RB) 5.00%, 08/15/44 (c) | | $ | 1,000 | | | $ | 1,004,925 | |
Illinois Housing Development Authority, Series G (RB) 5.00%, 10/01/46 (c) | | | 1,000 | | | | 1,019,779 | |
Illinois Housing Development Authority, Series K (RB) (FNMA/GNMA/FHLMC COLL) 5.35%, 04/01/47 (c) | | | 1,000 | | | | 1,028,586 | |
| Illinois State Toll Highway Authority, Series A (RB) | | | | | | | | |
| 4.00%, 01/01/46 (c) | | | 1,000 | | | | 955,964 | |
| 4.00%, 01/01/44 (c) | | | 1,005 | | | | 975,725 | |
Illinois State Toll Highway Authority, Series E (RB) 5.25%, 10/01/52 (c) | | | 530 | | | | 548,384 | |
Metropolitan Pier and Exposition Authority, McCormick Place Expansion Project, Series A (RB) 5.00%, 06/15/53 (c) | | | 735 | | | | 736,743 | |
Metropolitan Water Reclamation District of Greater Chicago, Series A (GO) 4.00%, 12/01/46 (c) | | | 1,500 | | | | 1,449,060 | |
Sales Tax Securitization Corp., Series A (RB) 4.00%, 01/01/48 (c) | | | 1,000 | | | | 885,978 | |
Sales Tax Securitization Corp., Series A (RB) (BAM-TCRS) 4.00%, 01/01/48 (c) | | | 1,000 | | | | 908,289 | |
State of Illinois (GO) (AGC) 5.75%, 05/01/45 (c) | | | 750 | | | | 806,571 | |
| State of Illinois, Series A (GO) | | | | | | | | |
| 5.00%, 03/01/46 (c) | | | 1,250 | | | | 1,286,670 | |
| 5.00%, 05/01/41 (c) | | | 630 | | | | 643,944 | |
State of Illinois, Series C (GO) 4.00%, 11/01/44 (c) | | | 900 | | | | 831,103 | |
| | | | | | | | 16,619,391 | |
| Indiana: 0.6% | | | | | | | | |
Indiana Municipal Power Agency, Series A (RB) 5.00%, 01/01/42 (c) | | | 1,000 | | | | 1,013,628 | |
| Indianapolis Local Public Improvement Bond Bank, Courthouse and Jail Project, Series A (RB) | | | | | | | | |
| 5.00%, 02/01/54 (c) | | | 1,000 | | | | 1,030,679 | |
| 5.00%, 02/01/49 (c) | | | 500 | | | | 517,584 | |
| | | | | | | | 2,561,891 | |
| Iowa: 0.4% | | | | | | | | |
Iowa Finance Authority, Midwestern Disaster Area, Iowa Fertilizer Co. Project, Series A (RB) 5.00%, 12/01/50 (c) (p) | | | 500 | | | | 519,046 | |
| | | Par
(000’s | ) | | Value | |
| Iowa (continued) | | | | | | | | |
Iowa Finance Authority, Series A (RB) 5.00%, 08/01/49 (c) | | $ | 530 | | | $ | 559,627 | |
Iowa Finance Authority, Single Family Mortgage, Series C (RB) 4.85%, 07/01/43 (c) | | | 500 | | | | 510,652 | |
| | | | | | | | 1,589,325 | |
| Kentucky: 0.4% | | | | | | | | |
Kentucky Bond Development Corp., Lexington Center Corp. Project (RB) 4.00%, 09/01/48 (c) | | | 1,225 | | | | 1,133,034 | |
Kentucky Economic Development Finance Authority, Louisville Arena Project, Series A (RB) (AGM) 4.00%, 12/01/41 (c) | | | 750 | | | | 724,241 | |
| | | | | | | | 1,857,275 | |
| Louisiana: 0.8% | | | | | | | | |
City of Shreveport, Louisiana Water and Sewer, Series B (RB) (AGM) 4.00%, 12/01/49 (c) | | | 700 | | | | 639,418 | |
Louisiana Stadium and Exposition District, Series A (RB) 5.25%, 07/01/53 (c) | | | 1,500 | | | | 1,606,217 | |
State of Louisiana, Series A (GO) 4.00%, 04/01/43 (c) | | | 1,500 | | | | 1,492,626 | |
| | | | | | | | 3,738,261 | |
| Maine: 0.2% | | | | | | | | |
Maine Turnpike Authority (RB) 4.00%, 07/01/50 (c) | | | 750 | | | | 705,289 | |
| Maryland: 1.4% | | | | | | | | |
County of Baltimore, Metropolitan District (GO) 5.00%, 03/01/49 (c) | | | 1,000 | | | | 1,080,527 | |
Maryland Community Development Administration, Series A (RB) (AGM) 1.95%, 09/01/41 (c) | | | 310 | | | | 197,699 | |
Maryland Health and Higher Educational Facilities Authority, Adventist Healthcare, Series B (RB) 4.00%, 01/01/51 (c) | | | 500 | | | | 405,133 | |
Maryland Health and Higher Educational Facilities Authority, Greater Baltimore Medical Center, Series A (RB) 3.00%, 07/01/46 (c) | | | 500 | | | | 393,336 | |
Maryland Health and Higher Educational Facilities Authority, Lifebridge Health (RB) 5.00%, 07/01/47 (c) | | | 1,000 | | | | 1,003,745 | |
See Notes to Financial Statements
VANECK LONG MUNI ETF
SCHEDULE OF INVESTMENTS
(continued)
| | | Par
(000’s | ) | | Value | |
| Maryland (continued) | | | | | | | | |
Maryland Stadium Authority, Built to Learn, Series A (RB) 4.00%, 06/01/52 (c) | | $ | 1,000 | | | $ | 914,732 | |
Maryland Stadium Authority, Construction and Revitalization Program, Series A (RB) 5.00%, 05/01/42 (c) | | | 1,000 | | | | 1,036,530 | |
Montgomery County, Trinity Health Credit Group, Series MD (RB) 5.00%, 12/01/44 (c) | | | 1,000 | | | | 1,005,926 | |
| | | | | | | | 6,037,628 | |
| Massachusetts: 3.9% | | | | | | | | |
Commonwealth of Massachusetts Transportation, Series A (RB) 3.00%, 06/01/50 (c) | | | 800 | | | | 590,905 | |
Commonwealth of Massachusetts Transportation, Series B (RB) 5.00%, 06/01/52 (c) | | | 1,000 | | | | 1,061,164 | |
| Commonwealth of Massachusetts, Series A (GO) | | | | | | | | |
| 5.00%, 01/01/45 (c) | | | 1,000 | | | | 1,035,530 | |
| 5.00%, 01/01/49 (c) | | | 500 | | | | 536,738 | |
| 5.00%, 04/01/42 (c) | | | 275 | | | | 283,998 | |
| 5.00%, 05/01/53 (c) | | | 1,000 | | | | 1,063,865 | |
| Commonwealth of Massachusetts, Series B (GO) | | | | | | | | |
| 2.12%, 04/01/51 (c) | | | 1,300 | | | | 764,657 | |
| 5.00%, 11/01/52 (c) | | | 1,190 | | | | 1,264,216 | |
Commonwealth of Massachusetts, Series C (GO) 3.00%, 03/01/48 (c) | | | 360 | | | | 271,657 | |
| Commonwealth of Massachusetts, Series D (GO) | | | | | | | | |
| 5.00%, 10/01/53 (c) | | | 1,000 | | | | 1,066,255 | |
| 5.00%, 07/01/45 (c) | | | 750 | | | | 796,578 | |
| Commonwealth of Massachusetts, Series E (GO) | | | | | | | | |
| 5.00%, 11/01/50 (c) | | | 1,000 | | | | 1,049,637 | |
| 5.00%, 11/01/45 (c) | | | 605 | | | | 644,039 | |
| Massachusetts Bay Transportation Authority, Sales Tax, Series A (RB) | | | | | | | | |
| 4.00%, 07/01/51 (c) | | | 800 | | | | 757,733 | |
| 4.00%, 07/01/53 (c) | | | 1,000 | | | | 940,472 | |
Massachusetts Development Finance Agency, Beth Israel Lahey Health, Inc., Series J (RB) 5.00%, 07/01/53 (c) | | | 500 | | | | 504,719 | |
Massachusetts Development Finance Agency, Boston Medical Center Issue, Series D (RB) 5.00%, 07/01/44 (c) | | | 500 | | | | 491,089 | |
| | | Par
(000’s | ) | | Value | |
| Massachusetts (continued) | | | | | | | | |
Massachusetts Development Finance Agency, Boston Medical Center Issue, Series G (RB) 5.25%, 07/01/52 (c) | | $ | 1,000 | | | $ | 1,051,914 | |
Massachusetts Development Finance Agency, Boston University, Series FF (RB) 5.00%, 10/01/48 (c) | | | 1,105 | | | | 1,182,835 | |
Massachusetts Port Authority, Series B (RB) (SBG) 5.00%, 07/01/44 (c) | | | 305 | | | | 321,232 | |
| Massachusetts School Building Authority, Sales Tax, Series A (RB) | | | | | | | | |
| 5.00%, 02/15/44 (c) | | | 555 | | | | 582,563 | |
| 5.00%, 08/15/50 (c) | | | 750 | | | | 784,430 | |
| | | | | | | | 17,046,226 | |
| Michigan: 2.2% | | | | | | | | |
Great Lakes Water Authority, Water Supply System, Second Lien, Series B (RB) 5.00%, 07/01/46 (c) | | | 390 | | | | 395,675 | |
Great Lakes Water Authority, Water Supply System, Senior Lien, Series A (RB) 5.00%, 07/01/46 (c) | | | 570 | | | | 578,295 | |
Michigan Finance Authority (RB) (BAM-TCRS) 4.00%, 11/01/48 (c) | | | 1,000 | | | | 926,429 | |
Michigan Finance Authority, Beaumont Health, Series A (RB) 5.00%, 11/01/44 (c) | | | 1,000 | | | | 1,010,406 | |
Michigan Finance Authority, McLaren Health Care, System A (RB) 4.00%, 02/15/47 (c) | | | 1,000 | | | | 925,838 | |
Michigan Finance Authority, Trinity Health Credit Group, Series A (RB) 5.00%, 12/01/42 (c) | | | 500 | | | | 512,600 | |
Michigan State Building Authority, Facilities Program, Series I (RB) 5.00%, 10/15/50 (c) | | | 500 | | | | 503,459 | |
| Michigan State Housing Development Authority, Rental Housing, Series A (RB) | | | | | | | | |
| 3.35%, 10/01/49 (c) | | | 500 | | | | 392,291 | |
| 3.60%, 10/01/60 (c) | | | 1,000 | | | | 773,040 | |
| 4.88%, 10/01/43 (c) | | | 1,000 | | | | 1,004,194 | |
Michigan State University, Board of Trustee, Series B (RB) 5.00%, 02/15/48 (c) | | | 765 | | | | 799,301 | |
State of Michigan, Trunk Line Fund (RB) 5.00%, 11/15/46 (c) | | | 1,000 | | | | 1,079,608 | |
See Notes to Financial Statements
| | | Par
(000’s | ) | | Value | |
| Michigan (continued) | | | | | | | | |
State of Michigan, Trunk Line Fund, Series A (RB) 4.00%, 11/15/46 (c) | | $ | 620 | | | $ | 599,146 | |
| | | | | | | | 9,500,282 | |
| Minnesota: 0.7% | | | | | | | | |
Duluth Economic Development Authority, Minnesota Health Facilities, Series A (RB) 5.25%, 02/15/58 (c) | | | 1,000 | | | | 1,014,214 | |
Minnesota Housing Finance Agency Residential Housing, Series B (RB) 2.50%, 07/01/51 (c) | | | 530 | | | | 347,304 | |
| Minnesota Housing Finance Agency Residential Housing, Series I (RB) | | | | | | | | |
| 2.15%, 07/01/45 (c) | | | 890 | | | | 561,874 | |
| 3.00%, 01/01/51 (c) | | | 385 | | | | 371,514 | |
Minnesota Housing Finance Agency Residential Housing, Series M (RB) 5.15%, 07/01/45 (c) | | | 500 | | | | 516,445 | |
St. Louis Park Independent School District No. 283, Series A (GO) (SD CRED PROG) 4.25%, 02/01/43 (c) | | | 500 | | | | 507,458 | |
| | | | | | | | 3,318,809 | |
| Mississippi: 0.1% | | | | | | | | |
Mississippi Hospital Equipment and Facilities Authority, Baptist Memorial Health Corp., Series A (RB) 5.00%, 09/01/41 (c) | | | 500 | | | | 502,384 | |
| Missouri: 0.7% | | | | | | | | |
| County of Jackson, Series A (RB) | | | | | | | | |
| 4.25%, 12/01/53 (c) | | | 1,000 | | | | 950,808 | |
| 4.38%, 12/01/58 (c) | | | 1,000 | | | | 964,145 | |
Health & Educational Facilities Authority of the State of Missouri (RB) 5.00%, 11/15/45 (c) | | | 1,000 | | | | 993,529 | |
| | | | | | | | 2,908,482 | |
| Nebraska: 0.6% | | | | | | | | |
Central Plains Energy Project, Gas Project Crossover No. 3, Series A (RB) 5.00%, 09/01/42 | | | 500 | | | | 516,896 | |
City of Omaha and County of Douglas, Public Building, Series B (GO) 4.00%, 05/01/50 (c) | | | 550 | | | | 520,087 | |
Nebraska Investment Finance Authority, Single Family Housing, Series E (RB) 4.80%, 09/01/53 (c) | | | 500 | | | | 502,915 | |
University of Nebraska Facilities Corp., Series A (RB) 4.00%, 07/15/59 (c) | | | 750 | | | | 691,170 | |
| | | Par
(000’s | ) | | Value | |
| Nebraska (continued) | | | | | | | | |
| 4.00%, 07/15/62 (c) | | $ | 500 | | | $ | 458,612 | |
| | | | | | | | 2,689,680 | |
| Nevada: 0.6% | | | | | | | | |
City of Carson, Tahoe Regional Healthcare Project (RB) 5.00%, 09/01/42 (c) | | | 390 | | | | 393,996 | |
City of Henderson, Utility System, Series A-1 (GO) 4.00%, 06/01/50 (c) | | | 675 | | | | 638,029 | |
County of Clarke, School District, Limited Tax, Series A (GO) 4.00%, 06/15/42 (c) | | | 500 | | | | 490,519 | |
Las Vegas Convention and Visitors Authority, Series B (RB) 4.00%, 07/01/49 (c) | | | 1,000 | | | | 939,890 | |
| | | | | | | | 2,462,434 | |
| New Hampshire: 0.1% | | | | | | | | |
National Finance Authority Hospital, St. Lukes University Health Network Project, Series B (RB) (AGM) 3.00%, 08/15/46 (c) | | | 500 | | | | 375,289 | |
| New Jersey: 4.0% | | | | | | | | |
New Jersey Economic Development Authority School Facilities, Series FFF (RB) 4.62%, 06/15/48 (c) | | | 1,000 | | | | 990,717 | |
New Jersey Educational Facilities Authority, New Jersey Princeton University, Series B (RB) 5.25%, 03/01/54 (c) | | | 1,500 | | | | 1,646,932 | |
New Jersey Educational Facilities Authority, New Jersey Princeton University, Series C (RB) 2.00%, 03/01/41 (c) | | | 500 | | | | 329,800 | |
New Jersey Health Care Facilities Financing Authority, Atlanticare Health System (RB) 2.50%, 07/01/51 (c) | | | 490 | | | | 294,057 | |
New Jersey Health Care Facilities Financing Authority, Inspira Health, Series A (RB) 4.00%, 07/01/41 (c) | | | 800 | | | | 776,965 | |
New Jersey Health Care Facilities Financing Authority, RWJ Barnabas Health, Series A (RB) 4.00%, 07/01/41 (c) | | | 305 | | | | 306,358 | |
New Jersey Housing and Mortgage Finance Agency, Single Family Housing (RB) 4.80%, 10/01/53 (c) | | | 500 | | | | 502,569 | |
See Notes to Financial Statements
VANECK LONG MUNI ETF
SCHEDULE OF INVESTMENTS
(continued)
| | | Par
(000’s | ) | | Value | |
| New Jersey (continued) | | | | | | | | |
New Jersey Housing and Mortgage Finance Agency, Single Family Housing, Series K (RB) 4.55%, 10/01/44 (c) | | $ | 1,000 | | | $ | 1,001,864 | |
| New Jersey Transportation Trust Fund Authority, Series AA (RB) | | | | | | | | |
| 4.00%, 06/15/45 (c) | | | 1,500 | | | | 1,423,844 | |
| 4.50%, 06/15/49 (c) | | | 910 | | | | 881,207 | |
| 5.00%, 06/15/45 (c) | | | 1,000 | | | | 1,005,671 | |
| New Jersey Transportation Trust Fund Authority, Series BB (RB) | | | | | | | | |
| 3.50%, 06/15/46 (c) | | | 365 | | | | 306,622 | |
| 4.00%, 06/15/44 (c) | | | 1,000 | | | | 954,491 | |
| 5.25%, 06/15/50 (c) | | | 1,000 | | | | 1,070,783 | |
| New Jersey Turnpike Authority, Series A (RB) | | | | | | | | |
| 4.00%, 01/01/48 (c) | | | 1,000 | | | | 966,012 | |
| 4.00%, 01/01/51 (c) | | | 1,000 | | | | 954,841 | |
New Jersey Turnpike Authority, Series B (RB) 5.25%, 01/01/49 (c) | | | 1,500 | | | | 1,643,743 | |
New Jersey Turnpike Authority, Series E (RB) 5.00%, 01/01/45 (c) | | | 955 | | | | 959,320 | |
South Jersey Transportation Authority, Transportation System, Series A (RB) 5.00%, 11/01/45 (c) | | | 500 | | | | 514,025 | |
Tobacco Settlement Financing Corp., Series A (RB) 5.00%, 06/01/46 (c) | | | 500 | | | | 511,264 | |
Tobacco Settlement Financing Corp., Series B (RB) 5.00%, 06/01/46 (c) | | | 465 | | | | 469,586 | |
| | | | | | | | 17,510,671 | |
| New Mexico: 0.0% | | | | | | | | |
New Mexico Mortgage Finance Authority, Single Family Mortgage, Series F (RB) 3.05%, 07/01/44 (c) | | | 290 | | | | 233,744 | |
| New York: 21.3% | | | | | | | | |
Battery Park City Authority, Series A (RB) 4.00%, 11/01/44 (c) | | | 1,000 | | | | 988,272 | |
City of New York, Series A (GO) 4.00%, 08/01/50 (c) | | | 1,000 | | | | 949,793 | |
City of New York, Series C (GO) 4.00%, 08/01/41 (c) | | | 1,000 | | | | 981,804 | |
| City of New York, Series D (GO) (BAM) | | | | | | | | |
| 4.00%, 03/01/50 (c) | | | 1,000 | | | | 950,233 | |
| 5.00%, 03/01/43 (c) | | | 750 | | | | 796,149 | |
City of New York, Series F (GO) 5.00%, 03/01/50 (c) | | | 1,000 | | | | 1,049,361 | |
| | | Par
(000’s | ) | | Value | |
| New York (continued) | | | | | | | | |
County of Monroe, Industrial Development Corp., University of Rochester Project, Series A (RB) 4.00%, 07/01/50 (c) | | $ | 900 | | | $ | 850,367 | |
Dutchess County Local Development Corp., Bard College Project, Series A (RB) 5.00%, 07/01/51 (c) | | | 1,000 | | | | 987,855 | |
Hudson Yards Infrastructure Corp., Series A (RB) 5.00%, 02/15/42 (c) | | | 645 | | | | 663,489 | |
Hudson Yards Infrastructure Corp., Series A (RB) (AGM) 4.00%, 02/15/47 (c) | | | 1,000 | | | | 953,210 | |
Long Island Power Authority Electric System (RB) 5.00%, 09/01/42 (c) | | | 1,000 | | | | 1,033,300 | |
Los Angeles Department of Water and Power, Series B (RB) 5.00%, 09/01/45 (c) | | | 1,000 | | | | 1,005,358 | |
| Metropolitan Transportation Authority, Series A (RB) | | | | | | | | |
| 4.00%, 11/15/51 (c) | | | 1,000 | | | | 936,500 | |
| 5.00%, 11/15/44 (c) | | | 1,000 | | | | 1,070,765 | |
Metropolitan Transportation Authority, Series A (RB) (AGM) 5.00%, 11/15/44 (c) | | | 715 | | | | 741,136 | |
| Metropolitan Transportation Authority, Series A-1 (RB) | | | | | | | | |
| 4.00%, 11/15/43 (c) | | | 400 | | | | 368,670 | |
| 4.00%, 11/15/49 (c) | | | 1,000 | | | | 895,534 | |
| 5.00%, 11/15/45 (c) | | | 590 | | | | 592,778 | |
Metropolitan Transportation Authority, Series B-1 (RB) 5.00%, 11/15/51 (c) | | | 500 | | | | 506,199 | |
| Metropolitan Transportation Authority, Series C-1 (RB) | | | | | | | | |
| 4.75%, 11/15/45 (c) | | | 1,000 | | | | 1,018,040 | |
| 5.25%, 11/15/56 (c) | | | 1,050 | | | | 1,066,969 | |
| Metropolitan Transportation Authority, Series D (RB) | | | | | | | | |
| 4.00%, 11/15/46 (c) | | | 250 | | | | 228,313 | |
| 4.00%, 11/15/42 (c) | | | 1,245 | | | | 1,158,408 | |
Metropolitan Transportation Authority, Series E (RB) 5.00%, 11/15/43 (c) | | | 180 | | | | 180,102 | |
Monroe County Industrial Development Corp. Rochester Regional Health Project, Series A (RB) 4.00%, 12/01/46 (c) | | | 650 | | | | 555,680 | |
MTA Hudson Rail Yards Trust, Series A (RB) 5.00%, 11/15/56 (c) | | | 1,000 | | | | 983,798 | |
See Notes to Financial Statements
| | | Par
(000’s | ) | | Value | |
| New York (continued) | | | | | | | | |
New York City Environmental Facilities, Clean Water and Drinking Water, Series B (RB) 4.00%, 06/15/49 (c) | | $ | 500 | | | $ | 480,367 | |
New York City Housing Development Corp., Housing Impact, Series A (RB) 4.80%, 02/01/53 (c) | | | 500 | | | | 501,863 | |
| New York City Housing Development Corp., Multi-Family Housing, Series A-1 (RB) | | | | | | | | |
| 4.75%, 11/01/54 (c) | | | 1,000 | | | | 999,566 | |
| 4.85%, 11/01/53 (c) | | | 1,500 | | | | 1,509,545 | |
New York City Housing Development Corp., Multi-Family Housing, Series C-1 (RB) 2.25%, 11/01/41 (c) | | | 800 | | | | 542,338 | |
New York City Housing Development Corp., Multi-Family Housing, Series E-1 (RB) 4.85%, 11/01/53 (c) | | | 750 | | | | 755,036 | |
New York City Housing Development Corp., Multi-Family Housing, Series J (RB) 3.05%, 11/01/49 (c) | | | 555 | | | | 406,663 | |
| New York City Municipal Water Finance Authority, Water and Sewer System, Series AA (RB) | | | | | | | | |
| 4.00%, 06/15/50 (c) | | | 1,000 | | | | 957,086 | |
| 5.00%, 06/15/48 (c) | | | 850 | | | | 898,693 | |
| New York City Municipal Water Finance Authority, Water and Sewer System, Series BB (RB) | | | | | | | | |
| 4.00%, 06/15/45 (c) | | | 2,000 | | | | 1,949,060 | |
| 5.00%, 06/15/49 (c) | | | 1,000 | | | | 1,042,578 | |
| 5.00%, 06/15/44 (c) | | | 955 | | | | 1,026,270 | |
| New York City Municipal Water Finance Authority, Water and Sewer System, Series CC (RB) | | | | | | | | |
| 3.75%, 06/15/47 (c) | | | 710 | | | | 616,995 | |
| 4.00%, 06/15/52 (c) | | | 500 | | | | 477,603 | |
| 4.00%, 06/15/45 (c) | | | 1,500 | | | | 1,400,744 | |
| 5.00%, 06/15/52 (c) | | | 1,000 | | | | 1,053,988 | |
| 5.25%, 06/15/54 (c) | | | 1,500 | | | | 1,640,017 | |
| New York City Municipal Water Finance Authority, Water and Sewer System, Series CC (RB) | | | | | | | | |
| 4.00%, 06/15/51 (c) | | | 1,000 | | | | 957,605 | |
| 5.00%, 06/15/51 (c) | | | 500 | | | | 526,100 | |
| New York City Municipal Water Finance Authority, Water and Sewer System, Series DD (RB) | | | | | | | | |
| 4.12%, 06/15/47 (c) | | | 1,000 | | | | 977,563 | |
| | | Par
(000’s | ) | | Value | |
| New York (continued) | | | | | | | | |
New York City Transitional Finance Authority Building Aid, Series S-1 (RB) (SAW) 3.00%, 07/15/49 (c) | | $ | 350 | | | $ | 262,712 | |
| New York City Transitional Finance Authority, Future Tax Secured Subordinate, Series B (RB) | | | | | | | | |
| 4.38%, 05/01/53 (c) | | | 1,500 | | | | 1,481,173 | |
| 5.25%, 05/01/50 (c) | | | 1,000 | | | | 1,086,323 | |
| New York City Transitional Finance Authority, Future Tax Secured Subordinate, Series B-1 (RB) | | | | | | | | |
| 4.00%, 08/01/42 (c) | | | 1,500 | | | | 1,478,953 | |
| 4.00%, 08/01/45 (c) | | | 1,000 | | | | 968,244 | |
New York City Transitional Finance Authority, Future Tax Secured Subordinate, Series C (RB) 5.25%, 05/01/48 (c) | | | 1,000 | | | | 1,091,319 | |
| New York City Transitional Finance Authority, Future Tax Secured Subordinate, Series C-1 (RB) | | | | | | | | |
| 4.00%, 05/01/41 (c) | | | 500 | | | | 495,826 | |
| 4.00%, 05/01/44 (c) | | | 1,000 | | | | 974,094 | |
| 4.00%, 11/01/42 (c) | | | 1,120 | | | | 1,093,903 | |
New York City Transitional Finance Authority, Future Tax Secured Subordinate, Series D-1 (RB) 4.00%, 11/01/47 (c) | | | 500 | | | | 481,374 | |
| New York City Transitional Finance Authority, Future Tax Secured Subordinate, Series E-1 (RB) | | | | | | | | |
| 2.25%, 02/01/51 (c) | | | 650 | | | | 379,521 | |
| 4.00%, 02/01/44 (c) | | | 1,000 | | | | 961,264 | |
| 5.00%, 02/01/43 (c) | | | 1,000 | | | | 1,026,969 | |
| New York City Transitional Finance Authority, Future Tax Secured Subordinate, Series F-1 (RB) | | | | | | | | |
| 4.00%, 02/01/51 (c) | | | 1,000 | | | | 951,430 | |
| 5.25%, 02/01/47 (c) | | | 1,000 | | | | 1,088,930 | |
New York City Water and Sewer System, Series BB (RB) 4.00%, 06/15/50 (c) | | | 640 | | | | 612,535 | |
New York City, Series D (GO) 4.00%, 04/01/50 (c) | | | 1,000 | | | | 950,163 | |
New York City, Series D-1 (GO) 5.00%, 12/01/43 (c) | | | 1,000 | | | | 1,049,038 | |
New York Liberty Development Corp., 1 World Trade Center Project (RB) 4.00%, 02/15/43 (c) | | | 620 | | | | 607,136 | |
See Notes to Financial Statements
VANECK LONG MUNI ETF
SCHEDULE OF INVESTMENTS
(continued)
| | | Par
(000’s | ) | | Value | |
| New York (continued) | | | | | | | | |
| New York State Dormitory Authority, New School, Series A (RB) | | | | | | | | |
| 4.00%, 07/01/43 (c) | | $ | 475 | | | $ | 448,305 | |
| 5.00%, 07/01/46 (c) | | | 420 | | | | 424,290 | |
New York State Dormitory Authority, Northwell Health, Series A (RB) 5.00%, 05/01/52 (c) | | | 1,300 | | | | 1,345,674 | |
| New York State Dormitory Authority, Personal Income Tax, Series A (RB) | | | | | | | | |
| 3.00%, 03/15/42 (c) | | | 500 | | | | 411,085 | |
| 5.00%, 03/15/49 (c) | | | 500 | | | | 525,092 | |
| 5.25%, 03/15/52 (c) | | | 800 | | | | 867,089 | |
| New York State Dormitory Authority, Personal Income Tax, Series B (RB) | | | | | | | | |
| 5.00%, 02/15/44 (c) | | | 730 | | | | 732,393 | |
| 5.00%, 02/15/42 (c) | | | 1,500 | | | | 1,549,317 | |
New York State Dormitory Authority, Sales Tax, Series A (RB) 4.00%, 03/15/48 (c) | | | 1,000 | | | | 954,608 | |
New York State Dormitory Authority, St. John's University, Series A (RB) 4.00%, 07/01/48 (c) | | | 550 | | | | 503,753 | |
| New York State Dormitory Authority, State Sales Tax, Series A (RB) | | | | | | | | |
| 4.00%, 03/15/47 (c) | | | 800 | | | | 763,210 | |
| 4.00%, 03/15/49 (c) | | | 1,000 | | | | 957,641 | |
| 5.00%, 03/15/45 (c) | | | 1,000 | | | | 1,034,121 | |
New York State Dormitory Authority, State Sales Tax, Series E (RB) 5.00%, 03/15/48 (c) | | | 500 | | | | 516,791 | |
New York State Mortgage Agency, Homeowner Mortgage (RB) 4.90%, 10/01/53 (c) | | | 1,355 | | | | 1,363,706 | |
New York State Mortgage Agency, Homeowner Mortgage (RB) (SBG) 2.55%, 04/01/50 (c) | | | 330 | | | | 214,638 | |
New York State Power Authority, Series A (RB) 4.00%, 11/15/50 (c) | | | 500 | | | | 476,934 | |
New York State Thruway Authority, Junior Indebtedness, Series B (RB) 4.00%, 01/01/45 (c) | | | 1,440 | | | | 1,371,214 | |
New York State Thruway Authority, Personal Income Tax, Series A (RB) 4.00%, 03/15/55 (c) | | | 1,000 | | | | 913,566 | |
| | | Par
(000’s | ) | | Value | |
| New York (continued) | | | | | | | | |
New York State Thruway Authority, Series P (RB) 5.25%, 01/01/54 (c) | | $ | 1,000 | | | $ | 1,084,641 | |
New York State Urban Development Corp., Personal Income Tax (RB) 5.00%, 03/15/63 (c) | | | 2,000 | | | | 2,100,249 | |
| New York State Urban Development Corp., Personal Income Tax, Series A (RB) | | | | | | | | |
| 4.00%, 03/15/53 (c) | | | 1,000 | | | | 928,755 | |
| 5.00%, 03/15/43 (c) | | | 500 | | | | 523,650 | |
| New York State Urban Development Corp., Personal Income Tax, Series C (RB) | | | | | | | | |
| 3.00%, 03/15/48 (c) | | | 550 | | | | 408,733 | |
| 5.00%, 03/15/47 (c) | | | 2,000 | | | | 2,102,906 | |
New York State Urban Development Corp., State Sales Tax, Series A (RB) 3.00%, 03/15/50 (c) | | | 1,000 | | | | 733,236 | |
New York State, Dormitory Authority, Personal Income Tax, Series D (RB) 5.00%, 02/15/48 (c) | | | 820 | | | | 857,172 | |
| New York Transportation Development Corp., Terminal 4 John F. Kennedy International Airport Project, Series C (RB) | | | | | | | | |
| 4.00%, 12/01/41 (c) | | | 1,230 | | | | 1,192,402 | |
| 4.00%, 12/01/42 (c) | | | 925 | | | | 889,492 | |
Port Authority of New York & New Jersey (RB) 5.00%, 10/15/41 (c) | | | 1,000 | | | | 1,014,467 | |
| Triborough Bridge and Tunnel Authority Sales Tax, Series A (RB) | | | | | | | | |
| 4.00%, 05/15/57 (c) | | | 840 | | | | 784,188 | |
| 4.25%, 05/15/58 (c) | | | 1,000 | | | | 968,079 | |
| Triborough Bridge and Tunnel Authority, Payroll Mobility Tax, Series B (RB) | | | | | | | | |
| 5.00%, 05/15/56 (c) | | | 500 | | | | 512,416 | |
| 5.25%, 11/15/53 (c) | | | 750 | | | | 811,808 | |
| Triborough Bridge and Tunnel Authority, Payroll Mobility Tax, Series C (RB) | | | | | | | | |
| 4.00%, 05/15/51 (c) | | | 750 | | | | 713,844 | |
| 5.00%, 05/15/51 (c) | | | 1,000 | | | | 1,054,951 | |
Triborough Bridge and Tunnel Authority, Payroll Mobility Tax, Series D (RB) 4.50%, 05/15/47 (c) | | | 500 | | | | 512,991 | |
| Triborough Bridge and Tunnel Authority, Series A (RB) | | | | | | | | |
| 5.00%, 11/15/49 (c) | | | 1,000 | | | | 1,049,844 | |
| 5.00%, 11/15/54 (c) | | | 750 | | | | 782,559 | |
| 5.00%, 11/15/51 (c) | | | 1,000 | | | | 1,049,992 | |
See Notes to Financial Statements
| | | Par
(000’s | ) | | Value | |
| New York (continued) | | | | | | | | |
TSASC, Inc., Tobacco Settlement, Series A (RB) 5.00%, 06/01/41 (c) | | $ | 1,000 | | | $ | 1,016,785 | |
| | | | | | | | 93,739,257 | |
| North Carolina: 0.8% | | | | | | | | |
North Carolina Housing Finance Agency, Home Ownership (RB) 4.88%, 07/01/42 (c) | | | 500 | | | | 510,920 | |
North Carolina Housing Finance Agency, Home Ownership, Series A (RB) 4.38%, 07/01/44 (c) | | | 1,000 | | | | 983,170 | |
North Carolina Medical Care Commission, Health Care Facilities, Series A (RB) 4.00%, 11/01/49 (c) | | | 1,000 | | | | 966,334 | |
| North Carolina Turnpike Authority, Triangle Expressway System (RB) | | | | | | | | |
| 5.00%, 01/01/44 (c) | | | 500 | | | | 512,536 | |
| 5.00%, 01/01/49 (c) | | | 750 | | | | 762,445 | |
| | | | | | | | 3,735,405 | |
| North Dakota: 0.2% | | | | | | | | |
North Dakota Housing Finance Agency, Home Mortgage Finance Program, Series A (RB) 4.70%, 07/01/47 (c) | | | 1,000 | | | | 1,006,681 | |
| Ohio: 1.8% | | | | | | | | |
Buckeye Tobacco Settlement Financing Authority, Series A-2 (RB) 4.00%, 06/01/48 (c) | | | 1,000 | | | | 891,736 | |
County of Allen, Ohio Hospital Facilities, Mercy Health, Series A (RB) 5.00%, 11/01/43 (c) | | | 600 | | | | 602,065 | |
| County of Cuyahoga, Ohio Hospital, The Metrohealth System (RB) | | | | | | | | |
| 5.00%, 02/15/42 (c) | | | 1,000 | | | | 1,002,451 | |
| 5.00%, 02/15/57 (c) | | | 1,000 | | | | 962,151 | |
| 5.25%, 02/15/47 (c) | | | 1,000 | | | | 1,002,385 | |
| 5.50%, 02/15/57 (c) | | | 1,000 | | | | 1,011,413 | |
County of Franklin, Ohio Various Purpose Sales Tax (RB) 5.00%, 06/01/48 (c) | | | 1,075 | | | | 1,114,119 | |
County of Hamilton, Ohio Healthcare Improvement, Life Enriching Communities Project (RB) 5.00%, 01/01/46 (c) | | | 250 | | | | 233,371 | |
County of Hamilton, Ohio Hospital Facilities, TriHealth, Inc. (RB) 5.00%, 08/15/42 (c) | | | 1,000 | | | | 1,020,881 | |
| | | | | | | | 7,840,572 | |
| | | Par
(000’s | ) | | Value | |
| Oklahoma: 0.3% | | | | | | | | |
Oklahoma Turnpike Authority, Series A (RB) 4.00%, 01/01/48 (c) | | $ | 700 | | | $ | 666,140 | |
University of Oklahoma, Series A (RB) (BAM) 5.00%, 07/01/49 (c) | | | 835 | | | | 894,256 | |
| | | | | | | | 1,560,396 | |
| Oregon: 0.9% | | | | | | | | |
City of Portland, Oregon Sewer System, Series A (RB) 5.00%, 12/01/42 (c) | | | 500 | | | | 551,680 | |
| Multnomah County School District No. 1J, Series B (GO) (SBG) | | | | | | | | |
| 2.00%, 06/15/42 (c) | | | 550 | | | | 355,898 | |
| 3.25%, 06/15/42 (c) | | | 295 | | | | 252,155 | |
Oregon Health and Science University, Series A (RB) 4.00%, 07/01/51 (c) | | | 1,000 | | | | 937,537 | |
Tri-County Metropolitan Transportation District of Oregon, Series A (RB) 3.00%, 09/01/44 (c) | | | 935 | | | | 740,854 | |
University of Oregon, Series A (RB) 5.00%, 04/01/50 (c) | | | 1,000 | | | | 1,042,591 | |
| | | | | | | | 3,880,715 | |
| Pennsylvania: 4.0% | | | | | | | | |
Chester County Health and Education Facilities Authority, Main Line Health System, Series A (RB) 4.00%, 09/01/50 (c) | | | 645 | | | | 599,414 | |
City of Philadelphia, Pennsylvania Gas Works (RB) 5.00%, 08/01/47 (c) | | | 805 | | | | 817,390 | |
| City of Philadelphia, Pennsylvania Water & Wastewater, Series A (RB) | | | | | | | | |
| 5.00%, 10/01/52 (c) | | | 500 | | | | 509,857 | |
| 5.00%, 10/01/47 (c) | | | 500 | | | | 511,955 | |
Commonwealth of Pennsylvania, Series A (CP) (FHA) 4.00%, 07/01/46 (c) | | | 1,170 | | | | 1,111,153 | |
Geisinger Authority, Health System, Series A (RB) 5.00%, 04/01/50 (c) | | | 1,000 | | | | 1,021,037 | |
Lancaster County, Hospital Authority, Penn State Health (RB) 5.00%, 11/01/51 (c) | | | 1,000 | | | | 1,019,596 | |
Pennsylvania Economic Development Financing Authority, Presbyterian Senior Living Project, Series B-2 (RB) 5.25%, 07/01/46 (c) | | | 1,000 | | | | 1,019,877 | |
See Notes to Financial Statements
VANECK LONG MUNI ETF
SCHEDULE OF INVESTMENTS
(continued)
| | | Par
(000’s | ) | | Value | |
| Pennsylvania (continued) | | | | | | | | |
Pennsylvania Housing Finance Agency, Single Family Mortgage (RB) 2.28%, 10/01/41 (c) | | $ | 500 | | | $ | 358,287 | |
| Pennsylvania Housing Finance Agency, Single Family Mortgage, Series A (RB) | | | | | | | | |
| 4.30%, 10/01/41 (c) | | | 1,000 | | | | 984,503 | |
| 4.85%, 10/01/43 (c) | | | 500 | | | | 509,557 | |
| 5.00%, 10/01/43 (c) | | | 1,000 | | | | 1,027,383 | |
Pennsylvania Housing Finance Agency, Single Family Mortgage, Series B (RB) 3.65%, 10/01/42 (c) | | | 260 | | | | 232,529 | |
Pennsylvania State University (RB) 5.25%, 09/01/53 (c) | | | 1,000 | | | | 1,088,164 | |
Pennsylvania Turnpike Commission, Oil Franchise Tax, Series A (RB) (AGM) 5.00%, 12/01/48 (c) | | | 290 | | | | 300,068 | |
Pennsylvania Turnpike Commission, Oil Franchise Tax, Series A (RB) (BAM) 4.00%, 12/01/51 (c) | | | 1,000 | | | | 951,129 | |
Pennsylvania Turnpike Commission, Series A (RB) 5.00%, 12/01/44 (c) | | | 1,000 | | | | 1,004,399 | |
Pennsylvania Turnpike Commission, Series A (RB) (AGM) 4.00%, 12/01/49 (c) | | | 1,045 | | | | 999,870 | |
Pennsylvania Turnpike Commission, Series A-1 (RB) 5.00%, 12/01/47 (c) | | | 900 | | | | 927,864 | |
| Pennsylvania Turnpike Commission, Series B (RB) | | | | | | | | |
| 4.00%, 12/01/46 (c) | | | 1,000 | | | | 946,533 | |
| 5.00%, 12/01/45 (c) | | | 800 | | | | 850,084 | |
Upper Merion Area School District, Series A (GO) (SAW) 4.00%, 01/15/46 (c) | | | 1,105 | | | | 1,062,065 | |
| | | | | | | | 17,852,714 | |
| Rhode Island: 0.1% | | | | | | | | |
State of Rhode Island, Series A (GO) 4.12%, 08/01/42 (c) | | | 600 | | | | 606,471 | |
| South Carolina: 1.0% | | | | | | | | |
South Carolina Jobs-Economic Development Authority, Mercy Health, Series A (RB) 4.00%, 12/01/44 (c) | | | 855 | | | | 814,695 | |
South Carolina Jobs-Economic Development Authority, Prisma Health, Series A (RB) 5.00%, 05/01/48 (c) | | | 1,000 | | | | 1,008,259 | |
| | | Par
(000’s | ) | | Value | |
| South Carolina (continued) | | | | | | | | |
South Carolina Public Service Authority, Santee Cooper, Series A (RB) 4.00%, 12/01/52 (c) | | $ | 500 | | | $ | 446,540 | |
South Carolina Public Service Authority, Series E (RB) 5.25%, 12/01/55 (c) | | | 1,500 | | | | 1,503,253 | |
University of South Carolina, Campus Village Project, Series A (RB) 5.00%, 05/01/46 (c) | | | 820 | | | | 871,770 | |
| | | | | | | | 4,644,517 | |
| Tennessee: 0.9% | | | | | | | | |
Metropolitan Government of Nashville and Davidson County, Vanderbilt University Medical Center, Series A (RB) 5.00%, 07/01/46 (c) | | | 1,500 | | | | 1,510,111 | |
Tennessee Housing Development Agency, Residential Finance Program (RB) 2.95%, 07/01/49 (c) | | | 335 | | | | 241,423 | |
Tennessee Housing Development Agency, Residential Finance Program, Series A (RB) 5.40%, 07/01/53 (c) | | | 1,000 | | | | 1,036,930 | |
Tennessee State School Bond Authority, Higher Education Facilities, Series A (RB) 5.00%, 11/01/42 (c) | | | 1,040 | | | | 1,069,962 | |
| | | | | | | | 3,858,426 | |
| Texas: 11.4% | | | | | | | | |
Arlington Higher Education Finance Corp., Harmony Public Schools, Series A (RB) 3.00%, 02/15/46 (c) | | | 1,000 | | | | 743,616 | |
Arlington Higher Education Finance Corp., Riverwalk Education Foundation, Inc. (RB) 4.00%, 08/15/44 (c) | | | 675 | | | | 649,899 | |
| Austin Independent School District, Unlimited Tax School Building (GO) | | | | | | | | |
| 4.00%, 08/01/48 (c) | | | 1,000 | | | | 955,274 | |
| 4.00%, 08/01/44 (c) | | | 750 | | | | 739,069 | |
| Board of Regents of the University of Texas System, Series A (RB) | | | | | | | | |
| 3.00%, 08/15/41 (c) | | | 525 | | | | 434,501 | |
| 4.00%, 07/01/41 (c) | | | 500 | | | | 502,684 | |
Central Texas Regional Mobility Authority, Senior Lien, Series E (RB) 5.00%, 01/01/45 (c) | | | 750 | | | | 778,876 | |
See Notes to Financial Statements
| | | Par
(000’s | ) | | Value | |
| Texas (continued) | | | | | | | | |
City of Austin, Texas Electricity Utility System, Series A (RB) 5.00%, 11/15/49 (c) | | $ | 1,375 | | | $ | 1,433,779 | |
City of Austin, Waterwaste System (RB) 5.00%, 11/15/43 (c) | | | 1,000 | | | | 1,082,128 | |
City of El Paso (GO) 4.00%, 08/15/45 (c) | | | 950 | | | | 910,565 | |
City of Lubbock, Texas Electric Light & Power System (RB) 4.00%, 04/15/46 (c) | | | 650 | | | | 606,332 | |
City of Royse, Independent School District (GO) 5.00%, 02/15/48 (c) | | | 950 | | | | 1,014,441 | |
| City of San Antonio, Texas Electric & Gas Systems (RB) | | | | | | | | |
| 5.00%, 02/01/44 (c) | | | 500 | | | | 531,627 | |
| 5.00%, 02/01/44 (c) | | | 260 | | | | 252,905 | |
Colin and Kaufman Counties, School Independent District (GO) 4.00%, 02/15/53 (c) | | | 1,000 | | | | 938,364 | |
Conroe Independent School District, Unlimited Tax School (GO) 5.00%, 02/15/49 (c) | | | 1,000 | | | | 1,072,558 | |
County of Collin, Limited Tax (GO) 4.00%, 02/15/43 (c) | | | 1,000 | | | | 989,804 | |
Cypress-Fairbanks Independent School District, Series A (GO) 2.25%, 02/15/43 (c) | | | 600 | | | | 397,964 | |
Dallas Fort Worth International Airport, Series B (RB) 4.00%, 11/01/45 (c) | | | 2,500 | | | | 2,413,404 | |
| Dallas Independent School District, Unlimited Tax School Building (GO) | | | | | | | | |
| 4.00%, 02/15/53 (c) | | | 1,000 | | | | 933,709 | |
| 4.00%, 02/15/54 (c) | | | 1,000 | | | | 929,451 | |
| 5.00%, 02/15/49 (c) | | | 1,000 | | | | 1,068,672 | |
Denton Independent School District, Unlimited Tax School Building (GO) 5.00%, 08/15/48 (c) | | | 1,000 | | | | 1,075,227 | |
El Paso Independent School District, Unlimited Tax School Building (GO) 4.00%, 08/15/48 (c) | | | 1,000 | | | | 955,050 | |
Ford Bens County, Unlimited Tax Road (GO) 5.25%, 03/01/53 (c) | | | 1,000 | | | | 1,081,408 | |
Grand Parkway Transportation Corp. System, First Tier Toll, Series C (RB) 4.00%, 10/01/49 (c) | | | 770 | | | | 702,910 | |
| | | Par
(000’s | ) | | Value | |
| Texas (continued) | | | | | | | | |
Grand Parkway Transportation Corp. System, Subordinate Tier Toll, Series A (RB) 5.00%, 10/01/48 (c) | | $ | 640 | | | $ | 658,426 | |
Harris County, Cultural Education Facilities Finance Corp., Houston Methodist Hospital (RB) 4.00%, 12/01/45 (c) | | | 590 | | | | 546,351 | |
Harris County, Cultural Education Facilities Finance Corp., Texas Children's Hospital, Series A (RB) 4.00%, 10/01/47 (c) | | | 1,000 | | | | 943,381 | |
Harris County, Flood Control District, Series A (GO) 4.00%, 10/01/45 (c) | | | 500 | | | | 485,651 | |
Harris County, Hospital District (RB) 4.00%, 02/15/42 (c) | | | 560 | | | | 524,050 | |
Harris County, Texas Toll Road, Series A (RB) 4.00%, 08/15/48 (c) | | | 1,000 | | | | 950,705 | |
Hurst Euless Bedford Independent School District (GO) 5.00%, 08/15/43 (c) | | | 1,000 | | | | 1,103,833 | |
Katy Independent School District (GO) 4.00%, 02/15/53 (c) | | | 750 | | | | 693,373 | |
Keller Independent School District (GO) 4.00%, 02/15/47 (c) | | | 1,000 | | | | 954,607 | |
Lamar Consolidated Independent School District (GO) (AGM) 5.50%, 02/15/58 (c) | | | 2,000 | | | | 2,190,413 | |
Leander Independent School District, Series A (GO) 0.00%, 08/16/42 (c) ^ | | | 900 | | | | 382,625 | |
Lower Colorado River Authority Transmission, LCRA Transmission Services Corp. Project (RB) 5.00%, 05/15/45 (c) | | | 1,500 | | | | 1,511,193 | |
Lower Colorado River Authority Transmission, LCRA Transmission Services Corp. Project, Series S (RB) 5.00%, 05/15/43 (c) | | | 500 | | | | 515,370 | |
North Texas Tollway Authority System, Second Tier (RB) 4.25%, 01/01/49 (c) | | | 750 | | | | 716,645 | |
Northwest Independent School District, Unlimited Tax School Building (GO) 4.00%, 02/15/47 (c) | | | 1,000 | | | | 971,579 | |
See Notes to Financial Statements
VANECK LONG MUNI ETF
SCHEDULE OF INVESTMENTS
(continued)
| | | Par
(000’s | ) | | Value | |
| Texas (continued) | | | | | | | | |
Pflugerville Independent School District, Unlimited Tax School Building, Series A (GO) 5.00%, 02/15/48 (c) | | $ | 1,000 | | | $ | 1,036,450 | |
San Jacinto College District, Series A (GO) 5.00%, 02/15/44 (c) | | | 900 | | | | 934,259 | |
State of Texas, Department of Housing & Community Affairs, Residential Mortgage, Series A (RB) 5.25%, 01/01/53 (c) | | | 1,000 | | | | 1,026,915 | |
| Texarkana Independent School District (GO) | | | | | | | | |
| 4.00%, 02/15/53 (c) | | | 1,000 | | | | 935,257 | |
| 4.00%, 08/15/53 (c) | | | 1,015 | | | | 953,510 | |
Texas Department of Housing and Community Affairs, Residential Mortgage, Series B (RB) 5.25%, 07/01/53 (c) | | | 1,000 | | | | 1,025,550 | |
| Texas Water Development Board (RB) | | | | | | | | |
| 4.00%, 10/15/45 (c) | | | 500 | | | | 486,217 | |
| 4.80%, 10/15/52 (c) | | | 1,000 | | | | 1,034,981 | |
| Texas Water Development Board, Series A (RB) | | | | | | | | |
| 4.00%, 10/15/49 (c) | | | 990 | | | | 936,165 | |
| 5.00%, 10/15/43 (c) | | | 840 | | | | 874,134 | |
Texas Water Development Board, Series B (RB) 4.00%, 10/15/43 (c) | | | 1,000 | | | | 978,704 | |
| Tomball Independent School District (GO) | | | | | | | | |
| 4.00%, 02/15/45 (c) | | | 1,000 | | | | 969,939 | |
| 5.00%, 02/15/42 (c) | | | 1,000 | | | | 1,090,348 | |
University of Houston, Series A (RB) 5.00%, 02/15/56 (c) | | | 500 | | | | 525,200 | |
Waller Independent School District, Series A (GO) 4.00%, 02/15/48 (c) | | | 500 | | | | 480,438 | |
Ysleta Independent School District (GO) 5.00%, 08/15/56 (c) | | | 500 | | | | 524,524 | |
| | | | | | | | 50,155,010 | |
| Utah: 0.6% | | | | | | | | |
Salt Lake City, International Airport, Series B (RB) 5.00%, 07/01/43 (c) | | | 360 | | | | 375,037 | |
| University of Utah, Board of Higher Education, Series A (RB) | | | | | | | | |
| 4.00%, 08/01/51 (c) | | | 1,000 | | | | 949,367 | |
| 5.00%, 08/01/46 (c) | | | 1,160 | | | | 1,242,678 | |
Utah County, IHC Health Services, Inc., Series B (RB) 3.00%, 05/15/47 (c) | | | 210 | | | | 160,933 | |
| | | | | | | | 2,728,015 | |
| | | Par
(000’s | ) | | Value | |
| Virginia: 1.2% | | | | | | | | |
Fairfax County Industrial Development Authority, Inova Health System Project, Series B (RB) 4.00%, 05/15/48 (c) | | $ | 1,000 | | | $ | 953,604 | |
| Hampton Roads Transportation Accountability Commission, Series A (RB) | | | | | | | | |
| 4.00%, 07/01/57 (c) | | | 600 | | | | 558,063 | |
| 5.00%, 07/01/60 (c) | | | 500 | | | | 521,429 | |
| 5.00%, 07/01/50 (c) | | | 625 | | | | 655,853 | |
University of Virginia, Series A (RB) 5.00%, 04/01/42 (c) | | | 1,000 | | | | 1,039,560 | |
Virginia Small Business Financing Authority, National senior Campuses, Inc., Series A (RB) 4.00%, 01/01/45 (c) | | | 500 | | | | 451,117 | |
Williamsburg Economic Development Authority, Virginia Student Housing, William and Mary Project, Series A (RB) (AGM) 4.38%, 07/01/63 (c) | | | 1,000 | | | | 962,353 | |
| | | | | | | | 5,141,979 | |
| Washington: 1.8% | | | | | | | | |
Central Puget Sound Regional Transit Authority, Sales Tax and Motor Vehicle Excise Tax, Series S (RB) 5.00%, 11/01/41 (c) | | | 1,000 | | | | 1,024,883 | |
| City of Seattle, Washington Municipal Light and Power, Series A (RB) | | | | | | | | |
| 4.00%, 05/01/45 (c) | | | 1,000 | | | | 951,151 | |
| 5.00%, 03/01/53 (c) | | | 1,000 | | | | 1,058,523 | |
Energy Northwest, Columbia Generating Station Electric, Series A (RB) 4.00%, 07/01/42 (c) | | | 1,000 | | | | 988,016 | |
King County, Highline School District No. 401, Unlimited Tax (GO) (SBG) 4.00%, 12/01/42 (c) | | | 500 | | | | 492,695 | |
King County, Public Hospital District No. 2, Evergreen Health, Series A (GO) 4.00%, 12/01/45 (c) | | | 650 | | | | 607,178 | |
| State of Washington, Various Purpose, Series A (GO) | | | | | | | | |
| 5.00%, 08/01/42 (c) | | | 1,000 | | | | 1,061,694 | |
| 5.00%, 08/01/43 (c) | | | 1,090 | | | | 1,171,245 | |
Washington State Housing Finance Commission, Radford Court and Nordheim Court Portfolio (RB) 5.00%, 07/01/54 (c) | | | 500 | | | | 503,835 | |
| | | | | | | | 7,859,220 | |
See Notes to Financial Statements
| | | Par
(000’s | ) | | Value | |
| West Virginia: 0.4% | | | | | | | | |
West Virginia Hospital Finance Authority, West Virginia University Health System, Series A (RB) 4.38%, 06/01/53 (c) | | $ | 1,000 | | | $ | 957,260 | |
West Virginia Parkways Authority, Turnpike Toll (RB) 5.00%, 06/01/47 (c) | | | 620 | | | | 655,616 | |
| | | | | | | | 1,612,876 | |
| Wisconsin: 0.9% | | | | | | | | |
Public Finance Authority, Pooled Charter School (RB) 5.75%, 07/01/62 (c) | | | 1,000 | | | | 1,074,490 | |
Public Finance Authority, Renown Regional Medical Center Project, Series A (RB) 4.25%, 06/01/41 (c) | | | 500 | | | | 489,107 | |
| | | Par
(000’s | ) | | Value | |
| Wisconsin (continued) | | | | | | | | |
Wisconsin Health and Educational Facilities Authority, Children's Hospital, Inc. (RB) 4.00%, 08/15/47 (c) | | $ | 1,000 | | | $ | 941,398 | |
Wisconsin Health and Educational Facilities Authority, Marshfield Clinic Health System, Inc., Series A (RB) 5.00%, 02/15/46 (c) | | | 250 | | | | 242,936 | |
Wisconsin Housing and Economic Development Authority, Home Ownership, Series A (RB) 4.85%, 09/01/43 (c) | | | 1,000 | | | | 1,018,534 | |
| | | | | | | | 3,766,465 | |
Total Municipal Bonds: 98.2%
(Cost: $450,991,900) | | | | | | | 432,652,276 | |
| Other assets less liabilities: 1.8% | | | | | | | 7,849,211 | |
| NET ASSETS: 100.0% | | | | | | $ | 440,501,487 | |
Definitions:
| AGC | Assured Guaranty Corp. |
| AGM | Assured Guaranty Municipal Corp. |
| BAM | Build America Assurance Co. |
| CP | Certificate of Participation |
| FHA | Federal Housing Association |
| GO | General Obligation |
| NATL | National Public Finance Guarantee Corp. |
| RB | Revenue Bond |
| SA | Special Assessment |
| SAW | State Aid Withholding |
| SBG | School Board Guaranteed |
| SD CRED PROG | Special District Credit Enhancement Program |
| ST | Special Tax |
Footnotes:
| (c) | Callable Security — the redemption date shown is the date the security may be redeemed by the issuer |
| (p) | Putable Security — the redemption date shown is the date the security may be redeemed by the investor |
| ^ | Zero Coupon Bond |
See Notes to Financial Statements
VANECK LONG MUNI ETF
SCHEDULE OF INVESTMENTS
(continued)
| Summary of Investments by Sector | | % of
Investments | | Value | |
| Hospitals | | | 14.5 | % | | $ | 62,865,801 | |
| Local GO | | | 14.4 | | | | 62,409,896 | |
| Tax | | | 14.4 | | | | 62,376,676 | |
| Water & Sewer | | | 9.6 | | | | 41,375,736 | |
| Education | | | 8.1 | | | | 35,256,627 | |
| Toll & Turnpike | | | 6.8 | | | | 29,445,551 | |
| State GO | | | 6.2 | | | | 26,652,785 | |
| Transportation | | | 5.6 | | | | 24,362,779 | |
| Single Family Housing | | | 4.5 | | | | 19,312,165 | |
| Power | | | 3.6 | | | | 15,795,719 | |
| Leasing COPS & Appropriations | | | 2.9 | | | | 12,455,440 | |
| Airport | | | 2.7 | | | | 11,624,769 | |
| Multi-Family Housing | | | 1.8 | | | | 7,876,796 | |
| Utilities | | | 1.7 | | | | 7,232,130 | |
| Tobacco | | | 0.9 | | | | 3,695,442 | |
| Miscellaneous | | | 0.8 | | | | 3,619,421 | |
| Industrial Development Revenue | | | 0.6 | | | | 2,600,941 | |
| Health | | | 0.6 | | | | 2,459,840 | |
| Unassigned | | | 0.2 | | | | 1,001,864 | |
| Pollution Control | | | 0.1 | | | | 231,898 | |
| | | | 100.0 | % | | $ | 432,652,276 | |
The summary of inputs used to value the Fund's investments as of April 30, 2024 is as follows:
| | | Level 1
Quoted
Prices | | | Level 2
Significant
Observable
Inputs | | | Level 3
Significant
Unobservable
Inputs | | | Value | |
| Municipal Bonds * | | $ | — | | | $ | 432,652,276 | | | $ | — | | | $ | 432,652,276 | |
| * | See Schedule of Investments for geographic sector breakouts. |
See Notes to Financial Statements
VANECK SHORT HIGH YIELD MUNI ETF
SCHEDULE OF INVESTMENTS
April 30, 2024
| | | Par
(000’s | ) | | Value | |
| MUNICIPAL BONDS: 98.3% | | | | | | | | |
| Alabama: 2.3% | | | | | | | | |
Black Belt Energy Gas District, Project No. 8, Series A (RB) 4.00%, 12/01/52 (c) (p) | | $ | 1,000 | | | $ | 980,730 | |
Black Belt Energy Gas District, Series C-1 (RB) 4.00%, 10/01/52 (c) (p) | | | 2,100 | | | | 2,098,286 | |
City of Birmingham, Special Care Facilities Financing Authority, Methodist Home (RB) 5.50%, 06/01/30 (c) | | | 500 | | | | 488,136 | |
Hoover Industrial Development Board, United States Steel Corp. Project (RB) 6.38%, 11/01/50 (p) | | | 390 | | | | 428,040 | |
Lower Alabama Gas District, Project No. 2 (RB) (SAW) 4.00%, 12/01/50 (c) (p) | | | 1,000 | | | | 999,194 | |
Southeast Alabama Gas Supply District, Project No. 2, Series B (RB) 5.00%, 06/01/49 (c) (p) | | | 1,000 | | | | 1,042,684 | |
Tuscaloosa County Industrial Development Authority, Hunt Refining Project, Series A (RB) 4.50%, 05/01/32 (c) | | | 1,224 | | | | 1,222,959 | |
| | | | | | | | 7,260,029 | |
| Arizona: 2.1% | | | | | | | | |
Arizona Industrial Development Authority Education Facility, Leman Academy of Excellence, East and Central Tucson Projects, Series A (RB) 4.00%, 07/01/29 (c) | | | 500 | | | | 484,537 | |
Arizona Industrial Development Authority, Basis School Projects, Series A (RB) 4.75%, 07/01/29 (c) | | | 1,085 | | | | 1,084,442 | |
Arizona Industrial Development Authority, Economic Development, Linder Village Project (RB) (AGM) 5.00%, 06/01/31 | | | 925 | | | | 923,538 | |
Arizona Industrial Development Authority, Pinecrest Academy of Nevada, Cadence Campus Project, Series A (RB) 4.00%, 07/15/30 (c) | | | 445 | | | | 432,580 | |
Arizona Industrial Development Authority, Pinecrest Academy of Northern Nevada Project, Series A (RB) 4.50%, 07/15/29 (c) | | | 500 | | | | 471,125 | |
Arizona Industrial Development Authority, Point 320 LLC, Series A (RB) 3.62%, 05/20/33 | | | 459 | | | | 424,092 | |
| | | Par
(000’s | ) | | Value | |
| Arizona (continued) | | | | | | | | |
City of Phoenix Civic Improvement Corp., Junior Lien Airport, Series B (RB) 5.00%, 07/01/30 (c) | | $ | 1,000 | | | $ | 1,066,449 | |
Industrial Development Authority of the City of Phoenix, Basis Schools, Inc. Project, Series A (RB) 4.00%, 07/01/25 | | | 225 | | | | 223,225 | |
Maricopa County Industrial Development Authority, Legacy Traditional Schools Projects, Series B (RB) 4.00%, 07/01/29 | | | 1,390 | | | | 1,358,849 | |
| Salt Verde Financial Corp. (RB) | | | | | | | | |
| 5.25%, 12/01/28 | | | 10 | | | | 10,404 | |
| 5.50%, 12/01/29 | | | 370 | | | | 392,438 | |
| | | | | | | | 6,871,679 | |
| Arkansas: 0.6% | | | | | | | | |
Arkansas Development Finance Authority, Baptist Memorial Health Care Corp., Series B-2 (RB) 5.00%, 09/01/44 (c) (p) | | | 2,000 | | | | 2,081,785 | |
| California: 7.6% | | | | | | | | |
Antelope Valley Healthcare District, Series A (RB) 5.00%, 03/01/26 | | | 300 | | | | 298,556 | |
California Community Choice Financing Authority, Clean Energy Project, Series A-1 (RB) 5.00%, 12/01/53 (c) (p) | | | 1,000 | | | | 1,047,704 | |
California Community Choice Financing Authority, Clean Energy Project, Series C (RB) 5.25%, 01/01/54 (c) (p) | | | 3,000 | | | | 3,131,369 | |
California Housing Finance Agency, Series A (RB) 4.00%, 03/20/33 | | | 2,787 | | | | 2,775,841 | |
California Municipal Finance Authority, CHF-Davis I, LLC-West Village Student Housing Project, Series A (RB) 5.00%, 05/15/30 (c) | | | 1,340 | | | | 1,416,200 | |
| California Municipal Finance Authority, Community Medical Centers, Series A (RB) | | | | | | | | |
| 5.00%, 02/01/27 | | | 50 | | | | 51,277 | |
| 5.00%, 02/01/28 (c) | | | 50 | | | | 51,493 | |
| California Municipal Finance Authority, LINXS APM Project, Series A (RB) | | | | | | | | |
| 5.00%, 06/30/27 | | | 610 | | | | 609,200 | |
| 5.00%, 06/30/28 | | | 220 | | | | 219,193 | |
See Notes to Financial Statements
VANECK SHORT HIGH YIELD MUNI ETF
SCHEDULE OF INVESTMENTS
(continued)
| | | Par
(000’s | ) | | Value | |
| California (continued) | | | | | | | | |
California Municipal Finance Authority, LINXS APM Project, Series A (RB) (AGM) 5.00%, 06/30/31 (c) | | $ | 260 | | | $ | 258,505 | |
California Municipal Finance Authority, United Airlines, Inc., International Airport Project (RB) 4.00%, 07/15/29 | | | 6,625 | | | | 6,587,784 | |
California Pollution Control Financing Authority, Solid Waste Disposal, CalPlant I Project (RB) 7.00%, 07/01/22 (d) * | | | 1,000 | | | | 13,500 | |
California Pollution Control Financing Authority, Solid Waste Disposal, CalPlant I Project (RB) (SAW) 7.50%, 07/01/32 (d) * | | | 1,360 | | | | 18,360 | |
California Pollution Control Financing Authority, Solid Waste Disposal, Waste Management, Inc. Project, Series A-1 (RB) 3.38%, 07/01/25 | | | 400 | | | | 398,474 | |
California Statewide Communities Development Authority, Baptist University, Series A (RB) 3.50%, 11/01/27 | | | 810 | | | | 785,840 | |
California Statewide Communities Development Authority, Daughters of Charity Health System, Series A (RB) 5.75%, 07/01/24 (c) (d) * | | | 2 | | | | 1,796 | |
California Statewide Communities Development Authority, Daughters of Charity Health System, Series G (RB) 5.50%, 07/01/22 (c) (d) * | | | 6 | | | | 6,096 | |
California Statewide Communities Development Authority, Irvine East Campus Armaments, CHF-Irvine, LLC (RB) 5.00%, 05/15/33 (c) | | | 300 | | | | 306,157 | |
California Statewide Communities Development Authority, NCCD-Hooper Street LLC-California College of the Arts Project (RB) 5.00%, 07/01/29 | | | 250 | | | | 255,188 | |
| City and County of San Francisco, Airport Commission, International Airport, Series H (RB) | | | | | | | | |
| 5.00%, 05/01/26 | | | 500 | | | | 512,076 | |
| 5.00%, 05/01/27 | | | 500 | | | | 518,511 | |
| | | Par
(000’s | ) | | Value | |
| California (continued) | | | | | | | | |
| 5.00%, 05/01/29 | | $ | 500 | | | $ | 532,663 | |
Compton Public Finance Authority (RB) 4.50%, 09/01/32 (c) | | | 1,000 | | | | 992,404 | |
County of Sacramento, Airport System, Series C (RB) 5.00%, 07/01/27 | | | 250 | | | | 259,888 | |
County of Sacramento, Airport System, Series E (RB) 5.00%, 07/01/28 | | | 115 | | | | 124,699 | |
El Centro Financing Authority, El Centro Regional Medical Center Project (RB) 4.50%, 07/01/29 (c) | | | 785 | | | | 757,452 | |
Irvine Unified School District Community Facilities District No. 09-1, Series D (ST) 5.00%, 09/01/26 | | | 110 | | | | 112,845 | |
MSR Energy Authority, Series A (RB) 6.12%, 11/01/29 | | | 240 | | | | 254,252 | |
Oakland Unified School District (GO) 5.00%, 08/01/26 | | | 380 | | | | 394,019 | |
| Palomar Health (RB) | | | | | | | | |
| 5.00%, 11/01/25 | | | 250 | | | | 250,972 | |
| 5.00%, 11/01/27 (c) | | | 90 | | | | 89,740 | |
Poway Unified School District Public Financing Authority, Series A (ST) 5.00%, 09/01/24 | | | 110 | | | | 110,192 | |
| San Francisco Community College District (GO) | | | | | | | | |
| 5.00%, 06/15/26 (c) | | | 205 | | | | 208,823 | |
| 5.00%, 06/15/25 | | | 1,000 | | | | 1,019,397 | |
Western Hills Water District, Diablo Grande Community Facilities District No. 1 (ST) 4.00%, 09/01/21 (d) * | | | 370 | | | | 100,825 | |
| | | | | | | | 24,471,291 | |
| Colorado: 2.6% | | | | | | | | |
City and County of Denver, Colorado Airport System, Series A (RB) 5.00%, 12/01/29 (c) | | | 295 | | | | 310,423 | |
City and County of Denver, United Airlines, Inc. Project (RB) 5.00%, 10/01/32 (c) | | | 2,425 | | | | 2,423,245 | |
Colorado Health Facilities Authority, Aberdeen Ridge, Series B-1 (RB) 3.50%, 05/15/30 (c) | | | 1,000 | | | | 920,198 | |
Denver Convention Center Hotel Authority (RB) 5.00%, 12/01/27 (c) | | | 600 | | | | 611,889 | |
See Notes to Financial Statements
| | | Par
(000’s | ) | | Value | |
| Colorado (continued) | | | | | | | | |
Fountain Urban Renewal Authority, South Academy Highlands Project, Series A (TA) 4.50%, 11/01/29 (c) | | $ | 510 | | | $ | 497,511 | |
Painted Prairie Public Improvement Authority (RB) 4.00%, 12/01/29 (c) | | | 1,000 | | | | 933,012 | |
Public Authority for Colorado Energy, Natural Gas Purchase (RB) 6.25%, 11/15/28 | | | 140 | | | | 147,381 | |
STC Metropolitan District No. 2, Series A (GO) 4.00%, 12/01/29 (c) | | | 500 | | | | 482,840 | |
Velocity Metropolitan District No. 3 (GO) 5.12%, 12/01/34 (c) | | | 1,000 | | | | 991,789 | |
Windler Public Improvement Authority, Series A-1 (RB) (BAM) 4.00%, 12/01/31 (c) | | | 1,000 | | | | 922,386 | |
| | | | | | | | 8,240,674 | |
| Connecticut: 0.6% | | | | | | | | |
Connecticut State Health and Educational Facilities Authority, Masonicare Issue, Series F (RB) 4.00%, 07/01/30 (c) | | | 120 | | | | 115,544 | |
| Connecticut State Health and Educational Facilities Authority, University of Hartford, Series N (RB) | | | | | | | | |
| 5.00%, 07/01/27 | | | 430 | | | | 427,614 | |
| 5.00%, 07/01/29 | | | 870 | | | | 867,593 | |
Town of Hamden, Whitney Center Project (RB) 5.00%, 01/01/30 (c) | | | 395 | | | | 394,395 | |
| | | | | | | | 1,805,146 | |
| Delaware: 0.3% | | | | | | | | |
Delaware State Economic Development Authority, NRG Energy Project, Series A (RB) 1.25%, 10/01/45 (c) (p) | | | 1,000 | | | | 940,432 | |
| District of Columbia: 0.1% | | | | | | | | |
District of Columbia, Latin American Montessori Bilingual Public Charter School (RB) 4.00%, 06/01/30 | | | 500 | | | | 483,971 | |
| Florida: 4.6% | | | | | | | | |
Capital Trust Agency, Education Growth Fund, LLC Charter School Portfolio Project, Series A-1 (RB) 3.38%, 07/01/31 | | | 1,540 | | | | 1,455,639 | |
| | | Par
(000’s | ) | | Value | |
| Florida (continued) | | | | | | | | |
Capital Trust Agency, Elim Senior Housing, Inc., Project (RB) 5.00%, 08/01/27 (c) | | $ | 350 | | | $ | 324,297 | |
Capital Trust Agency, The Marie Selby Botanical Gardens, Inc., Project (RB) 4.00%, 06/15/31 (c) | | | 535 | | | | 489,701 | |
Central Florida Expressway Authority, Series D (RB) (AGM) 5.00%, 07/01/33 (c) | | | 500 | | | | 563,609 | |
County of Broward, Florida Airport System, Series A (RB) 5.00%, 10/01/29 (c) | | | 290 | | | | 294,603 | |
County of Broward, School District, Series B (CP) 5.00%, 07/01/30 (c) | | | 315 | | | | 329,792 | |
County of Escambia, Health Facilities Authority, Baptist Health Care Corp., Series A (RB) (SAW) 5.00%, 08/15/31 (c) | | | 1,500 | | | | 1,566,747 | |
County of Miami-Dade, Industrial Development Authority, NCCD-Biscayne Properties LLC Project, Series A (RB) 5.00%, 06/01/30 (c) | | | 315 | | | | 310,128 | |
County of Miami-Dade, School Board, Series D (CP) 5.00%, 02/01/30 (c) | | | 120 | | | | 122,679 | |
County of Palm Beach, Atlantic University Housing Project, Series A (RB) 5.00%, 04/01/29 | | | 400 | | | | 407,542 | |
County of St. Lucie, School District, Sales Tax (RB) (AGM) 5.00%, 10/01/25 | | | 250 | | | | 254,659 | |
Florida Development Finance Corp. Education Facilities, Central School Project (RB) 5.00%, 08/15/32 | | | 500 | | | | 499,627 | |
Florida Development Finance Corp. Education Facilities, Cornerstone Chapter Academy Project (RB) 5.00%, 10/01/32 (c) | | | 500 | | | | 508,032 | |
Florida Development Finance Corp., Renaissance Chapter School Inc. Project, Series C (RB) 4.00%, 09/15/30 (c) | | | 470 | | | | 443,624 | |
Florida Development Finance Corp., Virgin Trains USA Passenger Rail Project, Series A (RB) 6.50%, 01/01/49 (c) (p) | | | 2,750 | | | | 2,781,292 | |
See Notes to Financial Statements
VANECK SHORT HIGH YIELD MUNI ETF
SCHEDULE OF INVESTMENTS
(continued)
| | | Par
(000’s | ) | | Value | |
| Florida (continued) | | | | | | | | |
| Florida Development Finance Corp., Waste Pro USA, Inc. Project (RB) | | | | | | | | |
| 5.00%, 05/01/29 (c) | | $ | 1,140 | | | $ | 1,138,503 | |
| 6.12%, 07/01/32 (c) (p) | | | 485 | | | | 495,097 | |
JEA Electric System, Series B (RB) 5.00%, 10/01/29 (c) | | | 110 | | | | 115,856 | |
Polk Country Industrial Development Authority, Florida Industrial Development (RB) 5.88%, 01/01/33 | | | 1,930 | | | | 1,846,707 | |
Village Community Development District No. 12 (SA) (SAW) 3.80%, 05/01/28 | | | 460 | | | | 461,097 | |
| Village Community Development District No. 13 (SA) | | | | | | | | |
| 2.62%, 05/01/24 | | | 125 | | | | 125,000 | |
| 3.00%, 05/01/29 | | | 235 | | | | 226,293 | |
| | | | | | | | 14,760,524 | |
| Georgia: 1.9% | | | | | | | | |
Atlanta Development Authorities Senior Health Care Facilities, Proton Treatment Center Project, Series A-1 (RB) 6.00%, 01/01/23 (d) * | | | 250 | | | | 112,500 | |
DeKalb County Housing Authority, Georgia Affordable Multifamily Housing, Series A (RB) 4.00%, 12/01/33 (c) | | | 1,500 | | | | 1,474,672 | |
Floyd County Development Authority, Spires at Berry College Project, Series A (RB) (SBG) 5.50%, 12/01/28 (c) | | | 250 | | | | 248,194 | |
Georgia Local Government, Grantor Trust, Series A (CP) (NATL) 4.75%, 06/01/28 | | | 380 | | | | 385,009 | |
| Georgia State, Road and Tollway Authority, Highway Grant Anticipation (RB) | | | | | | | | |
| 5.00%, 06/01/25 | | | 300 | | | | 304,797 | |
| 5.00%, 06/01/28 | | | 360 | | | | 387,269 | |
Glynn-Brunswick Memorial Hospital Authority, Southeast Georgia Health System Project (RB) 5.00%, 08/01/34 (c) | | | 1,500 | | | | 1,510,137 | |
Main Street Natural Gas, Inc., Series A-1 (RB) 5.50%, 09/15/25 | | | 135 | | | | 136,245 | |
| | | Par
(000’s | ) | | Value | |
| Georgia (continued) | | | | | | | | |
Main Street Natural Gas, Inc., Series C (RB) 4.00%, 03/01/50 (c) (p) | | $ | 1,000 | | | $ | 1,000,808 | |
Marietta Development Authority, University Facilities, Life University, Inc. Project, Series A (RB) 5.00%, 11/01/27 | | | 250 | | | | 251,257 | |
White County Development Authority, Truett McConnell University Project, Series A (RB) 5.00%, 10/01/29 (c) | | | 200 | | | | 196,003 | |
| | | | | | | | 6,006,891 | |
| Guam: 1.4% | | | | | | | | |
Guam Government, Business Privilege Tax, Series D (RB) 5.00%, 11/15/27 (c) | | | 360 | | | | 364,846 | |
| Guam Government, Business Privilege Tax, Series F (RB) | | | | | | | | |
| 5.00%, 01/01/30 | | | 1,000 | | | | 1,055,734 | |
| 5.00%, 01/01/31 | | | 1,000 | | | | 1,062,379 | |
Guam Government, Series A (RB) 5.00%, 12/01/25 | | | 1,000 | | | | 1,010,669 | |
Guam Power Authority, Series A (RB) 5.00%, 10/01/33 (c) | | | 940 | | | | 1,006,469 | |
| | | | | | | | 4,500,097 | |
| Hawaii: 0.1% | | | | | | | | |
State of Hawaii Department of Budget & Finance, Hawaiian Electric Company, Inc., Series A (RB) 3.10%, 05/01/26 | | | 500 | | | | 399,146 | |
| Illinois: 12.2% | | | | | | | | |
| Chicago Board of Education, Series A (GO) | | | | | | | | |
| 5.00%, 12/01/29 | | | 1,000 | | | | 1,047,927 | |
| 5.00%, 12/01/30 (c) | | | 1,000 | | | | 1,038,689 | |
| 5.00%, 12/01/32 (c) | | | 2,000 | | | | 2,095,853 | |
| 5.00%, 12/01/33 (c) | | | 1,500 | | | | 1,571,029 | |
| 7.00%, 12/01/26 (c) | | | 200 | | | | 208,749 | |
| Chicago Board of Education, Series A (GO) (AGM) | | | | | | | | |
| 5.00%, 12/01/29 (c) | | | 200 | | | | 208,829 | |
| 5.00%, 12/01/29 (c) | | | 250 | | | | 256,755 | |
| Chicago Board of Education, Series A (GO) (AMBAC) | | | | | | | | |
| 5.50%, 12/01/26 | | | 230 | | | | 233,104 | |
| 5.50%, 12/01/31 | | | 1,000 | | | | 1,055,176 | |
| Chicago Board of Education, Series A (GO) (NATL) | | | | | | | | |
| 0.00%, 12/01/28 ^ | | | 795 | | | | 652,793 | |
| 0.01%, 12/01/26 | | | 310 | | | | 277,735 | |
Chicago Board of Education, Series B (GO) 5.00%, 12/01/29 | | | 1,250 | | | | 1,309,908 | |
See Notes to Financial Statements
| | | Par
(000’s | ) | | Value | |
| Illinois (continued) | | | | | | | | |
| 5.00%, 12/01/32 (c) | | $ | 1,950 | | | $ | 2,024,920 | |
| 5.00%, 12/01/30 (c) | | | 1,250 | | | | 1,298,362 | |
| 5.00%, 12/01/33 (c) | | | 1,400 | | | | 1,453,100 | |
| 5.00%, 12/01/31 (c) | | | 2,000 | | | | 2,077,279 | |
| 5.00%, 12/01/31 (c) | | | 2,000 | | | | 2,096,362 | |
| 5.00%, 12/01/30 | | | 2,000 | | | | 2,112,984 | |
| Chicago Board of Education, Series C (GO) | | | | | | | | |
| 5.00%, 12/01/27 | | | 500 | | | | 515,603 | |
| 5.00%, 12/01/30 (c) | | | 1,560 | | | | 1,595,051 | |
Chicago Board of Education, Series E (GO) 5.12%, 12/01/32 (c) | | | 1,320 | | | | 1,319,979 | |
| Chicago O’Hare International Airport, Series B (RB) | | | | | | | | |
| 5.00%, 01/01/31 (c) | | | 295 | | | | 297,369 | |
| 5.00%, 01/01/29 (c) | | | 190 | | | | 191,442 | |
| 5.00%, 01/01/26 (c) | | | 105 | | | | 105,643 | |
Chicago School Reform Board of Trustees, Series A (GO) (NATL) 0.00%, 12/01/29 ^ | | | 575 | | | | 451,095 | |
| Chicago School Reform Board of Trustees, Series B-1 (GO) (NATL) | | | | | | | | |
| 0.00%, 12/01/25 ^ | | | 560 | | | | 523,321 | |
| 0.00%, 12/01/26 ^ | | | 490 | | | | 439,000 | |
| 0.00%, 12/01/28 ^ | | | 1,515 | | | | 1,246,235 | |
| 0.00%, 12/01/29 ^ | | | 585 | | | | 458,940 | |
| 0.01%, 12/01/30 | | | 190 | | | | 142,806 | |
| City of Chicago, Second Lien Water (RB) | | | | | | | | |
| 5.00%, 11/01/30 (c) | | | 100 | | | | 100,580 | |
| 5.00%, 11/01/28 (c) | | | 150 | | | | 150,823 | |
| 5.00%, 11/01/29 (c) | | | 270 | | | | 271,560 | |
City of Chicago, Second Lien Water, Series A-1 (RB) 5.00%, 11/01/30 (c) | | | 100 | | | | 103,238 | |
City of Chicago, Series A (GO) 5.00%, 01/01/30 | | | 1,500 | | | | 1,603,723 | |
County of Cook, Series A (GO) 5.00%, 11/15/28 (c) | | | 500 | | | | 515,858 | |
Eastern Illinois Economic Development Authority (RB) 5.00%, 11/01/33 (c) | | | 1,000 | | | | 989,581 | |
Illinois Finance Authority, Admiral Lake Project (RB) 5.00%, 05/15/33 (c) | | | 500 | | | | 465,169 | |
Illinois Finance Authority, Friendship Village of Schaumburg (RB) 5.00%, 02/15/27 (d) * | | | 1,190 | | | | 273,700 | |
Illinois Finance Authority, Lutheran Life Communities, Series A (RB) 5.00%, 11/01/28 (c) | | | 250 | | | | 239,798 | |
Illinois Finance Authority, Roosevelt University (RB) 5.40%, 04/01/27 (c) | | | 80 | | | | 78,960 | |
| | | Par
(000’s | ) | | Value | |
| Illinois (continued) | | | | | | | | |
Illinois Finance Authority, Three Crowns Park (RB) 4.00%, 02/15/27 (c) | | $ | 155 | | | $ | 152,705 | |
Illinois Municipal Electric Agency, Power Supply System, Series A (RB) 5.00%, 02/01/26 (c) | | | 785 | | | | 796,699 | |
| Illinois Sports Facilities Authority (RB) | | | | | | | | |
| 5.00%, 06/15/28 | | | 395 | | | | 412,013 | |
| 5.00%, 06/15/29 | | | 545 | | | | 574,601 | |
Illinois Sports Facilities Authority (RB) (AMBAC) 0.00%, 06/15/26 ^ | | | 260 | | | | 236,979 | |
Metropolitan Pier and Exposition Authority, McCormick Place Expansion Project, Series B (RB) 5.00%, 12/15/28 (c) | | | 500 | | | | 521,871 | |
Metropolitan Pier and Exposition Authority, McCormick Place Expansion Project, Series B (RB) (NATL) 0.00%, 06/15/28 ^ | | | 115 | | | | 98,481 | |
Northern Illinois Municipal Power Agency, Series A (RB) 5.00%, 12/01/29 (c) | | | 330 | | | | 341,919 | |
| State of Illinois (GO) | | | | | | | | |
| 3.50%, 06/01/30 (c) | | | 350 | | | | 334,946 | |
| 4.12%, 11/01/31 (c) | | | 100 | | | | 100,459 | |
| 5.00%, 05/01/27 (c) | | | 100 | | | | 100,086 | |
| 5.00%, 02/01/25 (c) | | | 150 | | | | 150,116 | |
| State of Illinois, Sales Tax (RB) | | | | | | | | |
| 5.00%, 06/15/25 (c) | | | 285 | | | | 285,476 | |
| 5.00%, 06/15/24 (c) | | | 190 | | | | 190,390 | |
| 5.00%, 06/15/26 | | | 235 | | | | 241,630 | |
State of Illinois, Series A (GO) 5.00%, 03/01/33 (c) |
|
|
700 |
|
|
|
761,181 |
|
State of Illinois, Series C (GO) 5.00%, 11/01/29 (c) |
|
|
315 |
|
|
|
328,905 |
|
State of Illinois, Series D (GO) 5.00%, 11/01/28 (c) |
|
|
460 |
|
|
|
480,226 |
|
| | | | | | | | 39,207,711 | |
| Indiana: 1.3% | | | | | | | | |
City of Anderson, Indiana Economic Development, Anderson University (RB) 4.75%, 10/01/27 (c) | | | 240 | | | | 228,366 | |
Indiana Finance Authority, Ohio Valley Electric Corp. Project, Series A (RB) 4.25%, 11/01/30 | | | 2,015 | | | | 2,000,684 | |
Indiana Finance Authority, United States Steel Corp. Project, Series A (RB) 4.12%, 12/01/26 | | | 2,000 | | | | 1,992,925 | |
| | | | | | | | 4,221,975 | |
See Notes to Financial Statements
VANECK SHORT HIGH YIELD MUNI ETF
SCHEDULE OF INVESTMENTS
(continued)
| | | Par
(000’s | ) | | Value | |
| Iowa: 0.8% | | | | | | | | |
| City of Coralville, Marriott Hotel and Convention Center, Series E (CP) | | | | | | | | |
| 4.00%, 06/01/29 (c) | | $ | 945 | | | $ | 900,264 | |
| 4.00%, 06/01/31 (c) | | | 1,000 | | | | 937,810 | |
Iowa Finance Authority, Northcrest, Inc. Project, Series B (RB) 5.00%, 03/01/28 (c) | | | 245 | | | | 244,308 | |
Iowa Higher Education Loan Authority, Wartburg College Project (RB) 4.00%, 10/01/25 | | | 530 | | | | 519,025 | |
| | | | | | | | 2,601,407 | |
| Kansas: 0.2% | | | | | | | | |
City of Goddard, Olympic Park Star Bond Project (RB) 3.60%, 06/01/30 (c) | | | 100 | | | | 96,493 | |
City of Wichita, Health Care Facilities, Series III (RB) 5.00%, 05/15/34 (c) | | | 600 | | | | 537,249 | |
| | | | | | | | 633,742 | |
| Kentucky: 0.8% | | | | | | | | |
City of Henderson, Pratt Paper, LLC Project, Series B (RB) 3.70%, 01/01/32 | | | 1,830 | | | | 1,770,491 | |
Commonwealth of Kentucky, State Property and Building Commission, Project No. 108, Series A (RB) 5.00%, 08/01/28 (c) | | | 140 | | | | 142,243 | |
Commonwealth of Kentucky, State Property and Building Commission, Project No. 108, Series B (RB) 5.00%, 08/01/26 | | | 140 | | | | 144,704 | |
Commonwealth of Kentucky, State Property and Building Commission, Project No. 112, Series B (RB) 5.00%, 11/01/28 (c) | | | 325 | | | | 337,239 | |
Kentucky Economic Development Finance Authority, Masonic Home Independent Living II, Inc., Series A (RB) 5.00%, 05/15/26 | | | 65 | | | | 63,588 | |
Kentucky Municipal Power Agency, Prairie State Project, Series A (RB) (NATL) 5.00%, 09/01/30 (c) | | | 175 | | | | 176,831 | |
| | | | | | | | 2,635,096 | |
| Louisiana: 2.0% | | | | | | | | |
Calcasieu Parish Service District, Lake Charles Memorial Hospital Project (RB) 5.00%, 12/01/27 | | | 1,025 | | | | 1,012,075 | |
| | | Par
(000’s | ) | | Value | |
| Louisiana (continued) | | | | | | | | |
Calcasieu Parish Service District, Lake Charles Memorial Hospital Project (RB) (SBG) 5.00%, 12/01/29 | | $ | 150 | | | $ | 148,225 | |
City of New Orleans, Louisiana Water (RB) 5.00%, 12/01/45 (c) | | | 305 | | | | 312,618 | |
Louisiana Local Government Environmental Facilities and Community Development Authority, Westlake Chemical Corp. Project (RB) 3.50%, 11/01/32 (c) | | | 2,310 | | | | 2,181,193 | |
Louisiana Public Facilities Authority, Solid Waste Disposal , Louisiana Pellets, Inc. Project (RB) 7.00%, 07/01/24 (d) * ∞ | | | 330 | | | | 4 | |
Louisiana Public Facilities Authority, Solid Waste Disposal , Louisiana Pellets, Inc. Project, Series A (RB) 7.50%, 07/01/23 (d) * ∞ | | | 521 | | | | 5 | |
| Parish of St James, Nustar Logistics, LP Project (RB) | | | | | | | | |
| 6.10%, 06/01/38 (p) | | | 1,500 | | | | 1,631,355 | |
| 6.10%, 12/01/40 (p) | | | 1,000 | | | | 1,087,548 | |
| | | | | | | | 6,373,023 | |
| Maryland: 0.6% | | | | | | | | |
City of Baltimore, East Baltimore Research Park Project, Series A (RB) 4.00%, 09/01/27 | | | 200 | | | | 196,350 | |
County of Frederick, Mount Saint Mary’s University, Series A (RB) 5.00%, 09/01/27 | | | 300 | | | | 300,800 | |
County of Howard, Series A (TA) 4.00%, 02/15/28 (c) | | | 200 | | | | 195,592 | |
Maryland Economic Development Corp., CNX Marine Terminal, Inc. Port of Baltimore Facility (RB) 5.75%, 09/01/25 (c) | | | 695 | | | | 700,027 | |
Maryland Economic Development Corp., Transportation Facilities, Series A (RB) 5.00%, 06/01/28 | | | 425 | | | | 444,871 | |
| | | | | | | | 1,837,640 | |
| Massachusetts: 0.6% | | | | | | | | |
Collegiate Charter School of Lowell (RB) 5.00%, 06/15/29 (c) | | | 490 | | | | 496,260 | |
See Notes to Financial Statements
| | | Par
(000’s | ) | | Value | |
| Massachusetts (continued) | | | | | | | | |
Massachusetts Development Finance Agency, Beth Israel Lahey Health, Inc., Series I (RB) 5.00%, 07/01/28 (c) | | $ | 310 | | | $ | 318,353 | |
Massachusetts Development Finance Agency, Newbridge on the Charles, Inc. (RB) 4.00%, 10/01/27 (c) | | | 250 | | | | 249,440 | |
Massachusetts Development Finance Agency, Suffolk University (RB) 5.00%, 07/01/28 (c) | | | 335 | | | | 346,082 | |
Massachusetts Development Finance Agency, UMass Memorial Health Care, Series I (RB) 5.00%, 07/01/28 (c) | | | 100 | | | | 102,096 | |
Massachusetts Educational Financing Authority (RB) 5.00%, 01/01/27 (c) | | | 275 | | | | 276,559 | |
| | | | | | | | 1,788,790 | |
| Michigan: 0.8% | | | | | | | | |
Michigan Finance Authority Higher Education, Aquinas College Project (RB) 4.00%, 05/01/31 | | | 500 | | | | 438,312 | |
Michigan Finance Authority Higher Education, Thomas M. Cooley Law School Project (RB) 6.25%, 07/01/29 (c) | | | 1,000 | | | | 987,404 | |
Michigan Strategic Fund, I-75 Improvement Project (RB) 5.00%, 06/30/30 (c) | | | 155 | | | | 160,339 | |
Wayne County Airport Authority, Detroit metropolitan Wayne County Airport, Series C (RB) 5.00%, 12/01/27 | | | 1,000 | | | | 1,060,741 | |
| | | | | | | | 2,646,796 | |
| Minnesota: 1.1% | | | | | | | | |
City of Anoka, Homestead at Anoka, Inc. Project (RB) 4.25%, 11/01/27 (c) | | | 80 | | | | 77,128 | |
City of Blaine, Senior Housing and Health Facility, Series A (RB) 5.12%, 07/01/25 (d) * | | | 415 | | | | 269,750 | |
City of Brooklyn Park, Charter School, Athlos Leadership Academy Project, Series A (RB) 5.25%, 07/01/30 (c) | | | 350 | | | | 339,761 | |
| City of Minneapolis, Fairview Health Services, Series A (RB) | | | | | | | | |
| 5.00%, 11/15/33 (c) | | | 1,000 | | | | 1,036,808 | |
| 5.00%, 11/15/35 (c) | | | 1,000 | | | | 1,033,423 | |
| 5.00%, 11/15/34 (c) | | | 605 | | | | 626,828 | |
| | | Par
(000’s | ) | | Value | |
| Minnesota (continued) | | | | | | | | |
Saint Paul Minnesota Housing and Redevelopment Authority, HMONG College Prep Academy Project, Series A (RB) 5.00%, 09/01/26 | | $ | 75 | | | $ | 75,348 | |
| | | | | | | | 3,459,046 | |
| Missouri: 0.6% | | | | | | | | |
City of St. Ann, Northwest Plaza Redevelopment Project, Series A (TA) 4.62%, 11/01/30 (c) | | | 430 | | | | 416,356 | |
City of St. Louis, Industrial Development Authority, Ballpark Village Development Project, Series A (RB) 3.88%, 11/15/29 (c) | | | 185 | | | | 164,317 | |
Lees Summit Industrial Development Authority, John Knox Village, Series A (RB) 5.00%, 08/15/32 (c) | | | 125 | | | | 125,038 | |
Maryland Heights Industrial Development Authority, San Louis Community Ice Center Project, Series A (RB) (BAM) 4.38%, 03/15/30 (c) | | | 330 | | | | 299,305 | |
Plaza at Noah’s Ark Community Improvement District (RB) 3.00%, 05/01/30 (c) | | | 500 | | | | 458,264 | |
St. Louis County, Industrial Development Authority, Friendship Village St. Louis, Series A (RB) 5.00%, 09/01/28 (c) | | | 500 | | | | 509,116 | |
| | | | | | | | 1,972,396 | |
| Nebraska: 0.8% | | | | | | | | |
| Central Plains Energy Project, Gas Project Crossover No. 3, Series A (RB) | | | | | | | | |
| 5.00%, 09/01/27 | | | 500 | | | | 516,175 | |
| 5.00%, 09/01/28 | | | 100 | | | | 104,153 | |
| 5.00%, 09/01/30 | | | 125 | | | | 131,512 | |
| 5.00%, 09/01/31 | | | 1,000 | | | | 1,052,767 | |
| 5.00%, 09/01/34 | | | 650 | | | | 685,723 | |
| | | | | | | | 2,490,330 | |
| Nevada: 1.0% | | | | | | | | |
City of Reno, Tax Increment Senior Lien, Series C (TA) 5.40%, 06/01/27 (c) | | | 250 | | | | 245,621 | |
City of Sparks, Tourism Improvement District No. 1, Legends at Sparks Marina, Series A (RB) 2.75%, 06/15/28 | | | 760 | | | | 724,261 | |
Clark County, Airport System, Series A-2 (RB) 5.00%, 07/01/25 (c) | | | 100 | | | | 100,162 | |
See Notes to Financial Statements
VANECK SHORT HIGH YIELD MUNI ETF
SCHEDULE OF INVESTMENTS
(continued)
| | | Par
(000’s | ) | | Value | |
| Nevada (continued) | | | | | | | | |
Clark County, Nevada Pollution Control, Southern California Edison Company (RB) 2.10%, 06/01/31 | | $ | 5 | | | $ | 4,229 | |
| Clark County, School District, Series B (GO) (AGM) | | | | | | | | |
| 5.00%, 06/15/29 | | | 250 | | | | 272,738 | |
| 5.00%, 06/15/30 (c) | | | 250 | | | | 270,844 | |
Clark County, School District, Series B (GO) (BAM) 5.00%, 06/15/30 | | | 250 | | | | 277,190 | |
Clark County, School District, Series C (GO) 5.00%, 06/15/28 (c) | | | 115 | | | | 117,217 | |
State of Nevada, Department of Business and Industry, Fulcrum Sierra Biofuels, LLC Project (RB) 5.88%, 12/15/27 (d) * | | | 344 | | | | 137,646 | |
Tahoe-Douglas Visitors Authority (RB) 5.00%, 07/01/33 (c) | | | 1,000 | | | | 1,047,414 | |
| | | | | | | | 3,197,322 | |
| New Hampshire: 0.1% | | | | | | | | |
National Finance Authority, Covanta Project, Series A (RB) 4.00%, 11/01/27 (c) | | | 250 | | | | 246,870 | |
New Hampshire Health and Education Facilities Authority, Hillside Village, Series A (RB) 5.25%, 07/01/27 (c) (d) * | | | 234 | | | | 56,219 | |
| | | | | | | | 303,089 | |
| New Jersey: 4.6% | | | | | | | | |
| New Jersey Economic Development Authority, Continental Airlines, Inc. Project (RB) | | | | | | | | |
| 5.25%, 09/15/29 (c) | | | 2,000 | | | | 2,002,962 | |
| 5.62%, 11/15/30 (c) | | | 1,000 | | | | 1,008,875 | |
| 5.75%, 09/15/27 (c) | | | 1,375 | | | | 1,375,830 | |
| New Jersey Economic Development Authority, Motor Vehicle Surcharges, Series A (RB) | | | | | | | | |
| 4.00%, 07/01/32 (c) | | | 1,155 | | | | 1,162,305 | |
| 4.00%, 07/01/34 (c) | | | 600 | | | | 592,805 | |
| 5.00%, 07/01/33 (c) | | | 1,000 | | | | 1,023,308 | |
New Jersey Economic Development Authority, New Jersey Transit Corp. Project, Series A (RB) 4.00%, 11/01/27 | | | 380 | | | | 386,292 | |
New Jersey Economic Development Authority, New Jersey Transit Corp. Project, Series B (RB) 5.00%, 11/01/25 | | | 115 | | | | 117,163 | |
| | | Par
(000’s | ) | | Value | |
| New Jersey (continued) | | | | | | | | |
New Jersey Economic Development Authority, New Jersey Transit Transportation Project, Series A (RB) (AGM) 5.00%, 11/01/30 (c) | | $ | 110 | | | $ | 119,590 | |
New Jersey Economic Development Authority, School Facilities Construction, Series AAA (RB) 5.50%, 06/15/28 (c) | | | 115 | | | | 119,997 | |
New Jersey Economic Development Authority, School Facilities Construction, Series BBB (RB) 5.50%, 06/15/30 (c) | | | 100 | | | | 105,874 | |
New Jersey Economic Development Authority, School Facilities Construction, Series PP (RB) 5.00%, 06/15/26 (c) | | | 340 | | | | 340,370 | |
| New Jersey Economic Development Authority, School Facilities Construction, Series XX (RB) | | | | | | | | |
| 4.25%, 06/15/26 (c) | | | 440 | | | | 440,196 | |
| 4.38%, 06/15/27 (c) | | | 130 | | | | 130,488 | |
| 5.00%, 06/15/26 (c) | | | 345 | | | | 350,937 | |
New Jersey Economic Development Authority, State House Project, Series B (RB) 4.00%, 06/15/29 (c) | | | 750 | | | | 761,717 | |
New Jersey Economic Development Authority, West Campus Housing, LLC, Series A (RB) 4.12%, 07/01/30 (c) | | | 175 | | | | 159,469 | |
| New Jersey Educational Facilities Authority, Higher Education Facilities Trust (RB) | | | | | | | | |
| 5.00%, 06/15/26 (c) | | | 145 | | | | 145,190 | |
| 5.00%, 06/15/25 (c) | | | 175 | | | | 175,192 | |
New Jersey Health Care Facilities Financing Authority, Barnabas Health, Series A (RB) 5.00%, 07/01/29 (c) | | | 500 | | | | 516,662 | |
New Jersey State Turnpike Authority, Series A (RB) (AGM) 5.25%, 01/01/26 | | | 500 | | | | 516,075 | |
| New Jersey Transportation Trust Fund Authority, Series A (RB) | | | | | | | | |
| 0.00%, 12/15/25 ^ | | | 120 | | | | 112,841 | |
| 0.00%, 12/15/26 ^ | | | 360 | | | | 326,550 | |
| 0.00%, 12/15/32 ^ | | | 5 | | | | 3,616 | |
| 5.00%, 12/15/30 (c) | | | 205 | | | | 219,421 | |
| 5.00%, 06/15/30 (c) | | | 395 | | | | 405,188 | |
See Notes to Financial Statements
| | | Par
(000 ’s | ) | | Value | |
| New Jersey (continued) | | | | | | | | |
New Jersey Transportation Trust Fund Authority, Series A-1 (RB) 5.00%, 06/15/29 (c) | | $ | 110 | | | $ | 112,820 | |
| New Jersey Transportation Trust Fund Authority, Series AA (RB) | | | | | | | | |
| 5.00%, 06/15/26 (c) | | | 275 | | | | 278,375 | |
| 5.25%, 06/15/29 (c) | | | 365 | | | | 371,137 | |
| 5.25%, 06/15/27 (c) | | | 100 | | | | 101,597 | |
| 5.25%, 06/15/28 (c) | | | 435 | | | | 442,111 | |
State of New Jersey, Covid-19 General Emergency, Series A (GO) 5.00%, 06/01/26 | | | 500 | | | | 516,641 | |
| State of New Jersey, Various Purposes (GO) | | | | | | | | |
| 3.00%, 06/01/26 | | | 80 | | | | 78,333 | |
| 5.00%, 06/01/27 | | | 100 | | | | 105,138 | |
Tobacco Settlement Financing Corp., Series A (RB) 5.00%, 06/01/29 (c) | | | 150 | | | | 158,376 | |
| | | | | | | | 14,783,441 | |
| New Mexico: 0.4% | | | | | | | | |
City of Farmington, New Mexico Pollution Control, Public Service Company of San Juan and Four Corners Projects, Series B (RB) 2.15%, 04/01/33 (c) | | | 700 | | | | 561,043 | |
City of Farmington, New Mexico Pollution Control, Southern California Edison Company Four Corners Project, Series B (RB) 1.80%, 04/01/29 | | | 1,000 | | | | 872,571 | |
| | | | | | | | 1,433,614 | |
| New York: 13.8% | | | | | | | | |
| Brooklyn Arena Local Development Corp., Barclays Center, Series A (RB) | | | | | | | | |
| 5.00%, 07/15/27 (c) | | | 100 | | | | 102,945 | |
| 5.00%, 07/15/28 (c) | | | 100 | | | | 102,816 | |
| 5.00%, 07/15/30 (c) | | | 1,800 | | | | 1,846,038 | |
| 5.00%, 07/15/26 | | | 100 | | | | 102,529 | |
Build NYC Resource Corp., Brooklyn Navy Yard Cogeneration Partners, L.P. Project (RB) 5.00%, 12/31/28 | | | 1,100 | | | | 1,041,187 | |
Build NYC Resource Corp., New World Preparatory Chapter School Project, Series A (RB) 4.00%, 06/15/31 | | | 275 | | | | 260,580 | |
Build NYC Resource Corp., Richmond Preparatory Chapter School Project, Series A (RB) 4.00%, 06/01/31 (c) | | | 595 | | | | 568,068 | |
| | | Par
(000’s | ) | | Value | |
| New York (continued) | | | | | | | | |
County of Suffolk, Series A (GO) (AGM) 5.00%, 02/01/26 | | $ | 250 | | | $ | 256,928 | |
County of Suffolk, Series B (GO) (AGM) 5.00%, 10/15/26 | | | 250 | | | | 260,374 | |
| Dutchess County Local Development Corp., Health Quest System, Inc., Series B (RB) | | | | | | | | |
| 5.00%, 07/01/30 (c) | | | 270 | | | | 273,414 | |
| 5.00%, 07/01/28 (c) | | | 275 | | | | 277,918 | |
Huntington Local Development Corp., Gurwin Independent Housing, Inc., Fountaingate Gardens Project (RB) 4.00%, 07/01/27 | | | 485 | | | | 468,193 | |
Metropolitan Transportation Authority, Series A-1 (RB) 5.00%, 11/15/30 (c) | | | 250 | | | | 256,558 | |
Metropolitan Transportation Authority, Series C-1 (RB) 5.00%, 11/15/29 (c) | | | 250 | | | | 264,831 | |
| Metropolitan Transportation Authority, Series D (RB) | | | | | | | | |
| 5.00%, 11/15/31 (c) | | | 500 | | | | 517,089 | |
| 5.00%, 11/15/30 (c) | | | 560 | | | | 592,642 | |
| Metropolitan Transportation Authority, Series D-1 (RB) | | | | | | | | |
| 5.00%, 11/15/28 (c) | | | 250 | | | | 255,492 | |
| 5.00%, 11/15/30 (c) | | | 250 | | | | 255,117 | |
| Monroe County Industrial Development Corp., Rochester Regional Health Project, Series A (RB) | | | | | | | | |
| 4.00%, 12/01/35 (c) | | | 675 | | | | 664,107 | |
| 5.00%, 12/01/31 (c) | | | 500 | | | | 519,915 | |
| 5.00%, 12/01/34 (c) | | | 1,060 | | | | 1,100,216 | |
Monroe County Industrial Development Corp., St. Ann's Community Project (RB) 4.00%, 01/01/30 (c) | | | 810 | | | | 732,758 | |
New York Convention Center Development Corp., Hotel Unit (RB) 5.00%, 11/15/26 (c) | | | 500 | | | | 508,728 | |
New York Liberty Development Corp., 3 World Trade Center Project (RB) 5.15%, 11/15/34 (c) | | | 1,000 | | | | 1,002,493 | |
| New York State Dormitory Authority, Montefiore Medical Center, Series A (RB) | | | | | | | | |
| 5.00%, 08/01/30 (c) | | | 945 | | | | 968,604 | |
| 5.00%, 08/01/29 (c) | | | 1,000 | | | | 1,023,697 | |
New York State Environmental Facilities Corp., Casella Waste Systems, Inc. Project (RB) 2.88%, 12/01/44 (p) | | | 1,000 | | | | 908,921 | |
See Notes to Financial Statements
VANECK SHORT HIGH YIELD MUNI ETF
SCHEDULE OF INVESTMENTS
(continued)
| | | Par
(000’s | ) | | Value | |
| New York (continued) | | | | | | | | |
New York State Environmental Facilities Corp., Casella Waste Systems, Inc. Project (RB) 2.75%, 09/01/50 (c) (p) | | $ | 600 | | | $ | 584,500 | |
| New York Transportation Development Corp., American Airlines, Inc. John F. Kennedy International Airport Project (RB) | | | | | | | | |
| 2.25%, 08/01/26 | | | 620 | | | | 600,280 | |
| 5.00%, 08/01/31 (c) | | | 4,155 | | | | 4,155,292 | |
| 5.00%, 08/01/26 (c) | | | 475 | | | | 475,144 | |
| 5.25%, 08/01/31 (c) | | | 1,790 | | | | 1,879,174 | |
| New York Transportation Development Corp., Delta Air Lines, Inc. - LaGuardia Airport Terminals C&D Redevelopment Project (RB) | | | | | | | | |
| 4.00%, 01/01/36 (c) | | | 1,000 | | | | 991,673 | |
| 4.00%, 10/01/30 | | | 4,380 | | | | 4,370,379 | |
| 5.00%, 01/01/31 (c) | | | 4,405 | | | | 4,552,354 | |
| 5.00%, 01/01/30 (c) | | | 1,785 | | | | 1,845,473 | |
| 5.00%, 10/01/35 (c) | | | 1,000 | | | | 1,056,974 | |
New York Transportation Development Corp., Delta Air Lines, Inc., LaGuardia Airport Terminals C&D Redevelopment Project (RB) 5.00%, 01/01/29 (c) | | | 780 | | | | 805,430 | |
New York Transportation Development Corp., John F. Kennedy International Airport Project (RB) 3.00%, 08/01/31 | | | 2,100 | | | | 1,969,883 | |
| New York Transportation Development Corp., Terminal 4 John F. Kennedy International Airport Project (RB) (AGM) | | | | | | | | |
| 5.00%, 12/01/30 | | | 1,430 | | | | 1,531,063 | |
| 5.00%, 12/01/31 | | | 1,885 | | | | 2,036,838 | |
Town of Oyster Bay, Public Improvement, Series B (GO) (AGM) 3.25%, 02/01/29 (c) | | | 665 | | | | 652,054 | |
| Town of Ramapo, Public Improvement, Series A (GO) (FGIC) | | | | | | | | |
| 4.00%, 05/15/27 (c) | | | 120 | | | | 112,212 | |
| 4.12%, 05/15/28 (c) | | | 100 | | | | 92,533 | |
Trust for Cultural Resources of The City of New York, Lincoln Center for the Performing Arts, Inc., Series A (RB) 5.00%, 12/01/31 (c) | | | 1,000 | | | | 1,102,402 | |
| TSASC, Inc., Tobacco Settlement Bonds, Series A (RB) | | | | | | | | |
| 5.00%, 06/01/28 (c) | | | 70 | | | | 72,906 | |
| 5.00%, 06/01/27 | | | 70 | | | | 72,869 | |
| | | Par
(000’s | ) | | Value | |
| New York (continued) | | | | | | | | |
Yonkers Economic Development Corp., Charter School of Educational Excellence Project, Series A (RB) 4.00%, 10/15/29 | | $ | 200 | | | $ | 196,821 | |
| | | | | | | | 44,288,412 | |
| North Carolina: 0.4% | | | | | | | | |
North Carolina Medical Care Commission, Vedan Health (RB) 5.00%, 06/01/33 (c) | | | 250 | | | | 254,051 | |
North Carolina Turnpike Authority, Triangle Expressway System (RB) 5.00%, 01/01/25 | | | 350 | | | | 352,786 | |
North Carolina Turnpike Authority, Triangle Expressway System (RB) (AGM) 5.00%, 01/01/32 (c) | | | 500 | | | | 536,253 | |
| | | | | | | | 1,143,090 | |
| North Dakota: 0.2% | | | | | | | | |
City of Grand Forks, Altru Health System (RB) 5.00%, 12/01/34 (c) | | | 500 | | | | 517,168 | |
County of Grand Forks, Red River Biorefinery, LLC Project, Series A (RB) 6.62%, 12/15/31 (c) (d) * | | | 3,000 | | | | 90,000 | |
| | | | | | | | 607,168 | |
| Ohio: 2.1% | | | | | | | | |
American Municipal Power, Inc., Series A (RB) 5.00%, 02/15/29 | | | 500 | | | | 537,666 | |
County of Cuyahoga, Health Care and Independent Living Facilities, Series A (RB) 5.00%, 05/15/32 (c) | | | 920 | | | | 898,583 | |
| County of Cuyahoga, Ohio Hospital, The Metrohealth System (RB) | | | | | | | | |
| 5.00%, 02/15/26 | | | 50 | | | | 50,624 | |
| 5.00%, 02/15/28 (c) | | | 110 | | | | 111,694 | |
| 5.00%, 02/15/27 | | | 350 | | | | 357,834 | |
County of Muskingum, Ohio Hospital Facilities, Genesis Healthcare System (RB) 5.00%, 02/15/27 (c) | | | 1,430 | | | | 1,417,133 | |
Ohio Air Quality Development Authority, American Electric Co. Project, Series A (RB) 2.40%, 12/01/38 (c) (p) | | | 500 | | | | 436,093 | |
Ohio Air Quality Development Authority, American Electric Co. Project, Series B (RB) 2.60%, 06/01/41 (c) (p) | | | 1,000 | | | | 876,335 | |
See Notes to Financial Statements
| | | Par
(000’s | ) | | Value | |
| Ohio (continued) | | | | | | | | |
Ohio Air Quality Development Authority, Ohio Valley Electric Corp. Project, Series A (RB) 3.25%, 09/01/29 | | $ | 2,000 | | | $ | 1,891,947 | |
| | | | | | | | 6,577,909 | |
| Oklahoma: 1.0% | | | | | | | | |
| Oklahoma Development Finance Authority, OU Medicine Project, Series B (RB) | | | | | | | | |
| 5.00%, 08/15/26 | | | 1,000 | | | | 1,008,853 | |
| 5.00%, 08/15/27 | | | 250 | | | | 254,317 | |
Tulsa Municipal Airport Trust, American Airlines, Inc. (RB) 5.00%, 06/01/35 (c) (p) | | | 2,000 | | | | 2,012,875 | |
| | | | | | | | 3,276,045 | |
| Pennsylvania: 3.7% | | | | | | | | |
| Allentown Neighborhood Improvement Zone Development Authority (RB) | | | | | | | | |
| 5.00%, 05/01/27 | | | 1,050 | | | | 1,068,566 | |
| 5.00%, 05/01/28 | | | 1,420 | | | | 1,425,175 | |
| 5.00%, 05/01/28 | | | 875 | | | | 891,211 | |
| Berks County Industrial Development Authority, Tower Health Project (RB) | | | | | | | | |
| 4.00%, 11/01/31 (c) | | | 200 | | | | 105,832 | |
| 5.00%, 11/01/24 | | | 1,000 | | | | 833,582 | |
| 5.00%, 11/01/25 | | | 1,000 | | | | 713,402 | |
| 5.00%, 11/01/26 | | | 400 | | | | 263,834 | |
| 5.00%, 11/01/30 (c) | | | 1,065 | | | | 570,230 | |
| Berks County Municipal Authority, Tower Health Project, Series A (RB) | | | | | | | | |
| 5.00%, 02/01/30 | | | 800 | | | | 433,288 | |
| 5.00%, 02/01/31 | | | 425 | | | | 227,147 | |
Berks County Municipal Authority, Tower Health Project, Series B-2 (RB) 5.00%, 02/01/40 (c) (p) | | | 1,500 | | | | 959,357 | |
| City of Philadelphia, Pennsylvania Gas Works (RB) | | | | | | | | |
| 5.00%, 10/01/26 | | | 100 | | | | 103,199 | |
| 5.00%, 08/01/25 | | | 80 | | | | 81,208 | |
Dauphin County General Authority University, Harrisburg University of Science and Technology Project (RB) 5.00%, 10/15/30 (c) | | | 500 | | | | 451,174 | |
Fulton County Industrial Development Authority, Medical Center Project (RB) 4.00%, 07/01/28 (c) | | | 660 | | | | 633,821 | |
| | | Par
(000’s | ) | | Value | |
| Pennsylvania (continued) | | | | | | | | |
Pennsylvania Economic Development Financing Authority, Penndot Major Bridges Package One Project (RB) 5.00%, 06/30/32 | | $ | 1,000 | | | $ | 1,091,100 | |
Pennsylvania Economic Development Financing Authority, Pennsylvania Rapid Bridge Replacement Project (RB) 5.00%, 06/30/26 | | | 130 | | | | 130,876 | |
Pennsylvania Turnpike Commission, Series A-2 (RB) 5.00%, 06/01/30 (c) | | | 100 | | | | 103,345 | |
| Philadelphia Authority for Industrial Development, University of the Arts (RB) | | | | | | | | |
| 4.50%, 03/15/29 (c) | | | 550 | | | | 530,843 | |
| 4.50%, 03/15/29 (c) | | | 25 | | | | 26,258 | |
Philadelphia Authority, Industrial Development, Electrical and Technology Charter School Project, Series A (RB) 4.00%, 06/01/31 | | | 565 | | | | 541,066 | |
State Public School Building Authority, School District of Philadelphia Project, Series A (RB) (SAW) 5.00%, 06/01/29 (c) | | | 200 | | | | 205,978 | |
| The Hospitals and Higher Education, Facilities Authority of Philadelphia (RB) | | | | | | | | |
| 5.00%, 07/01/26 | | | 115 | | | | 116,201 | |
| 5.00%, 07/01/29 (c) | | | 275 | | | | 279,854 | |
| | | | | | | | 11,786,547 | |
| Puerto Rico: 8.2% | | | | | | | | |
Puerto Rico Commonwealth Aqueduct and Sewer Authority, Series A (RB) 5.00%, 07/01/30 | | | 3,000 | | | | 3,175,734 | |
| Puerto Rico Commonwealth Aqueduct and Sewer Authority, Series B (RB) | | | | | | | | |
| 5.00%, 07/01/28 | | | 1,000 | | | | 1,042,630 | |
| 5.00%, 07/01/33 (c) | | | 2,000 | | | | 2,127,249 | |
| Puerto Rico Commonwealth, Series A-1 (GO) (BAM-TCRS) | | | | | | | | |
| 4.00%, 07/01/33 (c) | | | 4,000 | | | | 3,942,474 | |
| 5.38%, 07/01/25 | | | 3,638 | | | | 3,663,864 | |
| 5.62%, 07/01/27 | | | 1,000 | | | | 1,040,241 | |
| 5.62%, 07/01/29 | | | 3,000 | | | | 3,237,143 | |
| 5.75%, 07/01/31 | | | 2,000 | | | | 2,233,173 | |
Puerto Rico Electric Power Authority, Series SS (RB) (NATL) 5.00%, 07/01/24 (c) | | | 545 | | | | 545,061 | |
See Notes to Financial Statements
VANECK SHORT HIGH YIELD MUNI ETF
SCHEDULE OF INVESTMENTS
(continued)
| | | Par
(000’s | ) | | Value | |
| Puerto Rico (continued) | | | | | | | | |
Puerto Rico Municipal Finance Agency, Series A (RB) (AGM) 5.00%, 08/01/30 (c) | | $ | 780 | | | $ | 785,181 | |
| Puerto Rico Sales Tax Financing Corp., Series A-1 (RB) | | | | | | | | |
| 0.01%, 07/01/31 (c) | | | 2,000 | | | | 1,509,450 | |
| 0.01%, 07/01/33 (c) | | | 1,500 | | | | 1,036,904 | |
| 4.50%, 07/01/34 (c) | | | 1,000 | | | | 1,003,886 | |
Puerto Rico Sales Tax Financing Corp., Series A-1 (RB) (AGM) 0.01%, 07/01/29 (c) | | | 1,308 | | | | 1,073,115 | |
| | | | | | | | 26,416,105 | |
| Rhode Island: 0.6% | | | | | | | | |
| Rhode Island Commerce Corp., Department of Transportation, Series A (RB) | | | | | | | | |
| 5.00%, 05/15/31 (c) | | | 400 | | | | 440,018 | |
| 5.00%, 05/15/33 (c) | | | 250 | | | | 274,954 | |
Rhode Island Commerce Corp., Department of Transportation, Series B (RB) 5.00%, 06/15/26 | | | 155 | | | | 159,856 | |
Rhode Island Health and Educational Building Corp., Care New England, Series B (RB) 5.00%, 09/01/31 (c) | | | 1,000 | | | | 968,531 | |
| | | | | | | | 1,843,359 | |
| South Carolina: 0.5% | | | | | | | | |
South Carolina Jobs-Economic Development Authority, High Point Academy Project, Series A (RB) 5.00%, 06/15/29 (c) | | | 600 | | | | 605,681 | |
South Carolina Jobs-Economic Development Authority, The Woodlands at Furman (RB) 4.00%, 11/15/27 (c) | | | 250 | | | | 244,753 | |
| South Carolina Public Service Authority, Series A (RB) | | | | | | | | |
| 5.00%, 12/01/26 (c) | | | 290 | | | | 292,341 | |
| 5.00%, 12/01/31 (c) | | | 525 | | | | 536,965 | |
| | | | | | | | 1,679,740 | |
| Tennessee: 0.5% | | | | | | | | |
Memphis-Shelby County Industrial Development Board, Graceland Project, Series A (TA) 4.75%, 07/01/27 | | | 105 | | | | 91,150 | |
Tennessee Energy Acquisition Corp., Commodity Project, Series A (RB) 5.00%, 05/01/52 (c) (p) | | | 1,000 | | | | 1,051,489 | |
Tennessee Energy Acquisition Corp., Gas Project, Series A (RB) 5.25%, 09/01/26 | | | 525 | | | | 533,154 | |
| | | | | | | | 1,675,793 | |
| | | Par
(000’s | ) | | Value | |
| Texas: 8.6% | | | | | | | | |
| Austin Convention Enterprises, Inc., Convention Center Hotel, First Tier, Series A (RB) | | | | | | | | |
| 5.00%, 01/01/33 (c) | | $ | 1,200 | | | $ | 1,212,242 | |
| 5.00%, 01/01/32 (c) | | | 1,155 | | | | 1,167,007 | |
Austin Convention Enterprises, Inc., Convention Center Hotel, First Tier, Series A (RB) (SAW) 5.00%, 01/01/26 | | | 775 | | | | 774,989 | |
Austin Convention Enterprises, Inc., Convention Center Hotel, Second Tier, Series A (RB) 5.00%, 01/01/30 (c) | | | 500 | | | | 495,766 | |
Board of Regents of the University of Texas System, Series A (RB) (AGM) 5.00%, 08/15/31 (c) | | | 50 | | | | 54,650 | |
Calhoun County Navigation Industrial Development Authority, Max Midstream Texas LLC Project, Series A (RB) 3.62%, 07/01/26 (c) | | | 2,465 | | | | 2,312,601 | |
Central Texas Regional Mobility Authority, Series B (RB) 5.00%, 01/01/32 (c) | | | 750 | | | | 821,522 | |
Central Texas Regional Mobility Authority, Series C (RB) 5.00%, 01/01/27 (c) | | | 1,000 | | | | 1,020,085 | |
| City of Austin, Texas Airport System (RB) | | | | | | | | |
| 5.00%, 11/15/28 (c) | | | 395 | | | | 396,335 | |
| 5.00%, 11/15/25 | | | 625 | | | | 634,491 | |
City of Houston, Airport System, Series C (RB) 5.00%, 07/01/27 | | | 180 | | | | 186,683 | |
City of Houston, Airport System, United Airlines, Inc. Terminal E Project (RB) 5.00%, 07/01/29 (c) | | | 3,000 | | | | 3,000,334 | |
City of Houston, Airport System, United Airlines, Inc. Terminal E Project, Series A (RB) 5.00%, 07/01/27 | | | 250 | | | | 253,559 | |
City of Houston, Continental Airlines, Inc., Terminal Improvement Projects (RB) 6.50%, 07/15/30 (c) | | | 200 | | | | 200,132 | |
| City of Houston, Texas Airport System Special Facilities, United Airlines, Inc., Series C (RB) | | | | | | | | |
| 5.00%, 07/15/27 | | | 2,000 | | | | 2,028,789 | |
| 5.00%, 07/15/28 | | | 500 | | | | 510,211 | |
See Notes to Financial Statements
| | | Par
(000’s | ) | | Value | |
| Texas (continued) | | | | | | | | |
City of Houston, Texas Airport System Special Facilities, United Airlines, Inc., Technical Operations Center Project (RB) 5.00%, 07/15/28 | | $ | 1,500 | | | $ | 1,530,631 | |
City of Houston, Texas Airport System Special Facilities, United Airlines, Inc., Terminal Improvement Projects, Series B-1 (RB) 5.00%, 07/15/30 (c) | | | 1,000 | | | | 1,002,703 | |
City of Houston, Texas Airport System Special Facilities, United Airlines, Inc., Terminal Improvement Projects, Series B-2 (RB) 5.00%, 07/15/27 | | | 1,750 | | | | 1,775,190 | |
| Clifton Higher Education Finance Corp., Series A (RB) | | | | | | | | |
| 4.62%, 08/15/25 | | | 40 | | | | 40,150 | |
| 5.12%, 08/15/30 (c) | | | 200 | | | | 203,454 | |
Gulf Coast Industrial Development Authority, CITGO Petroleum Corp. Project (RB) 4.88%, 05/01/25 (c) | | | 335 | | | | 334,975 | |
Harris County, Houston Sports Authority, Junior Lien, Series H (RB) (NATL) 0.00%, 11/15/29 ^ | | | 315 | | | | 250,954 | |
Harris County, Houston Sports Authority, Third Lien, Series A (RB) (NATL) 0.00%, 11/15/33 (c) ^ | | | 1,005 | | | | 579,338 | |
| Lower Colorado River Authority, LCRA Transmission Services Corp. Project (RB) | | | | | | | | |
| 5.00%, 05/15/31 (c) | | | 335 | | | | 338,720 | |
| 5.00%, 05/15/33 (c) | | | 200 | | | | 215,941 | |
Matagorda County District No. 1, Pollution Control, Series B (RB) (AMBAC) 4.55%, 05/01/30 | | | 105 | | | | 106,270 | |
Mesquite Health Facility Development Corp., Christian Care Centers, Inc. Project (RB) (NATL) 5.00%, 02/15/30 (c) (d) * | | | 102 | | | | 1,015 | |
Mission Economic Development Corp., Senior Lien, Natgasoline Project (RB) 4.62%, 10/01/31 (c) | | | 3,200 | | | | 3,167,251 | |
New Hope Cultural Education Facilities Finance Corp., Carillon Lifecare Community Project (RB) 4.00%, 07/01/28 (c) | | | 1,000 | | | | 921,308 | |
| | | Par
(000’s | ) | | Value | |
| Texas (continued) | | | | | | | | |
New Hope Cultural Education Facilities Finance Corp., Legacy Preparatory Charter Academy, Series A (RB) 5.25%, 08/15/27 (c) | | $ | 150 | | | $ | 150,796 | |
New Hope Cultural Education Facilities Finance Corp., NCCD-College Station Properties LLC, Series A (RB) 5.00%, 07/01/23 (d) * | | | 100 | | | | 92,750 | |
North Texas Tollway Authority, Second Tier, Series B (RB) 5.00%, 01/01/27 (c) | | | 185 | | | | 188,986 | |
Port Beaumont Navigation District, Texas Dock & Wharf Facility, Series A (RB) 2.62%, 01/01/31 (c) | | | 550 | | | | 469,953 | |
| SA Energy Acquisition Public Facility Corp. (RB) | | | | | | | | |
| 5.50%, 08/01/24 | | | 55 | | | | 55,131 | |
| 5.50%, 08/01/25 | | | 125 | | | | 126,801 | |
| 5.50%, 08/01/27 | | | 110 | | | | 113,305 | |
Tarrant County Cultural Education Facilities Finance Corp., MRC Stevenson Oaks Project, Series A (RB) 6.25%, 11/15/31 (c) | | | 250 | | | | 242,558 | |
Tarrant County Cultural Education Facilities Finance Corp., Retirement Facility (RB) 4.00%, 05/15/27 (c) | | | 225 | | | | 219,286 | |
Texas Municipal Gas Acquisition and Supply Corp. I, Senior Lien, Series A (RB) 5.25%, 12/15/25 | | | 100 | | | | 101,193 | |
Texas Municipal Gas Acquisition and Supply Corp. III (RB) 5.00%, 12/15/28 | | | 350 | | | | 360,644 | |
| | | | | | | | 27,658,699 | |
| Utah: 0.5% | | | | | | | | |
Utah Charter School Finance Authority, Freedom Academy Foundation Project (RB) 4.50%, 06/15/27 | | | 700 | | | | 679,319 | |
Utah Salt Lake City, International Airport, Series A (RB) 5.00%, 07/01/31 | | | 1,000 | | | | 1,084,662 | |
| | | | | | | | 1,763,981 | |
| Virgin Islands: 0.4% | | | | | | | | |
Matching Fund Special Purpose Securitization Corp., Virgin Island, Series A (RB) 5.00%, 10/01/32 | | | 1,000 | | | | 1,074,591 | |
See Notes to Financial Statements
VANECK SHORT HIGH YIELD MUNI ETF
SCHEDULE OF INVESTMENTS
(continued)
| | | Par
(000’s | ) | | Value | |
| Virgin Islands (continued) | | | | | | | | |
Virgin Islands Public Finance Authority, Virgin Islands Gross Receipts Taxes, Series C (RB) 5.00%, 10/01/24 | | $ | 100 | | | $ | 99,857 | |
| Virgin Islands Water & Power Authority, Series B (RB) | | | | | | | | |
| 5.00%, 07/01/25 (c) | | | 55 | | | | 53,417 | |
| 5.00%, 07/01/24 (c) | | | 75 | | | | 74,622 | |
| | | | | | | | 1,302,487 | |
| Virginia: 1.7% | | | | | | | | |
Amherst Industrial Development Authority, Educational Facilities, Sweet Briar College (RB) 4.75%, 09/01/30 (c) | | | 140 | | | | 131,304 | |
Peninsula Town Center Community Development Authority (RB) 4.50%, 09/01/28 (c) | | | 325 | | | | 319,472 | |
Roanoke County Economic Development Authority, Series A (RB) 4.75%, 09/01/29 (c) (d) * | | | 1,530 | | | | 1,397,391 | |
| Virginia Beach Development Authority, Residential Care Facility, Series A (RB) | | | | | | | | |
| 5.75%, 09/01/30 (c) | | | 1,000 | | | | 1,035,130 | |
| 5.75%, 09/01/33 (c) | | | 1,000 | | | | 1,101,289 | |
Virginia College Building Authority, Marymount University Project, Series B (RB) 5.25%, 07/01/30 (c) | | | 710 | | | | 712,968 | |
Virginia Small Business Financing Authority, Elizabeth River Crossing OPCO LLC Project (RB) 4.00%, 01/01/31 | | | 635 | | | | 642,907 | |
| | | | | | | | 5,340,461 | |
| Washington: 1.7% | | | | | | | | |
King County, Public Hospital District No. 4, Snoqualmie Valley Hospital, Series A (RB) 5.00%, 12/01/25 | | | 75 | | | | 74,217 | |
Port Seattle Washington Industrial Development Corp., Delta Air Lines, Inc. Project (RB) 5.00%, 04/01/30 (c) | | | 1,800 | | | | 1,800,223 | |
Washington Health Care Facilities Authority, CommonSpirit Health, Series B-2 (RB) 5.00%, 08/01/49 (c) (p) | | | 480 | | | | 485,302 | |
Washington State, Convention Center Public Facilities District (RB) 4.00%, 07/01/31 | | | 2,250 | | | | 2,199,739 | |
| | | Par
(000’s | ) | | Value | |
| Washington (continued) | | | | | | | | |
| Washington State, Housing Finance Commission, Presbyterian Retirement Communities Northwest Projects, Series A (RB) | | | | | | | | |
| 4.00%, 01/01/26 (c) | | $ | 500 | | | $ | 486,425 | |
| 5.00%, 01/01/31 (c) | | | 365 | | | | 346,507 | |
| | | | | | | | 5,392,413 | |
| West Virginia: 0.6% | | | | | | | | |
County of Ohio, Fort Henry Centre Tax Increment Financing District No. 1, The Highlands Project (TA) 4.75%, 06/01/31 (c) | | | 680 | | | | 670,493 | |
West Virginia Economic Development Authority, Arch Resources Project (RB) (SAW) 4.12%, 07/01/45 (c) (p) | | | 1,000 | | | | 995,072 | |
West Virginia Hospital Finance Authority, West Virginia University Health System, Series A (RB) 5.00%, 06/01/26 | | | 150 | | | | 154,049 | |
| | | | | | | | 1,819,614 | |
| Wisconsin: 1.7% | | | | | | | | |
Public Finance Authority, Celanese Corp., Series C (RB) 4.30%, 11/01/30 (c) | | | 1,000 | | | | 977,819 | |
Public Finance Authority, Living Community First Mortgage (RB) 4.25%, 05/01/29 (c) | | | 430 | | | | 390,815 | |
Public Finance Authority, North Carolina Charter Educational Foundation Project, Series A (RB) 4.10%, 06/15/26 | | | 350 | | | | 342,077 | |
Public Finance Authority, Penick Village (RB) 4.00%, 09/01/29 (c) | | | 445 | | | | 414,687 | |
Public Finance Authority, Phoenix Academy Project, Series A (RB) 5.00%, 06/15/27 (c) | | | 150 | | | | 145,325 | |
Public Finance Authority, Prime Healthcare Foundation, Inc., Series A (RB) 5.00%, 12/01/27 | | | 1,235 | | | | 1,245,395 | |
Public Finance Authority, Waste Management, Inc. Project, Series A-1 (RB) 2.62%, 11/01/25 | | | 1,050 | | | | 1,026,391 | |
See Notes to Financial Statements
| | | Par
(000’s | ) | | Value | |
| Wisconsin (continued) | | | | | | | | |
Wisconsin Health and Educational Facilities Authority, Prohealth Care, Inc. (RB) 3.00%, 08/15/26 (c) | | $ | 825 | | | $ | 805,796 | |
| | | | | | | | 5,348,305 | |
Total Municipal Bonds: 98.3%
(Cost: $337,420,831) | | | | | | | 315,327,211 | |
| Other assets less liabilities: 1.7% | | | | | | | 5,399,500 | |
| NET ASSETS: 100.0% | | | | | | $ | 320,726,711 | |
Definitions:
| AGM | Assured Guaranty Municipal Corp. |
| AMBAC | American Municipal Bond Assurance Corp. |
| BAM | Build America Assurance Co. |
| CP | Certificate of Participation |
| FGIC | Financial Guaranty Insurance Co. |
| GO | General Obligation |
| NATL | National Public Finance Guarantee Corp. |
| RB | Revenue Bond |
| SA | Special Assessment |
| SAW | State Aid Withholding |
| SBG | School Board Guaranteed |
| TA | Tax Allocation |
Footnotes:
| (c) | Callable Security — the redemption date shown is the date the security may be redeemed by the issuer |
| (d) | Security in default |
| (p) | Putable Security — the redemption date shown is the date the security may be redeemed by the investor |
| * | Non-income producing |
| ^ | Zero Coupon Bond |
| ∞ | Security is valued using significant unobservable inputs that factor in discount for lack of marketability and is classified as Level 3 in the fair value hierarchy. |
| Summary of Investments by Sector | | % of
Investments | | Value | |
| Industrial Development Revenue | | | 23.0 | % | | $ | 72,557,749 | |
| Local GO | | | 11.6 | | | | 36,483,567 | |
| Hospitals | | | 9.1 | | | | 28,571,201 | |
| Tax | | | 8.8 | | | | 27,668,027 | |
| Education | | | 6.6 | | | | 20,749,982 | |
| State GO | | | 5.4 | | | | 17,072,926 | |
| Utilities | | | 5.4 | | | | 17,061,594 | |
| Airport | | | 5.0 | | | | 15,871,770 | |
| Power | | | 4.9 | | | | 15,423,038 | |
| Health | | | 4.8 | | | | 15,071,822 | |
| Leasing COPS & Appropriations | | | 4.2 | | | | 13,193,354 | |
| Transportation | | | 2.3 | | | | 7,310,534 | |
| Miscellaneous | | | 2.3 | | | | 7,309,539 | |
| Water & Sewer | | | 2.2 | | | | 6,971,814 | |
| Toll & Turnpike | | | 1.7 | | | | 5,324,638 | |
| Multi-Family Housing | | | 1.5 | | | | 4,674,604 | |
| Pollution Control | | | 0.6 | | | | 1,974,446 | |
| Refunded | | | 0.3 | | | | 1,023,481 | |
| Unassigned | | | 0.2 | | | | 708,973 | |
| Tobacco | | | 0.1 | | | | 304,152 | |
| | | | 100.0 | % | | $ | 315,327,211 | |
See Notes to Financial Statements
VANECK SHORT HIGH YIELD MUNI ETF
SCHEDULE OF INVESTMENTS
(continued)
The summary of inputs used to value the Fund's investments as of April 30, 2024 is as follows:
| | | Level 1
Quoted
Prices | | | Level 2
Significant
Observable
Inputs | | | Level 3
Significant
Unobservable
Inputs | | | Value | |
| Municipal Bonds | | | | | | | | | | | | | | | | |
| Alabama | | $ | — | | | $ | 7,260,029 | | | $ | — | | | $ | 7,260,029 | |
| Arizona | | | — | | | | 6,871,679 | | | | — | | | | 6,871,679 | |
| Arkansas | | | — | | | | 2,081,785 | | | | — | | | | 2,081,785 | |
| California | | | — | | | | 24,471,291 | | | | — | | | | 24,471,291 | |
| Colorado | | | — | | | | 8,240,674 | | | | — | | | | 8,240,674 | |
| Connecticut | | | — | | | | 1,805,146 | | | | — | | | | 1,805,146 | |
| Delaware | | | — | | | | 940,432 | | | | — | | | | 940,432 | |
| District of Columbia | | | — | | | | 483,971 | | | | — | | | | 483,971 | |
| Florida | | | — | | | | 14,760,524 | | | | — | | | | 14,760,524 | |
| Georgia | | | — | | | | 6,006,891 | | | | — | | | | 6,006,891 | |
| Guam | | | — | | | | 4,500,097 | | | | — | | | | 4,500,097 | |
| Hawaii | | | — | | | | 399,146 | | | | — | | | | 399,146 | |
| Illinois | | | — | | | | 39,207,711 | | | | — | | | | 39,207,711 | |
| Indiana | | | — | | | | 4,221,975 | | | | — | | | | 4,221,975 | |
| Iowa | | | — | | | | 2,601,407 | | | | — | | | | 2,601,407 | |
| Kansas | | | — | | | | 633,742 | | | | — | | | | 633,742 | |
| Kentucky | | | — | | | | 2,635,096 | | | | — | | | | 2,635,096 | |
| Louisiana | | | — | | | | 6,373,014 | | | | 9 | | | | 6,373,023 | |
| Maryland | | | — | | | | 1,837,640 | | | | — | | | | 1,837,640 | |
| Massachusetts | | | — | | | | 1,788,790 | | | | — | | | | 1,788,790 | |
| Michigan | | | — | | | | 2,646,796 | | | | — | | | | 2,646,796 | |
| Minnesota | | | — | | | | 3,459,046 | | | | — | | | | 3,459,046 | |
| Missouri | | | — | | | | 1,972,396 | | | | — | | | | 1,972,396 | |
| Nebraska | | | — | | | | 2,490,330 | | | | — | | | | 2,490,330 | |
| Nevada | | | — | | | | 3,197,322 | | | | — | | | | 3,197,322 | |
| New Hampshire | | | — | | | | 303,089 | | | | — | | | | 303,089 | |
| New Jersey | | | — | | | | 14,783,441 | | | | — | | | | 14,783,441 | |
| New Mexico | | | — | | | | 1,433,614 | | | | — | | | | 1,433,614 | |
| New York | | | — | | | | 44,288,412 | | | | — | | | | 44,288,412 | |
| North Carolina | | | — | | | | 1,143,090 | | | | — | | | | 1,143,090 | |
| North Dakota | | | — | | | | 607,168 | | | | — | | | | 607,168 | |
| Ohio | | | — | | | | 6,577,909 | | | | — | | | | 6,577,909 | |
| Oklahoma | | | — | | | | 3,276,045 | | | | — | | | | 3,276,045 | |
| Pennsylvania | | | — | | | | 11,786,547 | | | | — | | | | 11,786,547 | |
| Puerto Rico | | | — | | | | 26,416,105 | | | | — | | | | 26,416,105 | |
| Rhode Island | | | — | | | | 1,843,359 | | | | — | | | | 1,843,359 | |
| South Carolina | | | — | | | | 1,679,740 | | | | — | | | | 1,679,740 | |
| Tennessee | | | — | | | | 1,675,793 | | | | — | | | | 1,675,793 | |
| Texas | | | — | | | | 27,658,699 | | | | — | | | | 27,658,699 | |
| Utah | | | — | | | | 1,763,981 | | | | — | | | | 1,763,981 | |
| Virgin Islands | | | — | | | | 1,302,487 | | | | — | | | | 1,302,487 | |
| Virginia | | | — | | | | 5,340,461 | | | | — | | | | 5,340,461 | |
| Washington | | | — | | | | 5,392,413 | | | | — | | | | 5,392,413 | |
| West Virginia | | | — | | | | 1,819,614 | | | | — | | | | 1,819,614 | |
| Wisconsin | | | — | | | | 5,348,305 | | | | — | | | | 5,348,305 | |
| Total | | $ | — | | | $ | 315,327,202 | | | $ | 9 | | | $ | 315,327,211 | |
See Notes to Financial Statements
VANECK SHORT MUNI ETF
SCHEDULE OF INVESTMENTS
April 30, 2024
| | | Par
(000’s | ) | | Value | |
| MUNICIPAL BONDS: 97.5% | | | | | | | | |
| Alabama: 3.1% | | | | | | | | |
Alabama Federal Aid Highway Finance Authority, Series A (RB) 5.00%, 06/01/37 (c) | | $ | 1,000 | | | $ | 1,060,553 | |
Black Belt Energy Gas District Gas, Project No. 4, Series A (RB) 4.00%, 12/01/49 (c) (p) | | | 1,000 | | | | 1,000,854 | |
Black Belt Energy Gas District, Series C-1 (RB) 4.00%, 10/01/52 (c) (p) | | | 600 | | | | 599,510 | |
Black Belt Energy Gas District, Series D-1 (RB) 5.50%, 06/01/49 (c) (p) | | | 1,000 | | | | 1,056,029 | |
County of Jefferson (RB) 5.00%, 09/15/28 (c) | | | 525 | | | | 549,764 | |
Lower Alabama Gas District, Project No. 2 (RB) (SAW) 4.00%, 12/01/50 (c) (p) | | | 1,500 | | | | 1,498,791 | |
Southeast Energy Authority, Cooperative District Commodity Supply, Series A (RB) 5.25%, 01/01/54 (c) (p) | | | 1,000 | | | | 1,050,238 | |
The Black Belt Energy Gas District, Gas Project, Series E (RB) 5.00%, 05/01/53 (p) | | | 1,000 | | | | 1,035,657 | |
| | | | | | | | 7,851,396 | |
| Arizona: 1.4% | | | | | | | | |
Arizona Industrial Development Authority, Series A (RB) 5.00%, 11/01/28 (c) | | | 500 | | | | 527,277 | |
City of Phoenix Civic Improvement Corp., Junior Lien Wastewater System (RB) 5.00%, 07/01/29 (c) | | | 620 | | | | 640,536 | |
Maricopa County Industrial Development Authority, Banner Health, Series A (RB) | | | | | | | | |
| 5.00%, 01/01/26 | | | 700 | | | | 717,178 | |
| 5.00%, 01/01/53 (c) (p) | | | 500 | | | | 512,264 | |
Salt River Project Agricultural Improvement & Power District, Series A (RB) | | | | | | | | |
5.00%, 01/01/26 | | | 500 | | | | 513,658 | |
| 5.00%, 01/01/27 | | | 500 | | | | 523,170 | |
| | | | | | | | 3,434,083 | |
| California: 18.1% | | | | | | | | |
Bay Area Toll Authority, San Francisco Bay Area, Series A (RB) 2.95%, 04/01/47 (c) (p) | | | 1,155 | | | | 1,127,872 | |
Bay Area Toll Authority, Series B (RB) 2.85%, 04/01/47 (c) (p) | | | 375 | | | | 370,399 | |
| | | Par
(000’s | ) | | Value | |
| California (continued) | | | | | | | | |
California Community Choice Financing Authority, Clean Energy, Series A-1 (RB) 4.00%, 05/01/53 (c) (p) | | $ | 500 | | | $ | 498,382 | |
California Community Choice Financing Authority, Clean Energy, Series B-1 (RB) 5.00%, 07/01/53 (c) (p) | | | 1,000 | | | | 1,048,662 | |
California Community Choice Financing Authority, Clean Energy, Series D (RB) 5.50%, 05/01/54 (c) (p) | | | 1,000 | | | | 1,061,930 | |
California Health Facilities Financing Authority, Kaiser Permanente, Series A-1 (RB) 5.00%, 11/01/27 | | | 500 | | | | 535,007 | |
California Health Facilities Financing Authority, Providence St. Joseph Health, Series B-2 (RB) 4.00%, 10/01/36 (c) (p) | | | 500 | | | | 499,309 | |
California Health Facilities Financing Authority, Providence St. Joseph Health, Series B-3 (RB) 2.00%, 10/01/36 (c) (p) | | | 335 | | | | 324,652 | |
California Health Facilities Financing Authority, Providence St. Joseph Health, Series C (RB) 5.00%, 10/01/39 (p) | | | 585 | | | | 590,748 | |
California Infrastructure And Economic Development Bank, Series B-2 (RB) 3.00%, 10/01/47 (c) (p) | | | 500 | | | | 491,488 | |
California State Public Works Board, Kern Valley State Prison, Series D (RB) 5.00%, 06/01/25 | | | 825 | | | | 838,984 | |
California State Public Works Board, Natural Resources Headquarters, Series C (RB) 5.00%, 11/01/29 | | | 675 | | | | 744,025 | |
| California State Public Works Board, Various Capital Projects, Series B (RB) | | | | | | | | |
| 5.00%, 10/01/26 | | | 830 | | | | 863,967 | |
| 5.00%, 10/01/28 (c) | | | 785 | | | | 832,411 | |
California State Public Works Board, Various Correctional Facilities, Series D (RB) 5.00%, 09/01/26 | | | 500 | | | | 519,611 | |
California State University, Systemwide, Series B-3 (RB) 3.12%, 11/01/51 (c) (p) | | | 500 | | | | 495,741 | |
See Notes to Financial Statements
VANECK SHORT MUNI ETF
SCHEDULE OF INVESTMENTS
(continued)
| | | Par
(000’s | ) | | Value | |
| California (continued) | | | | | | | | |
California Statewide Communities Development Authority, Pollution Control, Southern California Edison Company, Series A (RB) 1.75%, 09/01/29 (c) | | $ | 2,500 | | | $ | 2,153,900 | |
City & County of San Francisco, Series R-1 (GO) 4.00%, 06/15/28 (c) | | | 1,000 | | | | 1,000,005 | |
City and County of San Francisco, Moscone Convention Center Expansion Project, Series B (CP) 4.00%, 04/01/30 (c) | | | 1,000 | | | | 1,003,820 | |
City of San Francisco, Public Utilities Commission Water, Series C (RB) 5.00%, 11/01/28 | | | 500 | | | | 547,401 | |
Foothill-Eastern Transportation Corridor Agency, Series A (RB) 0.00%, 01/01/27 ^ | | | 500 | | | | 457,166 | |
| Golden State Tobacco Securitization Corp., Enhanced Tobacco Settlement, Series A (RB) | | | | | | | | |
| 5.00%, 06/01/45 (c) | | | 1,870 | | | | 1,904,493 | |
| 5.00%, 06/01/40 (c) | | | 1,000 | | | | 1,018,445 | |
Golden State Tobacco Securitization Corp., Enhanced Tobacco Settlement, Series A (RB) (AGM) 0.00%, 06/01/26 ^ | | | 1,000 | | | | 929,411 | |
Los Angeles County Metropolitan Transportation Authority, Series A (RB) 5.00%, 07/01/25 | | | 500 | | | | 509,946 | |
Los Angeles Department of Water and Power System, Series A (RB) 5.00%, 07/01/29 | | | 500 | | | | 555,213 | |
Los Angeles Unified School District, Series A (GO) 5.00%, 07/01/24 | | | 875 | | | | 876,684 | |
Metropolitan Water District of Southern California, Series B (RB) 5.00%, 08/01/24 (c) | | | 1,000 | | | | 1,001,941 | |
Northern California Energy Authority, Series A (RB) 4.00%, 07/01/49 (p) | | | 1,000 | | | | 1,000,266 | |
Oakland Unified School District, Series A (GO) 5.00%, 08/01/40 (c) | | | 1,000 | | | | 1,020,862 | |
| Orange County Transportation Authority, I-405 Improvement Project (RB) | | | | | | | | |
| 4.00%, 10/15/24 | | | 675 | | | | 676,620 | |
| 5.00%, 10/15/24 | | | 750 | | | | 755,139 | |
| | | Par
(000’s | ) | | Value | |
| California (continued) | | | | | | | | |
Public Facilities Financing Authory of the City of San Diego, Subordinated Water, Series B (RB) 5.00%, 08/01/27 (c) | | $ | 500 | | | $ | 521,496 | |
Public Utilities Commission of the City & County of San Francisco, Wastewater Revenue, Series A (RB) 5.00%, 10/01/26 | | | 1,000 | | | | 1,046,854 | |
San Bernardino Community College District, Series A (GO) 4.00%, 08/01/49 (c) | | | 540 | | | | 558,390 | |
San Bernardino County, Capital Facilities, Project B (CP) 6.88%, 08/01/24 | | | 535 | | | | 538,962 | |
San Francisco Community College District (GO) 5.00%, 06/15/25 | | | 1,000 | | | | 1,019,397 | |
San Joaquin Hills, Agency Toll Road (RB) 0.00%, 01/01/25 ^ | | | 500 | | | | 488,306 | |
Southwestern Community College District, Series D (GO) 5.00%, 08/01/44 (c) | | | 500 | | | | 510,123 | |
State of California, Department of Water Resources, Series BB (RB) 5.00%, 12/01/26 | | | 500 | | | | 526,237 | |
| State of California, Various Purpose (GO) | | | | | | | | |
| 5.00%, 10/01/24 | | | 555 | | | | 558,258 | |
| 5.00%, 10/01/27 | | | 530 | | | | 562,519 | |
| 5.00%, 10/01/27 | | | 1,000 | | | | 1,061,357 | |
| 5.00%, 10/01/27 | | | 500 | | | | 530,678 | |
| 5.00%, 10/01/29 | | | 1,000 | | | | 1,101,669 | |
| 5.00%, 11/01/26 | | | 915 | | | | 953,806 | |
| 5.00%, 11/01/28 (c) | | | 1,000 | | | | 1,063,716 | |
| 5.00%, 11/01/28 | | | 910 | | | | 985,049 | |
| 5.00%, 10/01/29 (c) | | | 1,000 | | | | 1,033,064 | |
| 5.00%, 04/01/27 | | | 750 | | | | 788,150 | |
| 5.00%, 08/01/24 | | | 325 | | | | 326,051 | |
| 5.00%, 08/01/25 | | | 1,000 | | | | 1,019,921 | |
| 5.00%, 08/01/27 | | | 1,305 | | | | 1,380,455 | |
| 5.00%, 09/01/26 | | | 1,000 | | | | 1,038,994 | |
| 5.00%, 09/01/27 | | | 1,000 | | | | 1,059,576 | |
| 5.00%, 09/01/28 | | | 1,000 | | | | 1,079,098 | |
| | | | | | | | 46,006,626 | |
| Colorado: 1.7% | | | | | | | | |
Boulder Larimer & Weld Counties, St. Vrain Valley School District, Series C (GO) (SAW) 5.00%, 12/15/35 (c) | | | 500 | | | | 522,621 | |
City Of Colorado Springs, Colorado Utilities System, Series A-1 (RB) 5.00%, 11/15/26 | | | 500 | | | | 521,852 | |
See Notes to Financial Statements
| | | Par
(000’s | ) | | Value | |
| Colorado (continued) | | | | | | | | |
Colorado Health Facilities Authority, Sanford, Series A (RB) 5.00%, 11/01/25 | | $ | 500 | | | $ | 509,251 | |
Douglas County School District No. RE-1 (GO) (SAW) 5.00%, 12/15/24 | | | 500 | | | | 504,028 | |
Regional Transportation District, Fastracks Project, Series B (RB) 5.00%, 11/01/28 | | | 1,000 | | | | 1,085,539 | |
State of Colorado, Series A (CP) 5.00%, 12/15/26 | | | 500 | | | | 522,709 | |
University of Colorado, Series A-2 (RB) 4.00%, 06/01/34 (c) | | | 500 | | | | 519,397 | |
| | | | | | | | 4,185,397 | |
| Connecticut: 2.5% | | | | | | | | |
State of Connecticut, Series B (GO) (BAM) 3.00%, 06/01/29 | | | 1,000 | | | | 972,582 | |
State of Connecticut, Series E (GO) 5.00%, 11/15/25 | | | 670 | | | | 687,015 | |
State of Connecticut, Special Tax, Transportation Infrastructure Purpose, Series A (ST) 5.00%, 05/01/28 | | | 600 | | | | 643,990 | |
State of Connecticut, Transportation Infrastructure Purposes, Series A (ST) 5.00%, 05/01/26 | | | 1,015 | | | | 1,047,614 | |
State of Connecticut, Transportation Infrastructure Purposes, Series B (RB) 5.00%, 10/01/24 | | | 535 | | | | 537,900 | |
| University of Connecticut, Series A (RB) | | | | | | | | |
| 5.00%, 01/15/30 (c) | | | 745 | | | | 775,586 | |
| 5.00%, 04/15/26 | | | 550 | | | | 567,832 | |
| 5.00%, 04/15/29 (c) | | | 1,000 | | | | 1,068,893 | |
| | | | | | | | 6,301,412 | |
| Delaware: 0.6% | | | | | | | | |
Delaware State Economic Development Authority, NRG Energy Project, Series A (RB) 1.25%, 10/01/45 (c) (p) | | | 500 | | | | 470,216 | |
Delaware Transportation Authority (RB) 5.00%, 07/01/26 | | | 500 | | | | 518,380 | |
State of Delaware, Series A (GO) 5.00%, 10/01/25 | | | 410 | | | | 419,405 | |
| | | | | | | | 1,408,001 | |
| District of Columbia: 1.0% | | | | | | | | |
District of Columbia, Series D (GO) 5.00%, 06/01/25 | | | 315 | | | | 320,340 | |
| | | Par
(000’s | ) | | Value | |
| District of Columbia (continued) | | | | | | | | |
District of Columbia, Series E (GO) 5.00%, 06/01/25 | | $ | 500 | | | $ | 508,475 | |
Metropolitan Washington Airports Authority, Airport System, Series B (RB) 5.00%, 10/01/28 | | | 500 | | | | 541,894 | |
Metropolitan Washington Airports Authority, Dulles Toll Road, Series C (RB) (AGC) 6.50%, 10/01/41 (c) | | | 1,000 | | | | 1,073,556 | |
| | | | | | | | 2,444,265 | |
| Florida: 2.5% | | | | | | | | |
Central Florida Expressway Authority (RB) (AGM) 5.00%, 07/01/27 | | | 500 | | | | 527,117 | |
County of Miami-Dade (RB) 5.00%, 10/01/29 (c) | | | 510 | | | | 526,881 | |
County of Miami-Dade, Water and Sewer System (RB) 5.00%, 10/01/28 | | | 1,000 | | | | 1,076,492 | |
Florida State Board of Education, Public Education Capital Outlay, Series C (GO) 5.00%, 06/01/24 | | | 1,000 | | | | 1,000,934 | |
Florida State Department of Transportation, Turnpike Enterprise, Series A (RB) 5.00%, 07/01/26 (c) | | | 655 | | | | 665,504 | |
School Board of Miami-Dade County, Series A (CP) 5.00%, 05/01/28 (c) | | | 895 | | | | 904,789 | |
School District of Broward County, Series C (CP) 5.00%, 07/01/24 | | | 340 | | | | 340,524 | |
South Miami Health Facilities Authority, Baptist Health (RB) 5.00%, 08/15/29 (c) | | | 710 | | | | 742,484 | |
State of Florida, Board of Education, Lottery Revenue, Series A (RB) 5.00%, 07/01/24 | | | 650 | | | | 651,175 | |
| | | | | | | | 6,435,900 | |
| Georgia: 3.6% | | | | | | | | |
City of Atlanta, Water and Wastewater, Series A (RB) 5.00%, 11/01/24 | | | 500 | | | | 503,616 | |
Georgia State Road and Tollway Authority (RB) 5.00%, 06/01/29 | | | 800 | | | | 876,130 | |
Main Street Natural Gas, Inc., Gas Supply, Series B (RB) 5.00%, 07/01/53 (c) (p) | | | 1,000 | | | | 1,050,303 | |
Main Street Natural Gas, Inc., Series A (RB) 4.00%, 07/01/52 (c) (p) | | | 1,250 | | | | 1,248,304 | |
Main Street Natural Gas, Inc., Series B (RB) 4.00%, 08/01/49 (c) (p) | | | 500 | | | | 500,095 | |
See Notes to Financial Statements
VANECK SHORT MUNI ETF
SCHEDULE OF INVESTMENTS
(continued)
| | | Par
(000’s | ) | | Value | |
| Georgia (continued) | | | | | | | | |
| 5.00%, 12/01/52 (c) (p) | | $ | 500 | | | $ | 519,445 | |
| Main Street Natural Gas, Inc., Series C (RB) | | | | | | | | |
| 4.00%, 08/01/52 (c) (p) | | | 500 | | | | 485,501 | |
| 4.00%, 03/01/50 (c) (p) | | | 1,500 | | | | 1,501,212 | |
| State of Georgia, Series A (GO) | | | | | | | | |
| 5.00%, 02/01/29 (c) | | | 680 | | | | 700,277 | |
| 5.00%, 08/01/26 | | | 700 | | | | 727,212 | |
State of Georgia, Series C (GO) 5.00%, 07/01/26 | | | 1,000 | | | | 1,037,185 | |
| | | | | | | | 9,149,280 | |
| Hawaii: 1.1% | | | | | | | | |
| City & County of Honolulu, Rail Transit Project, Series E (GO) | | | | | | | | |
| 5.00%, 03/01/26 | | | 785 | | | | 808,268 | |
| 5.00%, 03/01/27 | | | 500 | | | | 524,534 | |
State of Hawaii, General Obligation, Series EO (GO) 5.00%, 08/01/25 (c) | | | 520 | | | | 521,758 | |
State of Hawaii, Series ET (GO) 3.00%, 10/01/29 (c) | | | 1,000 | | | | 980,492 | |
| | | | | | | | 2,835,052 | |
| Illinois: 5.2% | | | | | | | | |
Board of Trustees of the University of Illinois, Series A (RB) 5.00%, 04/01/25 | | | 500 | | | | 505,546 | |
Chicago O’Hare International Airport, Series B (RB) (AGM) 5.00%, 01/01/26 | | | 500 | | | | 513,086 | |
Chicago O’Hare International Airport, Series C (RB) 5.00%, 01/01/26 | | | 315 | | | | 323,244 | |
Chicago Transit Authority, Federal Transit Administration Section 5307 Urbanized Area Formula (RB) 5.00%, 06/01/25 | | | 340 | | | | 343,239 | |
| City of Chicago, Series A (GO) | | | | | | | | |
| 5.00%, 01/01/27 | | | 365 | | | | 376,165 | |
| 5.00%, 01/01/30 | | | 1,000 | | | | 1,069,149 | |
City of Chicago, Series B (GO) 4.00%, 01/01/30 | | | 358 | | | | 363,244 | |
| Illinois Finance Authority, Clean Water Initiative (RB) | | | | | | | | |
| 5.00%, 01/01/28 | | | 500 | | | | 533,715 | |
| 5.00%, 07/01/27 | | | 685 | | | | 723,844 | |
Illinois Finance Authority, Clean Water Initiative (RB) (AGM) 5.00%, 07/01/24 | | | 500 | | | | 500,854 | |
Illinois Finance Authority, Northshore University Health System, Series A (RB) (AGM) 5.00%, 08/15/26 | | | 500 | | | | 516,710 | |
Illinois State Toll Highway Authority, Series A (RB) 5.00%, 01/01/27 | | | 415 | | | | 433,258 | |
| | | Par
(000’s | ) | | Value | |
| Illinois (continued) | | | | | | | | |
Illinois State Toll Highway Authority, Series C (RB) 5.00%, 01/01/27 | | $ | 650 | | | $ | 678,597 | |
Illinois State, Series A (GO) 5.00%, 11/01/27 | | | 1,000 | | | | 1,045,238 | |
Metropolitan Water Reclamation District of Greater Chicago, Series A (GO) 5.00%, 12/01/29 (c) | | | 780 | | | | 809,149 | |
Regional Transportation Authority of Illinois, Series A (RB) 5.00%, 07/01/28 (c) | | | 735 | | | | 773,975 | |
State of Illinois (GO) 3.50%, 06/01/29 (c) | | | 685 | | | | 664,014 | |
State of Illinois (GO) (AGC) 5.50%, 05/01/25 | | | 335 | | | | 340,257 | |
State of Illinois, Series A (RB) 4.00%, 06/15/28 | | | 580 | | | | 595,290 | |
| State of Illinois, Series D (GO) | | | | | | | | |
| 5.00%, 11/01/25 | | | 1,345 | | | | 1,368,457 | |
| 5.00%, 11/01/26 | | | 800 | | | | 825,232 | |
| | | | | | | | 13,302,263 | |
| Indiana: 0.6% | | | | | | | | |
Indiana Finance Authority, Series C (RB) 5.00%, 12/01/24 | | | 575 | | | | 579,454 | |
Indiana Finance Authority, Series E (RB) 5.00%, 06/01/29 | | | 935 | | | | 1,024,901 | |
| | | | | | | | 1,604,355 | |
| Kentucky: 1.0% | | | | | | | | |
Kentucky Public Energy Authority, Gas Supply, Series B (RB) 4.00%, 01/01/49 (c) (p) | | | 500 | | | | 499,842 | |
Kentucky Public Energy Authority, Gas Supply, Series C-1 (RB) 4.00%, 12/01/49 (c) (p) | | | 1,100 | | | | 1,099,832 | |
Louisville & Jefferson County, Metro Government, Norton Healtcare, Inc., Series C (RB) 5.00%, 10/01/47 (c) (p) | | | 1,000 | | | | 1,022,227 | |
| | | | | | | | 2,621,901 | |
| Louisiana: 0.9% | | | | | | | | |
Louisiana Public Facilities Authority, Ochsner Clinic Project, Series B (RB) (SAW) 5.00%, 05/15/50 (c) (p) | | | 500 | | | | 503,983 | |
St. John Baptist Parish, Marathon Oil Co., Series B-2 (RB) 2.38%, 06/01/37 (p) | | | 750 | | | | 717,017 | |
State of Louisiana, Series A (GO) 5.00%, 02/01/29 | | | 1,000 | | | | 1,090,701 | |
| | | | | | | | 2,311,701 | |
See Notes to Financial Statements
| | | Par
(000’s | ) | | Value | |
| Maine: 0.2% | | | | | | | | |
State of Maine, Series B (GO) (SBG) 5.00%, 06/01/25 | | $ | 500 | | | $ | 508,262 | |
| Maryland: 2.5% | | | | | | | | |
County of Baltimore (GO) 5.00%, 03/01/30 | | | 945 | | | | 1,053,083 | |
County of Montgomery, Consolidated Public Improvement, Series A (GO) 4.00%, 08/01/29 | | | 750 | | | | 791,333 | |
| State of Maryland, Department of Transportation (RB) | | | | | | | | |
| 4.00%, 11/01/27 (c) | | | 500 | | | | 498,208 | |
| 5.00%, 10/01/26 | | | 595 | | | | 619,068 | |
State of Maryland, Series B (GO) 5.00%, 08/01/24 | | | 550 | | | | 551,613 | |
State of Maryland, State and Local Facilities Loan (GO) 4.00%, 06/01/27 (c) | | | 560 | | | | 558,163 | |
| State of Maryland, State and Local Facilities Loan, Series A (GO) | | | | | | | | |
| 5.00%, 03/15/28 (c) | | | 500 | | | | 526,801 | |
| 5.00%, 03/15/28 | | | 500 | | | | 536,751 | |
| 5.00%, 03/15/29 | | | 1,000 | | | | 1,094,706 | |
| | | | | | | | 6,229,726 | |
| Massachusetts: 2.8% | | | | | | | | |
Commonwealth of Massachusetts (RB) (NATL) 5.50%, 01/01/27 | | | 680 | | | | 719,771 | |
| Commonwealth of Massachusetts, Series A (GO) | | | | | | | | |
| 5.00%, 01/01/27 | | | 710 | | | | 743,272 | |
| 5.00%, 05/01/27 | | | 500 | | | | 527,079 | |
| 5.00%, 07/01/27 | | | 500 | | | | 528,817 | |
Commonwealth of Massachusetts, Series C (GO) 5.00%, 10/01/26 | | | 400 | | | | 416,653 | |
Commonwealth of Massachusetts, Series E (GO) 3.00%, 12/01/25 | | | 750 | | | | 741,228 | |
Massachusetts Bay Transportation Authority Subordinated Sales Tax Bonds Series A, Subseries A-1 & Subseries A-2 (RB) 5.00%, 07/01/24 | | | 515 | | | | 515,880 | |
Massachusetts Development Finance Agency, Harvard University Issue, Series A (RB) 5.00%, 10/15/26 | | | 500 | | | | 520,987 | |
Massachusetts Housing Finance Agency Housing Bonds, Series B-2 (RB) 0.90%, 06/01/26 (c) | | | 500 | | | | 460,716 | |
| | | Par
(000’s | ) | | Value | |
| Massachusetts (continued) | | | | | | | | |
Massachusetts State College Building Authority, Series A (RB) 5.00%, 05/01/49 (c) | | $ | 775 | | | $ | 786,812 | |
Massachusetts Water Resources Authority, Series C (RB) 5.00%, 08/01/40 (c) | | | 1,000 | | | | 1,037,772 | |
| | | | | | | | 6,998,987 | |
| Michigan: 0.6% | | | | | | | | |
Great Lakes Water Authority Water Supply System, Series A (RB) 5.00%, 07/01/24 | | | 590 | | | | 590,763 | |
State of Michigan, Grant Anticipation (RB) 5.00%, 03/15/26 | | | 500 | | | | 514,558 | |
State of Michigan, Trunk Line, Series B (RB) 5.00%, 11/15/27 | | | 500 | | | | 531,480 | |
| | | | | | | | 1,636,801 | |
| Minnesota: 1.5% | | | | | | | | |
Minneapolis- St. Paul Metropolitan Airports, Series A (RB) 5.00%, 01/01/29 | | | 1,000 | | | | 1,079,006 | |
Minneapolis-St. Paul Metropolitan Airports Commission, Series B (RB) 5.00%, 01/01/30 (c) | | | 515 | | | | 538,698 | |
Minneapolis-St. Paul Metropolitan Area, Series C (GO) 5.00%, 12/01/26 | | | 1,000 | | | | 1,045,870 | |
State of Minnesota, Various Purpose, Series A (GO) 5.00%, 08/01/24 | | | 1,200 | | | | 1,203,787 | |
| | | | | | | | 3,867,361 | |
| Mississippi: 0.2% | | | | | | | | |
State of Mississippi, Series A (GO) 5.00%, 10/01/29 (c) | | | 430 | | | | 455,495 | |
| Missouri: 0.8% | | | | | | | | |
Curators of the University of Missouri, Series A (RB) 5.00%, 11/01/29 (c) | | | 1,405 | | | | 1,413,834 | |
Missouri State Environmental Improvement and Energy Resources Authority, Water Pollution Control and Drinking Water, Series B (RB) 5.00%, 01/01/26 (c) | | | 500 | | | | 508,572 | |
| | | | | | | | 1,922,406 | |
See Notes to Financial Statements
VANECK SHORT MUNI ETF
SCHEDULE OF INVESTMENTS
(continued)
| | | Par
(000’s | ) | | Value | |
| Montana: 0.2% | | | | | | | | |
City of Forsyth, Montana Pollution Control, Northwestern Corp. Colstrip Project (RB) 3.88%, 07/01/28 (c) | | $ | 500 | | | $ | 502,868 | |
| Nevada: 0.7% | | | | | | | | |
Clark County (GO) 5.00%, 06/01/25 | | | 1,090 | | | | 1,106,503 | |
Clark County, Nevada Airport System, Series A (RB) 5.00%, 07/01/29 | | | 500 | | | | 547,132 | |
| | | | | | | | 1,653,635 | |
| New Jersey: 4.5% | | | | | | | | |
New Jersey Economic Development Authority, New Jersey Transit Corp. Project, Series B (RB) 4.00%, 11/01/25 | | | 660 | | | | 662,887 | |
New Jersey Economic Development Authority, School Facilities Construction, Series DDD (RB) 5.00%, 06/15/34 (c) | | | 615 | | | | 649,778 | |
| New Jersey Economic Development Authority, School Facilities Construction, Series WW (RB) | | | | | | | | |
| 5.25%, 06/15/40 (c) | | | 1,500 | | | | 1,529,896 | |
| 5.25%, 06/15/29 (c) | | | 1,000 | | | | 1,019,931 | |
| New Jersey Educational Facilities Authority, Higher Education Facilities Trust (RB) | | | | | | | | |
| 5.00%, 06/15/26 (c) | | | 500 | | | | 500,655 | |
| 5.00%, 06/15/24 | | | 575 | | | | 575,522 | |
| New Jersey Educational Facilities Authority, Princeton University, Series B (RB) | | | | | | | | |
| 5.00%, 07/01/25 | | | 1,000 | | | | 1,018,742 | |
| 5.00%, 07/01/28 (c) | | | 1,000 | | | | 1,059,936 | |
| New Jersey Transportation Trust Fund Authority, Series A (RB) | | | | | | | | |
| 5.00%, 12/15/24 | | | 1,000 | | | | 1,006,680 | |
| 5.00%, 12/15/26 | | | 500 | | | | 518,704 | |
| 5.00%, 06/15/24 | | | 1,410 | | | | 1,411,451 | |
New Jersey Transportation Trust Fund Authority, Series AA (RB) 5.00%, 06/15/25 | | | 500 | | | | 506,744 | |
| State of New Jersey, Various Purposes (GO) | | | | | | | | |
| 2.00%, 06/01/25 | | | 500 | | | | 486,515 | |
| 2.00%, 06/01/26 | | | 500 | | | | 475,481 | |
| | | | | | | | 11,422,922 | |
| New Mexico: 0.6% | | | | | | | | |
State of New Mexico, Series A (RB) 5.00%, 07/01/27 | | | 840 | | | | 887,893 | |
| | | Par
(000’s | ) | | Value | |
| New Mexico (continued) | | | | | | | | |
State of New Mexico, Series B (RB) 5.00%, 07/01/26 | | $ | 535 | | | $ | 553,192 | |
| | | | | | | | 1,441,085 | |
| New York: 14.0% | | | | | | | | |
City of New York, Series A (GO) 5.00%, 08/01/24 | | | 1,500 | | | | 1,504,734 | |
City of New York, Series A-1 (GO) 5.00%, 08/01/29 | | | 1,000 | | | | 1,092,290 | |
City of New York, Series C (GO) 5.00%, 08/01/24 | | | 750 | | | | 752,367 | |
City of New York, Series C (GO) (SD CRED PROG) 5.00%, 08/01/27 | | | 500 | | | | 527,010 | |
City of New York, Series C and D (GO) 5.00%, 08/01/26 | | | 325 | | | | 336,347 | |
City of New York, Series F-1 (GO) 5.00%, 03/01/27 | | | 410 | | | | 428,758 | |
County of Nassau, Series C (GO) 5.00%, 10/01/25 | | | 550 | | | | 562,463 | |
Dormitory Authority of the State of New York State, Series A (RB) 5.00%, 03/15/26 | | | 1,265 | | | | 1,304,615 | |
Long Island Power Authority Electric System (RB) (BAM) 5.00%, 09/01/26 | | | 510 | | | | 530,004 | |
Metropolitan Transportation Authority, Series A-1 (RB) 5.00%, 11/15/48 (p) | | | 2,000 | | | | 2,008,415 | |
Metropolitan Transportation Authority, Series A-2 (RB) (SD CRED PROG) 5.00%, 11/15/34 (p) | | | 1,160 | | | | 1,160,379 | |
Metropolitan Transportation Authority, Series B (RB) 5.00%, 11/15/26 | | | 500 | | | | 519,757 | |
New York City Housing Development Corp., Multi-Family Housing, Series F-2 (RB) (FHA 542 (C)) 0.60%, 05/01/61 (c) (p) | | | 300 | | | | 284,854 | |
New York City Transitional Finance Authority Future Tax Secured, Series A (RB) 5.00%, 11/01/27 | | | 440 | | | | 468,241 | |
New York City Transitional Finance Authority Future Tax Secured, Series F, Subseries F-1 (RB) 5.00%, 02/01/27 | | | 850 | | | | 890,888 | |
| New York City Transitional Finance Authority, Building Aid, Series S-1 (RB) (SAW) | | | | | | | | |
| 5.00%, 07/15/24 | | | 550 | | | | 551,237 | |
| 5.00%, 07/15/25 | | | 570 | | | | 580,423 | |
See Notes to Financial Statements
| | | Par
(000’s | ) | | Value | |
| New York (continued) | | | | | | | | |
New York City Transitional Finance Authority, Fiscal Series A, Subseries A-1 (RB) 5.00%, 11/01/26 | | $ | 1,000 | | | $ | 1,041,678 | |
New York City Transitional Finance Authority, Future Tax Secured Subordinate, Series E-1 (RB) 5.00%, 02/01/30 (c) | | | 1,190 | | | | 1,244,908 | |
New York City Water & Sewer System, Series BB-2 (RB) (AGM) 5.00%, 06/15/26 (c) | | | 430 | | | | 433,581 | |
New York City, Series A-1 (GO) 5.00%, 09/01/27 | | | 1,000 | | | | 1,055,681 | |
New York State Dormitory Authority, New York Cornell University, Series A (RB) 5.00%, 07/01/26 | | | 700 | | | | 727,369 | |
New York State Dormitory Authority, Personal Income Tax, Series A (RB) 5.00%, 03/15/29 | | | 1,000 | | | | 1,088,069 | |
New York State Dormitory Authority, Personal Income Tax, Series B (RB) 5.00%, 02/15/27 | | | 510 | | | | 537,097 | |
New York State Dormitory Authority, Series A (RB) 5.00%, 02/15/27 | | | 500 | | | | 525,607 | |
New York State Dormitory Authority, Series C (RB) 5.00%, 03/15/28 | | | 640 | | | | 686,073 | |
| New York State Dormitory Authority, State Sales Tax, Series B (RB) | | | | | | | | |
| 5.00%, 03/15/26 (c) | | | 500 | | | | 511,613 | |
| 5.00%, 03/15/29 (c) | | | 595 | | | | 605,003 | |
New York State Dormitory Authority, State Sales Tax, Series C (RB) 5.00%, 03/15/25 | | | 1,035 | | | | 1,049,312 | |
New York State Dormitory Authority, State Sales Tax, Series E (RB) 5.00%, 03/15/26 | | | 680 | | | | 702,576 | |
New York State Dormitory Authority, State University Dormitory Facilities, Series A (RB) 5.00%, 07/01/25 | | | 500 | | | | 508,568 | |
New York State Environmental Facilities Corp., State Clean Water And Drinking Water Revolving Funds, Series B (RB) 5.00%, 06/15/28 | | | 605 | | | | 653,493 | |
| | | Par
(000’s | ) | | Value | |
| New York (continued) | | | | | | | | |
New York State Housing Finance Agency, Series A-2 (RB) 2.50%, 11/01/60 (c) (p) | | $ | 975 | | | $ | 926,568 | |
New York State Housing Finance Agency, Series C (RB) (SONYMA HUD SECT 8) 3.80%, 11/01/62 (c) (p) | | | 500 | | | | 499,513 | |
New York State Housing Finance Agency, Series I (RB) (SAW) 1.75%, 05/01/24 (c) | | | 215 | | | | 215,000 | |
New York State Housing Finance Agency, Series L-2 (RB) 0.75%, 11/01/25 (c) | | | 630 | | | | 590,994 | |
New York State Thruway Authority, Series P (RB) 5.00%, 01/01/27 | | | 1,000 | | | | 1,046,861 | |
| New York State Urban Development Corp., State Personal Income, Series A (RB) | | | | | | | | |
| 5.00%, 03/15/25 | | | 495 | | | | 501,632 | |
| 5.00%, 03/15/28 (c) | | | 500 | | | | 516,140 | |
| 5.00%, 03/15/27 | | | 690 | | | | 725,080 | |
New York State Urban Development Corp., State Personal Income, Series C (RB) 5.00%, 03/15/27 | | | 500 | | | | 524,955 | |
New York State Urban Development Corp., State Personal Income, Series E (RB) 5.00%, 03/15/25 | | | 500 | | | | 506,699 | |
Triborough Bridge & Tunnel Authority, Series A-2 (RB) 2.00%, 05/15/45 (p) | | | 875 | | | | 833,914 | |
| Triborough Bridge & Tunnel Authority, Series A (RB) | | | | | | | | |
| 5.00%, 11/15/26 | | | 1,000 | | | | 1,044,202 | |
| 5.00%, 11/15/27 | | | 500 | | | | 532,861 | |
| 5.00%, 11/15/28 | | | 1,000 | | | | 1,087,228 | |
Triborough Bridge & Tunnel Authority, Series B (RB) 5.00%, 11/15/28 (c) | | | 1,000 | | | | 1,076,983 | |
| | | | | | | | 35,502,040 | |
| North Carolina: 1.6% | | | | | | | | |
County of Guilford, Series B (GO) 5.00%, 05/01/24 | | | 500 | | | | 500,000 | |
County of Mecklenburg, Series A (GO) 4.00%, 04/01/29 (c) | | | 500 | | | | 510,657 | |
County of Wake (RB) 5.00%, 09/01/26 | | | 375 | | | | 390,137 | |
See Notes to Financial Statements
VANECK SHORT MUNI ETF
SCHEDULE OF INVESTMENTS
(continued)
| | | Par
(000’s | ) | | Value | |
| North Carolina (continued) | | | | | | | | |
North Carolina Medical Care Commission Hospital, Caromont Health, Series B (RB) 5.00%, 02/01/51 (p) | | $ | 500 | | | $ | 510,269 | |
State of North Carolina, Grant Anticipation Vehicle (RB) 5.00%, 03/01/30 (c) | | | 1,500 | | | | 1,635,614 | |
State of North Carolina, Series B (RB) 5.00%, 05/01/29 (c) | | | 585 | | | | 616,557 | |
| | | | | | | | 4,163,234 | |
| Ohio: 2.4% | | | | | | | | |
American Municipal Power, Inc., Combined Hydroelectric Projects, Series A (RB) 5.00%, 02/15/28 | | | 500 | | | | 528,824 | |
City of Columbus, Various Purpose (GO) 5.00%, 04/01/29 (c) | | | 750 | | | | 795,663 | |
County of Allen, Ohio Hospital Facilities, Mercy Health, Series A (RB) 5.00%, 12/01/29 | | | 1,250 | | | | 1,361,024 | |
Lancaster Port Authority, Gas Supply (RB) (SBG) 5.00%, 08/01/49 (c) (p) | | | 485 | | | | 488,534 | |
Lucas-Plaza Hsg Development Corp., Bds Plaza Section 8, Proj B (RB) (FHA) 0.00%, 06/01/24 ^ | | | 500 | | | | 498,203 | |
Ohio Water Development Authority, Series A (RB) 5.00%, 06/01/29 (c) | | | 770 | | | | 839,906 | |
Ohio Water Development Authority, Series B (RB) 5.00%, 12/01/27 (c) | | | 1,000 | | | | 1,040,929 | |
State of Ohio, Highway Capital Improvement, Series R (GO) 5.00%, 05/01/27 | | | 500 | | | | 500,000 | |
| | | | | | | | 6,053,083 | |
| Oklahoma: 0.1% | | | | | | | | |
Canadian County Educational Facilities Authority, Mustang Public Schools (RB) 3.00%, 09/01/29 (c) | | | 330 | | | | 317,027 | |
| Oregon: 0.8% | | | | | | | | |
Beaverton School District 48J, Series B (GO) (SBG) 5.00%, 06/15/25 (c) | | | 1,000 | | | | 1,001,209 | |
City of Portland, Oregon Sewer System, Series A (RB) 5.00%, 12/01/26 | | | 500 | | | | 522,303 | |
Multnomah County School District No. 1J, Series B (GO) (SBG) 5.00%, 06/15/25 | | | 500 | | | | 508,538 | |
| | | | | | | | 2,032,050 | |
| | | Par
(000’s | ) | | Value | |
| Pennsylvania: 3.3% | | | | | | | | |
Allegheny County Sanitary Authority (RB) (BAM) 5.00%, 12/01/27 (c) | | $ | 500 | | | $ | 509,757 | |
City of Philadelphia, Series A (GO) 5.00%, 08/01/25 | | | 300 | | | | 304,785 | |
| Commonwealth of Pennsylvania (GO) | | | | | | | | |
| 5.00%, 01/01/26 | | | 560 | | | | 575,022 | |
| 5.00%, 03/15/27 (c) | | | 500 | | | | 505,739 | |
| 5.00%, 06/15/29 | | | 500 | | | | 500,605 | |
Commonwealth of Pennsylvania (GO) (SBG) 5.00%, 07/15/26 | | | 1,000 | | | | 1,035,384 | |
Commonwealth of Pennsylvania, First Series (GO) 5.00%, 07/15/27 | | | 1,000 | | | | 1,055,023 | |
County of Lehig, Valley Health Network, Series A (RB) (SBG) 5.00%, 07/01/26 | | | 600 | | | | 613,469 | |
Delaware River Port Authority, Series B (RB) 5.00%, 01/01/25 | | | 350 | | | | 353,131 | |
Delaware Valley, Pennsylvania Regional Finance Authority, Series A (RB) (AMBAC) 5.50%, 08/01/28 | | | 805 | | | | 868,592 | |
Montgomery County Industrial Development Authority, Series A (RB) 4.10%, 04/01/53 (p) | | | 500 | | | | 509,968 | |
Pennsylvania State (GO) 5.00%, 09/01/27 | | | 1,000 | | | | 1,057,626 | |
University of Pittsburgh of the Commonwealth, System of Higher Education (RB) 4.00%, 04/15/26 (c) | | | 500 | | | | 505,382 | |
| | | | | | | | 8,394,483 | |
| Rhode Island: 0.4% | | | | | | | | |
Rhode Island Health and Educational Building Corp., Providence Public Buildings Authority Issue, Series A (RB) (AGM) 5.00%, 05/15/26 (c) | | | 500 | | | | 506,098 | |
Tobacco Settlement Financing Corporation Tobacco Settlement Asset-Backed Bonds, Series A (RB) 5.00%, 06/01/26 (c) | | | 500 | | | | 506,278 | |
| | | | | | | | 1,012,376 | |
| Tennessee: 1.3% | | | | | | | | |
Johnson City Health & Educational Facilities Board, Series A (RB) 5.00%, 07/01/25 | | | 500 | | | | 504,238 | |
See Notes to Financial Statements
| | | Par
(000’s | ) | | Value | |
| Tennessee (continued) | | | | | | | | |
Metropolitan Government of Nashville & Davidson County (GO) 5.00%, 07/01/26 | | $ | 525 | | | $ | 544,076 | |
Tennessee Energy Acquisition Corp., Gas Project (RB) 4.00%, 11/01/49 (c) (p) | | | 1,775 | | | | 1,774,947 | |
Tennessee Energy Acquisition Corp., Gas Project, Series A-1 (RB) 5.00%, 05/01/53 (c) (p) | | | 500 | | | | 515,275 | |
| | | | | | | | 3,338,536 | |
| Texas: 9.0% | | | | | | | | |
Austin Independent School District (GO) 5.00%, 08/01/28 | | | 505 | | | | 545,359 | |
Bexar County, Limited Tax (GO) 5.00%, 06/15/27 (c) | | | 500 | | | | 516,582 | |
Board of Regents of the University of Texas System, Series B (RB) 5.00%, 08/15/29 | | | 1,000 | | | | 1,100,697 | |
City of Dallas, Series A (GO) 5.00%, 02/15/25 | | | 500 | | | | 505,685 | |
City of San Antonio, Electric and Gas Systems (RB) 5.00%, 02/01/27 (c) | | | 630 | | | | 649,820 | |
City of San Antonio, General Improvement (GO) 5.00%, 08/01/25 | | | 500 | | | | 509,324 | |
Comal Independent School District (GO) 5.00%, 02/01/26 | | | 775 | | | | 796,077 | |
Commonwealth of Pennsylvania (GO) 5.00%, 02/15/27 | | | 2,000 | | | | 2,095,747 | |
County of Harris, Flood Control District, Series A (GO) 5.00%, 10/01/29 (c) | | | 480 | | | | 488,683 | |
Dallas Independent School District, Series A (GO) 4.00%, 02/15/34 (c) | | | 500 | | | | 500,697 | |
Denton Independent School District (GO) 5.00%, 08/15/29 | | | 1,000 | | | | 1,097,101 | |
Denton Independent School District, Series A (GO) 5.00%, 08/15/45 (c) | | | 500 | | | | 509,483 | |
Ford Bend Independent School District, Limited Tax, Series B (GO) 5.00%, 02/15/28 | | | 910 | | | | 971,809 | |
Harris County, Texas Toll Road Senior Lien, Series A (RB) 5.00%, 08/15/27 | | | 1,000 | | | | 1,056,398 | |
Houston Independent School District (GO) 5.00%, 02/15/25 | | | 1,000 | | | | 1,011,059 | |
| | | Par
(000’s | ) | | Value | |
| Texas (continued) | | | | | | | | |
Houston Texas Utility System, Series A (RB) 5.00%, 11/15/27 | | $ | 1,000 | | | $ | 1,059,340 | |
Lower Colorado River Authority, LCRA Transmission Services Corp. Project, Series A (RB) (AGM) 5.00%, 05/15/27 | | | 500 | | | | 525,409 | |
North Texas Thruway Authority, Series I (RB) (AGC) 6.20%, 01/01/42 (c) | | | 1,000 | | | | 1,017,000 | |
North Texas Tollway Authority System, Series A (RB) 5.00%, 01/01/27 | | | 500 | | | | 522,258 | |
North Texas Tollway Authority, First Tier, Series A (RB) 5.00%, 01/01/30 (c) | | | 1,195 | | | | 1,222,965 | |
Texas Municipal Gas Acquisition & Supply Corp. III (RB) 5.00%, 12/15/26 | | | 600 | | | | 611,048 | |
Texas Municipal Gas Acquisition & Supply Corp. IV, Series A (RB) 5.50%, 01/01/54 (c) (p) | | | 1,000 | | | | 1,070,627 | |
Texas Transportation Commission Highway Improvement (GO) 5.00%, 04/01/30 | | | 1,000 | | | | 1,110,920 | |
Texas Water Development Board (RB) 5.00%, 04/15/26 | | | 1,000 | | | | 1,032,231 | |
Texas Water Development Board, Series B (RB) 5.00%, 10/15/24 | | | 500 | | | | 502,925 | |
University of Houston, Series A (RB) 5.00%, 02/15/26 | | | 1,000 | | | | 1,028,985 | |
Ysleta Independent School District (GO) 5.00%, 08/15/45 (c) | | | 650 | | | | 661,917 | |
| | | | | | | | 22,720,146 | |
| Utah: 0.2% | | | | | | | | |
County of Utah, IHL Health Services Inc., Series B-2 (RB) 5.00%, 05/15/57 (c) (p) | | | 500 | | | | 500,213 | |
| Virginia: 1.8% | | | | | | | | |
County of Fairfax, Public Improvement, Series A (GO) (SAW) 4.00%, 10/01/25 | | | 990 | | | | 999,151 | |
Hampton Roads Transportation Accountability Commission, Series A (RB) 5.00%, 07/01/26 | | | 750 | | | | 774,710 | |
See Notes to Financial Statements
VANECK SHORT MUNI ETF
SCHEDULE OF INVESTMENTS
(continued)
| | | Par
(000’s | ) | | Value | |
| Virginia (continued) | | | | | | | | |
Virginia College Building Authority, 21st Century College and Equipment Programs Educational Facilities, Series C (RB) 5.00%, 02/01/27 | | $ | 600 | | | $ | 629,670 | |
Virginia Commonwealth Transportation Board (RB) 5.00%, 03/15/27 (c) | | | 510 | | | | 529,805 | |
Virginia Public Building Authority, Public Facilities, Series A (RB) 5.00%, 08/01/29 (c) | | | 720 | | | | 763,444 | |
Wise County Industrial Development Authority, Virginia Electric and Power Co. Project, Series A (RB) (AGC) 0.75%, 10/01/40 (p) | | | 1,000 | | | | 935,375 | |
| | | | | | | | 4,632,155 | |
| Washington: 3.0% | | | | | | | | |
Central Puget Sound Regional Transit Authority, Motor Vehicle Excise Tax Improvement, Series S-1 (RB) 5.00%, 11/01/26 | | | 520 | | | | 542,308 | |
Central Puget Sound Regional Transit Authority, Series S-1 (RB) 5.00%, 11/01/31 (c) | | | 500 | | | | 512,186 | |
Energy Northwest Project Electric, Series A (RB) 5.00%, 07/01/25 | | | 1,000 | | | | 1,017,250 | |
| Energy Northwest Project Electric, Series C (RB) | | | | | | | | |
| 5.00%, 07/01/24 | | | 540 | | | | 540,878 | |
| 5.00%, 07/01/25 | | | 1,375 | | | | 1,398,718 | |
Energy Northwest, Project 3 Electric, Series A (RB) 5.00%, 07/01/28 (c) | | | 725 | | | | 764,282 | |
State of New Mexico, Series A (GO) 5.00%, 06/01/26 | | | 1,000 | | | | 1,033,485 | |
State of Washington, Various Purpose, Series R-A (GO) 5.00%, 08/01/24 | | | 750 | | | | 752,237 | |
Washington Health Care Facilities Authority, CommonSpirit Health, Series B-1 (RB) 5.00%, 08/01/49 (c) (p) | | | 1,000 | | | | 1,001,310 | |
| | | | | | | | 7,562,654 | |
| West Virginia: 0.4% | | | | | | | | |
State of West Virginia, Surface Transportation Improvements, Series A (RB) 5.00%, 09/01/26 | | | 1,000 | | | | 1,037,171 | |
| | | Par
(000’s | ) | | Value | |
| Wisconsin: 1.3% | | | | | | | | |
City of Milwaukee, Series N4 (GO) 5.00%, 04/01/26 | | $ | 750 | | | $ | 767,142 | |
| State of Wisconsin, Series A (GO) | | | | | | | | |
| 5.00%, 05/01/25 | | | 500 | | | | 507,670 | |
| 5.00%, 05/01/28 (c) | | | 500 | | | | 507,625 | |
State of Wisconsin, Series D (GO) 4.00%, 05/01/29 (c) | | | 1,500 | | | | 1,500,000 | |
| | | | | | | | 3,282,437 | |
Total Municipal Bonds: 97.5%
(Cost: $252,269,839) | | | | | | | 247,078,785 | |
| Other assets less liabilities: 2.5% | | | | | | | 6,394,118 | |
| NET ASSETS: 100.0% | | | | | | $ | 253,472,903 | |
See Notes to Financial Statements
Definitions:
| AGC | Assured Guaranty Corp. |
| AGM | Assured Guaranty Municipal Corp. |
| AMBAC | American Municipal Bond Assurance Corp. |
| BAM | Build America Assurance Co. |
| CP | Certificate of Participation |
| FHA | Federal Housing Association |
| GO | General Obligation |
| NATL | National Public Finance Guarantee Corp. |
| RB | Revenue Bond SAW State Aid Withholding |
| SBG | School Board Guaranteed |
| SD CRED PROG | Special District Credit Enhancement Program |
| ST | Special Tax |
Footnotes:
| (c) | Callable Security — the redemption date shown is the date the security may be redeemed by the issuer |
| (p) | Putable Security — the redemption date shown is the date the security may be redeemed by the investor |
| ^ | Zero Coupon Bond |
| Summary of Investments by Sector | | % of
Investments | | Value | |
| State GO | | | 18.3 | % | | $ | 45,308,158 | |
| Local GO | | | 14.3 | | | | 35,314,587 | |
| Refunded | | | 10.3 | | | | 25,402,557 | |
| Tax | | | 9.1 | | | | 22,493,599 | |
| Utilities | | | 8.0 | | | | 19,777,983 | |
| Education | | | 6.1 | | | | 14,937,545 | |
| Transportation | | | 5.8 | | | | 14,309,906 | |
| Water & Sewer | | | 5.5 | | | | 13,467,453 | |
| Hospitals | | | 4.4 | | | | 10,964,337 | |
| Power | | | 4.4 | | | | 10,881,061 | |
| Leasing COPS & Appropriations | | | 4.2 | | | | 10,433,388 | |
| Toll & Turnpike | | | 3.4 | | | | 8,492,666 | |
| Airport | | | 1.4 | | | | 3,543,060 | |
| Pollution Control | | | 1.4 | | | | 3,496,675 | |
| Multi-Family Housing | | | 1.2 | | | | 2,977,645 | |
| Miscellaneous | | | 1.1 | | | | 2,600,503 | |
| Tobacco | | | 0.6 | | | | 1,435,689 | |
| Industrial Development Revenue | | | 0.3 | | | | 717,018 | |
| Special Tax | | | 0.2 | | | | 524,955 | |
| | | | 100.0 | % | | $ | 247,078,785 | |
The summary of inputs used to value the Fund’s investments as of April 30, 2024 is as follows:
| | | | | | Level 2 | | | Level 3 | | | | |
| | | Level 1 | | | Significant | | | Significant | | | | |
| | | Quoted | | | Observable | | | Unobservable | | | | |
| | | Prices | | | Inputs | | | Inputs | | | Value | |
| Municipal Bonds * | | $ | — | | | $ | 247,078,785 | | | $ | — | | | $ | 247,078,785 | |
* See Schedule of Investments for geographic sector breakouts.
See Notes to Financial Statements
VANECK ETF TRUST
STATEMENTS OF ASSETS AND LIABILITIES
April 30, 2024
| | | CEF Muni Income
ETF | | | High Yield Muni
ETF | | | HIP Sustainable
Muni ETF | | | Intermediate
Muni ETF | |
| Assets: | | | | | | | | | | | | | | | | |
Investments, at value
Unaffiliated issuers (1) | | $ | 221,655,807 | | | $ | 2,860,351,179 | | | $ | 17,929,128 | | | $ | 1,773,401,154 | |
| Cash | | | 766 | | | | 14,291,954 | | | | 120,253 | | | | 16,792,454 | |
| Receivables: | | | | | | | | | | | | | | | | |
| Investment securities sold | | | — | | | | 2,076,601 | | | | — | | | | — | |
| Dividends and interest | | | 782,830 | | | | 43,449,708 | | | | 246,424 | | | | 22,244,815 | |
| Total assets | | | 222,439,403 | | | | 2,920,169,442 | | | | 18,295,805 | | | | 1,812,438,423 | |
| Liabilities: | | | | | | | | | | | | | | | | |
| Payables: | | | | | | | | | | | | | | | | |
| Investment securities purchased | | | — | | | | 4,080,810 | | | | — | | | | 7,501,810 | |
| Line of credit | | | 1,219,468 | | | | — | | | | — | | | | — | |
| Due to Adviser | | | 74,311 | | | | 763,880 | | | | 3,607 | | | | 268,044 | |
| Deferred Trustee fees | | | 4,195 | | | | 3,184 | | | | — | | | | 3,000 | |
| Accrued expenses | | | 2,941 | | | | — | | | | — | | | | — | |
| Total liabilities | | | 1,300,915 | | | | 4,847,874 | | | | 3,607 | | | | 7,772,854 | |
| NET ASSETS | | $ | 221,138,488 | | | $ | 2,915,321,568 | | | $ | 18,292,198 | | | $ | 1,804,665,569 | |
| Shares outstanding | | | 10,650,000 | | | | 56,846,401 | | | | 400,000 | | | | 39,348,916 | |
| Net asset value, redemption and offering price per share | | $ | 20.76 | | | $ | 51.28 | | | $ | 45.73 | | | $ | 45.86 | |
| Net Assets consist of: | | | | | | | | | | | | | | | | |
| Aggregate paid in capital | | $ | 287,047,847 | | | $ | 3,277,686,381 | | | $ | 19,518,631 | | | $ | 1,898,119,224 | |
| Total distributable loss | | | (65,909,359 | ) | | | (362,364,813 | ) | | | (1,226,433 | ) | | | (93,453,655 | ) |
| NET ASSETS | | $ | 221,138,488 | | | $ | 2,915,321,568 | | | $ | 18,292,198 | | | $ | 1,804,665,569 | |
| (1) | Cost of investments - Unaffiliated issuers | | $ | 258,686,899 | | | $ | 3,044,946,805 | | | $ | 19,059,224 | | | $ | 1,839,732,180 | |
See Notes to Financial Staements
VANECK ETF TRUST
STATEMENTS OF ASSETS AND LIABILITIES
April 30, 2024
| | | Long Muni ETF | | | Short High Yield
Muni ETF | | | Short Muni ETF | |
| Assets: | | | | | | | | | | | | |
Investments, at value
Unaffiliated issuers (1) | | $ | 432,652,276 | | | $ | 315,327,211 | | | $ | 247,078,785 | |
| Cash | | | 3,675,414 | | | | 587,693 | | | | 4,389,410 | |
| Receivables: | | | | | | | | | | | | |
| Investment securities sold | | | — | | | | 5,676,913 | | | | — | |
| Shares of beneficial interest sold | | | — | | | | — | | | | 848,546 | |
| Dividends and interest | | | 5,761,613 | | | | 4,796,714 | | | | 3,303,275 | |
| Total assets | | | 442,089,303 | | | | 326,388,531 | | | | 255,620,016 | |
| Liabilities: | | | | | | | | | | | | |
| Payables: | | | | | | | | | | | | |
| Investment securities purchased | | | 1,500,000 | | | | — | | | | 2,131,460 | |
| Shares of beneficial interest redeemed | | | — | | | | 5,568,060 | | | | — | |
| Due to Adviser | | | 86,119 | | | | 93,666 | | | | 13,802 | |
| Deferred Trustee fees | | | 1,517 | | | | — | | | | 1,600 | |
| Accrued expenses | | | 180 | | | | 94 | | | | 251 | |
| Total liabilities | | | 1,587,816 | | | | 5,661,820 | | | | 2,147,113 | |
| NET ASSETS | | $ | 440,501,487 | | | $ | 320,726,711 | | | $ | 253,472,903 | |
| Shares outstanding | | | 24,950,000 | | | | 14,400,000 | | | | 14,950,000 | |
| Net asset value, redemption and offering price per share | | $ | 17.66 | | | $ | 22.27 | | | $ | 16.95 | |
| Net Assets consist of: | | | | | | | | | | | | |
| Aggregate paid in capital | | $ | 475,872,760 | | | $ | 367,800,926 | | | $ | 262,678,660 | |
| Total distributable loss | | | (35,371,273 | ) | | | (47,074,215 | ) | | | (9,205,757 | ) |
| NET ASSETS | | $ | 440,501,487 | | | $ | 320,726,711 | | | $ | 253,472,903 | |
| (1) | Cost of investments - Unaffiliated issuers | | $ | 450,991,900 | | | $ | 337,420,831 | | | $ | 252,269,839 | |
See Notes to Financial Statements
VANECK ETF TRUST
STATEMENTS OF OPERATIONS
For the Year Ended April 30, 2024
| | | CEF Muni Income
ETF | | | High Yield Muni
ETF | | | HIP Sustainable
Muni ETF | | | Intermediate
Muni ETF | |
| Income: | | | | | | | | | | | | | | | | |
| Dividends | | $ | 9,046,116 | | | $ | — | | | $ | — | | | $ | — | |
| Interest | | | 4,778 | | | | 133,484,214 | | | | 455,600 | | | | 51,654,980 | |
| Total income | | | 9,050,894 | | | | 133,484,214 | | | | 455,600 | | | | 51,654,980 | |
| Expenses: | | | | | | | | | | | | | | | | |
| Management fees | | | 860,118 | | | | 9,221,777 | | | | 43,719 | | | | 4,275,649 | |
| Interest | | | 22,883 | | | | 2,890 | | | | — | | | | 27 | |
| Taxes | | | 58 | | | | 58 | | | | 58 | | | | 25 | |
| Total expenses | | | 883,059 | | | | 9,224,725 | | | | 43,777 | | | | 4,275,701 | |
| Net investment income | | | 8,167,835 | | | | 124,259,489 | | | | 411,823 | | | | 47,379,279 | |
| | | | | | | | | | | | | | | | | |
| Net realized gain (loss) on: | | | | | | | | | | | | | | | | |
| Investments | | | (12,820,832 | ) | | | (72,396,848 | ) | | | (34,254 | ) | | | (10,010,278 | ) |
| In-kind redemptions | | | 1,989,021 | | | | (15,300,780 | ) | | | — | | | | (4,688,707 | ) |
| Net realized loss | | | (10,831,811 | ) | | | (87,697,628 | ) | | | (34,254 | ) | | | (14,698,985 | ) |
| | | | | | | | | | | | | | | | | |
| Net change in unrealized appreciation (depreciation) on: | | | | | | | | | | | | | | | | |
| Investments | | | 7,317,408 | | | | 81,437,462 | | | | (1,406 | ) | | | 2,540,360 | |
| Net change in unrealized appreciation (depreciation) | | | 7,317,408 | | | | 81,437,462 | | | | (1,406 | ) | | | 2,540,360 | |
| Net increase in net assets resulting from operations | | $ | 4,653,432 | | | $ | 117,999,323 | | | $ | 376,163 | | | $ | 35,220,654 | |
See Notes to Financial Statements
VANECK ETF TRUST
STATEMENTS OF OPERATIONS
For the Year Ended April 30, 2024
| | | Long Muni ETF | | | Short High Yield
Muni ETF | | | Short Muni ETF | |
| Income: | | | | | | | | | | | | |
| Interest | | $ | 15,979,267 | | | $ | 12,268,023 | | | $ | 4,921,924 | |
| Total income | | | 15,979,267 | | | | 12,268,023 | | | | 4,921,924 | |
| Expenses: | | | | | | | | | | | | |
| Management fees | | | 1,013,976 | | | | 1,267,376 | | | | 223,495 | |
| Interest | | | 180 | | | | 4,290 | | | | 373 | |
| Taxes | | | 25 | | | | 58 | | | | 25 | |
| Total expenses | | | 1,014,181 | | | | 1,271,724 | | | | 223,893 | |
| Net investment income | | | 14,965,086 | | | | 10,996,299 | | | | 4,698,031 | |
| | | | | | | | | | | | | |
| Net realized gain (loss) on: | | | | | | | | | | | | |
| Investments | | | (5,203,462 | ) | | | (12,137,987 | ) | | | (1,176,149 | ) |
| In-kind redemptions | | | (751,336 | ) | | | (844,612 | ) | | | (704,119 | ) |
| Net realized loss | | | (5,954,798 | ) | | | (12,982,599 | ) | | | (1,880,268 | ) |
| | | | | | | | | | | | | |
| Net change in unrealized appreciation (depreciation) on: | | | | | | | | | | | | |
| Investments | | | (661,838 | ) | | | 11,200,258 | | | | 2,492,102 | |
| Net change in unrealized appreciation (depreciation) | | | (661,838 | ) | | | 11,200,258 | | | | 2,492,102 | |
| Net increase in net assets resulting from operations | | $ | 8,348,450 | | | $ | 9,213,958 | | | $ | 5,309,865 | |
See Notes to Financial Statements
VANECK ETF TRUST
STATEMENTS OF CHANGES IN NET ASSETS
| | | CEF Muni Income ETF | | | High Yield Muni ETF | |
| | | Year Ended
April 30, 2024 | | | Year Ended
April 30, 2023 | | | Year Ended
April 30, 2024 | | | Year Ended
April 30, 2023 | |
| Operations: | | | | | | | | | | | | | | | | |
| Net investment income | | $ | 8,167,835 | | | $ | 7,054,402 | | | $ | 124,259,489 | | | $ | 115,767,853 | |
| Net realized loss | | | (10,831,811 | ) | | | (10,058,432 | ) | | | (87,697,628 | ) | | | (223,053,505 | ) |
| Net change in unrealized appreciation (depreciation) | | | 7,317,408 | | | | (4,228,703 | ) | | | 81,437,462 | | | | 23,487,727 | |
| Net increase (decrease) in net assets resulting from operations | | | 4,653,432 | | | | (7,232,733 | ) | | | 117,999,323 | | | | (83,797,925 | ) |
| Distributions to shareholders from: | | | | | | | | | | | | | | | | |
| Distributable earnings | | | (8,652,299 | ) | | | (7,307,370 | ) | | | (120,571,988 | ) | | | (116,558,558 | ) |
| Return of capital | | | (943,651 | ) | | | — | | | | — | | | | — | |
| Total distributions | | | (9,595,950 | ) | | | (7,307,370 | ) | | | (120,571,988 | ) | | | (116,558,558 | ) |
| | | | | | | | | | | | | | | | | |
| Share transactions*: | | | | | | | | | | | | | | | | |
| Proceeds from sale of shares | | | 54,357,867 | | | | 108,726,605 | | | | 905,560,236 | | | | 1,884,282,300 | |
| Cost of shares redeemed | | | (32,677,141 | ) | | | (59,193,418 | ) | | | (788,031,487 | ) | | | (1,901,509,192 | ) |
| Net Increase (decrease) in net assets resulting from share transactions | | | 21,680,726 | | | | 49,533,187 | | | | 117,528,749 | | | | (17,226,892 | ) |
| Total increase (decrease) in net assets | | | 16,738,208 | | | | 34,993,084 | | | | 114,956,084 | | | | (217,583,375 | ) |
| Net Assets, beginning of year | | | 204,400,280 | | | | 169,407,196 | | | | 2,800,365,484 | | | | 3,017,948,859 | |
| Net Assets, end of year | | $ | 221,138,488 | | | $ | 204,400,280 | | | $ | 2,915,321,568 | | | $ | 2,800,365,484 | |
| *Shares of Common Stock Issued (no par value) | | | | | | | | | | | | | | | | |
| Shares sold | | | 2,725,000 | | | | 4,975,000 | | | | 18,050,000 | | | | 36,250,000 | |
| Shares redeemed | | | (1,600,000 | ) | | | (2,650,000 | ) | | | (15,650,000 | ) | | | (36,500,000 | ) |
| Net increase (decrease) | | | 1,125,000 | | | | 2,325,000 | | | | 2,400,000 | | | | (250,000 | ) |
See Notes to Financial Statements
VANECK ETF TRUST
STATEMENTS OF CHANGES IN NET ASSETS
| | | HIP Sustainable Muni ETF | | | Intermediate Muni ETF | |
| | | Year Ended
April 30, 2024 | | | Year Ended
April 30, 2023 | | | Year Ended
April 30, 2024 | | | Year Ended
April 30, 2023 | |
| Operations: | | | | | | | | | | | | | | | | |
| Net investment income | | $ | 411,823 | | | $ | 270,801 | | | $ | 47,379,279 | | | $ | 37,766,412 | |
| Net realized loss | | | (34,254 | ) | | | (50,609 | ) | | | (14,698,985 | ) | | | (41,185,667 | ) |
| Net change in unrealized appreciation (depreciation) | | | (1,406 | ) | | | 152,910 | | | | 2,540,360 | | | | 74,928,897 | |
| Net increase in net assets resulting from operations | | | 376,163 | | | | 373,102 | | | | 35,220,654 | | | | 71,509,642 | |
| Distributions to shareholders from: | | | | | | | | | | | | | | | | |
| Distributable earnings | | | (412,960 | ) | | | (244,845 | ) | | | (46,864,503 | ) | | | (37,452,413 | ) |
| | | | | | | | | | | | | | | | | |
| Share transactions*: | | | | | | | | | | | | | | | | |
| Proceeds from sale of shares | | | — | | | | 4,502,190 | | | | 298,049,733 | | | | 529,630,220 | |
| Cost of shares redeemed | | | — | | | | — | | | | (303,307,234 | ) | | | (437,272,087 | ) |
| Net Increase (decrease) in net assets resulting from share transactions | | | — | | | | 4,502,190 | | | | (5,257,501 | ) | | | 92,358,133 | |
| Total increase (decrease) in net assets | | | (36,797 | ) | | | 4,630,447 | | | | (16,901,350 | ) | | | 126,415,362 | |
| Net Assets, beginning of year | | | 18,328,995 | | | | 13,698,548 | | | | 1,821,566,919 | | | | 1,695,151,557 | |
| Net Assets, end of year | | $ | 18,292,198 | | | $ | 18,328,995 | | | $ | 1,804,665,569 | | | $ | 1,821,566,919 | |
| *Shares of Common Stock Issued (no par value) | | | | | | | | | | | | | | | | |
| Shares sold | | | — | | | | 100,000 | | | | 6,650,000 | | | | 11,650,000 | |
| Shares redeemed | | | — | | | | — | | | | (6,600,000 | ) | | | (9,450,000 | ) |
| Net increase | | | — | | | | 100,000 | | | | 50,000 | | | | 2,200,000 | |
See Notes to Financial Statements
VANECK ETF TRUST
STATEMENTS OF CHANGES IN NET ASSETS
| | | Long Muni ETF | | | Short High Yield Muni ETF | |
| | | Year Ended
April 30, 2024 | | | Year Ended
April 30, 2023 | | | Year Ended
April 30, 2024 | | | Year Ended
April 30, 2023 | |
| Operations: | | | | | | | | | | | | | | | | |
| Net investment income | | $ | 14,965,086 | | | $ | 7,123,325 | | | $ | 10,996,299 | | | $ | 10,922,410 | |
| Net realized loss | | | (5,954,798 | ) | | | (16,413,312 | ) | | | (12,982,599 | ) | | | (6,800,019 | ) |
| Net change in unrealized appreciation (depreciation) | | | (661,838 | ) | | | 11,529,092 | | | | 11,200,258 | | | | (1,990,336 | ) |
| Net increase in net assets resulting from operations | | | 8,348,450 | | | | 2,239,105 | | | | 9,213,958 | | | | 2,132,055 | |
| Distributions to shareholders from: | | | | | | | | | | | | | | | | |
| Distributable earnings | | | (14,425,095 | ) | | | (6,781,265 | ) | | | (11,222,995 | ) | | | (11,315,025 | ) |
| | | | | | | | | | | | | | | | | |
| Share transactions*: | | | | | | | | | | | | | | | | |
| Proceeds from sale of shares | | | 250,100,275 | | | | 121,166,375 | | | | 6,528,708 | | | | 49,297,949 | |
| Cost of shares redeemed | | | (116,997,223 | ) | | | (18,716,807 | ) | | | (81,403,031 | ) | | | (60,769,201 | ) |
| Net Increase (decrease) in net assets resulting from share transactions | | | 133,103,052 | | | | 102,449,568 | | | | (74,874,323 | ) | | | (11,471,252 | ) |
| Total increase (decrease) in net assets | | | 127,026,407 | | | | 97,907,408 | | | | (76,883,360 | ) | | | (20,654,222 | ) |
| Net Assets, beginning of year | | | 313,475,080 | | | | 215,567,672 | | | | 397,610,071 | | | | 418,264,293 | |
| Net Assets, end of year | | $ | 440,501,487 | | | $ | 313,475,080 | | | $ | 320,726,711 | | | $ | 397,610,071 | |
| *Shares of Common Stock Issued (no par value) | | | | | | | | | | | | | | | | |
| Shares sold | | | 14,150,000 | | | | 6,800,000 | | | | 300,000 | | | | 2,200,000 | |
| Shares redeemed | | | (6,700,000 | ) | | | (1,050,000 | ) | | | (3,700,000 | ) | | | (2,700,000 | ) |
| Net increase (decrease) | | | 7,450,000 | | | | 5,750,000 | | | | (3,400,000 | ) | | | (500,000 | ) |
See Notes to Financial Statements
VANECK ETF TRUST
STATEMENTS OF CHANGES IN NET ASSETS
| | | Short Muni ETF | |
| | | Year Ended
April 30, 2024 | | | Year Ended
April 30, 2023 | |
| Operations: | | | | | | | | |
| Net investment income | | $ | 4,698,031 | | | $ | 4,024,049 | |
| Net realized loss | | | (1,880,268 | ) | | | (6,143,979 | ) |
| Net change in unrealized appreciation (depreciation) | | | 2,492,102 | | | | 8,399,993 | |
| Net increase in net assets resulting from operations | | | 5,309,865 | | | | 6,280,063 | |
| Distributions to shareholders from: | | | | | | | | |
| Distributable earnings | | | (5,190,580 | ) | | | (4,788,660 | ) |
| | | | | | | | | |
| Share transactions*: | | | | | | | | |
| Proceeds from sale of shares | | | 34,692,781 | | | | 49,753,782 | |
| Cost of shares redeemed | | | (49,921,153 | ) | | | (110,242,493 | ) |
| Net Decrease in net assets resulting from share transactions | | | (15,228,372 | ) | | | (60,488,711 | ) |
| Total decrease in net assets | | | (15,109,087 | ) | | | (58,997,308 | ) |
| Net Assets, beginning of year | | | 268,581,990 | | | | 327,579,298 | |
| Net Assets, end of year | | $ | 253,472,903 | | | $ | 268,581,990 | |
| *Shares of Common Stock Issued (no par value) | | | | | | | | |
| Shares sold | | | 2,050,000 | | | | 2,950,000 | |
| Shares redeemed | | | (2,950,000 | ) | | | (6,500,000 | ) |
| Net decrease | | | (900,000 | ) | | | (3,550,000 | ) |
See Notes to Financial Statements
VANECK ETF TRUST
FINANCIAL HIGHLIGHTS
For a share outstanding throughout each year:
| | | CEF Muni Income ETF |
| | | Year Ended April 30, |
| | | 2024 | | 2023 | | 2022 | | 2021 | | 2020 |
| Net asset value, beginning of year | | | $ | 21.46 | | | | $ | 23.53 | | | | $ | 29.07 | | | | $ | 24.34 | | | | $ | 26.18 | |
| Net investment income (a) | | | | 0.79 | | | | | 0.95 | | | | | 1.14 | | | | | 1.14 | | | | | 1.09 | |
| Net realized and unrealized gain (loss) on investments | | | | (0.57 | ) | | | | (2.00 | ) | | | | (5.56 | ) | | | | 4.71 | | | | | (1.83 | ) |
| Total from investment operations | | | | 0.22 | | | | | (1.05 | ) | | | | (4.42 | ) | | | | 5.85 | | | | | (0.74 | ) |
| Distributions from: | | | | | | | | | | | | | | | | | | | | | | | | | |
| Net investment income | | | | (0.83 | ) | | | | (1.02 | ) | | | | (1.12 | ) | | | | (1.12 | ) | | | | (1.10 | ) |
| Return of capital | | | | (0.09 | ) | | | | — | | | | | — | | | | | — | | | | | — | |
| Total distributions | | | | (0.92 | ) | | | | (1.02 | ) | | | | (1.12 | ) | | | | (1.12 | ) | | | | (1.10 | ) |
| Net asset value, end of year | | | $ | 20.76 | | | | $ | 21.46 | | | | $ | 23.53 | | | | $ | 29.07 | | | | $ | 24.34 | |
| Total return (b) | | | | 1.16 | % | | | | (4.53 | )% | | | | (15.82 | )% | | | | 24.38 | % | | | | (3.17 | )% |
| | | | | | | | | | | | | | | | | | | | | | | | | | |
| Ratios to average net assets | | | | | | | | | | | | | | | | | | | | | | | | | |
| Gross expenses (c)(d) | | | | 0.41 | % | | | | 0.41 | % | | | | 0.40 | % | | | | 0.40 | % | | | | 0.45 | % |
| Net expenses (c)(d) | | | | 0.41 | % | | | | 0.41 | % | | | | 0.40 | % | | | | 0.40 | % | | | | 0.40 | % |
| Net expenses excluding interest and taxes (c)(d) | | | 0.40 | % | | | | 0.40 | % | | | | N/A | | | | | N/A | | | | | N/A | |
| Net investment income (c) | | | | 3.80 | % | | | | 4.30 | % | | | | 4.01 | % | | | | 4.17 | % | | | | 4.02 | % |
| Supplemental data | | | | | | | | | | | | | | | | | | | | | | | | | |
| Net assets, end of year (in millions) | | | | $221 | | | | | $204 | | | | | $169 | | | | | $177 | | | | | $142 | |
| Portfolio turnover rate (e) | | | | 14 | % | | | | 15 | % | | | | 15 | % | | | | 11 | % | | | | 10 | % |
| (a) | Calculated based upon average shares outstanding |
| (b) | Returns are not annualized and include adjustments in accordance with U.S. Generally Accepted Accounting Principles. Net asset values and returns for financial reporting purposes may differ from those for shareholder transactions. |
| (c) | The ratios presented do not reflect the Fund's proportionate share of income and expenses from the Fund's investment in underlying funds. |
| (d) | Periods after November 1, 2019 reflect a unitary management fee structure. |
| (e) | Portfolio turnover rate is not annualized and excludes in-kind transactions. |
See Notes to Financial Statements
VANECK ETF TRUST
FINANCIAL HIGHLIGHTS
For a share outstanding throughout each year:
| | | High Yield Muni ETF |
| | | Year Ended April 30, |
| | | 2024 | | 2023 | | 2022 | | 2021 | | 2020 |
| Net asset value, beginning of year | | | $ | 51.43 | | | | $ | 55.18 | | | | $ | 62.48 | | | | $ | 56.13 | | | | $ | 62.79 | |
| Net investment income (a) | | | | 2.22 | | | | | 2.01 | | | | | 2.09 | | | | | 2.36 | | | | | 2.69 | |
| Net realized and unrealized gain (loss) on investments | | | | (0.21 | ) | | | | (3.73 | ) | | | | (7.27 | ) | | | | 6.38 | | | | | (6.73 | ) |
| Total from investment operations | | | | 2.01 | | | | | (1.72 | ) | | | | (5.18 | ) | | | | 8.74 | | | | | (4.04 | ) |
| Distributions from: | | | | | | | | | | | | | | | | | | | | | | | | | |
| Net investment income | | | | (2.16 | ) | | | | (2.03 | ) | | | | (2.12 | ) | | | | (2.39 | ) | | | | (2.62 | ) |
| Net asset value, end of year | | | $ | 51.28 | | | | $ | 51.43 | | | | $ | 55.18 | | | | $ | 62.48 | | | | $ | 56.13 | |
| Total return (b) | | | | 4.04 | % | | | | (3.11 | )% | | | | (8.62 | )% | | | | 15.84 | % | | | | (6.86 | )% |
| | | | | | | | | | | | | | | | | | | | | | | | | | |
| Ratios to average net assets | | | | | | | | | | | | | | | | | | | | | | | | | |
| Expenses | | | | 0.32 | % | | | | 0.35 | % | | | | 0.35 | % | | | | 0.35 | % | | | | 0.35 | % |
| Net investment income | | | | 4.37 | % | | | | 3.84 | % | | | | 3.38 | % | | | | 3.91 | % | | | | 4.26 | % |
| Supplemental data | | | | | | | | | | | | | | | | | | | | | | | | | |
| Net assets, end of year (in millions) | | | $ | 2,915 | | | | $ | 2,800 | | | | $ | 3,018 | | | | $ | 3,461 | | | | $ | 2,570 | |
| Portfolio turnover rate (c) | | | | 29 | % | | | | 11 | % | | | | 11 | % | | | | 9 | % | | | | 12 | % |
| (a) | Calculated based upon average shares outstanding |
| (b) | Returns are not annualized and include adjustments in accordance with U.S. Generally Accepted Accounting Principles. Net asset values and returns for financial reporting purposes may differ from those for shareholder transactions. |
| (c) | Portfolio turnover rate is not annualized and excludes in-kind transactions. |
See Notes to Financial Statements
VANECK ETF TRUST
FINANCIAL HIGHLIGHTS
For a share outstanding throughout each period:
| | | HIP Sustainable Muni ETF |
| | | | | | | | | | | | | | |
| | | | | | | | | | | | | Period |
| | | | | | | | | | | | | Ended |
| | | Year Ended April 30, | | April 30, |
| | | 2024 | | 2023 | | 2022 (a) |
| Net asset value, beginning of period | | | $ | 45.82 | | | | $ | 45.66 | | | | $ | 50.00 | |
| Net investment income (b) | | | | 1.03 | | | | | 0.72 | | | | | 0.10 | |
| Net realized and unrealized gain (loss) on investments | | | | (0.09 | ) | | | | 0.09 | | | | | (4.22 | ) |
| Total from investment operations | | | | 0.94 | | | | | 0.81 | | | | | (4.12 | ) |
| Distributions from: | | | | | | | | | | | | | | | |
| Net investment income | | | | (1.03 | ) | | | | (0.65 | ) | | | | (0.22 | ) |
| Net asset value, end of period | | | $ | 45.73 | | | | $ | 45.82 | | | | $ | 45.66 | |
| Total return (c) | | | | 2.08 | % | | | | 1.79 | % | | | | (8.26 | )% |
| | | | | | | | | | | | | | | | |
| Ratios to average net assets | | | | | | | | | | | | | | | |
| Expenses | | | | 0.24 | % | | | | 0.24 | % | | | | 0.24 | %(d) |
| Net investment income | | | | 2.26 | % | | | | 1.59 | % | | | | 0.33 | %(d) |
| Supplemental data | | | | | | | | | | | | | | | |
| Net assets, end of period (in millions) | | | | $18 | | | | | $18 | | | | | $14 | |
| Portfolio turnover rate (e) | | | | 11 | % | | | | 14 | % | | | | 11 | % |
| (a) | For the period September 9, 2021 (commencement of operations) through April 30, 2022. |
| (b) | Calculated based upon average shares outstanding |
| (c) | Returns are not annualized and include adjustments in accordance with U.S. Generally Accepted Accounting Principles. Net asset values and returns for financial reporting purposes may differ from those for shareholder transactions. |
| (d) | Annualized |
| (e) | Portfolio turnover rate is not annualized and excludes in-kind transactions. |
See Notes to Financial Statements
VANECK ETF TRUST
FINANCIAL HIGHLIGHTS
For a share outstanding throughout each year:
| | | Intermediate Muni ETF |
| | | Year Ended April 30, |
| | | | | 2024 | | | | | 2023 | | | | | 2022 | | | | | 2021 | | | | | 2020 | |
| Net asset value, beginning of year | | | $ | 46.35 | | | | $ | 45.69 | | | | $ | 51.62 | | | | $ | 48.97 | | | | $ | 48.94 | |
| Net investment income (a) | | | | 1.17 | | | | | 0.97 | | | | | 0.83 | | | | | 0.98 | | | | | 1.09 | |
| Net realized and unrealized gain (loss) on investments | | | | (0.50 | ) | | | | 0.65 | | | | | (5.92 | ) | | | | 2.72 | | | | | 0.10 | |
| Total from investment operations | | | | 0.67 | | | | | 1.62 | | | | | (5.09 | ) | | | | 3.70 | | | | | 1.19 | |
| Distributions from: | | | | | | | | | | | | | | | | | | | | | | | | | |
| Net investment income | | | | (1.16 | ) | | | | (0.96 | ) | | | | (0.84 | ) | | | | (0.98 | ) | | | | (1.10 | ) |
| Net realized capital gains | | | | — | | | | | — | | | | | — | (b) | | | | (0.07 | ) | | | | (0.06 | ) |
| Total distributions | | | | (1.16 | ) | | | | (0.96 | ) | | | | (0.84 | ) | | | | (1.05 | ) | | | | (1.16 | ) |
| Net asset value, end of year | | | $ | 45.86 | | | | $ | 46.35 | | | | $ | 45.69 | | | | $ | 51.62 | | | | $ | 48.97 | |
| Total return (c) | | | | 1.48 | % | | | | 3.59 | % | | | | (9.99 | )% | | | | 7.59 | % | | | | 2.40 | % |
| | | | | | | | | | | | | | | | | | | | | | | | | | |
| Ratios to average net assets | | | | | | | | | | | | | | | | | | | | | | | | | |
| Expenses | | | | 0.23 | % | | | | 0.24 | % | | | | 0.24 | % | | | | 0.24 | % | | | | 0.24 | % |
| Net investment income | | | | 2.56 | % | | | | 2.12 | % | | | | 1.64 | % | | | | 1.90 | % | | | | 2.17 | % |
| Supplemental data | | | | | | | | | | | | | | | | | | | | | | | | | |
| Net assets, end of year (in millions) | | | $ | 1,805 | | | | $ | 1,822 | | | | $ | 1,695 | | | | $ | 1,801 | | | | $ | 1,582 | |
| Portfolio turnover rate (d) | | | | 16 | % | | | | 17 | % | | | | 4 | % | | | | 6 | % | | | | 7 | % |
| (a) | Calculated based upon average shares outstanding |
| (b) | Amount represents less than $0.005 per share. |
| (c) | Returns are not annualized and include adjustments in accordance with U.S. Generally Accepted Accounting Principles. Net asset values and returns for financial reporting purposes may differ from those for shareholder transactions. |
| (d) | Portfolio turnover rate is not annualized and excludes in-kind transactions. |
See Notes to Financial Statements
VANECK ETF TRUST
FINANCIAL HIGHLIGHTS
For a share outstanding throughout each year:
| | | Long Muni ETF |
| | | Year Ended April 30, |
| | | | | 2024 | | | | | 2023 | | | | | 2022 | | | | | 2021 | | | | | 2020 | |
| Net asset value, beginning of year | | | $ | 17.91 | | | | $ | 18.35 | | | | $ | 21.68 | | | | $ | 20.18 | | | | $ | 20.40 | |
| Net investment income (a) | | | | 0.62 | | | | | 0.52 | | | | | 0.46 | | | | | 0.52 | | | | | 0.57 | |
| Net realized and unrealized gain (loss) on investments | | | | (0.26 | ) | | | | (0.46 | ) | | | | (3.26 | ) | | | | 1.54 | | | | | (0.20 | ) |
| Total from investment operations | | | | 0.36 | | | | | 0.06 | | | | | (2.80 | ) | | | | 2.06 | | | | | 0.37 | |
| Distributions from: | | | | | | | | | | | | | | | | | | | | | | | | | |
| Net investment income | | | | (0.61 | ) | | | | (0.50 | ) | | | | (0.46 | ) | | | | (0.52 | ) | | | | (0.57 | ) |
| Net realized capital gains | | | | — | | | | | — | | | | | (0.07 | ) | | | | (0.04 | ) | | | | (0.02 | ) |
| Total distributions | | | | (0.61 | ) | | | | (0.50 | ) | | | | (0.53 | ) | | | | (0.56 | ) | | | | (0.59 | ) |
| Net asset value, end of year | | | $ | 17.66 | | | | $ | 17.91 | | | | $ | 18.35 | | | | $ | 21.68 | | | | $ | 20.18 | |
| Total return (b) | | | | 2.02 | % | | | | 0.40 | % | | | | (13.26 | )% | | | | 10.31 | % | | | | 1.75 | % |
| | | | | | | | | | | | | | | | | | | | | | | | | | |
| Ratios to average net assets | | | | | | | | | | | | | | | | | | | | | | | | | |
| Expenses | | | | 0.24 | % | | | | 0.24 | % | | | | 0.24 | % | | | | 0.24 | % | | | | 0.24 | % |
| Net investment income | | | | 3.54 | % | | | | 2.91 | % | | | | 2.15 | % | | | | 2.45 | % | | | | 2.72 | % |
| Supplemental data | | | | | | | | | | | | | | | | | | | | | | | | | |
| Net assets, end of year (in millions) | | | | $441 | | | | | $313 | | | | | $216 | | | | | $228 | | | | | $200 | |
| Portfolio turnover rate (c) | | | | 23 | % | | | | 32 | % | | | | 7 | % | | | | 23 | % | | | | 22 | % |
| (a) | Calculated based upon average shares outstanding |
| (b) | Returns are not annualized and include adjustments in accordance with U.S. Generally Accepted Accounting Principles. Net asset values and returns for financial reporting purposes may differ from those for shareholder transactions. |
| (c) | Portfolio turnover rate is not annualized and excludes in-kind transactions. |
See Notes to Financial Statements
VANECK ETF TRUST
FINANCIAL HIGHLIGHTS
For a share outstanding throughout each year:
| | | Short High Yield Muni ETF |
| | | Year Ended April 30, |
| | | | | 2024 | | | | | 2023 | | | | | 2022 | | | | | 2021 | | | | | 2020 | |
| Net asset value, beginning of year | | | $ | 22.34 | | | | $ | 22.86 | | | | $ | 25.06 | | | | $ | 23.09 | | | | $ | 24.70 | |
| Net investment income (a) | | | | 0.67 | | | | | 0.59 | | | | | 0.58 | | | | | 0.73 | | | | | 0.84 | |
| Net realized and unrealized gain (loss) on investments | | | | (0.06 | ) | | | | (0.50 | ) | | | | (2.18 | ) | | | | 1.99 | | | | | (1.64 | ) |
| Total from investment operations | | | | 0.61 | | | | | 0.09 | | | | | (1.60 | ) | | | | 2.72 | | | | | (0.80 | ) |
| Distributions from: | | | | | | | | | | | | | | | | | | | | | | | | | |
| Net investment income | | | | (0.68 | ) | | | | (0.61 | ) | | | | (0.60 | ) | | | | (0.75 | ) | | | | (0.81 | ) |
| Net asset value, end of year | | | $ | 22.27 | | | | $ | 22.34 | | | | $ | 22.86 | | | | $ | 25.06 | | | | $ | 23.09 | |
| Total return (b) | | | | 2.82 | % | | | | 0.43 | % | | | | (6.58 | )% | | | | 11.89 | % | | | | (3.44 | )% |
| | | | | | | | | | | | | | | | | | | | | | | | | | |
| Ratios to average net assets | | | | | | | | | | | | | | | | | | | | | | | | | |
| Expenses | | | | 0.35 | % | | | | 0.35 | % | | | | 0.35 | % | | | | 0.35 | % | | | | 0.35 | % |
| Net investment income | | | | 3.04 | % | | | | 2.64 | % | | | | 2.34 | % | | | | 2.98 | % | | | | 3.37 | % |
| Supplemental data | | | | | | | | | | | | | | | | | | | | | | | | | |
| Net assets, end of year (in millions) | | | | $321 | | | | | $398 | | | | | $418 | | | | | $306 | | | | | $263 | |
| Portfolio turnover rate (c) | | | | 18 | % | | | | 17 | % | | | | 16 | % | | | | 14 | % | | | | 17 | % |
| (a) | Calculated based upon average shares outstanding |
| (b) | Returns are not annualized and include adjustments in accordance with U.S. Generally Accepted Accounting Principles. Net asset values and returns for financial reporting purposes may differ from those for shareholder transactions. |
| (c) | Portfolio turnover rate is not annualized and excludes in-kind transactions. |
See Notes to Financial Statements
VANECK ETF TRUST
FINANCIAL HIGHLIGHTS
For a share outstanding throughout each year:
| | | Short Muni ETF |
| | | Year Ended April 30, |
| | | | | 2024 | | | | | 2023 | | | | | 2022 | | | | | 2021 | | | | | 2020 | |
| Net asset value, beginning of year | | | $ | 16.95 | | | | $ | 16.89 | | | | $ | 18.04 | | | | $ | 17.55 | | | | $ | 17.54 | |
| Net investment income (a) | | | | 0.31 | | | | | 0.21 | | | | | 0.15 | | | | | 0.23 | | | | | 0.27 | |
| Net realized and unrealized gain (loss) on investments | | | | 0.04 | | | | | 0.10 | | | | | (1.09 | ) | | | | 0.51 | | | | | 0.02 | |
| Total from investment operations | | | | 0.35 | | | | | 0.31 | | | | | (0.94 | ) | | | | 0.74 | | | | | 0.29 | |
| Distributions from: | | | | | | | | | | | | | | | | | | | | | | | | | |
| Net investment income | | | | (0.35 | ) | | | | (0.25 | ) | | | | (0.19 | ) | | | | (0.25 | ) | | | | (0.28 | ) |
| Net realized capital gains | | | | — | | | | | — | | | | | (0.02 | ) | | | | — | | | | | — | |
| Total distributions | | | | (0.35 | ) | | | | (0.25 | ) | | | | (0.21 | ) | | | | (0.25 | ) | | | | (0.28 | ) |
| Net asset value, end of year | | | $ | 16.95 | | | | $ | 16.95 | | | | $ | 16.89 | | | | $ | 18.04 | | | | $ | 17.55 | |
| Total return (b) | | | | 2.12 | % | | | | 1.83 | % | | | | (5.27 | )% | | | | 4.27 | % | | | | 1.66 | % |
| | | | | | | | | | | | | | | | | | | | | | | | | | |
| Ratios to average net assets | | | | | | | | | | | | | | | | | | | | | | | | | |
| Expenses | | | | 0.09 | % | | | | 0.20 | % | | | | 0.20 | % | | | | 0.20 | % | | | | 0.20 | % |
| Net investment income | | | | 1.86 | % | | | | 1.22 | % | | | | 0.86 | % | | | | 1.26 | % | | | | 1.54 | % |
| Supplemental data | | | | | | | | | | | | | | | | | | | | | | | | | |
| Net assets, end of year (in millions) | | | | $253 | | | | | $269 | | | | | $328 | | | | | $297 | | | | | $204 | |
| Portfolio turnover rate (c) | | | | 36 | % | | | | 19 | % | | | | 18 | % | | | | 30 | % | | | | 34 | % |
| (a) | Calculated based upon average shares outstanding |
| (b) | Returns are not annualized and include adjustments in accordance with U.S. Generally Accepted Accounting Principles. Net asset values and returns for financial reporting purposes may differ from those for shareholder transactions. |
| (c) | Portfolio turnover rate is not annualized and excludes in-kind transactions. |
See Notes to Financial Statements
VANECK ETF TRUST
NOTES TO FINANCIAL STATEMENTS
April 30, 2024
Note 1—Fund Organization—VanEck ETF Trust (the “Trust”) is registered under the Investment Company Act of 1940, as amended, as an open-end management investment company. The Trust was incorporated in Delaware as a statutory trust on March 15, 2001. The Trust operates as a series fund, and offers multiple investment portfolios, each of which represents a separate series of the Trust. These financial statements relate only to the investment portfolios listed in the table below (each a “Fund” and, collectively, the “Funds”).
| Fund | | Diversification Classification |
| CEF Muni Income ETF (“CEF Muni”) | | Diversified |
| High Yield Muni ETF (“High Yield”) | | Diversified |
| HIP Sustainable Muni ETF (“HIP Sustainable”) | | Non-Diversified |
| Intermediate Muni ETF (“Intermediate”) | | Diversified |
| Long Muni ETF (“Long”) | | Diversified |
| Short High Yield Muni ETF (“Short High Yield”) | | Diversified |
| Short Muni ETF (“Short”) | | Diversified |
Each Fund’s investment objective (except for HIP Sustainable) is to replicate as closely as possible, before fees and expenses, the price and yield performance of its index.
| Fund | | Index |
| CEF Muni | | S-Network Municipal Bond Closed-End Fund Index |
| High Yield | | ICE Broad High Yield Crossover Municipal Index |
| Intermediate | | ICE Intermediate AMT-Free Broad National Municipal Index |
| Long | | ICE Long AMT-Free Broad National Municipal Index |
| Short High Yield | | ICE 1-12 Year Broad High Yield Crossover Municipal Index |
| Short | | ICE Short AMT-Free Broad National Municipal Index |
The investment objective of HIP Sustainable is to seek current income generally exempt from federal income tax, other than federal alternative minimum tax. The Funds (except CEF Muni and HIP Sustainable) expect to use a sampling approach in seeking to achieve their objectives. Sampling means that Van Eck Associates Corporation (the “Adviser”) uses quantitative analysis to select bonds and other securities that represent a sample of securities in each Fund’s respective index in terms of key risk factors, performance attributes and other characteristics. The number of securities in each Fund will be based upon several factors, including asset size of the Fund. The Adviser generally expects each Fund to hold less than the total number of securities in its index, but reserves the right to hold as many securities as it believes necessary to achieve the Fund’s investment objective. CEF Muni seeks to achieve its objectives through a portfolio of securities in substantially the same weighting as its index. The HIP Sustainable is an actively managed exchange-traded fund that seeks to achieve its investment objectives by investing, under normal circumstances, in investment grade municipal debt securities that fund issuers with operations or projects helping to promote progress towards sustainable development, in alignment with the goals and metrics defined by the United Nations Sustainable Development Goals.
Note 2—Significant Accounting Policies— The preparation of financial statements in conformity with U.S. generally accepted accounting principles (“GAAP”) requires management to make estimates and assumptions that affect the reported amounts and disclosures in the financial statements. Actual results could differ from those estimates.
The Funds are investment companies and follow accounting and reporting requirements of Accounting Standards Codification (“ASC”) 946 Financial Services — Investment Companies.
The following summarizes the Funds’ significant accounting policies.
| A. | Security Valuation— The Funds value their investments in securities and other assets and liabilities at fair value daily. Fair value is the price that would be received to sell an asset or paid to transfer a liability in an orderly transaction between market participants on the measurement date. The Funds utilize various methods to measure the fair value of their investments on a recurring basis, which includes a hierarchy that prioritizes inputs to valuation methods used to measure fair value. The fair value hierarchy gives |
VANECK ETF TRUST
NOTES TO FINANCIAL STATEMENTS
(continued)
| | highest priority to unadjusted quoted prices in active markets for identical assets and liabilities (Level 1 measurements) and the lowest priority to unobservable inputs (Level 3 measurements). The inputs or methodologies used for valuing securities are not necessarily an indication of the risk associated with investing in those securities. The three levels of the fair value hierarchy are described below: |
| | |
| | Level 1 — Quoted prices in active markets for identical securities. |
| | |
| | Level 2 — Significant observable inputs (including quoted prices for similar securities, interest rates, prepayment speeds, credit risk, etc.). |
| | |
| | Level 3 — Significant unobservable inputs (including each Fund’s own assumptions in determining the fair value of investments). |
| | |
| | Securities traded on national exchanges are valued at the closing price on the markets in which the securities trade. Securities traded on the NASDAQ Stock Market LLC (“NASDAQ”) are valued at the NASDAQ official closing price. Over-the-counter securities not included on NASDAQ and listed securities for which no sale was reported are valued at the mean of the bid and ask prices. To the extent these securities are actively traded, they are categorized as Level 1 in the fair value hierarchy. Money market fund investments are valued at net asset value and are categorized as Level 1 in the fair value hierarchy. Debt securities are valued on the basis of evaluated prices furnished by an independent pricing service or provided by securities dealers. The pricing services may use valuation models or matrix pricing, which consider: (i) yield or price with respect to bonds that are considered comparable in characteristics such as rating, interest rate and maturity date and or (ii) quotations from bond dealers to determine current value, and are categorized as Level 2 in the fair value hierarchy. Short-term debt securities with sixty days or less to maturity are valued at amortized cost, which with accrued interest approximates fair value. The Funds’ Board of Trustees (“Trustees”) has designated the Adviser as valuation designee to perform the Funds’ fair value determinations, subject to board oversight and certain reporting and other requirements. The Adviser has adopted policies and procedures reasonably designed to comply with the requirements. Among other things, these procedures allow the Funds to utilize independent pricing services, quotations from securities dealers, and other market sources to determine fair value. The Pricing Committee convenes regularly to review the fair value of financial instruments or other assets. If market quotations for a security or other asset are not readily available, or if the Adviser believes they do not otherwise reflect the fair value of a security or asset, the security or asset will be fair valued by the Pricing Committee in accordance with the Funds’ valuation policies and procedures. The Pricing Committee employs various methods for calibrating the valuation approaches utilized to determine fair value, including a regular review of key inputs and assumptions, periodic comparisons to valuations provided by other independent pricing services, transactional back-testing and disposition analysis. |
| | |
| | Certain factors such as economic conditions, political events, market trends, the nature of and duration of any restrictions on disposition, trading in similar securities of the issuer or comparable issuers and other security specific information are used to determine the fair value of these securities. Depending on the relative significance of valuation inputs, these securities may be categorized either as Level 2 or Level 3 in the fair value hierarchy. The price which the Funds may realize upon sale of an investment may differ materially from the value presented in the Schedules of Investments. |
| | |
| | A summary of the inputs and the levels used to value the Funds’ investments are located in the Schedules of Investments. Additionally, tables that reconcile the valuation of the Funds’ Level 3 investments and that present additional information about valuation methodologies and unobservable inputs, if applicable, are located in the Schedules of Investments. |
| | |
| | B. Federal Income Taxes —It is each Fund’s policy to comply with the provisions of the Internal Revenue Code applicable to regulated investment companies and to distribute all of its net investment income and net realized capital gains, in any, to its shareholders. Therefore, no federal income tax provision is required. |
| | C. Distributions to Shareholders—Dividends to shareholders from net investment income, if any, are declared and paid at least monthly by each Fund. Distributions of net realized capital gains and return of capital, if any, are generally declared and paid annually. Income dividends and capital gain distributions are determined in accordance with U.S. income tax regulations, which may differ from such amounts determined in accordance with GAAP. |
| | |
| | D. Restricted Securities — The Funds may invest in securities that are subject to legal or contractual restrictions on resale. These securities generally may be resold in transactions exempt from registration or to the public if the securities are registered. Disposal of these securities may involve time-consuming negotiations and expense, and prompt sale at an acceptable price may be difficult. Information regarding restricted securities, if any, is included at the end of each Fund’s Schedule of Investments. |
| | |
| | E. Other— Security transactions are accounted for on trade date. Realized gains and losses are determined based on the specific identification method. Interest income, including amortization of premiums and discounts, is accrued using the effective interest method. Interest income is generally not earned on debt securities in default or upon determination that the income is not realizable. Dividend income is recorded on the ex-dividend date. |
| | |
| | The Funds earn interest on uninvested cash balances held at the custodian bank. Such amounts, if any, are presented in the Statements of Operations. |
| | |
| | The character of distributions received from certain investments may be comprised of net investment income, capital gains, and return of capital. It is the Funds’ policy to estimate the character of distributions received from these investments based on historical data if actual amounts are not available. After each calendar year end, these investments report the actual tax character of these distributions. Differences between the estimated and actual amounts are reflected in the Funds’ records in the year in which they are reported by adjusting the related cost basis of investments, capital gains and income, as necessary. |
| | |
| | In the normal course of business, the Funds enter into contracts that contain a variety of general indemnifications. The Funds’ maximum exposure under these agreements is unknown as this would involve future claims that may be made against the Funds that have not yet occurred. However, the Adviser believes the risk of loss under these arrangements to be remote. |
Note 3—Investment Management and Other Agreements— The Adviser is the investment adviser to the Funds. The Adviser receives a management fee, calculated daily and payable monthly based on an annual rate of each Fund’s average daily net assets. The Funds utilize a unitary management fee structure where the Adviser is responsible for all expenses of the Funds, excluding the fee payment under the investment management agreement, acquired fund fees and expenses, interest expense, trading expenses, taxes and extraordinary expenses.
The management fee rates for the year ended April 30, 2024, are as follows:
| Fund | | Management
Fee Rate |
| CEF Muni | | | 0.40 | % |
| High Yield* | | | 0.32 | |
| HIP Sustainable | | | 0.24 | |
| Intermediate** | | | 0.18 | |
| Long | | | 0.24 | |
| Short High Yield | | | 0.35 | |
| Short* | | | 0.07 | |
| | |
| * | Prior to June 20, 2023, the unitary management fee rate for High Yield and Short was 0.35% and 0.20%, respectively. |
| | |
| ** | Prior to March 7, 2024, the unitary management fee rate for Intermediate was 0.24%. |
VANECK ETF TRUST
NOTES TO FINANCIAL STATEMENTS
(continued)
In addition, Van Eck Securities Corporation (the “Distributor”), an affiliate of the Adviser, acts as the Funds’ distributor. Certain officers and a Trustee of the Trust are officers, directors or stockholders of the Adviser and Distributor.
At April 30, 2024, the Adviser owned approximately 13% of HIP Sustainable.
Note 4—Capital Share Transactions—As of April 30, 2024, there were an unlimited number of capital shares of beneficial interest authorized by the Trust with no par value. Fund shares are not individually redeemable and are issued and redeemed at their net asset value per share only through certain authorized broker-dealers (“Authorized Participants”) in blocks of shares (“Creation Units”).
The consideration for the purchase or redemption of Creation Units of the Funds generally consists of the in-kind contribution or distribution of a designated portfolio of securities (“Deposit Securities”) plus a balancing cash component to equate the transaction to the net asset value per share of the Fund on the transaction date. Cash may also be substituted in an amount equivalent to the value of certain Deposit Securities, generally as a result of market circumstances, or when the securities are not available in sufficient quantity for delivery, or are not eligible for trading by the Authorized Participant. The Funds may issue Creation Units in advance of receipt of Deposit Securities subject to various conditions, including, for the benefit of the Funds, a requirement to maintain cash collateral on deposit at the custodian equal to at least 115% of the daily marked to market value of the missing Deposit Securities.
Authorized Participants purchasing and redeeming Creation Units may pay transaction fees directly to the transfer agent. In addition, the Funds may impose variable fees on the purchase or redemption of Creation Units for cash, or on transactions effected outside the clearing process, to defray certain transaction costs. These variable fees, if any, are reflected in share transactions in the Statements of Changes in Net Assets.
Note 5—Investments—For the year ended April 30, 2024, purchases and sales of investments (excluding short-term investments and in-kind capital share transactions) and the purchases and sales of investments resulting from in-kind capital share transactions (excluding short-term investments) were as follows:
| | | | | | | In-Kind Capital Share Transactions |
| Fund | | Purchases | | Sales | | Purchases | | Sales |
| CEF Muni | | $ | 30,903,018 | | | $ | 30,549,231 | | | $ | 54,354,844 | | | $ | 32,644,664 | |
| High Yield | | | 1,055,628,569 | | | | 797,416,167 | | | | 31,998,764 | | | | 155,185,527 | |
| HIP Sustainable | | | 2,434,237 | | | | 1,991,992 | | | | — | | | | — | |
| Intermediate | | | 492,235,668 | | | | 293,702,933 | | | | 2,454,431 | | | | 183,240,130 | |
| Long | | | 282,422,023 | | | | 93,930,162 | | | | — | | | | 54,413,224 | |
| Short High Yield | | | 65,790,106 | | | | 120,046,791 | | | | — | | | | 15,688,393 | |
| Short | | | 100,991,022 | | | | 90,479,690 | | | | — | | | | 20,879,913 | |
During the year ended April 30, 2024, the High Yield, Intermediate, Long and Short funds engaged in purchases and sales of investments to funds or other accounts that are managed by the Adviser (or an affiliate of the Adviser). These transactions complied with Rule 17a-7 under the Act and aggregated to approximately $5 million of purchases and $1 million of sales for High Yield, $19 million of purchases and $38 million of sales for Intermediate, $1 million of purchases and $18 million sales for Long and $33 million of purchases and $1 million of sales for Short.
Note 6—Income Taxes—As of April 30, 2024, for Federal income tax purposes, the identified cost, gross unrealized appreciation, gross unrealized depreciation and net unrealized appreciation (depreciation) of investments owned were as follows:
| Fund | | Tax Cost of
Investments | | | Gross
Unrealized
Appreciation | | | Gross
Unrealized
Depreciation | | | Net Unrealized
Appreciation
(Depreciation) | |
| CEF Muni | | | $258,695,735 | | | | $1,492,600 | | | | $(38,532,528 | ) | | | $(37,039,928 | ) |
| High Yield | | | 3,045,213,975 | | | | 44,531,507 | | | | (229,394,303 | ) | | | (184,862,796 | ) |
| HIP Sustainable | | | 19,057,834 | | | | 51,846 | | | | (1,180,552 | ) | | | (1,128,706 | ) |
| Intermediate | | | 1,840,558,776 | | | | 10,906,333 | | | | (78,063,955 | ) | | | (67,157,622 | ) |
| Long | | | 450,908,855 | | | | 2,261,950 | | | | (20,518,529 | ) | | | (18,256,579 | ) |
| Short High Yield | | | 338,085,790 | | | | 1,973,588 | | | | (24,732,167 | ) | | | (22,758,579 | ) |
| Short | | | 253,543,258 | | | | 300,129 | | | | (6,764,602 | ) | | | (6,464,473 | ) |
At April 30 2024, the components of distributable earnings (loss) on a tax basis, for each Fund, we as follows:
| Fund | | Undistributed
Tax-Exempt
Income | | (Accumulated
Capital Losses)/
Undistributed
Capital Gains | | Other
Temporary
Differences | | Unrealized
Appreciation
(Depreciation) | | Total
Distributable
Earnings (Loss) |
| CEF Muni | | | $– | | | | $(28,865,237 | ) | | | $(4,194 | ) | | | $(37,039,928 | ) | | | $(65,909,359 | ) |
| High Yield | | | 13,854,172 | | | | (190,682,345 | ) | | | (673,844 | ) | | | (184,862,796 | ) | | | (362,364,813 | ) |
| HIP Sustainable | | | 35,568 | | | | (133,295 | ) | | | – | | | | (1,128,706 | ) | | | (1,226,433 | ) |
| Intermediate | | | 4,034,506 | | | | (30,327,538 | ) | | | (3,001 | ) | | | (67,157,622 | ) | | | (93,453,655 | ) |
| Long | | | 1,285,164 | | | | (18,398,342 | ) | | | (1,516 | ) | | | (18,256,579 | ) | | | (35,371,273 | ) |
| Short High Yield | | | 995,311 | | | | (25,072,743 | ) | | | (238,204 | ) | | | (22,758,579 | ) | | | (47,074,215 | ) |
| Short | | | 467,770 | | | | (3,207,454 | ) | | | (1,600 | ) | | | (6,464,473 | ) | | | (9,205,757 | ) |
The tax character of dividends paid to shareholders was as follows:
| | | April 30, 2024 | | | April 30, 2023 | |
| Fund | | Tax-Exempt
Income | | | Ordinary
Income* | | | Return
of Capital | | | Tax-Exempt
Income | | | Ordinary
Income* | |
| CEF Muni | | | $8,563,523 | | | | $88,776 | | | | $943,651 | | | | $7,256,211 | | | | $51,159 | |
| High Yield | | | 118,758,707 | | | | 1,813,281 | | | | – | | | | 115,016,067 | | | | 1,542,491 | |
| HIP Sustainable | | | 396,009 | | | | 16,951 | | | | – | | | | 231,881 | | | | 12,964 | |
| Intermediate | | | 46,387,875 | | | | 476,628 | | | | – | | | | 37,164,901 | | | | 287,512 | |
| Long | | | 14,222,682 | | | | 202,413 | | | | – | | | | 6,709,990 | | | | 71,275 | |
| Short High Yield | | | 11,115,147 | | | | 107,848 | | | | – | | | | 11,247,035 | | | | 67,990 | |
| Short | | | 5,071,706 | | | | 118,874 | | | | – | | | | 4,709,425 | | | | 79,235 | |
| * | Includes short-term capital gains (if any). |
At April 30 2024, the following Funds had capital loss carryforwards available to offset future capital gains:
| Fund | | Short-Term
Capital Losses
with No Expiration | | Long-Term
Capital Losses
with No Expiration | | Total |
| CEF Muni | | $ | (6,412,713 | ) | | $ | (22,452,524 | ) | | $ | (28,865,237 | ) |
| High Yield | | | (47,580,255 | ) | | | (143,102,090 | ) | | | (190,682,345 | ) |
| HIP Sustainable | | | (46,341 | ) | | | (86,954 | ) | | | (133,295 | ) |
| Intermediate | | | (5,200,343 | ) | | | (25,127,195 | ) | | | (30,327,538 | ) |
| Long | | | (5,098,505 | ) | | | (13,299,837 | ) | | | (18,398,342 | ) |
| Short High Yield | | | (5,658,481 | ) | | | (19,414,262 | ) | | | (25,072,743 | ) |
| Short | | | (635,922 | ) | | | (2,571,532 | ) | | | (3,207,454 | ) |
During the year ended April 30, 2024, as a result of permanent book to tax differences primarily due to the tax treatment of gains/ losses from securities redeemed in-kind, the Funds incurred differences that affected total distributable earnings (loss) and aggregate paid in capital by the amounts in the table below. Net assets were not affected by these reclassifications.
VANECK ETF TRUST
NOTES TO FINANCIAL STATEMENTS
(continued)
| Fund | | Increase
(Decrease)
in Total Distributable
Earnings (Loss) | | Increase
(Decrease)
in Aggregate
Paid in Capital |
| CEF Muni | | $ | (1,989,040 | ) | | $ | 1,989,040 | |
| High Yield | | | 15,300,780 | | | | (15,300,780 | ) |
| Intermediate | | | 4,688,706 | | | | (4,688,706 | ) |
| Long | | | 751,336 | | | | (751,336 | ) |
| Short High Yield | | | 844,614 | | | | (844,614 | ) |
| Short | | | 704,119 | | | | (704,119 | ) |
The Funds recognize the tax benefits of uncertain tax positions only where the position is “more-likely-than-not” to be sustained assuming examination by applicable tax authorities. Management has analyzed the Funds’ tax positions, and has concluded that no liability for unrecognized tax benefits should be recorded related to uncertain tax positions taken on return filings for all open tax years.
The Funds recognize interest and penalties, if any, related to uncertain tax positions as income tax expense in the Statements of Operations. During the year ended April 30, 2024, the Funds did not incur any interest or penalties.
Note 7—Principal Risks—Investments in municipal securities or in Funds holding municipal securities involve risks, including market fluctuations caused by factors such as economic and political developments, changes in interest rates and perceived trends in security prices. The market for municipal bonds may be less liquid than for taxable bonds.
High Yield and Short High Yield invest in non-investment grade securities, often referred to as “junk bonds.” Economic downturns may disrupt the high yield market and impair the ability of issuers to repay principal and interest. These high yield securities may involve greater risks and considerations not typically associated with investing in U.S. government bonds and other high quality fixed-income securities. Also, an increase in interest rates would likely have an adverse impact on the value of such obligations. Moreover, high yield securities may be less liquid due to the extent that there is no established retail secondary market. High Yield and Short High Yield may not be able to sell bonds at desired prices and large purchases or sales of certain high-yield bond issues may cause substantial fluctuations in share price, yield and total return.
CEF Muni invests in closed-end funds that may trade at a discount or premium to their net asset value. The Fund is dependent on the performance of underlying funds and are subject to the same risks of investing in municipal bonds. A closed-end fund may be leveraged as part of its investment strategy. As a result, the Fund may be indirectly exposed to the effects of leverage through its investment in the underlying funds. Investments in underlying funds that use leverage may cause the value of the Fund’s shares to be more volatile than if the Fund invested in underlying funds that do not utilize leverage.
The HIP Sustainable strategy of investing in municipal debt securities of issuers promoting sustainable development may limit the types and number of investments available to the Fund or cause the Fund to invest in securities that underperform the market as a whole. As a result, the Fund may underperform funds that do not have a sustainable investing strategy or funds with sustainable investing strategies that do not employ HIP (Human Impact + Profit) Ratings. In addition, the Fund relies on a data provider for the identification of issuers that promote sustainable development based on their HIP Ratings; however, there can be no guarantee that the data provider’s methodology will align with the Fund’s investment strategy or desirable issuers can be correctly identified.
A more complete description of risks is included in each Fund’s Prospectus and Statement of Additional Information.
Note 8—Trustee Deferred Compensation Plan—The Trust has a Deferred Compensation Plan (the “Plan”) for Trustees under which the Trustees can elect to defer receipt of their trustee fees until retirement, disability or termination from the Board of Trustees. The fees otherwise payable to the participating Trustees are deemed invested in shares of the Funds as directed by the Trustees.
A unitary management fee in which the Adviser is responsible for paying all the expenses of a Fund was adopted on September 1, 2010, for Intermediate, Long, Short, and High Yield Funds, and on November 1, 2019, for CEF Muni Fund. For these Funds, the liability for the Plan which is shown as “Deferred Trustee fees” in the Statements of Assets and Liabilities represents amounts accrued through these dates. Amounts accrued after these dates, including those from Short High Yield and HIP Sustainable, are obligations of the Adviser.
Note 9—Bank Line of Credit—The Funds may participate in a $200 million committed credit facility (the “Facility”) to be utilized for temporary financing until the settlement of sales or purchases of portfolio securities, the repurchase or redemption of shares of the Funds at the request of the shareholders and other temporary or emergency purposes. The Funds have agreed to pay commitment fees, pro rata, based on the unused but available balance. Interest is charged to the Funds based on prevailing market rates in effect at the time of borrowings. During the year ended April 30, 2024, the following Funds borrowed under this Facility:
| Fund | | Days
Outstanding | | Average
Daily
Loan Balance | | Average
Interest Rate |
| CEF Muni | | | 297 | | | $413,063 | | | 6.62 | % |
| High Yield | | | 7 | | | 1,980,525 | | | 6.68 | |
| Intermediate | | | 1 | | | 143,761 | | | 6.68 | |
| Long | | | 2 | | | 484,254 | | | 6.68 | |
| Short High Yield | | | 42 | | | 505,778 | | | 6.50 | |
Outstanding loan balances as of April 30, 2024, if any, are reflected in the Statements of Assets and Liabilities.
Note 10—New Regulatory Requirements— On October 26, 2022, the Securities and Exchange Commission (SEC) adopted rule and form amendments that require mutual funds and exchange-traded funds (ETFs) that are registered on Form N-1A to prepare and transmit tailored unaudited annual and semi-annual shareholder reports (TSRs), that highlight key information to investors, within 60 days of period-end. The new TSRs will be prepared separately for each fund.
In connection with these amendments, certain information that was previously disclosed in fund shareholder reports will instead be made available online, delivered free of charge upon request, and filed with the SEC on a semi-annual basis on Form N-CSR.
The SEC also amended Rule 30e-3 under the Investment Company Act, to require mutual funds and ETFs to provide TSRs directly to investors by mail (unless an investor elects electronic delivery). These rules are effective January 24, 2023, and the compliance date is July 24, 2024.
VANECK ETF TRUST
REPORT OF INDEPENDENT REGISTERED PUBLIC ACCOUNTING FIRM
To the Board of Trustees of VanEck ETF Trust and Shareholders of each of the seven funds listed in the table below
Opinions on the Financial Statements
We have audited the accompanying statements of assets and liabilities, including the schedules of investments, of each of the funds listed in the table below (seven of the funds constituting VanEck ETF Trust, hereafter collectively referred to as the “Funds”) as of April 30, 2024, the related statements of operations for the year ended April 30, 2024, and the statements of changes in net assets and the financial highlights for each of the two years in the period ended April 30, 2024, including the related notes (collectively referred to as the “financial statements”). In our opinion, the financial statements present fairly, in all material respects, the financial position of each of the Funds listed in the table below as of April 30, 2024, the results of each of their operations for the year ended April 30, 2024, and the changes in each of their net assets and each of the financial highlights for each of the two years in the period ended April 30, 2024, in conformity with accounting principles generally accepted in the United States of America.
| VanEck CEF Muni Income ETF | VanEck Long Muni ETF |
| VanEck High Yield Muni ETF | VanEck Short High Yield Muni ETF |
| VanEck HIP Sustainable Muni ETF | VanEck Short Muni ETF |
| VanEck Intermediate Muni ETF | |
The financial statements of the Funds as of and for the year or period ended April 30, 2022, and the financial highlights for each of the periods ended on or prior to April 30, 2022 (not presented herein, other than the financial highlights) were audited by other auditors whose report dated June 23, 2022, expressed an unqualified opinion on those financial statements and financial highlights.
Basis for Opinions
These financial statements are the responsibility of the Funds’ management. Our responsibility is to express an opinion on the Funds’ financial statements based on our audits. We are a public accounting firm registered with the Public Company Accounting Oversight Board (United States) (PCAOB) and are required to be independent with respect to the Funds in accordance with the U.S. federal securities laws and the applicable rules and regulations of the Securities and Exchange Commission and the PCAOB.
We conducted our audits of these financial statements in accordance with the standards of the PCAOB. Those standards require that we plan and perform the audit to obtain reasonable assurance about whether the financial statements are free of material misstatement, whether due to error or fraud.
Our audits included performing procedures to assess the risks of material misstatement of the financial statements, whether due to error or fraud, and performing procedures that respond to those risks. Such procedures included examining, on a test basis, evidence regarding the amounts and disclosures in the financial statements. Our audits also included evaluating the accounting principles used and significant estimates made by management, as well as evaluating the overall presentation of the financial statements. Our procedures included confirmation of securities owned as of April 30, 2024, by correspondence with the custodian, transfer agent and brokers; when replies were not received from brokers, we performed other auditing procedures. We believe that our audits provide a reasonable basis for our opinions.
/s/PricewaterhouseCoopers LLP
New York, New York
June 26, 2024
We have served as the auditor of one or more investment companies in the VanEck Funds complex since 2022.
VANECK ETF TRUST
TAX INFORMATION
(unaudited)
The per share amounts of taxable vs. tax-exempt income paid by the funds during the taxable year ended April 30, 2024 are listed in the table below. The information set forth below is for each Fund’s fiscal year. Shareholders, however, must report dividends on a calendar year basis for income tax purposes, which may include dividends for portions of two fiscal years of a Fund. Accordingly, the information needed by shareholders for calendar year 2024 income tax purposes will be sent to them in early 2025.
Additionally, all of the taxable ordinary income represents Qualified Interest Income (QII) for non-resident alien shareholders.
Please consult your tax advisor for proper treatment of this information.
| Fund Name | | Ticker
Symbol | | Tax-
Exempt
Interest
Per Share | | Tax-Exempt
Interest as a
Percentage
of the Total
Distribution | | Taxable
Ordinary
Income
Per Share | | Taxable
Income as a
Percentage
of the Total
Distribution | | Return of
Capital Per
Share (a) | | Return of
Capital as a
Percentage
of the Total
Distribution | | Total
Tax-Exempt
+ Ordinary
Income
+ Return
of Capital
Distribution
Per Share |
| CEF Muni | | XMPT | | $ | 0.8237 | | | | 89.44% | | | $ | 0.0085 | | | | 0.92% | | | $ | 0.0888 | | | | 9.64% | | | $ | 0.9210 | |
| High Yield | | HYD | | | 2.1244 | | | | 98.50 | | | | 0.0324 | | | | 1.50 | | | | - | | | | - | | | | 2.1568 | |
| HIP Sustainable | | SMI | | | 0.9900 | | | | 95.90 | | | | 0.0424 | | | | 4.10 | | | | - | | | | - | | | | 1.0324 | |
| Intermediate | | ITM | | | 1.1474 | | | | 98.99 | | | | 0.0118 | | | | 1.01 | | | | - | | | | - | | | | 1.1592 | |
| Long | | MLN | | | 0.5982 | | | | 98.59 | | | | 0.0085 | | | | 1.41 | | | | - | | | | - | | | | 0.6067 | |
| Short High Yield | | SHYD | | | 0.6738 | | | | 99.01 | | | | 0.0067 | | | | 0.99 | | | | - | | | | - | | | | 0.6805 | |
| Short | | SMB | | | 0.3388 | | | | 97.70 | | | | 0.0080 | | | | 2.30 | | | | - | | | | - | | | | 0.3468 | |
(a) A return of capital is not considered tax-exempt income to shareholders. Shareholders who received these distributions should treat them as a reduction of the cost basis of the applicable shares upon which these distributions were paid. In order to compute the required adjustment to cost basis, a shareholder should us the more detailed information provided on Form 8937-Organizational Actions Affecting Basis provided on the funds’ website at www.vaneck.com.
VANECK ETF TRUST
BOARD OF TRUSTEES AND OFFICERS
April 30, 2024 (unaudited)
Name, Address1
and Year of Birth | | Position(s)
Held with
the Trust | | Term of
Office2 and
Length of
Time Served | | Principal Occupation(s)
During Past Five Years | | Number of
Portfolios
in Fund
Complex3
Overseen | | Other Directorships Held
By Trustee During Past Five Years |
| Independent Trustees | | | | | | | | |
| | | | | | | | | |
David H. Chow,
1957*† | | Trustee | | Since 2006 | | Founder and CEO, DanCourt Management LLC (financial/ strategy consulting firm and Registered Investment Adviser), March 1999 to present. | | 69 | | Trustee, Berea College of Kentucky, May 2009 to present and currently Chairman of the Investment Committee; Trustee, MainStay Fund Complex4, January 2016 to present and currently Chairman of the Investment Committee. Formerly, Member of the Governing Council of the Independent Directors Council, October 2012 to September 2020. |
| | | | | | | | | | | |
Laurie A. Hesslein,
1959*† | | Trustee | | Since 2019 | | Citigroup, Managing Director and Business Head, Local Consumer Lending North America, and CEO and President, CitiFinancial Servicing LLC (2013 - 2017). | | 69 | | Formerly, Trustee, First Eagle Senior Loan Fund, March 2017 to December 2021; and Trustee, Eagle Growth and Income Opportunities Fund, March 2017 to December 2020. |
| | | | | | | | | | | |
R. Alastair Short,
1953*† | | Trustee | | Since 2006 | | President, Apex Capital Corporation (personal investment vehicle). | | 79 | | Chairman and Independent Director, EULAV Asset Management; Lead Independent Director, Total Fund Solution; Independent Director, Contingency Capital, LLC; Trustee, Kenyon Review; Trustee, Children’s Village. Formerly, Independent Director, Tremont offshore funds. |
| | | | | | | | | | | |
Peter J. Sidebottom,
1962*† | | Chairperson Trustee | | Since 2022 Since 2012 | | Global Lead Partner, Financial Services Strategy, Accenture, January 2021 to present; Lead Partner, North America Banking and Capital Markets Strategy, Accenture, May 2017 to December 2021. | | 69 | | Formerly, Board Member, Special Olympics, New Jersey, November 2011 to September 2013; Director, The Charlotte Research Institute, December 2000 to 2009; Board Member, Social Capital Institute, University of North Carolina Charlotte, November 2004 to January 2012; Board Member, NJ-CAN, July 2014 to 2016. |
| | | | | | | | | | | |
Richard D. Stamberger,
1959*† | | Trustee | | Since 2006 | | Senior Vice President, B2B, Future Plc (a global media company), July 2020 to August 2022; President, CEO and co-founder, SmartBrief, Inc., 1999 to 2020. | | 79 | | Director, Food and Friends, Inc., 2013 to present; Board Member, The Arc Foundation of the US, 2022 to present; Chairman, Lifetime Care Services, LLC, 2023 to present. |
| | | | | | | | | | | |
| Interested Trustee | | | | | | | | |
| | | | | | | | | |
Jan F. van Eck,
19635 | | Trustee, Chief Executive Officer and President | | Trustee (Since 2006); Chief Executive Officer and President (Since 2009) | | Director, President and Chief Executive Officer of Van Eck Associates Corporation (VEAC), Van Eck Absolute Return Advisers Corporation (VEARA) and Van Eck Securities Corporation (VESC); Officer and/or Director of other companies affiliated with VEAC and/or the Trust | | 79 | | Director, National Committee on US-China Relations. |
| 1 | The address for each Trustee and officer is 666 Third Avenue, 9th Floor, New York, New York 10017. |
| 2 | Each Trustee serves until resignation, death, retirement or removal. Officers are elected yearly by the Trustees. |
| 3 | The Fund Complex consists of the VanEck Funds, VanEck VIP Trust and the Trust. |
| 4 | The MainStay Fund Complex consists of MainStay Funds, MainStay Funds Trust, MainStay VP Funds Trust and MainStay MacKay Defined Term Municipal Opportunities Fund. |
| 5 | “Interested person” of the Trust within the meaning of the Investment Company Act of 1940, as amended. Mr. van Eck is an officer of VEAC, VEARA and VESC. |
| * | Member of the Audit Committee. |
| † | Member of the Nominating and Corporate Governance Committee. |
Officer’s Name,
Address1 and
Year of Birth | | Position(s)
Held with
the Trust | | Term of Office2
And Length of
Time Served | | Principal Occupation(s) During Past Five Years |
| Officer Information | | | | | | |
| | | | | | | |
Lawrence G. Altadonna,
1966 | | Vice President and Treasurer | | Since 2024 | | Vice President of VEAC and VEARA; Officer of other investment companies advised by VEAC and VEARA. Formerly, Fund Assistant Treasurer and Vice President of Credit Suisse Asset Management, LLC (June 2022- January 2024). |
| | | | | | | |
Matthew A. Babinsky,
1983 | | Vice President and Assistant Secretary | | Vice President (Since 2023); Assistant Secretary (Since 2016) | | Vice President, Associate General Counsel and Assistant Secretary of VEAC, VEARA and VESC; Officer of other investment companies advised by VEAC and VEARA. Formerly, Assistant Vice President of VEAC, VEARA and VESC. |
| | | | | | | |
Russell G. Brennan,
1964 | | Assistant Vice President and Assistant Treasurer | | Since 2008 | | Assistant Vice President of VEAC; Officer of other investment companies advised by VEAC and VEARA. |
| | | | | | | |
Charles T. Cameron,
1960 | | Vice President | | Since 2006 | | Portfolio Manager of VEAC; Officer and/or Portfolio Manager of other investment companies advised by VEAC and VEARA. Formerly, Director of Trading of VEAC. |
| | | | | | | |
John J. Crimmins,
1957 | | Vice President, Chief Financial Officer and Principal Accounting Officer | | Vice President, Chief Financial Officer and Principal Accounting Officer (Since 2012) | | Vice President of VEAC and VEARA; Officer of other investment companies advised by VEAC and VEARA. Formerly, Vice President of VESC. Formerly, Treasurer of other investment companies advised by VEAC and VEARA. |
| | | | | | | |
Susan Curry,
1966 | | Assistant Vice President | | Since 2022 | | Assistant Vice President of VEAC, VEARA and VESC. Formerly, Managing Director, Legg Mason, Inc. |
| | | | | | | |
Eduardo Escario,
1975 | | Vice President | | Since 2012 | | Regional Director, Business Development/Sales for Southern Europe and South America of VEAC. |
| | | | | | | |
F. Michael Gozzillo,
1965 | | Chief Compliance Officer | | Since 2018 | | Vice President and Chief Compliance Officer of VEAC and VEARA; Chief Compliance Officer of VESC; Officer of other investment companies advised by VEAC and VEARA. Formerly, Chief Compliance Officer of City National Rochdale, LLC and City National Rochdale Funds. |
| | | | | | | |
Laura Hamilton,
1977 | | Vice President | | Since 2019 | | Assistant Vice President of VEAC and VESC; Officer of other investment companies advised by VEAC and VEARA. Formerly, Operations Manager of Royce & Associates. |
| | | | | | | |
Nicholas Jackson,
1974 | | Assistant Vice President | | Since 2018 | | Director, Business Development of VanEck Australia Pty Ltd. Formerly, Vice President, Business Development of VanEck Australia Pty Ltd. |
| | | | | | | |
Laura I. Martínez,
1980 | | Vice President and Assistant Secretary | | Vice President (Since 2016); Assistant Secretary (Since 2008) | | Vice President, Associate General Counsel and Assistant Secretary of VEAC, VEARA and VESC; Officer of other investment companies advised by VEAC and VEARA. |
| | | | | | | |
Matthew McKinnon,
1970 | | Assistant Vice President | | Since 2018 | | Head of Asia - Business Development of VanEck Australia Pty Ltd. Formerly, Director, Intermediaries and Institutions of VanEck Australia Pty Ltd. |
| | | | | | | |
Lisa A. Moss,
1965 | | Assistant Vice President and Assistant Secretary | | Since 2022 | | Assistant Vice President of VEAC, VEARA and VESC; Formerly, Senior Counsel, Perkins Coie LLP. |
| | | | | | | |
Arian Neiron,
1979 | | Vice President | | Since 2018 | | CEO (since 2021) & Managing Director and Head of Asia Pacific of VanEck Australia Pty Ltd.; Officer and/or Director of other companies affiliated with VEAC and/or the Trust. |
VANECK ETF TRUST
BOARD OF TRUSTEES AND OFFICERS
(unaudited) (continued)
James Parker,
1969 | | Assistant Treasurer | | Since 2014 | | Assistant Vice President of VEAC and VEARA; Manager, Portfolio Administration of VEAC and VEARA. Officer of other investment companies advised by VEAC and VEARA. |
| | | | | | | |
Adam Phillips,
1970 | | Vice President | | Since 2018 | | ETF Chief Operating Officer of VEAC; Director of other companies affiliated with VEAC. |
| | | | | | | |
Philipp Schlegel,
1974 | | Vice President | | Since 2016 | | Managing Director of Van Eck Switzerland AG. |
| | | | | | | |
Jonathan R. Simon,
1974 | | Senior Vice President, Secretary and Chief Legal Officer | | Senior Vice President (Since 2016); Secretary and Chief Legal Officer (since 2014) | | Senior Vice President, General Counsel and Secretary of VEAC, VEARA and VESC; Officer and/or Director of other companies affiliated with VEAC and/or the Trust. Formerly, Vice President of VEAC, VEARA and VESC. |
| | | | | | | |
Andrew Tilzer,
1972 | | Assistant Vice President | | Since 2021 | | Vice President of VEAC and VEARA; Vice President of Portfolio Administration of VEAC. Formerly, Assistant Vice President, Portfolio Operations of VEAC. |
| 1 | The address for each Trustee and officer is 666 Third Avenue, 9th Floor, New York, New York 10017. |
| 2 | Officers are elected yearly by the Trustees. |
VANECK ETF TRUST
FUNDS’ LIQUIDITY RISK MANAGEMENT PROGRAM
(unaudited)
In accordance with Rule 22e-4 (the “Liquidity Rule”) under the 1940 Act, the Funds have implemented a Liquidity Risk Management Program (the “Program”). The Program outlines certain techniques, tools and arrangements employed for the assessment and management of Fund liquidity risk, and the terms, contents and frequency of reporting of certain issues to the Board. Liquidity is managed taking account of the Funds’ investment strategy, liquidity profile, and, importantly, the fact that for many Funds, redemptions are settled primarily as in-kind redemptions. In this regard, certain of the Funds qualify as “In-Kind ETFs” under the Liquidity Rule because they meet redemptions through in-kind transfers of securities, positions and assets other than a de minimis amount of cash and publish their portfolio holdings daily. In-Kind ETFs are exempt from the Liquidity Rule’s classification and highly liquid investment minimum (“HLIM”) provisions, discussed below.
Under the Program and in accordance with the Liquidity Rule, each Fund’s liquidity risk is assessed at least annually taking into consideration certain factors enumerated in the Liquidity Rule, as applicable. The Liquidity Rule calls for considering certain such factors under both normal and reasonably foreseeable stressed market conditions.
With respect to each Fund that does not qualify under the Liquidity Rule as an “In-Kind ETF,” the Liquidity Rule and the Program require that each portfolio holding be classified into one of four liquidity classification categories. The Liquidity Rule requires that such classification determinations be made taking into account relevant market, trading and investment-specific considerations as well as market depth. The relevant Funds utilize data from a third-party vendor to assist with these determinations.
Funds that do not qualify as “In-Kind ETFs” are also required to determine and periodically review an HLIM – a minimum percentage of Fund net assets that are to be invested in Highly Liquid Investments that are assets – and adopt certain related procedures. A Highly Liquid Investment is defined as cash and any investment reasonably expected to be convertible to cash in current market conditions in three business days or less without the conversion to cash significantly changing the market value of the investment.
The Liquidity Rule provides an exemption from the HLIM requirements for Funds that “primarily” hold Highly Liquid Investments, as defined in the Program. For the period January 1, 2023 to December 31, 2023 (the “Review Period”), the Funds that were not In-Kind ETFs qualified for an exemption and therefore have not determined an HLIM or adopted the related procedures.
The Board reviewed a report (“Report”) prepared by each Fund’s Adviser regarding the operation and effectiveness of the Program for the Review Period. The Report noted that, during the Review Period, the Funds maintained a high level of liquidity and primarily held assets that are defined under the Liquidity Rule as “Highly Liquid Investments.” The Report also noted the effectiveness of the Funds’ liquidity risk management during such time. Further information on liquidity risks applicable to the Fund can be found in the Fund’s prospectus.
This report is intended for the Funds’ shareholders. It may not be distributed to prospective investors unless it is preceded or accompanied by a VanEck ETF Trust (the “Trust”) prospectus and summary prospectus, which includes more complete information. Investing involves substantial risk and high volatility, including possible loss of principal. An investor should consider the investment objective, risks, charges and expenses of the Fund carefully before investing. To obtain a prospectus and summary prospectus, which contains this and other information, call 800.826.2333 or visit vaneck.com. Please read the prospectus and summary prospectus carefully before investing.
Additional information about the Trust’s Board of Trustees/Officers and a description of the policies and procedures the Trust uses to determine how to vote proxies relating to portfolio securities are provided in the Statement of Additional Information. The Statement of Additional Information and information regarding how the Trust voted proxies relating to portfolio securities during the most recent twelve month period ending June 30 is available, without charge, by calling 800.826.2333, or by visiting vaneck.com, or on the Securities and Exchange Commission’s website at http://www.sec.gov.
The Trust files its complete schedule of portfolio holdings with the Securities and Exchange Commission for the first and third quarters of each fiscal year on Form N-PORT. The Trust’s Form N-PORT filings are available on the Commission’s website at http://www.sec.gov and may be reviewed and copied at the Commission’s
Public Reference Room in Washington, D.C. Information on the operation of the Public Reference Room may be obtained by calling 202.942.8090. The Funds’ complete schedules of portfolio holdings are also available by calling 800.826.2333 or by visiting vaneck.com.

| Investment Adviser: | VanEck Associates Corporation | |
| Distributor: | VanEck Securities Corporation | |
| | 666 Third Avenue, New York, NY 10017 | |
| | vaneck.com | |
| Account Assistance: | 800.826.2333 | MUNIAR |
 | ANNUAL REPORT
April 30, 2024 |
| BDC Income ETF | BIZD |
| China Bond ETF | CBON |
| Dynamic High Income ETF | INC |
| Emerging Markets High Yield Bond ETF | HYEM |
| Fallen Angel High Yield Bond ETF | ANGL |
| Green Bond ETF | GRNB |
| IG Floating Rate ETF | FLTR |
| International High Yield Bond ETF | IHY |
| J.P. Morgan EM Local Currency Bond ETF | EMLC |
| Moody’s Analytics® BBB Corporate Bond ETF | MBBB |
| Moody’s Analytics® IG Corporate Bond ETF | MIG |
| Mortgage REIT Income ETF | MORT |
| Preferred Securities ex Financials ETF | PFXF |
Certain information contained in this report represents the opinion of the investment adviser which may change at any time. This information is not intended to be a forecast of future events, a guarantee of future results or investment advice. Current market conditions may not continue. Also, unless otherwise specifically noted, any discussion of the Funds’ holdings, the Funds’ performance, and the views of the investment adviser are as of April 30, 2024.
VANECK ETF TRUST
PRESIDENT’S LETTER
April 30, 2024 (unaudited)
Dear Fellow Shareholders:
The 2025 Problem—The Fiscal Deficit Bell is Ringing
They say that no one rings the bell at market tops and bottoms, but some important bells are ringing. Most importantly, gold prices are hitting all-time highs despite outflows from U.S. gold bullion ETFs. Gold prices aren’t rallying in a small way. They are reaching, bitcoin-like, for the sky. The biggest change in our view from year-end 2023 is (a) that the markets are beginning to see fiscal spending as out of control and (b) global economic growth has turned positive, a good sign for commodity investors.
At the end of 2023, we suggested that the three major macro factors—monetary policy, government spending and global economic growth—would not change much in 2024. While a big market impact (with surging 10-year interest rates) from out of control fiscal spending may only rest at 10% probability, we repeat that investors should prepare for this with a gold/bitcoin/real assets allocation. These assets are already in a bull market, which means that healthy corrections can be expected (20%?).
Discussion of Major Macro Factors
Let’s review the three main factors that impact markets.
| 1. | Monetary Policy: Not Very Stimulative to Maybe Looser |
I feel like a broken record, but our favorite inflation measure is wage inflation, not food or gas prices. That is the kind of inflation which is endemic and hard to manage once it takes hold. And with wage inflation around 4.5%, not near the U.S. Federal Reserve’s (“Fed’s”) 2% target, we didn’t expect a big Fed loosening coming into 2024. And that was “correct”—the Fed has not cut interest rates yet this year.
Yet, the two most important central banks in the world have softened their language. First, the Fed said that it would reduce its selling schedule of bonds in Jerome Powell’s comments after the March meeting. And Powell said that the 2% inflation was always a “long-term” target, which suggests that the 2% target is less important in 2024. Therefore, the Fed might be looser (even though wage inflation continues). And while it’s probably false, there have been rumors in China of central bank bond-buying which they haven’t done in over a decade and never under Xi Jinping. So, maybe marginally looser monetary policy, but with high wage inflation, no major changes are expected.
| 2. | Government Spending: “Also Muted” to Out of Control |
We entered 2024 expecting that the Republicans, in control of the House of Representatives, would seek to slow government spending. While we probably didn’t sufficiently appreciate the amount of some of the Biden Administration’s spending, as with the environmental Inflation Reduction Act (“IRA”), we didn’t expect any upside surprises in government spending in 2024. But by focusing on the change in spending, we probably underappreciated how large the fiscal deficits continue to be. These deficits are keeping the economy hot—at full employment—and are also pressuring inflation higher.
Now let’s look at 2025, which I think the markets are beginning to do. 2025 is a very important policy year for fiscal discipline. The reason is that Social Security will go bankrupt in 2033. If major fiscal problems are only addressed the year after a Presidential election, then it has to be addressed in 2025, because 2029 is WAY too late to fix any entitlement problem. But in the first quarter, we just learned that the major parties have nominated the two most profligate “peacetime” spenders in U.S. history.
We have 7% budget deficits in the middle of an economic boom! We may look back on this the same way we now look back at 1% interest rates on 10 year debt—an amazing situation that shouldn’t be and can’t last. But timing markets is almost impossible.
Are there signals, besides gold, that the market is concerned about 2025? Are other bells ringing? Actually, yes. U.S. credit default swaps are at elevated levels after rising in 2023 during the budget standoff. And emerging market debt has actually been outperforming U.S. debt for the last three years. See my investment outlook1 on www.vaneck.com for the charts.
VANECK ETF TRUST
PRESIDENT’S LETTER
(unaudited) (continued)
My last piece of evidence for the “out of control” scenario is an article from alternative media site, the Free Press. In an article mainly on social commentary, we suddenly see a chart on government spending.
Federal government current expenditures: Interest payments, Billions of Dollars, Quarterly, Seasonally Adjusted Annual Rate

Source: U.S. Bureau of Economic Analysis as of January 25, 2024. Shaded areas indicate U.S. recessions.
| 3. | Global Growth – from Low Levels to Expansion |
In the first quarter of 2024, the world economy moved into expansion mode, with good upwards momentum. As well, economic data from China in March was quite strong. For growth, my favorite statistics is PMI, partially because it shows a “yes or no” answer. If PMI is over 50, we are in expansion mode. And both global growth and China manufacturing moved into expansion mode in Q1. This is the reason commodity returns have been strong so far this year. And this data supports an allocation to commodities.
We thank you for investing in VanEck’s investment strategies. On the following pages, you will find financial statements for each of the funds for the twelve month period ended April 30, 2024. As always, we value your continued confidence in us and look forward to helping you meet your investment goals in the future.

Jan F. van Eck
CEO and President
VanEck ETF Trust
May 20, 2024
PS The investing outlook can change suddenly. To get our quarterly investment outlooks, please subscribe to “VanEck News & Insights”.2 Should you have any questions regarding fund performance, please contact us at 800.826.2333 or visit our website.
1 https://www.vaneck.com/us/en/insights/investment-outlook/
2 https://www.vaneck.com/us/en/subscribe/
VANECK ETF TRUST
MANAGEMENT DISCUSSION
April 30, 2024 (unaudited)
BDC Income ETF
• The Fund benefited from rising interest rates which drove higher business development companies’ (“BDCs”) net interest income given the floating rate nature of their loan portfolios.
• Resilient credit fundamentals also supported BDC performance, as average non-accrual levels and realized loss rates remained relatively low.
• Ares Capital Corporation was the leading contributor to Fund performance during the 12 month period ended April 30, 2024 (the “Period”), while Prospect Capital Corp was the leading detractor and one of only three BDCs held to post negative returns.
China Bond ETF
• Onshore Chinese bonds were supported by declining bond yields, reflecting a sluggish domestic recovery and market expectations for additional stimulus, which was offset by currency depreciation against the U.S. dollar.
• Sovereign bonds and policy banks contributed positively to performance, while credit related issuers detracted from performance.
• Within credit, the Utility and Insurance sectors were the largest contributors to performance over the year, while Real Estate, Energy and Financial Services detracted.
Dynamic High Income ETF
• Higher yields made fixed income and some income generating equities more appealing and generally provided a favorable environment for active managers to make opportunistic allocations.
• The largest contributors to return were attributable to strong returns from master limited partnerships and publicly traded business development companies. Fallen angel high yield bonds, the largest exposure in the Fund, also contributed positively.
• Notable detractors from Fund performance were attributable to the Fund’s allocation to long-term U.S. treasuries and to declines in real estate investment trusts (“REITs”) performance, despite the Fund’s modest allocation to the sector.
Emerging Markets High Yield Bond ETF
• The Fund benefited from a significant compression in emerging markets high yield bond spreads over the period and high carry, which drove positive returns and offset higher interest rates over the period.
• Industrial sector bonds, particularly from Energy issuers, made the biggest contribution to Fund performance for the period followed by Financials and Utilities, while the Real Estate sector was the biggest detractor.
• Argentina, Turkey and Mexico contributed the most to performance for the period, while exposure to China was the only detractor.
Fallen Angel High Yield Bond ETF
• High yield total returns rebounded (as compared to the prior fiscal two years), as higher carry and credit spread tightening contributed positively to performance, despite higher interest rates during the period.
• The Retail sector was the largest contributor to performance, followed by Energy and Telecom. No sectors detracted from performance.
• BB rated bonds contributed most to Fund performance, however lower quality bonds had the highest total returns in the period.
Green Bond ETF
• Although bond yields rose overall during the period, U.S. dollar denominated green bond returns were supported by high carry and, for corporate bonds, credit spread compression.
• Bonds in the Financials, Utilities and Consumer, Cyclicals sectors contributed most to performance while the Government Activity, Mortgage Securities and Consumer, Non-Cyclicals sectors detracted.
• From a country of risk perspective, India, China and the Republic of Korea contributed most to performance while Saudi Arabia, Chile and Supranational issuers detracted.
IG Floating Rate ETF
• The Fund benefited from higher interest rates which drove higher coupons, as the U.S. Federal Reserve increased its policy rate over the year from 5.0% to 5.5% and maintained its hawkish stance.
• The largest contribution to Fund performance came from the Financial sector, which has the largest weight within the Fund, followed by Technology and Industrials. No sectors had negative performance during the period.
• In terms of country of risk, the largest contribution to performance came from U.S. issuers, followed by UK and Australia issuers.
International High Yield Bond ETF
• Despite interest rate volatility and strength of the U.S. dollar over the period, the Fund benefited from a sharp decline in high yield spreads and high overall carry.
• Issuers in the Energy and Banking sector contributed the most to Fund performance while Real Estate and Capital Goods were the only sectors that detracted.
• In terms of country of risk, UK and Canadian issuers had the highest contribution to performance, while Chinese and Irish issuers detracted the most.
J.P. Morgan EM Local Currency Bond ETF
• Despite several headwinds over the period such as a stronger dollar, continued high interest rates in the U.S. and ongoing geopolitical risks, emerging markets local currency sovereign bonds benefited from favorable Fundamentals and high carry, and outperformed developed markets sovereign bonds over the period.
• During the period, bonds denominated in Colombian Peso, the Brazilian Real and Polish Zloty were the top contributors to Fund performance, whereas bonds denominated in Turkish Lira, Indonesian Rupee and Thai Bhat detracted the most.
• Local interest rates contributed positively to performance, but this was partially offset by currency depreciation.
Moody’s Analytics BBB Corporate Bond ETF
• Although intermediate-term bond yields rose overall during the period, returns of BBB rated corporate bonds were supported by high carry and credit spread compression.
• The Banking sector was the biggest contributor to Fund performance, followed by Utility and Telecom, while the Retail, Basic Industry and Insurance sectors were the only sectors that detracted.
• All maturity bands contributed positively to performance, with 1-3 year maturity bonds contributing the most.
VANECK ETF TRUST
MANAGEMENT DISCUSSION (unaudited) (continued)
Moody’s Analytics IG Corporate Bond ETF
• Although intermediate-term bond yields rose overall during the period, returns of investment grade rated corporate bonds were supported by high carry and credit spread compression.
• The Banking sector was the largest contributor to performance, followed by Financial Services and Consumer Goods, while the Energy and Retail sectors were the only sectors that detracted.
• Bonds with 3-5 year maturities contributed the most, while bonds with a maturity greater than 15 years were the only ones to detract.
Mortgage REIT Income ETF
• Rising interest rates, low mortgage originations and concerns around commercial real estate weighed on mortgage real estate investment trusts (mREITs) during the period.
• Despite headwinds, the Fund registered a positive total return with residential mREITs as the primary contributor to performance while commercial and hybrid mREITs also contributed, but to a lesser extent.
• Rithm Capital was the leading contributor to Fund performance during the period, while New York Mortgage Trust was the leading detractor.
Preferred Securities ex Financials ETF
• During the period, the Fund faced pressure from rising interest rates and general economic uncertainty; however, price declines were more than offset by income earned from coupons and dividends resulting in positive total return.
• Real estate contributed, by far, the most to the Fund’s performance over the period and, to a lesser degree, retail and energy sectors also contributed positively.
• The Fund’s exposure to materials, media and health care were the primary detractors from performance.
VANECK BDC INCOME ETF
PERFORMANCE COMPARISON
April 30, 2024 (unaudited)
| Average Annual Total Return |
| | | Share Price | | NAV | | MVBDCTRG1 | | SPTR2 |
| One Year | | | 27.94 | % | | | 28.03 | % | | | 27.95 | % | | | 22.66 | % |
| Five Year | | | 11.11 | % | | | 11.12 | % | | | 11.04 | % | | | 13.19 | % |
| Ten Year | | | 8.17 | % | | | 8.18 | % | | | 8.17 | % | | | 12.41 | % |
| 1 | MVIS® US Business Development Companies Index (MVBDCTRG) is a rules based, modified capitalization weighted, float adjusted index intended to give investors a means of tracking the overall performance of business development companies (BDCs). To be eligible for the MVBDCTRG Index and qualify as a BDC, a company must be organized under the laws of, and have its principal place of business in, the United States, be registered with the SEC and have elected to be regulated as a BDC under the 1940 Act. |
| | |
| | Index data prior to June 19, 2023 reflects that of the MVIS® US Business Development Companies Index (MVBIZDTG). From June 19, 2023 forward, the index data reflects that of MVBDCTRG. All index history reflects a blend of the performance of the aforementioned Indexes. |
| | |
| 2 | The S&P 500 Index (SPTR) is a market-value weighted index consisting of 500 stocks chosen for market size, liquidity, and industry group representation, with each stock’s weight in the index proportionate to its market value. |
Hypothetical Growth of $10,000
| This chart shows the value of a hypothetical $10,000 investment in the Fund at NAV over the past 10 years. The result is compared with the Fund’s benchmark and a broad-based index. | | 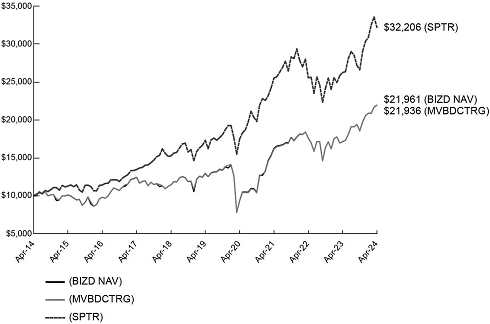 |
Past performance is no guarantee of future results. Performance results do not reflect the deduction of taxes that a shareholder would pay on fund distributions or on the redemption or sale of fund shares.
See “About Fund Performance” on page 20 for more information.
VANECK CHINA BOND ETF
PERFORMANCE COMPARISON
April 30, 2024 (unaudited)
| Average Annual Total Return |
| | | Share Price | | NAV | | CHQU01TR1 | | US002 |
| One Year | | | 0.75 | % | | | (1.16 | )% | | | 0.64 | % | | | (1.40 | )% |
| Five Year | | | 2.21 | % | | | 2.19 | % | | | 3.01 | % | | | (0.14 | )% |
| Life* | | | 1.67 | % | | | 1.67 | % | | | 2.59 | % | | | 1.06 | % |
| * | Inception of Fund: 11/10/14; First Day of Secondary Market Trading: 11/11/14. |
| | |
| 1 | ChinaBond China High Quality Bond Index (CHQU01TR) is comprised of fixed-rate, RMB-denominated bonds issued in the PRC by Chinese credit, governmental and quasi-governmental (e.g., policy banks) issuers. Chinese credit issuers are generally considered to be issuers of central enterprise bonds, local enterprise bonds, medium-term notes, corporate bonds and railway debt. Credit RMB Bonds must have an issuer rating of AAA or equivalent by one or more of the Chinese local rating agencies recognized by the relevant authorities in the PRC to be included in the Index. |
| | |
| | As of October 31, 2018, index data for the CHQU01TR for all periods presented reflect the stream of the Index which is denominated in USD and converted by the index provider using the “offshore” Renminbi (CNH) exchange rate. |
| | |
| 2 | The ICE BofA US Broad Market Index (US00) is a broad-based benchmark that measures the performance of U.S. dollar-denominated, investment grade debt securities, including U.S. Treasury notes and bonds, quasi-government securities, corporate securities, residential and commercial mortgage-backed securities and asset-backed securities. |
Hypothetical Growth of $10,000 (Since Inception)
| This chart shows the value of a hypothetical $10,000 investment in the Fund at NAV since inception. The result is compared with the Fund’s benchmark and a broad-based index. | |  |
Past performance is no guarantee of future results. Performance results do not reflect the deduction of taxes that a shareholder would pay on fund distributions or on the redemption or sale of fund shares.
See “About Fund Performance” on page 20 for more information.
VANECK DYNAMIC HIGH INCOME ETF
PERFORMANCE COMPARISON
April 30, 2024 (unaudited)
| Average Annual Total Return |
| | | Share Price | | NAV | | HG001 |
| One Year | | | 6.39 | % | | | 6.33 | % | | | 10.64 | % |
| Life* | | | 8.72 | % | | | 8.67 | % | | | 13.77 | % |
| * | Inception of Fund: 11/1/22; First Day of Secondary Market Trading: 11/2/22. |
| | |
| 1 | The ICE BofA Global High Yield Corporate & Sovereign Index (HG00) tracks the performance of the below investment grade global debt markets denominated in the major developed market currencies. |
Hypothetical Growth of $10,000 (Since Inception)
| This chart shows the value of a hypothetical $10,000 investment in the Fund at NAV since inception. The result is compared with the Fund’s benchmark and a broad-based index. | |  |
Past performance is no guarantee of future results. Performance results do not reflect the deduction of taxes that a shareholder would pay on fund distributions or on the redemption or sale of fund shares.
See “About Fund Performance” on page 20 for more information.
VANECK EMERGING MARKETS HIGH YIELD BOND ETF
PERFORMANCE COMPARISON
April 30, 2024 (unaudited)
| Average Annual Total Return |
| | | Share Price | | NAV | | EMLH1 | | US002 |
| One Year | | | 9.49 | % | | | 10.50 | % | | | 10.70 | % | | | (1.40 | )% |
| Five Year | | | 1.59 | % | | | 1.75 | % | | | 1.71 | % | | | (0.14 | )% |
| Ten Year | | | 2.99 | % | | | 3.08 | % | | | 3.40 | % | | | 1.24 | % |
| 1 | ICE BofA Diversified High Yield US Emerging Markets Corporate Plus Index (EMLH) is comprised of U.S. dollar denominated bonds issued by non-sovereign emerging market issuers that have a below investment grade rating (in accordance with the Index Provider’s methodology) and that are issued in the major domestic and Eurobond markets. |
| | |
| | Index data prior to May 11, 2015 reflects that of the BofA Merrill Lynch High Yield US Emerging Markets Liquid Corporate Plus Index. From May 11, 2015, forward, the index data reflects that of the EMLH. All Index history reflects a blend of the performance of the aforementioned Indexes. |
| | |
| 2 | The ICE BofA US Broad Market Index (US00) is a broad-based benchmark that measures the performance of U.S. dollar-denominated, investment grade debt securities, including U.S. Treasury notes and bonds, quasi-government securities, corporate securities, residential and commercial mortgage-backed securities and asset-backed securities. |
Hypothetical Growth of $10,000
| This chart shows the value of a hypothetical $10,000 investment in the Fund at NAV over the past 10 years. The result is compared with the Fund’s benchmark and a broad-based index. | | 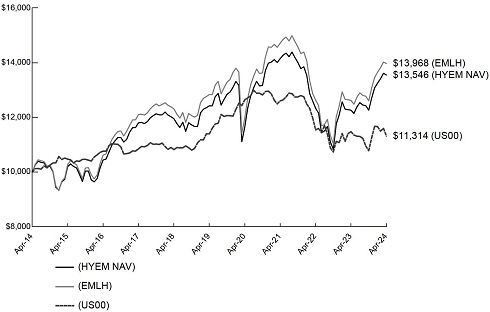 |
Past performance is no guarantee of future results. Performance results do not reflect the deduction of taxes that a shareholder would pay on fund distributions or on the redemption or sale of fund shares.
See “About Fund Performance” on page 20 for more information.
VANECK FALLEN ANGEL HIGH YIELD BOND ETF
PERFORMANCE COMPARISON
April 30, 2024 (unaudited)
| Average Annual Total Return |
| | | Share Price | | NAV | | H0CF1 | | US002 |
| One Year | | | 7.88 | % | | | 8.28 | % | | | 8.45 | % | | | (1.40 | )% |
| Five Year | | | 4.43 | % | | | 4.57 | % | | | 5.05 | % | | | (0.14 | )% |
| Ten Year | | | 5.67 | % | | | 5.66 | % | | | 6.22 | % | | | 1.24 | % |
| 1 | ICE US Fallen Angel High Yield 10% Constrained Index (H0CF) is comprised of below investment grade corporate bonds denominated in U.S. dollars that were rated investment grade at the time of issuance. Qualifying securities must be issued in the U.S. domestic market and have a below investment grade rating in accordance with the ICE Data’s methodology. The Index includes bonds issued by both U.S. and non-U.S. issuers. |
| | |
| | Index data prior to February 28, 2020 reflects that of ICE BofAML US Fallen Angel High Yield Index. From February 28, 2020, forward, the index data reflects that of H0CF. All Index history reflects a blend of the performance of the aforementioned Indexes. |
| | |
| 2 | The ICE BofA US Broad Market Index (US00) is a broad-based benchmark that measures the performance of U.S. dollar-denominated, investment grade debt securities, including U.S. Treasury notes and bonds, quasi-government securities, corporate securities, residential and commercial mortgage-backed securities and asset-backed securities. |
Hypothetical Growth of $10,000
| This chart shows the value of a hypothetical $10,000 investment in the Fund at NAV over the past 10 years. The result is compared with the Fund’s benchmark and a broad-based index. | | 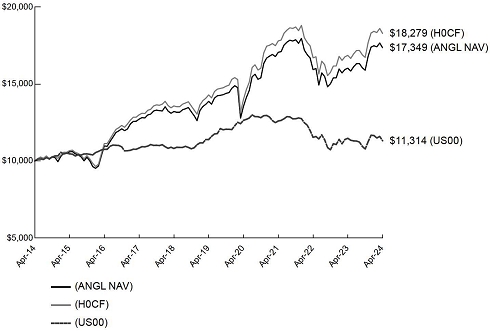 |
Past performance is no guarantee of future results. Performance results do not reflect the deduction of taxes that a shareholder would pay on fund distributions or on the redemption or sale of fund shares.
See “About Fund Performance” on page 20 for more information.
VANECK GREEN BOND ETF
PERFORMANCE COMPARISON
April 30, 2024 (unaudited)
| Average Annual Total Return |
| | | Share Price | | NAV | | SPGRUSST1 | | US002 |
| One Year | | | 2.32 | % | | | 1.89 | % | | | 2.20 | % | | | (1.40 | )% |
| Five Year | | | 0.40 | % | | | 0.31 | % | | | 0.58 | % | | | (0.14 | )% |
| Life* | | | 1.31 | % | | | 1.21 | % | | | 1.62 | % | | | 0.78 | % |
| * | Inception of Fund: 3/3/17; First Day of Secondary Market Trading: 3/4/17. |
| | |
| 1 | S&P Green Bond U.S. Dollar Select Index (SPGRUSST) is designed to provide a broad measure of the performance of the investable, U.S. dollar-denominated “green” bond market. The Index is comprised of bonds issued for qualified “green” purposes and seeks to measure the performance of U.S. dollar-denominated “green”-labeled bonds issued globally. For a bond to be eligible for inclusion in the Index, the issuer of the bond must indicate the bond’s “green” label and the rationale behind it, such as the intended use of proceeds. As an additional filter, the bond must be flagged as “green” by Climate Bonds Initiative (“CBI”) to be eligible for inclusion in the Index. |
| | |
| | Index data prior to September 1, 2019 reflects that of the S&P Green Bond Select Index. From September 1, 2019, forward, the index data reflects that of the SPGRUSST. All Index history reflects a blend of the performance of the aforementioned Indexes. |
| | |
| 2 | The ICE BofA US Broad Market Index (US00) is a broad-based benchmark that measures the performance of U.S. dollar-denominated, investment grade debt securities, including U.S. Treasury notes and bonds, quasi-government securities, corporate securities, residential and commercial mortgage-backed securities and asset-backed securities. |
Hypothetical Growth of $10,000 (Since Inception)
| This chart shows the value of a hypothetical $10,000 investment in the Fund at NAV since inception. The result is compared with the Fund’s benchmark and a broad-based index. | |  |
Past performance is no guarantee of future results. Performance results do not reflect the deduction of taxes that a shareholder would pay on fund distributions or on the redemption or sale of fund shares.
See “About Fund Performance” on page 20 for more information.
VANECK IG FLOATING RATE ETF
PERFORMANCE COMPARISON
April 30, 2024 (unaudited)
| Average Annual Total Return |
| | | Share Price | | NAV | | MVFLTR1 | | US002 |
| One Year | | | 8.11 | % | | | 8.12 | % | | | 8.13 | % | | | (1.40 | )% |
| Five Year | | | 3.08 | % | | | 3.08 | % | | | 3.15 | % | | | (0.14 | )% |
| Ten Year | | | 2.39 | % | | | 2.39 | % | | | 2.60 | % | | | 1.24 | % |
| 1 | MVIS® US Investment Grade Floating Rate Index (MVFLTR) is comprised of U.S. dollar-denominated floating rate notes with outstanding issue sizes greater than or equal to $500 million, issued by corporate entities or similar commercial entities that are public reporting companies in the United States with at least one investment grade rating. |
| | |
| 2 | The ICE BofA US Broad Market Index (US00) is a broad-based benchmark that measures the performance of U.S. dollar-denominated, investment grade debt securities, including U.S. Treasury notes and bonds, quasi-government securities, corporate securities, residential and commercial mortgage-backed securities and asset-backed securities. |
Hypothetical Growth of $10,000
| This chart shows the value of a hypothetical $10,000 investment in the Fund at NAV over the past 10 years. The result is compared with the Fund’s benchmark and a broad-based index. | |  |
Past performance is no guarantee of future results. Performance results do not reflect the deduction of taxes that a shareholder would pay on fund distributions or on the redemption or sale of fund shares.
See “About Fund Performance” on page 20 for more information.
VANECK INTERNATIONAL HIGH YIELD BOND ETF
PERFORMANCE COMPARISON
April 30, 2024 (unaudited)
| Average Annual Total Return |
| | | Share Price | | NAV | | HXUS1 | | US002 |
| One Year | | | 6.27 | % | | | 7.13 | % | | | 8.63 | % | | | (1.40 | )% |
| Five Year | | | 1.17 | % | | | 1.18 | % | | | 1.67 | % | | | (0.14 | )% |
| Ten Year | | | 1.82 | % | | | 1.87 | % | | | 2.40 | % | | | 1.24 | % |
| 1 | ICE BofA ex-US Issuers High Yield Constrained Index (HXUS) tracks the performance of below investment grade debt issued by corporations located throughout the world (which may include emerging market countries) excluding the United States, denominated in euros, U.S. dollars, Canadian dollars or pound sterling and issued in the major domestic or eurobond markets. |
| | |
| 2 | The ICE BofA US Broad Market Index (US00) is a broad-based benchmark that measures the performance of U.S. dollar-denominated, investment grade debt securities, including U.S. Treasury notes and bonds, quasi-government securities, corporate securities, residential and commercial mortgage-backed securities and asset-backed securities. |
Hypothetical Growth of $10,000
| This chart shows the value of a hypothetical $10,000 investment in the Fund at NAV over the past 10 years. The result is compared with the Fund’s benchmark and a broad-based index. | |  |
Past performance is no guarantee of future results. Performance results do not reflect the deduction of taxes that a shareholder would pay on fund distributions or on the redemption or sale of fund shares.
See “About Fund Performance” on page 20 for more information.
VANECK J.P. MORGAN EM LOCAL CURRENCY BOND ETF
PERFORMANCE COMPARISON
April 30, 2024 (unaudited)
| Average Annual Total Return |
| | | Share Price | | NAV | | GBIEMCOR1 | | US002 |
| One Year | | | 0.33 | % | | | 1.03 | % | | | 0.69 | % | | | (1.40 | )% |
| Five Year | | | (1.09 | )% | | | (0.96 | )% | | | (0.72 | )% | | | (0.14 | )% |
| Ten Year | | | (1.30 | )% | | | (1.26 | )% | | | (0.84 | )% | | | 1.24 | % |
| 1 | J.P. Morgan GBI-EM Global Core Index (GBIEMCOR) is designed to track the performance of bonds issued by emerging markets governments and denominated in the local currency of the issuer. |
| | |
| 2 | The ICE BofA US Broad Market Index (US00) is a broad-based benchmark that measures the performance of U.S. dollar-denominated, investment grade debt securities, including U.S. Treasury notes and bonds, quasi-government securities, corporate securities, residential and commercial mortgage-backed securities and asset-backed securities. |
Hypothetical Growth of $10,000
| This chart shows the value of a hypothetical $10,000 investment in the Fund at NAV over the past 10 years. The result is compared with the Fund’s benchmark and a broad-based index. | |  |
Past performance is no guarantee of future results. Performance results do not reflect the deduction of taxes that a shareholder would pay on fund distributions or on the redemption or sale of fund shares.
See “About Fund Performance” on page 20 for more information.
VANECK MOODY’S ANALYTICS BBB CORPORATE BOND ETF
PERFORMANCE COMPARISON
April 30, 2024 (unaudited)
| Average Annual Total Return |
| | | Share Price | | NAV | | MVBI1 | | US002 |
| One Year | | | 2.76 | % | | | 3.02 | % | | | 3.41 | % | | | (1.40 | )% |
| Life* | | | (2.14 | )% | | | (2.10 | )% | | | (2.06 | )% | | | (3.74 | )% |
| * | Inception of Fund: 12/1/20; First Day of Secondary Market Trading: 12/2/20. |
| | |
| 1 | MVIS® Moody’s Analytics® US BBB Corporate Bond Index (MVBI) is designed to track the performance of U.S. dollar-denominated BBB rated corporate bonds that offer an excess spread over fair value, while excluding bonds exhibiting the highest probability of being downgraded to non-investment grade, based on proprietary credit risk metrics developed by Moody’s Analytics, Inc. |
| | |
| 2 | The ICE BofA US Broad Market Index (US00) is a broad-based benchmark that measures the performance of U.S. dollar-denominated, investment grade debt securities, including U.S. Treasury notes and bonds, quasi-government securities, corporate securities, residential and commercial mortgage-backed securities and asset-backed securities. |
Hypothetical Growth of $10,000 (Since Inception)
| This chart shows the value of a hypothetical $10,000 investment in the Fund at NAV since inception. The result is compared with the Fund’s benchmark and a broad-based index. | | 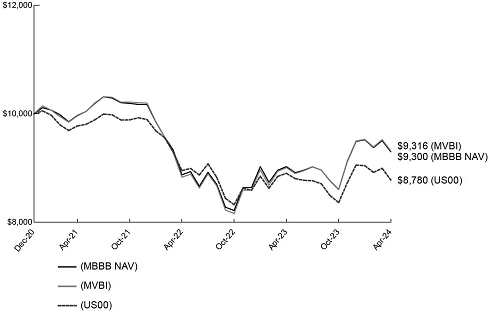 |
Past performance is no guarantee of future results. Performance results do not reflect the deduction of taxes that a shareholder would pay on fund distributions or on the redemption or sale of fund shares.
See “About Fund Performance” on page 20 for more information.
VANECK MOODY’S ANALYTICS IG CORPORATE BOND ETF
PERFORMANCE COMPARISON
April 30, 2024 (unaudited)
| Average Annual Total Return |
| | | Share Price | | NAV | | MVCI1 | | US002 |
| One Year | | | 2.20 | % | | | 2.36 | % | | | 2.77 | % | | | (1.40 | )% |
| Life* | | | (2.37 | )% | | | (2.35 | )% | | | (2.31 | )% | | | (3.74 | )% |
| * | Inception of Fund: 12/1/20; First Day of Secondary Market Trading: 12/2/20. |
| | |
| 1 | MVIS® Moody’s Analytics® US Investment Grade Corporate Bond Index (MVCI) is designed to track the performance of U.S. dollar-denominated investment grade corporate bonds that offer an excess spread over fair value, while excluding bonds exhibiting the highest probability of being downgraded to non-investment grade, based on proprietary credit risk metrics developed by Moody’s Analytics, Inc. |
| | |
| 2 | The ICE BofA US Broad Market Index (US00) is a broad-based benchmark that measures the performance of U.S. dollar-denominated, investment grade debt securities, including U.S. Treasury notes and bonds, quasi-government securities, corporate securities, residential and commercial mortgage-backed securities and asset-backed securities. |
Hypothetical Growth of $10,000 (Since Inception)
| This chart shows the value of a hypothetical $10,000 investment in the Fund at NAV since inception. The result is compared with the Fund’s benchmark and a broad-based index. | |  |
Past performance is no guarantee of future results. Performance results do not reflect the deduction of taxes that a shareholder would pay on fund distributions or on the redemption or sale of fund shares.
See “About Fund Performance” on page 20 for more information.
VANECK MORTGAGE REIT INCOME ETF
PERFORMANCE COMPARISON
April 30, 2024 (unaudited)
| Average Annual Total Return |
| | | Share Price | | NAV | | MVMORTTG1 | | SPTR2 |
| One Year | | | 8.81 | % | | | 8.59 | % | | | 8.66 | % | | | 22.66 | % |
| Five Year | | | (5.31 | )% | | | (5.28 | )% | | | (5.11 | )% | | | 13.19 | % |
| Ten Year | | | 1.16 | % | | | 1.16 | % | | | 1.46 | % | | | 12.41 | % |
| 1 | MVIS® US Mortgage REITs Index (MVMORTTG) is a rules based, modified capitalization weighted, float adjusted index intended to give investors a means of tracking the overall performance of publicly traded U.S. REITs that derive at least 50% of their revenues (or, where applicable, have at least 50% of their assets) from mortgage-related activity. |
| | |
| 2 | The S&P 500 Index (SPTR) is a market-value weighted index consisting of 500 stocks chosen for market size, liquidity, and industry group representation, with each stock’s weight in the index proportionate to its market value. |
Hypothetical Growth of $10,000
| This chart shows the value of a hypothetical $10,000 investment in the Fund at NAV over the past 10 years. The result is compared with the Fund’s benchmark and a broad-based index. | | 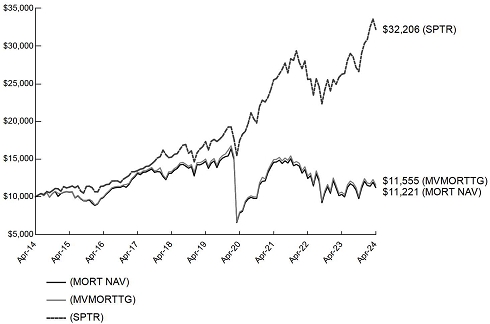 |
Past performance is no guarantee of future results. Performance results do not reflect the deduction of taxes that a shareholder would pay on fund distributions or on the redemption or sale of fund shares.
See “About Fund Performance” on page 20 for more information.
VANECK PREFERRED SECURITIES EX FINANCIALS ETF
PERFORMANCE COMPARISON
April 30, 2024 (unaudited)
| Average Annual Total Return |
| | | Share Price | | NAV | | PFAN1 | | SPTR2 |
| One Year | | | 4.85 | % | | | 5.04 | % | | | 5.45 | % | | | 22.66 | % |
| Five Year | | | 3.43 | % | | | 3.47 | % | | | 3.91 | % | | | 13.19 | % |
| Ten Year | | | 3.99 | % | | | 4.04 | % | | | 4.23 | % | | | 12.41 | % |
| 1 | ICE Exchange-Listed Fixed & Adjustable Rate Non-Financial Preferred Securities Index (PFAN) is a rules-based index designed to track the performance of exchange-listed U.S. dollar denominated hybrid debt, preferred stock and convertible preferred stock publicly issued by non-financial corporations in the U.S. domestic market. It includes both rated and unrated securities, and securities with either a fixed or floating rate coupon or dividend. |
| | |
| | Index data prior to June 1, 2021 reflects that of the Wells Fargo® Hybrid and Preferred Securities ex Financials Index. From June 1, 2021, forward, the index data reflects that of PFAN. All Index history reflects a blend of the performance of the aforementioned Indexes. |
| | |
| 2 | The S&P 500 Index (SPTR) is a market-value weighted index consisting of 500 stocks chosen for market size, liquidity, and industry group representation, with each stock’s weight in the index proportionate to its market value. |
Hypothetical Growth of $10,000
| This chart shows the value of a hypothetical $10,000 investment in the Fund at NAV over the past 10 years. The result is compared with the Fund’s benchmark and a broad-based index. | |  |
Past performance is no guarantee of future results. Performance results do not reflect the deduction of taxes that a shareholder would pay on fund distributions or on the redemption or sale of fund shares.
See “About Fund Performance” on page 20 for more information.
VANECK ETF TRUST
ABOUT FUND PERFORMANCE
(unaudited)
The price used to calculate market return (Share Price) is determined by using the closing price listed on its primary listing exchange. Since the shares of each Fund did not trade in the secondary market until after each Fund’s commencement, for the period from commencement to the first day of secondary market trading in shares of each Fund, the NAV of each Fund is used as a proxy for the secondary market trading price to calculate market returns.
The performance data quoted represents past performance. Past performance is not a guarantee of future results. Performance information for each Fund reflects temporary waivers of expenses and/or fees, if any. Had each Fund incurred all expenses, investment returns would have been reduced. These returns do not reflect the deduction of taxes that a shareholder would pay on Fund dividends and distributions or the sale of Fund shares.
Investment return and value of the shares of each Fund will fluctuate so that an investor’s shares, when sold, may be worth more or less than their original cost. Performance may be lower or higher than performance data quoted. Fund returns reflect reinvestment of dividends and capital gains distributions. Performance current to the most recent month-end is available by calling 800.826.2333 or by visiting vaneck.com.
Index returns assume the reinvestment of all income and do not reflect any management fees or brokerage expenses associated with Fund returns. Certain indices may take into account withholding taxes. Investors cannot invest directly in the Index. Returns for actual Fund investors may differ from what is shown because of differences in timing, the amount invested and fees and expenses.
MVBDCTRG, MVBIZDTG, MVFLTR, MVMORTTG, MVBI and MVCI are published by MarketVector Indexes GmbH (MarketVector), a wholly owned subsidiary of the Adviser, Van Eck Associates Corporation. CHQU01TR is published by China Central Depository & Clearing Co., Ltd. (China Central Depository). GBIEMCOR is published by JPMorgan Securities Inc. (J.P. Morgan). HG00, US00, EMLH, HOCF and HXUS are published by ICE Data Indices, LLC. SPGRUSST is published by S&P Dow Jones Indices (S&P). PFAN is published by Wells Fargo & Company, LLC (Wells Fargo).
MVIS, China Central Depository, J.P. Morgan, ICE Data Indices, LLC, S&P, Wells Fargo, and Bloomberg do not sponsor, endorse, or promote the Funds and bear no liability with respect to the Funds or any security.
VANECK ETF TRUST
EXPLANATION OF EXPENSES
(unaudited)
Hypothetical $1,000 investment at beginning of period
As a shareholder of a Fund, you incur operating expenses, including management fees and other Fund expenses. This disclosure is intended to help you understand the ongoing costs (in dollars) of investing in your Fund and to compare these costs with the ongoing costs of investing in other mutual funds.
The disclosure is based on an investment of $1,000 invested at the beginning of the period and held for the entire period, November 1, 2023 to April 30, 2024.
Actual Expenses
The first line in the table below provides information about account values and actual expenses. You may use the information in this line, together with the amount you invested, to estimate the expenses that you paid over the period. Simply divide your account value by $1,000 (for example, an $8,600 account value divided by $1,000 = 8.6), then multiply the result by the number in the first line under the heading entitled “Expenses Paid During the Period.”
Hypothetical Example for Comparison Purposes
The second line in the table below provides information about hypothetical account values and hypothetical expenses based on the Fund’s actual expense ratio and an assumed rate of return of 5% per year before expenses, which is not the Fund’s actual return. The hypothetical account values and expenses may not be used to estimate the actual ending account balance or expenses you paid for the period. You may use this information to compare the ongoing costs of investing in your Fund and other funds. To do so, compare this 5% hypothetical example with the 5% hypothetical examples that appear in the shareholder reports of other funds.
Please note that the expenses shown in the table are meant to highlight your ongoing costs only and do not reflect any transactional costs, such as brokerage commissions paid on purchases and sales. Therefore, the second line of the table is useful in comparing ongoing costs only, and will not help you determine the relative costs of owning different funds. In addition, if these transactional costs were included, your costs would have been higher.
| | | Beginning
Account
Value
November 1, 2023 | | Ending
Account
Value
April 30, 2024 | | Annualized
Expense
Ratio
During Period | | Expenses Paid
During the Period
November 1, 2023 -
April 30, 2024(a) |
| BDC Income ETF | | | | | | | | |
| Actual | | $1,000.00 | | $ 1,182.50 | | 0.43% | | $2.33 |
| Hypothetical (b) | | $1,000.00 | | $ 1,022.73 | | 0.43% | | $2.16 |
| China Bond ETF | | | | | | | | |
| Actual | | $1,000.00 | | $ 1,033.50 | | 0.50% | | $2.53 |
| Hypothetical (b) | | $1,000.00 | | $ 1,022.38 | | 0.50% | | $2.51 |
| Dynamic High Income ETF | | | | | | | | |
| Actual | | $1,000.00 | | $ 1,106.60 | | 0.11% | | $0.58 |
| Hypothetical (b) | | $1,000.00 | | $ 1,024.32 | | 0.11% | | $0.55 |
| Emerging Markets High Yield Bond ETF | | | | | | | | |
| Actual | | $1,000.00 | | $ 1,104.90 | | 0.40% | | $2.09 |
| Hypothetical (b) | | $1,000.00 | | $ 1,022.87 | | 0.40% | | $2.01 |
| Fallen Angel High Yield Bond ETF | | | | | | | | |
| Actual | | $1,000.00 | | $ 1,091.70 | | 0.32% | | $1.66 |
| Hypothetical (b) | | $1,000.00 | | $ 1,023.27 | | 0.32% | | $1.61 |
| Green Bond ETF | | | | | | | | |
| Actual | | $1,000.00 | | $ 1,056.30 | | 0.20% | | $1.02 |
| Hypothetical (b) | | $1,000.00 | | $ 1,023.87 | | 0.20% | | $1.01 |
| IG Floating Rate ETF | | | | | | | | |
| Actual | | $1,000.00 | | $ 1,042.30 | | 0.14% | | $0.71 |
| Hypothetical (b) | | $1,000.00 | | $ 1,024.17 | | 0.14% | | $0.70 |
VANECK ETF TRUST
EXPLANATION OF EXPENSES
(unaudited) (continued)
| | | Beginning
Account
Value
November 1, 2023 | | Ending
Account
Value
April 30, 2024 | | Annualized
Expense
Ratio
During Period | | Expenses Paid
During the Period
November 1, 2023 -
April 30, 2024(a) |
| International High Yield Bond ETF | | | | | | | | |
| Actual | | $1,000.00 | | $ 1,083.20 | | 0.40% | | $2.07 |
| Hypothetical (b) | | $1,000.00 | | $ 1,022.87 | | 0.40% | | $2.01 |
| J.P. Morgan EM Local Currency Bond ETF | | | | | | | | |
| Actual | | $1,000.00 | | $ 1,036.80 | | 0.30% | | $1.52 |
| Hypothetical (b) | | $1,000.00 | | $ 1,023.37 | | 0.30% | | $1.51 |
| Moody’s Analytics BBB Corporate Bond ETF | | | | | | | | |
| Actual | | $1,000.00 | | $ 1,080.50 | | 0.25% | | $1.29 |
| Hypothetical (b) | | $1,000.00 | | $ 1,023.62 | | 0.25% | | $1.26 |
| Moody’s Analytics IG Corporate Bond ETF | | | | | | | | |
| Actual | | $1,000.00 | | $ 1,074.80 | | 0.20% | | $1.03 |
| Hypothetical (b) | | $1,000.00 | | $ 1,023.87 | | 0.20% | | $1.01 |
| Mortgage REIT Income ETF | | | | | | | | |
| Actual | | $1,000.00 | | $ 1,148.70 | | 0.44% | | $2.35 |
| Hypothetical (b) | | $1,000.00 | | $ 1,022.68 | | 0.44% | | $2.21 |
| Preferred Securities ex Financials ETF | | | | | | | | |
| Actual | | $1,000.00 | | $ 1,120.30 | | 0.40% | | $2.11 |
| Hypothetical (b) | | $1,000.00 | | $ 1,022.87 | | 0.40% | | $2.01 |
| (a) | Expenses are equal to the Fund’s annualized expense ratio (for the six months ended April 30, 2024), multiplied by the average account value over the period, multiplied by the number of days in the most recent fiscal half year divided by the number of the days in the fiscal year (to reflect the one-half year period). |
| (b) | Assumes annual return of 5% before expenses |
VANECK BDC INCOME ETF
SCHEDULE OF INVESTMENTS
April 30, 2024
| | | Number
of Shares | | | Value | |
| COMMON STOCKS: 100.0% | | | | | | | | |
| Financial Services: 100.0% | | | | | | | | |
| Ares Capital Corp. | | | 10,278,053 | | | $ | 211,830,672 | |
| Bain Capital Specialty Finance, Inc. | | | 917,441 | | | | 15,257,044 | |
| Barings BDC, Inc. | | | 1,900,302 | | | | 17,634,803 | |
| BlackRock TCP Capital Corp. † | | | 1,762,606 | | | | 17,767,068 | |
| Blackstone Secured Lending Fund † | | | 1,607,040 | | | | 50,927,098 | |
| Blue Owl Capital Corp. † | | | 8,624,358 | | | | 137,127,292 | |
| Capital Southwest Corp. † | | | 885,100 | | | | 22,853,282 | |
| Carlyle Secured Lending, Inc. | | | 1,046,044 | | | | 17,960,576 | |
| CION Investment Corp. † | | | 1,121,617 | | | | 12,820,082 | |
| Fidus Investment Corp. † | | | 631,164 | | | | 12,850,499 | |
| FS KKR Capital Corp. † | | | 6,963,544 | | | | 133,142,961 | |
| Gladstone Investment Corp. † | | | 739,101 | | | | 10,569,144 | |
| Goldman Sachs BDC, Inc. † | | | 2,123,241 | | | | 32,995,165 | |
| Golub Capital BDC, Inc. † | | | 2,986,288 | | | | 51,871,823 | |
| Hercules Capital, Inc. † | | | 2,621,911 | | | | 50,130,938 | |
| Main Street Capital Corp. † | | | 1,043,122 | | | | 51,738,851 | |
| MidCap Financial Investment Corp. † | | | 1,343,779 | | | | 20,425,441 | |
| Morgan Stanley Direct Lending Fund | | | 1,629,325 | | | | 35,030,488 | |
| New Mountain Finance Corp. † | | | 1,779,648 | | | | 22,370,175 | |
| | | Number
of Shares | | | Value | |
| Financial Services (continued) | | | | | | | | |
| Oaktree Specialty Lending Corp. † | | | 1,626,178 | | | $ | 31,157,570 | |
| PennantPark Floating Rate Capital Ltd. † | | | 1,205,645 | | | | 13,708,184 | |
| Prospect Capital Corp. † | | | 7,161,403 | | | | 37,310,910 | |
| Sixth Street Specialty Lending, Inc. | | | 1,891,116 | | | | 41,018,306 | |
| SLR Investment Corp. | | | 954,950 | | | | 14,668,032 | |
| Trinity Capital, Inc. | | | 956,302 | | | | 14,507,101 | |
| TriplePoint Venture Growth BDC Corp. † | | | 774,768 | | | | 7,275,072 | |
| | | | | | | | | |
Total Common Stocks
(Cost: $1,031,458,983) | | | | | | | 1,084,948,577 | |
| | | | | | | | | |
SHORT-TERM INVESTMENT HELD AS
COLLATERAL FOR SECURITIES ON LOAN: 8.3% | |
Money Market Fund: 8.3%
(Cost: $89,871,466) | | | | | | | | |
| State Street Navigator Securities Lending Government Money Market Portfolio | | | 89,871,466 | | | | 89,871,466 | |
Total Investments: 108.3%
(Cost: $1,121,330,449) | | | | | | | 1,174,820,043 | |
| Liabilities in excess of other assets: (8.3)% | | | | | | | (90,478,308) | |
| NET ASSETS: 100.0% | | | | | | $ | 1,084,341,735 | |
Footnotes:
| † | Security fully or partially on loan. Total market value of securities on loan is $139,211,087. |
Summary of Investments by Sector
Excluding Collateral for Securities Loaned | | % of
Investments | | Value | |
| Financials | | | 100.0 | % | | $ | 1,084,948,577 | |
The summary of inputs used to value the Fund’s investments as of April 30, 2024 is as follows:
| | | Level 1
Quoted
Prices | | | Level 2
Significant
Observable
Inputs | | | Level 3
Significant
Unobservable
Inputs | | | Value | |
| Common Stocks * | | $ | 1,084,948,577 | | | $ | — | | | $ | — | | | $ | 1,084,948,577 | |
| Money Market Fund | | | 89,871,466 | | | | — | | | | — | | | | 89,871,466 | |
| Total Investments | | $ | 1,174,820,043 | | | $ | — | | | $ | — | | | $ | 1,174,820,043 | |
| * | See Schedule of Investments for industry sector breakouts. |
See Notes to Financial Statements
VANECK CHINA BOND ETF
SCHEDULE OF INVESTMENTS
April 30, 2024
| | | Par
(000’s | ) | | Value | |
| CORPORATE BONDS: 70.7% | | | | | | | | |
| Basic Materials: 5.8% | | | | | | | | |
China Chengtong Holdings Group Ltd. 3.53%, 10/28/26 | | CNY | 10,000 | | | $ | 1,387,601 | |
| Energy: 8.2% | | | | | | | | |
China National Petroleum Corp. 4.16%, 08/16/25 | | CNY | 6,000 | | | | 848,055 | |
China Petroleum & Chemical Corp. 3.20%, 07/27/26 | | CNY | 8,000 | | | | 1,120,916 | |
| | | | | | | | 1,968,971 | |
| Financials: 41.7% | | | | | | | | |
| Agricultural Development Bank of China | | | | | | | | |
| 2.25%, 04/22/25 | | CNY | 1,130 | | | | 156,306 | |
| 2.96%, 04/17/30 | | CNY | 1,160 | | | | 165,412 | |
| 3.63%, 07/19/26 | | CNY | 2,700 | | | | 384,358 | |
| 3.74%, 07/12/29 | | CNY | 2,740 | | | | 404,212 | |
| 3.75%, 01/25/29 | | CNY | 2,620 | | | | 385,765 | |
| 3.79%, 10/26/30 | | CNY | 1,110 | | | | 166,052 | |
| 3.85%, 01/06/27 | | CNY | 1,610 | | | | 231,757 | |
| 4.39%, 09/08/27 | | CNY | 3,270 | | | | 482,739 | |
| 4.65%, 05/11/28 | | CNY | 1,360 | | | | 204,614 | |
Central Huijin Investment Ltd. 2.87%, 04/20/26 | | CNY | 6,000 | | | | 836,689 | |
| China Development Bank | | | | | | | | |
| 2.77%, 10/24/32 | | CNY | 3,810 | | | | 537,994 | |
| 3.18%, 04/05/26 | | CNY | 1,070 | | | | 150,581 | |
| 3.34%, 07/14/25 | | CNY | 1,060 | | | | 148,544 | |
| 3.41%, 06/07/31 | | CNY | 1,640 | | | | 240,830 | |
| 3.45%, 09/20/29 | | CNY | 4,800 | | | | 699,724 | |
| 3.48%, 01/08/29 | | CNY | 4,460 | | | | 647,610 | |
| 3.65%, 05/21/29 | | CNY | 1,950 | | | | 286,086 | |
| 3.66%, 03/01/31 | | CNY | 1,170 | | | | 174,008 | |
| 3.70%, 10/20/30 | | CNY | 4,150 | | | | 616,834 | |
| 4.04%, 04/10/27 | | CNY | 1,760 | | | | 255,508 | |
| 4.04%, 07/06/28 | | CNY | 2,720 | | | | 402,093 | |
China Reform Holdings Corp. Ltd. 2.65%, 09/06/27 | | CNY | 10,000 | | | | 1,383,826 | |
| Export-Import Bank of China | | | | | | | | |
| | | Par
(000’s | ) | | Value | |
| Financials (continued) | | | | | | | | |
| 2.90%, 08/19/32 | | CNY | 1,390 | | | $ | 197,967 | |
| 3.23%, 03/23/30 | | CNY | 1,900 | | | | 274,580 | |
| 3.38%, 07/16/31 | | CNY | 1,750 | | | | 256,579 | |
| 3.74%, 11/16/30 | | CNY | 2,380 | | | | 355,099 | |
| | | | | | | | 10,045,767 | |
| Real Estate: 0.0% | | | | | | | | |
| China Fortune Land Development Co. Ltd. | | | | | | | | |
| 5.50%, 10/22/22 (d) *∞ | | CNY | 1,000 | | | | 2 | |
| 7.00%, 03/03/21 (d) *∞ | | CNY | 1,000 | | | | 1 | |
| | | | | | | | 3 | |
| Utilities: 15.0% | | | | | | | | |
China Southern Power Grid Co. Ltd. 2.42%, 10/24/25 | | CNY | 8,000 | | | | 1,112,786 | |
State Grid Corp. of China 2.88%, 08/30/27 | | CNY | 8,000 | | | | 1,119,708 | |
State Power Investment Corp. Ltd. 2.82%, 07/04/26 | | CNY | 10,000 | | | | 1,392,177 | |
| | | | | | | | 3,624,671 | |
Total Corporate Bonds
(Cost: $18,018,112) | | | | | | | 17,027,013 | |
| | | | | | | | | |
| GOVERNMENT OBLIGATIONS: 16.2% | | | | | | | | |
| China Government Bond | | | | | | | | |
| 2.52%, 08/25/33 | | CNY | 2,120 | | | | 296,004 | |
| 2.68%, 05/21/30 | | CNY | 3,450 | | | | 486,122 | |
| 2.69%, 08/12/26 | | CNY | 2,050 | | | | 287,064 | |
| 3.02%, 10/22/25 | | CNY | 2,150 | | | | 301,460 | |
| 3.02%, 05/27/31 | | CNY | 2,710 | | | | 390,923 | |
| 3.03%, 03/11/26 | | CNY | 1,850 | | | | 260,493 | |
| 3.25%, 06/06/26 | | CNY | 2,220 | | | | 315,039 | |
| 3.27%, 11/19/30 | | CNY | 2,980 | | | | 438,181 | |
| 3.28%, 12/03/27 | | CNY | 1,050 | | | | 151,508 | |
| 3.32%, 04/15/52 | | CNY | 3,090 | | | | 481,728 | |
| 3.81%, 09/14/50 | | CNY | 2,870 | | | | 481,262 | |
Total Government Obligations
(Cost: $4,229,280) | | | | | | | 3,889,784 | |
Total Investments: 86.9%
(Cost: $22,247,392) | | | | | | | 20,916,797 | |
| Other assets less liabilities: 13.1% | | | | | | | 3,159,311 | |
| NET ASSETS: 100.0% | | | | | | $ | 24,076,108 | |
Definitions:
Footnotes:
| (d) | Security in default |
| * | Non-income producing |
| ∞ | Security is valued using significant unobservable inputs that factor in discount for lack of marketability and is classified as Level 3 in the fair value hierarchy. |
See Notes to Financial Statements
| Summary of Investments by Sector | | % of
Investments | | Value | |
| Financials | | | 48.0 | % | | $ | 10,045,767 | |
| Government | | | 18.6 | | | | 3,889,784 | |
| Utilities | | | 17.3 | | | | 3,624,671 | |
| Energy | | | 9.4 | | | | 1,968,971 | |
| Basic Materials | | | 6.7 | | | | 1,387,601 | |
| Real Estate | | | 0.0 | | | | 3 | |
| | | | 100.0 | % | | $ | 20,916,797 | |
The summary of inputs used to value the Fund’s investments as of April 30, 2024 is as follows:
| | | Level 1
Quoted
Prices | | | Level 2
Significant
Observable
Inputs | | | Level 3
Significant
Unobservable
Inputs | | | Value | |
| Corporate Bonds | | | | | | | | | | | | | | | | |
| Basic Materials | | $ | — | | | $ | 1,387,601 | | | $ | — | | | $ | 1,387,601 | |
| Energy | | | — | | | | 1,968,971 | | | | — | | | | 1,968,971 | |
| Financials | | | — | | | | 10,045,767 | | | | — | | | | 10,045,767 | |
| Real Estate | | | — | | | | — | | | | 3 | | | | 3 | |
| Utilities | | | — | | | | 3,624,671 | | | | — | | | | 3,624,671 | |
| Government Obligations * | | | — | | | | 3,889,784 | | | | — | | | | 3,889,784 | |
| Total Investments | | $ | — | | | $ | 20,916,794 | | | $ | 3 | | | $ | 20,916,797 | |
| * | See Schedule of Investments for industry sector breakouts. |
See Notes to Financial Statements
VANECK DYNAMIC HIGH INCOME ETF
SCHEDULE OF INVESTMENTS
April 30, 2024
| | | Par
(000’s | ) | | Value | |
GOVERNMENT OBLIGATION: 7.1%
(Cost: $56,234) | | | | | | |
United States Treasury Note/ Bond 4.75%, 11/15/43 | | | 57 | | | $ | 55,931 | |
| | | | | | | | | |
| | | Number
of Shares | | | | | |
| EXCHANGE TRADED FUNDS: 93.1% (a) | | | | | | | | |
| First Trust SMID Cap Rising Dividend Achievers ETF | | | 963 | | | | 31,558 | |
| iShares Residential and Multisector Real Estate ETF | | | 391 | | | | 27,491 | |
| VanEck BDC Income ETF ‡ | | | 3,996 | | | | 66,533 | |
| VanEck CLO ETF ‡ | | | 187 | | | | 9,864 | |
| VanEck Durable High Dividend ETF ‡ | | | 1,046 | | | | 32,895 | |
| | | Number
of Shares | | | Value | |
| VanEck Emerging Markets High Yield Bond ETF ‡ | | | 3,679 | | | $ | 69,055 | |
| VanEck Energy Income ETF ‡ | | | 1,004 | | | | 75,987 | |
| VanEck Fallen Angel High Yield Bond ETF ‡ | | | 9,978 | | | | 282,079 | |
| VanEck IG Floating Rate ETF ‡ | | | 388 | | | | 9,886 | |
| VanEck Preferred Securities ex Financials ETF ‡ | | | 3,795 | | | | 64,439 | |
| WisdomTree International Hedged Quality Dividend Growth Fund | | | 706 | | | | 31,417 | |
| WisdomTree U.S. Quality Dividend Growth Fund | | | 426 | | | | 31,098 | |
Total Exchange Traded Funds
(Cost: $702,297) | | | | | | | 732,302 | |
Total Investments: 100.2%
(Cost: $758,531) | | | | | | | 788,233 | |
| Liabilities in excess of other assets: (0.2)% | | | | | | | (1,938) | |
| NET ASSETS: 100.0% | | | | | | $ | 786,295 | |
Footnotes:
| (a) | Each underlying fund’s shareholder reports and registration documents are available free of charge on the SEC’s website at https:// www.sec.gov. |
| ‡ | Affiliated issuer – as defined under the Investment Company Act of 1940. |
| Summary of Investments by Sector | | % of
Investments | | Value | |
| Exchange Traded Funds | | | 92.9 | % | | $ | 732,302 | |
| Government | | | 7.1 | | | | 55,931 | |
| | | | 100.0 | % | | $ | 788,233 | |
See Notes to Financial Statements
Transactions in securities of affiliates for the period ended April 30, 2024 were as follows:
| | | Value
4/30/2023 | | | Purchases | | | Sales
Proceeds | | | Realized Gain
(Loss) | | | Net Change in
Unrealized
Appreciation
(Depreciation) | | | Value
4/30/2024 | | | Dividend
Income | |
| VanEck BDC Income ETF | | | $38,788 | | | | $20,232 | | | | $– | | | | $(113)# | | | | $7,638* | | | | $66,533 | | | | $7,107 | |
| VanEck CLO ETF | | | – | | | | 9,861 | | | | – | | | | – | | | | 3 | | | | 9,864 | | | | – | |
| VanEck Durable High Dividend ETF | | | 87,147 | | | | 43,288 | | | | (96,536) | | | | 481 | | | | (1,485) | | | | 32,895 | | | | 3,804 | |
| VanEck Emerging Markets High Yield Bond ETF | | | 26,067 | | | | 41,951 | | | | – | | | | – | | | | 1,037 | | | | 69,055 | | | | 2,583 | |
| VanEck Energy Income ETF | | | 41,775 | | | | 21,167 | | | | – | | | | (833)† | | | | 14,234‡ | | | | 75,987 | | | | 1,299 | |
| VanEck Fallen Angel High Yield Bond ETF | | | 100,233 | | | | 180,551 | | | | – | | | | – | | | | 1,295 | | | | 282,079 | | | | 9,136 | |
| VanEck IG Floating Rate ETF | | | – | | | | 9,875 | | | | – | | | | – | | | | 11 | | | | 9,886 | | | | – | |
| VanEck International High Yield Bond ETF | | | 54,177 | | | | 26,778 | | | | (83,742) | | | | 8,030^ | | | | (5,078) | | | | – | | | | 2,815 | |
| VanEck J.P. Morgan EM Local Currency Bond ETF | | | 26,447 | | | | 13,318 | | | | (39,035) | | | | 2,107∞ | | | | (2,640) | | | | – | | | | 1,038 | |
| VanEck Mortgage REIT Income ETF | | | 18,744 | | | | 9,764 | | | | (28,550) | | | | (1,747) | | | | 1,789 | | | | – | | | | 2,473 | |
| VanEck Preferred Securities ex Financials ETF | | | 44,300 | | | | 21,998 | | | | – | | | | – | | | | (1,859) | | | | 64,439 | | | | 4,913 | |
| | | | $437,678 | | | | $398,783 | | | | $(247,863) | | | | $7,925 | | | | $14,945 | | | | $610,738 | | | | $35,168 | |
| # | Includes Return of Capital distribution reclassification of $113 |
| * | Includes Return of Capital distribution reclassification of $12 |
| ‡ | Includes Return of Capital distribution reclassification of $356 |
| ^ | Includes Return of Capital distribution reclassification of $165 |
| ∞ | Includes Return of Capital distribution reclassification of $197 |
| † | Includes Return of Capital distribution reclassification of $833 |
The summary of inputs used to value the Fund’s investments as of April 30, 2024 is as follows:
| | | Level 1
Quoted
Prices | | | Level 2
Significant
Observable
Inputs | | | Level 3
Significant
Unobservable
Inputs | | | Value | |
| Government Obligation * | | $ | — | | | $ | 55,931 | | | $ | — | | | $ | 55,931 | |
| Exchange Traded Funds | | | 732,302 | | | | — | | | | — | | | | 732,302 | |
| Total Investments | | $ | 732,302 | | | $ | 55,931 | | | $ | — | | | $ | 788,233 | |
| * | See Schedule of Investments for industry sector breakouts. |
See Notes to Financial Statements
VANECK EMERGING MARKETS HIGH YIELD BOND ETF
SCHEDULE OF INVESTMENTS
April 30, 2024
| | | Par
(000’s | ) | | Value | |
| CORPORATE BONDS: 94.5% | | | | | | | | |
| Argentina: 3.3% | | | | | | | | |
Generacion Mediterranea SA / Central Termica Roca SA 144A 9.88%, 12/01/27 | | $ | 397 | | | $ | 359,052 | |
| MercadoLibre, Inc. | | | | | | | | |
| 2.38%, 01/14/26 | | | 525 | | | | 489,709 | |
| 3.12%, 01/14/31 | | | 875 | | | | 718,348 | |
| Pampa Energia SA 144A | | | | | | | | |
| 7.50%, 01/24/27 | | | 850 | | | | 809,592 | |
| 9.12%, 04/15/29 | | | 425 | | | | 423,318 | |
Pan American Energy LLC 144A 9.12%, 04/30/27 | | | 410 | | | | 423,129 | |
Telecom Argentina SA 144A 8.00%, 07/18/26 | | | 525 | | | | 502,012 | |
Transportadora de Gas del Sur SA 144A 6.75%, 05/02/25 | | | 700 | | | | 679,984 | |
YPF Energia Electrica SA 144A 10.00%, 07/25/26 | | | 500 | | | | 498,358 | |
YPF SA 144A 6.95%, 07/21/27 | | | 1,125 | | | | 1,020,868 | |
| 7.00%, 09/30/33(s) | | | 825 | | | | 719,105 | |
| 7.00%, 12/15/47 | | | 725 | | | | 516,214 | |
| 8.50%, 07/28/25 | | | 1,575 | | | | 1,535,006 | |
| 8.50%, 06/27/29 | | | 562 | | | | 530,432 | |
| 9.00%, 02/12/26(s) | | | 769 | | | | 775,763 | |
| 9.00%, 06/30/29(s) | | | 1,050 | | | | 1,039,780 | |
| 9.50%, 01/17/31 | | | 925 | | | | 935,271 | |
| | | | | | | | 11,975,941 | |
| Austria: 0.1% | | | | | | | | |
Iochpe-Maxion Austria GmbH / Maxion Wheels de Mexico S de RL de CV 144A 5.00%, 05/07/28 | | | 300 | | | | 268,289 | |
| Azerbaijan: 1.1% | | | | | | | | |
Southern Gas Corridor CJSC 144A 6.88%, 03/24/26 | | | 2,750 | | | | 2,767,270 | |
State Oil Co. of the Azerbaijan Republic Reg S 6.95%, 03/18/30 | | | 1,075 | | | | 1,088,050 | |
| | | | | | | | 3,855,320 | |
| Bahrain: 0.7% | | | | | | | | |
| Bapco Energies BSCC 144A | | | | | | | | |
| 7.50%, 10/25/27 | | | 1,400 | | | | 1,415,484 | |
| 8.38%, 11/07/28 | | | 650 | | | | 687,450 | |
Mumtalakat Sukuk Holding Co. Reg S 4.10%, 01/21/27 | | | 600 | | | | 565,971 | |
| | | | | | | | 2,668,905 | |
| Bermuda: 0.3% | | | | | | | | |
| Digicel Group Holdings Ltd. 144A | | | | | | | | |
| 0.00%, 12/31/30^ | | | 32 | | | | 17,520 | |
| 0.00%, 12/31/30^ | | | 378 | | | | 28,381 | |
| | | Par
(000’s | ) | | Value | |
| Bermuda (continued) | | | | | | | | |
Investment Energy Resources Ltd. 144A 6.25%, 04/26/29 | | $ | 1,000 | | | $ | 958,220 | |
| | | | | | | | 1,004,121 | |
| Brazil: 6.8% | | | | | | | | |
Adecoagro SA 144A 6.00%, 09/21/27 | | | 700 | | | | 677,725 | |
Amaggi Luxembourg International Sarl 144A 5.25%, 01/28/28 | | | 500 | | | | 472,209 | |
Arcos Dorados Holdings, Inc. 144A 5.88%, 04/04/27 | | | 550 | | | | 541,472 | |
B3 SA - Brasil Bolsa Balcao 144A 4.12%, 09/20/31 | | | 425 | | | | 365,469 | |
Banco BTG Pactual SA 144A 2.75%, 01/11/26† | | | 350 | | | | 329,890 | |
Banco do Brasil SA/Cayman 144A 6.00%, 03/18/31 | | | 450 | | | | 436,567 | |
Banco Votorantim SA 144A 4.38%, 07/29/25 | | | 400 | | | | 388,273 | |
Braskem America Finance Co. 144A 7.12%, 07/22/41 | | | 375 | | | | 335,629 | |
Braskem Idesa SAPI 144A 7.45%, 11/15/29 | | | 1,275 | | | | 1,007,913 | |
| Braskem Netherlands Finance BV 144A | | | | | | | | |
| 4.50%, 01/10/28 | | | 650 | | | | 580,862 | |
| 4.50%, 01/31/30 | | | 950 | | | | 801,677 | |
| 5.88%, 01/31/50† | | | 500 | | | | 374,598 | |
| 8.50% (US Treasury Yield Curve Rate T 5 Year+8.22%), 01/23/81 | | | 350 | | | | 343,425 | |
Brazil Minas SPE via State of Minas Gerais 144A 5.33%, 02/15/28 | | | 302 | | | | 297,429 | |
| BRF SA 144A | | | | | | | | |
| 4.88%, 01/24/30 | | | 325 | | | | 286,498 | |
| 5.75%, 09/21/50 | | | 425 | | | | 321,796 | |
Centrais Eletricas Brasileiras SA 144A 4.62%, 02/04/30 | | | 475 | | | | 426,834 | |
| Cosan Luxembourg SA 144A | | | | | | | | |
| 5.50%, 09/20/29 | | | 425 | | | | 399,875 | |
| 7.00%, 01/20/27 | | | 250 | | | | 249,950 | |
CSN Inova Ventures 144A 6.75%, 01/28/28 | | | 925 | | | | 885,882 | |
Embraer Netherlands Finance BV 5.40%, 02/01/27† | | | 275 | | | | 270,185 | |
Embraer Netherlands Finance BV 144A 6.95%, 01/17/28 | | | 325 | | | | 331,550 | |
ERO Copper Corp. 144A 6.50%, 02/15/30† | | | 250 | | | | 236,919 | |
See Notes to Financial Statements
| | | Par
(000’s | ) | | Value | |
| Brazil (continued) | | | | | | | | |
| Globo Comunicacao e Participacoes SA 144A | | | | | | | | |
| 4.88%, 01/22/30 | | $ | 325 | | | $ | 283,653 | |
| 5.50%, 01/14/32 | | | 275 | | | | 239,472 | |
| Klabin Austria GmbH 144A | | | | | | | | |
| 3.20%, 01/12/31 | | | 325 | | | | 265,840 | |
| 5.75%, 04/03/29 | | | 425 | | | | 414,432 | |
| 7.00%, 04/03/49 | | | 478 | | | | 466,138 | |
MARB BondCo Plc 144A 3.95%, 01/29/31 | | | 750 | | | | 602,255 | |
MV24 Capital BV 144A 6.75%, 06/01/34 | | | 585 | | | | 538,168 | |
Natura &Co. Luxembourg Holdings Sarl 144A 4.12%, 05/03/28 | | | 300 | | | | 270,804 | |
| NBM US Holdings, Inc. 144A | | | | | | | | |
| 6.62%, 08/06/29 | | | 300 | | | | 293,340 | |
| 7.00%, 05/14/26 | | | 450 | | | | 447,583 | |
Nexa Resources SA 144A 6.50%, 01/18/28 | | | 325 | | | | 325,651 | |
| Petrobras Global Finance BV | | | | | | | | |
| 5.09%, 01/15/30 | | | 275 | | | | 258,012 | |
| 5.60%, 01/03/31 | | | 525 | | | | 497,540 | |
| 5.62%, 05/20/43 | | | 200 | | | | 170,547 | |
| 5.75%, 02/01/29 | | | 225 | | | | 219,178 | |
| 6.00%, 01/27/28 | | | 575 | | | | 574,320 | |
| 6.75%, 01/27/41 | | | 350 | | | | 333,664 | |
| 6.75%, 06/03/50 | | | 225 | | | | 204,295 | |
| 6.85%, 06/05/15† | | | 750 | | | | 651,980 | |
| 6.88%, 01/20/40 | | | 280 | | | | 270,178 | |
| 6.90%, 03/19/49† | | | 375 | | | | 347,991 | |
| 7.25%, 03/17/44 | | | 425 | | | | 417,470 | |
| 7.38%, 01/17/27 | | | 350 | | | | 360,351 | |
| 8.75%, 05/23/26 | | | 175 | | | | 183,605 | |
| Rede D’or Finance Sarl 144A | | | | | | | | |
| 4.50%, 01/22/30 | | | 499 | | | | 438,988 | |
| 4.95%, 01/17/28 | | | 250 | | | | 235,129 | |
Rio Oil Finance Trust Series 2014-3 144A 9.75%, 01/06/27 | | | 215 | | | | 223,244 | |
Rio Oil Finance Trust Series 2018-1 144A 8.20%, 04/06/28 | | | 312 | | | | 316,871 | |
Rumo Luxembourg Sarl 144A 5.25%, 01/10/28 | | | 250 | | | | 237,852 | |
Samarco Mineracao SA 144A 9.50%, 06/30/31 | | | 2,300 | | | | 2,100,675 | |
Simpar Europe SA 144A 5.20%, 01/26/31 | | | 325 | | | | 260,228 | |
Tupy Overseas SA 144A 4.50%, 02/16/31 | | | 250 | | | | 214,776 | |
| Ultrapar International SA 144A | | | | | | | | |
| 5.25%, 10/06/26 | | | 300 | | | | 291,650 | |
| 5.25%, 06/06/29 | | | 200 | | | | 190,291 | |
| Usiminas International Sarl 144A | | | | | | | | |
| | | Par
(000’s | ) | | Value | |
| Brazil (continued) | | | | | | | | |
| 5.88%, 07/18/26 | | $ | 500 | | | $ | 491,659 | |
XP, Inc. 144A 3.25%, 07/01/26 | | | 500 | | | | 467,243 | |
| | | | | | | | 24,467,700 | |
| British Virgin Islands: 0.5% | | | | | | | | |
Five Holding Ltd. 144A 9.38%, 10/03/28 | | | 500 | | | | 500,191 | |
| New Metro Global Ltd. Reg S | | | | | | | | |
| 4.50%, 05/02/26 | | | 500 | | | | 202,749 | |
| 4.62%, 10/15/25 | | | 400 | | | | 192,015 | |
Studio City Co. Ltd. 144A 7.00%, 02/15/27 | | | 500 | | | | 495,388 | |
Wanda Properties Global Co. Ltd. Reg S 11.00%, 02/13/26 | | | 350 | | | | 270,025 | |
YI Bright International Ltd. Reg S 7.40%, 08/17/26 | | | 200 | | | | 201,490 | |
| | | | | | | | 1,861,858 | |
| Canada: 1.4% | | | | | | | | |
| First Quantum Minerals Ltd. 144A | | | | | | | | |
| 8.62%, 06/01/31 | | | 1,825 | | | | 1,768,696 | |
| 9.38%, 03/01/29 | | | 2,100 | | | | 2,172,292 | |
Frontera Energy Corp. 144A 7.88%, 06/21/28 | | | 550 | | | | 449,180 | |
Gran Tierra Energy, Inc. 144A 9.50%, 10/15/29 | | | 700 | | | | 659,222 | |
| | | | | | | | 5,049,390 | |
| Cayman Islands: 4.8% | | | | | | | | |
Arabian Centres Sukuk II Ltd. 144A 5.62%, 10/07/26 | | | 2,100 | | | | 1,968,204 | |
Arada Sukuk Ltd. Reg S 8.12%, 06/08/27 | | | 700 | | | | 712,221 | |
Banco Bradesco SA 144A 4.38%, 03/18/27 | | | 350 | | | | 336,427 | |
Banco BTG Pactual SA/Cayman Islands 144A 6.25%, 04/08/29 | | | 250 | | | | 248,201 | |
| Banco do Brasil SA 144A | | | | | | | | |
| 3.25%, 09/30/26 | | | 450 | | | | 423,847 | |
| 4.88%, 01/11/29 | | | 350 | | | | 328,226 | |
| 6.25%, 04/18/30 | | | 400 | | | | 397,697 | |
Binghatti Sukuk SPC Ltd. Reg S 9.62%, 02/28/27 | | | 400 | | | | 411,500 | |
CT Trust 144A 5.12%, 02/03/32 | | | 1,000 | | | | 869,520 | |
| Dar Al-Arkan Sukuk Co. Ltd. Reg S | | | | | | | | |
| 7.75%, 02/07/26 | | | 500 | | | | 503,063 | |
| 8.00%, 02/25/29 | | | 800 | | | | 817,000 | |
EDO Sukuk Ltd. 144A 5.88%, 09/21/33 | | | 1,400 | | | | 1,412,075 | |
Ittihad International Ltd. 144A 9.75%, 11/09/28 | | | 500 | | | | 504,250 | |
See Notes to Financial Statements
VANECK EMERGING MARKETS HIGH YIELD BOND ETF
SCHEDULE OF INVESTMENTS
(continued)
| | | Par
(000’s | ) | | Value | |
| Cayman Islands (continued) | | | | | | | | |
KT21 T2 Co. Ltd. Reg S 6.12% (US Treasury Yield Curve Rate T 5 Year+5.33%), 12/16/31 | | $ | 350 | | | $ | 341,250 | |
Liberty Costa Rica Senior Secured Finance 144A 10.88%, 01/15/31 | | | 600 | | | | 623,619 | |
MAF Global Securities Ltd. Reg S 7.88% (US Treasury Yield Curve Rate T 5 Year+4.89%), 6/30/2027(o) | | | 600 | | | | 616,471 | |
Melco Resorts Finance Ltd. 144A 7.62%, 04/17/32 | | | 1,000 | | | | 979,700 | |
Nogaholding Sukuk Ltd. 144A 5.25%, 04/08/29 | | | 950 | | | | 904,211 | |
Nogaholding Sukuk Ltd. Reg S 6.62%, 05/25/33 | | | 950 | | | | 980,256 | |
Oryx Funding Ltd. 144A 5.80%, 02/03/31 | | | 900 | | | | 888,971 | |
Otel Sukuk Ltd. 144A 5.38%, 01/24/31 | | | 700 | | | | 684,673 | |
PD Sukuk Ltd. Reg S 8.75%, 09/23/25 | | | 400 | | | | 406,540 | |
Poinsettia Finance Ltd. Reg S 6.62%, 06/17/31 | | | 418 | | | | 350,566 | |
Rutas 2 & 7 Finance Ltd. 144A 0.00%, 09/30/36^ | | | 625 | | | | 423,787 | |
Sable International Finance Ltd. 144A 5.75%, 09/07/27 | | | 700 | | | | 668,923 | |
StoneCo Ltd. 144A 3.95%, 06/16/28 | | | 350 | | | | 301,233 | |
| | | | | | | | 17,102,431 | |
| Chile: 1.4% | | | | | | | | |
Agrosuper SA 144A 4.60%, 01/20/32† | | | 725 | | | | 610,831 | |
CAP SA 144A 3.90%, 04/27/31 | | | 450 | | | | 357,796 | |
| Falabella SA 144A | | | | | | | | |
| 3.38%, 01/15/32 | | | 925 | | | | 706,504 | |
| 3.75%, 10/30/27 | | | 500 | | | | 448,002 | |
| Latam Airlines Group SA 144A | | | | | | | | |
| 13.38%, 10/15/27† | | | 500 | | | | 556,688 | |
| 13.38%, 10/15/29 | | | 1,000 | | | | 1,150,311 | |
| VTR Comunicaciones SpA 144A | | | | | | | | |
| 4.38%, 04/15/29 | | | 600 | | | | 459,491 | |
| 5.12%, 01/15/28 | | | 575 | | | | 457,343 | |
VTR Finance NV 144A 6.38%, 07/15/28 | | | 600 | | | | 423,847 | |
| | | | | | | | 5,170,813 | |
| | | Par
(000’s | ) | | Value | |
| China: 4.9% | | | | | | | | |
Agile Group Holdings Ltd. Reg S 5.50%, 04/21/25 | | $ | 300 | | | $ | 36,489 | |
Bank of Communications Co. Ltd. Reg S 3.80% (US Treasury Yield Curve Rate T 5 Year+3.35%), 11/18/2025(o) | | | 3,875 | | | | 3,755,014 | |
ENN Clean Energy International Investment Ltd. 144A 3.38%, 05/12/26 | | | 800 | | | | 755,157 | |
Fortune Star BVI Ltd. Reg S 5.95%, 10/19/25 | | | 1,000 | | | | 937,267 | |
Fuqing Investment Management Ltd. Reg S 3.25%, 06/23/25 | | | 700 | | | | 624,690 | |
Glory Health Industry Ltd. Reg S 14.25%, 01/25/24(d) * | | | 200 | | | | 14,934 | |
Industrial & Commercial Bank of China Ltd. Reg S 3.20% (US Treasury Yield Curve Rate T 5 Year+2.37%), 9/24/2026(o) | | | 8,380 | | | | 7,914,176 | |
| Longfor Group Holdings Ltd. Reg S | | | | | | | | |
| 3.85%, 01/13/32 | | | 400 | | | | 213,248 | |
| 3.95%, 09/16/29 | | | 1,050 | | | | 630,447 | |
| 4.50%, 01/16/28 | | | 800 | | | | 536,794 | |
Mianyang Investment Holding Group Co. Ltd. Reg S 6.70%, 08/08/25 | | | 400 | | | | 399,991 | |
Pingan Real Estate Capital Ltd. Reg S 3.45%, 07/29/26 | | | 300 | | | | 246,008 | |
RKPF Overseas 2019 A Ltd. Reg S 6.00%, 09/04/25 | | | 400 | | | | 104,492 | |
West China Cement Ltd. Reg S 4.95%, 07/08/26 | | | 800 | | | | 652,365 | |
Zhangzhou Transportation Development Group Co. Ltd. Reg S 4.98%, 06/01/25 | | | 600 | | | | 595,020 | |
| | | | | | | | 17,416,092 | |
| Colombia: 5.6% | | | | | | | | |
Aris Mining Corp. 144A 6.88%, 08/09/26 | | | 450 | | | | 417,866 | |
Banco de Bogota SA 144A 6.25%, 05/12/26 | | | 1,450 | | | | 1,424,471 | |
Canacol Energy Ltd. 144A 5.75%, 11/24/28 | | | 700 | | | | 330,284 | |
| Ecopetrol SA | | | | | | | | |
| 4.62%, 11/02/31 | | | 1,036 | | | | 837,212 | |
| 5.38%, 06/26/26 | | | 1,250 | | | | 1,219,567 | |
See Notes to Financial Statements
| | | Par
(000’s | ) | | Value | |
| Colombia (continued) | | | | | | | | |
| 5.88%, 05/28/45 | | $ | 1,675 | | | $ | 1,189,306 | |
| 5.88%, 11/02/51 | | | 625 | | | | 423,791 | |
| 6.88%, 04/29/30 | | | 1,675 | | | | 1,598,954 | |
| 7.38%, 09/18/43 | | | 708 | | | | 623,992 | |
| 8.38%, 01/19/36 | | | 1,550 | | | | 1,507,796 | |
| 8.62%, 01/19/29 | | | 1,000 | | | | 1,040,983 | |
| 8.88%, 01/13/33 | | | 1,900 | | | | 1,945,839 | |
| Empresas Publicas de Medellin ESP 144A | | | | | | | | |
| 4.25%, 07/18/29 | | | 1,400 | | | | 1,194,879 | |
| 4.38%, 02/15/31 | | | 775 | | | | 631,548 | |
Geopark Ltd. 144A 5.50%, 01/17/27 | | | 675 | | | | 607,081 | |
Grupo Aval Ltd. 144A 4.38%, 02/04/30 | | | 1,400 | | | | 1,165,733 | |
Grupo de Inversiones Suramericana SA 144A 5.50%, 04/29/26 | | | 700 | | | | 682,407 | |
Oleoducto Central SA 144A 4.00%, 07/14/27 | | | 600 | | | | 555,883 | |
Orazul Energy Peru SA 144A 5.62%, 04/28/27 | | | 500 | | | | 470,875 | |
Telecomunicaciones Digitales SA 144A 4.50%, 01/30/30 | | | 850 | | | | 748,114 | |
Telefonica Celular del Paraguay SA 144A 5.88%, 04/15/27 | | | 700 | | | | 690,669 | |
Termocandelaria Power Ltd. 144A 7.88%, 01/30/29 | | | 613 | | | | 607,172 | |
| | | | | | | | 19,914,422 | |
| Costa Rica: 0.3% | | | | | | | | |
| Instituto Costarricense de Electricidad 144A | | | | | | | | |
| 6.38%, 05/15/43† | | | 575 | | | | 502,464 | |
| 6.75%, 10/07/31 | | | 450 | | | | 449,100 | |
| | | | | | | | 951,564 | |
| Cyprus: 0.3% | | | | | | | | |
| MHP Lux SA 144A | | | | | | | | |
| 6.25%, 09/19/29 | | | 525 | | | | 357,352 | |
| 6.95%, 04/03/26 | | | 775 | | | | 623,303 | |
| | | | | | | | 980,655 | |
| Czech Republic: 0.3% | | | | | | | | |
| Energo-Pro AS 144A | | | | | | | | |
| 8.50%, 02/04/27 | | | 650 | | | | 653,347 | |
| 11.00%, 11/02/28 | | | 400 | | | | 434,000 | |
| | | | | | | | 1,087,347 | |
| Dominican Republic: 0.1% | | | | | | | | |
Empresa Generadora de Electricidad Haina SA 144A 5.62%, 11/08/28 | | | 400 | | | | 364,621 | |
| France: 0.1% | | | | | | | | |
Aeropuertos Dominicanos Siglo XXI SA 144A 6.75%, 03/30/29 | | | 500 | | | | 501,925 | |
| | | Par
(000’s | ) | | Value | |
| Georgia: 0.3% | | | | | | | | |
Georgian Railway JSC 144A 4.00%, 06/17/28 | | $ | 575 | | | $ | 521,297 | |
Silknet JSC 144A 8.38%, 01/31/27 | | | 475 | | | | 481,199 | |
| | | | | | | | 1,002,496 | |
| Ghana: 0.2% | | | | | | | | |
Kosmos Energy Ltd. 144A 7.12%, 04/04/26† | | | 875 | | | | 848,055 | |
| Greece: 0.2% | | | | | | | | |
Navios South American Logistics, Inc. / Navios Logistics Finance US Inc 144A 10.75%, 07/01/25 | | | 675 | | | | 680,154 | |
| Guatemala: 0.5% | | | | | | | | |
Banco Industrial SA 144A 4.88% (US Treasury Yield Curve Rate T 5 Year+4.44%), 01/29/31 | | | 450 | | | | 431,194 | |
Central American Bottling Corp. / CBC Bottling Holdco SL / Beliv Holdco SL 144A 5.25%, 04/27/29 | | | 1,450 | | | | 1,354,945 | |
| | | | | | | | 1,786,139 | |
| Honduras: 0.1% | | | | | | | | |
Inversiones Atlantida SA 144A 7.50%, 05/19/26 | | | 475 | | | | 465,263 | |
| Hong Kong: 7.1% | | | | | | | | |
Agile Group Holdings Ltd. Reg S 6.05%, 10/13/25 | | | 650 | | | | 69,056 | |
Bank of East Asia Ltd. Reg S 5.83% (US Treasury Yield Curve Rate T 5 Year+5.53%), 10/21/2025(o) | | | 1,000 | | | | 962,500 | |
CAS Capital No 1 Ltd. Reg S 4.00% (US Treasury Yield Curve Rate T 5 Year+3.64%), 7/12/2026(o) | | | 1,050 | | | | 955,500 | |
Central Plaza Development Ltd. Reg S 3.85%, 07/14/25 | | | 600 | | | | 551,190 | |
| Champion Path Holdings Ltd. Reg S | | | | | | | | |
| 4.50%, 01/27/26 | | | 650 | | | | 615,386 | |
| 4.85%, 01/27/28 | | | 675 | | | | 605,239 | |
China CITIC Bank International Ltd. Reg S 3.25% (US Treasury Yield Curve Rate T 5 Year+2.53%), 7/29/2026(o) | | | 750 | | | | 706,897 | |
| 4.80% (US Treasury Yield Curve Rate T 5 Year+2.10%), 4/22/2027(o) | | | 900 | | | | 876,439 | |
See Notes to Financial Statements
VANECK EMERGING MARKETS HIGH YIELD BOND ETF
SCHEDULE OF INVESTMENTS
(continued)
| | | Par
(000’s | ) | | Value | |
| Hong Kong (continued) | | | | | | | | |
China Oil & Gas Group Ltd. Reg S 4.70%, 06/30/26 | | $ | 500 | | | $ | 434,146 | |
China Water Affairs Group Ltd. Reg S 4.85%, 05/18/26 | | | 500 | | | | 448,615 | |
| Fortune Star BVI Ltd. Reg S | | | | | | | | |
| 5.00%, 05/18/26 | | | 750 | | | | 668,175 | |
| 5.05%, 01/27/27 | | | 600 | | | | 511,919 | |
Franshion Brilliant Ltd. Reg S 4.25%, 07/23/29 | | | 650 | | | | 445,540 | |
| 6.00% (US Treasury Yield Curve Rate T 5 Year+5.58%), 2/8/2026(o) | | | 700 | | | | 593,179 | |
Health & Happiness H&H International Holdings Ltd. Reg S 13.50%, 06/26/26 | | | 400 | | | | 422,517 | |
| Huarong Finance 2017 Co. Ltd. Reg S | | | | | | | | |
| 4.25%, 11/07/27 | | | 1,700 | | | | 1,549,618 | |
| 4.75%, 04/27/27 | | | 1,050 | | | | 983,062 | |
| 4.95%, 11/07/47 | | | 550 | | | | 424,754 | |
Huarong Finance 2019 Co. Ltd. Reg S 4.50%, 05/29/29 | | | 750 | | | | 670,252 | |
Li & Fung Ltd. Reg S 5.00%, 08/18/25 | | | 400 | | | | 389,598 | |
| Melco Resorts Finance Ltd. 144A | | | | | | | | |
| 4.88%, 06/06/25 | | | 1,400 | | | | 1,364,597 | |
| 5.25%, 04/26/26 | | | 525 | | | | 504,363 | |
| 5.38%, 12/04/29 | | | 1,600 | | | | 1,431,860 | |
| 5.62%, 07/17/27† | | | 825 | | | | 780,830 | |
| 5.75%, 07/21/28 | | | 1,175 | | | | 1,090,676 | |
Nanyang Commercial Bank Ltd. Reg S 6.50% (US Treasury Yield Curve Rate T 5 Year+3.51%), 4/28/2027(o) | | | 800 | | | | 801,382 | |
| 7.35% (US Treasury Yield Curve Rate T 5 Year+3.16%), 9/7/2028(o) | | | 400 | | | | 409,848 | |
| RKPF Overseas 2020 A Ltd. Reg S | | | | | | | | |
| 5.12%, 07/26/26 | | | 700 | | | | 129,701 | |
| 5.20%, 01/12/26 | | | 800 | | | | 164,736 | |
Seaspan Corp. 144A 5.50%, 08/01/29 | | | 1,000 | | | | 861,435 | |
| Studio City Finance Ltd. 144A | | | | | | | | |
| 5.00%, 01/15/29 | | | 1,489 | | | | 1,267,448 | |
| 6.50%, 01/15/28 | | | 675 | | | | 631,120 | |
| Vanke Real Estate Hong Kong Co. Ltd. Reg S | | | | | | | | |
| 3.15%, 05/12/25 | | | 650 | | | | 424,408 | |
| 3.50%, 11/12/29 | | | 450 | | | | 181,714 | |
| 3.98%, 11/09/27 | | | 1,300 | | | | 559,392 | |
| Westwood Group Holdings Ltd. Reg S | | | | | | | | |
| | | Par
(000’s | ) | | Value | |
| Hong Kong (continued) | | | | | | | | |
| 2.80%, 01/20/26 | | $ | 750 | | | $ | 703,125 | |
Yanlord Land HK Co. Ltd. Reg S 5.12%, 05/20/26 | | | 750 | | | | 605,808 | |
Yuexiu REIT MTN Co. Ltd. Reg S 2.65%, 02/02/26 | | | 550 | | | | 485,692 | |
| | | | | | | | 25,281,717 | |
| Hungary: 0.3% | | | | | | | | |
OTP Bank Nyrt Reg S 8.75% (US Treasury Yield Curve Rate T 5 Year+5.06%), 05/15/33 | | | 950 | | | | 980,875 | |
| India: 3.7% | | | | | | | | |
Adani Green Energy UP Ltd. / Prayatna Developers Pvt Ltd. / Parampujya Solar Energy Pvt Ltd. 144A 6.70%, 03/12/42 | | | 600 | | | | 553,771 | |
Adani Renewable Energy RJ Ltd./ Kodangal Solar Parks Pvt Ltd. / Wardha Solar Maharashtra 144A 4.62%, 10/15/39 | | | 431 | | | | 349,622 | |
| Delhi International Airport Ltd. 144A | | | | | | | | |
| 6.12%, 10/31/26 | | | 700 | | | | 691,956 | |
| 6.45%, 06/04/29 | | | 700 | | | | 682,482 | |
GMR Hyderabad International Airport Ltd. 144A 4.25%, 10/27/27 | | | 550 | | | | 508,062 | |
| HPCL-Mittal Energy Ltd. Reg S | | | | | | | | |
| 5.25%, 04/28/27 | | | 550 | | | | 527,779 | |
| 5.45%, 10/22/26 | | | 400 | | | | 387,850 | |
IRB Infrastructure Developers Ltd. 144A 7.11%, 03/11/32 | | | 600 | | | | 593,550 | |
JSW Hydro Energy Ltd. 144A 4.12%, 05/18/31 | | | 765 | | | | 667,982 | |
JSW Infrastructure Ltd. 144A 4.95%, 01/21/29 | | | 600 | | | | 552,571 | |
| JSW Steel Ltd. 144A | | | | | | | | |
| 3.95%, 04/05/27 | | | 750 | | | | 691,641 | |
| 5.05%, 04/05/32 | | | 725 | | | | 620,804 | |
Periama Holdings LLC Reg S 5.95%, 04/19/26 | | | 975 | | | | 962,133 | |
ReNew Wind Energy AP2 / ReNew Power Pvt Ltd. other 9 Subsidiaries 144A 4.50%, 07/14/28 | | | 850 | | | | 758,128 | |
| Shriram Finance Ltd. 144A | | | | | | | | |
| 4.15%, 07/18/25 | | | 550 | | | | 532,113 | |
| 6.62%, 04/22/27 | | | 1,000 | | | | 993,728 | |
Tata Motors Ltd. Reg S 5.88%, 05/20/25 | | | 400 | | | | 398,170 | |
| UPL Corp. Ltd. Reg S | | | | | | | | |
See Notes to Financial Statements
| | | Par
(000’s | ) | | Value | |
| India (continued) | | | | | | | | |
| 5.25% (US Treasury Yield Curve Rate T 5 Year+3.87%), 2/27/2025(o) | | $ | 500 | | | $ | 346,510 | |
| Vedanta Resources Finance II Plc 144A | | | | | | | | |
| 9.25%, 04/23/26 | | | 825 | | | | 666,731 | |
| 13.88%, 01/21/27 | | | 658 | | | | 617,245 | |
Vedanta Resources Ltd. 144A 6.12%, 08/09/24 | | | 1,128 | | | | 1,001,432 | |
| | | | | | | | 13,104,260 | |
| Indonesia: 1.2% | | | | | | | | |
Bakrie Telecom Pte Ltd. Reg S 11.50%, 05/07/15(d) *∞ | | | 111 | | | | 1,068 | |
Cikarang Listrindo Tbk PT 144A 4.95%, 09/14/26 | | | 575 | | | | 551,700 | |
Indika Energy Capital IV Pte Ltd. 144A 8.25%, 10/22/25 | | | 625 | | | | 630,076 | |
Japfa Comfeed Indonesia Tbk PT Reg S 5.38%, 03/23/26 | | | 500 | | | | 453,760 | |
Medco Bell Pte Ltd. 144A 6.38%, 01/30/27 | | | 750 | | | | 730,787 | |
Medco Oak Tree Pte Ltd. 144A 7.38%, 05/14/26 | | | 675 | | | | 677,384 | |
Nickel Industries Ltd. 144A 11.25%, 10/21/28 | | | 600 | | | | 649,386 | |
Pakuwon Jati Tbk PT Reg S 4.88%, 04/29/28 | | | 600 | | | | 554,724 | |
| | | | | | | | 4,248,885 | |
| Ireland: 0.4% | | | | | | | | |
C&W Senior Finance Ltd. 144A 6.88%, 09/15/27 | | | 1,600 | | | | 1,516,880 | |
| Israel: 2.9% | | | | | | | | |
Energean Israel Finance Ltd. 144A Reg S 8.50%, 09/30/33 | | | 1,050 | | | | 1,013,002 | |
| Leviathan Bond Ltd. 144A Reg S | | | | | | | | |
| 6.12%, 06/30/25 | | | 825 | | | | 804,416 | |
| 6.50%, 06/30/27 | | | 825 | | | | 776,138 | |
| 6.75%, 06/30/30 | | | 745 | | | | 667,092 | |
Teva Pharmaceutical Finance Co. LLC 6.15%, 02/01/36 | | | 883 | | | | 839,607 | |
| Teva Pharmaceutical Finance Netherlands III BV | | | | | | | | |
| 3.15%, 10/01/26 | | | 3,680 | | | | 3,412,497 | |
| 4.10%, 10/01/46 | | | 2,248 | | | | 1,500,661 | |
| 6.75%, 03/01/28† | | | 1,400 | | | | 1,422,336 | |
| | | | | | | | 10,435,749 | |
| Kuwait: 0.3% | | | | | | | | |
| Kuwait Projects Co. SPC Ltd. Reg S | | | | | | | | |
| | | Par
(000’s | ) | | Value | |
| Kuwait (continued) | | | | | | | | |
| 4.23%, 10/29/26 | | $ | 600 | | | $ | 540,070 | |
| 4.50%, 02/23/27 | | | 750 | | | | 660,000 | |
| | | | | | | | 1,200,070 | |
| Luxembourg: 2.7% | | | | | | | | |
3R Lux SARL 144A 9.75%, 02/05/31 | | | 325 | | | | 341,935 | |
Acu Petroleo Luxembourg Sarl 144A 7.50%, 01/13/32 | | | 339 | | | | 325,159 | |
| Aegea Finance Sarl 144A | | | | | | | | |
| 6.75%, 05/20/29 | | | 250 | | | | 242,640 | |
| 9.00%, 01/20/31 | | | 325 | | | | 340,328 | |
Ambipar Lux Sarl 144A 9.88%, 02/06/31 | | | 500 | | | | 495,283 | |
| Cosan Luxembourg SA 144A | | | | | | | | |
| 7.25%, 06/27/31 | | | 325 | | | | 326,291 | |
| 7.50%, 06/27/30 | | | 375 | | | | 380,121 | |
| CSN Resources SA 144A | | | | | | | | |
| 4.62%, 06/10/31 | | | 625 | | | | 491,921 | |
| 5.88%, 04/08/32† | | | 450 | | | | 376,331 | |
| Energean Israel Finance Ltd. 144A Reg S | | | | | | | | |
| 4.88%, 03/30/26 | | | 795 | | | | 749,665 | |
| 5.38%, 03/30/28 | | | 875 | | | | 778,631 | |
| 5.88%, 03/30/31 | | | 875 | | | | 748,274 | |
FORESEA Holding SA 144A 7.50%, 06/15/30† | | | 200 | | | | 185,732 | |
FS Luxembourg Sarl 144A 8.88%, 02/12/31 | | | 350 | | | | 333,437 | |
Hidrovias International Finance SARL 144A 4.95%, 02/08/31 | | | 250 | | | | 205,997 | |
MC Brazil Downstream Trading Sarl 144A 7.25%, 06/30/31 | | | 1,046 | | | | 906,854 | |
| Minerva Luxembourg SA 144A | | | | | | | | |
| 4.38%, 03/18/31 | | | 875 | | | | 712,213 | |
| 8.88%, 09/13/33† | | | 500 | | | | 513,169 | |
Movida Europe SA 144A 7.85%, 04/11/29 | | | 300 | | | | 280,324 | |
Petrorio Luxembourg Trading Sarl 144A 6.12%, 06/09/26 | | | 400 | | | | 391,305 | |
Poinsettia Finance Ltd. 144A 6.62%, 06/17/31 | | | 167 | | | | 140,227 | |
Rumo Luxembourg Sarl 144A 4.20%, 01/18/32 | | | 325 | | | | 269,474 | |
| | | | | | | | 9,535,311 | |
| Macao: 0.3% | | | | | | | | |
MGM China Holdings Ltd. 144A 4.75%, 02/01/27 | | | 1,000 | | | | 944,628 | |
| Mauritius: 2.6% | | | | | | | | |
Axian Telecom 144A 7.38%, 02/16/27 | | | 525 | | | | 510,216 | |
See Notes to Financial Statements
VANECK EMERGING MARKETS HIGH YIELD BOND ETF
SCHEDULE OF INVESTMENTS
(continued)
| | | Par
(000’s | ) | | Value | |
| Mauritius (continued) | | | | | | | | |
Azure Power Energy Ltd. 144A 3.58%, 08/19/26 | | $ | 539 | | | $ | 482,347 | |
CA Magnum Holdings 144A 5.38%, 10/31/26 | | | 1,325 | | | | 1,250,668 | |
Clean Renewable Power Mauritius Pte Ltd. 144A 4.25%, 03/25/27 | | | 435 | | | | 400,744 | |
Diamond II Ltd. 144A 7.95%, 07/28/26 | | | 575 | | | | 576,343 | |
Greenko Power II Ltd. 144A 4.30%, 12/13/28 | | | 1,328 | | | | 1,186,900 | |
IHS Netherlands Holdco BV 144A 8.00%, 09/18/27 | | | 1,250 | | | | 1,180,938 | |
India Airport Infra 144A 6.25%, 10/25/25 | | | 475 | | | | 474,250 | |
India Clean Energy Holdings 144A 4.50%, 04/18/27 | | | 550 | | | | 493,529 | |
India Green Power Holdings 144A 4.00%, 02/22/27 | | | 607 | | | | 549,863 | |
Liquid Telecommunications Financing Plc 144A 5.50%, 09/04/26 | | | 800 | | | | 472,466 | |
Network i2i Ltd. 144A 3.98% (US Treasury Yield Curve Rate T 5 Year+3.39%), 3/3/2026(o) | | | 775 | | | | 734,227 | |
| UPL Corp. Ltd. Reg S | | | | | | | | |
| 4.50%, 03/08/28 | | | 400 | | | | 344,268 | |
| 4.62%, 06/16/30 | | | 800 | | | | 641,275 | |
| | | | | | | | 9,298,034 | |
| Mexico: 6.7% | | | | | | | | |
Alsea SAB de CV 144A 7.75%, 12/14/26 | | | 725 | | | | 733,090 | |
Banco Nacional de Comercio Exterior SNC 144A 2.72% (US Treasury Yield Curve Rate T 5 Year+2.00%), 08/11/31 | | | 700 | | | | 620,361 | |
Braskem Idesa SAPI 144A 6.99%, 02/20/32† | | | 1,625 | | | | 1,221,394 | |
Cemex SAB de CV 144A 3.88%, 07/11/31† | | | 1,525 | | | | 1,327,921 | |
| 5.12% (US Treasury Yield Curve Rate T 5 Year+4.53%), 6/8/2026(o) | | | 1,400 | | | | 1,347,227 | |
| 5.20%, 09/17/30 | | | 1,000 | | | | 947,448 | |
| 5.45%, 11/19/29 | | | 950 | | | | 917,803 | |
| 9.12% (US Treasury Yield Curve Rate T 5 Year+5.16%), 3/14/2028(o) | | | 1,400 | | | | 1,503,267 | |
CIBanco SA Institution de Banca Multiple Trust 144A 4.38%, 07/22/31 | | | 550 | | | | 448,806 | |
| Electricidad Firme de Mexico Holdings SA de CV 144A | | | | | | | | |
| | | Par
(000’s | ) | | Value | |
| Mexico (continued) | | | | | | | | |
| 4.90%, 11/20/26 | | $ | 450 | | | $ | 429,760 | |
Grupo Aeromexico SAB de CV 144A 8.50%, 03/17/27 | | | 850 | | | | 833,993 | |
Grupo Axo SAPI de CV 144A 5.75%, 06/08/26 | | | 475 | | | | 457,385 | |
Grupo KUO SAB De CV 144A 5.75%, 07/07/27 | | | 625 | | | | 581,653 | |
Metalsa Sapi De Cv 144A 3.75%, 05/04/31 | | | 450 | | | | 364,042 | |
Nemak SAB de CV 144A 3.62%, 06/28/31 | | | 675 | | | | 528,527 | |
| Petroleos Mexicanos | | | | | | | | |
| 4.50%, 01/23/26 | | | 275 | | | | 258,514 | |
| 5.35%, 02/12/28 | | | 475 | | | | 415,568 | |
| 5.50%, 06/27/44 | | | 175 | | | | 102,566 | |
| 5.62%, 01/23/46 | | | 150 | | | | 86,872 | |
| 5.95%, 01/28/31 | | | 900 | | | | 710,678 | |
| 6.35%, 02/12/48† | | | 375 | | | | 231,890 | |
| 6.38%, 01/23/45 | | | 300 | | | | 186,123 | |
| 6.49%, 01/23/27 | | | 375 | | | | 351,910 | |
| 6.50%, 03/13/27 | | | 950 | | | | 890,322 | |
| 6.50%, 01/23/29 | | | 300 | | | | 265,946 | |
| 6.50%, 06/02/41 | | | 375 | | | | 247,985 | |
| 6.62%, 06/15/35 | | | 650 | | | | 480,646 | |
| 6.62%, 06/15/38 | | | 125 | | | | 86,174 | |
| 6.70%, 02/16/32 | | | 1,625 | | | | 1,329,795 | |
| 6.75%, 09/21/47† | | | 1,325 | | | | 846,762 | |
| 6.84%, 01/23/30 | | | 575 | | | | 498,717 | |
| 6.88%, 08/04/26 | | | 600 | | | | 582,729 | |
| 6.95%, 01/28/60 | | | 900 | | | | 573,260 | |
| 7.69%, 01/23/50 | | | 1,925 | | | | 1,341,420 | |
| 8.75%, 06/02/29 | | | 450 | | | | 434,830 | |
| 10.00%, 02/07/33† | | | 475 | | | | 465,684 | |
Sixsigma Networks Mexico SA de CV 144A 7.50%, 05/02/25 | | | 375 | | | | 356,765 | |
| Total Play Telecomunicaciones SA de CV 144A | | | | | | | | |
| 6.38%, 09/20/28 | | | 800 | | | | 427,557 | |
| 10.50%, 12/31/28 | | | 500 | | | | 404,677 | |
| | | | | | | | 23,840,067 | |
| Morocco: 0.8% | | | | | | | | |
| OCP SA 144A | | | | | | | | |
| 3.75%, 06/23/31 | | | 1,125 | | | | 938,212 | |
| 4.50%, 10/22/25 | | | 750 | | | | 735,600 | |
| 5.12%, 06/23/51 | | | 950 | | | | 687,695 | |
| 6.88%, 04/25/44 | | | 725 | | | | 668,090 | |
| | | | | | | | 3,029,597 | |
| Netherlands: 1.9% | | | | | | | | |
| Braskem Netherlands Finance BV 144A | | | | | | | | |
| 7.25%, 02/13/33 | | | 575 | | | | 545,510 | |
| 8.50%, 01/12/31 | | | 550 | | | | 559,444 | |
Coruripe Netherlands BV 144A 10.00%, 02/10/27 | | | 200 | | | | 178,856 | |
See Notes to Financial Statements
| | | Par
(000’s | ) | | Value | |
| Netherlands (continued) | | | | | | | | |
Embraer Netherlands Finance BV 144A 7.00%, 07/28/30 | | $ | 500 | | | $ | 512,075 | |
Greenko Dutch BV 144A 3.85%, 03/29/26 | | | 956 | | | | 893,392 | |
Greenko Dutch BV Reg S 3.85%, 03/29/26 | | | 182 | | | | 170,170 | |
| Petrobras Global Finance BV | | | | | | | | |
| 5.50%, 06/10/51 | | | 325 | | | | 249,300 | |
| 6.50%, 07/03/33† | | | 500 | | | | 493,668 | |
| Teva Pharmaceutical Finance Netherlands III BV | | | | | | | | |
| 4.75%, 05/09/27† | | | 1,125 | | | | 1,077,303 | |
| 5.12%, 05/09/29† | | | 1,005 | | | | 952,751 | |
| 7.88%, 09/15/29 | | | 675 | | | | 709,511 | |
| 8.12%, 09/15/31† | | | 550 | | | | 594,224 | |
| | | | | | | | 6,936,204 | |
| Nigeria: 0.9% | | | | | | | | |
Access Bank Plc 144A 6.12%, 09/21/26 | | | 600 | | | | 558,000 | |
EBN Finance Co. BV 144A 7.12%, 02/16/26 | | | 450 | | | | 431,653 | |
Fidelity Bank Plc 144A 7.62%, 10/28/26 | | | 500 | | | | 476,075 | |
First Bank of Nigeria Ltd. Via FBN Finance Co. BV 144A 8.62%, 10/27/25 | | | 450 | | | | 448,209 | |
SEPLAT Energy Plc 144A 7.75%, 04/01/26 | | | 900 | | | | 871,807 | |
United Bank for Africa Plc 144A 6.75%, 11/19/26 | | | 500 | | | | 478,983 | |
| | | | | | | | 3,264,727 | |
| Oman: 1.6% | | | | | | | | |
Bank Muscat SAOG Reg S 4.75%, 03/17/26 | | | 700 | | | | 680,854 | |
Lamar Funding Ltd. 144A 3.96%, 05/07/25 | | | 1,375 | | | | 1,340,364 | |
| Mazoon Assets Co. SAOC 144A | | | | | | | | |
| 5.20%, 11/08/27 | | | 700 | | | | 687,176 | |
| 5.50%, 02/14/29 | | | 675 | | | | 664,936 | |
OmGrid Funding Ltd. 144A 5.20%, 05/16/27 | | | 600 | | | | 585,457 | |
OQ SAOC 144A 5.12%, 05/06/28 | | | 950 | | | | 922,178 | |
Oztel Holdings SPC Ltd. 144A 6.62%, 04/24/28 | | | 975 | | | | 991,926 | |
| | | | | | | | 5,872,891 | |
| Pakistan: 0.1% | | | | | | | | |
Pakistan Water & Power Development Authority Reg S 7.50%, 06/04/31 | | | 650 | | | | 481,193 | |
| Panama: 1.0% | | | | | | | | |
AES Panama Generation Holdings SRL 144A 4.38%, 05/31/30 | | | 1,620 | | | | 1,363,914 | |
| | | Par
(000’s | ) | | Value | |
| Panama (continued) | | | | | | | | |
Banco General SA 144A 5.25% (US Treasury Yield Curve Rate T 10 Year+3.67%), 5/7/2031(o) | | $ | 550 | | | $ | 461,568 | |
Banistmo SA 144A 4.25%, 07/31/27 | | | 550 | | | | 505,805 | |
Empresa de Transmision Electrica SA 144A 5.12%, 05/02/49 | | | 700 | | | | 482,557 | |
Global Bank Corp. 144A 5.25% (ICE LIBOR USD 3 Month+3.30%), 04/16/29 | | | 500 | | | | 453,352 | |
Multibank, Inc. 144A 7.75%, 02/03/28 | | | 300 | | | | 300,795 | |
| | | | | | | | 3,567,991 | |
| Paraguay: 0.2% | | | | | | | | |
Banco Continental SAECA 144A 2.75%, 12/10/25 | | | 300 | | | | 282,210 | |
Frigorifico Concepcion SA 144A 7.70%, 07/21/28 | | | 425 | | | | 371,818 | |
| | | | | | | | 654,028 | |
| Peru: 2.1% | | | | | | | | |
Banco Internacional del Peru SAA Interbank 144A 4.00% (US Treasury Yield Curve Rate T 1 Year+3.71%), 07/08/30 | | | 400 | | | | 384,281 | |
| 7.62% (US Treasury Yield Curve Rate T 1 Year+3.65%), 01/16/34 | | | 425 | | | | 437,000 | |
Camposol SA 144A 6.00%, 02/03/27 | | | 475 | | | | 372,719 | |
Cia de Minas Buenaventura SAA 144A 5.50%, 07/23/26 | | | 725 | | | | 695,754 | |
InRetail Shopping Malls 144A 5.75%, 04/03/28 | | | 525 | | | | 509,486 | |
Minsur SA 144A 4.50%, 10/28/31† | | | 700 | | | | 608,774 | |
Peru LNG Srl 144A 5.38%, 03/22/30 | | | 1,225 | | | | 1,046,377 | |
| Petroleos del Peru SA 144A | | | | | | | | |
| 4.75%, 06/19/32 | | | 1,425 | | | | 1,068,597 | |
| 5.62%, 06/19/47 | | | 2,700 | | | | 1,668,729 | |
San Miguel Industrias PET SA / NG PET R&P Latin America SA 144A 3.50%, 08/02/28 | | | 525 | | | | 448,400 | |
Volcan Cia Minera SAA 144A 4.38%, 02/11/26 | | | 475 | | | | 322,781 | |
| | | | | | | | 7,562,898 | |
| Philippines: 0.1% | | | | | | | | |
| Rizal Commercial Banking Corp. Reg S | | | | | | | | |
See Notes to Financial Statements
VANECK EMERGING MARKETS HIGH YIELD BOND ETF
SCHEDULE OF INVESTMENTS
(continued)
| | | Par
(000’s | ) | | Value | |
| Philippines (continued) | | | | | | | | |
| 6.50% (US Treasury Yield Curve Rate T 5 Year+6.24%), 8/27/2025(o) $ | | | 400 | | | $ | 392,998 | |
| Poland: 0.4% | | | | | | | | |
| Canpack SA / Canpack US LLC 144A | | | | | | | | |
| 3.12%, 11/01/25† | | | 450 | | | | 432,014 | |
| 3.88%, 11/15/29 | | | 1,150 | | | | 1,008,936 | |
| | | | | | | | 1,440,950 | |
| Saudi Arabia: 0.2% | | | | | | | | |
Dar Al-Arkan Sukuk Co. Ltd. Reg S 6.88%, 02/26/27 | | | 600 | | | | 595,185 | |
| Singapore: 1.6% | | | | | | | | |
Continuum Energy Aura Pte Ltd. 144A 9.50%, 02/24/27 | | | 625 | | | | 630,876 | |
Continuum Energy Levanter Pte Ltd. 144A 4.50%, 02/09/27 | | | 679 | | | | 646,198 | |
GLP Pte Ltd. Reg S 3.88%, 06/04/25 | | | 1,450 | | | | 1,267,445 | |
| 4.50% (US Treasury Yield Curve Rate T 5 Year+3.73%), 5/17/2026(o) | | | 1,100 | | | | 530,915 | |
| 4.60% (US Treasury Yield Curve Rate T 5 Year+3.73%), 6/29/2027(o) | | | 400 | | | | 189,267 | |
Greenko Solar Mauritius Ltd. 144A 5.95%, 07/29/26 | | | 700 | | | | 674,625 | |
Medco Maple Tree Pte Ltd. 144A 8.96%, 04/27/29 | | | 625 | | | | 640,620 | |
Star Energy Geothermal Wayang Windu Ltd. 144A 6.75%, 04/24/33 | | | 626 | | | | 620,003 | |
TML Holdings Pte Ltd. Reg S 4.35%, 06/09/26 | | | 500 | | | | 477,541 | |
| | | | | | | | 5,677,490 | |
| South Africa: 1.6% | | | | | | | | |
| Eskom Holdings SOC Ltd. 144A | | | | | | | | |
| 6.35%, 08/10/28 | | | 1,400 | | | | 1,326,073 | |
| 8.45%, 08/10/28 | | | 675 | | | | 666,130 | |
Eskom Holdings SOC Ltd. Reg S 4.31%, 07/23/27 | | | 550 | | | | 500,156 | |
MTN Mauritius Investments Ltd. 144A 6.50%, 10/13/26 | | | 700 | | | | 699,601 | |
Sasol Financing USA LLC 6.50%, 09/27/28† | | | 1,075 | | | | 1,021,762 | |
Transnet SOC Ltd. 144A 8.25%, 02/06/28 | | | 1,400 | | | | 1,379,896 | |
| | | | | | | | 5,593,618 | |
| Spain: 0.6% | | | | | | | | |
| AES Espana BV 144A | | | | | | | | |
| | | Par
(000’s | ) | | Value | |
| Spain (continued) | | | | | | | | |
| 5.70%, 05/04/28 | | $ | 400 | | | $ | 376,894 | |
AI Candelaria Spain SA 144A 5.75%, 06/15/33 | | | 750 | | | | 580,471 | |
Colombia Telecomunicaciones SA ESP 144A 4.95%, 07/17/30 | | | 700 | | | | 495,082 | |
International Airport Finance SA 144A 12.00%, 03/15/33 | | | 509 | | | | 542,723 | |
| | | | | | | | 1,995,170 | |
| Tanzania: 0.1% | | | | | | | | |
AngloGold Ashanti Holdings Plc 6.50%, 04/15/40 | | | 425 | | | | 417,806 | |
| Thailand: 0.6% | | | | | | | | |
Bangkok Bank PCL 144A 3.73% (US Treasury Yield Curve Rate T 5 Year+1.90%), 09/25/34 | | | 1,600 | | | | 1,393,889 | |
Kasikornbank PCL Reg S 3.34% (US Treasury Yield Curve Rate T 5 Year+1.70%), 10/02/31 | | | 1,000 | | | | 924,252 | |
| | | | | | | | 2,318,141 | |
| Trinidad and Tobago: 0.7% | | | | | | | | |
Heritage Petroleum Co. Ltd. 144A 9.00%, 08/12/29 | | | 700 | | | | 735,350 | |
National Gas Co. of Trinidad & Tobago Ltd. 144A 6.05%, 01/15/36 | | | 525 | | | | 476,054 | |
Telecommunications Services of Trinidad & Tobago Ltd. 144A 8.88%, 10/18/29 | | | 325 | | | | 315,294 | |
Trinidad Generation Unlimited 144A 5.25%, 11/04/27 | | | 850 | | | | 825,477 | |
| | | | | | | | 2,352,175 | |
| Turkey: 6.9% | | | | | | | | |
| Akbank TAS 144A | | | | | | | | |
| 6.80%, 02/06/26 | | | 825 | | | | 828,609 | |
| 6.80% (US Treasury Yield Curve Rate T 5 Year+6.01%), 06/22/31 | | | 650 | | | | 636,584 | |
Anadolu Efes Biracilik Ve Malt Sanayii AS 144A 3.38%, 06/29/28 | | | 575 | | | | 499,146 | |
Arcelik AS Reg S 8.50%, 09/25/28 | | | 500 | | | | 518,550 | |
Aydem Yenilenebilir Enerji AS 144A 7.75%, 02/02/27 | | | 900 | | | | 871,020 | |
Ford Otomotiv Sanayi AS 144A 7.12%, 04/25/29 | | | 600 | | | | 600,714 | |
See Notes to Financial Statements
| | | Par
(000’s | ) | | Value | |
| Turkey (continued) | | | | | | | | |
Limak Iskenderun Uluslararasi Liman Isletmeciligi AS 144A 9.50%, 07/10/36 | | $ | 495 | | | $ | 457,653 | |
Mersin Uluslararasi Liman Isletmeciligi AS 144A 8.25%, 11/15/28 | | | 800 | | | | 822,848 | |
Pegasus Hava Tasimaciligi AS 144A 9.25%, 04/30/26 | | | 550 | | | | 563,392 | |
QNB Finansbank AS Reg S 10.75% (US Treasury Yield Curve Rate T 5 Year+6.24%), 11/15/33 | | | 450 | | | | 487,645 | |
TAV Havalimanlari Holding AS 144A 8.50%, 12/07/28 | | | 575 | | | | 589,030 | |
| TC Ziraat Bankasi AS 144A | | | | | | | | |
| 5.38%, 03/02/26 | | | 800 | | | | 779,720 | |
| 8.00%, 01/16/29 | | | 600 | | | | 606,235 | |
| 9.50%, 08/01/26 | | | 750 | | | | 787,385 | |
Turk Ekonomi Bankasi AS Reg S 9.38% (US Treasury Yield Curve Rate T 5 Year+5.41%), 01/17/34 | | | 500 | | | | 515,587 | |
| Turkcell Iletisim Hizmetleri AS 144A | | | | | | | | |
| 5.75%, 10/15/25 | | | 675 | | | | 669,503 | |
| 5.80%, 04/11/28 | | | 675 | | | | 646,842 | |
Turkiye Garanti Bankasi AS 144A 8.38% (US Treasury Yield Curve Rate T 5 Year+4.09%), 02/28/34† | | | 650 | | | | 646,931 | |
| Turkiye Ihracat Kredi Bankasi AS 144A | | | | | | | | |
| 5.75%, 07/06/26 | | | 1,050 | | | | 1,024,084 | |
| 7.50%, 02/06/28 | | | 750 | | | | 748,905 | |
| 9.00%, 01/28/27 | | | 600 | | | | 624,738 | |
| 9.38%, 01/31/26 | | | 650 | | | | 678,694 | |
| Turkiye Sinai Kalkinma Bankasi AS 144A | | | | | | | | |
| 5.88%, 01/14/26 | | | 550 | | | | 542,845 | |
| 9.38%, 10/19/28 | | | 400 | | | | 426,856 | |
Turkiye Sise ve Cam Fabrikalari AS 144A 6.95%, 03/14/26 | | | 975 | | | | 984,165 | |
| Turkiye Vakiflar Bankasi TAO 144A | | | | | | | | |
| 5.50%, 10/01/26 | | | 675 | | | | 652,049 | |
| 6.50%, 01/08/26† | | | 1,025 | | | | 1,022,143 | |
| 9.00%, 10/12/28 | | | 1,000 | | | | 1,047,647 | |
Turkiye Varlik Fonu Yonetimi AS Reg S 8.25%, 02/14/29 | | | 750 | | | | 759,375 | |
Ulker Biskuvi Sanayi AS 144A 6.95%, 10/30/25† | | | 800 | | | | 797,636 | |
| | | Par
(000’s | ) | | Value | |
| Turkey (continued) | | | | | | | | |
Yapi ve Kredi Bankasi AS 144A 7.88% (US Treasury Yield Curve Rate T 5 Year+7.42%), 01/22/31 | | $ | 700 | | | $ | 699,490 | |
| 9.25%, 10/16/28 | | | 1,000 | | | | 1,062,290 | |
| 9.25% (US Treasury Yield Curve Rate T 5 Year+5.28%), 01/17/34 | | | 925 | | | | 948,301 | |
Ziraat Katilim Varlik Kiralama AS Reg S 9.38%, 11/12/26 | | | 700 | | | | 739,382 | |
Zorlu Yenilenebilir Enerji AS 144A 9.00%, 06/01/26 | | | 400 | | | | 393,800 | |
| | | | | | | | 24,679,794 | |
| Ukraine: 0.7% | | | | | | | | |
Kernel Holding SA 144A 6.75%, 10/27/27 | | | 400 | | | | 291,572 | |
| Metinvest BV 144A | | | | | | | | |
| 7.65%, 10/01/27 | | | 450 | | | | 313,875 | |
| 7.75%, 10/17/29 | | | 700 | | | | 463,155 | |
NAK Naftogaz Ukraine via Kondor Finance Plc 144A 7.62%, 11/08/28 | | | 650 | | | | 399,704 | |
NPC Ukrenergo 144A 6.88%, 11/09/28 | | | 1,100 | | | | 413,655 | |
Ukraine Railways Via Rail Capital Markets Plc Reg S 8.25%, 07/09/26 | | | 900 | | | | 541,281 | |
| | | | | | | | 2,423,242 | |
| United Arab Emirates: 1.8% | | | | | | | | |
Alpha Star Holding VII Ltd. Reg S 7.75%, 04/27/26 | | | 700 | | | | 705,191 | |
Alpha Star Holding VIII Ltd. Reg S 8.38%, 04/12/27 | | | 600 | | | | 612,719 | |
DP World Salaam Reg S 6.00% (US Treasury Yield Curve Rate T 5 Year+5.75%), 10/1/2025(o) | | | 1,950 | | | | 1,937,042 | |
GEMS Menasa Cayman Ltd. / GEMS Education Delaware LLC 144A 7.12%, 07/31/26 | | | 1,250 | | | | 1,243,260 | |
MAF Global Securities Ltd. Reg S 6.38% (US Treasury Yield Curve Rate T 5 Year+3.54%), 12/20/2025(o) | | | 550 | | | | 543,775 | |
Shelf Drilling Holdings Ltd. 144A 9.62%, 04/15/29 | | | 1,500 | | | | 1,420,866 | |
| | | | | | | | 6,462,853 | |
| United Kingdom: 3.2% | | | | | | | | |
| Allwyn Entertainment Financing UK Plc 144A | | | | | | | | |
See Notes to Financial Statements
VANECK EMERGING MARKETS HIGH YIELD BOND ETF
SCHEDULE OF INVESTMENTS
(continued)
| | | Par
(000’s | ) | | Value | |
| United Kingdom (continued) | | | | | | | | |
| 7.88%, 04/30/29 | | $ | 850 | | | $ | 870,179 | |
| Avianca Midco 2 Plc 144A | | | | | | | | |
| 9.00%, 12/01/28 | | | 425 | | | | 401,643 | |
| 9.00%, 12/01/28 | | | 1,900 | | | | 1,795,582 | |
Bidvest Group UK Plc 144A 3.62%, 09/23/26 | | | 1,125 | | | | 1,040,487 | |
Endeavour Mining Plc 144A 5.00%, 10/14/26 | | | 675 | | | | 636,187 | |
| IHS Holding Ltd. 144A | | | | | | | | |
| 5.62%, 11/29/26 | | | 675 | | | | 622,222 | |
| 6.25%, 11/29/28 | | | 750 | | | | 649,836 | |
Tullow Oil Plc 144A 10.25%, 05/15/26 | | | 2,000 | | | | 1,950,100 | |
Ukraine Railways Via Rail Capital Markets Plc Reg S 7.88%, 07/15/28 | | | 200 | | | | 117,750 | |
Vedanta Resources Finance II Plc 144A 13.88%, 12/09/28 | | | 1,386 | | | | 1,261,680 | |
| WE Soda Investments Holding Plc 144A | | | | | | | | |
| 9.38%, 02/14/31 | | | 600 | | | | 612,316 | |
| 9.50%, 10/06/28 | | | 1,400 | | | | 1,448,899 | |
| | | | | | | | 11,406,881 | |
| United States: 4.7% | | | | | | | | |
ABRA Global Finance 144A 11.50%, 03/02/28 | | | 620 | | | | 561,594 | |
| Azul Secured Finance LLP 144A | | | | | | | | |
| 10.88%, 05/28/30 | | | 350 | | | | 285,123 | |
| 11.93%, 08/28/28 | | | 550 | | | | 546,691 | |
Energuate Trust 144A 5.88%, 05/03/27 | | | 500 | | | | 473,143 | |
EnfraGen Energia Sur SA / EnfraGen Spain SA / Prime Energia SpA 144A 5.38%, 12/30/30 | | | 1,000 | | | | 818,871 | |
| Kosmos Energy Ltd. 144A | | | | | | | | |
| 7.50%, 03/01/28 | | | 650 | | | | 621,435 | |
| 7.75%, 05/01/27 | | | 600 | | | | 584,815 | |
Mercury Chile Holdco LLC 144A 6.50%, 01/24/27 | | | 500 | | | | 480,730 | |
| MGM China Holdings Ltd. 144A | | | | | | | | |
| 5.25%, 06/18/25 | | | 658 | | | | 648,127 | |
| 5.88%, 05/15/26 | | | 1,100 | | | | 1,081,150 | |
Mong Duong Finance Holdings BV 144A 5.12%, 05/07/29 | | | 876 | | | | 836,415 | |
Playtika Holding Corp. 144A 4.25%, 03/15/29 | | | 800 | | | | 689,102 | |
| Sasol Financing USA LLC | | | | | | | | |
| 4.38%, 09/18/26† | | | 800 | | | | 754,080 | |
| 5.50%, 03/18/31 | | | 1,200 | | | | 998,473 | |
Sasol Financing USA LLC 144A 8.75%, 05/03/29 | | | 1,300 | | | | 1,308,255 | |
| | | Par
(000’s | ) | | Value | |
| United States (continued) | | | | | | | | |
SierraCol Energy Andina LLC 144A 6.00%, 06/15/28† | | $ | 858 | | | $ | 743,434 | |
| Stillwater Mining Co. 144A | | | | | | | | |
| 4.00%, 11/16/26 | | | 900 | | | | 806,274 | |
| 4.50%, 11/16/29 | | | 750 | | | | 591,473 | |
| Wynn Macau Ltd. 144A | | | | | | | | |
| 5.12%, 12/15/29 | | | 575 | | | | 508,199 | |
| 5.50%, 01/15/26 | | | 1,325 | | | | 1,286,998 | |
| 5.50%, 10/01/27† | | | 625 | | | | 591,608 | |
| 5.62%, 08/26/28 | | | 1,825 | | | | 1,684,561 | |
| | | | | | | | 16,900,551 | |
| Uruguay: 0.1% | | | | | | | | |
Arcos Dorados BV 144A 6.12%, 05/27/29 | | | 450 | | | | 442,800 | |
| Uzbekistan: 0.5% | | | | | | | | |
Ipoteka-Bank ATIB Reg S 5.50%, 11/19/25 | | | 400 | | | | 385,400 | |
National Bank of Uzbekistan Reg S 4.85%, 10/21/25 | | | 400 | | | | 384,976 | |
Uzauto Motors AJ 144A 4.85%, 05/04/26 | | | 400 | | | | 373,600 | |
Uzbekneftegaz JSC 144A 4.75%, 11/16/28 | | | 900 | | | | 755,550 | |
| | | | | | | | 1,899,526 | |
| Zambia: 0.6% | | | | | | | | |
First Quantum Minerals Ltd. 144A 6.88%, 10/15/27 | | | 2,075 | | | | 1,998,050 | |
Total Corporate Bonds
(Cost: $366,387,997) | | | | | | | 338,176,736 | |
| | | | | | | | | |
| GOVERNMENT OBLIGATIONS: 2.8% | | | | | | | | |
| Argentina: 2.1% | | | | | | | | |
Ciudad Autonoma De Buenos Aires 144A 7.50%, 06/01/27 | | | 1,250 | | | | 1,218,781 | |
Provincia de Buenos Aires/ Government Bonds 144A 6.38%, 09/01/37(s) | | | 8,418 | | | | 3,735,522 | |
| Provincia de Cordoba 144A | | | | | | | | |
| 6.88%, 02/01/29(s) | | | 682 | | | | 506,331 | |
| 6.99%, 06/01/27(s) | | | 682 | | | | 545,761 | |
Provincia de Mendoza 144A 5.75%, 03/19/29(s) | | | 654 | | | | 529,615 | |
Provincia de Neuquen 144A 6.75%, 04/27/30(s) | | | 475 | | | | 394,000 | |
Provincia del Chubut 144A 7.75%, 07/26/30(s) | | | 634 | | | | 570,232 | |
| | | | | | | | 7,500,242 | |
| Turkey: 0.6% | | | | | | | | |
| Istanbul Metropolitan Municipality 144A | | | | | | | | |
| 6.38%, 12/09/25 | | | 750 | | | | 738,328 | |
| 10.50%, 12/06/28 | | | 950 | | | | 1,019,968 | |
See Notes to Financial Statements
| | | Par
(000’s | ) | | Value | |
| Turkey (continued) | | | | | | | | |
| 10.75%, 04/12/27 | | $ | 475 | | | $ | 509,423 | |
| | | | | | | | 2,267,719 | |
| Ukraine: 0.1% | | | | | | | | |
State Agency of Roads of Ukraine 144A 6.25%, 06/24/30 | | | 1,000 | | | | 289,335 | |
Total Government Obligations
(Cost: $10,324,479) | | | | | | | 10,057,296 | |
Total Investments Before Collateral for Securities Loaned: 97.3%
(Cost: $376,712,476) | | | | | | | 348,234,032 | |
| | | Number
of Shares | | | Value | |
| SHORT-TERM INVESTMENT HELD AS COLLATERAL FOR SECURITIES ON LOAN: 2.7% | | | | | |
Money Market Fund: 2.7%
(Cost: $9,793,937) | | | | | | | | |
| State Street Navigator Securities Lending Government Money Market Portfolio | | | 9,793,937 | | | $ | 9,793,937 | |
Total Investments: 100.0%
(Cost: $386,506,413) | | | | | | | 358,027,969 | |
| Other assets less liabilities: 0.0% | | | | | | | 2,105 | |
| NET ASSETS: 100.0% | | | | | | $ | 358,030,074 | |
Definitions:
| LIBOR | London Interbank Offered Rate |
| USD | United States Dollar |
Footnotes:
| (d) | Security in default |
| (o) | Perpetual Maturity — the date shown is the next call date |
| (s) | The rate shown reflects the rate in effect at the end of the reporting period. Coupon adjusts periodically based upon a predetermined schedule |
| * | Non-income producing |
| ^ | Zero Coupon Bond |
| † | Security fully or partially on loan. Total market value of securities on loan is $12,053,662. |
| ∞ | Security is valued using significant unobservable inputs that factor in discount for lack of marketability and is classified as Level 3 in the fair value hierarchy. |
| | |
| Reg S | Security was purchased pursuant to Regulation S under the Securities Act of 1933, which exempts from registration securities offered and sold outside of the United States. Such a security cannot be sold in the United States without either an effective registration statement filed pursuant to the Securities Act of 1933, or pursuant to an exemption from registration. |
| 144A | Security exempt from registration under Rule 144A of the Securities Act of 1933, as amended, or otherwise restricted. These securities may be resold in transactions exempt from registration, unless otherwise noted. These securities have an aggregate value of $244,120,229, or 68.2% of net assets. |
Summary of Investments by Sector
Excluding Collateral for Securities Loaned | | % of
Investments | | Value | |
| Financials | | | 28.7 | % | | $ | 99,836,239 | |
| Energy | | | 19.6 | | | | 68,241,341 | |
| Basic Materials | | | 11.9 | | | | 41,638,334 | |
| Industrials | | | 10.2 | | | | 35,412,224 | |
| Utilities | | | 8.0 | | | | 27,837,813 | |
| Consumer Cyclicals | | | 5.1 | | | | 17,695,515 | |
| Technology | | | 4.2 | | | | 14,480,472 | |
| Consumer Non-Cyclicals | | | 3.4 | | | | 11,837,937 | |
| Healthcare | | | 3.3 | | | | 11,605,522 | |
| Government | | | 2.9 | | | | 10,057,296 | |
| Real Estate | | | 2.7 | | | | 9,591,339 | |
| | | | 100.0 | % | | $ | 348,234,032 | |
See Notes to Financial Statements
VANECK EMERGING MARKETS HIGH YIELD BOND ETF
SCHEDULE OF INVESTMENTS
(continued)
The summary of inputs used to value the Fund’s investments as of April 30, 2024 is as follows:
| | | Level 1
Quoted
Prices | | | Level 2
Significant
Observable
Inputs | | | Level 3
Significant
Unobservable
Inputs | | | Value | |
| Corporate Bonds | | | | | | | | | | | | | | | | |
| Argentina | | $ | — | | | $ | 11,975,941 | | | $ | — | | | $ | 11,975,941 | |
| Austria | | | — | | | | 268,289 | | | | — | | | | 268,289 | |
| Azerbaijan | | | — | | | | 3,855,320 | | | | — | | | | 3,855,320 | |
| Bahrain | | | — | | | | 2,668,905 | | | | — | | | | 2,668,905 | |
| Bermuda | | | — | | | | 1,004,121 | | | | — | | | | 1,004,121 | |
| Brazil | | | — | | | | 24,467,700 | | | | — | | | | 24,467,700 | |
| British Virgin Islands | | | — | | | | 1,861,858 | | | | — | | | | 1,861,858 | |
| Canada | | | — | | | | 5,049,390 | | | | — | | | | 5,049,390 | |
| Cayman Islands | | | — | | | | 17,102,431 | | | | — | | | | 17,102,431 | |
| Chile | | | — | | | | 5,170,813 | | | | — | | | | 5,170,813 | |
| China | | | — | | | | 17,416,092 | | | | — | | | | 17,416,092 | |
| Colombia | | | — | | | | 19,914,422 | | | | — | | | | 19,914,422 | |
| Costa Rica | | | — | | | | 951,564 | | | | — | | | | 951,564 | |
| Cyprus | | | — | | | | 980,655 | | | | — | | | | 980,655 | |
| Czech Republic | | | — | | | | 1,087,347 | | | | — | | | | 1,087,347 | |
| Dominican Republic | | | — | | | | 364,621 | | | | — | | | | 364,621 | |
| France | | | — | | | | 501,925 | | | | — | | | | 501,925 | |
| Georgia | | | — | | | | 1,002,496 | | | | — | | | | 1,002,496 | |
| Ghana | | | — | | | | 848,055 | | | | — | | | | 848,055 | |
| Greece | | | — | | | | 680,154 | | | | — | | | | 680,154 | |
| Guatemala | | | — | | | | 1,786,139 | | | | — | | | | 1,786,139 | |
| Honduras | | | — | | | | 465,263 | | | | — | | | | 465,263 | |
| Hong Kong | | | — | | | | 25,281,717 | | | | — | | | | 25,281,717 | |
| Hungary | | | — | | | | 980,875 | | | | — | | | | 980,875 | |
| India | | | — | | | | 13,104,260 | | | | — | | | | 13,104,260 | |
| Indonesia | | | — | | | | 4,247,817 | | | | 1,068 | | | | 4,248,885 | |
| Ireland | | | — | | | | 1,516,880 | | | | — | | | | 1,516,880 | |
| Israel | | | — | | | | 10,435,749 | | | | — | | | | 10,435,749 | |
| Kuwait | | | — | | | | 1,200,070 | | | | — | | | | 1,200,070 | |
| Luxembourg | | | — | | | | 9,535,311 | | | | — | | | | 9,535,311 | |
| Macao | | | — | | | | 944,628 | | | | — | | | | 944,628 | |
| Mauritius | | | — | | | | 9,298,034 | | | | — | | | | 9,298,034 | |
| Mexico | | | — | | | | 23,840,067 | | | | — | | | | 23,840,067 | |
| Morocco | | | — | | | | 3,029,597 | | | | — | | | | 3,029,597 | |
| Netherlands | | | — | | | | 6,936,204 | | | | — | | | | 6,936,204 | |
| Nigeria | | | — | | | | 3,264,727 | | | | — | | | | 3,264,727 | |
| Oman | | | — | | | | 5,872,891 | | | | — | | | | 5,872,891 | |
| Pakistan | | | — | | | | 481,193 | | | | — | | | | 481,193 | |
| Panama | | | — | | | | 3,567,991 | | | | — | | | | 3,567,991 | |
| Paraguay | | | — | | | | 654,028 | | | | — | | | | 654,028 | |
| Peru | | | — | | | | 7,562,898 | | | | — | | | | 7,562,898 | |
| Philippines | | | — | | | | 392,998 | | | | — | | | | 392,998 | |
| Poland | | | — | | | | 1,440,950 | | | | — | | | | 1,440,950 | |
| Saudi Arabia | | | — | | | | 595,185 | | | | — | | | | 595,185 | |
| Singapore | | | — | | | | 5,677,490 | | | | — | | | | 5,677,490 | |
| South Africa | | | — | | | | 5,593,618 | | | | — | | | | 5,593,618 | |
| Spain | | | — | | | | 1,995,170 | | | | — | | | | 1,995,170 | |
| Tanzania | | | — | | | | 417,806 | | | | — | | | | 417,806 | |
| Thailand | | | — | | | | 2,318,141 | | | | — | | | | 2,318,141 | |
| Trinidad and Tobago | | | — | | | | 2,352,175 | | | | — | | | | 2,352,175 | |
| Turkey | | | — | | | | 24,679,794 | | | | — | | | | 24,679,794 | |
| Ukraine | | | — | | | | 2,423,242 | | | | — | | | | 2,423,242 | |
| United Arab Emirates | | | — | | | | 6,462,853 | | | | — | | | | 6,462,853 | |
| United Kingdom | | | — | | | | 11,406,881 | | | | — | | | | 11,406,881 | |
| United States | | | — | | | | 16,900,551 | | | | — | | | | 16,900,551 | |
See Notes to Financial Statements
| Uruguay | | $ | — | | | $ | 442,800 | | | $ | — | | | $ | 442,800 | |
| Uzbekistan | | | — | | | | 1,899,526 | | | | — | | | | 1,899,526 | |
| Zambia | | | — | | | | 1,998,050 | | | | — | | | | 1,998,050 | |
| Government Obligations * | | | — | | | | 10,057,296 | | | | — | | | | 10,057,296 | |
| Money Market Fund | | | 9,793,937 | | | | — | | | | — | | | | 9,793,937 | |
| Total Investments | | $ | 9,793,937 | | | $ | 348,232,964 | | | $ | 1,068 | | | $ | 358,027,969 | |
| * | See Schedule of Investments for geographic sector breakouts. |
See Notes to Financial Statements
VANECK FALLEN ANGEL HIGH YIELD BOND ETF
SCHEDULE OF INVESTMENTS
April 30, 2024
| | | Par
(000’s | ) | | Value | |
| CORPORATE BONDS: 98.1% | | | | | | | | |
| Australia: 3.1% | | | | | | | | |
| Buckeye Partners LP | | | | | | | | |
| 3.95%, 12/01/26 | | $ | 30,059 | | | $ | 28,324,433 | |
| 4.12%, 12/01/27 | | | 20,044 | | | | 18,679,828 | |
| 5.60%, 10/15/44 | | | 15,030 | | | | 11,607,414 | |
| 5.85%, 11/15/43 | | | 20,050 | | | | 16,948,265 | |
Port of Newcastle Investments Financing Pty Ltd. 144A 5.90%, 11/24/31 † | | | 15,080 | | | | 13,753,481 | |
| | | | | | | | 89,313,421 | |
| Canada: 4.3% | | | | | | | | |
Bombardier, Inc. 144A 7.45%, 05/01/34 | | | 25,579 | | | | 28,238,704 | |
| Methanex Corp. | | | | | | | | |
| 5.25%, 12/15/29 † | | | 35,064 | | | | 33,269,393 | |
| 5.65%, 12/01/44 | | | 15,025 | | | | 12,728,776 | |
Rogers Communications, Inc. 144A 5.25% (US Treasury Yield Curve Rate T 5 Year+3.59%), 03/15/82 † | | | 37,625 | | | | 35,815,065 | |
TransAlta Corp. 6.50%, 03/15/40 | | | 15,081 | | | | 14,623,232 | |
| | | | | | | | 124,675,170 | |
| Germany: 1.9% | | | | | | | | |
Dresdner Funding Trust I 144A 8.15%, 06/30/31 | | | 50,189 | | | | 54,214,439 | |
| Ireland: 2.7% | | | | | | | | |
| Perrigo Finance Unlimited Co. | | | | | | | | |
| 4.38%, 03/15/26 | | | 35,100 | | | | 33,953,230 | |
| 4.65%, 06/15/30 | | | 37,569 | | | | 34,458,941 | |
| 4.90%, 12/15/44 | | | 15,235 | | | | 12,017,299 | |
| | | | | | | | 80,429,470 | |
| Italy: 6.1% | | | | | | | | |
| Telecom Italia Capital SA | | | | | | | | |
| 6.00%, 09/30/34 † | | | 50,120 | | | | 42,261,217 | |
| 6.38%, 11/15/33 | | | 50,037 | | | | 44,251,772 | |
| 7.20%, 07/18/36 | | | 50,105 | | | | 45,433,786 | |
| 7.72%, 06/04/38 | | | 50,109 | | | | 46,638,821 | |
| | | | | | | | 178,585,596 | |
| United Kingdom: 5.3% | | | | | | | | |
Marks & Spencer Plc 144A 7.12%, 12/01/37 | | | 15,035 | | | | 15,408,170 | |
Standard Chartered Plc 144A 7.01%, 07/30/37 (o) | | | 37,584 | | | | 38,108,334 | |
Vodafone Group Plc 7.00% (USD Swap Semi 30/360 5 Year+4.87%), 04/04/79 | | | 100,229 | | | | 101,850,310 | |
| | | | | | | | 155,366,814 | |
| United States: 74.7% | | | | | | | | |
| Advance Auto Parts, Inc. | | | | | | | | |
| 1.75%, 10/01/27 † | | | 17,550 | | | | 15,079,643 | |
| 3.50%, 03/15/32 † | | | 17,570 | | | | 14,671,885 | |
| 3.90%, 04/15/30 | | | 25,055 | | | | 22,378,520 | |
| | | Par
(000’s | ) | | Value | |
| United States (continued) | | | | | | | | |
| 5.90%, 03/09/26 | | $ | 15,030 | | | $ | 14,994,367 | |
| 5.95%, 03/09/28 † | | | 15,056 | | | | 14,882,409 | |
Banc of California 3.25% (Term SOFR USD 3 Month+2.52%), 05/01/31 | | | 19,295 | | | | 17,675,378 | |
Bath & Body Works, Inc. 6.95%, 03/01/33 | | | 14,269 | | | | 13,801,904 | |
| Brandywine Operating Partnership LP | | | | | | | | |
| 3.95%, 11/15/27 | | | 22,563 | | | | 20,220,076 | |
| 4.55%, 10/01/29 † | | | 17,554 | | | | 15,068,664 | |
| 8.05%, 03/15/28 † | | | 17,545 | | | | 17,847,975 | |
Brightsphere Investment Group, Inc. 4.80%, 07/27/26 | | | 14,241 | | | | 13,721,204 | |
| Constellation Insurance, Inc. 144A | | | | | | | | |
| 6.62%, 05/01/31 † | | | 12,584 | | | | 11,877,933 | |
| 6.80%, 01/24/30 | | | 21,332 | | | | 20,473,391 | |
Crane NXT Co. 4.20%, 03/15/48 | | | 17,620 | | | | 12,104,940 | |
Crown Cork & Seal Co., Inc. 7.38%, 12/15/26 | | | 17,547 | | | | 18,126,384 | |
Delta Air Lines, Inc. 3.75%, 10/28/29 | | | 23,754 | | | | 21,435,838 | |
| 4.38%, 04/19/28 † | | | 20,545 | | | | 19,675,821 | |
Diversified Healthcare Trust 4.75%, 02/15/28 | | | 25,090 | | | | 19,772,382 | |
DPL, Inc. 4.35%, 04/15/29 | | | 20,071 | | | | 18,115,161 | |
Embarq Corp. 8.00%, 06/01/36 | | | 60,764 | | | | 24,913,240 | |
Entegris, Inc. 144A 4.75%, 04/15/29 | | | 80,194 | | | | 75,711,752 | |
| EQM Midstream Partners LP | | | | | | | | |
| 4.12%, 12/01/26 | | | 25,061 | | | | 24,001,188 | |
| 5.50%, 07/15/28 | | | 42,614 | | | | 41,544,565 | |
| 6.50%, 07/15/48 | | | 27,565 | | | | 27,219,759 | |
Fluor Corp. 4.25%, 09/15/28 | | | 29,594 | | | | 27,634,590 | |
Frontier Florida LLC 6.86%, 02/01/28 † | | | 15,083 | | | | 14,312,450 | |
Genting New York LLC / GENNY Capital, Inc. 144A 3.30%, 02/15/26 | | | 26,299 | | | | 25,152,226 | |
Genworth Holdings, Inc. 6.50%, 06/15/34 † | | | 13,159 | | | | 12,285,504 | |
Global Marine, Inc. 7.00%, 06/01/28 | | | 13,073 | | | | 12,054,740 | |
HB Fuller Co. 4.00%, 02/15/27 | | | 15,057 | | | | 14,350,893 | |
Hillenbrand, Inc. 5.00%, 09/15/26 | | | 18,787 | | | | 18,368,426 | |
| Hudson Pacific Properties LP | | | | | | | | |
| 3.25%, 01/15/30 † | | | 20,068 | | | | 15,246,060 | |
| 3.95%, 11/01/27 † | | | 20,070 | | | | 17,747,327 | |
| 4.65%, 04/01/29 † | | | 25,087 | | | | 21,161,443 | |
| 5.95%, 02/15/28 | | | 17,549 | | | | 16,061,115 | |
See Notes to Financial Statements
| | | Par
(000’s | ) | | Value | |
| United States (continued) | | | | | | | | |
| Kohl’s Corp. | | | | | | | | |
| 4.25%, 07/17/25 † | | $ | 17,667 | | | $ | 17,239,565 | |
| 4.62%, 05/01/31 | | | 25,093 | | | | 20,713,499 | |
| 5.55%, 07/17/45 † | | | 21,435 | | | | 14,727,345 | |
Lumen Technologies, Inc. 7.60%, 09/15/39 | | | 17,965 | | | | 5,369,188 | |
| Macy’s Retail Holdings LLC | | | | | | | | |
4.30%, 02/15/43 † | | | 12,554 | | | | 9,941,430 | |
| 4.50%, 12/15/34 † | | | 18,379 | | | | 15,682,029 | |
| 5.12%, 01/15/42 † | | | 12,533 | | | | 10,563,504 | |
Murphy Oil Corp. 5.88%, 12/01/42 | | | 17,019 | | | | 15,002,954 | |
Navient Corp. 5.62%, 08/01/33 | | | 29,780 | | | | 23,680,970 | |
| Newell Brands, Inc. | | | | | | | | |
| 5.70%, 04/01/26 † | | | 99,462 | | | | 97,960,019 | |
| 6.88%, 04/01/36 | | | 21,072 | | | | 18,416,372 | |
| 7.00%, 04/01/46 | | | 33,380 | | | | 27,116,451 | |
| Nordstrom, Inc. | | | | | | | | |
| 4.00%, 03/15/27 | | | 17,553 | | | | 16,675,599 | |
| 4.25%, 08/01/31 † | | | 21,310 | | | | 18,403,121 | |
| 4.38%, 04/01/30 † | | | 25,036 | | | | 22,369,004 | |
| 5.00%, 01/15/44 † | | | 48,405 | | | | 36,794,455 | |
| 6.95%, 03/15/28 † | | | 15,049 | | | | 14,938,480 | |
Oceaneering International, Inc. 6.00%, 02/01/28 † | | | 15,029 | | | | 14,796,659 | |
| Office Properties Income Trust | | | | | | | | |
| 2.40%, 02/01/27 | | | 17,525 | | | | 8,539,175 | |
| 2.65%, 06/15/26 | | | 15,076 | | | | 8,602,868 | |
| 3.45%, 10/15/31 | | | 20,019 | | | | 8,324,952 | |
Qwest Corp. 7.25%, 09/15/25 † | | | 12,533 | | | | 12,430,543 | |
| Resorts World Las Vegas LLC / RWLV Capital, Inc. Reg S | | | | | | | | |
| 4.62%, 04/16/29 | | | 50,254 | | | | 44,639,663 | |
| 4.62%, 04/06/31 | | | 17,651 | | | | 14,989,582 | |
| Rockies Express Pipeline LLC 144A | | | | | | | | |
| 3.60%, 05/15/25 | | | 18,447 | | | | 17,891,584 | |
| 4.80%, 05/15/30 | | | 17,550 | | | | 15,815,739 | |
| 4.95%, 07/15/29 | | | 27,573 | | | | 25,372,089 | |
| 6.88%, 04/15/40 | | | 25,089 | | | | 23,868,976 | |
| 7.50%, 07/15/38 | | | 12,533 | | | | 12,865,716 | |
| Royal Caribbean Cruises Ltd. | | | | | | | | |
| 3.70%, 03/15/28 | | | 25,020 | | | | 23,009,072 | |
| 7.50%, 10/15/27 | | | 15,047 | | | | 15,683,443 | |
Safeway, Inc. 7.25%, 02/01/31 | | | 13,102 | | | | 13,683,846 | |
| Seagate HDD Cayman | | | | | | | | |
| 4.09%, 06/01/29 | | | 24,733 | | | | 22,527,560 | |
| 4.12%, 01/15/31 | | | 13,813 | | | | 12,003,505 | |
| 4.88%, 06/01/27 † | | | 25,332 | | | | 24,492,753 | |
| 5.75%, 12/01/34 | | | 24,521 | | | | 23,270,736 | |
Sealed Air Corp. 144A 6.88%, 07/15/33 † | | | 22,591 | | | | 22,768,539 | |
| Service Properties Trust | | | | | | | | |
| | | Par
(000’s | ) | | Value | |
| United States (continued) | | | | | | | | |
| 3.95%, 01/15/28 | | $ | 20,050 | | | $ | 17,123,997 | |
| 4.38%, 02/15/30 | | | 20,036 | | | | 15,268,003 | |
| 4.75%, 10/01/26 | | | 22,572 | | | | 20,978,727 | |
| 4.95%, 02/15/27 † | | | 20,055 | | | | 18,474,285 | |
| 4.95%, 10/01/29 † | | | 21,310 | | | | 17,450,006 | |
| 5.25%, 02/15/26 | | | 17,559 | | | | 16,905,144 | |
| Spirit AeroSystems, Inc. | | | | | | | | |
| 3.85%, 06/15/26 | | | 15,032 | | | | 14,369,783 | |
| 4.60%, 06/15/28 | | | 35,100 | | | | 32,379,875 | |
Steelcase, Inc. 5.12%, 01/18/29 | | | 22,596 | | | | 21,163,234 | |
Tenet Healthcare Corp. 6.88%, 11/15/31 † | | | 18,131 | | | | 18,703,613 | |
| Toledo Hospital | | | | | | | | |
| 4.98%, 11/15/45 | | | 13,749 | | | | 9,411,191 | |
| 5.33%, 11/15/28 † | | | 16,071 | | | | 15,113,811 | |
| 6.01%, 11/15/48 † | | | 20,101 | | | | 16,192,562 | |
Topaz Solar Farms LLC 144A 5.75%, 09/30/39 | | | 26,553 | | | | 26,313,943 | |
| Transocean, Inc. | | | | | | | | |
| 6.80%, 03/15/38 † | | | 30,531 | | | | 24,736,555 | |
| 7.50%, 04/15/31 † | | | 19,829 | | | | 17,914,905 | |
| Travel + Leisure Co. | | | | | | | | |
| 6.00%, 04/01/27 | | | 20,072 | | | | 19,842,900 | |
| 6.60%, 10/01/25 | | | 17,554 | | | | 17,667,030 | |
Under Armour, Inc. 3.25%, 06/15/26 | | | 30,077 | | | | 28,345,927 | |
United States Cellular Corp. 6.70%, 12/15/33 † | | | 27,310 | | | | 26,677,274 | |
United States Steel Corp. 6.65%, 06/01/37 | | | 13,757 | | | | 13,552,274 | |
Valley National Bancorp 3.00% (Term SOFR USD 3 Month+2.36%), 06/15/31 | | | 15,091 | | | | 11,331,676 | |
| Vornado Realty LP | | | | | | | | |
| 2.15%, 06/01/26 | | | 20,070 | | | | 18,227,747 | |
| 3.40%, 06/01/31 | | | 17,573 | | | | 13,656,945 | |
Walgreen Co. 4.40%, 09/15/42 | | | 12,870 | | | | 10,322,873 | |
| Walgreens Boots Alliance, Inc. | | | | | | | | |
| 3.20%, 04/15/30 † | | | 25,040 | | | | 21,485,337 | |
| 3.45%, 06/01/26 | | | 72,540 | | | | 68,597,945 | |
| 4.10%, 04/15/50 † | | | 34,910 | | | | 24,567,593 | |
| 4.50%, 11/18/34 † | | | 15,186 | | | | 13,073,304 | |
| 4.65%, 06/01/46 † | | | 15,890 | | | | 12,821,512 | |
| 4.80%, 11/18/44 † | | | 36,270 | | | | 29,337,238 | |
Western Alliance Bancorp 3.00% (Term SOFR USD 3 Month+2.25%), 06/15/31 † | | | 30,079 | | | | 25,656,485 | |
| Xerox Corp. | | | | | | | | |
| 4.80%, 03/01/35 | | | 12,615 | | | | 8,525,375 | |
| 6.75%, 12/15/39 † | | | 17,602 | | | | 13,425,616 | |
XPO CNW, Inc. 6.70%, 05/01/34 | | | 14,997 | | | | 15,269,436 | |
Yum! Brands, Inc. 5.35%, 11/01/43 | | | 13,839 | | | | 12,875,699 | |
See Notes to Financial Statements
VANECK FALLEN ANGEL HIGH YIELD BOND ETF
SCHEDULE OF INVESTMENTS
(continued)
| | | Par
(000’s | ) | | Value | |
United States (continued) 6.88%, 11/15/37 | | $ | 16,338 | | | $ | 17,358,999 | |
| | | | | | | | 2,185,978,957 | |
Total Corporate Bonds
(Cost: $3,019,239,929) | | | | | | | 2,868,563,867 | |
| | | | | | | | | |
| | | Number
of Shares | | | | |
| SHORT-TERM INVESTMENT HELD AS COLLATERAL FOR SECURITIES ON LOAN: 5.0% | | | | | |
Money Market Fund: 5.0%
(Cost: $147,489,017) | | | | | | | | |
| State Street Navigator Securities Lending Government Money Market Portfolio | | | 147,489,017 | | | | 147,489,017 | |
Total Investments: 103.1%
(Cost: $3,166,728,946) | | | | | | | 3,016,052,884 | |
| Liabilities in excess of other assets: (3.1)% | | | | (89,708,360) | |
| NET ASSETS: 100.0% | | | | | | $ | 2,926,344,524 | |
Definitions:
| SOFR | Secured Overnight Financing Rate |
| USD | United States Dollar |
Footnotes:
| † | Security fully or partially on loan. Total market value of securities on loan is $180,703,191. |
| (o) | Perpetual Maturity — the date shown is the next call date |
| | |
| Reg S | Security was purchased pursuant to Regulation S under the Securities Act of 1933, which exempts from registration securities offered and sold outside of the United States. Such a security cannot be sold in the United States without either an effective registration statement filed pursuant to the Securities Act of 1933, or pursuant to an exemption from registration. |
| 144A | Security exempt from registration under Rule 144A of the Securities Act of 1933, as amended, or otherwise restricted. These securities may be resold in transactions exempt from registration, unless otherwise noted. These securities have an aggregate value of $463,650,081, or 15.8% of net assets. |
Summary of Investments by Sector
Excluding Collateral for Securities Loaned | | % of
Investments | | Value | |
| Consumer Cyclicals | | | 22.9 | % | | $ | 656,914,143 | |
| Technology | | | 19.7 | | | | 565,598,514 | |
| Energy | | | 12.2 | | | | 348,645,370 | |
| Real Estate | | | 10.7 | | | | 306,676,891 | |
| Industrials | | | 8.7 | | | | 250,708,070 | |
| Financials | | | 8.0 | | | | 229,025,313 | |
| Consumer Non-Cyclicals | | | 7.3 | | | | 209,297,818 | |
| Healthcare | | | 4.9 | | | | 139,850,646 | |
| Basic Materials | | | 4.0 | | | | 114,796,259 | |
| Utilities | | | 1.1 | | | | 32,738,393 | |
| Communications | | | 0.5 | | | | 14,312,450 | |
| | | | 100.0 | % | | $ | 2,868,563,867 | |
See Notes to Financial Statements
The summary of inputs used to value the Fund’s investments as of April 30, 2024 is as follows:
| | | Level 1
Quoted
Prices | | | Level 2
Significant
Observable
Inputs | | | Level 3
Significant
Unobservable
Inputs | | | Value | |
| Corporate Bonds * | | $ | — | | | $ | 2,868,563,867 | | | $ | — | | | $ | 2,868,563,867 | |
| Money Market Fund | | | 147,489,017 | | | | — | | | | — | | | | 147,489,017 | |
| Total Investments | | $ | 147,489,017 | | | $ | 2,868,563,867 | | | $ | — | | | $ | 3,016,052,884 | |
| * | See Schedule of Investments for geographic sector breakouts. |
See Notes to Financial Statements
VANECK GREEN BOND ETF
SCHEDULE OF INVESTMENTS
April 30, 2024
| | | Par
(000’s | ) | | Value | |
| CORPORATE BONDS: 87.8% | | | | | | | | |
| Argentina: 0.1% | | | | | | | | |
Genneia SA 144A 8.75%, 09/02/27 | | $ | 70 | | | $ | 68,285 | |
| Australia: 1.2% | | | | | | | | |
Bank of China Ltd. Reg S 0.75%, 09/29/24 | | | 200 | | | | 195,863 | |
China Construction Bank Corp. Reg S 4.50%, 05/31/26 | | | 200 | | | | 196,819 | |
FMG Resources August 2006 Pty Ltd. 144A 6.12%, 04/15/32 | | | 300 | | | | 290,825 | |
Muenchener Rueckversicherungs-
Gesellschaft AG in Muenchen 144A 5.88% (US Treasury Yield Curve Rate T 5 Year+3.98%), 05/23/42 | | | 450 | | | | 447,493 | |
| | | | | | | | 1,131,000 | |
| Bermuda: 0.4% | | | | | | | | |
Bacardi Ltd. / Bacardi-
Martini BV 144A 5.25%, 01/15/29 † | | | 200 | | | | 194,770 | |
Investment Energy Resources Ltd. 144A 6.25%, 04/26/29 | | | 200 | | | | 191,644 | |
| | | | | | | | 386,414 | |
| Brazil: 1.1% | | | | | | | | |
Banco BTG Pactual SA 144A 2.75%, 01/11/26 † | | | 150 | | | | 141,381 | |
Klabin Austria GmbH 144A 7.00%, 04/03/49 | | | 150 | | | | 146,278 | |
Klabin Finance SA 144A 4.88%, 09/19/27 | | | 140 | | | | 135,330 | |
Rumo Luxembourg Sarl 144A 5.25%, 01/10/28 | | | 200 | | | | 190,281 | |
Suzano Austria GmbH 144A 5.75%, 07/14/26 | | | 50 | | | | 49,849 | |
Suzano International Finance BV 5.50%, 01/17/27 † | | | 375 | | | | 370,203 | |
| | | | | | | | 1,033,322 | |
| British Virgin Islands: 0.3% | | | | | | | | |
Amipeace Ltd. Reg S 1.75%, 11/09/26 | | | 300 | | | | 273,967 | |
| Canada: 1.5% | | | | | | | | |
Azure Power Solar Energy Private Ltd. 144A 5.65%, 12/24/24 | | | 100 | | | | 97,785 | |
Brookfield Finance, Inc. 2.72%, 04/15/31 | | | 250 | | | | 208,815 | |
Canadian Imperial Bank of Commerce 0.95%, 10/23/25 | | | 250 | | | | 234,002 | |
| CDP Financial, Inc. Reg S | | | | | | | | |
| | | Par
(000’s | ) | | Value | |
| Canada (continued) | | | | | | | | |
| 1.00%, 05/26/26 | | $ | 350 | | | $ | 321,598 | |
Liberty Utilities Finance GP 1 144A 2.05%, 09/15/30 | | | 200 | | | | 157,935 | |
TransAlta Corp. 7.75%, 11/15/29 | | | 200 | | | | 204,909 | |
Tucson Electric Power Co. 1.50%, 08/01/30 | | | 150 | | | | 119,750 | |
| | | | | | | | 1,344,794 | |
| Cayman Islands: 1.2% | | | | | | | | |
Adib Sukuk Co. II Ltd. Reg S 5.70%, 11/15/28 | | | 200 | | | | 202,431 | |
Aldar Investment Properties Sukuk Ltd. Reg S 4.88%, 05/24/33 | | | 200 | | | | 190,551 | |
DP World Crescent Ltd. Reg S 5.50%, 09/13/33 | | | 350 | | | | 343,240 | |
Hongkong Land Finance Cayman Islands Co. Ltd. Reg S 2.25%, 07/15/31 | | | 200 | | | | 159,603 | |
Saudi Electricity Global Sukuk Co. 5 Reg S 1.74%, 09/17/25 | | | 200 | | | | 189,494 | |
| | | | | | | | 1,085,319 | |
| Chile: 1.3% | | | | | | | | |
Colbun SA 144A 3.15%, 01/19/32 | | | 150 | | | | 123,569 | |
Interchile SA 144A 4.50%, 06/30/56 | | | 350 | | | | 279,723 | |
| Inversiones CMPC SA 144A | | | | | | | | |
| 4.38%, 04/04/27 | | | 250 | | | | 238,741 | |
| 6.12%, 06/23/33 | | | 200 | | | | 198,012 | |
| Sociedad Quimica y Minera de Chile SA 144A | | | | | | | | |
| 3.50%, 09/10/51 | | | 300 | | | | 190,055 | |
| 6.50%, 11/07/33 † | | | 200 | | | | 200,652 | |
| | | | | | | | 1,230,752 | |
| China: 2.2% | | | | | | | | |
China Construction Bank Corp. Reg S 1.25%, 08/04/25 | | | 400 | | | | 379,015 | |
China Merchants Bank Co. Ltd. Reg S 1.20%, 09/10/25 | | | 400 | | | | 376,509 | |
ICBCIL Finance Co. Ltd. Reg S 6.63% (Term SOFR USD 3 Month+1.05%), 11/20/24 | | | 200 | | | | 200,494 | |
Industrial & Commercial Bank of China Ltd. Reg S 6.39% (SOFR Compound Index+1.04%), 09/16/24 | | | 500 | | | | 500,968 | |
Lenovo Group Ltd. 144A 6.54%, 07/27/32 | | | 200 | | | | 206,892 | |
| Midea Investment Development Co. Ltd. Reg S | | | | | | | | |
See Notes to Financial Statements
| | | Par
(000’s | ) | | Value | |
| China (continued) | | | | | | | | |
| 2.88%, 02/24/27 | | $ | 200 | | | $ | 185,324 | |
Wuhan Metro Group Co. Ltd. Reg S 2.96%, 09/24/24 | | | 200 | | | | 197,259 | |
| | | | | | | | 2,046,461 | |
| Colombia: 0.1% | | | | | | | | |
Consorcio Transmantaro SA 144A 4.70%, 04/16/34 | | | 150 | | | | 136,368 | |
| Denmark: 0.2% | | | | | | | | |
Kommunekredit Reg S 5.12%, 11/01/27 | | | 200 | | | | 200,342 | |
| Dominican Republic: 0.1% | | | | | | | | |
UEP Penonome II SA 144A 6.50%, 10/01/38 | | | 86 | | | | 71,395 | |
| France: 0.8% | | | | | | | | |
BNP Paribas SA 144A 1.68% (SOFR+0.91%), 06/30/27 | | | 300 | | | | 275,151 | |
Electricite de France SA 144A 3.62%, 10/13/25 | | | 450 | | | | 437,567 | |
| | | | | | | | 712,718 | |
| Georgia: 0.1% | | | | | | | | |
Georgian Railway JSC 144A 4.00%, 06/17/28 | | | 100 | | | | 90,660 | |
| Germany: 2.9% | | | | | | | | |
Bank of China Ltd. Reg S 3.12%, 06/16/25 | | | 200 | | | | 194,727 | |
| Kreditanstalt fuer Wiederaufbau | | | | | | | | |
| 0.75%, 09/30/30 | | | 550 | | | | 430,521 | |
| 1.00%, 10/01/26 | | | 1,050 | | | | 956,001 | |
| 1.75%, 09/14/29 † | | | 500 | | | | 428,808 | |
| 4.38%, 02/28/34 | | | 450 | | | | 435,832 | |
Landesbank Baden- Wuerttemberg Reg S 2.00%, 02/24/25 | | | 188 | | | | 182,507 | |
| | | | | | | | 2,628,396 | |
| Hong Kong: 2.9% | | | | | | | | |
Agricultural Bank of China Ltd. Reg S 2.00%, 03/01/25 | | | 500 | | | | 485,337 | |
Airport Authority Reg S 1.75%, 01/12/27 | | | 300 | | | | 274,844 | |
China Development Bank Reg S 0.62%, 09/09/24 | | | 200 | | | | 196,326 | |
China Water Affairs Group Ltd. Reg S 4.85%, 05/18/26 | | | 200 | | | | 179,446 | |
ICBCIL Finance Co. Ltd. Reg S 2.25%, 11/02/26 | | | 200 | | | | 184,550 | |
Industrial & Commercial Bank of China Ltd. Reg S 2.95%, 06/01/25 | | | 200 | | | | 194,375 | |
| Industrial Bank Co. Ltd. Reg S | | | | | | | | |
| | | Par
(000’s | ) | | Value | |
| Hong Kong (continued) | | | | | | | | |
| 3.25%, 05/18/25 | | $ | 200 | | | $ | 195,407 | |
Link Finance Cayman 2009 Ltd. Reg S 2.88%, 07/21/26 | | | 200 | | | | 188,609 | |
MTR Corp. CI Ltd. Reg S 2.50%, 11/02/26 | | | 200 | | | | 187,488 | |
MTR Corp. Ltd. Reg S 1.62%, 08/19/30 | | | 400 | | | | 324,813 | |
Xiaomi Best Time International Ltd. Reg S 4.10%, 07/14/51 | | | 100 | | | | 69,040 | |
Yanlord Land HK Co. Ltd. Reg S 5.12%, 05/20/26 | | | 200 | | | | 161,549 | |
| | | | | | | | 2,641,784 | |
| Hungary: 0.2% | | | | | | | | |
MVM Energetika Zrt Reg S 7.50%, 06/09/28 | | | 200 | | | | 205,988 | |
| India: 1.8% | | | | | | | | |
Adani Green Energy Ltd. 144A 4.38%, 09/08/24 | | | 250 | | | | 247,624 | |
Adani Green Energy UP Ltd. / Prayatna Developers Pvt Ltd. / Parampujya Solar Energy Pvt Ltd. 144A 6.70%, 03/12/42 | | | 100 | | | | 92,295 | |
Adani Renewable Energy RJ Ltd./ Kodangal Solar Parks Pvt Ltd. / Wardha Solar Maharashtra 144A 4.62%, 10/15/39 | | | 173 | | | | 139,849 | |
Indian Railway Finance Corp. Ltd. 144A 3.57%, 01/21/32 † | | | 100 | | | | 86,062 | |
Indian Railway Finance Corp. Ltd. Reg S 3.83%, 12/13/27 | | | 200 | | | | 187,085 | |
JSW Hydro Energy Ltd. 144A 4.12%, 05/18/31 | | | 161 | | | | 140,628 | |
Power Finance Corp. Ltd. Reg S 3.75%, 12/06/27 | | | 200 | | | | 186,437 | |
REC Ltd. 144A 5.62%, 04/11/28 | | | 200 | | | | 198,590 | |
REC Ltd. Reg S 3.88%, 07/07/27 | | | 200 | | | | 188,357 | |
ReNew Wind Energy AP2 / ReNew Power Pvt Ltd. other 9 Subsidiaries 144A 4.50%, 07/14/28 | | | 200 | | | | 178,383 | |
| | | | | | | | 1,645,310 | |
| Indonesia: 0.6% | | | | | | | | |
Pertamina Geothermal Energy PT 144A 5.15%, 04/27/28 | | | 200 | | | | 196,674 | |
See Notes to Financial Statements
VANECK GREEN BOND ETF
SCHEDULE OF INVESTMENTS
(continued)
| | | Par
(000’s | ) | | Value | |
| Indonesia (continued) | | | | | | | | |
Star Energy Geothermal Darajat II / Star Energy Geothermal Salak 144A 4.85%, 10/14/38 | | $ | 400 | | | $ | 356,380 | |
| | | | | | | | 553,054 | |
| Ireland: 1.2% | | | | | | | | |
Ardagh Metal Packaging Finance USA LLC / Ardagh Metal Packaging Finance Plc 144A 6.00%, 06/15/27 | | | 200 | | | | 194,088 | |
Bank of Ireland Group Plc 144A 6.25% (US Treasury Yield Curve Rate T 1 Year+2.65%), 09/16/26 | | | 350 | | | | 350,949 | |
| Smurfit Kappa Treasury ULC 144A | | | | | | | | |
| 5.20%, 01/15/30 | | | 300 | | | | 293,024 | |
| 5.78%, 04/03/54 | | | 300 | | | | 287,765 | |
| | | | | | | | 1,125,826 | |
| Japan: 3.7% | | | | | | | | |
Central Nippon Expressway Co. Ltd. Reg S 0.89%, 12/10/25 | | | 200 | | | | 185,239 | |
| Honda Motor Co. Ltd. | | | | | | | | |
| 2.27%, 03/10/25 | | | 200 | | | | 194,614 | |
| 2.97%, 03/10/32 | | | 600 | | | | 516,596 | |
| Japan Bank for International Cooperation | | | | | | | | |
| 1.62%, 01/20/27 | | | 200 | | | | 182,185 | |
| 4.38%, 10/05/27 | | | 250 | | | | 244,404 | |
Marubeni Corp. Reg S 1.58%, 09/17/26 | | | 200 | | | | 181,429 | |
| Norinchukin Bank 144A | | | | | | | | |
| 1.28%, 09/22/26 | | | 450 | | | | 406,883 | |
| 2.08%, 09/22/31 | | | 200 | | | | 159,004 | |
| NTT Finance Corp. 144A | | | | | | | | |
| 4.24%, 07/25/25 | | | 200 | | | | 196,658 | |
| 4.37%, 07/27/27 | | | 250 | | | | 242,397 | |
Renesas Electronics Corp. 144A 1.54%, 11/26/24 | | | 150 | | | | 146,177 | |
Sumitomo Mitsui Financial Group, Inc. 2.47%, 01/14/29 | | | 200 | | | | 175,317 | |
Sumitomo Mitsui Trust Bank Ltd. 144A 1.55%, 03/25/26 | | | 375 | | | | 348,263 | |
Toyota Motor Credit Corp. 2.15%, 02/13/30 | | | 200 | | | | 169,027 | |
| | | | | | | | 3,348,193 | |
| Luxembourg: 2.3% | | | | | | | | |
| European Investment Bank | | | | | | | | |
1.62%, 05/13/31 | | | 500 | | | | 407,716 | |
| 3.75%, 02/14/33 | | | 1,300 | | | | 1,206,268 | |
FS Luxembourg Sarl 144A 8.88%, 02/12/31 | | | 200 | | | | 190,535 | |
| | | Par
(000’s | ) | | Value | |
| Luxembourg (continued) | | | | | | | | |
Raizen Fuels Finance SA 144A 6.45%, 03/05/34 | | $ | 300 | | | $ | 299,100 | |
| | | | | | | | 2,103,619 | |
| Macao: 0.8% | | | | | | | | |
Bank of China Ltd. Reg S 6.13% (SOFR Compound Index+0.78%), 04/28/25 | | | 500 | | | | 500,133 | |
China Construction Bank Corp. Reg S 5.86% (SOFR Compound Index+0.50%), 12/21/24 | | | 200 | | | | 199,713 | |
| | | | | | | | 699,846 | |
| Mauritius: 0.9% | | | | | | | | |
Diamond II Ltd. 144A 7.95%, 07/28/26 | | | 100 | | | | 100,233 | |
Greenko Power II Ltd. 144A 4.30%, 12/13/28 | | | 90 | | | | 80,468 | |
Greenko Wind Projects Mauritius Ltd. 144A 5.50%, 04/06/25 | | | 250 | | | | 246,556 | |
India Clean Energy Holdings 144A 4.50%, 04/18/27 | | | 100 | | | | 89,733 | |
India Cleantech Energy 144A 4.70%, 08/10/26 | | | 128 | | | | 119,467 | |
India Green Power Holdings 144A 4.00%, 02/22/27 | | | 187 | | | | 169,189 | |
| | | | | | | | 805,646 | |
| Mexico: 0.4% | | | | | | | | |
Coca-Cola Femsa SAB de CV 1.85%, 09/01/32 | | | 250 | | | | 188,515 | |
Trust Fibra Uno 144A 7.38%, 02/13/34 | | | 200 | | | | 195,878 | |
| | | | | | | | 384,393 | |
| Netherlands: 3.7% | | | | | | | | |
ABN AMRO Bank NV 144A 2.47% (US Treasury Yield Curve Rate T 1 Year+1.10%), 12/13/29 | | | 350 | | | | 302,066 | |
Alcoa Nederland Holding BV 144A 7.12%, 03/15/31 | | | 200 | | | | 202,552 | |
Cooperatieve Rabobank UA 144A 1.00% (US Treasury Yield Curve Rate T 1 Year+0.73%), 09/24/26 | | | 350 | | | | 327,556 | |
| 1.11% (US Treasury Yield Curve Rate T 1 Year+0.55%), 02/24/27 | | | 250 | | | | 230,002 | |
Greenko Dutch BV 144A 3.85%, 03/29/26 | | | 455 | | | | 425,425 | |
ING Groep NV 144A 1.40% (US Treasury Yield Curve Rate T 1 Year+1.10%), 07/01/26 | | | 450 | | | | 427,156 | |
| 4.62%, 01/06/26 | | | 300 | | | | 295,089 | |
See Notes to Financial Statements
| | | Par
(000’s | ) | | Value | |
| Netherlands (continued) | | | | | | | | |
| Nederlandse Waterschapsbank NV 144A | | | | | | | | |
| 1.00%, 05/28/30 | | $ | 100 | | | $ | 79,541 | |
| 2.38%, 03/24/26 | | | 350 | | | | 332,438 | |
| NXP BV / NXP Funding LLC / NXP USA, Inc. | | | | | | | | |
| 2.50%, 05/11/31 | | | 550 | | | | 449,136 | |
| 3.40%, 05/01/30 | | | 200 | | | | 177,678 | |
| 5.00%, 01/15/33 | | | 200 | | | | 189,767 | |
| | | | | | | | 3,438,406 | |
| Norway: 0.6% | | | | | | | | |
| Kommunalbanken AS 144A | | | | | | | | |
| 0.50%, 10/21/24 | | | 200 | | | | 195,480 | |
| 2.12%, 02/11/25 | | | 325 | | | | 316,417 | |
| | | | | | | | 511,897 | |
| Pakistan: 0.2% | | | | | | | | |
Pakistan Water & Power Development Authority Reg S 7.50%, 06/04/31 | | | 200 | | | | 148,059 | |
| Portugal: 0.4% | | | | | | | | |
EDP Finance BV 144A 1.71%, 01/24/28 | | | 400 | | | | 348,730 | |
| Qatar: 0.2% | | | | | | | | |
QNB Finance Ltd. Reg S 1.62%, 09/22/25 | | | 200 | | | | 189,125 | |
| Saudi Arabia: 0.5% | | | | | | | | |
Saudi Electricity Global Sukuk Co. 5 Reg S 2.41%, 09/17/30 | | | 500 | | | | 419,835 | |
| Singapore: 2.0% | | | | | | | | |
Continuum Energy Aura Pte Ltd. 144A 9.50%, 02/24/27 | | | 100 | | | | 100,940 | |
Continuum Energy Levanter Pte Ltd. 144A 4.50%, 02/09/27 | | | 170 | | | | 161,550 | |
Greenko Solar Mauritius Ltd. 144A 5.95%, 07/29/26 | | | 300 | | | | 289,125 | |
Industrial & Commercial Bank of China Ltd. Reg S 1.00%, 10/28/24 | | | 450 | | | | 439,420 | |
| 5.95% (SOFR Compound Index+0.60%), 10/25/26 | | | 800 | | | | 801,786 | |
Star Energy Geothermal Wayang Windu Ltd. 144A 6.75%, 04/24/33 | | | 78 | | | | 77,500 | |
| | | | | | | | 1,870,321 | |
| South Africa: 0.2% | | | | | | | | |
Bank of China Ltd. Reg S 1.88%, 02/16/25 | | | 200 | | | | 194,308 | |
| South Korea: 5.5% | | | | | | | | |
| Export-Import Bank of Korea | | | | | | | | |
| 2.12%, 01/18/32 | | | 550 | | | | 441,716 | |
| 5.12%, 01/11/33 | | | 200 | | | | 196,083 | |
| | | Par
(000’s | ) | | Value | |
| South Korea (continued) | | | | | | | | |
Export-Import Bank of Korea 144A 1.75%, 10/19/28 | | $ | 250 | | | $ | 216,563 | |
Hyundai Capital Services, Inc. 144A 1.25%, 02/08/26 | | | 300 | | | | 276,794 | |
| Kia Corp. 144A | | | | | | | | |
| 1.75%, 10/16/26 | | | 200 | | | | 182,206 | |
| 2.38%, 02/14/25 | | | 200 | | | | 194,721 | |
Korea Development Bank 0.75%, 01/25/25 | | | 200 | | | | 193,208 | |
Korea East-West Power Co. Ltd. 144A 3.60%, 05/06/25 | | | 200 | | | | 195,872 | |
| Korea Electric Power Corp. 144A | | | | | | | | |
| 3.62%, 06/14/25 | | | 200 | | | | 195,648 | |
| 4.88%, 01/31/27 | | | 450 | | | | 443,500 | |
| 5.38%, 04/06/26 | | | 200 | | | | 199,358 | |
Korea Hydro & Nuclear Power Co. Ltd. 144A 5.00%, 07/18/28 | | | 200 | | | | 197,034 | |
Korea South-East Power Co. Ltd. Reg S 2.12%, 02/03/25 | | | 200 | | | | 194,660 | |
Korea Water Resources Corp. Reg S 3.50%, 04/27/25 | | | 200 | | | | 195,881 | |
| LG Chem Ltd. 144A | | | | | | | | |
| 1.38%, 07/07/26 | | | 200 | | | | 181,418 | |
| 2.38%, 07/07/31 | | | 225 | | | | 182,319 | |
| 3.25%, 10/15/24 | | | 250 | | | | 247,025 | |
| 3.62%, 04/15/29 | | | 50 | | | | 45,719 | |
| LG Energy Solution Ltd. 144A | | | | | | | | |
| 5.62%, 09/25/26 | | | 200 | | | | 198,806 | |
| 5.75%, 09/25/28 | | | 100 | | | | 100,061 | |
POSCO 144A 4.88%, 01/23/27 | | | 150 | | | | 146,844 | |
| SK Hynix, Inc. 144A | | | | | | | | |
| 2.38%, 01/19/31 | | | 250 | | | | 200,649 | |
| 6.50%, 01/17/33 | | | 200 | | | | 205,995 | |
SK On Co. Ltd. Reg S 5.38%, 05/11/26 | | | 200 | | | | 198,631 | |
| | | | | | | | 5,030,711 | |
| Spain: 0.6% | | | | | | | | |
| Avangrid, Inc. | | | | | | | | |
| 3.20%, 04/15/25 | | | 331 | | | | 322,805 | |
| 3.80%, 06/01/29 | | | 250 | | | | 228,154 | |
| | | | | | | | 550,959 | |
| Supranational: 4.0% | | | | | | | | |
| European Bank for Reconstruction & Development | | | | | | | | |
| 1.50%, 02/13/25 | | | 100 | | | | 96,991 | |
| 1.62%, 09/27/24 | | | 500 | | | | 492,349 | |
| European Investment Bank | | | | | | | | |
| 0.75%, 09/23/30 | | | 600 | | | | 468,950 | |
| 1.62%, 10/09/29 | | | 380 | | | | 323,132 | |
See Notes to Financial Statements
VANECK GREEN BOND ETF
SCHEDULE OF INVESTMENTS
(continued)
| | | Par
(000’s | ) | | Value | |
| Supranational (continued) | | | | | | | | |
| 2.12%, 04/13/26 † | | $ | 300 | | | $ | 283,783 | |
| 2.38%, 05/24/27 | | | 650 | | | | 604,024 | |
European Investment Bank 144A 2.88%, 06/13/25 | | | 750 | | | | 730,183 | |
| International Bank for Reconstruction & Development | | | | | | | | |
| 2.12%, 03/03/25 | | | 280 | | | | 272,679 | |
| 3.12%, 11/20/25 | | | 75 | | | | 72,652 | |
International Finance Corp. 2.12%, 04/07/26 | | | 344 | | | | 325,386 | |
| | | | | | | | 3,670,129 | |
| Sweden: 0.3% | | | | | | | | |
Swedbank AB 144A 1.54%, 11/16/26 | | | 350 | | | | 318,104 | |
| Turkey: 0.2% | | | | | | | | |
Aydem Yenilenebilir Enerji AS 144A 7.75%, 02/02/27 | | | 200 | | | | 193,560 | |
| United Arab Emirates: 1.7% | | | | | | | | |
Emirates NBD Bank PJSC Reg S 5.88%, 10/11/28 | | | 200 | | | | 204,344 | |
Industrial & Commercial Bank of China Ltd. Reg S 6.28% (SOFR Compound Index+0.93%), 01/19/26 | | | 400 | | | | 402,816 | |
| MAF Sukuk Ltd. Reg S | | | | | | | | |
| 3.93%, 02/28/30 | | | 200 | | | | 183,525 | |
| 4.64%, 05/14/29 | | | 200 | | | | 192,353 | |
Masdar Abu Dhabi Future Energy Co. Reg S 4.88%, 07/25/33 | | | 200 | | | | 191,026 | |
MDGH GMTN RSC Ltd. 144A 5.88%, 05/01/34 | | | 200 | | | | 205,525 | |
Sweihan PV Power Co. PJSC 144A 3.62%, 01/31/49 | | | 190 | | | | 149,988 | |
| | | | | | | | 1,529,577 | |
| United Kingdom: 2.0% | | | | | | | | |
Atlantica Sustainable Infrastructure Plc 144A 4.12%, 06/15/28 | | | 200 | | | | 181,290 | |
Brookfield Finance I UK Plc / Brookfield Finance, Inc. 2.34%, 01/30/32 | | | 150 | | | | 118,692 | |
China Construction Bank Corp. Reg S 3.12%, 05/17/25 | | | 350 | | | | 340,893 | |
China Merchants Bank Co. Ltd. Reg S 6.01% (SOFR Compound Index+0.65%), 06/13/26 | | | 200 | | | | 200,609 | |
Niagara Mohawk Power Corp. 144A 1.96%, 06/27/30 | | | 300 | | | | 244,186 | |
| | | Par
(000’s | ) | | Value | |
| United Kingdom (continued) | | | | | | | | |
Shanghai Pudong Development Bank Co. Ltd./London Reg S 3.25%, 07/14/25 | | $ | 200 | | | $ | 194,420 | |
Swire Properties MTN Financing Ltd. Reg S 3.50%, 01/10/28 | | | 200 | | | | 186,271 | |
Vmed O2 UK Financing I Plc 144A 4.75%, 07/15/31 | | | 450 | | | | 375,983 | |
| | | | | | | | 1,842,344 | |
| United States: 37.4% | | | | | | | | |
AES Andes SA 144A 6.35% (US Treasury Yield Curve Rate T 5 Year+4.92%), 10/07/79 | | | 200 | | | | 194,899 | |
| AES Corp. | | | | | | | | |
| 1.38%, 01/15/26 | | | 350 | | | | 324,229 | |
| 2.45%, 01/15/31 | | | 355 | | | | 285,764 | |
| 5.45%, 06/01/28 | | | 200 | | | | 196,996 | |
| Alexandria Real Estate Equities, Inc. | | | | | | | | |
| 2.00%, 05/18/32 | | | 350 | | | | 267,162 | |
| 2.95%, 03/15/34 | | | 311 | | | | 245,459 | |
| 3.80%, 04/15/26 | | | 150 | | | | 144,805 | |
Aligned Data Centers Issuer LLC 144A 1.94%, 08/15/46 | | | 388 | | | | 352,773 | |
American Homes 4 Rent LP 5.50%, 02/01/34 | | | 200 | | | | 192,922 | |
Amgen, Inc. 3.00%, 02/22/29 | | | 250 | | | | 226,401 | |
Apple, Inc. 3.00%, 06/20/27 | | | 300 | | | | 282,372 | |
| Ardagh Metal Packaging Finance USA LLC / Ardagh Metal Packaging Finance Plc 144A | | | | | | | | |
| 3.25%, 09/01/28 | | | 200 | | | | 173,458 | |
| 4.00%, 09/01/29 † | | | 305 | | | | 251,698 | |
Arizona Public Service Co. 2.65%, 09/15/50 | | | 200 | | | | 113,088 | |
| AvalonBay Communities, Inc. | | | | | | | | |
| 1.90%, 12/01/28 | | | 100 | | | | 86,278 | |
| 2.05%, 01/15/32 † | | | 250 | | | | 199,861 | |
Bank of America Corp. 2.46% (Term SOFR USD 3 Month+1.13%), 10/22/25 | | | 650 | | | | 639,462 | |
Bank of China Ltd. Reg S 4.62%, 06/26/26 | | | 300 | | | | 294,914 | |
| Boston Properties LP | | | | | | | | |
| 2.45%, 10/01/33 | | | 400 | | | | 289,969 | |
| 3.40%, 06/21/29 † | | | 225 | | | | 197,021 | |
| 4.50%, 12/01/28 | | | 575 | | | | 536,306 | |
| 6.50%, 01/15/34 | | | 300 | | | | 300,013 | |
CenterPoint Energy Houston Electric LLC 5.30%, 04/01/53 | | | 100 | | | | 94,136 | |
See Notes to Financial Statements
| | | Par
(000’s | ) | | Value | |
| United States (continued) | | | | | | | | |
| Clearway Energy Operating LLC 144A | | | | | | | | |
| 3.75%, 02/15/31 | | $ | 350 | | | $ | 296,303 | |
| 4.75%, 03/15/28 | | | 275 | | | | 259,405 | |
Comcast Corp. 4.65%, 02/15/33 | | | 300 | | | | 283,920 | |
Constellation Energy Generation LLC 5.75%, 03/15/54 | | | 300 | | | | 282,527 | |
Dana, Inc. 4.25%, 09/01/30 | | | 125 | | | | 108,435 | |
Deutsche Bank AG 1.69%, 03/19/26 | | | 300 | | | | 279,472 | |
Dominion Energy, Inc. 2.25%, 08/15/31 | | | 250 | | | | 199,235 | |
| DTE Electric Co. | | | | | | | | |
| 1.90%, 04/01/28 | | | 150 | | | | 132,429 | |
| 3.25%, 04/01/51 | | | 200 | | | | 132,101 | |
| 3.95%, 03/01/49 | | | 290 | | | | 224,436 | |
Duke Energy Carolinas LLC 3.95%, 11/15/28 † | | | 450 | | | | 426,165 | |
Duke Energy Progress LLC 3.45%, 03/15/29 | | | 300 | | | | 276,575 | |
| Equinix, Inc. | | | | | | | | |
| 1.00%, 09/15/25 | | | 300 | | | | 280,724 | |
| 2.50%, 05/15/31 | | | 400 | | | | 326,292 | |
| 3.90%, 04/15/32 | | | 350 | | | | 309,658 | |
ERP Operating LP 4.15%, 12/01/28 | | | 200 | | | | 190,537 | |
Evergy Kansas Central, Inc. 2.55%, 07/01/26 | | | 100 | | | | 94,184 | |
| Fannie Mae-Aces | | | | | | | | |
| 1.44%, 10/25/29 | | | 300 | | | | 246,205 | |
| 2.44%, 10/25/29 | | | 37 | | | | 32,436 | |
| 2.52%, 08/25/29 | | | 235 | | | | 206,978 | |
| 2.64%, 07/25/24 | | | 69 | | | | 68,110 | |
| 2.82%, 02/25/27 | | | 203 | | | | 191,297 | |
| 2.94%, 06/25/29 | | | 8 | | | | 7,497 | |
| 3.00%, 01/25/28 | | | 371 | | | | 344,999 | |
| 3.06%, 09/25/27 | | | 246 | | | | 230,039 | |
| 3.13%, 03/25/28 | | | 204 | | | | 189,887 | |
| 3.17%, 03/25/28 | | | 378 | | | | 351,818 | |
| 3.17%, 02/25/30 | | | 319 | | | | 288,390 | |
| 3.20%, 11/25/27 | | | 13 | | | | 11,951 | |
| 3.41%, 06/25/28 | | | 316 | | | | 295,715 | |
| 3.67%, 09/25/28 | | | 488 | | | | 458,912 | |
| 3.86%, 09/25/30 | | | 89 | | | | 82,495 | |
Federal Realty OP LP 1.25%, 02/15/26 | | | 100 | | | | 92,533 | |
Fifth Third Bancorp 1.71% (SOFR+0.69%), 11/01/27 | | | 200 | | | | 180,798 | |
| Ford Motor Co. | | | | | | | | |
| 3.25%, 02/12/32 | | | 1,150 | | | | 926,671 | |
| 6.10%, 08/19/32 | | | 250 | | | | 245,324 | |
| Freddie Mac Multifamily Structured Pass Through Certificates | | | | | | | | |
| | | Par
(000’s | ) | | Value | |
| United States (continued) | | | | | | | | |
| 1.30%, 06/25/30 | | $ | 30 | | | $ | 24,162 | |
| 1.49%, 11/25/30 | | | 400 | | | | 321,534 | |
| 2.88%, 04/25/26 | | | 285 | | | | 272,804 | |
| General Motors Co. | | | | | | | | |
| 5.40%, 10/15/29 | | | 150 | | | | 147,612 | |
| 5.60%, 10/15/32 † | | | 550 | | | | 540,683 | |
Hanwha Q Cells Americas Holdings Corp. 144A 5.00%, 07/27/28 | | | 200 | | | | 196,385 | |
HAT Holdings I LLC / HAT Holdings II LLC 144A 6.00%, 04/15/25 † | | | 150 | | | | 149,372 | |
| Healthpeak OP LLC | | | | | | | | |
| 1.35%, 02/01/27 | | | 200 | | | | 179,275 | |
| 2.12%, 12/01/28 † | | | 100 | | | | 86,633 | |
| Host Hotels & Resorts LP | | | | | | | | |
| 2.90%, 12/15/31 | | | 250 | | | | 203,493 | |
| 3.38%, 12/15/29 | | | 100 | | | | 87,332 | |
Hyundai Capital America 144A 5.80%, 06/26/25 | | | 200 | | | | 199,828 | |
| Interstate Power & Light Co. | | | | | | | | |
| 3.50%, 09/30/49 | | | 300 | | | | 205,571 | |
| 4.10%, 09/26/28 | | | 350 | | | | 331,279 | |
Jabil, Inc. 4.25%, 05/15/27 | | | 200 | | | | 191,766 | |
Johnson Controls International plc / Tyco Fire & Security Finance SCA 1.75%, 09/15/30 | | | 200 | | | | 161,303 | |
JPMorgan Chase & Co. 0.77% (SOFR+0.49%), 08/09/25 | | | 500 | | | | 492,818 | |
| 6.07% (SOFR+1.33%), 10/22/27 | | | 500 | | | | 505,975 | |
| Kaiser Foundation Hospitals | | | | | | | | |
| 2.81%, 06/01/41 | | | 500 | | | | 351,053 | |
| 3.15%, 05/01/27 | | | 80 | | | | 75,514 | |
| Kilroy Realty LP | | | | | | | | |
| 2.50%, 11/15/32 | | | 50 | | | | 36,599 | |
| 2.65%, 11/15/33 | | | 150 | | | | 107,333 | |
| 4.75%, 12/15/28 | | | 100 | | | | 94,000 | |
Leeward Renewable Energy Operations LLC 144A 4.25%, 07/01/29 | | | 100 | | | | 82,872 | |
LYB International Finance III LLC 5.62%, 05/15/33 | | | 150 | | | | 149,062 | |
Massachusetts Institute of Technology 3.96%, 07/01/38 | | | 200 | | | | 176,276 | |
Metropolitan Life Global Funding I 144A 0.95%, 07/02/25 | | | 300 | | | | 284,495 | |
| MidAmerican Energy Co. | | | | | | | | |
| 2.70%, 08/01/52 | | | 200 | | | | 116,813 | |
| 3.10%, 05/01/27 | | | 425 | | | | 399,320 | |
| 3.15%, 04/15/50 | | | 200 | | | | 130,583 | |
See Notes to Financial Statements
VANECK GREEN BOND ETF
SCHEDULE OF INVESTMENTS
(continued)
| | | Par
(000’s | ) | | Value | |
| United States (continued) | | | | | | | | |
| 3.65%, 04/15/29 | | $ | 150 | | | $ | 139,345 | |
| 3.65%, 08/01/48 | | | 400 | | | | 291,979 | |
| 3.95%, 08/01/47 | | | 175 | | | | 133,698 | |
| 4.25%, 07/15/49 | | | 275 | | | | 221,619 | |
| 5.35%, 01/15/34 | | | 300 | | | | 299,574 | |
Nature Conservancy/The 3.96%, 03/01/52 | | | 100 | | | | 77,914 | |
| New York State Electric & Gas Corp. 144A | | | | | | | | |
| 2.15%, 10/01/31 | | | 200 | | | | 155,777 | |
| 5.85%, 08/15/33 | | | 200 | | | | 200,698 | |
NextEra Energy Capital Holdings, Inc. 1.90%, 06/15/28 | | | 425 | | | | 369,629 | |
NiSource, Inc. 5.00%, 06/15/52 | | | 100 | | | | 86,563 | |
| Northern States Power Co. | | | | | | | | |
| 2.25%, 04/01/31 | | | 150 | | | | 123,120 | |
| 2.60%, 06/01/51 | | | 250 | | | | 144,835 | |
| 2.90%, 03/01/50 | | | 250 | | | | 156,524 | |
| 3.20%, 04/01/52 | | | 200 | | | | 130,199 | |
| 5.40%, 03/15/54 | | | 200 | | | | 189,856 | |
NSTAR Electric Co. 3.25%, 05/15/29 | | | 225 | | | | 205,328 | |
Oncor Electric Delivery Co. LLC 4.15%, 06/01/32 | | | 100 | | | | 91,495 | |
Owens Corning 3.95%, 08/15/29 † | | | 125 | | | | 116,289 | |
| PacifiCorp | | | | | | | | |
| 2.90%, 06/15/52 | | | 250 | | | | 141,446 | |
| 5.35%, 12/01/53 | | | 200 | | | | 174,808 | |
| 5.50%, 05/15/54 † | | | 450 | | | | 402,434 | |
Pattern Energy Operations LP / Pattern Energy Operations, Inc. 144A 4.50%, 08/15/28 | | | 250 | | | | 223,810 | |
| PepsiCo, Inc. | | | | | | | | |
| 2.88%, 10/15/49 | | | 250 | | | | 161,681 | |
| 3.90%, 07/18/32 | | | 500 | | | | 458,167 | |
PG&E Recovery Funding LLC 5.54%, 07/15/47 | | | 350 | | | | 341,791 | |
Piedmont Operating Partnership LP 3.15%, 08/15/30 | | | 150 | | | | 115,911 | |
PNC Financial Services Group, Inc. 2.20%, 11/01/24 | | | 160 | | | | 157,314 | |
| 4.76% (SOFR Compound Index+1.08%), 01/26/27 | | | 400 | | | | 394,218 | |
| Prologis LP | | | | | | | | |
| 1.25%, 10/15/30 † | | | 275 | | | | 214,103 | |
| 1.75%, 02/01/31 | | | 200 | | | | 159,050 | |
| Public Service Co. of Colorado | | | | | | | | |
| 3.20%, 03/01/50 | | | 250 | | | | 160,668 | |
| 3.70%, 06/15/28 | | | 200 | | | | 188,160 | |
| 4.10%, 06/15/48 | | | 110 | | | | 82,662 | |
| | | Par
(000’s | ) | | Value | |
| United States (continued) | | | | | | | | |
| Public Service Co. of Oklahoma | | | | | | | | |
| 2.20%, 08/15/31 | | $ | 200 | | | $ | 159,334 | |
| 3.15%, 08/15/51 | | | 250 | | | | 156,723 | |
| Public Service Electric and Gas Co. | | | | | | | | |
| 3.10%, 03/15/32 | | | 250 | | | | 213,025 | |
| 4.65%, 03/15/33 | | | 200 | | | | 188,825 | |
RWE Finance US LLC 144A 5.88%, 04/16/34 | | | 400 | | | | 392,561 | |
San Diego Gas & Electric Co. 4.95%, 08/15/28 | | | 200 | | | | 197,157 | |
| SCE Recovery Funding LLC | | | | | | | | |
| 4.70%, 06/15/40 | | | 145 | | | | 136,164 | |
| 5.11%, 12/15/47 | | | 200 | | | | 185,854 | |
Seattle Children’s Hospital 2.72%, 10/01/50 | | | 150 | | | | 92,832 | |
SK Battery America, Inc. Reg S 2.12%, 01/26/26 | | | 415 | | | | 383,638 | |
SLG Office Trust 2021-OVA 144A 2.59%, 07/15/41 | | | 600 | | | | 480,272 | |
Sonoco Products Co. 2.85%, 02/01/32 | | | 400 | | | | 329,213 | |
Southern Power Co. 4.15%, 12/01/25 | | | 350 | | | | 342,138 | |
Southwestern Public Service Co. 3.15%, 05/01/50 | | | 250 | | | | 156,026 | |
Sunnova Energy Corp. 144A 5.88%, 09/01/26 | | | 200 | | | | 124,579 | |
UDR, Inc. 1.90%, 03/15/33 | | | 175 | | | | 129,284 | |
Union Electric Co. 2.62%, 03/15/51 | | | 200 | | | | 116,616 | |
Vena Energy Capital Pte Ltd. Reg S 3.13%, 02/26/25 | | | 200 | | | | 194,804 | |
| Verizon Communications, Inc. | | | | | | | | |
| 1.50%, 09/18/30 | | | 300 | | | | 239,027 | |
| 2.85%, 09/03/41 | | | 900 | | | | 614,112 | |
| 3.88%, 03/01/52 † | | | 300 | | | | 221,619 | |
| 5.50%, 02/23/54 | | | 500 | | | | 475,181 | |
Vornado Realty LP 3.40%, 06/01/31 | | | 150 | | | | 116,573 | |
| Welltower OP LLC | | | | | | | | |
| 2.70%, 02/15/27 | | | 250 | | | | 232,280 | |
| 3.85%, 06/15/32 | | | 100 | | | | 88,109 | |
Wisconsin Electric Power Co. 4.75%, 09/30/32 | | | 250 | | | | 238,682 | |
Wisconsin Power and Light Co. 1.95%, 09/16/31 | | | 200 | | | | 158,023 | |
ZF North America Capital, Inc. 144A 6.75%, 04/23/30 | | | 300 | | | | 300,896 | |
See Notes to Financial Statements
| | | Par
(000’s | ) | | Value | |
| United States (continued) | | | | | | | | |
| 6.88%, 04/14/28 | | $ | 200 | | | $ | 201,547 | |
| 7.12%, 04/14/30 | | | 200 | | | | 204,699 | |
| | | | | | | | 34,326,642 | |
Total Corporate Bonds
(Cost: $88,138,034) | | | | | | | 80,536,559 | |
| | | | | | | | | |
| GOVERNMENT OBLIGATIONS: 10.1% | | | |
| Cayman Islands: 2.6% | | | | | | | | |
| Gaci First Investment Co. Reg S | | | | | | | | |
| 4.75%, 02/14/30 | | | 200 | | | | 191,512 | |
| 4.88%, 02/14/35 | | | 300 | | | | 276,920 | |
| 5.00%, 10/13/27 | | | 600 | | | | 590,738 | |
| 5.12%, 02/14/53 | | | 250 | | | | 206,240 | |
| 5.25%, 10/13/32 | | | 850 | | | | 833,008 | |
| 5.38%, 10/13/22 | | | 300 | | | | 246,083 | |
| | | | | | | | 2,344,501 | |
| Chile: 1.0% | | | | | | | | |
| Chile Government International Bond | | | | | | | | |
| 2.55%, 01/27/32 | | | 350 | | | | 287,010 | |
| 3.50%, 01/25/50 | | | 850 | | | | 586,324 | |
| | | | | | | | 873,334 | |
| China: 0.3% | | | | | | | | |
New Development Bank Reg S 5.12%, 04/26/26 | | | 300 | | | | 296,243 | |
| Egypt: 0.0% | | | | | | | | |
Egypt Government International Bond 144A 5.25%, 10/06/25 | | | 50 | | | | 47,497 | |
| Hong Kong: 2.6% | | | | | | | | |
| Hong Kong Government International Bond 144A | | | | | | | | |
| 0.62%, 02/02/26 | | | 200 | | | | 185,057 | |
| 2.38%, 02/02/51 | | | 200 | | | | 119,421 | |
| 4.00%, 06/07/28 | | | 200 | | | | 194,204 | |
| 4.00%, 06/07/33 | | | 700 | | | | 659,620 | |
| 4.25%, 06/07/26 | | | 200 | | | | 196,568 | |
| 4.50%, 01/11/28 | | | 450 | | | | 444,900 | |
| 4.62%, 01/11/33 | | | 300 | | | | 296,499 | |
Hong Kong Government International Bond Reg S 1.75%, 11/24/31 | | | 400 | | | | 325,668 | |
| | | | | | | | 2,421,937 | |
| Indonesia: 1.4% | | | | | | | | |
| Perusahaan Penerbit SBSN Indonesia III 144A | | | | | | | | |
| 2.30%, 06/23/25 | | | 350 | | | | 336,840 | |
| 3.55%, 06/09/51 | | | 275 | | | | 193,778 | |
| 3.90%, 08/20/24 | | | 250 | | | | 248,828 | |
| 4.70%, 06/06/32 | | | 500 | | | | 474,031 | |
| | | | | | | | 1,253,477 | |
| Israel: 0.6% | | | | | | | | |
| Israel Government International Bond | | | | | | | | |
| | | Par
(000’s | ) | | Value | |
| Israel (continued) | | | | | | | | |
| 4.50%, 01/17/33 | | $ | 600 | | | $ | 537,477 | |
| Japan: 0.2% | | | | | | | | |
Japan Finance Organization for Municipalities 144A 1.50%, 01/27/25 | | | 200 | | | | 194,090 | |
| Saudi Arabia: 0.3% | | | | | | | | |
Arab Petroleum Investments Corp. 144A 1.48%, 10/06/26 | | | 300 | | | | 273,110 | |
| Supranational: 0.9% | | | | | | | | |
| Asian Development Bank | | | | | | | | |
| 1.75%, 08/14/26 | | | 275 | | | | 255,713 | |
| 2.12%, 03/19/25 | | | 150 | | | | 145,811 | |
| 2.38%, 08/10/27 | | | 150 | | | | 138,604 | |
| 3.12%, 09/26/28 | | | 100 | | | | 93,249 | |
Central American Bank for Economic Integration Reg S 6.42% (Term SOFR USD 3 Month+1.11%), 11/15/24 | | | 200 | | | | 200,186 | |
| | | | | | | | 833,563 | |
| Turkey: 0.2% | | | | | | | | |
Istanbul Metropolitan Municipality 144A 10.50%, 12/06/28 | | | 200 | | | | 214,730 | |
Total Government Obligations
(Cost: $10,188,885) | | | | | | | 9,289,959 | |
| | | | | | | | | |
| MUNICIPAL BONDS: 0.7% | | | | | | | | |
| United States: 0.7% | | | | | | | | |
Commonwealth of Massachusetts (GO) 3.28%, 06/01/46 | | | 150 | | | | 114,714 | |
District of Columbia Water & Sewer Authority (RB) 4.81%, 10/01/14 | | | 170 | | | | 145,561 | |
Metropolitan Transportation Authority (RB) 5.17%, 11/15/49 | | | 200 | | | | 198,006 | |
Tennessee Valley Authority 1.50%, 09/15/31 † | | | 200 | | | | 160,164 | |
Total Municipal Bonds
(Cost: $820,527) | | | | | | | 618,445 | |
| | | | | | | | | |
| | | Number
of Shares | | | | | |
PREFERRED SECURITIES: 0.2%
(Cost: $173,320) | | | | | | | | |
| Canada: 0.2% | | | | | | | | |
Brookfield Finance, Inc. (USD)4.62%, 10/16/80 † | | | 7,000 | | | | 119,490 | |
| | | | | | | | | |
Total Investments Before Collateral for Securities Loaned: 98.8%
(Cost: $99,320,766) | | | | 90,564,453 | |
See Notes to Financial Statements
VANECK GREEN BOND ETF
SCHEDULE OF INVESTMENTS
(continued)
| | | Number
of Shares | | | | Value | |
| SHORT-TERM INVESTMENT HELD AS COLLATERAL FOR SECURITIES ON LOAN: 1.7% | | | | | |
Money Market Fund: 1.7%
(Cost: $1,573,215) | | | | | | | | |
| | | | | | | | | |
| | | Number
of Shares | | | Value | |
| State Street Navigator Securities Lending Government Money Market Portfolio | | | 1,573,215 | | | $ | 1,573,215 | |
Total Investments: 100.5%
(Cost: $100,893,981) | | | | | | | 92,137,668 | |
| Liabilities in excess of other assets: (0.5)% | | | | | | | (417,552) | |
| NET ASSETS: 100.0% | | | | | | $ | 91,720,116 | |
Definitions:
| GO | General Obligation |
| RB | Revenue Bond |
| SOFR | Secured Overnight Financing Rate |
| USD | United States Dollar |
Footnotes:
| † | Security fully or partially on loan. Total market value of securities on loan is $3,184,026. |
| | |
| Reg S | Security was purchased pursuant to Regulation S under the Securities Act of 1933, which exempts from registration securities offered and sold outside of the United States. Such a security cannot be sold in the United States without either an effective registration statement filed pursuant to the Securities Act of 1933, or pursuant to an exemption from registration. |
| 144A | Security exempt from registration under Rule 144A of the Securities Act of 1933, as amended, or otherwise restricted. These securities may be resold in transactions exempt from registration, unless otherwise noted. These securities have an aggregate value of $29,239,911, or 31.9% of net assets. |
Summary of Investments by Sector
Excluding Collateral for Securities Loaned | | % of
Investments | | Value | |
| Financials | | | 34.1 | % | | $ | 30,855,305 | |
| Utilities | | | 22.1 | | | | 20,057,962 | |
| Government | | | 10.8 | | | | 9,748,240 | |
| Real Estate | | | 7.3 | | | | 6,571,195 | |
| Basic Materials | | | 5.3 | | | | 4,802,995 | |
| Consumer Cyclicals | | | 5.0 | | | | 4,553,301 | |
| Technology | | | 4.9 | | | | 4,392,386 | |
| Mortgage Securities | | | 4.4 | | | | 3,978,003 | |
| Industrials | | | 2.4 | | | | 2,175,512 | |
| Consumer Non-Cyclicals | | | 1.4 | | | | 1,302,232 | |
| Energy | | | 1.2 | | | | 1,127,332 | |
| Healthcare | | | 0.8 | | | | 745,800 | |
| Academic & Educational Services | | | 0.2 | | | | 176,276 | |
| Institutions, Associations & Organizations | | | 0.1 | | | | 77,914 | |
| | | | 100.0 | % | | $ | 90,564,453 | |
The summary of inputs used to value the Fund’s investments as of April 30, 2024 is as follows:
| | | Level 1
Quoted
Prices | | | Level 2
Significant
Observable
Inputs | | | Level 3
Significant
Unobservable
Inputs | | | Value | |
| Corporate Bonds * | | $ | — | | | $ | 80,536,559 | | | $ | — | | | $ | 80,536,559 | |
| Government Obligations * | | | — | | | | 9,289,959 | | | | — | | | | 9,289,959 | |
| Municipal Bonds * | | | — | | | | 618,445 | | | | — | | | | 618,445 | |
| Preferred Securities * | | | 119,490 | | | | — | | | | — | | | | 119,490 | |
| Money Market Fund | | | 1,573,215 | | | | — | | | | — | | | | 1,573,215 | |
| Total Investments | | $ | 1,692,705 | | | $ | 90,444,963 | | | $ | — | | | $ | 92,137,668 | |
| * | See Schedule of Investments for geographic sector breakouts. |
See Notes to Financial Statements
VANECK IG FLOATING RATE ETF
SCHEDULE OF INVESTMENTS
April 30, 2024
| | | Par
(000’s | ) | | Value | |
| FLOATING RATE NOTES: 98.6% | | | | | | | | |
| Australia: 10.4% | | | | | | | | |
Australia & New Zealand Banking Group Ltd. 144A 5.91% (SOFR+0.56%), 03/18/26 | | $ | 11,650 | | | $ | 11,672,126 | |
| 6.10% (SOFR+0.75%), 07/03/25 † | | | 5,665 | | | | 5,688,745 | |
| 6.16% (SOFR+0.81%), 01/18/27 | | | 29,500 | | | | 29,730,223 | |
Commonwealth Bank of Australia 144A 5.75% (SOFR+0.40%), 07/07/25 | | | 8,157 | | | | 8,165,322 | |
| 5.88% (SOFR+0.52%), 06/15/26 | | | 20,679 | | | | 20,690,861 | |
| 5.99% (SOFR+0.63%), 09/12/25 | | | 6,650 | | | | 6,673,438 | |
| 6.10% (SOFR+0.74%), 03/14/25 | | | 3,550 | | | | 3,565,398 | |
| 6.11% (SOFR+0.75%), 03/13/26 | | | 5,525 | | | | 5,554,990 | |
Macquarie Bank Ltd. 144A 6.67% (SOFR+1.31%), 03/21/25 | | | 2,900 | | | | 2,926,154 | |
Macquarie Group Ltd. 144A 6.27% (SOFR+0.92%), 09/23/27 | | | 13,500 | | | | 13,506,736 | |
National Australia Bank Ltd. 144A 5.73% (SOFR+0.38%), 01/12/25 | | | 2,925 | | | | 2,927,663 | |
| 6.00% (SOFR+0.65%), 01/12/27 | | | 21,275 | | | | 21,341,666 | |
| 6.01% (SOFR+0.65%), 12/10/25 | | | 2,992 | | | | 3,004,582 | |
| 6.11% (SOFR+0.76%), 05/13/25 | | | 4,250 | | | | 4,265,608 | |
| 6.22% (SOFR+0.86%), 06/09/25 | | | 3,675 | | | | 3,695,487 | |
Westpac Banking Corp. 5.66% (SOFR+0.30%), 11/18/24 | | | 4,076 | | | | 4,077,182 | |
| 6.07% (SOFR+0.72%), 11/17/25 | | | 5,700 | | | | 5,722,328 | |
| 6.36% (SOFR+1.00%), 08/26/25 | | | 6,250 | | | | 6,304,067 | |
| | | | | | | | 159,512,576 | |
| Canada: 2.6% | | | | | | | | |
Bank of Montreal 6.51% (SOFR Compound Index+1.16%), 12/11/26 | | | 5,000 | | | | 5,067,373 | |
Canadian Imperial Bank of Commerce 6.29% (SOFR Compound Index+0.94%), 04/07/25 | | | 3,611 | | | | 3,631,475 | |
Royal Bank of Canada 6.06% (SOFR Compound Index+0.71%), 01/21/27 | | | 5,000 | | | | 5,026,904 | |
| | | Par
(000’s | ) | | Value | |
| Canada (continued) | | | | | | | | |
| 6.30% (SOFR Compound Index+0.95%), 01/19/27 | | $ | 20,350 | | | $ | 20,538,634 | |
Toronto-Dominion Bank 6.08% (SOFR+0.73%), 04/05/27 | | | 5,000 | | | | 5,004,075 | |
TransCanada PipeLines Ltd. 6.87% (SOFR Compound Index+1.52%), 03/09/26 | | | 350 | | | | 350,351 | |
| | | | | | | | 39,618,812 | |
| Finland: 1.3% | | | | | | | | |
Nordea Bank Abp 144A 6.09% (SOFR+0.74%), 03/19/27 | | | 20,150 | | | | 20,208,762 | |
| France: 3.3% | | | | | | | | |
Banque Federative du Credit Mutuel SA 144A 5.76% (SOFR Compound Index+0.41%), 02/04/25 | | | 3,847 | | | | 3,847,995 | |
BPCE SA 144A 7.33% (SOFR Compound Index+1.98%), 10/19/27 | | | 5,000 | | | | 5,094,737 | |
Credit Agricole SA 144A 6.22% (SOFR+0.87%), 03/11/27 | | | 24,150 | | | | 24,245,899 | |
| 6.64% (SOFR+1.29%), 07/05/26 | | | 5,575 | | | | 5,654,760 | |
Societe Generale SA 144A 6.40% (SOFR+1.05%), 01/21/26 | | | 8,680 | | | | 8,691,258 | |
| 7.01% (SOFR+1.66%), 01/19/28 | | | 3,000 | | | | 3,028,295 | |
| | | | | | | | 50,562,944 | |
| Japan: 4.3% | | | | | | | | |
Mitsubishi UFJ Financial Group, Inc. 6.29% (SOFR+0.94%), 02/20/26 | | | 6,936 | | | | 6,955,880 | |
Mizuho Financial Group, Inc. 6.32% (SOFR+0.96%), 05/22/26 | | | 20,050 | | | | 20,143,529 | |
Sumitomo Mitsui Financial Group, Inc. 6.23% (SOFR+0.88%), 01/14/27 | | | 20,620 | | | | 20,778,797 | |
Sumitomo Mitsui Trust Bank Ltd. 144A 6.48% (SOFR+1.12%), 03/09/26 | | | 5,550 | | | | 5,605,433 | |
| 6.51% (SOFR+1.15%), 09/14/26 | | | 13,100 | | | | 13,260,329 | |
| | | | | | | | 66,743,968 | |
| Netherlands: 3.1% | | | | | | | | |
ABN AMRO Bank NV 144A 7.14% (SOFR Compound Index+1.78%), 09/18/27 | | | 20,225 | | | | 20,487,094 | |
| ING Groep NV 6.92% (SOFR+1.56%), 09/11/27 | | | 21,700 | | | | 22,023,460 | |
See Notes to Financial Statements
VANECK IG FLOATING RATE ETF
SCHEDULE OF INVESTMENTS
(continued)
| | | Par
(000’s | ) | | Value | |
| Netherlands (continued) | | | | | | | | |
| 7.01% (SOFR Compound Index+1.64%), 03/28/26 | | $ | 5,735 | | | $ | 5,781,445 | |
| | | | | | | | 48,291,999 | |
| Singapore: 0.6% | | | | | | | | |
DBS Group Holdings Ltd. 144A 5.97% (SOFR+0.61%), 09/12/25 | | | 8,125 | | | | 8,153,133 | |
Pepsico Singapore Financing I Pte Ltd. 5.91% (SOFR Compound Index+0.56%), 02/16/27 | | | 1,625 | | | | 1,626,517 | |
| | | | | | | | 9,779,650 | |
| South Korea: 1.2% | | | | | | | | |
Korea National Oil Corp. 144A 6.19% (SOFR+0.83%), 04/03/27 | | | 10,000 | | | | 10,058,500 | |
| 6.43% (SOFR+1.08%), 11/14/26 | | | 8,750 | | | | 8,882,904 | |
| | | | | | | | 18,941,404 | |
| Spain: 0.2% | | | | | | | | |
Banco Santander SA 6.73% (SOFR+1.38%), 03/14/28 | | | 3,000 | | | | 3,019,974 | |
| Sweden: 1.4% | | | | | | | | |
Svenska Handelsbanken AB 144A 6.61% (SOFR+1.25%), 06/15/26 | | | 20,384 | | | | 20,687,799 | |
| Switzerland: 0.5% | | | | | | | | |
UBS Group AG 144A 6.93% (SOFR+1.58%), 05/12/26 | | | 7,669 | | | | 7,734,652 | |
| United Kingdom: 8.7% | | | | | | | | |
ANZ New Zealand Int’l Ltd. 144A 5.96% (SOFR+0.60%), 02/18/25 | | | 2,775 | | | | 2,781,356 | |
Barclays Plc 6.84% (SOFR+1.49%), 03/12/28 | | | 22,375 | | | | 22,577,622 | |
HSBC Holdings Plc 6.92% (SOFR+1.57%), 08/14/27 | | | 30,030 | | | | 30,567,782 | |
| 6.96% (Term SOFR USD 3 Month+1.64%), 09/12/26 | | | 13,742 | | | | 13,885,275 | |
Lloyds Banking Group Plc 6.91% (SOFR Compound Index+1.56%), 08/07/27 | | | 20,050 | | | | 20,334,075 | |
NatWest Group Plc 6.61% (SOFR+1.25%), 03/01/28 | | | 3,500 | | | | 3,522,800 | |
NatWest Markets Plc 144A 6.81% (SOFR+1.45%), 03/22/25 | | | 2,655 | | | | 2,677,006 | |
| Standard Chartered Plc 144A | | | | | | | | |
| | | Par
(000’s | ) | | Value | |
| United Kingdom (continued) | | | | | | | | |
| 6.29% (SOFR+0.93%), 11/23/25 | | $ | 5,550 | | | $ | 5,551,562 | |
| 7.11% (SOFR+1.74%), 03/30/26 | | | 5,668 | | | | 5,711,895 | |
| 7.28% (SOFR+1.93%), 07/06/27 | | | 20,600 | | | | 20,963,854 | |
UBS AG 6.29% (SOFR+0.93%), 09/11/25 | | | 5,725 | | | | 5,764,791 | |
| | | | | | | | 134,338,018 | |
| United States: 61.0% | | | | | | | | |
American Express Co. 6.00% (SOFR Compound Index+0.65%), 11/04/26 | | | 18,930 | | | | 18,986,210 | |
| 6.10% (SOFR+0.75%), 04/23/27 | | | 10,000 | | | | 10,019,078 | |
| 6.29% (SOFR Compound Index+0.93%), 03/04/25 | | | 2,745 | | | | 2,765,761 | |
| 6.33% (SOFR Compound Index+0.97%), 07/28/27 | | | 563 | | | | 566,294 | |
| 6.35% (SOFR Compound Index+1.00%), 02/16/28 | | | 13,000 | | | | 13,067,881 | |
| 6.71% (SOFR Compound Index+1.35%), 10/30/26 | | | 1,350 | | | | 1,366,369 | |
American Honda Finance Corp. 5.95% (SOFR+0.60%), 08/14/25 | | | 4,450 | | | | 4,458,914 | |
| 6.06% (SOFR+0.71%), 01/09/26 | | | 5,000 | | | | 5,021,647 | |
| 6.12% (SOFR+0.77%), 03/12/27 | | | 1,063 | | | | 1,069,430 | |
| 6.13% (SOFR Compound Index+0.78%), 04/23/25 | | | 7,950 | | | | 7,983,563 | |
| 6.14% (SOFR Compound Index+0.79%), 10/03/25 | | | 318 | | | | 319,543 | |
| 6.27% (SOFR+0.92%), 01/12/26 | | | 300 | | | | 302,305 | |
Athene Global Funding 144A 6.07% (SOFR Compound Index+0.71%), 01/07/25 | | | 6,000 | | | | 6,007,212 | |
| 6.56% (SOFR Compound Index+1.21%), 03/25/27 | | | 4,000 | | | | 4,008,968 | |
Bank of America Corp. 6.40% (SOFR+1.05%), 02/04/28 | | | 25,590 | | | | 25,783,938 | |
| 6.71% (SOFR+1.35%), 09/15/27 | | | 19,000 | | | | 19,271,479 | |
Bank of America NA 6.38% (SOFR+1.02%), 08/18/26 | | | 22,825 | | | | 23,151,305 | |
Bank of New York Mellon 5.80% (SOFR+0.45%), 03/13/26 | | | 5,825 | | | | 5,832,606 | |
BMW US Capital LLC 144A 5.97% (SOFR Compound Index+0.62%), 08/11/25 | | | 6,998 | | | | 7,020,893 | |
| 6.20% (SOFR Compound Index+0.84%), 04/01/25 | | | 100 | | | | 100,501 | |
See Notes to Financial Statements
| | | Par
(000’s | ) | | Value | |
| United States (continued) | | | | | | | | |
Bristol-Myers Squibb Co. 5.84% (SOFR+0.49%), 02/20/26 | | $ | 5,825 | | | $ | 5,847,125 | |
Capital One Financial Corp. 6.70% (SOFR+1.35%), 05/09/25 | | | 1,150 | | | | 1,150,145 | |
Caterpillar Financial Services Corp. 5.80% (SOFR+0.46%), 08/11/25 | | | 150 | | | | 150,477 | |
| 5.81% (SOFR+0.46%), 02/27/26 | | | 7,100 | | | | 7,119,247 | |
| 5.87% (SOFR+0.52%), 06/13/25 | | | 950 | | | | 953,572 | |
Charles Schwab Corp. 5.87% (SOFR Compound Index+0.52%), 05/13/26 | | | 5,733 | | | | 5,728,425 | |
| 6.41% (SOFR Compound Index+1.05%), 03/03/27 | | | 20,837 | | | | 21,021,558 | |
Citigroup, Inc. 6.02% (SOFR+0.67%), 05/01/25 | | | 2,944 | | | | 2,944,646 | |
| 6.14% (Term SOFR USD 3 Month+0.81%), 08/25/36 | | | 25,308 | | | | 21,723,064 | |
| 6.64% (SOFR+1.28%), 02/24/28 | | | 22,303 | | | | 22,561,663 | |
| 6.81% (Term SOFR USD 3 Month+1.51%), 07/01/26 | | | 24,531 | | | | 24,811,277 | |
Cooperatieve Rabobank UA 6.05% (SOFR Compound Index+0.70%), 07/18/25 | | | 7,575 | | | | 7,608,311 | |
| 6.06% (SOFR Compound Index+0.71%), 01/09/26 | | | 8,725 | | | | 8,769,439 | |
| 6.06% (SOFR Compound Index+0.71%), 03/05/27 | | | 24,750 | | | | 24,825,007 | |
Corebridge Global Funding 144A 6.65% (SOFR+1.30%), 09/25/26 | | | 7,800 | | | | 7,847,449 | |
Daimler Truck Finance North America LLC 144A 6.10% (SOFR+0.75%), 12/13/24 | | | 325 | | | | 325,790 | |
Ford Motor Credit Co. LLC 8.30% (SOFR+2.95%), 03/06/26 | | | 400 | | | | 413,345 | |
GA Global Funding Trust 144A 6.71% (SOFR+1.36%), 04/11/25 | | | 55 | | | | 55,289 | |
General Electric Co. 5.91% (Term SOFR USD 3 Month+0.64%), 05/05/26 | | | 10,171 | | | | 10,197,687 | |
General Motors Financial Co., Inc. 6.39% (SOFR+1.04%), 02/26/27 | | | 300 | | | | 300,059 | |
| 6.65% (SOFR Compound Index+1.30%), 04/07/25 | | | 860 | | | | 867,669 | |
| | | Par
(000’s | ) | | Value | |
| United States (continued) | | | | | | | | |
| 6.70% (SOFR Compound Index+1.35%), 05/08/27 | | $ | 15,750 | | | $ | 15,886,965 | |
Georgia Power Co. 6.10% (SOFR Compound Index+0.75%), 05/08/25 | | | 3,937 | | | | 3,952,865 | |
Glencore Funding LLC 144A 6.41% (SOFR Compound Index+1.06%), 04/04/27 | | | 6,250 | | | | 6,256,016 | |
Goldman Sachs Bank USA 6.12% (SOFR+0.77%), 03/18/27 | | | 32,000 | | | | 32,036,057 | |
Goldman Sachs Group, Inc. 6.42% (SOFR+1.06%), 08/10/26 | | | 20,418 | | | | 20,513,113 | |
| 6.74% (Term SOFR USD 3 Month+1.43%), 05/15/26 | | | 28,331 | | | | 28,586,925 | |
| 7.34% (Term SOFR USD 3 Month+2.01%), 10/28/27 | | | 28,549 | | | | 29,471,333 | |
Hartford Financial Services Group, Inc. 144A 7.69% (Term SOFR USD 3 Month+2.39%), 02/12/47 | | | 19,983 | | | | 17,761,663 | |
HSBC USA, Inc. 6.32% (SOFR+0.96%), 03/04/27 | | | 10,175 | | | | 10,235,087 | |
Hyundai Capital America 144A 6.39% (SOFR+1.04%), 03/19/27 | | | 12,500 | | | | 12,533,230 | |
| 6.50% (SOFR+1.15%), 08/04/25 | | | 5,675 | | | | 5,704,636 | |
| 6.67% (SOFR+1.32%), 11/03/25 | | | 450 | | | | 453,216 | |
| 6.85% (SOFR+1.50%), 01/08/27 | | | 1,575 | | | | 1,598,317 | |
John Deere Capital Corp. 5.79% (SOFR+0.44%), 03/06/26 | | | 5,600 | | | | 5,616,972 | |
| 5.83% (SOFR+0.48%), 10/22/25 | | | 11,000 | | | | 11,025,808 | |
| 5.85% (SOFR+0.50%), 07/03/25 | | | 4,810 | | | | 4,826,110 | |
| 5.91% (SOFR+0.56%), 03/07/25 | | | 200 | | | | 200,645 | |
| 5.92% (SOFR+0.57%), 03/03/26 | | | 310 | | | | 311,577 | |
| 6.14% (SOFR Compound Index+0.79%), 06/08/26 | | | 2,262 | | | | 2,283,512 | |
JPMorgan Chase & Co. 5.89% (SOFR+0.54%), 06/01/25 | | | 2,725 | | | | 2,726,130 | |
| 5.94% (SOFR+0.58%), 06/23/25 | | | 2,725 | | | | 2,727,218 | |
| 6.13% (SOFR+0.77%), 09/22/27 † | | | 19,275 | | | | 19,284,053 | |
| 6.24% (SOFR+0.89%), 04/22/27 † | | | 19,189 | | | | 19,257,388 | |
| 6.28% (SOFR+0.92%), 02/24/26 | | | 8,561 | | | | 8,609,792 | |
See Notes to Financial Statements
VANECK IG FLOATING RATE ETF
SCHEDULE OF INVESTMENTS
(continued)
| | | Par
(000’s | ) | | Value | |
| United States (continued) | | | | | | | | |
| 6.33% (SOFR+0.97%), 06/14/25 | | $ | 2,723 | | | $ | 2,726,076 | |
| 6.54% (SOFR+1.18%), 02/24/28 | | | 32,983 | | | | 33,324,874 | |
| 6.55% (SOFR+1.20%), 01/23/28 | | | 22,750 | | | | 23,018,878 | |
| 6.67% (SOFR+1.32%), 04/26/26 | | | 5,727 | | | | 5,779,014 | |
JPMorgan Chase Bank NA 6.36% (SOFR+1.00%), 12/08/26 | | | 18,250 | | | | 18,487,134 | |
Keurig Dr Pepper, Inc. 6.24% (SOFR Compound Index+0.88%), 03/15/27 | | | 5,500 | | | | 5,540,038 | |
MassMutual Global Funding II 144A 6.13% (SOFR+0.77%), 01/29/27 | | | 250 | | | | 251,071 | |
| 6.33% (SOFR+0.98%), 07/10/26 | | | 20,275 | | | | 20,462,792 | |
Mercedes-Benz Finance North America LLC 144A 6.02% (SOFR+0.67%), 01/09/26 | | | 7,500 | | | | 7,530,127 | |
| 6.28% (SOFR+0.93%), 03/30/25 | | | 272 | | | | 273,546 | |
Metropolitan Life Global Funding I 144A 6.26% (SOFR Compound Index+0.91%), 03/21/25 | | | 5,000 | | | | 5,026,343 | |
Morgan Stanley 6.31% (SOFR+0.95%), 02/18/26 | | | 8,809 | | | | 8,852,400 | |
Morgan Stanley Bank NA 6.13% (SOFR+0.78%), 07/16/25 | | | 4,350 | | | | 4,372,587 | |
| 6.43% (SOFR+1.08%), 01/14/28 | | | 14,500 | | | | 14,618,918 | |
National Rural Utilities Cooperative Finance Corp. 6.05% (SOFR+0.70%), 05/07/25 | | | 500 | | | | 502,233 | |
| 6.15% (SOFR+0.80%), 02/05/27 | | | 7,500 | | | | 7,535,172 | |
New York Life Global Funding 144A 5.83% (SOFR+0.48%), 06/09/26 | | | 150 | | | | 149,792 | |
| 5.93% (SOFR Compound Index+0.58%), 01/16/26 | | | 6,800 | | | | 6,820,702 | |
| 5.96% (SOFR Compound Index+0.61%), 04/21/25 | | | 5,000 | | | | 5,017,854 | |
| 6.02% (SOFR+0.67%), 04/02/27 | | | 16,250 | | | | 16,296,638 | |
| 6.28% (SOFR Compound Index+0.93%), 04/02/26 | | | 150 | | | | 151,499 | |
| NextEra Energy Capital Holdings, Inc. | | | | | | | | |
| | | Par
(000’s | ) | | Value | |
| United States (continued) | | | | | | | | |
| 6.11% (SOFR Compound Index+0.76%), 01/29/26 | | $ | 6,950 | | | $ | 6,968,726 | |
Northwestern Mutual Global Funding 144A 6.05% (SOFR+0.70%), 06/13/25 | | | 850 | | | | 853,828 | |
Pacific Life Global Funding II 144A 5.97% (SOFR+0.62%), 06/04/26 | | | 375 | | | | 375,234 | |
| 6.20% (SOFR+0.85%), 02/05/27 | | | 20,325 | | | | 20,384,803 | |
| 6.21% (SOFR Compound Index+0.86%), 06/16/25 | | | 725 | | | | 729,450 | |
| 6.41% (SOFR Compound Index+1.05%), 07/28/26 | | | 350 | | | | 352,512 | |
PepsiCo, Inc. 5.75% (SOFR Compound Index+0.40%), 02/13/26 | | | 5,000 | | | | 5,009,982 | |
Principal Life Global Funding II 144A 6.25% (SOFR+0.90%), 08/28/25 | | | 500 | | | | 502,875 | |
Protective Life Global Funding 144A 6.05% (SOFR+0.70%), 04/10/26 | | | 800 | | | | 802,470 | |
| 6.34% (SOFR+0.98%), 03/28/25 | | | 3,000 | | | | 3,017,277 | |
Public Storage Operating Co. 5.95% (SOFR Compound Index+0.60%), 07/25/25 | | | 935 | | | | 938,591 | |
| 6.05% (SOFR Compound Index+0.70%), 04/16/27 | | | 17,300 | | | | 17,367,046 | |
Roche Holdings, Inc. 144A 5.92% (SOFR+0.56%), 03/10/25 | | | 10,250 | | | | 10,279,976 | |
Spire Missouri, Inc. 5.85% (SOFR+0.50%), 12/02/24 | | | 500 | | | | 500,038 | |
State Street Corp. 6.19% (SOFR Compound Index+0.84%), 08/03/26 | | | 365 | | | | 367,848 | |
Toyota Motor Credit Corp. 5.67% (SOFR+0.32%), 01/13/25 | | | 50 | | | | 50,028 | |
| 5.91% (SOFR+0.56%), 01/10/25 | | | 5,000 | | | | 5,008,889 | |
| 5.93% (SOFR+0.60%), 06/09/25 | | | 6,675 | | | | 6,699,201 | |
| 6.00% (SOFR+0.65%), 01/05/26 | | | 9,800 | | | | 9,835,703 | |
| 6.00% (SOFR+0.65%), 03/19/27 | | | 1,000 | | | | 1,002,817 | |
| 6.24% (SOFR Compound Index+0.89%), 05/18/26 | | | 589 | | | | 593,439 | |
Truist Financial Corp. 5.76% (SOFR+0.40%), 06/09/25 | | | 5,579 | | | | 5,568,784 | |
See Notes to Financial Statements
| | | Par
(000’s | ) | | Value | |
| United States (continued) | | | | | | | | |
Verizon Communications, Inc. 6.15% (SOFR Compound Index+0.79%), 03/20/26 | | $ | 5,926 | | | $ | 5,971,030 | |
| 6.67% (Term SOFR USD 3 Month+1.36%), 05/15/25 | | | 4,847 | | | | 4,905,444 | |
Volkswagen Group of America Finance LLC 144A 6.18% (SOFR+0.83%), 03/20/26 | | | 7,500 | | | | 7,514,841 | |
| 6.29% (SOFR+0.93%), 09/12/25 | | | 5,825 | | | | 5,858,405 | |
Wells Fargo & Co. 6.42% (SOFR+1.07%), 04/22/28 | | | 7,500 | | | | 7,545,544 | |
| 6.67% (SOFR+1.32%), 04/25/26 | | | 8,375 | | | | 8,455,650 | |
| Wells Fargo Bank NA | | | | | | | | |
| | | Par
(000’s | ) | | Value | |
| United States (continued) | | | | | | | | |
| 6.43% (SOFR+1.07%), 12/11/26 | | $ | 21,175 | | | $ | 21,469,199 | |
| | | | | | | | 939,851,087 | |
Total Floating Rate Notes
(Cost: $1,510,682,784) | | | | | | | 1,519,291,645 | |
| | | | | | | | | |
| | | | Number
of Shares | | | | | |
| SHORT-TERM INVESTMENT HELD AS COLLATERAL FOR SECURITIES ON LOAN: 0.3% | | | | | |
Money Market Fund: 0.3%
(Cost: $4,149,731) | | | | | | | | |
| State Street Navigator Securities Lending Government Money Market Portfolio | | | 4,149,731 | | | | 4,149,731 | |
Total Investments: 98.9%
(Cost: $1,514,832,515) | | | | | | | 1,523,441,376 | |
| Other assets less liabilities: 1.1% | | | | | | | 16,331,134 | |
| NET ASSETS: 100.0% | | | | | | $ | 1,539,772,510 | |
Definitions:
| SOFR | Secured Overnight Financing Rate |
| USD | United States Dollar |
Footnotes:
| † | Security fully or partially on loan. Total market value of securities on loan is $3,804,013. |
| 144A | Security exempt from registration under Rule 144A of the Securities Act of 1933, as amended, or otherwise restricted. These securities may be resold in transactions exempt from registration, unless otherwise noted. These securities have an aggregate value of $529,061,437, or 34.4% of net assets. |
Summary of Investments by Sector
Excluding Collateral for Securities Loaned | | % of
Investments | | Value | |
| Financials | | | 87.5 | % | | $ | 1,328,971,530 | |
| Consumer Cyclicals | | | 4.6 | | | | 69,872,741 | |
| Industrials | | | 1.7 | | | | 26,074,517 | |
| Energy | | | 1.7 | | | | 25,547,770 | |
| Consumer Non-Cyclicals | | | 1.5 | | | | 22,374,224 | |
| Real Estate | | | 1.2 | | | | 18,305,636 | |
| Utilities | | | 0.7 | | | | 11,421,629 | |
| Technology | | | 0.7 | | | | 10,876,473 | |
| Healthcare | | | 0.4 | | | | 5,847,125 | |
| | | | 100.0 | % | | $ | 1,519,291,645 | |
The summary of inputs used to value the Fund’s investments as of April 30, 2024 is as follows:
| | | Level 1
Quoted
Prices | | | Level 2
Significant
Observable
Inputs | | | Level 3
Significant
Unobservable
Inputs | | | Value | |
| Floating Rate Notes * | | $ | — | | | $ | 1,519,291,645 | | | $ | — | | | $ | 1,519,291,645 | |
| Money Market Fund | | | 4,149,731 | | | | — | | | | — | | | | 4,149,731 | |
| Total Investments | | $ | 4,149,731 | | | $ | 1,519,291,645 | | | $ | — | | | $ | 1,523,441,376 | |
| * | See Schedule of Investments for geographic sector breakouts. |
See Notes to Financial Statements
VANECK INTERNATIONAL HIGH YIELD BOND ETF
SCHEDULE OF INVESTMENTS
April 30, 2024
| | | Par
(000’s | ) | | Value | |
| CORPORATE BONDS: 97.7% | | | | | | | | |
| Argentina: 1.2% | | | | | | | | |
MercadoLibre, Inc. 3.12%, 01/14/31 | | USD | 25 | | | $ | 20,524 | |
| Pampa Energia SA 144A | | | | | | | | |
| 7.50%, 01/24/27 | | USD | 50 | | | | 47,623 | |
| 9.12%, 04/15/29 | | USD | 25 | | | | 24,901 | |
Pan American Energy LLC 144A 9.12%, 04/30/27 | | USD | 25 | | | | 25,801 | |
Telecom Argentina SA 144A 8.00%, 07/18/26 | | USD | 25 | | | | 23,905 | |
Transportadora de Gas del Sur SA 144A 6.75%, 05/02/25 | | USD | 25 | | | | 24,285 | |
| YPF SA 144A | | | | | | | | |
| 6.95%, 07/21/27 | | USD | 50 | | | | 45,372 | |
| 7.00%, 09/30/33(s) | | USD | 25 | | | | 21,791 | |
| 7.00%, 12/15/47 | | USD | 25 | | | | 17,800 | |
| 8.50%, 07/28/25 | | USD | 50 | | | | 48,730 | |
| 9.00%, 02/12/26(s) | | USD | 31 | | | | 31,031 | |
| 9.00%, 06/30/29(s) | | USD | 25 | | | | 24,757 | |
| | | | | | | | 356,520 | |
| Australia: 1.0% | | | | | | | | |
| FMG Resources August 2006 Pty Ltd. 144A | | | | | | | | |
| 4.38%, 04/01/31 | | USD | 100 | | | | 88,147 | |
| 4.50%, 09/15/27 | | USD | 25 | | | | 23,603 | |
| 6.12%, 04/15/32 | | USD | 50 | | | | 48,471 | |
| Mineral Resources Ltd. 144A | | | | | | | | |
| 8.12%, 05/01/27 | | USD | 100 | | | | 101,060 | |
| 9.25%, 10/01/28 | | USD | 25 | | | | 26,240 | |
Nufarm Australia Ltd. / Nufarm Americas, Inc. 144A 5.00%, 01/27/30† | | USD | 30 | | | | 27,533 | |
| | | | | | | | 315,054 | |
| Austria: 0.2% | | | | | | | | |
Benteler International AG 144A 10.50%, 05/15/28 | | USD | 50 | | | | 53,284 | |
| Bermuda: 0.5% | | | | | | | | |
Borr IHC Ltd. / Borr Finance LLC 144A 10.00%, 11/15/28 | | USD | 100 | | | | 103,732 | |
| Digicel Group Holdings Ltd. 144A | | | | | | | | |
| 0.00%, 12/31/30^ | | USD | 3 | | | | 1,655 | |
| 0.00%, 12/31/30^ | | USD | 36 | | | | 2,680 | |
Investment Energy Resources Ltd. 144A 6.25%, 04/26/29† | | USD | 50 | | | | 47,911 | |
| | | | | | | | 155,978 | |
| Brazil: 5.6% | | | | | | | | |
Adecoagro SA 144A 6.00%, 09/21/27 | | USD | 50 | | | | 48,409 | |
Amaggi Luxembourg International Sarl 144A 5.25%, 01/28/28 | | USD | 50 | | | | 47,221 | |
| | | Par
(000’s | ) | | Value | |
| Brazil (continued) | | | | | | | | |
B3 SA - Brasil Bolsa Balcao 144A 4.12%, 09/20/31 | | USD | 50 | | | $ | 42,996 | |
Banco do Brasil SA/Cayman 144A 6.00%, 03/18/31 | | USD | 50 | | | | 48,508 | |
Braskem Idesa SAPI 144A 7.45%, 11/15/29 | | USD | 75 | | | | 59,289 | |
| Braskem Netherlands Finance BV 144A | | | | | | | | |
| 4.50%, 01/10/28 | | USD | 50 | | | | 44,682 | |
| 4.50%, 01/31/30 | | USD | 75 | | | | 63,290 | |
| 5.88%, 01/31/50 | | USD | 50 | | | | 37,460 | |
BRF SA 144A 4.88%, 01/24/30 | | USD | 100 | | | | 88,153 | |
Centrais Eletricas Brasileiras SA 144A 4.62%, 02/04/30 | | USD | 50 | | | | 44,930 | |
| Cosan Luxembourg SA 144A | | | | | | | | |
| 5.50%, 09/20/29 | | USD | 50 | | | | 47,044 | |
| 7.00%, 01/20/27 | | USD | 50 | | | | 49,990 | |
CSN Inova Ventures 144A 6.75%, 01/28/28 | | USD | 50 | | | | 47,886 | |
Embraer Netherlands Finance BV 5.40%, 02/01/27† | | USD | 25 | | | | 24,562 | |
| Klabin Austria GmbH 144A | | | | | | | | |
| 5.75%, 04/03/29 | | USD | 50 | | | | 48,757 | |
| 7.00%, 04/03/49 | | USD | 50 | | | | 48,759 | |
MARB BondCo Plc 144A 3.95%, 01/29/31 | | USD | 100 | | | | 80,301 | |
MV24 Capital BV 144A 6.75%, 06/01/34 | | USD | 81 | | | | 74,230 | |
Nexa Resources SA 144A 6.50%, 01/18/28 | | USD | 50 | | | | 50,100 | |
| Petrobras Global Finance BV | | | | | | | | |
| 5.60%, 01/03/31 | | USD | 50 | | | | 47,385 | |
| 5.62%, 05/20/43 | | USD | 25 | | | | 21,319 | |
| 5.75%, 02/01/29 | | USD | 25 | | | | 24,353 | |
| 6.00%, 01/27/28 | | USD | 50 | | | | 49,941 | |
| 6.25%, 12/14/26 | | GBP | 100 | | | | 125,249 | |
| 6.85%, 06/05/15† | | USD | 50 | | | | 43,465 | |
| 6.88%, 01/20/40 | | USD | 25 | | | | 24,123 | |
| 6.90%, 03/19/49† | | USD | 25 | | | | 23,199 | |
| 7.25%, 03/17/44 | | USD | 25 | | | | 24,557 | |
Rede D’or Finance Sarl 144A 4.50%, 01/22/30 | | USD | 50 | | | | 43,987 | |
Rumo Luxembourg Sarl 144A 5.25%, 01/10/28 | | USD | 50 | | | | 47,570 | |
Samarco Mineracao SA 144A 9.50%, 06/30/31 | | USD | 100 | | | | 91,334 | |
Ultrapar International SA 144A 5.25%, 10/06/26 | | USD | 50 | | | | 48,608 | |
Usiminas International Sarl 144A 5.88%, 07/18/26 | | USD | 50 | | | | 49,166 | |
See Notes to Financial Statements
| | | Par
(000’s | ) | | Value | |
| Brazil (continued) | | | | | | | | |
XP, Inc. 144A 3.25%, 07/01/26 | | USD | 50 | | | $ | 46,724 | |
| | | | | | | | 1,707,547 | |
| Bulgaria: 0.3% | | | | | | | | |
Bulgarian Energy Holding EAD Reg S 3.50%, 06/28/25 | | EUR | 100 | | | | 105,282 | |
| Burkina Faso: 0.1% | | | | | | | | |
IAMGOLD Corp. 144A 5.75%, 10/15/28 | | USD | 25 | | | | 23,138 | |
| Canada: 8.5% | | | | | | | | |
| 1011778 BC ULC / New Red Finance, Inc. 144A | | | | | | | | |
| 3.50%, 02/15/29† | | USD | 25 | | | | 22,343 | |
| 3.88%, 01/15/28 | | USD | 75 | | | | 69,254 | |
| 4.00%, 10/15/30 | | USD | 125 | | | | 107,880 | |
| Air Canada 144A | | | | | | | | |
| 3.88%, 08/15/26 | | USD | 25 | | | | 23,737 | |
| 4.62%, 08/15/29 | | CAD | 100 | | | | 69,513 | |
Algonquin Power & Utilities Corp. 4.75% (US Treasury Yield Curve Rate T 5 Year+3.25%), 01/18/82 | | USD | 50 | | | | 43,414 | |
| AltaGas Ltd. | | | | | | | | |
| 5.25% (Generic Canadian 5 Year+3.81%), 01/11/82 | | CAD | 15 | | | | 9,441 | |
| 7.35% (Generic Canadian 5 Year+4.54%), 08/17/82 | | CAD | 25 | | | | 18,432 | |
ATS Automation Tooling Systems, Inc. 144A 4.12%, 12/15/28 | | USD | 25 | | | | 22,503 | |
Baffinland Iron Mines Corp. / Baffinland Iron Mines LP 144A 8.75%, 07/15/26 | | USD | 25 | | | | 23,009 | |
Bausch + Lomb Corp. 144A 8.38%, 10/01/28 | | USD | 50 | | | | 51,700 | |
Baytex Energy Corp. 144A 8.50%, 04/30/30 | | USD | 50 | | | | 52,171 | |
| Bombardier, Inc. 144A | | | | | | | | |
| 7.12%, 06/15/26 | | USD | 75 | | | | 75,878 | |
| 7.88%, 04/15/27 | | USD | 83 | | | | 82,535 | |
| 8.75%, 11/15/30 | | USD | 25 | | | | 26,628 | |
| Brookfield Property Finance ULC | | | | | | | | |
| 3.93%, 08/24/25 | | CAD | 25 | | | | 17,689 | |
| 3.93%, 01/15/27 | | CAD | 50 | | | | 34,287 | |
Brookfield Residential Properties, Inc. / Brookfield Residential US LLC 144A 6.25%, 09/15/27 | | USD | 50 | | | | 48,127 | |
Capital Power Corp. 7.95% (Generic Canadian 5 Year+5.34%), 09/09/82 | | CAD | 25 | | | | 18,265 | |
| Cascades, Inc./Cascades USA Inc 144A | | | | | | | | |
| | | Par
(000’s | ) | | Value | |
| Canada (continued) | | | | | | | | |
| 5.38%, 01/15/28 | | USD | 25 | | | $ | 23,474 | |
Cineplex, Inc. 144A 7.62%, 03/31/29 | | CAD | 25 | | | | 18,481 | |
Corus Entertainment, Inc. Reg S 5.00%, 05/11/28 | | CAD | 25 | | | | 12,868 | |
Eldorado Gold Corp. 144A 6.25%, 09/01/29 | | USD | 25 | | | | 23,573 | |
Emera, Inc. 6.75%, 06/15/76 | | USD | 50 | | | | 49,617 | |
Enerflex Ltd. 144A 9.00%, 10/15/27 | | USD | 25 | | | | 25,624 | |
| First Quantum Minerals Ltd. 144A | | | | | | | | |
| 8.62%, 06/01/31 | | USD | 50 | | | | 48,457 | |
| 9.38%, 03/01/29 | | USD | 50 | | | | 51,721 | |
| Garda World Security Corp. 144A | | | | | | | | |
| 6.00%, 06/01/29 | | USD | 50 | | | | 44,253 | |
| 9.50%, 11/01/27 | | USD | 25 | | | | 24,907 | |
| GFL Environmental, Inc. 144A | | | | | | | | |
| 3.50%, 09/01/28 | | USD | 25 | | | | 22,500 | |
| 3.75%, 08/01/25 | | USD | 50 | | | | 48,675 | |
| 4.25%, 06/01/25 | | USD | 50 | | | | 49,328 | |
| 4.38%, 08/15/29 | | USD | 25 | | | | 22,589 | |
| 4.75%, 06/15/29 | | USD | 25 | | | | 23,091 | |
| 5.12%, 12/15/26 | | USD | 25 | | | | 24,372 | |
| goeasy Ltd. 144A | | | | | | | | |
| 4.38%, 05/01/26 | | USD | 25 | | | | 24,031 | |
| 9.25%, 12/01/28 | | USD | 15 | | | | 15,852 | |
Hudbay Minerals, Inc. 144A 4.50%, 04/01/26 | | USD | 50 | | | | 48,412 | |
Intelligent Packaging Ltd. Finco, Inc. / Intelligent Packaging Ltd Co-Issuer LLC 144A 6.00%, 09/15/28† | | USD | 40 | | | | 38,231 | |
Inter Pipeline Ltd. 6.88% (Canada Bankers’ Acceptances 3 Month+5.01%), 03/26/79 | | CAD | 25 | | | | 17,676 | |
Jones Deslauriers Insurance Management, Inc. 144A 8.50%, 03/15/30 | | USD | 25 | | | | 25,717 | |
Keyera Corp. 6.88% (Canada Bankers’ Acceptances 3 Month+5.17%), 06/13/79 | | CAD | 50 | | | | 35,782 | |
Laurentian Bank of Canada 5.09% (Canada Bankers’ Acceptances 3 Month+2.42%), 06/15/32 | | CAD | 25 | | | | 17,205 | |
| Mattamy Group Corp. 144A | | | | | | | | |
| 4.62%, 03/01/30† | | USD | 25 | | | | 22,413 | |
| 5.25%, 12/15/27 | | USD | 25 | | | | 23,958 | |
MEG Energy Corp. 144A 5.88%, 02/01/29 | | USD | 25 | | | | 24,211 | |
| Mercer International, Inc. | | | | | | | | |
See Notes to Financial Statements
VANECK INTERNATIONAL HIGH YIELD BOND ETF
SCHEDULE OF INVESTMENTS
(continued)
| | | Par
(000’s | ) | | Value | |
| Canada (continued) | | | | | | | | |
| 5.12%, 02/01/29 | | USD | 50 | | | $ | 43,722 | |
Methanex Corp. 5.25%, 12/15/29 | | USD | 50 | | | | 47,441 | |
New Gold, Inc. 144A 7.50%, 07/15/27 | | USD | 25 | | | | 24,870 | |
Northriver Midstream Finance LP 144A 5.62%, 02/15/26 | | USD | 25 | | | | 24,497 | |
| NOVA Chemicals Corp. 144A | | | | | | | | |
| 4.25%, 05/15/29† | | USD | 50 | | | | 41,900 | |
| 5.25%, 06/01/27 | | USD | 40 | | | | 37,670 | |
| 9.00%, 02/15/30 | | USD | 25 | | | | 25,791 | |
| Open Text Corp. 144A | | | | | | | | |
| 3.88%, 02/15/28 | | USD | 25 | | | | 22,843 | |
| 3.88%, 12/01/29 | | USD | 50 | | | | 43,807 | |
| Parkland Corp. 144A | | | | | | | | |
| 4.50%, 10/01/29 | | USD | 75 | | | | 68,033 | |
| 5.88%, 07/15/27 | | USD | 50 | | | | 48,903 | |
Pembina Pipeline Corp. 4.80% (Generic Canadian 5 Year+4.17%), 01/25/81 | | CAD | 50 | | | | 31,843 | |
Precision Drilling Corp. 144A 7.12%, 01/15/26 | | USD | 25 | | | | 25,019 | |
Rogers Communications, Inc. 5.00% (Generic Canadian 5 Year+3.58%), 12/17/81 | | CAD | 50 | | | | 34,951 | |
Rogers Communications, Inc. 144A 5.25% (US Treasury Yield Curve Rate T 5 Year+3.59%), 03/15/82 | | USD | 50 | | | | 47,595 | |
SNC-Lavalin Group, Inc. 7.00%, 06/12/26 | | CAD | 25 | | | | 18,772 | |
Strathcona Resources Ltd. 144A 6.88%, 08/01/26 | | USD | 25 | | | | 24,781 | |
Superior Plus LP / Superior General Partner, Inc. 144A 4.50%, 03/15/29 | | USD | 50 | | | | 45,272 | |
Teine Energy Ltd. 144A 6.88%, 04/15/29 | | USD | 25 | | | | 24,311 | |
Telesat Canada / Telesat LLC 144A 5.62%, 12/06/26 | | USD | 25 | | | | 12,172 | |
Terraform Global Operating LP 144A 6.12%, 03/01/26 | | USD | 25 | | | | 24,709 | |
TransAlta Corp. 7.75%, 11/15/29 | | USD | 25 | | | | 25,614 | |
Trivium Packaging Finance BV Reg S 3.75%, 08/15/26 | | EUR | 100 | | | | 104,631 | |
| Videotron Ltd. | | | | | | | | |
| 3.12%, 01/15/31 | | CAD | 50 | | | | 31,655 | |
| 4.50%, 01/15/30 | | CAD | 125 | | | | 86,426 | |
| | | | | | | | 2,591,052 | |
| | | Par
(000’s | ) | | Value | |
| Cayman Islands: 1.1% | | | | | | | | |
Arabian Centres Sukuk II Ltd. 144A 5.62%, 10/07/26 | | USD | 100 | | | $ | 93,724 | |
Banco do Brasil SA 144A 6.25%, 04/18/30 | | USD | 50 | | | | 49,712 | |
CT Trust 144A 5.12%, 02/03/32 | | USD | 100 | | | | 86,952 | |
Oryx Funding Ltd. 144A 5.80%, 02/03/31 | | USD | 100 | | | | 98,775 | |
| | | | | | | | 329,163 | |
| Chile: 0.2% | | | | | | | | |
Latam Airlines Group SA 144A 13.38%, 10/15/29 | | USD | 50 | | | | 57,516 | |
| China: 1.6% | | | | | | | | |
Bank of Communications Co. Ltd. Reg S 3.80% (US Treasury Yield Curve Rate T 5 Year+3.35%), 11/18/2025(o) | | USD | 200 | | | | 193,807 | |
Industrial & Commercial Bank of China Ltd. Reg S 3.20% (US Treasury Yield Curve Rate T 5 Year+2.37%), 9/24/2026(o) USD | | | 300 | | | | 283,324 | |
| | | | | | | | 477,131 | |
| Colombia: 2.6% | | | | | | | | |
Banco de Bogota SA 144A 6.25%, 05/12/26 | | USD | 100 | | | | 98,239 | |
| Ecopetrol SA | | | | | | | | |
| 4.62%, 11/02/31 | | USD | 75 | | | | 60,609 | |
| 5.38%, 06/26/26 | | USD | 50 | | | | 48,783 | |
| 5.88%, 05/28/45 | | USD | 75 | | | | 53,253 | |
| 6.88%, 04/29/30 | | USD | 75 | | | | 71,595 | |
| 8.38%, 01/19/36 | | USD | 75 | | | | 72,958 | |
| 8.62%, 01/19/29 | | USD | 50 | | | | 52,049 | |
| 8.88%, 01/13/33 | | USD | 100 | | | | 102,413 | |
Empresas Publicas de Medellin ESP 144A 4.25%, 07/18/29 | | USD | 75 | | | | 64,011 | |
Gran Tierra Energy International Holdings Ltd. 144A 6.25%, 02/15/25 | | USD | 25 | | | | 23,650 | |
Grupo Aval Ltd. 144A 4.38%, 02/04/30 | | USD | 100 | | | | 83,267 | |
Orazul Energy Peru SA 144A 5.62%, 04/28/27 | | USD | 50 | | | | 47,087 | |
| | | | | | | | 777,914 | |
| Costa Rica: 0.3% | | | | | | | | |
Instituto Costarricense de Electricidad 144A 6.38%, 05/15/43 | | USD | 100 | | | | 87,385 | |
| Cyprus: 0.1% | | | | | | | | |
MHP Lux SA 144A 6.95%, 04/03/26 | | USD | 50 | | | | 40,213 | |
See Notes to Financial Statements
| | | | Par
(000’s | ) | | | Value | |
| Czech Republic: 0.7% | | | | | | | | |
Allwyn International AS Reg S 3.88%, 02/15/27 | | EUR | 100 | | | $ | 104,331 | |
EP Infrastructure AS Reg S 1.70%, 07/30/26 | | EUR | 100 | | | | 98,534 | |
| | | | | | | | 202,865 | |
| Denmark: 0.3% | | | | | | | | |
Orsted AS Reg S 1.75% (EUR Swap Annual 5 Year+1.95%), 12/09/19 | | EUR | 100 | | | | 96,128 | |
| Finland: 0.2% | | | | | | | | |
SBB Treasury Oyj Reg S 1.12%, 11/26/29 | | EUR | 100 | | | | 64,621 | |
| France: 10.2% | | | | | | | | |
Air France-KLM Reg S 8.12%, 05/31/28 | | EUR | 100 | | | | 120,335 | |
| Altice France SA 144A | | | | | | | | |
| 5.12%, 07/15/29 | | USD | 100 | | | | 65,282 | |
| 5.50%, 10/15/29† | | USD | 50 | | | | 32,788 | |
Banijay Entertainment SASU 144A 8.12%, 05/01/29 | | USD | 50 | | | | 51,203 | |
CAB Selas Reg S 3.38%, 02/01/28 | | EUR | 100 | | | | 93,877 | |
Cerba Healthcare SACA Reg S 3.50%, 05/31/28 | | EUR | 100 | | | | 87,691 | |
CGG SA 144A 8.75%, 04/01/27 | | USD | 100 | | | | 93,805 | |
Constellium SE 144A 3.75%, 04/15/29 | | USD | 100 | | | | 88,770 | |
eircom Finance DAC Reg S 3.50%, 05/15/26 | | EUR | 100 | | | | 103,852 | |
| Electricite de France SA Reg S | | | | | | | | |
| 3.38% (EUR Swap Annual 5 Year+3.97%), 6/15/2030(o) | | EUR | 200 | | | | 187,129 | |
| 5.00% (EUR Swap Annual 12 Year+3.04%), 1/22/2026(o) | | EUR | 100 | | | | 106,443 | |
Elis SA Reg S 1.62%, 04/03/28 | | EUR | 100 | | | | 98,461 | |
ELO SACA Reg S 6.00%, 03/22/29 | | EUR | 100 | | | | 106,232 | |
Emeria SASU Reg S 3.38%, 03/31/28 | | EUR | 100 | | | | 91,557 | |
Eutelsat SA Reg S 2.25%, 07/13/27 | | EUR | 100 | | | | 89,015 | |
| Forvia SE Reg S | | | | | | | | |
| 2.38%, 06/15/27 | | EUR | 100 | | | | 101,185 | |
| 2.75%, 02/15/27 | | EUR | 100 | | | | 102,343 | |
| Iliad Holding SASU 144A | | | | | | | | |
| 6.50%, 10/15/26 | | USD | 100 | | | | 99,614 | |
| 7.00%, 10/15/28 | | USD | 100 | | | | 97,878 | |
Iliad Holding SASU Reg S 5.12%, 10/15/26 | | EUR | 100 | | | | 107,290 | |
| Loxam SAS Reg S | | | | | | | | |
| | | | Par
(000’s | ) | | | Value | |
| France (continued) | | | | | | | | |
| 3.75%, 07/15/26 | | EUR | 100 | | | $ | 105,759 | |
Matterhorn Telecom SA Reg S 3.12%, 09/15/26 | | EUR | 100 | | | | 104,385 | |
Picard Groupe SAS Reg S 3.88%, 07/01/26 | | EUR | 100 | | | | 104,479 | |
| Renault SA Reg S | | | | | | | | |
| 1.00%, 11/28/25 | | EUR | 50 | | | | 51,191 | |
| 1.25%, 06/24/25 | | EUR | 100 | | | | 103,490 | |
| 2.38%, 05/25/26 | | EUR | 100 | | | | 103,224 | |
Rexel SA Reg S 2.12%, 06/15/28 | | EUR | 100 | | | | 99,407 | |
SNF Group SACA Reg S 2.62%, 02/01/29 | | EUR | 100 | | | | 99,846 | |
Tereos Finance Groupe I SA Reg S 7.50%, 10/30/25 | | EUR | 100 | | | | 108,765 | |
| Valeo SE Reg S | | | | | | | | |
| 1.00%, 08/03/28 | | EUR | 100 | | | | 92,420 | |
| 5.38%, 05/28/27 | | EUR | 100 | | | | 109,733 | |
Veolia Environnement SA Reg S 2.50% (EUR Swap Annual 5 Year+2.84%), 9/20/2028(o) EUR | | | 100 | | | | 96,561 | |
| | | | | | | | 3,104,010 | |
| Germany: 3.9% | | | | | | | | |
| Bayer AG Reg S | | | | | | | | |
| 3.12% (EUR Swap Annual 5 Year+3.11%), 11/12/79 | | EUR | 100 | | | | 94,558 | |
| 5.38% (EUR Swap Annual 5 Year+4.46%), 03/25/82 | | EUR | 100 | | | | 99,632 | |
Cheplapharm Arzneimittel GmbH Reg S 4.38%, 01/15/28 | | EUR | 100 | | | | 103,249 | |
| Commerzbank AG Reg S | | | | | | | | |
| 4.00%, 03/23/26 | | EUR | 150 | | | | 160,388 | |
| 4.00%, 03/30/27 | | EUR | 50 | | | | 53,789 | |
Gruenenthal GmbH Reg S 3.62%, 11/15/26 | | EUR | 100 | | | | 104,850 | |
IHO Verwaltungs GmbH 144A 6.00%, 05/15/27 | | USD | 100 | | | | 98,360 | |
Mahle GmbH Reg S 2.38%, 05/14/28 | | EUR | 100 | | | | 94,449 | |
Nidda Healthcare Holding GmbH Reg S 7.50%, 08/21/26 | | EUR | 100 | | | | 110,526 | |
| Schaeffler AG Reg S | | | | | | | | |
| 2.88%, 03/26/27 | | EUR | 50 | | | | 52,025 | |
| 3.38%, 10/12/28 | | EUR | 100 | | | | 103,397 | |
ZF Europe Finance BV Reg S 3.00%, 10/23/29 | | EUR | 100 | | | | 98,423 | |
| | | | | | | | 1,173,646 | |
| Ghana: 0.3% | | | | | | | | |
Kosmos Energy Ltd. 144A 7.12%, 04/04/26 | | USD | 100 | | | | 96,921 | |
See Notes to Financial Statements
VANECK INTERNATIONAL HIGH YIELD BOND ETF
SCHEDULE OF INVESTMENTS
(continued)
| | | Par
(000’s | ) | | Value | |
| Greece: 1.7% | | | | | | | | |
Alpha Services and Holdings SA Reg S 5.50% (EUR Swap Annual 5 Year+5.82%), 06/11/31 | | EUR | 100 | | | $ | 105,455 | |
Eurobank SA Reg S 2.00% (EUR Swap Annual 1 Year+2.40%), 05/05/27 | | EUR | 100 | | | | 101,590 | |
National Bank of Greece SA Reg S 2.75% (EUR Swap Annual 5 Year+3.30%), 10/08/26 | | EUR | 100 | | | | 104,644 | |
Piraeus Financial Holdings SA Reg S 5.50% (EUR Swap Annual 5 Year+5.77%), 02/19/30 | | EUR | 100 | | | | 105,847 | |
Public Power Corp. SA Reg S 4.38%, 03/30/26 | | EUR | 100 | | | | 106,956 | |
| | | | | | | | 524,492 | |
| Guatemala: 0.3% | | | | | | | | |
Central American Bottling Corp. / CBC Bottling Holdco SL / Beliv Holdco SL 144A 5.25%, 04/27/29 | | USD | 100 | | | | 93,444 | |
| Hong Kong: 1.6% | | | | | | | | |
Huarong Finance 2017 Co. Ltd. Reg S 4.25%, 11/07/27 | | USD | 200 | | | | 182,308 | |
| Melco Resorts Finance Ltd. 144A | | | | | | | | |
| 5.38%, 12/04/29 | | USD | 100 | | | | 89,491 | |
| 5.62%, 07/17/27† | | USD | 50 | | | | 47,323 | |
| 5.75%, 07/21/28 | | USD | 50 | | | | 46,412 | |
RKPF Overseas 2020 A Ltd. Reg S 5.20%, 01/12/26 | | USD | 200 | | | | 41,184 | |
Studio City Finance Ltd. 144A 5.00%, 01/15/29 | | USD | 100 | | | | 85,121 | |
| | | | | | | | 491,839 | |
| India: 1.1% | | | | | | | | |
Delhi International Airport Ltd. 144A 6.45%, 06/04/29 | | USD | 100 | | | | 97,498 | |
JSW Steel Ltd. 144A 5.05%, 04/05/32 | | USD | 100 | | | | 85,628 | |
ReNew Pvt Ltd. 144A 5.88%, 03/05/27 | | USD | 91 | | | | 87,429 | |
Shriram Finance Ltd. 144A 6.62%, 04/22/27 | | USD | 50 | | | | 49,686 | |
| | | | | | | | 320,241 | |
| Indonesia: 0.3% | | | | | | | | |
Bakrie Telecom Pte Ltd. Reg S 11.50%, 05/07/15(d) *∞ | | USD | 150 | | | | 1,444 | |
Medco Bell Pte Ltd. 144A 6.38%, 01/30/27 | | USD | 100 | | | | 97,438 | |
| | | | | | | | 98,882 | |
| | | Par
(000’s | ) | | Value | |
| Ireland: 1.2% | | | | | | | | |
AerCap Global Aviation Trust 144A 6.50% (Term SOFR USD 3 Month+4.56%), 06/15/45 | | USD | 50 | | | $ | 49,756 | |
Ardagh Packaging Finance Plc / Ardagh Holdings USA, Inc. Reg S 4.75%, 07/15/27 | | GBP | 100 | | | | 61,670 | |
C&W Senior Finance Ltd. 144A 6.88%, 09/15/27 | | USD | 100 | | | | 94,805 | |
Virgin Media Vendor Financing Notes III DAC Reg S 4.88%, 07/15/28 | | GBP | 150 | | | | 168,129 | |
| | | | | | | | 374,360 | |
| Israel: 0.9% | | | | | | | | |
| Leviathan Bond Ltd. 144A Reg S | | | | | | | | |
| 6.12%, 06/30/25 | | USD | 25 | | | | 24,376 | |
| 6.50%, 06/30/27 | | USD | 25 | | | | 23,519 | |
| 6.75%, 06/30/30 | | USD | 15 | | | | 13,431 | |
Teva Pharmaceutical Finance Co. LLC 6.15%, 02/01/36 | | USD | 25 | | | | 23,771 | |
| Teva Pharmaceutical Finance Netherlands III BV | | | | | | | | |
| 3.15%, 10/01/26 | | USD | 90 | | | | 83,458 | |
| 4.10%, 10/01/46 | | USD | 75 | | | | 50,067 | |
| 6.75%, 03/01/28† | | USD | 50 | | | | 50,798 | |
| | | | | | | | 269,420 | |
| Italy: 6.7% | | | | | | | | |
Abertis Infraestructuras Finance BV Reg S 3.25% (EUR Swap Annual 5 Year+3.69%), 11/24/2025(o) | | EUR | 100 | | | | 104,091 | |
Banca Monte dei Paschi di Siena SpA Reg S 6.75% (Euribor 3 Month ACT/360+3.21%), 03/02/26 | | EUR | 100 | | | | 108,380 | |
Banco BPM SpA Reg S 3.25% (EUR Swap Annual 5 Year+3.80%), 01/14/31 | | EUR | 100 | | | | 103,783 | |
BPER Banca SPA Reg S 1.38% (Euribor 3 Month ACT/360+1.75%), 03/31/27 | | EUR | 100 | | | | 101,948 | |
Infrastrutture Wireless Italiane SpA Reg S 1.88%, 07/08/26 | | EUR | 100 | | | | 102,629 | |
| Intesa Sanpaolo SpA 144A | | | | | | | | |
| 4.20% (US Treasury Yield Curve Rate T 1 Year+2.60%), 06/01/32 | | USD | 25 | | | | 20,503 | |
| 4.95% (US Treasury Yield Curve Rate T 1 Year+2.75%), 06/01/42 | | USD | 25 | | | | 17,992 | |
Intesa Sanpaolo SpA Reg S 2.92%, 10/14/30 | | EUR | 100 | | | | 97,419 | |
See Notes to Financial Statements
| | | Par
(000’s | ) | | Value | |
| Italy (continued) | | | | | | | | |
| 3.93%, 09/15/26 | | EUR | 100 | | | $ | 106,600 | |
Mundys SpA Reg S 1.88%, 02/12/28 | | EUR | 100 | | | | 98,570 | |
Nexi SpA Reg S 2.12%, 04/30/29 | | EUR | 100 | | | | 95,791 | |
Poste Italiane SpA Reg S 2.62% (EUR Swap Annual 5 Year+2.68%), 3/24/2029(o) | | EUR | 100 | | | | 91,982 | |
| Telecom Italia Capital SA | | | | | | | | |
| 6.38%, 11/15/33 | | USD | 25 | | | | 22,109 | |
| 7.72%, 06/04/38 | | USD | 100 | | | | 93,075 | |
| Telecom Italia SpA Reg S | | | | | | | | |
| 1.62%, 01/18/29 | | EUR | 100 | | | | 91,381 | |
| 2.38%, 10/12/27 | | EUR | 100 | | | | 98,247 | |
| 3.62%, 05/25/26 | | EUR | 100 | | | | 104,549 | |
Telecom Italia SpA/Milano Reg S 6.88%, 02/15/28 | | EUR | 100 | | | | 112,084 | |
Terna - Rete Elettrica Nazionale Reg S 2.38% (EUR Swap Annual 5 Year+2.12%), 11/9/2027(o) | | EUR | 100 | | | | 98,589 | |
UniCredit SpA 144A 5.46% (US Treasury Yield Curve Rate T 5 Year+4.75%), 06/30/35 | | USD | 75 | | | | 69,030 | |
UniCredit SpA Reg S 2.73% (EUR Swap Annual 5 Year+2.80%), 01/15/32 | | EUR | 200 | | | | 202,387 | |
Webuild SpA Reg S 5.88%, 12/15/25 | | EUR | 100 | | | | 108,570 | |
| | | | | | | | 2,049,709 | |
| Japan: 1.6% | | | | | | | | |
| Rakuten Group, Inc. 144A | | | | | | | | |
| 5.12% (US Treasury Yield Curve Rate T 5 Year+4.58%), 4/22/2026(o) | | USD | 100 | | | | 83,301 | |
| 6.25% (US Treasury Yield Curve Rate T 5 Year+4.96%), 4/22/2026(o) † | | USD | 25 | | | | 18,141 | |
| SoftBank Group Corp. Reg S | | | | | | | | |
| 5.12%, 09/19/27 | | USD | 200 | | | | 189,912 | |
| 6.88% (USD SOFR Spread- Adjusted ICE Swap Rate 5 Year+4.85%), 7/19/2027(o) | | USD | 200 | | | | 194,285 | |
| | | | | | | | 485,639 | |
| Luxembourg: 6.7% | | | | | | | | |
Acu Petroleo Luxembourg Sarl 144A 7.50%, 01/13/32 | | USD | 48 | | | | 46,451 | |
Adler Financing Sarl 12.50%, 06/30/25 | | EUR | 75 | | | | 92,474 | |
Agps Bondco Plc Reg S 5.00%, 01/14/29 | | EUR | 100 | | | | 37,736 | |
Albion Financing 1 Sarl / Aggreko Holdings, Inc. 144A 6.12%, 10/15/26 | | USD | 100 | | | | 98,259 | |
| | | Par
(000’s | ) | | Value | |
| Luxembourg (continued) | | | | | | | | |
Altice Financing SA 144A 5.00%, 01/15/28 | | USD | 250 | | | $ | 197,577 | |
Altice France Holding SA 144A 10.50%, 05/15/27 | | USD | 150 | | | | 53,391 | |
Altice France Holding SA Reg S 8.00%, 05/15/27 | | EUR | 100 | | | | 32,345 | |
| Altice France SA 144A | | | | | | | | |
| 5.50%, 01/15/28 | | USD | 100 | | | | 67,659 | |
| 8.12%, 02/01/27 | | USD | 100 | | | | 75,381 | |
| Ardagh Packaging Finance Plc / Ardagh Holdings USA, Inc. 144A | | | | | | | | |
| 4.12%, 08/15/26 | | USD | 50 | | | | 41,719 | |
| 5.25%, 08/15/27 | | USD | 125 | | | | 63,880 | |
Cidron Aida Finco Sarl Reg S 5.00%, 04/01/28 | | EUR | 100 | | | | 101,768 | |
Cirsa Finance International Sarl Reg S 4.50%, 03/15/27 | | EUR | 100 | | | | 105,247 | |
Codere Finance 2 Luxembourg SA Reg S 11.00%, 09/30/26 | | EUR | 26 | | | | 9,326 | |
Consolidated Energy Finance SA 144A 12.00%, 02/15/31 | | USD | 50 | | | | 51,813 | |
CSN Resources SA 144A 4.62%, 06/10/31 | | USD | 100 | | | | 78,707 | |
| Energean Israel Finance Ltd. 144A Reg S | | | | | | | | |
| 4.88%, 03/30/26 | | USD | 35 | | | | 33,004 | |
| 5.38%, 03/30/28 | | USD | 25 | | | | 22,247 | |
| 5.88%, 03/30/31 | | USD | 35 | | | | 29,931 | |
Engineering - Ingegneria Informatica - SpA Reg S 5.88%, 09/30/26 | | EUR | 100 | | | | 103,175 | |
Eurofins Scientific SE Reg S 3.25% (Euribor 3 Month ACT/360+2.67%), 11/13/2025(o) | | EUR | 100 | | | | 104,072 | |
MC Brazil Downstream Trading Sarl 144A 7.25%, 06/30/31 | | USD | 48 | | | | 41,221 | |
Minerva Luxembourg SA 144A 4.38%, 03/18/31 | | USD | 100 | | | | 81,396 | |
Petrorio Luxembourg Trading Sarl 144A 6.12%, 06/09/26 | | USD | 50 | | | | 48,913 | |
Stena International SA Reg S 7.25%, 02/15/28 | | EUR | 100 | | | | 112,941 | |
Summer BC Holdco B Sarl Reg S 5.75%, 10/31/26 | | EUR | 100 | | | | 105,214 | |
Telenet Finance Luxembourg Notes Sarl Reg S 3.50%, 03/01/28 | | EUR | 100 | | | | 101,980 | |
See Notes to Financial Statements
VANECK INTERNATIONAL HIGH YIELD BOND ETF
SCHEDULE OF INVESTMENTS
(continued)
| | | Par
(000’s | ) | | Value | |
| Luxembourg (continued) | | | | | | | | |
TK Elevator US Newco, Inc. 144A 5.25%, 07/15/27 | | USD | 100 | | | $ | 95,763 | |
| | | | | | | | 2,033,590 | |
| Malta: 0.3% | | | | | | | | |
| VistaJet Malta Finance Plc / Vista Management Holding, Inc. 144A | | | | | | | | |
| 6.38%, 02/01/30† | | USD | 50 | | | | 38,762 | |
| 7.88%, 05/01/27† | | USD | 50 | | | | 44,516 | |
| | | | | | | | 83,278 | |
| Mauritius: 0.7% | | | | | | | | |
CA Magnum Holdings 144A 5.38%, 10/31/26 | | USD | 100 | | | | 94,390 | |
Greenko Power II Ltd. 144A 4.30%, 12/13/28 | | USD | 135 | | | | 120,702 | |
| | | | | | | | 215,092 | |
| Mexico: 4.1% | | | | | | | | |
| Cemex SAB de CV 144A | | | | | | | | |
| 3.88%, 07/11/31† | | USD | 50 | | | | 43,539 | |
| 5.12% (US Treasury Yield Curve Rate T 5 Year+4.53%), 6/8/2026(o) | | USD | 50 | | | | 48,115 | |
| 5.20%, 09/17/30 | | USD | 25 | | | | 23,686 | |
| 5.45%, 11/19/29 | | USD | 25 | | | | 24,153 | |
| 9.12% (US Treasury Yield Curve Rate T 5 Year+5.16%), 3/14/2028(o) | | USD | 50 | | | | 53,688 | |
Grupo KUO SAB De CV 144A 5.75%, 07/07/27 | | USD | 50 | | | | 46,532 | |
Nemak SAB de CV 144A 3.62%, 06/28/31 | | USD | 100 | | | | 78,300 | |
| Petroleos Mexicanos | | | | | | | | |
| 5.35%, 02/12/28 | | USD | 50 | | | | 43,744 | |
| 5.95%, 01/28/31 | | USD | 100 | | | | 78,964 | |
| 6.50%, 03/13/27 | | USD | 100 | | | | 93,718 | |
| 6.62%, 06/15/35 | | USD | 50 | | | | 36,973 | |
| 6.70%, 02/16/32 | | USD | 150 | | | | 122,750 | |
| 6.75%, 09/21/47† | | USD | 100 | | | | 63,907 | |
| 6.84%, 01/23/30 | | USD | 50 | | | | 43,367 | |
| 6.88%, 08/04/26 | | USD | 50 | | | | 48,561 | |
| 6.95%, 01/28/60 | | USD | 75 | | | | 47,772 | |
| 7.69%, 01/23/50 | | USD | 175 | | | | 121,947 | |
| Petroleos Mexicanos Reg S | | | | | | | | |
| 3.75%, 11/16/25 | | GBP | 100 | | | | 116,081 | |
| 4.88%, 02/21/28 | | EUR | 100 | | | | 95,074 | |
Total Play Telecomunicaciones SA de CV 144A 6.38%, 09/20/28 | | USD | 50 | | | | 26,722 | |
| | | | | | | | 1,257,593 | |
| Morocco: 0.3% | | | | | | | | |
OCP SA 144A 6.88%, 04/25/44 | | USD | 100 | | | | 92,150 | |
| Netherlands: 5.4% | | | | | | | | |
Braskem Netherlands Finance BV 144A 7.25%, 02/13/33 | | USD | 50 | | | | 47,436 | |
| | | Par
(000’s | ) | | Value | |
| Netherlands (continued) | | | | | | | | |
Dufry One BV Reg S 2.00%, 02/15/27 | | EUR | 100 | | | $ | 101,053 | |
Embraer Netherlands Finance BV 144A 7.00%, 07/28/30 | | USD | 50 | | | | 51,208 | |
| Petrobras Global Finance BV | | | | | | | | |
| 5.50%, 06/10/51 | | USD | 25 | | | | 19,177 | |
| 6.50%, 07/03/33† | | USD | 25 | | | | 24,683 | |
PPF Telecom Group BV Reg S 3.25%, 09/29/27 | | EUR | 100 | | | | 103,977 | |
Selecta Group BV Reg S 8.00%, 04/01/26 | | EUR | 53 | | | | 55,102 | |
Sunrise FinCo I BV 144A 4.88%, 07/15/31 | | USD | 100 | | | | 87,182 | |
| Telefonica Europe BV Reg S | | | | | | | | |
| 2.38% (EUR Swap Annual 8 Year+2.62%), 2/12/2029(o) | | EUR | 100 | | | | 93,999 | |
| 6.13% (EUR Swap Annual 7 Year+3.35%), 2/3/2030(o) | | EUR | 100 | | | | 110,901 | |
TenneT Holding BV Reg S 2.37% (EUR Swap Annual 5 Year+2.72%), 7/22/2025(o) | | EUR | 100 | | | | 104,108 | |
| Teva Pharmaceutical Finance Netherlands II BV | | | | | | | | |
| 3.75%, 05/09/27 | | EUR | 100 | | | | 104,322 | |
| 4.38%, 05/09/30 | | EUR | 100 | | | | 102,623 | |
| 7.38%, 09/15/29 | | EUR | 100 | | | | 118,355 | |
TMNL Holding BV Reg S 3.75%, 01/15/29 | | EUR | 100 | | | | 100,376 | |
United Group BV Reg S 3.62%, 02/15/28 | | EUR | 100 | | | | 100,170 | |
VZ Vendor Financing II BV Reg S 2.88%, 01/15/29 | | EUR | 100 | | | | 92,559 | |
Wintershall Dea Finance 2 BV Reg S 3.00% (EUR Swap Annual 5 Year+3.32%), 7/20/2028(o) | | EUR | 100 | | | | 93,605 | |
Ziggo Bond Co. BV 144A 5.12%, 02/28/30 | | USD | 50 | | | | 41,539 | |
Ziggo BV 144A 4.88%, 01/15/30 | | USD | 100 | | | | 87,591 | |
| | | | | | | | 1,639,966 | |
| Norway: 0.4% | | | | | | | | |
Adevinta ASA Reg S 2.62%, 11/15/25 | | EUR | 100 | | | | 107,131 | |
| Panama: 0.4% | | | | | | | | |
AES Panama Generation Holdings SRL 144A 4.38%, 05/31/30 | | USD | 74 | | | | 61,996 | |
Banistmo SA 144A 4.25%, 07/31/27 | | USD | 50 | | | | 45,982 | |
| | | | | | | | 107,978 | |
| Peru: 0.6% | | | | | | | | |
Minsur SA 144A 4.50%, 10/28/31 | | USD | 50 | | | | 43,484 | |
Peru LNG Srl 144A 5.38%, 03/22/30 | | USD | 100 | | | | 85,418 | |
See Notes to Financial Statements
| | | Par
(000’s | ) | | Value | |
| Peru (continued) | | | | | | | | |
Petroleos del Peru SA 144A 4.75%, 06/19/32 | | USD | 75 | | | $ | 56,242 | |
| | | | | | | | 185,144 | |
| Poland: 0.7% | | | | | | | | |
Canpack SA / Canpack US LLC 144A 3.88%, 11/15/29 | | USD | 100 | | | | 87,734 | |
mBank SA Reg S 8.38% (Euribor 3 Month ACT/360+4.90%), 09/11/27 | | EUR | 100 | | | | 113,502 | |
| | | | | | | | 201,236 | |
| Portugal: 1.0% | | | | | | | | |
| EDP - Energias de Portugal SA Reg S | | | | | | | | |
| 1.70% (EUR Swap Annual 5 Year+1.84%), 07/20/80 | | EUR | 100 | | | | 103,497 | |
| 1.88% (EUR Swap Annual 5 Year+2.38%), 08/02/81 | | EUR | 100 | | | | 100,820 | |
Novo Banco SA Reg S 4.25% (Euribor 3 Month ACT/360+1.30%), 03/08/28 | | EUR | 100 | | | | 105,978 | |
| | | | | | | | 310,295 | |
| Romania: 0.4% | | | | | | | | |
Banca Transilvania SA Reg S 8.88% (EUAMDB01+5.58%), 04/27/27 | | EUR | 100 | | | | 113,204 | |
| Singapore: 0.3% | | | | | | | | |
Star Energy Geothermal Wayang Windu Ltd. 144A 6.75%, 04/24/33 | | USD | 78 | | | | 77,500 | |
| South Africa: 0.5% | | | | | | | | |
Sasol Financing USA LLC 6.50%, 09/27/28† | | USD | 50 | | | | 47,524 | |
Transnet SOC Ltd. 144A 8.25%, 02/06/28 | | USD | 100 | | | | 98,564 | |
| | | | | | | | 146,088 | |
| Spain: 2.3% | | | | | | | | |
| Abengoa Abenewco 2 SA Reg S | | | | | | | | |
| 1.50%, 10/26/24(d) * | | USD | 63 | | | | 1,835 | |
| 1.50%, 10/26/24(d) *∞ | | USD | 64 | | | | 804 | |
Abengoa SA 0.00%, 03/31/27(s) ^∞ | | EUR | 100 | | | | 536 | |
Banco de Credito Social Cooperativo SA Reg S 5.25% (EUR Swap Annual 5 Year+5.42%), 11/27/31 | | EUR | 100 | | | | 103,249 | |
Banco de Sabadell SA Reg S 2.50% (EUR Swap Annual 5 Year+2.95%), 04/15/31 | | EUR | 100 | | | | 102,671 | |
Grifols SA Reg S 1.62%, 02/15/25 | | EUR | 150 | | | | 156,779 | |
Lorca Telecom Bondco SA Reg S 4.00%, 09/18/27 | | EUR | 100 | | | | 104,468 | |
Telefonica Europe BV Reg S 3.88% (EUR Swap Annual 8 Year+2.97%), 6/22/2026(o) | | EUR | 100 | | | | 104,827 | |
| | | Par
(000’s | ) | | Value | |
| Spain (continued) | | | | | | | | |
Unicaja Banco SA Reg S 7.25% (EUR Swap Annual 1 Year+4.25%), 11/15/27 | | EUR | 100 | | | $ | 113,374 | |
| | | | | | | | 688,543 | |
| Sweden: 1.6% | | | | | | | | |
Castellum AB Reg S 3.12% (EUR Swap Annual 5 Year+3.45%), 12/2/2026(o) | | EUR | 100 | | | | 93,403 | |
| Intrum AB Reg S | | | | | | | | |
| 3.00%, 09/15/27 | | EUR | 100 | | | | 65,852 | |
| 4.88%, 08/15/25 | | EUR | 100 | | | | 88,371 | |
Samhallsbyggnadsbolaget i Norden AB Reg S 2.62% (EUR Swap Annual 5 Year+2.81%), 1/30/2025(o) | | EUR | 100 | | | | 27,647 | |
Verisure Holding AB Reg S 3.25%, 02/15/27 | | EUR | 100 | | | | 102,849 | |
Verisure Midholding AB Reg S 5.25%, 02/15/29 | | EUR | 100 | | | | 103,310 | |
| | | | | | | | 481,432 | |
| Switzerland: 0.3% | | | | | | | | |
Techem Verwaltungsgesellschaft 675 mbH Reg S 2.00%, 07/15/25 | | EUR | 100 | | | | 104,982 | |
| Tanzania: 0.1% | | | | | | | | |
AngloGold Ashanti Holdings Plc 6.50%, 04/15/40 | | USD | 40 | | | | 39,323 | |
| Turkey: 1.9% | | | | | | | | |
Akbank TAS 144A 6.80%, 02/06/26 | | USD | 50 | | | | 50,219 | |
Mersin Uluslararasi Liman Isletmeciligi AS 144A 8.25%, 11/15/28 | | USD | 50 | | | | 51,428 | |
TC Ziraat Bankasi AS 144A 5.38%, 03/02/26 | | USD | 100 | | | | 97,465 | |
Turkcell Iletisim Hizmetleri AS 144A 5.80%, 04/11/28 | | USD | 100 | | | | 95,828 | |
Turkiye Ihracat Kredi Bankasi AS 144A 5.75%, 07/06/26 | | USD | 100 | | | | 97,532 | |
Turkiye Vakiflar Bankasi TAO 144A 6.50%, 01/08/26 | | USD | 100 | | | | 99,721 | |
Yapi ve Kredi Bankasi AS 144A 7.88% (US Treasury Yield Curve Rate T 5 Year+7.42%), 01/22/31 | | USD | 100 | | | | 99,927 | |
| | | | | | | | 592,120 | |
| United Arab Emirates: 0.6% | | | | | | | | |
GEMS Menasa Cayman Ltd. / GEMS Education Delaware LLC 144A 7.12%, 07/31/26 | | USD | 100 | | | | 99,461 | |
See Notes to Financial Statements
VANECK INTERNATIONAL HIGH YIELD BOND ETF
SCHEDULE OF INVESTMENTS
(continued)
| | | Par
(000’s) | | | Value | |
| United Arab Emirates (continued) | | | | | | | | |
Shelf Drilling Holdings Ltd. 144A 9.62%, 04/15/29 | | USD | 100 | | | $ | 94,724 | |
| | | | | | | | 194,185 | |
| United Kingdom: 10.3% | | | | | | | | |
Ardonagh Finco Ltd. 144A 7.75%, 02/15/31 | | USD | 100 | | | | 98,486 | |
Aston Martin Capital Holdings Ltd. 144A 10.00%, 03/31/29 | | USD | 50 | | | | 49,020 | |
Avianca Midco 2 Plc 144A 9.00%, 12/01/28 | | USD | 75 | | | | 70,878 | |
BCP V Modular Services Finance II Plc Reg S 4.75%, 11/30/28 | | EUR | 100 | | | | 101,011 | |
Bellis Acquisition Co. Plc Reg S 3.25%, 02/16/26 | | GBP | 100 | | | | 123,372 | |
British Telecommunications Plc Reg S 1.87% (EUR Swap Annual 5 Year+2.13%), 08/18/80 | | EUR | 100 | | | | 103,289 | |
Connect Finco Sarl / Connect US Finco LLC 144A 6.75%, 10/01/26 | | USD | 100 | | | | 96,936 | |
Drax Finco Plc Reg S 2.62%, 11/01/25 | | EUR | 100 | | | | 104,689 | |
eG Global Finance Plc 144A 12.00%, 11/30/28 | | USD | 100 | | | | 103,332 | |
Global Auto Holdings Ltd./ AAG FH UK Ltd 144A 8.75%, 01/15/32 | | USD | 50 | | | | 47,253 | |
Howden UK Refinance Plc / Howden UK Refinance 2 PLC / Howden US Refinance LLC 144A 7.25%, 02/15/31 | | USD | 50 | | | | 49,399 | |
IHS Holding Ltd. 144A 5.62%, 11/29/26 | | USD | 50 | | | | 46,091 | |
INEOS Finance Plc Reg S 6.62%, 05/15/28 | | EUR | 100 | | | | 109,318 | |
INEOS Quattro Finance 2 Plc 144A 9.62%, 03/15/29† | | USD | 100 | | | | 105,762 | |
International Consolidated Airlines Group SA Reg S 1.50%, 07/04/27 | | EUR | 100 | | | | 99,203 | |
Jaguar Land Rover Automotive Plc 144A 5.88%, 01/15/28 | | USD | 100 | | | | 97,297 | |
Jaguar Land Rover Automotive Plc Reg S 4.50%, 07/15/28 | | EUR | 100 | | | | 105,794 | |
Jerrold Finco Plc Reg S 5.25%, 01/15/27 | | GBP | 100 | | | | 119,463 | |
Marks & Spencer Plc 144A 7.12%, 12/01/37 | | USD | 40 | | | | 40,993 | |
Motion Bondco DAC 144A 6.62%, 11/15/27† | | USD | 100 | | | | 96,520 | |
| | | Par
(000’s) | | | Value | |
| United Kingdom (continued) | | | | | | | | |
NGG Finance Plc Reg S 5.62% (GBP Swap 12 Year+3.48%), 06/18/73 | | GBP | 100 | | | $ | 123,928 | |
Nomad Foods Bondco Plc Reg S 2.50%, 06/24/28 | | EUR | 100 | | | | 99,519 | |
Paysafe Finance Plc / Paysafe Holdings US Corp. 144A 4.00%, 06/15/29† | | USD | 100 | | | | 88,012 | |
Standard Chartered Plc 144A 7.01%, 07/30/37(o) | | USD | 50 | | | | 50,698 | |
Stonegate Pub Co. Financing 2019 Plc Reg S 8.00%, 07/13/25 | | GBP | 100 | | | | 120,344 | |
Tullow Oil Plc 144A 10.25%, 05/15/26 | | USD | 94 | | | | 91,655 | |
Vedanta Resources Finance II Plc 144A 13.88%, 12/09/28 | | USD | 84 | | | | 76,466 | |
Victoria Plc Reg S 3.62%, 08/24/26 | | EUR | 100 | | | | 88,325 | |
Virgin Media Secured Finance Plc 144A 5.50%, 05/15/29 | | USD | 25 | | | | 22,742 | |
Virgin Media Secured Finance Plc Reg S 4.25%, 01/15/30 | | GBP | 100 | | | | 106,005 | |
Vmed O2 UK Financing I Plc 144A 4.75%, 07/15/31 | | USD | 25 | | | | 20,888 | |
Vmed O2 UK Financing I Plc Reg S 4.00%, 01/31/29 | | GBP | 100 | | | | 108,635 | |
Vodafone Group Plc 7.00% (USD Swap Semi 30/360 5 Year+4.87%), 04/04/79 | | USD | 75 | | | | 76,213 | |
| Vodafone Group Plc Reg S | | | | | | | | |
| 4.88% (GBP Swap 5 Year+3.27%), 10/03/78 | | GBP | 100 | | | | 122,908 | |
| 8.00% (UK Govt Bonds 5 Year Note Generic Bid Yield+3.84%), 08/30/86 | | GBP | 100 | | | | 133,579 | |
WE Soda Investments Holding Plc 144A 9.50%, 10/06/28 | | USD | 50 | | | | 51,746 | |
| | | | | | | | 3,149,769 | |
| United States: 4.1% | | | | | | | | |
Amer Sports Co. 144A 6.75%, 02/16/31 | | USD | 25 | | | | 24,641 | |
Kronos Acquisition Holdings, Inc. / KIK Custom Products Inc 144A 7.00%, 12/31/27 | | USD | 50 | | | | 48,415 | |
LCPR Senior Secured Financing DAC 144A 6.75%, 10/15/27 | | USD | 75 | | | | 69,581 | |
| MGM China Holdings Ltd. 144A | | | | | | | | |
See Notes to Financial Statements
| | | Par
(000’s | ) | | Value | |
| United States (continued) | | | | | | | | |
| 5.88%, 05/15/26 | | USD | 100 | | | $ | 98,286 | |
Mong Duong Finance Holdings BV 144A 5.12%, 05/07/29 | | USD | 92 | | | | 88,044 | |
Open Text Holdings, Inc. 144A 4.12%, 02/15/30 | | USD | 50 | | | | 43,977 | |
Playtika Holding Corp. 144A 4.25%, 03/15/29 | | USD | 25 | | | | 21,534 | |
Q-Park Holding I BV Reg S 2.00%, 03/01/27 | | EUR | 100 | | | | 98,837 | |
Ritchie Bros Holdings, Inc. 144A 7.75%, 03/15/31 | | USD | 50 | | | | 51,919 | |
| Sasol Financing USA LLC | | | | | | | | |
| 4.38%, 09/18/26† | | USD | 50 | | | | 47,130 | |
| 5.50%, 03/18/31 | | USD | 50 | | | | 41,603 | |
Sigma Holdco BV Reg S 5.75%, 05/15/26 | | EUR | 100 | | | | 100,294 | |
Stillwater Mining Co. 144A 4.00%, 11/16/26 | | USD | 100 | | | | 89,586 | |
Telesat Canada / Telesat LLC 144A 6.50%, 10/15/27 | | USD | 25 | | | | 7,395 | |
| Wynn Macau Ltd. 144A | | | | | | | | |
| 5.12%, 12/15/29 | | USD | 75 | | | | 66,287 | |
| 5.50%, 01/15/26 | | USD | 25 | | | | 24,283 | |
| 5.50%, 10/01/27† | | USD | 50 | | | | 47,329 | |
| ZF North America Capital, Inc. 144A | | | | | | | | |
| 6.75%, 04/23/30 | | USD | 125 | | | | 125,373 | |
| 6.88%, 04/14/28 | | USD | 50 | | | | 50,387 | |
| 7.12%, 04/14/30 | | USD | 100 | | | | 102,350 | |
| | | | | | | | 1,247,251 | |
| Uzbekistan: 0.1% | | | | | | | | |
Uzbekneftegaz JSC 144A 4.75%, 11/16/28 | | USD | 50 | | | | 41,975 | |
| | | Par
(000’s | ) | | Value | |
| Zambia: 0.3% | | | | | | | | |
First Quantum Minerals Ltd. 144A 6.88%, 10/15/27 | | USD | 100 | | | $ | 96,292 | |
Total Corporate Bonds
(Cost: $32,540,832) | | | | | | | 29,729,511 | |
| | | | | | | | | |
| | | | | | | | | |
| | | Number
of Shares | | | | | |
COMMON STOCK: 0.0%
(Cost: $93,861) | | | | | | | | |
| France: 0.0% | | | | | | | | |
| Casino Guichard Perrachon SA (EUR) * | | | 32,888 | | | | 1,008 | |
| | | | | | | | | |
WARRANTS: 0.0%
(Cost: $16,090) | | | | | | | | |
| France: 0.0% | | | | | | | | |
Casino Guichard Perrachon SA, EUR 0.17, exp. 04/27/29 | | | 32,888 | | | | 14 | |
| | | | | | | | | |
Total Investments Before Collateral for Securities Loaned: 97.7%
(Cost: $32,650,783) | | | | | | | 29,730,533 | |
| | | | | | | | | |
SHORT-TERM INVESTMENT HELD AS
COLLATERAL FOR SECURITIES ON LOAN: 2.8% | | | |
Money Market Fund: 2.8%
(Cost: $860,040) | | | | | | | | |
| State Street Navigator Securities Lending Government Money Market Portfolio | | | 860,040 | | | | 860,040 | |
Total Investments: 100.5%
(Cost: $33,510,823) | | | | | | | 30,590,573 | |
| Liabilities in excess of other assets: (0.5)% | | | (162,572) | |
| NET ASSETS: 100.0% | | | | | | $ | 30,428,001 | |
Definitions:
| CAD | Canadian Dollar |
| EUR | Euro |
| GBP | British Pound |
| SOFR | Secured Overnight Financing Rate |
| USD | United States Dollar |
Footnotes:
| (d) | Security in default |
| (o) | Perpetual Maturity — the date shown is the next call date |
| (s) | The rate shown reflects the rate in effect at the end of the reporting period. Coupon adjusts periodically based upon a predetermined schedule |
| * | Non-income producing |
| ^ | Zero Coupon Bond |
| † | Security fully or partially on loan. Total market value of securities on loan is $944,012. |
See Notes to Financial Statements
VANECK INTERNATIONAL HIGH YIELD BOND ETF
SCHEDULE OF INVESTMENTS
(continued)
| ∞ | Security is valued using significant unobservable inputs that factor in discount for lack of marketability and is classified as Level 3 in the fair value hierarchy. |
| | |
| Reg S | Security was purchased pursuant to Regulation S under the Securities Act of 1933, which exempts from registration securities offered and sold outside of the United States. Such a security cannot be sold in the United States without either an effective registration statement filed pursuant to the Securities Act of 1933, or pursuant to an exemption from registration. |
| 144A | Security exempt from registration under Rule 144A of the Securities Act of 1933, as amended, or otherwise restricted. These securities may be resold in transactions exempt from registration, unless otherwise noted. These securities have an aggregate value of $12,746,217, or 41.9% of net assets. |
Summary of Investments by Sector
Excluding Collateral for Securities Loaned | | % of
Investments | | Value | |
| Financials | | | 29.1 | % | | $ | 8,656,719 | |
| Technology | | | 13.0 | | | | 3,863,134 | |
| Energy | | | 11.9 | | | | 3,525,574 | |
| Industrials | | | 11.5 | | | | 3,426,803 | |
| Consumer Cyclicals | | | 8.5 | | | | 2,515,929 | |
| Basic Materials | | | 8.1 | | | | 2,396,696 | |
| Utilities | | | 7.5 | | | | 2,232,459 | |
| Healthcare | | | 5.0 | | | | 1,496,624 | |
| Consumer Non-Cyclicals | | | 2.9 | | | | 872,599 | |
| Real Estate | | | 1.6 | | | | 464,514 | |
| Institutions, Associations & Organizations | | | 0.9 | | | | 279,482 | |
| | | | 100.0 | % | | $ | 29,730,533 | |
See Notes to Financial Statements
The summary of inputs used to value the Fund’s investments as of April 30, 2024 is as follows:
| | | Level 1
Quoted
Prices | | | Level 2
Significant
Observable
Inputs | | | Level 3
Significant
Unobservable
Inputs | | | Value | |
| Corporate Bonds | | | | | | | | | | | | | | | | |
| Argentina | | $ | — | | | $ | 356,520 | | | $ | — | | | $ | 356,520 | |
| Australia | | | — | | | | 315,054 | | | | — | | | | 315,054 | |
| Austria | | | — | | | | 53,284 | | | | — | | | | 53,284 | |
| Bermuda | | | — | | | | 155,978 | | | | — | | | | 155,978 | |
| Brazil | | | — | | | | 1,707,547 | | | | — | | | | 1,707,547 | |
| Bulgaria | | | — | | | | 105,282 | | | | — | | | | 105,282 | |
| Burkina Faso | | | — | | | | 23,138 | | | | — | | | | 23,138 | |
| Canada | | | — | | | | 2,591,052 | | | | — | | | | 2,591,052 | |
| Cayman Islands | | | — | | | | 329,163 | | | | — | | | | 329,163 | |
| Chile | | | — | | | | 57,516 | | | | — | | | | 57,516 | |
| China | | | — | | | | 477,131 | | | | — | | | | 477,131 | |
| Colombia | | | — | | | | 777,914 | | | | — | | | | 777,914 | |
| Costa Rica | | | — | | | | 87,385 | | | | — | | | | 87,385 | |
| Cyprus | | | — | | | | 40,213 | | | | — | | | | 40,213 | |
| Czech Republic | | | — | | | | 202,865 | | | | — | | | | 202,865 | |
| Denmark | | | — | | | | 96,128 | | | | — | | | | 96,128 | |
| Finland | | | — | | | | 64,621 | | | | — | | | | 64,621 | |
| France | | | — | | | | 3,104,010 | | | | — | | | | 3,104,010 | |
| Germany | | | — | | | | 1,173,646 | | | | — | | | | 1,173,646 | |
| Ghana | | | — | | | | 96,921 | | | | — | | | | 96,921 | |
| Greece | | | — | | | | 524,492 | | | | — | | | | 524,492 | |
| Guatemala | | | — | | | | 93,444 | | | | — | | | | 93,444 | |
| Hong Kong | | | — | | | | 491,839 | | | | — | | | | 491,839 | |
| India | | | — | | | | 320,241 | | | | — | | | | 320,241 | |
| Indonesia | | | — | | | | 97,438 | | | | 1,444 | | | | 98,882 | |
| Ireland | | | — | | | | 374,360 | | | | — | | | | 374,360 | |
| Israel | | | — | | | | 269,420 | | | | — | | | | 269,420 | |
| Italy | | | — | | | | 2,049,709 | | | | — | | | | 2,049,709 | |
| Japan | | | — | | | | 485,639 | | | | — | | | | 485,639 | |
| Luxembourg | | | — | | | | 2,033,590 | | | | — | | | | 2,033,590 | |
| Malta | | | — | | | | 83,278 | | | | — | | | | 83,278 | |
| Mauritius | | | — | | | | 215,092 | | | | — | | | | 215,092 | |
| Mexico | | | — | | | | 1,257,593 | | | | — | | | | 1,257,593 | |
| Morocco | | | — | | | | 92,150 | | | | — | | | | 92,150 | |
| Netherlands | | | — | | | | 1,639,966 | | | | — | | | | 1,639,966 | |
| Norway | | | — | | | | 107,131 | | | | — | | | | 107,131 | |
| Panama | | | — | | | | 107,978 | | | | — | | | | 107,978 | |
| Peru | | | — | | | | 185,144 | | | | — | | | | 185,144 | |
| Poland | | | — | | | | 201,236 | | | | — | | | | 201,236 | |
| Portugal | | | — | | | | 310,295 | | | | — | | | | 310,295 | |
| Romania | | | — | | | | 113,204 | | | | — | | | | 113,204 | |
| Singapore | | | — | | | | 77,500 | | | | — | | | | 77,500 | |
| South Africa | | | — | | | | 146,088 | | | | — | | | | 146,088 | |
| Spain | | | — | | | | 687,203 | | | | 1,340 | | | | 688,543 | |
| Sweden | | | — | | | | 481,432 | | | | — | | | | 481,432 | |
| Switzerland | | | — | | | | 104,982 | | | | — | | | | 104,982 | |
| Tanzania | | | — | | | | 39,323 | | | | — | | | | 39,323 | |
| Turkey | | | — | | | | 592,120 | | | | — | | | | 592,120 | |
| United Arab Emirates | | | — | | | | 194,185 | | | | — | | | | 194,185 | |
| United Kingdom | | | — | | | | 3,149,769 | | | | — | | | | 3,149,769 | |
| United States | | | — | | | | 1,247,251 | | | | — | | | | 1,247,251 | |
| Uzbekistan | | | — | | | | 41,975 | | | | — | | | | 41,975 | |
| Zambia | | | — | | | | 96,292 | | | | — | | | | 96,292 | |
| Common Stock * | | | — | | | | 1,008 | | | | — | | | | 1,008 | |
| Warrants * | | | 14 | | | | — | | | | — | | | | 14 | |
See Notes to Financial Statements
VANECK INTERNATIONAL HIGH YIELD BOND ETF
SCHEDULE OF INVESTMENTS
(continued)
| Money Market Fund | | | 860,040 | | | | — | | | | — | | | | 860,040 | |
| Total Investments | | $ | 860,054 | | | $ | 29,727,735 | | | $ | 2,784 | | | $ | 30,590,573 | |
| * | See Schedule of Investments for geographic sector breakouts. |
See Notes to Financial Statements
VANECK J.P. MORGAN EM LOCAL CURRENCY BOND ETF
SCHEDULE OF INVESTMENTS
April 30, 2024
| | | | Par
(000’s | ) | | Value | |
| CORPORATE BONDS: 7.4% | | | | | | | | |
| Canada: 0.0% | | | | | | | | |
Export Development Canada Reg S 30.00%, 12/05/25 | | TRY | 34,000 | | | $ | 888,212 | |
| Cayman Islands: 0.2% | | | | | | | | |
QNB Finance Ltd. 13.50%, 10/06/25 | | TRY | 30,800 | | | | 626,460 | |
| QNB Finance Ltd. Reg S | | | | | | | | |
| 3.50%, 03/09/26 | | CNY | 14,100 | | | | 1,946,565 | |
| 6.90%, 01/23/25 | | IDR | 45,000,000 | | | | 2,729,308 | |
| | | | | | | | 5,302,333 | |
| Colombia: 0.1% | | | | | | | | |
Empresas Publicas de Medellin ESP Reg S 7.62%, 09/10/24 | | COP | 3,596,000 | | | | 912,351 | |
Financiera de Desarrollo Territorial SA Findeter Reg S 7.88%, 08/12/24 | | COP | 4,500,000 | | | | 1,140,850 | |
| | | | | | | | 2,053,201 | |
| Germany: 0.1% | | | | | | | | |
Kreditanstalt fuer Wiederaufbau 0.62%, 07/25/25 | | PLN | 16,000 | | | | 3,722,710 | |
| Indonesia: 0.4% | | | | | | | | |
| Perusahaan Penerbit SBSN | | | | | | | | |
| 4.88%, 07/15/26 | | IDR | 43,810,000 | | | | 2,584,975 | |
| 6.38%, 03/15/34 | | IDR | 43,510,000 | | | | 2,562,480 | |
| 6.88%, 03/15/36 | | IDR | 27,780,000 | | | | 1,696,705 | |
| 8.88%, 11/15/31 | | IDR | 54,120,000 | | | | 3,711,035 | |
Perusahaan Penerbit SBSN Indonesia 5.88%, 07/15/28 | | IDR | 14,260,000 | | | | 845,052 | |
| | | | | | | | 11,400,247 | |
| Luxembourg: 0.4% | | | | | | | | |
| European Investment Bank Reg S | | | | | | | | |
| 1.00%, 02/25/28 | | PLN | 20,442 | | | | 4,249,893 | |
| 3.00%, 11/25/29 | | PLN | 34,250 | | | | 7,371,330 | |
| | | | | | | | 11,621,223 | |
| South Africa: 0.2% | | | | | | | | |
| Eskom Holdings SOC Ltd. | | | | | | | | |
| 0.01%, 08/18/27 | | ZAR | 82,555 | | | | 2,603,956 | |
| 7.50%, 09/15/33 | | ZAR | 11,000 | | | | 415,031 | |
| 7.85%, 04/02/26 | | ZAR | 24,350 | | | | 1,244,738 | |
Transnet SOC Ltd. 9.50%, 08/19/25 | | ZAR | 21,000 | | | | 1,099,793 | |
Transnet SOC Ltd. Reg S 13.50%, 04/18/28 | | ZAR | 5,150 | | | | 282,711 | |
| | | | | | | | 5,646,229 | |
| Supranational: 3.2% | | | | | | | | |
| European Investment Bank | | | | | | | | |
| 7.75%, 01/30/25 | | MXN | 25,600 | | | | 1,460,887 | |
| 8.12%, 12/21/26 | | ZAR | 202,095 | | | | 10,599,890 | |
| | | | Par
(000’s | ) | | Value | |
| Supranational (continued) | | | | | | | | |
European Investment Bank 144A 5.75%, 01/24/25 | | IDR | 51,750,000 | | | $ | 3,157,052 | |
| European Investment Bank Reg S | | | | | | | | |
| 2.75%, 08/25/26 | | PLN | 55,008 | | | | 12,777,223 | |
| 8.00%, 05/05/27 | | ZAR | 17,585 | | | | 916,079 | |
Inter-American Development Bank 7.50%, 12/05/24 | | MXN | 387,765 | | | | 22,366,725 | |
| International Finance Corp. | | | | | | | | |
| 7.00%, 07/20/27 | | MXN | 206,160 | | | | 10,947,769 | |
| 7.50%, 01/18/28 | | MXN | 117,900 | | | | 6,349,723 | |
| 7.75%, 01/18/30 | | MXN | 167,130 | | | | 8,882,310 | |
| 8.00%, 07/27/27 | | ZAR | 3,050 | | | | 158,327 | |
International Finance Corp. Reg S 8.38%, 05/31/29 | | MXN | 214,440 | | | | 11,736,263 | |
| | | | | | | | 89,352,248 | |
| United Kingdom: 1.6% | | | | | | | | |
| European Bank for Reconstruction & Development | | | | | | | | |
| 0.87%, 03/04/26 | | PLN | 7,000 | | | | 1,567,479 | |
| 3.70%, 02/02/26 | | CZK | 114,000 | | | | 4,790,336 | |
| 4.25%, 02/07/28 | | IDR | 47,900,000 | | | | 2,711,682 | |
| 5.67%, 11/04/24 | | CZK | 44,200 | | | | 1,887,928 | |
| 6.50%, 05/19/25 | | PLN | 6,100 | | | | 1,516,585 | |
| 8.00%, 06/24/24 | | PLN | 4,000 | | | | 993,451 | |
| 30.00%, 08/25/25 | | TRY | 117,100 | | | | 3,151,734 | |
| European Bank for Reconstruction & Development Reg S | | | | | | | | |
| 0.37%, 12/22/24 | | PLN | 15,870 | | | | 3,801,693 | |
| 3.01%, 03/13/28 | | PLN | 20,740 | | | | 4,630,417 | |
| 5.08%, 12/15/25 | | MXN | 339,790 | | | | 18,172,817 | |
| | | | | | | | 43,224,122 | |
| United States: 1.2% | | | | | | | | |
| International Bank for Reconstruction & Development | | | | | | | | |
| 2.00%, 02/18/26 | | CNY | 30,000 | | | | 4,081,340 | |
| 2.75%, 01/19/27 | | CNY | 21,000 | | | | 2,900,812 | |
| 4.25%, 01/22/26 | | MXN | 155,000 | | | | 8,189,615 | |
| 4.60%, 02/09/26 | | IDR | 41,600,000 | | | | 2,470,416 | |
| 5.30%, 06/25/30 | | MXN | 45,000 | | | | 2,065,058 | |
| 5.73%, 08/02/27 | | PLN | 3,600 | | | | 888,680 | |
| 7.25%, 01/21/27 | | MXN | 166,000 | | | | 8,975,311 | |
International Finance Corp. 5.02%, 02/11/28 | | MXN | 40,000 | | | | 2,012,419 | |
| | | | | | | | 31,583,651 | |
Total Corporate Bonds
(Cost: $217,713,669) | | | | | | | 204,794,176 | |
See Notes to Financial Statements
VANECK J.P. MORGAN EM LOCAL CURRENCY BOND ETF
SCHEDULE OF INVESTMENTS
(continued)
| | | | Par
(000’s | ) | | Value | |
| GOVERNMENT OBLIGATIONS: 90.8% | | | | | | | | |
| Brazil: 7.8% | | | | | | | | |
| Brazil Letras do Tesouro Nacional | | | | | | | | |
| 0.00%, 07/01/25 ^ | | BRL | 129,310 | | | $ | 22,228,528 | |
| 0.00%, 01/01/26 ^ | | BRL | 190,450 | | | | 31,010,888 | |
| 0.00%, 07/01/26 ^ | | BRL | 218,990 | | | | 33,800,485 | |
| 0.00%, 07/01/27 ^ | | BRL | 107,680 | | | | 14,862,952 | |
| 0.00%, 01/01/28 ^ | | BRL | 22,300 | | | | 2,901,545 | |
| 0.00%, 01/01/30 ^ | | BRL | 15,860 | | | | 1,652,719 | |
| Brazil Notas do Tesouro Nacional, Series F | | | | | | | | |
| 10.00%, 01/01/25 | | BRL | 137,105 | | | | 26,351,363 | |
| 10.00%, 01/01/27 | | BRL | 141,530 | | | | 26,706,698 | |
| 10.00%, 01/01/29 | | BRL | 156,260 | | | | 28,705,124 | |
| 10.00%, 01/01/31 | | BRL | 71,140 | | | | 12,720,772 | |
| 10.00%, 01/01/33 | | BRL | 72,650 | | | | 12,794,538 | |
| 10.00%, 01/01/35 | | BRL | 16,690 | | | | 2,906,572 | |
| | | | | | | | 216,642,184 | |
| Chile: 4.1% | | | | | | | | |
| Bonos de la Tesoreria de la Republica de Chile | | | | | | | | |
| 2.50%, 03/01/25 | | CLP | 23,535,000 | | | | 24,000,082 | |
| 4.50%, 03/01/26 | | CLP | 14,215,000 | | | | 14,578,909 | |
| 5.00%, 03/01/35 | | CLP | 17,640,000 | | | | 16,959,866 | |
| 6.00%, 01/01/43 | | CLP | 14,550,000 | | | | 15,280,005 | |
| Bonos de la Tesoreria de la Republica de Chile 144A Reg S | | | | | | | | |
| 2.30%, 10/01/28 | | CLP | 4,450,000 | | | | 4,014,282 | |
| 4.70%, 09/01/30 | | CLP | 17,095,000 | | | | 16,649,633 | |
| 5.00%, 10/01/28 | | CLP | 6,415,000 | | | | 6,452,091 | |
| 6.00%, 04/01/33 | | CLP | 11,705,000 | | | | 12,252,982 | |
| 7.00%, 05/01/34 | | CLP | 4,135,000 | | | | 4,636,453 | |
| | | | | | | | 114,824,303 | |
| China: 9.7% | | | | | | | | |
| Asian Infrastructure Investment Bank Reg S | | | | | | | | |
| 5.00%, 03/05/26 | | MXN | 55,650 | | | | 2,924,560 | |
| 30.00%, 09/29/27 | | TRY | 17,000 | | | | 525,072 | |
| China Government Bond | | | | | | | | |
| 1.99%, 04/09/25 | | CNY | 44,670 | | | | 6,180,649 | |
| 2.18%, 08/25/25 | | CNY | 32,760 | | | | 4,541,575 | |
| 2.18%, 08/15/26 | | CNY | 7,300 | | | | 1,012,327 | |
| 2.24%, 05/25/25 | | CNY | 15,880 | | | | 2,203,909 | |
| 2.26%, 02/24/25 | | CNY | 23,030 | | | | 3,193,683 | |
| 2.28%, 11/25/25 | | CNY | 22,480 | | | | 3,121,849 | |
| 2.30%, 05/15/26 | | CNY | 32,200 | | | | 4,474,021 | |
| 2.35%, 02/25/34 | | CNY | 11,140 | | | | 1,546,124 | |
| 2.37%, 01/20/27 | | CNY | 14,920 | | | | 2,078,716 | |
| 2.37%, 01/15/29 | | CNY | 23,830 | | | | 3,325,768 | |
| 2.39%, 11/15/26 | | CNY | 44,360 | | | | 6,176,209 | |
| 2.40%, 07/15/28 | | CNY | 12,110 | | | | 1,686,600 | |
| 2.44%, 10/15/27 | | CNY | 30,380 | | | | 4,240,462 | |
| 2.46%, 02/15/26 | | CNY | 2,120 | | | | 295,383 | |
| 2.48%, 04/15/27 | | CNY | 33,690 | | | | 4,708,681 | |
| 2.48%, 09/25/28 | | CNY | 7,680 | | | | 1,073,281 | |
| 2.50%, 07/25/27 | | CNY | 15,300 | | | | 2,138,881 | |
| 2.52%, 08/25/33 | | CNY | 41,120 | | | | 5,750,448 | |
| | | | Par
(000’s | ) | | Value | |
| China (continued) | | | | | | | | |
| 2.54%, 12/25/30 | | CNY | 32,740 | | | $ | 4,587,822 | |
| 2.55%, 10/15/28 | | CNY | 32,830 | | | | 4,606,282 | |
| 2.60%, 09/15/30 | | CNY | 34,620 | | | | 4,866,500 | |
| 2.60%, 09/01/32 | | CNY | 27,380 | | | | 3,840,895 | |
| 2.62%, 04/15/28 | | CNY | 45,690 | | | | 6,416,997 | |
| 2.62%, 09/25/29 | | CNY | 30,420 | | | | 4,284,411 | |
| 2.62%, 06/25/30 | | CNY | 21,300 | | | | 2,992,860 | |
| 2.64%, 01/15/28 | | CNY | 32,920 | | | | 4,624,701 | |
| 2.67%, 05/25/33 | | CNY | 24,480 | | | | 3,465,379 | |
| 2.67%, 11/25/33 | | CNY | 43,510 | | | | 6,166,165 | |
| 2.68%, 05/21/30 | | CNY | 53,680 | | | | 7,575,741 | |
| 2.69%, 08/12/26 | | CNY | 59,690 | | | | 8,371,668 | |
| 2.69%, 08/15/32 | | CNY | 28,640 | | | | 4,053,586 | |
| 2.75%, 06/15/29 | | CNY | 29,140 | | | | 4,126,459 | |
| 2.75%, 02/17/32 | | CNY | 33,470 | | | | 4,754,451 | |
| 2.76%, 05/15/32 | | CNY | 25,610 | | | | 3,638,669 | |
| 2.79%, 12/15/29 | | CNY | 28,690 | | | | 4,079,287 | |
| 2.80%, 03/24/29 | | CNY | 32,040 | | | | 4,550,339 | |
| 2.80%, 03/25/30 | | CNY | 30,310 | | | | 4,310,642 | |
| 2.80%, 11/15/32 | | CNY | 40,910 | | | | 5,850,926 | |
| 2.85%, 06/04/27 | | CNY | 47,560 | | | | 6,726,849 | |
| 2.88%, 02/25/33 | | CNY | 50,990 | | | | 7,323,323 | |
| 2.89%, 11/18/31 | | CNY | 26,790 | | | | 3,841,708 | |
| 2.91%, 10/14/28 | | CNY | 56,230 | | | | 8,012,548 | |
| 3.00%, 10/15/53 | | CNY | 11,040 | | | | 1,670,972 | |
| 3.01%, 05/13/28 | | CNY | 43,950 | | | | 6,286,510 | |
| 3.02%, 10/22/25 | | CNY | 43,840 | | | | 6,156,694 | |
| 3.02%, 05/27/31 | | CNY | 48,940 | | | | 7,070,858 | |
| 3.03%, 03/11/26 | | CNY | 21,530 | | | | 3,036,371 | |
| 3.12%, 12/05/26 | | CNY | 27,190 | | | | 3,872,213 | |
| 3.12%, 10/25/52 | | CNY | 23,610 | | | | 3,562,525 | |
| 3.13%, 11/21/29 | | CNY | 31,030 | | | | 4,499,601 | |
| 3.19%, 04/15/53 | | CNY | 11,960 | | | | 1,860,693 | |
| 3.22%, 12/06/25 | | CNY | 26,380 | | | | 3,726,178 | |
| 3.25%, 06/06/26 | | CNY | 39,530 | | | | 5,618,555 | |
| 3.25%, 11/22/28 | | CNY | 31,310 | | | | 4,547,066 | |
| 3.27%, 11/19/30 | | CNY | 46,630 | | | | 6,867,337 | |
| 3.28%, 12/03/27 | | CNY | 43,100 | | | | 6,228,874 | |
| 3.29%, 05/23/29 | | CNY | 35,560 | | | | 5,200,363 | |
| 3.32%, 04/15/52 | | CNY | 17,770 | | | | 2,774,708 | |
| 3.53%, 10/18/51 | | CNY | 17,720 | | | | 2,853,800 | |
| 3.72%, 04/12/51 | | CNY | 22,020 | | | | 3,658,932 | |
| 3.81%, 09/14/50 | | CNY | 36,040 | | | | 6,052,996 | |
| | | | | | | | 269,811,652 | |
| Colombia: 5.1% | | | | | | | | |
| Colombian TES | | | | | | | | |
| 5.75%, 11/03/27 | | COP | 40,675,500 | | | | 9,174,891 | |
| 6.00%, 04/28/28 | | COP | 68,729,100 | | | | 15,412,152 | |
| 6.25%, 11/26/25 | | COP | 21,797,000 | | | | 5,378,820 | |
| 6.25%, 07/09/36 | | COP | 25,375,000 | | | | 4,539,708 | |
| 7.00%, 03/26/31 | | COP | 63,143,000 | | | | 13,701,062 | |
| 7.00%, 06/30/32 | | COP | 57,832,200 | | | | 12,117,986 | |
| 7.25%, 10/18/34 | | COP | 57,618,700 | | | | 11,769,129 | |
| 7.25%, 10/26/50 | | COP | 58,709,200 | | | | 10,205,840 | |
| 7.50%, 08/26/26 | | COP | 61,969,100 | | | | 15,168,409 | |
| 7.75%, 09/18/30 | | COP | 45,373,100 | | | | 10,368,109 | |
| 9.25%, 05/28/42 | | COP | 78,751,400 | | | | 17,316,700 | |
See Notes to Financial Statements
| | | | Par
(000’s | ) | | Value | |
| Colombia (continued) | | | | | | | | |
| 13.25%, 02/09/33 | | COP | 53,417,000 | | | $ | 15,749,245 | |
| | | | | | | | 140,902,051 | |
| Czech Republic: 5.6% | | | | | | | | |
| Czech Republic Government Bond | | | | | | | | |
| 0.01%, 12/12/24 | | CZK | 51,240 | | | | 2,115,547 | |
| 0.05%, 11/29/29 | | CZK | 116,100 | | | | 3,927,520 | |
| 0.25%, 02/10/27 | | CZK | 249,610 | | | | 9,531,509 | |
| 1.20%, 03/13/31 | | CZK | 264,530 | | | | 9,229,151 | |
| 1.25%, 02/14/25 | | CZK | 170,790 | | | | 7,084,451 | |
| 1.50%, 04/24/40 | | CZK | 118,760 | | | | 3,397,099 | |
| 1.75%, 06/23/32 | | CZK | 263,020 | | | | 9,260,697 | |
| 1.95%, 07/30/37 | | CZK | 87,970 | | | | 2,835,808 | |
| 2.00%, 10/13/33 | | CZK | 256,210 | | | | 8,985,993 | |
| 2.75%, 07/23/29 | | CZK | 253,340 | | | | 10,028,864 | |
| 3.50%, 05/30/35 | | CZK | 139,850 | | | | 5,512,021 | |
| 4.50%, 11/11/32 | | CZK | 115,190 | | | | 4,960,816 | |
| 4.90%, 04/14/34 | | CZK | 118,370 | | | | 5,258,643 | |
| 5.00%, 09/30/30 | | CZK | 260,910 | | | | 11,557,806 | |
| 5.50%, 12/12/28 | | CZK | 172,870 | | | | 7,736,659 | |
| 5.75%, 03/29/29 | | CZK | 112,550 | | | | 5,096,356 | |
| 6.00%, 02/26/26 | | CZK | 155,310 | | | | 6,808,032 | |
| 6.20%, 06/16/31 | | CZK | 65,070 | | | | 3,089,709 | |
| Czech Republic Government Bond Reg S | | | | | | | | |
| 0.95%, 05/15/30 | | CZK | 253,910 | | | | 8,929,158 | |
| 1.00%, 06/26/26 | | CZK | 254,190 | | | | 10,099,564 | |
| 2.40%, 09/17/25 | | CZK | 141,280 | | | | 5,855,502 | |
| 2.50%, 08/25/28 | | CZK | 258,820 | | | | 10,266,377 | |
| 4.20%, 12/04/36 | | CZK | 134,730 | | | | 5,651,781 | |
| | | | | | | | 157,219,063 | |
| Dominican Republic: 1.2% | | | | | | | | |
| Dominican Republic International Bond 144A | | | | | | | | |
| 9.75%, 06/05/26 | | DOP | 141,100 | | | | 2,430,043 | |
| 11.25%, 09/15/35 | | DOP | 442,000 | | | | 7,988,723 | |
| 13.62%, 02/03/33 | | DOP | 858,450 | | | | 17,547,472 | |
| Dominican Republic International Bond Reg S | | | | | | | | |
| 9.75%, 06/05/26 | | DOP | 115,390 | | | | 1,987,262 | |
| 11.25%, 09/15/35 | | DOP | 92,000 | | | | 1,662,811 | |
| 13.62%, 02/03/33 | | DOP | 124,680 | | | | 2,548,569 | |
| | | | | | | | 34,164,880 | |
| Hungary: 4.6% | | | | | | | | |
| Hungary Government Bond | | | | | | | | |
| 1.00%, 11/26/25 | | HUF | 3,916,650 | | | | 9,755,133 | |
| 1.50%, 04/22/26 | | HUF | 3,509,920 | | | | 8,624,638 | |
| 1.50%, 08/26/26 | | HUF | 2,510,970 | | | | 6,057,080 | |
| 2.00%, 05/23/29 | | HUF | 2,893,980 | | | | 6,227,882 | |
| 2.25%, 04/20/33 † | | HUF | 4,179,360 | | | | 7,834,027 | |
| 2.25%, 06/22/34 | | HUF | 1,156,250 | | | | 2,083,776 | |
| 2.75%, 12/22/26 | | HUF | 2,760,100 | | | | 6,759,459 | |
| 3.00%, 10/27/27 | | HUF | 3,626,420 | | | | 8,669,298 | |
| 3.00%, 08/21/30 | | HUF | 3,705,860 | | | | 8,046,771 | |
| | | | Par
(000’s | ) | | Value | |
| Hungary (continued) | | | | | | | | |
| 3.00%, 10/27/38 | | HUF | 2,878,280 | | | $ | 5,043,979 | |
| 3.00%, 04/25/41 | | HUF | 1,741,540 | | | | 2,886,779 | |
| 3.25%, 10/22/31 | | HUF | 4,380,830 | | | | 9,348,595 | |
| 4.50%, 03/23/28 | | HUF | 1,733,510 | | | | 4,326,780 | |
| 4.75%, 11/24/32 | | HUF | 3,877,500 | | | | 9,023,065 | |
| 5.50%, 06/24/25 | | HUF | 3,096,250 | | | | 8,311,016 | |
| 6.75%, 10/22/28 | | HUF | 5,476,420 | | | | 14,730,590 | |
| 7.00%, 10/24/35 | | HUF | 980,700 | | | | 2,678,552 | |
| 9.50%, 10/21/26 | | HUF | 2,220,770 | | | | 6,369,451 | |
| | | | | | | | 126,776,871 | |
| Indonesia: 8.3% | | | | | | | | |
| Indonesia Treasury Bond | | | | | | | | |
| 5.12%, 04/15/27 | | IDR | 139,525,000 | | | | 8,151,288 | |
| 5.50%, 04/15/26 | | IDR | 119,425,000 | | | | 7,125,620 | |
| 6.12%, 05/15/28 | | IDR | 94,862,000 | | | | 5,618,545 | |
| 6.25%, 06/15/36 | | IDR | 61,540,000 | | | | 3,517,358 | |
| 6.38%, 08/15/28 | | IDR | 120,425,000 | | | | 7,205,229 | |
| 6.38%, 04/15/32 | | IDR | 195,160,000 | | | | 11,437,995 | |
| 6.38%, 07/15/37 | | IDR | 26,400,000 | | | | 1,534,425 | |
| 6.50%, 06/15/25 | | IDR | 66,190,000 | | | | 4,028,390 | |
| 6.50%, 02/15/31 | | IDR | 215,987,000 | | | | 12,709,005 | |
| 6.62%, 05/15/33 | | IDR | 111,933,000 | | | | 6,742,459 | |
| 6.62%, 02/15/34 | | IDR | 97,330,000 | | | | 5,735,646 | |
| 6.88%, 04/15/29 | | IDR | 107,838,000 | | | | 6,562,964 | |
| 7.00%, 05/15/27 | | IDR | 132,588,000 | | | | 8,177,371 | |
| 7.00%, 09/15/30 | | IDR | 198,855,000 | | | | 12,109,129 | |
| 7.00%, 02/15/33 | | IDR | 189,288,000 | | | | 11,624,856 | |
| 7.12%, 06/15/38 | | IDR | 97,670,000 | | | | 5,973,067 | |
| 7.12%, 06/15/42 | | IDR | 132,582,000 | | | | 8,064,648 | |
| 7.12%, 06/15/43 | | IDR | 80,490,000 | | | | 4,934,765 | |
| 7.50%, 08/15/32 | | IDR | 73,230,000 | | | | 4,587,909 | |
| 7.50%, 06/15/35 | | IDR | 171,710,000 | | | | 10,791,140 | |
| 7.50%, 05/15/38 | | IDR | 80,299,000 | | | | 5,072,738 | |
| 7.50%, 04/15/40 | | IDR | 174,232,000 | | | | 11,002,303 | |
| 8.25%, 05/15/29 | | IDR | 134,761,000 | | | | 8,664,063 | |
| 8.25%, 06/15/32 | | IDR | 53,204,000 | | | | 3,504,396 | |
| 8.25%, 05/15/36 | | IDR | 118,525,000 | | | | 7,890,605 | |
| 8.38%, 09/15/26 | | IDR | 164,002,000 | | | | 10,377,572 | |
| 8.38%, 03/15/34 | | IDR | 171,488,000 | | | | 11,400,859 | |
| 8.38%, 04/15/39 | | IDR | 68,343,000 | | | | 4,654,620 | |
| 8.75%, 05/15/31 | | IDR | 82,227,000 | | | | 5,474,544 | |
| 9.00%, 03/15/29 | | IDR | 108,742,000 | | | | 7,190,010 | |
| 9.50%, 07/15/31 | | IDR | 30,011,000 | | | | 2,096,894 | |
| 10.50%, 08/15/30 | | IDR | 47,802,000 | | | | 3,454,454 | |
| 11.00%, 09/15/25 | | IDR | 32,382,000 | | | | 2,109,259 | |
| | | | | | | | 229,524,126 | |
| Malaysia: 8.0% | | | | | | | | |
| Malaysia Government Bond | | | | | | | | |
| 2.63%, 04/15/31 | | MYR | 30,381 | | | | 5,872,788 | |
| 3.50%, 05/31/27 | | MYR | 28,227 | | | | 5,892,498 | |
| 3.52%, 04/20/28 | | MYR | 20,177 | | | | 4,192,303 | |
| 3.58%, 07/15/32 | | MYR | 23,676 | | | | 4,820,503 | |
| 3.73%, 06/15/28 | | MYR | 29,550 | | | | 6,176,365 | |
| 3.76%, 05/22/40 | | MYR | 36,563 | | | | 7,306,372 | |
| 3.83%, 07/05/34 | | MYR | 23,503 | | | | 4,841,182 | |
| 3.88%, 03/14/25 | | MYR | 22,046 | | | | 4,639,076 | |
| 3.88%, 08/15/29 | | MYR | 28,237 | | | | 5,943,031 | |
See Notes to Financial Statements
VANECK J.P. MORGAN EM LOCAL CURRENCY BOND ETF
SCHEDULE OF INVESTMENTS
(continued)
| | | | Par
(000’s | ) | | Value | |
| Malaysia (continued) | | | | | | | | |
| 3.90%, 11/30/26 | | MYR | 29,656 | | | $ | 6,265,120 | |
| 3.90%, 11/16/27 | | MYR | 31,535 | | | | 6,670,443 | |
| 3.91%, 07/15/26 | | MYR | 26,697 | | | | 5,637,139 | |
| 3.96%, 09/15/25 | | MYR | 28,023 | | | | 5,910,277 | |
| 4.07%, 06/15/50 | | MYR | 34,997 | | | | 7,093,182 | |
| 4.25%, 05/31/35 | | MYR | 20,043 | | | | 4,275,924 | |
| 4.46%, 03/31/53 | | MYR | 20,003 | | | | 4,299,456 | |
| 4.50%, 04/30/29 | | MYR | 12,163 | | | | 2,628,453 | |
| 4.64%, 11/07/33 | | MYR | 29,435 | | | | 6,483,339 | |
| 4.70%, 10/15/42 | | MYR | 29,908 | | | | 6,646,384 | |
| 4.76%, 04/07/37 | | MYR | 32,559 | | | | 7,292,886 | |
| 4.89%, 06/08/38 | | MYR | 31,450 | | | | 7,132,840 | |
| 4.92%, 07/06/48 | | MYR | 20,722 | | | | 4,769,626 | |
| Malaysia Government Investment Issue | | | | | | | | |
| 3.42%, 09/30/27 | | MYR | 30,362 | | | | 6,311,102 | |
| 3.45%, 07/15/36 | | MYR | 27,171 | | | | 5,380,537 | |
| 3.46%, 10/15/30 | | MYR | 35,044 | | | | 7,170,297 | |
| 3.60%, 07/31/28 | | MYR | 27,437 | | | | 5,718,279 | |
| 3.73%, 03/31/26 | | MYR | 31,154 | | | | 6,558,286 | |
| 3.99%, 10/15/25 | | MYR | 31,634 | | | | 6,680,486 | |
| 4.07%, 09/30/26 | | MYR | 33,397 | | | | 7,073,472 | |
| 4.13%, 08/15/25 | | MYR | 22,474 | | | | 4,751,447 | |
| 4.13%, 07/09/29 | | MYR | 28,708 | | | | 6,107,677 | |
| 4.19%, 10/07/32 | | MYR | 27,884 | | | | 5,944,765 | |
| 4.25%, 09/30/30 | | MYR | 27,767 | | | | 5,947,181 | |
| 4.26%, 07/26/27 | | MYR | 14,615 | | | | 3,117,646 | |
| 4.29%, 08/14/43 | | MYR | 26,148 | | | | 5,527,330 | |
| 4.37%, 10/31/28 | | MYR | 31,945 | | | | 6,862,310 | |
| 4.42%, 09/30/41 | | MYR | 26,178 | | | | 5,688,248 | |
| 4.47%, 09/15/39 | | MYR | 29,250 | | | | 6,397,449 | |
| 4.66%, 03/31/38 | | MYR | 13,575 | | | | 3,030,474 | |
| | | | | | | | 223,056,173 | |
| Mexico: 5.3% | | | | | | | | |
| Mexican Bonos | | | | | | | | |
| 5.00%, 03/06/25 | | MXN | 10,043 | | | | 562,493 | |
| 5.50%, 03/04/27 | | MXN | 294,232 | | | | 15,260,317 | |
| 5.75%, 03/05/26 | | MXN | 7,511 | | | | 404,757 | |
| 7.00%, 09/03/26 | | MXN | 12,487 | | | | 679,092 | |
| 7.50%, 06/03/27 | | MXN | 214,120 | | | | 11,641,522 | |
| 7.50%, 05/26/33 | | MXN | 338,328 | | | | 16,945,887 | |
| 7.75%, 05/29/31 | | MXN | 478,957 | | | | 24,927,056 | |
| 7.75%, 11/23/34 | | MXN | 154,640 | | | | 7,775,433 | |
| 7.75%, 11/13/42 | | MXN | 393,023 | | | | 18,632,887 | |
| 8.00%, 05/24/35 | | MXN | 29,484 | | | | 1,501,774 | |
| 8.00%, 11/07/47 | | MXN | 309,675 | | | | 14,894,956 | |
| 8.00%, 07/31/53 | | MXN | 273,988 | | | | 13,048,862 | |
| 8.50%, 03/01/29 | | MXN | 26,533 | | | | 1,465,688 | |
| 8.50%, 05/31/29 | | MXN | 35,737 | | | | 1,969,005 | |
| 8.50%, 11/18/38 | | MXN | 253,811 | | | | 13,211,272 | |
| 10.00%, 11/20/36 | | MXN | 89,619 | | | | 5,286,099 | |
| | | | | | | | 148,207,100 | |
| Peru: 4.3% | | | | | | | | |
| Peru Government Bond | | | | | | | | |
| 5.35%, 08/12/40 | | PEN | 36,729 | | | | 7,864,946 | |
| 5.40%, 08/12/34 | | PEN | 54,690 | | | | 12,621,022 | |
| 5.94%, 02/12/29 | | PEN | 60,877 | | | | 16,189,251 | |
| 6.15%, 08/12/32 | | PEN | 67,510 | | | | 17,019,100 | |
| | | | Par
(000’s | ) | | Value | |
| Peru (continued) | | | | | | | | |
| 6.35%, 08/12/28 | | PEN | 39,090 | | | $ | 10,630,175 | |
| 6.90%, 08/12/37 | | PEN | 65,489 | | | | 16,607,247 | |
| 6.95%, 08/12/31 | | PEN | 63,627 | | | | 17,129,569 | |
| 8.20%, 08/12/26 | | PEN | 23,922 | | | | 6,750,481 | |
Peru Government Bond 144A Reg S 7.30%, 08/12/33 | | PEN | 57,058 | | | | 15,344,973 | |
| | | | | | | | 120,156,764 | |
| Philippines: 0.1% | | | | | | | | |
Asian Development Bank 2.50%, 02/15/27 | | CNY | 14,000 | | | | 1,914,239 | |
| Poland: 5.0% | | | | | | | | |
| Republic of Poland Government Bond | | | | | | | | |
| 0.01%, 10/25/25 | | PLN | 19,832 | | | | 4,548,080 | |
| 0.25%, 10/25/26 | | PLN | 45,975 | | | | 10,055,462 | |
| 0.75%, 04/25/25 | | PLN | 17,284 | | | | 4,098,401 | |
| 1.25%, 10/25/30 | | PLN | 70,288 | | | | 13,361,651 | |
| 1.75%, 04/25/32 | | PLN | 65,022 | | | | 12,095,573 | |
| 2.50%, 07/25/26 | | PLN | 17,354 | | | | 4,040,339 | |
| 2.50%, 07/25/27 | | PLN | 50,849 | | | | 11,511,845 | |
| 2.75%, 04/25/28 | | PLN | 39,621 | | | | 8,866,005 | |
| 2.75%, 10/25/29 | | PLN | 49,284 | | | | 10,604,592 | |
| 3.25%, 07/25/25 | | PLN | 53,429 | | | | 12,898,067 | |
| 3.75%, 05/25/27 | | PLN | 46,071 | | | | 10,870,686 | |
| 4.75%, 07/25/29 | | PLN | 10,530 | | | | 2,508,218 | |
| 6.00%, 10/25/33 † | | PLN | 74,192 | | | | 18,702,686 | |
| 7.50%, 07/25/28 | | PLN | 52,316 | | | | 13,856,881 | |
| | | | | | | | 138,018,486 | |
| Romania: 5.0% | | | | | | | | |
| Romania Government Bond | | | | | | | | |
| 2.50%, 10/25/27 | | RON | 25,805 | | | | 4,913,694 | |
| 3.25%, 06/24/26 | | RON | 30,945 | | | | 6,288,668 | |
| 3.50%, 11/25/25 | | RON | 24,525 | | | | 5,083,084 | |
| 3.65%, 07/28/25 | | RON | 27,710 | | | | 5,792,927 | |
| 3.65%, 09/24/31 | | RON | 30,410 | | | | 5,375,251 | |
| 4.15%, 01/26/28 | | RON | 30,355 | | | | 6,072,826 | |
| 4.15%, 10/24/30 | | RON | 29,360 | | | | 5,507,475 | |
| 4.25%, 04/28/36 | | RON | 24,340 | | | | 4,106,699 | |
| 4.75%, 02/24/25 | | RON | 30,005 | | | | 6,383,662 | |
| 4.75%, 10/11/34 | | RON | 30,545 | | | | 5,526,873 | |
| 4.85%, 04/22/26 | | RON | 29,140 | | | | 6,128,034 | |
| 4.85%, 07/25/29 | | RON | 29,700 | | | | 5,937,461 | |
| 5.00%, 02/12/29 | | RON | 30,300 | | | | 6,115,637 | |
| 5.80%, 07/26/27 | | RON | 31,050 | | | | 6,584,448 | |
| 6.70%, 02/25/32 | | RON | 31,420 | | | | 6,720,927 | |
| 7.20%, 10/28/26 | | RON | 26,810 | | | | 5,877,649 | |
| 7.20%, 05/31/27 | | RON | 22,950 | | | | 5,052,776 | |
| 7.20%, 10/30/33 | | RON | 23,740 | | | | 5,229,583 | |
| 7.35%, 04/28/31 | | RON | 27,160 | | | | 6,064,484 | |
| 7.90%, 02/24/38 | | RON | 27,150 | | | | 6,318,598 | |
| 8.00%, 04/29/30 | | RON | 31,465 | | | | 7,185,379 | |
| 8.25%, 09/29/32 | | RON | 33,685 | | | | 7,854,683 | |
| 8.75%, 10/30/28 | | RON | 33,570 | | | | 7,830,773 | |
| | | | | | | | 137,951,591 | |
| Serbia: 1.2% | | | | | | | | |
| Serbia Treasury Bonds | | | | | | | | |
See Notes to Financial Statements
| | | | Par
(000’s | ) | | Value | |
| Serbia (continued) | | | | | | | | |
| 4.50%, 01/11/26 | | RSD | 893,170 | | | $ | 8,158,555 | |
| 4.50%, 08/20/32 | | RSD | 1,376,600 | | | | 11,486,469 | |
| 5.88%, 02/08/28 | | RSD | 916,540 | | | | 8,635,690 | |
| 7.00%, 10/26/31 | | RSD | 671,170 | | | | 6,553,897 | |
| | | | | | | | 34,834,611 | |
| South Africa: 6.1% | | | | | | | | |
| Republic of South Africa Government Bond | | | | | | | | |
| 6.25%, 03/31/36 | | ZAR | 153,418 | | | | 5,131,812 | |
| 6.50%, 02/28/41 | | ZAR | 136,125 | | | | 4,194,537 | |
| 7.00%, 02/28/31 | | ZAR | 282,863 | | | | 12,062,748 | |
| 8.00%, 01/31/30 | | ZAR | 518,920 | | | | 24,476,009 | |
| 8.25%, 03/31/32 | | ZAR | 453,345 | | | | 20,034,599 | |
| 8.50%, 01/31/37 | | ZAR | 428,691 | | | | 17,019,583 | |
| 8.75%, 01/31/44 | | ZAR | 370,842 | | | | 13,974,772 | |
| 8.75%, 02/28/48 | | ZAR | 615,392 | | | | 23,097,240 | |
| 8.88%, 02/28/35 | | ZAR | 463,695 | | | | 19,839,621 | |
| 9.00%, 01/31/40 | | ZAR | 361,678 | | | | 14,351,406 | |
| 10.50%, 12/21/26 | | ZAR | 213,494 | | | | 11,609,989 | |
| 11.62%, 03/31/53 | | ZAR | 56,346 | | | | 2,749,745 | |
| | | | | | | | 168,542,061 | |
| Thailand: 7.2% | | | | | | | | |
| Thailand Government Bond | | | | | | | | |
| 0.95%, 06/17/25 | | THB | 315,374 | | | | 8,379,895 | |
| 1.00%, 06/17/27 | | THB | 422,785 | | | | 10,923,409 | |
| 1.45%, 12/17/24 | | THB | 335,588 | | | | 9,007,721 | |
| 1.58%, 12/17/35 | | THB | 291,502 | | | | 6,881,073 | |
| 1.60%, 12/17/29 | | THB | 285,607 | | | | 7,309,327 | |
| 1.60%, 06/17/35 | | THB | 157,709 | | | | 3,762,525 | |
| 2.00%, 12/17/31 | | THB | 401,247 | | | | 10,316,741 | |
| 2.00%, 06/17/42 | | THB | 209,406 | | | | 4,746,846 | |
| 2.12%, 12/17/26 | | THB | 331,221 | | | | 8,881,629 | |
| 2.25%, 03/17/27 | | THB | 340,940 | | | | 9,159,046 | |
| 2.35%, 06/17/26 | | THB | 326,797 | | | | 8,817,209 | |
| 2.40%, 03/17/29 | | THB | 240,887 | | | | 6,454,046 | |
| 2.65%, 06/17/28 | | THB | 377,257 | | | | 10,231,557 | |
| 2.80%, 06/17/34 | | THB | 87,585 | | | | 2,376,482 | |
| 2.88%, 12/17/28 | | THB | 277,367 | | | | 7,596,560 | |
| 2.88%, 06/17/46 | | THB | 251,454 | | | | 6,334,694 | |
| 3.30%, 06/17/38 | | THB | 348,985 | | | | 9,707,596 | |
| 3.35%, 06/17/33 | | THB | 343,006 | | | | 9,687,249 | |
| 3.39%, 06/17/37 | | THB | 317,083 | | | | 8,939,010 | |
| 3.40%, 06/17/36 | | THB | 278,253 | | | | 7,840,521 | |
| 3.45%, 06/17/43 | | THB | 272,440 | | | | 7,529,022 | |
| 3.65%, 06/20/31 | | THB | 276,526 | | | | 7,929,592 | |
| 3.77%, 06/25/32 | | THB | 376,151 | | | | 10,919,534 | |
| 3.85%, 12/12/25 | | THB | 287,664 | | | | 7,940,997 | |
| | | | Par
(000’s | ) | | Value | |
| Thailand (continued) | | | | | | | | |
| 4.88%, 06/22/29 | | THB | 309,086 | | | $ | 9,255,169 | |
| | | | | | | | 200,927,450 | |
| Turkey: 1.0% | | | | | | | | |
| Turkiye Government Bond | | | | | | | | |
| 8.00%, 03/12/25 | | TRY | 19,055 | | | | 456,122 | |
| 10.50%, 08/11/27 | | TRY | 126,924 | | | | 2,356,071 | |
| 10.60%, 02/11/26 | | TRY | 43,918 | | | | 892,901 | |
| 11.00%, 02/24/27 | | TRY | 32,279 | | | | 622,619 | |
| 11.70%, 11/13/30 | | TRY | 108,464 | | | | 2,016,751 | |
| 12.40%, 03/08/28 | | TRY | 286,861 | | | | 5,621,772 | |
| 12.60%, 10/01/25 | | TRY | 15,234 | | | | 335,721 | |
| 16.90%, 09/02/26 | | TRY | 88,213 | | | | 1,954,900 | |
| 17.30%, 07/19/28 | | TRY | 236,865 | | | | 5,589,389 | |
| 17.80%, 07/13/33 | | TRY | 182,425 | | | | 4,102,302 | |
| 26.20%, 10/05/33 | | TRY | 112,560 | | | | 3,473,119 | |
| | | | | | | | 27,421,667 | |
| Uruguay: 1.2% | | | | | | | | |
| Uruguay Government International Bond | | | | | | | | |
| 8.25%, 05/21/31 | | UYU | 850,945 | | | | 21,170,941 | |
| 9.75%, 07/20/33 | | UYU | 268,980 | | | | 7,317,006 | |
Uruguay Government International Bond 144A 8.50%, 03/15/28 | | UYU | 25,635 | | | | 657,265 | |
Uruguay Government International Bond Reg S 8.50%, 03/15/28 | | UYU | 174,926 | | | | 4,484,989 | |
| | | | | | | | 33,630,201 | |
Total Government Obligations
(Cost: $2,760,257,039) | | | | 2,524,525,473 | |
Total Investments Before Collateral for Securities Loaned: 98.2%
(Cost: $2,977,970,708) | | 2,729,319,649 | |
| | | | | | | | | |
| | | | Number
of Shares | | | | | |
SHORT-TERM INVESTMENT HELD AS
COLLATERAL FOR SECURITIES ON LOAN: 0.2% |
Money Market Fund: 0.2%
(Cost: $5,691,051) | | | |
| State Street Navigator Securities Lending Government Money Market Portfolio | | | 5,691,051 | | | | 5,691,051 | |
Total Investments: 98.4%
(Cost: $2,983,661,759) | | | | 2,735,010,700 | |
| Other assets less liabilities: 1.6% | | | | 43,665,481 | |
| NET ASSETS: 100.0% | | | | | | $ | 2,778,676,181 | |
See Notes to Financial Statements
VANECK J.P. MORGAN EM LOCAL CURRENCY BOND ETF
SCHEDULE OF INVESTMENTS
(continued)
| Definitions: |
| |
| BRL | Brazilian Real |
| CLP | Chilean Peso |
| CNY | Chinese Yuan |
| COP | Colombian Peso |
| CZK | Czech Koruna |
| DOP | Dominican Peso |
| HUF | Hungarian Forint |
| IDR | Indonesian Rupiah |
| MXN | Mexican Peso |
| MYR | Malaysian Ringgit |
| PEN | Peruvian Nuevo Sol |
| PLN | Polish Zloty |
| RON | Romanian Leu |
| RSD | Serbian Dinar |
| THB | Thai Baht |
| TRY | Turkish Lira |
| UYU | Uruguayan Peso |
| ZAR | South African Rand |
Footnotes:
| ^ | Zero Coupon Bond |
| † | Security fully or partially on loan. Total market value of securities on loan is $5,532,214. |
| | |
| Reg S | Security was purchased pursuant to Regulation S under the Securities Act of 1933, which exempts from registration securities offered and sold outside of the United States. Such a security cannot be sold in the United States without either an effective registration statement filed pursuant to the Securities Act of 1933, or pursuant to an exemption from registration. |
| 144A | Security exempt from registration under Rule 144A of the Securities Act of 1933, as amended, or otherwise restricted. These securities may be resold in transactions exempt from registration, unless otherwise noted. These securities have an aggregate value of $91,130,969, or 3.3% of net assets. |
Summary of Investments by Sector
Excluding Collateral for Securities Loaned | | % of
Investments | | Value | |
| Government | | | 92.9 | % | | $ | 2,535,925,720 | |
| Financials | | | 6.8 | | | | 186,835,349 | |
| Utilities | | | 0.2 | | | | 5,176,076 | |
| Industrials | | | 0.1 | | | | 1,382,504 | |
| | | | 100.0 | % | | $ | 2,729,319,649 | |
The summary of inputs used to value the Fund’s investments as of April 30, 2024 is as follows:
| | | Level 1
Quoted
Prices | | | Level 2
Significant
Observable
Inputs | | | Level 3
Significant
Unobservable
Inputs | | | Value | |
| Corporate Bonds * | | $ | — | | | $ | 204,794,176 | | | $ | — | | | $ | 204,794,176 | |
| Government Obligations * | | | — | | | | 2,524,525,473 | | | | — | | | | 2,524,525,473 | |
| Money Market Fund | | | 5,691,051 | | | | — | | | | — | | | | 5,691,051 | |
| Total Investments | | $ | 5,691,051 | | | $ | 2,729,319,649 | | | $ | — | | | $ | 2,735,010,700 | |
| * | See Schedule of Investments for geographic sector breakouts. |
See Notes to Financial Statements
VANECK MOODY’S ANALYTICS BBB CORPORATE BOND ETF
SCHEDULE OF INVESTMENTS
April 30, 2024
| | | Par
(000’s | ) | | Value | |
| CORPORATE BONDS: 98.2% | | | | | | | | |
| Bermuda: 0.2% | | | | | | | | |
Arch Capital Group Ltd. 3.63%, 06/30/50 | | $ | 25 | | | $ | 17,368 | |
| Canada: 6.1% | | | | | | | | |
| Alimentation Couche-Tard, Inc. 144A | | | | | | | | |
| 3.55%, 07/26/27 | | | 40 | | | | 37,669 | |
| 3.80%, 01/25/50 | | | 25 | | | | 18,176 | |
| Bank of Nova Scotia | | | | | | | | |
| 4.50%, 12/16/25 | | | 50 | | | | 48,906 | |
| 4.59% (US Treasury Yield Curve Rate T 5 Year+2.05%), 05/04/37 | | | 50 | | | | 44,152 | |
Canadian Natural Resources Ltd. 3.85%, 06/01/27 | | | 25 | | | | 23,794 | |
Canadian Pacific Railway Co. 1.75%, 12/02/26 | | | 25 | | | | 22,809 | |
| CI Financial Corp. | | | | | | | | |
| 3.20%, 12/17/30 | | | 25 | | | | 19,917 | |
| 4.10%, 06/15/51 | | | 25 | | | | 14,701 | |
Emera US Finance LP 4.75%, 06/15/46 | | | 50 | | | | 39,025 | |
| Enbridge, Inc. | | | | | | | | |
| 2.50%, 08/01/33 | | | 25 | | | | 19,328 | |
| 3.12%, 11/15/29 | | | 75 | | | | 66,666 | |
| 4.25%, 12/01/26 | | | 25 | | | | 24,240 | |
| 8.50% (US Treasury Yield Curve Rate T 5 Year+4.43%), 01/15/84 | | | 50 | | | | 52,877 | |
Fortis, Inc. 3.06%, 10/04/26 | | | 25 | | | | 23,550 | |
Toronto-Dominion Bank 8.12% (US Treasury Yield Curve Rate T 5 Year+4.08%), 10/31/82 | | | 50 | | | | 51,540 | |
| | | | | | | | 507,350 | |
| France: 6.6% | | | | | | | | |
BNP Paribas SA 144A 2.59% (US Treasury Yield Curve Rate T 5 Year+2.05%), 08/12/35 | | | 75 | | | | 60,490 | |
| 4.38%, 09/28/25 | | | 25 | | | | 24,421 | |
Credit Agricole SA 144A 6.25% (SOFR+2.67%), 01/10/35 | | | 50 | | | | 49,471 | |
Societe Generale SA 144A 1.49% (US Treasury Yield Curve Rate T 1 Year+1.10%), 12/14/26 | | | 50 | | | | 46,436 | |
| 1.79% (US Treasury Yield Curve Rate T 1 Year+1.00%), 06/09/27 | | | 50 | | | | 45,705 | |
| 3.00%, 01/22/30 | | | 100 | | | | 85,330 | |
| 3.34% (US Treasury Yield Curve Rate T 1 Year+1.60%), 01/21/33 | | | 50 | | | | 40,951 | |
| 3.62%, 03/01/41 | | | 125 | | | | 82,505 | |
| | | Par
(000 ’s | ) | | Value | |
| France (continued) | | | | | | | | |
| 4.75%, 11/24/25 | | $ | 50 | | | $ | 48,803 | |
| 4.75%, 09/14/28 | | | 50 | | | | 48,114 | |
| 6.07% (US Treasury Yield Curve Rate T 1 Year+2.10%), 01/19/35 | | | 25 | | | | 24,437 | |
| | | | | | | | 556,663 | |
| Italy: 2.0% | | | | | | | | |
| Intesa Sanpaolo SpA 144A | | | | | | | | |
| 6.62%, 06/20/33 | | | 25 | | | | 25,198 | |
| 7.00%, 11/21/25 | | | 50 | | | | 50,638 | |
| 7.20%, 11/28/33 | | | 50 | | | | 52,280 | |
UniCredit SpA 144A 3.13% (US Treasury Yield Curve Rate T 1 Year+1.55%), 06/03/32 | | | 50 | | | | 41,318 | |
| | | | | | | | 169,434 | |
| Mexico: 0.7% | | | | | | | | |
Infraestructura Energetica Nova SAPI de CV 144A 4.75%, 01/15/51 | | | 50 | | | | 36,781 | |
Sitios Latinoamerica SAB de CV 144A 5.38%, 04/04/32 | | | 25 | | | | 22,858 | |
| | | | | | | | 59,639 | |
| Netherlands: 3.2% | | | | | | | | |
Deutsche Telekom International Finance BV 8.75%, 06/15/30 | | | 75 | | | | 86,506 | |
Deutsche Telekom International Finance BV 144A 4.38%, 06/21/28 | | | 25 | | | | 24,039 | |
Enel Finance International NV 144A 6.80%, 10/14/25 | | | 25 | | | | 25,427 | |
| Prosus NV 144A | | | | | | | | |
| 3.06%, 07/13/31 | | | 50 | | | | 40,094 | |
| 3.68%, 01/21/30 | | | 25 | | | | 21,531 | |
| 4.99%, 01/19/52 | | | 100 | | | | 72,875 | |
| | | | | | | | 270,472 | |
| Norway: 0.3% | | | | | | | | |
Var Energi ASA 144A 8.00%, 11/15/32 | | | 25 | | | | 27,530 | |
| United Kingdom: 1.0% | | | | | | | | |
Ferguson Finance Plc 144A 4.50%, 10/24/28 | | | 25 | | | | 24,080 | |
HSBC Holdings Plc 6.50%, 09/15/37 | | | 25 | | | | 25,253 | |
Lloyds Banking Group Plc 3.37% (US Treasury Yield Curve Rate T 5 Year+1.50%), 12/14/46 | | | 50 | | | | 33,882 | |
| | | | | | | | 83,215 | |
| United States: 78.1% | | | | | | | | |
Alcon Finance Corp. 144A 3.00%, 09/23/29 | | | 25 | | | | 22,193 | |
Altria Group, Inc. 3.40%, 05/06/30 | | | 25 | | | | 22,191 | |
See Notes to Financial Statements
VANECK MOODY’S ANALYTICS BBB CORPORATE BOND ETF
SCHEDULE OF INVESTMENTS
(continued)
| | | Par
(000’s | ) | | Value | |
| United States (continued) | | | | | | | | |
| 3.88%, 09/16/46 | | $ | 75 | | | $ | 53,178 | |
| 4.25%, 08/09/42 | | | 50 | | | | 39,042 | |
| 4.80%, 02/14/29 | | | 75 | | | | 72,819 | |
| 5.80%, 02/14/39 | | | 50 | | | | 48,855 | |
| 5.95%, 02/14/49 † | | | 25 | | | | 24,134 | |
| Ares Capital Corp. | | | | | | | | |
| 2.15%, 07/15/26 | | | 25 | | | | 22,963 | |
| 3.25%, 07/15/25 | | | 25 | | | | 24,114 | |
| 3.88%, 01/15/26 | | | 50 | | | | 48,158 | |
| AT&T, Inc. | | | | | | | | |
| 3.65%, 09/15/59 | | | 100 | | | | 64,926 | |
| 3.85%, 06/01/60 | | | 75 | | | | 50,829 | |
BAT Capital Corp. 3.73%, 09/25/40 | | | 50 | | | | 36,238 | |
Becton Dickinson & Co. 3.70%, 06/06/27 | | | 50 | | | | 47,486 | |
Berry Global, Inc. 1.57%, 01/15/26 | | | 50 | | | | 46,590 | |
Berry Global, Inc. 144A 4.88%, 07/15/26 | | | 25 | | | | 24,489 | |
Blue Owl Capital Corp. 3.40%, 07/15/26 | | | 50 | | | | 46,898 | |
Brighthouse Financial, Inc. 4.70%, 06/22/47 | | | 25 | | | | 19,031 | |
| Broadcom, Inc. | | | | | | | | |
| 3.15%, 11/15/25 | | | 50 | | | | 48,186 | |
| 4.15%, 11/15/30 | | | 50 | | | | 46,158 | |
| Broadcom, Inc. 144A | | | | | | | | |
| 1.95%, 02/15/28 | | | 50 | | | | 43,958 | |
| 3.42%, 04/15/33 | | | 50 | | | | 42,007 | |
Capital One Financial Corp. 6.38% (SOFR+2.86%), 06/08/34 | | | 75 | | | | 75,522 | |
Carlisle Cos, Inc. 2.75%, 03/01/30 | | | 25 | | | | 21,554 | |
CDW LLC / CDW Finance Corp. 3.57%, 12/01/31 | | | 25 | | | | 21,297 | |
| Centene Corp. | | | | | | | | |
| 2.62%, 08/01/31 | | | 75 | | | | 60,080 | |
| 3.38%, 02/15/30 | | | 75 | | | | 65,404 | |
| 4.62%, 12/15/29 | | | 75 | | | | 69,902 | |
CF Industries, Inc. 144A 4.50%, 12/01/26 | | | 25 | | | | 24,196 | |
| Charter Communications Operating LLC / Charter Communications Operating Capital | | | | | | | | |
| 2.25%, 01/15/29 | | | 25 | | | | 20,874 | |
| 2.30%, 02/01/32 | | | 50 | | | | 37,284 | |
| 2.80%, 04/01/31 | | | 25 | | | | 19,863 | |
| 4.91%, 07/23/25 | | | 75 | | | | 73,992 | |
| 5.05%, 03/30/29 | | | 75 | | | | 70,861 | |
| 5.12%, 07/01/49 | | | 20 | | | | 14,665 | |
| 5.38%, 04/01/38 | | | 50 | | | | 41,451 | |
| 5.38%, 05/01/47 | | | 75 | | | | 57,370 | |
| 6.48%, 10/23/45 | | | 75 | | | | 66,435 | |
| | | Par
(000’s | ) | | Value | |
| United States (continued) | | | | | | | | |
| Cheniere Corpus Christi Holdings LLC | | | | | | | | |
| 3.70%, 11/15/29 | | $ | 50 | | | $ | 45,435 | |
| 5.12%, 06/30/27 | | | 25 | | | | 24,652 | |
Cheniere Energy, Inc. 4.62%, 10/15/28 | | | 25 | | | | 23,917 | |
Cigna Group 3.40%, 03/15/50 | | | 75 | | | | 50,026 | |
Citigroup, Inc. 5.83% (SOFR+2.06%), 02/13/35 | | | 75 | | | | 72,215 | |
Columbia Pipeline Group, Inc. 4.50%, 06/01/25 | | | 25 | | | | 24,620 | |
| Conagra Brands, Inc. | | | | | | | | |
| 4.85%, 11/01/28 † | | | 50 | | | | 48,414 | |
| 5.30%, 11/01/38 | | | 50 | | | | 45,838 | |
Constellation Brands, Inc. 2.25%, 08/01/31 | | | 50 | | | | 40,057 | |
| Deutsche Bank AG | | | | | | | | |
| 2.13% (SOFR+1.87%), 11/24/26 | | | 50 | | | | 47,059 | |
| 3.74% (SOFR+2.26%), 01/07/33 | | | 75 | | | | 60,306 | |
| Equinix, Inc. | | | | | | | | |
| 2.15%, 07/15/30 | | | 25 | | | | 20,384 | |
| 3.20%, 11/18/29 | | | 25 | | | | 22,050 | |
| 3.90%, 04/15/32 | | | 25 | | | | 22,118 | |
Everest Reinsurance Holdings, Inc. 3.12%, 10/15/52 | | | 50 | | | | 30,202 | |
| Fiserv, Inc. | | | | | | | | |
| 3.20%, 07/01/26 | | | 50 | | | | 47,636 | |
| 3.85%, 06/01/25 | | | 50 | | | | 48,998 | |
| 4.20%, 10/01/28 | | | 50 | | | | 47,392 | |
| 5.45%, 03/02/28 | | | 75 | | | | 74,805 | |
| 5.62%, 08/21/33 | | | 25 | | | | 24,823 | |
Gartner, Inc. 144A 3.75%, 10/01/30 | | | 25 | | | | 21,781 | |
| General Mills, Inc. | | | | | | | | |
| 2.88%, 04/15/30 | | | 50 | | | | 43,554 | |
| 4.95%, 03/29/33 † | | | 25 | | | | 23,961 | |
GLP Capital LP / GLP Financing II, Inc. 5.30%, 01/15/29 | | | 25 | | | | 24,288 | |
| HCA, Inc. | | | | | | | | |
| 4.12%, 06/15/29 | | | 50 | | | | 46,470 | |
| 5.12%, 06/15/39 | | | 50 | | | | 45,112 | |
| 5.25%, 06/15/26 | | | 25 | | | | 24,748 | |
| 5.25%, 06/15/49 | | | 50 | | | | 43,295 | |
| 5.50%, 06/15/47 | | | 50 | | | | 44,988 | |
International Flavors & Fragrances, Inc. 5.00%, 09/26/48 | | | 50 | | | | 41,287 | |
International Flavors & Fragrances, Inc. 144A 1.83%, 10/15/27 | | | 75 | | | | 65,788 | |
| IQVIA, Inc. | | | | | | | | |
See Notes to Financial Statements
| | | Par
(000’s | ) | | Value | |
| United States (continued) | | | | | | | | |
| 6.25%, 02/01/29 | | $ | 25 | | | $ | 25,428 | |
ITC Holdings Corp. 144A 4.95%, 09/22/27 | | | 25 | | | | 24,481 | |
J M Smucker Co. 6.20%, 11/15/33 | | | 25 | | | | 25,836 | |
Kellanova 3.25%, 04/01/26 | | | 25 | | | | 23,984 | |
Keurig Dr Pepper, Inc. 5.10%, 03/15/27 | | | 50 | | | | 49,664 | |
| Keurig Dr. Pepper, Inc. | | | | | | | | |
| 3.95%, 04/15/29 | | | 25 | | | | 23,439 | |
| 4.05%, 04/15/32 | | | 50 | | | | 45,411 | |
KeyCorp 2.55%, 10/01/29 | | | 50 | | | | 41,505 | |
| Kraft Heinz Foods Co. | | | | | | | | |
| 3.00%, 06/01/26 | | | 50 | | | | 47,741 | |
| 5.00%, 06/04/42 | | | 25 | | | | 22,343 | |
| 5.20%, 07/15/45 | | | 50 | | | | 45,114 | |
| 6.88%, 01/26/39 | | | 25 | | | | 27,256 | |
Kraft Heinz Foods Co. 144A 7.12%, 08/01/39 | | | 50 | | | | 55,258 | |
| Lowe’s Cos, Inc. | | | | | | | | |
| 4.40%, 09/08/25 | | | 25 | | | | 24,651 | |
| 4.45%, 04/01/62 | | | 25 | | | | 19,116 | |
| 5.80%, 09/15/62 | | | 25 | | | | 23,995 | |
LPL Holdings, Inc. 144A 4.00%, 03/15/29 | | | 25 | | | | 22,679 | |
Marathon Petroleum Corp. 4.70%, 05/01/25 | | | 25 | | | | 24,751 | |
McCormick & Co., Inc. 3.40%, 08/15/27 | | | 25 | | | | 23,450 | |
| McDonald’s Corp. | | | | | | | | |
| 2.12%, 03/01/30 | | | 150 | | | | 126,224 | |
| 3.50%, 07/01/27 | | | 50 | | | | 47,401 | |
| 3.62%, 09/01/49 | | | 50 | | | | 35,796 | |
MetLife, Inc. 144A 9.25%, 04/08/38 | | | 25 | | | | 28,789 | |
| Mondelez International, Inc. | | | | | | | | |
| 1.50%, 05/04/25 | | | 25 | | | | 23,985 | |
| 2.75%, 04/13/30 | | | 25 | | | | 21,668 | |
| 3.00%, 03/17/32 | | | 25 | | | | 21,078 | |
MPLX LP 4.88%, 06/01/25 | | | 25 | | | | 24,769 | |
MSCI, Inc. 144A 3.62%, 09/01/30 | | | 25 | | | | 21,785 | |
NextEra Energy Capital Holdings, Inc. 2.25%, 06/01/30 | | | 25 | | | | 20,766 | |
| Oracle Corp. | | | | | | | | |
| 3.60%, 04/01/40 | | | 75 | | | | 56,229 | |
| 3.80%, 11/15/37 | | | 50 | | | | 40,068 | |
| 3.85%, 07/15/36 | | | 50 | | | | 40,986 | |
| 3.85%, 04/01/60 | | | 75 | | | | 49,971 | |
| 3.95%, 03/25/51 † | | | 50 | | | | 35,746 | |
| 4.00%, 07/15/46 | | | 50 | | | | 37,067 | |
| 4.10%, 03/25/61 | | | 50 | | | | 34,812 | |
| 4.38%, 05/15/55 | | | 50 | | | | 37,771 | |
| 5.38%, 07/15/40 | | | 50 | | | | 46,182 | |
| | | Par
(000’s | ) | | Value | |
| United States (continued) | | | | | | | | |
| 6.12%, 07/08/39 | | $ | 25 | | | $ | 25,140 | |
| Pacific Gas and Electric Co. | | | | | | | | |
| 2.10%, 08/01/27 | | | 75 | | | | 66,818 | |
| 2.50%, 02/01/31 | | | 50 | | | | 40,564 | |
| 3.25%, 06/01/31 | | | 50 | | | | 42,318 | |
| 3.50%, 08/01/50 † | | | 50 | | | | 32,093 | |
| 3.75%, 07/01/28 | | | 50 | | | | 46,134 | |
| 4.50%, 07/01/40 | | | 50 | | | | 40,611 | |
| 4.95%, 07/01/50 † | | | 75 | | | | 61,055 | |
| 6.75%, 01/15/53 † | | | 25 | | | | 25,793 | |
| 6.95%, 03/15/34 | | | 25 | | | | 26,434 | |
| Republic Services, Inc. | | | | | | | | |
| 1.75%, 02/15/32 | | | 25 | | | | 19,270 | |
| 3.95%, 05/15/28 | | | 50 | | | | 47,561 | |
Reynolds American, Inc. 5.85%, 08/15/45 | | | 75 | | | | 67,650 | |
Sherwin-Williams Co. 3.45%, 06/01/27 | | | 50 | | | | 47,226 | |
Southern Co. 3.70%, 04/30/30 | | | 50 | | | | 45,275 | |
Sprint Capital Corp. 6.88%, 11/15/28 | | | 50 | | | | 52,402 | |
Sprint LLC 7.62%, 03/01/26 | | | 75 | | | | 77,020 | |
| Time Warner Cable LLC | | | | | | | | |
| 4.50%, 09/15/42 | | | 50 | | | | 35,210 | |
| 5.50%, 09/01/41 | | | 50 | | | | 39,833 | |
| 7.30%, 07/01/38 | | | 100 | | | | 97,235 | |
| T-Mobile USA, Inc. | | | | | | | | |
| 2.05%, 02/15/28 | | | 50 | | | | 44,216 | |
| 2.55%, 02/15/31 | | | 50 | | | | 41,488 | |
| 3.38%, 04/15/29 | | | 75 | | | | 68,137 | |
| 3.60%, 11/15/60 | | | 50 | | | | 32,780 | |
| 3.75%, 04/15/27 | | | 100 | | | | 95,313 | |
| 3.88%, 04/15/30 | | | 60 | | | | 54,927 | |
| 4.38%, 04/15/40 | | | 50 | | | | 42,619 | |
| 4.85%, 01/15/29 | | | 50 | | | | 48,753 | |
| Tyson Foods, Inc. | | | | | | | | |
| 4.00%, 03/01/26 | | | 25 | | | | 24,278 | |
| 4.55%, 06/02/47 | | | 50 | | | | 39,518 | |
| 5.10%, 09/28/48 | | | 25 | | | | 21,409 | |
United Rentals North America, Inc. 144A 6.00%, 12/15/29 | | | 25 | | | | 24,769 | |
Verisk Analytics, Inc. 4.00%, 06/15/25 | | | 25 | | | | 24,497 | |
| Verizon Communications, Inc. | | | | | | | | |
| 0.85%, 11/20/25 | | | 25 | | | | 23,254 | |
| 2.10%, 03/22/28 | | | 50 | | | | 44,285 | |
| 2.35%, 03/15/32 † | | | 100 | | | | 79,827 | |
| 2.55%, 03/21/31 | | | 50 | | | | 41,517 | |
| 3.00%, 03/22/27 | | | 50 | | | | 46,882 | |
| 3.00%, 11/20/60 | | | 75 | | | | 43,448 | |
| 3.88%, 02/08/29 | | | 25 | | | | 23,429 | |
| 4.33%, 09/21/28 | | | 50 | | | | 47,927 | |
| 4.50%, 08/10/33 | | | 50 | | | | 46,191 | |
| VICI Properties LP | | | | | | | | |
See Notes to Financial Statements
VANECK MOODY’S ANALYTICS BBB CORPORATE BOND ETF
SCHEDULE OF INVESTMENTS
(continued)
| | | Par
(000’s | ) | | Value | |
| United States (continued) | | | | | | | | |
| 5.12%, 05/15/32 | | $ | 25 | | | $ | 23,246 | |
| 5.62%, 05/15/52 | | | 25 | | | | 21,849 | |
| VICI Properties LP / VICI Note Co., Inc. 144A | | | | | | | | |
| 3.75%, 02/15/27 | | | 50 | | | | 46,933 | |
| 4.25%, 12/01/26 | | | 50 | | | | 47,743 | |
| 4.62%, 12/01/29 | | | 50 | | | | 46,419 | |
| VMware LLC | | | | | | | | |
| 1.40%, 08/15/26 | | | 25 | | | | 22,739 | |
| 4.50%, 05/15/25 | | | 50 | | | | 49,406 | |
| | | Par
(000’s | ) | | Value | |
| United States (continued) | | | | | | | | |
Westinghouse Air Brake Technologies Corp. 3.45%, 11/15/26 | | $ | 25 | | | $ | 23,715 | |
Weyerhaeuser Co. 4.00%, 11/15/29 | | | 50 | | | | 46,255 | |
| | | | | | | | 6,452,018 | |
Total Corporate Bonds
(Cost: $8,537,128) | | | | | | | 8,143,689 | |
Total Investments: 98.2%
(Cost: $8,537,128) | | | | | | | 8,143,689 | |
| Other assets less liabilities: 1.8% | | | | | | | 150,975 | |
| NET ASSETS: 100.0% | | | | | | $ | 8,294,664 | |
Definitions:
| SOFR | Secured Overnight Financing Rate |
Footnotes:
| † | Security fully or partially on loan. Total market value of securities on loan is $237,762. |
| | |
| 144A | Security exempt from registration under Rule 144A of the Securities Act of 1933, as amended, or otherwise restricted. These securities may be resold in transactions exempt from registration, unless otherwise noted. These securities have an aggregate value of $1,640,425, or 19.8% of net assets. |
| Summary of Investments by Sector | | % of
Investments | | Value | |
| Technology | | | 25.0 | % | | $ | 2,039,216 | |
| Financials | | | 19.6 | | | | 1,595,247 | |
| Consumer Non-Cyclicals | | | 13.9 | | | | 1,129,232 | |
| Consumer Cyclicals | | | 10.7 | | | | 873,810 | |
| Industrials | | | 7.1 | | | | 581,712 | |
| Utilities | | | 6.7 | | | | 547,217 | |
| Healthcare | | | 6.7 | | | | 545,131 | |
| Energy | | | 4.5 | | | | 368,337 | |
| Real Estate | | | 4.0 | | | | 321,286 | |
| Basic Materials | | | 1.8 | | | | 142,501 | |
| | | | 100.0 | % | | $ | 8,143,689 | |
The summary of inputs used to value the Fund’s investments as of April 30, 2024 is as follows:
| | | Level 1
Quoted
Prices | | | Level 2
Significant
Observable
Inputs | | | Level 3
Significant
Unobservable
Inputs | | | Value | |
| Corporate Bonds * | | $ | — | | | $ | 8,143,689 | | | $ | — | | | $ | 8,143,689 | |
| * | See Schedule of Investments for geographic sector breakouts. |
See Notes to Financial Statements
VANECK MOODY’S ANALYTICS IG CORPORATE BOND ETF
SCHEDULE OF INVESTMENTS
April 30, 2024
| | | Par
(000’s | ) | | Value | |
| CORPORATE BONDS: 98.3% | | | | | | | | |
| Canada: 7.3% | | | | | | | | |
| Alimentation Couche-Tard, Inc. 144A | | | | | | | | |
| 3.55%, 07/26/27 | | $ | 50 | | | $ | 47,086 | |
| 3.80%, 01/25/50 | | | 25 | | | | 18,176 | |
Bank of Montreal 7.70% (US Treasury Yield Curve Rate T 5 Year+3.45%), 05/26/84 | | | 25 | | | | 25,019 | |
| Bank of Nova Scotia | | | | | | | | |
| 1.30%, 06/11/25 | | | 50 | | | | 47,699 | |
| 1.30%, 09/15/26 | | | 50 | | | | 45,369 | |
| 2.45%, 02/02/32 | | | 100 | | | | 80,382 | |
4.59% (US Treasury Yield Curve Rate T 5 Year+2.05%), 05/04/37 | | | 25 | | | | 22,076 | |
8.00% (US Treasury Yield Curve Rate T 5 Year+4.02%), 01/27/84 | | | 25 | | | | 25,195 | |
Brookfield Finance, Inc.
4.35%, 04/15/30 | | | 75 | | | | 70,085 | |
Canadian Natural Resources Ltd.
6.25%, 03/15/38 | | | 25 | | | | 25,213 | |
| Canadian Pacific Railway Co. | | | | | | | | |
| 1.75%, 12/02/26 | | | 25 | | | | 22,809 | |
| 6.12%, 09/15/15 | | | 25 | | | | 24,768 | |
CI Financial Corp.
4.10%, 06/15/51 | | | 50 | | | | 29,402 | |
Element Fleet Management Corp. 144A
6.27%, 06/26/26 | | | 25 | | | | 25,146 | |
Emera US Finance LP
3.55%, 06/15/26 | | | 25 | | | | 23,818 | |
| Enbridge, Inc. | | | | | | | | |
| 2.50%, 08/01/33 | | | 50 | | | | 38,657 | |
| 3.12%, 11/15/29 | | | 100 | | | | 88,887 | |
| 4.25%, 12/01/26 | | | 25 | | | | 24,240 | |
| 5.70%, 03/08/33 † | | | 25 | | | | 24,722 | |
Fortis, Inc.
3.06%, 10/04/26 | | | 25 | | | | 23,550 | |
Royal Bank of Canada
1.40%, 11/02/26 | | | 50 | | | | 45,443 | |
| Toronto-Dominion Bank | | | | | | | | |
| 1.15%, 06/12/25 | | | 50 | | | | 47,668 | |
| 1.20%, 06/03/26 | | | 50 | | | | 45,824 | |
| 2.80%, 03/10/27 | | | 25 | | | | 23,272 | |
| | | | | | | | 894,506 | |
| Denmark: 0.4% | | | | | | | | |
Danske Bank A/S 144A 1.55% (US Treasury Yield Curve Rate T 1 Year+0.73%), 09/10/27 | | | 50 | | | | 45,397 | |
| Finland: 0.2% | | | | | | | | |
Nordea Bank Abp 144A
0.75%, 08/28/25 | | | 25 | | | | 23,483 | |
| | | Par
(000’s | ) | | Value | |
| France: 6.6% | | | | | | | | |
BNP Paribas SA 144A 2.59% (US Treasury Yield Curve Rate T 5 Year+2.05%), 08/12/35 | | $ | 50 | | | $ | 40,327 | |
| 4.38%, 05/12/26 | | | 75 | | | | 72,662 | |
5.12% (US Treasury Yield Curve Rate T 1 Year+1.45%), 01/13/29 | | | 150 | | | | 147,778 | |
5.18% (SOFR+1.52%), 01/09/30 | | | 75 | | | | 73,574 | |
5.33% (US Treasury Yield Curve Rate T 1 Year+1.50%), 06/12/29 | | | 25 | | | | 24,771 | |
| Credit Agricole SA 144A | | | | | | | | |
| 5.51%, 07/05/33 | | | 75 | | | | 74,282 | |
| 5.59%, 07/05/26 | | | 50 | | | | 50,029 | |
Societe Generale SA 144A 1.49% (US Treasury Yield Curve Rate T 1 Year+1.10%), 12/14/26 | | | 100 | | | | 92,872 | |
1.79% (US Treasury Yield Curve Rate T 1 Year+1.00%), 06/09/27 | | | 100 | | | | 91,410 | |
| 3.00%, 01/22/30 | | | 100 | | | | 85,330 | |
3.34% (US Treasury Yield Curve Rate T 1 Year+1.60%), 01/21/33 | | | 50 | | | | 40,951 | |
| 4.68%, 06/15/27 | | | 50 | | | | 48,883 | |
| | | | | | | | 842,869 | |
| Germany: 0.3% | | | | | | | | |
Deutsche Bank AG 3.73% (SOFR+2.76%), 01/14/32 | | | 50 | | | | 41,186 | |
| India: 0.4% | | | | | | | | |
Adani Ports & Special Economic Zone Ltd. 144A
4.20%, 08/04/27 | | | 50 | | | | 45,247 | |
| Italy: 1.7% | | | | | | | | |
Intesa Sanpaolo SpA 144A
6.62%, 06/20/33 | | | 100 | | | | 100,794 | |
| 7.20%, 11/28/33 | | | 50 | | | | 52,280 | |
7.78% (US Treasury Yield Curve Rate T 1 Year+3.90%), 06/20/54 | | | 25 | | | | 25,635 | |
UniCredit SpA 144A 1.98% (US Treasury Yield Curve Rate T 1 Year+1.20%), 06/03/27 | | | 50 | | | | 46,045 | |
| | | | | | | | 224,754 | |
| Japan: 0.2% | | | | | | | | |
Nomura Holdings, Inc.
1.85%, 07/16/25 | | | 25 | | | | 23,792 | |
| Mexico: 0.4% | | | | | | | | |
Sitios Latinoamerica SAB de CV 144A
5.38%, 04/04/32 | | | 50 | | | | 45,715 | |
See Notes to Financial Statements
VANECK MOODY’S ANALYTICS IG CORPORATE BOND ETF
SCHEDULE OF INVESTMENTS
(continued)
| | | Par
(000’s | ) | | Value | |
| Netherlands: 1.5% | | | | | | | | |
| Prosus NV 144A | | | | | | | | |
| 3.06%, 07/13/31 | | $ | 50 | | | $ | 40,094 | |
| 3.68%, 01/21/30 | | | 50 | | | | 43,063 | |
| 4.03%, 08/03/50 | | | 50 | | | | 31,668 | |
| 4.99%, 01/19/52 | | | 100 | | | | 72,875 | |
| | | | | | | | 187,700 | |
| Norway: 0.4% | | | | | | | | |
Var Energi ASA 144A
8.00%, 11/15/32 | | | 50 | | | | 55,059 | |
| Saudi Arabia: 2.6% | | | | | | | | |
| Saudi Arabian Oil Co. 144A | | | | | | | | |
| 3.25%, 11/24/50 | | | 75 | | | | 48,328 | |
| 3.50%, 04/16/29 | | | 50 | | | | 46,007 | |
| 3.50%, 11/24/70 | | | 50 | | | | 31,028 | |
| 4.25%, 04/16/39 | | | 150 | | | | 126,831 | |
| 4.38%, 04/16/49 | | | 100 | | | | 79,422 | |
| | | | | | | | 331,616 | |
| Sweden: 0.6% | | | | | | | | |
Skandinaviska Enskilda Banken AB 144A 1.40%, 11/19/25 | | | 25 | | | | 23,477 | |
Svenska Handelsbanken AB 144A
3.95%, 06/10/27 | | | 50 | | | | 47,899 | |
| | | | | | | | 71,376 | |
| Switzerland: 1.4% | | | | | | | | |
UBS Group AG 144A 1.36% (US Treasury Yield Curve Rate T 1 Year+1.08%), 01/30/27 | | | 50 | | | | 46,157 | |
2.75% (US Treasury Yield Curve Rate T 1 Year+1.10%), 02/11/33 | | | 50 | | | | 39,746 | |
3.18% (US Treasury Yield Curve Rate T 1 Year+1.10%), 02/11/43 | | | 50 | | | | 34,800 | |
5.70% (US Treasury Yield Curve Rate T 1 Year+1.77%), 02/08/35 | | | 50 | | | | 48,505 | |
| | | | | | | | 169,208 | |
| Taiwan: 0.8% | | | | | | | | |
| TSMC Global Ltd. 144A | | | | | | | | |
| 0.75%, 09/28/25 | | | 50 | | | | 46,759 | |
| 1.25%, 04/23/26 | | | 50 | | | | 46,116 | |
| | | | | | | | 92,875 | |
| United Kingdom: 3.2% | | | | | | | | |
Barclays Plc 2.65% (US Treasury Yield Curve Rate T 1 Year+1.90%), 06/24/31 | | | 100 | | | | 82,697 | |
2.67% (US Treasury Yield Curve Rate T 1 Year+1.20%), 03/10/32 | | | 100 | | | | 81,098 | |
2.89% (US Treasury Yield Curve Rate T 1 Year+1.30%), 11/24/32 | | | 50 | | | | 40,550 | |
| | | Par
(000’s | ) | | Value | |
| United Kingdom (continued) | | | | | | | | |
3.33% (US Treasury Yield Curve Rate T 1 Year+1.30%), 11/24/42 | | $ | 50 | | | $ | 35,016 | |
| 4.38%, 01/12/26 | | | 50 | | | | 48,777 | |
| 4.84%, 05/09/28 | | | 50 | | | | 47,747 | |
HSBC Holdings Plc
4.25%, 08/18/25 | | | 50 | | | | 48,882 | |
| | | | | | | | 384,767 | |
| United States: 70.3% | | | | | | | | |
| Altria Group, Inc. | | | | | | | | |
| 2.45%, 02/04/32 † | | | 75 | | | | 59,235 | |
| 3.40%, 02/04/41 | | | 25 | | | | 17,517 | |
| 4.25%, 08/09/42 | | | 100 | | | | 78,084 | |
| 4.80%, 02/14/29 | | | 75 | | | | 72,819 | |
| 5.38%, 01/31/44 | | | 25 | | | | 23,376 | |
| 5.80%, 02/14/39 | | | 50 | | | | 48,855 | |
| 5.95%, 02/14/49 † | | | 60 | | | | 57,921 | |
| Apple, Inc. | | | | | | | | |
| 1.12%, 05/11/25 | | | 50 | | | | 47,883 | |
| 2.05%, 09/11/26 | | | 100 | | | | 93,154 | |
| 2.85%, 08/05/61 | | | 75 | | | | 44,684 | |
| 3.20%, 05/11/27 | | | 100 | | | | 94,843 | |
| 3.35%, 02/09/27 † | | | 50 | | | | 47,778 | |
| 4.10%, 08/08/62 | | | 50 | | | | 39,319 | |
| Ares Capital Corp. | | | | | | | | |
| 2.15%, 07/15/26 | | | 25 | | | | 22,963 | |
| 2.88%, 06/15/28 | | | 100 | | | | 87,880 | |
| AT&T, Inc. | | | | | | | | |
| 3.65%, 09/15/59 | | | 175 | | | | 113,620 | |
| 3.80%, 12/01/57 | | | 125 | | | | 84,402 | |
| 3.85%, 06/01/60 | | | 75 | | | | 50,829 | |
Becton Dickinson & Co.
3.70%, 06/06/27 | | | 50 | | | | 47,486 | |
| Berkshire Hathaway Energy Co. | | | | | | | | |
| 2.85%, 05/15/51 | | | 25 | | | | 14,992 | |
| 3.80%, 07/15/48 | | | 50 | | | | 35,948 | |
| 4.25%, 10/15/50 | | | 50 | | | | 38,304 | |
| 4.45%, 01/15/49 | | | 50 | | | | 40,173 | |
| 5.15%, 11/15/43 | | | 25 | | | | 23,184 | |
| 6.12%, 04/01/36 | | | 50 | | | | 51,187 | |
| Berkshire Hathaway Finance Corp. | | | | | | | | |
| 2.85%, 10/15/50 | | | 75 | | | | 47,242 | |
| 3.85%, 03/15/52 | | | 50 | | | | 37,874 | |
| 4.20%, 08/15/48 | | | 150 | | | | 124,712 | |
Berry Global, Inc.
1.57%, 01/15/26 | | | 25 | | | | 23,295 | |
Berry Global, Inc. 144A
4.88%, 07/15/26 | | | 50 | | | | 48,978 | |
Blue Owl Capital Corp.
3.40%, 07/15/26 | | | 50 | | | | 46,898 | |
Broadcom Corp. / Broadcom Cayman Finance Ltd. 3.88%, 01/15/27 | | | 75 | | | | 71,991 | |
Broadcom, Inc.
3.15%, 11/15/25 | | | 25 | | | | 24,093 | |
| Broadcom, Inc. 144A | | | | | | | | |
See Notes to Financial Statements
| | | Par
(000’s | ) | | Value | |
| United States (continued) | | | | | | | | |
| 3.42%, 04/15/33 | | $ | 125 | | | $ | 105,017 | |
| 4.93%, 05/15/37 | | | 75 | | | | 68,523 | |
Cameron LNG LLC 144A
3.70%, 01/15/39 | | | 75 | | | | 59,220 | |
Campbell Soup Co.
4.15%, 03/15/28 | | | 25 | | | | 23,827 | |
Capital One Financial Corp. 6.38% (SOFR+2.86%), 06/08/34 | | | 50 | | | | 50,348 | |
| Centene Corp. | | | | | | | | |
| 3.00%, 10/15/30 | | | 100 | | | | 83,913 | |
| 3.38%, 02/15/30 | | | 50 | | | | 43,603 | |
| 4.62%, 12/15/29 | | | 50 | | | | 46,602 | |
CF Industries, Inc. 144A
4.50%, 12/01/26 | | | 25 | | | | 24,196 | |
| Charter Communications Operating LLC / Charter Communications Operating Capital | | | | | | | | |
| 2.25%, 01/15/29 | | | 25 | | | | 20,874 | |
| 2.80%, 04/01/31 | | | 25 | | | | 19,863 | |
| 3.85%, 04/01/61 | | | 50 | | | | 27,960 | |
| 4.91%, 07/23/25 | | | 75 | | | | 73,992 | |
| 5.05%, 03/30/29 | | | 100 | | | | 94,482 | |
| 5.38%, 04/01/38 | | | 25 | | | | 20,726 | |
| 5.38%, 05/01/47 | | | 25 | | | | 19,123 | |
| 6.48%, 10/23/45 | | | 100 | | | | 88,580 | |
| Cheniere Corpus Christi Holdings LLC | | | | | | | | |
| 3.70%, 11/15/29 | | | 25 | | | | 22,717 | |
| 5.12%, 06/30/27 | | | 25 | | | | 24,652 | |
Cheniere Energy, Inc.
4.62%, 10/15/28 | | | 25 | | | | 23,917 | |
Coca-Cola Co.
3.45%, 03/25/30 | | | 50 | | | | 45,951 | |
| Conagra Brands, Inc. | | | | | | | | |
| 1.38%, 11/01/27 | | | 50 | | | | 43,257 | |
| 4.85%, 11/01/28 † | | | 25 | | | | 24,207 | |
| Constellation Brands, Inc. | | | | | | | | |
| 2.25%, 08/01/31 | | | 25 | | | | 20,028 | |
| 3.15%, 08/01/29 † | | | 50 | | | | 44,660 | |
Corning, Inc.
5.45%, 11/15/79 | | | 25 | | | | 22,089 | |
Costco Wholesale Corp.
1.38%, 06/20/27 | | | 50 | | | | 44,748 | |
| Credit Suisse AG | | | | | | | | |
| 1.25%, 08/07/26 | | | 100 | | | | 90,743 | |
| 5.00%, 07/09/27 | | | 100 | | | | 97,825 | |
Deutsche Bank AG 2.13% (SOFR+1.87%), 11/24/26 | | | 100 | | | | 94,117 | |
3.74% (SOFR+2.26%), 01/07/33 | | | 50 | | | | 40,204 | |
| Duke Energy Carolinas LLC | | | | | | | | |
| 3.20%, 08/15/49 | | | 25 | | | | 16,483 | |
| 4.95%, 01/15/33 | | | 75 | | | | 72,238 | |
Equinix, Inc.
3.20%, 11/18/29 | | | 50 | | | | 44,100 | |
| | | Par
(000’s | ) | | Value | |
| United States (continued) | | | | | | | | |
| Fiserv, Inc. | | | | | | | | |
| 2.25%, 06/01/27 | | $ | 100 | | | $ | 90,892 | |
| 3.50%, 07/01/29 | | | 50 | | | | 45,566 | |
| 3.85%, 06/01/25 | | | 25 | | | | 24,499 | |
| 4.20%, 10/01/28 | | | 75 | | | | 71,089 | |
| 5.15%, 03/15/27 | | | 25 | | | | 24,761 | |
Gartner, Inc. 144A
4.50%, 07/01/28 | | | 25 | | | | 23,532 | |
General Mills, Inc.
2.88%, 04/15/30 | | | 100 | | | | 87,107 | |
| GLP Capital LP / GLP Financing II, Inc. | | | | | | | | |
| 5.25%, 06/01/25 | | | 25 | | | | 24,785 | |
| 5.30%, 01/15/29 | | | 50 | | | | 48,577 | |
| HCA, Inc. | | | | | | | | |
| 2.38%, 07/15/31 | | | 50 | | | | 40,051 | |
| 4.12%, 06/15/29 | | | 100 | | | | 92,940 | |
| 5.25%, 06/15/26 | | | 25 | | | | 24,748 | |
| 5.50%, 06/15/47 | | | 125 | | | | 112,469 | |
| Home Depot, Inc. | | | | | | | | |
| 2.70%, 04/15/30 | | | 50 | | | | 43,588 | |
| 5.95%, 04/01/41 | | | 25 | | | | 25,915 | |
Huntington Bancshare)s, Inc.
2.55%, 02/04/30 | | | 25 | | | | 20,858 | |
International Flavors & Fragrances, Inc. 144A
1.83%, 10/15/27 | | | 75 | | | | 65,788 | |
ITC Holdings Corp. 144A
4.95%, 09/22/27 | | | 25 | | | | 24,481 | |
| Keurig Dr. Pepper, Inc. | | | | | | | | |
| 3.95%, 04/15/29 | | | 50 | | | | 46,878 | |
| 4.05%, 04/15/32 | | | 50 | | | | 45,411 | |
| 4.60%, 05/25/28 | | | 25 | | | | 24,271 | |
KeyBank NA
4.15%, 08/08/25 † | | | 50 | | | | 48,547 | |
KeyCorp
2.55%, 10/01/29 | | | 50 | | | | 41,505 | |
Kinder Morgan Energy Partners LP
5.50%, 03/01/44 | | | 25 | | | | 22,597 | |
| Kraft Heinz Foods Co. | | | | | | | | |
| 3.00%, 06/01/26 | | | 50 | | | | 47,741 | |
| 5.00%, 06/04/42 | | | 25 | | | | 22,343 | |
| 5.20%, 07/15/45 | | | 100 | | | | 90,227 | |
Kraft Heinz Foods Co. 144A
7.12%, 08/01/39 | | | 75 | | | | 82,887 | |
Lowe’s Cos, Inc.
3.00%, 10/15/50 † | | | 25 | | | | 15,372 | |
| 4.45%, 04/01/62 | | | 25 | | | | 19,116 | |
| 5.80%, 09/15/62 | | | 25 | | | | 23,995 | |
McCormick & Co., Inc.
3.40%, 08/15/27 | | | 25 | | | | 23,450 | |
| McDonald’s Corp. | | | | | | | | |
| 2.12%, 03/01/30 | | | 25 | | | | 21,037 | |
| 3.50%, 07/01/27 | | | 25 | | | | 23,700 | |
| 3.60%, 07/01/30 | | | 25 | | | | 22,754 | |
| 3.62%, 09/01/49 | | | 50 | | | | 35,796 | |
| 3.80%, 04/01/28 | | | 75 | | | | 71,219 | |
See Notes to Financial Statements
VANECK MOODY’S ANALYTICS IG CORPORATE BOND ETF
SCHEDULE OF INVESTMENTS
(continued)
| | | Par
(000’s | ) | | Value | |
| United States (continued) | | | | | | | | |
| 4.45%, 03/01/47 | | $ | 25 | | | $ | 20,590 | |
| 4.70%, 12/09/35 | | | 75 | | | | 69,944 | |
| 4.88%, 12/09/45 | | | 50 | | | | 44,188 | |
| 6.30%, 10/15/37 | | | 50 | | | | 52,704 | |
Meta Platforms, Inc.
4.65%, 08/15/62 | | | 50 | | | | 41,636 | |
| Metropolitan Life Global Funding I 144A | | | | | | | | |
| 1.88%, 01/11/27 | | | 75 | | | | 68,354 | |
| 5.15%, 03/28/33 | | | 25 | | | | 24,233 | |
| Mondelez International, Inc. | | | | | | | | |
| 2.62%, 03/17/27 | | | 50 | | | | 46,432 | |
| 2.62%, 09/04/50 | | | 25 | | | | 14,772 | |
| 2.75%, 04/13/30 | | | 25 | | | | 21,668 | |
| Nestle Holdings, Inc. 144A | | | | | | | | |
| 3.50%, 09/24/25 | | | 25 | | | | 24,357 | |
| 4.00%, 09/12/25 | | | 50 | | | | 49,107 | |
| 5.00%, 03/14/28 | | | 50 | | | | 49,683 | |
| Oracle Corp. | | | | | | | | |
| 3.85%, 07/15/36 | | | 75 | | | | 61,480 | |
| 4.12%, 05/15/45 † | | | 100 | | | | 76,326 | |
| 4.30%, 07/08/34 | | | 50 | | | | 44,424 | |
| 4.38%, 05/15/55 | | | 50 | | | | 37,771 | |
| 5.38%, 07/15/40 | | | 100 | | | | 92,364 | |
| 6.50%, 04/15/38 | | | 50 | | | | 52,115 | |
| Pacific Gas and Electric Co. | | | | | | | | |
| 3.25%, 06/01/31 | | | 50 | | | | 42,318 | |
| 3.50%, 08/01/50 † | | | 50 | | | | 32,093 | |
| 3.75%, 07/01/28 | | | 75 | | | | 69,201 | |
| 4.50%, 07/01/40 | | | 50 | | | | 40,611 | |
| 4.55%, 07/01/30 | | | 75 | | | | 69,648 | |
| 4.95%, 07/01/50 † | | | 75 | | | | 61,055 | |
| 6.15%, 01/15/33 | | | 50 | | | | 50,083 | |
| PepsiCo, Inc. | | | | | | | | |
| 2.75%, 04/30/25 | | | 50 | | | | 48,735 | |
| 2.75%, 03/19/30 | | | 50 | | | | 43,981 | |
| 3.60%, 02/18/28 | | | 75 | | | | 71,403 | |
| Philip Morris International, Inc. | | | | | | | | |
| 0.88%, 05/01/26 | | | 50 | | | | 45,734 | |
| 2.75%, 02/25/26 | | | 25 | | | | 23,847 | |
| 3.38%, 08/15/29 | | | 75 | | | | 68,399 | |
| 3.88%, 08/21/42 | | | 50 | | | | 38,285 | |
| 4.12%, 03/04/43 | | | 50 | | | | 39,469 | |
| 4.38%, 11/15/41 | | | 65 | | | | 53,659 | |
| 5.38%, 02/15/33 | | | 25 | | | | 24,515 | |
| 5.62%, 11/17/29 | | | 25 | | | | 25,220 | |
| 5.75%, 11/17/32 | | | 50 | | | | 50,358 | |
Public Service Co. of Colorado
1.88%, 06/15/31 | | | 50 | | | | 39,391 | |
| Republic Services, Inc. | | | | | | | | |
| 1.75%, 02/15/32 | | | 25 | | | | 19,270 | |
| 3.95%, 05/15/28 | | | 50 | | | | 47,561 | |
San Diego Gas & Electric Co.
1.70%, 10/01/30 | | | 75 | | | | 59,959 | |
Sherwin-Williams Co.
3.45%, 06/01/27 | | | 50 | | | | 47,226 | |
| | | Par
(000’s | ) | | Value | |
| United States (continued) | | | | | | | | |
Southern Co.
3.25%, 07/01/26 | | $ | 50 | | | $ | 47,691 | |
Sprint Capital Corp.
6.88%, 11/15/28 | | | 75 | | | | 78,603 | |
Sprint LLC
7.62%, 03/01/26 | | | 75 | | | | 77,020 | |
Sysco Corp.
3.75%, 10/01/25 | | | 25 | | | | 24,328 | |
| Time Warner Cable LLC | | | | | | | | |
| 4.50%, 09/15/42 | | | 25 | | | | 17,605 | |
| 5.88%, 11/15/40 | | | 25 | | | | 20,681 | |
| 6.55%, 05/01/37 | | | 100 | | | | 90,941 | |
| 6.75%, 06/15/39 | | | 75 | | | | 68,732 | |
| T-Mobile USA, Inc. | | | | | | | | |
| 1.50%, 02/15/26 | | | 25 | | | | 23,266 | |
| 3.00%, 02/15/41 | | | 25 | | | | 17,490 | |
| 3.60%, 11/15/60 | | | 75 | | | | 49,171 | |
| 3.75%, 04/15/27 | | | 100 | | | | 95,313 | |
| 3.88%, 04/15/30 | | | 125 | | | | 114,431 | |
| 4.38%, 04/15/40 | | | 50 | | | | 42,619 | |
| Tyson Foods, Inc. | | | | | | | | |
| 3.55%, 06/02/27 | | | 50 | | | | 47,212 | |
| 5.10%, 09/28/48 | | | 25 | | | | 21,409 | |
| 5.70%, 03/15/34 | | | 25 | | | | 24,533 | |
United Rentals North America, Inc. 144A
6.00%, 12/15/29 | | | 50 | | | | 49,538 | |
Verisk Analytics, Inc.
4.00%, 06/15/25 | | | 25 | | | | 24,497 | |
| Verizon Communications, Inc. | | | | | | | | |
| 2.35%, 03/15/32 | | | 50 | | | | 39,913 | |
| 3.00%, 11/20/60 | | | 25 | | | | 14,483 | |
| 3.70%, 03/22/61 | | | 75 | | | | 51,206 | |
| 4.02%, 12/03/29 | | | 150 | | | | 139,840 | |
| 4.12%, 03/16/27 | | | 75 | | | | 72,601 | |
| 4.33%, 09/21/28 | | | 50 | | | | 47,927 | |
| VICI Properties LP | | | | | | | | |
| 4.75%, 02/15/28 | | | 50 | | | | 48,059 | |
| 5.12%, 05/15/32 | | | 50 | | | | 46,491 | |
| 5.62%, 05/15/52 | | | 25 | | | | 21,849 | |
| VICI Properties LP / VICI Note Co., Inc. 144A | | | | | | | | |
| 4.12%, 08/15/30 | | | 50 | | | | 44,598 | |
| 4.25%, 12/01/26 | | | 75 | | | | 71,614 | |
Vistra Operations Co. LLC 144A
4.30%, 07/15/29 | | | 25 | | | | 23,097 | |
VMware LLC
4.50%, 05/15/25 | | | 50 | | | | 49,406 | |
Westinghouse Air Brake Technologies Corp.
3.45%, 11/15/26 | | | 25 | | | | 23,715 | |
| Weyerhaeuser Co. | | | | | | | | |
See Notes to Financial Statements
| | | Par
(000’s | ) | | Value | |
| United States (continued) | | | | | | | | |
| 4.00%, 04/15/30 | | $ | 50 | | | $ | 46,116 | |
| | | | | | | | 8,704,960 | |
Total Corporate Bonds
(Cost: $13,051,185) | | | | | | | 12,184,510 | |
| | | | | | | | | |
| | | Number
of Shares | | | | | |
| SHORT-TERM INVESTMENT HELD AS COLLATERAL FOR SECURITIES ON LOAN: 0.4% | | | | | |
Money Market Fund: 0.4%
(Cost: $45,033) | | | | | | | | |
| State Street Navigator Securities Lending Government Money Market Portfolio | | | 45,033 | | | | 45,033 | |
Total Investments: 98.7%
(Cost: $13,096,218) | | | | | | | 12,229,543 | |
| Other assets less liabilities: 1.3% | | | | 163,961 | |
| NET ASSETS: 100.0% | | | | | | $ | 12,393,504 | |
Definitions:
| SOFR | Secured Overnight Financing Rate |
| USD | United States Dollar |
Footnotes:
| † | Security fully or partially on loan. Total market value of securities on loan is $386,890. |
| | |
| 144A | Security exempt from registration under Rule 144A of the Securities Act of 1933, as amended, or otherwise restricted. These securities may be resold in transactions exempt from registration, unless otherwise noted. These securities have an aggregate value of $3,132,910, or 25.3% of net assets. |
Summary of Investments by Sector
Excluding Collateral for Securities Loaned | | % of
Investments | | Value | |
| Financials | | | 25.6 | % | | $ | 3,118,368 | |
| Technology | | | 21.0 | | | | 2,556,235 | |
| Consumer Non-Cyclicals | | | 18.7 | | | | 2,273,406 | |
| Consumer Cyclicals | | | 9.0 | | | | 1,098,225 | |
| Utilities | | | 6.0 | | | | 730,457 | |
| Energy | | | 5.7 | | | | 700,169 | |
| Industrials | | | 5.5 | | | | 675,952 | |
| Healthcare | | | 4.0 | | | | 491,812 | |
| Real Estate | | | 3.3 | | | | 396,191 | |
| Basic Materials | | | 1.2 | | | | 143,695 | |
| | | | 100.0 | % | | $ | 12,184,510 | |
The summary of inputs used to value the Fund’s investments as of April 30, 2024 is as follows:
| | | Level 1
Quoted
Prices | | | Level 2
Significant
Observable
Inputs | | | Level 3
Significant
Unobservable
Inputs | | | Value | |
| Corporate Bonds * | | $ | — | | | $ | 12,184,510 | | | $ | — | | | $ | 12,184,510 | |
| Money Market Fund | | | 45,033 | | | | — | | | | — | | | | 45,033 | |
| Total Investments | | $ | 45,033 | | | $ | 12,184,510 | | | $ | — | | | $ | 12,229,543 | |
| | |
| * | See Schedule of Investments for geographic sector breakouts. |
See Notes to Financial Statements
VANECK MORTGAGE REIT INCOME ETF
SCHEDULE OF INVESTMENTS
April 30, 2024
| | | Number
of Shares | | | Value | |
| COMMON STOCKS: 99.8% | | | | | | | | |
| Financial Services: 99.8% | | | | | | | | |
| AGNC Investment Corp. † | | | 3,237,132 | | | $ | 29,619,758 | |
| Annaly Capital Management, Inc. | | | 2,022,051 | | | | 37,893,236 | |
| Apollo Commercial Real Estate Finance, Inc. † | | | 813,574 | | | | 7,834,718 | |
| Arbor Realty Trust, Inc. † | | | 933,563 | | | | 11,977,613 | |
| Ares Commercial Real Estate Corp. † | | | 429,626 | | | | 2,917,161 | |
| ARMOUR Residential REIT, Inc. † | | | 313,271 | | | | 5,692,134 | |
| Blackstone Mortgage Trust, Inc. † | | | 670,571 | | | | 11,828,872 | |
| BrightSpire Capital, Inc. | | | 823,161 | | | | 5,177,683 | |
| Chimera Investment Corp. | | | 1,570,358 | | | | 6,469,875 | |
| Claros Mortgage Trust, Inc. | | | 337,011 | | | | 2,931,996 | |
| Dynex Capital, Inc. † | | | 441,852 | | | | 5,156,413 | |
| Ellington Financial, Inc. † | | | 590,621 | | | | 6,756,704 | |
| Franklin BSP Realty Trust, Inc. | | | 512,934 | | | | 6,406,546 | |
| Hannon Armstrong Sustainable Infrastructure Capital, Inc. † | | | 472,128 | | | | 11,807,921 | |
| KKR Real Estate Finance Trust, Inc. | | | 282,615 | | | | 2,659,407 | |
| Ladder Capital Corp. | | | 856,752 | | | | 9,192,949 | |
| | | Number
of Shares | | | Value | |
| Financial Services (continued) | | | | | | | | |
| MFA Financial, Inc. | | | 726,168 | | | $ | 7,690,119 | |
| New York Mortgage Trust, Inc. | | | 601,511 | | | | 4,120,350 | |
| Orchid Island Capital, Inc. † | | | 413,911 | | | | 3,447,879 | |
| PennyMac Mortgage Investment Trust † | | | 481,066 | | | | 6,662,764 | |
| Ready Capital Corp. † | | | 1,077,787 | | | | 9,182,745 | |
| Redwood Trust, Inc. | | | 833,242 | | | | 4,607,828 | |
| Rithm Capital Corp. | | | 2,102,293 | | | | 23,377,498 | |
| Starwood Property Trust, Inc. † | | | 1,299,201 | | | | 24,645,843 | |
| Two Harbors Investment Corp. | | | 601,144 | | | | 7,592,449 | |
Total Common Stocks
(Cost: $309,513,720) | | | | | | | 255,650,461 | |
| | | | | | | | | |
| SHORT-TERM INVESTMENT HELD AS COLLATERAL FOR SECURITIES ON LOAN: 9.6% | | | | | |
Money Market Fund: 9.6%
(Cost: $24,490,136) | | | | | | | | |
| State Street Navigator Securities Lending Government Money Market Portfolio | | | 24,490,136 | | | | 24,490,136 | |
Total Investments: 109.4%
(Cost: $334,003,856) | | | | | | | 280,140,597 | |
| Liabilities in excess of other assets: (9.4)% | | | | (24,098,059) | |
| NET ASSETS: 100.0% | | | | | | $ | 256,042,538 | |
Footnotes:
| † | Security fully or partially on loan. Total market value of securities on loan is $71,854,807. |
Summary of Investments by Sector
Excluding Collateral for Securities Loaned | | % of
Investments | | Value | |
| Financials | | | 100.0 | % | | $ | 255,650,461 | |
The summary of inputs used to value the Fund’s investments as of April 30, 2024 is as follows:
| | | Level 1
Quoted
Prices | | | Level 2
Significant
Observable
Inputs | | | Level 3
Significant
Unobservable
Inputs | | | Value | |
| Common Stocks * | | $ | 255,650,461 | | | $ | — | | | $ | — | | | $ | 255,650,461 | |
| Money Market Fund | | | 24,490,136 | | | | — | | | | — | | | | 24,490,136 | |
| Total Investments | | $ | 280,140,597 | | | $ | — | | | $ | — | | | $ | 280,140,597 | |
| * | See Schedule of Investments for industry sector breakouts. |
See Notes to Financial Statements
VANECK PREFERRED SECURITIES EX FINANCIALS ETF
SCHEDULE OF INVESTMENTS
April 30, 2024
| | | Number
of Shares | | | Value | |
| PREFERRED SECURITIES: 99.7% | | | | | | | | |
| Automobiles & Auto Parts: 4.7% | | | | | | | | |
| Ford Motor Co. | | | | | | | | |
| 6.00%, 12/01/59 | | | 1,156,766 | | | $ | 27,762,384 | |
| 6.20%, 06/01/59 | | | 1,084,466 | | | | 26,211,543 | |
| 6.50%, 08/15/62 | | | 867,576 | | | | 21,255,612 | |
| | | | | | | | 75,229,539 | |
| Banking Services: 1.3% | | | | | | | | |
SCE Trust VII
7.50%, 11/22/28 | | | 795,277 | | | | 20,756,730 | |
| Chemicals: 5.8% | | | | | | | | |
Albemarle Corp.
7.25%, 03/01/27 * | | | 1,662,853 | | | | 91,240,744 | |
| Consumer Goods Conglomerates: 0.4% | | | | | | | | |
Brookfield Infrastructure Finance ULC
5.00%, 05/24/81 | | | 361,489 | | | | 6,159,773 | |
| Diversified Retail: 1.9% | | | | | | | | |
Qurate Retail, Inc.
8.00%, 03/15/31 | | | 459,708 | | | | 21,224,719 | |
QVC, Inc.
6.25%, 11/26/68 | | | 723,266 | | | | 9,062,523 | |
| | | | | | | | 30,287,242 | |
| Electric Utilities & IPPs: 20.6% | | | | | | | | |
| Brookfield BRP Holdings Canada, Inc. | | | | | | | | |
| 4.62%, 04/30/26 | | | 506,088 | | | | 7,869,669 | |
| 4.88%, 12/09/26 | | | 375,950 | | | | 6,071,593 | |
| DTE Energy Co. | | | | | | | | |
| 4.38%, 12/01/81 | | | 404,865 | | | | 7,983,938 | |
| 5.25%, 12/01/77 | | | 578,387 | | | | 13,048,411 | |
| Duke Energy Corp. | | | | | | | | |
| 5.62%, 09/15/78 | | | 722,978 | | | | 17,047,821 | |
| 5.75%, 06/15/24 | | | 1,445,955 | | | | 35,787,386 | |
Entergy Arkansas LLC
4.88%, 09/01/66 | | | 592,840 | | | | 12,597,850 | |
Entergy Louisiana LLC
4.88%, 09/01/66 | | | 390,412 | | | | 8,276,734 | |
Entergy Mississippi LLC
4.90%, 10/01/66 | | | 375,950 | | | | 8,161,875 | |
Georgia Power Co.
5.00%, 10/01/77 | | | 390,412 | | | | 8,612,489 | |
NextEra Energy Capital Holdings, Inc.
5.65%, 03/01/79 | | | 994,098 | | | | 24,236,109 | |
NextEra Energy, Inc.
6.93%, 09/01/25 | | | 1,445,955 | | | | 58,922,666 | |
SCE Trust III 8.58% (Term SOFR USD 3 Month+3.25%) | | | 397,643 | | | | 10,048,439 | |
SCE Trust IV 5.38% (Term SOFR USD 3 Month+3.39%), 09/15/25 | | | 469,934 | | | | 11,085,743 | |
SCE Trust V 5.45% (Term SOFR USD 3 Month+4.05%), 03/15/26 | | | 433,788 | | | | 10,653,833 | |
SCE Trust VI
5.00% | | | 686,832 | | | | 13,613,010 | |
| | | Number
of Shares | | | Value | |
| Electric Utilities & IPPs (continued) | | | | | | | | |
| Southern Co. | | | | | | | | |
| 4.20%, 10/15/60 | | | 1,084,466 | | | $ | 20,832,592 | |
| 4.95%, 01/30/80 | | | 1,445,955 | | | | 30,900,058 | |
| 5.25%, 12/01/77 | | | 650,678 | | | | 14,672,789 | |
Tennessee Valley Authority 2.13% (US Treasury Yield Curve Rate T Note Constant Maturity 30 Year+0.94%), 06/01/28 | | | 370,887 | | | | 8,152,096 | |
| | | | | | | | 328,575,101 | |
| Food & Tobacco: 5.5% | | | | | | | | |
| CHS, Inc. | | | | | | | | |
| 6.75%, 09/30/24 | | | 712,132 | | | | 18,024,061 | |
| 7.50%, 01/21/25 | | | 748,285 | | | | 19,193,510 | |
| 7.88% | | | 775,760 | | | | 20,689,519 | |
| 8.00% | | | 443,618 | | | | 13,392,827 | |
| 9.86% | | | 607,302 | | | | 15,783,779 | |
| | | | | | | | 87,083,696 | |
| Investment Banking & Investment Services: 1.3% | | | | | |
BrightSpring Health Services, Inc.
6.75%, 02/01/27 | | | 289,189 | | | | 12,501,640 | |
KKR Real Estate Finance Trust, Inc.
6.50%, 04/16/26 | | | 473,981 | | | | 8,692,812 | |
| | | | | | | | 21,194,452 | |
| Machinery; Equipment & Components: 3.5% | | | | | |
Chart Industries, Inc.
6.75%, 12/15/25 | | | 290,997 | | | | 16,720,688 | |
RBC Bearings, Inc.
5.00%, 10/15/24 | | | 166,283 | | | | 18,685,221 | |
WESCO International, Inc. 10.62% (US Treasury Yield Curve Rate T 5 Year+10.32%), 06/22/25 | | | 778,504 | | | | 20,544,720 | |
| | | | | | | | 55,950,629 | |
| Multiline Utilities: 5.6% | | | | | | | | |
| Algonquin Power & Utilities Corp. | | | | | | | | |
| 6.20%, 07/01/79 | | | 506,088 | | | | 12,626,896 | |
| 7.75%, 06/15/24 | | | 831,423 | | | | 17,759,195 | |
| CMS Energy Corp. | | | | | | | | |
| 5.88%, 10/15/78 | | | 404,865 | | | | 9,749,149 | |
| 5.88%, 03/01/79 | | | 910,953 | | | | 22,136,158 | |
Sempra
5.75%, 07/01/79 | | | 1,095,313 | | | | 26,375,137 | |
| | | | | | | | 88,646,535 | |
| Natural Gas Utilities: 0.6% | | | | | | | | |
Spire, Inc.
5.90%, 08/15/24 | | | 361,489 | | | | 8,701,040 | |
| Office Equipment: 0.6% | | | | | | | | |
Pitney Bowes, Inc.
6.70%, 03/07/43 | | | 614,533 | | | | 10,090,632 | |
| Oil & Gas: 0.7% | | | | | | | | |
| NGL Energy Partners LP | | | | | | | | |
See Notes to Financial Statements
VANECK PREFERRED SECURITIES EX FINANCIALS ETF
SCHEDULE OF INVESTMENTS
(continued)
| | | Number
of Shares | | | Value | |
| Oil & Gas (continued) | | | | | | | | |
| 12.79% (Term SOFR USD 3 Month+7.47%) | | | 454,897 | | | $ | 11,144,977 | |
| Oil & Gas Related Equipment and Services: 3.6% | | |
Energy Transfer LP
7.60%, 05/15/24 | | | 1,153,959 | | | | 28,779,737 | |
NuStar Energy LP 11.23% (Term SOFR USD 3 Month+5.90%) | | | 556,695 | | | | 14,201,289 | |
NuStar Logistics LP 6.98% (Term SOFR USD 3 Month+7.00%), 01/15/43 | | | 581,994 | | | | 14,759,368 | |
| | | | | | | | 57,740,394 | |
| Professional & Commercial Services: 1.4% | | | | | | | | |
BIP Bermuda Holdings I Ltd.
5.12%, 01/21/27 | | | 433,788 | | | | 7,695,399 | |
Clarivate Plc
5.25%, 06/01/24 | | | 518,381 | | | | 14,053,309 | |
| | | | | | | | 21,748,708 | |
| Real Estate Operations: 2.2% | | | | | | | | |
Brookfield Property Preferred LP
6.25%, 07/26/81 | | | 970,382 | | | | 14,080,243 | |
| DigitalBridge Group, Inc. | | | | | | | | |
| 7.12% | | | 419,903 | | | | 9,531,798 | |
| 7.15% | | | 465,167 | | | | 10,401,134 | |
| | | | | | | | 34,013,175 | |
| Residential & Commercial REITs: 24.5% | | | | | | | | |
| AGNC Investment Corp. | | | | | | | | |
| 6.12%, 04/15/25 | | | 831,423 | | | | 19,422,041 | |
| 6.50%, 10/15/24 | | | 581,994 | | | | 14,218,113 | |
| 10.70% (Term SOFR USD 3 Month+5.37%) | | | 469,934 | | | | 11,988,016 | |
| Annaly Capital Management, Inc. | | | | | | | | |
| 6.75%, 06/30/24 | | | 639,840 | | | | 16,053,586 | |
| 9.74% (Term SOFR USD 3 Month+4.43%) | | | 614,533 | | | | 15,467,796 | |
| 10.56% (Term SOFR USD 3 Month+5.25%) | | | 1,041,090 | | | | 26,329,166 | |
Arbor Realty Trust, Inc. 6.25% (Term SOFR USD 3 Month+5.44%), 10/12/26 | | | 410,072 | | | | 7,820,073 | |
| Chimera Investment Corp. | | | | | | | | |
| 7.75%, 09/30/25 | | | 375,950 | | | | 7,812,241 | |
| 11.35% (Term SOFR USD 3 Month+6.05%) | | | 469,934 | | | | 11,649,664 | |
Digital Realty Trust, Inc.
5.20%, 10/10/24 | | | 498,857 | | | | 10,575,768 | |
| Diversified Healthcare Trust | | | | | | | | |
| 5.62%, 08/01/42 | | | 506,088 | | | | 6,376,709 | |
| 6.25%, 02/01/46 | | | 361,489 | | | | 5,136,759 | |
Franklin BSP Realty Trust, Inc.
7.50% | | | 373,343 | | | | 7,500,461 | |
Hudson Pacific Properties, Inc.
4.75%, 11/26/26 | | | 614,533 | | | | 8,726,369 | |
| | | Number
of Shares | | | Value | |
| Residential & Commercial REITs (continued) | | | |
Kimco Realty Corp.
5.25% | | | 378,262 | | | $ | 8,408,764 | |
MFA Financial, Inc.
6.50%, 03/31/25 | | | 397,643 | | | | 8,807,792 | |
PennyMac Mortgage Investment Trust 6.75%, 08/24/26 | | | 361,489 | | | | 6,814,068 | |
| Public Storage | | | | | | | | |
| 3.88%, 10/06/25 | | | 408,481 | | | | 6,952,347 | |
| 4.00%, 11/19/26 | | | 1,502,065 | | | | 26,675,266 | |
| 4.10%, 01/13/27 | | | 361,489 | | | | 6,488,728 | |
| 4.62%, 06/17/25 | | | 816,969 | | | | 16,813,222 | |
| 4.70%, 11/15/24 | | | 374,215 | | | | 7,742,508 | |
| 4.88%, 09/12/24 | | | 457,208 | | | | 9,930,558 | |
| 5.05% | | | 433,788 | | | | 9,860,001 | |
| 5.15% | | | 404,865 | | | | 9,166,144 | |
| 5.60% | | | 412,096 | | | | 10,166,408 | |
| Rithm Capital Corp. | | | | | | | | |
| 6.38%, 02/15/25 | | | 574,916 | | | | 13,033,346 | |
| 7.00% (US Treasury Yield Curve Rate T 5 Year+6.22%), 11/15/26 | | | 672,370 | | | | 15,101,430 | |
| 7.12%, 08/15/24 | | | 407,041 | | | | 10,057,983 | |
RLJ Lodging Trust
1.95% | | | 465,455 | | | | 11,506,048 | |
Two Harbors Investment Corp.
7.62%, 07/27/27 | | | 367,288 | | | | 8,300,709 | |
UMH Properties, Inc.
6.38% | | | 423,958 | | | | 9,242,284 | |
| Vornado Realty Trust | | | | | | | | |
| 4.45%, 09/22/26 | | | 433,788 | | | | 5,530,797 | |
| 5.25%, 11/24/25 | | | 895,771 | | | | 13,430,708 | |
| 5.40% | | | 433,788 | | | | 6,675,997 | |
| | | | | | | | 389,781,870 | |
| Telecommunications Services: 15.5% | | | | | | | | |
| AT&T, Inc. | | | | | | | | |
| 4.75%, 02/18/25 | | | 2,530,430 | | | | 49,697,645 | |
| 5.00%, 12/12/24 | | | 1,735,153 | | | | 36,004,425 | |
| 5.35%, 11/01/66 | | | 1,912,282 | | | | 42,892,485 | |
| 5.62%, 08/01/67 | | | 1,192,920 | | | | 28,439,213 | |
| Qwest Corp. | | | | | | | | |
| 6.50%, 09/01/56 | | | 1,413,425 | | | | 13,738,491 | |
| 6.75%, 06/15/57 | | | 954,329 | | | | 9,381,054 | |
| Telephone and Data Systems, Inc. | | | | | | | | |
| 6.00%, 09/30/26 | | | 997,714 | | | | 15,005,618 | |
| 6.62%, 03/31/26 | | | 607,302 | | | | 10,530,617 | |
| United States Cellular Corp. | | | | | | | | |
| 5.50%, 03/01/70 | | | 722,978 | | | | 12,847,319 | |
| 5.50%, 06/01/70 | | | 722,978 | | | | 12,760,562 | |
| 6.25%, 09/01/69 | | | 722,978 | | | | 13,924,556 | |
| | | | | | | | 245,221,985 | |
Total Preferred Securities
(Cost: $1,695,531,685) | | | | | | | 1,583,567,222 | |
Total Investments: 99.7%
(Cost: $1,695,531,685) | | | | | | | 1,583,567,222 | |
| Other assets less liabilities: 0.3% | | | | | | | 4,650,925 | |
| NET ASSETS: 100.0% | | | | | | $ | 1,588,218,147 | |
See Notes to Financial Statements
Definitions:
| SOFR | Secured Overnight Financing Rate |
| USD | United States Dollar |
Footnotes:
| Summary of Investments by Sector | | % of
Investments | | Value | |
| Residential & Commercial REITs | | | 24.6 | % | | $ | 389,781,870 | |
| Electric Utilities & IPPs | | | 20.7 | | | | 328,575,101 | |
| Telecommunications Services | | | 15.5 | | | | 245,221,985 | |
| Chemicals | | | 5.8 | | | | 91,240,744 | |
| Multiline Utilities | | | 5.6 | | | | 88,646,535 | |
| Food & Tobacco | | | 5.5 | | | | 87,083,696 | |
| Automobiles & Auto Parts | | | 4.8 | | | | 75,229,539 | |
| Oil & Gas Related Equipment and Services | | | 3.6 | | | | 57,740,394 | |
| Machinery; Equipment & Components | | | 3.5 | | | | 55,950,629 | |
| Real Estate Operations | | | 2.2 | | | | 34,013,175 | |
| Diversified Retail | | | 1.9 | | | | 30,287,242 | |
| Professional & Commercial Services | | | 1.4 | | | | 21,748,708 | |
| Investment Banking & Investment Services | | | 1.3 | | | | 21,194,452 | |
| Banking Services | | | 1.3 | | | | 20,756,730 | |
| Oil & Gas | | | 0.7 | | | | 11,144,977 | |
| Office Equipment | | | 0.6 | | | | 10,090,632 | |
| Natural Gas Utilities | | | 0.6 | | | | 8,701,040 | |
| Consumer Goods Conglomerates | | | 0.4 | | | | 6,159,773 | |
| | | | 100.0 | % | | $ | 1,583,567,222 | |
The summary of inputs used to value the Fund’s investments as of April 30, 2024 is as follows:
| | | Level 1
Quoted
Prices | | | Level 2
Significant
Observable
Inputs | | | Level 3
Significant
Unobservable
Inputs | | | Value | |
| Preferred Securities * | | $ | 1,583,567,222 | | | $ | — | | | $ | — | | | $ | 1,583,567,222 | |
| * | See Schedule of Investments for industry sector breakouts. |
See Notes to Financial Statements
VANECK ETF TRUST
STATEMENTS OF ASSETS AND LIABILITIES
April 30, 2024
| | | BDC Income ETF | | | China Bond ETF | | | Dynamic High
Income ETF | | | Emerging
Markets High
Yield Bond ETF | |
| Assets: | | | | | | | | | | | | | | | | |
| Investments, at value (1) | | | | | | | | | | | | | | | | |
| Unaffiliated issuers (2) | | $ | 1,084,948,577 | | | $ | 20,916,797 | | | $ | 177,495 | | | $ | 348,234,032 | |
| Affiliated issuers (3) | | | — | | | | — | | | | 610,738 | | | | — | |
| Short-term investments held as collateral for securities loaned (4) | | | 89,871,466 | | | | — | | | | — | | | | 9,793,937 | |
| Cash | | | 7,364 | | | | 1,267 | | | | — | | | | 6,631,014 | |
| Cash denominated in foreign currency, at value (5) | | | — | | | | 473,892 | (a) | | | — | | | | 2,760 | |
| Receivables: | | | | | | | | | | | | | | | | |
| Investment securities sold | | | — | | | | 2,413,808 | | | | — | | | | 6,414,170 | |
| Shares of beneficial interest sold | | | 7,486,641 | | | | — | | | | — | | | | — | |
| Due from Adviser | | | — | | | | 6,415 | | | | — | | | | — | |
| Dividends and interest | | | 1,160,249 | | | | 325,373 | | | | 1,249 | | | | 6,001,943 | |
| Prepaid expenses | | | — | | | | 297 | | | | — | | | | — | |
| Total assets | | | 1,183,474,297 | | | | 24,137,849 | | | | 789,482 | | | | 377,077,856 | |
| Liabilities: | | | | | | | | | | | | | | | | |
| Payables: | | | | | | | | | | | | | | | | |
| Investment securities purchased | | | 7,486,470 | | | | — | | | | — | | | | 9,093,658 | |
| Collateral for securities loaned | | | 89,871,466 | | | | — | | | | — | | | | 9,793,937 | |
| Line of credit | | | 1,396,706 | | | | — | | | | — | | | | — | |
| Due to Adviser | | | 341,713 | | | | — | | | | 65 | | | | 119,988 | |
| Due to custodian | | | — | | | | — | | | | 3,122 | | | | — | |
| Deferred Trustee fees | | | 9,395 | | | | 1,491 | | | | — | | | | 40,196 | |
| Accrued expenses | | | 26,812 | | | | 60,250 | | | | — | | | | 3 | |
| Total liabilities | | | 99,132,562 | | | | 61,741 | | | | 3,187 | | | | 19,047,782 | |
| NET ASSETS | | $ | 1,084,341,735 | | | $ | 24,076,108 | | | $ | 786,295 | | | $ | 358,030,074 | |
| Shares outstanding | | | 65,175,000 | | | | 1,100,000 | | | | 30,000 | | | | 19,000,000 | |
| Net asset value, redemption and offering price per share | | $ | 16.64 | | | $ | 21.89 | | | $ | 26.21 | | | $ | 18.84 | |
| Net Assets consist of: | | | | | | | | | | | | | | | | |
| Aggregate paid in capital | | $ | 1,141,047,289 | | | $ | 26,260,245 | | | $ | 756,594 | | | $ | 595,870,929 | |
| Total distributable earnings (loss) | | | (56,705,554 | ) | | | (2,184,137 | ) | | | 29,701 | | | | (237,840,855 | ) |
| NET ASSETS | | $ | 1,084,341,735 | | | $ | 24,076,108 | | | $ | 786,295 | | | $ | 358,030,074 | |
| (1) | Value of securities on loan | | $ | 139,211,087 | | | $ | — | | | $ | — | | | $ | 12,053,662 | |
| (2) | Cost of investments - Unaffiliated issuers | | $ | 1,031,458,983 | | | $ | 22,247,392 | | | $ | 178,737 | | | $ | 376,712,476 | |
| (3) | Cost of investments - Affiliated issuers | | $ | — | | | $ | — | | | $ | 579,794 | | | $ | — | |
| (4) | Cost of short-term investments held as collateral for securities loaned | | $ | 89,871,466 | | | $ | — | | | $ | — | | | $ | 9,793,937 | |
| (5) | Cost of cash denominated in foreign currency | | $ | — | | | $ | 477,307 | | | $ | — | | | $ | 2,767 | |
| (a) | Includes $29,122 on foreign investor minimum settlement reserve funds (see Note 2G). |
See Notes to Financial Statements
VANECK ETF TRUST
STATEMENTS OF ASSETS AND LIABILITIES
April 30, 2024
| | | Fallen Angel High
Yield Bond ETF | | | Green Bond ETF | | | IG Floating Rate
ETF | | | International
High Yield Bond
ETF | |
| Assets: | | | | | | | | | | | | | | | | |
| Investments, at value (1) | | | | | | | | | | | | | | | | |
| Unaffiliated issuers (2) | | $ | 2,868,563,867 | | | $ | 90,564,453 | | | $ | 1,519,291,645 | | | $ | 29,730,533 | |
| Short-term investments held as collateral for securities loaned (3) | | | 147,489,017 | | | | 1,573,215 | | | | 4,149,731 | | | | 860,040 | |
| Cash | | | 41,561,140 | | | | 413,784 | | | | 13,380,159 | | | | 198,142 | |
| Cash denominated in foreign currency, at value (4) | | | — | | | | 1,160 | | | | — | | | | 24,545 | |
| Receivables: | | | | | | | | | | | | | | | | |
| Investment securities sold | | | 212,410,236 | | | | 1,526,641 | | | | 233,731,088 | | | | 911,709 | |
| Shares of beneficial interest sold | | | — | | | | — | | | | 21,652,037 | | | | — | |
| Dividends and interest | | | 43,475,773 | | | | 812,306 | | | | 12,554,864 | | | | 533,838 | |
| Total assets | | | 3,313,500,033 | | | | 94,891,559 | | | | 1,804,759,524 | | | | 32,258,807 | |
| Liabilities: | | | | | | | | | | | | | | | | |
| Payables: | | | | | | | | | | | | | | | | |
| Investment securities purchased | | | 238,977,613 | | | | 1,582,148 | | | | 260,647,801 | | | | 927,264 | |
| Collateral for securities loaned | | | 147,489,017 | | | | 1,573,215 | | | | 4,149,731 | | | | 860,040 | |
| Due to Adviser | | | 620,916 | | | | 15,007 | | | | 167,864 | | | | 10,045 | |
| Deferred Trustee fees | | | 67,963 | | | | 1,073 | | | | 21,618 | | | | 33,385 | |
| Accrued expenses | | | — | | | | — | | | | — | | | | 72 | |
| Total liabilities | | | 387,155,509 | | | | 3,171,443 | | | | 264,987,014 | | | | 1,830,806 | |
| NET ASSETS | | $ | 2,926,344,524 | | | $ | 91,720,116 | | | $ | 1,539,772,510 | | | $ | 30,428,001 | |
| Shares outstanding | | | 103,200,000 | | | | 3,950,000 | | | | 60,450,000 | | | | 1,500,000 | |
| Net asset value, redemption and offering price per share | | $ | 28.36 | | | $ | 23.22 | | | $ | 25.47 | | | $ | 20.29 | |
| Net Assets consist of: | | | | | | | | | | | | | | | | |
| Aggregate paid in capital | | $ | 3,530,432,611 | | | $ | 104,957,249 | | | $ | 1,530,328,267 | | | $ | 52,058,777 | |
| Total distributable earnings (loss) | | | (604,088,087 | ) | | | (13,237,133 | ) | | | 9,444,243 | | | | (21,630,776 | ) |
| NET ASSETS | | $ | 2,926,344,524 | | | $ | 91,720,116 | | | $ | 1,539,772,510 | | | $ | 30,428,001 | |
| (1) | Value of securities on loan | | $ | 180,703,191 | | | $ | 3,184,026 | | | $ | 3,804,013 | | | $ | 944,012 | |
| (2) | Cost of investments - Unaffiliated issuers | | $ | 3,019,239,929 | | | $ | 99,320,766 | | | $ | 1,510,682,784 | | | $ | 32,650,783 | |
| (3) | Cost of short-term investments held as collateral for securities loaned | | $ | 147,489,017 | | | $ | 1,573,215 | | | $ | 4,149,731 | | | $ | 860,040 | |
| (4) | Cost of cash denominated in foreign currency | | $ | — | | | $ | 1,179 | | | $ | — | | | $ | 24,738 | |
See Notes to Financial Statements
VANECK ETF TRUST
STATEMENTS OF ASSETS AND LIABILITIES
April 30, 2024
| | | J.P. Morgan EM
Local Currency
Bond ETF | | | Moody’s Analytics
BBB Corporate
Bond ETF | | | Moody’s Analytics
IG Corporate
Bond ETF | | | Mortgage REIT
Income ETF | |
| Assets: | | | | | | | | | | | | | | | | |
| Investments, at value (1) | | | | | | | | | | | | | | | | |
| Unaffiliated issuers (2) | | $ | 2,729,319,649 | | | $ | 8,143,689 | | | $ | 12,184,510 | | | $ | 255,650,461 | |
| Short-term investments held as collateral for securities loaned (3) | | | 5,691,051 | | | | — | | | | 45,033 | | | | 24,490,136 | |
| Cash | | | — | | | | 59,175 | | | | 110,942 | | | | 482 | |
| Cash denominated in foreign currency, at value (4) | | | 4,735,196 | | | | — | | | | — | | | | — | |
| Receivables: | | | | | | | | | | | | | | | | |
| Investment securities sold | | | 47,779,454 | | | | 361,504 | | | | 459,600 | | | | — | |
| Dividends and interest | | | 57,971,238 | | | | 102,901 | | | | 144,954 | | | | 658,395 | |
| Prepaid expenses | | | 9,774 | | | | — | | | | — | | | | — | |
| Total assets | | | 2,845,506,362 | | | | 8,667,269 | | | | 12,945,039 | | | | 280,799,474 | |
| | | | | | | | | | | | | | | | | |
| Liabilities: | | | | | | | | | | | | | | | | |
| Payables: | | | | | | | | | | | | | | | | |
| Investment securities purchased | | | 28,449,064 | | | | 370,895 | | | | 504,458 | | | | — | |
| Shares of beneficial interest redeemed | | | 28,538,115 | | | | — | | | | — | | | | — | |
| Collateral for securities loaned | | | 5,691,051 | | | | — | | | | 45,033 | | | | 24,490,136 | |
| Line of credit | | | — | | | | — | | | | — | | | | 148,291 | |
| Due to Adviser | | | 650,113 | | | | 1,710 | | | | 2,044 | | | | 83,436 | |
| Due to custodian | | | 2,250,507 | | | | — | | | | — | | | | — | |
| Deferred Trustee fees | | | 295,988 | | | | — | | | | — | | | | 16,359 | |
| Accrued expenses | | | 955,343 | | | | — | | | | — | | | | 18,714 | |
| Total liabilities | | | 66,830,181 | | | | 372,605 | | | | 551,535 | | | | 24,756,936 | |
| NET ASSETS | | $ | 2,778,676,181 | | | $ | 8,294,664 | | | $ | 12,393,504 | | | $ | 256,042,538 | |
| Shares outstanding | | | 116,422,682 | | | | 400,000 | | | | 600,000 | | | | 23,950,000 | |
| Net asset value, redemption and offering price per share | | $ | 23.87 | | | $ | 20.74 | | | $ | 20.66 | | | $ | 10.69 | |
| | | | | | | | | | | | | | | | | |
| Net Assets consist of: | | | | | | | | | | | | | | | | |
| Aggregate paid in capital | | $ | 3,677,005,867 | | | $ | 9,999,885 | | | $ | 14,999,828 | | | $ | 438,560,637 | |
| Total distributable earnings (loss) | | | (898,329,686 | ) | | | (1,705,221 | ) | | | (2,606,324 | ) | | | (182,518,099 | ) |
| NET ASSETS | | $ | 2,778,676,181 | | | $ | 8,294,664 | | | $ | 12,393,504 | | | $ | 256,042,538 | |
| (1) | Value of securities on loan | | $ | 5,532,214 | | | $ | 237,762 | | | $ | 386,890 | | | $ | 71,854,807 | |
| (2) | Cost of investments - Unaffiliated issuers | | $ | 2,977,970,708 | | | $ | 8,537,128 | | | $ | 13,051,184 | | | $ | 309,513,720 | |
| (3) | Cost of short-term investments held as collateral for securities loaned | | $ | 5,691,051 | | | $ | — | | | $ | 45,033 | | | $ | 24,490,136 | |
| (4) | Cost of cash denominated in foreign currency | | $ | 4,733,193 | | | $ | — | | | $ | — | | | $ | — | |
See Notes to Financial Statements
VANECK ETF TRUST
STATEMENTS OF ASSETS AND LIABILITIES
April 30, 2024
| | | Preferred
Securities ex
Financials ETF | |
| Assets: | | | | |
| Investments, at value | | | | |
| Unaffiliated issuers (1) | | $ | 1,583,567,222 | |
| Cash | | | 4,335,980 | |
| Receivables: | | | | |
| Investment securities sold | | | 77,631 | |
| Shares of beneficial interest sold | | | 6,805,396 | |
| Dividends and interest | | | 4,254,592 | |
| Total assets | | | 1,599,040,821 | |
| | | | | |
| Liabilities: | | | | |
| Payables: | | | | |
| Investment securities purchased | | | 10,255,303 | |
| Due to Adviser | | | 522,443 | |
| Deferred Trustee fees | | | 36,282 | |
| Accrued expenses | | | 8,646 | |
| Total liabilities | | | 10,822,674 | |
| NET ASSETS | | $ | 1,588,218,147 | |
| Shares outstanding | | | 93,350,000 | |
| Net asset value, redemption and offering price per share | | $ | 17.01 | |
| | | | | |
| Net Assets consist of: | | | | |
| Aggregate paid in capital | | $ | 1,806,961,090 | |
| Total distributable earnings (loss) | | | (218,742,943 | ) |
| NET ASSETS | | $ | 1,588,218,147 | |
| (1) Cost of investments - Unaffiliated issuers | | $ | 1,695,531,685 | |
See Notes to Financial Statements
VANECK ETF TRUST
STATEMENTS OF OPERATIONS
For the Year Ended April 30, 2024
| | | BDC Income ETF | | | China Bond ETF | | | Dynamic High
Income ETF | | | Emerging
Markets High
Yield Bond ETF | |
| Income: | | | | | | | | | | | | | | | | |
| Dividends - unaffiliated issuers | | $ | 89,273,098 | | | $ | — | | | $ | 535 | | | $ | — | |
| Dividends - affiliated issuers | | | — | | | | — | | | | 35,168 | | | | — | |
| Interest | | | 37,225 | | | | 934,632 | | | | 2,942 | | | | 25,047,966 | |
| Securities lending income | | | 3,818,125 | | | | — | | | | — | | | | 210,825 | |
| Foreign taxes withheld | | | — | | | | (438 | ) | | | — | | | | (1,771 | ) |
| Total income | | | 93,128,448 | | | | 934,194 | | | | 38,645 | | | | 25,257,020 | |
| | | | | | | | | | | | | | | | | |
| Expenses: | | | | | | | | | | | | | | | | |
| Management fees | | | 3,097,821 | | | | 132,524 | | | | 753 | | | | 1,502,499 | |
| Professional fees | | | — | | | | 52,147 | | | | — | | | | — | |
| Custody and accounting fees | | | — | | | | 47,810 | | | | — | | | | — | |
| Reports to shareholders | | | — | | | | 13,728 | | | | — | | | | — | |
| Trustees’ fees and expenses | | | — | | | | 910 | | | | — | | | | — | |
| Registration fees | | | — | | | | 6,536 | | | | — | | | | — | |
| Insurance | | | — | | | | 2,342 | | | | — | | | | — | |
| Interest | | | 177,320 | | | | 3,718 | | | | — | | | | — | |
| Taxes | | | 2,150 | | | | 243 | | | | 58 | | | | 172 | |
| Other | | | — | | | | 808 | | | | — | | | | — | |
| Total expenses | | | 3,277,291 | | | | 260,766 | | | | 811 | | | | 1,502,671 | |
| Expenses assumed by the Adviser | | | — | | | | (91,634 | ) | | | — | | | | — | |
| Net expenses | | | 3,277,291 | | | | 169,132 | | | | 811 | | | | 1,502,671 | |
| Net investment income | | | 89,851,157 | | | | 765,062 | | | | 37,834 | | | | 23,754,349 | |
| | | | | | | | | | | | | | | | | |
| Net realized gain (loss) on: | | | | | | | | | | | | | | | | |
| Investments - unaffiliated issuers | | | (10,065,812 | ) | | | (3,305,157 | ) | | | (4,737 | ) | | | (18,329,370 | ) |
| Investments - affiliated issuers | | | — | | | | — | | | | 7,925 | | | | — | |
| In-kind redemptions - unaffiliated issuers | | | 12,475,244 | | | | — | | | | — | | | | (8,423,276 | ) |
| Capital gain distributions from investment companies | | | 1,315,178 | | | | — | | | | — | | | | — | |
| Foreign currency transactions and foreign denominated assets and liabilities | | | — | | | | (56,832 | ) | | | — | | | | 2 | |
| Net realized gain (loss) | | | 3,724,610 | | | | (3,361,989 | ) | | | 3,188 | | | | (26,752,644 | ) |
| | | | | | | | | | | | | | | | | |
| Net change in unrealized appreciation (depreciation) on: | | | | | | | | | | | | | | | | |
| Investments - unaffiliated issuers | | | 93,198,589 | | | | 1,779,043 | | | | (7,998 | ) | | | 38,155,898 | |
| Investments - affiliated issuers | | | — | | | | — | | | | 14,945 | | | | — | |
| Foreign currency translations and foreign denominated assets and liabilities | | | — | | | | (12,629 | ) | | | — | | | | (76 | ) |
| Net change in unrealized appreciation (depreciation) | | | 93,198,589 | | | | 1,766,414 | | | | 6,947 | | | | 38,155,822 | |
| Net increase (decrease) in net assets resulting from operations | | $ | 186,774,356 | | | $ | (830,513 | ) | | $ | 47,969 | | | $ | 35,157,527 | |
See Notes to Financial Statements
VANECK ETF TRUST
STATEMENTS OF OPERATIONS
For the Year Ended April 30, 2024
| | | Fallen Angel
High Yield Bond
ETF | | | Green Bond ETF | | | IG Floating Rate
ETF | | | International
High Yield Bond
ETF | |
| Income: | | | | | | | | | | | | | | | | |
| Dividends | | $ | — | | | $ | 8,093 | | | $ | — | | | $ | — | |
| Interest | | | 169,142,429 | | | | 3,004,959 | | | | 80,674,419 | | | | 2,354,252 | |
| Securities lending income | | | 1,768,546 | | | | 16,945 | | | | 83,551 | | | | 21,738 | |
| Foreign taxes withheld | | | — | | | | (1,071 | ) | | | (10,639 | ) | | | (768 | ) |
| Total income | | | 170,910,975 | | | | 3,028,926 | | | | 80,747,331 | | | | 2,375,222 | |
| | | | | | | | | | | | | | | | | |
| Expenses: | | | | | | | | | | | | | | | | |
| Management fees | | | 9,336,776 | | | | 164,439 | | | | 1,751,440 | | | | 167,682 | |
| Interest | | | 26,876 | | | | 2,010 | | | | 2,600 | | | | 103 | |
| Taxes | | | 2,150 | | | | 173 | | | | 4,150 | | | | 58 | |
| Total expenses | | | 9,365,802 | | | | 166,622 | | | | 1,758,190 | | | | 167,843 | |
| Net investment income | | | 161,545,173 | | | | 2,862,304 | | | | 78,989,141 | | | | 2,207,379 | |
| | | | | | | | | | | | | | | | | |
| Net realized gain (loss) on: | | | | | | | | | | | | | | | | |
| Investments | | | (171,852,514 | ) | | | (817,987 | ) | | | 812,520 | | | | (1,369,564 | ) |
| In-kind redemptions | | | 14,884,276 | | | | — | | | | 444,804 | | | | (3,723,209 | ) |
| Foreign currency transactions and foreign denominated assets and liabilities | | | — | | | | — | | | | — | | | | 2,472 | |
| Net realized gain (loss) | | | (156,968,238 | ) | | | (817,987 | ) | | | 1,257,324 | | | | (5,090,301 | ) |
| | | | | | | | | | | | | | | | | |
| Net change in unrealized appreciation (depreciation) on: | | | | | | | | | | | | | | | | |
| Investments | | | 199,769,798 | | | | (190,715 | ) | | | 17,025,169 | | | | 5,515,657 | |
| Foreign currency translations and foreign denominated assets and liabilities | | | — | | | | (19 | ) | | | — | | | | (25,059 | ) |
| Net change in unrealized appreciation (depreciation) | | | 199,769,798 | | | | (190,734 | ) | | | 17,025,169 | | | | 5,490,598 | |
| Net increase in net assets resulting from operations | | $ | 204,346,733 | | | $ | 1,853,583 | | | $ | 97,271,634 | | | $ | 2,607,676 | |
See Notes to Financial Statements
VANECK ETF TRUST
STATEMENTS OF OPERATIONS
For the Year Ended April 30, 2024
| | | J.P. Morgan EM
Local Currency
Bond ETF | | | Moody’s
Analytics BBB
Corporate Bond
ETF | | | Moody’s
Analytics IG
Corporate Bond
ETF | | | Mortgage REIT
Income ETF | |
| Income: | | | | | | | | | | | | | | | | |
| Dividends | | $ | — | | | $ | — | | | $ | — | | | $ | 23,917,532 | |
| Interest | | | 203,439,563 | | | | 416,618 | | | | 603,109 | | | | 9,630 | |
| Securities lending income | | | 66,221 | | | | 395 | | | | 824 | | | | 336,636 | |
| Foreign taxes withheld | | | (3,427,186 | ) | | | — | | | | — | | | | — | |
| Total income | | | 200,078,598 | | | | 417,013 | | | | 603,933 | | | | 24,263,798 | |
| | | | | | | | | | | | | | | | | |
| Expenses: | | | | | | | | | | | | | | | | |
| Management fees | | | 8,435,661 | | | | 20,731 | | | | 24,846 | | | | 895,665 | |
| Professional fees | | | 56,948 | | | | — | | | | — | | | | — | |
| Custody and accounting fees | | | 779,259 | | | | — | | | | — | | | | — | |
| Reports to shareholders | | | 318,698 | | | | — | | | | — | | | | — | |
| Trustees’ fees and expenses | | | 50,223 | | | | — | | | | — | | | | — | |
| Registration fees | | | 9,989 | | | | — | | | | — | | | | — | |
| Insurance | | | 43,710 | | | | — | | | | — | | | | — | |
| Interest | | | 17,765 | | | | — | | | | 40 | | | | 76,345 | |
| Taxes | | | 358 | | | | 58 | | | | 58 | | | | 1,150 | |
| Other | | | 37,295 | | | | — | | | | — | | | | — | |
| Total expenses | | | 9,749,906 | | | | 20,789 | | | | 24,944 | | | | 973,160 | |
| Expenses assumed by the Adviser | | | (358,443 | ) | | | — | | | | — | | | | — | |
| Net expenses | | | 9,391,463 | | | | 20,789 | | | | 24,944 | | | | 973,160 | |
| Net investment income | | | 190,687,135 | | | | 396,224 | | | | 578,989 | | | | 23,290,638 | |
| | | | | | | | | | | | | | | | | |
| Net realized gain (loss) on: | | | | | | | | | | | | | | | | |
| Investments (1) | | | (211,366,948 | ) | | | (242,308 | ) | | | (224,972 | ) | | | (20,636,442 | ) |
| In-kind redemptions | | | (269,319 | ) | | | — | | | | — | | | | 3,030,892 | |
| Capital gain distributions from investment companies | | | — | | | | — | | | | — | | | | 211,308 | |
| Foreign currency transactions and foreign denominated assets and liabilities | | | (27,812,201 | ) | | | — | | | | — | | | | — | |
| Net realized loss | | | (239,448,468 | ) | | | (242,308 | ) | | | (224,972 | ) | | | (17,394,242 | ) |
| | | | | | | | | | | | | | | | | |
| Net change in unrealized appreciation (depreciation) on: | | | | | | | | | | | | | | | | |
| Investments (2) | | | 73,695,523 | | | | 91,158 | | | | (67,098 | ) | | | 9,541,624 | |
| Foreign currency translations and foreign denominated assets and liabilities | | | (1,599,531 | ) | | | — | | | | — | | | | — | |
| Net change in unrealized appreciation (depreciation) | | | 72,095,992 | | | | 91,158 | | | | (67,098 | ) | | | 9,541,624 | |
| Net increase in net assets resulting from operations | | $ | 23,334,659 | | | $ | 245,074 | | | $ | 286,919 | | | $ | 15,438,020 | |
| (1) Net of foreign taxes | | $ | (302,789 | ) | | $ | — | | | $ | — | | | $ | — | |
| (2) Net of foreign taxes | | $ | 1,024,395 | | | $ | — | | | $ | — | | | $ | — | |
See Notes to Financial Statements
VANECK ETF TRUST
STATEMENTS OF OPERATIONS
For the Year Ended April 30, 2024
| | | Preferred
Securities ex
Financials ETF | |
| Income: | | | | |
| Dividends | | $ | 103,296,781 | |
| Interest | | | 1,042,568 | |
| Securities lending income | | | 667,139 | |
| Foreign taxes withheld | | | (329,619 | ) |
| Total income | | | 104,676,869 | |
| | | | | |
| Expenses: | | | | |
| Management fees | | | 5,266,563 | |
| Interest | | | 54,335 | |
| Taxes | | | 1,150 | |
| Total expenses | | | 5,322,048 | |
| Net investment income | | | 99,354,821 | |
| | | | | |
| Net realized gain (loss) on: | | | | |
| Investments | | | (37,206,855 | ) |
| In-kind redemptions | | | 4,744,996 | |
| Capital gain distributions from investment companies | | | 1,136,881 | |
| Net realized loss | | | (31,324,978 | ) |
| | | | | |
| Net change in unrealized appreciation (depreciation) on: | | | | |
| Investments | | | (4,235,878 | ) |
| Net change in unrealized appreciation (depreciation) | | | (4,235,878 | ) |
| Net increase in net assets resulting from operations | | $ | 63,793,965 | |
See Notes to Financial Statements
VANECK ETF TRUST
STATEMENTS OF CHANGES IN NET ASSETS
| | | BDC Income ETF | | | China Bond ETF | |
| | | Year Ended
April 30, 2024 | | | Year Ended
April 30, 2023 | | | Year Ended
April 30, 2024 | | | Year Ended
April 30, 2023 | |
| Operations: | | | | | | | | | | | | | | | | |
| Net investment income | | $ | 89,851,157 | | | $ | 59,049,435 | | | $ | 765,062 | | | $ | 2,055,010 | |
| Net realized gain (loss) | | | 3,724,610 | | | | (23,904,976 | ) | | | (3,361,989 | ) | | | (5,715,883 | ) |
| Net change in unrealized appreciation (depreciation) | | | 93,198,589 | | | | (58,310,532 | ) | | | 1,766,414 | | | | (75,243 | ) |
| Net increase (decrease) in net assets resulting from operations | | | 186,774,356 | | | | (23,166,073 | ) | | | (830,513 | ) | | | (3,736,116 | ) |
| Distributions to shareholders from: | | | | | | | | | | | | | | | | |
| Distributable earnings | | | (89,851,157 | ) | | | (59,501,743 | ) | | | — | | | | — | |
| Return of capital | | | (187,793 | ) | | | (1,673,017 | ) | | | (1,040,340 | ) | | | (1,816,350 | ) |
| Total distributions | | | (90,038,950 | ) | | | (61,174,760 | ) | | | (1,040,340 | ) | | | (1,816,350 | ) |
| | | | | | | | | | | | | | | | | |
| Share transactions*: | | | | | | | | | | | | | | | | |
| Proceeds from sale of shares | | | 510,600,418 | | | | 184,695,569 | | | | 2,165,020 | | | | — | |
| Cost of shares redeemed | | | (100,247,033 | ) | | | (148,132,044 | ) | | | (19,651,805 | ) | | | (80,600,929 | ) |
| Net Increase (decrease) in net assets resulting from share transactions | | | 410,353,385 | | | | 36,563,525 | | | | (17,486,785 | ) | | | (80,600,929 | ) |
| Total increase (decrease) in net assets | | | 507,088,791 | | | | (47,777,308 | ) | | | (19,357,638 | ) | | | (86,153,395 | ) |
| Net Assets, beginning of year | | | 577,252,944 | | | | 625,030,252 | | | | 43,433,746 | | | | 129,587,141 | |
| Net Assets, end of year | | $ | 1,084,341,735 | | | $ | 577,252,944 | | | $ | 24,076,108 | | | $ | 43,433,746 | |
| *Shares of Common Stock Issued (no par value) | | | | | | | | | | | | | | | | |
| Shares sold | | | 31,825,000 | | | | 12,250,000 | | | | 100,000 | | | | — | |
| Shares redeemed | | | (6,350,000 | ) | | | (9,850,000 | ) | | | (900,000 | ) | | | (3,600,000 | ) |
| Net increase (decrease) | | | 25,475,000 | | | | 2,400,000 | | | | (800,000 | ) | | | (3,600,000 | ) |
See Notes to Financial Statements
VANECK ETF TRUST
STATEMENTS OF CHANGES IN NET ASSETS
| | | Dynamic High Income ETF | | | Emerging Markets High Yield Bond ETF | |
| | | Year Ended
April 30, 2024 | | | Period Ended
April 30, 2023(a) | | | Year Ended
April 30, 2024 | | | Year Ended
April 30, 2023 | |
| Operations: | | | | | | | | | | | | | | | | |
| Net investment income | | $ | 37,834 | | | $ | 11,730 | | | $ | 23,754,349 | | | $ | 32,407,182 | |
| Net realized gain (loss) | | | 3,188 | | | | (2,103 | ) | | | (26,752,644 | ) | | | (153,601,452 | ) |
| Net change in unrealized appreciation (depreciation) | | | 6,947 | | | | 22,754 | | | | 38,155,822 | | | | 74,160,121 | |
| Net increase (decrease) in net assets resulting from operations | | | 47,969 | | | | 32,381 | | | | 35,157,527 | | | | (47,034,149 | ) |
| Distributions to shareholders from: | | | | | | | | | | | | | | | | |
| Distributable earnings | | | (38,919 | ) | | | (11,730 | ) | | | (24,467,300 | ) | | | (37,523,220 | ) |
| Return of capital | | | (4,123 | ) | | | (1,494 | ) | | | — | | | | — | |
| Total distributions | | | (43,042 | ) | | | (13,224 | ) | | | (24,467,300 | ) | | | (37,523,220 | ) |
| | | | | | | | | | | | | | | | | |
| Share transactions*: | | | | | | | | | | | | | | | | |
| Proceeds from sale of shares | | | 259,635 | | | | 502,576 | | | | 58,806,313 | | | | 49,753,232 | |
| Cost of shares redeemed | | | — | | | | — | | | | (142,479,278 | ) | | | (685,821,304 | ) |
| Net Increase (decrease) in net assets resulting from share transactions | | | 259,635 | | | | 502,576 | | | | (83,672,965 | ) | | | (636,068,072 | ) |
| Total increase (decrease) in net assets | | | 264,562 | | | | 521,733 | | | | (72,982,738 | ) | | | (720,625,441 | ) |
| Net Assets, beginning of period | | | 521,733 | | | | — | | | | 431,012,812 | | | | 1,151,638,253 | |
| Net Assets, end of period | | $ | 786,295 | | | $ | 521,733 | | | $ | 358,030,074 | | | $ | 431,012,812 | |
| *Shares of Common Stock Issued (no par value) | | | | | | | | | | | | | | | | |
| Shares sold | | | 10,000 | | | | 20,000 | | | | 3,200,000 | | | | 2,700,000 | |
| Shares redeemed | | | — | | | | — | | | | (7,900,000 | ) | | | (38,000,000 | ) |
| Net increase (decrease) | | | 10,000 | | | | 20,000 | | | | (4,700,000 | ) | | | (35,300,000 | ) |
| (a) | For the period November 2, 2022 (commencement of operations) through April 30, 2023. |
See Notes to Financial Statements
VANECK ETF TRUST
STATEMENTS OF CHANGES IN NET ASSETS
| | | Fallen Angel High Yield Bond ETF | | | Green Bond ETF | |
| | | Year Ended
April 30, 2024 | | | Year Ended
April 30, 2023 | | | Year Ended
April 30, 2024 | | | Year Ended
April 30, 2023 | |
| Operations: | | | | | | | | | | | | | | | | |
| Net investment income | | $ | 161,545,173 | | | $ | 141,495,726 | | | $ | 2,862,304 | | | $ | 2,135,125 | |
| Net realized loss | | | (156,968,238 | ) | | | (207,540,159 | ) | | | (817,987 | ) | | | (3,775,617 | ) |
| Net change in unrealized appreciation (depreciation) | | | 199,769,798 | | | | 45,359,290 | | | | (190,734 | ) | | | 1,503,619 | |
| Net increase (decrease) in net assets resulting from operations | | | 204,346,733 | | | | (20,685,143 | ) | | | 1,853,583 | | | | (136,873 | ) |
| Distributions to shareholders from: | | | | | | | | | | | | | | | | |
| Distributable earnings | | | (159,923,520 | ) | | | (148,186,700 | ) | | | (2,789,760 | ) | | | (2,159,765 | ) |
| | | | | | | | | | | | | | | | | |
| Share transactions*: | | | | | | | | | | | | | | | | |
| Proceeds from sale of shares | | | 1,563,881,393 | | | | 1,920,657,258 | | | | 17,196,427 | | | | — | |
| Cost of shares redeemed | | | (1,465,425,739 | ) | | | (2,794,164,212 | ) | | | — | | | | (17,574,625 | ) |
| Increase (decrease) in net assets resulting from share transactions | | | 98,455,654 | | | | (873,506,954 | ) | | | 17,196,427 | | | | (17,574,625 | ) |
| Total increase (decrease) in net assets | | | 142,878,867 | | | | (1,042,378,797 | ) | | | 16,260,250 | | | | (19,871,263 | ) |
| Net Assets, beginning of year | | | 2,783,465,657 | | | | 3,825,844,454 | | | | 75,459,866 | | | | 95,331,129 | |
| Net Assets, end of year | | $ | 2,926,344,524 | | | $ | 2,783,465,657 | | | $ | 91,720,116 | | | $ | 75,459,866 | |
| *Shares of Common Stock Issued (no par value) | | | | | | | | | | | | | | | | |
| Shares sold | | | 56,000,000 | | | | 69,550,000 | | | | 750,000 | | | | — | |
| Shares redeemed | | | (53,150,000 | ) | | | (101,400,000 | ) | | | — | | | | (750,000 | ) |
| Net increase (decrease) | | | 2,850,000 | | | | (31,850,000 | ) | | | 750,000 | | | | (750,000 | ) |
See Notes to Financial Statements
VANECK ETF TRUST
STATEMENTS OF CHANGES IN NET ASSETS
| | | IG Floating Rate ETF | | | International High Yield Bond ETF | |
| | | Year Ended
April 30, 2024 | | | Year Ended
April 30, 2023 | | | Year Ended
April 30, 2024 | | | Year Ended
April 30, 2023 | |
| Operations: | | | | | | | | | | | | | | | | |
| Net investment income | | $ | 78,989,141 | | | $ | 44,136,995 | | | $ | 2,207,379 | | | $ | 2,966,234 | |
| Net realized gain (loss) | | | 1,257,324 | | | | (4,106,028 | ) | | | (5,090,301 | ) | | | (6,221,536 | ) |
| Net change in unrealized appreciation (depreciation) | | | 17,025,169 | | | | (1,621,240 | ) | | | 5,490,598 | | | | 3,305,546 | |
| Net increase in net assets resulting from operations | | | 97,271,634 | | | | 38,409,727 | | | | 2,607,676 | | | | 50,244 | |
| Distributions to shareholders from: | | | | | | | | | | | | | | | | |
| Distributable earnings | | | (77,301,370 | ) | | | (39,541,190 | ) | | | (1,811,747 | ) | | | (2,745,823 | ) |
| Return of capital | | | — | | | | — | | | | (464,333 | ) | | | (324,327 | ) |
| Total distributions | | | (77,301,370 | ) | | | (39,541,190 | ) | | | (2,276,080 | ) | | | (3,070,150 | ) |
| | | | | | | | | | | | | | | | | |
| Share transactions*: | | | | | | | | | | | | | | | | |
| Proceeds from sale of shares | | | 554,846,586 | | | | 331,514,195 | | | | — | | | | 11,761,829 | |
| Cost of shares redeemed | | | (181,365,192 | ) | | | (318,579,661 | ) | | | (35,962,025 | ) | | | (22,099,405 | ) |
| Increase (decrease) in net assets resulting from share transactions | | | 373,481,394 | | | | 12,934,534 | | | | (35,962,025 | ) | | | (10,337,576 | ) |
| Total increase (decrease) in net assets | | | 393,451,658 | | | | 11,803,071 | | | | (35,630,429 | ) | | | (13,357,482 | ) |
| Net Assets, beginning of year | | | 1,146,320,852 | | | | 1,134,517,781 | | | | 66,058,430 | | | | 79,415,912 | |
| Net Assets, end of year | | $ | 1,539,772,510 | | | $ | 1,146,320,852 | | | $ | 30,428,001 | | | $ | 66,058,430 | |
| *Shares of Common Stock Issued (no par value) | | | | | | | | | | | | | | | | |
| Shares sold | | | 21,950,000 | | | | 13,250,000 | | | | — | | | | 600,000 | |
| Shares redeemed | | | (7,200,000 | ) | | | (12,800,000 | ) | | | (1,800,000 | ) | | | (1,100,000 | ) |
| Net increase (decrease) | | | 14,750,000 | | | | 450,000 | | | | (1,800,000 | ) | | | (500,000 | ) |
See Notes to Financial Statements
VANECK ETF TRUST
STATEMENTS OF CHANGES IN NET ASSETS
| | | J.P. Morgan EM Local Currency Bond
ETF | | | Moody’s Analytics BBB Corporate Bond
ETF | |
| | | Year Ended
April 30, 2024 | | | Year Ended
April 30, 2023 | | | Year Ended
April 30, 2024 | | | Year Ended
April 30, 2023 | |
| Operations: | | | | | | | | | | | | | | | | |
| Net investment income | | $ | 190,687,135 | | | $ | 173,784,121 | | | $ | 396,224 | | | $ | 313,202 | |
| Net realized loss | | | (239,448,468 | ) | | | (235,655,592 | ) | | | (242,308 | ) | | | (879,505 | ) |
| Net change in unrealized appreciation (depreciation) | | | 72,095,992 | | | | 201,337,025 | | | | 91,158 | | | | 702,133 | |
| Net increase in net assets resulting from operations | | | 23,334,659 | | | | 139,465,554 | | | | 245,074 | | | | 135,830 | |
| Distributions to shareholders from: | | | | | | | | | | | | | | | | |
| Distributable earnings | | | (74,799,534 | ) | | | (23,143,273 | ) | | | (395,240 | ) | | | (299,760 | ) |
| Return of capital | | | (116,037,962 | ) | | | (149,840,524 | ) | | | — | | | | — | |
| Total distributions | | | (190,837,496 | ) | | | (172,983,797 | ) | | | (395,240 | ) | | | (299,760 | ) |
| | | | | | | | | | | | | | | | | |
| Share transactions*: | | | | | | | | | | | | | | | | |
| Proceeds from sale of shares | | | 362,831,748 | | | | 459,045,576 | | | | — | | | | — | |
| Cost of shares redeemed | | | (640,998,130 | ) | | | (274,639,215 | ) | | | — | | | | — | |
| Net Increase (decrease) in net assets resulting from share transactions | | | (278,166,382 | ) | | | 184,406,361 | | | | — | | | | — | |
| Total increase (decrease) in net assets | | | (445,669,219 | ) | | | 150,888,118 | | | | (150,166 | ) | | | (163,930 | ) |
| Net Assets, beginning of year | | | 3,224,345,400 | | | | 3,073,457,282 | | | | 8,444,830 | | | | 8,608,760 | |
| Net Assets, end of year | | $ | 2,778,676,181 | | | $ | 3,224,345,400 | | | $ | 8,294,664 | | | $ | 8,444,830 | |
| *Shares of Common Stock Issued (no par value) | | | | | | | | | | | | | | | | |
| Shares sold | | | 14,400,000 | | | | 18,400,000 | | | | — | | | | — | |
| Shares redeemed | | | (26,300,000 | ) | | | (11,400,000 | ) | | | — | | | | — | |
| Net increase (decrease) | | | (11,900,000 | ) | | | 7,000,000 | | | | — | | | | — | |
See Notes to Financial Statements
VANECK ETF TRUST
STATEMENTS OF CHANGES IN NET ASSETS
| | | Moody’s Analytics IG Corporate Bond ETF | | | Mortgage REIT Income ETF | |
| | | Year Ended
April 30, 2024 | | | Year Ended
April 30, 2023 | | | Year Ended
April 30, 2024 | | | Year Ended
April 30, 2023 | |
| Operations: | | | | | | | | | | | | | | | | |
| Net investment income | | $ | 578,989 | | | $ | 443,779 | | | $ | 23,290,638 | | | $ | 16,885,952 | |
| Net realized loss | | | (224,972 | ) | | | (1,334,692 | ) | | | (17,394,242 | ) | | | (25,025,938 | ) |
| Net change in unrealized appreciation (depreciation) | | | (67,098 | ) | | | 1,037,261 | | | | 9,541,624 | | | | (27,385,519 | ) |
| Net increase (decrease) in net assets resulting from operations | | | 286,919 | | | | 146,348 | | | | 15,438,020 | | | | (35,525,505 | ) |
| Distributions to shareholders from: | | | | | | | | | | | | | | | | |
| Distributable earnings | | | (577,080 | ) | | | (430,440 | ) | | | (23,290,638 | ) | | | (16,885,952 | ) |
| Return of capital | | | — | | | | — | | | | (2,175,757 | ) | | | (5,467,268 | ) |
| Total distributions | | | (577,080 | ) | | | (430,440 | ) | | | (25,466,395 | ) | | | (22,353,220 | ) |
| | | | | | | | | | | | | | | | | |
| Share transactions*: | | | | | | | | | | | | | | | | |
| Proceeds from sale of shares | | | — | | | | — | | | | 98,094,333 | | | | 61,069,628 | |
| Cost of shares redeemed | | | — | | | | — | | | | (21,455,897 | ) | | | (24,680,759 | ) |
| Increase in net assets resulting from share transactions | | | — | | | | — | | | | 76,638,436 | | | | 36,388,869 | |
| Total increase (decrease) in net assets | | | (290,161 | ) | | | (284,092 | ) | | | 66,610,061 | | | | (21,489,856 | ) |
| Net Assets, beginning of year | | | 12,683,665 | | | | 12,967,757 | | | | 189,432,477 | | | | 210,922,333 | |
| Net Assets, end of year | | $ | 12,393,504 | | | $ | 12,683,665 | | | $ | 256,042,538 | | | $ | 189,432,477 | |
| *Shares of Common Stock Issued (no par value) | | | | | | | | | | | | | | | | |
| Shares sold | | | — | | | | — | | | | 8,650,000 | | | | 5,250,000 | |
| Shares redeemed | | | — | | | | — | | | | (1,900,000 | ) | | | (1,900,000 | ) |
| Net increase | | | — | | | | — | | | | 6,750,000 | | | | 3,350,000 | |
See Notes to Financial Statements
VANECK ETF TRUST
STATEMENTS OF CHANGES IN NET ASSETS
| | | Preferred Securities ex Financials ETF | |
| | | Year Ended
April 30, 2024 | | | Year Ended
April 30, 2023 | |
| Operations: | | | | | | | | |
| Net investment income | | $ | 99,354,821 | | | $ | 62,024,311 | |
| Net realized loss | | | (31,324,978 | ) | | | (10,656,813 | ) |
| Net change in unrealized appreciation (depreciation) | | | (4,235,878 | ) | | | (76,072,758 | ) |
| Net increase (decrease) in net assets resulting from operations | | | 63,793,965 | | | | (24,705,260 | ) |
| Distributions to shareholders from: | | | | | | | | |
| Distributable earnings | | | (103,210,465 | ) | | | (62,856,300 | ) |
| | | | | | | | | |
| Share transactions*: | | | | | | | | |
| Proceeds from sale of shares | | | 610,528,274 | | | | 232,255,280 | |
| Cost of shares redeemed | | | (42,538,023 | ) | | | (87,347,038 | ) |
| Net Increase in net assets resulting from share transactions | | | 567,990,251 | | | | 144,908,242 | |
| Total increase in net assets | | | 528,573,751 | | | | 57,346,682 | |
| Net Assets, beginning of year | | | 1,059,644,396 | | | | 1,002,297,714 | |
| Net Assets, end of year | | $ | 1,588,218,147 | | | $ | 1,059,644,396 | |
| *Shares of Common Stock Issued (no par value) | | | | | | | | |
| Shares sold | | | 35,350,000 | | | | 13,000,000 | |
| Shares redeemed | | | (2,500,000 | ) | | | (4,850,000 | ) |
| Net increase | | | 32,850,000 | | | | 8,150,000 | |
See Notes to Financial Statements
VANECK ETF TRUST
FINANCIAL HIGHLIGHTS
For a share outstanding throughout each year:
| | | BDC Income ETF |
| | | Year Ended April 30, |
| | | 2024 | | 2023 | | 2022 | | 2021 | | 2020 |
| | | | | | | | | | | | | | | | | | | | | | | | | | |
| Net asset value, beginning of year | | | $ | 14.54 | | | | $ | 16.76 | | | | $ | 16.76 | | | | $ | 10.75 | | | | $ | 16.55 | |
| Net investment income (a) | | | | 1.84 | | | | | 1.63 | | | | | 1.44 | | | | | 1.43 | | | | | 1.54 | |
| Net realized and unrealized gain (loss) on investments | | | | 2.04 | | | | | (2.18 | ) | | | | (0.06 | ) | | | | 6.02 | | | | | (5.86 | ) |
| Total from investment operations | | | | 3.88 | | | | | (0.55 | ) | | | | 1.38 | | | | | 7.45 | | | | | (4.32 | ) |
| Distributions from: | | | | | | | | | | | | | | | | | | | | | | | | | |
| Net investment income | | | | (1.78 | ) | | | | (1.63 | ) | | | | (1.38 | ) | | | | (1.44 | ) | | | | (1.48 | ) |
| Return of capital | | | | — | (b) | | | | (0.04 | ) | | | | — | | | | | — | (b) | | | | — | |
| Total distributions | | | | (1.78 | ) | | | | (1.67 | ) | | | | (1.38 | ) | | | | (1.44 | ) | | | | (1.48 | ) |
| Net asset value, end of year | | | $ | 16.64 | | | | $ | 14.54 | | | | $ | 16.76 | | | | $ | 16.76 | | | | $ | 10.75 | |
| Total return (c) | | | | 28.03 | % | | | | (2.60 | )% | | | | 8.23 | % | | | | 73.81 | % | | | | (27.77 | )% |
| | | | | | | | | | | | | | | | | | | | | | | | | | |
| Ratios to average net assets | | | | | | | | | | | | | | | | | | | | | | | | | |
| Gross expenses (d)(e) | | | | 0.42 | % | | | | 0.42 | % | | | | 0.41 | % | | | | 0.46 | % | | | | 0.48 | % |
| Net expenses (d)(e) | | | | 0.42 | % | | | | 0.42 | % | | | | 0.41 | % | | | | 0.41 | % | | | | 0.41 | % |
| Net expenses excluding interest and taxes (d)(e) | | | | 0.40 | % | | | | 0.40 | % | | | | 0.40 | % | | | | 0.40 | % | | | | 0.40 | % |
| Net investment income (d) | | | | 11.60 | % | | | | 10.75 | % | | | | 8.34 | % | | | | 10.57 | % | | | | 9.95 | % |
| Supplemental data | | | | | | | | | | | | | | | | | | | | | | | | | |
| Net assets, end of year (in millions) | | | $ | 1,084 | | | | | $577 | | | | | $625 | | | | | $412 | | | | | $170 | |
| Portfolio turnover rate (f) | | | | 12 | % | | | | 28 | % | | | | 29 | % | | | | 26 | % | | | | 22 | % |
| (a) | Calculated based upon average shares outstanding |
| (b) | Amount represents less than $0.005 per share. |
| (c) | Returns are not annualized and include adjustments in accordance with U.S. Generally Accepted Accounting Principles. Net asset values and returns for financial reporting purposes may differ from those for shareholder transactions. |
| (d) | The ratios presented do not reflect the Fund’s proportionate share of income and expenses from the Fund’s investment in underlying funds. |
| (e) | Periods after April 30, 2021 reflect a unitary management fee structure. |
| (f) | Portfolio turnover rate is not annualized and excludes in-kind transactions. |
See Notes to Financial Statements
VANECK ETF TRUST
FINANCIAL HIGHLIGHTS
For a share outstanding throughout each year:
| | | China Bond ETF |
| | | Year Ended April 30, |
| | | 2024 | | 2023 | | 2022 | | 2021 | | 2020 |
| | | | | | | | | | | |
| Net asset value, beginning of year | | | $ | 22.86 | | | | $ | 23.56 | | | | $ | 24.07 | | | | $ | 22.39 | | | | $ | 22.89 | |
| Net investment income (a) | | | | 0.51 | | | | | 0.57 | | | | | 0.66 | | | | | 0.73 | | | | | 0.87 | |
| Net realized and unrealized gain (loss) on investments | | | | (0.79 | ) | | | | (0.76 | ) | | | | (0.40 | ) | | | | 1.60 | | | | | (0.49 | ) |
| Total from investment operations | | | | (0.28 | ) | | | | (0.19 | ) | | | | 0.26 | | | | | 2.33 | | | | | 0.38 | |
| Distributions from: | | | | | | | | | | | | | | | | | | | | | | | | | |
| Net investment income | | | | — | | | | | — | (b) | | | | (0.76 | ) | | | | (0.65 | ) | | | | (0.79 | ) |
| Return of capital | | | | (0.69 | ) | | | | (0.51 | ) | | | | (0.01 | ) | | | | — | | | | | (0.09 | ) |
| Total distributions | | | | (0.69 | ) | | | | (0.51 | ) | | | | (0.77 | ) | | | | (0.65 | ) | | | | (0.88 | ) |
| Net asset value, end of year | | | $ | 21.89 | | | | $ | 22.86 | | | | $ | 23.56 | | | | $ | 24.07 | | | | $ | 22.39 | |
| Total return (c) | | | | (1.21 | )% | | | | (0.80 | )% | | | | 1.02 | % | | | | 10.56 | % | | | | 1.76 | % |
| | | | | | | | | | | | | | | | | | | | | | | | | | |
| Ratios to average net assets | | | | | | | | | | | | | | | | | | | | | | | | | |
| Gross expenses | | | | 0.79 | % | | | | 0.51 | % | | | | 0.52 | % | | | | 0.68 | % | | | | 3.53 | % |
| Net expenses | | | | 0.51 | % | | | | 0.51 | % | | | | 0.51 | % | | | | 0.50 | % | | | | 0.50 | % |
| Net expenses excluding interest and taxes | | | | 0.50 | % | | | | 0.50 | % | | | | 0.50 | % | | | | 0.50 | % | | | | 0.50 | % |
| Net investment income | | | | 2.31 | % | | | | 2.51 | % | | | | 2.69 | % | | | | 3.07 | % | | | | 3.93 | % |
| Supplemental data | | | | | | | | | | | | | | | | | | | | | | | | | |
| Net assets, end of year (in millions) | | | | $24 | | | | | $43 | | | | | $130 | | | | | $104 | | | | | $4 | |
| Portfolio turnover rate (d) | | | | 65 | % | | | | 10 | % | | | | 60 | % | | | | 17 | % | | | | 21 | % |
| (a) | Calculated based upon average shares outstanding |
| (b) | Amount represents less than $0.005 per share. |
| (c) | Returns are not annualized and include adjustments in accordance with U.S. Generally Accepted Accounting Principles. Net asset values and returns for financial reporting purposes may differ from those for shareholder transactions. |
| (d) | Portfolio turnover rate is not annualized and excludes in-kind transactions. |
See Notes to Financial Statements
VANECK ETF TRUST
FINANCIAL HIGHLIGHTS
For a share outstanding throughout each period:
| | | Dynamic High Income ETF |
| | | | | | | | | |
| | | Year Ended
April 30,
2024 | | Period
Ended
April 30,
2023 (a) |
| | | | | |
| Net asset value, beginning of period | | | $ | 26.09 | | | | $ | 25.13 | |
| Net investment income (b) | | | | 1.31 | | | | | 0.59 | |
| Net realized and unrealized gain on investments | | | | 0.29 | | | | | 1.03 | |
| Total from investment operations | | | | 1.60 | | | | | 1.62 | |
| Distributions from: | | | | | | | | | | |
| Net investment income | | | | (1.30 | ) | | | | (0.59 | ) |
| Net realized capital gains | | | | (0.04 | ) | | | | — | |
| Return of capital | | | | (0.14 | ) | | | | (0.07 | ) |
| Total distributions | | | | (1.48 | ) | | | | (0.66 | ) |
| Net asset value, end of period | | | $ | 26.21 | | | | $ | 26.09 | |
| Total return (c) | | | | 6.33 | % | | | | 6.47 | % |
| | | | | | | | | | | |
| Ratios to average net assets | | | | | | | | | | |
| Expenses (d) | | | | 0.11 | % | | | | 0.10 | %(e) |
| Expenses excluding interest and taxes (d) | | | | 0.10 | % | | | | 0.10 | %(e) |
| Net investment income (d) | | | | 5.03 | % | | | | 4.55 | %(e) |
| Supplemental data | | | | | | | | | | |
| Net assets, end of period (in millions) | | | | $1 | | | | | $1 | |
| Portfolio turnover rate (f) | | | | 52 | % | | | | 8 | % |
| (a) | For the period November 2, 2022 (commencement of operations) through April 30, 2023. |
| (b) | Calculated based upon average shares outstanding |
| (c) | Returns are not annualized and include adjustments in accordance with U.S. Generally Accepted Accounting Principles. Net asset values and returns for financial reporting purposes may differ from those for shareholder transactions. |
| (d) | The ratios presented do not reflect the Fund’s proportionate share of income and expenses from the Fund’s investment in underlying funds. |
| (e) | Annualized |
| (f) | Portfolio turnover rate is not annualized and excludes in-kind transactions. |
See Notes to Financial Statements
VANECK ETF TRUST
FINANCIAL HIGHLIGHTS
For a share outstanding throughout each year:
| | | Emerging Markets High Yield Bond ETF |
| | | Year Ended April 30, |
| | | 2024 | | 2023 | | 2022 | | 2021 | | 2020 |
| | | | | | | | | | | |
| Net asset value, beginning of year | | | $ | 18.19 | | | | $ | 19.52 | | | | $ | 23.63 | | | | $ | 20.54 | | | | $ | 23.34 | |
| Net investment income (a) | | | | 1.15 | | | | | 1.10 | | | | | 1.20 | | | | | 1.29 | | | | | 1.42 | |
| Net realized and unrealized gain (loss) on investments | | | | 0.67 | | | | | (1.25 | ) | | | | (4.11 | ) | | | | 3.06 | | | | | (2.77 | ) |
| Total from investment operations | | | | 1.82 | | | | | (0.15 | ) | | | | (2.91 | ) | | | | 4.35 | | | | | (1.35 | ) |
| Distributions from: | | | | | | | | | | | | | | | | | | | | | | | | | |
| Net investment income | | | | (1.17 | ) | | | | (1.18 | ) | | | | (1.20 | ) | | | | (1.26 | ) | | | | (1.45 | ) |
| Net asset value, end of year | | | $ | 18.84 | | | | $ | 18.19 | | | | $ | 19.52 | | | | $ | 23.63 | | | | $ | 20.54 | |
| Total return (b) | | | | 10.50 | % | | | | (0.56 | )% | | | | (12.84 | )% | | | | 21.53 | % | | | | (6.27 | )% |
| | | | | | | | | | | | | | | | | | | | | | | | | | |
| Ratios to average net assets | | | | | | | | | | | | | | | | | | | | | | | | | |
| Gross expenses (c) | | | | 0.40 | % | | | | 0.40 | % | | | | 0.40 | % | | | | 0.45 | % | | | | 0.47 | % |
| Net expenses (c) | | | | 0.40 | % | | | | 0.40 | % | | | | 0.40 | % | | | | 0.40 | % | | | | 0.40 | % |
| Net investment income | | | | 6.32 | % | | | | 6.08 | % | | | | 5.39 | % | | | | 5.58 | % | | | | 6.19 | % |
| Supplemental data | | | | | | | | | | | | | | | | | | | | | | | | | |
| Net assets, end of year (in millions) | | | | $358 | | | | | $431 | | | | | $1,152 | | | | | $784 | | | | | $308 | |
| Portfolio turnover rate (d) | | | | 30 | % | | | | 21 | % | | | | 34 | % | | | | 31 | % | | | | 28 | % |
| (a) | Calculated based upon average shares outstanding |
| (b) | Returns are not annualized and include adjustments in accordance with U.S. Generally Accepted Accounting Principles. Net asset values and returns for financial reporting purposes may differ from those for shareholder transactions. |
| (c) | Periods after April 30, 2021 reflect a unitary management fee structure. |
| (d) | Portfolio turnover rate is not annualized and excludes in-kind transactions. |
See Notes to Financial Statements
VANECK ETF TRUST
FINANCIAL HIGHLIGHTS
For a share outstanding throughout each year:
| | | Fallen Angel High Yield Bond ETF |
| | | Year Ended April 30, |
| | | 2024 | | 2023 | | 2022 | | 2021 | | 2020 |
| | | | | | | | | | | |
| Net asset value, beginning of year | | | $ | 27.74 | | | | $ | 28.94 | | | | $ | 32.20 | | | | $ | 26.84 | | | | $ | 29.00 | |
| Net investment income (a) | | | | 1.61 | | | | | 1.29 | | | | | 1.19 | | | | | 1.49 | | | | | 1.54 | |
| Net realized and unrealized gain (loss) on investments | | | | 0.61 | | | | | (1.15 | ) | | | | (3.22 | ) | | | | 5.35 | | | | | (2.16 | ) |
| Total from investment operations | | | | 2.22 | | | | | 0.14 | | | | | (2.03 | ) | | | | 6.84 | | | | | (0.62 | ) |
| Distributions from: | | | | | | | | | | | | | | | | | | | | | | | | | |
| Net investment income | | | | (1.60 | ) | | | | (1.34 | ) | | | | (1.23 | ) | | | | (1.48 | ) | | | | (1.54 | ) |
| Net asset value, end of year | | | $ | 28.36 | | | | $ | 27.74 | | | | $ | 28.94 | | | | $ | 32.20 | | | | $ | 26.84 | |
| Total return (b) | | | | 8.26 | % | | | | 0.60 | % | | | | (6.63 | )% | | | | 25.95 | % | | | | (2.38 | )% |
| | | | | | | | | | | | | | | | | | | | | | | | | | |
| Ratios to average net assets | | | | | | | | | | | | | | | | | | | | | | | | | |
| Gross expenses (c) | | | | 0.33 | % | | | | 0.35 | % | | | | 0.35 | % | | | | 0.43 | % | | | | 0.43 | % |
| Net expenses (c) | | | | 0.33 | % | | | | 0.35 | % | | | | 0.35 | % | | | | 0.35 | % | | | | 0.35 | % |
| Net investment income | | | | 5.77 | % | | | | 4.68 | % | | | | 3.70 | % | | | | 4.83 | % | | | | 5.35 | % |
| Supplemental data | | | | | | | | | | | | | | | | | | | | | | | | | |
| Net assets, end of year (in millions) | | | $ | 2,926 | | | | $ | 2,783 | | | | $ | 3,826 | | | | $ | 4,915 | | | | $ | 1,683 | |
| Portfolio turnover rate (d) | | | | 71 | % | | | | 31 | % | | | | 44 | % | | | | 27 | % | | | | 68 | % |
| (a) | Calculated based upon average shares outstanding |
| (b) | Returns are not annualized and include adjustments in accordance with U.S. Generally Accepted Accounting Principles. Net asset values and returns for financial reporting purposes may differ from those for shareholder transactions. |
| (c) | Periods after April 30, 2021 reflect a unitary management fee structure. |
| (d) | Portfolio turnover rate is not annualized and excludes in-kind transactions. |
See Notes to Financial Statements
VANECK ETF TRUST
FINANCIAL HIGHLIGHTS
For a share outstanding throughout each year:
| | | Green Bond ETF |
| | | Year Ended April 30, |
| | | 2024 | | 2023 | | 2022 | | 2021 | | 2020 |
| | | | | | | | | | | |
| Net asset value, beginning of year | | | $ | 23.58 | | | | $ | 24.13 | | | | $ | 27.16 | | | | $ | 26.85 | | | | $ | 25.87 | |
| Net investment income (a) | | | | 0.81 | | | | | 0.63 | | | | | 0.55 | | | | | 0.55 | | | | | 0.58 | |
| Net realized and unrealized gain (loss) on investments | | | | (0.38 | ) | | | | (0.54 | ) | | | | (3.03 | ) | | | | 0.28(b) | | | | | 1.00 | |
| Total from investment operations | | | | 0.43 | | | | | 0.09 | | | | | (2.48 | ) | | | | 0.83 | | | | | 1.58 | |
| Distributions from: | | | | | | | | | | | | | | | | | | | | | | | | | |
| Net investment income | | | | (0.79 | ) | | | | (0.64 | ) | | | | (0.55 | ) | | | | (0.52 | ) | | | | (0.50 | ) |
| Return of capital | | | | — | | | | | — | | | | | — | | | | | — | | | | | (0.10 | ) |
| Total distributions | | | | (0.79 | ) | | | | (0.64 | ) | | | | (0.55 | ) | | | | (0.52 | ) | | | | (0.60 | ) |
| Net asset value, end of year | | | $ | 23.22 | | | | $ | 23.58 | | | | $ | 24.13 | | | | $ | 27.16 | | | | $ | 26.85 | |
| Total return (c) | | | | 1.89 | % | | | | 0.41 | % | | | | (9.30 | )% | | | | 3.07 | % | | | | 6.17 | % |
| | | | | | | | | | | | | | | | | | | | | | | | | | |
| Ratios to average net assets | | | | | | | | | | | | | | | | | | | | | | | | | |
| Gross expenses (d) | | | | 0.20 | % | | | | 0.20 | % | | | | 0.20 | % | | | | 0.65 | % | | | | 0.83 | % |
| Net expenses (d) | | | | 0.20 | % | | | | 0.20 | % | | | | 0.20 | % | | | | 0.20 | % | | | | 0.23 | % |
| Net investment income | | | | 3.48 | % | | | | 2.71 | % | | | | 2.07 | % | | | | 2.01 | % | | | | 2.17 | % |
| Supplemental data | | | | | | | | | | | | | | | | | | | | | | | | | |
| Net assets, end of year (in millions) | | | | $92 | | | | | $75 | | | | | $95 | | | | | $84 | | | | | $32 | |
| Portfolio turnover rate (e) | | | | 14 | % | | | | 20 | % | | | | 19 | % | | | | 25 | % | | | | 83 | % |
| (a) | Calculated based upon average shares outstanding |
| (b) | The amount shown does not correspond with the aggregate net gain (loss) on investments for the period due to the timing of sales and repurchase of shares in relation to fluctuating market values of the investments of the Fund. |
| (c) | Returns are not annualized and include adjustments in accordance with U.S. Generally Accepted Accounting Principles. Net asset values and returns for financial reporting purposes may differ from those for shareholder transactions. |
| (d) | Periods after April 30, 2021 reflect a unitary management fee structure. |
| (e) | Portfolio turnover rate is not annualized and excludes in-kind transactions. |
See Notes to Financial Statements
VANECK ETF TRUST
FINANCIAL HIGHLIGHTS
For a share outstanding throughout each year:
| | | IG Floating Rate ETF |
| | | Year Ended April 30, |
| | | 2024 | | 2023 | | 2022 | | 2021 | | 2020 |
| | | | | | | | | | | |
| Net asset value, beginning of year | | | $ | 25.08 | | | | $ | 25.07 | | | | $ | 25.33 | | | | $ | 24.61 | | | | $ | 25.25 | |
| Net investment income (a) | | | | 1.59 | | | | | 0.98 | | | | | 0.14 | | | | | 0.23 | | | | | 0.68 | |
| Net realized and unrealized gain (loss) on investments | | | | 0.38 | | | | | (0.09 | ) | | | | (0.25 | ) | | | | 0.76 | | | | | (0.61 | ) |
| Total from investment operations | | | | 1.97 | | | | | 0.89 | | | | | (0.11 | ) | | | | 0.99 | | | | | 0.07 | |
| Distributions from: | | | | | | | | | | | | | | | | | | | | | | | | | |
| Net investment income | | | | (1.58 | ) | | | | (0.88 | ) | | | | (0.15 | ) | | | | (0.27 | ) | | | | (0.71 | ) |
| Net asset value, end of year | | | $ | 25.47 | | | | $ | 25.08 | | | | $ | 25.07 | | | | $ | 25.33 | | | | $ | 24.61 | |
| Total return (b) | | | | 8.12 | % | | | | 3.61 | % | | | | (0.45 | )% | | | | 4.07 | % | | | | 0.26 | % |
| | | | | | | | | | | | | | | | | | | | | | | | | | |
| Ratios to average net assets | | | | | | | | | | | | | | | | | | | | | | | | | |
| Gross expenses (c) | | | | 0.14 | % | | | | 0.14 | % | | | | 0.14 | % | | | | 0.39 | % | | | | 0.40 | % |
| Net expenses (c) | | | | 0.14 | % | | | | 0.14 | % | | | | 0.14 | % | | | | 0.14 | % | | | | 0.14 | % |
| Net investment income | | | | 6.31 | % | | | | 3.95 | % | | | | 0.56 | % | | | | 0.93 | % | | | | 2.70 | % |
| Supplemental data | | | | | | | | | | | | | | | | | | | | | | | | | |
| Net assets, end of year (in millions) | | | $ | 1,540 | | | | $ | 1,146 | | | | $ | 1,135 | | | | | $560 | | | | | $461 | |
| Portfolio turnover rate (d) | | | | 89 | % | | | | 55 | % | | | | 78 | % | | | | 72 | % | | | | 40 | % |
| (a) | Calculated based upon average shares outstanding |
| (b) | Returns are not annualized and include adjustments in accordance with U.S. Generally Accepted Accounting Principles. Net asset values and returns for financial reporting purposes may differ from those for shareholder transactions. |
| (c) | Periods after April 30, 2021 reflect a unitary management fee structure. |
| (d) | Portfolio turnover rate is not annualized and excludes in-kind transactions. |
See Notes to Financial Statements
VANECK ETF TRUST
FINANCIAL HIGHLIGHTS
For a share outstanding throughout each year:
| | | International High Yield Bond ETF |
| | | Year Ended April 30, |
| | | 2024 | | 2023 | | 2022 | | 2021 | | 2020 |
| | | | | | | | | | | |
| Net asset value, beginning of year | | | $ | 20.02 | | | | $ | 20.90 | | | | $ | 25.71 | | | | $ | 22.21 | | | | $ | 24.54 | |
| Net investment income (a) | | | | 1.06 | | | | | 0.96 | | | | | 1.02 | | | | | 1.13 | | | | | 1.26 | |
| Net realized and unrealized gain (loss) on investments | | | | 0.33 | | | | | (0.85 | ) | | | | (4.78 | ) | | | | 3.54 | | | | | (2.33 | ) |
| Total from investment operations | | | | 1.39 | | | | | 0.11 | | | | | (3.76 | ) | | | | 4.67 | | | | | (1.07 | ) |
| Distributions from: | | | | | | | | | | | | | | | | | | | | | | | | | |
| Net investment income | | | | (0.88 | ) | | | | (0.89 | ) | | | | (1.05 | ) | | | | (1.10 | ) | | | | (1.17 | ) |
| Return of capital | | | | (0.24 | ) | | | | (0.10 | ) | | | | — | | | | | (0.07 | ) | | | | (0.09 | ) |
| Total distributions | | | | (1.12 | ) | | | | (0.99 | ) | | | | (1.05 | ) | | | | (1.17 | ) | | | | (1.26 | ) |
| Net asset value, end of year | | | $ | 20.29 | | | | $ | 20.02 | | | | $ | 20.90 | | | | $ | 25.71 | | | | $ | 22.21 | |
| Total return (b) | | | | 7.13 | % | | | | 0.78 | % | | | | (15.07 | )% | | | | 21.30 | % | | | | (4.67 | )% |
| | | | | | | | | | | | | | | | | | | | | | | | | | |
| Ratios to average net assets | | | | | | | | | | | | | | | | | | | | | | | | | |
| Gross expenses (c) | | | | 0.40 | % | | | | 0.40 | % | | | | 0.40 | % | | | | 0.56 | % | | | | 0.62 | % |
| Net expenses (c) | | | | 0.40 | % | | | | 0.40 | % | | | | 0.40 | % | | | | 0.40 | % | | | | 0.40 | % |
| Net investment income | | | | 5.27 | % | | | | 4.89 | % | | | | 4.21 | % | | | | 4.54 | % | | | | 5.17 | % |
| Supplemental data | | | | | | | | | | | | | | | | | | | | | | | | | |
| Net assets, end of year (in millions) | | | | $30 | | | | | $66 | | | | | $79 | | | | | $100 | | | | | $89 | |
| Portfolio turnover rate (d) | | | | 31 | % | | | | 22 | % | | | | 25 | % | | | | 33 | % | | | | 37 | % |
| (a) | Calculated based upon average shares outstanding |
| (b) | Returns are not annualized and include adjustments in accordance with U.S. Generally Accepted Accounting Principles. Net asset values and returns for financial reporting purposes may differ from those for shareholder transactions. |
| (c) | Periods after April 30, 2021 reflect a unitary management fee structure. |
| (d) | Portfolio turnover rate is not annualized and excludes in-kind transactions. |
See Notes to Financial Statements
VANECK ETF TRUST
FINANCIAL HIGHLIGHTS
For a share outstanding throughout each year:
| | | J.P. Morgan EM Local Currency Bond ETF |
| | | Year Ended April 30, |
| | | 2024 | | 2023 | | 2022 | | 2021 | | 2020 |
| | | | | | | | | | | |
| Net asset value, beginning of year | | | $ | 25.13 | | | | $ | 25.33 | | | | $ | 31.14 | | | | $ | 29.36 | | | | $ | 33.11 | |
| Net investment income (a) | | | | 1.52 | | | | | 1.43 | | | | | 1.47 | | | | | 1.55 | | | | | 2.00 | |
| Net realized and unrealized gain (loss) on investments | | | | (1.25 | ) | | | | (0.21 | ) | | | | (5.84 | ) | | | | 1.78 | | | | | (3.75 | ) |
| Total from investment operations | | | | 0.27 | | | | | 1.22 | | | | | (4.37 | ) | | | | 3.33 | | | | | (1.75 | ) |
| Distributions from: | | | | | | | | | | | | | | | | | | | | | | | | | |
| Net investment income | | | | (0.60 | ) | | | | (0.18 | ) | | | | (0.77 | ) | | | | (0.01 | ) | | | | (0.48 | ) |
| Return of capital | | | | (0.93 | ) | | | | (1.24 | ) | | | | (0.67 | ) | | | | (1.54 | ) | | | | (1.52 | ) |
| Total distributions | | | | (1.53 | ) | | | | (1.42 | ) | | | | (1.44 | ) | | | | (1.55 | ) | | | | (2.00 | ) |
| Net asset value, end of year | | | $ | 23.87 | | | | $ | 25.13 | | | | $ | 25.33 | | | | $ | 31.14 | | | | $ | 29.36 | |
| Total return (b) | | | | 1.03 | % | | | | 5.16 | % | | | | (14.56 | )% | | | | 11.40 | % | | | | (5.79 | )% |
| | | | | | | | | | | | | | | | | | | | | | | | | | |
| Ratios to average net assets | | | | | | | | | | | | | | | | | | | | | | | | | |
| Gross expenses | | | | 0.31 | % | | | | 0.31 | % | | | | 0.32 | % | | | | 0.31 | % | | | | 0.36 | % |
| Net expenses | | | | 0.30 | % | | | | 0.30 | % | | | | 0.30 | % | | | | 0.30 | % | | | | 0.30 | % |
| Net investment income | | | | 6.10 | % | | | | 5.87 | % | | | | 5.00 | % | | | | 4.92 | % | | | | 6.05 | % |
| Supplemental data | | | | | | | | | | | | | | | | | | | | | | | | | |
| Net assets, end of year (in millions) | | | $ | 2,779 | | | | $ | 3,224 | | | | $ | 3,073 | | | | $ | 3,380 | | | | $ | 3,339 | |
| Portfolio turnover rate (c) | | | | 37 | % | | | | 29 | % | | | | 33 | % | | | | 40 | % | | | | 39 | % |
| (a) | Calculated based upon average shares outstanding |
| (b) | Returns are not annualized and include adjustments in accordance with U.S. Generally Accepted Accounting Principles. Net asset values and returns for financial reporting purposes may differ from those for shareholder transactions. |
| (c) | Portfolio turnover rate is not annualized and excludes in-kind transactions. |
See Notes to Financial Statements
VANECK ETF TRUST
FINANCIAL HIGHLIGHTS
For a share outstanding throughout each period:
| | | Moody’s Analytics BBB Corporate Bond ETF |
| | | | | | | | | | | | | | | | | |
| | | | | | | | | Period |
| | | | | | | | | Ended |
| | | Year Ended April 30, | | April 30, |
| | | 2024 | | 2023 | | 2022 | | 2021 (a) |
| | | | | | | | | |
| Net asset value, beginning of period | | | $ | 21.11 | | | | $ | 21.52 | | | | $ | 24.73 | | | | $ | 25.00 | |
| Net investment income (b) | | | | 0.99 | | | | | 0.78 | | | | | 0.55 | | | | | 0.22 | |
| Net realized and unrealized loss on investments | | | | (0.37 | ) | | | | (0.44 | ) | | | | (3.19 | ) | | | | (0.30 | ) |
| Total from investment operations | | | | 0.62 | | | | | 0.34 | | | | | (2.64 | ) | | | | (0.08 | ) |
| Distributions from: | | | | | | | | | | | | | | | | | | | | |
| Net investment income | | | | (0.99 | ) | | | | (0.75 | ) | | | | (0.57 | ) | | | | (0.19 | ) |
| Net asset value, end of period | | | $ | 20.74 | | | | $ | 21.11 | | | | $ | 21.52 | | | | $ | 24.73 | |
| Total return (c) | | | | 3.02 | % | | | | 1.70 | % | | | | (10.96 | )% | | | | (0.32 | )% |
| | | | | | | | | | | | | | | | | | | | | |
| Ratios to average net assets | | | | | | | | | | | | | | | | | | | | |
| Expenses | | | | 0.25 | % | | | | 0.25 | % | | | | 0.25 | % | | | | 0.25 | %(d) |
| Net investment income | | | | 4.78 | % | | | | 3.75 | % | | | | 2.26 | % | | | | 2.14 | %(d) |
| Supplemental data | | | | | | | | | | | | | | | | | | | | |
| Net assets, end of period (in millions) | | | | $8 | | | | | $8 | | | | | $9 | | | | | $10 | |
| Portfolio turnover rate (e) | | | | 62 | % | | | | 91 | % | | | | 48 | % | | | | 35 | % |
| (a) | For the period December 2, 2020 (commencement of operations) through April 30, 2021. |
| (b) | Calculated based upon average shares outstanding |
| (c) | Returns are not annualized and include adjustments in accordance with U.S. Generally Accepted Accounting Principles. Net asset values and returns for financial reporting purposes may differ from those for shareholder transactions. |
| (d) | Annualized |
| (e) | Portfolio turnover rate is not annualized and excludes in-kind transactions. |
See Notes to Financial Statements
VANECK ETF TRUST
FINANCIAL HIGHLIGHTS
For a share outstanding throughout each period:
| | | Moody’s Analytics IG Corporate Bond ETF |
| | | | | | | | | | | | | | | | | |
| | | | | | | | | Period |
| | | | | | | | | Ended |
| | | Year Ended April 30, | | April 30, |
| | | 2024 | | 2023 | | 2022 | | 2021 (a) |
| | | | | | | | | |
| Net asset value, beginning of period | | | $ | 21.14 | | | | $ | 21.61 | | | | $ | 24.58 | | | | $ | 25.00 | |
| Net investment income (b) | | | | 0.96 | | | | | 0.74 | | | | | 0.52 | | | | | 0.21 | |
| Net realized and unrealized loss on investments | | | | (0.48 | ) | | | | (0.49 | ) | | | | (2.96 | ) | | | | (0.45 | ) |
| Total from investment operations | | | | 0.48 | | | | | 0.25 | | | | | (2.44 | ) | | | | (0.24 | ) |
| Distributions from: | | | | | | | | | | | | | | | | | | | | |
| Net investment income | | | | (0.96 | ) | | | | (0.72 | ) | | | | (0.53 | ) | | | | (0.18 | ) |
| Net asset value, end of period | | | $ | 20.66 | | | | $ | 21.14 | | | | $ | 21.61 | | | | $ | 24.58 | |
| Total return (c) | | | | 2.36 | % | | | | 1.22 | % | | | | (10.15 | )% | | | | (0.97 | )% |
| | | | | | | | | | | | | | | | | | | | | |
| Ratios to average net assets | | | | | | | | | | | | | | | | | | | | |
| Expenses | | | | 0.20 | % | | | | 0.20 | % | | | | 0.20 | % | | | | 0.20 | %(d) |
| Net investment income | | | | 4.66 | % | | | | 3.53 | % | | | | 2.13 | % | | | | 2.10 | %(d) |
| Supplemental data | | | | | | | | | | | | | | | | | | | | |
| Net assets, end of period (in millions) | | | | $12 | | | | | $13 | | | | | $13 | | | | | $15 | |
| Portfolio turnover rate (e) | | | | 54 | % | | | | 84 | % | | | | 53 | % | | | | 28 | % |
| (a) | For the period December 2, 2020 (commencement of operations) through April 30, 2021. |
| (b) | Calculated based upon average shares outstanding |
| (c) | Returns are not annualized and include adjustments in accordance with U.S. Generally Accepted Accounting Principles. Net asset values and returns for financial reporting purposes may differ from those for shareholder transactions. |
| (d) | Annualized |
| (e) | Portfolio turnover rate is not annualized and excludes in-kind transactions. |
See Notes to Financial Statements
VANECK ETF TRUST
FINANCIAL HIGHLIGHTS
For a share outstanding throughout each year:
| | | Mortgage REIT Income ETF |
| | | Year Ended April 30, |
| | | 2024 | | 2023 | | 2022 | | 2021 | | 2020 |
| | | | | | | | | | | |
| Net asset value, beginning of year | | | $ | 11.01 | | | | $ | 15.23 | | | | $ | 19.45 | | | | $ | 11.42 | | | | $ | 23.63 | |
| Net investment income (a) | | | | 1.17 | | | | | 1.21 | | | | | 0.76 | | | | | 0.86 | | | | | 1.45 | |
| Net realized and unrealized gain (loss) on investments | | | | (0.22 | ) | | | | (3.82 | ) | | | | (3.44 | ) | | | | 8.49 | | | | | (11.90 | ) |
| Total from investment operations | | | | 0.95 | | | | | (2.61 | ) | | | | (2.68 | ) | | | | 9.35 | | | | | (10.45 | ) |
| Distributions from: | | | | | | | | | | | | | | | | | | | | | | | | | |
| Net investment income | | | | (1.16 | ) | | | | (1.21 | ) | | | | (0.79 | ) | | | | (0.83 | ) | | | | (1.45 | ) |
| Return of capital | | | | (0.11 | ) | | | | (0.40 | ) | | | | (0.75 | ) | | | | (0.49 | ) | | | | (0.31 | ) |
| Total distributions | | | | (1.27 | ) | | | | (1.61 | ) | | | | (1.54 | ) | | | | (1.32 | ) | | | | (1.76 | ) |
| Net asset value, end of year | | | $ | 10.69 | | | | $ | 11.01 | | | | $ | 15.23 | | | | $ | 19.45 | | | | $ | 11.42 | |
| Total return (b) | | | | 8.59 | % | | | | (16.95 | )% | | | | (14.74 | )% | | | | 85.71 | % | | | | (46.63 | )% |
| | | | | | | | | | | | | | | | | | | | | | | | | | |
| Ratios to average net assets | | | | | | | | | | | | | | | | | | | | | | | | | |
| Gross expenses (c) | | | | 0.43 | % | | | | 0.43 | % | | | | 0.41 | % | | | | 0.49 | % | | | | 0.50 | % |
| Net expenses (c) | | | | 0.43 | % | | | | 0.43 | % | | | | 0.41 | % | | | | 0.41 | % | | | | 0.41 | % |
| Net expenses excluding interest and taxes (c) | | | | 0.40 | % | | | | 0.40 | % | | | | 0.40 | % | | | | 0.40 | % | | | | 0.40 | % |
| Net investment income | | | | 10.40 | % | | | | 9.30 | % | | | | 4.15 | % | | | | 5.55 | % | | | | 6.70 | % |
| Supplemental data | | | | | | | | | | | | | | | | | | | | | | | | | |
| Net assets, end of year (in millions) | | | | $256 | | | | | $189 | | | | | $211 | | | | | $310 | | | | | $119 | |
| Portfolio turnover rate (d) | | | | 16 | % | | | | 19 | % | | | | 12 | % | | | | 31 | % | | | | 16 | % |
| (a) | Calculated based upon average shares outstanding |
| (b) | Returns are not annualized and include adjustments in accordance with U.S. Generally Accepted Accounting Principles. Net asset values and returns for financial reporting purposes may differ from those for shareholder transactions. |
| (c) | Periods after April 30, 2021 reflect a unitary management fee structure. |
| (d) | Portfolio turnover rate is not annualized and excludes in-kind transactions. |
See Notes to Financial Statements
VANECK ETF TRUST
FINANCIAL HIGHLIGHTS
For a share outstanding throughout each year:
| | | Preferred Securities ex Financials ETF |
| | | Year Ended April 30, |
| | | 2024 | | 2023 | | 2022 | | 2021 | | 2020 |
| | | | | | | | | | | |
| Net asset value, beginning of year | | | $ | 17.51 | | | | $ | 19.15 | | | | $ | 20.97 | | | | $ | 18.23 | | | | $ | 19.37 | |
| Net investment income (a) | | | | 1.29 | | | | | 1.12 | | | | | 1.01 | | | | | 0.98 | | | | | 1.06 | |
| Net realized and unrealized gain (loss) on investments | | | | (0.45 | ) | | | | (1.62 | ) | | | | (1.68 | ) | | | | 2.72 | | | | | (1.12 | ) |
| Total from investment operations | | | | 0.84 | | | | | (0.50 | ) | | | | (0.67 | ) | | | | 3.70 | | | | | (0.06 | ) |
| Distributions from: | | | | | | | | | | | | | | | | | | | | | | | | | |
| Net investment income | | | | (1.34 | ) | | | | (1.14 | ) | | | | (1.13 | ) | | | | (0.96 | ) | | | | (1.08 | ) |
| Return of capital | | | | — | | | | | — | | | | | (0.02 | ) | | | | — | | | | | — | |
| Total distributions | | | | (1.34 | ) | | | | (1.14 | ) | | | | (1.15 | ) | | | | (0.96 | ) | | | | (1.08 | ) |
| Net asset value, end of year | | | $ | 17.01 | | | | $ | 17.51 | | | | $ | 19.15 | | | | $ | 20.97 | | | | $ | 18.23 | |
| Total return (b) | | | | 5.04 | % | | | | (2.50 | )% | | | | (3.61 | )% | | | | 20.78 | % | | | | (0.54 | )% |
| | | | | | | | | | | | | | | | | | | | | | | | | | |
| Ratios to average net assets | | | | | | | | | | | | | | | | | | | | | | | | | |
| Gross expenses (c) | | | | 0.40 | % | | | | 0.41 | % | | | | 0.40 | % | | | | 0.43 | % | | | | 0.44 | % |
| Net expenses (c) | | | | 0.40 | % | | | | 0.41 | % | | | | 0.40 | % | | | | 0.40 | % | | | | 0.41 | % |
| Net expenses excluding interest and taxes (c) | | | | 0.40 | % | | | | 0.40 | % | | | | 0.40 | % | | | | 0.40 | % | | | | 0.40 | % |
| Net investment income | | | | 7.55 | % | | | | 6.28 | % | | | | 4.79 | % | | | | 4.97 | % | | | | 5.41 | % |
| Supplemental data | | | | | | | | | | | | | | | | | | | | | | | | | |
| Net assets, end of year (in millions) | | | $ | 1,588 | | | | $ | 1,060 | | | | $ | 1,002 | | | | | $948 | | | | | $689 | |
| Portfolio turnover rate (d) | | | | 27 | % | | | | 27 | % | | | | 37 | % | | | | 36 | % | | | | 45 | % |
| (a) | Calculated based upon average shares outstanding |
| (b) | Returns are not annualized and include adjustments in accordance with U.S. Generally Accepted Accounting Principles. Net asset values and returns for financial reporting purposes may differ from those for shareholder transactions. |
| (c) | Periods after April 30, 2021 reflect a unitary management fee structure. |
| (d) | Portfolio turnover rate is not annualized and excludes in-kind transactions. |
See Notes to Financial Statements
VANECK ETF TRUST
NOTES TO FINANCIAL STATEMENTS
April 30, 2024
Note 1—Fund Organization—VanEck ETF Trust (the “Trust”), is registered under the Investment Company Act of 1940, as amended, as an open-end management investment company. The Trust was incorporated in Delaware as a statutory trust on March 15, 2001. The Trust operates as a series fund, and offers multiple investment portfolios, each of which represents a separate series of the Trust. These financial statements relate only to the investment portfolios listed in the diversification table below (each a “Fund” and, collectively, the “Funds”).
| Fund | | Diversification Classification |
| | | |
| BDC Income ETF (“BDC Income”) | | Diversified |
| China Bond ETF (“China Bond”) | | Non-Diversified |
| Dynamic High Income ETF (Dynamic Income”) | | Non-Diversified |
| Emerging Markets High Yield Bond ETF (“Emerging Markets High Yield”) | | Diversified |
| Fallen Angel High Yield Bond ETF (“Fallen Angel”) | | Diversified |
| Green Bond ETF (“Green Bond”) | | Diversified |
| IG Floating Rate ETF (“Floating Rate”) | | Non-Diversified |
| International High Yield Bond ETF (“International High Yield”) | | Diversified |
| J.P. Morgan EM Local Currency Bond ETF (“J.P. Morgan EM”) | | Non-Diversified |
| Moody’s Analytics BBB Corporate Bond ETF (“Moody’s Analytics BBB”) | | Non-Diversified |
| Moody’s Analytics IG Corporate Bond ETF (“Moody’s Analytics IG”) | | Diversified |
| Mortgage REIT Income ETF (“Mortgage REIT”) | | Non-Diversified |
| Preferred Securities ex Financials ETF (“Preferred Securities”) | | Non-Diversified |
Each Fund’s investment objective, except Dynamic High Income ETF, is to replicate as closely as possible, before fees and expenses, the price and yield performance of its index which are listed in the table below. The investment objective of Dynamic High Income ETF is to provide high current income with consideration for capital appreciation.
| Fund | Index |
| | |
| BDC Income | MVIS® US Business Development Companies Index |
| China Bond | ChinaBond China High Quality Bond Index |
| Emerging Markets High Yield | ICE BofA Diversified High Yield US Emerging Markets Corporate Plus Index |
| Fallen Angel | ICE US Fallen Angel High Yield 10% Constrained Index |
| Green Bond | S&P Green Bond U.S. Dollar Select Index |
| Floating Rate | MVIS® US Investment Grade Floating Rate Index |
| International High Yield | ICE BofA Global ex-US Issuers High Yield Constrained Index |
| J.P. Morgan EM | J.P. Morgan GBI-EM Global Core Index |
| Moody’s Analytics BBB | MVIS® Moody’s Analytics® US BBB Corporate Bond Index |
| Moody’s Analytics IG | MVIS® Moody’s Analytics® US Investment Grade Corporate Bond Index |
| Mortgage REIT | MVIS® US Mortgage REITs Index |
| Preferred Securities | ICE Exchange-Listed Fixed & Adjustable Rate Non-Financial Preferred Securities Index |
Van Eck Associates Corporation (“VEAC”) serves as the investment adviser for the Funds, except for BDC Income. Effective March 7, 2024, Van Eck Absolute Return Advisers Corporation (“VEARA”) serves as the investment adviser to BDC Income. VEAC and VEARA are collectively referred to as the “Adviser”. Effective January 12, 2024, China Asset Management (Hong Kong) Limited no longer serves as the sub-adviser to China Bond.
The Funds (except BDC Income, Dynamic Income, Mortgage REIT and Preferred Securities) expect to use a sampling approach in seeking to achieve their objectives. Sampling means that the Adviser uses quantitative analysis to select bonds and other securities that represent a sample of securities in the index in terms of key risk factors, performance attributes and other characteristics. The number of securities in each Fund will be based upon several factors, including asset size of the Fund. The Adviser generally expects each Fund to hold less than the total number of securities in the index, but reserves the right to hold as many securities as it believes necessary to achieve the Fund’s investment objective. China Bond seeks to achieve its investment objective by primarily investing in RMB bonds through Bond Connect. BDC Income, Mortgage REIT and Preferred Securities each seek to achieve their investment objective through a portfolio of securities in
substantially the same weighting as their index. Dynamic High Income ETF is an actively managed exchange-traded fund that seeks to achieve its investment objective by investing in exchange traded products (“ETPs”) that are registered under the applicable federal securities laws and that invest in securities that generate income.
Note 2—Significant Accounting Policies—The preparation of financial statements in conformity with U.S. generally accepted accounting principles (“GAAP”) requires management to make estimates and assumptions that affect the reported amounts and disclosures in the financial statements. Actual results could differ from those estimates.
The Funds are investment companies and follow accounting and reporting requirements of Accounting Standards Codification (“ASC”) 946, Financial Services-Investment Companies.
The following summarizes the Funds’ significant accounting policies.
| A. | Security Valuation—The Funds value their investments in securities and other assets and liabilities at fair value daily. Fair value is the price that would be received to sell an asset or paid to transfer a liability in an orderly transaction between market participants on the measurement date. The Funds utilize various methods to measure the fair value of their investments on a recurring basis, which includes a hierarchy that prioritizes inputs to valuation methods used to measure fair value. The fair value hierarchy gives highest priority to unadjusted quoted prices in active markets for identical assets and liabilities (Level 1 measurements) and the lowest priority to unobservable inputs (Level 3 measurements). The inputs or methodologies used for valuing securities are not necessarily an indication of the risk associated with investing in those securities. The three levels of the fair value hierarchy are described below: |
| | |
| | Level 1 — Quoted prices in active markets for identical securities. |
| | |
| | Level 2 — Significant observable inputs (including quoted prices for similar securities, interest rates, prepayment speeds, credit risk, etc.). |
| | |
| | Level 3 — Significant unobservable inputs (including each Fund’s own assumptions in determining the fair value of investments). |
| | |
| | Securities traded on national exchanges are valued at the closing price on the markets in which the securities trade. Securities traded on the NASDAQ Stock Market LLC (“NASDAQ”) are valued at the NASDAQ official closing price. Over-the-counter securities not included on NASDAQ and listed securities for which no sale was reported are valued at the mean of the bid and ask prices. To the extent these securities are actively traded, they are categorized as Level 1 in the fair value hierarchy. Money market fund investments are valued at net asset value and are categorized as Level 1 in the fair value hierarchy. Debt securities are valued on the basis of evaluated prices furnished by an independent pricing service or provided by securities dealers. The pricing services may use valuation models or matrix pricing, which consider: (i) yield or price with respect to bonds that are considered comparable in characteristics such as rating, interest rate and maturity date and or (ii) quotations from bond dealers to determine current value, and are categorized as Level 2 in the fair value hierarchy (described below). Short-term debt securities with sixty days or less to maturity are valued at amortized cost, which with accrued interest approximates fair value. The Funds’ Board of Trustees (“Trustees”) has designated the Adviser as valuation designee to perform the Funds’ fair value determinations, subject to board oversight and certain reporting and other requirements. The Adviser has adopted policies and procedures reasonably designed to comply with the requirements. The Pricing Committee of the Adviser provides oversight of the Funds’ valuation policies and procedures, which are approved by the Trustees. Among other things, these procedures allow the Funds to utilize independent pricing services, quotations from securities dealers, and other market sources to determine fair value. The Pricing Committee convenes regularly to review the fair value of financial instruments or other assets. If market quotations for a security or other asset are not readily available, or if the Adviser believes they do not otherwise reflect the fair value of a security or asset, the security or asset will be fair valued by the Pricing Committee in accordance with the Funds’ valuation policies and procedures. The Pricing Committee employs various methods for calibrating the valuation approaches utilized to |
VANECK ETF TRUST
NOTES TO FINANCIAL STATEMENTS
(continued)
| | determine fair value, including a regular review of key inputs and assumptions, periodic comparisons to valuations provided by other independent pricing services, transactional back-testing and disposition analysis. |
| | |
| | Certain factors such as economic conditions, political events, market trends, the nature of and duration of any restrictions on disposition, trading in similar securities of the issuer or comparable issuers and other security specific information are used to determine the fair value of these securities. Depending on the relative significance of valuation inputs, these securities may be categorized either as Level 2 or Level 3 in the fair value hierarchy. The price which the Funds may realize upon sale of an investment may differ materially from the value presented in the Schedules of Investments. |
| | |
| | A summary of the inputs and the levels used to value the Funds’ investments are located in the Schedules of Investments. Additionally, tables that reconcile the valuation of the Funds’ Level 3 investments and that present additional information about valuation methodologies and unobservable inputs, if applicable, are located in the Schedules of Investments. |
| | |
| B. | Federal Income Taxes—It is each Fund’s policy to comply with the provisions of the Internal Revenue Code applicable to regulated investment companies and to distribute all of its net investment income and net realized capital gains, if any, to its shareholders. Therefore, no federal income tax provision is required. |
| | |
| C. | Distributions to Shareholders—Dividends to shareholders from net investment income, if any, are declared and paid at least monthly by each Fund (except BDC Income and Mortgage REIT, which are declared and paid quarterly). Distributions of net realized capital gains and return of capital, if any, are generally declared and paid annually. Income dividends and capital gain distributions are determined in accordance with U.S. income tax regulations, which may differ from such amounts determined in accordance with GAAP. Dividends and distributions that exceed earnings and profit for tax purposes are reported for tax purposes as a return of capital. |
| | |
| D. | Currency Translation—Assets and liabilities denominated in foreign currencies and commitments under foreign currency contracts are translated into U.S. dollars at the closing prices of such currencies each business day as quoted by one or more sources. Purchases and sales of investments are translated at the exchange rates prevailing when such investments are acquired or sold. Foreign denominated income and expenses are translated at the exchange rates prevailing when accrued. The portion of realized and unrealized gains and losses on investments that result from fluctuations in foreign currency exchange rates is not separately disclosed in the financial statements. Such amounts are included with the net realized and unrealized gains and losses on investment securities in the Statements of Operations. Recognized gains or losses attributable to foreign currency fluctuations on foreign currency denominated assets, other than investments, and liabilities are recorded as net realized gain (loss) and net change in unrealized appreciation (depreciation) on foreign currency transactions and foreign denominated assets and liabilities in the Statements of Operations. Any currency denominated in Rubles cannot be repatriated and such currency was valued at $0 as of April 30, 2024. |
| | |
| E. | Restricted Securities—The Funds may invest in securities that are subject to legal or contractual restrictions on resale. These securities generally may be resold in transactions exempt from registration or to the public if the securities are registered. Disposal of these securities may involve time-consuming negotiations and expense, and prompt sale at an acceptable price may be difficult. Information regarding restricted securities, if any, is included at the end of each Fund’s Schedule of Investments. |
| | |
| F. | Offsetting Assets and Liabilities—In the ordinary course of business, the Funds enter into transactions subject to enforceable master netting or other similar agreements. Generally, the right of offset in those agreements allows the Funds to offset any exposure to a specific counterparty with any collateral received or delivered to that counterparty based on the terms of the agreements. The Funds may receive cash and or securities as collateral for securities lending. For financial reporting purposes, the Funds present securities lending assets and liabilities on a gross basis in the Statements of Assets and Liabilities. Cash collateral received for securities lending in the form of money market fund investments, if any, at April 30, |
| | 2024 is presented in the Schedules of Investments and in the Statements of Assets and Liabilities. Non-cash collateral is disclosed in Note 9 (Securities Lending). |
| | |
| G. | Other—Security transactions are accounted for on trade date. Realized gains and losses are determined based on the specific identification method. Interest income, including amortization of premiums and discounts, is accrued using the effective interest method. Interest income is generally not earned on debt securities in default or upon determination that the income is not realizable. Dividend income is recorded on the ex-dividend date. |
| | |
| | The Funds earn interest income on uninvested cash balances held at the custodian bank. Such amounts, if any, are presented as interest income in the Statements of Operations. |
| | |
| | The character of distributions received from certain investments may be comprised of net investment income, capital gains, and return of capital. It is the Funds’ policy to estimate the character of distributions received from these investments based on historical data if actual amounts are not available. After each calendar year end, these investments report the actual tax character of distributions. Differences between the estimated and actual amounts are reflected in the Funds’ records in the year in which they are reported by adjusting the related cost basis of investments, capital gains and income, as necessary. |
| | |
| | In the normal course of business, the Funds enter into contracts that contain a variety of general indemnifications. The Funds’ maximum exposure under these agreements is unknown as this would involve future claims that may be made against the Funds that have not yet occurred. However, the Adviser believes the risk of loss under these arrangements to be remote. |
| | |
| | China Bond is required to hold foreign investor minimum settlement reserve funds by the China Securities Depository and Clearing Corporation Limited. Refer to cash denominated in foreign currency, at value on the Statement of Assets and Liabilities for the amount held at April 30, 2024. |
Note 3—Investment Management and Other Agreements—The Adviser is the investment adviser to the Funds. The Adviser receives a management fee, calculated daily and payable monthly based on an annual rate of each Fund’s average daily net assets. The Adviser has agreed, until at least September 1, 2024, to waive management fees and assume expenses to prevent total annual operating expenses (excluding acquired fund fees and expenses, interest expense, trading expenses, taxes and extraordinary expenses) from exceeding the expense limitations for the Funds listed in the table below.
The expense limitations and management fee rates for the year ended April 30, 2024 are as follows:
| Fund | | Management
Fees | | Expense
Limitations |
| China Bond | | | 0.40 | % | | | 0.50 | % |
| J.P. Morgan EM | | | 0.27 | | | | 0.30 | |
Refer to the Statements of Operations for amounts waived/assumed by the Adviser.
The Funds listed in the table below utilize a unitary management fee structure where the Adviser will pay all Fund expenses, except for the fee payment under the investment management agreement, acquired fund fees and expenses, interest expense, trading expenses, taxes and extraordinary expenses.
The unitary management fee rates for the year ended April 30, 2024 are as follows:
| Fund | | Management
Fee Rate |
| BDC Income | | | 0.40 | % |
| Dynamic Income | | | 0.10 | |
| Emerging Markets High Yield | | | 0.40 | |
| Fallen Angel | | | 0.25 | * |
| Floating Rate | | | 0.14 | |
| Green Bond | | | 0.20 | |
| International High Yield | | | 0.40 | |
VANECK ETF TRUST
NOTES TO FINANCIAL STATEMENTS
(continued)
| Fund | | Management
Fee Rate |
| Moody’s Analytics BBB | | | 0.25 | |
| Moody’s Analytics IG | | | 0.20 | |
| Mortgage REIT | | | 0.40 | |
| Preferred Securities | | | 0.40 | |
| * | Prior to March 7, 2024, the management fee was 0.35%. |
In addition, Van Eck Securities Corporation, an affiliate of the Adviser, acts as the Funds’ distributor (the “Distributor”). Certain officers and a Trustee of the Trust are officers, directors or stockholders of the Adviser and Distributor.
At April 30, 2024, the Adviser owned approximately 82% and 24% of Moody’s Analytics BBB and Moody’s Analytics IG, respectively.
Note 4—Capital Share Transactions—As of April 30, 2024, there were an unlimited number of capital shares of beneficial interest authorized by the Trust with no par value. Fund shares are not individually redeemable and are issued and redeemed at their net asset value per share only through certain authorized broker-dealers (“Authorized Participants”) in blocks of shares (“Creation Units”).
The consideration for the purchase or redemption of Creation Units of the Funds generally consists of the in-kind contribution or distribution of securities constituting the Funds’ underlying index (“Deposit Securities”) plus a balancing cash component to equate the transaction to the net asset value per share of the Fund on the transaction date. Cash may also be substituted in an amount equivalent to the value of certain Deposit Securities, generally as a result of market circumstances, or when the securities are not available in sufficient quantity for delivery, or are not eligible for trading by the Authorized Participant. The Funds may issue Creation Units in advance of receipt of Deposit Securities subject to various conditions, including, for the benefit of the Funds, a requirement to maintain cash collateral on deposit at the custodian equal to at least 115% of the daily marked to market value of the missing Deposit Securities.
Authorized Participants purchasing and redeeming Creation Units may pay transaction fees directly to the transfer agent. In addition, the Funds may impose variable fees on the purchase or redemption of Creation Units for cash, or on transactions effected outside the clearing process, to defray certain transaction costs. These variable fees, if any, are reflected in share transactions in the Statements of Changes in Net Assets.
Note 5—Investments—For the year ended April 30, 2024, purchases and sales of investments (excluding short-term investments and in-kind capital share transactions) and the purchases and sales of investments resulting from in-kind capital share transactions (excluding short-term investments) were as follows:
| | | | | | | In-Kind Capital Share Transactions |
| Fund | | Purchases | | Sales | | Purchases | | Sales |
| BDC Income | | $ | 94,867,578 | | | $ | 95,003,795 | | | $ | 510,705,887 | | | $ | 98,773,247 | |
| China Bond | | | 20,065,208 | | | | 38,748,826 | | | | — | | | | — | |
| Dynamic Income | | | 427,484 | | | | 386,832 | | | | 219,013 | | | | — | |
| Emerging Markets High Yield | | | 138,651,445 | | | | 108,770,818 | | | | 21,096,556 | | | | 132,464,973 | |
| Fallen Angel | | | 1,963,450,231 | | | | 1,976,548,181 | | | | 1,495,883,399 | | | | 1,402,855,175 | |
| Floating Rate | | | 1,144,358,343 | | | | 1,070,142,390 | | | | 418,362,408 | | | | 140,314,464 | |
| Green Bond | | | 14,051,166 | | | | 11,298,146 | | | | 14,021,605 | | | | — | |
| International High Yield | | | 12,820,905 | | | | 12,929,582 | | | | — | | | | 35,347,088 | |
| J.P. Morgan EM | | | 1,106,273,534 | | | | 1,141,243,785 | | | | 98,675,150 | | | | 377,459,341 | |
| Moody’s Analytics BBB | | | 5,066,528 | | | | 5,107,275 | | | | — | | | | — | |
| Moody’s Analytics IG | | | 6,575,645 | | | | 6,651,192 | | | | — | | | | — | |
| Mortgage REIT | | | 37,518,922 | | | | 35,910,209 | | | | 98,124,984 | | | | 21,788,578 | |
| Preferred Securities | | | 455,642,902 | | | | 353,633,348 | | | | 560,126,375 | | | | 40,761,026 | |
Note 6—Income Taxes—As of April 30, 2024, for Federal income tax purposes, the identified tax cost, gross unrealized appreciation, gross unrealized depreciation and net unrealized appreciation (depreciation) of investments owned were as follows:
Fund | | Tax Cost of
Investments | | | Gross
Unrealized
Appreciation | | | Gross
Unrealized
Depreciation | | | Net Unrealized
Appreciation
(Depreciation) | |
| BDC Income | | | $1,128,444,019 | | | | $79,883,404 | | | | $(33,507,380) | | | | $46,376,024 | |
| China Bond | | | 22,247,392 | | | | 114,864 | | | | (1,445,459) | | | | (1,330,595) | |
| Dynamic Income | | | 758,532 | | | | 34,002 | | | | (4,301) | | | | 29,701 | |
| Emerging Markets High Yield | | | 388,161,239 | | | | 4,139,277 | | | | (34,272,547) | | | | (30,133,270) | |
| Fallen Angel | | | 3,190,107,802 | | | | 33,608,413 | | | | (207,663,331) | | | | (174,054,918) | |
| Floating Rate | | | 1,515,382,061 | | | | 10,475,338 | | | | (2,416,023) | | | | 8,059,315 | |
| Green Bond | | | 100,959,599 | | | | 397,458 | | | | (9,219,389) | | | | (8,821,931) | |
| International High Yield | | | 33,625,354 | | | | 396,634 | | | | (3,431,414) | | | | (3,034,780) | |
| J.P. Morgan EM | | | 3,079,633,116 | | | | 59,407,442 | | | | (404,029,858) | | | | (344,622,416) | |
| Moody’s Analytics BBB | | | 8,552,614 | | | | 78,258 | | | | (487,183) | | | | (408,925) | |
| Moody’s Analytics IG | | | 13,099,115 | | | | 83,537 | | | | (953,109) | | | | (869,572) | |
| Mortgage REIT | | | 335,777,528 | | | | 5,426,473 | | | | (61,063,404) | | | | (55,636,931) | |
| Preferred Securities | | | 1,705,832,963 | | | | 32,787,658 | | | | (155,053,400) | | | | (122,265,742) | |
At April 30, 2024, the components of total distributable earnings (loss) on a tax basis, for each Fund, were as follows:
| Fund | | Undistributed
Ordinary
Income | | (Accumulated
Capital Losses)/
Undistributed
Capital Gains | | Post-October
Losses
Deferred* | | Other
Temporary
Differences | | Unrealized
Appreciation
(Depreciation) | | Total
Distributable
Earnings (Loss) |
| BDC Income | | | $– | | | | $(103,072,184) | | | | $– | | | | $(9,394) | | | | $46,376,024 | | | | $(56,705,554) | |
| China Bond | | | – | | | | (32,113) | | | | (814,997) | | | | (1,491) | | | | (1,335,536) | | | | (2,184,137) | |
| Dynamic Income | | | – | | | | – | | | | – | | | | – | | | | 29,701 | | | | 29,701 | |
| Emerging Markets High Yield | | | 1,764,767 | | | | (209,338,019) | | | | – | | | | (134,326) | | | | (30,133,277) | | | | (237,840,855) | |
| Fallen Angel | | | 15,832,986 | | | | (445,798,191) | | | | – | | | | (67,964) | | | | (174,054,918) | | | | (604,088,087) | |
| Floating Rate | | | 7,682,503 | | | | (6,275,958) | | | | – | | | | (21,617) | | | | 8,059,315 | | | | 9,444,243 | |
| Green Bond | | | 286,174 | | | | (4,700,283) | | | | – | | | | (1,074) | | | | (8,821,950) | | | | (13,237,133) | |
| International High Yield | | | – | | | | (18,423,099) | | | | (133,983) | | | | (36,396) | | | | (3,037,298) | | | | (21,630,776) | |
| J.P. Morgan EM | | | – | | | | (446,936,551) | | | | (112,162,376) | | | | 6,616,259 | | | | (345,847,018) | | | | (898,329,686) | |
| Moody’s Analytics BBB | | | 34,134 | | | | (1,330,430) | | | | – | | | | – | | | | (408,925) | | | | (1,705,221) | |
| Moody’s Analytics IG | | | 48,863 | | | | (1,785,616) | | | | – | | | | – | | | | (869,571) | | | | (2,606,324) | |
| Mortgage REIT | | | – | | | | (126,864,808) | | | | – | | | | (16,360) | | | | (55,636,931) | | | | (182,518,099) | |
| Preferred Securities | | | 11,784,132 | | | | (102,681,580) | | | | – | | | | (5,579,753) | | | | (122,265,742) | | | | (218,742,943) | |
*Post-October losses represent certain ordinary, specified and / or capital losses incurred after October 31, 2023. These losses are deemed to arise on the first day of the funds’ next taxable year.
The tax character of distributions paid to shareholders was as follows:
| | | April 30, 2024 | | | April 30, 2023 | |
| Fund | | Ordinary
Income* | | | Long-Term
Capital Gains | | | Return
of Capital | | | Ordinary
Income* | | | Return
of Capital | |
| BDC Income | | $89,851,157 | | | $– | | | $187,793 | | | $59,501,743 | | | $1,673,017 | |
| China Bond | | – | | | – | | | 1,040,340 | | | – | | | 1,816,350 | |
| Dynamic Income | | 37,834 | | | 1,085 | | | 4,123 | | | 11,730 | | | 1,494 | |
| Emerging Markets High Yield | | 24,467,300 | | | – | | | – | | | 37,523,220 | | | – | |
| Fallen Angel | | 159,923,520 | | | – | | | – | | | 148,186,700 | | | – | |
| Floating Rate | | 77,301,370 | | | – | | | – | | | 39,541,190 | | | – | |
| Green Bond | | 2,789,760 | | | – | | | – | | | 2,159,765 | | | – | |
| International High Yield | | 1,811,747 | | | – | | | 464,333 | | | 2,745,823 | | | 324,327 | |
| J.P. Morgan EM | | 74,799,534 | | | – | | | 116,037,962 | | | 23,143,273 | | | 149,840,524 | |
| Moody’s Analytics BBB | | 395,240 | | | – | | | – | | | 299,760 | | | – | |
| Moody’s Analytics IG | | 577,080 | | | – | | | – | | | 430,440 | | | – | |
| Mortgage REIT | | 23,290,638 | | | – | | | 2,175,757 | | | 16,885,952 | | | 5,467,268 | |
| Preferred Securities | | 103,210,465 | | | – | | | – | | | 62,856,300 | | | – | |
VANECK ETF TRUST
NOTES TO FINANCIAL STATEMENTS
(continued)
*Includes short-term capital gains (if any).
At April 30, 2024, the Funds had capital loss carryforwards available to offset future capital gains, as follows:
| Fund | | Short-Term
Capital Losses
with No Expiration | | Long-Term
Capital Losses
with No Expiration | | Total |
| BDC Income | | $ | (40,799,495 | ) | | $ | (62,272,689 | ) | | $ | (103,072,184 | ) |
| China Bond | | | – | | | | (32,113 | ) | | | (32,113 | ) |
| Emerging Markets High Yield | | | (84,628,310 | ) | | | (124,709,709 | ) | | | (209,338,019 | ) |
| Fallen Angel | | | (138,922,175 | ) | | | (306,876,016 | ) | | | (445,798,191 | ) |
| Floating Rate | | | (3,507,250 | ) | | | (2,768,708 | ) | | | (6,275,958 | ) |
| Green Bond | | | (1,553,585 | ) | | | (3,146,698 | ) | | | (4,700,283 | ) |
| International High Yield | | | (2,525,144 | ) | | | (15,897,955 | ) | | | (18,423,099 | ) |
| J.P. Morgan EM | | | (125,158,514 | ) | | | (321,778,037 | ) | | | (446,936,551 | ) |
| Moody’s Analytics BBB | | | (328,413 | ) | | | (1,002,017 | ) | | | (1,330,430 | ) |
| Moody’s Analytics IG | | | (266,864 | ) | | | (1,518,752 | ) | | | (1,785,616 | ) |
| Mortgage REIT | | | (22,977,063 | ) | | | (103,887,745 | ) | | | (126,864,808 | ) |
| Preferred Securities | | | (37,436,543 | ) | | | (65,245,037 | ) | | | (102,681,580 | ) |
During the year ended April 30, 2024, Dynamic High Income and Floating Rate utilized $2,103 and $558,188, respectively, of their capital loss carryforward available from prior years.
During the year ended April 30, 2024, as a result of permanent book to tax differences, primarily due to the tax treatment of in-kind redemptions, the Funds incurred differences that affected total distributable earnings (loss) and aggregate paid in capital by the amounts in the table below. Net assets were not affected by these reclassifications.
| Fund | | Increase
(Decrease)
in Total Distributable
Earnings (Loss) | | Increase
(Decrease)
in Aggregate
Paid in Capital |
| BDC Income | | $ | (11,012,397 | ) | | $ | 11,012,397 | |
| China Bond | | | 4,652,821 | | | | (4,652,821 | ) |
| Emerging Markets High Yield | | | 9,187,684 | | | | (9,187,684 | ) |
| Fallen Angel | | | 12,654 | | | | (12,654 | ) |
| Floating Rate | | | (385,501 | ) | | | 385,501 | |
| International High Yield | | | 3,745,300 | | | | (3,745,300 | ) |
| J.P. Morgan EM | | | 19,700,157 | | | | (19,700,157 | ) |
| Mortgage REIT | | | (2,740,181 | ) | | | 2,740,181 | |
| Preferred Securities | | | (3,792,886 | ) | | | 3,792,886 | |
Realized gains or losses attributable to fluctuations in foreign exchange rates on investments and other foreign currency denominated assets and liabilities result in permanent book to tax differences, which may affect the tax character of distributions and undistributed net investment income at the end of the Funds’ fiscal year and may result in a tax return of capital.
The Funds recognize the tax benefits of uncertain tax positions only where the position is “more-likely-than-not” to be sustained assuming examination by applicable tax authorities. Management has analyzed the Funds’ tax positions, and has concluded that no liability for unrecognized tax benefits should be recorded related to uncertain tax positions taken on return filings for all open tax years. The Funds do not have exposure for additional years that might still be open in certain foreign jurisdictions. Therefore, no provision for income tax is required in the Funds’ financial statements. However, the Funds are subject to foreign taxes on the appreciation in value of certain investments. The Funds provide for such taxes on both realized and unrealized appreciation.
The Funds recognize interest and penalties, if any, related to uncertain tax positions as income tax expense in the Statements of Operations. During the year ended April 30, 2024, the Funds did not incur any interest or penalties.
China generally imposes withholding tax (“WHT”) at a rate of 10% (which may be reduced by the double taxation agreement/arrangement) on interest income derived by nonresidents in the Chinese corporate bond market, including Qualified Foreign Institutional Investors (“QFII”), Renminbi Qualified Foreign Institutional Investors (“RQFIIs”) and investors in the China Bond Connect Program.
On November 7, 2018, the PRC issued guidance (Circular 108) clarifying that nonresidents (including QFIIs, and RQFIIs) are exempted from withholding income tax and value added tax with respect to bond interest income derived in the Chinese domestic bond market from November 7, 2018 to November 6, 2021. On November 26, 2021, the PRC Ministry of Finance and PRC State Taxation Administration jointly issued Caishui [2021] No. 34 (“Circular 34”) to formally extend the tax exemption period provided in Circular 108 to December 31, 2025.
Additionally, under the PRC Corporate Income Tax regime, China also imposes WHT at a rate of 10% (subject to treaty relief) on PRC-sourced capital gains derived by nonresident enterprises, provided that the nonresident enterprises (i) do not have places of business, establishments or permanent establishments in the PRC; and (ii) are not PRC tax resident enterprises. However, capital gains derived by a nonresident pursuant to an RQFII license and investments through the China Bond Connect Program from the transfer of bonds issued by PRC entities are considered to be non PRC-sourced and therefore not subject to WHT.
PRC rules for taxation of RQFIIs (and QFIIs) and investment through the China Bond Connect Program are evolving and future tax guidance issued by the PRC State Administration of Taxation and/or PRC Ministry of Finance may apply retroactively regarding the tax treatment of capital gains derived from the transfer of Chinese bonds by nonresidents, even if such rules are adverse to China Bond and J.P. Morgan EM and their shareholders. If the PRC tax authorities were to issue differing formal guidance or tax rules regarding capital gains from Chinese Bonds to RQFIIs, which is the former Sub-Adviser in this case, and begin collecting capital gains tax, China Bond could be subject to a tax liability via the former Sub-Adviser. If the PRC tax authorities were to issue differing formal guidance or tax rules regarding capital gains from Chinese Bond investments made through the Bond Connect Program, and begin collecting capital gains tax, China Bond and J.P. Morgan EM could be subject to a tax liability. The impact of any such tax liability on the return for China Bond and J.P. Morgan EM could be substantial.
Note 7—Principal Risks—Non-diversified funds generally hold securities of fewer issuers than diversified funds (see Note 1) and may be more susceptible to the risks associated with these particular issuers, or to a single economic, political or regulatory occurrence affecting these issuers.
Investments in bonds or in Funds holding bonds involve risks, including market fluctuations caused by factors such as economic and political developments, changes in interest rates and perceived trends in security prices.
The Funds (except BDC Income, China Bond, Floating Rate, Mortgage REIT and Preferred Securities) may directly or indirectly invest in non-investment grade securities, often referred to as “junk bonds.” Economic downturns may disrupt the high yield market and impair the ability of issuers to repay principal and interest. These high yield securities may involve greater risks and considerations not typically associated with investing in U.S. government bonds and other high quality fixed-income securities. Also, an increase in interest rates would likely have an adverse impact on the value of such obligations. Moreover, high yield securities may be less liquid to the extent that there is no established retail secondary market. These Funds may not be able to sell bonds at desired prices and large purchases or sales of certain high-yield bond issues may cause substantial fluctuations in share price, yield and total return.
Additionally, certain Funds may invest in securities of emerging market issuers, which are exposed to a number of risks that may make these investments volatile in price or difficult to trade. Political risks may include unstable governments, nationalization, restrictions on foreign ownership, laws that prevent investors from getting their money out of a country, sanctions and investment restrictions and legal systems that do not protect property risks as well as the laws of the United States. These and other factors can make emerging market securities more volatile and potentially less liquid than securities issued in more developed markets. These risks include devaluation of currencies, currency controls, less reliable information about
VANECK ETF TRUST
NOTES TO FINANCIAL STATEMENTS
(continued)
issuers, different securities transaction clearance and settlement practices, future adverse economic developments and political conflicts, or natural or other disasters, such as the recent coronavirus outbreak. Certain securities of Chinese issuers are, or may in the future become restricted, and the Funds may be forced to sell such restricted securities and incur a loss as a result.
BDC Income invests in business development companies which generally invest in less mature private companies or thinly traded U.S. public companies which involve greater risk than well-established publicly-traded companies.
China Bond, Emerging Markets High Yield, Fallen Angel, Green Bond, International High Yield, Floating Rate, J.P. Morgan EM, Moody’s Analytics BBB, and Moody’s Analytics IG invest in foreign securities. Investments in foreign securities may involve a greater degree of risk than investments in domestic securities due to political, economic or social instability. Foreign investments may also be subject to foreign taxes and settlement delays. Since the Funds may have significant investments in foreign debt securities, they may be subject to greater credit and interest risks and greater currency fluctuations than portfolios with significant investments in domestic debt securities.
Dynamic High Income ETF may concentrate its investments in ETPs that invest directly in, or have exposure to, equity and debt securities. Such investments may subject the ETPs to greater volatility than investments in traditional securities. The Fund is dependent on the performance of underlying funds and is subject to the risks of those funds.
Green Bond may invest in bonds whose proceeds are used principally for climate mitigation, climate adaption or other environmentally beneficial projects. Some “green” investments may be dependent on government tax incentives and subsidies and on political support for certain environmental technologies and companies.
Moody’s Analytics BBB invests in BBB-rated bonds, which are typically subject to greater risk of downgrade than other investment grade bonds. The risk of downgrade to below-investment grade will be heightened during an economic downturn or a substantial period of rising interest rates. Any downgrade of such bonds would relegate them from the investment grade universe to the high yield (or “junk” bond) universe, which could negatively affect their value.
Mortgage REIT invests directly in mortgage real estate investment trusts (“mortgage REITs”) and is exposed to the risks specific to the real estate market as well as the risks that relate specifically to the way in which mortgage REITs are organized and operated. Mortgage REITs receive principal and interest payments from the owners of the mortgaged properties. Accordingly, mortgage REITs are subject to the credit risk of the borrowers to whom they extend credit. To the extent that a mortgage REIT invests in mortgage-backed securities, it may be subject to default risk or interest rate risk. Mortgage REIT may invest in mortgage REITs that may trade at a discount or premium to their net asset value.
Preferred Securities invests in preferred securities which are essentially contractual obligations that declare distributions but permit the issuer to defer or suspend distributions. For tax purposes, this may require the Fund to account for the distribution that has been deferred or suspended, even though it may not have received this income. Preferred securities are also subject to credit risk. Credit risk refers to the possibility that the issuer of a security will be unable and/or unwilling to make timely distributions of dividends. In addition, preferred securities are subject to interest rate risk. Preferred securities interest rates may move in an inverse direction to that of general interest rates.
Preferred Securities may invest directly in real estate investment trusts (“REITs”) and is exposed to the risk of owning real estate directly, as well as to risks that relate specifically to the way in which REITs are organized and operated. REITs generally invest directly in real estate, in mortgages or in some combination of the two. The Fund indirectly bears management expenses along with the direct expenses of the Fund. Individual REITs may own a limited number of properties and may concentrate in a particular region or property type. REITs may also be subject to heavy cash flow dependency, default by borrowers and self-liquidation.
Should the Chinese government impose restrictions on the ability of China Bond to repatriate funds associated with direct investment in bonds issued in the PRC, the Fund may be unable to satisfy distribution requirements applicable to regulated investment companies (“RICs”) under the Internal Revenue Code of 1986, as amended (the “Internal Revenue Code”), and the Fund may therefore be subject to Fund-level U.S. federal taxes.
A more complete description of risks is included in each Fund’s Prospectus and Statement of Additional Information.
Note 8—Trustee Deferred Compensation Plan—The Trust has a Deferred Compensation Plan (the “Plan”) for Trustees under which the Trustees can elect to defer receipt of their trustee fees until retirement, disability or termination from the Board of Trustees. The fees otherwise payable to the participating Trustees are deemed invested in shares of the Funds as directed by the Trustees.
A unitary management fee was adopted on May 1, 2021, for BDC Income, Emerging Markets High Yield, Fallen Angel, Green Bond, International High Yield, Floating Rate, Mortgage REIT, and Preferred Securities. For these Funds, the liability for the Plan shown as “Deferred Trustee fees” in the Statements of Assets and Liabilities represents amounts accrued through April 30, 2021. Dynamic Income, Moody’s Analytics BBB and Moody’s Analytics IG commenced operations with a unitary management fee and therefore bear no costs or liabilities relative to the Plan.
For China Bond and J.P. Morgan EM, the expense for the Plan is included in “Trustees’ fees and expenses” in the Statements of Operations, and the liability for the Plan is shown as “Deferred Trustee fees” in the Statements of Assets and Liabilities.
Note 9—Securities Lending—To generate additional income, each of the Funds may lend its securities pursuant to a securities lending agreement with the securities lending agent. Each Fund may lend up to 33% of its investments requiring that the loan be continuously collateralized by cash, cash equivalents, U.S. government securities, or any combination of cash and such securities at all times equal to at least 102% (105% for foreign securities) of the market value of securities loaned. Daily market fluctuations could cause the value of loaned securities to be more or less than the value of the collateral received. When this occurs, the collateral is adjusted and settled on the next business day. During the term of the loan, the Funds will continue to receive any dividends, interest or amounts equivalent thereto, on the securities loaned while receiving a fee from the borrower and or earning interest on the investment of the cash collateral. Such fees and interest are shared with the securities lending agent under the terms of the securities lending agreement. Securities lending income is disclosed as such in the Statements of Operations. Cash collateral is maintained on the Funds’ behalf by the lending agent and is invested in the State Street Navigator Securities Lending Government Money Market Portfolio. Non-cash collateral consists of U.S. Treasuries and U.S. Government Agency securities, and is not disclosed in the Funds’ Schedules of Investments or Statements of Assets and Liabilities as it is held by the agent on behalf of the Funds. The Funds do not have the ability to re-hypothecate those securities. Loans are subject to termination at the option of the borrower or the Funds. Upon termination of the loan, the borrower will return to the Fund securities identical to the securities loaned. The Funds bear the risk of delay in recovery of, or even loss of rights in, the securities loaned should the borrower of the securities fail financially. The value of loaned securities and related cash collateral, if any, at April 30, 2024 is presented on a gross basis in the Schedules of Investments and Statements of Assets and Liabilities. The following is a summary of the Funds’ securities on loan and related collateral as of April 30, 2024:
| Fund | | Market Value
of Securities
on Loan | | Cash
Collateral | | Non-Cash
Collateral | | Total
Collateral |
| BDC Income | | $ | 139,211,087 | | | $ | 89,871,466 | | | $ | 55,225,051 | | | $ | 145,096,517 | |
| Emerging Markets High Yield | | | 12,053,662 | | | | 9,793,937 | | | | 2,758,350 | | | | 12,552,287 | |
| Fallen Angel | | | 180,703,191 | | | | 147,489,017 | | | | 52,717,497 | | | | 200,206,514 | |
| Floating Rate | | | 3,804,013 | | | | 4,149,731 | | | | 716,763 | | | | 4,866,494 | |
| Green Bond | | | 3,184,026 | | | | 1,573,215 | | | | 1,733,230 | | | | 3,306,445 | |
VANECK ETF TRUST
NOTES TO FINANCIAL STATEMENTS
(continued)
| Fund | | Market Value
of Securities
on Loan | | Cash
Collateral | | Non-Cash
Collateral | | Total
Collateral |
| International High Yield | | | 944,012 | | | | 860,040 | | | | 149,090 | | | | 1,009,130 | |
| J.P. Morgan EM | | | 5,532,214 | | | | 5,691,051 | | | | – | | | | 5,691,051 | |
| Moody’s Analytics BBB | | | 237,762 | | | | – | | | | 249,565 | | | | 249,565 | |
| Moody’s Analytics IG | | | 386,890 | | | | 45,033 | | | | 359,643 | | | | 404,676 | |
| Mortgage REIT | | | 71,854,807 | | | | 24,490,136 | | | | 50,613,804 | | | | 75,103,940 | |
The following table presents money market fund investments held as collateral by type of security on loan as of April 30, 2024:
| | | Gross Amount of Recognized Liabilities for Securities Lending Transactions*
in the Statements of Assets and Liabilities |
| Fund | | Corporate Bonds | | Equity Securities | | Government
Obligations |
| BDC Income | | $ | – | | | $ | 89,871,466 | | | $ | – | |
| Emerging Markets High Yield | | | 9,793,937 | | | | – | | | | – | |
| Fallen Angel | | | 147,489,017 | | | | – | | | | – | |
| Floating Rate | | | 4,149,731 | | | | – | | | | – | |
| Green Bond | | | 1,314,915 | | | | 110,250 | | | | 148,050 | |
| International High Yield | | | 860,040 | | | | – | | | | – | |
| J.P. Morgan EM | | | – | | | | – | | | | 5,691,051 | |
| Moody’s Analytics IG | | | 45,033 | | | | – | | | | – | |
| Mortgage REIT | | | – | | | | 24,490,136 | | | | – | |
| * | Remaining contractual maturity: overnight and continuous |
Note 10—Bank Line of Credit—The Funds may participate in a $200 million committed credit facility (the “Facility”) to be utilized for temporary financing until the settlement of sales or purchases of portfolio securities, the repurchase or redemption of shares of the Funds at the request of the shareholders and other temporary or emergency purposes. The Funds have agreed to pay commitment fees, pro rata, based on the unused but available balance. Interest is charged to the Funds based on prevailing market rates in effect at the time of borrowings. During the year ended April 30, 2024, the following Funds borrowed under this Facility:
| Fund | | Days
Outstanding | | | Average
Daily
Loan Balance | | | Average
Interest Rate |
| BDC Income | | | 252 | | | | $3,848,195 | | | | 6.61 | % |
| China Bond | | | 4 | | | | 2,154,561 | | | | 6.42 | |
| Fallen Angel | | | 5 | | | | 2,037,770 | | | | 6.48 | |
| J.P. Morgan EM | | | 22 | | | | 3,371,913 | | | | 6.65 | |
| Moody’s Analytics IG | | | 1 | | | | 213,761 | | | | 6.68 | |
| Mortgage REIT | | | 188 | | | | 2,236,108 | | | | 6.65 | |
| Preferred Securities | | | 65 | | | | 4,287,503 | | | | 6.53 | |
Outstanding loan balances as of April 30, 2024, if any, are reflected in the Statements of Assets and Liabilities.
Note 11—New Regulatory Requirements—On October 26, 2022, the Securities and Exchange Commission (SEC) adopted rule and form amendments that require mutual funds and exchange-traded funds (ETFs) that are registered on Form N-1A to prepare and transmit tailored unaudited annual and semi-annual shareholder reports (TSRs), that highlight key information to investors, within 60 days of period-end. The new TSRs will be prepared separately for each fund.
In connection with these amendments, certain information that was previously disclosed in fund shareholder reports will instead be made available online, delivered free of charge upon request, and filed on a semiannual basis on Form N-CSR which will be available at https://www.sec.gov.
The SEC also amended Rule 30e-3 under the Investment Company Act, to require mutual funds and ETFs to provide TSRs directly to investors by mail (unless an investor elects electronic delivery). These rules are effective January 24, 2023, and the compliance date is July 24, 2024.
Note 12—Subsequent Event Review—Effective after the close of trading on the NYSE Arca, Inc. on May 31, 2024, the China Bond ETF changed its benchmark index from the ChinaBond China High Quality Bond Index to the FTSE Chinese Broad Bond 0-10 Years Diversified Select Index.
VANECK ETF TRUST
REPORT OF INDEPENDENT REGISTERED PUBLIC ACCOUNTING FIRM
To the Board of Trustees of VanEck ETF Trust and Shareholders of each of the thirteen funds listed in the table below
Opinions on the Financial Statements
We have audited the accompanying statements of assets and liabilities, including the schedules of investments, of each of the funds listed in the table below (thirteen of the funds constituting VanEck ETF Trust, hereafter collectively referred to as the “Funds”) as of April 30, 2024, the related statements of operations and of changes in net assets for each of the periods indicated in the table below, including the related notes and the financial highlights for each of the periods indicated in the table below (collectively referred to as the “financial statements”). In our opinion, the financial statements present fairly, in all material respects, the financial position of each of the Funds listed in the table below as of April 30, 2024, the results of each of their operations, the changes in each of their net assets and each of the financial highlights for each of the periods indicated in the table below, in conformity with accounting principles generally accepted in the United States of America.
| Funds | | |
| | | |
| VanEck BDC Income ETF (1) | VanEck International High Yield Bond ETF (1) |
| VanEck China Bond ETF (1) | VanEck J.P. Morgan EM Local Currency Bond ETF (1) |
| VanEck Dynamic High Income ETF (2) | VanEck Moody’s Analytics BBB Corporate Bond ETF (1) |
| VanEck Emerging Markets High Yield Bond ETF (1) | VanEck Moody’s Analytics IG Corporate Bond ETF (1) |
| VanEck Fallen Angel High Yield Bond ETF (1) | VanEck Mortgage REIT Income ETF (1) |
| VanEck Green Bond ETF (1) | VanEck Preferred Securities ex Financials ETF (1) |
| VanEck IG Floating Rate ETF (1) | |
(1) Statement of operations for the year ended April 30, 2024 and the statement of changes in net assets and financial highlights for each of the two years in the period ended April 30, 2024. (2) Statement of operations for the year ended April 30, 2024 and the statement of changes in net assets and financial highlights for the year ended April 30, 2024 and the period November 2, 2022 (commencement of operations) through April 30, 2023.
The financial statements of the Funds (other than VanEck Dynamic High Income ETF) as of and for the year or period ended April 30, 2022, and the financial highlights for each of the periods ended on or prior to April 30, 2022 (not presented herein, other than the financial highlights) were audited by other auditors whose report dated June 23, 2022, expressed an unqualified opinion on those financial statements and financial highlights.
Basis for Opinions
These financial statements are the responsibility of the Funds’ management. Our responsibility is to express an opinion on the Funds’ financial statements based on our audits. We are a public accounting firm registered with the Public Company Accounting Oversight Board (United States) (PCAOB) and are required to be independent with respect to the Funds in accordance with the U.S. federal securities laws and the applicable rules and regulations of the Securities and Exchange Commission and the PCAOB.
We conducted our audits of these financial statements in accordance with the standards of the PCAOB. Those standards require that we plan and perform the audit to obtain reasonable assurance about whether the financial statements are free of material misstatement, whether due to error or fraud.
Our audits included performing procedures to assess the risks of material misstatement of the financial statements, whether due to error or fraud, and performing procedures that respond to those risks. Such procedures included examining, on a test basis, evidence regarding the amounts and disclosures in the financial statements. Our audits also included evaluating the accounting principles used and significant estimates made by management, as well as evaluating the overall presentation of the financial statements. Our procedures included confirmation of securities owned as of April 30, 2024, by correspondence with the
custodian, transfer agent and brokers; when replies were not received from brokers, we performed other auditing procedures. We believe that our audits provide a reasonable basis for our opinions.
/s/PricewaterhouseCoopers LLP
New York, New York
June 26, 2024
We have served as the auditor of one or more investment companies in the VanEck Funds complex since 2022.
VANECK ETF TRUST
TAX INFORMATION
(unaudited)
The information set forth below is for each Fund’s fiscal year. Shareholders, however, must report dividends on a calendar year basis for income tax purposes, which may include dividends for portions of two fiscal years of a Fund. Accordingly, the information needed by shareholders for calendar year 2024 income tax purposes will be sent to them in early 2025. Please consult your tax advisor for additional information regarding the treatment of these distributions.
| Fund Name | | Ticker
Symbol | | Payable
Date | | Total
Distribution
Paid
Per Share | | | Return of
Capital (a) | | | Income
Dividends | | | Foreign
Taxes
Paid (b) | | | Total
Ordinary
Income
Dividends | | | Foreign
Source
Income as
a % of Total
Ordinary
Income (b) | |
| China Bond | | CBON | | | Monthly | | | | $0.6851 | | | | $0.6851 | | | | $- | | | | $- | | | | $- | | | | -% | |
| Emerging Markets High Yield | | HYEM | | | Monthly | | | | 1.1741 | | | | - | | | | 1.1741 | | | | 0.0001 | | | | 1.1742 | | | | 94.04 | |
| Fallen Angel | | ANGL | | | Monthly | | | | 1.5996 | | | | - | | | | 1.5996 | | | | - | | | | 1.5996 | | | | - | |
| Floating Rate | | FLTR | | | Monthly | | | | 1.5817 | | | | - | | | | 1.5817 | | | | - | | | | 1.5817 | | | | - | |
| Green Bond | | GRNB | | | Monthly | | | | 0.7940 | | | | - | | | | 0.7940 | | | | 0.0003 | | | | 0.7943 | | | | 57.78 | |
| International High Yield | | IHY | | | Monthly | | | | 1.1175 | | | | 0.2363 | | | | 0.8812 | | | | 0.0005 | | | | 0.8817 | | | | 100.00 | |
| J.P. Morgan EM | | EMLC | | | Monthly | | | | 1.5288 | | | | 0.9300 | | | | 0.5988 | | | | 0.0298 | | | | 0.6286 | | | | 100.00 | |
| Moody’s Analytics BBB | | MBBB | | | Monthly | | | | 0.9881 | | | | - | | | | 0.9881 | | | | - | | | | 0.9881 | | | | - | |
| Moody’s Analytics IG | | MIG | | | Monthly | | | | 0.9618 | | | | - | | | | 0.9618 | | | | - | | | | 0.9618 | | | | - | |
| Fund Name | | Ticker Symbol | | Payable
Date | | Section 163(j)-
Interest
Dividends as
a % of the
Total Ordinary
Income
Distribution (c) | | Qualified
Interest
Income
(QII) as a %
of the Total
Ordinary Income
Distribution (d) |
| Emerging Markets High Yield | | HYEM | | Monthly | | | 94.21 | % | | | - | % |
| Fallen Angel | | ANGL | | Monthly | | | 94.47 | | | | 77.77 | |
| Floating Rate | | FLTR | | Monthly | | | 99.54 | | | | 61.34 | |
| Green Bond | | GRNB | | Monthly | | | 94.28 | | | | 38.63 | |
| International High Yield | | IHY | | Monthly | | | 94.39 | | | | - | |
| J.P. Morgan EM | | EMLC | | Monthly | | | 99.44 | | | | - | |
| Moody’s Analytics BBB | | MBBB | | Monthly | | | 98.49 | | | | 76.29 | |
| Moody’s Analytics IG | | MIG | | Monthly | | | 97.29 | | | | 66.78 | |
(a) A return of capital is not considered taxable income to shareholders. Shareholders who received these distributions should not include these amounts in taxable income and should treat them as a reduction of the cost basis of the applicable shares upon which these distributions were paid. In order to compute the required adjustment to cost basis, a shareholder should use the more detailed information provided on Form 8937 - Organizational Actions Affecting Basis provided on the funds’ website at www.vaneck.com.
(b) Funds with an amount in these columns have qualified to pass-through foreign taxes and foreign source income to their shareholders.
Accordingly, shareholders may include their share of foreign source income on Form 1116 (Form 1118 for corporations) and may either deduct your portion of the taxes in computing your taxable income or take a credit for such taxes against your tax liability. To determine your portion of foreign source income, multiply the dollar amount of your ordinary dividends by the percentage indicated.
(c) These amounts represent distributions paid during the taxable year ended April 30, 2024 that are eligible to be treated as interest income for purposes of Section 163(j) and the regulations thereunder. To treat a dividend as interest income, shareholders must have held shares on which the dividend was paid for at least 180 days during the 361-day period surrounding the ex-dividend date of the distribution.
(d) These amounts represent distributions paid during the taxable year ended April 30, 2024 that were considered to be Qualified Interest Income (“QII”) distributions. The QII distributions may be exempt from United States withholding tax when distributed to non-U.S. shareholders with proper documentation.
| Fund Name | | Ticker
Symbol | | Payable
Date | | Total
Distribution
Per Share | | Return
of Capital
(Non-Dividend)
Distribution (a) | | Ordinary
Income
Dividends | | Foreign
Taxes
Paid (b) | | Total
Ordinary
Income
Dividends | | Foreign
Source
Income as
a % of Total
Ordinary
Income (b) | | Long-term
Capital
Gains |
| BDC Income | | BIZD | | Quarterly | | | $1.7816 | | | | $0.0031 | | | | $1.7785 | | | | $- | | | | $1.7785 | | | | -% | | | | $- | |
| Dynamic Income | | INC | | Monthly | | | 1.4751 | | | | 0.1406 | | | | 1.2983 | | | | 0.0018 | | | | 1.3001 | | | | 19.72 | | | | 0.0362 | |
| Mortgage REIT | | MORT | | Quarterly | | | 1.2679 | | | | 0.1098 | | | | 1.1581 | | | | - | | | | 1.1581 | | | | - | | | | - | |
| Preferred Securities | | PFXF | | Monthly | | | 1.3417 | | | | - | | | | 1.3417 | | | | - | | | | 1.3417 | | | | - | | | | - | |
| Fund Name | | Ticker
Symbol | | Payable
Date | | Percent of
Ordinary
Income
Dividends
that are
QDI Eligible
(c) | | | Percent of
Ordinary
Income Dividends
that are
DRD Eligible (d) | | | Section 199A
QBI as a
Percent of
Ordinary
Income
Dividends (e) (f) | | | Section
163(j)-
Interest
Dividends
as a % of
the Total
Ordinary
Income
Distribution
(g) | | | Qualified
Interest
Income
(QII) as a %
of the Total
Ordinary
Income
Distribution
(h) | |
| BDC Income | | BIZD | | Quarterly | | | 0.68% | | | | 0.13% | | | | 0.31% | | | | 53.29% | | | | 72.99% | |
| Dynamic Income | | INC | | Quarterly | | | 17.71 | | | | 14.97 | | | | 6.86 | | | | 52.77 | | | | 34.76 | |
| Mortgage REIT | | MORT | | Quarterly | | | 2.66 | | | | - | | | | 77.79 | | | | - | | | | - | |
| Preferred Securities | | PFXF | | Monthly | | | 20.53 | | | | 17.12 | | | | 17.83 | | | | 41.92 | | | | 30.75 | |
(a) A return of capital is not considered taxable income to shareholders. Shareholders who received these distributions should not include these amounts in taxable income and should treat them as a reduction of the cost basis of the applicable shares upon which these distributions were paid. In order to compute the required adjustment to cost basis, a shareholder should use the more detailed information provided on Form 8937 - Organizational Actions Affecting Basis provided on the funds’ website at www.vaneck.com.
(b) Funds with an amount in these columns have qualified to pass-through foreign taxes and foreign source income to their shareholders. Accordingly, shareholders may include their share of foreign source income on Form 1116 (Form 1118 for corporations) and may either deduct your portion of the taxes in computing your taxable income or take a credit for such taxes against your tax liability. To determine your portion of foreign source income, multiply the dollar amount of your ordinary dividends by the percentage indicated.
(c) All or a portion of a shareholder’s ordinary income dividend may be taxed at a reduced capital gains rate rather than the higher marginal tax rates applicable to ordinary income. The amount of a dividend subject to this lower rate is known as Qualified Dividend Income or QDI and is reported in Box 1b of the Form 1099-DIV. Shareholders who received Form 1099-DIV should use the amounts reported to them on Form 1099-DIV when preparing their tax return.
To treat a dividend as qualifying for lower rates, shareholders must have held shares on which the dividend was paid for at least 61 days during the 121-day period beginning 60 days before the ex-dividend date of the distribution.
(d) QDI information does not apply to shareholders that are corporations for U.S. tax purposes. Corporate shareholders should use the information regarding the Dividends Received Deduction or DRD. This data is being provided to corporate shareholders in order for them to compute their share of dividends qualifying for the DRD for corporations. To determine your share of income eligible for the DRD, multiply the dollar amount of your ordinary dividends by the percentage indicated.
(e) The Section 199A amount represents the percentage of each Fund’s ordinary income distributions that represent Qualified Business Income (QBI) for purposes of the Internal Revenue Code Section 199A deduction. Section 199A allows a deduction of up to 20% on QBI for non-corporate taxpayers.
To treat a dividend as qualifying for the QBI or DRD, shareholders must have held shares on which the dividend was paid for at least 46 days during the 91-day period beginning 45 days before the ex-dividend date of the distribution.
(f) Amounts are estimated and subject to change. Shareholders should utilize the information on their 2024 Form 1099s received in 2025. (g) These amounts represent distributions paid during the taxable year ended April 30, 2024 that are eligible to be treated as interest income for purposes of Section 163(j) and the regulations thereunder. To treat a dividend as interest income, shareholders must have held shares on which the dividend was paid for at least 180 days during the 361-day period surrounding the ex-dividend date of the distribution. (h) These amounts represent distributions paid during the taxable year ended April 30, 2024 that were considered to be Qualified Interest Income (“QII”) distributions. The QII distributions may be exempt from United States withholding tax when distributed to non-U.S. shareholders with proper documentation.
VANECK ETF TRUST
BOARD OF TRUSTEES AND OFFICERS
April 30, 2023 (unaudited)
Name, Address1
and Year of Birth | | Position(s)
Held with
the Trust | | Term of
Office2 and
Length of
Time Served | | Principal Occupation(s)
During Past Five Years | | Number of
Portfolios
in Fund
Complex3
Overseen | | Other Directorships Held
By Trustee During Past Five Years |
| Independent Trustees | | | | | | | | | | |
| | | | | | | | | | | |
David H. Chow,
1957*† | | Trustee | | Since 2006 | | Founder and CEO, DanCourt Management LLC (financial/ strategy consulting firm and Registered Investment Adviser), March 1999 to present. | | 69 | | Trustee, Berea College of Kentucky, May 2009 to present and currently Chairman of the Investment Committee; Trustee, MainStay Fund Complex4, January 2016 to present and currently Chairman of the Investment Committee. Formerly, Member of the Governing Council of the Independent Directors Council, October 2012 to September 2020. |
| | | | | | | | | | | |
Laurie A. Hesslein,
1959*† | | Trustee | | Since 2019 | | Citigroup, Managing Director and Business Head, Local Consumer Lending North America, and CEO and President, CitiFinancial Servicing LLC (2013 - 2017). | | 69 | | Formerly, Trustee, First Eagle Senior Loan Fund, March 2017 to December 2021; and Trustee, Eagle Growth and Income Opportunities Fund, March 2017 to December 2020. |
| | | | | | | | | | | |
R. Alastair Short,
1953*† | | Trustee | | Since 2006 | | President, Apex Capital Corporation (personal investment vehicle). | | 79 | | Chairman and Independent Director, EULAV Asset Management; Lead Independent Director, Total Fund Solution; Independent Director, Contingency Capital, LLC; Trustee, Kenyon Review; Trustee, Children’s Village. Formerly, Independent Director, Tremont offshore funds. |
| | | | | | | | | | | |
| Peter J. Sidebottom, 1962*† | | Chairperson Trustee | | Since 2022
Since 2012 | | Global Lead Partner, Financial Services Strategy, Accenture, January 2021 to present; Lead Partner, North America Banking and Capital Markets Strategy, Accenture, May 2017 to December 2021. | | 69 | | Formerly, Board Member, Special Olympics, New Jersey, November 2011 to September 2013; Director, The Charlotte Research Institute, December 2000 to 2009; Board Member, Social Capital Institute, University of North Carolina Charlotte, November 2004 to January 2012; Board Member, NJ-CAN, July 2014 to 2016. |
| | | | | | | | | | | |
Richard D. Stamberger,
1959*† | | Trustee | | Since 2006 | | Senior Vice President, B2B, Future Plc (a global media company), July 2020 to August 2022; President, CEO and co-founder, SmartBrief, Inc., 1999 to 2020. | | 79 | | Director, Food and Friends, Inc., 2013 to present; Board Member, The Arc Foundation of the US, 2022 to present; Chairman, Lifetime Care Services, LLC, 2023 to present |
| | | | | | | | | | | |
| Interested Trustee | | | | | | | | | | |
| | | | | | | | | | | |
Jan F. van Eck,
19635 | | Trustee, Chief Executive Officer and President | | Trustee (Since 2006); Chief Executive Officer and President (Since 2009) | | Director, President and Chief Executive Officer of Van Eck Associates Corporation (VEAC), Van Eck Absolute Return Advisers Corporation (VEARA) and Van Eck Securities Corporation (VESC); Officer and/or Director of other companies affiliated with VEAC and/or the Trust | | 79 | | Director, National Committee on US-China Relations. |
| 1 | The address for each Trustee and officer is 666 Third Avenue, 9th Floor, New York, New York 10017. |
| 2 | Each Trustee serves until resignation, death, retirement or removal. Officers are elected yearly by the Trustees. |
| 3 | The Fund Complex consists of the VanEck Funds, VanEck VIP Trust and the Trust. |
| 4 | The MainStay Fund Complex consists of MainStay Funds, MainStay Funds Trust, MainStay VP Funds Trust and MainStay MacKay Defined Term Municipal Opportunities Fund. |
| 5 | “Interested person” of the Trust within the meaning of the Investment Company Act of 1940, as amended. Mr. van Eck is an officer of VEAC, VEARA and VESC. |
| * | Member of the Audit Committee. |
| † | Member of the Nominating and Corporate Governance Committee. |
Officer’s Name,
Address1 and
Year of Birth | | Position(s)
Held with
the Trust | | Term of Office2
And Length of
Time Served | | Principal Occupation(s) During Past Five Years |
| Officer Information | | | | | | |
| | | | | | | |
Lawrence G. Altadonna,
1966 | | Vice President and Treasurer | | Since 2024 | | Vice President of VEAC and VEARA; Officer of other investment companies advised by VEAC and VEARA. Formerly, Fund Assistant Treasurer and Vice President of Credit Suisse Asset Management, LLC (June 2022- January 2024). |
| | | | | | | |
Matthew A. Babinsky,
1983 | | Vice President and Assistant Secretary | | Vice President (Since 2023); Assistant Secretary (Since 2016) | | Vice President, Associate General Counsel and Assistant Secretary of VEAC, VEARA and VESC; Officer of other investment companies advised by VEAC and VEARA. Formerly, Assistant Vice President of VEAC, VEARA and VESC. |
| | | | | | | |
Russell G. Brennan,
1964 | | Assistant Vice President and Assistant Treasurer | | Since 2008 | | Assistant Vice President of VEAC; Officer of other investment companies advised by VEAC and VEARA. |
| | | | | | | |
Charles T. Cameron,
1960 | | Vice President | | Since 2006 | | Portfolio Manager of VEAC; Officer and/or Portfolio Manager of other investment companies advised by VEAC and VEARA. Formerly, Director of Trading of VEAC. |
| | | | | | | |
John J. Crimmins,
1957 | | Vice President, Chief Financial Officer and Principal Accounting Officer | | Vice President, Chief Financial Officer and Principal Accounting Officer (Since 2012) | | Vice President of VEAC and VEARA; Officer of other investment companies advised by VEAC and VEARA. Formerly, Vice President of VESC. Formerly, Treasurer of other investment companies advised by VEAC and VEARA. |
| | | | | | | |
Susan Curry,
1966 | | Assistant Vice President | | Since 2022 | | Assistant Vice President of VEAC, VEARA and VESC. Formerly, Managing Director, Legg Mason, Inc. |
| | | | | | | |
Eduardo Escario,
1975 | | Vice President | | Since 2012 | | Regional Director, Business Development/Sales for Southern Europe and South America of VEAC. |
| | | | | | | |
F. Michael Gozzillo,
1965 | | Chief Compliance Officer | | Since 2018 | | Vice President and Chief Compliance Officer of VEAC and VEARA; Chief Compliance Officer of VESC; Officer of other investment companies advised by VEAC and VEARA. Formerly, Chief Compliance Officer of City National Rochdale, LLC and City National Rochdale Funds. |
| | | | | | | |
Laura Hamilton,
1977 | | Vice President | | Since 2019 | | Assistant Vice President of VEAC and VESC; Officer of other investment companies advised by VEAC and VEARA. Formerly, Operations Manager of Royce & Associates. |
| | | | | | | |
Nicholas Jackson,
1974 | | Assistant Vice President | | Since 2018 | | Director, Business Development of VanEck Australia Pty Ltd. Formerly, Vice President, Business Development of VanEck Australia Pty Ltd. |
| | | | | | | |
Laura I. Martínez,
1980 | | Vice President and Assistant Secretary | | Vice President (Since 2016); Assistant Secretary (Since 2008) | | Vice President, Associate General Counsel and Assistant Secretary of VEAC, VEARA and VESC; Officer of other investment companies advised by VEAC and VEARA. |
| | | | | | | |
Matthew McKinnon,
1970 | | Assistant Vice President | | Since 2018 | | Head of Asia - Business Development of VanEck Australia Pty Ltd. Formerly, Director, Intermediaries and Institutions of VanEck Australia Pty Ltd. |
| | | | | | | |
Lisa A. Moss,
1965 | | Assistant Vice President and Assistant Secretary | | Since 2022 | | Assistant Vice President of VEAC, VEARA and VESC; Formerly, Senior Counsel, Perkins Coie LLP. |
| | | | | | | |
Arian Neiron,
1979 | | Vice President | | Since 2018 | | CEO (since 2021) & Managing Director and Head of Asia Pacific of VanEck Australia Pty Ltd.; Officer and/or Director of other companies affiliated with VEAC and/or the Trust. |
VANECK ETF TRUST
BOARD OF TRUSTEES AND OFFICERS
(unaudited) (continued)
James Parker,
1969 | | Assistant Treasurer | | Since 2014 | | Assistant Vice President of VEAC and VEARA; Manager, Portfolio Administration of VEAC and VEARA. Officer of other investment companies advised by VEAC and VEARA. |
| | | | | | | |
Adam Phillips,
1970 | | Vice President | | Since 2018 | | ETF Chief Operating Officer of VEAC; Director of other companies affiliated with VEAC. |
| | | | | | | |
Philipp Schlegel,
1974 | | Vice President | | Since 2016 | | Managing Director of Van Eck Switzerland AG. |
| | | | | | | |
Jonathan R. Simon,
1974 | | Senior Vice President, Secretary and Chief Legal Officer | | Senior Vice President (Since 2016);
Secretary and Chief Legal Officer (since 2014) | | Senior Vice President, General Counsel and Secretary of VEAC, VEARA and VESC; Officer and/or Director of other companies affiliated with VEAC and/or the Trust. Formerly, Vice President of VEAC, VEARA and VESC. |
| | | | | | | |
Andrew Tilzer,
1972 | | Assistant Vice President | | Since 2021 | | Vice President of VEAC and VEARA; Vice President of Portfolio Administration of VEAC. Formerly, Assistant Vice President, Portfolio Operations of VEAC. |
| 1 | The address for each Trustee and officer is 666 Third Avenue, 9th Floor, New York, New York 10017. |
| 2 | Officers are elected yearly by the Trustees. |
VANECK ETF TRUST
FUNDS’ LIQUIDITY RISK MANAGEMENT PROGRAM
(unaudited)
In accordance with Rule 22e-4 (the “Liquidity Rule”) under the 1940 Act, the Funds have implemented a Liquidity Risk Management Program (the “Program”). The Program outlines certain techniques, tools and arrangements employed for the assessment and management of Fund liquidity risk, and the terms, contents and frequency of reporting of certain issues to the Board. Liquidity is managed taking account of the Funds’ investment strategy, liquidity profile, and, importantly, the fact that for many Funds, redemptions are settled primarily as in-kind redemptions. In this regard, certain of the Funds qualify as “In-Kind ETFs” under the Liquidity Rule because they meet redemptions through in-kind transfers of securities, positions and assets other than a de minimis amount of cash and publish their portfolio holdings daily. In-Kind ETFs are exempt from the Liquidity Rule’s classification and highly liquid investment minimum (“HLIM”) provisions, discussed below.
Under the Program and in accordance with the Liquidity Rule, each Fund’s liquidity risk is assessed at least annually taking into consideration certain factors enumerated in the Liquidity Rule, as applicable. The Liquidity Rule calls for considering certain such factors under both normal and reasonably foreseeable stressed market conditions.
With respect to each Fund that does not qualify under the Liquidity Rule as an “In-Kind ETF,” the Liquidity Rule and the Program require that each portfolio holding be classified into one of four liquidity classification categories. The Liquidity Rule requires that such classification determinations be made taking into account relevant market, trading and investment-specific considerations as well as market depth. The relevant Funds utilize data from a third-party vendor to assist with these determinations.
Funds that do not qualify as “In-Kind ETFs” are also required to determine and periodically review an HLIM – a minimum percentage of Fund net assets that are to be invested in Highly Liquid Investments that are assets – and adopt certain related procedures. A Highly Liquid Investment is defined as cash and any investment reasonably expected to be convertible to cash in current market conditions in three business days or less without the conversion to cash significantly changing the market value of the investment.
The Liquidity Rule provides an exemption from the HLIM requirements for Funds that “primarily” hold Highly Liquid Investments, as defined in the Program. For the period January 1, 2023 to December 31, 2023 (the “Review Period”), the Funds that were not In-Kind ETFs qualified for an exemption and therefore have not determined an HLIM or adopted the related procedures.
The Board reviewed a report (“Report”) prepared by each Fund’s Adviser regarding the operation and effectiveness of the Program for the Review Period. The Report noted that, during the Review Period, the Funds maintained a high level of liquidity and primarily held assets that are defined under the Liquidity Rule as “Highly Liquid Investments.” The Report also noted the effectiveness of the Funds’ liquidity risk management during such time. Further information on liquidity risks applicable to the Fund can be found in the Fund’s prospectus.
This report is intended for the Funds’ shareholders. It may not be distributed to prospective investors unless it is preceded or accompanied by a VanEck ETF Trust (the “Trust”) prospectus and summary prospectus, which includes more complete information. Investing involves substantial risk and high volatility, including possible loss of principal. An investor should consider the investment objective, risks, charges and expenses of the Fund carefully before investing. To obtain a prospectus and summary prospectus, which contains this and other information, call 800.826.2333 or visit vaneck.com. Please read the prospectus and summary prospectus carefully before investing.
Additional information about the Trust’s Board of Trustees/Officers and a description of the policies and procedures the Trust uses to determine how to vote proxies relating to portfolio securities are provided in the Statement of Additional Information. The Statement of Additional Information and information regarding how the Trust voted proxies relating to portfolio securities during the most recent twelve month period ending June 30 is available, without charge, by calling 800.826.2333, or by visiting vaneck.com, or on the Securities and Exchange Commission’s website at http://www.sec.gov.
The Trust files its complete schedule of portfolio holdings with the Securities and Exchange Commission for the first and third quarters of each fiscal year on Form N-PORT. The Trust’s Form N-PORT filings are available on the Commission’s website at http://www.sec.gov and may be reviewed and copied at the Commission’s Public Reference Room in Washington, D.C. Information on the operation of the Public Reference Room may be obtained by calling 202.942.8090. The Funds’ complete schedules of portfolio holdings are also available by calling 800.826.2333 or by visiting vaneck.com.

| Investment Adviser: | VanEck Associates Corporation | |
| Distributor: | VanEck Securities Corporation | |
| | 666 Third Avenue, New York, NY 10017 | |
| | vaneck.com | |
| Account Assistance: | 800.826.2333 | INCOMEAR |
| (a) | The Registrant has adopted a code of ethics (the “Code of Ethics”) that applies to the principal executive officer, principal financial officer, principal accounting officer or controller, or persons performing similar functions. |
| | |
| (b) | The Registrant’s code of ethics is reasonably designed as described in this Form N-CSR. |
| | |
| (c) | The Registrant has not amended its Code of Ethics during the period covered by the shareholder report presented in Item 1 hereto. |
| | |
| (d) | The Registrant has not granted a waiver or an implicit waiver from a provision of its Code of Ethics during the period covered by the shareholder report presented in Item 1 hereto. |
| | |
| (e) | Not applicable. |
| | |
| (f) | The Registrant’s Code of Ethics is attached as an Exhibit hereto. |
| Item 3. | AUDIT COMMITTEE FINANCIAL EXPERT. |
| | The Registrant’s Board of Trustees has determined that David Chow, Laurie A. Hesslein, R. Alastair Short, Peter Sidebottom and Richard Stamberger, members of the Audit Committee, are “audit committee financial experts” and “independent” as such terms are defined in the instructions to Form N-CSR Item 3(a)(2). |
| Item 4. | PRINCIPAL ACCOUNTANT FEES AND SERVICES. |
| | The principal accountant fees disclosed in Item 4(a), 4(b), 4(c), 4(d) and 4(g) are for the Funds of the Registrant for which the fiscal year end is April 30. |
| | |
| (a) | Audit Fees. The aggregate Audit Fees of PricewaterhouseCoopers LLP for professional services billed for the audits of the financial statements, or services that are normally provided in connection with statutory and regulatory filings or engagements for the fiscal years ended April 30, 2024 and April 30, 2023, were $450,000 and $450,180, respectively. |
| | |
| (b) | Audit-Related Fees. Not applicable. |
| | |
| (c) | Tax Fees. The aggregate Tax Fees of PricewaterhouseCoopers LLP for professional services billed for the review of Federal, state and excise tax returns and other tax compliance consultations for the fiscal years ended April 30, 2024 and April 30, 2023, were $184,250 and $183,250, respectively. |
| | |
| (d) | All Other Fees. Not applicable. |
| | |
| (e) | The Audit Committee will pre-approve all audit and non-audit services, to be provided to the Funds, by the independent accountants as required by Section 10A of the Securities Exchange Act of 1934. The Audit Committee has authorized the Chairman of the Audit Committee to approve, between meeting dates, appropriate non-audit services. |
| | |
| | The Audit Committee after considering all factors, including a review of independence issues, will recommend to the Board of Trustees the independent auditors to be selected to audit the financial statements of the Funds. |
| (f) | Not applicable. |
| | |
| (g) | Non-audit fees. The aggregate non-audit fees of PricewaterhouseCoopers LLP for professional services rendered and billed to the registrant’s investment adviser, and entities controlled by, or under common control with the adviser that provide ongoing services to the registrant for the fiscal years ended April 30, 2024 and April 30, 2023, were $210,000 and $0 respectively. |
| | |
| (h) | Not applicable. |
| Item 5. | AUDIT COMMITTEE OF LISTED REGISTRANTS. |
| | The Registrant’s Board has an Audit Committee established in accordance with Section 3(a)(58)(A) of the Exchange Act (15 U.S.C. 78c(a)(58)(A)) consisting of five Independent Trustees. Ms. Hesslein and Messrs. Chow, Short, Sidebottom and Stamberger currently serve as members of the Audit Committee. Ms. Hesslein is the Chairperson of the Audit Committee. |
| Item 6. | SCHEDULE OF INVESTMENTS. |
| | Information included in Item 1. |
| Item 7. | DISCLOSURE OF PROXY VOTING POLICIES AND PROCEDURES FOR CLOSED-END MANAGEMENT INVESTMENT COMPANIES. |
| Item 8. | PORTFOLIO MANAGERS OF CLOSED-END MANAGEMENT INVESTMENT COMPANIES. |
| Item 9. | PURCHASES OF EQUITY SECURITIES BY CLOSED-END MANAGEMENT INVESTMENT COMPANY AND AFFILIATED PURCHASERS. |
| Item 10. | SUBMISSION OF MATTERS TO A VOTE OF SECURITY HOLDERS. |
| Item 11. | CONTROLS AND PROCEDURES. |
| (a) | The registrant’s principal executive and principal financial officers, or persons performing similar functions, have concluded that the registrant’s disclosure controls and procedures (as defined in Rule 30a-3(c) under the Investment Company Act of 1940, as amended (the “1940 Act”) (17 CFR 270.30a-3 (c)) are effective, as of a date within 90 days of the filing date of the report that includes the disclosure required by this paragraph, based on their evaluation of these controls and procedures required by Rule 30a-3(b) under the 1940 Act (17 CFR 270.30a-3(b)) and Rules 13a-15(b) or 15d-15(b) under the Securities Exchange Act of 1934, as amended (17 CFR 240.13a-15(b) or 240.15d-15 (b)). |
| | |
| (b) | There were no changes in the registrant’s internal control over financial reporting (as defined in Rule 30a-3(d) under the 1940 Act (17 CFR 270.30a(d)) that occurred during the period covered by this report that has materially affected, or is reasonably likely to materially affect, the registrant’s internal control over financial reporting. |
| Item 12. | DISCLOSURE OF SECURITIES LENDING ACTIVITIES FOR CLOSED-END MANAGEMENT INVESTMENT COMPANIES. |
SIGNATURES
Pursuant to the requirements of the Securities Exchange Act of 1934 and the Investment Company Act of 1940, the registrant has duly caused this report to be signed on its behalf by the undersigned, thereunto duly authorized.
(Registrant) VANECK ETF TRUST
| By (Signature and Title) | /s/ John J. Crimmins, CFO | |
Date July 8, 2024
Pursuant to the requirements of the Securities Exchange Act of 1934 and the Investment Company Act of 1940, this report has been signed below by the following persons on behalf of the registrant and in the capacities and on the dates indicated.
| By (Signature and Title) | /s/ Jan F. van Eck, CEO | |
Date July 8, 2024
| By (Signature and Title) | /s/ John J. Crimmins, CFO | |
Date July 8, 2024