UNITED STATES
SECURITIES AND EXCHANGE COMMISSION
Washington, D.C. 20549
FORMN-CSR
CERTIFIED SHAREHOLDER REPORT OF REGISTERED MANAGEMENT INVESTMENT
COMPANIES
Investment Company Act file number 811-10385
Pacific Funds Series Trust
(Exact name of registrant as specified in charter)
700 Newport Center Drive, P.O. Box 7500
Newport Beach, CA 92660
(Address of principal executive offices) (Zip code)
Robin S. Yonis
Vice President, General Counsel and Assistant Secretary of Pacific Funds Series Trust
700 Newport Center Drive, P.O. Box 9000
Newport Beach, CA 92660
(Name and address of agent for service)
Copies to:
Anthony H. Zacharski, Esq.
Dechert LLP
90 State House Square
Hartford, CT 06103
Registrant’s telephone number, including area code:949-219-6767
Date of fiscal year end: March 31
Date of reporting period:March 31, 2019
FormN-CSR is to be used by management investment companies to file reports with the Commission not later than 10 days after the transmission to stockholders of any report that is required to be transmitted to stockholders under Rule30e-1 under the Investment Company Act of 1940 (17 CFR270.30e-1). The Commission may use the information provided on FormN-CSR in its regulatory, disclosure review, inspection, and policymaking roles.
A registrant is required to disclose the information specified by FormN-CSR, and the Commission will make this information public. A registrant is not required to respond to the collection of information contained in FormN-CSR unless the Form displays a currently valid Office of Management and Budget (“OMB”) control number. Please direct comments concerning the accuracy of the information collection burden estimate and any suggestions for reducing the burden to Secretary, Securities and Exchange Commission, 100 F Street, NW, Washington, DC 20549. The OMB has reviewed this collection of information under the clearance requirements of 44 U.S.C. § 3507.
Item 1. Reports to Stockholders.
The following is a copy of the report transmitted to stockholders pursuant to Rule30e-1 under the Act (17 CFR 27030e-1).
ANNUAL REPORT

PACIFIC FUNDS
ANNUAL REPORT
AS OF MARCH 31, 2019
Pacific Funds Series Trust, which is a Delaware statutory trust, may be referred to as “Pacific Funds” or the “Trust”.
Beginning January 2021, as permitted by regulations adopted by the U.S. Securities and Exchange Commission, paper copies of Pacific Funds shareholder reports like this one will no longer be sent by mail, unless you specifically request paper copies of the reports from Pacific Funds or from your financial intermediary (such as a broker-dealer or bank). Instead, the reports will be made available on a website, and you will be notified by mail each time a report is posted and provided with a website link to access the report.
If you already elected to receive shareholder reports electronically, you will not be affected by this change and you need not take any action. You may elect to receive shareholder reports and other communications from Pacific Funds electronically by contacting Pacific Funds using one of the methods listed in the Where To Go For More Information section or by contacting your financial intermediary directly.
You may elect to receive all future reports in paper free of charge. You can inform Pacific Funds or your financial intermediary that you wish to continue receiving paper copies by contacting Pacific Funds using one of the methods listed in the Where To Go For More Information section or by contacting your financial intermediary directly. Your election to receive reports in paper will apply to all communications received for all Funds held with Pacific Funds.
PACIFIC FUNDS
Dear Shareholders:
We are pleased to share with you the Annual Report for the fiscal year ended March 31, 2019 for Pacific Funds Series Trust (“Pacific Funds” or the “Trust”). Pacific Funds is comprised of thirty-four Funds, seventeen of which are included in this report (each individually, a “Fund” and collectively, the “Funds”) and are available for direct investment. Pacific Life Fund Advisors LLC (PLFA), as Adviser to the Funds, manages Pacific FundsSM Portfolio Optimization Conservative, Pacific FundsSM Portfolio Optimization Moderate-Conservative, Pacific FundsSM Portfolio Optimization Moderate, Pacific FundsSM Portfolio Optimization Growth, Pacific FundsSM Portfolio Optimization Aggressive-Growth (together, the “Portfolio Optimization Funds”), and Pacific FundsSM Diversified Alternatives. PLFA also does business under the name “Pacific Asset Management” and manages Pacific FundsSM Short Duration Income, Pacific FundsSM Core Income, Pacific FundsSM Strategic Income, Pacific FundsSM Floating Rate Income, and Pacific FundsSM High Income under that name.
Each of the Portfolio Optimization Funds and Pacific Funds Diversified Alternatives is an asset allocation “Fund of Funds” that invests in Class P shares of certain other funds of the Trust (the “PF Underlying Funds”). PLFA supervises the management of those PF Underlying Funds which are only available for investment by the Portfolio Optimization Funds and Pacific Funds Diversified Alternatives and are included in a separate PF Underlying Funds Annual Report. Please see “Where to Go for More Information” for instructions on how to obtain the PF Underlying Funds’ Annual Report. The Portfolio Optimization Funds and Pacific Funds Diversified Alternatives also invest in Class P shares of Pacific FundsSM Core Income, Pacific FundsSM High Income, Pacific FundsSM Floating Rate Income and Pacific FundsSMSmall-Cap Growth.
The Adviser, Pacific Asset Management and Rothschild & Co Asset Management US Inc. (together, the “Managers”) and their Funds as of March 31, 2019 are listed below:
| | | | |
| | | |
| Manager | | Fund | | Page
Number |
| | | |
| Pacific Life Fund Advisors LLC (PLFA) | | Pacific FundsSM Portfolio Optimization Conservative | | A-4 |
| | Pacific FundsSM Portfolio Optimization Moderate-Conservative | | A-5 |
| | Pacific FundsSM Portfolio Optimization Moderate | | A-7 |
| | Pacific FundsSM Portfolio Optimization Growth | | A-9 |
| | Pacific FundsSM Portfolio Optimization Aggressive-Growth | | A-10 |
| | Pacific FundsSM Diversified Alternatives | | A-11 |
| | | |
| Pacific Asset Management | | Pacific FundsSM Short Duration Income | | A-12 |
| | Pacific FundsSM Core Income | | A-13 |
| | Pacific FundsSM Strategic Income | | A-14 |
| | Pacific FundsSM Floating Rate Income | | A-15 |
| | Pacific FundsSM High Income | | A-16 |
| | | |
| Rothschild & Co Asset Management US Inc. (Rothschild & Co AMUS) | | Pacific FundsSM Large-Cap | | A-17 |
| | Pacific FundsSM Large-Cap Value | | A-18 |
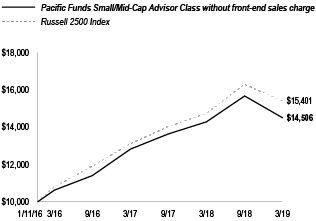
| | Pacific FundsSM Small/Mid-Cap | | A-19 |
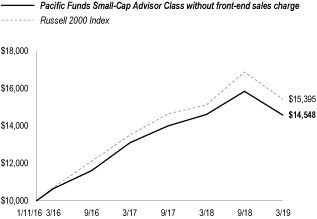
| | Pacific FundsSM Small-Cap | | A-20 |
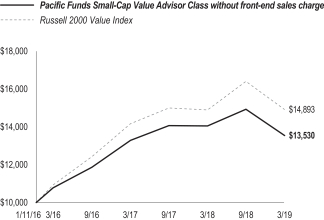
| | Pacific FundsSM Small-Cap Value | | A-21 |
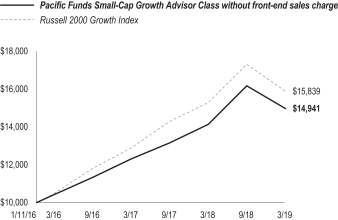
| | Pacific FundsSM Small-Cap Growth | | A-22 |
The Adviser and the Managers have prepared a discussion regarding the performance of the Funds of the Trust that they manage, including commentary discussing positive and negative factors affecting performance for the past twelve months.
We appreciate your confidence in Pacific Funds and look forward to serving your financial needs in the years to come.
Sincerely,
| | |
 | |  |
| |
| James T. Morris | | Adrian Griggs |
| |
| Chairman of the Board | | Chief Executive Officer |
| |
| Pacific Funds Series Trust | | Pacific Funds Series Trust |
A-1
PACIFIC FUNDS PERFORMANCE DISCUSSION
This Annual Report is provided for the general information of investors with beneficial interests in the Trust. This report is not authorized for distribution to prospective investors unless preceded or accompanied by a current Trust prospectus, as supplemented, which contains information about the Trust and each of its Funds, including their investment objectives, risks, charges and expenses. You should read the prospectus carefully before investing. There is no assurance that a Fund will achieve its investment objective. Each Fund is subject to market risk. The value of a Fund changes as its asset values go up or down. The value of a Fund’s shares will fluctuate, and when redeemed, may be worth more or less than their original cost. The total return for each Fund of the Trust is net of fees and includes reinvestment of all dividends and capital gain distributions, if any, and does not include deductions of any applicable share class sales charges. Past performance is not predictive of future performance. This report shows you the performance of the Funds compared to benchmark indices. Index performance is provided for illustrative and comparative purposes only and does not predict or depict the performance of the Funds. Indices are unmanaged, do not incur transaction costs, do not include fees and expenses, and cannot be purchased directly by investors. Index returns include reinvested dividends.
The composite benchmarks for the Portfolio Optimization Funds are composed of up to four broad-based indices. The percentage amounts of each broad-based index within each composite benchmark are based on each Fund’s target asset class allocations in effect during the reporting period. The percentages attributed to a broad-based index within a composite benchmark will change if a Fund’s target asset class allocations change.
PLFA supervises the management of the Funds contained in this report, subject to the oversight of the Trust’s Board of Trustees (Board). PLFA also does business under the name “Pacific Asset Management” and manages the Pacific Funds Short Duration Income, Pacific Funds Core Income, Pacific Funds Strategic Income, Pacific Funds Floating Rate Income, and Pacific Funds High Income under that name. PLFA has written the general market conditions commentary which expresses PLFA’s opinions and views on how the market generally performed for the fiscal year ended March 31, 2019 (the reporting period) as well as separate commentary specific to those Funds that it directly manages that is based on its opinion of how these Funds performed during the year.
All views and opinions expressed in the management discussion of fund performance are subject to change at any time based upon market, economic or other conditions, and the Trust, its Adviser, Pacific Asset Management and Rothschild & Co AMUS disclaim any responsibility to update such views. These views and options may not be relied upon as investment advice or recommendations, or as an offer for any particular security. Any references to “we”, “I”, or “ours” are references to the Managers. Any sectors referenced are provided by the applicable Manager and could be different from the sectors listed in the Schedules of Investments if obtained from another source. The Managers may include statements that constitute “forward-looking statements” under the United States (U.S.) securities laws. Forward-looking statements include information concerning possible or assumed future results of the Trust’s investment operations, asset levels, earnings, expenses, industry or market conditions, regulatory developments and other aspects of the Trust’s operations or general economic conditions. In addition, when used in this report, words such as “believes”, “expects”, “anticipates”, “intends”, “plans”, “estimates”, “projects” and future or conditional verbs such as “will”, “may”, “could”, “should”, and “would”, or any other statement that necessarily depends on future events, are intended to identify forward- looking statements. Forward-looking statements are not guarantees of performance or economic results. They involve risks, uncertainties and assumptions. Although such statements are based on expectations that the Managers believe to be reasonable, actual results may differ materially from expectations. Investors must not rely on any forward-looking statements. Statements of facts and performance data are from sources considered reliable, but no representation or warranty is made as to their completeness or accuracy.
In connection with any forward-looking statements and any investment in the Trust, investors should carefully consider the investment objectives, policies and risks described in the Trust’s current prospectus, as supplemented, and Statement of Additional Information, as supplemented, as filed with the U.S. Securities and Exchange Commission (SEC), which may be obtained from the SEC’s website atwww.sec.gov.
Market Conditions(for the year ended March 31, 2019)
Executive Summary
After a turbulent fourth quarter of 2018, global equity markets bounced higher in the last quarter of the reporting period. Concerns over Federal Reserve (Fed) rate hikes, trade and other geopolitical issues led to a global slowdown. While the Fed had been signaling additional rate hikes in 2019, the global slowdown convinced the central bank to hold off on further monetary tightening. Additionally, trade negotiations between the U.S. and China appeared to make progress. These conditions helped ease some concerns, which in turn boosted equities over the last quarter of the reporting period.
Fixed Income
The U.S.ten-year Treasury yield fluctuated over the reporting period, rising from approximately 2.70% at the start of the reporting period to 3.20% in the fourth quarter of 2018 before plunging back down to 2.40% by the end of the reporting period. The broad bond market (as defined by the Bloomberg Barclays U.S. Aggregate Bond Index) returned 4.48% for the reporting period. Spread sectors were mixed over the reporting period. Within the U.S., riskier credit tiers performed well over the last quarter of the reporting period as credit spreads tightened after they spiked in the fourth quarter of 2018. Emerging market bonds were challenged by the strengthening U.S. dollar, although they experienced some recovery over the last quarter of the reporting period.
Domestic Equity
Domestic equities rose over the reporting period and fared better than foreign markets. Over the reporting period, the S&P 500 Index returned 9.50%. Growth stocks finished higher than value stocks, as the financial sector (which represents a large part of value indices) struggled over the reporting period as interest margins were pressured by a flattening yield curve. On the other hand, technology stocks fared well over the reporting period. Bond proxy sectors such as real estate and utilities delivered gains as theten-year Treasury yield
A-2
See benchmark definitions on A-23 and A-24
PACIFIC FUNDS PERFORMANCE DISCUSSION (Continued)
had been sinking since November 2018, making the higher dividend sectors more attractive. Large corporations held up better than their smaller counterparts. Small-capitalization companies had lower credit ratings, and their debt levels as a percentage of total capital increased.
International Equity
Although international equities finished higher over the last quarter of the reporting period, they ended in negative territory over the reporting period as the Morgan Stanley Capital International (MSCI) Europe, Australasia and Far East (EAFE) Index returned-3.71% over this period. European stocks generally struggled. Geopolitical issues like Brexit (Britain’s exit from the European Union) and trade tensions caused headwinds that held back performance. Furthermore, the U.S. dollar rally was a headwind for unhedged international exposures. Emerging market equities also performed poorly over the reporting period as the MSCI Emerging Markets Index returned-7.41%. Emerging market equities became volatile, particularly for Chinese markets as trade tensions caused businesses to scramble and its consumers to become less optimistic. Chinese equities staged a significant recovery however, with the Shenzhen Composite up 33.70% for the last quarter of the reporting period.
Concluding Remarks
Going forward, we expect to see several themes impact the markets. The U.S. economy should continue to stay on course as business and consumer confidence remain supportive, especially if trade tensions begin to fade. However, we expect U.S.-China trade negotiations to remain an area of investor focus. As the effects of the tax cuts wind down, we anticipate U.S. earnings growth to decelerate and stock buybacks to ebb from very high levels seen throughout 2018.
Regarding central banks, the Fed is expected to take a pause. While markets had been anticipating additional interest rate hikes, they are now pricing in a rate cut by the end of 2019. The European Central Bank ended its bond purchasing program and will be going through a transition as it will need to find a successor for Mario Drahghi who is scheduled to step down in October 2019. Several emerging market central banks may find some relief from the Fed refraining from additional rate hikes.
In the U.S., investors may continue to focus on the yield curve, which has historically inverted prior to recessions, but it generally did not lead to equities falling immediately thereafter. Nonetheless, U.S. corporations will have to deal with rising wage growth caused by the tight labor market and increasing input costs resulting from the tariffs imposed on Chinese goods. Additionally, a steady stream of share buybacks has generally lifted prices and when this trend recedes, U.S. stocks may begin to trail.
Overseas, we believe foreign stocks are fairly attractive relative to U.S. equities based on price multiples although they also exhibit heightened geopolitical risks. Additionally, international industries tend to have a higher concentration in defensive sectors than those of the U.S., which tend to be more technology-related. Technology-related stocks are generally trading at a considerable premium compared to others, which may limit further upside. This is particularly true if market sentiment toward defensive sectors gains momentum. Emerging markets’price-to-book multiples compared to those of U.S. equities are near historic lows. Furthermore, the U.S. and China will likely be inclined to reach a trade deal sooner than later, as rising tensions are weighing down sentiment. Once a deal with China is reached, the Trump administration may extend the trade war to Europe and Japan with automobile tariffs. This would be particularly challenging for Germany, which is already flirting with a potential recession.
In fixed income, we anticipate the Fed may refrain from pursuing an aggressive monetary policy, as inflation risks remain somewhat subdued, although wage growth has been accelerating. Additionally, loose credit standards and heightened leverage have become more concerning, especially for leveraged loans. Although we do not anticipate a significant deterioration in credit fundamentals in the near term, we will closely monitor these conditions as challenges in credit markets have tended to precede equity markets in the lead up to a recession. While we do not see recession likely in the near term, we are watching this sector of the market for an early warning. We expect broad alternatives to provide continued diversification, especially for strategies that can successfully take advantage of rapidly changing developments in currency or commodity markets.
Performance of the Portfolio Optimization Funds and Pacific Funds Diversified Alternatives
The performance of the Portfolio Optimization Funds and Pacific Funds Diversified Alternatives are composites of the performance of each of the PF Underlying Funds in which each invests (which may include bonds, domestic and/or international equities). The Portfolio Optimization Funds are compared to two broad-based indices; however, to further assist in performance comparisons, composite benchmarks were constructed for the Portfolio Optimization Funds. Each composite benchmark is comprised of up to four broad-based indices shown below. The composite benchmarks were constructed with allocations to each asset class that correspond to the target allocations for Portfolio Optimization Funds. However, the actual allocations of any Portfolio Optimization Fund will naturally vary from these targets as a result of market performance over time. Pacific Funds Diversified Alternatives does not have a composite benchmark. Theone-year performance for these broad-based indices for the year ended March 31, 2019 is shown in the following table:
| | | | |
Broad-Based Indices | | | |
S&P 500 Index (representing U.S. Stocks) | | | 9.50% | |
Morgan Stanley Capital International (MSCI) EAFE Index (Net) (International Stocks) | | | (3.71% | ) |
Bloomberg Barclays U.S. Aggregate Bond Index (Fixed Income) | | | 4.48% | |
ICE BofA Merrill Lynch U.S.3-MonthT-Bill Index (Cash) | | | 2.12% | |
| | |
| | See benchmark definitions on A-23 and A-24 |
A-3
PACIFIC FUNDS PERFORMANCE DISCUSSION (Continued)
Pacific Funds Portfolio Optimization Conservative (managed by Pacific Life Fund Advisors LLC)
Q. How did the Fund perform for the year ended March 31, 2019?
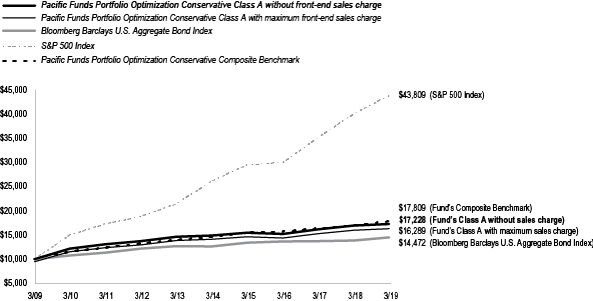
A. For the year ended March 31, 2019, Pacific Funds Portfolio Optimization Conservative’s Class A (without sales charge) returned 1.88%, compared to a 4.48% return for the Bloomberg Barclays U.S. Aggregate Bond Index, a 9.50% return for the S&P 500 Index, and a 4.94% return for the Pacific Funds Portfolio Optimization Conservative Composite Benchmark.
The following graph compares the performance of a hypothetical $10,000 investment in Class A shares of the Fund to its benchmarks for the ten-year period ended March 31, 2019. For comparison purposes, the performance of all classes for the periods ended March 31, 2019 are also shown in the table below. Performance data for Class B, C and Advisor Class shares will vary due to differences in fees and sales charges. The Fund’s performance reflects reinvestments of all dividends and capital gains distributions, if any.
Performance Comparison
Average Annual Total Returns for the Periods Ended March 31, 2019
| | | | | | | | | | | | |
| | | 1 Year | | | 5 Years | | | 10 Years | |
Fund’s Class A without sales charge | | | 1.88% | | | | 2.97% | | | | 5.59% | |
Fund’s Class A with maximum sales charge | | | (3.69% | ) | | | 1.81% | | | | 5.00% | |
Fund’s Class B without sales charge | | | 1.15% | | | | 2.22% | | | | 5.01% | |
Fund’s Class B with maximum sales charge | | | (3.39% | ) | | | 1.89% | | | | 5.01% | |
Fund’s Class C without sales charge | | | 1.13% | | | | 2.24% | | | | 4.87% | |
Fund’s Class C with maximum sales charge | | | 0.22% | | | | 2.24% | | | | 4.87% | |
Bloomberg Barclays U.S. Aggregate Bond Index | | | 4.48% | | | | 2.74% | | | | 3.77% | |
S&P 500 Index | | | 9.50% | | | | 10.91% | | | | 15.92% | |
Pacific Funds Portfolio Optimization Conservative Composite Benchmark | | | 4.94% | | | | 4.05% | | | | 5.94% | |
Average Annual Total Returns for the Periods Ended March 31, 2019
| | | | | | | | | | | | |
| | | 1 Year | | | 5 Years | | | Since Inception (12/31/12) | |
Fund’s Advisor Class without sales charge | | | 2.26% | | | | 3.24% | | | | 3.22% | |
Bloomberg Barclays U.S. Aggregate Bond Index | | | 4.48% | | | | 2.74% | | | | 2.15% | |
S&P 500 Index | | | 9.50% | | | | 10.91% | | | | 13.96% | |
Pacific Funds Portfolio Optimization Conservative Composite Benchmark | | | 4.94% | | | | 4.05% | | | | 4.25% | |
|
| |
Performance data shown represents past performance. Investment return and principal value will fluctuate so that shares of the Fund when redeemed may be worth more or less than their original cost. Past performance is not predictive of future performance. The table does not reflect the deduction of taxes that a shareholder would pay on Fund distributions or redemption of Fund shares. |
Q. Discuss both positive and negative factors that materially affected the Fund’s performance during the year, including relevant market conditions, investment strategies and techniques, and particular sectors or securities.
A. For the reporting period, the Fund’s Class A underperformed the Pacific Funds Portfolio Optimization Conservative Composite Benchmark. The Pacific Funds Portfolio Optimization Conservative Composite Benchmark is comprised of the Bloomberg Barclays U.S. Aggregate Bond, S&P 500, ICE BofA Merrill Lynch U.S.3-MonthT-Bill, and MSCI EAFE (Net) Indices in a weighting that is fixed and specific to the Fund. The Fund was primarily invested in various fixed income strategies, with a smaller allocation to equity and alternative strategies, during the reporting period. Fixed income investments included allocations to intermediate-term bond, short duration bond, inflation-indexed bond, emerging markets bond, and floating rate strategies. The equity segment consisted mainly of allocations to domestic and foreign large-capitalization strategies. The Fund’s alternatives allocation consisted of investments in a currency strategy and an equity long/short strategy.
| | |
| | See benchmark definitions on A-23 and A-24 |
A-4
PACIFIC FUNDS PERFORMANCE DISCUSSION (Continued)
Among the fixed income lineup, high yield bonds contributed to performance over the reporting period as the asset class fared relatively well. However, the PF Managed Bond Fund, which represented the largest weight in the Fund, underperformed the Bloomberg Barclays U.S. Aggregate Bond Index and likewise detracted from performance over the reporting period. Additionally, exposure to short-term bonds also detracted from performance.
As for domestic equities, exposure to value stocks was a headwind over the reporting period as growth sectors such as information technology surged past value sectors. On the other hand, the exposure to real estate helped performance.
International equities held back performance over the reporting period. An overweight to emerging markets had a negative impact on performance, although the PF Emerging Markets Fund outpaced its benchmark, the MSCI Emerging Markets Index, which helped offset the drag from the exposure to the asset class.
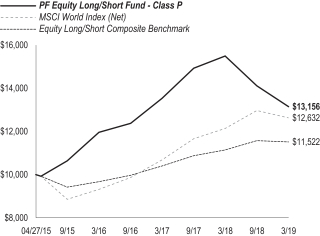
Alternatives as a group also detracted from performance over the reporting period. The PF Equity Long/Short Fund primarily detracted from performance.
Pacific Funds Portfolio Optimization Moderate-Conservative (managed by Pacific Life Fund Advisors LLC)
Q. How did the Fund perform for the year ended March 31, 2019?
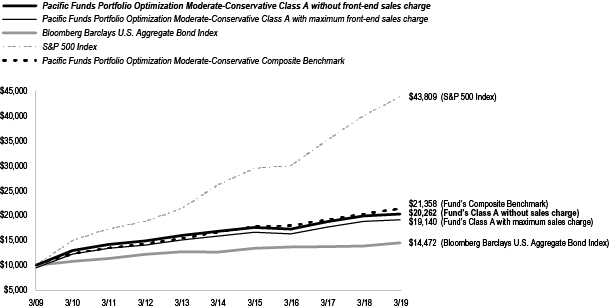
A. For the year ended March 31, 2019, Pacific Funds Portfolio Optimization Moderate-Conservative’s Class A (without sales charge) returned 1.91%, compared to a 4.48% return for the Bloomberg Barclays U.S. Aggregate Bond Index, a 9.50% return for the S&P 500 Index, and a 5.28% return for the Pacific Funds Portfolio Optimization Moderate-Conservative Composite Benchmark.
The following graph compares the performance of a hypothetical $10,000 investment in Class A shares of the Fund to its benchmarks for the ten-year period ended March 31, 2019. For comparison purposes, the performance of all classes for the periods ended March 31, 2019 are also shown in the table below. Performance data for Class B, C and Advisor Class shares will vary due to differences in fees and sales charges. The Fund’s performance reflects reinvestments of all dividends and capital gains distributions, if any.
Performance Comparison
Average Annual Total Returns for the Periods Ended March 31, 2019
| | | | | | | | | | | | |
| | | 1 Year | | | 5 Years | | | 10 Years | |
Fund’s Class A without sales charge | | | 1.91% | | | | 3.85% | | | | 7.32% | |
Fund’s Class A with maximum sales charge | | | (3.68% | ) | | | 2.68% | | | | 6.71% | |
Fund’s Class B without sales charge | | | 1.07% | | | | 3.07% | | | | 6.73% | |
Fund’s Class B with maximum sales charge | | | (3.16% | ) | | | 2.77% | | | | 6.73% | |
Fund’s Class C without sales charge | | | 1.11% | | | | 3.09% | | | | 6.56% | |
Fund’s Class C with maximum sales charge | | | 0.26% | | | | 3.09% | | | | 6.56% | |
Bloomberg Barclays U.S. Aggregate Bond Index | | | 4.48% | | | | 2.74% | | | | 3.77% | |
S&P 500 Index | | | 9.50% | | | | 10.91% | | | | 15.92% | |
Pacific Funds Portfolio Optimization Moderate-Conservative Composite Benchmark | | | 5.28% | | | | 5.17% | | | | 7.88% | |
Average Annual Total Returns for the Periods Ended March 31, 2019
| | | | | | | | | | | | |
| | | 1 Year | | | 5 Years | | | Since Inception (12/31/12) | |
Fund’s Advisor Class without sales charge | | | 2.10% | | | | 4.09% | | | | 4.71% | |
Bloomberg Barclays U.S. Aggregate Bond Index | | | 4.48% | | | | 2.74% | | | | 2.15% | |
S&P 500 Index | | | 9.50% | | | | 10.91% | | | | 13.96% | |
Pacific Funds Portfolio Optimization Moderate-Conservative Composite Benchmark | | | 5.28% | | | | 5.17% | | | | 6.00% | |
|
| |
Performance data shown represents past performance. Investment return and principal value will fluctuate so that shares of the Fund when redeemed may be worth more or less than their original cost. Past performance is not predictive of future performance. The table does not reflect the deduction of taxes that a shareholder would pay on Fund distributions or redemption of Fund shares. |
| | |
| | See benchmark definitions on A-23 and A-24 |
A-5
PACIFIC FUNDS PERFORMANCE DISCUSSION (Continued)
Q. Discuss both positive and negative factors that materially affected the Fund’s performance during the year, including relevant market conditions, investment strategies and techniques, and particular sectors or securities.
A. For the reporting period, the Fund’s Class A underperformed the Pacific Funds Portfolio Optimization Moderate-Conservative Composite Benchmark. The Pacific Funds Portfolio Optimization Moderate-Conservative Composite Benchmark is comprised of the Bloomberg Barclays U.S. Aggregate Bond, S&P 500, MSCI EAFE (Net), and ICE BofA Merrill Lynch U.S.3-MonthT-Bill Indices in a weighting that is fixed and specific to the Fund. The Fund had a diversified allocation mix that was modestly tilted to fixed income during the reporting period. Fixed income investments included intermediate-term bond strategies as well as short duration bond, inflation-indexed bond, high yield bond, emerging markets bond, and floating rate strategies. The Fund’s equity exposure was diversified across style (growth/value), market capitalization and region (including an allocation to foreign small-capitalization and emerging markets strategies). The Fund’s alternatives allocation consisted of investments in a currency strategy and an equity long/short strategy.
Among the fixed income lineup, high yield bonds contributed to performance over the reporting period as the asset class fared relatively well. However, the PF Managed Bond Fund, which represented the largest weight in the Fund, underperformed the Bloomberg Barclays U.S. Aggregate Bond Index and likewise detracted from relative performance over the reporting period. Additionally, exposure to short-term bonds also detracted from performance.
As for domestic equities, exposure to value stocks was a headwind over the reporting period as growth sectors such as information technology surged past value sectors. The exposure to real estate also helped performance.
International equities held back performance over the reporting period. An overweight to emerging markets had a negative impact on performance, although the PF Emerging Markets Fund outpaced its benchmark, the MSCI Emerging Markets Index, which helped offset the drag from the exposure to the asset class.
Alternatives as a group also detracted from performance over the reporting period. The PF Equity Long/Short Fund primarily detracted from performance.
| | |
| | See benchmark definitions on A-23 and A-24 |
A-6
PACIFIC FUNDS PERFORMANCE DISCUSSION (Continued)
Pacific Funds Portfolio Optimization Moderate (managed by Pacific Life Fund Advisors LLC)
Q. How did the Fund perform for the year ended March 31, 2019?
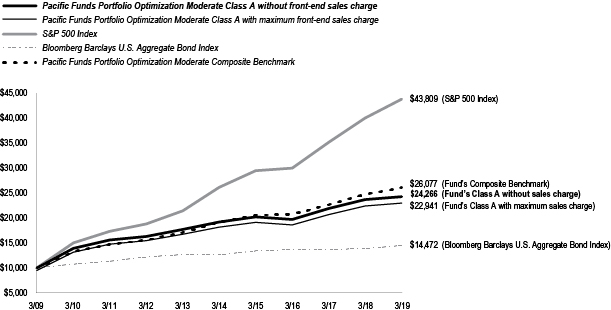
A. For the year ended March 31, 2019, Pacific Funds Portfolio Optimization Moderate’s Class A (without sales charge) returned 2.49%, compared to a 9.50% return for the S&P 500 Index, a 4.48% return for the Bloomberg Barclays U.S. Aggregate Bond Index, and a 5.68% return for the Pacific Funds Portfolio Optimization Moderate Composite Benchmark.
The following graph compares the performance of a hypothetical $10,000 investment in Class A shares of the Fund to its benchmarks for the ten-year period ended March 31, 2019. For comparison purposes, the performance of all classes for the periods ended March 31, 2019 are also shown in the table below. Performance data for Class B, C and Advisor Class shares will vary due to differences in fees and sales charges. The Fund’s performance reflects reinvestments of all dividends and capital gains distributions, if any.
Performance Comparison
Average Annual Total Returns for the Periods Ended March 31, 2019
| | | | | | | | | | | | |
| | | 1 Year | | | 5 Years | | | 10 Years | |
Fund’s Class A without sales charge | | | 2.49% | | | | 4.81% | | | | 9.27% | |
Fund’s Class A with maximum sales charge | | | (3.15% | ) | | | 3.64% | | | | 8.66% | |
Fund’s Class B without sales charge | | | 1.75% | | | | 4.04% | | | | 8.68% | |
Fund’s Class B with maximum sales charge | | | (2.45% | ) | | | 3.75% | | | | 8.68% | |
Fund’s Class C without sales charge | | | 1.78% | | | | 4.04% | | | | 8.53% | |
Fund’s Class C with maximum sales charge | | | 0.94% | | | | 4.04% | | | | 8.53% | |
S&P 500 Index | | | 9.50% | | | | 10.91% | | | | 15.92% | |
Bloomberg Barclays U.S. Aggregate Bond Index | | | 4.48% | | | | 2.74% | | | | 3.77% | |
Pacific Funds Portfolio Optimization Moderate Composite Benchmark | | | 5.68% | | | | 6.43% | | | | 10.06% | |
Average Annual Total Returns for the Periods Ended March 31, 2019
| | | | | | | | | | | | |
| | | 1 Year | | | 5 Years | | | Since Inception (12/31/12) | |
Fund’s Advisor Class without sales charge | | | 2.75% | | | | 5.07% | | | | 6.31% | |
S&P 500 Index | | | 9.50% | | | | 10.91% | | | | 13.96% | |
Bloomberg Barclays U.S. Aggregate Bond Index | | | 4.48% | | | | 2.74% | | | | 2.15% | |
Pacific Funds Portfolio Optimization Moderate Composite Benchmark | | | 5.68% | | | | 6.43% | | | | 7.98% | |
|
| |
Performance data shown represents past performance. Investment return and principal value will fluctuate so that shares of the Fund when redeemed may be worth more or less than their original cost. Past performance is not predictive of future performance. The table does not reflect the deduction of taxes that a shareholder would pay on Fund distributions or redemption of Fund shares. |
Q. Discuss both positive and negative factors that materially affected the Fund’s performance during the year, including relevant market conditions, investment strategies and techniques, and particular sectors or securities.
A. For the reporting period, the Fund’s Class A underperformed the Pacific Funds Portfolio Optimization Moderate Composite Benchmark. The Pacific Funds Portfolio Optimization Moderate Composite Benchmark is comprised of the S&P 500, Bloomberg Barclays U.S. Aggregate Bond, MSCI EAFE (Net), and ICE BofA Merrill Lynch U.S.3-MonthT-Bill Indices in a weighting that is fixed and specific to the Fund. The Fund is allocated to a mix of equity and fixed income strategies over the reporting period, with a larger allocation toward equity investments. The equity exposure was diversified across style (growth/value), market capitalization and region (including allocations to foreign small-capitalization and emerging markets stocks). The Fund also maintained exposure to select market sectors such as publicly-traded real estate investment trusts (REITs). Fixed income investments included intermediate-term bond, short duration bond, inflation-indexed bond, emerging markets bond, and floating rate loan strategies. The Fund’s alternatives allocation consisted of investments in a currency strategy and an equity long/short strategy.
| | |
| | See benchmark definitions on A-23 and A-24 |
A-7
PACIFIC FUNDS PERFORMANCE DISCUSSION (Continued)
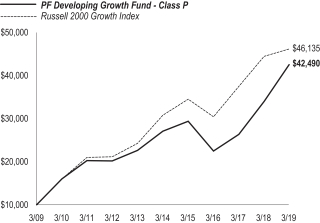
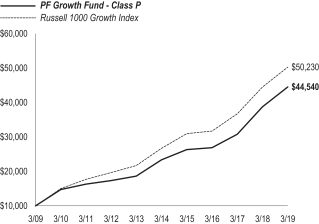
Within domestic equities exposure to value stocks was a headwind over the reporting period as growth sectors such as information technology surged past value sectors like financials. The exposure to real estate also helped performance. Furthermore, the PF Growth and PF Developing Growth Funds outperformed their respective benchmarks, which contributed to performance.
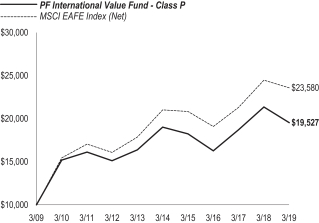
International equities held back performance over the reporting period. An overweight to emerging markets had a negative impact on performance, although the PF Emerging Markets Fund outpaced its benchmark, the MSCI Emerging Markets Index, which helped offset the drag from the exposure to the asset class. Additionally, the PF International Value Fund underperformed its benchmark, which held back performance.
Among the fixed income lineup, high yield bonds contributed to performance over the reporting period as the asset class fared relatively well. However, the PF Managed Bond Fund, which represented the largest weight in the Fund, underperformed the Bloomberg Barclays U.S. Aggregate Bond Index and likewise detracted from relative performance over the reporting period. Additionally, exposure to short-term bonds also detracted from performance.
Alternatives as a group also detracted from performance over the reporting period. The PF Equity Long/Short Fund primarily detracted from performance.
| | |
| | See benchmark definitions on A-23 and A-24 |
A-8
PACIFIC FUNDS PERFORMANCE DISCUSSION (Continued)
Pacific Funds Portfolio Optimization Growth (managed by Pacific Life Fund Advisors LLC)
Q. How did the Fund perform for the year ended March 31, 2019?
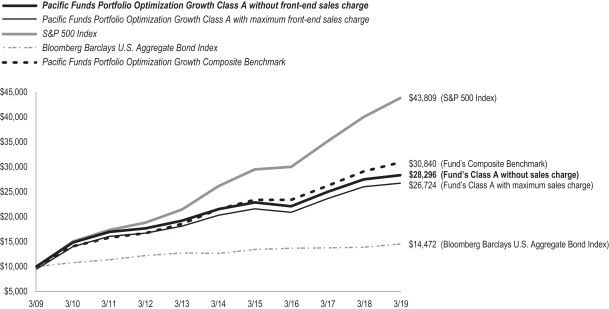
A. For the year ended March 31, 2019, Pacific Funds Portfolio Optimization Growth’s Class A (without sales charge) returned 2.92%, compared to a 9.50% return for the S&P 500 Index, a 4.48% return for the Bloomberg Barclays U.S. Aggregate Bond Index, and a 5.98% return for the Pacific Funds Portfolio Optimization Growth Composite Benchmark.
The following graph compares the performance of a hypothetical $10,000 investment in Class A shares of the Fund to its benchmarks for the ten-year period ended March 31, 2019. For comparison purposes, the performance of all classes for the periods ended March 31, 2019 are also shown in the table below. Performance data for Class B, C and Advisor Class shares will vary due to differences in fees and sales charges. The Fund’s performance reflects reinvestments of all dividends and capital gains distributions, if any.
Performance Comparison
Average Annual Total Returns for the Periods Ended March 31, 2019
| | | | | | | | | | | | |
| | | 1 Year | | | 5 Years | | | 10 Years | |
Fund’s Class A without sales charge | | | 2.92% | | | | 5.67% | | | | 10.96% | |
Fund’s Class A with maximum sales charge | | | (2.74% | ) | | | 4.47% | | | | 10.33% | |
Fund’s Class B without sales charge | | | 2.15% | | | | 4.89% | | | | 10.40% | |
Fund’s Class B with maximum sales charge | | | (1.96% | ) | | | 4.61% | | | | 10.40% | |
Fund’s Class C without sales charge | | | 2.12% | | | | 4.88% | | | | 10.26% | |
Fund’s Class C with maximum sales charge | | | 1.30% | | | | 4.88% | | | | 10.26% | |
S&P 500 Index | | | 9.50% | | | | 10.91% | | | | 15.92% | |
Bloomberg Barclays U.S. Aggregate Bond Index | | | 4.48% | | | | 2.74% | | | | 3.77% | |
Pacific Funds Portfolio Optimization Growth Composite Benchmark | | | 5.98% | | | | 7.49% | | | | 11.92% | |
Average Annual Total Returns for the Periods Ended March 31, 2019
| | | | | | | | | | | | |
| | | 1 Year | | | 5 Years | | | Since Inception (12/31/12) | |
Fund’s Advisor Class without sales charge | | | 3.12% | | | | 5.92% | | | | 7.77% | |
S&P 500 Index | | | 9.50% | | | | 10.91% | | | | 13.96% | |
Bloomberg Barclays U.S. Aggregate Bond Index | | | 4.48% | | | | 2.74% | | | | 2.15% | |
Pacific Funds Portfolio Optimization Growth Composite Benchmark | | | 5.98% | | | | 7.49% | | | | 9.66% | |
|
| |
Performance data shown represents past performance. Investment return and principal value will fluctuate so that shares of the Fund when redeemed may be worth more or less than their original cost. Past performance is not predictive of future performance. The table does not reflect the deduction of taxes that a shareholder would pay on Fund distributions or redemption of Fund shares. |
Q. Discuss both positive and negative factors that materially affected the Fund’s performance during the year, including relevant market conditions, investment strategies and techniques, and particular sectors or securities.
A. For the reporting period, the Fund’s Class A underperformed the Pacific Funds Portfolio Optimization Growth Composite Benchmark. The Pacific Funds Portfolio Optimization Growth Composite Benchmark is comprised of the S&P 500, Bloomberg Barclays U.S. Aggregate Bond, and MSCI EAFE (Net) Indices in a weighting that is fixed and specific to the Fund. The Fund had a diversified allocation mix that was tilted to equity. The equity exposure was diversified across style (growth/value), market capitalization and region (including allocations to foreign small capitalization and emerging markets stocks). The Fund also maintained exposure to select market sectors such as publicly-traded REITs. Fixed income investments included intermediate-term bond strategies as well as specific strategies such as short duration bond, inflation-indexed bond and emerging markets bond strategies. The Fund’s alternatives allocation consisted of investments in a currency strategy and an equity long/short strategy.
| | |
| | See benchmark definitions on A-23 and A-24 |
A-9
PACIFIC FUNDS PERFORMANCE DISCUSSION (Continued)
Within domestic equities exposure to value stocks was a headwind over the reporting period as growth sectors such as information technology surged past value sectors like financials. The exposure to real estate also helped performance. Furthermore, the PF Growth and PF Developing Growth Funds outperformed their respective benchmarks, which contributed to performance.
International equities held back performance over the reporting period. An overweight to emerging markets had a negative impact on performance, although the PF Emerging Markets Fund outpaced its benchmark, the MSCI Emerging Markets Index, which helped offset the drag from the exposure to the asset class. Additionally, the PF International Value Fund underperformed its benchmark, which held back performance.
Among the fixed income lineup, high yield bonds contributed to performance over the reporting period as the asset class fared relatively well. However, the PF Managed Bond Fund, which represented the largest weight in the Fund, underperformed the Bloomberg Barclays U.S. Aggregate Bond Index and likewise detracted from relative performance over the reporting period. Additionally, exposure to short-term bonds also detracted from performance.
Alternatives as a group also detracted from performance over the reporting period. The PF Equity Long/Short Fund primarily detracted from performance.
Pacific Funds Portfolio Optimization Aggressive-Growth (managed by Pacific Life Fund Advisors LLC)
Q. How did the Fund perform for the year ended March 31, 2019?
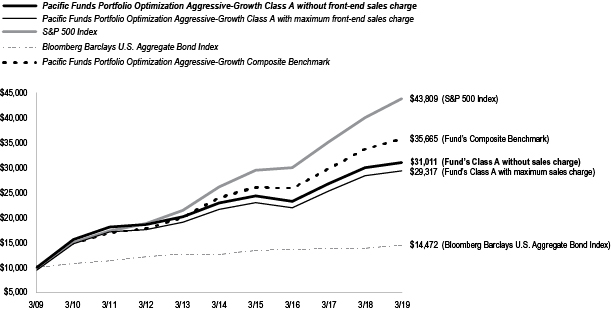
A. For the year ended March 31, 2019, Pacific Funds Portfolio Optimization Aggressive-Growth’s Class A (without sales charge) returned 3.39%, compared to a 9.50% return for the S&P 500 Index, a 4.48% return for the Bloomberg Barclays U.S. Aggregate Bond Index, and a 5.79% return for the Pacific Funds Portfolio Optimization Aggressive-Growth Composite Benchmark.
The following graph compares the performance of a hypothetical $10,000 investment in Class A shares of the Fund to its benchmarks for the ten-year period ended March 31, 2019. For comparison purposes, the performance of all classes for the periods ended March 31, 2019 are also shown in the table below. Performance data for Class B, C and Advisor Class shares will vary due to differences in fees and sales charges. The Fund’s performance reflects reinvestments of all dividends and capital gains distributions, if any.
Performance Comparison
Average Annual Total Returns for the Periods Ended March 31, 2019
| | | | | | | | | | | | |
| | | 1 Year | | | 5 Years | | | 10 Years | |
Fund’s Class A without sales charge | | | 3.39% | | | | 6.26% | | | | 11.98% | |
Fund’s Class A with maximum sales charge | | | (2.29% | ) | | | 5.06% | | | | 11.36% | |
Fund’s Class B without sales charge | | | 2.59% | | | | 5.49% | | | | 11.53% | |
Fund’s Class B with maximum sales charge | | | (1.56% | ) | | | 5.19% | | | | 11.53% | |
Fund’s Class C without sales charge | | | 2.57% | | | | 5.49% | | | | 11.36% | |
Fund’s Class C with maximum sales charge | | | 1.74% | | | | 5.49% | | | | 11.36% | |
S&P 500 Index | | | 9.50% | | | | 10.91% | | | | 15.92% | |
Bloomberg Barclays U.S. Aggregate Bond Index | | | 4.48% | | | | 2.74% | | | | 3.77% | |
Pacific Funds Portfolio Optimization Aggressive-Growth Composite Benchmark | | | 5.79% | | | | 8.29% | | | | 13.56% | |
Average Annual Total Returns for the Periods Ended March 31, 2019
| | | | | | | | | | | | |
| | | 1 Year | | | 5 Years | | | Since Inception (12/31/12) | |
Fund’s Advisor Class without sales charge | | | 3.57% | | | | 6.53% | | | | 8.65% | |
S&P 500 Index | | | 9.50% | | | | 10.91% | | | | 13.96% | |
Bloomberg Barclays U.S. Aggregate Bond Index | | | 4.48% | | | | 2.74% | | | | 2.15% | |
Pacific Funds Portfolio Optimization Aggressive-Growth Composite Benchmark | | | 5.79% | | | | 8.29% | | | | 11.15% | |
|
| |
Performance data shown represents past performance. Investment return and principal value will fluctuate so that shares of the Fund when redeemed may be worth more or less than their original cost. Past performance is not predictive of future performance. The table does not reflect the deduction of taxes that a shareholder would pay on Fund distributions or redemption of Fund shares. |
| | |
| | See benchmark definitions on A-23 and A-24 |
A-10
PACIFIC FUNDS PERFORMANCE DISCUSSION (Continued)
Q. Discuss both positive and negative factors that materially affected the Fund’s performance during the year, including relevant market conditions, investment strategies and techniques, and particular sectors or securities.
A. For the reporting period, the Fund’s Class A underperformed the Pacific Funds Portfolio Optimization Aggressive-Growth Composite Benchmark. The Pacific Funds Portfolio Optimization Aggressive-Growth Composite Benchmark is comprised of the S&P 500, MSCI EAFE (Net), and Bloomberg Barclays U.S. Aggregate Bond Indices in a weighting that is fixed and specific to the Fund. The Fund is primarily allocated to domestic and international equity funds that are diversified across style (growth/value), market capitalization and region (which included allocations to foreign small-capitalization and emerging markets stocks). The Fund also maintained exposure to select sectors, such as publicly-traded REITs, as well as a small allocation to intermediate-term fixed income securities. The Fund’s alternatives allocation consisted of investments in a currency strategy and an equity long/short strategy.
Within domestic equities exposure to value stocks was a headwind over the reporting period as growth sectors such as information technology surged past value sectors like financials. The exposure to real estate also helped performance. Furthermore, the PF Growth and PF Developing Growth Funds outperformed their respective benchmarks, which contributed to performance.
International equities held back performance over the reporting period. An overweight to emerging markets had a negative impact on performance, although the PF Emerging Markets Fund outpaced its benchmark, the MSCI Emerging Markets Index, which helped offset the drag from the exposure to the asset class. Additionally, the PF International Value underperformed its benchmark, which held back performance.
The Fund’s allocation to fixed income is relatively a minor position. Nonetheless, exposure to short-term bonds detracted from performance.
Alternatives as a group also detracted from performance over the reporting period. The PF Equity Long/Short Fund primarily detracted from performance.
Pacific Funds Diversified Alternatives (managed by Pacific Life Fund Advisors LLC)
Q. How did the Fund perform for the year ended March 31, 2019?
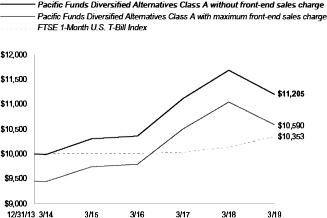
A. For the year ended March 31, 2019, Pacific Funds Diversified Alternatives’ Class A (without sales charge) returned-4.15%, compared to a 2.08% return for its benchmark, the FTSE1-Month U.S.T-Bill Index.
The following graph compares the performance of a hypothetical $10,000 investment in Class A shares of the Fund to its benchmark for the period from inception through March 31, 2019. For comparison purposes, the performance of all classes for the periods ended March 31, 2019 are also shown in the table below. Performance data for Class C and Advisor Class shares will vary due to differences in fees and sales charges. The Fund’s performance reflects reinvestments of all dividends and capital gains distributions, if any.
Performance Comparison
Average Annual Total Returns for the Periods Ended March 31, 2019
| | | | | | | | | | | | |
| | | 1 Year | | | 5 Years | | | Since
Inception
(12/31/13) | |
Fund’s Class A without sales charge | | | (4.15% | ) | | | 2.32% | | | | 2.19% | |
Fund’s Class A with maximum sales charge | | | (9.43% | ) | | | 1.17% | | | | 1.10% | |
Fund’s Class C without sales charge | | | (4.81% | ) | | | 1.56% | | | | 1.43% | |
Fund’s Class C with maximum sales charge | | | (5.76% | ) | | | 1.56% | | | | 1.43% | |
Fund’s Advisor Class without sales charge | | | (3.91% | ) | | | 2.56% | | | | 2.42% | |
FTSE1-Month U.S.T-Bill Index | | | 2.08% | | | | 0.69% | | | | 0.66% | (1) |
| | (1) | Due to data limitation, the benchmark since inception return reflects the commencement period from the first calendar day of the month the portfolio commenced its operations. |
|
| |
Performance data shown represents past performance. Investment return and principal value will fluctuate so that shares of the Fund when redeemed may be worth more or less than their original cost. Past performance is not predictive of future performance. The table does not reflect the deduction of taxes that a shareholder would pay on Fund distributions or redemption of Fund shares. |
Q. Discuss both positive and negative factors that materially affected the Fund’s performance during the year, including relevant market conditions, investment strategies and techniques, and particular sectors or securities.
A. For the reporting period, the Fund’s Class A underperformed the benchmark. The Fund is a “fund of funds” that seeks to achieve its investment goal by investing in other funds, and seeks to maintain a low to moderate correlation of its returns with the returns of traditional equity and fixed income asset classes over long-term periods by gaining exposure to a number ofnon-traditional asset classes and alternative investment strategies. Over the reporting period, the Fund was primarily invested innon-traditional asset classes and alternative investment strategies. The Fund’s investments included currencies and long-short equity strategies. The Fund also invested in inflation-indexed debt, floating rate loans, real estate, internationalsmall-cap, and emerging markets equity and debt strategies.
| | |
| | See benchmark definitions on A-23 and A-24 |
A-11
PACIFIC FUNDS PERFORMANCE DISCUSSION (Continued)
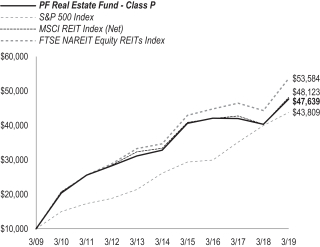
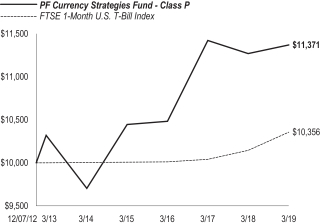
The Fund’s allocations to the PF Real Estate Fund, PF Currency Strategies Fund and Pacific Funds Floating Rate Income were the top contributors to performance. The PF Real Estate Fund benefited from an overweight position to residential REITs. The PF Currency Strategies Fund’s short position in the Korean won largely contributed to performance. Pacific Funds Floating Rate Income benefited from an overweight position to second lien bank loans.
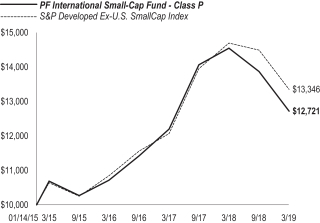
The PF Equity Long/Short Fund was the weakest-performing fund over the reporting period. PF InternationalSmall-Cap Fund, PF Emerging Markets Fund and PF Emerging Markets Debt Fund also detracted from performance over the reporting period. These funds have exposure to foreign markets, which struggled over the reporting period, as trade tensions intensified.
Pacific Funds Short Duration Income (managed by Pacific Asset Management)
Q. How did the Fund perform for the year ended March 31, 2019?
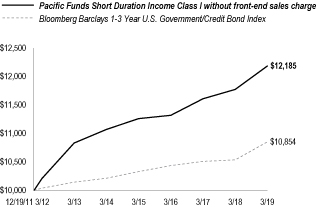
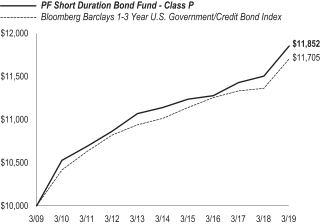
A. For the year ended March 31, 2019, Pacific Funds Short Duration Income’s Class I (without sales charge) returned 3.47%, compared to a 3.03% return for its benchmark, the Bloomberg Barclays1-3 Year U.S. Government/Credit Bond Index.
The following graph compares the performance of a hypothetical $10,000 investment in Class I shares of the Fund to its benchmark for the period from inception through March 31, 2019. For comparison purposes, the performance of all classes for the periods ended March 31, 2019 are also shown in the table below. Performance data for Class A, C and Advisor Class shares will vary due to differences in fees and sales charges. The Fund’s performance reflects reinvestments of all dividends and capital gains distributions, if any.
Performance Comparison
Average Annual Total Returns for the Periods Ended March 31, 2019
| | | | | | | | | | | | |
| | | 1 Year | | | 5 Years | | | Since
Inception
(12/19/11) | |
Fund’s Class I without sales charge | | | 3.47% | | | | 1.94% | | | | 2.75% | |
Bloomberg Barclays1-3 Year U.S. Government/Credit Bond Index | | | 3.03% | | | | 1.22% | | | | 1.14% | |
| | | |
| | | 1 Year | | | 5 Years | | | Since Inception (06/29/12) | |
Fund’s Class A without sales charge | | | 3.11% | | | | 1.66% | | | | 2.23% | |
Fund’s Class A with maximum sales charge | | | (0.01% | ) | | | 1.05% | | | | 1.76% | |
Fund’s Class C without sales charge | | | 2.35% | | | | 0.89% | | | | 1.47% | |
Fund’s Class C with maximum sales charge | | | 1.35% | | | | 0.89% | | | | 1.47% | |
Fund’s Advisor Class without sales charge | | | 3.46% | | | | 1.93% | | | | 2.48% | |
Bloomberg Barclays1-3 Year U.S. Government/Credit Bond Index | | | 3.03% | | | | 1.22% | | | | 1.14% | |
|
| |
Performance data shown represents past performance. Investment return and principal value will fluctuate so that shares of the Fund when redeemed may be worth more or less than their original cost. Past performance is not predictive of future performance. The table does not reflect the deduction of taxes that a shareholder would pay on Fund distributions or redemption of Fund shares. |
Q. Discuss both positive and negative factors that materially affected the Fund’s performance during the year, including relevant market conditions, investment strategies and techniques, and particular sectors or securities.
A. For the reporting period, the Fund’s Class I outperformed the benchmark. The Fund uses a short term corporate debt focused strategy. Using a fundamental approach with atop-down overlay, Pacific Asset Management’s team of portfolio managers and research analysts look at the relative value of each security and assess the macro environment and marketplace for tailwinds and catalysts in the process of individual investment selection.
The Fund’s asset allocation and focus on short maturity BBB-rated securities were the primary contributors to performance. The Fund’s allocations tonon-investment grade debt securities, bank loans and high yield bonds, benefited performance during the reporting period. The Fund’s underweight to treasury and government related securities also benefited performance. The Fund’s underweight to duration detracted from performance given the flattening of the yield curve seen during the reporting period. Security selection in pharmaceuticals and chemicals benefited performance while overweights to banking and midstream hurt performance.
The significant spread widening seen in December 2018 and subsequent rally in the first quarter 2019 leave us with a neutral view of investment-grade corporate credit as we enter April 2019. We believe that stable monetary policy should help the technical picture for the asset class. From an asset allocation perspective, we like floating-rate loans andBBB-rated investment-grade names in preferred sectors. We hold limited exposure in high yield bonds favoring bank loans. We expect to maintain exposure to securitized assets and have looked to add to certain deal structures. Sector and credit selection remain vital as we focus on deleveraging stories and sectors, while staying cautious with sectors experiencing more deterioration in credit metrics. We are also mindful of sectors that can be meaningfully impacted by slowing global growth, evolution of trade-policy changes and rising cost inflation, such as technology, automotive and chemicals. We are underweight duration relative to the benchmark.
| | |
| | See benchmark definitions on A-23 and A-24 |
A-12
PACIFIC FUNDS PERFORMANCE DISCUSSION (Continued)
Pacific Funds Core Income (managed by Pacific Asset Management)
Q. How did the Fund perform for the year ended March 31, 2019?
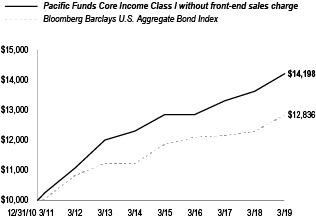
A. For the year ended March 31, 2019, Pacific Funds Core Income’s Class I (without sales charge) returned 4.30%, compared to a 4.48% return for its benchmark, the Bloomberg Barclays U.S. Aggregate Bond Index.
The following graph compares the performance of a hypothetical $10,000 investment in Class I shares of the Fund to its benchmark for the period from inception through March 31, 2019. For comparison purposes, the performance of all classes for the periods ended March 31, 2019 are also shown in the table below. Performance data for Class A, C, P and Advisor Class shares will vary due to differences in fees and sales charges. The Fund’s performance reflects reinvestments of all dividends and capital gains distributions, if any.
Performance Comparison
Average Annual Total Returns for the Periods Ended March 31, 2019
| | | | | | | | | | | | |
| | | 1 Year | | | 5 Years | | | Since
Inception
(12/31/10) | |
Fund’s Class I without sales charge | | | 4.30% | | | | 2.92% | | | | 4.34% | |
Fund’s Class A without sales charge | | | 3.99% | | | | 2.62% | | | | 4.07% | |
Fund’s Class A with maximum sales charge | | | (0.40% | ) | | | 1.74% | | | | 3.53% | |
Bloomberg Barclays U.S. Aggregate Bond Index | | | 4.48% | | | | 2.74% | | | | 3.08% | |
| | | |
| | | 1 Year | | | 5 Years | | | Since Inception (06/30/11) | |
Fund’s Class C without sales charge | | | 3.11% | | | | 1.85% | | | | 2.94% | |
Fund’s Class C with maximum sales charge | | | 2.11% | | | | 1.85% | | | | 2.94% | |
Bloomberg Barclays U.S. Aggregate Bond Index | | | 4.48% | | | | 2.74% | | | | 2.92% | |
| | | |
| | | 1 Year | | | 5 Years | | | Since Inception (06/29/12) | |
Fund’s Advisor Class without sales charge | | | 4.19% | | | | 2.90% | | | | 3.40% | |
Bloomberg Barclays U.S. Aggregate Bond Index | | | 4.48% | | | | 2.74% | | | | 2.26% | |
| | | |
| | | | | | 1 Year | | | Since Inception (04/27/15) | |
Fund’s Class P without sales charge | | | | | | | 4.29% | | | | 2.35% | |
Bloomberg Barclays U.S. Aggregate Bond Index | | | | | | | 4.48% | | | | 1.99% | |
|
| |
Performance data shown represents past performance. Investment return and principal value will fluctuate so that shares of the Fund when redeemed may be worth more or less than their original cost. Past performance is not predictive of future performance. The table does not reflect the deduction of taxes that a shareholder would pay on Fund distributions or redemption of Fund shares. |
Q. Discuss both positive and negative factors that materially affected the Fund’s performance during the year, including relevant market conditions, investment strategies and techniques, and particular sectors or securities.
A. For the reporting period, the Fund’s Class I underperformed the benchmark. The Fund uses an intermediate term corporate debt focused strategy. Using a fundamental approach with atop-down overlay, Pacific Asset Management’s team of portfolio managers and research analysts look at the relative value of each security and assess the macro environment and marketplace for tailwinds and catalysts in the process of individual investment selection.
The Fund’s underweight to duration detracted from performance given the flattening of the yield curve seen during the reporting period. The Fund’s allocation tonon-investment grade securities, bank loans and high yield bonds, and to underweight treasury and government related securities benefited performance. Security selection in pharmaceuticals and chemicals benefited performance while overweight’s to banking and midstream hurt performance.
The significant spread widening seen in December 2018 and subsequent rally in the first quarter 2019 continues to leave us with a more neutral view of investment-grade corporate credit as we enter April 2019. Stable monetary policy should help the technical picture for the asset class. From an asset allocation perspective, we like the improved relative value in floating-rate loans andBBB-rated investment-grade names in preferred sectors. We expect to maintain exposure to securitized assets and have looked to add to certain deal structures as they became more attractive due to thesell-off in December 2018. Sector and credit selection remain vital as we focus on deleveraging stories and sectors, while staying cautious with sectors experiencing more deterioration in credit metrics. We are also mindful of sectors that can be meaningfully impacted by slowing global growth, evolution of trade-policy changes and rising cost inflation, such as technology, automotive and chemicals. We are underweight duration relative to the benchmark.
| | |
| | See benchmark definitions on A-23 and A-24 |
A-13
PACIFIC FUNDS PERFORMANCE DISCUSSION (Continued)
Pacific Funds Strategic Income (managed by Pacific Asset Management)
Q. How did the Fund perform for the year ended March 31, 2019?
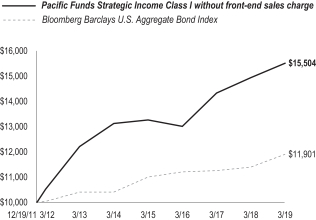
A. For the year ended March 31, 2019, Pacific Funds Strategic Income’s Class I (without sales charge) returned 3.77%, compared to a 4.48% return for its benchmark, the Bloomberg Barclays U.S. Aggregate Bond Index.
The following graph compares the performance of a hypothetical $10,000 investment in Class I shares of the Fund to its benchmark for the period from inception through March 31, 2019. For comparison purposes, the performance of all classes for the periods ended March 31, 2019 are also shown in the table below. Performance data for Class A, C and Advisor Class shares will vary due to differences in fees and sales charges. The Fund’s performance reflects reinvestments of all dividends and capital gains distributions, if any.
Performance Comparison
Average Annual Total Returns for the Periods Ended March 31, 2019
| | | | | | | | | | | | |
| | | 1 Year | | | 5 Years | | | Since Inception (12/19/11) | |
Fund’s Class I without sales charge | | | 3.77% | | | | 3.40% | | | | 6.21% | |
Bloomberg Barclays U.S Aggregate Bond Index | | | 4.48% | | | | 2.74% | | | | 2.42% | |
| | | |
| | | 1 Year | | | 5 Years | | | Since Inception (06/29/12) | |
Fund’s Class A without sales charge | | | 3.43% | | | | 3.10% | | | | 5.25% | |
Fund’s Class A with maximum sales charge | | | (1.00% | ) | | | 2.20% | | | | 4.58% | |
Fund’s Class C without sales charge | | | 2.73% | | | | 2.35% | | | | 4.50% | |
Fund’s Class C with maximum sales charge | | | 1.74% | | | | 2.35% | | | | 4.50% | |
Fund’s Advisor Class without sales charge | | | 3.70% | | | | 3.36% | | | | 5.50% | |
Bloomberg Barclays U.S Aggregate Bond Index | | | 4.48% | | | | 2.74% | | | | 2.26% | |
|
| |
Performance data shown represents past performance. Investment return and principal value will fluctuate so that shares of the Fund when redeemed may be worth more or less than their original cost. Past performance is not predictive of future performance. The table does not reflect the deduction of taxes that a shareholder would pay on Fund distributions or redemption of Fund shares. |
Q. Discuss both positive and negative factors that materially affected the Fund’s performance during the year, including relevant market conditions, investment strategies and techniques, and particular sectors or securities.
A. For the reporting period, the Fund’s Class I underperformed the benchmark. The Fund uses anon-investment grade focused multi-sector credit strategy. Using a fundamental approach with atop-down overlay, Pacific Asset Management’s team of portfolio managers and research analysts look at the relative value of each security and assess the macro environment and marketplace for tailwinds and catalysts in the process of individual investment selection.
The Fund underperformed the benchmark for the reporting period primarily driven by asset allocation and duration. The Fund focuses on U.S. credit sectors including bank loans, high yield bonds, and corporate debt. The Fund’s overweight to bank loans detracted from performance. The Fund’s underweight to longer maturity government bonds detracted from performance. The Fund’s underweight in duration also detracted from performance given the flattening of the yield curve seen during the reporting period. Sector allocations in midstream, gaming, and cable & satellite benefited performance while building materials, packaging, and metals & mining detracted.
The significant spread widening seen in December 2018 and subsequent rally in the first quarter 2019 continues to leave us with a positive view of corporate credit as we enter the new fiscal year. We believe that improved relative value should help the technical picture for credit, specifically as monetary policy stabilizes. From an asset allocation perspective, we like the improved relative value in bank loans and investment-grade names in preferred sectors. After increasing our exposure in December 2018 to high yield bonds, we have reduced that exposure in favor of bank loan securities based on relative value. Sector and credit selection remain vital as we focus on deleveraging stories and sectors, while staying cautious with sectors experiencing more deterioration in credit metrics. We are also mindful of sectors that can be meaningfully impacted by slowing global growth, evolution of trade-policy changes and rising cost inflation, such as technology, automotive and chemicals. We are underweight duration relative to the benchmark.
| | |
| | See benchmark definitions on A-23 and A-24 |
A-14
PACIFIC FUNDS PERFORMANCE DISCUSSION (Continued)
Pacific Funds Floating Rate Income (managed by Pacific Asset Management)
Q. How did the Fund perform for the year ended March 31, 2019?
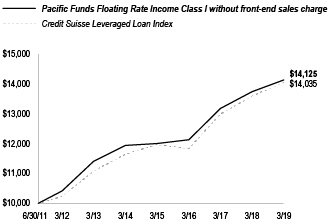
A. For the year ended March 31, 2019, Pacific Funds Floating Rate Income’s Class I (without sales charge) returned 2.88%, compared to a 3.33% return for its benchmark, the Credit Suisse Leveraged Loan Index.
The following graph compares the performance of a hypothetical $10,000 investment in Class I shares of the Fund to its benchmark for the period from inception through March 31, 2019. For comparison purposes, the performance of all classes for the periods ended March 31, 2019 are also shown in the table below. Performance data for Class A, C, P and Advisor Class shares will vary due to differences in fees and sales charges. The Fund’s performance reflects reinvestments of all dividends and capital gains distributions, if any.
Performance Comparison
Average Annual Total Returns for the Periods Ended March 31, 2019
| | | | | | | | | | | | |
| | | 1 Year | | | 5 Years | | | Since
Inception
(06/30/11) | |
Fund’s Class I without sales charge | | | 2.88% | | | | 3.43% | | | | 4.56% | |
Credit Suisse Leveraged Loan Index | | | 3.33% | | | | 3.83% | | | | 4.47% | |
| | | |
| | | 1 Year | | | 5 Years | | | Since Inception (12/30/11) | |
Fund’s Class A without sales charge | | | 2.57% | | | | 3.12% | | | | 4.55% | |
Fund’s Class A with maximum sales charge | | | (0.48% | ) | | | 2.49% | | | | 4.11% | |
Fund’s Class C without sales charge | | | 1.86% | | | | 2.37% | | | | 3.80% | |
Fund’s Class C with maximum sales charge | | | 0.88% | | | | 2.37% | | | | 3.80% | |
Credit Suisse Leveraged Loan Index | | | 3.33% | | | | 3.83% | | | | 5.03% | |
| | | |
| | | 1 Year | | | 5 Years | | | Since Inception (06/29/12) | |
Fund’s Advisor Class without sales charge | | | 2.83% | | | | 3.39% | | | | 4.38% | |
Credit Suisse Leveraged Loan Index | | | 3.33% | | | | 3.83% | | | | 4.76% | |
| | | |
| | | 1 Year | | | 5 Years | | | Since Inception (12/31/12) | |
Fund’s Class P without sales charge | | | 2.87% | | | | 3.41% | | | | 3.90% | |
Credit Suisse Leveraged Loan Index | | | 3.33% | | | | 3.83% | | | | 4.26% | |
|
| |
Performance data shown represents past performance. Investment return and principal value will fluctuate so that shares of the Fund when redeemed may be worth more or less than their original cost. Past performance is not predictive of future performance. The table does not reflect the deduction of taxes that a shareholder would pay on Fund distributions or redemption of Fund shares. |
Q. Discuss both positive and negative factors that materially affected the Fund’s performance during the year, including relevant market conditions, investment strategies and techniques, and particular sectors or securities.
A. For the reporting period, the Fund’s Class I underperformed the benchmark. Using a fundamental approach with a top down overlay, Pacific Asset Management’s team of portfolio managers and research analysts look for investment opportunities in floating rate loans and floating rate debt securities.
The Fund’s underperformance to the benchmark was primarily attributable to the focus on larger bank loan issuers. During the reporting period, larger issuers underperformed. This was most pronounced during the year end 2018 volatility as more liquid, larger issuers underperformed. The Fund benefited from overweights to second lien bank loans, which outperformed during the reporting period. Given the liquidity driven selloff seen in December 2018 along with the broader outperformance of smaller facility sizes during the reporting period, second liens outperformed their first lien counterparts. The Fund’s overweight to B versus BB-rated issuers was a contributor to performance as B-rated issuers outperformed BB’s.
The Fund’s overweight to chemicals and underweight to media/telecommunications contributed to performance. The Fund’s overweight to forest products/containers and overweight to manufacturing detracted from performance.
We enter the new fiscal year underweight risk as measured to our benchmark by yield. While prices have recovered much of the liquidity driven selloff seen in December 2018, the asset class provides attractive yields and stable corporate health conditions. Our underweight in yield to our benchmark is primarily attributable to our limited exposure to distressed issuers (those below$90-dollar price). We are focused on the performing segment of the bank loan market. At the end of the reporting period, we are overweight to food/tobacco securities, forest products/containers securities, and manufacturing securities. We are underweight to technology, health care, and media/telecommunication securities.
| | |
| | See benchmark definitions on A-23 and A-24 |
A-15
PACIFIC FUNDS PERFORMANCE DISCUSSION (Continued)
Pacific Funds High Income (managed by Pacific Asset Management)
Q. How did the Fund perform for the year ended March 31, 2019?
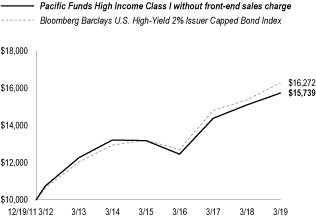
A. For the year ended March 31, 2019, Pacific Funds High Income’s Class I (without sales charge) returned 4.27%, compared to a 5.93% return for its benchmark, the Bloomberg Barclays U.S. High-Yield 2% Issuer Capped Bond Index.
The following graph compares the performance of a hypothetical $10,000 investment in Class I shares of the Fund to its benchmark for the period from inception through March 31, 2019. For comparison purposes, the performance of all classes for the periods ended March 31, 2019 are also shown in the table below. Performance data for Class A, C, P and Advisor Class shares will vary due to differences in fees and sales charges. The Fund’s performance reflects reinvestments of all dividends and capital gains distributions, if any.
Performance Comparison
Average Annual Total Returns for the Periods Ended March 31, 2019
| | | | | | | | | | | | |
| | | 1 Year | | | 5 Years | | | Since
Inception
(12/19/11) | |
Fund’s Class I without sales charge | | | 4.27% | | | | 3.54% | | | | 6.43% | |
Bloomberg Barclays U.S. High-Yield 2% Issuer Capped Bond Index | | | 5.93% | | | | 4.69% | | | | 6.92% | |
| | | |
| | | 1 Year | | | 5 Years | | | Since Inception (06/29/12) | |
Fund’s Class A without sales charge | | | 3.97% | | | | 3.27% | | | | 5.35% | |
Fund’s Class A with maximum sales charge | | | (0.41% | ) | | | 2.38% | | | | 4.67% | |
Fund’s Class C without sales charge | | | 3.35% | | | | 2.53% | | | | 4.60% | |
Fund’s Class C with maximum sales charge | | | 2.37% | | | | 2.53% | | | | 4.60% | |
Fund’s Advisor Class without sales charge | | | 4.23% | | | | 3.53% | | | | 5.60% | |
Bloomberg Barclays U.S. High-Yield 2% Issuer Capped Bond Index | | | 5.93% | | | | 4.69% | | | | 6.21% | |
| | | |
| | | | | | 1 Year | | | Since
Inception
(01/14/15) | |
Fund’s Class P without sales charge | | | | | | | 4.27% | | | | 4.99% | |
Bloomberg Barclays U.S. High-Yield 2% Issuer Capped Bond Index | | | | | | | 5.93% | | | | 5.74% | |
|
| |
Performance data shown represents past performance. Investment return and principal value will fluctuate so that shares of the Fund when redeemed may be worth more or less than their original cost. Past performance is not predictive of future performance. The table does not reflect the deduction of taxes that a shareholder would pay on Fund distributions or redemption of Fund shares. |
Q. Discuss both positive and negative factors that materially affected the Fund’s performance during the year, including relevant market conditions, investment strategies and techniques, and particular sectors or securities.
A. For the reporting period, the Fund’s Class I underperformed the benchmark. The Fund seeks a high level of current income by investing innon-investment grade, debt instruments or in instruments with characteristics ofnon-investment grade instruments. Using a fundamental approach with atop-down overlay, Pacific Asset Management’s team of portfolio managers and research analysts look at the relative value of each security and assess the macro environment and marketplace for tailwinds and catalysts.
During the reporting period, the Fund underperformed the benchmark primarily due to sector allocations and security selection. Sanchez Energy and Halcon Resources were notable detractors in the independent exploration& production sector. Ahern Rentals was a notable detractor in the construction machinery sector. On a sector basis, notable positive contributors include food and beverage and finance companies while underweight allocations to cable/satellite and health care sectors detracted. Duration was neutral to performance during the reporting period.
As we enter the new fiscal year, we believe it is especially important amid current market conditions to maintain our focus on credit selection as the key to our high-yield investment process. The Fund’s investments continue to be focused on U.S.-centric companies, targeting a relatively healthy U.S. consumer and companies with strong underlying fundamentals. We expect building materials, restaurant, and manufacturing sectors to continue to benefit from the relative strength of U.S. consumers and growing government spending. In the case of housing-related sectors, our focus on less cyclical roofing exposures provides both attractive yield and some downside protection. The Fund remains underweight exposure to industries in secular decline, which include phone companies in the wirelines sector and hardware companies susceptible to rapid change in the technology sector.
| | |
| | See benchmark definitions on A-23 and A-24 |
A-16
PACIFIC FUNDS PERFORMANCE DISCUSSION (Continued)
Pacific Funds Large-Cap (managed by Rothschild & Co Asset Management US Inc.)
Q. How did the Fund perform for the year ended March 31, 2019?
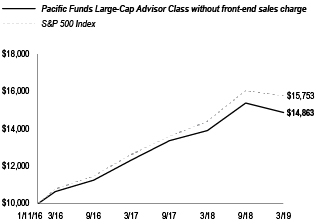
A. For the year ended March 31, 2019, Pacific FundsLarge-Cap’s Advisor Class (without sales charge) returned 6.97%, compared to a 9.50% return for its benchmark, the S&P 500 Index.
The following graph compares the performance of a hypothetical $10,000 investment in Advisor Class shares of the Fund to its benchmark for the period from inception through March 31, 2019. For comparison purposes, the performance of all classes for the periods ended March 31, 2019 are also shown in the table below. Performance data for Class A, C, and S shares will vary due to differences in fees and sales charges. The Fund’s performance reflects reinvestments of all dividends and capital gains distributions, if any.
Performance Comparison
Average Annual Total Returns for the Periods Ended March 31, 2019
| | | | | | | | |
| | | 1 Year | | | Since
Inception
(1/11/16) | |
Fund’s Advisor Class without sales charge(1) | | | 6.97% | | | | 13.06% | |
Fund’s Class A without sales charge | | | 6.74% | | | | 12.77% | |
Fund’s Class A with maximum sales charge | | | 2.17% | | | | 11.28% | |
Fund’s Class C without sales charge | | | 5.97% | | | | 11.94% | |
Fund’s Class C with maximum sales charge | | | 4.97% | | | | 11.94% | |
S&P 500 Index | | | 9.50% | | | | 15.13% | |
| | |
| | | 1 Year | | | Since
Inception
(03/20/15) | |
Fund’s Class S without sales charge | | | 7.06% | | | | 7.61% | |
S&P 500 Index | | | 9.50% | | | | 9.86% | |
| | (1) | The performance chart previously reflected the returns for Investor Class shares, which are no longer available for this Fund. Advisor Class returns are now shown because Advisor Class has the greatest net assets relative to the other share classes of the Fund. |
|
| |
Performance data shown represents past performance. Investment return and principal value will fluctuate so that shares of the Fund when redeemed may be worth more or less than their original cost. Past performance is not predictive of future performance. The table does not reflect the deduction of taxes that a shareholder would pay on Fund distributions or redemption of Fund shares. |
Q. Discuss both positive and negative factors that materially affected the Fund’s performance during the year, including relevant market conditions, investment strategies and techniques, and particular sectors or securities.
A. For the reporting period, the Fund’s Advisor Class underperformed the benchmark. We at Rothschild & Co AMUS implement the Fund’s strategy by investing in common stocks and other equity securities of large capitalization U.S. companies. We analyze a variety of quantitative and fundamental inputs in making stock decisions, and seek to build a portfolio that is well diversified at the issuer level and by economic sector. Our focus remains on identifying stocks with attractive relative valuations and the ability to exceed investors’ expectations.
Leading sectors contributing to performance of the Fund included utilities, real estate, and information technology. Conversely, financials, energy, and industrials detracted from the Fund’s performance. Sector allocation was negative, with headwinds from an underweight to information technology outpacing tailwinds from an underweight to industrials. Stock selection was also negative, and the primary driver of the Fund’s performance, with the effects of detractors in health care, industrials, and consumer discretionary exceeding those of contributors in consumer staples, and information technology.
Turning to individual stocks, detractors from the Fund’s performance included Noble Energy, a large international exploration and production company. The Fund’s position in Noble was a headwind during the reporting period as shares were impacted by amid-2018 cut to production and guidance as well as a concurrent raise to capital expenditures. Noble also removed longer term production guidance, which added to uncertainty. Lastly, they were negatively impacted by headlines in Colorado, where ananti-oil industry measure made the state’s ballot for the November 2018 election. While this measure was defeated, there remains continued concern for the industry in the state and we subsequently exited our position in the stock. Cigna Corporation, a healthcare services company, underperformed in the first quarter of 2019 due to macro headwinds pressuring healthcare services stocks. Sentiment across the drug supply chain has been adversely impacted by growing political uncertainty and the potential for changes to payment models in some markets. Although Cigna management has reaffirmed guidance, which contemplates many of the industry’s headwinds, shares were still weak in the first quarter of 2019. Marathon Petroleum, a crude refining company, negatively impacted the Fund’s performance as shares of the refiningsub-sector generally lagged due to weaker margins on products such as gasoline and narrower crude differentials, which hurts profitability. As a result, there have been some investor concerns and market pressures that Marathon may miss consensus earnings estimates.
The top contributors to the Fund’s performance included Eli Lilly and Company, a pharmaceutical company. Eli Lilly’s shares performed relatively well in 2018, driven by strong third quarter of 2018 results and performing relatively well during the fourth quarter of 2018 reversal. Visa Inc., a payment technology company, is the biggest company in what is effectively a duopoly market. Visa recently reported a good fourth quarter 2018 and fiscal year 2019 outlook was better than expected. Visa continues to benefit from the ongoing shift from cash/check to credit/debt.
| | |
| | See benchmark definitions on A-23 and A-24 |
A-17
PACIFIC FUNDS PERFORMANCE DISCUSSION (Continued)
Pacific Funds Large-Cap Value (managed by Rothschild & Co Asset Management US Inc.)
Q. How did the Fund perform for the year ended March 31, 2019?
A. For the year ended March 31, 2019, Pacific FundsLarge-Cap Value’s Advisor Class (without sales charge) returned 3.47%, compared to a 5.67% return for its benchmark, the Russell 1000 Value Index.
The following graph compares the performance of a hypothetical $10,000 investment in Advisor Class shares of the Fund to its benchmark for the period from inception through March 31, 2019. For comparison purposes, the performance of all classes for the periods ended March 31, 2019 are also shown in the table below. Performance data for Class A, C, and S shares will vary due to differences in fees and sales charges. The Fund’s performance reflects reinvestments of all dividends and capital gains distributions, if any.
Performance Comparison
Average Annual Total Returns for the Periods Ended March 31, 2019
| | | | | | | | |
| | | 1 Year | | | Since
Inception
(1/11/16) | |
Fund’s Advisor Class without sales charge(1) | | | 3.47% | | | | 10.36% | |
Fund’s Class A without sales charge | | | 3.14% | | | | 10.07% | |
Fund’s Class A with maximum sales charge | | | (1.22% | ) | | | 8.59% | |
Fund’s Class C without sales charge | | | 2.40% | | | | 9.25% | |
Fund’s Class C with maximum sales charge | | | 1.44% | | | | 9.25% | |
Fund’s Class S without sales charge | | | 3.39% | | | | 10.42% | |
Russell 1000 Value Index | | | 5.67% | | | | 12.36% | |
| | (1) | The performance chart previously reflected the returns for Investor Class shares, which are no longer available for this Fund. Advisor Class returns are now shown because Advisor Class has the greatest net assets relative to the other share classes of the Fund. |
|
| |
Performance data shown represents past performance. Investment return and principal value will fluctuate so that shares of the Fund when redeemed may be worth more or less than their original cost. Past performance is not predictive of future performance. The table does not reflect the deduction of taxes that a shareholder would pay on Fund distributions or redemption of Fund shares. |
Q. Discuss both positive and negative factors that materially affected the Fund’s performance during the year, including relevant market conditions, investment strategies and techniques, and particular sectors or securities.
A. For the reporting period, the Fund’s Advisor Class underperformed the benchmark. We at Rothschild & Co AMUS implement the Fund’s strategy by investing in common stocks and other equity securities of large capitalization U.S. companies. We analyze a variety of quantitative and fundamental inputs in making stock decisions, and seek to build a portfolio that is well diversified at the issuer level and by economic sector. Our focus remains on identifying stocks with attractive relative valuations and the ability to exceed investors’ expectations.
Leading sectors contributing to performance of the Fund included utilities, information technology, and real estate. Conversely, consumer discretionary, financials, and industrials detracted from the Fund’s performance. Sector allocation was neutral for the reporting period. Stock selection was negative, and the primary driver of the Fund’s performance, with the effects of detractors in health care, consumer discretionary, and industrials exceeding those of contributors in information technology, and consumer staples.
Turning to individual stocks, detractors from the Fund’s performance included financial services company State Street Corporation (State Street). State Street announced a dilutive acquisition (Charles River Development) that was not well received by investors. The Fund continues to hold State Street stock due to a combination of its valuation profile, perceived low market expectations, and well-positioned business model against a competitive landscape. Northrop Grumman Corporation, an aerospace and defense technology company, declined for multiple reasons including investor profit-taking, assumptions that U.S.-North Korean tensions have been eased, and worries that the large budget deficits may cut into various defense programs. CVS Health Corporation, a retail pharmacy and healthcare company, was pressured from sentiment across the drug supply chain, which has been adversely impacted by growing political uncertainly. CVS’s guidance for 2019 includes a greater amount of investment in the business, which largely offsets the Aetna deal-related synergy for 2019.
The top contributors to the Fund’s performance included Broadcom Inc., a semiconductor and software solutions provider. Broadcom reported strong quarterly earnings and boosted its dividend by 50% in 2018. Broadcom also issued fiscal year 2019 guidance above expectations due to additive tailwinds from CA Technologies’ results (a software company Broadcom acquired). The stock performed well versus its semiconductor peers due to its cheap valuation, high free cash flow generation, and attractive dividend yield. The stock avoided the semi market downturn in the fourth quarter of 2018 because it has low exposure to cyclical end markets. Microsoft Corporation, a technology company, continued to perform well after delivering sound quarterly results. Microsoft had better than expected revenues, margins, and earnings per share. The results also served as an affirmation that revenues and earnings will accelerate in fiscal year 2019, driven by Azure and Office 365 as they are now large enough to move the needle. Eli Lilly and Company, a pharmaceutical company, performed relatively well in 2018, driven by strong third quarter 2018 results and performing relatively well during the fourth quarter of 2018 reversal.
| | |
| | See benchmark definitions on A-23 and A-24 |
A-18
PACIFIC FUNDS PERFORMANCE DISCUSSION (Continued)
Pacific Funds Small/Mid-Cap (managed by Rothschild & Co Asset Management US Inc.)
Q. How did the Fund perform for the year ended March 31, 2019?
A. For the year ended March 31, 2019, Pacific FundsSmall/Mid-Cap’s Advisor Class (without sales charge) returned 1.50%, compared to a 4.48% return for its benchmark, the Russell 2500 Index.
The following graph compares the performance of a hypothetical $10,000 investment in Advisor Class shares of the Fund to its benchmark for the period from inception through March 31, 2019. For comparison purposes, the performance of all classes for the periods ended March 31, 2019 are also shown in the table below. Performance data for Class A, C, and S shares will vary due to differences in fees and sales charges. The Fund’s performance reflects reinvestments of all dividends and capital gains distributions, if any.
Performance Comparison
Average Annual Total Returns for the Periods Ended March 31, 2019
| | | | | | | | |
| | | 1 Year | | | Since
Inception
(01/11/16) | |
Fund’s Advisor Class without sales charge(1) | | | 1.50% | | | | 12.22% | |
Fund’s Class A without sales charge | | | 1.19% | | | | 11.96% | |
Fund’s Class A with maximum sales charge | | | (3.14% | ) | | | 10.48% | |
Fund’s Class C without sales charge | | | 0.43% | | | | 11.12% | |
Fund’s Class C with maximum sales charge | | | (0.55% | ) | | | 11.12% | |
Russell 2500 Index | | | 4.48% | | | | 14.33% | |
| | |
| | | 1 Year | | | Since
Inception
(12/31/14) | |
Fund’s Class S without sales charge | | | 1.52% | | | | 7.63% | |
Russell 2500 Index | | | 4.48% | | | | 8.06% | |
| | (1) | The performance chart previously reflected the returns for Investor Class shares, which are no longer available for this Fund. Advisor Class returns are now shown because Advisor Class has the greatest net assets relative to the other share classes of the Fund. |
|
| |
Performance data shown represents past performance. Investment return and principal value will fluctuate so that shares of the Fund when redeemed may be worth more or less than their original cost. Past performance is not predictive of future performance. The table does not reflect the deduction of taxes that a shareholder would pay on Fund distributions or redemption of Fund shares. |
Q. Discuss both positive and negative factors that materially affected the Fund’s performance during the year, including relevant market conditions, investment strategies and techniques, and particular sectors or securities.
A. For the reporting period, the Fund’s Advisor Class underperformed the benchmark. We at Rothschild & Co AMUS implement the Fund’s strategy by investing in common stocks and other equity securities of small and medium capitalization U.S. companies. We analyze a variety of quantitative and fundamental inputs in making stock decisions, and seek to build a portfolio that is well diversified at the issuer level and by economic sector. Our focus remains on identifying stocks with attractive relative valuations and the ability to exceed investors’ expectations.
Leading sectors contributing to performance of the Fund included utilities, information technology, and health care. Conversely, materials, energy, and financials detracted from the Fund’s performance. Sector allocation was negative for the reporting period as headwinds from underweights to real estate and utilities outpaced tailwinds from an overweight to health care and an underweight to financials. Stock selection was also negative, and the primary driver of the Fund’s performance, with the effects of detractors in materials, consumer discretionary, and industrials exceeding those of contributors in health care, information technology, and consumer staples.
Turning to individual stocks, detractors from the Fund’s performance included Cooper Standard, an automotive parts supplier. Cooper Standard recently reported a challenging first quarter 2019 due to margin headwinds and production disruption in Europe. Raw material costs have been rising and some of their clients have been slow to accept price increases. Guidance, however, was maintained for 2019 as pricing headwinds appear to be stabilizing. Owens Corning, a manufacturer of building products and composite materials, reported weaker-than-expected results in early 2018, as price hikes only partially offset transportation and raw material cost inflation. The stock weakened further in the second half of 2018 when concerns over rising interest rates caused investors to sell all building products and home building stocks. Central Garden & Pet, a manufacturer and distributor of garden products, recently reported disappointing results for their seasonally smallest first quarter. Costs came in higher than anticipated and the company had a larger order move from the first quarter to the second quarter of 2019. However, guidance was maintained for 2019 and the shares continue to trade at a discount to their peers.
The top contributors to the Fund’s performance included LiveRamp Holdings, anad-tech company. After rebounding from 2018 pressures, LiveRamp executed on its initiatives and reported its first quarter 2019 as a pure play transaction/subscription advertising-technology company with better-than-expected results. Insperity, Inc., an HR outsourcing company, continued to execute on its growth plans with an increased and more productive salesforce and a broader service offering driving better-than-expected quarterly results and annual guidance. Amedisys, Inc., a provider of home health, hospice, and personal care, reported better-than-expected quarterly results and continually raised full year guidance on better sales and cost cuts, as positive fundamental tailwinds from healthcare migration from costlyin-patient care to lower cost outpatient care in the home and hospice progressed.
| | |
| | See benchmark definitions on A-23 and A-24 |
A-19
PACIFIC FUNDS PERFORMANCE DISCUSSION (Continued)
Pacific Funds Small-Cap (managed by Rothschild & Co Asset Management US Inc.)
Q. How did the Fund perform for the year ended March 31, 2019?
A. For the year ended March 31, 2019, Pacific FundsSmall-Cap’s Advisor Class (without sales charge) returned-0.26%, compared to a 2.05% return for its benchmark, the Russell 2000 Index.
The following graph compares the performance of a hypothetical $10,000 investment in Advisor Class shares of the Fund to its benchmark for the period from inception through March 31, 2019. For comparison purposes, the performance of all classes for the periods ended March 31, 2019 are also shown in the table below. Performance data for Class A, C, and S shares will vary due to differences in fees and sales charges. The Fund’s performance reflects reinvestments of all dividends and capital gains distributions, if any.
Performance Comparison
Average Annual Total Returns for the Periods Ended March 31, 2019
| | | | | | | | |
| | | 1 Year | | | Since
Inception
(01/11/16) | |
Fund’s Advisor Class without sales charge(1) | | | (0.26% | ) | | | 12.32% | |
Fund’s Class A without sales charge | | | (0.53% | ) | | | 12.04% | |
Fund’s Class A with maximum sales charge | | | (4.75% | ) | | | 10.56% | |
Fund’s Class C without sales charge | | | (1.17% | ) | | | 11.21% | |
Fund’s Class C with maximum sales charge | | | (2.11% | ) | | | 11.21% | |
Russell 2000 Index | | | 2.05% | | | | 14.31% | |
| | |
| | | 1 Year | | | Since
Inception
(12/31/14) | |
Fund’s Class S without sales charge | | | (0.18% | ) | | | 6.98% | |
Russell 2000 Index | | | 2.05% | | | | 7.42% | |
| | (1) | The performance chart previously reflected the returns for Investor Class shares, which are no longer available for this Fund. Advisor Class returns are now shown because Advisor Class has the greatest net assets relative to the other share classes of the Fund. |
|
| |
Performance data shown represents past performance. Investment return and principal value will fluctuate so that shares of the Fund when redeemed may be worth more or less than their original cost. Past performance is not predictive of future performance. The table does not reflect the deduction of taxes that a shareholder would pay on Fund distributions or redemption of Fund shares. |
Q. Discuss both positive and negative factors that materially affected the Fund’s performance during the year, including relevant market conditions, investment strategies and techniques, and particular sectors or securities.
A. For the reporting period, the Fund’s Advisor Class underperformed the benchmark. We at Rothschild & Co AMUS implement the Fund’s strategy by investing in common stocks and other equity securities of small capitalization U.S. companies. We analyze a variety of quantitative and fundamental inputs in making stock decisions, and seek to build a portfolio that is well diversified at the issuer level and by economic sector. Our focus remains on identifying stocks with attractive relative valuations and the ability to exceed investors’ expectations.
Leading sectors contributing to performance of the Fund included communication services, and utilities. Conversely, materials, energy, and consumer discretionary detracted from the Fund’s performance. Sector allocation was positive for the reporting period as tailwinds from an underweight to energy and an overweight to information technology outpaced headwinds from an overweight to industrials and an underweight to real estate. Stock selection was negative, and the primary driver of the Fund’s performance, with the effects of detractors in consumer discretionary, materials, and financials exceeding those of contributors in health care, and communication services.
Turning to individual stocks, detractors from the Fund’s performance included Cooper Standard, an automotive parts supplier. Cooper recently reported a challenging fourth quarter 2018 due to margin headwinds and production disruption in Europe. Raw material costs have been rising and some of their clients have been slow to accept price increases. Guidance, however, was maintained for 2019 as pricing headwinds appear to be stabilizing. Central Garden & Pet, a manufacturer and distributor of garden products, in the first quarter of 2019, reported disappointing results for what is typically their smallest quarter of the year. Costs came in higher than anticipated and Central Garden had a larger order move from the first quarter to the second quarter. However, guidance was maintained for the full year and the shares continue to trade at a discount to their peers. Trinseo SA, a largely commodity chemicals company, lowered earnings guidance range in late 2018 due to higher raw materials costs and a slowdown in demand from the automotive industry. Additionally, the stock was caught up in the headwinds provided by the October of 2018sell-off in the basic materials sector.
The top contributors to the Fund’s performance included Insperity, Inc., an HR outsourcing provider. Insperity continued to execute on its growth plans with an increased and more productive salesforce and a broader service offering driving better-than-expected quarterly results and annual guidance. Glu Mobile, a mobile game publisher, continued to outperform due to increased optimism over the potential from its new game titles and positive trends within its existing growth games. LiveRamp Holdings, anad-tech company, rebounded from 2018 pressures as it executed on its initiatives and in the first quarter of 2019 reported its first quarter as a pure play transaction/subscription advertising-technology company with better-than-expected results.
| | |
| | See benchmark definitions on A-23 and A-24 |
A-20
PACIFIC FUNDS PERFORMANCE DISCUSSION (Continued)
Pacific Funds Small-Cap Value (managed by Rothschild & Co Asset Management US Inc.)
Q. How did the Fund perform for the year ended March 31, 2019?
A. For the year ended March 31, 2019, Pacific Funds Small-Cap Value’s Advisor Class (without sales charge) returned-3.51%, compared to a 0.17% return for its benchmark, the Russell 2000 Value Index.
The following graph compares the performance of a hypothetical $10,000 investment in Advisor Class shares of the Fund to its benchmark for the period from inception through March 31, 2019. For comparison purposes, the performance of all classes for the periods ended March 31, 2019 are also shown in the table below. Performance data for Class A, C, and S shares will vary due to differences in fees and sales charges. The Fund’s performance reflects reinvestments of all dividends and capital gains distributions, if any.
Performance Comparison
Average Annual Total Returns for the Periods Ended March 31, 2019
| | | | | | | | |
| | | 1 Year | | | Since
Inception
(01/11/16) | |
Fund’s Advisor Class without sales charge(1) | | | (3.51% | ) | | | 9.82% | |
Fund’s Class A without sales charge | | | (3.68% | ) | | | 9.53% | |
Fund’s Class A with maximum sales charge | | | (7.80% | ) | | | 8.07% | |
Fund’s Class C without sales charge | | | (4.47% | ) | | | 8.73% | |
Fund’s Class C with maximum sales charge | | | (5.28% | ) | | | 8.73% | |
Russell 2000 Value Index | | | 0.17% | | | | 13.15% | |
| | |
| | | 1 Year | | | Since
Inception
(12/31/14) | |
Fund’s Class S without sales charge | | | (3.52% | ) | | | 4.74% | |
Russell 2000 Value Index | | | 0.17% | | | | 6.02% | |
| | (1) | The performance chart previously reflected the returns for Investor Class shares, which are no longer available for this Fund. Advisor Class returns are now shown because Advisor Class has the greatest net assets relative to the other share classes of the Fund. |
|
| |
Performance data shown represents past performance. Investment return and principal value will fluctuate so that shares of the Fund when redeemed may be worth more or less than their original cost. Past performance is not predictive of future performance. The table does not reflect the deduction of taxes that a shareholder would pay on Fund distributions or redemption of Fund shares. |
Q. Discuss both positive and negative factors that materially affected the Fund’s performance during the year, including relevant market conditions, investment strategies and techniques, and particular sectors or securities.
A. For the reporting period, the Fund’s Advisor Class underperformed the benchmark. We at Rothschild & Co AMUS implement the Fund’s strategy by investing in common stocks and other equity securities of small capitalization U.S. companies. We analyze a variety of quantitative and fundamental inputs in making stock decisions, and seek to build a portfolio that is well diversified at the issuer level and by economic sector. Our focus remains on identifying stocks with attractive relative valuations and the ability to exceed investors’ expectations.
Leading sectors contributing to performance of the Fund included communication services, utilities, and health care. Conversely, consumer staples, materials, and consumer discretionary detracted from the Fund’s performance. Sector allocation was negative for the reporting period due to headwinds from an overweight to health care and an underweight to communication services outpacing tailwinds from an underweight to energy. Stock selection was also negative, and the primary driver of the Fund’s performance, with the effects of detractors in consumer discretionary, industrials, and financials, exceeding those of contributors in health care, information technology, and utilities.
Turning to individual stocks, detractors from the Fund’s performance included Cooper Standard, an automotive parts supplier. Cooper recently reported a challenging fourth quarter 2018 due to margin headwinds and production disruption in Europe. Raw material costs have been rising and some of their clients have been slow to accept price increases. Guidance, however, was maintained for 2019 as pricing headwinds appear to be stabilizing. Central Garden & Pet, a manufacturer and distributor of garden products, in the first quarter of 2019, reported disappointing results for what is typically their smallest quarter of the year. Costs came in higher than anticipated and Central Garden had a larger order move from the first quarter to the second quarter in 2019. However, guidance was maintained for the full year and the shares continue to trade at a discount to their peers. Trinseo SA, a largely commodity chemicals company, lowered earnings guidance range in late 2018 due to higher raw materials costs and a slowdown in demand from the automotive industry. Additionally, the stock was caught up in the headwinds provided by the October of 2018sell-off in the basic materials sector.
The top contributors to the Fund’s performance included LiveRamp, anad-tech company. After rebounding from 2018 pressures, LiveRamp executed on its initiatives and in the first quarter of 2019 reported it as a pure play transaction/subscription advertising-technology company with better-than-expected results. Horizon Pharma, a pharmaceutical company, announced positive phase-three data for its biologic drug candidate to treat a thyroid related ophthalmic disease that has commercial potential. Horizon Pharma expects to file for final approval with the Food and Drug Administration in second quarter 2019 and launch in 2020. Verint Systems, a company which operates in two segments: customer engagement and cyber intelligence, reported better-than-expected fourth quarter of 2018 earnings and guidance. In addition, their customer engagement segment is experiencing accelerated adoption of their cloud-based offerings, which is driving strong revenue growth and profitability.
| | |
| | See benchmark definitions on A-23 and A-24 |
A-21
PACIFIC FUNDS PERFORMANCE DISCUSSION (Continued)
Pacific Funds Small-Cap Growth (managed by Rothschild & Co Asset Management US Inc.)
Q. How did the Fund perform for the year ended March 31, 2019?
A. For the year ended March 31, 2019, Pacific Funds Small-Cap Growth’s Advisor Class (without sales charge) returned 5.86%, compared to a 3.85% return for its benchmark, the Russell 2000 Growth Index.
The following graph compares the performance of a hypothetical $10,000 investment in Advisor Class shares of the Fund to its benchmark for the period from inception through March 31, 2019. For comparison purposes, the performance of all classes for the periods ended March 31, 2019 are also shown in the table below. Performance data for Class A, C, and S shares will vary due to differences in fees and sales charges. The Fund’s performance reflects reinvestments of all dividends and capital gains distributions, if any.
Performance Comparison
Average Annual Total Returns for the Periods Ended March 31, 2019
| | | | | | | | |
| | | 1 Year | | | Since
Inception
(01/11/16) | |
Fund’s Advisor Class without sales charge(1) | | | 5.86% | | | | 13.25% | |
Fund’s Class A without sales charge | | | 5.65% | | | | 12.94% | |
Fund’s Class A with maximum sales charge | | | 1.19% | | | | 11.43% | |
Fund’s Class C without sales charge | | | 4.82% | | | | 12.11% | |
Fund’s Class C with maximum sales charge | | | 3.85% | | | | 12.11% | |
Fund’s Class S without sales charge | | | 5.92% | | | | 13.36% | |
Russell 2000 Growth Index | | | 3.85% | | | | 15.33% | |
| | |
| | | 1 Year | | | Since
Inception
(06/08/16) | |
Fund’s Class P without sales charge | | | 5.86% | | | | 12.05% | |
Russell 2000 Growth Index | | | 3.85% | | | | 13.16% | |
| | (1) | The performance chart previously reflected the returns for Investor Class shares, which are no longer available for this Fund. Advisor Class returns are now shown because Advisor Class has the greatest net assets relative to the other share classes of the Fund. |
|
| |
Performance data shown represents past performance. Investment return and principal value will fluctuate so that shares of the Fund when redeemed may be worth more or less than their original cost. Past performance is not predictive of future performance. The table does not reflect the deduction of taxes that a shareholder would pay on Fund distributions or redemption of Fund shares. |
Q. Discuss both positive and negative factors that materially affected the Fund’s performance during the year, including relevant market conditions, investment strategies and techniques, and particular sectors or securities.
A. For the reporting period, the Fund’s Advisor Class outperformed the benchmark. We at Rothschild & Co AMUS implement the Fund’s strategy by investing in common stocks and other equity securities of small capitalization U.S. companies. We analyze a variety of quantitative and fundamental inputs in making stock decisions, and seek to build a portfolio that is well diversified at the issuer level and by economic sector. Our focus remains on identifying stocks with attractive relative valuations and the ability to exceed investors’ expectations.
Leading sectors contributing to performance of the Fund included communication services, consumer staples, and real estate. Conversely, energy, materials, and financials detracted from the Fund’s performance. Sector allocation was positive for the reporting period due to tailwinds from an overweight to information technology and an underweight to energy. Stock selection was also positive, and the primary driver of the Fund’s performance, with the effects of contributors in information technology, communication services, and industrials exceeding those of detractors in consumer discretionary, materials, and financials.
Turning to individual stocks, the top contributors to the Fund’s performance included Glu Mobile, a mobile game publisher. Glu Mobile continued to outperform due to increased optimism over the potential from its new game titles and positive trends within its existing growth games. LiveRamp Holdings, anad-tech company, rebounded from 2018 pressures as it executed on its initiatives and reported its first quarter 2019 as a pure play transaction/subscription advertising-technology company with better-than-expected results. Insperity, Inc., an HR outsourcing provider, continued to execute on its growth plans with an increased and more productive salesforce and a broader service offering driving better-than-expected quarterly results and annual guidance.
Detractors from the Fund’s performance included Shutterfly, Inc., an internet photo, card, and personalized gift company. Although Shutterfly reported solid results and guidance driven by its LifeTouch and Commercial Printing units, the stock was under pressure as the company tempered growth assumptions for its consumer segment as the company has been reducing its reliance on promotions. Delux Corporation, a check printer and business services company, reported mixed results with better than expected earnings but modestly weaker sales in 2018. Puma, a biotechnology company, sold off as the marketplace questioned the company’s potential fit in treating breast cancer. Additionally, Puma missed third quarter 2018 sales estimates partially due to inadequate physician educational efforts in conjunction with the sale of its breast cancer treatment option, Nerlynx. However, more recent reports indicated better-than-expected results of Nerlynx and the company’s conservative guidance was well received by investors.
| | |
| | See benchmark definitions on A-23 and A-24 |
A-22
PACIFIC FUNDS PERFORMANCE DISCUSSION (Continued)
Benchmark Definitions
Bloomberg Barclays1-3 Year U.S. Government/Credit Bond Indexmeasures performance of U.S. dollar-denominated U.S. Treasuries, government related, and investment grade U.S. corporate securities with maturities of one to three years. Results include the reinvestment of all distributions.
Bloomberg Barclays U.S. Aggregate Bond Indexmeasures the performance of the U.S. investment grade bonds market, which includes investment grade U.S. government bonds, investment grade corporate bonds, mortgage pass-through securities and asset-backed securities that are publicly offered for sale in the U.S. The securities in the index must have at least 1 year remaining to maturity. In addition, the securities must be denominated in U.S. dollars and must be fixed rate,non-convertible, and taxable. Results include the reinvestment of all distributions.
Bloomberg Barclays U.S. High-Yield 2% Issuer Capped Bond Indexis an index that is an issuer-constrained version for the U.S. Corporate High-Yield Index that covers the U.S. dollar-denominated,non-investment grade fixed-rate taxable corporate bond market and limits issuer exposures to a maximum of 2% and redistributes the excess market value index-wide on apro-rata basis. The total return is equal to the change in price plus the coupon return. Results include the reinvestment of all distributions.
Credit Suisse Leveraged Loan Indextracks the investable market of the U.S. dollar-denominated leveraged loan market. It consists of issues rated “5B” or lower, meaning that the highest rated issues included in this index are Moody’s/S&P ratings of Baa1/BB+ or Ba1/BBB+. All loans are funded term loans with a tenor of at least one year and are made by issuers domiciled in developed countries. Results include the reinvestment of all distributions.
FTSE1-Month U.S. Treasury Bill(T-Bill) Indexis a market value-weighted index of public obligations of the U.S. Treasury with maturities of one month. Results include the reinvestment of all distributions.
ICE BofA Merrill Lynch U.S.3-Month Treasury Bill(T-Bill) Indexis an index comprised of a single issue purchased at the beginning of the month and held for a full month. At the end of the month that issue is sold and rolled into a newly selected issue. The issue selected at eachmonth-end rebalancing is the outstanding Treasury Bill that matures closest to, but not beyond, three months from the rebalancing date. To qualify for selection, an issue must have settled on or before themonth-end rebalancing date. Results include the reinvestment of all distributions.
Morgan Stanley Capital International (MSCI) Emerging Markets Index (Net)is a free float-adjusted market capitalization index that is designed to measure equity market performance of large andmid-capitalization securities in emerging markets. As of March 31, 2019, the MSCI Emerging Markets Index (Net) consists of the following 24 emerging market country indices: Brazil, Chile, China, Colombia, Czech Republic, Egypt, Greece, Hungary, India, Indonesia, South Korea, Malaysia, Mexico, Pakistan, Peru, Philippines, Poland, Qatar, Russia, South Africa, Taiwan, Thailand, Turkey, and United Arab Emirates. The word “(Net)” in the index name means the net total return for the index, which includes the reinvestment of dividends after the deduction of withholding tax, applying the tax rate tonon-resident individuals who do not benefit from double taxation treaties.
MSCI Europe, Australasia and Far East (EAFE) Index (Net)is a free float-adjusted market capitalization index that is designed to measure the equity market performance of developed markets, excluding the U.S. & Canada. As of March 31, 2019, the MSCI EAFE Index (Net) consists of the following 21 developed market country indices: Australia, Austria, Belgium, Denmark, Finland, France, Germany, Hong Kong, Ireland, Israel, Italy, Japan, the Netherlands, New Zealand, Norway, Portugal, Singapore, Spain, Sweden, Switzerland, and the United Kingdom. The word “(Net)” in the index name means the net total return for the index, which includes the reinvestment of dividends after the deduction of withholding tax, applying the tax rate to nonresident individuals who do not benefit from double taxation treaties.
Pacific Funds Portfolio Optimization Composite Benchmarks:The composite benchmarks for the Portfolio Optimization Funds show the performance of a combination of three or more broad-based market indices that represent fixed income, domestic equity, international equity and cash asset class categories in weights that are fixed and specific to each Fund. The composition of each Fund’s composite benchmark is shown below. Results include the reinvestment of all distributions. Prior to July 1, 2012, the weighting to each asset category was adjusted annually to reflect the Fund’s target allocations for the year.
Pacific Funds Portfolio Optimization Conservative Composite Benchmarkis 71% Bloomberg Barclays U.S. Aggregate Bond; 17% S&P 500; 7% ICE BofA Merrill Lynch U.S.3-Month Treasury Bill; and 5% MSCI EAFE (Net) Indices. Results include the reinvestment of all distributions.
Pacific Funds Portfolio Optimization Moderate-Conservative Composite Benchmarkis 55% Bloomberg Barclays U.S. Aggregate Bond; 30% S&P 500; 10% MSCI EAFE (Net); and 5% ICE BofA Merrill Lynch U.S.3-Month Treasury Bill Indices. Results include the reinvestment of all distributions.
Pacific Funds Portfolio Optimization Moderate Composite Benchmarkis 45% S&P 500; 38% Bloomberg Barclays U.S. Aggregate Bond; 15% MSCI EAFE (Net); and 2% ICE BofA Merrill Lynch U.S.3-Month Treasury Bill Indices. Results include the reinvestment of all distributions.
Pacific Funds Portfolio Optimization Growth Composite Benchmarkis 58% S&P 500; 23% Bloomberg Barclays U.S. Aggregate Bond; and 19% MSCI EAFE (Net) Indices. Results include the reinvestment of all distributions. Results include the reinvestment of all distributions.
Pacific Funds Portfolio Optimization Aggressive-Growth Composite Benchmarkis 69% S&P 500; 26% MSCI EAFE (Net); and 5% Bloomberg Barclays U.S. Aggregate Bond Indices. Results include the reinvestment of all distributions.
Russell 1000 Indexmeasures the performance of the large-capitalization segment of the U.S. equity universe. It is a subset of the Russell 3000 Index and includes approximately 1,000 of the largest securities based on a combination of their market capitalization and current index membership. The Russell 1000 Index represents approximately 92% of the investable U.S. equity market. It is constructed to provide a comprehensive and unbiased barometer for the large-capitalization and is completely reconstituted annually to ensure new and growing equities are reflected. Results include the reinvestment of all distributions.
Russell 1000 Value Indexmeasures the performance of thelarge-cap value segment of the U.S. equity universe. It includes those Russell 1000 Index companies with lowerprice-to-book ratios and lower expected growth values. The Russell 1000 Value Index is constructed to provide a comprehensive and unbiased barometer for thelarge-cap value segment. The Index is completely reconstituted annually to ensure new and growing equities are included and that the represented companies continue to reflect value characteristics. Results include the reinvestment of all distributions.
A-23
PACIFIC FUNDS PERFORMANCE DISCUSSION (Continued)
Russell 2000 Growth Indexmeasures the performance of thesmall-cap growth segment of the U.S. equity universe. It includes those Russell 2000 Index companies with higherprice-to-value ratios and higher forecasted growth values. The Russell 2000 Growth Index is constructed to provide a comprehensive and unbiased barometer for thesmall-cap growth segment. The Index is completely reconstituted annually to ensure larger stocks do not distort the performance and characteristics of the truesmall-cap opportunity set and that the represented companies continue to reflect growth characteristics. Results include the reinvestment of all distributions.
Russell 2000 Indexmeasures the performance of thesmall-cap segment of the U.S. equity universe. The Russell 2000 Index is a subset of the Russell 3000® Index representing approximately 10% of the total market capitalization of that index. It includes approximately 2,000 of the smallest securities based on a combination of their market cap and current index membership. The Russell 2000 Index is constructed to provide a comprehensive and unbiasedsmall-cap barometer and is completely reconstituted annually to ensure larger stocks do not distort the performance and characteristics of the truesmall-cap opportunity set. Results include the reinvestment of all distributions.
Russell 2000 Value Indexmeasures the performance of thesmall-cap value segment of the U.S. equity universe. It includes those Russell 2000 Index companies with lowerprice-to-book ratios and lower forecasted growth values. The Russell 2000 Value Index is constructed to provide a comprehensive and unbiased barometer for thesmall-cap value segment. The Index is completely reconstituted annually to ensure larger stocks do not distort the performance and characteristics of the truesmall-cap opportunity set and that the represented companies continue to reflect value characteristics. Results include the reinvestment of all distributions.
Russell 2500 Indexmeasures the performance of the small tomid-cap segment of the U.S. equity universe, commonly referred to as “smid cap.” The Russell 2500 Index is a subset of the Russell 3000 Index. It includes approximately 2,500 of the smallest securities based on a combination of their market cap and current index membership. The Russell 2500 Index is constructed to provide a comprehensive and unbiased barometer for the“small-to-mid-cap” segment. The Index is completely reconstituted annually to ensure larger stocks do not distort the performance and characteristics of the true small tomid-cap opportunity set. Results include the reinvestment of all distributions.
Russell 3000 Indexmeasures the performance of the largest 3.000 U.S. companies representing approximately 98% of the investable U.S. equity market. Results include the reinvestment of all distributions.
S&P 500 Indexis a capitalization-weighted index of 500 stocks. The index is designed to measure performance of the broad domestic economy through changes in the aggregate market value of 500 stocks representing all major industries. Results include the reinvestment of all distributions.
A-24
PACIFIC FUNDSSM
PACIFIC FUNDSSM PORTFOLIO OPTIMIZATION CONSERVATIVE
Schedule of Investments
March 31, 2019
PACIFIC FUNDS
PACIFIC FUNDSSM PORTFOLIO OPTIMIZATION MODERATE-CONSERVATIVE
Schedule of Investments
March 31, 2019
| | | | | | | | |
| | |
Shares | | | Value | |
AFFILIATED MUTUAL FUNDS - 100.1% | |
| | |
Pacific Funds Core Income ‘P’ | | | 719,553 | | | | $7,598,484 | |
Pacific Funds Floating Rate Income ‘P’ | | | 642,043 | | | | 6,356,221 | |
Pacific Funds High Income ‘P’ | | | 1,665,211 | | | | 16,618,804 | |
PF Inflation Managed Fund ‘P’ | | | 1,603,248 | | | | 14,124,612 | |
PF Managed Bond Fund ‘P’ | | | 8,892,241 | | | | 93,902,067 | |
PF Short Duration Bond Fund ‘P’ | | | 3,730,981 | | | | 37,048,639 | |
PF Emerging Markets Debt Fund ‘P’ | | | 1,390,604 | | | | 12,751,835 | |
Pacific FundsSmall-Cap Growth ‘P’ | | | 62,990 | | | | 760,923 | |
PF Developing Growth Fund ‘P’ | | | 27,043 | | | | 498,405 | |
PF Growth Fund ‘P’ | | | 85,494 | | | | 2,323,716 | |
PFLarge-Cap Value Fund ‘P’ | | | 390,693 | | | | 4,668,784 | |
PF Multi-Asset Fund ‘P’ | | | 3,815,950 | | | | 37,434,469 | |
PFSmall-Cap Value Fund ‘P’ | | | 152,930 | | | | 1,255,559 | |
PF Emerging Markets Fund ‘P’ | | | 346,940 | | | | 5,103,493 | |
PF InternationalLarge-Cap Fund ���P’ | | | 120,141 | | | | 1,396,039 | |
PF InternationalSmall-Cap Fund ‘P’ | | | 132,682 | | | | 1,272,421 | |
PF International Value Fund ‘P’ | | | 183,198 | | | | 1,375,816 | |
PF Real Estate Fund ‘P’ | | | 316,262 | | | | 3,877,366 | |
PF Currency Strategies Fund ‘P’ * | | | 412,666 | | | | 3,796,527 | |
PF Equity Long/Short Fund ‘P’ | | | 485,030 | | | | 3,802,632 | |
| | | | | | | | |
| |
Total Affiliated Mutual Funds
(Cost $252,060,175) | | | | 255,966,812 | |
| | | | | | | | |
| |
TOTAL INVESTMENTS - 100.1%
(Cost $252,060,175) | | | | 255,966,812 | |
| |
OTHER ASSETS & LIABILITIES, NET - (0.1%) | | | | (257,040 | ) |
| | | | | | | | |
| |
NET ASSETS - 100.0% | | | | $255,709,772 | |
| | | | | | | | |
Notes to Schedule of Investments
| (a) | As of March 31, 2019, the Funds’ composition as a percentage of net assets was as follows: |
| | | | |
Pacific Funds Portfolio Optimization Conservative | |
Affiliated Fixed Income Funds | | | 73.7% | |
Affiliated Equity Funds | | | 26.4% | |
| | | | |
| | | 100.1% | |
Other Assets & Liabilities, Net | | | (0.1% | ) |
| | | | |
| | | 100.0% | |
| | | | |
| | | | | | | | |
| | |
Shares | | | Value | |
AFFILIATED MUTUAL FUNDS - 100.2% | |
| | |
Pacific Funds Core Income ‘P’ | | | 835,432 | | | | $8,822,165 | |
Pacific Funds Floating Rate Income ‘P’ | | | 749,113 | | | | 7,416,217 | |
Pacific Funds High Income ‘P’ | | | 2,240,218 | | | | 22,357,375 | |
PF Inflation Managed Fund ‘P’ | | | 1,062,120 | | | | 9,357,278 | |
PF Managed Bond Fund ‘P’ | | | 10,336,263 | | | | 109,150,939 | |
PF Short Duration Bond Fund ‘P’ | | | 3,000,109 | | | | 29,791,079 | |
PF Emerging Markets Debt Fund ‘P’ | | | 1,824,004 | | | | 16,726,117 | |
Pacific FundsSmall-Cap Growth ‘P’ | | | 91,791 | | | | 1,108,836 | |
PF Developing Growth Fund ‘P’ | | | 39,407 | | | | 726,274 | |
PF Growth Fund ‘P’ | | | 359,943 | | | | 9,783,262 | |
PFLarge-Cap Value Fund ‘P’ | | | 1,784,964 | | | | 21,330,322 | |
PF Multi-Asset Fund ‘P’ | | | 8,313,164 | | | | 81,552,140 | |
PFSmall-Cap Value Fund ‘P’ | | | 445,698 | | | | 3,659,180 | |
PF Emerging Markets Fund ‘P’ | | | 884,778 | | | | 13,015,087 | |
PF InternationalLarge-Cap Fund ‘P’ | | | 557,068 | | | | 6,473,127 | |
PF InternationalSmall-Cap Fund ‘P’ | | | 386,716 | | | | 3,708,606 | |
PF International Value Fund ‘P’ | | | 946,499 | | | | 7,108,208 | |
PF Real Estate Fund ‘P’ | | | 768,237 | | | | 9,418,586 | |
PF Currency Strategies Fund ‘P’ * | | | 601,413 | | | | 5,533,000 | |
PF Equity Long/Short Fund ‘P’ | | | 706,856 | | | | 5,541,750 | |
| | | | | | | | |
| |
Total Affiliated Mutual Funds
(Cost $365,369,917) | | | | 372,579,548 | |
| | | | | | | | |
| |
TOTAL INVESTMENTS - 100.2%
(Cost $365,369,917) | | | | 372,579,548 | |
| |
OTHER ASSETS & LIABILITIES, NET - (0.2%) | | | | (647,116 | ) |
| | | | | | | | |
| |
NET ASSETS - 100.0% | | | | $371,932,432 | |
| | | | | | | | |
| | | | |
Pacific Funds Portfolio Optimization Moderate-Conservative | |
Affiliated Fixed Income Funds | | | 54.8% | |
Affiliated Equity Funds | | | 45.4% | |
| | | | |
| | | 100.2% | |
Other Assets & Liabilities, Net | | | (0.2% | ) |
| | | | |
| | | 100.0% | |
| | | | |
| (b) | The Funds’ investments are affiliated mutual funds (See Note 7C in Notes to Financial Statements). |
| (c) | Fair Value Measurements |
The following is a summary of the Funds’ investments as categorized under the three-tier hierarchy of inputs used in valuing the Funds’ assets and liabilities (See Note 3D in Notes to Financial Statements) as of March 31, 2019:
| | | | | | | | | | | | | | | | | | |
| | | | | Total Value at
March 31, 2019 | | | Level 1
Quoted Price | | | Level 2
Significant
Observable Inputs | | | Level 3
Significant
Unobservable Inputs | |
Pacific Funds Portfolio Optimization Conservative | | | | | | | | | | | | | | | | |
Assets | | Affiliated Mutual Funds | | | $255,966,812 | | | | $255,966,812 | | | | $— | | | | $— | |
| | | | | | | | | | | | | | | | | | |
| | | | |
Pacific Funds Portfolio Optimization Moderate-Conservative | | | | | | | | | | | | | | | | |
Assets | | Affiliated Mutual Funds | | | $372,579,548 | | | | $372,579,548 | | | | $— | | | | $— | |
| | | | | | | | | | | | | | | | | | |
| | |
| See Notes to Financial Statements | | See explanation of symbols and terms, if any, on B-41 |
B-1
PACIFIC FUNDS
PACIFIC FUNDSSM PORTFOLIO OPTIMIZATION MODERATE
Schedule of Investments
March 31, 2019
PACIFIC FUNDS
PACIFIC FUNDSSM PORTFOLIO OPTIMIZATION GROWTH
Schedule of Investments
March 31, 2019
| | | | | | | | |
| | |
Shares | | | Value | |
AFFILIATED MUTUAL FUNDS - 100.1% | |
| | |
Pacific Funds Core Income ‘P’ | | | 1,705,157 | | | | $18,006,462 | |
Pacific Funds Floating Rate Income ‘P’ | | | 1,157,560 | | | | 11,459,848 | |
Pacific Funds High Income ‘P’ | | | 4,621,588 | | | | 46,123,452 | |
PF Inflation Managed Fund ‘P’ | | | 1,314,690 | | | | 11,582,422 | |
PF Managed Bond Fund ‘P’ | | | 20,793,323 | | | | 219,577,492 | |
PF Short Duration Bond Fund ‘P’ | | | 6,962,809 | | | | 69,140,691 | |
PF Emerging Markets Debt Fund ‘P’ | | | 2,508,684 | | | | 23,004,631 | |
Pacific FundsSmall-Cap Growth ‘P’ | | | 568,122 | | | | 6,862,909 | |
PF Developing Growth Fund ‘P’ | | | 243,900 | | | | 4,495,080 | |
PF Growth Fund ‘P’ | | | 3,170,326 | | | | 86,169,450 | |
PFLarge-Cap Value Fund ‘P’ | | | 6,333,214 | | | | 75,681,904 | |
PF Multi-Asset Fund ‘P’ | | | 40,879,651 | | | | 401,029,374 | |
PFSmall-Cap Value Fund ‘P’ | | | 2,758,415 | | | | 22,646,588 | |
PF Emerging Markets Fund ‘P’ | | | 3,129,270 | | | | 46,031,557 | |
PF InternationalLarge-Cap Fund ‘P’ | | | 1,674,660 | | | | 19,459,547 | |
PF InternationalSmall-Cap Fund ‘P’ | | | 1,196,762 | | | | 11,476,951 | |
PF International Value Fund ‘P’ | | | 2,929,111 | | | | 21,997,625 | |
PF Real Estate Fund ‘P’ | | | 2,377,260 | | | | 29,145,205 | |
PF Currency Strategies Fund ‘P’ * | | | 1,550,929 | | | | 14,268,549 | |
PF Equity Long/Short Fund ‘P’ | | | 1,822,838 | | | | 14,291,047 | |
| | | | | | | | |
| |
Total Affiliated Mutual Funds
(Cost $1,091,114,470) | | | | 1,152,450,784 | |
| | | | | | | | |
| |
TOTAL INVESTMENTS - 100.1%
(Cost $1,091,114,470) | | | | 1,152,450,784 | |
| |
OTHER ASSETS & LIABILITIES, NET - (0.1%) | | | | (1,716,315 | ) |
| | | | | | | | |
| |
NET ASSETS - 100.0% | | | | $1,150,734,469 | |
| | | | | | | | |
Notes to Schedule of Investments
| (a) | As of March 31, 2019, the Funds’ composition as a percentage of net assets was as follows: |
| | | | |
Pacific Funds Portfolio Optimization Moderate | |
Affiliated Equity Funds | | | 65.4% | |
Affiliated Fixed Income Funds | | | 34.7% | |
| | | | |
| | | 100.1% | |
Other Assets & Liabilities, Net | | | (0.1% | ) |
| | | | |
| | | 100.0% | |
| | | | |
| | | | | | | | |
| | |
Shares | | | Value | |
AFFILIATED MUTUAL FUNDS - 100.1% | |
| | |
Pacific Funds Core Income ‘P’ | | | 551,278 | | | | $5,821,489 | |
Pacific Funds Floating Rate Income ‘P’ | | | 446,197 | | | | 4,417,354 | |
Pacific Funds High Income ‘P’ | | | 2,672,255 | | | | 26,669,108 | |
PF Inflation Managed Fund ‘P’ | | | 506,778 | | | | 4,464,711 | |
PF Managed Bond Fund ‘P’ | | | 6,640,606 | | | | 70,124,800 | |
PF Short Duration Bond Fund ‘P’ | | | 1,789,323 | | | | 17,767,979 | |
PF Emerging Markets Debt Fund ‘P’ | | | 1,450,540 | | | | 13,301,449 | |
Pacific FundsSmall-Cap Growth ‘P’ | | | 875,996 | | | | 10,582,026 | |
PF Developing Growth Fund ‘P’ | | | 376,068 | | | | 6,930,939 | |
PF Growth Fund ‘P’ | | | 2,080,820 | | | | 56,556,688 | |
PFLarge-Cap Value Fund ‘P’ | | | 4,405,375 | | | | 52,644,228 | |
PF Multi-Asset Fund ‘P’ | | | 44,783,728 | | | | 439,328,375 | |
PFSmall-Cap Value Fund ‘P’ | | | 3,190,005 | | | | 26,189,940 | |
PF Emerging Markets Fund ‘P’ | | | 3,317,191 | | | | 48,795,883 | |
PF InternationalLarge-Cap Fund ‘P’ | | | 2,050,550 | | | | 23,827,393 | |
PF InternationalSmall-Cap Fund ‘P’ | | | 922,642 | | | | 8,848,134 | |
PF International Value Fund ‘P’ | | | 3,532,093 | | | | 26,526,020 | |
PF Real Estate Fund ‘P’ | | | 2,199,286 | | | | 26,963,249 | |
PF Currency Strategies Fund ‘P’ * | | | 956,556 | | | | 8,800,318 | |
PF Equity Long/Short Fund ‘P’ | | | 1,124,252 | | | | 8,814,136 | |
| | | | | | | | |
| |
Total Affiliated Mutual Funds
(Cost $822,784,568) | | | | 887,374,219 | |
| | | | | | | | |
| |
TOTAL INVESTMENTS - 100.1%
(Cost $822,784,568) | | | | 887,374,219 | |
| |
OTHER ASSETS & LIABILITIES, NET - (0.1%) | | | | (1,107,021 | ) |
| | | | | | | | |
| |
NET ASSETS - 100.0% | | | | $886,267,198 | |
| | | | | | | | |
| | | | |
Pacific Funds Portfolio Optimization Growth | |
Affiliated Equity Funds | | | 84.0% | |
Affiliated Fixed Income Funds | | | 16.1% | |
| | | | |
| | | 100.1% | |
Other Assets & Liabilities, Net | | | (0.1% | ) |
| | | | |
| | | 100.0% | |
| | | | |
| (b) | The Funds’ investments are affiliated mutual funds (See Note 7C in Notes to Financial Statements). |
| (c) | Fair Value Measurements |
The following is a summary of the Funds’ investments as categorized under the three-tier hierarchy of inputs used in valuing the Funds’ assets and liabilities (See Note 3D in Notes to Financial Statements) as of March 31, 2019:
| | | | | | | | | | | | | | | | | | |
| | | | | Total Value at
March 31, 2019 | | | Level 1
Quoted Price | | | Level 2
Significant
Observable Inputs | | | Level 3
Significant
Unobservable Inputs | |
Pacific Funds Portfolio Optimization Moderate | |
Assets | | Affiliated Mutual Funds | | | $1,152,450,784 | | | | $1,152,450,784 | | | | $— | | | | $— | |
| | | | | | | | | | | | | | | | | | |
|
Pacific Funds Portfolio Optimization Growth | |
Assets | | Affiliated Mutual Funds | | | $887,374,219 | | | | $887,374,219 | | | | $— | | | | $— | |
| | | | | | | | | | | | | | | | | | |
| | |
| See Notes to Financial Statements | | See explanation of symbols and terms, if any, on B-41 |
B-2
PACIFIC FUNDS
PACIFIC FUNDSSM PORTFOLIO OPTIMIZATION AGGRESSIVE-GROWTH
Schedule of Investments
March 31, 2019
PACIFIC FUNDS
PACIFIC FUNDSSM DIVERSIFIED ALTERNATIVES
Schedule of Investments
March 31, 2019
| | | | | | | | |
| | |
Shares | | | Value | |
AFFILIATED MUTUAL FUNDS - 100.2% | |
| | |
Pacific Funds Core Income ‘P’ | | | 29,764 | | | | $314,307 | |
Pacific Funds Floating Rate Income ‘P’ | | | 384 | | | | 3,801 | |
Pacific Funds High Income ‘P’ | | | 156,300 | | | | 1,559,871 | |
PF Managed Bond Fund ‘P’ | | | 415,624 | | | | 4,388,991 | |
PF Short Duration Bond Fund ‘P’ | | | 156,987 | | | | 1,558,880 | |
PF Emerging Markets Debt Fund ‘P’ | | | 169,685 | | | | 1,556,007 | |
Pacific FundsSmall-Cap Growth ‘P’ | | | 384,269 | | | | 4,641,966 | |
PF Developing Growth Fund ‘P’ | | | 164,974 | | | | 3,040,477 | |
PF Growth Fund ‘P’ | | | 1,159,106 | | | | 31,504,514 | |
PFLarge-Cap Value Fund ‘P’ | | | 1,404,273 | | | | 16,781,066 | |
PF Multi-Asset Fund ‘P’ | | | 18,020,247 | | | | 176,778,623 | |
PFSmall-Cap Value Fund ‘P’ | | | 2,052,323 | | | | 16,849,568 | |
PF Emerging Markets Fund ‘P’ | | | 1,269,940 | | | | 18,680,820 | |
PF InternationalLarge-Cap Fund ‘P’ | | | 599,671 | | | | 6,968,174 | |
PF InternationalSmall-Cap Fund ‘P’ | | | 485,677 | | | | 4,657,643 | |
PF International Value Fund ‘P’ | | | 1,056,638 | | | | 7,935,351 | |
PF Real Estate Fund ‘P’ | | | 771,818 | | | | 9,462,486 | |
PF Currency Strategies Fund ‘P’ * | | | 251,769 | | | | 2,316,273 | |
PF Equity Long/Short Fund ‘P’ | | | 295,907 | | | | 2,319,912 | |
| | | | | | | | |
| |
Total Affiliated Mutual Funds
(Cost $281,697,035) | | | | 311,318,730 | |
| | | | | | | | |
| |
TOTAL INVESTMENTS - 100.2%
(Cost $281,697,035) | | | | 311,318,730 | |
| |
OTHER ASSETS & LIABILITIES, NET - (0.2%) | | | | (511,571 | ) |
| | | | | | | | |
| |
NET ASSETS - 100.0% | | | | $310,807,159 | |
| | | | | | | | |
Notes to Schedule of Investments
| (a) | As of March 31, 2019, the Funds’ composition as a percentage of net assets was as follows: |
| | | | |
Pacific Funds Portfolio Optimization Aggressive-Growth | | | | |
Affiliated Equity Funds | | | 97.2% | |
Affiliated Fixed Income Funds | | | 3.0% | |
| | | | |
| | | 100.2% | |
Other Assets & Liabilities, Net | | | (0.2% | ) |
| | | | |
| | | 100.0% | |
| | | | |
| | | | | | | | |
| | |
Shares | | | Value | |
AFFILIATED MUTUAL FUNDS - 100.1% | |
| | |
Pacific Funds Floating Rate Income ‘P’ | | | 256,336 | | | | $2,537,722 | |
PF Inflation Managed Fund ‘P’ | | | 161,727 | | | | 1,424,818 | |
PF Emerging Markets Debt Fund ‘P’ | | | 462,889 | | | | 4,244,694 | |
PF Emerging Markets Fund ‘P’ | | | 153,969 | | | | 2,264,887 | |
PF InternationalSmall-Cap Fund ‘P’ | | | 206,096 | | | | 1,976,456 | |
PF Real Estate Fund ‘P’ | | | 233,965 | | | | 2,868,409 | |
PF Currency Strategies Fund ‘P’ * | | | 1,068,376 | | | | 9,829,062 | |
PF Equity Long/Short Fund ‘P’ | | | 394,639 | | | | 3,093,972 | |
| | | | | | | | |
| |
Total Affiliated Mutual Funds
(Cost $28,465,004) | | | | 28,240,020 | |
| | | | | | | | |
| |
TOTAL INVESTMENTS - 100.1%
(Cost $28,465,004) | | | | 28,240,020 | |
| |
OTHER ASSETS & LIABILITIES, NET - (0.1%) | | | | (16,956 | ) |
| | | | | | | | |
| |
NET ASSETS - 100.0% | | | | $28,223,064 | |
| | | | | | | | |
| | | | |
Pacific Funds Diversified Alternatives | |
Affiliated Equity Funds | | | 71.0% | |
Affiliated Fixed Income Funds | | | 29.1% | |
| | | | |
| | | 100.1% | |
Other Assets & Liabilities, Net | | | (0.1% | ) |
| | | | |
| | | 100.0% | |
| | | | |
| (b) | The Funds’ investments are affiliated mutual funds (See Note 7C in Notes to Financial Statements). |
| (c) | Fair Value Measurements |
The following is a summary of the Funds’ investments as categorized under the three-tier hierarchy of inputs used in valuing the Funds’ assets and liabilities (See Note 3D in Notes to Financial Statements) as of March 31, 2019:
| | | | | | | | | | | | | | | | | | |
| | | | | Total Value at
March 31, 2019 | | | Level 1
Quoted Price | | | Level 2
Significant
Observable Inputs | | | Level 3
Significant
Unobservable Inputs | |
Pacific Funds Portfolio Optimization Aggressive-Growth | |
Assets | | Affiliated Mutual Funds | | | $311,318,730 | | | | $311,318,730 | | | | $— | | | | $— | |
| | | | | | | | | | | | | | | | | | |
|
Pacific Funds Diversified Alternatives | |
Assets | | Affiliated Mutual Funds | | | $28,240,020 | | | | $28,240,020 | | | | $— | | | | $— | |
| | | | | | | | | | | | | | | | | | |
| | |
| See Notes to Financial Statements | | See explanation of symbols and terms, if any, on B-41 |
B-3
PACIFIC FUNDS
PACIFIC FUNDSSM SHORT DURATION INCOME
Schedule of Investments
March 31, 2019
| | | | | | | | |
| | | Principal Amount | | | Value | |
CORPORATE BONDS & NOTES - 57.3% | | | | | | | | |
| | |
Basic Materials - 2.1% | | | | | | | | |
| | |
Anglo American Capital PLC (South Africa)
3.750% due 04/10/22 ~ | | | $5,000,000 | | | | $5,016,274 | |
DowDuPont Inc
3.794% (USD LIBOR + 1.110%)
due 11/15/23 § | | | 5,000,000 | | | | 5,018,462 | |
Glencore Funding LLC (Switzerland) | | | | | | | | |
3.000% due 10/27/22 ~ | | | 3,000,000 | | | | 2,959,113 | |
4.125% due 03/12/24 ~ | | | 2,500,000 | | | | 2,529,100 | |
| | | | | | | | |
| | | | | | | 15,522,949 | |
| | | | | | | | |
Communications - 5.3% | |
| | |
Alibaba Group Holding Ltd (China) | | | | | | | | |
2.800% due 06/06/23 | | | 1,700,000 | | | | 1,687,615 | |
3.125% due 11/28/21 | | | 2,856,000 | | | | 2,875,703 | |
AT&T Inc
3.200% due 03/01/22 | | | 3,000,000 | | | | 3,028,186 | |
Charter Communications Operating LLC | | | | | | | | |
3.579% due 07/23/20 | | | 3,738,000 | | | | 3,766,223 | |
4.464% due 07/23/22 | | | 500,000 | | | | 517,691 | |
DISH DBS Corp
5.125% due 05/01/20 | | | 2,000,000 | | | | 2,017,500 | |
Fox Corp
3.666% due 01/25/22 ~ | | | 1,200,000 | | | | 1,224,532 | |
Sprint Communications Inc
6.000% due 11/15/22 | | | 2,000,000 | | | | 2,020,600 | |
Sprint Corp
7.250% due 09/15/21 | | | 1,000,000 | | | | 1,052,500 | |
Sprint Spectrum Co LLC
3.360% due 03/20/23 ~ | | | 7,187,500 | | | | 7,203,313 | |
Tencent Holdings Ltd (China)
2.875% due 02/11/20 ~ | | | 2,765,000 | | | | 2,765,846 | |
The Interpublic Group of Cos Inc
3.750% due 10/01/21 | | | 2,000,000 | | | | 2,036,079 | |
Verizon Communications Inc
3.784% (USD LIBOR + 1.100%)
due 05/15/25 § | | | 8,250,000 | | | | 8,257,803 | |
| | | | | | | | |
| | | | | | | 38,453,591 | |
| | | | | | | | |
Consumer, Cyclical - 5.3% | |
| | |
Alimentation Couche-Tard Inc (Canada)
2.700% due 07/26/22 ~ | | | 3,000,000 | | | | 2,971,076 | |
British Airways Pass-Through Trust ‘A’
(United Kingdom)
4.625% due 12/20/25 ~ | | | 765,463 | | | | 799,411 | |
Daimler Finance North America LLC (Germany) | | | | | | | | |
2.300% due 02/12/21 ~ | | | 5,000,000 | | | | 4,941,881 | |
3.750% due 11/05/21 ~ | | | 2,100,000 | | | | 2,137,827 | |
Delta Air Lines Inc
2.600% due 12/04/20 | | | 2,050,000 | | | | 2,038,080 | |
Delta Air Lines Pass-Through Trust ‘A’
4.750% due 11/07/21 | | | 848,760 | | | | 861,152 | |
Delta Air Lines Pass-Through Trust ‘AA’
3.204% due 10/25/25 | | | 3,000,000 | | | | 3,044,132 | |
Ford Motor Credit Co LLC
5.584% due 03/18/24 | | | 2,300,000 | | | | 2,334,189 | |
General Motors Financial Co Inc | | | | | | | | |
3.550% due 04/09/21 | | | 1,500,000 | | | | 1,508,525 | |
3.911% (USD LIBOR + 1.310%) due 06/30/22 § | | | 2,745,000 | | | | 2,725,574 | |
Hyundai Capital America
3.750% due 07/08/21 ~ | | | 2,100,000 | | | | 2,115,808 | |
Jack Ohio Finance LLC
6.750% due 11/15/21 ~ | | | 2,000,000 | | | | 2,065,000 | |
Lennar Corp
4.500% due 06/15/19 | | | 1,500,000 | | | | 1,500,938 | |
| | | | | | | | |
| | | Principal Amount | | | Value | |
Marriott International Inc
3.600% due 04/15/24 | | $ | 2,450,000 | | | $ | 2,471,767 | |
Sands China Ltd (Macau) | | | | | | | | |
4.600% due 08/08/23 | | | 3,300,000 | | | | 3,409,746 | |
5.125% due 08/08/25 | | | 1,500,000 | | | | 1,566,204 | |
United Airlines Pass-Through Trust ‘B’ | | | | | | | | |
3.650% due 07/07/27 | | | 685,764 | | | | 678,080 | |
4.625% due 03/03/24 | | | 672,537 | | | | 683,600 | |
4.750% due 10/11/23 | | | 509,736 | | | | 518,402 | |
US Airways Pass-Through Trust ‘A’
3.950% due 05/15/27 | | | 718,348 | | | | 729,465 | |
| | | | | | | | |
| | | | | | | 39,100,857 | |
| | | | | | | | |
Consumer,Non-Cyclical - 9.0% | |
| | |
Altria Group Inc
3.800% due 02/14/24 | | | 2,000,000 | | | | 2,037,827 | |
Anheuser-Busch InBev Worldwide Inc (Belgium) | | | | | | | | |
3.500% due 01/12/24 | | | 3,350,000 | | | | 3,412,180 | |
4.150% due 01/23/25 | | | 2,000,000 | | | | 2,086,396 | |
BAT Capital Corp (United Kingdom) | | | | | | | | |
2.764% due 08/15/22 | | | 4,500,000 | | | | 4,430,022 | |
3.283% (USD LIBOR + 0.590%) due 08/14/20 § | | | 2,400,000 | | | | 2,395,306 | |
BAT International Finance PLC (United Kingdom)
3.250% due 06/07/22 ~ | | | 2,640,000 | | | | 2,639,652 | |
Bausch Health Cos Inc
6.500% due 03/15/22 ~ | | | 1,575,000 | | | | 1,632,094 | |
Boston Scientific Corp
3.450% due 03/01/24 | | | 1,000,000 | | | | 1,019,126 | |
Campbell Soup Co
3.300% due 03/15/21 | | | 4,000,000 | | | | 4,027,119 | |
Cigna Corp
3.200% due 09/17/20 ~ | | | 4,000,000 | | | | 4,020,679 | |
3.677% (USD LIBOR + 0.890%) due 07/15/23 § ~ | | | 2,300,000 | | | | 2,290,133 | |
Conagra Brands Inc
3.800% due 10/22/21 | | | 1,200,000 | | | | 1,222,824 | |
Constellation Brands Inc
3.384% (USD LIBOR + 0.700%)
due 11/15/21 § | | | 1,500,000 | | | | 1,500,918 | |
DaVita Inc
5.750% due 08/15/22 | | | 2,500,000 | | | | 2,553,125 | |
General Mills Inc
3.783% (USD LIBOR + 1.010%)
due 10/17/23 § | | | 3,100,000 | | | | 3,123,764 | |
Humana Inc
2.625% due 10/01/19 | | | 1,500,000 | | | | 1,498,219 | |
Imperial Brands Finance PLC (United Kingdom)
3.750% due 07/21/22 ~ | | | 1,000,000 | | | | 1,014,057 | |
Keurig Dr Pepper Inc | | | | | | | | |
3.130% due 12/15/23 | | | 2,500,000 | | | | 2,489,486 | |
3.551% due 05/25/21 ~ | | | 2,500,000 | | | | 2,528,171 | |
Mars Inc
2.700% due 04/01/25 ~ | | | 2,150,000 | | | | 2,142,256 | |
McKesson Corp
3.650% due 11/30/20 | | | 2,350,000 | | | | 2,379,606 | |
Moody’s Corp
2.625% due 01/15/23 | | | 3,000,000 | | | | 2,959,213 | |
Takeda Pharmaceutical Co Ltd (Japan)
4.000% due 11/26/21 ~ | | | 3,500,000 | | | | 3,591,277 | |
Teva Pharmaceutical Finance Netherlands III BV (Israel)
2.200% due 07/21/21 | | | 4,500,000 | | | | 4,292,682 | |
United Rentals North America Inc
5.750% due 11/15/24 | | | 4,000,000 | | | | 4,125,000 | |
| | | | | | | | |
| | | | | | | 65,411,132 | |
| | | | | | | | |
| | |
| See Notes to Financial Statements | | See explanation of symbols and terms, if any, on B-41 |
B-4
PACIFIC FUNDS
PACIFIC FUNDS SHORT DURATION INCOME
Schedule of Investments (Continued)
March 31, 2019
| | | | | | | | |
| | | Principal Amount | | | Value | |
Energy - 5.2% | |
| | |
Andeavor Logistics LP
3.500% due 12/01/22 | | | $4,900,000 | | | | $4,955,444 | |
Energy Transfer Operating LP
3.600% due 02/01/23 | | | 4,325,000 | | | | 4,365,727 | |
4.500% due 04/15/24 | | | 1,800,000 | | | | 1,881,673 | |
Enterprise Products Operating LLC
3.350% due 03/15/23 | | | 2,500,000 | | | | 2,538,733 | |
EQT Corp
2.500% due 10/01/20 | | | 2,800,000 | | | | 2,764,205 | |
Harvest Operations Corp (South Korea)
4.200% due 06/01/23 ~ | | | 2,350,000 | | | | 2,461,312 | |
Kinder Morgan Energy Partners LP
4.150% due 03/01/22 | | | 720,000 | | | | 743,360 | |
Kinder Morgan Inc
5.625% due 11/15/23 ~ | | | 5,136,000 | | | | 5,633,078 | |
Midwest Connector Capital Co LLC | | | | | | | | |
3.625% due 04/01/22 ~ | | | 1,000,000 | | | | 1,015,116 | |
3.900% due 04/01/24 ~ | | | 2,000,000 | | | | 2,035,564 | |
Newfield Exploration Co
5.625% due 07/01/24 | | | 5,000,000 | | | | 5,468,985 | |
Sabine Pass Liquefaction LLC
5.625% due 02/01/21 | | | 2,000,000 | | | | 2,078,710 | |
Shell International Finance BV (Netherlands)
3.088% (USD LIBOR + 0.400%)
due 11/13/23 § | | | 2,250,000 | | | | 2,248,425 | |
| | | | | | | | |
| | | | | | | 38,190,332 | |
| | | | | | | | |
Financial - 24.7% | |
| | |
AerCap Ireland Capital DAC (Ireland) | | | | | | | | |
3.300% due 01/23/23 | | | 3,100,000 | | | | 3,045,609 | |
4.250% due 07/01/20 | | | 2,000,000 | | | | 2,027,554 | |
Air Lease Corp | | | | | | | | |
2.500% due 03/01/21 | | | 2,000,000 | | | | 1,985,300 | |
2.750% due 01/15/23 | | | 2,000,000 | | | | 1,953,386 | |
3.500% due 01/15/22 | | | 1,350,000 | | | | 1,363,384 | |
Alexandria Real Estate Equities Inc REIT
4.000% due 01/15/24 | | | 1,250,000 | | | | 1,294,174 | |
American Express Co | | | | | | | | |
2.500% due 08/01/22 | | | 2,000,000 | | | | 1,978,222 | |
3.700% due 11/05/21 | | | 2,400,000 | | | | 2,454,110 | |
Australia & New Zealand Banking Group Ltd (Australia)
3.393% (USD LIBOR + 0.710%)
due 05/19/22 § ~ | | | 3,000,000 | | | | 3,014,618 | |
Bank of America Corp
2.328% due 10/01/21 | | | 2,450,000 | | | | 2,428,182 | |
3.503% (USD LIBOR + 0.770%) due 02/05/26 § | | | 4,750,000 | | | | 4,644,958 | |
3.550% due 03/05/24 | | | 1,700,000 | | | | 1,727,447 | |
3.732% (USD LIBOR + 0.960%) due 07/23/24 § | | | 5,000,000 | | | | 5,013,335 | |
BOC Aviation Ltd (Singapore)
2.750% due 09/18/22 ~ | | | 3,500,000 | | | | 3,426,955 | |
Capital One Financial Corp
3.471% (USD LIBOR + 0.720%)
due 01/30/23 § | | | 1,625,000 | | | | 1,604,958 | |
Capital One NA
3.901% (USD LIBOR + 1.150%)
due 01/30/23 § | | | 1,625,000 | | | | 1,628,705 | |
Cboe Global Markets Inc
1.950% due 06/28/19 | | | 1,750,000 | | | | 1,746,562 | |
Citibank NA
3.061% (USD LIBOR + 0.300%)
due 10/20/20 § | | | 1,000,000 | | | | 999,814 | |
Citigroup Inc
2.750% due 04/25/22 | | | 3,316,000 | | | | 3,304,589 | |
4.056% (USD LIBOR + 1.430%) due 09/01/23 § | | | 4,500,000 | | | | 4,576,630 | |
Citizens Bank NA
3.250% due 02/14/22 | | | 2,500,000 | | | | 2,524,905 | |
3.551% (USD LIBOR + 0.950%) due 03/29/23 § | | | 2,000,000 | | | | 2,002,522 | |
| | | | | | | | |
| | | Principal Amount | | | Value | |
Cooperatieve Rabobank UA (Netherlands)
3.064% (USD LIBOR + 0.480%)
due 01/10/23 § | | $ | 3,000,000 | | | $ | 2,978,261 | |
3.470% (USD LIBOR + 0.860%) due 09/26/23 § ~ | | | 1,500,000 | | | | 1,493,179 | |
Credit Suisse Group AG (Switzerland)
3.793% (USD LIBOR + 1.200%)
due 12/14/23 § ~ | | | 3,000,000 | | | | 2,988,788 | |
Crown Castle International Corp REIT | | | | | | | | |
2.250% due 09/01/21 | | | 3,000,000 | | | | 2,958,794 | |
4.875% due 04/15/22 | | | 2,000,000 | | | | 2,109,624 | |
Fifth Third Bancorp
3.650% due 01/25/24 | | | 2,250,000 | | | | 2,306,685 | |
GE Capital International Funding Co Unlimited Co
2.342% due 11/15/20 | | | 4,000,000 | | | | 3,951,497 | |
GLP Capital LP REIT
4.875% due 11/01/20 | | | 4,250,000 | | | | 4,341,375 | |
HSBC Holdings PLC (United Kingdom)
3.262% due 03/13/23 | | | 3,400,000 | | | | 3,410,904 | |
Industrial & Commercial Bank of China Ltd (China)
2.452% due 10/20/21 | | | 3,830,000 | | | | 3,766,685 | |
Jackson National Life Global Funding
3.300% due 02/01/22 ~ | | | 4,350,000 | | | | 4,412,029 | |
JPMorgan Chase & Co
2.972% due 01/15/23 | | | 2,000,000 | | | | 2,001,140 | |
3.502% (USD LIBOR + 0.730%) due 04/23/24 § | | | 4,000,000 | | | | 3,970,503 | |
3.671% (USD LIBOR + 0.900%) due 04/25/23 § | | | 3,450,000 | | | | 3,468,198 | |
4.009% (USD LIBOR + 1.230%) due 10/24/23 § | | | 3,500,000 | | | | 3,554,433 | |
KeyBank NA
3.300% due 02/01/22 | | | 1,350,000 | | | | 1,373,830 | |
Metropolitan Life Global Funding I
3.375% due 01/11/22 ~ | | | 1,800,000 | | | | 1,827,885 | |
Mitsubishi UFJ Financial Group Inc (Japan) | | | | | | | | |
2.665% due 07/25/22 | | | 3,000,000 | | | | 2,977,080 | |
3.218% due 03/07/22 | | | 2,150,000 | | | | 2,167,423 | |
Morgan Stanley
2.625% due 11/17/21 | | | 2,000,000 | | | | 1,990,272 | |
2.750% due 05/19/22 | | | 2,000,000 | | | | 1,989,478 | |
3.691% (USD LIBOR + 0.930%) due 07/22/22 § | | | 5,000,000 | | | | 5,027,818 | |
4.179% (USD LIBOR + 1.400%) due 10/24/23 § | | | 1,500,000 | | | | 1,523,954 | |
New York Life Global Funding | | | | | | | | |
2.950% due 01/28/21 ~ | | | 3,000,000 | | | | 3,018,472 | |
3.250% due 08/06/21 ~ | | | 1,500,000 | | | | 1,518,936 | |
SL Green Operating Partnership LP REIT
3.663% (USD LIBOR + 0.980%)
due 08/16/21 § | | | 750,000 | | | | 746,871 | |
Sumitomo Mitsui Financial Group Inc (Japan) | | | | | | | | |
2.784% due 07/12/22 | | | 3,250,000 | | | | 3,235,854 | |
3.513% (USD LIBOR + 0.740%) due 01/17/23 § | | | 5,000,000 | | | | 5,003,478 | |
SunTrust Bank
3.525% due 10/26/21 | | | 2,200,000 | | | | 2,223,782 | |
The Goldman Sachs Group Inc
2.350% due 11/15/21 | | | 2,000,000 | | | | 1,970,452 | |
3.524% (USD LIBOR + 0.780%) due 10/31/22 § | | | 2,000,000 | | | | 1,992,430 | |
3.625% due 02/20/24 | | | 950,000 | | | | 960,509 | |
3.649% (USD LIBOR + 1.050%) due 06/05/23 § | | | 3,750,000 | | | | 3,756,152 | |
3.854% (USD LIBOR + 1.170%) due 05/15/26 § | | | 4,900,000 | | | | 4,811,335 | |
The Huntington National Bank
3.125% due 04/01/22 | | | 3,500,000 | | | | 3,528,131 | |
The PNC Financial Services Group Inc
3.500% due 01/23/24 | | | 1,650,000 | | | | 1,696,126 | |
| | |
| See Notes to Financial Statements | | See explanation of symbols and terms, if any, on B-41 |
B-5
PACIFIC FUNDS
PACIFIC FUNDS SHORT DURATION INCOME
Schedule of Investments (Continued)
March 31, 2019
| | | | | | | | |
| | | Principal Amount | | | Value | |
UBS AG (Switzerland)
2.450% due 12/01/20 ~ | | $ | 4,200,000 | | | $ | 4,177,694 | |
US Bank NA
3.000% due 02/04/21 | | | 3,300,000 | | | | 3,322,698 | |
Wells Fargo & Co | | | | | | | | |
2.625% due 07/22/22 | | | 4,400,000 | | | | 4,370,828 | |
3.450% due 02/13/23 | | | 3,000,000 | | | | 3,035,164 | |
Westpac Banking Corp (Australia)
3.151% (USD LIBOR + 0.570%)
due 01/11/23 § | | | 3,000,000 | | | | 2,994,596 | |
3.300% due 02/26/24 | | | 3,000,000 | | | | 3,035,913 | |
Zions Bancorp NA | | | | | | | | |
3.350% due 03/04/22 | | | 3,000,000 | | | | 3,028,033 | |
3.500% due 08/27/21 | | | 1,000,000 | | | | 1,011,084 | |
| | | | | | | | |
| | | | | | | 180,774,292 | |
| | | | | | | | |
Industrial - 2.7% | |
| | |
Masco Corp
3.500% due 04/01/21 | | | 2,811,000 | | | | 2,831,569 | |
Penske Truck Leasing Co LP
4.125% due 08/01/23 ~ | | | 2,750,000 | | | | 2,833,165 | |
Reynolds Group Issuer Inc
6.287% (USD LIBOR + 3.500%)
due 07/15/21 § ~ | | | 2,500,000 | | | | 2,515,625 | |
Roper Technologies Inc
3.650% due 09/15/23 | | | 2,250,000 | | | | 2,300,710 | |
Ryder System Inc
3.650% due 03/18/24 | | | 3,000,000 | | | | 3,063,422 | |
United Technologies Corp | | | | | | | | |
3.350% due 08/16/21 | | | 3,000,000 | | | | 3,042,057 | |
3.650% due 08/16/23 | | | 3,000,000 | | | | 3,081,769 | |
| | | | | | | | |
| | | | | | | 19,668,317 | |
| | | | | | | | |
Technology - 0.6% | |
| | |
Broadcom Inc
3.125% due 10/15/22 ~ | | | 2,500,000 | | | | 2,488,575 | |
Fiserv Inc
3.800% due 10/01/23 | | | 2,000,000 | | | | 2,052,125 | |
| | | | | | | | |
| | | | | | | 4,540,700 | |
| | | | | | | | |
Utilities - 2.4% | |
| | |
American Electric Power Co Inc
3.650% due 12/01/21 | | | 1,750,000 | | | | 1,786,366 | |
Duke Energy Corp
2.400% due 08/15/22 | | | 2,150,000 | | | | 2,126,661 | |
Duke Energy Progress LLC
3.375% due 09/01/23 | | | 1,650,000 | | | | 1,697,518 | |
Emera US Finance LP (Canada)
2.150% due 06/15/19 | | | 3,500,000 | | | | 3,493,306 | |
FirstEnergy Corp
2.850% due 07/15/22 | | | 3,800,000 | | | | 3,776,361 | |
Sempra Energy
3.287% (USD LIBOR + 0.500%)
due 01/15/21 § | | | 3,000,000 | | | | 2,975,847 | |
WEC Energy Group Inc
3.100% due 03/08/22 | | | 1,600,000 | | | | 1,614,213 | |
| | | | | | | | |
| | | | | | | 17,470,272 | |
| | | | | | | | |
Total Corporate Bonds & Notes
(Cost $416,150,963) | | | | 419,132,442 | |
| | | | | |
| | | | | | | | |
| | | Principal Amount | | | Value | |
|
SENIOR LOAN NOTES - 7.8% | |
|
Communications - 0.8% | |
| | |
CSC Holdings LLC
4.734% (USD LIBOR + 2.250%)
due 07/17/25 § | | | $967,148 | | | | $942,003 | |
Sprint Communications Inc Term B | | | | | | | | |
5.000% (USD LIBOR + 2.500%) due 02/03/24 § | | | 2,942,462 | | | | 2,859,706 | |
5.500% (USD LIBOR + 3.000%) due 02/03/24 § | | | 1,995,000 | | | | 1,958,841 | |
| | | | | | | | |
| | | | | | | 5,760,550 | |
| | | | | | | | |
Consumer, Cyclical - 2.3% | |
| | |
Bass Pro Group LLC Term B
7.499% (USD LIBOR + 5.000%)
due 09/25/24 § | | | 989,950 | | | | 970,145 | |
Caesars Resort Collection LLC Term B
5.249% (USD LIBOR + 2.750%)
due 12/22/24 § | | | 2,992,424 | | | | 2,963,036 | |
Golden Nugget LLC Term B
5.242% (USD LIBOR + 2.750%)
due 10/04/23 § | | | 1,416,784 | | | | 1,404,387 | |
Hilton Worldwide Finance LLC TermB-2
4.236% (USD LIBOR + 1.750%)
due 10/25/23 § | | | 3,103,035 | | | | 3,096,662 | |
Marriott Ownership Resorts Inc Term B
4.749% (USD LIBOR + 2.250%)
due 08/29/25 § | | | 3,591,000 | | | | 3,577,534 | |
New Red Finance Inc Term B (Canada)
4.749% (USD LIBOR + 2.250%)
due 02/17/24 § | | | 1,458,690 | | | | 1,435,898 | |
SeaWorld Parks & Entertainment Inc TermB-5
5.499% (USD LIBOR + 3.000%)
due 03/31/24 § | | | 3,468,595 | | | | 3,454,506 | |
| | | | | | | | |
| | | | | | | 16,902,168 | |
| | | | | | | | |
Consumer,Non-Cyclical - 0.7% | |
| | |
Albertson’s LLC TermB-7
5.499% (USD LIBOR + 3.000%)
due 11/16/25 § | | | 1,698,337 | | | | 1,679,761 | |
Bausch Health Americas Inc Term B
5.481% (USD LIBOR + 3.000%)
due 06/01/25 § | | | 1,387,500 | | | | 1,379,081 | |
US Foods Inc Term B
4.499% (USD LIBOR + 2.000%)
due 06/27/23 § | | | 2,456,186 | | | | 2,427,326 | |
| | | | | | | | |
| | | | | | | 5,486,168 | |
| | | | | | | | |
Financial - 0.6% | |
| | |
MGM Growth Properties Operating Partnership LP REIT Term B
4.499% (USD LIBOR + 2.000%)
due 03/25/25 § | | | 1,455,000 | | | | 1,435,600 | |
USI Inc Term B
5.601% (USD LIBOR + 3.000%)
due 05/16/24 § | | | 3,466,203 | | | | 3,353,551 | |
| | | | | | | | |
| | | | | | | 4,789,151 | |
| | | | | | | | |
Industrial - 2.2% | |
| | |
Advanced Disposal Services Inc Term B
4.660% (USD LIBOR + 2.250%)
due 11/10/23 § | | | 1,994,595 | | | | 1,986,335 | |
Avolon (US) LLC TermB-3 (Ireland)
4.488% (USD LIBOR + 2.000%)
due 01/15/25 § | | | 699,688 | | | | 695,196 | |
Berry Global Inc Term Q
4.610% (USD LIBOR + 2.000%)
due 10/01/22 § | | | 3,131,746 | | | | 3,117,456 | |
| | |
| See Notes to Financial Statements | | See explanation of symbols and terms, if any, on B-41 |
B-6
PACIFIC FUNDS
PACIFIC FUNDS SHORT DURATION INCOME
Schedule of Investments (Continued)
March 31, 2019
| | | | | | | | |
| | | Principal Amount | | | Value | |
GFL Environmental Inc Term B (Canada)
5.499% (USD LIBOR + 2.750%)
due 05/31/25 § | | | $3,238,709 | | | | $3,145,596 | |
Proampac PG Borrower LLC
6.141% (USD LIBOR + 3.500%)
due 11/18/23 § | | | 1,959,900 | | | | 1,894,978 | |
Reynolds Group Holdings Inc Term B
5.249% (USD LIBOR + 3.000%)
due 02/05/23 § | | | 2,681,383 | | | | 2,653,373 | |
StandardAero Aviation Holdings Inc
6.250% (USD LIBOR + 3.750%)
due 07/07/22 § | | | 2,487,113 | | | | 2,488,668 | |
| | | | | | | | |
| | | | | | | 15,981,602 | |
| | | | | | | | |
Technology - 0.5% | |
| | |
Tempo Acquisition LLC Term B
5.499% (USD LIBOR + 3.000%)
due 05/01/24 § | | | 1,974,874 | | | | 1,958,829 | |
Vertafore Inc Term B
5.749% (USD LIBOR + 3.250%)
due 07/02/25 § | | | 1,496,250 | | | | 1,472,684 | |
| | | | | | | | |
| | | | | | | 3,431,513 | |
| | | | | | | | |
Utilities - 0.7% | |
| | |
Talen Energy Supply LLC TermB-1
6.500% (USD LIBOR + 4.000%)
due 07/06/23 §¥ | | | 2,466,234 | | | | 2,448,765 | |
Vistra Operations Co LLC TermB-1
4.499% (USD LIBOR + 2.000%)
due 08/04/23 § | | | 2,690,120 | | | | 2,656,493 | |
| | | | | | | | |
| | | | | | | 5,105,258 | |
| | | | | | | | �� |
Total Senior Loan Notes
(Cost $57,857,066) | | | | 57,456,410 | |
| | | | | |
|
ASSET-BACKED SECURITIES - 20.8% | |
| | |
Ally Auto Receivables Trust | | | | | | | | |
2.480% due 05/16/22 | | | 535,000 | | | | 533,376 | |
3.020% due 09/15/23 | | | 1,000,000 | | | | 997,453 | |
American Express Credit Account Master Trust | | | | | | | | |
1.930% due 09/15/22 | | | 2,140,000 | | | | 2,127,222 | |
2.350% due 05/15/25 | | | 1,500,000 | | | | 1,491,804 | |
AmeriCredit Automobile Receivables Trust | | | | | | | | |
1.460% due 05/10/21 | | | 1,377,007 | | | | 1,374,139 | |
1.530% due 07/08/21 | | | 533,027 | | | | 531,499 | |
1.980% due 12/20/21 | | | 1,511,119 | | | | 1,505,281 | |
2.300% due 02/18/22 | | | 3,280,000 | | | | 3,259,092 | |
2.360% due 12/19/22 | | | 2,500,000 | | | | 2,481,535 | |
2.600% due 09/18/23 | | | 2,000,000 | | | | 1,990,510 | |
2.730% due 03/08/21 | | | 1,117,919 | | | | 1,117,432 | |
2.970% due 11/20/23 | | | 1,500,000 | | | | 1,509,215 | |
3.080% due 12/18/23 | | | 2,000,000 | | | | 2,002,197 | |
3.130% due 02/18/25 | | | 1,550,000 | | | | 1,563,429 | |
3.450% due 06/18/24 | | | 2,000,000 | | | | 2,024,588 | |
3.500% due 01/18/24 | | | 2,000,000 | | | | 2,028,306 | |
Apidos CLO XV ‘A1RR’ (Cayman)
3.771% (USD LIBOR + 1.010%)
due 04/20/31 § ~ | | | 1,250,000 | | | | 1,236,563 | |
Apidos CLO XXV ‘A1R’ (Cayman)
3.931% (USD LIBOR + 1.170%)
due 10/20/31 § ~ | | | 2,000,000 | | | | 1,985,485 | |
Apidos CLO XXX ‘A1A’ (Cayman)
3.560% (USD LIBOR + 1.140%)
due 10/18/31 § ~ | | | 3,000,000 | | | | 2,982,322 | |
Atrium XIII (Cayman)
3.941% (USD LIBOR + 1.180%)
due 11/21/30 § ~ | | | 470,000 | | | | 469,039 | |
Buttermilk Park CLO Ltd ‘A1’ (Cayman)
3.887% (USD LIBOR + 1.100%)
due 10/15/31 § ~ | | | 850,000 | | | | 842,210 | |
| | | | | | | | |
| | | Principal Amount | | | Value | |
Capital Auto Receivables Asset Trust | | | | | | | | |
2.390% due 11/20/20 | | $ | 2,663,000 | | | $ | 2,660,693 | |
3.480% due 10/20/23 ~ | | | 1,000,000 | | | | 1,009,047 | |
Carlyle Global Market Strategies CLO Ltd (Cayman)
3.815% (USD LIBOR + 1.050%)
due 07/27/31 § ~ | | | 500,000 | | | | 495,319 | |
4.761% (USD LIBOR + 2.000%) due 04/20/27 § ~ | | | 1,550,000 | | | | 1,549,486 | |
Chase Issuance Trust | | | | | | | | |
1.370% due 06/15/21 | | | 1,215,000 | | | | 1,211,832 | |
1.490% due 07/15/22 | | | 4,600,000 | | | | 4,540,471 | |
CIFC Funding2015-III Ltd (Cayman)
3.631% (USD LIBOR + 0.870%)
due 04/19/29 § ~ | | | 3,000,000 | | | | 2,976,131 | |
Citibank Credit Card Issuance Trust | | | | | | | | |
1.750% due 11/19/21 | | | 1,255,000 | | | | 1,248,113 | |
1.800% due 09/20/21 | | | 1,346,000 | | | | 1,340,749 | |
Dryden 33 CLO Ltd (Cayman)
4.537% (USD LIBOR + 1.750%)
due 04/15/29 § ~ | | | 2,000,000 | | | | 2,002,979 | |
Dryden 55 CLO Ltd (Cayman)
3.807% (USD LIBOR + 1.020%)
due 04/15/31 § ~ | | | 2,500,000 | | | | 2,472,598 | |
Dryden 58 CLO Ltd (Cayman)
3.773% (USD LIBOR + 1.000%)
due 07/17/31 § ~ | | | 2,000,000 | | | | 1,973,915 | |
Dryden 61 CLO Ltd (Cayman)
3.597% (USD LIBOR + 1.160%)
due 01/17/32 § ~ | | | 5,000,000 | | | | 4,975,175 | |
Dryden 64 CLO Ltd (Cayman)
3.750% (USD LIBOR + 0.970%)
due 04/18/31 § ~ | | | 2,000,000 | | | | 1,972,770 | |
Dryden 75 CLO Ltd (Cayman)
4.335% (USD LIBOR + 1.800%)
due 01/15/29 § ~ | | | 4,000,000 | | | | 3,970,690 | |
Ford Credit Auto Owner Trust | | | | | | | | |
2.030% due 08/15/20 | | | 757,238 | | | | 756,348 | |
2.140% due 10/15/22 | | | 2,000,000 | | | | 1,989,208 | |
2.350% due 04/15/23 | | | 1,000,000 | | | | 991,703 | |
2.500% due 05/15/24 | | | 1,750,000 | | | | 1,733,723 | |
3.380% due 03/15/24 | | | 1,650,000 | | | | 1,688,814 | |
GM Financial Consumer Automobile Receivables Trust ‘B’
3.270% due 01/16/24 | | | 1,200,000 | | | | 1,215,816 | |
MagnetiteXIV-R Ltd ‘A1’ (Cayman)
3.900% (USD LIBOR + 1.120%)
due 10/18/31 § ~ | | | 3,000,000 | | | | 2,974,100 | |
Magnetite XVIII Ltd (Cayman)
3.764% (USD LIBOR + 1.080%)
due 11/15/28 § ~ | | | 3,000,000 | | | | 2,992,533 | |
Magnetite XXI Ltd ‘A’ (Cayman)
3.909% (USD LIBOR + 1.280%)
due 04/20/30 § ~ | | | 1,000,000 | | | | 999,970 | |
Navient Private Education Loan Trust
3.610% due 12/15/59 ~ | | | 1,400,000 | | | | 1,427,458 | |
Navient Student Loan Trust ‘A1’
2.676% (USD LIBOR + 0.190%)
due 03/25/67 § ~ | | | 943,462 | | | | 943,316 | |
2.887% (USD LIBOR + 0.400%) due 12/15/59 § ~ | | | 1,300,000 | | | | 1,301,625 | |
Navient Student Loan Trust ‘A2’
2.906% (USD LIBOR + 0.420%)
due 08/27/29 § | | | 1,348,814 | | | | 1,349,048 | |
Navient Student Loan Trust ‘A2A’
3.390% due 12/15/59 ~ | | | 2,000,000 | | | | 2,002,380 | |
Nelnet Student Loan Trust ‘A1’
2.806% (USD LIBOR + 0.320%)
due 05/25/66 § ~ | | | 826,358 | | | | 826,562 | |
| | |
| See Notes to Financial Statements | | See explanation of symbols and terms, if any, on B-41 |
B-7
PACIFIC FUNDS
PACIFIC FUNDS SHORT DURATION INCOME
Schedule of Investments (Continued)
March 31, 2019
| | | | | | | | |
| | | Principal Amount | | | Value | |
OCP CLO Ltd (Cayman)
3.585% (USD LIBOR + 0.820%)
due 10/26/27 § ~ | | $ | 2,000,000 | | | $ | 1,988,940 | |
Octagon Investment Partners 25 Ltd (Cayman)
3.561% (USD LIBOR + 0.800%)
due 10/20/26 § ~ | | | 3,000,000 | | | | 2,987,400 | |
OneMain Financial Issuance Trust
2.370% due 09/14/32 ~ | | | 1,600,000 | | | | 1,587,981 | |
Regatta XIV Funding Ltd ‘A’ (Cayman)
3.961% (USD LIBOR + 1.190%)
due 10/25/31 § ~ | | | 2,500,000 | | | | 2,470,548 | |
Santander Drive Auto Receivables Trust | | | | | | | | |
2.580% due 05/16/22 | | | 1,000,000 | | | | 997,411 | |
2.660% due 11/15/21 | | | 433,049 | | | | 432,870 | |
3.030% due 09/15/22 | | | 2,000,000 | | | | 2,003,951 | |
3.210% due 09/15/23 | | | 2,000,000 | | | | 2,009,670 | |
3.270% due 01/17/23 | | | 1,600,000 | | | | 1,607,450 | |
3.290% due 10/17/22 | | | 1,150,000 | | | | 1,153,904 | |
3.420% due 04/15/25 | | | 1,750,000 | | | | 1,764,614 | |
3.520% due 12/15/22 | | | 2,250,000 | | | | 2,272,804 | |
SLC Student Loan Trust
2.711% (USD LIBOR + 0.100%)
due 09/15/26 § | | | 1,548,239 | | | | 1,546,665 | |
2.721% (USD LIBOR + 0.110%) due 03/15/27 § | | | 2,345,530 | | | | 2,335,037 | |
2.731% (USD LIBOR + 0.120%) due 06/15/29 § | | | 1,232,974 | | | | 1,225,300 | |
3.526% (USD LIBOR + 0.875%) due 11/25/42 § | | | 424,030 | | | | 427,408 | |
4.211% (USD LIBOR + 1.600%) due 12/15/32 § | | | 406,177 | | | | 417,401 | |
SLM Private Credit Student Loan Trust
2.901% (USD LIBOR + 0.290%)
due 06/15/39 § | | | 1,618,243 | | | | 1,574,250 | |
2.921% (USD LIBOR + 0.310%) due 12/15/38 § | | | 800,000 | | | | 774,827 | |
SLM Private Education Loan Trust
3.500% due 06/15/44 ~ | | | 720,000 | | | | 719,090 | |
SLM Student Loan Trust
2.891% (USD LIBOR + 0.120%)
due 01/25/27 § | | | 463,773 | | | | 461,396 | |
2.921% (USD LIBOR + 0.150%)
due 10/25/29 § | | | 279,645 | | | | 277,828 | |
3.151% (USD LIBOR + 0.380%)
due 10/25/24 § | | | 2,149,905 | | | | 2,152,319 | |
3.321% (USD LIBOR + 0.550%)
due 04/27/26 § ~ | | | 786,991 | | | | 788,308 | |
3.401% (USD LIBOR + 0.630%)
due 01/25/40 § ~ | | | 3,150,000 | | | | 3,125,290 | |
SMB Private Education Loan Trust | | | | | | | | |
2.340% due 09/15/34 ~ | | | 4,491,019 | | | | 4,406,892 | |
2.490% due 06/15/27 ~ | | | 767,261 | | | | 762,102 | |
2.700% due 05/15/31 ~ | | | 1,130,548 | | | | 1,126,007 | |
2.750% due 07/15/27 ~ | | | 537,719 | | | | 536,979 | |
3.050% due 05/15/26 ~ | | | 2,672,989 | | | | 2,680,125 | |
3.440% due 07/15/36 ~ | | | 1,850,000 | | | | 1,880,782 | |
3.500% due 02/15/36 ~ | | | 1,000,000 | | | | 1,021,159 | |
3.600% due 01/15/37 ~ | | | 3,000,000 | | | | 3,060,725 | |
3.630% due 11/15/35 ~ | | | 2,954,000 | | | | 3,037,124 | |
Verizon Owner Trust | | | | | | | | |
1.680% due 05/20/21 ~ | | | 1,532,772 | | | | 1,527,338 | |
2.930% due 09/20/23 | | | 1,250,000 | | | | 1,260,124 | |
Volvo Financial Equipment LLC
3.130% due 11/15/23 ~ | | | 2,000,000 | | | | 2,020,728 | |
| | | | | | | | |
| |
Total Asset-Backed Securities
(Cost $151,727,042) | | | | 152,068,016 | |
| | | | | |
| | | | | | | | |
| | | Principal Amount | | | Value | |
|
U.S. TREASURY OBLIGATIONS - 10.0% | |
|
U.S. Treasury Notes - 10.0% | |
| | |
0.875% due 09/15/19 | | $ | 4,500,000 | | | $ | 4,468,889 | |
1.250% due 04/30/19 | | | 1,600,000 | | | | 1,599,120 | |
1.250% due 05/31/19 | | | 3,000,000 | | | | 2,994,039 | |
1.250% due 06/30/19 | | | 5,000,000 | | | | 4,984,668 | |
2.000% due 01/15/21 | | | 5,000,000 | | | | 4,973,926 | |
2.000% due 07/31/22 | | | 3,000,000 | | | | 2,979,023 | |
2.625% due 12/15/21 | | | 10,000,000 | | | | 10,104,883 | |
2.750% due 09/30/20 | | | 4,000,000 | | | | 4,023,906 | |
2.750% due 11/30/20 | | | 28,000,000 | | | | 28,195,781 | |
2.875% due 10/31/20 | | | 8,500,000 | | | | 8,571,055 | |
| | | | | | | | |
| |
Total U.S. Treasury Obligations
(Cost $72,490,868) | | | | 72,895,290 | |
| | | | | |
| | |
MUNICIPAL BONDS - 0.1% | | | | | | | | |
| | |
Pennsylvania Higher Education Assistance Agency ‘A’
3.671% (USD LIBOR + 0.900%)
due 07/25/29 § | | | 673,463 | | | | 676,608 | |
| | | | | |
| | |
Total Municipal Bonds
(Cost $674,726) | | | | | | | 676,608 | |
| | | | | |
| | |
| | | Shares | | | | |
SHORT-TERM INVESTMENT - 3.8% | | | | | | | | |
| | |
Money Market Fund - 3.8% | | | | | | | | |
| | |
BlackRock Liquidity FundsT-Fund Portfolio
‘Institutional’ 2.370% | | | 28,168,855 | | | | 28,168,855 | |
| | | | | |
| | |
Total Short-Term Investment
(Cost $28,168,855) | | | | | | | 28,168,855 | |
| | | | | |
| | |
Total Investments - 99.8%
(Cost $727,069,520) | | | | | | | 730,397,621 | |
| | |
OTHER ASSETS & LIABILITIES, NET - 0.2% | | | | | | | 1,616,339 | |
| | | | | |
| | |
Net Assets - 100.0% | | | | | | | $732,013,960 | |
| | | | | | | | |
Notes to Schedule of Investments
| (a) | As of March 31, 2019, the Fund’s composition as a percentage of net assets was as follows: |
| | | | |
Corporate Bonds & Notes | | | 57.3% | |
Asset-Backed Securities | | | 20.8% | |
U.S. Treasury Obligations | | | 10.0% | |
Senior Loan Notes | | | 7.8% | |
Short-Term Investment | | | 3.8% | |
Others (each less than 3.0%) | | | 0.1% | |
| | | | |
| | | 99.8% | |
Other Assets & Liabilities, Net | | | 0.2% | |
| | | | |
| | | 100.0% | |
| | | | |
| | |
| See Notes to Financial Statements | | See explanation of symbols and terms, if any, on B-41 |
B-8
PACIFIC FUNDS
PACIFIC FUNDS SHORT DURATION INCOME
Schedule of Investments (Continued)
March 31, 2019
| (b) | Fair Value Measurements |
The following is a summary of the Fund’s investments as categorized under the three-tier hierarchy of inputs used in valuing the Fund’s assets and liabilities (See Note 3D in Notes to Financial Statements) as of March 31, 2019:
| | | | | | | | | | | | | | | | | | |
| | | | | Total Value at
March 31, 2019 | | | Level 1
Quoted Price | | | Level 2
Significant
Observable Inputs | | | Level 3
Significant
Unobservable Inputs | |
Assets | | Corporate Bonds & Notes | | | $419,132,442 | | | | $— | | | | $419,132,442 | | | | $— | |
| | Senior Loan Notes | | | 57,456,410 | | | | — | | | | 57,456,410 | | | | — | |
| | Asset-Backed Securities | | | 152,068,016 | | | | — | | | | 152,068,016 | | | | — | |
| | U.S. Treasury Obligations | | | 72,895,290 | | | | — | | | | 72,895,290 | | | | — | |
| | Municipal Bonds | | | 676,608 | | | | — | | | | 676,608 | | | | — | |
| | Short-Term Investment | | | 28,168,855 | | | | 28,168,855 | | | | — | | | | — | |
| | | | | | | | | | | | | | | | | | |
| | Total | | | $730,397,621 | | | | $28,168,855 | | | | $702,228,766 | | | | $— | |
| | | | | | | | | | | | | | | | | | |
| | |
| See Notes to Financial Statements | | See explanation of symbols and terms, if any, on B-41 |
B-9
PACIFIC FUNDS
PACIFIC FUNDSSM CORE INCOME
Schedule of Investments
March 31, 2019
| | | | | | | | |
| | | Principal Amount | | | Value | |
CORPORATE BONDS & NOTES - 46.7% | |
|
Basic Materials - 0.4% | |
| | |
Syngenta Finance NV (Switzerland)
5.182% due 04/24/28 ~ | | | $2,700,000 | | | | $2,748,973 | |
| | | | | | | | |
| | |
Communications - 3.8% | | | | | | | | |
| | |
Amazon.com Inc
4.250% due 08/22/57 | | | 2,000,000 | | | | 2,158,993 | |
AT&T Inc
4.850% due 03/01/39 | | | 2,400,000 | | | | 2,416,963 | |
5.250% due 03/01/37 | | | 4,000,000 | | | | 4,222,136 | |
Charter Communications Operating LLC
5.750% due 04/01/48 | | | 2,000,000 | | | | 2,096,839 | |
Fox Corp
4.709% due 01/25/29 ~ | | | 1,700,000 | | | | 1,821,711 | |
5.576% due 01/25/49 ~ | | | 1,800,000 | | | | 2,039,927 | |
Sprint Communications Inc
6.000% due 11/15/22 | | | 2,500,000 | | | | 2,525,750 | |
Sprint Corp
7.250% due 09/15/21 | | | 3,500,000 | | | | 3,683,750 | |
Sprint Spectrum Co LLC
3.360% due 03/20/23 ~ | | | 2,750,000 | | | | 2,756,050 | |
| | | | | | | | |
| | | | | | | 23,722,119 | |
| | | | | | | | |
Consumer, Cyclical - 9.1% | | | | | | | | |
| | |
Air Canada Pass-Through Trust ‘A’ (Canada)
4.125% due 11/15/26 ~ | | | 4,188,406 | | | | 4,278,038 | |
Alimentation Couche-Tard Inc (Canada)
4.500% due 07/26/47 ~ | | | 3,000,000 | | | | 2,822,271 | |
American Airlines Pass-Through Trust ‘AA’
3.575% due 07/15/29 | | | 4,403,114 | | | | 4,437,411 | |
3.600% due 03/22/29 | | | 2,659,557 | | | | 2,671,792 | |
American Airlines Pass-Through Trust ‘B’
4.375% due 04/01/24 | | | 625,237 | | | | 629,207 | |
British Airways Pass-Through Trust ‘A’ (United Kingdom)
4.625% due 12/20/25 ~ | | | 3,061,853 | | | | 3,197,646 | |
Continental Airlines Pass-Through Trust ‘A’
4.000% due 04/29/26 | | | 2,619,561 | | | | 2,668,678 | |
Delta Air Lines Pass-Through Trust ‘AA’
3.625% due 01/30/29 | | | 1,357,920 | | | | 1,390,514 | |
Downstream Development Authority of the Quapaw Tribe of Oklahoma
10.500% due 02/15/23 ~ | | | 2,750,000 | | | | 2,856,563 | |
Ford Motor Credit Co LLC
5.584% due 03/18/24 | | | 1,850,000 | | | | 1,877,500 | |
General Motors Co
5.000% due 10/01/28 | | | 3,000,000 | | | | 2,997,808 | |
Hawaiian Airlines Pass-Through Certificates ‘A’
3.900% due 07/15/27 | | | 1,810,457 | | | | 1,801,405 | |
Jack Ohio Finance LLC
6.750% due 11/15/21 ~ | | | 2,000,000 | | | | 2,065,000 | |
Lennar Corp
6.250% due 12/15/21 | | | 2,500,000 | | | | 2,640,625 | |
Mattamy Group Corp (Canada)
6.500% due 10/01/25 ~ | | | 2,500,000 | | | | 2,478,875 | |
Nordstrom Inc
5.000% due 01/15/44 | | | 2,500,000 | | | | 2,267,618 | |
Six Flags Entertainment Corp
4.875% due 07/31/24 ~ | | | 2,000,000 | | | | 1,973,750 | |
Spirit Airlines Pass- Through Trust ‘AA’
3.375% due 08/15/31 | | | 428,749 | | | | 423,723 | |
4.100% due 10/01/29 | | | 581,700 | | | | 594,817 | |
Tesla Inc
5.300% due 08/15/25 ~ | | | 1,500,000 | | | | 1,305,000 | |
United Airlines Pass Through Trust ‘AA’
4.150% due 02/25/33 | | | 2,500,000 | | | | 2,595,277 | |
| | | | | | | | |
| | | Principal Amount | | | Value | |
United Airlines Pass-Through Trust ‘B’
3.650% due 04/07/27 | | | $1,645,833 | | | | $1,626,784 | |
4.750% due 10/11/23 | | | 3,772,048 | | | | 3,836,173 | |
US Airways Pass-Through Trust ‘A’
4.625% due 12/03/26 | | | 2,450,098 | | | | 2,561,581 | |
Virgin Australia Pass-Through Trust ‘A’ (Australia)
5.000% due 04/23/25 ~ | | | 683,774 | | | | 699,398 | |
| | | | | | | | |
| | | | | | | 56,697,454 | |
| | | | | | | | |
Consumer,Non-Cyclical - 5.1% | |
| | |
Anheuser-Busch InBev Worldwide Inc (Belgium)
5.450% due 01/23/39 | | | 5,000,000 | | | | 5,424,750 | |
BAT Capital Corp (United Kingdom)
4.390% due 08/15/37 | | | 2,500,000 | | | | 2,261,478 | |
Bausch Health Cos Inc
6.500% due 03/15/22 ~ | | | 2,000,000 | | | | 2,072,500 | |
CHS/Community Health Systems Inc
5.125% due 08/01/21 | | | 2,000,000 | | | | 1,976,200 | |
Cigna Corp
4.375% due 10/15/28 ~ | | | 3,350,000 | | | | 3,475,356 | |
Conagra Brands Inc
5.300% due 11/01/38 | | | 1,500,000 | | | | 1,526,856 | |
Eli Lilly & Co
3.375% due 03/15/29 | | | 1,800,000 | | | | 1,850,492 | |
4.150% due 03/15/59 | | | 1,800,000 | | | | 1,862,400 | |
Mars Inc
3.875% due 04/01/39 ~ | | | 2,000,000 | | | | 2,019,677 | |
MEDNAX Inc
5.250% due 12/01/23 ~ | | | 2,000,000 | | | | 2,030,000 | |
Pfizer Inc
3.450% due 03/15/29 | | | 900,000 | | | | 925,052 | |
Takeda Pharmaceutical Co Ltd (Japan)
4.400% due 11/26/23 ~ | | | 3,900,000 | | | | 4,102,544 | |
Teva Pharmaceutical Finance Netherlands III BV (Israel)
2.200% due 07/21/21 | | | 1,000,000 | | | | 953,929 | |
Verisk Analytics Inc
4.125% due 03/15/29 | | | 1,650,000 | | | | 1,696,765 | |
| | | | | | | | |
| | | | | | | 32,177,999 | |
| | | | | | | | |
Energy - 5.2% | | | | | | | | |
| | |
Andeavor Logistics LP
5.200% due 12/01/47 | | | 1,200,000 | | | | 1,206,016 | |
5.250% due 01/15/25 | | | 6,500,000 | | | | 6,755,969 | |
6.875% due 02/15/23 | | | 1,000,000 | | | | 1,005,585 | |
Concho Resources Inc
4.300% due 08/15/28 | | | 2,750,000 | | | | 2,841,553 | |
Diamondback Energy Inc
5.375% due 05/31/25 | | | 3,000,000 | | | | 3,138,750 | |
Energy Transfer Partners LP
4.750% due 01/15/26 | | | 3,000,000 | | | | 3,137,776 | |
EQM Midstream Partners LP
6.500% due 07/15/48 | | | 3,250,000 | | | | 3,291,070 | |
EQT Corp
3.900% due 10/01/27 | | | 2,000,000 | | | | 1,873,218 | |
Kinder Morgan Energy Partners LP
4.300% due 05/01/24 | | | 2,720,000 | | | | 2,844,017 | |
5.000% due 08/15/42 | | | 2,500,000 | | | | 2,509,231 | |
Petroleos Mexicanos (Mexico)
6.350% due 02/12/48 | | | 2,100,000 | | | | 1,861,965 | |
Southwestern Energy Co
6.200% due 01/23/25 | | | 1,750,000 | | | | 1,728,125 | |
| | | | | | | | |
| | | | | | | 32,193,275 | |
| | | | | | | | |
Financial - 15.5% | | | | | | | | |
| | |
Ares Capital Corp
4.250% due 03/01/25 | | | 1,750,000 | | | | 1,710,686 | |
Bank of America Corp
4.183% due 11/25/27 | | | 4,850,000 | | | | 4,937,058 | |
4.200% due 08/26/24 | | | 3,500,000 | | | | 3,626,552 | |
4.250% due 10/22/26 | | | 5,500,000 | | | | 5,660,167 | |
| | |
| See Notes to Financial Statements | | See explanation of symbols and terms, if any, on B-41 |
B-10
PACIFIC FUNDS
PACIFIC FUNDS CORE INCOME
Schedule of Investments (Continued)
March 31, 2019
| | | | | | | | |
| | | Principal Amount | | | Value | |
Citigroup Inc
4.125% due 07/25/28 | | | $3,600,000 | | | | $3,626,893 | |
4.400% due 06/10/25 | | | 5,000,000 | | | | 5,184,486 | |
4.600% due 03/09/26 | | | 3,948,000 | | | | 4,130,889 | |
Columbia Property Trust Operating
Partnership LP REIT
4.150% due 04/01/25 | | | 3,500,000 | | | | 3,506,615 | |
Duke Realty LP REIT
3.750% due 12/01/24 | | | 3,420,000 | | | | 3,495,623 | |
GLP Capital LP REIT
5.250% due 06/01/25 | | | 1,950,000 | | | | 2,047,773 | |
Healthcare Realty Trust Inc REIT
3.625% due 01/15/28 | | | 1,900,000 | | | | 1,846,987 | |
Hudson Pacific Properties LP REIT
3.950% due 11/01/27 | | | 2,250,000 | | | | 2,189,203 | |
JPMorgan Chase & Co
4.125% due 12/15/26 | | | 4,000,000 | | | | 4,136,109 | |
Liberty Property LP REIT
4.375% due 02/01/29 | | | 800,000 | | | | 835,756 | |
MassMutual Global Funding II
3.400% due 03/08/26 ~ | | | 3,500,000 | | | | 3,561,243 | |
Mid-America Apartments LP REIT
3.950% due 03/15/29 | | | 4,600,000 | | | | 4,687,825 | |
Morgan Stanley
5.000% due 11/24/25 | | | 7,500,000 | | | | 8,051,461 | |
National Rural Utilities Cooperative Finance Corp
3.700% due 03/15/29 | | | 1,350,000 | | | | 1,404,836 | |
Nuveen LLC
4.000% due 11/01/28 ~ | | | 2,050,000 | | | | 2,190,848 | |
Piedmont Operating Partnership LP REIT
4.450% due 03/15/24 | | | 3,100,000 | | | | 3,182,203 | |
Teachers Insurance & Annuity Association
of America
4.270% due 05/15/47 ~ | | | 3,000,000 | | | | 3,101,408 | |
The Goldman Sachs Group Inc
3.272% due 09/29/25 | | | 2,000,000 | | | | 1,976,134 | |
3.500% due 11/16/26 | | | 8,000,000 | | | | 7,907,262 | |
The Howard Hughes Corp
5.375% due 03/15/25 ~ | | | 2,500,000 | | | | 2,500,000 | |
UDR Inc REIT
2.950% due 09/01/26 | | | 2,000,000 | | | | 1,917,337 | |
Ventas Realty LP REIT
3.500% due 02/01/25 | | | 4,450,000 | | | | 4,457,777 | |
Wells Fargo & Co
4.400% due 06/14/46 | | | 3,750,000 | | | | 3,750,205 | |
Weyerhaeuser Co REIT
4.000% due 11/15/29 | | | 850,000 | | | | 876,399 | |
| | | | | | | | |
| | | | | | | 96,499,735 | |
| | | | | | | | |
Industrial - 2.2% | | | | | | | | |
| | |
Allegion US Holding Co Inc
3.550% due 10/01/27 | | | 3,786,000 | | | | 3,604,772 | |
Ardagh Packaging Finance PLC (Ireland)
7.250% due 05/15/24 ~ | | | 1,000,000 | | | | 1,057,200 | |
Masco Corp
7.750% due 08/01/29 | | | 2,000,000 | | | | 2,432,801 | |
Norbord Inc (Canada)
6.250% due 04/15/23 ~ | | | 2,000,000 | | | | 2,057,500 | |
Owens-Brockway Glass Container Inc
5.000% due 01/15/22 ~ | | | 2,500,000 | | | | 2,571,875 | |
Penske Truck Leasing Co Lp
4.450% due 01/29/26 ~ | | | 1,200,000 | | | | 1,228,014 | |
TransDigm Inc
6.250% due 03/15/26 ~ | | | 1,000,000 | | | | 1,040,000 | |
| | | | | | | | |
| | | | | | | 13,992,162 | |
| | | | | | | | |
Technology - 1.1% | | | | | | | | |
| | |
Broadcom Inc
4.250% due 04/15/26 ~ | | | 3,000,000 | | | | 2,977,830 | |
Dell International LLC
4.900% due 10/01/26 ~ | | | 1,600,000 | | | | 1,631,842 | |
| | | | | | | | |
| | | Principal Amount | | | Value | |
KLA-Tencor Corp
4.100% due 03/15/29 | | | $1,650,000 | | | | $1,690,107 | |
Lam Research Corp
3.750% due 03/15/26 | | | 450,000 | | | | 459,000 | |
| | | | | | | | |
| | | | | | | 6,758,779 | |
| | | | | | | | |
Utilities - 4.3% | | | | | | | | |
| | |
Duke Energy Progress LLC
3.450% due 03/15/29 | | | 1,700,000 | | | | 1,744,249 | |
Electricite de France SA (France)
4.500% due 09/21/28 ~ | | | 3,000,000 | | | | 3,099,778 | |
Exelon Corp
5.100% due 06/15/45 | | | 2,000,000 | | | | 2,239,276 | |
FirstEnergy Corp
4.850% due 07/15/47 | | | 2,400,000 | | | | 2,582,207 | |
IPALCO Enterprises Inc
3.700% due 09/01/24 | | | 3,500,000 | | | | 3,527,011 | |
Jersey Central Power & Light Co
4.300% due 01/15/26 ~ | | | 1,700,000 | | | | 1,772,557 | |
Metropolitan Edison Co
4.300% due 01/15/29 ~ | | | 2,800,000 | | | | 2,936,001 | |
MidAmerican Energy Co
4.250% due 07/15/49 | | | 1,650,000 | | | | 1,759,467 | |
Nevada Power Co
3.700% due 05/01/29 | | | 3,000,000 | | | | 3,106,047 | |
Northern States Power Co
4.200% due 09/01/48 | | | 2,850,000 | | | | 2,932,835 | |
Talen Energy Supply LLC
6.500% due 06/01/25 | | | 1,000,000 | | | | 885,000 | |
| | | | | | | | |
| | | | | | | 26,584,428 | |
| | | | | | | | |
Total Corporate Bonds & Notes
(Cost $287,006,237) | | | | | | | 291,374,924 | |
| | | | | | | | |
|
SENIOR LOAN NOTES - 12.9% | |
| | |
Communications - 1.3% | | | | | | | | |
| | |
Level 3 Parent LLC Term B
4.736% (USD LIBOR + 2.250%)
due 02/22/24 § | | | 2,500,000 | | | | 2,475,000 | |
Sprint Communications Inc Term B
5.000% (USD LIBOR + 2.500%)
due 02/03/24 § | | | 2,944,925 | | | | 2,862,099 | |
5.500% (USD LIBOR + 3.000%) due 02/03/24 § | | | 2,493,750 | | | | 2,448,551 | |
| | | | | | | | |
| | | | | | | 7,785,650 | |
| | | | | | | | |
Consumer, Cyclical - 3.8% | | | | | | | | |
| | |
Bass Pro Group LLC Term B
7.499% (USD LIBOR + 5.000%)
due 09/25/24 § | | | 1,979,900 | | | | 1,940,290 | |
Caesars Resort Collection LLC Term B
5.249% (USD LIBOR + 2.750%)
due 12/22/24 § | | | 1,994,950 | | | | 1,975,357 | |
ClubCorp Holdings Inc Term B
5.351% (USD LIBOR + 2.750%)
due 09/18/24 § | | | 2,203,353 | | | | 2,090,982 | |
Golden Nugget LLC Term B
5.242% (USD LIBOR + 2.750%)
due 10/04/23 § | | | 3,305,830 | | | | 3,276,904 | |
Hilton Worldwide Finance LLC TermB-2
4.236% (USD LIBOR + 1.750%)
due 10/25/23 § | | | 4,182,817 | | | | 4,174,226 | |
Marriott Ownership Resorts Inc Term B
4.749% (USD LIBOR + 2.250%)
due 08/29/25 § | | | 1,396,500 | | | | 1,391,263 | |
| | |
| See Notes to Financial Statements | | See explanation of symbols and terms, if any, on B-41 |
B-11
PACIFIC FUNDS
PACIFIC FUNDS CORE INCOME
Schedule of Investments (Continued)
March 31, 2019
| | | | | | | | |
| | | Principal Amount | | | Value | |
New Red Finance Inc Term B (Canada)
4.749% (USD LIBOR + 2.250%)
due 02/17/24 § | | | $5,265,561 | | | | $5,183,286 | |
SeaWorld Parks & Entertainment Inc TermB-5
5.499% (USD LIBOR + 3.000%)
due 03/31/24 § | | | 3,934,774 | | | | 3,918,791 | |
| | | | | | | | |
| | | | | | | 23,951,099 | |
| | | | | | | | |
Consumer,Non-Cyclical - 1.3% | | | | | | | | |
| | |
Albertson’s LLC TermB-7
5.499% (USD LIBOR + 3.000%)
due 11/16/25 § | | | 2,562,084 | | | | 2,534,060 | |
Bausch Health Americas Inc Term B
5.481% (USD LIBOR + 3.000%)
due 06/01/25 § | | | 1,850,000 | | | | 1,838,774 | |
US Foods Inc Term B
4.499% (USD LIBOR + 2.000%)
due 06/27/23 § | | | 3,902,468 | | | | 3,856,614 | |
| | | | | | | | |
| | | | | | | 8,229,448 | |
| | | | | | | | |
Financial - 1.0% | | | | | | | | |
| | |
HUB International Ltd Term B
5.515% (USD LIBOR + 3.000%)
due 04/25/25 § | | | 1,488,750 | | | | 1,442,072 | |
USI Inc Term B
5.601% (USD LIBOR + 3.000%)
due 05/16/24 § | | | 4,937,468 | | | | 4,777,001 | |
| | | | | | | | |
| | | | | | | 6,219,073 | |
| | | | | | | | |
Industrial - 3.4% | | | | | | | | |
| | |
Advanced Disposal Services Inc Term B
4.660% (USD LIBOR + 2.250%)
due 11/10/23 § | | | 1,994,595 | | | | 1,986,335 | |
Avolon (US) LLC TermB-3 (Ireland)
4.488% (USD LIBOR + 2.000%)
due 01/15/25 § | | | 1,399,376 | | | | 1,390,392 | |
GFL Environmental Inc Term B (Canada)
5.499% (USD LIBOR + 2.750%)
due 05/31/25 § | | | 4,731,190 | | | | 4,595,169 | |
Proampac PG Borrower LLC
6.141% (USD LIBOR + 3.500%)
due 11/18/23 § | | | 3,919,800 | | | | 3,789,956 | |
Reynolds Group Holdings Inc Term B
5.249% (USD LIBOR + 3.000%)
due 02/05/23 § | | | 3,950,239 | | | | 3,908,975 | |
TransDigm Inc | | | | | | | | |
Term E 4.999% (USD LIBOR + 2.500%) due 05/30/25 § | | | 1,923,215 | | | | 1,876,037 | |
Term F 4.999% (USD LIBOR + 2.500%) due 06/09/23 § | | | 3,831,593 | | | | 3,747,179 | |
| | | | | | | | |
| | | | | | | 21,294,043 | |
| | | | | | | | |
Technology - 0.9% | | | | | | | | |
| | |
Tempo Acquisition LLC Term B
5.499% (USD LIBOR + 3.000%)
due 05/01/24 § | | | 1,974,874 | | | | 1,958,828 | |
Vertafore Inc Term B
5.749% (USD LIBOR + 3.250%)
due 07/02/25 § | | | 3,990,000 | | | | 3,927,157 | |
| | | | | | | | |
| | | | | | | 5,885,985 | |
| | | | | | | | |
Utilities - 1.2% | | | | | | | | |
| | |
Talen Energy Supply LLC TermB-1
6.500% (USD LIBOR + 4.000%)
due 07/06/23 § | | | 3,915,106 | | | | 3,887,375 | |
Vistra Operations Co LLC TermB-1
4.499% (USD LIBOR + 2.000%)
due 08/04/23 § | | | 3,385,342 | | | | 3,343,025 | |
| | | | | | | | |
| | | | | | | 7,230,400 | |
| | | | | | | | |
Total Senior Loan Notes
(Cost $81,568,955) | | | | | | | 80,595,698 | |
| | | | | | | | |
| | | | | | | | |
| | | Principal Amount | | | Value | |
MORTGAGE-BACKED SECURITIES - 1.4% | | | | | | | | |
| | |
Fannie Mae - 0.7% | | | | | | | | |
2.500% due 04/01/34 | | | $4,500,000 | | | | $4,474,013 | |
| | | | | | | | |
| | |
Freddie Mac - 0.7% | | | | | | | | |
2.500% due 04/01/34 | | | 4,000,000 | | | | 3,979,688 | |
| | | | | | | | |
| | |
Total Mortgage-Backed Securities
(Cost $8,364,063) | | | | | | | 8,453,701 | |
| | | | | | | | |
| | |
ASSET-BACKED SECURITIES - 18.0% | | | | | | | | |
| | |
AmeriCredit Automobile Receivables Trust
2.240% due 06/19/23 | | | 950,000 | | | | 943,209 | |
2.400% due 05/18/22 | | | 1,850,000 | | | | 1,841,553 | |
2.690% due 06/19/23 | | | 1,050,000 | | | | 1,047,753 | |
2.710% due 08/18/22 | | | 1,500,000 | | | | 1,496,685 | |
3.130% due 02/18/25 | | | 1,250,000 | | | | 1,260,830 | |
3.360% due 02/18/25 | | | 1,000,000 | | | | 1,010,315 | |
Apidos CLO XXX ‘A2’ (Cayman)
4.020% (USD LIBOR + 1.600%)
due 10/18/31 § ~ | | | 3,600,000 | | | | 3,555,164 | |
Buttermilk Park CLO Ltd ‘A1’ (Cayman)
3.887% (USD LIBOR + 1.100%)
due 10/15/31 § ~ | | | 1,600,000 | | | | 1,585,336 | |
Capital Auto Receivables Asset Trust
1.690% due 03/20/21 | | | 1,250,000 | | | | 1,245,363 | |
2.110% due 03/22/21 | | | 600,000 | | | | 596,903 | |
3.090% due 08/22/22 ~ | | | 1,600,000 | | | | 1,605,949 | |
Carlyle Global Market Strategies CLO Ltd (Cayman)
3.815% (USD LIBOR + 1.050%)
due 07/27/31 § ~ | | | 1,000,000 | | | | 990,638 | |
4.315% (USD LIBOR + 1.550%) due 07/27/31 § ~ | | | 2,000,000 | | | | 1,968,964 | |
4.761% (USD LIBOR + 2.000%) due 04/20/27 § ~ | | | 2,975,000 | | | | 2,974,013 | |
CIFC Funding2015-III Ltd ‘AR’ (Cayman)
3.631% (USD LIBOR + 0.870%)
due 04/19/29 § ~ | | | 3,000,000 | | | | 2,976,131 | |
4.411% (USD LIBOR + 1.650%) due 04/19/29 § ~ | | | 1,805,000 | | | | 1,721,519 | |
Dryden 33 Senior Loan Fund (Cayman)
4.537% (USD LIBOR + 1.750%)
due 04/15/29 § ~ | | | 2,000,000 | | | | 2,002,979 | |
Dryden 53 CLO Ltd (Cayman)
4.187% (USD LIBOR + 1.400%)
due 01/15/31 § ~ | | | 1,500,000 | | | | 1,468,153 | |
Dryden 55 CLO Ltd (Cayman)
4.687% (USD LIBOR + 1.900%)
due 04/15/31 § ~ | | | 1,000,000 | | | | 965,048 | |
Dryden 58 CLO Ltd (Cayman)
4.273% (USD LIBOR + 1.500%)
due 07/17/31 § # ~ | | | 2,000,000 | | | | 1,963,147 | |
4.573% (USD LIBOR + 1.800%) due 07/17/31 § # ~ | | | 2,000,000 | | | | 1,902,069 | |
Dryden 61 CLO Ltd (Cayman)
4.087% (USD LIBOR + 1.650%)
due 01/17/32 § ~ | | | 2,250,000 | | | | 2,230,489 | |
4.487% (USD LIBOR + 2.050%) due 01/17/32 § ~ | | | 2,250,000 | | | | 2,174,583 | |
Dryden 64 CLO Ltd (Cayman)
4.180% (USD LIBOR + 1.400%)
due 04/18/31 § ~ | | | 1,600,000 | | | | 1,571,200 | |
Dryden 75 CLO Ltd (Cayman)
4.985% (USD LIBOR + 2.450%)
due 01/15/29 § ~ | | | 1,500,000 | | | | 1,488,936 | |
Ford Credit Auto Owner Trust
1.730% due 03/15/22 | | | 850,000 | | | | 838,246 | |
2.240% due 06/15/22 | | | 1,000,000 | | | | 992,618 | |
2.350% due 04/15/23 | | | 2,500,000 | | | | 2,479,257 | |
3.190% due 07/15/31 ~ | | | 4,000,000 | | | | 4,009,957 | |
| | |
| See Notes to Financial Statements | | See explanation of symbols and terms, if any, on B-41 |
B-12
PACIFIC FUNDS
PACIFIC FUNDS CORE INCOME
Schedule of Investments (Continued)
March 31, 2019
| | | | | | | | |
| | | Principal Amount | | | Value | |
Madison Park Funding Ltd (Cayman)
4.284% (USD LIBOR + 1.600%)
due 07/15/30 § ~ | | | $2,600,000 | | | | $2,581,401 | |
4.530% (USD LIBOR + 1.750%) due 10/18/30 § ~ | | | 2,600,000 | | | | 2,592,884 | |
4.534% (USD LIBOR + 1.850%) due 07/15/30 § ~ | | | 1,400,000 | | | | 1,362,310 | |
Navient Student Loan Trust
3.206% (USD LIBOR + 0.720%)
due 03/25/67 § ~ | | | 2,000,000 | | | | 1,981,120 | |
Octagon Investment Partners 25 Ltd (Cayman)
3.961% (USD LIBOR + 1.200%)
due 10/20/26 § ~ | | | 2,000,000 | | | | 1,965,080 | |
OneMain Financial Issuance Trust
2.370% due 09/14/32 ~ | | | 4,000,000 | | | | 3,969,953 | |
Regatta XIV Funding Ltd ‘A’ (Cayman)
3.961% (USD LIBOR + 1.190%)
due 10/25/31 § ~ | | | 3,300,000 | | | | 3,261,124 | |
Santander Drive Auto Receivables Trust
2.630% due 07/15/22 | | | 2,350,000 | | | | 2,347,211 | |
2.660% due 11/15/21 | | | 866,099 | | | | 865,740 | |
2.960% due 03/15/24 | | | 1,850,000 | | | | 1,852,004 | |
3.290% due 10/17/22 | | | 750,000 | | | | 752,546 | |
3.350% due 07/17/23 | | | 2,000,000 | | | | 2,010,712 | |
3.510% due 08/15/23 | | | 2,500,000 | | | | 2,515,614 | |
SLM Private Credit Student Loan Trust ‘A’
2.901% (USD LIBOR + 0.290%)
due 06/15/39 § | | | 3,236,486 | | | | 3,148,499 | |
SLM Student Loan Trust
3.321% (USD LIBOR + 0.550%)
due 10/25/64 § ~ | | | 10,000,000 | | | | 9,910,032 | |
SMB Private Education Loan Trust
2.340% due 09/15/34 ~ | | | 2,178,414 | | | | 2,137,607 | |
2.700% due 05/15/31 ~ | | | 1,815,267 | | | | 1,807,975 | |
2.820% due 10/15/35 ~ | | | 4,450,000 | | | | 4,406,758 | |
2.880% due 09/15/34 ~ | | | 4,372,141 | | | | 4,322,396 | |
3.440% due 07/15/36 ~ | | | 1,850,000 | | | | 1,880,782 | |
3.500% due 02/15/36 ~ | | | 2,300,000 | | | | 2,348,665 | |
3.600% due 01/15/37 ~ | | | 1,550,000 | | | | 1,581,375 | |
3.630% due 11/15/35 ~ | | | 2,000,000 | | | | 2,056,279 | |
| | | | | | | | |
| | |
Total Asset-Backed Securities
(Cost $113,079,767) | | | | | | | 112,565,074 | |
| | | | | | | | |
| | |
U.S. TREASURY OBLIGATIONS - 16.0% | | | | | | | | |
| | |
U.S. Treasury Bonds - 6.1% | | | | | | | | |
| | |
2.250% due 08/15/46 | | | 4,050,000 | | | | 3,621,032 | |
2.500% due 02/15/46 | | | 3,500,000 | | | | 3,300,049 | |
2.500% due 05/15/46 | | | 3,000,000 | | | | 2,827,090 | |
2.750% due 11/15/47 | | | 4,000,000 | | | | 3,952,812 | |
2.875% due 11/15/46 | | | 3,000,000 | | | | 3,044,824 | |
3.000% due 11/15/44 | | | 4,000,000 | | | | 4,158,047 | |
3.000% due 02/15/48 | | | 4,750,000 | | | | 4,927,476 | |
3.000% due 02/15/49 | | | 5,500,000 | | | | 5,710,977 | |
3.375% due 11/15/48 | | | 6,000,000 | | | | 6,694,336 | |
| | | | | | | | |
| | | | | | | 38,236,643 | |
| | | | | | | | |
| | | | | | | | |
| | | Principal Amount | | | Value | |
U.S. Treasury Notes - 9.9% | | | | | | | | |
| | |
1.250% due 07/31/23 | | | $5,000,000 | | | | $4,799,121 | |
1.375% due 08/31/23 | | | 4,000,000 | | | | 3,856,877 | |
1.375% due 09/30/23 | | | 4,500,000 | | | | 4,335,119 | |
1.625% due 11/15/22 | | | 5,000,000 | | | | 4,897,168 | |
1.625% due 05/15/26 | | | 5,000,000 | | | | 4,772,754 | |
2.000% due 10/31/21 | | | 1,400,000 | | | | 1,391,742 | |
2.000% due 11/30/22 | | | 6,000,000 | | | | 5,954,063 | |
2.125% due 12/31/21 | | | 4,500,000 | | | | 4,487,695 | |
2.250% due 02/15/27 | | | 2,000,000 | | | | 1,986,484 | |
2.500% due 02/28/26 | | | 7,400,000 | | | | 7,489,031 | |
2.625% due 02/15/29 | | | 2,000,000 | | | | 2,039,180 | |
2.875% due 08/15/28 | | | 2,250,000 | | | | 2,340,571 | |
3.125% due 11/15/28 | | | 12,400,000 | | | | 13,168,945 | |
| | | | | | | | |
| | | | | | | 61,518,750 | |
| | | | | | | | |
Total U.S. Treasury Obligations
(Cost $97,419,589) | | | | | | | 99,755,393 | |
| | | | | | | | |
|
FOREIGN GOVERNMENT BONDS & NOTES - 1.9% | |
| | |
Brazilian Government (Brazil)
4.500% due 05/30/29 | | | 3,015,000 | | | | 2,966,790 | |
Chile Government (Chile)
2.250% due 10/30/22 | | | 2,000,000 | | | | 1,983,480 | |
Export-Import Bank of Korea (South Korea)
2.250% due 01/21/20 | | | 1,900,000 | | | | 1,893,551 | |
Mexico Government (Mexico)
4.500% due 04/22/29 | | | 2,300,000 | | | | 2,383,950 | |
Province of British Columbia (Canada)
2.000% due 10/23/22 | | | 3,000,000 | | | | 2,955,987 | |
| | | | | | | | |
| | |
Total Foreign Government Bonds & Notes
(Cost $12,100,224) | | | | | | | 12,183,758 | |
| | | | | | | | |
| | |
| | | Shares | | | | |
SHORT-TERM INVESTMENT - 4.3% | | | | | | | | |
| | |
Money Market Fund - 4.3% | | | | | | | | |
| | |
BlackRock Liquidity FundsT-Fund Portfolio
‘Institutional’ 2.370% | | | 26,587,987 | | | | 26,587,987 | |
| | | | | | | | |
| | |
Total Short-Term Investment
(Cost $26,587,987) | | | | | | | 26,587,987 | |
| | | | | | | | |
| | |
TOTAL INVESTMENTS - 101.2%
(Cost $626,126,822) | | | | | | | 631,516,535 | |
| | |
OTHER ASSETS & LIABILITIES, NET - (1.2%) | | | | | | | (7,462,760 | ) |
| | | | | | | | |
| | |
NET ASSETS - 100.0% | | | | | | | $624,053,775 | |
| | | | | | | | |
Notes to Schedule of Investments
| (a) | As of March 31, 2019, the Fund’s composition as a percentage of net assets was as follows: |
| | | | |
Corporate Bonds & Notes | | | 46.7% | |
Asset-Backed Securities | | | 18.0% | |
U.S. Treasury Obligations | | | 16.0% | |
Senior Loan Notes | | | 12.9% | |
Short-Term Investment | | | 4.3% | |
Others (each less than 3.0%) | | | 3.3% | |
| | | | |
| | | 101.2% | |
Other Assets & Liabilities, Net | | | (1.2% | ) |
| | | | |
| | | 100.0% | |
| | | | |
| | |
| See Notes to Financial Statements | | See explanation of symbols and terms, if any, on B-41 |
B-13
PACIFIC FUNDS
PACIFIC FUNDS CORE INCOME
Schedule of Investments (Continued)
March 31, 2019
| (b) | Fair Value Measurements |
The following is a summary of the Fund’s investments as categorized under the three-tier hierarchy of inputs used in valuing the Fund’s assets and liabilities (See Note 3D in Notes to Financial Statements) as of March 31, 2019:
| | | | | | | | | | | | | | | | | | |
| | | | | Total Value at
March 31, 2019 | | | Level 1
Quoted Price | | | Level 2
Significant
Observable Inputs | | | Level 3
Significant
Unobservable Inputs | |
Assets | | Corporate Bonds & Notes | | | $291,374,924 | | | | $— | | | | $291,374,924 | | | | $— | |
| | Senior Loan Notes | | | 80,595,698 | | | | — | | | | 80,595,698 | | | | — | |
| | Mortgage-Backed Securities | | | 8,453,701 | | | | — | | | | 8,453,701 | | | | — | |
| | Asset-Backed Securities | | | 112,565,074 | | | | — | | | | 112,565,074 | | | | — | |
| | U.S. Treasury Obligations | | | 99,755,393 | | | | — | | | | 99,755,393 | | | | — | |
| | Foreign Government Bonds & Notes | | | 12,183,758 | | | | — | | | | 12,183,758 | | | | — | |
| | Short-Term Investment | | | 26,587,987 | | | | 26,587,987 | | | | — | | | | — | |
| | | | | | | | | | | | | | | | | | |
| | Total | | | $631,516,535 | | | | $26,587,987 | | | | $604,928,548 | | | | $— | |
| | | | | | | | | | | | | | | | | | |
| | |
| See Notes to Financial Statements | | See explanation of symbols and terms, if any, on B-41 |
B-14
PACIFIC FUNDS
PACIFIC FUNDSSM STRATEGIC INCOME
Schedule of Investments
March 31, 2019
| | | | | | | | |
| | | Shares | | | Value | |
COMMON STOCKS - 3.3% | |
|
Basic Materials - 0.2% | |
| | |
Constellium NV ‘A’ * | | | 176,660 | | | | $1,409,747 | |
| | | | | | | | |
|
Consumer, Cyclical - 0.9% | |
| | |
Las Vegas Sands Corp | | | 20,642 | | | | 1,258,336 | |
Lennar Corp ‘A’ | | | 22,751 | | | | 1,116,847 | |
Mohawk Industries Inc * | | | 6,772 | | | | 854,288 | |
Party City Holdco Inc * | | | 130,066 | | | | 1,032,724 | |
Six Flags Entertainment Corp | | | 12,456 | | | | 614,704 | |
Tailored Brands Inc | | | 76,227 | | | | 597,620 | |
| | | | | | | | |
| | | | | | | 5,474,519 | |
| | | | | | | | |
Consumer,Non-Cyclical - 0.2% | |
| | |
United Rentals Inc * | | | 10,501 | | | | 1,199,739 | |
| | | | | | | | |
|
Financial - 0.8% | |
| | |
Bank of America Corp | | | 46,717 | | | | 1,288,922 | |
Citigroup Inc | | | 17,345 | | | | 1,079,206 | |
The Goldman Sachs Group Inc | | | 4,792 | | | | 920,016 | |
Wells Fargo & Co | | | 26,387 | | | | 1,275,020 | |
| | | | | | | | |
| | | | | | | 4,563,164 | |
| | | | | | | | |
Industrial - 1.0% | |
| | |
Berry Global Group Inc * | | | 23,046 | | | | 1,241,488 | |
Caterpillar Inc | | | 6,465 | | | | 875,943 | |
Crown Holdings Inc * | | | 21,023 | | | | 1,147,225 | |
Evoqua Water Technologies Corp * | | | 113,006 | | | | 1,421,615 | |
Xylem Inc | | | 15,010 | | | | 1,186,390 | |
| | | | | | | | |
| | | | | | | 5,872,661 | |
| | | | | | | | |
Technology - 0.2% | |
| | |
NXP Semiconductors NV (Netherlands) | | | 10,877 | | | | 961,418 | |
| | | | | | | | |
| |
Total Common Stocks
(Cost $21,371,654) | | | | 19,481,248 | |
| | | | | |
| | |
| | | Principal Amount | | | | |
CORPORATE BONDS & NOTES - 59.8% | |
|
Basic Materials - 3.3% | |
| | |
Anglo American Capital PLC (South Africa)
4.125% due 09/27/22 ~ | | | $700,000 | | | | 710,000 | |
Barminco Finance Pty Ltd (Australia)
6.625% due 05/15/22 ~ | | | 4,125,000 | | | | 4,228,125 | |
Constellium NV
5.750% due 05/15/24 ~ | | | 1,375,000 | | | | 1,381,875 | |
5.875% due 02/15/26 ~ | | | 250,000 | | | | 246,094 | |
6.625% due 03/01/25 ~ | | | 1,250,000 | | | | 1,278,125 | |
Glencore Finance Canada Ltd (Switzerland)
4.250% due 10/25/22 ~ | | | 1,400,000 | | | | 1,447,413 | |
Glencore Funding LLC (Switzerland)
4.000% due 03/27/27 ~ | | | 3,750,000 | | | | 3,645,605 | |
4.125% due 05/30/23 ~ | | | 1,000,000 | | | | 1,019,131 | |
4.125% due 03/12/24 ~ | | | 250,000 | | | | 252,910 | |
JW Aluminum Continuous Cast Co
10.250% due 06/01/26 ~ | | | 1,825,000 | | | | 1,870,625 | |
Syngenta Finance NV (Switzerland)
4.892% due 04/24/25 ~ | | | 3,000,000 | | | | 3,059,732 | |
| | | | | | | | |
| | | | | | | 19,139,635 | |
| | | | | | | | |
| | | | | | | | |
| | | Principal Amount | | | Value | |
Communications - 4.6% | |
| | |
AT&T Inc
3.400% due 05/15/25 | | $ | 3,000,000 | | | $ | 2,973,310 | |
4.350% due 03/01/29 | | | 3,000,000 | | | | 3,068,563 | |
Charter Communications Operating LLC
3.750% due 02/15/28 | | | 1,500,000 | | | | 1,450,871 | |
4.200% due 03/15/28 | | | 1,500,000 | | | | 1,491,192 | |
5.050% due 03/30/29 | | | 1,500,000 | | | | 1,582,396 | |
Clear Channel Worldwide Holdings Inc
9.250% due 02/15/24 ~ | | | 1,375,000 | | | | 1,460,938 | |
CSC Holdings LLC
6.500% due 02/01/29 ~ | | | 2,025,000 | | | | 2,159,156 | |
Frontier Communications Corp
8.000% due 04/01/27 ~ | | | 2,000,000 | | | | 2,070,000 | |
Sprint Capital Corp
8.750% due 03/15/32 | | | 2,000,000 | | | | 2,115,200 | |
Sprint Communications Inc
6.000% due 11/15/22 | | | 1,000,000 | | | | 1,010,300 | |
Sprint Corp
7.625% due 02/15/25 | | | 1,340,000 | | | | 1,370,150 | |
Sprint Spectrum Co LLC
3.360% due 03/20/23 ~ | | | 125,000 | | | | 125,275 | |
The Interpublic Group of Cos Inc
4.650% due 10/01/28 | | | 2,000,000 | | | | 2,085,946 | |
Uber Technologies Inc
7.500% due 11/01/23 ~ | | | 1,000,000 | | | | 1,045,000 | |
8.000% due 11/01/26 ~ | | | 2,600,000 | | | | 2,775,500 | |
| | | | | | | | |
| | | | | | | 26,783,797 | |
| | | | | | | | |
Consumer, Cyclical - 10.9% | |
| | |
Air Canada Pass-Through Trust ‘B’ (Canada)
3.875% due 09/15/24 ~ | | | 776,428 | | | | 770,294 | |
American Airlines Pass-Through Trust ‘A’
4.100% due 07/15/29 | | | 1,320,910 | | | | 1,348,270 | |
American Airlines Pass-Through Trust ‘B’
5.250% due 07/15/25 | | | 1,122,632 | | | | 1,160,418 | |
Beazer Homes USA Inc
5.875% due 10/15/27 | | | 3,975,000 | | | | 3,488,062 | |
6.750% due 03/15/25 | | | 1,000,000 | | | | 950,000 | |
Caesars Resort Collection LLC
5.250% due 10/15/25 ~ | | | 2,475,000 | | | | 2,394,562 | |
Constellation Merger Sub Inc
8.500% due 09/15/25 ~ | | | 3,250,000 | | | | 2,957,500 | |
Downstream Development Authority of the Quapaw Tribe of Oklahoma
10.500% due 02/15/23 ~ | | | 2,250,000 | | | | 2,337,187 | |
Ford Motor Credit Co LLC
5.584% due 03/18/24 | | | 500,000 | | | | 507,432 | |
Gateway Casinos & Entertainment Ltd (Canada)
8.250% due 03/01/24 ~ | | | 1,275,000 | | | | 1,343,531 | |
General Motors Financial Co Inc
3.200% due 07/06/21 | | | 1,550,000 | | | | 1,544,068 | |
4.375% due 09/25/21 | | | 1,500,000 | | | | 1,532,826 | |
5.100% due 01/17/24 | | | 1,000,000 | | | | 1,038,721 | |
5.650% due 01/17/29 | | | 1,000,000 | | | | 1,034,724 | |
Golden Nugget Inc
6.750% due 10/15/24 ~ | | | 1,725,000 | | | | 1,737,937 | |
8.750% due 10/01/25 ~ | | | 1,950,000 | | | | 2,052,375 | |
Hyundai Capital America
4.125% due 06/08/23 ~ | | | 3,500,000 | | | | 3,569,215 | |
Jack Ohio Finance LLC
6.750% due 11/15/21 ~ | | | 3,500,000 | | | | 3,613,750 | |
L Brands Inc
5.250% due 02/01/28 | | | 3,425,000 | | | | 3,056,813 | |
Lennar Corp
4.750% due 11/29/27 | | | 3,575,000 | | | | 3,590,078 | |
Marriott International Inc
3.600% due 04/15/24 | | | 550,000 | | | | 554,887 | |
| | |
| See Notes to Financial Statements | | See explanation of symbols and terms, if any, on B-41 |
B-15
PACIFIC FUNDS
PACIFIC FUNDS STRATEGIC INCOME
Schedule of Investments (Continued)
March 31, 2019
| | | | | | | | |
| | | Principal Amount | | | Value | |
Mattamy Group Corp (Canada)
6.500% due 10/01/25 ~ | | $ | 1,450,000 | | | $ | 1,437,748 | |
6.875% due 12/15/23 ~ | | | 1,500,000 | | | | 1,537,500 | |
Mattel Inc
3.150% due 03/15/23 | | | 1,425,000 | | | | 1,282,500 | |
5.450% due 11/01/41 | | | 1,925,000 | | | | 1,434,125 | |
Norwegian Air Shuttle ASA Pass-Through Trust ‘B’ (Norway)
7.500% due 05/10/25 ~ | | | 323,820 | | | | 336,676 | |
Panther BF Aggregator 2 LP
6.250% due 05/15/26 ~ | | | 2,000,000 | | | | 2,045,000 | |
8.500% due 05/15/27 ~ | | | 575,000 | | | | 577,875 | |
Scientific Games International Inc
8.250% due 03/15/26 ~ | | | 1,325,000 | | | | 1,354,813 | |
Tesla Inc
5.300% due 08/15/25 ~ | | | 5,150,000 | | | | 4,480,500 | |
The Men’s Wearhouse Inc
7.000% due 07/01/22 | | | 2,000,000 | | | | 1,980,000 | |
United Airlines Pass Through Trust ‘AA’
4.150% due 02/25/33 | | | 3,000,000 | | | | 3,114,332 | |
Wyndham Destinations Inc
5.625% due 03/01/21 | | | 1,250,000 | | | | 1,296,875 | |
5.750% due 04/01/27 | | | 1,750,000 | | | | 1,742,388 | |
| | | | | | | | |
| | | | | | | 63,202,982 | |
| | | | | | | | |
Consumer,Non-Cyclical - 6.1% | |
| | |
Ahern Rentals Inc
7.375% due 05/15/23 ~ | | | 5,300,000 | | | | 4,909,125 | |
Anheuser-Busch InBev Worldwide Inc (Belgium)
4.750% due 01/23/29 | | | 2,150,000 | | | | 2,291,404 | |
5.800% due 01/23/59 | | | 3,000,000 | | | | 3,349,249 | |
Bacardi Ltd (Bermuda)
4.700% due 05/15/28 ~ | | | 2,000,000 | | | | 2,004,777 | |
BAT Capital Corp (United Kingdom)
3.222% due 08/15/24 | | | 2,200,000 | | | | 2,153,621 | |
Bausch Health Americas Inc
8.500% due 01/31/27 ~ | | | 625,000 | | | | 664,062 | |
Bausch Health Cos Inc
9.000% due 12/15/25 ~ | | | 1,000,000 | | | | 1,090,050 | |
Conagra Brands Inc
4.600% due 11/01/25 | | | 900,000 | | | | 947,861 | |
Eagle Holding Co II LLC
7.625% Cash or 8.375% PIK
due 05/15/22 ~ | | | 3,046,000 | | | | 3,080,268 | |
Jaguar Holding Co II
6.375% due 08/01/23 ~ | | | 500,000 | | | | 510,625 | |
JBS Investments II GmbH
7.000% due 01/15/26 ~ | | | 600,000 | | | | 618,000 | |
JBS USA LUX SA
5.750% due 06/15/25 ~ | | | 500,000 | | | | 514,375 | |
Pilgrim’s Pride Corp
5.750% due 03/15/25 ~ | | | 625,000 | | | | 634,375 | |
5.875% due 09/30/27 ~ | | | 1,100,000 | | | | 1,111,000 | |
Prime Security Services Borrower LLC
9.250% due 05/15/23 ~ | | | 2,520,000 | | | | 2,652,300 | |
RegionalCare Hospital Partners Holdings Inc
9.750% due 12/01/26 ~ | | | 1,675,000 | | | | 1,742,000 | |
Reynolds American Inc (United Kingdom)
4.450% due 06/12/25 | | | 1,500,000 | | | | 1,542,548 | |
TMS International Corp
7.250% due 08/15/25 ~ | | | 4,300,000 | | | | 4,175,386 | |
Verscend Escrow Corp
9.750% due 08/15/26 ~ | | | 1,450,000 | | | | 1,451,813 | |
| | | | | | | | |
| | | | | | | 35,442,839 | |
| | | | | | | | |
Energy - 10.2% | |
| | |
Andeavor Logistics LP
5.250% due 01/15/25 | | | 4,825,000 | | | | 5,015,007 | |
Antero Midstream Partners LP
5.750% due 03/01/27 ~ | | | 825,000 | | | | 839,437 | |
| | | | | | | | |
| | | Principal Amount | | | Value | |
Archrock Partners LP
6.875% due 04/01/27 ~ | | $ | 1,325,000 | | | $ | 1,354,415 | |
Ascent Resources Utica Holdings LLC
7.000% due 11/01/26 ~ | | | 2,650,000 | | | | 2,560,562 | |
Calfrac Holdings LP (Canada)
8.500% due 06/15/26 ~ | | | 2,500,000 | | | | 1,950,000 | |
Concho Resources Inc
4.375% due 01/15/25 | | | 3,000,000 | | | | 3,086,236 | |
Endeavor Energy Resources LP
5.500% due 01/30/26 ~ | | | 3,075,000 | | | | 3,174,938 | |
5.750% due 01/30/28 ~ | | | 750,000 | | | | 791,250 | |
Energy Transfer Partners LP
4.050% due 03/15/25 | | | 1,200,000 | | | | 1,220,360 | |
4.750% due 01/15/26 | | | 1,550,000 | | | | 1,621,184 | |
5.800% due 06/15/38 | | | 3,000,000 | | | | 3,221,182 | |
6.250% due 02/15/23 | | | 3,200,000 | | | | 3,028,720 | |
EnLink Midstream Partners LP
4.400% due 04/01/24 | | | 2,500,000 | | | | 2,484,375 | |
EP Energy LLC
7.750% due 05/15/26 ~ | | | 1,375,000 | | | | 1,127,500 | |
EQM Midstream Partners LP
4.750% due 07/15/23 | | | 2,850,000 | | | | 2,909,617 | |
EQT Corp
3.900% due 10/01/27 | | | 3,000,000 | | | | 2,809,827 | |
Halcon Resources Corp
6.750% due 02/15/25 | | | 3,850,000 | | | | 2,329,250 | |
Kinder Morgan Energy Partners LP
4.300% due 05/01/24 | | | 5,165,000 | | | | 5,400,496 | |
Midwest Connector Capital Co LLC
3.900% due 04/01/24 ~ | | | 450,000 | | | | 458,002 | |
Moss Creek Resources Holdings Inc
7.500% due 01/15/26 ~ | | | 3,550,000 | | | | 3,292,625 | |
MPLX LP
4.000% due 03/15/28 | | | 2,500,000 | | | | 2,487,981 | |
4.800% due 02/15/29 | | | 350,000 | | | | 368,960 | |
Sabine Pass Liquefaction LLC
5.625% due 03/01/25 | | | 2,525,000 | | | | 2,778,870 | |
Sunoco Logistics Partners Operations LP
4.000% due 10/01/27 | | | 1,200,000 | | | | 1,192,245 | |
Targa Resources Partners LP
5.000% due 01/15/28 | | | 650,000 | | | | 641,063 | |
5.125% due 02/01/25 | | | 900,000 | | | | 922,500 | |
5.375% due 02/01/27 | | | 200,000 | | | | 205,500 | |
5.875% due 04/15/26 ~ | | | 1,350,000 | | | | 1,433,700 | |
6.500% due 07/15/27 ~ | | | 325,000 | | | | 351,406 | |
Ultra Resources Inc
7.125% due 04/15/25 ~ | | | 765,000 | | | | 164,475 | |
| | | | | | | | |
| | | | | | | 59,221,683 | |
| | | | | | | | |
Financial - 11.9% | |
| | |
AerCap Ireland Capital DAC (Ireland)
3.300% due 01/23/23 | | | 1,850,000 | | | | 1,817,541 | |
3.950% due 02/01/22 | | | 750,000 | | | | 760,229 | |
4.450% due 10/01/25 | | | 3,000,000 | | | | 3,027,412 | |
Air Lease Corp
3.625% due 04/01/27 | | | 1,500,000 | | | | 1,414,065 | |
3.750% due 02/01/22 | | | 1,750,000 | | | | 1,766,360 | |
4.250% due 09/15/24 | | | 1,000,000 | | | | 1,028,924 | |
4.625% due 10/01/28 | | | 3,000,000 | | | | 3,014,772 | |
Bank of America Corp
3.252% (USD LIBOR + 0.650%)
due 06/25/22 § | | | 3,000,000 | | | | 3,001,592 | |
3.366% due 01/23/26 | | | 1,000,000 | | | | 1,002,185 | |
3.503% (USD LIBOR + 0.770%) due 02/05/26 § | | | 2,000,000 | | | | 1,955,772 | |
4.183% due 11/25/27 | | | 2,500,000 | | | | 2,544,875 | |
BOC Aviation Ltd (Singapore)
3.500% due 09/18/27 ~ | | | 4,000,000 | | | | 3,902,888 | |
| | |
| See Notes to Financial Statements | | See explanation of symbols and terms, if any, on B-41 |
B-16
PACIFIC FUNDS
PACIFIC FUNDS STRATEGIC INCOME
Schedule of Investments (Continued)
March 31, 2019
| | | | | | | | |
| | | Principal Amount | | | Value | |
Citigroup Inc
3.731% (USD LIBOR + 0.960%)
due 04/25/22 § | | $ | 3,000,000 | | | $ | 3,024,668 | |
3.980% due 03/20/30 | | | 3,000,000 | | | | 3,059,197 | |
4.075% due 04/23/29 | | | 3,000,000 | | | | 3,081,166 | |
4.400% due 06/10/25 | | | 1,500,000 | | | | 1,555,346 | |
GLP Capital LP REIT
5.300% due 01/15/29 | | | 3,000,000 | | | | 3,161,790 | |
JPMorgan Chase & Co
3.125% due 01/23/25 | | | 1,100,000 | | | | 1,102,086 | |
4.005% due 04/23/29 | | | 2,000,000 | | | | 2,057,882 | |
Marsh & McLennan Cos Inc
3.875% due 03/15/24 | | | 2,500,000 | | | | 2,596,516 | |
Morgan Stanley
3.591% due 07/22/28 | | | 4,000,000 | | | | 3,976,660 | |
3.772% due 01/24/29 | | | 1,050,000 | | | | 1,057,871 | |
3.958% (USD LIBOR + 1.220%) due 05/08/24 § | | | 2,000,000 | | | | 2,015,796 | |
5.000% due 11/24/25 | | | 2,000,000 | | | | 2,147,056 | |
The Goldman Sachs Group Inc
3.272% due 09/29/25 | | | 2,500,000 | | | | 2,470,168 | |
3.500% due 11/16/26 | | | 1,000,000 | | | | 988,408 | |
3.625% due 02/20/24 | | | 350,000 | | | | 353,872 | |
3.750% due 02/25/26 | | | 1,300,000 | | | | 1,306,969 | |
3.779% (USD LIBOR + 1.000%) due 07/24/23 § | | | 3,000,000 | | | | 3,000,045 | |
The Howard Hughes Corp
5.375% due 03/15/25 ~ | | | 3,000,000 | | | | 3,000,000 | |
Wells Fargo & Co
3.750% due 01/24/24 | | | 4,000,000 | | | | 4,120,087 | |
| | | | | | | | |
| | | | | | | 69,312,198 | |
| | | | | | | | |
Industrial - 10.4% | |
| | |
Allegion US Holding Co Inc
3.200% due 10/01/24 | | | 3,000,000 | | | | 2,905,165 | |
Apex Tool Group LLC
9.000% due 02/15/23 ~ | | | 2,425,000 | | | | 2,340,125 | |
ARD Finance SA (Luxembourg)
7.125% Cash or 7.875% PIK
due 09/15/23 | | | 2,050,000 | | | | 2,052,562 | |
ARD Securities Finance SARL (Luxembourg)
8.750% Cash or PIK
due 01/31/23 ~ | | | 1,826,562 | | | | 1,739,800 | |
Ardagh Packaging Finance PLC (Ireland)
7.250% due 05/15/24 ~ | | | 1,400,000 | | | | 1,480,080 | |
Brand Industrial Services Inc
8.500% due 07/15/25 ~ | | | 2,425,000 | | | | 2,188,562 | |
BWAY Holding Co
5.500% due 04/15/24 ~ | | | 850,000 | | | | 847,067 | |
7.250% due 04/15/25 ~ | | | 4,400,000 | | | | 4,259,728 | |
Cloud Crane LLC
10.125% due 08/01/24 ~ | | | 2,800,000 | | | | 3,017,000 | |
Flex Acquisition Co Inc
6.875% due 01/15/25 ~ | | | 2,650,000 | | | | 2,544,000 | |
Hulk Finance Corp (Canada)
7.000% due 06/01/26 ~ | | | 2,325,000 | | | | 2,208,750 | |
Itron Inc
5.000% due 01/15/26 ~ | | | 3,125,000 | | | | 3,082,031 | |
Masco Corp
3.500% due 04/01/21 | | | 1,075,000 | | | | 1,082,866 | |
7.750% due 08/01/29 | | | 4,110,000 | | | | 4,999,405 | |
New Enterprise Stone & Lime Co Inc
10.125% due 04/01/22 ~ | | | 3,943,000 | | | | 4,012,003 | |
Novelis Corp
5.875% due 09/30/26 ~ | | | 2,225,000 | | | | 2,219,438 | |
Standard Industries Inc
4.750% due 01/15/28 ~ | | | 5,768,000 | | | | 5,522,860 | |
5.000% due 02/15/27 ~ | | | 1,500,000 | | | | 1,455,450 | |
Titan Acquisition Ltd (Canada)
7.750% due 04/15/26 ~ | | | 3,395,000 | | | | 2,936,675 | |
| | | | | | | | |
| | | Principal Amount | | | Value | |
TransDigm Inc
6.500% due 07/15/24 | | $ | 1,175,000 | | | $ | 1,211,719 | |
TransDigm UK Holdings PLC
6.875% due 05/15/26 ~ | | | 3,500,000 | | | | 3,491,250 | |
US Concrete Inc
6.375% due 06/01/24 | | | 2,150,000 | | | | 2,193,000 | |
Zekelman Industries Inc
9.875% due 06/15/23 ~ | | | 2,785,000 | | | | 2,967,766 | |
| | | | | | | | |
| | | | | | | 60,757,302 | |
| | | | | | | | |
Technology - 1.9% | |
| | |
Broadcom Inc
4.250% due 04/15/26 ~ | | | 5,000,000 | | | | 4,963,050 | |
Dell International LLC
4.000% due 07/15/24 ~ | | | 3,000,000 | | | | 3,026,404 | |
Infor Software Parent LLC
7.125% Cash or 7.875% PIK
due 05/01/21 ~ | | | 3,000,000 | | | | 3,019,080 | |
KLA-Tencor Corp
4.100% due 03/15/29 | | | 50,000 | | | | 51,215 | |
| | | | | | | | |
| | | | | | | 11,059,749 | |
| | | | | | | | |
Utilities - 0.5% | |
| | |
Electricite de France SA (France)
4.500% due 09/21/28 ~ | | | 3,000,000 | | | | 3,099,778 | |
| | | | | | | | |
| |
Total Corporate Bonds & Notes
(Cost $347,879,614) | | | | 348,019,963 | |
| | | | | |
|
SENIOR LOAN NOTES - 25.3% | |
|
Basic Materials - 0.6% | |
| | |
Aleris International Inc
7.249% (USD LIBOR + 4.750%)
due 02/27/23 § | | | 3,473,750 | | | | 3,480,698 | |
| | | | | |
|
Communications - 2.9% | |
| | |
Charter Communications Operating LLC Term B
4.500% (USD LIBOR + 2.000%)
due 04/30/25 §¥ | | | 2,493,687 | | | | 2,480,106 | |
CSC Holdings LLC
4.734% (USD LIBOR + 2.250%)
due 07/17/25 § | | | 644,766 | | | | 628,002 | |
Term B 4.984% (USD LIBOR + 2.500%) due 01/25/26 § | | | 3,970,000 | | | | 3,889,981 | |
SBA Senior Finance II LLC Term B
due 04/11/25¥ | | | 3,989,950 | | | | 3,911,396 | |
Sprint Communications Inc Term B
5.000% (USD LIBOR + 2.500%)
due 02/03/24 § | | | 2,454,925 | | | | 2,385,880 | |
5.500% (USD LIBOR + 3.000%) due 02/03/24 § | | | 1,496,250 | | | | 1,469,130 | |
Uber Technologies Inc
due 04/04/25¥ | | | 1,994,975 | | | | 2,001,708 | |
| | | | | | | | |
| | | | | | | 16,766,203 | |
| | | | | | | | |
Consumer, Cyclical - 6.0% | |
| | |
Bass Pro Group LLC Term B
7.499% (USD LIBOR + 5.000%)
due 09/25/24 § | | | 3,989,873 | | | | 3,910,052 | |
BJ’s Wholesale Club Inc Term B
5.499% (USD LIBOR + 3.000%)
due 02/03/24 § | | | 2,985,000 | | | | 2,981,534 | |
Caesars Resort Collection LLC Term B
5.249% (USD LIBOR + 2.750%)
due 12/22/24 § | | | 6,433,712 | | | | 6,370,527 | |
ClubCorp Holdings Inc Term B
5.351% (USD LIBOR + 2.750%)
due 09/18/24 § | | | 3,427,438 | | | | 3,252,639 | |
| | |
| See Notes to Financial Statements | | See explanation of symbols and terms, if any, on B-41 |
B-17
PACIFIC FUNDS
PACIFIC FUNDS STRATEGIC INCOME
Schedule of Investments (Continued)
March 31, 2019
| | | | | | | | |
| | | Principal Amount | | | Value | |
Neiman Marcus Group Ltd LLC
5.733% (USD LIBOR + 3.250%)
due 10/25/20 § | | $ | 2,434,097 | | | $ | 2,267,259 | |
New Red Finance Inc Term B (Canada)
4.749% (USD LIBOR + 2.250%)
due 02/17/24 § | | | 5,923,416 | | | | 5,830,863 | |
SeaWorld Parks & Entertainment Inc TermB-5
5.499% (USD LIBOR + 3.000%)
due 03/31/24 § | | | 4,430,964 | | | | 4,412,965 | |
SRS Distribution Inc Term B
5.749% (USD LIBOR + 3.250%)
due 05/24/25 § | | | 2,985,000 | | | | 2,856,893 | |
Tacala Investment Corp Term B
5.749% (USD LIBOR + 3.250%)
due 02/01/25 § | | | 2,970,000 | | | | 2,936,564 | |
| | | | | | | | |
| | | | | | | 34,819,296 | |
| | | | | | | | |
Consumer,Non-Cyclical - 2.7% | |
| | |
Air Medical Group Holdings Inc Term B
6.736% (USD LIBOR + 4.250%)
due 03/14/25 § | | | 3,473,618 | | | | 3,277,143 | |
Albertson’s LLC TermB-7
5.499% (USD LIBOR + 3.000%)
due 11/16/25 § | | | 2,992,500 | | | | 2,959,768 | |
Bausch Health Americas Inc Term B
5.481% (USD LIBOR + 3.000%)
due 06/01/25 § | | | 3,261,218 | | | | 3,241,429 | |
Envision Healthcare Corp Term B
6.249% (USD LIBOR + 3.750%)
due 10/11/25 § | | | 2,992,500 | | | | 2,804,846 | |
Refinitiv US Holdings Inc Term B
6.249% (USD LIBOR + 3.750%)
due 10/01/25 § | | | 3,740,625 | | | | 3,635,031 | |
| | | | | | | | |
| | | | | | | 15,918,217 | |
| | | | | | | | |
Financial - 1.4% | |
| | |
HUB International Ltd Term B
5.515% (USD LIBOR + 3.000%)
due 04/25/25 § | | | 4,466,250 | | | | 4,326,215 | |
USI Inc Term B
5.601% (USD LIBOR + 3.000%)
due 05/16/24 § | | | 3,940,000 | | | | 3,811,950 | |
| | | | | | | | |
| | | | | | | 8,138,165 | |
| | | | | | | | |
Industrial - 10.6% | |
| | |
Accudyne Industries Borrower SCA Term B (Luxembourg)
5.499% (USD LIBOR + 3.250%)
due 08/18/24 § | | | 5,039,705 | | | | 5,039,287 | |
Advanced Disposal Services Inc Term B
4.660% (USD LIBOR + 2.250%)
due 11/10/23 §¥ | | | 4,837,837 | | | | 4,817,803 | |
Avolon (US) LLC TermB-3 (Ireland)
4.488% (USD LIBOR + 2.000%)
due 01/15/25 § | | | 2,833,469 | | | | 2,815,279 | |
Brand Industrial Services Inc
6.956% (USD LIBOR + 4.250%)
due 06/21/24 § | | | 3,939,850 | | | | 3,792,105 | |
BWAY Holding Co Term B
6.033% (USD LIBOR + 3.250%)
due 04/03/24 § | | | 3,196,819 | | | | 3,126,489 | |
Crosby US Acquisition Corp
5.491% (USD LIBOR + 3.000%)
due 11/22/20 § | | | 4,149,967 | | | | 4,056,593 | |
(2nd Lien) 8.491% (USD LIBOR + 6.000%) due 11/22/21 § | | | 1,650,000 | | | | 1,604,625 | |
Dynasty Acquisition Co Inc
due 01/24/26¥ | | | 2,601,399 | | | | 2,605,348 | |
| | | | | | | | |
| | | Principal Amount | | | Value | |
EWT Holdings III Corp
5.499% (USD LIBOR + 3.000%)
due 12/20/24 § | | $ | 2,777,256 | | | $ | 2,749,483 | |
Flex Acquisition Co Inc
5.626% (USD LIBOR + 3.000%)
due 12/29/23 § | | | 1,965,000 | | | | 1,909,119 | |
Term B 5.876% (USD LIBOR + 3.250%) due 06/22/25 § | | | 995,000 | | | | 967,282 | |
GFL Environmental Inc Term B (Canada)
5.499% (USD LIBOR + 2.750%)
due 05/31/25 § | | | 2,736,216 | | | | 2,657,549 | |
Kloeckner Pentaplast of America Inc Term B (Luxembourg)
6.749% (USD LIBOR + 4.250%)
due 06/30/22 § | | | 2,955,000 | | | | 2,611,481 | |
NCI Building Systems Inc Term B
6.547% (USD LIBOR + 3.750%)
due 04/12/25 § | | | 3,986,825 | | | | 3,807,418 | |
North American Lifting Holdings Inc
7.101% (USD LIBOR + 4.500%)
due 11/27/20 § | | | 2,480,389 | | | | 2,331,566 | |
(2nd Lien) 11.601% (USD LIBOR + 9.000%) due 11/27/21 § | | | 2,000,000 | | | | 1,700,000 | |
Proampac PG Borrower LLC
6.141% (USD LIBOR + 3.500%)
due 11/18/23 § | | | 3,192,342 | | | | 3,086,595 | |
Reynolds Group Holdings Inc Term B
5.249% (USD LIBOR + 3.000%)
due 02/05/23 § | | | 4,987,245 | | | | 4,935,148 | |
Standard Aero Ltd
due 01/24/26¥ | | | 1,398,601 | | | | 1,400,724 | |
Titan Acquisition Ltd Term B (Canada)
5.499% (USD LIBOR + 3.000%)
due 03/28/25 § | | | 2,977,444 | | | | 2,772,744 | |
TransDigm Inc | |
Term F 4.999% (USD LIBOR + 2.500%) due 06/09/23 § | | | 972,486 | | | | 951,061 | |
Term G 4.999% (USD LIBOR + 2.500%) due 08/22/24 § | | | 2,467,513 | | | | 2,408,223 | |
| | | | | | | | |
| | | | | | | 62,145,922 | |
| | | | | | | | |
Technology - 0.6% | |
|
Vertafore Inc | |
(2nd Lien) 9.749% (USD LIBOR + 7.250%) due 07/02/26 § | | | 1,000,000 | | | | 990,938 | |
Term B 5.749% (USD LIBOR + 3.250%) due 07/02/25 § | | | 2,493,750 | | | | 2,454,473 | |
| | | | | | | | |
| | | | | | | 3,445,411 | |
| | | | | | | | |
Utilities - 0.5% | |
| | |
Talen Energy Supply LLC TermB-1
6.500% (USD LIBOR + 4.000%)
due 07/06/23 §¥ | | | 2,962,368 | | | | 2,941,385 | |
| | | | | | | | |
| |
Total Senior Loan Notes
(Cost $150,561,980) | | | | 147,655,297 | |
| | | | | |
|
ASSET-BACKED SECURITIES - 4.0% | |
| | |
Apidos CLO XXX ‘A2’ (Cayman)
4.020% (USD LIBOR + 1.600%)
due 10/18/31 § ~ | | | 2,400,000 | | | | 2,370,109 | |
Buttermilk Park CLO Ltd ‘A1’ (Cayman)
3.887% (USD LIBOR + 1.100%)
due 10/15/31 § ~ | | | 700,000 | | | | 693,585 | |
| | |
| See Notes to Financial Statements | | See explanation of symbols and terms, if any, on B-41 |
B-18
PACIFIC FUNDS
PACIFIC FUNDS STRATEGIC INCOME
Schedule of Investments (Continued)
March 31, 2019
| | | | | | | | |
| | | Principal Amount | | | Value | |
Carlyle Global Market Strategies CLO Ltd (Cayman)
4.761% (USD LIBOR + 2.000%)
due 04/20/27 § ~ | | $ | 1,200,000 | | | $ | 1,199,602 | |
CIFC Funding2015-III Ltd (Cayman)
4.411% (USD LIBOR + 1.650%)
due 04/19/29 § ~ | | | 1,100,000 | | | | 1,049,125 | |
Dryden Senior Loan Fund ‘B’ (Cayman)
4.087% (USD LIBOR + 1.650%)
due 01/17/32 § ~ | | | 1,500,000 | | | | 1,486,993 | |
4.180% (USD LIBOR + 1.400%) due 04/18/31 § ~ | | | 2,600,000 | | | | 2,553,200 | |
4.273% (USD LIBOR + 1.500%) due 07/17/31 § ~ | | | 1,500,000 | | | | 1,472,360 | |
Dryden Senior Loan Fund ‘C’ (Cayman)
4.487% (USD LIBOR + 2.050%)
due 01/17/32 § ~ | | | 1,500,000 | | | | 1,449,722 | |
4.573% (USD LIBOR + 1.800%) due 07/17/31 § ~ | | | 1,500,000 | | | | 1,426,551 | |
4.687% (USD LIBOR + 1.900%) due 04/15/31 § ~ | | | 250,000 | | | | 241,262 | |
Madison Park Funding XXVIII Ltd (Cayman)
4.284% (USD LIBOR + 1.600%)
due 07/15/30 § ~ | | | 2,000,000 | | | | 1,985,693 | |
4.534% (USD LIBOR + 1.850%) due 07/15/30 § ~ | | | 1,000,000 | | | | 973,079 | |
Madison Park Funding XXIX Ltd (Cayman)
4.530% (USD LIBOR + 1.750%)
due 10/18/30 § ~ | | | 2,650,000 | | | | 2,642,747 | |
Regatta XIII Funding Ltd ‘D’ (Cayman)
8.737% (USD LIBOR + 5.950%)
due 07/15/31 § ~ | | | 2,500,000 | | | | 2,271,540 | |
SLM Private Credit Student Loan Trust
2.901% (USD LIBOR + 0.290%)
due 06/15/39 § | | | 1,618,243 | | | | 1,574,250 | |
| | | | | | | | |
| | | | | | | 23,389,818 | |
| | | | | | | | |
Total Asset-Backed Securities
(Cost $23,844,726) | | | | 23,389,818 | |
| | | | | |
| | | | | | | | |
| | | Principal Amount | | | Value | |
|
FOREIGN GOVERNMENT BONDS & NOTES - 1.1% | |
| | |
Mexico Government (Mexico)
3.750% due 01/11/28 | | $ | 2,750,000 | | | $ | 2,720,988 | |
4.500% due 04/22/29 | | | 700,000 | | | | 725,550 | |
4.600% due 02/10/48 | | | 3,000,000 | | | | 2,907,375 | |
| | | | | | | | |
| |
Total Foreign Government Bonds & Notes
(Cost $6,426,277) | | | | 6,353,913 | |
| | | | | |
| | |
| | | Shares | | | | |
SHORT-TERM INVESTMENT - 7.7% | | | | | | | | |
| | |
Money Market Fund - 7.7% | | | | | | | | |
| | |
BlackRock Liquidity FundsT-Fund Portfolio
‘Institutional’ 2.370% | | | 44,607,986 | | | | 44,607,986 | |
| | | | | | | | |
| |
Total Short-Term Investment
(Cost $44,607,986) | | | | 44,607,986 | |
| | | | | |
| |
TOTAL INVESTMENTS - 101.2%
(Cost $594,692,237) | | | | 589,508,225 | |
| |
OTHER ASSETS & LIABILITIES, NET - (1.2%) | | | | (7,193,002 | ) |
| | | | | |
| |
NET ASSETS - 100.0% | | | | $582,315,223 | |
| | | | | | | | |
Notes to Schedule of Investments
| (a) | As of March 31, 2019, the Fund’s composition as a percentage of net assets was as follows: |
| | | | |
Corporate Bonds & Notes | | | 59.8% | |
Senior Loan Notes | | | 25.3% | |
Short-Term Investment | | | 7.7% | |
Asset-Backed Securities | | | 4.0% | |
Common Stocks | | | 3.3% | |
Others (each less than 3.0%) | | �� | 1.1% | |
| | | | |
| | | 101.2% | |
Other Assets & Liabilities, Net | | | (1.2% | ) |
| | | | |
| | | 100.0% | |
| | | | |
| (b) | Fair Value Measurements |
The following is a summary of the Fund’s investments as categorized under the three-tier hierarchy of inputs used in valuing the Fund’s assets and liabilities (See Note 3D in Notes to Financial Statements) as of March 31, 2019:
| | | | | | | | | | | | | | | | | | |
| | | | | Total Value at
March 31, 2019 | | | Level 1
Quoted Price | | | Level 2 Significant Observable Inputs | | | Level 3 Significant Unobservable Inputs | |
Assets | | Common Stocks | | | $19,481,248 | | | | $19,481,248 | | | | $— | | | | $— | |
| | Corporate Bonds & Notes | | | 348,019,963 | | | | — | | | | 348,019,963 | | | | — | |
| | Senior Loan Notes | | | 147,655,297 | | | | — | | | | 147,655,297 | | | | — | |
| | Asset-Backed Securities | | | 23,389,818 | | | | — | | | | 23,389,818 | | | | — | |
| | Foreign Government Bonds & Notes | | | 6,353,913 | | | | — | | | | 6,353,913 | | | | — | |
| | Short-Term Investment | | | 44,607,986 | | | | 44,607,986 | | | | — | | | | — | |
| | | | | | | | | | | | | | | | | | |
| | Total | | | $589,508,225 | | | | $64,089,234 | | | | $525,418,991 | | | | $— | |
| | | | | | | | | | | | | | | | | | |
| | |
| See Notes to Financial Statements | | See explanation of symbols and terms, if any, on B-41 |
B-19
PACIFIC FUNDS
PACIFIC FUNDSSM FLOATING RATE INCOME
Schedule of Investments
March 31, 2019
| | | | | | | | |
| | | Principal Amount | | | Value | |
CORPORATE BONDS & NOTES - 4.0% | |
|
Communications - 0.9% | |
| | |
CommScope Finance LLC
5.500% due 03/01/24 ~ | | | $5,000,000 | | | | $5,126,450 | |
Sprint Communications Inc
7.000% due 08/15/20 | | | 10,000,000 | | | | 10,350,000 | |
| | | | | | | | |
| | | | | | | 15,476,450 | |
| | | | | | | | |
Consumer,Non-Cyclical - 0.5% | |
| | |
Ahern Rentals Inc
7.375% due 05/15/23 ~ | | | 7,013,000 | | | | 6,495,791 | |
Prime Security Services Borrower LLC
9.250% due 05/15/23 ~ | | | 2,588,000 | | | | 2,723,870 | |
| | | | | | | | |
| | | | | | | 9,219,661 | |
| | | | | | | | |
Industrial - 2.6% | |
| | |
GFL Environmental Inc (Canada)
5.375% due 03/01/23 ~ | | | 250,000 | | | | 237,500 | |
5.625% due 05/01/22 ~ | | | 7,336,000 | | | | 7,134,260 | |
Reynolds Group Issuer Inc
5.750% due 10/15/20 | | | 6,567,643 | | | | 6,584,062 | |
6.287% (USD LIBOR + 3.500%) due 07/15/21 § ~ | | | 20,750,000 | | | | 20,879,688 | |
TransDigm Inc
6.000% due 07/15/22 | | | 5,500,000 | | | | 5,602,190 | |
6.250% due 03/15/26 ~ | | | 5,000,000 | | | | 5,200,000 | |
| | | | | | | | |
| | | | | | | 45,637,700 | |
| | | | | | | | |
Total Corporate Bonds & Notes
(Cost $70,469,887) | | | | 70,333,811 | |
| | | | | |
|
SENIOR LOAN NOTES - 95.1% | |
|
Basic Materials - 4.6% | |
| | |
Aleris International Inc
7.249% (USD LIBOR + 4.750%)
due 02/27/23 § | | | 10,917,500 | | | | 10,939,335 | |
Messer Industries USA Inc Term B
5.101% (USD LIBOR + 2.500%)
due 03/01/26 §¥ | | | 21,200,000 | | | | 20,829,000 | |
PQ Corp Term B
5.244% (USD LIBOR + 2.500%)
due 02/08/25 § | | | 11,598,394 | | | | 11,482,410 | |
Solenis International LLC
6.629% (USD LIBOR + 4.000%)
due 06/26/25 § | | | 15,542,245 | | | | 15,333,388 | |
Starfruit US Holdco LLC Term B (Netherlands)
5.740% (USD LIBOR + 3.250%)
due 10/01/25 § | | | 17,700,000 | | | | 17,473,104 | |
Vantage Specialty Chemicals Inc Term B
6.059% (USD LIBOR + 3.500%)
due 10/28/24 § | | | 4,690,625 | | | | 4,608,539 | |
| | | | | | | | |
| | | | | | | 80,665,776 | |
| | | | | | | | |
Communications - 9.1% | |
| | |
Ancestry.com Operations Inc Term B
due 10/19/23¥ | | | 13,000,000 | | | | 12,935,000 | |
Charter Communications Operating LLC Term B
4.500% (USD LIBOR + 2.000%)
due 04/30/25 § | | | 24,603,740 | | | | 24,469,748 | |
CommScope Inc TermB-2
due 04/04/26¥ | | | 4,600,000 | | | | 4,609,752 | |
CSC Holdings LLC
4.734% (USD LIBOR + 2.250%)
due 07/17/25 § | | | 2,573,691 | | | | 2,506,775 | |
Term B 4.984% (USD LIBOR + 2.500%) due 01/25/26 §¥ | | | 13,775,186 | | | | 13,497,533 | |
| | | | | | | | |
| | | Principal Amount | | | Value | |
iHeartCommunications Inc Term D
11.249% (USD LIBOR + 6.750%)
due 01/30/20 * §Y | | $ | 10,125,000 | | | $ | 7,252,031 | |
MTN Infrastructure TopCo Inc Term B
5.499% (USD LIBOR + 3.000%)
due 11/17/24 § | | | 11,072,216 | | | | 10,993,791 | |
SBA Senior Finance II LLC Term B
4.500% (USD LIBOR + 2.000%)
due 04/11/25 §¥ | | | 24,104,577 | | | | 23,630,006 | |
Sprint Communications Inc Term B
5.000% (USD LIBOR + 2.500%)
due 02/03/24 § | | | 20,364,144 | | | | 19,791,402 | |
5.500% (USD LIBOR + 3.000%) due 02/03/24 § | | | 29,925,000 | | | | 29,382,609 | |
Uber Technologies Inc
6.493% (USD LIBOR + 4.000%)
due 04/04/25 §¥ | | | 10,987,281 | | | | 11,024,363 | |
| | | | | | | | |
| | | | | | | 160,093,010 | |
| | | | | | | | |
Consumer, Cyclical - 22.1% | |
| | |
American Builders & Contractors Supply Co Inc TermB-2
4.499% (USD LIBOR + 2.000%)
due 10/31/23 § | | | 22,826,335 | | | | 22,253,645 | |
Bass Pro Group LLC Term B
7.499% (USD LIBOR + 5.000%)
due 09/25/24 § | | | 17,071,727 | | | | 16,730,190 | |
BJ’s Wholesale Club Inc Term B
5.499% (USD LIBOR + 3.000%)
due 02/03/24 §¥ | | | 14,873,878 | | | | 14,856,610 | |
Caesars Resort Collection LLC Term B
5.249% (USD LIBOR + 2.750%)
due 12/22/24 § | | | 27,612,198 | | | | 27,341,019 | |
ClubCorp Holdings Inc Term B
5.351% (USD LIBOR + 2.750%)
due 09/18/24 § | | | 12,328,468 | | | | 11,699,716 | |
EG America LLC (United Kingdom) | |
(2nd Lien) 10.601% (USD LIBOR + 8.000%) due 03/23/26 § | | | 9,310,000 | | | | 9,077,250 | |
Term B 6.601% (USD LIBOR + 4.000%) due 02/05/25 § | | | 535,744 | | | | 524,136 | |
EG Finco Ltd TermB-1 (United Kingdom)
6.601% (USD LIBOR + 4.000%)
due 02/05/25 § | | | 9,100,145 | | | | 8,902,972 | |
Flynn Restaurant Group LP
5.999% (USD LIBOR + 3.500%)
due 06/29/25 § | | | 8,848,310 | | | | 8,627,103 | |
(2nd Lien) 9.490% (USD LIBOR + 7.000%) due 06/29/26 § | | | 10,635,000 | | | | 10,209,600 | |
Formula One Management Ltd TermB-3 | | | | | | | | |
(United Kingdom) 4.999% (USD LIBOR + 2.500%) due 02/01/24 § | | | 14,500,000 | | | | 13,956,250 | |
Golden Nugget LLC Term B
5.242% (USD LIBOR + 2.750%)
due 10/04/23 § | | | 18,899,087 | | | | 18,733,720 | |
IRB Holding Corp Term B
5.739% (USD LIBOR + 3.250%)
due 02/05/25 § | | | 14,542,610 | | | | 14,210,864 | |
J Crew Group Inc Term B
5.782% (USD LIBOR + 3.220%)
due 03/05/21 § | | | 8,800,932 | | | | 6,068,243 | |
K-MAC Holdings Corp | | | | | | | | |
5.736% (USD LIBOR + 3.250%) due 03/16/25 § | | | 3,018,735 | | | | 2,988,548 | |
(2nd Lien) 9.236% (USD LIBOR + 6.750%) due 03/16/26 § | | | 7,500,000 | | | | 7,457,723 | |
| | |
| See Notes to Financial Statements | | See explanation of symbols and terms, if any, on B-41 |
B-20
PACIFIC FUNDS
PACIFIC FUNDS FLOATING RATE INCOME
Schedule of Investments (Continued)
March 31, 2019
| | | | | | | | |
| | | Principal Amount | | | Value | |
Navistar Inc Term B
6.000% (USD LIBOR + 3.500%)
due 11/06/24 § | | $ | 5,929,999 | | | $ | 5,920,066 | |
New Red Finance Inc Term B (Canada)
4.749% (USD LIBOR + 2.250%)
due 02/17/24 § | | | 26,844,320 | | | | 26,424,878 | |
NPC International Inc | | | | | | | | |
6.051% (USD LIBOR + 3.500%) due 04/20/24 § | | | 8,294,423 | | | | 7,520,280 | |
(2nd Lien) 10.134% (USD LIBOR + 7.500%) due 04/18/25 § | | | 11,582,389 | | | | 10,105,634 | |
Panther BF Aggregator 2 LP Term B
due 03/18/26¥ | | | 11,375,000 | | | | 11,260,966 | |
Petco Animal Supplies Inc TermB-1
5.994% (USD LIBOR + 3.250%)
due 01/26/23 § | | | 1,136,905 | | | | 874,280 | |
SeaWorld Parks & Entertainment Inc TermB-5
5.499% (USD LIBOR + 3.000%)
due 03/31/24 § | | | 13,464,319 | | | | 13,409,627 | |
SMG US Midco 2 Inc
5.499% (USD LIBOR + 3.250%)
due 01/23/25 § | | | 6,921,353 | | | | 6,855,026 | |
(2nd Lien) 9.499% (USD LIBOR + 7.000%) due 01/23/26 § | | | 18,290,000 | | | | 18,518,625 | |
Spin Holdco Inc Term B
6.029% (USD LIBOR + 3.250%)
due 11/14/22 § | | | 16,761,837 | | | | 16,332,315 | |
SRS Distribution Inc Term B
5.749% (USD LIBOR + 3.250%)
due 05/24/25 § | | | 20,873,248 | | | | 19,977,431 | |
Tacala Investment Corp | |
(2nd Lien) 9.499% (USD LIBOR + 7.000%) due 02/01/26 § | | | 8,250,000 | | | | 8,188,125 | |
Term B 5.749% (USD LIBOR + 3.250%) due 02/01/25 § | | | 10,001,438 | | | | 9,888,842 | |
The Talbots Inc Term B
9.499% (USD LIBOR + 7.000%)
due 11/28/22 § | | | 2,962,500 | | | | 2,881,031 | |
Thor Industries Inc Term B
6.250% (USD LIBOR + 3.750%)
due 02/01/26 § | | | 7,460,438 | | | | 7,147,943 | |
Univar USA Inc | | | | | | | | |
TermB-3 | | | | | | | | |
4.749% (USD LIBOR + 2.500%) due 07/01/24 § | | | 18,051,668 | | | | 17,879,618 | |
TermB-4 4.999% (USD LIBOR + 2.500%) due 07/01/24 § | | | 5,500,000 | | | | 5,486,250 | |
Wok Holdings Inc Term B
8.989% (USD LIBOR + 6.500%)
due 03/01/26 § | | | 6,625,000 | | | | 6,560,817 | |
| | | | | | | | |
| | | | | | | 388,869,343 | |
| | | | | | | | |
Consumer,Non-Cyclical - 18.1% | |
| | |
Air Medical Group Holdings Inc Term B
5.739% (USD LIBOR + 3.250%)
due 04/28/22 § | | | 3,310,188 | | | | 3,119,025 | |
6.736% (USD LIBOR + 4.250%) due 03/14/25 § | | | 3,162,661 | | | | 2,983,774 | |
Albertson’s LLC | | | | | | | | |
TermB-6 5.479% (USD LIBOR + 3.000%) due 06/22/23 § | | | 6,828,266 | | | | 6,778,474 | |
TermB-7 5.499% (USD LIBOR + 3.000%) due 11/16/25 § | | | 19,192,861 | | | | 18,982,929 | |
| | | | | | | | |
| | | Principal Amount | | | Value | |
AlixPartners LLP Term B
5.249% (USD LIBOR + 2.750%)
due 04/04/24 §¥ | | $ | 21,501,172 | | | $ | 21,407,104 | |
Allied Universal Holdco LLC
6.249% (USD LIBOR + 3.750%)
due 07/28/22 § | | | 15,545,813 | | | | 15,053,524 | |
Term B 6.749% (USD LIBOR + 4.250%) due 07/28/22 § | | | 5,486,250 | | | | 5,370,808 | |
Alphabet Holding Co Inc
5.999% (USD LIBOR + 3.500%)
due 09/28/24 § | | | 11,084,305 | | | | 10,301,476 | |
Arterra Wines Canada Inc TermB-1 (Canada)
5.365% (USD LIBOR + 2.750%)
due 12/15/23 § | | | 8,025,178 | | | | 7,924,863 | |
Bausch Health Americas Inc Term B
5.231% (USD LIBOR + 2.750%)
due 11/27/25 § | | | 3,787,975 | | | | 3,750,095 | |
5.481% (USD LIBOR + 3.000%) due 06/01/25 § | | | 20,165,913 | | | | 20,043,547 | |
CHG PPC Parent LLC Term B
5.249% (USD LIBOR + 2.750%)
due 03/30/25 § | | | 12,967,337 | | | | 12,772,827 | |
Garda World Security Corp Term B (Canada)
6.120% (USD LIBOR + 3.500%)
due 05/26/24 § | | | 7,548,787 | | | | 7,498,460 | |
Heartland Dental LLC
6.249% (USD LIBOR + 3.750%)
due 04/30/25 § | | | 12,628,143 | | | | 12,296,655 | |
H-Food Holdings LLC
6.186% (USD LIBOR + 3.688%)
due 05/31/25 § | | | 2,468,813 | | | | 2,407,092 | |
TermB-2 6.499% (USD LIBOR + 4.000%) due 05/31/25 § | | | 16,024,838 | | | | 15,811,178 | |
Jaguar Holding Co II
4.999% (USD LIBOR + 2.500%)
due 08/18/22 §¥ | | | 22,951,862 | | | | 22,741,669 | |
NVA Holdings Inc TermB-3
5.249% (USD LIBOR + 2.750%)
due 02/02/25 § | | | 24,019,396 | | | | 23,288,798 | |
Ortho-Clinical Diagnostics SA Term B (Luxembourg)
5.749% (USD LIBOR + 3.250%)
due 06/01/25 §¥ | | | 13,092,695 | | | | 12,628,991 | |
PetVet Care Centers LLC
4.226% (USD LIBOR + 2.750%)
due 02/14/25 § | | | 2,549,604 | | | | 2,415,750 | |
5.236% (USD LIBOR + 2.750%)
due 02/14/25 § | | | 11,318,175 | | | | 10,723,971 | |
(2nd Lien) 8.736% (USD LIBOR + 6.250%) due 02/15/26 § | | | 7,000,000 | | | | 6,825,000 | |
Term B 5.736% (USD LIBOR + 3.250%) due 02/14/25 § | | | 518,073 | | | | 503,826 | |
Prime Security Services Borrower LLC Term B
5.249% (USD LIBOR + 2.750%)
due 05/02/22 § | | | 18,476,107 | | | | 18,317,748 | |
PSC Industrial Outsourcing LP | |
(2nd Lien) 10.984% (USD LIBOR + 8.500%) due 10/05/25 § | | | 5,000,000 | | | | 4,775,000 | |
Term B 6.234% (USD LIBOR + 3.750%) due 10/05/24 § | | | 8,648,050 | | | | 8,545,354 | |
Refinitiv US Holdings Inc Term B
6.249% (USD LIBOR + 3.750%)
due 10/01/25 § | | | 3,890,250 | | | | 3,780,432 | |
RegionalCare Hospital Partners Holdings Inc
6.982% (USD LIBOR + 4.500%)
due 11/16/25 § | | | 11,870,250 | | | | 11,773,804 | |
| | |
| See Notes to Financial Statements | | See explanation of symbols and terms, if any, on B-41 |
B-21
PACIFIC FUNDS
PACIFIC FUNDS FLOATING RATE INCOME
Schedule of Investments (Continued)
March 31, 2019
| | | | | | | | |
| | | Principal Amount | | | Value | |
VetCor Professional Practices LLC
5.499% (USD LIBOR + 3.000%)
due 07/02/25 § | | $ | 15,383,750 | | | $ | 14,999,156 | |
Wand NewCo 3 Inc Term B
5.982% (USD LIBOR + 3.500%)
due 02/05/26 §¥ | | | 11,250,000 | | | | 11,276,370 | |
| | | | | | | | |
| | | | | | | 319,097,700 | |
| | | | | | | | |
Diversified - 2.5% | |
| | |
First Eagle Holdings Inc Term B
5.351% (USD LIBOR + 2.750%)
due 12/01/24 § | | | 2,743,125 | | | | 2,736,267 | |
Travelport Finance Luxembourg Sarl | |
(Luxembourg) due 03/18/26¥ | | | 10,000,000 | | | | 9,768,750 | |
Term B due 03/16/25¥ | | | 31,583,333 | | | | 31,570,921 | |
| | | | | | | | |
| | | | | | | 44,075,938 | |
| | | | | | | | |
Energy - 0.9% | |
| | |
Prairie ECI Acquiror LP
7.366% (USD LIBOR + 4.750%)
due 03/11/26 §¥ | | | 16,425,000 | | | | 16,496,859 | |
| | | | | | | | |
|
Financial - 6.0% | |
| | |
Alliant Holdings Intermediate LLC Term B
5.232% (USD LIBOR + 3.000%)
due 05/10/25 § | | | 9,433,585 | | | | 9,103,409 | |
AssuredPartners Inc Term B
5.749% (USD LIBOR + 3.250%)
due 10/22/24 § | | | 16,714,224 | | | | 16,212,797 | |
BCPE Rover Merger Sub Inc (2nd Lien)
10.749% (USD LIBOR + 8.250%)
due 11/28/26 § | | | 1,750,000 | | | | 1,728,125 | |
Deerfield Dakota Holding LLC
6.489% (USD LIBOR + 4.000%)
due 02/13/25 § | | | 875,000 | | | | 871,719 | |
Term B
5.749% (USD LIBOR + 3.250%)
due 02/13/25 § | | | 20,942,528 | | | | 20,517,144 | |
DTZ US Borrower LLC Term B
5.749% (USD LIBOR + 3.250%)
due 08/21/25 § | | | 8,706,250 | | | | 8,653,194 | |
HUB International Ltd Term B
5.515% (USD LIBOR + 3.000%)
due 04/25/25 § | | | 18,245,526 | | | | 17,673,455 | |
NFP Corp Term B
5.499% (USD LIBOR + 3.000%)
due 01/08/24 § | | | 15,041,100 | | | | 14,520,302 | |
USI Inc Term B
5.601% (USD LIBOR + 3.000%)
due 05/16/24 §¥ | | | 16,519,919 | | | | 15,983,022 | |
| | | | | | | | |
| | | | | | | 105,263,167 | |
| | | | | | | | |
Industrial - 21.5% | |
| | |
Accudyne Industries Borrower SCA Term B (Luxembourg)
5.499% (USD LIBOR + 3.250%)
due 08/18/24 §¥ | | | 28,284,656 | | | | 28,282,308 | |
Advanced Disposal Services Inc Term B
4.660% (USD LIBOR + 2.250%)
due 11/10/23 §¥ | | | 24,308,584 | | | | 24,207,922 | |
Berry Global Inc | |
Term Q 4.610% (USD LIBOR + 2.000%) due 10/01/22 §¥ | | | 12,500,000 | | | | 12,442,962 | |
Term T 4.243% (USD LIBOR + 1.750%) due 01/06/21 § | | | 2,290,500 | | | | 2,285,104 | |
Brand Industrial Services Inc
6.956% (USD LIBOR + 4.250%)
due 06/21/24 § | | | 16,974,145 | | | | 16,337,615 | |
| | | | | | | | |
| | | Principal Amount | | | Value | |
Crosby US Acquisition Corp
5.491% (USD LIBOR + 3.000%)
due 11/22/20 § | | $ | 18,698,815 | | | $ | 18,278,092 | |
(2nd Lien) 8.491% (USD LIBOR + 6.000%)
due 11/22/21 §¥ | | | 9,286,340 | | | | 9,030,965 | |
DiversiTech Holdings Inc Term B Term B
5.601% (USD LIBOR + 3.000%)
due 06/01/24 § | | | 6,602,043 | | | | 6,379,224 | |
Dynasty Acquisition Co Inc
due 01/24/26¥ | | | 4,665,171 | | | | 4,672,253 | |
Engineered Machinery Holdings Inc
5.851% (USD LIBOR + 3.250%)
due 07/19/24 § | | | 1,994,949 | | | | 1,925,126 | |
6.851% (USD LIBOR + 4.250%)
due 07/19/24 § | | | 3,241,875 | | | | 3,204,052 | |
EWT Holdings III Corp
5.499% (USD LIBOR + 3.000%)
due 12/20/24 § | | | 14,348,693 | | | | 14,205,206 | |
Filtration Group Corp Term B
5.499% (USD LIBOR + 3.000%)
due 03/29/25 §¥ | | | 21,390,965 | | | | 21,261,721 | |
Flex Acquisition Co Inc Term B
5.876% (USD LIBOR + 3.250%)
due 06/22/25 § | | | 10,987,450 | | | | 10,681,372 | |
Gates Global LLC TermB-2
5.249% (USD LIBOR + 3.000%)
due 03/31/24 §¥ | | | 12,076,873 | | | | 11,967,964 | |
GFL Environmental Inc Term B (Canada)
5.499% (USD LIBOR + 2.750%)
due 05/31/25 § | | | 21,148,484 | | | | 20,540,465 | |
Kloeckner Pentaplast of America Inc Term B (Luxembourg)
6.749% (USD LIBOR + 4.250%)
due 06/30/22 § | | | 7,745,176 | | | | 6,844,799 | |
Multi-Color Corp Term B
4.499% (USD LIBOR + 2.000%)
due 10/31/24 § | | | 14,712,753 | | | | 14,703,557 | |
NCI Building Systems Inc Term B
6.547% (USD LIBOR + 3.750%)
due 04/12/25 § | | | 17,604,176 | | | | 16,811,988 | |
Plastipak Holdings Inc Term B
5.000% (USD LIBOR + 2.500%)
due 10/14/24 § | | | 13,148,287 | | | | 12,974,072 | |
Pro Mach Group Inc Term B
5.239% (USD LIBOR + 3.000%)
due 03/07/25 § | | | 10,083,294 | | | | 9,768,191 | |
Reynolds Group Holdings Inc Term B
5.249% (USD LIBOR + 3.000%)
due 02/05/23 §¥ | | | 23,916,056 | | | | 23,666,229 | |
Standard Aero Ltd
due 04/04/26¥ | | | 2,508,156 | | | | 2,511,964 | |
StandardAero Aviation Holdings Inc
6.250% (USD LIBOR + 3.750%)
due 07/07/22 § | | | 25,179,183 | | | | 25,194,920 | |
The Hillman Group Inc Term B
6.499% (USD LIBOR + 3.500%)
due 05/31/25 §¥ | | | 11,597,029 | | | | 11,129,529 | |
Transcendia Holdings Inc Term B
5.999% (USD LIBOR + 3.500%)
due 05/30/24 § | | | 4,120,466 | | | | 3,914,443 | |
TransDigm Inc | |
Term E 4.999% (USD LIBOR + 2.500%) due 05/30/25 § | | | 6,915,038 | | | | 6,745,405 | |
Term F 4.999% (USD LIBOR + 2.500%) due 06/09/23 § | | | 8,175,399 | | | | 7,995,287 | |
| | |
| See Notes to Financial Statements | | See explanation of symbols and terms, if any, on B-41 |
B-22
PACIFIC FUNDS
PACIFIC FUNDS FLOATING RATE INCOME
Schedule of Investments (Continued)
March 31, 2019
| | | | | | | | |
| | | Principal Amount | | | Value | |
Term G 4.999% (USD LIBOR + 2.500%) due 08/22/24 § | | | $20,981,112 | | | | $20,476,978 | |
Vertiv Group Corp Term B
6.629% (USD LIBOR + 4.000%)
due 11/15/23 § | | | 10,875,000 | | | | 10,249,687 | |
| | | | | | | | |
| | | | | | | 378,689,400 | |
| | | | | | | | |
Technology - 9.1% | |
|
Applied Systems Inc | |
(2nd Lien) 9.499% (USD LIBOR + 7.000%) due 09/19/25 § | | | 14,239,070 | | | | 14,412,616 | |
Term B
5.499% (USD LIBOR + 3.250%)
due 09/19/24 § | | | 1,243,687 | | | | 1,229,954 | |
CCC Information Services Inc | |
(2nd Lien) 9.249% (USD LIBOR + 6.750%) due 04/27/25 § | | | 4,605,000 | | | | 4,581,975 | |
Term B 5.500% (USD LIBOR + 3.000%) due 04/27/24 § | | | 3,210,329 | | | | 3,161,673 | |
First Data Corp
due 07/10/22¥ | | | 21,415,097 | | | | 21,384,987 | |
4.486% (USD LIBOR + 2.250%)
due 04/26/24 §¥ | | | 15,375,000 | | | | 15,346,172 | |
Kronos Inc (2nd Lien)
10.986% (USD LIBOR + 8.250%)
due 11/01/24 § | | | 10,685,000 | | | | 10,870,075 | |
Sophia LP Term B
5.851% (USD LIBOR + 3.250%)
due 09/30/22 §¥ | | | 19,135,430 | | | | 19,021,804 | |
SS&C European Holdings SARL TermB-4
4.749% (USD LIBOR + 2.500%)
due 04/16/25 § | | | 6,088,794 | | | | 6,046,301 | |
SS&C Technologies Inc TermB-3
4.749% (USD LIBOR + 2.500%)
due 04/16/25 § | | | 8,468,447 | | | | 8,409,346 | |
Tempo Acquisition LLC Term B
5.499% (USD LIBOR + 3.000%)
due 05/01/24 § | | | 25,169,507 | | | | 24,965,005 | |
The Dun & Bradstreet Corp Term B
due 02/06/26¥ | | | 4,500,000 | | | | 4,468,127 | |
Vertafore Inc
(2nd Lien)
9.749% (USD LIBOR + 7.250%)
due 07/02/26 § | | | 16,275,000 | | | | 16,127,516 | |
Term B
5.749% (USD LIBOR + 3.250%)
due 07/02/25 § | | | 10,324,125 | | | | 10,161,520 | |
| | | | | | | | |
| | | | | | | 160,187,071 | |
| | | | | | | | |
| | | | | | | | |
| | | Principal Amount | | | Value | |
Utilities - 1.2% | |
| | |
Talen Energy Supply LLC
TermB-1
6.500% (USD LIBOR + 4.000%)
due 07/06/23 § | | | $10,642,583 | | | | $10,567,201 | |
TermB-2 6.499% (USD LIBOR + 4.000%) due 04/13/24 §¥ | | | 10,227,186 | | | | 10,154,318 | |
| | | | | | | | |
| | | | | | | 20,721,519 | |
| | | | | | | | |
Total Senior Loan Notes
(Cost $1,698,577,431) | | | | 1,674,159,783 | |
| | | | | |
| | |
| | | Shares | | | | |
SHORT-TERM INVESTMENT - 5.1% | |
|
Money Market Fund - 5.1% | |
| | |
BlackRock Liquidity FundsT-Fund Portfolio
‘Institutional’ 2.370% | | | 90,036,341 | | | | 90,036,341 | |
| | | | | | | | |
| |
Total Short-Term Investment
(Cost $90,036,341) | | | | 90,036,341 | |
| | | | | |
| |
TOTAL INVESTMENTS - 104.2%
(Cost $1,859,083,659) | | | | 1,834,529,935 | |
| |
OTHER ASSETS & LIABILITIES, NET - (4.2%) | | | | (74,555,831 | ) |
| | | | | |
| |
NET ASSETS - 100.0% | | | | $1,759,974,104 | |
| | | | | | | | |
Notes to Schedule of Investments
| (a) | As of March 31, 2019, the Fund’s composition by sector as a percentage of net assets was as follows: |
| | | | |
Industrial | | | 24.1% | |
Consumer, Cyclical | | | 22.1% | |
Consumer,Non-Cyclical | | | 18.6% | |
Communications | | | 10.0% | |
Technology | | | 9.1% | |
Financial | | | 6.0% | |
Short-Term Investment | | | 5.1% | |
Basic Materials | | | 4.6% | |
Others (each less than 3.0%) | | | 4.6% | |
| | | | |
| | | 104.2% | |
Other Assets & Liabilities, Net | | | (4.2% | ) |
| | | | |
| | | 100.0% | |
| | | | |
| (b) | An investment with a value of $7,252,031 or 0.4% of the Fund’s net assets was in default as of March 31, 2019. |
| (c) | Pursuant to the terms of the following senior loan agreements, the Fund had unfunded loan commitments which could be extended at the option of the borrower. |
| | | | | | | | | | | | |
| Borrower | | Unfunded Loan
Commitments | | | Value | | | Unrealized
Appreciation
(Depreciation) | |
Heartland Dental LLC | | | $282,608 | | | | $275,190 | | | | ($7,418 | ) |
PetVet Care Centers LLC | | | 792,547 | | | | 755,825 | | | | (36,722 | ) |
| | | | | | | | | | | | |
| | | $1,075,155 | | | | $1,031,015 | | | | ($44,140 | ) |
| | | | | | | | | | | | |
| | |
| See Notes to Financial Statements | | See explanation of symbols and terms, if any, on B-41 |
B-23
PACIFIC FUNDS
PACIFIC FUNDS FLOATING RATE INCOME
Schedule of Investments (Continued)
March 31, 2019
| (d) | Fair Value Measurements |
The following is a summary of the Fund’s investments as categorized under the three-tier hierarchy of inputs used in valuing the Fund’s assets and liabilities (See Note 3D in Notes to Financial Statements) as of March 31, 2019:
| | | | | | | | | | | | | | | | | | |
| | | | | Total Value at
March 31, 2019 | | | Level 1
Quoted Price | | | Level 2
Significant
Observable Inputs | | | Level 3
Significant
Unobservable Inputs | |
Assets | | Corporate Bonds & Notes | | | $70,333,811 | | | | $— | | | | $70,333,811 | | | | $— | |
| | Senior Loan Notes | | | 1,674,159,783 | | | | — | | | | 1,674,159,783 | | | | — | |
| | Short-Term Investment | | | 90,036,341 | | | | 90,036,341 | | | | — | | | | — | |
| | Unfunded Loan Commitments | | | 1,031,015 | | | | — | | | | 1,031,015 | | | | — | |
| | | | | | | | | | | | | | | | | | |
| | Total | | | $1,835,560,950 | | | | $90,036,341 | | | | $1,745,524,609 | | | | $— | |
| | | | | | | | | | | | | | | | | | |
| | |
| See Notes to Financial Statements | | See explanation of symbols and terms, if any, on B-41 |
B-24
PACIFIC FUNDS
PACIFIC FUNDSSM HIGH INCOME
Schedule of Investments
March 31, 2019
| | | | | | | | |
| | | Shares | | | Value | |
COMMON STOCKS - 0.8% | |
|
Basic Materials - 0.1% | |
| | |
Constellium NV ‘A’ * | | | 11,516 | | | | $91,898 | |
| | | | | | | | |
|
Consumer, Cyclical - 0.3% | |
| | |
Cedar Fair LP | | | 1,693 | | | | 89,086 | |
Mohawk Industries Inc * | | | 377 | | | | 47,559 | |
Party City Holdco Inc * | | | 9,344 | | | | 74,191 | |
Six Flags Entertainment Corp | | | 2,227 | | | | 109,902 | |
Tailored Brands Inc | | | 8,670 | | | | 67,973 | |
| | | | | | | | |
| | | | | | | 388,711 | |
| | | | | | | | |
Financial - 0.2% | |
| | |
Citigroup Inc | | | 1,430 | | | | 88,975 | |
Outfront Media Inc REIT | | | 4,360 | | | | 102,024 | |
The Goldman Sachs Group Inc | | | 486 | | | | 93,307 | |
| | | | | | | | |
| | | | | | | 284,306 | |
| | | | | | | | |
Industrial - 0.1% | |
| | |
Evoqua Water Technologies Corp * | | | 5,617 | | | | 70,662 | |
Xylem Inc | | | 976 | | | | 77,143 | |
| | | | | | | | |
| | | | | | | 147,805 | |
| | | | | | | | |
Technology - 0.1% | |
| | |
NXP Semiconductors NV (Netherlands) | | | 745 | | | | 65,850 | |
| | | | | | | | |
| |
Total Common Stocks
(Cost $1,053,762) | | | | 978,570 | |
| | | | | |
| | |
| | | Principal
Amount | | | | |
CORPORATE BONDS & NOTES - 76.8% | |
|
Basic Materials - 2.4% | |
| | |
Alcoa Nederland Holding BV
7.000% due 09/30/26 ~ | | | $400,000 | | | | 433,248 | |
Barminco Finance Pty Ltd (Australia)
6.625% due 05/15/22 ~ | | | 1,125,000 | | | | 1,153,125 | |
Constellium NV
6.625% due 03/01/25 ~ | | | 350,000 | | | | 357,875 | |
Hexion Inc
6.625% due 04/15/20 | | | 500,000 | | | | 418,750 | |
JW Aluminum Continuous Cast Co
10.250% due 06/01/26 ~ | | | 325,000 | | | | 333,125 | |
Olin Corp
5.000% due 02/01/30 | | | 400,000 | | | | 393,500 | |
| | | | | | | | |
| | | | | | | 3,089,623 | |
| | | | | | | | |
Communications - 12.5% | |
| | |
Altice Financing SA (Luxembourg)
7.500% due 05/15/26 ~ | | | 125,000 | | | | 124,062 | |
Altice France SA (France)
7.375% due 05/01/26 ~ | | | 450,000 | | | | 442,125 | |
Charter Communications Operating LLC
5.050% due 03/30/29 | | | 2,250,000 | | | | 2,373,594 | |
Clear Channel Worldwide Holdings Inc
9.250% due 02/15/24 ~ | | | 400,000 | | | | 425,000 | |
CommScope Finance LLC
5.500% due 03/01/24 ~ | | | 100,000 | | | | 102,529 | |
6.000% due 03/01/26 ~ | | | 300,000 | | | | 311,061 | |
8.250% due 03/01/27 ~ | | | 300,000 | | | | 312,000 | |
CSC Holdings LLC
6.500% due 02/01/29 ~ | | | 1,050,000 | | | | 1,119,562 | |
6.625% due 10/15/25 ~ | | | 1,350,000 | | | | 1,434,375 | |
Frontier Communications Corp
8.000% due 04/01/27 ~ | | | 100,000 | | | | 103,500 | |
8.500% due 04/01/26 ~ | | | 25,000 | | | | 23,282 | |
11.000% due 09/15/25 | | | 550,000 | | | | 365,156 | |
| | | | | | | | |
| | | Principal
Amount | | | Value | |
Intelsat Jackson Holdings SA (Luxembourg)
8.000% due 02/15/24 ~ | | | $75,000 | | | | $78,375 | |
8.500% due 10/15/24 ~ | | | 425,000 | | | | 415,437 | |
Level 3 Financing Inc
5.250% due 03/15/26 | | | 1,925,000 | | | | 1,925,000 | |
Outfront Media Capital LLC
5.875% due 03/15/25 | | | 725,000 | | | | 744,937 | |
Radiate Holdco LLC
6.875% due 02/15/23 ~ | | | 425,000 | | | | 422,875 | |
Sprint Capital Corp
6.875% due 11/15/28 | | | 1,400,000 | | | | 1,349,250 | |
8.750% due 03/15/32 | | | 400,000 | | | | 423,040 | |
Sprint Corp
7.625% due 02/15/25 | | | 1,150,000 | | | | 1,175,875 | |
7.625% due 03/01/26 | | | 475,000 | | | | 483,313 | |
Townsquare Media Inc
6.500% due 04/01/23 ~ | | | 175,000 | | | | 168,219 | |
Uber Technologies Inc
8.000% due 11/01/26 ~ | | | 450,000 | | | | 480,375 | |
Virgin Media Secured Finance PLC (United Kingdom)
5.500% due 08/15/26 ~ | | | 950,000 | | | | 969,000 | |
| | | | | | | | |
| | | | | | | 15,771,942 | |
| | | | | | | | |
Consumer, Cyclical - 15.7% | |
| | |
American Airlines Pass-Through Trust ‘B’
5.250% due 07/15/25 | | | 130,973 | | | | 135,382 | |
American Axle & Manufacturing Inc
6.250% due 04/01/25 | | | 600,000 | | | | 587,250 | |
6.500% due 04/01/27 | | | 75,000 | | | | 73,031 | |
Beazer Homes USA Inc
5.875% due 10/15/27 | | | 1,650,000 | | | | 1,447,875 | |
Caesars Resort Collection LLC
5.250% due 10/15/25 ~ | | | 1,225,000 | | | | 1,185,187 | |
CCM Merger Inc
6.000% due 03/15/22 ~ | | | 425,000 | | | | 437,219 | |
Cedar Fair LP
5.375% due 06/01/24 | | | 500,000 | | | | 513,095 | |
5.375% due 04/15/27 | | | 500,000 | | | | 504,375 | |
Constellation Merger Sub Inc
8.500% due 09/15/25 ~ | | | 875,000 | | | | 796,250 | |
Core & Main LP
6.125% due 08/15/25 ~ | | | 875,000 | | | | 859,950 | |
Downstream Development Authority of the Quapaw Tribe of Oklahoma
10.500% due 02/15/23 ~ | | | 600,000 | | | | 623,250 | |
Golden Nugget Inc
6.750% due 10/15/24 ~ | | | 1,025,000 | | | | 1,032,687 | |
8.750% due 10/01/25 ~ | | | 725,000 | | | | 763,062 | |
Hilton Grand Vacations Borrower LLC
6.125% due 12/01/24 | | | 875,000 | | | | 912,187 | |
IHO Verwaltungs GmbH (Germany)
4.750% Cash or 5.500% PIK
due 09/15/26 ~ | | | 600,000 | | | | 573,000 | |
Jacobs Entertainment Inc
7.875% due 02/01/24 ~ | | | 700,000 | | | | 735,000 | |
Lennar Corp
4.750% due 05/30/25 | | | 600,000 | | | | 615,750 | |
Mattamy Group Corp (Canada)
6.500% due 10/01/25 ~ | | | 850,000 | | | | 842,817 | |
Mattel Inc | | | | | | | | |
3.150% due 03/15/23 | | | 625,000 | | | | 562,500 | |
5.450% due 11/01/41 | | | 325,000 | | | | 242,125 | |
6.750% due 12/31/25 ~ | | | 100,000 | | | | 98,625 | |
Merlin Entertainments PLC (United Kingdom)
5.750% due 06/15/26 ~ | | | 525,000 | | | | 542,719 | |
New Red Finance Inc (Canada)
5.000% due 10/15/25 ~ | | | 925,000 | | | | 916,027 | |
| | |
| See Notes to Financial Statements | | See explanation of symbols and terms, if any, on B-41 |
B-25
PACIFIC FUNDS
PACIFIC FUNDS HIGH INCOME
Schedule of Investments (Continued)
March 31, 2019
| | | | | | | | |
| | | Principal
Amount | | | Value | |
Panther BF Aggregator 2 LP
6.250% due 05/15/26 ~ | | $ | 500,000 | | | $ | 511,250 | |
8.500% due 05/15/27 ~ | | | 250,000 | | | | 251,250 | |
Scientific Games International Inc
5.000% due 10/15/25 ~ | | | 650,000 | | | | 638,625 | |
8.250% due 03/15/26 ~ | | | 200,000 | | | | 204,500 | |
Six Flags Entertainment Corp
5.500% due 04/15/27 ~ | | | 750,000 | | | | 743,475 | |
Taylor Morrison Communities Inc
6.625% due 05/15/22 | | | 675,000 | | | | 700,312 | |
Tesla Inc
5.300% due 08/15/25 ~ | | | 725,000 | | | | 630,750 | |
The Men’s Wearhouse Inc
7.000% due 07/01/22 | | | 911,000 | | | | 901,890 | |
US Airways Pass-Through Trust ‘B’
5.375% due 05/15/23 | | | 172,912 | | | | 178,624 | |
| | | | | | | | |
| | | | | | | 19,760,039 | |
| | | | | | | | |
Consumer,Non-Cyclical - 10.6% | |
| | |
Ahern Rentals Inc
7.375% due 05/15/23 ~ | | | 1,595,000 | | | | 1,477,369 | |
Bausch Health Americas Inc
8.500% due 01/31/27 ~ | | | 125,000 | | | | 132,812 | |
Bausch Health Cos Inc | | | | | | | | |
5.500% due 11/01/25 ~ | | | 275,000 | | | | 281,875 | |
5.750% due 08/15/27 ~ | | | 600,000 | | | | 616,500 | |
6.125% due 04/15/25 ~ | | | 75,000 | | | | 74,437 | |
7.000% due 03/15/24 ~ | | | 100,000 | | | | 106,050 | |
9.000% due 12/15/25 ~ | | | 1,150,000 | | | | 1,253,557 | |
CHS/Community Health Systems Inc
5.125% due 08/01/21 | | | 700,000 | | | | 691,670 | |
Eagle Holding Co II LLC
7.625% Cash or 8.375% PIK
due 05/15/22 ~ | | | 635,000 | | | | 642,144 | |
HCA Inc
4.500% due 02/15/27 | | | 1,000,000 | | | | 1,029,377 | |
5.375% due 09/01/26 | | | 150,000 | | | | 158,250 | |
5.875% due 02/01/29 | | | 875,000 | | | | 943,862 | |
Jaguar Holding Co II
6.375% due 08/01/23 ~ | | | 90,000 | | | | 91,912 | |
JBS Investments II GmbH
7.000% due 01/15/26 ~ | | | 700,000 | | | | 721,000 | |
JBS USA LUX SA
5.875% due 07/15/24 ~ | | | 325,000 | | | | 335,156 | |
7.250% due 06/01/21 ~ | | | 50,000 | | | | 50,600 | |
Pilgrim’s Pride Corp
5.750% due 03/15/25 ~ | | | 205,000 | | | | 208,075 | |
5.875% due 09/30/27 ~ | | | 300,000 | | | | 303,000 | |
RegionalCare Hospital Partners Holdings Inc
9.750% due 12/01/26 ~ | | | 525,000 | | | | 546,000 | |
Tenet Healthcare Corp
6.250% due 02/01/27 ~ | | | 600,000 | | | | 623,250 | |
6.750% due 06/15/23 | | | 1,125,000 | | | | 1,162,969 | |
TMS International Corp
7.250% due 08/15/25 ~ | | | 1,315,000 | | | | 1,276,891 | |
Verscend Escrow Corp
9.750% due 08/15/26 ~ | | | 625,000 | | | | 625,781 | |
| | | | | | | | |
| | | | | | | 13,352,537 | |
| | | | | | | | |
Energy - 11.0% | |
| | |
Andeavor Logistics LP
6.875% due 02/15/23 | | | 650,000 | | | | 653,630 | |
Antero Midstream Partners LP
5.750% due 03/01/27 ~ | | | 150,000 | | | | 152,625 | |
Archrock Partners LP
6.875% due 04/01/27 ~ | | | 475,000 | | | | 485,545 | |
Ascent Resources Utica Holdings LLC
7.000% due 11/01/26 ~ | | | 825,000 | | | | 797,156 | |
Calfrac Holdings LP (Canada)
8.500% due 06/15/26 ~ | | | 600,000 | | | | 468,000 | |
Callon Petroleum Co
6.125% due 10/01/24 | | | 125,000 | | | | 126,250 | |
6.375% due 07/01/26 | | | 100,000 | | | | 100,750 | |
| | | | | | | | |
| | | Principal
Amount | | | Value | |
Cheniere Corpus Christi Holdings LLC
5.125% due 06/30/27 | | $ | 1,075,000 | | | $ | 1,130,094 | |
5.875% due 03/31/25 | | | 375,000 | | | | 408,750 | |
Cheniere Energy Partners
5.625% due 10/01/26 ~ | | | 675,000 | | | | 693,563 | |
Chesapeake Energy Corp
8.000% due 01/15/25 | | | 150,000 | | | | 153,750 | |
8.000% due 06/15/27 | | | 25,000 | | | | 24,750 | |
Crestwood Midstream Partners LP
5.750% due 04/01/25 | | | 250,000 | | | | 257,500 | |
6.250% due 04/01/23 | | | 750,000 | | | | 772,500 | |
Denbury Resources Inc
5.500% due 05/01/22 | | | 30,000 | | | | 21,000 | |
Endeavor Energy Resources LP
5.500% due 01/30/26 ~ | | | 50,000 | | | | 51,625 | |
5.750% due 01/30/28 ~ | | | 375,000 | | | | 395,625 | |
Energy Transfer Operating LP
6.250% due 02/15/23 | | | 675,000 | | | | 638,871 | |
EP Energy LLC
7.750% due 09/01/22 | | | 170,000 | | | | 41,863 | |
7.750% due 05/15/26 ~ | | | 575,000 | | | | 471,500 | |
Halcon Resources Corp
6.750% due 02/15/25 | | | 300,000 | | | | 181,500 | |
Hilcorp Energy I LP
6.250% due 11/01/28 ~ | | | 500,000 | | | | 503,750 | |
Moss Creek Resources Holdings Inc
7.500% due 01/15/26 ~ | | | 485,000 | | | | 449,838 | |
Parsley Energy LLC
5.250% due 08/15/25 ~ | | | 225,000 | | | | 223,172 | |
5.375% due 01/15/25 ~ | | | 225,000 | | | | 226,125 | |
5.625% due 10/15/27 ~ | | | 25,000 | | | | 25,063 | |
Sanchez Energy Corp
6.125% due 01/15/23 | | | 135,000 | | | | 18,900 | |
SESI LLC
7.750% due 09/15/24 | | | 300,000 | | | | 249,750 | |
SM Energy Co
5.625% due 06/01/25 | | | 550,000 | | | | 511,302 | |
Targa Resources Partners LP
5.125% due 02/01/25 | | | 500,000 | | | | 512,500 | |
5.375% due 02/01/27 | | | 50,000 | | | | 51,375 | |
5.875% due 04/15/26 ~ | | | 950,000 | | | | 1,008,900 | |
6.500% due 07/15/27 ~ | | | 50,000 | | | | 54,063 | |
Transocean Inc
7.500% due 04/15/31 | | | 875,000 | | | | 752,500 | |
Ultra Resources Inc
7.125% due 04/15/25 ~ | | | 115,000 | | | | 24,725 | |
USA Compression Partners LP
6.875% due 09/01/27 ~ | | | 900,000 | | | | 919,125 | |
Whiting Petroleum Corp
6.250% due 04/01/23 | | | 300,000 | | | | 303,000 | |
6.625% due 01/15/26 | | | 25,000 | | | | 24,625 | |
| | | | | | | | |
| | | | | | | 13,885,560 | |
| | | | | | | | |
|
Financial - 6.6% | |
| | |
Ally Financial Inc
5.750% due 11/20/25 | | | 2,400,000 | | | | 2,565,264 | |
GLP Capital LP REIT
5.750% due 06/01/28 | | | 750,000 | | | | 808,087 | |
MGM Growth Properties Operating
Partnership LP REIT
5.625% due 05/01/24 | | | 1,075,000 | | | | 1,127,406 | |
5.750% due 02/01/27 ~ | | | 150,000 | | | | 155,438 | |
Springleaf Finance Corp
6.125% due 03/15/24 | | | 625,000 | | | | 640,613 | |
6.875% due 03/15/25 | | | 25,000 | | | | 25,875 | |
7.125% due 03/15/26 | | | 625,000 | | | | 637,497 | |
8.250% due 12/15/20 | | | 675,000 | | | | 726,469 | |
The Howard Hughes Corp
5.375% due 03/15/25 ~ | | | 1,650,000 | | | | 1,650,000 | |
| | | | | | | | |
| | | | | | | 8,336,649 | |
| | | | | | | | |
| | |
| See Notes to Financial Statements | | See explanation of symbols and terms, if any, on B-41 |
B-26
PACIFIC FUNDS
PACIFIC FUNDS HIGH INCOME
Schedule of Investments (Continued)
March 31, 2019
| | | | | | | | |
| | | Principal
Amount | | | Value | |
|
Industrial - 15.4% | |
| | |
Apex Tool Group LLC
9.000% due 02/15/23 ~ | | $ | 325,000 | | | $ | 313,625 | |
ARD Securities Finance SARL (Luxembourg)
8.750% Cash or PIK
due 01/31/23 ~ | | | 468,287 | | | | 446,043 | |
Ardagh Packaging Finance PLC (Ireland)
7.250% due 05/15/24 ~ | | | 500,000 | | | | 528,600 | |
BBA US Holdings Inc
5.375% due 05/01/26 ~ | | | 900,000 | | | | 929,250 | |
Bombardier Inc (Canada)
5.750% due 03/15/22 ~ | | | 325,000 | | | | 334,344 | |
7.500% due 03/15/25 ~ | | | 300,000 | | | | 310,125 | |
Brand Industrial Services Inc
8.500% due 07/15/25 ~ | | | 950,000 | | | | 857,375 | |
BWAY Holding Co
5.500% due 04/15/24 ~ | | | 125,000 | | | | 124,569 | |
7.250% due 04/15/25 ~ | | | 1,575,000 | | | | 1,524,789 | |
BWX Technologies Inc
5.375% due 07/15/26 ~ | | | 875,000 | | | | 892,500 | |
Cloud Crane LLC
10.125% due 08/01/24 ~ | | | 475,000 | | | | 511,813 | |
Flex Acquisition Co Inc
6.875% due 01/15/25 ~ | | | 985,000 | | | | 945,600 | |
GFL Environmental Inc (Canada)
5.625% due 05/01/22 ~ | | | 300,000 | | | | 291,750 | |
Hulk Finance Corp (Canada)
7.000% due 06/01/26 ~ | | | 525,000 | | | | 498,750 | |
Itron Inc
5.000% due 01/15/26 ~ | | | 1,300,000 | | | | 1,282,125 | |
Mueller Water Products Inc
5.500% due 06/15/26 ~ | | | 1,176,000 | | | | 1,196,580 | |
New Enterprise Stone & Lime Co Inc
10.125% due 04/01/22 ~ | | | 1,140,000 | | | | 1,159,950 | |
Novelis Corp
5.875% due 09/30/26 ~ | | | 650,000 | | | | 648,375 | |
Park Aerospace Holdings Ltd (Ireland)
5.250% due 08/15/22 ~ | | | 425,000 | | | | 436,645 | |
5.500% due 02/15/24 ~ | | | 550,000 | | | | 572,000 | |
Sensata Technologies BV
5.625% due 11/01/24 ~ | | | 1,175,000 | | | | 1,257,250 | |
Standard Industries Inc
4.750% due 01/15/28 ~ | | | 1,325,000 | | | | 1,268,688 | |
Titan Acquisition Ltd (Canada)
7.750% due 04/15/26 ~ | | | 685,000 | | | | 592,525 | |
TransDigm Inc
6.250% due 03/15/26 ~ | | | 350,000 | | | | 364,000 | |
6.500% due 07/15/24 | | | 775,000 | | | | 799,219 | |
TransDigm UK Holdings PLC
6.875% due 05/15/26 ~ | | | 825,000 | | | | 822,938 | |
US Concrete Inc
6.375% due 06/01/24 | | | 500,000 | | | | 510,000 | |
| | | | | | | | |
| | | | | | | 19,419,428 | |
| | | | | | | | |
|
Technology - 0.8% | |
| | |
Infor Software Parent LLC
7.125% Cash or 7.875% PIK
due 05/01/21 ~ | | | 1,025,000 | | | | 1,031,519 | |
| | | | | | | | |
|
Utilities - 1.8% | |
| | |
Calpine Corp
5.250% due 06/01/26 ~ | | | 175,000 | | | | 174,781 | |
5.875% due 01/15/24 ~ | | | 350,000 | | | | 359,625 | |
NRG Energy Inc
7.250% due 05/15/26 | | | 640,000 | | | | 706,522 | |
Talen Energy Supply LLC
6.500% due 06/01/25 | | | 775,000 | | | | 685,875 | |
| | | | | | | | |
| | | Principal
Amount | | | Value | |
Vistra Energy Corp
7.625% due 11/01/24 | | $ | 98,000 | | | $ | 103,882 | |
Vistra Operations Co LLC
5.500% due 09/01/26 ~ | | | 200,000 | | | | 208,500 | |
| | | | | | | | |
| | | | | | | 2,239,185 | |
| | | | | | | | |
Total Corporate Bonds & Notes
(Cost $96,968,115) | | | | 96,886,482 | |
| | | | | |
|
SENIOR LOAN NOTES - 10.4% | |
|
Basic Materials - 1.0% | |
| | |
Aleris International Inc
7.249% (USD LIBOR + 4.750%)
due 02/27/23 § | | | 248,125 | | | | 248,621 | |
Messer Industries USA Inc Term B
due 03/01/26¥ | | | 1,000,000 | | | | 982,500 | |
| | | | | | | | |
| | | | | | | 1,231,121 | |
| | | | | | | | |
|
Communications - 1.0% | |
| | |
SBA Senior Finance II LLC Term B
due 04/11/25¥ | | | 997,487 | | | | 977,849 | |
Sprint Communications Inc Term B
5.500% (USD LIBOR + 3.000%)
due 02/03/24 § | | | 249,375 | | | | 244,855 | |
| | | | | | | | |
| | | | | | | 1,222,704 | |
| | | | | | | | |
|
Consumer, Cyclical - 2.6% | |
| | |
Bass Pro Group LLC Term B
due 09/25/24¥ | | | 997,468 | | | | 977,513 | |
Neiman Marcus Group Ltd LLC
5.733% (USD LIBOR + 3.250%)
due 10/25/20 § | | | 346,096 | | | | 322,375 | |
New Red Finance Inc Term B (Canada)
due 02/17/24¥ | | | 997,456 | | | | 981,870 | |
SeaWorld Parks & Entertainment Inc TermB-5
due 03/31/24¥ | | | 997,455 | | | | 993,404 | |
| | | | | | | | |
| | | | 3,275,162 | |
| | | | | |
|
Financial - 1.5% | |
| | |
Deerfield Dakota Holding LLC Term B
due 02/13/25¥ | | | 997,481 | | | | 977,220 | |
USI Inc Term B
due 05/16/24¥ | | | 997,468 | | | | 965,051 | |
| | | | | | | | |
| | | | 1,942,271 | |
| | | | | |
|
Industrial - 4.3% | |
| | |
Advanced Disposal Services Inc Term B
4.660% (USD LIBOR + 2.250%)
due 11/10/23 §¥ | | | 847,704 | | | | 844,192 | |
Crosby US Acquisition Corp
8.491% (USD LIBOR + 6.000%)
due 11/22/21 § | | | 400,000 | | | | 389,000 | |
Dynasty Acquisition Co Inc
due 01/24/26¥ | | | 650,350 | | | | 651,337 | |
EWT Holdings III Corp
5.499% (USD LIBOR + 3.000%)
due 12/20/24 § | | | 1,177,619 | | | | 1,165,843 | |
NCI Building Systems Inc Term B
6.547% (USD LIBOR + 3.750%)
due 04/12/25 § | | | 748,116 | | | | 714,450 | |
North American Lifting Holdings Inc
11.601% (USD LIBOR + 9.000%)
due 11/27/21 § | | | 350,000 | | | | 297,500 | |
| | |
| See Notes to Financial Statements | | See explanation of symbols and terms, if any, on B-41 |
B-27
PACIFIC FUNDS
PACIFIC FUNDS HIGH INCOME
Schedule of Investments (Continued)
March 31, 2019
| | | | | | | | |
| | | Principal
Amount | | | Value | |
Reynolds Group Holdings Inc Term B
due 02/05/23¥ | | $ | 997,449 | | | $ | 987,030 | |
Standard Aero Ltd
due 01/24/26¥ | | | 349,650 | | | | 350,181 | |
| | | | | | | | |
| | | | 5,399,533 | |
| | | | | |
Total Senior Loan Notes
(Cost $13,172,486) | | | | 13,070,791 | |
| | | | | |
|
ASSET-BACKED SECURITIES - 0.8% | |
| | |
Benefit Street Partners CLO Ltd ‘D’ (Cayman)
8.711% (USD LIBOR + 5.950%)
due 04/20/31 § ~ | | | 250,000 | | | | 237,209 | |
Benefit Street Partners CLO Ltd ‘E’ (Cayman)
9.513% (USD LIBOR + 6.700%)
due 01/17/32 § ~ | | | 250,000 | | | | 246,215 | |
Dryden Senior Loan Fund ‘F’ (Cayman)
9.987% (USD LIBOR + 7.200%)
due 04/15/31 § ~ | | | 250,000 | | | | 217,366 | |
Neuberger Berman Loan Advisers CLO Ltd ‘E’ (Cayman)
9.511% (USD LIBOR + 6.750%)
due 01/20/31 § ~ | | | 300,000 | | | | 296,005 | |
| | | | | | | | |
| |
Total Asset-Backed Securities
(Cost $1,027,723) | | | | 996,795 | |
| | | | | |
| | | | | | | | |
| | | Shares | | | Value | |
|
SHORT-TERM INVESTMENT - 18.2% | |
|
Money Market Fund - 18.2% | |
| | |
BlackRock Liquidity FundsT-Fund Portfolio
‘Institutional’ 2.370% | | | 22,914,671 | | | $ | 22,914,671 | |
| | | | | | | | |
| |
Total Short-Term Investment
(Cost $22,914,671) | | | | 22,914,671 | |
| | | | | |
| |
TOTAL INVESTMENTS - 107.0%
(Cost $135,136,757) | | | | 134,847,309 | |
| |
OTHER ASSETS & LIABILITIES, NET - (7.0%) | | | | (8,786,209 | ) |
| | | | | |
| |
NET ASSETS - 100.0% | | | | $126,061,100 | |
| | | | | |
Notes to Schedule of Investments
| (a) | As of March 31, 2019, the Fund’s composition by sector as a percentage of net assets was as follows: |
| | | | |
Industrial | | | 19.8% | |
Consumer, Cyclical | | | 18.6% | |
Short-Term Investment | | | 18.2% | |
Communications | | | 13.5% | |
Energy | | | 11.0% | |
Consumer,Non-Cyclical | | | 10.6% | |
Financial | | | 8.3% | |
Basic Materials | | | 3.5% | |
Others (each less than 3.0%) | | | 3.5% | |
| | | | |
| | | 107.0% | |
Other Assets & Liabilities, Net | | | (7.0% | ) |
| | | | |
| | | 100.0% | |
| | | | |
| (b) | Fair Value Measurements |
The following is a summary of the Fund’s investments as categorized under the three-tier hierarchy of inputs used in valuing the Fund’s assets and liabilities (See Note 3D in Notes to Financial Statements) as of March 31, 2019:
| | | | | | | | | | | | | | | | | | |
| | | | | Total Value at
March 31, 2019 | | | Level 1
Quoted Price | | | Level 2
Significant
Observable Inputs | | | Level 3
Significant
Unobservable Inputs | |
Assets | | Common Stocks | | | $978,570 | | | | $978,570 | | | | $— | | | | $— | |
| | Corporate Bonds & Notes | | | 96,886,482 | | | | — | | | | 96,886,482 | | | | — | |
| | Senior Loan Notes | | | 13,070,791 | | | | — | | | | 13,070,791 | | | | — | |
| | Asset-Backed Securities | | | 996,795 | | | | — | | | | 996,795 | | | | — | |
| | Short-Term Investment | | | 22,914,671 | | | | 22,914,671 | | | | — | | | | — | |
| | | | | | | | | | | | | | | | | | |
| | Total | | | $134,847,309 | | | | $23,893,241 | | | | $110,954,068 | | | | $— | |
| | | | | | | | | | | | | | | | | | |
| | |
| See Notes to Financial Statements | | See explanation of symbols and terms, if any, on B-41 |
B-28
PACIFIC FUNDS
PACIFIC FUNDSSM LARGE-CAP
Schedule of Investments
March 31, 2019
| | | | | | | | |
| | | Shares | | | Value | |
COMMON STOCKS - 98.1% | |
|
Basic Materials - 2.2% | |
| | |
Air Products & Chemicals Inc | | | 1,145 | | | | $218,649 | |
DowDuPont Inc | | | 4,069 | | | | 216,918 | |
| | | | | | | | |
| | | | 435,567 | |
| | | | | |
Communications - 19.7% | |
| | |
Alphabet Inc ‘A’ * | | | 537 | | | | 631,990 | |
Alphabet Inc ‘C’ * | | | 152 | | | | 178,343 | |
Amazon.com Inc * | | | 454 | | | | 808,461 | |
AT&T Inc | | | 6,043 | | | | 189,509 | |
Cisco Systems Inc | | | 8,369 | | | | 451,842 | |
Comcast Corp ‘A’ | | | 8,844 | | | | 353,583 | |
Expedia Group Inc | | | 1,311 | | | | 156,009 | |
Facebook Inc ‘A’ * | | | 2,872 | | | | 478,734 | |
Netflix Inc * | | | 341 | | | | 121,587 | |
Verizon Communications Inc | | | 7,034 | | | | 415,920 | |
Viacom Inc ‘B’ | | | 3,978 | | | | 111,663 | |
| | | | | | | | |
| | | | 3,897,641 | |
| | | | | |
Consumer, Cyclical - 6.1% | |
| | |
Alaska Air Group Inc | | | 2,920 | | | | 163,870 | |
AutoZone Inc * | | | 239 | | | | 244,765 | |
Delta Air Lines Inc | | | 3,308 | | | | 170,858 | |
Foot Locker Inc | | | 1,794 | | | | 108,716 | |
Polaris Industries Inc | | | 1,607 | | | | 135,679 | |
PVH Corp | | | 1,496 | | | | 182,437 | |
Royal Caribbean Cruises Ltd | | | 1,760 | | | | 201,731 | |
| | | | | | | | |
| | | | 1,208,056 | |
| | | | | |
Consumer,Non-Cyclical - 20.1% | |
| | |
Allergan PLC | | | 1,202 | | | | 175,985 | |
Biogen Inc * | | | 635 | | | | 150,101 | |
Cigna Corp | | | 1,345 | | | | 216,303 | |
CVS Health Corp | | | 4,052 | | | | 218,524 | |
Eli Lilly & Co | | | 2,265 | | | | 293,906 | |
General Mills Inc | | | 4,881 | | | | 252,592 | |
Gilead Sciences Inc | | | 3,292 | | | | 214,013 | |
Medtronic PLC | | | 3,699 | | | | 336,905 | |
Pfizer Inc | | | 9,013 | | | | 382,782 | |
The JM Smucker Co | | | 2,065 | | | | 240,573 | |
The Kroger Co | | | 8,066 | | | | 198,424 | |
The Procter & Gamble Co | | | 4,166 | | | | 433,472 | |
Thermo Fisher Scientific Inc | | | 1,181 | | | | 323,263 | |
Tyson Foods Inc ‘A’ | | | 3,564 | | | | 247,449 | |
UnitedHealth Group Inc | | | 1,197 | | | | 295,970 | |
| | | | | | | | |
| | | | 3,980,262 | |
| | | | | |
Energy - 5.8% | |
| | |
Chevron Corp | | | 2,405 | | | | 296,248 | |
EOG Resources Inc | | | 2,463 | | | | 234,428 | |
Marathon Petroleum Corp | | | 3,778 | | | | 226,113 | |
Phillips 66 | | | 1,719 | | | | 163,597 | |
Pioneer Natural Resources Co | | | 1,522 | | | | 231,770 | |
| | | | | | | | |
| | | | 1,152,156 | |
| | | | | |
Financial - 19.0% | |
| | |
American Express Co | | | 2,149 | | | | 234,886 | |
American Tower Corp REIT | | | 1,059 | | | | 208,687 | |
AvalonBay Communities Inc REIT | | | 1,152 | | | | 231,241 | |
Bank of America Corp | | | 14,052 | | | | 387,695 | |
E*TRADE Financial Corp | | | 3,981 | | | | 184,838 | |
Highwoods Properties Inc REIT | | | 3,464 | | | | 162,046 | |
JPMorgan Chase & Co | | | 4,466 | | | | 452,093 | |
Prudential Financial Inc | | | 2,356 | | | | 216,469 | |
State Street Corp | | | 3,022 | | | | 198,878 | |
T Rowe Price Group Inc | | | 2,319 | | | | 232,178 | |
The Charles Schwab Corp | | | 3,337 | | | | 142,690 | |
| | | | | | | | |
| | | Shares | | | Value | |
The Hartford Financial Services Group Inc | | | 4,096 | | | | $203,653 | |
The Travelers Cos Inc | | | 1,542 | | | | 211,501 | |
Visa Inc ‘A’ | | | 3,266 | | | | 510,117 | |
Zions Bancorp NA | | | 4,071 | | | | 184,864 | |
| | | | | | | | |
| | | | 3,761,836 | |
| | | | | |
Industrial - 7.9% | |
| | |
Caterpillar Inc | | | 1,761 | | | | 238,598 | |
Honeywell International Inc | | | 685 | | | | 108,860 | |
Ingersoll-Rand PLC | | | 2,256 | | | | 243,535 | |
Raytheon Co | | | 1,329 | | | | 241,984 | |
The Boeing Co | | | 1,082 | | | | 412,697 | |
Waste Management Inc | | | 2,987 | | | | 310,379 | |
| | | | | | | | |
| | | | 1,556,053 | |
| | | | | |
Technology - 15.1% | |
| | |
Adobe Systems Inc * | | | 937 | | | | 249,701 | |
Apple Inc | | | 3,194 | | | | 606,700 | |
Broadcom Inc | | | 1,115 | | | | 335,292 | |
DXC Technology Co | | | 2,445 | | | | 157,238 | |
Electronic Arts Inc * | | | 1,255 | | | | 127,546 | |
Intel Corp | | | 5,616 | | | | 301,579 | |
Microsoft Corp | | | 8,095 | | | | 954,724 | |
Synopsys Inc * | | | 2,258 | | | | 260,009 | |
| | | | | | | | |
| | | | 2,992,789 | |
| | | | | |
Utilities - 2.2% | |
| | |
Ameren Corp | | | 2,368 | | | | 174,166 | |
DTE Energy Co | | | 2,036 | | | | 253,971 | |
| | | | | | | | |
| | | | 428,137 | |
| | | | | |
Total Common Stocks
(Cost $16,502,955) | | | | 19,412,497 | |
| | | | | |
|
SHORT-TERM INVESTMENT - 1.7% | |
|
Money Market Fund - 1.7% | |
| | |
BlackRock Liquidity FundsT-Fund Portfolio
‘Institutional’ 2.370% | | | 331,154 | | | | 331,154 | |
| | | | | | | | |
| |
Total Short-Term Investment
(Cost $331,154) | | | | 331,154 | |
| | | | | |
| |
TOTAL INVESTMENTS - 99.8%
(Cost $16,834,109) | | | | 19,743,651 | |
| |
OTHER ASSETS & LIABILITIES, NET - 0.2% | | | | 40,949 | |
| | | | | |
| |
NET ASSETS - 100.0% | | | | $19,784,600 | |
| | | | | | | | |
Notes to Schedule of Investments
| (a) | As of March 31, 2019, the Fund’s composition by sector as a percentage of net assets was as follows: |
| | | | |
Consumer,Non-Cyclical | | | 20.1% | |
Communications | | | 19.7% | |
Financial | | | 19.0% | |
Technology | | | 15.1% | |
Industrial | | | 7.9% | |
Consumer, Cyclical | | | 6.1% | |
Energy | | | 5.8% | |
Others (each less than 3.0%) | | | 6.1% | |
| | | | |
| | | 99.8% | |
Other Assets & Liabilities, Net | | | 0.2% | |
| | | | |
| | | 100.0% | |
| | | | |
| | |
| See Notes to Financial Statements | | See explanation of symbols and terms, if any, on B-41 |
B-29
PACIFIC FUNDS
PACIFIC FUNDS LARGE-CAP
Schedule of Investments (Continued)
March 31, 2019
| (b) | Fair Value Measurements |
The following is a summary of the Fund’s investments as categorized under the three-tier hierarchy of inputs used in valuing the Fund’s assets and liabilities (See Note 3D in Notes to Financial Statements) as of March 31, 2019:
| | | | | | | | | | | | | | | | | | |
| | | | | Total Value at
March 31, 2019 | | | Level 1
Quoted Price | | | Level 2
Significant
Observable Inputs | | | Level 3
Significant
Unobservable Inputs | |
Assets | | Common Stocks | | | $19,412,497 | | | | $19,412,497 | | | | $— | | | | $— | |
| | Short-Term Investment | | | 331,154 | | | | 331,154 | | | | — | | | | — | |
| | | | | | | | | | | | | | | | | | |
| | Total | | | $19,743,651 | | | | $19,743,651 | | | | $— | | | | $— | |
| | | | | | | | | | | | | | | | | | |
| | |
| See Notes to Financial Statements | | See explanation of symbols and terms, if any, on B-41 |
B-30
PACIFIC FUNDS
PACIFIC FUNDSSM LARGE-CAP VALUE
Schedule of Investments
March 31, 2019
| | | | | | | | |
| | | Shares | | | Value | |
COMMON STOCKS - 98.5% | |
|
Basic Materials - 2.0% | |
| | |
Air Products & Chemicals Inc | | | 1,439 | | | | $274,791 | |
Nucor Corp | | | 1,759 | | | | 102,638 | |
| | | | | | | | |
| | | | 377,429 | |
| | | | | |
Communications - 13.7% | |
| | |
Alphabet Inc ‘A’ * | | | 194 | | | | 228,317 | |
AT&T Inc | | | 12,153 | | | | 381,118 | |
Cisco Systems Inc | | | 12,024 | | | | 649,176 | |
Comcast Corp ‘A’ | | | 11,335 | | | | 453,173 | |
The Walt Disney Co | | | 2,185 | | | | 242,601 | |
Verizon Communications Inc | | | 9,674 | | | | 572,024 | |
| | | | | | | | |
| | | | 2,526,409 | |
| | | | | |
Consumer, Cyclical - 4.2% | |
| | |
BorgWarner Inc | | | 2,082 | | | | 79,970 | |
Delta Air Lines Inc | | | 4,798 | | | | 247,817 | |
PVH Corp | | | 1,565 | | | | 190,852 | |
Royal Caribbean Cruises Ltd | | | 2,266 | | | | 259,729 | |
| | | | | | | | |
| | | | 778,368 | |
| | | | | |
Consumer,Non-Cyclical - 20.7% | |
| | |
Allergan PLC | | | 998 | | | | 146,117 | |
Biogen Inc * | | | 642 | | | | 151,756 | |
Cigna Corp | | | 1,076 | | | | 173,042 | |
Danaher Corp | | | 1,313 | | | | 173,342 | |
Eli Lilly & Co | | | 1,554 | | | | 201,647 | |
Gilead Sciences Inc | | | 2,924 | | | | 190,089 | |
Hill-Rom Holdings Inc | | | 1,245 | | | | 131,796 | |
Medtronic PLC | | | 3,878 | | | | 353,208 | |
Merck & Co Inc | | | 4,948 | | | | 411,525 | |
PepsiCo Inc | | | 2,231 | | | | 273,409 | |
Pfizer Inc | | | 12,913 | | | | 548,415 | |
The Procter & Gamble Co | | | 4,078 | | | | 424,316 | |
Thermo Fisher Scientific Inc | | | 866 | | | | 237,041 | |
Tyson Foods Inc ‘A’ | | | 3,676 | | | | 255,225 | |
UnitedHealth Group Inc | | | 605 | | | | 149,592 | |
| | | | | | | | |
| | | | 3,820,520 | |
| | | | | |
Energy - 9.9% | |
| | |
Chevron Corp | | | 3,915 | | | | 482,250 | |
ConocoPhillips | | | 4,149 | | | | 276,904 | |
Diamondback Energy Inc | | | 1,927 | | | | 195,648 | |
EOG Resources Inc | | | 2,394 | | | | 227,861 | |
Helmerich & Payne Inc | | | 2,773 | | | | 154,068 | |
Marathon Petroleum Corp | | | 4,796 | | | | 287,041 | |
Phillips 66 | | | 2,145 | | | | 204,140 | |
| | | | | | | | |
| | | | 1,827,912 | |
| | | | | |
Financial - 26.6% | |
| | |
Alexandria Real Estate Equities Inc REIT | | | 1,448 | | | | 206,427 | |
American Express Co | | | 2,233 | | | | 244,067 | |
AvalonBay Communities Inc REIT | | | 680 | | | | 136,496 | |
Bank of America Corp | | | 20,903 | | | | 576,714 | |
Berkshire Hathaway Inc ‘B’ * | | | 1,086 | | | | 218,166 | |
Discover Financial Services | | | 3,445 | | | | 245,146 | |
E*TRADE Financial Corp | | | 4,249 | | | | 197,281 | |
Equity LifeStyle Properties Inc REIT | | | 1,459 | | | | 166,764 | |
Highwoods Properties Inc REIT | | | 2,400 | | | | 112,272 | |
Intercontinental Exchange Inc | | | 2,887 | | | | 219,816 | |
JPMorgan Chase & Co | | | 6,726 | | | | 680,873 | |
Morgan Stanley | | | 3,621 | | | | 152,806 | |
Prologis Inc REIT | | | 4,132 | | | | 297,297 | |
Prudential Financial Inc | | | 2,458 | | | | 225,841 | |
State Street Corp | | | 3,229 | | | | 212,500 | |
SunTrust Banks Inc | | | 3,690 | | | | 218,632 | |
The Allstate Corp | | | 1,843 | | | | 173,574 | |
| | | | | | | | |
| | | Shares | | | Value | |
The Charles Schwab Corp | | | 2,200 | | | | $94,072 | |
The Hartford Financial Services Group Inc | | | 4,343 | | | | 215,934 | |
The Travelers Cos Inc | | | 1,310 | | | | 179,680 | |
Wells Fargo & Co | | | 2,821 | | | | 136,311 | |
| | | | | | | | |
| | | | 4,910,669 | |
| | | | | |
Industrial - 9.8% | |
| | |
Caterpillar Inc | | | 1,294 | | | | 175,324 | |
Honeywell International Inc | | | 1,230 | | | | 195,472 | |
Ingersoll-Rand PLC | | | 2,743 | | | | 296,107 | |
Owens Corning | | | 2,513 | | | | 118,413 | |
Parker-Hannifin Corp | | | 1,247 | | | | 214,010 | |
Raytheon Co | | | 1,441 | | | | 262,377 | |
The Boeing Co | | | 487 | | | | 185,752 | |
Waste Management Inc | | | 3,463 | | | | 359,840 | |
| | | | | | | | |
| | | | 1,807,295 | |
| | | | | |
Technology - 6.6% | |
| | |
Broadcom Inc | | | 1,113 | | | | 334,690 | |
Intel Corp | | | 3,292 | | | | 176,780 | |
Microsoft Corp | | | 3,258 | | | | 384,249 | |
Oracle Corp | | | 5,957 | | | | 319,950 | |
| | | | | | | | |
| | | | 1,215,669 | |
| | | | | |
Utilities - 5.0% | |
| | |
American Electric Power Co Inc | | | 3,437 | | | | 287,849 | |
DTE Energy Co | | | 2,024 | | | | 252,474 | |
Xcel Energy Inc | | | 6,776 | | | | 380,879 | |
| | | | | | | | |
| | | | 921,202 | |
| | | | | |
Total Common Stocks
(Cost $14,741,730) | | | | 18,185,473 | |
| | | | | |
|
SHORT-TERM INVESTMENT - 1.2% | |
|
Money Market Fund - 1.2% | |
| | |
BlackRock Liquidity FundsT-Fund Portfolio
‘Institutional’ 2.370% | | | 215,626 | | | | 215,626 | |
| | | | | | | | |
| |
Total Short-Term Investment
(Cost $215,626) | | | | 215,626 | |
| | | | | |
| |
TOTAL INVESTMENTS - 99.7%
(Cost $14,957,356) | | | | 18,401,099 | |
| |
OTHER ASSETS & LIABILITIES, NET - 0.3% | | | | 58,692 | |
| | | | | |
| |
NET ASSETS - 100.0% | | | | $18,459,791 | |
| | | | | | | | |
Notes to Schedule of Investments
| (a) | As of March 31, 2019, the Fund’s composition by sector as a percentage of net assets was as follows: |
| | | | |
Financial | | | 26.6% | |
Consumer,Non-Cyclical | | | 20.7% | |
Communications | | | 13.7% | |
Energy | | | 9.9% | |
Industrial | | | 9.8% | |
Technology | | | 6.6% | |
Utilities | | | 5.0% | |
Consumer, Cyclical | | | 4.2% | |
Others (each less than 3.0%) | | | 3.2% | |
| | | | |
| | | 99.7% | |
Other Assets & Liabilities, Net | | | 0.3% | |
| | | | |
| | | 100.0% | |
| | | | |
| | |
| See Notes to Financial Statements | | See explanation of symbols and terms, if any, on B-41 |
B-31
PACIFIC FUNDS
PACIFIC FUNDS LARGE-CAP VALUE
Schedule of Investments (Continued)
March 31, 2019
| (b) | Fair Value Measurements |
The following is a summary of the Fund's investments as categorized under the three-tier hierarchy of inputs used in valuing the Fund's assets and liabilities (See Note 3D in Notes to Financial Statements) as of March 31, 2019:
| | | | | | | | | | | | | | | | | | |
| | | | | Total Value at
March 31, 2019 | | | Level 1
Quoted Price | | | Level 2
Significant
Observable Inputs | | | Level 3
Significant
Unobservable Inputs | |
Assets | | Common Stocks | | | $18,185,473 | | | | $18,185,473 | | | | $— | | | | $— | |
| | Short-Term Investment | | | 215,626 | | | | 215,626 | | | | — | | | | — | |
| | | | | | | | | | | | | | | | | | |
| | Total | | | $18,401,099 | | | | $18,401,099 | | | | $— | | | | $— | |
| | | | | | | | | | | | | | | | | | |
| | |
| See Notes to Financial Statements | | See explanation of symbols and terms, if any, on B-41 |
B-32
PACIFIC FUNDS
PACIFIC FUNDSSM SMALL/MID-CAP
Schedule of Investments
March 31, 2019
| | | | | | | | |
| | | Shares | | | Value | |
COMMON STOCKS - 97.6% | |
|
Basic Materials - 4.0% | |
| | |
Allegheny Technologies Inc * | | | 76,755 | | | | $1,962,625 | |
Commercial Metals Co | | | 59,604 | | | | 1,018,036 | |
Kaiser Aluminum Corp | | | 30,399 | | | | 3,183,687 | |
Kraton Corp * | | | 53,531 | | | | 1,722,628 | |
PolyOne Corp | | | 50,180 | | | | 1,470,776 | |
Rogers Corp * | | | 13,594 | | | | 2,159,815 | |
Steel Dynamics Inc | | | 45,568 | | | | 1,607,183 | |
The Chemours Co | | | 44,660 | | | | 1,659,566 | |
| | | | | | | | |
| | | | 14,784,316 | |
| | | | | |
Communications - 5.1% | |
| | |
CDW Corp | | | 29,483 | | | | 2,841,277 | |
Ciena Corp * | | | 97,971 | | | | 3,658,237 | |
GrubHub Inc * | | | 18,650 | | | | 1,295,615 | |
LogMeIn Inc | | | 17,616 | | | | 1,411,042 | |
NETGEAR Inc * | | | 58,767 | | | | 1,946,363 | |
Sinclair Broadcast Group Inc ‘A’ | | | 76,246 | | | | 2,933,946 | |
Viavi Solutions Inc * | | | 194,549 | | | | 2,408,517 | |
Vonage Holdings Corp * | | | 270,626 | | | | 2,717,085 | |
| | | | | | | | |
| | | | 19,212,082 | |
| | | | | |
Consumer, Cyclical - 10.8% | |
| | |
Altra Industrial Motion Corp | | | 65,323 | | | | 2,028,279 | |
AMC Entertainment Holdings Inc ‘A’ | | | 64,360 | | | | 955,746 | |
Aramark | | | 98,616 | | | | 2,914,103 | |
BJ’s Restaurants Inc | | | 60,090 | | | | 2,841,055 | |
Bloomin’ Brands Inc | | | 172,386 | | | | 3,525,294 | |
Capri Holdings Ltd * | | | 48,838 | | | | 2,234,339 | |
Cooper-Standard Holdings Inc * | | | 5,894 | | | | 276,782 | |
G-III Apparel Group Ltd * | | | 49,745 | | | | 1,987,810 | |
iRobot Corp * | | | 29,223 | | | | 3,439,255 | |
Lithia Motors Inc ‘A’ | | | 17,107 | | | | 1,586,674 | |
Marriott Vacations Worldwide Corp | | | 6,295 | | | | 588,583 | |
Pool Corp | | | 12,941 | | | | 2,134,877 | |
SeaWorld Entertainment Inc * | | | 105,368 | | | | 2,714,280 | |
SkyWest Inc | | | 52,666 | | | | 2,859,237 | |
Sleep Number Corp * | | | 65,493 | | | | 3,078,171 | |
Steven Madden Ltd | | | 61,758 | | | | 2,089,891 | |
Texas Roadhouse Inc | | | 18,209 | | | | 1,132,418 | |
The Children’s Place Inc | | | 18,309 | | | | 1,781,099 | |
Wolverine World Wide Inc | | | 63,072 | | | | 2,253,563 | |
| | | | | | | | |
| | | | 40,421,456 | |
| | | | | |
Consumer,Non-Cyclical - 28.8% | |
| | |
Acadia Healthcare Co Inc * | | | 18,480 | | | | 541,649 | |
Adtalem Global Education Inc * | | | 60,071 | | | | 2,782,489 | |
Amedisys Inc * | | | 29,542 | | | | 3,641,347 | |
Amicus Therapeutics Inc * | | | 131,377 | | | | 1,786,727 | |
AMN Healthcare Services Inc * | | | 39,686 | | | | 1,868,814 | |
BioScrip Inc * | | | 212,226 | | | | 424,452 | |
BioTelemetry Inc * | | | 21,956 | | | | 1,374,885 | |
Cardtronics PLC ‘A’ * | | | 65,876 | | | | 2,343,868 | |
Central Garden & Pet Co ‘A’ * | | | 76,543 | | | | 1,779,625 | |
Charles River Laboratories International Inc * | | | 32,246 | | | | 4,683,732 | |
Encompass Health Corp | | | 32,829 | | | | 1,917,214 | |
Euronet Worldwide Inc * | | | 31,462 | | | | 4,486,167 | |
Green Dot Corp ‘A’ * | | | 56,801 | | | | 3,444,981 | |
Helen of Troy Ltd * | | | 14,377 | | | | 1,667,157 | |
Hill-Rom Holdings Inc | | | 49,774 | | | | 5,269,076 | |
Horizon Pharma PLC * | | | 91,818 | | | | 2,426,750 | |
Hostess Brands Inc * | | | 156,901 | | | | 1,961,262 | |
ICF International Inc | | | 38,362 | | | | 2,918,581 | |
Insperity Inc | | | 42,212 | | | | 5,219,936 | |
Ionis Pharmaceuticals Inc * | | | 35,425 | | | | 2,875,447 | |
J&J Snack Foods Corp | | | 11,142 | | | | 1,769,795 | |
Jazz Pharmaceuticals PLC * | | | 14,939 | | | | 2,135,530 | |
| | | | | | | | |
| | | Shares | | | Value | |
Lamb Weston Holdings Inc | | | 46,271 | | | | $3,467,549 | |
LHC Group Inc * | | | 40,512 | | | | 4,491,160 | |
LivaNova PLC * | | | 35,758 | | | | 3,477,466 | |
LiveRamp Holdings Inc * | | | 85,023 | | | | 4,639,705 | |
MarketAxess Holdings Inc | | | 7,097 | | | | 1,746,430 | |
Merit Medical Systems Inc * | | | 28,094 | | | | 1,737,052 | |
Myriad Genetics Inc * | | | 60,269 | | | | 2,000,931 | |
Neurocrine Biosciences Inc * | | | 18,469 | | | | 1,627,119 | |
Performance Food Group Co * | | | 109,516 | | | | 4,341,214 | |
Post Holdings Inc * | | | 16,198 | | | | 1,772,061 | |
PRA Health Sciences Inc * | | | 29,086 | | | | 3,207,895 | |
Quidel Corp * | | | 36,878 | | | | 2,414,403 | |
Service Corp International | | | 94,921 | | | | 3,811,078 | |
Supernus Pharmaceuticals Inc * | | | 68,095 | | | | 2,386,049 | |
Syneos Health Inc * | | | 36,424 | | | | 1,885,306 | |
Teleflex Inc | | | 9,188 | | | | 2,776,246 | |
The Cooper Cos Inc | | | 14,984 | | | | 4,437,811 | |
| | | | | | | | |
| | | | 107,538,959 | |
| | | | | |
Energy - 3.1% | |
| | |
Diamondback Energy Inc | | | 33,566 | | | | 3,407,956 | |
Helix Energy Solutions Group Inc * | | | 209,478 | | | | 1,656,971 | |
Helmerich & Payne Inc | | | 58,938 | | | | 3,274,595 | |
WPX Energy Inc * | | | 231,630 | | | | 3,036,669 | |
| | | | | | | | |
| | | | 11,376,191 | |
| | | | | |
Financial - 21.5% | |
| | |
Aircastle Ltd | | | 143,851 | | | | 2,911,544 | |
Alleghany Corp * | | | 5,783 | | | | 3,541,509 | |
Blucora Inc * | | | 72,242 | | | | 2,411,438 | |
Chemical Financial Corp | | | 61,088 | | | | 2,514,382 | |
Deluxe Corp | | | 41,841 | | | | 1,829,288 | |
Douglas Emmett Inc REIT | | | 65,643 | | | | 2,653,290 | |
East West Bancorp Inc | | | 53,229 | | | | 2,553,395 | |
Equity LifeStyle Properties Inc REIT | | | 32,632 | | | | 3,729,838 | |
Essent Group Ltd * | | | 74,666 | | | | 3,244,238 | |
Everest Re Group Ltd | | | 16,562 | | | | 3,576,729 | |
Highwoods Properties Inc REIT | | | 46,325 | | | | 2,167,083 | |
Horace Mann Educators Corp | | | 47,718 | | | | 1,680,151 | |
Hudson Pacific Properties Inc REIT | | | 73,031 | | | | 2,513,727 | |
IBERIABANK Corp | | | 50,443 | | | | 3,617,268 | |
Lamar Advertising Co ‘A’ REIT | | | 50,127 | | | | 3,973,066 | |
Life Storage Inc REIT | | | 31,454 | | | | 3,059,531 | |
Mid-America Apartment Communities Inc REIT | | | 14,501 | | | | 1,585,394 | |
Moelis & Co ‘A’ | | | 17,688 | | | | 735,998 | |
Old Republic International Corp | | | 158,885 | | | | 3,323,874 | |
PacWest Bancorp | | | 67,550 | | | | 2,540,556 | |
PotlatchDeltic Corp REIT | | | 38,529 | | | | 1,456,011 | |
PS Business Parks Inc REIT | | | 12,597 | | | | 1,975,588 | |
Radian Group Inc | | | 182,717 | | | | 3,789,551 | |
Ryman Hospitality Properties Inc REIT | | | 39,664 | | | | 3,261,967 | |
Simmons First National Corp ‘A’ | | | 73,515 | | | | 1,799,647 | |
The Hanover Insurance Group Inc | | | 28,340 | | | | 3,235,578 | |
Virtu Financial Inc ‘A’ | | | 121,627 | | | | 2,888,641 | |
Western Alliance Bancorp * | | | 41,571 | | | | 1,706,074 | |
Wintrust Financial Corp | | | 37,971 | | | | 2,556,587 | |
Zions Bancorp | | | 76,597 | | | | 3,478,270 | |
| | | | | | | | |
| | | | 80,310,213 | |
| | | | | |
Industrial - 12.7% | |
| | |
Aerojet Rocketdyne Holdings Inc * | | | 90,713 | | | | 3,223,033 | |
Ambarella Inc * | | | 40,027 | | | | 1,729,166 | |
American Woodmark Corp * | | | 30,035 | | | | 2,481,792 | |
EMCOR Group Inc | | | 44,178 | | | | 3,228,528 | |
EnPro Industries Inc | | | 23,853 | | | | 1,537,326 | |
Generac Holdings Inc * | | | 58,558 | | | | 2,999,926 | |
Graphic Packaging Holding Co | | | 219,846 | | | | 2,776,655 | |
Harsco Corp * | | | 90,759 | | | | 1,829,701 | |
Hubbell Inc | | | 13,904 | | | | 1,640,394 | |
ITT Inc | | | 45,871 | | | | 2,660,518 | |
| | |
| See Notes to Financial Statements | | See explanation of symbols and terms, if any, on B-41 |
B-33
PACIFIC FUNDS
PACIFIC FUNDS SMALL/MID-CAP
Schedule of Investments (Continued)
March 31, 2019
| | | | | | | | |
| | | Shares | | | Value | |
Kirby Corp * | | | 20,134 | | | | $1,512,265 | |
MasTec Inc * | | | 68,549 | | | | 3,297,207 | |
PerkinElmer Inc | | | 29,098 | | | | 2,803,883 | |
Rexnord Corp * | | | 58,558 | | | | 1,472,148 | |
Ryder System Inc | | | 36,000 | | | | 2,231,640 | |
Sanmina Corp * | | | 46,370 | | | | 1,337,775 | |
Sonoco Products Co | | | 43,131 | | | | 2,653,850 | |
Spirit AeroSystems Holdings Inc ‘A’ | | | 26,251 | | | | 2,402,754 | |
SPX Corp * | | | 86,500 | | | | 3,009,335 | |
US Concrete Inc * | | | 33,530 | | | | 1,388,813 | |
US Ecology Inc | | | 21,936 | | | | 1,227,977 | |
| | | | | | | | |
| | | | 47,444,686 | |
| | | | | |
Technology - 9.5% | |
| | |
Aspen Technology Inc * | | | 13,129 | | | | 1,368,829 | |
Benefitfocus Inc * | | | 40,481 | | | | 2,004,619 | |
Bottomline Technologies DE Inc * | | | 70,729 | | | | 3,542,816 | |
CommVault Systems Inc * | | | 43,092 | | | | 2,789,776 | |
j2 Global Inc | | | 37,726 | | | | 3,267,072 | |
MKS Instruments Inc | | | 23,707 | | | | 2,205,936 | |
Nuance Communications Inc * | | | 80,537 | | | | 1,363,491 | |
RealPage Inc * | | | 57,692 | | | | 3,501,327 | |
Silicon Laboratories Inc * | | | 37,605 | | | | 3,040,740 | |
SPS Commerce Inc * | | | 37,298 | | | | 3,955,826 | |
Synopsys Inc * | | | 29,369 | | | | 3,381,840 | |
TiVo Corp | | | 107,985 | | | | 1,006,420 | |
Zebra Technologies Corp ‘A’ * | | | 19,757 | | | | 4,139,684 | |
| | | | | | | | |
| | | | 35,568,376 | |
| | | | | |
Utilities - 2.1% | |
| | |
Black Hills Corp | | | 39,629 | | | | 2,935,320 | |
CMS Energy Corp | | | 38,423 | | | | 2,134,013 | |
Portland General Electric Co | | | 49,747 | | | | 2,578,884 | |
| | | | | | | | |
| | | | 7,648,217 | |
| | | | | |
Total Common Stocks
(Cost $329,367,796) | | | | 364,304,496 | |
| | | | | |
| | | | | | | | |
| | | Shares | | | Value | |
SHORT-TERM INVESTMENT - 2.7% | |
|
Money Market Fund - 2.7% | |
| | |
BlackRock Liquidity FundsT-Fund Portfolio
‘Institutional’ 2.370% | | | 10,160,211 | | | | $10,160,211 | |
| | | | | | | | |
| |
Total Short-Term Investment
(Cost $10,160,211) | | | | 10,160,211 | |
| | | | | |
| |
TOTAL INVESTMENTS - 100.3%
(Cost $339,528,007) | | | | 374,464,707 | |
| |
OTHER ASSETS & LIABILITIES, NET - (0.3%) | | | | (1,125,260 | ) |
| | | | | |
| |
NET ASSETS - 100.0% | | | | $373,339,447 | |
| | | | | | | | |
Notes to Schedule of Investments
| (a) | As of March 31, 2019, the Fund’s composition by sector as a percentage of net assets was as follows: |
| | | | |
Consumer,Non-Cyclical | | | 28.8% | |
Financial | | | 21.5% | |
Industrial | | | 12.7% | |
Consumer, Cyclical | | | 10.8% | |
Technology | | | 9.5% | |
Communications | | | 5.1% | |
Basic Materials | | | 4.0% | |
Energy | | | 3.1% | |
Others (each less than 3.0%) | | | 4.8% | |
| | | | |
| | | 100.3% | |
Other Assets & Liabilities, Net | | | (0.3% | ) |
| | | | |
| | | 100.0% | |
| | | | |
| (b) | Fair Value Measurements |
The following is a summary of the Fund’s investments as categorized under the three-tier hierarchy of inputs used in valuing the Fund’s assets and liabilities (See Note 3D in Notes to Financial Statements) as of March 31, 2019:
| | | | | | | | | | | | | | | | | | |
| | | | | Total Value at
March 31, 2019 | | | Level 1
Quoted Price | | | Level 2
Significant
Observable Inputs | | | Level 3
Significant
Unobservable Inputs | |
Assets | | Common Stocks | | | $364,304,496 | | | | $364,304,496 | | | | $— | | | | $— | |
| | Short-Term Investment | | | 10,160,211 | | | | 10,160,211 | | | | — | | | | — | |
| | | | | | | | | | | | | | | | | | |
| | Total | | | $374,464,707 | | | | $374,464,707 | | | | $— | | | | $— | |
| | | | | | | | | | | | | | | | | | |
| | |
| See Notes to Financial Statements | | See explanation of symbols and terms, if any, on B-41 |
B-34
PACIFIC FUNDS
PACIFIC FUNDSSM SMALL-CAP
Schedule of Investments
March 31, 2019
| | | | | | | | |
| | | Shares | | | Value | |
COMMON STOCKS - 98.4% | |
|
Basic Materials - 3.4% | |
| | |
Allegheny Technologies Inc * | | | 7,278 | | | | $186,098 | |
Commercial Metals Co | | | 5,813 | | | | 99,286 | |
Kraton Corp * | | | 4,417 | | | | 142,139 | |
PolyOne Corp | | | 4,065 | | | | 119,145 | |
Rogers Corp * | | | 760 | | | | 120,749 | |
| | | | | | | | |
| | | | 667,417 | |
| | | | | |
Communications - 3.9% | |
| | |
Ciena Corp * | | | 5,308 | | | | 198,201 | |
NETGEAR Inc * | | | 2,330 | | | | 77,170 | |
Perficient Inc * | | | 4,446 | | | | 121,776 | |
Sinclair Broadcast Group Inc ‘A’ | | | 4,610 | | | | 177,393 | |
Viavi Solutions Inc * | | | 6,450 | | | | 79,851 | |
Vonage Holdings Corp * | | | 12,318 | | | | 123,673 | |
| | | | | | | | |
| | | | 778,064 | |
| | | | | |
Consumer, Cyclical - 10.2% | |
| | |
Altra Industrial Motion Corp | | | 5,679 | | | | 176,333 | |
Beacon Roofing Supply Inc * | | | 1,069 | | | | 34,379 | |
BJ’s Restaurants Inc | | | 2,557 | | | | 120,895 | |
Bloomin’ Brands Inc | | | 6,874 | | | | 140,573 | |
Callaway Golf Co | | | 5,736 | | | | 91,374 | |
Cooper-Standard Holdings Inc * | | | 970 | | | | 45,551 | |
Del Taco Restaurants Inc * | | | 8,146 | | | | 81,949 | |
G-III Apparel Group Ltd * | | | 2,596 | | | | 103,736 | |
Lithia Motors Inc ‘A’ | | | 1,314 | | | | 121,873 | |
Marriott Vacations Worldwide Corp | | | 1,740 | | | | 162,690 | |
SeaWorld Entertainment Inc * | | | 3,585 | | | | 92,350 | |
SkyWest Inc | | | 3,787 | | | | 205,596 | |
Sleep Number Corp * | | | 4,183 | | | | 196,601 | |
Steven Madden Ltd | | | 4,590 | | | | 155,326 | |
Texas Roadhouse Inc | | | 1,137 | | | | 70,710 | |
The Children’s Place Inc | | | 1,460 | | | | 142,029 | |
Wolverine World Wide Inc | | | 2,018 | | | | 72,103 | |
| | | | | | | | |
| | | | 2,014,068 | |
| | | | | |
Consumer,Non-Cyclical - 27.9% | |
| | |
Acadia Healthcare Co Inc * | | | 4,107 | | | | 120,376 | |
Adtalem Global Education Inc * | | | 4,022 | | | | 186,299 | |
Amedisys Inc * | | | 2,191 | | | | 270,063 | |
Amicus Therapeutics Inc * | | | 7,206 | | | | 98,002 | |
AMN Healthcare Services Inc * | | | 3,126 | | | | 147,203 | |
Amphastar Pharmaceuticals Inc * | | | 5,620 | | | | 114,817 | |
BioScrip Inc * | | | 27,897 | | | | 55,794 | |
BioTelemetry Inc * | | | 2,188 | | | | 137,013 | |
Cardtronics PLC ‘A’ * | | | 3,926 | | | | 139,687 | |
Central Garden & Pet Co ‘A’ * | | | 5,287 | | | | 122,923 | |
FibroGen Inc * | | | 2,363 | | | | 128,429 | |
Green Dot Corp ‘A’ * | | | 2,314 | | | | 140,344 | |
Helen of Troy Ltd * | | | 1,361 | | | | 157,821 | |
Horizon Pharma PLC * | | | 10,836 | | | | 286,395 | |
Hostess Brands Inc * | | | 10,135 | | | | 126,687 | |
ICF International Inc | | | 2,368 | | | | 180,157 | |
Insperity Inc | | | 2,534 | | | | 313,354 | |
J&J Snack Foods Corp | | | 669 | | | | 106,264 | |
LHC Group Inc * | | | 2,334 | | | | 258,747 | |
LivaNova PLC * | | | 2,142 | | | | 208,310 | |
LiveRamp Holdings Inc * | | | 4,956 | | | | 270,449 | |
Merit Medical Systems Inc * | | | 4,745 | | | | 293,383 | |
Myriad Genetics Inc * | | | 4,555 | | | | 151,226 | |
NuVasive Inc * | | | 2,504 | | | | 142,202 | |
Orthofix Medical Inc * | | | 2,527 | | | | 142,548 | |
Performance Food Group Co * | | | 5,031 | | | | 199,429 | |
Quidel Corp * | | | 2,641 | | | | 172,906 | |
SP Plus Corp * | | | 1,897 | | | | 64,726 | |
Supernus Pharmaceuticals Inc * | | | 5,507 | | | | 192,965 | |
| | | | | | | | |
| | | Shares | | | Value | |
Syneos Health Inc * | | | 3,950 | | | | $204,452 | |
TrueBlue Inc * | | | 3,509 | | | | 82,953 | |
Ultragenyx Pharmaceutical Inc * | | | 732 | | | | 50,772 | |
Vanda Pharmaceuticals Inc * | | | 7,294 | | | | 134,210 | |
Viad Corp | | | 2,051 | | | | 115,451 | |
| | | | | | | | |
| | | | 5,516,357 | |
| | | | | |
Energy - 2.4% | |
| | |
Helix Energy Solutions Group Inc * | | | 18,316 | | | | 144,879 | |
Magnolia Oil & Gas Corp * | | | 12,681 | | | | 152,172 | |
PDC Energy Inc * | | | 3,244 | | | | 131,966 | |
QEP Resources Inc * | | | 5,326 | | | | 41,490 | |
| | | | | | | | |
| | | | 470,507 | |
| | | | | |
Financial - 23.4% | |
| | |
AG Mortgage Investment Trust Inc REIT | | | 5,032 | | | | 84,739 | |
Aircastle Ltd | | | 8,678 | | | | 175,643 | |
Americold Realty Trust REIT | | | 6,202 | | | | 189,223 | |
Argo Group International Holdings Ltd | | | 3,088 | | | | 218,198 | |
Armada Hoffler Properties Inc REIT | | | 4,212 | | | | 65,665 | |
Blucora Inc * | | | 2,833 | | | | 94,566 | |
BrightSphere Investment Group PLC | | | 11,616 | | | | 157,513 | |
Cathay General Bancorp | | | 4,356 | | | | 147,712 | |
CenterState Bank Corp | | | 5,437 | | | | 129,455 | |
Chemical Financial Corp | | | 3,125 | | | | 128,625 | |
Deluxe Corp | | | 1,921 | | | | 83,986 | |
Enterprise Financial Services Corp | | | 3,086 | | | | 125,816 | |
Essent Group Ltd * | | | 2,445 | | | | 106,235 | |
First Bancorp | | | 1,354 | | | | 47,065 | |
First Industrial Realty Trust Inc REIT | | | 7,141 | | | | 252,506 | |
First Interstate BancSystem Inc ‘A’ | | | 1,424 | | | | 56,704 | |
First Midwest Bancorp Inc | | | 5,818 | | | | 119,036 | |
Heritage Insurance Holdings Inc | | | 4,892 | | | | 71,423 | |
Home BancShares Inc | | | 6,745 | | | | 118,510 | |
Horace Mann Educators Corp | | | 2,296 | | | | 80,842 | |
IBERIABANK Corp | | | 2,214 | | | | 158,766 | |
Investors Bancorp Inc | | | 2,465 | | | | 29,210 | |
Moelis & Co ‘A’ | | | 2,866 | | | | 119,254 | |
National Storage Affiliates Trust REIT | | | 3,658 | | | | 104,290 | |
NexPoint Residential Trust Inc REIT | | | 1,518 | | | | 58,200 | |
Old National Bancorp | | | 9,003 | | | | 147,649 | |
Pacific Premier Bancorp Inc | | | 1,513 | | | | 40,140 | |
PotlatchDeltic Corp REIT | | | 2,968 | | | | 112,161 | |
Preferred Bank | | | 1,267 | | | | 56,977 | |
PS Business Parks Inc REIT | | | 1,474 | | | | 231,167 | |
Radian Group Inc | | | 7,531 | | | | 156,193 | |
Ryman Hospitality Properties Inc REIT | | | 2,495 | | | | 205,189 | |
Sandy Spring Bancorp Inc | | | 2,093 | | | | 65,469 | |
Simmons First National Corp ‘A’ | | | 6,159 | | | | 150,772 | |
Stifel Financial Corp | | | 2,578 | | | | 136,015 | |
Sunstone Hotel Investors Inc REIT | | | 9,602 | | | | 138,269 | |
United Community Banks Inc | | | 5,873 | | | | 146,414 | |
WSFS Financial Corp | | | 3,081 | | | | 118,927 | |
| | | | | | | | |
| | | | 4,628,524 | |
| | | | | |
Industrial - 11.9% | |
| | |
Air Transport Services Group Inc * | | | 6,397 | | | | 147,451 | |
Ambarella Inc * | | | 2,075 | | | | 89,640 | |
American Woodmark Corp * | | | 985 | | | | 81,391 | |
EMCOR Group Inc | | | 2,658 | | | | 194,247 | |
EnerSys | | | 2,041 | | | | 132,992 | |
Generac Holdings Inc * | | | 2,057 | | | | 105,380 | |
Harsco Corp * | | | 8,201 | | | | 165,332 | |
MasTec Inc * | | | 4,601 | | | | 221,308 | |
Rexnord Corp * | | | 5,418 | | | | 136,209 | |
Saia Inc * | | | 3,153 | | | | 192,648 | |
SPX Corp * | | | 3,397 | | | | 118,182 | |
SYNNEX Corp | | | 1,203 | | | | 114,754 | |
Trinseo SA | | | 2,613 | | | | 118,369 | |
Universal Forest Products Inc | | | 3,729 | | | | 111,460 | |
| | |
| See Notes to Financial Statements | | See explanation of symbols and terms, if any, on B-41 |
B-35
PACIFIC FUNDS
PACIFIC FUNDS SMALL-CAP
Schedule of Investments (Continued)
March 31, 2019
| | | | | | | | |
| | | Shares | | | Value | |
US Concrete Inc * | | | 1,496 | | | | $61,964 | |
US Ecology Inc | | | 1,473 | | | | 82,458 | |
Vishay Intertechnology Inc | | | 8,859 | | | | 163,626 | |
Werner Enterprises Inc | | | 3,215 | | | | 109,792 | |
| | | | | | | | |
| | | | 2,347,203 | |
| | | | | |
Technology - 11.7% | |
| | |
Allscripts Healthcare Solutions Inc * | | | 14,369 | | | | 137,080 | |
Benefitfocus Inc * | | | 1,789 | | | | 88,591 | |
Bottomline Technologies DE Inc * | | | 1,703 | | | | 85,303 | |
CACI International Inc ‘A’ * | | | 1,248 | | | | 227,161 | |
CommVault Systems Inc * | | | 2,407 | | | | 155,829 | |
Entegris Inc | | | 5,505 | | | | 196,473 | |
Glu Mobile Inc * | | | 21,837 | | | | 238,897 | |
j2 Global Inc | | | 2,360 | | | | 204,376 | |
RealPage Inc * | | | 1,860 | | | | 112,883 | |
Silicon Laboratories Inc * | | | 1,228 | | | | 99,296 | |
SPS Commerce Inc * | | | 1,882 | | | | 199,605 | |
TiVo Corp | | | 6,694 | | | | 62,388 | |
Verint Systems Inc * | | | 4,736 | | | | 283,497 | |
Virtusa Corp * | | | 2,667 | | | | 142,551 | |
Xperi Corp | | | 3,667 | | | | 85,808 | |
| | | | | | | | |
| | | | 2,319,738 | |
| | | | | |
Utilities - 3.6% | |
| | |
ALLETE Inc | | | 2,508 | | | | 206,233 | |
Black Hills Corp | | | 2,774 | | | | 205,470 | |
Portland General Electric Co | | | 1,492 | | | | 77,345 | |
Southwest Gas Holdings Inc | | | 2,780 | | | | 228,683 | |
| | | | | | | | |
| | | | 717,731 | |
| | | | | |
Total Common Stocks
(Cost $17,427,133) | | | | 19,459,609 | |
| | | | | |
| | | | | | | | |
| | | Shares | | | Value | |
SHORT-TERM INVESTMENT - 1.7% | |
|
Money Market Fund - 1.7% | |
| | |
BlackRock Liquidity FundsT-Fund Portfolio
‘Institutional’ 2.370% | | | 330,656 | | | | $330,656 | |
| | | | | | | | |
| |
Total Short-Term Investment
(Cost $330,656) | | | | 330,656 | |
| | | | | |
| |
TOTAL INVESTMENTS - 100.1%
(Cost $17,757,789) | | | | 19,790,265 | |
| |
OTHER ASSETS & LIABILITIES, NET - (0.1%) | | | | (23,298 | ) |
| | | | | |
| |
NET ASSETS - 100.0% | | | | $19,766,967 | |
| | | | | | | | |
Notes to Schedule of Investments
| (a) | As of March 31, 2019, the Fund’s composition by sector as a percentage of net assets was as follows: |
| | | | |
Consumer,Non-Cyclical | | | 27.9% | |
Financial | | | 23.4% | |
Industrial | | | 11.9% | |
Technology | | | 11.7% | |
Consumer, Cyclical | | | 10.2% | |
Communications | | | 3.9% | |
Utilities | | | 3.6% | |
Basic Materials | | | 3.4% | |
Others (each less than 3.0%) | | | 4.1% | |
| | | | |
| | | 100.1% | |
Other Assets & Liabilities, Net | | | (0.1% | ) |
| | | | |
| | | 100.0% | |
| | | | |
| (b) | Fair Value Measurements |
The following is a summary of the Fund’s investments as categorized under the three-tier hierarchy of inputs used in valuing the Fund’s assets and liabilities (See Note 3D in Notes to Financial Statements) as of March 31, 2019:
| | | | | | | | | | | | | | | | | | |
| | | | | Total Value at
March 31, 2019 | | | Level 1
Quoted Price | | | Level 2
Significant
Observable Inputs | | | Level 3
Significant
Unobservable Inputs | |
Assets | | Common Stocks | | | $19,459,609 | | | | $19,459,609 | | | | $— | | | | $— | |
| | Short-Term Investment | | | 330,656 | | | | 330,656 | | | | — | | | | — | |
| | | | | | | | | | | | | | | | | | |
| | Total | | | $19,790,265 | | | | $19,790,265 | | | | $— | | | | $— | |
| | | | | | | | | | | | | | | | | | |
| | |
| See Notes to Financial Statements | | See explanation of symbols and terms, if any, on B-41 |
B-36
PACIFIC FUNDS
PACIFIC FUNDSSM SMALL-CAP VALUE
Schedule of Investments
March 31, 2019
| | | | | | | | |
| | | Shares | | | Value | |
COMMON STOCKS - 97.1% | | | | | | | | |
| | |
Basic Materials - 3.1% | | | | | | | | |
| | |
Allegheny Technologies Inc * | | | 5,868 | | | | $150,045 | |
Commercial Metals Co | | | 4,630 | | | | 79,080 | |
Kaiser Aluminum Corp | | | 1,343 | | | | 140,652 | |
Kraton Corp * | | | 4,994 | | | | 160,707 | |
| | | | | | | | |
| | | | | | | 530,484 | |
| | | | | | | | |
Communications - 2.9% | | | | | | | | |
| | |
Ciena Corp * | | | 3,911 | | | | 146,037 | |
NETGEAR Inc * | | | 3,789 | | | | 125,492 | |
Perficient Inc * | | | 4,555 | | | | 124,762 | |
Viavi Solutions Inc * | | | 8,309 | | | | 102,865 | |
| | | | | | | | |
| | | | | | | 499,156 | |
| | | | | | | | |
Consumer, Cyclical - 7.9% | | | | | | | | |
| | |
Altra Industrial Motion Corp | | | 3,956 | | | | 122,834 | |
Beacon Roofing Supply Inc * | | | 1,930 | | | | 62,069 | |
Bloomin’ Brands Inc | | | 7,144 | | | | 146,095 | |
Caleres Inc | | | 2,448 | | | | 60,441 | |
Callaway Golf Co | | | 5,022 | | | | 80,001 | |
Conn’s Inc * | | | 3,127 | | | | 71,483 | |
Cooper-Standard Holdings Inc * | | | 1,575 | | | | 73,962 | |
Del Taco Restaurants Inc * | | | 10,384 | | | | 104,463 | |
G-III Apparel Group Ltd * | | | 2,805 | | | | 112,088 | |
Marriott Vacations Worldwide Corp | | | 1,503 | | | | 140,531 | |
SkyWest Inc | | | 4,806 | | | | 260,918 | |
The Children’s Place Inc | | | 1,411 | | | | 137,262 | |
| | | | | | | | |
| | | | | | | 1,372,147 | |
| | | | | | | | |
Consumer,Non-Cyclical - 15.3% | | | | | | | | |
| | |
Aaron’s Inc | | | 3,310 | | | | 174,106 | |
Acadia Healthcare Co Inc * | | | 4,997 | | | | 146,462 | |
Adtalem Global Education Inc * | | | 5,692 | | | | 263,653 | |
AngioDynamics Inc * | | | 4,524 | | | | 103,419 | |
BioScrip Inc * | | | 24,969 | | | | 49,938 | |
Central Garden & Pet Co ‘A’ * | | | 5,559 | | | | 129,247 | |
CONMED Corp | | | 2,619 | | | | 217,848 | |
Helen of Troy Ltd * | | | 1,628 | | | | 188,783 | |
Horizon Pharma PLC * | | | 7,151 | | | | 189,001 | |
Hostess Brands Inc * | | | 8,374 | | | | 104,675 | |
ICF International Inc | | | 2,314 | | | | 176,049 | |
LivaNova PLC * | | | 1,049 | | | | 102,015 | |
Magellan Health Inc * | | | 1,149 | | | | 75,742 | |
Myriad Genetics Inc * | | | 3,410 | | | | 113,212 | |
Orthofix Medical Inc * | | | 2,471 | | | | 139,389 | |
SP Plus Corp * | | | 6,057 | | | | 206,665 | |
Syneos Health Inc * | | | 3,781 | | | | 195,705 | |
Viad Corp | | | 1,577 | | | | 88,769 | |
| | | | | | | | |
| | | | | | | 2,664,678 | |
| | | | | | | | |
Energy - 2.9% | | | | | | | | |
| | |
Exterran Corp * | | | 4,903 | | | | 82,616 | |
Helix Energy Solutions Group Inc * | | | 15,800 | | | | 124,978 | |
Magnolia Oil & Gas Corp * | | | 5,684 | | | | 68,208 | |
PDC Energy Inc * | | | 3,588 | | | | 145,960 | |
QEP Resources Inc * | | | 11,185 | | | | 87,131 | |
| | | | | | | | |
| | | | | | | 508,893 | |
| | | | | | | | |
Financial - 40.2% | | | | | | | | |
| | |
Agree Realty Corp REIT | | | 1,546 | | | | 107,200 | |
Aircastle Ltd | | | 8,885 | | | | 179,832 | |
Americold Realty Trust REIT | | | 5,806 | | | | 177,141 | |
Argo Group International Holdings Ltd | | | 3,079 | | | | 217,562 | |
Armada Hoffler Properties Inc REIT | | | 7,327 | | | | 114,228 | |
Blucora Inc * | | | 2,964 | | | | 98,938 | |
BrightSphere Investment Group PLC | | | 11,505 | | | | 156,008 | |
Cadence BanCorp | | | 5,906 | | | | 109,556 | |
| | | | | | | | |
| | | Shares | | | Value | |
Camden National Corp | | | 2,661 | | | $ | 111,017 | |
Cathay General Bancorp | | | 4,896 | | | | 166,023 | |
CenterState Bank Corp | | | 6,524 | | | | 155,336 | |
Chemical Financial Corp | | | 3,837 | | | | 157,931 | |
Deluxe Corp | | | 2,314 | | | | 101,168 | |
Enterprise Financial Services Corp | | | 2,887 | | | | 117,703 | |
Essent Group Ltd * | | | 3,405 | | | | 147,947 | |
First Bancorp | | | 4,544 | | | | 157,949 | |
First Industrial Realty Trust Inc REIT | | | 7,737 | | | | 273,580 | |
First Interstate BancSystem Inc ‘A’ | | | 4,572 | | | | 182,057 | |
First Midwest Bancorp Inc | | | 7,991 | | | | 163,496 | |
Heritage Financial Corp | | | 3,584 | | | | 108,022 | |
Heritage Insurance Holdings Inc | | | 6,123 | | | | 89,396 | |
Hilltop Holdings Inc | | | 6,276 | | | | 114,537 | |
Home BancShares Inc | | | 7,499 | | | | 131,757 | |
Horace Mann Educators Corp | | | 2,239 | | | | 78,835 | |
Horizon Bancorp Inc | | | 6,783 | | | | 109,139 | |
IBERIABANK Corp | | | 3,129 | | | | 224,381 | |
Invesco Mortgage Capital Inc REIT | | | 13,548 | | | | 214,058 | |
Investors Bancorp Inc | | | 10,632 | | | | 125,989 | |
Life Storage Inc REIT | | | 1,131 | | | | 110,012 | |
MFA Financial Inc REIT | | | 29,933 | | | | 217,613 | |
National Storage Affiliates Trust REIT | | | 6,864 | | | | 195,693 | |
NexPoint Residential Trust Inc REIT | | | 2,201 | | | | 84,386 | |
Old National Bancorp | | | 8,051 | | | | 132,036 | |
Old Second Bancorp Inc | | | 7,912 | | | | 99,612 | |
Pacific Premier Bancorp Inc | | | 2,215 | | | | 58,764 | |
PotlatchDeltic Corp REIT | | | 3,732 | | | | 141,032 | |
Preferred Bank | | | 2,243 | | | | 100,868 | |
PS Business Parks Inc REIT | | | 1,733 | | | | 271,786 | |
QCR Holdings Inc | | | 2,631 | | | | 89,244 | |
Radian Group Inc | | | 10,212 | | | | 211,797 | |
Ryman Hospitality Properties Inc REIT | | | 3,521 | | | | 289,567 | |
Sandy Spring Bancorp Inc | | | 3,133 | | | | 98,000 | |
Simmons First National Corp ‘A’ | | | 6,151 | | | | 150,576 | |
Stifel Financial Corp | | | 3,155 | | | | 166,458 | |
Sunstone Hotel Investors Inc REIT | | | 15,963 | | | | 229,867 | |
United Community Banks Inc | | | 5,592 | | | | 139,409 | |
WSFS Financial Corp | | | 3,055 | | | | 117,923 | |
| | | | | | | | |
| | | | | | | 6,995,429 | |
| | | | | | | | |
Industrial - 11.8% | | | | | | | | |
| | |
Astronics Corp * | | | 3,976 | | | | 130,095 | |
Belden Inc | | | 1,432 | | | | 76,898 | |
EMCOR Group Inc | | | 3,164 | | | | 231,225 | |
EnerSys | | | 1,793 | | | | 116,832 | |
Harsco Corp * | | | 4,769 | | | | 96,143 | |
Knowles Corp * | | | 7,214 | | | | 127,183 | |
MasTec Inc * | | | 1,805 | | | | 86,821 | |
Rexnord Corp * | | | 5,002 | | | | 125,750 | |
Sanmina Corp * | | | 7,856 | | | | 226,646 | |
SYNNEX Corp | | | 1,316 | | | | 125,533 | |
TriMas Corp * | | | 5,678 | | | | 171,646 | |
Trinseo SA | | | 3,116 | | | | 141,155 | |
Universal Forest Products Inc | | | 5,099 | | | | 152,409 | |
Vishay Intertechnology Inc | | | 6,669 | | | | 123,176 | |
Werner Enterprises Inc | | | 3,379 | | | | 115,393 | |
| | | | | | | | |
| | | | | | | 2,046,905 | |
| | | | | | | | |
Technology - 6.8% | | | | | | | | |
| | |
Allscripts Healthcare Solutions Inc * | | | 12,550 | | | | 119,727 | |
CACI International Inc ‘A’ * | | | 1,848 | | | | 336,373 | |
CSG Systems International Inc | | | 3,760 | | | | 159,048 | |
Insight Enterprises Inc * | | | 3,017 | | | | 166,116 | |
TiVo Corp | | | 10,080 | | | | 93,946 | |
Verint Systems Inc * | | | 5,197 | | | | 311,092 | |
| | | | | | | | |
| | | | | | | 1,186,302 | |
| | | | | | | | |
| | |
| See Notes to Financial Statements | | See explanation of symbols and terms, if any, on B-41 |
B-37
PACIFIC FUNDS
PACIFIC FUNDS SMALL-CAP VALUE
Schedule of Investments (Continued)
March 31, 2019
| | | | | | | | |
| | | Shares | | | Value | |
Utilities - 6.2% | | | | | | | | |
| | |
ALLETE Inc | | | 3,536 | | | $ | 290,765 | |
Black Hills Corp | | | 3,382 | | | | 250,505 | |
Portland General Electric Co | | | 5,464 | | | | 283,254 | |
Southwest Gas Holdings Inc | | | 3,051 | | | | 250,975 | |
| | | | | | | | |
| | | | | | | 1,075,499 | |
| | | | | | | | |
| | |
Total Common Stocks
(Cost $15,389,500) | | | | | | | 16,879,493 | |
| | | | | | | | |
| | |
EXCHANGE-TRADED FUND - 1.3% | | | | | | | | |
| | |
iShares Russell 2000 Value | | | 1,885 | | | | 226,012 | |
| | | | | | | | |
| | |
Total Exchange-Traded Fund
(Cost $223,112) | | | | | | | 226,012 | |
| | | | | | | | |
| | |
SHORT-TERM INVESTMENT - 1.2% | | | | | | | | |
| | |
Money Market Fund - 1.2% | | | | | | | | |
| | |
BlackRock Liquidity FundsT-Fund Portfolio
‘Institutional’ 2.370% | | | 212,456 | | | | 212,456 | |
| | | | | | | | |
| | |
Total Short-Term Investment
(Cost $212,456) | | | | | | | 212,456 | |
| | | | | | | | |
| | |
TOTAL INVESTMENTS - 99.6%
(Cost $15,825,068) | | | | | | | 17,317,961 | |
| | |
OTHER ASSETS & LIABILITIES, NET - 0.4% | | | | | | | 65,365 | |
| | | | | | | | |
| | |
NET ASSETS - 100.0% | | | | | | | $17,383,326 | |
| | | | | | | | |
Notes to Schedule of Investments
| (a) | As of March 31, 2019, the Fund’s composition by sector as a percentage of net assets was as follows: |
| | | | |
Financial | | | 40.2% | |
Consumer,Non-Cyclical | | | 15.3% | |
Industrial | | | 11.8% | |
Consumer, Cyclical | | | 7.9% | |
Technology | | | 6.8% | |
Utilities | | | 6.2% | |
Basic Materials | | | 3.1% | |
Others (each less than 3.0%) | | | 8.3% | |
| | | | |
| | | 99.6% | |
Other Assets & Liabilities, Net | | | 0.4% | |
| | | | |
| | | 100.0% | |
| | | | |
| (b) | Fair Value Measurements |
The following is a summary of the Fund’s investments as categorized under the three-tier hierarchy of inputs used in valuing the Fund’s assets and liabilities (See Note 3D in Notes to Financial Statements) as of March 31, 2019:
| | | | | | | | | | | | | | | | | | |
| | | | | Total Value at
March 31, 2019 | | | Level 1
Quoted Price | | | Level 2
Significant
Observable Inputs | | | Level 3
Significant
Unobservable Inputs | |
Assets | | Common Stocks | | | $16,879,493 | | | | $16,879,493 | | | | $— | | | | $— | |
| | Exchange-Traded Fund | | | 226,012 | | | | 226,012 | | | | — | | | | — | |
| | Short-Term Investment | | | 212,456 | | | | 212,456 | | | | — | | | | — | |
| | | | | | | | | | | | | | | | | | |
| | Total | | | $17,317,961 | | | | $17,317,961 | | | | $— | | | | $— | |
| | | | | | | | | | | | | | | | | | |
| | |
| See Notes to Financial Statements | | See explanation of symbols and terms, if any, on B-41 |
B-38
PACIFIC FUNDS
PACIFIC FUNDSSMSMALL-CAP GROWTH
Schedule of Investments
March 31, 2019
| | | | | | | | |
| | | Shares | | | Value | |
COMMON STOCKS - 98.2% | |
|
Basic Materials - 3.1% | |
| | |
Kaiser Aluminum Corp | | | 3,494 | | | | $365,927 | |
PolyOne Corp | | | 9,951 | | | | 291,664 | |
Rogers Corp * | | | 2,890 | | | | 459,163 | |
| | | | | | | | |
| | | | 1,116,754 | |
| | | | | |
Communications - 5.5% | |
| | |
Ciena Corp * | | | 8,083 | | | | 301,819 | |
NETGEAR Inc * | | | 9,878 | | | | 327,159 | |
Shutterfly Inc * | | | 6,746 | | | | 274,157 | |
Sinclair Broadcast Group Inc ‘A’ | | | 9,801 | | | | 377,143 | |
Viavi Solutions Inc * | | | 17,414 | | | | 215,585 | |
Vonage Holdings Corp * | | | 45,650 | | | | 458,326 | |
| | | | | | | | |
| | | | 1,954,189 | |
| | | | | |
Consumer, Cyclical - 13.0% | |
| | |
AMC Entertainment Holdings Inc ‘A’ | | | 10,241 | | | | 152,079 | |
Beacon Roofing Supply Inc * | | | 6,842 | | | | 220,039 | |
BJ’s Restaurants Inc | | | 6,691 | | | | 316,351 | |
Bloomin’ Brands Inc | | | 20,845 | | | | 426,280 | |
G-III Apparel Group Ltd * | | | 10,405 | | | | 415,784 | |
Golden Entertainment Inc * | | | 8,881 | | | | 125,755 | |
iRobot Corp * | | | 3,100 | | | | 364,839 | |
Lithia Motors Inc ‘A’ | | | 3,800 | | | | 352,450 | |
SeaWorld Entertainment Inc * | | | 15,899 | | | | 409,558 | |
Shake Shack Inc ‘A’ * | | | 7,482 | | | | 442,560 | |
Sleep Number Corp * | | | 7,401 | | | | 347,847 | |
Steven Madden Ltd | | | 10,039 | | | | 339,720 | |
The Children’s Place Inc | | | 3,498 | | | | 340,285 | |
Wolverine World Wide Inc | | | 10,200 | | | | 364,446 | |
| | | | | | | | |
| | | | 4,617,993 | |
| | | | | |
Consumer,Non-Cyclical - 35.7% | |
| | |
Acadia Healthcare Co Inc * | | | 9,984 | | | | 292,631 | |
Amedisys Inc * | | | 3,319 | | | | 409,100 | |
Amicus Therapeutics Inc * | | | 26,871 | | | | 365,446 | |
AMN Healthcare Services Inc * | | | 6,777 | | | | 319,129 | |
Amphastar Pharmaceuticals Inc * | | | 9,685 | | | | 197,865 | |
Avanos Medical Inc * | | | 5,735 | | | | 244,770 | |
BioScrip Inc * | | | 58,814 | | | | 117,628 | |
BioTelemetry Inc * | | | 6,300 | | | | 394,506 | |
Cardtronics PLC ‘A’ * | | | 14,539 | | | | 517,298 | |
Chegg Inc * | | | 13,949 | | | | 531,736 | |
Esperion Therapeutics Inc * | | | 5,735 | | | | 230,260 | |
FibroGen Inc * | | | 6,598 | | | | 358,601 | |
Green Dot Corp ‘A’ * | | | 7,956 | | | | 482,531 | |
Heron Therapeutics Inc * | | | 9,619 | | | | 235,088 | |
Horizon Pharma PLC * | | | 28,270 | | | | 747,176 | |
Insperity Inc | | | 4,944 | | | | 611,375 | |
iRhythm Technologies Inc * | | | 4,767 | | | | 357,334 | |
J&J Snack Foods Corp | | | 2,205 | | | | 350,242 | |
LHC Group Inc * | | | 4,857 | | | | 538,447 | |
LivaNova PLC * | | | 4,975 | | | | 483,819 | |
LiveRamp Holdings Inc * | | | 8,925 | | | | 487,037 | |
Merit Medical Systems Inc * | | | 6,783 | | | | 419,393 | |
Myriad Genetics Inc * | | | 11,330 | | | | 376,156 | |
NuVasive Inc * | | | 4,948 | | | | 280,997 | |
Orthofix Medical Inc * | | | 6,336 | | | | 357,414 | |
Performance Food Group Co * | | | 13,107 | | | | 519,561 | |
PTC Therapeutics Inc * | | | 5,955 | | | | 224,146 | |
Puma Biotechnology Inc * | | | 6,468 | | | | 250,894 | |
Quidel Corp * | | | 6,936 | | | | 454,100 | |
Revance Therapeutics Inc * | | | 9,393 | | | | 148,034 | |
Supernus Pharmaceuticals Inc * | | | 11,362 | | | | 398,124 | |
Syneos Health Inc * | | | 6,545 | | | | 338,769 | |
| | | | | | | | |
| | | Shares | | | Value | |
Ultragenyx Pharmaceutical Inc * | | | 5,982 | | | | $414,912 | |
Vanda Pharmaceuticals Inc * | | | 13,820 | | | | 254,288 | |
| | | | | | | | |
| | | | 12,708,807 | |
| | | | | |
Energy - 0.5% | |
| | |
Matador Resources Co * | | | 10,364 | | | | 200,336 | |
| | | | | | | | |
|
Financial - 8.8% | |
| | |
Blucora Inc * | | | 12,757 | | | | 425,829 | |
BrightSphere Investment Group PLC | | | 17,916 | | | | 242,941 | |
Deluxe Corp | | | 6,693 | | | | 292,618 | |
Essent Group Ltd * | | | 9,258 | | | | 402,260 | |
Home BancShares Inc | | | 15,911 | | | | 279,556 | |
Moelis & Co ‘A’ | | | 5,988 | | | | 249,161 | |
Pacific Premier Bancorp Inc | | | 7,351 | | | | 195,022 | |
Preferred Bank | | | 5,085 | | | | 228,672 | |
PS Business Parks Inc REIT | | | 2,450 | | | | 384,234 | |
Ryman Hospitality Properties Inc REIT | | | 5,313 | | | | 436,941 | |
| | | | | | | | |
| | | | 3,137,234 | |
| | | | | |
Industrial - 12.9% | |
| | |
Aerojet Rocketdyne Holdings Inc * | | | 9,394 | | | | 333,769 | |
Ambarella Inc * | | | 5,223 | | | | 225,634 | |
American Woodmark Corp * | | | 3,895 | | | | 321,844 | |
Astronics Corp * | | | 8,106 | | | | 265,228 | |
EnPro Industries Inc | | | 4,272 | | | | 275,330 | |
Generac Holdings Inc * | | | 7,970 | | | | 408,303 | |
Harsco Corp * | | | 14,206 | | | | 286,393 | |
Masonite International Corp * | | | 4,753 | | | | 237,127 | |
MasTec Inc * | | | 8,141 | | | | 391,582 | |
Saia Inc * | | | 5,211 | | | | 318,392 | |
SPX Corp * | | | 13,715 | | | | 477,145 | |
Tetra Tech Inc | | | 5,730 | | | | 341,451 | |
Trinseo SA | | | 5,151 | | | | 233,340 | |
US Concrete Inc * | | | 5,171 | | | | 214,183 | |
US Ecology Inc | | | 4,643 | | | | 259,915 | |
| | | | | | | | |
| | | | 4,589,636 | |
| | | | | |
Technology - 18.7% | |
| | |
Allscripts Healthcare Solutions Inc * | | | 34,211 | | | | 326,373 | |
Benefitfocus Inc * | | | 6,546 | | | | 324,158 | |
Bottomline Technologies DE Inc * | | | 9,696 | | | | 485,673 | |
Cloudera Inc * | | | 25,769 | | | | 281,913 | |
CommVault Systems Inc * | | | 6,628 | | | | 429,097 | |
Cornerstone OnDemand Inc * | | | 9,337 | | | | 511,481 | |
Glu Mobile Inc * | | | 58,181 | | | | 636,500 | |
HubSpot Inc * | | | 3,194 | | | | 530,875 | |
j2 Global Inc | | | 5,959 | | | | 516,049 | |
Lumentum Holdings Inc * | | | 7,532 | | | | 425,859 | |
MaxLinear Inc * | | | 11,503 | | | | 293,672 | |
RealPage Inc * | | | 4,676 | | | | 283,786 | |
Silicon Laboratories Inc * | | | 4,494 | | | | 363,385 | |
SPS Commerce Inc * | | | 3,967 | | | | 420,740 | |
TiVo Corp | | | 17,755 | | | | 165,476 | |
Virtusa Corp * | | | 7,725 | | | | 412,901 | |
Xperi Corp | | | 10,744 | | | | 251,410 | |
| | | | | | | | |
| | | | 6,659,348 | |
| | | | | |
Total Common Stocks
(Cost $28,717,161) | | | | 34,984,297 | |
| | | | | |
| | |
| See Notes to Financial Statements | | See explanation of symbols and terms, if any, on B-41 |
B-39
PACIFIC FUNDS
PACIFIC FUNDSSMALL-CAP GROWTH
Schedule of Investments (Continued)
March 31, 2019
| | | | | | | | |
| | | Shares | | | Value | |
SHORT-TERM INVESTMENT - 1.4% | |
|
Money Market Fund - 1.4% | |
| | |
BlackRock Liquidity FundsT-Fund Portfolio
‘Institutional’ 2.370% | | | 503,436 | | | | $503,436 | |
| | | | | | | | |
| |
Total Short-Term Investment
(Cost $503,436) | | | | 503,436 | |
| | | | | |
| |
TOTAL INVESTMENTS - 99.6%
(Cost $29,220,597) | | | | 35,487,733 | |
| |
OTHER ASSETS & LIABILITIES, NET - 0.4% | | | | 126,368 | |
| | | | | |
| |
NET ASSETS - 100.0% | | | | $35,614,101 | |
| | | | | | | | |
Notes to Schedule of Investments
| (a) | As of March 31, 2019, the Fund’s composition by sector as a percentage of net assets was as follows: |
| | | | |
Consumer,Non-Cyclical | | | 35.7% | |
Technology | | | 18.7% | |
Consumer, Cyclical | | | 13.0% | |
Industrial | | | 12.9% | |
Financial | | | 8.8% | |
Communications | | | 5.5% | |
Basic Materials | | | 3.1% | |
Others (each less than 3.0%) | | | 1.9% | |
| | | | |
| | | 99.6% | |
Other Assets & Liabilities, Net | | | 0.4% | |
| | | | |
| | | 100.0% | |
| | | | |
| (b) | Fair Value Measurements |
The following is a summary of the Fund’s investments as categorized under the three-tier hierarchy of inputs used in valuing the Fund’s assets and liabilities (See Note 3D in Notes to Financial Statements) as of March 31, 2019:
| | | | | | | | | | | | | | | | | | |
| | | | | Total Value at
March 31, 2019 | | | Level 1
Quoted Price | | | Level 2
Significant
Observable Inputs | | | Level 3
Significant
Unobservable Inputs | |
Assets | | Common Stocks | | | $34,984,297 | | | | $34,984,297 | | | | $— | | | | $— | |
| | Short-Term Investment | | | 503,436 | | | | 503,436 | | | | — | | | | — | |
| | | | | | | | | | | | | | | | | | |
| | Total | | | $35,487,733 | | | | $35,487,733 | | | | $— | | | | $— | |
| | | | | | | | | | | | | | | | | | |
| | |
| See Notes to Financial Statements | | See explanation of symbols and terms, if any, on B-41 |
B-40
PACIFIC FUNDS
Schedule of Investments (Continued)
Explanation of Symbols and Terms
March 31, 2019
| | |
|
Explanation of Symbols: |
| |
| * | | Non-income producing investments. |
| § | | Variable rate investments. The rate shown is based on the latest available information as of March 31, 2019. For Senior Loan Notes, the rate shown may represent a weighted average interest rate. Interest rates for certain securities are subject to interest rate caps and floors, which would result in a period end rate being more, less or equal to the referenced rate plus spread. Certain variable rate securities are not based on a published reference rate and spread but are determined by the issuer or agent and are based on current market conditions. These securities do not indicate a reference rate and spread in their description. |
| Y | | Issuer filed bankruptcy and/or is in default as of March 31, 2019. |
| ¥ | | All or a portion of this senior loan position has not settled. Rates do not take effect until settlement date. Rates shown, if any, are for the settled portion. |
| # | | Securities purchased on a when-issued basis. Rates do not take effect until settlement date. |
| ~ | | Securities are not registered under the Securities Act of 1933 (1933 Act). These securities are either (1) exempt from registration pursuant to Rule 144A under the 1933 Act and may only be sold to “qualified institutional buyers”, or (2) the securities comply with Regulation S rules governing offers and sales made outside the United States without registration under the 1933 Act and contain certain restrictions as to public resale. |
|
Reference Rate Abbreviation: |
| |
| USD LIBOR | | United States Dollar London Interbank Offered Rate |
|
Other Abbreviations: |
| |
| PIK | | Payment In Kind |
| REIT | | Real Estate Investment Trust |
Notes:
For debt investments, the interest rates disclosed in the Schedules of Investments reflect the stated coupon rate or for discounted investments or zero coupon bonds, the yield-to-maturity.
The countries listed in the Schedules of Investments are based on country of risk (See Note 4 in Notes to Financial Statements under Investments and Risks - Foreign and Emerging Markets Investments).
The sectors listed in the Schedules of Investments are obtained from a third party source (that is not affiliated with the Trust or the investment adviser) believed to be reliable. Sector names and weightings could be different if obtained from another source.
See Notes to Financial Statements
B-41
PACIFIC FUNDS
STATEMENTS OF ASSETS AND LIABILITIES
MARCH 31, 2019
| | | | | | | | | | | | | | | | | | | | | | | | | | | | | | |
| | | | | | | | Pacific Funds Portfolio Optimization | | | Pacific Funds
Diversified
Alternatives | |
| | | | | | | | Conservative | | | Moderate-
Conservative | | | Moderate | | | Growth | | | Aggressive-
Growth | |
ASSETS | | | | | | | | | | | | | | | | | | | | | | | | | | | | |
Investments in affiliated mutual funds, at value | | | | | | | $255,966,812 | | | | $372,579,548 | | | | $1,152,450,784 | | | | $887,374,219 | | | | $311,318,730 | | | | $28,240,020 | |
Receivables: | | | | | | | | | | | | | | | | | | | | | | | | | | | | |
| | Fund shares sold | | | | | | | 138,205 | | | | 83,176 | | | | 365,509 | | | | 293,308 | | | | 74,692 | | | | 8,344 | |
| | Securities sold | | | | | | | 90,099 | | | | 176,514 | | | | 1,035,036 | | | | 181,478 | | | | 133,941 | | | | 28,572 | |
| | Due from adviser | | | | | | | 14,296 | | | | 19,717 | | | | 47,842 | | | | 35,185 | | | | 15,436 | | | | 672 | |
Prepaid expenses and other assets | | | | | | | 19,687 | | | | 20,586 | | | | 27,404 | | | | 25,579 | | | | 19,960 | | | | 10,437 | |
Total Assets | | | | | | | 256,229,099 | | | | 372,879,541 | | | | 1,153,926,575 | | | | 887,909,769 | | | | 311,562,759 | | | | 28,288,045 | |
LIABILITIES | | | | | | | | | | | | | | | | | | | | | | | | | | | | |
Payables: | | | | | | | | | | | | | | | | | | | | | | | | | | | | |
| | Fund shares redeemed | | | | | | | 340,247 | | | | 689,572 | | | | 2,413,029 | | | | 1,053,482 | | | | 552,967 | | | | 46,490 | |
| | Accrued advisory fees | | | | | | | 43,295 | | | | 63,214 | | | | 195,646 | | | | 150,456 | | | | 52,802 | | | | 4,839 | |
| | Accrued administration fees | | | | | | | 32,471 | | | | 47,411 | | | | 146,734 | | | | 112,842 | | | | 39,602 | | | | 3,630 | |
| | Accrued support service expenses | | | | | | | 11,702 | | | | 16,997 | | | | 50,577 | | | | 37,842 | | | | 13,054 | | | | 1,453 | |
| | Accrued legal, audit and tax service fees | | | | | | | 31,001 | | | | 45,176 | | | | 134,372 | | | | 100,643 | | | | 34,621 | | | | 3,837 | |
| | Accrued trustees’ fees and expenses and deferred compensation | | | | | | | 4,725 | | | | 5,571 | | | | 14,797 | | | | 10,187 | | | | 2,981 | | | | 53 | |
| | Accrued distribution fees | | | | | | | 15,746 | | | | 20,255 | | | | 57,930 | | | | 41,395 | | | | 13,043 | | | | 367 | |
| | Accrued service fees | | | | | | | 10,211 | | | | 14,946 | | | | 46,041 | | | | 35,445 | | | | 12,254 | | | | 278 | |
| | Accrued other (1) | | | | | | | 29,929 | | | | 43,967 | | | | 132,980 | | | | 100,279 | | | | 34,276 | | | | 4,034 | |
Total Liabilities | | | | | | | 519,327 | | | | 947,109 | | | | 3,192,106 | | | | 1,642,571 | | | | 755,600 | | | | 64,981 | |
NET ASSETS | | | | | | | $255,709,772 | | | | $371,932,432 | | | | $1,150,734,469 | | | | $886,267,198 | | | | $310,807,159 | | | | $28,223,064 | |
NET ASSETS CONSIST OF: | | | | | | | | | | | | | | | | | | | | | | | | | | | | |
Paid-in capital | | | | | | | $254,602,912 | | | | $367,993,786 | | | | $1,066,713,556 | | | | $792,870,831 | | | | $268,932,965 | | | | $30,525,461 | |
Undistributed/accumulated earnings (deficit) | | | | | | | 1,106,860 | | | | 3,938,646 | | | | 84,020,913 | | | | 93,396,367 | | | | 41,874,194 | | | | (2,302,397 | ) |
NET ASSETS | | | | | | | $255,709,772 | | | | $371,932,432 | | | | $1,150,734,469 | | | | $886,267,198 | | | | $310,807,159 | | | | $28,223,064 | |
Class A Shares: | | | | | | | | | | | | | | | | | | | | | | | | | | | | |
| | Net Assets | | | | | | | $121,011,646 | | | | $199,827,131 | | | | $652,731,035 | | | | $529,246,711 | | | | $193,470,472 | | | | $3,797,213 | |
| | Shares of beneficial interest outstanding | | | | | | | 11,830,609 | | | | 18,667,514 | | | | 54,354,174 | | | | 41,456,527 | | | | 13,581,101 | | | | 402,487 | |
| | Net Asset Value per share* | | | | | | | $10.23 | | | | $10.70 | | | | $12.01 | | | | $12.77 | | | | $14.25 | | | | $9.43 | |
| | Sales Charge — Maximum is 5.50% of offering price | | | | | | | 0.60 | | | | 0.62 | | | | 0.70 | | | | 0.74 | | | | 0.83 | | | | 0.55 | |
| | Maximum offering price per share | | | | | | | $10.83 | | | | $11.32 | | | | $12.71 | | | | $13.51 | | | | $15.08 | | | | $9.98 | |
Class B Shares: | | | | | | | | | | | | | | | | | | | | | | | | | | | | |
| | Net Assets | | | | | | | $16,572,514 | | | | $27,881,796 | | | | $89,874,631 | | | | $66,562,463 | | | | $21,042,524 | | | | | |
| | Shares of beneficial interest outstanding | | | | | | | 1,660,954 | | | | 2,668,361 | | | | 7,619,970 | | | | 5,323,192 | | | | 1,524,797 | | | | | |
| | Net Asset Value per share* | | | | | | | $9.98 | | | | $10.45 | | | | $11.79 | | | | $12.50 | | | | $13.80 | | | | | |
Class C Shares: | | | | | | | | | | | | | | | | | | | | | | | | | | | | |
| | Net Assets | | | | | | | $111,232,539 | | | | $136,522,017 | | | | $381,169,917 | | | | $270,999,795 | | | | $85,434,482 | | | | $2,972,257 | |
| | Shares of beneficial interest outstanding | | | | | | | 11,161,492 | | | | 13,079,688 | | | | 32,395,173 | | | | 21,769,022 | | | | 6,207,765 | | | | 321,361 | |
| | Net Asset Value per share* | | | | | | | $9.97 | | | | $10.44 | | | | $11.77 | | | | $12.45 | | | | $13.76 | | | | $9.25 | |
Advisor Class: | | | | | | | | | | | | | | | | | | | | | | | | | | | | |
| | Net Assets | | | | | | | $6,893,073 | | | | $7,701,488 | | | | $26,958,886 | | | | $19,458,229 | | | | $10,859,681 | | | | $21,453,594 | |
| | Shares of beneficial interest outstanding | | | | | | | 671,680 | | | | 716,525 | | | | 2,237,225 | | | | 1,517,938 | | | | 759,820 | | | | 2,264,696 | |
| | Net Asset Value per share | | | | | | | $10.26 | | | | $10.75 | | | | $12.05 | | | | $12.82 | | | | $14.29 | | | | $9.47 | |
| | | | | | | | | | | | | | | | | | | | | | | | | | | | | | |
Investments in affiliated mutual funds, at cost | | | | | | | $252,060,175 | | | | $365,369,917 | | | | $1,091,114,470 | | | | $822,784,568 | | | | $281,697,035 | | | | $28,465,004 | |
| * | Redemption price per share is equal to the Net Asset Value per share less any applicable contingent deferred sales charge. |
| (1) | Accrued other for the Pacific Funds Diversified Alternatives includes $2,273 of accrued printing fees. |
See Notes to Financial Statements
C-1
PACIFIC FUNDS
STATEMENTS OF ASSETS AND LIABILITIES (Continued)
MARCH 31, 2019
| | | | | | | | | | | | | | | | | | | | | | | | | | |
| | | | | | | | Pacific Funds
Short Duration
Income | | | Pacific Funds
Core Income | | | Pacific Funds
Strategic
Income | | | Pacific Funds
Floating Rate
Income | | | Pacific Funds
High Income | |
ASSETS | | | | | | | | | | | | | | | | | | | | | | | | |
Investments, at value (excluding derivatives) | | | | | | | $730,397,621 | | | | $631,516,535 | | | | $589,508,225 | | | | $1,834,529,935 | | | | $134,847,309 | |
Cash | | | | | | | 11,035 | | | | 28,242 | | | | 164,875 | | | | 947,810 | | | | 10,098 | |
Foreign currency held, at value | | | | | | | — | | | | — | | | | 4,985 | | | | — | | | | 623 | |
Receivables: | | | | | | | | | | | | | | | | | | | | | | | | |
| | Dividends and interest | | | | | | | 4,238,013 | | | | 4,594,307 | | | | 5,808,829 | | | | 5,148,116 | | | | 1,834,684 | |
| | Fund shares sold | | | | | | | 7,417,226 | | | | 3,251,753 | | | | 3,446,418 | | | | 4,708,722 | | | | 5 | |
| | Securities sold | | | | | | | 1,575,918 | | | | 3,151,837 | | | | 6,763,817 | | | | 125,997,439 | | | | 446,680 | |
| | Due from adviser | | | | | | | 162,162 | | | | 140,760 | | | | 136,746 | | | | 407,096 | | | | 15,227 | |
Prepaid expenses and other assets | | | | | | | 28,892 | | | | 21,552 | | | | 22,531 | | | | 142,022 | | | | 13,426 | |
Total Assets | | | | | | | 743,830,867 | | | | 642,704,986 | | | | 605,856,426 | | | | 1,971,881,140 | | | | 137,168,052 | |
LIABILITIES | | | | | | | | | | | | | | | | | | | | | | | | |
Payables: | | | | | | | | | | | | | | | | | | | | | | | | |
| | Fund shares redeemed | | | | | | | 2,228,146 | | | | 1,581,440 | | | | 2,170,177 | | | | 7,809,807 | | | | 101,412 | |
| | Securities purchased | | | | | | | 8,921,136 | | | | 16,151,433 | | | | 20,338,744 | | | | 200,977,142 | | | | 10,917,818 | |
| | Income distributions | | | | | | | 71,637 | | | | 305,931 | | | | 399,832 | | | | 1,037,612 | | | | 627 | |
| | Accrued advisory fees | | | | | | | 238,845 | | | | 255,152 | | | | 292,758 | | | | 968,750 | | | | 46,374 | |
| | Accrued administration fees | | | | | | | 168,976 | | | | 144,698 | | | | 145,658 | | | | 386,144 | | | | 13,198 | |
| | Accrued support service expenses | | | | | | | 26,868 | | | | 26,174 | | | | 25,115 | | | | 80,984 | | | | 2,708 | |
| | Accrued custodian fees and expenses | | | | | | | 11,911 | | | | 19,912 | | | | 15,481 | | | | 69,740 | | | | 2,966 | |
| | Accrued legal, audit and tax service fees | | | | | | | 68,274 | | | | 70,067 | | | | 65,225 | | | | 207,493 | | | | 6,827 | |
| | Accrued trustees’ fees and expenses and deferred compensation | | | | | | | 973 | | | | 948 | | | | 910 | | | | 2,934 | | | | 98 | |
| | Accrued distribution fees | | | | | | | 5,693 | | | | 10,010 | | | | 7,227 | | | | 24,258 | | | | 459 | |
| | Accrued service fees | | | | | | | 6,787 | | | | 6,698 | | | | 4,933 | | | | 16,438 | | | | 365 | |
| | Accrued other | | | | | | | 67,661 | | | | 78,748 | | | | 75,143 | | | | 281,594 | | | | 14,100 | |
Unfunded loan commitment depreciation | | | | | | | — | | | | — | | | | — | | | | 44,140 | | | | — | |
Total Liabilities | | | | | | | 11,816,907 | | | | 18,651,211 | | | | 23,541,203 | | | | 211,907,036 | | | | 11,106,952 | |
NET ASSETS | | | | | | | $732,013,960 | | | | $624,053,775 | | | | $582,315,223 | | | | $1,759,974,104 | | | | $126,061,100 | |
NET ASSETS CONSIST OF: | | | | | | | | | | | | | | | | | | | | | |
Paid-in capital | | | | | | | $730,950,168 | | | | $641,179,224 | | | | $597,443,320 | | | | $1,839,066,799 | | | | $136,039,569 | |
Undistributed/accumulated earnings (deficit) | | | | | | | 1,063,792 | | | | (17,125,449 | ) | | | (15,128,097 | ) | | | (79,092,695 | ) | | | (9,978,469 | ) |
NET ASSETS | | | | | | | $732,013,960 | | | | $624,053,775 | | | | $582,315,223 | | | | $1,759,974,104 | | | | $126,061,100 | |
Class A Shares: | | | | | | | | | | | | | | | | | | | | | | | | |
| | Net Assets | | | | | | | $118,935,430 | | | | $82,135,813 | | | | $61,503,285 | | | | $202,929,163 | | | | $5,174,237 | |
| | Shares of beneficial interest outstanding | | | | | | | 11,543,770 | | | | 7,806,798 | | | | 5,800,779 | | | | 20,532,300 | | | | 513,625 | |
| | Net Asset Value per share* | | | | | | | $10.30 | | | | $10.52 | | | | $10.60 | | | | $9.88 | | | | $10.07 | |
| | Sales Charge (1) | | | | | | | 0.32 | | | | 0.47 | | | | 0.47 | | | | 0.31 | | | | 0.45 | |
| | Maximum offering price per share | | | | | | | $10.62 | | | | $10.99 | | | | $11.07 | | | | $10.19 | | | | $10.52 | |
Class C Shares: | | | | | | | | | | | | | | | | | | | | | |
| | Net Assets | | | | | | | $46,166,849 | | | | $81,308,520 | | | | $58,634,135 | | | | $197,080,949 | | | | $3,725,513 | |
| | Shares of beneficial interest outstanding | | | | | | | 4,489,553 | | | | 7,726,350 | | | | 5,542,338 | | | | 19,980,038 | | | | 370,351 | |
| | Net Asset Value per share* | | | | | | | $10.28 | | | | $10.52 | | | | $10.58 | | | | $9.86 | | | | $10.06 | |
Class I Shares: | | | | | | | | | | | | | | | | | | | | | | | | |
| | Net Assets | | | | | | | $83,435,708 | | | | $26,394,032 | | | | $5,749,904 | | | | $497,335,473 | | | | $175,017 | |
| | Shares of beneficial interest outstanding | | | | | | | 8,108,768 | | | | 2,506,427 | | | | 545,554 | | | | 50,248,886 | | | | 17,534 | |
| | Net Asset Value per share | | | | | | | $10.29 | | | | $10.53 | | | | $10.54 | | | | $9.90 | | | | $9.98 | |
Class P Shares: | | | | | | | | | | | | | | | | | | | | | | | | |
| | Net Assets | | | | | | | | | | | $40,570,151 | | | | | | | | $32,176,438 | | | | $113,317,493 | |
| | Shares of beneficial interest outstanding | | | | | | | | | | | 3,841,184 | | | | | | | | 3,251,633 | | | | 11,355,574 | |
| | Net Asset Value Per Share | | | | | | | | | | | $10.56 | | | | | | | | $9.90 | | | | $9.98 | |
Advisor Class: | | | | | | | | | | | | | | | | | | | | | | | | |
| | Net Assets | | | | | | | $483,475,973 | | | | $393,645,259 | | | | $456,427,899 | | | | $830,452,081 | | | | $3,668,840 | |
| | Shares of beneficial interest outstanding | | | | | | | 46,911,396 | | | | 37,332,163 | | | | 43,041,230 | | | | 83,734,806 | | | | 363,905 | |
| | Net Asset Value per share | | | | | | | $10.31 | | | | $10.54 | | | | $10.60 | | | | $9.92 | | | | $10.08 | |
| | | | | | | | | | | | | | | | | | | | | | | | | | |
Investments, at cost (excluding derivatives) | | | | | | | $727,069,520 | | | | $626,126,822 | | | | $594,692,237 | | | | $1,859,083,659 | | | | $135,136,757 | |
Foreign currency held, at cost | | | | | | | — | | | | — | | | | 6,640 | | | | — | | | | 788 | |
| * | Redemption price per share is equal to the Net Asset Value per share less any applicable contingent deferred sales charge. |
| (1) | The Class A shares of Pacific Funds Short Duration Income and Pacific Funds Floating Rate Income are subject to a maximum 3.00% front-end sales charge. The Class A shares of Pacific Funds Core Income, Pacific Funds Strategic Income, and Pacific Funds High Income are subject to a maximum 4.25% front-end sales charge. |
See Notes to Financial Statements
C-2
PACIFIC FUNDS
STATEMENTS OF ASSETS AND LIABILITIES (Continued)
MARCH 31, 2019
| | | | | | | | | | | | | | | | | | | | | | | | | | | | |
| | | | | | | Pacific Funds
Large-Cap | | | Pacific Funds
Large-Cap
Value | | | Pacific Funds
Small/Mid-Cap | | | Pacific Funds
Small-Cap | | | Pacific Funds
Small-Cap
Value | | | Pacific Funds
Small-Cap
Growth | |
ASSETS | | | | | | | | | | | | | | | | | | | | | | | | | | |
Investments, at value (excluding derivatives) | | | | | $19,743,651 | | | | $18,401,099 | | | | $374,464,707 | | | | $19,790,265 | | | | $17,317,961 | | | | $35,487,733 | |
Receivables: | | | | | | | | | | | | | | | | | | | | | | | | | | |
| | Dividends and interest | | | | | 12,453 | | | | 22,167 | | | | 228,030 | | | | 17,256 | | | | 31,769 | | | | 11,509 | |
| | Fund shares sold | | | | | 1,983 | | | | 1,234 | | | | 320,233 | | | | 17,797 | | | | 68,049 | | | | 1,200 | |
| | Securities sold | | | | | 473,740 | | | | 261,232 | | | | 599,951 | | | | 29,527 | | | | 69,035 | | | | 215,249 | |
| | Due from adviser | | | | | 3,199 | | | | 3,910 | | | | 45,101 | | | | 6,384 | | | | 3,902 | | | | 5,589 | |
Prepaid expenses and other assets | | | | | 11,025 | | | | 11,097 | | | | 14,184 | | | | 10,984 | | | | 11,245 | | | | 11,940 | |
Total Assets | | | | | 20,246,051 | | | | 18,700,739 | | | | 375,672,206 | | | | 19,872,213 | | | | 17,501,961 | | | | 35,733,220 | |
LIABILITIES | | | | | | | | | | | | | | | | | | | | | | | | | | |
Payables: | | | | | | | | | | | | | | | | | | | | | | | | | | |
| | Fund shares redeemed | | | | | 197 | | | | 29,765 | | | | 509,707 | | | | 63,097 | | | | 35,341 | | | | 12,027 | |
| | Securities purchased | | | | | 439,798 | | | | 186,718 | | | | 1,381,408 | | | | 15,314 | | | | 57,658 | | | | 51,450 | |
| | Accrued advisory fees | | | | | 9,069 | | | | 10,101 | | | | 267,255 | | | | 14,260 | | | | 12,562 | | | | 29,988 | |
| | Accrued administration fees | | | | | 4,853 | | | | 4,570 | | | | 93,543 | | | | 4,965 | | | | 4,043 | | | | 6,481 | |
| | Accrued support service expenses | | | | | 835 | | | | 1,159 | | | | 10,283 | | | | 806 | | | | 1,050 | | | | 2,515 | |
| | Accrued custodian fees and expenses | | | | | 390 | | | | 620 | | | | 5,629 | | | | 534 | | | | 622 | | | | 1,200 | |
| | Accrued legal, audit and tax service fees | | | | | 2,169 | | | | 3,068 | | | | 26,844 | | | | 2,143 | | | | 2,804 | | | | 6,471 | |
| | Accrued trustees’ fees and expenses and deferred compensation | | | | | 30 | | | | 42 | | | | 373 | | | | 29 | | | | 38 | | | | 91 | |
| | Accrued distribution fees | | | | | 477 | | | | 427 | | | | 2,056 | | | | 110 | | | | 159 | | | | 117 | |
| | Accrued service fees | | | | | 488 | | | | 320 | | | | 1,579 | | | | 240 | | | | 106 | | | | 166 | |
| | Accrued other | | | | | 3,145 | | | | 4,158 | | | | 34,082 | | | | 3,748 | | | | 4,252 | | | | 8,613 | |
Total Liabilities | | | | | 461,451 | | | | 240,948 | | | | 2,332,759 | | | | 105,246 | | | | 118,635 | | | | 119,119 | |
NET ASSETS | | | | | $19,784,600 | | | | $18,459,791 | | | | $373,339,447 | | | | $19,766,967 | | | | $17,383,326 | | | | $35,614,101 | |
NET ASSETS CONSIST OF: | | | | | | | | | | | | | | | | | | | | | | | | | | |
Paid-in capital | | | | | $17,154,951 | | | | $14,012,453 | | | | $346,061,589 | | | | $18,477,865 | | | | $16,390,910 | | | | $31,676,344 | |
Undistributed/accumulated earnings (deficit) | | | | | 2,629,649 | | | | 4,447,338 | | | | 27,277,858 | | | | 1,289,102 | | | | 992,416 | | | | 3,937,757 | |
NET ASSETS | | | | | $19,784,600 | | | | $18,459,791 | | | | $373,339,447 | | | | $19,766,967 | | | | $17,383,326 | | | | $35,614,101 | |
Class A Shares: | | | | | | | | | | | | | | | | | | | | | | | | | | |
| | Net Assets | | | | | $8,079,735 | | | | $4,353,194 | | | | $21,872,283 | | | | $4,986,237 | | | | $1,297,810 | | | | $3,125,736 | |
| | Shares of beneficial interest outstanding | | | | | 647,628 | | | | 399,711 | | | | 1,679,582 | | | | 411,306 | | | | 142,620 | | | | 261,219 | |
| | Net Asset Value per share* | | | | | $12.48 | | | | $10.89 | | | | $13.02 | | | | $12.12 | | | | $9.10 | | | | $11.97 | |
| | Sales Charge — Maximum is 4.25% of offering price | | | | | 0.55 | | | | 0.48 | | | | 0.58 | | | | 0.54 | | | | 0.40 | | | | 0.53 | |
| | Maximum offering price per share | | | | | $13.03 | | | | $11.37 | | | | $13.60 | | | | $12.66 | | | | $9.50 | | | | $12.50 | |
Class C Shares: | | | | | | | | | | | | | | | | | | | | | | | | | | |
| | Net Assets | | | | | $3,899,872 | | | | $3,475,441 | | | | $16,874,983 | | | | $902,176 | | | | $1,287,190 | | | | $959,259 | |
| | Shares of beneficial interest outstanding | | | | | 314,059 | | | | 320,979 | | | | 1,328,285 | | | | 75,580 | | | | 144,016 | | | | 82,349 | |
| | Net Asset Value per share* | | | | | $12.42 | | | | $10.83 | | | | $12.70 | | | | $11.94 | | | | $8.94 | | | | $11.65 | |
Class P Shares: | | | | | | | | | | | | | | | | | | | | | | | | | | |
| | Net Assets | | | | | | | | | | | | | | | | | | | | | | | | | $23,954,771 | |
| | Shares of beneficial interest outstanding | | | | | | | | | | | | | | | | | | | | | | | | | 1,983,167 | |
| | Net Asset Value Per Share | | | | | | | | | | | | | | | | | | | | | | | | | $12.08 | |
Advisor Class: | | | | | | | | | | | | | | | | | | | | | | | | | | |
| | Net Assets | | | | | $6,895,671 | | | | $9,799,467 | | | | $328,170,646 | | | | $13,220,279 | | | | $11,663,944 | | | | $5,287,803 | |
| | Shares of beneficial interest outstanding | | | | | 548,579 | | | | 896,964 | | | | 25,038,994 | | | | 1,073,024 | | | | 1,273,169 | | | | 437,603 | |
| | Net Asset Value per share | | | | | $12.57 | | | | $10.93 | | | | $13.11 | | | | $12.32 | | | | $9.16 | | | | $12.08 | |
Class S: | | | | | | | | | | | | | | | | | | | | | | | | | | |
| | Net Assets | | | | | $909,322 | | | | $831,689 | | | | $6,421,535 | | | | $658,275 | | | | $3,134,382 | | | | $2,286,532 | |
| | Shares of beneficial interest outstanding | | | | | 73,747 | | | | 76,717 | | | | 489,590 | | | | 58,331 | | | | 343,499 | | | | 188,733 | |
| | Net Asset Value per share | | | | | $12.33 | | | | $10.84 | | | | $13.12 | | | | $11.29 | | | | $9.12 | | | | $12.12 | |
| | | | | | | | | | | | | | | | | | | | | | | | | | | | |
Investments, at cost (excluding derivatives) | | | | | $16,834,109 | | | | $14,957,356 | | | | $339,528,007 | | | | $17,757,789 | | | | $15,825,068 | | | | $29,220,597 | |
| * | Redemption price per share is equal to the Net Asset Value per share less any applicable contingent deferred sales charge. |
See Notes to Financial Statements
C-3
PACIFIC FUNDS
STATEMENTS OF OPERATIONS
FOR THE YEAR ENDED MARCH 31, 2019
| | | | | | | | | | | | | | | | | | | | | | | | | | | | | | |
| | | | | | | | Pacific Funds Portfolio Optimization | | | Pacific Funds
Diversified
Alternatives | |
| | | | | | | | Conservative | | | Moderate-
Conservative | | | Moderate | | | Growth | | | Aggressive-
Growth | |
INVESTMENT INCOME | | | | | | | | | | | | | | | | | | | | | | | | | | | | |
Dividends from affiliated mutual fund investments | | | | | | | $6,730,294 | | | | $8,776,697 | | | | $21,781,058 | | | | $13,409,103 | | | | $3,883,564 | | | | $432,736 | |
Total Investment Income | | | | | | | 6,730,294 | | | | 8,776,697 | | | | 21,781,058 | | | | 13,409,103 | | | | 3,883,564 | | | | 432,736 | |
| | | | | | | |
EXPENSES | | | | | | | | | | | | | | | | | | | | | | | | | | | | |
Advisory fees | | | | | | | 553,384 | | | | 817,122 | | | | 2,467,476 | | | | 1,869,388 | | | | 643,120 | | | | 75,879 | |
Administration fees | | | | | | | 415,038 | | | | 612,843 | | | | 1,850,607 | | | | 1,402,041 | | | | 482,339 | | | | 56,909 | |
Support services expenses | | | | | | | 49,877 | | | | 74,111 | | | | 221,671 | | | | 167,618 | | | | 57,347 | | | | 6,946 | |
Shareholder report expenses | | | | | | | 25,188 | | | | 37,437 | | | | 112,667 | | | | 85,471 | | | | 29,489 | | | | 3,853 | |
Distribution fees (1) | | | | | | | | | | | | | | | | | | | | | | | | | | | | |
| | Class B | | | | | | | 151,081 | | | | 246,433 | | | | 778,965 | | | | 578,049 | | | | 178,904 | | | | | |
| | Class C | | | | | | | 922,086 | | | | 1,163,630 | | | | 3,199,440 | | | | 2,210,787 | | | | 691,304 | | | | 23,244 | |
| | Class R (2) | | | | | | | 11,459 | | | | 12,318 | | | | 56,548 | | | | 33,281 | | | | 16,001 | | | | | |
| | | | | | | |
Service fees (1) | | | | | | | | | | | | | | | | | | | | | | | | | | | | |
| | Class A | | | | | | | 304,496 | | | | 523,906 | | | | 1,637,869 | | | | 1,321,555 | | | | 468,966 | | | | 12,286 | |
| | Class B | | | | | | | 50,360 | | | | 82,145 | | | | 259,655 | | | | 192,683 | | | | 59,635 | | | | | |
| | Class C | | | | | | | 307,362 | | | | 387,876 | | | | 1,066,480 | | | | 736,929 | | | | 230,434 | | | | 7,748 | |
| | Class R (2) | | | | | | | 11,459 | | | | 12,317 | | | | 56,548 | | | | 33,281 | | | | 16,001 | | | | | |
Transfer agencyout-of-pocket expenses | | | | | | | 20,123 | | | | 29,250 | | | | 87,167 | | | | 66,747 | | | | 22,501 | | | | 2,846 | |
Registration fees | | | | | | | 75,041 | | | | 77,749 | | | | 98,972 | | | | 90,888 | | | | 76,088 | | | | 51,139 | |
Legal, audit and tax service fees | | | | | | | 34,718 | | | | 50,705 | | | | 151,073 | | | | 113,290 | | | | 38,987 | | | | 4,450 | |
Trustees’ fees and expenses | | | | | | | 12,979 | | | | 19,224 | | | | 57,412 | | | | 43,321 | | | | 14,790 | | | | 1,809 | |
Recoupment of adviser reimbursement (3) | | | | | | | — | | | | — | | | | — | | | | — | | | | — | | | | 20,655 | |
Other | | | | | | | 12,843 | | | | 16,849 | | | | 45,392 | | | | 34,868 | | | | 13,936 | | | | 3,152 | |
Total Expenses | | | | | | | 2,957,494 | | | | 4,163,915 | | | | 12,147,942 | | | | 8,980,197 | | | | 3,039,842 | | | | 270,916 | |
Adviser Expense Reimbursement (3) | | | | | | | (230,770 | ) | | | (305,325 | ) | | | (774,354 | ) | | | (602,203 | ) | | | (253,140 | ) | | | — | |
Net Expenses | | | | | | | 2,726,724 | | | | 3,858,590 | | | | 11,373,588 | | | | 8,377,994 | | | | 2,786,702 | | | | 270,916 | |
NET INVESTMENT INCOME (LOSS) | | | | | | | 4,003,570 | | | | 4,918,107 | | | | 10,407,470 | | | | 5,031,109 | | | | 1,096,862 | | | | 161,820 | |
| | | | | | | |
NET REALIZED AND UNREALIZED GAIN (LOSS) | | | | | | | | | | | | | | | | | | | | | | | | | | | | |
Net Realized Gain (Loss) On: | | | | | | | | | | | | | | | | | | | | | | | | | | | | |
| | Investment security transactions in affiliated mutual funds | | | | | | | 6,058,957 | | | | 20,237,831 | | | | 53,947,431 | | | | 58,195,978 | | | | 24,938,503 | | | | (2,117,807 | ) |
| | Capital gain distributions from affiliated mutual fund investments | | | | | | | 2,940,789 | | | | 6,331,866 | | | | 55,483,361 | | | | 58,312,701 | | | | 25,598,971 | | | | 519,864 | |
| | Net Realized Gain (Loss) | | | | | | | 8,999,746 | | | | 26,569,697 | | | | 109,430,792 | | | | 116,508,679 | | | | 50,537,474 | | | | (1,597,943 | ) |
| | | | | | | |
Change In Net Unrealized Appreciation (Depreciation) On: | | | | | | | | | | | | | | | | | | | | | | | | | | | | |
| | Investment securities in affiliated mutual fund investments | | | | | | | (9,753,514 | ) | | | (26,777,500 | ) | | | (97,037,490 | ) | | | (99,596,050 | ) | | | (42,365,388 | ) | | | (574,150 | ) |
| | Change in Net Unrealized Appreciation (Depreciation) | | | | | | | (9,753,514 | ) | | | (26,777,500 | ) | | | (97,037,490 | ) | | | (99,596,050 | ) | | | (42,365,388 | ) | | | (574,150 | ) |
NET GAIN (LOSS) | | | | | | | (753,768 | ) | | | (207,803 | ) | | | 12,393,302 | | | | 16,912,629 | | | | 8,172,086 | | | | (2,172,093 | ) |
NET INCREASE (DECREASE) IN NET ASSETS
RESULTING FROM OPERATIONS | | | | | | | $3,249,802 | | | | $4,710,304 | | | | $22,800,772 | | | | $21,943,738 | | | | $9,268,948 | | | | ($2,010,273 | ) |
| (1) | The Advisor Class shares are not subject to distribution and service fees (see Notes 1 and 6 in Notes to Financial Statements). |
| (2) | Class R shares were converted to Class A shares on March 22, 2019 (see Note 1 in Notes to Financial Statements). |
| (3) | See Note 7B in Notes to Financial Statements. |
See Notes to Financial Statements
C-4
PACIFIC FUNDS
STATEMENTS OF OPERATIONS (Continued)
FOR THE YEAR ENDED MARCH 31, 2019
| | | | | | | | | | | | | | | | | | | | | | | | |
| | | | | | | Pacific Funds
Short Duration
Income | | | Pacific Funds
Core Income | | | Pacific Funds
Strategic
Income | | | Pacific Funds
Floating Rate
Income | | | Pacific Funds
High Income | |
INVESTMENT INCOME | | | | | | | | | | | | | | | | | | | | | | |
Dividends, net of foreign taxes withheld | | | | | $418,409 | | | | $293,444 | | | | $979,676 | | | | $2,946,590 | | | | $107,367 | |
Interest, net of foreign taxes withheld | | | | | 16,435,203 | | | | 24,976,208 | | | | 29,316,312 | | | | 102,026,090 | | | | 4,414,427 | |
Other | | | | | — | | | | — | | | | — | | | | — | | | | 18 | |
Total Investment Income | | | | | 16,853,612 | | | | 25,269,652 | | | | 30,295,988 | | | | 104,972,680 | | | | 4,521,812 | |
| | | | | | |
EXPENSES | | | | | | | | | | | | | | | | | | | | | | |
Advisory fees | | | | | 2,027,531 | | | | 3,101,928 | | | | 3,379,103 | | | | 11,488,663 | | | | 421,995 | |
Administration fees | | | | | 1,469,665 | | | | 1,761,665 | | | | 1,682,376 | | | | 4,546,089 | | | | 123,636 | |
Support services expenses | | | | | 83,459 | | | | 113,809 | | | | 98,315 | | | | 295,651 | | | | 11,928 | |
Custodian fees and expenses | | | | | 14,142 | | | | 26,526 | | | | 19,332 | | | | 92,953 | | | | 3,607 | |
Shareholder report expenses | | | | | 45,025 | | | | 55,025 | | | | 52,044 | | | | 163,930 | | | | 6,821 | |
Distribution fees (1) | | | | | | | | | | | | | | | | | | | | | | |
| | Class C | | | | | 327,323 | | | | 658,742 | | | | 428,617 | | | | 1,492,365 | | | | 30,889 | |
Service fees (1) | | | | | | | | | | | | | | | | | | | | | | |
| | Class A | | | | | 226,724 | | | | 246,916 | | | | 165,213 | | | | 530,324 | | | | 13,311 | |
| | Class C | | | | | 109,108 | | | | 219,581 | | | | 142,872 | | | | 497,455 | | | | 10,296 | |
Transfer agencyout-of-pocket expenses | | | | | 34,406 | | | | 46,751 | | | | 40,634 | | | | 124,696 | | | | 5,091 | |
Registration fees | | | | | 114,137 | | | | 88,845 | | | | 107,609 | | | | 153,548 | | | | 56,254 | |
Legal, audit and tax service fees | | | | | 74,036 | | | | 77,698 | | | | 72,737 | | | | 303,556 | | | | 8,287 | |
Trustees’ fees and expenses | | | | | 22,456 | | | | 29,943 | | | | 25,976 | | | | 79,812 | | | | 3,249 | |
Interest expense | | | | | — | | | | — | | | | — | | | | 381,710 | | | | — | |
Other | | | | | 35,400 | | | | 47,134 | | | | 45,615 | | | | 83,724 | | | | 18,774 | |
Total Expenses | | | | | 4,583,412 | | | | 6,474,563 | | | | 6,260,443 | | | | 20,234,476 | | | | 714,138 | |
Advisory Fee Waiver (2) | | | | | — | | | | — | | | | — | | | | (191,872 | ) | | | — | |
Adviser Expense Reimbursement (3) | | | | | (1,385,844 | ) | | | (1,843,904 | ) | | | (1,612,421 | ) | | | (4,391,138 | ) | | | (169,374 | ) |
Net Expenses | | | | | 3,197,568 | | | | 4,630,659 | | | | 4,648,022 | | | | 15,651,466 | | | | 544,764 | |
NET INVESTMENT INCOME (LOSS) | | | | | 13,656,044 | | | | 20,638,993 | | | | 25,647,966 | | | | 89,321,214 | | | | 3,977,048 | |
| | | | | | |
NET REALIZED AND UNREALIZED GAIN (LOSS) | | | | | | | | | | | | | | | | | | | | | | |
Net Realized Gain (Loss) On: | | | | | | | | | | | | | | | | | | | | | | |
| | Investment security transactions | | | | | (868,315 | ) | | | (7,715,010 | ) | | | (2,204,849 | ) | | | (16,678,087 | ) | | | (1,030,376 | ) |
| | Net Realized Gain (Loss) | | | | | (868,315 | ) | | | (7,715,010 | ) | | | (2,204,849 | ) | | | (16,678,087 | ) | | | (1,030,376 | ) |
| | | | | | |
Change In Net Unrealized Appreciation (Depreciation) On: | | | | | | | | | | | | | | | | | | | | | | |
| | Investment securities | | | | | 6,040,386 | | | | 10,264,861 | | | | (3,634,674 | ) | | | (27,999,595 | ) | | | 86,579 | |
| | Foreign currencies | | | | | — | | | | — | | | | (185 | ) | | | — | | | | (23 | ) |
| | Unfunded loan commitments | | | | | — | | | | — | | | | 9,744 | | | | (107,452 | ) | | | — | |
| | Change in Net Unrealized Appreciation (Depreciation) | | | | | 6,040,386 | | | | 10,264,861 | | | | (3,625,115 | ) | | | (28,107,047 | ) | | | 86,556 | |
NET GAIN (LOSS) | | | | | 5,172,071 | | | | 2,549,851 | | | | (5,829,964 | ) | | | (44,785,134 | ) | | | (943,820 | ) |
NET INCREASE (DECREASE) IN NET ASSETS
RESULTING FROM OPERATIONS | | | | | $18,828,115 | | | | $23,188,844 | | | | $19,818,002 | | | | $44,536,080 | | | | $3,033,228 | |
| | | | | | | | | | | | | | | | | | | | | | | | |
Foreign taxes withheld on dividends and interest | | | | | $8,313 | | | | $1,758 | | | | $3,194 | | | | $— | | | | $1,676 | |
| (1) | The Class I, Class P, and the Advisor class shares are not subject to distribution and service fees (see Notes 1 and 6 in Notes to Financial Statements). |
| (2) | See Note 6 in Notes to Financial Statements. |
| (3) | See Note 7B in Notes to Financial Statements. |
See Notes to Financial Statements
C-5
PACIFIC FUNDS
STATEMENTS OF OPERATIONS (Continued)
FOR THE YEAR ENDED MARCH 31, 2019
| | | | | | | | | | | | | | | | | | | | | | | | | | | | | | |
| | | | | | | | Pacific Funds
Large-Cap | | | Pacific Funds
Large-Cap
Value | | | Pacific Funds
Small/Mid-Cap | | | Pacific Funds
Small-Cap | | | Pacific Funds
Small-Cap
Value | | | Pacific Funds
Small-Cap
Growth | |
INVESTMENT INCOME | | | | | | | | | | | | | | | | | | | | | | | | | | | | |
Dividends, net of foreign taxes withheld | | | | | | | $370,656 | | | | $661,781 | | | | $3,304,992 | | | | $250,639 | | | | $423,478 | | | | $359,277 | |
Total Investment Income | | | | | | | 370,656 | | | | 661,781 | | | | 3,304,992 | | | | 250,639 | | | | 423,478 | | | | 359,277 | |
| | | | | | | |
EXPENSES | | | | | | | | | | | | | | | | | | | | | | | | | | | | |
Advisory fees | | | | | | | 124,383 | | | | 180,914 | | | | 2,374,423 | | | | 195,234 | | | | 225,053 | | | | 486,139 | |
Administration fees | | | | | | | 56,429 | | | | 81,354 | | | | 824,919 | | | | 68,247 | | | | 67,776 | | | | 111,859 | |
Support services expenses | | | | | | | 2,993 | | | | 4,247 | | | | 39,966 | | | | 3,630 | | | | 3,896 | | | | 9,417 | |
Custodian fees and expenses | | | | | | | 398 | | | | 763 | | | | 6,640 | | | | 582 | | | | 647 | | | | 1,370 | |
Shareholder report expenses | | | | | | | 1,777 | | | | 2,609 | | | | 24,216 | | | | 2,286 | | | | 2,514 | | | | 5,533 | |
Distribution fees (1) | | | | | | | | | | | | | | | | | | | | | | | | | | | | |
| | Class C | | | | | | | 29,635 | | | | 29,393 | | | | 126,120 | | | | 6,828 | | | | 10,846 | | | | 6,571 | |
| | Investor Class (2) | | | | | | | 274 | | | | 89 | | | | 4,864 | | | | 2,789 | | | | 156 | | | | 1,318 | |
Service fees (1) | | | | | | | | | | | | | | | | | | | | | | | | | | | | |
| | Class A | | | | | | | 15,976 | | | | 9,735 | | | | 60,749 | | | | 10,494 | | | | 3,286 | | | | 5,430 | |
| | Class C | | | | | | | 9,878 | | | | 9,798 | | | | 42,040 | | | | 2,276 | | | | 3,616 | | | | 2,190 | |
Transfer agencyout-of-pocket expenses | | | | | | | 1,359 | | | | 2,098 | | | | 18,533 | | | | 1,671 | | | | 2,059 | | | | 4,402 | |
Registration fees | | | | | | | 53,533 | | | | 53,476 | | | | 72,625 | | | | 56,869 | | | | 53,550 | | | | 54,335 | |
Legal, audit and tax service fees | | | | | | | 2,515 | | | | 3,602 | | | | 31,653 | | | | 2,605 | | | | 3,335 | | | | 7,693 | |
Trustees’ fees and expenses | | | | | | | 886 | | | | 1,357 | | | | 11,807 | | | | 1,061 | | | | 1,322 | | | | 2,804 | |
Other | | | | | | | 2,964 | | | | 3,623 | | | | 18,204 | | | | 4,020 | | | | 4,132 | | | | 5,828 | |
Total Expenses | | | | | | | 303,000 | | | | 383,058 | | | | 3,656,759 | | | | 358,592 | | | | 382,188 | | | | 704,889 | |
Advisory Fee Waiver (3) | | | | | | | (19,036 | ) | | | — | | | | — | | | | — | | | | — | | | | — | |
Adviser Expense Reimbursement (4) | | | | | | | (85,164 | ) | | | (98,891 | ) | | | (493,273 | ) | | | (94,696 | ) | | | (90,131 | ) | | | (103,024 | ) |
Net Expenses | | | | | | | 198,800 | | | | 284,167 | | | | 3,163,486 | | | | 263,896 | | | | 292,057 | | | | 601,865 | |
NET INVESTMENT INCOME (LOSS) | | | | | | | 171,856 | | | | 377,614 | | | | 141,506 | | | | (13,257 | ) | | | 131,421 | | | | (242,588 | ) |
| | | | | | | |
NET REALIZED AND UNREALIZED GAIN (LOSS) | | | | | | | | | | | | | | | | | | | | | | | | | | | | |
Net Realized Gain (Loss) On: | | | | | | | | | | | | | | | | | | | | | | | | | | | | |
| | Investment security transactions | | | | | | | 255,129 | | | | 1,566,245 | | | | (1,202,028 | ) | | | 293,078 | | | | 1,654,755 | | | | 1,869,965 | |
| | Net Realized Gain (Loss) | | | | | | | 255,129 | | | | 1,566,245 | | | | (1,202,028 | ) | | | 293,078 | | | | 1,654,755 | | | | 1,869,965 | |
| | | | | | | |
Change In Net Unrealized Appreciation (Depreciation) On: | | | | | | | | | | | | | | | | | | | | | | | | | | | | |
| | Investment securities | | | | | | | 794,723 | | | | (1,146,418 | ) | | | 8,050,964 | | | | (434,380 | ) | | | (3,313,252 | ) | | | (622,046 | ) |
| | Change in Net Unrealized Appreciation (Depreciation) | | | | | | | 794,723 | | | | (1,146,418 | ) | | | 8,050,964 | | | | (434,380 | ) | | | (3,313,252 | ) | | | (622,046 | ) |
NET GAIN (LOSS) | | | | | | | 1,049,852 | | | | 419,827 | | | | 6,848,936 | | | | (141,302 | ) | | | (1,658,497 | ) | | | 1,247,919 | |
NET INCREASE (DECREASE) IN NET ASSETS
RESULTING FROM OPERATIONS | | | | | | | $1,221,708 | | | | $797,441 | | | | $6,990,442 | | | | ($154,559 | ) | | | ($1,527,076 | ) | | | $1,005,331 | |
| (1) | The Class P, Advisor, and Class S shares are not subject to distribution and service fees (see Notes 1 and 6 in Notes to Financial Statements). |
| (2) | Investor Class shares were converted to Class A shares on July 31, 2018 (see Note 1 in Notes to Financial Statements). |
| (3) | See Note 6 in Notes to Financial Statements. |
| (4) | See Note 7B in Notes to Financial Statements. |
See Notes to Financial Statements
C-6
PACIFIC FUNDS
STATEMENTS OF CHANGES IN NET ASSETS
| | | | | | | | | | | | | | | | | | | | | | | | | | | | | | | | | | | | | | |
| | | | | | Pacific Funds Portfolio
Optimization Conservative | | | | | | Pacific Funds Portfolio
Optimization Moderate-Conservative | | | | | | Pacific Funds Portfolio
Optimization Moderate | |
| | | | | | | | Year Ended
March 31, 2019 | | | Year Ended
March 31, 2018 | | | | | | Year Ended
March 31, 2019 | | | Year Ended
March 31, 2018 | | | | | | Year Ended
March 31, 2019 | | | Year Ended
March 31, 2018 | |
OPERATIONS | | | | | | | | | | | | | | | | | | | | | | | | | | | | | | | | | | | | |
Net investment income (loss) | | | | | | | $4,003,570 | | | | $5,719,354 | | | | | | | | $4,918,107 | | | | $7,534,144 | | | | | | | | $10,407,470 | | | | $14,645,844 | |
Net realized gain (loss) | | | | | | | 8,999,746 | | | | 17,159,884 | | | | | | | | 26,569,697 | | | | 39,487,398 | | | | | | | | 109,430,792 | | | | 142,206,222 | |
Change in net unrealized appreciation (depreciation) | | | | | | | (9,753,514 | ) | | | (9,276,548 | ) | | | | | | | (26,777,500 | ) | | | (18,755,868 | ) | | | | | | | (97,037,490 | ) | | | (49,367,075 | ) |
Net Increase (Decrease) in Net Assets
Resulting from Operations | | | | | | | 3,249,802 | | | | 13,602,690 | | | | | | | | 4,710,304 | | | | 28,265,674 | | | | | | | | 22,800,772 | | | | 107,484,991 | |
| | | | | | | |
DIVIDENDS AND DISTRIBUTIONS TO SHAREHOLDERS | | | | | | | | | | | | | | | | | | | | | | | | | | | | | |
Total distributable earnings | | | | | | | | | | | | | | | | | | | | | | | | | | | | | | | | | | | | |
| | Class A | | | | | | | (12,592,979 | ) | | | | | | | | | | | (33,217,964 | ) | | | | | | | | | | | (112,777,136 | ) | | | | |
| | Class B | | | | | | | (1,853,035 | ) | | | | | | | | | | | (4,924,308 | ) | | | | | | | | | | | (16,690,844 | ) | | | | |
| | Class C | | | | | | | (12,087,506 | ) | | | | | | | | | | | (23,842,136 | ) | | | | | | | | | | | (71,737,804 | ) | | | | |
| | Class R | | | | | | | (468,143 | ) | | | | | | | | | | | (814,614 | ) | | | | | | | | | | | (3,856,053 | ) | | | | |
| | Advisor Class | | | | | | | (827,847 | ) | | | | | | | | | | | (1,073,763 | ) | | | | | | | | | | | (4,965,609 | ) | | | | |
Net investment income | | | | | | | | | | | | | | | | | | | | | | | | | | | | | | | | | | | | |
| | Class A | | | | | | | | | | | (2,912,601 | ) | | | | | | | | | | | (4,861,302 | ) | | | | | | | | | | | (11,726,102 | ) |
| | Class B | | | | | | | | | | | (421,675 | ) | | | | | | | | | | | (633,795 | ) | | | | | | | | | | | (1,396,913 | ) |
| | Class C | | | | | | | | | | | (2,263,679 | ) | | | | | | | | | | | (2,848,132 | ) | | | | | | | | | | | (5,375,396 | ) |
| | Class R | | | | | | | | | | | (118,481 | ) | | | | | | | | | | | (100,872 | ) | | | | | | | | | | | (382,575 | ) |
| | Advisor Class | | | | | | | | | | | (147,955 | ) | | | | | | | | | | | (115,522 | ) | | | | | | | | | | | (428,003 | ) |
Net realized gains | | | | | | | | | | | | | | | | | | | | | | | | | | | | | | | | | | | | |
| | Class A | | | | | | | | | | | — | | | | | | | | | | | | (2,532,640 | ) | | | | | | | | | | | (15,115,123 | ) |
| | Class B | | | | | | | | | | | — | | | | | | | | | | | | (462,792 | ) | | | | | | | | | | | (2,761,348 | ) |
| | Class C | | | | | | | | | | | — | | | | | | | | | | | | (2,043,625 | ) | | | | | | | | | | | (10,579,522 | ) |
| | Class R | | | | | | | | | | | — | | | | | | | | | | | | (56,995 | ) | | | | | | | | | | | (548,419 | ) |
| | Advisor Class | | | | | | | | | | | — | | | | | | | | | | | | (55,238 | ) | | | | | | | | | | | (489,198 | ) |
Net Decrease from Dividends and
Distributions to Shareholders | | | | | | | (27,829,510 | ) | | | (5,864,391 | ) | | | | | | | (63,872,785 | ) | | | (13,710,913 | ) | | | | | | | (210,027,446 | ) | | | (48,802,599 | ) |
| | | | | | | | | |
CAPITAL SHARE TRANSACTIONS | | | | | | | | | | | | | | | | | | | | | | | | | | | | | | | | | | | | |
Proceeds from sale of shares | | | | | | | | | | | | | | | | | | | | | | | | | | | | | | | | | | | | |
| | Class A | | | | | | | 17,040,384 | | | | 21,118,348 | | | | | | | | 22,266,413 | | | | 28,225,155 | | | | | | | | 67,659,104 | | | | 65,600,073 | |
| | Class B | | | | | | | 644,833 | | | | 1,060,894 | | | | | | | | 298,059 | | | | 838,578 | | | | | | | | 811,986 | | | | 2,400,014 | |
| | Class C | | | | | | | 10,935,788 | | | | 14,413,486 | | | | | | | | 10,682,389 | | | | 11,011,781 | | | | | | | | 24,399,313 | | | | 30,037,376 | |
| | Class R | | | | | | | 659,721 | | | | 1,904,395 | | | | | | | | 620,066 | | | | 658,179 | | | | | | | | 3,956,944 | | | | 6,480,702 | |
| | Advisor Class | | | | | | | 3,309,815 | | | | 7,308,745 | | | | | | | | 5,901,913 | | | | 2,838,923 | | | | | | | | 17,181,484 | | | | 13,885,108 | |
Dividends and distribution reinvestments | | | | | | | | | | | | | | | | | | | | | | | | | | | | | | | | | | | | |
| | Class A | | | | | | | 12,486,167 | | | | 2,851,921 | | | | | | | | 32,858,005 | | | | 7,238,144 | | | | | | | | 111,916,625 | | | | 26,555,935 | |
| | Class B | | | | | | | 1,805,246 | | | | 403,817 | | | | | | | | 4,801,673 | | | | 1,058,797 | | | | | | | | 16,476,006 | | | | 4,060,560 | |
| | Class C | | | | | | | 11,921,411 | | | | 2,169,873 | | | | | | | | 23,453,860 | | | | 4,734,975 | | | | | | | | 70,315,954 | | | | 15,594,027 | |
| | Class R | | | | | | | 468,143 | | | | 118,481 | | | | | | | | 814,614 | | | | 157,867 | | | | | | | | 3,856,053 | | | | 930,994 | |
| | Advisor Class | | | | | | | 792,027 | | | | 130,245 | | | | | | | | 1,064,963 | | | | 148,989 | | | | | | | | 4,839,682 | | | | 806,051 | |
Cost of shares repurchased | | | | | | | | | | | | | | | | | | | | | | | | | | | | | | | | | | | | |
| | Class A | | | | | | | (33,270,001 | ) | | | (33,043,648 | ) | | | | | | | (57,777,975 | ) | | | (51,882,098 | ) | | | | | | | (141,741,982 | ) | | | (152,420,279 | ) |
| | Class B | | | | | | | (8,717,936 | ) | | | (7,281,860 | ) | | | | | | | (11,484,193 | ) | | | (9,415,432 | ) | | | | | | | (31,961,495 | ) | | | (26,922,276 | ) |
| | Class C | | | | | | | (37,513,896 | ) | | | (36,458,058 | ) | | | | | | | (49,618,847 | ) | | | (46,863,745 | ) | | | | | | | (113,479,765 | ) | | | (116,379,682 | ) |
| | Class R | | | | | | | (1,421,688 | ) | | | (5,572,314 | ) | | | | | | | (836,162 | ) | | | (1,760,589 | ) | | | | | | | (6,285,146 | ) | | | (8,442,266 | ) |
| | Advisor Class | | | | | | | (4,658,762 | ) | | | (4,859,568 | ) | | | | | | | (3,480,671 | ) | | | (2,855,308 | ) | | | | | | | (13,708,609 | ) | | | (10,245,364 | ) |
Share class conversions | | | | | | | | | | | | | | | | | | | | | | | | | | | | | | | | | | | | |
| | Class A (1) | | | | | | | 4,294,105 | | | | — | | | | | | | | 4,987,595 | | | | — | | | | | | | | 22,187,993 | | | | — | |
| | Class R (1) | | | | | | | (4,294,105 | ) | | | — | | | | | | | | (4,987,595 | ) | | | — | | | | | | | | (22,187,993 | ) | | | — | |
Net Increase (Decrease) in Net Assets from
Capital Share Transactions | | | | | | | (25,518,748 | ) | | | (35,735,243 | ) | | | | | | | (20,435,893 | ) | | | (55,865,784 | ) | | | | | | | 14,236,154 | | | | (148,059,027 | ) |
NET INCREASE (DECREASE) IN NET ASSETS | | | | | | | (50,098,456 | ) | | | (27,996,944 | ) | | | | | | | (79,598,374 | ) | | | (41,311,023 | ) | | | | | | | (172,990,520 | ) | | | (89,376,635 | ) |
| | | | | | | | | |
NET ASSETS | | | | | | | | | | | | | | | | | | | | | | | | | | | | | | | | | | | | |
Beginning of Year | | | | | | | 305,808,228 | | | | 333,805,172 | | | | | | | | 451,530,806 | | | | 492,841,829 | | | | | | | | 1,323,724,989 | | | | 1,413,101,624 | |
End of Year | | | | | | | $255,709,772 | | | | $305,808,228 | | | | | | | | $371,932,432 | | | | $451,530,806 | | | | | | | | $1,150,734,469 | | | | $1,323,724,989 | |
Undistributed/Accumulated Net Investment Income (Loss) | | | | | | | | | | | $204,014 | | | | | | | | | | | | ($365,209 | ) | | | | | | | | | | | ($262,560 | ) |
| (1) | Class R shares were converted to Class A shares on March 22, 2019 (see Note 1 in Notes to Financial Statements). |
See Notes to Financial Statements
C-7
PACIFIC FUNDS
STATEMENTS OF CHANGES IN NET ASSETS (Continued)
| | | | | | | | | | | | | | | | | | | | | | | | | | | | | | | | | | | | | | |
| | | | | | Pacific Funds Portfolio
Optimization Growth | | | | | | Pacific Funds Portfolio
Optimization Aggressive-Growth | | | | | | Pacific Funds
Diversified Alternatives | |
| | | | | | | | Year Ended
March 31, 2019 | | | Year Ended
March 31, 2018 | | | | | | Year Ended
March 31, 2019 | | | Year Ended
March 31, 2018 | | | | | | Year Ended
March 31, 2019 | | | Year Ended
March 31, 2018 | |
OPERATIONS | | | | | | | | | | | | | | | | | | | | | | | | | | | | | | | | | | | | |
Net investment income (loss) | | | | | | | $5,031,109 | | | | $8,452,838 | | | | | | | | $1,096,862 | | | | $1,490,511 | | | | | | | | $161,820 | | | | $566,858 | |
Net realized gain (loss) | | | | | | | 116,508,679 | | | | 111,873,756 | | | | | | | | 50,537,474 | | | | 34,901,107 | | | | | | | | (1,597,943 | ) | | | 145,674 | |
Change in net unrealized appreciation (depreciation) | | | | | | | (99,596,050 | ) | | | (23,161,117 | ) | | | | | | | (42,365,388 | ) | | | 1,005,591 | | | | | | | | (574,150 | ) | | | 258,496 | |
Net Increase (Decrease) in Net Assets
Resulting from Operations | | | | | | | 21,943,738 | | | | 97,165,477 | | | | | | | | 9,268,948 | | | | 37,397,209 | | | | | | | | (2,010,273 | ) | | | 971,028 | |
| | | | | | | | |
DIVIDENDS AND DISTRIBUTIONS TO SHAREHOLDERS | | | | | | | | | | | | | | | | | | | | | | | | | | | | | | | | | |
Total distributable earnings | | | | | | | | | | | | | | | | | | | | | | | | | | | | | | | | | | | | |
| | Class A | | | | | | | (99,899,454 | ) | | | | | | | | | | | (34,560,435 | ) | | | | | | | | | | | (49,863 | ) | | | | |
| | Class B | | | | | | | (13,714,779 | ) | | | | | | | | | | | (4,182,986 | ) | | | | | | | | | | | | | | | | |
| | Class C | | | | | | | (54,931,185 | ) | | | | | | | | | | | (16,772,422 | ) | | | | | | | | | | | (19,294 | ) | | | | |
| | Class R | | | | | | | (2,517,415 | ) | | | | | | | | | | | (1,055,968 | ) | | | | | | | | | | | | | | | | |
| | Advisor Class | | | | | | | (4,602,497 | ) | | | | | | | | | | | (2,356,107 | ) | | | | | | | | | | | (342,244 | ) | | | | |
Net investment income | | | | | | | | | | | | | | | | | | | | | | | | | | | | | | | | | | | | |
| | Class A | | | | | | | | | | | (8,314,557 | ) | | | | | | | | | | | (2,191,024 | ) | | | | | | | | | | | (98,284 | ) |
| | Class B | | | | | | | | | | | (854,443 | ) | | | | | | | | | | | (170,680 | ) | | | | | | | | | | | | |
| | Class C | | | | | | | | | | | (3,023,542 | ) | | | | | | | | | | | (605,589 | ) | | | | | | | | | | | (55,299 | ) |
| | Class R | | | | | | | | | | | (211,322 | ) | | | | | | | | | | | (77,380 | ) | | | | | | | | | | | | |
| | Advisor Class | | | | | | | | | | | (269,165 | ) | | | | | | | | | | | (122,224 | ) | | | | | | | | | | | (489,276 | ) |
Net realized gains | | | | | | | | | | | | | | | | | | | | | | | | | | | | | | | | | | | | |
| | Class A | | | | | | | | | | | (14,105,079 | ) | | | | | | | | | | | (5,356,432 | ) | | | | | | | | | | | — | |
| | Class B | | | | | | | | | | | (2,390,612 | ) | | | | | | | | | | | (830,146 | ) | | | | | | | | | | | | |
| | Class C | | | | | | | | | | | (8,452,254 | ) | | | | | | | | | | | (2,902,552 | ) | | | | | | | | | | | — | |
| | Class R | | | | | | | | | | | (415,832 | ) | | | | | | | | | | | (230,283 | ) | | | | | | | | | | | | |
| | Advisor Class | | | | | | | | | | | (405,922 | ) | | | | | | | | | | | (256,767 | ) | | | | | | | | | | | — | |
Net Decrease from Dividends and
Distributions to Shareholders | | | | | | | (175,665,330 | ) | | | (38,442,728 | ) | | | | | | | (58,927,918 | ) | | | (12,743,077 | ) | | | | | | | (411,401 | ) | | | (642,859 | ) |
| | | | | | | | | |
CAPITAL SHARE TRANSACTIONS | | | | | | | | | | | | | | | | | | | | | | | | | | | | | | | | | | | | |
Proceeds from sale of shares | | | | | | | | | | | | | | | | | | | | | | | | | | | | | | | | | | | | |
| | Class A | | | | | | | 53,017,761 | | | | 51,974,122 | | | | | | | | 21,090,137 | | | | 17,680,573 | | | | | | | | 1,419,189 | | | | 2,577,620 | |
| | Class B | | | | | | | 641,777 | | | | 2,326,243 | | | | | | | | 319,857 | | | | 1,055,232 | | | | | | | | | | | | | |
| | Class C | | | | | | | 19,642,987 | | | | 22,707,932 | | | | | | | | 8,385,039 | | | | 13,056,528 | | | | | | | | 471,820 | | | | 2,068,688 | |
| | Class R | | | | | | | 1,826,895 | | | | 2,363,340 | | | | | | | | 1,045,959 | | | | 1,544,987 | | | | | | | | | | | | | |
| | Advisor Class | | | | | | | 15,584,736 | | | | 6,843,745 | | | | | | | | 6,990,405 | | | | 4,131,416 | | | | | | | | 15,293,512 | | | | 25,813,307 | |
Dividends and distribution reinvestments | | | | | | | | | | | | | | | | | | | | | | | | | | | | | | | | | | | | |
| | Class A | | | | | | | 99,254,420 | | | | 22,209,123 | | | | | | | | 34,287,460 | | | | 7,488,586 | | | | | | | | 47,058 | | | | 92,137 | |
| | Class B | | | | | | | 13,510,901 | | | | 3,159,808 | | | | | | | | 4,169,079 | | | | 986,595 | | | | | | | | | | | | | |
| | Class C | | | | | | | 54,318,779 | | | | 11,246,878 | | | | | | | | 16,485,319 | | | | 3,424,678 | | | | | | | | 19,294 | | | | 55,259 | |
| | Class R | | | | | | | 2,517,415 | | | | 627,154 | | | | | | | | 1,055,968 | | | | 307,663 | | | | | | | | | | | | | |
| | Advisor Class | | | | | | | 4,350,180 | | | | 610,159 | | | | | | | | 2,321,572 | | | | 362,989 | | | | | | | | 340,690 | | | | 487,508 | |
Cost of shares repurchased | | | | | | | | | | | | | | | | | | | | | | | | | | | | | | | | | | | | |
| | Class A | | | | | | | (106,383,272 | ) | | | (111,400,463 | ) | | | | | | | (29,140,734 | ) | | | (29,068,542 | ) | | | | | | | (2,264,191 | ) | | | (478,948 | ) |
| | Class B | | | | | | | (24,161,042 | ) | | | (20,370,468 | ) | | | | | | | (6,974,878 | ) | | | (7,037,527 | ) | | | | | | | | | | | | |
| | Class C | | | | | | | (71,029,532 | ) | | | (83,362,341 | ) | | | | | | | (22,731,074 | ) | | | (25,517,655 | ) | | | | | | | (411,384 | ) | | | (540,742 | ) |
| | Class R | | | | | | | (4,117,896 | ) | | | (3,743,904 | ) | | | | | | | (2,882,205 | ) | | | (2,178,564 | ) | | | | | | | | | | | | |
| | Advisor Class | | | | | | | (12,372,320 | ) | | | (5,247,841 | ) | | | | | | | (6,533,420 | ) | | | (2,145,476 | ) | | | | | | | (25,128,437 | ) | | | (2,514,438 | ) |
Share class conversions | | | | | | | | | | | | | | | | | | | | | | | | | | | | | | | | | | | | |
| | Class A (1) | | | | | | | 13,475,454 | | | | — | | | | | | | | 5,855,112 | | | | — | | | | | | | | | | | | | |
| | Class R (1) | | | | | | | (13,475,454 | ) | | | — | | | | | | | | (5,855,112 | ) | | | — | | | | | | | | | | | | | |
Net Increase (Decrease) in Net Assets from
Capital Share Transactions | | | | | | | 46,601,789 | | | | (100,056,513 | ) | | | | | | | 27,888,484 | | | | (15,908,517 | ) | | | | | | | (10,212,449 | ) | | | 27,560,391 | |
NET INCREASE (DECREASE) IN NET ASSETS | | | | | | | (107,119,803 | ) | | | (41,333,764 | ) | | | | | | | (21,770,486 | ) | | | 8,745,615 | | | | | | | | (12,634,123 | ) | | | 27,888,560 | |
| | | | | | | | | |
NET ASSETS | | | | | | | | | | | | | | | | | | | | | | | | | | | | | | | | | | | | |
Beginning of Year | | | | | | | 993,387,001 | | | | 1,034,720,765 | | | | | | | | 332,577,645 | | | | 323,832,030 | | | | | | | | 40,857,187 | | | | 12,968,627 | |
End of Year | | | | | | | $886,267,198 | | | | $993,387,001 | | | | | | | | $310,807,159 | | | | $332,577,645 | | | | | | | | $28,223,064 | | | | $40,857,187 | |
Undistributed/Accumulated Net Investment Income (Loss) | | | | | | | | | | | ($1,234,668 | ) | | | | | | | | | | | ($357,597 | ) | | | | | | | | | | | ($13,526 | ) |
| (1) | Class R shares were converted to Class A shares on March 22, 2019 (see Note 1 in Notes to Financial Statements). |
See Notes to Financial Statements
C-8
PACIFIC FUNDS
STATEMENTS OF CHANGES IN NET ASSETS (Continued)
| | | | | | | | | | | | | | | | | | | | | | | | | | | | | | | | | | | | | | |
| | | | | | | | Pacific Funds
Short Duration Income | | | | | | Pacific Funds
Core Income | | | | | | Pacific Funds
Strategic Income | |
| | | | | | | | Year Ended
March 31, 2019 | | | Year Ended
March 31, 2018 | | | | | | Year Ended
March 31, 2019 | | | Year Ended
March 31, 2018 | | | | | | Year Ended
March 31, 2019 | | | Year Ended
March 31, 2018 | |
OPERATIONS | | | | | | | | | | | | | | | | | | | | | | | | | | | | | | | | | | | | |
Net investment income (loss) | | | | | | | $13,656,044 | | | | $7,415,954 | | | | | | | | $20,638,993 | | | | $20,722,649 | | | | | | | | $25,647,966 | | | | $16,428,184 | |
Net realized gain (loss) | | | | | | | (868,315 | ) | | | 808,998 | | | | | | | | (7,715,010 | ) | | | 3,341,867 | | | | | | | | (2,204,849 | ) | | | 4,492,052 | |
Change in net unrealized appreciation (depreciation) | | | | | | | 6,040,386 | | | | (4,727,335 | ) | | | | | | | 10,264,861 | | | | (8,743,244 | ) | | | | | | | (3,625,115 | ) | | | (5,940,603 | ) |
Net Increase (Decrease) in Net Assets
Resulting from Operations | | | | | | | 18,828,115 | | | | 3,497,617 | | | | | | | | 23,188,844 | | | | 15,321,272 | | | | | | | | 19,818,002 | | | | 14,979,633 | |
| | | | | | | | | |
DIVIDENDS AND DISTRIBUTIONS TO SHAREHOLDERS | | | | | | | | | | | | | | | | | | | | | | | | | | | | | | | | | | | | |
Total distributable earnings | | | | | | | | | | | | | | | | | | | | | | | | | | | | | | | | | | | | |
| | Class A | | | | | | | (2,288,424 | ) | | | | | | | | | | | (3,145,957 | ) | | | | | | | | | | | (2,887,137 | ) | | | | |
| | Class C | | | | | | | (761,316 | ) | | | | | | | | | | | (2,167,183 | ) | | | | | | | | | | | (2,122,133 | ) | | | | |
| | Class I | | | | | | | (1,010,121 | ) | | | | | | | | | | | (502,503 | ) | | | | | | | | | | | (229,143 | ) | | | | |
| | Class P | | | | | | | | | | | | | | | | | | | (1,845,313 | ) | | | | | | | | | | | | | | | | |
| | Advisor Class | | | | | | | (9,439,029 | ) | | | | | | | | | | | (13,013,000 | ) | | | | | | | | | | | (20,322,895 | ) | | | | |
Net investment income | | | | | | | | | | | | | | | | | | | | | | | | | | | | | | | | | | | | |
| | Class A | | | | | | | | | | | (1,670,968 | ) | | | | | | | | | | | (3,861,326 | ) | | | | | | | | | | | (2,533,746 | ) |
| | Class C | | | | | | | | | | | (522,455 | ) | | | | | | | | | | | (2,037,140 | ) | | | | | | | | | | | (1,592,221 | ) |
| | Class I | | | | | | | | | | | (89,609 | ) | | | | | | | | | | | (139,896 | ) | | | | | | | | | | | (136,861 | ) |
| | Class P | | | | | | | | | | | | | | | | | | | | | | | (3,205,207 | ) | | | | | | | | | | | | |
| | Advisor Class | | | | | | | | | | | (5,007,525 | ) | | | | | | | | | | | (11,251,230 | ) | | | | | | | | | | | (11,977,951 | ) |
Net realized gains | | | | | | | | | | | | | | | | | | | | | | | | | | | | | | | | | | | | |
| | Class A | | | | | | | | | | | — | | | | | | | | | | | | — | | | | | | | | | | | | — | |
| | Class C | | | | | | | | | | | — | | | | | | | | | | | | — | | | | | | | | | | | | — | |
| | Class I | | | | | | | | | | | — | | | | | | | | | | | | — | | | | | | | | | | | | — | |
| | Class P | | | | | | | | | | | | | | | | | | | | | | | — | | | | | | | | | | | | | |
| | Advisor Class | | | | | | | | | | | — | | | | | | | | | | | | — | | | | | | | | | | | | — | |
Net Decrease from Dividends and
Distributions to Shareholders | | | | | | | (13,498,890 | ) | | | (7,290,557 | ) | | | | | | | (20,673,956 | ) | | | (20,494,799 | ) | | | | | | | (25,561,308 | ) | | | (16,240,779 | ) |
| | | | | | | | | |
CAPITAL SHARE TRANSACTIONS | | | | | | | | | | | | | | | | | | | | | | | | | | | | | | | | | | | | |
Proceeds from sale of shares | | | | | | | | | | | | | | | | | | | | | | | | | | | | | | | | | | | | |
| | Class A | | | | | | | 70,623,211 | | | | 58,408,543 | | | | | | | | 18,564,517 | | | | 30,371,212 | | | | | | | | 24,665,776 | | | | 31,105,423 | |
| | Class C | | | | | | | 15,901,633 | | | | 15,019,325 | | | | | | | | 7,830,292 | | | | 11,003,930 | | | | | | | | 16,877,365 | | | | 19,269,415 | |
| | Class I | | | | | | | 84,288,064 | | | | 2,696,087 | | | | | | | | 23,761,756 | | | | 1,487,585 | | | | | | | | 2,795,211 | | | | 2,419,650 | |
| | Class P | | | | | | | | | | | | | | | | | | | 5,903,182 | | | | 1,057,954 | | | | | | | | | | | | | |
| | Advisor Class | | | | | | | 384,985,237 | | | | 249,409,205 | | | | | | | | 210,403,956 | | �� | | 266,427,285 | | | | | | | | 285,918,426 | | | | 301,909,775 | |
Dividends and distribution reinvestments | | | | | | | | | | | | | | | | | | | | | | | | | | | | | | | | | | | | |
| | Class A | | | | | | | 2,000,466 | | | | 1,505,440 | | | | | | | | 2,830,461 | | | | 3,401,268 | | | | | | | | 2,432,833 | | | | 2,058,751 | |
| | Class C | | | | | | | 726,149 | | | | 491,064 | | | | | | | | 1,967,047 | | | | 1,813,120 | | | | | | | | 1,826,650 | | | | 1,371,761 | |
| | Class I | | | | | | | 1,009,574 | | | | 89,514 | | | | | | | | 501,767 | | | | 139,095 | | | | | | | | 226,671 | | | | 134,988 | |
| | Class P | | | | | | | | | | | | | | | | | | | 1,845,313 | | | | 3,205,207 | | | | | | | | | | | | | |
| | Advisor Class | | | | | | | 8,986,733 | | | | 4,566,532 | | | | | | | | 9,198,335 | | | | 7,861,439 | | | | | | | | 15,471,909 | | | | 9,467,320 | |
Cost of shares repurchased | | | | | | | | | | | | | | | | | | | | | | | | | | | | | | | | | | | | |
| | Class A | | | | | | | (48,667,567 | ) | | | (31,774,445 | ) | | | | | | | (71,051,776 | ) | | | (61,588,358 | ) | | | | | | | (36,906,963 | ) | | | (28,122,369 | ) |
| | Class C | | | | | | | (15,125,797 | ) | | | (13,904,093 | ) | | | | | | | (29,915,702 | ) | | | (31,816,511 | ) | | | | | | | (16,886,426 | ) | | | (13,321,375 | ) |
| | Class I | | | | | | | (6,860,042 | ) | | | (1,825,490 | ) | | | | | | | (2,653,440 | ) | | | (1,833,325 | ) | | | | | | | (1,123,649 | ) | | | (1,106,790 | ) |
| | Class P | | | | | | | | | | | | | | | | | | | (33,707,701 | ) | | | (59,290,467 | ) | | | | | | | | | | | | |
| | Advisor Class | | | | | | | (186,314,605 | ) | | | (141,710,576 | ) | | | | | | | (216,921,483 | ) | | | (219,522,626 | ) | | | | | | | (245,658,070 | ) | | | (122,216,357 | ) |
Net Increase (Decrease) in Net Assets from
Capital Share Transactions | | | | | | | 311,553,056 | | | | 142,971,106 | | | | | | | | (71,443,476 | ) | | | (47,283,192 | ) | | | | | | | 49,639,733 | | | | 202,970,192 | |
NET INCREASE (DECREASE) IN NET ASSETS | | | | | | | 316,882,281 | | | | 139,178,166 | | | | | | | | (68,928,588 | ) | | | (52,456,719 | ) | | | | | | | 43,896,427 | | | | 201,709,046 | |
| | | | | | | | | |
NET ASSETS | | | | | | | | | | | | | | | | | | | | | | | | | | | | | | | | | | | | |
Beginning of Year | | | | | | | 415,131,679 | | | | 275,953,513 | | | | | | | | 692,982,363 | | | | 745,439,082 | | | | | | | | 538,418,796 | | | | 336,709,750 | |
End of Year | | | | | | | $732,013,960 | | | | $415,131,679 | | | | | | | | $624,053,775 | | | | $692,982,363 | | | | | | | | $582,315,223 | | | | $538,418,796 | |
Undistributed/Accumulated Net Investment Income (Loss) | | | | | | | | | | | $166,774 | | | | | | | | | | | | $350,493 | | | | | | | | | | | | $367,263 | |
See Notes to Financial Statements
C-9
PACIFIC FUNDS
STATEMENTS OF CHANGES IN NET ASSETS (Continued)
| | | | | | | | | | | | | | | | | | | | | | | | | | |
| | | | | | | | Pacific Funds
Floating Rate Income | | | | | | Pacific Funds
High Income | |
| | | | | | | | Year Ended
March 31, 2019 | | | Year Ended
March 31, 2018 | | | | | | Year Ended
March 31, 2019 | | | Year Ended
March 31, 2018 | |
OPERATIONS | | | | | | | | | | | | | | | | | | | | | | | | |
Net investment income (loss) | | | | | | | $89,321,214 | | | | $52,185,397 | | | | | | | | $3,977,048 | | | | $1,365,516 | |
Net realized gain (loss) | | | | | | | (16,678,087 | ) | | | 848,283 | | | | | | | | (1,030,376 | ) | | | 525,467 | |
Change in net unrealized appreciation (depreciation) | | | | | | | (28,107,047 | ) | | | (4,167,986 | ) | | | | | | | 86,556 | | | | (968,872 | ) |
Net Increase (Decrease) in Net Assets Resulting from Operations | | | | | | | 44,536,080 | | | | 48,865,694 | | | | | | | | 3,033,228 | | | | 922,111 | |
| | | | | | |
DIVIDENDS AND DISTRIBUTIONS TO SHAREHOLDERS | | | | | | | | | | | | | | | | | | | | | | | | |
Total distributable earnings | | | | | | | | | | | | | | | | | | | | | | | | |
| | Class A | | | | | | | (10,451,833 | ) | | | | | | | | | | | (292,486 | ) | | | | |
| | Class C | | | | | | | (8,439,626 | ) | | | | | | | | | | | (195,304 | ) | | | | |
| | Class I | | | | | | | (23,883,146 | ) | | | | | | | | | | | (11,349 | ) | | | | |
| | Class P | | | | | | | (2,709,538 | ) | | | | | | | | | | | (3,340,878 | ) | | | | |
| | Advisor Class | | | | | | | (44,322,870 | ) | | | | | | | | | | | (148,700 | ) | | | | |
Net investment income | | | | | | | | | | | | | | | | | | | | | | | | |
| | Class A | | | | | | | | | | | (8,455,737 | ) | | | | | | | | | | | (287,489 | ) |
| | Class C | | | | | | | | | | | (6,345,408 | ) | | | | | | | | | | | (212,556 | ) |
| | Class I | | | | | | | | | | | (10,496,193 | ) | | | | | | | | | | | (124,627 | ) |
| | Class P | | | | | | | | | | | (3,251,568 | ) | | | | | | | | | | | (651,705 | ) |
| | Advisor Class | | | | | | | | | | | (23,304,092 | ) | | | | | | | | | | | (123,295 | ) |
Net realized gains | | | | | | | | | | | | | | | | | | | | | | | | |
| | Class A | | | | | | | | | | | — | | | | | | | | | | | | — | |
| | Class C | | | | | | | | | | | — | | | | | | | | | | | | — | |
| | Class I | | | | | | | | | | | — | | | | | | | | | | | | — | |
| | Class P | | | | | | | | | | | — | | | | | | | | | | | | — | |
| | Advisor Class | | | | | | | | | | | — | | | | | | | | | | | | — | |
Net Decrease from Dividends and Distributions to Shareholders | | | | | | | (89,807,013 | ) | | | (51,852,998 | ) | | | | | | | (3,988,717 | ) | | | (1,399,672 | ) |
| | | | | | |
CAPITAL SHARE TRANSACTIONS | | | | | | | | | | | | | | | | | | | | | | | | |
Proceeds from sale of shares | | | | | | | | | | | | | | | | | | | | | | | | |
| | Class A | | | | | | | 104,234,100 | | | | 83,291,116 | | | | | | | | 3,220,786 | | | | 3,546,975 | |
| | Class C | | | | | | | 56,249,918 | | | | 46,285,914 | | | | | | | | 716,716 | | | | 762,952 | |
| | Class I | | | | | | | 418,708,224 | | | | 131,227,624 | | | | | | | | 42,055 | | | | 458,335 | |
| | Class P | | | | | | | 2,293,667 | | | | 6,914,472 | | | | | | | | 65,198,232 | | | | 60,058,075 | |
| | Advisor Class | | | | | | | 654,273,775 | | | | 456,907,837 | | | | | | | | 2,682,948 | | | | 1,531,699 | |
Dividends and distribution reinvestments | | | | | | | | | | | | | | | | | | | | | | | | |
| | Class A | | | | | | | 9,440,707 | | | | 7,678,324 | | | | | | | | 284,987 | | | | 283,527 | |
| | Class C | | | | | | | 7,744,275 | | | | 5,716,395 | | | | | | | | 188,590 | | | | 210,060 | |
| | Class I | | | | | | | 14,404,875 | | | | 6,157,540 | | | | | | | | 11,283 | | | | 124,561 | |
| | Class P | | | | | | | 2,709,538 | | | | 3,251,568 | | | | | | | | 3,340,878 | | | | 651,705 | |
| | Advisor Class | | | | | | | 39,800,982 | | | | 20,332,301 | | | | | | | | 146,871 | | | | 119,839 | |
Cost of shares repurchased | | | | | | | | | | | | | | | | | | | | | | | | |
| | Class A | | | | | | | (114,633,080 | ) | | | (88,619,207 | ) | | | | | | | (3,703,876 | ) | | | (3,956,374 | ) |
| | Class C | | | | | | | (53,193,064 | ) | | | (40,876,685 | ) | | | | | | | (1,528,238 | ) | | | (1,330,054 | ) |
| | Class I | | | | | | | (219,420,364 | ) | | | (92,405,337 | ) | | | | | | | (85,863 | ) | | | (5,617,055 | ) |
| | Class P | | | | | | | (36,334,229 | ) | | | (24,098,458 | ) | | | | | | | (23,286,646 | ) | | | (1,993,459 | ) |
| | Advisor Class | | | | | | | (555,917,071 | ) | | | (210,975,450 | ) | | | | | | | (1,650,968 | ) | | | (1,423,922 | ) |
Net Increase (Decrease) in Net Assets from
Capital Share Transactions | | | | | | | 330,362,253 | | | | 310,787,954 | | | | | | | | 45,577,755 | | | | 53,426,864 | |
NET INCREASE (DECREASE) IN NET ASSETS | | | | | | | 285,091,320 | | | | 307,800,650 | | | | | | | | 44,622,266 | | | | 52,949,303 | |
| | | | | | |
NET ASSETS | | | | | | | | | | | | | | | | | | | | | | | | |
Beginning of Year | | | | | | | 1,474,882,784 | | | | 1,167,082,134 | | | | | | | | 81,438,834 | | | | 28,489,531 | |
End of Year | | | | | | | $1,759,974,104 | | | | $1,474,882,784 | | | | | | | | $126,061,100 | | | | $81,438,834 | |
Undistributed/Accumulated Net Investment Income (Loss) | | | | | | | | | | | $873,980 | | | | | | | | | | | | $94,127 | |
See Notes to Financial Statements
C-10
PACIFIC FUNDS
STATEMENTS OF CHANGES IN NET ASSETS (Continued)
| | | | | | | | | | | | | | | | | | | | | | | | | | | | | | | | | | | | | | |
| | | | | | | | Pacific FundsLarge-Cap | | | | | | Pacific FundsLarge-Cap Value | | | | | | Pacific FundsSmall/Mid-Cap | |
| | | | | | | | Year Ended
March 31, 2019 | | | Year Ended
March 31, 2018 | | | | | | Year Ended
March 31, 2019 | | | Year Ended
March 31, 2018 | | | | | | Year Ended
March 31, 2019 | | | Year Ended
March 31, 2018 | |
OPERATIONS | | | | | | | | | | | | | | | | | | | | | | | | | | | | | | | | | | | | |
Net investment income (loss) | | | | | | | $171,856 | | | | $86,807 | | | | | | | | $377,614 | | | | $318,398 | | | | | | | | $141,506 | | | | ($236,628 | ) |
Net realized gain (loss) | | | | | | | 255,129 | | | | 422,128 | | | | | | | | 1,566,245 | | | | 1,291,881 | | | | | | | | (1,202,028 | ) | | | 657,794 | |
Change in net unrealized appreciation (depreciation) | | | | | | | 794,723 | | | | 1,000,877 | | | | | | | | (1,146,418 | ) | | | 1,131,106 | | | | | | | | 8,050,964 | | | | 16,333,908 | |
Net Increase (Decrease) in Net Assets
Resulting from Operations | | | | | | | 1,221,708 | | | | 1,509,812 | | | | | | | | 797,441 | | | | 2,741,385 | | | | | | | | 6,990,442 | | | | 16,755,074 | |
| | | | | | | | | |
DIVIDENDS AND DISTRIBUTIONS TO SHAREHOLDERS | | | | | | | | | | | | | | | | | | | | | | | | | | | | | | | | | | | | |
Total distributable earnings | | | | | | | | | | | | | | | | | | | | | | | | | | | | | | | | | | | | |
| | Class A | | | | | | | (293,281 | ) | | | | | | | | | | | (279,931 | ) | | | | | | | | | | | (640,045 | ) | | | | |
| | Class C | | | | | | | (166,794 | ) | | | | | | | | | | | (230,757 | ) | | | | | | | | | | | (466,266 | ) | | | | |
| | Advisor Class | | | | | | | (407,953 | ) | | | | | | | | | | | (1,377,251 | ) | | | | | | | | | | | (5,717,212 | ) | | | | |
| | Class S | | | | | | | (31,514 | ) | | | | | | | | | | | (45,410 | ) | | | | | | | | | | | (187,396 | ) | | | | |
Net investment income | | | | | | | | | | | | | | | | | | | | | | | | | | | | | | | | | | | | |
| | Class A | | | | | | | | | | | (35,500 | ) | | | | | | | | | | | (35,012 | ) | | | | | | | | | | | — | |
| | Class C | | | | | | | | | | | (2,093 | ) | | | | | | | | | | | (25,207 | ) | | | | | | | | | | | — | |
| | Advisor Class | | | | | | | | | | | (40,042 | ) | | | | | | | | | | | (285,750 | ) | | | | | | | | | | | — | |
| | Investor Class | | | | | | | | | | | (3,345 | ) | | | | | | | | | | | (1,526 | ) | | | | | | | | | | | — | |
| | Class S | | | | | | | | | | | (9,360 | ) | | | | | | | | | | | (25,707 | ) | | | | | | | | | | | — | |
Net realized gains | | | | | | | | | | | | | | | | | | | | | | | | | | | | | | | | | | | | |
| | Class A | | | | | | | | | | | (30,938 | ) | | | | | | | | | | | (69,181 | ) | | | | | | | | | | | (20,277 | ) |
| | Class C | | | | | | | | | | | (23,450 | ) | | | | | | | | | | | (94,471 | ) | | | | | | | | | | | (14,961 | ) |
| | Advisor Class | | | | | | | | | | | (38,500 | ) | | | | | | | | | | | (496,519 | ) | | | | | | | | | | | (150,439 | ) |
| | Investor Class | | | | | | | | | | | (4,283 | ) | | | | | | | | | | | (2,272 | ) | | | | | | | | | | | (8,905 | ) |
| | Class S | | | | | | | | | | | (3,547 | ) | | | | | | | | | | | (37,097 | ) | | | | | | | | | | | (10,307 | ) |
Net Decrease from Dividends and
Distributions to Shareholders | | | | | | | (899,542 | ) | | | (191,058 | ) | | | | | | | (1,933,349 | ) | | | (1,072,742 | ) | | | | | | | (7,010,919 | ) | | | (204,889 | ) |
| | | | | | | | | |
CAPITAL SHARE TRANSACTIONS | | | | | | | | | | | | | | | | | | | | | | | | | | | | | | | | | | | | |
Proceeds from sale of shares | | | | | | | | | | | | | | | | | | | | | | | | | | | | | | | | | | | | |
| | Class A | | | | | | | 4,770,361 | | | | 2,836,240 | | | | | | | | 1,558,272 | | | | 1,653,951 | | | | | | | | 13,119,138 | | | | 15,490,343 | |
| | Class C | | | | | | | 1,180,700 | | | | 1,039,440 | | | | | | | | 765,875 | | | | 1,510,001 | | | | | | | | 4,827,893 | | | | 8,607,340 | |
| | Advisor Class | | | | | | | 1,509,946 | | | | 9,049,665 | | | | | | | | 284,501 | | | | 1,451,424 | | | | | | | | 228,165,055 | | | | 118,174,037 | |
| | Investor Class | | | | | | | 21 | | | | 377,037 | | | | | | | | — | | | | 23,121 | | | | | | | | 637,610 | | | | 4,781,673 | |
| | Class S | | | | | | | 342,150 | | | | 356,031 | | | | | | | | 283,922 | | | | 494,965 | | | | | | | | 569,158 | | | | 491,152 | |
Dividends and distribution reinvestments | | | | | | | | | | | | | | | | | | | | | | | | | | | | | | | | | | | | |
| | Class A | | | | | | | 291,142 | | | | 65,908 | | | | | | | | 271,766 | | | | 101,722 | | | | | | | | 637,748 | | | | 19,606 | |
| | Class C | | | | | | | 166,366 | | | | 22,688 | | | | | | | | 229,197 | | | | 105,137 | | | | | | | | 466,266 | | | | 14,371 | |
| | Advisor Class | | | | | | | 403,573 | | | | 76,302 | | | | | | | | 1,375,545 | | | | 777,555 | | | | | | | | 5,608,985 | | | | 147,311 | |
| | Investor Class | | | | | | | — | | | | 7,628 | | | | | | | | — | | | | 3,798 | | | | | | | | — | | | | 8,905 | |
| | Class S | | | | | | | 31,514 | | | | 12,907 | | | | | | | | 45,410 | | | | 62,804 | | | | | | | | 187,396 | | | | 10,307 | |
Cost of shares repurchased | | | | | | | | | | | | | | | | | | | | | | | | | | | | | | | | | | | | |
| | Class A | | | | | | | (2,442,917 | ) | | | (2,988,482 | ) | | | | | | | (734,887 | ) | | | (1,189,450 | ) | | | | | | | (17,793,874 | ) | | | (14,661,733 | ) |
| | Class C | | | | | | | (1,029,023 | ) | | | (640,775 | ) | | | | | | | (1,680,413 | ) | | | (552,537 | ) | | | | | | | (3,349,491 | ) | | | (1,682,738 | ) |
| | Advisor Class | | | | | | | (3,153,984 | ) | | | (3,725,130 | ) | | | | | | | (10,646,030 | ) | | | (8,592,650 | ) | | | | | | | (83,368,175 | ) | | | (23,352,704 | ) |
| | Investor Class | | | | | | | (138,888 | ) | | | (270,990 | ) | | | | | | | (3,085 | ) | | | (21,651 | ) | | | | | | | (2,180,734 | ) | | | (5,902,271 | ) |
| | Class S | | | | | | | (171,384 | ) | | | (897,495 | ) | | | | | | | (1,479,100 | ) | | | (40,946 | ) | | | | | | | (4,167,845 | ) | | | (37,472 | ) |
Share class conversions | | | | | | | | | | | | | | | | | | | | | | | | | | | | | | | | | | | | |
| | Class A (1) | | | | | | | 336,632 | | | | — | | | | | | | | 106,330 | | | | — | | | | | | | | 5,349,094 | | | | — | |
| | Investor Class (1) | | | | | | | (336,632 | ) | | | — | | | | | | | | (106,330 | ) | | | — | | | | | | | | (5,349,094 | ) | | | — | |
Net Increase (Decrease) in Net Assets from
Capital Share Transactions | | | | | | | 1,759,577 | | | | 5,320,974 | | | | | | | | (9,729,027 | ) | | | (4,212,756 | ) | | | | | | | 143,359,130 | | | | 102,108,127 | |
NET INCREASE (DECREASE) IN NET ASSETS | | | | | | | 2,081,743 | | | | 6,639,728 | | | | | | | | (10,864,935 | ) | | | (2,544,113 | ) | | | | | | | 143,338,653 | | | | $118,658,312 | |
| | | | | | | | | |
NET ASSETS | | | | | | | | | | | | | | | | | | | | | | | | | | | | | | | | | | | | |
Beginning of Year | | | | | | | 17,702,857 | | | | 11,063,129 | | | | | | | | 29,324,726 | | | | 31,868,839 | | | | | | | | 230,000,794 | | | | 111,342,482 | |
End of Year | | | | | | | $19,784,600 | | | | $17,702,857 | | | | | | | | $18,459,791 | | | | $29,324,726 | | | | | | | | $373,339,447 | | | | $230,000,794 | |
Undistributed/Accumulated Net Investment Income (Loss) | | | | | | | | | | | $17,741 | | | | | | | | | | | | $49,423 | | | | | | | | | | | | $— | |
| (1) | Investor Class shares were converted to Class A shares on July 31, 2018 (see Note 1 in Notes to Financial Statements). |
See Notes to Financial Statements
C-11
PACIFIC FUNDS
STATEMENTS OF CHANGES IN NET ASSETS (Continued)
| | | | | | | | | | | | | | | | | | | | | | | | | | | | | | | | | | | | | | |
| | | | | | | | Pacific FundsSmall-Cap | | | | | | Pacific FundsSmall-Cap Value | | | | | | Pacific Funds Small-Cap Growth | |
| | | | | | | | Year Ended
March 31, 2019 | | | Year Ended
March 31, 2018 | | | | | | Year Ended
March 31, 2019 | | | Year Ended
March 31, 2018 | | | | | | Year Ended
March 31, 2019 | | | Year Ended
March 31, 2018 | |
OPERATIONS | | | | | | | | | | | | | | | | | | | | | | | | | | | | | | | | | | | | |
Net investment income (loss) | | | | | | | ($13,257 | ) | | | ($1,502 | ) | | | | | | | $131,421 | | | | $111,562 | | | | | | | | ($242,588 | ) | | | ($149,089 | ) |
Net realized gain (loss) | | | | | | | 293,078 | | | | 271,077 | | | | | | | | 1,654,755 | | | | 2,665,440 | | | | | | | | 1,869,965 | | | | 2,754,520 | |
Change in net unrealized appreciation (depreciation) | | | | | | | (434,380 | ) | | | 1,124,666 | | | | | | | | (3,313,252 | ) | | | (874,669 | ) | | | | | | | (622,046 | ) | | | 1,827,259 | |
Net Increase (Decrease) in Net Assets
Resulting from Operations | | | | | | | (154,559 | ) | | | 1,394,241 | | | | | | | | (1,527,076 | ) | | | 1,902,333 | | | | | | | | 1,005,331 | | | | 4,432,690 | |
| | | | | | | | | |
DIVIDENDS AND DISTRIBUTIONS TO SHAREHOLDERS | | | | | | | | | | | | | | | | | | | | | | | | | | | | | | | | | | | | |
Total distributable earnings | | | | | | | | | | | | | | | | | | | | | | | | | | | | | | | | | | | | |
| | Class A | | | | | | | (266,919 | ) | | | | | | | | | | | (184,456 | ) | | | | | | | | | | | (217,723 | ) | | | | |
| | Class C | | | | | | | (45,131 | ) | | | | | | | | | | | (205,173 | ) | | | | | | | | | | | (78,739 | ) | | | | |
| | Class P | | | | | | | | | | | | | | | | | | | | | | | | | | | | | | | (2,593,389 | ) | | | | |
| | Advisor Class | | | | | | | (724,054 | ) | | | | | | | | | | | (2,622,348 | ) | | | | | | | | | | | (1,438,459 | ) | | | | |
| | Class S | | | | | | | (22,537 | ) | | | | | | | | | | | (970,543 | ) | | | | | | | | | | | (595,834 | ) | | | | |
Net investment income | | | | | | | | | | | | | | | | | | | | | | | | | | | | | | | | | | | | |
| | Class A | | | | | | | | | | | (1,364 | ) | | | | | | | | | | | (2,806 | ) | | | | | | | | | | | — | |
| | Class C | | | | | | | | | | | — | | | | | | | | | | | | — | | | | | | | | | | | | — | |
| | Class P | | | | | | | | | | | | | | | | | | | | | | | | | | | | | | | | | | | — | |
| | Advisor Class | | | | | | | | | | | (8,019 | ) | | | | | | | | | | | (89,039 | ) | | | | | | | | | | | — | |
| | Investor Class | | | | | | | | | | | — | | | | | | | | | | | | (354 | ) | | | | | | | | | | | — | |
| | Class S | | | | | | | | | | | — | | | | | | | | | | | | (60,605 | ) | | | | | | | | | | | — | |
Net realized gains | | | | | | | | | | | | | | | | | | | | | | | | | | | | | | | | | | | | |
| | Class A | | | | | | | | | | | (25,601 | ) | | | | | | | | | | | (93,928 | ) | | | | | | | | | | | (20,463 | ) |
| | Class C | | | | | | | | | | | (14,438 | ) | | | | | | | | | | | (126,239 | ) | | | | | | | | | | | (23,761 | ) |
| | Class P | | | | | | | | | | | | | | | | | | | | | | | | | | | | | | | | | | | (482,393 | ) |
| | Advisor Class | | | | | | | | | | | (204,616 | ) | | | | | | | | | | | (1,716,659 | ) | | | | | | | | | | | (505,887 | ) |
| | Investor Class | | | | | | | | | | | (47 | ) | | | | | | | | | | | (6,608 | ) | | | | | | | | | | | (50,324 | ) |
| | Class S | | | | | | | | | | | (5,916 | ) | | | | | | | | | | | (823,893 | ) | | | | | | | | | | | (430,196 | ) |
Net Decrease from Dividends and
Distributions to Shareholders | | | | | | | (1,058,641 | ) | | | (260,001 | ) | | | | | | | (3,982,520 | ) | | | (2,920,131 | ) | | | | | | | (4,924,144 | ) | | | (1,513,024 | ) |
| | | | | | | | | |
CAPITAL SHARE TRANSACTIONS | | | | | | | | | | | | | | | | | | | | | | | | | | | | | | | | | | | | |
Proceeds from sale of shares | | | | | | | | | | | | | | | | | | | | | | | | | | | | | | | | | | | | |
| | Class A | | | | | | | 976,454 | | | | 1,248,952 | | | | | | | | 521,330 | | | | 820,522 | | | | | | | | 1,002,273 | | | | 322,272 | |
| | Class C | | | | | | | 439,449 | | | | 347,384 | | | | | | | | 581,842 | | | | 857,695 | | | | | | | | 671,100 | | | | 594,445 | |
| | Class P | | | | | | | | | | | | | | | | | | | | | | | | | | | | | | | 14,581,877 | | | | 15,447,521 | |
| | Advisor Class | | | | | | | 5,813,754 | | | | 7,913,651 | | | | | | | | 4,150,430 | | | | 2,581,805 | | | | | | | | 6,511,680 | | | | 2,024,783 | |
| | Investor Class | | | | | | | 362,923 | | | | 3,164,853 | | | | | | | | 39,672 | | | | 119,544 | | | | | | | | 202 | | | | 190,193 | |
| | Class S | | | | | | | 273,636 | | | | 304,126 | | | | | | | | 220,011 | | | | 455,387 | | | | | | | | 505,875 | | | | 738,140 | |
Dividends and distribution reinvestments | | | | | | | | | | | | | | | | | | | | | | | | | | | | | | | | | | | | |
| | Class A | | | | | | | 257,678 | | | | 22,792 | | | | | | | | 184,456 | | | | 95,628 | | | | | | | | 217,723 | | | | 20,463 | |
| | Class C | | | | | | | 45,131 | | | | 14,438 | | | | | | | | 205,173 | | | | 126,228 | | | | | | | | 78,739 | | | | 23,761 | |
| | Class P | | | | | | | | | | | | | | | | | | | | | | | | | | | | | | | 2,593,389 | | | | 482,393 | |
| | Advisor Class | | | | | | | 701,863 | | | | 150,773 | | | | | | | | 2,591,080 | | | | 1,778,765 | | | | | | | | 1,436,386 | | | | 505,887 | |
| | Investor Class | | | | | | | — | | | | 47 | | | | | | | | — | | | | 6,962 | | | | | | | | — | | | | 50,324 | |
| | Class S | | | | | | | 22,537 | | | | 5,916 | | | | | | | | 970,543 | | | | 884,498 | | | | | | | | 595,834 | | | | 430,196 | |
Cost of shares repurchased | | | | | | | | | | | | | | | | | | | | | | | | | | | | | | | | | | | | |
| | Class A | | | | | | | (1,562,670 | ) | | | (757,281 | ) | | | | | | | (479,587 | ) | | | (518,797 | ) | | | | | | | (179,852 | ) | | | (191,258 | ) |
| | Class C | | | | | | | (310,509 | ) | | | (271,294 | ) | | | | | | | (794,484 | ) | | | (466,654 | ) | | | | | | | (516,714 | ) | | | (77,739 | ) |
| | Class P | | | | | | | | | | | | | | | | | | | | | | | | | | | | | | | (18,163,421 | ) | | | (2,042,042 | ) |
| | Advisor Class | | | | | | | (7,275,080 | ) | | | (2,556,841 | ) | | | | | | | (7,174,364 | ) | | | (8,873,257 | ) | | | | | | | (15,180,871 | ) | | | (3,478,137 | ) |
| | Investor Class | | | | | | | (168,462 | ) | | | (613,752 | ) | | | | | | | (8,110 | ) | | | (165,781 | ) | | | | | | | — | | | | (22,005 | ) |
| | Class S | | | | | | | (75,001 | ) | | | (15,132 | ) | | | | | | | (6,113,704 | ) | | | (1,012,550 | ) | | | | | | | (8,750,477 | ) | | | (1,050,902 | ) |
Share class conversions | | | | | | | | | | | | | | | | | | | | | | | | | | | | | | | | | | | | |
| | Class A (1) | | | | | | | 3,512,299 | | | | — | | | | | | | | 201,962 | | | | — | | | | | | | | 1,611,351 | | | | — | |
| | Investor Class (1) | | | | | | | (3,512,299 | ) | | | — | | | | | | | | (201,962 | ) | | | — | | | | | | | | (1,611,351 | ) | | | — | |
Net Increase (Decrease) in Net Assets from Capital Share Transactions | | | | | | | (498,297 | ) | | | 8,958,632 | | | | | | | | (5,105,712 | ) | | | (3,310,005 | ) | | | | | | | (14,596,257 | ) | | | 13,968,295 | |
NET INCREASE (DECREASE) IN NET ASSETS | | | | | | | (1,711,497 | ) | | | 10,092,872 | | | | | | | | (10,615,308 | ) | | | (4,327,803 | ) | | | | | | | (18,515,070 | ) | | | 16,887,961 | |
| | | | | | | | | |
NET ASSETS | | | | | | | | | | | | | | | | | | | | | | | | | | | | | | | | | | | | |
Beginning of Year | | | | | | | 21,478,464 | | | | 11,385,592 | | | | | | | | 27,998,634 | | | | 32,326,437 | | | | | | | | 54,129,171 | | | | 37,241,210 | |
End of Year | | | | | | | $19,766,967 | | | | $21,478,464 | | | | | | | | $17,383,326 | | | | $27,998,634 | | | | | | | | $35,614,101 | | | | $54,129,171 | |
Undistributed/Accumulated Net Investment Income (Loss) | | | | | | | | | | | $— | | | | | | | | | | | | $1,539 | | | | | | | | | | | | ($42,866 | ) |
| (1) | Investor Class shares were converted to Class A shares on July 31, 2018 (see Note 1 in Notes to Financial Statements). |
See Notes to Financial Statements
C-12
PACIFIC FUNDS
FINANCIAL HIGHLIGHTS
Selected per share, ratios and supplemental data for each year or period ended March 31, were as follows:
| | | | | | | | | | | | | | | | | | | | | | | | | | | | | | | | | | | | | | | | | | | | | | | | | | | | | | | | |
| Fund | | | | | Selected Per Share Data | | | | | | Ratios to Average Net Assets | | | Supplemental Data | |
| | | | | | Investment Operations | | | Distributions | | | | | | | | | | | | | | | | | | | | | | |
For the Year or Period Ended (1) | | Net Asset Value,
Beginning of Year or Period | | | Net Investment Income (Loss) (2) | | | Net Realized and
Unrealized Gain (Loss) | | | Total | | | Net Investment Income | | | Capital Gains | | | Total | | | Net Asset Value,
End of Year or Period | | | Expenses Before Reductions (3) | | | Expenses After Reductions (3), (4) | | | Net Investment Income (Loss) (3) | | | Total Returns (5) | | | Net Assets, End of Year or Period
(in thousands) | | | Portfolio Turnover Rates | |
Pacific Funds Portfolio Optimization Conservative (6) | | | | | | | | | | | | | | | | | | | | | | | | | | | | | | | | | | | | | | | | | | | | | |
| | | | | | | | | | | | |
Class A | | | | | | | | | | | | | | | | | | | | | | | | | | | | | | | | | | | | | | | | | | | | | | | | | |
| 4/1/2018 - 3/31/2019 | | | $11.24 | | | | $0.20 | | | | ($0.04 | ) | | | $0.16 | | | | ($0.21 | ) | | | ($0.96 | ) | | | ($1.17 | ) | | | $10.23 | | | | 0.68 | % | | | 0.60 | % | | | 1.83 | % | | | 1.88 | % | | | $121,012 | | | | 30 | % |
| 4/1/2017 - 3/31/2018 | | | 10.98 | | | | 0.25 | | | | 0.26 | | | | 0.51 | | | | (0.25 | ) | | | — | | | | (0.25 | ) | | | 11.24 | | | | 0.68 | % | | | 0.60 | % | | | 2.18 | % | | | 4.60 | % | | | 131,023 | | | | 30 | % |
| 4/1/2016 - 3/31/2017 | | | 10.63 | | | | 0.19 | | | | 0.52 | | | | 0.71 | | | | (0.22 | ) | | | (0.14 | ) | | | (0.36 | ) | | | 10.98 | | | | 0.68 | % | | | 0.60 | % | | | 1.70 | % | | | 6.59 | % | | | 136,881 | | | | 57 | % |
| 4/1/2015 - 3/31/2016 | | | 11.22 | | | | 0.22 | | | | (0.43 | ) | | | (0.21 | ) | | | (0.28 | ) | | | (0.10 | ) | | | (0.38 | ) | | | 10.63 | | | | 0.67 | % | | | 0.60 | % | | | 1.99 | % | | | (1.73 | %) | | | 154,762 | | | | 42 | % |
| 4/1/2014 - 3/31/2015 | | | 11.29 | | | | 0.16 | | | | 0.26 | | | | 0.42 | | | | (0.23 | ) | | | (0.26 | ) | | | (0.49 | ) | | | 11.22 | | | | 0.68 | % | | | 0.60 | % | | | 1.44 | % | | | 3.71 | % | | | 169,945 | | | | 17 | % |
Class B | | | | | | | | | | | | | | | | | | | | | | | | | | | | | | | | | | | | | | | | | | | | | | | | | |
| 4/1/2018 - 3/31/2019 | | | $11.00 | | | | $0.11 | | | | ($0.03 | ) | | | $0.08 | | | | ($0.14 | ) | | | ($0.96 | ) | | | ($1.10 | ) | | | $9.98 | | | | 1.43 | % | | | 1.35 | % | | | 1.08 | % | | | 1.15 | % | | | $16,573 | | | | 30 | % |
| 4/1/2017 - 3/31/2018 | | | 10.76 | | | | 0.16 | | | | 0.26 | | | | 0.42 | | | | (0.18 | ) | | | — | | | | (0.18 | ) | | | 11.00 | | | | 1.43 | % | | | 1.35 | % | | | 1.43 | % | | | 3.78 | % | | | 24,600 | | | | 30 | % |
| 4/1/2016 - 3/31/2017 | | | 10.45 | | | | 0.10 | | | | 0.50 | | | | 0.60 | | | | (0.15 | ) | | | (0.14 | ) | | | (0.29 | ) | | | 10.76 | | | | 1.43 | % | | | 1.35 | % | | | 0.95 | % | | | 5.89 | % | | | 29,734 | | | | 57 | % |
| 4/1/2015 - 3/31/2016 | | | 11.05 | | | | 0.13 | | | | (0.41 | ) | | | (0.28 | ) | | | (0.22 | ) | | | (0.10 | ) | | | (0.32 | ) | | | 10.45 | | | | 1.42 | % | | | 1.35 | % | | | 1.24 | % | | | (2.51 | %) | | | 33,675 | | | | 42 | % |
| 4/1/2014 - 3/31/2015 | | | 11.14 | | | | 0.08 | | | | 0.25 | | | | 0.33 | | | | (0.16 | ) | | | (0.26 | ) | | | (0.42 | ) | | | 11.05 | | | | 1.43 | % | | | 1.35 | % | | | 0.69 | % | | | 3.00 | % | | | 37,979 | | | | 17 | % |
Class C | | | | | | | | | | | | | | | | | | | | | | | | | | | | | | | | | | | | | | | | | | | | | | | | | |
| 4/1/2018 - 3/31/2019 | | | $11.00 | | | | $0.11 | | | | ($0.03 | ) | | | $0.08 | | | | ($0.15 | ) | | | ($0.96 | ) | | | ($1.11 | ) | | | $9.97 | | | | 1.43 | % | | | 1.35 | % | | | 1.08 | % | | | 1.13 | % | | | $111,233 | | | | 30 | % |
| 4/1/2017 - 3/31/2018 | | | 10.76 | | | | 0.16 | | | | 0.26 | | | | 0.42 | | | | (0.18 | ) | | | — | | | | (0.18 | ) | | | 11.00 | | | | 1.43 | % | | | 1.35 | % | | | 1.43 | % | | | 3.89 | % | | | 137,036 | | | | 30 | % |
| 4/1/2016 - 3/31/2017 | | | 10.44 | | | | 0.10 | | | | 0.51 | | | | 0.61 | | | | (0.15 | ) | | | (0.14 | ) | | | (0.29 | ) | | | 10.76 | | | | 1.43 | % | | | 1.35 | % | | | 0.95 | % | | | 5.79 | % | | | 153,433 | | | | 57 | % |
| 4/1/2015 - 3/31/2016 | | | 11.05 | | | | 0.13 | | | | (0.42 | ) | | | (0.29 | ) | | | (0.22 | ) | | | (0.10 | ) | | | (0.32 | ) | | | 10.44 | | | | 1.42 | % | | | 1.35 | % | | | 1.24 | % | | | (2.51 | %) | | | 173,137 | | | | 42 | % |
| 4/1/2014 - 3/31/2015 | | | 11.13 | | | | 0.08 | | | | 0.26 | | | | 0.34 | | | | (0.16 | ) | | | (0.26 | ) | | | (0.42 | ) | | | 11.05 | | | | 1.43 | % | | | 1.35 | % | | | 0.69 | % | | | 3.09 | % | | | 191,946 | | | | 17 | % |
Advisor Class | | | | | | | | | | | | | | | | | | | | | | | | | | | | | | | | | | | | | | | | | | | | | | | | | |
| 4/1/2018 - 3/31/2019 | | | $11.26 | | | | $0.22 | | | | ($0.03 | ) | | | $0.19 | | | | ($0.23 | ) | | | ($0.96 | ) | | | ($1.19 | ) | | | $10.26 | | | | 0.43 | % | | | 0.35 | % | | | 2.08 | % | | | 2.26 | % | | | $6,893 | | | | 30 | % |
| 4/1/2017 - 3/31/2018 | | | 11.00 | | | | 0.28 | | | | 0.25 | | | | 0.53 | | | | (0.27 | ) | | | — | | | | (0.27 | ) | | | 11.26 | | | | 0.43 | % | | | 0.35 | % | | | 2.43 | % | | | 4.79 | % | | | 8,135 | | | | 30 | % |
| 4/1/2016 - 3/31/2017 | | | 10.65 | | | | 0.21 | | | | 0.52 | | | | 0.73 | | | | (0.24 | ) | | | (0.14 | ) | | | (0.38 | ) | | | 11.00 | | | | 0.43 | % | | | 0.35 | % | | | 1.95 | % | | | 6.89 | % | | | 5,404 | | | | 57 | % |
| 4/1/2015 - 3/31/2016 | | | 11.23 | | | | 0.25 | | | | (0.43 | ) | | | (0.18 | ) | | | (0.30 | ) | | | (0.10 | ) | | | (0.40 | ) | | | 10.65 | | | | 0.42 | % | | | 0.35 | % | | | 2.24 | % | | | (1.53 | %) | | | 4,976 | | | | 42 | % |
| 4/1/2014 - 3/31/2015 | | | 11.29 | | | | 0.19 | | | | 0.26 | | | | 0.45 | | | | (0.25 | ) | | | (0.26 | ) | | | (0.51 | ) | | | 11.23 | | | | 0.43 | % | | | 0.35 | % | | | 1.69 | % | | | 4.01 | % | | | 7,872 | | | | 17 | % |
Pacific Funds Portfolio Optimization Moderate-Conservative(6) | | | | | | | | | | | | | | | | | | | | | | | | | | | | | | | | | | | | | | | | | |
| | | | | | | | | | | | |
Class A | | | | | | | | | | | | | | | | | | | | | | | | | | | | | | | | | | | | | | | | | | | | | | | | | |
| 4/1/2018 - 3/31/2019 | | | $12.58 | | | | $0.18 | | | | ($0.06 | ) | | | $0.12 | | | | ($0.20 | ) | | | ($1.80 | ) | | | ($2.00 | ) | | | $10.70 | | | | 0.68 | % | | | 0.60 | % | | | 1.55 | % | | | 1.91 | % | | | $199,827 | | | | 45 | % |
| 4/1/2017 - 3/31/2018 | | | 12.21 | | | | 0.25 | | | | 0.53 | | | | 0.78 | | | | (0.27 | ) | | | (0.14 | ) | | | (0.41 | ) | | | 12.58 | | | | 0.67 | % | | | 0.60 | % | | | 1.95 | % | | | 6.36 | % | | | 227,420 | | | | 30 | % |
| 4/1/2016 - 3/31/2017 | | | 11.73 | | | | 0.20 | | | | 0.79 | | | | 0.99 | | | | (0.24 | ) | | | (0.27 | ) | | | (0.51 | ) | | | 12.21 | | | | 0.67 | % | | | 0.60 | % | | | 1.68 | % | | | 8.49 | % | | | 236,725 | | | | 53 | % |
| 4/1/2015 - 3/31/2016 | | | 12.61 | | | | 0.25 | | | | (0.50 | ) | | | (0.25 | ) | | | (0.29 | ) | | | (0.34 | ) | | | (0.63 | ) | | | 11.73 | | | | 0.67 | % | | | 0.60 | % | | | 2.07 | % | | | (1.87 | %) | | | 255,376 | | | | 34 | % |
| 4/1/2014 - 3/31/2015 | | | 12.48 | | | | 0.18 | | | | 0.40 | | | | 0.58 | | | | (0.25 | ) | | | (0.20 | ) | | | (0.45 | ) | | | 12.61 | | | | 0.67 | % | | | 0.60 | % | | | 1.40 | % | | | 4.69 | % | | | 276,898 | | | | 17 | % |
Class B | | | | | | | | | | | | | | | | | | | | | | | | | | | | | | | | | | | | | | | | | | | | | | | | | |
| 4/1/2018 - 3/31/2019 | | | $12.35 | | | | $0.09 | | | | ($0.06 | ) | | | $0.03 | | | | ($0.13 | ) | | | ($1.80 | ) | | | ($1.93 | ) | | | $10.45 | | | | 1.43 | % | | | 1.35 | % | | | 0.80 | % | | | 1.07 | % | | | $27,882 | | | | 45 | % |
| 4/1/2017 - 3/31/2018 | | | 12.01 | | | | 0.15 | | | | 0.52 | | | | 0.67 | | | | (0.19 | ) | | | (0.14 | ) | | | (0.33 | ) | | | 12.35 | | | | 1.42 | % | | | 1.35 | % | | | 1.20 | % | | | 5.58 | % | | | 39,004 | | | | 30 | % |
| 4/1/2016 - 3/31/2017 | | | 11.56 | | | | 0.11 | | | | 0.78 | | | | 0.89 | | | | (0.17 | ) | | | (0.27 | ) | | | (0.44 | ) | | | 12.01 | | | | 1.42 | % | | | 1.35 | % | | | 0.93 | % | | | 7.75 | % | | | 45,184 | | | | 53 | % |
| 4/1/2015 - 3/31/2016 | | | 12.46 | | | | 0.16 | | | | (0.49 | ) | | | (0.33 | ) | | | (0.23 | ) | | | (0.34 | ) | | | (0.57 | ) | | | 11.56 | | | | 1.42 | % | | | 1.35 | % | | | 1.32 | % | | | (2.61 | %) | | | 47,540 | | | | 34 | % |
| 4/1/2014 - 3/31/2015 | | | 12.36 | | | | 0.08 | | | | 0.40 | | | | 0.48 | | | | (0.18 | ) | | | (0.20 | ) | | | (0.38 | ) | | | 12.46 | | | | 1.42 | % | | | 1.35 | % | | | 0.65 | % | | | 3.91 | % | | | 51,223 | | | | 17 | % |
Class C | | | | | | | | | | | | | | | | | | | | | | | | | | | | | | | | | | | | | | | | | | | | | | | | | |
| 4/1/2018 - 3/31/2019 | | | $12.34 | | | | $0.09 | | | | ($0.06 | ) | | | $0.03 | | | | ($0.13 | ) | | | ($1.80 | ) | | | ($1.93 | ) | | | $10.44 | | | | 1.43 | % | | | 1.35 | % | | | 0.80 | % | | | 1.11 | % | | | $136,522 | | | | 45 | % |
| 4/1/2017 - 3/31/2018 | | | 12.00 | | | | 0.15 | | | | 0.52 | | | | 0.67 | | | | (0.19 | ) | | | (0.14 | ) | | | (0.33 | ) | | | 12.34 | | | | 1.42 | % | | | 1.35 | % | | | 1.20 | % | | | 5.60 | % | | | 174,766 | | | | 30 | % |
| 4/1/2016 - 3/31/2017 | | | 11.56 | | | | 0.11 | | | | 0.77 | | | | 0.88 | | | | (0.17 | ) | | | (0.27 | ) | | | (0.44 | ) | | | 12.00 | | | | 1.42 | % | | | 1.35 | % | | | 0.93 | % | | | 7.74 | % | | | 200,105 | | | | 53 | % |
| 4/1/2015 - 3/31/2016 | | | 12.45 | | | | 0.16 | | | | (0.48 | ) | | | (0.32 | ) | | | (0.23 | ) | | | (0.34 | ) | | | (0.57 | ) | | | 11.56 | | | | 1.42 | % | | | 1.35 | % | | | 1.32 | % | | | (2.61 | %) | | | 221,192 | | | | 34 | % |
| 4/1/2014 - 3/31/2015 | | | 12.35 | | | | 0.08 | | | | 0.40 | | | | 0.48 | | | | (0.18 | ) | | | (0.20 | ) | | | (0.38 | ) | | | 12.45 | | | | 1.42 | % | | | 1.35 | % | | | 0.65 | % | | | 3.93 | % | | | 240,803 | | | | 17 | % |
Advisor Class | | | | | | | | | | | | | | | | | | | | | | | | | | | | | | | | | | | | | | | | | | | | | |
| 4/1/2018 - 3/31/2019 | | | $12.62 | | | | $0.21 | | | | ($0.06 | ) | | | $0.15 | | | | ($0.22 | ) | | | ($1.80 | ) | | | ($2.02 | ) | | | $10.75 | | | | 0.42 | % | | | 0.35 | % | | | 1.80 | % | | | 2.10 | % | | | $7,701 | | | | 45 | % |
| 4/1/2017 - 3/31/2018 | | | 12.24 | | | | 0.28 | | | | 0.53 | | | | 0.81 | | | | (0.29 | ) | | | (0.14 | ) | | | (0.43 | ) | | | 12.62 | | | | 0.42 | % | | | 0.35 | % | | | 2.20 | % | | | 6.62 | % | | | 5,196 | | | | 30 | % |
| 4/1/2016 - 3/31/2017 | | | 11.75 | | | | 0.23 | | | | 0.79 | | | | 1.02 | | | | (0.26 | ) | | | (0.27 | ) | | | (0.53 | ) | | | 12.24 | | | | 0.42 | % | | | 0.35 | % | | | 1.93 | % | | | 8.78 | % | | | 4,895 | | | | 53 | % |
| 4/1/2015 - 3/31/2016 | | | 12.62 | | | | 0.28 | | | | (0.49 | ) | | | (0.21 | ) | | | (0.32 | ) | | | (0.34 | ) | | | (0.66 | ) | | | 11.75 | | | | 0.42 | % | | | 0.35 | % | | | 2.32 | % | | | (1.60 | %) | | | 4,891 | | | | 34 | % |
| 4/1/2014 - 3/31/2015 | | | 12.49 | | | | 0.21 | | | | 0.40 | | | | 0.61 | | | | (0.28 | ) | | | (0.20 | ) | | | (0.48 | ) | | | 12.62 | | | | 0.42 | % | | | 0.35 | % | | | 1.65 | % | | | 4.89 | % | | | 5,568 | | | | 17 | % |
| | |
| See Notes to Financial Statements | | See explanation of references on C-21 |
C-13
PACIFIC FUNDS
FINANCIAL HIGHLIGHTS (Continued)
Selected per share, ratios and supplemental data for each year or period ended March 31, were as follows:
| | | | | | | | | | | | | | | | | | | | | | | | | | | | | | | | | | | | | | | | | | | | | | | | | | | | | | | | |
| Fund | | | | | Selected Per Share Data | | | | | | Ratios to Average Net Assets | | | Supplemental Data | |
| | | | | | Investment Operations | | | Distributions | | | | | | | | | | | | | | | | | | | | | | |
For the Year or Period Ended (1) | | Net Asset Value,
Beginning of Year or Period | | | Net Investment Income (Loss) (2) | | | Net Realized and
Unrealized Gain (Loss) | | | Total | | | Net Investment Income | | | Capital Gains | | | Total | | | Net Asset Value,
End of Year or Period | | | Expenses Before Reductions (3) | | | Expenses After Reductions (3), (4) | | | Net Investment Income (Loss) (3) | | | Total Returns (5) | | | Net Assets, End of Year or Period
(in thousands) | | | Portfolio Turnover Rates | |
Pacific Funds Portfolio Optimization Moderate (6) | | | | | | | | | | | | | | | | | | | | | | | | | | | | | | | | | | | | | | | | | | | | | |
| | | | | | | | | | | |
Class A | | | | | | | | | | | | | | | | | | | | | | | | | | | | | | | | | | | | | | | | | | | | | |
| 4/1/2018 - 3/31/2019 | | | $14.26 | | | | $0.16 | | | | $0.04 | | | | $0.20 | | | | ($0.23 | ) | | | ($2.22 | ) | | | ($2.45 | ) | | | $12.01 | | | | 0.66 | % | | | 0.60 | % | | | 1.17 | % | | | 2.49 | % | | | $652,731 | | | | 41 | % |
| 4/1/2017 - 3/31/2018 | | | 13.67 | | | | 0.20 | | | | 0.94 | | | | 1.14 | | | | (0.24 | ) | | | (0.31 | ) | | | (0.55 | ) | | | 14.26 | | | | 0.66 | % | | | 0.60 | % | | | 1.40 | % | | | 8.36 | % | | | 690,689 | | | | 36 | % |
| 4/1/2016 - 3/31/2017 | | | 12.99 | | | | 0.22 | | | | 1.17 | | | | 1.39 | | | | (0.24 | ) | | | (0.47 | ) | | | (0.71 | ) | | | 13.67 | | | | 0.66 | % | | | 0.60 | % | | | 1.60 | % | | | 10.94 | % | | | 720,438 | | | | 48 | % |
| 4/1/2015 - 3/31/2016 | | | 14.20 | | | | 0.25 | | | | (0.60 | ) | | | (0.35 | ) | | | (0.28 | ) | | | (0.58 | ) | | | (0.86 | ) | | | 12.99 | | | | 0.66 | % | | | 0.60 | % | | | 1.85 | % | | | (2.50 | %) | | | 771,853 | | | | 35 | % |
| 4/1/2014 - 3/31/2015 | | | 13.98 | | | | 0.18 | | | | 0.55 | | | | 0.73 | | | | (0.32 | ) | | | (0.19 | ) | | | (0.51 | ) | | | 14.20 | | | | 0.66 | % | | | 0.60 | % | | | 1.28 | % | | | 5.30 | % | | | 844,759 | | | | 19 | % |
Class B | | | | | | | | | | | | | | | | | | | | | | | | | | | | | | | | | | | | | | | | | | | | | |
| 4/1/2018 - 3/31/2019 | | | $14.06 | | | | $0.06 | | | | $0.04 | | | | $0.10 | | | | ($0.15 | ) | | | ($2.22 | ) | | | ($2.37 | ) | | | $11.79 | | | | 1.41 | % | | | 1.35 | % | | | 0.42 | % | | | 1.75 | % | | | $89,875 | | | | 41 | % |
| 4/1/2017 - 3/31/2018 | | | 13.52 | | | | 0.09 | | | | 0.92 | | | | 1.01 | | | | (0.16 | ) | | | (0.31 | ) | | | (0.47 | ) | | | 14.06 | | | | 1.41 | % | | | 1.35 | % | | | 0.65 | % | | | 7.53 | % | | | 119,870 | | | | 36 | % |
| 4/1/2016 - 3/31/2017 | | | 12.87 | | | | 0.11 | | | | 1.17 | | | | 1.28 | | | | (0.16 | ) | | | (0.47 | ) | | | (0.63 | ) | | | 13.52 | | | | 1.41 | % | | | 1.35 | % | | | 0.85 | % | | | 10.18 | % | | | 134,766 | | | | 48 | % |
| 4/1/2015 - 3/31/2016 | | | 14.10 | | | | 0.15 | | | | (0.60 | ) | | | (0.45 | ) | | | (0.20 | ) | | | (0.58 | ) | | | (0.78 | ) | | | 12.87 | | | | 1.41 | % | �� | | 1.35 | % | | | 1.10 | % | | | (3.21 | %) | | | 142,921 | | | | 35 | % |
| 4/1/2014 - 3/31/2015 | | | 13.89 | | | | 0.07 | | | | 0.55 | | | | 0.62 | | | | (0.22 | ) | | | (0.19 | ) | | | (0.41 | ) | | | 14.10 | | | | 1.41 | % | | | 1.35 | % | | | 0.53 | % | | | 4.49 | % | | | 159,975 | | | | 19 | % |
Class C | | | | | | | | | | | | | | | | | | | | | | | | | | | | | | | | | | | | | | | | | | | | | |
| 4/1/2018 - 3/31/2019 | | | $14.04 | | | | $0.05 | | | | $0.06 | | | | $0.11 | | | | ($0.16 | ) | | | ($2.22 | ) | | | ($2.38 | ) | | | $11.77 | | | | 1.41 | % | | | 1.35 | % | | | 0.42 | % | | | 1.78 | % | | | $381,170 | | | | 41 | % |
| 4/1/2017 - 3/31/2018 | | | 13.50 | | | | 0.09 | | | | 0.92 | | | | 1.01 | | | | (0.16 | ) | | | (0.31 | ) | | | (0.47 | ) | | | 14.04 | | | | 1.41 | % | | | 1.35 | % | | | 0.65 | % | | | 7.47 | % | | | 465,913 | | | | 36 | % |
| 4/1/2016 - 3/31/2017 | | | 12.85 | | | | 0.11 | | | | 1.17 | | | | 1.28 | | | | (0.16 | ) | | | (0.47 | ) | | | (0.63 | ) | | | 13.50 | | | | 1.41 | % | | | 1.35 | % | | | 0.85 | % | | | 10.19 | % | | | 515,691 | | | | 48 | % |
| 4/1/2015 - 3/31/2016 | | | 14.08 | | | | 0.15 | | | | (0.60 | ) | | | (0.45 | ) | | | (0.20 | ) | | | (0.58 | ) | | | (0.78 | ) | | | 12.85 | | | | 1.41 | % | | | 1.35 | % | | | 1.10 | % | | | (3.22 | %) | | | 554,661 | | | | 35 | % |
| 4/1/2014 - 3/31/2015 | | | 13.87 | | | | 0.07 | | | | 0.55 | | | | 0.62 | | | | (0.22 | ) | | | (0.19 | ) | | | (0.41 | ) | | | 14.08 | | | | 1.41 | % | | | 1.35 | % | | | 0.53 | % | | | 4.51 | % | | | 601,814 | | | | 19 | % |
Advisor Class | | | | | | | | | | | | | | | | | | | | | | | | | | | | | | | | | | | | | | | | | | | | | |
| 4/1/2018 - 3/31/2019 | | | $14.29 | | | | $0.19 | | | | $0.04 | | | | $0.23 | | | | ($0.25 | ) | | | ($2.22 | ) | | | ($2.47 | ) | | | $12.05 | | | | 0.41 | % | | | 0.35 | % | | | 1.42 | % | | | 2.75 | % | | | $26,959 | | | | 41 | % |
| 4/1/2017 - 3/31/2018 | | | 13.69 | | | | 0.24 | | | | 0.94 | | | | 1.18 | | | | (0.27 | ) | | | (0.31 | ) | | | (0.58 | ) | | | 14.29 | | | | 0.41 | % | | | 0.35 | % | | | 1.65 | % | | | 8.54 | % | | | 23,088 | | | | 36 | % |
| 4/1/2016 - 3/31/2017 | | | 13.00 | | | | 0.25 | | | | 1.18 | | | | 1.43 | | | | (0.27 | ) | | | (0.47 | ) | | | (0.74 | ) | | | 13.69 | | | | 0.41 | % | | | 0.35 | % | | | 1.85 | % | | | 11.30 | % | | | 17,983 | | | | 48 | % |
| 4/1/2015 - 3/31/2016 | | | 14.20 | | | | 0.29 | | | | (0.60 | ) | | | (0.31 | ) | | | (0.31 | ) | | | (0.58 | ) | | | (0.89 | ) | | | 13.00 | | | | 0.41 | % | | | 0.35 | % | | | 2.10 | % | | | (2.24 | %) | | | 19,835 | | | | 35 | % |
| 4/1/2014 - 3/31/2015 | | | 13.98 | | | | 0.22 | | | | 0.55 | | | | 0.77 | | | | (0.36 | ) | | | (0.19 | ) | | | (0.55 | ) | | | 14.20 | | | | 0.41 | % | | | 0.35 | % | | | 1.53 | % | | | 5.54 | % | | | 21,896 | | | | 19 | % |
Pacific Funds Portfolio Optimization Growth (6) | | | | | | | | | | | | | | | | | | | | | | | | | | | | | | | | | | | | | | | | | | | | | |
| | | | | | | | | | | |
Class A | | | | | | | | | | | | | | | | | | | | | | | | | | | | | | | | | | | | | | | | | | | | | |
| 4/1/2018 - 3/31/2019 | | | $15.46 | | | | $0.12 | | | | $0.13 | | | | $0.25 | | | | ($0.21 | ) | | | ($2.73 | ) | | | ($2.94 | ) | | | $12.77 | | | | 0.66 | % | | | 0.60 | % | | | 0.84 | % | | | 2.92 | % | | | $529,247 | | | | 53 | % |
| 4/1/2017 - 3/31/2018 | | | 14.61 | | | | 0.18 | | | | 1.30 | | | | 1.48 | | | | (0.23 | ) | | | (0.40 | ) | | | (0.63 | ) | | | 15.46 | | | | 0.66 | % | | | 0.60 | % | | | 1.14 | % | | | 10.10 | % | | | 555,328 | | | | 39 | % |
| 4/1/2016 - 3/31/2017 | | | 13.74 | | | | 0.22 | | | | 1.54 | | | | 1.76 | | | | (0.23 | ) | | | (0.66 | ) | | | (0.89 | ) | | | 14.61 | | | | 0.67 | % | | | 0.60 | % | | | 1.55 | % | | | 13.08 | % | | | 560,395 | | | | 43 | % |
| 4/1/2015 - 3/31/2016 | | | 15.34 | | | | 0.19 | | | | (0.69 | ) | | | (0.50 | ) | | | (0.23 | ) | | | (0.87 | ) | | | (1.10 | ) | | | 13.74 | | | | 0.66 | % | | | 0.60 | % | | | 1.29 | % | | | (3.35 | %) | | | 570,267 | | | | 34 | % |
| 4/1/2014 - 3/31/2015 | | | 14.74 | | | | 0.16 | | | | 0.77 | | | | 0.93 | | | | (0.33 | ) | | | — | | | | (0.33 | ) | | | 15.34 | | | | 0.66 | % | | | 0.60 | % | | | 1.07 | % | | | 6.36 | % | | | 607,360 | | | | 21 | % |
Class B | | | | | | | | | | | | | | | | | | | | | | | | | | | | | | | | | | | | | | | | | | | | | | | | | |
| 4/1/2018 - 3/31/2019 | | | $15.23 | | | | $0.01 | | | | $0.12 | | | | $0.13 | | | | ($0.13 | ) | | | ($2.73 | ) | | | ($2.86 | ) | | | $12.50 | | | | 1.42 | % | | | 1.35 | % | | | 0.08 | % | | | 2.15 | % | | | $66,562 | | | | 53 | % |
| 4/1/2017 - 3/31/2018 | | | 14.42 | | | | 0.06 | | | | 1.29 | | | | 1.35 | | | | (0.14 | ) | | | (0.40 | ) | | | (0.54 | ) | | | 15.23 | | | | 1.41 | % | | | 1.35 | % | | | 0.39 | % | | | 9.33 | % | | | 88,937 | | | | 39 | % |
| 4/1/2016 - 3/31/2017 | | | 13.59 | | | | 0.11 | | | | 1.53 | | | | 1.64 | | | | (0.15 | ) | | | (0.66 | ) | | | (0.81 | ) | | | 14.42 | | | | 1.42 | % | | | 1.35 | % | | | 0.80 | % | | | 12.30 | % | | | 98,256 | | | | 43 | % |
| 4/1/2015 - 3/31/2016 | | | 15.22 | | | | 0.08 | | | | (0.69 | ) | | | (0.61 | ) | | | (0.15 | ) | | | (0.87 | ) | | | (1.02 | ) | | | 13.59 | | | | 1.41 | % | | | 1.35 | % | | | 0.54 | % | | | (4.13 | %) | | | 102,001 | | | | 34 | % |
| 4/1/2014 - 3/31/2015 | | | 14.62 | | | | 0.05 | | | | 0.77 | | | | 0.82 | | | | (0.22 | ) | | | — | | | | (0.22 | ) | | | 15.22 | | | | 1.41 | % | | | 1.35 | % | | | 0.32 | % | | | 5.61 | % | | | 119,159 | | | | 21 | % |
Class C | | | | | | | | | | | | | | | | | | | | | | | | | | | | | | | | | | | | | | | | | | | | | | | | | |
| 4/1/2018 - 3/31/2019 | | | $15.18 | | | | $0.01 | | | | $0.13 | | | | $0.14 | | | | ($0.14 | ) | | | ($2.73 | ) | | | ($2.87 | ) | | | $12.45 | | | | 1.42 | % | | | 1.35 | % | | | 0.08 | % | | | 2.12 | % | | | $271,000 | | | | 53 | % |
| 4/1/2017 - 3/31/2018 | | | 14.38 | | | | 0.06 | | | | 1.28 | | | | 1.34 | | | | (0.14 | ) | | | (0.40 | ) | | | (0.54 | ) | | | 15.18 | | | | 1.41 | % | | | 1.35 | % | | | 0.39 | % | | | 9.29 | % | | | 317,342 | | | | 39 | % |
| 4/1/2016 - 3/31/2017 | | | 13.55 | | | | 0.11 | | | | 1.53 | | | | 1.64 | | | | (0.15 | ) | | | (0.66 | ) | | | (0.81 | ) | | | 14.38 | | | | 1.42 | % | | | 1.35 | % | | | 0.80 | % | | | 12.33 | % | | | 347,447 | | | | 43 | % |
| 4/1/2015 - 3/31/2016 | | | 15.18 | | | | 0.08 | | | | (0.69 | ) | | | (0.61 | ) | | | (0.15 | ) | | | (0.87 | ) | | | (1.02 | ) | | | 13.55 | | | | 1.41 | % | | | 1.35 | % | | | 0.54 | % | | | (4.13 | %) | | | 366,805 | | | | 34 | % |
| 4/1/2014 - 3/31/2015 | | | 14.59 | | | | 0.05 | | | | 0.76 | | | | 0.81 | | | | (0.22 | ) | | | — | | | | (0.22 | ) | | | 15.18 | | | | 1.41 | % | | | 1.35 | % | | | 0.32 | % | | | 5.59 | % | | | 398,716 | | | | 21 | % |
Advisor Class | | | | | | | | | | | | | | | | | | | | | | | | | | | | | | | | | | | | | | | | | | | | | | | | | |
| 4/1/2018 - 3/31/2019 | | | $15.51 | | | | $0.16 | | | | $0.12 | | | | $0.28 | | | | ($0.24 | ) | | | ($2.73 | ) | | | ($2.97 | ) | | | $12.82 | | | | 0.41 | % | | | 0.35 | % | | | 1.09 | % | | | 3.12 | % | | | $19,458 | | | | 53 | % |
| 4/1/2017 - 3/31/2018 | | | 14.64 | | | | 0.22 | | | | 1.31 | | | | 1.53 | | | | (0.26 | ) | | | (0.40 | ) | | | (0.66 | ) | | | 15.51 | | | | 0.41 | % | | | 0.35 | % | | | 1.39 | % | | | 10.42 | % | | | 16,280 | | | | 39 | % |
| 4/1/2016 - 3/31/2017 | | | 13.76 | | | | 0.26 | | | | 1.54 | | | | 1.80 | | | | (0.26 | ) | | | (0.66 | ) | | | (0.92 | ) | | | 14.64 | | | | 0.42 | % | | | 0.35 | % | | | 1.80 | % | | | 13.34 | % | | | 13,275 | | | | 43 | % |
| 4/1/2015 - 3/31/2016 | | | 15.35 | | | | 0.22 | | | | (0.68 | ) | | | (0.46 | ) | | | (0.26 | ) | | | (0.87 | ) | | | (1.13 | ) | | | 13.76 | | | | 0.41 | % | | | 0.35 | % | | | 1.54 | % | | | (3.10 | %) | | | 12,084 | | | | 34 | % |
| 4/1/2014 - 3/31/2015 | | | 14.75 | | | | 0.19 | | | | 0.78 | | | | 0.97 | | | | (0.37 | ) | | | — | | | | (0.37 | ) | | | 15.35 | | | | 0.41 | % | | | 0.35 | % | | | 1.32 | % | | | 6.61 | % | | | 10,165 | | | | 21 | % |
| | |
| See Notes to Financial Statements | | See explanation of references on C-21 |
C-14
PACIFIC FUNDS
FINANCIAL HIGHLIGHTS (Continued)
Selected per share, ratios and supplemental data for each year or period ended March 31, were as follows:
| | | | | | | | | | | | | | | | | | | | | | | | | | | | | | | | | | | | | | | | | | | | | | | | | | | | | | | | |
| Fund | | | | | Selected Per Share Data | | | | | | Ratios to Average Net Assets | | | Supplemental Data | |
| | | | | | Investment Operations | | | Distributions | | | | | | | | | | | | | | | | | | | | | | |
For the Year or Period Ended (1) | | Net Asset Value,
Beginning of Year or Period | | | Net Investment Income (Loss) (2) | | | Net Realized and
Unrealized Gain (Loss) | | | Total | | | Net Investment Income | | | Capital Gains | | | Total | | | Net Asset Value,
End of Year or Period | | | Expenses Before Reductions (3) | | | Expenses After Reductions (3), (4) | | | Net Investment Income (Loss) (3) | | | Total Returns (5) | | | Net Assets, End of Year or Period
(in thousands) | | | Portfolio Turnover Rates | |
Pacific Funds Portfolio Optimization Aggressive-Growth (6) | | | | | | | | | | | | | | | | | | | | | | | | | | | | | | | | | |
| | | | | | | | | | | | | | |
| Class A | | | | | | | | | | | | | | | | | | | | | | | | | | | | | | | | | | | | | | | | | | | | | | | | | | | | | | | | |
| 4/1/2018 - 3/31/2019 | | | $17.03 | | | | 0.10 | | | | $0.25 | | | | $0.35 | | | | ($0.25 | ) | | | ($2.88 | ) | | | ($3.13 | ) | | | $14.25 | | | | 0.68 | % | | | 0.60 | % | | | 0.61 | % | | | 3.39 | % | | | $193,470 | | | | 55 | % |
| 4/1/2017 - 3/31/2018 | | | 15.79 | | | | 0.12 | | | | 1.81 | | | | 1.93 | | | | (0.20 | ) | | | (0.49 | ) | | | (0.69 | ) | | | 17.03 | | | | 0.68 | % | | | 0.60 | % | | | 0.74 | % | | | 12.17 | % | | | 189,903 | | | | 41 | % |
| 4/1/2016 - 3/31/2017 | | | 14.70 | | | | 0.19 | | | | 1.96 | | | | 2.15 | | | | (0.19 | ) | | | (0.87 | ) | | | (1.06 | ) | | | 15.79 | | | | 0.68 | % | | | 0.60 | % | | | 1.25 | % | | | 15.06 | % | | | 179,825 | | | | 41 | % |
| 4/1/2015 - 3/31/2016 | | | 15.85 | | | | 0.16 | | | | (0.85 | ) | | | (0.69 | ) | | | (0.28 | ) | | | (0.18 | ) | | | (0.46 | ) | | | 14.70 | | | | 0.68 | % | | | 0.60 | % | | | 1.03 | % | | | (4.37 | %) | | | 170,874 | | | | 35 | % |
| 4/1/2014 - 3/31/2015 | | | 15.23 | | | | 0.15 | | | | 0.79 | | | | 0.94 | | | | (0.32 | ) | | | — | | | | (0.32 | ) | | | 15.85 | | | | 0.68 | % | | | 0.60 | % | | | 0.97 | % | | | 6.18 | % | | | 177,171 | | | | 20 | % |
| Class B | | | | | | | | | | | | | | | | | | | | | | | | | | | | | | | | | | | | | | | | | | | | | | | | | | | | | | | | |
| 4/1/2018 - 3/31/2019 | | | $16.62 | | | | (0.02 | ) | | | $0.24 | | | | $0.22 | | | | ($0.16 | ) | | | ($2.88 | ) | | | ($3.04 | ) | | | $13.80 | | | | 1.43 | % | | | 1.35 | % | | | (0.14 | %) | | | 2.59 | % | | | $21,043 | | | | 55 | % |
| 4/1/2017 - 3/31/2018 | | | 15.46 | | | | (0.00 | )(7) | | | 1.75 | | | | 1.75 | | | | (0.10 | ) | | | (0.49 | ) | | | (0.59 | ) | | | 16.62 | | | | 1.43 | % | | | 1.35 | % | | | (0.01 | %) | | | 11.35 | % | | | 27,173 | | | | 41 | % |
| 4/1/2016 - 3/31/2017 | | | 14.43 | | | | 0.07 | | | | 1.93 | | | | 2.00 | | | | (0.10 | ) | | | (0.87 | ) | | | (0.97 | ) | | | 15.46 | | | | 1.43 | % | | | 1.35 | % | | | 0.50 | % | | | 14.22 | % | | | 29,946 | | | | 41 | % |
| 4/1/2015 - 3/31/2016 | | | 15.57 | | | | 0.04 | | | | (0.84 | ) | | | (0.80 | ) | | | (0.16 | ) | | | (0.18 | ) | | | (0.34 | ) | | | 14.43 | | | | 1.43 | % | | | 1.35 | % | | | 0.28 | % | | | (5.15 | %) | | | 30,038 | | | | 35 | % |
| 4/1/2014 - 3/31/2015 | | | 14.94 | | | | 0.03 | | | | 0.80 | | | | 0.83 | | | | (0.20 | ) | | | — | | | | (0.20 | ) | | | 15.57 | | | | 1.43 | % | | | 1.35 | % | | | 0.22 | % | | | 5.55 | % | | | 35,840 | | | | 20 | % |
| Class C | | | | | | | | | | | | | | | | | | | | | | | | | | | | | | | | | | | | | | | | | | | | | | | | | | | | | | | | |
| 4/1/2018 - 3/31/2019 | | | $16.59 | | | | (0.02 | ) | | | $0.24 | | | | $0.22 | | | | ($0.17 | ) | | | ($2.88 | ) | | | ($3.05 | ) | | | $13.76 | | | | 1.43 | % | | | 1.35 | % | | | (0.14 | %) | | | 2.57 | % | | | $85,434 | | | | 55 | % |
| 4/1/2017 - 3/31/2018 | | | 15.43 | | | | (0.00 | )(7) | | | 1.75 | | | | 1.75 | | | | (0.10 | ) | | | (0.49 | ) | | | (0.59 | ) | | | 16.59 | | | | 1.43 | % | | | 1.35 | % | | | (0.01 | %) | | | 11.39 | % | | | 97,877 | | | | 41 | % |
| 4/1/2016 - 3/31/2017 | | | 14.41 | | | | 0.07 | | | | 1.93 | | | | 2.00 | | | | (0.11 | ) | | | (0.87 | ) | | | (0.98 | ) | | | 15.43 | | | | 1.43 | % | | | 1.35 | % | | | 0.50 | % | | | 14.18 | % | | | 99,582 | | | | 41 | % |
| 4/1/2015 - 3/31/2016 | | | 15.55 | | | | 0.04 | | | | (0.83 | ) | | | (0.79 | ) | | | (0.17 | ) | | | (0.18 | ) | | | (0.35 | ) | | | 14.41 | | | | 1.43 | % | | | 1.35 | % | | | 0.28 | % | | | (5.13 | %) | | | 100,573 | | | | 35 | % |
| 4/1/2014 - 3/31/2015 | | | 14.93 | | | | 0.03 | | | | 0.79 | | | | 0.82 | | | | (0.20 | ) | | | — | | | | (0.20 | ) | | | 15.55 | | | | 1.43 | % | | | 1.35 | % | | | 0.22 | % | | | 5.54 | % | | | 110,241 | | | | 20 | % |
| Advisor Class | | | | | | | | | | | | | | | | | | | | | | | | | | | | | | | | | | | | | | | | | | | | | | | | | | | | | | | | |
| 4/1/2018 - 3/31/2019 | | | $17.07 | | | | 0.14 | | | | $0.23 | | | | $0.37 | | | | ($0.27 | ) | | | ($2.88 | ) | | | ($3.15 | ) | | | $14.29 | | | | 0.43 | % | | | 0.35 | % | | | 0.86 | % | | | 3.57 | % | | | $10,860 | | | | 55 | % |
| 4/1/2017 - 3/31/2018 | | | 15.82 | | | | 0.17 | | | | 1.80 | | | | 1.97 | | | | (0.23 | ) | | | (0.49 | ) | | | (0.72 | ) | | | 17.07 | | | | 0.43 | % | | | 0.35 | % | | | 0.99 | % | | | 12.48 | % | | | 10,067 | | | | 41 | % |
| 4/1/2016 - 3/31/2017 | | | 14.71 | | | | 0.23 | | | | 1.97 | | | | 2.20 | | | | (0.22 | ) | | | (0.87 | ) | | | (1.09 | ) | | | 15.82 | | | | 0.43 | % | | | 0.35 | % | | | 1.50 | % | | | 15.32 | % | | | 7,166 | | | | 41 | % |
| 4/1/2015 - 3/31/2016 | | | 15.86 | | | | 0.19 | | | | (0.84 | ) | | | (0.65 | ) | | | (0.32 | ) | | | (0.18 | ) | | | (0.50 | ) | | | 14.71 | | | | 0.43 | % | | | 0.35 | % | | | 1.28 | % | | | (4.13 | %) | | | 6,679 | | | | 35 | % |
| 4/1/2014 - 3/31/2015 | | | 15.23 | | | | 0.19 | | | | 0.79 | | | | 0.98 | | | | (0.35 | ) | | | — | | | | (0.35 | ) | | | 15.86 | | | | 0.43 | % | | | 0.35 | % | | | 1.22 | % | | | 6.50 | % | | | 6,480 | | | | 20 | % |
Pacific Funds Diversified Alternatives | | | | | | | | | | | | | | | | | | | | | | | | | | | | | | | | | | | | | | | | | | | | | | | | | |
| | | | | | | | | | | | | | |
| Class A | | | | | | | | | | | | | | | | | | | | | | | | | | | | | | | | | | | | | | | | | | | | | | | | | | | | | | | | |
| 4/1/2018 - 3/31/2019 | | | $9.95 | | | | $0.03 | | | | ($0.44 | ) | | | ($0.41 | ) | | | ($0.05 | ) | | | ($0.06 | ) | | | ($0.11 | ) | | | $9.43 | | | | 0.85 | % | | | 0.85 | % | | | 0.29 | % | | | (4.15 | %) | | | $3,797 | | | | 58 | % |
| 4/1/2017 - 3/31/2018 | | | 9.70 | | | | 0.23 | | | | 0.26 | | | | 0.49 | | | | (0.24 | ) | | | — | | | | (0.24 | ) | | | 9.95 | | | | 0.88 | % | | | 0.85 | % | | | 2.36 | % | | | 5.13 | % | | | 4,904 | | | | 20 | % |
| 4/1/2016 - 3/31/2017 | | | 9.63 | | | | 0.58 | | | | 0.11 | | | | 0.69 | | | | (0.62 | ) | | | — | | | | (0.62 | ) | | | 9.70 | | | | 1.24 | % | | | 0.85 | % | | | 5.96 | % | | | 7.28 | % | | | 2,647 | | | | 37 | % |
| 4/1/2015 - 3/31/2016 | | | 10.00 | | | | 0.35 | | | | (0.31 | ) | | | 0.04 | | | | (0.37 | ) | | | (0.04 | ) | | | (0.41 | ) | | | 9.63 | | | | 1.36 | % | | | 0.85 | % | | | 3.65 | % | | | 0.55 | % | | | 3,136 | | | | 73 | % |
| 4/1/2014 - 3/31/2015 | | | 9.99 | | | | 0.38 | | | | (0.06 | ) | | | 0.32 | | | | (0.29 | ) | | | (0.02 | ) | | | (0.31 | ) | | | 10.00 | | | | 2.83 | % | | | 0.85 | % | | | 3.77 | % | | | 3.19 | % | | | 1,465 | | | | 23 | % |
| Class C | | | | | | | | | | | | | | | | | | | | | | | | | | | | | | | | | | | | | | | | | | | | | | | | | | | | | | | | |
| 4/1/2018 - 3/31/2019 | | | $9.77 | | | | ($0.04 | ) | | | ($0.42 | ) | | | ($0.46 | ) | | | $— | | | | ($0.06 | ) | | | ($0.06 | ) | | | $9.25 | | | | 1.60 | % | | | 1.60 | % | | | (0.45 | %) | | | (4.81 | %) | | | $2,972 | | | | 58 | % |
| 4/1/2017 - 3/31/2018 | | | 9.57 | | | | 0.16 | | | | 0.24 | | | | 0.40 | | | | (0.20 | ) | | | — | | | | (0.20 | ) | | | 9.77 | | | | 1.63 | % | | | 1.60 | % | | | 1.61 | % | | | 4.31 | % | | | 3,070 | | | | 20 | % |
| 4/1/2016 - 3/31/2017 | | | 9.55 | | | | 0.51 | | | | 0.10 | | | | 0.61 | | | | (0.59 | ) | | | — | | | | (0.59 | ) | | | 9.57 | | | | 1.99 | % | | | 1.60 | % | | | 5.21 | % | | | 6.48 | % | | | 1,452 | | | | 37 | % |
| 4/1/2015 - 3/31/2016 | | | 9.92 | | | | 0.28 | | | | (0.31 | ) | | | (0.03 | ) | | | (0.30 | ) | | | (0.04 | ) | | | (0.34 | ) | | | 9.55 | | | | 2.11 | % | | | 1.60 | % | | | 2.90 | % | | | (0.19 | %) | | | 661 | | | | 73 | % |
| 4/1/2014 - 3/31/2015 | | | 9.97 | | | | 0.30 | | | | (0.06 | ) | | | 0.24 | | | | (0.27 | ) | | | (0.02 | ) | | | (0.29 | ) | | | 9.92 | | | | 3.58 | % | | | 1.60 | % | | | 3.02 | % | | | 2.39 | % | | | 558 | | | | 23 | % |
| Advisor Class | | | | | | | | | | | | | | | | | | | | | | | | | | | | | | | | | | | | | | | | | | | | | | | | | | | | | | | | |
| 4/1/2018 - 3/31/2019 | | | $9.98 | | | | $0.05 | | | | ($0.43 | ) | | | ($0.38 | ) | | | ($0.07 | ) | | | ($0.06 | ) | | | ($0.13 | ) | | | $9.47 | | | | 0.60 | % | | | 0.60 | % | | | 0.54 | % | | | (3.91 | %) | | | $21,454 | | | | 58 | % |
| 4/1/2017 - 3/31/2018 | | | 9.73 | | | | 0.26 | | | | 0.25 | | | | 0.51 | | | | (0.26 | ) | | | — | | | | (0.26 | ) | | | 9.98 | | | | 0.63 | % | | | 0.60 | % | | | 2.61 | % | | | 5.38 | % | | | 32,883 | | | | 20 | % |
| 4/1/2016 - 3/31/2017 | | | 9.65 | | | | 0.61 | | | | 0.12 | | | | 0.73 | | | | (0.65 | ) | | | — | | | | (0.65 | ) | | | 9.73 | | | | 0.99 | % | | | 0.60 | % | | | 6.21 | % | | | 7.49 | % | | | 8,870 | | | | 37 | % |
| 4/1/2015 - 3/31/2016 | | | 10.01 | | | | 0.39 | | | | (0.33 | ) | | | 0.06 | | | | (0.38 | ) | | | (0.04 | ) | | | (0.42 | ) | | | 9.65 | | | | 1.11 | % | | | 0.60 | % | | | 3.90 | % | | | 0.86 | % | | | 2,476 | | | | 73 | % |
| 4/1/2014 - 3/31/2015 | | | 9.99 | | | | 0.41 | | | | (0.08 | ) | | | 0.33 | | | | (0.29 | ) | | | (0.02 | ) | | | (0.31 | ) | | | 10.01 | | | | 2.58 | % | | | 0.60 | % | | | 4.02 | % | | | 3.37 | % | | | 3,771 | | | | 23 | % |
Pacific Funds Short Duration Income | | | | | | | | | | | | | | | | | | | | | | | | | | | | | | | | | | | | | | | | | | | | | | | | | |
| | | | | | | | | | | | | | |
| Class A | | | | | | | | | | | | | | | | | | | | | | | | | | | | | | | | | | | | | | | | | | | | | | | | | | | | | | | | |
| 4/1/2018 - 3/31/2019 | | | $10.24 | | | | $0.26 | | | | $0.05 | | | | $0.31 | | | | ($0.25 | ) | | | $— | | | | ($0.25 | ) | | | $10.30 | | | | 1.03 | % | | | 0.75 | % | | | 2.57 | % | | | 3.11 | % | | | $118,935 | | | | 50 | % |
| 4/1/2017 - 3/31/2018 | | | 10.32 | | | | 0.21 | | | | (0.09 | ) | | | 0.12 | | | | (0.20 | ) | | | — | | | | (0.20 | ) | | | 10.24 | | | | 1.04 | % | | | 0.75 | % | | | 2.03 | % | | | 1.18 | % | | | 94,197 | | | | 76 | % |
| 4/1/2016 - 3/31/2017 | | | 10.26 | | | | 0.18 | | | | 0.06 | | | | 0.24 | | | | (0.18 | ) | | | — | | | | (0.18 | ) | | | 10.32 | | | | 1.05 | % | | | 0.83 | % | | | 1.77 | % | | | 2.36 | % | | | 66,901 | | | | 86 | % |
| 4/1/2015 - 3/31/2016 | | | 10.41 | | | | 0.17 | | | | (0.15 | ) | | | 0.02 | | | | (0.17 | ) | | | — | | | | (0.17 | ) | | | 10.26 | | | | 1.06 | % | | | 0.85 | % | | | 1.62 | % | | | 0.15 | % | | | 69,477 | | | | 41 | % |
| 4/1/2014 - 3/31/2015 | | | 10.46 | | | | 0.19 | | | | (0.03 | ) | | | 0.16 | | | | (0.18 | ) | | | (0.03 | ) | | | (0.21 | ) | | | 10.41 | | | | 1.09 | % | | | 0.85 | % | | | 1.77 | % | | | 1.51 | % | | | 48,685 | | | | 78 | % |
| | |
| See Notes to Financial Statements | | See explanation of references on C-21 |
C-15
PACIFIC FUNDS
FINANCIAL HIGHLIGHTS (Continued)
Selected per share, ratios and supplemental data for each year or period ended March 31, were as follows:
| | | | | | | | | | | | | | | | | | | | | | | | | | | | | | | | | | | | | | | | | | | | | | | | | | | | | | | | |
| Fund | | | | | Selected Per Share Data | | | | | | Ratios to Average Net Assets | | | Supplemental Data | |
| | | | | | Investment Operations | | | Distributions | | | | | | | | | | | | | | | | | | | | | | |
For the Year or Period Ended (1) | | Net Asset Value,
Beginning of Year or Period | | | Net Investment Income (Loss) (2) | | | Net Realized and
Unrealized Gain (Loss) | | | Total | | | Net Investment Income | | | Capital Gains | | | Total | | | Net Asset Value,
End of Year or Period | | | Expenses Before Reductions (3) | | | Expenses After Reductions (3), (4) | | | Net Investment Income (Loss) (3) | | | Total Returns (5) | | | Net Assets, End of Year or Period
(in thousands) | | | Portfolio Turnover Rates | |
Pacific Funds Short Duration Income (Continued) | | | | | | | | | | | | | | | | | | | | | | | | | | | | | | | | | |
| | | | | | | | | | | | | |
Class C | | | | | | | | | | | | | | | | | | | | | | | | | | | | | | | | | | | | | | | | | | | | | | | | | | | | | |
| 4/1/2018 - 3/31/2019 | | | $10.22 | | | | $0.19 | | | | $0.05 | | | | $0.24 | | | | ($0.18 | ) | | | $— | | | | ($0.18 | ) | | | $10.28 | | | | 1.78 | % | | | 1.50 | % | | | 1.82 | % | | | 2.35 | % | | | $46,167 | | | | 50 | % |
| 4/1/2017 - 3/31/2018 | | | 10.30 | | | | 0.13 | | | | (0.09 | ) | | | 0.04 | | | | (0.12 | ) | | | — | | | | (0.12 | ) | | | 10.22 | | | | 1.79 | % | | | 1.50 | % | | | 1.28 | % | | | 0.43 | % | | | 44,337 | | | | 76 | % |
| 4/1/2016 - 3/31/2017 | | | 10.24 | | | | 0.11 | | | | 0.05 | | | | 0.16 | | | | (0.10 | ) | | | — | | | | (0.10 | ) | | | 10.30 | | | | 1.80 | % | | | 1.58 | % | | | 1.02 | % | | | 1.60 | % | | | 43,092 | | | | 86 | % |
| 4/1/2015 - 3/31/2016 | | | 10.39 | | | | 0.09 | | | | (0.15 | ) | | | (0.06 | ) | | | (0.09 | ) | | | — | | | | (0.09 | ) | | | 10.24 | | | | 1.81 | % | | | 1.60 | % | | | 0.87 | % | | | (0.58 | %) | | | 44,180 | | | | 41 | % |
| 4/1/2014 - 3/31/2015 | | | 10.45 | | | | 0.11 | | | | (0.03 | ) | | | 0.08 | | | | (0.11 | ) | | | (0.03 | ) | | | (0.14 | ) | | | 10.39 | | | | 1.84 | % | | | 1.60 | % | | | 1.02 | % | | | 0.68 | % | | | 31,569 | | | | 78 | % |
Class I | | | | | | | | | | | | | | | | | | | | | | | | | | | | | | | | | | | | | | | | | | | | | | | | | | | | | |
| 4/1/2018 - 3/31/2019 | | | $10.22 | | | | $0.29 | | | | $0.06 | | | | $0.35 | | | | ($0.28 | ) | | | $— | | | | ($0.28 | ) | | | $10.29 | | | | 0.63 | % | | | 0.50 | % | | | 2.82 | % | | | 3.47 | % | | | $83,436 | | | | 50 | % |
| 4/1/2017 - 3/31/2018 | | | 10.30 | | | | 0.24 | | | | (0.09 | ) | | | 0.15 | | | | (0.23 | ) | | | — | | | | (0.23 | ) | | | 10.22 | | | | 0.64 | % | | | 0.50 | % | | | 2.28 | % | | | 1.43 | % | | | 4,329 | | | | 76 | % |
| 4/1/2016 - 3/31/2017 | | | 10.25 | | | | 0.21 | | | | 0.05 | | | | 0.26 | | | | (0.21 | ) | | | — | | | | (0.21 | ) | | | 10.30 | | | | 0.65 | % | | | 0.53 | % | | | 2.06 | % | | | 2.56 | % | | | 3,407 | | | | 86 | % |
| 4/1/2015 - 3/31/2016 | | | 10.39 | | | | 0.20 | | | | (0.14 | ) | | | 0.06 | | | | (0.20 | ) | | | — | | | | (0.20 | ) | | | 10.25 | | | | 0.66 | % | | | 0.55 | % | | | 1.92 | % | | | 0.54 | % | | | 1,695 | | | | 41 | % |
| 4/1/2014 - 3/31/2015 | | | 10.45 | | | | 0.21 | | | | (0.03 | ) | | | 0.18 | | | | (0.21 | ) | | | (0.03 | ) | | | (0.24 | ) | | | 10.39 | | | | 0.69 | % | | | 0.57 | % | | | 2.05 | % | | | 1.70 | % | | | 1,516 | | | | 78 | % |
Advisor Class | | | | | | | | | | | | | | | | | | | | | | | | | | | | | | | | | | | | | | | | | | | | | | | | | | | | | |
| 4/1/2018 - 3/31/2019 | | | $10.24 | | | | $0.29 | | | | $0.06 | | | | $0.35 | | | | ($0.28 | ) | | | $— | | | | ($0.28 | ) | | | $10.31 | | | | 0.78 | % | | | 0.50 | % | | | 2.82 | % | | | 3.46 | % | | | $483,476 | | | | 50 | % |
| 4/1/2017 - 3/31/2018 | | | 10.32 | | | | 0.24 | | | | (0.09 | ) | | | 0.15 | | | | (0.23 | ) | | | — | | | | (0.23 | ) | | | 10.24 | | | | 0.79 | % | | | 0.50 | % | | | 2.28 | % | | | 1.43 | % | | | 272,268 | | | | 76 | % |
| 4/1/2016 - 3/31/2017 | | | 10.26 | | | | 0.21 | | | | 0.06 | | | | 0.27 | | | | (0.21 | ) | | | — | | | | (0.21 | ) | | | 10.32 | | | | 0.80 | % | | | 0.57 | % | | | 2.02 | % | | | 2.62 | % | | | 162,554 | | | | 86 | % |
| 4/1/2015 - 3/31/2016 | | | 10.41 | | | | 0.19 | | | | (0.15 | ) | | | 0.04 | | | | (0.19 | ) | | | — | | | | (0.19 | ) | | | 10.26 | | | | 0.81 | % | | | 0.60 | % | | | 1.87 | % | | | 0.40 | % | | | 129,455 | | | | 41 | % |
| 4/1/2014 - 3/31/2015 | | | 10.46 | | | | 0.21 | | | | (0.02 | ) | | | 0.19 | | | | (0.21 | ) | | | (0.03 | ) | | | (0.24 | ) | | | 10.41 | | | | 0.83 | % | | | 0.60 | % | | | 2.02 | % | | | 1.78 | % | | | 51,901 | | | | 78 | % |
Pacific Funds Core Income | | | | | | | | | | | | | | | | | | | | | | | | | | | | | | | | | | | | | | | | | | | | | | | | | | | | | |
| | | | | | | | | | | | | |
Class A | | | | | | | | | | | | | | | | | | | | | | | | | | | | | | | | | | | | | | | | | | | | | | | | | | | | | |
| 4/1/2018 - 3/31/2019 | | | $10.45 | | | | $0.33 | | | | $0.07 | | | | $0.40 | | | | ($0.33 | ) | | | $— | | | | ($0.33 | ) | | | $10.52 | | | | 1.13 | % | | | 0.85 | % | | | 3.22 | % | | | 3.99 | % | | | $82,136 | | | | 93 | % |
| 4/1/2017 - 3/31/2018 | | | 10.51 | | | | 0.28 | | | | (0.06 | ) | | | 0.22 | | | | (0.28 | ) | | | — | | | | (0.28 | ) | | | 10.45 | | | | 1.12 | % | | | 0.85 | % | | | 2.62 | % | | | 2.05 | % | | | 132,006 | | | | 91 | % |
| 4/1/2016 - 3/31/2017 | | | 10.45 | | | | 0.28 | | | | 0.06 | | | | 0.34 | | | | (0.28 | ) | | | — | | | | (0.28 | ) | | | 10.51 | | | | 1.13 | % | | | 0.93 | % | | | 2.63 | % | | | 3.23 | % | | | 160,226 | | | | 82 | % |
| 4/1/2015 - 3/31/2016 | | | 10.79 | | | | 0.31 | | | | (0.34 | ) | | | (0.03 | ) | | | (0.31 | ) | | | — | | | | (0.31 | ) | | | 10.45 | | | | 1.14 | % | | | 0.95 | % | | | 2.92 | % | | | (0.27 | %) | | | 196,297 | | | | 74 | % |
| 4/1/2014 - 3/31/2015 | | | 10.66 | | | | 0.31 | | | | 0.13 | | | | 0.44 | | | | (0.31 | ) | | | — | | | | (0.31 | ) | | | 10.79 | | | | 1.14 | % | | | 0.93 | % | | | 2.93 | % | | | 4.17 | % | | | 218,368 | | | | 53 | % |
Class C | | | | | | | | | | | | | | | | | | | | | | | | | | | | | | | | | | | | | | | | | | | | | | | | | | | | | |
| 4/1/2018 - 3/31/2019 | | | $10.46 | | | | $0.26 | | | | $0.06 | | | | $0.32 | | | | ($0.26 | ) | | | $— | | | | ($0.26 | ) | | | $10.52 | | | | 1.88 | % | | | 1.60 | % | | | 2.47 | % | | | 3.11 | % | | | $81,309 | | | | 93 | % |
| 4/1/2017 - 3/31/2018 | | | 10.51 | | | | 0.20 | | | | (0.05 | ) | | | 0.15 | | | | (0.20 | ) | | | — | | | | (0.20 | ) | | | 10.46 | | | | 1.87 | % | | | 1.60 | % | | | 1.87 | % | | | 1.38 | % | | | 101,156 | | | | 91 | % |
| 4/1/2016 - 3/31/2017 | | | 10.45 | | | | 0.20 | | | | 0.06 | | | | 0.26 | | | | (0.20 | ) | | | — | | | | (0.20 | ) | | | 10.51 | | | | 1.88 | % | | | 1.68 | % | | | 1.88 | % | | | 2.46 | % | | | 120,546 | | | | 82 | % |
| 4/1/2015 - 3/31/2016 | | | 10.79 | | | | 0.23 | | | | (0.34 | ) | | | (0.11 | ) | | | (0.23 | ) | | | — | | | | (0.23 | ) | | | 10.45 | | | | 1.89 | % | | | 1.70 | % | | | 2.17 | % | | | (1.03 | %) | | | 140,657 | | | | 74 | % |
| 4/1/2014 - 3/31/2015 | | | 10.66 | | | | 0.23 | | | | 0.13 | | | | 0.36 | | | | (0.23 | ) | | | — | | | | (0.23 | ) | | | 10.79 | | | | 1.89 | % | | | 1.68 | % | | | 2.18 | % | | | 3.42 | % | | | 183,952 | | | | 53 | % |
Class I | | | | | | | | | | | | | | | | | | | | | | | | | | | | | | | | | | | | | | | | | | | | | | | | | | | | | |
| 4/1/2018 - 3/31/2019 | | | $10.46 | | | | $0.36 | | | | $0.08 | | | | $0.44 | | | | ($0.37 | ) | | | $— | | | | ($0.37 | ) | | | $10.53 | | | | 0.73 | % | | | 0.55 | % | | | 3.52 | % | | | 4.30 | % | | | $26,394 | | | | 93 | % |
| 4/1/2017 - 3/31/2018 | | | 10.52 | | | | 0.31 | | | | (0.06 | ) | | | 0.25 | | | | (0.31 | ) | | | — | | | | (0.31 | ) | | | 10.46 | | | | 0.72 | % | | | 0.55 | % | | | 2.92 | % | | | 2.35 | % | | | 4,339 | | | | 91 | % |
| 4/1/2016 - 3/31/2017 | | | 10.46 | | | | 0.31 | | | | 0.06 | | | | 0.37 | | | | (0.31 | ) | | | — | | | | (0.31 | ) | | | 10.52 | | | | 0.73 | % | | | 0.62 | % | | | 2.93 | % | | | 3.54 | % | | | 4,563 | | | | 82 | % |
| 4/1/2015 - 3/31/2016 | | | 10.80 | | | | 0.34 | | | | (0.34 | ) | | | 0.00 | | | | (0.34 | ) | | | — | | | | (0.34 | ) | | | 10.46 | | | | 0.74 | % | | | 0.65 | % | | | 3.22 | % | | | 0.03 | % | | | 3,585 | | | | 74 | % |
| 4/1/2014 - 3/31/2015 | | | 10.67 | | | | 0.34 | | | | 0.13 | | | | 0.47 | | | | (0.34 | ) | | | — | | | | (0.34 | ) | | | 10.80 | | | | 0.73 | % | | | 0.65 | % | | | 3.21 | % | | | 4.46 | % | | | 3,806 | | | | 53 | % |
Class P | | | | | | | | | | | | | | | | | | | | | | | | | | | | | | | | | | | | | |
| 4/1/2018 - 3/31/2019 | | | $10.49 | | | | $0.37 | | | | $0.07 | | | | $0.44 | | | | ($0.37 | ) | | | $— | | | | ($0.37 | ) | | | $10.56 | | | | 0.73 | % | | | 0.55 | % | | | 3.52 | % | | | 4.29 | % | | | $40,570 | | | | 93 | % |
| 4/1/2017 - 3/31/2018 | | | 10.55 | | | | 0.31 | | | | (0.07 | ) | | | 0.24 | | | | (0.30 | ) | | | — | | | | (0.30 | ) | | | 10.49 | | | | 0.72 | % | | | 0.60 | % | | | 2.87 | % | | | 2.29 | % | | | 66,750 | | | | 91 | % |
| 4/1/2016 - 3/31/2017 | | | 10.49 | | | | 0.30 | | | | 0.06 | | | | 0.36 | | | | (0.30 | ) | | | — | | | | (0.30 | ) | | | 10.55 | | | | 0.73 | % | | | 0.70 | % | | | 2.86 | % | | | 3.46 | % | | | 122,260 | | | | 82 | % |
| 4/27/2015 - 3/31/2016 | | | 10.88 | | | | 0.31 | | | | (0.39 | ) | | | (0.08 | ) | | | (0.31 | ) | | | — | | | | (0.31 | ) | | | 10.49 | | | | 0.74 | % | | | 0.70 | % | | | 3.17 | % | | | (0.75 | %) | | | 15,964 | | | | 74 | % |
Advisor Class | | | | | | | | | | | | | | | | | | | | | | | | | | | | | | | | | | | | | | | | | | | | | | | | | | | | | |
| 4/1/2018 - 3/31/2019 | | | $10.48 | | | | $0.36 | | | | $0.07 | | | | $0.43 | | | | ($0.37 | ) | | | $— | | | | ($0.37 | ) | | | $10.54 | | | | 0.88 | % | | | 0.55 | % | | | 3.52 | % | | | 4.19 | % | | | $393,645 | | | | 93 | % |
| 4/1/2017 - 3/31/2018 | | | 10.53 | | | | 0.31 | | | | (0.05 | ) | | | 0.26 | | | | (0.31 | ) | | | — | | | | (0.31 | ) | | | 10.48 | | | | 0.87 | % | | | 0.55 | % | | | 2.92 | % | | | 2.45 | % | | | 388,730 | | | | 91 | % |
| 4/1/2016 - 3/31/2017 | | | 10.47 | | | | 0.31 | | | | 0.05 | | | | 0.36 | | | | (0.30 | ) | | | — | | | | (0.30 | ) | | | 10.53 | | | | 0.88 | % | | | 0.66 | % | | | 2.90 | % | | | 3.50 | % | | | 337,844 | | | | 82 | % |
| 4/1/2015 - 3/31/2016 | | | 10.81 | | | | 0.33 | | | | (0.34 | ) | | | (0.01 | ) | | | (0.33 | ) | | | — | | | | (0.33 | ) | | | 10.47 | | | | 0.89 | % | | | 0.70 | % | | | 3.17 | % | | | (0.02 | %) | | | 249,677 | | | | 74 | % |
| 4/1/2014 - 3/31/2015 | | | 10.68 | | | | 0.34 | | | | 0.13 | | | | 0.47 | | | | (0.34 | ) | | | — | | | | (0.34 | ) | | | 10.81 | | | | 0.88 | % | | | 0.69 | % | | | 3.17 | % | | | 4.43 | % | | | 219,437 | | | | 53 | % |
| | |
| See Notes to Financial Statements | | See explanation of references on C-21 |
C-16
PACIFIC FUNDS
FINANCIAL HIGHLIGHTS (Continued)
Selected per share, ratios and supplemental data for each year or period ended March 31, were as follows:
| | | | | | | | | | | | | | | | | | | | | | | | | | | | | | | | | | | | | | | | | | | | | | | | | | | | | | | | |
| Fund | | | | | Selected Per Share Data | | | | | | Ratios to Average Net Assets | | | Supplemental Data | |
| | | | | | Investment Operations | | | Distributions | | | | | | | | | | | | | | | | | | | | | | |
For the Year or Period Ended (1) | | Net Asset Value,
Beginning of Year or Period | | | Net Investment Income (Loss) (2) | | | Net Realized and
Unrealized Gain (Loss) | | | Total | | | Net Investment Income | | | Capital Gains | | | Total | | | Net Asset Value,
End of Year or Period | | | Expenses Before Reductions (3) | | | Expenses After Reductions (3), (4) | | | Net Investment Income (Loss) (3) | | | Total Returns (5) | | | Net Assets, End of Year or Period
(in thousands) | | | Portfolio Turnover Rates | |
Pacific Funds Strategic Income | | | | | | | | | | | | | | | | | | | | | | | | | | | | | | | | | | | | | | | | | | | | | |
| | | | | | | | | | | |
Class A | | | | | | | | | | | | | | | | | | | | | | | | | | | | | | | | | | | | | | | | | | | | | |
| 4/1/2018 - 3/31/2019 | | | $10.71 | | | | $0.47 | | | | ($0.11 | ) | | | $0.36 | | | | ($0.47 | ) | | | $— | | | | ($0.47 | ) | | | $10.60 | | | | 1.23 | % | | | 0.95 | % | | | 4.43 | % | | | 3.43 | % | | | $61,503 | | | | 99 | % |
| 4/1/2017 - 3/31/2018 | | | 10.68 | | | | 0.40 | | | | 0.02 | | | | 0.42 | | | | (0.39 | ) | | | — | | | | (0.39 | ) | | | 10.71 | | | | 1.23 | % | | | 0.95 | % | | | 3.70 | % | | | 3.95 | % | | | 71,948 | | | | 94 | % |
| 4/1/2016 - 3/31/2017 | | | 10.09 | | | | 0.39 | | | | 0.59 | | | | 0.98 | | | | (0.39 | ) | | | — | | | | (0.39 | ) | | | 10.68 | | | | 1.25 | % | | | 1.02 | % | | | 3.71 | % | | | 9.82 | % | | | 66,765 | | | | 116 | % |
| 4/1/2015 - 3/31/2016 | | | 10.75 | | | | 0.43 | | | | (0.66 | ) | | | (0.23 | ) | | | (0.43 | ) | | | — | | | | (0.43 | ) | | | 10.09 | | | | 1.26 | % | | | 1.05 | % | | | 4.20 | % | | | (2.17 | %) | | | 52,218 | | | | 94 | % |
| 4/1/2014 - 3/31/2015 | | | 11.20 | | | | 0.46 | | | | (0.37 | ) | | | 0.09 | | | | (0.44 | ) | | | (0.10 | ) | | | (0.54 | ) | | | 10.75 | | | | 1.28 | % | | | 1.05 | % | | | 4.18 | % | | | 0.84 | % | | | 51,175 | | | | 157 | % |
Class C | | | | | | | | | | | | | | | | | | | | | | | | | | | | | | | | | | | | | | | | | | | | | |
| 4/1/2018 - 3/31/2019 | | | $10.69 | | | | $0.39 | | | | ($0.11 | ) | | | $0.28 | | | | ($0.39 | ) | | | $— | | | | ($0.39 | ) | | | $10.58 | | | | 1.98 | % | | | 1.65 | % | | | 3.73 | % | | | 2.73 | % | | | $58,634 | | | | 99 | % |
| 4/1/2017 - 3/31/2018 | | | 10.66 | | | | 0.32 | | | | 0.02 | | | | 0.34 | | | | (0.31 | ) | | | — | | | | (0.31 | ) | | | 10.69 | | | | 1.98 | % | | | 1.65 | % | | | 3.00 | % | | | 3.25 | % | | | 57,389 | | | | 94 | % |
| 4/1/2016 - 3/31/2017 | | | 10.07 | | | | 0.31 | | | | 0.59 | | | | 0.90 | | | | (0.31 | ) | | | — | | | | (0.31 | ) | | | 10.66 | | | | 2.00 | % | | | 1.76 | % | | | 2.97 | % | | | 9.03 | % | | | 50,016 | | | | 116 | % |
| 4/1/2015 - 3/31/2016 | | | 10.73 | | | | 0.36 | | | | (0.67 | ) | | | (0.31 | ) | | | (0.35 | ) | | | — | | | | (0.35 | ) | | | 10.07 | | | | 2.01 | % | | | 1.80 | % | | | 3.45 | % | | | (2.90 | %) | | | 44,196 | | | | 94 | % |
| 4/1/2014 - 3/31/2015 | | | 11.19 | | | | 0.38 | | | | (0.38 | ) | | | — | | | | (0.36 | ) | | | (0.10 | ) | | | (0.46 | ) | | | 10.73 | | | | 2.03 | % | | | 1.80 | % | | | 3.43 | % | | | 0.03 | % | | | 42,684 | | | | 157 | % |
Class I | | | | | | | | | | | | | | | | | | | | | | | | | | | | | | | | | | | | | | | | | | | | | |
| 4/1/2018 - 3/31/2019 | | | $10.65 | | | | $0.50 | | | | ($0.11 | ) | | | $0.39 | | | | ($0.50 | ) | | | $— | | | | ($0.50 | ) | | | $10.54 | | | | 0.83 | % | | | 0.65 | % | | | 4.73 | % | | | 3.77 | % | | | $5,750 | | | | 99 | % |
| 4/1/2017 - 3/31/2018 | | | 10.62 | | | | 0.43 | | | | 0.02 | | | | 0.45 | | | | (0.42 | ) | | | — | | | | (0.42 | ) | | | 10.65 | | | | 0.83 | % | | | 0.65 | % | | | 4.00 | % | | | 4.28 | % | | | 3,882 | | | | 94 | % |
| 4/1/2016 - 3/31/2017 | | | 10.03 | | | | 0.42 | | | | 0.59 | | | | 1.01 | | | | (0.42 | ) | | | — | | | | (0.42 | ) | | | 10.62 | | | | 0.85 | % | | | 0.71 | % | | | 4.01 | % | | | 10.20 | % | | | 2,446 | | | | 116 | % |
| 4/1/2015 - 3/31/2016 | | | 10.70 | | | | 0.46 | | | | (0.67 | ) | | | (0.21 | ) | | | (0.46 | ) | | | — | | | | (0.46 | ) | | | 10.03 | | | | 0.86 | % | | | 0.75 | % | | | 4.50 | % | | | (1.98 | %) | | | 948 | | | | 94 | % |
| 4/1/2014 - 3/31/2015 | | | 11.15 | | | | 0.49 | | | | (0.37 | ) | | | 0.12 | | | | (0.47 | ) | | | (0.10 | ) | | | (0.57 | ) | | | 10.70 | | | | 0.88 | % | | | 0.77 | % | | | 4.46 | % | | | 1.13 | % | | | 1,381 | | | | 157 | % |
Advisor Class | | | | | | | | | | | | | | | | | | | | | | | | | | | | | | | | | | | | | | | | | | | | | |
| 4/1/2018 - 3/31/2019 | | | $10.71 | | | | $0.49 | | | | ($0.11 | ) | | | $0.38 | | | | ($0.49 | ) | | | $— | | | | ($0.49 | ) | | | $10.60 | | | | 0.98 | % | | | 0.70 | % | | | 4.68 | % | | | 3.70 | % | | | $456,428 | | | | 99 | % |
| 4/1/2017 - 3/31/2018 | | | 10.68 | | | | 0.43 | | | | 0.02 | | | | 0.45 | | | | (0.42 | ) | | | — | | | | (0.42 | ) | | | 10.71 | | | | 0.98 | % | | | 0.70 | % | | | 3.95 | % | | | 4.21 | % | | | 405,200 | | | | 94 | % |
| 4/1/2016 - 3/31/2017 | | | 10.09 | | | | 0.42 | | | | 0.58 | | | | 1.00 | | | | (0.41 | ) | | | — | | | | (0.41 | ) | | | 10.68 | | | | 1.00 | % | | | 0.77 | % | | | 3.96 | % | | | 10.09 | % | | | 217,482 | | | | 116 | % |
| 4/1/2015 - 3/31/2016 | | | 10.76 | | | | 0.46 | | | | (0.68 | ) | | | (0.22 | ) | | | (0.45 | ) | | | — | | | | (0.45 | ) | | | 10.09 | | | | 1.01 | % | | | 0.80 | % | | | 4.45 | % | | | (2.01 | %) | | | 115,565 | | | | 94 | % |
| 4/1/2014 - 3/31/2015 | | | 11.20 | | | | 0.48 | | | | (0.35 | ) | | | 0.13 | | | | (0.47 | ) | | | (0.10 | ) | | | (0.57 | ) | | | 10.76 | | | | 1.03 | % | | | 0.80 | % | | | 4.43 | % | | | 1.20 | % | | | 66,223 | | | | 157 | % |
Pacific Funds Floating Rate Income | | | | | | | | | | | | | | | | | | | | | | | | | | | | | | | | | | | | | | | | | | | | | |
| | | | | | | | | | | |
Class A | | | | | | | | | | | | | | | | | | | | | | | | | | | | | | | | | | | | | | | | | | | | | |
| 4/1/2018 - 3/31/2019 | | | $10.12 | | | | $0.49 | | | | ($0.24 | ) | | | $0.25 | | | | ($0.49 | ) | | | $— | | | | ($0.49 | ) | | | $9.88 | | | | 1.29 | % | | | 1.01 | %(8) | | | 4.92 | % | | | 2.57 | % | | | $202,929 | | | | 122 | % |
| 4/1/2017 - 3/31/2018 | | | 10.15 | | | | 0.42 | | | | (0.04 | ) | | | 0.38 | | | | (0.41 | ) | | | — | | | | (0.41 | ) | | | 10.12 | | | | 1.28 | % | | | 1.01 | % | | | 4.11 | % | | | 3.85 | % | | | 209,034 | | | | 158 | % |
| 4/1/2016 - 3/31/2017 | | | 9.76 | | | | 0.42 | | | | 0.38 | | | | 0.80 | | | | (0.41 | ) | | | — | | | | (0.41 | ) | | | 10.15 | | | | 1.30 | % | | | 1.09 | % | | | 4.21 | % | | | 8.32 | % | | | 207,238 | | | | 168 | % |
| 4/1/2015 - 3/31/2016 | | | 10.08 | | | | 0.39 | | | | (0.32 | ) | | | 0.07 | | | | (0.39 | ) | | | — | | | | (0.39 | ) | | | 9.76 | | | | 1.30 | % | | | 1.12 | % | | | 3.92 | % | | | 0.72 | % | | | 191,376 | | | | 99 | % |
| 4/1/2014 - 3/31/2015 | | | 10.51 | | | | 0.44 | | | | (0.40 | ) | | | 0.04 | | | | (0.44 | ) | | | (0.03 | ) | | | (0.47 | ) | | | 10.08 | | | | 1.29 | % | | | 1.07 | % | | | 4.20 | % | | | 0.38 | % | | | 215,160 | | | | 80 | % |
Class C | | | | | | | | | | | | | | | | | | | | | | | | | | | | | | | | | | | | | | | | | | | | | |
| 4/1/2018 - 3/31/2019 | | | $10.10 | | | | $0.42 | | | | ($0.24 | ) | | | $0.18 | | | | ($0.42 | ) | | | $— | | | | ($0.42 | ) | | | $9.86 | | | | 2.04 | % | | | 1.71 | %(8) | | | 4.22 | % | | | 1.86 | % | | | $197,081 | | | | 122 | % |
| 4/1/2017 - 3/31/2018 | | | 10.13 | | | | 0.34 | | | | (0.03 | ) | | | 0.31 | | | | (0.34 | ) | | | — | | | | (0.34 | ) | | | 10.10 | | | | 2.03 | % | | | 1.71 | % | | | 3.41 | % | | | 3.14 | % | | | 191,239 | | | | 158 | % |
| 4/1/2016 - 3/31/2017 | | | 9.74 | | | | 0.35 | | | | 0.37 | | | | 0.72 | | | | (0.33 | ) | | | — | | | | (0.33 | ) | | | 10.13 | | | | 2.05 | % | | | 1.83 | % | | | 3.47 | % | | | 7.54 | % | | | 180,612 | | | | 168 | % |
| 4/1/2015 - 3/31/2016 | | | 10.06 | | | | 0.31 | | | | (0.31 | ) | | | 0.00 | | | | (0.32 | ) | | | — | | | | (0.32 | ) | | | 9.74 | | | | 2.05 | % | | | 1.87 | % | | | 3.17 | % | | | (0.04 | %) | | | 161,326 | | | | 99 | % |
| 4/1/2014 - 3/31/2015 | | | 10.50 | | | | 0.36 | | | | (0.40 | ) | | | (0.04 | ) | | | (0.37 | ) | | | (0.03 | ) | | | (0.40 | ) | | | 10.06 | | | | 2.04 | % | | | 1.82 | % | | | 3.45 | % | | | (0.46 | %) | | | 179,798 | | | | 80 | % |
Class I | | | | | | | | | | | | | | | | | | | | | | | | | | | | | | | | | | | | | | | | | | | | | |
| 4/1/2018 - 3/31/2019 | | | $10.14 | | | | $0.52 | | | | ($0.23 | ) | | | $0.29 | | | | ($0.53 | ) | | | $— | | | | ($0.53 | ) | | | $9.90 | | | | 0.90 | % | | | 0.71 | %(8) | | | 5.22 | % | | | 2.88 | % | | | $497,335 | | | | 122 | % |
| 4/1/2017 - 3/31/2018 | | | 10.16 | | | | 0.45 | | | | (0.03 | ) | | | 0.42 | | | | (0.44 | ) | | | — | | | | (0.44 | ) | | | 10.14 | | | | 0.88 | % | | | 0.71 | % | | | 4.41 | % | | | 4.25 | % | | | 294,352 | | | | 158 | % |
| 4/1/2016 - 3/31/2017 | | | 9.77 | | | | 0.45 | | | | 0.38 | | | | 0.83 | | | | (0.44 | ) | | | — | | | | (0.44 | ) | | | 10.16 | | | | 0.89 | % | | | 0.78 | % | | | 4.52 | % | | | 8.63 | % | | | 249,811 | | | | 168 | % |
| 4/1/2015 - 3/31/2016 | | | 10.09 | | | | 0.42 | | | | (0.32 | ) | | | 0.10 | | | | (0.42 | ) | | | — | | | | (0.42 | ) | | | 9.77 | | | | 0.90 | % | | | 0.82 | % | | | 4.22 | % | | | 1.02 | % | | | 91,984 | | | | 99 | % |
| 4/1/2014 - 3/31/2015 | | | 10.53 | | | | 0.46 | | | | (0.40 | ) | | | 0.06 | | | | (0.47 | ) | | | (0.03 | ) | | | (0.50 | ) | | | 10.09 | | | | 0.89 | % | | | 0.81 | % | | | 4.46 | % | | | 0.55 | % | | | 88,508 | | | | 80 | % |
Class P | | | | | | | | | | | | | | | | | | | | | | | | | | | | | | | | | | | | | | | | | | | | | |
| 4/1/2018 - 3/31/2019 | | | $10.14 | | | | $0.53 | | | | ($0.25 | ) | | | $0.28 | | | | ($0.52 | ) | | | $— | | | | ($0.52 | ) | | | $9.90 | | | | 0.89 | % | | | 0.71 | %(8) | | | 5.22 | % | | | 2.87 | % | | | $32,176 | | | | 122 | % |
| 4/1/2017 - 3/31/2018 | | | 10.16 | | | | 0.44 | | | | (0.02 | ) | | | 0.42 | | | | (0.44 | ) | | | — | | | | (0.44 | ) | | | 10.14 | | | | 0.88 | % | | | 0.76 | % | | | 4.36 | % | | | 4.20 | % | | | 64,557 | | | | 158 | % |
| 4/1/2016 - 3/31/2017 | | | 9.76 | | | | 0.45 | | | | 0.38 | | | | 0.83 | | | | (0.43 | ) | | | — | | | | (0.43 | ) | | | 10.16 | | | | 0.89 | % | | | 0.87 | % | | | 4.43 | % | | | 8.56 | % | | | 78,660 | | | | 168 | % |
| 4/1/2015 - 3/31/2016 | | | 10.09 | | | | 0.41 | | | | (0.33 | ) | | | 0.08 | | | | (0.41 | ) | | | — | | | | (0.41 | ) | | | 9.76 | | | | 0.90 | % | | | 0.87 | % | | | 4.17 | % | | | 0.97 | % | | | 568 | | | | 99 | % |
| 4/1/2014 - 3/31/2015 | | | 10.52 | | | | 0.45 | | | | (0.38 | ) | | | 0.07 | | | | (0.47 | ) | | | (0.03 | ) | | | (0.50 | ) | | | 10.09 | | | | 0.89 | % | | | 0.83 | % | | | 4.44 | % | | | 0.64 | % | | | 691 | | | | 80 | % |
| | |
| See Notes to Financial Statements | | See explanation of references on C-21 |
C-17
PACIFIC FUNDS
FINANCIAL HIGHLIGHTS (Continued)
Selected per share, ratios and supplemental data for each year or period ended March 31, were as follows:
| | | | | | | | | | | | | | | | | | | | | | | | | | | | | | | | | | | | | | | | | | | | | | | | | | | | | | | | |
| Fund | | | | | Selected Per Share Data | | | | | | Ratios to Average Net Assets | | | Supplemental Data | |
| | | | | | Investment Operations | | | Distributions | | | | | | | | | | | | | | | | | | | | | | |
For the Year or Period Ended (1) | | Net Asset Value,
Beginning of Year or Period | | | Net Investment Income (Loss) (2) | | | Net Realized and
Unrealized Gain (Loss) | | | Total | | | Net Investment Income | | | Capital Gains | | | Total | | | Net Asset Value,
End of Year or Period | | | Expenses Before Reductions (3) | | | Expenses After Reductions (3), (4) | | | Net Investment Income (Loss) (3) | | | Total Returns (5) | | | Net Assets, End of Year or Period
(in thousands) | | | Portfolio Turnover Rates | |
Pacific Funds Floating Rate Income (Continued) | | | | | | | | | | | | | | | | | | | | | | | | | | | | | | | | | |
| | | | | | | | | | | |
Advisor Class | | | | | | | | | | | | | | | | | | | | | | | | | | | | | | | | | | | | | | | | | | | | | |
| 4/1/2018 - 3/31/2019 | | | $10.16 | | | | $0.52 | | | | ($0.24 | ) | | | $0.28 | | | | ($0.52 | ) | | | $— | | | | ($0.52 | ) | | | $9.92 | | | | 1.04 | % | | | 0.76 | %(8) | | | 5.17 | % | | | 2.83 | % | | | $830,452 | | | | 122 | % |
| 4/1/2017 - 3/31/2018 | | | 10.18 | | | | 0.44 | | | | (0.02 | ) | | | 0.42 | | | | (0.44 | ) | | | — | | | | (0.44 | ) | | | 10.16 | | | | 1.03 | % | | | 0.76 | % | | | 4.36 | % | | | 4.20 | % | | | 715,700 | | | | 158 | % |
| 4/1/2016 - 3/31/2017 | | | 9.79 | | | | 0.45 | | | | 0.37 | | | | 0.82 | | | | (0.43 | ) | | | — | | | | (0.43 | ) | | | 10.18 | | | | 1.04 | % | | | 0.83 | % | | | 4.47 | % | | | 8.56 | % | | | 450,761 | | | | 168 | % |
| 4/1/2015 - 3/31/2016 | | | 10.11 | | | | 0.41 | | | | (0.32 | ) | | | 0.09 | | | | (0.41 | ) | | | — | | | | (0.41 | ) | | | 9.79 | | | | 1.05 | % | | | 0.87 | % | | | 4.17 | % | | | 0.96 | % | | | 231,437 | | | | 99 | % |
| 4/1/2014 - 3/31/2015 | | | 10.54 | | | | 0.46 | | | | (0.39 | ) | | | 0.07 | | | | (0.47 | ) | | | (0.03 | ) | | | (0.50 | ) | | | 10.11 | | | | 1.04 | % | | | 0.82 | % | | | 4.45 | % | | | 0.63 | % | | | 270,383 | | | | 80 | % |
Pacific Funds High Income | | | | | | | | | | | | | | | | | | | | | | | | | | | | | | | | | | | | | | | | | | | | | |
| | | | | | | | | | | | | |
Class A | | | | | | | | | | | | | | | | | | | | | | | | | | | | | | | | | | | | | | | | | | | | | | | | | | | | | |
| 4/1/2018 - 3/31/2019 | | | $10.23 | | | | $0.55 | | | | ($0.16 | ) | | | $0.39 | | | | ($0.55 | ) | | | $ — | | | | ($0.55 | ) | | | $10.07 | | | | 1.31 | % | | | 0.95 | % | | | 5.48 | % | | | 3.97 | % | | | $5,174 | | | | 64 | % |
| 4/1/2017 - 3/31/2018 | | | 10.29 | | | | 0.50 | | | | (0.03 | ) | | | 0.47 | | | | (0.53 | ) | | | — | | | | (0.53 | ) | | | 10.23 | | | | 1.46 | % | | | 0.95 | % | | | 4.82 | % | | | 4.66 | % | | | 5,463 | | | | 72 | % |
| 4/1/2016 - 3/31/2017 | | | 9.44 | | | | 0.48 | | | | 0.92 | | | | 1.40 | | | | (0.55 | ) | | | — | | | | (0.55 | ) | | | 10.29 | | | | 1.32 | % | | | 1.03 | % | | | 4.81 | % | | | 15.16 | % | | | 5,626 | | | | 61 | % |
| 4/1/2015 - 3/31/2016 | | | 10.48 | | | | 0.50 | | | | (1.10 | ) | | | (0.60 | ) | | | (0.44 | ) | | | — | | | | (0.44 | ) | | | 9.44 | | | | 1.28 | % | | | 1.05 | % | | | 5.05 | % | | | (5.79 | %) | | | 10,391 | | | | 54 | % |
| 4/1/2014 - 3/31/2015 | | | 11.22 | | | | 0.54 | | | | (0.60 | ) | | | (0.06 | ) | | | (0.52 | ) | | | (0.16 | ) | | | (0.68 | ) | | | 10.48 | | | | 1.50 | % | | | 1.05 | % | | | 4.90 | % | | | (0.49 | %) | | | 5,900 | | | | 60 | % |
Class C | | | | | | | | | | | | | | | | | | | | | | | | | | | | | | | | | | | | | | | | | | | | | | | | | | | | | |
| 4/1/2018 - 3/31/2019 | | | $10.21 | | | | $0.48 | | | | ($0.15 | ) | | | $0.33 | | | | ($0.48 | ) | | | $ — | | | | ($0.48 | ) | | | $10.06 | | | | 2.06 | % | | | 1.65 | % | | | 4.78 | % | | | 3.35 | % | | | $3,726 | | | | 64 | % |
| 4/1/2017 - 3/31/2018 | | | 10.28 | | | | 0.43 | | | | (0.04 | ) | | | 0.39 | | | | (0.46 | ) | | | — | | | | (0.46 | ) | | | 10.21 | | | | 2.21 | % | | | 1.65 | % | | | 4.12 | % | | | 3.84 | % | | | 4,418 | | | | 72 | % |
| 4/1/2016 - 3/31/2017 | | | 9.43 | | | | 0.41 | | | | 0.92 | | | | 1.33 | | | | (0.48 | ) | | | — | | | | (0.48 | ) | | | 10.28 | | | | 2.07 | % | | | 1.76 | % | | | 4.07 | % | | | 14.36 | % | | | 4,802 | | | | 61 | % |
| 4/1/2015 - 3/31/2016 | | | 10.47 | | | | 0.43 | | | | (1.10 | ) | | | (0.67 | ) | | | (0.37 | ) | | | — | | | | (0.37 | ) | | | 9.43 | | | | 2.03 | % | | | 1.80 | % | | | 4.30 | % | | | (6.52 | %) | | | 4,324 | | | | 54 | % |
| 4/1/2014 - 3/31/2015 | | | 11.21 | | | | 0.45 | | | | (0.59 | ) | | | (0.14 | ) | | | (0.44 | ) | | | (0.16 | ) | | | (0.60 | ) | | | 10.47 | | | | 2.24 | % | | | 1.80 | % | | | 4.15 | % | | | (1.22 | %) | | | 5,419 | | | | 60 | % |
Class I | | | | | | | | | | | | | | | | | | | | | | | | | | | | | | | | | | | | | | | | | | | | | | | | | | | | | |
| 4/1/2018 - 3/31/2019 | | | $10.14 | | | | $0.57 | | | | ($0.16 | ) | | | $0.41 | | | | ($0.57 | ) | | | $ — | | | | ($0.57 | ) | | | $9.98 | | | | 0.91 | % | | | 0.70 | % | | | 5.73 | % | | | 4.27 | % | | | $175 | | | | 64 | % |
| 4/1/2017 - 3/31/2018 | | | 10.21 | | | | 0.52 | | | | (0.02 | ) | | | 0.50 | | | | (0.57 | ) | | | — | | | | (0.57 | ) | | | 10.14 | | | | 1.07 | % | | | 0.70 | % | | | 5.07 | % | | | 4.95 | % | | | 211 | | | | 72 | % |
| 4/1/2016 - 3/31/2017 | | | 9.37 | | | | 0.51 | | | | 0.91 | | | | 1.42 | | | | (0.58 | ) | | | — | | | | (0.58 | ) | | | 10.21 | | | | 0.90 | % | | | 0.73 | % | | | 5.10 | % | | | 15.52 | % | | | 5,204 | | | | 61 | % |
| 4/1/2015 - 3/31/2016 | | | 10.41 | | | | 0.54 | | | | (1.11 | ) | | | (0.57 | ) | | | (0.47 | ) | | | — | | | | (0.47 | ) | | | 9.37 | | | | 0.88 | % | | | 0.75 | % | | | 5.35 | % | | | (5.57 | %) | | | 58 | | | | 54 | % |
| 4/1/2014 - 3/31/2015 | | | 11.14 | | | | 0.57 | | | | (0.61 | ) | | | (0.04 | ) | | | (0.53 | ) | | | (0.16 | ) | | | (0.69 | ) | | | 10.41 | | | | 1.10 | % | | | 0.77 | % | | | 5.18 | % | | | (0.30 | %) | | | 241 | | | | 60 | % |
| | | | | | | | | | | | | |
Class P | | | | | | | | | | | | | | | | | | | | | | | | | | | | | | | | | | | | | | | | | | | | | | | | | | | | | |
| 4/1/2018 - 3/31/2019 | | | $10.14 | | | | $0.57 | | | | ($0.16 | ) | | | $0.41 | | | | ($0.57 | ) | | | $ — | | | | ($0.57 | ) | | | $9.98 | | | | 0.91 | % | | | 0.70 | % | | | 5.73 | % | | | 4.27 | % | | | $113,317 | | | | 64 | % |
| 4/1/2017 - 3/31/2018 | | | 10.20 | | | | 0.52 | | | | (0.02 | ) | | | 0.50 | | | | (0.56 | ) | | | — | | | | (0.56 | ) | | | 10.14 | | | | 1.06 | % | | | 0.73 | % | | | 5.04 | % | | | 4.92 | % | | | 68,844 | | | | 72 | % |
| 4/1/2016 - 3/31/2017 | | | 9.36 | | | | 0.49 | | | | 0.93 | | | | 1.42 | | | | (0.58 | ) | | | — | | | | (0.58 | ) | | | 10.20 | | | | 0.95 | % | | | 0.80 | % | | | 5.04 | % | | | 15.47 | % | | | 10,554 | | | | 61 | % |
| 4/1/2015 - 3/31/2016 | | | 10.40 | | | | 0.52 | | | | (1.09 | ) | | | (0.57 | ) | | | (0.47 | ) | | | — | | | | (0.47 | ) | | | 9.36 | | | | 0.88 | % | | | 0.80 | % | | | 5.30 | % | | | (5.60 | %) | | | 113,998 | | | | 54 | % |
| 1/14/2015 - 3/31/2015 | | | 10.22 | | | | 0.11 | | | | 0.19 | | | | 0.30 | | | | (0.12 | ) | | | — | | | | (0.12 | ) | | | 10.40 | | | | 1.06 | % | | | 0.80 | % | | | 5.15 | % | | | 2.94 | % | | | 38,919 | | | | 60 | % |
Advisor Class | | | | | | | | | | | | | | | | | | | | | | | | | | | | | | | | | | | | | | | | | | | | | | | | | | | | | |
| 4/1/2018 - 3/31/2019 | | | $10.24 | | | | $0.58 | | | | ($0.17 | ) | | | $0.41 | | | | ($0.57 | ) | | | $ — | | | | ($0.57 | ) | | | $10.08 | | | | 1.06 | % | | | 0.70 | % | | | 5.73 | % | | | 4.23 | % | | | $3,669 | | | | 64 | % |
| 4/1/2017 - 3/31/2018 | | | 10.30 | | | | 0.53 | | | | (0.03 | ) | | | 0.50 | | | | (0.56 | ) | | | — | | | | (0.56 | ) | | | 10.24 | | | | 1.21 | % | | | 0.70 | % | | | 5.07 | % | | | 4.91 | % | | | 2,503 | | | | 72 | % |
| 4/1/2016 - 3/31/2017 | | | 9.44 | | | | 0.51 | | | | 0.93 | | | | 1.44 | | | | (0.58 | ) | | | — | | | | (0.58 | ) | | | 10.30 | | | | 1.06 | % | | | 0.77 | % | | | 5.07 | % | | | 15.58 | % | | | 2,304 | | | | 61 | % |
| 4/1/2015 - 3/31/2016 | | | 10.49 | | | | 0.53 | | | | (1.12 | ) | | | (0.59 | ) | | | (0.46 | ) | | | — | | | | (0.46 | ) | | | 9.44 | | | | 1.03 | % | | | 0.80 | % | | | 5.30 | % | | | (5.66 | %) | | | 1,666 | | | | 54 | % |
| 4/1/2014 - 3/31/2015 | | | 11.23 | | | | 0.57 | | | | (0.60 | ) | | | (0.03 | ) | | | (0.55 | ) | | | (0.16 | ) | | | (0.71 | ) | | | 10.49 | | | | 1.24 | % | | | 0.80 | % | | | 5.15 | % | | | (0.23 | %) | | | 3,807 | | | | 60 | % |
Pacific Funds Large-Cap(9) | | | | | | | | | | | | | | | | | | | | | | | | | | | | | | | | | | | | | | | | | | | | | |
| | | | | | | | | | | | | | |
| Class A | | | | | | | | | | | | | | | | | | | | | | | | | | | | | | | | | | | | | | | | | | | | | | | | | | | | | | | | |
| 4/1/2018 - 3/31/2019 | | | $12.28 | | | | $0.12 | | | | $0.67 | | | | $0.79 | | | | ($0.09 | ) | | | ($0.50 | ) | | | ($0.59 | ) | | | $12.48 | | | | 1.54 | % | | | 1.00 | % | | | 0.93 | % | | | 6.74 | % | | | $8,080 | | | | 79 | % |
| 4/1/2017 - 3/31/2018 | | | 11.08 | | | | 0.08 | | | | 1.30 | | | | 1.38 | | | | (0.10 | ) | | | (0.08 | ) | | | (0.18 | ) | | | 12.28 | | | | 1.73 | % | | | 1.00 | % | | | 0.69 | % | | | 12.43 | % | | | 4,939 | | | | 98 | % |
| 4/1/2016 - 3/31/2017 | | | 9.66 | | | | 0.11 | | | | 1.40 | | | | 1.51 | | | | (0.09 | ) | | | — | | | | (0.09 | ) | | | 11.08 | | | | 2.86 | % | | | 1.00 | % | | | 1.08 | % | | | 15.69 | % | | | 4,599 | | | | 108 | % |
| 1/11/2016 - 3/31/2016 | | | 9.10 | | | | 0.03 | | | | 0.53 | | | | 0.56 | | | | — | | | | — | | | | — | | | | 9.66 | | | | 6.07 | % | | | 1.00 | % | | | 1.35 | % | | | 6.15 | % | | | 551 | | | | 27 | % |
| Class C | | | | | | | | | | | | | | | | | | | | | | | | | | | | | | | | | | | | | | | | | | | | | | | | | | | | | | | | |
| 4/1/2018 - 3/31/2019 | | | $12.22 | | | | $0.02 | | | | $0.69 | | | | $0.71 | | | | ($0.01 | ) | | | ($0.50 | ) | | | ($0.51 | ) | | | $12.42 | | | | 2.30 | % | | | 1.75 | % | | | 0.19 | % | | | 5.97 | % | | | $3,900 | | | | 79 | % |
| 4/1/2017 - 3/31/2018 | | | 11.03 | | | | (0.01 | ) | | | 1.29 | | | | 1.28 | | | | (0.01 | ) | | | (0.08 | ) | | | (0.09 | ) | | | 12.22 | | | | 2.48 | % | | | 1.75 | % | | | (0.06 | %) | | | 11.60 | % | | | 3,545 | | | | 98 | % |
| 4/1/2016 - 3/31/2017 | | | 9.65 | | | | 0.03 | | | | 1.39 | | | | 1.42 | | | | (0.04 | ) | | | — | | | | (0.04 | ) | | | 11.03 | | | | 3.61 | % | | | 1.75 | % | | | 0.33 | % | | | 14.74 | % | | | 2,804 | | | | 108 | % |
| 1/11/2016 - 3/31/2016 | | | 9.10 | | | | 0.01 | | | | 0.54 | | | | 0.55 | | | | — | | | | — | | | | — | | | | 9.65 | | | | 6.82 | % | | | 1.75 | % | | | 0.60 | % | | | 6.04 | % | | | 525 | | | | 27 | % |
| | |
| See Notes to Financial Statements | | See explanation of references on C-21 |
C-18
PACIFIC FUNDS
FINANCIAL HIGHLIGHTS (Continued)
Selected per share, ratios and supplemental data for each year or period ended March 31, were as follows:
| | | | | | | | | | | | | | | | | | | | | | | | | | | | | | | | | | | | | | | | | | | | | | | | | | | | | | | | |
| Fund | | | | | Selected Per Share Data | | | | | | Ratios to Average Net Assets | | | Supplemental Data | |
| | | | | | Investment Operations | | | Distributions | | | | | | | | | | | | | | | | | | | | | | |
For the Year or Period Ended (1) | | Net Asset Value,
Beginning of Year or Period | | | Net Investment Income (Loss) (2) | | | Net Realized and
Unrealized Gain (Loss) | | | Total | | | Net Investment Income | | | Capital Gains | | | Total | | | Net Asset Value,
End of Year or Period | | | Expenses Before Reductions (3) | | | Expenses After Reductions (3), (4) | | | Net Investment Income (Loss) (3) | | | Total Returns (5) | | | Net Assets, End of Year or Period
(in thousands) | | | Portfolio Turnover Rates | |
Pacific Funds Large-Cap (Continued)(9) | | | | | | | | | | | | | | | | | | | | | | | | | | | | | | | | | | | | | | | | | | | | | |
| Advisor Class | | | | | | | | | | | | | | | | | | | | | | | | | | | | | | | | | | | | | | | | | | | | | | | | | | | | | | | | |
| 4/1/2018 - 3/31/2019 | | | $12.37 | | | | $0.15 | | | | $0.67 | | | | $0.82 | | | | ($0.12 | ) | | | ($0.50 | ) | | | ($0.62 | ) | | | $12.57 | | | | 1.30 | % | | | 0.75 | % | | | 1.19 | % | | | 6.97 | % | | | $6,896 | | | | 79 | % |
| 4/1/2017 - 3/31/2018 | | | 11.11 | | | | 0.12 | | | | 1.30 | | | | 1.42 | | | | (0.08 | ) | | | (0.08 | ) | | | (0.16 | ) | | | 12.37 | | | | 1.48 | % | | | 0.75 | % | | | 0.94 | % | | | 12.83 | % | | | 8,070 | | | | 98 | % |
| 4/1/2016 - 3/31/2017 | | | 9.67 | | | | 0.14 | | | | 1.39 | | | | 1.53 | | | | (0.09 | ) | | | — | | | | (0.09 | ) | | | 11.11 | | | | 2.61 | % | | | 0.75 | % | | | 1.33 | % | | | 15.89 | % | | | 2,176 | | | | 108 | % |
| 1/11/2016 - 3/31/2016 | | | 9.10 | | | | 0.03 | | | | 0.54 | | | | 0.57 | | | | — | | | | — | | | | — | | | | 9.67 | | | | 5.82 | % | | | 0.75 | % | | | 1.60 | % | | | 6.26 | % | | | 564 | | | | 27 | % |
| Class S | | | | | | | | | | | | | | | | | | | | | | | | | | | | | | | | | | | | | | | | | | | | | | | | | | | | | | | | |
| 4/1/2018 - 3/31/2019 | | | $12.15 | | | | $0.16 | | | | $0.66 | | | | $0.82 | | | | ($0.14 | ) | | | ($0.50 | ) | | | ($0.64 | ) | | | $12.33 | | | | 1.15 | % | | | 0.65 | % | | | 1.28 | % | | | 7.06 | % | | | $909 | | | | 79 | % |
| 4/1/2017 - 3/31/2018 | | | 11.03 | | | | 0.12 | | | | 1.30 | | | | 1.42 | | | | (0.22 | ) | | | (0.08 | ) | | | (0.30 | ) | | | 12.15 | | | | 1.33 | % | | | 0.65 | % | | | 1.04 | % | | | 12.85 | % | | | 692 | | | | 98 | % |
| 4/1/2016 - 3/31/2017 | | | 9.66 | | | | 0.15 | | | | 1.39 | | | | 1.54 | | | | (0.17 | ) | | | — | | | | (0.17 | ) | | | 11.03 | | | | 2.46 | % | | | 0.65 | % | | | 1.43 | % | | | 16.08 | % | | | 1,184 | | | | 108 | % |
| 12/1/2015 - 3/31/2016 | | | 10.09 | | | | 0.05 | | | | (0.30 | ) | | | (0.25 | ) | | | (0.18 | )(10) | | | — | | | | (0.18 | ) | | | 9.66 | | | | 5.99 | % | | | 0.65 | % | | | 1.70 | % | | | (2.54 | %) | | | 1,879 | | | | 27 | % |
| 3/20/2015 - 11/30/2015 | | | 10.26 | | | | 0.12 | | | | (0.29 | ) | | | (0.17 | ) | | | — | | | | — | | | | — | | | | 10.09 | | | | 9.85 | % | | | 0.65 | % | | | 1.72 | % | | | (1.66 | %) | | | 1,895 | | | | 45 | % |
Pacific Funds Large-Cap Value (9) | | | | | | | | | | | | | | | | | | | | | | | | | | | | | | | | | | | | | | | | | | | | | |
| | | | | | | | | | | | | | |
| Class A | | | | | | | | | | | | | | | | | | | | | | | | | | | | | | | | | | | | | | | | | | | | | | | | | | | | | | | | |
| 4/1/2018 - 3/31/2019 | | | $11.34 | | | | $0.14 | | | | $0.18 | | | | $0.32 | | | | ($0.13 | ) | | | ($0.64 | ) | | | ($0.77 | ) | | | $10.89 | | | | 1.46 | % | | | 1.10 | % | | | 1.27 | % | | | 3.14 | % | | | $4,353 | | | | 39 | % |
| 4/1/2017 - 3/31/2018 | | | 10.75 | | | | 0.11 | | | | 0.86 | | | | 0.97 | | | | (0.13 | ) | | | (0.25 | ) | | | (0.38 | ) | | | 11.34 | | | | 1.47 | % | | | 1.10 | % | | | 0.96 | % | | | 9.03 | % | | | 3,304 | | | | 50 | % |
| 4/1/2016 - 3/31/2017 | | | 9.46 | | | | 0.14 | | | | 1.27 | | | | 1.41 | | | | (0.10 | ) | | | (0.02 | ) | | | (0.12 | ) | | | 10.75 | | | | 1.79 | % | | | 1.10 | % | | | 1.35 | % | | | 14.92 | % | | | 2,572 | | | | 65 | % |
| 1/11/2016 - 3/31/2016 | | | 8.97 | | | | 0.04 | | | | 0.45 | | | | 0.49 | | | | — | | | | — | | | | — | | | | 9.46 | | | | 10.34 | % | | | 1.10 | % | | | 1.92 | % | | | 5.46 | % | | | 499 | | | | 48 | % |
| Class C | | | | | | | | | | | | | | | | | | | | | | | | | | | | | | | | | | | | | | | | | | | | | | | | | | | | | | | | |
| 4/1/2018 - 3/31/2019 | | | $11.25 | | | | $0.06 | | | | $0.19 | | | | $0.25 | | | | ($0.03 | ) | | | ($0.64 | ) | | | ($0.67 | ) | | | $10.83 | | | | 2.21 | % | | | 1.85 | % | | | 0.53 | % | | | 2.40 | % | | | $3,475 | | | | 39 | % |
| 4/1/2017 - 3/31/2018 | | | 10.69 | | | | 0.02 | | | | 0.86 | | | | 0.88 | | | | (0.07 | ) | | | (0.25 | ) | | | (0.32 | ) | | | 11.25 | | | | 2.22 | % | | | 1.85 | % | | | 0.21 | % | | | 8.16 | % | | | 4,327 | | | | 50 | % |
| 4/1/2016 - 3/31/2017 | | | 9.45 | | | | 0.06 | | | | 1.26 | | | | 1.32 | | | | (0.06 | ) | | | (0.02 | ) | | | (0.08 | ) | | | 10.69 | | | | 2.54 | % | | | 1.85 | % | | | 0.60 | % | | | 14.03 | % | | | 3,056 | | | | 65 | % |
| 1/11/2016 - 3/31/2016 | | | 8.97 | | | | 0.02 | | | | 0.46 | | | | 0.48 | | | | — | | | | — | | | | — | | | | 9.45 | | | | 11.09 | % | | | 1.85 | % | | | 1.17 | % | | | 5.35 | % | | | 477 | | | | 48 | % |
| Advisor Class | | | | | | | | | | | | | | | | | | | | | | | | | | | | | | | | | | | | | | | | | | | | | | | | | | | | | | | | |
| 4/1/2018 - 3/31/2019 | | | $11.37 | | | | $0.17 | | | | $0.19 | | | | $0.36 | | | | ($0.16 | ) | | | ($0.64 | ) | | | ($0.80 | ) | | | $10.93 | | | | 1.21 | % | | | 0.85 | % | | | 1.53 | % | | | 3.47 | % | | | $9,799 | | | | 39 | % |
| 4/1/2017 - 3/31/2018 | | | 10.78 | | | | 0.14 | | | | 0.87 | | | | 1.01 | | | | (0.17 | ) | | | (0.25 | ) | | | (0.42 | ) | | | 11.37 | | | | 1.22 | % | | | 0.85 | % | | | 1.21 | % | | | 9.33 | % | | | 19,624 | | | | 50 | % |
| 4/1/2016 - 3/31/2017 | | | 9.47 | | | | 0.16 | | | | 1.26 | | | | 1.42 | | | | (0.09 | ) | | | (0.02 | ) | | | (0.11 | ) | | | 10.78 | | | | 1.54 | % | | | 0.85 | % | | | 1.60 | % | | | 15.10 | % | | | 24,779 | | | | 65 | % |
| 1/11/2016 - 3/31/2016 | | | 8.97 | | | | 0.04 | | | | 0.46 | | | | 0.50 | | | | — | | | | — | | | | — | | | | 9.47 | | | | 10.09 | % | | | 0.85 | % | | | 2.17 | % | | | 5.57 | % | | | 777 | | | | 48 | % |
| | | | | | | | | | | | | | |
| Class S | | | | | | | | | | | | | | | | | | | | | | | | | | | | | | | | | | | | | | | | | | | | | | | | | | | | | | | | |
| 4/1/2018 - 3/31/2019 | | | $11.34 | | | | $0.19 | | | | $0.15 | | | | $0.34 | | | | ($0.20 | ) | | | ($0.64 | ) | | | ($0.84 | ) | | | $10.84 | | | | 1.06 | % | | | 0.75 | % | | | 1.63 | % | | | 3.39 | % | | | $832 | | | | 39 | % |
| 4/1/2017 - 3/31/2018 | | | 10.75 | | | | 0.15 | | | | 0.86 | | | | 1.01 | | | | (0.17 | ) | | | (0.25 | ) | | | (0.42 | ) | | | 11.34 | | | | 1.07 | % | | | 0.75 | % | | | 1.31 | % | | | 9.36 | % | | | 1,963 | | | | 50 | % |
| 4/1/2016 - 3/31/2017 | | | 9.47 | | | | 0.17 | | | | 1.28 | | | | 1.45 | | | | (0.15 | ) | | | (0.02 | ) | | | (0.17 | ) | | | 10.75 | | | | 1.39 | % | | | 0.75 | % | | | 1.70 | % | | | 15.35 | % | | | 1,365 | | | | 65 | % |
| 1/11/2016 - 3/31/2016 | | | 8.97 | | | | 0.04 | | | | 0.46 | | | | 0.50 | | | | — | | | | — | | | | — | | | | 9.47 | | | | 9.93 | % | | | 0.75 | % | | | 2.27 | % | | | 5.57 | % | | | 210 | | | | 48 | % |
Pacific Funds Small/Mid-Cap (9), (11) | | | | | | | | | | | | | | | | | | | | | | | | | | | | | | | | | | | | | | | | | | | | | |
| | | | | | | | | | | | | | |
| Class A | | | | | | | | | | | | | | | | | | | | | | | | | | | | | | | | | | | | | | | | | | | | | | | | | | | | | | | | |
4/1/2018 - 3/31/2019
| | | $13.23 | | | | ($0.02 | ) | | | $0.16 | | | | $0.14 | | | | $— | | | | ($0.35 | ) | | | ($0.35 | ) | | | $13.02 | | | | 1.48 | % | | | 1.30 | % | | | (0.11 | %) | | | 1.19 | % | | | $21,872 | | | | 33 | % |
| 4/1/2017 - 3/31/2018 | | | 11.93 | | | | (0.04 | ) | | | 1.35 | | | | 1.31 | | | | — | | | | (0.01 | ) | | | (0.01 | ) | | | 13.23 | | | | 1.51 | % | | | 1.30 | % | | | (0.28 | %) | | | 11.02 | % | | | 21,131 | | | | 23 | % |
| 4/1/2016 - 3/31/2017 | | | 9.93 | | | | (0.02 | ) | | | 2.05 | | | | 2.03 | | | | — | | | | (0.03 | ) | | | (0.03 | ) | | | 11.93 | | | | 1.71 | % | | | 1.30 | % | | | (0.19 | %) | | | 20.44 | % | | | 18,360 | | | | 45 | % |
| 1/11/2016 - 3/31/2016 | | | 9.33 | | | | 0.00 | (7) | | | 0.60 | | | | 0.60 | | | | — | | | | — | | | | — | | | | 9.93 | | | | 5.43 | % | | | 1.30 | % | | | 0.07 | % | | | 6.43 | % | | | 2,254 | | | | 11 | % |
| Class C | | | | | | | | | | | | | | | | | | | | | | | | | | | | | | | | | | | | | | | | | | | | | | | | | | | | | | | | |
| 4/1/2018 - 3/31/2019 | | | $13.01 | | | | ($0.11 | ) | | | $0.15 | | | | $0.04 | | | | $— | | | | ($0.35 | ) | | | ($0.35 | ) | | | $12.70 | | | | 2.23 | % | | | 2.05 | % | | | (0.87 | %) | | | 0.43 | % | | | $16,875 | | | | 33 | % |
| 4/1/2017 - 3/31/2018 | | | 11.81 | | | | (0.13 | ) | | | 1.34 | | | | 1.21 | | | | — | | | | (0.01 | ) | | | (0.01 | ) | | | 13.01 | | | | 2.26 | % | | | 2.05 | % | | | (1.03 | %) | | | 10.28 | % | | | 15,458 | | | | 23 | % |
| 4/1/2016 - 3/31/2017 | | | 9.91 | | | | (0.10 | ) | | | 2.03 | | | | 1.93 | | | | — | | | | (0.03 | ) | | | (0.03 | ) | | | 11.81 | | | | 2.46 | % | | | 2.05 | % | | | (0.94 | %) | | | 19.47 | % | | | 7,383 | | | | 45 | % |
| 1/11/2016 - 3/31/2016 | | | 9.33 | | | | (0.01 | ) | | | 0.59 | | | | 0.58 | | | | — | | | | — | | | | — | | | | 9.91 | | | | 6.18 | % | | | 2.05 | % | | | (0.68 | %) | | | 6.22 | % | | | 527 | | | | 11 | % |
| Advisor Class | | | | | | | | | | | | | | | | | | | | | | | | | | | | | | | | | | | | | | | | | | | | | | | | | | | | | | | | |
| 4/1/2018 - 3/31/2019 | | | $13.28 | | | | $0.02 | | | | $0.16 | | | | $0.18 | | | | ($0.00 | )(7) | | | ($0.35 | ) | | | ($0.35 | ) | | | $13.11 | | | | 1.23 | % | | | 1.05 | % | | | 0.13 | % | | | 1.50 | % | | | $328,171 | | | | 33 | % |
| 4/1/2017 - 3/31/2018 | | | 11.94 | | | | 0.00 | (7) | | | 1.35 | | | | 1.35 | | | | — | | | | (0.01 | ) | | | (0.01 | ) | | | 13.28 | | | | 1.26 | % | | | 1.05 | % | | | (0.03 | %) | | | 11.34 | % | | | 176,897 | | | | 23 | % |
| 4/1/2016 - 3/31/2017 | | | 9.92 | | | | 0.01 | | | | 2.05 | | | | 2.06 | | | | (0.01 | ) | | | (0.03 | ) | | | (0.04 | ) | | | 11.94 | | | | 1.46 | % | | | 1.05 | % | | | 0.06 | % | | | 20.73 | % | | | 70,260 | | | | 45 | % |
| 1/11/2016 - 3/31/2016 | | | 9.33 | | | | 0.01 | | | | 0.58 | | | | 0.59 | | | | — | | | | — | | | | — | | | | 9.92 | | | | 5.18 | % | | | 1.05 | % | | | 0.32 | % | | | 6.32 | % | | | 1,965 | | | | 11 | % |
| | |
| See Notes to Financial Statements | | See explanation of references on C-21 |
C-19
PACIFIC FUNDS
FINANCIAL HIGHLIGHTS (Continued)
Selected per share, ratios and supplemental data for each year or period ended March 31, were as follows:
| | | | | | | | | | | | | | | | | | | | | | | | | | | | | | | | | | | | | | | | | | | | | | | | | | | | | | | | |
| Fund | | | | | Selected Per Share Data | | | | | | Ratios to Average Net Assets | | | Supplemental Data | |
| | | | | �� | Investment Operations | | | Distributions | | | | | | | | | | | | | | | | | | | | | | |
For the Year or Period Ended (1) | | Net Asset Value,
Beginning of Year or Period | | | Net Investment Income (Loss) (2) | | | Net Realized and
Unrealized Gain (Loss) | | | Total | | | Net Investment Income | | | Capital Gains | | | Total | | | Net Asset Value,
End of Year or Period | | | Expenses Before Reductions (3) | | | Expenses After Reductions (3), (4) | | | Net Investment Income (Loss) (3) | | | Total Returns (5) | | | Net Assets, End of Year or Period
(in thousands) | | | Portfolio Turnover Rates | |
Pacific Funds Small/Mid-Cap (Continued)(9), (11) | | | | | | | | | | | | | | | | | | | | | | | | | | | | | | | | | | | | | | | | | | | | | |
| Class S | | | | | | | | | | | | | | | | | | | | | | | | | | | | | | | | | | | | | | | | | | | | | | | | | | | | | | | | |
| 4/1/2018 - 3/31/2019 | | | $13.29 | | | | $0.02 | | | | $0.16 | | | | $0.18 | | | | ($0.00 | )(7) | | | ($0.35 | ) | | | ($0.35 | ) | | | $13.12 | | | | 1.08 | % | | | 1.00 | % | | | 0.19 | % | | | 1.52 | % | | | $6,422 | | | | 33 | % |
| 4/1/2017 - 3/31/2018 | | | 11.94 | | | | 0.00 | (7) | | | 1.36 | | | | 1.36 | | | | — | | | | (0.01 | ) | | | (0.01 | ) | | | 13.29 | | | | 1.11 | % | | | 1.00 | % | | | 0.02 | % | | | 11.43 | % | | | 9,977 | | | | 23 | % |
| 4/1/2016 - 3/31/2017 | | | 9.92 | | | | 0.01 | | | | 2.05 | | | | 2.06 | | | | (0.01 | ) | | | (0.03 | ) | | | (0.04 | ) | | | 11.94 | | | | 1.31 | % | | | 1.00 | % | | | 0.11 | % | | | 20.78 | % | | | 8,531 | | | | 45 | % |
| 12/1/2015 - 3/31/2016 | | | 10.48 | | | | 0.01 | | | | (0.49 | ) | | | (0.48 | ) | | | (0.03 | ) | | | (0.05 | ) | | | (0.08 | ) | | | 9.92 | | | | 9.62 | % | | | 1.00 | % | | | 0.37 | % | | | (4.55 | %) | | | 711 | | | | 11 | % |
| 12/31/2014 - 11/30/2015 | | | 10.00 | | | | 0.01 | | | | 0.47 | | | | 0.48 | | | | — | | | | — | | | | — | | | | 10.48 | | | | 29.84 | % | | | 1.00 | % | | | 0.12 | % | | | 4.80 | % | | | 524 | | | | 30 | % |
Pacific Funds Small-Cap (9), (11) | | | | | | | | | | | | | | | | | | | | | | | | | | | | | | | | | | | | | | | | | | | | | | | | | |
| | | | | | | | | | | | | | |
| Class A | | | | | | | | | | | | | | | | | | | | | | | | | | | | | | | | | | | | | | | | | | | | | | | | | | | | | | | | |
| 4/1/2018 - 3/31/2019 | | | $12.86 | | | | ($0.03 | ) | | | ($0.06 | ) | | | ($0.09 | ) | | | $— | | | | ($0.65 | ) | | | ($0.65 | ) | | | $12.12 | | | | 1.72 | % | | | 1.30 | % | | | (0.21 | %) | | | (0.53 | %) | | | $4,986 | | | | 56 | % |
| 4/1/2017 - 3/31/2018 | | | 11.77 | | | | (0.02 | ) | | | 1.33 | | | | 1.31 | | | | (0.01 | ) | | | (0.21 | ) | | | (0.22 | ) | | | 12.86 | | | | 1.89 | % | | | 1.30 | % | | | (0.16 | %) | | | 11.17 | % | | | 2,367 | | | | 62 | % |
| 4/1/2016 - 3/31/2017 | | | 9.68 | | | | (0.00 | )(7) | | | 2.19 | | | | 2.19 | | | | (0.10 | ) | | | — | | | | (0.10 | ) | | | 11.77 | | | | 3.44 | % | | | 1.30 | % | | | (0.04 | %) | | | 22.70 | % | | | 1,759 | | | | 62 | % |
| 1/11/2016 - 3/31/2016 | | | 9.10 | | | | 0.01 | | | | 0.57 | | | | 0.58 | | | | — | | | | — | | | | — | | | | 9.68 | | | | 17.67 | % | | | 1.30 | % | | | 0.31 | % | | | 6.37 | % | | | 324 | | | | 27 | % |
| Class C | | | | | | | | | | | | | | | | | | | | | | | | | | | | | | | | | | | | | | | | | | | | | | | | | | | | | | | | |
| 4/1/2018 - 3/31/2019 | | | $12.76 | | | | ($0.12 | ) | | | ($0.05 | ) | | | ($0.17 | ) | | | $— | | | | ($0.65 | ) | | | ($0.65 | ) | | | $11.94 | | | | 2.47 | % | | | 2.05 | % | | | (0.96 | %) | | | (1.17 | %) | | | $902 | | | | 56 | % |
| 4/1/2017 - 3/31/2018 | | | 11.76 | | | | (0.11 | ) | | | 1.32 | | | | 1.21 | | | | — | | | | (0.21 | ) | | | (0.21 | ) | | | 12.76 | | | | 2.64 | % | | | 2.05 | % | | | (0.91 | %) | | | 10.32 | % | | | 797 | | | | 62 | % |
| 4/1/2016 - 3/31/2017 | | | 9.66 | | | | (0.09 | ) | | | 2.19 | | | | 2.10 | | | | — | | | | — | | | | — | | | | 11.76 | | | | 4.19 | % | | | 2.05 | % | | | (0.79 | %) | | | 21.74 | % | | | 641 | | | | 62 | % |
| 1/11/2016 - 3/31/2016 | | | 9.10 | | | | (0.01 | ) | | | 0.57 | | | | 0.56 | | | | — | | | | — | | | | — | | | | 9.66 | | | | 18.42 | % | | | 2.05 | % | | | (0.44 | %) | | | 6.15 | % | | | 130 | | | | 27 | % |
| Advisor Class | | | | | | | | | | | | | | | | | | | | | | | | | | | | | | | | | | | | | | | | | | | | | | | | | | | | | | | | |
| 4/1/2018 - 3/31/2019 | | | $13.04 | | | | $0.01 | | | | ($0.07 | ) | | | ($0.06 | ) | | | ($0.01 | ) | | | ($0.65 | ) | | | ($0.66 | ) | | | $12.32 | | | | 1.47 | % | | | 1.05 | % | | | 0.04 | % | | | (0.26 | %) | | | $13,220 | | | | 56 | % |
| 4/1/2017 - 3/31/2018 | | | 11.90 | | | | 0.01 | | | | 1.35 | | | | 1.36 | | | | (0.01 | ) | | | (0.21 | ) | | | (0.22 | ) | | | 13.04 | | | | 1.64 | % | | | 1.05 | % | | | 0.09 | % | | | 11.45 | % | | | 14,767 | | | | 62 | % |
| 4/1/2016 - 3/31/2017 | | | 9.68 | | | | 0.02 | | | | 2.21 | | | | 2.23 | | | | (0.01 | ) | | | — | | | | (0.01 | ) | | | 11.90 | | | | 3.19 | % | | | 1.05 | % | | | 0.21 | % | | | 23.03 | % | | | 8,265 | | | | 62 | % |
| 1/11/2016 - 3/31/2016 | | | 9.10 | | | | 0.01 | | | | 0.57 | | | | 0.58 | | | | — | | | | — | | | | — | | | | 9.68 | | | | 17.42 | % | | | 1.05 | % | | | 0.56 | % | | | 6.37 | % | | | 153 | | | | 27 | % |
| Class S | | | | | | | | | | | | | | | | | | | | | | | | | | | | | | | | | | | | | | | | | | | | | | | | | | | | | | | | |
| 4/1/2018 - 3/31/2019 | | | $12.00 | | | | $0.01 | | | | ($0.06 | ) | | | ($0.05 | ) | | | ($0.01 | ) | | | ($0.65 | ) | | | ($0.66 | ) | | | $11.29 | | | | 1.32 | % | | | 1.00 | % | | | 0.09 | % | | | (0.18 | %) | | | $658 | | | | 56 | % |
| 4/1/2017 - 3/31/2018 | | | 10.95 | | | | 0.02 | | | | 1.24 | | | | 1.26 | | | | — | | | | (0.21 | ) | | | (0.21 | ) | | | 12.00 | | | | 1.49 | % | | | 1.00 | % | | | 0.14 | % | | | 11.54 | % | | | 457 | | | | 62 | % |
| 4/1/2016 - 3/31/2017 | | | 9.67 | | | | 0.03 | | | | 2.17 | | | | 2.20 | | | | (0.92 | ) | | | — | | | | (0.92 | ) | | | 10.95 | | | | 3.04 | % | | | 1.00 | % | | | 0.26 | % | | | 23.03 | % | | | 140 | | | | 62 | % |
| 12/1/2015 - 3/31/2016 | | | 10.31 | | | | 0.02 | | | | (0.60 | ) | | | (0.58 | ) | | | (0.06 | ) | | | — | | | | (0.06 | ) | | | 9.67 | | | | 10.38 | % | | | 1.00 | % | | | 0.61 | % | | | (5.68 | %) | | | 497 | | | | 27 | % |
| 12/31/2014 - 11/30/2015 | | | 10.00 | | | | 0.02 | | | | 0.29 | | | | 0.31 | | | | — | | | | — | | | | — | | | | 10.31 | | | | 30.41 | % | | | 1.00 | % | | | 0.24 | % | | | 3.10 | % | | | 516 | | | | 27 | % |
Pacific Funds Small-Cap Value (9), (11) | | | | | | | | | | | | | | | | | | | | | | | | | | | | | | | | | | | | | | | | | |
| | | | | | | | | | | | | | |
| Class A | | | | | | | | | | | | | | | | | | | | | | | | | | | | | | | | | | | | | | | | | | | | | | | | | | | | | | | | |
| 4/1/2018 - 3/31/2019 | | | $11.17 | | | | $0.03 | | | | ($0.49 | ) | | | ($0.46 | ) | | | ($0.03 | ) | | | ($1.58 | ) | | | ($1.61 | ) | | | $9.10 | | | | 1.67 | % | | | 1.30 | % | | | 0.30 | % | | | (3.68 | %) | | | $1,298 | | | | 51 | % |
| 4/1/2017 - 3/31/2018 | | | 11.52 | | | | 0.02 | | | | 0.62 | | | | 0.64 | | | | (0.03 | ) | | | (0.96 | ) | | | (0.99 | ) | | | 11.17 | | | | 1.65 | % | | | 1.30 | % | | | 0.14 | % | | | 5.41 | % | | | 1,105 | | | | 47 | % |
| 4/1/2016 - 3/31/2017 | | | 9.47 | | | | 0.03 | | | | 2.13 | | | | 2.16 | | | | (0.06 | ) | | | (0.05 | ) | | | (0.11 | ) | | | 11.52 | | | | 1.90 | % | | | 1.30 | % | | | 0.23 | % | | | 22.65 | % | | | 743 | | | | 76 | % |
| 1/11/2016 - 3/31/2016 | | | 8.80 | | | | 0.02 | | | | 0.65 | | | | 0.67 | | | | — | | | | — | | | | — | | | | 9.47 | | | | 15.99 | % | | | 1.30 | % | | | 0.97 | % | | | 7.73 | % | | | 148 | | | | 17 | % |
| Class C | | | | | | | | | | | | | | | | | | | | | | | | | | | | | | | | | | | | | | | | | | | | | | | | | | | | | | | | |
| 4/1/2018 - 3/31/2019 | | | $11.06 | | | | ($0.05 | ) | | | ($0.49 | ) | | | ($0.54 | ) | | | $— | | | | ($1.58 | ) | | | ($1.58 | ) | | | $8.94 | | | | 2.42 | % | | | 2.05 | % | | | (0.45 | %) | | | (4.47 | %) | | | $1,287 | | | | 51 | % |
| 4/1/2017 - 3/31/2018 | | | 11.46 | | | | (0.07 | ) | | | 0.63 | | | | 0.56 | | | | — | | | | (0.96 | ) | | | (0.96 | ) | | | 11.06 | | | | 2.40 | % | | | 2.05 | % | | | (0.61 | %) | | | 4.72 | % | | | 1,568 | | | | 47 | % |
| 4/1/2016 - 3/31/2017 | | | 9.46 | | | | (0.06 | ) | | | 2.12 | | | | 2.06 | | | | (0.01 | ) | | | (0.05 | ) | | | (0.06 | ) | | | 11.46 | | | | 2.65 | % | | | 2.05 | % | | | (0.52 | %) | | | 21.81 | % | | | 1,105 | | | | 76 | % |
| 1/11/2016 - 3/31/2016 | | | 8.80 | | | | 0.00 | (7) | | | 0.66 | | | | 0.66 | | | | — | | | | — | | | | — | | | | 9.46 | | | | 16.74 | % | | | 2.05 | % | | | 0.22 | % | | | 7.50 | % | | | 121 | | | | 17 | % |
| Advisor Class | | | | | | | | | | | | | | | | | | | | | | | | | | | | | | | | | | | | | | | | | | | | | | | | | | | | | | | | |
| 4/1/2018 - 3/31/2019 | | | $11.24 | | | | $0.06 | | | | ($0.51 | ) | | | ($0.45 | ) | | | ($0.05 | ) | | | ($1.58 | ) | | | ($1.63 | ) | | | $9.16 | | | | 1.42 | % | | | 1.05 | % | | | 0.55 | % | | | (3.51 | %) | | | $11,664 | | | | 51 | % |
| 4/1/2017 - 3/31/2018 | | | 11.59 | | | | 0.05 | | | | 0.63 | | | | 0.68 | | | | (0.07 | ) | | | (0.96 | ) | | | (1.03 | ) | | | 11.24 | | | | 1.40 | % | | | 1.05 | % | | | 0.39 | % | | | 5.70 | % | | | 15,511 | | | | 47 | % |
| 4/1/2016 - 3/31/2017 | | | 9.48 | | | | 0.05 | | | | 2.15 | | | | 2.20 | | | | (0.04 | ) | | | (0.05 | ) | | | (0.09 | ) | | | 11.59 | | | | 1.65 | % | | | 1.05 | % | | | 0.48 | % | | | 23.02 | % | | | 20,617 | | | | 76 | % |
| 1/11/2016 - 3/31/2016 | | | 8.80 | | | | 0.02 | | | | 0.66 | | | | 0.68 | | | | — | | | | — | | | | — | | | | 9.48 | | | | 15.74 | % | | | 1.05 | % | | | 1.22 | % | | | 7.84 | % | | | 261 | | | | 17 | % |
| Class S | | | | | | | | | | | | | | | | | | | | | | | | | | | | | | | | | | | | | | | | | | | | | | | | | | | | | | | | |
| 4/1/2018 - 3/31/2019 | | | $11.21 | | | | $0.07 | | | | ($0.52 | ) | | | ($0.45 | ) | | | ($0.06 | ) | | | ($1.58 | ) | | | ($1.64 | ) | | | $9.12 | | | | 1.27 | % | | | 1.00 | % | | | 0.60 | % | | | (3.52 | %) | | | $3,134 | | | | 51 | % |
| 4/1/2017 - 3/31/2018 | | | 11.55 | | | | 0.05 | | | | 0.64 | | | | 0.69 | | | | (0.07 | ) | | | (0.96 | ) | | | (1.03 | ) | | | 11.21 | | | | 1.25 | % | | | 1.00 | % | | | 0.44 | % | | | 5.78 | % | | | 9,657 | | | | 47 | % |
| 4/1/2016 - 3/31/2017 | | | 9.47 | | | | 0.06 | | | | 2.13 | | | | 2.19 | | | | (0.06 | ) | | | (0.05 | ) | | | (0.11 | ) | | | 11.55 | | | | 1.50 | % | | | 1.00 | % | | | 0.53 | % | | | 23.02 | % | | | 9,655 | | | | 76 | % |
| 12/1/2015 - 3/31/2016 | | | 10.14 | | | | 0.04 | | | | (0.49 | ) | | | (0.45 | ) | | | (0.12 | ) | | | (0.10 | ) | | | (0.22 | ) | | | 9.47 | | | | 16.02 | % | | | 1.00 | % | | | 1.27 | % | | | (4.37 | %) | | | 1,118 | | | | 17 | % |
| 12/31/2014 - 11/30/2015 | | | 10.00 | | | | 0.06 | | | | 0.08 | | | | 0.14 | | | | — | | | | — | | | | — | | | | 10.14 | | | | 26.85 | % | | | 1.00 | % | | | 0.63 | % | | | 1.40 | % | | | 706 | | | | 29 | % |
| | |
| See Notes to Financial Statements | | See explanation of references on C-21 |
C-20
PACIFIC FUNDS
FINANCIAL HIGHLIGHTS (Continued)
Selected per share, ratios and supplemental data for each year or period ended March 31, were as follows:
| | | | | | | | | | | | | | | | | | | | | | | | | | | | | | | | | | | | | | | | | | | | | | | | | | | | | | | | |
| Fund | | | | | Selected Per Share Data | | | | | | Ratios to Average Net Assets | | | Supplemental Data | |
| | | | | | Investment Operations | | | Distributions | | | | | | | | | | | | | | | | | | | | | | |
For the Year or Period Ended (1) | | Net Asset Value,
Beginning of Year or Period | | | Net Investment Income (Loss) (2) | | | Net Realized and
Unrealized Gain (Loss) | | | Total | | | Net Investment Income | | | Capital Gains | | | Total | | | Net Asset Value,
End of Year or Period | | | Expenses Before Reductions (3) | | | Expenses After Reductions (3), (4) | | | Net Investment Income (Loss) (3) | | | Total Returns (5) | | | Net Assets, End of Year or Period
(in thousands) | | | Portfolio Turnover Rates | |
Pacific Funds Small-Cap Growth (9) | | | | | | | | | | | | | | | | | | | | | | | | | | | | | | | | | | | | | | | | | |
| | | | | | | | | | | | | | |
| Class A | | | | | | | | | | | | | | | | | | | | | | | | | | | | | | | | | | | | | | | | | | | | | | | | | | | | | | | | |
| 4/1/2018 - 3/31/2019 | | | $12.26 | | | | ($0.08 | ) | | | $0.73 | | | | $0.65 | | | | $— | | | | ($0.94 | ) | | | ($0.94 | ) | | | $11.97 | | | | 1.56 | % | | | 1.26 | % | | | (0.63 | %) | | | 5.65 | % | | | $3,126 | | | | 72 | % |
| 4/1/2017 - 3/31/2018 | | | 11.14 | | | | (0.08 | ) | | | 1.68 | | | | 1.60 | | | | — | | | | (0.48 | ) | | | (0.48 | ) | | | 12.26 | | | | 1.62 | % | | | 1.30 | % | | | (0.65 | %) | | | 14.51 | % | | | 713 | | | | 51 | % |
| 4/1/2016 - 3/31/2017 | | | 9.61 | | | | (0.07 | ) | | | 1.80 | | | | 1.73 | | | | — | | | | (0.20 | ) | | | (0.20 | ) | | | 11.14 | | | | 1.93 | % | | | 1.30 | % | | | (0.68 | %) | | | 17.83 | % | | | 514 | | | | 49 | % |
| 1/11/2016 - 3/31/2016 | | | 9.27 | | | | (0.01 | ) | | | 0.35 | | | | 0.34 | | | | — | | | | — | | | | — | | | | 9.61 | | | | 12.44 | % | | | 1.30 | % | | | (0.70 | %) | | | 3.88 | % | | | 43 | | | | 7 | % |
| Class C | | | | | | | | | | | | | | | | | | | | | | | | | | | | | | | | | | | | | | | | | | | | | | | | | | | | | | | | |
| 4/1/2018 - 3/31/2019 | | | $12.06 | | | | ($0.17 | ) | | | $0.70 | | | | $0.53 | | | | $— | | | | ($0.94 | ) | | | ($0.94 | ) | | | $11.65 | | | | 2.31 | % | | | 2.05 | % | | | (1.42 | %) | | | 4.82 | % | | | $959 | | | | 72 | % |
| 4/1/2017 - 3/31/2018 | | | 11.05 | | | | (0.16 | ) | | | 1.65 | | | | 1.49 | | | | — | | | | (0.48 | ) | | | (0.48 | ) | | | 12.06 | | | | 2.37 | % | | | 2.05 | % | | | (1.40 | %) | | | 13.62 | % | | | 759 | | | | 51 | % |
| 4/1/2016 - 3/31/2017 | | | 9.61 | | | | (0.15 | ) | | | 1.79 | | | | 1.64 | | | | — | | | | (0.20 | ) | | | (0.20 | ) | | | 11.05 | | | | 2.68 | % | | | 2.05 | % | | | (1.43 | %) | | | 17.14 | % | | | 187 | | | | 49 | % |
| 1/11/2016 - 3/31/2016 | | | 9.27 | | | | (0.03 | ) | | | 0.37 | | | | 0.34 | | | | — | | | | — | | | | — | | | | 9.61 | | | | 13.19 | % | | | 2.05 | % | | | (1.45 | %) | | | 3.67 | % | | | 34 | | | | 7 | % |
| Class P | | | | | | | | | | | | | | | | | | | | | | | | | | | | | | | | | | | | | | | | | | | | | | | | | | | | | | | | |
| 4/1/2018 - 3/31/2019 | | | $12.35 | | | | ($0.05 | ) | | | $0.72 | | | | $0.67 | | | | $— | | | | ($0.94 | ) | | | ($0.94 | ) | | | $12.08 | | | | 1.16 | % | | | 1.05 | % | | | (0.42 | %) | | | 5.86 | % | | | $23,955 | | | | 72 | % |
| 4/1/2017 - 3/31/2018 | | | 11.19 | | | | (0.05 | ) | | | 1.69 | | | | 1.64 | | | | — | | | | (0.48 | ) | | | (0.48 | ) | | | 12.35 | | | | 1.22 | % | | | 1.05 | % | | | (0.40 | %) | | | 14.80 | % | | | 26,764 | | | | 51 | % |
| 6/8/2016 - 3/31/2017 | | | 10.06 | | | | (0.04 | ) | | | 1.37 | | | | 1.33 | | | | — | | | | (0.20 | ) | | | (0.20 | ) | | | 11.19 | | | | 1.43 | % | | | 1.05 | % | | | (0.43 | %) | | | 13.29 | % | | | 12,385 | | | | 49 | % |
| Advisor Class | | | | | | | | | | | | | | | | | | | | | | | | | | | | | | | | | | | | | | | | | | | | | | | | | | | | | | | | |
| 4/1/2018 - 3/31/2019 | | | $12.35 | | | | ($0.05 | ) | | | $0.72 | | | | $0.67 | | | | $— | | | | ($0.94 | ) | | | ($0.94 | ) | | | $12.08 | | | | 1.31 | % | | | 1.05 | % | | | (0.42 | %) | | | 5.86 | % | | | $5,288 | | | | 72 | % |
| 4/1/2017 - 3/31/2018 | | | 11.19 | | | | (0.05 | ) | | | 1.69 | | | | 1.64 | | | | — | | | | (0.48 | ) | | | (0.48 | ) | | | 12.35 | | | | 1.37 | % | | | 1.05 | % | | | (0.40 | %) | | | 14.80 | % | | | 13,574 | | | | 51 | % |
| 4/1/2016 - 3/31/2017 | | | 9.64 | | | | (0.05 | ) | | | 1.80 | | | | 1.75 | | | | — | | | | (0.20 | ) | | | (0.20 | ) | | | 11.19 | | | | 1.68 | % | | | 1.05 | % | | | (0.43 | %) | | | 18.23 | % | | | 13,321 | | | | 49 | % |
| 1/11/2016 - 3/31/2016 | | | 9.27 | | | | (0.01 | ) | | | 0.38 | | | | 0.37 | | | | — | | | | — | | | | — | | | | 9.64 | | | | 12.19 | % | | | 1.05 | % | | | (0.45 | %) | | | 3.99 | % | | | 234 | | | | 7 | % |
| Class S | | | | | | | | | | | | | | | | | | | | | | | | | | | | | | | | | | | | | | | | | | | | | | | | | | | | | | | | |
| 4/1/2018 - 3/31/2019 | | | $12.38 | | | | ($0.04 | ) | | | $0.72 | | | | $0.68 | | | | $— | | | | ($0.94 | ) | | | ($0.94 | ) | | | $12.12 | | | | 1.16 | % | | | 0.90 | % | | | (0.27 | %) | | | 5.92 | % | | | $2,287 | | | | 72 | % |
| 4/1/2017 - 3/31/2018 | | | 11.20 | | | | (0.03 | ) | | | 1.69 | | | | 1.66 | | | | — | | | | (0.48 | ) | | | (0.48 | ) | | | 12.38 | | | | 1.22 | % | | | 0.90 | % | | | (0.25 | %) | | | 14.97 | % | | | 10,826 | | | | 51 | % |
| 4/1/2016 - 3/31/2017 | | | 9.63 | | | | (0.03 | ) | | | 1.80 | | | | 1.77 | | | | (0.00 | )(7) | | | (0.20 | ) | | | (0.20 | ) | | | 11.20 | | | | 1.53 | % | | | 0.90 | % | | | (0.28 | %) | | | 18.47 | % | | | 9,680 | | | | 49 | % |
| 1/11/2016 - 3/31/2016 | | | 9.27 | | | | (0.00 | )(7) | | | 0.36 | | | | 0.36 | | | | — | | | | — | | | | — | | | | 9.63 | | | | 12.04 | % | | | 0.90 | % | | | (0.29 | %) | | | 3.88 | % | | | 411 | | | | 7 | % |
| (1) | | For share classes that commenced operations after April 1, 2014, the first date reported represents the commencement date of operations for that share class. |
| (2) | | Net investment income (loss) per share has been calculated using the average shares method. |
| (3) | | The ratios are annualized for periods of less than one full year. |
| (4) | | The ratios of expenses after expense reductions to average net assets are after advisory fee waivers and adviser expense reimbursements, if any, as discussed in Notes 6 and 7B in Notes to Financial Statements. The expense ratios for all the Portfolio Optimization Funds and Pacific Funds Diversified Alternatives do not include fees and expenses of the underlying funds (see Note 1 in Notes to Financial Statements) in which the Portfolio Optimization Funds and Pacific Funds Diversified Alternatives invest. |
| (5) | | The total returns include reinvestment of all dividends and capital gain distributions, if any, and do not include deductions of any applicable sales charges. Total returns are not annualized for periods less than one full year. |
| (6) | | Class R shares were converted to Class A shares on March 22, 2019 (see Note 1 in Notes to Financial Statements). |
| (7) | | Reflects an amount rounding to less than $0.01 per share. |
| (8) | | The annualized ratios of expenses, excluding interest expense, after expense reductions to average net assets for the year ended March 31, 2019 are as follows: |
| | | | | | | | | | |
| Fund | | Class A | | Class C | | Class I | | Class P | | Advisor Class |
Pacific Funds Floating Rate Income | | 0.99% | | 1.69% | | 0.69% | | 0.69% | | 0.74% |
| (9) | | Investor Class shares were converted to Class A shares on July 31, 2018 (see Note 1 in Notes to Financial Statements). |
| (10) | | Includes $0.01 per share return of capital distribution. |
| (11) | | Because of the change in fiscal year end from November 30 to March 31 for the Fund, the following periods are shown for the Fund prior to April 1, 2016: (i) the period from December 31, 2014 through November 30, 2015, which reflects the fiscal year end prior to the reorganization and (ii) the period from December 1, 2015 or class commencement date through March 31, 2016, which reflects the change in fiscal year end for the Fund upon the reorganization. |
| | |
| See Notes to Financial Statements | | |
C-21
PACIFIC FUNDS
NOTES TO FINANCIAL STATEMENTS
1. ORGANIZATION
Pacific Funds Series Trust (which may be referred to as “Pacific Funds” or the “Trust”) is registered under the Investment Company Act of 1940 (“1940 Act”), as amended, as a diversified, open-end, management investment company, and is organized as a Delaware statutory trust. Pacific Life Fund Advisors LLC (“PLFA” or the “Investment Adviser”) serves as investment adviser to the Trust. As of March 31, 2019, the Trust was comprised of thirty-four separate funds, seventeen of which are presented in these financial statements (each individually a “Fund”, and collectively the “Funds”):
|
| |
| Fund |
| |
| Pacific FundsSM Portfolio Optimization Conservative (1) |
| |
| Pacific FundsSM Portfolio Optimization Moderate-Conservative (1) |
| |
| Pacific FundsSM Portfolio Optimization Moderate (1) |
| |
| Pacific FundsSM Portfolio Optimization Growth (1) |
| |
| Pacific FundsSM Portfolio Optimization Aggressive-Growth (1) |
| |
| Pacific FundsSM Diversified Alternatives |
| |
| Pacific FundsSM Short Duration Income (2) |
| |
| Pacific FundsSM Core Income (2) |
| |
| Pacific FundsSM Strategic Income (2) |
|
| |
| Fund |
| |
| Pacific FundsSM Floating Rate Income (2) |
| |
| Pacific FundsSM High Income (2) |
| |
| Pacific FundsSMLarge-Cap (3) |
| |
| Pacific FundsSMLarge-Cap Value (3) |
| |
| Pacific FundsSMSmall/Mid-Cap (3) |
| |
| Pacific FundsSMSmall-Cap (3) |
| |
| Pacific FundsSMSmall-Cap Value (3) |
| |
| Pacific FundsSMSmall-Cap Growth (3) |
| | (1) | These Funds are collectively known as the “Portfolio Optimization Funds”. |
| | (2) | These Funds are collectively known as the “PF Fixed Income Funds”. |
| | (3) | These Funds are collectively known as the “PF U.S. Equity Funds”. |
The Portfolio Optimization Funds offer Class A, Class B, Class C, and Advisor Class shares. Pacific Funds Diversified Alternatives offers Class A, Class C, and Advisor Class shares. Each class is distinguished by its applicable sales charges and level of distribution and/or service fees (see Note 6) and in general: (i) Class A shares are subject to a maximum 5.50% front-end sales charge; (ii) Class B shares are subject to a maximum 5.00% contingent deferred sales charge (“CDSC”); (iii) Class C shares are subject to a maximum 1.00% CDSC; and (iv) Advisor Class shares are sold at net asset value without a sales charge. The sales charge for Class A shares is reduced for purchases of $50,000 or more and may be waived in certain circumstances. There is no sales charge for Class A shares for purchases of $1 million or more, although there is a CDSC of 1.00% on redemptions of such Class A shares within one year of purchase, which may be waived in certain circumstances. Class B shares were closed to any new or additional purchases (except through reinvestment of dividends and capital gains distributions) as of the close of business on July 31, 2017, and effective July 31, 2019, all Class B shares will be converted to Class A shares and Class B shares will be terminated. Effective March 22, 2019, all Class R shares in the Portfolio Optimization Funds were converted to Class A shares within each Fund, and Class R shares were concurrently terminated.
The PF Fixed Income Funds offer Class A, Class C, Class I, and Advisor Class shares. Additionally, Pacific Funds Core Income, Pacific Funds Floating Rate Income, and Pacific Funds High Income offer Class P shares. Each class is distinguished by its applicable sales charges and level of distribution and/or service fees (see Note 6) and in general: (i) Class A shares of Pacific Funds Short Duration Income and Pacific Funds Floating Rate Income are subject to a maximum 3.00% front-end sales charge, and Class A shares of Pacific Funds Core Income, Pacific Funds Strategic Income, and Pacific Funds High Income are subject to a maximum 4.25% front-end sales charge; (ii) Class C shares are subject to a maximum 1.00% CDSC; and (iii) Class I, Class P, and Advisor Class shares are sold at net asset value without a sales charge. The sales charge for Class A shares is reduced for purchases of $100,000 or more and may be waived in certain circumstances. There is no sales charge for Class A shares for purchases of $500,000 or more, although there is a CDSC of 1.00% of such Class A shares within one year of purchase, which may be waived in certain circumstances.
The PF U.S. Equity Funds offer Class A, Class C, Advisor Class, and Class S shares. Additionally, Pacific Funds Small-Cap Growth offers Class P shares. Each class is distinguished by its applicable sales charges and level of distribution and/or service fees (see Note 6) and in general: (i) Class A shares are subject to a maximum 4.25% front-end sales charge; (ii) Class C shares are subject to a maximum 1.00% CDSC; and (iii) Class P, Advisor Class, and Class S shares are sold at net asset value without a sales charge. The sales charge for Class A shares is reduced for purchases of $100,000 or more and may be waived in certain circumstances. There is no sales charge for Class A shares for purchases of $500,000 or more, although there is a CDSC of 1.00% of such Class A shares within one year of purchase, which may be waived in certain circumstances. Effective July 31, 2018, all Investor Class shares in the PF U.S. Equity Funds were converted to Class A shares within each Fund, and Investor Class shares were concurrently terminated.
The Trust’s distributor receives all net commissions (front-end sales charges and CDSCs) from the sales of all applicable share classes (see Note 6).
The Portfolio Optimization Funds invest their assets in Class P shares of certain other funds of the Trust (collectively, the “PF Underlying Funds”) as well as Class P shares of Pacific Funds Core Income, Pacific Funds Floating Rate Income, Pacific Funds High Income, and Pacific Funds Small-Cap Growth. Pacific Funds Diversified Alternatives invests all of its assets in certain PF Underlying Funds and Class P shares of Pacific Funds Floating Rate Income.
There is a separate annual report containing the financial statements for the PF Underlying Funds, which is available without charge.For information on how to obtain the annual report for these Funds, see the Where to Go for More Information section of this report on page F-21.
D-1
PACIFIC FUNDS
NOTES TO FINANCIAL STATEMENTS (Continued)
The Trust’s Board of Trustees approved a plan of liquidation for Pacific Funds Diversified Alternatives which is expected to occur on or about July 31, 2019.
2. SIGNIFICANT ACCOUNTING POLICIES
The following is a summary of the significant accounting policies followed by the Trust in the preparation of its financial statements in conformity with accounting principles generally accepted in the United States of America (“U.S. GAAP”), which may require management to make estimates and assumptions that affect the reported amounts of assets and liabilities and disclosures of contingent assets and liabilities at the date of the financial statements and the increases and decreases in net assets from operations during the reporting period. Actual results could differ from those estimates. Each Fund qualifies as an investment company under U.S. GAAP and follows the accounting and reporting guidance applicable to the Investment Companies Topic of U.S. GAAP. The following Accounting Standards Update (“ASU”) was implemented during this reporting cycle.
On August 28, 2018, the FASB issued ASU No. 2018-13,Fair Value Measurement (Topic 820): Disclosure Framework – Changes to the Disclosure Requirements for Fair Value Measurement.This update intends to improve the effectiveness of disclosure requirements on fair value measurements, including the consideration of costs and benefits. As a result of the implementation of ASU 2018-13, certain disclosures were removed from the Schedules of Investments and Note 3D.
A. INVESTMENT TRANSACTIONS AND INCOME
Investment transactions are recorded on a trade date basis. Securities purchased or sold on a when-issued or delayed-delivery basis as well as certain loan transactions and mortgage securities (such as Government National Mortgage Association (“GNMA”) securities) may be settled a month or more after the trade date. Dividend income is recorded on the ex-dividend date, except certain dividends from foreign securities, which are recorded as soon as a Fund is informed of the ex-dividend date or upon receipt of the dividend. A Fund’s estimated components of distributions received from real estate investment trusts may be considered income, return of capital distributions or capital gain distributions. Return of capital distributions are recorded as a reduction of cost of the related investments. Interest income, adjusted for amortization of premium and accretion of discount, is recorded daily on an accrual basis. Investment income is recorded net of foreign taxes withheld, if any. A Fund may be subject to foreign taxes on income, gains on investments, or currency repatriation, a portion of which may be recoverable. A Fund will accrue such taxes and reclaims as applicable, based upon the current interpretation of tax rules and regulations that exist in the markets in which that Fund invests. Facility fees and other fees (such as origination fees) received from floating rate senior loan notes purchased (see Note 4) by a Fund are amortized over the expected term of each applicable senior loan. Commitment fees received by a Fund relating to unfunded senior loan commitments are amortized to income over the period of the commitment. Consent fees, which are compensation for agreeing to changes in the terms of debt instruments, are recorded as interest income when received. Realized gains and losses from investment transactions are recorded on the basis of identified cost. Gains and losses realized on principal paydowns from mortgage-backed and asset-backed securities are recorded as interest income. Litigation settlements on securities that were previously held are recorded as realized gains on investment securities.
B. DISTRIBUTIONS TO SHAREHOLDERS
For the Portfolio Optimization Funds, Pacific Funds Diversified Alternatives, and PF U.S. Equity Funds, dividends on net investment income, if any, are generally declared and paid annually. For the PF Fixed Income Funds (except Pacific Funds Floating Rate Income), dividends on net investment income, if any, are generally declared and paid monthly. For Pacific Funds Floating Rate Income, dividends, if any, are generally declared daily and paid monthly. Dividends may be declared more or less frequently if advantageous to the specific Fund and its shareholders.
All realized capital gains are distributed at least annually for each Fund. Dividends and distributions paid to shareholders are recorded on the ex-dividend date.
C. FOREIGN CURRENCY TRANSLATION
The Trust’s accounting records are maintained in U.S. dollars. The market value of investments and other assets and liabilities, which are denominated in non-U.S. currencies, are translated into U.S. dollars based on the applicable exchange rates at the end of each business day. Purchases and sales of investments and income and expenses, denominated in foreign currencies, are translated into U.S. dollars at the exchange rates in effect on the transaction date.
None of the Funds separately report the effect of changes in foreign exchange rates from changes in market prices of investments held. Such changes are included with the net realized gain or loss and change in net unrealized appreciation or depreciation on investments. Other foreign currency transactions resulting in realized and unrealized gain or loss, if any, are reported separately as net realized gain or loss on foreign currency transactions and change in net unrealized appreciation or depreciation on foreign currencies.
D. ALLOCATION OF INCOME, EXPENSES, GAINS AND LOSSES
Income, non-class specific expenses, and realized and unrealized gains and losses are allocated on a daily basis to each class of shares based upon the relative portion of net assets of each class. Certain Trust expenses directly attributable to a particular Fund are charged to that Fund (such as fund-specific transactional fees, proxies, liquidations, litigation, and organizational/start-up costs) and class-specific fees and expenses are charged directly to the respective share class within each Fund. Generally, other Trust expenses are allocated proportionately among all the Funds in relation to the net assets of each Fund.
E. OFFERING COSTS
A new Fund bears all costs (or the applicable pro-rata share if there is more than one new Fund) associated with the offering expenses of the Fund including legal, printing, and support services (see Notes 6 and 7A). All such costs are amortized as an expense of the new Fund on a straight-line basis over twelve months from commencement of operations.
D-2
PACIFIC FUNDS
NOTES TO FINANCIAL STATEMENTS (Continued)
F. NEW PRONOUNCEMENTS NOT YET ADOPTED
On March 30, 2017, the FASB issued ASU 2017-08,Premium Amortization on Purchased Callable Debt Securities, which requires the premium associated with the purchase of callable debt securities be amortized to the earliest call date and no longer amortized through the contractual life of the instrument. The changes are effective for fiscal years, and interim periods within those fiscal years, beginning after December 15, 2018. Management has determined that this new accounting pronouncement will have no material impact on the financial statements of the Trust.
3. VALUATION AND FAIR VALUE MEASUREMENTS
A. VALUATION POLICY
The Trust’s Board of Trustees (the “Board”) has adopted a policy (“Valuation Policy”) for determining the value of the Trust’s investments each business day. Under the Valuation Policy, the Board has delegated certain functions to the Trustee Valuation Committee (“TVC”) and/or the Valuation Oversight Committee (“VOC”) or its delegate to determine the fair value of certain investments, which includes using third party pricing services. Each valuation committee that values the Funds’ investments does so in accordance with the Valuation Policy. Notes 3B and 3C below describe in greater detail the methodologies used to value each Fund’s investments.
B. DETERMINATION OF NET ASSET VALUE (“NAV”)
Each Fund presented in these financial statements is divided into shares and share classes. The price per share of each class of a Fund’s shares is called the NAV. The NAV forms the basis for all transactions involving buying, selling, exchanging or reinvesting shares. Each Fund’s NAV is calculated by taking the total value of a Fund’s assets, subtracting a Fund’s liabilities, and dividing by the total number of shares outstanding.
Each Fund’s NAV is calculated once per day, every day the New York Stock Exchange (“NYSE”) is open, including days when foreign markets and/or bond markets are closed. For purposes of calculating the NAV, the value of investments held by each Fund is generally determined as of the scheduled closing time of the NYSE, which is usually 4:00 p.m. Eastern Time. Information that becomes known to the Trust or its agents after the scheduled close of the NYSE on a particular day will not normally be used to retroactively adjust the price of an investment for that same business day. Such information may include late dividend notifications, legal or regulatory matters, corporate actions, and corrected/adjusted last sales prices or official closing prices from an exchange.
Each Fund’s NAV will not be calculated on days when the NYSE is closed. There may be a delay in calculating the NAV if: (i) the NYSE is closed on a day other than a regular holiday or weekend, (ii) trading on the NYSE is restricted, (iii) an emergency exists (as determined by the SEC), making the sale of investments or determinations of NAV not practicable, or (iv) the SEC permits a delay for the protection of shareholders.
Certain Funds may hold investments that are primarily listed on foreign exchanges. Because those investments trade on weekends and other days when the Funds do not calculate their NAVs, the value of those investments may change on days when a shareholder will not be able to purchase or redeem shares of those Funds.
C. INVESTMENT VALUATION
The value of each security or other investment is the amount which a Fund might reasonably expect to receive for the investment upon its current sale in the ordinary course of business. For purposes of calculating the NAV, the value of investments held by each Fund is based primarily on pricing data obtained from various sources approved by the Board.
Domestic Equity Investments
For domestic equity investments (including exchange-traded funds), the Trust generally uses the official closing price or last reported sale price from an exchange as of the scheduled closing time of the NYSE and does not normally take into account trading, clearances or settlements that take place after the scheduled close of the NYSE. Investments for which no official closing price or last reported sales price are reported are generally valued at the mean between the most recent bid and ask prices obtained from approved pricing services, established market makers, or from broker-dealers.
Over-the-Counter (“OTC”) Investments
OTC investments (including forward commitments, swap agreements and option contracts) are generally valued by approved pricing services that use evaluated prices from various observable market and other factors. Certain OTC swap agreements are valued using industry pricing models, broker quotes or other methodologies pursuant to the Trust’s Valuation Policy.
Domestic and Foreign Debt Investments
Debt investments are generally valued using the mean between bid and ask prices provided by approved pricing and quotation services, which are based upon evaluated prices determined from various observable market and other factors. Certain debt investments are valued by using a benchmark, matrix, or other pricing methodology approved pursuant to the Valuation Policy.
Investments in Mutual Funds
Fund investments in affiliated or unaffiliated mutual funds are valued at their respective published NAVs.
Investment Values Determined by a Valuation Committee
The Trust’s Valuation Policy includes methodologies approved for valuing investments in circumstances where market quotations are not readily available. In such circumstances, the Valuation Policy provides that the value of such investments may be determined in accordance with Board approved formulas and methodologies (“Alternate Valuation Methodologies”). Under the Valuation Policy these Alternate Valuation
D-3
PACIFIC FUNDS
NOTES TO FINANCIAL STATEMENTS (Continued)
Methodologies may include, among others, amortized cost, the use of broker quotes, the use of purchase prices, last reported sale/trade prices, and benchmark, proxy, and matrix pricing. In the event market quotations or Alternate Valuation Methodologies are not readily available or are determined to be unreliable, the value of the investments will be determined in good faith by the TVC, or determined by the VOC or its delegate pursuant to the Valuation Policy and then subsequently submitted for approval or ratification to either the TVC or the Board. Valuations determined by the TVC or the VOC or its delegate may require subjective inputs about the value of such investments. While these valuations are intended to estimate the value a Fund might reasonably expect to receive upon the current sale of the investments in the ordinary course of business, such values may differ from the value that a Fund would actually realize if the investments were sold or values that would be obtained if a different valuation methodology had been used.
Market quotations are considered not readily available if: (i) the market quotations received are deemed unreliable or inaccurate, (ii) approved pricing services do not provide a valuation for a particular investment, or (iii) material events occur after the close of the principal market for a particular investment but prior to the scheduled close of the NYSE.
D. FAIR VALUE MEASUREMENTS AND DISCLOSURES
The Trust characterizes its investments as Level 1, Level 2, or Level 3 based upon the various inputs or methodologies used to value the investments. Under the Valuation Policy, the VOC determines the level in which each investment is characterized. The VOC includes investment, legal, and compliance members of the Trust’s Investment Adviser, accounting members of the Trust’s Administrator (see Note 6), and the Trust’s Chief Compliance Officer (“CCO”). The three-tier hierarchy of inputs is summarized in the three broad levels listed below:
| | • Level 1 - | Quoted prices (unadjusted) in active markets for identical investments |
| | • Level 2 - | Significant observable market-based inputs, other than Level 1 quoted prices, or unobservable inputs that are corroborated by market data |
| | • Level 3 - | Significant unobservable inputs that are not corroborated by observable market data |
The VOC reviews the Valuation Policy periodically (at least annually) to determine the appropriateness of the pricing methodologies used to value each Fund’s investments. The VOC also periodically evaluates how the Trust’s investments are characterized within the three-tier hierarchy and the appropriateness of third party pricing sources. The VOC also periodically (at least annually) conducts back-testing of the value of various Level 2 and Level 3 investments to evaluate the effectiveness of the pricing methodologies including the unobservable inputs used to value those investments. Such back-testing includes comparing Level 2 and Level 3 investment values to subsequently available exchange-traded prices, transaction prices, and/or observable vendor prices. All changes to the Valuation Policy are reported to the Board on a quarterly basis with material changes, as determined by the Trust’s CCO, requiring approval by the Board.
The inputs or methodologies used for characterizing each Fund’s investments within the three-tier hierarchy are not necessarily an indication of the relative risks associated with investing in those investments. Foreign equity investments that are valued with the assistance of a statistical research service approved by the Board and based on significant observable inputs are reflected as Level 2. Changes in valuation techniques may result in transfers into or out of an assigned level within the hierarchy. A summary of each Fund’s investments as of March 31, 2019, as categorized under the three-tier hierarchy of inputs, can be found in the Notes to Schedule of Investments section of each Fund’s Schedule of Investments.
The following is a description of valuation inputs and techniques that the Trust currently utilizes to fair value each major category of assets and liabilities:
Equity Securities (Common and Preferred Stock) and Mutual Funds
Equity securities (foreign or domestic) that are actively traded on a securities exchange are fair valued based on quoted prices from the applicable exchange, and to the extent valuation adjustments are not applied to these securities, they are categorized as Level 1. Equity securities traded on inactive markets are fair valued using significant other observable inputs which include broker-dealer quotes, recently executed transactions adjusted for changes in the benchmark index, or evaluated price quotes received from pricing vendors that take into account the integrity of the market sector and issuer, the individual characteristics of the security, and information received from broker-dealers and other market sources pertaining to the issuer or security. To the extent that these inputs are observable and timely, the fair values of these securities would be categorized as Level 2; otherwise the fair values would be categorized as Level 3.
Investments in registered mutual funds, including affiliated registered mutual funds, are valued at their respective published NAV and are categorized as Level 1.
U.S. Treasury Obligations
U.S. Treasuries are fair valued based on pricing models that evaluate the mean between the most recently published bid and ask price from market data sources. The models also take into consideration yield curves and data received from active market makers and inter-dealer brokers. Yield curves change daily in response to market conditions and are generally obtained from the new issue market and broker-dealer sources. To the extent that these inputs are observable and timely, the fair values of U.S. Treasury obligations would be categorized as Level 2; otherwise the fair values would be categorized as Level 3.
Mortgage-Backed and Asset-Backed Securities
Mortgage-backed securities, including government sponsored enterprises, are fair valued using pricing models based on inputs that include issuer type, coupon, and cash flows, mortgage prepayment projection tables and adjustable rate mortgage evaluations that incorporate index data, periodic and life caps, the next coupon reset date, and the convertibility of the bond. To the extent that these inputs are observable and timely, the fair values of mortgage-backed securities would be categorized as Level 2; otherwise the fair value would be categorized as Level 3.
Asset-backed securities and collateralized mortgage obligations are fair valued using pricing models based on a security’s average life volatility. The models also take into account tranche characteristics such as coupon average life, collateral types, ratings, the issuer and tranche
D-4
PACIFIC FUNDS
NOTES TO FINANCIAL STATEMENTS (Continued)
type, underlying collateral and performance of the collateral, and discount margin for certain floating rate issues. To the extent that these inputs are observable and timely, the fair values of asset-backed securities and collateralized mortgage obligations would be categorized as Level 2; otherwise the fair values would be categorized as Level 3.
Foreign Government Bonds and Notes
Foreign government bonds and notes are fair valued based on discounted cash flow models that incorporate option adjusted spreads along with benchmark curves and credit spreads. In addition, international bond markets are monitored daily for information pertaining to the issuer and/or the specific issue. To the extent that these inputs are observable and timely, the fair values of foreign government bonds and notes would be categorized as Level 2; otherwise the fair values would be categorized as Level 3.
Corporate Bonds and Notes and U.S. Government Agency Issues
Corporate bonds held by a Fund are generally comprised of two main categories: investment grade bonds and high yield bonds. Investment grade bonds are reported at fair value using various inputs and techniques, which include broker-dealer quotations, live trading levels, recently executed transactions in securities of the issuer or comparable issuers, issuer credit information, and option-adjusted spread models where applicable. Fair values for high yield bonds are based primarily on broker-dealer quotations from relevant market makers and recently executed transactions in securities of the issuer or comparable issuers. The broker-dealer quotations received are supported by credit analysis of the issuer that takes into consideration credit quality assessments, daily trading activity, and the activity of the underlying equities, listed bonds, and sector-specific trends. To the extent that these inputs are observable and timely, the fair values of corporate bonds would be categorized as Level 2; otherwise the fair values would be categorized as Level 3.
U.S. Government Agency Issues are reported at fair value using various inputs and techniques, which include broker-dealer quotations, live trading levels, recently executed transactions in securities of the issuer, issuer credit information, and option-adjusted spread models where applicable. To the extent that these inputs are observable and timely, the fair values of U.S. Government Agency Issues would be categorized as Level 2; otherwise the fair values would be categorized as Level 3.
Swap Agreements
Total Return Swaps– Total return swaps that are traded and cleared on a securities exchange or swap execution facility are fair valued based on quoted prices from the applicable exchange and are categorized as Level 2. Total Return swaps traded over-the-counter are fair valued using pricing models that take into account among other factors, index spread curves, nominal values, modified duration values and cash flows. To the extent that these inputs are observable and timely, the fair values of total return swaps would be categorized as Level 2; otherwise the fair values would be categorized as Level 3.
Senior Loan Notes
Floating rate senior loan notes (“Senior Loans”) are fair valued based on a quoted price received from a single broker-dealer or an average of quoted prices received from multiple broker-dealers or valued relative to other benchmark securities when broker-dealer quotes are unavailable. To the extent that these inputs are observable, the fair values of Senior Loans would be categorized as Level 2; otherwise the fair values would be categorized as Level 3.
Unfunded loan commitments on senior loan participations and assignments, if any, are marked to market daily and valued according to the Trust’s valuation policies and procedures. Any outstanding unfunded loan commitments are presented in the Notes to Schedules of Investments section of each applicable Fund’s Schedule of Investments. Any applicable net unrealized appreciation or depreciation at the end of the reporting period is recorded as an asset (unfunded loan commitment appreciation) or a liability (unfunded loan commitment depreciation) and any change in net unrealized appreciation or depreciation for the reporting period is recorded as a change in net unrealized appreciation or depreciation on unfunded loan commitment. As of March 31, 2019, the Floating Rate Income Fund had unfunded loan commitments of $1,075,155 (see details in the Notes to Schedules of Investments).
4. INVESTMENTS AND RISKS
General Investment Risks
An investment in each Fund represents an indirect investment in the assets owned by that Fund. As with any mutual fund, the value of the assets owned by each Fund may move up or down, and as a result, an investment in a Fund at any point in time may be worth more or less than the original amount invested.
A Fund’s transactions in listed securities are settled/paid for upon delivery to or from their counterparties; therefore, the risk of counterparty default for listed securities is considered minimal, as delivery of securities sold is only made once a Fund has received payment. Payment is made on a purchase once the securities have been delivered by the counterparty. The trade will fail if either party fails to meet its obligations.
Market and Regulatory Risks
Events in the financial markets and economy may cause volatility and uncertainty and affect Fund performance. Market events may affect a single issuer, industry, sector, or the market as a whole. In addition, because of interdependencies between markets, events in one market may adversely impact other markets or issuers in which a Fund invests in unforeseen ways. Traditionally liquid investments may experience periods of diminished liquidity. During a general downturn in the financial markets, multiple asset classes may decline in value and a Fund may lose value, regardless of the individual results of the securities and other instruments in which the Fund invests. Governmental and regulatory actions, including tax law changes, may also impair Fund management and have unexpected or adverse consequences on particular markets, strategies, or investments. Future market or regulatory events may impact a Fund in unforeseen ways, such as causing the Fund to alter its existing strategies or potentially, to liquidate and close.
D-5
PACIFIC FUNDS
NOTES TO FINANCIAL STATEMENTS (Continued)
Fund of Funds Investments
The Portfolio Optimization Funds and Pacific Funds Diversified Alternatives are exposed to the same risks as the applicable PF Underlying Funds, Pacific Funds Core Income, Pacific Funds Floating Rate Income, Pacific Funds High Income, and Pacific Funds Small-Cap Growth in direct proportion to the allocation of assets among those funds. This annual report contains information about the risks associated with investing in Pacific Funds Core Income, Pacific Funds Floating Rate Income, Pacific Funds High Income, and Pacific Funds Small-Cap Growth. The annual report for the PF Underlying Funds contains information about the risks associated with investing in the PF Underlying Funds. Allocations among the PF Underlying Funds, Pacific Funds Core Income, Pacific Funds Floating Rate Income, Pacific Funds High Income, and Pacific Funds Small-Cap Growth are determined using an asset allocation process, which seeks to optimize returns by allocating among different asset classes given various levels of risk tolerance. The allocations of the Portfolio Optimization Funds and Pacific Funds Diversified Alternatives may not effectively decrease risk or increase returns for investors, and the selection and weighting of allocations to asset classes and/or PF Underlying Funds, Pacific Funds Core Income, Pacific Funds Floating Rate Income, Pacific Funds High Income, and Pacific Funds Small-Cap Growth may cause them to underperform other mutual funds with a similar investment objective. Although the Portfolio Optimization Funds and Pacific Funds Diversified Alternatives seek to provide diversification across major asset classes, they may invest a significant portion of their assets in any one or several PF Underlying Funds, Pacific Funds Core Income, Pacific Funds Floating Rate Income, Pacific Funds High Income, and Pacific Funds Small-Cap Growth (See Note 7C).
Equity Investments
Stock markets are volatile. Equity investments tend to go up or down in value, sometimes rapidly and unpredictably, in response to many factors, including a company’s historical and prospective earnings, the value of its assets, general economic conditions, interest rates, investor perceptions, and market liquidity. Due to the complexities of markets, events in one market or sector may adversely impact other markets or sectors.
Debt Investments
Debt investments are subject to many risks, including, but not limited to, interest rate risk, credit risk, market and regulatory risk, price volatility, and liquidity risk, which may affect their value. There is a risk that an issuer or guarantor of a debt investment might be unable or unwilling to meet its financial obligations and might not make interest or principal payments on an instrument when those payments are due (“default”). Defaults may potentially reduce a Fund’s income or ability to recover amounts due and may reduce the value of the debt investment, sometimes dramatically. High yield/high risk or “junk” securities may be more volatile than higher rated securities. High yield/high risk securities (including loans) are typically issued by companies that are highly leveraged, less creditworthy, or financially distressed and are considered to be mostly speculative in nature (high risk), subject to greater liquidity risk, and subject to a greater risk of default than higher rated securities, especially during periods of economic uncertainty or during economic downturns. Debt investments, including bonds, fixed rate loans, and short-term instruments may be affected by changes in interest rates. Debt investments with longer durations tend to be more sensitive to changes in interest rates, making them more volatile than debt investments with shorter durations or floating or adjustable interest rates. The value of debt investments may fall when interest rates rise. Certain debt investments may be difficult to value, purchase, and sell, particularly during adverse market conditions, because there is a limited market for the investment or there are restrictions on resale.
Given the historically low interest rate environment in the U.S., risks associated with rising interest rates are heightened. The negative impact on debt investments from potential interest rate increases could be swift and significant, including falling market values, increased redemptions and reduced liquidity. Substantial redemptions from bond and other income funds may worsen that impact. Additionally, regulations applicable to and changing business practices of broker-dealers that make markets in debt investments may result in those broker-dealers restricting their market making activities for certain debt investments, which may reduce the liquidity and increase the volatility of such debt investments.
Certain asset-backed instruments, such as collateralized debt obligations, collateralized mortgage obligations, and other mortgage-related securities, structured investment vehicles, and other debt investments may have exposure to subprime loans or subprime mortgages, which are loans to persons with lower credit ratings. These instruments may present credit risk that is not transparent and that is greater than indicated by their ratings. The value of these instruments may be more acutely affected by downturns in the credit markets or the real estate market than certain other investments, and it may be difficult to value these instruments because of a thin secondary market.
Foreign and Emerging Markets Investments
Exposure to foreign markets can involve additional risks relating to market, economic, political, regulatory, geopolitical, or other conditions. These factors can make foreign investments more volatile and less liquid than U.S. investments. In addition, foreign markets can react differently to these conditions than the U.S. market. Markets and economies throughout the world are becoming increasingly interconnected, and conditions or events in one market, country or region may adversely impact investments or issuers in another market, country or region. Investments in or exposure to investments in emerging market countries may be riskier than investments in or exposure to investments in U.S. and certain developed markets. Risk may be more enhanced for investments in or exposure to investments in frontier market countries.
The Funds may face potential risks associated with the United Kingdom’s vote on June 23, 2016 to leave the European Union (the “EU”), commonly referred to as “Brexit.” There are considerable uncertainties about the repercussions resulting from Brexit, including the impact on trade agreements, regulations, and treaties. The exact time frame for the implementation of Brexit is unknown and may change. Brexit may also increase the likelihood that other EU members may decide to leave the EU. These potential consequences may result in increased market volatility and illiquidity in the United Kingdom, the EU, and other financial markets, as well as slower economic growth and fluctuations in exchange rates. Any of these events may have a significant adverse effect on global markets and economies, which in turn could negatively impact the value of the Funds’ investments.
The countries listed in the Schedules of Investments for individual investment holdings (each a “Holding”) are each considered the country of risk to which a Holding, and therefore the Fund, is exposed. Each Holding’s country of risk is obtained from a third-party source that uses factors such as reporting currency, sales/revenue and location of management of the Holding’s issuer to determine country of risk. The country of risk
D-6
PACIFIC FUNDS
NOTES TO FINANCIAL STATEMENTS (Continued)
may not be exclusive, however, as there may be other countries of risk to which a Holding is exposed that are not disclosed, although the country identified is expected to be the primary country of risk for that Holding. A Holding is generally subject to greater country risk based on where it conducts business or is economically tied to rather than where it is formed or incorporated. Foreign markets risks may include currency risk, market and regulatory risk, liquidity risk, emerging markets risk, frontier markets risk, and geographic focus risk, among other risks.
Senior Loan Participations and Assignments
Certain Funds may invest in Senior Loans of domestic or foreign corporations, partnerships, and other entities (“Borrowers”), the interest rates of which float or adjust periodically based upon a specified adjustment schedule, benchmark indicator, or prevailing interest rates. Senior Loans generally pay interest at rates which are periodically redetermined by reference to a base lending rate plus a premium. These base lending rates generally include prime rates of one or more major U.S. banks, London Interbank Offered Rates (“LIBOR”) or certificates of deposit rates. Senior Loans often require prepayments from excess cash flow or permit the Borrower to repay at its election. The degree to which Borrowers repay cannot be predicted with accuracy. As a result, the actual maturity may be substantially less than the stated maturities. Senior Loans are exempt from registration under the Securities Act of 1933, may contain certain restrictions on resale, and cannot be sold publicly. A Fund’s investments in Senior Loans may be in the form of participations in loans or assignments of all or a portion of loans from third parties.
When a Fund purchases assignments, it acquires all the rights and obligations under the loan agreement of the assigning lender. Assignments may, however, be arranged through private negotiations between potential assignees and potential assignors, and the rights and obligations acquired by the purchaser of an assignment may differ from, and be more limited than those held by the assigning lender.
When a Fund purchases a participation of a Senior Loan interest, the Fund typically enters into a contractual agreement with the lender or other third party selling the participation. A participation interest in Senior Loans includes the right to receive payments of principal, interest, and any fees to which it is entitled from the lender and only upon receipt by the lender of payments from the Borrower, but not from the Borrower directly. When investing in a participation interest, if a Borrower is unable to meet its obligations under a loan agreement, a Fund generally has no right to enforce compliance with the terms of the loan agreement. As a result, the Fund assumes the credit risk of the Borrower, the selling participant, and any other persons that are interpositioned between the Fund and the Borrower. If the lead lender in a typical lending syndicate becomes insolvent, enters Federal Deposit Insurance Corporation (“FDIC”) receivership or, if not FDIC insured, enters into bankruptcy, the Fund may incur certain costs and delays in receiving payment or may suffer a loss of principal and/or interest. As of March 31, 2019, no participation interest in Senior Loans was held by any of the Funds presented in these financial statements.
U.S. Government Securities
Certain Funds may invest in securities issued by U.S. Government agencies or government-sponsored enterprises. U.S. Government securities are obligations of, and in certain cases, guaranteed by the U.S. Government, its agencies, or instrumentalities. Some U.S. Government securities, such as Treasury Bills, Treasury Notes, Treasury Bonds, and securities guaranteed by GNMA (or “Ginnie Mae”), are supported by the full faith and credit of the U.S. Government; others, such as those of the Federal Home Loan Bank, are supported by the right of the issuer to borrow from the U.S. Department of the Treasury (the “U.S. Treasury”); others, such as those of the Federal National Mortgage Association (“FNMA” or “Fannie Mae”), are supported by the discretionary authority of the U.S. Government to purchase the agency’s obligations. Securities not backed by the full faith and credit of the U.S. Government may be subject to a greater risk of default. U.S. Government securities may include zero coupon securities, which do not distribute interest on a current basis and tend to be subject to greater risk than interest-paying securities of similar maturities.
Government-related guarantors (i.e., not backed by the full faith and credit of the U.S. Government) include FNMA and the Federal Home Loan Mortgage Corporation (“FHLMC” or “Freddie Mac”). FNMA and FHLMC are government-sponsored corporations, the common stocks of which are owned entirely by private stockholders. FNMA purchases conventional (i.e., not insured or guaranteed by any government agency) residential mortgages from a list of approved seller/servicers which include state and federally chartered savings and loan associations, mutual savings banks, commercial banks and credit unions, and mortgage bankers. Pass-through securities issued by FNMA are guaranteed as to timely payment of principal and interest by FNMA, but are not backed by the full faith and credit of the U.S. Government. FHLMC issues Participation Certificates (“PCs”), which are pass-through securities, each representing an undivided interest in a pool of residential mortgages. FHLMC guarantees the timely payment of interest and ultimate collection of principal, but PCs are not backed by the full faith and credit of the U.S. Government.
Segregation and Collateral
If a Fund engages in certain transactions, such as derivative investments or repurchase agreements, it may require collateral in the form of cash or investments to be held in segregated accounts at the Trust’s custodian, with an exchange or clearing member firm, or segregated on the Fund’s books and records maintained by the custodian and/or the manager of the Fund. In each instance that segregation of collateral is required, it is done so in accordance with the 1940 Act and/or any interpretive guidance issued by the SEC. In the event of the counterparty default on the transaction, a Fund has the right to liquidate the collateral and apply the proceeds to the counterparty’s obligations to that Fund. Upon an event of default, if the seller defaults and the value of the collateral declines, or if the seller enters an insolvency proceeding, realization of the collateral by the Fund may be delayed, limited or wholly denied. There is also a possibility that a Fund could experience a delay in selling investments that are segregated as collateral.
5.DERIVATIVEINVESTMENTSANDRISKS,ANDENFORCEABLEMASTERNETTINGARRANGEMENTS
A. PRINCIPAL MARKET RISKS MANAGED BY INVESTING IN DERIVATIVES
Derivative instruments are investments whose values are tied to the value of an underlying security or asset, a group of assets, interest rates, exchange rates, currency or an index. Certain Funds are permitted to invest in derivative instruments, including, but not limited to, futures contracts, option contracts, forward foreign currency contracts, and swap agreements. Derivatives may have little or no initial cash investment
D-7
PACIFIC FUNDS
NOTES TO FINANCIAL STATEMENTS (Continued)
value relative to their market value exposure and therefore can produce significant gains or losses in excess of their cost. This is sometimes referred to as leverage. Leverage can magnify a Fund’s gains and losses and therefore increase its volatility. A Fund’s investments in derivatives may increase, decrease or change the level or types of exposure to certain risk factors. The primary risks a Fund may attempt to manage through investing in derivative instruments include, but are not limited to, interest rate, foreign investments and currency, price volatility, and credit (including counterparty) risks.
Interest Rate Risk– A Fund may be exposed to interest rate risk through investments in debt securities. Interest rate risk is the risk that debt securities will decline in value as a result of changes in interest rates. For example, the value of bonds, fixed rate loans and short-term money market instruments may decline in value when interest rates rise. In a low interest rate environment, the risks associated with rising interest rates are heightened. Debt securities with longer durations tend to be more sensitive to changes in interest rates, making them more volatile than debt securities with shorter durations or money market instruments. Therefore, duration is a potentially useful tool to measure the sensitivity of a debt security’s yield (market price to interest rate movement). To manage these risks, certain Funds may invest in derivative instruments tied to interest rates.
Foreign Investments and Currency Risk– A Fund may be exposed to foreign investments and/or currency risk through direct investment in securities or through options, futures or currency transactions. The prices of foreign securities that are denominated in foreign currencies are affected by the value of the U.S. dollar. With respect to securities denominated in foreign currencies, in general, as the value of the U.S. dollar rises, the U.S. dollar price of a foreign security will fall. As the value of the U.S. dollar falls, the U.S. dollar value of the foreign security will rise. Currency rates in foreign countries may fluctuate significantly over short periods of time for a number of reasons. Foreign investments may be riskier than U.S. investments for many reasons, including changes in currency exchange rates, unstable political and economic conditions, a lack of adequate and timely company information, differences in the way securities markets operate, relatively lower market liquidity, less stringent financial reporting and accounting guidance and controls, less secure foreign banks or securities depositories than those in the U.S., foreign taxation issues, and foreign controls on investments. As a result, a Fund’s investments in foreign currency-denominated securities and other foreign investments may reduce the returns of the Fund. To manage these risks, certain Funds may invest in derivative instruments tied to foreign investments and/or currencies.
PriceVolatilityRisk– Derivatives tied to equity and debt securities are exposed to potential price volatility. Debt securities are affected by many factors, including prevailing interest rates, market conditions, and market liquidity. Volatility of below investment grade debt securities (including loans) may be relatively greater than for investment grade debt securities. Equity securities tend to go up or down in value, sometimes rapidly and unpredictably. The prices of equity securities change in response to many factors, including a company’s historical and prospective earnings, the value of its assets, general economic conditions, interest rates, investor perceptions, and market liquidity. Due to the complexities of markets, events in one market or sector may adversely impact other markets or sectors. To manage these risks, certain Funds may invest in various derivative instruments. Derivative instruments may be used to manage a Fund’s exposure to price volatility risk but may also be subject to greater price volatility than investments in traditional securities. The value of commodity-linked derivative instruments may be affected by changes in overall market movements, commodity index volatility, changes in interest rates, or factors affecting a particular industry or commodity, such as drought, floods, weather, livestock disease, embargoes, tariffs, and international economic, political, and regulatory developments.
Credit and Counterparty Risk– Credit risk is the risk that a debt security’s issuer (or borrower or counterparty) will be unable or unwilling to meet its financial obligations (e.g., may not be able to make principal and/or interest payments when they are due or otherwise default on other financial terms) and/or may go bankrupt. This is also sometimes described as counterparty risk. A Fund may lose money if the issuer or guarantor of debt security, or counterparty of a derivative contract, repurchase or reverse repurchase agreement, or a loan of Fund securities, is unable or unwilling to make timely principal and/or interest payments, or to otherwise honor its obligations. A Fund may attempt to minimize concentrations of credit risk by undertaking transactions with a large number of borrowers or counterparties on recognized and reputable exchanges. A Fund’s investments in debt investments may range in quality from those rated in the lowest category in which it is permitted to invest to those rated in the highest category by a rating agency, or if unrated, determined by the manager to be of comparable quality.
Similar to credit risk, a Fund may be exposed to counterparty risk, or the risk that an institution or other entity with which a Fund has unsettled or open transactions will default. Financial assets of counterparties, which potentially expose a Fund to counterparty risk, consist mainly of cash due from counterparties and investments. Certain managers may attempt to minimize credit risks to the Funds by performing extensive reviews of each counterparty, entering into transactions with counterparties that the manager believes to be creditworthy at the time of the transaction and requiring the posting of collateral in applicable transactions. To manage these risks, certain Funds may invest in derivative instruments tied to a security issuers’ financial strength.
B. DERIVATIVE INVESTMENTS
In addition to managing the market risks described above, certain Funds, if permitted by their investment objectives, may also invest in derivatives for purposes of hedging, duration management, to gain exposure to specific investment opportunities, as a substitute for securities, to enhance returns, or to otherwise help achieve a Fund’s investment goal. Each derivative instrument and the reasons a Fund invested in derivatives during the reporting period are discussed in further detail below. The Portfolio Optimization Funds and Pacific Funds Diversified Alternatives are exposed to the same derivative risks as the applicable PF Underlying Funds, Pacific Funds Core Income, Pacific Funds Floating Rate Income, Pacific Funds High Income, and/or Pacific Funds Small-Cap Growth in direct proportion to the allocation of assets among those funds. The annual report of the PF Underlying Funds discusses in further detail the derivative instruments and the reasons a PF Underlying Fund invested in derivatives during the reporting period.
Swap Agreements– Swap agreements are bilaterally negotiated agreements between the Funds and their counterparties to exchange swap investment cash flows, assets, foreign currencies or market-linked returns at specified intervals. Swap agreements are privately negotiated in
D-8
PACIFIC FUNDS
NOTES TO FINANCIAL STATEMENTS (Continued)
the OTC market or are executed in a multilateral or other execution facility platform, such as a registered commodities exchange (“centrally cleared swaps”). In connection with these agreements, cash and securities may be identified as collateral in accordance with the terms of the respective swap agreements to provide assets of value and recourse in the event of default or bankruptcy/insolvency. Swaps are marked-to-market daily based upon values received from third party vendors or quotations from market makers. Market values greater than zero are recorded as an asset and market values less than zero are recorded as a liability. The change in value of swaps, including accruals of periodic amounts of interest to be paid or received on swaps, is recorded as unrealized appreciation or depreciation. Daily changes in valuation of centrally cleared swaps, if any, are recorded as variation margin receivable or payable. OTC swap payments received or made at the beginning of the measurement period are recorded as an asset or liability and represent payments made or received upon entering into the swap agreement to compensate for differences between the stated terms of the swap agreement and prevailing market conditions (credit spreads, currency exchange rates, interest rates, and other relevant factors). These upfront payments are recorded as realized gain or loss when the swap is closed. A liquidation payment received or made at the termination of the swap is recorded as realized gain or loss. Net periodic payments received by a Fund are recorded as realized gain.
Total Return Swaps– A Fund investing in total return swaps is subject to the risk that there is no liquid market for these agreements, that the counterparties may default on their obligations to perform or that there may be unfavorable changes in the value of the underlying index or reference instrument (generally caused by changes in interest rates or declines in credit quality). A total return swap agreement is one in which one party makes payments based on a set rate, either fixed or variable, while the other party makes payments based on the return of an underlying index or reference instrument, which includes both the income it generates and any capital gains. To the extent the total return of the index or reference instrument underlying the transaction exceeds or falls short of the offsetting interest rate obligation, a Fund will receive a payment from or make a payment to the counterparty. A Fund’s maximum risk of loss from counterparty credit risk related to total return swaps is the discounted net value of the cash flows to be received from or paid to the counterparty over the contract’s remaining life, to the extent that the amount is positive. The risk may be mitigated to some extent if a master netting arrangement between a Fund and the counterparty is in place and to the extent a Fund obtains collateral to cover a Fund’s exposure to the counterparty.
A Fund may enter into fully funded total return swaps which involves one party making an initial payment equal to the estimated value of the reference instrument. The parties to the swap then exchange respective commitments to pay or receive a net amount based on the change in the fair value of a reference instrument and a specified notional amount.
None of the Funds presented in these financial statements held total return swaps as of March 31, 2019.
C. ENFORCEABLE MASTER NETTING ARRANGEMENTS
Master Agreements and Netting Arrangements– Certain Funds are parties to various agreements, including but not limited to International Swaps and Derivatives Association Agreements and related Credit Support Annex, Master Repurchase Agreements, and Master Securities Forward Transactions Agreements (collectively “Master Agreements”), which govern the terms of certain transactions with select counterparties. These Master Agreements generally include provisions for general obligations, representations, agreements, collateral, and certain events of default or termination. These Master Agreements also include provisions for netting arrangements that help reduce credit and counterparty risk associated with relevant transactions (“netting arrangements”). The netting arrangements are generally tied to credit related events that, if triggered, would cause an event of default or termination giving a Fund or counterparty the right to terminate early and cause settlement, on a net basis, of all transactions under the applicable Master Agreement. In the event of an early termination as a result of an event of default under the Master Agreement, the total value exposure of all transactions will be offset against collateral exchanged to date, which would result in a net receivable or payable that would be due from or to the counterparty. However, bankruptcy or insolvency laws of a particular jurisdiction may impose restrictions on or prohibitions against the right of offset in the event of a bankruptcy or insolvency. Credit related events include, but are not limited to, bankruptcy, failure to make timely payments, restructuring, obligation acceleration, obligation default, a material decline in net assets, decline in credit rating or repudiation/moratorium. Any election made by a counterparty to early terminate the transactions under a Master Agreement could have a material adverse impact on a Fund’s financial statements. A Fund’s overall exposure to credit risk, subject to netting arrangements can change substantially within a short period, as it is affected by each transaction subject to the arrangement.
Master Agreements can also help limit counterparty risk by specifying collateral posting arrangements at pre-arranged exposure levels. Under the Master Agreements, collateral is routinely transferred if the total net exposure to certain transactions under the relevant Master Agreement with a counterparty in a given Fund exceeds a specified threshold, net of collateral already in place, which typically ranges from $0 to $250,000 depending on the counterparty and the type of Master Agreement. Collateral under the Master Agreements is usually in the form of cash or U.S. Treasury Bills but could include other types of securities. If permitted under the Master Agreement, certain funds may rehypothecate cash collateral received from a counterparty. The value of all derivative transactions outstanding under a Master Agreement is calculated daily to determine the amount of collateral to be received or pledged by the counterparty. Posting of collateral for OTC derivative transactions are covered under tri-party collateral agreements between the Trust, the Trust’s custodian, and each counterparty. Collateral for centrally cleared derivatives transactions are posted with the applicable derivatives clearing organization.
None of the Funds presented in these financial statements were subject to enforceable master agreements with netting arrangements as of March 31, 2019.
D-9
PACIFIC FUNDS
NOTES TO FINANCIAL STATEMENTS (Continued)
6. INVESTMENT ADVISORY, ADMINISTRATION AND SHAREHOLDER SERVICES, SUPPORT SERVICES, AND DISTRIBUTION AGREEMENTS
Pursuant to an Investment Advisory Agreement, PLFA, a wholly-owned subsidiary of Pacific Life Insurance Company (“Pacific Life”), serves as Investment Adviser to each Fund of the Trust. PLFA manages the Portfolio Optimization Funds and Pacific Funds Diversified Alternatives. PLFA also manages the PF Fixed Income Funds under the name Pacific Asset Management. For the PF U.S. Equity Funds, PLFA has retained another investment management firm to sub-advise each Fund, as discussed later in this section. PLFA receives investment advisory fees from each Fund which are based on the following annual percentage of the average daily net assets of each Fund:
| | | | |
| Fund | | Advisory Fee
Rate | | Advisory Fee Waiver Rate through July 31, 2019 |
Pacific Funds Portfolio Optimization Conservative Pacific Funds Portfolio Optimization Moderate-Conservative Pacific Funds Portfolio Optimization Moderate Pacific Funds Portfolio Optimization Growth Pacific Funds Portfolio Optimization Aggressive-Growth Pacific Funds Diversified Alternatives | | 0.20% | | 0.025% above $2 billion to $3 billion 0.050% on next $2 billion 0.075% on next $2.5 billion 0.100% on excess |
| Pacific Funds Short Duration Income | | 0.40% | | 0.025% above $1 billion to $2 billion 0.050% on next $1 billion 0.075% on excess |
| Pacific Funds Core Income | | 0.50% |
Pacific Funds Strategic Income Pacific Funds High Income | | 0.60% |
| Pacific Funds Floating Rate Income | | 0.65% | | |
| Pacific FundsLarge-Cap | | 0.65% | | 0.10% |
| Pacific FundsLarge-Cap Value | | 0.65% | | |
Pacific FundsSmall/Mid-Cap Pacific FundsSmall-Cap Pacific FundsSmall-Cap Value Pacific FundsSmall-Cap Growth | | 0.85% | | |
Pursuant to a Sub-Advisory Agreement, the Trust and PLFA engaged Rothschild & Co Asset Management US Inc. under PLFA’s supervision to act as sub-adviser for the PF U.S. Equity Funds. PLFA, as Investment Adviser to each PF U.S. Equity Fund, pays related management fees to Rothschild & Co Asset Management US Inc. as compensation for its sub-advisory services provided to each PF U.S. Equity Fund.
Pursuant to an Administration and Shareholder Services Agreement (the “Administration Agreement”), Pacific Life serves as administrator (the “Administrator”) to the Trust. The administration fee is for procuring or providing administrative, transfer agency, and shareholder services. In addition, Pacific Life and PLFA provide support services to the Trust that are outside the scope of the Administrator’s and Investment Adviser’s responsibilities under the Administration Agreement and Investment Advisory Agreement. Under the Support Services Agreement, the Trust compensates Pacific Life and PLFA for their expenses in providing support services to the Trust in connection with various matters, some of which include the time spent by legal, accounting, and compliance personnel of Pacific Life and PLFA (including individuals who may be officers or Trustees of the Trust), to attend meetings of the Board and to provide assistance with the coordination and supervision in connection with the services procured for the Trust. Support services do not include services for which PLFA is responsible pursuant to the Investment Advisory Agreement. The Trust reimburses Pacific Life and PLFA for these support services on an approximate cost basis.
Pacific Life receives an administration fee from each Fund and applicable share class presented in these financial statements, which are based on the following annual percentage of average daily net assets of each Fund:
| | | | |
| Fund | | Share Class(1) | | Administration Fee Rate |
| Portfolio Optimization Funds | | A, B, C, R, and Advisor | | 0.15% |
| Pacific Funds Diversified Alternatives | | A, C, and Advisor | | 0.15% |
Pacific Funds Short Duration Income Pacific Funds Strategic Income | | A, C, and Advisor | | 0.30% |
| | | I | | 0.15% |
Pacific Funds Core Income Pacific Funds Floating Rate Income Pacific Funds High Income | | A, C, and Advisor | | 0.30% |
| | | I and P | | 0.15% |
| PF U.S. Equity Funds | | A, C, Advisor, and Investor | | 0.30% |
| | | S | | 0.15% |
| Pacific FundsSmall-Cap Growth | | P | | 0.15% |
| | (1) | Investor Class shares were converted to Class A shares on July 31, 2018, and Class R shares were converted to Class A shares on March 22, 2019 (see Note 1 in Notes to Financial Statements). |
Pursuant to a Distribution Agreement, Pacific Select Distributors, LLC (the “Distributor”), a wholly-owned subsidiary of Pacific Life, serves as distributor of the Trust’s shares. Under the Distribution Agreement, the Distributor bears all expenses of providing services, including costs of sales presentations, mailings, advertisements, and other marketing efforts by the Distributor in connection with the distribution or sale of the Trust’s shares and makes distribution and/or service payments to selling groups in connection with the sale of certain of the Trust’s shares and subsequent servicing needs of shareholders provided by selling groups. The Distributor receives distribution and service fees pursuant to class-specific distribution and service plans, each adopted in accordance with Rule 12b-1 (“12b-1”) under the 1940 Act (together the “12b-1 Plans”) for
D-10
PACIFIC FUNDS
NOTES TO FINANCIAL STATEMENTS (Continued)
Class B, C, and R shares. The Distributor also receives service fees pursuant to a non-12b-1 service plan for Class A shares (“Class A Plan”). The Distributor receives distribution and/or service fees from each Fund and applicable share class presented in these financial statements, which are based on the following annual percentages of average daily net assets:
| | | | | | |
| Plan | | Share Class | | Distribution
Fee Rate | | Service Fee
Rate |
| 12b-1 Plans | | B and C | | 0.75% | | 0.25% |
| | | R (1) | | 0.25% | | 0.25% |
| | | Investor (1) | | 0.25% | | |
| Class A Plan | | A | | | | 0.25% |
| | (1) | Investor Class shares were converted to Class A shares on July 31, 2018, and Class R shares were converted to Class A shares on March 22, 2019 (see Note 1 in Notes to Financial Statements). |
There are no distribution and service fees for Class I, Class P, Advisor Class, and Class S shares. The distribution and service fees are accrued daily. For the fiscal year ended March 31, 2019, the Distributor, acting as underwriter, received net commissions (front-end sales charges) of $5,678,507 from the sale of Class A shares and received $262,379 in CDSC from redemptions of Class A, B, and C shares.
7. TRANSACTIONS WITH AFFILIATES
A. ADVISORY FEES, ADMINISTRATION FEES, DISTRIBUTION AND/OR SERVICE FEES, AND EXPENSES FOR SUPPORT SERVICES
The Investment Adviser, the Distributor, and Pacific Life are related parties. The advisory fees earned by the Investment Adviser, including any advisory fee waiver, the administration fees earned by Pacific Life, the distribution and/or service fees earned by the Distributor, and expenses for support services recovered by PLFA and Pacific Life (see Note 6) from each Fund presented in these financial statements for the fiscal year ended March 31, 2019 are presented in the Statements of Operations. The amounts of each of these fees that remained payable as of March 31, 2019 are presented in the Statements of Assets and Liabilities.
B. EXPENSE LIMITATION AGREEMENTS
To help limit the Trust’s expenses, PLFA has contractually agreed to reimburse each Fund presented in these financial statements for certain operating expenses that exceed an annual rate based on a percentage of a Fund’s average daily net assets. These operating expenses include, but are not limited to: administration fees and expenses; organizational expenses; custody expenses; expenses for audit, tax, and certain legal services; preparation, printing, filing, and distribution to existing shareholders of proxies, prospectuses and shareholder reports, and other regulatory documents, as applicable; independent trustees’ fees and expenses; and establishing, overseeing, and administering the Trust’s compliance program. These operating expenses do not include: investment advisory fees; distribution and/or service fees; dividends on securities sold short; acquired fund fees and expenses; interest (including commitment fees); taxes (including foreign taxes on dividends, interest or gains); brokerage commissions and other transactional expenses; and extraordinary expenses such as litigation expenses, liquidation expenses, reorganization expenses, and other expenses not incurred in the ordinary course of each Fund’s business. The expense caps for each Fund and share class presented in these financial statements are as follows:
| | | | |
| Fund | | Share Class (1) | | Expense Caps |
| Portfolio Optimization Funds | | A, B, C, R, and Advisor | | 0.15% through 7/31/2019 and 0.30% thereafter through 7/31/2023 |
| Pacific Funds Short Duration Income | | A, C, I, and Advisor | | 0.10% through 7/31/2019 |
| Pacific Funds Core Income | | A and C | | 0.10% through 7/31/2019 |
| | | I, Advisor, and P | | 0.05% through 7/31/2019 |
| Pacific Funds Strategic Income | | A and Advisor | | 0.10% through 7/31/2019 |
| | | C and I | | 0.05% through 7/31/2019 |
| Pacific Funds Floating Rate Income | | A and Advisor | | 0.10% through 7/31/2019 |
| | | C, I, and P | | 0.05% through 7/31/2019 |
| Pacific Funds High Income | | A, I, Advisor, and P | | 0.10% through 7/31/2019 |
| | | C | | 0.05% through 7/31/2019 |
| Pacific Funds Diversified Alternatives | | A, C, and Advisor | | 0.40% through 7/31/2019 |
Pacific FundsLarge-Cap Pacific FundsLarge-Cap Value | | A | | 0.20% through 7/31/2020 |
| | C, Advisor, and Investor | | 0.20% through 7/31/2019 |
| | | S | | 0.10% through 7/31/2019 |
Pacific FundsSmall/Mid-Cap Pacific FundsSmall-Cap Pacific FundsSmall-Cap Value | | A | | 0.20% through 7/31/2020 |
| | C and Advisor | | 0.20% through 7/31/2019 |
| | Investor | | 0.25% through 7/31/2019 |
| | | S | | 0.15% through 7/31/2019 |
| Pacific FundsSmall-Cap Growth | | A | | 0.15% through 7/31/2020 |
| | | C, Advisor, and P | | 0.20% through 7/31/2019 |
| | | Investor | | 0.15% through 7/31/2019 |
| | | S | | 0.05% through 7/31/2019 |
| | (1) | Investor Class shares were converted to Class A shares on July 31, 2018, and Class R shares were converted to Class A shares on March 22, 2019 (see Note 1 in Notes to Financial Statements). |
There is no guarantee that PLFA will continue to cap expenses for a Fund upon the expiration of the expense cap. In addition, any expense reimbursements made by PLFA to a Fund are subject to recoupment by PLFA from such Fund in future periods, not to exceed three years from
D-11
PACIFIC FUNDS
NOTES TO FINANCIAL STATEMENTS (Continued)
the date on which the reimbursement took place, provided that the recoupment would be limited to the lesser of: (i) the expense cap in effect at the time of the reimbursement or (ii) the expense cap in effect at the time of recoupment. Any amounts repaid to PLFA will have the effect of increasing such expenses of the applicable Fund, but not above the expense cap. The amounts of adviser reimbursement to each applicable Fund presented in these financial statements for the fiscal year ended March 31, 2019 are presented in the Statements of Operations. Any amounts that remained due from the Investment Adviser as of March 31, 2019 are presented in the Statements of Assets and Liabilities.
The cumulative expense reimbursement amounts, if any, as of March 31, 2019 that are subject to recoupment by PLFA from the Funds presented in these financial statements are as follows:
| | | | | | | | | | | | |
| Fund | | 3/31/2020 | | | 3/31/2021 | | | 3/31/2022 | |
Pacific Funds Portfolio Optimization Conservative | | | $290,877 | | | | $250,155 | | | | $230,770 | |
Pacific Funds Portfolio Optimization Moderate-Conservative | | | 376,333 | | | | 334,819 | | | | 305,325 | |
Pacific Funds Portfolio Optimization Moderate | | | 946,295 | | | | 841,944 | | | | 774,354 | |
Pacific Funds Portfolio Optimization Growth | | | 694,650 | | | | 646,561 | | | | 602,203 | |
Pacific Funds Portfolio Optimization Aggressive-Growth | | | 256,470 | | | | 256,481 | | | | 253,140 | |
Pacific Funds Diversified Alternatives | | | 28,564 | | | | 4,935 | | | | — | |
Pacific Funds Short Duration Income | | | 600,137 | | | | 1,000,932 | | | | 1,385,844 | |
Pacific Funds Core Income | | | 1,321,088 | | | | 2,102,504 | | | | 1,843,904 | |
Pacific Funds Strategic Income | | | 587,614 | | | | 1,246,313 | | | | 1,612,421 | |
Pacific Funds Floating Rate Income | | | 1,512,901 | | | | 3,114,566 | | | | 4,391,138 | |
Pacific Funds High Income | | | 118,054 | | | | 119,953 | | | | 169,374 | |
Pacific FundsLarge-Cap | | | 136,174 | | | | 87,705 | | | | 85,164 | |
Pacific FundsLarge-Cap Value | | | 157,996 | | | | 111,953 | | | | 98,891 | |
Pacific FundsSmall/Mid-Cap | | | 202,048 | | | | 341,697 | | | | 493,273 | |
Pacific FundsSmall-Cap | | | 135,916 | | | | 88,698 | | | | 94,696 | |
Pacific FundsSmall-Cap Value | | | 161,192 | | | | 104,441 | | | | 90,131 | |
Pacific FundsSmall-Cap Growth | | | 150,256 | | | | 107,736 | | | | 103,024 | |
| | | | | | | | | | | | |
Total | | | $7,676,565 | | | | $10,761,393 | | | | $12,533,652 | |
| | | | | | | | | | | | |
During the fiscal year ended March 31, 2019, PLFA recouped $20,655 from Pacific Funds Diversified Alternatives under the expense limitation agreement. There was no recoupment of expense reimbursement by PLFA from any other Funds presented in these financial statements for the fiscal year ended March 31, 2019.
C. INVESTMENTS IN AFFILIATED FUNDS
As of March 31, 2019, each of the Portfolio Optimization Funds and Pacific Funds Diversified Alternatives (aggregate of all share classes) owned Class P shares in each of the applicable affiliated PF Underlying Funds, Pacific Funds Core Income, Pacific Funds Floating Rate Income, Pacific Funds High Income, and/or Pacific Funds Small-Cap Growth. A summary of holdings and transactions with affiliated mutual fund investments as of and for the fiscal year ended March 31, 2019 is as follows:
| | | | | | | | | | | | | | | | | | | | | | | | | | | | | | | | |
| Fund/Underlying Fund | | Beginning Value as of April 1, 2018 | | | Purchase Cost (1) | | | Distributions Received and Reinvested (2) | | | Sales Proceeds | | | Net Realized Gain (Loss) (3) | | | Change in Unrealized Appreciation (Depreciation) | | | As of March 31, 2019 | |
| | Ending Value | | | Shares Balance | |
| Pacific Funds Portfolio Optimization Conservative | | | | | | | | | | | | | | | | | | | | | |
Pacific Funds Core Income | | | $12,008,188 | | | | $1,304,895 | | | | $346,912 | | | | $6,019,919 | | | | ($258,818 | ) | | | $217,226 | | | | $7,598,484 | | | | 719,553 | |
Pacific Funds Floating Rate Income | | | 10,788,557 | | | | 271,470 | | | | 457,500 | | | | 4,974,374 | | | | (76,695 | ) | | | (110,237 | ) | | | 6,356,221 | | | | 642,043 | |
Pacific Funds High Income | | | 13,332,629 | | | | 8,331,744 | | | | 582,310 | | | | 5,490,781 | | | | (65,876 | ) | | | (71,222 | ) | | | 16,618,804 | | | | 1,665,211 | |
PF Inflation Managed | | | 22,457,862 | | | | 528,693 | | | | 558,809 | | | | 9,221,581 | | | | (59,776 | ) | | | (139,395 | ) | | | 14,124,612 | | | | 1,603,248 | |
PF Managed Bond | | | 108,532,267 | | | | 7,610,463 | | | | 3,040,694 | | | | 25,010,160 | | | | (771,698 | ) | | | 500,501 | | | | 93,902,067 | | | | 8,892,241 | |
PF Short Duration Bond | | | 40,140,896 | | | | 13,032,521 | | | | 656,964 | | | | 17,363,664 | | | | (137,073 | ) | | | 718,995 | | | | 37,048,639 | | | | 3,730,981 | |
PF Emerging Markets Debt | | | 12,362,023 | | | | 4,144,160 | | | | 201,566 | | | | 3,762,375 | | | | (206,910 | ) | | | 13,371 | | | | 12,751,835 | | | | 1,390,604 | |
Pacific FundsSmall-Cap Growth | | | — | | | | 1,117,793 | | | | — | | | | 283,986 | | | | 20,454 | | | | (93,338 | ) | | | 760,923 | | | | 62,990 | |
PF Comstock (4) | | | 4,391,519 | | | | 1,922 | | | | — | | | | 4,622,244 | | | | 2,624,866 | | | | (2,396,063 | ) | | | — | | | | — | |
PF Developing Growth | | | — | | | | 562,545 | | | | — | | | | 54,762 | | | | (4,621 | ) | | | (4,757 | ) | | | 498,405 | | | | 27,043 | |
PF Growth | | | 2,177,824 | | | | 2,305,215 | | | | — | | | | 2,374,694 | | | | 1,119,578 | | | | (904,207 | ) | | | 2,323,716 | | | | 85,494 | |
PFLarge-Cap Growth (4) | | | 431,220 | | | | 192 | | | | — | | | | 474,559 | | | | 231,702 | | | | (188,555 | ) | | | — | | | | — | |
PFLarge-Cap Value | | | 5,438,384 | | | | 1,109,193 | | | | 53,302 | | | | 2,129,515 | | | | 2,150,873 | | | | (1,953,453 | ) | | | 4,668,784 | | | | 390,693 | |
PF Multi-Asset | | | 28,274,555 | | | | 22,727,990 | | | | 592,903 | | | | 15,109,836 | | | | (468,311 | ) | | | 1,417,168 | | | | 37,434,469 | | | | 3,815,950 | |
PFSmall-Cap Value | | | 1,469,882 | | | | 227,692 | | | | 4,319 | | | | 400,016 | | | | 288,243 | | | | (334,561 | ) | | | 1,255,559 | | | | 152,930 | |
PF Main Street Core (4) | | | 1,735,705 | | | | 769 | | | | — | | | | 1,833,744 | | | | 1,138,476 | | | | (1,041,206 | ) | | | — | | | | — | |
PFMid-Cap Equity | | | 736,134 | | | | 321 | | | | — | | | | 780,526 | | | | 450,159 | | | | (406,088 | ) | | | — | | | | — | |
PFMid-Cap Value (4) | | | 4,689,761 | | | | 2,050 | | | | — | | | | 4,795,169 | | | | 1,119,128 | | | | (1,015,770 | ) | | | — | | | | — | |
PF Emerging Markets | | | 7,523,652 | | | | 2,251,876 | | | | 25,718 | | | | 4,284,274 | | | | 1,050,896 | | | | (1,464,375 | ) | | | 5,103,493 | | | | 346,940 | |
PF InternationalLarge-Cap | | | 5,745,646 | | | | 1,465,748 | | | | 13,906 | | | | 5,885,243 | | | | 1,541,462 | | | | (1,485,480 | ) | | | 1,396,039 | | | | 120,141 | |
PF InternationalSmall-Cap | | | 3,013,395 | | | | 399,268 | | | | 12,233 | | | | 1,739,896 | | | | (257,689 | ) | | | (154,890 | ) | | | 1,272,421 | | | | 132,682 | |
PF International Value | | | 2,434,976 | | | | 1,455,439 | | | | 37,528 | | | | 2,373,894 | | | | 695,671 | | | | (873,904 | ) | | | 1,375,816 | | | | 183,198 | |
PF Real Estate | | | 1,539,980 | | | | 2,595,321 | | | | 48,836 | | | | 616,828 | | | | 127,037 | | | | 183,020 | | | | 3,877,366 | | | | 316,262 | |
PF Currency Strategies | | | 5,609,576 | | | | 627,109 | | | | — | | | | 2,486,566 | | | | (150,573 | ) | | | 196,981 | | | | 3,796,527 | | | | 412,666 | |
PF Equity Long/Short | | | 5,580,935 | | | | 2,198,185 | | | | 88,035 | | | | 3,103,509 | | | | (580,343 | ) | | | (380,671 | ) | | | 3,802,632 | | | | 485,030 | |
PF Global Absolute Return (4) | | | 5,670,880 | | | | 409,108 | | | | — | | | | 5,576,830 | | | | (520,554 | ) | | | 17,396 | | | | — | | | | — | |
| | | $306,086,446 | | | | $74,681,682 | | | | $6,721,535 | | | | $130,768,945 | | | | $8,999,608 | | | | ($9,753,514 | ) | | | $255,966,812 | | | | | |
D-12
PACIFIC FUNDS
NOTES TO FINANCIAL STATEMENTS (Continued)
| | | | | | | | | | | | | | | | | | | | | | | | | | | | | | | | |
| Fund/Underlying Fund | | Beginning Value as of April 1, 2018 | | | Purchase Cost (1) | | | Distributions Received and Reinvested (2) | | | Sales Proceeds | | | Net Realized Gain (Loss) (3) | | | Change in Unrealized Appreciation (Depreciation) | | | As of March 31, 2019 | |
| | Ending Value | | | Shares Balance | |
| Pacific Funds Portfolio Optimization Moderate-Conservative | | | | | | | | | | | | | | | | | | | | | |
Pacific Funds Core Income | | | $15,100,997 | | | | $955,614 | | | | $412,943 | | | | $7,590,547 | | | | ($316,037 | ) | | | $259,195 | | | | $8,822,165 | | | | 835,432 | |
Pacific Funds Floating Rate Income | | | 16,022,369 | | | | 189,764 | | | | 670,511 | | | | 9,200,969 | | | | (158,419 | ) | | | (107,039 | ) | | | 7,416,217 | | | | 749,113 | |
Pacific Funds High Income | | | 11,598,181 | | | | 13,232,313 | | | | 628,941 | | | | 2,948,808 | | | | (64,915 | ) | | | (88,337 | ) | | | 22,357,375 | | | | 2,240,218 | |
PF Inflation Managed | | | 18,850,021 | | | | 447,912 | | | | 500,466 | | | | 10,252,777 | | | | (77,592 | ) | | | (110,752 | ) | | | 9,357,278 | | | | 1,062,120 | |
PF Managed Bond | | | 136,762,116 | | | | 11,129,677 | | | | 3,521,587 | | | | 41,836,699 | | | | (1,400,178 | ) | | | 974,436 | | | | 109,150,939 | | | | 10,336,263 | |
PF Short Duration Bond | | | 31,521,230 | | | | 16,873,525 | | | | 626,035 | | | | 19,692,901 | | | | (71,500 | ) | | | 534,690 | | | | 29,791,079 | | | | 3,000,109 | |
PF Emerging Markets Debt | | | 16,056,221 | | | | 8,088,298 | | | | 267,369 | | | | 7,389,867 | | | | (406,154 | ) | | | 110,250 | | | | 16,726,117 | | | | 1,824,004 | |
Pacific FundsSmall-Cap Growth | | | 1,509,760 | | | | 1,800,037 | | | | — | | | | 2,188,457 | | | | 65,854 | | | | (78,358 | ) | | | 1,108,836 | | | | 91,791 | |
PF Comstock (4) | | | 11,118,411 | | | | 6,069 | | | | — | | | | 11,703,487 | | | | 5,318,267 | | | | (4,739,260 | ) | | | — | | | | — | |
PF Developing Growth | | | 652,667 | | | | 786,181 | | | | — | | | | 861,633 | | | | 42,625 | | | | 106,434 | | | | 726,274 | | | | 39,407 | |
PF Growth | | | 2,330,560 | | | | 9,735,447 | | | | — | | | | 2,618,058 | | | | 1,798,716 | | | | (1,463,403 | ) | | | 9,783,262 | | | | 359,943 | |
PFLarge-Cap Growth (4) | | | 2,348,242 | | | | 1,309 | | | | — | | | | 2,584,861 | | | | 1,282,835 | | | | (1,047,525 | ) | | | — | | | | — | |
PFLarge-Cap Value | | | 12,587,390 | | | | 16,586,825 | | | | 75,876 | | | | 8,201,163 | | | | 5,424,784 | | | | (5,143,390 | ) | | | 21,330,322 | | | | 1,784,964 | |
PF Multi-Asset | | | 71,419,307 | | | | 61,787,867 | | | | 1,553,843 | | | | 55,289,674 | | | | (1,501,678 | ) | | | 3,582,475 | | | | 81,552,140 | | | | 8,313,164 | |
PF Main Street Core (4) | | | 10,528,986 | | | | 5,831 | | | | — | | | | 11,124,917 | | | | 5,448,379 | | | | (4,858,279 | ) | | | — | | | | — | |
PFMid-Cap Equity | | | 2,840,731 | | | | 1,547 | | | | — | | | | 3,012,429 | | | | 1,492,029 | | | | (1,321,878 | ) | | | — | | | | — | |
PFMid-Cap Value (4) | | | 6,957,566 | | | | 3,808 | | | | — | | | | 7,114,239 | | | | 1,631,022 | | | | (1,478,157 | ) | | | — | | | | — | |
PFSmall-Cap Value | | | 4,388,500 | | | | 667,817 | | | | 12,738 | | | | 1,277,590 | | | | 873,311 | | | | (1,005,596 | ) | | | 3,659,180 | | | | 445,698 | |
PF Emerging Markets | | | 17,886,152 | | | | 4,442,342 | | | | 75,811 | | | | 8,511,279 | | | | 2,563,184 | | | | (3,441,123 | ) | | | 13,015,087 | | | | 884,778 | |
PF InternationalLarge-Cap | | | 12,990,756 | | | | 4,830,089 | | | | 40,994 | | | | 11,603,230 | | | | 4,986,379 | | | | (4,771,861 | ) | | | 6,473,127 | | | | 557,068 | |
PF InternationalSmall-Cap | | | 8,945,799 | | | | 1,417,863 | | | | 36,066 | | | | 5,446,029 | | | | (701,555 | ) | | | (543,538 | ) | | | 3,708,606 | | | | 386,716 | |
PF International Value | | | 9,943,151 | | | | 5,172,519 | | | | 102,734 | | | | 7,613,149 | | | | 2,088,060 | | | | (2,585,107 | ) | | | 7,108,208 | | | | 946,499 | |
PF Real Estate | | | 4,571,967 | | | | 5,679,580 | | | | 108,003 | | | | 1,727,839 | | | | 140,533 | | | | 646,342 | | | | 9,418,586 | | | | 768,237 | |
PF Currency Strategies | | | 8,332,641 | | | | 810,248 | | | | — | | | | 3,681,811 | | | | (242,570 | ) | | | 314,492 | | | | 5,533,000 | | | | 601,413 | |
PF Equity Long/Short | | | 8,288,482 | | | | 3,315,115 | | | | 129,765 | | | | 4,767,329 | | | | (899,049 | ) | | | (525,234 | ) | | | 5,541,750 | | | | 706,856 | |
PF Global Absolute Return (4) | | | 8,422,793 | | | | 642,109 | | | | — | | | | 8,321,088 | | | | (746,837 | ) | | | 3,023 | | | | — | | | | — | |
| | | $451,974,996 | | | | $168,609,706 | | | | $8,763,682 | | | | $256,560,830 | | | | $26,569,494 | | | | ($26,777,500 | ) | | | $372,579,548 | | | | | |
| | | | | |
| Pacific Funds Portfolio Optimization Moderate | | | | | | | | | | | | | | | | | | | | | |
Pacific Funds Core Income | | | $29,863,502 | | | | $1,718,136 | | | | $809,636 | | | | $14,290,849 | | | | ($642,535 | ) | | | $548,572 | | | | $18,006,462 | | | | 1,705,157 | |
Pacific Funds Floating Rate Income | | | 20,353,016 | | | | 499,172 | | | | 809,021 | | | | 9,885,793 | | | | (121,346 | ) | | | (194,222 | ) | | | 11,459,848 | | | | 1,157,560 | |
Pacific Funds High Income | | | 33,708,038 | | | | 23,837,724 | | | | 1,542,948 | | | | 12,584,815 | | | | (172,570 | ) | | | (207,873 | ) | | | 46,123,452 | | | | 4,621,588 | |
PF Inflation Managed | | | 27,244,820 | | | | 389,848 | | | | 746,214 | | | | 16,493,364 | | | | (150,335 | ) | | | (154,761 | ) | | | 11,582,422 | | | | 1,314,690 | |
PF Managed Bond | | | 264,563,772 | | | | 23,816,188 | | | | 6,887,056 | | | | 75,105,060 | | | | (2,485,528 | ) | | | 1,901,064 | | | | 219,577,492 | | | | 20,793,323 | |
PF Short Duration Bond | | | 40,623,281 | | | | 49,351,594 | | | | 1,005,779 | | | | 22,743,200 | | | | (11,859 | ) | | | 915,096 | | | | 69,140,691 | | | | 6,962,809 | |
PF Emerging Markets Debt | | | 27,187,923 | | | | 2,921,640 | | | | 363,203 | | | | 6,778,984 | | | | (366,211 | ) | | | (322,940 | ) | | | 23,004,631 | | | | 2,508,684 | |
Pacific FundsSmall-Cap Growth | | | 9,630,161 | | | | 5,607,812 | | | | — | | | | 8,621,452 | | | | 82,721 | | | | 163,667 | | | | 6,862,909 | | | | 568,122 | |
PF Comstock (4) | | | 37,382,885 | | | | 14,452 | | | | — | | | | 39,353,930 | | | | 16,370,294 | | | | (14,413,701 | ) | | | — | | | | — | |
PF Developing Growth | | | 3,232,758 | | | | 2,372,589 | | | | — | | | | 1,825,390 | | | | 279,155 | | | | 435,968 | | | | 4,495,080 | | | | 243,900 | |
PF Growth | | | 67,208,407 | | | | 27,604,291 | | | | 13,159 | | | | 17,974,616 | | | | 3,987,784 | | | | 5,330,425 | | | | 86,169,450 | | | | 3,170,326 | |
PFLarge-Cap Growth (4) | | | 17,088,528 | | | | 6,727 | | | | — | | | | 18,814,005 | | | | 9,151,981 | | | | (7,433,231 | ) | | | — | | | | — | |
PFLarge-Cap Value | | | 47,781,415 | | | | 40,126,960 | | | | 993,220 | | | | 15,340,996 | | | | 20,981,697 | | | | (18,860,392 | ) | | | 75,681,904 | | | | 6,333,214 | |
PF Multi-Asset | | | 303,577,481 | | | | 181,558,524 | | | | 5,825,282 | | | | 100,006,397 | | | | (3,875,474 | ) | | | 13,949,958 | | | | 401,029,374 | | | | 40,879,651 | |
PF Main Street Core (4) | | | 50,936,766 | | | | 19,933 | | | | — | | | | 53,827,910 | | | | 21,970,718 | | | | (19,099,507 | ) | | | — | | | | — | |
PFMid-Cap Equity | | | 12,957,985 | | | | 4,983 | | | | — | | | | 13,742,693 | | | | 5,232,856 | | | | (4,453,131 | ) | | | — | | | | — | |
PFMid-Cap Value (4) | | | 34,830,270 | | | | 13,455 | | | | — | | | | 35,613,186 | | | | 8,084,026 | | | | (7,314,565 | ) | | | — | | | | — | |
PFSmall-Cap Value | | | 32,641,447 | | | | 4,021,232 | | | | 97,256 | | | | 13,074,321 | | | | 5,989,727 | | | | (7,028,753 | ) | | | 22,646,588 | | | | 2,758,415 | |
PF Emerging Markets | | | 66,250,540 | | | | 10,917,676 | | | | 308,866 | | | | 28,249,454 | | | | 8,866,789 | | | | (12,062,860 | ) | | | 46,031,557 | | | | 3,129,270 | |
PF InternationalLarge-Cap | | | 42,435,927 | | | | 9,889,964 | | | | 420,926 | | | | 32,789,806 | | | | 16,929,781 | | | | (17,427,245 | ) | | | 19,459,547 | | | | 1,674,660 | |
PF InternationalSmall-Cap | | | 33,146,658 | | | | 4,413,078 | | | | 137,753 | | | | 21,615,353 | | | | (3,103,599 | ) | | | (1,501,586 | ) | | | 11,476,951 | | | | 1,196,762 | |
PF International Value | | | 42,201,525 | | | | 8,907,766 | | | | 1,120,497 | | | | 26,097,794 | | | | 5,561,800 | | | | (9,696,169 | ) | | | 21,997,625 | | | | 2,929,111 | |
PF Real Estate | | | 13,566,494 | | | | 17,422,904 | | | | 329,913 | | | | 4,539,977 | | | | 1,668,436 | | | | 697,435 | | | | 29,145,205 | | | | 2,377,260 | |
PF Currency Strategies | | | 23,314,463 | | | | 44,091 | | | | — | | | | 9,333,179 | | | | (714,315 | ) | | | 957,489 | | | | 14,268,549 | | | | 1,550,929 | |
PF Equity Long/Short | | | 21,894,327 | | | | 8,484,624 | | | | 353,720 | | | | 12,598,076 | | | | (2,453,733 | ) | | | (1,389,815 | ) | | | 14,291,047 | | | | 1,822,838 | |
PF Global Absolute Return (4) | | | 22,242,579 | | | | 1,635,261 | | | | — | | | | 21,871,287 | | | | (1,630,140 | ) | | | (376,413 | ) | | | — | | | | — | |
| | | $1,325,864,968 | | | | $425,600,624 | | | | $21,764,449 | | | | $633,171,887 | | | | $109,430,120 | | | | ($97,037,490 | ) | | | $1,152,450,784 | | | | | |
D-13
PACIFIC FUNDS
NOTES TO FINANCIAL STATEMENTS (Continued)
| | | | | | | | | | | | | | | | | | | | | | | | | | | | | | | | |
| Fund/Underlying Fund | | Beginning Value as of April 1, 2018 | | | Purchase Cost (1) | | | Distributions Received and Reinvested (2) | | | Sales Proceeds | | | Net Realized Gain (Loss) (3) | | | Change in Unrealized Appreciation (Depreciation) | | | As of March 31, 2019 | |
| | Ending Value | | | Shares Balance | |
| Pacific Funds Portfolio Optimization Growth | | | | | | | | | | | | | | | | | | | | | |
Pacific Funds Core Income | | | $9,763,241 | | | | $1,610,600 | | | | $273,311 | | | | $5,796,080 | | | | ($236,405 | ) | | | $206,822 | | | | $5,821,489 | | | | 551,278 | |
Pacific Funds Floating Rate Income | | | 10,270,420 | | | | 263,854 | | | | 376,743 | | | | 6,362,150 | | | | (72,919 | ) | | | (58,594 | ) | | | 4,417,354 | | | | 446,197 | |
Pacific Funds High Income | | | 10,228,959 | | | | 18,232,572 | | | | 582,508 | | | | 2,250,929 | | | | (49,739 | ) | | | (74,263 | ) | | | 26,669,108 | | | | 2,672,255 | |
PF Inflation Managed | | | 5,165,217 | | | | 313,748 | | | | 142,109 | | | | 1,119,499 | | | | (6,346 | ) | | | (30,518 | ) | | | 4,464,711 | | | | 506,778 | |
PF Managed Bond | | | 88,559,419 | | | | 18,429,960 | | | | 2,139,512 | | | | 38,857,930 | | | | (1,314,440 | ) | | | 1,168,279 | | | | 70,124,800 | | | | 6,640,606 | |
PF Short Duration Bond | | | — | | | | 42,289,087 | | | | 342,146 | | | | 25,161,427 | | | | 64,510 | | | | 233,663 | | | | 17,767,979 | | | | 1,789,323 | |
PF Emerging Markets Debt | | | 20,604,556 | | | | 1,830,630 | | | | 276,659 | | | | 8,883,872 | | | | (416,369 | ) | | | (110,155 | ) | | | 13,301,449 | | | | 1,450,540 | |
Pacific FundsSmall-Cap Growth | | | 10,727,966 | | | | 4,427,839 | | | | — | | | | 4,974,862 | | | | 470,354 | | | | (69,271 | ) | | | 10,582,026 | | | | 875,996 | |
PF Comstock (4) | | | 47,629,727 | | | | 43,885 | | | | — | | | | 50,160,798 | | | | 17,123,715 | | | | (14,636,529 | ) | | | — | | | | — | |
PF Developing Growth | | | 3,930,872 | | | | 3,575,521 | | | | — | | | | 1,424,936 | | | | 57,538 | | | | 791,944 | | | | 6,930,939 | | | | 376,068 | |
PF Growth | | | 100,139,562 | | | | 2,495,416 | | | | 14,646 | | | | 58,092,298 | | | | 6,166,455 | | | | 5,832,907 | | | | 56,556,688 | | | | 2,080,820 | |
PFLarge-Cap Growth (4) | | | 16,756,209 | | | | 15,835 | | | | — | | | | 18,457,461 | | | | 8,824,199 | | | | (7,138,782 | ) | | | — | | | | — | |
PFLarge-Cap Value | | | 61,938,367 | | | | 28,936,063 | | | | 1,135,640 | | | | 41,644,317 | | | | 20,821,992 | | | | (18,543,517 | ) | | | 52,644,228 | | | | 4,405,375 | |
PF Multi-Asset | | | 242,328,530 | | | | 235,776,161 | | | | 5,462,931 | | | | 51,844,268 | | | | (2,487,611 | ) | | | 10,092,632 | | | | 439,328,375 | | | | 44,783,728 | |
PF Main Street Core (4) | | | 53,064,448 | | | | 49,766 | | | | — | | | | 56,101,141 | | | | 21,612,313 | | | | (18,625,386 | ) | | | — | | | | — | |
PFMid-Cap Equity | | | 9,818,882 | | | | 9,049 | | | | — | | | | 10,418,488 | | | | 3,931,959 | | | | (3,341,402 | ) | | | — | | | | — | |
PFMid-Cap Value (4) | | | 19,899,376 | | | | 18,549 | | | | — | | | | 20,357,771 | | | | 4,615,478 | | | | (4,175,632 | ) | | | — | | | | — | |
PFSmall-Cap Value | | | 29,677,556 | | | | 4,347,054 | | | | 89,009 | | | | 6,943,789 | | | | 6,576,996 | | | | (7,556,886 | ) | | | 26,189,940 | | | | 3,190,005 | |
PF Emerging Markets | | | 60,251,593 | | | | 14,485,719 | | | | 294,120 | | | | 23,503,323 | | | | 7,844,911 | | | | (10,577,137 | ) | | | 48,795,883 | | | | 3,317,191 | |
PF InternationalLarge-Cap | | | 45,115,963 | | | | 6,845,248 | | | | 458,293 | | | | 28,555,991 | | | | 18,025,801 | | | | (18,061,921 | ) | | | 23,827,393 | | | | 2,050,550 | |
PF InternationalSmall-Cap | | | 30,151,859 | | | | 4,198,759 | | | | 126,044 | | | | 21,551,026 | | | | (2,435,763 | ) | | | (1,641,739 | ) | | | 8,848,134 | | | | 922,642 | |
PF International Value | | | 62,945,157 | | | | 6,961,103 | | | | 1,215,138 | | | | 40,110,957 | | | | 7,710,012 | | | | (12,194,433 | ) | | | 26,526,020 | | | | 3,532,093 | |
PF Real Estate | | | 15,419,418 | | | | 18,010,547 | | | | 251,326 | | | | 8,804,215 | | | | 2,545,587 | | | | (459,414 | ) | | | 26,963,249 | | | | 2,199,286 | |
PF Currency Strategies | | | 13,485,480 | | | | 167,271 | | | | — | | | | 4,987,054 | | | | (308,461 | ) | | | 443,082 | | | | 8,800,318 | | | | 956,556 | |
PF Equity Long/Short | | | 13,539,320 | | | | 5,682,857 | | | | 220,571 | | | | 8,245,019 | | | | (1,623,892 | ) | | | (759,701 | ) | | | 8,814,136 | | | | 1,124,252 | |
PF Global Absolute Return (4) | | | 13,765,686 | | | | 1,131,264 | | | | — | | | | 13,655,186 | | | | (931,665 | ) | | | (310,099 | ) | | | — | | | | — | |
| | | $995,177,783 | | | | $420,148,357 | | | | $13,400,706 | | | | $558,264,787 | | | | $116,508,210 | | | | ($99,596,050 | ) | | | $887,374,219 | | | | | |
| | | | | |
| Pacific Funds Portfolio Optimization Aggressive-Growth | | | | | | | | | | | | | | | | | | | | | |
Pacific Funds Core Income | | | $— | | | | $313,940 | | | | $2,509 | | | | $10,307 | | | | $92 | | | | $8,073 | | | | $314,307 | | | | 29,764 | |
Pacific Funds Floating Rate Income | | | 3,463,583 | | | | 111,175 | | | | 127,178 | | | | 3,661,456 | | | | (55,399 | ) | | | 18,720 | | | | 3,801 | | | | 384 | |
Pacific Funds High Income | | | — | | | | 1,563,878 | | | | 4,170 | | | | 11,313 | | | | 17 | | | | 3,119 | | | | 1,559,871 | | | | 156,300 | |
PF Managed Bond | | | 24,042 | | | | 4,411,157 | | | | — | | | | 167,953 | | | | 1,479 | | | | 120,266 | | | | 4,388,991 | | | | 415,624 | |
PF Short Duration Bond | | | — | | | | 5,693,584 | | | | 23,721 | | | | 4,205,568 | | | | 26,658 | | | | 20,485 | | | | 1,558,880 | | | | 156,987 | |
PF Emerging Markets Debt | | | 3,456,106 | | | | 444,664 | | | | 48,569 | | | | 2,268,201 | | | | (113,104 | ) | | | (12,027 | ) | | | 1,556,007 | | | | 169,685 | |
Pacific FundsSmall-Cap Growth | | | 4,903,851 | | | | 1,628,397 | | | | — | | | | 2,094,665 | | | | 230,349 | | | | (25,966 | ) | | | 4,641,966 | | | | 384,269 | |
PF Comstock (4) | | | 16,355,050 | | | | 66,051 | | | | — | | | | 17,280,515 | | | | 6,466,138 | | | | (5,606,724 | ) | | | — | | | | — | |
PF Developing Growth | | | 1,649,781 | | | | 1,583,057 | | | | — | | | | 550,851 | | | | 177,117 | | | | 181,373 | | | | 3,040,477 | | | | 164,974 | |
PF Growth | | | 34,863,767 | | | | 1,605,969 | | | | 7,573 | | | | 9,763,471 | | | | 2,373,655 | | | | 2,417,021 | | | | 31,504,514 | | | | 1,159,106 | |
PFLarge-Cap Growth (4) | | | 13,397,863 | | | | 55,376 | | | | — | | | | 14,810,591 | | | | 5,986,879 | | | | (4,629,527 | ) | | | — | | | | — | |
PFLarge-Cap Value | | | 27,201,526 | | | | 9,404,060 | | | | 456,549 | | | | 21,539,647 | | | | 9,691,219 | | | | (8,432,641 | ) | | | 16,781,066 | | | | 1,404,273 | |
PF Multi-Asset | | | 87,733,392 | | | | 99,910,256 | | | | 1,998,180 | | | | 15,894,576 | | | | (777,861 | ) | | | 3,809,232 | | | | 176,778,623 | | | | 18,020,247 | |
PF Main Street Core (4) | | | 20,845,041 | | | | 85,400 | | | | — | | | | 22,112,380 | | | | 8,071,578 | | | | (6,889,639 | ) | | | — | | | | — | |
PFMid-Cap Equity | | | 4,958,077 | | | | 20,016 | | | | — | | | | 5,278,504 | | | | 1,915,516 | | | | (1,615,105 | ) | | | — | | | | — | |
PFMid-Cap Value (4) | | | 4,427,120 | | | | 18,015 | | | | — | | | | 4,543,806 | | | | 1,037,089 | | | | (938,418 | ) | | | — | | | | — | |
PFSmall-Cap Value | | | 13,341,629 | | | | 6,771,556 | | | | 41,713 | | | | 2,921,022 | | | | 2,926,608 | | | | (3,310,916 | ) | | | 16,849,568 | | | | 2,052,323 | |
PF Emerging Markets | | | 23,672,464 | | | | 4,478,040 | | | | 123,900 | | | | 8,514,185 | | | | 2,788,831 | | | | (3,868,230 | ) | | | 18,680,820 | | | | 1,269,940 | |
PF InternationalLarge-Cap | | | 19,109,882 | | | | 989,721 | | | | 224,703 | | | | 13,213,306 | | | | 8,219,676 | | | | (8,362,502 | ) | | | 6,968,174 | | | | 599,671 | |
PF InternationalSmall-Cap | | | 11,811,550 | | | | 1,871,563 | | | | 51,675 | | | | 7,443,824 | | | | (1,073,910 | ) | | | (559,411 | ) | | | 4,657,643 | | | | 485,677 | |
PF International Value | | | 26,144,575 | | | | 862,395 | | | | 595,218 | | | | 17,644,831 | | | | 2,736,433 | | | | (4,758,439 | ) | | | 7,935,351 | | | | 1,056,638 | |
PF Real Estate | | | 5,190,610 | | | | 4,876,054 | | | | 117,658 | | | | 1,584,619 | | | | 587,610 | | | | 275,173 | | | | 9,462,486 | | | | 771,818 | |
PF Currency Strategies | | | 3,509,231 | | | | 110,558 | | | | — | | | | 1,341,278 | | | | (43,086 | ) | | | 80,848 | | | | 2,316,273 | | | | 251,769 | |
PF Equity Long/Short | | | 3,381,718 | | | | 1,484,555 | | | | 57,402 | | | | 1,995,784 | | | | (395,819 | ) | | | (212,160 | ) | | | 2,319,912 | | | | 295,907 | |
PF Global Absolute Return (4) | | | 3,448,337 | | | | 313,055 | | | | — | | | | 3,442,945 | | | | (240,454 | ) | | | (77,993 | ) | | | — | | | | — | |
| | | $332,889,195 | | | | $148,672,492 | | | | $3,880,718 | | | | $182,295,598 | | | | $50,537,311 | | | | ($42,365,388 | ) | | | $311,318,730 | | | | | |
| | | | | |
| Pacific Funds Diversified Alternatives | | | | | | | | | | | | | | | | | | | | | |
Pacific Funds Floating Rate Income | | | $3,683,217 | | | | $1,048,408 | | | | $179,812 | | | | $2,287,604 | | | | ($20,465 | ) | | | ($65,646 | ) | | | $2,537,722 | | | | 256,336 | |
PF Inflation Managed | | | 2,056,202 | | | | 579,420 | | | | 55,199 | | | | 1,236,543 | | | | (28,202 | ) | | | (1,258 | ) | | | 1,424,818 | | | | 161,727 | |
PF Emerging Markets Debt | | | 6,089,353 | | | | 1,153,303 | | | | 77,912 | | | | 2,881,304 | | | | (223,902 | ) | | | 29,332 | | | | 4,244,694 | | | | 462,889 | |
PF Emerging Markets | | | 2,799,853 | | | | 2,636,368 | | | | 4,746 | | | | 3,038,911 | | | | 34,672 | | | | (171,841 | ) | | | 2,264,887 | | | | 153,969 | |
PF InternationalSmall-Cap | | | 2,775,316 | | | | 821,853 | | | | 10,127 | | | | 1,249,648 | | | | (180,672 | ) | | | (200,520 | ) | | | 1,976,456 | | | | 206,096 | |
PF Real Estate | | | 1,228,163 | | | | 2,490,853 | | | | 44,267 | | | | 1,231,638 | | | | 100,112 | | | | 236,652 | | | | 2,868,409 | | | | 233,965 | |
PF Currency Strategies | | | 8,334,492 | | | | 7,574,240 | | | | — | | | | 6,033,915 | | | | (128,284 | ) | | | 82,529 | | | | 9,829,062 | | | | 1,068,376 | |
PF Equity Long/Short | | | 4,411,448 | | | | 1,816,494 | | | | 57,543 | | | | 2,446,434 | | | | (377,762 | ) | | | (367,317 | ) | | | 3,093,972 | | | | 394,639 | |
PF Global Absolute Return (4) | | | 9,387,866 | | | | 2,823,823 | | | | — | | | | 11,322,150 | | | | (773,458 | ) | | | (116,081 | ) | | | — | | | | — | |
| | | $40,765,910 | | | | $20,944,762 | | | | $429,606 | | | | $31,728,147 | | | | ($1,597,961 | ) | | | ($574,150 | ) | | | $28,240,020 | | | | | |
| | (1) | Purchase cost excludes distributions received and reinvested, if any. |
| | (2) | Distributions received include distributions from net investment income, if any, from the PF Underlying Funds, Pacific Funds Core Income, Pacific Funds Floating Rate Income, Pacific Funds High Income, and/or Pacific FundsSmall-Cap Growth. |
D-14
PACIFIC FUNDS
NOTES TO FINANCIAL STATEMENTS (Continued)
| | (3) | Net realized gain (loss) includes capital gains distributions from the PF Underlying Funds, Pacific Funds Core Income, Pacific Funds Floating Rate Income, Pacific Funds High Income, and/or Pacific Funds Small-Cap Growth, if any. |
| | (4) | All shares in the PF Comstock, PF Large-Cap Growth, PF Main Street Core, PF Mid-Cap Equity, PF Mid-Cap Value, and PF Global Absolute Return Funds were fully redeemed during the fiscal year ended March 31, 2019. |
As of March 31, 2019, Pacific Life owned the following percentages of the total shares outstanding (aggregate of all share classes) of each of the following Funds:
| | | | |
| Fund | | Ownership
Percentage | |
Pacific FundsLarge-Cap Value | | | 40.20% | |
Pacific FundsSmall-Cap Value | | | 37.20% | |
D. INDEPENDENT TRUSTEES
The Trust pays each independent trustee of the Board retainer fees and specified amounts for various Board and committee services and for chairing those committees. The fees and expenses of the independent trustees of the Board are presented in the Statements of Operations. Each independent trustee of the Board is eligible to participate in the Trust’s Deferred Compensation Plan (the “Plan”). The Plan allows each independent trustee to voluntarily defer receipt of all or a percentage of fees, which otherwise would be payable for services performed. Amounts in the deferral account are obligations of each Fund at the time of such deferral and are payable in accordance with the Plan. A Trustee who defers compensation has the ability to select credit rate options that track the performance, at NAV of Class A of certain series of the Trust without a sales load or at NAV of Class I shares of the Pacific Select Fund. Pacific Select Fund is a Delaware statutory trust and is registered under the 1940 Act as an open-end management investment company. PLFA is the Investment Adviser to Pacific Select Fund. The obligation of each Fund under the Plan (the “DCP Liability”) is recorded as a liability (accrued trustees’ fees and expenses and deferred compensation). Accordingly, the market value appreciation or depreciation on a Fund’s DCP Liability account will cause the expenses of that Fund to increase or decrease due to market fluctuation. The change in net unrealized appreciation or depreciation on a Fund’s DCP Liability account is recorded as an increase or decrease to expenses (trustees’ fees and expenses). For the fiscal year ended March 31, 2019, such expenses increased by $6,196 for all applicable Funds presented in these financial statements as a result of the market value appreciation on such accounts. As of March 31, 2019, the total amount in the DCP Liability accounts for all applicable Funds presented in these financial statements was $42,280.
E. OFFICERS OF THE TRUST
None of the officers of the Trust received compensation from the Trust.
F. INDEMNIFICATIONS
Under the Trust’s organizational documents, its officers and trustees are indemnified against certain liabilities arising out of performance of their duties to the Trust. In addition, the Trust entered into an agreement with each of the trustees which provides that the Trust will indemnify and hold harmless each trustee against any expenses actually and reasonably incurred by any trustee in any proceeding arising out of or in connection with the trustee’s services to the Trust, to the fullest extent permitted by the Trust’s Declaration of Trust and By-Laws, the general trust law of the State of Delaware, the Securities Act of 1933, and the 1940 Act, each as now or hereinafter in force. In the normal course of business, the Trust enters into contracts with service providers and others that contain general indemnification clauses. The Trust’s maximum exposure under these arrangements and agreements is dependent on future claims that may be made against the Trust and/or the trustees and, therefore, cannot be estimated; however, based on experience, the risk of loss from such claims is considered remote.
G. INTERFUND TRANSACTIONS
In accordance with Rule 17a-7 under the 1940 Act and applicable Trust policies and procedures, purchase and sale transactions may be conducted between a Fund of the Trust and another Fund of the Trust or certain affiliates of the Trust if conducted at the independent “current market price” (the last sales price, intra-day price, or average of highest bid/lowest offer, as applicable) on a commission-free basis with no remuneration paid in connection with the transaction (other than cash payment against prompt delivery). At the quarterly Board meeting subsequent to the purchase and sale transactions taking place, the Board will be asked to determine that the transactions were conducted in compliance with applicable Trust policies and procedures.
For the fiscal year ended March 31, 2019, the purchase and sale transactions with an affiliated Fund conducted in compliance with Rule 17a-7 under the 1940 Act are summarized in the following table:
| | | | | | | | | | | | |
| Fund | | Purchases | | | Sales | | | Net Realized Gain (Loss) | |
| Pacific Funds Short Duration Income | | | $— | | | | $8,672,559 | | | | ($90,280 | ) |
| Pacific Funds Core Income | | | — | | | | 21,520,873 | | | | (154,729 | ) |
8. COMMITTED LINE OF CREDIT
The Trust has an unsecured $200,000,000 ($125,000,000 prior to November 30, 2018) committed revolving line of credit agreement with a syndicate of banks, which is renewed annually. The committed line of credit applies to Pacific Funds Floating Rate Income only. The interest rate on borrowing under the line of credit agreement is the higher of the Federal Funds effective rate, plus 1.20%. Pacific Funds Floating Rate Income paid an upfront fee of 0.025% and pays a commitment fee equal to 0.20% (0.25% prior to November 30, 2018) per annum on the daily unused portion of the committed line up to a maximum, including upfront fee, of $450,000 ($312,500 prior to November 30, 2018). As of March 31, 2019, the actual interest rate on borrowing by the Trust was 3.58%. The commitment fees and interest incurred by Pacific Funds Floating Rate Income are recorded as an expense. For the fiscal year ended March 31, 2019, Pacific Funds Floating Rate Income had no loans outstanding in connection with this revolving line of credit.
D-15
PACIFIC FUNDS
NOTES TO FINANCIAL STATEMENTS (Continued)
9. PURCHASES AND SALES OF INVESTMENTS
The cost of purchases and proceeds from sales of investments (excluding short-term investments) for the fiscal year ended March 31, 2019, are summarized in the following table:
| | | | | | | | | | | | | | | | |
| | | U.S. Government Securities | | | Other Securities | |
| Fund | | Purchases | | | Sales | | | Purchases | | | Sales | |
| Pacific Funds Portfolio Optimization Conservative | | | $— | | | | $— | | | | $84,344,006 | | | | $130,768,945 | |
| Pacific Funds Portfolio Optimization Moderate-Conservative | | | — | | | | — | | | | 183,705,254 | | | | 256,560,830 | |
| Pacific Funds Portfolio Optimization Moderate | | | — | | | | — | | | | 502,848,434 | | | | 633,171,887 | |
| Pacific Funds Portfolio Optimization Growth | | | — | | | | — | | | | 491,861,764 | | | | 558,264,787 | |
| Pacific Funds Portfolio Optimization Aggressive-Growth | | | — | | | | — | | | | 178,152,181 | | | | 182,295,598 | |
| Pacific Funds Diversified Alternatives | | | — | | | | — | | | | 21,894,232 | | | | 31,728,147 | |
| Pacific Funds Short Duration Income | | | 67,801,152 | | | | — | | | | 461,895,346 | | | | 245,471,429 | |
| Pacific Funds Core Income | | | 199,495,198 | | | | 175,914,273 | | | | 376,229,055 | | | | 494,054,752 | |
| Pacific Funds Strategic Income | | | 40,631,484 | | | | 44,562,969 | | | | 509,513,823 | | | | 491,460,489 | |
| Pacific Funds Floating Rate Income | | | — | | | | — | | | | 2,468,520,579 | | | | 2,101,187,452 | |
| Pacific Funds High Income | | | — | | | | — | | | | 80,419,226 | | | | 44,364,418 | |
| Pacific FundsLarge-Cap | | | — | | | | — | | | | 15,924,353 | | | | 14,959,507 | |
| Pacific FundsLarge-Cap Value | | | — | | | | — | | | | 10,534,088 | | | | 21,567,758 | |
| Pacific FundsSmall/Mid-Cap | | | — | | | | — | | | | 225,319,604 | | | | 91,080,353 | |
| Pacific FundsSmall-Cap | | | — | | | | — | | | | 12,531,679 | | | | 13,973,950 | |
| Pacific FundsSmall-Cap Value | | | — | | | | — | | | | 13,165,098 | | | | 22,173,783 | |
| Pacific FundsSmall-Cap Growth | | | — | | | | — | | | | 39,618,268 | | | | 58,777,529 | |
10. FEDERAL INCOME TAX INFORMATION
Each Fund intends to qualify each year as a regulated investment company (“RIC”) under Subchapter M of the Internal Revenue Code (the “Code”). A Fund that qualifies as a RIC does not have to pay income tax as long as it distributes sufficient taxable income and net capital gains. Each Fund declared and paid sufficient dividends on net investment income and capital gains distributions during the fiscal year or period ended March 31, 2019, to qualify as a RIC and is not required to pay Federal income tax under the Code. Accordingly, no provision for Federal income taxes is required in the financial statements. Required distributions are based on net investment income and net realized gains determined in accordance with income tax regulations, which may differ from U.S. GAAP for financial reporting purposes. These differences are primarily due to differing treatments for short-term capital gain distributions received, late year ordinary and post-October capital losses, capital loss carryforwards, and losses deferred due to wash sales. Permanent book and tax differences relating to shareholder distributions will result in reclassifications of capital accounts. In addition, the year in which amounts are distributed may differ from the year in which the net investment income is earned and the net gains are realized by each Fund.
The following table shows the accumulated capital losses and components of distributable earnings on a tax basis, and late year ordinary losses and post-October capital losses deferred, if any, for tax purposes as of March 31, 2019:
| | | | | | | | | | | | | | | | | | | | | | | | | | | | | | | | |
| | | | | | Distributable Earning | | | | | | Late-Year Ordinary and
Post-October Losses Deferrals | |
| Fund | | Accumulated
Capital
Losses | | | Undistributed
Ordinary
Income | | | Undistributed
Long-Term
Capital Gains | | | | | | Late-Year
Ordinary
Losses | | | Short-Term
Capital
Losses | | | Long-Term
Capital
Losses | | | Total | |
Pacific Funds Portfolio Optimization Conservative | | | $— | | | | $78,457 | | | | $474,053 | | | | | | | | $— | | | | $— | | | | $— | | | | $— | |
Pacific Funds Portfolio OptimizationModerate-Conservative | | | — | | | | — | | | | 1,191,046 | | | | | | | | 265,871 | | | | — | | | | — | | | | 265,871 | |
Pacific Funds Portfolio Optimization Moderate | | | — | | | | — | | | | 36,583,909 | | | | | | | | 1,286,457 | | | | — | | | | — | | | | 1,286,457 | |
Pacific Funds Portfolio Optimization Growth | | | — | | | | — | | | | 41,074,489 | | | | | | | | 1,624,522 | | | | — | | | | — | | | | 1,624,522 | |
Pacific Funds Portfolio Optimization Aggressive-Growth | | | — | | | | — | | | | 17,856,281 | | | | | | | | 364,724 | | | | — | | | | — | | | | 364,724 | |
Pacific Funds Diversified Alternatives | | | (1,184,816 | ) | | | 4,512 | | | | — | | | | | | | | — | | | | — | | | | — | | | | — | |
Pacific Funds Short Duration Income | | | (2,538,276 | ) | | | 345,628 | | | | — | | | | | | | | — | | | | — | | | | — | | | | — | |
Pacific Funds Core Income | | | (22,574,194 | ) | | | 572,189 | | | | — | | | | | | | | — | | | | — | | | | — | | | | — | |
Pacific Funds Strategic Income | | | (10,252,266 | ) | | | 747,906 | | | | — | | | | | | | | — | | | | — | | | | — | | | | — | |
Pacific Funds Floating Rate Income | | | (54,035,929 | ) | | | 1,425,793 | | | | — | | | | | | | | — | | | | — | | | | — | | | | — | |
Pacific Funds High Income | | | (9,624,106 | ) | | | 84,552 | | | | — | | | | | | | | — | | | | — | | | | — | | | | — | |
Pacific Funds Large-Cap | | | — | | | | 43,380 | | | | — | | | | | | | | — | | | | 181,330 | | | | — | | | | 181,330 | |
Pacific Funds Large-Cap Value | | | — | | | | 77,863 | | | | 1,291,253 | | | | | | | | — | | | | 319,187 | | | | — | | | | 319,187 | |
Pacific Funds Small/Mid-Cap | | | — | | | | 117,516 | | | | — | | | | | | | | — | | | | 3,050,463 | | | | 1,826,908 | | | | 4,877,371 | |
Pacific Funds Small-Cap | | | — | | | | — | | | | — | | | | | | | | 16,454 | | | | 619,130 | | | | — | | | | 635,584 | |
Pacific Funds Small-Cap Value | | | — | | | | — | | | | — | | | | | | | | 4,052 | | | | 438,737 | | | | — | | | | 442,789 | |
Pacific Funds Small-Cap Growth | | | — | | | | — | | | | — | | | | | | | | 58,336 | | | | 1,213,535 | | | | — | | | | 1,271,871 | |
D-16
PACIFIC FUNDS
NOTES TO FINANCIAL STATEMENTS (Continued)
Accumulated capital losses represent net capital loss carryovers as of March 31, 2019 that may be available to offset future realized capital gains and thereby reduce future capital gains distributions. The following table shows the amounts of capital loss carryover, if any, by each of the applicable Funds as of March 31, 2019 and capital loss carryover from prior years utilized during the year or period ended March 31, 2019:
| | | | | | | | | | | | | | | | |
| | | Unlimited Period of Net Capital Loss Carryover | | | Accumulated
Capital Loss
Carryover | | | Capital Loss
Carryover Utilized
During the
Year Ended
March 31, 2019 | |
|
| Fund | | Short Term | | | Long Term | |
Pacific Funds Diversified Alternatives | | | ($790,301 | ) | | | ($394,515 | ) | | | ($1,184,816 | ) | | | $— | |
Pacific Funds Short Duration Income | | | (694,385 | ) | | | (1,843,891 | ) | | | (2,538,276 | ) | | | — | |
Pacific Funds Core Income | | | (8,959,078 | ) | | | (13,615,116 | ) | | | (22,574,194 | ) | | | — | |
Pacific Funds Strategic Income | | | (2,725,800 | ) | | | (7,526,466 | ) | | | (10,252,266 | ) | | | 680,941 | |
Pacific Funds Floating Rate Income | | | (8,051,085 | ) | | | (45,984,844 | ) | | | (54,035,929 | ) | | | — | |
Pacific Funds High Income | | | (3,919,736 | ) | | | (5,704,370 | ) | | | (9,624,106 | ) | | | — | |
The aggregate cost of investments and the composition of unrealized appreciation and depreciation on investments and net unrealized appreciation and/or depreciation on derivatives for Federal income tax purposes as of March 31, 2019, were as follows:
| | | | | | | | | | | | | | | | | | | | | | | | |
| Fund | | Total Cost of
Investments
on Tax Basis (1) | | | Gross
Unrealized
Appreciation
on Investments | | | Gross
Unrealized
Depreciation
on Investments | | | Net Unrealized
Appreciation
(Depreciation)
on Investments | | | Net Unrealized
Appreciation
(Depreciation)
on Other (2) | | | Net Unrealized
Appreciation
(Depreciation) | |
Pacific Funds Portfolio Optimization Conservative | | | $255,408,161 | | | | $5,057,374 | | | | ($4,498,723 | ) | | | $558,651 | | | | $— | | | | $558,651 | |
Pacific Funds Portfolio Optimization Moderate-Conservative | | | 369,561,121 | | | | 8,372,777 | | | | (5,354,350 | ) | | | 3,018,427 | | | | — | | | | 3,018,427 | |
Pacific Funds Portfolio Optimization Moderate | | | 1,103,714,358 | | | | 64,510,937 | | | | (15,774,511 | ) | | | 48,736,426 | | | | — | | | | 48,736,426 | |
Pacific Funds Portfolio Optimization Growth | | | 833,419,003 | | | | 66,213,056 | | | | (12,257,840 | ) | | | 53,955,216 | | | | — | | | | 53,955,216 | |
Pacific Funds Portfolio Optimization Aggressive-Growth | | | 286,933,585 | | | | 30,039,865 | | | | (5,654,720 | ) | | | 24,385,145 | | | | — | | | | 24,385,145 | |
Pacific Funds Diversified Alternatives | | | 29,362,113 | | | | 520,000 | | | | (1,642,093 | ) | | | (1,122,093 | ) | | | — | | | | (1,122,093 | ) |
Pacific Funds Short Duration Income | | | 727,069,543 | | | | 5,150,962 | | | | (1,822,884 | ) | | | 3,328,078 | | | | — | | | | 3,328,078 | |
Pacific Funds Core Income | | | 626,334,048 | | | | 9,782,434 | | | | (4,599,947 | ) | | | 5,182,487 | | | | — | | | | 5,182,487 | |
Pacific Funds Strategic Income | | | 594,730,475 | | | | 7,679,127 | | | | (12,901,377 | ) | | | (5,222,250 | ) | | | (1,655 | ) | | | (5,223,905 | ) |
Pacific Funds Floating Rate Income | | | 1,859,930,742 | | | | 2,276,963 | | | | (27,677,770 | ) | | | (25,400,807 | ) | | | (44,140 | ) | | | (25,444,947 | ) |
Pacific Funds High Income | | | 135,285,432 | | | | 1,211,651 | | | | (1,649,774 | ) | | | (438,123 | ) | | | (165 | ) | | | (438,288 | ) |
Pacific Funds Large-Cap | | | 16,976,052 | | | | 3,342,037 | | | | (574,438 | ) | | | 2,767,599 | | | | — | | | | 2,767,599 | |
Pacific Funds Large-Cap Value | | | 15,003,690 | | | | 3,826,668 | | | | (429,259 | ) | | | 3,397,409 | | | | — | | | | 3,397,409 | |
Pacific Funds Small/Mid-Cap | | | 342,426,994 | | | | 48,687,230 | | | | (16,649,517 | ) | | | 32,037,713 | | | | — | | | | 32,037,713 | |
Pacific Funds Small-Cap | | | 17,865,579 | | | | 3,122,130 | | | | (1,197,444 | ) | | | 1,924,686 | | | | — | | | | 1,924,686 | |
Pacific Funds Small-Cap Value | | | 15,882,756 | | | | 2,592,621 | | | | (1,157,416 | ) | | | 1,435,205 | | | | — | | | | 1,435,205 | |
Pacific Funds Small-Cap Growth | | | 30,278,105 | | | | 7,753,935 | | | | (2,544,307 | ) | | | 5,209,628 | | | | — | | | | 5,209,628 | |
| | (1) | The difference between the total cost of investments on tax basis and investments, at cost, as presented in the Statements of Assets and Liabilities is primarily due to wash sale loss deferrals. |
| | (2) | Other includes net appreciation or depreciation on derivatives, short sales, and foreign currencies, if any. |
Each Fund recognizes the financial statement effects of a tax position taken or expected to be taken in a tax return when it is more likely than not, based on the technical merits, that the position will be sustained upon examination by the applicable tax authority. Tax positions not deemed to meet the more-likely-than-not threshold would be recorded as a tax liability for unrecognized tax benefits with a corresponding income tax expense. Management has analyzed all open tax years, as defined by the statute of limitations, for all major jurisdictions and has determined that no provision for income tax is required in the financial statements. Each Fund remains subject to examination by Federal and State tax authorities for the returns filed for tax years ended as of and after March 31, 2015.
D-17
PACIFIC FUNDS
NOTES TO FINANCIAL STATEMENTS (Continued)
11. TAX CHARACTER OF DISTRIBUTIONS
The tax character of income and capital gains distributions to shareholders during the fiscal years ended March 31, 2019 and 2018, were as follows:
| | | | | | | | | | | | | | | | | | | | | | | | | | | | |
| | | For the Year Ended March 31, 2019 | | | | | | For the Year Ended March 31, 2018 | |
| Fund | | Ordinary
Income | | | Long-Term
Capital Gains | | | Total
Distributions | | | | | | Ordinary
Income | | | Long-Term
Capital Gains | | | Total
Distributions | |
Pacific Funds Portfolio Optimization Conservative | | | $4,642,221 | | | | $23,187,289 | | | | $27,829,510 | | | | | | | | $5,864,391 | | | | $— | | | | $5,864,391 | |
Pacific Funds Portfolio Optimization Moderate-Conservative | | | 6,200,006 | | | | 57,672,779 | | | | 63,872,785 | | | | | | | | 8,726,055 | | | | 4,984,858 | | | | 13,710,913 | |
Pacific Funds Portfolio Optimization Moderate | | | 19,771,780 | | | | 190,255,666 | | | | 210,027,446 | | | | | | | | 19,841,711 | | | | 28,960,888 | | | | 48,802,599 | |
Pacific Funds Portfolio Optimization Growth | | | 13,505,156 | | | | 162,160,174 | | | | 175,665,330 | | | | | | | | 13,468,839 | | | | 24,973,889 | | | | 38,442,728 | |
Pacific Funds Portfolio Optimization Aggressive-Growth | | | 4,899,802 | | | | 54,028,116 | | | | 58,927,918 | | | | | | | | 3,290,514 | | | | 9,452,563 | | | | 12,743,077 | |
Pacific Funds Diversified Alternatives | | | 200,331 | | | | 211,070 | | | | 411,401 | | | | | | | | 642,859 | | | | — | | | | 642,859 | |
Pacific Funds Short Duration Income | | | 13,498,890 | | | | — | | | | 13,498,890 | | | | | | | | 7,264,060 | | | | — | | | | 7,264,060 | |
Pacific Funds Core Income | | | 20,673,956 | | | | — | | | | 20,673,956 | | | | | | | | 20,400,769 | | | | — | | | | 20,400,769 | |
Pacific Funds Strategic Income | | | 25,561,308 | | | | — | | | | 25,561,308 | | | | | | | | 16,016,399 | | | | — | | | | 16,016,399 | |
Pacific Funds Floating Rate Income | | | 89,807,013 | | | | — | | | | 89,807,013 | | | | | | | | 51,890,071 | | | | — | | | | 51,890,071 | |
Pacific Funds High Income | | | 3,988,717 | | | | — | | | | 3,988,717 | | | | | | | | 1,400,258 | | | | — | | | | 1,400,258 | |
Pacific Funds Large-Cap | | | 262,635 | | | | 636,907 | | | | 899,542 | | | | | | | | 99,599 | | | | 91,459 | | | | 191,058 | |
Pacific Funds Large-Cap Value | | | 468,565 | | | | 1,464,784 | | | | 1,933,349 | | | | | | | | 787,226 | | | | 285,516 | | | | 1,072,742 | |
Pacific Funds Small/Mid-Cap | | | 23,990 | | | | 6,986,929 | | | | 7,010,919 | | | | | | | | 158,695 | | | | 46,194 | | | | 204,889 | |
Pacific Funds Small-Cap | | | 171,014 | | | | 887,627 | | | | 1,058,641 | | | | | | | | 130,030 | | | | 129,971 | | | | 260,001 | |
Pacific Funds Small-Cap Value | | | 528,529 | | | | 3,453,991 | | | | 3,982,520 | | | | | | | | 2,228,046 | | | | 692,924 | | | | 2,920,970 | |
Pacific Funds Small-Cap Growth | | | 555,700 | | | | 4,368,444 | | | | 4,924,144 | | | | | | | | 508,907 | | | | 1,004,117 | | | | 1,513,024 | |
12. RECLASSIFICATIONS OF ACCOUNTS
During the fiscal year ended March 31, 2019, reclassifications as shown in the following table have been made in each Fund’s capital accounts to report these balances on a tax basis, excluding certain temporary differences, as of March 31, 2019. Additional adjustments may be required in subsequent reporting periods. These reclassifications, which have no impact on the NAV of the Funds, are primarily attributable to non-deductible expenses, swap income, redesignation of dividends paid, partnerships, defaulted bonds, and short-term capital gains received under Federal tax rules, versus U.S. GAAP. The calculation net investment income per share in the financial highlights excludes these adjustments.
| | | | | | | | | | | | |
| Fund | | Paid-In Capital | | | Undistributed/
Accumulated
Net Investment
Income (Loss) | | | Undistributed/
Accumulated
Net Realized
Gain (Loss) | |
Pacific Funds Portfolio Optimization Conservative | | | ($17 | ) | | | $462,588 | | | | ($462,571 | ) |
Pacific Funds Portfolio Optimization Moderate-Conservative | | | (39 | ) | | | 1,274,662 | | | | (1,274,623 | ) |
Pacific Funds Portfolio Optimization Moderate | | | (145 | ) | | | 7,816,687 | | | | (7,816,542 | ) |
Pacific Funds Portfolio Optimization Growth | | | (95 | ) | | | 6,935,703 | | | | (6,935,608 | ) |
Pacific Funds Portfolio Optimization Aggressive-Growth | | | 38 | | | | 3,597,653 | | | | (3,597,691 | ) |
Pacific Funds Diversified Alternatives | | | — | | | | 56,219 | | | | (56,219 | ) |
Pacific Funds Short Duration Income | | | — | | | | (49,938 | ) | | | 49,938 | |
Pacific Funds Core Income | | | — | | | | (49,272 | ) | | | 49,272 | |
Pacific Funds Strategic Income | | | (3,636 | ) | | | (105,847 | ) | | | 109,483 | |
Pacific Funds High Income | | | (606 | ) | | | 1,467 | | | | (861 | ) |
Pacific Funds Large-Cap | | | — | | | | (257 | ) | | | 257 | |
Pacific Funds Large-Cap Value | | | — | | | | (198 | ) | | | 198 | |
Pacific Funds Small/Mid-Cap | | | — | | | | (398 | ) | | | 398 | |
Pacific Funds Small-Cap | | | (855 | ) | | | 10,710 | | | | (9,855 | ) |
Pacific Funds Small-Cap Value | | | — | | | | (437 | ) | | | 437 | |
Pacific Funds Small-Cap Growth | | | (50,283 | ) | | | 227,118 | | | | (176,835 | ) |
D-18
PACIFIC FUNDS
NOTES TO FINANCIAL STATEMENTS (Continued)
13. SHARES OF BENEFICIAL INTEREST
Each Fund is authorized to issue an unlimited number of shares of beneficial interest with no par value unless otherwise determined by the trustees of the Board. Changes in shares of beneficial interest of each Fund for the fiscal year or period ended March 31, 2019 and 2018, were as follows:
| | | | | | | | | | | | | | | | | | | | | | | | | | | | | | | | | | | | | | | | | | | | |
| | | Pacific Funds Portfolio
Optimization Conservative (1) | | | | | | Pacific Funds Portfolio
Optimization
Moderate-Conservative (1) | | | | | | Pacific Funds Portfolio
Optimization Moderate (1) | | | | | | Pacific Funds Portfolio
Optimization Growth (1) | |
| | | Year Ended
3/31/2019 | | | Year Ended
3/31/2018 | | | | | | Year Ended
3/31/2019 | | | Year Ended
3/31/2018 | | | | | | Year Ended
3/31/2019 | | | Year Ended
3/31/2018 | | | | | | Year Ended
3/31/2019 | | | Year Ended
3/31/2018 | |
| | | | | | | | | | | |
Class A | | | | | | | | | | | | | | | | | | | | | | | | | | | | | | | | | | | | | | | | | | | | |
Shares sold | | | 1,597,168 | | | | 1,862,768 | | | | | | | | 1,937,860 | | | | 2,219,877 | | | | | | | | 5,162,968 | | | | 4,573,013 | | | | | | | | 3,767,426 | | | | 3,358,865 | |
Dividends and distribution reinvested | | | 1,257,417 | | | | 251,720 | | | | | | | | 3,178,474 | | | | 567,952 | | | | | | | | 9,730,329 | | | | 1,840,517 | | | | | | | | 8,167,065 | | | | 1,421,816 | |
Shares repurchased | | | (3,103,888 | ) | | | (2,925,798 | ) | | | | | | | (4,994,834 | ) | | | (4,098,294 | ) | | | | | | | (10,845,624 | ) | | | (10,664,851 | ) | | | | | | | (7,456,705 | ) | | | (7,232,106 | ) |
Converted from Class R shares | | | 420,991 | | | | — | | | | | | | | 468,319 | | | | — | | | | | | | | 1,861,409 | | | | — | | | | | | | | 1,066,096 | | | | — | |
Net increase (decrease) | | | 171,688 | | | | (811,310 | ) | | | | | | | 589,819 | | | | (1,310,465 | ) | | | | | | | 5,909,082 | | | | (4,251,321 | ) | | | | | | | 5,543,882 | | | | (2,451,425 | ) |
Beginning shares outstanding | | | 11,658,921 | | | | 12,470,231 | | | | | | | | 18,077,695 | | | | 19,388,160 | | | | | | | | 48,445,092 | | | | 52,696,413 | | | | | | | | 35,912,645 | | | | 38,364,070 | |
Ending shares outstanding | | | 11,830,609 | | | | 11,658,921 | | | | | | | | 18,667,514 | | | | 18,077,695 | | | | | | | | 54,354,174 | | | | 48,445,092 | | | | | | | | 41,456,527 | | | | 35,912,645 | |
| | | | | | | | | | | |
Class B | | | | | | | | | | | | | | | | | | | | | | | | | | | | | | | | | | | | | | | | | | | | |
Shares sold | | | 63,288 | | | | 96,799 | | | | | | | | 26,848 | | | | 68,406 | | | | | | | | 64,612 | | | | 173,280 | | | | | | | | 46,713 | | | | 156,935 | |
Dividends and distribution reinvested | | | 186,621 | | | | 36,347 | | | | | | | | 476,846 | | | | 84,578 | | | | | | | | 1,460,526 | | | | 285,597 | | | | | | | | 1,137,653 | | | | 205,810 | |
Shares repurchased | | | (825,329 | ) | | | (658,988 | ) | | | | | | | (994,617 | ) | | | (756,471 | ) | | | | | | | (2,427,834 | ) | | | (1,905,989 | ) | | | | | | | (1,701,102 | ) | | | (1,336,648 | ) |
Net increase (decrease) | | | (575,420 | ) | | | (525,842 | ) | | | | | | | (490,923 | ) | | | (603,487 | ) | | | | | | | (902,696 | ) | | | (1,447,112 | ) | | | | | | | (516,736 | ) | | | (973,903 | ) |
Beginning shares outstanding | | | 2,236,374 | | | | 2,762,216 | | | | | | | | 3,159,284 | | | | 3,762,771 | | | | | | | | 8,522,666 | | | | 9,969,778 | | | | | | | | 5,839,928 | | | | 6,813,831 | |
Ending shares outstanding | | | 1,660,954 | | | | 2,236,374 | | | | | | | | 2,668,361 | | | | 3,159,284 | | | | | | | | 7,619,970 | | | | 8,522,666 | | | | | | | | 5,323,192 | | | | 5,839,928 | |
| | | | | | | | | | | |
Class C | | | | | | | | | | | | | | | | | | | | | | | | | | | | | | | | | | | | | | | | | | | | |
Shares sold | | | 1,043,597 | | | | 1,302,659 | | | | | | | | 960,955 | | | | 888,220 | | | | | | | | 1,880,807 | | | | 2,134,712 | | | | | | | | 1,424,262 | | | | 1,500,550 | |
Dividends and distribution reinvested | | | 1,232,997 | | | | 195,310 | | | | | | | | 2,331,644 | | | | 378,552 | | | | | | | | 6,244,815 | | | | 1,098,406 | | | | | | | | 4,590,292 | | | | 734,622 | |
Shares repurchased | | | (3,578,110 | ) | | | (3,293,276 | ) | | | | | | | (4,376,803 | ) | | | (3,774,978 | ) | | | | | | | (8,912,732 | ) | | | (8,262,627 | ) | | | | | | | (5,149,545 | ) | | | (5,498,751 | ) |
Net increase (decrease) | | | (1,301,516 | ) | | | (1,795,307 | ) | | | | | | | (1,084,204 | ) | | | (2,508,206 | ) | | | | | | | (787,110 | ) | | | (5,029,509 | ) | | | | | | | 865,009 | | | | (3,263,579 | ) |
Beginning shares outstanding | | | 12,463,008 | | | | 14,258,315 | | | | | | | | 14,163,892 | | | | 16,672,098 | | | | | | | | 33,182,283 | | | | 38,211,792 | | | | | | | | 20,904,013 | | | | 24,167,592 | |
Ending shares outstanding | | | 11,161,492 | | | | 12,463,008 | | | | | | | | 13,079,688 | | | | 14,163,892 | | | | | | | | 32,395,173 | | | | 33,182,283 | | | | | | | | 21,769,022 | | | | 20,904,013 | |
| | | | | | | | | | | |
Class R | | | | | | | | | | | | | | | | | | | | | | | | | | | | | | | | | | | | | | | | | | | | |
Shares sold | | | 61,451 | | | | 169,031 | | | | | | | | 52,493 | | | | 52,403 | | | | | | | | 298,466 | | | | 452,515 | | | | | | | | 128,201 | | | | 153,184 | |
Dividends and distribution reinvested | | | 47,513 | | | | 10,522 | | | | | | | | 79,531 | | | | 12,463 | | | | | | | | 337,098 | | | | 64,753 | | | | | | | | 208,360 | | | | 40,288 | |
Shares repurchased | | | (133,625 | ) | | | (496,622 | ) | | | | | | | (71,303 | ) | | | (141,956 | ) | | | | | | | (465,670 | ) | | | (592,663 | ) | | | | | | | (271,319 | ) | | | (241,006 | ) |
Converted to Class A shares | | | (424,537 | ) | | | — | | | | | | | | (472,409 | ) | | | — | | | | | | | | (1,870,573 | ) | | | — | | | | | | | | (1,070,764 | ) | | | — | |
Net increase (decrease) | | | (449,198 | ) | | | (317,069 | ) | | | | | | | (411,688 | ) | | | (77,090 | ) | | | | | | | (1,700,679 | ) | | | (75,395 | ) | | | | | | | (1,005,522 | ) | | | (47,534 | ) |
Beginning shares outstanding | | | 449,198 | | | | 766,267 | | | | | | | | 411,688 | | | | 488,778 | | | | | | | | 1,700,679 | | | | 1,776,074 | | | | | | | | 1,005,522 | | | | 1,053,056 | |
Ending shares outstanding | | | — | | | | 449,198 | | | | | | | | — | | | | 411,688 | | | | | | | | — | | | | 1,700,679 | | | | | | | | — | | | | 1,005,522 | |
| | | | | | | | | | | |
Advisor Class | | | | | | | | | | | | | | | | | | | | | | | | | | | | | | | | | | | | | | | | | | | | |
Shares sold | | | 299,940 | | | | 645,171 | | | | | | | | 508,196 | | | | 223,680 | | | | | | | | 1,257,594 | | | | 960,627 | | | | | | | | 1,022,418 | | | | 442,524 | |
Dividends and distribution reinvested | | | 79,399 | | | | 11,476 | | | | | | | | 102,586 | | | | 11,659 | | | | | | | | 418,832 | | | | 55,742 | | | | | | | | 356,472 | | | | 38,927 | |
Shares repurchased | | | (429,827 | ) | | | (425,881 | ) | | | | | | | (306,020 | ) | | | (223,525 | ) | | | | | | | (1,054,902 | ) | | | (713,947 | ) | | | | | | | (910,814 | ) | | | (338,539 | ) |
Net increase (decrease) | | | (50,488 | ) | | | 230,766 | | | | | | | | 304,762 | | | | 11,814 | | | | | | | | 621,524 | | | | 302,422 | | | | | | | | 468,076 | | | | 142,912 | |
Beginning shares outstanding | | | 722,168 | | | | 491,402 | | | | | | | | 411,763 | | | | 399,949 | | | | | | | | 1,615,701 | | | | 1,313,279 | | | | | | | | 1,049,862 | | | | 906,950 | |
Ending shares outstanding | | | 671,680 | | | | 722,168 | | | | | | | | 716,525 | | | | 411,763 | | | | | | | | 2,237,225 | | | | 1,615,701 | | | | | | | | 1,517,938 | | | | 1,049,862 | |
D-19
PACIFIC FUNDS
NOTES TO FINANCIAL STATEMENTS (Continued)
| | | | | | | | | | | | | | | | | | | | | | | | | | | | | | | | | | | | | | | | | | | | |
| | | Pacific Funds Portfolio
Optimization Aggressive-Growth (1) | | | | | | Pacific Funds
Diversified Alternatives | | | | | | Pacific Funds
Short Duration Income | | | | | | Pacific Funds
Core Income | |
| | | Year Ended
3/31/2019 | | | Year Ended
3/31/2018 | | | | | | Year Ended
3/31/2019 | | | Year Ended
3/31/2018 | | | | | | Year Ended
3/31/2019 | | | Year Ended
3/31/2018 | | | | | | Year Ended
3/31/2019 | | | Year Ended
3/31/2018 | |
| | | | | | | | | | | |
Class A | | | | | | | | | | | | | | | | | | | | | | | | | | | | | | | | | | | | | | | | | | | | |
Shares sold | | | 1,335,888 | | | | 1,046,502 | | | | | | | | 145,343 | | | | 259,543 | | | | | | | | 6,906,877 | | | | 5,645,132 | | | | | | | | 1,795,140 | | | | 2,853,778 | |
Dividends and distribution reinvested | | | 2,541,596 | | | | 438,169 | | | | | | | | 5,158 | | | | 9,360 | | | | | | | | 195,764 | | | | 145,784 | | | | | | | | 274,431 | | | | 320,338 | |
Shares repurchased | | | (1,862,315 | ) | | | (1,719,876 | ) | | | | | | | (241,054 | ) | | | (48,684 | ) | | | | | | | (4,760,683 | ) | | | (3,072,099 | ) | | | | | | | (6,891,164 | ) | | | (5,788,158 | ) |
Converted from Class R shares | | | 415,846 | | | | — | | | | | | | | | | | | | | | | | | | | | | | | | | | | | | | | | | | | | |
Net increase (decrease) | | | 2,431,015 | | | | (235,205 | ) | | | | | | | (90,553 | ) | | | 220,219 | | | | | | | | 2,341,958 | | | | 2,718,817 | | | | | | | | (4,821,593 | ) | | | (2,614,042 | ) |
Beginning shares outstanding | | | 11,150,086 | | | | 11,385,291 | | | | | | | | 493,040 | | | | 272,821 | | | | | | | | 9,201,812 | | | | 6,482,995 | | | | | | | | 12,628,391 | | | | 15,242,433 | |
Ending shares outstanding | | | 13,581,101 | | | | 11,150,086 | | | | | | | | 402,487 | | | | 493,040 | | | | | | | | 11,543,770 | | | | 9,201,812 | | | | | | | | 7,806,798 | | | | 12,628,391 | |
| | | | | | | | | | | |
Class B | | | | | | | | | | | | | | | | | | | | | | | | | | | | | | | | | | | | | | | | | | | | |
Shares sold | | | 19,924 | | | | 65,522 | | | | | | | | | | | | | | | | | | | | | | | | | | | | | | | | | | | | | |
Dividends and distribution reinvested | | | 319,371 | | | | 59,328 | | | | | | | | | | | | | | | | | | | | | | | | | | | | | | | | | | | | | |
Shares repurchased | | | (449,268 | ) | | | (427,490 | ) | | | | | | | | | | | | | | | | | | | | | | | | | | | | | | | | | | | | |
Net increase (decrease) | | | (109,973 | ) | | | (302,640 | ) | | | | | | | | | | | | | | | | | | | | | | | | | | | | | | | | | | | | |
Beginning shares outstanding | | | 1,634,770 | | | | 1,937,410 | | | | | | | | | | | | | | | | | | | | | | | | | | | | | | | | | | | | | |
Ending shares outstanding | | | 1,524,797 | | | | 1,634,770 | | | | | | | | | | | | | | | | | | | | | | | | | | | | | | | | | | | | | |
| | | | | | | | | | | |
Class C | | | | | | | | | | | | | | | | | | | | | | | | | | | | | | | | | | | | | | | | | | | | |
Shares sold | | | 536,522 | | | | 789,991 | | | | | | | | 49,757 | | | | 212,173 | | | | | | | | 1,561,216 | | | | 1,455,593 | | | | | | | | 758,103 | | | | 1,034,435 | |
Dividends and distribution reinvested | | | 1,266,010 | | | | 206,344 | | | | | | | | 2,153 | | | | 5,700 | | | | | | | | 71,193 | | | | 47,646 | | | | | | | | 190,738 | | | | 170,753 | |
Shares repurchased | | | (1,494,004 | ) | | | (1,550,277 | ) | | | | | | | (44,642 | ) | | | (55,446 | ) | | | | | | | (1,482,348 | ) | | | (1,347,545 | ) | | | | | | | (2,896,942 | ) | | | (2,995,730 | ) |
Net increase (decrease) | | | 308,528 | | | | (553,942 | ) | | | | | | | 7,268 | | | | 162,427 | | | | | | | | 150,061 | | | | 155,694 | | | | | | | | (1,948,101 | ) | | | (1,790,542 | ) |
Beginning shares outstanding | | | 5,899,237 | | | | 6,453,179 | | | | | | | | 314,093 | | | | 151,666 | | | | | | | | 4,339,492 | | | | 4,183,798 | | | | | | | | 9,674,451 | | | | 11,464,993 | |
Ending shares outstanding | | | 6,207,765 | | | | 5,899,237 | | | | | | | | 321,361 | | | | 314,093 | | | | | | | | 4,489,553 | | | | 4,339,492 | | | | | | | | 7,726,350 | | | | 9,674,451 | |
| | | | | | | | | | | |
Class I | | | | | | | | | | | | | | | | | | | | | | | | | | | | | | | | | | | | | | | | | | | | |
Shares sold | | | | | | | | | | | | | | | | | | | | | | | | | | | 8,258,360 | | | | 260,960 | | | | | | | | 2,299,766 | | | | 139,908 | |
Dividends and distribution reinvested | | | | | | | | | | | | | | | | | | | | | | | | | | | 98,905 | | | | 8,683 | | | | | | | | 48,616 | | | | 13,088 | |
Shares repurchased | | | | | | | | | | | | | | | | | | | | | | | | | | | (671,956 | ) | | | (176,849 | ) | | | | | | | (256,700 | ) | | | (172,027 | ) |
Net increase (decrease) | | | | | | | | | | | | | | | | | | | | | | | | | | | 7,685,309 | | | | 92,794 | | | | | | | | 2,091,682 | | | | (19,031 | ) |
Beginning shares outstanding | | | | | | | | | | | | | | | | | | | | | | | | | | | 423,459 | | | | 330,665 | | | | | | | | 414,745 | | | | 433,776 | |
Ending shares outstanding | | | | | | | | | | | | | | | | | | | | | | | | | | | 8,108,768 | | | | 423,459 | | | | | | | | 2,506,427 | | | | 414,745 | |
| | | | | | | | | | | |
Class P | | | | | | | | | | | | | | | | | | | | | | | | | | | | | | | | | | | | | | | | | | | | |
Shares sold | | | | | | | | | | | | | | | | | | | | | | | | | | | | | | | | | | | | | | | 572,904 | | | | 99,141 | |
Dividends and distribution reinvested | | | | | | | | | | | | | | | | | | | | | | | | | | | | | | | | | | | | | | | 178,230 | | | | 300,661 | |
Shares repurchased | | | | | | | | | | | | | | | | | | | | | | | | | | | | | | | | | | | | | | | (3,271,812 | ) | | | (5,627,239 | ) |
Net increase (decrease) | | | | | | | | | | | | | | | | | | | | | | | | | | | | | | | | | | | | | | | (2,520,678 | ) | | | (5,227,437 | ) |
Beginning shares outstanding | | | | | | | | | | | | | | | | | | | | | | | | | | | | | | | | | | | | | | | 6,361,862 | | | | 11,589,299 | |
Ending shares outstanding | | | | | | | | | | | | | | | | | | | | | | | | | | | | | | | | | | | | | | | 3,841,184 | | | | 6,361,862 | |
| | | | | | | | | | | |
Class R | | | | | | | | | | | | | | | | | | | | | | | | | | | | | | | | | | | | | | | | | | | | |
Shares sold | | | 67,161 | | | | 91,655 | | | | | | | | | | | | | | | | | | | | | | | | | | | | | | | | | | | | | |
Dividends and distribution reinvested | | | 79,068 | | | | 18,141 | | | | | | | | | | | | | | | | | | | | | | | | | | | | | | | | | | | | | |
Shares repurchased | | | (173,616 | ) | | | (128,684 | ) | | | | | | | | | | | | | | | | | | | | | | | | | | | | | | | | | | | | |
Converted to Class A shares | | | (419,559 | ) | | | — | | | | | | | | | | | | | | | | | | | | | | | | | | | | | | | | | | | | | |
Net increase (decrease) | | | (446,946 | ) | | | (18,888 | ) | | | | | | | | | | | | | | | | | | | | | | | | | | | | | | | | | | | | |
Beginning shares outstanding | | | 446,946 | | | | 465,834 | | | | | | | | | | | | | | | | | | | | | | | | | | | | | | | | | | | | | |
Ending shares outstanding | | | — | | | | 446,946 | | | | | | | | | | | | | | | | | | | | | | | | | | | | | | | | | | | | | |
| | | | | | | | | | | |
Advisor Class | | | | | | | | | | | | | | | | | | | | | | | | | | | | | | | | | | | | | | | | | | | | |
Shares sold | | | 438,835 | | | | 244,236 | | | | | | | | 1,575,973 | | | | 2,584,747 | | | | | | | | 37,658,195 | | | | 24,113,523 | | | | | | | | 20,320,549 | | | | 24,984,787 | |
Dividends and distribution reinvested | | | 171,437 | | | | 21,172 | | | | | | | | 37,227 | | | | 49,465 | | | | | | | | 879,181 | | | | 442,376 | | | | | | | | 890,108 | | | | 738,996 | |
Shares repurchased | | | (440,195 | ) | | | (128,735 | ) | | | | | | | (2,642,015 | ) | | | (252,423 | ) | | | | | | | (18,219,176 | ) | | | (13,714,412 | ) | | | | | | | (20,984,812 | ) | | | (20,688,961 | ) |
Net increase (decrease) | | | 170,077 | | | | 136,673 | | | | | | | | (1,028,815 | ) | | | 2,381,789 | | | | | | | | 20,318,200 | | | | 10,841,487 | | | | | | | | 225,845 | | | | 5,034,822 | |
Beginning shares outstanding | | | 589,743 | | | | 453,070 | | | | | | | | 3,293,511 | | | | 911,722 | | | | | | | | 26,593,196 | | | | 15,751,709 | | | | | | | | 37,106,318 | | | | 32,071,496 | |
Ending shares outstanding | | | 759,820 | | | | 589,743 | | | | | | | | 2,264,696 | | | | 3,293,511 | | | | | | | | 46,911,396 | | | | 26,593,196 | | | | | | | | 37,332,163 | | | | 37,106,318 | |
D-20
PACIFIC FUNDS
NOTES TO FINANCIAL STATEMENTS (Continued)
| | | | | | | | | | | | | | | | | | | | | | | | | | | | | | | | | | | | | | | | | | | | |
| | | Pacific Funds
Strategic Income | | | | | | Pacific Funds
Floating Rate Income | | | | | | Pacific Funds
High Income | | | | | | Pacific Funds
Large Cap (2) | |
| | | Year Ended
3/31/2019 | | | Year Ended
3/31/2018 | | | | | | Year Ended
3/31/2019 | | | Year Ended
3/31/2018 | | | | | | Year Ended
3/31/2019 | | | Year Ended
3/31/2018 | | | | | | Year Ended
3/31/2019 | | | Year Ended
3/31/2018 | |
| | | | | | | | | | | |
Class A | | | | | | | | | | | | | | | | | | | | | | | | | | | | | | | | | | | | | | | | | | | | |
Shares sold | | | 2,341,369 | | | | 2,876,142 | | | | | | | | 10,387,541 | | | | 8,217,926 | | | | | | | | 318,509 | | | | 340,288 | | | | | | | | 386,615 | | | | 240,285 | |
Dividends and distribution reinvested | | | 230,963 | | | | 190,685 | | | | | | | | 945,317 | | | | 758,911 | | | | | | | | 28,421 | | | | 27,282 | | | | | | | | 24,568 | | | | 5,266 | |
Shares repurchased | | | (3,490,755 | ) | | | (2,600,456 | ) | | | | | | | (11,448,005 | ) | | | (8,747,944 | ) | | | | | | | (367,358 | ) | | | (380,058 | ) | | | | | | | (191,324 | ) | | | (258,602 | ) |
Converted from Investor Class shares | | | | | | | | | | | | | | | | | | | | | | | | | | | | | | | | | | | | | | | 25,599 | | | | — | |
Net increase (decrease) | | | (918,423 | ) | | | 466,371 | | | | | | | | (115,147 | ) | | | 228,893 | | | | | | | | (20,428 | ) | | | (12,488 | ) | | | | | | | 245,458 | | | | (13,051 | ) |
Beginning shares outstanding | | | 6,719,202 | | | | 6,252,831 | | | | | | | | 20,647,447 | | | | 20,418,554 | | | | | | | | 534,053 | | | | 546,541 | | | | | | | | 402,170 | | | | 415,221 | |
Ending shares outstanding | | | 5,800,779 | | | | 6,719,202 | | | | | | | | 20,532,300 | | | | 20,647,447 | | | | | | | | 513,625 | | | | 534,053 | | | | | | | | 647,628 | | | | 402,170 | |
| | | | | | | | | | | |
Class C | | | | | | | | | | | | | | | | | | | | | | | | | | | | | | | | | | | | | | | | | | | | |
Shares sold | | | 1,602,978 | | | | 1,785,872 | | | | | | | | 5,608,379 | | | | 4,575,555 | | | | | | | | 70,178 | | | | 73,339 | | | | | | | | 92,449 | | | | 86,657 | |
Dividends and distribution reinvested | | | 173,947 | | | | 127,294 | | | | | | | | 777,998 | | | | 566,096 | | | | | | | | 18,823 | | | | 20,241 | | | | | | | | 13,973 | | | | 1,836 | |
Shares repurchased | | | (1,605,346 | ) | | | (1,235,156 | ) | | | | | | | (5,331,948 | ) | | | (4,042,161 | ) | | | | | | | (151,227 | ) | | | (128,162 | ) | | | | | | | (82,407 | ) | | | (52,654 | ) |
Net increase (decrease) | | | 171,579 | | | | 678,010 | | | | | | | | 1,054,429 | | | | 1,099,490 | | | | | | | | (62,226 | ) | | | (34,582 | ) | | | | | | | 24,015 | | | | 35,839 | |
Beginning shares outstanding | | | 5,370,759 | | | | 4,692,749 | | | | | | | | 18,925,609 | | | | 17,826,119 | | | | | | | | 432,577 | | | | 467,159 | | | | | | | | 290,044 | | | | 254,205 | |
Ending shares outstanding | | | 5,542,338 | | | | 5,370,759 | | | | | | | | 19,980,038 | | | | 18,925,609 | | | | | | | | 370,351 | | | | 432,577 | | | | | | | | 314,059 | | | | 290,044 | |
| | | | | | | | | | | |
Class I | | | | | | | | | | | | | | | | | | | | | | | | | | | | | | | | | | | | | | | | | | | | |
Shares sold | | | 266,253 | | | | 225,115 | | | | | | | | 41,819,219 | | | | 12,933,593 | | | | | | | | 4,184 | | | | 44,474 | | | | | | | | | | | | | |
Dividends and distribution reinvested | | | 21,679 | | | | 12,568 | | | | | | | | 1,441,669 | | | | 607,872 | | | | | | | | 1,133 | | | | 12,101 | | | | | | | | | | | | | |
Shares repurchased | | | (106,987 | ) | | | (103,454 | ) | | | | | | | (22,046,425 | ) | | | (9,085,917 | ) | | | | | | | (8,590 | ) | | | (545,262 | ) | | | | | | | | | | | | |
Net increase (decrease) | | | 180,945 | | | | 134,229 | | | | | | | | 21,214,463 | | | | 4,455,548 | | | | | | | | (3,273 | ) | | | (488,687 | ) | | | | | | | | | | | | |
Beginning shares outstanding | | | 364,609 | | | | 230,380 | | | | | | | | 29,034,423 | | | | 24,578,875 | | | | | | | | 20,807 | | | | 509,494 | | | | | | | | | | | | | |
Ending shares outstanding | | | 545,554 | | | | 364,609 | | | | | | | | 50,248,886 | | | | 29,034,423 | | | | | | | | 17,534 | | | | 20,807 | | | | | | | | | | | | | |
| | | | | | | | | | | |
Class P | | | | | | | | | | | | | | | | | | | | | | | | | | | | | | | | | | | | | | | | | | | | |
Shares sold | | | | | | | | | | | | | | | 228,488 | | | | 681,526 | | | | | | | | 6,546,223 | | | | 5,887,930 | | | | | | | | | | | | | |
Dividends and distribution reinvested | | | | | | | | | | | | | | | 270,242 | | | | 321,026 | | | | | | | | 335,872 | | | | 63,442 | | | | | | | | | | | | | |
Shares repurchased | | | | | | | | | | | | | | | (3,616,047 | ) | | | (2,374,473 | ) | | | | | | | (2,318,220 | ) | | | (194,186 | ) | | | | | | | | | | | | |
Net increase (decrease) | | | | | | | | | | | | | | | (3,117,317 | ) | | | (1,371,921 | ) | | | | | | | 4,563,875 | | | | 5,757,186 | | | | | | | | | | | | | |
Beginning shares outstanding | | | | | | | | | | | | | | | 6,368,950 | | | | 7,740,871 | | | | | | | | 6,791,699 | | | | 1,034,513 | | | | | | | | | | | | | |
Ending shares outstanding | | | | | | | | | | | | | | | 3,251,633 | | | | 6,368,950 | | | | | | | | 11,355,574 | | | | 6,791,699 | | | | | | | | | | | | | |
| | | | | | | | | | | |
Advisor Class | | | | | | | | | | | | | | | | | | | | | | | | | | | | | | | | | | | | | | | | | | | | |
Shares sold | | | 27,129,988 | | | | 27,902,838 | | | | | | | | 64,917,350 | | | | 44,928,526 | | | | | | | | 268,474 | | | | 146,665 | | | | | | | | 116,828 | | | | 774,299 | |
Dividends and distribution reinvested | | | 1,470,432 | | | | 876,500 | | | | | | | | 3,974,259 | | | | 2,003,170 | | | | | | | | 14,645 | | | | 11,534 | | | | | | | | 33,826 | | | | 6,060 | |
Shares repurchased | | | (23,396,524 | ) | | | (11,306,609 | ) | | | | | | | (55,606,814 | ) | | | (20,747,337 | ) | | | | | | | (163,761 | ) | | | (137,360 | ) | | | | | | | (254,493 | ) | | | (323,783 | ) |
Net increase (decrease) | | | 5,203,896 | | | | 17,472,729 | | | | | | | | 13,284,795 | | | | 26,184,359 | | | | | | | | 119,358 | | | | 20,839 | | | | | | | | (103,839 | ) | | | 456,576 | |
Beginning shares outstanding | | | 37,837,334 | | | | 20,364,605 | | | | | | | | 70,450,011 | | | | 44,265,652 | | | | | | | | 244,547 | | | | 223,708 | | | | | | | | 652,418 | | | | 195,842 | |
Ending shares outstanding | | | 43,041,230 | | | | 37,837,334 | | | | | | | | 83,734,806 | | | | 70,450,011 | | | | | | | | 363,905 | | | | 244,547 | | | | | | | | 548,579 | | | | 652,418 | |
| | | | | | | | | | | |
Investor Class | | | | | | | | | | | | | | | | | | | | | | | | | | | | | | | | | | | | | | | | | | | | |
Shares sold | | | | | | | | | | | | | | | | | | | | | | | | | | | | | | | | | | | | | | | 1 | | | | 31,271 | |
Dividends and distribution reinvested | | | | | | | | | | | | | | | | | | | | | | | | | | | | | | | | | | | | | | | — | | | | 618 | |
Shares repurchased | | | | | | | | | | | | | | | | | | | | | | | | | | | | | | | | | | | | | | | (11,710 | ) | | | (21,675 | ) |
Converted to Class A shares | | | | | | | | | | | | | | | | | | | | | | | | | | | | | | | | | | | | | | | (25,899 | ) | | | — | |
Net increase (decrease) | | | | | | | | | | | | | | | | | | | | | | | | | | | | | | | | | | | | | | | (37,608 | ) | | | 10,214 | |
Beginning shares outstanding | | | | | | | | | | | | | | | | | | | | | | | | | | | | | | | | | | | | | | | 37,608 | | | | 27,394 | |
Ending shares outstanding | | | | | | | | | | | | | | | | | | | | | | | | | | | | | | | | | | | | | | | — | | | | 37,608 | |
| | | | | | | | | | | |
Class S | | | | | | | | | | | | | | | | | | | | | | | | | | | | | | | | | | | | | | | | | | | | |
Shares sold | | | | | | | | | | | | | | | | | | | | | | | | | | | | | | | | | | | | | | | 27,885 | | | | 29,866 | |
Dividends and distribution reinvested | | | | | | | | | | | | | | | | | | | | | | | | | | | | | | | | | | | | | | | 2,694 | | | | 1,039 | |
Shares repurchased | | | | | | | | | | | | | | | | | | | | | | | | | | | | | | | | | | | | | | | (13,797 | ) | | | (81,335 | ) |
Net increase (decrease) | | | | | | | | | | | | | | | | | | | | | | | | | | | | | | | | | | | | | | | 16,782 | | | | (50,430 | ) |
Beginning shares outstanding | | | | | | | | | | | | | | | | | | | | | | | | | | | | | | | | | | | | | | | 56,965 | | | | 107,395 | |
Ending shares outstanding | | | | | | | | | | | | | | | | | | | | | | | | | | | | | | | | | | | | | | | 73,747 | | | | 56,965 | |
D-21
PACIFIC FUNDS
NOTES TO FINANCIAL STATEMENTS (Continued)
| | | | | | | | | | | | | | | | | | | | | | | | | | | | | | | | | | | | | | | | | | | | |
| | | Pacific Funds
Large-Cap Value (2) | | | | | | Pacific Funds
Small/Mid-Cap (2) | | | | | | Pacific Funds
Small Cap (2) | | | | | | Pacific Funds
Small-Cap Value (2) | |
| | | Year Ended
3/31/2019 | | | Year Ended
3/31/2018 | | | | | | Year Ended
3/31/2019 | | | Year Ended
3/31/2018 | | | | | | Year Ended
3/31/2019 | | | Year Ended
3/31/2018 | | | | | | Year Ended
3/31/2019 | | | Year Ended
3/31/2018 | |
| | | | | | | | | | | |
Class A | | | | | | | | | | | | | | | | | | | | | | | | | | | | | | | | | | | | | | | | | | | | |
Shares sold | | | 139,398 | | | | 148,815 | | | | | | | | 959,599 | | | | 1,217,736 | | | | | | | | 74,585 | | | | 95,701 | | | | | | | | 50,481 | | | | 71,018 | |
Dividends and distribution reinvested | | | 25,810 | | | | 8,802 | | | | | | | | 50,979 | | | | 1,494 | | | | | | | | 22,024 | | | | 1,776 | | | | | | | | 20,866 | | | | 8,365 | |
Shares repurchased | | | (65,874 | ) | | | (105,439 | ) | | | | | | | (1,308,902 | ) | | | (1,162,227 | ) | | | | | | | (124,092 | ) | | | (62,757 | ) | | | | | | | (44,430 | ) | | | (45,061 | ) |
Converted from Investor Class shares | | | 9,042 | | | | — | | | | | | | | 381,261 | | | | — | | | | | | | | 254,699 | | | | — | | | | | | | | 16,830 | | | | — | |
Net increase (decrease) | | | 108,376 | | | | 52,178 | | | | | | | | 82,937 | | | | 57,003 | | | | | | | | 227,216 | | | | 34,720 | | | | | | | | 43,747 | | | | 34,322 | |
Beginning shares outstanding | | | 291,335 | | | | 239,157 | | | | | | | | 1,596,645 | | | | 1,539,642 | | | | | | | | 184,090 | | | | 149,370 | | | | | | | | 98,873 | | | | 64,551 | |
Ending shares outstanding | | | 399,711 | | | | 291,335 | | | | | | | | 1,679,582 | | | | 1,596,645 | | | | | | | | 411,306 | | | | 184,090 | | | | | | | | 142,620 | | | | 98,873 | |
| | | | | | | | | | | |
Class C | | | | | | | | | | | | | | | | | | | | | | | | | | | | | | | | | | | | | | | | | | | | |
Shares sold | | | 67,413 | | | | 138,902 | | | | | | | | 360,736 | | | | 694,691 | | | | | | | | 33,490 | | | | 28,721 | | | | | | | | 51,115 | | | | 75,210 | |
Dividends and distribution reinvested | | | 21,776 | | | | 9,196 | | | | | | | | 38,125 | | | | 1,110 | | | | | | | | 3,907 | | | | 1,132 | | | | | | | | 23,610 | | | | 11,162 | |
Shares repurchased | | | (152,752 | ) | | | (49,534 | ) | | | | | | | (258,364 | ) | | | (132,991 | ) | | | | | | | (24,258 | ) | | | (21,930 | ) | | | | | | | (72,522 | ) | | | (41,000 | ) |
Net increase (decrease) | | | (63,563 | ) | | | 98,564 | | | | | | | | 140,497 | | | | 562,810 | | | | | | | | 13,139 | | | | 7,923 | | | | | | | | 2,203 | | | | 45,372 | |
Beginning shares outstanding | | | 384,542 | | | | 285,978 | | | | | | | | 1,187,788 | | | | 624,978 | | | | | | | | 62,441 | | | | 54,518 | | | | | | | | 141,813 | | | | 96,441 | |
Ending shares outstanding | | | 320,979 | | | | 384,542 | | | | | | | | 1,328,285 | | | | 1,187,788 | | | | | | | | 75,580 | | | | 62,441 | | | | | | | | 144,016 | | | | 141,813 | |
| | | | | | | | | | | |
Advisor Class | | | | | | | | | | | | | | | | | | | | | | | | | | | | | | | | | | | | | | | | | | | | |
Shares sold | | | 25,082 | | | | 128,648 | | | | | | | | 17,674,456 | | | | 9,245,101 | | | | | | | | 445,685 | | | | 633,456 | | | | | | | | 366,798 | | | | 221,165 | |
Dividends and distribution reinvested | | | 130,404 | | | | 66,983 | | | | | | | | 446,050 | | | | 11,179 | | | | | | | | 59,142 | | | | 11,601 | | | | | | | | 290,957 | | | | 154,246 | |
Shares repurchased | | | (983,832 | ) | | | (768,092 | ) | | | | | | | (6,398,099 | ) | | | (1,824,233 | ) | | | | | | | (564,333 | ) | | | (207,244 | ) | | | | | | | (764,333 | ) | | | (775,141 | ) |
Net increase (decrease) | | | (828,346 | ) | | | (572,461 | ) | | | | | | | 11,722,407 | | | | 7,432,047 | | | | | | | | (59,506 | ) | | | 437,813 | | | | | | | | (106,578 | ) | | | (399,730 | ) |
Beginning shares outstanding | | | 1,725,310 | | | | 2,297,771 | | | | | | | | 13,316,587 | | | | 5,884,540 | | | | | | | | 1,132,530 | | | | 694,717 | | | | | | | | 1,379,747 | | | | 1,779,477 | |
Ending shares outstanding | | | 896,964 | | | | 1,725,310 | | | | | | | | 25,038,994 | | | | 13,316,587 | | | | | | | | 1,073,024 | | | | 1,132,530 | | | | | | | | 1,273,169 | | | | 1,379,747 | |
| | | | | | | | | | | |
Investor Class | | | | | | | | | | | | | | | | | | | | | | | | | | | | | | | | | | | | | | | | | | | | |
Shares sold | | | — | | | | 1,998 | | | | | | | | 47,147 | | | | 372,712 | | | | | | | | 26,848 | | | | 240,780 | | | | | | | | 3,432 | | | | 10,384 | |
Dividends and distribution reinvested | | | — | | | | 332 | | | | | | | | — | | | | 679 | | | | | | | | — | | | | 4 | | | | | | | | — | | | | 610 | |
Shares repurchased | | | — | | | | (1,977 | ) | | | | | | | (160,177 | ) | | | (450,208 | ) | | | | | | | (12,459 | ) | | | (51,108 | ) | | | | | | | (703 | ) | | | (14,758 | ) |
Converted to Class A shares | | | (9,411 | ) | | | — | | | | | | | | (382,123 | ) | | | — | | | | | | | | (253,088 | ) | | | — | | | | | | | | (16,862 | ) | | | — | |
Net increase (decrease) | | | (9,411 | ) | | | 353 | | | | | | | | (495,153 | ) | | | (76,817 | ) | | | | | | | (238,699 | ) | | | 189,676 | | | | | | | | (14,133 | ) | | | (3,764 | ) |
Beginning shares outstanding | | | 9,411 | | | | 9,058 | | | | | | | | 495,153 | | | | 571,970 | | | | | | | | 238,699 | | | | 49,023 | | | | | | | | 14,133 | | | | 17,897 | |
Ending shares outstanding | | | — | | | | 9,411 | | | | | | | | — | | | | 495,153 | | | | | | | | — | | | | 238,699 | | | | | | | | — | | | | 14,133 | |
| | | | | | | | | | | |
Class S | | | | | | | | | | | | | | | | | | | | | | | | | | | | | | | | | | | | | | | | | | | | |
Shares sold | | | 26,017 | | | | 44,243 | | | | | | | | 43,496 | | | | 38,303 | | | | | | | | 24,159 | | | | 26,161 | | | | | | | | 23,929 | | | | 39,304 | |
Dividends and distribution reinvested | | | 4,341 | | | | 5,426 | | | | | | | | 14,903 | | | | 782 | | | | | | | | 2,072 | | | | 495 | | | | | | | | 109,327 | | | | 76,957 | |
Shares repurchased | | | (126,709 | ) | | | (3,641 | ) | | | | | | | (319,577 | ) | | | (2,909 | ) | | | | | | | (6,013 | ) | | | (1,361 | ) | | | | | | | (650,921 | ) | | | (90,779 | ) |
Net increase (decrease) | | | (96,351 | ) | | | 46,028 | | | | | | | | (261,178 | ) | | | 36,176 | | | | | | | | 20,218 | | | | 25,295 | | | | | | | | (517,665 | ) | | | 25,482 | |
Beginning shares outstanding | | | 173,068 | | | | 127,040 | | | | | | | | 750,768 | | | | 714,592 | | | | | | | | 38,113 | | | | 12,818 | | | | | | | | 861,164 | | | | 835,682 | |
Ending shares outstanding | | | 76,717 | | | | 173,068 | | | | | | | | 489,590 | | | | 750,768 | | | | | | | | 58,331 | | | | 38,113 | | | | | | | | 343,499 | | | | 861,164 | |
D-22
PACIFIC FUNDS
NOTES TO FINANCIAL STATEMENTS (Continued)
| | | | | | | | |
| | | Pacific Funds
Small-Cap Growth (2) | |
| | | Year Ended
3/31/2019 | | | Year Ended
3/31/2018 | |
| | |
Class A | | | | | | | | |
Shares sold | | | 77,662 | | | | 26,759 | |
Dividends and distribution reinvested | | | 19,251 | | | | 1,727 | |
Shares repurchased | | | (15,565 | ) | | | (16,453 | ) |
Converted from Investor Class shares | | | 121,703 | | | | — | |
Net increase (decrease) | | | 203,051 | | | | 12,033 | |
Beginning shares outstanding | | | 58,168 | | | | 46,135 | |
Ending shares outstanding | | | 261,219 | | | | 58,168 | |
| | |
Class C | | | | | | | | |
Shares sold | | | 54,538 | | | | 50,695 | |
Dividends and distribution reinvested | | | 7,132 | | | | 2,034 | |
Shares repurchased | | | (42,292 | ) | | | (6,659 | ) |
Net increase (decrease) | | | 19,378 | | | | 46,070 | |
Beginning shares outstanding | | | 62,971 | | | | 16,901 | |
Ending shares outstanding | | | 82,349 | | | | 62,971 | |
| | |
Class P | | | | | | | | |
Shares sold | | | 1,061,823 | | | | 1,192,397 | |
Dividends and distribution reinvested | | | 227,291 | | | | 40,435 | |
Shares repurchased | | | (1,473,699 | ) | | | (171,822 | ) |
Net increase (decrease) | | | (184,585 | ) | | | 1,061,010 | |
Beginning shares outstanding | | | 2,167,752 | | | | 1,106,742 | |
Ending shares outstanding | | | 1,983,167 | | | | 2,167,752 | |
| | |
Advisor Class | | | | | | | | |
Shares sold | | | 507,082 | | | | 170,917 | |
Dividends and distribution reinvested | | | 125,778 | | | | 42,405 | |
Shares repurchased | | | (1,294,013 | ) | | | (304,493 | ) |
Net increase (decrease) | | | (661,153 | ) | | | (91,171 | ) |
Beginning shares outstanding | | | 1,098,756 | | | | 1,189,927 | |
Ending shares outstanding | | | 437,603 | | | | 1,098,756 | |
| | |
Investor Class | | | | | | | | |
Shares sold | | | 15 | | | | 15,685 | |
Dividends and distribution reinvested | | | — | | | | 4,250 | |
Shares repurchased | | | — | | | | (1,916 | ) |
Converted to Class A shares | | | (121,841 | ) | | | — | |
Net increase (decrease) | | | (121,826 | ) | | | 18,019 | |
Beginning shares outstanding | | | 121,826 | | | | 103,807 | |
Ending shares outstanding | | | — | | | | 121,826 | |
| | |
Class S | | | | | | | | |
Shares sold | | | 41,602 | | | | 61,575 | |
Dividends and distribution reinvested | | | 51,992 | | | | 35,999 | |
Shares repurchased | | | (779,220 | ) | | | (87,375 | ) |
Net increase (decrease) | | | (685,626 | ) | | | 10,199 | |
Beginning shares outstanding | | | 874,359 | | | | 864,160 | |
Ending shares outstanding | | | 188,733 | | | | 874,359 | |
| (1) | Class R shares were converted to Class A shares on March 22, 2019 (see Note 1 in Notes to Financial Statements). |
| (2) | Investor Class shares were converted to Class A shares on July 31, 2018 (see Note 1 in Notes to Financial Statements). |
D-23
REPORT OF INDEPENDENT REGISTERED PUBLIC ACCOUNTING FIRM
To the Board of Trustees and Shareholders of
Pacific Funds Series Trust:
Opinion on the Financial Statements and Financial Highlights
We have audited the accompanying statements of assets and liabilities of Pacific FundsSM Portfolio Optimization Conservative, Pacific FundsSM Portfolio Optimization Moderate-Conservative, Pacific FundsSM Portfolio Optimization Moderate, Pacific FundsSM Portfolio Optimization Growth, Pacific FundsSM Portfolio Optimization Aggressive-Growth, Pacific FundsSM Diversified Alternatives, Pacific FundsSM Short Duration Income, Pacific FundsSM Core Income, Pacific FundsSM Strategic Income, Pacific FundsSM Floating Rate Income, Pacific FundsSM High Income, Pacific FundsSMLarge-Cap, Pacific FundsSMLarge-Cap Value, Pacific FundsSMSmall/Mid-Cap, Pacific FundsSMSmall-Cap, Pacific FundsSMSmall-Cap Value, and Pacific FundsSMSmall-Cap Growth (the “Funds”) (seventeen of the funds comprising Pacific Funds Series Trust), including the schedules of investments, as of March 31, 2019; the related statements of operations for the year then ended, the statements of changes in net assets for each of the two years in the period then ended, and the financial highlights for each of the periods indicated in the table below; and the related notes. In our opinion, the financial statements and financial highlights present fairly, in all material respects, the financial position of each of the Funds as of March 31, 2019, and the results of their operations for the year then ended, the changes in their net assets for each of the two years in the period then ended, and the financial highlights for the periods listed in the table below, in conformity with accounting principles generally accepted in the United States of America.
| | |
| Individual Fund Comprising the Pacific Funds Series Trust | | Financial Highlights |
| Pacific FundsSM Portfolio Optimization Conservative, Pacific FundsSM Portfolio Optimization Moderate-Conservative, Pacific FundsSM Portfolio Optimization Moderate, Pacific FundsSM Portfolio Optimization Growth, Pacific FundsSM Portfolio Optimization Aggressive-Growth, Pacific FundsSM Diversified Alternatives, Pacific FundsSM Short Duration Income, Pacific FundsSM Core Income, Pacific FundsSM Strategic Income, Pacific FundsSM Floating Rate Income, and Pacific FundsSM High Income | | For the years ended March 31, 2019, 2018, 2017, 2016, and 2015 |
| Pacific FundsSMLarge-Cap, Pacific FundsSMSmall/Mid-Cap, Pacific FundsSMSmall-Cap, and Pacific FundsSMSmall-Cap Value | | For the years ended March 31, 2019, 2018, 2017, and the period from December 1, 2015 through March 31, 2016 |
| Pacific FundsSMLarge-Cap Value and Pacific FundsSMSmall-Cap Growth | | For the years ended March 31, 2019, 2018, 2017, and the period from January 11, 2016 through March 31, 2016 |
The financial statements of Pacific FundsSM Large-Cap, for the period from March 20, 2015 (commencement of operations) through November 30, 2015, Pacific FundsSM Small/Mid-Cap, Pacific FundsSM Small-Cap, and Pacific FundsSMSmall-Cap Value, for the period from December 31, 2014 (commencement of operations) through November 30, 2015 were audited by other auditors whose report, dated January 28, 2016, expressed an unqualified opinion on those statements.
Basis for Opinion
These financial statements and financial highlights are the responsibility of the Funds’ management. Our responsibility is to express an opinion on the Funds’ financial statements and financial highlights based on our audits. We are a public accounting firm registered with the Public Company Accounting Oversight Board (United States) (PCAOB) and are required to be independent with respect to the Funds in accordance with the U.S. federal securities laws and the applicable rules and regulations of the Securities and Exchange Commission and the PCAOB.
We conducted our audits in accordance with the standards of the PCAOB. Those standards require that we plan and perform the audit to obtain reasonable assurance about whether the financial statements and financial highlights are free of material misstatement, whether due to error or fraud. The Funds are not required to have, nor were we engaged to perform, an audit of their internal control over financial reporting. As part of our audits we are required to obtain an understanding of internal control over financial reporting but not for the purpose of expressing an opinion on the effectiveness of the Funds’ internal control over financial reporting. Accordingly, we express no such opinion.
Our audits included performing procedures to assess the risks of material misstatement of the financial statements and financial highlights, whether due to error or fraud, and performing procedures that respond to those risks. Such procedures included examining, on a test basis, evidence regarding the amounts and disclosures in the financial statements and financial highlights. Our audits also included evaluating the accounting principles used and significant estimates made by management, as well as evaluating the overall presentation of the financial statements and financial highlights. Our procedures included confirmation of securities owned as of March 31, 2019, by correspondence with the custodian and brokers; when replies were not received from brokers, we performed other auditing procedures. We believe that our audits provide a reasonable basis for our opinion.

Philadelphia, PA
May 24, 2019
We have served as the auditor of one or more affiliated investment companies of Pacific Funds Series Trust since 1988.
E-1
PACIFIC FUNDS
OTHER TAX INFORMATION
(Unaudited)
For corporate shareholders, the percentage of investment income (dividend income and short-term gains, if any) for each of the Funds that qualify for the dividends-received deductions for the year ended March 31, 2019 is as follows:
| | | | |
| Fund | | Percentage | |
Pacific Funds Portfolio Optimization Conservative | | | 3.93% | |
Pacific Funds Portfolio Optimization Moderate-Conservative | | | 6.82% | |
Pacific Funds Portfolio Optimization Moderate | | | 16.33% | |
Pacific Funds Portfolio Optimization Growth | | | 25.27% | |
Pacific Funds Portfolio Optimization Aggressive-Growth | | | 28.60% | |
Pacific Funds Strategic Income | | | 1.21% | |
Pacific Funds Large-Cap | | | 100.00% | |
Pacific Funds Large-Cap Value | | | 100.00% | |
Pacific Funds Small/Mid-Cap | | | 100.00% | |
Pacific Funds Small-Cap | | | 75.12% | |
Pacific Funds Small-Cap Value | | | 36.59% | |
Pacific Funds Small-Cap Growth | | | 57.85% | |
For the year ended March 31, 2019, certain dividends paid by the Funds may be subject to a maximum tax rate of 15%, as provided by the Jobs and Growth Tax Relief Reconciliation Act of 2003. Of the distributions made by the following Funds, the corresponding percentages represent the amount of each distribution which may qualify for the 15% dividend income tax rate.
| | | | |
| Fund | | Percentage | |
Pacific Funds Portfolio Optimization Conservative | | | 7.31% | |
Pacific Funds Portfolio Optimization Moderate-Conservative | | | 13.96% | |
Pacific Funds Portfolio Optimization Moderate | | | 36.66% | |
Pacific Funds Portfolio Optimization Growth | | | 56.75% | |
Pacific Funds Portfolio Optimization Aggressive-Growth | | | 70.36% | |
Pacific Funds Diversified Alternatives | | | 7.78% | |
Pacific Funds Strategic Income | | | 1.65% | |
Pacific Funds Large-Cap | | | 100.00% | |
Pacific Funds Large-Cap Value | | | 100.00% | |
Pacific Funds Small/Mid-Cap | | | 100.00% | |
Pacific Funds Small-Cap | | | 75.12% | |
Pacific Funds Small-Cap Value | | | 52.04% | |
Pacific Funds Small-Cap Growth | | | 67.74% | |
Shareholders should not use the above tax information to prepare their tax returns. The information will be included with your Form 1099 DIV which will be sent to you separately in January 2020. The Funds intend to pass through the maximum allowable percentages to shareholders.
The following Funds designated the listed amounts as long-term capital gains distributions during the year ended March 31, 2019. Distributable long-term gains are based on net realized long-term gains determined on a tax basis and may differ from such amounts for financial reporting purposes.
| | | | |
| Fund | | Amount | |
Pacific Funds Portfolio Optimization Conservative | | | $23,187,289 | |
Pacific Funds Portfolio Optimization Moderate-Conservative | | | 57,672,779 | |
Pacific Funds Portfolio Optimization Moderate | | | 190,255,666 | |
Pacific Funds Portfolio Optimization Growth | | | 162,160,174 | |
Pacific Funds Portfolio Optimization Aggressive-Growth | | | 54,028,116 | |
Pacific Funds Diversified Alternatives | | | 211,070 | |
Pacific Funds Large-Cap | | | 636,907 | |
Pacific Funds Large-Cap Value | | | 1,869,302 | |
Pacific Funds Small/Mid-Cap | | | 6,986,929 | |
Pacific Funds Small-Cap | | | 887,627 | |
Pacific Funds Small-Cap Value | | | 3,453,991 | |
Pacific Funds Small-Cap Growth | | | 4,368,444 | |
F-1
PACIFIC FUNDS
DISCLOSURE OF FUND EXPENSES
(Unaudited)
We believe it is important for you to understand the impact of fees and expenses regarding your investment. All mutual funds have operating expenses. As a shareholder of a mutual fund, you incur two types of costs: (1) transactions costs such as initial sales charges (loads) on purchase payments and/or contingent deferred sales charges on redemptions; and (2) ongoing costs, which include advisory fees, administration fees, distribution and/or service fees, and other fund expenses. The following example is intended to help you understand your ongoing costs (in dollars) of investing in each fund and to compare these costs with those of other mutual funds. The example is based on an investment of $1,000.00 made at the beginning of the period and held for the entiresix-month period from October 1, 2018 to March 31, 2019.
ACTUAL EXPENSES
The first section of the table for each fund entitled “Actual Fund Return”, provides information about actual account values and actual expenses based on each fund’s actual performance and each fund’s actual expenses, after any applicable fee waivers and expense reimbursements (See Notes 6 and 7B in Notes to Financial Statements). The “Ending Account Value at 03/31/19” column shown is derived from the fund’s actual performance; the “Annualized Expense Ratio” column shows the fund’s actual annualized expense ratio; and the “Expenses Paid During the Period 10/01/18-03/31/19” column shows the dollar amount that would have been paid by you. All the information illustrated in the following table is based on the pastsix-month period from October 1, 2018 to March 31, 2019.
You may use the information in this section, together with the amount you invested, to estimate the expenses that you paid over the period. To do so, for each fund in your account, simply divide that fund’s value by $1,000.00 (for example, an $8,600.00 fund value divided by $1,000.00 = 8.6), then multiply the result by the number given for your fund(s) in the “Expenses Paid During the Period 10/01/18-03/31/19.”
HYPOTHETICAL EXAMPLE FOR COMPARISON PURPOSES
The second section of the table for each fund, entitled “Hypothetical”, provides information about hypothetical account values and hypothetical expenses based on a 5% per year hypothetical rate of return and actual fund’s expenses, after any applicable fee waivers and expense reimbursements (See Notes 6 and 7B in Notes to Financial Statements). It assumes that the fund had an annual 5% rate of return before expenses, but that the expense ratio is unchanged. The hypothetical account values and expenses may not be used to estimate the actual ending account values or expenses you paid for the period.
You may use the hypothetical example information to compare the ongoing costs of investing in the fund compared to other mutual funds. To do so, compare this 5% hypothetical example with the 5% hypothetical examples that appear in the shareholder reports of other mutual funds.
Please note that the expenses shown in the table are meant to highlight your ongoing costs only and do not reflect any transactional costs, such as initial sales charges (loads) or contingent deferred sales charges. Therefore, the second section of the table is useful in comparing ongoing costs only, and will not help you determine the relative total costs of owning different mutual funds. In addition, if these other costs were included, your costs would have been higher.
| | | | | | | | | | | | | | | | |
| | | Beginning Account Value at 10/01/18 | | | Ending Account Value at 03/31/19 | | | Annualized Expense Ratio | | | Expenses Paid During the Period 10/01/18 - 03/31/19 (1) | |
| Pacific Funds Portfolio Optimization Conservative(2) | |
Actual Fund Return | | | | | | | | | | | | | | | | |
| | | | |
Class A | | | $1,000.00 | | | | $1,015.20 | | | | 0.60% | | | | $3.01 | |
| | | | |
Class B | | | 1,000.00 | | | | 1,011.50 | | | | 1.35% | | | | 6.77 | |
| | | | |
Class C | | | 1,000.00 | | | | 1,012.20 | | | | 1.35% | | | | 6.77 | |
| | | | |
Advisor Class | | | 1,000.00 | | | | 1,017.10 | | | | 0.35% | | | | 1.76 | |
| | | | |
Hypothetical | | | | | | | | | | | | | | | | |
| | | | |
Class A | | | $1,000.00 | | | | $1,021.94 | | | | 0.60% | | | | $3.02 | |
| | | | |
Class B | | | 1,000.00 | | | | 1,018.20 | | | | 1.35% | | | | 6.79 | |
| | | | |
Class C | | | 1,000.00 | | | | 1,018.20 | | | | 1.35% | | | | 6.79 | |
| | | | |
Advisor Class | | | 1,000.00 | | | | 1,023.19 | | | | 0.35% | | | | 1.77 | |
| Pacific Funds Portfolio Optimization Moderate-Conservative(2) | |
Actual Fund Return | | | | | | | | | | | | | | | | |
| | | | |
Class A | | | $1,000.00 | | | | $1,006.30 | | | | 0.60% | | | | $3.00 | |
| | | | |
Class B | | | 1,000.00 | | | | 1,001.80 | | | | 1.35% | | | | 6.74 | |
| | | | |
Class C | | | 1,000.00 | | | | 1,002.10 | | | | 1.35% | | | | 6.74 | |
| | | | |
Advisor Class | | | 1,000.00 | | | | 1,007.50 | | | | 0.35% | | | | 1.75 | |
| | | | |
Hypothetical | | | | | | | | | | | | | | | | |
| | | | |
Class A | | | $1,000.00 | | | | $1,021.94 | | | | 0.60% | | | | $3.02 | |
| | | | |
Class B | | | 1,000.00 | | | | 1,018.20 | | | | 1.35% | | | | 6.79 | |
| | | | |
Class C | | | 1,000.00 | | | | 1,018.20 | | | | 1.35% | | | | 6.79 | |
| | | | |
Advisor Class | | | 1,000.00 | | | | 1,023.19 | | | | 0.35% | | | | 1.77 | |
| Pacific Funds Portfolio Optimization Moderate(2) | |
Actual Fund Return | | | | | | | | | | | | | | | | |
| | | | |
Class A | | | $1,000.00 | | | | $993.60 | | | | 0.60% | | | | $2.98 | |
| | | | |
Class B | | | 1,000.00 | | | | 990.70 | | | | 1.35% | | | | 6.70 | |
| | | | |
Class C | | | 1,000.00 | | | | 990.30 | | | | 1.35% | | | | 6.70 | |
| | | | |
Advisor Class | | | 1,000.00 | | | | 994.70 | | | | 0.35% | | | | 1.74 | |
| | | | |
Hypothetical | | | | | | | | | | | | | | | | |
| | | | |
Class A | | | $1,000.00 | | | | $1,021.94 | | | | 0.60% | | | | $3.02 | |
| | | | |
Class B | | | 1,000.00 | | | | 1,018.20 | | | | 1.35% | | | | 6.79 | |
| | | | |
Class C | | | 1,000.00 | | | | 1,018.20 | | | | 1.35% | | | | 6.79 | |
| | | | |
Advisor Class | | | 1,000.00 | | | | 1,023.19 | | | | 0.35% | | | | 1.77 | |
| Pacific Funds Portfolio Optimization Growth(2) | |
Actual Fund Return | | | | | | | | | | | | | | | | |
| | | | |
Class A | | | $1,000.00 | | | | $984.10 | | | | 0.60% | | | | $2.97 | |
| | | | |
Class B | | | 1,000.00 | | | | 980.90 | | | | 1.35% | | | | 6.67 | |
| | | | |
Class C | | | 1,000.00 | | | | 980.50 | | | | 1.35% | | | | 6.67 | |
| | | | |
Advisor Class | | | 1,000.00 | | | | 985.40 | | | | 0.35% | | | | 1.73 | |
| | | | |
Hypothetical | | | | | | | | | | | | | | | | |
| | | | |
Class A | | | $1,000.00 | | | | $1,021.94 | | | | 0.60% | | | | $3.02 | |
| | | | |
Class B | | | 1,000.00 | | | | 1,018.20 | | | | 1.35% | | | | 6.79 | |
| | | | |
Class C | | | 1,000.00 | | | | 1,018.20 | | | | 1.35% | | | | 6.79 | |
| | | | |
Advisor Class | | | 1,000.00 | | | | 1,023.19 | | | | 0.35% | | | | 1.77 | |
See explanation of references on page F-4
F-2
PACIFIC FUNDS
DISCLOSURE OF FUND EXPENSES (Continued)
(Unaudited)
| | | | | | | | | | | | | | | | |
| | | Beginning Account Value at 10/01/18 | | | Ending Account Value at 03/31/19 | | | Annualized Expense Ratio | | | Expenses Paid During the Period 10/01/18 - 03/31/19 (1) | |
| Pacific Funds Portfolio Optimization Aggressive-Growth(2) | |
Actual Fund Return | | | | | | | | | | | | | | | | |
| | | | |
Class A | | | $1,000.00 | | | | $978.70 | | | | 0.60% | | | | $2.96 | |
| | | | |
Class B | | | 1,000.00 | | | | 974.30 | | | | 1.35% | | | | 6.65 | |
| | | | |
Class C | | | 1,000.00 | | | | 974.50 | | | | 1.35% | | | | 6.65 | |
| | | | |
Advisor Class | | | 1,000.00 | | | | 979.00 | | | | 0.35% | | | | 1.73 | |
| | | | |
Hypothetical | | | | | | | | | | | | | | | | |
| | | | |
Class A | | | $1,000.00 | | | | $1,021.94 | | | | 0.60% | | | | $3.02 | |
| | | | |
Class B | | | 1,000.00 | | | | 1,018.20 | | | | 1.35% | | | | 6.79 | |
| | | | |
Class C | | | 1,000.00 | | | | 1,018.20 | | | | 1.35% | | | | 6.79 | |
| | | | |
Advisor Class | | | 1,000.00 | | | | 1,023.19 | | | | 0.35% | | | | 1.77 | |
| Pacific Funds Diversified Alternatives(2) | |
Actual Fund Return | | | | | | | | | | | | | | | | |
| | | | |
Class A | | | $1,000.00 | | | | $998.70 | | | | 0.85% | | | | $4.24 | |
| | | | |
Class C | | | 1,000.00 | | | | 995.60 | | | | 1.60% | | | | 7.96 | |
| | | | |
Advisor Class | | | 1,000.00 | | | | 1,000.00 | | | | 0.60% | | | | 2.99 | |
| | | | |
Hypothetical | | | | | | | | | | | | | | | | |
| | | | |
Class A | | | $1,000.00 | | | | $1,020.69 | | | | 0.85% | | | | $4.28 | |
| | | | |
Class C | | | 1,000.00 | | | | 1,016.95 | | | | 1.60% | | | | 8.05 | |
| | | | |
Advisor Class | | | 1,000.00 | | | | 1,021.94 | | | | 0.60% | | | | 3.02 | |
| Pacific Funds Short Duration Income | |
Actual Fund Return | | | | | | | | | | | | | | | | |
| | | | |
Class A | | | $1,000.00 | | | | $1,019.50 | | | | 0.75% | | | | $3.78 | |
| | | | |
Class C | | | 1,000.00 | | | | 1,015.70 | | | | 1.50% | | | | 7.54 | |
| | | | |
Class I | | | 1,000.00 | | | | 1,020.70 | | | | 0.50% | | | | 2.52 | |
| | | | |
Advisor Class | | | 1,000.00 | | | | 1,021.70 | | | | 0.50% | | | | 2.52 | |
| | | | |
Hypothetical | | | | | | | | | | | | | | | | |
| | | | |
Class A | | | $1,000.00 | | | | $1,021.19 | | | | 0.75% | | | | $3.78 | |
| | | | |
Class C | | | 1,000.00 | | | | 1,017.45 | | | | 1.50% | | | | 7.54 | |
| | | | |
Class I | | | 1,000.00 | | | | 1,022.44 | | | | 0.50% | | | | 2.52 | |
| | | | |
Advisor Class | | | 1,000.00 | | | | 1,022.44 | | | | 0.50% | | | | 2.52 | |
| Pacific Funds Core Income | |
Actual Fund Return | | | | | | | | | | | | | | | | |
| | | | |
Class A | | | $1,000.00 | | | | $1,034.40 | | | | 0.85% | | | | $4.31 | |
| | | | |
Class C | | | 1,000.00 | | | | 1,030.50 | | | | 1.60% | | | | 8.10 | |
| | | | |
Class I | | | 1,000.00 | | | | 1,036.90 | | | | 0.55% | | | | 2.79 | |
| | | | |
Class P | | | 1,000.00 | | | | 1,036.80 | | | | 0.55% | | | | 2.79 | |
| | | | |
Advisor Class | | | 1,000.00 | | | | 1,035.90 | | | | 0.55% | | | | 2.79 | |
| | | | |
Hypothetical | | | | | | | | | | | | | | | | |
| | | | |
Class A | | | $1,000.00 | | | | $1,020.69 | | | | 0.85% | | | | $4.28 | |
| | | | |
Class C | | | 1,000.00 | | | | 1,016.95 | | | | 1.60% | | | | 8.05 | |
| | | | |
Class I | | | 1,000.00 | | | | 1,022.19 | | | | 0.55% | | | | 2.77 | |
| | | | |
Class P | | | 1,000.00 | | | | 1,022.19 | | | | 0.55% | | | | 2.77 | |
| | | | |
Advisor Class | | | 1,000.00 | | | | 1,022.19 | | | | 0.55% | | | | 2.77 | |
| | | | | | | | | | | | | | | | |
| | | Beginning Account Value at 10/01/18 | | | Ending Account Value at 03/31/19 | | | Annualized Expense Ratio | | | Expenses Paid During the Period 10/01/18 - 03/31/19(1) | |
| Pacific Funds Strategic Income | |
Actual Fund Return | | | | | | | | | | | | | | | | |
| | | | |
Class A | | | $1,000.00 | | | | $1,016.70 | | | | 0.95% | | | | $4.78 | |
| | | | |
Class C | | | 1,000.00 | | | | 1,013.20 | | | | 1.65% | | | | 8.28 | |
| | | | |
Class I | | | 1,000.00 | | | | 1,018.30 | | | | 0.65% | | | | 3.27 | |
| | | | |
Advisor Class | | | 1,000.00 | | | | 1,018.00 | | | | 0.70% | | | | 3.52 | |
| | | | |
Hypothetical | | | | | | | | | | | | | | | | |
| | | | |
Class A | | | $1,000.00 | | | | $1,020.19 | | | | 0.95% | | | | $4.78 | |
| | | | |
Class C | | | 1,000.00 | | | | 1,016.70 | | | | 1.65% | | | | 8.30 | |
| | | | |
Class I | | | 1,000.00 | | | | 1,021.69 | | | | 0.65% | | | | 3.28 | |
| | | | |
Advisor Class | | | 1,000.00 | | | | 1,021.44 | | | | 0.70% | | | | 3.53 | |
| Pacific Funds Floating Rate Income | |
Actual Fund Return | | | | | | | | | | | | | | | | |
| | | | |
Class A | | | $1,000.00 | | | | $1,001.30 | | | | 1.02% | | | | $5.09 | |
| | | | |
Class C | | | 1,000.00 | | | | 997.70 | | | | 1.72% | | | | 8.57 | |
| | | | |
Class I | | | 1,000.00 | | | | 1,002.80 | | | | 0.72% | | | | 3.60 | |
| | | | |
Class P | | | 1,000.00 | | | | 1,002.80 | | | | 0.72% | | | | 3.60 | |
| | | | |
Advisor Class | | | 1,000.00 | | | | 1,002.50 | | | | 0.77% | | | | 3.84 | |
| | | | |
Hypothetical | | | | | | | | | | | | | | | | |
| | | | |
Class A | | | $1,000.00 | | | | $1,019.85 | | | | 1.02% | | | | $5.14 | |
| | | | |
Class C | | | 1,000.00 | | | | 1,016.36 | | | | 1.72% | | | | 8.65 | |
| | | | |
Class I | | | 1,000.00 | | | | 1,021.34 | | | | 0.72% | | | | 3.63 | |
| | | | |
Class P | | | 1,000.00 | | | | 1,021.34 | | | | 0.72% | | | | 3.63 | |
| | | | |
Advisor Class | | | 1,000.00 | | | | 1,021.09 | | | | 0.77% | | | | 3.88 | |
| Pacific Funds High Income | |
Actual Fund Return | | | | | | | | | | | | | | | | |
| | | | |
Class A | | | $1,000.00 | | | | $1,011.80 | | | | 0.95% | | | | $4.76 | |
| | | | |
Class C | | | 1,000.00 | | | | 1,009.20 | | | | 1.65% | | | | 8.27 | |
| | | | |
Class I | | | 1,000.00 | | | | 1,013.20 | | | | 0.70% | | | | 3.51 | |
| | | | |
Class P | | | 1,000.00 | | | | 1,013.20 | | | | 0.70% | | | | 3.51 | |
| | | | |
Advisor Class | | | 1,000.00 | | | | 1,013.10 | | | | 0.70% | | | | 3.51 | |
| | | | |
Hypothetical | | | | | | | | | | | | | | | | |
| | | | |
Class A | | | $1,000.00 | | | | $1,020.19 | | | | 0.95% | | | | $4.78 | |
| | | | |
Class C | | | 1,000.00 | | | | 1,016.70 | | | | 1.65% | | | | 8.30 | |
| | | | |
Class I | | | 1,000.00 | | | | 1,021.44 | | | | 0.70% | | | | 3.53 | |
| | | | |
Class P | | | 1,000.00 | | | | 1,021.44 | | | | 0.70% | | | | 3.53 | |
| | | | |
Advisor Class | | | 1,000.00 | | | | 1,021.44 | | | | 0.70% | | | | 3.53 | |
| Pacific Funds Large-Cap | |
Actual Fund Return | | | | | | | | | | | | | | | | |
| | | | |
Class A | | | $1,000.00 | | | | $966.70 | | | | 1.00% | | | | $4.90 | |
| | | | |
Class C | | | 1,000.00 | | | | 962.80 | | | | 1.75% | | | | 8.56 | |
| | | | |
Advisor Class | | | 1,000.00 | | | | 967.30 | | | | 0.75% | | | | 3.68 | |
| | | | |
Class S | | | 1,000.00 | | | | 967.80 | | | | 0.65% | | | | 3.19 | |
| | | | |
Hypothetical | | | | | | | | | | | | | | | | |
| | | | |
Class A | | | $1,000.00 | | | | $1,019.95 | | | | 1.00% | | | | $5.04 | |
| | | | |
Class C | | | 1,000.00 | | | | 1,016.21 | | | | 1.75% | | | | 8.80 | |
| | | | |
Advisor Class | | | 1,000.00 | | | | 1,021.19 | | | | 0.75% | | | | 3.78 | |
| | | | |
Class S | | | 1,000.00 | | | | 1,021.69 | | | | 0.65% | | | | 3.28 | |
| | |
| | See explanation of references on page F-4 |
F-3
PACIFIC FUNDS
DISCLOSURE OF FUND EXPENSES (Continued)
(Unaudited)
| | | | | | | | | | | | | | | | |
| | | Beginning Account Value at 10/01/18 | | | Ending Account Value at 03/31/19 | | | Annualized Expense Ratio | | | Expenses Paid During the Period 10/01/18 - 03/31/19(1) | |
| Pacific Funds Large-Cap Value | |
Actual Fund Return | | | | | | | | | | | | | | | | |
| | | | |
Class A | | | $1,000.00 | | | | $979.50 | | | | 1.10% | | | | $5.43 | |
| | | | |
Class C | | | 1,000.00 | | | | 976.30 | | | | 1.85% | | | | 9.12 | |
| | | | |
Advisor Class | | | 1,000.00 | | | | 981.20 | | | | 0.85% | | | | 4.20 | |
| | | | |
Class S | | | 1,000.00 | | | | 980.30 | | | | 0.75% | | | | 3.70 | |
| | | | |
Hypothetical | | | | | | | | | | | | | | | | |
| | | | |
Class A | | | $1,000.00 | | | | $1,019.45 | | | | 1.10% | | | | $5.54 | |
| | | | |
Class C | | | 1,000.00 | | | | 1,015.71 | | | | 1.85% | | | | 9.30 | |
| | | | |
Advisor Class | | | 1,000.00 | | | | 1,020.69 | | | | 0.85% | | | | 4.28 | |
| | | | |
Class S | | | 1,000.00 | | | | 1,021.19 | | | | 0.75% | | | | 3.78 | |
| Pacific Funds Small/Mid-Cap | |
Actual Fund Return | | | | | | | | | | | | | | | | |
| | | | |
Class A | | | $1,000.00 | | | | $923.20 | | | | 1.30% | | | | $6.23 | |
| | | | |
Class C | | | 1,000.00 | | | | 919.50 | | | | 2.05% | | | | 9.81 | |
| | | | |
Advisor Class | | | 1,000.00 | | | | 925.10 | | | | 1.05% | | | | 5.04 | |
| | | | |
Class S | | | 1,000.00 | | | | 925.40 | | | | 1.00% | | | | 4.80 | |
| | | | |
Hypothetical | | | | | | | | | | | | | | | | |
| | | | |
Class A | | | $1,000.00 | | | | $1,018.45 | | | | 1.30% | | | | $6.54 | |
| | | | |
Class C | | | 1,000.00 | | | | 1,014.71 | | | | 2.05% | | | | 10.30 | |
| | | | |
Advisor Class | | | 1,000.00 | | | | 1,019.70 | | | | 1.05% | | | | 5.29 | |
| | | | |
Class S | | | 1,000.00 | | | | 1,019.95 | | | | 1.00% | | | | 5.04 | |
| Pacific Funds Small-Cap | |
Actual Fund Return | | | | | | | | | | | | | | | | |
| | | | |
Class A | | | $1,000.00 | | | | $918.90 | | | | 1.30% | | | | $6.22 | |
| | | | |
Class C | | | 1,000.00 | | | | 915.80 | | | | 2.05% | | | | 9.79 | |
| | | | |
Advisor Class | | | 1,000.00 | | | | 920.50 | | | | 1.05% | | | | 5.03 | |
| | | | |
Class S | | | 1,000.00 | | | | 920.70 | | | | 1.00% | | | | 4.79 | |
| | | | |
Hypothetical | | | | | | | | | | | | | | | | |
| | | | |
Class A | | | $1,000.00 | | | | $1,018.45 | | | | 1.30% | | | | $6.54 | |
| | | | |
Class C | | | 1,000.00 | | | | 1,014.71 | | | | 2.05% | | | | 10.30 | |
| | | | |
Advisor Class | | | 1,000.00 | | | | 1,019.70 | | | | 1.05% | | | | 5.29 | |
| | | | |
Class S | | | 1,000.00 | | | | 1,019.95 | | | | 1.00% | | | | 5.04 | |
| | | | | | | | | | | | | | | | |
| | | Beginning
Account
Value at
10/01/18 | | | Ending
Account
Value at
03/31/19 | | | Annualized
Expense
Ratio | | | Expenses
Paid During
the Period 10/01/18 -
03/31/19(1) | |
| Pacific Funds Small-Cap Value | |
Actual Fund Return | | | | | | | | | | | | | | | | |
| | | | |
Class A | | | $1,000.00 | | | | $908.00 | | | | 1.30% | | | | $6.18 | |
| | | | |
Class C | | | 1,000.00 | | | | 904.60 | | | | 2.05% | | | | 9.73 | |
| | | | |
Advisor Class | | | 1,000.00 | | | | 908.30 | | | | 1.05% | | | | 5.00 | |
| | | | |
Class S | | | 1,000.00 | | | | 908.10 | | | | 1.00% | | | | 4.76 | |
| | | | |
Hypothetical | | | | | | | | | | | | | | | | |
| | | | |
Class A | | | $1,000.00 | | | | $1,018.45 | | | | 1.30% | | | | $6.54 | |
| | | | |
Class C | | | 1,000.00 | | | | 1,014.71 | | | | 2.05% | | | | 10.30 | |
| | | | |
Advisor Class | | | 1,000.00 | | | | 1,019.70 | | | | 1.05% | | | | 5.29 | |
| | | | |
Class S | | | 1,000.00 | | | | 1,019.95 | | | | 1.00% | | | | 5.04 | |
| Pacific Funds Small-Cap Growth | |
Actual Fund Return | | | | | | | | | | | | | | | | |
| | | | |
Class A | | | $1,000.00 | | | | $925.90 | | | | 1.25% | | | | $6.00 | |
| | | | |
Class C | | | 1,000.00 | | | | 922.70 | | | | 2.05% | | | | 9.83 | |
| | | | |
Class P | | | 1,000.00 | | | | 927.20 | | | | 1.05% | | | | 5.05 | |
| | | | |
Advisor Class | | | 1,000.00 | | | | 926.50 | | | | 1.05% | | | | 5.04 | |
| | | | |
Class S | | | 1,000.00 | | | | 926.70 | | | | 0.90% | | | | 4.32 | |
| | | | |
Hypothetical | | | | | | | | | | | | | | | | |
| | | | |
Class A | | | $1,000.00 | | | | $1,018.70 | | | | 1.25% | | | | $6.29 | |
| | | | |
Class C | | | 1,000.00 | | | | 1,014.71 | | | | 2.05% | | | | 10.30 | |
| | | | |
Class P | | | 1,000.00 | | | | 1,019.70 | | | | 1.05% | | | | 5.29 | |
| | | | |
Advisor Class | | | 1,000.00 | | | | 1,019.70 | | | | 1.05% | | | | 5.29 | |
| | | | |
Class S | | | 1,000.00 | | | | 1,020.44 | | | | 0.90% | | | | 4.53 | |
| (1) | Expenses paid during the period are equal to the fund’s annualized expense ratio (shown in table above), multiplied by the average account value over the period, multiplied by the number of days in the most recent fiscal half-year or applicable period, then divided by 365 days. |
| (2) | The annualized expense ratios for the Portfolio Optimization Funds and Pacific Funds Diversified Alternatives do not include fees and expenses of their respective PF Underlying Funds and the Class P shares of Pacific Funds Core Income, Pacific Funds Floating Rate Income, Pacific Funds High Income, and Pacific Funds Small-Cap Growth in which the Portfolio Optimization Funds and Pacific Funds Diversified Alternatives invest (see Note 1 in Notes to Financial Statements). |
F-4
PACIFIC FUNDS
TRUSTEES AND OFFICERS INFORMATION
(Unaudited)
The business and affairs of the Pacific Funds Series Trust (which may be referred to as “Pacific Funds” or the “Trust”) are managed under the direction of the Board of Trustees under the Declaration of Trust. Information pertaining to the trustees and officers of the Trust is set forth below, effective April 1, 2019. Trustees who are not deemed to be “interested persons” of the Trust, as defined in the 1940 Act, are referred to as “Independent Trustees.” Certain trustees and officers are deemed to be “interested persons” of the Trust and thus are referred to as “Interested Persons”, because of their positions with Pacific Life Insurance Company (“Pacific Life”) and Pacific Life Fund Advisors LLC, a wholly-owned subsidiary of Pacific Life. The Trust’s Statement of Additional Information includes additional information about the trustees. For information on availability of the Trust’s Statement of Additional Information, refer to the WHERE TO GO FOR MORE INFORMATION section of this report.
The address of each trustee and officer is c/o Pacific Funds Series Trust, 700 Newport Center Drive, Newport Beach, CA 92660.
| | | | | | | | |
Name and Age | | Position(s) with the Fund and Length of Time Served* | | Current Directorship(s) Held and Principal Occupation(s) (and certain additional occupation information) During Past 5 years | | Number of Funds In Fund Complex Overseen** | |
| |
INDEPENDENT TRUSTEES | | | | |
| | | |
Gale K. Caruso Year of birth 1957 | | Trustee since 1/01/06 | | Trustee (1/06 to present) of Pacific Select Fund; Independent Trustee (2/15 to present) of Matthews Asia Funds. Formerly: Member of the Board of Directors of LandAmerica Financial Group, Inc.; President and Chief Executive Officer of Zurich Life; Chairman, President and Chief Executive Officer of Scudder Canada Investor Services, Ltd.; Managing Director of Scudder Kemper Investments; Member of the Advisory Council to the Trust for Public Land in Maine; Member of the Board of Directors of Make-A-Wish of Maine. | |
| 89
|
|
| | | |
Paul A. Keller Year of birth 1954 | | Trustee since 6/20/16 | | Trustee (6/16 to present) of Pacific Select Fund; Consultant to the Trust and Pacific Select Fund (11/15 to 6/16); Independent Trustee (8/10 to present) of Fenimore Asset Management Trust (FAM Funds); Business Consultant (7/10 to present) (sole proprietor); Certified Public Accountant in New York (1982 to present); Adjunct Professor of Accounting (2011 to 2015), SUNY College at Old Westbury; Interim Chief Financial Officer (2014 to 2015) of The Leon Levy Foundation. Formerly: Partner of PricewaterhouseCoopers LLP; Partner of McGladrey & Pullen LLP. | | | 89 | |
| | | |
Lucie H. Moore Year of birth 1956 | | Trustee since 6/13/01 | | Trustee (10/98 to present ) of Pacific Select Funds; Member of the Board of Trustees (2014 to present) of Azusa Pacific University; Member of the Board of Trustees (2016 to present) of Pacifica Christian High School Orange County. Formerly: Partner of Gibson, Dunn & Crutcher (Law); Member of the Board of Trustees of Sage Hill School; Member of the Board of Trustees of The Pegasus School; and Member of the Advisory Board of Court Appointed Special Advocates (CASA) of Orange County. | |
| 89
|
|
| | | |
Nooruddin (Rudy) Veerjee Year of birth 1958 | | Trustee since 9/13/05 | | Trustee (1/05 to present) of Pacific Select Fund. Formerly: President of Transamerica Insurance and Investment Group; President of Transamerica Asset Management; Chairman and Chief Executive Officer of Transamerica Premier Funds (Mutual Fund); and Director of various Transamerica Life Companies. | |
| 89
|
|
F-5
PACIFIC FUNDS
TRUSTEES AND OFFICERS INFORMATION (Continued)
(Unaudited)
| | | | | | | | |
Name and Age | | Position(s) with the Fund and Length of Time Served* | | Current Directorship(s) Held and Principal Occupation(s) During Past 5 years | | Number of Funds In Fund Complex Overseen** | |
| | |
INTERESTED PERSONS | | | | | | |
| | | |
James T. Morris Year of birth 1960 | | Chairman of the Board and Trustee since 1/11/07 | | Director (4/07 to present), Chairman (5/08 to present), Chief Executive Officer (4/07 to present) and President (1/16 to present) of Pacific Mutual Holding Company and Pacific LifeCorp; Director (4/07 to present), Chairman (5/08 to present), Chief Executive Officer (4/07 to present) and President (1/16 to present) of Pacific Life; Chief Executive Officer (5/07 to 10/15) and President (5/07 to 3/12) of Pacific Life Fund Advisors LLC; Director (4/16 to present) of Edison International (a public utility holding company); and Chairman of the Board and Trustee (1/07 to present) of Pacific Select Fund. | | | 89 | |
| | | |
Adrian S. Griggs Year of birth 1966 | | Chief Executive Officer since 1/01/18 | | Chief Operating Officer (1/17 to present), Executive Vice President (4/12 to present) and Chief Financial Officer (4/12 to 2/17) of Pacific Mutual Holding Company and Pacific LifeCorp; Chief Operating Officer (1/17 to present), Executive Vice President (4/12 to present), Chief Financial Officer (4/12 to 2/17) and Director (1/16 to present) of Pacific Life; Chief Financial Officer (4/12 to 10/15) and Executive Vice President (4/12 to 10/15) of Pacific Life Fund Advisors LLC; Chief Executive Officer (1/15 to present) of Pacific Select Distributors, LLC; and Chief Executive Officer (1/18 to present) of Pacific Select Fund. | | | 89 | |
| | | |
Howard T. Hirakawa Year of birth 1962 | | Senior Vice President since 12/10/14 (Vice President 6/06 to 12/09/14) | | Senior Vice President (4/14 to present), Vice President (5/07 to 3/14) of Pacific Life Fund Advisors LLC; and Senior Vice President (12/14 to present) and Vice President (6/06 to 12/14) of Pacific Select Fund. | | | 89 | |
| | | |
Robin S. Yonis Year of birth 1954 | | Vice President and General Counsel since 6/13/01 and Assistant Secretary since 9/17/15 | | Vice President, Fund Advisor General Counsel and Assistant Secretary (5/07 to present) of Pacific Life Fund Advisors LLC; and Vice President and General Counsel (4/05 to present) and Assistant Secretary (9/15 to present) of Pacific Select Fund. | | | 89 | |
| | | |
Sharon E. Pacheco Year of birth 1957 | | Vice President and Chief Compliance Officer since 6/04/04 | | Vice President and Chief Compliance Officer (11/03 to present) of Pacific Mutual Holding Company and Pacific LifeCorp; Vice President (2/00 to present) and Chief Compliance Officer (1/03 to present) of Pacific Life; Vice President and Chief Compliance Officer (5/07 to present) of Pacific Life Fund Advisors LLC; and Vice President and Chief Compliance Officer (6/04 to present) of Pacific Select Fund. | | | 89 | |
| | | |
Jane M. Guon Year of birth 1964 | | Vice President and Secretary since 1/01/11 | | Vice President and Secretary (1/11 to present) of Pacific Mutual Holding Company, Pacific LifeCorp and Pacific Life; Director (1/11 to 3/17) of Pacific Life; Vice President and Secretary (1/11 to present) of Pacific Life Fund Advisors LLC; Vice President and Secretary (1/11 to present) of Pacific Select Distributors, LLC; and Vice President and Secretary (1/11 to present) of Pacific Select Fund. | | | 89 | |
| | | |
Laurene E. MacElwee Year of birth 1966 | | Vice President since 4/04/05 and Assistant Secretary since 6/13/01 | | Vice President (4/11 to present) and Assistant Secretary (5/07 to present) of Pacific Life Fund Advisors LLC; and Vice President (12/11 to present), Assistant Secretary (4/05 to present) of Pacific Select Fund. | | | 89 | |
| | | |
Carleton J. Muench Year of birth 1973 | | Vice President since 11/30/06 | | Vice President (4/14 to present) and Assistant Vice President (5/07 to 3/14) of Pacific Life Fund Advisors LLC; and Vice President (12/14 to present) and Assistant Vice President (11/06 to 12/14) of Pacific Select Fund. | | | 89 | |
F-6
PACIFIC FUNDS
TRUSTEES AND OFFICERS INFORMATION (Continued)
(Unaudited)
| | | | | | | | |
Name and Age | | Position(s) with the Fund and Length of Time Served* | | Current Directorship(s) Held and Principal Occupation(s) During Past 5 years | | Number of Funds In Fund Complex Overseen** | |
| | |
INTERESTED PERSONS (Continued) | | | | | | |
| | | |
Trevor T. Smith Year of birth 1975 | | Vice President since 3/23/16 and Treasurer since 4/01/18 (Assistant Treasurer 3/23/16 to 3/31/18) | | Assistant Vice President (1/17 to present) and Director of Variable Products Accounting (4/09 to 12/16) of Pacific Life; Assistant Vice President (3/16 to present), Treasurer (4/18 to present) and Assistant Treasurer (3/16 to 3/18) of Pacific Select Fund. | | | 89 | |
| | | |
Kevin W. Steiner Year of birth 1975 | | Vice President since 1/01/13 | | Assistant Vice President (4/12 to present) of Pacific Life Fund Advisors LLC; and Assistant Vice President (1/13 to present) of Pacific Select Fund. | | | 89 | |
| | | |
Audrey L. Cheng Year of birth 1975 | | Vice President since 12/11/13 | | Assistant Vice President (9/11 to present) of Pacific Life; Assistant Vice President (12/13 to present) of Pacific Select Fund. | | | 89 | |
| | * | A trustee serves until he or she resigns, retires, or his or her successor is elected and qualified. |
| | ** | As of March 31, 2019, the “Fund Complex” consisted of Pacific Select Fund (55 funds) and Pacific Funds (34 funds). |
F-7
PACIFIC FUNDS
APPROVAL OF INVESTMENT ADVISORY
AND SUB-ADVISORY AGREEMENTS
(Unaudited)
I. Introduction and Background
The Board of Trustees (the “Trustees” or “Board”) of Pacific Funds Series Trust (“Pacific Funds” or the “Trust”) oversees the management of each of the separate funds of the Trust (each a “Fund” and collectively, the “Funds”) and, as required by Section 15(c) of the Investment Company Act of 1940, as amended (the “1940 Act”), initially approves and, after the initial period, determines annually whether to renew the investment advisory agreement (the “Advisory Agreement”) with Pacific Life Fund Advisors LLC (“PLFA”) and eachsub-advisory agreement (the“Sub-Advisory Agreements,” together with the Advisory Agreement, as may be amended from time to time, the “Agreements”) between the Trust, PLFA and the varioussub-advisers (each a“Sub-Adviser” and collectively, the“Sub-Advisers”). PLFA serves as the investment adviser for all of the Funds and directly manages Pacific Funds Short Duration Income, Pacific Funds Core Income, Pacific Funds Strategic Income, Pacific Funds Floating Rate Income and Pacific Funds High Income (the “PAM Managed Funds”) under the name Pacific Asset Management (“PAM”); Pacific Funds Portfolio Optimization Conservative, Pacific Funds Portfolio Optimization Moderate-Conservative, Pacific Funds Portfolio Optimization Moderate, Pacific Funds Portfolio Optimization Growth and Pacific Funds Portfolio Optimization Aggressive-Growth (the “Portfolio Optimization Funds”); and Pacific Funds Diversified Alternatives (together with the Portfolio Optimization Funds, the “Asset Allocation Funds” and together with the Portfolio Optimization Funds and the PAM Managed Funds, the “Directly Managed Funds”). For all other Funds, PLFA has retained other third-party firms to serve asSub-Advisers under PLFA’s oversight. The Board, including all of the Trustees who are not “interested persons” of the Trust, PLFA, theSub-Advisers or the distributor, as that term is defined in the 1940 Act (“Independent Trustees”), last renewed the Agreements at anin-person meeting of the Trustees held on December 12, 2018.1
At this meeting and other meetings, the Board considered information (both written and oral) provided to assist it in its review of the Agreements and made assessments with respect to each Agreement. The Board requested, received and reviewed written materials from PLFA and eachSub-Adviser that were submitted in response to requests from the Independent Trustees and supporting materials relating to those questions and responses. In addition, the Board receivedin-person presentations about the Funds throughout the year, and the Independent Trustees were advised by independent legal counsel with respect to these and other relevant matters. The Board reviewed a variety of factors and considered a significant amount of information, including information received on an ongoing basis at Board and committee meetings, which included reports on Fund performance, expenses, fee comparisons, investment advisory, compliance, and other services provided to the Funds by PLFA and theSub-Advisers. The Board also reviewed financial and profitability information regarding PLFA and theSub-Advisers and information regarding the organization and operations of each entity, such as their compliance monitoring, portfolio trading and brokerage practices, risk management and the personnel providing investment management and administrative services to each Fund. The Board considered the services provided to the Funds under the Agreements and the fees and expenses incurred by and charged to the Funds under the Agreements. The Board took into account that PLFA and its affiliates provide additional services to the Funds under other affiliated service agreements that are essential for the operation of the Funds and that although PLFA and its affiliates are separately compensated under those affiliated service agreements, these additional services are provided in connection with PLFA’s advisory relationship with the Funds. The Board reviewed data provided by PLFA that was gathered from various independent providers of investment company data to provide the Board with information concerning the Funds’ investment performance, advisory fees and expense information (both on an absolute basis and compared to peers). Additionally, the Independent Trustees retained an independent consultant (“Independent Consultant”) with substantial industry experience in providing investment company boards with analysis to assist directors and trustees with their annual 15(c) review process, to assist the Trustees with certain of their analyses and to provide other relevant information. In connection with the analysis, the Independent Consultant utilized and provided the Independent Trustees with information obtained from independent service providers as well as from other sources.
The Trustees’ determinations were made on the basis of each Trustee’s business judgment after consideration of all the information presented. In reviewing the materials presented and in considering the information in the management presentations, the Trustees did not identify any single issue or particular information that, in isolation, would be a controlling factor in making a final decision regarding the proposed Agreements. Individual Trustees may have given different weights to certain factors and assigned various degrees of materiality to information received in connection with the approval process. The following summary describes the most important, but not all, of the factors considered by the Trustees in approving the Agreements. In the case of the Independent Trustees, certain factors were considered in light of the legal advice furnished to them by independent legal counsel and information from the Independent Consultant that they had retained. This discussion is not intended to beall-inclusive.
II. Annual Consideration and Approval of Investment Advisory andSub-Advisory Agreements
In evaluating the Advisory Agreement and eachSub-Advisory Agreement, the Board, including all the Independent Trustees, considered the following factors, among others:
A. Nature, Extent and Quality of Services
PLFA – The Trustees considered the depth and quality of PLFA’s investment management process, including its monitoring and oversight of theSub-Advisers and PAM, and the benefits to shareholders of retaining PLFA and continuing the Advisory Agreement in light of the nature, extent, and quality of the services that have been provided by PLFA, including PAM, since the Advisory Agreement was last renewed. The Trustees considered the overall financial strength and stability of PLFA and its ability to continue to provide a high level and quality of services to the Funds. They also considered PLFA’s responsiveness to questions or concerns raised by the Trustees throughout the year, including PLFA’s willingness to consider and implement investment and operational changes designed to improve investment results and the services provided to the Funds and their shareholders.
| 1 | At the December 12th meeting, the Board did not consider the continuance of theSub-Advisory Agreements relating to the PFMid-Cap Equity Fund and PF Real Estate Fund, as those agreements were not up for renewal at that time. |
F-8
PACIFIC FUNDS
APPROVAL OF INVESTMENT ADVISORY
AND SUB-ADVISORY AGREEMENTS (Continued)
(Unaudited)
The Trustees noted that officers and employees of PLFA regularly consult with, and report to, the Board regarding the investment management services provided to the Funds. The Trustees considered the experience, capability and integrity of PLFA’s senior management and other personnel and the low turnover rates of its key personnel. The Trustees noted that the investment, legal, compliance, risk management and accounting professionals of PLFA and its affiliates have access to and utilize a variety of resources and systems relating to investment management, compliance, trading, performance and risk analysis, security valuation and fund accounting. The Trustees took into account the scope of services provided by PLFA under the Advisory Agreement. The Trustees considered that although PLFA is separately compensated at approximate cost for time spent on Fund matters by certain legal, compliance and accounting professionals of PLFA and its affiliates for services outside of the scope of the Advisory Agreement, these services are being provided as a result of PLFA’s advisory relationship with the Funds. The Trustees further considered PLFA’s continuing need and ability to attract and retain qualified personnel and to maintain and enhance its resources and systems to provide appropriate investment management, compliance, risk management and monitoring services for the Funds. The Trustees also considered the additional resources that PLFA has continued to invest in to enhance its management and oversight of the Funds, including additional tools designed to ensure the Funds’ compliance with new laws and regulations. The Trustees considered that PLFA employs a well-defined method of comparing and evaluating the performance of the asset allocation funds. In addition, the Trustees considered PLFA’ssub-adviser research process and the role of PLFA’s internal conflicts review committee in considering and evaluating potential conflicts of interest with regard toSub-Adviser selection and monitoring.
Directly Managed Funds – The Trustees considered the services provided by PLFA in rendering investment management services for those Funds for which theday-to-day investment management is provided by PLFA, including PAM. The Trustees considered that PLFA, including PAM, is responsible for identifying investments for each Directly Managed Fund and determining when and what securities, cash and/or other investments to purchase, retain, or sell for each Directly Managed Fund. The Trustees also considered that PLFA, including PAM, is responsible for the valuation of portfolio securities, including, but not limited to, the review of custodian pricing files, research and analysis related to fair valued securities and due diligence oversight of pricing vendors. The Trustees additionally noted that PLFA is responsible for evaluating and voting proxies for portfolio holdings of the Directly Managed Funds. With respect to the Asset Allocation Funds, the Trustees also considered, among other things, PLFA’s experience, resources and expertise in analyzing the composition of the various Funds that serve as investment options for the Asset Allocation Funds (collectively, the “Underlying Funds”) and in developing an asset allocation that is appropriate for each Asset Allocation Fund’s investment objectives and risk profile. The Trustees considered, in this regard, the tools and resources used by PLFA in constructing its asset allocation models. The Trustees considered that PLFA had recently engaged a third-party consulting firm to review PLFA’s asset allocation process, and that the firm had reported favorably on PLFA’s asset allocation capabilities. With respect to the PAM Managed Funds, the Trustees also considered the investment oversight and monitoring of PAM discussed below under“Sub-Advised Funds.”
The Trustees also considered that PLFA provides certain additional services to the Funds outside of the scope of the Advisory Agreement at approximate cost and that such services are essential for the administration and operation of the Funds, including administration of the Funds’ compliance program. In this regard, the Trustees considered PLFA’s policies, procedures and systems to ensure compliance with applicable laws and regulations with respect to the Directly Managed Funds, its attention to matters that may involve conflicts of interest between itself and a Fund, and that all material rebalancing of PLFA’s asset allocation models are presented to an internal conflicts review committee that considers and evaluates potential conflicts of interest in the allocation among the Underlying Funds. The Trustees reviewed information provided throughout the year on PLFA’s compliance policies and procedures, its compliance history, and received reports from the Trust’s Chief Compliance Officer (“CCO”) on compliance by PLFA with applicable laws and regulations. The Trustees also reviewed information on any responses by PLFA to regulatory and compliance developments throughout the year. The Trustees further noted the compliance monitoring conducted by PLFA and PAM on an ongoing basis and noted the development of additional procedures and systems necessary to maintain compliance with applicable laws and regulations as well as the resources that PLFA dedicates to these programs. The Trustees considered that the CCO has in place a systematic process for periodically reviewing PLFA’s written compliance policies and procedures, including the assessment of PLFA’s compliance program as required under Rule38a-1 of the 1940 Act and PLFA’s code of ethics. The Trustees also considered that PLFA continues to cooperate with the CCO in reviewing its compliance operations.
Sub-Advised Funds – The Trustees considered PLFA’s responsibilities in rendering services to theSub-Advised Funds and the fact that PLFA monitors and evaluates the performance of theSub-Advisers in comparison to each Fund’s investment objective as well as to appropriate benchmark indices and groups of peer funds. The Trustees also considered that PLFA monitors eachSub-Advised Fund’s adherence to its investment objectives and policies. The Trustees noted that PLFA provides the Board with periodic and special reports related to eachSub-Advised Fund’s performance and PLFA’s investment monitoring and evaluation. The Trustees also considered PLFA’s process in continuously analyzing and, from time to time as necessary and appropriate, recommending for consideration by the Board, the termination of aSub-Advisory Agreement with aSub-Adviser and the replacement of aSub-Adviser.
For both Directly Managed Funds andSub-Advised Funds, the Trustees considered the high quality of the products, information, analysis and services provided by PLFA to the Funds, including return analysis, attribution analysis, risk analysis and stress testing, preparation of periodic performance and other reports, assessment of liquidity, analysis of derivatives, and coordination and oversight of other service providers to the Trust. The Trustees also noted that PLFA regularly informs the Trustees about matters relevant to the Trust and its shareholders, including relationships with financial intermediaries.
The Trustees considered the analyses conducted by PLFA of the Underlying Funds and aSub-Adviser’s management of an Underlying Fund in the broader context of asset allocation strategies intended to target certain return and risk characteristics. The Trustees noted that PLFA has historically recommended new Underlying Funds that PLFA believed would contribute to the Asset Allocation Funds’ targeted return and risk objectives. The Trustees also took into account PLFA’s continuing analysis of the Underlying Funds and eachSub-Adviser’s investment performance for the impact on broader asset allocation strategies for the Asset Allocation Funds.
F-9
PACIFIC FUNDS
APPROVAL OF INVESTMENT ADVISORY
AND SUB-ADVISORY AGREEMENTS (Continued)
(Unaudited)
The Trustees considered the depth and quality of PLFA’s monitoring and oversight of theSub-Advisers and PAM. The Board noted that PLFA monitors numerous investment, performance, and risk metrics for the Funds. The Trustees considered PLFA’s continued investment in, and development of, its research and analytical capabilities, including investments in personnel and enhanced analytical tools for assessing Fund performance and the performance of theSub-Advisers, including analytical tools relating to return analysis, risk analysis, and Fund performance attribution and reporting on such matters to the Trustees. The Trustees noted that PLFA uses these tools to analyze a Fund’s performance and risk profile and identify Funds that are underperforming as well as those that are performing well, and to analyze the Funds’ performance records against various measures. The Board considered that PLFA also conducts various analyses to assess the sources of and reasons for performance. The Trustees noted that PLFA has developed, and continues to enhance, processes to oversee and monitor the performance ofSub-Advisers, including the use of analytical methods to review Fund performance and execution of investment strategies. The Board noted that PLFA provides the Board with analyses of these data over rolling periods to assist the Board in identifying trends in Fund performance and other areas, and periodically provides the Trustees with information on economic and market trends to provide a context for assessing recent performance. The Trustees also noted that PLFA has developed effective methods for tracking theSub-Advisers’ investment style consistency, for analyzing the use of derivatives bySub-Advisers and for monitoring Fund liquidity. With respect to the PAM Managed Funds, the Board considered that PLFA provides oversight, diligence and reporting with regard to its PAM unit that is similar to the process it employs with regard to theSub-Advisers. In making their assessments, the Trustees considered that PLFA has historically exercised diligence in monitoring the performance of theSub-Advisers and PAM, and has recommended and taken measures to attempt to remedy relative underperformance by a Fund when PLFA and the Trustees believed it to be appropriate. The Trustees also considered the significant work performed by PLFA in conducting searches for newSub-Advisers to replace existingSub-Advisers where appropriate or to manage new Funds in the Trust.
The Board also noted that PLFA conducts regular due diligence onSub-Advisers involving onsite visits,in-person meetings and telephonic meetings to gather information that PLFA uses to gain anin-depth understanding of aSub-Adviser’s investment process and to seek to identify issues that may be relevant to aSub-Adviser’s services to a Fund or a Fund’s performance, including, but not limited to, aSub-Adviser’s investment process, investment capabilities, resources and personnel, the financial strength of aSub-Adviser, significant staffing changes that could affect a Fund, material changes in aSub-Adviser’s assets under management, compliance and regulatory concerns, best execution review and portfolio security valuation support.
The Trustees considered the time and attention paid by PLFA to matters involving the valuation of Fund securities for both the PAM Managed Funds andSub-Advised Funds. The Trustees considered that PLFA has established a Valuation Oversight Committee that is responsible for, among other things, researching and evaluating information concerning securities that are not actively or publicly traded, valuing securities subject to a trading halt or for which a market quotation is not readily available, the valuation of equity securities traded in foreign markets, oversight of and due diligence on pricing vendors and the development of alternate valuation methodologies. The Trustees also considered the information and support provided by PLFA in connection with the Trustees’ fair valuation responsibilities.
The Trustees considered PLFA’s oversight, review and analysis of trade execution reports and trends in trade execution for both the PAM Managed Funds andSub-Advised Funds. The Trustees noted that PLFA works with a third-party transaction cost analysis consultant that provides statistical analysis on portfolio trading, and that PLFA presents information about the Funds’ portfolio trading costs to the Board annually and, where warranted, engages in a dialogue with personnel of aSub-Adviser on trading costs and the quality of execution. The Board also noted that PLFA conducts regular review and analysis of eachSub-Adviser’s use of research obtained with commissions paid to broker-dealers for executing portfolio transactions (“soft dollars”) and presents information about theSub-Advisers’ use of soft dollars to the Board annually and, where deemed necessary, discusses such soft dollar use withSub-Advisers.
The Trustees also considered PLFA’s implementation of transition management programs when handling significant changes in the Funds, such as cash movements between the Funds arising from reallocations byfunds-of-funds and the transition of Fund assets from oneSub-Adviser to another, including steps taken by PLFA to reduce transaction costs associated with a Fund transition. The Trustees considered that PLFA coordinates the onboarding process for newSub-Advisers and oversees the establishment of necessary accounts and documentation for theSub-Advisers to begin managing Fund assets.
In addition to the services described above, the Trustees also considered the compliance monitoring that PLFA and its affiliates conduct on theSub-Advisers and the commitment of PLFA and its affiliates to those programs and PLFA’s efforts to keep the Trustees informed about the compliance programs ofSub-Advisers. In this regard, the Trustees reviewed information and reports from the Trust’s CCO on compliance by theSub-Advisers with applicable laws and regulations. The Trustees considered that the CCO has in place a systematic process for periodically reviewing eachSub-Adviser’s written compliance policies and procedures, including the assessment of eachSub-Adviser’s compliance program as required under Rule38a-1 of the 1940 Act, and eachSub-Adviser’s code of ethics. The Trustees considered that PLFA is compensated at approximate cost for the administration of the Funds’ compliance program. The Trustees also considered that eachSub-Adviser continues to cooperate with the CCO in reviewing its compliance operations.
Sub-Advisers. The Trustees considered the benefits to shareholders of retaining eachSub-Adviser and continuing theSub-Advisory Agreements, particularly in light of the nature, extent, and quality of the services that have been provided by theSub-Advisers. The Trustees considered the services provided by eachSub-Adviser in rendering investment management services to aSub-Advised Fund. The Trustees considered that eachSub-Adviser is responsible for identifying investments for aSub-Advised Fund and determining when and what securities, cash and/or other investments to purchase, retain, or sell for aSub-Advised Fund. The Trustees also considered that eachSub-Adviser is responsible for evaluating and voting proxies for portfolio holdings of aSub-Advised Fund. The Trustees considered the quality of the portfolio management services which have benefited and should continue to benefit theSub-Advised Funds and their shareholders, the organizational
F-10
PACIFIC FUNDS
APPROVAL OF INVESTMENT ADVISORY
AND SUB-ADVISORY AGREEMENTS (Continued)
(Unaudited)
depth and resources of theSub-Advisers, including the background and experience of eachSub-Adviser’s management personnel, and the expertise of eachSub-Adviser’s portfolio management team, as well as the investment methodology used by theSub-Adviser. The Trustees also considered that eachSub-Adviser provides PLFA with information that assists PLFA in performing its oversight role, including information about theSub-Adviser’s compliance program.
The Board concluded that it was satisfied with the nature, extent and quality of the investment management services provided by PLFA and eachSub-Adviser.
B. Investment Results
The Trustees considered the investment results of each Fund in light of its objective, strategies and market conditions. The Trustees compared each Fund’s total returns with the total returns of a group of appropriate peer funds (each a “Selected Performance Peer Group”), which were selected by an Independent Consultant using data from third-party data vendor Morningstar, and the Trustees reviewed a description of the Independent Consultant’s methodology for selecting the peer funds in each Selected Performance Peer Group. In addition, with respect to Funds other than the Portfolio Optimization Funds, the Trustees compared each Fund’s total returns with the total returns of the Fund’s broad-based market index, sector index, composite index or an alternative index selected by the Independent Consultant, as applicable (each, a “primary benchmark”). With respect to the Portfolio Optimization Funds, the Trustees compared each Fund’s total returns with the total returns of a custom benchmark that is comprised of certain broad-based market indices based on the broad asset class target allocations for the Fund. The Trustees took into account the views of the Independent Consultant that these custom benchmarks appeared to be reasonable benchmarks for performance reporting purposes.
The information provided to the Trustees included each Fund’s performance record for theone-, three-, five- andten-year or since inception periods ended September 30, 2018, as available, compared to the applicable benchmark and Selected Performance Peer Group. The Trustees placed greater emphasis on a Fund’s performance against peers as opposed to an unmanaged index.
The Trustees considered the performance of each Fund on acase-by-case basis and noted that some Funds had outperformed their Selected Performance Peer Group over certain periods and/or exceeded the return of their respective benchmark while others underperformed their Selected Performance Peer Group over certain periods and/or trailed the return of their respective benchmark. In considering each Fund’s investment results, the Board placed greater emphasis on each Fund’s longer-term performance track record rather than shorter-term performance. The Board also took into account that each Fund’s track record is measured as of a specific date, and that track records can vary as of different measurement dates. Therefore, in reviewing a Fund that is currently underperforming, the Trustees also considered the broader perspective of the Fund’s performance over varying time periods, the market conditions experienced during the periods under review, as well as the outlook for the Fund going forward in light of expected future market conditions. In the case of the Underlying Funds, the Board also took into account the views of PLFA about the role of a particular Fund within a broader asset allocation strategy for the Asset Allocation Funds. Where there had been a change inSub-Adviser for a Fund, the Board took into account that the currentSub-Adviser was only responsible for certain portions of the Fund’s performance record. The Trustees discussed with PLFA the fact that certain periods of underperformance may be transitory while other periods of underperformance may be reflective of broader issues that may warrant consideration of corrective action. The Trustees discussed these Funds with representatives of PLFA, including an assessment of the approach used by theSub-Advisers, and the approach used by PLFA and PAM with respect to the Directly Managed Funds, as well as the oversight and monitoring by PLFA as the investment adviser, to gain an understanding of underperformance and to assess whether any actions would be appropriate. In addition, the Board considered any specific actions that PLFA, PAM or aSub-Adviser has taken, or agreed to take, to enhance the investment performance of a Fund, and the results of those actions. In reviewing the performance of each Fund, the Board took into account, among other things, each Fund’s performance track record. A summary of each Fund’s track record is provided below.
PF Growth Fund
The Fund: (1) outperformed its Selected Performance Peer Group median for theone-, three-, five- andten-year periods; (2) outperformed its primary benchmark for theone- and three-year periods and underperformed for the five- andten-year periods; and (3) is ranked in the first quintile of its Selected Performance Peer Group for theone-, three- and five-year periods, and the third quintile for theten-year period. In evaluating the performance of the Fund, the Board also considered that the currentSub-Adviser has managed the Fund since 2013.
PFLarge-Cap Value Fund
The Fund: (1) underperformed its Selected Performance Peer Group median for theone-, three-, five- andten-year periods; (2) underperformed its primary benchmark for theone-, three-, five- andten-year periods; and (3) is ranked in the fourth quintile of its Selected Performance Peer Group for theone- and three-year periods and the third quintile for the five- andten-year periods. In evaluating the performance of the Fund, the Board also considered PLFA’s views as to the reasons for the Fund’s relative performance against peers and its benchmark over various time periods and PLFA’s future outlook for the Fund. The Board also considered that PLFA has added the Fund to its performance “watch list” and will be monitoring the Fund closely for improved performance.
Pacific FundsLarge-Cap
The Fund: (1) outperformed its Selected Performance Peer Group median for theone-year period; (2) underperformed its primary benchmark for theone-year period; and (3) is ranked in the third quintile of its Selected Performance Peer Group for theone-year period. In evaluating the performance of the Fund, the Board also considered that the Fund had not been in operation for a sufficient time period to establish a meaningful track record.
F-11
PACIFIC FUNDS
APPROVAL OF INVESTMENT ADVISORY
AND SUB-ADVISORY AGREEMENTS (Continued)
(Unaudited)
Pacific FundsLarge-Cap Value
The Fund: (1) underperformed its Selected Performance Peer Group median for theone-year period; (2) outperformed its primary benchmark for theone-year period; and (3) is ranked in the third quintile of its Selected Performance Peer Group for theone-year period. In evaluating the performance of the Fund, the Board also considered that the Fund had not been in operation for a sufficient time period to establish a meaningful track record.
PF Developing Growth Fund
The Fund: (1) outperformed its Selected Performance Peer Group median for theone- and three-year periods and underperformed for the five- andten-year periods; (2) outperformed its primary benchmark for theone- and three-year periods and underperformed for the five- andten-year periods; and (3) is ranked in the first quintile of its Selected Performance Peer Group for theone-year period, the second quintile for the three-year period, the fourth quintile for the five-year period, and the third quintile for theten-year period. In evaluating the performance of the Fund, the Board also considered that the currentSub-Adviser has managed the Fund since 2014.
PFMid-Cap Equity Fund
The Fund: (1) outperformed its Selected Performance Peer Group median for theone-, three-, five- andten-year periods; (2) outperformed its primary benchmark for theone-, three- and five-year periods and underperformed for theten-year period; and (3) is ranked in the first quintile of its Selected Performance Peer Group for theone-, three- and five-year periods and the second quintile for theten-year period. In evaluating the performance of the Fund, the Board also considered that it had recently approved a newSub-Advisory Agreement for the Fund effective June 2018 and, therefore, theSub-Advisory Agreement was not up for renewal at this time.
Pacific FundsSmall/Mid-Cap
The Fund: (1) outperformed its Selected Performance Peer Group median for theone-year period; (2) underperformed its primary benchmark for theone-year period; and (3) is ranked in the second quintile of its Selected Performance Peer Group for theone-year period. In evaluating the performance of the Fund, the Board also considered that the Fund had not been in operation for a sufficient time period to establish a meaningful track record.
Pacific FundsSmall-Cap
The Fund: (1) outperformed its Selected Performance Peer Group median for theone-year period; (2) underperformed its primary benchmark for theone-year period; and (3) is ranked in the second quintile of its Selected Performance Peer Group for theone-year period. In evaluating the performance of the Fund, the Board also considered that the Fund had not been in operation for a sufficient time period to establish a meaningful track record.
Pacific FundsSmall-Cap Growth
The Fund: (1) underperformed its Selected Performance Peer Group median for theone-year period; (2) outperformed its primary benchmark for theone-year period; and (3) is ranked in the fourth quintile of its Selected Performance Peer Group for theone-year period. In evaluating the performance of the Fund, the Board also considered that the Fund had not been in operation for a sufficient time period to establish a meaningful track record.
PFSmall-Cap Value Fund
The Fund: (1) outperformed its Selected Performance Peer Group median for theone-, three-, five- andten-year periods; (2) underperformed its primary benchmark for theone- and three-year periods and outperformed for the five- andten-year periods; and (3) is ranked in the second quintile of its Selected Performance Peer Group for theone- andten-year periods and the first quintile for the three- and five-year periods. In evaluating the performance of the Fund, the Board also considered that the currentSub-Adviser has managed the Fund since 2014.
Pacific FundsSmall-Cap Value
The Fund: (1) underperformed its Selected Performance Peer Group median for theone-year period; (2) underperformed its primary benchmark for theone-year period; and (3) is ranked in the fourth quintile of its Selected Performance Peer Group for theone-year period. In evaluating the performance of the Fund, the Board also considered that the Fund had not been in operation for a sufficient time period to establish a meaningful track record.
PF Emerging Markets Fund
The Fund: (1) outperformed its Selected Performance Peer Group median for theone-, three-, five- andten-year periods; (2) outperformed its primary benchmark for theone-, three- andten-year periods and underperformed for the five-year period; and (3) is ranked in the first quintile of its Selected Performance Peer Group for theone-, three- andten-year periods and the second quintile for the five-year period.
PF Emerging Markets Debt Fund
The Fund: (1) underperformed its Selected Performance Peer Group median for theone-year period and outperformed for the three- and five-year periods; (2) underperformed its primary benchmark for theone-year period and outperformed for the three- and five-year periods; and (3) is ranked in the fourth quintile of its Selected Performance Peer Group for theone-year period, the first quintile for the three-year period and the third quintile for the five-year period.
F-12
PACIFIC FUNDS
APPROVAL OF INVESTMENT ADVISORY
AND SUB-ADVISORY AGREEMENTS (Continued)
(Unaudited)
PF InternationalLarge-Cap Fund
The Fund: (1) outperformed its Selected Performance Peer Group median for theone- andten-year periods, performed in line for the three-year period, and underperformed for the five-year period; (2) outperformed its primary benchmark for theone-, three-, five- andten-year periods; and (3) is ranked in the third quintile of its Selected Performance Peer Group for theone- and three-year periods, the fourth quintile for the five-year period and the second quintile for theten-year period.
PF InternationalSmall-Cap Fund
The Fund: (1) underperformed the Selected Performance Peer Group median for theone- and three-year periods; (2) underperformed its primary benchmark for theone- and three-year periods; and (3) is ranked in the fourth quintile of its Selected Performance Peer Group for theone-and three-year periods. In evaluating the performance of the Fund, the Board also considered PLFA’s views as to the reasons for the Fund’s relative performance against peers and its benchmark over various time periods. The Board also considered PLFA’s views as to the competitive nature of theSub-Adviser’s longer-term performance and its confidence in theSub-Adviser’s investment process.
PF International Value Fund
The Fund: (1) outperformed its Selected Performance Peer Group median for theone- and three-year periods and underperformed for the five- andten-year periods; (2) underperformed its primary benchmark for theone-, three-, five- andten-year periods; and (3) is ranked in the first quintile of its Selected Performance Peer Group for theone- andthree-year periods, the fourth quintile for the five-year period and the fifth quintile for theten-year period. In evaluating the performance of the Fund, the Board also considered that the currentSub-Adviser has managed the Fund since 2017.
PF Currency Strategies Fund
The Fund: (1) outperformed its Selected Performance Peer Group median for theone-, three- and five-year periods; (2) underperformed its primary benchmark for theone-, three- and five-year periods; and (3) is ranked in the first quintile of its Selected Performance Peer Group for theone-, three- and five-year periods. In evaluating the performance of the Fund, the Board also considered that the Fund had aco-Sub-Adviser from 2014 until 2018.
Pacific Funds Diversified Alternatives
The Fund: (1) underperformed its Selected Performance Peer Group median for theone-year period and outperformed for the three-year period; (2) underperformed its primary benchmark for theone- and three-year periods; and (3) is ranked in the fifth quintile of its Selected Performance Peer Group for theone-year period and the first quintile for the three-year period. In evaluating the performance of the Fund, the Board also considered PLFA’s views as to the reasons for the Fund’s relative performance against peers and its benchmark over various time periods and PLFA’s future outlook for the Fund.
PF Equity Long/Short Fund
The Fund: (1) underperformed its Selected Performance Peer Group median for theone-year period and outperformed its Selected Performance Peer Group median for the three-year period; (2) underperformed its primary benchmark for theone-year period and outperformed for the three-year period; and (3) is ranked in the fifth quintile of its Selected Performance Peer Group for theone-year period and the first quintile for the three-year period. In evaluating the performance of the Fund, the Board also considered PLFA’s views as to the reasons for the Fund’s relative performance against peers and its benchmark over various time periods and PLFA’s future outlook for the Fund. The Board also considered PLFA’s representation that theSub-Adviser’s investment style is currently out of favor.
PF Global Absolute Return Fund
The Fund: (1) underperformed its Selected Performance Peer Group median for theone- and three-year periods and outperformed for the five-year period; (2) underperformed its primary benchmark for theone-, three- and five-year periods; and (3) is ranked in the fourth quintile of its Selected Performance Peer Group for theone- and three-year periods and the third quintile for the five-year period. In evaluating the performance of the Fund, the Board also considered that the Selected Performance Peer Group was of limited usefulness due to the diversity of investment approaches of funds in the peer group. The Board also considered PLFA’s views as to the reasons for the Fund’s relative performance against peers and its benchmark over various time periods and PLFA’s future outlook for the Fund. The Board also considered that PLFA has added the Fund to its performance “watch list” and will be monitoring its performance closely.
PF Real Estate Fund
The Fund: (1) slightly underperformed its Selected Performance Peer Group median for theone-year period and underperformed for the three-, five- andten-year periods; (2) underperformed its primary benchmark for theone-, three-, five- andten-year periods; and (3) is ranked in the third quintile of its Selected Performance Peer Group for theone-year period, the fifth quintile for the three- and five-year periods and the fourth quintile for theten-year period. In evaluating the performance of the Fund, the Board also considered that it had recently approved a newSub-Advisory Agreement for a newSub-Adviser to the Fund effective May 2018 and, therefore, theSub-Advisory Agreement was not up for renewal at this time.
Pacific Funds Core Income
The Fund: (1) outperformed its Selected Performance Peer Group median for theone-, three- and five-year periods; (2) outperformed its primary benchmark for theone-, three- and five-year periods; and (3) is ranked in the first quintile of its Selected Performance Peer Group for theone-, three- and five-year periods.
F-13
PACIFIC FUNDS
APPROVAL OF INVESTMENT ADVISORY
AND SUB-ADVISORY AGREEMENTS (Continued)
(Unaudited)
Pacific Funds Floating Rate Income
The Fund: (1) outperformed its Selected Performance Peer Group median for theone-, three- and five-year periods; (2) underperformed its primary benchmark for theone-, three- and five-year periods; and (3) is ranked in the second quintile of its Selected Performance Peer Group for theone-, three- and five-year periods.
Pacific Funds High Income
The Fund: (1) outperformed its Selected Performance Peer Group median for theone- and three-year periods and performed in line for the five-year period; (2) slightly underperformed its primary benchmark for theone-year period and underperformed for the three- and five-year periods; and (3) is ranked in the second quintile of its Selected Performance Peer Group for theone- and three-year periods and the third quintile for the five-year period.
PF Inflation Managed Fund
The Fund: (1) outperformed its Selected Performance Peer Group median for theone-, three-, five- andten-year periods; (2) slightly outperformed its primary benchmark for theone-year period, underperformed for the three- and five-year periods and outperformed for theten-year period; and (3) is ranked in the second quintile of its Selected Performance Peer Group for theone-, three- and five-year periods and the first quintile for theten-year period. In evaluating the performance of the Fund, the Board also considered that the currentSub-Adviserco-managed the Fund with another firm from January 2015 to October 2016 and since October 2016 has been the soleSub-Adviser.
PF Managed Bond Fund
The Fund: (1) underperformed its Selected Performance Peer Group median for theone-year period and outperformed for the three-, five- andten-year periods; (2) underperformed its primary benchmark for theone-year period and outperformed for the three-, five- andten-year periods; and (3) is ranked in the fifth quintile of its Selected Performance Peer Group for theone-year period and the first quintile for the three-, five- andten-year periods. In evaluating the performance of the Fund, the Board also considered that one of the Fund’sco-Sub-Advisers was the soleSub-Adviser from the Fund’s inception until 2014, and that the otherco-Sub-Adviser hasco-managed the Fund since 2014.
PF Short Duration Bond Fund
The Fund: (1) outperformed its Selected Performance Peer Group median for theone-year period and underperformed for the three-, five- andten-year periods; (2) outperformed its primary benchmark for theone-, three- and five-year periods and slightly underperformed for theten-year period; and (3) is ranked in the third quintile of its Selected Performance Peer Group for theone- and three-year periods, the fourth quintile for the five-year period and the fifth quintile for theten-year period. In evaluating the performance of the Fund, the Board also considered that the currentSub-Adviser has managed the Fund since 2011.
Pacific Funds Short Duration Income
The Fund: (1) outperformed its Selected Performance Peer Group median for theone-, three- and five-year periods; (2) outperformed its primary benchmark for theone-, three- and five-year periods; and (3) is ranked in the first quintile of its Selected Performance Peer Group for theone-, three- and five-year periods.
Pacific Funds Strategic Income
The Fund: (1) outperformed its Selected Performance Peer Group median for theone-, three- and five-year periods; (2) outperformed its primary benchmark for theone-, three- and five-year periods; and (3) is ranked in the first quintile of its Selected Performance Peer Group for theone-, three-, and five-year periods.
Pacific Funds Portfolio Optimization Conservative
The Fund: (1) underperformed its Selected Performance Peer Group median for theone-, three- and five-year periods and performed in line for theten-year period; (2) underperformed its custom benchmark for theone-, five- andten-year periods and outperformed for the three-year period; and (3) is ranked in the fifth quintile of its Selected Performance Peer Group for theone-year period, the fourth quintile for the three- and five-year periods and the third quintile for theten-year period. In evaluating the performance of the Fund, the Board also considered PLFA’s views as to the reasons for the Fund’s relative performance against peers and its benchmark over various time periods and PLFA’s future outlook for the Fund. The Board considered that PLFA would continue to manage exposures to asset classes and underlying managers in an effort to improve performance.
Pacific Funds Portfolio Optimization Moderate-Conservative
The Fund: (1) underperformed its Selected Performance Peer Group median for theone-, three-, five- andten-year periods; (2) underperformed its custom benchmark for theone-, five- andten-year periods and outperformed for the three-year period; and (3) is ranked in the fourth quintile of its Selected Performance Peer Group for theone-, five- andten-year periods and the third quintile for the three-year period. In evaluating the performance of the Fund, the Board also considered PLFA’s views as to the reasons for the Fund’s relative performance against peers and its benchmark over various time periods and PLFA’s future outlook for the Fund. The Board considered that PLFA would continue to manage exposures to asset classes and underlying managers in an effort to improve performance.
Pacific Funds Portfolio Optimization Moderate
The Fund: (1) underperformed its Selected Performance Peer Group median for theone-, three-, five- andten-year periods; (2) underperformed its custom benchmark for theone-, five- andten-year periods and outperformed for the three-year period; and (3) is ranked in the fourth quintile of its Selected Performance Peer Group for theone-, three- and five-year periods and the fifth quintile for theten-year
F-14
PACIFIC FUNDS
APPROVAL OF INVESTMENT ADVISORY
AND SUB-ADVISORY AGREEMENTS (Continued)
(Unaudited)
period. In evaluating the performance of the Fund, the Board also considered PLFA’s views as to the reasons for the Fund’s relative performance against peers and its benchmark over various time periods and PLFA’s future outlook for the Fund. The Board considered that PLFA would continue to manage exposures to asset classes and underlying managers in an effort to improve performance.
Pacific Funds Portfolio Optimization Growth
The Fund: (1) underperformed its Selected Performance Peer Group median for theone-, three-, five- andten-year periods; (2) underperformed its custom benchmark for theone-, five- andten-year periods and outperformed for the three-year period; and (3) is ranked in the fourth quintile of its Selected Performance Peer Group for theone-, five- andten-year periods and the third quintile for the three-year period. In evaluating the performance of the Fund, the Board also considered PLFA’s views as to the reasons for the Fund’s relative performance against peers and its benchmark over various time periods and PLFA’s future outlook for the Fund. The Board considered that PLFA would continue to manage exposures to asset classes and underlying managers in an effort to improve performance.
Pacific Funds Portfolio Optimization Aggressive-Growth
The Fund: (1) outperformed its Selected Performance Peer Group for theone- and three-year periods and underperformed for the five- andten-year periods; (2) underperformed its custom benchmark for theone-, five- andten-year periods and outperformed for the three-year period; and (3) is ranked in the second quintile of its Selected Performance Peer Group for theone- and three-year periods and the fourth quintile for the five- andten-year periods.
The Trustees reviewed the monitoring of eachSub-Advisers’ investment results by PLFA, including PLFA’s historical practice of recommending to the Trustees the use of a newsub-adviser if performance lagged and the prospects for improvement within a reasonable timeframe were not promising, and reviewed the monitoring of the PAM unit’s investment results by PLFA. Generally, the Trustees noted that there continues to be a record of well-managed Funds that are appropriate to serve as Underlying Funds in the Asset Allocation Funds and that the Asset Allocation Funds provide a range of professionally managed asset allocation investment options. The Trustees considered the steps PLFA has taken to seek to improve performance of the Asset Allocation Funds, including ongoing assessment of asset allocation determinations, diversifying asset class investment options by adding additional Underlying Funds, and adding or changingSub-Advisers to the Underlying Funds. The Trustees also noted that the Funds continue to deliver the investment style as disclosed to shareholders. The Trustees also noted the use by investors of the Asset Allocation Funds and the benefits the Asset Allocation Funds provide for shareholders generally.
The Board concluded that PLFA continues to have a long record of effectively managing a multi-manager fund group and asset allocation funds designed to give shareholders a reasonable array of choices through which to implement their investment programs. The Board further concluded that PLFA was appropriately implementing each Fund’s investment objective either directly or through the selection ofSub-Advisers and that PLFA’s record in managing each Fund indicates that PLFA’s continued management, as well as the continuation of the respectiveSub-Advisory Agreements, will benefit each Fund and its shareholders.
C. Advisory Fees and Total Expense Ratios
The Trustees requested, received and reviewed information from PLFA relating to the advisory fees paid by the Funds and thesub-advisory fees paid by PLFA, including the portion of the advisory fees paid to eachSub-Adviser as compared to the portion retained by PLFA. The Trustees considered the nature and quality of the services provided by PLFA and also considered the nature and quality of services provided by eachSub-Adviser. The Independent Trustees also requested and reviewed information from the Independent Consultant along with the Independent Consultant’s analysis of advisory fees,sub-advisory fees and certain Fund expenses, excluding any applicable service or distribution fees, which were selected by the Independent Consultant for purposes of the peer group expense comparisons (“Operating Expenses”). The Trustees reviewed the advisory fees,sub-advisory fees and Operating Expenses of each Fund and compared such amounts with the fees and expense levels of a group of appropriate peer funds identified by the Independent Consultant (each a “Selected Expense Peer Group”). The Trustees reviewed a description of the Independent Consultant’s methodology for constructing the Selected Expense Peer Groups, noting that each Selected Expense Peer Group includes a group ofsimilarly-sized funds with comparable strategies from a universe of funds that (i) included bothsub-advised and directly managed funds; (ii) excluded funds that are managed withnon-standard business models and expense structures; and (iii) excluded index funds. With respect to the Portfolio Optimization Funds, the Trustees also compared the net expense ratio with the average net expense ratio of funds in the Morningstar Category determined to be similar to the relevant Portfolio Optimization Fund (“Comparable Peer Fund Average”).
A summary of certain comparative fee and expense information considered by the Trustees for each Fund is provided below.
PF Growth Fund
The Trustees considered that (a) the advisory fee for the Fund is less than the median advisory fee rate of the funds in its Selected Expense Peer Group and ranked in the first quintile of its Selected Expense Peer Group; and (b) the Operating Expenses for the Fund are less than the median Operating Expenses of the funds in its Selected Expense Peer Group and ranked in the second quintile of its Selected Expense Peer Group.
PFLarge-Cap Value Fund
The Trustees considered that (a) the advisory fee for the Fund is slightly less than the median advisory fee rate of the funds in its Selected Expense Peer Group and ranked in the second quintile of its Selected Expense Peer Group; and (b) the Operating Expenses for the Fund are slightly less than the median Operating Expenses of the funds in its Selected Expense Peer Group and ranked in the second quintile of its Selected Expense Peer Group.
F-15
PACIFIC FUNDS
APPROVAL OF INVESTMENT ADVISORY
AND SUB-ADVISORY AGREEMENTS (Continued)
(Unaudited)
Pacific FundsLarge-Cap
The Trustees considered that (a) the advisory fee for the Fund is less than the median advisory fee rate of the funds in its Selected Expense Peer Group and ranked in the first quintile of its Selected Expense Peer Group; and (b) the Operating Expenses for the Fund are less than the median Operating Expenses of the funds in its Selected Expense Peer Group and ranked in the second quintile of its Selected Expense Peer Group. The Trustees considered that PLFA currently has contractually agreed to waive 0.10% of its advisory fee.
Pacific FundsLarge-Cap Value
The Trustees considered that (a) the advisory fee for the Fund is less than the median advisory fee rate of the funds in its Selected Expense Peer Group and ranked in the second quintile of its Selected Expense Peer Group; and (b) the Operating Expenses for the Fund are less than the median Operating Expenses of the funds in its Selected Expense Peer Group and ranked in the first quintile of its Selected Expense Peer Group.
PF Developing Growth Fund
The Trustees considered that (a) the advisory fee for the Fund is less than the median advisory fee rate of the funds in its Selected Expense Peer Group and ranked in the first quintile of its Selected Expense Peer Group; and (b) the Operating Expenses for the Fund are less than the median Operating Expenses of the funds in its Selected Expense Peer Group and ranked in the first quintile of its Selected Expense Peer Group.
PFMid-Cap Equity Fund
The Trustees considered that (a) the advisory fee for the Fund is less than the median advisory fee rate of the funds in its Selected Expense Peer Group and ranked in the first quintile of its Selected Expense Peer Group; and (b) the Operating Expenses for the Fund are less than the median Operating Expenses of the funds in its Selected Expense Peer Group and ranked in the first quintile of its Selected Expense Peer Group.
Pacific FundsSmall/Mid-Cap
The Trustees considered that (a) the advisory fee for the Fund is slightly greater than the median advisory fee rate of the funds in its Selected Expense Peer Group and ranked in the fourth quintile of its Selected Expense Peer Group; and (b) the Operating Expenses for the Fund are in line with the median Operating Expenses of the funds in its Selected Expense Peer Group and ranked in the third quintile of its Selected Expense Peer Group.
Pacific FundsSmall-Cap
The Trustees considered that (a) the advisory fee for the Fund is slightly less than the median advisory fee rate of the funds in its Selected Expense Peer Group and ranked in the third quintile of its Selected Expense Peer Group; and (b) the Operating Expenses for the Fund are slightly less than the median Operating Expenses of the funds in its Selected Expense Peer Group and ranked in the second quintile of its Selected Expense Peer Group.
Pacific FundsSmall-Cap Growth
The Trustees considered that (a) the advisory fee for the Fund is slightly less than the median advisory fee rate of the funds in its Selected Expense Peer Group and ranked in the third quintile of its Selected Expense Peer Group; and (b) the Operating Expenses for the Fund are less than the median Operating Expenses of the funds in its Selected Expense Peer Group and ranked in the first quintile of its Selected Expense Peer Group.
PFSmall-Cap Value Fund
The Trustees considered that (a) the advisory fee for the Fund is less than the median advisory fee rate of the funds in its Selected Expense Peer Group and ranked in the first quintile of its Selected Expense Peer Group; and (b) the Operating Expenses for the Fund are less than the median Operating Expenses of the funds in its Selected Expense Peer Group and ranked in the first quintile of its Selected Expense Peer Group.
Pacific FundsSmall-Cap Value
The Trustees considered that (a) the advisory fee for the Fund is in line with the median advisory fee rate of the funds in its Selected Expense Peer Group and ranked in the third quintile of its Selected Expense Peer Group; and (b) the Operating Expenses for the Fund are less than the median Operating Expenses of the funds in its Selected Expense Peer Group and ranked in the second quintile of its Selected Expense Peer Group.
PF Emerging Markets Fund
The Trustees considered that (a) the advisory fee for the Fund is less than the median advisory fee rate of the funds in its Selected Expense Peer Group and ranked in the first quintile of its Selected Expense Peer Group; and (b) the Operating Expenses for the Fund are less than the median Operating Expenses of the funds in its Selected Expense Peer Group and ranked in the first quintile of its Selected Expense Peer Group.
PF Emerging Markets Debt Fund
The Trustees considered that (a) the advisory fee for the Fund is slightly less than the median advisory fee rate of the funds in its Selected Expense Peer Group and ranked in the second quintile of its Selected Expense Peer Group; and (b) the Operating Expenses for the Fund are
F-16
PACIFIC FUNDS
APPROVAL OF INVESTMENT ADVISORY
AND SUB-ADVISORY AGREEMENTS (Continued)
(Unaudited)
slightly less than the median Operating Expenses of the funds in its Selected Expense Peer Group and ranked in the second quintile of its Selected Expense Peer Group. The Trustees considered that PLFA currently has contractually agreed to waive 0.02% of its advisory fee.
PF InternationalLarge-Cap Fund
The Trustees considered that (a) the advisory fee for the Fund is slightly greater than the median advisory fee rate of the funds in its Selected Expense Peer Group and ranked in the fourth quintile of its Selected Expense Peer Group; and (b) the Operating Expenses for the Fund are less than the median Operating Expenses of the funds in its Selected Expense Peer Group and ranked in the second quintile of its Selected Expense Peer Group.
PF InternationalSmall-Cap Fund
The Trustees considered that (a) the advisory fee for the Fund is less than the median advisory fee rate of the funds in its Selected Expense Peer Group and ranked in the first quintile of its Selected Expense Peer Group; and (b) the Operating Expenses for the Fund are less than the median Operating Expenses of the funds in its Selected Expense Peer Group and ranked in the first quintile of its Selected Expense Peer Group.
PF International Value Fund
The Trustees considered that (a) the advisory fee for the Fund is less than the median advisory fee rate of the funds in its Selected Expense Peer Group and ranked in the first quintile of its Selected Expense Peer Group; and (b) the Operating Expenses for the Fund are less than the median Operating Expenses of the funds in its Selected Expense Peer Group and ranked in the first quintile of its Selected Expense Peer Group.
PF Currency Strategies Fund
The Trustees considered that (a) the advisory fee for the Fund is in line with the median advisory fee rate of the funds in its Selected Expense Peer Group and ranked in the third quintile of its Selected Expense Peer Group; and (b) the Operating Expenses for the Fund are less than the median Operating Expenses of the funds in its Selected Expense Peer Group and ranked in the first quintile of its Selected Expense Peer Group.
Pacific Funds Diversified Alternatives
The Trustees considered that (a) the advisory fee for the Fund is less than the median advisory fee rate of the funds in its Selected Expense Peer Group and ranked in the first quintile of its Selected Expense Peer Group; and (b) the Operating Expenses for the Fund are less than the median Operating Expenses of the funds in its Selected Expense Peer Group and ranked in the third quintile of its Selected Expense Peer Group. The Trustees noted that pursuant to a fee waiver agreement, PLFA has agreed to a breakpoint schedule that will reduce its advisory fee once the Fund attains varying higher asset levels, but that the Fund has not yet reached the first breakpoint.
PF Equity Long/Short Fund
The Trustees considered that (a) the advisory fee for the Fund is less than the median advisory fee rate of the funds in its Selected Expense Peer Group and ranked in the second quintile of its Selected Expense Peer Group; and (b) the Operating Expenses for the Fund are less than the median Operating Expenses of the funds in its Selected Expense Peer Group and ranked in the second quintile of its Selected Expense Peer Group. The Trustees considered that PLFA currently has contractually agreed to waive 0.15% of its advisory fee. The Trustees also considered that the Operating Expenses for the Fund include investment related expenses.
PF Global Absolute Return Fund
The Trustees considered that (a) the advisory fee for the Fund is less than the median advisory fee rate of the funds in its Selected Expense Peer Group and ranked in the second quintile of its Selected Expense Peer Group; and (b) the Operating Expenses for the Fund are slightly greater than the median Operating Expenses of the funds in its Selected Expense Peer Group and ranked in the third quintile of its Selected Expense Peer Group.
PF Real Estate Fund
The Trustees considered that (a) the advisory fee for the Fund is in line with the median advisory fee rate of the funds in its Selected Expense Peer Group and ranked in the third quintile of its Selected Expense Peer Group; and (b) the Operating Expenses for the Fund are less than the median Operating Expenses of the funds in its Selected Expense Peer Group and ranked in the second quintile of its Selected Expense Peer Group. The Trustees considered that PLFA currently has contractually agreed to waive 0.15% of its advisory fee.
Pacific Funds Core Income
The Trustees considered that (a) the advisory fee for the Fund is slightly greater than the median advisory fee rate of the funds in its Selected Expense Peer Group and ranked in the third quintile of its Selected Expense Peer Group; and (b) the Operating Expenses for the Fund are less than the median Operating Expenses of the funds in its Selected Expense Peer Group and ranked in the second quintile of its Selected Expense Peer Group. The Trustees noted that pursuant to a fee waiver agreement, PLFA has agreed to a breakpoint schedule that will reduce its advisory fee once the Fund attains varying higher asset levels, but that the Fund has not yet reached the first breakpoint.
Pacific Funds Floating Rate Income
The Trustees considered that (a) the advisory fee for the Fund is slightly greater than the median advisory fee rate of the funds in its Selected Expense Peer Group and ranked in the fourth quintile of its Selected Expense Peer Group; and (b) the Operating Expenses for the Fund are slightly less than the median Operating Expenses of the funds in its Selected Expense Peer Group and ranked in the second quintile of its
F-17
PACIFIC FUNDS
APPROVAL OF INVESTMENT ADVISORY
AND SUB-ADVISORY AGREEMENTS (Continued)
(Unaudited)
Selected Expense Peer Group. The Trustees noted that pursuant to a fee waiver agreement, PLFA has agreed to a breakpoint schedule that had the effect of reducing the Fund’s advisory fee based on the Fund having attained varying higher asset levels.
Pacific Funds High Income
The Trustees considered that (a) the advisory fee for the Fund is less than the median advisory fee rate of the funds in its Selected Expense Peer Group and ranked in the second quintile of its Selected Expense Peer Group; and (b) the Operating Expenses for the Fund are less than the median Operating Expenses of the funds in its Selected Expense Peer Group and ranked in the first quintile of its Selected Expense Peer Group. The Trustees noted that pursuant to a fee waiver agreement, PLFA has agreed to a breakpoint schedule that will reduce its advisory fee once the Fund attains varying higher asset levels, but that the Fund has not yet reached the first breakpoint.
PF Inflation Managed Fund
The Trustees considered that (a) the advisory fee for the Fund is slightly less than the median advisory fee rate of the funds in its Selected Expense Peer Group and ranked in the second quintile of its Selected Expense Peer Group; and (b) the Operating Expenses for the Fund are in line with the median Operating Expenses of the funds in its Selected Expense Peer Group and ranked in the third quintile of its Selected Expense Peer Group.
PF Managed Bond Fund
The Trustees considered that (a) the advisory fee for the Fund is slightly less than the median advisory fee rate of the funds in its Selected Expense Peer Group and ranked in the second quintile of its Selected Expense Peer Group; and (b) the Operating Expenses for the Fund are slightly less than the median Operating Expenses of the funds in its Selected Expense Peer Group and ranked in the third quintile of its Selected Expense Peer Group.
PF Short Duration Bond Fund
The Trustees considered that (a) the advisory fee for the Fund is less than the median advisory fee rate of the funds in its Selected Expense Peer Group and ranked in the first quintile of its Selected Expense Peer Group; and (b) the Operating Expenses for the Fund are slightly less than the median Operating Expenses of the funds in its Selected Expense Peer Group and ranked in the second quintile of its Selected Expense Peer Group.
Pacific Funds Short Duration Income
The Trustees considered that (a) the advisory fee for the Fund is slightly less than the median advisory fee rate of the funds in its Selected Expense Peer Group and ranked in the third quintile of its Selected Expense Peer Group; and (b) the Operating Expenses for the Fund are slightly less than the median Operating Expenses of the funds in its Selected Expense Peer Group and ranked in the second quintile of its Selected Expense Peer Group. The Trustees noted that pursuant to a fee waiver agreement, PLFA has agreed to a breakpoint schedule that will reduce its advisory fee once the Fund attains varying higher asset levels, but that the Fund has not yet reached the first breakpoint.
Pacific Funds Strategic Income
The Trustees considered that (a) the advisory fee for the Fund is greater than the median advisory fee rate of the funds in its Selected Expense Peer Group and ranked in the fifth quintile of its Selected Expense Peer Group; and (b) the Operating Expenses for the Fund are in line with the median Operating Expenses of the funds in its Selected Expense Peer Group and ranked in the third quintile of its Selected Expense Peer Group. The Trustees further noted that pursuant to a fee waiver agreement, PLFA has agreed to a breakpoint schedule that will reduce its advisory fee once the Fund attains varying higher asset levels, but that the Fund has not yet reached the first breakpoint. The Trustees considered that the Selected Expense Peer Group also contains intermediate-term bond funds which generally have a lower advisory fee than multisector bond funds, such as the Fund.
Pacific Funds Portfolio Optimization Conservative
The Trustees considered that (a) the advisory fee for the Fund is slightly greater than the median advisory fee rate of the funds in its Selected Expense Peer Group and ranked in the third quintile of its Selected Expense Peer Group; (b) the Operating Expenses for the Fund are greater than the median Operating Expenses of the funds in its Selected Expense Peer Group and ranked in the fourth quintile of its Selected Expense Peer Group; and (c) the net expense ratio was greater than the Comparable Peer Fund Average. The Trustees noted that pursuant to a fee waiver agreement, PLFA has agreed to a breakpoint schedule that will reduce its advisory fee once the Fund attains varying higher asset levels, but that the Fund has not yet reached the first breakpoint.
Pacific Funds Portfolio Optimization Moderate-Conservative
The Trustees considered that (a) the advisory fee for the Fund is slightly greater than the median advisory fee rate of the funds in its Selected Expense Peer Group and ranked in the third quintile of its Selected Expense Peer Group; (b) the Operating Expenses for the Fund are greater than the median Operating Expenses of the funds in its Selected Expense Peer Group and ranked in the fourth quintile of its Selected Expense Peer Group; and (c) the net expense ratio was slightly less than the Comparable Peer Fund Average. The Trustees noted that pursuant to a fee waiver agreement, PLFA has agreed to a breakpoint schedule that will reduce its advisory fee once the Fund attains varying higher asset levels, but that the Fund has not yet reached the first breakpoint.
Pacific Funds Portfolio Optimization Moderate
The Trustees considered that (a) the advisory fee for the Fund is slightly greater than the median advisory fee rate of the funds in its Selected Expense Peer Group and ranked in the third quintile of its Selected Expense Peer Group; (b) the Operating Expenses for the Fund are greater
F-18
PACIFIC FUNDS
APPROVAL OF INVESTMENT ADVISORY
AND SUB-ADVISORY AGREEMENTS (Continued)
(Unaudited)
than the median Operating Expenses of the funds in its Selected Expense Peer Group and ranked in the fourth quintile of its Selected Expense Peer Group; and (c) the net expense ratio was less than the Comparable Peer Fund Average. The Trustees noted that pursuant to a fee waiver agreement, PLFA has agreed to a breakpoint schedule that will reduce its advisory fee once the Fund attains varying higher asset levels, but that the Fund has not yet reached the first breakpoint.
Pacific Funds Portfolio Optimization Growth
The Trustees considered that (a) the advisory fee for the Fund is slightly greater than the median advisory fee rate of the funds in its Selected Expense Peer Group and ranked in the third quintile of its Selected Expense Peer Group; (b) the Operating Expenses for the Fund are greater than the median Operating Expenses of the funds in its Selected Expense Peer Group and ranked in the fourth quintile of its Selected Expense Peer Group; and (c) the net expense ratio was slightly less than the Comparable Peer Fund Average. The Trustees noted that pursuant to a fee waiver agreement, PLFA has agreed to a breakpoint schedule that will reduce its advisory fee once the Fund attains varying higher asset levels, but that the Fund has not yet reached the first breakpoint.
Pacific Funds Portfolio Optimization Aggressive-Growth
The Trustees considered that (a) the advisory fee for the Fund is slightly greater than the median advisory fee rate of the funds in its Selected Expense Peer Group and ranked in the third quintile of its Selected Expense Peer Group; (b) the Operating Expenses for the Fund are greater than the median Operating Expenses of the funds in its Selected Expense Peer Group and ranked in the fourth quintile of its Selected Expense Peer Group; and (c) the net expense ratio was less than the Comparable Peer Fund Average. The Trustees noted that pursuant to a fee waiver agreement, PLFA has agreed to a breakpoint schedule that will reduce its advisory fee once the Fund attains varying higher asset levels, but that the Fund has not yet reached the first breakpoint.
During their review, the Trustees considered that all of the Funds, except for the Equity Long/Short Fund, were subject to contractual expense limitations on certain operating expenses agreed to by PLFA.
The Trustees also considered information from theSub-Advisers regarding the comparativesub-advisory fees charged under other investment advisory contracts for similarly managed accounts, such as contracts of eachSub-Adviser with other similarly managed registered investment companies or other types of clients. The Trustees noted that in many cases there were differences in the level of services provided to the Funds by theSub-Advisers and that the level of services provided by theseSub-Advisers on these other accounts differed due to the nature of the accounts or because there were other reasons to support the difference in fees, such as an affiliation between theSub-Adviser and the account. These differences often explained variations in fee schedules. The Trustees were mindful that, with regard to theSub-Advised Funds, the fee rates were the result of arms’ length negotiations between PLFA and theSub-Advisers, and that anysub-advisory fees are paid by PLFA and are not paid directly by a Fund.
The Board concluded that the advisory fees,sub-advisory fees and total expenses of each Fund were fair and reasonable.
D. Costs, Level of Profits and Economies of Scale
The Trustees reviewed information provided by PLFA regarding PLFA’s costs of sponsoring and operating the Funds and information regarding the profitability of PLFA from each Fund. For purposes of analyzing PLFA’s costs and profitability with respect to the Funds, the Trustees assigned credibility to PLFA’s view that little weight should be given to the fees of Pacific Select Fund, anotheropen-end investment company advised by PLFA that consists of multiple funds, on the basis that there are significant differences between Pacific Funds and Pacific Select Fund, including differences in fund size and platforms on which the funds are offered. For theSub-Advised Funds, the Trustees also reviewed information provided by theSub-Advisers regarding their costs in managing theSub-Advised Funds and their profitability from the Funds.
PLFA and theSub-Advisers’ Costs and Profitability. The Trustees noted that, based on the data available, PLFA appears to be providing and operating products that are competitively priced with other funds, especially other multi-manager and asset allocation funds. The Trustees noted PLFA’s willingness to build its investment capabilities and to sponsor new funds that PLFA believed would benefit the Asset Allocation Funds, despite the potential subsidies required by PLFA during a new Fund’sstart-up phase. The Trustees also noted that the analysis of the Trust’s profitability to PLFA supported a conclusion that PLFA’s costs and profitability are reasonable, whether considered inclusive or exclusive of distribution costs.
The Trustees also reviewed information provided regarding the structure and manner in which PLFA’s investment professionals were compensated and their respective views of the relationship of such compensation to the attraction and retention of quality personnel. The Trustees considered PLFA’s willingness to invest in technology, infrastructure and staff to reinforce and offer new services and to accommodate changing regulatory requirements. The Trustees also considered the organizational strengths of theSub-Advisers and their ability to attract and retain investment personnel over time and to sustain the staffing of investment teams that provide services to theSub-Advised Funds.
With respect to theSub-Advisers, the Trustees noted that it was difficult in many cases to accurately determine or evaluate theSub-Advisers’ costs and the profitability of theSub-Advisory Agreements to theSub-Advisers because of, among other things, the differences in the types and content of information provided by theSub-Advisers, the fact that manySub-Advisers manage substantial assets other than the Funds and, further, that any such assessment would involve assumptions regarding theSub-Advisers’ expense allocation policies, capital structure, cost of capital, business mix and other factors.
Accordingly, in the case of theSub-Advisers, the Trustees considered the data described above in light of the arms’ length nature of the relationship (for theSub-Advised Funds) between PLFA and suchSub-Advisers with respect to the negotiation of fundsub-advisory fees and the fact that such fees are paid by PLFA.
F-19
PACIFIC FUNDS
APPROVAL OF INVESTMENT ADVISORY
AND SUB-ADVISORY AGREEMENTS (Continued)
(Unaudited)
Economies of Scale. The Trustees noted and considered the extent to which economies of scale are realized by PLFA and theSub-Advisers as each Fund grows, and whether advisory fee levels reflect economies of scale if the Funds grow in size. The Trustees noted PLFA’s commitment to competitive total expenses of certain Funds through expense limitation agreements and, for certain Asset Allocation and PAM Managed Funds, through advisory fee waivers. The Trustees also noted PLFA’s and its affiliates’ consistent reinvestment in the business in the form of adding to investment capabilities and resources, improvements in technology, product innovations and customer service. The Trustees considered information relating to economies of scale provided by PLFA, PLFA’s willingness to discuss and evaluate the topic of economies of scale with the Trustees, and PLFA’s agreement to enter into advisory fee waivers for certain PAM Managed Funds and Asset Allocation Funds that create effective breakpoints at asset levels at which PLFA believes it will have attained a level of profit that can be shared with these Funds.
With respect to theSub-Advised Funds, the Trustees considered that the advisory fee for each Fund was originally set at an amount that was intended to be lower than peers to attract assets at the Fund’s inception. The Trustees noted that because fees for the Funds started relatively low from the first dollar under management in relation to peers, economies of scale will be realized at higher asset levels than would otherwise be the case. The Trustees also considered that someSub-Advisers have agreed to breakpoints in theirsub-advisory fee schedules. The Trustees noted that in setting its advisory fees relatively low at inception as compared to peers, and in subsidizing the expenses of the Funds from their inception and for many years, PLFA’s economics from theSub-Advised Funds should be considered separate and apart from the economics of theSub-Advisers. The Trustees noted PLFA’s view that thesub-advisory fee breakpoints were important for PLFA’s economics to overcome its expenses from the Funds. The Trustees also noted that shareholders will benefit from effective breakpoints for the Asset Allocation Funds.
The Trustees also considered PLFA’s willingness to reduce its own fees through certain advisory fee waivers and expense limitation agreements, whereby PLFA will reimburse the Funds for certain expenses that exceed stated expense caps. The Trustees considered that the advisory fee waivers effectively implement breakpoints in PLFA’s advisory fees at higher asset levels of these Funds, which are intended to share economies of scale that PLFA has attained.
The Trustees noted that PLFA and its affiliates had consistently reinvested in the business in the form of improvements in technology, product innovations, personnel and resources. The Trustees additionally noted that economies of scale were difficult to measure with precision, particularly on a Fund by Fund basis. This analysis is complicated by the additional services and content provided by PLFA and its affiliates through reinvestment in the business, as discussed above. The Trustees considered that the Funds are well managed, and provide shareholders with sophisticated asset allocation investment options at reasonable fee levels. The Board noted that PLFA had taken steps to ensure that shareholders benefit by negotiating favorable terms with service providers, and to provide certain support services, including, but not limited to, legal, compliance and accounting services, to the Funds on an approximate cost basis as opposed to an asset-based charge.
The Board determined that PLFA and its affiliates are sharing economies of scale given its agreement to reduce its own fees through fee waivers as assets grow for certain Funds, its commitment to competitive total expenses of the Funds, and the consistent reinvestment in the business in the form of improvements in technology and other resources and investments in personnel. The Board considered that PLFA has not yet attained levels of profitability that warrant sharing of economies of scale for some Funds, including theSub-Advised Funds, but noted that shareholders will benefit in the future from the effective breakpoints for the Asset Allocation Funds. The Board further considered that it will continue to review whether there are additional economies of scale that will be realized as the Funds grow that can be shared with shareholders. The Board concluded that the Funds’ cost structures were reasonable and that overall profitability appeared reasonable at the current time. The Board further concluded that PLFA was sharing economies of scale with each Fund and its shareholders to their benefit.
E. Ancillary Benefits
The Trustees requested and received from PLFA and theSub-Advisers information concerning other benefits received by PLFA, Pacific Life, theSub-Advisers, and their affiliates as a result of their respective relationship with the Funds, including various service arrangements with PLFA affiliates and reimbursement at an approximate cost basis for support services in the case of PLFA, as well as commissions paid to broker-dealers affiliated with certainSub-Advisers and the use of soft-dollars by certain of theSub-Advisers. The Trustees also considered ancillary benefits received by Pacific Life and its affiliates from the Funds. The Trustees considered information concerning other significant economic relations between theSub-Advisers and their affiliates and with PLFA and its affiliates and noted PLFA’s processes and procedures to identify and disclose such relationships and any potential conflicts of interest to the Board. The Trustees also considered PLFA’s and eachSub-Adviser’s strong practices and procedures with regard to managing conflicts of interest and ensuring that such conflicts do not prevent PLFA or theSub-Advisers from acting in the best interests of the Funds and their shareholders.
The Board concluded that such benefits were consistent with those generally derived by investment advisers to mutual funds or were otherwise not unusual.
F. Conclusion
Based on their review, including their consideration of each of the factors referred to above, and assisted by the advice of the Independent Consultant and independent counsel to the Independent Trustees, the Board, including the Independent Trustees, concluded that the Advisory Agreement and each applicableSub-Advisory Agreement are fair and reasonable with respect to each applicable Fund and its shareholders, and that the renewal of the Advisory Agreement and each applicableSub-Advisory Agreement would be in the best interests of each Fund and its shareholders. The Board did not indicate that any single factor was determinative of its decision to approve the Advisory Agreement and each applicableSub-Advisory Agreement, but indicated that the Board based its determination on the total mix of information available to it.
F-20
PACIFIC FUNDS
WHERE TO GO FOR MORE INFORMATION
(Unaudited)
Availability of Quarterly Holdings
The Trust files Part F of Form N-PORT (complete schedules of fund holdings) with the Securities and Exchange Commission (the “SEC”) for the first and third quarters of each fiscal year not later than 60 days after the close of the applicable quarter end. The Trust’s Part F of FormN-PORT (when required) is filed pursuant to applicable regulations and is available after filing on the SEC’s website at http://www.sec.gov.
Availability of Proxy Voting Record
By August 31 of each year, the Trust files information regarding how the Trust’s managers voted proxies relating to fund securities during the most recent twelve-month period ended June 30. Such information is available after filing on the Trust’s’ website and on the SEC’s website noted below.
Information Relating to Investments Held by the Trust
For complete descriptions of the various securities and other instruments held by the Trust and their risks, please see the Trust’s prospectus and Statement of Additional Information (“SAI”). The prospectus and SAI are available as noted below.
Availability of Proxy Voting Policies
A description of the Proxy Voting Policies and Procedures that the Trust uses to determine how to vote proxies relating to fund securities is described in the Trust’s SAI.
How to obtain Information
The Trust’s prospectus, SAI (including Proxy Voting Policies) and annual and semi-annual reports are available:
| • | | On the Trust’s website at https://www.pacificlife.com/pacificfunds.html |
| • | | On the SEC’s website at http://www.sec.gov |
| • | | Upon request by calling, without charge, 1-800-722-2333, 7 a.m. through 5 p.m. Pacific Time |
F-21
Pacific Funds
Mailing address:
P.O. Box 9768
Providence, RI 02940-9768
ADDRESS SERVICE REQUESTED
Annual Report as of March 31, 2019 for:
• Pacific Funds

PF Underlying Funds
Annual Report
As of March 31, 2019
PACIFIC FUNDS
ANNUAL REPORT
AS OF MARCH 31, 2019
Pacific Funds Series Trust, which is a Delaware statutory trust, may be referred to as “Pacific Funds” or the “Trust”.
PACIFIC FUNDS
| | | | |
| | | |
| Sub-Adviser/Adviser | | Fund | | Page
Number |
| | | |
| Pacific Investment Management Company LLC (PIMCO) | | PF Inflation Managed Fund | | A-4 |
| | | |
| Pacific Investment Management Company LLC (PIMCO)/Western Asset Management Company, LLC (Western Asset) | | PF Managed Bond Fund | | A-5 |
| | | |
| T. Rowe Price Associates, Inc. (T. Rowe Price) | | PF Short Duration Bond Fund | | A-6 |
| | | |
| Ashmore Investment Management Limited (Ashmore) | | PF Emerging Markets Debt Fund | | A-7 |
| | | |
| Lord, Abbett & Co. LLC (Lord Abbett) | | PF Developing Growth Fund | | A-8 |
| | | |
| MFS Investment Management (MFS) | | PF Growth Fund | | A-9 |
| | | |
| ClearBridge Investments, LLC (ClearBridge) | | PFLarge-Cap Value Fund | | A-10 |
| | | |
| Rothschild & Co Asset Management US Inc. (Rothschild & Co AMUS) | | PFMid-Cap Equity Fund | | A-11 |
| | | |
| Pacific Life Fund Advisors LLC (PLFA)/ Pacific Asset Management | | PF Multi-Asset Fund | | A-13 |
| | | |
| AllianceBernstein L.P. (AB) | | PFSmall-Cap Value Fund | | A-14 |
| | | |
| OppenheimerFunds, Inc. (Oppenheimer) | | PF Emerging Markets Fund | | A-15 |
| | | |
| MFS Investment Management (MFS) | | PF InternationalLarge-Cap Fund | | A-16 |
| | | |
| QS Investors, LLC (QS Investors) | | PF InternationalSmall-Cap Fund | | A-17 |
| | | |
| Wellington Management Company LLP (Wellington) | | PF International Value Fund | | A-18 |
| | | |
| Principal Real Estate Investors, LLC (Principal REI) | | PF Real Estate Fund | | A-19 |
| | | |
| UBS Asset Management (Americas) Inc. (UBS AM) | | PF Currency Strategies Fund | | A-20 |
| | | |
| AQR Capital Management, LLC (AQR) | | PF Equity Long/Short Fund | | A-22 |
A-1
PACIFIC FUNDS PERFORMANCE DISCUSSION
This Annual Report is provided for the general information of investors with beneficial interests in Pacific Funds Series Trust (the “Trust”) and contains information on certain funds (the “Funds” or “Underlying Funds”) of the Trust. This report is not authorized for distribution to prospective investors unless preceded or accompanied by a current Trust prospectus, as supplemented, which contains information about the Trust and each of its Funds, including their investment objectives, risks, charges and expenses. You should read the prospectus carefully before investing. There is no assurance that a Fund will achieve its investment objective. Each Fund is subject to market risk. The value of a Fund changes as its asset values go up or down. The value of a Fund’s shares will fluctuate, and when redeemed, may be worth more or less than their original cost. The total return for each Fund of the Trust is net of fees and includes reinvestment of all dividends and capital gain distributions, if any. Past performance is not predictive of future performance. This report shows you the performance of the Funds compared to benchmark indices. Index performance is provided for illustrative and comparative purposes only and does not predict or depict the performance of the Funds. Indices are unmanaged, do not incur transaction costs, do not include fees and expenses and cannot be purchased directly by investors. Index returns include reinvested dividends.
Pacific Life Fund Advisors LLC (“PLFA” or the “Adviser”) supervises the management of the Funds contained in this report, subject to the oversight of the Trust’s Board of Trustees (Board). PLFA also directly manages the PF Multi-Asset Fund. In addition, PLFA does business under the name “Pacific Asset Management” and manages the collateral portion of the PF Multi-Asset Fund under this name. PLFA has written the general market conditions commentary which expresses PLFA’s opinions and views on how the market generally performed for the fiscal year ended March 31, 2019 (the reporting period) as well as separate commentary specific to the Fund that it directly manages that is based on its opinion of how this Fund performed during the year.
For the other Funds of the Trust, PLFA has retained other firms to serve assub-advisers under its supervision(“Sub-Advisers”). Each of theSub-Advisers has written a separate commentary specific to the Fund(s) that they manage that is based on their opinions of how their Fund(s) performed during the year. The views expressed in those commentaries reflect those of theSub-Advisers for the fiscal year ended March 31, 2019.
All views and opinions expressed in the management discussion of fund performance are subject to change at any time based upon market, economic or other conditions, and the Trust, its Adviser and theSub-Advisers disclaim any responsibility to update such views. These views and options may not be relied upon as investment advice or recommendations, or as an offer for any particular security. Any references to “we”, “I”, or “ours” are references to theSub-Adviser or Adviser, as applicable. Any sectors referenced are provided by the applicableSub-Adviser or Adviser and could be different from the sectors listed in the Schedules of Investments if obtained from another source. The Adviser andSub-Advisers may include statements that constitute “forward-looking statements” under the United States (U.S.) securities laws. Forward-looking statements include information concerning possible or assumed future results of the Trust’s investment operations, asset levels, earnings, expenses, industry or market conditions, regulatory developments and other aspects of the Trust’s operations or general economic conditions. In addition, when used in this report, words such as “believes”, “expects”, “anticipates”, “intends”, “plans”, “estimates”, “projects” and future or conditional verbs such as “will”, “may”, “could”, “should” and “would,” or any other statement that necessarily depends on future events, are intended to identify forward-looking statements. Forward-looking statements are not guarantees of performance or economic results. They involve risks, uncertainties and assumptions. Although such statements are based on expectations that the Adviser or aSub-Adviser believes to be reasonable, actual results may differ materially from expectations. Investors must not rely on any forward- looking statements. Statements of facts and performance data are from sources considered reliable, but no representation or warranty is made as to their completeness or accuracy.
In connection with any forward-looking statements and any investment in the Trust, investors should carefully consider the investment objectives, policies and risks described in the Trust’s current prospectus, as supplemented, and Statement of Additional Information, as supplemented, as filed with the U.S. Securities and Exchange Commission (SEC), which may be obtained from the SEC’s website atwww.sec.gov.
Market Conditions (for the year ended March 31, 2019)
Executive Summary
After a turbulent fourth quarter of 2018, global equity markets bounced higher in the last quarter of the reporting period. Concerns over Federal Reserve (Fed) rate hikes, trade and other geopolitical issues led to a global slowdown. While the Fed had been signaling additional rate hikes in 2019, the global slowdown convinced the central bank to hold off on further monetary tightening. Additionally, trade negotiations between the U.S. and China appeared to make progress. These conditions helped ease some concerns, which in turn boosted equities over the last quarter of the reporting period.
Fixed Income
The U.S.ten-year Treasury yield fluctuated over the reporting period, rising from approximately 2.70% at the start of the reporting period to 3.20% in the fourth quarter of 2018 before plunging back down to 2.40% by the end of the reporting period. The broad bond market (as defined by the Bloomberg Barclays U.S. Aggregate Bond Index) returned 4.48% for the reporting period. Spread sectors were mixed over the reporting period. Within the U.S., riskier credit tiers performed well over the last quarter of the reporting period as credit spreads tightened after they spiked in the fourth quarter of 2018. Emerging market bonds were challenged by the strengthening U.S. dollar, although they experienced some recovery over the last quarter of the reporting period.
Domestic Equity
Domestic equities rose over the reporting period and fared better than foreign markets. Over the reporting period, the S&P 500 Index returned 9.50%. Growth stocks finished higher than value stocks, as the financial sector (which represents a large part of value indices) struggled over the reporting period as interest margins were pressured by a flattening yield curve. On the other hand, technology stocks fared well over the reporting period. Bond proxy sectors such as real estate and utilities delivered gains as theten-year Treasury yield had been
| | |
| | See benchmark definitions on A-23 – A-25 |
A-2
PACIFIC FUNDS PERFORMANCE DISCUSSION (Continued)
sinking since November 2018, making the higher dividend sectors more attractive. Large corporations held up better than their smaller counterparts. Small-capitalization companies had lower credit ratings, and their debt levels as a percentage of total capital increased.
International Equity
Although international equities finished higher over the last quarter of the reporting period, they ended in negative territory over the reporting period as the MSCI (Morgan Stanley Capital International) Europe, Australasia and Far East (EAFE) Index returned-3.71% over this period. European stocks generally struggled. Geopolitical issues like Brexit (Britain’s exit from the European Union) and trade tensions caused headwinds that held back performance. Furthermore, the U.S. dollar rally was a headwind for unhedged international exposures. Emerging market equities also performed poorly over the reporting period as the MSCI Emerging Markets Index returned-7.41%. Emerging market equities became volatile, particularly for Chinese markets as trade tensions caused businesses to scramble and its consumers to become less optimistic. Chinese equities staged a significant recovery however, with the Shenzhen Composite up 33.70% for the last quarter of the reporting period.
Concluding Remarks
Going forward, we expect to see several themes impact the markets. The U.S. economy should continue to stay on course as business and consumer confidence remain supportive, especially if trade tensions begin to fade. However, we expect U.S.-China trade negotiations to remain an area of investor focus. As the effects of the tax cuts wind down, we anticipate U.S. earnings growth to decelerate and stock buybacks to ebb from very high levels seen throughout 2018.
Regarding central banks, the Fed is expected to take a pause. While markets had been anticipating additional interest rate hikes, they are now pricing in a rate cut by the end of 2019. The European Central Bank (ECB) ended its bond purchasing program and will be going through a transition as it will need to find a successor for Mario Drahghi who is scheduled to step down in October 2019. Several emerging market central banks may find some relief from the Fed refraining from additional rate hikes.
In the U.S., investors may continue to focus on the yield curve, which has historically inverted prior to recessions, but it generally did not lead to equities falling immediately thereafter. Nonetheless, U.S. corporations will have to deal with rising wage growth caused by the tight labor market and increasing input costs resulting from the tariffs imposed on Chinese goods. Additionally, a steady stream of share buybacks has generally lifted prices and when this trend recedes, U.S. stocks may begin to trail.
Overseas, we believe foreign stocks are fairly attractive relative to U.S. equities based on price multiples although they also exhibit heightened geopolitical risks. Additionally, international industries tend to have a higher concentration in defensive sectors than those of the U.S., which tend to be more technology-related. Technology-related stocks are generally trading at a considerable premium compared to others, which may limit further upside. This is particularly true if market sentiment toward defensive sectors gains momentum. Emerging markets’price-to-book multiples compared to those of U.S. equities are near historic lows. Furthermore, the U.S. and China will likely be inclined to reach a trade deal sooner than later, as rising tensions are weighing down sentiment. Once a deal with China is reached, the Trump administration may extend the trade war to Europe and Japan with automobile tariffs. This would be particularly challenging for Germany, which is already flirting with a potential recession.
In fixed income, we anticipate the Fed may refrain from pursuing an aggressive monetary policy, as inflation risks remain somewhat subdued, although wage growth has been accelerating. Additionally, loose credit standards and heightened leverage have become more concerning, especially for leveraged loans. Although we do not anticipate a significant deterioration in credit fundamentals in the near term, we will closely monitor these conditions as challenges in credit markets have tended to precede equity markets in the lead up to a recession. While we do not see recession likely in the near term, we are watching this sector of the market for an early warning. We expect broad alternatives to provide continued diversification, especially for strategies that can successfully take advantage of rapidly changing developments in currency or commodity markets.
| | |
| | See benchmark definitions on A-23 – A-25 |
A-3
PACIFIC FUNDS PERFORMANCE DISCUSSION (Continued)
PF Inflation Managed Fund(sub-advised by Pacific Investment Management Company LLC)
Q. How did the Fund perform for the year ended March 31, 2019?
A. For the year ended March 31, 2019, the PF Inflation Managed Fund’s Class P returned 2.50%, compared to a 2.70% return for its benchmark, the Bloomberg Barclays U.S. TIPS Index.
The following graph compares the performance of a hypothetical $10,000 investment in Class P shares of the Fund to its benchmark for the ten-year period ended March 31, 2019. The Fund’s performance reflects reinvestments of all dividends and capital gains distributions, if any.
Performance Comparison
Average Annual Total Returns for the Periods Ended March 31, 2019(1)
| | | | | | | | | | | | |
| | | 1 Year | | | 5 Years | | | 10 Years | |
Fund’s Class P | | | 2.50% | | | | 1.42% | | | | 3.45% | |
Bloomberg Barclays U.S. TIPS Index | | | 2.70% | | | | 1.94% | | | | 3.41% | |
| | (1) | Effective October 31, 2016, Pacific Investment Management Company LLC (“PIMCO”) became the sole sub-adviser to the Fund. Between January 15, 2015 and October 31, 2016, Western Asset Management Company, LLC served as co-sub-adviser of the Fund with PIMCO. Prior to January 15, 2015, PIMCO served as the solesub-adviser. |
|
| |
Performance data shown represents past performance. Investment return and principal value will fluctuate so that shares of the Fund when redeemed may be worth more or less than their original cost. Past performance is not predictive of future performance. |
Q. Discuss both positive and negative factors that materially affected the Fund’s performance during the year, including relevant market conditions, investment strategies and techniques, and particular sectors or securities.
A. For the reporting period, the Fund’s Class P underperformed the benchmark. We at PIMCO implement the Fund’s investment strategies by investing in bonds and derivative instruments, focusing on inflation-indexed debt securities.
An overweight to U.S. breakeven inflation, the difference between nominal and real interest rates, detracted from performance. The Fund’s short position to United Kingdom Retail Price Index (U.K. RPI) and European breakevens contributed to performance. Long exposure to German nominal interest rates contributed to performance, as German nominal interest rates fell at the long end of the curve. An underweight to nominal interest rates, particularly in the U.S. and U.K., detracted from performance as interest rates fell. Exposure to investment grade credit generated positive returns over the reporting period.
During the reporting period, the Fund purchased credit protection to reduce credit exposure to individual issuers, reduce broader credit risk, and to take advantage of the basis between the credit default swap and cash bond market. The Fund entered into interest rate swaps to manage nominal or real interest rate exposure in various global markets and as a substitute for cash bond exposure. The Fund entered into futures contracts to manage interest rate exposure, as a substitute for cash bond exposure and for purposes of liquidity. Interest rate swaps and futures allow the Fund manager to effectively manage risk and gain or reduce exposure by targeting specific markets and areas of the yield curve that may not otherwise be accessible through the use of cash bonds. The Fund sold/wrote options on futures, currencies, bond indices, and swaps as a means of capitalizing on anticipated changes in market volatility and to generate income. The Fund purchased and sold foreign currency contracts in connection with settling planned purchases or sales of securities, to hedge the currency exposure associated with some or all of the Fund’s securities, and to express certain views on currency markets. The Fund also held inflation caps and floors to hedge duration.
| | |
| | See benchmark definitions on A-23 – A-25 |
A-4
PACIFIC FUNDS PERFORMANCE DISCUSSION (Continued)
PF Managed Bond Fund(co-sub-advised by Pacific Investment Management Company LLC and Western Asset Management Company, LLC)
Q. How did the Fund perform for the year ended March 31, 2019?
A. For the year ended March 31, 2019, the PF Managed Bond Fund’s Class P returned 3.43%, compared to a 4.48% return for its benchmark, the Bloomberg Barclays U.S. Aggregate Bond Index.
The following graph compares the performance of a hypothetical $10,000 investment in Class P shares of the Fund to its benchmark for the ten-year period ended March 31, 2019. The Fund’s performance reflects reinvestments of all dividends and capital gains distributions, if any.
Performance Comparison
Average Annual Total Returns for the Periods Ended March 31, 2019(1)
| | | | | | | | | | | | |
| | | 1 Year | | | 5 Years | | | 10 Years | |
Fund’s Class P | | | 3.43% | | | | 3.54% | | | | 5.12% | |
Bloomberg Barclays U.S Aggregate Bond Index | | | 4.48% | | | | 2.74% | | | | 3.77% | |
| | (1) | Western Asset Management Company, LLC became co-sub-adviser to the Fund on August 1, 2014, and some investment policies changed at that time. Pacific Investment Management Company LLC was the sole sub-adviser to the Fund before that date. |
|
| |
Performance data shown represents past performance. Investment return and principal value will fluctuate so that shares of the Fund when redeemed may be worth more or less than their original cost. Past performance is not predictive of future performance. |
Q. Discuss both positive and negative factors that materially affected the Fund’s performance during the year, including relevant market conditions, investment strategies and techniques, and particular sectors or securities.
A. For the reporting period, the Fund’s Class P underperformed the benchmark. The Fund isco-sub-advised by PIMCO and Western Asset. The following are separate discussions from eachco-sub-adviser.
PIMCO
We at PIMCO implement the investment strategies for the PIMCO managed portion of the Fund by investing in debt securities and derivative instruments. Our portion of the Fund underperformed the benchmark for the reporting period.
U.S. and European Core duration strategies added to performance, while tactical shorts to Italian, Japanese, and Australian duration detracted from performance. Within spread sectors, exposure to and selection withinnon-Agency mortgage backed securities (MBS) contributed to performance, while an overweight to agency MBS detracted from performance. Opportunistic positioning within investment grade and high yield credit contributed to performance. Within currencies, exposure to the Argentine peso, Russian ruble and Swedish krona detracted from performance, while exposure to the Mexican peso and Turkish lira contributed to performance over the reporting period.
During the reporting period, our portion of the Fund sold credit protection through credit default swaps to obtain exposure to the credit risk of individual securities or to the broader investment grade, high yield, emerging market, mortgage, or other sectors through the use of credit default swaps and credit default swaps on credit indices. Our portion of the Fund also purchased credit protection during the reporting period to reduce credit exposure to individual issuers, reduce broader credit risk, and to take advantage of the basis between the credit default swap and cash bond market. Our portion of the Fund entered into interest rate swaps to manage nominal or real interest rate exposure in various global markets and as a substitute for cash bond exposure. Our portion of the Fund entered into futures contracts to manage interest rate exposure, as a substitute for cash bond exposure, and for purposes of liquidity. Our portion of the Fund sold/wrote options and swaptions on futures, bond indices, currencies, and swaps and also purchased options on futures, bond indices, currencies, andTo-Be-Announced (TBAs) (agencyMBS-related instrument) as a means of capitalizing on anticipated changes in market volatility and to generate income. Our portion of the Fund purchased and sold foreign currency contracts in connection with settling planned purchases or sales of securities, to hedge the currency exposure associated with some or all of the Fund’s securities, and to express certain views on currency markets. Lastly, our portion of the Fund also held inflation floors to hedge duration.
Western Asset
For Western Asset’s portion of the Fund, a global investment platform is utilized to build a diversified portfolio of investment grade bonds with opportunistic allocations to high yield, emerging markets andnon-U.S. dollar securities to enhance returns. Value is added through yield curve positioning and duration management as well as issue selection and sector rotation.
Our portion of the Fund outperformed the benchmark for the reporting period. Our portion of the Fund’s macro top down strategies were a meaningful net contributor to performance during the reporting period. Our portion of the Fund’s long duration position was a large positive
| | |
| | See benchmark definitions on A-23 – A-25 |
A-5
PACIFIC FUNDS PERFORMANCE DISCUSSION (Continued)
contributor as rates declined over the reporting period, withten-year U.S. Treasury (UST) yields decreasing from 2.74% to 2.41%. However, our portion of the Fund’s yield curve positioning, with an emphasis on longer-dated yields, was a detractor to returns as the yield curve steepened.
Spread sectors delivered mixed performance during the reporting period. Emerging markets exposure weighed the most heavily on our portion of the Fund’s performance during the reporting period as the asset class suffered due to a stronger U.S. dollar, a weakened outlook fornon-U.S. economies, and a number of idiosyncratic events. Corporate credit exposures, including opportunistic overweights to both investment grade and high yield credit, delivered strong positive performance over the reporting period.Non-agency mortgage exposure was among the largest positive contributors to performance over the reporting period as the housing market was generally stable. Overweight exposures to commercial mortgage-backed securities (CMBS) also contributed as their spreads tightened.
With respect to currency positions, our portion of the Fund’s exposures to emerging market currencies, in aggregate, weighed on performance during the reporting period. In particular, long exposures to the Brazilian real, Argentine peso and Mexican peso weighed on performance as each currency saw significant declines relative to the U.S. dollar over the reporting period. However, our portion of the Fund’s exposures tonon-U.S. developed market currencies contributed positively over the reporting period. In particular, a short position in the euro was a strong contributor as the currency declined 8.8% relative to the U.S. dollar over the reporting period.
Derivatives, primarily interest rate futures and options, were used to manage our portion of the Fund’s duration and yield curve positioning as well as currency positions, and detracted from returns.
PF Short Duration Bond Fund(sub-advised by T. Rowe Price Associates, Inc.)
Q. How did the Fund perform for the year ended March 31, 2019?
A. For the year ended March 31, 2019, the PF Short Duration Bond Fund’s Class P returned 3.05%, compared to a 3.03% return for its benchmark, the Bloomberg Barclays1-3 Year U.S. Government/Credit Bond Index.
The following graph compares the performance of a hypothetical $10,000 investment in Class P shares of the Fund to its benchmark for the ten-year period ended March 31, 2019. The Fund’s performance reflects reinvestments of all dividends and capital gains distributions, if any.
Performance Comparison
Average Annual Total Returns for the Periods Ended March 31, 2019(1)
| | | | | | | | | | | | |
| | | 1 Year | | | 5 Years | | | 10 Years | |
Fund’s Class P | | | 3.05% | | | | 1.25% | | | | 1.71% | |
Bloomberg Barclays1-3 Year U.S. Government/Credit Bond Index | | | 3.03% | | | | 1.22% | | | | 1.59% | |
| | (1) | T. Rowe Price Associates, Inc. began managing the Fund on July 1, 2011, and some investment policies changed at that time. Another firm managed the Fund before that date. |
|
| |
Performance data shown represents past performance. Investment return and principal value will fluctuate so that shares of the Fund when redeemed may be worth more or less than their original cost. Past performance is not predictive of future performance. |
Q. Discuss both positive and negative factors that materially affected the Fund’s performance during the year, including relevant market conditions, investment strategies and techniques, and particular sectors or securities.
A. For the reporting period, the Fund’s Class P outperformed the benchmark. We at T. Rowe Price maintain the Fund’s strategy by investing in debt securities (including derivatives on such securities). In our attempt to seek current income, the strategy focuses on high-quality, investment-grade securities, generally expecting to track the duration of the benchmark (plus or minus a half year), as well as using futures, forwards, and swaps. Furthermore, the Fund invests inout-of-benchmark securitized sectors to pick up incremental yield in the strategy. In addition to making active sector allocation and security selection decisions, we also monitor the Fund’s duration as part of our management of the Fund. Duration is often used to measure a bond’s sensitivity to interest rates.
Sector allocation was the primary contributor to the Fund’s positive relative performance. Our strategic overweight allocation to bonds with1-3-year maturities, corporate bonds, both investment-grade and crossover bonds (i.e., bonds that are split rated on the lower end of the investment-grade credit ratings spectrum or the highest end of thenon-investment-grade ratings spectrum), contributed to the Fund’s relative performance for the reporting period. Solid demand from investors looking to minimize interest rate and duration risk provided support for short-maturity corporate bonds. As a result, the Fund’s significant overweight to the U.S. investment-grade corporate sector provided a meaningful contribution to relative results. Our corresponding underweight allocation to U.S. Treasury securities helped relative results, as risk assets rallied throughout most of the reporting period in line with strong stock market performance and with the Fed signaling a less aggressive monetary policy in the near term. Similarly, the Fund’sout-of-benchmark exposure to CMBS and asset backed securities (ABS) also helped relative performance, while its position in MBS detracted.
| | |
| | See benchmark definitions on A-23 – A-25 |
A-6
PACIFIC FUNDS PERFORMANCE DISCUSSION (Continued)
Our yield curve position detracted as we undercarried the benchmark. Throughout most of the reporting period, the Fund was tactically positioned for a shorter duration than the benchmark as a defensive stance to help protect against interest rate risk amid rising rates. This positioning caused the Fund to undercarry the benchmark, leading to yield curve underperformance.
Security selection within investment-grade corporates was a drag on performance. Select bonds within financial industries, especially Italian banking and finance names, underperformed amid Italy’s showdown with the European Union over its outsized budget deficit.
As of the end of the reporting period, the Fund held interest rate futures and currency forwards generating gross exposure of approximately 29.80%. The estimated return impact from employing currency forwards was 0.02% and -0.02% from futures for the reporting period.
PF Emerging Markets Debt Fund(sub-advised by Ashmore Investment Management Limited)
Q. How did the Fund perform for the year ended March 31, 2019?
A. For the year ended March 31, 2019, the PF Emerging Markets Debt Fund’s Class P returned-0.61%, compared to a 4.21% return for the broad-based J.P. Morgan Emerging Markets Bond Index (EMBI) Global Diversified Index and-0.94% for the Emerging Markets Debt Composite Benchmark.
The following graph compares the performance of a hypothetical $10,000 investment in Class P shares of the Fund to its benchmarks for the period from inception through March 31, 2019. The Fund’s performance reflects reinvestments of all dividends and capital gains distributions, if any.
Performance Comparison
Average Annual Total Returns for the Periods Ended March 31, 2019
| | | | | | | | | | | | |
| | | 1 Year | | | 5 Years | | | Since
Inception
(06/29/12) | |
Fund’s Class P | | | (0.61% | ) | | | 4.02% | | | | 3.56% | |
J.P. Morgan EMBI Global Diversified Index | | | 4.21% | | | | 5.44% | | | | 5.16% | |
Emerging Markets Debt Composite Benchmark | | | (0.94% | ) | | | 2.38% | | | | 2.48% | |
|
| |
Performance data shown represents past performance. Investment return and principal value will fluctuate so that shares of the Fund when redeemed may be worth more or less than their original cost. Past performance is not predictive of future performance. |
Q. Discuss both positive and negative factors that materially affected the Fund’s performance during the year, including relevant market conditions, investment strategies and techniques, and particular sectors or securities.
A. For the reporting period, the Fund’s Class P underperformed the broad-based J.P. Morgan EMBI Global Diversified Index and outperformed the sector-specific Emerging Markets Debt Composite Benchmark.
The Fund invests its assets in debt instruments that are economically tied to emerging market countries, which are issued by governments (sovereigns), government-guaranteed or majority government-owned entities (quasi-sovereigns), government agencies and instrumentalities and corporate issuers, and may be denominated in any currency, including the local currency of the issuer. We at Ashmore tactically manage exposure to emerging market sovereign external debt, local currency sovereign debt and corporate debt in seeking to maximize total return consistent with prudent investment management.
Over the reporting period, the Fund’s allocation to emerging markets sovereign external debt increased, starting the reporting period at 55% and ending at around 59% of the Fund’s net asset value (NAV). Over the reporting period, the Fund’s exposure to corporate debt increased, starting the reporting period at 6.40% and ending at around 8.50% of NAV. Finally, the Fund’s exposure to emerging market local currency bonds and net exchange rate positions was actively managed, starting the reporting period at 56%, and ending at around 54% of NAV. Over the same period, the broad-based J.P. Morgan EMBI Global Diversified Index (representing the emerging markets sovereign external debt asset class) strongly outperformed the J.P. Morgan Government Bond Index(GBI)-EM Global Diversified (representing the emerging markets local currency bonds asset class).
The Fund’s security selection in local currency sovereign debt detracted from the Fund’s absolute and relative returns over the reporting period. The Fund’s overweight position in hard currency sovereign external debt and theoff-benchmark allocation to corporate debt contributed positively to the Fund’s relative performance over the reporting period.
In the emerging markets sovereign external debt space, the top country contributor to performance was Ecuador. Within local currency assets, the top two contributors to the Fund’s performance were an overweight position in the Brazilian real, and an underweight position in the Turkish lira, respectively. The largest detractors over the reporting period wereoff-benchmark positions in Jamaican corporate bonds, and overweight positions in the Argentinean peso and Polish zloty. Overall, the largest country contributors to Fund performance were overweight positions to Brazil and Ecuador and underweight positions to Turkey.
| | |
| | See benchmark definitions on A-23 – A-25 |
A-7
PACIFIC FUNDS PERFORMANCE DISCUSSION (Continued)
The Fund’s positions in derivatives are mainly in foreign exchange (FX) forwards—notably to hedge the FX exposure of some local currency bond positions, through interest rate swaps and total return swaps—for efficient fund management purposes.
The following are summary developments in various countries in which the Fund invested during the reporting period.
The announcement of an agreement between Ecuador and the International Monetary Fund (IMF) in February 2019 triggered spread tightening in Ecuadorian debt. The agreement involved total funding of more than ten billion U.S. dollars, with 4.2 billion U.S. dollars from the IMF and the balance from a number of other multilateral development institutions including the World Bank, the Inter-American Development Bank, the Development Bank of Latin America and others. Ecuador will not need to access the public markets for three years as a result of the agreement, likely resetting the spread level for eventual new issuance at much lower levels.
In Brazil, despite the uncertain political outlook in therun-up to the October 2018 presidential election, the election of a fiscally conservative president contributed to a positive environment for local bond markets. Modest, but positive economic growth has kept inflationary pressures contained, with the IPCA inflation rate (Brazil’s Consumer Price Index used to measure inflation) peaking at 4.50% in the fall, The Monetary Policy Committee of the Central Bank of Brazil (COPOM) cut the SELIC (the Central Bank of Brazil’s overnight rate) target rate to 6.50% early in the reporting period and left it there for the balance of the reporting period. Business confidence has been increasingly supported by the government’s liberal agenda (reforms, privatizations and positive/technically strong appointments to key posts at state-owned enterprises), as well as the appointments announced in the economic team. A positive surprise in the government’s primary deficit allowed the net debt/gross domestic product (GDP) for November 2018 to come in unchanged at 53.50%. This allowed the Brazil yield curve to benefit fully, and even outperform the tightening in the global yield curve in December 2018, taking theten-year bond yields down to 9.24% at the end of the reporting period.
Argentina’s recession continued with third quarter 2018 GDP down 3.50% year-over-year, reflecting the ongoing tightening of domestic financial conditions. Domestic demand contracted, which led to an accelerated adjustment of the current account deficit. By September 2018, the depreciation of the Argentine peso had led the trade balance to swing into a surplus. Confidence indicators and investment spending confirm that the short-term outlook for the Argentine economy remains challenging, but we believe that the government’s economic policies will allow it to see through the necessary economic adjustment.
Turkey had a difficult year in 2018, as excessive credit growth and loose monetary policy fueled a large current account deficit early in the reporting period. Pressure on external funding conditions in the first quarter of the reporting period were inadequately addressed ahead of the parliamentary and presidential election in June 2018. This led to a balance of payments and exchange rate crisis during the summer. The central bank’s belated reaction in September 2018 allowed it to stabilize the exchange rate, but the lira still dropped 39% against the U.S. dollar during the reporting period, and the economy began experiencing a painfulre-balancing that we believe could have been avoided using a more prudent, and more orthodox, economic policy. The Fund’s underweight position in Turkey over the reporting period allowed the performance impact to be somewhat limited and contributed to relative performance over the period.
PF Developing Growth Fund(sub-advised by Lord, Abbett & Co. LLC)
Q. How did the Fund perform for the year ended March 31, 2019?
A. For the year ended March 31, 2019, the PF Developing Growth Fund’s Class P returned 25.05%, compared to a 3.85% return for its benchmark, the Russell 2000 Growth Index.
The following graph compares the performance of a hypothetical $10,000 investment in Class P shares of the Fund to its benchmark for the ten-year period ended March 31, 2019. The Fund’s performance reflects reinvestments of all dividends and capital gains distributions, if any.
Performance Comparison
Average Annual Total Returns for the Periods Ended March 31, 2019(1)
| | | | | | | | | | | | |
| | | 1 Year | | | 5 Years | | | 10 Years | |
Fund’s Class P | | | 25.05% | | | | 9.41% | | | | 15.57% | |
Russell 2000 Growth Index | | | 3.85% | | | | 8.41% | | | | 16.52% | |
| | (1) | Effective October 31, 2016, the Fund changed its name from PF Small-Cap Growth Fund. Lord, Abbett & Co. LLC began managing the Fund on May 1, 2014 and some investment policies changed at that time. Other firms managed the Fund before that date. |
|
| |
Performance data shown represents past performance. Investment return and principal value will fluctuate so that shares of the Fund when redeemed may be worth more or less than their original cost. Past performance is not predictive of future performance. |
| | |
| | See benchmark definitions on A-23 – A-25 |
A-8
PACIFIC FUNDS PERFORMANCE DISCUSSION (Continued)
Q. Discuss both positive and negative factors that materially affected the Fund’s performance during the year, including relevant market conditions, investment strategies and techniques, and particular sectors or securities.
A. For the reporting period, the Fund’s Class P outperformed the benchmark. The Fund seeks capital appreciation by investing in small-capitalization growth companies that we at Lord Abbett believe have above-average long-term growth potential and that are strongly positioned in the “developing growth” phase, which we define as the period of swift development after a company’sstart-up phase when growth occurs at a rate generally not equaled by established companies in their mature years. These types of companies include companies that can transform markets through innovative products and services.
The leading contributor to the Fund’s relative performance during the reporting period was security selection in the information technology sector. Within this sector, the Fund’s holdings of Trade Desk, Inc., a provider of an advertisement technology platform, contributed. Trade Desk reported a strong fourth quarter 2018, with revenue growth acceleration driven by strength in its connected television business. Another contributor within this sector during the reporting period was the Fund’s position in Twilio, Inc., a provider of a cloud based communications software platform. Shares of Twilio benefited from the firm’s ability to capitalize on its vast and growing addressable market, through the introduction of new products like Flex, a cloud contact application, and from expanding its footprint with its acquisition of SendGrid.
Security selection within the health care sector also contributed to the Fund’s relative performance during the reporting period. Within this sector, the Fund’s holdings of Tandem Diabetes Care, Inc., a designer and developer of products related to diabetes, contributed as the company reported a strong fourth quarter 2018 across the board, driven by a substantial increase in pump shipments. The Fund’s holdings of Glaukos Corp., a medical device company, also contributed. Shares of Glaukos rose after Alcon, a major competitor, announced it was withdrawing its CyPass micro-stent from the market, providing tailwind for sales in Glaukos’ product.
Additionally, security selection within the consumer discretionary sector was a major contributor to the Fund’s performance during the reporting period. Specifically, the Fund’s holding of Planet Fitness, Inc., an operator of fitness center franchises, contributed. Shares of Planet Fitness continued their ascent during the reporting period, as an increase in black card membership prices helped earnings.
The leading detractor from the Fund’s performance relative to the benchmark during the reporting period was security selection within the financials sector. Within this sector, the Fund’s position in Western Alliance Bancorp, a provider of various banking services, detracted. Shares of Western Alliance Bancorp declined as investors were concerned about a possible moderation in growth due to increased competition for loans among banks andnon-banks. Another detractor within the sector was the Fund’s position in CenterState Bank Corporation, a bank holding company. U.S. banks, like Western Alliance and CenterState, faced headwinds during the latter half of the reporting period, as investors appeared to expect commercial and industrial loan growth to decline, while the industry continued to face tougher competition fromnon-bank lenders and corporate clients.
Security selection in the communication services (formerly telecommunication services) sector also detracted from the Fund’s performance relative to the benchmark during the reporting period. Within this sector, the Fund’s holdings of Eventbrite, Inc., an operator of a self-service online ticketing platform, detracted. Eventbrite, which conducted its initial public offering in September 2018, declined during the reporting period as investors were concerned about its valuation and pending share lockup expiration. Additionally, though it beat consensus estimates in its first public reporting, it was not of the magnitude investors expected.
PF Growth Fund(sub-advised by MFS Investment Management)
Q. How did the Fund perform for the year ended March 31, 2019?
A. For the year ended March 31, 2019, the PF Growth Fund’s Class P returned 14.99%, compared to a 12.75% return for its benchmark, the Russell 1000 Growth Index.
The following graph compares the performance of a hypothetical $10,000 investment in Class P shares of the Fund to its benchmark for the ten-year period ended March 31, 2019. The Fund’s performance reflects reinvestments of all dividends and capital gains distributions, if any.
Performance Comparison
Average Annual Total Returns for the Periods Ended March 31, 2019(1)
| | | | | | | | | | | | |
| | | 1 Year | | | 5 Years | | | 10 Years | |
Fund’s Class P | | | 14.99% | | | | 13.81% | | | | 16.11% | |
Russell 1000 Growth Index | | | 12.75% | | | | 13.50% | | | | 17.52% | |
| | (1) | MFS Investment Management began managing the Fund on May 1, 2013, and some investment policies changed at that time. Another firm managed the Fund before that date. |
|
| |
Performance data shown represents past performance. Investment return and principal value will fluctuate so that shares of the Fund when redeemed may be worth more or less than their original cost. Past performance is not predictive of future performance. |
| | |
| | See benchmark definitions on A-23 – A-25 |
A-9
PACIFIC FUNDS PERFORMANCE DISCUSSION (Continued)
Q. Discuss both positive and negative factors that materially affected the Fund’s performance during the year, including relevant market conditions, investment strategies and techniques, and particular sectors or securities.
A. For the reporting period, the Fund’s Class P outperformed the benchmark. The strategy is an actively managed, research-driven growth fund. We, the MFS investment management team, build the Fund from the bottom up, selecting companies with the best opportunities for growth two to three years into the future. When applying the Fund’s valuation analysis, we consider the magnitude and potential growth rate of a company against what the market has discounted. At the sector level, we typically limit significant over- and under-weights relative to the benchmark, allowingbottom-up stock selection to drive performance results over time.
Stock selection and, to a lesser extent, an overweight allocation to the financial sector contributed to performance relative to the benchmark. Within this sector, the Fund’s overweight positions in global payment transactions company MasterCard, global payments technology company Visa and communications real estate investment trust (REIT) American Tower also contributed to relative results.
Stock selection and, to a lesser extent, an underweight allocation to the industrial sector also benefited relative results. However, there were no individual stocks within this sector that were among the Fund’s largest relative contributors during the reporting period.
Stock selection in the consumer,non-cyclical sector bolstered relative results, led by an overweight position in analytical equipment, software and services provider Thermo Fisher Scientific. Additionally, holding shares of industrial and consumer products and services company Danaher (security is not a benchmark constituent) and pharmaceutical and medical products maker Abbott Laboratories (security is not a benchmark constituent), and not holding shares of pharmaceutical company Abbvie, further supported relative results.
Stock selection and, to a lesser extent, an overweight allocation to the technology sector strengthened relative returns. Within this sector, the Fund’s overweight positions in business and financial solutions software company Intuit, customer information software manager Salesforce.com and software company Adobe Systems contributed to relative results.
Stock selection in the consumer, cyclical sector detracted from relative performance. Within this sector, the Fund’s overweight positions in video game makers Activision Blizzard and Electronic Arts and online travel company Booking Holdings detracted from relative returns.
Stocks in other sectors that detracted from relative results included the Fund’s overweight positions in alcoholic beverages company Constellation Brands, tobacco manufacturer Philip Morris International, financial services provider Charles Schwab and wellsite services provider Concho Resources (security was not held in the Fund at reporting period end). In addition, the Fund’s position in shares of investment bank and asset manager Morgan Stanley (security is not a benchmark constituent and was not held in the Fund at reporting period end) and design and manufacturer of connectivity and sensors solutions TE Connectivity (security is not a benchmark constituent and was not held in the Fund at reporting period end), and an underweight position in computer and personal electronics maker Apple, also detracted from relative performance.
PFLarge-Cap Value Fund(sub-advised by ClearBridge Investments, LLC)
Q. How did the Fund perform for the year ended March 31, 2019?
A. For the year ended March 31, 2019, the PFLarge-Cap Value Fund’s Class P returned 5.49%, compared to a 5.67% return for its benchmark, the Russell 1000 Value Index.
The following graph compares the performance of a hypothetical $10,000 investment in Class P shares of the Fund to its benchmark for the ten-year period ended March 31, 2019. The Fund’s performance reflects reinvestments of all dividends and capital gains distributions, if any.
Performance Comparison
Average Annual Total Returns for the Periods Ended March 31, 2019
| | | | | | | | | | | | |
| | | 1 Year | | | 5 Years | | | 10 Years | |
Fund’s Class P | | | 5.49% | | | | 6.95% | | | | 13.16% | |
Russell 1000 Value Index | | | 5.67% | | | | 7.72% | | | | 14.52% | |
|
| |
Performance data shown represents past performance. Investment return and principal value will fluctuate so that shares of the Fund when redeemed may be worth more or less than their original cost. Past performance is not predictive of future performance. |
Q. Discuss both positive and negative factors that materially affected the Fund’s performance during the year, including relevant market conditions, investment strategies and techniques, and particular sectors or securities.
A. For the reporting period, the Fund’s Class P underperformed the benchmark. We, the ClearBridge large-capitalization value team, use an interactive, research-driven approach to identify large-capitalization companies with strong business franchises and attractive valuations. We look for companies with proven business models and sustainable competitive advantages capable of generating superior returns over time across a range of potential scenarios. We place an emphasis on near- and medium-term cash flows over those with a longer projected time frames when
| | |
| | See benchmark definitions on A-23 – A-25 |
A-10
PACIFIC FUNDS PERFORMANCE DISCUSSION (Continued)
discounting earnings from emerging business models or products. We consider valuations relative to normalized earnings power. There is no change to our disciplined investment approach that focuses on competitively well-positioned companies with strong business franchises capable of generating superior returns across cycles.
Relative to the benchmark, overall sector allocation detracted from performance for the reporting period. The Fund’s underweights to the utilities and real estate sectors, as well as its overweight to the financials and materials sectors, detracted from performance. Stock selection in the energy, consumer staples, and utilities sectors also detracted from relative performance. On an individual stock basis, the leading detractors from relative Fund performance for the reporting period included our holdings in Halliburton in the energy sector, British American Tobacco in the consumer staples sector, Freeport-McMoRan in the materials sector, TE Connectivity in the information technology sector and State Street in the financials sector.
Relative to the benchmark, overall stock selection contributed to performance for the reporting period. The Fund’s stock selection in the financials, industrials and information technology sectors contributed the most to relative performance for the reporting period. In terms of allocation, the Fund’s underweight position in the consumer discretionary sector and overweight position in the communication services sector contributed to relative performance for the reporting period. The Fund’s cash position also helped performance. On an individual stock basis, the leading contributors to relative performance included positions in Motorola and Microsoft in the information technology sector, Twenty-First Century Fox in the communication services sector, American Tower in the real estate sector and Anthem in the health care sector.
During the reporting period, we established new positions in Berkshire Hathaway and Charles Schwab in the financials sector, Comcast in the communication services sector, Deere and UPS in the industrials sector and Pfizer in the health care sector. We exited our positions in British American Tobacco, Kimberly-Clark and McCormick in the consumer staples sector, Citigroup and Synchrony Financial in the financials sector, Freeport-McMoRan in the materials sector and National Oilwell Varco in the energy sector. In addition, Disney’s acquisition of certain assets of Fox, a Fund holding, closed during the first quarter of 2019; the Fund received cash for those assets and we retained the spinoff Fox entity (mostly comprising Fox’s sports and news assets) in the Fund. The Fund also received shares of AT&T (and cash) through its acquisition of Fund holding Time Warner, and Resideo Technologies and Garrett Motion were spun off from Fund holding Honeywell and not kept in the Fund.
PFMid-Cap Equity Fund(sub-advised by Rothschild & Co Asset Management US Inc.)
Q. How did the Fund perform for the year ended March 31, 2019?
A. For the year ended March 31, 2019, the PFMid-Cap Equity Fund’s Class P returned 5.37%, compared to a 6.47% return for its benchmark, the Russell Midcap Index.
The following graph compares the performance of a hypothetical $10,000 investment in Class P shares of the Fund to its benchmark for the ten-year period ended March 31, 2019. The Fund’s performance reflects reinvestments of all dividends and capital gains distributions, if any.
Performance Comparison
Average Annual Total Returns for the Periods Ended March 31, 2019(1)
| | | | | | | | | | | | |
| | | 1 Year | | | 5 Years | | | 10 Years | |
Fund’s Class P | | | 5.37% | | | | 9.45% | | | | 15.46% | |
Russell Midcap Index | | | 6.47% | | | | 8.81% | | | | 16.88% | |
| | (1) | Rothschild & Co AMUS began managing the Fund on June 13, 2018. Scout Investment, Inc. managed the Fund from January 1, 2013 through June 12, 2018. Another firm managed the Fund before that date. |
| | | | | | |
| |
Performance data shown represents past performance. Investment return and principal value will fluctuate so that shares of the Fund when redeemed may be worth more or less than their original cost. Past performance is not predictive of future performance. |
Q. Discuss both positive and negative factors that materially affected the Fund’s performance during the year, including relevant market conditions, investment strategies and techniques, and particular sectors or securities.
A. For the reporting period, the Fund’s Class P underperformed the benchmark.
Rothschild & Co AMUS
Rothschild & Co AMUS assumed management of the Fund on June 13, 2018. During that approximately nine-month period from June 13, 2018 through March 31, 2019 when Rothschild & Co AMUS managed the Fund, the Fund’s Class P underperformed the benchmark. We at Rothschild & Co AMUS implement the Fund’s strategy by investing in common stocks and other equity securities of medium capitalization U.S. companies. We analyze a variety of quantitative and fundamental inputs in making stock decisions, and seek to build a portfolio that is well
| | |
| | See benchmark definitions on A-23 – A-25 |
A-11
PACIFIC FUNDS PERFORMANCE DISCUSSION (Continued)
diversified at the issuer level and by economic sector. Our focus remains on identifying stocks with attractive relative valuations and the ability to exceed investors’ expectations.
With respect to individual stocks, the top detractors from the Fund’s performance included GrubHub, an online food ordering and delivery platform. The company reported mixed results and guidance due to incremental investment to penetrate what appears to be a very large market opportunity. In addition, the stock has been under-pressure due to overall competitive concerns. Noble Energy, a large international exploration and production company, provided a headwind during the reporting period as shares were impacted by amid-2018 cut to production and guidance as well as a concurrent raise to capital expenditures. The company also removed longer term production guidance, which added to uncertainty. Lastly, the company was hurt by negative headlines in Colorado, where ananti-oil industry measure made the state’s ballot for the November election. While this measure was defeated, there remains continued concern for the industry in the state and we subsequently exited our position in the stock.
Sectors which detracted the most from performance of the Fund included energy, materials, and communication services. Conversely, utilities and consumer staples contributed to the Fund’s performance. Sector allocation was not a material driver of performance though a residual 2.50% position in cash provided a modest tailwind. Stock selection was negative, and the primary driver of the Fund’s performance, with the effects of detractors in consumer discretionary, industrials, and materials exceeding those of contributors in health care and information technology.
Individual contributors to the Fund’s performance included Euronet Worldwide, a payment processor, which reported better-than-expected first quarter 2019 results and guidance largely due to its ePay and electronic funds transfer segments. In addition, the stock’s outperformance was augmented by increased visibility for accelerated growth from the Visa dynamic currency conversion fee change coming in April. Ionis Pharmaceuticals, a health care company, benefited from its lead commercial drug Spinraza, which treats rare neuromuscular disease and is partnered with Biogen, exceeding expectations as the company’s pipeline continues to mature towards meaningful pivotal trials.
Scout Investments, Inc. (Scout)
Scout managed the Fund during the period from April 1, 2018 through June 12, 2018. During that approximatelytwo-month period from April 1, 2018 through June 12, 2018 when Scout managed the Fund, the Fund’s Class P outperformed the benchmark. We at Scout maintained the Fund’s strategy, which was keenly focused on individual stock selection, by investing Fund assets primarily in equity securities of companies with medium market capitalizations. We sought to invest in the securities of companies that had the potential to benefit from either macroeconomic or company-specific factors, and that were attractively priced relative to their fundamentals. The strategy invested inmid-cap stocks with emphasis on stocks with positive cash flows, strong balance sheets, attractive valuations, and fundamentaltop-down (macroeconomic or political changes) orbottom-up (company-specific) catalysts to unlock that value, while selecting away from those stocks that the strategy perceived to be exposed to unnecessary risk factors. The Fund generally owned stocks of companies that were considered either “value” or “growth” companies.
Stock selection in five out of eleven sectors contributed to the Fund’s outperformance during the period when Scout managed the Fund, with positive contributions from the health care, real estate, materials, energy, and utilities sectors. The information technology, financials, consumer discretionary, industrials, telecommunications, and consumer staples sectors were a drag on overall stock selection during the period when Scout managed the Fund.
Overall, sector allocation was detrimental to relative performance during the period when Scout managed the Fund with the overweight position in financials having the largest negative impact, followed by underweight positions in utilities and real estate. The Fund’s underweight position in the consumer staples sector had the largest positive impact on performance during the period when Scout managed the Fund among the sectors, followed by the overweight of the health care sector. All other sectors had a minimal impact on relative performance. The Fund also experienced a small cash drag due to strong equity returns.
At the security level, the health care sector performance benefited from a rally in ABIOMED, Inc., the Fund’s top contributor during the period when Scout managed the Fund, as investors continued to appreciate ABIOMED’s near monopoly market position in small cardiovascular pumps, and the growth potential of this business. Oil refining and marketing company Andeavor was the second largest individual contributor as the stock rose sharply due to a takeover bid from a larger rival. Finally, Newfield Exploration rose as oil prices rebounded.
The detractors from performance during the period when Scout managed the Fund were an eclectic group consisting of pharmaceutical maker Nektar Therapeutics, Everest RE Group LTD, a provider of property and casualty insurance and reinsurance, and DXC Technology Company, a provider of outsourced technology and consulting services. Nektar fell as disappointing data on their combination clinical trial forNKTR-214 was released. Everest RE Group fell as property casualty losses, particularly from the California wildfires was higher than expected, and DXC Technology Company fell as guidance disappointed investors, and thespin-off of government information technology services company Perspecta hurt investor sentiment.
| | |
| | See benchmark definitions on A-23 – A-25 |
A-12
PACIFIC FUNDS PERFORMANCE DISCUSSION (Continued)
PF Multi-Asset Fund(managed by Pacific Life Fund Advisors LLC, collateral portion managed by Pacific Asset Management)
Q. How did the Fund perform for the year ended March 31, 2019?
A. For the year ended March 31, 2019, the PF Multi-Asset Fund’s Class P returned 5.72%, compared to a 4.01% return for its benchmark, the MSCI World Index (Net).
The following graph compares the performance of a hypothetical $10,000 investment in Class P shares of the Fund to its benchmarks for the period from inception through March 31, 2019. The Fund’s performance reflects reinvestments of all dividends and capital gains distributions, if any.
Performance Comparison
Average Annual Total Returns for the Periods Ended March 31, 2019
| | | | | | | | |
| | | 1 Year | | | Since
Inception
(01/31/18) | |
Fund’s Class P | | | 5.72% | | | | (0.36% | ) |
MSCI World Index (Net) | | | 4.01% | | | | (2.13% | ) |
| | | | | | |
| |
Performance data shown represents past performance. Investment return and principal value will fluctuate so that shares of the Fund when redeemed may be worth more or less than their original cost. Past performance is not predictive of future performance. |
Q. Discuss both positive and negative factors that materially affected the Fund’s performance during the year, including relevant market conditions, investment strategies and techniques, and particular sectors or securities.
A. For the reporting period, the Fund’s Class P outperformed the benchmark. The Fund buys and sells total return swap agreements to gain exposure to the large-capitalization andmid-capitalization asset classes of the U.S. and developednon-U.S. equity markets, including growth and value styles, that may be denominated in foreign currencies. We at PLFA actively manage the Fund’s exposures in these asset classes in seeking to contribute to overall returns for the Fund.
The primary contributors to the Fund’s performance were the Fund’s overweight position to U.S. equities relative to the benchmark. Additionally, the exposure to U.S. growth also contributed to the Fund’s performance. Furthermore, U.S.mid-capitalization companies also outperformed foreign markets, which contributed to performance. Separately, the Fund’s collateral pool outperformed the financing expense of the Fund’s swap positions, further contributing to performance.
On the other hand, the exposure to U.S. large-capitalization value detracted from performance. The financial sector, which is among the larger exposures in value indices, was among the worst performing sectors over the reporting period. Banks have struggled as interest rate spreads have tightened, which hurt their profitability.
| | |
| | See benchmark definitions on A-23 – A-25 |
A-13
PACIFIC FUNDS PERFORMANCE DISCUSSION (Continued)
PF Small-Cap Value Fund(sub-advised by AllianceBernstein L.P.)
Q. How did the Fund perform for the year ended March 31, 2019?
A. For the year ended March 31, 2019, the PF Small-Cap Value Fund’s Class P returned -4.23%, compared to a 0.17% return for its benchmark, the Russell 2000 Value Index.
The following graph compares the performance of a hypothetical $10,000 investment in Class P shares of the Fund to its benchmark for the ten-year period ended March 31, 2019. The Fund’s performance reflects reinvestments of all dividends and capital gains distributions, if any.
Performance Comparison
Average Annual Total Returns for the Periods Ended March 31, 2019(1)
| | | | | | | | | | | | |
| | | 1 Year | | | 5 Years | | | 10 Years | |
Fund’s Class P | | | (4.23% | ) | | | 6.64% | | | | 14.31% | |
Russell 2000 Value Index | | | 0.17% | | | | 5.59% | | | | 14.12% | |
| | (1) | AllianceBernstein L.P. began managing the Fund on May 1, 2014 and some investment policies changed at that time. Another firm managed the Fund before that date. |
|
| |
Performance data shown represents past performance. Investment return and principal value will fluctuate so that shares of the Fund when redeemed may be worth more or less than their original cost. Past performance is not predictive of future performance. |
Q. Discuss both positive and negative factors that materially affected the Fund’s performance during the year, including relevant market conditions, investment strategies and techniques, and particular sectors or securities.
A. For the reporting period, the Fund’s Class P underperformed the benchmark. We at AB maintain the Fund’s investment objective by seeking long-term growth of capital. The Fund seeks out-of-favor small-capitalization stocks with attractive long-term earnings prospects that the Fund’s investment team believes are undervalued. We believe that small-capitalization stocks offer greater opportunity for fundamental stock selection than large-capitalization stocks, since small-capitalization stocks are covered by fewer industry analysts. The Fund invests primarily in equity securities of small-capitalization U.S. companies.
During the reporting period, the Fund’s performance declined in absolute terms and underperformed its benchmark. Overall security selection detracted from its performance mainly due to the Fund’s financials, consumer discretionary and industrials holdings. Stock selection in the health care and technology sectors contributed to the Fund’s relative performance.
Overall sector allocation also detracted from the Fund’s performance during the reporting period. Underweight positions in utilities and real estate and an overweight to energy detracted from performance during the reporting period. An overweight to technology and an underweight to financials contributed to the Fund’s performance.
Cooper Standard, an automotive parts supplier, detracted from Fund performance after reporting disappointing fourth-quarter 2018 earnings and providing 2019 guidance meaningfully below investor expectations. The company pointed to decelerating global auto demand growth, rising raw material costs and pricing pressure as drivers of its weaker operating performance.
Texas Capital Bancshares, a Dallas-based regional bank, also detracted from performance relative to the benchmark. The bank reported weaker-than-expected earnings due to slowing loan growth and rising deposit costs, which was the result of increased competition.
Chemicals company Trinseo, a manufacturer of products such as styrene, which is used in a variety of end markets including tires, detracted from performance during the reporting period. The company preannounced disappointing profitability results due to weaker demand from certain Chinese end markets for its products.
Molina Healthcare, a managed-care company providing health care services for Medicaid, rose sharply after it reported better-than-expected profitability. Under its new CEO, Molina showed meaningful improvement in reducing its medical and overhead costs.
Finisar, a manufacturer of components used in data centers and telecommunication infrastructure, also contributed to performance relative to the benchmark in the reporting period. The company announced that it had reached a deal to be acquired at a significant premium by one of its competitors.
Verint Systems, a software company with products focused on cyber intelligence and customer engagement solutions, reported strong earnings results for its fiscal fourth quarter 2019 and raised revenue and earnings guidance for its fiscal full-year 2020. Markets were particularly encouraged by the potential for sustainable strong top-line growth in its business.
| | |
| | See benchmark definitions on A-23 – A-25 |
A-14
PACIFIC FUNDS PERFORMANCE DISCUSSION (Continued)
PF Emerging Markets Fund(sub-advised by OppenheimerFunds, Inc.)
Q. How did the Fund perform for the year ended March 31, 2019?
A. For the year ended March 31, 2019, the PF Emerging Markets Fund’s Class P returned-3.61%, compared to a-7.41% return for its benchmark, the MSCI Emerging Markets Index (Net).
The following graph compares the performance of a hypothetical $10,000 investment in Class P shares of the Fund to its benchmark for the ten-year period ended March 31, 2019. The Fund’s performance reflects reinvestments of all dividends and capital gains distributions, if any.
Performance Comparison
Average Annual Total Returns for the Periods Ended March 31, 2019
| | | | | | | | | | | | |
| | | 1 Year | | | 5 Years | | | 10 Years | |
Fund’s Class P | | | (3.61% | ) | | | 3.73% | | | | 11.39% | |
MSCI Emerging Markets Index (Net) | | | (7.41% | ) | | | 3.68% | | | | 8.94% | |
|
| |
Performance data shown represents past performance. Investment return and principal value will fluctuate so that shares of the Fund when redeemed may be worth more or less than their original cost. Past performance is not predictive of future performance. |
Q. Discuss both positive and negative factors that materially affected the Fund’s performance during the year, including relevant market conditions, investment strategies and techniques, and particular sectors or securities.
A. For the reporting period, the Fund’s Class P outperformed the benchmark. We, the Oppenheimer Emerging Markets team, are long-term investors in companies that we believe have competitive advantages and real options that manifest themselves over many years. The Fund mainly invests in common stocks of issuers in developing or emerging markets throughout the world, and focuses on companies with above-average earnings growth potential. While cyclical slowdowns can hurt all companies, extraordinary companies can often emerge from difficult periods with even greater competitive advantages. This is because such companies tend to have the cash flow and balance sheet flexibility to invest their businesses even during tough times. Using our long-term focus, we seek to take advantage of dislocations in the market and to buy these companies at compelling valuations.
On a sector basis, the Fund’s outperformance in relation to its benchmark was greatest within the consumer discretionary, financials and information technology sectors. The Fund underperformed its benchmark in the communication services, consumer staples and materials sectors due to stock selection.
With respect to the Fund’s country exposure, the top three performers versus the benchmark were France, Hong Kong and China. The Fund’s overweight position in France and Hong Kong, along with stock selection in China, benefited the Fund’s performance. Detractors from performance included the Fund’s overweight positions in the U.K. and the U.S., along with stock selection in the United Arab Emirates.
During the reporting period, the top individual contributors to performance included Kering (consumer discretionary) (France), Novatek (energy) (Russia) and Huazhu Group (consumer discretionary) (China).
Kering, domiciled in France, is the third largest luxury group in the world. The company controls iconic brands such as Gucci, Yves Saint Laurent, and Bottega Veneta. Kering has been successful in targeting a new customer base through the Gucci label, Asian consumers and millennials. Kering has focused heavily on retaining this customer base through investments in a strong digital and e-commerce strategy. With a focus on digital distribution, we believe there will be further market share gains in Asia.
Novatek is a Russian energy company. It has always stood at the forefront of technological and business innovation, finding creative ways to add value to its constantly expanding natural gas and condensate resource base. Novatek is going through another transformation: from a large, local independent gas player to a global liquefied natural gas (LNG) major. Saudi Aramco’s interest in acquiring a portion of one of Novatek’s latest projects, Arctic LNG 2, supports our belief that the company can evolve into a cash generative play on the exploding global appetite for cleaner energy.
Huazhu Group is one of the largest hotel operators in China with 3,700 hotels under management. Huazhu Group pioneered the budget hotel segment in China using an asset light franchise model, which alleviates the heavy capital requirements that are common for hotel operators. The company’s demonstrable foresight allowed them to capitalize on the developing middle class of China. Huazhu made a strategic shift to developmid-scale hotels to take advantage of the changing demands and taste of the Chinese consumer base, as well as the business traveler. They also entered into a strategic partnership with Accor hotels to gain access to high scale brands. The company continues to refine and expand its business model, and has steadily improved revenue per available room, (RevPar). We believe there is still ample room for growth as strong hotel openings—management expects800-900 in 2019—should support revenue growth in 2019 and beyond.
| | |
| | See benchmark definitions on A-23 – A-25 |
A-15
PACIFIC FUNDS PERFORMANCE DISCUSSION (Continued)
The most significant detractors from performance for the reporting period included Tencent (communication services) (China), Naver (communication services) (South Korea) and Glencore (materials) (U.K.).
Tencent is a Chinese internet company that dominates the Chinese consumer market through a broad ecosystem built on gaming, messaging, payment, and content. Although Tencent continues to diversify, the company still derives the majority of gross profits from gaming. Gaming growth is slowing as a result of a very large base of comparison. Additionally, in early 2018, approvals for new PC and mobile games were delayed due to changes in administrative procedures at the regulators. These factors coupled with unresolved trade issues between the U.S. and China, which negatively impacted all U.S.-listed Chinese companies, and a global correction in technology stocks have contributed to earnings downgrades. As of December 2018, the Chinese government has resumed video game approvals, which has helped stabilize sentiment around the company and the share price. We believe many investors do not fully appreciate the growth from traditional business segments, such as advertising, and the many other areas that are still in the nascent stages of growth and profitability including content, fintech and cloud.
Naver is the leading South Korean internet portal. Naver’s dominance came under government scrutiny in 2018, negatively impacting the share price- this has since moderated as the government’s intentions were clarified. The company’s margins were impacted by investments in a number of fronts including financial technology, artificial intelligence, cloud, taxi hailing and other investments in South East Asia- this too should moderate as these investments mature.
Glencore is one of the world’s leading producers and marketers of commodities and one of the most diversified. The industry should benefit from more stable commodity prices as well as material growth in the electric vehicle market over the next several years, which is expected to drive strong demand for commodities of which Glencore is one of the leading producers—copper, cobalt and nickel. Over half of cobalt’s production is based in the Democratic Republic of Congo (DRC). Glencore’s stock price has been adversely impacted by ongoing political and policy controversies at the Katanga mine in the DRC. Importantly, we expect the company to prioritize the return of cash to shareholders in the coming years.
PF InternationalLarge-Cap Fund(sub-advised by MFS Investment Management)
Q. How did the Fund perform for the year ended March 31, 2019?
A. For the year ended March 31, 2019, the PF InternationalLarge-Cap Fund’s Class P returned 0.62%, compared to a-3.71% return for its benchmark, the MSCI EAFE Index (Net).
The following graph compares the performance of a hypothetical $10,000 investment in Class P shares of the Fund to its benchmark for the ten-year period ended March 31, 2019. The Fund’s performance reflects reinvestments of all dividends and capital gains distributions, if any.
Performance Comparison
Average Annual Total Returns for the Periods Ended March 31, 2019
| | | | | | | | | | | | |
| | | 1 Year | | | 5 Years | | | 10 Years | |
Fund’s Class P | | | 0.62% | | | | 3.84% | | | | 9.99% | |
MSCI EAFE Index (Net) | | | (3.71% | ) | | | 2.33% | | | | 8.96% | |
| | | | | | |
| |
Performance data shown represents past performance. Investment return and principal value will fluctuate so that shares of the Fund when redeemed may be worth more or less than their original cost. Past performance is not predictive of future performance. |
Q. Discuss both positive and negative factors that materially affected the Fund’s performance during the year, including relevant market conditions, investment strategies and techniques, and particular sectors or securities.
A. For the reporting period, the Fund’s Class P outperformed the benchmark. We at MFS use abottom-up investment style, which involves the research of the fundamentals of each individual opportunity and analyzing certain aspects of a company such as earnings, cash flows, growth potential and management abilities. In managing the Fund, we invest primarily in the securities of foreign issuers with large market capitalizations.
A combination of an overweight allocation and stock selection in the consumer,non-cyclical sector contributed to performance relative to the benchmark. The Fund’s overweight positions in imaging products and medical-related equipment manufacturer HOYA (Japan), global food company Nestle (Switzerland), credit risk services provider Experian (U.K.), medical products and equipment manufacturer Terumo (Japan) and pharmaceutical and diagnostic company Roche Holding (Switzerland) contributed to relative performance.
| | |
| | See benchmark definitions on A-23 – A-25 |
A-16
PACIFIC FUNDS PERFORMANCE DISCUSSION (Continued)
A combination of stock selection and an underweight allocation to the consumer, cyclical sector also contributed to relative returns. Within this sector, the fund’s overweight position in luxury goods company LVMH (France) contributed to relative results.
Stock selection within both the technology and industrial sectors further contributed to relative performance. Within the technology sector, the Fund’s holding of information technology services and solutions firm Tata Consultancy Services (security is not a benchmark constituent) (India) and an overweight position in shares of security software provider Check Point Software Technologies (Israel) contributed to relative results. Within the industrial sector, the Fund’s holding of railroad company Canadian National Railway (security is not a benchmark constituent) (Canada) contributed to relative performance.
Another top relative contributor during the reporting period included the Fund’s overweight position in insurance company AIA Group (Hong Kong).
Stock selection in the communications sector detracted from relative performance led by the Fund’s overweight positions in communications company WPP Group (U.K.) and advertising and broadcasting company ProSiebenSat.1 Media (Germany).
A combination of an underweight allocation and stock selection in both the utilities and energy sectors detracted from relative results. However, there were no individual stocks within either sector that were among the Fund’s top relative detractors during the reporting period.
Other top relative detractors during the reporting period included overweight positions in pharmaceutical company Bayer (Germany), investment management and banking firm UBS (Switzerland), financial services firm ING Groep (Netherlands), wealth management firm Julius Baer (Switzerland), human resources and employment services provider Randstad Holdings (Netherlands) and automotive component manufacturer Denso (Japan). Not owning a position in mining giant BHP Billiton (U.K.) detracted from relative performance. The Fund’s holding of beverage manufacturer AmBev (security is not a benchmark constituent) (Brazil) further detracted from relative results.
PF InternationalSmall-Cap Fund(sub-advised by QS Investors, LLC)
Q. How did the Fund perform for the year ended March 31, 2019?
A. For the year ended March 31, 2019, the PF InternationalSmall-Cap Fund’s Class P returned-12.54%, compared to a-9.16% return for its benchmark, the S&P DevelopedEx-U.S. SmallCap Index.
The following graph compares the performance of a hypothetical $10,000 investment in Class P shares of the Fund to its benchmark for the period from inception through March 31, 2019. The Fund’s performance reflects reinvestments of all dividends and capital gains distributions, if any.
Performance Comparison
Average Annual Total Returns for the Periods Ended March 31, 2019(1)
| | | | | | | | |
| | | 1 Year | | | Since
Inception
(01/14/15) | |
Fund’s Class P | | | (12.54% | ) | | | 5.89% | |
S&P DevelopedEx-U.S. SmallCap Index | | | (9.16% | ) | | | 7.10% | |
| | (1) | Effective April 1, 2016, QS Investors, LLC (“QS Investors”) began managing the Fund. QS Batterymarch Financial Management, Inc., which was named Batterymarch Financial Management, Inc. prior to June 30, 2014 and which came under common management with QS Investors as of May 31, 2014, managed the Fund prior to that date. |
| | | | | | |
| |
Performance data shown represents past performance. Investment return and principal value will fluctuate so that shares of the Fund when redeemed may be worth more or less than their original cost. Past performance is not predictive of future performance. |
Q. Discuss both positive and negative factors that materially affected the Fund’s performance during the year, including relevant market conditions, investment strategies and techniques, and particular sectors or securities.
A. For the reporting period, the Fund’s Class P underperformed the benchmark. We at QS Investors seek to manage a well-diversified, style neutral portfolio with modest region and sector allocations in relation to the benchmark throughbottom-up stock selection based on fundamentals and implemented with quantitative tools, risk controls and cost-efficient trading. The Fund primarily invests in securities of companies with small market capitalizations that are located in developed foreign countries. The Fund continues to invest in more than 200 companies and generally expects to invest a significant amount of its assets in about the same number ofnon-U.S. countries as the benchmark (which is comprised of developed countries outside the U.S.).
For the reporting period, stock selection results were mixed across all major regions and most sectors and detracted from performance overall. Stock selection detracted from relative return in continental Europe, Japan and in the resource-based countries of Australia, New Zealand and Canada. Selection in Japanese real estate and European industrials stocks were the primary detractors at the industry group level.
| | |
| | See benchmark definitions on A-23 – A-25 |
A-17
PACIFIC FUNDS PERFORMANCE DISCUSSION (Continued)
At the security level, the largest detractors from relative performance were overweights to Japanese real estate company Leopalace21 Corporation, which experienced declining performance as news broke out about defective apartments and building code violations, and France’s Eramet SA which is in the materials sector, whose performance rebound was cut short by strikes at the company’s nickel mines in New Caledonia. Not holding Germany’s Wirecard AG, which is included in the benchmark, was also a large detractor from the Fund’s performance as the global internet technology and financial services provider continued to do well. An overweight position to Oriflame Holding AG, a cosmetic manufacturer and wholesaler based in Switzerland, was also a detractor from relative performance.
Stock selection contributed to relative returns in Asia Developed ex Japan and the U.K., led by the banks sector. At the security level, an overweight to Singapore skin care company, Best World International Limited, was the primary contributor. That security returned approximately 63% over the reporting period, as the company continued to see strong growth in China during the first quarter of the reporting period. Having overweight positions to Japanese food production and distribution company, Kobe Bussan Co., Ltd., and Japanese IT company, Daiwabo Holdings Co., Ltd., also contributed to performance with returns in excess of 70% and 35%, respectively, for the reporting period. Not holding Aryzta AG, a food company based in Switzerland, also contributed to performance.
Region and sector allocation results were mixed and detracted from performance overall for the reporting period, with the impact of an underweight to the U.K. and an overweight to the smaller region of Asia Developed ex Japan having the largest negative impact.
PF International Value Fund(sub-advised by Wellington Management Company LLP)
Q. How did the Fund perform for the year ended March 31, 2019?
A. For the year ended March 31, 2019, the PF International Value Fund’s Class P returned-8.51%, compared to a-3.71% return for its benchmark, the MSCI EAFE Index (Net).
The following graph compares the performance of a hypothetical $10,000 investment in Class P shares of the Fund to its benchmark for the ten-year period ended March 31, 2019. The Fund’s performance reflects reinvestments of all dividends and capital gains distributions, if any.
Performance Comparison
Average Annual Total Returns for the Periods Ended March 31, 2019(1)
| | | | | | | | | | | | |
| | | 1 Year | | | 5 Years | | | 10 Years | |
Fund’s Class P | | | (8.51% | ) | | | 0.53% | | | | 6.92% | |
MSCI EAFE Index (Net) | | | (3.71% | ) | | | 2.33% | | | | 8.96% | |
| | (1) | Wellington Management Company LLP began managing the Fund on May 1, 2017 and some investment policies changed at that time. Other firms managed the Fund before that date. |
| | | | | | |
| |
Performance data shown represents past performance. Investment return and principal value will fluctuate so that shares of the Fund when redeemed may be worth more or less than their original cost. Past performance is not predictive of future performance. |
Q. Discuss both positive and negative factors that materially affected the Fund’s performance during the year, including relevant market conditions, investment strategies and techniques, and particular sectors or securities.
A. For the reporting period the Fund’s Class P underperformed the benchmark. The Fund invests primarily in a diversified portfolio of equity securities of largenon-U.S. companies that we at Wellington believe to be undervalued. We use a “contrarian value” approach to selecting securities, applying fundamental analysis to identify securities that we believe are undervalued by the market.
The Fund’s underperformance relative to its benchmark was largely driven by security selection. Weak security selection within the financials, industrials, and utilities sectors drove relative underperformance but was partially offset by stronger selection in the information technology, communication services, and materials sectors. Sector allocation, which is a residual of our fundamental stock selection process, also detracted from relative performance. The Fund’s overweight position in financials and underweight positions in health care and consumer staples detracted most from relative performance. An overweight allocation to the energy sector contributed positively to performance and somewhat offset these detractions. On acountry-by-country basis, weak security selection in Japan, Switzerland and France detracted most from relative performance. Stronger contributions came from our holdings in Sweden, U.K. and Italy.
Top individual issuer detractors from relative performance included Societe Generale SA (financials) and UniCredit SPA (financials). Societe Generale is a French universal bank with retail, insurance, and investment banking. The stock traded down throughout the reporting period as a result of increased political tension in Europe, missing earnings estimates and targets in the fourth quarter of 2018, and moving their 2018
| | |
| | See benchmark definitions on A-23 – A-25 |
A-18
PACIFIC FUNDS PERFORMANCE DISCUSSION (Continued)
dividend from cash to a scrip option. UniCredit is an Italian retail and commercial bank. The stock traded down due to the uncertainty of the political climate in Italy as well as the sizeable exposure the bank has to Turkey. We maintained positions in both companies as of the end of the reporting period.
Top individual issuer contributors to benchmark-relative returns included AirFrance-KLM (industrials) and Ericsson LM (information technology). AirFrance-KLM, one of the three major European airlines, outperformed during the reporting period driven by multiple strong earnings, low oil prices, and a new CEO at the helm. Were-initiated a position during the second quarter of 2018 as labor strikes, higher energy prices, and the lack of a CEO drove the company’s enterprise value back to the lows seen during the financial crisis. We maintained a position in the stock as of the end of the reporting period. Ericsson LM is a Swedish telecommunication equipment company. Shares benefited from multiple consecutive strong earnings results over the period as well as the global ban on its competitor, Huawei. We trimmed our position on strength but continued to hold the stock as of the end of the reporting period.
PF Real Estate Fund(sub-advised by Principal Real Estate Investors, LLC)
Q. How did the Fund perform for the year ended March 31, 2019?
A. For the year ended March 31, 2019, the PF Real Estate Fund’s Class P returned 18.20%, compared to a 9.50% return for the broad- based S&P 500 Index, a 19.16% return for the sector-specific benchmark the MSCI U.S. REIT (Net), and a 20.86% return for the sector-specific benchmark, the Financial Times Stock Exchange (FTSE) National Association of REIT (NAREIT) Equity REITs Index.
The following graph compares the performance of a hypothetical $10,000 investment in Class P shares of the Fund to its benchmarks for the ten-year period ended March 31, 2019. The Fund’s performance reflects reinvestments of all dividends and capital gains distributions, if any.
Performance Comparison
Average Annual Total Returns for the Periods Ended March 31, 2019(1)
| | | | | | | | | | | | |
| | | 1 Year | | | 5 Years | | | 10 Years | |
Fund’s Class P | | | 18.20% | | | | 7.71% | | | | 16.89% | |
S&P 500 Index | | | 9.50% | | | | 10.91% | | | | 15.92% | |
MSCI U.S. REIT (Net) | | | 19.16% | | | | 7.62% | | | | 17.01% | |
FTSE NAREIT Equity REITs Index | | | 20.86% | | | | 9.12% | | | | 18.28% | |
| | (1) | Principal Real Estate Investors LLC began managing the Fund on May 1, 2018, and some investment policies changed at that time. Another firm managed the Fund before that date. |
| | | | | | |
| |
Performance data shown represents past performance. Investment return and principal value will fluctuate so that shares of the Fund when redeemed may be worth more or less than their original cost. Past performance is not predictive of future performance. |
Q. Discuss both positive and negative factors that materially affected the Fund’s performance during the year, including relevant market conditions, investment strategies and techniques, and particular sectors or securities.
A. For the reporting period, the Fund’s Class P outperformed the broad-based S&P 500 Index but underperformed both the sector-specific FTSE NAREIT Equity REITs Index and the sector-specific MSCI U.S. REITs Index (Net).
Principal REI
Principal REI assumed management of the Fund on May 1, 2018. During theten-month period from May 1, 2018 through March 31, 2019 when Principal REI managed the Fund, the Fund’s Class P outperformed both the broad-based S&P 500 Index and the sector-specific MSCI REITs Index. We, the Principal REIT team, utilize a fundamental style of investing. We rely on skilled portfolio managers and analysts to provide deep forward-looking perspectives and carry out rigorous, fundamental research on all investment opportunities. Security selection focuses on identifying relative stock mispricings amongst groups of comparable stocks. Alpha generation isbottom-up as we believe security selection is the most reliable and repeatable source of consistent outperformance. We construct portfolios to diversify risk and sources of alpha so excess return generation is consistent over the long term.Top-down and quantitative elements are incorporated, but represent a minor role in our investment process.
Fund performance was driven by a mix of selection decisions as well as positioning relative to the defensive and macro driven themes. A few notable positive contributors helped to dampen relative underperformance. Selection in retail stocks despite the weak landscape and an overweight to defensive apartments were positive contributors. The Fund also benefitted fromnon-index holdings in towers as the group is supported by structural growth drivers. Finally, an underweight to the diversified REITs contributed to performance.
| | |
| | See benchmark definitions on A-23 – A-25 |
A-19
PACIFIC FUNDS PERFORMANCE DISCUSSION (Continued)
Among the factors that detracted from relative performance was weak stock selection in U.S. data centers as the Fund’s holdings underperformed peers relative to the broad-based benchmark on concerns of the pace of leasing growth slowing for the group as well as a broader technology stock selloff. Market leadership by defensive oriented stocks like special purpose property owners detracted from the Fund performance due to an overall underweight to the group, however, good selection more than offset this underperformance. Investors favored these stocks for their higher yields, less economic sensitivity, and lower volatility despite more expensive relative valuations. For the same reason, hotels were weak performers and our exposure there also detracted from performance relative to the broad-based benchmark.
Morgan Stanley Investment Management Inc. (Morgan Stanley)
Morgan Stanley managed the Fund from April 1, 2018 through April 19, 2018. During this period when Morgan Stanley managed the Fund, the Fund’s Class P underperformed both the sector-specific FTSE NAREIT Equity REITs Index and the broad-based S&P 500 Index. Transitioning the Fund’s portfolio of investments to a new manager accounted for the Fund’s performance during the remainder of the reporting period from April 20, 2018 to April 30, 2018. We, the managers at Morgan Stanley, maintained our core investment philosophy as a real estate value investor, which resulted in the ownership of stocks whose share prices we believed provided real estate exposure at the best valuation relative to their underlying asset values. Our company-specific research led us to an overweighting in the Fund (relative to the sector-specific benchmark) to a group of companies that are focused in the ownership of New York City (NYC) office assets, Class A retail malls and a number of shopping center, apartment and office stocks and an underweighting to companies concentrated in the ownership of health care, data center and net lease assets.
REITs underperformed the broader equity markets, as measured by the broad-based benchmark, as share price weakness appeared to be largely related to concerns with regard to the impact on REIT share prices in a higher interest rate environment. During the period when Morgan Stanley managed the Fund, the Fund modestly outperformed the sector-specific index frombottom-up stock selection but underperformed fromtop-down sector allocation. Stock selection in primary central business district (CBD) office assets contributed to relative performance. This was partially offset by stock selection in diversified assets. From atop-down perspective, the underweight to health care assets contributed to relative performance. But this was more than offset by the overweight to primary CBD office and mall stocks and the underweight to hotels, industrial and diversified assets. There was a wider-than-typical disparity in relative valuations among the various REIT sectors during the period when Morgan Stanley managed the Fund. We saw the most attractive value in the NYC office and Class A mall sectors, which were trading at significant discounts to net asset values. Given share price declines we also saw attractive value in a number of stocks in the shopping center, apartment and office sectors.
PF Currency Strategies Fund(co-sub-advised by UBS Asset Management (Americas) Inc.)
Q. How did the Fund perform for the year ended March 31, 2019?
A. For the year ended March 31, 2019, the PF Currency Strategies Fund’s Class P returned 0.88% compared to a 2.08% return for the FTSE1-Month U.S.T-Bill Index.
The following graph compares the performance of a hypothetical $10,000 investment in Class P shares of the Fund to its benchmark for the period from inception through March 31, 2019. The Fund’s performance reflects reinvestments of all dividends and capital gains distributions, if any.
Performance Comparison
Average Annual Total Returns for the Periods Ended March 31, 2019(1)
| | | | | | | | | | | | |
| | | 1 Year | | | 5 Years | | | Since
Inception
(12/07/12) | |
Fund’s Class P | | | 0.88% | | | | 3.22% | | | | 2.06% | |
FTSE1-Month U.S.T-Bill Index | | | 2.08% | | | | 0.69% | | | | 0.56% | (2) |
| | (1) | UBS Asset Management (Americas) Inc. (“UBS”) became the sole sub-adviser of the Fund on October 16, 2018 and was previously co-sub-adviser with Macro Currency Group from November 1, 2013 to October 15, 2018. UBS was the sole sub-adviser to the Fund before that date. Prior to October 30, 2015, UBS was named UBS Global Asset Management (Americas) Inc. |
| | (2) | Due to data limitation, the benchmark since inception return reflects the commencement period from the first calendar day of the month the portfolio commenced its operations. |
| | |
| |
Performance data shown represents past performance. Investment return and principal value will fluctuate so that shares of the Fund when redeemed may be worth more or less than their original cost. Past performance is not predictive of future performance. |
| | |
| | See benchmark definitions on A-23 – A-25 |
A-20
PACIFIC FUNDS PERFORMANCE DISCUSSION (Continued)
Q. Discuss both positive and negative factors that materially affected the Fund’s performance during the year, including relevant market conditions, investment strategies and techniques, and particular sectors or securities.
A. For the reporting period, the Fund’s Class P underperformed the benchmark.
Macro Currency Group (MCG)
MCG managed a portion of the Fund from April 1, 2018 through October 15, 2018. During that approximatelysix-month period when MCG managed the Fund, the Fund’s Class P outperformed the benchmark. MCG’s portion of the Fund is a combination of “systematic” and “discretionary” sub components. The systematic sub component seeks to capture longer-term fundamental shifts in currency movements, as such its investment time horizon is typically twelve months. The discretionary component of the Fund applies a qualitative approach that seeks to identify and take advantage of macroeconomic themes that influence exchange rates over the shorter-term (typically a two week tosix-month horizon), a shorter time horizon than the systematic strategy. Both the systematic and discretionary approaches utilizenon-deliverable currency forwards as part of the Fund’s investment strategy.
Performance of the strategy for MCG’s portion of the Fund was heavily impacted by the outcome of European elections in the first half of the reporting period and the Sintra central bank offsite meeting which heralded the beginning of policy normalization for several major central banks.
Over the course of the approximatelysix-month period when MCG managed the Fund, we held various positions, both long and short, across the developed market currency universe primarily through the use of derivatives, includingnon-deliverable forwards. Contributing to the positive performance of our portion of the Fund were long positions in peripheral European currencies including the British pound sterling and Danish krone, each of which benefited from improving growth backdrops and the British pound sterling particularly from growing optimism on post-Brexit relations with the EU. A long position in Japanese yen contributed to performance as it benefited from market volatility in the first quarter of 2018. The Norwegian krone (held both long and short during the period when MCG managed the Fund) also contributed to performance as we navigated developments in the Central Bank monetary policy and economic backdrop. The main detractor from MCG’s portion of the Fund’s performance was a short position in the euro, which rallied during the period when MCG managed the Fund. Constructive outcomes in European elections, particularly France, coupled with the initiation of policy normalization by the ECB helped drive the euro higher. Other short positions that detracted from performance were the Swiss franc and the Swedish krona, as both currencies were lifted by the rising euro. The Canadian dollar long position (held both long and short during the period when MCG managed the Fund) hurt performance as Stephen Poloz (Governor of the Bank of Canada) signaled a potential policy shift by indicating there may be more slack in the labour market and our long U.S. dollar suffered due to U.S. dollar weakness over the course of the reporting period.
UBS AM
UBS AM assumed sole management of the Fund on October 16, 2018. For the period of October 16, 2018 through March 31, 2019 when UBS AM managed the Fund, the Fund’s Class P underperformed the benchmark. We at UBS AM seek to implement the Fund’s strategy by gaining positive (or long) exposures to currencies that we believe are undervalued and negative (or short) exposures to currencies that we believe to be overvalued. For the reporting period, derivatives, includingnon-deliverable forwards, had a positive impact on the UBS AM portion of the Fund’s performance.
The UBS AM portion of the Fund held a long euro against U.S. dollar position which detracted from the Fund’s performance as the political risks and slowing growth in the Eurozone weighed on the euro. These dynamics equally impacted the performance of the Fund’s long euro against Swiss franc.
Similarly, the UBS AM portion of the Fund’s long Japanese yen against U.S. dollar detracted over the reporting period. The performance of this position ebbed and flowed through the course of the reporting period, largely reflecting investor risk appetite in response to changes in the global growth outlook.‘Risk-on’ sentiment through 2019 thus far has led to softer performance from Japanese yen. That said, the Japanese yen strength through market stress towards the end of 2018 led to positive performance from the Fund’s long Japanese yen against Korean won.
However, a long Turkish lira position against the U.S. dollar had a negative impact on the UBS AM portion of the Fund’s performance as concerns over the reliance on U.S. dollar denominated funding in the Turkish corporate sector escalated and the implications for the banking sector and broader economy caused a material depreciation in the lira. Increased tensions between Turkey and the U.S. also drove down the value of the lira.
Contributing to performance, the UBS AM portion of the Fund held a short New Zealand dollar position against the U.S. dollar throughout the reporting period. We view the New Zealand dollar as the most overvalued developed market currency and over the reporting period, improving U.S. growth relative to New Zealand as well as relative monetary policy as the Fed raised rates helped this trade to outperform.
Over the reporting period, the UBS AM portion of the Fund also held a long U.S. dollar position against the Canadian dollar which contributed to performance. The majority of weakness in Canadian dollar through the reporting period came in the fourth quarter 2018 which coincided with weakness in oil prices resulting from concerns about oversupply.
In emerging markets, the Fund’s long Mexican peso position against the U.S. dollar contributed to performance. We believed that the Mexican peso was attractively valued and offered positive interest rate relative to U.S. dollar, even after inflation has been taken into account. Over the reporting period, the positioning in this pair was adjusted tactically and benefitted from some of the volatility induced by the Mexican presidential election. Rate hikes and a positive outcome in trade negotiations with the U.S. also helped Mexican peso to perform well at times throughout the reporting period.
Although we trimmed the UBS AM portion of the Fund’s long Japanese yen position following strength through the beginning of 2019, we remain constructive on the Japanese yen and the outlook for the Japanese economy. We perceive Japanese yen to be the most attractively valued currency in the Group of Ten (G10) currencies, which are ten of the most heavily traded and liquid currencies among advanced economies, and this position to some extent offsets some of therisk-on emerging market positions we currently hold within the Fund. This position is partially held against Korean won while Korean growth has been reasonable, inflation remains below target and Korean won is susceptible to a slowing, rebalancing China that could increasingly become a competitor in terms of high value goods.
| | |
| | See benchmark definitions on A-23 – A-25 |
A-21
PACIFIC FUNDS PERFORMANCE DISCUSSION (Continued)
We retain conviction in the Mexican peso. It continues to benefit from tailwinds such as valuation and carry, while having also recently agreed a trade deal with the U.S. We believe the political risk in Mexico is being priced too cautiously by the market—we see scope for this to reduce and retain conviction in the strength of Mexico’s institutions and monetary policy independence against this backdrop. The UBS AM portion of the Fund’s short to Canadian dollar is predicated on scope for policy error, and a frothy housing sector.
We retain the view that tighter global monetary conditions remain a headwind for emerging markets, commodities and risk seeking trades in general, suggesting more scope for euro to rise further towards its long-term equilibrium levels versus both New Zealand dollar and Australian dollar. New Zealand and Australia are relatively indebted countries whose normal interest rate premium versus the U.S. dollar is currently below itslong-run average. Both economies are positively exposed to world commodities prices, albeit of different varieties, for which softer emerging market growth, especially in China, is expected to be a headwind: in China we think that government policy is designed more to stabilize the economy rather than engineer a new spurt in growth.
We are of the view that too much pessimism is currently priced into European currencies. We see scope for euro to be more positive than expected particularly as Chinese stimulus takes hold through the middle of the 2019 offering support to external demand. We continue to focus on those currencies with stronger valuation support such as Swedish krona and Norway krone, with support for euro, on account of the negative interest rate differentials relative to U.S. dollar. Accordingly, we increased exposure to Swedish krona on weakness through the end of the reporting period, funding this from U.S. dollar.
PF Equity Long/Short Fund(sub-advised by AQR Capital Management, LLC)
Q. How did the Fund perform for the year ended March 31, 2019?
A. For the year ended March 31, 2019, the PF Equity Long/Short Fund’s Class P returned-15.08%, compared to a 4.01% return for the broad- based MSCI World Index (Net) and 3.32% for the Equity Long/Short Composite Benchmark.
The following graph compares the performance of a hypothetical $10,000 investment in Class P shares of the Fund to its benchmarks for the period from inception through March 31, 2019. The Fund’s performance reflects reinvestments of all dividends and capital gains distributions, if any.
Performance Comparison
Average Annual Total Returns for the Periods Ended March 31, 2019
| | | | | | | | |
| | | 1 Year | | | Since
Inception
(04/27/15) | |
Fund’s Class P | | | (15.08% | ) | | | 7.23% | |
MSCI World Index (Net) | | | 4.01% | | | | 6.13% | |
Equity Long/Short Composite Benchmark | | | 3.32% | | | | 3.68% | |
| | | | | | |
| |
Performance data shown represents past performance. Investment return and principal value will fluctuate so that shares of the Fund when redeemed may be worth more or less than their original cost. Past performance is not predictive of future performance. |
Q. Discuss both positive and negative factors that materially affected the Fund’s performance during the year, including relevant market conditions, investment strategies and techniques, and particular sectors or securities.
A. For the reporting period, the Fund’s Class P underperformed both the broad-based MSCI World Index (Net) and the style-specific Equity Long/ Short Composite Benchmark. We at AQR manage the Fund’s strategy by seeking to provide higher risk-adjusted returns with lower volatility relative to global equity markets. The strategy seeks to generate returns from three different sources: 1) the potential gains from the Fund’s long and short equity positions by generally entering into total return basket swaps, 2) overall exposure to equity markets, generally through the use of futures and currency forwards contracts, and 3) the active increase and decrease of the Fund’s net exposure to equity markets. The strategy primarily seeks to add alpha (excess return over the broad-based benchmark) via its long/short stock portfolio. The Fund invests both in total return basket swaps and futures contracts, as well as currency forwards, to gain economic exposure to specific stocks and global equity markets. These derivative positions are responsible for substantially all the performance in the Fund.
Negative performance was largely driven by the Fund’s market neutral stock selection component, which employs abottom-up stock and industry selection investment process, using fundamental investing concepts and evaluating them across stocks to create signals that are divided into broad themes. Within stock selection, the best performing themes over the reporting period were earnings quality and stability. Conversely, investor sentiment and value were the worst performing themes. By sector, financials were the largest contributors to performance, while industrials, information technology and materials were the largest detractors. By country, Switzerland was the largest contributor to performance. Stock selection within the U.S. was responsible for the lion’s share of negative performance, though Japan, the U.K., Canada and Sweden also detracted. The Fund’s strategic beta exposure component contributed to performance, though not enough to offset losses. The
| | |
| | See benchmark definitions on A-23 – A-25 |
A-22
PACIFIC FUNDS PERFORMANCE DISCUSSION (Continued)
Fund’s tactical market exposure (the desired deviation from a beta of 0.50) contributed. This was due mainly to an underweight position to the broad-based benchmark which was particularly beneficial during the month of October when markets fell. While tactical positioning was largely underweight over the reporting period, our view on the broad-based benchmark ended the reporting period positive with a target beta to the index of 0.50.
The Fund ended the reporting period with a highly diversified stock portfolio of 853 long positions and 804 short positions. Securities remained globally diversified, with around 40% of the Fund invested outside of the U.S. As of the end of the reporting period, the Fund’s largest net long exposures were in information technology and health care, while its largest net short exposures were in consumer discretionary and financials.
Benchmark Definitions
Bloomberg Barclays1-3 Year U.S. Government/Credit Bond Indexmeasures performance of U.S. dollar-denominated U.S. Treasuries, government-related, and investment grade U.S. corporate securities with maturities of one to three years. Results include the reinvestment of all distributions.
Bloomberg Barclays U.S. Aggregate Bond Indexmeasures the performance of the U.S. investment grade bond market, which includes investment grade U.S. government bonds, investment grade corporate bonds, mortgage pass-through securities and asset-backed securities that are publicly offered for sale in the U.S. The securities in the Index must have at least 1 year remaining to maturity. In addition, the securities must be denominated in U.S. dollars and must be fixed rate, nonconvertible, and taxable. Results include the reinvestment of all distributions.
Bloomberg Barclays U.S. Treasury Inflation-Protected Securities (TIPS) Indexis an index of all outstanding treasury inflation protected securities issued by the U.S. government. The total return is equal to the change in price plus the coupon return. Results include the reinvestment of all distributions.
Emerging Markets Debt Composite Benchmarkis 50% J.P. Morgan EMBI Global Diversified; 25% J.P. Morgan ELMI+; 25% J.P. MorganGBI- EM Global Diversified. Results include the reinvestment of all distributions.
Equity Long/Short Composite Benchmarkis 50% ICE BofA Merrill Lynch U.S.3-MonthT-Bill Index and 50% MSCI World Index (Net). Results include the reinvestment of all distributions.
FTSE1-Month U.S. Treasury Bill(T-Bill) Indexis a market value-weighted index of public obligations of the U.S. Treasury with maturities of one month. Results include the reinvestment of all distributions.
FTSE National Association of Real Estate Investment Trusts (NAREIT) Equity Real Estate Investment Trusts (REITs) Index is one index of a series of indices represented in the FTSE NAREIT U.S. Real Estate Index Series and is a free float adjusted market capitalization weighted index oftax-qualified REITs listed on the New York Stock Exchange (NYSE), American Stock Exchange and National Association of Securities Dealers Automated Questions (NASDAQ). Results include the reinvestment of all distributions.
ICE BofA Merrill Lynch U.S.3-Month Treasury Bill(T-Bill) Indexis an index comprised of a single issue purchased at the beginning of the month and held for a full month. At the end of the month that issue is sold and rolled into a newly selected issue. The issue selected at eachmonth-end rebalancing is the outstanding Treasury Bill that matures closest to, but not beyond, three months from the rebalancing date. To qualify for selection, an issue must have settled on or before themonth-end rebalancing date. Results include the reinvestment of all distributions.
J.P. Morgan Emerging Local Markets Index Plus (ELMI+)is a performance benchmark for emerging markets money market instruments and tracks total returns for local-currency-denominated money market instruments. The benchmark was introduced in June 1996 and consists of foreign exchange forward contracts laddered with maturities ranging from one to three months. Country weights are based on a trade-weighted allocation, with maximum weight of 10% for countries with convertible currencies and 2% for countries withnon-convertible currencies. Results include the reinvestment of all distributions.
J.P. Morgan Emerging Markets Bond Index (EMBI) Global Diversifiedtracks total returns of U.S. dollar-denominated debt instruments issued by emerging market sovereign and quasi-sovereign entities: Brady bonds, loans, Eurobonds. The diversified index limits the exposure of some of the larger countries. The performance of the index does not reflect the deduction of expenses associated with a fund, such as investment management fees. Results include the reinvestment of all distributions.
J.P. Morgan Government Bond Index-Emerging Markets(GBI-EM) Global Diversifiedtracks total returns of emerging markets local currency denominated fixed income instruments. The benchmark instruments of the index are regularly traded, fixed rate local sovereign bonds to which international investors can gain exposure. Country weights are based on a trade-weighted allocation, with maximum weight of 10% for countries. Results include the reinvestment of all distributions.
Morgan Stanley Capital International (MSCI) Emerging Markets Index (Net)is a free float-adjusted market capitalization index that is designed to measure equity market performance of large andmid-capitalization securities in emerging markets. As of March 31, 2019, the MSCI Emerging Markets Index (Net) consists of the following 24 emerging market country indices: Brazil, Chile, China, Colombia, Czech Republic, Egypt, Greece, Hungary, India, Indonesia, South Korea, Malaysia, Mexico, Pakistan, Peru, Philippines, Poland, Qatar, Russia, South Africa, Taiwan, Thailand, Turkey, and United Arab Emirates. The word “(Net)” in the index name means the net total return for the index, which includes the reinvestment of dividends after the deduction of withholding tax, applying the tax rate tonon-resident individuals who do not benefit from double taxation treaties.
A-23
PACIFIC FUNDS PERFORMANCE DISCUSSION (Continued)
MSCI Europe, Australasia and Far East (EAFE) Index (Net)is a free float-adjusted market capitalization index that is designed to measure the equity market performance of developed markets, excluding the U.S. & Canada. As of March 31, 2019, the MSCI EAFE Index (Net) consists of the following 21 developed market country indices: Australia, Austria, Belgium, Denmark, Finland, France, Germany, Hong Kong, Ireland, Israel, Italy, Japan, the Netherlands, New Zealand, Norway, Portugal, Singapore, Spain, Sweden, Switzerland, and the U.K. The word “(Net)” in the index name means the net total return for the index, which includes the reinvestment of dividends after the deduction of withholding tax, applying the tax rate tonon-resident individuals who do not benefit from double taxation treaties.
MSCI U.S. Real Estate Investment Trust (“REIT”) Index (Net)is a free float-adjusted market capitalization index that is comprised of equity REITs and represents approximately 99% of the U.S. REIT universe and securities that are classified in the Equity REITs Industry (under the Real Estate sector) according to the Global Industry Classification Standard (GICS). The index excludes mortgage REITs and selected specialized REITs. The word “(Net)” in the index name means the net total return for the index, which includes the reinvestment of dividends after the deduction of withholding tax, applying the tax rate tonon-resident individuals who do not benefit from double taxation treaties.
MSCI World Index (Net)is a free float-adjusted market capitalization weighted index that is designed to measure the equity market performance of developed markets. As of March 31, 2019, the MSCI World Index (Net) consists of the following 23 developed market country indices: Australia, Austria, Belgium, Canada, Denmark, Finland, France, Germany, Hong Kong, Ireland, Israel, Italy, Japan, Netherlands, New Zealand, Norway, Portugal, Singapore, Spain, Sweden, Switzerland, the U.K., and the U.S. The word “(Net)” in the index name means the net total return for the index, which includes the reinvestment of dividends after the deduction of withholding tax, applying the tax rate tonon-resident individuals who do not benefit from double taxation treaties.
Russell 1000 Growth Indexmeasures the performance of thelarge-cap growth segment of the U.S. equity universe. It includes those Russell 1000 Index companies with higherprice-to-book ratios and higher forecasted growth values. The Russell 1000 Growth Index is constructed to provide a comprehensive and unbiased barometer for thelarge-cap growth segment. The Index is completely reconstituted annually to ensure new and growing equities are included and that the represented companies continue to reflect growth characteristics. Results include the reinvestment of all distributions.
Russell 1000 Indexmeasures the performance of the large-capitalization segment of the U.S. equity universe. It is a subset of the Russell 3000 Index and includes approximately 1,000 of the largest securities based on a combination of their market capitalization and current index membership. The Russell 1000 Index represents approximately 92% of the investable U.S. equity market. It is constructed to provide a comprehensive and unbiased barometer for the large-capitalization and is completely reconstituted annually to ensure new and growing equities are reflected. Results include the reinvestment of all distributions.
Russell 1000 Value Indexmeasures the performance of thelarge-cap value segment of the U.S. equity universe. It includes those Russell 1000 Index companies with lowerprice-to-book ratios and lower expected growth values. The Russell 1000 Value Index is constructed to provide a comprehensive and unbiased barometer for thelarge-cap value segment. The Index is completely reconstituted annually to ensure new and growing equities are included and that the represented companies continue to reflect value characteristics. Results include the reinvestment of all distributions.
Russell 2000 Growth Indexmeasures the performance of thesmall-cap growth segment of the U.S. equity universe. It includes those Russell 2000 Index companies with higherprice-to-value ratios and higher forecasted growth values. The Russell 2000 Growth Index is constructed to provide a comprehensive and unbiased barometer for thesmall-cap growth segment. The Index is completely reconstituted annually to ensure larger stocks do not distort the performance and characteristics of the truesmall-cap opportunity set and that the represented companies continue to reflect growth characteristics. Results include the reinvestment of all distributions.
Russell 2000 Indexmeasures the performance of thesmall-cap segment of the U.S. equity universe. The Russell 2000 Index is a subset of the Russell 3000® Index representing approximately 10% of the total market capitalization of that index. It includes approximately 2,000 of the smallest securities based on a combination of their market cap and current index membership. The Russell 2000 Index is constructed to provide a comprehensive and unbiasedsmall-cap barometer and is completely reconstituted annually to ensure larger stocks do not distort the performance and characteristics of the truesmall-cap opportunity set. Results include the reinvestment of all distributions.
Russell 2000 Value Indexmeasures the performance of thesmall-cap value segment of the U.S. equity universe. It includes those Russell 2000 Index companies with lowerprice-to-book ratios and lower forecasted growth values. The Russell 2000 Value Index is constructed to provide a comprehensive and unbiased barometer for thesmall-cap value segment. The Index is completely reconstituted annually to ensure larger stocks do not distort the performance and characteristics of the truesmall-cap opportunity set and that the represented companies continue to reflect value characteristics. Results include the reinvestment of all distributions.
Russell 3000 Indexmeasures the performance of the largest 3.000 U.S. companies representing approximately 98% of the investable U.S. equity market. Results include the reinvestment of all distributions.
Russell Midcap Indexmeasures the performance of themid-cap segment of the U.S. equity universe. The Russell Midcap is a subset of the Russell 1000 Index. It includes approximately 800 of the smallest securities based on a combination of their market cap and current index membership. The Russell Midcap represents approximately 31% of the total market capitalization of the Russell 1000 companies. The Russell Midcap Index is constructed to provide a comprehensive and unbiased barometer for themid-cap segment. The Index is completely reconstituted annually to ensure larger stocks do not distort the performance and characteristics of the truemid-cap opportunity set. Results include the reinvestment of all distributions.
A-24
PACIFIC FUNDS PERFORMANCE DISCUSSION (Continued)
Russell Midcap Value Indexmeasures the performance of themid-cap value segment of the U.S. equity universe. It includes those Russell Midcap Index companies with lowerprice-to-book ratios and lower forecasted growth values. The Russell Midcap Value Index is constructed to provide a comprehensive and unbiased barometer of themid-cap value market. The Index is completely reconstituted annually to ensure larger stocks do not distort the performance and characteristics of the truemid-cap value market. Results include the reinvestment of all distributions.
S&P 500 Indexis a capitalization-weighted index of 500 stocks. The index is designed to measure performance of the broad domestic economy through changes in the aggregate market value of 500 stocks representing all major industries. Results include the reinvestment of all distributions.
S&P DevelopedEx-U.S. SmallCap Indexcomprises the stocks representing the lowest 15% of float-adjusted market cap in each developed country, excluding the U.S. It is a subset of the S&P Global BMI, a comprehensive, rules-based index measuring global stock market performance. Results include the reinvestment of all distributions.
A-25
PACIFIC FUNDSSM
PF INFLATION MANAGED FUND
Schedule of Investments
March 31, 2019
| | | | | | | | |
| | | Principal Amount | | | Value | |
CORPORATE BONDS & NOTES - 3.6% | |
|
Communications - 0.3% | |
| | |
AT&T Inc
3.376% (USD LIBOR + 0.750%)
due 06/01/21 § | | | $100,000 | | | | $100,451 | |
| | | | | | | | |
|
Energy - 0.9% | |
| | |
Petrobras Global Finance BV (Brazil)
5.999% due 01/27/28 | | | 180,000 | | | | 182,610 | |
7.375% due 01/17/27 | | | 180,000 | | | | 199,035 | |
| | | | | | | | |
| | | | 381,645 | |
| | | | | | | | |
Financial - 1.9% | |
| | |
Bank of America Corp
5.875% due 03/15/28 | | | 10,000 | | | | 10,161 | |
Royal Bank of Scotland Group PLC (United Kingdom)
7.500% due 08/10/20 | | | 200,000 | | | | 204,250 | |
The Goldman Sachs Group Inc
3.811% (USD LIBOR + 1.200%)
due 09/15/20 § | | | 100,000 | | | | 101,064 | |
UniCredit SPA (Italy)
7.830% due 12/04/23 ~ | | | 400,000 | | | | 445,804 | |
| | | | | | | | |
| | | | 761,279 | |
| | | | | | | | |
Industrial - 0.2% | |
| | |
General Electric Co
3.150% due 09/07/22 | | | 100,000 | | | | 99,730 | |
| | | | | | | | |
|
Utilities - 0.3% | |
| | |
Dominion Energy Gas Holdings LLC
3.211% (USD LIBOR + 0.600%)
due 06/15/21 § | | | 100,000 | | | | 99,991 | |
NextEra Energy Capital Holdings Inc
2.930% (USD LIBOR + 0.315%)
due 09/03/19 § | | | 20,000 | | | | 20,007 | |
| | | | | | | | |
| | | | 119,998 | |
| | | | | | | | |
Total Corporate Bonds & Notes
(Cost $1,393,843) | | | | 1,463,103 | |
| | | | | | | | |
|
MORTGAGE-BACKED SECURITIES - 15.1% | |
|
Collateralized Mortgage Obligation - Commercial - 0.3% | |
| | |
Latitude Management Real Estate Capital Inc
3.471% (USD LIBOR + 0.980%)
due 02/22/32 § ~ | | | 108,554 | | | | 108,203 | |
| | | | | | | | |
|
Collateralized Mortgage Obligations - Residential - 5.1% | |
| | |
Alternative Loan Trust
2.606% (USD LIBOR + 0.120%)
due 06/25/36 § | | | 138,773 | | | | 129,936 | |
6.000% due 03/25/37 | | | 174,772 | | | | 124,974 | |
Banc of America Mortgage Trust
4.206% due 07/25/35 § | | | 37,751 | | | | 35,037 | |
Chevy Chase Funding LLC Mortgage-Backed Certificates
2.846% (USD LIBOR + 0.360%)
due 03/25/35 § ~ | | | 141,384 | | | | 141,668 | |
Citigroup Mortgage Loan Trust
4.654% due 03/25/37 § | | | 102,304 | | | | 100,296 | |
Countrywide Home Loan Mortgage
Pass-Through Trust
4.366% due 01/19/34 § | | | 9,139 | | | | 9,313 | |
| | | | | | | | |
| | | Principal Amount | | | Value | |
Credit Suisse Mortgage Trust
2.636% (USD LIBOR + 0.150%)
due 09/29/36 § ~ | | | $302,000 | | | | $283,826 | |
Fannie Mae | | | | | | | | |
2.836% (USD LIBOR + 0.350%)
due 07/25/37 § | | | 21,508 | | | | 21,499 | |
2.866% (USD LIBOR + 0.380%)
due 07/25/37 § | | | 32,802 | | | | 32,830 | |
2.926% (USD LIBOR + 0.440%)
due 05/25/36 § | | | 15,806 | | | | 15,690 | |
2.931% (USD LIBOR + 0.445%)
due 02/25/37 § | | | 6,378 | | | | 6,393 | |
Government National Mortgage Association
2.888% (USD LIBOR + 0.400%)
due 02/20/49 § | | | 299,419 | | | | 298,969 | |
3.030% (USD LIBOR + 0.150%)
due 08/20/68 § | | | 100,798 | | | | 99,465 | |
GreenPoint Mortgage Funding Trust
2.666% (USD LIBOR + 0.180%)
due 09/25/46 § | | | 24,593 | | | | 23,032 | |
GSR Mortgage Loan Trust
4.521% due 09/25/35 § | | | 11,328 | | | | 11,586 | |
JP Morgan Alternative Loan Trust
2.946% (USD LIBOR + 0.460%)
due 03/25/36 § | | | 71,057 | | | | 68,548 | |
JP Morgan Mortgage Trust
4.252% due 06/25/35 § | | | 35,681 | | | | 35,556 | |
Merrill Lynch Mortgage Investors Trust
4.308% due 12/25/34 § | | | 43,399 | | | | 43,740 | |
Residential Accredit Loans Inc Trust
2.666% (USD LIBOR + 0.180%)
due 06/25/46 § | | | 91,021 | | | | 37,355 | |
Residential Asset Securitization Trust
6.500% due 09/25/36 | | | 193,638 | | | | 128,781 | |
Structured Adjustable Rate Mortgage Loan Trust
0.440% (USD LIBOR + 0.250%)
due 02/25/35 § | | | 14,051 | | | | 13,028 | |
Structured Asset Mortgage Investments II Trust
2.696% (USD LIBOR + 0.210%)
due 05/25/36 § | | | 69,537 | | | | 64,386 | |
Towd Point Mortgage Funding PLC (United Kingdom)
1.860% (GBP LIBOR + 1.025%)
due 10/20/51 § # ~ | | | GBP 250,000 | | | | 325,696 | |
WaMu Mortgage Pass-Through Certificates
2.856% (USD LIBOR + 0.370%)
due 01/25/45 § | | | $50,699 | | | | 50,709 | |
| | | | | | | | |
| | | | 2,102,313 | |
| | | | | | | | |
Fannie Mae - 9.7% | |
| | |
3.000% due 05/01/49 | | | 200,000 | | | | 198,961 | |
3.500% due 05/01/49 | | | 1,100,000 | | | | 1,114,523 | |
3.500% due 06/01/49 | | | 470,000 | | | | 475,875 | |
4.000% due 05/01/49 | | | 2,100,000 | | | | 2,158,570 | |
| | | | | | | | |
| | | | 3,947,929 | |
| | | | | | | | |
Total Mortgage-Backed Securities
(Cost $6,161,590) | | | | 6,158,445 | |
| | | | | | | | |
|
ASSET-BACKED SECURITIES - 6.8% | |
| | |
Asset Backed Funding Corp Trust
3.086% (USD LIBOR + 0.600%)
due 10/25/34 § | | | 21,723 | | | | 21,838 | |
B&M CLO Ltd (Cayman)
3.509% (USD LIBOR + 0.730%)
due 04/16/26 § ~ | | | 222,886 | | | | 222,212 | |
Countrywide Asset-Backed Certificates
2.626% (USD LIBOR + 0.140%)
due 07/25/37 § | | | 293,615 | | | | 266,119 | |
2.676% (USD LIBOR + 0.190%)
due 11/25/37 § | | | 153,368 | | | | 146,621 | |
2.686% (USD LIBOR + 0.200%)
due 09/25/37 § | | | 77,433 | | | | 64,663 | |
| | |
| See Notes to Financial Statements | | See explanation of symbols and terms, if any, on B-97 and B-98 |
B-1
PACIFIC FUNDS
PF INFLATION MANAGED FUND
Schedule of Investments (Continued)
March 31, 2019
| | | | | | | | |
| | | Principal Amount | | | Value | |
Credit-Based Asset Servicing & Securitization LLC
2.706% (USD LIBOR + 0.220%)
due 07/25/37 § ~ | | | $341,293 | | | | $230,285 | |
Crown Point CLO Ltd (Cayman)
3.713% (USD LIBOR + 0.940%)
due 07/17/28 § ~ | | | 200,000 | | | | 198,375 | |
Freddie Mac Structured Pass-Through Certificates
2.770% (USD LIBOR + 0.140%)
due 09/25/31 § | | | 875 | | | | 867 | |
Home Equity Asset Trust
3.341% (USD LIBOR + 0.855%)
due 08/25/34 § | | | 30,158 | | | | 29,929 | |
Home Equity Mortgage Loan Asset-Backed Trust
2.706% (USD LIBOR + 0.220%)
due 04/25/37 § | | | 93,255 | | | | 73,966 | |
Long Beach Mortgage Loan Trust
2.606% (USD LIBOR + 0.120%)
due 08/25/36 § | | | 87,207 | | | | 45,822 | |
Loomis Sayles CLO II Ltd (Cayman)
3.687% (USD LIBOR + 0.900%)
due 04/15/28 § ~ | | | 280,000 | | | | 277,009 | |
MidOcean Credit CLO IV (Cayman)
3.587% (USD LIBOR + 0.800%)
due 04/15/27 § ~ | | | 450,000 | | | | 448,613 | |
Option One Mortgage Loan Trust
2.626% (USD LIBOR + 0.140%)
due 01/25/37 § | | | 79,520 | | | | 59,621 | |
2.626% (USD LIBOR + 0.140%)
due 03/25/37 § | | | 100,412 | | | | 74,753 | |
Saxon Asset Securities Trust
2.796% (USD LIBOR + 0.310%)
due 09/25/47 § | | | 26,157 | | | | 25,338 | |
Soundview Home Loan Trust
2.686% (USD LIBOR + 0.200%)
due 06/25/37 § | | | 77,539 | | | | 57,595 | |
TICP CLO Ltd (Cayman)
3.601% (USD LIBOR + 0.840%)
due 04/20/28 § # ~ | | | 450,000 | | | | 445,972 | |
Venture CLO Ltd (Cayman)
3.650% (USD LIBOR + 1.150%)
due 10/22/31 § ~ | | | 100,000 | | | | 99,820 | |
| | | | | | | | |
| |
Total Asset-Backed Securities
(Cost $2,806,929) | | | | 2,789,418 | |
| | | | | | | | |
|
U.S. TREASURY OBLIGATIONS - 102.9% | |
|
U.S. Treasury Inflation Protected Securities - 102.9% | |
| | |
0.125% due 04/15/21 ^ | | | 318,612 | | | | 316,193 | |
0.125% due 04/15/22 ^ | | | 517,510 | | | | 512,356 | |
0.125% due 01/15/23 ^ | | | 350,051 | | | | 346,261 | |
0.125% due 07/15/24 ^ | | | 3,943,498 | | | | 3,896,839 | |
0.125% due 07/15/26 ^ | | | 126,013 | | | | 123,349 | |
0.250% due 01/15/25 ^ | | | 1,059,542 | | | | 1,049,029 | |
0.375% due 07/15/25 ^ | | | 1,388,350 | | | | 1,388,296 | |
0.375% due 01/15/27 ^ | | | 427,232 | | | | 423,747 | |
0.375% due 07/15/27 ^ | | | 3,405,990 | | | | 3,383,054 | |
0.500% due 01/15/28 ^ | | | 4,387,978 | | | | 4,381,676 | |
0.625% due 07/15/21 ^ | | | 1,956,651 | | | | 1,974,784 | |
0.625% due 04/15/23 ^ | | | 283,744 | | | | 285,868 | |
0.625% due 01/15/24 ^ | | | 1,311,797 | | | | 1,325,243 | |
0.625% due 01/15/26 ^ | | | 2,510,636 | | | | 2,540,843 | |
0.750% due 07/15/28 ^ | | | 902,493 | | | | 923,459 | |
0.750% due 02/15/42 ^ | | | 111,396 | | | | 108,714 | |
0.750% due 02/15/45 ^ | | | 117,581 | | | | 113,285 | |
0.875% due 01/15/29 ^ | | | 837,371 | | | | 865,117 | |
0.875% due 02/15/47 ^ | | | 45,881 | | | | 45,512 | |
1.000% due 02/15/46 ^ | | | 611,896 | | | | 625,170 | |
1.000% due 02/15/48 ^ | | | 1,285,112 | | | | 1,315,625 | |
1.125% due 01/15/21 ^ | | | 3,613,104 | | | | 3,660,377 | |
| | | | | | | | |
| | | Principal Amount | | | Value | |
1.375% due 02/15/44 ^ | | | $2,570,495 | | | | $2,846,769 | |
2.000% due 01/15/26 ^ | | | 4,327,133 | | | | 4,776,712 | |
2.125% due 02/15/40 ^ | | | 11,646 | | | | 14,557 | |
2.125% due 02/15/41 ^ | | | 298,849 | | | | 375,613 | |
2.375% due 01/15/25 ^ | | | 2,670,740 | | | | 2,967,779 | |
2.500% due 01/15/29 ^ | | | 689,365 | | | | 817,776 | |
3.375% due 04/15/32 ^ | | | 83,668 | | | | 112,883 | |
3.875% due 04/15/29 ^ | | | 470,066 | | | | 621,621 | |
| | | | | | | | |
| | | | 42,138,507 | |
| | | | | | | | |
Total U.S. Treasury Obligations
(Cost $41,615,212) | | | | 42,138,507 | |
| | | | | | | | |
|
FOREIGN GOVERNMENT BONDS & NOTES - 10.4% | |
| | |
Argentina Bonar (Argentina)
44.503% (ARS Deposit + 2.000%)
due 04/03/22 § | | | ARS 12,000 | | | | 269 | |
Argentina POM Politica Monetaria (Argentina)
66.312% (ARS Reference + 0.000%)
due 06/21/20 § | | | 710,000 | | | | 18,407 | |
Argentine Republic Government (Argentina)
6.875% due 01/26/27 | | | $230,000 | | | | 186,789 | |
Australia Government (Australia)
1.250% due 02/21/22 ^ ~ | | | AUD 962,289 | | | | 802,396 | |
Autonomous Community of Catalonia (Spain)
4.950% due 02/11/20 | | | EUR 100,000 | | | | 116,141 | |
French Republic Government OAT (France) | | | | | | | | |
0.250% due 07/25/24 ^ ~ | | | 520,780 | | | | 637,831 | |
1.850% due 07/25/27 ^ ~ | | | 109,607 | | | | 154,551 | |
2.100% due 07/25/23 ^ ~ | | | 225,564 | | | | 290,704 | |
2.250% due 07/25/20 ^ ~ | | | 375,345 | | | | 447,900 | |
Italy Buoni Poliennali Del Tesoro (Italy)
2.350% due 09/15/24 ^ ~ | | | 133,952 | | | | 161,779 | |
Mexican Bonos (Mexico)
7.750% due 05/29/31 | | | MXN 493,000 | | | | 24,568 | |
New Zealand Government (New Zealand)
2.000% due 09/20/25 ^ ~ | | | NZD 850,000 | | | | 678,174 | |
Peruvian Government International (Peru)
5.940% due 02/12/29 ~ | | | PEN 200,000 | | | | 63,537 | |
United Kingdom Gilt Inflation-Linked (United Kingdom) | | | | | | | | |
0.125% due 08/10/28 ^ ~ | | | GBP 395,261 | | | | 647,415 | |
0.125% due 11/22/65 ^ ~ | | | 9,780 | | | | 30,345 | |
| | | | | | | | |
| |
Total Foreign Government Bonds & Notes
(Cost $4,357,575) | | | | 4,260,806 | |
| | | | | | | | |
|
SHORT-TERM INVESTMENTS - 1.5% | |
|
Commercial Paper - 0.6% | |
| | |
Energy Transfer Partners LP
3.405% due 04/22/19 | | | $250,000 | | | | 249,496 | |
| | | | | | | | |
|
Foreign Government Issue - 0.0% | |
| | |
Argentina Treasury Bills (Argentina)
(32.642%) due 06/28/19 | | | ARS 50,000 | | | | 1,270 | |
| | | | | | | | |
| | |
| See Notes to Financial Statements | | See explanation of symbols and terms, if any, on B-97 and B-98 |
B-2
PACIFIC FUNDS
PF INFLATION MANAGED FUND
Schedule of Investments (Continued)
March 31, 2019
| | | | | | | | |
| | |
| | | Shares | | | Value | |
Money Market Fund - 0.9% | |
| | |
BlackRock Liquidity FundsT-Fund Portfolio
‘Institutional’ 2.370% | | | 376,230 | | | | $376,230 | |
| | | | | | | | |
| | |
Total Short-Term Investments
(Cost $627,052) | | | | | | | 626,996 | |
| | | | | | | | |
| | |
TOTAL INVESTMENTS - 140.3%
(Cost $56,962,201) | | | | | | | 57,437,275 | |
| | |
DERIVATIVES - (0.1%) | | | | | | | | |
(See Notes (c) through (g) in Notes to Schedule of Investments) | | | | (56,517 | ) |
| | | | | | | | |
| | |
OTHER ASSETS & LIABILITIES, NET - (40.2%) | | | | | | | (16,431,368 | ) |
| | | | | | | | |
| |
NET ASSETS - 100.0% | | | | $40,949,390 | |
| | | | | | | | |
Notes to Schedule of Investments
| (a) | As of March 31, 2019, the Fund’s composition as a percentage of net assets was as follows: |
| | | | |
U.S. Treasury Obligations | | | 102.9% | |
Mortgage-Backed Securities | | | 15.1% | |
Foreign Government Bonds & Notes | | | 10.4% | |
Asset-Backed Securities | | | 6.8% | |
Corporate Bonds & Notes | | | 3.6% | |
Others (each less than 3.0%) | | | 1.5% | |
| | | | |
| | | 140.3% | |
Derivatives | | | (0.1% | ) |
Other Assets & Liabilities, Net | | | (40.2% | ) |
| | | | |
| | | 100.0% | |
| | | | |
| (b) | The average amount of borrowings by the Fund on sale-buyback financing transactions during the year ended March 31, 2019 was $16,993,737 at a weighted average interest rate of 2.034%. |
| (c) | Open futures contracts outstanding as of March 31, 2019 were as follows: |
| | | | | | | | | | | | | | | | | | | | |
| Long Futures Outstanding | | Expiration
Month | | | Number of
Contracts | | | Notional
Amount | | | Value | | | Unrealized
Appreciation
(Depreciation) | |
Euro-Bobl | | | 06/19 | | | | 10 | | | | $1,480,840 | | | | $1,493,505 | | | | $12,665 | |
Euro-Bund | | | 06/19 | | | | 32 | | | | 5,877,302 | | | | 5,970,969 | | | | 93,667 | |
U.S. Treasury2-Year Notes | | | 06/19 | | | | 22 | | | | 4,673,172 | | | | 4,688,063 | | | | 14,891 | |
U.S. Treasury Long Bonds | | | 06/19 | | | | 7 | | | | 1,023,118 | | | | 1,047,594 | | | | 24,476 | |
| | | | | | | | | | | | | | | | | | | | |
| | | | | | | | | | | | | | | | | | | 145,699 | |
| | | | | | | | | | | | | | | | | | | | |
| | | | | |
Short Futures Outstanding | | | | | | | | | | | | | | | |
Australia3-Year Bonds | | | 06/19 | | | | 13 | | | | 904,657 | | | | 910,651 | | | | (5,994 | ) |
Euro-BTP | | | 06/19 | | | | 9 | | | | 1,283,257 | | | | 1,307,103 | | | | (23,846 | ) |
Euro-BUXL | | | 06/19 | | | | 5 | | | | 1,022,138 | | | | 1,074,978 | | | | (52,840 | ) |
Euro-OAT | | | 06/19 | | | | 17 | | | | 3,053,177 | | | | 3,102,091 | | | | (48,914 | ) |
Euro-Schatz | | | 06/19 | | | | 50 | | | | 6,267,682 | | | | 6,280,428 | | | | (12,746 | ) |
Long Gilt | | | 06/19 | | | | 8 | | | | 1,326,621 | | | | 1,347,990 | | | | (21,369 | ) |
U.S. Treasury5-Year Notes | | | 06/19 | | | | 19 | | | | 2,177,553 | | | | 2,200,734 | | | | (23,181 | ) |
U.S. Treasury10-Year Notes | | | 06/19 | | | | 18 | | | | 2,222,666 | | | | 2,235,938 | | | | (13,272 | ) |
U.S. Treasury Ultra10-Year Notes | | | 06/19 | | | | 28 | | | | 3,647,041 | | | | 3,717,875 | | | | (70,834 | ) |
| | | | | | | | | | | | | | | | | | | | |
| | | | | | | | | | | | | | | | | | | (272,996 | ) |
| | | | | | | | | | | | | | | | | | | | |
| | | | | |
Total Futures Contracts | | | | | | | | | | | | | | | | | | | ($127,297 | ) |
| | | | | | | | | | | | | | | | | | | | |
| (d) | Forward foreign currency contracts outstanding as of March 31, 2019 were as follows: |
| | | | | | | | | | | | | | | | | | | | | | | | | | | | | | | | | | | | | | | | |
Currency
Purchased | | | | | | Currency
Sold | | | | | | Settlement
Month | | | | Counterparty | | | | | Unrealized
Appreciation | | | | | | Unrealized
Depreciation | |
| ARS | | | 190,553 | | | | | | | USD | | | 4,050 | | | | | | | 07/19 | | | | GSC | | | | | | | $— | | | | | | | | ($210 | ) |
| AUD | | | 1,130,000 | | | | | | | USD | | | 800,986 | | | | | | | 04/19 | | | | GSC | | | | | | | 1,433 | | | | | | | | — | |
| CNH | | | 1,193,960 | | | | | | | USD | | | 173,000 | | | | | | | 04/19 | | | | JPM | | | | | | | 4,669 | | | | | | | | — | |
| COP | | | 937,438,500 | | | | | | | USD | | | 299,238 | | | | | | | 06/19 | | | | JPM | | | | | | | — | | | | | | | | (6,347 | ) |
| EUR | | | 1,866,000 | | | | | | | USD | | | 2,095,201 | | | | | | | 04/19 | | | | JPM | | | | | | | — | | | | | | | | (1,323 | ) |
| EUR | | | 77,000 | | | | | | | USD | | | 87,480 | | | | | | | 04/19 | | | | SCB | | | | | | | — | | | | | | | | (1,077 | ) |
| GBP | | | 63,000 | | | | | | | USD | | | 83,489 | | | | | | | 04/19 | | | | BRC | | | | | | | — | | | | | | | | (1,419 | ) |
| GBP | | | 547,000 | | | | | | | USD | | | 724,167 | | | | | | | 04/19 | | | | SCB | | | | | | | — | | | | | | | | (11,584 | ) |
| IDR | | | 4,260,022,700 | | | | | | | USD | | | 298,467 | | | | | | | 06/19 | | | | SCB | | | | | | | — | | | | | | | | (3,159 | ) |
| JPY | | | 69,800,000 | | | | | | | USD | | | 632,397 | | | | | | | 04/19 | | | | BRC | | | | | | | — | | | | | | | | (1,872 | ) |
| KRW | | | 98,517,060 | | | | | | | USD | | | 87,000 | | | | | | | 06/19 | | | | JPM | | | | | | | — | | | | | | | | (208 | ) |
| NZD | | | 916,000 | | | | | | | USD | | | 622,544 | | | | | | | 04/19 | | | | SCB | | | | | | | 1,295 | | | | | | | | — | |
| RUB | | | 20,899,395 | | | | | | | USD | | | 315,059 | | | | | | | 05/19 | | | | SCB | | | | | | | 1,235 | | | | | | | | — | |
| TWD | | | 2,980,131 | | | | | | | USD | | | 97,000 | | | | | | | 06/19 | | | | BRC | | | | | | | — | | | | | | | | (126 | ) |
| USD | | | 807,768 | | | | | | | AUD | | | 1,130,000 | | | | | | | 04/19 | | | | GSC | | | | | | | 5,350 | | | | | | | | — | |
| USD | | | 801,460 | | | | | | | AUD | | | 1,130,000 | | | | | | | 05/19 | | | | GSC | | | | | | | — | | | | | | | | (1,432 | ) |
| USD | | | 172,182 | | | | | | | CNH | | | 1,208,102 | | | | | | | 04/19 | | | | BRC | | | | | | | — | | | | | | | | (7,592 | ) |
| USD | | | 96,000 | | | | | | | COP | | | 300,580,320 | | | | | | | 06/19 | | | | RBS | | | | | | | 2,088 | | | | | | | | — | |
| USD | | | 1,122,272 | | | | | | | EUR | | | 992,000 | | | | | | | 04/19 | | | | BRC | | | | | | | 9,128 | | | | | | | | — | |
| USD | | | 1,085,539 | | | | | | | EUR | | | 951,000 | | | | | | | 04/19 | | | | JPM | | | | | | | 18,402 | | | | | | | | — | |
| USD | | | 2,100,683 | | | | | | | EUR | | | 1,866,000 | | | | | | | 05/19 | | | | JPM | | | | | | | 1,445 | | | | | | | | — | |
| USD | | | 810,372 | | | | | | | GBP | | | 610,000 | | | | | | | 04/19 | | | | UBS | | | | | | | 15,719 | | | | | | | | — | |
| USD | | | 725,264 | | | | | | | GBP | | | 547,000 | | | | | | | 05/19 | | | | SCB | | | | | | | 11,595 | | | | | | | | — | |
| USD | | | 94,000 | | | | | | | IDR | | | 1,355,726,280 | | | | | | | 06/19 | | | | RBS | | | | | | | 20 | | | | | | | | — | |
| | |
| See Notes to Financial Statements | | See explanation of symbols and terms, if any, on B-97 and B-98 |
B-3
PACIFIC FUNDS
PF INFLATION MANAGED FUND
Schedule of Investments (Continued)
March 31, 2019
| | | | | | | | | | | | | | | | | | | | | | | | | | | | | | | | | | | | | | |
Currency
Purchased | | | | | Currency
Sold | | | | | Settlement
Month | | | | | Counterparty | | | | | Unrealized
Appreciation | | | | | | Unrealized
Depreciation | |
| USD | | | 141,914 | | | | | JPY | | | 15,800,000 | | | | | | 04/19 | | | | | | BRC | | | | | | $— | | | | | | | | ($697 | ) |
| USD | | | 244,787 | | | | | JPY | | | 27,000,000 | | | | | | 04/19 | | | | | | BRC | | | | | | 1,085 | | | | | | | | — | |
| USD | | | 274,416 | | | | | KRW | | | 307,620,554 | | | | | | 06/19 | | | | | | GSC | | | | | | 3,406 | | | | | | | | — | |
| USD | | | 33,665 | | | | | MXN | | | 663,000 | | | | | | 06/19 | | | | | | BRC | | | | | | — | | | | | | | | (16 | ) |
| USD | | | 629,874 | | | | | NZD | | | 916,000 | | | | | | 04/19 | | | | | | SCB | | | | | | 6,035 | | | | | | | | — | |
| USD | | | 622,865 | | | | | NZD | | | 916,000 | | | | | | 05/19 | | | | | | SCB | | | | | | — | | | | | | | | (1,325 | ) |
| USD | | | 21,000 | | | | | PEN | | | 69,386 | | | | | | 04/19 | | | | | | BRC | | | | | | 108 | | | | | | | | — | |
| USD | | | 87,000 | | | | | RUB | | | 5,689,699 | | | | | | 04/19 | | | | | | RBS | | | | | | 522 | | | | | | | | — | |
| USD | | | 45,872 | | | | | RUB | | | 3,045,108 | | | | | | 05/19 | | | | | | GSC | | | | | | — | | | | | | | | (213 | ) |
| USD | | | 73,250 | | | | | SGD | | | 99,060 | | | | | | 06/19 | | | | | | BRC | | | | | | 44 | | | | | | | | — | |
| USD | | | 302,273 | | | | | TWD | | | 9,285,222 | | | | | | 06/19 | | | | | | SCB | | | | | | 442 | | | | | | | | — | |
| | | | | | | | | | | | | | | | | | | | | | | | | | | | | | | | | | | | | | |
| | | | | | | |
Total Forward Foreign Currency Contracts | | | | | | | | | | | | | | | $84,021 | | | | | | | | ($38,600 | ) |
| | | | | | | | | | | | | | | | | | | | | | | | | | | | | | | | | | | | | | |
| (e) | Purchased options outstanding as of March 31, 2019 were as follows: |
Interest Rate Swaptions
| | | | | | | | | | | | | | | | | | | | | | | | | | | | | | | | |
| Description | | Pay/Receive
Floating Rate | | | Floating Rate Index | | | Exercise
Rate | | | Expiration
Date | | | Counter-
party | | | Notional
Amount | | | Cost | | | Value | |
Call -2-Year Interest Rate Swap | | | Pay | | | | 3-Month USD-LIBOR | | | | 2.500% | | | | 02/20/20 | | | | MSC | | | | $4,000,000 | | | | $17,700 | | | | $30,278 | |
Call -2-Year Interest Rate Swap | | | Pay | | | | 3-MonthUSD-LIBOR | | | | 2.500% | | | | 02/21/20 | | | | MSC | | | | 4,000,000 | | | | 16,279 | | | | 30,334 | |
Call -2-Year Interest Rate Swap | | | Pay | | | | 3-MonthUSD-LIBOR | | | | 2.250% | | | | 03/26/20 | | | | MSC | | | | 3,800,000 | | | | 22,519 | | | | 19,971 | |
Call -2-Year Interest Rate Swap | | | Pay | | | | 3-MonthUSD-LIBOR | | | | 2.250% | | | | 03/27/20 | | | | MSC | | | | 1,600,000 | | | | 10,819 | | | | 8,432 | |
| | | | | | | | | | | | | | | | | | | | | | | | | | | | | | | | |
| | | | | | | | |
| | | | | | | | | | | | | | | | | | | | | | | | | | | $67,317 | | | | $89,015 | |
| | | | | | | | | | | | | | | | | | | | | | | | | | | | | | | | |
Options on Futures
| | | | | | | | | | | | | | | | | | | | | | | | | | | | |
| Description | | Exercise
Price | | | Expiration
Date | | | Exchange | | | Number of
Contracts | | | Notional
Amount | | | Cost | | | Value | |
Call - Euro-Schatz (05/19) | | | EUR 114.00 | | | | 05/24/19 | | | | EUX | | | | 66 | | | | EUR 7,524,000 | | | | $418 | | | | $370 | |
Call - U.S. Treasury5-Year Notes (06/19) | | | $123.00 | | | | 05/24/19 | | | | CME | | | | 2 | | | | $246,000 | | | | 17 | | | | 16 | |
Call - U.S. Treasury10-Year Notes (06/19) | | | 137.50 | | | | 05/24/19 | | | | CME | | | | 29 | | | | 3,987,500 | | | | 249 | | | | 453 | |
Call -Euro-BTP (05/19) | | | EUR 153.00 | | | | 05/24/19 | | | | EUX | | | | 11 | | | | EUR 1,683,000 | | | | 135 | | | | 123 | |
Call -Euro-OAT (05/19) | | | 173.00 | | | | 05/24/19 | | | | EUX | | | | 3 | | | | 519,000 | | | | 37 | | | | 34 | |
| | | | | | | | | | | | | | | | | | | | | | | | | | | | |
| | | | | | | | | | | | | | | | | | | | | | | 856 | | | | 996 | |
| | | | | | | | | | | | | | | | | | | | | | | | | | | | |
| | | | | | | |
Put - Euro-Bobl (05/19) | | | 126.00 | | | | 05/24/19 | | | | EUX | | | | 27 | | | | 3,402,000 | | | | 178 | | | | 151 | |
Put - Euro-Bobl (05/19) | | | 128.75 | | | | 05/24/19 | | | | EUX | | | | 3 | | | | 386,250 | | | | 20 | | | | 17 | |
Put - Euro-Bund (05/19) | | | 144.00 | | | | 05/24/19 | | | | EUX | | | | 24 | | | | 3,456,000 | | | | 287 | | | | 269 | |
Put - Euro-Bund (05/19) | | | 153.50 | | | | 05/24/19 | | | | EUX | | | | 7 | | | | 1,074,500 | | | | 86 | | | | 79 | |
| | | | | | | | | | | | | | | | | | | | | | | | | | | | |
| | | | | | | | | | | | | | | | | | | | | | | 571 | | | | 516 | |
| | | | | | | | | | | | | | | | | | | | | | | | | | | | |
| | | | | | | |
Total Options on Futures | | | | | | | | | | | | | | | | | | | | | | | $1,427 | | | | $1,512 | |
| | | | | | | | | | | | | | | | | | | | | | | | | | | | |
| | | | | | | |
Total Purchased Options | | | | | | | | | | | | | | | | | | | | | | | $68,744 | | | | $90,527 | |
| | | | | | | | | | | | | | | | | | | | | | | | | | | | |
| (f) | Premiums received and value of written options outstanding as of March 31, 2019 were as follows: |
Inflation Floor/Cap Options
| | | | | | | | | | | | | | | | | | | | | | | | | | |
| Description | | Initial
Index | | | Floating Rate | | Expiration
Date | | | Counter-
party | | | Notional
Amount | | | Premium | | | Value | |
Cap - U.S. CPI Urban Consumers | | | 233.92 | | | Maximum of [0, Final Index/
Initial Index - (1 + 4.000%)10] | | | 04/22/24 | | | | JPM | | | | $1,900,000 | | | | $13,823 | | | | ($178 | ) |
Cap - U.S. CPI Urban Consumers | | | 234.78 | | | Maximum of [0, Final Index/
Initial Index - (1 + 4.000%)10] | | | 05/16/24 | | | | JPM | | | | 200,000 | | | | 1,390 | | | | (2 | ) |
| | | | | | | | | | | | | | | | | | | | | | | | | | |
| | | | | | | | | | | | | | | | | | | | | 15,213 | | | | (180 | ) |
| | | | | | | | | | | | | | | | | | | | | | | | | | |
Floor - U.S. CPI Urban Consumers | | | 234.81 | | | Maximum of [0, 0.000% -
((Final Index/InitialIndex)-1)] | | | 03/24/20 | | | | JPM | | | | 700,000 | | | | 7,910 | | | | (1 | ) |
Floor - U.S. CPI Urban Consumers | | | 216.69 | | | Maximum of [0, (1 + 0.000%)10 -
Final Index/Initial Index] | | | 04/07/20 | | | | CIT | | | | 1,900,000 | | | | 16,840 | | | | — | |
Floor - U.S. CPI Urban Consumers | | | 217.97 | | | Maximum of [0, (1 + 0.000%)10- Final Index/Initial Index] | | | 09/29/20 | | | | CIT | | | | 300,000 | | | | 3,870 | | | | — | |
| | | | | | | | | | | | | | | | | | | | | | | | | | |
| | | | | | | | | | | | | | | | | | | | | 28,620 | | | | (1 | ) |
| | | | | | | | | | | | | | | | | | | | | | | | | | |
| | | | | | | |
Total Inflation Floor/Cap Options | | | | | | | | | | | | | | | | | | | | | $43,833 | | | | ($181 | ) |
| | | | | | | | | | | | | | | | | | | | | | | | | | |
| | |
| See Notes to Financial Statements | | See explanation of symbols and terms, if any, on B-97 and B-98 |
B-4
PACIFIC FUNDS
PF INFLATION MANAGED FUND
Schedule of Investments (Continued)
March 31, 2019
Interest Rate Floor Options
| | | | | | | | | | | | | | | | | | | | | | | | |
| Description | | Exercise Rate | | | Floating Rate Index | | Expiration
Date | | | Counter-
party | | Notional
Amount | | | Premium | | | Value | |
Floor - ICE Swap Rate | | | 0.000% | | | 2-Year/10-Year ICE Swap Rate | | | 01/02/20 | | | MSC | | | $700,000 | | | | $543 | | | | ($206 | ) |
| | | | | | | | | | | | | | | | | | | | | | | | |
Interest Rate Swaptions
| | | | | | | | | | | | | | | | | | | | | | | | | | | | | | | | |
| Description | | Pay/Receive
Floating Rate | | | Floating Rate Index | | | Exercise
Rate | | | Expiration
Date | | | Counter-
party | | | Notional
Amount | | | Premium | | | Value | |
Call -5-Year Interest Rate Swap | | | Receive | | | | 3-Month USD-LIBOR | | | | 2.521% | | | | 02/20/20 | | | | MSC | | | | $1,700,000 | | | | $17,586 | | | | ($29,948 | ) |
Call -5-Year Interest Rate Swap | | | Receive | | | | 3-MonthUSD-LIBOR | | | | 2.527% | | | | 02/21/20 | | | | MSC | | | | 1,700,000 | | | | 16,180 | | | | (30,297 | ) |
Call -5-Year Interest Rate Swap | | | Receive | | | | 3-MonthUSD-LIBOR | | | | 2.338% | | | | 03/26/20 | | | | MSC | | | | 800,000 | | | | 11,040 | | | | (10,502 | ) |
Call -5-Year Interest Rate Swap | | | Receive | | | | 3-MonthUSD-LIBOR | | | | 2.344% | | | | 03/26/20 | | | | MSC | | | | 800,000 | | | | 12,000 | | | | (10,631 | ) |
Call -5-Year Interest Rate Swap | | | Receive | | | | 3-MonthUSD-LIBOR | | | | 2.361% | | | | 03/27/20 | | | | MSC | | | | 600,000 | | | | 9,784 | | | | (8,269 | ) |
| | | | | | | | | | | | | | | | | | | | | | | | | | | | | | | | |
| | | | | | | | |
| | | | | | | | | | | | | | | | | | | | | | | | | | | $66,590 | | | | ($89,647 | ) |
| | | | | | | | | | | | | | | | | | | | | | | | | | | | | | | | |
Options on Futures
| | | | | | | | | | | | | | | | | | | | | | | | | | | | |
| Description | | Exercise
Price | | | Expiration
Date | | | Exchange | | | Number of
Contracts | | | Notional
Amount | | | Premium | | | Value | |
Call - U.S. Treasury10-Year Notes (05/19) | | | $125.00 | | | | 04/26/19 | | | | CME | | | | 3 | | | | $375,000 | | | | $980 | | | | ($750 | ) |
Call - Euro Bund (05/19) | | | EUR 166.00 | | | | 05/24/19 | | | | EUX | | | | 4 | | | | EUR 664,000 | | | | 2,112 | | | | (5,474 | )�� |
Call - Euro Bund (05/19) | | | 167.00 | | | | 05/24/19 | | | | EUX | | | | 1 | | | | 167,000 | | | | 632 | | | | (841 | ) |
| | | | | | | | | | | | | | | | | | | | | | | | | | | | |
| | | | | | | | | | | | | | | | | | | | | | | 3,724 | | | | (7,065 | ) |
| | | | | | | | | | | | | | | | | | | | | | | | | | | | |
| | | | | | | |
Put - Euro-Bund (05/19) | | | 162.50 | | | | 05/24/19 | | | | EUX | | | | 4 | | | | 650,000 | | | | 1,797 | | | | (538 | ) |
| | | | | | | | | | | | | | | | | | | | | | | | | | | | |
| | | | | | | |
Total Options on Futures | | | | | | | | | | | | | | | | | | | | | | | $5,521 | | | | ($7,603 | ) |
| | | | | | | | | | | | | | | | | | | | | | | | | | | | |
| | | | | | | |
Total Written Options | | | | | | | | | | | | | | | | | | | | | | | $116,487 | | | | ($97,637 | ) |
| | | | | | | | | | | | | | | | | | | | | | | | | | | | |
| (g) | Swap agreements outstanding as of March 31, 2019 were as follows: |
Credit Default Swaps on Corporate Issues – Sell Protection (1)
| | | | | | | | | | | | | | | | | | | | | | | | | | | | | | | | | | |
| Referenced Obligation | | Payment
Frequency | | | Fixed Deal
Receive Rate | | | Expiration
Date | | | Exchange | | Implied Credit
Spread at
03/31/19 (2) | | | Notional
Amount (3) | | | Value | | | Upfront
Premiums
Paid (Received) | | | Unrealized
Appreciation
(Depreciation) | |
Daimler AG | | | Q | | | | 1.000% | | | | 12/20/20 | | | ICE | | | 0.271% | | | | EUR 10,000 | | | | $160 | | | | $166 | | | | ($6 | ) |
| | | | | | | | | | | | | | | | | | | | | | | | | | | | | | | | | | |
Credit Default Swaps on Credit Indices – Buy Protection (4)
| | | | | | | | | | | | | | | | | | | | | | | | | | | | | | | | |
| Referenced Obligation | | Payment
Frequency | | | Fixed Deal
Pay Rate | | | Expiration
Date | | | Exchange | | | Notional
Amount (3) | | | Value (5) | | | Upfront
Premiums
Paid
(Received) | | | Unrealized
Appreciation
(Depreciation) | |
iTraxx Main 28 5Y | | | Q | | | | 1.000% | | | | 12/20/22 | | | | ICE | | | | EUR 40,000 | | | | ($1,111 | ) | | | ($1,207 | ) | | | $96 | |
CDX HY31 5Y | | | Q | | | | 5.000% | | | | 12/20/23 | | | | ICE | | | | $294,000 | | | | (19,731 | ) | | | (16,395 | ) | | | (3,336 | ) |
| | | | | | | | | | | | | | | | | | | | | | | | | | | | | | | | |
| | | | | | | | | | | | | | | | | | | | | | | ($20,842 | ) | | | ($17,602 | ) | | | ($3,240 | ) |
| | | | | | | | | | | | | | | | | | | | | | | | | | | | | | | | |
Credit Default Swaps on Credit Indices – Sell Protection (1)
| | | | | | | | | | | | | | | | | | | | | | | | | | | | | | | | |
| Referenced Obligation | | Payment
Frequency | | | Fixed Deal
Receive Rate | | | Expiration
Date | | | Counter-
party | | | Notional
Amount (3) | | | Value (5) | | | Upfront
Premiums
Paid
(Received) | | | Unrealized
Appreciation
(Depreciation) | |
CMBX NA AAA 7 | | | M | | | | 0.500% | | | | 01/17/47 | | | | DUB | | | | $60,000 | | | | $551 | | | | ($1,864 | ) | | | $2,415 | |
CMBX NA AAA 7 | | | M | | | | 0.500% | | | | 01/17/47 | | | | MSC | | | | 40,000 | | | | 367 | | | | (1,242 | ) | | | 1,609 | |
| | | | | | | | | | | | | | | | | | | | | | | | | | | | | | | | |
| | | | | | | | | | | | | | | | | | | | | | | $918 | | | | ($3,106 | ) | | | $4,024 | |
| | | | | | | | | | | | | | | | | | | | | | | | | | | | | | | | |
Credit Default Swaps on Sovereign Issues – Buy Protection (4)
| | | | | | | | | | | | | | | | | | | | | | | | | | | | | | | | | | | | |
| Referenced Obligation | | Payment
Frequency | | | Fixed Deal
Pay Rate | | | Expiration
Date | | | Counter-
party | | | Implied Credit
Spread at
03/31/19 (2) | | | Notional
Amount (3) | | | Value | | | Upfront
Premiums
Paid
(Received) | | | Unrealized Appreciation
(Depreciation) | |
Mexico Government | | | Q | | | | 1.000% | | | | 12/20/23 | | | | BRC | | | | 1.116% | | | | $300,000 | | | | $1,441 | | | | $2,693 | | | | ($1,252 | ) |
| | | | | | | | | | | | | | | | | | | | | | | | | | | | | | | | | | | | |
| | | | | | |
Total Credit Default Swaps | | | | | | | | | | | | | | | | ($18,323 | ) | | | ($17,849 | ) | | | ($474 | ) |
| | | | | | | | | | | | | | | | | | | | | | | | | | | | | | | | | | | | |
| | |
| See Notes to Financial Statements | | See explanation of symbols and terms, if any, on B-97 and B-98 |
B-5
PACIFIC FUNDS
PF INFLATION MANAGED FUND
Schedule of Investments (Continued)
March 31, 2019
| | (1) | If the Fund is a seller of protection and a credit event occurs, as defined under the terms of that particular swap agreement, the Fund will either (i) pay to the buyer of protection an amount equal to the notional amount of the swap and take delivery of the referenced obligation or underlying investments comprising the referenced index or (ii) pay a net settlement amount in the form of cash or investments equal to the notional amount of the swap less the recovery value of the referenced obligation or underlying investments comprising the referenced index. |
| | (2) | An implied credit spread is the spread in yield between a U.S. Treasury security and the referenced obligation or underlying investment that are identical in all respects except for the quality rating. Implied credit spreads, represented in absolute terms, utilized in determining the value of credit default swap agreements on corporate and sovereign issues as of year end serve as an indicator of the current status of the payment/performance risk and represent the likelihood of risk of default for the credit derivative. The implied credit spread of a particular referenced entity reflects the cost of buying/selling protection and may include upfront payments required to be made to enter into the agreement. Wider credit spreads, in comparison to narrower credit spreads, represent a deterioration of the referenced entity’s credit soundness and a greater likelihood of risk of default or other credit event occurring as defined under the terms of the agreement. A credit spread identified as “Defaulted” indicates a credit event has occurred for the referenced entity or obligation. |
| | (3) | The maximum potential amount the Fund could be required to pay as a seller of credit protection or receive as a buyer of credit protection if a credit event occurs as defined under the terms of that particular swap agreement. |
| | (4) | If the Fund is a buyer of protection and a credit event occurs, as defined under the terms of that particular swap agreement, the Fund will either (i) receive from the seller of protection an amount equal to the notional amount of the swap and deliver the referenced obligation or underlying investments comprising the referenced index or (ii) receive a net settlement amount in the form of cash or investments equal to the notional amount of the swap less the recovery value of the referenced obligation or underlying investments comprising the referenced index. |
| | (5) | The quoted market prices and resulting values for credit default swap agreements on credit indices serve as an indicator of the current status of the payment/performance risk and represent the expected amount paid or received for the credit derivative had the notional amount of the swap agreement been closed/sold as of year end. Increasing values (buy protection) or decreasing values (sell protection), when compared to the notional amount of the swap, represent a deterioration of the referenced entity’s credit soundness and a greater likelihood of risk of default or other credit event occurring as defined under the terms of the agreement. |
Interest Rate Swaps – Long
| | | | | | | | | | | | | | | | | | | | | | | | | | | | | | | | |
| Receive | | Pay | | | Payment
Frequency
Receive Rate/
Pay Rate | | | Counterparty | | | Expiration
Date | | | Notional
Amount | | | Value | | | Upfront
Premiums
Paid
(Received) | | | Unrealized
Appreciation
(Depreciation) | |
1.788% | | | U.S. CPI Urban Consumers | | | | Z / Z | | | | MSC | | | | 07/18/26 | | | | $100,000 | | | | ($2,390 | ) | | | $— | | | | ($2,390 | ) |
1.805% | | | U.S. CPI Urban Consumers | | | | Z / Z | | | | MSC | | | | 09/20/26 | | | | 10,000 | | | | (214 | ) | | | — | | | | (214 | ) |
| | | | | | | | | | | | | | | | | | | | | | | | | | | | | | | | |
| | | | | | | | | | | | | | | | | | | | | | | (2,604 | ) | | | — | | | | (2,604 | ) |
| | | | | | | | | | | | | | | | | | | | | | | | | | | | | | | | |
| | | | | | | | |
| | | | | | | | | Exchange | | | | | | | | | | | | | | | | |
1.535% | | | Eurostat Eurozone HICP | | | | Z / Z | | | | LCH | | | | 06/15/23 | | | | EUR 700,000 | | | | 19,074 | | | | 56 | | | | 19,018 | |
2.500% | | | 3-MonthUSD-LIBOR | | | | S / Q | | | | CME | | | | 12/19/23 | | | | $120,000 | | | | 1,094 | | | | (305 | ) | | | 1,399 | |
2.750% | | | 3-MonthUSD-LIBOR | | | | S / Q | | | | LCH | | | | 12/19/23 | | | | 400,000 | | | | 8,217 | | | | (2,706 | ) | | | 10,923 | |
1.168% | | | Eurostat Eurozone HICP | | | | Z / Z | | | | LCH | | | | 03/15/24 | | | | EUR 1,200,000 | | | | 12,058 | | | | 1,105 | | | | 10,953 | |
1.800% | | | U.S. CPI Urban Consumers | | | | Z / Z | | | | LCH | | | | 09/12/26 | | | | $100,000 | | | | (2,106 | ) | | | (1,009 | ) | | | (1,097 | ) |
1.780% | | | U.S. CPI Urban Consumers | | | | Z / Z | | | | LCH | | | | 09/15/26 | | | | 100,000 | | | | (2,334 | ) | | | (4,854 | ) | | | 2,520 | |
1.385% | | | Eurostat Eurozone HICP | | | | Z / Z | | | | LCH | | | | 12/15/26 | | | | EUR 290,000 | | | | 6,516 | | | | (4,074 | ) | | | 10,590 | |
1.360% | | | Eurostat Eurozone HICP | | | | Z / Z | | | | LCH | | | | 06/15/27 | | | | 30,000 | | | | 706 | | | | (442 | ) | | | 1,148 | |
2.180% | | | U.S. CPI Urban Consumers | | | | Z / Z | | | | LCH | | | | 09/20/27 | | | | $20,000 | | | | 219 | | | | — | | | | 219 | |
2.335% | | | U.S. CPI Urban Consumers | | | | Z / Z | | | | LCH | | | | 02/05/28 | | | | 960,000 | | | | 29,835 | | | | 1,470 | | | | 28,365 | |
1.535% | | | Eurostat Eurozone HICP | | | | Z / Z | | | | LCH | | | | 03/15/28 | | | | EUR 40,000 | | | | 1,809 | | | | — | | | | 1,809 | |
2.353% | | | U.S. CPI Urban Consumers | | | | Z / Z | | | | LCH | | | | 05/09/28 | | | | $120,000 | | | | 4,190 | | | | — | | | | 4,190 | |
2.360% | | | U.S. CPI Urban Consumers | | | | Z / Z | | | | LCH | | | | 05/09/28 | | | | 180,000 | | | | 6,423 | | | | — | | | | 6,423 | |
2.364% | | | U.S. CPI Urban Consumers | | | | Z / Z | | | | LCH | | | | 05/10/28 | | | | 180,000 | | | | 6,481 | | | | — | | | | 6,481 | |
1.620% | | | Eurostat Eurozone HICP | | | | Z / Z | | | | LCH | | | | 05/15/28 | | | | EUR 340,000 | | | | 18,411 | | | | 21 | | | | 18,390 | |
2.379% | | | U.S. CPI Urban Consumers | | | | Z / Z | | | | LCH | | | | 07/09/28 | | | | $500,000 | | | | 18,182 | | | | (288 | ) | | | 18,470 | |
3.593% | | | GBP Retail Price | | | | Z / Z | | | | LCH | | | | 11/15/28 | | | | GBP 120,000 | | | | 3,035 | | | | — | | | | 3,035 | |
3.595% | | | GBP Retail Price | | | | Z / Z | | | | LCH | | | | 11/15/28 | | | | 60,000 | | | | 1,542 | | | | — | | | | 1,542 | |
3.190% | | | GBP Retail Price | | | | Z / Z | | | | LCH | | | | 04/15/30 | | | | 300,000 | | | | (7,146 | ) | | | (16,949 | ) | | | 9,803 | |
3.400% | | | GBP Retail Price | | | | Z / Z | | | | LCH | | | | 06/15/30 | | | | 200,000 | | | | 3,992 | | | | 2,391 | | | | 1,601 | |
3.530% | | | GBP Retail Price | | | | Z / Z | | | | LCH | | | | 10/15/31 | | | | 50,000 | | | | 669 | | | | 477 | | | | 192 | |
3.500% | | | GBP Retail Price | | | | Z / Z | | | | LCH | | | | 09/15/33 | | | | 60,000 | | | | (4 | ) | | | 47 | | | | (51 | ) |
3.579% | | | GBP Retail Price | | | | Z / Z | | | | LCH | | | | 10/15/33 | | | | 170,000 | | | | 4,808 | | | | — | | | | 4,808 | |
1.796% | | | Eurostat Eurozone HICP | | | | Z / Z | | | | LCH | | | | 11/15/38 | | | | EUR 100,000 | | | | 9,371 | | | | 6 | | | | 9,365 | |
1.808% | | | Eurostat Eurozone HICP | | | | Z / Z | | | | LCH | | | | 11/15/38 | | | | 100,000 | | | | 9,670 | | | | — | | | | 9,670 | |
1.945% | | | Eurostat Eurozone HICP | | | | Z / Z | | | | LCH | | | | 11/15/48 | | | | 20,000 | | | | 3,000 | | | | — | | | | 3,000 | |
| | | | | | | | | | | | | | | | | | | | | | | | | | | | | | | | |
| | | | | | | | | | | | | | | | | | | | | | | 157,712 | | | | (25,054 | ) | | | 182,766 | |
| | | | | | | | | | | | | | | | | | | | | | | | | | | | | | | | |
| | | | | | |
Total Interest Rate Swaps – Long | | | | | | | | | | | | | | | | $155,108 | | | | ($25,054 | ) | | | $180,162 | |
| | | | | | | | | | | | | | | | | | | | | | | | | | | | | | | | |
| | |
| See Notes to Financial Statements | | See explanation of symbols and terms, if any, on B-97 and B-98 |
B-6
PACIFIC FUNDS
PF INFLATION MANAGED FUND
Schedule of Investments (Continued)
March 31, 2019
Interest Rate Swaps – Short
| | | | | | | | | | | | | | | | | | | | | | | | | | | | |
| Pay | | Receive | | Payment
Frequency
Pay Rate/
Receive Rate | | Exchange | | | Expiration
Date | | | Notional
Amount | | | Value | | | Upfront
Premiums
Paid
(Received) | | | Unrealized
Appreciation
(Depreciation) | |
1.160% | | France CPI Ex Tobacco | | Z / Z | | | LCH | | | | 08/15/20 | | | | EUR 80,000 | | | | ($716 | ) | | | $57 | | | | ($773 | ) |
2.027% | | U.S. CPI Urban Consumers | | Z / Z | | | LCH | | | | 11/23/20 | | | | $100,000 | | | | (225 | ) | | | — | | | | (225 | ) |
2.021% | | U.S. CPI Urban Consumers | | Z / Z | | | LCH | | | | 11/25/20 | | | | 100,000 | | | | (211 | ) | | | — | | | | (211 | ) |
1.875% | | U.S. CPI Urban Consumers | | Z / Z | | | LCH | | | | 03/14/21 | | | | 3,400,000 | | | | (754 | ) | | | — | | | | (754 | ) |
2.210% | | U.S. CPI Urban Consumers | | Z / Z | | | LCH | | | | 02/05/23 | | | | 120,000 | | | | (1,926 | ) | | | — | | | | (1,926 | ) |
2.263% | | U.S. CPI Urban Consumers | | Z / Z | | | LCH | | | | 04/27/23 | | | | 60,000 | | | | (1,331 | ) | | | — | | | | (1,331 | ) |
2.263% | | U.S. CPI Urban Consumers | | Z / Z | | | LCH | | | | 05/09/23 | | | | 120,000 | | | | (2,599 | ) | | | — | | | | (2,599 | ) |
2.281% | | U.S. CPI Urban Consumers | | Z / Z | | | LCH | | | | 05/10/23 | | | | 180,000 | | | | (4,052 | ) | | | — | | | | (4,052 | ) |
1.030% | | France CPI Ex Tobacco | | Z / Z | | | LCH | | | | 03/15/24 | | | | EUR 1,200,000 | | | | (6,041 | ) | | | (265 | ) | | | (5,776 | ) |
2.000% | | 3-MonthUSD-LIBOR | | S / Q | | | CME | | | | 07/27/26 | | | | $400,000 | | | | 6,146 | | | | 5,823 | | | | 323 | |
2.400% | | 3-MonthUSD-LIBOR | | S / Q | | | CME | | | | 12/07/26 | | | | 400,000 | | | | (504 | ) | | | — | | | | (504 | ) |
1.750% | | 3-MonthUSD-LIBOR | | S / Q | | | LCH | | | | 12/21/26 | | | | 340,000 | | | | 14,459 | | | | (2,170 | ) | | | 16,629 | |
3.250% | | 3-MonthNZD-Bank Bills | | S / Q | | | CME | | | | 03/21/28 | | | | NZD 100,000 | | | | (6,518 | ) | | | 307 | | | | (6,825 | ) |
3.100% | | 3-MonthUSD-LIBOR | | S / Q | | | CME | | | | 04/17/28 | | | | $1,590,000 | | | | (41,496 | ) | | | (4,824 | ) | | | (36,672 | ) |
2.765% | | 3-MonthUSD-LIBOR | | S / Q | | | CME | | | | 07/18/28 | | | | 150,000 | | | | (4,456 | ) | | | — | | | | (4,456 | ) |
3.134% | | 3-MonthUSD-LIBOR | | S / Q | | | CME | | | | 09/13/28 | | | | 1,500,000 | | | | (38,615 | ) | | | — | | | | (38,615 | ) |
3.428% | | GBP Retail Price | | Z / Z | | | LCH | | | | 03/15/47 | | | | GBP 30,000 | | | | 1,311 | | | | 1,776 | | | | (465 | ) |
2.000% | | U.S. Fed Funds | | A / A | | | LCH | | | | 12/15/47 | | | | $40,000 | | | | 2,534 | | | | (72 | ) | | | 2,606 | |
2.500% | | 3-MonthUSD-LIBOR | | S / Q | | | CME | | | | 06/20/48 | | | | 140,000 | | | | 3,558 | | | | 16,766 | | | | (13,208 | ) |
2.948% | | 3-MonthUSD-LIBOR | | S / Q | | | CME | | | | 10/19/48 | | | | 10,000 | | | | (698 | ) | | | — | | | | (698 | ) |
2.750% | | 3-MonthUSD-LIBOR | | S / Q | | | CME | | | | 12/19/48 | | | | 30,000 | | | | (837 | ) | | | 508 | | | | (1,345 | ) |
3.000% | | 3-MonthUSD-LIBOR | | S / Q | | | CME | | | | 12/19/48 | | | | 300,000 | | | | (24,435 | ) | | | 17,921 | | | | (42,356 | ) |
1.500% | | 6-Month GBP LIBOR | | S / S | | | LCH | | | | 09/18/49 | | | | GBP 70,000 | | | | (2,863 | ) | | | 1,123 | | | | (3,986 | ) |
| | | | | | | | | | | | | | | | | | | | | | | | | | | | |
| | | | | | |
| | | | | | | | | | | | | | | ($110,269 | ) | | | $36,950 | | | | ($147,219 | ) |
| | | | | | | | | | | | | | | | | | | | | | | | | | | | |
| | | | | | |
Total Interest Rate Swaps | | | | | | | | | | | | | | | $44,839 | | | | $11,896 | | | | $32,943 | |
| | | | | | | | | | | | | | | | | | | | | | | | | | | | |
| | | | | | |
Total Swap Agreements | | | | | | | | | | | | | | | $26,516 | | | | ($5,953 | ) | | | $32,469 | |
| | | | | | | | | | | | | | | | | | | | | | | | | | | | |
Balances reported in the Statement of Assets and Liabilities for Over the Counter (OTC) Swaps and Centrally Cleared Swaps
| | | | | | | | |
| | | Upfront
Premium
Paid
(Received) | | | Unrealized Appreciation
(Deprecation) | |
OTC Swap Agreements | | | | | | | | |
Assets | | | $2,693 | | | | $4,024 | |
Liabilities | | | (3,106 | ) | | | (3,856 | ) |
Centrally Cleared Swap Agreements (6) | | | | | | | | |
Assets | | | 50,020 | | | | 203,568 | |
Liabilities | | | (55,560 | ) | | | (171,267 | ) |
| | | | | | | | |
| | | ($5,953 | ) | | | $32,469 | |
| | | | | | | | |
| | (6) | Includes cumulative value on centrally cleared swaps, as reported in the Schedule of Investments. Only current day’s variation margin is reported within the Statement of Assets and Liabilities. |
| | |
| See Notes to Financial Statements | | See explanation of symbols and terms, if any, on B-97 and B-98 |
B-7
PACIFIC FUNDS
PF INFLATION MANAGED FUND
Schedule of Investments (Continued)
March 31, 2019
| (h) | Fair Value Measurements |
The following is a summary of the Fund’s investments as categorized under the three-tier hierarchy of inputs used in valuing the Fund’s assets and liabilities (See Note 3D in Notes to Financial Statements) as of March 31, 2019:
| | | | | | | | | | | | | | | | | | |
| | | | | Total Value at
March 31, 2019 | | | Level 1
Quoted Price | | | Level 2
Significant
Observable Inputs | | | Level 3
Significant
Unobservable Inputs | |
Assets | | Corporate Bonds & Notes | | | $1,463,103 | | | | $— | | | | $1,463,103 | | | | $— | |
| | Mortgage-Backed Securities | | | 6,158,445 | | | | — | | | | 6,158,445 | | | | — | |
| | Asset-Backed Securities | | | 2,789,418 | | | | — | | | | 2,789,418 | | | | — | |
| | U.S. Treasury Obligations | | | 42,138,507 | | | | — | | | | 42,138,507 | | | | — | |
| | Foreign Government Bonds & Notes | | | 4,260,806 | | | | — | | | | 4,260,806 | | | | — | |
| | Short-Term Investments | | | 626,996 | | | | 376,230 | | | | 250,766 | | | | — | |
| | Derivatives: | | | | | | | | | | | | | | | | |
| | Credit Contracts | | | | | | | | | | | | | | | | |
| | Swaps | | | 4,120 | | | | — | | | | 4,120 | | | | — | |
| | Foreign Currency Contracts | | | | | | | | | | | | | | | | |
| | Forward Foreign Currency Contracts | | | 84,021 | | | | — | | | | 84,021 | | | | — | |
| | Interest Rate Contracts | | | | | | | | | | | | | | | | |
| | Futures | | | 145,699 | | | | 145,699 | | | | — | | | | — | |
| | Purchased Options | | | 90,527 | | | | — | | | | 90,527 | | | | — | |
| | Swaps | | | 203,472 | | | | — | | | | 203,472 | | | | — | |
| | | | | | | | | | | | | | | | | | |
| | Total Interest Rate Contracts | | | 439,698 | | | | 145,699 | | | | 293,999 | | | | — | |
| | | | | | | | | | | | | | | | | | |
| | Total Assets - Derivatives | | | 527,839 | | | | 145,699 | | | | 382,140 | | | | — | |
| | | | | | | | | | | | | | | | | | |
| | Total Assets | | | 57,965,114 | | | | 521,929 | | | | 57,443,185 | | | | — | |
| | | | | | | | | | | | | | | | | | |
| | | | | |
Liabilities | | Sale-buyback Financing Transactions | | | (21,850,850 | ) | | | — | | | | (21,850,850 | ) | | | — | |
| | Derivatives: | | | | | | | | | | | | | | | | |
| | Credit Contracts | | | | | | | | | | | | | | | | |
| | Swaps | | | (4,594 | ) | | | — | | | | (4,594 | ) | | | — | |
| | Foreign Currency Contracts | | | | | | | | | | | | | | | | |
| | Forward Foreign Currency Contracts | | | (38,600 | ) | | | — | | | | (38,600 | ) | | | — | |
| | Interest Rate Contracts | | | | | | | | | | | | | | | | |
| | Futures | | | (272,996 | ) | | | (272,996 | ) | | | — | | | | — | |
| | Written Options | | | (97,637 | ) | | | — | | | | (97,637 | ) | | | — | |
| | Swaps | | | (170,529 | ) | | | — | | | | (170,529 | ) | | | — | |
| | | | | | | | | | | | | | | | | | |
| | Total Interest Rate Contracts | | | (541,162 | ) | | | (272,996 | ) | | | (268,166 | ) | | | — | |
| | | | | | | | | | | | | | | | | | |
| | Total Liabilities - Derivatives | | | (584,356 | ) | | | (272,996 | ) | | | (311,360 | ) | | | — | |
| | | | | | | | | | | | | | | | | | |
| | Total Liabilities | | | (22,435,206 | ) | | | (272,996 | ) | | | (22,162,210 | ) | | | — | |
| | | | | | | | | | | | | | | | | | |
| | Total | | | $35,529,908 | | | | $248,933 | | | | $35,280,975 | | | | $— | |
| | | | | | | | | | | | | | | | | | |
| | |
| See Notes to Financial Statements | | See explanation of symbols and terms, if any, on B-97 and B-98 |
B-8
PACIFIC FUNDS
PF MANAGED BOND FUND
Schedule of Investments
March 31, 2019
| | | | | | | | |
| | | Principal Amount | | | Value | |
CORPORATE BONDS & NOTES - 48.2% | |
|
Basic Materials - 1.0% | |
| | |
Anglo American Capital PLC (South Africa)
3.625% due 09/11/24 ~ | | | $250,000 | | | | $248,020 | |
ArcelorMittal (Luxembourg) | |
4.550% due 03/11/26 | | | 10,000 | | | | 10,234 | |
7.000% due 10/15/39 | | | 80,000 | | | | 91,354 | |
Barrick Gold Corp (Canada)
5.250% due 04/01/42 | | | 30,000 | | | | 32,495 | |
Barrick North America Finance LLC (Canada)
5.700% due 05/30/41 | | | 90,000 | | | | 103,160 | |
BHP Billiton Finance USA Ltd (Australia) | |
2.875% due 02/24/22 | | | 15,000 | | | | 15,159 | |
6.750% due 10/19/75 ~ | | | 270,000 | | | | 299,302 | |
Braskem Finance Ltd (Brazil)
5.750% due 04/15/21 ~ | | | 400,000 | | | | 416,200 | |
Freeport-McMoRan Inc | |
3.550% due 03/01/22 | | | 170,000 | | | | 168,512 | |
4.000% due 11/14/21 | | | 20,000 | | | | 20,175 | |
Glencore Funding LLC (Switzerland) | |
2.875% due 04/16/20 ~ | | | 60,000 | | | | 59,782 | |
3.875% due 10/27/27 ~ | | | 30,000 | | | | 28,840 | |
4.000% due 03/27/27 ~ | | | 260,000 | | | | 252,762 | |
4.125% due 03/12/24 ~ | | | 170,000 | | | | 171,979 | |
Indonesia Asahan Aluminium Persero PT (Indonesia)
6.530% due 11/15/28 ~ | | | 700,000 | | | | 800,458 | |
Newcrest Finance Pty Ltd (Australia)
4.450% due 11/15/21 ~ | | | 500,000 | | | | 513,021 | |
Nutrien Ltd (Canada)
4.875% due 03/30/20 | | | 40,000 | | | | 40,801 | |
Resolute Forest Products Inc
5.875% due 05/15/23 | | | 100,000 | | | | 100,125 | |
SASOL Financing USA LLC (South Africa)
5.875% due 03/27/24 | | | 500,000 | | | | 530,816 | |
Southern Copper Corp (Peru)
6.750% due 04/16/40 | | | 360,000 | | | | 433,530 | |
Syngenta Finance NV (Switzerland)
3.698% due 04/24/20 ~ | | | 600,000 | | | | 602,304 | |
Vale Overseas Ltd (Brazil)
6.875% due 11/21/36 | | | 48,000 | | | | 55,080 | |
Yamana Gold Inc (Brazil)
4.625% due 12/15/27 | | | 90,000 | | | | 88,213 | |
| | | | | | | | |
| | | | | | | 5,082,322 | |
| | | | | | | | |
Communications - 4.8% | |
| | |
Altice Financing SA (Luxembourg)
5.250% due 02/15/23 ~ | | | EUR 300,000 | | | | 346,259 | |
Altice France SA (France) | |
6.250% due 05/15/24 ~ | | | $800,000 | | | | 809,000 | |
7.375% due 05/01/26 ~ | | | 200,000 | | | | 196,500 | |
Amazon.com Inc | |
3.875% due 08/22/37 | | | 70,000 | | | | 73,221 | |
4.050% due 08/22/47 | | | 80,000 | | | | 84,737 | |
4.950% due 12/05/44 | | | 120,000 | | | | 143,854 | |
AT&T Inc | |
3.000% due 02/15/22 | | | 30,000 | | | | 30,141 | |
3.400% due 05/15/25 | | | 50,000 | | | | 49,555 | |
3.800% due 03/15/22 | | | 800,000 | | | | 821,325 | |
4.350% due 06/15/45 | | | 340,000 | | | | 313,072 | |
British Telecommunications PLC (United Kingdom)
9.625% due 12/15/30 | | | 30,000 | | | | 42,948 | |
CCO Holdings LLC
5.125% due 05/01/27 ~ | | | 180,000 | | | | 181,575 | |
Charter Communications Operating LLC | |
3.579% due 07/23/20 | | | 2,060,000 | | | | 2,075,553 | |
4.200% due 03/15/28 | | | 60,000 | | | | 59,648 | |
| | | | | | | | |
| | | Principal Amount | | | Value | |
4.464% due 07/23/22 | | $ | 1,000,000 | | | $ | 1,035,381 | |
5.050% due 03/30/29 | | | 200,000 | | | | 210,986 | |
5.375% due 04/01/38 | | | 20,000 | | | | 20,165 | |
5.750% due 04/01/48 | | | 10,000 | | | | 10,484 | |
6.384% due 10/23/35 | | | 50,000 | | | | 55,923 | |
6.834% due 10/23/55 | | | 30,000 | | | | 34,072 | |
Comcast Cable Communications Holdings Inc
9.455% due 11/15/22 | | | 400,000 | | | | 491,726 | |
Comcast Corp | |
3.375% due 08/15/25 | | | 150,000 | | | | 152,201 | |
3.700% due 04/15/24 | | | 1,000,000 | | | | 1,033,831 | |
3.950% due 10/15/25 | | | 200,000 | | | | 209,441 | |
3.999% due 11/01/49 | | | 51,000 | | | | 49,803 | |
4.150% due 10/15/28 | | | 430,000 | | | | 453,749 | |
4.250% due 10/15/30 | | | 120,000 | | | | 127,743 | |
4.700% due 10/15/48 | | | 30,000 | | | | 32,721 | |
5.650% due 06/15/35 | | | 20,000 | | | | 23,562 | |
Deutsche Telekom International Finance BV (Germany)
2.820% due 01/19/22 ~ | | | 1,500,000 | | | | 1,496,641 | |
DISH DBS Corp
5.875% due 11/15/24 | | | 200,000 | | | | 168,750 | |
eBay Inc | |
2.750% due 01/30/23 | | | 500,000 | | | | 494,293 | |
3.800% due 03/09/22 | | | 800,000 | | | | 817,866 | |
Fox Corp | |
4.030% due 01/25/24 ~ | | | 50,000 | | | | 51,913 | |
4.709% due 01/25/29 ~ | | | 80,000 | | | | 85,728 | |
5.476% due 01/25/39 ~ | | | 70,000 | | | | 77,770 | |
5.576% due 01/25/49 ~ | | | 30,000 | | | | 33,999 | |
NBCUniversal Media LLC
4.375% due 04/01/21 | | | 130,000 | | | | 134,232 | |
Netflix Inc
5.375% due 02/01/21 | | | 20,000 | | | | 20,819 | |
Sprint Capital Corp
8.750% due 03/15/32 | | | 160,000 | | | | 169,216 | |
Sprint Communications Inc
7.000% due 03/01/20 ~ | | | 600,000 | | | | 617,250 | |
Sprint Corp | |
7.250% due 09/15/21 | | | 470,000 | | | | 494,675 | |
7.875% due 09/15/23 | | | 20,000 | | | | 21,050 | |
Sprint Spectrum Co LLC | |
3.360% due 03/20/23 ~ | | | 125,000 | | | | 125,275 | |
4.738% due 09/20/29 ~ | | | 450,000 | | | | 456,188 | |
Telefonica Emisiones SAU (Spain)
5.213% due 03/08/47 | | | 150,000 | | | | 152,584 | |
Telstra Corp Ltd (Australia)
4.800% due 10/12/21 ~ | | | 800,000 | | | | 833,664 | |
The Interpublic Group of Cos Inc
4.000% due 03/15/22 | | | 800,000 | | | | 816,949 | |
The Walt Disney Co | |
6.200% due 12/15/34 ~ | | | 100,000 | | | | 130,833 | |
6.650% due 11/15/37 ~ | | | 10,000 | | | | 13,828 | |
Time Warner Cable LLC | |
4.125% due 02/15/21 | | | 770,000 | | | | 782,378 | |
5.875% due 11/15/40 | | | 160,000 | | | | 166,773 | |
6.550% due 05/01/37 | | | 100,000 | | | | 110,769 | |
7.300% due 07/01/38 | | | 60,000 | | | | 70,083 | |
8.250% due 04/01/19 | | | 60,000 | | | | 60,000 | |
Time Warner Entertainment Co LP
8.375% due 07/15/33 | | | 20,000 | | | | 26,135 | |
United Group BV (Netherlands)
4.875% due 07/01/24 ~ | | | EUR 600,000 | | | | 690,505 | |
UPCB Finance IV Ltd (Netherlands)
5.375% due 01/15/25 ~ | | | $200,000 | | | | 203,500 | |
Verizon Communications Inc | |
2.625% due 08/15/26 | | | 20,000 | | | | 19,108 | |
3.376% due 02/15/25 | | | 1,356,000 | | | | 1,376,098 | |
3.500% due 11/01/24 | | | 80,000 | | | | 82,007 | |
3.850% due 11/01/42 | | | 20,000 | | | | 18,944 | |
| | |
| See Notes to Financial Statements | | See explanation of symbols and terms, if any, on B-97 and B-98 |
B-9
PACIFIC FUNDS
PF MANAGED BOND FUND
Schedule of Investments (Continued)
March 31, 2019
| | | | | | | | |
| | | Principal Amount | | | Value | |
3.875% due 02/08/29 | | | $30,000 | | | | $30,871 | |
4.329% due 09/21/28 | | | 255,000 | | | | 270,599 | |
4.400% due 11/01/34 | | | 90,000 | | | | 93,885 | |
4.500% due 08/10/33 | | | 220,000 | | | | 233,290 | |
5.500% due 03/16/47 | | | 30,000 | | | | 35,224 | |
Virgin Media Receivables Financing Notes (United Kingdom)
5.500% due 09/15/24 ~ | | | GBP 400,000 | | | | 525,477 | |
Vodafone Group PLC (United Kingdom) | |
3.750% due 01/16/24 | | | $1,300,000 | | | | 1,312,354 | |
4.375% due 05/30/28 | | | 220,000 | | | | 224,031 | |
5.250% due 05/30/48 | | | 60,000 | | | | 60,101 | |
WPP Finance 2010 (United Kingdom)
4.750% due 11/21/21 | | | 1,000,000 | | | | 1,034,125 | |
| | | | | | | | |
| | | | | | | 23,808,956 | |
| | | | | | | | |
Consumer, Cyclical - 3.9% | |
| | |
Allison Transmission Inc
5.000% due 10/01/24 ~ | | | 20,000 | | | | 20,025 | |
Daimler Finance North America LLC (Germany) | |
2.850% due 01/06/22 ~ | | | 900,000 | | | | 895,970 | |
3.350% due 05/04/21 ~ | | | 500,000 | | | | 503,283 | |
3.400% due 02/22/22 ~ | | | 1,100,000 | | | | 1,111,054 | |
Delta Air Lines Pass-Through Trust ‘A’
6.821% due 02/10/24 | | | 153,966 | | | | 168,554 | |
Ford Motor Co
4.750% due 01/15/43 | | | 10,000 | | | | 7,867 | |
Ford Motor Credit Co LLC | |
0.060% (EUR LIBOR + 0.370%)
due 12/01/21 § | | | EUR 800,000 | | | | 858,830 | |
3.200% due 01/15/21 | | | $900,000 | | | | 887,555 | |
3.919% (USD LIBOR + 1.235%)
due 02/15/23 § | | | 300,000 | | | | 283,904 | |
5.085% due 01/07/21 | | | 600,000 | | | | 611,458 | |
5.139% (USD LIBOR + 2.550%)
due 01/07/21 § | | | 1,000,000 | | | | 1,009,824 | |
5.875% due 08/02/21 | | | 200,000 | | | | 207,287 | |
8.125% due 01/15/20 | | | 600,000 | | | | 621,976 | |
General Motors Co | |
5.150% due 04/01/38 | | | 20,000 | | | | 18,332 | |
5.950% due 04/01/49 | | | 20,000 | | | | 19,407 | |
6.250% due 10/02/43 | | | 40,000 | | | | 40,088 | |
General Motors Financial Co Inc | |
0.241% (EUR LIBOR + 0.550%)
due 03/26/22 § ~ | | | EUR 700,000 | | | | 771,201 | |
2.450% due 11/06/20 | | | $480,000 | | | | 474,448 | |
3.150% due 01/15/20 | | | 400,000 | | | | 400,630 | |
3.200% due 07/13/20 | | | 600,000 | | | | 601,627 | |
4.200% due 03/01/21 | | | 400,000 | | | | 405,920 | |
4.250% due 05/15/23 | | | 30,000 | | | | 30,528 | |
4.350% due 01/17/27 | | | 20,000 | | | | 19,473 | |
5.100% due 01/17/24 | | | 800,000 | | | | 830,977 | |
Harley-Davidson Financial Services Inc
3.550% due 05/21/21 ~ | | | 500,000 | | | | 499,171 | |
Hilton Worldwide Finance LLC
4.875% due 04/01/27 | | | 130,000 | | | | 131,950 | |
Marriott International Inc
4.150% due 12/01/23 | | | 800,000 | | | | 832,712 | |
McDonald’s Corp | | | | | | | | |
3.195% (USD LIBOR + 0.430%)
due 10/28/21 § | | | 500,000 | | | | 500,259 | |
3.500% due 03/01/27 | | | 10,000 | | | | 10,151 | |
3.700% due 01/30/26 | | | 130,000 | | | | 134,416 | |
3.800% due 04/01/28 | | | 30,000 | | | | 31,047 | |
MGM Resorts International
7.750% due 03/15/22 | | | 800,000 | | | | 886,000 | |
Newell Brands Inc | |
3.850% due 04/01/23 | | | 30,000 | | | | 29,695 | |
4.200% due 04/01/26 | | | 50,000 | | | | 47,803 | |
| | | | | | | | |
| | | Principal Amount | | | Value | |
Sands China Ltd (Macau)
5.125% due 08/08/25 | | | $310,000 | | | | $323,682 | |
The TJX Cos Inc
2.250% due 09/15/26 | | | 20,000 | | | | 19,017 | |
VOC Escrow Ltd
5.000% due 02/15/28 ~ | | | 140,000 | | | | 136,850 | |
Volkswagen Group of America Finance LLC (Germany) | | | | | | | | |
3.638% (USD LIBOR + 0.940%)
due 11/12/21 § ~ | | | 800,000 | | | | 801,742 | |
4.625% due 11/13/25 ~ | | | 800,000 | | | | 829,008 | |
4.750% due 11/13/28 ~ | | | 1,000,000 | | | | 1,009,808 | |
Volkswagen International Finance NV (Germany)
1.242% (EUR LIBOR + 1.550%)
due 11/16/24 § ~ | | | EUR 600,000 | | | | 679,999 | |
Volkswagen Leasing GmbH (Germany)
0.250% due 02/16/21 ~ | | | 100,000 | | | | 112,196 | |
Walmart Inc
3.700% due 06/26/28 | | | $160,000 | | | | 168,603 | |
WestJet Airlines Ltd (Canada)
3.500% due 06/16/21 ~ | | | 600,000 | | | | 585,180 | |
William Lyon Homes Inc
7.000% due 08/15/22 | | | 10,000 | | | | 10,050 | |
ZF North America Capital Inc (Germany)
4.500% due 04/29/22 ~ | | | 500,000 | | | | 502,200 | |
| | | | | | | | |
| | | | | | | 19,081,757 | |
| | | | | | | | |
Consumer,Non-Cyclical - 6.9% | |
|
Abbott Laboratories | |
3.750% due 11/30/26 | | | 88,000 | | | | 91,515 | |
4.750% due 11/30/36 | | | 70,000 | | | | 78,890 | |
4.900% due 11/30/46 | | | 80,000 | | | | 92,623 | |
AbbVie Inc | |
2.900% due 11/06/22 | | | 900,000 | | | | 898,548 | |
3.375% due 11/14/21 | | | 700,000 | | | | 708,190 | |
3.600% due 05/14/25 | | | 70,000 | | | | 70,265 | |
Aetna Inc
2.800% due 06/15/23 | | | 40,000 | | | | 39,322 | |
Allergan Funding SCS | |
3.450% due 03/15/22 | | | 80,000 | | | | 80,735 | |
3.800% due 03/15/25 | | | 180,000 | | | | 182,581 | |
4.550% due 03/15/35 | | | 30,000 | | | | 29,466 | |
4.750% due 03/15/45 | | | 21,000 | | | | 21,008 | |
Allergan Sales LLC
5.000% due 12/15/21 ~ | | | 700,000 | | | | 728,925 | |
Altria Group Inc | |
2.850% due 08/09/22 | | | 80,000 | | | | 79,875 | |
3.490% due 02/14/22 | | | 40,000 | | | | 40,662 | |
3.800% due 02/14/24 | | | 60,000 | | | | 61,135 | |
4.400% due 02/14/26 | | | 290,000 | | | | 298,969 | |
4.800% due 02/14/29 | | | 170,000 | | | | 175,582 | |
5.375% due 01/31/44 | | | 30,000 | | | | 30,215 | |
5.800% due 02/14/39 | | | 90,000 | | | | 95,485 | |
5.950% due 02/14/49 | | | 20,000 | | | | 21,492 | |
6.200% due 02/14/59 | | | 30,000 | | | | 32,322 | |
Amgen Inc | |
2.125% due 05/01/20 | | | 20,000 | | | | 19,929 | |
3.625% due 05/22/24 | | | 30,000 | | | | 30,890 | |
4.663% due 06/15/51 | | | 11,000 | | | | 11,108 | |
5.375% due 05/15/43 | | | 30,000 | | | | 32,890 | |
Anheuser-Busch Cos LLC (Belgium) | |
3.650% due 02/01/26 ~ | | | 110,000 | | | | 110,507 | |
4.900% due 02/01/46 ~ | | | 100,000 | | | | 100,647 | |
Anheuser-Busch InBev Finance Inc (Belgium)
3.300% due 02/01/23 | | | 320,000 | | | | 324,892 | |
Anheuser-Busch InBev Worldwide Inc (Belgium) | |
2.500% due 07/15/22 | | | 300,000 | | | | 297,453 | |
4.150% due 01/23/25 | | | 90,000 | | | | 93,888 | |
4.750% due 01/23/29 | | | 450,000 | | | | 479,596 | |
| | |
| See Notes to Financial Statements | | See explanation of symbols and terms, if any, on B-97 and B-98 |
B-10
PACIFIC FUNDS
PF MANAGED BOND FUND
Schedule of Investments (Continued)
March 31, 2019
| | | | | | | | |
| | | Principal Amount | | | Value | |
Anthem Inc | |
2.950% due 12/01/22 | | | $90,000 | | | | $90,008 | |
3.125% due 05/15/22 | | | 150,000 | | | | 151,357 | |
3.350% due 12/01/24 | | | 40,000 | | | | 40,387 | |
3.650% due 12/01/27 | | | 80,000 | | | | 79,957 | |
Bacardi Ltd (Bermuda)
4.500% due 01/15/21 ~ | | | 600,000 | | | | 609,978 | |
BAT Capital Corp (United Kingdom) | |
2.764% due 08/15/22 | | | 800,000 | | | | 787,559 | |
3.557% due 08/15/27 | | | 180,000 | | | | 170,750 | |
4.540% due 08/15/47 | | | 170,000 | | | | 149,401 | |
Bausch Health Cos Inc | |
6.125% due 04/15/25 ~ | | | 100,000 | | | | 99,250 | |
7.000% due 03/15/24 ~ | | | 110,000 | | | | 116,655 | |
Baxalta Inc
2.875% due 06/23/20 | | | 149,000 | | | | 148,880 | |
Bayer US Finance II LLC (Germany)
3.875% due 12/15/23 ~ | | | 600,000 | | | | 605,184 | |
Becton Dickinson & Co | |
3.363% due 06/06/24 | | | 110,000 | | | | 110,198 | |
3.734% due 12/15/24 | | | 50,000 | | | | 50,824 | |
4.685% due 12/15/44 | | | 40,000 | | | | 41,402 | |
Campbell Soup Co | |
3.300% due 03/15/21 | | | 600,000 | | | | 604,068 | |
3.650% due 03/15/23 | | | 800,000 | | | | 812,018 | |
Celgene Corp | |
2.250% due 08/15/21 | | | 50,000 | | | | 49,240 | |
2.875% due 02/19/21 | | | 500,000 | | | | 499,674 | |
3.250% due 08/15/22 | | | 400,000 | | | | 404,460 | |
3.550% due 08/15/22 | | | 90,000 | | | | 91,984 | |
3.875% due 08/15/25 | | | 50,000 | | | | 51,374 | |
5.000% due 08/15/45 | | | 150,000 | | | | 157,919 | |
Centene Corp
6.125% due 02/15/24 | | | 120,000 | | | | 125,886 | |
Cigna Corp | |
3.265% (USD LIBOR + 0.650%)
due 09/17/21 § ~ | | | 1,200,000 | | | | 1,199,990 | |
3.677% (USD LIBOR + 0.890%)
due 07/15/23 § ~ | | | 700,000 | | | | 696,997 | |
3.750% due 07/15/23 ~ | | | 150,000 | | | | 153,952 | |
4.125% due 11/15/25 ~ | | | 40,000 | | | | 41,451 | |
4.375% due 10/15/28 ~ | | | 210,000 | | | | 217,858 | |
Conagra Brands Inc
3.800% due 10/22/21 | | | 800,000 | | | | 815,216 | |
Constellation Brands Inc | |
2.250% due 11/06/20 | | | 800,000 | | | | 792,270 | |
4.250% due 05/01/23 | | | 30,000 | | | | 31,461 | |
CVS Health Corp | |
3.125% due 03/09/20 | | | 700,000 | | | | 702,127 | |
3.700% due 03/09/23 | | | 1,050,000 | | | | 1,067,369 | |
4.100% due 03/25/25 | | | 250,000 | | | | 257,048 | |
4.300% due 03/25/28 | | | 690,000 | | | | 700,429 | |
5.050% due 03/25/48 | | | 110,000 | | | | 111,040 | |
5.125% due 07/20/45 | | | 60,000 | | | | 61,279 | |
Danone SA (France)
2.589% due 11/02/23 ~ | | | 200,000 | | | | 195,929 | |
DP World PLC (United Arab Emirates)
5.625% due 09/25/48 ~ | | | 200,000 | | | | 208,655 | |
Eli Lilly & Co
3.100% due 05/15/27 | | | 20,000 | | | | 20,111 | |
EMD Finance LLC (Germany)
2.400% due 03/19/20 ~ | | | 500,000 | | | | 497,863 | |
Gilead Sciences Inc | |
3.650% due 03/01/26 | | | 30,000 | | | | 30,646 | |
3.700% due 04/01/24 | | | 80,000 | | | | 82,719 | |
4.150% due 03/01/47 | | | 130,000 | | | | 125,891 | |
4.750% due 03/01/46 | | | 30,000 | | | | 31,504 | |
GlaxoSmithKline Capital PLC (United Kingdom)
2.850% due 05/08/22 | | | 80,000 | | | | 80,318 | |
| | | | | | | | |
| | | Principal Amount | | | Value | |
HCA Inc | |
4.500% due 02/15/27 | | | $40,000 | | | | $41,175 | |
5.000% due 03/15/24 | | | 100,000 | | | | 106,005 | |
5.875% due 03/15/22 | | | 400,000 | | | | 430,016 | |
7.500% due 02/15/22 | | | 80,000 | | | | 88,424 | |
Humana Inc | |
3.150% due 12/01/22 | | | 50,000 | | | | 50,252 | |
3.950% due 03/15/27 | | | 50,000 | | | | 50,607 | |
4.625% due 12/01/42 | | | 50,000 | | | | 51,572 | |
4.800% due 03/15/47 | | | 20,000 | | | | 21,138 | |
4.950% due 10/01/44 | | | 20,000 | | | | 21,425 | |
IHS Markit Ltd
5.000% due 11/01/22 ~ | | | 900,000 | | | | 943,470 | |
Japan Tobacco Inc (Japan)
2.000% due 04/13/21 ~ | | | 300,000 | | | | 294,026 | |
Johnson & Johnson
3.625% due 03/03/37 | | | 100,000 | | | | 101,684 | |
Keurig Dr Pepper Inc
4.057% due 05/25/23 ~ | | | 1,000,000 | | | | 1,029,588 | |
Kraft Heinz Foods Co | |
3.267% (USD LIBOR + 0.570%)
due 02/10/21 § | | | 900,000 | | | | 897,663 | |
3.500% due 06/06/22 | | | 800,000 | | | | 809,355 | |
3.500% due 07/15/22 | | | 30,000 | | | | 30,308 | |
3.950% due 07/15/25 | | | 120,000 | | | | 121,056 | |
4.000% due 06/15/23 | | | 620,000 | | | | 638,462 | |
Mars Inc | |
2.700% due 04/01/25 ~ | | | 40,000 | | | | 39,856 | |
3.200% due 04/01/30 ~ | | | 40,000 | | | | 40,094 | |
Medtronic Global Holdings SCA
3.350% due 04/01/27 | | | 100,000 | | | | 101,967 | |
Medtronic Inc
3.500% due 03/15/25 | | | 160,000 | | | | 165,377 | |
Merck & Co Inc
2.750% due 02/10/25 | | | 90,000 | | | | 90,263 | |
Mondelez International Holdings Netherlands BV
2.000% due 10/28/21 ~ | | | 900,000 | | | | 877,828 | |
Mylan NV
2.250% due 11/22/24 ~ | | | EUR 900,000 | | | | 1,031,266 | |
Pernod Ricard SA (France) | |
4.250% due 07/15/22 ~ | | | $800,000 | | | | 830,901 | |
4.450% due 01/15/22 ~ | | | 150,000 | | | | 155,925 | |
5.750% due 04/07/21 ~ | | | 750,000 | | | | 790,349 | |
Philip Morris International Inc | |
2.500% due 08/22/22 | | | 210,000 | | | | 208,299 | |
2.500% due 11/02/22 | | | 80,000 | | | | 79,369 | |
4.500% due 03/20/42 | | | 30,000 | | | | 29,864 | |
Reckitt Benckiser Treasury Services PLC (United Kingdom)
2.375% due 06/24/22 ~ | | | 600,000 | | | | 591,343 | |
Reynolds American Inc (United Kingdom) | |
3.250% due 06/12/20 | | | 81,000 | | | | 81,139 | |
5.850% due 08/15/45 | | | 50,000 | | | | 51,452 | |
6.150% due 09/15/43 | | | 30,000 | | | | 31,400 | |
6.875% due 05/01/20 | | | 400,000 | | | | 416,105 | |
Takeda Pharmaceutical Co Ltd (Japan) | |
4.000% due 11/26/21 ~ | | | 1,000,000 | | | | 1,026,079 | |
4.400% due 11/26/23 ~ | | | 1,000,000 | | | | 1,051,934 | |
Teva Pharmaceutical Finance IV BV (Israel)
3.650% due 11/10/21 | | | 110,000 | | | | 107,872 | |
Teva Pharmaceutical Finance Netherlands III BV (Israel) | |
1.700% due 07/19/19 | | | 80,000 | | | | 79,830 | |
2.200% due 07/21/21 | | | 660,000 | | | | 629,593 | |
2.800% due 07/21/23 | | | 100,000 | | | | 89,314 | |
United Rentals North America Inc | |
5.500% due 07/15/25 | | | 50,000 | | | | 51,250 | |
5.875% due 09/15/26 | | | 90,000 | | | | 93,375 | |
| | |
| See Notes to Financial Statements | | See explanation of symbols and terms, if any, on B-97 and B-98 |
B-11
PACIFIC FUNDS
PF MANAGED BOND FUND
Schedule of Investments (Continued)
March 31, 2019
| | | | | | | | |
| | | Principal Amount | | | Value | |
UnitedHealth Group Inc | |
3.750% due 07/15/25 | | | $80,000 | | | | $83,638 | |
3.875% due 12/15/28 | | | 120,000 | | | | 125,687 | |
Wm Wrigley Jr Co
3.375% due 10/21/20 ~ | | | 70,000 | | | | 70,728 | |
| | | | | | | | |
| | | | | | | 34,278,464 | |
| | | | | | | | |
Energy - 1.7% | |
|
Anadarko Petroleum Corp | |
4.850% due 03/15/21 | | | 24,000 | | | | 24,891 | |
5.550% due 03/15/26 | | | 50,000 | | | | 54,624 | |
6.450% due 09/15/36 | | | 310,000 | | | | 358,000 | |
Antero Resources Corp
5.375% due 11/01/21 | | | 40,000 | | | | 40,300 | |
Apache Corp | |
3.250% due 04/15/22 | | | 24,000 | | | | 24,036 | |
4.250% due 01/15/44 | | | 170,000 | | | | 151,182 | |
4.375% due 10/15/28 | | | 20,000 | | | | 20,186 | |
4.750% due 04/15/43 | | | 30,000 | | | | 28,382 | |
5.100% due 09/01/40 | | | 80,000 | | | | 79,344 | |
Baker Hughes LLC
3.200% due 08/15/21 | | | 60,000 | | | | 60,543 | |
BG Energy Capital PLC (United Kingdom)
4.000% due 10/15/21 ~ | | | 800,000 | | | | 820,082 | |
Blue Racer Midstream LLC
6.125% due 11/15/22 ~ | | | 30,000 | | | | 30,600 | |
BP Capital Markets America Inc | |
3.119% due 05/04/26 | | | 110,000 | | | | 109,712 | |
3.410% due 02/11/26 | | | 150,000 | | | | 153,319 | |
BP Capital Markets PLC (United Kingdom) | |
3.506% due 03/17/25 | | | 130,000 | | | | 132,975 | |
3.535% due 11/04/24 | | | 40,000 | | | | 41,233 | |
Chesapeake Energy Corp | |
6.125% due 02/15/21 | | | 20,000 | | | | 20,700 | |
6.625% due 08/15/20 | | | 10,000 | | | | 10,313 | |
Chevron Corp
2.954% due 05/16/26 | | | 80,000 | | | | 80,614 | |
Cimarex Energy Co
3.900% due 05/15/27 | | | 170,000 | | | | 169,835 | |
Concho Resources Inc | |
3.750% due 10/01/27 | | | 10,000 | | | | 9,937 | |
4.300% due 08/15/28 | | | 80,000 | | | | 82,663 | |
4.375% due 01/15/25 | | | 50,000 | | | | 51,437 | |
ConocoPhillips
6.500% due 02/01/39 | | | 10,000 | | | | 13,507 | |
Continental Resources Inc | |
3.800% due 06/01/24 | | | 50,000 | | | | 50,529 | |
4.375% due 01/15/28 | | | 40,000 | | | | 41,207 | |
4.500% due 04/15/23 | | | 40,000 | | | | 41,472 | |
Devon Energy Corp | |
3.250% due 05/15/22 | | | 130,000 | | | | 131,121 | |
5.000% due 06/15/45 | | | 160,000 | | | | 168,108 | |
5.850% due 12/15/25 | | | 235,000 | | | | 267,043 | |
Ecopetrol SA (Colombia)
5.875% due 05/28/45 | | | 170,000 | | | | 176,800 | |
Energy Transfer Operating LP | |
4.500% due 04/15/24 | | | 50,000 | | | | 52,269 | |
4.950% due 06/15/28 | | | 40,000 | | | | 42,029 | |
5.250% due 04/15/29 | | | 30,000 | | | | 32,249 | |
6.250% due 04/15/49 | | | 10,000 | | | | 11,224 | |
Energy Transfer Partners LP
5.875% due 03/01/22 | | | 80,000 | | | | 85,573 | |
Enterprise Products Operating LLC
4.150% due 10/16/28 | | | 160,000 | | | | 168,659 | |
EOG Resources Inc
4.150% due 01/15/26 | | | 70,000 | | | | 74,224 | |
Exxon Mobil Corp | |
3.043% due 03/01/26 | | | 140,000 | | | | 142,177 | |
4.114% due 03/01/46 | | | 50,000 | | | | 54,237 | |
KazMunayGas National Co JSC (Kazakhstan)
5.375% due 04/24/30 ~ | | | 200,000 | | | | 210,180 | |
| | | | | | | | |
| | | Principal Amount | | | Value | |
Kinder Morgan Energy Partners LP | |
3.500% due 03/01/21 | | | $80,000 | | | | $80,804 | |
3.950% due 09/01/22 | | | 150,000 | | | | 154,228 | |
Kinder Morgan Inc
4.300% due 03/01/28 | | | 110,000 | | | | 113,797 | |
MPLX LP | |
4.000% due 03/15/28 | | | 50,000 | | | | 49,760 | |
4.500% due 04/15/38 | | | 100,000 | | | | 95,364 | |
4.700% due 04/15/48 | | | 180,000 | | | | 172,934 | |
4.875% due 12/01/24 | | | 100,000 | | | | 106,824 | |
Noble Energy Inc | |
3.850% due 01/15/28 | | | 100,000 | | | | 98,690 | |
5.250% due 11/15/43 | | | 80,000 | | | | 81,836 | |
Oasis Petroleum Inc
6.875% due 01/15/23 | | | 10,000 | | | | 10,025 | |
Occidental Petroleum Corp | |
3.000% due 02/15/27 | | | 80,000 | | | | 79,716 | |
4.100% due 02/15/47 | | | 120,000 | | | | 122,868 | |
4.200% due 03/15/48 | | | 10,000 | | | | 10,456 | |
4.400% due 04/15/46 | | | 80,000 | | | | 85,044 | |
4.625% due 06/15/45 | | | 50,000 | | | | 54,856 | |
Petrobras Global Finance BV (Brazil) | |
5.299% due 01/27/25 | | | 955,000 | | | | 971,245 | |
6.900% due 03/19/49 | | | 30,000 | | | | 29,742 | |
Petroleos Mexicanos (Mexico) | |
6.375% due 01/23/45 | | | 70,000 | | | | 62,093 | |
6.875% due 08/04/26 | | | 220,000 | | | | 229,856 | |
Range Resources Corp | |
4.875% due 05/15/25 | | | 10,000 | | | | 9,325 | |
5.000% due 03/15/23 | | | 150,000 | | | | 147,562 | |
Schlumberger Holdings Corp
3.000% due 12/21/20 ~ | | | 40,000 | | | | 40,178 | |
Shell International Finance BV (Netherlands) | |
2.875% due 05/10/26 | | | 50,000 | | | | 49,880 | |
3.875% due 11/13/28 | | | 150,000 | | | | 159,209 | |
4.000% due 05/10/46 | | | 50,000 | | | | 52,245 | |
4.375% due 05/11/45 | | | 130,000 | | | | 142,478 | |
4.550% due 08/12/43 | | | 50,000 | | | | 55,754 | |
Sinopec Group Overseas Development Ltd (China)
4.375% due 04/10/24 ~ | | | 290,000 | | | | 304,690 | |
Targa Resources Partners LP | |
4.250% due 11/15/23 | | | 60,000 | | | | 59,925 | |
5.375% due 02/01/27 | | | 30,000 | | | | 30,825 | |
5.875% due 04/15/26 ~ | | | 40,000 | | | | 42,480 | |
6.500% due 07/15/27 ~ | | | 10,000 | | | | 10,813 | |
6.875% due 01/15/29 ~ | | | 20,000 | | | | 21,825 | |
The Williams Cos Inc
7.500% due 01/15/31 | | | 190,000 | | | | 239,079 | |
Transcontinental Gas Pipe Line Co LLC
7.850% due 02/01/26 | �� | | 220,000 | | | | 275,455 | |
Whiting Petroleum Corp
5.750% due 03/15/21 | | | 40,000 | | | | 40,660 | |
| | | | | | | | |
| | | | | | | 8,610,037 | |
| | | | | | | | |
Financial - 23.4% | |
|
AerCap Ireland Capital DAC (Ireland) | |
3.950% due 02/01/22 | | | 800,000 | | | | 810,911 | |
4.450% due 12/16/21 | | | 1,000,000 | | | | 1,026,355 | |
4.450% due 10/01/25 | | | 500,000 | | | | 504,569 | |
4.625% due 07/01/22 | | | 800,000 | | | | 826,040 | |
AIB Group PLC (Ireland)
4.750% due 10/12/23 ~ | | | 500,000 | | | | 516,878 | |
Aircastle Ltd
5.125% due 03/15/21 | | | 500,000 | | | | 516,162 | |
Ambac LSNI LLC (Cayman)
7.592% (USD LIBOR + 5.000%)
due 02/12/23 § ~ | | | 360,255 | | | | 363,857 | |
American Express Co | |
3.375% due 05/17/21 | | | 1,100,000 | | | | 1,114,680 | |
3.400% due 02/27/23 | | | 700,000 | | | | 711,357 | |
American Express Credit Corp
2.375% due 05/26/20 | | | 80,000 | | | | 79,755 | |
| | |
| See Notes to Financial Statements | | See explanation of symbols and terms, if any, on B-97 and B-98 |
B-12
PACIFIC FUNDS
PF MANAGED BOND FUND
Schedule of Investments (Continued)
March 31, 2019
| | | | | | | | |
| | | Principal Amount | | | Value | |
American Homes 4 Rent LP REIT
4.250% due 02/15/28 | | | $100,000 | | | | $99,155 | |
American International Group Inc
3.750% due 07/10/25 | | | 630,000 | | | | 631,717 | |
American Tower Corp REIT
5.900% due 11/01/21 | | | 500,000 | | | | 535,531 | |
Australia & New Zealand Banking Group Ltd (Australia) | |
3.143% (USD LIBOR + 0.460%)
due 05/17/21 § ~ | | | 500,000 | | | | 500,887 | |
3.300% due 05/17/21 | | | 500,000 | | | | 505,500 | |
AvalonBay Communities Inc REIT
3.450% due 06/01/25 | | | 300,000 | | | | 305,876 | |
Banco Bilbao Vizcaya Argentaria SA (Spain)
8.875% due 04/14/21 ~ | | | EUR 800,000 | | | | 989,030 | |
Banco Santander SA (Spain) | |
3.848% due 04/12/23 | | | $200,000 | | | | 201,907 | |
4.379% due 04/12/28 | | | 200,000 | | | | 202,955 | |
Bank of America Corp | |
3.004% due 12/20/23 | | | 155,000 | | | | 154,667 | |
3.389% (USD LIBOR + 0.790%)
due 03/05/24 § | | | 700,000 | | | | 697,973 | |
3.419% due 12/20/28 | | | 203,000 | | | | 198,865 | |
3.500% due 04/19/26 | | | 110,000 | | | | 111,309 | |
3.550% due 03/05/24 | | | 390,000 | | | | 396,297 | |
3.593% due 07/21/28 | | | 100,000 | | | | 99,697 | |
3.779% (USD LIBOR + 1.000%)
due 04/24/23 § | | | 500,000 | | | | 504,147 | |
3.864% due 07/23/24 | | | 500,000 | | | | 514,067 | |
3.974% due 02/07/30 | | | 320,000 | | | | 326,762 | |
4.000% due 04/01/24 | | | 250,000 | | | | 260,441 | |
4.100% due 07/24/23 | | | 500,000 | | | | 523,315 | |
4.200% due 08/26/24 | | | 160,000 | | | | 165,785 | |
4.250% due 10/22/26 | | | 720,000 | | | | 740,967 | |
4.330% due 03/15/50 | | | 30,000 | | | | 31,016 | |
4.450% due 03/03/26 | | | 90,000 | | | | 93,932 | |
6.100% due 03/17/25 | | | 160,000 | | | | 169,449 | |
6.250% due 09/05/24 | | | 60,000 | | | | 63,635 | |
Bank of Montreal (Canada)
3.803% due 12/15/32 | | | 60,000 | | | | 58,076 | |
Banque Federative du Credit Mutuel SA (France)
3.750% due 07/20/23 ~ | | | 600,000 | | | | 615,515 | |
Barclays Bank PLC (United Kingdom) | |
3.171% (USD LIBOR + 0.400%)
due 10/25/19 § | | | 900,000 | | | | 901,577 | |
7.625% due 11/21/22 | | | 800,000 | | | | 870,468 | |
Barclays PLC (United Kingdom) | |
3.650% due 03/16/25 | | | 300,000 | | | | 293,490 | |
3.684% due 01/10/23 | | | 500,000 | | | | 499,740 | |
4.114% (USD LIBOR + 1.430%)
due 02/15/23 § | | | 1,000,000 | | | | 994,609 | |
4.610% due 02/15/23 | | | 1,000,000 | | | | 1,022,400 | |
4.972% due 05/16/29 | | | 200,000 | | | | 206,927 | |
6.500% due 09/15/19 | | | EUR 600,000 | | | | 680,613 | |
8.000% due 12/15/20 | | | 600,000 | | | | 725,834 | |
Berkshire Hathaway Finance Corp
4.250% due 01/15/49 | | | $120,000 | | | | 125,900 | |
Blackstone CQP Holdco LP
6.000% due 08/18/21 ~ | | | 600,000 | | | | 600,000 | |
BNP Paribas SA (France) | |
4.375% due 03/01/33 ~ | | | 450,000 | | | | 442,131 | |
4.400% due 08/14/28 ~ | | | 340,000 | | | | 350,470 | |
4.705% due 01/10/25 ~ | | | 230,000 | | | | 239,327 | |
5.198% due 01/10/30 ~ | | | 200,000 | | | | 216,304 | |
Boston Properties LP REIT
4.500% due 12/01/28 | | | 600,000 | | | | 639,576 | |
BPCE SA (France)
4.000% due 09/12/23 ~ | | | 850,000 | | | | 864,150 | |
Capital One Financial Corp
4.250% due 04/30/25 | | | 500,000 | | | | 519,773 | |
| | | | | | | | |
| | | Principal Amount | | | Value | |
Carlyle Finance LLC
5.650% due 09/15/48 ~ | | | $150,000 | | | | $149,181 | |
CBL & Associates LP REIT
5.950% due 12/15/26 | | | 1,200,000 | | | | 882,000 | |
Chubb INA Holdings Inc | |
2.300% due 11/03/20 | | | 50,000 | | | | 49,777 | |
3.350% due 05/03/26 | | | 60,000 | | | | 61,159 | |
Citibank NA | |
2.850% due 02/12/21 | | | 800,000 | | | | 803,265 | |
3.650% due 01/23/24 | | | 1,600,000 | | | | 1,652,556 | |
Citigroup Inc | |
2.750% due 04/25/22 | | | 800,000 | | | | 797,247 | |
4.075% due 04/23/29 | | | 150,000 | | | | 154,058 | |
4.400% due 06/10/25 | | | 170,000 | | | | 176,272 | |
4.450% due 09/29/27 | | | 650,000 | | | | 669,271 | |
5.300% due 05/06/44 | | | 102,000 | | | | 112,784 | |
5.500% due 09/13/25 | | | 220,000 | | | | 241,506 | |
5.950% due 01/30/23 | | | 300,000 | | | | 305,425 | |
5.950% due 05/15/25 | | | 1,350,000 | | | | 1,378,276 | |
6.675% due 09/13/43 | | | 70,000 | | | | 89,826 | |
8.125% due 07/15/39 | | | 10,000 | | | | 15,041 | |
Commonwealth Bank of Australia (Australia)
5.000% due 10/15/19 ~ | | | 70,000 | | | | 70,856 | |
Cooperatieve Rabobank UA (Netherlands) | |
3.125% due 04/26/21 | | | 400,000 | | | | 402,010 | |
3.750% due 07/21/26 | | | 290,000 | | | | 286,490 | |
4.375% due 08/04/25 | | | 330,000 | | | | 340,699 | |
4.625% due 12/01/23 | | | 290,000 | | | | 303,269 | |
5.500% due 06/29/20 ~ | | | EUR 700,000 | | | | 815,351 | |
6.625% due 06/29/21 ~ | | | 400,000 | | | | 489,708 | |
6.875% due 03/19/20 ~ | | | 300,000 | | | | 358,506 | |
11.000% due 06/30/19 ~ | | | $160,000 | | | | 163,600 | |
Credit Agricole SA (France)
8.375% due 10/13/19 ~ | | | 300,000 | | | | 309,000 | |
Credit Suisse Group AG (Switzerland)
3.837% (USD LIBOR + 1.240%)
due 06/12/24 § ~ | | | 750,000 | | | | 746,194 | |
Credit Suisse Group Funding Guernsey Ltd
(Switzerland) | |
3.750% due 03/26/25 | | | 800,000 | | | | 807,334 | |
3.800% due 09/15/22 | | | 800,000 | | | | 815,707 | |
3.800% due 06/09/23 | | | 500,000 | | | | 508,311 | |
4.875% due 05/15/45 | | | 270,000 | | | | 294,125 | |
Danske Bank AS (Denmark)
5.000% due 01/12/22 ~ | | | 200,000 | | | | 204,912 | |
Deutsche Bank AG (Germany) | |
3.150% due 01/22/21 | | | 600,000 | | | | 591,288 | |
3.767% (USD LIBOR + 0.970%)
due 07/13/20 § | | | 500,000 | | | | 498,381 | |
3.950% due 02/27/23 | | | 500,000 | | | | 493,784 | |
4.250% due 10/14/21 | | | 900,000 | | | | 904,937 | |
4.607% (USD LIBOR + 1.910%)
due 05/10/19 § | | | 1,100,000 | | | | 1,101,234 | |
5.000% due 02/14/22 | | | 900,000 | | | | 920,635 | |
Digital Realty Trust LP REIT
4.450% due 07/15/28 | | | 500,000 | | | | 523,183 | |
EPR Properties REIT
5.250% due 07/15/23 | | | 400,000 | | | | 421,714 | |
ERP Operating LP REIT
3.375% due 06/01/25 | | | 200,000 | | | | 203,329 | |
Fifth Third Bancorp
3.650% due 01/25/24 | | | 70,000 | | | | 71,764 | |
GE Capital International Funding Co | |
2.342% due 11/15/20 | | | 1,183,000 | | | | 1,168,655 | |
3.373% due 11/15/25 | | | 205,000 | | | | 199,248 | |
GE Capital UK Funding Unlimited Co
5.875% due 11/04/20 | | | GBP 600,000 | | | | 831,827 | |
GLP Capital LP REIT
5.375% due 04/15/26 | | | $60,000 | | | | 62,844 | |
Goodman US Finance Three LLC REIT (Australia)
3.700% due 03/15/28 ~ | | | 200,000 | | | | 194,686 | |
| | |
| See Notes to Financial Statements | | See explanation of symbols and terms, if any, on B-97 and B-98 |
B-13
PACIFIC FUNDS
PF MANAGED BOND FUND
Schedule of Investments (Continued)
March 31, 2019
| | | | | | | | |
| | | Principal Amount | | | Value | |
Host Hotels & Resorts LP REIT
4.000% due 06/15/25 | | | $200,000 | | | | $199,397 | |
HSBC Holdings PLC (United Kingdom) | |
1.500% due 12/04/24 ~ | | | EUR 900,000 | | | | 1,042,069 | |
3.283% (USD LIBOR + 0.600%)
due 05/18/21 § | | | $500,000 | | | | 499,911 | |
3.400% due 03/08/21 | | | 1,740,000 | | | | 1,756,291 | |
3.683% (USD LIBOR + 1.000%)
due 05/18/24 § | | | 500,000 | | | | 496,169 | |
3.900% due 05/25/26 | | | 200,000 | | | | 202,845 | |
3.950% due 05/18/24 | | | 200,000 | | | | 204,187 | |
4.583% due 06/19/29 | | | 350,000 | | | | 368,623 | |
5.875% due 09/28/26 | | | GBP 200,000 | | | | 262,782 | |
6.500% due 03/23/28 | | | $390,000 | | | | 386,465 | |
Industrial & Commercial Bank of China Ltd (China)
3.504% (USD LIBOR + 0.875%)
due 11/29/19 § ~ | | | 800,000 | | | | 801,768 | |
ING Bank NV (Netherlands)
5.800% due 09/25/23 ~ | | | 200,000 | | | | 216,485 | |
ING Groep NV (Netherlands) | |
3.150% due 03/29/22 | | | 800,000 | | | | 801,380 | |
4.625% due 01/06/26 ~ | | | 700,000 | | | | 735,445 | |
International Lease Finance Corp
5.875% due 08/15/22 | | | 150,000 | | | | 161,860 | |
Intesa Sanpaolo SPA (Italy) | |
3.375% due 01/12/23 ~ | | | 220,000 | | | | 214,957 | |
5.017% due 06/26/24 ~ | | | 370,000 | | | | 357,970 | |
Jackson National Life Global Funding
3.300% due 06/11/21 ~ | | | 400,000 | | | | 404,376 | |
JPMorgan Chase & Co | |
2.550% due 10/29/20 | | | 1,000,000 | | | | 997,835 | |
2.700% due 05/18/23 | | | 1,400,000 | | | | 1,387,411 | |
3.125% due 01/23/25 | | | 500,000 | | | | 500,948 | |
3.509% due 01/23/29 | | | 150,000 | | | | 149,286 | |
3.514% due 06/18/22 | | | 500,000 | | | | 507,222 | |
3.797% due 07/23/24 | | | 500,000 | | | | 513,878 | |
4.023% due 12/05/24 | | | 210,000 | | | | 218,115 | |
4.125% due 12/15/26 | | | 170,000 | | | | 175,785 | |
4.203% due 07/23/29 | | | 170,000 | | | | 177,659 | |
4.250% due 10/01/27 | | | 120,000 | | | | 124,849 | |
4.950% due 06/01/45 | | | 250,000 | | | | 278,166 | |
JPMorgan Chase Bank NA | |
3.086% due 04/26/21 | | | 300,000 | | | | 300,884 | |
3.105% (USD LIBOR + 0.340%)
due 04/26/21 § | | | 500,000 | | | | 499,915 | |
KEB Hana Bank (South Korea)
3.375% due 01/30/22 ~ | | | 900,000 | | | | 910,703 | |
Kilroy Realty LP REIT
4.750% due 12/15/28 | | | 1,000,000 | | | | 1,065,543 | |
Kimco Realty Corp REIT
2.700% due 03/01/24 | | | 900,000 | | | | 871,186 | |
KKR Group Finance Co II LLC
5.500% due 02/01/43 ~ | | | 30,000 | | | | 32,213 | |
Lifestorage LP REIT
3.500% due 07/01/26 | | | 800,000 | | | | 771,589 | |
Lloyds Bank PLC (United Kingdom)
3.300% due 05/07/21 | | | 500,000 | | | | 504,175 | |
Lloyds Banking Group PLC (United Kingdom) | |
3.263% (AUD Bank Bill + 1.400%)
due 03/07/25 § | | | AUD 800,000 | | | | 554,840 | |
3.574% due 11/07/28 | | | $200,000 | | | | 192,400 | |
4.000% due 03/07/25 | | | AUD 900,000 | | | | 656,132 | |
4.450% due 05/08/25 | | | $500,000 | | | | 519,739 | |
4.500% due 11/04/24 | | | 260,000 | | | | 264,511 | |
7.000% due 06/27/19 ~ | | | GBP 800,000 | | | | 1,044,314 | |
7.625% due 06/27/23 ~ | | | 600,000 | | | | 827,852 | |
MetLife Inc
4.750% due 02/08/21 | | | $100,000 | | | | 103,673 | |
Metropolitan Life Global Funding
3.450% due 12/18/26 ~ | | | 700,000 | | | | 714,079 | |
| | | | | | | | |
| | | Principal Amount | | | Value | |
Mid-America Apartments LP REIT
4.200% due 06/15/28 | | | $700,000 | | | | $724,817 | |
Mitsubishi UFJ Financial Group Inc (Japan) | |
2.998% due 02/22/22 | | | 80,000 | | | | 80,227 | |
3.455% due 03/02/23 | | | 600,000 | | | | 608,818 | |
Mizuho Financial Group Inc (Japan)
3.922% due 09/11/24 | | | 600,000 | | | | 618,253 | |
Morgan Stanley | |
3.125% due 07/27/26 | | | 200,000 | | | | 195,143 | |
3.247% (USD LIBOR + 0.550%)
due 02/10/21 § | | | 500,000 | | | | 500,568 | |
3.737% due 04/24/24 | | | 850,000 | | | | 867,930 | |
3.772% due 01/24/29 | | | 40,000 | | | | 40,300 | |
3.941% (USD LIBOR + 1.180%)
due 01/20/22 § | | | 500,000 | | | | 505,150 | |
4.431% due 01/23/30 | | | 160,000 | | | | 169,021 | |
Nasdaq Inc
3.850% due 06/30/26 | | | 800,000 | | | | 812,382 | |
National Australia Bank Ltd (Australia)
3.625% due 06/20/23 | | | 500,000 | | | | 512,528 | |
National Retail Properties Inc REIT
3.500% due 10/15/27 | | | 200,000 | | | | 197,186 | |
Nationwide Building Society (United Kingdom)
6.875% due 06/20/19 ~ | | | GBP 500,000 | | | | 655,158 | |
Navient Corp
8.000% due 03/25/20 | | | $600,000 | | | | 625,500 | |
New York Life Global Funding
2.900% due 01/17/24 ~ | | | 1,000,000 | | | | 1,006,475 | |
Oversea-Chinese Banking Corp Ltd (Singapore)
3.144% (USD LIBOR + 0.450%)
due 05/17/21 § ~ | | | 400,000 | | | | 401,300 | |
Regions Bank
3.374% due 08/13/21 | | | 500,000 | | | | 502,509 | |
Reliance Standard Life Global Funding II
2.500% due 01/15/20 ~ | | | 30,000 | | | | 29,872 | |
Royal Bank of Canada (Canada) | |
2.150% due 10/26/20 | | | 70,000 | | | | 69,562 | |
3.200% due 04/30/21 | | | 80,000 | | | | 80,967 | |
Royal Bank of Scotland Group PLC
(United Kingdom) | |
2.000% due 03/08/23 ~ | | | EUR 900,000 | | | | 1,033,381 | |
2.500% due 03/22/23 ~ | | | 800,000 | | | | 939,624 | |
3.875% due 09/12/23 | | | $800,000 | | | | 804,082 | |
4.269% due 03/22/25 | | | 200,000 | | | | 202,201 | |
4.519% due 06/25/24 | | | 200,000 | | | | 204,707 | |
5.125% due 05/28/24 | | | 720,000 | | | | 739,335 | |
6.125% due 12/15/22 | | | 70,000 | | | | 74,690 | |
7.500% due 08/10/20 | | | 800,000 | | | | 817,000 | |
8.625% due 08/15/21 | | | 600,000 | | | | 640,500 | |
Santander Holdings USA Inc | |
4.450% due 12/03/21 | | | 1,000,000 | | | | 1,030,216 | |
4.500% due 07/17/25 | | | 130,000 | | | | 134,176 | |
Santander UK Group Holdings PLC
(United Kingdom) | |
2.375% due 03/16/20 | | | 40,000 | | | | 39,875 | |
2.875% due 10/16/20 | | | 1,100,000 | | | | 1,099,474 | |
3.750% due 11/15/21 | | | 1,000,000 | | | | 1,018,346 | |
Simon Property Group LP REIT
2.500% due 09/01/20 | | | 400,000 | | | | 399,425 | |
Skandinaviska Enskilda Banken AB (Sweden) | |
3.113% (USD LIBOR + 0.430%)
due 05/17/21 § ~ | | | 500,000 | | | | 500,171 | |
3.250% due 05/17/21 ~ | | | 500,000 | | | | 504,727 | |
Societe Generale SA (France)
4.250% due 09/14/23 ~ | | | 500,000 | | | | 513,334 | |
Standard Chartered PLC (United Kingdom)
5.700% due 03/26/44 ~ | | | 210,000 | | | | 228,775 | |
Sumitomo Mitsui Financial Group Inc (Japan)
2.058% due 07/14/21 | | | 120,000 | | | | 117,994 | |
| | |
| See Notes to Financial Statements | | See explanation of symbols and terms, if any, on B-97 and B-98 |
B-14
PACIFIC FUNDS
PF MANAGED BOND FUND
Schedule of Investments (Continued)
March 31, 2019
| | | | | | | | |
| | | Principal Amount | | | Value | |
Svenska Handelsbanken AB (Sweden)
3.350% due 05/24/21 | | | $250,000 | | | | $252,967 | |
Synchrony Bank
3.650% due 05/24/21 | | | 500,000 | | | | 504,872 | |
Teachers Insurance & Annuity Association of America | |
4.900% due 09/15/44 ~ | | | 40,000 | | | | 44,752 | |
6.850% due 12/16/39 ~ | | | 18,000 | | | | 24,811 | |
The Depository Trust & Clearing Corp
4.875% due 06/15/20 ~ | | | 250,000 | | | | 250,261 | |
The Goldman Sachs Group Inc | |
3.200% due 02/23/23 | | | 60,000 | | | | 60,146 | |
3.401% (USD LIBOR + 0.750%)
due 02/23/23 § | | | 600,000 | | | | 595,084 | |
3.500% due 01/23/25 | | | 700,000 | | | | 698,486 | |
3.524% (USD LIBOR + 0.780%)
due 10/31/22 § | | | 500,000 | | | | 498,107 | |
3.750% due 05/22/25 | | | 600,000 | | | | 606,108 | |
3.811% (USD LIBOR + 1.200%)
due 09/15/20 § | | | 500,000 | | | | 505,321 | |
3.814% due 04/23/29 | | | 200,000 | | | | 198,441 | |
3.850% due 07/08/24 | | | 310,000 | | | | 316,879 | |
3.854% (USD LIBOR + 1.170%)
due 05/15/26 § | | | 1,000,000 | | | | 981,905 | |
4.223% due 05/01/29 | | | 470,000 | | | | 481,396 | |
4.250% due 10/21/25 | | | 720,000 | | | | 738,190 | |
5.150% due 05/22/45 | | | 130,000 | | | | 138,037 | |
6.250% due 02/01/41 | | | 230,000 | | | | 286,388 | |
The Toronto-Dominion Bank (Canada) | |
2.500% due 01/18/23 ~ | | | 1,200,000 | | | | 1,197,706 | |
3.250% due 06/11/21 | | | 100,000 | | | | 101,256 | |
3.350% due 10/22/21 ~ | | | 500,000 | | | | 509,480 | |
UBS AG (Switzerland)
3.175% (USD LIBOR + 0.580%)
due 06/08/20 § ~ | | | 1,200,000 | | | | 1,204,981 | |
UBS Group Funding Switzerland AG (Switzerland) | |
2.859% due 08/15/23 ~ | | | 200,000 | | | | 197,199 | |
3.000% due 04/15/21 ~ | | | 1,000,000 | | | | 1,000,135 | |
3.491% due 05/23/23 ~ | | | 260,000 | | | | 261,448 | |
4.125% due 09/24/25 ~ | | | 1,000,000 | | | | 1,034,056 | |
4.125% due 04/15/26 ~ | | | 200,000 | | | | 207,164 | |
4.253% due 03/23/28 ~ | | | 270,000 | | | | 281,255 | |
7.000% due 01/31/24 ~ | | | 250,000 | | | | 253,904 | |
UniCredit SPA (Italy) | |
6.572% due 01/14/22 ~ | | | 350,000 | | | | 366,880 | |
7.830% due 12/04/23 ~ | | | 1,800,000 | | | | 2,006,118 | |
VEREIT Operating Partnership LP REIT
3.950% due 08/15/27 | | | 200,000 | | | | 197,388 | |
Vesteda Finance BV (Netherlands)
2.500% due 10/27/22 ~ | | | EUR 600,000 | | | | 716,345 | |
Visa Inc | |
3.150% due 12/14/25 | | | $150,000 | | | | 152,780 | |
4.300% due 12/14/45 | | | 150,000 | | | | 166,072 | |
Washington Prime Group LP REIT
5.950% due 08/15/24 | | | 950,000 | | | | 891,660 | |
WEA Finance LLC REIT (France)
3.750% due 09/17/24 ~ | | | 270,000 | | | | 276,008 | |
Wells Fargo & Co | |
3.000% due 10/23/26 | | | 200,000 | | | | 195,439 | |
3.450% due 02/13/23 | | | 110,000 | | | | 111,289 | |
3.584% due 05/22/28 | | | 100,000 | | | | 100,596 | |
3.750% due 01/24/24 | | | 950,000 | | | | 978,521 | |
3.974% (USD LIBOR + 1.230%)
due 10/31/23 § | | | 2,000,000 | | | | 2,032,883 | |
4.150% due 01/24/29 | | | 130,000 | | | | 136,064 | |
4.300% due 07/22/27 | | | 380,000 | | | | 395,842 | |
4.400% due 06/14/46 | | | 30,000 | | | | 30,002 | |
4.600% due 04/01/21 | | | 80,000 | | | | 82,675 | |
4.900% due 11/17/45 | | | 190,000 | | | | 202,998 | |
5.375% due 11/02/43 | | | 80,000 | | | | 90,225 | |
5.606% due 01/15/44 | | | 150,000 | | | | 173,378 | |
5.875% due 06/15/25 | | | 60,000 | | | | 64,167 | |
| | | | | | | | |
| | | Principal Amount | | | Value | |
Wells Fargo Bank NA
3.625% due 10/22/21 | | | $300,000 | | | | $305,822 | |
Westpac Banking Corp (Australia) | |
2.300% due 05/26/20 | | | 40,000 | | | | 39,841 | |
2.600% due 11/23/20 | | | 50,000 | | | | 49,941 | |
| | | | | | | | |
| | | | | | | 116,420,801 | |
| | | | | | | | |
Industrial - 2.7% | |
|
Aviation Capital Group LLC | |
2.875% due 01/20/22 ~ | | | 500,000 | | | | 492,765 | |
4.125% due 08/01/25 ~ | | | 600,000 | | | | 598,992 | |
CNH Industrial Capital LLC
4.875% due 04/01/21 | | | 400,000 | | | | 412,000 | |
DAE Funding LLC (United Arab Emirates)
5.750% due 11/15/23 ~ | | | 160,000 | | | | 164,800 | |
Eaton Corp | |
2.750% due 11/02/22 | | | 130,000 | | | | 129,632 | |
4.150% due 11/02/42 | | | 30,000 | | | | 30,151 | |
GATX Corp | |
3.453% (USD LIBOR + 0.720%)
due 11/05/21 § | | | 1,000,000 | | | | 995,278 | |
4.750% due 06/15/22 | | | 400,000 | | | | 415,439 | |
4.850% due 06/01/21 | | | 290,000 | | | | 298,966 | |
General Electric Co | |
3.150% due 09/07/22 | | | 77,000 | | | | 76,792 | |
5.300% due 02/11/21 | | | 200,000 | | | | 207,101 | |
5.500% due 01/08/20 | | | 20,000 | | | | 20,438 | |
5.875% due 01/14/38 | | | 40,000 | | | | 42,668 | |
6.750% due 03/15/32 | | | 30,000 | | | | 34,712 | |
6.875% due 01/10/39 | | | 298,000 | | | | 353,391 | |
Harris Corp
5.054% due 04/27/45 | | | 60,000 | | | | 66,387 | |
John Deere Capital Corp
3.157% (USD LIBOR + 0.550%)
due 06/07/23 § | | | 500,000 | | | | 499,939 | |
Lockheed Martin Corp | |
3.100% due 01/15/23 | | | 20,000 | | | | 20,237 | |
3.550% due 01/15/26 | | | 70,000 | | | | 72,335 | |
4.500% due 05/15/36 | | | 30,000 | | | | 32,608 | |
Northrop Grumman Corp | |
2.930% due 01/15/25 | | | 40,000 | | | | 39,498 | |
3.250% due 01/15/28 | | | 280,000 | | | | 275,723 | |
NTT Finance Corp (Japan)
1.900% due 07/21/21 ~ | | | 800,000 | | | | 784,303 | |
Park Aerospace Holdings Ltd (Ireland)
5.250% due 08/15/22 ~ | | | 50,000 | | | | 51,370 | |
Penske Truck Leasing Co LP | |
4.125% due 08/01/23 ~ | | | 600,000 | | | | 618,145 | |
4.250% due 01/17/23 ~ | | | 800,000 | | | | 827,201 | |
Raytheon Co
3.125% due 10/15/20 | | | 70,000 | | | | 70,739 | |
Rockwell Collins Inc | |
2.800% due 03/15/22 | | | 500,000 | | | | 499,162 | |
3.100% due 11/15/21 | | | 800,000 | | | | 801,907 | |
3.200% due 03/15/24 | | | 1,000,000 | | | | 1,000,294 | |
SMBC Aviation Capital Finance DAC (Ireland)
3.000% due 07/15/22 ~ | | | 1,100,000 | | | | 1,087,533 | |
The Boeing Co
4.875% due 02/15/20 | | | 170,000 | | | | 173,133 | |
TTX Co
2.600% due 06/15/20 ~ | | | 550,000 | | | | 548,629 | |
Union Pacific Corp | |
3.950% due 09/10/28 | | | 180,000 | | | | 189,111 | |
4.500% due 09/10/48 | | | 180,000 | | | | 191,934 | |
United Parcel Service Inc | |
2.500% due 04/01/23 | | | 50,000 | | | | 49,892 | |
3.050% due 11/15/27 | | | 30,000 | | | | 30,031 | |
United Technologies Corp | |
3.950% due 08/16/25 | | | 60,000 | | | | 62,412 | |
4.125% due 11/16/28 | | | 30,000 | | | | 31,294 | |
4.500% due 06/01/42 | | | 60,000 | | | | 62,152 | |
| | |
| See Notes to Financial Statements | | See explanation of symbols and terms, if any, on B-97 and B-98 |
B-15
PACIFIC FUNDS
PF MANAGED BOND FUND
Schedule of Investments (Continued)
March 31, 2019
| | | | | | | | |
| | | Principal Amount | | | Value | |
Waste Management Inc
3.500% due 05/15/24 | | | $100,000 | | | | $102,570 | |
WRKCo Inc
4.650% due 03/15/26 | | | 1,000,000 | | | | 1,062,475 | |
XPO Logistics Inc
6.500% due 06/15/22 ~ | | | 30,000 | | | | 30,773 | |
| | | | | | | | |
| | | | | | | 13,554,912 | |
| | | | | | | | |
Technology - 1.6% | |
| | |
Activision Blizzard Inc
2.600% due 06/15/22 | | | 900,000 | | | | 892,873 | |
Apple Inc
2.450% due 08/04/26 | | | 180,000 | | | | 174,065 | |
Broadcom Corp
2.650% due 01/15/23 | | | 700,000 | | | | 682,136 | |
Broadcom Inc
3.125% due 10/15/22 ~ | | | 900,000 | | | | 895,887 | |
Dell International LLC | |
4.420% due 06/15/21 ~ | | | 500,000 | | | | 513,239 | |
5.450% due 06/15/23 ~ | | | 500,000 | | | | 533,127 | |
Hewlett Packard Enterprise Co
3.318% (USD LIBOR + 0.720%)
due 10/05/21 § | | | 600,000 | | | | 597,981 | |
Intel Corp | |
3.700% due 07/29/25 | | | 50,000 | | | | 52,489 | |
3.734% due 12/08/47 | | | 36,000 | | | | 36,427 | |
Microsoft Corp | |
2.400% due 08/08/26 | | | 490,000 | | | | 475,939 | |
2.700% due 02/12/25 | | | 60,000 | | | | 60,104 | |
2.875% due 02/06/24 | | | 240,000 | | | | 243,152 | |
3.300% due 02/06/27 | | | 240,000 | | | | 246,944 | |
3.450% due 08/08/36 | | | 20,000 | | | | 20,130 | |
3.950% due 08/08/56 | | | 30,000 | | | | 31,378 | |
NXP BV (Netherlands) | |
4.625% due 06/01/23 ~ | | | 700,000 | | | | 728,700 | |
4.875% due 03/01/24 ~ | | | 800,000 | | | | 845,176 | |
salesforce.com Inc | |
3.250% due 04/11/23 | | | 80,000 | | | | 81,996 | |
3.700% due 04/11/28 | | | 30,000 | | | | 31,486 | |
VMware Inc
2.950% due 08/21/22 | | | 500,000 | | | | 495,162 | |
| | | | | | | | |
| | | | | | | 7,638,391 | |
| | | | | | | | |
Utilities - 2.2% | |
| | |
American Electric Power Co Inc
2.150% due 11/13/20 | | | 500,000 | | | | 495,564 | |
Duke Energy Carolinas LLC
5.300% due 02/15/40 | | | 60,000 | | | | 72,625 | |
Duke Energy Corp | |
3.150% due 08/15/27 | | | 200,000 | | | | 196,539 | |
3.193% (USD LIBOR + 0.500%)
due 05/14/21 § ~ | | | 500,000 | | | | 499,903 | |
3.550% due 09/15/21 | | | 800,000 | | | | 812,874 | |
Duke Energy Ohio Inc
3.650% due 02/01/29 | | | 20,000 | | | | 20,802 | |
Emera US Finance LP (Canada)
2.700% due 06/15/21 | | | 800,000 | | | | 793,190 | |
Entergy Corp
5.125% due 09/15/20 | | | 400,000 | | | | 408,718 | |
FirstEnergy Corp | |
3.900% due 07/15/27 | | | 190,000 | | | | 193,110 | |
4.250% due 03/15/23 | | | 170,000 | | | | 177,505 | |
7.375% due 11/15/31 | | | 590,000 | | | | 781,956 | |
IPALCO Enterprises Inc
3.450% due 07/15/20 | | | 800,000 | | | | 800,751 | |
LG&E & KU Energy LLC
4.375% due 10/01/21 | | | 500,000 | | | | 513,888 | |
National Fuel Gas Co
4.900% due 12/01/21 | | | 2,000,000 | | | | 2,058,865 | |
| | | | | | | | |
| | | Principal Amount | | | Value | |
NextEra Energy Capital Holdings Inc | |
3.200% due 02/25/22 | | | $900,000 | | | | $908,608 | |
3.352% (USD LIBOR + 0.720%)
due 02/25/22 § | | | 900,000 | | | | 902,105 | |
Niagara Mohawk Power Corp
4.278% due 12/15/28 ~ | | | 1,100,000 | | | | 1,169,135 | |
Pacific Gas & Electric Co
3.500% due 10/01/20 *Y | | | 40,000 | | | | 37,000 | |
Progress Energy Inc
4.400% due 01/15/21 | | | 30,000 | | | | 30,732 | |
Virginia Electric & Power Co
6.350% due 11/30/37 | | | 160,000 | | | | 206,673 | |
| | | | | | | | |
| | | | | | | 11,080,543 | |
| | | | | | | | |
Total Corporate Bonds & Notes
(Cost $236,437,756) | | | | | | | 239,556,183 | |
| | | | | | | | |
| | |
SENIOR LOAN NOTES - 0.7% | | | | | | | | |
| | |
Communications - 0.1% | | | | | | | | |
| | |
Altice France SA TermB-12 (France)
6.171% (USD LIBOR + 3.000%)
due 01/31/26 § | | | 256,046 | | | | 245,964 | |
Charter Communications Operating LLC Term B
4.500% (USD LIBOR + 2.000%)
due 04/30/25 § | | | 120,551 | | | | 119,895 | |
Intelsat Jackson Holdings SA TermB-3
(Luxembourg)
due 11/27/23¥ | | | 40,000 | | | | 39,325 | |
Level 3 Parent LLC Term B
4.736% (USD LIBOR + 2.250%)
due 02/22/24 § | | | 70,000 | | | | 69,300 | |
Univision Communications Inc TermC-5
5.249% (USD LIBOR + 2.750%)
due 03/15/24 § | | | 141,716 | | | | 133,871 | |
UPC Financing Partnership Term AR
4.984% (USD LIBOR + 2.500%)
due 01/15/26 § | | | 54,177 | | | | 54,045 | |
Ziggo Secured Finance Partnership Term E (Netherlands)
4.984% (USD LIBOR + 2.500%)
due 04/15/25 § | | | 109,750 | | | | 107,075 | |
| | | | | | | | |
| | | | | | | 769,475 | |
| | | | | | | | |
Consumer, Cyclical - 0.2% | |
| | |
Alterra Mountain Co Term B
due 07/31/24¥ | | | 80,000 | | | | 79,717 | |
American Builders & Contractors Supply Co Inc TermB-2
4.499% (USD LIBOR + 2.000%)
due 10/31/23 § | | | 39,394 | | | | 38,405 | |
Beacon Roofing Supply Inc Term B
4.749% (USD LIBOR + 2.250%)
due 01/02/25 § | | | 86,690 | | | | 84,532 | |
Boyd Gaming Corp Term B
4.658% (USD LIBOR + 2.500%)
due 09/15/23 § | | | 200,000 | | | | 198,100 | |
Caesars Resort Collection LLC Term B
5.249% (USD LIBOR + 2.750%)
due 12/22/24 § | | | 90,928 | | | | 90,035 | |
CityCenter Holdings LLC Term B
4.749% (USD LIBOR + 2.250%)
due 04/18/24 § | | | 23,091 | | | | 22,668 | |
Michaels Stores Inc Term B
4.997% (USD LIBOR + 2.500%)
due 01/28/23 § | | | 107,412 | | | | 105,330 | |
Panther BF Aggregator 2 LP Term B
due 03/18/26¥ | | | 150,000 | | | | 148,496 | |
Party City Holdings Inc
5.000% (USD LIBOR + 2.750%)
due 08/19/22 § | | | 196,331 | | | | 195,178 | |
| | |
| See Notes to Financial Statements | | See explanation of symbols and terms, if any, on B-97 and B-98 |
B-16
PACIFIC FUNDS
PF MANAGED BOND FUND
Schedule of Investments (Continued)
March 31, 2019
| | | | | | | | |
| | | Principal Amount | | | Value | |
PetSmart Inc Term B
5.490% (USD LIBOR + 3.000%)
due 03/11/22 § | | | $96,572 | | | | $86,854 | |
Scientific Games International Inc TermB-5
5.314% (USD LIBOR + 2.750%)
due 08/14/24 § | | | 176,158 | | | | 171,597 | |
| | | | | | | | |
| | | | | | | 1,220,912 | |
| | | | | | | | |
Consumer,Non-Cyclical - 0.2% | |
| | |
Air Medical Group Holdings Inc Term B
5.739% (USD LIBOR + 3.250%)
due 04/28/22 § | | | 307,027 | | | | 289,296 | |
Atlantic Aviation FBO Inc Term B
6.250% (USD LIBOR + 3.750%)
due 12/06/25 § | | | 19,950 | | | | 20,124 | |
Catalent Pharma Solutions Inc Term B
4.749% (USD LIBOR + 2.250%)
due 05/20/24 § | | | 85,956 | | | | 85,703 | |
Change Healthcare Holdings LLC Term B
5.249% (USD LIBOR + 2.750%)
due 03/01/24 § | | | 82,492 | | | | 81,461 | |
Envision Healthcare Corp Term B
6.249% (USD LIBOR + 3.750%)
due 10/11/25 § | | | 29,925 | | | | 28,049 | |
MPH Acquisition Holdings LLC Term B
5.351% (USD LIBOR + 3.000%)
due 06/07/23 §¥ | | | 96,441 | | | | 93,464 | |
Post Holdings Inc Term B
4.490% (USD LIBOR + 2.000%)
due 05/24/24 § | | | 31,088 | | | | 30,894 | |
Prime Security Services Borrower LLC Term B
due 05/02/22¥ | | | 69,607 | | | | 69,010 | |
RegionalCare Hospital Partners Holdings Inc
6.982% (USD LIBOR + 4.500%)
due 11/16/25 § | | | 59,850 | | | | 59,364 | |
VVC Holding Corp Term B
7.197% (USD LIBOR + 4.500%)
due 02/11/26 § | | | 80,000 | | | | 78,933 | |
| | | | | | | | |
| | | | | | | 836,298 | |
| | | | | | | | |
Diversified - 0.0% | | | | | | | | |
| | |
First Eagle Holdings Inc Term B
5.351% (USD LIBOR + 2.750%)
due 12/01/24 § | | | 29,925 | | | | 29,850 | |
| | | | | | | | |
| | |
Financial - 0.0% | | | | | | | | |
| | |
Asurion LLC | | | | | | | | |
TermB-4 due 08/04/22¥ | | | 79,771 | | | | 79,472 | |
TermB-7 5.499% (USD LIBOR + 3.000%)
due 11/03/24 §¥ | | | 39,899 | | | | 39,694 | |
Focus Financial Partners LLC Term B
due 07/03/24¥ | | | 9,975 | | | | 9,946 | |
LPL Holdings Inc
due 09/21/24¥ | | | 20,000 | | | | 19,874 | |
The Edelman Financial Center LLC Term B
due 07/19/25¥ | | | 59,875 | | | | 59,613 | |
| | | | | | | | |
| | | | | | | 208,599 | |
| | | | | | | | |
Industrial - 0.1% | |
| | |
Avolon (US) LLC TermB-3 (Ireland)
4.488% (USD LIBOR + 2.000%)
due 01/15/25 § | | | 5,516 | | | | 5,481 | |
Berry Global Inc Term Q
4.610% (USD LIBOR + 2.000%)
due 10/01/22 § | | | 73,116 | | | | 72,782 | |
| | | | | | | | |
| | | Principal Amount | | | Value | |
Quikrete Holdings Inc Term B
5.249% (USD LIBOR + 2.750%)
due 11/15/23 § | | | $10,071 | | | | $9,819 | |
Reynolds Group Holdings Inc Term B
due 02/05/23¥ | | | 239,388 | | | | 236,887 | |
| | | | | | | | |
| | | | | | | 324,969 | |
| | | | | | | | |
Technology - 0.1% | |
| | |
Dell International LLC Term B
4.500% (USD LIBOR + 2.000%)
due 09/07/23 § | | | 174,282 | | | | 172,496 | |
First Data Corp | |
4.486% (USD LIBOR + 2.250%)
due 07/10/22 § | | | 10,000 | | | | 9,986 | |
4.486% (USD LIBOR + 2.250%)
due 04/26/24 § | | | 146,263 | | | | 145,989 | |
McAfee LLC Term B
6.249% (USD LIBOR + 3.750%)
due 09/29/24 § | | | 39,900 | | | | 39,845 | |
| | | | | | | | |
| | | | | | | 368,316 | |
| | | | | | | | |
Total Senior Loan Notes
(Cost $3,832,141) | | | | | | | 3,758,419 | |
| | | | | | | | |
| | |
MORTGAGE-BACKED SECURITIES - 54.7% | | | | | | | | |
|
Collateralized Mortgage Obligations - Commercial - 2.3% | |
| | |
Ashford Hospitality Trust
3.484% (USD LIBOR + 1.000%)
due 05/15/35 § ~ | | | 600,000 | | | | 600,293 | |
BAMLLRe-REMIC Trust
5.779% due 08/10/45 § ~ | | | 1,661,137 | | | | 1,180,128 | |
BBCCRE Trust
4.563% due 08/10/33 § ~ | | | 320,000 | | | | 286,765 | |
BX Commercial Mortgage Trust
4.534% (USD LIBOR + 2.050%)
due 11/15/35 § ~ | | | 114,488 | | | | 114,988 | |
BX Trust
3.404% (USD LIBOR + 0.920%)
due 07/15/34 § ~ | | | 302,122 | | | | 301,741 | |
CD Commercial Mortgage Trust
5.398% due 12/11/49 § | | | 816 | | | | 517 | |
Commercial Mortgage Trust
4.351% due 02/10/48 § | | | 90,000 | | | | 90,195 | |
Credit Suisse Commercial Mortgage Trust
5.373% due 12/15/39 | | | 77,556 | | | | 52,463 | |
CSMC Trust | |
4.373% due 09/15/37 ~ | | | 830,000 | | | | 742,344 | |
8.484% (USD LIBOR + 6.000%)
due 11/15/33 § ~ | | | 490,000 | | | | 492,805 | |
DBUBS Mortgage Trust
5.339% due 08/10/44 § ~ | | | 260,000 | | | | 271,816 | |
Fannie Mae
3.673% due 09/25/28 § | | | 280,000 | | | | 293,655 | |
Fannie Mae (IO) | |
0.364% due 10/25/24 § | | | 10,944,907 | | | | 187,293 | |
Freddie Mac Multifamily Structured Pass-Through Certificates | | | | | | | | |
3.030% (USD LIBOR + 0.540%)
due 12/25/28 § | | | 60,000 | | | | 60,142 | |
Freddie Mac Multifamily Structured Pass-Through Certificates (IO) | | | | | | | | |
0.417% due 08/25/19 § | | | 8,688,047 | | | | 3,221 | |
GE Commercial Mortgage Co
5.677% due 12/10/49 § | | | 180,000 | | | | 43,456 | |
Government National Mortgage Association (IO) | |
0.411% due 01/16/53 § | | | 10,978,117 | | | | 313,060 | |
0.587% due 04/16/47 § | | | 3,964,433 | | | | 149,511 | |
GRACE Mortgage Trust
3.520% due 06/10/28 ~ | | | 600,000 | | | | 604,816 | |
| | |
| See Notes to Financial Statements | | See explanation of symbols and terms, if any, on B-97 and B-98 |
B-17
PACIFIC FUNDS
PF MANAGED BOND FUND
Schedule of Investments (Continued)
March 31, 2019
| | | | | | | | |
| | | Principal Amount | | | Value | |
GS Mortgage Securities Trust | |
3.203% due 02/10/29 ~ | | | $400,000 | | | | $401,918 | |
3.784% (USD LIBOR + 1.300%)
due 09/15/31 § ~ | | | 1,120,000 | | | | 1,100,271 | |
5.622% due 11/10/39 | | | 133,591 | | | | 115,341 | |
JP Morgan Chase Commercial Mortgage Securities Trust | |
5.438% due 01/15/49 ~ | | | 470,000 | | | | 101,246 | |
5.502% due 06/12/47 § | | | 220,000 | | | | 168,548 | |
5.607% due 02/12/49 § | | | 969,768 | | | | 702,597 | |
ML-CFC Commercial Mortgage Trust
5.450% due 08/12/48 § | | | 62,847 | | | | 46,100 | |
Morgan Stanley Bank of America Merrill
Lynch Trust
3.040% due 04/15/48 | | | 1,000,000 | | | | 1,008,246 | |
Morgan Stanley Capital I Trust | |
3.402% due 07/13/29 § ~ | | | 600,000 | | | | 605,390 | |
3.446% due 07/13/29 § ~ | | | 700,000 | | | | 705,271 | |
Waterfall Commercial Mortgage Trust
4.104% due 09/14/22 § ~ | | | 215,776 | | | | 218,803 | |
Wells Fargo Commercial Mortgage Trust (IO)
1.278% due 03/15/50 § | | | 4,746,441 | | | | 383,859 | |
WFRBS Commercial Mortgage Trust (IO)
1.327% due 03/15/44 § ~ | | | 4,045,414 | | | | 87,479 | |
| | | | | | | | |
| | | | | | | 11,434,278 | |
| | | | | | | | |
Collateralized Mortgage Obligations - Residential - 6.9% | |
|
Alternative Loan Trust | |
2.656% (USD LIBOR + 0.170%)
due 07/25/46 § | | | 358,451 | | | | 347,662 | |
2.696% (USD LIBOR + 0.210%)
due 05/25/35 § | | | 294,177 | | | | 277,966 | |
3.661% due 06/25/37 § | | | 123,381 | | | | 105,756 | |
American Home Mortgage Investment Trust
6.700% due 06/25/36 | | | 1,376,564 | | | | 501,911 | |
Banc of America Funding Trust
4.633% due 05/25/35 § | | | 22,583 | | | | 23,756 | |
BCAP LLC Trust | |
0.184% due 03/28/37 § ~ | | | 1,675,822 | | | | 1,621,251 | |
4.917% due 03/26/37 ~ | | | 43,493 | | | | 43,564 | |
Bear Stearns Adjustable Rate Mortgage Trust | |
4.354% due 08/25/33 § | | | 26,502 | | | | 26,695 | |
4.717% due 10/25/36 § | | | 10,778 | | | | 10,421 | |
4.807% due 01/25/35 § | | | 365,718 | | | | 369,590 | |
Bear StearnsALT-A Trust | |
3.960% due 11/25/36 § | | | 50,394 | | | | 42,067 | |
4.568% due 05/25/35 § | | | 19,665 | | | | 19,830 | |
Chase Mortgage Finance Trust | |
4.134% due 09/25/36 § | | | 74,856 | | | | 70,029 | |
4.646% due 02/25/37 § | | | 251,175 | | | | 254,960 | |
ChaseFlex Trust
2.636% (USD LIBOR + 0.150%)
due 08/25/37 § | | | 439,642 | | | | 452,261 | |
Chevy Chase Funding LLC | |
2.736% (USD LIBOR + 0.250%)
due 08/25/35 § ~ | | | 19,764 | | | | 19,649 | |
2.966% due 05/25/35 § ~ | | | 841,130 | | | | 661,248 | |
Citigroup Mortgage Loan Trust Inc
4.240% (UST + 2.150%)
due 09/25/35 § | | | 11,093 | | | | 11,281 | |
COLT Mortgage Loan Trust
3.000% due 05/25/46 ~ | | | 81,769 | | | | 81,611 | |
Countrywide Home Loan Mortgage
Pass-Through Trust
3.126% (USD LIBOR + 0.640%)
due 03/25/35 § | | | 10,076 | | | | 10,109 | |
Credit Suisse First Boston Mortgage
Securities Corp
6.000% due 11/25/35 | | | 49,675 | | | | 41,245 | |
CSMC Trust
3.500% due 02/25/48 § ~ | | | 3,581,301 | | | | 3,510,502 | |
Downey Saving & Loan Association Mortgage Loan Trust
2.662% (USD LIBOR + 0.180%)
due 04/19/47 § | | | 103,835 | | | | 92,848 | |
| | | | | | | | |
| | | Principal Amount | | | Value | |
Eurosail-UK PLC (United Kingdom) | |
1.793% (GBP LIBOR + 0.950%)
due 06/13/45 § ~ | | | GBP 780,970 | | | | $1,006,892 | |
Fannie Mae | |
2.959% (USD LIBOR + 0.450%)
due 09/25/46 § | | | $667,953 | | | | 667,802 | |
3.875% (US PRIME - 1.625%)
due 11/25/23 § | | | 72,422 | | | | 69,903 | |
5.500% due 04/25/35 | | | 394,506 | | | | 444,494 | |
Fannie Mae (IO) | |
3.515% (6.000% - USD LIBOR)
due 11/25/45 § | | | 1,823,673 | | | | 329,401 | |
3.615% (6.100% - USD LIBOR)
due 09/25/46 § | | | 1,152,752 | | | | 166,917 | |
4.000% due 03/25/43 | | | 438,332 | | | | 75,405 | |
4.000% due 04/25/43 | | | 1,682,871 | | | | 286,083 | |
Freddie Mac (IO) | |
3.500% due 04/15/43 | | | 1,012,406 | | | | 154,977 | |
3.616% (6.100% - USD LIBOR)
due 08/15/44 § | | | 293,494 | | | | 56,282 | |
4.000% due 04/15/43 | | | 421,134 | | | | 51,177 | |
Freddie Mac REMICS | | | | | | | | |
3.000% due 08/15/48 | | | 595,526 | | | | 589,968 | |
8.000% due 04/15/30 | | | 75,987 | | | | 87,264 | |
Freddie Mac Structured Agency Credit Risk
Debt Notes | |
5.636% (USD LIBOR + 3.150%)
due 07/25/30 § | | | 1,120,000 | | | | 1,088,659 | |
6.486% (USD LIBOR + 4.000%)
due 08/25/24 § | | | 415,855 | | | | 450,664 | |
GMACM Mortgage Loan Trust
6.000% due 12/25/35 | | | 714,977 | | | | 693,471 | |
Government National Mortgage Association | |
2.809% (USD LIBOR + 0.300%)
due 05/20/68 § | | | 465,350 | | | | 462,996 | |
3.109% (USD LIBOR + 0.600%)
due 07/20/65 § | | | 686,299 | | | | 685,944 | |
3.247% (USD LIBOR + 0.750%)
due 04/20/67 § | | | 754,143 | | | | 767,245 | |
3.309% (USD LIBOR + 0.800%)
due 06/20/66 § | | | 758,715 | | | | 764,480 | |
3.309% (USD LIBOR + 0.800%)
due 07/20/66 § | | | 1,218,084 | | | | 1,224,622 | |
5.263% due 09/20/66 § | | | 912,602 | | | | 1,005,933 | |
Government National Mortgage Association (IO) | |
3.618% (6.100% - USD LIBOR)
due 10/16/46 § | | | 246,408 | | | | 49,080 | |
3.662% (6.150% - USD LIBOR)
due 02/20/46 § | | | 1,595,062 | | | | 262,753 | |
4.000% due 11/20/44 | | | 1,037,655 | | | | 191,107 | |
4.500% due 11/16/45 | | | 362,856 | | | | 74,973 | |
Great Hall Mortgages PLC (United Kingdom)
2.745% (USD LIBOR + 0.130%)
due 06/18/39 § ~ | | | 306,409 | | | | 300,532 | |
GSR Mortgage Loan Trust | |
6.000% due 11/25/35 | | | 722,954 | | | | 589,850 | |
6.000% due 07/25/37 | | | 368,907 | | | | 326,973 | |
HarborView Mortgage Loan Trust | |
2.646% (USD LIBOR + 0.160%)
due 05/25/38 § | | | 354,777 | | | | 305,855 | |
2.652% (USD LIBOR + 0.170%)
due 12/19/36 § | | | 217,601 | | | | 199,720 | |
2.922% (USD LIBOR + 0.440%)
due 05/19/35 § | | | 318,090 | | | | 309,002 | |
4.425% due 08/19/36 § | | | 149,142 | | | | 139,490 | |
4.961% due 02/25/36 § | | | 64,609 | | | | 42,484 | |
JP Morgan Mortgage Trust | |
3.500% due 09/25/48 § ~ | | | 1,484,835 | | | | 1,481,435 | |
3.500% due 10/25/48 § ~ | | | 691,303 | | | | 689,763 | |
3.500% due 10/25/48 § ~ | | | 2,323,019 | | | | 2,317,845 | |
4.327% due 07/25/35 § | | | 37,957 | | | | 38,260 | |
| | |
| See Notes to Financial Statements | | See explanation of symbols and terms, if any, on B-97 and B-98 |
B-18
PACIFIC FUNDS
PF MANAGED BOND FUND
Schedule of Investments (Continued)
March 31, 2019
| | | | | | | | |
| | | Principal Amount | | | Value | |
5.750% due 01/25/36 | | | $15,885 | | | | $12,264 | |
Ludgate Funding PLC (United Kingdom)
1.001% (GBP LIBOR + 0.160%)
due 01/01/61 § ~ | | | GBP 503,793 | | | | 612,285 | |
Merrill Lynch Mortgage Investors Trust
4.336% due 11/25/35 § | | | $385,635 | | | | 389,583 | |
Morgan Stanley Resecuritization Trust
3.042% (US FED + 0.710%)
due 12/27/46 § ~ | | | 1,687,602 | | | | 1,280,495 | |
Nomura Resecuritization Trust
7.599% due 06/26/35 § ~ | | | 1,853,826 | | | | 1,834,976 | |
RBSSP Resecuritization Trust
4.616% due 12/25/35 § ~ | | | 135,698 | | | | 139,329 | |
Reperforming Loan REMIC Trust | |
2.826% (USD LIBOR + 0.340%)
due 06/25/35 § ~ | | | 33,818 | | | | 32,678 | |
2.826% (USD LIBOR + 0.340%)
due 01/25/36 § ~ | | | 201,131 | | | | 197,323 | |
Towd Point Mortgage Funding PLC
(United Kingdom)
1.860% (GBP LIBOR + 1.025%)
due 10/20/51 § # ~ | | | GBP 1,500,000 | | | | 1,954,173 | |
WaMu Mortgage Pass-Through Certificates Trust
3.874% due 02/25/37 § | | | $163,249 | | | | 156,981 | |
Wells Fargo Mortgage-Backed Securities Trust | |
4.558% due 12/25/34 § | | | 16,628 | | | | 17,077 | |
4.675% due 04/25/36 § | | | 13,175 | | | | 13,222 | |
4.955% due 03/25/36 § | | | 125,092 | | | | 124,377 | |
5.145% due 04/25/35 § | | | 337,559 | | | | 345,758 | |
| | | | | | | | |
| | | | | | | 34,156,434 | |
| | | | | | | | |
Fannie Mae - 36.2% | |
| | |
2.310% due 08/01/22 | | | 500,000 | | | | 496,986 | |
2.810% due 04/01/25 | | | 30,000 | | | | 30,216 | |
3.000% due 09/01/21 - 05/01/49 | | | 41,038,607 | | | | 40,844,464 | |
3.500% due 04/01/34 - 05/01/49 | | | 54,538,008 | | | | 55,280,909 | |
3.597% (US FED + 1.200%)
due 10/01/44 § | | | 14,473 | | | | 14,574 | |
4.000% due 06/01/25 - 06/01/57 | | | 66,327,079 | | | | 68,232,722 | |
4.262% (US FED + 1.926%)
due 12/01/36 § | | | 2,921 | | | | 3,037 | |
4.293% (UST + 2.043%)
due 09/01/35 § | | | 41,119 | | | | 43,201 | |
4.386% (USD LIBOR + 1.641%)
due 11/01/32 § | | | 32,617 | | | | 33,180 | |
4.500% due 04/01/19 - 09/01/57 | | | 11,260,666 | | | | 11,743,348 | |
4.730% (UST + 2.360%)
due 11/01/34 § | | | 33,419 | | | | 35,390 | |
4.737% (USD LIBOR + 1.737%)
due 12/01/35 § | | | 4,947 | | | | 5,019 | |
5.000% due 02/01/25 - 04/01/49 | | | 1,304,703 | | | | 1,380,554 | |
5.500% due 12/01/20 - 08/01/39 | | | 1,426,777 | | | | 1,541,979 | |
6.000% due 02/01/33 - 06/01/40 | | | 227,346 | | | | 250,093 | |
| | | | | | | | |
| | | | | | | 179,935,672 | |
| | | | | | | | |
Freddie Mac - 4.2% | |
| | |
3.000% due 02/01/38 - 04/01/49 | | | 4,889,351 | | | | 4,876,142 | |
3.500% due 10/01/42 - 04/01/49 | | | 5,723,971 | | | | 5,819,032 | |
4.000% due 10/01/46 - 04/01/49 | | | 7,023,164 | | | | 7,232,387 | |
4.085% (USD LIBOR + 1.345%)
due 09/01/35 § | | | 5,831 | | | | 6,022 | |
4.172% (UST + 2.250%)
due 04/01/32 § | | | 10,737 | | | | 11,244 | |
4.347% (USD LIBOR + 1.721%)
due 06/01/35 § | | | 54,496 | | | | 57,035 | |
4.500% due 11/01/44 | | | 142,701 | | | | 151,667 | |
| | | | | | | | |
| | | Principal Amount | | | Value | |
4.620% (USD LIBOR + 1.870%)
due 09/01/35 § | | | $28,561 | | | | $30,031 | |
4.722% (UST + 2.250%)
due 11/01/31 § | | | 2,482 | | | | 2,612 | |
5.000% due 08/01/48 - 04/01/49 | | | 2,032,172 | | | | 2,153,229 | |
5.500% due 03/01/23 - 05/01/40 | | | 576,547 | | | | 631,952 | |
6.000% due 03/01/23 | | | 9,886 | | | | 10,708 | |
| | | | | | | | |
| | | | | | | 20,982,061 | |
| | | | | | | | |
Government National Mortgage Association - 5.1% | |
| | |
3.000% due 09/15/42 - 04/20/49 | | | 2,041,210 | | | | 2,054,390 | |
3.500% due 03/20/45 - 04/20/49 | | | 5,664,179 | | | | 5,790,264 | |
4.000% due 12/20/47 - 05/20/49 | | | 2,773,288 | | | | 2,863,851 | |
4.500% due 06/20/48 - 04/20/49 | | | 5,146,261 | | | | 5,350,557 | |
5.000% due 10/15/38 - 05/20/49 | | | 9,080,565 | | | | 9,498,460 | |
| | | | | | | | |
| | | | 25,557,522 | |
| | | | | | | | |
Total Mortgage-Backed Securities
(Cost $272,396,040) | | | | 272,065,967 | |
| | | | | | | | |
| | |
ASSET-BACKED SECURITIES - 5.3% | | | | | | | | |
| | |
Ally Auto Receivables Trust
2.720% due 05/17/21 | | | 494,997 | | | | 495,056 | |
Apex Credit CLO Ltd (Cayman)
3.611% (USD LIBOR + 1.050%)
due 10/27/28 § ~ | | | 800,000 | | | | 799,871 | |
Argent Securities Inc | |
3.306% (USD LIBOR + 0.820%)
due 02/25/34 § | | | 654,892 | | | | 636,184 | |
3.611% (USD LIBOR + 1.125%)
due 11/25/34 § | | | 469,638 | | | | 468,894 | |
Asset-Backed Funding Certificates Trust
3.186% (USD LIBOR + 0.700%)
due 06/25/34 § | | | 60,527 | | | | 59,862 | |
Basic Asset Backed Securities Trust
2.796% (USD LIBOR + 0.310%)
due 04/25/36 § | | | 488,723 | | | | 487,730 | |
Bear Stearns Asset Backed Securities I Trust | |
2.686% (USD LIBOR + 0.200%)
due 12/25/36 § | | | 198,276 | | | | 198,229 | |
2.726% (USD LIBOR + 0.240%)
due 12/25/36 § | | | 1,286,718 | | | | 1,109,402 | |
3.491% (USD LIBOR + 1.005%)
due 06/25/35 § | | | 291,748 | | | | 291,090 | |
Business Loan Express Business Loan Trust
2.916% (USD LIBOR + 0.430%)
due 02/25/31 § ~ | | | 112,678 | | | | 109,497 | |
Chapel BV (Netherlands)
0.352% (EUR LIBOR + 0.660%)
due 11/17/64 § ~ | | | EUR 1,456 | | | | 1,635 | |
Chesapeake Funding II LLC | |
2.854% (USD LIBOR + 0.370%)
due 08/15/30 § ~ | | | $583,189 | | | | 582,084 | |
3.230% due 08/15/30 ~ | | | 583,189 | | | | 587,411 | |
CIT Mortgage Loan Trust
3.840% (USD LIBOR + 1.350%)
due 10/25/37 § ~ | | | 539,675 | | | | 545,844 | |
Citigroup Mortgage Loan Trust | |
2.656% (USD LIBOR + 0.170%)
due 05/25/37 § | | | 125,317 | | | | 124,823 | |
2.936% (USD LIBOR + 0.450%)
due 11/25/45 § ~ | | | 488,602 | | | | 484,810 | |
Community Funding CLO (Cayman)
5.750% due 11/01/27 ~ | | | 649,859 | | | | 660,918 | |
Countrywide Asset-Backed Certificates | |
2.626% (USD LIBOR + 0.140%)
due 07/25/37 § | | | 367,019 | | | | 332,649 | |
2.886% (USD LIBOR + 0.400%)
due 06/25/36 § | | | 500,000 | | | | 492,849 | |
| | |
| See Notes to Financial Statements | | See explanation of symbols and terms, if any, on B-97 and B-98 |
B-19
PACIFIC FUNDS
PF MANAGED BOND FUND
Schedule of Investments (Continued)
March 31, 2019
| | | | | | | | |
| | | Principal Amount | | | Value | |
Credit Acceptance Auto Loan Trust
3.470% due 05/17/27 ~ | | | $600,000 | | | | $604,858 | |
First Franklin Mortgage Loan Trust
3.146% (USD LIBOR + 0.660%)
due 05/25/36 § | | | 447,926 | | | | 448,162 | |
Freddie Mac Structured Pass-Through Certificates 3.089% due 11/25/27 | | | 200,000 | | | | 200,552 | |
Gallatin CLO (Cayman)
3.811% (USD LIBOR + 1.050%)
due 01/21/28 § ~ | | | 500,000 | | | | 498,038 | |
GM Financial Consumer Automobile Receivables Trust
2.740% due 07/16/21 | | | 507,716 | | | | 507,850 | |
GSAA Home Equity Trust | |
2.586% (USD LIBOR + 0.100%)
due 03/25/37 § | | | 485,022 | | | | 233,238 | |
6.000% due 08/25/47 | | | 506,244 | | | | 480,111 | |
Home Equity Asset Trust
3.386% (USD LIBOR + 0.900%)
due 11/25/34 § | | | 457,745 | | | | 461,680 | |
Jamestown CLO VIII Ltd (Cayman)
3.657% (USD LIBOR + 0.870%)
due 01/15/28 § ~ | | | 700,000 | | | | 693,773 | |
Legacy Mortgage Asset Trust
4.000% due 01/25/59 ~ | | | 380,610 | | | | 383,777 | |
LoanCore Issuer Ltd (Cayman)
3.614% (USD LIBOR + 1.130%)
due 05/15/28 § ~ | | | 500,000 | | | | 500,889 | |
Long Beach Mortgage Loan Trust
2.786% (USD LIBOR + 0.300%)
due 02/25/36 § | | | 1,071,553 | | | | 891,656 | |
Mastr Asset Backed Securities Trust
2.706% (USD LIBOR + 0.220%)
due 10/25/36 § | | | 676,613 | | | | 306,314 | |
Merrill Lynch Mortgage Investors Trust
2.646% (USD LIBOR + 0.160%)
due 04/25/37 § | | | 432,567 | | | | 255,551 | |
Monarch Grove CLO (Cayman)
3.651% (USD LIBOR + 0.880%)
due 01/25/28 § ~ | | | 500,000 | | | | 495,887 | |
Morgan Stanley Home Equity Loan Trust | |
2.586% (USD LIBOR + 0.100%)
due 12/25/36 § | | | 1,045,754 | | | | 601,371 | |
2.626% (USD LIBOR + 0.140%)
due 12/25/36 § | | | 825,460 | | | | 477,067 | |
Mountain View CLO Ltd (Cayman)
3.587% (USD LIBOR + 0.800%)
due 10/15/26 § ~ | | | 579,571 | | | | 577,542 | |
Navient Private Education Trust
3.420% due 01/15/43 ~ | | | 150,000 | | | | 152,331 | |
Navient Student Loan Trust | |
2.726% (USD LIBOR + 0.240%)
due 03/25/67 § ~ | | | 130,554 | | | | 130,538 | |
3.430% due 12/15/59 ~ | | | 1,616,003 | | | | 1,625,699 | |
3.636% (USD LIBOR + 1.150%)
due 07/26/66 § ~ | | | 150,000 | | | | 152,385 | |
Oaktree CLO Ltd (Cayman)
3.981% (USD LIBOR + 1.220%)
due 10/20/26 § ~ | | | 706,279 | | | | 706,282 | |
OneMain Financial Issuance Trust
3.190% due 03/18/26 ~ | | | 82,387 | | | | 82,505 | |
Option One Mortgage Loan Trust
2.616% (USD LIBOR + 0.130%)
due 07/25/37 § | | | 996,906 | | | | 717,607 | |
SBA Small Business Investment Cos | |
3.113% due 03/10/29 | | | 200,000 | | | | 203,144 | |
3.548% due 09/10/28 | | | 294,879 | | | | 305,186 | |
| | | | | | | | |
| | | Principal Amount | | | Value | |
Securitized Asset-Backed Receivables LLC Trust | |
2.616% (USD LIBOR + 0.130%)
due 05/25/37 § | | | $80,200 | | | | $62,139 | |
2.626% (USD LIBOR + 0.140%)
due 05/25/36 § | | | 183,604 | | | | 115,931 | |
SLM Private Education Loan Trust
5.734% (USD LIBOR + 3.250%)
due 05/16/44 § ~ | | | 84,429 | | | | 85,306 | |
SLM Student Loan Trust
2.881% (USD LIBOR + 0.110%)
due 10/27/25 § | | | 72,104 | | | | 72,059 | |
SMB Private Education Loan Trust
3.984% (USD LIBOR + 1.500%)
due 04/15/32 § ~ | | | 550,000 | | | | 560,110 | |
Sofi Professional Loan Program Trust
2.640% due 08/25/47 ~ | | | 399,915 | | | | 399,410 | |
Structured Asset Investment Loan Trust
3.221% (USD LIBOR + 0.735%)
due 08/25/35 § | | | 359,831 | | | | 360,911 | |
Structured Asset Securities Corp Mortgage Loan Trust
2.936% (USD LIBOR + 0.450%)
due 05/25/37 § ~ | | | 1,000,000 | | | | 955,628 | |
Venture XII CLO Ltd (Cayman)
3.429% (USD LIBOR + 0.800%)
due 02/28/26 § ~ | | | 700,000 | | | | 698,206 | |
Venture XVI CLO Ltd (Cayman)
3.637% (USD LIBOR + 0.850%)
due 01/15/28 § ~ | | | 700,000 | | | | 695,318 | |
Westlake Automobile Receivables Trust | |
2.530% due 09/16/19 ~ | | | 19,552 | | | | 19,549 | |
2.980% due 01/18/22 ~ | | | 700,000 | | | | 700,896 | |
Zais CLO 1 Ltd (Cayman)
3.937% (USD LIBOR + 1.150%)
due 04/15/28 § ~ | | | 500,000 | | | | 497,400 | |
| | | | | | | | |
| |
Total Asset-Backed Securities
(Cost $24,604,792) | | | | 26,385,694 | |
| | | | | | | | |
| | |
U.S. TREASURY OBLIGATIONS - 20.4% | | | | | | | | |
| |
U.S. Treasury Bonds - 6.9% | | | | | |
| | |
2.875% due 05/15/43 | | | 4,700,000 | | | | 4,783,719 | |
3.000% due 05/15/42 | | | 1,800,000 | | | | 1,877,098 | |
3.000% due 08/15/48 | | | 6,300,000 | | | | 6,538,096 | |
3.125% due 02/15/43 | | | 3,500,000 | | | | 3,717,041 | |
3.625% due 08/15/43 | | | 11,800,000 | | | | 13,590,051 | |
3.750% due 11/15/43 | | | 1,500,000 | | | | 1,762,588 | |
4.250% due 05/15/39 | | | 200,000 | | | | 250,613 | |
4.375% due 05/15/40 | | | 1,000,000 | | | | 1,275,039 | |
4.625% due 02/15/40 | | | 400,000 | | | | 526,289 | |
| | | | | | | | |
| | | | | | | 34,320,534 | |
| | | | | | | | |
U.S. Treasury Inflation Protected Securities - 3.6% | |
| | |
0.125% due 07/15/26 ^ | | | 840,088 | | | | 822,325 | |
0.375% due 01/15/27 ^ | | | 937,827 | | | | 930,177 | |
0.625% due 01/15/26 ^ | | | 1,483,076 | | | | 1,500,920 | |
0.750% due 07/15/28 ^ | | | 4,011,080 | | | | 4,104,263 | |
0.750% due 02/15/42 ^ | | | 813,191 | | | | 793,616 | |
0.875% due 01/15/29 ^ | | | 6,978,090 | | | | 7,209,312 | |
1.000% due 02/15/48 ^ | | | 1,633,184 | | | | 1,671,962 | |
1.000% due 02/15/49 ^ | | | 600,180 | | | | 617,332 | |
1.375% due 02/15/44 ^ | | | 302,411 | | | | 334,914 | |
| | | | | | | | |
| | | | | | | 17,984,821 | |
| | | | | | | | |
U.S. Treasury Notes - 9.9% | |
| | |
1.625% due 05/31/23 | | | 2,000,000 | | | | 1,952,227 | |
1.875% due 07/31/22 ‡ | | | 1,700,000 | | | | 1,681,008 | |
1.875% due 08/31/22 | | | 4,000,000 | | | | 3,954,453 | |
| | |
| See Notes to Financial Statements | | See explanation of symbols and terms, if any, on B-97 and B-98 |
B-20
PACIFIC FUNDS
PF MANAGED BOND FUND
Schedule of Investments (Continued)
March 31, 2019
| | | | | | | | |
| | | Principal Amount | | | Value | |
2.000% due 10/31/22 | | | $1,000,000 | | | | $992,500 | |
2.125% due 03/31/24 | | | 590,000 | | | | 587,061 | |
2.125% due 09/30/24 | | | 2,100,000 | | | | 2,085,029 | |
2.250% due 01/31/24 | | | 2,000,000 | | | | 2,001,211 | |
2.250% due 02/15/27 | | | 600,000 | | | | 595,945 | |
2.250% due 08/15/27 | | | 300,000 | | | | 297,451 | |
2.500% due 01/31/21 | | | 1,160,000 | | | | 1,164,395 | |
2.500% due 01/31/24 | | | 190,000 | | | | 192,327 | |
2.625% due 02/15/29 ‡ | | | 2,150,000 | | | | 2,192,118 | |
2.750% due 02/15/24 | | | 400,000 | | | | 409,445 | |
2.875% due 10/31/23 ‡ | | | 30,000,000 | | | | 30,836,133 | |
3.125% due 11/15/28 | | | 50,000 | | | | 53,101 | |
| | | | | | | | |
| | | | 48,994,404 | |
| | | | | | | | |
Total U.S. Treasury Obligations
(Cost $98,723,512) | | | | 101,299,759 | |
| | | | | | | | |
|
FOREIGN GOVERNMENT BONDS & NOTES - 4.3% | |
| | |
Abu Dhabi Government International Bond (United Arab Emirates)
2.500% due 10/11/22 ~ | | | 200,000 | | | | 198,370 | |
Argentina POM Politica Monetaria (Argentina)
54.196% (ARS Reference + 0.000%)
due 06/21/20 § | | | ARS 1,230,000 | | | | 31,887 | |
Argentine Bonos del Tesoro (Argentina)
18.200% due 10/03/21 | | | 4,750,000 | | | | 85,332 | |
Argentine Republic Government International (Argentina) | |
3.750% due 12/31/38 | | | $250,000 | | | | 145,312 | |
5.625% due 01/26/22 | | | 430,000 | | | | 371,735 | |
7.500% due 04/22/26 | | | 340,000 | | | | 289,382 | |
Autonomous Community of Catalonia (Spain)
4.950% due 02/11/20 | | | EUR 400,000 | | | | 464,564 | |
Brazil Notas do Tesouro Nacional ‘F’ (Brazil)
10.000% due 01/01/21 | | | BRL 5,338,000 | | | | 1,425,365 | |
Brazilian Government International (Brazil) | |
4.625% due 01/13/28 | | | $270,000 | | | | 272,635 | |
5.000% due 01/27/45 | | | 400,000 | | | | 369,650 | |
5.625% due 01/07/41 | | | 120,000 | | | | 120,750 | |
5.625% due 02/21/47 | | | 200,000 | | | | 199,125 | |
China Government (China) | |
3.310% due 11/30/25 ~ | | | CNY 3,000,000 | | | | 451,138 | |
3.380% due 11/21/24 ~ | | | 500,000 | | | | 75,806 | |
3.390% due 05/21/25 ~ | | | 1,000,000 | | | | 151,339 | |
Colombia Government (Colombia)
5.625% due 02/26/44 | | | $200,000 | | | | 225,940 | |
Egypt Government International Bond (Egypt)
5.577% due 02/21/23 ~ | | | 200,000 | | | | 198,964 | |
Indonesia Government (Indonesia) | |
3.500% due 01/11/28 | | | 200,000 | | | | 194,920 | |
4.875% due 05/05/21 ~ | | | 500,000 | | | | 519,045 | |
5.125% due 01/15/45 ~ | | | 200,000 | | | | 213,256 | |
Israel Government International Bond (Israel)
4.125% due 01/17/48 | | | 600,000 | | | | 622,611 | |
Japan Bank for International Cooperation (Japan)
2.375% due 07/21/22 | | | 700,000 | | | | 696,292 | |
Japanese Government CPI Linked (Japan)
0.100% due 03/10/26 ^ | | | JPY 289,031,262 | | | | 2,711,673 | |
Kenya Government International Bond (Kenya)
6.875% due 06/24/24 ~ | | | $200,000 | | | | 205,802 | |
Kuwait International Government (Kuwait)
3.500% due 03/20/27 ~ | | | 470,000 | | | | 481,068 | |
Mexican Bonos (Mexico) | |
6.500% due 06/09/22 | | | MXN 30,710,000 | | | | 1,525,228 | |
7.750% due 11/13/42 | | | 44,120,000 | | | | 2,113,232 | |
Nigeria Government International Bond (Nigeria)
6.500% due 11/28/27 ~ | | | $200,000 | | | | 198,159 | |
| | | | | | | | |
| | | Principal Amount | | | Value | |
Peru Government Bond (Peru)
6.150% due 08/12/32 ~ | | | PEN 3,000,000 | | | | $952,707 | |
Peruvian Government International (Peru) | |
5.625% due 11/18/50 | | | $30,000 | | | | 38,565 | |
5.940% due 02/12/29 ~ | | | PEN 1,300,000 | | | | 412,991 | |
6.550% due 03/14/37 | | | $100,000 | | | | 135,125 | |
Province of Ontario (Canada) | |
1.650% due 09/27/19 | | | 200,000 | | | | 199,132 | |
3.150% due 06/02/22 | | | CAD 900,000 | | | | 699,991 | |
Province of Quebec (Canada)
3.500% due 07/29/20 | | | $600,000 | | | | 608,027 | |
Qatar Government International Bond (Qatar)
4.500% due 04/23/28 ~ | | | 1,000,000 | | | | 1,070,544 | |
Republic of Poland Government International (Poland)
4.000% due 01/22/24 | | | 320,000 | | | | 335,174 | |
Russian Federal (Russia) | |
7.000% due 08/16/23 | | | RUB 26,040,000 | | | | 384,683 | |
7.050% due 01/19/28 | | | 60,232,000 | | | | 856,802 | |
Tokyo Metropolitan Government (Japan)
2.500% due 06/08/22 ~ | | | $1,000,000 | | | | 993,898 | |
| | | | | | | | |
| |
Total Foreign Government Bonds & Notes
(Cost $22,949,510) | | | | 21,246,219 | |
| | | | | | | | |
| | |
MUNICIPAL BONDS - 0.5% | | | | | | | | |
| | |
City of Chicago IL ‘B’
5.630% due 01/01/22 | | | 270,000 | | | | 274,606 | |
Tobacco Settlement Finance Authority of WV ‘A’ | |
7.467% due 06/01/47 | | | 720,000 | | | | 719,964 | |
University of Arizona ‘A’
6.423% due 08/01/35 | | | 1,300,000 | | | | 1,359,397 | |
| | | | | | | | |
| |
Total Municipal Bonds
(Cost $2,259,067) | | | | 2,353,967 | |
| | | | | | | | |
| | |
SHORT-TERM INVESTMENTS - 6.4% | | | | | | | | |
| |
Commercial Paper - 0.3% | | | | | |
| | |
MUFG Bank Ltd
2.663% due 05/07/19 | | | 1,280,000 | | | | 1,276,594 | |
| | | | | | | | |
|
Foreign Government Issues - 3.6% | |
| | |
Hellenic Republic Treasury Bills (Greece)
4.750% due 04/17/19 ~ | | | EUR 300,000 | | | | 337,123 | |
Japan Treasury Bills (Japan) | |
(0.182%) due 05/13/19 | | | JPY 1,080,000,000 | | | | 9,746,749 | |
(0.182%) due 05/20/19 | | | 90,000,000 | | | | 812,258 | |
(0.182%) due 06/03/19 | | | 790,000,000 | | | | 7,130,308 | |
| | | | | | | | |
| | | | 18,026,438 | |
| | | | | | | | |
| | |
| | | Shares | | | | |
Money Market Fund - 1.4% | | | | | | | | |
| | |
BlackRock Liquidity FundsT-Fund Portfolio
‘Institutional’ 2.370% | | | 7,182,485 | | | | 7,182,485 | |
| | | | | | | | |
| | |
| See Notes to Financial Statements | | See explanation of symbols and terms, if any, on B-97 and B-98 |
B-21
PACIFIC FUNDS
PF MANAGED BOND FUND
Schedule of Investments (Continued)
March 31, 2019
| | | | | | | | |
| | | Principal Amount | | | Value | |
|
U. S. Government Agency Issues - 1.1% | |
|
Federal Home Loan Bank | |
2.266% due 04/12/19 | | | $330,000 | | | | $329,757 | |
2.361% due 04/22/19 | | | 800,000 | | | | 798,875 | |
2.400% due 05/03/19 | | | 730,000 | | | | 728,436 | |
2.430% due 05/22/19 | | | 860,000 | | | | 857,064 | |
2.437% due 05/31/19 | | | 1,420,000 | | | | 1,414,296 | |
2.456% due 07/08/19 | | | 520,000 | | | | 516,589 | |
2.457% due 07/10/19 | | | 440,000 | | | | 437,055 | |
2.464% due 09/27/19 | | | 420,000 | | | | 414,988 | |
| | | | | | | | |
| | | | | | | 5,497,060 | |
| | | | | | | | |
Total Short-Term Investments
(Cost $32,131,284) | | | | 31,982,577 | |
| | | | | | | | |
| |
TOTAL INVESTMENTS - 140.5%
(Cost $693,334,102) | | | | 698,648,785 | |
| |
DERIVATIVES - (0.3%) | | | | | |
(See Notes (f) through (j) in Notes to Schedule of Investments) | | | | (1,265,918 | ) |
| | | | | | | | |
| |
OTHER ASSETS & LIABILITIES, NET - (40.2%) | | | | (200,024,205 | ) |
| | | | | | | | |
| |
NET ASSETS - 100.0% | | | | $497,358,662 | |
| | | | | | | | |
Notes to Schedule of Investments
| (a) | As of March 31, 2019, the Fund’s composition as a percentage of net assets was as follows: |
| | | | |
Mortgage-Backed Securities | | | 54.7% | |
Corporate Bonds & Notes | | | 48.2% | |
U.S. Treasury Obligations | | | 20.4% | |
Short-Term Investments | | | 6.4% | |
Asset-Backed Securities | | | 5.3% | |
Foreign Government Bonds & Notes | | | 4.3% | |
Others (each less than 3.0%) | | | 1.2% | |
| | | | |
| | | 140.5% | |
Derivatives | | | (0.3% | ) |
Other Assets & Liabilities, Net | | | (40.2% | ) |
| | | | |
| | | 100.0% | |
| | | | |
| (b) | An investment with a value of $37,000 or 0.0% of the Fund’s net assets was in default as of March 31, 2019. |
| (c) | As of March 31, 2019, investments with a total aggregate value of $5,371,491 were fully or partially segregated with the broker(s)/custodian as collateral for a reverse repurchase agreement, open futures contracts, forward foreign currency contracts, option contracts and swap agreements. |
| (d) | The average amount of borrowings by the Fund on reverse repurchase agreements during the year ended March 31, 2019 was $2,045,000 at a weighted average interest rate of 2.460%. The average amount of borrowings by the Fund on sale-buyback financing transactions during the year ended March 31, 2019 was $24,901,295 at a weighted average interest rate of 1.477%. |
| (e) | A reverse repurchase agreement outstanding as of March 31, 2019 was as follows: |
| | | | | | | | | | | | | | | | | | | | | | | | | | |
Counter-
party | | Collateral Pledged | | Interest
Rate | | | Settlement
Date | | | Maturity
Date | | | Repurchase
Amount | | | Principal
Amount | | | Value | |
DUB | | U.S. Treasury Note 2.625% due 02/15/29 | | | 2.460% | | | | 03/26/19 | | | | 04/09/19 | | | | ($2,046,956 | ) | | | $2,045,000 | | | | ($2,045,000 | ) |
| | | | | | | | | | | | | | | | | | | | | | | | | | |
| (f) | Open futures contracts outstanding as of March 31, 2019 were as follows: |
| | | | | | | | | | | | | | | | | | | | |
| Long Futures Outstanding | | Expiration Month | | | Number of
Contracts | | | Notional
Amount | | | Value | | | Unrealized
Appreciation
(Depreciation) | |
AUD FX | | | 06/19 | | | | 24 | | | | $1,702,540 | | | | $1,706,160 | | | | $3,620 | |
CAD FX | | | 06/19 | | | | 53 | | | | 3,969,582 | | | | 3,976,590 | | | | 7,008 | |
CHF FX | | | 06/19 | | | | 5 | | | | 628,419 | | | | 632,125 | | | | 3,706 | |
Euribor | | | 06/19 | | | | 254 | | | | 71,440,033 | | | | 71,448,719 | | | | 8,686 | |
EUR FX | | | 06/19 | | | | 97 | | | | 13,748,418 | | | | 13,687,306 | | | | (61,112 | ) |
Euro-Bobl | | | 06/19 | | | | 7 | | | | 1,036,433 | | | | 1,045,454 | | | | 9,021 | |
Euro-BTP | | | 06/19 | | | | 23 | | | | 3,260,244 | | | | 3,340,374 | | | | 80,130 | |
Euro-Bund | | | 06/19 | | | | 134 | | | | 24,622,540 | | | | 25,003,433 | | | | 380,893 | |
Eurodollar | | | 12/19 | | | | 310 | | | | 75,188,086 | | | | 75,616,750 | | | | 428,664 | |
Eurodollar | | | 03/20 | | | | 8 | | | | 1,953,915 | | | | 1,953,700 | | | | (215 | ) |
Eurodollar | | | 06/20 | | | | 60 | | | | 14,577,122 | | | | 14,666,250 | | | | 89,128 | |
Eurodollar | | | 03/21 | | | | 36 | | | | 8,778,091 | | | | 8,809,200 | | | | 31,109 | |
JPY FX | | | 06/19 | | | | 4 | | | | 452,860 | | | | 453,925 | | | | 1,065 | |
MXN FX | | | 06/19 | | | | 132 | | | | 3,350,706 | | | | 3,356,100 | | | | 5,394 | |
U.S.Treasury 2-Year Notes | | | 06/19 | | | | 25 | | | | 5,310,825 | | | | 5,327,344 | | | | 16,519 | |
U.S. Treasury5-Year Notes | | | 06/19 | | | | 1,439 | | | | 165,129,620 | | | | 166,676,679 | | | | 1,547,059 | |
U.S. Treasury10-Year Notes | | | 06/19 | | | | 219 | | | | 26,862,960 | | | | 27,203,906 | | | | 340,946 | |
U.S. Treasury Long Bonds | | | 06/19 | | | | 294 | | | | 42,731,597 | | | | 43,998,938 | | | | 1,267,341 | |
U.S. Ultra Long Bonds | | | 06/19 | | | | 69 | | | | 11,163,761 | | | | 11,592,000 | | | | 428,239 | |
| | | | | | | | | | | | | | | | | | | | |
| | | | | | | | | | | | | | | | | | | 4,587,201 | |
| | | | | | | | | | | | | | | | | | | | |
| | | | | |
Short Futures Outstanding | | | | | | | | | | | | | | | |
Australia10-Year Bonds | | | 06/19 | | | | 148 | | | | 10,016,168 | | | | 10,322,221 | | | | (306,053 | ) |
Canada10-Year Bonds | | | 06/19 | | | | 24 | | | | 2,446,195 | | | | 2,497,070 | | | | (50,875 | ) |
Euro-BTP | | | 06/19 | | | | 239 | | | | 33,900,045 | | | | 34,710,845 | | | | (810,800 | ) |
Euro-Bund | | | 06/19 | | | | 122 | | | | 22,275,350 | | | | 22,764,319 | | | | (488,969 | ) |
Euro-BUXL | | | 06/19 | | | | 28 | | | | 5,724,601 | | | | 6,019,878 | | | | (295,277 | ) |
Eurodollar | | | 03/20 | | | | 47 | | | | 11,407,440 | | | | 11,477,988 | | | | (70,548 | ) |
Eurodollar | | | 06/20 | | | | 181 | | | | 44,032,353 | | | | 44,243,188 | | | | (210,835 | ) |
Eurodollar | | | 09/20 | | | | 123 | | | | 29,944,618 | | | | 30,085,800 | | | | (141,182 | ) |
Eurodollar | | | 12/20 | | | | 43 | | | | 10,442,502 | | | | 10,519,413 | | | | (76,911 | ) |
| | |
| See Notes to Financial Statements | | See explanation of symbols and terms, if any, on B-97 and B-98 |
B-22
PACIFIC FUNDS
PF MANAGED BOND FUND
Schedule of Investments (Continued)
March 31, 2019
| | | | | | | | | | | | | | | | | | | | |
| Short Futures Outstanding | | Expiration
Month | | | Number of
Contracts | | | Notional
Amount | | | Value | | | Unrealized
Appreciation
(Depreciation) | |
Euro-OAT | | | 06/19 | | | | 136 | | | | $24,235,714 | | | | $24,816,728 | | | | ($581,014 | ) |
Euro-Schatz | | | 06/19 | | | | 2 | | | | 250,704 | | | | 251,217 | | | | (513 | ) |
GBP FX | | | 06/19 | | | | 13 | | | | 1,081,220 | | | | 1,060,800 | | | | 20,420 | |
Japan10-Year Bonds | | | 06/19 | | | | 3 | | | | 4,134,418 | | | | 4,149,057 | | | | (14,639 | ) |
Long Gilt | | | 06/19 | | | | 18 | | | | 2,988,266 | | | | 3,032,978 | | | | (44,712 | ) |
U.S. Treasury10-Year Notes | | | 06/19 | | | | 775 | | | | 94,905,240 | | | | 96,269,531 | | | | (1,364,291 | ) |
U.S. Treasury Long Bonds | | | 06/19 | | | | 208 | | | | 30,334,209 | | | | 31,128,500 | | | | (794,291 | ) |
| | | | | | | | | | | | | | | | | | | | |
| | | | | | | | | | | | | | | | | | | (5,230,490 | ) |
| | | | | | | | | | | | | | | | | | | | |
| | | | | |
Total Futures Contracts | | | | | | | | | | | | | | | | | | | ($643,289 | ) |
| | | | | | | | | | | | | | | | | | | | |
| (g) | Forward foreign currency contracts outstanding as of March 31, 2019 were as follows: |
| | | | | | | | | | | | | | | | | | | | | | | | | | | | | | |
Currency
Purchased | | | | | Currency
Sold | | | | | Settlement
Month | | | | Counterparty | | | | Unrealized
Appreciation | | | Unrealized
Depreciation | |
| ARS | | | 19,790,000 | | | | | USD | | | 402,522 | | | | | 09/19 | | | | JPM | | | | | $— | | | | ($37,995 | ) |
| AUD | | | 171,000 | | | | | USD | | | 121,282 | | | | | 04/19 | | | | JPM | | | | | 144 | | | | — | |
| BRL | | | 4,047,254 | | | | | USD | | | 1,088,402 | | | | | 04/19 | | | | BRC | | | | | — | | | | (50,695 | ) |
| BRL | | | 822,068 | | | | | USD | | | 219,310 | | | | | 04/19 | | | | CIT | | | | | — | | | | (10,297 | ) |
| BRL | | | 5,110,000 | | | | | USD | | | 1,363,066 | | | | | 04/19 | | | | JPM | | | | | — | | | | (64,006 | ) |
| BRL | | | 2,800,000 | | | | | USD | | | 709,741 | | | | | 07/19 | | | | BRC | | | | | — | | | | (583 | ) |
| BRL | | | 4,530,000 | | | | | USD | | | 1,161,181 | | | | | 07/19 | | | | CIT | | | | | — | | | | (13,864 | ) |
| CAD | | | 1,547,335 | | | | | USD | | | 1,163,001 | | | | | 04/19 | | | | BRC | | | | | — | | | | (4,578 | ) |
| CAD | | | 6,622,000 | | | | | USD | | | 5,018,473 | | | | | 04/19 | | | | HSB | | | | | — | | | | (62,696 | ) |
| CAD | | | 693,427 | | | | | USD | | | 524,649 | | | | | 04/19 | | | | JPM | | | | | — | | | | (5,510 | ) |
| CNH | | | 11,614,807 | | | | | USD | | | 1,724,544 | | | | | 04/19 | | | | JPM | | | | | 3,011 | | | | — | |
| CNY | | | 23,561 | | | | | USD | | | 3,417 | | | | | 04/19 | | | | BRC | | | | | 89 | | | | — | |
| CNY | | | 23,561 | | | | | USD | | | 3,504 | | | | | 07/19 | | | | BRC | | | | | — | | | | (3 | ) |
| EUR | | | 140,000 | | | | | USD | | | 160,028 | | | | | 04/19 | | | | CIT | | | | | — | | | | (2,739 | ) |
| EUR | | | 864,000 | | | | | USD | | | 972,637 | | | | | 04/19 | | | | HSB | | | | | — | | | | (3,125 | ) |
| EUR | | | 12,880,000 | | | | | USD | | | 14,465,150 | | | | | 04/19 | | | | JPM | | | | | — | | | | (12,235 | ) |
| EUR | | | 340,000 | | | | | USD | | | 384,842 | | | | | 04/19 | | | | UBS | | | | | — | | | | (3,321 | ) |
| GBP | | | 880,000 | | | | | USD | | | 1,129,462 | | | | | 04/19 | | | | CIT | | | | | 17,762 | | | | — | |
| GBP | | | 340,000 | | | | | USD | | | 439,865 | | | | | 05/19 | | | | BRC | | | | | 4,008 | | | | — | |
| GBP | | | 6,209,000 | | | | | USD | | | 8,166,443 | | | | | 05/19 | | | | HSB | | | | | — | | | | (60,544 | ) |
| IDR | | | 24,934,145,970 | | | | | USD | | | 1,712,451 | | | | | 04/19 | | | | CIT | | | | | 30,498 | | | | — | |
| IDR | | | 2,330,062,113 | | | | | USD | | | 162,703 | | | | | 04/19 | | | | JPM | | | | | 2,850 | | | | — | |
| INR | | | 110,406,272 | | | | | USD | | | 1,539,929 | | | | | 04/19 | | | | BRC | | | | | 47,954 | | | | — | |
| JPY | | | 292,800,000 | | | | | USD | | | 2,633,662 | | | | | 05/19 | | | | BRC | | | | | 18,278 | | | | — | |
| JPY | | | 275,400,000 | | | | | USD | | | 2,507,580 | | | | | 05/19 | | | | JPM | | | | | — | | | | (13,235 | ) |
| JPY | | | 519,200,000 | | | | | USD | | | 4,672,582 | | | | | 05/19 | | | | RBS | | | | | 29,903 | | | | — | |
| JPY | | | 817,300,000 | | | | | USD | | | 7,365,705 | | | | | 05/19 | | | | SCB | | | | | 36,723 | | | | — | |
| MXN | | | 126,473,880 | | | | | USD | | | 6,573,433 | | | | | 04/19 | | | | CIT | | | | | — | | | | (76,886 | ) |
| MXN | | | 26,435,767 | | | | | USD | | | 1,362,643 | | | | | 04/19 | | | | JPM | | | | | — | | | | (4,348 | ) |
| MXN | | | 23,550,000 | | | | | USD | | | 1,191,506 | | | | | 06/19 | | | | BRC | | | | | 4,856 | | | | — | |
| MXN | | | 17,105,000 | | | | | USD | | | 872,646 | | | | | 08/19 | | | | BRC | | | | | — | | | | (10,140 | ) |
| MXN | | | 76,952,000 | | | | | USD | | | 3,908,474 | | | | | 08/19 | | | | JPM | | | | | — | | | | (28,232 | ) |
| PEN | | | 2,376,211 | | | | | USD | | | 711,964 | | | | | 04/19 | | | | HSB | | | | | 3,518 | | | | — | |
| PHP | | | 156,259,511 | | | | | USD | | | 2,958,900 | | | | | 04/19 | | | | BRC | | | | | 5,142 | | | | — | |
| PHP | | | 156,259,511 | | | | | USD | | | 2,931,148 | | | | | 07/19 | | | | JPM | | | | | 7,682 | | | | — | |
| RUB | | | 63,821,095 | | | | | USD | | | 940,690 | | | | | 04/19 | | | | CIT | | | | | 28,086 | | | | — | |
| RUB | | | 6,454,104 | | | | | USD | | | 96,156 | | | | | 04/19 | | | | JPM | | | | | 2,840 | | | | — | |
| TWD | | | 807,700 | | | | | USD | | | 26,356 | | | | | 04/19 | | | | BRC | | | | | — | | | | (156 | ) |
| TWD | | | 807,700 | | | | | USD | | | 26,265 | | | | | 07/19 | | | | JPM | | | | | 29 | | | | — | |
| USD | | | 301,118 | | | | | ARS | | | 12,339,822 | | | | | 05/19 | | | | CIT | | | | | 33,380 | | | | — | |
| USD | | | 1,653,373 | | | | | AUD | | | 2,310,107 | | | | | 04/19 | | | | BRC | | | | | 12,487 | | | | — | |
| USD | | | 7,114 | | | | | AUD | | | 10,003 | | | | | 04/19 | | | | CIT | | | | | 9 | | | | — | |
| USD | | | 3,542 | | | | | AUD | | | 5,002 | | | | | 04/19 | | | | JPM | | | | | — | | | | (11 | ) |
| USD | | | 269,633 | | | | | AUD | | | 381,000 | | | | | 04/19 | | | | RBS | | | | | — | | | | (917 | ) |
| USD | | | 1,335,714 | | | | | AUD | | | 1,876,000 | | | | | 04/19 | | | | SCB | | | | | 3,557 | | | | — | |
| USD | | | 121,356 | | | | | AUD | | | 171,000 | | | | | 05/19 | | | | JPM | | | | | — | | | | (143 | ) |
| USD | | | 714,650 | | | | | BRL | | | 2,800,000 | | | | | 04/19 | | | | BRC | | | | | 355 | | | | — | |
| USD | | | 1,169,032 | | | | | BRL | | | 4,530,000 | | | | | 04/19 | | | | CIT | | | | | 13,404 | | | | — | |
| USD | | | 5,811,039 | | | | | CAD | | | 7,743,000 | | | | | 04/19 | | | | JPM | | | | | 16,328 | | | | — | |
| USD | | | 1,687,267 | | | | | CNH | | | 11,614,807 | | | | | 04/19 | | | | BRC | | | | | — | | | | (40,289 | ) |
| USD | | | 1,723,572 | | | | | CNH | | | 11,614,807 | | | | | 07/19 | | | | JPM | | | | | — | | | | (3,355 | ) |
| USD | | | 3,510 | | | | | CNY | | | 23,561 | | | | | 04/19 | | | | BRC | | | | | 4 | | | | — | |
| USD | | | 1,541,418 | | | | | EUR | | | 1,362,000 | | | | | 04/19 | | | | BRC | | | | | 12,733 | | | | — | |
| USD | | | 14,977,944 | | | | | EUR | | | 12,914,128 | | | | | 04/19 | | | | CIT | | | | | 469,008 | | | | — | |
| USD | | | 199,420 | | | | | EUR | | | 176,000 | | | | | 04/19 | | | | HSB | | | | | 1,926 | | | | — | |
| | |
| See Notes to Financial Statements | | See explanation of symbols and terms, if any, on B-97 and B-98 |
B-23
PACIFIC FUNDS
PF MANAGED BOND FUND
Schedule of Investments (Continued)
March 31, 2019
| | | | | | | | | | | | | | | | | | | | | | | | | | | | | | |
Currency
Purchased | | | | | Currency
Sold | | | | | Settlement
Month | | | | Counterparty | | | | Unrealized
Appreciation | | | Unrealized
Depreciation | |
| USD | | | 14,373,402 | | | | | EUR | | | 12,592,000 | | | | | 04/19 | | | | JPM | | | | | $243,657 | | | | $— | |
| USD | | | 242,583 | | | | | EUR | | | 214,000 | | | | | 04/19 | | | | UBS | | | | | 2,450 | | | | — | |
| USD | | | 13,409,021 | | | | | EUR | | | 11,911,000 | | | | | 05/19 | | | | JPM | | | | | 9,224 | | | | — | |
| USD | | | 5,972,409 | | | | | GBP | | | 4,466,000 | | | | | 05/19 | | | | BRC | | | | | 142,010 | | | | — | |
| USD | | | 381,586 | | | | | GBP | | | 291,000 | | | | | 05/19 | | | | JPM | | | | | 1,683 | | | | — | |
| USD | | | 752,810 | | | | | GBP | | | 577,000 | | | | | 05/19 | | | | SCB | | | | | — | | | | (468 | ) |
| USD | | | 3,772,363 | | | | | JPY | | | 405,242,363 | | | | | 04/19 | | | | CIT | | | | | 109,859 | | | | — | |
| USD | | | 496,149 | | | | | JPY | | | 54,000,000 | | | | | 05/19 | | | | BRC | | | | | 6,895 | | | | — | |
| USD | | | 6,573,959 | | | | | JPY | | | 723,500,000 | | | | | 05/19 | | | | JPM | | | | | 21,094 | | | | — | |
| USD | | | 10,330,468 | | | | | JPY | | | 1,116,000,000 | | | | | 05/19 | | | | UBS | | | | | 223,885 | | | | — | |
| USD | | | 7,187,522 | | | | | JPY | | | 790,000,000 | | | | | 06/19 | | | | UBS | | | | | 22,785 | | | | — | |
| USD | | | 1,205,091 | | | | | MXN | | | 23,550,000 | | | | | 04/19 | | | | BRC | | | | | — | | | | (4,972 | ) |
| USD | | | 9,890,936 | | | | | MXN | | | 190,798,549 | | | | | 04/19 | | | | CIT | | | | | 90,243 | | | | — | |
| USD | | | 862,500 | | | | | MXN | | | 16,953,730 | | | | | 05/19 | | | | JPM | | | | | — | | | | (4,354 | ) |
| USD | | | 1,192,965 | | | | | MXN | | | 23,550,000 | | | | | 06/19 | | | | HSB | | | | | — | | | | (3,397 | ) |
| USD | | | 2,687,039 | | | | | MXN | | | 53,295,072 | | | | | 08/19 | | | | HSB | | | | | — | | | | (322 | ) |
| USD | | | 2,053,181 | | | | | MXN | | | 40,761,928 | | | | | 08/19 | | | | RBS | | | | | — | | | | (2,207 | ) |
| USD | | | 197,082 | | | | | PEN | | | 653,800 | | | | | 04/19 | | | | DUB | | | | | 222 | | | | — | |
| USD | | | 2,953,308 | | | | | PHP | | | 156,259,511 | | | | | 04/19 | | | | BRC | | | | | — | | | | (10,734 | ) |
| USD | | | 4,568,617 | | | | | PHP | | | 241,661,000 | | | | | 05/19 | | | | DUB | | | | | 2,485 | | | | — | |
| USD | | | 26,165 | | | | | TWD | | | 807,700 | | | | | 04/19 | | | | JPM | | | | | — | | | | (36 | ) |
| | | | | | | | | | | | | | | | | | | | | | | | | | | | | | |
| | | |
Total Forward Foreign Currency Contracts | | | | | $1,683,056 | | | | ($536,393 | ) |
| | | | | | | | | | | | | | | | | | | | | | | | | | | | | | |
| (h) | Purchased options outstanding as of March 31, 2019 were as follows: |
Credit Default Swaptions on Credit Indices – Sell Protection
| | | | | | | | | | | | | | | | | | | | | | |
| Description | | Exercise
Rate | | | Expiration
Date | | | Counter-
party | | Notional
Amount | | | Cost | | | Value | |
Call - CDX IG 31 5Y | | | 0.650% | | | | 04/17/19 | | | BRC | | | $1,550,000 | | | | $1,705 | | | | $5,960 | |
| | | | | | | | | | | | | | | | | | | | | | |
Foreign Currency Options
| | | | | | | | | | | | | | | | | | | | | | | | |
| Description | | Exercise
Price | | | Expiration
Date | | | Counter-
party | | | Notional
Amount | | | Cost | | | Value | |
Put - MXN versus USD | | | MXN 19.21 | | | | 05/13/19 | | | | JPM | | | | $2,300,000 | | | | $31,142 | | | | $15,450 | |
Put - EUR versus USD | | | $1.16 | | | | 06/21/19 | | | | CIT | | | | 1,500,000 | | | | 10,275 | | | | 4,207 | |
| | | | | | | | | | | | | | | | | | | | | | | | |
| | | | | | | | | | | | | | | | | | | $41,417 | | | | $19,657 | |
| | | | | | | | | | | | | | | | | | | | | | | | |
Options on Futures
| | | | | | | | | | | | | | | | | | | | | | | | | | | | |
| Description | | Exercise
Price | | | Expiration
Date | | | Exchange | | | Number of
Contracts | | | Notional
Amount | | | Cost | | | Value | |
Call -EUR-FX (04/19) | | | $1.14 | | | | 04/05/19 | | | | CME | | | | 2 | | | | $283,750 | | | | $630 | | | | $250 | |
Call -AUD-FX (04/19) | | | 71.00 | | | | 04/05/19 | | | | CME | | | | 1 | | | | 71,000 | | | | 432 | | | | 360 | |
Call -AUD-FX (04/19) | | | 71.50 | | | | 04/05/19 | | | | CME | | | | 2 | | | | 143,000 | | | | 1,325 | | | | 320 | |
Call -AUD-FX (04/19) | | | 72.00 | | | | 04/05/19 | | | | CME | | | | 1 | | | | 72,000 | | | | 633 | | | | 60 | |
Call -CAD-FX (04/19) | | | 76.00 | | | | 04/05/19 | | | | CME | | | | 2 | | | | 152,000 | | | | 1,205 | | | | 20 | |
Call - U.S. Treasury10-Year Notes (05/19) | | | 129.00 | | | | 04/26/19 | | | | CME | | | | 25 | | | | 3,225,000 | | | | 825 | | | | 781 | |
Call - U.S. Treasury10-Year Notes (05/19) | | | 130.00 | | | | 04/26/19 | | | | CME | | | | 834 | | | | 108,420,000 | | | | 14,474 | | | | 26,063 | |
Call - U.S. Treasury30-Year Bonds (05/19) | | | 151.00 | | | | 04/26/19 | | | | CME | | | | 2 | | | | 302,000 | | | | 1,394 | | | | 1,281 | |
Call - Euro-Bund (05/19) | | | EUR 173.00 | | | | 04/26/19 | | | | CME | | | | 62 | | | | EUR 10,726,000 | | | | 788 | | | | 695 | |
Call -EUR-FX (05/19) | | | $1.14 | | | | 05/03/19 | | | | CME | | | | 2 | | | | $283,750 | | | | 1,692 | | | | 1,275 | |
Call -EUR-FX (05/19) | | | 1.15 | | | | 05/03/19 | | | | CME | | | | 3 | | | | 431,250 | | | | 2,183 | | | | 563 | |
Call -AUD-FX (05/19) | | | 71.00 | | | | 05/03/19 | | | | CME | | | | 2 | | | | 142,000 | | | | 1,405 | | | | 1,400 | |
Call -AUD-FX (05/19) | | | 71.50 | | | | 05/03/19 | | | | CME | | | | 1 | | | | 71,500 | | | | 562 | | | | 470 | |
Call -CAD-FX (05/19) | | | 75.00 | | | | 05/03/19 | | | | CME | | | | 2 | | | | 150,000 | | | | 825 | | | | 1,100 | |
Call - CAD Treasury10-Year Notes (06/19) | | | CAD 160.00 | | | | 05/17/19 | | | | MSE | | | | 22 | | | | CAD 3,520,000 | | | | 200 | | | | 82 | |
Call - U.S. Treasury10-Year Notes (06/19) | | | $129.00 | | | | 05/24/19 | | | | CME | | | | 36 | | | | $4,644,000 | | | | 1,750 | | | | 2,250 | |
Call -Euro-OAT (06/19) | | | EUR 175.00 | | | | 05/24/19 | | | | EUX | | | | 114 | | | | EUR 19,950,000 | | | | 1,397 | | | | 1,279 | |
Call - U.S. Treasury30-Year Bonds (06/19) | | | $189.00 | | | | 05/24/19 | | | | CME | | | | 78 | | | | $14,742,000 | | | | 671 | | | | — | |
Call - U.S. Treasury30-Year Bonds (06/19) | | | 190.00 | | | | 05/24/19 | | | | CME | | | | 42 | | | | 7,980,000 | | | | 361 | | | | — | |
Call - U.S. Treasury30-Year Bonds (06/19) | | | 191.00 | | | | 05/24/19 | | | | CME | | | | 49 | | | | 9,359,000 | | | | 421 | | | | — | |
| | | | | | | | | | | | | | | | | | | | | | | | | | | | |
| | | | | | | | | | | | | | | | | | | | | | | 33,173 | | | | 38,249 | |
| | | | | | | | | | | | | | | | | | | | | | | | | | | | |
| | | | | | | |
Put -CAD-FX (04/19) | | | 75.50 | | | | 04/05/19 | | | | CME | | | | 2 | | | | 151,000 | | | | 1,325 | | | | 1,080 | |
Put - U.S. Treasury2-Year Notes (05/19) | | | 105.13 | | | | 04/26/19 | | | | CME | | | | 1 | | | | 210,250 | | | | 33 | | | | — | |
Put - U.S. Treasury2-Year Notes (05/19) | | | 105.25 | | | | 04/26/19 | | | | CME | | | | 9 | | | | 1,894,500 | | | | 156 | | | | — | |
Put - U.S. Treasury5-Year Notes (05/19) | | | 111.00 | | | | 04/26/19 | | | | CME | | | | 861 | | | | 95,571,000 | | | | 8,217 | | | | — | |
Put - U.S. Treasury10-Year Notes (05/19) | | | 124.25 | | | | 04/26/19 | | | | CME | | | | 4 | | | | 497,000 | | | | 1,772 | | | | 2,188 | |
| | |
| See Notes to Financial Statements | | See explanation of symbols and terms, if any, on B-97 and B-98 |
B-24
PACIFIC FUNDS
PF MANAGED BOND FUND
Schedule of Investments (Continued)
March 31, 2019
| | | | | | | | | | | | | | | | | | | | | | | | | | | | |
| Description | | Exercise
Price | | | Expiration
Date | | | Exchange | | | Number of
Contracts | | | Notional
Amount | | | Cost | | | Value | |
Put - U.S. Treasury10-Year Notes (05/19) | | | $124.50 | | | | 04/26/19 | | | | CME | | | | 2 | | | | $249,000 | | | | $1,066 | | | | $1,375 | |
Put - U.S. Treasury30-Year Bonds (05/19) | | | 128.00 | | | | 04/26/19 | | | | CME | | | | 20 | | | | 2,560,000 | | | | 660 | | | | — | |
Put - U.S. Treasury30-Year Bonds (05/19) | | | 129.00 | | | | 04/26/19 | | | | CME | | | | 122 | | | | 15,738,000 | | | | 2,118 | | | | — | |
Put - U.S. Treasury30-Year Bonds (05/19) | | | 130.00 | | | | 04/26/19 | | | | CME | | | | 115 | | | | 14,950,000 | | | | 1,996 | | | | — | |
Put - U.S. Treasury30-Year Bonds (05/19) | | | 131.00 | | | | 04/26/19 | | | | CME | | | | 25 | | | | 3,275,000 | | | | 434 | | | | — | |
Put - U.S. Treasury30-Year Bonds (05/19) | | | 148.00 | | | | 04/26/19 | | | | CME | | | | 1 | | | | 148,000 | | | | 1,080 | | | | 437 | |
Put - U.S. Treasury30-Year Bonds (05/19) | | | 148.50 | | | | 04/26/19 | | | | CME | | | | 1 | | | | 148,500 | | | | 830 | | | | 594 | |
Put - U.S. Treasury30-Year Bonds (05/19) | | | 149.00 | | | | 04/26/19 | | | | CME | | | | 2 | | | | 298,000 | | | | 1,831 | | | | 1,594 | |
Put - Euro-Bund (05/19) | | | EUR 165.00 | | | | 04/26/19 | | | | CME | | | | 2 | | | | EUR 330,000 | | | | 1,192 | | | | 606 | |
Put - Euro-Bund (05/19) | | | 166.50 | | | | 04/26/19 | | | | CME | | | | 2 | | | | 333,000 | | | | 1,685 | | | | 1,862 | |
Put -EUR-FX (05/19) | | | $1.14 | | | | 05/03/19 | | | | CME | | | | 1 | | | | $141,875 | | | | 852 | | | | 1,400 | |
Put - U.S. Treasury5-Year Notes (06/19) | | | 108.25 | | | | 05/24/19 | | | | CME | | | | 326 | | | | 35,289,500 | | | | 2,804 | | | | — | |
Put - U.S. Treasury5-Year Notes (06/19) | | | 108.50 | | | | 05/24/19 | | | | CME | | | | 172 | | | | 18,662,000 | | | | 1,479 | | | | — | |
Put - U.S. Treasury5-Year Notes (06/19) | | | 108.75 | | | | 05/24/19 | | | | CME | | | | 17 | | | | 1,848,750 | | | | 146 | | | | — | |
Put - U.S. Treasury10-Year Notes (06/19) | | | 112.00 | | | | 05/24/19 | | | | CME | | | | 163 | | | | 18,256,000 | | | | 1,402 | | | | — | |
Put - U.S. Treasury10-Year Notes (06/19) | | | 112.50 | | | | 05/24/19 | | | | CME | | | | 5 | | | | 562,500 | | | | 43 | | | | — | |
Put - U.S. Treasury10-Year Notes (06/19) | | | 121.00 | | | | 05/24/19 | | | | CME | | | | 7 | | | | 847,000 | | | | 340 | | | | 328 | |
Put - Euro-Bund (06/19) | | | EUR 145.00 | | | | 05/24/19 | | | | EUX | | | | 94 | | | | EUR 13,630,000 | | | | 1,131 | | | | 1,054 | |
| | | | | | | | | | | | | | | | | | | | | | | | | | | | |
| | | | | | | | | | | | | | | | | | | | | | | 32,592 | | | | 12,518 | |
| | | | | | | | | | | | | | | | | | | | | | | | | | | | |
| | | | | | | |
Total Options on Futures | | | | | | | | | | | | | | | | | | | | | | | $65,765 | | | | $50,767 | |
| | | | | | | | | | | | | | | | | | | | | | | | | | | | |
Options on Securities
| | | | | | | | | | | | | | | | | | | | | | | | |
| Description | | Exercise
Price | | | Expiration
Date | | | Counter-
party | | | Notional
Amount | | | Cost | | | Value | |
Put - Fannie Mae 3.500% due 4/10/49 | | | $69.00 | | | | 04/03/19 | | | | JPM | | | | $10,000,000 | | | | $391 | | | | $— | |
| | | | | | | | | | | | | | | | | | | | | | | | |
| | | | | | |
Total Purchased Options | | | | | | | | | | | | | | | | | | | $109,278 | | | | $76,384 | |
| | | | | | | | | | | | | | | | | | | | | | | | |
| (i) | Premiums received and value of written options outstanding as of March 31, 2019 were as follows: |
Credit Default Swaptions on Credit Indices – Sell Protection
| | | | | | | | | | | | | | | | | | | | | | |
| Description | | Exercise
Rate | | | Expiration
Date | | | Counter-
party | | Notional
Amount | | | Premium | | | Value | |
Put - CDX IG 31 5Y | | | 0.800% | | | | 04/17/19 | | | BRC | | | $1,550,000 | | | | $1,550 | | | | ($145 | ) |
| | | | | | | | | | | | | | | | | | | | | | |
Inflation Floor/Cap Options
| | | | | | | | | | | | | | | | | | | | | | | | |
| Description | | Initial
Index | | | Floating Rate | | Expiration
Date | | | Counter-
party | | Notional
Amount | | | Premium | | | Value | |
Floor - U.S. CPI Urban Consumers | | | 215.95 | | | Maximum of [0, (1 + 0.000%)10 -Final Index/Initial Index] | | | 03/12/20 | | | CIT | | | $1,100,000 | | | | $9,460 | | | | $— | |
Floor - U.S. CPI Urban Consumers | | | 217.97 | | | Maximum of [0, (1 + 0.000%)10 - Final Index/Initial Index] | | | 09/29/20 | | | CIT | | | 600,000 | | | | 7,740 | | | | — | |
| | | | | | | | | | | | | | | | | | | | | | | | |
| | | | | | | | | | | | | | | | | | | $17,200 | | | | $— | |
| | | | | | | | | | | | | | | | | | | | | | | | |
Options on Futures
| | | | | | | | | | | | | | | | | | | | | | | | | | |
| Description | | Exercise
Price | | | Expiration
Date | | | Exchange | | Number of
Contracts | | | Notional
Amount | | | Premium | | | Value | |
Call -EUR-FX (04/19) | | | $1.16 | | | | 04/05/19 | | | CME | | | 3 | | | | $433,125 | | | | $1,742 | | | | ($19 | ) |
Call - U.S. Treasury5-Year Notes (05/19) | | | 115.25 | | | | 04/26/19 | | | CME | | | 5 | | | | 576,250 | | | | 1,202 | | | | (3,437 | ) |
Call - U.S. Treasury5-Year Notes (05/19) | | | 116.25 | | | | 04/26/19 | | | CME | | | 30 | | | | 3,487,500 | | | | 6,229 | | | | (5,859 | ) |
Call - U.S. Treasury10-Year Notes (05/19) | | | 122.50 | | | | 04/26/19 | | | CME | | | 6 | | | | 735,000 | | | | 2,255 | | | | (10,594 | ) |
Call - U.S. Treasury10-Year Notes (05/19) | | | 123.00 | | | | 04/26/19 | | | CME | | | 1 | | | | 123,000 | | | | 326 | | | | (1,328 | ) |
Call - U.S. Treasury10-Year Notes (05/19) | | | 123.50 | | | | 04/26/19 | | | CME | | | 3 | | | | 370,500 | | | | 885 | | | | (2,812 | ) |
Call - U.S. Treasury10-Year Notes (05/19) | | | 124.50 | | | | 04/26/19 | | | CME | | | 12 | | | | 1,494,000 | | | | 3,245 | | | | (4,875 | ) |
Call - U.S. Treasury10-Year Notes (05/19) | | | 125.00 | | | | 04/26/19 | | | CME | | | 18 | | | | 2,250,000 | | | | 5,375 | | | | (4,500 | ) |
Call - U.S. Treasury10-Year Notes (05/19) | | | 126.00 | | | | 04/26/19 | | | CME | | | 1 | | | | 126,000 | | | | 248 | | | | (109 | ) |
Call - U.S. Treasury30-Year Bonds (05/19) | | | 146.00 | | | | 04/26/19 | | | CME | | | 1 | | | | 146,000 | | | | 717 | | | | (3,766 | ) |
Call - U.S. Treasury30-Year Bonds (05/19) | | | 150.00 | | | | 04/26/19 | | | CME | | | 3 | | | | 450,000 | | | | 1,682 | | | | (2,953 | ) |
Call - U.S. Treasury30-Year Bonds (05/19) | | | 153.00 | | | | 04/26/19 | | | CME | | | 4 | | | | 612,000 | | | | 1,430 | | | | (1,062 | ) |
Call - Euro-Bund (05/19) | | | EUR 165.50 | | | | 04/26/19 | | | EUX | | | 43 | | | | EUR 7,116,500 | | | | 19,688 | | | | (60,294 | ) |
Call - Euro-Bund (05/19) | | | 166.00 | | | | 04/26/19 | | | EUX | | | 24 | | | | 3,984,000 | | | | 13,814 | | | | (25,038 | ) |
Call -CAD-FX (05/19) | | | $75.50 | | | | 05/03/19 | | | CME | | | 6 | | | | $453,000 | | | | 1,795 | | | | (1,920 | ) |
Call - U.S. Treasury10-Year Notes (06/19) | | | 123.00 | | | | 05/24/19 | | | CME | | | 5 | | | | 615,000 | | | | 3,194 | | | | (7,422 | ) |
Call - U.S. Treasury10-Year Notes (06/19) | | | 123.50 | | | | 05/24/19 | | | CME | | | 3 | | | | 370,500 | | | | 1,401 | | | | (3,422 | ) |
Call - U.S. Treasury10-Year Notes (06/19) | | | 125.00 | | | | 05/24/19 | | | CME | | | 12 | | | | 1,500,000 | | | | 6,370 | | | | (5,437 | ) |
Call - U.S. Treasury30-Year Bonds (06/19) | | | 148.00 | | | | 05/24/19 | | | CME | | | 2 | | | | 296,000 | | | | 1,684 | | | | (5,031 | ) |
Call -EUR-FX (06/19) | | | 1.15 | | | | 06/07/19 | | | CME | | | 2 | | | | 287,500 | | | | 1,920 | | | | (950 | ) |
| | | | | | | | | | | | | | | | | | | | | | | | | | |
| | | | | | | | | | | | | | | | | | | | | 75,202 | | | | (150,828 | ) |
| | | | | | | | | | | | | | | | | | | | | | | | | | |
| | |
| See Notes to Financial Statements | | See explanation of symbols and terms, if any, on B-97 and B-98 |
B-25
PACIFIC FUNDS
PF MANAGED BOND FUND
Schedule of Investments (Continued)
March 31, 2019
| | | | | | | | | | | | | | | | | | | | | | | | | | | | |
| Description | | Exercise
Price | | | Expiration
Date | | | Exchange | | | Number of
Contracts | | | Notional
Amount | | | Premium | | | Value | |
Put - U.S. Treasury10-Year Notes (04/19) | | | $123.50 | | | | 04/05/19 | | | | CME | | | | 7 | | | | $864,500 | | | | $1,082 | | | | ($438 | ) |
Put - U.S. Treasury10-Year Notes (04/19) | | | 123.75 | | | | 04/12/19 | | | | CME | | | | 4 | | | | 495,000 | | | | 884 | | | | (875 | ) |
Put - U.S. Treasury5-Year Notes (05/19) | | | 115.00 | | | | 04/26/19 | | | | CME | | | | 25 | | | | 2,875,000 | | | | 2,269 | | | | (1,563 | ) |
Put - U.S. Treasury5-Year Notes (05/19) | | | 115.25 | | | | 04/26/19 | | | | CME | | | | 5 | | | | 576,250 | | | | 523 | | | | (547 | ) |
Put - U.S. Treasury5-Year Notes (05/19) | | | 115.50 | | | | 04/26/19 | | | | CME | | | | 3 | | | | 346,500 | | | | 440 | | | | (586 | ) |
Put - U.S. Treasury5-Year Notes (05/19) | | | 116.25 | | | | 04/26/19 | | | | CME | | | | 6 | | | | 697,500 | | | | 2,427 | | | | (3,703 | ) |
Put - U.S. Treasury10-Year Notes (05/19) | | | 121.00 | | | | 04/26/19 | | | | CME | | | | 2 | | | | 242,000 | | | | 747 | | | | — | |
Put - U.S. Treasury10-Year Notes (05/19) | | | 122.00 | | | | 04/26/19 | | | | CME | | | | 6 | | | | 732,000 | | | | 1,537 | | | | (188 | ) |
Put - U.S. Treasury10-Year Notes (05/19) | | | 122.50 | | | | 04/26/19 | | | | CME | | | | 80 | | | | 9,800,000 | | | | 29,537 | | | | (3,750 | ) |
Put - U.S. Treasury10-Year Notes (05/19) | | | 123.00 | | | | 04/26/19 | | | | CME | | | | 14 | | | | 1,722,000 | | | | 2,023 | | | | (1,531 | ) |
Put - U.S. Treasury10-Year Notes (05/19) | | | 123.50 | | | | 04/26/19 | | | | CME | | | | 1 | | | | 123,500 | | | | 155 | | | | (219 | ) |
Put - U.S. Treasury10-Year Notes (05/19) | | | 123.75 | | | | 04/26/19 | | | | CME | | | | 4 | | | | 495,000 | | | | 993 | | | | (1,250 | ) |
Put - U.S. Treasury10-Year Notes (05/19) | | | 124.00 | | | | 04/26/19 | | | | CME | | | | 3 | | | | 372,000 | | | | 885 | | | | (1,266 | ) |
Put - U.S. Treasury30-Year Bonds (05/19) | | | 144.00 | | | | 04/26/19 | | | | CME | | | | 3 | | | | 432,000 | | | | 1,167 | | | | (141 | ) |
Put - U.S. Treasury30-Year Bonds (05/19) | | | 145.00 | | | | 04/26/19 | | | | CME | | | | 1 | | | | 145,000 | | | | 358 | | | | (63 | ) |
Put - U.S. Treasury30-Year Bonds (05/19) | | | 146.00 | | | | 04/26/19 | | | | CME | | | | 4 | | | | 584,000 | | | | 962 | | | | (437 | ) |
Put - U.S. Treasury30-Year Bonds (05/19) | | | 147.00 | | | | 04/26/19 | | | | CME | | | | 4 | | | | 588,000 | | | | 1,603 | | | | (875 | ) |
Put - U.S. Treasury30-Year Bonds (05/19) | | | 147.50 | | | | 04/26/19 | | | | CME | | | | 2 | | | | 295,000 | | | | 622 | | | | (625 | ) |
Put - Euro-Bund (05/19) | | | EUR 162.50 | | | | 04/26/19 | | | | CME | | | | 1 | | | | EUR 162,500 | | | | 362 | | | | (34 | ) |
Put - Euro-Bund (05/19) | | | 164.00 | | | | 04/26/19 | | | | CME | | | | 4 | | | | 656,000 | | | | 623 | | | | (494 | ) |
Put - U.S. Treasury5-Year Notes (06/19) | | | $115.25 | | | | 05/24/19 | | | | CME | | | | 6 | | | | $691,500 | | | | 1,255 | | | | (1,359 | ) |
Put - U.S. Treasury10-Year Notes (06/19) | | | 123.00 | | | | 05/24/19 | | | | CME | | | | 5 | | | | 615,000 | | | | 1,398 | | | | (1,328 | ) |
Put - U.S. Treasury10-Year Notes (06/19) | | | 123.50 | | | | 05/24/19 | | | | CME | | | | 12 | | | | 1,482,000 | | | | 3,870 | | | | (5,063 | ) |
Put - U.S. Treasury30-Year Bonds (06/19) | | | 144.00 | | | | 05/24/19 | | | | CME | | | | 4 | | | | 576,000 | | | | 3,493 | | | | (625 | ) |
Put - U.S. Treasury30-Year Bonds (06/19) | | | 145.00 | | | | 05/24/19 | | | | CME | | | | 2 | | | | 290,000 | | | | 590 | | | | (469 | ) |
Put - U.S. Treasury30-Year Bonds (06/19) | | | 146.00 | | | | 05/24/19 | | | | CME | | | | 1 | | | | 146,000 | | | | 655 | | | | (359 | ) |
| | | | | | | | | | | | | | | | | | | | | | | | | | | | |
| | | | | | | | | | | | | | | | | | | | | | | 60,460 | | | | (27,788 | ) |
| | | | | | | | | | | | | | | | | | | | | | | | | | | | |
| | | | | | | |
Total Options on Futures | | | | | | | | | | | | | | | | | | | | | | | $135,662 | | | | ($178,616 | ) |
| | | | | | | | | | | | | | | | | | | | | | | | | | | | |
| | | | | | | |
Total Written Options | | | | | | | | | | | | | | | | | | | | | | | $154,412 | | | | ($178,761 | ) |
| | | | | | | | | | | | | | | | | | | | | | | | | | | | |
| (j) | Swap agreements outstanding as of March 31, 2019 were as follows: |
Credit Default Swaps on Corporate and Sovereign Issues – Sell Protection (1)
| | | | | | | | | | | | | | | | | | | | | | | | | | | | | | | | | | | | |
| Referenced Obligation | | Payment
Frequency | | | Fixed Deal
Receive Rate | | | Expiration
Date | | | Counter-
party | | | Implied Credit
Spread at
3/31/19 (2) | | | Notional
Amount (3) | | | Value | | | Upfront
Premiums
Paid
(Received) | | | Unrealized
Appreciation
(Depreciation) | |
Brazil Government | | | Q | | | | 1.000% | | | | 09/20/19 | | | | HSB | | | | 0.611% | | | | $1,800,000 | | | | $3,967 | | | | $2,858 | | | | $1,109 | |
Petrobras International Co SA | | | Q | | | | 1.000% | | | | 12/20/19 | | | | GSC | | | | 0.426% | | | | 300,000 | | | | 1,352 | | | | (32,995 | ) | | | 34,347 | |
Russian Federation | | | Q | | | | 1.000% | | | | 12/20/23 | | | | JPM | | | | 1.267% | | | | 500,000 | | | | (5,686 | ) | | | (13,052 | ) | | | 7,366 | |
| | | | | | | | | | | | | | | | | | | | | | | | | | | | | | | | | | | | |
| | | | | | | | | | | | | | | | | | | | | | | | | | | (367 | ) | | | (43,189 | ) | | | 42,822 | |
| | | | | | | | | | | | | | | | | | | | | | | | | | | | | | | | | | | | |
| | | | | | | | | |
| | | | | | | | | | | | Exchange | | | | | | | | | | | | | | | | |
Deutsche Bank AG | | | Q | | | | 1.000% | | | | 12/20/19 | | | | ICE | | | | 0.574% | | | | EUR 700,000 | | | | 2,241 | | | | (5,436 | ) | | | 7,677 | |
Citigroup Inc | | | Q | | | | 1.000% | | | | 12/20/20 | | | | ICE | | | | 0.310% | | | | $900,000 | | | | 10,779 | | | | 18,995 | | | | (8,216) | |
Tesco PLC | | | Q | | | | 1.000% | | | | 06/20/22 | | | | ICE | | | | 0.717% | | | | EUR 800,000 | | | | 8,264 | | | | 3,758 | | | | 4,506 | |
| | | | | | | | | | | | | | | | | | | | | | | | | | | | | | | | | | | | |
| | | | | | | | | | | | | | | | | | | | | | | | | | | 21,284 | | | | 17,317 | | | | 3,967 | |
| | | | | | | | | | | | | | | | | | | | | | | | | | | | | | | | | | | | |
| | | | | |
Total Credit Default Swaps on Corporate and Sovereign Issues - Sell Protection | | | | | | | | | | | | $20,917 | | | | ($25,872 | ) | | | $46,789 | |
| | | | | | | | | | | | | | | | | | | | | | | | | | | | | |
Credit Default Swaps on Credit Indices – Buy Protection (4)
| | | | | | | | | | | | | | | | | | | | | | | | | | | | | | |
| Referenced Obligation | | Payment
Frequency | | | Fixed Deal
Pay Rate | | | Expiration
Date | | | Exchange | | Notional
Amount (3) | | | Value (5) | | | Upfront
Premiums
Paid
(Received) | | | Unrealized
Appreciation
(Depreciation) | |
CDX IG 31 5Y | | | Q | | | | 1.000% | | | | 12/20/23 | | | ICE | | | $2,800,000 | | | | ($54,704 | ) | | | ($51,694 | ) | | | ($3,010) | |
| | | | | | | | | | | | | | | | | | | | | | | | | | | | | | |
Credit Default Swaps on Credit Indices – Sell Protection (1)
| | | | | | | | | | | | | | | | | | | | | | | | | | | | | | | | |
| Referenced Obligation | | Payment
Frequency | | | Fixed Deal
Receive Rate | | | Expiration
Date | | | Exchange | | | Notional
Amount (3) | | | Value (5) | | | Upfront
Premiums
Paid
(Received) | | | Unrealized
Appreciation
(Depreciation) | |
CDX IG 23 2Y | | | Q | | | | 1.000% | | | | 12/20/19 | | | | ICE | | | | $990,000 | | | | $5,484 | | | | $12,936 | | | | ($7,452) | |
CDX IG 25 5Y | | | Q | | | | 1.000% | | | | 12/20/20 | | | | ICE | | | | 2,290,000 | | | | 27,690 | | | | 41,980 | | | | (14,290) | |
CDX IG 32 5Y | | | Q | | | | 1.000% | | | | 06/20/24 | | | | ICE | | | | 17,424,659 | | | | 310,377 | | | | 279,100 | | | | 31,277 | |
CDX HY 32 5Y | | | Q | | | | 5.000% | | | | 06/20/24 | | | | ICE | | | | 1,330,000 | | | | 88,583 | | | | 81,116 | | | | 7,467 | |
CDX IG 32 10Y | | | Q | | | | 1.000% | | | | 06/20/29 | | | | ICE | | | | 620,000 | | | | (4,455 | ) | | | (7,148 | ) | | | 2,693 | |
| | | | | | | | | | | | | | | | | | | | | | | | | | | | | | | | |
| | | | | | | | | | | | | | | | | | | | | | | $427,679 | | | | $407,984 | | | | $19,695 | |
| | | | | | | | | | | | | | | | | | | | | | | | | | | | | | | | |
| | | | | | | | |
Total Credit Default Swaps | | | | | | | | | | | | | | | | | | | | | | | $393,892 | | | | $330,418 | | | | $63,474 | |
| | | | | | | | | | | | | | | | | | | | | | | | | | | | | | | | |
| | |
| See Notes to Financial Statements | | See explanation of symbols and terms, if any, on B-97 and B-98 |
B-26
PACIFIC FUNDS
PF MANAGED BOND FUND
Schedule of Investments (Continued)
March 31, 2019
| | (1) | If the Fund is a seller of protection and a credit event occurs, as defined under the terms of that particular swap agreement, the Fund will either (i) pay to the buyer of protection an amount equal to the notional amount of the swap and take delivery of the referenced obligation or underlying investments comprising the referenced index or (ii) pay a net settlement amount in the form of cash or investments equal to the notional amount of the swap less the recovery value of the referenced obligation or underlying investments comprising the referenced index. |
| | (2) | An implied credit spread is the spread in yield between a U.S. Treasury security and the referenced obligation or underlying investment that are identical in all respects except for the quality rating. Implied credit spreads, represented in absolute terms, utilized in determining the value of credit default swap agreements on corporate and sovereign issues as of year end serve as an indicator of the current status of the payment/performance risk and represent the likelihood of risk of default for the credit derivative. The implied credit spread of a particular referenced entity reflects the cost of buying/selling protection and may include upfront payments required to be made to enter into the agreement. Wider credit spreads, in comparison to narrower credit spreads, represent a deterioration of the referenced entity’s credit soundness and a greater likelihood of risk of default or other credit event occurring as defined under the terms of the agreement. A credit spread identified as “Defaulted” indicates a credit event has occurred for the referenced entity or obligation. |
| | (3) | The maximum potential amount the Fund could be required to pay as a seller of credit protection or receive as a buyer of credit protection if a credit event occurs as defined under the terms of that particular swap agreement. |
| | (4) | If the Fund is a buyer of protection and a credit event occurs, as defined under the terms of that particular swap agreement, the Fund will either (i) receive from the seller of protection an amount equal to the notional amount of the swap and deliver the referenced obligation or underlying investments comprising the referenced index or (ii) receive a net settlement amount in the form of cash or investments equal to the notional amount of the swap less the recovery value of the referenced obligation or underlying investments comprising the referenced index. |
| | (5) | The quoted market prices and resulting values for credit default swap agreements on credit indices serve as an indicator of the current status of the payment/performance risk and represent the expected amount paid or received for the credit derivative had the notional amount of the swap agreement been closed/sold as of year end. Increasing values (buy protection) or decreasing values (sell protection), when compared to the notional amount of the swap, represent a deterioration of the referenced entity’s credit soundness and a greater likelihood of risk of default or other credit event occurring as defined under the terms of the agreement. |
Interest Rate Swaps – Long
| | | | | | | | | | | | | | | | | | | | | | | | | | | | | | | | |
| Receive | | Pay | | | Payment
Frequency
Receive Rate
Pay Rate | | | Counterparty | | | Expiration
Date | | | Notional
Amount | | | Value | | | Upfront
Premiums
Paid
(Received) | | | Unrealized
Appreciation
(Depreciation) | |
8.410% | | | Brazil CETIP Interbank | | | | Z / Z | | | | CIT | | | | 01/02/20 | | | | BRL 52,950,000 | | | | $353,103 | | | | $16,850 | | | | $336,253 | |
| | | | | | | | | | | | | | | | | | | | | | | | | | | | | | | | |
| | | | | | | | |
| | | | | | | | | Exchange | | | | | | | | | | | | | | | | |
1.705% | | | 3-Month USD-LIBOR | | | | S / Q | | | | CME | | | | 09/28/19 | | | | $4,380,000 | | | | (20,063 | ) | | | — | | | | (20,063 | ) |
1.138% | | | 3-MonthUSD-LIBOR | | | | S / Q | | | | CME | | | | 10/17/19 | | | | 12,330,000 | | | | (100,557 | ) | | | — | | | | (100,557 | ) |
0.250% | | | 6-MonthJPY-LIBOR | | | | S / S | | | | CME | | | | 12/20/19 | | | | JPY 690,000,000 | | | | 10,862 | | | | 28,114 | | | | (17,252 | ) |
1.671% | | | 3-MonthUSD-LIBOR | | | | S / Q | | | | CME | | | | 06/14/20 | | | | $12,160,000 | | | | (122,621 | ) | | | (3,505 | ) | | | (119,116 | ) |
7.351% | | | 28-Day MXN TIIE | | | | L / L | | | | CME | | | | 04/05/21 | | | | MXN 294,420,000 | | | | (188,933 | ) | | | (2,293 | ) | | | (186,640 | ) |
2.851% | | | 3-MonthUSD-LIBOR | | | | S / Q | | | | CME | | | | 12/18/21 | | | | $1,170,000 | | | | 15,706 | | | | — | | | | 15,706 | |
7.330% | | | 28-Day MXN TIIE | | | | L / L | | | | CME | | | | 04/06/22 | | | | MXN 202,000,000 | | | | (150,802 | ) | | | (4,832 | ) | | | (145,970 | ) |
2.800% | | | 3-MonthUSD-LIBOR | | | | S / Q | | | | CME | | | | 08/22/23 | | | | $5,000,000 | | | | 105,316 | | | | — | | | | 105,316 | |
0.100% | | | 6-MonthJPY-LIBOR | | | | S / S | | | | LCH | | | | 03/20/24 | | | | JPY 2,790,000,000 | | | | 191,687 | | | | 88,967 | | | | 102,720 | |
0.380% | | | 6-MonthJPY-LIBOR | | | | S / S | | | | LCH | | | | 06/18/28 | | | | 60,000,000 | | | | 16,105 | | | | 3,524 | | | | 12,581 | |
1.000% | | | 6-MonthEUR-LIBOR | | | | A / S | | | | LCH | | | | 06/19/29 | | | | EUR 2,900,000 | | | | 160,039 | | | | 8,925 | | | | 151,114 | |
0.750% | | | 6-MonthEUR-LIBOR | | | | A / S | | | | LCH | | | | 09/18/29 | | | | 17,100,000 | | | | 388,526 | | | | 150,039 | | | | 238,487 | |
3.000% | | | 3-MonthUSD-LIBOR | | | | S / Q | | | | CME | | | | 02/15/36 | | | | $2,358,000 | | | | 141,640 | | | | 1,383 | | | | 140,257 | |
1.501% | | | 6-MonthEUR-LIBOR | | | | A / S | | | | LCH | | | | 07/04/42 | | | | EUR 4,000,000 | | | | 456,435 | | | | 7,425 | | | | 449,010 | |
1.250% | | | 6-MonthEUR-LIBOR | | | | A / S | | | | LCH | | | | 09/18/49 | | | | 1,300,000 | | | | 63,056 | | | | 9,814 | | | | 53,242 | |
| | | | | | | | | | | | | | | | | | | | | | | | | | | | | | | | |
| | | | | | | | | | | | | | | | | | | | | | | 966,396 | | | | 287,561 | | | | 678,835 | |
| | | | | | | | | | | | | | | | | | | | | | | | | | | | | | | | |
| | | | | | |
Total Interest Rate Swaps - Long | | | | | | | | | | | | | | | | $1,319,499 | | | | $304,411 | | | | $1,015,088 | |
| | | | | | | | | | | | | | | | | | | | | | | | | | | | | | | | |
Interest Rate Swaps – Short
| | | | | | | | | | | | | | | | | | | | | | | | | | |
| Pay | | Receive | | Payment
Frequency
Pay Rate
Receive Rate | | Exchange | | Expiration
Date | | | Notional
Amount | | | Value | | | Upfront
Premiums
Paid
(Received) | | | Unrealized
Appreciation
(Depreciation) | |
1.271% | | 6-MonthGBP-LIBOR | | S / S | | CME | | | 10/26/21 | | | | GBP 3,436,000 | | | | ($26,998 | ) | | | $1,668 | | | | ($28,666 | ) |
1.385% | | 3-MonthGBP-LIBOR | | A / A | | CME | | | 10/30/21 | | | | 4,215,000 | | | | (24,369 | ) | | | — | | | | (24,369 | ) |
3-Month USD-LIBOR | | 1 Day U.S. Fed Funds + 0.254% | | Q / Q | | CME | | | 06/19/24 | | | | $7,744,000 | | | | 1,797 | | | | — | | | | 1,797 | |
1.250% | | 6-MonthGBP-LIBOR | | S / S | | LCH | | | 09/18/24 | | | | GBP 6,900,000 | | | | (69,621 | ) | | | 15,876 | | | | (85,497 | ) |
2.250% | | 3-Month USD-LIBOR | | A / A | | CME | | | 12/31/25 | | | | $5,421,000 | | | | (65,327 | ) | | | (33,019 | ) | | | (32,308 | ) |
2.250% | | 3-MonthUSD-LIBOR | | S / Q | | CME | | | 12/31/25 | | | | 1,984,000 | | | | 8,286 | | | | 2,724 | | | | 5,562 | |
2.500% | | 3-MonthUSD-LIBOR | | S / Q | | CME | | | 01/31/26 | | | | 8,369,000 | | | | (92,251 | ) | | | (112,446 | ) | | | 20,195 | |
0.300% | | 6-MonthJPY-LIBOR | | S / S | | CME | | | 03/18/26 | | | | JPY 1,290,000,000 | | | | (250,612 | ) | | | (108,134 | ) | | | (142,478 | ) |
0.300% | | 6-MonthJPY-LIBOR | | S / S | | LCH | | | 03/18/26 | | | | 970,000,000 | | | | (189,763 | ) | | | (62,183 | ) | | | (127,580 | ) |
0.300% | | 6-MonthJPY-LIBOR | | S / S | | LCH | | | 09/20/27 | | | | 440,000,000 | | | | (89,813 | ) | | | (16,315 | ) | | | (73,498 | ) |
2.500% | | 3-MonthUSD-LIBOR | | S / Q | | CME | | | 12/20/27 | | | | $2,000,000 | | | | (16,974 | ) | | | (11,780 | ) | | | (5,194 | ) |
0.300% | | 6-MonthJPY-LIBOR | | S / S | | LCH | | | 03/20/28 | | | | JPY 100,000,000 | | | | (20,355 | ) | | | 7,176 | | | | (27,531 | ) |
0.399% | | 6-MonthJPY-LIBOR | | S / S | | LCH | | | 06/18/28 | | | | 50,000,000 | | | | (14,283 | ) | | | (43 | ) | | | (14,240 | ) |
2.250% | | 3-MonthUSD-LIBOR | | S / Q | | LCH | | | 06/20/28 | | | | $5,200,000 | | | | 61,919 | | | | 328,188 | | | | (266,269 | ) |
0.450% | | 6-MonthJPY-LIBOR | | S / S | | LCH | | | 03/20/29 | | | | JPY 560,000,000 | | | | (184,667 | ) | | | (31,011 | ) | | | (153,656 | ) |
1.500% | | 6-Month GBP-LIBOR | | S / S | | LCH | | | 06/19/29 | | | | GBP 900,000 | | | | (30,836 | ) | | | (6,956 | ) | | | (23,880 | ) |
1.500% | | 6-MonthGBP-LIBOR | | S / S | | LCH | | | 09/18/29 | | | | 2,700,000 | | | | (88,690 | ) | | | (19,143 | ) | | | (69,547 | ) |
| | |
| See Notes to Financial Statements | | See explanation of symbols and terms, if any, on B-97 and B-98 |
B-27
PACIFIC FUNDS
PF MANAGED BOND FUND
Schedule of Investments (Continued)
March 31, 2019
| | | | | | | | | | | | | | | | | | | | | | | | | | | | | | |
| Pay | | Receive | | Payment
Frequency
Pay Rate
Receive Rate | | | Exchange | | | Expiration
Date | | | Notional
Amount | | | Value | | | Upfront
Premiums
Paid
(Received) | | | Unrealized
Appreciation
(Depreciation) | |
0.750% | | 6-Month JPY-LIBOR | | | S / S | | | | LCH | | | | 03/20/38 | �� | | | JPY 250,000,000 | | | | ($163,390 | ) | | | $20,988 | | | | ($184,378 | ) |
0.800% | | 6-MonthJPY-LIBOR | | | S / S | | | | LCH | | | | 10/22/38 | | | | 10,000,000 | | | | (7,358 | ) | | | — | | | | (7,358 | ) |
0.705% | | 6-MonthJPY-LIBOR | | | S / S | | | | LCH | | | | 10/31/38 | | | | 50,000,000 | | | | (28,524 | ) | | | 3,205 | | | | (31,729 | ) |
0.785% | | 6-MonthJPY-LIBOR | | | S / S | | | | LCH | | | | 11/12/38 | | | | 20,000,000 | | | | (14,188 | ) | | | 68 | | | | (14,256 | ) |
0.750% | | 6-MonthJPY-LIBOR | | | S / S | | | | LCH | | | | 12/20/38 | | | | 725,000,000 | | | | (469,938 | ) | | | (25,105 | ) | | | (444,833 | ) |
3.330% | | 3-Month USD-LIBOR | | | S / Q | | | | CME | | | | 02/15/44 | | | | $1,833,000 | | | | (246,991 | ) | | | 832 | | | | (247,823 | ) |
2.875% | | 3-MonthUSD-LIBOR | | | S / Q | | | | CME | | | | 05/15/44 | | | | 2,072,000 | | | | (102,256 | ) | | | 11,714 | | | | (113,970 | ) |
3.000% | | 3-MonthUSD-LIBOR | | | S / Q | | | | CME | | | | 05/15/44 | | | | 1,776,000 | | | | (129,901 | ) | | | 1,416 | | | | (131,317 | ) |
2.750% | | 3-MonthUSD-LIBOR | | | S / Q | | | | CME | | | | 08/15/44 | | | | 1,683,000 | | | | (42,813 | ) | | | (866 | ) | | | (41,947 | ) |
0.641% | | 6-MonthJPY-LIBOR | | | S / S | | | | CME | | | | 05/09/46 | | | | JPY 187,300,000 | | | | (62,616 | ) | | | — | | | | (62,616 | ) |
1.750% | | 3-MonthCAD-CDOR | | | S / S | | | | CME | | | | 12/16/46 | | | | CAD 300,000 | | | | 30,344 | | | | 38,920 | | | | (8,576 | ) |
1.498% | | 6-MonthEUR-LIBOR | | | A / S | | | | CME | | | | 08/23/47 | | | | EUR 543,000 | | | | (68,969 | ) | | | (827 | ) | | | (68,142 | ) |
1.000% | | 6-MonthJPY-LIBOR | | | S / S | | | | LCH | | | | 03/21/48 | | | | JPY 20,000,000 | | | | (24,572 | ) | | | (615 | ) | | | (23,957 | ) |
2.905% | | 3-MonthUSD-LIBOR | | | S / Q | | | | CME | | | | 08/22/48 | | | | $1,400,000 | | | | (84,751 | ) | | | 44,506 | | | | (129,257 | ) |
2.940% | | 3-MonthUSD-LIBOR | | | S / Q | | | | CME | | | | 08/22/48 | | | | 300,000 | | | | (20,394 | ) | | | — | | | | (20,394 | ) |
1.750% | | 6-Month GBP-LIBOR | | | S / S | | | | LCH | | | | 06/19/49 | | | | GBP 3,100,000 | | | | (383,032 | ) | | | (215,267 | ) | | | (167,765 | ) |
| | | | | | | | | | | | | | | | | | | | | | | | | | | | | | |
| | | | | | | | | | | | | | | | | | | | | ($2,911,906 | ) | | | ($166,429 | ) | | | ($2,745,477 | ) |
| | | | | | | | | | | | | | | | | | | | | | | | | | | | | | |
| | | | | | |
Total Interest Rate Swaps | | | | | | | | | | | | | | | | ($1,592,407 | ) | | | $137,982 | | | | ($1,730,389 | ) |
| | | | | | | | | | | | | | | | | | | | | | | | | | | | | | |
| | | | | | |
Total Swap Agreements | | | | | | | | | | | | | | | | ($1,198,515 | ) | | | $468,400 | | | | ($1,666,915 | ) |
| | | | | | | | | | | | | | | | | | | | | | | | | | | | | | |
Balances reported in the Statement of Assets and Liabilities for Over the Counter (OTC) Swaps and Centrally Cleared Swaps
| | | | | | | | |
| | | Upfront
Premium
Paid
(Received) | | | Unrealized
Appreciation
(Deprecation) | |
OTC Swap Agreements | | | | | | | | |
Assets | | | $19,708 | | | | $379,075 | |
Liabilities | | | (46,047 | ) | | | — | |
Centrally Cleared Swap Agreements (6) | | | | | | | | |
Assets | | | 1,213,357 | | | | 1,349,607 | |
Liabilities | | | (718,618 | ) | | | (3,395,597 | ) |
| | | | | | | | |
| | | $468,400 | | | | ($1,666,915 | ) |
| | | | | | | | |
| | (6) | Includes cumulative value on centrally cleared swaps, as reported in the Schedule of Investments. Only current day’s variation margin is reported within the Statement of Assets and Liabilities. |
| | |
| See Notes to Financial Statements | | See explanation of symbols and terms, if any, on B-97 and B-98 |
B-28
PACIFIC FUNDS
PF MANAGED BOND FUND
Schedule of Investments (Continued)
March 31, 2019
| (k) | Fair Value Measurements |
The following is a summary of the Fund’s investments as categorized under the three-tier hierarchy of inputs used in valuing the Fund’s assets and liabilities (See Note 3D in Notes to Financial Statements) as of March 31, 2019:
| | | | | | | | | | | | | | | | | | |
| | | | | Total Value at
March 31, 2019 | | | Level 1
Quoted Price | | | Level 2
Significant
Observable Inputs | | | Level 3
Significant
Unobservable Inputs | |
Assets | | Corporate Bonds & Notes | | | $239,556,183 | | | | $— | | | | $239,556,183 | | | | $— | |
| | Senior Loan Notes | | | 3,758,419 | | | | — | | | | 3,758,419 | | | | — | |
| | Mortgage-Backed Securities | | | 272,065,967 | | | | — | | | | 272,065,967 | | | | — | |
| | Asset-Backed Securities | | | 26,385,694 | | | | — | | | | 26,385,694 | | | | — | |
| | U.S. Treasury Obligations | | | 101,299,759 | | | | — | | | | 101,299,759 | | | | — | |
| | Foreign Government Bonds & Notes | | | 21,246,219 | | | | — | | | | 21,246,219 | | | | — | |
| | Municipal Bonds | | | 2,353,967 | | | | — | | | | 2,353,967 | | | | — | |
| | Short-Term Investments | | | 31,982,577 | | | | 7,182,485 | | | | 24,800,092 | | | | — | |
| | Derivatives: | | | | | | | | | | | | | | | | |
| | Credit Contracts | | | | | | | | | | | | | | | | |
| | Purchased Options | | | 5,960 | | | | — | | | | 5,960 | | | | — | |
| | Swaps | | | 96,442 | | | | — | | | | 96,442 | | | | — | |
| | | | | | | | | | | | | | | | | | |
| | Total Credit Contracts | | | 102,402 | | | | — | | | | 102,402 | | | | — | |
| | | | | | | | | | | | | | | | | | |
| | Foreign Currency Contracts | | | | | | | | | | | | | | | | |
| | Futures | | | 41,213 | | | | 41,213 | | | | — | | | | — | |
| | Forward Foreign Currency Contracts | | | 1,683,056 | | | | — | | | | 1,683,056 | | | | — | |
| | Purchased Options | | | 27,955 | | | | — | | | | 27,955 | | | | — | |
| | | | | | | | | | | | | | �� | | | | |
| | Total Foreign Currency Contracts | | | 1,752,224 | | | | 41,213 | | | | 1,711,011 | | | | — | |
| | | | | | | | | | | | | | | | | | |
| | Interest Rate Contracts | | | | | | | | | | | | | | | | |
| | Futures | | | 4,627,735 | | | | 4,627,735 | | | | — | | | | — | |
| | Purchased Options | | | 42,469 | | | | — | | | | 42,469 | | | | — | |
| | Swaps | | | 1,632,240 | | | | — | | | | 1,632,240 | | | | — | |
| | | | | | | | | | | | | | | | | | |
| | Total Interest Rate Contracts | | | 6,302,444 | | | | 4,627,735 | | | | 1,674,709 | | | | — | |
| | | | | | | | | | | | | | | | | | |
| | Total Assets - Derivatives | | | 8,157,070 | | | | 4,668,948 | | | | 3,488,122 | | | | — | |
| | | | | | | | | | | | | | | | | | |
| | Total Assets | | | 706,805,855 | | | | 11,851,433 | | | | 694,954,422 | | | | — | |
| | | | | | | | | | | | | | | | | | |
| | | | | |
Liabilities | | Reverse Repurchase Agreement | | | (2,045,000 | ) | | | — | | | | (2,045,000 | ) | | | — | |
| | Sale-buyback Financing Transactions | | | (10,978,581 | ) | | | — | | | | (10,978,581 | ) | | | — | |
| | Derivatives: | | | | | | | | | | | | | | | | |
| | Credit Contracts | | | | | | | | | | | | | | | | |
| | Written Options | | | (145 | ) | | | — | | | | (145 | ) | | | — | |
| | Swaps | | | (32,968 | ) | | | — | | | | (32,968 | ) | | | — | |
| | | | | | | | | | | | | | | | | | |
| | Total Credit Contracts | | | (33,113 | ) | | | — | | | | (33,113 | ) | | | — | |
| | | | | | | | | | | | | | | | | | |
| | Foreign Currency Contracts | | | | | | | | | | | | | | | | |
| | Futures | | | (61,112 | ) | | | (61,112 | ) | | | — | | | | — | |
| | Forward Foreign Currency Contracts | | | (536,393 | ) | | | — | | | | (536,393 | ) | | | — | |
| | Written Options | | | (2,889 | ) | | | — | | | | (2,889 | ) | | | — | |
| | | | | | | | | | | | | | | | | | |
| | Total Foreign Currency Contracts | | | (600,394 | ) | | | (61,112 | ) | | | (539,282 | ) | | | — | |
| | | | | | | | | | | | | | | | | | |
| | Interest Rate Contracts | | | | | | | | | | | | | | | | |
| | Futures | | | (5,251,125 | ) | | | (5,251,125 | ) | | | — | | | | — | |
| | Written Options | | | (175,727 | ) | | | — | | | | (175,727 | ) | | | — | |
| | Swaps | | | (3,362,629 | ) | | | — | | | | (3,362,629 | ) | | | — | |
| | | | | | | | | | | | | | | | | | |
| | Total Interest Rate Contracts | | | (8,789,481 | ) | | | (5,251,125 | ) | | | (3,538,356 | ) | | | — | |
| | | | | | | | | | | | | | | | | | |
| | Total Liabilities - Derivatives | | | (9,422,988 | ) | | | (5,312,237 | ) | | | (4,110,751 | ) | | | — | |
| | | | | | | | | | | | | | | | | | |
| | Total Liabilities | | | (22,446,569 | ) | | | (5,312,237 | ) | | | (17,134,332 | ) | | | — | |
| | | | | | | | | | | | | | | | | | |
| | Total | | | $684,359,286 | | | | $6,539,196 | | | | $677,820,090 | | | | $— | |
| | | | | | | | | | | | | | | | | | |
| | |
| See Notes to Financial Statements | | See explanation of symbols and terms, if any, on B-97 and B-98 |
B-29
PACIFIC FUNDS
PF SHORT DURATION BOND FUND
Schedule of Investments
March 31, 2019
| | | | | | | | |
| | | Principal Amount | | | Value | |
CORPORATE BONDS & NOTES - 54.3% | |
|
Basic Materials - 2.6% | |
| | |
Anglo American Capital PLC (South Africa)
3.750% due 04/10/22 ~ | | | $250,000 | | | | $250,814 | |
ArcelorMittal (Luxembourg) | |
5.250% due 08/05/20 | | | 470,000 | | | | 483,063 | |
5.500% due 03/01/21 | | | 290,000 | | | | 303,117 | |
Celulosa Arauco y Constitucion SA (Chile)
7.250% due 07/29/19 | | | 120,000 | | | | 121,847 | |
CNAC HK Finbridge Co Ltd (China)
3.000% due 07/19/20 ~ | | | 200,000 | | | | 199,685 | |
DowDuPont Inc
3.766% due 11/15/20 | | | 300,000 | | | | 305,328 | |
International Flavors & Fragrances Inc
3.400% due 09/25/20 | | | 65,000 | | | | 65,422 | |
INVISTA Finance LLC
4.250% due 10/15/19 ~ | | | 1,040,000 | | | | 1,049,528 | |
LyondellBasell Industries NV
6.000% due 11/15/21 | | | 200,000 | | | | 214,029 | |
Solvay Finance America LLC (Belgium)
3.400% due 12/03/20 ~ | | | 525,000 | | | | 527,761 | |
Vale Overseas Ltd (Brazil)
4.375% due 01/11/22 | | | 505,000 | | | | 517,372 | |
| | | | | | | | |
| | | | | | | 4,037,966 | |
| | | | | | | | |
Communications - 3.7% | |
| | |
America Movil Sab de CV (Mexico)
5.000% due 03/30/20 | | | 520,000 | | | | 530,120 | |
Axiata SPV2 Bhd (Malaysia)
3.466% due 11/19/20 ~ | | | 220,000 | | | | 221,250 | |
Baidu Inc (China)
2.750% due 06/09/19 | | | 410,000 | | | | 410,130 | |
Charter Communications Operating LLC | |
3.579% due 07/23/20 | | | 370,000 | | | | 372,794 | |
4.464% due 07/23/22 | | | 425,000 | | | | 440,037 | |
Comcast Corp
3.700% due 04/15/24 | | | 595,000 | | | | 615,129 | |
Crown Castle Towers LLC
3.720% due 07/15/43 ~ | | | 55,000 | | | | 55,820 | |
CSC Holdings LLC
10.875% due 10/15/25 ~ | | | 200,000 | | | | 231,400 | |
Discovery Communications LLC
2.200% due 09/20/19 | | | 145,000 | | | | 144,430 | |
Expedia Group Inc
5.950% due 08/15/20 | | | 65,000 | | | | 67,564 | |
Fox Corp | |
3.666% due 01/25/22 ~ | | | 90,000 | | | | 91,840 | |
4.030% due 01/25/24 ~ | | | 105,000 | | | | 109,017 | |
JD.com Inc (China)
3.125% due 04/29/21 | | | 560,000 | | | | 553,865 | |
NBCUniversal Media LLC
5.150% due 04/30/20 | | | 520,000 | | | | 533,196 | |
Omnicom Group Inc
6.250% due 07/15/19 | | | 510,000 | | | | 514,703 | |
The Interpublic Group of Cos Inc
3.500% due 10/01/20 | | | 45,000 | | | | 45,410 | |
Time Warner Cable LLC
8.250% due 04/01/19 | | | 830,000 | | | | 830,000 | |
| | | | | | | | |
| | | | | | | 5,766,705 | |
| | | | | | | | |
Consumer, Cyclical - 5.5% | |
| | |
American Airlines Pass Through Trust
3.700% due 04/15/27 | | | 180,395 | | | | 176,371 | |
Daimler Finance North America LLC (Germany) | |
1.750% due 10/30/19 ~ | | | 165,000 | | | | 163,954 | |
2.200% due 05/05/20 ~ | | | 350,000 | | | | 347,320 | |
2.300% due 02/12/21 ~ | | | 805,000 | | | | 795,643 | |
| | | | | | | | |
| | | Principal Amount | | | Value | |
Delta Air Lines Inc | |
2.600% due 12/04/20 | | | $65,000 | | | | $64,622 | |
2.875% due 03/13/20 | | | 885,000 | | | | 883,589 | |
DR Horton Inc
2.550% due 12/01/20 | | | 125,000 | | | | 124,244 | |
Ford Motor Credit Co LLC | |
2.021% due 05/03/19 | | | 250,000 | | | | 249,777 | |
2.681% due 01/09/20 | | | 700,000 | | | | 697,148 | |
3.157% due 08/04/20 | | | 410,000 | | | | 407,220 | |
General Motors Financial Co Inc | |
3.200% due 07/13/20 | | | 435,000 | | | | 436,179 | |
3.442% (USD LIBOR + 0.850%)
due 04/09/21 § | | | 200,000 | | | | 198,537 | |
4.200% due 11/06/21 | | | 65,000 | | | | 66,270 | |
Harley-Davidson Financial Services Inc | |
2.150% due 02/26/20 ~ | | | 165,000 | | | | 163,582 | |
3.141% (USD LIBOR + 0.500%)
due 05/21/20 § ~ | | | 135,000 | | | | 135,041 | |
3.555% (USD LIBOR + 0.940%)
due 03/02/21 § ~ | | | 270,000 | | | | 270,052 | |
4.050% due 02/04/22 ~ | | | 315,000 | | | | 318,698 | |
Hyundai Capital America
1.750% due 09/27/19 ~ | | | 175,000 | | | | 174,135 | |
Lennar Corp
2.950% due 11/29/20 | | | 775,000 | | | | 772,094 | |
Nissan Motor Acceptance Corp | |
2.150% due 09/28/20 ~ | | | 625,000 | | | | 614,515 | |
2.600% due 09/28/22 ~ | | | 115,000 | | | | 112,016 | |
O’Reilly Automotive Inc
3.800% due 09/01/22 | | | 240,000 | | | | 246,343 | |
QVC Inc
3.125% due 04/01/19 | | | 600,000 | | | | 600,000 | |
Volkswagen Group of America Finance LLC (Germany)
3.875% due 11/13/20 ~ | | | 425,000 | | | | 430,442 | |
| | | | | | | | |
| | | | | | | 8,447,792 | |
| | | | | | | | |
Consumer,Non-Cyclical - 10.1% | |
| | |
Abbott Laboratories
2.900% due 11/30/21 | | | 545,000 | | | | 547,630 | |
AbbVie Inc | |
2.300% due 05/14/21 | | | 295,000 | | | | 291,474 | |
2.900% due 11/06/22 | | | 205,000 | | | | 204,669 | |
3.200% due 11/06/22 | | | 45,000 | | | | 45,432 | |
Altria Group Inc | |
3.490% due 02/14/22 | | | 170,000 | | | | 172,815 | |
3.800% due 02/14/24 | | | 440,000 | | | | 448,322 | |
BAT Capital Corp (United Kingdom)
2.297% due 08/14/20 | | | 790,000 | | | | 782,413 | |
Baxalta Inc
3.600% due 06/23/22 | | | 95,000 | | | | 95,560 | |
Bayer US Finance II LLC (Germany) | |
3.232% (USD LIBOR + 0.630%)
due 06/25/21 § ~ | | | 210,000 | | | | 208,263 | |
3.500% due 06/25/21 ~ | | | 530,000 | | | | 532,406 | |
Becton Dickinson and Co | |
2.404% due 06/05/20 | | | 755,000 | | | | 749,809 | |
2.675% due 12/15/19 | | | 575,000 | | | | 573,240 | |
3.476% (USD LIBOR + 0.875%)
due 12/29/20 § | | | 56,000 | | | | 56,006 | |
Bunge Ltd Finance Corp | |
3.000% due 09/25/22 | | | 100,000 | | | | 99,600 | |
3.500% due 11/24/20 | | | 465,000 | | | | 467,484 | |
Campbell Soup Co
3.300% due 03/15/21 | | | 460,000 | | | | 463,119 | |
Celgene Corp | |
2.750% due 02/15/23 | | | 155,000 | | | | 153,665 | |
2.875% due 02/19/21 | | | 165,000 | | | | 164,892 | |
3.250% due 02/20/23 | | | 45,000 | | | | 45,432 | |
3.550% due 08/15/22 | | | 405,000 | | | | 413,929 | |
3.625% due 05/15/24 | | | 40,000 | | | | 40,711 | |
| | |
| See Notes to Financial Statements | | See explanation of symbols and terms, if any, on B-97 and B-98 |
B-30
PACIFIC FUNDS
PF SHORT DURATION BOND FUND
Schedule of Investments (Continued)
March 31, 2019
| | | | | | | | |
| | | Principal Amount | | | Value | |
Cigna Corp | |
3.265% (USD LIBOR + 0.650%)
due 09/17/21 § ~ | | | $110,000 | | | | $109,999 | |
3.400% due 09/17/21 ~ | | | 185,000 | | | | 187,057 | |
Conagra Brands Inc
3.511% (USD LIBOR + 0.750%)
due 10/22/20 § | | | 70,000 | | | | 69,940 | |
CVS Health Corp | |
3.125% due 03/09/20 | | | 435,000 | | | | 436,322 | |
3.350% due 03/09/21 | | | 635,000 | | | | 640,412 | |
Elanco Animal Health Inc | |
3.912% due 08/27/21 ~ | | | 145,000 | | | | 147,505 | |
4.272% due 08/28/23 ~ | | | 70,000 | | | | 72,218 | |
Equifax Inc | |
2.300% due 06/01/21 | | | 255,000 | | | | 250,418 | |
3.554% (USD LIBOR + 0.870%)
due 08/15/21 § | | | 105,000 | | | | 104,384 | |
3.600% due 08/15/21 | | | 105,000 | | | | 106,028 | |
ERAC USA Finance LLC
2.350% due 10/15/19 ~ | | | 253,000 | | | | 252,308 | |
Express Scripts Holding Co
3.376% (USD LIBOR + 0.750%)
due 11/30/20 § | | | 105,000 | | | | 105,005 | |
HCA Inc
4.250% due 10/15/19 | | | 55,000 | | | | 55,289 | |
6.500% due 02/15/20 | | | 970,000 | | | | 998,540 | |
HPHT Finance 15 Ltd (Hong Kong)
2.875% due 03/17/20 ~ | | | 200,000 | | | | 199,941 | |
Humana Inc | |
2.900% due 12/15/22 | | | 20,000 | | | | 19,874 | |
3.150% due 12/01/22 | | | 105,000 | | | | 105,530 | |
3.850% due 10/01/24 | | | 15,000 | | | | 15,299 | |
Imperial Brands Finance PLC (United Kingdom)
2.950% due 07/21/20 ~ | | | 525,000 | | | | 523,554 | |
Keurig Dr Pepper Inc
3.551% due 05/25/21 ~ | | | 550,000 | | | | 556,198 | |
Molson Coors Brewing Co
2.250% due 03/15/20 | | | 450,000 | | | | 447,254 | |
Pernod Ricard SA (France)
5.750% due 04/07/21 ~ | | | 240,000 | | | | 252,912 | |
Reynolds American Inc (United Kingdom)
8.125% due 06/23/19 | | | 300,000 | | | | 303,406 | |
Shire Acquisitions Investments Ireland DAC
1.900% due 09/23/19 | | | 1,800,000 | | | | 1,792,427 | |
Takeda Pharmaceutical Co Ltd (Japan)
3.800% due 11/26/20 ~ | | | 220,000 | | | | 223,357 | |
Teva Pharmaceutical Finance Netherlands III BV (Israel)
1.700% due 07/19/19 | | | 1,050,000 | | | | 1,047,770 | |
Tyson Foods Inc
2.250% due 08/23/21 | | | 160,000 | | | | 157,617 | |
| | | | | | | | |
| | | | | | | 15,737,435 | |
| | | | | | | | |
Energy - 4.7% | |
| | |
Cenovus Energy Inc (Canada)
5.700% due 10/15/19 | | | 682,692 | | | | 692,551 | |
China Shenhua Overseas Capital Co Ltd (China)
3.125% due 01/20/20 ~ | | | 725,000 | | | | 723,011 | |
Columbia Pipeline Group Inc
3.300% due 06/01/20 | | | 380,000 | | | | 381,691 | |
DCP Midstream Operating LP
2.700% due 04/01/19 | | | 730,000 | | | | 730,000 | |
Encana Corp (Canada)
6.500% due 05/15/19 | | | 355,000 | | | | 355,878 | |
Energy Transfer Operating LP
7.500% due 10/15/20 | | | 705,000 | | | | 750,871 | |
Eni SPA (Italy)
4.000% due 09/12/23 ~ | | | 270,000 | | | | 277,312 | |
EnLink Midstream Partners LP
2.700% due 04/01/19 | | | 470,000 | | | | 470,000 | |
| | | | | | | | |
| | | Principal Amount | | | Value | |
Enterprise Products Operating LLC
3.500% due 02/01/22 | | | $95,000 | | | | $96,889 | |
Marathon Oil Corp
2.700% due 06/01/20 | | | 445,000 | | | | 443,052 | |
Petroleos Mexicanos (Mexico)
8.000% due 05/03/19 | | | 265,000 | | | | 266,458 | |
Phillips 66
3.246% (USD LIBOR + 0.600%)
due 02/26/21 § | | | 165,000 | | | | 165,005 | |
Plains All American Pipeline LP | |
2.600% due 12/15/19 | | | 96,000 | | | | 95,678 | |
5.000% due 02/01/21 | | | 120,000 | | | | 123,399 | |
5.750% due 01/15/20 | | | 470,000 | | | | 479,593 | |
Sabine Pass Liquefaction LLC
5.625% due 02/01/21 | | | 505,000 | | | | 524,874 | |
Schlumberger Holdings Corp | |
3.000% due 12/21/20 ~ | | | 435,000 | | | | 436,936 | |
3.750% due 05/01/24 ~ | | | 210,000 | | | | 214,827 | |
The Williams Cos Inc
3.350% due 08/15/22 | | | 120,000 | | | | 121,003 | |
| | | | | | | | |
| | | | | | | 7,349,028 | |
| | | | | | | | |
Financial - 17.1% | |
| | |
ABN AMRO Bank NV (Netherlands)
3.209% (USD LIBOR + 0.570%)
due 08/27/21 § ~ | | | 200,000 | | | | 200,393 | |
AerCap Ireland Capital DAC (Ireland) | |
3.950% due 02/01/22 | | | 400,000 | | | | 405,456 | |
4.625% due 10/30/20 | | | 430,000 | | | | 440,369 | |
AIG Global Funding
3.350% due 06/25/21 ~ | | | 100,000 | | | | 100,660 | |
Air Lease Corp | |
2.500% due 03/01/21 | | | 70,000 | | | | 69,485 | |
3.500% due 01/15/22 | | | 90,000 | | | | 90,892 | |
Alexandria Real Estate Equities Inc REIT
2.750% due 01/15/20 | | | 1,390,000 | | | | 1,387,878 | |
American Campus Communities Operating Partnership LP REIT
3.350% due 10/01/20 | | | 240,000 | | | | 241,000 | |
American Express Co
3.000% due 02/22/21 | | | 365,000 | | | | 367,010 | |
Aon PLC
2.800% due 03/15/21 | | | 550,000 | | | | 549,134 | |
Banco de Credito del Peru (Peru)
2.250% due 10/25/19 ~ | | | 200,000 | | | | 199,560 | |
Banco Santander Chile (Chile)
2.500% due 12/15/20 ~ | | | 445,000 | | | | 442,699 | |
Bank of America Corp | |
2.503% due 10/21/22 | | | 95,000 | | | | 93,887 | |
3.152% (USD LIBOR + 0.380%)
due 01/23/22 § | | | 660,000 | | | | 658,036 | |
3.252% (USD LIBOR + 0.650%)
due 06/25/22 § | | | 230,000 | | | | 230,122 | |
3.921% (USD LIBOR + 1.160%)
due 01/20/23 § | | | 295,000 | | | | 298,752 | |
Barclays Bank PLC (United Kingdom)
2.650% due 01/11/21 | | | 610,000 | | | | 605,827 | |
BPCE SA (France)
3.883% (USD LIBOR + 1.220%)
due 05/22/22 § ~ | | | 250,000 | | | | 251,639 | |
Brixmor Operating Partnership LP REIT
3.875% due 08/15/22 | | | 35,000 | | | | 35,509 | |
Capital One Financial Corp
2.400% due 10/30/20 | | | 455,000 | | | | 452,623 | |
3.900% due 01/29/24 | | | 170,000 | | | | 173,899 | |
China Overseas Finance Cayman Ltd (China)
4.250% due 05/08/19 ~ | | | 500,000 | | | | 500,622 | |
Citigroup Inc | |
2.700% due 03/30/21 | | | 245,000 | | | | 244,882 | |
2.900% due 12/08/21 | | | 485,000 | | | | 484,909 | |
| | |
| See Notes to Financial Statements | | See explanation of symbols and terms, if any, on B-97 and B-98 |
B-31
PACIFIC FUNDS
PF SHORT DURATION BOND FUND
Schedule of Investments (Continued)
March 31, 2019
| | | | | | | | |
| | | Principal Amount | | | Value | |
Citizens Bank NA | |
2.250% due 10/30/20 | | | $250,000 | | | | $247,991 | |
3.250% due 02/14/22 | | | 305,000 | | | | 308,038 | |
CNA Financial Corp
5.875% due 08/15/20 | | | 365,000 | | | | 379,666 | |
CNO Financial Group Inc
4.500% due 05/30/20 | | | 1,240,000 | | | | 1,252,400 | |
Cooperatieve Rabobank UA (Netherlands)
3.950% due 11/09/22 | | | 375,000 | | | | 382,230 | |
Crown Castle International Corp REIT | |
2.250% due 09/01/21 | | | 255,000 | | | | 251,498 | |
3.400% due 02/15/21 | | | 285,000 | | | | 287,505 | |
Danske Bank AS (Denmark)
2.200% due 03/02/20 ~ | | | 480,000 | | | | 474,700 | |
Deutsche Bank AG (Germany)
4.028% (USD LIBOR + 1.290%)
due 02/04/21 § | | | 250,000 | | | | 248,008 | |
Discover Bank | |
3.100% due 06/04/20 | | | 635,000 | | | | 636,582 | |
7.000% due 04/15/20 | | | 810,000 | | | | 842,608 | |
First Niagara Financial Group Inc
7.250% due 12/15/21 | | | 120,000 | | | | 132,634 | |
GE Capital International Funding Co Unlimited Co
2.342% due 11/15/20 | | | 1,110,000 | | | | 1,096,540 | |
Highwoods Realty LP REIT
3.625% due 01/15/23 | | | 175,000 | | | | 175,747 | |
HSBC Bank USA NA
4.875% due 08/24/20 | | | 475,000 | | | | 488,190 | |
HSBC Holdings PLC (United Kingdom)
3.283% (USD LIBOR + 0.600%)
due 05/18/21 § | | | 200,000 | | | | 199,964 | |
ING Groep NV (Netherlands)
3.751% (USD LIBOR + 1.150%)
due 03/29/22 § | | | 205,000 | | | | 205,962 | |
International Lease Finance Corp
6.250% due 05/15/19 | | | 340,000 | | | | 341,253 | |
iStar Inc REIT
4.625% due 09/15/20 | | | 450,000 | | | | 456,187 | |
JPMorgan Chase & Co
3.151% (USD LIBOR + 0.550%)
due 03/09/21 § | | | 490,000 | | | | 490,634 | |
KeyBank NA
3.300% due 02/01/22 | | | 420,000 | | | | 427,414 | |
Marsh & McLennan Cos Inc
3.875% due 03/15/24 | | | 190,000 | | | | 197,335 | |
Mitsubishi UFJ Financial Group Inc (Japan) | |
3.218% due 03/07/22 | | | 955,000 | | | | 962,739 | |
3.415% (USD LIBOR + 0.650%)
due 07/26/21 § | | | 68,000 | | | | 68,144 | |
Morgan Stanley | |
3.247% (USD LIBOR + 0.550%)
due 02/10/21 § | | | 310,000 | | | | 310,352 | |
5.500% due 07/24/20 | | | 125,000 | | | | 129,316 | |
Regions Bank
2.972% (USD LIBOR + 0.380%)
due 04/01/21 § | | | 535,000 | | | | 531,916 | |
Reinsurance Group of America Inc | |
5.000% due 06/01/21 | | | 35,000 | | | | 36,443 | |
6.450% due 11/15/19 | | | 677,000 | | | | 691,440 | |
Santander UK Group Holdings PLC (United Kingdom)
2.875% due 10/16/20 | | | 405,000 | | | | 404,806 | |
Santander UK PLC (United Kingdom)
2.125% due 11/03/20 | | | 385,000 | | | | 380,839 | |
SBA Tower Trust REIT | |
3.168% due 04/09/47 ~ | | | 285,000 | | | | 284,898 | |
3.448% due 03/15/48 ~ | | | 210,000 | | | | 211,552 | |
Standard Chartered PLC (United Kingdom)
2.100% due 08/19/19 ~ | | | 200,000 | | | | 199,370 | |
| | | | | | | | |
| | | Principal Amount | | | Value | |
Synchrony Financial
2.700% due 02/03/20 | | | $1,095,000 | | | | $1,093,774 | |
The Goldman Sachs Group Inc | |
2.875% due 02/25/21 | | | 105,000 | | | | 105,099 | |
3.524% (USD LIBOR + 0.780%)
due 10/31/22 § | | | 100,000 | | | | 99,621 | |
3.875% (USD LIBOR + 1.110%)
due 04/26/22 § | | | 295,000 | | | | 296,665 | |
5.750% due 01/24/22 | | | 260,000 | | | | 279,044 | |
Trinity Acquisition PLC
3.500% due 09/15/21 | | | 115,000 | | | | 116,011 | |
UBS Group Funding Switzerland AG (Switzerland) | |
3.000% due 04/15/21 ~ | | | 680,000 | | | | 680,092 | |
3.871% (USD LIBOR + 1.220%)
due 05/23/23 § ~ | | | 255,000 | | | | 256,771 | |
US Bank NA
3.085% (USD LIBOR + 0.320%)
due 04/26/21 § | | | 275,000 | | | | 275,232 | |
Ventas Realty LP REIT
3.100% due 01/15/23 | | | 60,000 | | | | 60,054 | |
Wells Fargo & Co
2.550% due 12/07/20 | | | 23,000 | | | | 22,947 | |
Wells Fargo Bank NA
3.325% due 07/23/21 | | | 580,000 | | | | 583,993 | |
Willis Towers Watson PLC
5.750% due 03/15/21 | | | 470,000 | | | | 492,379 | |
| | | | | | | | |
| | | | | | | 26,621,826 | |
| | | | | | | | |
Industrial - 5.4% | |
| | |
Avnet Inc
3.750% due 12/01/21 | | | 197,000 | | | | 199,059 | |
Boral Finance PTY Ltd (Australia)
3.000% due 11/01/22 ~ | | | 35,000 | | | | 34,346 | |
CNH Industrial Capital LLC | |
3.375% due 07/15/19 | | | 130,000 | | | | 130,181 | |
3.875% due 10/15/21 | | | 475,000 | | | | 481,223 | |
4.375% due 11/06/20 | | | 480,000 | | | | 489,624 | |
DAE Funding LLC (United Arab Emirates) | |
4.000% due 08/01/20 ~ | | | 210,000 | | | | 211,050 | |
5.250% due 11/15/21 ~ | | | 220,000 | | | | 224,950 | |
Eagle Materials Inc
4.500% due 08/01/26 | | | 50,000 | | | | 50,673 | |
Eastern Creation II Investment Holdings Ltd (China)
2.750% due 09/26/20 ~ | | | 400,000 | | | | 396,812 | |
GATX Corp | |
2.500% due 07/30/19 | | | 215,000 | | | | 214,478 | |
2.600% due 03/30/20 | | | 235,000 | | | | 234,337 | |
Harris Corp
2.700% due 04/27/20 | | | 410,000 | | | | 408,577 | |
Kansas City Southern
2.350% due 05/15/20 | | | 400,000 | | | | 397,328 | |
Keysight Technologies Inc
3.300% due 10/30/19 | | | 880,000 | | | | 882,088 | |
Martin Marietta Materials Inc | |
3.133% (USD LIBOR + 0.500%)
due 12/20/19 § | | | 150,000 | | | | 149,856 | |
3.313% (USD LIBOR + 0.650%)
due 05/22/20 § | | | 220,000 | | | | 219,994 | |
Park Aerospace Holdings Ltd (Ireland)
3.625% due 03/15/21 ~ | | | 230,000 | | | | 228,850 | |
Penske Truck Leasing Co LP | |
2.500% due 06/15/19 ~ | | | 230,000 | | | | 229,698 | |
3.050% due 01/09/20 ~ | | | 865,000 | | | | 865,219 | |
3.200% due 07/15/20 ~ | | | 50,000 | | | | 50,120 | |
3.300% due 04/01/21 ~ | | | 325,000 | | | | 326,384 | |
3.650% due 07/29/21 ~ | | | 115,000 | | | | 116,618 | |
Roper Technologies Inc | |
3.000% due 12/15/20 | | | 315,000 | | | | 315,778 | |
3.650% due 09/15/23 | | | 95,000 | | | | 97,141 | |
| | |
| See Notes to Financial Statements | | See explanation of symbols and terms, if any, on B-97 and B-98 |
B-32
PACIFIC FUNDS
PF SHORT DURATION BOND FUND
Schedule of Investments (Continued)
March 31, 2019
| | | | | | | | |
| | | Principal Amount | | | Value | |
SMBC Aviation Capital Finance DAC (Ireland)
4.125% due 07/15/23 ~ | | | $265,000 | | | | $270,975 | |
United Technologies Corp
3.333% (USD LIBOR + 0.650%)
due 08/16/21 § | | | 125,000 | | | | 125,083 | |
Vulcan Materials Co | |
3.211% (USD LIBOR + 0.600%)
due 06/15/20 § | | | 640,000 | | | | 639,209 | |
3.276% (USD LIBOR + 0.650%)
due 03/01/21 § | | | 390,000 | | | | 389,750 | |
| | | | | | | | |
| | | | | | | 8,379,401 | |
| | | | | | | | |
Technology - 2.0% | |
|
Broadcom Corp | |
2.375% due 01/15/20 | | | 615,000 | | | | 612,050 | |
3.000% due 01/15/22 | | | 415,000 | | | | 413,532 | |
DXC Technology Co | |
2.875% due 03/27/20 | | | 280,000 | | | | 279,910 | |
3.576% (USD LIBOR + 0.950%)
due 03/01/21 § | | | 368,000 | | | | 368,007 | |
Fidelity National Information Services Inc
2.250% due 08/15/21 | | | 250,000 | | | | 245,729 | |
Hewlett Packard Enterprise Co
2.100% due 10/04/19 ~ | | | 155,000 | | | | 154,362 | |
Microchip Technology Inc
3.922% due 06/01/21 ~ | | | 245,000 | | | | 247,287 | |
Xerox Corp
5.625% due 12/15/19 | | | 675,000 | | | | 687,636 | |
| | | | | | | | |
| | | | | | | 3,008,513 | |
| | | | | | | | |
Utilities - 3.2% | |
| | |
American Electric Power Co Inc
3.650% due 12/01/21 | | | 50,000 | | | | 51,039 | |
CenterPoint Energy Inc
3.600% due 11/01/21 | | | 75,000 | | | | 76,159 | |
Dominion Energy Inc | |
2.579% due 07/01/20 | | | 260,000 | | | | 258,640 | |
2.962% due 07/01/19 | | | 405,000 | | | | 405,087 | |
Edison International | |
2.125% due 04/15/20 | | | 395,000 | | | | 392,073 | |
2.400% due 09/15/22 | | | 183,000 | | | | 169,660 | |
EDP Finance BV (Portugal)
4.900% due 10/01/19 ~ | | | 375,000 | | | | 378,383 | |
Enel Finance International NV (Italy)
2.875% due 05/25/22 ~ | | | 320,000 | | | | 314,798 | |
4.250% due 09/14/23 ~ | | | 205,000 | | | | 209,716 | |
ENN Energy Holdings Ltd (China)
3.250% due 10/23/19 ~ | | | 200,000 | | | | 200,059 | |
Exelon Generation Co LLC | |
2.950% due 01/15/20 | | | 575,000 | | | | 574,468 | |
4.000% due 10/01/20 | | | 219,000 | | | | 222,113 | |
FirstEnergy Corp
2.850% due 07/15/22 | | | 240,000 | | | | 238,507 | |
NextEra Energy Capital Holdings Inc | |
2.300% due 04/01/19 | | | 200,000 | | | | 200,000 | |
3.179% (USD LIBOR + 0.550%)
due 08/28/21 § | | | 210,000 | | | | 209,604 | |
San Diego Gas & Electric Co
1.914% due 02/01/22 | | | 83,572 | | | | 81,544 | |
Sempra Energy | |
1.625% due 10/07/19 | | | 265,000 | | | | 263,147 | |
2.875% due 10/01/22 | | | 25,000 | | | | 24,658 | |
3.287% (USD LIBOR + 0.500%)
due 01/15/21 § | | | 145,000 | | | | 143,833 | |
State Grid Overseas Investment Ltd (China)
2.250% due 05/04/20 ~ | | | 615,000 | | | | 610,087 | |
| | | | | | | | |
| | | | | | | 5,023,575 | |
| | | | | | | | |
Total Corporate Bonds & Notes
(Cost $83,904,609) | | | | 84,372,241 | |
| | | | | |
| | | | | | | | |
| | | Principal Amount | | | Value | |
MORTGAGE-BACKED SECURITIES - 17.5% | |
|
Collateralized Mortgage Obligations - Commercial - 3.3% | |
| | |
BAMLL Commercial Mortgage Securities Trust
3.334% (USD LIBOR + 0.850%)
due 09/15/34 § ~ | | | $600,000 | | | | $597,851 | |
3.490% due 04/14/33 ~ | | | 130,000 | | | | 131,373 | |
Banc of America Commercial Mortgage Trust
1.957% due 02/15/50 | | | 65,032 | | | | 64,262 | |
BX Commercial Mortgage Trust
3.234% (USD LIBOR + 0.750%)
due 11/15/35 § ~ | | | 130,843 | | | | 130,659 | |
BX Trust | |
3.884% (USD LIBOR + 1.400%)
due 10/15/32 § ~ | | | 385,000 | | | | 383,534 | |
4.734% (USD LIBOR + 2.250%)
due 10/15/32 § ~ | | | 125,000 | | | | 124,639 | |
Citigroup Commercial Mortgage Trust | |
1.637% due 06/10/48 | | | 41,764 | | | | 41,603 | |
1.643% due 09/10/58 | | | 22,618 | | | | 22,428 | |
CLNS Trust | |
3.293% (USD LIBOR + 0.800%)
due 06/11/32 § ~ | | | 395,000 | | | | 394,304 | |
3.493% (USD LIBOR + 1.000%)
due 06/11/32 § ~ | | | 200,000 | | | | 199,402 | |
Commercial Mortgage Trust | |
1.443% due 08/10/49 | | | 46,840 | | | | 46,061 | |
1.667% due 07/10/50 | | | 37,558 | | | | 37,471 | |
1.770% due 02/10/49 | | | 4,867 | | | | 4,825 | |
1.965% due 02/10/50 | | | 64,349 | | | | 63,726 | |
3.221% due 10/10/48 | | | 200,000 | | | | 200,874 | |
3.349% (USD LIBOR + 0.850%)
due 02/13/32 § ~ | | | 180,000 | | | | 180,134 | |
CSAIL Commercial Mortgage Trust
2.025% due 09/15/50 | | | 149,038 | | | | 147,107 | |
Great Wolf Trust | |
3.484% (USD LIBOR + 0.850%)
due 09/15/34 § ~ | | | 175,000 | | | | 174,706 | |
3.954% (USD LIBOR + 1.320%)
due 09/15/34 § ~ | | | 250,000 | | | | 249,904 | |
GS Mortgage Securities Corp Trust | |
3.432% (USD LIBOR + 0.950%)
due 11/15/35 § ~ | | | 165,000 | | | | 164,886 | |
4.484% (USD LIBOR + 2.000%)
due 11/15/35 § ~ | | | 100,000 | | | | 99,781 | |
GS Mortgage Securities Trust | |
1.429% due 10/10/49 | | | 36,729 | | | | 36,199 | |
1.593% due 07/10/48 | | | 25,352 | | | | 25,192 | |
InTown Hotel Portfolio Trust | |
3.184% (USD LIBOR + 0.700%)
due 01/15/33 § ~ | | | 100,000 | | | | 99,492 | |
3.734% (USD LIBOR + 1.250%)
due 01/15/33 § ~ | | | 100,000 | | | | 99,543 | |
JPMBB Commercial Mortgage Securities Trust
1.423% due 06/15/49 | | | 13,446 | | | | 13,288 | |
Morgan Stanley Bank of America Merrill Lynch Trust | |
1.597% due 05/15/49 | | | 11,160 | | | | 11,046 | |
1.706% due 05/15/48 | | | 69,163 | | | | 68,583 | |
4.110% due 10/15/47 § | | | 95,000 | | | | 99,325 | |
Morgan Stanley Capital I Trust | |
1.638% due 05/15/48 | | | 59,083 | | | | 58,617 | |
3.334% (USD LIBOR + 0.850%)
due 11/15/34 § ~ | | | 195,000 | | | | 193,944 | |
3.484% (USD LIBOR + 1.000%)
due 11/15/34 § ~ | | | 155,000 | | | | 154,358 | |
RETL Trust RVP ‘A’
3.634% (USD LIBOR + 1.150%)
due 03/15/36 § ~ | | | 170,000 | | | | 170,529 | |
| | |
| See Notes to Financial Statements | | See explanation of symbols and terms, if any, on B-97 and B-98 |
B-33
PACIFIC FUNDS
PF SHORT DURATION BOND FUND
Schedule of Investments (Continued)
March 31, 2019
| | | | | | | | |
| | | Principal Amount | | | Value | |
SLIDE Fund Trust
4.334% (USD LIBOR + 1.850%)
due 06/15/31 § ~ | | | $128,255 | | | | $128,553 | |
Wells Fargo Commercial Mortgage Trust | |
1.441% due 10/15/49 | | | 10,923 | | | | 10,861 | |
1.531% due 05/15/48 | | | 11,314 | | | | 11,287 | |
1.577% due 01/15/59 | | | 28,075 | | | | 27,816 | |
1.968% due 07/15/50 | | | 120,911 | | | | 119,518 | |
1.975% due 09/15/50 | | | 115,511 | | | | 113,920 | |
WFRBS Commercial Mortgage Trust
4.697% due 04/15/45 | | | 195,000 | | | | 201,693 | |
| | | | | | | | |
| | | | | | | 5,103,294 | |
| | | | | | | | |
Collateralized Mortgage Obligations - Residential - 9.0% | |
| | |
Angel Oak Mortgage Trust I LLC
4.500% due 11/25/48 § ~ | | | 160,000 | | | | 164,519 | |
COLT Mortgage Loan Trust | |
2.415% due 10/25/47 § ~ | | | 131,351 | | | | 131,265 | |
2.568% due 10/25/47 § ~ | | | 57,034 | | | | 56,986 | |
2.614% due 05/27/47 § ~ | | | 96,259 | | | | 95,983 | |
2.773% due 10/25/47 § ~ | | | 34,566 | | | | 34,597 | |
2.930% due 02/25/48 § ~ | | | 54,452 | | | | 54,369 | |
3.074% due 05/27/47 § ~ | | | 27,901 | | | | 27,879 | |
3.084% due 02/25/48 § ~ | | | 45,376 | | | | 45,299 | |
3.337% due 05/25/49 § ~ | | | 190,000 | | | | 190,356 | |
3.470% due 07/27/48 § ~ | | | 210,538 | | | | 211,324 | |
3.542% due 07/27/48 § ~ | | | 102,717 | | | | 103,033 | |
4.006% due 12/28/48 § ~ | | | 333,229 | | | | 336,289 | |
4.108% due 12/28/48 § ~ | | | 323,972 | | | | 327,011 | |
Deephaven Residential Mortgage Trust | |
2.577% due 10/25/47 § ~ | | | 161,289 | | | | 160,949 | |
2.711% due 10/25/47 § ~ | | | 42,444 | | | | 42,361 | |
2.813% due 10/25/47 § ~ | | | 42,444 | | | | 42,342 | |
2.976% due 12/25/57 § ~ | | | 112,384 | | | | 112,589 | |
3.479% due 04/25/58 § ~ | | | 177,689 | | | | 179,015 | |
3.485% due 12/26/46 § ~ | | | 29,155 | | | | 29,243 | |
3.963% due 08/25/58 § ~ | | | 83,923 | | | | 84,410 | |
4.080% due 10/25/58 § ~ | | | 636,766 | | | | 646,528 | |
Fannie Mae Connecticut Avenue Securities | |
3.166% (USD LIBOR + 0.680%)
due 10/25/30 § | | | 189,200 | | | | 189,186 | |
3.206% (USD LIBOR + 0.720%)
due 01/25/31 § | | | 88,986 | | | | 88,996 | |
3.236% (USD LIBOR + 0.750%)
due 02/25/30 § | | | 160,071 | | | | 160,129 | |
3.236% (USD LIBOR + 0.750%)
due 02/25/30 § | | | 71,892 | | | | 71,889 | |
3.336% (USD LIBOR + 0.850%)
due 11/25/29 § | | | 174,041 | | | | 174,290 | |
Fannie Mae REMICS | |
2.786% (USD LIBOR + 0.300%)
due 11/25/47 § | | | 41,976 | | | | 41,701 | |
2.986% (USD LIBOR + 0.500%)
due 11/25/46 § | | | 148,207 | | | | 148,639 | |
2.986% (USD LIBOR + 0.500%)
due 11/25/46 § | | | 144,548 | | | | 144,853 | |
2.986% (USD LIBOR + 0.500%)
due 11/25/46 § | | | 105,195 | | | | 105,485 | |
3.000% due 11/25/47 | | | 336,589 | | | | 341,933 | |
4.000% due 06/25/44 | | | 35,871 | | | | 37,010 | |
5.000% due 08/25/19 | | | 396 | | | | 396 | |
Flagstar Mortgage Trust
4.000% due 09/25/48 § ~ | | | 529,083 | | | | 537,097 | |
Freddie Mac REMICS
2.000% due 02/15/40 | | | 226,260 | | | | 223,735 | |
Freddie Mac Structured Agency Credit Risk Debt | |
3.036% (USD LIBOR + 0.550%)
due 04/25/30 § | | | 141,306 | | | | 141,129 | |
3.236% (USD LIBOR + 0.750%)
due 03/25/30 § | | | 225,099 | | | | 225,050 | |
| | | | | | | | |
| | | Principal Amount | | | Value | |
3.286% (USD LIBOR + 0.800%)
due 12/25/29 § | | | $162,292 | | | | $162,394 | |
3.686% (USD LIBOR + 1.200%)
due 08/25/29 § | | | 161,122 | | | | 161,576 | |
3.819% due 05/25/48 § ~ | | | 69,307 | | | | 69,252 | |
3.981% due 09/25/47 § ~ | | | 22,692 | | | | 22,907 | |
4.167% due 08/25/48 § ~ | | | 69,465 | | | | 69,964 | |
4.460% due 11/25/48 § ~ | | | 421,080 | | | | 422,517 | |
4.686% (USD LIBOR + 2.200%)
due 09/25/24 § | | | 512,771 | | | | 522,879 | |
Freddie Mac Whole Loan Securities Trust
3.864% due 05/25/47 § ~ | | | 60,970 | | | | 61,414 | |
Galton Funding Mortgage Trust | |
3.500% due 11/25/57 § ~ | | | 167,951 | | | | 166,869 | |
4.000% due 02/25/59 § ~ | | | 280,183 | | | | 279,474 | |
Government National Mortgage Association | |
2.788% (USD LIBOR + 0.300%)
due 09/20/48 § | | | 39,425 | | | | 39,122 | |
2.938% (USD LIBOR + 0.450%)
due 02/20/49 § | | | 34,923 | | | | 34,910 | |
2.938% (USD LIBOR + 0.450%)
due 02/20/49 § | | | 44,844 | | | | 44,827 | |
GS Mortgage-Backed Securities Trust
2.456% due 07/25/44 § ~ | | | 28,253 | | | | 27,918 | |
Homeward Opportunities Fund I Trust
3.766% due 06/25/48 § ~ | | | 135,250 | | | | 136,915 | |
Homeward Opportunities Fund I Trust | |
3.454% due 01/25/59 § # ~ | | | 350,000 | | | | 349,995 | |
3.606% due 01/25/59 § # ~ | | | 240,000 | | | | 239,995 | |
3.897% due 06/25/48 § ~ | | | 110,659 | | | | 111,987 | |
Metlife Securitization Trust
3.000% due 04/25/55 § ~ | | | 131,951 | | | | 131,052 | |
New Residential Mortgage Loan Trust | |
3.675% due 01/25/49 § ~ | | | 578,844 | | | | 583,334 | |
3.986% due 11/25/48 § ~ | | | 220,817 | | | | 226,226 | |
Sequoia Mortgage Trust | |
3.500% due 02/25/48 § ~ | | | 286,860 | | | | 289,970 | |
4.000% due 06/25/48 § ~ | | | 269,681 | | | | 275,226 | |
4.000% due 08/25/48 § ~ | | | 488,358 | | | | 498,127 | |
4.500% due 08/25/48 § ~ | | | 81,393 | | | | 83,823 | |
STACR Trust | |
3.286% (USD LIBOR + 0.800%)
due 12/25/30 § ~ | | | 360,000 | | | | 360,050 | |
3.336% (USD LIBOR + 0.850%)
due 02/25/47 § ~ | | | 450,000 | | | | 450,101 | |
3.736% (USD LIBOR + 1.250%)
due 02/25/47 § ~ | | | 215,000 | | | | 216,003 | |
Starwood Mortgage Residential Trust | |
3.468% due 04/25/49 § ~ | | | 120,000 | | | | 120,150 | |
4.121% due 10/25/48 § ~ | | | 637,833 | | | | 649,432 | |
Verus Securitization Trust | |
2.929% due 02/25/48 § ~ | | | 56,691 | | | | 56,557 | |
3.402% due 12/25/59 § ~ | | | 120,000 | | | | 120,186 | |
3.677% due 06/01/58 § ~ | | | 184,754 | | | | 186,990 | |
3.779% due 06/01/58 § ~ | | | 80,328 | | | | 81,081 | |
3.830% due 06/01/58 § ~ | | | 80,328 | | | | 80,864 | |
3.836% due 02/25/59 § ~ | | | 479,574 | | | | 483,709 | |
4.148% due 10/25/58 § ~ | | | 499,440 | | | | 508,520 | |
| | | | | | | | |
| | | | | | | 14,034,181 | |
| | | | | | | | |
Fannie Mae - 3.2% | | | | | | | | |
| | |
3.000% due 11/01/29 - 09/01/30 | | | 184,456 | | | | 186,565 | |
3.500% due 06/01/29 - 11/01/47 | | | 1,520,100 | | | | 1,553,650 | |
4.000% due 06/01/33 - 09/01/48 | | | 764,506 | | | | 789,610 | |
4.500% due 04/01/26 - 03/01/46 | | | 734,448 | | | | 767,137 | |
5.000% due 01/01/20 - 02/01/49 | | | 1,060,248 | | | | 1,133,169 | |
5.500% due 10/01/35 - 02/01/42 | | | 457,704 | | | | 497,131 | |
6.000% due 11/01/35 - 09/01/39 | | | 102,852 | | | | 113,320 | |
| | | | | | | | |
| | | 4,824,314 | | | | 5,040,582 | |
| | | | | | | | |
| | |
| See Notes to Financial Statements | | See explanation of symbols and terms, if any, on B-97 and B-98 |
B-34
PACIFIC FUNDS
PF SHORT DURATION BOND FUND
Schedule of Investments (Continued)
March 31, 2019
| | | | | | | | |
| | | Principal Amount | | | Value | |
Freddie Mac - 0.0% | | | | | |
| | |
5.500% due 01/01/20 - 12/01/39 | | | $26,665 | | | | $29,142 | |
| | | | | | | | |
|
Government National Mortgage Association - 2.0% | |
| | |
4.000% due 11/20/48 | | | 178,050 | | | | 184,056 | |
4.500% due 11/20/48 | | | 301,122 | | | | 313,194 | |
5.000% due 01/20/48 - 10/20/48 | | | 2,064,871 | | | | 2,164,221 | |
5.500% due 09/15/45 | | | 229,317 | | | | 251,393 | |
6.000% due 07/15/36 | | | 114,164 | | | | 128,455 | |
| | | | | | | | |
| | | 2,887,524 | | | | 3,041,319 | |
| | | | | | | | |
Total Mortgage-Backed Securities
(Cost $27,252,942) | | | | 27,248,518 | |
| | | | | |
|
ASSET-BACKED SECURITIES - 16.3% | |
| | |
Allegro Ltd (Cayman)
3.611% (USD LIBOR + 0.840%)
due 07/25/27 § ~ | | | 310,000 | | | | 308,556 | |
Ally Auto Receivables Trust | |
2.410% due 01/15/21 ~ | | | 240,000 | | | | 239,974 | |
2.460% due 09/15/22 | | | 40,000 | | | | 39,775 | |
2.840% due 09/15/22 | | | 85,000 | | | | 84,938 | |
2.930% due 11/15/23 | | | 70,000 | | | | 69,651 | |
Ally Master Owner Trust
3.300% due 07/17/23 | | | 105,000 | | | | 106,606 | |
American Express Credit Account Master Trust
3.070% due 10/15/24 | | | 865,000 | | | | 872,274 | |
AmeriCredit Automobile Receivables Trust | |
1.530% due 07/08/21 | | | 70,360 | | | | 70,158 | |
2.690% due 06/19/23 | | | 110,000 | | | | 109,765 | |
2.710% due 08/18/22 | | | 100,000 | | | | 99,779 | |
2.710% due 09/08/22 | | | 315,000 | | | | 313,959 | |
2.740% due 12/08/22 | | | 535,000 | | | | 532,760 | |
3.000% due 06/08/21 | | | 110,000 | | | | 110,063 | |
3.080% due 12/18/23 | | | 522,000 | | | | 522,573 | |
3.340% due 08/08/21 | | | 135,000 | | | | 135,521 | |
3.820% due 03/18/24 | | | 860,000 | | | | 876,087 | |
ARI Fleet Lease Trust | |
1.910% due 04/15/26 ~ | | | 45,410 | | | | 45,197 | |
2.550% due 10/15/26 ~ | | �� | 623,603 | | | | 622,643 | |
Ascentium Equipment Receivables Trust | |
2.290% due 06/10/21 ~ | | | 83,839 | | | | 83,507 | |
2.920% due 12/10/20 ~ | | | 70,732 | | | | 70,801 | |
Avis Budget Rental Car Funding AESOP LLC | |
2.500% due 02/20/21 ~ | | | 240,000 | | | | 239,342 | |
2.500% due 07/20/21 ~ | | | 275,000 | | | | 273,780 | |
2.720% due 11/20/22 ~ | | | 535,000 | | | | 531,834 | |
3.700% due 03/20/23 ~ | | | 100,000 | | | | 100,953 | |
4.530% due 03/20/23 ~ | | | 130,000 | | | | 131,705 | |
Bayview Mortgage Fund Trust
3.500% due 01/28/58 § ~ | | | 184,063 | | | | 185,086 | |
Bayview Opportunity Master Fund Trust
3.500% due 01/28/55 § ~ | | | 113,378 | | | | 114,004 | |
BlueMountain CLO Ltd (Cayman)
3.710% (USD LIBOR + 0.930%)
due 07/18/27 § ~ | | | 270,000 | | | | 268,005 | |
BMW Vehicle Lease Trust
2.180% due 06/22/20 | | | 185,000 | | | | 184,511 | |
California Republic Auto Receivables Trust
2.510% due 02/16/21 | | | 60,000 | | | | 59,916 | |
Capital Auto Receivables Asset Trust | |
1.540% due 08/20/20 | | | 2,397 | | | | 2,395 | |
1.630% due 01/20/21 | | | 33,837 | | | | 33,775 | |
2.430% due 05/20/22 ~ | | | 40,000 | | | | 39,782 | |
2.700% due 09/20/22 ~ | | | 65,000 | | | | 64,279 | |
3.360% due 11/21/22 ~ | | | 160,000 | | | | 160,177 | |
3.480% due 10/20/23 ~ | | | 60,000 | | | | 60,543 | |
3.690% due 12/20/23 ~ | | | 80,000 | | | | 80,681 | |
| | | | | | | | |
| | | Principal Amount | | | Value | |
Carlyle Global Market Strategies CLO Ltd (Cayman)
3.761% (USD LIBOR + 1.000%)
due 04/20/27 § ~ | | | $250,000 | | | | $250,786 | |
CarMax Auto Owner Trust | |
1.400% due 08/15/21 | | | 128,835 | | | | 127,897 | |
3.000% due 05/16/22 | | | 515,000 | | | | 513,407 | |
3.270% due 03/15/22 | | | 155,000 | | | | 154,741 | |
CBAM Ltd (Cayman)
4.009% (USD LIBOR + 1.280%)
due 02/12/30 § ~ | | | 760,000 | | | | 760,129 | |
Chrysler Capital Auto Receivables Trust
1.640% due 07/15/21 ~ | | | 30,633 | | | | 30,543 | |
CNH Equipment Trust | |
1.930% due 03/15/24 | | | 315,000 | | | | 310,531 | |
2.400% due 02/15/23 | | | 265,000 | | | | 264,688 | |
3.010% due 04/15/24 | | | 195,000 | | | | 197,110 | |
Cole Park CLO Ltd (Cayman)
3.811% (USD LIBOR + 1.050%)
due 10/20/28 § # ~ | | | 435,000 | | | | 433,209 | |
Driven Brands Funding LLC
5.216% due 07/20/45 ~ | | | 420,863 | | | | 437,084 | |
Elara HGV Timeshare Issuer LLC | |
2.530% due 02/25/27 ~ | | | 40,816 | | | | 40,416 | |
2.690% due 03/25/30 ~ | | | 70,547 | | | | 70,169 | |
Enterprise Fleet Financing LLC
2.040% due 02/22/22 ~ | | | 295,000 | | | | 292,964 | |
3.140% due 02/20/24 ~ | | | 145,000 | | | | 145,650 | |
Ford Credit Auto Owner Trust | |
2.030% due 12/15/27 ~ | | | 350,000 | | | | 344,492 | |
3.520% due 07/15/30 ~ | | | 545,000 | | | | 556,362 | |
GM Financial Automobile Leasing Trust | |
2.120% due 09/20/21 | | | 65,000 | | | | 64,678 | |
2.260% due 08/20/20 | | | 45,000 | | | | 44,890 | |
3.110% due 12/20/21 | | | 105,000 | | | | 104,899 | |
3.370% due 10/20/22 | | | 245,000 | | | | 244,679 | |
3.500% due 04/20/22 | | | 80,000 | | | | 80,402 | |
3.560% due 12/20/22 | | | 275,000 | | | | 276,978 | |
GM Financial Consumer Automobile Trust
2.450% due 07/17/23 ~ | | | 100,000 | | | | 99,248 | |
GMF Floorplan Owner Revolving Trust | |
2.410% due 05/17/21 ~ | | | 100,000 | | | | 99,926 | |
2.630% due 07/15/22 ~ | | | 190,000 | | | | 189,092 | |
3.500% due 09/15/23 ~ | | | 220,000 | | | | 224,104 | |
GreatAmerica Leasing Receivables Funding LLC | |
2.060% due 06/22/20 ~ | | | 59,188 | | | | 59,035 | |
2.600% due 06/15/21 ~ | | | 95,000 | | | | 94,873 | |
Hardee’s Funding LLC
4.250% due 06/20/48 ~ | | | 134,361 | | | | 136,085 | |
Hilton Grand Vacations Trust | |
1.770% due 11/25/26 ~ | | | 60,460 | | | | 59,860 | |
2.660% due 12/26/28 ~ | | | 54,417 | | | | 54,029 | |
2.960% due 12/26/28 ~ | | | 54,417 | | | | 53,671 | |
Hyundai Auto Lease Securitization Trust
1.650% due 07/15/20 ~ | | | 30,554 | | | | 30,541 | |
Hyundai Auto Receivables Trust
2.380% due 04/17/23 | | | 395,000 | | | | 391,796 | |
Madison Park Funding Ltd (Cayman)
3.951% (USD LIBOR + 1.190%)
due 10/21/30 § ~ | | | 500,000 | | | | 498,002 | |
Mill City Mortgage Loan Trust
2.500% due 04/25/57 § ~ | | | 48,982 | | | | 48,669 | |
MMAF Equipment Finance LLC | |
2.040% due 02/16/22 ~ | | | 93,807 | | | | 93,289 | |
3.200% due 09/12/22 ~ | | | 210,000 | | | | 211,624 | |
MVW Owner Trust | |
2.150% due 04/22/30 ~ | | | 17,205 | | | | 17,076 | |
2.420% due 12/20/34 ~ | | | 62,879 | | | | 61,728 | |
Navient Private Education Refi Loan Trust
2.530% due 02/18/42 ~ | | | 166,556 | | | | 165,869 | |
| | |
| See Notes to Financial Statements | | See explanation of symbols and terms, if any, on B-97 and B-98 |
B-35
PACIFIC FUNDS
PF SHORT DURATION BOND FUND
Schedule of Investments (Continued)
March 31, 2019
| | | | | | | | |
| | | Principal Amount | | | Value | |
Neuberger Berman CLO Ltd (Cayman)
3.637% (USD LIBOR + 0.850%)
due 01/15/28 § ~ | | | $250,000 | | | | $248,300 | |
Nissan Master Owner Trust Receivables
1.540% due 06/15/21 | | | 75,000 | | | | 74,805 | |
OCP CLO Ltd (Cayman) | |
3.585% (USD LIBOR + 0.820%)
due 10/26/27 § ~ | | | 360,000 | | | | 358,009 | |
3.881% (USD LIBOR + 1.120%)
due 07/20/29 § ~ | | | 415,000 | | | | 413,953 | |
OZLM VIII Ltd (Cayman)
3.625% (USD LIBOR + 1.170%)
due 10/17/29 § ~ | | | 250,000 | | | | 249,248 | |
Planet Fitness Master Issuer LLC
4.262% due 09/05/48 ~ | | | 199,000 | | | | 202,680 | |
Santander Drive Auto Receivables Trust | |
2.100% due 06/15/21 | | | 11,143 | | | | 11,133 | |
2.460% due 03/15/22 | | | 126,000 | | | | 125,727 | |
2.580% due 05/16/22 | | | 30,000 | | | | 29,922 | |
2.960% due 03/15/24 | | | 960,000 | | | | 961,040 | |
3.210% due 09/15/23 | | | 210,000 | | | | 211,015 | |
3.270% due 01/17/23 | | | 110,000 | | | | 110,512 | |
3.490% due 05/17/21 | | | 155,000 | | | | 155,340 | |
3.520% due 12/15/22 | | | 125,000 | | | | 126,267 | |
3.530% due 08/16/21 | | | 105,000 | | | | 105,410 | |
3.650% due 12/15/21 | | | 120,000 | | | | 120,602 | |
4.020% due 04/15/22 | | | 105,000 | | | | 106,057 | |
Santander Retail Auto Lease Trust
2.960% due 11/21/22 ~ | | | 85,000 | | | | 84,849 | |
Sierra Timeshare Conduit Receivables Funding LLC
2.910% due 03/20/34 ~ | | | 850,574 | | | | 844,557 | |
Sierra Timeshare Receivables Funding LLC | |
2.300% due 10/20/31 ~ | | | 40,239 | | | | 40,075 | |
2.330% due 07/20/33 ~ | | | 22,887 | | | | 22,579 | |
2.400% due 03/22/32 ~ | | | 33,485 | | | | 33,344 | |
2.430% due 10/20/33 ~ | | | 60,415 | | | | 60,089 | |
2.580% due 09/20/32 ~ | | | 202,698 | | | | 201,857 | |
3.080% due 03/21/33 ~ | | | 174,555 | | | | 174,315 | |
SLM Student Loan Trust | |
2.886% (USD LIBOR + 0.400%)
due 03/25/25 § | | | 122,758 | | | | 120,234 | |
4.271% (USD LIBOR + 1.500%)
due 04/25/23 § | | | 23,783 | | | | 24,071 | |
4.471% (USD LIBOR + 1.700%)
due 07/25/23 § | | | 37,231 | | | | 37,738 | |
SMB Private Education Loan Trust | |
3.050% due 05/15/26 ~ | | | 83,531 | | | | 83,754 | |
3.484% (USD LIBOR + 1.000%)
due 06/15/27 § ~ | | | 83,120 | | | | 83,639 | |
3.634% (USD LIBOR + 1.150%)
due 05/15/26 § ~ | | | 177,503 | | | | 178,788 | |
3.984% (USD LIBOR + 1.500%)
due 04/15/32 § ~ | | | 225,000 | | | | 229,136 | |
Synchrony Credit Card Master Note Trust | |
2.620% due 09/15/23 | | | 85,000 | | | | 84,502 | |
3.360% due 03/15/24 | | | 780,000 | | | | 779,311 | |
Towd Point Mortgage Trust | |
2.250% due 07/25/56 § ~ | | | 54,720 | | | | 53,849 | |
2.750% due 02/25/55 § ~ | | | 35,915 | | | | 35,691 | |
2.750% due 04/25/55 § ~ | | | 60,923 | | | | 60,536 | |
2.750% due 05/25/55 § ~ | | | 58,757 | | | | 58,335 | |
2.750% due 08/25/55 § ~ | | | 50,669 | | | | 50,139 | |
2.750% due 10/25/56 § ~ | | | 62,157 | | | | 61,635 | |
2.750% due 04/25/57 § ~ | | | 135,292 | | | | 134,085 | |
3.000% due 01/25/58 § ~ | | | 93,609 | | | | 92,883 | |
3.750% due 05/25/58 § ~ | | | 120,191 | | | | 121,905 | |
Toyota Auto Receivables Owner Trust
3.000% due 05/15/24 | | | 1,085,000 | | | | 1,099,738 | |
| | | | | | | | |
| | | Principal Amount | | | Value | |
Verizon Owner Trust | |
2.360% due 05/20/21 ~ | | | $125,000 | | | | $124,269 | |
2.530% due 04/20/22 ~ | | | 120,000 | | | | 119,274 | |
2.650% due 09/20/21 ~ | | | 100,000 | | | | 99,687 | |
Volvo Financial Equipment LLC | |
1.670% due 02/18/20 ~ | | | 2,905 | | | | 2,903 | |
3.060% due 12/15/25 ~ | | | 265,000 | | | | 264,479 | |
Wheels SPV LLC
1.590% due 05/20/25 ~ | | | 6,979 | | | | 6,973 | |
World Omni Automobile Lease Securitization Trust
2.320% due 08/15/22 | | | 55,000 | | | | 54,831 | |
| | | | | | | | |
| |
Total Asset-Backed Securities
(Cost $25,238,707) | | | | 25,314,646 | |
| | | | | |
|
U.S. GOVERNMENT AGENCY ISSUES - 0.5% | |
| | |
Federal Home Loan Banks
2.625% due 05/28/20 | | | 830,000 | | | | 831,959 | |
| | | | | | | | |
| |
Total U.S. Government Agency Issues
(Cost $829,827) | | | | 831,959 | |
| | | | | |
|
U.S. TREASURY OBLIGATIONS - 11.4% | |
|
U.S. Treasury Notes - 11.4% | |
| | |
2.375% due 03/15/22 | | | 3,815,000 | | | | 3,833,255 | |
2.500% due 12/31/20 | | | 7,145,000 | | | | 7,168,445 | |
2.625% due 12/15/21 | | | 4,505,000 | | | | 4,552,250 | |
2.875% due 10/31/20 | | | 1,200,000 | | | | 1,210,031 | |
2.875% due 10/15/21 | | | 935,000 | | | | 949,555 | |
| | | | | | | | |
| | | | | | | 17,713,536 | |
| | | | | | | | |
Total U.S. Treasury Obligations
(Cost $17,627,198) | | | | 17,713,536 | |
| | | | | |
|
MUNICIPAL BONDS - 0.1% | |
| | |
State Board of Administration Finance Corp FL ‘A’
2.163% due 07/01/19 | | | 150,000 | | | | 149,846 | |
| | | | | | | | |
| |
Total Municipal Bonds
(Cost $150,000) | | | | 149,846 | |
| | | | | |
| | |
| | | Shares | | | | |
SHORT-TERM INVESTMENT - 0.2% | |
|
Money Market Fund - 0.2% | |
| | |
BlackRock Liquidity FundsT-Fund Portfolio
‘Institutional’ 2.370% | | | 228,015 | | | | 228,015 | |
| | | | | | | | |
| |
Total Short-Term Investment
(Cost $228,015) | | | | 228,015 | |
| | | | | |
| |
TOTAL INVESTMENTS - 100.3%
(Cost $155,231,298) | | | | 155,858,761 | |
| | |
DERIVATIVES - 0.1% | | | | | | | | |
(See Notes (b) and (c) in Notes to Schedule of Investments) | | | | 79,225 | |
| | | | | |
| |
OTHER ASSETS & LIABILITIES, NET - (0.4%) | | | | (580,358 | ) |
| | | | | |
| |
NET ASSETS - 100.0% | | | | $155,357,628 | |
| | | | | | | | |
| | |
| See Notes to Financial Statements | | See explanation of symbols and terms, if any, on B-97 and B-98 |
B-36
PACIFIC FUNDS
PF SHORT DURATION BOND FUND
Schedule of Investments (Continued)
March 31, 2019
Notes to Schedule of Investments
| (a) | As of March 31, 2019, the Fund’s composition as a percentage of net assets was as follows: |
| | | | |
Corporate Bonds & Notes | | | 54.3% | |
Mortgage-Backed Securities | | | 17.5% | |
Asset-Backed Securities | | | 16.3% | |
U.S. Treasury Obligations | | | 11.4% | |
Others (each less than 3.0%) | | | 0.8% | |
| | | | |
| | | 100.3% | |
| | | | |
Derivatives | | | 0.1% | |
Other Assets & Liabilities, Net | | | (0.4% | ) |
| | | | |
| | | 100.0% | |
| | | | |
| (b) | Open futures contracts outstanding as of March 31, 2019 were as follows: |
| | | | | | | | | | | | | | | | | | | | |
| Long Futures Outstanding | | Expiration
Month | | | Number of
Contracts | | | Notional
Amount | | | Value | | | Unrealized
Appreciation
(Depreciation) | |
U.S. Treasury2-Year Notes | | | 06/19 | | | | 165 | | | | $35,045,334 | | | | $35,160,469 | | | | $115,135 | |
U.S. Treasury5-Year Notes | | | 06/19 | | | | 34 | | | | 3,903,673 | | | | 3,938,156 | | | | 34,483 | |
U.S. Treasury Ultra10-Year Notes | | | 06/19 | | | | 2 | | | | 259,612 | | | | 265,563 | | | | 5,951 | |
| | | | | | | | | | | | | | | | | | | | |
| | | | | | | | | | | | | | | | | | | 155,569 | |
| | | | | | | | | | | | | | | | | | | | |
| | | | | |
Short Futures Outstanding | | | | | | | | | | | | | | | |
U.S. Treasury10-Year Notes | | | 06/19 | | | | 52 | | | | 6,381,192 | | | | 6,459,375 | | | | (78,183 | ) |
| | | | | | | | | | | | | | | | | | | | |
| | | | | |
Total Futures Contracts | | | | | | | | | | | | | | | | | | | $77,386 | |
| | | | | | | | | | | | | | | | | | | | |
| (c) | Forward foreign currency contracts outstanding as of March 31, 2019 were as follows: |
| | | | | | | | | | | | | | | | | | | | | | | | | | | | | | | | | | | | |
Currency
Purchased | | | | | Currency
Sold | | | | | Settlement
Month | | | | Counterparty | | | | | Unrealized
Appreciation | | | | | | Unrealized
Depreciation | |
| EUR | | | 203,245 | | | | | USD | | | 229,559 | | | | | 05/19 | | | | | HSB | | | | | | $— | | | | | | | | ($482 | ) |
| USD | | | 46,600 | | | | | EUR | | | 41,000 | | | | | 05/19 | | | | | BNP | | | | | | 389 | | | | | | | | — | |
| USD | | | 46,747 | | | | | EUR | | | 41,000 | | | | | 05/19 | | | | | CIT | | | | | | 536 | | | | | | | | — | |
| USD | | | 91,266 | | | | | EUR | | | 80,245 | | | | | 05/19 | | | | | SSB | | | | | | 822 | | | | | | | | — | |
| USD | | | 46,784 | | | | | EUR | | | 41,000 | | | | | 05/19 | | | | | UBS | | | | | | 574 | | | | | | | | — | |
| | | | | | | | | | | | | | | | | | | | | | | | | | | | | | | | | | | | |
| | | | | |
Total Forward Foreign Currency Contracts | | | | | | | | | $2,321 | | | | | | | | ($482 | ) |
| | | | | | | | | | | | | | | | | | |
| (d) | Fair Value Measurements |
The following is a summary of the Fund’s investments as categorized under the three-tier hierarchy of inputs used in valuing the Fund’s assets and liabilities (See Note 3D in Notes to Financial Statements) as of March 31, 2019:
| | | | | | | | | | | | | | | | | | |
| | | | | Total Value at
March 31, 2019 | | | Level 1
Quoted Price | | | Level 2
Significant
Observable Inputs | | | Level 3
Significant Unobservable Inputs | |
Assets | | Corporate Bonds & Notes | | | $84,372,241 | | | | $— | | | | $84,372,241 | | | | $— | |
| | Mortgage-Backed Securities | | | 27,248,518 | | | | — | | | | 27,248,518 | | | | — | |
| | Asset-Backed Securities | | | 25,314,646 | | | | — | | | | 25,314,646 | | | | — | |
| | U.S. Government Agency Issues | | | 831,959 | | | | — | | | | 831,959 | | | | — | |
| | U.S. Treasury Obligations | | | 17,713,536 | | | | — | | | | 17,713,536 | | | | — | |
| | Municipal Bonds | | | 149,846 | | | | — | | | | 149,846 | | | | — | |
| | Short-Term Investment | | | 228,015 | | | | 228,015 | | | | — | | | | — | |
| | Derivatives: | | | | | | | | | | | | | | | | |
| | Foreign Currency Contracts | | | | | | | | | | | | | | | | |
| | Forward Foreign Currency Contracts | | | 2,321 | | | | — | | | | 2,321 | | | | — | |
| | Interest Rate Contracts | | | | | | | | | | | | | | | | |
| | Futures | | | 155,569 | | | | 155,569 | | | | — | | | | — | |
| | | | | | | | | | | | | | | | | | |
| | Total Assets - Derivatives | | | 157,890 | | | | 155,569 | | | | 2,321 | | | | — | |
| | | | | | | | | | | | | | | | | | |
| | Total Assets | | | 156,016,651 | | | | 383,584 | | | | 155,633,067 | | | | — | |
| | | | | | | | | | | | | | | | | | |
Liabilities | | Derivatives: | | | | | | | | | | | | | | | | |
| | Foreign Currency Contracts | | | | | | | | | | | | | | | | |
| | Forward Foreign Currency Contracts | | | (482 | ) | | | — | | | | (482 | ) | | | — | |
| | Interest Rate Contracts | | | | | | | | | | | | | | | | |
| | Futures | | | (78,183 | ) | | | (78,183 | ) | | | — | | | | — | |
| | | | | | | | | | | | | | | | | | |
| | Total Liabilities - Derivatives | | | (78,665 | ) | | | (78,183 | ) | | | (482 | ) | | | — | |
| | | | | | | | | | | | | | | | | | |
| | Total | | | $155,937,986 | | | | $305,401 | | | | $155,632,585 | | | | $— | |
| | | | | | | | | | | | | | | | | | |
| | |
| See Notes to Financial Statements | | See explanation of symbols and terms, if any, on B-97 and B-98 |
B-37
PACIFIC FUNDS
PF EMERGING MARKETS DEBT FUND
Schedule of Investments
March 31, 2019
| | | | | | | | |
| | | Principal Amount | | | Value | |
CORPORATE BONDS & NOTES - 20.0% | |
|
Argentina - 0.5% | |
| | |
Rio Energy SA
6.875% due 02/01/25 ~ | | | $150,000 | | | | $114,180 | |
YPF SA | |
6.950% due 07/21/27 ~ | | | 80,000 | | | | 71,340 | |
7.000% due 12/15/47 ~ | | | 30,000 | | | | 23,940 | |
8.500% due 07/28/25 ~ | | | 160,000 | | | | 157,600 | |
| | | | | | | | |
| | | | | | | 367,060 | |
| | | | | | | | |
Azerbaijan - 0.8% | |
| | |
Southern Gas Corridor CJSC
6.875% due 03/24/26 ~ | | | 220,000 | | | | 247,225 | |
State Oil Co of the Azerbaijan Republic
6.950% due 03/18/30 ~ | | | 270,000 | | | | 304,627 | |
| | | | | | | | |
| | | | | | | 551,852 | |
| | | | | | | | |
Brazil - 1.8% | |
| | |
Gol Finance Inc
7.000% due 01/31/25 ~ | | | 90,000 | | | | 83,813 | |
Petrobras Global Finance BV | |
6.850% due 06/05/15 | | | 210,000 | | | | 203,899 | |
6.875% due 01/20/40 | | | 240,000 | | | | 245,580 | |
8.750% due 05/23/26 | | | 210,000 | | | | 248,850 | |
Rumo Luxembourg Sarl
5.875% due 01/18/25 ~ | | | 200,000 | | | | 202,625 | |
Vale Overseas Ltd | |
6.875% due 11/21/36 | | | 120,000 | | | | 137,700 | |
6.875% due 11/10/39 | | | 120,000 | | | | 138,000 | |
| | | | | | | | |
| | | | | | | 1,260,467 | |
| | | | | | | | |
Chile - 1.5% | |
|
Corp Nacional del Cobre de Chile | |
4.375% due 02/05/49 ~ | | | 246,000 | | | | 250,071 | |
4.875% due 11/04/44 ~ | | | 200,000 | | | | 219,421 | |
5.625% due 10/18/43 ~ | | | 200,000 | | | | 241,698 | |
Empresa Nacional del Petroleo
4.500% due 09/14/47 ~ | | | 200,000 | | | | 190,502 | |
VTR Finance BV
6.875% due 01/15/24 ~ | | | 180,000 | | | | 185,175 | |
| | | | | | | | |
| | | | | | | 1,086,867 | |
| | | | | | | | |
China - 1.4% | �� |
| | |
Amber Circle Funding Ltd
3.250% due 12/04/22 ~ | | | 200,000 | | | | 200,103 | |
China Evergrande Group
7.500% due 06/28/23 ~ | | | 200,000 | | | | 189,145 | |
Sinochem Overseas Capital Co Ltd | |
4.500% due 11/12/20 ~ | | | 100,000 | | | | 102,163 | |
6.300% due 11/12/40 ~ | | | 100,000 | | | | 127,224 | |
Sunac China Holdings Ltd
7.950% due 08/08/22 ~ | | | 200,000 | | | | 204,542 | |
Yuzhou Properties Co Ltd
6.375% due 03/06/21 ~ | | | 200,000 | | | | 200,720 | |
| | | | | | | | |
| | | | | | | 1,023,897 | |
| | | | | | | | |
Colombia - 0.4% | |
| | |
Empresas Publicas de Medellin ESP
8.375% due 11/08/27 ~ | | | COP 336,000,000 | | | | 107,265 | |
Millicom International Cellular SA
5.125% due 01/15/28 ~ | | | $200,000 | | | | 192,250 | |
| | | | | | | | |
| | | | | | | 299,515 | |
| | | | | | | | |
Georgia - 0.3% | |
| | |
Georgian Railway JSC
7.750% due 07/11/22 ~ | | | 200,000 | | | | 214,578 | |
| | | | | | | | |
| | | | | | | | |
| | | Principal Amount | | | Value | |
Indonesia - 0.9% | |
| | |
P.T. Pertamina Persero
6.000% due 05/03/42 ~ | | $ | 200,000 | | | $ | 217,685 | |
P.T. Perusahaan Listrik Negara
5.500% due 11/22/21 ~ | | | 430,000 | | | | 453,113 | |
| | | | | | | | |
| | | | | | | 670,798 | |
| | | | | | | | |
Israel - 0.3% | |
| | |
Teva Pharmaceutical Finance Netherlands III BV
6.750% due 03/01/28 | | | 200,000 | | | | 201,962 | |
| | | | | | | | |
|
Jamaica - 0.2% | |
| | |
Digicel Ltd
6.000% due 04/15/21 ~ | | | 200,000 | | | | 168,042 | |
| | | | | | | | |
|
Kazakhstan - 0.9% | |
| | |
Development Bank of Kazakhstan JSC
4.125% due 12/10/22 ~ | | | 220,000 | | | | 221,986 | |
Halyk Savings Bank of Kazakhstan JSC
5.500% due 12/21/22 ~ | | | 66,249 | | | | 66,481 | |
Kazakhstan Temir Zholy Finance BV
6.950% due 07/10/42 ~ | | | 300,000 | | | | 344,626 | |
| | | | | | | | |
| | | | | | | 633,093 | |
| | | | | | | | |
Luxembourg - 0.3% | |
| | |
Altice Financing SA
7.500% due 05/15/26 ~ | | | 200,000 | | | | 197,900 | |
| | | | | | | | |
|
Malaysia - 0.4% | |
| | |
Wakala Global Sukuk Bhd
4.646% due 07/06/21 ~ | | | 250,000 | | | | 259,768 | |
| | | | | | | | |
|
Mexico - 3.2% | |
| | |
Axtel SAB de CV
6.375% due 11/14/24 ~ | | | 200,000 | | | | 200,690 | |
BBVA Bancomer SA
5.125% due 01/18/33 ~ | | | 200,000 | | | | 184,650 | |
Comision Federal de Electricidad | |
5.750% due 02/14/42 ~ | | | 200,000 | | | | 203,000 | |
8.180% due 12/23/27 ~ | | | MXN 950,000 | | | | 44,538 | |
Mexichem SAB de CV
6.750% due 09/19/42 ~ | | | $200,000 | | | | 216,752 | |
Petroleos Mexicanos | |
5.500% due 06/27/44 | | | 45,000 | | | | 36,900 | |
5.625% due 01/23/46 | | | 351,000 | | | | 291,109 | |
6.000% due 03/05/20 | | | 50,000 | | | | 51,210 | |
6.350% due 02/12/48 | | | 131,000 | | | | 116,151 | |
6.375% due 01/23/45 | | | 53,000 | | | | 47,014 | |
6.500% due 06/02/41 | | | 115,000 | | | | 104,384 | |
6.750% due 09/21/47 | | | 498,000 | | | | 459,425 | |
6.875% due 08/04/26 | | | 192,000 | | | | 200,602 | |
7.190% due 09/12/24 ~ | | | MXN 3,170,000 | | | | 137,593 | |
| | | | | | | | |
| | | | | | | 2,294,018 | |
| | | | | | | | |
Morocco - 0.3% | |
| | |
OCP SA
6.875% due 04/25/44 ~ | | | $200,000 | | | | 218,383 | |
| | | | | | | | |
|
Pakistan - 0.5% | |
| | |
The Second Pakistan International Sukuk Co Ltd
6.750% due 12/03/19 ~ | | | 350,000 | | | | 353,938 | |
| | | | | | | | |
| | |
| See Notes to Financial Statements | | See explanation of symbols and terms, if any, on B-97 and B-98 |
B-38
PACIFIC FUNDS
PF EMERGING MARKETS DEBT FUND
Schedule of Investments (Continued)
March 31, 2019
| | | | | | | | |
| | | Principal Amount | | | Value | |
Paraguay - 0.3% | |
| | |
Telefonica Celular del Paraguay SA
5.875% due 04/15/27 ~ | | $ | 200,000 | | | $ | 203,400 | |
| | | | | | | | |
|
Peru - 0.3% | |
| | |
Banco de Credito del Peru
4.850% due 10/30/20 ~ | | | PEN 358,000 | | | | 107,908 | |
Patrimonio EN Fideicomiso
5.750% due 04/03/28 ~ | | | $75,000 | | | | 78,262 | |
| | | | | | | | |
| | | | | | | 186,170 | |
| | | | | | | | |
Philippines - 0.4% | |
| | |
Power Sector Assets & Liabilities Management Corp
7.390% due 12/02/24 ~ | | | 230,000 | | | | 277,538 | |
| | | | | | | | |
|
Russia - 0.6% | |
| | |
Credit Bank of Moscow
5.875% due 11/07/21 ~ | | | 200,000 | | | | 198,051 | |
SCF Capital Designated Activity Co
5.375% due 06/16/23 ~ | | | 232,000 | | | | 234,582 | |
| | | | | | | | |
| | | | | | | 432,633 | |
| | | | | | | | |
Singapore - 0.2% | |
| | |
Puma International Financing SA
5.125% due 10/06/24 ~ | | | 200,000 | | | | 181,162 | |
| | | | | | | | |
|
South Africa - 1.1% | |
| | |
Absa Group Ltd
6.250% due 04/25/28 ~ | | | 200,000 | | | | 200,145 | |
Eskom Holdings SOC Ltd | |
6.750% due 08/06/23 ~ | | | 200,000 | | | | 197,880 | |
7.125% due 02/11/25 ~ | | | 200,000 | | | | 198,256 | |
MTN Mauritius Investments Ltd
4.755% due 11/11/24 ~ | | | 200,000 | | | | 190,447 | |
| | | | | | | | |
| | | | | | | 786,728 | |
| | | | | | | | |
Ukraine - 0.6% | |
| | |
Metinvest BV
7.750% due 04/23/23 ~ | | | 200,000 | | | | 196,223 | |
Ukreximbank
9.750% due 01/22/25 ~ | | | 200,000 | | | | 202,250 | |
| | | | | | | | |
| | | | | | | 398,473 | |
| | | | | | | | |
United Kingdom - 0.7% | |
|
Standard Chartered Bank | |
6.625% due 05/17/33 ~ | | | IDR 270,000,000 | | | | 16,658 | |
7.590% due 01/13/26 ~ | | | INR 17,870,000 | | | | 262,149 | |
8.125% due 05/17/24 ~ | | | IDR 369,000,000 | | | | 27,053 | |
8.250% due 05/19/36 ~ | | | 980,000,000 | | | | 70,241 | |
8.375% due 03/17/34 ~ | | | 810,000,000 | | | | 58,529 | |
9.000% due 03/20/29 ~ | | | 311,000,000 | | | | 23,815 | |
11.000% due 09/17/25 ~ | | | 432,000,000 | | | | 35,730 | |
12.800% due 06/17/21 ~ | | | 157,000,000 | | | | 12,377 | |
| | | | | | | | |
| | | | | | | 506,552 | |
| | | | | | | | |
Venezuela - 2.1% | |
|
Petroleos de Venezuela SA | |
5.375% due 04/12/27 *Y ~ | | | $113,000 | | | | 26,725 | |
8.500% due 10/27/20Y ~ | | | 1,460,500 | | | | 1,307,148 | |
9.000% due 11/17/21 *Y ~ | | | 239,354 | | | | 65,774 | |
9.750% due 05/17/35 *Y ~ | | | 306,278 | | | | 87,871 | |
12.750% due 02/17/22 *Y ~ | | | 117,000 | | | | 32,877 | |
| | | | | | | | |
| | | | | | | 1,520,395 | |
| | | | | | | | |
Total Corporate Bonds & Notes
(Cost $14,313,343) | | | | 14,295,189 | |
| | | | | | | | |
| | | | | | | | |
| | | Principal Amount | | | Value | |
SENIOR LOAN NOTES - 0.8% | |
|
United Arab Emirates - 0.8% | |
| | |
Dubai World Corp Term B1
2.000% Cash or 1.750% PIK
due 09/30/22 | | $ | 651,462 | | | $ | 609,117 | |
| | | | | | | | |
| |
Total Senior Loan Notes
(Cost $603,570) | | | | 609,117 | |
| | | | | | | | |
|
FOREIGN GOVERNMENT BONDS & NOTES - 73.9% | |
|
Angola - 0.4% | |
| | |
Angolan Government
8.250% due 05/09/28 ~ | | | 279,000 | | | | 291,823 | |
| | | | | | | | |
|
Argentina - 2.3% | |
| | |
Argentina Bonar
47.623% (ARS Deposit + 3.250%)
due 03/01/20 § | | | ARS 470,000 | | | | 10,719 | |
44.503% (ARS Deposit + 2.000%)
due 04/03/22 § | | | 4,931,267 | | | | 110,593 | |
Argentina POM Politica Monetaria
54.196% (ARS Reference + 0.000%)
due 06/21/20 § | | | 2,443,250 | | | | 63,341 | |
Argentine Republic Government | |
3.750% due 12/31/38 § | | | $442,217 | | | | 257,039 | |
5.875% due 01/11/28 | | | 228,000 | | | | 175,588 | |
6.875% due 04/22/21 | | | 210,000 | | | | 192,255 | |
6.875% due 01/11/48 | | | 319,000 | | | | 235,661 | |
7.500% due 04/22/26 | | | 252,000 | | | | 214,483 | |
7.625% due 04/22/46 | | | 194,000 | | | | 153,503 | |
8.280% due 12/31/33 | | | 56,080 | | | | 45,635 | |
8.280% due 12/31/33 | | | 112,160 | | | | 93,373 | |
Autonomous City of Buenos Aires Argentina
52.792% (ARS Deposit +3.250%)
due 03/29/24 § | | | ARS 2,641,873 | | | | 54,173 | |
Provincia de Buenos Aires Argentina
45.741% (ARS Deposit + 3.750%)
due 04/12/25 § ~ | | | 3,263,000 | | | | 66,441 | |
| | | | | | | | |
| | | | | | | 1,672,804 | |
| | | | | | | | |
Bahrain - 0.6% | |
|
Bahrain Government | |
7.000% due 10/12/28 ~ | | | $200,000 | | | | 215,202 | |
7.500% due 09/20/47 ~ | | | 200,000 | | | | 213,646 | |
| | | | | | | | |
| | | | | | | 428,848 | |
| | | | | | | | |
Belarus - 1.2% | |
|
Republic of Belarus | |
6.200% due 02/28/30 ~ | | | 200,000 | | | | 196,139 | |
6.875% due 02/28/23 ~ | | | 460,000 | | | | 483,345 | |
7.625% due 06/29/27 ~ | | | 200,000 | | | | 215,394 | |
| | | | | | | | |
| | | | | | | 894,878 | |
| | | | | | | | |
Brazil - 8.3% | |
|
Brazil Letras do Tesouro Nacional | |
6.530% due 01/01/20 | | | BRL 2,906,000 | | | | 707,539 | |
7.389% due 07/01/21 | | | 10,575,000 | | | | 2,299,877 | |
7.687% due 01/01/22 | | | 400,000 | | | | 83,282 | |
Brazil Notas do Tesouro Nacional ‘F’ | |
10.000% due 01/01/27 | | | 5,307,000 | | | | 1,439,368 | |
10.000% due 01/01/29 | | | 1,183,000 | | | | 322,344 | |
Brazilian Government | |
2.625% due 01/05/23 | | | $200,000 | | | | 194,650 | |
4.250% due 01/07/25 | | | 200,000 | | | | 203,852 | |
4.625% due 01/13/28 | | | 200,000 | | | | 201,952 | |
| | |
| See Notes to Financial Statements | | See explanation of symbols and terms, if any, on B-97 and B-98 |
B-39
PACIFIC FUNDS
PF EMERGING MARKETS DEBT FUND
Schedule of Investments (Continued)
March 31, 2019
| | | | | | | | |
| | | Principal Amount | | | Value | |
5.625% due 02/21/47 | | $ | 200,000 | | | $ | 199,125 | |
7.125% due 01/20/37 | | | 100,000 | | | | 117,625 | |
8.250% due 01/20/34 | | | 110,000 | | | | 140,662 | |
| | | | | | | | |
| | | | | | | 5,910,276 | |
| | | | | | | | |
Chile - 2.9% | |
|
Bonos de la Tesoreria de la Republica en pesos | |
4.500% due 03/01/21 | | | CLP 1,185,000,000 | | | | 1,778,025 | |
4.500% due 03/01/26 | | | 50,000,000 | | | | 76,010 | |
5.000% due 03/01/35 | | | 145,000,000 | | | | 230,263 | |
| | | | | | | | |
| | | | | | | 2,084,298 | |
| | | | | | | | |
Colombia - 2.8% | |
|
Colombia Government | |
3.875% due 04/25/27 | | | $200,000 | | | | 203,352 | |
5.625% due 02/26/44 | | | 200,000 | | | | 225,940 | |
6.125% due 01/18/41 | | | 183,000 | | | | 216,674 | |
7.375% due 09/18/37 | | | 110,000 | | | | 144,238 | |
8.125% due 05/21/24 | | | 185,000 | | | | 224,312 | |
Colombian TES | |
6.000% due 04/28/28 | | | COP 463,100,000 | | | | 141,409 | |
6.250% due 11/26/25 | | | 461,200,000 | | | | 146,683 | |
7.000% due 06/30/32 | | | 510,000,000 | | | | 163,254 | |
7.250% due 10/18/34 | | | 262,300,000 | | | | 85,042 | |
7.750% due 09/18/30 | | | 820,700,000 | | | | 280,578 | |
10.000% due 07/24/24 | | | 376,700,000 | | | | 141,006 | |
| | | | | | | | |
| | | | | | | 1,972,488 | |
| | | | | | | | |
Croatia - 1.0% | |
|
Croatia Government | |
6.000% due 01/26/24 ~ | | | $310,000 | | | | 347,772 | |
6.375% due 03/24/21 ~ | | | 200,000 | | | | 212,373 | |
6.625% due 07/14/20 ~ | | | 160,000 | | | | 167,436 | |
| | | | | | | | |
| | | | | | | 727,581 | |
| | | | | | | | |
Dominican Republic - 1.8% | |
|
Dominican Republic | |
5.500% due 01/27/25 ~ | | | 290,000 | | | | 299,065 | |
5.875% due 04/18/24 ~ | | | 120,000 | | | | 126,001 | |
6.600% due 01/28/24 ~ | | | 100,000 | | | | 108,126 | |
6.850% due 01/27/45 ~ | | | 270,000 | | | | 289,913 | |
6.875% due 01/29/26 ~ | | | 290,000 | | | | 319,365 | |
7.450% due 04/30/44 ~ | | | 130,000 | | | | 147,063 | |
| | | | | | | | |
| | | | | | | 1,289,533 | |
| | | | | | | | |
Ecuador - 7.4% | |
|
Ecuador Government | |
7.875% due 01/23/28 ~ | | | 370,000 | | | | 353,258 | |
7.950% due 06/20/24 ~ | | | 368,000 | | | | 367,540 | |
8.750% due 06/02/23 ~ | | | 458,000 | | | | 481,473 | |
8.875% due 10/23/27 ~ | | | 490,000 | | | | 491,837 | |
9.625% due 06/02/27 ~ | | | 250,000 | | | | 260,938 | |
9.650% due 12/13/26 ~ | | | 652,000 | | | | 685,415 | |
10.500% due 03/24/20 ~ | | | 1,159,000 | | | | 1,220,137 | |
10.750% due 03/28/22 ~ | | | 1,094,000 | | | | 1,226,647 | |
10.750% due 01/31/29 ~ | | | 200,000 | | | | 221,050 | |
| | | | | | | | |
| | | | | | | 5,308,295 | |
| | | | | | | | |
Egypt - 1.2% | |
|
Egypt Government | |
6.588% due 02/21/28 ~ | | | 200,000 | | | | 196,427 | |
7.500% due 01/31/27 ~ | | | 450,000 | | | | 472,334 | |
8.500% due 01/31/47 ~ | | | 200,000 | | | | 204,658 | |
| | | | | | | | |
| | | | | | | 873,419 | |
| | | | | | | | |
El Salvador - 1.0% | |
|
El Salvador Government | |
5.875% due 01/30/25 ~ | | | 102,000 | | | | 99,451 | |
6.375% due 01/18/27 ~ | | | 103,000 | | | | 101,327 | |
7.625% due 02/01/41 ~ | | | 150,000 | | | | 154,314 | |
| | | | | | | | |
| | | Principal Amount | | | Value | |
7.650% due 06/15/35 ~ | | $ | 55,000 | | | $ | 57,407 | |
8.250% due 04/10/32 ~ | | | 113,000 | | | | 122,181 | |
8.625% due 02/28/29 ~ | | | 171,000 | | | | 190,453 | |
| | | | | | | | |
| | | | | | | 725,133 | |
| | | | | | | | |
Gabon - 0.3% | |
| | |
Gabon Government
6.375% due 12/12/24 ~ | | | 200,000 | | | | 192,154 | |
| | | | | | | | |
|
Ghana - 1.0% | |
|
Ghana Government | |
7.875% due 03/26/27 ~ | | | 310,000 | | | | 313,575 | |
8.125% due 03/26/32 ~ | | | 200,000 | | | | 199,560 | |
8.627% due 06/16/49 ~ | | | 200,000 | | | | 195,630 | |
| | | | | | | | |
| | | | | | | 708,765 | |
| | | | | | | | |
Hungary - 1.2% | |
|
Hungary Government | |
5.375% due 02/21/23 | | | 318,000 | | | | 343,667 | |
5.375% due 03/25/24 | | | 174,000 | | | | 190,986 | |
5.750% due 11/22/23 | | | 266,000 | | | | 294,624 | |
7.625% due 03/29/41 | | | 30,000 | | | | 44,649 | |
| | | | | | | | |
| | | | | | | 873,926 | |
| | | | | | | | |
India - 1.6% | |
| | |
Export-Import Bank of India
4.000% due 01/14/23 ~ | | | 200,000 | | | | 203,598 | |
India Government | |
7.170% due 01/08/28 | | | INR 30,000,000 | | | | 425,805 | |
7.350% due 06/22/24 | | | 10,000,000 | | | | 146,748 | |
7.370% due 04/16/23 | | | 23,650,000 | | | | 349,099 | |
7.720% due 05/25/25 | | | 4,000,000 | | | | 59,355 | |
| | | | | | | | |
| | | | | | | 1,184,605 | |
| | | | | | | | |
Indonesia - 6.0% | |
|
Indonesia Government | |
5.125% due 01/15/45 ~ | | | $200,000 | | | | 213,256 | |
5.250% due 01/17/42 ~ | | | 200,000 | | | | 215,647 | |
5.250% due 01/08/47 ~ | | | 200,000 | | | | 217,021 | |
5.950% due 01/08/46 ~ | | | 200,000 | | | | 236,152 | |
6.625% due 02/17/37 ~ | | | 100,000 | | | | 122,602 | |
8.500% due 10/12/35 ~ | | | 100,000 | | | | 142,597 | |
Indonesia Treasury | |
5.625% due 05/15/23 | | | IDR 5,329,000,000 | | | | 356,033 | |
6.125% due 05/15/28 | | | 5,180,000,000 | | | | 330,189 | |
6.625% due 05/15/33 | | | 3,646,000,000 | | | | 224,943 | |
7.000% due 05/15/27 | | | 298,000,000 | | | | 20,196 | |
7.500% due 08/15/32 | | | 4,001,000,000 | | | | 269,756 | |
7.500% due 05/15/38 | | | 689,000,000 | | | | 45,685 | |
8.250% due 07/15/21 | | | 3,687,000,000 | | | | 267,517 | |
8.250% due 05/15/29 | | | 5,146,000,000 | | | | 378,397 | |
8.250% due 05/15/36 | | | 958,000,000 | | | | 68,664 | |
8.375% due 03/15/24 | | | 5,581,000,000 | | | | 411,379 | |
8.375% due 09/15/26 | | | 7,369,000,000 | | | | 544,266 | |
Perusahaan Penerbit SBSN Indonesia III
4.550% due 03/29/26 ~ | | | $200,000 | | | | 208,250 | |
| | | | | | | | |
| | | | | | | 4,272,550 | |
| | | | | | | | |
Ivory Coast - 0.8% | |
| | |
Ivory Coast Government
5.750% due 12/31/32 § ~ | | | 639,835 | | | | 607,968 | |
| | | | | | | | |
|
Jamaica - 0.3% | |
| | |
Jamaica Government
7.875% due 07/28/45 | | | 200,000 | | | | 240,000 | |
| | | | | | | | |
| | |
| See Notes to Financial Statements | | See explanation of symbols and terms, if any, on B-97 and B-98 |
B-40
PACIFIC FUNDS
PF EMERGING MARKETS DEBT FUND
Schedule of Investments (Continued)
March 31, 2019
| | | | | | | | |
| | | Principal Amount | | | Value | |
|
Kazakhstan - 0.4% | |
| | |
Kazakhstan Government
6.500% due 07/21/45 ~ | | $ | 230,000 | | | $ | 295,782 | |
| | | | | | | | |
|
Kenya - 0.3% | |
| | |
Kenya Government
8.250% due 02/28/48 ~ | | | 200,000 | | | | 203,126 | |
| | | | | | | | |
|
Lebanon - 2.0% | |
|
Lebanon Government | |
5.450% due 11/28/19 ~ | | | 156,000 | | | | 152,701 | |
6.000% due 01/27/23 ~ | | | 60,000 | | | | 51,403 | |
6.100% due 10/04/22 ~ | | | 469,000 | | | | 408,537 | |
6.375% due 03/09/20 | | | 145,000 | | | | 140,388 | |
6.600% due 11/27/26 ~ | | | 99,000 | | | | 79,664 | |
6.850% due 03/23/27 ~ | | | 117,000 | | | | 94,589 | |
7.000% due 03/23/32 ~ | | | 150,000 | | | | 117,332 | |
7.250% due 03/23/37 ~ | | | 53,000 | | | | 40,945 | |
8.250% due 04/12/21 ~ | | | 395,000 | | | | 370,806 | |
| | | | | | | | |
| | | | | | | 1,456,365 | |
| | | | | | | | |
Malaysia - 1.3% | |
|
Malaysia Government | |
3.659% due 10/15/20 | | | MYR 3,000,000 | | | | 738,268 | |
4.181% due 07/15/24 | | | 217,000 | | | | 54,446 | |
4.232% due 06/30/31 | | | 201,000 | | | | 50,239 | |
4.498% due 04/15/30 | | | 194,000 | | | | 49,903 | |
4.642% due 11/07/33 | | | 180,000 | | | | 46,645 | |
| | | | | | | | |
| | | | | | | 939,501 | |
| | | | | | | | |
Mexico - 1.3% | |
|
Mexican Bonos | |
6.500% due 06/09/22 | | | MXN 7,750,000 | | | | 384,908 | |
7.500% due 06/03/27 | | | 690,000 | | | | 34,456 | |
8.500% due 05/31/29 | | | 720,000 | | | | 38,161 | |
10.000% due 12/05/24 | | | 1,850,000 | | | | 104,724 | |
Mexico Government | |
4.750% due 03/08/44 | | | $68,000 | | | | 66,946 | |
5.550% due 01/21/45 | | | 94,000 | | | | 103,189 | |
5.750% due 10/12/10 | | | 112,000 | | | | 115,052 | |
6.050% due 01/11/40 | | | 60,000 | | | | 68,550 | |
| | | | | | | | |
| | | | | | | 915,986 | |
| | | | | | | | |
Morocco - 0.5% | |
| | |
Morocco Government
4.250% due 12/11/22 ~ | | | 320,000 | | | | 327,056 | |
| | | | | | | | |
|
Nigeria - 0.6% | |
|
Nigeria Government | |
6.500% due 11/28/27 ~ | | | 200,000 | | | | 198,159 | |
9.248% due 01/21/49 ~ | | | 200,000 | | | | 222,313 | |
| | | | | | | | |
| | | | | | | 420,472 | |
| | | | | | | | |
Oman - 0.5% | |
|
Oman Government | |
6.500% due 03/08/47 ~ | | | 200,000 | | | | 175,586 | |
6.750% due 01/17/48 ~ | | | 200,000 | | | | 178,185 | |
| | | | | | | | |
| | | | | | | 353,771 | |
| | | | | | | | |
Pakistan - 1.2% | |
|
Pakistan Government | |
6.875% due 12/05/27 ~ | | | 200,000 | | | | 198,000 | |
7.250% due 04/15/19 ~ | | | 230,000 | | | | 229,816 | |
8.250% due 04/15/24 ~ | | | 200,000 | | | | 214,000 | |
8.250% due 09/30/25 ~ | | | 200,000 | | | | 214,500 | |
| | | | | | | | |
| | | | | | | 856,316 | |
| | | | | | | | |
| | | | | | | | |
| | | Principal Amount | | | Value | |
Panama - 1.0% | |
|
Panama Government | |
4.300% due 04/29/53 | | $ | 200,000 | | | $ | 204,810 | |
6.700% due 01/26/36 | | | 120,000 | | | | 157,200 | |
7.125% due 01/29/26 | | | 100,000 | | | | 122,375 | |
8.875% due 09/30/27 | | | 70,000 | | | | 97,202 | |
9.375% due 04/01/29 | | | 70,000 | | | | 102,480 | |
| | | | | | | | |
| | | | | | | 684,067 | |
| | | | | | | | |
Paraguay - 0.3% | |
| | |
Paraguay Government
4.625% due 01/25/23 ~ | | | 200,000 | | | | 206,837 | |
| | | | | | | | |
|
Peru - 2.4% | |
| | |
Fondo MIVIVIENDA SA
7.000% due 02/14/24 ~ | | | PEN 236,000 | | | | 76,932 | |
Peruvian Government | |
5.625% due 11/18/50 | | | $317,000 | | | | 407,503 | |
5.940% due 02/12/29 ~ | | | PEN 423,000 | | | | 134,381 | |
6.150% due 08/12/32 ~ | | | 128,000 | | | | 40,649 | |
6.900% due 08/12/37 ~ | | | 1,018,000 | | | | 344,749 | |
7.350% due 07/21/25 | | | $278,000 | | | | 350,558 | |
8.750% due 11/21/33 | | | 230,000 | | | | 361,100 | |
| | | | | | | | |
| | | | | | | 1,715,872 | |
| | | | | | | | |
Philippines - 1.0% | |
|
Philippine Government | |
6.375% due 10/23/34 | | | 130,000 | | | | 173,616 | |
7.750% due 01/14/31 | | | 170,000 | | | | 239,400 | |
9.500% due 02/02/30 | | | 170,000 | | | | 262,568 | |
10.625% due 03/16/25 | | | 46,000 | | | | 65,493 | |
| | | | | | | | |
| | | | | | | 741,077 | |
| | | | | | | | |
Qatar - 1.0% | |
|
Qatar Government | |
4.000% due 03/14/29 ~ | | | 200,000 | | | | 206,436 | |
4.817% due 03/14/49 ~ | | | 200,000 | | | | 210,806 | |
5.103% due 04/23/48 ~ | | | 246,000 | | | | 269,985 | |
| | | | | | | | |
| | | | | | | 687,227 | |
| | | | | | | | |
Romania - 0.5% | |
|
Romanian Government | |
4.375% due 08/22/23 ~ | | | 302,000 | | | | 313,455 | |
6.125% due 01/22/44 ~ | | | 38,000 | | | | 43,630 | |
| | | | | | | | |
| | | | | | | 357,085 | |
| | | | | | | | |
Russia - 2.1% | |
|
Russia Federal | |
7.050% due 01/19/28 | | | RUB 15,890,000 | | | | 226,036 | |
7.500% due 08/18/21 | | | 31,429,000 | | | | 477,554 | |
7.750% due 09/16/26 | | | 19,402,000 | | | | 290,372 | |
8.500% due 09/17/31 | | | 7,410,000 | | | | 115,093 | |
Russia Foreign | |
4.375% due 03/21/29 ~ | | | $200,000 | | | | 198,010 | |
5.250% due 06/23/47 ~ | | | 200,000 | | | | 201,190 | |
| | | | | | | | |
| | | | | | | 1,508,255 | |
| | | | | | | | |
Saudi Arabia - 0.6% | |
|
Saudi Government | |
4.375% due 04/16/29 ~ | | | 200,000 | | | | 208,775 | |
5.250% due 01/16/50 ~ | | | 200,000 | | | | 213,773 | |
| | | | | | | | |
| | | | | | | 422,548 | |
| | | | | | | | |
Senegal - 0.3% | |
| | |
Senegal Government
6.250% due 05/23/33 ~ | | | 200,000 | | | | 192,551 | |
| | | | | | | | |
| | |
| See Notes to Financial Statements | | See explanation of symbols and terms, if any, on B-97 and B-98 |
B-41
PACIFIC FUNDS
PF EMERGING MARKETS DEBT FUND
Schedule of Investments (Continued)
March 31, 2019
| | | | | | | | |
| | | Principal Amount | | | Value | |
|
South Africa - 4.8% | |
|
Republic of South Africa Government | |
4.300% due 10/12/28 | | $ | 424,000 | | | $ | 396,631 | |
4.875% due 04/14/26 | | | 200,000 | | | | 198,615 | |
5.000% due 10/12/46 | | | 200,000 | | | | 178,396 | |
5.650% due 09/27/47 | | | 230,000 | | | | 219,729 | |
6.250% due 03/31/36 | | | ZAR 650,000 | | | | 32,739 | |
6.500% due 02/28/41 | | | 3,572,000 | | | | 175,410 | |
7.000% due 02/28/31 | | | 8,370,000 | | | | 486,436 | |
8.000% due 01/31/30 | | | 3,325,000 | | | | 212,570 | |
8.250% due 03/31/32 | | | 3,313,000 | | | | 210,798 | |
8.500% due 01/31/37 | | | 470,000 | | | | 29,270 | |
8.750% due 01/31/44 | | | 5,729,000 | | | | 359,723 | |
8.750% due 02/28/48 | | | 4,695,000 | | | | 293,894 | |
8.875% due 02/28/35 | | | 5,209,000 | | | | 340,268 | |
9.000% due 01/31/40 | | | 2,272,760 | | | | 146,736 | |
10.500% due 12/21/26 | | | 2,117,000 | | | | 161,965 | |
| | | | | | | | |
| | | | | | | 3,443,180 | |
| | | | | | | | |
Sri Lanka - 0.6% | |
|
Sri Lanka Government | |
6.200% due 05/11/27 ~ | | | $200,000 | | | | 192,453 | |
7.850% due 03/14/29 ~ | | | 200,000 | | | | 209,261 | |
| | | | | | | | |
| | | | | | | 401,714 | |
| | | | | | | | |
Suriname - 0.3% | |
| | |
Republic of Suriname
9.250% due 10/26/26 ~ | | | 200,000 | | | | 197,300 | |
| | | | | | | | |
|
Thailand - 2.0% | |
|
Thailand Government | |
1.875% due 06/17/22 | | | THB 17,766,000 | | | | 559,900 | |
2.000% due 12/17/22 | | | 5,000 | | | | 158 | |
2.125% due 12/17/26 | | | 2,461,000 | | | | 76,480 | |
2.400% due 12/17/23 | | | 4,756,000 | | | | 152,051 | |
2.875% due 12/17/28 | | | 2,311,000 | | | | 75,590 | |
2.875% due 06/17/46 | | | 333,000 | | | | 9,857 | |
3.300% due 06/17/38 | | | 4,126,000 | | | | 136,557 | |
3.400% due 06/17/36 | | | 3,290,000 | | | | 111,632 | |
3.775% due 06/25/32 | | | 6,951,000 | | | | 244,491 | |
4.875% due 06/22/29 | | | 1,138,000 | | | | 43,271 | |
| | | | | | | | |
| | | | | | | 1,409,987 | |
| | | | | | | | |
Turkey - 1.5% | |
|
Turkey Government | |
3.000% due 02/23/22 ^ ~ | | | TRY 354,379 | | | | 59,810 | |
4.875% due 04/16/43 | | | $200,000 | | | | 148,623 | |
5.750% due 03/22/24 | | | 200,000 | | | | 189,688 | |
6.125% due 10/24/28 | | | 200,000 | | | | 182,359 | |
6.250% due 09/26/22 | | | 200,000 | | | | 197,792 | |
7.000% due 06/05/20 | | | 42,000 | | | | 42,478 | |
7.375% due 02/05/25 | | | 130,000 | | | | 130,813 | |
8.000% due 03/12/25 | | | TRY 90,000 | | | | 9,766 | |
10.700% due 08/17/22 | | | 920,000 | | | | 122,436 | |
| | | | | | | | |
| | | | | | | 1,083,765 | |
| | | | | | | | |
Ukraine - 2.1% | |
|
Ukraine Government | |
7.375% due 09/25/32 ~ | | | $600,000 | | | | 536,244 | |
7.750% due 09/01/22 ~ | | | 114,000 | | | | 113,104 | |
7.750% due 09/01/23 ~ | | | 114,000 | | | | 111,206 | |
7.750% due 09/01/25 ~ | | | 310,000 | | | | 296,157 | |
7.750% due 09/01/26 ~ | | | 100,000 | | | | 94,233 | |
7.750% due 09/01/27 ~ | | | 126,000 | | | | 117,873 | |
9.750% due 11/01/28 ~ | | | 200,000 | | | | 206,650 | |
| | | | | | | | |
| | | | | | | 1,475,467 | |
| | | | | | | | |
| | | | | | | | |
| | | Principal Amount | | | Value | |
Uruguay - 1.1% | |
|
Uruguay Government | |
4.125% due 11/20/45 | | $ | 108,548 | | | $ | 106,377 | |
4.975% due 04/20/55 | | | 248,082 | | | | 259,246 | |
5.100% due 06/18/50 | | | 90,000 | | | | 95,963 | |
7.625% due 03/21/36 | | | 82,000 | | | | 113,262 | |
7.875% due 01/15/33 | | | 133,000 | | | | 185,119 | |
8.500% due 03/15/28 ~ | | | UYU 1,208,000 | | | | 31,568 | |
9.875% due 06/20/22 ~ | | | 725,000 | | | | 21,557 | |
| | | | | | | | |
| | | | | | | 813,092 | |
| | | | | | | | |
Venezuela - 1.3% | |
|
Venezuela Government | |
7.750% due 10/13/19 *Y ~ | | | $85,000 | | | | 24,756 | |
8.250% due 10/13/24 *Y ~ | | | 166,100 | | | | 50,038 | |
9.000% due 05/07/23 *Y ~ | | | 73,000 | | | | 22,174 | |
9.250% due 09/15/27 *Y | | | 252,000 | | | | 80,640 | |
9.250% due 05/07/28 *Y ~ | | | 121,000 | | | | 36,149 | |
11.750% due 10/21/26 *Y ~ | | | 768,700 | | | | 244,062 | |
11.950% due 08/05/31 *Y ~ | | | 1,255,900 | | | | 389,329 | |
12.750% due 08/23/22 *Y ~ | | | 211,000 | | | | 63,827 | |
| | | | | | | | |
| | | | | | | 910,975 | |
| | | | | | | | |
Vietnam - 0.5% | |
|
Vietnam Government | |
4.800% due 11/19/24 ~ | | | 200,000 | | | | 209,766 | |
6.750% due 01/29/20 ~ | | | 180,000 | | | | 185,286 | |
| | | | | | | | |
| | | | | | | 395,052 | |
| | | | | | | | |
Zambia - 0.3% | |
| | |
Zambia Government
8.970% due 07/30/27 ~ | | | 307,000 | | | | 225,492 | |
| | | | | | | | |
| |
Total Foreign Government Bonds & Notes
(Cost $53,823,762) | | | | 52,899,262 | |
| | | | | |
|
SHORT-TERM INVESTMENTS - 3.9% | |
|
Foreign Government Issues - 0.6% | |
| | |
Argentina Treasury Bill (Argentina)
1.860% due 07/31/20 | | | ARS 1,966,404 | | | | 44,243 | |
Egypt Treasury Bills (Egypt) | |
14.466% due 07/16/19 | | | EGP 1,650,000 | | | | 91,513 | |
14.818% due 07/30/19 | | | 800,000 | | | | 44,096 | |
15.087% due 08/13/19 | | | 1,150,000 | | | | 62,998 | |
15.758% due 10/22/19 | | | 3,775,000 | | | | 200,644 | |
| | | | | | | | |
| | | | | | | 443,494 | |
| | | | | | | | |
| | |
| | | Shares | | | | |
Money Market Fund - 3.3% | |
| | |
BlackRock Liquidity FundsT-Fund Portfolio
‘Institutional’ 2.370% | | | 2,317,924 | | | | 2,317,924 | |
| | | | | | | | |
| |
Total Short-Term Investments
(Cost $2,753,063) | | | | 2,761,418 | |
| | | | | |
| |
TOTAL INVESTMENTS - 98.6%
(Cost $71,493,738) | | | | 70,564,986 | |
| |
DERIVATIVES - (0.1%) (See Notes (d) and (e) in Notes to Schedule of Investments) | | | | (75,996 | ) |
| | | | | | | | |
| |
OTHER ASSETS & LIABILITIES, NET - 1.5% | | | | 1,109,736 | |
| | | | | | | | |
| |
NET ASSETS - 100.0% | | | | $71,598,726 | |
| | | | | |
| | |
| See Notes to Financial Statements | | See explanation of symbols and terms, if any, on B-97 and B-98 |
B-42
PACIFIC FUNDS
PF EMERGING MARKETS DEBT FUND
Schedule of Investments (Continued)
March 31, 2019
Notes to Schedule of Investments
| (a) | As of March 31, 2019, the Fund’s composition as a percentage of net assets was as follows: |
| | | | |
Foreign Government Bonds & Notes | | | 73.9% | |
Corporate Bonds & Notes | | | 20.0% | |
Short-Term Investments | | | 3.9% | |
Others (each less than 3.0%) | | | 0.8% | |
| | | | |
| | | 98.6% | |
Derivatives | | | (0.1% | ) |
Other Assets & Liabilities, Net | | | 1.5% | |
| | | | |
| | | 100.0% | |
| | | | |
| (b) | As of March 31, 2019, the Fund’s composition by country of risk as a percentage of net assets was as follows: |
| | | | |
Brazil | | | 10.1% | |
Ecuador | | | 7.4% | |
Indonesia | | | 6.9% | |
South Africa | | | 5.9% | |
Mexico | | | 4.5% | |
Chile | | | 4.4% | |
Venezuela | | | 3.4% | |
United States (Includes Short-Term Investments) | | | 3.3% | |
Colombia | | | 3.2% | |
Others (each less than 3.0%) | | | 49.5% | |
| | | | |
| | | 98.6% | |
Derivatives | | | (0.1% | ) |
Other Assets & Liabilities, Net | | | 1.5% | |
| | | | |
| | | 100.0% | |
| | | | |
| (c) | Investments with a total aggregate value of $2,431,370 or 3.4% of the Fund’s net assets were in default as of March 31, 2019. |
| (d) | Forward foreign currency contracts outstanding as of March 31, 2019 were as follows: |
| | | | | | | | | | | | | | | | | | | | | | | | | | | | | | |
Currency
Purchased | | | | | Currency
Sold | | | | | Settlement
Month | | | | Counterparty | | | | Unrealized
Appreciation | | | Unrealized
Depreciation | |
| ARS | | | 1,865,250 | | | | | USD | | | 45,405 | | | | | 04/19 | | | | BNP | | | | | $ — | | | | ($3,694 | ) |
| ARS | | | 8,633,100 | | | | | USD | | | 210,000 | | | | | 04/19 | | | | GSC | | | | | — | | | | (14,718 | ) |
| ARS | | | 2,167,500 | | | | | USD | | | 50,898 | | | | | 04/19 | | | | HSB | | | | | — | | | | (2,917 | ) |
| BRL | | | 8,959,694 | | | | | USD | | | 2,396,537 | | | | | 04/19 | | | | MER | | | | | — | | | | (108,752 | ) |
| BRL | | | 1,426,515 | | | | | USD | | | 366,069 | | | | | 05/19 | | | | MER | | | | | — | | | | (2,549 | ) |
| CLP | | | 651,485,570 | | | | | USD | | | 966,854 | | | | | 04/19 | | | | CSF | | | | | — | | | | (9,456 | ) |
| CNH | | | 298,272 | | | | | USD | | | 44,091 | | | | | 04/19 | | | | BNP | | | | | 273 | | | | — | |
| CNH | | | 3,663,769 | | | | | USD | | | 540,909 | | | | | 04/19 | | | | HSB | | | | | 4,025 | | | | — | |
| CNH | | | 4,537,023 | | | | | USD | | | 675,403 | | | | | 05/19 | | | | BNP | | | | | — | | | | (649 | ) |
| CNY | | | 11,614,679 | | | | | USD | | | 1,736,255 | | | | | 04/19 | | | | BNP | | | | | — | | | | (7,923 | ) |
| COP | | | 2,687,054,600 | | | | | USD | | | 857,448 | | | | | 04/19 | | | | CSF | | | | | — | | | | (16,189 | ) |
| CZK | | | 21,926,870 | | | | | USD | | | 965,004 | | | | | 04/19 | | | | BRC | | | | | — | | | | (11,285 | ) |
| CZK | | | 1,877,650 | | | | | USD | | | 81,740 | | | | | 04/19 | | | | JPM | | | | | — | | | | (71 | ) |
| CZK | | | 5,759,531 | | | | | USD | | | 255,954 | | | | | 05/19 | | | | MER | | | | | — | | | | (5,230 | ) |
| CZK | | | 7,167,339 | | | | | USD | | | 316,001 | | | | | 07/19 | | | | SCB | | | | | — | | | | (3,498 | ) |
| HUF | | | 134,610,000 | | | | | USD | | | 482,655 | | | | | 04/19 | | | | BNP | | | | | — | | | | (11,488 | ) |
| HUF | | | 145,840,808 | | | | | USD | | | 524,966 | | | | | 05/19 | | | | HSB | | | | | — | | | | (13,272 | ) |
| HUF | | | 145,840,808 | | | | | USD | | | 532,212 | | | | | 06/19 | | | | MER | | | | | — | | | | (19,541 | ) |
| ILS | | | 1,043,585 | | | | | USD | | | 284,394 | | | | | 04/19 | | | | SCB | | | | | 3,481 | | | | — | |
| INR | | | 23,199,901 | | | | | USD | | | 323,646 | | | | | 04/19 | | | | BNP | | | | | 9,091 | | | | — | |
| INR | | | 12,324,721 | | | | | USD | | | 170,302 | | | | | 04/19 | | | | SCB | | | | | 6,462 | | | | — | |
| INR | | | 11,521,655 | | | | | USD | | | 163,000 | | | | | 05/19 | | | | ANZ | | | | | 1,568 | | | | — | |
| INR | | | 15,650,115 | | | | | USD | | | 221,000 | | | | | 05/19 | | | | BRC | | | | | 2,537 | | | | — | |
| KRW | | | 2,117,540,107 | | | | | USD | | | 1,879,601 | | | | | 04/19 | | | | BNP | | | | | — | | | | (16,367 | ) |
| MXN | | | 51,350,298 | | | | | USD | | | 2,639,643 | | | | | 04/19 | | | | BSC | | | | | — | | | | (7,320 | ) |
| MXN | | | 4,125,184 | | | | | USD | | | 213,589 | | | | | 04/19 | | | | HSB | | | | | — | | | | (2,123 | ) |
| PEN | | | 292,586 | | | | | USD | | | 87,423 | | | | | 04/19 | | | | CSF | | | | | 606 | | | | — | |
| PHP | | | 17,313,683 | | | | | USD | | | 328,284 | | | | | 04/19 | | | | HSB | | | | | — | | | | (712 | ) |
| PLN | | | 1,088,447 | | | | | USD | | | 288,629 | | | | | 04/19 | | | | GSC | | | | | — | | | | (4,856 | ) |
| PLN | | | 157,806 | | | | | USD | | | 42,590 | | | | | 04/19 | | | | MER | | | | | — | | | | (1,448 | ) |
| PLN | | | 5,443,328 | | | | | USD | | | 1,429,770 | | | | | 05/19 | | | | DUB | | | | | — | | | | (9,134 | ) |
| PLN | | | 5,665,505 | | | | | USD | | | 1,489,237 | | | | | 05/19 | | | | HSB | | | | | — | | | | (10,616 | ) |
| RON | | | 1,211,068 | | | | | USD | | | 288,514 | | | | | 04/19 | | | | BNP | | | | | — | | | | (4,275 | ) |
| RON | | | 189,399 | | | | | USD | | | 45,000 | | | | | 04/19 | | | | CIT | | | | | — | | | | (548 | ) |
| RON | | | 1,179,049 | | | | | USD | | | 280,086 | | | | | 05/19 | | | | BNP | | | | | — | | | | (3,677 | ) |
| RON | | | 1,323,034 | | | | | USD | | | 314,148 | | | | | 06/19 | | | | JPM | | | | | — | | | | (4,275 | ) |
| RUB | | | 1,949,640 | | | | | USD | | | 29,370 | | | | | 04/19 | | | | CSF | | | | | 193 | | | | — | |
| RUB | | | 42,324,013 | | | | | USD | | | 631,623 | | | | | 04/19 | | | | GSC | | | | | 10,142 | | | | — | |
| RUB | | | 17,756,860 | | | | | USD | | | 266,238 | | | | | 04/19 | | | | MSC | | | | | 3,011 | | | | — | |
| RUB | | | 86,540,448 | | | | | USD | | | 1,310,127 | | | | | 05/19 | | | | HSB | | | | | — | | | | (3,070 | ) |
| SGD | | | 1,948,810 | | | | | USD | | | 1,436,711 | | | | | 04/19 | | | | HSB | | | | | 2,116 | | | | — | |
| THB | | | 9,724,100 | | | | | USD | | | 312,120 | | | | | 04/19 | | | | CIT | | | | | — | | | | (5,464 | ) |
| THB | | | 22,166,000 | | | | | USD | | | 711,304 | | | | | 04/19 | | | | GSC | | | | | — | | | | (12,284 | ) |
| TRY | | | 8,115,238 | | | | | USD | | | 1,435,436 | | | | | 04/19 | | | | JPM | | | | | — | | | | (30,666 | ) |
| TRY | | | 61,720 | | | | | USD | | | 10,845 | | | | | 05/19 | | | | JPM | | | | | — | | | | (425 | ) |
| TWD | | | 34,480,508 | | | | | USD | | | 1,123,766 | | | | | 04/19 | | | | HSB | | | | | — | | | | (5,419 | ) |
| USD | | | 76,520 | | | | | ARS | | | 3,219,196 | | | | | 04/19 | | | | BNP | | | | | 3,236 | | | | — | |
| | |
| See Notes to Financial Statements | | See explanation of symbols and terms, if any, on B-97 and B-98 |
B-43
PACIFIC FUNDS
PF EMERGING MARKETS DEBT FUND
Schedule of Investments (Continued)
March 31, 2019
| | | | | | | | | | | | | | | | | | | | | | | | | | | | | | |
Currency
Purchased | | | | | Currency
Sold | | | | | Settlement
Month | | | | Counterparty | | | | Unrealized
Appreciation | | | Unrealized
Depreciation | |
| USD | | | 286,740 | | | | | ARS | | | 12,436,765 | | | | | 04/19 | | | | CSF | | | | | $7,218 | | | | $— | |
| USD | | | 30,000 | | | | | BRL | | | 115,365 | | | | | 04/19 | | | | BSC | | | | | 543 | | | | — | |
| USD | | | 695,000 | | | | | BRL | | | 2,700,353 | | | | | 04/19 | | | | DUB | | | | | 5,487 | | | | — | |
| USD | | | 60,000 | | | | | BRL | | | 225,577 | | | | | 04/19 | | | | JPM | | | | | 2,401 | | | | — | |
| USD | | | 411,713 | | | | | BRL | | | 1,594,460 | | | | | 04/19 | | | | MER | | | | | 4,581 | | | | — | |
| USD | | | 1,230,910 | | | | | BRL | | | 4,323,939 | | | | | 04/19 | | | | SCB | | | | | 126,827 | | | | — | |
| USD | | | 108,010 | | | | | BRL | | | 421,887 | | | | | 05/19 | | | | BNP | | | | | 500 | | | | — | |
| USD | | | 138,720 | | | | | BRL | | | 546,161 | | | | | 05/19 | | | | DUB | | | | | — | | | | (459 | ) |
| USD | | | 105,000 | | | | | BRL | | | 406,844 | | | | | 05/19 | | | | GSC | | | | | 1,324 | | | | — | |
| USD | | | 130,090 | | | | | BRL | | | 509,615 | | | | | 05/19 | | | | MER | | | | | 224 | | | | — | |
| USD | | | 1,491,794 | | | | | BRL | | | 5,918,246 | | | | | 12/19 | | | | BNP | | | | | 10,921 | | | | — | |
| USD | | | 44,000 | | | | | CLP | | | 28,821,320 | | | | | 04/19 | | | | CIT | | | | | 1,645 | | | | — | |
| USD | | | 533,000 | | | | | CLP | | | 352,837,249 | | | | | 04/19 | | | | CSF | | | | | 14,484 | | | | — | |
| USD | | | 1,713,488 | | | | | CLP | | | 1,141,165,586 | | | | | 04/19 | | | | GSC | | | | | 36,474 | | | | — | |
| USD | | | 36,000 | | | | | CLP | | | 24,439,320 | | | | | 04/19 | | | | JPM | | | | | 85 | | | | — | |
| USD | | | 270,000 | | | | | CNH | | | 1,819,470 | | | | | 04/19 | | | | HSB | | | | | — | | | | (621 | ) |
| USD | | | 274,740 | | | | | CNH | | | 1,853,149 | | | | | 04/19 | | | | SCB | | | | | — | | | | (890 | ) |
| USD | | | 36,000 | | | | | CNY | | | 241,614 | | | | | 04/19 | | | | BRC | | | | | 46 | | | | — | |
| USD | | | 30,000 | | | | | COP | | | 93,360,432 | | | | | 04/19 | | | | BNP | | | | | 771 | | | | — | |
| USD | | | 425,000 | | | | | COP | | | 1,348,206,250 | | | | | 04/19 | | | | DUB | | | | | 2,906 | | | | — | |
| USD | | | 87,000 | | | | | COP | | | 273,180,000 | | | | | 04/19 | | | | HSB | | | | | 1,473 | | | | — | |
| USD | | | 44,000 | | | | | COP | | | 137,984,000 | | | | | 04/19 | | | | MER | | | | | 800 | | | | — | |
| USD | | | 59,000 | | | | | CZK | | | 1,347,428 | | | | | 04/19 | | | | BNP | | | | | 393 | | | | — | |
| USD | | | 81,000 | | | | | CZK | | | 1,832,893 | | | | | 04/19 | | | | CIT | | | | | 1,277 | | | | — | |
| USD | | | 70,000 | | | | | CZK | | | 1,597,050 | | | | | 04/19 | | | | HSB | | | | | 536 | | | | — | |
| USD | | | 21,000 | | | | | CZK | | | 473,803 | | | | | 05/19 | | | | HSB | | | | | 374 | | | | — | |
| USD | | | 105,000 | | | | | HUF | | | 29,418,270 | | | | | 04/19 | | | | HSB | | | | | 2,029 | | | | — | |
| USD | | | 44,000 | | | | | HUF | | | 12,147,713 | | | | | 04/19 | | | | JPM | | | | | 1,480 | | | | — | |
| USD | | | 90,000 | | | | | IDR | | | 1,292,535,000 | | | | | 04/19 | | | | BNP | | | | | — | | | | (279 | ) |
| USD | | | 498,386 | | | | | IDR | | | 7,059,606,800 | | | | | 04/19 | | | | JPM | | | | | 5,297 | | | | — | |
| USD | | | 327,000 | | | | | IDR | | | 4,710,194,000 | | | | | 05/19 | | | | BNP | | | | | — | | | | (195 | ) |
| USD | | | 249,997 | | | | | IDR | | | 3,581,661,230 | | | | | 05/19 | | | | GSC | | | | | 1,195 | | | | — | |
| USD | | | 78,181 | | | | | IDR | | | 1,123,693,070 | | | | | 05/19 | | | | JPM | | | | | 123 | | | | — | |
| USD | | | 151,458 | | | | | IDR | | | 2,181,000,000 | | | | | 05/19 | | | | SCB | | | | | — | | | | (46 | ) |
| USD | | | 35,000 | | | | | ILS | | | 126,418 | | | | | 04/19 | | | | MER | | | | | 127 | | | | — | |
| USD | | | 36,000 | | | | | INR | | | 2,493,936 | | | | | 04/19 | | | | BRC | | | | | 231 | | | | — | |
| USD | | | 358,463 | | | | | INR | | | 24,812,417 | | | | | 04/19 | | | | GSC | | | | | 2,598 | | | | — | |
| USD | | | 75,000 | | | | | INR | | | 5,257,500 | | | | | 04/19 | | | | HSB | | | | | — | | | | (404 | ) |
| USD | | | 177,000 | | | | | INR | | | 12,792,144 | | | | | 05/19 | | | | DUB | | | | | — | | | | (5,715 | ) |
| USD | | | 176,000 | | | | | INR | | | 12,689,600 | | | | | 05/19 | | | | GSC | | | | | — | | | | (5,250 | ) |
| USD | | | 76,000 | | | | | KRW | | | 85,994,000 | | | | | 04/19 | | | | ANZ | | | | | 333 | | | | — | |
| USD | | | 30,000 | | | | | KRW | | | 33,480,900 | | | | | 04/19 | | | | BRC | | | | | 540 | | | | — | |
| USD | | | 36,000 | | | | | KRW | | | 40,744,482 | | | | | 04/19 | | | | GSC | | | | | 149 | | | | — | |
| USD | | | 105,000 | | | | | KRW | | | 118,440,000 | | | | | 04/19 | | | | HSB | | | | | 784 | | | | — | |
| USD | | | 119,000 | | | | | MXN | | | 2,291,135 | | | | | 04/19 | | | | BNP | | | | | 1,552 | | | | — | |
| USD | | | 330,000 | | | | | MXN | | | 6,351,180 | | | | | 04/19 | | | | BSC | | | | | 4,425 | | | | — | |
| USD | | | 546,710 | | | | | MXN | | | 10,707,781 | | | | | 04/19 | | | | DUB | | | | | — | | | | (2,193 | ) |
| USD | | | 72,325 | | | | | MXN | | | 1,397,153 | | | | | 04/19 | | | | HSB | | | | | 704 | | | | — | |
| USD | | | 520,000 | | | | | MXN | | | 10,163,950 | | | | | 04/19 | | | | MER | | | | | — | | | | (1,025 | ) |
| USD | | | 89,329 | | | | | MYR | | | 363,693 | | | | | 04/19 | | | | DUB | | | | | 210 | | | | — | |
| USD | | | 80,000 | | | | | PEN | | | 265,400 | | | | | 04/19 | | | | MER | | | | | 151 | | | | — | |
| USD | | | 115,000 | | | | | PLN | | | 439,530 | | | | | 04/19 | | | | BNP | | | | | 409 | | | | — | |
| USD | | | 55,000 | | | | | PLN | | | 209,603 | | | | | 04/19 | | | | CIT | | | | | 354 | | | | — | |
| USD | | | 72,000 | | | | | PLN | | | 272,523 | | | | | 04/19 | | | | DUB | | | | | 950 | | | | — | |
| USD | | | 268,006 | | | | | PLN | | | 1,010,678 | | | | | 05/19 | | | | SCB | | | | | 4,233 | | | | — | |
| USD | | | 37,000 | | | | | RON | | | 154,505 | | | | | 04/19 | | | | BNP | | | | | 738 | | | | — | |
| USD | | | 40,000 | | | | | RON | | | 169,256 | | | | | 04/19 | | | | HSB | | | | | 275 | | | | — | |
| USD | | | 105,510 | | | | | RON | | | 434,965 | | | | | 04/19 | | | | ING | | | | | 3,423 | | | | — | |
| USD | | | 135,000 | | | | | RUB | | | 8,978,580 | | | | | 04/19 | | | | GSC | | | | | — | | | | (1,143 | ) |
| USD | | | 597,152 | | | | | RUB | | | 39,019,824 | | | | | 04/19 | | | | HSB | | | | | 5,489 | | | | — | |
| USD | | | 295,270 | | | | | RUB | | | 19,470,626 | | | | | 04/19 | | | | MSC | | | | | 34 | | | | — | |
| USD | | | 55,000 | | | | | RUB | | | 3,623,769 | | | | | 04/19 | | | | SCB | | | | | 52 | | | | — | |
| USD | | | 115,000 | | | | | SGD | | | 155,681 | | | | | 04/19 | | | | BNP | | | | | 59 | | | | — | |
| USD | | | 55,000 | | | | | SGD | | | 74,795 | | | | | 04/19 | | | | HSB | | | | | — | | | | (222 | ) |
| USD | | | 160,000 | | | | | THB | | | 5,064,640 | | | | | 04/19 | | | | BNP | | | | | 283 | | | | — | |
| USD | | | 60,000 | | | | | THB | | | 1,875,438 | | | | | 04/19 | | | | MSC | | | | | 857 | | | | — | |
| USD | | | 41,672 | | | | | TRY | | | 245,093 | | | | | 04/19 | | | | BNP | | | | | — | | | | (754 | ) |
| USD | | | 50,000 | | | | | TRY | | | 295,350 | | | | | 04/19 | | | | BRC | | | | | — | | | | (1,126 | ) |
| USD | | | 96,000 | | | | | TRY | | | 540,797 | | | | | 04/19 | | | | HSB | | | | | 2,387 | | | | — | |
| USD | | | 95,000 | | | | | TRY | | | 531,440 | | | | | 04/19 | | | | MER | | | | | 3,006 | | | | — | |
| USD | | | 90,000 | | | | | TWD | | | 2,775,600 | | | | | 04/19 | | | | HSB | | | | | — | | | | (24 | ) |
| | |
| See Notes to Financial Statements | | See explanation of symbols and terms, if any, on B-97 and B-98 |
B-44
PACIFIC FUNDS
PF EMERGING MARKETS DEBT FUND
Schedule of Investments (Continued)
March 31, 2019
| | | | | | | | | | | | | | | | | | | | | | | | | | | | | | | | |
Currency
Purchased | | | | | Currency
Sold | | | | | Settlement
Month | | | | Counterparty | | | | | Unrealized
Appreciation | | | Unrealized
Depreciation | |
| USD | | | 37,000 | | | | | TWD | | | 1,137,565 | | | | | 04/19 | | | | | SCB | | | | | | $104 | | | | $— | |
| USD | | | 86,000 | | | | | ZAR | | | 1,234,683 | | | | | 04/19 | | | | | BNP | | | | | | 746 | | | | — | |
| USD | | | 346,564 | | | | | ZAR | | | 4,832,252 | | | | | 04/19 | | | | | HSB | | | | | | 12,902 | | | | — | |
| USD | | | 333,086 | | | | | ZAR | | | 4,732,463 | | | | | 04/19 | | | | | MER | | | | | | 6,313 | | | | — | |
| USD | | | 151,618 | | | | | ZAR | | | 2,204,134 | | | | | 05/19 | | | | | DUB | | | | | | 18 | | | | — | |
| ZAR | | | 845,714 | | | | | USD | | | 59,148 | | | | | 04/19 | | | | | BRC | | | | | | — | | | | (752 | ) |
| ZAR | | | 770,426 | | | | | USD | | | 54,430 | | | | | 04/19 | | | | | CIT | | | | | | — | | | | (1,233 | ) |
| ZAR | | | 1,756,342 | | | | | USD | | | 124,000 | | | | | 04/19 | | | | | GSC | | | | | | — | | | | (2,726 | ) |
| ZAR | | | 1,531,567 | | | | | USD | | | 114,157 | | | | | 04/19 | | | | | HSB | | | | | | — | | | | (8,404 | ) |
| ZAR | | | 2,510,776 | | | | | USD | | | 177,000 | | | | | 04/19 | | | | | MER | | | | | | — | | | | (3,633 | ) |
| | | | | | | | | | | | | | | | | | | | | | | | | | | | | | | | |
| | | | |
Total Forward Foreign Currency Contracts | | | | | | | | | $332,591 | | | | ($391,005 | ) |
| | | | | | | | | | | | | | | | | | | | | | | | | | | | | | | | |
| (e) | Swap agreements outstanding as of March 31, 2019 were as follows: |
Interest Rate Swaps – Long
| | | | | | | | | | | | | | | | | | | | | | | | | | | | | | | | |
| Receive | | Pay | | | Payment
Frequency
Receive Rate/
Pay Rate | | | Exchange | | | Expiration
Date | | | Notional
Amount | | | Value | | | Upfront
Premiums
Paid
(Received) | | | Unrealized
Appreciation
(Depreciation) | |
2.400% | | | 6-Month PLN-WIBOR | | | | A / S | | | | LCH | | | | 03/26/23 | | | | PLN 1,060,000 | | | | $5,586 | | | | $— | | | | $5,586 | |
8.156% | | | 28-DayMXN-TIIE | | | | L / L | | | | CME | | | | 12/13/23 | | | | MXN 52,000,000 | | | | 37,630 | | | | — | | | | 37,630 | |
| | | | | | | | | | | | | | | | | | | | | | | | | | | | | | | | |
| | | | | | | | | | | | | | | | | | | | | | | $43,216 | | | | $— | | | | $43,216 | |
| | | | | | | | | | | | | | | | | | | | | | | | | | | | | | | | |
Interest Rate Swaps – Short
| | | | | | | | | | | | | | | | | | | | | | | | | | | | | | | | |
| Pay | | Receive | | | Payment
Frequency
Receive Rate/
Pay Rate | | | Exchange | | | Expiration
Date | | | Notional
Amount | | | Value | | | Upfront
Premiums
Paid
(Received) | | | Unrealized
Appreciation
(Depreciation) | |
2.069% | | | 6-Month CZK-PRIBOR | | | | A / S | | | | LCH | | | | 09/19/23 | | | | CZK 20,000,000 | | | | ($8,399 | ) | | | $— | | | | ($8,399 | ) |
6.600% | | | 6-MonthINR-MIBOR | | | | S / S | | | | LCH | | | | 12/13/23 | | | | INR 66,000,000 | | | | (32,610 | ) | | | — | | | | (32,610 | ) |
8.255% | | | 28-DayMXN-TIIE | | | | L / L | | | | CME | | | | 12/06/28 | | | | MXN 12,000,000 | | | | (7,111 | ) | | | — | | | | (7,111 | ) |
8.410% | | | 28-DayMXN-TIIE | | | | L / L | | | | CME | | | | 12/06/28 | | | | 11,000,000 | | | | (12,678 | ) | | | — | | | | (12,678 | ) |
| | | | | | | | | | | | | | | | | | | | | | | | | | | | | | | | |
| | | | | | | | | | | | | | | | | | | | | | | ($60,798 | ) | | | $— | | | | ($60,798 | ) |
| | | | | | | | | | | | | | | | | | | | | | | | | | | | | | | | |
| | | | |
Total Interest Rate Swaps | | | | | | | | ($17,582 | ) | | | $— | | | | ($17,582 | ) |
| | | | | | | | | | | | | | | | | | | | | | | | | | | | | | | | |
Balances reported in the Statement of Assets and Liabilities for Centrally Cleared Swaps
| | | | | | | | |
| | | Upfront
Premium
Paid
(Received) | | | Unrealized
Appreciation
(Deprecation) | |
Centrally Cleared Swap Agreements (1) | | | | | | | | |
Assets | | | $— | | | | $43,216 | |
Liabilities | | | — | | | | (60,798 | ) |
| | | | | | | | |
| | | $— | | | | ($17,582 | ) |
| | | | | | | | |
| | (1) | Includes cumulative value on centrally cleared swaps, as reported in the Schedule of Investments. Only current day’s variation margin is reported within the Statement of Assets and Liabilities. |
| | |
| See Notes to Financial Statements | | See explanation of symbols and terms, if any, on B-97 and B-98 |
B-45
PACIFIC FUNDS
PF EMERGING MARKETS DEBT FUND
Schedule of Investments (Continued)
March 31, 2019
| (f) | Fair Value Measurements |
The following is a summary of the Fund’s investments as categorized under the three-tier hierarchy of inputs used in valuing the Fund’s assets and liabilities (See Note 3D in Notes to Financial Statements) as of March 31, 2019:
| | | | | | | | | | | | | | | | | | |
| | | | | Total Value at
March 31, 2019 | | | Level 1
Quoted Price | | | Level 2
Significant
Observable Inputs | | | Level 3
Significant
Unobservable Inputs | |
Assets | | Corporate Bonds & Notes | | | $14,295,189 | | | | $— | | | | $14,295,189 | | | | $— | |
| | Senior Loan Notes | | | 609,117 | | | | — | | | | 609,117 | | | | — | |
| | Foreign Government Bonds & Notes | | | 52,899,262 | | | | — | | | | 52,899,262 | | | | — | |
| | Short-Term Investments | | | 2,761,418 | | | | 2,317,924 | | | | 443,494 | | | | — | |
| | Derivatives: | | | | | | | | | | | | | | | | |
| | Foreign Currency Contracts | | | | | | | | | | | | | | | | |
| | Forward Foreign Currency Contracts | | | 332,591 | | | | — | | | | 332,591 | | | | — | |
| | Interest Rate Contracts | | | | | | | | | | | | | | | | |
| | Swaps | | | 43,216 | | | | — | | | | 43,216 | | | | — | |
| | | | | | | | | | | | | | | | | | |
| | Total Assets - Derivatives | | | 375,807 | | | | — | | | | 375,807 | | | | — | |
| | | | | | | | | | | | | | | | | | |
| | Total Assets | | | 70,940,793 | | | | 2,317,924 | | | | 68,622,869 | | | | — | |
| | | | | | | | | | | | | | | | | | |
| | | | | |
Liabilities | | Derivatives: | | | | | | | | | | | | | | | | |
| | Foreign Currency Contracts | | | | | | | | | | | | | | | | |
| | Forward Foreign Currency Contracts | | | (391,005 | ) | | | — | | | | (391,005 | ) | | | — | |
| | Interest Rate Contracts | | | | | | | | | | | | | | | | |
| | Swaps | | | (60,798 | ) | | | — | | | | (60,798 | ) | | | — | |
| | | | | | | | | | | | | | | | | | |
| | Total Liabilities - Derivatives | | | (451,803 | ) | | | — | | | | (451,803 | ) | | | — | |
| | | | | | | | | | | | | | | | | | |
| | Total Liabilities | | | (451,803 | ) | | | — | | | | (451,803 | ) | | | — | |
| | | | | | | | | | | | | | | | | | |
| | Total | | | $70,488,990 | | | | $2,317,924 | | | | $68,171,066 | | | | $— | |
| | | | | | | | | | | | | | | | | | |
| | |
| See Notes to Financial Statements | | See explanation of symbols and terms, if any, on B-97 and B-98 |
B-46
PACIFIC FUNDS
PF DEVELOPING GROWTH FUND
Schedule of Investments
March 31, 2019
| | | | | | | | |
| | | Shares | | | Value | |
COMMON STOCKS - 99.0% | | | | | | | | |
| | |
Basic Materials - 0.5% | | | | | | | | |
| | |
Codexis Inc * | | | 3,577 | | | | $73,436 | |
| | | | | | | | |
| | |
Communications - 17.1% | | | | | | | | |
| | |
Acacia Communications Inc * | | | 3,223 | | | | 184,839 | |
Anaplan Inc * | | | 2,955 | | | | 116,309 | |
Cargurus Inc * | | | 4,806 | | | | 192,528 | |
Etsy Inc * | | | 5,730 | | | | 385,171 | |
Mimecast Ltd * | | | 4,361 | | | | 206,493 | |
Okta Inc * | | | 2,733 | | | | 226,101 | |
Quantenna Communications Inc * | | | 1,059 | | | | 25,765 | |
RingCentral Inc ‘A’ * | | | 1,619 | | | | 174,528 | |
Roku Inc * | | | 3,279 | | | | 211,528 | |
The Trade Desk Inc ‘A’ * | | | 1,469 | | | | 290,789 | |
Wix.com Ltd (Israel) * | | | 1,413 | | | | 170,733 | |
World Wrestling Entertainment Inc ‘A’ | | | 2,603 | | | | 225,888 | |
Zscaler Inc * | | | 3,807 | | | | 270,031 | |
| | | | | | | | |
| | | | | | | 2,680,703 | |
| | | | | | | | |
Consumer, Cyclical - 11.2% | | | | | | | | |
| | |
BJ’s Wholesale Club Holdings Inc * | | | 6,525 | | | | 178,785 | |
Dave & Buster’s Entertainment Inc | | | 1,701 | | | | 84,829 | |
Fox Factory Holding Corp * | | | 3,200 | | | | 223,648 | |
iRobot Corp * | | | 2,588 | | | | 304,582 | |
Malibu Boats Inc ‘A’ * | | | 4,317 | | | | 170,867 | |
Planet Fitness Inc ‘A’ * | | | 6,100 | | | | 419,192 | |
RH * | | | 769 | | | | 79,169 | |
YETI Holdings Inc * | | | 9,591 | | | | 290,128 | |
| | | | | | | | |
| | | | | | | 1,751,200 | |
| | | | | | | | |
Consumer,Non-Cyclical - 40.0% | | | | | | | | |
| | |
Agios Pharmaceuticals Inc * | | | 1,042 | | | | 70,272 | |
Allogene Therapeutics Inc * | | | 2,310 | | | | 66,782 | |
Amarin Corp PLC ADR (Ireland) * | | | 5,489 | | | | 113,952 | |
Argenx SE ADR (Netherlands) * | | | 1,562 | | | | 195,000 | |
Array BioPharma Inc * | | | 5,352 | | | | 130,482 | |
Audentes Therapeutics Inc * | | | 2,632 | | | | 102,701 | |
Blueprint Medicines Corp * | | | 2,884 | | | | 230,864 | |
Bright Horizons Family Solutions Inc * | | | 1,805 | | | | 229,434 | |
Calavo Growers Inc | | | 1,457 | | | | 122,169 | |
CareDx Inc * | | | 9,245 | | | | 291,402 | |
Chegg Inc * | | | 8,515 | | | | 324,592 | |
Denali Therapeutics Inc * | | | 6,181 | | | | 143,523 | |
Emergent BioSolutions Inc * | | | 822 | | | | 41,527 | |
FibroGen Inc * | | | 884 | | | | 48,045 | |
Glaukos Corp * | | | 4,776 | | | | 374,295 | |
Grand Canyon Education Inc * | | | 1,823 | | | | 208,752 | |
Guardant Health Inc * | | | 1,935 | | | | 148,414 | |
GW Pharmaceuticals PLC ADR (United Kingdom) * | | | 1,225 | | | | 206,498 | |
Haemonetics Corp * | | | 465 | | | | 40,678 | |
Insperity Inc | | | 2,726 | | | | 337,097 | |
Inspire Medical Systems Inc * | | | 3,850 | | | | 218,603 | |
Insulet Corp * | | | 918 | | | | 87,293 | |
Invitae Corp * | | | 5,603 | | | | 131,222 | |
iRhythm Technologies Inc * | | | 2,348 | | | | 176,006 | |
Masimo Corp * | | | 1,325 | | | | 183,221 | |
Mirati Therapeutics Inc * | | | 1,696 | | | | 124,317 | |
Myovant Sciences Ltd * | | | 5,439 | | | | 129,829 | |
Nevro Corp * | | | 1,334 | | | | 83,388 | |
Paylocity Holding Corp * | | | 2,003 | | | | 178,648 | |
Penumbra Inc * | | | 1,707 | | | | 250,946 | |
Repligen Corp * | | | 3,412 | | | | 201,581 | |
Sage Therapeutics Inc * | | | 892 | | | | 141,873 | |
Sarepta Therapeutics Inc * | | | 559 | | | | 66,627 | |
Sprouts Farmers Market Inc * | | | 1,978 | | | | 42,606 | |
Strategic Education Inc | | | 809 | | | | 106,230 | |
| | | | | | | | |
| | | Shares | | | Value | |
Tactile Systems Technology Inc * | | | 1,708 | | | $ | 90,046 | |
Tandem Diabetes Care Inc * | | | 6,139 | | | | 389,827 | |
Teladoc Health Inc * | | | 1,303 | | | | 72,447 | |
uniQure NV (Netherlands) * | | | 3,038 | | | | 181,217 | |
| | | | | | | | |
| | | | | | | 6,282,406 | |
| | | | | | | | |
Financial - 3.3% | | | | | | | | |
| | |
CenterState Bank Corp | | | 3,373 | | | | 80,311 | |
eHealth Inc * | | | 2,536 | | | | 158,094 | |
Evercore Inc ‘A’ | | | 840 | | | | 76,440 | |
Noah Holdings Ltd ADR (China) * | | | 855 | | | | 41,433 | |
Webster Financial Corp | | | 1,607 | | | | 81,427 | |
Western Alliance Bancorp * | | | 1,004 | | | | 41,204 | |
Wintrust Financial Corp | | | 610 | | | | 41,071 | |
| | | | | | | | |
| | | | | | | 519,980 | |
| | | | | | | | |
Industrial - 8.7% | | | | | | | | |
| | |
Aerovironment Inc * | | | 1,839 | | | | 125,806 | |
Alarm.com Holdings Inc * | | | 1,140 | | | | 73,986 | |
Axon Enterprise Inc * | | | 2,943 | | | | 160,129 | |
Cactus Inc ‘A’ * | | | 4,301 | | | | 153,116 | |
Chart Industries Inc * | | | 2,377 | | | | 215,166 | |
Curtiss-Wright Corp | | | 328 | | | | 37,175 | |
Generac Holdings Inc * | | | 3,473 | | | | 177,922 | |
Novanta Inc * | | | 945 | | | | 80,070 | |
NV5 Global Inc * | | | 1,623 | | | | 96,341 | |
RBC Bearings Inc * | | | 973 | | | | 123,736 | |
Trex Co Inc * | | | 1,867 | | | | 114,858 | |
| | | | | | | | |
| | | | | | | 1,358,305 | |
| | | | | | | | |
Technology - 18.2% | | | | | | | | |
| | |
Alteryx Inc ‘A’ * | | | 2,882 | | | | 241,713 | |
Appian Corp * | | | 3,081 | | | | 106,079 | |
Coupa Software Inc * | | | 3,052 | | | | 277,671 | |
Elastic NV * | | | 1,399 | | | | 111,738 | |
EPAM Systems Inc * | | | 842 | | | | 142,407 | |
Everbridge Inc * | | | 4,846 | | | | 363,498 | |
Five9 Inc * | | | 5,828 | | | | 307,893 | |
HubSpot Inc * | | | 939 | | | | 156,071 | |
Inphi Corp * | | | 3,644 | | | | 159,389 | |
Monolithic Power Systems Inc | | | 1,128 | | | | 152,833 | |
New Relic Inc * | | | 2,237 | | | | 220,792 | |
Paycom Software Inc * | | | 649 | | | | 122,745 | |
Semtech Corp * | | | 2,982 | | | | 151,814 | |
Twilio Inc ‘A’ * | | | 2,651 | | | | 342,456 | |
| | | | | | | | |
| | | | | | | 2,857,099 | |
| | | | | | | | |
| | |
Total Common Stocks
(Cost $11,574,364) | | | | | | | 15,523,129 | |
| | | | | | | | |
| | |
SHORT-TERM INVESTMENT - 0.8% | | | | | | | | |
| | |
Money Market Fund - 0.8% | | | | | | | | |
| | |
BlackRock Liquidity FundsT-Fund Portfolio
‘Institutional’ 2.370% | | | 132,155 | | | | 132,155 | |
| | | | | | | | |
| | |
Total Short-Term Investment
(Cost $132,155) | | | | | | | 132,155 | |
| | | | | | | | |
| | |
TOTAL INVESTMENTS - 99.8%
(Cost $11,706,519) | | | | | | | 15,655,284 | |
| | |
OTHER ASSETS & LIABILITIES, NET - 0.2% | | | | | | | 31,710 | |
| | | | | | | | |
| | |
NET ASSETS - 100.0% | | | | | | | $15,686,994 | |
| | | | | | | | |
| | |
| See Notes to Financial Statements | | See explanation of symbols and terms, if any, on B-97 and B-98 |
B-47
PACIFIC FUNDS
PF DEVELOPING GROWTH FUND
Schedule of Investments (Continued)
March 31, 2019
Notes to Schedule of Investments
| (a) | As of March 31, 2019, the Fund’s composition by sector as a percentage of net assets was as follows: |
| | | | |
Consumer,Non-Cyclical | | | 40.0% | |
Technology | | | 18.2% | |
Communications | | | 17.1% | |
Consumer, Cyclical | | | 11.2% | |
Industrial | | | 8.7% | |
Financial | | | 3.3% | |
Others (each less than 3.0%) | | | 1.3% | |
| | | | |
| | | 99.8% | |
Other Assets & Liabilities, Net | | | 0.2% | |
| | | | |
| | | 100.0% | |
| | | | |
| (b) | Fair Value Measurements |
The following is a summary of the Fund’s investments as categorized under the three-tier hierarchy of inputs used in valuing the Fund’s assets and liabilities (See Note 3D in Notes to Financial Statements) as of March 31, 2019:
| | | | | | | | | | | | | | | | | | |
| | | | | Total Value at
March 31, 2019 | | | Level 1
Quoted Price | | | Level 2
Significant
Observable Inputs | | | Level 3
Significant
Unobservable Inputs | |
Assets | | Common Stocks | | | $15,523,129 | | | | $15,523,129 | | | | $— | | | | $— | |
| | Short-Term Investment | | | 132,155 | | | | 132,155 | | | | — | | | | — | |
| | | | | | | | | | | | | | | | | | |
| | Total | | | $15,655,284 | | | | $15,655,284 | | | | $— | | | | $— | |
| | | | | | | | | | | | | | | | | | |
| | |
| See Notes to Financial Statements | | See explanation of symbols and terms, if any, on B-97 and B-98 |
B-48
PACIFIC FUNDS
PF GROWTH FUND
Schedule of Investments
March 31, 2019
| | | | | | | | |
| | | Shares | | | Value | |
COMMON STOCKS - 99.7% | | | | | | | | |
| | |
Basic Materials - 1.5% | | | | | | | | |
| | |
The Sherwin-Williams Co | | | 6,584 | | | | $2,835,795 | |
| | | | | | | | |
| | |
Communications - 19.7% | | | | | | | | |
| | |
Alibaba Group Holding Ltd ADR (China) * | | | 4,117 | | | | 751,147 | |
Alphabet Inc ‘A’ * | | | 6,494 | | | | 7,642,724 | |
Alphabet Inc ‘C’ * | | | 3,765 | | | | 4,417,512 | |
Amazon.com Inc * | | | 6,582 | | | | 11,720,897 | |
Booking Holdings Inc * | | | 368 | | | | 642,127 | |
Charter Communications Inc ‘A’ * | | | 2,105 | | | | 730,246 | |
Comcast Corp ‘A’ | | | 33,521 | | | | 1,340,170 | |
Facebook Inc ‘A’ * | | | 29,460 | | | | 4,910,687 | |
Lyft Inc ‘A’ * | | | 1,004 | | | | 78,603 | |
Netflix Inc * | | | 11,479 | | | | 4,092,952 | |
Spotify Technology SA * | | | 2,597 | | | | 360,464 | |
| | | | | | | | |
| | | | | | | 36,687,529 | |
| | | | | | | | |
Consumer, Cyclical - 6.9% | | | | | | | | |
| | |
Chipotle Mexican Grill Inc * | | | 1,246 | | | | 885,046 | |
Costco Wholesale Corp | | | 5,537 | | | | 1,340,729 | |
Dollar General Corp | | | 7,797 | | | | 930,182 | |
Dollar Tree Inc * | | | 11,373 | | | | 1,194,620 | |
Hilton Worldwide Holdings Inc | | | 9,816 | | | | 815,808 | |
Lululemon Athletica Inc * | | | 3,784 | | | | 620,084 | |
Marriott International Inc ‘A’ | | | 12,394 | | | | 1,550,365 | |
NIKE Inc ‘B’ | | | 29,131 | | | | 2,453,121 | |
Ross Stores Inc | | | 20,119 | | | | 1,873,079 | |
Starbucks Corp | | | 12,886 | | | | 957,945 | |
Wynn Resorts Ltd | | | 2,144 | | | | 255,822 | |
| | | | | | | | |
| | | | | | | 12,876,801 | |
| | | | | | | | |
Consumer,Non-Cyclical - 26.6% | | | | | | | | |
| | |
Abbott Laboratories | | | 28,550 | | | | 2,282,287 | |
Biogen Inc * | | | 3,578 | | | | 845,768 | |
BioMarin Pharmaceutical Inc * | | | 4,261 | | | | 378,505 | |
Boston Scientific Corp * | | | 48,972 | | | | 1,879,545 | |
Colgate-Palmolive Co | | | 26,351 | | | | 1,806,098 | |
Constellation Brands Inc ‘A’ | | | 8,091 | | | | 1,418,595 | |
CoStar Group Inc * | | | 432 | | | | 201,493 | |
Danaher Corp | | | 31,594 | | | | 4,171,040 | |
Edwards Lifesciences Corp * | | | 7,364 | | | | 1,408,954 | |
Elanco Animal Health Inc * | | | 11,336 | | | | 363,545 | |
Eli Lilly & Co | | | 8,610 | | | | 1,117,234 | |
FleetCor Technologies Inc * | | | 7,959 | | | | 1,962,610 | |
Global Payments Inc | | | 19,298 | | | | 2,634,563 | |
Illumina Inc * | | | 2,519 | | | | 782,628 | |
Medtronic PLC | | | 31,938 | | | | 2,908,913 | |
Monster Beverage Corp * | | | 5,914 | | | | 322,786 | |
PayPal Holdings Inc * | | | 22,365 | | | | 2,322,382 | |
Pernod Ricard SA (France) | | | 2,670 | | | | 479,429 | |
Philip Morris International Inc | | | 8,982 | | | | 793,919 | |
Regeneron Pharmaceuticals Inc * | | | 1,895 | | | | 778,125 | |
Square Inc ‘A’ * | | | 7,339 | | | | 549,838 | |
Stryker Corp | | | 8,758 | | | | 1,729,880 | |
The Estee Lauder Cos Inc ‘A’ | | | 8,751 | | | | 1,448,728 | |
Thermo Fisher Scientific Inc | | | 19,086 | | | | 5,224,220 | |
Total System Services Inc | | | 8,001 | | | | 760,175 | |
TransUnion | | | 14,772 | | | | 987,360 | |
Verisk Analytics Inc | | | 23,206 | | | | 3,086,398 | |
Vertex Pharmaceuticals Inc * | | | 11,224 | | | | 2,064,655 | |
Worldpay Inc ‘A’ * | | | 14,911 | | | | 1,692,398 | |
Zoetis Inc | | | 30,713 | | | | 3,091,878 | |
| | | | | | | | |
| | | | | | | 49,493,949 | |
| | | | | | | | |
Energy - 0.4% | | | | | | | | |
| | |
Pioneer Natural Resources Co | | | 5,092 | | | | 775,410 | |
| | | | | | | | |
| | | | | | | | |
| | | Shares | | | Value | |
Financial - 13.2% | | | | | | | | |
| | |
American Tower Corp REIT | | | 17,071 | | | | $3,364,011 | |
Aon PLC | | | 14,846 | | | | 2,534,212 | |
Intercontinental Exchange Inc | | | 19,269 | | | | 1,467,142 | |
Mastercard Inc ‘A’ | | | 31,695 | | | | 7,462,588 | |
The Charles Schwab Corp | | | 15,064 | | | | 644,137 | |
Visa Inc ‘A’ | | | 57,924 | | | | 9,047,150 | |
| | | | | | | | |
| | | | | | | 24,519,240 | |
| | | | | | | | |
Industrial - 7.2% | | | | | | | | |
| | |
AMETEK Inc | | | 19,557 | | | | 1,622,644 | |
Amphenol Corp ‘A’ | | | 15,953 | | | | 1,506,601 | |
Canadian Pacific Railway Ltd (Canada) | | | 8,102 | | | | 1,669,255 | |
FLIR Systems Inc | | | 7,418 | | | | 352,948 | |
Fortive Corp | | | 15,626 | | | | 1,310,865 | |
Roper Technologies Inc | | | 7,728 | | | | 2,642,744 | |
Union Pacific Corp | | | 13,246 | | | | 2,214,731 | |
Vulcan Materials Co | | | 18,552 | | | | 2,196,557 | |
| | | | | | | | |
| | | | | | | 13,516,345 | |
| | | | | | | | |
Technology - 24.2% | | | | | | | | |
| | |
Activision Blizzard Inc | | | 28,354 | | | | 1,290,958 | |
Adobe Inc * | | | 30,248 | | | | 8,060,790 | |
Analog Devices Inc | | | 8,598 | | | | 905,111 | |
Apple Inc | | | 14,464 | | | | 2,747,437 | |
Electronic Arts Inc * | | | 23,711 | | | | 2,409,749 | |
Fidelity National Information Services Inc | | | 17,612 | | | | 1,991,917 | |
Fiserv Inc * | | | 48,402 | | | | 4,272,929 | |
Intuit Inc | | | 14,123 | | | | 3,691,893 | |
Microsoft Corp | | | 105,772 | | | | 12,474,750 | |
MSCI Inc | | | 8,893 | | | | 1,768,284 | |
PTC Inc * | | | 4,803 | | | | 442,741 | |
salesforce.com Inc * | | | 31,485 | | | | 4,986,279 | |
| | | | | | | | |
| | | | | | | 45,042,838 | |
| | | | | | | | |
| | |
Total Common Stocks
(Cost $104,667,275) | | | | | | | 185,747,907 | |
| | | | | | | | |
| | |
SHORT-TERM INVESTMENT - 0.4% | | | | | | | | |
| | |
Money Market Fund - 0.4% | | | | | | | | |
| | |
BlackRock Liquidity FundsT-Fund Portfolio
‘Institutional’ 2.370% | | | 842,920 | | | | 842,920 | |
| | | | | | | | |
| | |
Total Short-Term Investment
(Cost $842,920) | | | | | | | 842,920 | |
| | | | | | | | |
| | |
TOTAL INVESTMENTS - 100.1%
(Cost $105,510,195) | | | | | | | 186,590,827 | |
| | |
OTHER ASSETS & LIABILITIES, NET - (0.1%) | | | | | | | (259,930 | ) |
| | | | | | | | |
| | |
NET ASSETS - 100.0% | | | | | | | $186,330,897 | |
| | | | | | | | |
Notes to Schedule of Investments
| (a) | As of March 31, 2019, the Fund’s composition by sector as a percentage of net assets was as follows: |
| | | | |
Consumer,Non-Cyclical | | | 26.6% | |
Technology | | | 24.2% | |
Communications | | | 19.7% | |
Financial | | | 13.2% | |
Industrial | | | 7.2% | |
Consumer, Cyclical | | | 6.9% | |
Others (each less than 3.0%) | | | 2.3% | |
| | | | |
| | | 100.1% | |
Other Assets & Liabilities, Net | | | (0.1% | ) |
| | | | |
| | | 100.0% | |
| | | | |
| | |
| See Notes to Financial Statements | | See explanation of symbols and terms, if any, on B-97 and B-98 |
B-49
PACIFIC FUNDS
PF GROWTH FUND
Schedule of Investments (Continued)
March 31, 2019
| (b) | Fair Value Measurements |
The following is a summary of the Fund’s investments as categorized under the three-tier hierarchy of inputs used in valuing the Fund’s assets and liabilities (See Note 3D in Notes to Financial Statements) as of March 31, 2019:
| | | | | | | | | | | | | | | | | | |
| | | | | Total Value at
March 31, 2019 | | | Level 1
Quoted Price | | | Level 2
Significant
Observable Inputs | | | Level 3
Significant
Unobservable Inputs | |
Assets | | Common Stocks | | | | | | | | | | | | | | | | |
| | Basic Materials | | | $2,835,795 | | | | $2,835,795 | | | | $— | | | | $— | |
| | Communications | | | 36,687,529 | | | | 36,687,529 | | | | — | | | | — | |
| | Consumer, Cyclical | | | 12,876,801 | | | | 12,876,801 | | | | — | | | | — | |
| | Consumer, Non-Cyclical | | | 49,493,949 | | | | 49,014,520 | | | | 479,429 | | | | — | |
| | Energy | | | 775,410 | | | | 775,410 | | | | — | | | | — | |
| | Financial | | | 24,519,240 | | | | 24,519,240 | | | | — | | | | — | |
| | Industrial | | | 13,516,345 | | | | 13,516,345 | | | | — | | | | — | |
| | Technology | | | 45,042,838 | | | | 45,042,838 | | | | — | | | | — | |
| | | | | | | | | | | | | | | | | | |
| | Total Common Stocks | | | 185,747,907 | | | | 185,268,478 | | | | 479,429 | | | | — | |
| | | | | | | | | | | | | | | | | | |
| | Short-Term Investment | | | 842,920 | | | | 842,920 | | | | — | | | | — | |
| | | | | | | | | | | | | | | | | | |
| | Total | | | $186,590,827 | | | | $186,111,398 | | | | $479,429 | | | | $— | |
| | | | | | | | | | | | | | | | | | |
| | |
| See Notes to Financial Statements | | See explanation of symbols and terms, if any, on B-97 and B-98 |
B-50
PACIFIC FUNDS
PF LARGE-CAP VALUE FUND
Schedule of Investments
March 31, 2019
| | | | | | | | |
| | | Shares | | | Value | |
COMMON STOCKS - 96.7% | | | | | | | | |
| | |
Basic Materials - 3.1% | | | | | | | | |
| | |
Air Products & Chemicals Inc | | | 15,701 | | | | $2,998,263 | |
PPG Industries Inc | | | 20,880 | | | | 2,356,726 | |
| | | | | | | | |
| | | | | | | 5,354,989 | |
| | | | | | | | |
Communications - 13.3% | | | | | | | | |
| | |
AT&T Inc | | | 94,408 | | | | 2,960,635 | |
Charter Communications Inc ‘A’ * | | | 11,503 | | | | 3,990,506 | |
Comcast Corp ‘A’ | | | 140,062 | | | | 5,599,679 | |
DISH Network Corp ‘A’ * | | | 91,359 | | | | 2,895,167 | |
Fox Corp ‘B’ * | | | 46,525 | | | | 1,669,317 | |
Motorola Solutions Inc | | | 40,568 | | | | 5,696,559 | |
| | | | | | | | |
| | | | | | | 22,811,863 | |
| | | | | | | | |
Consumer, Cyclical - 2.0% | | | | | | | | |
| | |
The Home Depot Inc | | | 17,780 | | | | 3,411,804 | |
| | | | | | | | |
| | |
Consumer,Non-Cyclical - 18.9% | | | | | | | | |
| | |
AmerisourceBergen Corp | | | 24,024 | | | | 1,910,388 | |
Amgen Inc | | | 15,423 | | | | 2,930,062 | |
Anheuser-Busch InBev SA/NV ADR (Belgium) | | | 28,806 | | | | 2,418,840 | |
Anthem Inc | | | 16,291 | | | | 4,675,191 | |
CVS Health Corp | | | 32,536 | | | | 1,754,666 | |
Johnson & Johnson | | | 25,670 | | | | 3,588,409 | |
Merck & Co Inc | | | 52,958 | | | | 4,404,517 | |
Novartis AG ADR (Switzerland) | | | 21,881 | | | | 2,103,639 | |
Pfizer Inc | | | 56,210 | | | | 2,387,239 | |
Philip Morris International Inc | | | 35,058 | | | | 3,098,777 | |
UnitedHealth Group Inc | | | 12,221 | | | | 3,021,764 | |
| | | | | | | | |
| | | | | | | 32,293,492 | |
| | | | | | | | |
Energy - 9.2% | | | | | | | | |
| | |
Chevron Corp | | | 28,585 | | | | 3,521,100 | |
Exxon Mobil Corp | | | 38,427 | | | | 3,104,902 | |
Halliburton Co | | | 60,460 | | | | 1,771,478 | |
Royal Dutch Shell PLC ‘A’ ADR (Netherlands) | | | 37,434 | | | | 2,342,994 | |
Schlumberger Ltd | | | 34,259 | | | | 1,492,665 | |
Suncor Energy Inc (Canada) | | | 109,000 | | | | 3,534,870 | |
| | | | | | | | |
| | | | | | | 15,768,009 | |
| | | | | | | | |
Financial - 28.3% | | | | | | | | |
| | |
American Express Co | | | 37,712 | | | | 4,121,922 | |
American Tower Corp REIT | | | 24,509 | | | | 4,829,744 | |
Bank of America Corp | | | 167,027 | | | | 4,608,275 | |
Berkshire Hathaway Inc ‘B’ * | | | 10,690 | | | | 2,147,514 | |
Capital One Financial Corp | | | 23,245 | | | | 1,898,884 | |
JPMorgan Chase & Co | | | 73,224 | | | | 7,412,465 | |
Marsh & McLennan Cos Inc | | | 32,296 | | | | 3,032,594 | |
MetLife Inc | | | 36,162 | | | | 1,539,416 | |
State Street Corp | | | 23,353 | | | | 1,536,861 | |
The Bank of New York Mellon Corp | | | 44,487 | | | | 2,243,479 | |
The Charles Schwab Corp | | | 49,110 | | | | 2,099,944 | |
The Progressive Corp | | | 35,975 | | | | 2,593,438 | |
The Travelers Cos Inc | | | 19,208 | | | | 2,634,569 | |
US Bancorp | | | 91,469 | | | | 4,407,891 | |
Wells Fargo & Co | | | 69,696 | | | | 3,367,711 | |
| | | | | | | | |
| | | | | | | 48,474,707 | |
| | | | | | | | |
| | | | | | | | |
| | | Shares | | | Value | |
Industrial - 14.6% | | | | | | | | |
| | |
Deere & Co | | | 16,110 | | | $ | 2,575,022 | |
Honeywell International Inc | | | 29,822 | | | | 4,739,312 | |
Illinois Tool Works Inc | | | 28,015 | | | | 4,020,993 | |
Martin Marietta Materials Inc | | | 11,776 | | | | 2,369,096 | |
TE Connectivity Ltd | | | 49,007 | | | | 3,957,315 | |
United Parcel Service Inc ‘B’ | | | 29,545 | | | | 3,301,358 | |
United Technologies Corp | | | 30,467 | | | | 3,926,892 | |
| | | | | | | | |
| | | | | | | 24,889,988 | |
| | | | | | | | |
Technology - 5.5% | | | | | | | | |
| | |
Microsoft Corp | | | 40,950 | | | | 4,829,643 | |
Oracle Corp | | | 65,157 | | | | 3,499,582 | |
Xerox Corp | | | 34,441 | | | | 1,101,423 | |
| | | | | | | | |
| | | | | | | 9,430,648 | |
| | | | | | | | |
Utilities - 1.8% | | | | | | | | |
| | |
Sempra Energy | | | 23,686 | | | | 2,981,120 | |
| | | | | | | | |
| | |
Total Common Stocks
(Cost $94,166,104) | | | | | | | 165,416,620 | |
| | | | | | | | |
| | |
SHORT-TERM INVESTMENT - 3.3% | | | | | | | | |
| | |
BlackRock Liquidity FundsT-Fund Portfolio
‘Institutional’ 2.370% | | | 5,633,761 | | | | 5,633,761 | |
| | | | | | | | |
| | |
Total Short-Term Investment
(Cost $5,633,761) | | | | | | | 5,633,761 | |
| | | | | | | | |
| | |
TOTAL INVESTMENTS - 100.0%
(Cost $99,799,865) | | | | | | | 171,050,381 | |
| | |
OTHER ASSETS & LIABILITIES, NET - (0.0%) | | | | | | | (4,463 | ) |
| | | | | | | | |
| | |
NET ASSETS - 100.0% | | | | | | | $171,045,918 | |
| | | | | | | | |
Notes to Schedule of Investments
| (a) | As of March 31, 2019, the Fund’s composition by sector as a percentage of net assets was as follows: |
| | | | |
Financial | | | 28.3% | |
Consumer,Non-Cyclical | | | 18.9% | |
Industrial | | | 14.6% | |
Communications | | | 13.3% | |
Energy | | | 9.2% | |
Technology | | | 5.5% | |
Short-Term Investment | | | 3.3% | |
Basic Materials | | | 3.1% | |
Others (each less than 3.0%) | | | 3.8% | |
| | | | |
| | | 100.0% | |
Other Assets & Liabilities, Net | | | (0.0% | ) |
| | | | |
| | | 100.0% | |
| | | | |
| | |
| See Notes to Financial Statements | | See explanation of symbols and terms, if any, on B-97 and B-98 |
B-51
PACIFIC FUNDS
PF LARGE-CAP VALUE FUND
Schedule of Investments (Continued)
March 31, 2019
| (b) | Fair Value Measurements |
The following is a summary of the Fund’s investments as categorized under the three-tier hierarchy of inputs used in valuing the Fund’s assets and liabilities (See Note 3D in Notes to Financial Statements) as of March 31, 2019:
| | | | | | | | | | | | | | | | | | |
| | | | | Total Value at
March 31, 2019 | | | Level 1
Quoted Price | | | Level 2
Significant
Observable Inputs | | | Level 3
Significant
Unobservable Inputs | |
Assets | | Common Stocks | | | $165,416,620 | | | | $165,416,620 | | | | $— | | | | $— | |
| | Short-Term Investment | | | 5,633,761 | | | | 5,633,761 | | | | — | | | | — | |
| | | | | | | | | | | | | | | | | | |
| | Total | | | $171,050,381 | | | | $171,050,381 | | | | $— | | | | $— | |
| | | | | | | | | | | | | | | | | | |
| | |
| See Notes to Financial Statements | | See explanation of symbols and terms, if any, on B-97 and B-98 |
B-52
PACIFIC FUNDS
PF MID-CAP EQUITY FUND
Schedule of Investments
March 31, 2019
| | | | | | | | |
| | | Shares | | | Value | |
COMMON STOCKS - 98.5% | | | | | | | | |
| | |
Basic Materials - 2.5% | | | | | | | | |
| | |
Eastman Chemical Co | | | 1,275 | | | | $96,747 | |
Steel Dynamics Inc | | | 2,000 | | | | 70,540 | |
The Chemours Co | | | 2,200 | | | | 81,752 | |
| | | | | | | | |
| | | | | | | 249,039 | |
| | | | | | | | |
Communications - 5.5% | | | | | | | | |
| | |
eBay Inc | | | 2,876 | | | | 106,815 | |
GrubHub Inc * | | | 1,620 | | | | 112,541 | |
LogMeIn Inc | | | 1,100 | | | | 88,110 | |
RingCentral Inc ‘A’ * | | | 1,500 | | | | 161,700 | |
Viacom Inc ‘B’ | | | 2,927 | | | | 82,161 | |
| | | | | | | | |
| | | | 551,327 | |
| | | | | | | | |
Consumer, Cyclical - 9.6% | | | | | | | | |
| | |
Alaska Air Group Inc | | | 1,700 | | | | 95,404 | |
Aramark | | | 3,200 | | | | 94,560 | |
BorgWarner Inc | | | 1,760 | | | | 67,602 | |
Capri Holdings Ltd * | | | 1,700 | | | | 77,775 | |
Lululemon Athletica Inc * | | | 875 | | | | 143,386 | |
Pool Corp | | | 825 | | | | 136,100 | |
PVH Corp | | | 860 | | | | 104,877 | |
Royal Caribbean Cruises Ltd | | | 1,175 | | | | 134,678 | |
Tiffany & Co | | | 900 | | | | 94,995 | |
| | | | | | | | |
| | | | 949,377 | |
| | | | | | | | |
Consumer,Non-Cyclical - 25.0% | | | | | | | | |
| | |
Amicus Therapeutics Inc * | | | 6,225 | | | | 84,660 | |
Booz Allen Hamilton Holding Corp | | | 3,100 | | | | 180,234 | |
Euronet Worldwide Inc * | | | 1,228 | | | | 175,100 | |
General Mills Inc | | | 2,000 | | | | 103,500 | |
Hill-Rom Holdings Inc | | | 1,200 | | | | 127,032 | |
Horizon Pharma PLC * | | | 3,600 | | | | 95,148 | |
Ionis Pharmaceuticals Inc * | | | 2,000 | | | | 162,340 | |
Jazz Pharmaceuticals PLC * | | | 825 | | | | 117,934 | |
Lamb Weston Holdings Inc | | | 2,015 | | | | 151,004 | |
ManpowerGroup Inc | | | 1,600 | | | | 132,304 | |
MarketAxess Holdings Inc | | | 600 | | | | 147,648 | |
Neurocrine Biosciences Inc * | | | 1,100 | | | | 96,910 | |
Post Holdings Inc * | | | 1,400 | | | | 153,160 | |
Service Corp International | | | 4,100 | | | | 164,615 | |
Syneos Health Inc * | | | 2,500 | | | | 129,400 | |
Teleflex Inc | | | 500 | | | | 151,080 | |
The Cooper Cos Inc | | | 600 | | | | 177,702 | |
Tyson Foods Inc ‘A’ | | | 1,900 | | | | 131,917 | |
| | | | | | | | |
| | | | 2,481,688 | |
| | | | | | | | |
Energy - 5.2% | | | | | | | | |
| | |
Diamondback Energy Inc | | | 920 | | | | 93,408 | |
Helmerich & Payne Inc | | | 1,575 | | | | 87,507 | |
Marathon Petroleum Corp | | | 1,956 | | | | 117,067 | |
Pioneer Natural Resources Co | | | 900 | | | | 137,052 | |
WPX Energy Inc * | | | 6,386 | | | | 83,720 | |
| | | | | | | | |
| | | | 518,754 | |
| | | | | | | | |
Financial - 19.8% | | | | | | | | |
| | |
Air Lease Corp | | | 1,935 | | | | 66,467 | |
Alleghany Corp | | | 300 | | | | 183,720 | |
AvalonBay Communities Inc REIT | | | 625 | | | | 125,456 | |
Discover Financial Services | | | 2,100 | | | | 149,436 | |
Douglas Emmett Inc REIT | | | 3,200 | | | | 129,344 | |
E*TRADE Financial Corp | | | 2,668 | | | | 123,875 | |
Equity LifeStyle Properties Inc REIT | | | 945 | | | | 108,014 | |
Everest Re Group Ltd | | | 500 | | | | 107,980 | |
Highwoods Properties Inc REIT | | | 2,700 | | | | 126,306 | |
Hudson Pacific Properties Inc REIT | | | 3,500 | | | | 120,470 | |
Mid-America Apartment Communities Inc REIT | | | 1,300 | | | | 142,129 | |
| | | | | | | | |
| | | Shares | | | Value | |
Raymond James Financial Inc | | | 1,400 | | | | $112,574 | |
Ryman Hospitality Properties Inc REIT | | | 1,261 | | | | 103,705 | |
SunTrust Banks Inc | | | 2,600 | | | | 154,050 | |
Western Alliance Bancorp * | | | 2,000 | | | | 82,080 | |
Zions Bancorp | | | 2,800 | | | | 127,148 | |
| | | | | | | | |
| | | | 1,962,754 | |
| | | | | | | | |
Industrial - 13.8% | | | | | | | | |
| | |
Graphic Packaging Holding Co | | | 5,700 | | | | 71,991 | |
Hubbell Inc | | | 940 | | | | 110,901 | |
Ingersoll-Rand PLC | | | 1,745 | | | | 188,373 | |
ITT Inc | | | 1,800 | | | | 104,400 | |
Kirby Corp * | | | 1,400 | | | | 105,154 | |
Packaging Corp of America | | | 1,030 | | | | 102,361 | |
Parker-Hannifin Corp | | | 690 | | | | 118,418 | |
PerkinElmer Inc | | | 1,300 | | | | 125,268 | |
Spirit AeroSystems Holdings Inc ‘A’ | | | 1,700 | | | | 155,601 | |
Stanley Black & Decker Inc | | | 1,000 | | | | 136,170 | |
Waste Management Inc | | | 1,500 | | | | 155,865 | |
| | | | | | | | |
| | | | 1,374,502 | |
| | | | | | | | |
Technology - 11.9% | | | | | | | | |
| | |
Analog Devices Inc | | | 2,034 | | | | 214,119 | |
DXC Technology Co | | | 1,801 | | | | 115,822 | |
Nuance Communications Inc * | | | 6,500 | | | | 110,045 | |
ON Semiconductor Corp * | | | 3,249 | | | | 66,832 | |
PTC Inc * | | | 1,200 | | | | 110,616 | |
RealPage Inc * | | | 1,800 | | | | 109,242 | |
Synopsys Inc * | | | 1,800 | | | | 207,270 | |
Take-Two Interactive Software Inc * | | | 1,200 | | | | 113,244 | |
Zebra Technologies Corp ‘A’ * | | | 630 | | | | 132,004 | |
| | | | | | | | |
| | | | 1,179,194 | |
| | | | | | | | |
Utilities - 5.2% | | | | | | | | |
| | |
Ameren Corp | | | 2,530 | | | | 186,082 | |
CMS Energy Corp | | | 3,400 | | | | 188,836 | |
Public Service Enterprise Group Inc | | | 2,331 | | | | 138,485 | |
| | | | | | | | |
| | | | 513,403 | |
| | | | | | | | |
Total Common Stocks
(Cost $9,226,971) | | | | 9,780,038 | |
| | | | | | | | |
|
SHORT-TERM INVESTMENT - 1.2% | |
|
Money Market Fund - 1.2% | |
| | |
BlackRock Liquidity FundsT-Fund Portfolio
‘Institutional’ 2.370% | | | 120,047 | | | | 120,047 | |
| | | | | | | | |
| |
Total Short-Term Investment
(Cost $120,047) | | | | 120,047 | |
| | | | | | | | |
| | |
TOTAL INVESTMENTS - 99.7%
(Cost $9,347,018) | | | | | | | 9,900,085 | |
| | |
OTHER ASSETS & LIABILITIES, NET - 0.3% | | | | | | | 29,001 | |
| | | | | | | | |
| | |
NET ASSETS - 100.0% | | | | | | | $9,929,086 | |
| | | | | | | | |
| | |
| See Notes to Financial Statements | | See explanation of symbols and terms, if any, on B-97 and B-98 |
B-53
PACIFIC FUNDS
PF MID-CAP EQUITY FUND
Schedule of Investments (Continued)
March 31, 2019
Notes to Schedule of Investments
| (a) | As of March 31, 2019, the Fund’s composition by sector as a percentage of net assets was as follows: |
| | | | |
Consumer,Non-Cyclical | | | 25.0% | |
Financial | | | 19.8% | |
Industrial | | | 13.8% | |
Technology | | | 11.9% | |
Consumer, Cyclical | | | 9.6% | |
Communications | | | 5.5% | |
Energy | | | 5.2% | |
Utilities | | | 5.2% | |
Others (each less than 3.0%) | | | 3.7% | |
| | | | |
| | | 99.7% | |
Other Assets & Liabilities, Net | | | 0.3% | |
| | | | |
| | | 100.0% | |
| | | | |
| (b) | Fair Value Measurements |
The following is a summary of the Fund’s investments as categorized under the three-tier hierarchy of inputs used in valuing the Fund’s assets and liabilities (See Note 3D in Notes to Financial Statements) as of March 31, 2019:
| | | | | | | | | | | | | | | | | | |
| | | | | Total Value at
March 31, 2019 | | | Level 1
Quoted Price | | | Level 2
Significant
Observable Inputs | | | Level 3
Significant
Unobservable Inputs | |
Assets | | Common Stocks | | | $9,780,038 | | | | $9,780,038 | | | | $— | | | | $— | |
| | Short-Term Investment | | | 120,047 | | | | 120,047 | | | | — | | | | — | |
| | | | | | | | | | | | | | | | | | |
| | Total | | | $9,900,085 | | | | $9,900,085 | | | | $— | | | | $— | |
| | | | | | | | | | | | | | | | | | |
| | |
| See Notes to Financial Statements | | See explanation of symbols and terms, if any, on B-97 and B-98 |
B-54
PACIFIC FUNDS
PF MULTI-ASSET FUND
Schedule of Investments
March 31, 2019
| | | | | | | | |
| | | Principal Amount | | | Value | |
CORPORATE BONDS & NOTES - 39.8% | |
|
Basic Materials - 0.7% | |
| | |
Anglo American Capital PLC (South Africa)
4.125% due 04/15/21 ~ | | | $1,600,000 | | | | $1,615,984 | |
DowDuPont Inc
3.794% (USD LIBOR + 1.110%)
due 11/15/23 § | | | 5,000,000 | | | | 5,018,462 | |
Glencore Funding LLC (Switzerland)
3.000% due 10/27/22 ~ | | | 1,600,000 | | | | 1,578,194 | |
| | | | | | | | |
| | | | | | | 8,212,640 | |
| | | | | | | | |
Communications - 2.3% | |
|
AT&T Inc | |
3.000% due 06/30/22 | | | 3,200,000 | | | | 3,216,545 | |
3.737% (USD LIBOR + 0.950%)
due 07/15/21 § | | | 1,800,000 | | | | 1,821,833 | |
3.777% (USD LIBOR + 1.180%)
due 06/12/24 § | | | 3,750,000 | | | | 3,721,866 | |
Comcast Corp
3.450% due 10/01/21 | | | 2,500,000 | | | | 2,550,936 | |
eBay Inc
3.800% due 03/09/22 | | | 3,060,000 | | | | 3,128,338 | |
Fox Corp
3.666% due 01/25/22 ~ | | | 900,000 | | | | 918,399 | |
Sprint Spectrum Co LLC
3.360% due 03/20/23 ~ | | | 3,250,000 | | | | 3,257,150 | |
The Interpublic Group of Cos Inc
3.500% due 10/01/20 | | | 2,000,000 | | | | 2,018,215 | |
Verizon Communications Inc
3.615% (USD LIBOR + 1.000%)
due 03/16/22 § | | | 4,800,000 | | | | 4,874,046 | |
| | | | | | | | |
| | | | | | | 25,507,328 | |
| | | | | | | | |
Consumer, Cyclical - 4.5% | |
|
Alimentation Couche-Tard Inc (Canada) | |
2.350% due 12/13/19 ~ | | | 4,200,000 | | | | 4,181,627 | |
2.700% due 07/26/22 ~ | | | 2,000,000 | | | | 1,980,717 | |
Daimler Finance North America LLC (Germany) | |
3.113% (USD LIBOR + 0.450%)
due 02/22/21 § ~ | | | 6,000,000 | | | | 5,986,476 | |
3.750% due 11/05/21 ~ | | | 2,900,000 | | | | 2,952,237 | |
Ford Motor Credit Co LLC | |
2.681% due 01/09/20 | | | 3,200,000 | | | | 3,186,962 | |
3.336% due 03/18/21 | | | 2,000,000 | | | | 1,970,602 | |
3.818% (USD LIBOR + 1.080%)
due 08/03/22 § | | | 3,200,000 | | | | 3,060,593 | |
General Motors Financial Co Inc | |
3.911% (USD LIBOR + 1.310%)
due 06/30/22 § | | | 1,700,000 | | | | 1,687,969 | |
4.200% due 03/01/21 | | | 3,000,000 | | | | 3,044,401 | |
Marriott International Inc
3.245% (USD LIBOR + 0.650%)
due 03/08/21 § | | | 3,000,000 | | | | 3,008,359 | |
Nissan Motor Acceptance Corp | |
2.650% due 07/13/22 ~ | | | 4,033,000 | | | | 3,939,010 | |
3.243% (USD LIBOR + 0.630%)
due 09/21/21 § ~ | | | 2,500,000 | | | | 2,476,431 | |
3.447% (USD LIBOR + 0.650%)
due 07/13/22 § ~ | | | 1,700,000 | | | | 1,671,737 | |
Toyota Motor Credit Corp
3.075% (USD LIBOR + 0.480%)
due 09/08/22 § | | | 3,500,000 | | | | 3,499,709 | |
Volkswagen Group of America Finance LLC (Germany)
3.875% due 11/13/20 ~ | | | 5,000,000 | | | | 5,064,022 | |
Walmart Inc
3.400% due 06/26/23 | | | 3,050,000 | | | | 3,147,446 | |
| | | | | | | | |
| | | | | | | 50,858,298 | |
| | | | | | | | |
| | | | | | | | |
| | | Principal Amount | | | Value | |
Consumer,Non-Cyclical - 7.2% | |
| | |
Altria Group Inc
3.490% due 02/14/22 | | | $1,650,000 | | | | $1,677,320 | |
Anheuser-Busch InBev Finance Inc (Belgium) | |
2.650% due 02/01/21 | | | 1,954,000 | | | | 1,951,793 | |
3.300% due 02/01/23 | | | 3,800,000 | | | | 3,858,090 | |
Anheuser-Busch InBev Worldwide Inc (Belgium)
3.500% due 01/12/24 | | | 1,300,000 | | | | 1,324,130 | |
AstraZeneca PLC (United Kingdom)
3.348% (USD LIBOR + 0.665%)
due 08/17/23 § | | | 2,400,000 | | | | 2,388,721 | |
BAT Capital Corp (United Kingdom)
2.764% due 08/15/22 | | | 2,500,000 | | | | 2,461,123 | |
BAT International Finance PLC (United Kingdom)
3.500% due 06/15/22 ~ | | | 3,200,000 | | | | 3,215,789 | |
Bayer US Finance II LLC (Germany) | |
3.500% due 06/25/21 ~ | | | 1,750,000 | | | | 1,757,946 | |
3.621% (USD LIBOR + 1.010%)
due 12/15/23 § ~ | | | 2,000,000 | | | | 1,971,808 | |
Boston Scientific Corp
3.450% due 03/01/24 | | | 1,000,000 | | | | 1,019,126 | |
Cigna Corp | |
3.200% due 09/17/20 ~ | | | 8,000,000 | | | | 8,041,358 | |
3.677% (USD LIBOR + 0.890%)
due 07/15/23 § ~ | | | 3,450,000 | | | | 3,435,200 | |
Conagra Brands Inc
3.511% (USD LIBOR + 0.750%)
due 10/22/20 § | | | 2,000,000 | | | | 1,998,298 | |
Constellation Brands Inc
3.384% (USD LIBOR + 0.700%)
due 11/15/21 § | | | 2,500,000 | | | | 2,501,530 | |
Danone SA (France)
2.077% due 11/02/21 ~ | | | 2,500,000 | | | | 2,452,786 | |
General Mills Inc
3.783% (USD LIBOR + 1.010%)
due 10/17/23 § | | | 4,061,000 | | | | 4,092,131 | |
Imperial Brands Finance PLC (United Kingdom)
2.950% due 07/21/20 ~ | | | 4,200,000 | | | | 4,188,434 | |
Keurig Dr Pepper Inc
3.551% due 05/25/21 ~ | | | 7,000,000 | | | | 7,078,878 | |
Medtronic Inc
3.150% due 03/15/22 | | | 6,200,000 | | | | 6,318,545 | |
Moody’s Corp
3.250% due 06/07/21 | | | 3,000,000 | | | | 3,026,303 | |
Nestle Holdings Inc
3.350% due 09/24/23 ~ | | | 3,000,000 | | | | 3,093,097 | |
Philip Morris International Inc
2.625% due 02/18/22 | | | 2,000,000 | | | | 1,998,759 | |
Reynolds American Inc (United Kingdom)
3.250% due 06/12/20 | | | 2,347,000 | | | | 2,351,028 | |
Smithfield Foods Inc
3.350% due 02/01/22 ~ | | | 2,900,000 | | | | 2,839,652 | |
UnitedHealth Group Inc | |
3.350% due 07/15/22 | | | 2,300,000 | | | | 2,351,344 | |
3.500% due 06/15/23 | | | 4,400,000 | | | | 4,538,657 | |
| | | | | | | | |
| | | | | | | 81,931,846 | |
| | | | | | | | |
Energy - 1.7% | |
| | |
Andeavor Logistics LP
3.500% due 12/01/22 | | | 1,606,000 | | | | 1,624,172 | |
Energy Transfer Operating LP | |
3.600% due 02/01/23 | | | 3,400,000 | | | | 3,432,017 | |
4.500% due 04/15/24 | | | 900,000 | | | | 940,837 | |
Enterprise Products Operating LLC
5.250% due 01/31/20 | | | 2,100,000 | | | | 2,140,280 | |
Equinor ASA (Norway)
2.450% due 01/17/23 | | | 1,000,000 | | | | 993,835 | |
Kinder Morgan Energy Partners LP
3.950% due 09/01/22 | | | 2,000,000 | | | | 2,056,373 | |
| | |
| See Notes to Financial Statements | | See explanation of symbols and terms, if any, on B-97 and B-98 |
B-55
PACIFIC FUNDS
PF MULTI-ASSET FUND
Schedule of Investments (Continued)
March 31, 2019
| | | | | | | | |
| | | Principal Amount | | | Value | |
Kinder Morgan Inc
5.625% due 11/15/23 ~ | | $ | 2,000,000 | | | $ | 2,193,566 | |
Midwest Connector Capital Co LLC
3.625% due 04/01/22 ~ | | | 1,250,000 | | | | 1,268,895 | |
MPLX LP
3.375% due 03/15/23 | | | 1,500,000 | | | | 1,513,229 | |
Shell International Finance BV (Netherlands)
3.088% (USD LIBOR + 0.400%)
due 11/13/23 § | | | 2,750,000 | | | | 2,748,075 | |
| | | | | | | | |
| | | | | | | 18,911,279 | |
| | | | | | | | |
Financial - 20.3% | |
| | |
AerCap Ireland Capital DAC (Ireland)
3.950% due 02/01/22 | | | 960,000 | | | | 973,094 | |
AIG Global Funding
3.062% (USD LIBOR + 0.460%)
due 06/25/21 § ~ | | | 2,000,000 | | | | 2,001,185 | |
Air Lease Corp | |
2.625% due 07/01/22 | | | 1,500,000 | | | | 1,466,263 | |
3.500% due 01/15/22 | | | 2,650,000 | | | | 2,676,272 | |
American Express Co | |
3.289% (USD LIBOR + 0.650%)
due 02/27/23 § | | | 5,000,000 | | | | 4,993,618 | |
3.700% due 11/05/21 | | | 3,050,000 | | | | 3,118,765 | |
Australia & New Zealand Banking Group Ltd (Australia)
2.300% due 06/01/21 | | | 2,500,000 | | | | 2,474,501 | |
Bank of America Corp | |
2.503% due 10/21/22 | | | 1,200,000 | | | | 1,185,940 | |
3.921% (USD LIBOR + 1.160%)
due 01/20/23 § | | | 9,321,000 | | | | 9,439,547 | |
Boston Properties LP REIT
4.125% due 05/15/21 | | | 1,500,000 | | | | 1,536,989 | |
Capital One Financial Corp
3.450% due 04/30/21 | | | 5,000,000 | | | | 5,063,291 | |
Citibank NA | |
3.061% (USD LIBOR + 0.300%)
due 10/20/20 § | | | 1,000,000 | | | | 999,814 | |
3.165% due 02/19/22 | | | 6,000,000 | | | | 6,024,024 | |
Citigroup Inc
2.750% due 04/25/22 | | | 1,000,000 | | | | 996,559 | |
Citizens Bank NA | |
3.250% due 02/14/22 | | | 2,500,000 | | | | 2,524,905 | |
3.551% (USD LIBOR + 0.950%)
due 03/29/23 § | | | 4,000,000 | | | | 4,005,043 | |
Cooperatieve Rabobank UA (Netherlands) | |
2.250% due 01/14/20 | | | 4,000,000 | | | | 3,986,920 | |
3.470% (USD LIBOR + 0.860%)
due 09/26/23 § ~ | | | 2,500,000 | | | | 2,488,632 | |
Duke Realty LP REIT
3.875% due 10/15/22 | | | 2,000,000 | | | | 2,055,639 | |
HSBC Bank USA NA
4.875% due 08/24/20 | | | 4,000,000 | | | | 4,111,071 | |
HSBC Holdings PLC (United Kingdom)
3.400% due 03/08/21 | | | 6,290,000 | | | | 6,348,892 | |
ING Bank NV (Netherlands)
2.750% due 03/22/21 ~ | | | 2,200,000 | | | | 2,195,975 | |
Intercontinental Exchange Inc
3.450% due 09/21/23 | | | 2,200,000 | | | | 2,253,679 | |
Jackson National Life Global Funding | |
2.500% due 06/27/22 ~ | | | 1,850,000 | | | | 1,830,582 | |
3.300% due 02/01/22 ~ | | | 2,650,000 | | | | 2,687,788 | |
JPMorgan Chase & Co | |
2.295% due 08/15/21 | | | 2,000,000 | | | | 1,977,922 | |
2.972% due 01/15/23 | | | 2,000,000 | | | | 2,001,140 | |
JPMorgan Chase Bank NA | |
3.053% (USD LIBOR + 0.370%)
due 02/19/21 § | | | 4,000,000 | | | | 4,005,444 | |
3.105% (USD LIBOR + 0.340%)
due 04/26/21 § | | | 2,000,000 | | | | 1,999,660 | |
| | | | | | | | |
| | | Principal Amount | | | Value | |
Metropolitan Life Global Funding I
3.450% due 10/09/21 ~ | | $ | 2,100,000 | | | $ | 2,128,623 | |
Mid-America Apartments LP REIT
4.300% due 10/15/23 | | | 2,000,000 | | | | 2,085,185 | |
Mitsubishi UFJ Financial Group Inc (Japan) | |
3.355% (USD LIBOR + 0.740%)
due 03/02/23 § | | | 5,300,000 | | | | 5,300,378 | |
3.561% (USD LIBOR + 0.790%)
due 07/25/22 § | | | 4,000,000 | | | | 4,003,053 | |
Mitsubishi UFJ Trust & Banking Corp (Japan)
2.650% due 10/19/20 ~ | | | 6,000,000 | | | | 5,985,623 | |
New York Life Global Funding | |
1.500% due 10/24/19 ~ | | | 4,000,000 | | | | 3,975,025 | |
2.950% due 01/28/21 ~ | | | 2,000,000 | | | | 2,012,314 | |
3.121% (USD LIBOR + 0.520%)
due 06/10/22 § ~ | | | 2,000,000 | | | | 2,005,152 | |
3.250% due 08/06/21 ~ | | | 1,500,000 | | | | 1,518,936 | |
PNC Bank NA
2.450% due 11/05/20 | | | 3,700,000 | | | | 3,686,984 | |
Protective Life Global Funding
3.117% (USD LIBOR + 0.520%)
due 06/28/21 § ~ | | | 3,000,000 | | | | 3,005,644 | |
Royal Bank of Canada (Canada) | |
2.150% due 10/26/20 | | | 2,000,000 | | | | 1,987,482 | |
3.258% (USD LIBOR + 0.660%)
due 10/05/23 § | | | 6,000,000 | | | | 5,974,863 | |
3.700% due 10/05/23 | | | 400,000 | | | | 413,697 | |
SL Green Operating Partnership LP REIT
3.663% (USD LIBOR + 0.980%)
due 08/16/21 § | | | 3,000,000 | | | | 2,987,484 | |
Sumitomo Mitsui Banking Corp (Japan)
2.650% due 07/23/20 | | | 2,000,000 | | | | 1,997,856 | |
Sumitomo Mitsui Financial Group Inc (Japan) | |
2.784% due 07/12/22 | | | 2,500,000 | | | | 2,489,118 | |
3.513% (USD LIBOR + 0.740%)
due 01/17/23 § | | | 3,130,000 | | | | 3,132,177 | |
3.579% (USD LIBOR + 0.800%)
due 10/16/23 § | | | 7,500,000 | | | | 7,503,894 | |
3.621% (USD LIBOR + 0.860%)
due 07/19/23 § | | | 5,000,000 | | | | 5,019,986 | |
SunTrust Bank | |
3.328% (USD LIBOR + 0.590%)
due 08/02/22 § | | | 6,000,000 | | | | 5,962,944 | |
3.525% due 10/26/21 | | | 2,800,000 | | | | 2,830,268 | |
Svenska Handelsbanken AB (Sweden)
2.450% due 03/30/21 | | | 2,300,000 | | | | 2,290,446 | |
The Goldman Sachs Group Inc
3.625% due 02/20/24 | | | 2,300,000 | | | | 2,325,443 | |
The PNC Financial Services Group Inc
3.500% due 01/23/24 | | | 1,700,000 | | | | 1,747,523 | |
The Toronto-Dominion Bank (Canada)
3.401% (USD LIBOR + 0.640%)
due 07/19/23 § | | | 10,000,000 | | | | 10,012,395 | |
UBS Group Funding Switzerland AG
(Switzerland)
2.650% due 02/01/22 ~ | | | 2,500,000 | | | | 2,479,466 | |
United Overseas Bank Ltd (Singapore)
3.200% due 04/23/21 ~ | | | 2,000,000 | | | | 2,018,779 | |
US Bank NA | | | | | | | | |
3.050% due 07/24/20 | | | 3,750,000 | | | | 3,773,863 | |
3.104% due 05/21/21 | | | 4,000,000 | | | | 4,017,390 | |
USAA Capital Corp
3.000% due 07/01/20 ~ | | | 3,000,000 | | | | 3,015,352 | |
Wells Fargo & Co | | | | | | | | |
2.600% due 07/22/20 | | | 2,940,000 | | | | 2,936,407 | |
2.625% due 07/22/22 | | | 7,000,000 | | | | 6,953,591 | |
3.889% (USD LIBOR + 1.110%)
due 01/24/23 § | | | 9,800,000 | | | | 9,901,224 | |
Wells Fargo Bank NA
3.325% due 07/23/21 | | | 5,000,000 | | | | 5,034,419 | |
| | |
| See Notes to Financial Statements | | See explanation of symbols and terms, if any, on B-97 and B-98 |
B-56
PACIFIC FUNDS
PF MULTI-ASSET FUND
Schedule of Investments (Continued)
March 31, 2019
| | | | | | | | |
| | | Principal Amount | | | Value | |
Westpac Banking Corp (Australia) | | | | | | | | |
3.307% (USD LIBOR + 0.710%)
due 06/28/22 § | | $ | 4,000,000 | | | $ | 4,022,973 | |
3.404% (USD LIBOR + 0.720%)
due 05/15/23 § | | | 1,750,000 | | | | 1,755,284 | |
3.650% due 05/15/23 | | | 3,251,000 | | | | 3,341,832 | |
Zions Bancorp NA
3.500% due 08/27/21 | | | 1,750,000 | | | | 1,769,396 | |
| | | | | | | | |
| | | | | | | 230,825,623 | |
| | | | | | | | |
Industrial - 0.6% | |
| | |
Union Pacific Corp
3.200% due 06/08/21 | | | 2,350,000 | | | | 2,374,887 | |
United Technologies Corp
3.350% due 08/16/21 | | | 4,000,000 | | | | 4,056,075 | |
| | | | | | | | |
| | | | | | | 6,430,962 | |
| | | | | | | | |
Technology - 1.2% | |
| | |
Apple Inc | | | | | | | | |
2.400% due 01/13/23 | | | 4,200,000 | | | | 4,172,784 | |
2.400% due 05/03/23 | | | 3,000,000 | | | | 2,974,118 | |
Broadcom Inc | | | | | | | | |
3.125% due 04/15/21 ~ | | | 2,000,000 | | | | 1,997,640 | |
3.125% due 10/15/22 ~ | | | 500,000 | | | | 497,715 | |
Fiserv Inc
3.800% due 10/01/23 | | | 2,200,000 | | | | 2,257,337 | |
Hewlett Packard Enterprise Co
3.318% (USD LIBOR + 0.720%)
due 10/05/21 § | | | 2,100,000 | | | | 2,092,934 | |
| | | | | | | | |
| | | | | | | 13,992,528 | |
| | | | | | | | |
Utilities - 1.3% | |
| | |
American Electric Power Co Inc
3.650% due 12/01/21 | | | 1,250,000 | | | | 1,275,976 | |
Consolidated Edison Co of New York Inc
3.002% (USD LIBOR + 0.400%)
due 06/25/21 § | | | 3,000,000 | | | | 2,996,571 | |
Dominion Energy Inc
2.579% due 07/01/20 | | | 3,100,000 | | | | 3,083,790 | |
Duke Energy Corp
1.800% due 09/01/21 | | | 1,705,000 | | | | 1,664,929 | |
Electricite de France SA (France)
4.600% due 01/27/20 ~ | | | 1,500,000 | | | | 1,525,774 | |
Enel Finance International NV (Italy)
2.875% due 05/25/22 ~ | | | 2,500,000 | | | | 2,459,362 | |
WEC Energy Group Inc
3.375% due 06/15/21 | | | 2,100,000 | | | | 2,125,966 | |
| | | | | | | | |
| | | | | | | 15,132,368 | |
| | | | | | | | |
Total Corporate Bonds & Notes
(Cost $448,733,194) | | | | 451,802,872 | |
| | | | | |
|
ASSET-BACKED SECURITIES - 21.3% | |
|
Ally Auto Receivables Trust | |
1.810% due 06/15/20 | | | 380,922 | | | | 380,602 | |
2.720% due 05/17/21 | | | 6,599,958 | | | | 6,600,741 | |
2.850% due 03/15/22 | | | 5,250,000 | | | | 5,257,804 | |
American Express Credit Account Master Trust | | | | | | | | |
1.640% due 12/15/21 | | | 32,400,000 | | | | 32,350,081 | |
1.930% due 09/15/22 | | | 1,697,000 | | | | 1,686,867 | |
2.670% due 10/17/22 | | | 3,000,000 | | | | 3,002,650 | |
AmeriCredit Automobile Receivables Trust | | | | | | | | |
1.800% due 10/08/21 | | | 2,500,000 | | | | 2,485,635 | |
1.830% due 05/18/21 | | | 1,064,069 | | | | 1,062,115 | |
1.870% due 08/18/21 | | | 1,281,880 | | | | 1,277,848 | |
1.980% due 12/20/21 | | | 1,412,261 | | | | 1,406,805 | |
2.300% due 02/18/22 | | | 3,750,000 | | | | 3,726,096 | |
2.710% due 07/19/21 | | | 1,527,056 | | | | 1,526,739 | |
2.860% due 11/18/21 | | | 10,539,672 | | | | 10,546,866 | |
2.930% due 06/20/22 | | | 3,500,000 | | | | 3,504,582 | |
| | | | | | | | |
| | | Principal Amount | | | Value | |
Capital Auto Receivables Asset Trust | | | | | | | | |
2.020% due 08/20/21 ~ | | $ | 3,155,000 | | | $ | 3,142,330 | |
2.390% due 11/20/20 | | | 1,500,000 | | | | 1,498,700 | |
2.540% due 10/20/20 ~ | | | 1,344,130 | | | | 1,343,424 | |
3.020% due 02/22/21 ~ | | | 6,000,000 | | | | 6,009,338 | |
Carmax Auto Owner Trust
3.020% due 07/15/22 | | | 2,250,000 | | | | 2,256,233 | |
Chase Issuance Trust | | | | | | | | |
1.270% due 07/15/21 | | | 1,750,000 | | | | 1,743,346 | |
1.370% due 06/15/21 | | | 13,040,000 | | | | 13,006,003 | |
1.580% due 08/15/21 | | | 6,345,000 | | | | 6,320,770 | |
2.894% (USD LIBOR + 0.410%)
due 05/15/21 § | | | 2,595,000 | | | | 2,596,129 | |
Citibank Credit Card Issuance Trust | | | | | | | | |
1.800% due 09/20/21 | | | 12,115,000 | | | | 12,067,741 | |
1.920% due 04/07/22 | | | 3,400,000 | | | | 3,377,075 | |
2.150% due 07/15/21 | | | 7,317,000 | | | | 7,306,970 | |
CNH Equipment Trust | |
1.840% due 03/15/21 | | | 813,935 | | | | 811,692 | |
2.960% due 05/16/22 | | | 4,000,000 | | | | 4,007,858 | |
Ford Credit Auto Owner Trust | | | | | | | | |
1.800% due 09/15/20 | | | 1,232,862 | | | | 1,232,586 | |
2.030% due 08/15/20 | | | 841,376 | | | | 840,386 | |
2.960% due 09/15/21 | | | 6,000,000 | | | | 6,010,226 | |
GM Financial Consumer Automobile Receivables Trust | | | | | | | | |
2.740% due 07/16/21 | | | 4,654,064 | | | | 4,655,295 | |
2.930% due 11/16/21 | | | 4,243,312 | | | | 4,250,293 | |
Honda Auto Receivables Owner Trust | | | | | | | | |
1.360% due 01/18/23 | | | 1,440,000 | | | | 1,422,217 | |
1.800% due 01/21/20 | | | 232,695 | | | | 232,550 | |
2.360% due 06/15/20 | | | 1,829,264 | | | | 1,827,905 | |
2.660% due 12/18/20 | | | 2,316,569 | | | | 2,317,105 | |
2.670% due 12/21/20 | | | 8,502,759 | | | | 8,505,300 | |
John Deere Owner Trust | |
2.420% due 10/15/20 | | | 1,485,895 | | | | 1,484,676 | |
2.830% due 04/15/21 | | | 2,750,000 | | | | 2,751,062 | |
Mercedes-Benz Auto Receivables Trust
2.710% due 04/15/21 | | | 4,958,837 | | | | 4,960,567 | |
Navient Student Loan Trust | | | | | | | | |
2.726% (USD LIBOR + 0.240%)
due 09/27/66 § ~ | | | 1,756,217 | | | | 1,754,946 | |
2.726% (USD LIBOR + 0.240%)
due 03/25/67 § ~ | | | 1,305,543 | | | | 1,305,381 | |
2.756% (USD LIBOR + 0.270%)
due 03/25/67 § ~ | | | 3,230,676 | | | | 3,228,404 | |
Nelnet Student Loan Trust | | | | | | | | |
2.761% (USD LIBOR + 0.110%)
due 08/23/27 § | | | 1,356,951 | | | | 1,355,269 | |
2.871% (USD LIBOR + 0.100%)
due 01/25/30 § | | | 1,219,556 | | | | 1,219,069 | |
Nissan Auto Receivables Owner Trust | | | | | | | | |
1.590% due 07/15/22 | | | 1,000,000 | | | | 991,522 | |
2.390% due 12/15/20 | | | 2,011,082 | | | | 2,009,014 | |
2.820% due 01/18/22 | | | 4,500,000 | | | | 4,506,552 | |
3.070% due 10/15/21 | | | 2,500,000 | | | | 2,508,748 | |
Santander Drive Auto Receivables Trust | | | | | | | | |
1.890% due 06/15/21 | | | 714,981 | | | | 714,466 | |
2.100% due 06/15/21 | | | 1,337,133 | | | | 1,335,963 | |
2.580% due 10/15/20 | | | 707,632 | | | | 707,536 | |
2.580% due 05/16/22 | | | 2,000,000 | | | | 1,994,821 | |
2.730% due 04/15/21 | | | 1,838,370 | | | | 1,837,359 | |
2.780% due 03/15/21 | | | 2,305,407 | | | | 2,304,894 | |
2.910% due 01/18/22 | | | 3,750,000 | | | | 3,752,086 | |
2.970% due 07/15/21 | | | 5,600,000 | | | | 5,602,228 | |
SLC Student Loan Trust
2.711% (USD LIBOR + 0.100%)
due 09/15/26 § | | | 1,548,239 | | | | 1,546,665 | |
SLM Private Education Loan Trust
3.740% due 02/15/29 ~ | | | 455,647 | | | | 456,067 | |
| | |
| See Notes to Financial Statements | | See explanation of symbols and terms, if any, on B-97 and B-98 |
B-57
PACIFIC FUNDS
PF MULTI-ASSET FUND
Schedule of Investments (Continued)
March 31, 2019
| | | | | | | | |
| | | Principal Amount | | | Value | |
SLM Student Loan Trust | | | | | | | | |
2.861% (USD LIBOR + 0.090%)
due 10/25/24 § | | $ | 601,209 | | | $ | 600,601 | |
2.871% (USD LIBOR + 0.100%)
due 04/25/27 § | | | 876,308 | | | | 874,850 | |
3.321% (USD LIBOR + 0.550%)
due 04/27/26 § ~ | | | 1,004,670 | | | | 1,005,822 | |
SMB Private Education Loan Trust | | | | | | | | |
2.834% (USD LIBOR + 0.350%)
due 03/16/26 § ~ | | | 1,702,264 | | | | 1,700,917 | |
2.960% (USD LIBOR + 0.350%)
due 02/16/26 § ~ | | | 1,500,000 | | | | 1,500,776 | |
Toyota Auto Receivables Owner Trust | | | | | | | | |
1.740% due 08/17/20 | | | 1,297,684 | | | | 1,294,935 | |
2.640% due 03/15/21 | | | 2,390,708 | | | | 2,390,504 | |
2.830% due 10/15/21 | | | 4,000,000 | | | | 4,007,727 | |
2.980% due 08/15/21 | | | 4,000,000 | | | | 4,010,270 | |
Verizon Owner Trust | |
1.420% due 01/20/21 ~ | | | 1,023,653 | | | | 1,022,448 | |
2.060% due 09/20/21 ~ | | | 2,000,000 | | | | 1,993,944 | |
Volvo Financial Equipment LLC
2.900% due 11/15/21 ~ | | | 2,000,000 | | | | 2,004,288 | |
| | | | | | | | |
| |
Total Asset-Backed Securities
(Cost $241,558,805) | | | | 242,331,280 | |
| | | | | |
|
U.S. TREASURY OBLIGATIONS - 38.8% | |
|
U.S. Treasury Notes - 38.8% | |
| | |
0.750% due 07/15/19 | | | 38,000,000 | | | | 37,811,484 | |
0.750% due 08/15/19 | | | 14,000,000 | | | | 13,910,313 | |
1.375% due 07/31/19 ‡ | | | 50,000,000 | | | | 49,823,242 | |
1.375% due 01/15/20 | | | 43,000,000 | | | | 42,650,625 | |
1.750% due 03/31/22 | | | 8,000,000 | | | | 7,892,188 | |
2.000% due 01/31/20 ‡ | | | 55,500,000 | | | | 55,326,563 | |
2.000% due 01/15/21 | | | 10,000,000 | | | | 9,947,852 | |
2.000% due 07/31/22 | | | 10,000,000 | | | | 9,930,078 | |
2.500% due 05/31/20 | | | 20,500,000 | | | | 20,530,430 | |
2.500% due 12/31/20 | | | 20,000,000 | | | | 20,065,625 | |
2.625% due 02/28/23 | | | 600,000 | | | | 609,023 | |
2.750% due 09/30/20 | | | 10,000,000 | | | | 10,059,766 | |
2.750% due 11/30/20 ‡ | | | 50,000,000 | | | | 50,349,610 | |
| | | | | | | | |
| | | Principal Amount | | | Value | |
2.875% due 11/15/21 | | $ | 31,000,000 | | | $ | 31,498,906 | |
3.125% due 05/15/19 ‡ | | | 80,250,000 | | | | 80,313,812 | |
| | | | | | | | |
| | | | | | | 440,719,517 | |
| | | | | | | | |
Total U.S. Treasury Obligations
(Cost $439,402,028) | | | | 440,719,517 | |
| | | | | |
| | |
| | | Shares | | | | |
SHORT-TERM INVESTMENT - 0.6% | |
|
Money Market Fund - 0.6% | |
| | |
BlackRock Liquidity FundsT-Fund Portfolio
‘Institutional’ 2.370% | | | 6,804,165 | | | | 6,804,165 | |
| | | | | | | | |
| |
Total Short-Term Investment
(Cost $6,804,165) | | | | 6,804,165 | |
| | | | | |
| |
TOTAL INVESTMENTS - 100.5%
(Cost $1,136,498,192) | | | | 1,141,657,834 | |
| | |
DERIVATIVES - (0.4%) | | | | | | | | |
(See Notes (c) and (d) in Notes to Schedule of Investments) | | | | (4,558,043 | ) |
| | | | | |
| |
OTHER ASSETS & LIABILITIES, NET - (0.1%) | | | | (685,599 | ) |
| | | | | |
| |
NET ASSETS - 100.0% | | | | $1,136,414,192 | |
| | | | | |
Notes to Schedule of Investments
| (a) | As of March 31, 2019, the Fund’s composition as a percentage of net assets was as follows: |
| | | | |
Corporate Bonds & Notes | | | 39.8% | |
U.S. Treasury Obligations | | | 38.8% | |
Asset-Backed Securities | | | 21.3% | |
Others (less than 3.0%) | | | 0.6% | |
| | | | |
| | | 100.5% | |
Derivatives | | | (0.4% | ) |
Other Assets & Liabilities, Net | | | (0.1% | ) |
| | | | |
| | | 100.0% | |
| | | | |
| (b) | As of March 31, 2019, investments with a total aggregate value of $29,905,133 were fully or partially segregated with the broker(s)/custodian as collateral for open futures contracts and swap agreements. |
| (c) | Open futures contracts outstanding as of March 31, 2019 were as follows: |
| | | | | | | | | | | | | | | | | | | | |
| Short Futures Outstanding | | Expiration
Month | | | Number of
Contracts | | | Notional
Amount | | | Value | | | Unrealized
Appreciation
(Depreciation) | |
MSCI EAFE Index | | | 06/19 | | | | 39 | | | | $3,663,215 | | | | $3,639,480 | | | | $23,735 | |
S&P 500E-Mini Index | | | 06/19 | | | | 67 | | | | 9,472,895 | | | | 9,506,630 | | | | (33,735 | ) |
S&P Mid 400E-Mini Index | | | 06/19 | | | | 19 | | | | 3,608,690 | | | | 3,611,900 | | | | (3,210 | ) |
| | | | | | | | | | | | | | | | | | | | |
| | | | | |
Total Futures Contracts | | | | | | | | | | | | | | | | | | | ($13,210 | ) |
| | | | | | | | | | | | | | | | | | | | |
| | |
| See Notes to Financial Statements | | See explanation of symbols and terms, if any, on B-97 and B-98 |
B-58
PACIFIC FUNDS
PF MULTI-ASSET FUND
Schedule of Investments (Continued)
March 31, 2019
| (d) | Swap agreements outstanding as of March 31, 2019 were as follows: |
Total Return Swaps – Long
| | | | | | | | | | | | | | | | | | | | | | | | | | | | | | | | |
| Receive | | Pay | | | Payment
Frequency | | | Counter-
party | | | Expiration
Date | | | Notional
Amount | | | Value | | | Upfront
Premiums
Paid
(Received) | | | Unrealized
Appreciation
(Depreciation) | |
MSCI World Index | | | 3-Month USD-LIBOR -0.140% | | | | Z | | | | BRC | | | | 05/16/19 | | | | $2,003,682 | | | | ($30,511 | ) | | | $— | | | | ($30,511 | ) |
S&P 500 Index | | | 3-Month USD-LIBOR + 0.500% | | | | Z | | | | BRC | | | | 05/16/19 | | | | 25,385,812 | | | | 397,456 | | | | — | | | | 397,456 | |
S&PMid-Cap 400 Index | | | 3-MonthUSD-LIBOR + 0.340% | | | | Z | | | | JPM | | | | 05/16/19 | | | | 89,715,469 | | | | (3,115,364 | ) | | | — | | | | (3,115,364 | ) |
MSCI EAFE Index | | | 3-MonthUSD-LIBOR - 0.110% | | | | Z | | | | MSC | | | | 05/16/19 | | | | 63,074,578 | | | | (5,107,055 | ) | | | — | | | | (5,107,055 | ) |
MSCI Japan Index | | | 3-MonthUSD-LIBOR + 0.150% | | | | Z | | | | MSC | | | | 05/16/19 | | | | 3,752,840 | | | | (434,710 | ) | | | — | | | | (434,710 | ) |
MSCI World Index | | | 3-MonthUSD-LIBOR - 0.120% | | | | Z | | | | MSC | | | | 05/16/19 | | | | 488,766,512 | | | | (9,856,865 | ) | | | — | | | | (9,856,865 | ) |
MSCI World Index | | | 3-MonthUSD-LIBOR - 0.290% | | | | Z | | | | CIT | | | | 08/15/19 | | | | 1,010,318 | | | | (17,757 | ) | | | — | | | | (17,757 | ) |
MSCI World Index | | | 3-MonthUSD-LIBOR - 0.300% | | | | Z | | | | CIT | | | | 08/15/19 | | | | 268,553,574 | | | | (5,658,587 | ) | | | — | | | | (5,658,587 | ) |
RussellMid-Cap Value Index | | | 3-MonthUSD-LIBOR + 0.150% | | | | Z | | | | CIT | | | | 08/15/19 | | | | 48,179,597 | | | | (1,537,963 | ) | | | — | | | | (1,537,963 | ) |
Russell 1000 Index | | | 3-MonthUSD-LIBOR + 0.170% | | | | Z | | | | MSC | | | | 08/15/19 | | | | 2,006,441 | | | | 19,676 | | | | — | | | | 19,676 | |
Russell 2000 Index | | | 3-MonthUSD-LIBOR - 0.100% | | | | Z | | | | MSC | | | | 08/15/19 | | | | 2,013,003 | | | | (185,372 | ) | | | — | | | | (185,372 | ) |
Russell Mid-Cap Growth Index | | | 3-MonthUSD-LIBOR + 0.100% | | | | Z | | | | MSC | | | | 08/15/19 | | | | 57,471,010 | | | | 1,213,374 | | | | — | | | | 1,213,374 | |
Russell 2000 Index | | | 3-MonthUSD-LIBOR - 0.040% | | | | Z | | | | BOA | | | | 11/15/19 | | | | 2,511,506 | | | | (69,490 | ) | | | — | | | | (69,490 | ) |
MSCI World Index | | | 3-MonthUSD-LIBOR - 0.195% | | | | Z | | | | CIT | | | | 11/15/19 | | | | 117,269,133 | | | | 745,793 | | | | — | | | | 745,793 | |
MSCI EAFE Index | | | 3-MonthUSD-LIBOR - 0.110% | | | | Z | | | | GSC | | | | 11/15/19 | | | | 3,165,374 | | | | (29,384 | ) | | | — | | | | (29,384 | ) |
MSCI World Index | | | 3-MonthUSD-LIBOR - 0.190% | | | | Z | | | | GSC | | | | 11/15/19 | | | | 7,409,357 | | | | 141,514 | | | | — | | | | 141,514 | |
MSCI EAFE Index | | | 3-MonthUSD-LIBOR - 0.120% | | | | Z | | | | JPM | | | | 11/15/19 | | | | 53,279,861 | | | | (501,836 | ) | | | — | | | | (501,836 | ) |
MSCI Pacific Index | | | 3-MonthUSD-LIBOR + 0.025% | | | | Z | | | | SGN | | | | 11/15/19 | | | | 2,158,342 | | | | (67,249 | ) | | | — | | | | (67,249 | ) |
RussellMid-Cap Growth Index | | | 3-MonthUSD-LIBOR + 0.220% | | | | Z | | | | SGN | | | | 11/15/19 | | | | 29,216,958 | | | | 2,506,674 | | | | — | | | | 2,506,674 | |
RussellMid-Cap Value Index | | | 3-MonthUSD-LIBOR + 0.220% | | | | Z | | | | SGN | | | | 11/15/19 | | | | 21,269,956 | | | | (62,183 | ) | | | — | | | | (62,183 | ) |
Russell 1000 Index | | | 3-MonthUSD-LIBOR + 0.110% | | | | Z | | | | BRC | | | | 03/19/20 | | | | 32,521,626 | | | | 457,563 | | | | — | | | | 457,563 | |
Russell 2000 Index | | | 3-MonthUSD-LIBOR - 0.110% | | | | Z | | | | BRC | | | | 03/19/20 | | | | 10,228,127 | | | | (65,802 | ) | | | — | | | | (65,802 | ) |
MSCI World Index | | | 3-MonthUSD-LIBOR - 0.410% | | | | Z | | | | JPM | | | | 03/19/20 | | | | 203,560,488 | | | | 2,524,064 | | | | — | | | | 2,524,064 | |
MSCI EAFE Index | | | 3-MonthUSD-LIBOR - 0.330% | | | | Z | | | | MSC | | | | 03/19/20 | | | | 22,964,192 | | | | 205,222 | | | | — | | | | 205,222 | |
RussellMid-Cap Value Index | | | 3-MonthUSD-LIBOR + 0.070% | | | | Z | | | | SGN | | | | 03/19/20 | | | | 95,875,569 | | | | 613,306 | | | | — | | | | 613,306 | |
| | | | | | | | | | | | | | | | | | | | | | | | | | | | | | | | |
| | | | | | | | | | | | | | | | | | | | | | | ($17,915,486 | ) | | | $— | | | | ($17,915,486 | ) |
| | | | | | | | | | | | | | | | | | | | | | | | | | | | | | | | |
Total Return Swaps – Short
| | | | | | | | | | | | | | | | | | | | | | | | | | | | | | | | |
| Pay | | Receive | | | Payment
Frequency | | | Counter-
party | | | Expiration
Date | | | Notional
Amount | | | Value | | | Upfront
Premiums
Paid
(Received) | | | Unrealized
Appreciation
(Depreciation) | |
MSCI Canada Index | | | 3-Month USD-LIBOR - 0.440% | | | | Z | | | | BRC | | | | 05/16/19 | | | | $21,323,971 | | | | $77,551 | | | | $— | | | | $77,551 | |
MSCI Europe Index | | | 3-MonthUSD-LIBOR - 0.270% | | | | Z | | | | BRC | | | | 05/16/19 | | | | 89,467,806 | | | | 6,835,673 | | | | — | | | | 6,835,673 | |
MSCI Pacific Index | | | 3-Month USD-LIBOR + 0.150% | | | | Z | | | | BRC | | | | 05/16/19 | | | | 59,034,942 | | | | 5,285,835 | | | | — | | | | 5,285,835 | |
RussellMid-Cap Growth Index | | | 3-MonthUSD-LIBOR + 0.380% | | | | Z | | | | GSC | | | | 05/16/19 | | | | 8,118,948 | | | | (354,587 | ) | | | — | | | | (354,587 | ) |
RussellMid-Cap Value Index | | | 3-MonthUSD-LIBOR + 0.340% | | | | Z | | | | GSC | | | | 05/16/19 | | | | 15,714,227 | | | | 425,596 | | | | — | | | | 425,596 | |
Russell 1000 Value Index | | | 3-MonthUSD-LIBOR + 0.430% | | | | Z | | | | JPM | | | | 05/16/19 | | | | 29,434,197 | | | | 321,537 | | | | — | | | | 321,537 | |
Russell 2000 Index | | | 3-MonthUSD-LIBOR - 0.080% | | | | Z | | | | JPM | | | | 05/16/19 | | | | 1,527,132 | | | | 65,930 | | | | — | | | | 65,930 | |
Russell 1000 Growth Index | | | 3-Month USD-LIBOR + 0.440% | | | | Z | | | | MSC | | | | 05/16/19 | | | | 23,922,997 | | | | (966,337 | ) | | | — | | | | (966,337 | ) |
MSCI Canada Index | | | 3-MonthUSD-LIBOR - 0.750% | | | | Z | | | | BRC | | | | 08/15/19 | | | | 1,003,341 | | | | 37,844 | | | | — | | | | 37,844 | |
MSCI Pacific Index | | | 3-Month USD-LIBOR + 0.080% | | | | Z | | | | BRC | | | | 08/15/19 | | | | 6,993,777 | | | | 534,220 | | | | — | | | | 534,220 | |
MSCI EAFE Index | | | 3-MonthUSD-LIBOR - 0.120% | | | | Z | | | | CIT | | | | 08/15/19 | | | | 29,132,719 | | | | 2,079,041 | | | | — | | | | 2,079,041 | |
MSCI Europe Index | | | 3-MonthUSD-LIBOR - 0.180% | | | | Z | | | | CIT | | | | 08/15/19 | | | | 13,098,545 | | | | 903,398 | | | | — | | | | 903,398 | |
Russell 1000 Growth Index | | | 3-MonthUSD-LIBOR + 0.130% | | | | Z | | | | CIT | | | | 08/15/19 | | | | 6,034,578 | | | | (110,374 | ) | | | — | | | | (110,374 | ) |
Russell 1000 Value Index | | | 3-MonthUSD-LIBOR + 0.130% | | | | Z | | | | CIT | | | | 08/15/19 | | | | 9,999,752 | | | | (15,664 | ) | | | — | | | | (15,664 | ) |
RussellMid-Cap Index | | | 3-MonthUSD-LIBOR | | | | Z | | | | GSC | | | | 08/15/19 | | | | 1,002,540 | | | | 9,518 | | | | — | | | | 9,518 | |
S&PMid-Cap 400 Index | | | 3-MonthUSD-LIBOR | | | | Z | | | | GSC | | | | 08/15/19 | | | | 7,011,906 | | | | 419,158 | | | | — | | | | 419,158 | |
DJ Industrial Average Index | | | 3-MonthUSD-LIBOR + 0.140% | | | | Z | | | | MSC | | | | 08/15/19 | | | | 8,996,094 | | | | (203,189 | ) | | | — | | | | (203,189 | ) |
S&P 500 Index | | | 3-MonthUSD-LIBOR + 0.130% | | | | Z | | | | MSC | | | | 08/15/19 | | | | 34,097,730 | | | | (461,309 | ) | | | — | | | | (461,309 | ) |
Russell 1000 Index | | | 3-MonthUSD-LIBOR + 0.310% | | | | Z | | | | BOA | | | | 11/15/19 | | | | 30,501,803 | | | | (491,843 | ) | | | — | | | | (491,843 | ) |
MSCI Canada Index | | | 3-MonthUSD-LIBOR - 0.460% | | | | Z | | | | SGN | | | | 11/15/19 | | | | 17,636,258 | | | | (96,673 | ) | | | — | | | | (96,673 | ) |
MSCI EAFE Index | | | 3-MonthUSD-LIBOR - 0.270% | | | | Z | | | | BOA | | | | 03/19/20 | | | | 19,334,556 | | | | (192,690 | ) | | | — | | | | (192,690 | ) |
MSCI Pacific Index | | | 3-MonthUSD-LIBOR - 0.110% | | | | Z | | | | BRC | | | | 03/19/20 | | | | 34,086,854 | | | | (211,635 | ) | | | — | | | | (211,635 | ) |
MSCI Europe Index | | | 3-MonthUSD-LIBOR - 0.350% | | | | Z | | | | SGN | | | | 03/19/20 | | | | 42,910,158 | | | | (520,347 | ) | | | — | | | | (520,347 | ) |
| | | | | | | | | | | | | | | | | | | | | | | | | | | | | | | | |
| | | | | | | | | | | | | | | | | | | | | | | $13,370,653 | | | | $— | | | | $13,370,653 | |
| | | | | | | | | | | | | | | | | | | | | | | | | | | | | | | | |
| | | | | | | |
Total Swap Agreements | | | | | | | | | | | | | | | | | | | | ($4,544,833 | ) | | | $— | | | | ($4,544,833 | ) |
| | | | | | | | | | | | | | | | | | | | | | | | | | | | | | | | |
| | |
| See Notes to Financial Statements | | See explanation of symbols and terms, if any, on B-97 and B-98 |
B-59
PACIFIC FUNDS
PF MULTI-ASSET FUND
Schedule of Investments (Continued)
March 31, 2019
Balances reported in the Statement of Assets and Liabilities for Over the Counter (OTC) Swaps
| | | | | | | | |
| | | Upfront
Premium
Paid
(Received) | | | Unrealized
Appreciation
(Deprecation) | |
OTC Swap Agreements | | | | | | | | |
Assets | | | $— | | | | $25,819,943 | |
Liabilities | | | — | | | | (30,364,776 | ) |
| | | | | | | | |
| | | $— | | | | ($4,544,833 | ) |
| | | | | | | | |
| (e) | Fair Value Measurements |
The following is a summary of the Fund’s investments as categorized under the three-tier hierarchy of inputs used in valuing the Fund’s assets and liabilities (See Note 3D in Notes to Financial Statements) as of March 31, 2019:
| | | | | | | | | | | | | | | | | | |
| | | | | Total Value at
March 31, 2019 | | | Level 1
Quoted Price | | | Level 2
Significant
Observable Inputs | | | Level 3
Significant
Unobservable Inputs | |
Assets | | Corporate Bonds & Notes | | | $451,802,872 | | | | $— | | | | $451,802,872 | | | | $— | |
| | Asset-Backed Securities | | | 242,331,280 | | | | — | | | | 242,331,280 | | | | — | |
| | U.S. Treasury Obligations | | | 440,719,517 | | | | — | | | | 440,719,517 | | | | — | |
| | Short-Term Investment | | | 6,804,165 | | | | 6,804,165 | | | | — | | | | — | |
| | Derivatives: | | | | | | | | | | | | | | | | |
| | Equity Contracts | | | | | | | | | | | | | | | | |
| | Futures | | | 23,735 | | | | 23,735 | | | | — | | | | — | |
| | Swaps | | | 25,819,943 | | | | — | | | | 25,819,943 | | | | — | |
| | | | | | | | | | | | | | | | | | |
| | Total Equity Contracts | | | 25,843,678 | | | | 23,735 | | | | 25,819,943 | | | | — | |
| | | | | | | | | | | | | | | | | | |
| | Total Assets - Derivatives | | | 25,843,678 | | | | 23,735 | | | | 25,819,943 | | | | — | |
| | | | | | | | | | | | | | | | | | |
| | Total Assets | | | 1,167,501,512 | | | | 6,827,900 | | | | 1,160,673,612 | | | | — | |
| | | | | | | | | | | | | | | | | | |
| | | | | |
Liabilities | | Derivatives: | | | | | | | | | | | | | | | | |
| | Equity Contracts | | | | | | | | | | | | | | | | |
| | Futures | | | (36,945 | ) | | | (36,945 | ) | | | — | | | | — | |
| | Swaps | | | (30,364,776 | ) | | | — | | | | (30,364,776 | ) | | | — | |
| | | | | | | | | | | | | | | | | | |
| | Total Equity Contracts | | | (30,401,721 | ) | | | (36,945 | ) | | | (30,364,776 | ) | | | — | |
| | | | | | | | | | | | | | | | | | |
| | Total Liabilities - Derivatives | | | (30,401,721 | ) | | | (36,945 | ) | | | (30,364,776 | ) | | | — | |
| | | | | | | | | | | | | | | | | | |
| | Total Liabilities | | | (30,401,721 | ) | | | (36,945 | ) | | | (30,364,776 | ) | | | — | |
| | | | | | | | | | | | | | | | | | |
| | Total | | | $1,137,099,791 | | | | $6,790,955 | | | | $1,130,308,836 | | | | $— | |
| | | | | | | | | | | | | | | | | | |
| | |
| See Notes to Financial Statements | | See explanation of symbols and terms, if any, on B-97 and B-98 |
B-60
PACIFIC FUNDS
PF SMALL-CAP VALUE FUND
Schedule of Investments
March 31, 2019
| | | | | | | | |
| | | Shares | | | Value | |
COMMON STOCKS - 96.3% | | | | | | | | |
| | |
Basic Materials - 0.7% | | | | | | | | |
| | |
Orion Engineered Carbons SA (Luxembourg) | | | 25,195 | | | | $478,453 | |
| | | | | | | | |
| | |
Communications - 5.4% | | | | | | | | |
| | |
A10 Networks Inc * | | | 107,956 | | | | 765,408 | |
Criteo SA ADR (France) * | | | 24,218 | | | | 485,087 | |
Extreme Networks Inc * | | | 88,224 | | | | 660,798 | |
Finisar Corp * | | | 35,887 | | | | 831,502 | |
Houghton Mifflin Harcourt Co * | | | 73,989 | | | | 537,900 | |
Scholastic Corp | | | 13,620 | | | | 541,531 | |
| | | | | | | | |
| | | | | | | 3,822,226 | |
| | | | | | | | |
Consumer, Cyclical - 12.9% | | | | | | | | |
| | |
Bloomin’ Brands Inc | | | 31,893 | | | | 652,212 | |
BMC Stock Holdings Inc * | | | 27,577 | | | | 487,286 | |
Citi Trends Inc | | | 27,710 | | | | 535,080 | |
Cooper-Standard Holdings Inc * | | | 9,850 | | | | 462,556 | |
Dana Inc | | | 21,135 | | | | 374,935 | |
El Pollo Loco Holdings Inc * | | | 33,905 | | | | 441,104 | |
Hawaiian Holdings Inc | | | 28,395 | | | | 745,369 | |
Knoll Inc | | | 27,394 | | | | 518,021 | |
Red Robin Gourmet Burgers Inc * | | | 22,752 | | | | 655,485 | |
REV Group Inc | | | 53,082 | | | | 581,248 | |
Signet Jewelers Ltd | | | 18,753 | | | | 509,331 | |
Skechers U.S.A. Inc ‘A’ * | | | 19,779 | | | | 664,772 | |
SkyWest Inc | | | 17,704 | | | | 961,150 | |
Taylor Morrison Home Corp ‘A’ * | | | 53,568 | | | | 950,832 | |
Tower International Inc | | | 26,080 | | | | 548,462 | |
| | | | | | | | |
| | | | | | | 9,087,843 | |
| | | | | | | | |
Consumer,Non-Cyclical - 9.1% | | | | | | | | |
| | |
Booz Allen Hamilton Holding Corp | | | 9,561 | | | | 555,877 | |
Cott Corp | | | 56,020 | | | | 818,452 | |
Fresh Del Monte Produce Inc | | | 21,320 | | | | 576,280 | |
ICON PLC (Ireland) * | | | 5,122 | | | | 699,563 | |
Molina Healthcare Inc * | | | 6,336 | | | | 899,459 | |
Nomad Foods Ltd (United Kingdom) * | | | 53,154 | | | | 1,086,999 | |
Sotheby’s * | | | 18,455 | | | | 696,676 | |
Tivity Health Inc * | | | 1,313 | | | | 23,056 | |
Viad Corp | | | 9,379 | | | | 527,944 | |
WellCare Health Plans Inc * | | | 1,994 | | | | 537,881 | |
| | | | | | | | |
| | | | | | | 6,422,187 | |
| | | | | | | | |
Energy - 7.4% | | | | | | | | |
| | |
Dril-Quip Inc * | | | 12,650 | | | | 580,002 | |
Helix Energy Solutions Group Inc * | | | 66,084 | | | | 522,724 | |
MRC Global Inc * | | | 44,397 | | | | 776,060 | |
Oasis Petroleum Inc * | | | 80,160 | | | | 484,166 | |
Oil States International Inc * | | | 28,952 | | | | 491,026 | |
Patterson-UTI Energy Inc | | | 43,670 | | | | 612,253 | |
QEP Resources Inc * | | | 96,550 | | | | 752,124 | |
RPC Inc | | | 42,031 | | | | 479,574 | |
SM Energy Co | | | 31,674 | | | | 553,978 | |
| | | | | | | | |
| | | | | | | 5,251,907 | |
| | | | | | | | |
Financial - 30.2% | | | | | | | | |
| | |
1st Source Corp | | | 11,735 | | | | 527,019 | |
Armada Hoffler Properties Inc REIT | | | 44,946 | | | | 700,708 | |
Associated Banc-Corp | | | 36,740 | | | | 784,399 | |
BankUnited Inc | | | 27,543 | | | | 919,936 | |
City Office REIT Inc | | | 69,859 | | | | 790,105 | |
Cousins Properties Inc REIT | | | 50,805 | | | | 490,776 | |
Empire State Realty Trust Inc ‘A’ REIT | | | 49,071 | | | | 775,322 | |
Essent Group Ltd * | | | 19,824 | | | | 861,353 | |
First American Financial Corp | | | 15,065 | | | | 775,847 | |
| | | | | | | | |
| | | Shares | | | Value | |
Heritage Financial Corp | | | 26,824 | | | $ | 808,475 | |
IBERIABANK Corp | | | 12,947 | | | | 928,429 | |
Independence Realty Trust Inc REIT | | | 89,164 | | | | 962,080 | |
Independent Bank Group Inc | | | 16,732 | | | | 858,184 | |
Kemper Corp | | | 7,235 | | | | 550,873 | |
National Storage Affiliates Trust REIT | | | 32,047 | | | | 913,660 | |
Sandy Spring Bancorp Inc | | | 24,206 | | | | 757,164 | |
Selective Insurance Group Inc | | | 12,795 | | | | 809,668 | |
STAG Industrial Inc REIT | | | 37,963 | | | | 1,125,603 | |
State Auto Financial Corp | | | 11,480 | | | | 377,922 | |
Sterling Bancorp | | | 50,060 | | | | 932,618 | |
Synovus Financial Corp | | | 22,460 | | | | 771,726 | |
Texas Capital Bancshares Inc * | | | 15,631 | | | | 853,296 | |
TriCo Bancshares | | | 18,499 | | | | 726,826 | |
Umpqua Holdings Corp | | | 49,390 | | | | 814,935 | |
Webster Financial Corp | | | 15,853 | | | | 803,272 | |
WSFS Financial Corp | | | 21,955 | | | | 847,463 | |
Zions Bancorp NA | | | 19,037 | | | | 864,470 | |
| | | | | | | | |
| | | | | | | 21,332,129 | |
| | | | | | | | |
Industrial - 11.8% | | | | | | | | |
| | |
AAR Corp | | | 16,715 | | | | 543,405 | |
Air Transport Services Group Inc * | | | 18,199 | | | | 419,487 | |
Atlas Air Worldwide Holdings Inc * | | | 10,426 | | | | 527,139 | |
Columbus Mckinnon Corp | | | 12,392 | | | | 425,665 | |
Control4 Corp * | | | 39,608 | | | | 670,563 | |
Covenant Transportation Group Inc ‘A’ * | | | 18,575 | | | | 352,553 | |
EnerSys | | | 6,041 | | | | 393,632 | |
Granite Construction Inc | | | 11,647 | | | | 502,568 | |
Graphic Packaging Holding Co | | | 69,149 | | | | 873,352 | |
Kennametal Inc | | | 2,000 | | | | 73,500 | |
Oshkosh Corp | | | 4,745 | | | | 356,492 | |
Primoris Services Corp | | | 31,832 | | | | 658,286 | |
Regal Beloit Corp | | | 8,120 | | | | 664,784 | |
Terex Corp | | | 13,586 | | | | 436,518 | |
Trinseo SA | | | 16,159 | | | | 732,003 | |
TTM Technologies Inc * | | | 9,120 | | | | 106,978 | |
Tutor Perini Corp * | | | 35,310 | | | | 604,507 | |
| | | | | | | | |
| | | | | | | 8,341,432 | |
| | | | | | | | |
Technology - 13.9% | | | | | | | | |
| | |
CommVault Systems Inc * | | | 9,455 | | | | 612,117 | |
CSG Systems International Inc | | | 13,036 | | | | 551,423 | |
Kulicke & Soffa Industries Inc (Singapore) | | | 43,690 | | | | 965,986 | |
Luxoft Holding Inc * | | | 21,694 | | | | 1,273,655 | |
MagnaChip Semiconductor Corp (South Korea) * | | | 92,555 | | | | 684,907 | |
MaxLinear Inc * | | | 27,868 | | | | 711,470 | |
Nanometrics Inc * | | | 17,924 | | | | 553,493 | |
NCR Corp * | | | 35,659 | | | | 973,134 | |
NetScout Systems Inc * | | | 30,643 | | | | 860,149 | |
Unisys Corp * | | | 48,130 | | | | 561,677 | |
Verint Systems Inc * | | | 20,320 | | | | 1,216,355 | |
WNS Holdings Ltd ADR (India) * | | | 16,357 | | | | 871,337 | |
| | | | | | | | |
| | | | | | | 9,835,703 | |
| | | | | | | | |
Utilities - 4.9% | | | | | | | | |
| | |
Black Hills Corp | | | 11,602 | | | | 859,360 | |
PNM Resources Inc | | | 19,494 | | | | 922,846 | |
Portland General Electric Co | | | 17,784 | | | | 921,923 | |
Southwest Gas Holdings Inc | | | 8,800 | | | | 723,888 | |
| | | | | | | | |
| | | | | | | 3,428,017 | |
| | | | | | | | |
| | |
Total Common Stocks
(Cost $60,861,701) | | | | | | | 67,999,897 | |
| | | | | | | | |
| | |
| See Notes to Financial Statements | | See explanation of symbols and terms, if any, on B-97 and B-98 |
B-61
PACIFIC FUNDS
PF SMALL-CAP VALUE FUND
Schedule of Investments (Continued)
March 31, 2019
| | | | | | | | |
| | | Shares | | | Value | |
|
SHORT-TERM INVESTMENT - 3.5% | |
| | |
Money Market Fund - 3.5% | | | | | | | | |
| | |
BlackRock Liquidity FundsT-Fund Portfolio
‘Institutional’ 2.370% | | | 2,472,973 | | | $ | 2,472,973 | |
| | | | | | | | |
| |
Total Short-Term Investment
(Cost $2,472,973) | | | | 2,472,973 | |
| | | | | | | | |
| | |
TOTAL INVESTMENTS - 99.8%
(Cost $63,334,674) | | | | | | | 70,472,870 | |
| |
OTHER ASSETS & LIABILITIES, NET - 0.2% | | | | 144,676 | |
| | | | | | | | |
| |
NET ASSETS - 100.0% | | | | $70,617,546 | |
| | | | | | | | |
Notes to Schedule of Investments
| (a) | As of March 31, 2019, the Fund’s composition by sector as a percentage of net assets was as follows: |
| | | | |
Financial | | | 30.2% | |
Technology | | | 13.9% | |
Consumer, Cyclical | | | 12.9% | |
Industrial | | | 11.8% | |
Consumer,Non-Cyclical | | | 9.1% | |
Energy | | | 7.4% | |
Communications | | | 5.4% | |
Utilities | | | 4.9% | |
Short-Term Investment | | | 3.5% | |
Others (each less than 3.0%) | | | 0.7% | |
| | | | |
| | | 99.8% | |
Other Assets & Liabilities, Net | | | 0.2% | |
| | | | |
| | | 100.0% | |
| | | | |
| (b) | Fair Value Measurements |
The following is a summary of the Fund’s investments as categorized under the three-tier hierarchy of inputs used in valuing the Fund’s assets and liabilities (See Note 3D in Notes to Financial Statements) as of March 31, 2019:
| | | | | | | | | | | | | | | | | | |
| | | | | Total Value at
March 31, 2019 | | | Level 1
Quoted Price | | | Level 2
Significant
Observable Inputs | | | Level 3
Significant
Unobservable Inputs | |
Assets | | Common Stocks | | | $67,999,897 | | | | $67,999,897 | | | | $— | | | | $— | |
| | Short-Term Investment | | | 2,472,973 | | | | 2,472,973 | | | | — | | | | — | |
| | | | | | | | | | | | | | | | | | |
| | Total | | | $70,472,870 | | | | $70,472,870 | | | | $— | | | | $— | |
| | | | | | | | | | | | | | | | | | |
| | |
| See Notes to Financial Statements | | See explanation of symbols and terms, if any, on B-97 and B-98 |
B-62
PACIFIC FUNDS
PF EMERGING MARKETS FUND
Schedule of Investments
March 31, 2019
| | | | | | | | |
| | | Shares | | | Value | |
PREFERRED STOCKS - 1.4% | |
|
Brazil - 1.4% | |
| | |
Itau Unibanco Holding SA ADR | | | 70,200 | | | | $618,462 | |
Lojas Americanas SA | | | 296,618 | | | | 1,261,366 | |
| | | | | | | | |
| | | | 1,879,828 | |
| | | | | |
India - 0.0% | |
| | |
Zee Entertainment Enterprises Ltd
6.000% due 03/05/22 | | | 708,924 | | | | 56,386 | |
| | | | | | | | |
| |
Total Preferred Stocks
(Cost $1,616,422) | | | | 1,936,214 | |
| | | | | |
|
COMMON STOCKS - 96.7% | |
|
Argentina - 1.2% | |
| | |
MercadoLibre Inc * | | | 3,130 | | | | 1,589,195 | |
| | | | | | | | |
|
Brazil - 3.3% | |
| | |
Atacadao Distribuicao Comercio e Industria Ltda | | | 308,900 | | | | 1,584,993 | |
B3 SA - Brasil Bolsa Balcao | | | 227,953 | | | | 1,856,064 | |
StoneCo Ltd ‘A’ * | | | 2,530 | | | | 104,008 | |
Vale SA ADR | | | 68,640 | | | | 896,438 | |
| | | | | | | | |
| | | | 4,441,503 | |
| | | | | |
Chile - 1.2% | |
| | |
Banco de Chile | | | 1,386,585 | | | | 204,110 | |
SACI Falabella | | | 193,108 | | | | 1,435,884 | |
| | | | | | | | |
| | | | 1,639,994 | |
| | | | | |
China - 25.9% | |
| | |
Alibaba Group Holding Ltd ADR * | | | 50,102 | | | | 9,141,110 | |
China International Capital Corp Ltd ‘H’ ~ | | | 291,200 | | | | 675,989 | |
Dong-E-E-Jiao Co Ltd ‘A’ | | | 93,600 | | | | 658,983 | |
Huazhu Group Ltd ADR | | | 85,477 | | | | 3,602,001 | |
Innovent Biologics Inc * ~ | | | 61,500 | | | | 224,699 | |
Jiangsu Hengrui Medicine Co Ltd ‘A’ | | | 387,307 | | | | 3,761,850 | |
Meituan Dianping ‘B’ * | | | 357,000 | | | | 2,412,950 | |
Pinduoduo Inc ADR * | | | 14,410 | | | | 357,368 | |
Ping An Healthcare and Technology Co Ltd * ~ | | | 9,048 | | | | 51,182 | |
Ping An Insurance Group Co of China Ltd ‘A’ | | | 123,175 | | | | 1,411,138 | |
Shanghai Junshi Biosciences Co Ltd ‘H’ * ~ | | | 51,000 | | | | 194,256 | |
Sinopharm Group Co Ltd ‘H’ | | | 409,400 | | | | 1,706,943 | |
Sunny Optical Technology Group Co Ltd | | | 68,800 | | | | 824,801 | |
Tencent Holdings Ltd | | | 113,322 | | | | 5,211,429 | |
Tencent Music Entertainment Group ADR * | | | 31 | | | | 561 | |
Wuxi Biologics Cayman Inc * ~ | | | 87,000 | | | | 847,502 | |
Yum China Holdings Inc | | | 48,690 | | | | 2,186,668 | |
ZTO Express Cayman Inc ADR | | | 79,100 | | | | 1,445,948 | |
| | | | | | | | |
| | | | 34,715,378 | |
| | | | | |
Colombia - 0.5% | |
| | |
Grupo Aval Acciones y Valores SA ADR | | | 92,199 | | | | 718,230 | |
| | | | | | | | |
|
Egypt - 0.5% | |
| | |
Commercial International Bank Egypt SAE | | | 156,036 | | | | 614,129 | |
| | | | | | | | |
|
France - 6.4% | |
| | |
Kering SA | | | 9,847 | | | | 5,648,289 | |
LVMH Moet Hennessy Louis Vuitton SE | | | 7,786 | | | | 2,867,860 | |
| | | | | | | | |
| | | | 8,516,149 | |
| | | | | |
Hong Kong - 6.5% | |
| | |
AIA Group Ltd | | | 416,400 | | | | 4,163,904 | |
Hong Kong Exchanges & Clearing Ltd | | | 70,927 | | | | 2,478,085 | |
| | | | | | | | |
| | | Shares | | | Value | |
Hutchison China MediTech Ltd ADR * | | | 12,440 | | | | $380,415 | |
Jardine Strategic Holdings Ltd | | | 45,770 | | | | 1,716,825 | |
| | | | | | | | |
| | | | 8,739,229 | |
| | | | | |
India - 11.3% | |
| | |
Bandhan Bank Ltd ~ | | | 23,306 | | | | 176,784 | |
Biocon Ltd | | | 82,647 | | | | 729,185 | |
Cholamandalam Investment and Finance Co Ltd | | | 23,559 | | | | 494,032 | |
Housing Development Finance Corp Ltd | | | 173,633 | | | | 4,931,687 | |
Kotak Mahindra Bank Ltd | | | 224,734 | | | | 4,330,093 | |
Oberoi Realty Ltd | | | 35,987 | | | | 274,489 | |
Odisha Cement Ltd * | | | 22,888 | | | | 326,924 | |
Tata Consultancy Services Ltd | | | 56,928 | | | | 1,645,338 | |
UltraTech Cement Ltd | | | 12,248 | | | | 707,239 | |
Zee Entertainment Enterprises Ltd | | | 233,554 | | | | 1,503,197 | |
| | | | | | | | |
| | | | 15,118,968 | |
| | | | | |
Indonesia - 1.1% | |
| | |
P.T. Bank Central Asia Tbk | | | 382,200 | | | | 745,819 | |
P.T. Indocement Tunggal Prakarsa Tbk | | | 426,200 | | | | 657,008 | |
| | | | | | | | |
| | | | 1,402,827 | |
| | | | | |
Italy - 1.5% | |
| | |
Moncler SPA | | | 19,789 | | | | 798,681 | |
PRADA SPA | | | 407,000 | | | | 1,213,244 | |
| | | | | | | | |
| | | | 2,011,925 | |
| | | | | |
Mexico - 6.4% | |
| | |
Alsea SAB de CV | | | 237,890 | | | | 498,080 | |
Banco Santander Mexico SA Institucion de Banca Multiple Grupo Financiero Santand ‘B’ | | | 423,811 | | | | 578,830 | |
Fomento Economico Mexicano SAB de CV | | | 236,199 | | | | 2,177,238 | |
Fomento Economico Mexicano SAB de CV ADR | | | 10,520 | | | | 970,786 | |
Grupo Aeroportuario del Sureste SAB de CV ‘B’ | | | 41,108 | | | | 664,327 | |
Grupo Financiero Inbursa SAB de CV ‘O’ | | | 704,391 | | | | 974,740 | |
Grupo Mexico SAB de CV ‘B’ | | | 730,984 | | | | 2,001,236 | |
Wal-Mart de Mexico SAB de CV | | | 261,798 | | | | 699,872 | |
| | | | | | | | |
| | | | 8,565,109 | |
| | | | | |
Peru - 1.3% | |
| | |
Credicorp Ltd | | | 7,150 | | | | 1,715,643 | |
| | | | | | | | |
|
Philippines - 3.6% | |
| | |
Ayala Corp | | | 25,590 | | | | 458,275 | |
Ayala Land Inc | | | 1,061,200 | | | | 908,042 | |
BDO Unibank Inc | | | 54,640 | | | | 139,466 | |
Jollibee Foods Corp | | | 123,910 | | | | 748,038 | |
SM Investments Corp | | | 90,697 | | | | 1,614,923 | |
SM Prime Holdings Inc | | | 1,248,670 | | | | 949,387 | |
| | | | | | | | |
| | | | 4,818,131 | |
| | | | | |
Russia - 7.9% | |
| | |
LUKOIL PJSC ADR | | | 15,521 | | | | 1,391,695 | |
MMC Norilsk Nickel PJSC | | | 1,064 | | | | 222,144 | |
MMC Norilsk Nickel PJSC ADR | | | 6,457 | | | | 136,372 | |
Novatek PJSC GDR ~ | | | 31,170 | | | | 5,344,319 | |
Polyus PJSC GDR ~ | | | 8,300 | | | | 341,130 | |
Sberbank of Russia PJSC | | | 397,063 | | | | 1,297,042 | |
Yandex NV ‘A’ * | | | 52,510 | | | | 1,803,193 | |
| | | | | | | | |
| | | | 10,535,895 | |
| | | | | |
South Africa - 2.3% | |
| | |
FirstRand Ltd | | | 465,281 | | | | 2,037,318 | |
Shoprite Holdings Ltd | | | 93,561 | | | | 1,030,767 | |
Steinhoff International Holdings NV * | | | 369,477 | | | | 48,141 | |
| | | | | | | | |
| | | | 3,116,226 | |
| | | | | |
South Korea - 4.0% | |
| | |
Amorepacific Corp | | | 4,933 | | | | 821,052 | |
AMOREPACIFIC Group | | | 4,297 | | | | 264,043 | |
| | |
| See Notes to Financial Statements | | See explanation of symbols and terms, if any, on B-97 and B-98 |
B-63
PACIFIC FUNDS
PF EMERGING MARKETS FUND
Schedule of Investments (Continued)
March 31, 2019
| | | | | | | | |
| | | Shares | | | Value | |
LG Household & Health Care Ltd | | | 1,372 | | | | $1,714,511 | |
NAVER Corp | | | 2,333 | | | | 255,329 | |
Samsung Biologics Co Ltd * ~ | | | 3,427 | | | | 967,333 | |
Samsung Electronics Co Ltd | | | 35,182 | | | | 1,387,681 | |
| | | | | | | | |
| | | | 5,409,949 | |
| | | | | |
Switzerland - 3.7% | |
| | |
Glencore PLC | | | 1,201,026 | | | | 4,977,270 | |
| | | | | | | | |
|
Taiwan - 5.2% | |
| | |
Taiwan Semiconductor Manufacturing Co Ltd | | | 869,995 | | | | 6,967,841 | |
| | | | | | | | |
|
Thailand - 0.5% | |
| | |
The Siam Commercial Bank PCL | | | 147,400 | | | | 613,217 | |
| | | | | | | | |
|
Turkey - 1.4% | |
| | |
Akbank T.A.S. | | | 645,765 | | | | 735,288 | |
Anadolu Efes Biracilik Ve Malt Sanayii AS | | | 130,442 | | | | 410,434 | |
BIM Birlesik Magazalar AS | | | 22,526 | | | | 307,861 | |
Turkiye Garanti Bankasi AS | | | 292,791 | | | | 440,464 | |
| | | | | | | | |
| | | | 1,894,047 | |
| | | | | |
United Arab Emirates - 1.0% | |
| | |
DP World Ltd | | | 46,714 | | | | 747,424 | |
Emaar Properties PJSC | | | 429,824 | | | | 549,974 | |
| | | | | | | | |
| | | | 1,297,398 | |
| | | | | |
| |
Total Common Stocks
(Cost $84,091,128) | | | | 129,418,253 | |
| | | | | | | | |
| | | | | |
|
SHORT-TERM INVESTMENT - 2.1% | |
|
Money Market Fund - 2.1% | |
| | |
BlackRock Liquidity FundsT-Fund Portfolio
‘Institutional’ 2.370% | | | 2,754,867 | | | | 2,754,867 | |
| | | | | | | | |
| |
Total Short-Term Investment
(Cost $2,754,867) | | | | 2,754,867 | |
| | | | | |
| |
TOTAL INVESTMENTS - 100.2%
(Cost $88,462,417) | | | | 134,109,334 | |
| |
OTHER ASSETS & LIABILITIES, NET - (0.2%) | | | | (222,550 | ) |
| | | | | |
| |
NET ASSETS - 100.0% | | | | $133,886,784 | |
| | | | | |
Notes to Schedule of Investments
| (a) | As of March 31, 2019, the Fund’s composition by sector as a percentage of net assets was as follows: |
| | | | |
Financial | | | 26.2% | |
Consumer, Cyclical | | | 18.1% | |
Communications | | | 16.7% | |
Consumer,Non-cyclical | | | 13.5% | |
Technology | | | 7.5% | |
Basic Materials | | | 6.4% | |
Energy | | | 5.0% | |
Industrial | | | 3.5% | |
Others (each less than 3.0%) | | | 3.3% | |
| | | | |
| | | 100.2% | |
Other Assets & Liabilities, Net | | | (0.2% | ) |
| | | | |
| | | 100.0% | |
| | | | |
| (b) | As of March 31, 2019, the Fund’s composition by country of risk as a percentage of net assets was as follows: |
| | | | |
China | | | 25.9% | |
India | | | 11.3% | |
Russia | | | 7.9% | |
Hong Kong | | | 6.5% | |
Mexico | | | 6.4% | |
France | | | 6.4% | |
Taiwan | | | 5.2% | |
Brazil | | | 4.7% | |
South Korea | | | 4.0% | |
Switzerland | | | 3.7% | |
Philippines | | | 3.6% | |
Others (each less than 3.0%) | | | 14.6% | |
| | | | |
| | | 100.2% | |
Other Assets & Liabilities, Net | | | (0.2% | ) |
| | | | |
| | | 100.0% | |
| | | | |
| | |
| See Notes to Financial Statements | | See explanation of symbols and terms, if any, on B-97 and B-98 |
B-64
PACIFIC FUNDS
PF EMERGING MARKETS FUND
Schedule of Investments (Continued)
March 31, 2019
| (c) | Fair Value Measurements |
The following is a summary of the Fund’s investments as categorized under the three-tier hierarchy of inputs used in valuing the Fund’s assets and liabilities (See Note 3D in Notes to Financial Statements) as of March 31, 2019:
| | | | | | | | | | | | | | | | | | |
| | | | | Total Value at
March 31, 2019 | | | Level 1
Quoted Price | | | Level 2
Significant
Observable Inputs | | | Level 3
Significant
Unobservable Inputs | |
Assets | | Preferred Stocks | | | $1,936,214 | | | | $1,936,214 | | | | $— | | | | $— | |
| | Common Stocks | | | | | | | | | | | | | | | | |
| | Argentina | | | 1,589,195 | | | | 1,589,195 | | | | — | | | | — | |
| | Brazil | | | 4,441,503 | | | | 4,441,503 | | | | — | | | | — | |
| | Chile | | | 1,639,994 | | | | 1,435,884 | | | | 204,110 | | | | — | |
| | China | | | 34,715,378 | | | | 16,927,351 | | | | 17,788,027 | | | | — | |
| | Colombia | | | 718,230 | | | | 718,230 | | | | — | | | | — | |
| | Egypt | | | 614,129 | | | | — | | | | 614,129 | | | | — | |
| | France | | | 8,516,149 | | | | — | | | | 8,516,149 | | | | — | |
| | Hong Kong | | | 8,739,229 | | | | 380,415 | | | | 8,358,814 | | | | — | |
| | India | | | 15,118,968 | | | | 326,924 | | | | 14,792,044 | | | | — | |
| | Indonesia | | | 1,402,827 | | | | — | | | | 1,402,827 | | | | — | |
| | Italy | | | 2,011,925 | | | | — | | | | 2,011,925 | | | | — | |
| | Mexico | | | 8,565,109 | | | | 8,565,109 | | | | — | | | | — | |
| | Peru | | | 1,715,643 | | | | 1,715,643 | | | | — | | | | — | |
| | Philippines | | | 4,818,131 | | | | 748,038 | | | | 4,070,093 | | | | — | |
| | Russia | | | 10,535,895 | | | | 1,939,565 | | | | 8,596,330 | | | | — | |
| | South Africa | | | 3,116,226 | | | | 48,141 | | | | 3,068,085 | | | | — | |
| | South Korea | | | 5,409,949 | | | | — | | | | 5,409,949 | | | | — | |
| | Switzerland | | | 4,977,270 | | | | — | | | | 4,977,270 | | | | — | |
| | Taiwan | | | 6,967,841 | | | | — | | | | 6,967,841 | | | | — | |
| | Thailand | | | 613,217 | | | | — | | | | 613,217 | | | | — | |
| | Turkey | | | 1,894,047 | | | | 307861 | | | | 1,586,186 | | | | — | |
| | United Arab Emirates | | | 1,297,398 | | | | 747,424 | | | | 549,974 | | | | — | |
| | | | | | | �� | | | | | | | | | | | |
| | Total Common Stocks | | | 129,418,253 | | | | 39,891,283 | | | | 89,526,970 | | | | — | |
| | | | | | | | | | | | | | | | | | |
| | Short-Term Investment | | | 2,754,867 | | | | 2,754,867 | | | | — | | | | — | |
| | | | | | | | | | | | | | | | | | |
| | Total | | | $134,109,334 | | | | $44,582,364 | | | | $89,526,970 | | | | $— | |
| | | | | | | | | | | | | | | | | | |
| | |
| See Notes to Financial Statements | | See explanation of symbols and terms, if any, on B-97 and B-98 |
B-65
PACIFIC FUNDS
PF INTERNATIONAL LARGE-CAP FUND
Schedule of Investments
March 31, 2019
| | | | | | | | |
| | | Shares | | | Value | |
COMMON STOCKS - 98.0% | |
|
Australia - 1.7% | |
| | |
Amcor Ltd | | | 24,814 | | | | $271,500 | |
Rio Tinto PLC | | | 12,123 | | | | 704,630 | |
| | | | | | | | |
| | | | 976,130 | |
| | | | | |
Belgium - 1.4% | |
| | |
KBC Group NV | | | 11,668 | | | | 815,724 | |
| | | | | | | | |
|
Brazil - 0.5% | |
| | |
Ambev SA ADR | | | 74,793 | | | | 321,610 | |
| | | | | | | | |
|
Canada - 3.5% | |
| | |
Canadian National Railway Co | | | 13,633 | | | | 1,219,881 | |
Suncor Energy Inc | | | 24,527 | | | | 794,900 | |
| | | | | | | | |
| | | | 2,014,781 | |
| | | | | |
China - 2.2% | |
| | |
Baidu Inc ADR * | | | 2,374 | | | | 391,354 | |
Yum China Holdings Inc | | | 20,451 | | | | 918,454 | |
| | | | | | | | |
| | | | 1,309,808 | |
| | | | | |
Denmark - 2.5% | |
| | |
Carlsberg AS ‘B’ | | | 3,359 | | | | 420,037 | |
Novo Nordisk AS ‘B’ | | | 20,098 | | | | 1,050,429 | |
| | | | | | | | |
| | | | 1,470,466 | |
| | | | | |
France - 15.5% | |
| | |
Air Liquide SA | | | 10,929 | | | | 1,390,847 | |
Danone SA | | | 9,747 | | | | 750,532 | |
Dassault Systemes SE | | | 2,255 | | | | 336,106 | |
Engie SA | | | 41,156 | | | | 613,756 | |
EssilorLuxottica SA | | | 5,404 | | | | 590,335 | |
Hermes International | | | 313 | | | | 206,666 | |
L’Oreal SA | | | 2,662 | | | | 716,857 | |
Legrand SA | | | 7,425 | | | | 497,106 | |
LVMH Moet Hennessy Louis Vuitton SE | | | 3,752 | | | | 1,381,995 | |
Pernod Ricard SA | | | 6,425 | | | | 1,153,683 | |
Schneider Electric SE | | | 17,476 | | | | 1,371,673 | |
| | | | | | | | |
| | | | 9,009,556 | |
| | | | | |
Germany - 8.7% | |
| | |
Bayer AG | | | 16,077 | | | | 1,035,234 | |
Beiersdorf AG | | | 10,700 | | | | 1,113,937 | |
Deutsche Boerse AG | | | 2,931 | | | | 375,814 | |
Merck KGaA | | | 5,419 | | | | 618,695 | |
MTU Aero Engines AG | | | 1,442 | | | | 326,847 | |
ProSiebenSat.1 Media SE | | | 18,027 | | | | 256,650 | |
SAP SE | | | 11,704 | | | | 1,353,042 | |
| | | | | | | | |
| | | | 5,080,219 | |
| | | | | |
Hong Kong - 2.7% | |
| | |
AIA Group Ltd | | | 159,826 | | | | 1,598,223 | |
| | | | | | | | |
| |
|
India - 3.2% | |
| | |
Housing Development Finance Corp Ltd | | | 22,441 | | | | 637,390 | |
Tata Consultancy Services Ltd | | | 41,749 | | | | 1,206,633 | |
| | | | | | | | |
| | | | 1,844,023 | |
| | | | | |
Ireland - 0.4% | |
| | |
Ryanair Holdings PLC ADR * | | | 2,776 | | | | 208,033 | |
| | | | | | | | |
|
Israel - 1.2% | |
| | |
Check Point Software Technologies Ltd * | | | 5,533 | | | | 699,869 | |
| | | | | | | | |
| | | | | | | | |
| | | Shares | | | Value | |
Italy - 2.1% | |
| | |
Eni SPA | | | 35,941 | | | | $635,028 | |
Intesa Sanpaolo SPA | | | 237,158 | | | | 578,791 | |
| | | | | | | | |
| | | | 1,213,819 | |
| | | | | |
Japan - 14.0% | |
| | |
Daikin Industries Ltd | | | 8,300 | | | | 975,621 | |
Denso Corp | | | 13,100 | | | | 511,807 | |
FANUC Corp | | | 2,800 | | | | 478,838 | |
Hoya Corp | | | 21,200 | | | | 1,404,230 | |
Japan Tobacco Inc | | | 28,000 | | | | 693,499 | |
Kubota Corp | | | 50,400 | | | | 732,578 | |
Kyocera Corp | | | 13,000 | | | | 765,477 | |
Olympus Corp | | | 98,800 | | | | 1,074,867 | |
Shin-Etsu Chemical Co Ltd | | | 4,200 | | | | 353,425 | |
Terumo Corp | | | 37,200 | | | | 1,138,532 | |
| | | | | | | | |
| | | | 8,128,874 | |
| | | | | |
Netherlands - 3.6% | |
| | |
Akzo Nobel NV | | | 9,900 | | | | 879,455 | |
ING Groep NV | | | 55,230 | | | | 669,242 | |
Randstad NV | | | 10,989 | | | | 536,573 | |
| | | | | | | | |
| | | | 2,085,270 | |
| | | | | |
Singapore - 1.5% | |
| | |
DBS Group Holdings Ltd | | | 46,800 | | | | 873,610 | |
| | | | | | | | |
|
Spain - 2.0% | |
| | |
Amadeus IT Group SA | | | 14,701 | | | | 1,178,275 | |
| | | | | | | | |
|
Sweden - 0.9% | |
| | |
Essity AB ‘B’ | | | 17,256 | | | | 497,979 | |
| | | | | | | | |
|
Switzerland - 13.0% | |
| | |
Julius Baer Group Ltd | | | 6,981 | | | | 282,397 | |
Nestle SA | | | 24,167 | | | | 2,304,333 | |
Novartis AG | | | 12,148 | | | | 1,167,660 | |
Roche Holding AG | | | 6,311 | | | | 1,739,027 | |
Sika AG | | | 3,086 | | | | 431,584 | |
UBS Group AG | | | 75,613 | | | | 917,454 | |
Zurich Insurance Group AG | | | 2,163 | | | | 716,032 | |
| | | | | | | | |
| | | | 7,558,487 | |
| | | | | |
Taiwan - 1.4% | |
| | |
Taiwan Semiconductor Manufacturing Co Ltd ADR | | | 19,442 | | | | 796,344 | |
| | | | | | | | |
|
United Kingdom - 15.2% | |
| | |
Barclays PLC | | | 165,329 | | | | 333,019 | |
Compass Group PLC | | | 49,611 | | | | 1,167,274 | |
Diageo PLC | | | 26,950 | | | | 1,102,855 | |
Experian PLC | | | 41,780 | | | | 1,130,797 | |
Just Eat PLC * | | | 32,242 | | | | 315,503 | |
Linde PLC | | | 3,926 | | | | 691,262 | |
Prudential PLC | | | 18,136 | | | | 363,547 | |
Reckitt Benckiser Group PLC | | | 9,022 | | | | 750,838 | |
RELX PLC * | | | 30,480 | | | | 651,501 | |
RELX PLC | | | 14,414 | | | | 308,451 | |
Rolls-Royce Holdings PLC * | | | 51,486 | | | | 606,333 | |
Smiths Group PLC | | | 21,013 | | | | 393,214 | |
Tesco PLC | | | 138,111 | | | | 417,995 | |
WPP PLC | | | 57,330 | | | | 605,640 | |
| | | | | | | | |
| | | | 8,838,229 | |
| | | | | |
United States - 0.8% | |
| | |
QIAGEN NV * | | | 11,523 | | | | 467,745 | |
| | | | | | | | |
| |
Total Common Stocks
(Cost $38,953,283) | | | | 56,987,074 | |
| | | | | |
| | |
| See Notes to Financial Statements | | See explanation of symbols and terms, if any, on B-97 and B-98 |
B-66
PACIFIC FUNDS
PF INTERNATIONAL LARGE-CAP FUND
Schedule of Investments (Continued)
March 31, 2019
| | | | | | | | |
| | | Shares | | | Value | |
SHORT-TERM INVESTMENT - 0.5% | |
|
Money Market Fund - 0.5% | |
| | |
BlackRock Liquidity FundsT-Fund Portfolio
‘Institutional’ 2.370% | | | 271,176 | | | | $271,176 | |
| | | | | | | | |
| |
Total Short-Term Investment
(Cost $271,176) | | | | 271,176 | |
| | | | | |
| |
TOTAL INVESTMENTS - 98.5%
(Cost $39,224,459) | | | | 57,258,250 | |
| |
OTHER ASSETS & LIABILITIES, NET - 1.5% | | | | 893,910 | |
| | | | | |
| |
NET ASSETS - 100.0% | | | | $58,152,160 | |
| | | | | | | | |
Notes to Schedule of Investments
| (a) | As of March 31, 2019, the Fund’s composition by sector as a percentage of net assets was as follows: |
| | | | |
Consumer,Non-Cyclical | | | 37.4% | |
Industrial | | | 16.3% | |
Financial | | | 14.0% | |
Technology | | | 9.6% | |
Consumer, Cyclical | | | 7.6% | |
Basic Materials | | | 6.9% | |
Others (each less than 3.0%) | | | 6.7% | |
| | | | |
| | | 98.5% | |
Other Assets & Liabilities, Net | | | 1.5% | |
| | | | |
| | | 100.0% | |
| | | | |
| (b) | As of March 31, 2019, the Fund’s composition by country of risk as a percentage of net assets was as follows: |
| | | | |
France | | | 15.5% | |
United Kingdom | | | 15.2% | |
Japan | | | 14.0% | |
Switzerland | | | 13.0% | |
Germany | | | 8.7% | |
Netherlands | | | 3.6% | |
Canada | | | 3.5% | |
India | | | 3.2% | |
Others (each less than 3.0%) | | | 21.8% | |
| | | | |
| | | 98.5% | |
Other Assets & Liabilities, Net | | | 1.5% | |
| | | | |
| | | 100.0% | |
| | | | |
| (c) | Fair Value Measurements |
The following is a summary of the Fund’s investments as categorized under the three-tier hierarchy of inputs used in valuing the Fund’s assets and liabilities (See Note 3D in Notes to Financial Statements) as of March 31, 2019:
| | | | | | | | | | | | | | | | | | |
| | | | | Total Value at
March 31, 2019 | | | Level 1
Quoted Price | | | Level 2
Significant
Observable Inputs | | | Level 3
Significant
Unobservable Inputs | |
Assets | | Common Stocks | | | | | | | | | | | | | | | | |
| | Australia | | | $976,130 | | | | $— | | | | $976,130 | | | | $— | |
| | Belgium | | | 815,724 | | | | — | | | | 815,724 | | | | — | |
| | Brazil | | | 321,610 | | | | 321,610 | | | | — | | | | — | |
| | Canada | | | 2,014,781 | | | | 2,014,781 | | | | — | | | | — | |
| | China | | | 1,309,808 | | | | 1,309,808 | | | | — | | | | — | |
| | Denmark | | | 1,470,466 | | | | — | | | | 1,470,466 | | | | — | |
| | France | | | 9,009,556 | | | | — | | | | 9,009,556 | | | | — | |
| | Germany | | | 5,080,219 | | | | — | | | | 5,080,219 | | | | — | |
| | Hong Kong | | | 1,598,223 | | | | — | | | | 1,598,223 | | | | — | |
| | India | | | 1,844,023 | | | | — | | | | 1,844,023 | | | | — | |
| | Ireland | | | 208,033 | | | | 208,033 | | | | — | | | | — | |
| | Israel | | | 699,869 | | | | 699,869 | | | | — | | | | — | |
| | Italy | | | 1,213,819 | | | | — | | | | 1,213,819 | | | | — | |
| | Japan | | | 8,128,874 | | | | — | | | | 8,128,874 | | | | — | |
| | Netherlands | | | 2,085,270 | | | | — | | | | 2,085,270 | | | | — | |
| | Singapore | | | 873,610 | | | | — | | | | 873,610 | | | | — | |
| | Spain | | | 1,178,275 | | | | — | | | | 1,178,275 | | | | — | |
| | Sweden | | | 497,979 | | | | — | | | | 497,979 | | | | — | |
| | Switzerland | | | 7,558,487 | | | | — | | | | 7,558,487 | | | | — | |
| | Taiwan | | | 796,344 | | | | 796,344 | | | | — | | | | — | |
| | United Kingdom | | | 8,838,229 | | | | — | | | | 8,838,229 | | | | — | |
| | United States | | | 467,745 | | | | — | | | | 467,745 | | | | — | |
| | | | | | | | | | | | | | | | | | |
| | Total Common Stocks | | | 56,987,074 | | | | 5,350,445 | | | | 51,636,629 | | | | — | |
| | | | | | | | | | | | | | | | | | |
| | Short-Term Investment | | | 271,176 | | | | 271,176 | | | | — | | | | — | |
| | | | | | | | | | | | | | | | | | |
| | Total | | | $57,258,250 | | | | $5,621,621 | | | | $51,636,629 | | | | $— | |
| | | | | | | | | | | | | | | | | | |
| | |
| See Notes to Financial Statements | | See explanation of symbols and terms, if any, on B-97 and B-98 |
B-67
PACIFIC FUNDS
PF INTERNATIONAL SMALL-CAP FUND
Schedule of Investments
March 31, 2019
| | | | | | | | |
| | | Shares | | | Value | |
COMMON STOCKS - 98.1% | |
|
Australia - 2.7% | |
| | |
Accent Group Ltd | | | 78,925 | | | | $80,792 | |
Ansell Ltd | | | 4,750 | | | | 85,819 | |
Australian Pharmaceutical Industries Ltd | | | 34,050 | | | | 36,694 | |
Aveo Group » | | | 54,968 | | | | 76,951 | |
Charter Hall Long Wale REIT | | | 37,084 | | | | 120,128 | |
Charter Hall Retail REIT | | | 32,885 | | | | 108,678 | |
Mayne Pharma Group Ltd * | | | 94,152 | | | | 46,571 | |
Perseus Mining Ltd * | | | 252,616 | | | | 82,502 | |
Sandfire Resources NL | | | 23,536 | | | | 115,680 | |
Shopping Centres Australasia Property Group REIT | | | 62,080 | | | | 116,426 | |
| | | | | | | | |
| | | | 870,241 | |
| | | | | |
Austria - 0.2% | |
| | |
AT&S Austria Technologie & Systemtechnik AG | | | 4,089 | | | | 70,321 | |
| | | | | | | | |
|
Belgium - 0.9% | |
| | |
Barco NV | | | 1,182 | | | | 181,226 | |
Fagron | | | 6,142 | | | | 110,387 | |
| | | | | | | | |
| | | | 291,613 | |
| | | | | |
Canada - 10.7% | |
| | |
AGF Management Ltd ‘B’ | | | 21,600 | | | | 87,444 | |
Alaris Royalty Corp | | | 7,300 | | | | 115,152 | |
Artis REIT | | | 9,900 | | | | 82,306 | |
Baytex Energy Corp * | | | 49,876 | | | | 84,722 | |
Boardwalk REIT | | | 3,000 | | | | 91,548 | |
Canfor Corp * | | | 7,300 | | | | 74,838 | |
Choice Properties REIT | | | 10,200 | | | | 107,316 | |
CI Financial Corp | | | 5,900 | | | | 80,530 | |
Corus Entertainment Inc | | | 24,800 | | | | 109,863 | |
Crescent Point Energy Corp | | | 23,100 | | | | 74,848 | |
CT REIT | | | 8,900 | | | | 95,637 | |
Detour Gold Corp * | | | 10,247 | | | | 96,156 | |
Dundee Precious Metals Inc * | | | 40,200 | | | | 133,263 | |
Empire Co Ltd ‘A’ | | | 6,100 | | | | 132,056 | |
Enerplus Corp | | | 20,000 | | | | 167,621 | |
Genworth MI Canada Inc | | | 4,842 | | | | 146,708 | |
Gluskin Sheff + Associates Inc | | | 9,900 | | | | 106,308 | |
Granite REIT | | | 3,100 | | | | 148,116 | |
Hudbay Minerals Inc | | | 14,700 | | | | 105,051 | |
Medical Facilities Corp | | | 8,200 | | | | 108,180 | |
New Gold Inc * | | | 104,600 | | | | 89,231 | |
Parex Resources Inc * | | | 9,300 | | | | 145,588 | |
Points International Ltd * | | | 6,100 | | | | 81,984 | |
Polaris Infrastructure Inc | | | 14,900 | | | | 126,215 | |
Precision Drilling Corp * | | | 30,100 | | | | 71,401 | |
Seven Generations Energy Ltd ‘A’ * | | | 12,700 | | | | 91,709 | |
Sherritt International Corp * | | | 216,900 | | | | 68,169 | |
SmartCentres REIT | | | 4,400 | | | | 115,272 | |
Superior Plus Corp | | | 13,800 | | | | 118,240 | |
TransAlta Corp | | | 20,800 | | | | 152,846 | |
Trevali Mining Corp * | | | 300,000 | | | | 89,797 | |
Trican Well Service Ltd * | | | 35,700 | | | | 34,195 | |
WestJet Airlines Ltd | | | 6,700 | | | | 97,415 | |
| | | | | | | | |
| | | | 3,429,725 | |
| | | | | |
China - 0.4% | |
| | |
Gemdale Properties & Investment Corp Ltd | | | 999,886 | | | | 127,575 | |
| | | | | | | | |
|
Denmark - 1.3% | |
| | |
Alm Brand AS | | | 11,512 | | | | 99,346 | |
D/S Norden AS * | | | 5,920 | | | | 80,555 | |
Royal Unibrew AS | | | 1,964 | | | | 145,043 | |
Spar Nord Bank AS | | | 11,086 | | | | 97,186 | |
| | | | | | | | |
| | | | 422,130 | |
| | | | | |
| | | | | | | | |
| | | Shares | | | Value | |
Egypt - 0.2% | | | | | |
| | |
Centamin PLC | | | 60,081 | | | $ | 69,663 | |
| | | | | | | | |
|
Finland - 1.1% | |
| | |
Finnair OYJ | | | 13,109 | | | | 118,074 | |
Outotec OYJ * | | | 23,609 | | | | 103,712 | |
Valmet OYJ | | | 4,689 | | | | 118,802 | |
| | | | | | | | |
| | | | 340,588 | |
| | | | | |
France - 5.2% | |
| | |
Alstom SA | | | 4,159 | | | | 180,343 | |
Alten SA | | | 1,505 | | | | 161,139 | |
Arkema SA | | | 1,029 | | | | 98,165 | |
Beneteau SA | | | 5,091 | | | | 59,705 | |
Casino Guichard Perrachon SA | | | 2,745 | | | | 119,012 | |
Eiffage SA | | | 2,087 | | | | 200,620 | |
Eramet | | | 1,690 | | | | 94,074 | |
Eutelsat Communications SA | | | 4,464 | | | | 78,174 | |
Ipsen SA | | | 1,101 | | | | 150,982 | |
IPSOS | | | 2,941 | | | | 73,652 | |
Kaufman & Broad SA | | | 2,448 | | | | 100,023 | |
Nexity SA | | | 2,272 | | | | 110,895 | |
Rexel SA | | | 8,497 | | | | 95,892 | |
Rothschild & Co | | | 2,514 | | | | 80,014 | |
Teleperformance | | | 345 | | | | 62,020 | |
| | | | | | | | |
| | | | 1,664,710 | |
| | | | | |
Germany - 5.3% | |
| | |
Bauer AG | | | 4,214 | | | | 72,591 | |
CECONOMY AG * | | | 11,960 | | | | 63,593 | |
Covestro AG ~ | | | 1,788 | | | | 98,647 | |
CTS Eventim AG & Co KGaA | | | 1,385 | | | | 65,670 | |
DIC Asset AG | | | 9,941 | | | | 111,960 | |
Hamburger Hafen und Logistik AG | | | 3,500 | | | | 79,968 | |
HOCHTIEF AG | | | 1,346 | | | | 195,025 | |
Jenoptik AG | | | 6,100 | | | | 227,753 | |
LEG Immobilien AG | | | 1,977 | | | | 242,947 | |
Salzgitter AG | | | 2,345 | | | | 67,918 | |
Siltronic AG | | | 926 | | | | 81,687 | |
Software AG | | | 2,955 | | | | 100,023 | |
TAG Immobilien AG | | | 6,804 | | | | 168,045 | |
Talanx AG | | | 3,265 | | | | 126,012 | |
| | | | | | | | |
| | | | 1,701,839 | |
| | | | | |
Hong Kong - 1.9% | |
| | |
Cathay Pacific Airways Ltd | | | 64,000 | | | | 112,027 | |
Champion REIT | | | 112,000 | | | | 97,032 | |
Dah Sing Financial Holdings Ltd | | | 17,000 | | | | 89,304 | |
Kerry Properties Ltd | | | 36,000 | | | | 160,950 | |
Melco International Development Ltd | | | 41,000 | | | | 96,185 | |
SmarTone Telecommunications Holdings Ltd | | | 56,715 | | | | 61,677 | |
| | | | | | | | |
| | | | 617,175 | |
| | | | | |
Israel - 1.8% | |
| | |
AudioCodes Ltd | | | 8,903 | | | | 123,217 | |
CyberArk Software Ltd * | | | 1,256 | | | | 149,527 | |
Gazit-Globe Ltd | | | 11,368 | | | | 91,468 | |
Nova Measuring Instruments Ltd * | | | 4,465 | | | | 112,429 | |
Silicom Ltd * | | | 2,700 | | | | 103,275 | |
| | | | | | | | |
| | | | 579,916 | |
| | | | | |
Italy - 3.5% | |
| | |
A2A SPA | | | 109,319 | | | | 199,737 | |
Banca IFIS SPA | | | 4,849 | | | | 80,071 | |
Cairo Communication SPA | | | 22,348 | | | | 94,542 | |
DiaSorin SPA | | | 1,248 | | | | 125,876 | |
El.En. SPA | | | 4,911 | | | | 103,646 | |
ERG SPA | | | 6,801 | | | | 128,806 | |
Fincantieri SPA | | | 56,949 | | | | 70,100 | |
| | |
| See Notes to Financial Statements | | See explanation of symbols and terms, if any, on B-97 and B-98 |
B-68
PACIFIC FUNDS
PF INTERNATIONAL SMALL-CAP FUND
Schedule of Investments (Continued)
March 31, 2019
| | | | | | | | |
| | | Shares | | | Value | |
Iren SPA | | | 47,451 | | | $ | 121,138 | |
Rizzoli Corriere Della Sera Mediagroup SPA * | | | 67,088 | | | | 96,008 | |
Unieuro SPA * ~ | | | 6,000 | | | | 88,859 | |
| | | | | | | | |
| | | | 1,108,783 | |
| | | | | |
Japan - 23.7% | |
| | |
Asahi Co Ltd | | | 6,800 | | | | 94,147 | |
Asahi Diamond Industrial Co Ltd | | | 14,000 | | | | 96,841 | |
Avex Inc | | | 6,200 | | | | 82,798 | |
Capcom Co Ltd | | | 8,600 | | | | 193,018 | |
Citizen Watch Co Ltd | | | 15,500 | | | | 86,613 | |
cocokara fine Inc | | | 1,800 | | | | 71,607 | |
Daiho Corp | | | 3,900 | | | | 114,189 | |
DMG Mori Co Ltd | | | 8,300 | | | | 103,188 | |
Financial Products Group Co Ltd | | | 9,700 | | | | 79,636 | |
First-corp Inc | | | 11,500 | | | | 84,918 | |
Foster Electric Co Ltd | | | 6,600 | | | | 99,424 | |
Fudo Tetra Corp | | | 5,200 | | | | 67,852 | |
Glory Ltd | | | 4,600 | | | | 110,586 | |
Goldcrest Co Ltd | | | 9,400 | | | | 127,082 | |
Kaken Pharmaceutical Co Ltd | | | 1,700 | | | | 77,433 | |
Kinden Corp | | | 5,300 | | | | 87,949 | |
Kito Corp | | | 6,000 | | | | 90,913 | |
Kobe Bussan Co Ltd | | | 4,600 | | | | 174,746 | |
Kureha Corp | | | 2,500 | | | | 140,446 | |
Look Holdings Inc | | | 7,126 | | | | 97,765 | |
Marvelous Inc | | | 10,100 | | | | 78,475 | |
Megmilk Snow Brand Co Ltd | | | 3,500 | | | | 85,364 | |
Meidensha Corp | | | 7,300 | | | | 100,392 | |
Meitec Corp | | | 3,100 | | | | 141,210 | |
Mitsui E&S Holdings Co Ltd * | | | 8,400 | | | | 79,417 | |
Mitsui Matsushima Holdings Co Ltd | | | 7,800 | | | | 86,887 | |
Morinaga & Co Ltd | | | 1,900 | | | | 82,630 | |
Nagase & Co Ltd | | | 12,600 | | | | 181,411 | |
NichiiGakkan Co Ltd | | | 7,332 | | | | 86,469 | |
Nihon Unisys Ltd | | | 8,400 | | | | 223,010 | |
Nippon Carbon Co Ltd | | | 1,900 | | | | 84,716 | |
Nippon Electric Glass Co Ltd | | | 3,000 | | | | 79,708 | |
Nippon Piston Ring Co Ltd | | | 8,100 | | | | 115,225 | |
NIPPON REIT Investment Corp | | | 39 | | | | 150,316 | |
Nippon Steel Corp | | | 4,430 | | | | 78,414 | |
Nippon Thompson Co Ltd | | | 21,125 | | | | 97,561 | |
Nippon Yakin Kogyo Co Ltd | | | 54,500 | | | | 124,230 | |
Nissin Kogyo Co Ltd | | | 6,300 | | | | 79,113 | |
Nojima Corp | | | 5,500 | | | | 100,020 | |
North Pacific Bank Ltd | | | 30,200 | | | | 75,667 | |
Obara Group Inc | | | 2,600 | | | | 86,336 | |
OSJB Holdings Corp | | | 34,900 | | | | 87,433 | |
Rengo Co Ltd | | | 13,300 | | | | 124,935 | |
Restar Holdings Corp | | | 3,200 | | | | 59,326 | |
Riken Vitamin Co Ltd | | | 3,600 | | | | 114,252 | |
Roland DG Corp | | | 3,600 | | | | 75,848 | |
Ryobi Ltd | | | 5,600 | | | | 125,978 | |
Sanken Electric Co Ltd | | | 3,000 | | | | 55,872 | |
Sankyu Inc | | | 2,100 | | | | 102,641 | |
Seven Bank Ltd | | | 32,300 | | | | 95,485 | |
Shinoken Group Co Ltd | | | 10,600 | | | | 71,735 | |
Ship Healthcare Holdings Inc | | | 4,400 | | | | 180,991 | |
Sinanen Holdings Co Ltd | | | 3,900 | | | | 74,129 | |
Sojitz Corp | | | 24,300 | | | | 85,861 | |
Sumitomo Mitsui Construction Co Ltd | | | 16,000 | | | | 111,623 | |
Sumitomo Seika Chemicals Co Ltd | | | 2,400 | | | | 88,457 | |
Tachi-S Co Ltd | | | 6,500 | | | | 93,211 | |
Takara Leben Co Ltd | | | 17,100 | | | | 53,206 | |
The Oita Bank Ltd | | | 2,900 | | | | 90,735 | |
The Okinawa Electric Power Co Inc | | | 8,706 | | | | 148,262 | |
TOA ROAD Corp | | | 3,600 | | | | 94,418 | |
Tocalo Co Ltd | | | 7,300 | | | | 57,733 | |
Toho Holdings Co Ltd | | | 6,400 | | | | 159,977 | |
Toho Zinc Co Ltd | | | 2,400 | | | | 68,027 | |
| | | | | | | | |
| | | Shares | | | Value | |
Tokyu Construction Co Ltd | | | 10,200 | | | $ | 76,605 | |
Topy Industries Ltd | | | 3,900 | | | | 78,177 | |
Tosei Corp | | | 17,400 | | | | 157,683 | |
Toyo Construction Co Ltd | | | 23,300 | | | | 90,061 | |
Toyota Boshoku Corp | | | 5,200 | | | | 78,832 | |
Ube Industries Ltd | | | 2,700 | | | | 55,672 | |
Unipres Corp | | | 5,400 | | | | 84,576 | |
Unitika Ltd * | | | 15,100 | | | | 58,135 | |
V Technology Co Ltd | | | 700 | | | | 89,075 | |
Wacom Co Ltd | | | 23,500 | | | | 99,274 | |
Yuasa Trading Co Ltd | | | 6,100 | | | | 172,324 | |
| | | | | | | | |
| | | | 7,558,271 | |
| | | | | |
Jordan - 0.5% | |
| | |
Hikma Pharmaceuticals PLC | | | 6,895 | | | | 161,029 | |
| | | | | | | | |
|
Malta - 0.3% | |
| | |
Kindred Group PLC SDR | | | 10,241 | | | | 102,734 | |
| | | | | | | | |
|
Netherlands - 3.9% | |
| | |
Aalberts Industries NV | | | 3,707 | | | | 128,326 | |
ASR Nederland NV | | | 5,522 | | | | 230,083 | |
BE Semiconductor Industries NV | | | 2,967 | | | | 79,210 | |
Boskalis Westminster | | | 3,395 | | | | 87,888 | |
Flow Traders ~ | | | 2,526 | | | | 69,649 | |
Heijmans NV * | | | 9,578 | | | | 95,828 | |
Intertrust NV ~ | | | 6,321 | | | | 119,243 | |
Koninklijke Volkerwessels NV | | | 3,598 | | | | 74,183 | |
OCI NV * | | | 2,341 | | | | 64,490 | |
SBM Offshore NV | | | 8,057 | | | | 153,481 | |
Signify NV ~ | | | 4,956 | | | | 132,592 | |
| | | | | | | | |
| | | | 1,234,973 | |
| | | | | |
New Zealand - 0.5% | |
| | |
Air New Zealand Ltd | | | 41,810 | | | | 72,234 | |
Z Energy Ltd | | | 19,707 | | | | 84,073 | |
| | | | | | | | |
| | | | 156,307 | |
| | | | | |
Norway - 0.8% | |
| | |
Aker Solutions ASA * | | | 17,817 | | | | 90,092 | |
Norway Royal Salmon ASA | | | 3,406 | | | | 78,980 | |
Norwegian Finans Holding ASA * | | | 11,374 | | | | 88,429 | |
| | | | | | | | |
| | | | 257,501 | |
| | | | | |
Peru - 0.3% | |
| | |
Hochschild Mining PLC | | | 39,298 | | | | 105,685 | |
| | | | | | | | |
|
Portugal - 0.3% | |
| | |
Sonae SGPS SA | | | 89,239 | | | | 92,384 | |
| | | | | | | | |
|
Singapore - 0.3% | |
| | |
IGG Inc | | | 67,000 | | | | 93,046 | |
| | | | | | | | |
|
South Korea - 5.7% | |
| | |
Binggrae Co Ltd | | | 1,300 | | | | 76,848 | |
Chong Kun Dang Pharmaceutical Corp | | | 1 | | | | 90 | |
Dong-A ST Co Ltd | | | 1,141 | | | | 96,997 | |
Doosan Bobcat Inc | | | 2,715 | | | | 73,977 | |
DY POWER Corp | | | 5,883 | | | | 85,276 | |
GS Engineering & Construction Corp | | | 2,239 | | | | 84,240 | |
Handsome Co Ltd | | | 2,890 | | | | 113,426 | |
Huchems Fine Chemical Corp | | | 5,565 | | | | 109,368 | |
Hyundai Marine & Fire Insurance Co Ltd | | | 4,695 | | | | 156,884 | |
Korea Petrochemical Ind Co Ltd | | | 508 | | | | 70,431 | |
Kumho Petrochemical Co Ltd | | | 1,276 | | | | 107,227 | |
| | |
| See Notes to Financial Statements | | See explanation of symbols and terms, if any, on B-97 and B-98 |
B-69
PACIFIC FUNDS
PF INTERNATIONAL SMALL-CAP FUND
Schedule of Investments (Continued)
March 31, 2019
| | | | | | | | |
| | | Shares | | | Value | |
LG Uplus Corp | | | 10,894 | | | $ | 148,366 | |
Moorim P&P Co Ltd | | | 15,847 | | | | 79,456 | |
OCI Co Ltd | | | 969 | | | | 79,532 | |
SFA Engineering Corp | | | 3,509 | | | | 134,106 | |
Silicon Works Co Ltd | | | 2,115 | | | | 78,925 | |
SK Discovery Co Ltd | | | 2,819 | | | | 65,889 | |
SL Corp | | | 4,911 | | | | 95,298 | |
Soulbrain Co Ltd | | | 1,766 | | | | 82,329 | |
Value Added Technology Co Ltd | | | 3,868 | | | | 82,384 | |
| | | | | | | | |
| | | | 1,821,049 | |
| | | | | |
Spain - 2.9% | |
| | |
Atlantica Yield PLC | | | 5,882 | | | | 114,464 | |
Bankinter SA | | | 17,756 | | | | 135,332 | |
Construcciones y Auxiliar de Ferrocarriles SA | | | 3,310 | | | | 159,165 | |
Enagas SA | | | 7,780 | | | | 226,496 | |
Faes Farma SA | | | 25,208 | | | | 106,604 | |
Sacyr SA | | | 33,000 | | | | 83,574 | |
Talgo SA * ~ | | | 13,258 | | | | 85,756 | |
| | | | | | | | |
| | | | 911,391 | |
| | | | | |
Sweden - 3.4% | |
| | |
Betsson AB * | | | 11,489 | | | | 87,183 | |
Evolution Gaming Group AB ~ | | | 1,821 | | | | 143,702 | |
Fastighets AB Balder * | | | 2,925 | | | | 93,834 | |
Hemfosa Fastigheter AB | | | 16,931 | | | | 148,691 | |
JM AB | | | 5,996 | | | | 107,513 | |
NetEnt AB * | | | 20,268 | | | | 73,645 | |
Nobina AB ~ | | | 9,373 | | | | 60,427 | |
Nyfosa AB * | | | 16,931 | | | | 101,433 | |
SSAB AB ‘A’ | | | 32,965 | | | | 118,738 | |
Wihlborgs Fastigheter AB | | | 10,910 | | | | 148,804 | |
| | | | | | | | |
| | | | 1,083,970 | |
| | | | | |
Switzerland - 6.0% | |
| | |
Adecco Group AG | | | 1,809 | | | | 96,609 | |
Baloise Holding AG | | | 1,051 | | | | 173,704 | |
Cembra Money Bank AG | | | 1,439 | | | | 136,173 | |
Coca-Cola HBC AG | | | 6,397 | | | | 218,134 | |
Emmi AG | | | 161 | | | | 141,728 | |
Forbo Holding AG | | | 70 | | | | 109,874 | |
Julius Baer Group Ltd | | | 4,702 | | | | 190,206 | |
Logitech International SA | | | 3,770 | | | | 148,057 | |
PSP Swiss Property AG | | | 1,738 | | | | 188,889 | |
Siegfried Holding AG | | | 357 | | | | 128,225 | |
Sonova Holding AG | | | 1,224 | | | | 242,560 | |
Tecan Group AG | | | 618 | | | | 145,954 | |
| | | | | | | | |
| | | | 1,920,113 | |
| | | | | |
Tanzania - 0.3% | |
| | |
Acacia Mining PLC * | | | 31,708 | | | | 81,291 | |
| | | | | | | | |
|
United Kingdom - 12.8% | |
| | |
Aggreko PLC | | | 8,555 | | | | 87,805 | |
Auto Trader Group PLC ~ | | | 22,698 | | | | 154,379 | |
Barratt Developments PLC | | | 8,727 | | | | 68,170 | |
Bellway PLC | | | 5,355 | | | | 212,446 | |
Charter Court Financial Services Group PLC ~ | | | 30,495 | | | | 131,865 | |
Cobham PLC * | | | 91,005 | | | | 130,892 | |
Computacenter PLC | | | 8,703 | | | | 125,425 | |
Dialog Semiconductor PLC * | | | 4,028 | | | | 122,844 | |
Drax Group PLC | | | 28,180 | | | | 138,951 | |
EI Group PLC * | | | 62,035 | | | | 172,099 | |
Fevertree Drinks PLC | | | 3,874 | | | | 152,478 | |
Great Portland Estates PLC REIT | | | 17,025 | | | | 165,602 | |
Gulf Keystone Petroleum Ltd * | | | 32,731 | | | | 108,255 | |
Hansteen Holdings PLC REIT | | | 88,190 | | | | 111,877 | |
Inchcape PLC | | | 9,828 | | | | 73,128 | |
Intermediate Capital Group PLC | | | 7,339 | | | | 101,941 | |
| | | | | | | | |
| | | Shares | | | Value | |
International Personal Finance PLC | | | 31,062 | | | $ | 78,770 | |
J D Wetherspoon PLC | | | 7,389 | | | | 126,072 | |
Keller Group PLC | | | 13,168 | | | | 105,825 | |
Man Group PLC | | | 29,607 | | | | 52,447 | |
OneSavings Bank PLC | | | 25,380 | | | | 126,886 | |
Paragon Banking Group PLC | | | 20,981 | | | | 119,098 | |
Playtech PLC | | | 23,173 | | | | 131,323 | |
QinetiQ Group PLC | | | 45,074 | | | | 177,005 | |
Redrow PLC * | | | 15,232 | | | | 119,355 | |
Rightmove PLC | | | 22,345 | | | | 148,579 | |
Safestore Holdings PLC REIT | | | 26,388 | | | | 205,012 | |
Saga PLC | | | 72,082 | | | | 104,399 | |
Spirent Communications PLC | | | 66,136 | | | | 123,868 | |
Stagecoach Group PLC | | | 36,558 | | | | 73,137 | |
Tate & Lyle PLC | | | 15,046 | | | | 142,311 | |
WH Smith PLC | | | 6,648 | | | | 183,918 | |
| | | | | | | | |
| | | | 4,076,162 | |
| | | | | |
United States - 1.2% | |
| | |
Argonaut Gold Inc * | | | 54,300 | | | | 76,390 | |
BRP Inc | | | 4,300 | | | | 119,313 | |
IMAX Corp * | | | 5,077 | | | | 115,147 | |
Viemed Healthcare Inc * | | | 13,500 | | | | 66,573 | |
| | | | | | | | |
| | | | 377,423 | |
| | | | | |
| |
Total Common Stocks
(Cost $29,968,829) | | | | 31,327,608 | |
| | | | | |
|
SHORT-TERM INVESTMENT - 1.1% | |
|
Money Market Fund - 1.1% | |
| | |
BlackRock Liquidity FundsT-Fund Portfolio
‘Institutional’ 2.370% | | | 362,848 | | | | 362,848 | |
| | | | | | | | |
| |
Total Short-Term Investment
(Cost $362,848) | | | | 362,848 | |
| | | | | |
| |
TOTAL INVESTMENTS - 99.2%
(Cost $30,331,677) | | | | 31,690,456 | |
| |
OTHER ASSETS & LIABILITIES, NET - 0.8% | | | | 243,212 | |
| | | | | |
| |
NET ASSETS - 100.0% | | | | $31,933,668 | |
| | | | | | | | |
Notes to Schedule of Investments
| (a) | As of March 31, 2019, the Fund’s composition by sector as a percentage of net assets was as follows: |
| | | | |
Financial | | | 22.1% | |
Industrial | | | 17.9% | |
Consumer, Cyclical | | | 15.3% | |
Consumer,Non-Cyclical | | | 13.4% | |
Basic Materials | | | 8.6% | |
Technology | | | 7.7% | |
Energy | | | 4.8% | |
Communications | | | 4.4% | |
Utilities | | | 3.7% | |
Others (each less than 3.0%) | | | 1.3% | |
| | | | |
| | | 99.2% | |
Other Assets & Liabilities, Net | | | 0.8% | |
| | | | |
| | | 100.0% | |
| | | | |
| | |
| See Notes to Financial Statements | | See explanation of symbols and terms, if any, on B-97 and B-98 |
B-70
PACIFIC FUNDS
PF INTERNATIONAL SMALL-CAP FUND
Schedule of Investments (Continued)
March 31, 2019
| (b) | As of March 31, 2019, the Fund’s composition by country of risk as a percentage of net assets was as follows: |
| | | | |
Japan | | | 23.7% | |
United Kingdom | | | 12.8% | |
Canada | | | 10.7% | |
Switzerland | | | 6.0% | |
South Korea | | | 5.7% | |
Germany | | | 5.3% | |
France | | | 5.2% | |
Netherlands | | | 3.9% | |
Italy | | | 3.5% | |
Sweden | | | 3.4% | |
Others (each less than 3.0%) | | | 19.0% | |
| | | | |
| | | 99.2% | |
Other Assets & Liabilities, Net | | | 0.8% | |
| | | | |
| | | 100.0% | |
| | | | |
| (c) | Fair Value Measurements |
The following is a summary of the Fund’s investments as categorized under the three-tier hierarchy of inputs used in valuing the Fund’s assets and liabilities (See Note 3D in Notes to Financial Statements) as of March 31, 2019:
| | | | | | | | | | | | | | | | | | |
| | | | | Total Value at
March 31, 2019 | | | Level 1
Quoted Price | | | Level 2
Significant
Observable Inputs | | | Level 3
Significant
Unobservable Inputs | |
Assets | | Common Stocks | | | | | | | | | | | | | | | | |
| | Australia | | | $870,241 | | | | $— | | | | $870,241 | | | | $— | |
| | Austria | | | 70,321 | | | | | | | | 70,321 | | | | — | |
| | Belgium | | | 291,613 | | | | — | | | | 291,613 | | | | — | |
| | Canada | | | 3,429,725 | | | | 3,429,725 | | | | — | | | | — | |
| | China | | | 127,575 | | | | — | | | | 127,575 | | | | — | |
| | Denmark | | | 422,130 | | | | — | | | | 422,130 | | | | — | |
| | Egypt | | | 69,663 | | | | — | | | | 69,663 | | | | | |
| | Finland | | | 340,588 | | | | — | | | | 340,588 | | | | — | |
| | France | | | 1,664,710 | | | | 119,012 | | | | 1,545,698 | | | | — | |
| | Germany | | | 1,701,839 | | | | 257,240 | | | | 1,444,599 | | | | — | |
| | Hong Kong | | | 617,175 | | | | — | | | | 617,175 | | | | — | |
| | Israel | | | 579,916 | | | | 488,448 | | | | 91,468 | | | | — | |
| | Italy | | | 1,108,783 | | | | — | | | | 1,108,783 | | | | — | |
| | Japan | | | 7,558,271 | | | | — | | | | 7,558,271 | | | | — | |
| | Jordan | | | 161,029 | | | | — | | | | 161,029 | | | | | |
| | Malta | | | 102,734 | | | | — | | | | 102,734 | | | | — | |
| | Netherlands | | | 1,234,973 | | | | 206,775 | | | | 1,028,198 | | | | — | |
| | New Zealand | | | 156,307 | | | | — | | | | 156,307 | | | | — | |
| | Norway | | | 257,501 | | | | 78,980 | | | | 178,521 | | | | — | |
| | Peru | | | 105,685 | | | | — | | | | 105,685 | | | | | |
| | Portugal | | | 92,384 | | | | — | | | | 92,384 | | | | | |
| | Singapore | | | 93,046 | | | | — | | | | 93,046 | | | | — | |
| | South Korea | | | 1,821,049 | | | | 190,274 | | | | 1,630,775 | | | | — | |
| | Spain | | | 911,391 | | | | 114,464 | | | | 796,927 | | | | — | |
| | Sweden | | | 1,083,970 | | | | 101,433 | | | | 982,537 | | | | — | |
| | Switzerland | | | 1,920,113 | | | | — | | | | 1,920,113 | | | | — | |
| | Tanzania | | | 81,291 | | | | — | | | | 81,291 | | | | — | |
| | United Kingdom | | | 4,076,162 | | | | 1,127,099 | | | | 2,949,063 | | | | — | |
| | United States | | | 377,423 | | | | 377,423 | | | | — | | | | — | |
| | | | | | | | | | | | | | | | | | |
| | Total Common Stocks | | | 31,327,608 | | | | 6,490,873 | | | | 24,836,735 | | | | — | |
| | | | | | | | | | | | | | | | | | |
| | Short-Term Investment | | | 362,848 | | | | 362,848 | | | | — | | | | — | |
| | | | | | | | | | | | | | | | | | |
| | Total | | | $31,690,456 | | | | $6,853,721 | | | | $24,836,735 | | | | $— | |
| | | | | | | | | | | | | | | | | | |
| | |
| See Notes to Financial Statements | | See explanation of symbols and terms, if any, on B-97 and B-98 |
B-71
PACIFIC FUNDS
PF INTERNATIONAL VALUE FUND
Schedule of Investments
March 31, 2019
| | | | | | | | |
| | | Shares | | | Value | |
PREFERRED STOCKS - 0.3% | |
|
Brazil - 0.3% | |
| | |
Telefonica Brasil SA | | | 17,845 | | | | $216,491 | |
| | | | | | | | |
| |
Total Preferred Stocks
(Cost $200,774) | | | | 216,491 | |
| | | | | | | | |
|
COMMON STOCKS - 95.9% | |
|
Argentina - 0.5% | |
| | |
YPF SA ADR | | | 25,498 | | | | 357,227 | |
| | | | | | | | |
|
Belgium - 1.2% | |
| | |
Ageas | | | 15,503 | | | | 747,815 | |
| | | | | | | | |
|
Canada - 2.3% | |
| | |
ARC Resources Ltd | | | 23,587 | | | | 160,971 | |
Barrick Gold Corp | | | 48,215 | | | | 660,979 | |
Cameco Corp | | | 16,386 | | | | 193,191 | |
Eldorado Gold Corp *l | | | — | | | | 1 | |
Kinross Gold Corp * | | | 90,199 | | | | 310,285 | |
Tourmaline Oil Corp | | | 10,136 | | | | 156,551 | |
| | | | | | | | |
| | | | 1,481,978 | |
| | | | | |
China - 5.4% | |
| | |
China Mobile Ltd | | | 84,723 | | | | 864,542 | |
China Telecom Corp Ltd ‘H’ | | | 1,501,743 | | | | 835,606 | |
China Unicom Hong Kong Ltd | | | 786,067 | | | | 1,000,841 | |
Dongfeng Motor Group Co Ltd ‘H’ | | | 776,191 | | | | 778,688 | |
| | | | | | | | |
| | | | 3,479,677 | |
| | | | | |
|
Denmark - 1.3% | |
| | |
AP Moller - Maersk AS ‘B’ | | | 646 | | | | 819,030 | |
| | | | | | | | |
|
Finland - 0.5% | |
| | |
Nokia OYJ | | | 57,213 | | | | 325,922 | |
| | | | | | | | |
|
France - 11.6% | |
| | |
AirFrance-KLM * | | | 13,358 | | | | 150,234 | |
Alstom SA | | | 13,476 | | | | 584,348 | |
BNP Paribas SA | | | 21,546 | | | | 1,025,340 | |
Cie de Saint-Gobain | | | 32,144 | | | | 1,165,514 | |
Engie SA | | | 44,125 | | | | 658,033 | |
Renault SA | | | 10,230 | | | | 676,387 | |
Rexel SA | | | 54,067 | | | | 610,164 | |
Societe Generale SA | | | 27,349 | | | | 790,212 | |
TOTAL SA | | | 33,501 | | | | 1,864,317 | |
| | | | | | | | |
| | | | 7,524,549 | |
| | | | | |
Germany - 3.1% | |
| | |
CECONOMY AG | | | 37,460 | | | | 199,179 | |
E.ON SE | | | 41,533 | | | | 462,191 | |
METRO AG | | | 36,038 | | | | 598,544 | |
RWE AG | | | 23,296 | | | | 625,552 | |
Salzgitter AG | | | 4,774 | | | | 138,268 | |
| | | | | | | | |
| | | | 2,023,734 | |
| | | | | |
India - 0.8% | |
| | |
Canara Bank * | | | 67,196 | | | | 282,378 | |
NTPC Ltd | | | 135,775 | | | | 263,815 | |
| | | | | | | | |
| | | | 546,193 | |
| | | | | |
| | | | | | | | |
| | | Shares | | | Value | |
|
Ireland - 1.0% | |
| | |
Bank of Ireland Group PLC | | | 104,751 | | | $ | 625,158 | |
| | | | | | | | |
|
Italy - 7.0% | |
| | |
Assicurazioni Generali SPA | | | 50,633 | | | | 938,767 | |
BPER Banca | | | 104,644 | | | | 428,219 | |
Eni SPA | | | 85,199 | | | | 1,505,348 | |
Saipem SPA * | | | 134,928 | | | | 714,520 | |
UniCredit SPA | | | 75,708 | | | | 972,512 | |
| | | | | | | | |
| | | | 4,559,366 | |
| | | | | |
Japan - 26.5% | |
| | |
Benesse Holdings Inc | | | 5,329 | | | | 138,678 | |
Canon Inc | | | 19,638 | | | | 570,190 | |
Chiyoda Corp | | | 24,328 | | | | 58,165 | |
Citizen Watch Co Ltd | | | 57,235 | | | | 319,827 | |
Dai-ichi Life Holdings Inc | | | 41,549 | | | | 578,417 | |
DeNA Co Ltd | | | 21,872 | | | | 329,702 | |
Eisai Co Ltd | | | 6,813 | | | | 383,346 | |
Fuji Media Holdings Inc | | | 12,000 | | | | 165,764 | |
Fujitsu Ltd | | | 7,990 | | | | 577,834 | |
Gree Inc | | | 52,192 | | | | 213,629 | |
Hitachi Metals Ltd | | | 37,583 | | | | 437,852 | |
Honda Motor Co Ltd | | | 48,968 | | | | 1,330,009 | |
Ibiden Co Ltd | | | 19,153 | | | | 291,881 | |
Inpex Corp | | | 70,750 | | | | 673,039 | |
JGC Corp | | | 35,933 | | | | 479,116 | |
JSR Corp | | | 43,747 | | | | 680,623 | |
Mitsubishi Estate Co Ltd | | | 29,600 | | | | 537,090 | |
Mitsubishi Heavy Industries Ltd | | | 16,522 | | | | 687,545 | |
Mitsubishi UFJ Financial Group Inc | | | 232,962 | | | | 1,152,182 | |
Mizuho Financial Group Inc | | | 591,182 | | | | 914,838 | |
Nikon Corp | | | 21,439 | | | | 303,118 | |
Nippon Television Holdings Inc | | | 22,834 | | | | 342,795 | |
Nomura Holdings Inc | | | 169,900 | | | | 613,960 | |
Shimamura Co Ltd | | | 6,110 | | | | 517,833 | |
Sumitomo Mitsui Financial Group Inc | | | 30,690 | | | | 1,074,724 | |
Sumitomo Mitsui Trust Holdings Inc | | | 20,952 | | | | 752,996 | |
T&D Holdings Inc | | | 83,804 | | | | 882,522 | |
Takeda Pharmaceutical Co Ltd | | | 27,562 | | | | 1,128,726 | |
THK Co Ltd | | | 9,700 | | | | 240,913 | |
Yahoo Japan Corp | | | 350,178 | | | | 858,865 | |
| | | | | | | | |
| | | | 17,236,179 | |
| | | | | |
Netherlands - 4.2% | |
| | |
ING Groep NV | | | 74,035 | | | | 897,108 | |
PostNL NV | | | 109,374 | | | | 279,668 | |
Royal Dutch Shell PLC ‘B’ | | | 49,651 | | | | 1,569,257 | |
| | | | | | | | |
| | | | 2,746,033 | |
| | | | | |
|
Norway - 0.8% | |
| | |
Norsk Hydro ASA | | | 134,241 | | | | 545,932 | |
| | | | | | | | |
|
Russia - 2.5% | |
| | |
Gazprom PJSC ADR | | | 178,126 | | | | 805,129 | |
LUKOIL PJSC ADR | | | 5,244 | | | | 468,866 | |
Sberbank of Russia PJSC ADR | | | 27,184 | | | | 358,285 | |
| | | | | | | | |
| | | | 1,632,280 | |
| | | | | |
South Africa - 3.2% | |
| | |
Anglo American Platinum Ltd | | | 4,136 | | | | 211,153 | |
Anglo American PLC | | | 34,725 | | | | 928,773 | |
Gold Fields Ltd ADR | | | 162,482 | | | | 606,058 | |
Impala Platinum Holdings Ltd * | | | 58,826 | | | | 249,658 | |
MTN Group Ltd | | | 11,995 | | | | 73,834 | |
| | | | | | | | |
| | | | 2,069,476 | |
| | | | | |
| | |
| See Notes to Financial Statements | | See explanation of symbols and terms, if any, on B-97 and B-98 |
B-72
PACIFIC FUNDS
PF INTERNATIONAL VALUE FUND
Schedule of Investments (Continued)
March 31, 2019
| | | | | | | | |
| | | Shares | | | Value | |
South Korea - 3.9% | |
| | |
KB Financial Group Inc | | | 17,893 | | | $ | 662,080 | |
Kia Motors Corp | | | 16,812 | | | | 523,949 | |
KT Corp ADR | | | 59,968 | | | | 746,002 | |
Shinhan Financial Group Co Ltd | | | 16,871 | | | | 626,457 | |
| | | | | | | | |
| | | | 2,558,488 | |
| | | | | |
|
Spain - 0.9% | |
| | |
CaixaBank SA | | | 178,491 | | | | 558,176 | |
| | | | | | | | |
|
Sweden - 0.7% | |
| | |
Telefonaktiebolaget LM Ericsson ‘B’ | | | 48,252 | | | | 444,492 | |
| | | | | | | | |
|
Switzerland - 5.7% | |
| | |
Adecco Group AG | | | 18,655 | | | | 996,263 | |
Julius Baer Group Ltd | | | 16,556 | | | | 669,726 | |
LafargeHolcim Ltd | | | 17,840 | | | | 882,057 | |
UBS Group AG | | | 93,241 | | | | 1,131,344 | |
| | | | | | | | |
| | | | 3,679,390 | |
| | | | | |
Taiwan - 1.0% | |
| | |
MediaTek Inc | | | 38,643 | | | | 355,296 | |
Shin Kong Financial Holding Co Ltd | | | 1,019,394 | | | | 300,741 | |
| | | | | | | | |
| | | | 656,037 | |
| | | | | |
United Kingdom - 11.8% | |
| | |
AstraZeneca PLC | | | 3,897 | | | | 311,066 | |
BP PLC | | | 183,642 | | | | 1,333,519 | |
BT Group PLC | | | 244,411 | | | | 710,096 | |
Centrica PLC | | | 383,535 | | | | 571,316 | |
HSBC Holdings PLC | | | 171,597 | | | | 1,394,380 | |
J Sainsbury PLC | | | 189,457 | | | | 581,382 | |
Kingfisher PLC | | | 216,043 | | | | 662,546 | |
Land Securities Group PLC REIT | | | 32,043 | | | | 381,505 | |
Marks & Spencer Group PLC | | | 145,297 | | | | 527,326 | |
Standard Chartered PLC | | | 103,804 | | | | 800,161 | |
The British Land Co PLC REIT | | | 47,852 | | | | 367,392 | |
| | | | | | | | |
| | | | | | | 7,640,689 | |
| | | | | | | | |
| | |
Total Common Stocks
(Cost $62,516,150) | | | | | | | 62,257,821 | |
| | | | | | | | |
| | | | | | | | |
| | | Shares | | | Value | |
SHORT-TERM INVESTMENT - 2.3% | |
|
Money Market Fund - 2.3% | |
| | |
BlackRock Liquidity FundsT-Fund Portfolio
‘Institutional’ 2.370% | | | 1,494,462 | | | | $1,494,462 | |
| | | | | | | | |
| |
Total Short-Term Investment
(Cost $1,494,462) | | | | 1,494,462 | |
| | | | | | | | |
| |
TOTAL INVESTMENTS - 98.5%
(Cost $64,211,386) | | | | 63,968,774 | |
| |
OTHER ASSETS & LIABILITIES, NET - 1.5% | | | | 987,555 | |
| | | | | | | | |
| |
NET ASSETS - 100.0% | | | | $64,956,329 | |
| | | | | | | | |
Notes to Schedule of Investments
| (a) | As of March 31, 2019, the Fund’s composition by sector as a percentage of net assets was as follows: |
| | | | |
Financial | | | 31.5% | |
Energy | | | 14.8% | |
Communications | | | 10.1% | |
Consumer, Cyclical | | | 9.7% | |
Industrial | | | 8.9% | |
Basic Materials | | | 7.6% | |
Consumer,Non-cyclical | | | 6.4% | |
Utilities | | | 4.0% | |
Technology | | | 3.2% | |
Others (each less than 3.0%) | | | 2.3% | |
| | | | |
| | | 98.5% | |
Other Assets & Liabilities, Net | | | 1.5% | |
| | | | |
| | | 100.0% | |
| | | | |
| (b) | As of March 31, 2019, the Fund’s composition by country of risk as a percentage of net assets was as follows: |
| | | | |
Japan | | | 26.5% | |
United Kingdom | | | 11.8% | |
France | | | 11.6% | |
Italy | | | 7.0% | |
Switzerland | | | 5.7% | |
China | | | 5.4% | |
Netherlands | | | 4.2% | |
South Korea | | | 3.9% | |
South Africa | | | 3.2% | |
Germany | | | 3.1% | |
Others (each less than 3.0%) | | | 16.1% | |
| | | | |
| | | 98.5% | |
Other Assets & Liabilities, Net | | | 1.5% | |
| | | | |
| | | 100.0% | |
| | | | |
| | |
| See Notes to Financial Statements | | See explanation of symbols and terms, if any, on B-97 and B-98 |
B-73
PACIFIC FUNDS
PF INTERNATIONAL VALUE FUND
Schedule of Investments (Continued)
March 31, 2019
| (c) | Fair Value Measurements |
The following is a summary of the Fund’s investments as categorized under the three-tier hierarchy of inputs used in valuing the Fund’s assets and liabilities (See Note 3D in Notes to Financial Statements) as of March 31, 2019:
| | | | | | | | | | | | | | | | | | |
| | | | | Total Value at
March 31, 2019 | | | Level 1
Quoted Price | | | Level 2
Significant
Observable Input | | | Level 3
Significant
Unobservable Input | |
Assets | | Preferred Stocks | | | $216,491 | | | | $216,491 | | | | $— | | | | $— | |
| | Common Stocks | | | | | | | | | | | | | | | | |
| | Argentina | | | 357,227 | | | | 357,227 | | | | — | | | | — | |
| | Belgium | | | 747,815 | | | | — | | | | 747,815 | | | | — | |
| | Canada | | | 1,481,978 | | | | 1,481,978 | | | | — | | | | — | |
| | China | | | 3,479,677 | | | | — | | | | 3,479,677 | | | | — | |
| | Denmark | | | 819,030 | | | | — | | | | 819,030 | | | | — | |
| | Finland | | | 325,922 | | | | — | | | | 325,922 | | | | — | |
| | France | | | 7,524,549 | | | | — | | | | 7,524,549 | | | | — | |
| | Germany | | | 2,023,734 | | | | 199,179 | | | | 1,824,555 | | | | — | |
| | India | | | 546,193 | | | | — | | | | 546,193 | | | | — | |
| | Ireland | | | 625,158 | | | | — | | | | 625,158 | | | | — | |
| | Italy | | | 4,559,366 | | | | — | | | | 4,559,366 | | | | — | |
| | Japan | | | 17,236,179 | | | | — | | | | 17,236,179 | | | | — | |
| | Netherlands | | | 2,746,033 | | | | — | | | | 2,746,033 | | | | — | |
| | Norway | | | 545,932 | | | | — | | | | 545,932 | | | | — | |
| | Russia | | | 1,632,280 | | | | 1,632,280 | | | | | | | | — | |
| | South Africa | | | 2,069,476 | | | | 606,058 | | | | 1,463,418 | | | | — | |
| | South Korea | | | 2,558,488 | | | | 746,002 | | | | 1,812,486 | | | | — | |
| | Spain | | | 558,176 | | | | — | | | | 558,176 | | | | — | |
| | Sweden | | | 444,492 | | | | — | | | | 444,492 | | | | — | |
| | Switzerland | | | 3,679,390 | | | | — | | | | 3,679,390 | | | | — | |
| | Taiwan | | | 656,037 | | | | — | | | | 656,037 | | | | — | |
| | United Kingdom | | | 7,640,689 | | | | — | | | | 7,640,689 | | | | — | |
| | | | | | | | | | | | | | | | | | |
| | Total Common Stocks | | | 62,257,821 | | | | 5,022,724 | | | | 57,235,097 | | | | — | |
| | | | | | | | | | | | | | | | | | |
| | Short-Term Investment | | | 1,494,462 | | | | 1,494,462 | | | | — | | | | — | |
| | | | | | | | | | | | | | | | | | |
| | Total | | | $63,968,774 | | | | $6,733,677 | | | | $57,235,097 | | | | $— | |
| | | | | | | | | | | | | | | | | | |
| | |
| See Notes to Financial Statements | | See explanation of symbols and terms, if any, on B-97 and B-98 |
B-74
PACIFIC FUNDS
PF REAL ESTATE FUND
Schedule of Investments
March 31, 2019
| | | | | | | | |
| | | Shares | | | Value | |
COMMON STOCKS - 99.4% | |
|
Consumer, Cyclical - 3.6% | |
| | |
Extended Stay America Inc | | | 31,622 | | | | $567,615 | |
Hilton Grand Vacations Inc * | | | 23,225 | | | | 716,491 | |
Hilton Worldwide Holdings Inc | | | 19,716 | | | | 1,638,597 | |
| | | | | | | | |
| | | | 2,922,703 | |
| | | | | |
Financial - 93.5% | |
| | |
Alexandria Real Estate Equities Inc REIT | | | 25,900 | | | | 3,692,304 | |
American Homes 4 Rent ‘A’ REIT | | | 65,494 | | | | 1,488,024 | |
American Tower Corp REIT | | | 3,775 | | | | 743,902 | |
Apartment Investment & Management Co ‘A’ REIT | | | 51,927 | | | | 2,611,409 | |
AvalonBay Communities Inc REIT | | | 25,557 | | | | 5,130,057 | |
Boston Properties Inc REIT | | | 18,442 | | | | 2,469,015 | |
Corporate Office Properties Trust REIT | | | 21,814 | | | | 595,522 | |
Crown Castle International Corp REIT | | | 6,070 | | | | 776,960 | |
CubeSmart REIT | | | 40,896 | | | | 1,310,308 | |
Duke Realty Corp REIT | | | 40,162 | | | | 1,228,154 | |
EPR Properties REIT | | | 21,968 | | | | 1,689,339 | |
Equinix Inc REIT | | | 10,495 | | | | 4,755,914 | |
Equity LifeStyle Properties Inc REIT | | | 11,951 | | | | 1,365,999 | |
Equity Residential REIT | | | 11,784 | | | | 887,571 | |
Essex Property Trust Inc REIT | | | 12,406 | | | | 3,588,311 | |
Extra Space Storage Inc REIT | | | 26,423 | | | | 2,692,768 | |
First Industrial Realty Trust Inc REIT | | | 20,667 | | | | 730,785 | |
HCP Inc REIT | | | 30,692 | | | | 960,660 | |
Healthcare Trust of America Inc ‘A’ REIT | | | 82,077 | | | | 2,346,581 | |
Hudson Pacific Properties Inc REIT | | | 30,061 | | | | 1,034,700 | |
Invitation Homes Inc REIT | | | 148,049 | | | | 3,602,032 | |
Kilroy Realty Corp REIT | | | 24,598 | | | | 1,868,464 | |
Physicians Realty Trust REIT | | | 35,836 | | | | 674,075 | |
Prologis Inc REIT | | | 85,915 | | | | 6,181,584 | |
Public Storage REIT | | | 6,409 | | | | 1,395,752 | |
Regency Centers Corp REIT | | | 44,901 | | | | 3,030,368 | |
Sabra Health Care REIT Inc | | | 28,785 | | | | 560,444 | |
Simon Property Group Inc REIT | | | 21,824 | | | | 3,976,551 | |
Spirit Realty Capital Inc REIT | | | 31,058 | | | | 1,233,934 | |
STORE Capital Corp REIT | | | 75,269 | | | | 2,521,512 | |
Sun Communities Inc REIT | | | 19,489 | | | | 2,309,836 | |
Sunstone Hotel Investors Inc REIT | | | 94,215 | | | | 1,356,696 | |
Tanger Factory Outlet Centers Inc REIT | | | 21,572 | | | | 452,581 | |
Taubman Centers Inc REIT | | | 14,641 | | | | 774,216 | |
Terreno Realty Corp REIT | | | 17,914 | | | | 753,105 | |
VICI Properties Inc REIT | | | 46,417 | | | | 1,015,604 | |
Welltower Inc REIT | | | 53,337 | | | | 4,138,951 | |
Weyerhaeuser Co REIT | | | 19,191 | | | | 505,491 | |
| | | | | | | | |
| | | | 76,449,479 | |
| | | | | |
| | | | | | | | |
| | | Shares | | | Value | |
Technology - 2.3% | |
| | |
InterXion Holding NV (Netherlands) * | | | 27,710 | | | | $1,849,088 | |
| | | | | | | | |
| | |
Total Common Stocks
(Cost $69,714,310) | | | | | | | 81,221,270 | |
| | | | | |
| | | | | | | | |
| | |
SHORT-TERM INVESTMENT - 0.5% | | | | | | | | |
| | |
Money Market Fund - 0.5% | | | | | | | | |
| | |
BlackRock Liquidity FundsT-Fund Portfolio
‘Institutional’ 2.370% | | | 391,136 | | | | 391,136 | |
| | | | | | | | |
| | |
Total Short-Term Investment
(Cost $391,136) | | | | | | | 391,136 | |
| | | | | |
| | |
TOTAL INVESTMENTS - 99.9%
(Cost $70,105,446) | | | | | | | 81,612,406 | |
| | |
OTHER ASSETS & LIABILITIES, NET - 0.1% | | | | | | | 100,217 | |
| | | | | |
| | |
NET ASSETS - 100.0% | | | | | | | $81,712,623 | |
| | | | | | | | |
Notes to Schedule of Investments
| (a) | As of March 31, 2019, the Fund’s composition by property sector as a percentage of net assets was as follows: |
| | | | |
REITS-Apartments | | | 21.2% | |
REITS-Diversified | | | 13.1% | |
REITS-Office Property | | | 11.8% | |
REITS-Health Care | | | 10.6% | |
REITS-Warehouse/Industrial | | | 9.4% | |
REITS-Storage | | | 6.6% | |
REITS-Regional Malls | | | 6.4% | |
REITS-Single Tenant | | | 4.6% | |
REITS-Manufactured Homes | | | 4.5% | |
REITS-Shopping Centers | | | 3.7% | |
Hotels & Motels | | | 3.6% | |
Others (each less than 3.0%) | | | 3.9% | |
| | | | |
| | | 99.4% | |
Short-Term Investment | | | 0.5% | |
Other Assets & Liabilities, Net | | | 0.1% | |
| | | | |
| | | 100.0% | |
| | | | |
| (b) | Fair Value Measurements |
The following is a summary of the Fund’s investments as categorized under the three-tier hierarchy of inputs used in valuing the Fund’s assets and liabilities (See Note 3D in Notes to Financial Statements) as of March 31, 2019:
| | | | | | | | | | | | | | | | | | |
| | | | | Total Value at
March 31, 2019 | | | Level 1
Quoted Price | | | Level 2
Significant
Observable Inputs | | | Level 3
Significant
Unobservable Inputs | |
Assets | | Common Stocks | | | $81,221,270 | | | | $81,221,270 | | | | $— | | | | $— | |
| | Short-Term Investment | | | 391,136 | | | | 391,136 | | | | — | | | | — | |
| | | | | | | | | | | | | | | | | | |
| | Total | | | $81,612,406 | | | | $81,612,406 | | | | $— | | | | $— | |
| | | | | | | | | | | | | | | | | | |
| | |
| See Notes to Financial Statements | | See explanation of symbols and terms, if any, on B-97 and B-98 |
B-75
PACIFIC FUNDS
PF CURRENCY STRATEGIES FUND
Schedule of Investments
March 31, 2019
| | | | | | | | |
| | | Principal Amount | | | Value | |
U.S. TREASURY OBLIGATIONS - 8.7% | | | | | | | | |
| | |
U.S. Treasury Notes - 8.7% | | | | | | | | |
| | |
0.750% due 08/15/19 ‡ | | | $3,900,000 | | | | $3,875,016 | |
| | | | | | | | |
| |
Total U.S. Treasury Obligations
(Cost $3,874,025) | | | | 3,875,016 | |
| | | | | | | | |
|
FOREIGN GOVERNMENT BONDS & NOTES - 43.0% | |
|
Canada - 7.7% | |
| | |
Canadian Government
1.250% due 02/01/20 | | | CAD 4,600,000 | | | | 3,430,474 | |
| | | | | | | | |
|
France - 6.5% | |
| | |
French Republic Government OAT
1.000% due 05/25/19 ~ | | | EUR 2,600,000 | | | | 2,922,656 | |
| | | | | | | | |
|
Germany - 15.2% | |
| | |
Bundesrepublik Deutschland Bundesanleihe
3.250% due 01/04/20 ~ | | | 5,850,000 | | | | 6,757,995 | |
| | | | | | | | |
|
Sweden - 5.6% | |
| | |
Sweden Government International
1.500% due 07/25/19 ~ | | | $2,500,000 | | | | 2,492,475 | |
| | | | | | | | |
|
United Kingdom - 8.0% | |
| | |
United Kingdom Gilt
1.750% due 07/22/19 ~ | | | GBP 2,730,000 | | | | 3,566,658 | |
| | | | | | | | |
| |
Total Foreign Government Bonds & Notes
(Cost $19,480,443) | | | | 19,170,258 | |
| | | | | |
| | | | | | | | |
| | | Shares | | | Value | |
SHORT-TERM INVESTMENT - 50.2% | |
|
Money Market Fund - 50.2% | |
| | |
BlackRock Liquidity FundsT-Fund Portfolio
‘Institutional’ 2.370% | | | 22,337,764 | | | | $22,337,764 | |
| | | | | | | | |
| |
Total Short-Term Investment
(Cost $22,337,764) | | | | 22,337,764 | |
| | | | | |
| |
TOTAL INVESTMENTS - 101.9%
(Cost $45,692,232) | | | | 45,383,038 | |
| | |
DERIVATIVES - 0.6% | | | | | | | | |
(See Note (c) in Notes to Schedule of Investments) | | | | 257,745 | |
| | | | | |
| |
OTHER ASSETS & LIABILITIES, NET - (2.5%) | | | | (1,103,628 | ) |
| | | | | |
| |
NET ASSETS - 100.0% | | | | $44,537,155 | |
| | | | | |
Notes to Schedule of Investments
| (a) | As of March 31, 2019, the Fund’s composition as a percentage of net assets was as follows: |
| | | | |
Short-Term Investment | | | 50.2% | |
Foreign Government Bonds & Notes | | | 43.0% | |
U.S. Treasury Obligations | | | 8.7% | |
| | | | |
| | | 101.9% | |
Derivatives | | | 0.6% | |
Other Assets & Liabilities, Net | | | (2.5% | ) |
| | | | |
| | | 100.0% | |
| | | | |
| (b) | As of March 31, 2019, an investment with a value of $654,701 was fully or partially segregated with the broker(s)/custodian as collateral for forward foreign currency contracts. |
| (c) | Forward foreign currency contracts outstanding as of March 31, 2019 were as follows: |
| | | | | | | | | | | | | | | | | | | | | | | | | | | | | | |
Currency
Purchased | | | | | Currency
Sold | | | | | Settlement
Month | | | | Counterparty | | | | Unrealized
Appreciation | | | Unrealized
Depreciation | |
| AUD | | | 2,200,000 | | | | | USD | | | 1,560,845 | | | | | 04/19 | | | | GSC | | | | | $1,683 | | | | $— | |
| CAD | | | 1,820,000 | | | | | USD | | | 1,366,039 | | | | | 04/19 | | | | CIB | | | | | — | | | | (3,651 | ) |
| CHF | | | 1,570,000 | | | | | USD | | | 1,571,918 | | | | | 04/19 | | | | SSB | | | | | 6,831 | | | | — | |
| COP | | | 12,456,342,000 | | | | | USD | | | 3,940,322 | | | | | 04/19 | | | | JPM | | | | | — | | | | (36,360 | ) |
| JPY | | | 1,802,100,000 | | | | | USD | | | 16,268,772 | | | | | 04/19 | | | | SSB | | | | | 11,154 | | | | — | |
| KRW | | | 1,771,000,000 | | | | | USD | | | 1,566,286 | | | | | 04/19 | | | | SSB | | | | | — | | | | (6,946 | ) |
| MXN | | | 315,000,000 | | | | | USD | | | 16,034,859 | | | | | 04/19 | | | | GSC | | | | | 158,264 | | | | — | |
| MYR | | | 17,342,000 | | | | | USD | | | 4,236,472 | | | | | 04/19 | | | | CIB | | | | | 12,120 | | | | — | |
| NOK | | | 71,930,000 | | | | | USD | | | 8,199,366 | | | | | 04/19 | | | | JPM | | | | | 144,828 | | | | — | |
| NZD | | | 5,305,000 | | | | | USD | | | 3,642,652 | | | | | 04/19 | | | | BRC | | | | | — | | | | (29,061 | ) |
| NZD | | | 385,000 | | | | | USD | | | 262,614 | | | | | 04/19 | | | | SSB | | | | | — | | | | (364 | ) |
| SEK | | | 147,580,000 | | | | | USD | | | 15,633,574 | | | | | 04/19 | | | | JPM | | | | | 255,859 | | | | — | |
| THB | | | 26,740,000 | | | | | USD | | | 844,722 | | | | | 04/19 | | | | MSC | | | | | — | | | | (1,831 | ) |
| USD | | | 8,243,652 | | | | | AUD | | | 11,740,000 | | | | | 04/19 | | | | SSB | | | | | — | | | | (94,563 | ) |
| USD | | | 11,475,095 | | | | | CAD | | | 15,425,000 | | | | | 04/19 | | | | MSC | | | | | — | | | | (71,520 | ) |
| USD | | | 8,273,574 | | | | | CHF | | | 8,330,000 | | | | | 04/19 | | | | SSB | | | | | — | | | | (102,845 | ) |
| USD | | | 609,868 | | | | | COP | | | 1,895,776,000 | | | | | 04/19 | | | | GSC | | | | | 15,710 | | | | — | |
| USD | | | 1,601,082 | | | | | EUR | | | 1,410,000 | | | | | 04/19 | | | | CIB | | | | | 17,602 | | | | — | |
| USD | | | 1,472,085 | | | | | EUR | | | 1,310,000 | | | | | 04/19 | | | | MSC | | | | | 909 | | | | — | |
| USD | | | 264,447 | | | | | GBP | | | 200,000 | | | | | 04/19 | | | | CIB | | | | | 3,777 | | | | — | |
| USD | | | 3,369,694 | | | | | GBP | | | 2,570,000 | | | | | 04/19 | | | | SSB | | | | | 20,096 | | | | — | |
| USD | | | 2,661,608 | | | | | JPY | | | 296,300,000 | | | | | 04/19 | | | | SSB | | | | | — | | | | (15,126 | ) |
| USD | | | 8,315,576 | | | | | KRW | | | 9,444,000,000 | | | | | 04/19 | | | | SSB | | | | | 269 | | | | — | |
| USD | | | 2,801,448 | | | | | MXN | | | 53,450,000 | | | | | 04/19 | | | | GSC | | | | | 53,757 | | | | — | |
| USD | | | 865,554 | | | | | MYR | | | 3,528,000 | | | | | 04/19 | | | | GSC | | | | | 1,235 | | | | — | |
| | |
| See Notes to Financial Statements | | See explanation of symbols and terms, if any, on B-97 and B-98 |
B-76
PACIFIC FUNDS
PF CURRENCY STRATEGIES FUND
Schedule of Investments (Continued)
March 31, 2019
| | | | | | | | | | | | | | | | | | | | | | | | | | | | | | | | |
Currency
Purchased | | | | | Currency
Sold | | | | | Settlement
Month | | | | Counterparty | | | | | Unrealized
Appreciation | | | Unrealized
Depreciation | |
| USD | | | 1,663,683 | | | | | NOK | | | 14,230,000 | | | | | 04/19 | | | | | MSC | | | | | | $12,941 | | | | $— | |
| USD | | | 23,947,455 | | | | | NZD | | | 35,315,000 | | | | | 04/19 | | | | | SSB | | | | | | — | | | | (107,959 | ) |
| USD | | | 2,479,359 | | | | | SEK | | | 22,870,000 | | | | | 04/19 | | | | | JPM | | | | | | 17,024 | | | | — | |
| USD | | | 4,213,409 | | | | | THB | | | 133,860,000 | | | | | 04/19 | | | | | BRC | | | | | | — | | | | (6,088 | ) |
| | | | | | | | | | | | | | | | | | | | | | | | | | | | | | | | |
| | | | |
Total Forward Foreign Currency Contracts | | | | | | | | | $734,059 | | | | ($476,314 | ) |
| | | | | | | | | | | | | | |
| (d) | Fair Value Measurements |
The following is a summary of the Fund’s investments as categorized under the three-tier hierarchy of inputs used in valuing the Fund’s assets and liabilities (See Note 3D in Notes to Financial Statements) as of March 31, 2019:
| | | | | | | | | | | | | | | | | | |
| | | | | Total Value at
March 31, 2019 | | | Level 1
Quoted Price | | | Level 2
Significant
Observable Inputs | | | Level 3
Significant
Unobservable Inputs | |
Assets | | U.S. Treasury Obligations | | | $3,875,016 | | | | $— | | | | $3,875,016 | | | | $— | |
| | Foreign Government Bonds & Notes | | | 19,170,258 | | | | — | | | | 19,170,258 | | | | — | |
| | Short-Term Investment | | | 22,337,764 | | | | 22,337,764 | | | | — | | | | — | |
| | Derivatives: | | | | | | | | | | | | | | | | |
| | Foreign Currency Contracts | | | | | | | | | | | | | | | | |
| | Forward Foreign Currency Contracts | | | 734,059 | | | | — | | | | 734,059 | | | | — | |
| | | | | | | | | | | | | | | | | | |
| | Total Assets | | | 46,117,097 | | | | 22,337,764 | | | | 23,779,333 | | | | — | |
| | | | | | | | | | | | | | | | | | |
| | | | | |
Liabilities | | Derivatives: | | | | | | | | | | | | | | | | |
| | Foreign Currency Contracts | | | | | | | | | | | | | | | | |
| | Forward Foreign Currency Contracts | | | (476,314 | ) | | | — | | | | (476,314 | ) | | | | |
| | | | | | | | | | | | | | | | | | |
| | Total Liabilities | | | (476,314 | ) | | | — | | | | (476,314 | ) | | | — | |
| | | | | | | | | | | | | | | | | | |
| | Total | | | $45,640,783 | | | | $22,337,764 | | | | $23,303,019 | | | | $— | |
| | | | | | | | | | | | | | | | | | |
| | |
| See Notes to Financial Statements | | See explanation of symbols and terms, if any, on B-97 and B-98 |
B-77
PACIFIC FUNDS
PF EQUITY LONG/SHORT FUND
Schedule of Investments
March 31, 2019
| | | | | | | | |
| | |
Shares | | |
Value | |
SHORT-TERM INVESTMENTS - 77.0% | | | | | | | | |
| |
Money Market Fund - 29.1% | | | | | |
| | |
BlackRock Liquidity FundsT-Fund Portfolio
‘Institutional’ 2.370% | | | 10,997,036 | | | | $10,997,036 | |
| | | | | | | | |
| | |
| | | Principal Amount | | | | |
U.S. Treasury Bills - 47.9% | | | | | |
| | |
2.301% due 04/25/19 | | | $5,933,000 | | | | 5,923,764 | |
2.315% due 04/18/19 | | | 5,002,000 | | | | 4,996,358 | |
2.422% due 09/12/19 ‡ | | | 3,129,000 | | | | 3,095,334 | |
2.427% due 08/01/19 ‡ | | | 1,052,000 | | | | 1,043,533 | |
2.434% due 09/19/19 ‡ | | | 3,129,000 | | | | 3,093,735 | |
| | | | | | | | |
| | |
| | | | | | | 18,152,724 | |
| | | | | | | | |
| | |
Total Short-Term Investments
(Cost $29,146,740) | | | | | | | 29,149,760 | |
| | | | | | | | |
| | |
TOTAL INVESTMENTS - 77.0%
(Cost $29,146,740) | | | | | | | 29,149,760 | |
| |
DERIVATIVES - (0.5%) | | | | | |
(See Notes (c) through (e) in Notes to Schedule of Investments) | | | | (201,545 | ) |
| | | | | | | | |
| |
OTHER ASSETS & LIABILITIES, NET - 23.5% | | | | 8,922,256 | |
| | | | | | | | |
| |
NET ASSETS - 100.0% | | | | $37,870,471 | |
| | | | | | | | |
Notes to Schedule of Investments
| (a) | As of March 31, 2019, the Fund’s composition as a percentage of net assets was as follows: |
| | | | |
Short-Term Investments | | | 77.0% | |
Derivatives | | | (0.5% | ) |
Other Assets & Liabilities, Net | | | 23.5% | |
| | | | |
| | | 100.0% | |
| | | | |
| (b) | As of March 31, 2019, investments with a total aggregate value of $2,414,677 were fully or partially segregated with the broker(s)/custodian as collateral for open futures contracts, forward foreign currencies contracts, and swap agreements. |
| (c) | Open futures contracts outstanding as of March 31, 2019 were as follows: |
| | | | | | | | | | | | | | | | | | | | |
| Long Futures Outstanding | | Expiration
Month | | | Number of
Contracts | | | Notional
Amount | | | Value | | | Unrealized
Appreciation
(Depreciation) | |
AEX Index | | | 04/19 | | | | 2 | | | | $239,545 | | | | $245,862 | | | | $6,317 | |
CAC 40 Index | | | 04/19 | | | | 12 | | | | 714,500 | | | | 719,225 | | | | 4,725 | |
DAX Index | | | 06/19 | | | | 2 | | | | 652,963 | | | | 646,944 | | | | (6,019 | ) |
FTSE 100 Index | | | 06/19 | | | | 12 | | | | 1,106,154 | | | | 1,127,120 | | | | 20,966 | |
FTSE MIB Index | | | 06/19 | | | | 1 | | | | 114,870 | | | | 116,332 | | | | 1,462 | |
Hang Seng Index | | | 04/19 | | | | 1 | | | | 182,931 | | | | 185,205 | | | | 2,274 | |
IBEX 35 Index | | | 04/19 | | | | 2 | | | | 204,658 | | | | 206,143 | | | | 1,485 | |
MSCI SGX Index | | | 04/19 | | | | 2 | | | | 52,946 | | | | 53,082 | | | | 136 | |
OMX Index | | | 04/19 | | | | 13 | | | | 215,554 | | | | 216,205 | | | | 651 | |
S&P 500E-Mini Index | | | 06/19 | | | | 84 | | | | 11,711,440 | | | | 11,918,760 | | | | 207,320 | |
S&P/TSE 60 Index | | | 06/19 | | | | 1 | | | | 143,587 | | | | 143,241 | | | | (346 | ) |
SPI 200 Index | | | 06/19 | | | | 5 | | | | 548,463 | | | | 547,715 | | | | (748 | ) |
TOPIX Index | | | 06/19 | | | | 9 | | | | 1,296,388 | | | | 1,292,791 | | | | (3,597 | ) |
| | | | | | | | | | | | | | | | | | | | |
| | | | | |
Total Futures Contracts | | | | | | | | | | | | | | | | | | | $234,626 | |
| | | | | | | | | | | | | | | | | | | | |
| (d) | Forward foreign currency contracts outstanding as of March 31, 2019 were as follows: |
| | | | | | | | | | | | | | | | | | | | | | | | | | |
Currency
Purchased | | | | | Currency
Sold | | | | | Settlement
Month | | | | Counterparty | | Unrealized
Appreciation | | Unrealized
Depreciation | |
| AUD | | | 324,997 | | | | | USD | | | 231,645 | | | | | 06/19 | | | | CIT | | $— | | | ($533 | ) |
| AUD | | | 325,003 | | | | | USD | | | 231,650 | | | | | 06/19 | | | | JPM | | — | | | (533 | ) |
| CAD | | | 453,000 | | | | | USD | | | 341,452 | | | | | 06/19 | | | | CIT | | — | | | (1,781 | ) |
| CAD | | | 453,000 | | | | | USD | | | 341,453 | | | | | 06/19 | | | | JPM | | — | | | (1,782 | ) |
| CHF | | | 294,000 | | | | | USD | | | 296,286 | | | | | 06/19 | | | | CIT | | 1,260 | | | — | |
| CHF | | | 294,000 | | | | | USD | | | 296,279 | | | | | 06/19 | | | | JPM | | 1,267 | | | — | |
| DKK | | | 411,500 | | | | | USD | | | 63,092 | | | | | 06/19 | | | | CIT | | — | | | (805 | ) |
| DKK | | | 411,500 | | | | | USD | | | 63,120 | | | | | 06/19 | | | | JPM | | — | | | (833 | ) |
| EUR | | | 945,511 | | | | | USD | | | 1,080,722 | | | | | 06/19 | | | | CIT | | — | | | (12,770 | ) |
| EUR | | | 945,489 | | | | | USD | | | 1,080,698 | | | | | 06/19 | | | | JPM | | — | | | (12,771 | ) |
| GBP | | | 440,501 | | | | | USD | | | 583,249 | | | | | 06/19 | | | | CIT | | — | | | (7,188 | ) |
| GBP | | | 440,499 | | | | | USD | | | 583,247 | | | | | 06/19 | | | | JPM | | — | | | (7,189 | ) |
| HKD | | | 1,071,500 | | | | | USD | | | 136,957 | | | | | 06/19 | | | | CIT | | — | | | (127 | ) |
| | |
| See Notes to Financial Statements | | See explanation of symbols and terms, if any, on B-97 and B-98 |
B-78
PACIFIC FUNDS
PF EQUITY LONG/SHORT FUND
Schedule of Investments (Continued)
March 31, 2019
| | | | | | | | | | | | | | | | | | | | | | | | | | | | | | |
Currency
Purchased | | | | | Currency
Sold | | | | | Settlement
Month | | | | | Counterparty | | | Unrealized
Appreciation | | Unrealized
Depreciation | |
| HKD | | | 1,071,500 | | | | | USD | | | 136,957 | | | | | | 06/19 | | | | | | JPM | | | $— | | | ($127 | ) |
| ILS | | | 67,501 | | | | | USD | | | 18,819 | | | | | | 06/19 | | | | | | CIT | | | — | | | (132 | ) |
| ILS | | | 67,499 | | | | | USD | | | 18,819 | | | | | | 06/19 | | | | | | JPM | | | — | | | (132 | ) |
| JPY | | | 90,130,500 | | | | | USD | | | 818,073 | | | | | | 06/19 | | | | | | CIT | | | 345 | | | — | |
| JPY | | | 90,130,500 | | | | | USD | | | 818,074 | | | | | | 06/19 | | | | | | JPM | | | 344 | | | — | |
| NOK | | | 190,512 | | | | | USD | | | 22,238 | | | | | | 06/19 | | | | | | CIT | | | — | | | (80 | ) |
| NOK | | | 190,488 | | | | | USD | | | 22,235 | | | | | | 06/19 | | | | | | JPM | | | — | | | (80 | ) |
| NZD | | | 10,994 | | | | | USD | | | 7,529 | | | | | | 06/19 | | | | | | CIT | | | — | | | (30 | ) |
| NZD | | | 11,006 | | | | | USD | | | 7,537 | | | | | | 06/19 | | | | | | JPM | | | — | | | (31 | ) |
| SEK | | | 792,500 | | | | | USD | | | 85,925 | | | | | | 06/19 | | | | | | CIT | | | — | | | (163 | ) |
| SEK | | | 792,500 | | | | | USD | | | 85,932 | | | | | | 06/19 | | | | | | JPM | | | — | | | (169 | ) |
| SGD | | | 64,000 | | | | | USD | | | 47,452 | | | | | | 06/19 | | | | | | CIT | | | — | | | (156 | ) |
| SGD | | | 64,000 | | | | | USD | | | 47,452 | | | | | | 06/19 | | | | | | JPM | | | — | | | (156 | ) |
| USD | | | 4,245 | | | | | AUD | | | 6,000 | | | | | | 06/19 | | | | | | CIT | | | — | | | (22 | ) |
| USD | | | 4,245 | | | | | AUD | | | 6,000 | | | | | | 06/19 | | | | | | JPM | | | — | | | (22 | ) |
| USD | | | 6,720 | | | | | CAD | | | 9,000 | | | | | | 06/19 | | | | | | CIT | | | — | | | (29 | ) |
| USD | | | 6,720 | | | | | CAD | | | 9,000 | | | | | | 06/19 | | | | | | JPM | | | — | | | (29 | ) |
| USD | | | 5,031 | | | | | CHF | | | 5,000 | | | | | | 06/19 | | | | | | CIT | | | — | | | (29 | ) |
| USD | | | 5,031 | | | | | CHF | | | 5,000 | | | | | | 06/19 | | | | | | JPM | | | — | | | (29 | ) |
| USD | | | 1,993 | | | | | DKK | | | 13,000 | | | | | | 06/19 | | | | | | CIT | | | 25 | | | — | |
| USD | | | 1,993 | | | | | DKK | | | 13,000 | | | | | | 06/19 | | | | | | JPM | | | 25 | | | — | |
| USD | | | 14,250 | | | | | EUR | | | 12,500 | | | | | | 06/19 | | | | | | CIT | | | 131 | | | — | |
| USD | | | 14,250 | | | | | EUR | | | 12,500 | | | | | | 06/19 | | | | | | JPM | | | 131 | | | — | |
| USD | | | 17,169 | | | | | GBP | | | 13,000 | | | | | | 06/19 | | | | | | CIT | | | 168 | | | — | |
| USD | | | 17,169 | | | | | GBP | | | 13,000 | | | | | | 06/19 | | | | | | JPM | | | 168 | | | — | |
| USD | | | 1,661 | | | | | HKD | | | 13,000 | | | | | | 06/19 | | | | | | CIT | | | 1 | | | — | |
| USD | | | 1,661 | | | | | HKD | | | 13,000 | | | | | | 06/19 | | | | | | JPM | | | 1 | | | — | |
| USD | | | 696 | | | | | ILS | | | 2,500 | | | | | | 06/19 | | | | | | CIT | | | 4 | | | — | |
| USD | | | 696 | | | | | ILS | | | 2,500 | | | | | | 06/19 | | | | | | JPM | | | 4 | | | — | |
| USD | | | 24,100 | | | | | JPY | | | 2,672,000 | | | | | | 06/19 | | | | | | CIT | | | — | | | (162 | ) |
| USD | | | 24,100 | | | | | JPY | | | 2,672,000 | | | | | | 06/19 | | | | | | JPM | | | — | | | (162 | ) |
| USD | | | 289 | | | | | NOK | | | 2,500 | | | | | | 06/19 | | | | | | CIT | | | — | | | (1 | ) |
| USD | | | 289 | | | | | NOK | | | 2,500 | | | | | | 06/19 | | | | | | JPM | | | — | | | (1 | ) |
| USD | | | 1,296 | | | | | SEK | | | 12,000 | | | | | | 06/19 | | | | | | CIT | | | — | | | (2 | ) |
| USD | | | 1,296 | | | | | SEK | | | 12,000 | | | | | | 06/19 | | | | | | JPM | | | — | | | (2 | ) |
| USD | | | 2,952 | | | | | SGD | | | 4,000 | | | | | | 06/19 | | | | | | CIT | | | — | | | (4 | ) |
| USD | | | 2,952 | | | | | SGD | | | 4,000 | | | | | | 06/19 | | | | | | JPM | | | — | | | (4 | ) |
| | | | | | | | | | | | | | | | | | | | | | | | | | | | | | |
| | | | | | |
Total Forward Foreign Currency Contracts | | | | | | | | | | | | | | | $3,874 | | | ($48,066 | ) |
| | | | | | | | | | | | | | | | | | | | | | | | | | | |
| (e) | Swap agreements outstanding as of March 31, 2019 were as follows: |
Total Return Basket Swaps
| | | | | | | | | | | | | | | | | | | | | | | | | | | | | | | | |
| Counterparty | | Payment
Frequency | | | Currency | | | Expiration
Dates (1) | | | Notional
Amount Long (2) | | | Notional
Amount Short (2) | | | Unrealized
Appreciation
(Depreciation) (3) | | | Net Dividends and
Financing Fees,
Including Cash (4) | | | Net Value of
Reference
Entities | |
GSC | | | M | | | | USD | | | | 05/11/23 - 04/03/24 | | | | $37,660,275 | | | | ($33,604,207 | ) | | | ($139,460 | ) | | | ($14,409 | ) | | | $3,931,017 | |
JPM | | | M | | | | AUD | | | | 04/05/19 - 04/21/20 | | | | 1,227,430 | | | | (1,222,818 | ) | | | (16,227 | ) | | | 1,744 | | | | (13,359 | ) |
JPM | | | M | | | | GBP | | | | 04/05/19 - 05/05/20 | | | | 4,728,046 | | | | (4,553,102 | ) | | | (204,621 | ) | | | (33,804 | ) | | | 4,127 | |
JPM | | | M | | | | HKD | | | | 05/14/19 - 04/21/20 | | | | 638,980 | | | | (639,867 | ) | | | (535 | ) | | | 4,386 | | | | (5,808 | ) |
JPM | | | M | | | | SGD | | | | 09/17/19 - 04/21/20 | | | | 164,171 | | | | (177,449 | ) | | | 15,804 | | | | 2,376 | | | | 150 | |
MSC | | | M | | | | CAD | | | | 05/02/19 | | | | 1,628,045 | | | | (1,589,856 | ) | | | (38,813 | ) | | | (3,414 | ) | | | 2,790 | |
MSC | | | M | | | | CHF | | | | 05/04/20 | | | | 1,003,992 | | | | (1,033,540 | ) | | | 73,879 | | | | 46,839 | | | | (2,508 | ) |
MSC | | | M | | | | DKK | | | | 05/01/20 | | | | 962,993 | | | | (929,975 | ) | | | 71,896 | | | | 20,943 | | | | 83,971 | |
MSC | | | M | | | | EUR | | | | 05/04/20 | | | | 10,658,232 | | | | (8,774,100 | ) | | | 135,185 | | | | 79,362 | | | | 1,939,955 | |
MSC | | | M | | | | JPY | | | | 05/01/20 | | | | 8,735,190 | | | | (8,543,222 | ) | | | (203,711 | ) | | | 35,256 | | | | (46,999 | ) |
MSC | | | M | | | | NOK | | | | 05/04/20 | | | | 505,055 | | | | (404,496 | ) | | | (23,033 | ) | | | (10,560 | ) | | | 88,086 | |
MSC | | | M | | | | SEK | | | | 05/04/20 | | | | 1,049,027 | | | | (756,878 | ) | | | (73,546 | ) | | | (45,842 | ) | | | 264,445 | |
| | | | | | | | | | | | | | | | | | | | | | | | | | | | | | | | |
| | | | | | | | | | | | | | | $68,961,436 | | | | ($62,229,510 | ) | | | ($403,182 | ) | | | $82,877 | | | | $6,245,867 | |
| | | | | | | | | | | | | | | | | | | | | | | | | | | | | | | | |
| | (1) | The expiration date(s) of the underlying investments in each basket swap are equal to or fall within the range disclosed. |
| | (2) | Notional amount is representative of the cost basis of the long and short positions. |
| | (3) | Unrealized Appreciation (Depreciation) includes Net Dividends and Financing Fees, Including Cash. |
| | (4) | Net Dividends and Financing Fees, Including Cash, includes the gains (losses) realized within the swap when the swap resets. |
The percentages shown below are based on net assets.
| | | | | | | | |
| Description | | Counter-
party | | | Expiration
Dates (1) | |
The Fund receives or pays the net total return on all positions within the basket and pays financing based upon the then-current1-MonthUSD-LIBOR and the1-Day USD Federal Funds plus or minus a specified spread (rates range from (0.743%) to 0.250%) as negotiated by the parties, which is denominated in USD based on the local currencies of the positions within the swap. | | | GSC | | |
| 05/11/23-
04/03/24 |
|
| | |
| See Notes to Financial Statements | | See explanation of symbols and terms, if any, on B-97 and B-98 |
B-79
PACIFIC FUNDS
PF EQUITY LONG/SHORT FUND
Schedule of Investments (Continued)
March 31, 2019
The following table represents the individual long and short positions and related values within the total return basket swap as of March 31, 2019:
| | | | | | | | |
| | |
| Referenced Entity | | Shares | | | Value | |
Long Positions: 100.7% | | | | | | | | |
| | |
United States 100.7% | | | | | | | | |
| | |
3M Co | | | 611 | | | | $126,954 | |
Abbott Laboratories | | | 746 | | | | 59,635 | |
AbbVie Inc | | | 3,014 | | | | 242,898 | |
ABIOMED Inc | | | 161 | | | | 45,980 | |
Accenture PLC ‘A’ | | | 477 | | | | 83,962 | |
Activision Blizzard Inc | | | 1,375 | | | | 62,604 | |
Acuity Brands Inc | | | 92 | | | | 11,041 | |
Adobe Inc | | | 983 | | | | 261,960 | |
Adtalem Global Education Inc | | | 632 | | | | 29,274 | |
AES Corp | | | 1,794 | | | | 32,436 | |
Aflac Inc | | | 2,729 | | | | 136,450 | |
AGCO Corp | | | 378 | | | | 26,290 | |
Agilent Technologies Inc | | | 3,517 | | | | 282,696 | |
Air Products & Chemicals Inc | | | 139 | | | | 26,543 | |
Akamai Technologies Inc | | | 1,154 | | | | 82,753 | |
Alcoa Corp | | | 2,149 | | | | 60,516 | |
Alexion Pharmaceuticals Inc | | | 948 | | | | 128,151 | |
Align Technology Inc | | | 84 | | | | 23,884 | |
Alkermes PLC | | | 1,968 | | | | 71,812 | |
Allergan PLC | | | 471 | | | | 68,959 | |
ALLETE Inc | | | 900 | | | | 74,007 | |
Allison Transmission Holdings Inc | | | 322 | | | | 14,464 | |
Alphabet Inc ‘A’ | | | 53 | | | | 62,375 | |
Altria Group Inc | | | 2,610 | | | | 149,892 | |
Amazon.com Inc | | | 73 | | | | 129,995 | |
AMC Networks Inc ‘A’ | | | 1,649 | | | | 93,597 | |
Amdocs Ltd | | | 1,802 | | | | 97,506 | |
Ameren Corp | | | 1,464 | | | | 107,677 | |
American Eagle Outfitters Inc | | | 1,906 | | | | 42,256 | |
American Electric Power Co Inc | | | 1,452 | | | | 121,605 | |
American Financial Group Inc | | | 153 | | | | 14,720 | |
Ameriprise Financial Inc | | | 345 | | | | 44,195 | |
Amgen Inc | | | 994 | | | | 188,840 | |
Anadarko Petroleum Corp | | | 1,321 | | | | 60,079 | |
ANSYS Inc | | | 345 | | | | 63,035 | |
Anthem Inc | | | 295 | | | | 84,659 | |
Apple Hospitality Inc REIT | | | 464 | | | | 7,563 | |
Apple Inc | | | 1,151 | | | | 218,632 | |
Applied Materials Inc | | | 3,232 | | | | 128,181 | |
Aramark | | | 221 | | | | 6,531 | |
Archer-Daniels-Midland Co | | | 2,185 | | | | 94,239 | |
Armstrong World Industries Inc | | | 214 | | | | 16,996 | |
Arrow Electronics Inc | | | 914 | | | | 70,433 | |
Aspen Technology Inc | | | 880 | | | | 91,749 | |
Associated Banc-Corp | | | 3,824 | | | | 81,642 | |
Assured Guaranty Ltd | | | 4,412 | | | | 196,025 | |
Athene Holding Ltd ‘A’ | | | 5,063 | | | | 206,570 | |
Autodesk Inc | | | 330 | | | | 51,421 | |
Automatic Data Processing Inc | | | 263 | | | | 42,012 | |
AutoZone Inc | | | 162 | | | | 165,907 | |
AvalonBay Communities Inc REIT | | | 181 | | | | 36,332 | |
Avangrid Inc | | | 363 | | | | 18,277 | |
Avery Dennison Corp | | | 851 | | | | 96,163 | |
Avnet Inc | | | 2,361 | | | | 102,397 | |
Axis Capital Holdings Ltd | | | 723 | | | | 39,606 | |
Bank of America Corp | | | 2,761 | | | | 76,176 | |
Baxter International Inc | | | 2,336 | | | | 189,940 | |
Bed Bath & Beyond Inc | | | 3,907 | | | | 66,380 | |
Belden Inc | | | 323 | | | | 17,345 | |
Berry Global Group Inc | | | 469 | | | | 25,265 | |
Best Buy Co Inc | | | 1,431 | | | | 101,687 | |
Biogen Inc | | | 2,012 | | | | 475,597 | |
Bio-Rad Laboratories Inc ‘A’ | | | 335 | | | | 102,403 | |
Booking Holdings Inc | | | 35 | | | | 61,072 | |
Booz Allen Hamilton Holding Corp | | | 1,693 | | | | 98,431 | |
Boston Properties Inc REIT | | | 218 | | | | 29,186 | |
| | | | | | | | |
| | |
| Referenced Entity | | Shares | | | Value | |
Boston Scientific Corp | | | 2,737 | | | $ | 105,046 | |
Brandywine Realty Trust REIT | | | 515 | | | | 8,168 | |
Brinker International Inc | | | 1,568 | | | | 69,588 | |
Bristol-Myers Squibb Co | | | 4,459 | | | | 212,739 | |
Brixmor Property Group Inc REIT | | | 2,498 | | | | 45,888 | |
Broadridge Financial Solutions Inc | | | 1,634 | | | | 169,429 | |
Bruker Corp | | | 6,720 | | | | 258,317 | |
Brunswick Corp | | | 1,575 | | | | 79,270 | |
Cable One Inc | | | 13 | | | | 12,758 | |
Cabot Corp | | | 278 | | | | 11,573 | |
CACI International Inc ‘A’ | | | 36 | | | | 6,553 | |
Cadence Design Systems Inc | | | 2,907 | | | | 184,624 | |
Camden Property Trust REIT | | | 129 | | | | 13,094 | |
Capital One Financial Corp | | | 743 | | | | 60,696 | |
Capri Holdings Ltd | | | 3,254 | | | | 148,871 | |
Cardinal Health Inc | | | 3,670 | | | | 176,711 | |
Carlisle Cos Inc | | | 207 | | | | 25,382 | |
Caterpillar Inc | | | 205 | | | | 27,775 | |
CBS Corp ‘B’ | | | 4,611 | | | | 219,161 | |
CDK Global Inc | | | 2,243 | | | | 131,933 | |
CDW Corp | | | 2,911 | | | | 280,533 | |
Celanese Corp | | | 837 | | | | 82,537 | |
Centene Corp | | | 1,553 | | | | 82,464 | |
CenterPoint Energy Inc | | | 4,502 | | | | 138,211 | |
Cerner Corp | | | 1,216 | | | | 69,567 | |
CF Industries Holdings Inc | | | 400 | | | | 16,352 | |
CH Robinson Worldwide Inc | | | 179 | | | | 15,571 | |
Charles River Laboratories International Inc | | | 1,796 | | | | 260,869 | |
Chevron Corp | | | 372 | | | | 45,823 | |
Ciena Corp | | | 1,250 | | | | 46,675 | |
Cigna Corp | | | 170 | | | | 27,339 | |
Cimarex Energy Co | | | 326 | | | | 22,787 | |
Cirrus Logic Inc | | | 1,669 | | | | 70,215 | |
Cisco Systems Inc | | | 4,078 | | | | 220,171 | |
Citigroup Inc | | | 201 | | | | 12,506 | |
Citizens Financial Group Inc | | | 888 | | | | 28,860 | |
Citrix Systems Inc | | | 277 | | | | 27,606 | |
Clean Harbors Inc | | | 796 | | | | 56,938 | |
CNA Financial Corp | | | 298 | | | | 12,918 | |
Cognizant Technology Solutions Corp ‘A’ | | | 2,411 | | | | 174,677 | |
Colgate-Palmolive Co | | | 4,193 | | | | 287,388 | |
Colombia Sportswear Co | | | 542 | | | | 56,466 | |
Comcast Corp ‘A’ | | | 5,392 | | | | 215,572 | |
Comerica Inc | | | 577 | | | | 42,306 | |
CommScope Holding Co Inc | | | 4,838 | | | | 105,130 | |
CommVault Systems Inc | | | 1,608 | | | | 104,102 | |
Conduent Inc | | | 6,178 | | | | 85,442 | |
ConocoPhillips | | | 3,329 | | | | 222,177 | |
Consolidated Edison Inc | | | 1,215 | | | | 103,044 | |
Constellation Brands Inc ‘A’ | | | 275 | | | | 48,216 | |
CoreLogic Inc | | | 358 | | | | 13,339 | |
Corporate Office Properties Trust REIT | | | 288 | | | | 7,862 | |
Crane Co | | | 988 | | | | 83,605 | |
Cummins Inc | | | 1,098 | | | | 173,341 | |
Curtiss-Wright Corp | | | 1,212 | | | | 137,368 | |
Dana Inc | | | 1,402 | | | | 24,871 | |
Danaher Corp | | | 344 | | | | 45,415 | |
DaVita Inc | | | 715 | | | | 38,817 | |
Deckers Outdoor Corp | | | 1,059 | | | | 155,662 | |
Dell Technologies Inc ‘C’ | | | 136 | | | | 7,982 | |
Delta Air Lines Inc | | | 393 | | | | 20,298 | |
Deluxe Corp | | | 2,106 | | | | 92,074 | |
DENTSPLY SIRONA Inc | | | 494 | | | | 24,497 | |
Devon Energy Corp | | | 1,893 | | | | 59,743 | |
DexCom Inc | | | 346 | | | | 41,209 | |
Dick’s Sporting Goods Inc | | | 1,471 | | | | 54,148 | |
Discover Financial Services | | | 638 | | | | 45,400 | |
Dollar General Corp | | | 219 | | | | 26,127 | |
Dominion Energy Inc | | | 114 | | | | 8,739 | |
| | |
| See Notes to Financial Statements | | See explanation of symbols and terms, if any, on B-97 and B-98 |
B-80
PACIFIC FUNDS
PF EQUITY LONG/SHORT FUND
Schedule of Investments (Continued)
March 31, 2019
| | | | | | | | |
| | |
| Referenced Entity | | Shares | | | Value | |
Domtar Corp | | | 1,776 | | | $ | 88,178 | |
Douglas Emmett Inc REIT | | | 160 | | | | 6,467 | |
Dover Corp | | | 730 | | | | 68,474 | |
DTE Energy Co | | | 272 | | | | 33,929 | |
DXC Technology Co | | | 2,228 | | | | 143,283 | |
Eastman Chemical Co | | | 1,299 | | | | 98,568 | |
Eaton Corp PLC | | | 2,086 | | | | 168,048 | |
eBay Inc | | | 5,068 | | | | 188,226 | |
Ecolab Inc | | | 178 | | | | 31,424 | |
Edwards Lifesciences Corp | | | 319 | | | | 61,034 | |
Electronic Arts Inc | | | 945 | | | | 96,040 | |
EMCOR Group Inc | | | 487 | | | | 35,590 | |
Emerson Electric Co | | | 2,453 | | | | 167,957 | |
Entergy Corp | | | 678 | | | | 64,837 | |
EPAM Systems Inc | | | 52 | | | | 8,795 | |
Equinix Inc REIT | | | 77 | | | | 34,893 | |
Equity Residential REIT | | | 159 | | | | 11,976 | |
Everest Re Group Ltd | | | 50 | | | | 10,798 | |
Eversource Energy | | | 489 | | | | 34,695 | |
Exelixis Inc | | | 8,590 | | | | 204,442 | |
Exelon Corp | | | 9,226 | | | | 462,499 | |
Expeditors International of Washington Inc | | | 84 | | | | 6,376 | |
Extended Stay America Inc | | | 487 | | | | 8,742 | |
F5 Networks Inc | | | 596 | | | | 93,530 | |
Facebook Inc ‘A’ | | | 619 | | | | 103,181 | |
Fair Isaac Corp | | | 403 | | | | 109,467 | |
Federated Investors Inc ‘B’ | | | 1,643 | | | | 48,156 | |
FedEx Corp | | | 146 | | | | 26,486 | |
Fidelity National Financial Inc | | | 1,205 | | | | 44,043 | |
Fifth Third Bancorp | | | 3,218 | | | | 81,158 | |
First American Financial Corp | | | 913 | | | | 47,020 | |
Flex Ltd | | | 9,167 | | | | 91,670 | |
FLIR Systems Inc | | | 844 | | | | 40,158 | |
Fluor Corp | | | 773 | | | | 28,446 | |
Foot Locker Inc | | | 2,636 | | | | 159,742 | |
Fortinet Inc | | | 2,077 | | | | 174,406 | |
Franklin Resources Inc | | | 532 | | | | 17,630 | |
Gardner Denver Holdings Inc | | | 1,399 | | | | 38,906 | |
General Dynamics Corp | | | 56 | | | | 9,480 | |
General Electric Co | | | 3,070 | | | | 30,669 | |
Genpact Ltd | | | 979 | | | | 34,441 | |
Gilead Sciences Inc | | | 5,178 | | | | 336,622 | |
Globus Medical Inc ‘A’ | | | 974 | | | | 48,125 | |
GrafTech International Ltd | | | 4,205 | | | | 53,782 | |
Graham Holdings Co ‘B’ | | | 119 | | | | 81,298 | |
Greif Inc ‘A’ | | | 451 | | | | 18,604 | |
H&R Block Inc | | | 4,278 | | | | 102,415 | |
Haemonetics Corp | | | 1,277 | | | | 111,712 | |
HCA Healthcare Inc | | | 1,052 | | | | 137,160 | |
HD Supply Holdings Inc | | | 277 | | | | 12,008 | |
Healthcare Trust of America Inc ‘A’ REIT | | | 269 | | | | 7,691 | |
Helen of Troy Ltd | | | 68 | | | | 7,885 | |
Herman Miller Inc | | | 4,319 | | | | 151,942 | |
Hewlett Packard Enterprise Co | | | 1,313 | | | | 20,260 | |
Hill-Rom Holdings Inc | | | 749 | | | | 79,289 | |
HollyFrontier Corp | | | 2,773 | | | | 136,626 | |
Hologic Inc | | | 609 | | | | 29,476 | |
Honeywell International Inc | | | 2,379 | | | | 378,071 | |
Host Hotels & Resorts Inc REIT | | | 400 | | | | 7,560 | |
HP Inc | | | 9,065 | | | | 176,133 | |
Humana Inc | | | 761 | | | | 202,426 | |
Huntington Ingalls Industries Inc | | | 923 | | | | 191,246 | |
Huntsman Corp | | | 984 | | | | 22,130 | |
IAC/InterActiveCorp | | | 219 | | | | 46,014 | |
ICU Medical Inc | | | 54 | | | | 12,924 | |
IDACORP Inc | | | 1,014 | | | | 100,934 | |
IDEXX Laboratories Inc | | | 133 | | | | 29,739 | |
Illumina Inc | | | 126 | | | | 39,147 | |
Incyte Corp | | | 653 | | | | 56,165 | |
Ingersoll-Rand PLC | | | 1,129 | | | | 121,876 | |
| | | | | | | | |
| | |
| Referenced Entity | | Shares | | | Value | |
Ingredion Inc | | | 683 | | | | $64,673 | |
Inogen Inc | | | 495 | | | | 47,208 | |
Insperity Inc | | | 642 | | | | 79,390 | |
Intel Corp | | | 2,365 | | | | 127,001 | |
International Business Machines Corp | | | 2,207 | | | | 311,408 | |
International Paper Co | | | 4,893 | | | | 226,399 | |
Intuit Inc | | | 1,280 | | | | 334,605 | |
Ionis Pharmaceuticals Inc | | | 837 | | | | 67,939 | |
IQVIA Holdings Inc | | | 860 | | | | 123,711 | |
ITT Inc | | | 1,095 | | | | 63,510 | |
Jabil Inc | | | 358 | | | | 9,519 | |
Jazz Pharmaceuticals PLC | | | 622 | | | | 88,915 | |
John Wiley & Sons Inc ‘A’ | | | 1,278 | | | | 56,513 | |
Johnson & Johnson | | | 1,369 | | | | 191,373 | |
JPMorgan Chase & Co | | | 482 | | | | 48,793 | |
Juniper Networks Inc | | | 4,741 | | | | 125,494 | |
KAR Auction Services Inc | | | 449 | | | | 23,038 | |
Kennametal Inc | | | 528 | | | | 19,404 | |
KeyCorp | | | 2,992 | | | | 47,124 | |
Keysight Technologies Inc | | | 1,980 | | | | 172,656 | |
Kimberly-Clark Corp | | | 2,589 | | | | 320,777 | |
KLA-Tencor Corp | | | 568 | | | | 67,825 | |
Kohl’s Corp | | | 381 | | | | 26,201 | |
Laboratory Corp of America Holdings | | | 551 | | | | 84,292 | |
Lam Research Corp | | | 474 | | | | 84,851 | |
Lamar Advertising Co ‘A’ REIT | | | 98 | | | | 7,767 | |
Landstar System Inc | | | 127 | | | | 13,893 | |
Las Vegas Sands Corp | | | 2,657 | | | | 161,971 | |
Lear Corp | | | 400 | | | | 54,284 | |
Liberty Media Corp-Liberty SiriusXM | | | 1,942 | | | | 74,262 | |
Lincoln Electric Holdings Inc | | | 234 | | | | 19,626 | |
Lincoln National Corp | | | 792 | | | | 46,490 | |
Lockheed Martin Corp | | | 706 | | | | 211,913 | |
LogMeIn Inc | | | 292 | | | | 23,389 | |
Louisiana-Pacific Corp | | | 309 | | | | 7,533 | |
Lowe’s Cos Inc | | | 227 | | | | 24,850 | |
Lululemon Athletica Inc | | | 1,032 | | | | 169,114 | |
LyondellBasell Industries NV ‘A’ | | | 2,126 | | | | 178,754 | |
Macy’s Inc | | | 4,177 | | | | 100,373 | |
Manhattan Associates Inc | | | 1,253 | | | | 69,053 | |
ManpowerGroup Inc | | | 1,170 | | | | 96,747 | |
Marathon Oil Corp | | | 1,060 | | | | 17,713 | |
Marathon Petroleum Corp | | | 1,322 | | | | 79,122 | |
Masco Corp | | | 231 | | | | 9,081 | |
Masimo Corp | | | 1,288 | | | | 178,105 | |
MAXIMUS Inc | | | 1,078 | | | | 76,516 | |
McKesson Corp | | | 1,605 | | | | 187,881 | |
Medical Properties Trust Inc REIT | | | 339 | | | | 6,275 | |
MEDNAX Inc | | | 2,174 | | | | 59,068 | |
Medtronic PLC | | | 3,560 | | | | 324,245 | |
Merck & Co Inc | | | 2,990 | | | | 248,678 | |
MetLife Inc | | | 4,197 | | | | 178,666 | |
Micron Technology Inc | | | 3,593 | | | | 148,499 | |
Microsoft Corp | | | 2,972 | | | | 350,518 | |
MKS Instruments Inc | | | 981 | | | | 91,282 | |
Molson Coors Brewing Co ‘B’ | | | 184 | | | | 10,976 | |
Monster Beverage Corp | | | 2,225 | | | | 121,441 | |
Morgan Stanley | | | 1,402 | | | | 59,164 | |
Motorola Solutions Inc | | | 444 | | | | 62,346 | |
MSA Safety Inc | | | 1,576 | | | | 162,958 | |
MSC Industrial Direct Co Inc ‘A’ | | | 422 | | | | 34,904 | |
Murphy USA Inc | | | 596 | | | | 51,030 | |
Mylan NV | | | 4,122 | | | | 116,817 | |
National Instruments Corp | | | 2,281 | | | | 101,185 | |
NetApp Inc | | | 1,261 | | | | 87,438 | |
Neurocrine Biosciences Inc | | | 104 | | | | 9,162 | |
NIKE Inc ‘B’ | | | 1,615 | | | | 135,999 | |
Norfolk Southern Corp | | | 436 | | | | 81,484 | |
NorthWestern Corp | | | 1,354 | | | | 95,335 | |
Norwegian Cruise Line Holdings Ltd | | | 950 | | | | 52,212 | |
| | |
| See Notes to Financial Statements | | See explanation of symbols and terms, if any, on B-97 and B-98 |
B-81
PACIFIC FUNDS
PF EQUITY LONG/SHORT FUND
Schedule of Investments (Continued)
March 31, 2019
| | | | | | | | |
| | |
| Referenced Entity | | Shares | | | Value | |
Nu Skin Enterprises Inc ‘A’ | | | 1,322 | | | | $63,271 | |
Nuance Communications Inc | | | 2,084 | | | | 35,282 | |
Nucor Corp | | | 1,382 | | | | 80,640 | |
nVent Electric PLC | | | 2,769 | | | | 74,708 | |
OGE Energy Corp | | | 720 | | | | 31,046 | |
Old Republic International Corp | | | 304 | | | | 6,360 | |
Omnicom Group Inc | | | 717 | | | | 52,334 | |
ON Semiconductor Corp | | | 818 | | | | 16,826 | |
Oracle Corp | | | 5,006 | | | | 268,872 | |
O’Reilly Automotive Inc | | | 247 | | | | 95,910 | |
Oshkosh Corp | | | 819 | | | | 61,531 | |
Outfront Media Inc REIT | | | 493 | | | | 11,536 | |
Packaging Corp of America | | | 1,878 | | | | 186,636 | |
Palo Alto Networks Inc | | | 76 | | | | 18,459 | |
Parker-Hannifin Corp | | | 440 | | | | 75,513 | |
Patterson Cos Inc | | | 360 | | | | 7,866 | |
Patterson-UTI Energy Inc | | | 2,595 | | | | 36,382 | |
Paycom Software Inc | | | 293 | | | | 55,415 | |
PayPal Holdings Inc | | | 316 | | | | 32,813 | |
Pentair PLC | | | 1,549 | | | | 68,946 | |
PepsiCo Inc | | | 1,566 | | | | 191,913 | |
Pfizer Inc | | | 6,649 | | | | 282,383 | |
Philip Morris International Inc | | | 1,675 | | | | 148,053 | |
Phillips 66 | | | 3,232 | | | | 307,589 | |
Pilgrim’s Pride Corp | | | 2,266 | | | | 50,509 | |
Pinnacle West Capital Corp | | | 1,402 | | | | 134,003 | |
Pitney Bowes Inc | | | 4,618 | | | | 31,726 | |
PolyOne Corp | | | 882 | | | | 25,851 | |
Popular Inc | | | 967 | | | | 50,410 | |
PRA Health Sciences Inc | | | 1,443 | | | | 159,148 | |
Proofpoint Inc | | | 59 | | | | 7,164 | |
Prudential Financial Inc | | | 272 | | | | 24,991 | |
Public Service Enterprise Group Inc | | | 4,208 | | | | 249,997 | |
PulteGroup Inc | | | 2,681 | | | | 74,961 | |
PVH Corp | | | 165 | | | | 20,122 | |
QIAGEN NV | | | 3,890 | | | | 158,245 | |
Qorvo Inc | | | 639 | | | | 45,835 | |
QUALCOMM Inc | | | 627 | | | | 35,758 | |
Qurate Retail Inc | | | 896 | | | | 14,318 | |
Ralph Lauren Corp | | | 996 | | | | 129,161 | |
Raymond James Financial Inc | | | 208 | | | | 16,725 | |
Raytheon Co | | | 1,299 | | | | 236,522 | |
Regal Beloit Corp | | | 830 | | | | 67,952 | |
Regeneron Pharmaceuticals Inc | | | 109 | | | | 44,758 | |
Regions Financial Corp | | | 2,005 | | | | 28,371 | |
Reinsurance Group of America Inc | | | 1,262 | | | | 179,179 | |
Reliance Steel & Aluminum Co | | | 947 | | | | 85,476 | |
Republic Services Inc | | | 899 | | | | 72,262 | |
Resideo Technologies Inc | | | 2,394 | | | | 46,180 | |
ResMed Inc | | | 89 | | | | 9,253 | |
Robert Half International Inc | | | 1,882 | | | | 122,631 | |
Ross Stores Inc | | | 326 | | | | 30,351 | |
Sabre Corp | | | 1,980 | | | | 42,352 | |
salesforce.com Inc | | | 226 | | | | 35,792 | |
Sally Beauty Holdings Inc | | | 1,560 | | | | 28,720 | |
Schneider National Inc ‘B’ | | | 2,034 | | | | 42,816 | |
Science Applications International Corp | | | 412 | | | | 31,703 | |
Seagate Technology PLC | | | 150 | | | | 7,184 | |
Senior Housing Properties Trust REIT | | | 728 | | | | 8,576 | |
Service Corp International | | | 1,913 | | | | 76,807 | |
Signet Jewelers Ltd | | | 586 | | | | 15,916 | |
Silgan Holdings Inc | | | 1,702 | | | | 50,430 | |
Simon Property Group Inc REIT | | | 128 | | | | 23,323 | |
Skechers U.S.A. Inc ‘A’ | | | 233 | | | | 7,831 | |
Skyworks Solutions Inc | | | 1,311 | | | | 108,131 | |
Snap-on Inc | | | 213 | | | | 33,339 | |
SolarWinds Corp | | | 1,363 | | | | 26,606 | |
Sonoco Products Co | | | 1,556 | | | | 95,741 | |
Southwest Airlines Co | | | 218 | | | | 11,316 | |
Southwestern Energy Co | | | 6,383 | | | | 29,936 | |
| | | | | | | | |
| | |
| Referenced Entity | | Shares | | | Value | |
Spirit AeroSystems Holdings Inc ‘A’ | | | 3,276 | | | | $299,852 | |
Starbucks Corp | | | 863 | | | | 64,155 | |
State Street Corp | | | 183 | | | | 12,043 | |
Steel Dynamics Inc | | | 4,791 | | | | 168,979 | |
STERIS PLC | | | 104 | | | | 13,315 | |
Stryker Corp | | | 239 | | | | 47,207 | |
Symantec Corp | | | 9,479 | | | | 217,922 | |
Synchrony Financial | | | 6,035 | | | | 192,517 | |
Synopsys Inc | | | 336 | | | | 38,690 | |
Sysco Corp | | | 362 | | | | 24,167 | |
Tapestry Inc | | | 1,931 | | | | 62,738 | |
Target Corp | | | 981 | | | | 78,735 | |
TE Connectivity Ltd | | | 1,215 | | | | 98,111 | |
Tech Data Corp | | | 1,542 | | | | 157,916 | |
TEGNA Inc | | | 9,342 | | | | 131,722 | |
Teledyne Technologies Inc | | | 470 | | | | 111,395 | |
Telephone & Data Systems Inc | | | 1,399 | | | | 42,991 | |
Texas Instruments Inc | | | 874 | | | | 92,705 | |
Textron Inc | | | 258 | | | | 13,070 | |
The Allstate Corp | | | 1,841 | | | | 173,385 | |
The Boeing Co | | | 614 | | | | 234,192 | |
The Boston Beer Co Inc ‘A’ | | | 259 | | | | 76,335 | |
The Cooper Cos Inc | | | 22 | | | | 6,516 | |
The Estee Lauder Cos Inc ‘A’ | | | 419 | | | | 69,365 | |
The Gap Inc | | | 2,486 | | | | 65,084 | |
The Hartford Financial Services Group Inc | | | 2,542 | | | | 126,388 | |
The Hershey Co | | | 96 | | | | 11,024 | |
The Home Depot Inc | | | 541 | | | | 103,812 | |
The Interpublic Group of Cos Inc | | | 2,277 | | | | 47,840 | |
The Kroger Co | | | 5,047 | | | | 124,156 | |
The Michaels Cos Inc | | | 4,311 | | | | 49,232 | |
The Mosaic Co | | | 370 | | | | 10,105 | |
The PNC Financial Services Group Inc | | | 700 | | | | 85,862 | |
The Procter & Gamble Co | | | 4,176 | | | | 434,513 | |
The Progressive Corp | | | 117 | | | | 8,435 | |
The Timken Co | | | 1,045 | | | | 45,583 | |
The TJX Cos Inc | | | 606 | | | | 32,245 | |
The Travelers Cos Inc | | | 67 | | | | 9,190 | |
The Ultimate Software Group Inc | | | 233 | | | | 76,920 | |
The Walt Disney Co | | | 1,055 | | | | 117,137 | |
Thermo Fisher Scientific Inc | | | 151 | | | | 41,332 | |
T-Mobile US Inc | | | 1,106 | | | | 76,425 | |
Toll Brothers Inc | | | 3,068 | | | | 111,062 | |
Tractor Supply Co | | | 1,132 | | | | 110,664 | |
TripAdvisor Inc | | | 1,271 | | | | 65,393 | |
Tupperware Brands Corp | | | 3,279 | | | | 83,877 | |
Twilio Inc ‘A’ | | | 50 | | | | 6,459 | |
Tyson Foods Inc ‘A’ | | | 2,796 | | | | 194,126 | |
UGI Corp | | | 2,655 | | | | 147,140 | |
United Continental Holdings Inc | | | 412 | | | | 32,869 | |
United States Cellular Corp | | | 502 | | | | 23,047 | |
United Technologies Corp | | | 275 | | | | 35,445 | |
United Therapeutics Corp | | | 1,892 | | | | 222,064 | |
Univar Inc | | | 504 | | | | 11,169 | |
Unum Group | | | 2,473 | | | | 83,662 | |
Urban Outfitters Inc | | | 3,403 | | | | 100,865 | |
US Foods Holding Corp | | | 258 | | | | 9,007 | |
Valero Energy Corp | | | 2,317 | | | | 196,551 | |
Varian Medical Systems Inc | | | 799 | | | | 113,234 | |
Veeva Systems Inc ‘A’ | | | 270 | | | | 34,252 | |
Ventas Inc REIT | | | 162 | | | | 10,337 | |
VeriSign Inc | | | 185 | | | | 33,589 | |
Verisk Analytics Inc | | | 74 | | | | 9,842 | |
Verizon Communications Inc | | | 3,439 | | | | 203,348 | |
Vertex Pharmaceuticals Inc | | | 320 | | | | 58,864 | |
VF Corp | | | 770 | | | | 66,921 | |
Viacom Inc ‘B’ | | | 5,310 | | | | 149,052 | |
Vishay Intertechnology Inc | | | 2,471 | | | | 45,639 | |
VMware Inc ‘A’ | | | 334 | | | | 60,290 | |
Vornado Realty Trust REIT | | | 128 | | | | 8,632 | |
| | |
| See Notes to Financial Statements | | See explanation of symbols and terms, if any, on B-97 and B-98 |
B-82
PACIFIC FUNDS
PF EQUITY LONG/SHORT FUND
Schedule of Investments (Continued)
March 31, 2019
| | | | | | | | |
| | |
| Referenced Entity | | Shares | | | Value | |
Wabtec Corp | | | 7 | | | $ | 519 | |
Walgreens Boots Alliance Inc | | | 133 | | | | 8,415 | |
Walmart Inc | | | 681 | | | | 66,418 | |
Waste Management Inc | | | 1,910 | | | | 198,468 | |
Waters Corp | | | 133 | | | | 33,478 | |
Weight Watchers International Inc | | | 4,322 | | | | 87,088 | |
Weingarten Realty Investors REIT | | | 986 | | | | 28,959 | |
Wells Fargo & Co | | | 1,982 | | | | 95,770 | |
Werner Enterprises Inc | | | 844 | | | | 28,823 | |
WESCO International Inc | | | 3,597 | | | | 190,677 | |
West Pharmaceutical Services Inc | | | 359 | | | | 39,562 | |
Westrock Co | | | 237 | | | | 9,089 | |
Whirlpool Corp | | | 170 | | | | 22,591 | |
World Fuel Services Corp | | | 2,232 | | | | 64,482 | |
WR Grace & Co | | | 553 | | | | 43,156 | |
WW Grainger Inc | | | 423 | | | | 127,293 | |
Wyndham Destinations Inc | | | 196 | | | | 7,936 | |
Xerox Corp | | | 4,449 | | | | 142,279 | |
Xilinx Inc | | | 981 | | | | 124,381 | |
Zebra Technologies Corp ‘A’ | | | 636 | | | | 133,261 | |
Zendesk Inc | | | 113 | | | | 9,605 | |
Zimmer Biomet Holdings Inc | | | 228 | | | | 29,116 | |
Zoetis Inc | | | 886 | | | | 89,194 | |
Zynga Inc ‘A’ | | | 25,896 | | | | 138,026 | |
| | | | | | | | |
| | | | | | | 38,140,205 | |
| | | | | | | | |
| | |
Total Long Positions 100.7% | | | | | | | 38,140,205 | |
| | | | | | | | |
| | |
Short Positions: (90.3%) | | | | | | | | |
| | |
Argentina (0.1%) | | | | | | | | |
| | |
MercadoLibre Inc | | | 45 | | | | (22,848 | ) |
| | | | | | | | |
| | |
Bermuda (0.1%) | | | | | | | | |
| | |
RenaissanceRe Holdings Ltd | | | 306 | | | | (43,911 | ) |
| | | | | | | | |
| | |
Ghana (0.1%) | | | | | | | | |
| | |
Kosmos Energy Ltd | | | 8,032 | | | | (50,039 | ) |
| | | | | | | | |
| | |
Panama (0.3%) | | | | | | | | |
| | |
Copa Holdings SA ‘A’ | | | 1,391 | | | | (112,129 | ) |
| | | | | | | | |
| | |
Sweden (0.3%) | | | | | | | | |
| | |
Autoliv Inc | | | 1,476 | | | | (108,530 | ) |
| | | | | | | | |
| | |
United Kingdom (0.4%) | | | | | | | | |
| | |
Janus Henderson Group PLC | | | 476 | | | | (11,890 | ) |
Linde PLC | | | 862 | | | | (151,652 | ) |
| | | | | | | | |
| | | | | | | (163,542 | ) |
| | | | | | | | |
United States (89.0%) | | | | | | | | |
| | |
2U Inc | | | 1,567 | | | | (111,022 | ) |
Aaron’s Inc | | | 467 | | | | (24,564 | ) |
Acadia Healthcare Co Inc | | | 5,570 | | | | (163,257 | ) |
ACI Worldwide Inc | | | 2,111 | | | | (69,389 | ) |
Adient PLC | | | 9,177 | | | | (118,934 | ) |
Advanced Micro Devices Inc | | | 4,863 | | | | (124,104 | ) |
AECOM | | | 889 | | | | (26,377 | ) |
Agios Pharmaceuticals Inc | | | 2,195 | | | | (148,031 | ) |
Alaska Air Group Inc | | | 2,100 | | | | (117,852 | ) |
Albemarle Corp | | | 2,717 | | | | (222,740 | ) |
Allegheny Technologies Inc | | | 6,680 | | | | (170,808 | ) |
Allegion PLC | | | 351 | | | | (31,839 | ) |
Alliant Energy Corp | | | 795 | | | | (37,468 | ) |
Ally Financial Inc | | | 637 | | | | (17,511 | ) |
Alnylam Pharmaceuticals Inc | | | 420 | | | | (39,249 | ) |
AMERCO | | | 30 | | | | (11,145 | ) |
American Airlines Group Inc | | | 3,856 | | | | (122,467 | ) |
American Homes 4 Rent ‘A’ REIT | | | 1,416 | | | | (32,172 | ) |
| | | | | | | | |
| | |
| Referenced Entity | | Shares | | | Value | |
American International Group Inc | | | 932 | | | | ($40,132 | ) |
American Tower Corp REIT | | | 139 | | | | (27,391 | ) |
AmerisourceBergen Corp | | | 1,858 | | | | (147,748 | ) |
Amphenol Corp ‘A’ | | | 155 | | | | (14,638 | ) |
Analog Devices Inc | | | 441 | | | | (46,424 | ) |
Antero Resources Corp | | | 2,692 | | | | (23,770 | ) |
AO Smith Corp | | | 521 | | | | (27,780 | ) |
Apache Corp | | | 1,441 | | | | (49,945 | ) |
AptarGroup Inc | | | 159 | | | | (16,916 | ) |
Aptiv PLC | | | 4,160 | | | | (330,678 | ) |
Arch Capital Group Ltd | | | 315 | | | | (10,181 | ) |
Arcosa Inc | | | 976 | | | | (29,817 | ) |
Arista Networks Inc | | | 29 | | | | (9,119 | ) |
ASGN Inc | | | 655 | | | | (41,586 | ) |
Atlassian Corp PLC ‘A’ | | | 233 | | | | (26,187 | ) |
AutoNation Inc | | | 1,107 | | | | (39,542 | ) |
Avanos Medical Inc | | | 776 | | | | (33,120 | ) |
Avis Budget Group Inc | | | 328 | | | | (11,434 | ) |
Baker Hughes a GE Co | | | 3,980 | | | | (110,326 | ) |
Ball Corp | | | 806 | | | | (46,635 | ) |
BancorpSouth Bank | | | 3,046 | | | | (85,958 | ) |
Bank of Hawaii Corp | | | 857 | | | | (67,592 | ) |
Bank OZK | | | 1,441 | | | | (41,760 | ) |
BB&T Corp | | | 2,007 | | | | (93,386 | ) |
Becton Dickinson and Co | | | 230 | | | | (57,438 | ) |
BGC Partners Inc ‘A’ | | | 5,439 | | | | (28,881 | ) |
BioMarin Pharmaceutical Inc | | | 711 | | | | (63,158 | ) |
Bio-Techne Corp | | | 179 | | | | (35,540 | ) |
Black Hills Corp | | | 1,323 | | | | (97,995 | ) |
Bluebird Bio Inc | | | 846 | | | | (133,101 | ) |
BOK Financial Corp | | | 82 | | | | (6,687 | ) |
BorgWarner Inc | | | 169 | | | | (6,491 | ) |
Boyd Gaming Corp | | | 268 | | | | (7,332 | ) |
Broadcom Inc | | | 110 | | | | (33,078 | ) |
Brookdale Senior Living Inc | | | 13,080 | | | | (86,066 | ) |
Brown-Forman Corp ‘B’ | | | 981 | | | | (51,777 | ) |
Bunge Ltd | | | 998 | | | | (52,964 | ) |
Burlington Stores Inc | | | 298 | | | | (46,691 | ) |
BWX Technologies Inc | | | 3,313 | | | | (164,259 | ) |
Caesars Entertainment Corp | | | 8,218 | | | | (71,414 | ) |
Callon Petroleum Co | | | 21,370 | | | | (161,344 | ) |
Campbell Soup Co | | | 2,686 | | | | (102,417 | ) |
CarMax Inc | | | 2,275 | | | | (158,795 | ) |
Carpenter Technology Corp | | | 284 | | | | (13,021 | ) |
Cars.com Inc | | | 898 | | | | (20,474 | ) |
Casey’s General Stores Inc | | | 280 | | | | (36,056 | ) |
Catalent Inc | | | 1,286 | | | | (52,199 | ) |
Cathay General Bancorp | | | 932 | | | | (31,604 | ) |
Cboe Global Markets Inc | | | 157 | | | | (14,984 | ) |
Centennial Resource Development Inc ‘A’ | | | 7,959 | | | | (69,960 | ) |
CenturyLink Inc | | | 580 | | | | (6,954 | ) |
Charter Communications Inc ‘A’ | | | 543 | | | | (188,372 | ) |
Cheniere Energy Inc | | | 2,078 | | | | (142,052 | ) |
Chipotle Mexican Grill Inc | | | 53 | | | | (37,646 | ) |
Choice Hotels International Inc | | | 109 | | | | (8,474 | ) |
Chubb Ltd | | | 55 | | | | (7,704 | ) |
Church & Dwight Co Inc | | | 455 | | | | (32,410 | ) |
Cincinnati Financial Corp | | | 1,473 | | | | (126,531 | ) |
CME Group Inc | | | 135 | | | | (22,218 | ) |
CMS Energy Corp | | | 152 | | | | (8,442 | ) |
CNX Resources Corp | | | 828 | | | | (8,918 | ) |
Cognex Corp | | | 3,368 | | | | (171,296 | ) |
Coherent Inc | | | 563 | | | | (79,788 | ) |
Colony Capital Inc REIT | | | 31,993 | | | | (170,203 | ) |
Commerce Bancshares Inc | | | 1,438 | | | | (83,490 | ) |
Commercial Metals Co | | | 6,779 | | | | (115,785 | ) |
Compass Minerals International Inc | | | 1,880 | | | | (102,216 | ) |
Conagra Brands Inc | | | 9,305 | | | | (258,121 | ) |
Concho Resources Inc | | | 1,291 | | | | (143,249 | ) |
Copart Inc | | | 3,096 | | | | (187,587 | ) |
CoStar Group Inc | | | 116 | | | | (54,105 | ) |
Cousins Properties Inc REIT | | | 5,980 | | | | (57,767 | ) |
| | |
| See Notes to Financial Statements | | See explanation of symbols and terms, if any, on B-97 and B-98 |
B-83
PACIFIC FUNDS
PF EQUITY LONG/SHORT FUND
Schedule of Investments (Continued)
March 31, 2019
| | | | | | | | |
| | |
| Referenced Entity | | Shares | | | Value | |
Cree Inc | | | 2,772 | | | | ( $ 158,614 | ) |
Crown Castle International Corp REIT | | | 296 | | | | (37,888 | ) |
Crown Holdings Inc | | | 888 | | | | (48,458 | ) |
Cullen/Frost Bankers Inc | | | 1,139 | | | | (110,563 | ) |
CVS Health Corp | | | 872 | | | | (47,027 | ) |
Cypress Semiconductor Corp | | | 1,824 | | | | (27,214 | ) |
CyrusOne Inc REIT | | | 1,683 | | | | (88,257 | ) |
Deere & Co | | | 970 | | | | (155,045 | ) |
Delphi Technologies PLC | | | 1,341 | | | | (25,828 | ) |
Diamond Offshore Drilling Inc | | | 958 | | | | (10,049 | ) |
Digital Realty Trust Inc REIT | | | 1,506 | | | | (179,214 | ) |
Discovery Inc ‘A’ | | | 2,623 | | | | (70,873 | ) |
DISH Network Corp ‘A’ | | | 2,386 | | | | (75,612 | ) |
Dolby Laboratories Inc ‘A’ | | | 166 | | | | (10,453 | ) |
Dollar Tree Inc | | | 117 | | | | (12,290 | ) |
Domino’s Pizza Inc | | | 446 | | | | (115,113 | ) |
Donaldson Co Inc | | | 252 | | | | (12,615 | ) |
DowDuPont Inc | | | 4,139 | | | | (220,650 | ) |
DR Horton Inc | | | 2,083 | | | | (86,195 | ) |
Dril-Quip Inc | | | 1,900 | | | | (87,115 | ) |
Duke Energy Corp | | | 199 | | | | (17,910 | ) |
Dunkin’ Brands Group Inc | | | 2,074 | | | | (155,757 | ) |
Dycom Industries Inc | | | 1,176 | | | | (54,025 | ) |
E*TRADE Financial Corp | | | 1,955 | | | | (90,771 | ) |
Eagle Materials Inc | | | 985 | | | | (83,036 | ) |
Eaton Vance Corp | | | 1,021 | | | | (41,157 | ) |
Eldorado Resorts Inc | | | 526 | | | | (24,559 | ) |
Element Solutions Inc | | | 15,855 | | | | (160,136 | ) |
Energizer Holdings Inc | | | 1,724 | | | | (77,459 | ) |
EnerSys | | | 449 | | | | (29,257 | ) |
Ensco PLC ‘A’ | | | 29,236 | | | | (114,897 | ) |
EOG Resources Inc | | | 375 | | | | (35,693 | ) |
EQT Corp | | | 1,742 | | | | (36,129 | ) |
Equifax Inc | | | 117 | | | | (13,865 | ) |
Equitrans Midstream Corp | | | 2,174 | | | | (47,350 | ) |
Euronet Worldwide Inc | | | 804 | | | | (114,642 | ) |
Exact Sciences Corp | | | 305 | | | | (26,419 | ) |
Expedia Group Inc | | | 105 | | | | (12,495 | ) |
Extra Space Storage Inc REIT | | | 65 | | | | (6,624 | ) |
Extraction Oil & Gas Inc | | | 5,645 | | | | (23,878 | ) |
Fastenal Co | | | 1,367 | | | | (87,912 | ) |
First Horizon National Corp | | | 3,837 | | | | (53,641 | ) |
First Republic Bank | | | 4,027 | | | | (404,552 | ) |
First Solar Inc | | | 2,216 | | | | (117,093 | ) |
FirstEnergy Corp | | | 2,450 | | | | (101,945 | ) |
Fiserv Inc | | | 319 | | | | (28,161 | ) |
Five Below Inc | | | 157 | | | | (19,507 | ) |
FleetCor Technologies Inc | | | 91 | | | | (22,440 | ) |
Floor & Decor Holdings Inc ‘A’ | | | 2,726 | | | | (112,366 | ) |
Flowserve Corp | | | 1,153 | | | | (52,046 | ) |
FMC Corp | | | 473 | | | | (36,336 | ) |
FNB Corp | | | 7,323 | | | | (77,624 | ) |
Ford Motor Co | | | 8,697 | | | | (76,360 | ) |
Fortive Corp | | | 778 | | | | (65,266 | ) |
Freeport-McMoRan Inc | | | 8,110 | | | | (104,538 | ) |
Fulton Financial Corp | | | 2,245 | | | | (34,753 | ) |
Gartner Inc | | | 305 | | | | (46,262 | ) |
GATX Corp | | | 178 | | | | (13,594 | ) |
GCI Liberty Inc ‘A’ | | | 2,089 | | | | (116,169 | ) |
General Mills Inc | | | 696 | | | | (36,018 | ) |
Gentex Corp | | | 1,710 | | | | (35,363 | ) |
Global Payments Inc | | | 2,435 | | | | (332,426 | ) |
GoDaddy Inc ‘A’ | | | 938 | | | | (70,528 | ) |
Grand Canyon Education Inc | | | 325 | | | | (37,216 | ) |
Granite Construction Inc | | | 5,392 | | | | (232,665 | ) |
Graphic Packaging Holding Co | | | 12,627 | | | | (159,479 | ) |
GrubHub Inc | | | 1,067 | | | | (74,124 | ) |
Guidewire Software Inc | | | 730 | | | | (70,927 | ) |
Hancock Whitney Corp | | | 993 | | | | (40,117 | ) |
Hanesbrands Inc | | | 3,463 | | | | (61,918 | ) |
Harley-Davidson Inc | | | 1,751 | | | | (62,441 | ) |
| | | | | | | | |
| | |
| Referenced Entity | | Shares | | | Value | |
Harris Corp | | | 474 | | | | ( $ 75,703 | ) |
Hasbro Inc | | | 1,036 | | | | (88,081 | ) |
Healthcare Realty Trust Inc REIT | | | 374 | | | | (12,009 | ) |
Healthcare Services Group Inc | | | 2,794 | | | | (92,174 | ) |
HealthEquity Inc | | | 1,406 | | | | (104,016 | ) |
HEICO Corp | | | 1,059 | | | | (100,467 | ) |
Helmerich & Payne Inc | | | 431 | | | | (23,946 | ) |
Henry Schein Inc | | | 471 | | | | (28,312 | ) |
Hess Corp | | | 2,228 | | | | (134,192 | ) |
Hilton Grand Vacations Inc | | | 769 | | | | (23,724 | ) |
Home BancShares Inc AR | | | 6,344 | | | | (111,464 | ) |
Hormel Foods Corp | | | 1,088 | | | | (48,699 | ) |
Hubbell Inc | | | 150 | | | | (17,697 | ) |
Huntington Bancshares Inc | | | 2,015 | | | | (25,550 | ) |
Hyatt Hotels Corp ‘A’ | | | 202 | | | | (14,659 | ) |
Insulet Corp | | | 3,082 | | | | (293,067 | ) |
Integra LifeSciences Holdings Corp | | | 367 | | | | (20,449 | ) |
International Flavors & Fragrances Inc | | | 2,562 | | | | (329,960 | ) |
International Game Technology PLC | | | 5,065 | | | | (65,794 | ) |
Invesco Ltd | | | 2,178 | | | | (42,057 | ) |
Invitation Homes Inc REIT | | | 2,524 | | | | (61,409 | ) |
IPG Photonics Corp | | | 1,127 | | | | (171,056 | ) |
Jack in the Box Inc | | | 337 | | | | (27,317 | ) |
Jacobs Engineering Group Inc | | | 2,441 | | | | (183,539 | ) |
JetBlue Airways Corp | | | 580 | | | | (9,489 | ) |
Johnson Controls International PLC | | | 924 | | | | (34,133 | ) |
Jones Lang LaSalle Inc | | | 113 | | | | (17,422 | ) |
KB Home | | | 3,076 | | | | (74,347 | ) |
Kemper Corp | | | 1,905 | | | | (145,047 | ) |
Kilroy Realty Corp REIT | | | 111 | | | | (8,432 | ) |
Kimco Realty Corp REIT | | | 1,213 | | | | (22,441 | ) |
Kirby Corp | | | 558 | | | | (41,911 | ) |
Knight-Swift Transportation Holdings Inc | | | 4,663 | | | | (152,387 | ) |
L Brands Inc | | | 1,155 | | | | (31,855 | ) |
Legg Mason Inc | | | 2,388 | | | | (65,360 | ) |
Leggett & Platt Inc | | | 641 | | | | (27,063 | ) |
Leidos Holdings Inc | | | 359 | | | | (23,008 | ) |
LendingTree Inc | | | 404 | | | | (142,030 | ) |
Lennar Corp ‘A’ | | | 2,004 | | | | (98,376 | ) |
Liberty Broadband Corp ‘C’ | | | 246 | | | | (22,568 | ) |
Ligand Pharmaceuticals Inc | | | 639 | | | | (80,329 | ) |
Lions Gate Entertainment Corp ‘A’ | | | 2,315 | | | | (36,207 | ) |
Littelfuse Inc | | | 686 | | | | (125,181 | ) |
Live Nation Entertainment Inc | | | 1,468 | | | | (93,277 | ) |
Livent Corpl | | | — | | | | (7 | ) |
LiveRamp Holdings Inc | | | 258 | | | | (14,079 | ) |
LKQ Corp | | | 2,940 | | | | (83,437 | ) |
Loews Corp | | | 1,125 | | | | (53,921 | ) |
Lumentum Holdings Inc | | | 1,983 | | | | (112,119 | ) |
Mack-Cali Realty Corp REIT | | | 437 | | | | (9,701 | ) |
Macquarie Infrastructure Corp | | | 5,524 | | | | (227,699 | ) |
Markel Corp | | | 149 | | | | (148,440 | ) |
MarketAxess Holdings Inc | | | 652 | | | | (160,444 | ) |
Marriott Vacations Worldwide Corp | | | 125 | | | | (11,688 | ) |
Marsh & McLennan Cos Inc | | | 156 | | | | (14,648 | ) |
Martin Marietta Materials Inc | | | 1,012 | | | | (203,594 | ) |
Marvell Technology Group Ltd | | | 10,557 | | | | (209,979 | ) |
MasTec Inc | | | 3,970 | | | | (190,957 | ) |
Matador Resources Co | | | 5,925 | | | | (114,530 | ) |
Mattel Inc | | | 10,297 | | | | (133,861 | ) |
McCormick & Co Inc | | | 1,442 | | | | (217,208 | ) |
McDonald’s Corp | | | 168 | | | | (31,903 | ) |
MDU Resources Group Inc | | | 367 | | | | (9,480 | ) |
Medidata Solutions Inc | | | 1,256 | | | | (91,989 | ) |
Mercury General Corp | | | 265 | | | | (13,269 | ) |
Meredith Corp | | | 3,050 | | | | (168,543 | ) |
MGM Resorts International | | | 976 | | | | (25,044 | ) |
Microchip Technology Inc | | | 2,446 | | | | (202,920 | ) |
Mohawk Industries Inc | | | 396 | | | | (49,955 | ) |
Molina Healthcare Inc | | | 276 | | | | (39,181 | ) |
Monolithic Power Systems Inc | | | 491 | | | | (66,526 | ) |
| | |
| See Notes to Financial Statements | | See explanation of symbols and terms, if any, on B-97 and B-98 |
B-84
PACIFIC FUNDS
PF EQUITY LONG/SHORT FUND
Schedule of Investments (Continued)
March 31, 2019
| | | | | | | | |
| | |
| Referenced Entity | | Shares | | | Value | |
Murphy Oil Corp | | | 276 | | | | ( $ 8,087 | ) |
Nabors Industries Ltd | | | 14,986 | | | | (51,552 | ) |
Nasdaq Inc | | | 245 | | | | (21,435 | ) |
National Fuel Gas Co | | | 981 | | | | (59,802 | ) |
National Oilwell Varco Inc | | | 3,764 | | | | (100,273 | ) |
NCR Corp | | | 834 | | | | (22,760 | ) |
Nektar Therapeutics | | | 546 | | | | (18,346 | ) |
Netflix Inc | | | 379 | | | | (135,136 | ) |
NetScout Systems Inc | | | 1,108 | | | | (31,102 | ) |
New York Community Bancorp Inc | | | 39,110 | | | | (452,503 | ) |
Newell Brands Inc | | | 12,766 | | | | (195,830 | ) |
NewMarket Corp | | | 225 | | | | (97,551 | ) |
Newmont Mining Corp | | | 3,758 | | | | (134,424 | ) |
News Corp ‘A’ | | | 4,082 | | | | (50,780 | ) |
NextEra Energy Inc | | | 407 | | | | (78,681 | ) |
NiSource Inc | | | 11,701 | | | | (335,351 | ) |
Noble Energy Inc | | | 5,911 | | | | (146,179 | ) |
Nordson Corp | | | 80 | | | | (10,602 | ) |
Northern Trust Corp | | | 992 | | | | (89,687 | ) |
NOW Inc | | | 6,848 | | | | (95,598 | ) |
NRG Energy Inc | | | 1,707 | | | | (72,513 | ) |
Nutanix Inc ‘A’ | | | 605 | | | | (22,833 | ) |
NuVasive Inc | | | 2,371 | | | | (134,649 | ) |
NVIDIA Corp | | | 565 | | | | (101,451 | ) |
Oasis Petroleum Inc | | | 9,773 | | | | (59,029 | ) |
Oceaneering International Inc | | | 2,912 | | | | (45,922 | ) |
Okta Inc | | | 381 | | | | (31,520 | ) |
Olin Corp | | | 1,560 | | | | (36,098 | ) |
Ollie’s Bargain Outlet Holdings Inc | | | 693 | | | | (59,134 | ) |
Omega Healthcare Investors Inc REIT | | | 1,963 | | | | (74,888 | ) |
ONEOK Inc | | | 4,163 | | | | (290,744 | ) |
Owens Corning | | | 1,534 | | | | (72,282 | ) |
PacWest Bancorp | | | 2,631 | | | | (98,952 | ) |
Park Hotels & Resorts Inc REIT | | | 3,709 | | | | (115,276 | ) |
Parsley Energy Inc ‘A’ | | | 480 | | | | (9,264 | ) |
Pebblebrook Hotel Trust REIT | | | 3,264 | | | | (101,380 | ) |
Penn National Gaming Inc | | | 1,903 | | | | (38,250 | ) |
Penske Automotive Group Inc | | | 619 | | | | (27,638 | ) |
Penumbra Inc | | | 590 | | | | (86,736 | ) |
People’s United Financial Inc | | | 8,334 | | | | (137,011 | ) |
PerkinElmer Inc | | | 905 | | | | (87,206 | ) |
Perrigo Co PLC | | | 756 | | | | (36,409 | ) |
Pinnacle Financial Partners Inc | | | 4,176 | | | | (228,427 | ) |
Plantronics Inc | | | 949 | | | | (43,758 | ) |
Polaris Industries Inc | | | 1,151 | | | | (97,179 | ) |
Pool Corp | | | 407 | | | | (67,143 | ) |
Post Holdings Inc | | | 1,333 | | | | (145,830 | ) |
PotlatchDeltic Corp REIT | | | 1,121 | | | | (42,363 | ) |
PPG Industries Inc | | | 110 | | | | (12,416 | ) |
PPL Corp | | | 1,411 | | | | (44,785 | ) |
Premier Inc ‘A’ | | | 3,651 | | | | (125,923 | ) |
Prestige Consumer Healthcare I | | | 3,389 | | | | (101,365 | ) |
Primerica Inc | | | 130 | | | | (15,880 | ) |
Principal Financial Group Inc | | | 2,745 | | | | (137,772 | ) |
Prologis Inc REIT | | | 122 | | | | (8,778 | ) |
Prosperity Bancshares Inc | | | 2,305 | | | | (159,183 | ) |
Pure Storage Inc ‘A’ | | | 2,463 | | | | (53,669 | ) |
Quest Diagnostics Inc | | | 615 | | | | (55,301 | ) |
Range Resources Corp | | | 8,003 | | | | (89,954 | ) |
RealPage Inc | | | 301 | | | | (18,268 | ) |
Realty Income Corp REIT | | | 195 | | | | (14,344 | ) |
Regency Centers Corp REIT | | | 232 | | | | (15,658 | ) |
RingCentral Inc ‘A’ | | | 155 | | | | (16,709 | ) |
Royal Gold Inc | | | 954 | | | | (86,747 | ) |
Sage Therapeutics Inc | | | 186 | | | | (29,583 | ) |
Sanderson Farms Inc | | | 1,982 | | | | (261,307 | ) |
SBA Communications Corp REIT | | | 277 | | | | (55,306 | ) |
Schlumberger Ltd | | | 390 | | | | (16,992 | ) |
Scientific Games Corp | | | 3,175 | | | | (64,834 | ) |
Seattle Genetics Inc | | | 1,346 | | | | (98,581 | ) |
SEI Investments Co | | | 122 | | | | (6,375 | ) |
| | | | | | | | |
| | |
| Referenced Entity | | Shares | | | Value | |
Sempra Energy | | | 2,951 | | | | ( $ 371,413 | ) |
Sensata Technologies Holding PLC | | | 1,072 | | | | (48,261 | ) |
Sensient Technologies Corp | | | 733 | | | | (49,690 | ) |
ServiceMaster Global Holdings Inc | | | 407 | | | | (19,007 | ) |
Signature Bank/New York NY | | | 585 | | | | (74,921 | ) |
Silicon Laboratories Inc | | | 416 | | | | (33,638 | ) |
Sirius XM Holdings Inc | | | 5,781 | | | | (32,778 | ) |
SITE Centers Corp REIT | | | 2,597 | | | | (35,371 | ) |
Six Flags Entertainment Corp | | | 426 | | | | (21,023 | ) |
SL Green Realty Corp REIT | | | 268 | | | | (24,099 | ) |
SLM Corp | | | 26,607 | | | | (263,675 | ) |
Sotheby’s | | | 2,391 | | | | (90,260 | ) |
Southwest Gas Holdings Inc | | | 524 | | | | (43,104 | ) |
Spectrum Brands Holdings Inc | | | 416 | | | | (22,788 | ) |
Sprouts Farmers Market Inc | | | 2,882 | | | | (62,078 | ) |
Square Inc ‘A’ | | | 1,196 | | | | (89,604 | ) |
SS&C Technologies Holdings Inc | | | 119 | | | | (7,579 | ) |
Stanley Black & Decker Inc | | | 205 | | | | (27,915 | ) |
Stericycle Inc | | | 2,282 | | | | (124,186 | ) |
Sterling Bancorp | | | 14,744 | | | | (274,681 | ) |
Stifel Financial Corp | | | 3,867 | | | | (204,023 | ) |
SVB Financial Group | | | 662 | | | | (147,202 | ) |
Switch Inc ‘A’ | | | 8,269 | | | | (85,253 | ) |
Synaptics Inc | | | 924 | | | | (36,729 | ) |
Syneos Health Inc | | | 347 | | | | (17,961 | ) |
SYNNEX Corp | | | 725 | | | | (69,158 | ) |
Synovus Financial Corp | | | 2,428 | | | | (83,426 | ) |
Take-Two Interactive Software Inc | | | 236 | | | | (22,271 | ) |
Targa Resources Corp | | | 1,450 | | | | (60,248 | ) |
TCF Financial Corp | | | 335 | | | | (6,931 | ) |
Teleflex Inc | | | 115 | | | | (34,748 | ) |
Tempur Sealy International Inc | | | 490 | | | | (28,258 | ) |
Tenet Healthcare Corp | | | 330 | | | | (9,517 | ) |
Teradyne Inc | | | 250 | | | | (9,960 | ) |
Terex Corp | | | 455 | | | | (14,619 | ) |
Tesla Inc | | | 1,456 | | | | (407,476 | ) |
Texas Capital Bancshares Inc | | | 310 | | | | (16,923 | ) |
Texas Roadhouse Inc | | | 236 | | | | (14,677 | ) |
The Bank of New York Mellon Corp | | | 815 | | | | (41,100 | ) |
The Brink’s Co | | | 748 | | | | (56,407 | ) |
The Charles Schwab Corp | | | 4,536 | | | | (193,959 | ) |
The Cheesecake Factory Inc | | | 139 | | | | (6,800 | ) |
The Chemours Co | | | 1,079 | | | | (40,096 | ) |
The Goodyear Tire & Rubber Co | | | 2,319 | | | | (42,090 | ) |
The Hain Celestial Group Inc | | | 5,876 | | | | (135,853 | ) |
The Hanover Insurance Group Inc | | | 82 | | | | (9,362 | ) |
The JM Smucker Co | | | 118 | | | | (13,747 | ) |
The Kraft Heinz Co | | | 4,769 | | | | (155,708 | ) |
The Macerich Co REIT | | | 1,038 | | | | (44,997 | ) |
The Madison Square Garden Co ‘A’ | | | 196 | | | | (57,453 | ) |
The Middleby Corp | | | 1,194 | | | | (155,256 | ) |
The New York Times Co ‘A’ | | | 2,136 | | | | (70,168 | ) |
The ScottsMiracle-Gro Co | | | 355 | | | | (27,896 | ) |
The Wendy’s Co | | | 2,178 | | | | (38,964 | ) |
The Western Union Co | | | 1,639 | | | | (30,272 | ) |
The Williams Cos Inc | | | 6,258 | | | | (179,730 | ) |
Thor Industries Inc | | | 1,093 | | | | (68,170 | ) |
Tiffany & Co | | | 1,553 | | | | (163,919 | ) |
Torchmark Corp | | | 360 | | | | (29,502 | ) |
Total System Services Inc | | | 1,249 | | | | (118,667 | ) |
TransDigm Group Inc | | | 303 | | | | (137,559 | ) |
Transocean Ltd | | | 20,897 | | | | (182,013 | ) |
TransUnion | | | 1,289 | | | | (86,157 | ) |
TreeHouse Foods Inc | | | 739 | | | | (47,702 | ) |
TRI Pointe Group Inc | | | 5,705 | | | | (72,111 | ) |
Trimble Inc | | | 962 | | | | (38,865 | ) |
Trinity Industries Inc | | | 2,996 | | | | (65,103 | ) |
Trustmark Corp | | | 2,346 | | | | (78,896 | ) |
Twitter Inc | | | 879 | | | | (28,902 | ) |
UMB Financial Corp | | | 765 | | | | (48,991 | ) |
Under Armour Inc ‘A’ | | | 5,653 | | | | (119,504 | ) |
| | |
| See Notes to Financial Statements | | See explanation of symbols and terms, if any, on B-97 and B-98 |
B-85
PACIFIC FUNDS
PF EQUITY LONG/SHORT FUND
Schedule of Investments (Continued)
March 31, 2019
| | | | | | | | |
| | |
| Referenced Entity | | Shares | | | Value | |
United Bankshares Inc | | | 8,454 | | | | ( $ 306,373 | ) |
United Parcel Service Inc ‘B’ | | | 357 | | | | (39,891 | ) |
United Rentals Inc | | | 277 | | | | (31,647 | ) |
United States Steel Corp | | | 1,822 | | | | (35,511 | ) |
Uniti Group Inc REIT | | | 6,668 | | | | (74,615 | ) |
Universal Display Corp | | | 1,277 | | | | (195,189 | ) |
Urban Edge Properties REIT | | | 1,609 | | | | (30,571 | ) |
Vail Resorts Inc | | | 313 | | | | (68,015 | ) |
Valley National Bancorp | | | 5,726 | | | | (54,855 | ) |
Valmont Industries Inc | | | 69 | | | | (8,977 | ) |
VEREIT Inc REIT | | | 29,467 | | | | (246,639 | ) |
ViaSat Inc | | | 3,531 | | | | (273,653 | ) |
VICI Properties Inc REIT | | | 299 | | | | (6,542 | ) |
Virtu Financial Inc ‘A’ | | | 6,343 | | | | (150,646 | ) |
Visa Inc ‘A’ | | | 1,928 | | | | (301,134 | ) |
Visteon Corp | | | 2,375 | | | | (159,956 | ) |
Vulcan Materials Co | | | 900 | | | | (106,560 | ) |
WABCO Holdings Inc | | | 511 | | | | (67,365 | ) |
Wabtec Corp | | | 3,696 | | | | (272,469 | ) |
Washington Federal Inc | | | 3,387 | | | | (97,850 | ) |
Watsco Inc | | | 45 | | | | (6,444 | ) |
Wayfair Inc ‘A’ | | | 151 | | | | (22,416 | ) |
Weatherford International PLC | | | 22,300 | | | | (15,565 | ) |
Webster Financial Corp | | | 2,724 | | | | (138025 | ) |
WEC Energy Group Inc | | | 974 | | | | (77,024 | ) |
Welbilt Inc | | | 9,146 | | | | (149,812 | ) |
| | | | | | | | |
| | |
| Referenced Entity | | Shares | | | Value | |
WellCare Health Plans Inc | | | 957 | | | | ($258,151 | ) |
Welltower Inc REIT | | | 884 | | | | (68,599 | ) |
Western Alliance Bancorp | | | 238 | | | | (9,768 | ) |
Western Digital Corp | | | 929 | | | | (44,648 | ) |
Weyerhaeuser Co REIT | | | 4,037 | | | | (106,335 | ) |
White Mountains Insurance Group Ltd | | | 8 | | | | (7,404 | ) |
Willis Towers Watson PLC | | | 117 | | | | (20,551 | ) |
Woodward Inc | | | 119 | | | | (11,292 | ) |
Workday Inc ‘A’ | | | 184 | | | | (35,484 | ) |
World Wrestling Entertainment Inc ‘A’ | | | 1,059 | | | | (91,900 | ) |
WP Carey Inc REIT | | | 504 | | | | (39,478 | ) |
WPX Energy Inc | | | 5,265 | | | | (69,024 | ) |
WR Berkley Corp | | | 148 | | | | (12,539 | ) |
Wyndham Hotels & Resorts Inc | | | 295 | | | | (14,747 | ) |
XPO Logistics Inc | | | 1,412 | | | | (75,881 | ) |
Xylem Inc | | | 1,372 | | | | (108,443 | ) |
Zayo Group Holdings Inc | | | 1,569 | | | | (44,591 | ) |
Zillow Group Inc ‘C’ | | | 3,391 | | | | (117,804 | ) |
Zions Bancorp NA | | | 327 | | | | (14,849 | ) |
| | | | | | | | |
| | | | | | | (33,708,189 | ) |
| | | | | | | | |
| | |
Total Short Positions (90.3%) | | | | | | | (34,209,188 | ) |
| | | | | | | | |
| | |
Total Long and Short Positions 10.4% | | | | | | | $3,931,017 | |
| | | | | | | | |
| | | | | | | | |
| Description | | Counter-
party | | | Expiration Dates (1) | |
The Fund receives or pays the net total return on all positions within the basket and pays financing based upon the then-current1-MonthAUD-BBSW plus or minus a specified spread (rates range from (0.782%) to 0.350%) as negotiated by the parties, which is denominated in AUD based on the local currencies of the positions within the swap. | | | JPM | | |
| 04/05/19-
04/21/20 |
|
The following table represents the individual long and short positions and related values within the total return basket swap as of March 31, 2019:
| | | | | | | | |
| | |
| Referenced Entity | | Shares | | | Value | |
Long Positions: 3.3% | | | | | | | | |
| | |
Australia 3.3% | | | | | | | | |
| | |
AGL Energy Ltd | | | 3,305 | | | | $51,088 | |
Alumina Ltd | | | 5,736 | | | | 9,878 | |
Aurizon Holdings Ltd | | | 35,009 | | | | 113,184 | |
Australia & New Zealand Banking Group Ltd | | | 2,456 | | | | 45,422 | |
Bank of Queensland Ltd | | | 2,051 | | | | 13,261 | |
Bendigo & Adelaide Bank Ltd | | | 7,504 | | | | 51,645 | |
BlueScope Steel Ltd | | | 9,898 | | | | 98,243 | |
Caltex Australia Ltd | | | 896 | | | | 16,669 | |
CIMIC Group Ltd | | | 4,685 | | | | 162,888 | |
Coca-Cola Amatil Ltd | | | 1,548 | | | | 9,514 | |
Flight Centre Travel Group Ltd | | | 763 | | | | 22,793 | |
Fortescue Metals Group Ltd | | | 2,390 | | | | 12,096 | |
Iluka Resources Ltd | | | 8,656 | | | | 55,441 | |
Incitec Pivot Ltd | | | 6,288 | | | | 13,943 | |
Newcrest Mining Ltd | | | 2,225 | | | | 40,295 | |
Oil Search Ltd | | | 1,129 | | | | 6,281 | |
Origin Energy Ltd | | | 8,347 | | | | 42,728 | |
Qantas Airways Ltd | | | 15,709 | | | | 63,212 | |
Santos Ltd | | | 16,998 | | | | 82,300 | |
South32 Ltd | | | 31,590 | | | | 83,897 | |
Telstra Corp Ltd | | | 27,839 | | | | 65,646 | |
Washington H Soul Pattinson & Co Ltd | | | 494 | | | | 9,245 | |
Woodside Petroleum Ltd | | | 6,786 | | | | 166,597 | |
WorleyParsons Ltd | | | 1,119 | | | | 11,231 | |
| | | | | | | | |
| | | | | | | 1,247,497 | |
| | | | | | | | |
| | |
Total Long Positions 3.3% | | | | | | | 1,247,497 | |
| | | | | | | | |
| | | | | | | | |
| | |
| Referenced Entity | | Shares | | | Value | |
Short Positions: (3.3%) | | | | | | | | |
| | |
Australia (3.0%) | | | | | | | | |
| | |
Amcor Ltd | | | 3,609 | | | | ( $ 39,488 | ) |
AMP Ltd | | | 33,332 | | | | (49,781 | ) |
APA Group » | | | 7,528 | | | | (53,438 | ) |
Challenger Ltd | | | 10,734 | | | | (63,263 | ) |
Cochlear Ltd | | | 95 | | | | (11,714 | ) |
CSL Ltd | | | 2,480 | | | | (344,106 | ) |
Domino’s Pizza Enterprises Ltd | | | 627 | | | | (19,334 | ) |
Magellan Financial Group Ltd | | | 341 | | | | (8,844 | ) |
Medibank Pvt Ltd | | | 5,383 | | | | (10,566 | ) |
Ramsay Health Care Ltd | | | 2,583 | | | | (118,117 | ) |
REA Group Ltd | | | 171 | | | | (9,081 | ) |
SEEK Ltd | | | 12,512 | | | | (156,089 | ) |
Sonic Healthcare Ltd | | | 2,747 | | | | (47,942 | ) |
Sydney Airport » | | | 11,950 | | | | (63,082 | ) |
Tabcorp Holdings Ltd | | | 3,279 | | | | (10,760 | ) |
Transurban Group » | | | 6,981 | | | | (65,476 | ) |
Treasury Wine Estates Ltd | | | 2,418 | | | | (25,668 | ) |
Vocus Group Ltd | | | 18,377 | | | | (48,207 | ) |
| | | | | | | | |
| | | | | | | (1,144,956 | ) |
| | | | | | | | |
Ireland (0.3%) | | | | | | | | |
| | |
James Hardie Industries PLC | | | 8,983 | | | | (115,900 | ) |
| | | | | | | | |
| | |
Total Short Positions (3.3%) | | | | | | | (1,260,856 | ) |
| | | | | | | | |
| | |
Total Long and Short Positions (0.0%) | | | | | | | ($13,359 | ) |
| | | | | | | | |
| | | | | | | | |
| Description | | Counter-
party | | | Expiration
Dates (1) | |
The Fund receives or pays the net total return on all positions within the basket and pays financing based upon the then-current1-MonthGBP-LIBOR plus or minus a specified spread (rates range from (1.363%) to 0.300%) as negotiated by the parties, which is denominated in GBP based on the local currencies of the positions within the swap. | | | JPM | | |
| 04/05/19-
05/05/20 |
|
| | |
| See Notes to Financial Statements | | See explanation of symbols and terms, if any, on B-97 and B-98 |
B-86
PACIFIC FUNDS
PF EQUITY LONG/SHORT FUND
Schedule of Investments (Continued)
March 31, 2019
The following table represents the individual long and short positions and related values within the total return basket swap as of March 31, 2019:
| | | | | | | | |
| | |
| Referenced Entity | | Shares | | | Value | |
Long Positions: 11.8% | | | | | | | | |
| | |
Australia 1.0% | | | | | | | | |
| | |
BHP Group PLC | | | 7,933 | | | | $191,400 | |
Rio Tinto PLC | | | 2,958 | | | | 171,929 | |
| | | | | | | | |
| | | | | | | 363,329 | |
| | | | | | | | |
Netherlands 0.5% | | | | | | | | |
| | |
Royal Dutch Shell PLC ‘A’ | | | 5,474 | | | | 172,026 | |
| | | | | | | | |
| | |
Russia 0.5% | | | | | | | | |
| | |
Evraz PLC | | | 22,713 | | | | 183,761 | |
| | | | | | | | |
| | |
South Africa 0.4% | | | | | | | | |
| | |
Anglo American PLC | | | 3,027 | | | | 80,962 | |
Investec PLC | | | 15,207 | | | | 87,632 | |
| | | | | | | | |
| | | | | | | 168,594 | |
| | | | | | | | |
Switzerland 0.4% | | | | | | | | |
| | |
Coca-Cola HBC AG | | | 3,684 | | | | 125,623 | |
IWG PLC | | | 11,396 | | | | 37,027 | |
| | | | | | | | |
| | | | | | | 162,650 | |
| | | | | | | | |
United Kingdom 8.9% | | | | | | | | |
| | |
Aggreko PLC | | | 1,361 | | | | 13,969 | |
Ashtead Group PLC | | | 559 | | | | 13,514 | |
Associated British Foods PLC | | | 597 | | | | 18,984 | |
BAE Systems PLC | | | 6,283 | | | | 39,494 | |
Barclays PLC | | | 41,803 | | | | 84,203 | |
Barratt Developments PLC | | | 2,878 | | | | 22,481 | |
Bellway PLC | | | 502 | | | | 19,916 | |
Berkeley Group Holdings PLC | | | 1,022 | | | | 49,133 | |
BP PLC | | | 12,293 | | | | 89,266 | |
British American Tobacco PLC | | | 153 | | | | 6,383 | |
Britvic PLC | | | 3,123 | | | | 38,759 | |
BT Group PLC | | | 42,135 | | | | 122,416 | |
Burberry Group PLC | | | 10,794 | | | | 275,105 | |
Centrica PLC | | | 215,891 | | | | 321,592 | |
Close Brothers Group PLC | | | 3,062 | | | | 58,058 | |
Direct Line Insurance Group PLC | | | 3,753 | | | | 17,265 | |
Dixons Carphone PLC | | | 12,623 | | | | 24,146 | |
Drax Group PLC | | | 31,645 | | | | 156,036 | |
easyJet PLC | | | 425 | | | | 6,186 | |
Experian PLC | | | 262 | | | | 7,091 | |
Hays PLC | | | 24,240 | | | | 47,429 | |
Howden Joinery Group PLC | | | 1,315 | | | | 8,319 | |
Imperial Brands PLC | | | 3,419 | | | | 116,955 | |
Inchcape PLC | | | 13,595 | | | | 101,157 | |
Indivior PLC | | | 56,826 | | | | 71,137 | |
Intermediate Capital Group PLC | | | 583 | | | | 8,098 | |
International Consolidated Airlines Group SA | | | 2,741 | | | | 18,239 | |
J Sainsbury PLC | | | 41,187 | | | | 126,389 | |
Kingfisher PLC | | | 2,040 | | | | 6,256 | |
Man Group PLC | | | 56,209 | | | | 99,571 | |
Marks & Spencer Group PLC | | | 13,083 | | | | 47,482 | |
Meggitt PLC | | | 10,244 | | | | 67,155 | |
Mondi PLC | | | 3,254 | | | | 72,054 | |
Moneysupermarket.com Group PLC | | | 19,420 | | | | 94,153 | |
National Grid PLC | | | 25,103 | | | | 278,653 | |
Next PLC | | | 189 | | | | 13,736 | |
Pennon Group PLC | | | 1,442 | | | | 13,971 | |
Persimmon PLC | | | 2,987 | | | | 84,489 | |
Petrofac Ltd | | | 3,780 | | | | 24,096 | |
Playtech Plc | | | 1,229 | | | | 6,965 | |
Provident Financial PLC | | | 2,502 | | | | 16,703 | |
Reckitt Benckiser Group PLC | | | 462 | | | | 38,449 | |
Rolls-Royce Holdings PLC | | | 1,883 | | | | 22,175 | |
Royal Mail PLC | | | 23,450 | | | | 72,866 | |
Spectris PLC | | | 561 | | | | 18,358 | |
Standard Chartered PLC | | | 896 | | | | 6,907 | |
Standard Life Aberdeen PLCl | | | — | | | | 2 | |
| | | | | | | | |
| | |
| Referenced Entity | | Shares | | | Value | |
Tate & Lyle PLC | | | 13,217 | | | | $125,012 | |
Taylor Wimpey PLC | | | 14,330 | | | | 32,776 | |
Tesco PLC | | | 3,284 | | | | 9,939 | |
United Utilities Group PLC | | | 696 | | | | 7,392 | |
Vodafone Group PLC | | | 91,235 | | | | 166,254 | |
WH Smith PLC | | | 1,571 | | | | 43,462 | |
William Hill PLC | | | 34,980 | | | | 73,194 | |
Wm Morrison Supermarkets PLC | | | 12,174 | | | | 36,115 | |
WPP PLC | | | 2,939 | | | | 31,048 | |
| | | | | | | | |
| | | | | | | 3,390,953 | |
| | | | | | | | |
United States 0.1% | | | | | | | | |
| | |
Ferguson PLC | | | 367 | | | | 23,375 | |
| | | | | | | | |
| | |
Total Long Positions 11.8% | | | | | | | 4,464,688 | |
| | | | | | | | |
| | |
Short Positions: (11.8%) | | | | | | | | |
| | |
Chile (0.0%) | | | | | | | | |
| | |
Antofagasta PLC | | | 509 | | | | (6,404 | ) |
| | | | | | | | |
| | |
Germany (0.3%) | | | | | | | | |
| | |
TUI AG | | | 11,596 | | | | (111,222 | ) |
| | | | | | | | |
| | |
South Africa (0.0%) | | | | | | | | |
| | |
Old Mutual Ltd | | | 8,734 | | | | (12,848 | ) |
| | | | | | | | |
| | |
Switzerland (0.1%) | | | | | | | | |
| | |
Mediclinic International PLC | | | 7,977 | | | | (31,699 | ) |
| | | | | | | | |
| | |
United Arab Emirates (0.8%) | | | | | | | | |
| | |
NMC Health PLC | | | 9,831 | | | | (293,032 | ) |
| | | | | | | | |
| | |
United Kingdom (10.6%) | | | | | | | | |
| | |
AA PLC | | | 10,732 | | | | (12,720 | ) |
Admiral Group PLC | | | 4,873 | | | | (137,839 | ) |
Ashmore Group PLC | | | 4,986 | | | | (27,757 | ) |
ASOS PLC | | | 5,597 | | | | (233,727 | ) |
Babcock International Group PLC | | | 1,688 | | | | (10,861 | ) |
Balfour Beatty PLC | | | 5,091 | | | | (17,397 | ) |
BBA Aviation PLC | | | 6,062 | | | | (19,673 | ) |
Beazley PLC | | | 6,454 | | | | (43,310 | ) |
Bunzl PLC | | | 3,524 | | | | (116,314 | ) |
Capita PLC | | | 3,908 | | | | (6,320 | ) |
Cobham PLC | | | 5,884 | | | | (8,463 | ) |
Compass Group PLC | | | 2,693 | | | | (63,362 | ) |
ConvaTec Group PLC | | | 10,844 | | | | (20,009 | ) |
Croda International PLC | | | 267 | | | | (17,541 | ) |
CYBG PLC | | | 6,428 | | | | (16,619 | ) |
DS Smith PLC | | | 1,500 | | | | (6,571 | ) |
Greene King PLC | | | 768 | | | | (6,658 | ) |
GVC Holdings PLC | | | 20,793 | | | | (151,594 | ) |
Halma PLC | | | 4,280 | | | | (93,313 | ) |
Hargreaves Lansdown PLC | | | 9,195 | | | | (223,383 | ) |
HSBC Holdings PLC | | | 20,560 | | | | (167,072 | ) |
Informa PLC | | | 7,171 | | | | (69,538 | ) |
Inmarsat PLC | | | 11,388 | | | | (82,402 | ) |
Intertek Group PLC | | | 1,054 | | | | (66,770 | ) |
ITV PLC | | | 33,793 | | | | (55,993 | ) |
JD Sports Fashion PLC | | | 1,398 | | | | (9,160 | ) |
John Wood Group PLC | | | 25,732 | | | | (170,090 | ) |
Johnson Matthey PLC | | | 545 | | | | (22,350 | ) |
Jupiter Fund Management PLC | | | 5,815 | | | | (27,410 | ) |
Just Eat PLC | | | 10,677 | | | | (104,479 | ) |
Legal & General Group PLC | | | 5,678 | | | | (20,376 | ) |
Lloyds Banking Group PLC | | | 74,054 | | | | (59,997 | ) |
Melrose Industries PLC | | | 103,426 | | | | (247,039 | ) |
Merlin Entertainments PLC | | | 29,872 | | | | (133,722 | ) |
| | |
| See Notes to Financial Statements | | See explanation of symbols and terms, if any, on B-97 and B-98 |
B-87
PACIFIC FUNDS
PF EQUITY LONG/SHORT FUND
Schedule of Investments (Continued)
March 31, 2019
| | | | | | | | |
| | |
| Referenced Entity | | Shares | | | Value | |
Micro Focus International PLC | | | 11,561 | | | | ($300,581 | ) |
Ocado Group PLC | | | 7,262 | | | | (129,660 | ) |
Pearson PLC | | | 4,677 | | | | (51,025 | ) |
Prudential PLC | | | 6,554 | | | | (131,379 | ) |
Quilter PLC | | | 16,351 | | | | (31,255 | ) |
Rentokil Initial PLC | | | 11,673 | | | | (53,769 | ) |
Rightmove PLC | | | 1,789 | | | | (11,896 | ) |
Rotork PLC | | | 8,229 | | | | (30,343 | ) |
Royal Bank of Scotland Group PLC | | | 15,602 | | | | (50,240 | ) |
Schroders PLC | | | 1,064 | | | | (37,466 | ) |
Severn Trent PLC | | | 262 | | | | (6,748 | ) |
Smith & Nephew PLC | | | 2,011 | | | | (39,937 | ) |
Spirax-Sarco Engineering PLC | | | 463 | | | | (43,392 | ) |
| | | | | | | | |
| | |
| Referenced Entity | | Shares | | | Value | |
SSE PLC | | | 3,290 | | | | ($50,903 | ) |
St James’s Place PLC | | | 11,135 | | | | (149,223 | ) |
The Sage Group PLC | | | 3,775 | | | | (34,503 | ) |
The Weir Group PLC | | | 7,503 | | | | (152,499 | ) |
Thomas Cook Group PLC | | | 52,963 | | | | (17,223 | ) |
Whitbread PLC | | | 3,226 | | | | (213,485 | ) |
| | | | | | | | |
| | | | | | | (4,005,356 | ) |
| | | | | | | | |
| | |
Total Short Positions (11.8%) | | | | | | | (4,460,561 | ) |
| | | | | | | | |
| | |
Total Long and Short Positions 0.0% | | | | | | | $ 4,127 | |
| | | | | | | | |
| | | | | | | | |
| Description | | Counter-
party | | | Expiration
Dates (1) | |
The Fund receives or pays the net total return on all positions within the basket and pays financing based upon the then-current1-MonthHKD-HIBOR plus or minus a specified spread (rates range from (1.001%) to 0.441%) as negotiated by the parties, which is denominated in HKD based on the local currencies of the positions within the swap. | | | JPM | | |
| 05/14/19-
04/21/20 |
|
The following table represents the individual long and short positions and related values within the total return basket swap as of March 31, 2019:
| | | | | | | | |
| | |
| Referenced Entity | | Shares | | | Value | |
Long Positions: 1.8% | | | | | | | | |
| | |
Hong Kong 1.7% | | | | | | | | |
| | |
Chow Tai Fook Jewellery Group Ltd | | | 3,400 | | | | $3,442 | |
CK Asset Holdings Ltd | | | 7,000 | | | | 62,341 | |
CK Hutchison Holdings Ltd | | | 3,000 | | | | 31,546 | |
CLP Holdings Ltd | | | 500 | | | | 5,799 | |
Henderson Land Development Co Ltd | | | 4,000 | | | | 25,458 | |
HKT Trust & HKT Ltd ‘SS’ | | | 5,000 | | | | 8,038 | |
Hysan Development Co Ltd | | | 5,000 | | | | 26,801 | |
Kerry Properties Ltd | | | 17,500 | | | | 78,239 | |
Li & Fung Ltd | | | 202,000 | | | | 36,390 | |
Melco International Development Ltd | | | 30,000 | | | | 70,380 | |
New World Development Co Ltd | | | 13,000 | | | | 21,576 | |
Sun Hung Kai Properties Ltd | | | 1,500 | | | | 25,786 | |
Swire Properties Ltd | | | 6,000 | | | | 25,823 | |
The Wharf Holdings Ltd | | | 3,000 | | | | 9,069 | |
WH Group Ltd | | | 24,500 | | | | 26,206 | |
Wheelock & Co Ltd | | | 12,000 | | | | 88,069 | |
Yue Yuen Industrial Holdings Ltd | | | 24,000 | | | | 82,626 | |
| | | | | | | | |
| | | | | | | 627,589 | |
| | | | | | | | |
Macao 0.1% | | | | | | | | |
| | |
SJM Holdings Ltd | | | 7,000 | | | | 8,002 | |
Wynn Macau Ltd | | | 10,800 | | | | 25,506 | |
| | | | | | | | |
| | | | | | | 33,508 | |
| | | | | | | | |
| | |
Total Long Positions 1.8% | | | | | | | 661,097 | |
| | | | | | | | |
| | | | | | | | |
| | |
| Referenced Entity | | Shares | | | Value | |
Short Positions: (1.8%) | | | | | | | | |
| | |
China (0.2%) | | | | | | | | |
| | |
Minth Group Ltd | | | 20,000 | | | | ( $ 63,063 | ) |
| | | | | | | | |
| | |
Hong Kong (1.4%) | | | | | | | | |
| | |
AIA Group Ltd | | | 12,200 | | | | (121,997 | ) |
ASM Pacific Technology Ltd | | | 10,100 | | | | (112,857 | ) |
Hang Seng Bank Ltd | | | 400 | | | | (9,877 | ) |
HK Electric Investments & HK Electric Investments Ltd ‘SS’ | | | 14,500 | | | | (14,814 | ) |
Hong Kong & China Gas Co Ltd | | | 21,497 | | | | (51,555 | ) |
MTR Corp Ltd | | | 27,256 | | | | (168,875 | ) |
Techtronic Industries Co Ltd | | | 1,500 | | | | (10,102 | ) |
Wharf Real Estate Investment Co Ltd | | | 4,000 | | | | (29,811 | ) |
| | | | | | | | |
| | | | | | | (519,888 | ) |
| | | | | | | | |
Macao (0.2%) | | | | | | | | |
| | |
MGM China Holdings Ltd | | | 30,597 | | | | (64,164 | ) |
Sands China Ltd | | | 2,400 | | | | (12,079 | ) |
| | | | | | | | |
| | | | | | | (76,243 | ) |
| | | | | | | | |
United States (0.0%) | | | | | | | | |
| | |
Samsonite International SA | | | 2,400 | | | | (7,711 | ) |
| | | | | | | | |
| | |
Total Short Positions (1.8%) | | | | | | | (666,905 | ) |
| | | | | | | | |
| | |
Total Long and Short Positions (0.0%) | | | | | | | ($5,808 | ) |
| | | | | | | | |
| | | | | | | | |
| Description | | Counter-
party | | | Expiration
Dates (1) | |
The Fund receives or pays the net total return on all positions within the basket and pays financing based upon the then-current1-MonthSGD-SIBOR plus or minus a specified spread (rates range from (2.000%) to 0.402%) as negotiated by the parties, which is denominated in SGD based on the local currencies of the positions within the swap. | | | JPM | | |
| 09/17/19-
04/21/20 |
|
| | |
| See Notes to Financial Statements | | See explanation of symbols and terms, if any, on B-97 and B-98 |
B-88
PACIFIC FUNDS
PF EQUITY LONG/SHORT FUND
Schedule of Investments (Continued)
March 31, 2019
The following table represents the individual long and short positions and related values within the total return basket swap as of March 31, 2019:
| | | | | | | | |
| | |
| Referenced Entity | | Shares | | | Value | |
Long Positions: 0.4% | | | | | | | | |
| | |
China 0.2% | | | | | | | | |
| | |
Yangzijiang Shipbuilding Holdings Ltd | | | 77,506 | | | | $86,067 | |
| | | | | | | | |
| | |
Singapore 0.2% | | | | | | | | |
| | |
ComfortDelGro Corp Ltd | | | 32,400 | | | | 61,581 | |
Genting Singapore Ltd | | | 28,300 | | | | 21,769 | |
| | | | | | | | |
| | | | | | | 83,350 | |
| | | | | | | | |
| | |
Total Long Positions 0.4% | | | | | | | 169,417 | |
| | | | | | | | |
| | | | | | | | |
| | |
| Referenced Entity | | Shares | | | Value | |
| | |
Short Positions: (0.4%) | | | | | | | | |
| | |
Singapore (0.4%) | | | | | | | | |
| | |
City Developments Ltd | | | 1,200 | | | | ($8,031 | ) |
Keppel Corp Ltd | | | 2,400 | | | | (11,043 | ) |
Singapore Airlines Ltd | | | 900 | | | | (6,427 | ) |
Singapore Post Ltd | | | 34,200 | | | | (25,268 | ) |
Singapore Telecommunications Ltd | | | 29,900 | | | | (66,758 | ) |
Venture Corp Ltd | | | 600 | | | | (7,972 | ) |
Wilmar International Ltd | | | 17,900 | | | | (43,768 | ) |
| | | | | | | | |
| | | | | | | (169,267 | ) |
| | | | | | | | |
| | |
Total Short Positions (0.4%) | | | | | | | (169,267 | ) |
| | | | | | | | |
| | |
Total Long and Short Positions 0.0% | | | | | | | $150 | |
| | | | | | | | |
| | | | | | | | |
| Description | | Counter-
party | | | Expiration
Date (1) | |
The Fund receives or pays the net total return on all positions within the basket and pays financing based upon the then-current1-DayCAD-USD Discount Rate plus or minus a specified spread (rates range from (0.660%) to 0.330%) as negotiated by the parties, which is denominated in CAD based on the local currencies of the positions within the swap. | | | MSC | | | | 05/02/19 | |
The following table represents the individual long and short positions and related values within the total return basket swap as of March 31, 2019:
| | | | | | | | |
| | |
| Referenced Entity | | Shares | | | Value | |
Long Positions: 4.4% | | | | | | | | |
| | |
Canada 4.0% | | | | | | | | |
| | |
Air Canada | | | 14,299 | | | | $344,648 | |
Alimentation Couche-Tard Inc ‘B’ | | | 914 | | | | 53,841 | |
Bank of Montreal | | | 1,021 | | | | 76,395 | |
Canadian Imperial Bank of Commerce | | | 1,599 | | | | 126,355 | |
Canadian National Railway Co | | | 72 | | | | 6,445 | |
Canadian Pacific Railway Ltd | | | 215 | | | | 44,298 | |
Canadian Tire Corp Ltd ‘A’ | | | 86 | | | | 9,266 | |
CGI Inc | | | 329 | | | | 22,618 | |
CI Financial Corp | | | 931 | | | | 12,707 | |
Empire Co Ltd ‘A’ | | | 6,890 | | | | 149,158 | |
Finning International Inc | | | 2,285 | | | | 40,627 | |
George Weston Ltd | | | 180 | | | | 12,943 | |
Gildan Activewear Inc | | | 1,627 | | | | 58,501 | |
Husky Energy Inc | | | 2,323 | | | | 23,033 | |
iA Financial Corp Inc | | | 528 | | | | 19,471 | |
Linamar Corp | | | 1,153 | | | | 41,345 | |
Loblaw Cos Ltd | | | 354 | | | | 17,462 | |
Magna International Inc | | | 1,831 | | | | 89,156 | |
Manulife Financial Corp | | | 469 | | | | 7,932 | |
Methanex Corp | | | 819 | | | | 46,516 | |
National Bank of Canada | | | 1,350 | | | | 60,926 | |
Quebecor Inc ‘B’ | | | 641 | | | | 15,714 | |
Royal Bank of Canada | | | 221 | | | | 16,673 | |
Seven Generations Energy Ltd ‘A’ | | | 3,142 | | | | 22,689 | |
Teck Resources Ltd ‘B’ | | | 1,540 | | | | 35,632 | |
The Bank of Nova Scotia | | | 132 | | | | 7,027 | |
Thomson Reuters Corp | | | 114 | | | | 6,745 | |
West Fraser Timber Co Ltd | | | 3,188 | | | | 155,064 | |
| | | | | | | | |
| | | | | | | 1,523,187 | |
| | | | | | | | |
United States 0.4% | | | | | | | | |
| | |
Bausch Health Cos Inc | | | 975 | | | | 24,055 | |
BRP Inc | | | 3,796 | | | | 105,329 | |
| | | | | | | | |
| | | | | | | 129,384 | |
| | | | | | | | |
| | |
Total Long Positions 4.4% | | | | | | | 1,652,571 | |
| | | | | | | | |
Short Positions: (4.4%) | | | | | | | | |
| | |
Brazil (0.0%) | | | | | | | | |
| | |
Yamana Gold Inc | | | 3,278 | | | | (8,536 | ) |
| | | | | | | | |
| | | | | | | | |
| | |
| Referenced Entity | | Shares | | | Value | |
| | |
Canada (3.9%) | | | | | | | | |
| | |
Agnico Eagle Mines Ltd | | | 1,372 | | | | ($59,650 | ) |
AltaGas Ltd | | | 8,546 | | | | (112,489 | ) |
Barrick Gold Corp | | | 2,291 | | | | (31,407 | ) |
BlackBerry Ltd | | | 2,014 | | | | (20,301 | ) |
Bombardier Inc ‘B’ | | | 15,759 | | | | (30,307 | ) |
Brookfield Asset Management Inc ‘A’ | | | 798 | | | | (37,178 | ) |
Cameco Corp | | | 4,097 | | | | (48,287 | ) |
Canadian Utilities Ltd ‘A’ | | | 352 | | | | (9,609 | ) |
CCL Industries Inc ‘B’ | | | 169 | | | | (6,842 | ) |
Cenovus Energy Inc | | | 8,869 | | | | (76,986 | ) |
Dollarama Inc | | | 248 | | | | (6,616 | ) |
Element Fleet Management Corp | | | 9,804 | | | | (61,993 | ) |
Enbridge Inc | | | 2,301 | | | | (83,338 | ) |
Encana Corp | | | 3,385 | | | | (24,520 | ) |
Franco-Nevada Corp | | | 475 | | | | (35,612 | ) |
Inter Pipeline Ltd | | | 1,447 | | | | (23,941 | ) |
Keyera Corp | | | 3,217 | | | | (75,854 | ) |
Onex Corp | | | 234 | | | | (13,199 | ) |
Pembina Pipeline Corp | | | 1,484 | | | | (54,514 | ) |
Peyto Exploration & Development Corp | | | 1,477 | | | | (7,726 | ) |
PrairieSky Royalty Ltd | | | 4,511 | | | | (60,761 | ) |
Restaurant Brands International Inc | | | 619 | | | | (40,271 | ) |
Saputo Inc | | | 323 | | | | (11,009 | ) |
Shopify Inc ‘A’ | | | 256 | | | | (52,845 | ) |
SNC-Lavalin Group Inc | | | 2,704 | | | | (68,614 | ) |
The Stars Group Inc | | | 1,953 | | | | (34,139 | ) |
TransCanada Corp | | | 2,946 | | | | (132,315 | ) |
Vermilion Energy Inc | | | 921 | | | | (22,736 | ) |
Wheaton Precious Metals Corp | | | 8,500 | | | | (202,331 | ) |
Whitecap Resources Inc | | | 5,360 | | | | (18,490 | ) |
| | | | | | | | |
| | | | | | | (1,463,880 | ) |
| | | | | | | | |
Chile (0.1%) | | | | | | | | |
| | |
Lundin Mining Corp | | | 4,760 | | | | (22,084 | ) |
| | | | | | | | |
| | |
Zambia (0.4%) | | | | | | | | |
| | |
First Quantum Minerals Ltd | | | 13,697 | | | | (155,281 | ) |
| | | | | | | | |
| | |
Total Short Positions (4.4%) | | | | | | | (1,649,781 | ) |
| | | | | | | | |
| | |
Total Long and Short Positions 0.0% | | | | | | | $2,790 | |
| | | | | | | | |
| | |
| See Notes to Financial Statements | | See explanation of symbols and terms, if any, on B-97 and B-98 |
B-89
PACIFIC FUNDS
PF EQUITY LONG/SHORT FUND
Schedule of Investments (Continued)
March 31, 2019
| | | | | | | | |
| Description | | Counter-
party | | | Expiration
Date (1) | |
The Fund receives or pays the net total return on all positions within the basket and pays financing based upon the then-current1-DayCHF-TOIS plus or minus a specified spread (rates range from (2.750%) to 0.350%) as negotiated by the parties, which is denominated in CHF based on the local currencies of the positions within the swap. | | | MSC | | | | 05/04/20 | |
The following table represents the individual long and short positions and related values within the total return basket swap as of March 31, 2019:
| | | | | | | | |
| | |
| Referenced Entity | | Shares | | | Value | |
Long Positions: 2.7% | | | | | | | | |
| | |
Switzerland 2.7% | | | | | | | | |
| | |
Adecco Group AG | | | 4,204 | | | | $224,513 | |
Aryzta AG | | | 13,129 | | | | 18,000 | |
Baloise Holding AG | | | 55 | | | | 9,090 | |
Barry Callebaut AG | | | 5 | | | | 9,038 | |
DKSH Holding AG | | | 177 | | | | 10,208 | |
Flughafen Zurich AG | | | 165 | | | | 30,112 | |
GAM Holding AG | | | 2,374 | | | | 7,415 | |
Georg Fischer AG | | | 8 | | | | 7,294 | |
Helvetia Holding AG | | | 37 | | | | 22,601 | |
Nestle SA | | | 876 | | | | 83,527 | |
Roche Holding AG | | | 892 | | | | 245,795 | |
Sonova Holding AG | | | 351 | | | | 69,558 | |
Swiss Life Holding AG | | | 39 | | | | 17,183 | |
Temenos AG | | | 1,037 | | | | 152,994 | |
Zurich Insurance Group AG | | | 387 | | | | 128,111 | |
| | | | | | | | |
| | | | | | | 1,035,439 | |
| | | | | | | | |
| | |
Total Long Positions 2.7% | | | | | | | 1,035,439 | |
| | | | | | | | |
| | |
Short Positions: (2.7%) | | | | | | | | |
| | |
Austria (0.1%) | | | | | | | | |
| | |
ams AG | | | 1,668 | | | | (45,090 | ) |
| | | | | | | | |
| | | | | | | | |
| | |
| Referenced Entity | | Shares | | | Value | |
| | |
Switzerland (2.6%) | | | | | | | | |
| | |
ABB Ltd | | | 590 | | | | ( $ 11,089 | ) |
Chocoladefabriken Lindt & Spruengli AG | | | 1 | | | | (6,799 | ) |
Cie Financiere Richemont SA | | | 2,410 | | | | (175,817 | ) |
Credit Suisse Group AG | | | 4,102 | | | | (47,815 | ) |
dormakaba Holding AG | | | 19 | | | | (13,614 | ) |
EMS-Chemie Holding AG | | | 65 | | | | (35,285 | ) |
Geberit AG | | | 20 | | | | (8,180 | ) |
Givaudan SA | | | 32 | | | | (81,905 | ) |
Idorsia Ltd | | | 2,332 | | | | (41,108 | ) |
Julius Baer Group Ltd | | | 2,466 | | | | (99,755 | ) |
LafargeHolcim Ltd | | | 396 | | | | (19,579 | ) |
Lonza Group AG | | | 478 | | | | (148,398 | ) |
OC Oerlikon Corp AG | | | 2,742 | | | | (35,120 | ) |
Partners Group Holding AG | | | 10 | | | | (7,275 | ) |
Sika AG | | | 314 | | | | (43,914 | ) |
Straumann Holding AG | | | 64 | | | | (52,320 | ) |
Sunrise Communications Group AG | | | 86 | | | | (6,334 | ) |
Swisscom AG | | | 97 | | | | (47,459 | ) |
The Swatch Group AG | | | 128 | | | | (36,659 | ) |
Vifor Pharma AG | | | 550 | | | | (74,432 | ) |
| | | | | | | | |
| | | | | | | (992,857 | ) |
| | | | | | | | |
| | |
Total Short Positions (2.7%) | | | | | | | (1,037,947 | ) |
| | | | | | | | |
| | |
Total Long and Short Positions (0.0%) | | | | | | | ($2,508 | ) |
| | | | | | | | |
| | | | | | | | |
| Description | | Counter-
party | | | Expiration
Date (1) | |
The Fund receives or pays the net total return on all positions within the basket and pays financing based upon the then-current1-WeekDKK-CIBOR plus or minus a specified spread (rates range from (0.350%) to 0.350%) as negotiated by the parties, which is denominated in DKK based on the local currencies of the positions within the swap. | | | MSC | | | | 05/01/20 | |
The following table represents the individual long and short positions and related values within the total return basket swap as of March 31, 2019:
| | | | | | | | |
| | |
| Referenced Entity | | Shares | | | Value | |
Long Positions: 2.7% | | | | | | | | |
| | |
Denmark 2.7% | | | | | | | | |
| | |
Carlsberg AS ‘B’ | | | 563 | | | | $70,402 | |
GN Store Nord AS | | | 3,829 | | | | 177,828 | |
H Lundbeck AS | | | 4,614 | | | | 200,086 | |
Novo Nordisk AS ‘B’ | | | 1,860 | | | | 97,214 | |
Orsted AS | | | 1,544 | | | | 117,017 | |
Pandora AS | | | 5,715 | | | | 267,571 | |
Rockwool International AS ‘B’ | | | 339 | | | | 79,500 | |
| | | | | | | | |
| | | | | | | 1,009,618 | |
| | | | | | | | |
| | |
Total Long Positions 2.7% | | | | | | | 1,009,618 | |
| | | | | | | | |
| | | | | | | | |
| | |
| Referenced Entity | | Shares | | | Value | |
Short Positions: (2.5%) | | | | | | | | |
| | |
Denmark (2.5%) | | | | | | | | |
| | |
AP Moller – Maersk AS ‘B’ | | | 250 | | | | ( $ 316,962 | ) |
Chr Hansen Holding AS | | | 794 | | | | (80,594 | ) |
Demant AS | | | 313 | | | | (9,264 | ) |
Dfds AS | | | 676 | | | | (27,986 | ) |
FLSmidth & Co AS ‘B’ | | | 315 | | | | (13,621 | ) |
Genmab AS | | | 1,660 | | | | (288,039 | ) |
ISS AS | | | 1,621 | | | | (49,370 | ) |
Novozymes AS ‘B’ | | | 1,228 | | | | (56,477 | ) |
Tryg AS | | | 1,743 | | | | (47,849 | ) |
Vestas Wind Systems AS | | | 421 | | | | (35,485 | ) |
| | | | | | | | |
| | | | | | | (925,647 | ) |
| | | | | | | | |
| | |
Total Short Positions (2.5%) | | | | | | | (925,647 | ) |
| | | | | | | | |
| | |
Total Long and Short Positions 0.2% | | | | | | | $83,971 | |
| | | | | | | | |
| | | | | | | | |
| Description | | Counter-
party | | | Expiration
Date (1) | |
The Fund receives or pays the net total return on all positions within the basket and pays financing based upon the then-current1-DayEUR-EONIA plus or minus a specified spread (rates range from (5.000%) to 0.350%) as negotiated by the parties, which is denominated in EUR based on the local currencies of the positions within the swap. | | | MSC | | | | 05/04/20 | |
| | |
| See Notes to Financial Statements | | See explanation of symbols and terms, if any, on B-97 and B-98 |
B-90
PACIFIC FUNDS
PF EQUITY LONG/SHORT FUND
Schedule of Investments (Continued)
March 31, 2019
The following table represents the individual long and short positions and related values within the total return basket swap as of March 31, 2019:
| | | | | | | | |
| | |
| Referenced Entity | | Shares | | | Value | |
Long Positions: 28.6% | | | | | | | | |
| | |
Belgium 0.7% | | | | | | | | |
| | |
Ageas | | | 1,104 | | | | $53,253 | |
bpost SA | | | 2,735 | | | | 29,508 | |
Proximus SADP | | | 559 | | | | 16,156 | |
Solvay SA | | | 597 | | | | 64,635 | |
UCB SA | | | 1,022 | | | | 87,793 | |
| | | | | | | | |
| | | | | | | 251,345 | |
| | | | | | | | |
Finland 2.0% | | | | | | | | |
| | |
Cargotec OYJ ‘B’ | | | 240 | | | | 8,855 | |
Kesko OYJ ‘B’ | | | 2,485 | | | | 151,287 | |
Neste OYJ | | | 3,459 | | | | 368,734 | |
Nokia OYJ | | | 21,940 | | | | 124,984 | |
Orion OYJ ‘B’ | | | 849 | | | | 31,902 | |
Sampo OYJ ‘A’ | | | 165 | | | | 7,478 | |
UPM-Kymmene OYJ | | | 2,519 | | | | 73,573 | |
| | | | | | | | |
| | | | | | | 766,813 | |
| | | | | | | | |
France 6.5% | | | | | | | | |
| | |
Arkema SA | | | 300 | | | | 28,620 | |
Atos SE | | | 1,709 | | | | 164,985 | |
AXA SA | | | 9,592 | | | | 241,249 | |
Bouygues SA | | | 339 | | | | 12,119 | |
Bureau Veritas SA | | | 1,062 | | | | 24,915 | |
Capgemini SE | | | 776 | | | | 94,162 | |
Carrefour SA | | | 5,936 | | | | 110,868 | |
Cie de Saint-Gobain | | | 1,453 | | | | 52,685 | |
CNP Assurances | | | 2,750 | | | | 60,550 | |
Eiffage SA | | | 103 | | | | 9,901 | |
Electricite de France SA | | | 14,981 | | | | 205,081 | |
Engie SA | | | 23,068 | | | | 344,011 | |
Eutelsat Communications SA | | | 5,774 | | | | 101,115 | |
Kering SA | | | 69 | | | | 39,579 | |
Peugeot SA | | | 11,695 | | | | 285,378 | |
Publicis Groupe SA | | | 121 | | | | 6,478 | |
Renault SA | | | 126 | | | | 8,331 | |
Sanofi | | | 806 | | | | 71,270 | |
Societe BIC SA | | | 274 | | | | 24,427 | |
Sopra Steria Group | | | 127 | | | | 14,754 | |
Suez | | | 5,151 | | | | 68,240 | |
Teleperformance | | | 1,446 | | | | 259,944 | |
TOTAL SA | | | 3,806 | | | | 211,802 | |
Veolia Environnement SA | | | 1,093 | | | | 24,455 | |
| | | | | | | | |
| | | | | | | 2,464,919 | |
| | | | | | | | |
Germany 6.6% | | | | | | | | |
| | |
adidas AG | | | 548 | | | | 133,286 | |
Allianz SE | | | 1,461 | | | | 325,582 | |
Aurubis AG | | | 1,127 | | | | 60,455 | |
Carl Zeiss Meditec AG | | | 283 | | | | 23,651 | |
CECONOMY AG | | | 5,682 | | | | 30,212 | |
Covestro AG | | | 5,886 | | | | 324,739 | |
Deutsche Lufthansa AG | | | 10,425 | | | | 229,153 | |
E.ON SE | | | 29,358 | | | | 326,704 | |
Evonik Industries AG | | | 2,171 | | | | 59,245 | |
Freenet AG | | | 419 | | | | 9,013 | |
Hannover Rueck SE | | | 78 | | | | 11,208 | |
HeidelbergCement AG | | | 1,570 | | | | 113,169 | |
HOCHTIEF AG | | | 354 | | | | 51,292 | |
HUGO BOSS AG | | | 148 | | | | 10,119 | |
KION Group AG | | | 420 | | | | 21,978 | |
LANXESS AG | | | 595 | | | | 31,809 | |
METRO AG | | | 1,096 | | | | 18,203 | |
Muenchener Rueckversicherungs-Gesellschaft AG in Muenchen | | | 508 | | | | 120,394 | |
ProSiebenSat.1 Media SE | | | 5,438 | | | | 77,421 | |
Puma SE | | | 25 | | | | 14,499 | |
| | | | | | | | |
| | |
| Referenced Entity | | Shares | | | Value | |
Rheinmetall AG | | | 616 | | | | $64,308 | |
Salzgitter AG | | | 2,320 | | | | 67,194 | |
SAP SE | | | 1,117 | | | | 129,131 | |
Schaeffler AG - Preferred | | | 966 | | | | 7,867 | |
Software AG | | | 4,000 | | | | 135,396 | |
Talanx AG | | | 1,450 | | | | 55,962 | |
Wirecard AG | | | 366 | | | | 45,978 | |
| | | | | | | | |
| | | | | | | 2,497,968 | |
| | | | | | | | |
Italy 5.1% | | | | | | | | |
| | |
A2A SPA | | | 130,222 | | | | 237,930 | |
Autogrill SPA | | | 5,174 | | | | 49,819 | |
BPER Banca | | | 8,679 | | | | 35,516 | |
Enel SPA | | | 62,887 | | | | 402,970 | |
Eni SPA | | | 35,839 | | | | 633,225 | |
Hera SPA | | | 28,772 | | | | 104,126 | |
Italgas SPA | | | 15,857 | | | | 97,982 | |
Leonardo SPA | | | 547 | | | | 6,357 | |
Saipem SPA | | | 18,053 | | | | 95,601 | |
Snam SPA | | | 22,800 | | | | 117,287 | |
Unipol Gruppo SPA | | | 24,811 | | | | 123,766 | |
UnipolSai Assicurazioni SPA | | | 10,081 | | | | 27,224 | |
| | | | | | | | |
| | | | | | | 1,931,803 | |
| | | | | | | | |
Luxembourg 0.8% | | | | | | | | |
| | |
APERAM SA | | | 481 | | | | 13,728 | |
ArcelorMittal | | | 2,198 | | | | 44,607 | |
SES SA | | | 15,031 | | | | 233,779 | |
| | | | | | | | |
| | | | | | | 292,114 | |
| | | | | | | | |
Netherlands 2.5% | | | | | | | | |
| | |
Aegon NV | | | 9,226 | | | | 44,317 | |
Akzo Nobel NV | | | 104 | | | | 9,239 | |
ASM International NV | | | 1,579 | | | | 85,804 | |
ASR Nederland NV | | | 5,951 | | | | 247,958 | |
Koninklijke Ahold Delhaize NV | | | 9,267 | | | | 246,723 | |
Koninklijke DSM NV | | | 60 | | | | 6,545 | |
NN Group NV | | | 2,383 | | | | 99,149 | |
Signify NV | | | 6,937 | | | | 185,591 | |
Wolters Kluwer NV | | | 663 | | | | 45,170 | |
| | | | | | | | |
| | | | | | | 970,496 | |
| | | | | | | | |
Spain 3.4% | | | | | | | | |
| | |
ACS Actividades de Construccion y Servicios SA | | | 2,748 | | | | 120,808 | |
Amadeus IT Group SA | | | 521 | | | | 41,758 | |
Banco Bilbao Vizcaya Argentaria SA | | | 1,228 | | | | 7,016 | |
Enagas SA | | | 855 | | | | 24,891 | |
Endesa SA | | | 13,655 | | | | 348,483 | |
Iberdrola SA | | | 25,551 | | | | 224,333 | |
Mediaset Espana Comunicacion SA | | | 2,095 | | | | 15,655 | |
Melia Hotels International SA | | | 2,299 | | | | 21,352 | |
Naturgy Energy Group SA | | | 900 | | | | 25,190 | |
Red Electrica Corp SA | | | 8,390 | | | | 178,848 | |
Repsol SA | | | 15,787 | | | | 270,090 | |
| | | | | | | | |
| | | | | | | 1,278,424 | |
| | | | | | | | |
Switzerland 0.1% | | | | | | | | |
| | |
STMicroelectronics NV | | | 1,504 | | | | 22,310 | |
| | | | | | | | |
| | |
United Kingdom 0.9% | | | | | | | | |
| | |
CNH Industrial NV | | | 822 | | | | 8,375 | |
Dialog Semiconductor PLC | | | 2,246 | | | | 68,497 | |
Fiat Chrysler Automobiles NV | | | 12,994 | | | | 194,075 | |
Unilever NV | | | 1,384 | | | | 80,690 | |
| | | | | | | | |
| | | | | | | 351,637 | |
| | | | | | | | |
| | |
Total Long Positions 28.6% | | | | | | | 10,827,829 | |
| | | | | | | | |
| | |
| See Notes to Financial Statements | | See explanation of symbols and terms, if any, on B-97 and B-98 |
B-91
PACIFIC FUNDS
PF EQUITY LONG/SHORT FUND
Schedule of Investments (Continued)
March 31, 2019
| | | | | | | | |
| | |
| Referenced Entity | | Shares | | | Value | |
| | |
Short Positions: (23.5%) | | | | | | | | |
| | |
Belgium (0.6%) | | | | | | | | |
| | |
Anheuser-Busch InBev SA NV | | | 561 | | | | ($47,093 | ) |
Telenet Group Holding NV | | | 929 | | | | (44,676 | ) |
Umicore SA | | | 3,573 | | | | (159,026 | ) |
| | | | | | | | |
| | | | | | | (250,795 | ) |
| | | | | | | | |
Finland (0.7%) | | | | | | | | |
| | |
Elisa OYJ | | | 1,362 | | | | (61,449 | ) |
Huhtamaki OYJ | | | 2,819 | | | | (105,045 | ) |
Kone OYJ ‘B’ | | | 418 | | | | (21,112 | ) |
Outokumpu OYJ | | | 16,266 | | | | (59,211 | ) |
Wartsila OYJ Abp | | | 467 | | | | (7,553 | ) |
| | | | | | | | |
| | | | | | | (254,370 | ) |
| | | | | | | | |
France (6.8%) | | | | | | | | |
| | |
Accor SA | | | 1,875 | | | | (75,955 | ) |
AirFrance-KLM | | | 553 | | | | (6,220 | ) |
Altran Technologies SA | | | 10,278 | | | | (112,882 | ) |
Amundi SA | | | 452 | | | | (28,466 | ) |
BioMerieux | | | 296 | | | | (24,482 | ) |
Bollore SA | | | 64,195 | | | | (290,283 | ) |
Cie Generale des Etablissements Michelin SCA | | | 186 | | | | (21,975 | ) |
Cie Plastic Omnium SA | | | 1,942 | | | | (51,737 | ) |
Edenred | | | 3,712 | | | | (169,047 | ) |
Elior Group SA | | | 2,396 | | | | (32,083 | ) |
EssilorLuxottica SA | | | 2,118 | | | | (231,371 | ) |
Getlink SE | | | 4,757 | | | | (72,137 | ) |
Iliad SA | | | 1,933 | | | | (194,229 | ) |
Ingenico Group SA | | | 1,651 | | | | (117,934 | ) |
JCDecaux SA | | | 2,727 | | | | (82,961 | ) |
Legrand SA | | | 142 | | | | (9,507 | ) |
LVMH Moet Hennessy Louis Vuitton SE | | | 17 | | | | (6,262 | ) |
Orpea | | | 1,769 | | | | (212,409 | ) |
Remy Cointreau SA | | | 1,025 | | | | (136,711 | ) |
SEB SA | | | 512 | | | | (86,202 | ) |
Sodexo SA | | | 467 | | | | (51,426 | ) |
SPIE SA | | | 528 | | | | (9,341 | ) |
Ubisoft Entertainment SA | | | 685 | | | | (61,084 | ) |
Valeo SA | | | 11,096 | | | | (322,149 | ) |
Vivendi SA | | | 4,453 | | | | (129,049 | ) |
Worldline SA | | | 570 | | | | (33,777 | ) |
| | | | | | | | |
| | | | | | | (2,569,679 | ) |
| | | | | | | | |
Germany (6.0%) | | | | | | | | |
| | |
1&1 Drillisch AG | | | 1,504 | | | | (53,598 | ) |
Axel Springer SE | | | 172 | | | | (8,891 | ) |
Bayer AG | | | 363 | | | | (23,374 | ) |
Bayerische Motoren Werke AG | | | 265 | | | | (20,437 | ) |
Bilfinger SE | | | 258 | | | | (8,994 | ) |
Continental AG | | | 779 | | | | (117,520 | ) |
Daimler AG | | | 4,299 | | | | (252,281 | ) |
Delivery Hero SE | | | 2,946 | | | | (106,411 | ) |
Deutsche Bank AG | | | 32,510 | | | | (265,023 | ) |
Fielmann AG | | | 234 | | | | (16,155 | ) |
Fraport AG Frankfurt Airport Services Worldwide | | | 1,011 | | | | (77,559 | ) |
GEA Group AG | | | 6,582 | | | | (172,507 | ) |
Infineon Technologies AG | | | 4,007 | | | | (79,549 | ) |
| | | | | | | | |
| | |
| Referenced Entity | | Shares | | | Value | |
Jungheinrich AG Preferred | | | 214 | | | | ($6,966 | ) |
MTU Aero Engines AG | | | 146 | | | | (33,093 | ) |
OSRAM Licht AG | | | 4,576 | | | | (157,640 | ) |
RWE AG | | | 2,544 | | | | (68,312 | ) |
Sartorius AG Preferred | | | 455 | | | | (78,196 | ) |
thyssenkrupp AG | | | 20,030 | | | | (275,532 | ) |
United Internet AG | | | 4,734 | | | | (173,104 | ) |
Volkswagen AG Preferred | | | 242 | | | | (38,153 | ) |
Zalando SE | | | 6,252 | | | | (243,709 | ) |
| | | | | | | | |
| | | | | | | (2,277,004 | ) |
| | | | | | | | |
Italy (3.8%) | | | | | | | | |
| | |
Banco BPM SPA | | | 49,948 | | | | (103,499 | ) |
Brembo SPA | | | 9,798 | | | | (111,205 | ) |
Buzzi Unicem SPA | | | 3,896 | | | | (79,821 | ) |
Davide Campari-Milano SPA | | | 10,740 | | | | (105,517 | ) |
Ferrari NV | | | 2,747 | | | | (369,056 | ) |
Intesa Sanpaolo SPA | | | 63,234 | | | | (154,325 | ) |
Moncler SPA | | | 549 | | | | (22,158 | ) |
Pirelli & C SPA | | | 28,405 | | | | (183,145 | ) |
Prysmian SPA | | | 6,410 | | | | (121,486 | ) |
Recordati SPA | | | 233 | | | | (9,079 | ) |
Unione di Banche Italiane SPA | | | 62,908 | | | | (166,705 | ) |
| | | | | | | | |
| | | | | | | (1,425,996 | ) |
| | | | | | | | |
Luxembourg (0.8%) | | | | | | | | |
| | |
Eurofins Scientific SE | | | 322 | | | | (133,393 | ) |
Tenaris SA | | | 11,373 | | | | (160,212 | ) |
| | | | | | | | |
| | | | | | | (293,605 | ) |
| | | | | | | | |
Netherlands (1.4%) | | | | | | | | |
| | |
Aalberts Industries NV | | | 250 | | | | (8,692 | ) |
ALTICE EUROPE NA | | | 6,656 | | | | (17,489 | ) |
ASML Holding NV | | | 674 | | | | (126,679 | ) |
Boskalis Westminster | | | 2,302 | | | | (59,593 | ) |
Koninklijke Vopak NV | | | 1,044 | | | | (50,005 | ) |
OCI NV | | | 2,682 | | | | (73,884 | ) |
SBM Offshore NV | | | 9,532 | | | | (181,578 | ) |
| | | | | | | | |
| | | | | | | (517,920 | ) |
| | | | | | | | |
Spain (2.9%) | | | | | | | | |
| | |
Aena SME SA | | | 70 | | | | (12,614 | ) |
Almirall SA | | | 662 | | | | (11,304 | ) |
Banco de Sabadell SA | | | 14,293 | | | | (14,246 | ) |
Banco Santander SA | | | 27,237 | | | | (126,477 | ) |
Bankia SA | | | 39,128 | | | | (101,452 | ) |
Bankinter SA | | | 9,423 | | | | (71,820 | ) |
Cellnex Telecom SA | | | 10,056 | | | | (295,224 | ) |
Ferrovial SA | | | 5,381 | | | | (126,096 | ) |
Grifols SA | | | 7,602 | | | | (213,161 | ) |
Industria de Diseno Textil SA | | | 4,027 | | | | (118,400 | ) |
| | | | | | | | |
| | | | | | | (1,090,794 | ) |
| | | | | | | | |
United States (0.5%) | | | | | | | | |
| | |
QIAGEN NV | | | 5,117 | | | | (207,711 | ) |
| | | | | | | | |
| | |
Total Short Positions (23.5%) | | | | | | | (8,887,874 | ) |
| | | | | | | | |
| | |
Total Long and Short Positions 5.1% | | | | | | | $1,939,955 | |
| | | | | | | | |
| | | | | | | | |
| Description | | Counter-
party | | | Expiration
Date (1) | |
The Fund receives or pays the net total return on all positions within the basket and pays financing based upon the then-current1-DayJPY-MUTSC plus or minus a specified spread (rates range from (1.380%) to 0.450%) as negotiated by the parties, which is denominated in JPY based on the local currencies of the positions within the swap. | | | MSC | | | | 05/01/20 | |
| | |
| See Notes to Financial Statements | | See explanation of symbols and terms, if any, on B-97 and B-98 |
B-92
PACIFIC FUNDS
PF EQUITY LONG/SHORT FUND
Schedule of Investments (Continued)
March 31, 2019
The following table represents the individual long and short positions and related values within the total return basket swap as of March 31, 2019:
| | | | | | | | |
| | |
| Referenced Entity | | Shares | | | Value | |
Long Positions: 23.2% | | | | | | | | |
| | |
Japan 23.2% | | | | | | | | |
| | |
AGC Inc | | | 500 | | | | $17,563 | |
Aisin Seiki Co Ltd | | | 1,000 | | | | 35,799 | |
Ajinomoto Co Inc | | | 600 | | | | 9,604 | |
Alfresa Holdings Corp | | | 6,300 | | | | 179,530 | |
Alps Alpine Co Ltd | | | 3,100 | | | | 64,815 | |
ANA Holdings Inc | | | 400 | | | | 14,675 | |
Asahi Kasei Corp | | | 700 | | | | 7,249 | |
Astellas Pharma Inc | | | 9,800 | | | | 147,253 | |
Bandai Namco Holdings Inc | | | 1,200 | | | | 56,341 | |
Brother Industries Ltd | | | 1,700 | | | | 31,573 | |
Chubu Electric Power Co Inc | | | 3,900 | | | | 60,969 | |
Citizen Watch Co Ltd | | | 6,500 | | | | 36,322 | |
Concordia Financial Group Ltd | | | 13,800 | | | | 53,356 | |
Credit Saison Co Ltd | | | 1,200 | | | | 15,877 | |
Dai Nippon Printing Co Ltd | | | 700 | | | | 16,767 | |
Daicel Corp | | | 4,800 | | | | 52,276 | |
Dai-ichi Life Holdings Inc | | | 2,800 | | | | 38,980 | |
DeNA Co Ltd | | | 1,200 | | | | 18,089 | |
East Japan Railway Co | | | 300 | | | | 28,970 | |
Eisai Co Ltd | | | 100 | | | | 5,627 | |
Fuji Electric Co Ltd | | | 2,600 | | | | 74,024 | |
FUJIFILM Holdings Corp | | | 300 | | | | 13,664 | |
Fujitsu Ltd | | | 2,100 | | | | 151,871 | |
GungHo Online Entertainment Inc | | | 18,800 | | | | 68,626 | |
Hakuhodo DY Holdings Inc | | | 7,200 | | | | 115,936 | |
Haseko Corp | | | 16,000 | | | | 201,661 | |
Hitachi Capital Corp | | | 700 | | | | 16,257 | |
Hitachi High-Technologies Corp | | | 2,000 | | | | 82,179 | |
Hitachi Ltd | | | 3,900 | | | | 126,713 | |
Hoshizaki Corp | | | 1,000 | | | | 62,076 | |
Idemitsu Kosan Co Ltd | | | 1,100 | | | | 36,793 | |
IHI Corp | | | 2,400 | | | | 57,817 | |
Inpex Corp | | | 5,400 | | | | 51,370 | |
Itochu Techno-Solutions Corp | | | 7,900 | | | | 184,832 | |
Japan Airlines Co Ltd | | | 9,000 | | | | 317,156 | |
Japan Post Holdings Co Ltd | | | 600 | | | | 7,022 | |
JFE Holdings Inc | | | 8,000 | | | | 136,167 | |
JTEKT Corp | | | 2,200 | | | | 27,166 | |
JXTG Holdings Inc | | | 22,200 | | | | 101,342 | |
Kajima Corp | | | 7,500 | | | | 110,945 | |
Kakaku.com Inc | | | 300 | | | | 5,757 | |
Kaken Pharmaceutical Co Ltd | | | 300 | | | | 13,665 | |
Kamigumi Co Ltd | | | 7,100 | | | | 164,673 | |
Kaneka Corp | | | 1,400 | | | | 52,560 | |
Kobe Steel Ltd | | | 3,300 | | | | 24,827 | |
Konica Minolta Inc | | | 900 | | | | 8,874 | |
Kose Corp | | | 800 | | | | 147,449 | |
Kyushu Railway Co | | | 300 | | | | 9,868 | |
LIXIL Group Corp | | | 500 | | | | 6,683 | |
Mabuchi Motor Co Ltd | | | 1,000 | | | | 34,877 | |
Marubeni Corp | | | 13,600 | | | | 94,294 | |
Matsumotokiyoshi Holdings Co Ltd | | | 2,700 | | | | 90,215 | |
Mazda Motor Corp | | | 8,200 | | | | 91,938 | |
Mebuki Financial Group Inc | | | 20,100 | | | | 51,448 | |
Medipal Holdings Corp | | | 4,500 | | | | 107,072 | |
Mitsubishi Chemical Holdings Corp | | | 7,500 | | | | 52,970 | |
Mitsubishi Corp | | | 500 | | | | 13,921 | |
Mitsubishi Gas Chemical Co Inc | | | 8,600 | | | | 123,183 | |
Mitsubishi Tanabe Pharma Corp | | | 600 | | | | 8,037 | |
Mitsubishi UFJ Financial Group Inc | | | 15,900 | | | | 78,638 | |
Mitsubishi UFJ Lease & Finance Co Ltd | | | 1,500 | | | | 7,657 | |
Mitsui & Co Ltd | | | 700 | | | | 10,892 | |
Mixi Inc | | | 4,400 | | | | 101,808 | |
NHK Spring Co Ltd | | | 10,100 | | | | 90,890 | |
Nikon Corp | | | 10,700 | | | | 151,283 | |
| | | | | | | | |
| | |
| Referenced Entity | | Shares | | | Value | |
Nippon Express Co Ltd | | | 3,400 | | | | $189,571 | |
Nippon Shokubai Co Ltd | | | 500 | | | | 32,707 | |
Nippon Telegraph & Telephone Corp | | | 3,300 | | | | 140,683 | |
Nitto Denko Corp | | | 1,400 | | | | 73,793 | |
Nomura Research Institute Ltd | | | 500 | | | | 22,775 | |
NTT Data Corp | | | 1,700 | | | | 18,795 | |
Obayashi Corp | | | 13,600 | | | | 137,070 | |
Oji Holdings Corp | | | 8,600 | | | | 53,517 | |
Olympus Corp | | | 9,200 | | | | 100,089 | |
Oracle Corp Japan | | | 700 | | | | 47,074 | |
Orient Corp | | | 11,900 | | | | 12,170 | |
ORIX Corp | | | 700 | | | | 10,057 | |
Osaka Gas Co Ltd | | | 500 | | | | 9,885 | |
Otsuka Corp | | | 1,600 | | | | 59,860 | |
Persol Holdings Co Ltd | | | 2,400 | | | | 38,972 | |
Pola Orbis Holdings Inc | | | 3,800 | | | | 121,548 | |
Renesas Electronics Corp | | | 17,000 | | | | 79,001 | |
Resona Holdings Inc | | | 13,600 | | | | 58,915 | |
Rinnai Corp | | | 100 | | | | 7,081 | |
Rohm Co Ltd | | | 200 | | | | 12,531 | |
Sankyo Co Ltd | | | 200 | | | | 7,636 | |
Santen Pharmaceutical Co Ltd | | | 1,400 | | | | 20,925 | |
Sawai Pharmaceutical Co Ltd | | | 300 | | | | 17,400 | |
SCSK Corp | | | 1,800 | | | | 80,372 | |
Seibu Holdings Inc | | | 600 | | | | 10,513 | |
SG Holdings Co Ltd | | | 3,300 | | | | 96,270 | |
Shimadzu Corp | | | 300 | | | | 8,707 | |
Shimizu Corp | | | 1,100 | | | | 9,580 | |
Shinsei Bank Ltd | | | 6,100 | | | | 86,801 | |
Shionogi & Co Ltd | | | 1,900 | | | | 117,955 | |
Showa Denko KK | | | 2,100 | | | | 74,231 | |
SoftBank Group Corp | | | 700 | | | | 68,234 | |
Sojitz Corp | | | 52,900 | | | | 186,915 | |
Sony Corp | | | 3,900 | | | | 164,663 | |
Square Enix Holdings Co Ltd | | | 3,800 | | | | 133,557 | |
Sugi Holdings Co Ltd | | | 200 | | | | 8,826 | |
SUMCO Corp | | | 600 | | | | 6,664 | |
Sumitomo Chemical Co Ltd | | | 5,800 | | | | 27,076 | |
Sumitomo Corp | | | 7,800 | | | | 108,141 | |
Sumitomo Dainippon Pharma Co Ltd | | | 9,400 | | | | 233,299 | |
Sumitomo Heavy Industries Ltd | | | 2,000 | | | | 65,000 | |
Sumitomo Mitsui Financial Group Inc | | | 1,500 | | | | 52,528 | |
Sundrug Co Ltd | | | 1,800 | | | | 49,677 | |
Suzuken Co Ltd | | | 2,700 | | | | 156,613 | |
Sysmex Corp | | | 200 | | | | 12,115 | |
Taiheiyo Cement Corp | | | 5,400 | | | | 180,354 | |
Taisei Corp | | | 3,000 | | | | 139,568 | |
Taisho Pharmaceutical Holdings Co Ltd | | | 300 | | | | 28,660 | |
Teijin Ltd | | | 4,600 | | | | 76,066 | |
The Chugoku Bank Ltd | | | 3,200 | | | | 30,012 | |
The Gunma Bank Ltd | | | 16,800 | | | | 63,665 | |
The Hachijuni Bank Ltd | | | 21,500 | | | | 89,247 | |
The Hiroshima Bank Ltd | | | 7,100 | | | | 36,190 | |
The Iyo Bank Ltd | | | 7,100 | | | | 37,586 | |
THK Co Ltd | | | 1,700 | | | | 42,222 | |
Tohoku Electric Power Co Inc | | | 4,500 | | | | 57,458 | |
Tokyo Broadcasting System Holdings Inc | | | 4,500 | | | | 82,477 | |
Tokyo Electric Power Co Holdings Inc | | | 12,900 | | | | 81,607 | |
Tokyo Gas Co Ltd | | | 1,400 | | | | 37,898 | |
Tosoh Corp | | | 6,300 | | | | 98,300 | |
Toyo Seikan Group Holdings Ltd | | | 3,600 | | | | 73,848 | |
Toyo Suisan Kaisha Ltd | | | 1,500 | | | | 57,179 | |
Toyota Boshoku Corp | | | 5,700 | | | | 86,412 | |
Toyota Tsusho Corp | | | 1,900 | | | | 62,080 | |
West Japan Railway Co | | | 200 | | | | 15,069 | |
Yamaguchi Financial Group Inc | | | 1,300 | | | | 11,022 | |
| | | | | | | | |
| | | | | | | 8,795,443 | |
| | | | | | | | |
| | |
Total Long Positions 23.2% | | | | | | | 8,795,443 | |
| | | | | | | | |
| | |
| See Notes to Financial Statements | | See explanation of symbols and terms, if any, on B-97 and B-98 |
B-93
PACIFIC FUNDS
PF EQUITY LONG/SHORT FUND
Schedule of Investments (Continued)
March 31, 2019
| | | | | | | | |
| | |
| Referenced Entity | | Shares | | | Value | |
| | |
Short Positions: (23.3%) | | | | | | | | |
| | |
Japan (23.3%) | | | | | | | | |
| | |
Aeon Co Ltd | | | 4,500 | | | | ($94,254 | ) |
AEON Financial Service Co Ltd | | | 3,400 | | | | (69,336 | ) |
Asahi Intecc Co Ltd | | | 3,500 | | | | (164,831 | ) |
Asics Corp | | | 9,100 | | | | (122,454 | ) |
Bridgestone Corp | | | 3,700 | | | | (142,574 | ) |
Calbee Inc | | | 3,400 | | | | (91,827 | ) |
Canon Inc | | | 5,900 | | | | (171,307 | ) |
Chugai Pharmaceutical Co Ltd | | | 1,300 | | | | (89,543 | ) |
CyberAgent Inc | | | 2,100 | | | | (85,933 | ) |
Daifuku Co Ltd | | | 4,000 | | | | (209,237 | ) |
Daiichi Sankyo Co Ltd | | | 2,400 | | | | (110,826 | ) |
Daiwa Securities Group Inc | | | 19,800 | | | | (96,511 | ) |
Denso Corp | | | 1,800 | | | | (70,325 | ) |
Disco Corp | | | 700 | | | | (100,248 | ) |
FamilyMart UNY Holdings Co Ltd | | | 9,384 | | | | (239,206 | ) |
FANUC Corp | | | 1,100 | | | | (188,115 | ) |
Fast Retailing Co Ltd | | | 700 | | | | (329,673 | ) |
Fukuoka Financial Group Inc | | | 700 | | | | (15,544 | ) |
Hamamatsu Photonics KK | | | 1,804 | | | | (69,983 | ) |
Hirose Electric Co Ltd | | | 700 | | | | (73,709 | ) |
Hitachi Chemical Co Ltd | | | 3,300 | | | | (73,438 | ) |
Hitachi Construction Machinery Co Ltd | | | 200 | | | | (5,300 | ) |
Hitachi Metals Ltd | | | 5,800 | | | | (67,572 | ) |
Hokuriku Electric Power Co | | | 7,800 | | | | (61,246 | ) |
Isetan Mitsukoshi Holdings Ltd | | | 3,100 | | | | (31,362 | ) |
J Front Retailing Co Ltd | | | 1,400 | | | | (16,682 | ) |
Japan Airport Terminal Co Ltd | | | 2,000 | | | | (84,740 | ) |
Japan Post Bank Co Ltd | | | 6,600 | | | | (72,113 | ) |
JGC Corp | | | 3,400 | | | | (45,334 | ) |
Kansai Paint Co Ltd | | | 5,700 | | | | (108,955 | ) |
Kawasaki Heavy Industries Ltd | | | 800 | | | | (19,787 | ) |
Keihan Holdings Co Ltd | | | 600 | | | | (25,260 | ) |
Keikyu Corp | | | 5,000 | | | | (84,950 | ) |
Keio Corp | | | 2,100 | | | | (135,843 | ) |
Keisei Electric Railway Co Ltd | | | 200 | | | | (7,273 | ) |
Keyence Corp | | | 300 | | | | (187,559 | ) |
Kikkoman Corp | | | 1,500 | | | | (73,757 | ) |
Kintetsu Group Holdings Co Ltd | | | 1,100 | | | | (51,310 | ) |
Koito Manufacturing Co Ltd | | | 1,700 | | | | (96,650 | ) |
Komatsu Ltd | | | 1,700 | | | | (39,650 | ) |
Kubota Corp | | | 700 | | | | (10,175 | ) |
Kuraray Co Ltd | | | 1,300 | | | | (16,583 | ) |
Kyowa Hakko Kirin Co Ltd | | | 2,200 | | | | (48,012 | ) |
Kyushu Electric Power Co Inc | | | 3,300 | | | | (38,979 | ) |
Lawson Inc | | | 200 | | | | (11,095 | ) |
M3 Inc | | | 10,400 | | | | (175,029 | ) |
Makita Corp | | | 1,200 | | | | (41,940 | ) |
Marui Group Co Ltd | | | 9,553 | | | | (193,154 | ) |
McDonald’s Holdings Co Japan Ltd | | | 500 | | | | (23,132 | ) |
MISUMI Group Inc | | | 7,200 | | | | (179,764 | ) |
Mitsubishi Logistics Corp | | | 2,800 | | | | (78,301 | ) |
Mitsubishi Materials Corp | | | 500 | | | | (13,221 | ) |
MonotaRO Co Ltd | | | 500 | | | | (11,177 | ) |
Murata Manufacturing Co Ltd | | | 3,000 | | | | (150,135 | ) |
Nabtesco Corp | | | 2,700 | | | | (79,120 | ) |
Nagoya Railroad Co Ltd | | | 3,100 | | | | (85,908 | ) |
Nexon Co Ltd | | | 1,600 | | | | (25,162 | ) |
| | | | | | | | |
| | |
| Referenced Entity | | Shares | | | Value | |
NGK Spark Plug Co Ltd | | | 1,000 | | | | ($18,626 | ) |
Nidec Corp | | | 1,300 | | | | (165,535 | ) |
Nifco Inc | | | 1,100 | | | | (28,084 | ) |
Nintendo Co Ltd | | | 200 | | | | (57,338 | ) |
Nippon Paint Holdings Co Ltd | | | 7,100 | | | | (280,266 | ) |
Nippon Shinyaku Co Ltd | | | 900 | | | | (65,713 | ) |
Nippon Yusen KK | | | 700 | | | | (10,280 | ) |
Nissan Chemical Corp | | | 400 | | | | (18,375 | ) |
Nissan Motor Co Ltd | | | 10,400 | | | | (85,406 | ) |
Nisshin Seifun Group Inc | | | 400 | | | | (9,195 | ) |
Nitori Holdings Co Ltd | | | 1,200 | | | | (155,155 | ) |
NOK Corp | | | 500 | | | | (7,805 | ) |
Nomura Holdings Inc | | | 39,400 | | | | (142,378 | ) |
Odakyu Electric Railway Co Ltd | | | 5,300 | | | | (128,613 | ) |
Omron Corp | | | 400 | | | | (18,792 | ) |
Oriental Land Co Ltd | | | 500 | | | | (56,868 | ) |
Otsuka Holdings Co Ltd | | | 800 | | | | (31,498 | ) |
Pan Pacific International Holding Corp | | | 2,400 | | | | (159,010 | ) |
Park24 Co Ltd | | | 800 | | | | (17,392 | ) |
PeptiDream Inc | | | 2,400 | | | | (118,200 | ) |
Pigeon Corp | | | 500 | | | | (20,514 | ) |
Rakuten Inc | | | 3,500 | | | | (33,215 | ) |
Ricoh Co Ltd | | | 10,600 | | | | (111,006 | ) |
Seiko Epson Corp | | | 600 | | | | (9,204 | ) |
Seven Bank Ltd | | | 8,600 | | | | (25,423 | ) |
Sharp Corp | | | 600 | | | | (6,629 | ) |
Shikoku Electric Power Co Inc | | | 5,700 | | | | (69,529 | ) |
Shimano Inc | | | 1,200 | | | | (195,380 | ) |
Shiseido Co Ltd | | | 400 | | | | (28,962 | ) |
SMC Corp | | | 200 | | | | (75,391 | ) |
Sony Financial Holdings Inc | | | 1,900 | | | | (35,857 | ) |
Sumitomo Electric Industries Ltd | | | 2,400 | | | | (31,927 | ) |
Sumitomo Metal Mining Co Ltd | | | 2,700 | | | | (80,006 | ) |
Suntory Beverage & Food Ltd | | | 200 | | | | (9,406 | ) |
Takeda Pharmaceutical Co Ltd | | | 2,700 | | | | (110,571 | ) |
TDK Corp | | | 900 | | | | (70,834 | ) |
Terumo Corp | | | 7,000 | | | | (214,240 | ) |
The Bank of Kyoto Ltd | | | 500 | | | | (20,935 | ) |
The Chiba Bank Ltd | | | 3,600 | | | | (19,576 | ) |
The Chugoku Electric Power Co Inc | | | 7,500 | | | | (93,620 | ) |
The Shizuoka Bank Ltd | | | 800 | | | | (6,094 | ) |
The Yokohama Rubber Co Ltd | | | 3,100 | | | | (57,707 | ) |
Toho Co Ltd | | | 200 | | | | (8,045 | ) |
Tokio Marine Holdings Inc | | | 1,400 | | | | (67,825 | ) |
Tokyo Electron Ltd | | | 100 | | | | (14,506 | ) |
Toray Industries Inc | | | 7,000 | | | | (44,670 | ) |
TOTO Ltd | | | 2,100 | | | | (89,292 | ) |
Toyota Industries Corp | | | 2,300 | | | | (115,573 | ) |
Toyota Motor Corp | | | 2,500 | | | | (147,277 | ) |
Tsuruha Holdings Inc | | | 300 | | | | (24,433 | ) |
Welcia Holdings Co Ltd | | | 1,000 | | | | (33,974 | ) |
Yahoo Japan Corp | | | 3,600 | | | | (8,830 | ) |
Yamaha Corp | | | 400 | | | | (20,029 | ) |
Yamaha Motor Co Ltd | | | 5,900 | | | | (116,055 | ) |
Yaskawa Electric Corp | | | 7,800 | | | | (246,274 | ) |
| | | | | | | | |
| | | | | | | (8,842,442 | ) |
| | | | | | | | |
| | |
Total Short Positions (23.3%) | | | | | | | (8,842,442 | ) |
| | | | | | | | |
| | |
Total Long and Short Positions (0.1%) | | | | | | | ($46,999 | ) |
| | | | | | | | |
| | | | | | | | |
| Description | | Counter-
party | | | Expiration
Date (1) | |
The Fund receives or pays the net total return on all positions within the basket and pays financing based upon the then-current1-WeekNOK-NIBOR plus or minus a specified spread (rates range from (0.350%) to 0.350%) as negotiated by the parties, which is denominated in NOK based on the local currencies of the positions within the swap. | | | MSC | | | | 05/04/20 | |
| | |
| See Notes to Financial Statements | | See explanation of symbols and terms, if any, on B-97 and B-98 |
B-94
PACIFIC FUNDS
PF EQUITY LONG/SHORT FUND
Schedule of Investments (Continued)
March 31, 2019
The following table represents the individual long and short positions and related values within the total return basket swap as of March 31, 2019:
| | | | | | | | |
| | |
| Referenced Entity | | Shares | | | Value | |
Long Positions: 1.5% | | | | | | | | |
| | |
Norway 1.5% | | | | | | | | |
| | |
Equinor ASA | | | 12,967 | | | | $284,238 | |
Leroy Seafood Group ASA | | | 16,323 | | | | 118,587 | |
Norsk Hydro ASA | | | 3,003 | | | | 12,213 | |
Salmar ASA | | | 3,237 | | | | 155,480 | |
| | | | | | | | |
| | | | | | | 570,518 | |
| | | | | | | | |
| | |
Total Long Positions 1.5% | | | | | | | 570,518 | |
| | | | | | | | |
| | | | | | | | |
| | |
| Referenced Entity | | Shares | | | Value | |
| | |
Short Position: (1.3%) | | | | | | | | |
| | |
Norway (1.0%) | | | | | | | | |
| | |
Gjensidige Forsikring ASA | | | 3,717 | | | | ( $ 64,250 | ) |
Schibsted ASA ‘A’ | | | 5,141 | | | | (202,075 | ) |
Telenor ASA | | | 321 | | | | (6,428 | ) |
Yara International ASA | | | 2,552 | | | | (104,568 | ) |
| | | | | | | | |
| | | | | | | (377,321 | ) |
| | | | | | | | |
United Kingdom (0.3%) | | | | | | | | |
| | |
Subsea 7 SA | | | 8,486 | | | | (105,111 | ) |
| | | | | | | | |
| | |
Total Short Position (1.3%) | | | | | | | (482,432 | ) |
| | | | | | | | |
| | |
Total Long and Short Positions 0.2% | | | | | | | $88,086 | |
| | | | | | | | |
| | | | | | | | |
| Description | | Counter-
party | | | Expiration
Date (1) | |
The Fund receives or pays the net total return on all positions within the basket and pays financing based upon the then-current1-WeekSEK-STIBOR plus or minus a specified spread (rates range from (2.350%) to 0.350%) as negotiated by the parties, which is denominated in SEK based on the local currencies of the positions within the swap. | | | MSC | | | | 05/04/20 | |
The following table represents the individual long and short positions and related values within the total return basket swap as of March 31, 2019:
| | | | | | | | |
| | |
| Referenced Entity | | Shares | | | Value | |
Long Positions: 2.7% | | | | | | | | |
| | |
Malta 0.3% | | | | | | | | |
| | |
Kindred Group PLC SDR | | | 12,638 | | | | $126,780 | |
| | | | | | | | |
| | |
Sweden 2.4% | | | | | | | | |
| | |
AAK AB | | | 762 | | | | 11,375 | |
Axfood AB | | | 2,285 | | | | 42,535 | |
Boliden AB | | | 3,284 | | | | 93,591 | |
Electrolux AB ‘B’ | | | 1,014 | | | | 26,111 | |
Essity AB ‘B’ | | | 2,993 | | | | 86,373 | |
Fingerprint Cards AB ‘B’ | | | 23,233 | | | | 33,146 | |
Sandvik AB | | | 1,432 | | | | 23,290 | |
Securitas AB ‘B’ | | | 2,934 | | | | 47,461 | |
Skanska AB ‘B’ | | | 1,303 | | | | 23,697 | |
Swedish Match AB | | | 1,826 | | | | 93,168 | |
Swedish Orphan Biovitrum AB | | | 10,275 | | | | 241,035 | |
Telefonaktiebolaget LM Ericsson ‘B’ | | | 12,533 | | | | 115,453 | |
Telia Co AB | | | 4,134 | | | | 18,635 | |
Volvo AB ‘B’ | | | 2,267 | | | | 35,175 | |
| | | | | | | | |
| | | | | | | 891,045 | |
| | | | | | | | |
| | |
Total Long Positions 2.7% | | | | | | | 1,017,825 | |
| | | | | | | | |
| | |
Short Positions: (2.0%) | | | | | | | | |
| | |
Colombia (0.2%) | | | | | | | | |
| | |
Millicom International Cellular SA SDR | | | 1,338 | | | | (81,259 | ) |
| | | | | | | | |
| | | | | | | | |
| | |
| Referenced Entity | | Shares | | | Value | |
| | |
Finland (0.2%) | | | | | | | | |
| | |
Nordea Bank Abp | | | 9,897 | | | | ( $ 75,364 | ) |
| | | | | | | | |
| | |
Sweden (1.6%) | | | | | | | | |
| | |
Assa Abloy AB ‘B’ | | | 3,107 | | | | (67,056 | ) |
BillerudKorsnas AB | | | 2,681 | | | | (35,604 | ) |
Elekta AB ‘B’ | | | 919 | | | | (11,447 | ) |
Epiroc AB ‘A’ | | | 2,675 | | | | (27,017 | ) |
Getinge AB ‘B’ | | | 535 | | | | (6,239 | ) |
Hexpol AB | | | 1,130 | | | | (9,532 | ) |
Husqvarna AB ‘B’ | | | 13,172 | | | | (107,726 | ) |
Nibe Industrier AB ‘B’ | | | 821 | | | | (10,524 | ) |
Nordic Entertainment Group AB ‘B’ | | | 441 | | | | (10,341 | ) |
Saab AB ‘B’ | | | 1,115 | | | | (35,767 | ) |
Svenska Cellulosa AB SCA ‘B’ | | | 9,366 | | | | (81,323 | ) |
Svenska Handelsbanken AB ‘A’ | | | 9,396 | | | | (99,203 | ) |
Tele2 AB ‘B’ | | | 7,118 | | | | (94,978 | ) |
| | | | | | | | |
| | | | | | | (596,757 | ) |
| | | | | | | | |
| | |
Total Short Positions (2.0%) | | | | | | | (753,380 | ) |
| | | | | | | | |
| | |
Total Long and Short Positions 0.7% | | | | | | | $264,445 | |
| | | | | | | | |
| | |
Total Basket Swaps 16.5% | | | | | | | $6,245,867 | |
| | | | | | | | |
Total Return Swaps – Long
| | | | | | | | | | | | | | | | | | | | | | | | | | | | | | | | | | | | |
| Receive | | Pay | | | Payment Frequency | | | Counter- Party | | | Expiration Date | | | Number of Contracts | | | Notional
Amount | | | Value | | | Upfront Premiums
Paid (Received) | | | Unrealized
Appreciation (Depreciation) | |
MSCI Canada Index appreciation | | | MSCI Canada Index depreciation | | | | M | | | | JPM | | | | 06/19/19 | | | | 76 | | | | $371,658 | | | | ($71 | ) | | | $— | | | | ($71 | ) |
MSCI Hong Kong Index appreciation | | | MSCI Hong Kong Index depreciation | | | | M | | | | JPM | | | | 06/19/19 | | | | 13 | | | | 153,553 | | | | 2,367 | | | | — | | | | 2,367 | |
MSCI Italy Index appreciation | | | MSCI Italy Index depreciation | | | | M | | | | JPM | | | | 06/19/19 | | | | 922 | | | | 106,332 | | | | 3,377 | | | | — | | | | 3,377 | |
MSCI Japan Index appreciation | | | MSCI Japan Index depreciation | | | | M | | | | JPM | | | | 06/19/19 | | | | 17,823 | | | | 300,453 | | | | (2,287 | ) | | | — | | | | (2,287 | ) |
Swiss Market Index appreciation | | | Swiss Market Index depreciation | | | | M | | | | MSC | | | | 06/21/19 | | | | 6 | | | | 560,382 | | | | 7,817 | | | | — | | | | 7,817 | |
| | | | | | | | | | | | | | | | | | | | | | | | | | | | | | | | | | | | |
| | | | | | | | | | | | | | | | | | | | | | | | | | | $11,203 | | | | $— | | | | $11,203 | |
| | | | | | | | | | | | | | | | | | | | | | | | | | | | | | | | | | | | |
| | | | | | | | | |
Total Swap Agreements | | | | | | | | | | | | | | | | | | | | | | | | | | | | | | | | | | | ($391,979 | ) |
| | | | | | | | | | | | | | | | | | | | | | | | | | | | | | | | | | | | |
| | |
| See Notes to Financial Statements | | See explanation of symbols and terms, if any, on B-97 and B-98 |
B-95
PACIFIC FUNDS
PF EQUITY LONG/SHORT FUND
Schedule of Investments (Continued)
March 31, 2019
Balances reported in the Statement of Assets and Liabilities for Over the Counter (OTC) Swaps
| | | | | | | | |
| | | Upfront
Premium
Paid
(Received) | | | Unrealized
Appreciation
(Deprecation) | |
OTC Swap Agreements | | | | | | | | |
Assets | | | $— | | | | $310,325 | |
Liabilities | | | — | | | | (702,304 | ) |
| | | | | | | | |
| | | $— | | | | ($391,979 | ) |
| | | | | | | | |
| (f) | Fair Value Measurements |
The following is a summary of the Fund’s investments as categorized under the three-tier hierarchy of inputs used in valuing the Fund’s assets and liabilities (See Note 3D in Notes to Financial Statements) as of March 31, 2019:
| | | | | | | | | | | | | | | | | | |
| | | | | Total Value at
March 31, 2019 | | | Level 1
Quoted Price | | | Level 2
Significant
Observable Inputs | | | Level 3
Significant
Unobservable Inputs | |
Assets | | Short-Term Investments | | | $29,149,760 | | | | $10,997,036 | | | | $18,152,724 | | | | $— | |
| | Derivatives: | | | | | | | | | | | | | | | | |
| | Equity Contracts | | | | | | | | | | | | | | | | |
| | Futures | | | 245,336 | | | | 245,336 | | | | — | | | | — | |
| | Swaps | | | 310,325 | | | | — | | | | 310,325 | | | | — | |
| | | | | | | | | | | | | | | | | | |
| | Total Equity Contracts | | | 555,661 | | | | 245,336 | | | | 310,325 | | | | — | |
| | | | | | | | | | | | | | | | | | |
| | Foreign Currency Contracts | | | | | | | | | | | | | | | | |
| | Forward Foreign Currency Contracts | | | 3,874 | | | | — | | | | 3,874 | | | | — | |
| | | | | | | | | | | | | | | | | | |
| | Total Assets - Derivatives | | | 559,535 | | | | 245,336 | | | | 314,199 | | | | — | |
| | | | | | | | | | | | | | | | | | |
| | Total Assets | | | 29,709,295 | | | | 11,242,372 | | | | 18,466,923 | | | | — | |
| | | | | | | | | | | | | | | | | | |
| | | | | |
Liabilities | | Derivatives: | | | | | | | | | | | | | | | | |
| | Equity Contracts | | | | | | | | | | | | | | | | |
| | Futures | | | (10,710 | ) | | | (10,710 | ) | | | — | | | | — | |
| | Swaps | | | (702,304 | ) | | | — | | | | (702,304 | ) | | | — | |
| | | | | | | | | | | | | | | | | | |
| | Total Equity Contracts | | | (713,014 | ) | | | (10,710 | ) | | | (702,304 | ) | | | — | |
| | | | | | | | | | | | | | | | | | |
| | Foreign Currency Contracts | | | | | | | | | | | | | | | | |
| | Forward Foreign Currency Contracts | | | (48,066 | ) | | | — | | | | (48,066 | ) | | | — | |
| | | | | | | | | | | | | | | | | | |
| | Total Liabilities - Derivatives | | | (761,080 | ) | | | (10,710 | ) | | | (750,370 | ) | | | — | |
| | | | | | | | | | | | | | | | | | |
| | Total Liabilities | | | (761,080 | ) | | | (10,710 | ) | | | (750,370 | ) | | | — | |
| | | | | | | | | | | | | | | | | | |
| | Total | | | $28,948,215 | | | | $11,231,662 | | | | $17,716,553 | | | | $— | |
| | | | | | | | | | | | | | | | | | |
| | |
| See Notes to Financial Statements | | See explanation of symbols and terms, if any, on B-97 and B-98 |
B-96
PACIFIC FUNDS
Schedule of Investments (Continued)
Explanation of Symbols and Terms
March 31, 2019
| | |
|
Explanation of Symbols: |
| |
| * | | Non-income producing investments. |
| ^ | | Investments with their principal amount adjusted for inflation. |
| § | | Variable rate investments. The rate shown is based on the latest available information as of March 31, 2019. For Senior Loan Notes, the rate shown may represent a weighted average interest rate. Interest rates for certain securities are subject to interest rate caps and floors, which would result in a period end rate being more, less or equal to the referenced rate plus spread. Certain variable rate securities are not based on a published reference rate and spread but are determined by the issuer or agent and are based on current market conditions. These securities do not indicate a reference rate and spread in their description. |
| Y | | Issuer filed bankruptcy and/or is in default as of March 31, 2019. |
| ¥ | | All or a portion of this senior loan position has not settled. Rates do not take effect until settlement date. Rates shown, if any, are for the settled portion. |
| # | | Securities purchased on a when-issued basis. Rates do not take effect until settlement date. |
| ~ | | Securities are not registered under the Securities Act of 1933 (1933 Act) and these securities are either (1) exempt from registration pursuant to Rule 144A of the 1933 Act and may only be sold to “qualified institutional buyers”, or (2) the securities comply with Regulation S rules governing offers and sales made outside the United States without registration under the 1933 Act and contain certain restrictions as to public resale. |
| ‡ | | Investments were fully or partially segregated with the broker(s)/custodian as collateral for reverse repurchase agreement, futures contracts, forward foreign currency contracts, option contracts and/or swap agreements as of March 31, 2019. |
| l | | Total shares owned by the Fund as of March 31, 2019 were less than one share. |
| » | | Stapled Security. A security contractually bound to one or more other securities to form a single saleable unit which cannot be sold separately. |
|
Counterparty & Exchange Abbreviations: |
| |
| ANZ | | Australia and New Zealand Banking Group |
| BNP | | BNP Paribas |
| BOA | | Bank of America |
| BRC | | Barclays |
| BSC | | Banco Santander Central Hispano |
| CIB | | Canadian Imperial Bank of Commerce |
| CIT | | Citigroup |
| CME | | Chicago Mercantile Exchange |
| CSF | | Credit Suisse |
| DUB | | Deutsche Bank |
| EUX | | Eurex Exchange |
| GSC | | Goldman Sachs |
| HSB | | HSBC |
| ICE | | Intercontinental Exchange Inc |
| ING | | ING Baring |
| JPM | | JPMorgan Chase |
| LCH | | London Clearing House |
| MER | | Merrill Lynch |
| MSC | | Morgan Stanley |
| MSE | | Montreal Exchange |
| RBS | | Royal Bank of Scotland |
| SCB | | Standard Chartered Bank |
| SGN | | Societe Generale |
| SSB | | State Street Bank |
| UBS | | UBS |
|
Currency Abbreviations: |
| |
| ARS | | Argentine Peso |
| AUD | | Australian Dollar |
| BRL | | Brazilian Real |
| | |
|
|
| |
| CAD | | Canadian Dollar |
| CHF | | Swiss Franc |
| CLP | | Chilean Peso |
| CNH | | Renminbi Offshore (Hong Kong) |
| CNY | | Chinese Renminbi |
| COP | | Colombian Peso |
| CZK | | Czech Koruna |
| DKK | | Danish Krone |
| EGP | | Egyptian Pound |
| EUR | | Euro |
| GBP | | British Pound |
| HKD | | Hong Kong Dollar |
| HUF | | Hungarian Forint |
| IDR | | Indonesian Rupiah |
| ILS | | Israeli Shekel |
| INR | | Indian Rupee |
| JPY | | Japanese Yen |
| KRW | | Korean Won |
| MXN | | Mexican Peso |
| MYR | | Malaysian Ringgit |
| NOK | | Norwegian Krone |
| NZD | | New Zealand Dollar |
| PEN | | Peruvian Nuevo Sol |
| PHP | | Philippine Peso |
| PLN | | Polish Zloty |
| RON | | Romanian Leu |
| RUB | | Russian Ruble |
| SEK | | Swedish Krona |
| SGD | | Singapore Dollar |
| THB | | Thai Baht |
| TRY | | Turkish Lira |
| TWD | | Taiwan Dollar |
| USD | | United States Dollar |
| UYU | | Uruguayan Peso |
| ZAR | | South African Rand |
| | |
|
Payment Frequency Abbreviations: |
| |
| A | | Annual |
| L | | Lunar |
| M | | Monthly |
| Q | | Quarterly |
| S | | Semiannual |
| Z | | At Maturity |
|
Reference Rate Abbreviations: |
| |
| ARS Deposit | | Argentina Deposit Rate |
| ARS Reference | | Argentina Reference Rate |
| AUD Bank Bill | | Australian Dollar Bank Bill Rate |
| EUR LIBOR | | Euro London Interbank Offered Rate |
| GBP LIBOR | | British Pound London Interbank Offered Rate |
| US FED | | United States Federal Reserve Bank Rate |
| US PRIME | | United States Prime Rate |
| USD LIBOR | | United States Dollar London Interbank Offered Rate |
| UST | | United States Treasury Rate |
|
Other Abbreviations: |
| |
| ADR | | American Depositary Receipt |
| GDR | | Global Depositary Receipt |
| IO | | Interest Only |
| PIK | | Payment In Kind |
| REIT | | Real Estate Investment Trust |
| SDR | | Swedish Depositary Receipt |
| | |
| See Notes to Financial Statements | | |
B-97
PACIFIC FUNDS
Schedule of Investments (Continued)
Explanation of Symbols and Terms (Continued)
March 31, 2019
Notes:
For debt investments, the interest rates disclosed in the Schedules of Investments reflect the stated coupon rate or for discounted investments or zero coupon bonds, the yield-to-maturity.
The countries listed in the Schedules of Investments are based on country of risk (See Note 4 in Notes to Financial Statements under Investments and Risks - Foreign and Emerging Markets Investments).
The sectors listed in the Schedules of Investments are obtained from a third party source (that is not affiliated with the Trust or the investment adviser) believed to be reliable. Sector names and weightings could be different if obtained from another source.
The credit spreads, if any, shown in the Schedules of Investments were obtained from published reports or other sources believed to be reliable, and are not audited by the Independent Registered Public Accounting Firm.
| | |
| See Notes to Financial Statements | | |
B-98
PACIFIC FUNDS
STATEMENTS OF ASSETS AND LIABILITIES
March 31, 2019
| | | | | | | | | | | | | | | | | | | | | | | | | | | | | | |
| | | | | | | | PF Inflation
Managed
Fund | | | PF Managed
Bond
Fund | | | PF Short Duration
Bond
Fund | | | PF Emerging
Markets Debt
Fund | | | PF Developing
Growth
Fund | | | PF Growth
Fund | |
ASSETS | | | | | | | | | | | | | | | | | | | | | | | | | | | | |
Investments, at value (excluding derivatives) | | | | | | | $57,437,275 | | | | $698,648,785 | | | | $155,858,761 | | | | $70,564,986 | | | | $15,655,284 | | | | $186,590,827 | |
Outstanding purchased options, at value | | | | | | | 90,527 | | | | 76,384 | | | | — | | | | — | | | | — | | | | — | |
Cash | | | | | | | — | | | | — | | | | — | | | | 316,445 | | | | — | | | | — | |
Cash (segregated for derivative instruments) | | | | | | | 400,000 | | | | 1,689,000 | | | | 92,300 | | | | 610,997 | | | | — | | | | — | |
Foreign currency held, at value | | | | | | | 176,175 | | | | 3,089,979 | | | | 3,551 | | | | 174,721 | | | | — | | | | — | |
Receivables: | | | | | | | | | | | | | | | | | | | | | | | | | | | | |
| | Dividends and interest | | | | | | | 147,766 | | | | 3,596,995 | | | | 1,022,156 | | | | 943,981 | | | | 1,244 | | | | 71,149 | |
| | Securities sold | | | | | | | 16,999,499 | | | | 187,505,054 | | | | 433,436 | | | | 93,529 | | | | 75,876 | | | | — | |
| | Variation margin on futures contracts | | | | | | | 12,049 | | | | 1,311,227 | | | | — | | | | — | | | | — | | | | — | |
| | Variation margin on swap agreements | | | | | | | 4,839 | | | | 1,566,981 | | | | — | | | | — | | | | — | | | | — | |
| | Due from adviser | | | | | | | 5,442 | | | | 41,244 | | | | 16,974 | | | | 17,163 | | | | 1,527 | | | | 6,452 | |
Forward foreign currency contracts appreciation | | | | | | | 84,021 | | | | 1,683,056 | | | | 2,321 | | | | 332,591 | | | | — | | | | — | |
Swap premiums paid | | | | | | | 2,693 | | | | 19,708 | | | | — | | | | — | | | | — | | | | — | |
Swap agreements appreciation | | | | | | | 4,024 | | | | 379,075 | | | | — | | | | — | | | | — | | | | — | |
Prepaid expenses and other assets | | | | | | | 174 | | | | 9,491 | | | | 743 | | | | 285 | | | | — | | | | 1,379 | |
Total Assets | | | | | | | 75,364,484 | | | | 899,616,979 | | | | 157,430,242 | | | | 73,054,698 | | | | 15,733,931 | | | | 186,669,807 | |
LIABILITIES | | | | | | | | | | | | | | | | | | | | | | | | | | | | |
Payables: | | | | | | | | | | | | | | | | | | | | | | | | | | | | |
| | Fund shares redeemed | | | | | | | 22,055 | | | | 296,646 | | | | 93,587 | | | | 40,826 | | | | 7,465 | | | | 106,820 | |
| | Securities purchased | | | | | | | 12,339,714 | | | | 384,209,238 | | | | 1,787,526 | | | | 635,888 | | | | 19,300 | | | | 72,288 | |
| | Sale-buyback financing transactions | | | | | | | 21,850,850 | | | | 10,978,581 | | | | — | | | | — | | | | — | | | | — | |
| | Reverse repurchase agreement | | | | | | | — | | | | 2,045,000 | | | | — | | | | — | | | | — | | | | — | |
| | Due to custodian | | | | | | | — | | | | 73,943 | | | | — | | | | — | | | | — | | | | — | |
| | Due to brokers | | | | | | | — | | | | 3,370,000 | | | | — | | | | 250,000 | | | | — | | | | — | |
| | Swap agreements | | | | | | | 2,503 | | | | 38,605 | | | | — | | | | — | | | | — | | | | — | |
| | Variation margin on futures contracts | | | | | | | — | | | | — | | | | 29,734 | | | | — | | | | — | | | | — | |
| | Variation margin on swap agreements | | | | | | | — | | | | — | | | | — | | | | 10,534 | | | | — | | | | — | |
| | Accrued advisory fees | | | | | | | 17,410 | | | | 169,684 | | | | 63,575 | | | | 47,015 | | | | 7,684 | | | | 80,223 | |
| | Accrued administration fees | | | | | | | 6,529 | | | | 63,632 | | | | 23,840 | | | | 9,219 | | | | 1,921 | | | | 21,879 | |
| | Accrued support service expenses | | | | | | | 2,789 | | | | 20,424 | | | | 7,700 | | | | 3,653 | | | | 525 | | | | 6,605 | |
| | Accrued custodian fees and expenses | | | | | | | 6,404 | | | | 55,681 | | | | 7,376 | | | | 28,936 | | | | 205 | | | | 3,798 | |
| | Accrued legal, audit and tax service fees | | | | | | | 6,941 | | | | 55,240 | | | | 19,771 | | | | 9,258 | | | | 1,355 | | | | 17,339 | |
| | Accrued trustees’ fees and expenses and deferred compensation | | | | | | | 2,719 | | | | 15,400 | | | | 2,347 | | | | 97 | | | | 2,318 | | | | 4,148 | |
| | Accrued foreign capital gains tax | | | | | | | — | | | | — | | | | — | | | | 2,237 | | | | — | | | | — | |
| | Accrued other (1) | | | | | | | 13,981 | | | | 105,042 | | | | 36,676 | | | | 27,304 | | | | 6,164 | | | | 25,810 | |
Forward foreign currency contracts depreciation | | | | | | | 38,600 | | | | 536,393 | | | | 482 | | | | 391,005 | | | | — | | | | — | |
Outstanding options written, at value | | | | | | | 97,637 | | | | 178,761 | | | | — | | | | — | | | | — | | | | — | |
Swap premiums received | | | | | | | 3,106 | | | | 46,047 | | | | — | | | | — | | | | — | | | | — | |
Swap agreements depreciation | | | | | | | 3,856 | | | | — | | | | — | | | | — | | | | — | | | | — | |
Total Liabilities | | | | | | | 34,415,094 | | | | 402,258,317 | | | | 2,072,614 | | | | 1,455,972 | | | | 46,937 | | | | 338,910 | |
NET ASSETS | | | | | | | $40,949,390 | | | | $497,358,662 | | | | $155,357,628 | | | | $71,598,726 | | | | $15,686,994 | | | | $186,330,897 | |
NET ASSETS CONSIST OF: | | | | | | | | | | | | | | | | | | | | | | | | | | | | |
Paid-in capital | | | | | | | $50,727,064 | | | | $507,350,432 | | | | $156,187,043 | | | | $80,693,037 | | | | $12,080,267 | | | | $103,186,423 | |
Undistributed/accumulated earnings (deficit) | | | | | | | (9,777,674 | ) | | | (9,991,770 | ) | | | (829,415 | ) | | | (9,094,311 | ) | | | 3,606,727 | | | | 83,144,474 | |
NET ASSETS | | | | | | | $40,949,390 | | | | $497,358,662 | | | | $155,357,628 | | | | $71,598,726 | | | | $15,686,994 | | | | $186,330,897 | |
Class P Shares: | | | | | | | | | | | | | | | | | | | | | | | | | | | | |
| | Shares of beneficial interest outstanding | | | | | | | 4,648,564 | | | | 47,078,053 | | | | 15,640,207 | | | | 7,806,405 | | | | 851,393 | | | | 6,855,689 | |
| | Net Asset Value Per Share | | | | | | | $8.81 | | | | $10.56 | | | | $9.93 | | | | $9.17 | | | | $18.43 | | | | $27.18 | |
| | | | | | | | | | | | | | | | | | | | | | | | | | | | | | |
Investments, at cost (excluding derivatives) | | | | | | | $56,962,201 | | | | $693,334,102 | | | | $155,231,298 | | | | $71,493,738 | | | | $11,706,519 | | | | $105,510,195 | |
Outstanding purchased options, at cost | | | | | | | 68,744 | | | | 109,278 | | | | — | | | | — | | | | — | | | | — | |
Foreign currency held, at cost | | | | | | | 176,876 | | | | 3,118,528 | | | | 3,581 | | | | 175,826 | | | | — | | | | — | |
Premiums received from outstanding options written | | | | | | | 116,487 | | | | 154,412 | | | | — | | | | — | | | | — | | | | — | |
| (1) | Accrued other for the PF Inflation Managed, PF Managed Bond, PF Short Duration Bond, PF Emerging Markets Debt, and PF Developing Growth Funds include $7,017, $51,788, $21,538, $12,874, and $4,349 of accrued accounting fees, respectively. |
See Notes to Financial Statements
C-1
PACIFIC FUNDS
STATEMENTS OF ASSETS AND LIABILITIES (Continued)
March 31, 2019
| | | | | | | | | | | | | | | | | | | | | | | | | | | | | | |
| | | | | | | | PF Large-Cap
Value
Fund | | | PF Mid-Cap
Equity
Fund | | | PF Multi-Asset
Fund | | | PF Small-Cap
Value
Fund | | | PF Emerging
Markets
Fund | | | PF International
Large-Cap
Fund | |
ASSETS | | | | | | | | | | | | | | | | | | | | | | | | | | | | |
Investments, at value (excluding derivatives) | | | | | | | $171,050,381 | | | | $9,900,085 | | | | $1,141,657,834 | | | | $70,472,870 | | | | $134,109,334 | | | | $57,258,250 | |
Cash | | | | | | | — | | | | — | | | | 577,734 | | | | — | | | | — | | | | 3,233 | |
Foreign currency held, at value | | | | | | | — | | | | — | | | | — | | | | — | | | | 51,360 | | | | — | |
Receivables: | | | | | | | | | | | | | | | | | | | | | | | | | | | | |
| | Dividends and interest | | | | | | | 282,260 | | | | 9,326 | | | | 5,840,075 | | | | 82,907 | | | | 215,845 | | | | 1,008,802 | |
| | Securities sold | | | | | | | — | | | | 37,917 | | | | — | | | | 320,723 | | | | 350,331 | | | | 254,547 | |
| | Due from adviser | | | | | | | 1,614 | | | | — | | | | 53,866 | | | | 2,966 | | | | — | | | | — | |
Swap agreements appreciation | | | | | | | — | | | | — | | | | 25,819,943 | | | | — | | | | — | | | | — | |
Prepaid expenses and other assets | | | | | | | 2,744 | | | | — | | | | 10,486 | | | | — | | | �� | 1,863 | | | | 560 | |
Total Assets | | | | | | | 171,336,999 | | | | 9,947,328 | | | | 1,173,959,938 | | | | 70,879,466 | | | | 134,728,733 | | | | 58,525,392 | |
LIABILITIES | | | | | | | | | | | | | | | | | | | | | | | | | | | | |
Payables: | | | | | | | | | | | | | | | | | | | | | | | | | | | | |
| | Fund shares redeemed | | | | | | | 98,923 | | | | — | | | | 577,734 | | | | 35,727 | | | | 69,685 | | | | 29,094 | |
| | Securities purchased | | | | | | | — | | | | — | | | | 5,512,639 | | | | 142,225 | | | | 134,426 | | | | 61,220 | |
| | Due to custodian | | | | | | | — | | | | — | | | | 173,662 | | | | — | | | | — | | | | 345 | |
| | Variation margin on futures contracts | | | | | | | — | | | | — | | | | 102,875 | | | | — | | | | — | | | | — | |
| | Accrued advisory fees | | | | | | | 98,965 | | | | 6,628 | | | | 341,689 | | | | 47,151 | | | | 207,203 | | | | 68,311 | |
| | Accrued administration fees | | | | | | | 22,838 | | | | 1,247 | | | | 146,438 | | | | 9,430 | | | | 16,621 | | | | 6,144 | |
| | Accrued support service expenses | | | | | | | 7,809 | | | | 388 | | | | 47,093 | | | | 2,825 | | | | 5,741 | | | | 2,270 | |
| | Accrued custodian fees and expenses | | | | | | | 4,157 | | | | 1,719 | | | | 25,090 | | | | 1,708 | | | | 108,880 | | | | 44,822 | |
| | Accrued legal, audit and tax service fees | | | | | | | 22,307 | | | | 1,395 | | | | 116,134 | | | | 7,820 | | | | 15,695 | | | | 6,913 | |
| | Accrued trustees’ fees and expenses and deferred compensation | | | | | | | 8,369 | | | | 1,310 | | | | 1,706 | | | | 1,020 | | | | 1,724 | | | | 4,106 | |
| | Accrued foreign capital gains tax | | | | | | | — | | | | — | | | | — | | | | — | | | | 240,042 | | | | 126,905 | |
| | Accrued other (1) | | | | | | | 27,713 | | | | 5,555 | | | | 135,910 | | | | 14,014 | | | | 41,932 | | | | 23,102 | |
Swap agreements depreciation | | | | | | | — | | | | — | | | | 30,364,776 | | | | — | | | | — | | | | — | |
Total Liabilities | | | | | | | 291,081 | | | | 18,242 | | | | 37,545,746 | | | | 261,920 | | | | 841,949 | | | | 373,232 | |
NET ASSETS | | | | | | | $171,045,918 | | | | $9,929,086 | | | | $1,136,414,192 | | | | $70,617,546 | | | | $133,886,784 | | | | $58,152,160 | |
NET ASSETS CONSIST OF: | | | | | | | | | | | | | | | | | | | | | | | | | | | | |
Paid-in capital | | | | | | | $96,248,283 | | | | $9,442,974 | | | | $1,130,970,270 | | | | $63,342,263 | | | | $88,982,898 | | | | $36,476,403 | |
Undistributed/accumulated earnings (deficit) | | | | | | | 74,797,635 | | | | 486,112 | | | | 5,443,922 | | | | 7,275,283 | | | | 44,903,886 | | | | 21,675,757 | |
NET ASSETS | | | | | | | $171,045,918 | | | | $9,929,086 | | | | $1,136,414,192 | | | | $70,617,546 | | | | $133,886,784 | | | | $58,152,160 | |
Class P Shares: | | | | | | | | | | | | | | | | | | | | | | | | | | | | |
| | Shares of beneficial interest outstanding | | | | | | | 14,318,522 | | | | 880,013 | | | | 115,812,746 | | | | 8,599,383 | | | | 9,102,089 | | | | 5,002,089 | |
| | Net Asset Value Per Share | | | | | | | $11.95 | | | | $11.28 | | | | $9.81 | | | | $8.21 | | | | $14.71 | | | | $11.63 | |
| | | | | | | | | | | | | | | | | | | | | | | | | | | | | | |
Investments, at cost (excluding derivatives) | | | | | | | $99,799,865 | | | | $9,347,018 | | | | $1,136,498,192 | | | | $63,334,674 | | | | $88,462,417 | | | | $39,224,459 | |
Foreign currency held, at cost | | | | | | | — | | | | — | | | | — | | | | — | | | | 51,276 | | | | — | |
| (1) | Accrued other for the PF Mid-Cap Equity Fund includes $3,594 of accrued accounting fees. |
See Notes to Financial Statements
C-2
PACIFIC FUNDS
STATEMENTS OF ASSETS AND LIABILITIES (Continued)
March 31, 2019
| | | | | | | | | | | | | | | | | | | | | | | | | | |
| | | | | | | | PF International
Small-Cap
Fund | | | PF International
Value
Fund | | | PF Real Estate
Fund | | | PF Currency
Strategies
Fund | | | PF Equity
Long/Short
Fund | |
ASSETS | | | | | | | | | | | | | | | | | | | | | | | | |
Investments, at value (excluding derivatives) | | | | | | | $31,690,456 | | | | $63,968,774 | | | | $81,612,406 | | | | $45,383,038 | | | | $29,149,760 | |
Cash (segregated for derivative instruments) | | | | | | | — | | | | — | | | | — | | | | — | | | | 8,263,000 | |
Foreign currency held, at value | | | | | | | 53,666 | | | | 84,160 | | | | — | | | | 32,251 | | | | 38,063 | |
Receivables: | | | | | | | | | | | | | | | | | | | | | | | | |
| | Dividends and interest | | | | | | | 393,581 | | | | 1,023,436 | | | | 248,681 | | | | 148,854 | | | | 27,069 | |
| | Securities sold | | | | | | | — | | | | 132,845 | | | | 368,225 | | | | — | | | | — | |
| | Variation margin on futures contracts | | | | | | | — | | | | — | | | | — | | | | — | | | | 943,901 | |
| | Due from adviser | | | | | | | 9,293 | | | | — | | | | 1,137 | | | | — | | | | — | |
Forward foreign currency contracts appreciation | | | | | | | — | | | | — | | | | — | | | | 734,059 | | | | 3,874 | |
Swap agreements appreciation | | | | | | | — | | | | — | | | | — | | | | — | | | | 310,325 | |
Prepaid expenses and other assets | | | | | | | 2 | | | | 1,117 | | | | 430 | | | | 144 | | | | — | |
Total Assets | | | | | | | 32,146,998 | | | | 65,210,332 | | | | 82,230,879 | | | | 46,298,346 | | | | 38,735,992 | |
LIABILITIES | | | | | | | | | | | | | | | | | | | | | | | | |
Payables: | | | | | | | | | | | | | | | | | | | | | | | | |
| | Fund shares redeemed | | | | | | | 18,390 | | | | 33,138 | | | | 43,960 | | | | 29,757 | | | | 22,899 | |
| | Securities purchased | | | | | | | 77,042 | | | | 72,466 | | | | 408,734 | | | | — | | | | — | |
| | Swap agreements | | | | | | | — | | | | — | | | | — | | | | — | | | | 1,189 | |
| | Due to brokers | | | | | | | — | | | | — | | | | — | | | | 1,200,000 | | | | — | |
| | Accrued advisory fees | | | | | | | 29,946 | | | | 46,940 | | | | 40,690 | | | | 27,221 | | | | 26,637 | |
| | Accrued administration fees | | | | | | | 5,285 | | | | 7,249 | | | | 8,138 | | | | 6,282 | | | | 3,996 | |
| | Accrued support service expenses | | | | | | | 3,183 | | | | 2,892 | | | | 2,063 | | | | 2,397 | | | | 2,122 | |
| | Accrued custodian fees and expenses | | | | | | | 42,087 | | | | 49,748 | | | | 771 | | | | 4,295 | | | | 5,075 | |
| | Accrued legal, audit and tax service fees | | | | | | | 8,155 | | | | 8,419 | | | | 5,304 | | | | 6,475 | | | | 5,765 | |
| | Accrued trustees’ fees and expenses and deferred compensation | | | | | | | 115 | | | | 5,128 | | | | 554 | | | | 1,265 | | | | 77 | |
| | Accrued foreign capital gains tax | | | | | | | — | | | | 644 | | | | — | | | | — | | | | — | |
| | Accrued other (1) | | | | | | | 29,127 | | | | 27,379 | | | | 8,042 | | | | 7,185 | | | | 47,391 | |
Forward foreign currency contracts depreciation | | | | | | | — | | | | — | | | | — | | | | 476,314 | | | | 48,066 | |
Swap agreements depreciation | | | | | | | — | | | | — | | | | — | | | | — | | | | 702,304 | |
Total Liabilities | | | | | | | 213,330 | | | | 254,003 | | | | 518,256 | | | | 1,761,191 | | | | 865,521 | |
NET ASSETS | | | | | | | $31,933,668 | | | | $64,956,329 | | | | $81,712,623 | | | | $44,537,155 | | | | $37,870,471 | |
NET ASSETS CONSIST OF: | | | | | | | | | | | | | | | | | | | | | | | | |
Paid-in capital | | | | | | | $36,673,393 | | | | $67,413,897 | | | | $70,323,693 | | | | $45,001,833 | | | | $38,952,674 | |
Undistributed/accumulated earnings (deficit) | | | | | | | (4,739,725 | ) | | | (2,457,568 | ) | | | 11,388,930 | | | | (464,678 | ) | | | (1,082,203 | ) |
NET ASSETS | | | | | | | $31,933,668 | | | | $64,956,329 | | | | $81,712,623 | | | | $44,537,155 | | | | $37,870,471 | |
Class P Shares: | | | | | | | | | | | | | | | | | | | | | | | | |
| | Shares of beneficial interest outstanding | | | | | | | 3,330,575 | | | | 8,647,538 | | | | 6,666,827 | | | | 4,841,712 | | | | 4,829,519 | |
| | Net Asset Value Per Share | | | | | | | $9.59 | | | | $7.51 | | | | $12.26 | | | | $9.20 | | | | $7.84 | |
| | | | | | | | | | | | | | | | | | | | | | | | | | |
Investments, at cost (excluding derivatives) | | | | | | | $30,331,677 | | | | $64,211,386 | | | | $70,105,446 | | | | $45,692,232 | | | | $29,146,740 | |
Foreign currency held, at cost | | | | | | | 53,763 | | | | 84,331 | | | | — | | | | 32,745 | | | | 38,110 | |
| (1) | Accrued other for the PF International Small-Cap and PF Equity Long/Short Funds include $18,477 and $40,000 of accrued accounting fees, respectively. |
See Notes to Financial Statements
C-3
PACIFIC FUNDS
STATEMENTS OF OPERATIONS
FOR THE YEAR ENDED MARCH 31, 2019
| | | | | | | | | | | | | | | | | | | | | | | | | | | | | | |
| | | | | | | | PF Inflation
Managed
Fund | | | PF Managed
Bond
Fund | | | PF Short Duration
Bond
Fund | | | PF Emerging
Markets Debt
Fund | | | PF Developing
Growth
Fund | | | PF Growth
Fund | |
INVESTMENT INCOME | | | | | | | | | | | | | | | | | | | | | | | | | | | | |
Dividends, net of foreign taxes withheld | | | | | | | $8,647 | | | | $214,215 | | | | $29,856 | | | | $94,204 | | | | $23,146 | | | | $1,220,354 | |
Interest, net of foreign taxes withheld | | | | | | | 1,952,899 | | | | 18,930,426 | | | | 3,981,222 | | | | 5,053,392 | | | | 214 | | | | 5,586 | |
Other | | | | | | | — | | | | 84 | | | | — | | | | 63 | | | | — | | | | — | |
Total Investment Income | | | | | | | 1,961,546 | | | | 19,144,725 | | | | 4,011,078 | | | | 5,147,659 | | | | 23,360 | | | | 1,225,940 | |
| | | | | | | |
EXPENSES | | | | | | | | | | | | | | | | | | | | | | | | | | | | |
Advisory fees | | | | | | | 267,765 | | | | 2,097,530 | | | | 554,192 | | | | 641,884 | | | | 71,446 | | | | 952,698 | |
Administration fees | | | | | | | 100,412 | | | | 786,574 | | | | 207,822 | | | | 122,653 | | | | 17,862 | | | | 259,827 | |
Support services expenses | | | | | | | 11,836 | | | | 93,581 | | | | 21,890 | | | | 14,586 | | | | 1,986 | | | | 31,070 | |
Custodian fees and expenses | | | | | | | 8,690 | | | | 60,840 | | | | 8,154 | | | | 43,009 | | | | 160 | | | | 4,839 | |
Shareholder report expenses | | | | | | | 7,079 | | | | 45,260 | | | | 11,129 | | | | 8,416 | | | | 989 | | | | 16,118 | |
Transfer agencyout-of-pocket expenses | | | | | | | 5,120 | | | | 38,994 | | | | 9,182 | | | | 6,245 | | | | 839 | | | | 13,046 | |
Registration fees | | | | | | | 383 | | | | 2,642 | | | | 1,028 | | | | 495 | | | | 70 | | | | 874 | |
Legal, audit and tax service fees | | | | | | | 8,433 | | | | 61,628 | | | | 20,798 | | | | 10,766 | | | | 1,512 | | | | 20,362 | |
Trustees’ fees and expenses | | | | | | | 3,180 | | | | 24,192 | | | | 5,794 | | | | 3,933 | | | | 508 | | | | 8,094 | |
Interest expense | | | | | | | 345,818 | | | | 443,322 | | | | — | | | | — | | | | — | | | | — | |
Other (1) | | | | | | | 14,005 | | | | 116,579 | | | | 41,981 | | | | 37,406 | | | | 8,762 | | | | 18,510 | |
Total Expenses | | | | | | | 772,721 | | | | 3,771,142 | | | | 881,970 | | | | 889,393 | | | | 104,134 | | | | 1,325,438 | |
Advisory Fee Waiver (2) | | | | | | | — | | | | — | | | | — | | | | (6,412 | ) | | | — | | | | — | |
Adviser Expense Reimbursement (3) | | | | | | | (58,726 | ) | | | (443,715 | ) | | | (119,957 | ) | | | (124,856 | ) | | | (14,826 | ) | | | (112,913 | ) |
Net Expenses | | | | | | | 713,995 | | | | 3,327,427 | | | | 762,013 | | | | 758,125 | | | | 89,308 | | | | 1,212,525 | |
NET INVESTMENT INCOME (LOSS) | | | | | | | 1,247,551 | | | | 15,817,298 | | | | 3,249,065 | | | | 4,389,534 | | | | (65,948 | ) | | | 13,415 | |
| | | | | | | |
NET REALIZED AND UNREALIZED GAIN (LOSS) | | | | | | | | | | | | | | | | | | | | | | | | | | | | |
Net Realized Gain (Loss) On: | | | | | | | | | | | | | | | | | | | | | | | | | | | | |
| | Investment security transactions (4) | | | | | | | (447,816 | ) | | | (3,722,276 | ) | | | 342,850 | | | | (486,692 | ) | | | 920,420 | | | | 6,959,954 | |
| | Foreign currency transactions | | | | | | | (108,590 | ) | | | (1,039,572 | ) | | | (11,649 | ) | | | (1,682,136 | ) | | | — | | | | (131 | ) |
| | Forward foreign currency contract transactions | | | | | | | 288,703 | | | | 304,230 | | | | 27,273 | | | | (1,321,835 | ) | | | — | | | | — | |
| | Futures contract transactions | | | | | | | (376,015 | ) | | | (7,662,369 | ) | | | 6,425 | | | | — | | | | — | | | | — | |
| | Purchased option transactions | | | | | | | (12,415 | ) | | | (1,843,685 | ) | | | — | | | | — | | | | — | | | | — | |
| | Swap transactions | | | | | | | 57,235 | | | | 2,443,686 | | | | — | | | | (99,285 | ) | | | — | | | | — | |
| | Written option transactions | | | | | | | 103,842 | | | | 2,334,154 | | | | — | | | | — | | | | — | | | | — | |
| | Net Realized Gain (Loss) | | | | | | | (495,056 | ) | | | (9,185,832 | ) | | | 364,899 | | | | (3,589,948 | ) | | | 920,420 | | | | 6,959,823 | |
| | | | | | | |
Change In Net Unrealized Appreciation (Depreciation) On: | | | | | | | | | | | | | | | | | | | | | | | | | | | | |
| | Investment securities (5) | | | | | | | 519,843 | | | | 8,214,785 | | | | 1,340,298 | | | | (1,472,688 | ) | | | 1,206,745 | | | | 19,702,652 | |
| | Foreign currencies | | | | | | | 4,370 | | | | (54,550 | ) | | | — | | | | (15,097 | ) | | | — | | | | (51 | ) |
| | Forward foreign currency contracts | | | | | | | 57,760 | | | | 3,585,658 | | | | 1,682 | | | | (93,157 | ) | | | — | | | | — | |
| | Futures contracts | | | | | | | (70,614 | ) | | | (2,648,245 | ) | | | 59,375 | | | | — | | | | — | | | | — | |
| | Purchased options | | | | | | | 25,019 | | | | 128,667 | | | | — | | | | — | | | | — | | | | — | |
| | Swaps | | | | | | | (20,011 | ) | | | (1,467,008 | ) | | | — | | | | 4,201 | | | | — | | | | — | |
| | Written options | | | | | | | (27,626 | ) | | | (128,243 | ) | | | — | | | | — | | | | — | | | | — | |
| | Change in Net Unrealized Appreciation (Depreciation) | | | | | | | 488,741 | | | | 7,631,064 | | | | 1,401,355 | | | | (1,576,741 | ) | | | 1,206,745 | | | | 19,702,601 | |
NET GAIN (LOSS) | | | | | | | (6,315 | ) | | | (1,554,768 | ) | | | 1,766,254 | | | | (5,166,689 | ) | | | 2,127,165 | | | | 26,662,424 | |
NET INCREASE (DECREASE) IN NET ASSETS
RESULTING FROM OPERATIONS | | | | | | | $1,241,236 | | | | $14,262,530 | | | | $5,015,319 | | | | ($777,155 | ) | | | $2,061,217 | | | | $26,675,839 | |
| | | | | | | | | | | | | | | | | | | | | | | | | | | | | | |
Foreign taxes withheld on dividends and interest | | | | | | | $— | | | | $14,506 | | | | $— | | | | $34,398 | | | | $— | | | | $4,315 | |
| (1) | Other expense for the PF Short Duration Bond and PF Developing Growth Funds include $38,184 and $8,035 of accounting fees, respectively. |
| (2) | See Note 6 in Notes to Financial Statements. |
| (3) | See Note 7B in Notes to Financial Statements. |
| (4) | Net realized gain (loss) on investment security transactions for the PF Emerging Markets Debt Fund is net of foreign capital gains tax withheld of $8,067. |
| (5) | Change in net unrealized appreciation (depreciation) on investment securities for the PF Emerging Markets Debt Fund was net of increase in deferred foreign capital gain tax of $1,174. |
See Notes to Financial Statements
C-4
PACIFIC FUNDS
STATEMENTS OF OPERATIONS (Continued)
FOR THE YEAR ENDED MARCH 31, 2019
| | | | | | | | | | | | | | | | | | | | | | | | | | | | | | |
| | | | | | | | PF Large-Cap
Value
Fund | | | PF Mid-Cap
Equity
Fund | | | PF Multi-Asset
Fund | | | PF Small-Cap
Value
Fund | | | PF Emerging
Markets
Fund | | | PF International
Large-Cap
Fund | |
INVESTMENT INCOME | | | | | | | | | | | | | | | | | | | | | | | | | | | | |
Dividends, net of foreign taxes withheld | | | | | | | $4,400,292 | | | | $190,212 | | | | $259,482 | | | | $958,190 | | | | $2,596,576 | | | | $2,224,919 | |
Interest, net of foreign taxes withheld | | | | | | | — | | | | — | | | | 29,988,585 | | | | — | | | | — | | | | 1,403 | |
Total Investment Income | | | | | | | 4,400,292 | | | | 190,212 | | | | 30,248,067 | | | | 958,190 | | | | 2,596,576 | | | | 2,226,322 | |
| | | | | | | |
EXPENSES | | | | | | | | | | | | | | | | | | | | | | | | | | | | |
Advisory fees | | | | | | | 1,216,100 | | | | 90,921 | | | | 3,890,681 | | | | 574,780 | | | | 1,160,512 | | | | 570,559 | |
Administration fees | | | | | | | 280,638 | | | | 20,982 | | | | 1,667,434 | | | | 114,956 | | | | 217,596 | | | | 100,687 | |
Support services expenses | | | | | | | 34,570 | | | | 2,935 | | | | 183,950 | | | | 13,672 | | | | 26,714 | | | | 13,450 | |
Custodian fees and expenses | | | | | | | 4,252 | | | | 1,634 | | | | 28,950 | | | | 1,892 | | | | 170,971 | | | | 56,108 | |
Shareholder report expenses | | | | | | | 14,545 | | | | 363 | | | | 116,751 | | | | 6,343 | | | | 13,927 | | | | 4,359 | |
Transfer agencyout-of-pocket expenses | | | | | | | 13,826 | | | | 1,111 | | | | 80,617 | | | | 5,578 | | | | 11,033 | | | | 5,363 | |
Registration fees | | | | | | | 966 | | | | 38 | | | | 6,507 | | | | 359 | | | | 735 | | | | 265 | |
Legal, audit and tax service fees | | | | | | | 22,528 | | | | 2,177 | | | | 137,240 | | | | 8,564 | | | | 17,349 | | | | 7,439 | |
Trustees’ fees and expenses | | | | | | | 8,503 | | | | 700 | | | | 51,117 | | | | 3,451 | | | | 6,950 | | | | 3,370 | |
Offering expenses | | | | | | | — | | | | — | | | | 73,317 | | | | — | | | | — | | | | — | |
Other (1) | | | | | | | 19,186 | | | | 9,262 | | | | 41,747 | | | | 13,799 | | | | 62,755 | | | | 34,337 | |
Total Expenses | | | | | | | 1,615,114 | | | | 130,123 | | | | 6,278,311 | | | | 743,394 | | | | 1,688,542 | | | | 795,937 | |
Adviser Expense Reimbursement (2) | | | | | | | (118,375 | ) | | | (18,220 | ) | | | (609,033 | ) | | | (53,658 | ) | | | (310,434 | ) | | | (124,692 | ) |
Net Expenses | | | | | | | 1,496,739 | | | | 111,903 | | | | 5,669,278 | | | | 689,736 | | | | 1,378,108 | | | | 671,245 | |
NET INVESTMENT INCOME (LOSS) | | | | | | | 2,903,553 | | | | 78,309 | | | | 24,578,789 | | | | 268,454 | | | | 1,218,468 | | | | 1,555,077 | |
| | | | | | | |
NET REALIZED AND UNREALIZED GAIN (LOSS) | | | | | | | | | | | | | | | | | | | | | | | | | | | | |
Net Realized Gain (Loss) On: | | | | | | | | | | | | | | | | | | | | | | | | | | | | |
| | Investment security transactions (3) | | | | | | | 12,044,515 | | | | 9,353,760 | | | | (443,987 | ) | | | 8,893,312 | | | | 11,196,437 | | | | 36,165,579 | |
| | Foreign currency transactions | | | | | | | — | | | | — | | | | — | | | | — | | | | (318,572 | ) | | | 12,214 | |
| | Futures contract transactions | | | | | | | — | | | | — | | | | (1,316,693 | ) | | | — | | | | — | | | | — | |
| | Swap transactions | | | | | | | — | | | | — | | | | (768,299 | ) | | | — | | | | — | | | | — | |
| | Net Realized Gain (Loss) | | | | | | | 12,044,515 | | | | 9,353,760 | | | | (2,528,979 | ) | | | 8,893,312 | | | | 10,877,865 | | | | 36,177,793 | |
| | | | | | | |
Change In Net Unrealized Appreciation (Depreciation) On: | | | | | | | | | | | | | | | | | | | | | | | | | | | | |
| | Investment securities (4) | | | | | | | (6,152,759 | ) | | | (7,615,837 | ) | | | 5,705,224 | | | | (11,477,373 | ) | | | (19,708,494 | ) | | | (36,903,646 | ) |
| | Foreign currencies | | | | | | | — | | | | — | | | | — | | | | — | | | | (3,100 | ) | | | (34,754 | ) |
| | Futures contracts | | | | | | | — | | | | — | | | | (13,210 | ) | | | — | | | | — | | | | — | |
| | Swaps | | | | | | | — | | | | — | | | | 11,755,791 | | | | — | | | | — | | | | — | |
| | Change in Net Unrealized Appreciation (Depreciation) | | | | | | | (6,152,759 | ) | | | (7,615,837 | ) | | | 17,447,805 | | | | (11,477,373 | ) | | | (19,711,594 | ) | | | (36,938,400 | ) |
NET GAIN (LOSS) | | | | | | | 5,891,756 | | | | 1,737,923 | | | | 14,918,826 | | | | (2,584,061 | ) | | | (8,833,729 | ) | | | (760,607 | ) |
NET INCREASE (DECREASE) IN NET ASSETS
RESULTING FROM OPERATIONS | | | | | | | $8,795,309 | | | | $1,816,232 | | | | $39,497,615 | | | | ($2,315,607 | ) | | | ($7,615,261 | ) | | | $794,470 | |
| | | | | | | | | | | | | | | | | | | | | | | | | | | | | | |
Foreign taxes withheld on dividends and interest | | | | | | | $76,454 | | | | $— | | | | $21,825 | | | | $5,767 | | | | $415,576 | | | | $285,250 | |
| (1) | Other expense for the PFMid-Cap Equity Fund includes $8,108 of accounting fees. |
| (2) | See Note 7B in Notes to Financial Statements. |
| (3) | Net realized gain (loss) on investment security transactions for the PF InternationalLarge-Cap Fund is net of foreign capital gains tax withheld of ($132,584). |
| (4) | Change in net unrealized appreciation (depreciation) on investment securities for the PF Emerging Markets and PF InternationalLarge-Cap Funds was net of increase in deferred foreign capital gains tax of $232,805 and $121,628, respectively. |
See Notes to Financial Statements
C-5
PACIFIC FUNDS
STATEMENTS OF OPERATIONS (Continued)
FOR THE YEAR ENDED MARCH 31, 2019
| | | | | | | | | | | | | | | | | | | | | | | | | | |
| | | | | | | | PF International
Small-Cap
Fund | | | PF International
Value
Fund | | | PF Real Estate
Fund | | | PF Currency
Strategies
Fund | | | PF Equity
Long/Short
Fund | |
INVESTMENT INCOME | | | | | | | | | | | | | | | | | | | | | | | | |
Dividends, net of foreign taxes withheld | | | | | | | $2,018,014 | | | | $3,190,356 | | | | $1,508,617 | | | | $345,245 | | | | $171,232 | |
Interest, net of foreign taxes withheld | | | | | | | — | | | | — | | | | — | | | | 586,131 | | | | 735,860 | |
Total Investment Income | | | | | | | 2,018,014 | | | | 3,190,356 | | | | 1,508,617 | | | | 931,376 | | | | 907,092 | |
| | | | | | |
EXPENSES | | | | | | | | | | | | | | | | | | | | | | | | |
Advisory fees | | | | | | | 634,043 | | | | 547,092 | | | | 412,265 | | | | 372,465 | | | | 543,731 | |
Administration fees | | | | | | | 111,890 | | | | 126,252 | | | | 68,711 | | | | 85,953 | | | | 70,921 | |
Support services expenses | | | | | | | 14,173 | | | | 16,568 | | | | 7,587 | | | | 10,391 | | | | 11,700 | |
Custodian fees and expenses | | | | | | | 55,019 | | | | 73,787 | | | | 867 | | | | 5,544 | | | | 6,455 | |
Shareholder report expenses | | | | | | | 8,067 | | | | 6,447 | | | | 3,659 | | | | 5,008 | | | | 5,695 | |
Transfer agencyout-of-pocket expenses | | | | | | | 6,035 | | | | 6,715 | | | | 3,212 | | | | 4,302 | | | | 5,886 | |
Registration fees | | | | | | | 428 | | | | 353 | | | | 277 | | | | 310 | | | | 273 | |
Legal, audit and tax service fees | | | | | | | 9,669 | | | | 9,406 | | | | 5,938 | | | | 7,095 | | | | 7,117 | |
Trustees’ fees and expenses | | | | | | | 3,825 | | | | 4,203 | | | | 1,963 | | | | 2,751 | | | | 2,504 | |
Other (1) | | | | | | | 37,487 | | | | 37,239 | | | | 6,892 | | | | 4,637 | | | | 79,541 | |
Total Expenses | | | | | | | 880,636 | | | | 828,062 | | | | 511,371 | | | | 498,456 | | | | 733,823 | |
Advisory Fee Waiver (2) | | | | | | | — | | | | — | | | | (32,189 | ) | | | — | | | | (70,921 | ) |
Adviser Expense Reimbursement (3) | | | | | | | (60,110 | ) | | | (154,717 | ) | | | (30,395 | ) | | | — | | | | — | |
Net Expenses | | | | | | | 820,526 | | | | 673,345 | | | | 448,787 | | | | 498,456 | | | | 662,902 | |
NET INVESTMENT INCOME (LOSS) | | | | | | | 1,197,488 | | | | 2,517,011 | | | | 1,059,830 | | | | 432,920 | | | | 244,190 | |
| | | | | | |
NET REALIZED AND UNREALIZED GAIN (LOSS) | | | | | | | | | | | | | | | | | | | | | | | | |
Net Realized Gain (Loss) On: | | | | | | | | | | | | | | | | | | | | | | | | |
| | Investment security transactions | | | | | | | (6,777,035 | ) | | | 5,403,345 | | | | 4,602,459 | | | | 5,100 | | | | (102,220 | ) |
| | Foreign currency transactions | | | | | | | (34,601 | ) | | | (38,738 | ) | | | — | | | | (509,933 | ) | | | (33,244 | ) |
| | Forward foreign currency contract transactions | | | | | | | — | | | | — | | | | — | | | | 1,496,939 | | | | (861,818 | ) |
| | Futures contract transactions | | | | | | | — | | | | — | | | | — | | | | — | | | | (350,728 | ) |
| | Purchased option transactions | | | | | | | — | | | | — | | | | — | | | | (263,580 | ) | | | — | |
| | Swap transactions | | | | | | | — | | | | — | | | | — | | | | — | | | | (2,390,780 | ) |
| | Written option transactions | | | | | | | — | | | | — | | | | — | | | | 235,799 | | | | — | |
| | Net Realized Gain (Loss) | | | | | | | (6,811,636 | ) | | | 5,364,607 | | | | 4,602,459 | | | | 964,325 | | | | (3,738,790 | ) |
| | | | | | |
Change In Net Unrealized Appreciation (Depreciation) On: | | | | | | | | | | | | | | | | | | | | | | | | |
| | Investment securities (4) | | | | | | | (6,329,604 | ) | | | (16,049,027 | ) | | | 1,960,973 | | | | (548,580 | ) | | | 9,668 | |
| | Foreign currencies | | | | | | | (15,467 | ) | | | (20,412 | ) | | | — | | | | (2,625 | ) | | | 373 | |
| | Forward foreign currency contracts | | | | | | | — | | | | — | | | | — | | | | (617,264 | ) | | | (19,158 | ) |
| | Futures contracts | | | | | | | — | | | | — | | | | — | | | | — | | | | 1,007,448 | |
| | Purchased options | | | | | | | — | | | | — | | | | — | | | | 477,239 | | | | — | |
| | Swaps | | | | | | | — | | | | — | | | | — | | | | — | | | | (6,581,524 | ) |
| | Written options | | | | | | | — | | | | — | | | | — | | | | (193,674 | ) | | | — | |
| | Change in Net Unrealized Appreciation (Depreciation) | | | | | | | (6,345,071 | ) | | | (16,069,439 | ) | | | 1,960,973 | | | | (884,904 | ) | | | (5,583,193 | ) |
NET GAIN (LOSS) | | | | | | | (13,156,707 | ) | | | (10,704,832 | ) | | | 6,563,432 | | | | 79,421 | | | | (9,321,983 | ) |
NET INCREASE (DECREASE) IN NET ASSETS
RESULTING FROM OPERATIONS | | | | | | | ($11,959,219 | ) | | | ($8,187,821 | ) | | | $7,623,262 | | | | $512,341 | | | | ($9,077,793 | ) |
| | | | | | | | | | | | | | | | | | | | | | | | | | |
Foreign taxes withheld on dividends and interest | | | | | | | $236,919 | | | | $492,715 | | | | $— | | | | $— | | | | $— | |
| (1) | Other expense for the PF Equity Long/Short Fund includes $72,972 of accounting fees. |
| (2) | See Note 6 in Notes to Financial Statements. |
| (3) | See Note 7B in Notes to Financial Statements. |
| (4) | Change in net unrealized appreciation (depreciation) on investment securities for the PF International Value Fund was net of decrease in deferred foreign capital gains tax of $19,590. |
See Notes to Financial Statements
C-6
PACIFIC FUNDS
STATEMENTS OF CHANGES IN NET ASSETS
| | | | | | | | | | | | | | | | | | | | | | | | | | | | | | | | | | | | | | |
| | | | | | | | Year Ended
March 31, 2019 | | | Year Ended
March 31, 2018 | | | | | | Year Ended
March 31, 2019 | | | Year Ended
March 31, 2018 | | | | | | Year Ended
March 31, 2019 | | | Year Ended
March 31, 2018 | |
| | | | | | | | PF Inflation
Managed Fund | | | | | | PF Managed
Bond Fund | | | | | | PF Short Duration Bond Fund | |
OPERATIONS | | | | | | | | | | | | | | | | | | | | | | | | | | | | | | | | | | | | |
Net investment income (loss) | | | | | | | $1,247,551 | | | | $488,345 | | | | | | | | $15,817,298 | | | | $18,549,661 | | | | | | | | $3,249,065 | | | | $2,448,443 | |
Net realized gain (loss) | | | | | | | (495,056 | ) | | | 15,306 | | | | | | | | (9,185,832 | ) | | | 9,219,892 | | | | | | | | 364,899 | | | | (803,745 | ) |
Change in net unrealized appreciation (depreciation) | | | | | | | 488,741 | | | | (36,317 | ) | | | | | | | 7,631,064 | | | | (4,482,311 | ) | | | | | | | 1,401,355 | | | | (655,791 | ) |
Net Increase (Decrease) in Net Assets
Resulting from Operations | | | | | | | 1,241,236 | | | | 467,334 | | | | | | | | 14,262,530 | | | | 23,287,242 | | | | | | | | 5,015,319 | | | | 988,907 | |
| | | | | | | | |
DIVIDENDS AND DISTRIBUTIONS TO SHAREHOLDERS | | | | | | | | | | | | | | | | | | | | | | | | | | | | | | | | | |
Total distributable earnings - Class P | | | | | | | (2,002,797 | ) | | | | | | | | | | | (15,588,848 | ) | | | | | | | | | | | (2,654,646 | ) | | | | |
Net investment income - Class P | | | | | | | | | | | (165,026 | ) | | | | | | | | | | | (26,381,232 | ) | | | | | | | | | | | (2,387,342 | ) |
Net realized gains - Class P | | | | | | | | | | | — | | | | | | | | | | | | (871,668 | ) | | | | | | | | | | | — | |
Net Decrease from Dividends and
Distributions to Shareholders | | | | | | | (2,002,797 | ) | | | (165,026 | ) | | | | | | | (15,588,848 | ) | | | (27,252,900 | ) | | | | | | | (2,654,646 | ) | | | (2,387,342 | ) |
| | | | | | | | | |
CAPITAL SHARE TRANSACTIONS | | | | | | | | | | | | | | | | | | | | | | | | | | | | | | | | | | | | |
Proceeds from sale of shares - Class P | | | | | | | 2,259,623 | | | | 64,592,086 | | | | | | | | 65,397,455 | | | | 5,783,284 | | | | | | | | 127,240,312 | | | | 4,942,999 | |
Dividends and distribution reinvestments - Class P | | | | | | | 2,002,797 | | | | 165,026 | | | | | | | | 15,588,848 | | | | 27,252,900 | | | | | | | | 2,654,646 | | | | 2,387,342 | |
Cost of shares repurchased - Class P | | | | | | | (38,323,765 | ) | | | (2,417,220 | ) | | | | | | | (180,977,802 | ) | | | (172,610,204 | ) | | | | | | | (89,166,761 | ) | | | (61,302,167 | ) |
Net Increase (Decrease) in Net Assets from
Capital Share Transactions | | | | | | | (34,061,345 | ) | | | 62,339,892 | | | | | | | | (99,991,499 | ) | | | (139,574,020 | ) | | | | | | | 40,728,197 | | | | (53,971,826 | ) |
NET INCREASE (DECREASE) IN NET ASSETS | | | | | | | (34,822,906 | ) | | | 62,642,200 | | | | | | | | (101,317,817 | ) | | | (143,539,678 | ) | | | | | | | 43,088,870 | | | | (55,370,261 | ) |
| | | | | | | | | |
NET ASSETS | | | | | | | | | | | | | | | | | | | | | | | | | | | | | | | | | | | | |
Beginning of Year | | | | | | | 75,772,296 | | | | 13,130,096 | | | | | | | | 598,676,479 | | | | 742,216,157 | | | | | | | | 112,268,758 | | | | 167,639,019 | |
End of Year | | | | | | | $40,949,390 | | | | $75,772,296 | | | | | | | | $497,358,662 | | | | $598,676,479 | | | | | | | | $155,357,628 | | | | $112,268,758 | |
Undistributed/Accumulated Net Investment Income (Loss) | | | | | | | | | | | $186,399 | | | | | | | | | | | | ($1,643,668 | ) | | | | | | | | | | | $644,281 | |
| | | | | | | |
| | | | | | | | PF Emerging Markets
Debt Fund | | | | | | PF Developing
Growth Fund | | | | | | PF Growth Fund | |
OPERATIONS | | | | | | | | | | | | | | | | | | | | | | | | | | | | | | | | | | | | |
Net investment income (loss) | | | | | | | $4,389,534 | | | | $2,347,533 | | | | | | | | ($65,948 | ) | | | ($41,051 | ) | | | | | | | $13,415 | | | | $231,718 | |
Net realized gain (loss) | | | | | | | (3,589,948 | ) | | | 1,779,170 | | | | | | | | 920,420 | | | | 1,272,919 | | | | | | | | 6,959,823 | | | | 10,114,729 | |
Change in net unrealized appreciation (depreciation) | | | | | | | (1,576,741 | ) | | | (420,204 | ) | | | | | | | 1,206,745 | | | | 1,084,703 | | | | | | | | 19,702,601 | | | | 18,433,706 | |
Net Increase (Decrease) in Net Assets
Resulting from Operations | | | | | | | (777,155 | ) | | | 3,706,499 | | | | | | | | 2,061,217 | | | | 2,316,571 | | | | | | | | 26,675,839 | | | | 28,780,153 | |
| | | | | | | | |
DIVIDENDS AND DISTRIBUTIONS TO SHAREHOLDERS | | | | | | | | | | | | | | | | | | | | | | | | | | | | | | | | | |
Total distributable earnings - Class P | | | | | | | (1,235,277 | ) | | | | | | | | | | | (95,677 | ) | | | | | | | | | | | (10,767,593 | ) | | | | |
Net investment income - Class P | | | | | | | | | | | (3,464,056 | ) | | | | | | | | | | | — | | | | | | | | | | | | (255,381 | ) |
Net realized gains - Class P | | | | | | | | | | | — | | | | | | | | | | | | — | | | | | | | | | | | | (5,034,209 | ) |
Net Decrease from Dividends and
Distributions to Shareholders | | | | | | | (1,235,277 | ) | | | (3,464,056 | ) | | | | | | | (95,677 | ) | | | — | | | | | | | | (10,767,593 | ) | | | (5,289,590 | ) |
| | | | | | | | | |
CAPITAL SHARE TRANSACTIONS | | | | | | | | | | | | | | | | | | | | | | | | | | | | | | | | | | | | |
Proceeds from sale of shares - Class P | | | | | | | 18,582,694 | | | | 46,255,849 | | | | | | | | 8,879,889 | | | | 1,177,216 | | | | | | | | 43,746,338 | | | | 78,781,362 | |
Dividends and distribution reinvestments - Class P | | | | | | | 1,235,277 | | | | 3,464,056 | | | | | | | | 95,677 | | | | — | | | | | | | | 10,767,593 | | | | 5,289,590 | |
Cost of shares repurchased - Class P | | | | | | | (31,964,603 | ) | | | (6,818,320 | ) | | | | | | | (4,717,570 | ) | | | (2,835,820 | ) | | | | | | | (90,823,136 | ) | | | (35,961,516 | ) |
Net Increase (Decrease) in Net Assets from
Capital Share Transactions | | | | | | | (12,146,632 | ) | | | 42,901,585 | | | | | | | | 4,257,996 | | | | (1,658,604 | ) | | | | | | | (36,309,205 | ) | | | 48,109,436 | |
NET INCREASE (DECREASE) IN NET ASSETS | | | | | | | (14,159,064 | ) | | | 43,144,028 | | | | | | | | 6,223,536 | | | | 657,967 | | | | | | | | (20,400,959 | ) | | | 71,599,999 | |
| | | | | | | | | |
NET ASSETS | | | | | | | | | | | | | | | | | | | | | | | | | | | | | | | | | | | | |
Beginning of Year | | | | | | | 85,757,790 | | | | 42,613,762 | | | | | | | | 9,463,458 | | | | 8,805,491 | | | | | | | | 206,731,856 | | | | 135,131,857 | |
End of Year | | | | | | | $71,598,726 | | | | $85,757,790 | | | | | | | | $15,686,994 | | | | $9,463,458 | | | | | | | | $186,330,897 | | | | $206,731,856 | |
Undistributed/Accumulated Net Investment Income (Loss) | | | | | | | | | | | ($385,597 | ) | | | | | | | | | | | ($1,866 | ) | | | | | | | | | | | $5,432 | |
See Notes to Financial Statements
C-7
PACIFIC FUNDS
STATEMENTS OF CHANGES IN NET ASSETS (Continued)
| | | | | | | | | | | | | | | | | | | | | | | | | | | | | | | | | | | | | | |
| | | | | | | | Year Ended
March 31, 2019 | | | Year Ended
March 31, 2018 | | | | | | Year Ended
March 31, 2019 | | | Year Ended
March 31, 2018 | | | | | | Year Ended
March 31, 2019 | | | Year/Period
Ended
March 31, 2018 (1) | |
| | | | | | | | PFLarge-Cap
Value Fund | | | | | | PFMid-Cap
Equity Fund | | | | | | PF Multi-Asset
Fund | |
OPERATIONS | | | | | | | | | | | | | | | | | | | | | | | | | | | | | | | | | | | | |
Net investment income (loss) | | | | | | | $2,903,553 | | | | $5,264,729 | | | | | | | | $78,309 | | | | $255,243 | | | | | | | | $24,578,789 | | | | $1,047,910 | |
Net realized gain (loss) | | | | | | | 12,044,515 | | | | 105,969,265 | | | | | | | | 9,353,760 | | | | 15,006,079 | | | | | | | | (2,528,979 | ) | | | (1,288,736 | ) |
Change in net unrealized appreciation (depreciation) | | | | | | | (6,152,759 | ) | | | (74,455,651 | ) | | | | | | | (7,615,837 | ) | | | (5,362,910 | ) | | | | | | | 17,447,805 | | | | (16,846,206 | ) |
Net Increase (Decrease) in Net Assets
Resulting from Operations | | | | | | | 8,795,309 | | | | 36,778,343 | | | | | | | | 1,816,232 | | | | 9,898,412 | | | | | | | | 39,497,615 | | | | (17,087,032 | ) |
| | | | | | | | | |
DIVIDENDS AND DISTRIBUTIONS TO SHAREHOLDERS | | | | | | | | | | | | | | | | | | | | | | | | | | | | | | | | | | | | |
Total distributable earnings - Class P | | | | | | | (65,461,743 | ) | | | | | | | | | | | (19,252 | ) | | | | | | | | | | | (15,433,139 | ) | | | | |
Net investment income - Class P | | | | | | | | | | | (5,568,048 | ) | | | | | | | | | | | (279,701 | ) | | | | | | | | | | | — | |
Net realized gains - Class P | | | | | | | | | | | (5,764,837 | ) | | | | | | | | | | | (10,976,374 | ) | | | | | | | | | | | — | |
Net Decrease from Dividends and
Distributions to Shareholders | | | | | | | (65,461,743 | ) | | | (11,332,885 | ) | | | | | | | (19,252 | ) | | | (11,256,075 | ) | | | | | | | (15,433,139 | ) | | | — | |
| | | | | | | | | |
CAPITAL SHARE TRANSACTIONS | | | | | | | | | | | | | | | | | | | | | | | | | | | | | | | | | | | | |
Proceeds from sale of shares - Class P | | | | | | | 96,163,101 | | | | 2,825,708 | | | | | | | | 10,035,915 | | | | 226,914 | | | | | | | | 601,760,853 | | | | 750,387,520 | |
Dividends and distribution reinvestments - Class P | | | | | | | 65,461,743 | | | | 11,332,885 | | | | | | | | 19,252 | | | | 11,256,075 | | | | | | | | 15,433,139 | | | | — | |
Cost of shares repurchased - Class P | | | | | | | (88,855,637 | ) | | | (318,212,161 | ) | | | | | | | (33,232,671 | ) | | | (44,826,567 | ) | | | | | | | (238,144,754 | ) | | | (10 | ) |
Net Increase (Decrease) in Net Assets from
Capital Share Transactions | | | | | | | 72,769,207 | | | | (304,053,568 | ) | | | | | | | (23,177,504 | ) | | | (33,343,578 | ) | | | | | | | 379,049,238 | | | | 750,387,510 | |
NET INCREASE (DECREASE) IN NET ASSETS | | | | | | | 16,102,773 | | | | (278,608,110 | ) | | | | | | | (21,380,524 | ) | | | (34,701,241 | ) | | | | | | | 403,113,714 | | | | 733,300,478 | |
| | | | | | | | | |
NET ASSETS | | | | | | | | | | | | | | | | | | | | | | | | | | | | | | | | | | | | |
Beginning of Year or Period | | | | | | | 154,943,145 | | | | 433,551,255 | | | | | | | | 31,309,610 | | | | 66,010,851 | | | | | | | | 733,300,478 | | | | — | |
End of Year or Period | | | | | | | $171,045,918 | | | | $154,943,145 | | | | | | | | $9,929,086 | | | | $31,309,610 | | | | | | | | $1,136,414,192 | | | | $733,300,478 | |
Undistributed/Accumulated Net Investment Income (Loss) | | | | | | | | | | | $625,163 | | | | | | | | | | | | ($1,016 | ) | | | | | | | | | | | $1,064,555 | |
| | | | | | |
| | | | | | PFSmall-Cap
Value Fund | | | | | | PF Emerging
Markets Fund | | | | | | PF International
Large-Cap Fund | |
OPERATIONS | | | | | | | | | | | | | | | | | | | | | | | | | | | | | | | | | | | | |
Net investment income (loss) | | | | | | | $268,454 | | | | $194,522 | | | | | | | | $1,218,468 | | | | $1,311,410 | | | | | | | | $1,555,077 | | | | $2,258,631 | |
Net realized gain (loss) | | | | | | | 8,893,312 | | | | 13,993,171 | | | | | | | | 10,877,865 | | | | 29,818,496 | | | | | | | | 36,177,793 | | | | 32,271,447 | |
Change in net unrealized appreciation (depreciation) | | | | | | | (11,477,373 | ) | | | (5,896,589 | ) | | | | | | | (19,711,594 | ) | | | 17,643,260 | | | | | | | | (36,938,400 | ) | | | (6,291,224 | ) |
Net Increase (Decrease) in Net Assets
Resulting from Operations | | | | | | | (2,315,607 | ) | | | 8,291,104 | | | | | | | | (7,615,261 | ) | | | 48,773,166 | | | | | | | | 794,470 | | | | 28,238,854 | |
| | | | | | | | | |
DIVIDENDS AND DISTRIBUTIONS TO SHAREHOLDERS | | | | | | | | | | | | | | | | | | | | | | | | | | | | | | | | | | | | |
Total distributable earnings - Class P | | | | | | | (16,428,676 | ) | | | | | | | | | | | (15,394,527 | ) | | | | | | | | | | | (24,018,845 | ) | | | | |
Net investment income - Class P | | | | | | | | | | | (230,521 | ) | | | | | | | | | | | (1,205,327 | ) | | | | | | | | | | | (2,849,998 | ) |
Net realized gains - Class P | | | | | | | | | | | (15,035,437 | ) | | | | | | | | | | | — | | | | | | | | | | | | — | |
Net Decrease from Dividends and
Distributions to Shareholders | | | | | | | (16,428,676 | ) | | | (15,265,958 | ) | | | | | | | (15,394,527 | ) | | | (1,205,327 | ) | | | | | | | (24,018,845 | ) | | | (2,849,998 | ) |
| | | | | | | | | |
CAPITAL SHARE TRANSACTIONS | | | | | | | | | | | | | | | | | | | | | | | | | | | | | | | | | | | | |
Proceeds from sale of shares - Class P | | | | | | | 16,035,351 | | | | 759,572 | | | | | | | | 39,212,019 | | | | 2,759,146 | | | | | | | | 24,020,771 | | | | 5,456,504 | |
Dividends and distribution reinvestments - Class P | | | | | | | 16,428,676 | | | | 15,265,958 | | | | | | | | 15,394,527 | | | | 1,205,327 | | | | | | | | 24,018,845 | | | | 2,849,998 | |
Cost of shares repurchased - Class P | | | | | | | (24,616,740 | ) | | | (46,126,238 | ) | | | | | | | (76,101,427 | ) | | | (73,761,115 | ) | | | | | | | (92,047,573 | ) | | | (84,980,635 | ) |
Net Increase (Decrease) in Net Assets from
Capital Share Transactions | | | | | | | 7,847,287 | | | | (30,100,708 | ) | | | | | | | (21,494,881 | ) | | | (69,796,642 | ) | | | | | | | (44,007,957 | ) | | | (76,674,133 | ) |
NET INCREASE (DECREASE) IN NET ASSETS | | | | | | | (10,896,996 | ) | | | (37,075,562 | ) | | | | | | | (44,504,669 | ) | | | (22,228,803 | ) | | | | | | | (67,232,332 | ) | | | (51,285,277 | ) |
| | | | | | | | | |
NET ASSETS | | | | | | | | | | | | | | | | | | | | | | | | | | | | | | | | | | | | |
Beginning of Year | | | | | | | 81,514,542 | | | | 118,590,104 | | | | | | | | 178,391,453 | | | | 200,620,256 | | | | | | | | 125,384,492 | | | | 176,669,769 | |
End of Year | | | | | | | $70,617,546 | | | | $81,514,542 | | | | | | | | $133,886,784 | | | | $178,391,453 | | | | | | | | $58,152,160 | | | | $125,384,492 | |
Undistributed/Accumulated Net Investment Income (Loss) | | | | | | | | | | | ($743 | ) | | | | | | | | | | | ($1,522,112 | ) | | | | | | | | | | | ($249,495 | ) |
| (1) | PF Multi-Asset Fund commenced operations on January 31, 2018. |
See Notes to Financial Statements
C-8
PACIFIC FUNDS
STATEMENTS OF CHANGES IN NET ASSETS (Continued)
| | | | | | | | | | | | | | | | | | | | | | | | | | | | | | | | | | | | | | |
| | | | | | | | Year Ended
March 31, 2019 | | | Year Ended
March 31, 2018 | | | | | | Year Ended
March 31, 2019 | | | Year Ended
March 31, 2018 | | | | | | Year Ended
March 31, 2019 | | | Year Ended
March 31, 2018 | |
| | | | | | | | PF International
Small-Cap Fund | | | | | | PF International
Value Fund | | | | | | PF Real Estate
Fund | |
OPERATIONS | | | | | | | | | | | | | | | | | | | | | | | | | | | | | | | | | | | | |
Net investment income (loss) | | | | | | | $1,197,488 | | | | $754,316 | | | | | | | | $2,517,011 | | | | $5,038,239 | | | | | | | | $1,059,830 | | | | $777,524 | |
Net realized gain (loss) | | | | | | | (6,811,636 | ) | | | 4,296,821 | | | | | | | | 5,364,607 | | | | 27,546,854 | | | | | | | | 4,602,459 | | | | 4,246,790 | |
Change in net unrealized appreciation (depreciation) | | | | | | | (6,345,071 | ) | | | 1,654,919 | | | | | | | | (16,069,439 | ) | | | (9,695,966 | ) | | | | | | | 1,960,973 | | | | (6,500,964 | ) |
Net Increase (Decrease) in Net Assets
Resulting from Operations | | | | | | | (11,959,219 | ) | | | 6,706,056 | | | | | | | | (8,187,821 | ) | | | 22,889,127 | | | | | | | | 7,623,262 | | | | (1,476,650 | ) |
| | | | | | | | |
DIVIDENDS AND DISTRIBUTIONS TO SHAREHOLDERS | | | | | | | | | | | | | | | | | | | | | | | | | | | | | | | | | |
Total distributable earnings - Class P | | | | | | | (1,873,319 | ) | | | | | | | | | | | (13,896,218 | ) | | | | | | | | | | | (6,470,668 | ) | | | | |
Net investment income - Class P | | | | | | | | | | | (1,105,961 | ) | | | | | | | | | | | (7,139,546 | ) | | | | | | | | | | | (616,661 | ) |
Net realized gains - Class P | | | | | | | | | | | (3,413,550 | ) | | | | | | | | | | | — | | | | | | | | | | | | (5,759,868 | ) |
Net Decrease from Dividends and
Distributions to Shareholders | | | | | | | (1,873,319 | ) | | | (4,519,511 | ) | | | | | | | (13,896,218 | ) | | | (7,139,546 | ) | | | | | | | (6,470,668 | ) | | | (6,376,529 | ) |
| | | | | | | | | |
CAPITAL SHARE TRANSACTIONS | | | | | | | | | | | | | | | | | | | | | | | | | | | | | | | | | | | | |
Proceeds from sale of shares - Class P | | | | | | | 13,122,384 | | | | 49,538,815 | | | | | | | | 23,359,226 | | | | 5,213,861 | | | | | | | | 51,075,260 | | | | 9,367,327 | |
Dividends and distribution reinvestments - Class P | | | | | | | 1,873,319 | | | | 4,519,511 | | | | | | | | 13,896,218 | | | | 7,139,546 | | | | | | | | 6,470,668 | | | | 6,376,529 | |
Cost of shares repurchased - Class P | | | | | | | (59,045,777 | ) | | | (9,226,369 | ) | | | | | | | (93,840,625 | ) | | | (59,107,900 | ) | | | | | | | (18,505,117 | ) | | | (5,409,463 | ) |
Net Increase (Decrease) in Net Assets from
Capital Share Transactions | | | | | | | (44,050,074 | ) | | | 44,831,957 | | | | | | | | (56,585,181 | ) | | | (46,754,493 | ) | | | | | | | 39,040,811 | | | | 10,334,393 | |
NET INCREASE (DECREASE) IN NET ASSETS | | | | | | | (57,882,612 | ) | | | 47,018,502 | | | | | | | | (78,669,220 | ) | | | (31,004,912 | ) | | | | | | | 40,193,405 | | | | 2,481,214 | |
| | | | | | | | | |
NET ASSETS | | | | | | | | | | | | | | | | | | | | | | | | | | | | | | | | | | | | |
Beginning of Year | | | | | | | 89,816,280 | | | | 42,797,778 | | | | | | | | 143,625,549 | | | | 174,630,461 | | | | | | | | 41,519,218 | | | | 39,038,004 | |
End of Year | | | | | | | $31,933,668 | | | | $89,816,280 | | | | | | | | $64,956,329 | | | | $143,625,549 | | | | | | | | $81,712,623 | | | | $41,519,218 | |
Undistributed/Accumulated Net Investment Income (Loss) | | | | | | | | | | | ($93,534 | ) | | | | | | | | | | | $593,345 | | | | | | | | | | | | $141,085 | |
| | | | | | |
| | | | | | PF Currency
Strategies Fund | | | | | | PF Equity
Long/Short Fund | | | | | | | |
OPERATIONS | | | | | | | | | | | | | | | | | | | | | | | | | | | | | | | | | | | | |
Net investment income (loss) | | | | | | | $432,920 | | | | ($119,890 | ) | | | | | | | $244,190 | | | | ($300,859 | ) | | | | | | | | | | | | |
Net realized gain (loss) | | | | | | | 964,325 | | | | (900,769 | ) | | | | | | | (3,738,790 | ) | | | 16,433,672 | | | | | | | | | | | | | |
Change in net unrealized appreciation (depreciation) | | | | | | | (884,904 | ) | | | (433,088 | ) | | | | | | | (5,583,193 | ) | | | (6,424,573 | ) | | | | | | | | | | | | |
Net Increase (Decrease) in Net Assets
Resulting from Operations | | | | | | | 512,341 | | | | (1,453,747 | ) | | | | | | | (9,077,793 | ) | | | 9,708,240 | | | | | | | | | | | | | |
| | | | | | | | |
DIVIDENDS AND DISTRIBUTIONS TO SHAREHOLDERS | | | | | | | | | | | | | | | | | | | | | | | | | | | | | | | | | |
Total distributable earnings - Class P | | | | | | | — | | | | | | | | | | | | (2,425,959 | ) | | | | | | | | | | | | | | | | |
Net investment income - Class P | | | | | | | | | | | (2,053,772 | ) | | | | | | | | | | | (4,575,880 | ) | | | | | | | | | | | | |
Net realized gains - Class P | | | | | | | | | | | — | | | | | | | | | | | | (5,371,424 | ) | | | | | | | | | | | | |
Net Decrease from Dividends and
Distributions to Shareholders | | | | | | | — | | | | (2,053,772 | ) | | | | | | | (2,425,959 | ) | | | (9,947,304 | ) | | | | | | | | | | | | |
| | | | | | | | | |
CAPITAL SHARE TRANSACTIONS | | | | | | | | | | | | | | | | | | | | | | | | | | | | | | | | | | | | |
Proceeds from sale of shares - Class P | | | | | | | 9,333,517 | | | | 7,841,564 | | | | | | | | 22,981,830 | | | | 3,506,269 | | | | | | | | | | | | | |
Dividends and distribution reinvestments - Class P | | | | | | | — | | | | 2,053,772 | | | | | | | | 2,425,959 | | | | 9,947,304 | | | | | | | | | | | | | |
Cost of shares repurchased - Class P | | | | | | | (27,863,804 | ) | | | (31,655,007 | ) | | | | | | | (33,156,148 | ) | | | (27,173,385 | ) | | | | | | | | | | | | |
Net Increase (Decrease) in Net Assets from
Capital Share Transactions | | | | | | | (18,530,287 | ) | | | (21,759,671 | ) | | | | | | | (7,748,359 | ) | | | (13,719,812 | ) | | | | | | | | | | | | |
NET INCREASE (DECREASE) IN NET ASSETS | | | | | | | (18,017,946 | ) | | | (25,267,190 | ) | | | | | | | (19,252,111 | ) | | | (13,958,876 | ) | | | | | | | | | | | | |
| | | | | | | | | |
NET ASSETS | | | | | | | | | | | | | | | | | | | | | | | | | | | | | | | | | | | | |
Beginning of Year | | | | | | | 62,555,101 | | | | 87,822,291 | | | | | | | | 57,122,582 | | | | 71,081,458 | | | | | | | | | | | | | |
End of Year | | | | | | | $44,537,155 | | | | $62,555,101 | | | | | | | | $37,870,471 | | | | $57,122,582 | | | | | | | | | | | | | |
Undistributed/Accumulated Net Investment Income (Loss) | | | | | | | | | | | ($1,805,479 | ) | | | | | | | | | | | ($5,259,736 | ) | | | | | | | | | | | | |
See Notes to Financial Statements
C-9
PACIFIC FUNDS
STATEMENT OF CASH FLOWS (1)
FOR THE YEAR ENDED MARCH 31, 2019
| | | | | | | | | | |
| | | | | | | | PF Inflation
Managed Fund | |
CASH FLOWS FROM OPERATING ACTIVITIES(2): | | | | | | | | |
Net increase (decrease) in net assets from operations | | | | | | | $1,241,236 | |
Adjustments to reconcile net increase (decrease) in net assets from operations to net cash provided by (used in) operating activities: | | | | | | | | |
| | Purchases of long-term securities | | | | | | | (106,304,473 | ) |
| | Proceeds from disposition of long-term securities | | | | | | | 135,465,681 | |
| | Proceeds (purchases) of short-term securities, net | | | | | | | 4,512,750 | |
| | Proceeds (purchases) from foreign currency transactions | | | | | | | 4,370 | |
| | (Increase) decrease in dividends and interest receivable | | | | | | | 20,495 | |
| | (Increase) decrease in receivable for securities sold | | | | | | | (15,650,780 | ) |
| | (Increase) decrease in receivable for swap agreements | | | | | | | 13,394 | |
| | (Increase) decrease in receivable due from adviser | | | | | | | (2,669 | ) |
| | (Increase) decrease in prepaid expenses and other assets | | | | | | | (174 | ) |
| | (Increase) decrease in variation margin on futures contracts | | | | | | | (31,288 | ) |
| | (Increase) decrease in variation margin on swap agreements | | | | | | | (65,901 | ) |
| | Increase (decrease) in swap premiums | | | | | | | (2,693 | ) |
| | Increase (decrease) in payable for securities purchased | | | | | | | 9,307,141 | |
| | Increase (decrease) in payable for due to custodian | | | | | | | (16 | ) |
| | Increase (decrease) in payable for swap agreements | | | | | | | 2,503 | |
| | Increase (decrease) in accrued advisory fees | | | | | | | 650 | |
| | Increase (decrease) in accrued administration fees | | | | | | | 244 | |
| | Increase (decrease) in accrued support services expenses | | | | | | | 2,342 | |
| | Increase (decrease) in accrued custodian fees and expenses | | | | | | | 4,757 | |
| | Increase (decrease) in accrued legal, audit and tax service fees | | | | | | | 4,496 | |
| | Increase (decrease) in accrued trustees’ fees and expenses and deferred compensation | | | | | | | 471 | |
| | Increase (decrease) in accrued other payable | | | | | | | 10,192 | |
| | Change in net unrealized (appreciation) depreciation on investment securities | | | | | | | (519,843 | ) |
| | Change in net unrealized (appreciation) depreciation on foreign currencies | | | | | | | (4,370 | ) |
| | Change in net unrealized (appreciation) depreciation on forward foreign currency contracts | | | | | | | (57,760 | ) |
| | Change in net unrealized (appreciation) depreciation on purchased options | | | | | | | (25,019 | ) |
| | Change in net unrealized (appreciation) depreciation on swaps (3) | | | | | | | (7,062 | ) |
| | Change in net unrealized (appreciation) depreciation on written options | | | | | | | 27,626 | |
| | Net realized (gain) loss on investment security transactions | | | | | | | 447,816 | |
| | Net realized (gain) loss on foreign currency transactions | | | | | | | 90,386 | |
| | Net realized (gain) loss on purchased option transactions | | | | | | | 12,415 | |
| | Net realized (gain) loss on written option transactions | | | | | | | (103,842 | ) |
| | Net amortization on investments | | | | | | | 180,871 | |
Net cash provided by (used in) operating activities | | | | | | | 28,573,946 | |
| | |
CASH FLOWS FROM FINANCING ACTIVITIES: | | | | | | | | |
Proceeds from shares sold | | | | | | | 2,264,026 | |
Payment of shares redeemed | | | | | | | (38,327,188 | ) |
Increase (decrease) in payable for reverse repurchase agreement | | | | | | | (2,450,000 | ) |
Proceeds from sale-buyback financing activities | | | | | | | 1,156,274,892 | |
Payment on sale-buyback financing transactions | | | | | | | (1,146,119,514 | ) |
Net cash provided by (used in) financing activities | | | | | | | (28,357,784 | ) |
| | |
NET INCREASE (DECREASE) IN CASH AND FOREIGN CURRENCY | | | | | | | 216,162 | |
| | |
CASH AND FOREIGN CURRENCY: | | | | | | | | |
Beginning of Year | | | | | | | 360,013 | |
End of Year (4) | | | | | | | $576,175 | |
| (1) | Information on financial transactions which have been settled through the receipt or disbursement of cash is presented in the Statement of Cash Flows. The cash amounts shown in the Statement of Cash Flows are the amount included within the Statements of Assets and Liabilities and include cash and foreign currency, if any, but does not include any short-term investments. The PF Inflation Managed Fund has not met the exemption criteria under the Financial Accounting Standards Board Accounting Standards Codification Topic 230, Statement of Cash Flows, and therefore includes a Statement of Cash Flows. All other funds have met the exemption criteria. |
| (2) | Interest paid by the PF Inflation Managed Fund was $345,818. |
| (3) | Excludes centrally cleared swaps included in variation margin. |
| (4) | Includes cash (segregated for derivative instruments) of $400,000. |
See Notes to Financial Statements
C-10
PACIFIC FUNDS
FINANCIAL HIGHLIGHTS
Selected per share, ratios and supplemental data for each year or period ended March 31, were as follows:
| | | | | | | | | | | | | | | | | | | | | | | | | | | | | | | | | | | | | | | | | | | | | | | | | | | | | | | | |
| Fund | | Selected Per Share Data | | | Ratios to Average Net Assets | | | Supplemental Data | |
| | | | | | Investment Operations | | | Distributions | | | | | | | | | | | | | | | | | | | | | | |
For the Year or Period Ended (1) | | Net Asset Value,
Beginning of Year or Period | | | Net Investment Income (Loss) (2) | | | Net Realized and
Unrealized Gain (Loss) | | | Total | | | Net Investment Income | | | Capital Gains | | | Total | | | Net Asset Value,
End of Year or Period | | | Expenses Before Reductions (3) | | | Expenses After Reductions (3), (4) | | | Net Investment Income (Loss) (3) | | | Total Returns (5) | | | Net Assets, End of Year or Period
(in thousands) | | | Portfolio Turnover Rates | |
PF Inflation Managed Fund | | | | | | | | | | | | | | | | | | | | | | | | | | | | | | | | | | | | | | | | | | | | | | | | | | | | | |
| 4/1/2018 - 3/31/2019 | | | $8.88 | | | | $0.16 | | | | $0.05 | | | | $0.21 | | | | ($0.28 | ) | | | $— | | | | ($0.28 | ) | | | $8.81 | | | | 1.15 | % | | | 1.07 | %(6) | | | 1.86 | % | | | 2.50 | % | | | $40,949 | | | | 126 | % |
| 4/1/2017 - 3/31/2018 | | | 8.92 | | | | 0.27 | | | | (0.19 | ) | | | 0.08 | | | | (0.12 | ) | | | — | | | | (0.12 | ) | | | 8.88 | | | | 1.06 | % | | | 0.94 | % | | | 3.08 | % | | | 0.87 | % | | | 75,772 | | | | 108 | % |
| 4/1/2016 - 3/31/2017 | | | 8.73 | | | | 0.29 | | | | (0.10 | ) | | | 0.19 | | | | — | | | | — | | | | — | | | | 8.92 | | | | 0.98 | % | | | 0.80 | % | | | 3.35 | % | | | 2.18 | % | | | 13,130 | | | | 194 | % |
| 4/1/2015 - 3/31/2016 | | | 8.80 | | | | 0.20 | | | | (0.27 | ) | | | (0.07 | ) | | | — | | | | — | | | | — | | | | 8.73 | | | | 0.79 | % | | | 0.64 | % | | | 2.36 | % | | | (0.80 | %) | | | 52,190 | | | | 89 | % |
| 4/1/2014 - 3/31/2015 | | | 8.84 | | | | 0.06 | | | | 0.15 | | | | 0.21 | | | | (0.25 | ) | | | — | | | | (0.25 | ) | | | 8.80 | | | | 0.68 | % | | | 0.58 | % | | | 0.68 | % | | | 2.38 | % | | | 126,154 | | | | 139 | % |
PF Managed Bond Fund | | | | | | | | | | | | | | | | | | | | | | | | | | | | | | | | | | | | | |
| 4/1/2018 - 3/31/2019 | | | $10.58 | | | | $0.31 | | | | $0.03 | | | | $0.34 | | | | ($0.36 | ) | | | $— | | | | ($0.36 | ) | | | $10.56 | | | | 0.72 | % | | | 0.63 | %(6) | | | 3.02 | % | | | 3.43 | % | | | $497,359 | | | | 520 | % |
| 4/1/2017 - 3/31/2018 | | | 10.67 | | | | 0.29 | | | | 0.05 | | | | 0.34 | | | | (0.42 | ) | | | (0.01 | ) | | | (0.43 | ) | | | 10.58 | | | | 0.64 | % | | | 0.57 | % | | | 2.63 | % | | | 3.29 | % | | | 598,676 | | | | 364 | % |
| 4/1/2016 - 3/31/2017 | | | 10.57 | | | | 0.26 | | | | 0.10 | | | | 0.36 | | | | (0.15 | ) | | | (0.11 | ) | | | (0.26 | ) | | | 10.67 | | | | 0.64 | % | | | 0.56 | % | | | 2.39 | % | | | 3.42 | % | | | 742,216 | | | | 372 | % |
| 4/1/2015 - 3/31/2016 | | | 11.06 | | | | 0.28 | | | | (0.16 | ) | | | 0.12 | | | | (0.25 | ) | | | (0.36 | ) | | | (0.61 | ) | | | 10.57 | | | | 0.64 | % | | | 0.55 | % | | | 2.58 | % | | | 1.31 | % | | | 421,377 | | | | 370 | % |
| 4/1/2014 - 3/31/2015 | | | 10.76 | | | | 0.15 | | | | 0.52 | | | | 0.67 | | | | (0.17 | ) | | | (0.20 | ) | | | (0.37 | ) | | | 11.06 | | | | 0.63 | % | | | 0.55 | % | | | 1.37 | % | | | 6.32 | % | | | 643,882 | | | | 578 | % |
PF Short Duration Bond Fund | | | | | | | | | | | | | | | | | | | | | | | | | | | | | | | | | | | | | |
| 4/1/2018 - 3/31/2019 | | | $9.79 | | | | $0.23 | | | | $0.07 | | | | $0.30 | | | | ($0.16 | ) | | | $— | | | | ($0.16 | ) | | | $9.93 | | | | 0.64 | % | | | 0.55 | % | | | 2.34 | % | | | 3.05 | % | | | $155,358 | | | | 164 | % |
| 4/1/2017 - 3/31/2018 | | | 9.88 | | | | 0.15 | | | | (0.09 | ) | | | 0.06 | | | | (0.15 | ) | | | — | | | | (0.15 | ) | | | 9.79 | | | | 0.63 | % | | | 0.55 | % | | | 1.56 | % | | | 0.65 | % | | | 112,269 | | | | 67 | % |
| 4/1/2016 - 3/31/2017 | | | 9.84 | | | | 0.12 | | | | 0.01 | | | | 0.13 | | | | (0.09 | ) | | | — | | | | (0.09 | ) | | | 9.88 | | | | 0.68 | % | | | 0.55 | % | | | 1.16 | % | | | 1.36 | % | | | 167,639 | | | | 233 | % |
| 4/1/2015 - 3/31/2016 | | | 10.01 | | | | 0.12 | | | | (0.09 | ) | | | 0.03 | | | | (0.20 | ) | | | — | | | | (0.20 | ) | | | 9.84 | | | | 0.65 | % | | | 0.55 | % | | | 1.18 | % | | | 0.35 | % | | | 75,899 | | | | 98 | % |
| 4/1/2014 - 3/31/2015 | | | 10.05 | | | | 0.11 | | | | (0.02 | ) | | | 0.09 | | | | (0.13 | ) | | | — | | | | (0.13 | ) | | | 10.01 | | | | 0.64 | % | | | 0.55 | % | | | 1.11 | % | | | 0.88 | % | | | 213,334 | | | | 60 | % |
PF Emerging Markets Debt Fund | | | | | | | | | | | | | | | | | | | | | | | | | | | | | | | | | | | | | |
| 4/1/2018 - 3/31/2019 | | | $9.37 | | | | $0.47 | | | | ($0.54 | ) | | | ($0.07 | ) | | | ($0.13 | ) | | | $— | | | | ($0.13 | ) | | | $9.17 | | | | 1.09 | % | | | 0.93 | % | | | 5.37 | % | | | (0.61 | %) | | | $71,599 | | | | 60 | % |
| 4/1/2017 - 3/31/2018 | | | 9.39 | | | | 0.51 | | | | 0.30 | | | | 0.81 | | | | (0.83 | ) | | | — | | | | (0.83 | ) | | | 9.37 | | | | 1.11 | % | | | 0.94 | % | | | 5.28 | % | | | 8.76 | % | | | 85,758 | | | | 68 | % |
| 4/1/2016 - 3/31/2017 | | | 9.14 | | | | 0.72 | | | | 0.58 | | | | 1.30 | | | | (1.05 | ) | | | — | | | | (1.05 | ) | | | 9.39 | | | | 1.10 | % | | | 0.94 | % | | | 7.58 | % | | | 14.88 | % | | | 42,614 | | | | 75 | % |
| 4/1/2015 - 3/31/2016 | | | 8.89 | | | | 0.61 | | | | (0.35 | ) | | | 0.26 | | | | (0.01 | ) | | | — | | | | (0.01 | ) | | | 9.14 | | | | 1.07 | % | | | 0.94 | % | | | 6.91 | % | | | 2.93 | % | | | 108,161 | | | | 80 | % |
| 4/1/2014 - 3/31/2015 | | | 9.69 | | | | 0.50 | | | | (0.95 | ) | | | (0.45 | ) | | | (0.35 | ) | | | — | | | | (0.35 | ) | | | 8.89 | | | | 1.08 | % | | | 0.94 | % | | | 5.20 | % | | | (4.73 | %) | | | 162,011 | | | | 105 | % |
PF Developing Growth Fund | | | | | | | | | | | | | | | | | | | | | | | | | | | | | | | | | | | | | |
| 4/1/2018 - 3/31/2019 | | | $14.84 | | | | ($0.09 | ) | | | $3.80 | | | | $3.71 | | | | $— | | | | ($0.12 | ) | | | ($0.12 | ) | | | $18.43 | | | | 0.87 | % | | | 0.75 | % | | | (0.55 | %) | | | 25.05 | % | | | $15,687 | | | | 127 | % |
| 4/1/2017 - 3/31/2018 | | | 11.50 | | | | (0.06 | ) | | | 3.40 | | | | 3.34 | | | | — | | | | — | | | | — | | | | 14.84 | | | | 0.90 | % | | | 0.75 | % | | | (0.45 | %) | | | 29.04 | % | | | 9,463 | | | | 86 | % |
| 4/1/2016 - 3/31/2017 | | | 9.80 | | | | (0.04 | ) | | | 1.74 | | | | 1.70 | | | | — | | | | — | | | | — | | | | 11.50 | | | | 0.90 | % | | | 0.75 | % | | | (0.40 | %) | | | 17.35 | % | | | 8,805 | | | | 123 | % |
| 4/1/2015 - 3/31/2016 | | | 14.80 | | | | (0.07 | ) | | | (3.18 | ) | | | (3.25 | ) | | | — | | | | (1.75 | ) | | | (1.75 | ) | | | 9.80 | | | | 0.82 | % | | | 0.75 | % | | | (0.51 | %) | | | (23.59 | %) | | | 42,196 | | | | 229 | % |
| 4/1/2014 - 3/31/2015 | | | 15.54 | | | | (0.05 | ) | | | 1.20 | | | | 1.15 | | | | — | | | | (1.89 | ) | | | (1.89 | ) | | | 14.80 | | | | 0.82 | % | | | 0.75 | % | | | (0.35 | %) | | | 8.36 | % | | | 83,731 | | | | 264 | % |
PF Growth Fund | | | | | | | | | | | | | | | | | | | | | | | | | | | | | | | | | | | | | |
| 4/1/2018 - 3/31/2019 | | | $25.38 | | | | $0.00 | (7) | | | $3.62 | | | | $3.62 | | | | ($0.01 | ) | | | ($1.81 | ) | | | ($1.82 | ) | | | $27.18 | | | | 0.77 | % | | | 0.70 | % | | | 0.01 | % | | | 14.99 | % | | | $186,331 | | | | 28 | % |
| 4/1/2017 - 3/31/2018 | | | 20.94 | | | | 0.04 | | | | 5.33 | | | | 5.37 | | | | (0.04 | ) | | | (0.89 | ) | | | (0.93 | ) | | | 25.38 | | | | 0.76 | % | | | 0.70 | % | | | 0.16 | % | | | 25.93 | % | | | 206,732 | | | | 34 | % |
| 4/1/2016 - 3/31/2017 | | | 18.82 | | | | 0.02 | | | | 2.61 | | | | 2.63 | | | | (0.02 | ) | | | (0.49 | ) | | | (0.51 | ) | | | 20.94 | | | | 0.77 | % | | | 0.70 | % | | | 0.12 | % | | | 14.25 | % | | | 135,132 | | | | 43 | % |
| 4/1/2015 - 3/31/2016 | | | 19.30 | | | | 0.02 | | | | 0.43 | | | | 0.45 | | | | (0.09 | ) | | | (0.84 | ) | | | (0.93 | ) | | | 18.82 | | | | 0.76 | % | | | 0.70 | % | | | 0.11 | % | | | 2.17 | % | | | 122,698 | | | | 35 | % |
| 4/1/2014 - 3/31/2015 | | | 17.33 | | | | 0.05 | | | | 2.19 | | | | 2.24 | | | | (0.13 | ) | | | (0.14 | ) | | | (0.27 | ) | | | 19.30 | | | | 0.76 | % | | | 0.70 | % | | | 0.30 | % | | | 12.96 | % | | | 147,893 | | | | 39 | % |
PF Large-Cap Value Fund | | | | | | | | | | | | | | | | | | | | | | | | | | | | | | | | | | | | | |
| 4/1/2018 - 3/31/2019 | | | $17.14 | | | | $0.24 | | | | $0.46 | | | | $0.70 | | | | ($0.17 | ) | | | ($5.72 | ) | | | ($5.89 | ) | | | $11.95 | | | | 0.86 | % | | | 0.80 | % | | | 1.55 | % | | | 5.49 | % | | | $171,046 | | | | 43 | % |
| 4/1/2017 - 3/31/2018 | | | 16.60 | | | | 0.22 | | | | 0.79 | | | | 1.01 | | | | (0.23 | ) | | | (0.24 | ) | | | (0.47 | ) | | | 17.14 | | | | 0.86 | % | | | 0.80 | % | | | 1.27 | % | | | 6.01 | % | | | 154,943 | | | | 7 | % |
| 4/1/2016 - 3/31/2017 | | | 14.78 | | | | 0.22 | | | | 2.11 | | | | 2.33 | | | | (0.20 | ) | | | (0.31 | ) | | | (0.51 | ) | | | 16.60 | | | | 0.86 | % | | | 0.80 | % | | | 1.40 | % | | | 15.88 | % | | | 433,551 | | | | 21 | % |
| 4/1/2015 - 3/31/2016 | | | 16.46 | | | | 0.23 | | | | (0.43 | ) | | | (0.20 | ) | | | (0.22 | ) | | | (1.26 | ) | | | (1.48 | ) | | | 14.78 | | | | 0.86 | % | | | 0.80 | % | | | 1.45 | % | | | (1.29 | %) | | | 299,971 | | | | 10 | % |
| 4/1/2014 - 3/31/2015 | | | 16.71 | | | | 0.23 | | | | 1.36 | | | | 1.59 | | | | (0.38 | ) | | | (1.46 | ) | | | (1.84 | ) | | | 16.46 | | | | 0.86 | % | | | 0.80 | % | | | 1.37 | % | | | 9.40 | % | | | 344,403 | | | | 13 | % |
PF Mid-Cap Equity Fund | | | | | | | | | | | | | | | | | | | | | | | | | | | | | | | | | | | | | |
| 4/1/2018 - 3/31/2019 | | | $10.73 | | | | $0.06 | | | | $0.51 | | | | $0.57 | | | | ($0.02 | ) | | | $— | | | | ($0.02 | ) | | | $11.28 | | | | 0.93 | % | | | 0.80 | % | | | 0.56 | % | | | 5.37 | % | | | $9,929 | | | | 119 | % |
| 4/1/2017 - 3/31/2018 | | | 11.00 | | | | 0.05 | | | | 1.75 | | | | 1.80 | | | | (0.04 | ) | | | (2.03 | ) | | | (2.07 | ) | | | 10.73 | | | | 0.88 | % | | | 0.80 | % | | | 0.40 | % | | | 16.31 | % | | | 31,310 | | | | 77 | % |
| 4/1/2016 - 3/31/2017 | | | 10.63 | | | | 0.05 | | | | 2.43 | | | | 2.48 | | | | (0.17 | ) | | | (1.94 | ) | | | (2.11 | ) | | | 11.00 | | | | 0.89 | % | | | 0.80 | % | | | 0.45 | % | | | 24.02 | % | | | 66,011 | | | | 101 | % |
| 4/1/2015 - 3/31/2016 | | | 12.15 | | | | 0.15 | | | | (0.59 | ) | | | (0.44 | ) | | | (0.12 | ) | | | (0.96 | ) | | | (1.08 | ) | | | 10.63 | | | | 0.86 | % | | | 0.80 | % | | | 1.34 | % | | | (3.79 | %) | | | 169,595 | | | | 184 | % |
| 4/1/2014 - 3/31/2015 | | | 12.84 | | | | 0.05 | | | | 0.80 | | | | 0.85 | | | | (0.03 | ) | | | (1.51 | ) | | | (1.54 | ) | | | 12.15 | | | | 0.86 | % | | | 0.80 | % | | | 0.40 | % | | | 7.44 | % | | | 218,141 | | | | 172 | % |
PF Multi-Asset Fund | | | | | | | | | | | | | | | | | | | | | | | | | | | | | | | | | | | | | | | | | | | | | |
| 4/1/2018 - 3/31/2019 | | | $9.42 | | | | $0.21 | | | | $0.31 | | | | $0.52 | | | | ($0.13 | ) | | | $— | | | | ($0.13 | ) | | | $9.81 | | | | 0.56 | % | | | 0.51 | % | | | 2.21 | % | | | 5.72 | % | | | $1,136,414 | | | | 75 | % |
| 1/31/2018 - 3/31/2018 | | | 10.00 | | | | 0.03 | | | | (0.61 | ) | | | (0.58 | ) | | | — | | | | — | | | | — | | | | 9.42 | | | | 0.59 | % | | | 0.51 | % | | | 1.68 | % | | | (5.80 | %) | | | 733,300 | | | | 37 | % |
| | |
| See Notes to Financial Statements | | See explanation of references, if any, on C-13 |
C-11
PACIFIC FUNDS
FINANCIAL HIGHLIGHTS(Continued)
Selected per share, ratios and supplemental data for each year or period ended March 31, were as follows:
| | | | | | | | | | | | | | | | | | | | | | | | | | | | | | | | | | | | | | | | | | | | | | | | | | | | | | | | |
| Fund | | Selected Per Share Data | | | Ratios to Average Net Assets | | | Supplemental Data | |
| | | | | | Investment Operations | | | Distributions | | | | | | | | | | | | | | | | | | | | | | |
For the Year or Period Ended (1) | | Net Asset Value,
Beginning of Year or Period | | | Net Investment Income (Loss) (2) | | | Net Realized and
Unrealized Gain (Loss) | | | Total | | | Net Investment Income | | | Capital Gains | | | Total | | | Net Asset Value,
End of Year or Period | | | Expenses Before Reductions (3) | | | Expenses After Reductions (3), (4) | | | Net Investment Income (Loss) (3) | | | Total Returns (5) | | | Net Assets, End of Year or Period
(in thousands) | | | Portfolio Turnover Rates | |
PF Small-Cap Value Fund | | | | | | | | | | | | | | | | | | | | | | | | | | | | | | | | | | | | | |
| 4/1/2018 - 3/31/2019 | | | $11.22 | | | | $0.04 | | | | ($0.56 | ) | | | ($0.52 | ) | | | ($0.03 | ) | | | ($2.46 | ) | | | ($2.49 | ) | | | $8.21 | | | | 0.97 | % | | | 0.90 | % | | | 0.35 | % | | | (4.23 | %) | | | $70,618 | | | | 56 | % |
| 4/1/2017 - 3/31/2018 | | | 12.09 | | | | 0.02 | | | | 0.79 | | | | 0.81 | | | | (0.02 | ) | | | (1.66 | ) | | | (1.68 | ) | | | 11.22 | | | | 0.97 | % | | | 0.90 | % | | | 0.17 | % | | | 6.54 | % | | | 81,515 | | | | 30 | % |
| 4/1/2016 - 3/31/2017 | | | 10.14 | | | | 0.01 | | | | 2.44 | | | | 2.45 | | | | (0.07 | ) | | | (0.43 | ) | | | (0.50 | ) | | | 12.09 | | | | 0.98 | % | | | 0.90 | % | | | 0.12 | % | | | 23.99 | % | | | 118,590 | | | | 49 | % |
| 4/1/2015 - 3/31/2016 | | | 10.45 | | | | 0.03 | | | | (0.27 | ) | | | (0.24 | ) | | | (0.01 | ) | | | (0.06 | ) | | | (0.07 | ) | | | 10.14 | | | | 0.96 | % | | | 0.90 | % | | | 0.33 | % | | | (2.29 | %) | | | 199,324 | | | | 55 | % |
| 4/1/2014 - 3/31/2015 | | | 13.55 | | | | 0.07 | | | | 1.17 | | | | 1.24 | | | | (0.14 | ) | | | (4.20 | ) | | | (4.34 | ) | | | 10.45 | | | | 0.96 | % | | | 0.90 | % | | | 0.55 | % | | | 11.55 | % | | | 145,801 | | | | 140 | % |
PF Emerging Markets Fund | | | | | | | | | | | | | | | | | | | | | | | | | | | | | | | | | | | | | |
| 4/1/2018 - 3/31/2019 | | | $17.30 | | | | $0.13 | | | | ($0.95 | ) | | | ($0.82 | ) | | | ($0.09 | ) | | | ($1.68 | ) | | | ($1.77 | ) | | | $14.71 | | | | 1.16 | % | | | 0.95 | % | | | 0.84 | % | | | (3.61 | %) | | | $133,887 | | | | 46 | % |
| 4/1/2017 - 3/31/2018 | | | 13.81 | | | | 0.10 | | | | 3.49 | | | | 3.59 | | | | (0.10 | ) | | | — | | | | (0.10 | ) | | | 17.30 | | | | 1.20 | % | | | 0.95 | % | | | 0.63 | % | | | 25.93 | % | | | 178,391 | | | | 34 | % |
| 4/1/2016 - 3/31/2017 | | | 12.09 | | | | 0.08 | | | | 1.71 | | | | 1.79 | | | | (0.07 | ) | | | — | | | | (0.07 | ) | | | 13.81 | | | | 1.20 | % | | | 0.95 | % | | | 0.64 | % | | | 14.83 | % | | | 200,620 | | | | 69 | % |
| 4/1/2015 - 3/31/2016 | | | 13.58 | | | | 0.10 | | | | (1.47 | ) | | | (1.37 | ) | | | (0.12 | ) | | | — | | | | (0.12 | ) | | | 12.09 | | | | 1.23 | % | | | 0.95 | % | | | 0.84 | % | | | (10.09 | %) | | | 118,049 | | | | 65 | % |
| 4/1/2014 - 3/31/2015 | | | 14.75 | | | | 0.12 | | | | (0.71 | ) | | | (0.59 | ) | | | (0.19 | ) | | | (0.39 | ) | | | (0.58 | ) | | | 13.58 | | | | 1.23 | % | | | 0.95 | % | | | 0.81 | % | | | (4.15 | %) | | | 138,242 | | | | 40 | % |
PF International Large-Cap Fund | | | | | | | | | | | | | | | | | | | | | | | | | | | | | | | | | | | | | |
| 4/1/2018 - 3/31/2019 | | | $20.85 | | | | $0.41 | | | | ($1.09 | ) | | | ($0.68 | ) | | | ($0.24 | ) | | | ($8.30 | ) | | | ($8.54 | ) | | | $11.63 | | | | 1.19 | % | | | 1.00 | % | | | 2.32 | % | | | 0.62 | % | | | $58,152 | | | | 41 | % |
| 4/1/2017 - 3/31/2018 | | | 18.19 | | | | 0.26 | | | | 2.74 | | | | 3.00 | | | | (0.34 | ) | | | — | | | | (0.34 | ) | | | 20.85 | | | | 1.14 | % | | | 1.00 | % | | | 1.28 | % | | | 16.54 | % | | | 125,384 | | | | 10 | % |
| 4/1/2016 - 3/31/2017 | | | 16.69 | | | | 0.25 | | | | 1.58 | | | | 1.83 | | | | (0.33 | ) | | | — | | | | (0.33 | ) | | | 18.19 | | | | 1.13 | % | | | 1.00 | % | | | 1.46 | % | | | 11.17 | % | | | 176,670 | | | | 16 | % |
| 4/1/2015 - 3/31/2016 | | | 18.50 | | | | 0.20 | | | | (1.85 | ) | | | (1.65 | ) | | | (0.16 | ) | | | — | | | | (0.16 | ) | | | 16.69 | | | | 1.10 | % | | | 1.00 | % | | | 1.17 | % | | | (8.93 | %) | | | 289,863 | | | | 24 | % |
| 4/1/2014 - 3/31/2015 | | | 18.46 | | | | 0.29 | | | | 0.01 | | | | 0.30 | | | | (0.26 | ) | | | — | | | | (0.26 | ) | | | 18.50 | | | | 1.10 | % | | | 1.00 | % | | | 1.56 | % | | | 1.70 | % | | | 220,898 | | | | 41 | % |
PF International Small-Cap Fund | | | | | | | | | | | | | | | | | | | | | | | | | | | | | | | | | | | | | |
| 4/1/2018 - 3/31/2019 | | | $11.24 | | | | $0.17 | | | | ($1.58 | ) | | | ($1.41 | ) | | | ($0.05 | ) | | | ($0.19 | ) | | | ($0.24 | ) | | | $9.59 | | | | 1.18 | % | | | 1.10 | % | | | 1.61 | % | | | (12.54 | %) | | | $31,934 | | | | 50 | % |
| 4/1/2017 - 3/31/2018 | | | 10.50 | | | | 0.19 | | | | 1.79 | | | | 1.98 | | | | (0.29 | ) | | | (0.95 | ) | | | (1.24 | ) | | | 11.24 | | | | 1.16 | % | | | 1.10 | % | | | 1.63 | % | | | 19.24 | % | | | 89,816 | | | | 52 | % |
| 4/1/2016 - 3/31/2017 | | | 10.27 | | | | 0.21 | | | | 1.10 | | | | 1.31 | | | | (0.41 | ) | | | (0.67 | ) | | | (1.08 | ) | | | 10.50 | | | | 1.18 | % | | | 1.09 | % | | | 2.07 | % | | | 13.85 | % | | | 42,798 | | | | 53 | % |
| 4/1/2015 - 3/31/2016 | | | 10.69 | | | | 0.15 | | | | (0.12 | ) | | | 0.03 | | | | (0.32 | ) | | | (0.13 | ) | | | (0.45 | ) | | | 10.27 | | | | 1.11 | % | | | 1.08 | % | | | 1.37 | % | | | 0.22 | % | | | 118,558 | | | | 51 | % |
| 1/14/2015 - 3/31/2015 | | | 10.00 | | | | 0.03 | | | | 0.66 | | | | 0.69 | | | | — | | | | — | | | | — | | | | 10.69 | | | | 1.24 | % | | | 1.08 | % | | | 1.34 | % | | | 6.90 | % | | | 127,493 | | | | 8 | % |
PF International Value Fund | | | | | | | | | | | | | | | | | | | | | | | | | | | | | | | | | | | | | |
| 4/1/2018 - 3/31/2019 | | | $10.17 | | | | $0.28 | | | | ($1.20 | ) | | | ($0.92 | ) | | | ($0.34 | ) | | | ($1.40 | ) | | | ($1.74 | ) | | | $7.51 | | | | 0.98 | % | | | 0.80 | % | | | 2.99 | % | | | (8.51 | %) | | | $64,956 | | | | 54 | % |
| 4/1/2017 - 3/31/2018 | | | 9.31 | | | | 0.30 | | | | 0.99 | | | | 1.29 | | | | (0.43 | ) | | | — | | | | (0.43 | ) | | | 10.17 | | | | 0.92 | % | | | 0.80 | % | | | 2.95 | % | | | 14.01 | % | | | 143,626 | | | | 111 | % |
| 4/1/2016 - 3/31/2017 | | | 8.35 | | | | 0.21 | | | | 1.03 | | | | 1.24 | | | | (0.28 | ) | | | — | | | | (0.28 | ) | | | 9.31 | | | | 0.90 | % | | | 0.80 | % | | | 2.43 | % | | | 15.15 | % | | | 174,630 | | | | 67 | % |
| 4/1/2015 - 3/31/2016 | | | 9.51 | | | | 0.16 | | | | (1.19 | ) | | | (1.03 | ) | | | (0.13 | ) | | | — | | | | (0.13 | ) | | | 8.35 | | | | 0.92 | % | | | 0.80 | % | | | 1.80 | % | | | (10.87 | %) | | | 140,760 | | | | 73 | % |
| 4/1/2014 - 3/31/2015 | | | 10.33 | | | | 0.22 | | | | (0.65 | ) | | | (0.43 | ) | | | (0.39 | ) | | | — | | | | (0.39 | ) | | | 9.51 | | | | 0.91 | % | | | 0.80 | % | | | 2.19 | % | | | (4.07 | %) | | | 142,653 | | | | 87 | % |
PF Real Estate Fund | | | | | | | | | | | | | | | | | | | | | | | | | | | | | | | | | | | | | |
| 4/1/2018 - 3/31/2019 | | | $11.86 | | | | $0.28 | | | | $1.75 | | | | $2.03 | | | | ($0.21 | ) | | | ($1.42 | ) | | | ($1.63 | ) | | | $12.26 | | | | 1.12 | % | | | 0.98 | % | | | 2.31 | % | | | 18.20 | % | | | $81,713 | | | | 104 | % |
| 4/1/2017 - 3/31/2018 | | | 14.94 | | | | 0.30 | | | | (0.75 | ) | | | (0.45 | ) | | | (0.22 | ) | | | (2.41 | ) | | | (2.63 | ) | | | 11.86 | | | | 1.13 | % | | | 1.05 | % | | | 2.12 | % | | | (4.15 | %) | | | 41,519 | | | | 47 | % |
| 4/1/2016 - 3/31/2017 | | | 15.99 | | | | 0.16 | | | | (0.18 | ) | | | (0.02 | ) | | | (0.39 | ) | | | (0.64 | ) | | | (1.03 | ) | | | 14.94 | | | | 1.12 | % | | | 1.05 | % | | | 1.01 | % | | | (0.14 | %) | | | 39,038 | | | | 27 | % |
| 4/1/2015 - 3/31/2016 | | | 16.87 | | | | 0.36 | | | | 0.15 | | | | 0.51 | | | | (0.23 | ) | | | (1.16 | ) | | | (1.39 | ) | | | 15.99 | | | | 1.12 | % | | | 1.05 | % | | | 2.33 | % | | | 3.61 | % | | | 70,717 | | | | 26 | % |
| 4/1/2014 - 3/31/2015 | | | 14.19 | | | | 0.22 | | | | 3.11 | | | | 3.33 | | | | (0.31 | ) | | | (0.34 | ) | | | (0.65 | ) | | | 16.87 | | | | 1.11 | % | | | 1.05 | % | | | 1.41 | % | | | 23.69 | % | | | 49,486 | | | | 34 | % |
PF Currency Strategies Fund | | | | | | | | | | | | | | | | | | | | | | | | | | | | | | | | | | | | | | | | | | | | | |
| 4/1/2018 - 3/31/2019 | | | $9.12 | | | | $0.07 | | | | $0.01 | | | | $0.08 | | | | $— | | | | $— | | | | $— | | | | $9.20 | | | | 0.87 | % | | | 0.87 | % | | | 0.76 | % | | | 0.88 | % | | | $44,537 | | | | 97 | % |
| 4/1/2017 - 3/31/2018 | | | 9.49 | | | | (0.01 | ) | | | (0.13 | ) | | | (0.14 | ) | | | (0.23 | ) | | | — | | | | (0.23 | ) | | | 9.12 | | | | 0.88 | % | | | 0.88 | % | | | (0.15 | %) | | | (1.32 | %) | | | 62,555 | | | | 0 | % |
| 4/1/2016 - 3/31/2017 | | | 9.75 | | | | (0.06 | ) | | | 0.90 | | | | 0.84 | | | | (1.10 | ) | | | — | | | | (1.10 | ) | | | 9.49 | | | | 0.90 | % | | | 0.90 | % | | | (0.62 | %) | | | 8.95 | % | | | 87,822 | | | | 0 | % |
| 4/1/2015 - 3/31/2016 | | | 9.92 | | | | (0.08 | ) | | | 0.11 | | | | 0.03 | | | | (0.20 | ) | | | — | | | | (0.20 | ) | | | 9.75 | | | | 0.86 | % | | | 0.86 | % | | | (0.78 | %) | | | 0.35 | % | | | 127,251 | | | | 82 | % |
| 4/1/2014 - 3/31/2015 | | | 9.41 | | | | (0.07 | ) | | | 0.79 | | | | 0.72 | | | | (0.21 | ) | | | — | | | | (0.21 | ) | | | 9.92 | | | | 0.86 | % | | | 0.86 | % | | | (0.76 | %) | | | 7.69 | % | | | 187,572 | | | | 141 | % |
PF Equity Long/Short Fund | | | | | | | | | | | | | | | | | | | | | | | | | | | | | | | | | | | | | | | | | | | | | |
| 4/1/2018 - 3/31/2019 | | | $9.71 | | | | $0.04 | | | | ($1.51 | ) | | | ($1.47 | ) | | | ($0.15 | ) | | | ($0.25 | ) | | | ($0.40 | ) | | | $7.84 | | | | 1.55 | % | | | 1.40 | % | | | 0.52 | % | | | (15.08 | %) | | | $37,870 | | | | 0 | % |
| 4/1/2017 - 3/31/2018 | | | 9.78 | | | | (0.04 | ) | | | 1.41 | | | | 1.37 | | | | (0.64 | ) | | | (0.80 | ) | | | (1.44 | ) | | | 9.71 | | | | 1.39 | % | | | 1.24 | % | | | (0.41 | %) | | | 14.45 | % | | | 57,123 | | | | 0 | % |
| 4/1/2016 - 3/31/2017 | | | 10.31 | | | | (0.10 | ) | | | 1.38 | | | | 1.28 | | | | (1.81 | ) | | | — | | | | (1.81 | ) | | | 9.78 | | | | 1.43 | % | | | 1.28 | % | | | (0.95 | %) | | | 13.10 | % | | | 71,081 | | | | 0 | % |
| 4/27/2015 - 3/31/2016 | | | 10.00 | | | | (0.12 | ) | | | 2.09 | | | | 1.97 | | | | (1.66 | ) | | | — | | | | (1.66 | ) | | | 10.31 | | | | 1.42 | % | | | 1.27 | % | | | (1.21 | %) | | | 20.01 | % | | | 167,587 | | | | 0 | % |
| | |
| See Notes to Financial Statements | | See explanation of references, if any, on C-13 |
C-12
PACIFIC FUNDS
FINANCIAL HIGHLIGHTS(Continued)
Selected per share, ratios and supplemental data for each year or period ended March 31, were as follows:
| (1) | For share classes that commenced operations after April 1, 2014, the first date reported represents the commencement date of operations for that share class. |
| (2) | Net investment income (loss) per share has been calculated using the average shares method. |
| (3) | The ratios are annualized for periods of less than one full year. |
| (4) | The ratios of expenses after expense reductions to average net assets are after advisory fee waivers and adviser expense reimbursements, if any, as discussed in Note 6 and Note 7B, respectively, in Notes to the Financial Statements. |
| (5) | The total returns include reinvestment of all dividends and capital gains distribution, if any. Total returns are not annualized for periods less than one full year. |
| (6) | The annualized ratios of expenses, excluding interest expense, after expense reductions to average net assets for the year ended March 31, 2019 are as follows: |
| | | | |
Fund | | Class P | |
PF Inflation Managed Fund | | | 0.55% | |
PF Managed Bond Fund | | | 0.55% | |
| (7) | Reflects an amount rounding to less than $0.01 per share. |
| | |
| See Notes to Financial Statements | | |
C-13
PACIFIC FUNDS
NOTES TO FINANCIAL STATEMENTS
1. ORGANIZATION
Pacific Funds Series Trust (which may be referred to as “Pacific Funds” or the “Trust”) is registered under the Investment Company Act of 1940 (“1940 Act”), as amended, as a diversified,open-end, management investment company, and is organized as a Delaware statutory trust. Pacific Life Fund Advisors LLC (“PLFA” or the “Investment Adviser”) serves as investment adviser to the Trust. As of March 31, 2019, the Trust was comprised of thirty-four separate active funds, seventeen of which are presented in these financial statements (each individually a “Fund”, and collectively the “Funds”). All of the Funds listed in the table below (collectively known as the “PF Underlying Funds”) offer Class P shares only, which are sold at net asset value:
| | | | |
| |
| PF Underlying Funds |
| | | |
| PF Inflation Managed Fund | | PFLarge-Cap Value Fund | | PF InternationalSmall-Cap Fund |
| | | |
| PF Managed Bond Fund | | PFMid-Cap Equity Fund (1) | | PF International Value Fund |
| | | |
| PF Short Duration Bond Fund | | PF Multi-Asset Fund | | PF Real Estate Fund |
| | | |
| PF Emerging Markets Debt Fund | | PFSmall-Cap Value Fund | | PF Currency Strategies Fund |
| | | |
| PF Developing Growth Fund | | PF Emerging Markets Fund | | PF Equity Long/Short Fund |
| | | |
| PF Growth Fund | | PF InternationalLarge-Cap Fund | | |
| (1) | Class P shares of the PFMid-Cap Equity are currently not available for investment by any fund of funds of the Trust. |
Presently, only the following Fund of Funds, the Investment Adviser, and certain of its affiliates can invest in Class P shares of the PF Underlying Funds.
| | |
| |
| Fund of Funds |
| | |
| Pacific FundsSM Portfolio Optimization Conservative* | | Pacific FundsSM Portfolio Optimization Growth* |
| | |
| Pacific FundsSM Portfolio Optimization Moderate-Conservative* | | Pacific FundsSM Portfolio Optimization Aggressive-Growth* |
| | |
| Pacific FundsSM Portfolio Optimization Moderate* | | Pacific FundsSM Diversified Alternatives |
| * | These Funds are collectively known as the “Portfolio Optimization Funds”. |
There is a separate annual report containing the financial statements for the Portfolio Optimization Funds and Pacific Funds Diversified Alternatives, which is available without charge.For information on how to obtain the annual report for these Funds, see the Where to Go for More Information section of this report on pageF-20.
2. SIGNIFICANT ACCOUNTING POLICIES
The following is a summary of the significant accounting policies followed by the Trust in the preparation of its financial statements in conformity with accounting principles generally accepted in the United States of America (“U.S. GAAP”), which may require management to make estimates and assumptions that affect the reported amounts of assets and liabilities and disclosures of contingent assets and liabilities at the date of the financial statements and the increases and decreases in net assets from operations during the reporting period. Actual results could differ from those estimates. Each Fund qualifies as an investment company under U.S. GAAP and follows the accounting and reporting guidance applicable to the Investment Companies Topic of U.S. GAAP. The following Accounting Standards Update(s) (each an “ASU”) were implemented during this reporting cycle.
On November 17, 2016, the FASB issued ASUNo. 2016-18,Statement of Cash Flows (Topic 230): Restricted Cash. This update intends to reduce diversity in the presentation of restricted cash and restricted cash equivalents in the statement. Any restricted cash and restricted cash equivalents is included as components of cash and cash equivalents as presented on the statement of cash flows (disclosures have been amended as reported on page C-10).
On August 28, 2018, the FASB issued ASUNo. 2018-13,Fair Value Measurement (Topic 820): Disclosure Framework – Changes to the Disclosure Requirements for Fair Value Measurement. This update intends to improve the effectiveness of disclosure requirements on fair value measurements, including the consideration of costs and benefits. As a result of the implementation of ASU2018-13, certain disclosures were removed from the Schedules of Investments and Note 3D.
A. INVESTMENT TRANSACTIONS AND INCOME
Investment transactions are recorded on a trade date basis. Securities purchased or sold on a when-issued or delayed-delivery basis as well as certain loan transactions and mortgage securities (such as Government National Mortgage Association (“GNMA”) securities) may be settled a month or more after the trade date. Dividend income is recorded on theex-dividend date, except certain dividends from foreign securities, which are recorded as soon as a Fund is informed of theex-dividend date or upon receipt of the dividend. A Fund’s estimated components of distributions received from real estate investment trusts may be considered income, return of capital distributions or capital gain distributions. Return of capital distributions are recorded as a reduction of cost of the related investments. Interest income, adjusted for amortization of premium and accretion of discount, is recorded daily on an accrual basis. Investment income is recorded net of foreign taxes withheld, if any. A Fund may be subject to foreign taxes on income, gains on investments, or currency repatriation, a portion of which may be recoverable. A Fund will accrue such taxes and reclaims as applicable, based upon the current interpretation of tax rules and regulations that exist in the markets in which that Fund invests. Facility fees and other fees (such as origination fees) received from floating rate senior loan notes purchased (see Note 4) by a Fund are amortized over the expected term of each applicable senior loan. Commitment fees received by a Fund relating to unfunded senior loan commitments are amortized to income over the period of the commitment. Consent fees, which are compensation for agreeing to changes in the terms of debt instruments, are recorded as interest income when received. Realized gains and losses from investment
D-1
PACIFIC FUNDS
NOTES TO FINANCIAL STATEMENTS (Continued)
transactions are recorded on the basis of identified cost. Gains and losses realized on principal paydowns from mortgage-backed and asset-backed securities are recorded as interest income. Litigation settlements on securities that were previously held are recorded as realized gains on investment securities.
B. DISTRIBUTIONS TO SHAREHOLDERS
Each Fund presented in these financial statements distributes all of its net investment income and realized capital gains, if any, to shareholders at least annually, although distributions could occur more often if advantageous to the applicable Fund and its shareholders. Dividends and distributions paid to shareholders are recorded on theex-dividend date. Each Fund may utilize the consent dividend provision of Section 565 of the Internal Revenue Code to effectively distribute income and capital gains for tax purposes even though they are not actually paid by the Fund.
C. FOREIGN CURRENCY TRANSLATION
The Trust’s accounting records are maintained in U.S. dollars. The market value of investments and other assets and liabilities, which are denominated innon-U.S. currencies, are translated into U.S. dollars based on the applicable exchange rates at the end of each business day. Purchases and sales of investments and income and expenses, denominated in foreign currencies, are translated into U.S. dollars at the exchange rates in effect on the transaction date.
None of the Funds separately report the effect of changes in foreign exchange rates from changes in market prices of investments held. Such changes are included with the net realized gain or loss and change in net unrealized appreciation or depreciation on investments. Other foreign currency transactions resulting in realized and unrealized gain or loss, if any, are reported separately as net realized gain or loss on foreign currency transactions and change in net unrealized appreciation or depreciation on foreign currencies.
D. ALLOCATION OF INCOME, EXPENSES, GAINS AND LOSSES
Certain Trust expenses directly attributable to a particular Fund are charged to that Fund (such as fund-specific transactional fees, proxies, liquidations, litigation, andorganizational/start-up costs). Generally, other Trust expenses are allocated proportionately among all the Funds in relation to the net assets of each Fund.
E. OFFERING COSTS
A new Fund bears all costs (or the applicablepro-rata share if there is more than one new Fund) associated with the offering expenses of the Fund, including legal, printing, and support services (see Notes 6 and 7A). All such costs are amortized as an expense of the new Fund on a straight-line basis over twelve months from commencement of operations.
F. NEW PRONOUNCEMENTS NOT YET ADOPTED
On March 30, 2017, the FASB issued ASU2017-08,Premium Amortization on Purchased Callable Debt Securities, which requires the premium associated with the purchase of callable debt securities be amortized to the earliest call date and no longer amortized through the contractual life of the instrument. The changes are effective for fiscal years, and interim periods within those fiscal years, beginning after December 15, 2018. Management has determined that this new accounting pronouncement will have no impact on the financial statements.
3. VALUATION AND FAIR VALUE MEASUREMENTS
A. VALUATION POLICY
The Trust’s Board of Trustees (the “Board”) has adopted a policy (“Valuation Policy”) for determining the value of the Trust’s investments each business day. Under the Valuation Policy, the Board has delegated certain functions to the Trustee Valuation Committee (“TVC”) and/or the Valuation Oversight Committee (“VOC”) or its delegate to determine the fair value of certain investments, which includes using third party pricing services. Each valuation committee that values the Funds’ investments does so in accordance with the Valuation Policy. Notes 3B and 3C below describe in greater detail the methodologies used to value each Fund’s investments.
B. DETERMINATION OF NET ASSET VALUE (“NAV”)
Each Fund presented in these financial statements is divided into shares. The price per share of a Fund’s shares is called its NAV. The NAV forms the basis for all transactions involving buying, selling, exchanging or reinvesting shares. Each Fund’s NAV is calculated by taking the total value of a Fund’s assets, subtracting a Fund’s liabilities, and dividing by the total number of shares outstanding.
Each Fund’s NAV is calculated once per day, every day the New York Stock Exchange (“NYSE”) is open, including days when foreign markets and/or bond markets are closed. For purposes of calculating the NAV, the value of investments held by each Fund is generally determined as of the scheduled closing time of the NYSE, which is usually 4:00 p.m. Eastern Time. Information that becomes known to the Trust or its agents after the scheduled close of the NYSE on a particular day will not normally be used to retroactively adjust the price of an investment for that same business day. Such information may include late dividend notifications, legal or regulatory matters, corporate actions, and corrected/adjusted last sales prices or official closing prices from an exchange.
Each Fund’s NAV will not be calculated on days when the NYSE is closed. There may be a delay in calculating the NAV if: (i) the NYSE is closed on a day other than a regular holiday or weekend, (ii) trading on the NYSE is restricted, (iii) an emergency exists (as determined by the SEC), making the sale of investments or determinations of NAV not practicable, or (iv) the SEC permits a delay for the protection of shareholders.
Certain Funds may hold investments that are primarily listed on foreign exchanges. Because those investments trade on weekends and other days when the Funds do not calculate their NAVs, the value of those investments may change on days when a shareholder will not be able to purchase or redeem shares of those Funds.
D-2
PACIFIC FUNDS
NOTES TO FINANCIAL STATEMENTS (Continued)
C. INVESTMENT VALUATION
The value of each security or other investment is the amount which a Fund might reasonably expect to receive for the investment upon its current sale in the ordinary course of business. For purposes of calculating the NAV, the value of investments held by each Fund is based primarily on pricing data obtained from various sources approved by the Board.
Domestic Equity Investments
For domestic equity investments (including exchange-traded funds), the Trust generally uses the official closing price or last reported sale price from an exchange as of the scheduled closing time of the NYSE and does not normally take into account trading, clearances or settlements that take place after the scheduled close of the NYSE. Investments for which no official closing price or last reported sales price are reported are generally valued at the mean between the most recent bid and ask prices obtained from approved pricing services, established market makers, or from broker-dealers.
Foreign Equity Investments
For foreign equity investments, the Trust generally uses the official closing price or the last reported sale price from the principal foreign exchanges, which may be earlier than the scheduled close of the NYSE. The Trust then may adjust for market events occurring between the close of certain foreign exchanges and the scheduled close of the NYSE. The Trust has retained an independent statistical analysis service approved by the Board to assist in determining the value of certain foreign equity investments. This service utilizes proprietary computer models based on historical performance of markets and other considerations to determine adjustments for market events. Quotations of foreign investments in foreign currencies and those valued using forward currency rates are converted into U.S. dollar equivalents using a foreign exchange quotation from an approved source.
Exchange Traded Futures Contracts, Option Contracts, and Swap Agreements
Exchange traded futures contracts, option contracts, and swap agreements are generally valued using the settlement price determined by the relevant exchange. Exchange traded futures contracts, option contracts, and swap agreements for which no settlement price is reported, are generally valued at the mean between the most recent bid and ask prices obtained from approved pricing services, established market makers, or from broker-dealers.
Over-the-Counter (“OTC”) Investments
OTC investments (including forward commitments, swap agreements and option contracts) are generally valued by approved pricing services that use evaluated prices from various observable market and other factors. Certain OTC swap agreements are valued using industry pricing models, broker quotes or other methodologies pursuant to the Trust’s Valuation Policy. Forward foreign currency contracts are generally valued using the mean between broker-dealer bid and ask quotations, and foreign currency exchange rates gathered from leading market makers.
Domestic and Foreign Debt Investments
Debt investments are generally valued using the mean between bid and ask prices provided by approved pricing and quotation services, which are based upon evaluated prices determined from various observable market and other factors. Certain debt investments are valued by using a benchmark, matrix, or other pricing methodology approved pursuant to the Valuation Policy.
Investments in Mutual Funds
Fund investments in affiliated or unaffiliated mutual funds are valued at their respective published NAVs.
Investment Values Determined by a Valuation Committee
The Trust’s Valuation Policy includes methodologies approved for valuing investments in circumstances where market quotations are not readily available. In such circumstances, the Valuation Policy provides that the value of such investments may be determined in accordance with Board approved formulas and methodologies (“Alternate Valuation Methodologies”). Under the Valuation Policy these Alternate Valuation Methodologies may include, among others, amortized cost, the use of broker quotes, the use of purchase prices, last reported sale/trade prices, and benchmark, proxy, and matrix pricing. In the event market quotations or Alternate Valuation Methodologies are not readily available or are determined to be unreliable, the value of the investments will be determined in good faith by the TVC, or determined by the VOC or its delegate pursuant to the Valuation Policy and then subsequently submitted for approval or ratification to either the TVC or the Board. Valuations determined by the TVC or the VOC or its delegate may require subjective inputs about the value of such investments. While these valuations are intended to estimate the value, a Fund might reasonably expect to receive upon the current sale of the investments in the ordinary course of business, such values may differ from the value that a Fund would actually realize if the investments were sold or values that would be obtained if a different valuation methodology had been used.
Market quotations are considered not readily available if: (i) the market quotations received are deemed unreliable or inaccurate, (ii) approved pricing services do not provide a valuation for a particular investment, or (iii) material events occur after the close of the principal market for a particular investment but prior to the scheduled close of the NYSE.
D. FAIR VALUE MEASUREMENTS AND DISCLOSURES
The Trust characterizes its investments as Level 1, Level 2, or Level 3 based upon the various inputs or methodologies used to value the investments. Under the Valuation Policy, the VOC determines the level in which each investment is characterized. The VOC includes investment, legal, and compliance members of the Trust’s Investment Adviser, accounting members of the Trust’s Administrator (see Note 6), and the Trust’s Chief Compliance Officer (“CCO”). The three-tier hierarchy of inputs is summarized in the three broad levels listed below:
D-3
PACIFIC FUNDS
NOTES TO FINANCIAL STATEMENTS (Continued)
| | • Level 1 - | Quoted prices (unadjusted) in active markets for identical investments |
| | • Level 2 - | Significant observable market-based inputs, other than Level 1 quoted prices, or unobservable inputs that are corroborated by market data |
| | • Level 3 - | Significant unobservable inputs that are not corroborated by observable market data |
The VOC reviews the Valuation Policy periodically (at least annually) to determine the appropriateness of the pricing methodologies used to value each Fund’s investments. The VOC also periodically evaluates how the Trust’s investments are characterized within the three-tier hierarchy and the appropriateness of third party pricing sources. The VOC also periodically (at least annually) conducts back-testing of the value of various Level 2 and Level 3 investments to evaluate the effectiveness of the pricing methodologies including the unobservable inputs used to value those investments. Such back-testing includes comparing Level 2 and Level 3 investment values to subsequently available exchange-traded prices, transaction prices, and/or observable vendor prices. All changes to the Valuation Policy are reported to the Board on a quarterly basis with material changes, as determined by the Trust’s CCO, requiring approval by the Board.
The inputs or methodologies used for characterizing each Fund’s investments within the three-tier hierarchy are not necessarily an indication of the relative risks associated with investing in those investments. Foreign equity investments that are valued with the assistance of a statistical research service approved by the Board (as described in Note 3C) and based on significant observable inputs are reflected as Level 2. Changes in valuation techniques may result in transfers into or out of an assigned level within the hierarchy. A summary of each Fund’s investments as of March 31, 2019, as categorized under the three-tier hierarchy of inputs, can be found in the Notes to Schedule of Investments section of each Fund’s Schedule of Investments.
The following is a description of valuation inputs and techniques that the Trust currently utilizes to fair value each major category of assets and liabilities:
Equity Securities (Common and Preferred Stock) and Mutual Funds
Equity securities (foreign or domestic) that are actively traded on a securities exchange are fair valued based on quoted prices from the applicable exchange, and to the extent valuation adjustments are not applied to these securities, they are categorized as Level 1. Equity securities traded on inactive markets and certain foreign equity securities are fair valued using significant other observable inputs which include broker-dealer quotes, recently executed transactions adjusted for changes in the benchmark index, or evaluated price quotes received from pricing vendors that take into account the integrity of the market sector and issuer, the individual characteristics of the security, and information received from broker-dealers and other market sources pertaining to the issuer or security. To the extent that these inputs are observable and timely, the fair values of these securities would be categorized as Level 2; otherwise the fair values would be categorized as Level 3.
Investments in registered mutual funds, including affiliated registered mutual funds, are valued at their respective published NAV and are categorized as Level 1.
U.S. Treasury Obligations
U.S. Treasuries are fair valued based on pricing models that evaluate the mean between the most recently published bid and ask price from market data sources. The models also take into consideration yield curves and data received from active market makers and inter-dealer brokers. Yield curves change daily in response to market conditions and are generally obtained from the new issue market and broker-dealer sources. To the extent that these inputs are observable and timely, the fair values of U.S. Treasury obligations would be categorized as Level 2; otherwise the fair values would be categorized as Level 3.
Mortgage-Backed and Asset-Backed Securities
Mortgage-backed securities, including government sponsored enterprises, are fair valued using pricing models based on inputs that include issuer type, coupon, and cash flows, mortgage prepayment projection tables and adjustable rate mortgage evaluations that incorporate index data, periodic and life caps, the next coupon reset date, and the convertibility of the bond. To the extent that these inputs are observable and timely, the fair values of mortgage-backed securities would be categorized as Level 2; otherwise the fair value would be categorized as Level 3.
Asset-backed securities and collateralized mortgage obligations are fair valued using pricing models based on a security’s average life volatility. The models also take into account tranche characteristics such as coupon average life, collateral types, ratings, the issuer and tranche type, underlying collateral and performance of the collateral, and discount margin for certain floating rate issues. To the extent that these inputs are observable and timely, the fair values of asset-backed securities and collateralized mortgage obligations would be categorized as Level 2; otherwise the fair values would be categorized as Level 3.
Municipal Bonds
Municipal bonds are fair valued based on pricing models that take into account, among other factors, information received from market makers and broker-dealers, current trades, bid lists, offerings, market movements, the callability of the bond, state of issuance, benchmark yield curves, and bond insurance. To the extent that these inputs are observable and timely, the fair values of municipal bonds would be categorized as Level 2; otherwise the fair values would be categorized as Level 3.
Foreign Government Bonds and Notes
Foreign government bonds and notes are fair valued based on discounted cash flow models that incorporate option adjusted spreads along with benchmark curves and credit spreads. In addition, international bond markets are monitored daily for information pertaining to the issuer and/or the specific issue. To the extent that these inputs are observable and timely, the fair values of foreign government bonds and notes would be categorized as Level 2; otherwise the fair values would be categorized as Level 3.
Corporate Bonds and Notes and U.S. Government Agency Issues
Corporate bonds held by a Fund are generally comprised of two main categories: investment grade bonds and high yield bonds. Investment grade bonds are reported at fair value using various inputs and techniques, which include broker-dealer quotations, live trading levels, recently executed transactions in securities of the issuer or comparable issuers, issuer credit information, and option-adjusted spread models where applicable. Fair values for high yield bonds are based primarily on broker-dealer quotations from relevant market makers and recently executed
D-4
PACIFIC FUNDS
NOTES TO FINANCIAL STATEMENTS (Continued)
transactions in securities of the issuer or comparable issuers. The broker-dealer quotations received are supported by credit analysis of the issuer that takes into consideration credit quality assessments, daily trading activity, and the activity of the underlying equities, listed bonds, and sector-specific trends. To the extent that these inputs are observable and timely, the fair values of corporate bonds would be categorized as Level 2; otherwise the fair values would be categorized as Level 3.
U.S. Government Agency Issues are reported at fair value using various inputs and techniques, which include broker-dealer quotations, live trading levels, recently executed transactions in securities of the issuer, issuer credit information, and option-adjusted spread models where applicable. To the extent that these inputs are observable and timely, the fair values of U.S. Government Agency Issues would be categorized as Level 2; otherwise the fair values would be categorized as Level 3.
Futures Contracts
Futures contracts and options on futures contracts that are actively traded on commodity exchanges are fair valued based on quoted prices from the applicable exchange, and to the extent valuation adjustments are not applied to futures contracts, they are categorized as Level 1. To the extent that valuation adjustments are observable and timely, the fair values of futures contracts would be categorized as Level 2; otherwise the fair values would be categorized as Level 3.
Option Contracts
Exchange listed option contracts that are traded on securities exchanges are categorized as Level 2 if they are fair valued based on quoted prices from the applicable exchange, or when valuation adjustments are applied to option contracts, or such valuation adjustments are observable and timely, otherwise the fair values would be categorized as Level 3. OTC option contracts are fair valued based on either broker-dealer quotations or pricing models that incorporate various inputs such as interest rates, credit spreads, currency exchange rates and volatility measurements forin-the-money,at-the-money, andout-of-the-money contracts based on a given strike price. To the extent that these inputs are observable and timely, the fair values of OTC option contracts would be categorized as Level 2; otherwise the fair values would be categorized as Level 3.
Forward Foreign Currency Contracts
Forward foreign currency contracts are fair valued using the mean between broker-dealer bid and ask quotations, and forward foreign currency exchange rates gathered from leading market makers. To the extent that these inputs are observable and timely, the fair values of forward foreign currency contracts would be categorized as Level 2; otherwise the fair values would be categorized as Level 3.
Swap Agreements
Interest Rate Swaps –Interest rate swaps that are traded and cleared on a securities exchange or swap execution facility are fair valued based on quoted prices from the applicable exchange and are categorized as Level 2. Interest rate swaps tradedover-the-counter are fair valued using pricing models that are based on real-time snap shots of relevant interest rate curves that are built using the most actively traded securities for a given maturity. The pricing models also incorporate cash and money market rates. In addition, market data pertaining to interest rate swaps are monitored regularly to ensure that interest rates are properly depicting the current market rate. To the extent that these inputs are observable and timely, the fair values of interest rate swaps would be categorized as Level 2; otherwise the fair values would be categorized as Level 3.
Credit Default Swaps– Credit default swaps that are traded and cleared on a securities exchange or swap execution facility are fair valued based on quoted prices from the applicable exchange and are categorized as Level 2. Credit default swaps tradedover-the-counter are fair valued using pricing models that take into account, among other factors, information received from market makers and broker-dealers, default probabilities from index specific credit spread curves, recovery rates, and cash flows. To the extent that these inputs are observable and timely, the fair values of credit default swaps would be categorized as Level 2; otherwise the fair values would be categorized as Level 3.
Total Return Swaps– Total return swaps that are traded and cleared on a securities exchange or swap execution facility are fair valued based on quoted prices from the applicable exchange and are categorized as Level 2. Total Return swaps tradedover-the-counter are fair valued using pricing models that take into account among other factors, index spread curves, nominal values, modified duration values and cash flows. To the extent that these inputs are observable and timely, the fair values of total return swaps would be categorized as Level 2; otherwise the fair values would be categorized as Level 3.
Total Return Basket Swaps– The value of total return basket swaps are derived from a combination of (i) the net value of the underlying positions, which are valued daily using the last sale or closing price on the principal exchange on which the securities are traded; (ii) financing costs; (iii) the value of dividends or accrued interest; (iv) cash balances within the swap; and (v) other factors, as applicable. To the extent that these inputs are observable and timely, the fair values of total return basket swaps would be categorized as Level 2; otherwise the fair values would be categorized as Level 3.
Volatility Swaps– Volatility swaps tradedover-the-counter are fair valued using pricing models that are based on real-time snap shots of relevant discount interest rate curves, volatility inputs, and present value of future cash flows, which are observable from the market and built using the most actively traded securities for a given maturity. In addition, market data pertaining to volatility swaps are monitored regularly to ensure that volatility rates are properly depicting the current volatility rate. To the extent that these inputs are observable and timely, the fair values of volatility swaps would be categorized as Level 2; otherwise the fair values would be categorized as Level 3.
Senior Loan Notes
Floating rate senior loan notes (“Senior Loans”) are fair valued based on a quoted price received from a single broker-dealer or an average of quoted prices received from multiple broker-dealers or valued relative to other benchmark securities when broker-dealer quotes are unavailable. To the extent that these inputs are observable, the fair values of Senior Loans would be categorized as Level 2; otherwise the fair values would be categorized as Level 3.
D-5
PACIFIC FUNDS
NOTES TO FINANCIAL STATEMENTS (Continued)
Unfunded loan commitments on senior loan participations and assignments, if any, are marked to market daily and valued according to the Trust’s valuation policies and procedures. Any outstanding unfunded loan commitments are presented in the Notes to Schedules of Investments section of each applicable Fund’s Schedule of Investments. Any applicable net unrealized appreciation or depreciation at the end of the reporting period is recorded as an asset (unfunded loan commitment appreciation) or a liability (unfunded loan commitment depreciation) and any change in net unrealized appreciation or depreciation for the reporting period is recorded as a change in net unrealized appreciation or depreciation on unfunded loan commitment. As of March 31, 2019, none of the Funds presented in this report had any unfunded loan commitments.
Credit-Oriented Investments
Fornon-publicly traded instruments that represent debt to the Trust, the carrying amount approximates fair value due to the relatively short-term maturity of these financial instruments. The Trust may use market transactions for identical or similar instruments or a market yield approach, which utilizes expected future cash flows that are discounted using estimated current market rates. Discounted cash flow calculations may be adjusted to reflect current market conditions and/or the perceived credit risk of each Fund as applicable. Consideration may also include an evaluation of collateral. To the extent that these inputs are observable and timely, the fair values for credit-oriented investments are categorized as Level 2; otherwise the fair values would be categorized as Level 3.
4. INVESTMENTS AND RISKS
General Investment Risks
An investment in each Fund represents an indirect investment in the assets owned by that Fund. As with any mutual fund, the value of the assets owned by each Fund may move up or down, and as a result, an investment in a Fund at any point in time may be worth more or less than the original amount invested.
A Fund’s transactions in listed securities are settled/paid for upon delivery to or from their counterparties; therefore, the risk of counterparty default for listed securities is considered minimal, as delivery of securities sold is only made once a Fund has received payment. Payment is made on a purchase once the securities have been delivered by the counterparty. The trade will fail if either party fails to meet its obligations.
Market and Regulatory Risks
Events in the financial markets and economy may cause volatility and uncertainty and affect Fund performance. Market events may affect a single issuer, industry, sector, or the market as a whole. In addition, because of interdependencies between markets, events in one market may adversely impact other markets or issuers in which a Fund invests in unforeseen ways. Traditionally liquid investments may experience periods of diminished liquidity. During a general downturn in the financial markets, multiple asset classes may decline in value and a Fund may lose value, regardless of the individual results of the securities and other instruments in which the Fund invests. Governmental and regulatory actions, including tax law changes, may also impair Fund management and have unexpected or adverse consequences on particular markets, strategies, or investments. Future market or regulatory events may impact a Fund in unforeseen ways, such as causing the Fund to alter its existing strategies or potentially, to liquidate and close.
Equity Investments
Stock markets are volatile. Equity investments tend to go up or down in value, sometimes rapidly and unpredictably, in response to many factors, including a company’s historical and prospective earnings, the value of its assets, general economic conditions, interest rates, investor perceptions, and market liquidity. Due to the complexities of markets, events in one market or sector may adversely impact other markets or sectors.
Debt Investments
Debt investments are subject to many risks, including, but not limited to, interest rate risk, credit risk, market and regulatory risk, price volatility, and liquidity risk, which may affect their value. There is a risk that an issuer or guarantor of a debt investment might be unable or unwilling to meet its financial obligations and might not make interest or principal payments on an instrument when those payments are due (“default”). Defaults may potentially reduce a Fund’s income or ability to recover amounts due and may reduce the value of the debt investment, sometimes dramatically. High yield/high risk or “junk” securities may be more volatile than higher rated securities. High yield/high risk securities (including loans) are typically issued by companies that are highly leveraged, less creditworthy, or financially distressed and are considered to be mostly speculative in nature (high risk), subject to greater liquidity risk, and subject to a greater risk of default than higher rated securities, especially during periods of economic uncertainty or during economic downturns. Debt investments, including bonds, fixed rate loans, and short-term instruments may be affected by changes in interest rates. Debt investments with longer durations tend to be more sensitive to changes in interest rates, making them more volatile than debt investments with shorter durations or floating or adjustable interest rates. The value of debt investments may fall when interest rates rise. Certain debt investments may be difficult to value, purchase, and sell, particularly during adverse market conditions, because there is a limited market for the investment or there are restrictions on resale.
Given the historically low interest rate environment in the U.S., risks associated with rising interest rates are heightened. The negative impact on debt investments from potential interest rate increases could be swift and significant, including falling market values, increased redemptions and reduced liquidity. Substantial redemptions from bond and other income funds may worsen that impact. Additionally, regulations applicable to and changing business practices of broker-dealers that make markets in debt investments may result in those broker-dealers restricting their market making activities for certain debt investments, which may reduce the liquidity and increase the volatility of such debt investments.
Certain asset-backed instruments, such as collateralized debt obligations, collateralized mortgage obligations, and other mortgage-related securities, structured investment vehicles, and other debt investments may have exposure to subprime loans or subprime mortgages, which are loans to persons with lower credit ratings. These instruments may present credit risk that is not transparent and that is greater than indicated by their ratings. The value of these instruments may be more acutely affected by downturns in the credit markets or the real estate market than certain other investments, and it may be difficult to value these instruments because of a thin secondary market.
D-6
PACIFIC FUNDS
NOTES TO FINANCIAL STATEMENTS (Continued)
Foreign and Emerging Markets Investments
Exposure to foreign markets can involve additional risks relating to market, economic, political, regulatory, geopolitical, or other conditions. These factors can make foreign investments more volatile and less liquid than U.S. investments. In addition, foreign markets can react differently to these conditions than the U.S. market. Markets and economies throughout the world are becoming increasingly interconnected, and conditions or events in one market, country or region may adversely impact investments or issuers in another market, country, or region. Investments in or exposure to investments in emerging market countries may be riskier than investments in or exposure to investments in U.S. and certain developed markets. Risk may be more enhanced for investments in or exposure to investments in frontier market countries.
The Funds may face potential risks associated with the United Kingdom’s vote on June 23, 2016 to leave the European Union (the “EU”), commonly referred to as “Brexit.” There are considerable uncertainties about the repercussions resulting from Brexit, including the impact on trade agreements, regulations, and treaties. The exact time frame for the implementation of Brexit is unknown and may change. Brexit may also increase the likelihood that other EU members may decide to leave the EU. These potential consequences may result in increased market volatility and illiquidity in the United Kingdom, the EU, and other financial markets, as well as slower economic growth and fluctuations in exchange rates. Any of these events may have a significant adverse effect on global markets and economies, which in turn could negatively impact the value of the Funds’ investments.
The countries listed in the Schedules of Investments for individual investment holdings (each a “Holding”) are each considered the country of risk to which a Holding, and therefore the Fund, is exposed. Each Holding’s country of risk is obtained from a third-party source that uses factors such as reporting currency, sales/revenue and location of management of the Holding’s issuer to determine country of risk. The country of risk may not be exclusive, however, as there may be other countries of risk to which a Holding is exposed that are not disclosed, although the country identified is expected to be the primary country of risk for that Holding. A Holding is generally subject to greater country risk based on where it conducts business or is economically tied to rather than where it is formed or incorporated. Foreign markets risks may include currency risk, market and regulatory risk, liquidity risk, emerging markets risk, frontier markets risk and geographic focus risk, among other risks.
Senior Loan Participations and Assignments
Certain Funds may invest in Senior Loans of domestic or foreign corporations, partnerships, and other entities (“Borrowers”), the interest rates of which float or adjust periodically based upon a specified adjustment schedule, benchmark indicator, or prevailing interest rates. Senior Loans generally pay interest at rates which are periodically redetermined by reference to a base lending rate plus a premium. These base lending rates generally include prime rates of one or more major U.S. banks, London Interbank Offered Rates (“LIBOR”) or certificates of deposit rates. Senior Loans often require prepayments from excess cash flow or permit the Borrower to repay at its election. The degree to which Borrowers repay cannot be predicted with accuracy. As a result, the actual maturity may be substantially less than the stated maturities. Senior Loans are exempt from registration under the Securities Act of 1933, may contain certain restrictions on resale, and cannot be sold publicly. A Fund’s investments in Senior Loans may be in the form of participations in loans or assignments of all or a portion of loans from third parties.
When a Fund purchases assignments, it acquires all the rights and obligations under the loan agreement of the assigning lender. Assignments may, however, be arranged through private negotiations between potential assignees and potential assignors, and the rights and obligations acquired by the purchaser of an assignment may differ from, and be more limited than those held by the assigning lender.
When a Fund purchases a participation of a Senior Loan interest, the Fund typically enters into a contractual agreement with the lender or other third party selling the participation. A participation interest in Senior Loans includes the right to receive payments of principal, interest, and any fees to which it is entitled from the lender and only upon receipt by the lender of payments from the Borrower, but not from the Borrower directly. When investing in a participation interest, if a Borrower is unable to meet its obligations under a loan agreement, a Fund generally has no right to enforce compliance with the terms of the loan agreement. As a result, the Fund assumes the credit risk of the Borrower, the selling participant, and any other persons that are interpositioned between the Fund and the Borrower. If the lead lender in a typical lending syndicate becomes insolvent, enters Federal Deposit Insurance Corporation (“FDIC”) receivership or, if not FDIC insured, enters into bankruptcy, the Fund may incur certain costs and delays in receiving payment or may suffer a loss of principal and/or interest. As of March 31, 2019, no participation interest in Senior Loans was held by any of the Funds presented in these financial statements.
Inflation-Indexed Bonds
Certain Funds may invest in inflation-indexed bonds. Inflation-indexed bonds are debt securities whose principal value is periodically adjusted to the rate of inflation. The interest rate on these bonds is generally fixed at issuance at a rate lower than typical bonds. Over the life of an inflation-indexed bond, however, interest will be paid based on a principal value, which is adjusted for inflation. Any increase or decrease in the principal amount of an inflation-indexed bond will result in an adjustment to interest income.
Mortgage-Related and Other Asset-Backed Securities
Certain Funds may invest in mortgage-related and other asset-backed securities. These securities include mortgage pass-through securities, collateralized mortgage obligations (“CMOs”), collateralized loan obligations (“CLOs”), mortgage dollar rolls, CMO residuals, stripped mortgage-backed securities (“SMBS”), and other securities that directly or indirectly represent a participation in, or are secured by and payable from, mortgage loans secured by real property. Mortgage-related and other asset-backed securities are debt securities issued by a corporation, trust, or custodian, or by a U.S. Government agency or instrumentality, that are collateralized by a pool of mortgages, mortgage pass-through securities, U.S. Government securities or other assets. The value of some mortgage-related and asset-backed securities may be particularly sensitive to changes in prevailing interest rates. Early repayment of principal on some mortgage-related securities may expose a Fund to a lower rate of return upon reinvestment of principal. The value of these securities may fluctuate in response to the market’s perception of the creditworthiness of the issuers. Additionally, although mortgage and mortgage-related securities are generally supported by some form of government or private guarantee and/or insurance, there is no assurance that private guarantors or issuers will meet their obligations.
D-7
PACIFIC FUNDS
NOTES TO FINANCIAL STATEMENTS (Continued)
SMBS represent a participation in, or are secured by and payable from, mortgage loans on real property, and may be structured in classes with rights to receive varying proportions of principal and interest. SMBS include interest-only securities (“IOs”), which receive all of the interest, and principal-only securities (“POs”), which receive the entire principal. The cash flows and yields on IOs are extremely sensitive to the rate of principal payments (including prepayments) on the underlying mortgage loans. If the underlying mortgages experience higher than anticipated prepayments, an investor in IOs of SMBS may fail to recoup fully its initial investment, even if the IOs are highly rated or are derived from securities guaranteed by the U.S. Government. Unlike other debt and other mortgage-backed securities, the market value of IOs tends to move in the same direction as interest rates. As prepayments on the underlying mortgages of POs increase, the yields on POs increase. Payments received from IOs are recorded as interest income. Because principal will not be received at the maturity of an IO, adjustments are made to the book value of the security on the coupon date until maturity. These adjustments are included in interest income. Payments received from POs are treated as reductions to the cost and par value of the securities. Any excess principal paydown gains or losses associated with the payments received are recorded as interest income.
U.S. Government Securities
Certain Funds may invest in securities issued by U.S. Government agencies or government-sponsored enterprises. U.S. Government securities are obligations of, and in certain cases, guaranteed by the U.S. Government, its agencies, or instrumentalities. Some U.S. Government securities, such as Treasury Bills, Treasury Notes, Treasury Bonds, and securities guaranteed by GNMA (or “Ginnie Mae”), are supported by the full faith and credit of the U.S. Government; others, such as those of the Federal Home Loan Bank, are supported by the right of the issuer to borrow from the U.S. Department of the Treasury (the “U.S. Treasury”); others, such as those of the Federal National Mortgage Association (“FNMA” or “Fannie Mae”), are supported by the discretionary authority of the U.S. Government to purchase the agency’s obligations. Securities not backed by the full faith and credit of the U.S. Government may be subject to a greater risk of default. U.S. Government securities may include zero coupon securities, which do not distribute interest on a current basis and tend to be subject to greater risk than interest-paying securities of similar maturities.
Government-related guarantors (i.e., not backed by the full faith and credit of the U.S. Government) include FNMA and the Federal Home Loan Mortgage Corporation (“FHLMC” or “Freddie Mac”). FNMA and FHLMC are government-sponsored corporations, the common stocks of which are owned entirely by private stockholders. FNMA purchases conventional (i.e., not insured or guaranteed by any government agency) residential mortgages from a list of approved seller/servicers which include state and federally chartered savings and loan associations, mutual savings banks, commercial banks and credit unions, and mortgage bankers. Pass-through securities issued by FNMA are guaranteed as to timely payment of principal and interest by FNMA, but are not backed by the full faith and credit of the U.S. Government. FHLMC issues Participation Certificates (“PCs”), which are pass-through securities, each representing an undivided interest in a pool of residential mortgages. FHLMC guarantees the timely payment of interest and ultimate collection of principal, but PCs are not backed by the full faith and credit of the U.S. Government.
When-Issued Securities
Certain Funds may purchase and sell securities on a when-issued basis, including To Be Announced (“TBA”) securities. These transactions are made conditionally because a security, although authorized, has not yet been issued in the market. A commitment by a Fund is made regarding these transactions to purchase or sell securities for a predetermined price or yield, with payment and delivery taking place beyond the customary settlement period. A Fund may sell when-issued securities before they are delivered, which may result in a capital gain or loss. Risk may arise upon entering these contracts from the potential inability of a counterparty to meet the terms of their contracts, or if the issuer does not issue the securities due to political, economic, or other factors.
Delayed-Delivery Transactions
Certain Funds may purchase or sell securities on a delayed-delivery basis, including TBA securities. Payment and delivery may take place after the customary settlement period for that security. The price or yield of the underlying securities is fixed at the time the transaction is negotiated. When delayed-delivery purchases are outstanding, a Fund will set aside, and maintain until the settlement date in a segregated account, liquid assets in an amount sufficient to meet the purchase price. When purchasing a security on a delayed-delivery basis, a Fund assumes the rights and risks of ownership of the security, including the risk of price and yield fluctuations, and takes such fluctuations into account when determining its NAV. A Fund may dispose of or renegotiate a delayed-delivery transaction after it is entered into, and may sell delayed-delivery securities before they are delivered, which may result in a capital gain or loss. When a Fund has sold a security on a delayed-delivery basis, the Fund does not participate in future gains and losses with respect to the security.
Repurchase Agreements
Certain Funds may enter into repurchase agreements with institutions that the Investment Adviser orsub-adviser has determined are creditworthy. Under the terms of a typical repurchase agreement, a Fund takes possession of an underlying security (collateral) subject to an obligation of the seller to repurchase, and a Fund to resell the security at an agreed upon price and time. Repurchase agreements permit a Fund to maintain liquidity and potentially earn income over periods of time that may be as short as overnight. The collateral for all repurchase agreements are held in safekeeping for the benefit of the Funds at the Trust’s custodian, or broker-dealer, or a designatedsub-custodian under atri-party repurchase agreement. All repurchase agreements entered into by a Fund are collateralized with cash or securities of a type that the Fund is permitted to hold. The collateral is evaluated daily to ensure its market value equals or exceeds the current market value of the repurchase agreements, including accrued interest, except in the case of a repurchase agreement entered into for the purposes of selling a security short, where the value of the collateral delivered to a Fund must equal or exceed 95% of the value of the repurchase price during the term of the repurchase agreement. The terms of a repurchase agreement entered into for the purposes of selling a security short may provide that the cash purchase price paid by a Fund is more than the value of the collateral received that it is obligated to return to the counterparty under the repurchase agreement. Since in such a transaction, a Fund normally will have used the collateral received to settle the short sale, a Fund will segregate liquid assets equal to the marked to market value of the collateral received that it is obligated to return to the counterparty under the repurchase agreement.
D-8
PACIFIC FUNDS
NOTES TO FINANCIAL STATEMENTS (Continued)
In the event of default on the obligation to repurchase a security held by a Fund as collateral, the Fund has the right to liquidate the security and apply the proceeds to the counterparty’s obligations to the Fund under the repurchase agreement. Upon an event of default under the repurchase agreement, if the seller defaults and the value of the collateral declines or if the seller enters an insolvency proceeding, realization of the collateral by the Fund may be delayed, limited, or wholly denied.
Borrowings and Other Financing Transactions
The following disclosures contain information on a Fund’s ability to lend or borrow cash or securities to the extent permitted under the 1940 Act, which may be viewed as borrowing or financing transactions by a Fund. The location and fair value amounts of these instruments are described below. For a detailed description of credit and counterparty risks that can be associated with borrowings and other financing transactions see Note 5.
Reverse Repurchase Agreements –Certain Funds may enter into reverse repurchase agreements. In a reverse repurchase agreement, a Fund sells a security that it holds to a financial institution with an agreement to repurchase the same security at an agreed-upon price and date. Securities sold under reverse repurchase agreements are recorded as a liability. Interest payments made are recorded as a component of interest expense. In periods of increased demand for the security, a Fund may receive a fee for use of the security by the counterparty, which may result in interest income to the Fund. A reverse repurchase agreement involves the risk that the market value of the security sold by a Fund may decline below the repurchase price of the security. A Fund will segregate assets determined to be liquid by the manager or otherwise cover its obligations under reverse repurchase agreements.
Sale-Buybacks Financing Transactions– Certain Funds may enter into transactions referred to as sale-buybacks. A sale-buyback transaction consists of a sale of a security by a Fund to a financial institution, the counterparty, with a simultaneous agreement to repurchase the same or substantially the same security at an agreed-upon price and date. Such transactions are recorded as secured borrowings. A Fund is not entitled to receive principal and interest payments, if any, made on the security sold to the counterparty during the term of the agreement. The agreed-upon proceeds for securities to be repurchased by a Fund are recorded as a liability. A Fund will recognize net income represented by the price differential between the price received for the transferred security and the agreed-upon repurchase price. This is commonly referred to as the price drop. A price drop consists of (i) the foregone interest and inflationary income adjustments, if any, a Fund would have otherwise received had the security not been sold and (ii) the negotiated financing terms between a Fund and counterparty. Foregone interest and inflationary income adjustments, if any, are recorded as components of interest income. Interest payments based upon negotiated financing terms made by the Fund to counterparties are recorded as a component of interest expense. In periods of increased demand for the security, a Fund may receive a fee for use of the security by the counterparty, which may result in interest income to a Fund. A Fund will segregate assets determined to be liquid or otherwise cover its obligations under sale-buyback transactions.
Short Sales –Certain Funds may enter into short sales. A short sale is a transaction in which a Fund sells securities it does not own. A Fund’s use of short sales involves the risk that the price of the security in the open market may be higher when purchased to close out the Fund’s short position, resulting in a loss to the Fund. Such a loss is theoretically unlimited because there is no limit on the potential increase in the price of a security or guarantee as to the price at which the manager would be able to purchase the security in the open market.
When a Fund sells securities short, it must borrow those securities to make delivery to the buyer. The Fund incurs an expense for such borrowing. The Fund may be required to pledge a portion of its assets to the broker as collateral for the borrowed securities. The Fund may not be able to purchase a security that it needs to deliver to close out a short position at an acceptable price. This may result in losses and/or require the Fund to sell long positions before the manager had intended. A Fund may not be able to successfully implement its short sale strategy, which may limit its ability to achieve its investment goal, due to limited availability of desired or eligible securities, the cost of borrowing securities, regulatory changes limiting or barring short sales, or for other reasons. Securities sold in short sale transactions and the interest and dividends payable on such securities, if any, are recorded as a liability.
The use of proceeds received from selling short to purchase additional securities (long positions) results in leverage, which may increase a Fund’s exposure to long positions. Leverage could magnify gains and losses and, therefore, increase a Fund’s volatility.
Segregation and Collateral
If a Fund engages in certain transactions, such as derivative investments, repurchase agreements, orrepurchase-to-maturity transactions accounted for as secured borrowings, it may require collateral in the form of cash or investments to be held in segregated accounts at the Trust’s custodian, with an exchange or clearing member firm, or segregated on the Fund’s books and records maintained by the custodian and/or the manager of the Fund. In each instance that segregation of collateral is required, it is done so in accordance with the 1940 Act and/or any interpretive guidance issued by the SEC. In the event of the counterparty default on the transaction, a Fund has the right to liquidate the collateral and apply the proceeds to the counterparty’s obligations to that Fund. Upon an event of default, if the seller defaults and the value of the collateral declines, or if the seller enters an insolvency proceeding, realization of the collateral by the Fund may be delayed, limited or wholly denied. There is also a possibility that a Fund could experience a delay in selling investments that are segregated as collateral.
5. DERIVATIVE INVESTMENTS AND RISKS, AND ENFORCEABLE MASTER NETTING ARRANGEMENTS
A. PRINCIPAL MARKET RISKS MANAGED BY INVESTING IN DERIVATIVES
Derivative instruments are investments whose values are tied to the value of an underlying security or asset, a group of assets, interest rates, exchange rates, currency or an index. Certain Funds are permitted to invest in derivative instruments, including, but not limited to, futures contracts, option contracts, forward foreign currency contracts, and swap agreements. Derivatives may have little or no initial cash investment value relative to their market value exposure and therefore can produce significant gains or losses in excess of their cost. This is sometimes referred to as leverage. Leverage can magnify a Fund’s gains and losses and therefore increase its volatility. A Fund’s investments in derivatives may increase, decrease or change the level or types of exposure to certain risk factors. The primary risks a Fund may attempt to manage through investing in derivative instruments include, but are not limited to, interest rate, foreign investments and currency, price volatility, and credit (including counterparty) risks.
D-9
PACIFIC FUNDS
NOTES TO FINANCIAL STATEMENTS (Continued)
Interest Rate Risk– A Fund may be exposed to interest rate risk through investments in debt securities. Interest rate risk is the risk that debt securities will decline in value as a result of changes in interest rates. For example, the value of bonds, fixed rate loans and short-term money market instruments may decline in value when interest rates rise. In a low interest rate environment, the risks associated with rising interest rates are heightened. Debt securities with longer durations tend to be more sensitive to changes in interest rates, making them more volatile than debt securities with shorter durations or money market instruments. Therefore, duration is a potentially useful tool to measure the sensitivity of a debt security’s yield (market price to interest rate movement). To manage these risks, certain Funds may invest in derivative instruments tied to interest rates.
Foreign Investments and Currency Risk –A Fund may be exposed to foreign investments and/or currency risk through direct investment in securities or through options, futures or currency transactions. The prices of foreign securities that are denominated in foreign currencies are affected by the value of the U.S. dollar. With respect to securities denominated in foreign currencies, in general, as the value of the U.S. dollar rises, the U.S. dollar price of a foreign security will fall. As the value of the U.S. dollar falls, the U.S. dollar value of the foreign security will rise. Currency rates in foreign countries may fluctuate significantly over short periods of time for a number of reasons. Foreign investments may be riskier than U.S. investments for many reasons, including changes in currency exchange rates, unstable political and economic conditions, a lack of adequate and timely company information, differences in the way securities markets operate, relatively lower market liquidity, less stringent financial reporting and accounting guidance and controls, less secure foreign banks or securities depositories than those in the U.S., foreign taxation issues, and foreign controls on investments. As a result, a Fund’s investments in foreign currency-denominated securities and other foreign investments may reduce the returns of the Fund. To manage these risks, certain Funds may invest in derivative instruments tied to foreign investments and/or currencies.
Price Volatility Risk –Derivatives tied to equity and debt securities are exposed to potential price volatility. Debt securities are affected by many factors, including prevailing interest rates, market conditions, and market liquidity. Volatility of below investment grade debt securities (including loans) may be relatively greater than for investment grade debt securities. Equity securities tend to go up or down in value, sometimes rapidly and unpredictably. The prices of equity securities change in response to many factors, including a company’s historical and prospective earnings, the value of its assets, general economic conditions, interest rates, investor perceptions, and market liquidity. Due to the complexities of markets, events in one market or sector may adversely impact other markets or sectors. To manage these risks, certain Funds may invest in various derivative instruments. Derivative instruments may be used to manage a Fund’s exposure to price volatility risk but may also be subject to greater price volatility than investments in traditional securities. The value of commodity-linked derivative instruments may be affected by changes in overall market movements, commodity index volatility, changes in interest rates, or factors affecting a particular industry or commodity, such as drought, floods, weather, livestock disease, embargoes, tariffs, and international economic, political, and regulatory developments.
Credit and Counterparty Risk –Credit risk is the risk that a debt security’s issuer (or borrower or counterparty) will be unable or unwilling to meet its financial obligations (e.g., may not be able to make principal and/or interest payments when they are due or otherwise default on other financial terms) and/or may go bankrupt. This is also sometimes described as counterparty risk. A Fund may lose money if the issuer or guarantor of debt security, or counterparty of a derivative contract, repurchase or reverse repurchase agreement, or a loan of Fund securities, is unable or unwilling to make timely principal and/or interest payments, or to otherwise honor its obligations. A Fund may attempt to minimize concentrations of credit risk by undertaking transactions with a large number of borrowers or counterparties on recognized and reputable exchanges. A Fund’s investments in debt investments may range in quality from those rated in the lowest category in which it is permitted to invest to those rated in the highest category by a rating agency, or if unrated, determined by the manager to be of comparable quality.
Similar to credit risk, a Fund may be exposed to counterparty risk, or the risk that an institution or other entity with which a Fund has unsettled or open transactions will default. Financial assets of counterparties, which potentially expose a Fund to counterparty risk, consist mainly of cash due from counterparties and investments. Certain managers may attempt to minimize credit risks to the Funds by performing extensive reviews of each counterparty, entering into transactions with counterparties that the manager believes to be creditworthy at the time of the transaction and requiring the posting of collateral in applicable transactions. To manage these risks, certain Funds may invest in derivative instruments tied to a security issuers’ financial strength.
B. DERIVATIVE INVESTMENTS
In addition to managing the market risks described above, certain Funds, if permitted by their investment objectives, may also invest in derivatives for purposes of hedging, duration management, to gain exposure to specific investment opportunities, as a substitute for securities, to enhance returns, or to otherwise help achieve a Fund’s investment goal. Each derivative instrument and the reasons a Fund invested in derivatives during the reporting period are discussed in further detail below.
Futures Contracts –A futures contract is a commitment to buy or sell a specific amount of a financial instrument or commodity at a negotiated price on a specified future date. Futures contracts are subject to the possibility of illiquid markets, and the possibility of an imperfect correlation between the value of the instruments and the underlying securities. Initial margin is deposited with a futures broker upon entering into futures contracts and can be funded with either cash or securities, in accordance with the initial margin requirements of the broker or the exchange. During the period a futures contract is open, changes in the value of the contract are recognized as unrealized appreciation or depreciation bymarking-to-market on a daily basis to reflect the market value of the contract at the end of each day’s trading. Variation margin receivables or payables represent the difference between the change in unrealized appreciation and depreciation on the open contracts and the cash deposits made on the margin accounts. When the contract is closed, a Fund records a realized gain or loss equal to the difference between the proceeds from (or cost of) the closing transaction and the Fund’s cost of the contract. Futures contracts are valued at the settlement price established each day by the board of trade or exchange on which they are traded.
D-10
PACIFIC FUNDS
NOTES TO FINANCIAL STATEMENTS (Continued)
During the reporting period, the following Funds entered into futures contracts for the reasons described: the PF Inflation Managed and PF Managed Bond Funds used futures contracts to manage interest rate risk exposure, as a substitute for cash bond exposure, and for purposes of liquidity. The PF Short Duration Bond Fund entered into interest rate futures to manage duration and yield curve exposure. The PF Multi-Asset Fund entered into futures contracts to gain exposure to various markets, for purposes of hedging, and as part of the Fund’s investment strategy. The PF Equity Long/Short Fund used futures to gain exposure to equity markets.
Option Contracts –An option contract is a commitment that gives the purchaser of the contract the right, but not the obligation, to buy or sell an underlying reference asset at a specific price on or before a specified future date. On the other hand, the writer of an option contract is obligated, upon the exercise of the option, to buy or sell an underlying reference asset at a specific price on or before a specified future date. A swaption is an option contract granting the owner the right to enter into an underlying swap. Inflation-capped options are options on U.S. inflation rates at a stated strike price. The seller of an inflation-capped option receives an upfront premium and in return the buyer receives the right to receive a payment at the expiration of the option if the cumulative annualized inflation rate over the life of the option is above (for caps) or below (for floors) the stated strike price. The purpose of inflation-capped options is to protect the buyer from inflation erosion above a certain rate on a given notional exposure. A floor can be used to give downside protection to investments in inflation-linked products below a certain rate on a given notional exposure. Writing put options or purchasing call options tends to increase a Fund’s exposure to the underlying instrument. Writing call options or purchasing put options tends to decrease a Fund’s exposure to the underlying instrument. When a Fund writes or purchases a call, put, or inflation-capped option, an amount equal to the premium received or paid by the Fund is recorded as a liability or an investment, respectively, and subsequently adjusted to the current market value, based on the quoted daily settlement price of the option written or purchased. Certain options may be written or purchased with premiums to be determined on a future date. The premiums for these options are based upon implied volatility parameters at specified terms. Premiums received or paid from writing or purchasing options, which expire unexercised, are treated by a Fund on the expiration date as realized gains or losses. The difference between the premium and the amount paid or received on a closing purchase or sale transaction, including brokerage commissions, is also treated as a realized gain or loss. If an option is exercised, the premium paid or realized is added to the cost of the purchase or proceeds from the sale in determining whether the Fund has realized a gain or loss on investment transactions. A Fund, as a writer of an option, may have no control over whether the underlying instrument may be sold (call) or purchased (put) and as a result bears the market risk of an unfavorable change in the price of the underlying written option. In addition, an illiquid market may make it difficult for a Fund to close out an option contract.
The maximum risk of loss associated with writing put options is limited to the exercised fair value of the option contract. The maximum risk of loss associated with writing call options is potentially unlimited. Listed option contracts present minimal counterparty credit risk since they are exchange traded and the exchange’s clearinghouse, as counterparty to all exchange-traded options, guarantees the options against default. A Fund’s maximum risk of loss from counterparty credit risk related to OTC option contracts is limited to the premium paid.
During the reporting period, the following Funds entered into option contracts for the reasons described: the PF Inflation Managed Fund purchased and wrote options on futures, currencies, bond indices, and swaps as a means of capitalizing on anticipated changes in market volatility and to generate income. The PF Managed Bond Fund purchased and wrote options and swaptions on futures, bond indices, currencies, and swaps and also purchased options on TBAs as a means of capitalizing on anticipated changes in market volatility and to generate income. The PF Managed Bond Fund held inflation floors, and the PF Inflation Managed Fund held inflation caps and floors, to hedge duration. The PF Currency Strategies Fund purchased options to hedge risk on currency investments.
Forward Foreign Currency Contracts –A forward foreign currency contract (“Forward Contract”) is a commitment to buy or sell a specific amount of a foreign currency at a negotiated price on a specified future date. Forward Contracts can help a Fund manage the risk of changes in currency exchange rates. The market value of a Forward Contract fluctuates with changes in foreign currency rates. These contracts aremarked-to-market daily at the applicable forward currency translation rates. A Fund records realized gains or losses at the time the Forward Contract is closed. A Forward Contract is extinguished through a closing transaction or upon delivery of the currency or entering an offsetting contract. A Fund’s maximum risk of loss from counterparty credit risk related to Forward Contracts is the fair value of the contract. The risk may be mitigated to some extent if a master netting arrangement between a Fund and the counterparty is in place and to the extent a Fund obtains collateral to cover the Fund’s exposure to the counterparty.
During the reporting period, the following Funds entered into forward foreign currency contracts for the reasons described: the PF Inflation Managed and PF Managed Bond Funds purchased and sold forward contracts in connection with settling planned purchases or sales of investments, to hedge and manage the currency exposure associated with some or all of the Funds’ investments, to manage interest rate risk and yield curve exposures, and as part of the investment strategy of these Funds. The PF Short Duration Bond Fund entered into Forward Contracts in order to decrease currency exposure. The PF Emerging Markets Debt Fund entered into Forward Contracts to gain exposure to various markets, for purposes of hedging, and as part of the Fund’s investment strategy. The PF Currency Strategies and PF Equity Long/Short Funds purchased and soldnon-deliverable Forward Contracts to gain or increase exposure to various currencies (both long and short positions), for hedging purposes to protect the Funds’ returns against adverse currency movements, and as a part of the investment strategies of these Funds.
Swap Agreements –Swap agreements are bilaterally negotiated agreements between the Funds and their counterparties to exchange swap investment cash flows, assets, foreign currencies or market-linked returns at specified intervals. Swap agreements are privately negotiated in the OTC market or are executed in a multilateral or other execution facility platform, such as a registered commodities exchange (“centrally cleared swaps”). In connection with these agreements, cash and securities may be identified as collateral in accordance with the terms of the respective swap agreements to provide assets of value and recourse in the event of default or bankruptcy/insolvency. Swaps aremarked-to-market daily based upon values received from third party vendors or quotations from market makers. Market values greater than zero are recorded as an asset and market values less than zero are recorded as a liability. The change in value of swaps, including accruals of periodic amounts of interest to be paid or received on swaps, is recorded as unrealized appreciation or depreciation. Daily changes in valuation
D-11
PACIFIC FUNDS
NOTES TO FINANCIAL STATEMENTS (Continued)
of centrally cleared swaps, if any, are recorded as variation margin receivable or payable. OTC swap payments received or made at the beginning of the measurement period are recorded as an asset or liability and represent payments made or received upon entering into the swap agreement to compensate for differences between the stated terms of the swap agreement and prevailing market conditions (credit spreads, currency exchange rates, interest rates, and other relevant factors). These upfront payments are recorded as realized gain or loss when the swap is closed. A liquidation payment received or made at the termination of the swap is recorded as realized gain or loss. Net periodic payments received by a Fund are recorded as realized gain.
Interest Rate Swaps– Interest rate swap agreements involve the exchange by a Fund with another party of their respective commitments to pay or receive interest with respect to the notional amount of principal. Certain forms of interest rate swap agreements may include: (i) interest rate caps, under which, in return for a premium, one party agrees to make payments to the other to the extent that interest rates exceed a specified rate, or “cap”, (ii) interest rate floors, under which, in return for a premium, one party agrees to make payments to the other to the extent that interest rates fall below a specified rate, or “floor”, (iii) interest rate collars, under which a party sells a cap and purchases a floor or vice versa in an attempt to protect itself against interest rate movements exceeding given minimum or maximum levels, (iv) callable interest rate swaps, under which the counterparty may terminate the swap transaction in whole at zero cost by a predetermined date and time prior to the maturity date, (v) spreadlocks, which allow the interest rate swap users to lock in the forward differential (or spread) between the interest rate swap rate and a specified benchmark, or (vi) basis swaps, under which two parties can exchange variable interest rates based on different money markets.
A Fund investing in interest rate swaps is subject to the risk that there is no liquid market for these agreements, that the counterparties may default on their obligations to perform or disagree as to the meaning of the contractual terms in the agreements, or that there may be unfavorable changes in interest rates. A Fund’s maximum risk of loss from counterparty credit risk related to interest rate swaps is the discounted net value of the cash flows to be received from/paid to the counterparty over the contract’s remaining life, to the extent that the amount is positive. The risk may be mitigated to some extent if a master netting arrangement between a Fund and the counterparty is in place and to the extent a Fund obtains collateral to cover the Fund’s exposure to the counterparty.
During the reporting period, the following Funds entered into interest rate swap agreements for the reasons described: the PF Inflation Managed and PF Managed Bond Funds entered into interest rate swaps to manage nominal or real interest rate risk in various global markets, and as a substitute for cash bond exposure. The PF Emerging Markets Debt Fund entered into interest rate swaps to gain exposure to various markets, for purposes of hedging, and as part of the Fund’s investment strategy.
Cross-currency swaps are interest rate swaps in which interest cash flows are exchanged between two parties based on the notional amounts of two different currencies. The notional amounts are typically determined based on the spot exchange rates at the inception of the trade. Cross-currency swaps also involve the exchange of the notional amounts at the start of the contract at the current spot rate with an agreement tore-exchange such amounts at a later date at either the same exchange rate, a specified rate or the then current spot rate. The entire principal value of a cross-currency swap is subject to the risk that the counterparty to the swap will default on its contractual delivery obligations.
During the reporting period, none of the Funds held cross-currency swaps.
Credit Default Swaps– Credit default swap agreements involve one party making a stream of payments (referred to as the buyer of protection) to another party (the seller of protection) in exchange for the right to receive a specified return in the event of a default or other credit event for the referenced entity, obligation or index. A Fund investing in credit default swaps is subject to the risk that there is no liquid market for these agreements, that the counterparties may default on their obligations to perform or disagree as to the meaning of the contractual terms in the agreements, or that there may be unfavorable changes in interest rates.
As a seller of protection, a Fund generally receives an upfront payment and/or a fixed rate of income throughout the term of the swap provided there is no credit event. As the seller, a Fund would effectively add leverage to the Fund because, in addition to the total net assets, a Fund would be subject to investment exposure on the notional amount of the swap.
If a Fund is a seller of protection and a credit event occurs, as defined under the terms of that particular swap agreement, a Fund will either (i) pay to the buyer of protection an amount equal to the notional amount of the swap and take delivery of the referenced obligation, other deliverable obligations or underlying securities comprising the referenced index, or (ii) pay a net settlement amount in the form of cash or securities equal to the notional amount of the swap less the recovery value of the referenced obligation or underlying securities comprising the referenced index. If a Fund is a buyer of protection and a credit event occurs, as defined under the terms of that particular swap agreement, a Fund will either (i) receive from the seller of protection an amount equal to the notional amount of the swap and deliver the referenced obligation, other deliverable obligations or underlying securities comprising the referenced index, or (ii) receive a net settlement amount in the form of cash or securities equal to the notional amount of the swap less the recovery value of the referenced obligation or underlying securities comprising the referenced index. Recovery values are assumed by market makers considering either industry standard recovery rates or entity specific factors and considerations until a credit event occurs. If a credit event has occurred, the recovery value is determined by a facilitated auction whereby a minimum number of allowable broker bids, together with a specified valuation method, are used to calculate the settlement value.
Credit default swap agreements on corporate and sovereign issues involve one party making a stream of payments to another party in exchange for the right to receive a specified return in the event of a default or other credit event. If a credit event occurs and cash settlement is not elected, a variety of other deliverable obligations may be delivered in lieu of the specific referenced obligation. The ability to deliver other obligations may result in acheapest-to-deliver option (the buyer of protection’s right to choose the deliverable obligation with the lowest value following a credit event).
Credit default swap agreements on asset-backed securities involve one party making a stream of payments to another party in exchange for the right to receive a specified return in the event of a default or other credit event. Unlike credit default swaps on corporate and sovereign
D-12
PACIFIC FUNDS
NOTES TO FINANCIAL STATEMENTS (Continued)
issues, deliverable obligations in most instances would be limited to the specific referenced obligation as performance for asset-backed securities can vary across deals. Prepayments, principal paydowns, and other writedowns or loss events on the underlying mortgage loans will reduce the outstanding principal balance of the referenced obligation. These reductions may be temporary or permanent as defined under the terms of the swap agreement and the notional amount for the swap agreement will be adjusted by corresponding amounts.
Credit default swap agreements on credit indices involve one party making a stream of payments to another party in exchange for the right to receive a specified return in the event of a write-down, principal shortfall, interest shortfall or default of all or part of the referenced entities comprising the credit index. Credit default swap agreements on indices are benchmarks for protecting investors owning bonds against default. A credit index is a list of a basket of credit instruments or exposures designed to be representative of some part of the credit market as a whole. These indices are made up of reference credits that are judged by a poll of dealers to be the most liquid entities in the credit default swap market based on the sector of the index. Components of the indices may include, but are not limited to, investment grade securities, high yield securities, asset-backed securities, emerging markets, and/or various credit ratings within each sector. Credit indices are traded using credit default swaps with standardized terms including a fixed spread and standard maturity dates. An index credit default swap references all the names in the index, and if there is a default, the credit event is settled based on that name’s weight in the index. The composition of the indices changes periodically, usually every six months, and for most indices, each name has an equal weight in the index.
An implied credit spread is the spread in yield between a U.S. Treasury security and the referenced obligation or underlying investment that are identical in all respects except for the quality rating. Wider credit spreads, in absolute terms when compared to the notional amount of the swap, represent a deterioration of the referenced entity’s credit soundness and a greater likelihood or risk of default or other credit event occurring as defined under the terms of the agreement. Implied credit spreads, represented in absolute terms, utilized in determining the market value of credit default swap agreements on corporate and sovereign issues or U.S. Treasury obligation issues as of period end, are disclosed in the Notes to Schedules of Investments and serve as an indicator of the current status of the payment/performance risk and represent the likelihood or risk of default for the credit derivative. The implied credit spread of a particular referenced entity reflects the cost of buying/selling protection and may include upfront payments required to be made to enter into the agreement. For credit default swap agreements on asset-backed securities and credit indices, the quoted market prices and resulting values serve as the indicator of the current status of the payment/performance risk.
A Fund may use pair trades of credit default swaps. Pair trades attempt to match a long position with a short position of two securities in the same market sector for hedging purposes. Pair trades of credit default swaps attempt to gain exposure to credit risk while hedging or offsetting the effects of overall market movements. For example, a Fund may purchase protection through a credit default swap referenced to the debt of an issuer, and simultaneously selling protection through a credit default swap referenced to the debt of a different issuer with the intent to realize gains from the pricing differences of the two issuers who are expected to have similar market risks.
A Fund may use spread curve trades by simultaneously purchasing and selling protection through credit default swaps referenced to the same issuer but with different maturities. Spread curves attempt to gain exposure to credit risk on a forward basis by realizing gains on the expected differences in spreads.
A Fund’s maximum risk of loss from counterparty credit risk related to credit default swaps, either as the buyer or seller of protection, is the fair value of the contract. The risk may be mitigated to some extent if a master netting arrangement between a Fund and the counterparty is in place and to the extent a Fund obtains collateral to cover the Fund’s exposure to the counterparty.
The aggregate fair value of credit default swaps in a net liability position is reflected as unrealized depreciation and is disclosed in the Notes to Schedules of Investments. The collateral posted, net of assets received as collateral, for swap agreements is also disclosed in the Notes to Schedules of Investments. The maximum potential amount of future payments (undiscounted) that a Fund as a seller of protection could be required to make under a credit default swap agreement is an amount equal to the notional amount of the agreement. Notional amounts of all credit default swap agreements outstanding as of March 31, 2019 for which a Fund is the seller of protection are disclosed in the Notes to Schedules of Investments. These potential amounts are partially offset by any recovery values of the respective referenced obligations, upfront payments received upon entering into the agreement, or net amounts received from the settlement of buy protection credit default swap agreements entered into by a Fund for the same referenced entity or entities.
During the reporting period, the following Funds entered into credit default swap agreements for the reasons described: the PF Inflation Managed and PF Managed Bond Funds purchased credit protection through credit default swaps to reduce credit exposure to individual issuers, reduce broad credit risk, and to benefit from price differences between the credit default swap and cash bonds markets. The PF Managed Bond Fund also entered into credit default swaps and credit default swaps on credit indices to obtain exposure to the credit risk of individual securities or to the broader investment grade, high yield, emerging market, mortgage, or other asset classes.
Total Return Swaps– A Fund investing in total return swaps is subject to the risk that there is no liquid market for these agreements, that the counterparties may default on their obligations to perform or that there may be unfavorable changes in the value of the underlying index or reference instrument (generally caused by changes in interest rates or declines in credit quality). A total return swap agreement is one in which one party makes payments based on a set rate, either fixed or variable, while the other party makes payments based on the return of an underlying index or reference instrument, which includes both the income it generates and any capital gains. To the extent the total return of the index or reference instrument underlying the transaction exceeds or falls short of the offsetting interest rate obligation, a Fund will receive a payment from or make a payment to the counterparty. A Fund’s maximum risk of loss from counterparty credit risk related to total return swaps is the discounted net value of the cash flows to be received from or paid to the counterparty over the contract’s remaining life, to the extent that the amount is positive. The risk may be mitigated to some extent if a master netting arrangement between a Fund and the counterparty is in place and to the extent a Fund obtains collateral to cover a Fund’s exposure to the counterparty.
D-13
PACIFIC FUNDS
NOTES TO FINANCIAL STATEMENTS (Continued)
A Fund may enter into fully funded total return swaps which involves one party making an initial payment equal to the estimated value of the reference instrument. The parties to the swap then exchange respective commitments to pay or receive a net amount based on the change in the fair value of a reference instrument and a specified notional amount.
During the reporting period, the following Funds entered into total return swap agreements for the reasons described: the PF Emerging Markets Debt and the PF Multi-Asset Funds entered into total return swaps to gain exposure to various markets, for purposes of hedging, and as part of each Fund’s investment strategy. The PF Equity Long/Short Fund used total return swaps to gain exposure to various markets.
Total Return Basket Swaps– A total return basket swap is designed to function as a Fund of direct investments in long and short equity or fixed income positions. The Fund has the ability to trade in and out of long and short positions within the swap and will receive all of the economic benefits and risks equivalent to direct investments in these positions such as: capital appreciation or depreciation, corporate actions, and dividends and interest received and paid, all of which are reflected in the swap value. The swap value also includes interest charges and credits (“financing fees”) related to the notional values of the long and short positions and cash balances within the swap. These financing fees are based on defined market rates or a specified benchmark rate, plus or minus a specified spread. Positions within the swap are reset periodically, and financing fees are reset monthly. At maturity, any unrealized gain or loss on positions and accrued financing costs become available for cash settlement between the Fund and the swap counterparty. Cash settlement in and out of the swap may occur at a reset date or any other date, at the discretion of the Fund and the counterparty, over the life of the agreement, and is generally determined based on limits and thresholds established as part of the Master Agreement between the Fund and the counterparty. A change in the market value of a total return basket swap contract is recognized as a change in unrealized appreciation or depreciation on swaps in the Statements of Operations. Cash settlements between a Fund and the counterparty are recognized as realized gain or loss on swap transactions in the Statements of Operations. Total return basket swaps outstanding at period end, if any, are disclosed in Notes to Schedule of Investments.
During the reporting period, the PF Equity Long/Short Fund entered into total return basket swaps to gain exposure to equity indices and to gain security level stock exposure.
Volatility Swaps– Volatility swap agreements involve two parties agreeing to exchange cash flows based on the measured variance (or square of volatility) of a specified underlying reference asset. One party agrees to exchange a “fixed rate” or strike price payment for the “floating rate” or realized price variance on the underlying reference asset with respect to the notional amount. At inception, the strike price is generally chosen such that the fair value of the swap is zero.
At the maturity date, a net cash flow is exchanged, where the payoff amount is equivalent to the difference between the realized price variance of the underlying reference asset and the strike price multiplied by the notional amount. As a receiver of the realized price variance, the Fund would receive the payoff amount when the realized price variance of the underlying reference asset is greater than the strike price and would owe the payoff amount when the variance is less than the strike. As a payer of the realized price variance, the Fund would owe the payoff amount when the realized price variance of the underlying reference asset is greater than the strike price and would receive the payoff amount when the variance is less than the strike. This type of agreement is essentially a forward contract on the future realized price variance of the underlying reference asset.
None of the Funds presented in these financial statements held volatility swaps as of March 31, 2019.
The following is a summary of the location of fair value amounts of derivative investments, if any, disclosed in the Trust’s Statements of Assets and Liabilities:
| | | | |
| | | Location on the Statements of Assets and Liabilities |
| Derivative Investments Risk Type | | Asset Derivative Investments | | Liability Derivative Investments |
| Credit contracts | | Outstanding purchased options, at value | | Outstanding options written, at value |
| Equity contracts | | Receivable: Variation margin on futures contracts | | Payable: Variation margin on futures contracts |
| Interest rate contracts | | Receivable: Variation margin on swap agreements Swap agreements appreciation | | Payable: Variation margin on swap agreements Swap agreements depreciation |
| Foreign currency contracts | | Outstanding purchased options, at value | | Outstanding options written, at value |
| | Receivable: Variation margin on futures contracts Receivable: Variation margin on swap agreements | | Payable: Variation margin on futures contracts Payable: Variation margin on swap agreements |
| | Swap agreements appreciation | | Swap agreements depreciation |
| | | Forward foreign currency contracts appreciation | | Forward foreign currency contracts depreciation |
The following is a summary of fair values of derivative investments disclosed in the Trust’s Statements of Assets and Liabilities, categorized by primary risk exposure as of March 31, 2019:
| | | | | | | | | | | | | | | | | | | | |
| | | Asset Derivative Investments Value | |
| Fund | | Total Value at
March 31, 2019 | | | Credit
Contracts | | | Equity
Contracts | | | Foreign Currency
Contracts | | | Interest Rate
Contracts | |
| PF Inflation Managed | | | $527,839 | | | | $4,120 | * | | | $— | | | | $84,021 | | | | $439,698 | * |
| PF Managed Bond | | | 8,157,070 | | | | 102,402 | * | | | — | | | | 1,752,224 | * | | | 6,302,444 | * |
| PF Short Duration Bond | | | 157,890 | | | | — | | | | — | | | | 2,321 | | | | 155,569 | * |
| PF Emerging Markets Debt | | | 375,807 | | | | — | | | | — | | | | 332,591 | | | | 43,216 | * |
| PF Multi-Asset | | | 25,843,678 | | | | — | | | | 25,843,678 | * | | | — | | | | — | |
| PF Currency Strategies | | | 734,059 | | | | — | | | | — | | | | 734,059 | | | | — | |
| PF Equity Long/Short | | | 559,535 | | | | — | | | | 555,661 | * | | | 3,874 | | | | — | |
D-14
PACIFIC FUNDS
NOTES TO FINANCIAL STATEMENTS (Continued)
| | | | | | | | | | | | | | | | | | | | |
| | | Liability Derivative Investments Value | |
| Fund | | Total Value at
March 31, 2019 | | | Credit
Contracts | | | Equity
Contracts | | | Foreign Currency
Contracts | | | Interest Rate
Contracts | |
| PF Inflation Managed | | | ($584,356 | ) | | | ($4,594 | )* | | | $— | | | | ($38,600 | ) | | | ($541,162 | )* |
| PF Managed Bond | | | (9,422,988 | ) | | | (33,113 | )* | | | — | | | | (600,394 | )* | | | (8,789,481 | )* |
| PF Short Duration Bond | | | (78,665 | ) | | | — | | | | — | | | | (482 | ) | | | (78,183 | )* |
| PF Emerging Markets Debt | | | (451,803 | ) | | | — | | | | — | | | | (391,005 | ) | | | (60,798 | )* |
| PF Multi-Asset | | | (30,401,721 | ) | | | — | | | | (30,401,721 | )* | | | — | | | | — | |
| PF Currency Strategies | | | (476,314 | ) | | | — | | | | — | | | | (476,314 | ) | | | — | |
| PF Equity Long/Short | | | (761,080 | ) | | | — | | | | (713,014 | )* | | | (48,066 | ) | | | — | |
| | * | Includes cumulative appreciation (depreciation) of futures contracts and centrally cleared options, and/or centrally cleared swaps as reported in the Notes to Schedules of Investments. |
The following is a summary of the location of realized gains and losses and changes in net unrealized appreciation and depreciation on derivative investments, if any, disclosed in the Trust’s Statements of Operations:
| | |
| Derivative Investments Risk Type | | Location of Gain (Loss) on Derivative Investments Recognized in the Statements of Operations |
| Credit contracts | | Net realized gain (loss) on futures contract transactions |
| Equity contracts | | Net realized gain (loss) on purchased option transactions |
| Interest rate contracts | | Net realized gain (loss) on swap transactions Net realized gain (loss) on written option transactions |
| | Change in net unrealized appreciation (depreciation) on futures contracts |
| | Change in net unrealized appreciation (depreciation) on purchased options |
| | | Change in net unrealized appreciation (depreciation) on swaps Change in net unrealized appreciation (depreciation) on written options |
| Foreign currency contracts | | Net realized gain (loss) on forward foreign currency contract transactions |
| | Net realized gain (loss) on futures contract transactions |
| | Net realized gain (loss) on purchased option transactions Net realized gain (loss) on swap transactions |
| | Net realized gain (loss) on written option transactions |
| | Change in net unrealized appreciation (depreciation) on forward foreign currency contracts |
| | Change in net unrealized appreciation (depreciation) on futures contracts |
| | Change in net unrealized appreciation (depreciation) on purchased options |
| | Change in net unrealized appreciation (depreciation) on swaps |
| | | Change in net unrealized appreciation (depreciation) on written options |
The following is a summary of each Fund’s net realized gain and/or loss and change in net unrealized appreciation and/or depreciation on derivative investments recognized in the Trust’s Statements of Operations categorized by primary risk exposure for the fiscal year ended March 31, 2019:
| | | | | | | | | | | | | | | | | | | | |
| | | Realized Gain (Loss) on Derivative Investments Recognized in the
Statements of Operations | |
| Fund | | Total | | | Credit
Contracts | | | Equity
Contracts | | | Foreign Currency
Contracts | | | Interest Rate
Contracts | |
| PF Inflation Managed | | | $61,350 | | | | ($4,318 | ) | | | $— | | | | $288,703 | | | | ($223,035 | ) |
| PF Managed Bond | | | (4,423,984 | ) | | | 438,558 | | | | — | | | | (534,243 | ) | | | (4,328,299 | ) |
| PF Short Duration Bond | | | 33,698 | | | | — | | | | — | | | | 27,273 | | | | 6,425 | |
| PF Emerging Markets Debt | | | (1,421,120 | ) | | | — | | | | — | | | | (1,321,835 | ) | | | (99,285 | ) |
| PF Multi-Asset | | | (2,084,992 | ) | | | — | | | | (2,084,992 | ) | | | — | | | | — | |
| PF Currency Strategies | | | 1,469,158 | | | | — | | | | — | | | | 1,469,158 | | | | — | |
| PF Equity Long/Short | | | (3,603,326 | ) | | | — | | | | (2,741,508 | ) | | | (861,818 | ) | | | — | |
| | | | | | | | | | | | | | | | | | | | |
| | | Change in Net Unrealized Appreciation (Depreciation) on Derivative Investments Recognized
in the Statements of Operations | |
| Fund | | Total | | | Credit
Contracts | | | Equity
Contracts | | | Foreign Currency
Contracts | | | Interest Rate
Contracts | |
| PF Inflation Managed | | | ($35,472 | ) | | | ($5,249 | ) | | | $— | | | | $57,760 | | | | ($87,983 | ) |
| PF Managed Bond | | | (529,171 | ) | | | 68,735 | | | | — | | | | 3,250,830 | | | | (3,848,736 | ) |
| PF Short Duration Bond | | | 61,057 | | | | — | | | | — | | | | 1,682 | | | | 59,375 | |
| PF Emerging Markets Debt | | | (88,956 | ) | | | — | | | | — | | | | (93,157 | ) | | | 4,201 | |
| PF Multi-Asset | | | 11,742,581 | | | | — | | | | 11,742,581 | | | | — | | | | — | |
| PF Currency Strategies | | | (333,699 | ) | | | — | | | | — | | | | (333,699 | ) | | | — | |
| PF Equity Long/Short | | | (5,593,234 | ) | | | — | | | | (5,574,076 | ) | | | (19,158 | ) | | | — | |
For financial reporting purposes, the Trust does not offset fair value amounts recognized for derivative instruments and fair value amounts recognized for the right to reclaim cash collateral (receivables) or the obligation to return cash collateral (payables) arising from derivative instruments recognized at fair value executed with the same counterparty under a master netting arrangement.
D-15
PACIFIC FUNDS
NOTES TO FINANCIAL STATEMENTS (Continued)
The following is a summary of the average number of positions and values of derivative investments by derivative type for the fiscal year ended March 31, 2019:
| | | | | | | | | | | | | | | | | | | | | | | | | | | | | | | | | | | | | | | | | | | | |
| | | Average Positions and Values of Derivative Investments by Derivative Type | |
| | | Futures Contracts | | | | | | Forward Contracts | | | | | | Options Contracts | | | | | | Swap Agreements | |
| Fund | | Number of
Positions | | | Value | | | | | | Number of
Positions | | | Value | | | | | | Number of
Positions | | | Value | | | | | | Number of
Positions | | | Value | |
| PF Inflation Managed | | | 11 | | | | ($95,691 | ) | | | | | | | 31 | | | | $33,817 | | | | | | | | 21 | | | | ($11,712 | ) | | | | | | | 56 | | | | $58,774 | |
| PF Managed Bond | | | 36 | | | | (37,289 | ) | | | | | | | 90 | | | | (248,256 | ) | | | | | | | 85 | | | | (62,618 | ) | | | | | | | 54 | | | | (1,189,472 | ) |
| PF Short Duration Bond | | | 4 | | | | 39,545 | | | | | | | | 4 | | | | 881 | | | | | | | | — | | | | — | | | | | | | | — | | | | — | |
| PF Emerging Markets Debt | | | — | | | | — | | | | | | | | 118 | | | | 65,746 | | | | | | | | — | | | | — | | | | | | | | 15 | | | | (63,234 | ) |
| PF Multi-Asset | | | 1 | | | | 153,414 | | | | | | | | — | | | | — | | | | | | | | — | | | | — | | | | | | | | 46 | | | | (23,869,316 | ) |
| PF Currency Strategies | | | — | | | | — | | | | | | | | 64 | | | | 657,448 | | | | | | | | 1 | | | | 31,613 | | | | | | | | — | | | | — | |
| PF Equity Long/Short | | | 12 | | | | (323,217 | ) | | | | | | | 49 | | | | (33,807 | ) | | | | | | | — | | | | — | | | | | | | | 18 | | | | 1,427,092 | |
The table shown above and the amounts of net realized gains and losses and changes in net unrealized appreciation and depreciation on derivative investments as disclosed in the Statements of Operations serve as indicators of volume of derivative activity for each applicable Fund for the fiscal year ended March 31, 2019.
C. ENFORCEABLE MASTER NETTING ARRANGEMENTS
Master Agreements and Netting Arrangements– Certain Funds are parties to various agreements, including but not limited to International Swaps and Derivatives Association Agreements and related Credit Support Annex, Master Repurchase Agreements, and Master Securities Forward Transactions Agreements (collectively “Master Agreements”), which govern the terms of certain transactions with select counterparties. These Master Agreements generally include provisions for general obligations, representations, agreements, collateral, and certain events of default or termination. These Master Agreements also include provisions for netting arrangements that help reduce credit and counterparty risk associated with relevant transactions (“netting arrangements”). The netting arrangements are generally tied to credit related events that, if triggered, would cause an event of default or termination giving a Fund or counterparty the right to terminate early and cause settlement, on a net basis, of all transactions under the applicable Master Agreement. In the event of an early termination as a result of an event of default under the Master Agreement, the total value exposure of all transactions will be offset against collateral exchanged to date, which would result in a net receivable or payable that would be due from or to the counterparty. However, bankruptcy or insolvency laws of a particular jurisdiction may impose restrictions on or prohibitions against the right of offset in the event of a bankruptcy or insolvency of the counterparty. Credit related events include, but are not limited to, bankruptcy, failure to make timely payments, restructuring, obligation acceleration, obligation default, a material decline in net assets, decline in credit rating or repudiation/moratorium. Any election made by a counterparty to early terminate the transactions under a Master Agreement could have a material adverse impact on a Fund’s financial statements. A Fund’s overall exposure to credit risk, subject to netting arrangements can change substantially within a short period, as it is affected by each transaction subject to the arrangement.
Master Agreements can also help limit counterparty risk by specifying collateral posting arrangements atpre-arranged exposure levels. Under the Master Agreements, collateral is routinely transferred if the total net exposure to certain transactions under the relevant Master Agreement with a counterparty in a given Fund exceeds a specified threshold, net of collateral already in place, which typically ranges from $0 to $250,000 depending on the counterparty and the type of Master Agreement. Collateral under the Master Agreements is usually in the form of cash or U.S. Treasury Bills but could include other types of securities. If permitted under the Master Agreement, certain funds may rehypothecate cash collateral received from a counterparty. The value of all derivative transactions outstanding under a Master Agreement is calculated daily to determine the amount of collateral to be received or pledged by the counterparty. Posting of collateral for OTC derivative transactions are covered undertri-party collateral agreements between the Trust, the Trust’s custodian, and each counterparty. Collateral for centrally cleared derivatives transactions are posted with the applicable derivatives clearing organization.
The following is a summary of financial and derivative instruments that are subject to enforceable master agreements with netting arrangements (or similar arrangements) and collateral received and pledged in connection with the master agreements with netting arrangements (or similar arrangements) as of March 31, 2019:
| | | | | | | | | | | | | | | | | | | | | | | | | | | | | | | | | | | | | | | | | | | | | |
| | | Gross Amounts
Presented in the
Statements of
Assets and
Liabilities | | Gross Amounts Not Offset in
Statements of Assets and Liabilities | | | | Gross Amounts
Presented in the
Statements of
Assets and
Liabilities | | Gross Amounts Not Offset
in Statements of Assets and
Liabilities |
Description | | Financial
Instruments | | Collateral
Received | | Net
Amount | | | | Financial
Instruments | | Collateral
Pledged | | Net
Amount |
| | | Assets | | | | Liabilities |
| | | | | | | | | |
PF Inflation Managed | | | | | | | | | | | | | | | | | | | | | | | | | | | | | | | | | | | | | | | | | | | | | |
Swap agreements | | | | $4,024 | | | | | ($1,609 | ) | | | | $— | | | | | $2,415 | | | | | | | | | | ($3,856 | ) | | | | $1,609 | | | | | $— | | | | | ($2,247 | ) |
Option contracts | | | | 89,015 | | | | | (89,015 | ) | | | | — | | | | | — | | | | | | | | | | (90,034 | ) | | | | 89,015 | | | | | — | | | | | (1,019 | ) |
Forward foreign currency contracts | | | | 84,021 | | | | | (37,243 | ) | | | | — | | | | | 46,778 | | | | | | | | | | (38,600 | ) | | | | 37,243 | | | | | — | | | | | (1,357 | ) |
Sale-buyback financing transactions | | | | | | | | | | | | | | | | | | | | | | | | | | | | | (21,850,850 | ) | | | | 21,850,850 | | | | | — | | | | | — | |
| | | | | | | | | |
PF Managed Bond | | | | | | | | | | | | | | | | | | | | | | | | | | | | | | | | | | | | | | | | | | | | | |
Swap agreements | | | | 379,075 | | | | | — | | | | | (343,619 | ) | | | | 35,456 | | | | | | | | | | — | | | | | — | | | | | — | | | | | — | |
Option contracts | | | | 25,617 | | | | | (145 | ) | | | | (15,450 | ) | | | | 10,022 | | | | | | | | | | (145 | ) | | | | 145 | | | | | — | | | | | — | |
Forward foreign currency contracts | | | | 1,683,056 | | | | | (411,753 | ) | | | | (364,568 | ) | | | | 906,735 | | | | | | | | | | (536,393 | ) | | | | 411,753 | | | | | — | | | | | (124,640 | ) |
Reverse repurchase agreements | | | | | | | | | | | | | | | | | | | | | | | | | | | | | (2,045,000 | ) | | | | — | | | | | 2,042,617 | | | | | (2,383 | ) |
Sale-buyback financing transactions | | | | | | | | | | | | | | | | | | | | | | | | | | | | | (10,978,581 | ) | | | | 10,957,941 | | | | | — | | | | | (20,640 | ) |
D-16
PACIFIC FUNDS
NOTES TO FINANCIAL STATEMENTS (Continued)
| | | | | | | | | | | | | | | | | | | | | | | | | | | | | | | | | | | | | | | | | | | | | |
| | | Gross Amounts
Presented in the
Statements of
Assets and
Liabilities | | Gross Amounts Not Offset in
Statements of Assets and Liabilities | | | | Gross Amounts
Presented in the
Statements of
Assets and
Liabilities | | Gross Amounts Not Offset
in Statements of Assets and
Liabilities |
Description | | Financial
Instruments | | Collateral
Received | | Net
Amount | | | | Financial
Instruments | | Collateral
Pledged | | Net
Amount |
| | | Assets | | | | Liabilities |
| | | | | | | | | |
PF Short Duration Bond | | | | | | | | | | | | | | | | | | | | | | | | | | | | | | | | | | | | | | | | | | | | | |
Forward foreign currency contracts | | | $ | 2,321 | | | | | $— | | | | $ | — | | | | $ | 2,321 | | | | | | | | | | ($482 | ) | | | $ | — | | | | $ | — | | | | | ($482 | ) |
| | | | | | | | | |
PF Emerging Markets Debt | | | | | | | | | | | | | | | | | | | | | | | | | | | | | | | | | | | | | | | | | | | | | |
Forward foreign currency contracts | | | | 332,591 | | | | | (175,735 | ) | | | | (3,902 | ) | | | | 152,954 | | | | | | | | | | (391,005 | ) | | | | 175,735 | | | | | 60,761 | | | | | (154,509 | ) |
| | | | | | | | | |
PF Multi-Asset | | | | | | | | | | | | | | | | | | | | | | | | | | | | | | | | | | | | | | | | | | | | | |
Swap agreements | | | | 25,819,943 | | | | | (9,516,406 | ) | | | | (16,056,850 | ) | | | | 246,687 | | | | | | | | | | (30,364,776 | ) | | | | 9,516,406 | | | | | 20,668,547 | | | | | (179,823 | ) |
| | | | | | | | | |
PF Currency Strategies | | | | | | | | | | | | | | | | | | | | | | | | | | | | | | | | | | | | | | | | | | | | | |
Forward foreign currency contracts | | | | 734,059 | | | | | (92,211 | ) | | | | (612,000 | ) | | | | 29,848 | | | | | | | | | | (476,314 | ) | | | | 92,211 | | | | | 348,954 | | | | | (35,149 | ) |
| | | | | | | | | |
PF Equity Long/Short | | | | | | | | | | | | | | | | | | | | | | | | | | | | | | | | | | | | | | | | | | | | | |
Swap agreements | | | | 310,325 | | | | | (310,325 | ) | | | | — | | | | | — | | | | | | | | | | (702,304 | ) | | | | 310,325 | | | | | 391,979 | | | | | — | |
Forward foreign currency contracts | | | | 3,874 | | | | | (3,874 | ) | | | | — | | | | | — | | | | | | | | | | (48,066 | ) | | | | 3,874 | | | | | 44,192 | | | | | — | |
During the reporting period, certain Funds may have had investments in repurchase agreements. The gross value and related collateral received for these investments, if any, are presented in each applicable Fund’s Schedule of Investments and the value of these investments is also presented in the Statements of Assets and Liabilities. The value of the related collateral, if any, held by each applicable Fund presented in these financial statements, exceeded the value of the repurchase agreements as of March 31, 2019.
6. INVESTMENT ADVISORY, ADMINISTRATION AND SHAREHOLDER SERVICES, SUPPORT SERVICES, AND DISTRIBUTION AGREEMENTS
Pursuant to an Investment Advisory Agreement, PLFA, a wholly-owned subsidiary of Pacific Life Insurance Company (“Pacific Life”) serves as Investment Adviser to each Fund of the Trust. PLFA manages the PF Multi-Asset Fund. PLFA receives investment advisory fees from each Fund which are based on annual percentages of the average daily net assets of each Fund. Pursuant toSub-Advisory Agreements, the Trust and PLFA engage various investment management firms under PLFA’s supervision tosub-advise certain PF Underlying Funds presented in these financial statements. PLFA, as Investment Adviser of the Trust, pays related management fees to thesesub-advisers as compensation for theirsub-advisory services provided to the Trust. As of March 31, 2019, the investment advisory fees that PLFA receives from each Fund presented in these financial statements based upon an annual percentage of the average daily net assets of each Fund, and thesub-adviser of each Fund, are as follows:
| | | | | | |
| Fund | | Advisory Fees | | Advisory Fee Waiver | | Sub-Adviser |
| PF Inflation Managed | | 0.40% | | | | Pacific Investment Management Company LLC |
| PF Managed Bond | | 0.40% | | | | Pacific Investment Management Company LLC and Western Asset Management Company(co-sub-advisors) |
| PF Short Duration Bond | | 0.40% | | | | T. Rowe Price Associates, Inc. |
| PF Emerging Markets Debt | | 0.785% | | 0.02% (effective November 1, 2018 through July 31, 2020) | | Ashmore Investment Management Limited |
| PF Developing Growth | | 0.60% | | | | Lord, Abbett & Co. LLC |
| PF Growth | | 0.55% | | | | MFS Investment Management |
| PFLarge-Cap Value | | 0.65% | | | | ClearBridge Investments, LLC |
| PFMid-Cap Equity | | 0.65% | | | | Scout Investments, Inc. (April 1, 2018 through June 12, 2018); Rothschild & Co Asset Management US Inc. (June 13, 2018 to present) |
| PF Multi-Asset | | 0.35% | | | | |
| PFSmall-Cap Value | | 0.75% | | | | AllianceBernstein L.P. |
| PF Emerging Markets | | 0.80% | | | | OppenheimerFunds, Inc. |
| PF InternationalLarge-Cap | | 0.85% | | | | MFS Investment Management |
| PF InternationalSmall-Cap | | 0.85% | | | | QS Investors, LLC |
| PF International Value | | 0.65% | | | | Wellington Management Company LLP |
| PF Real Estate | | 0.90% | | 0.15% (effective November 1, 2018 through July 31, 2020) | | Morgan Stanley Investment Management Inc. (April 1, 2018 through April 30, 2018); Principal Real Estate Investors, LLC (May 1, 2018 to present) |
| PF Currency Strategies | | 0.65% | | | | UBS Asset Management (Americas) Inc. (solesub-adviser as of October 16, 2018; previouslyco-sub-adviser with Macro Currency Group) |
| PF Equity Long/Short | | 1.15% | | 0.15% (through July 31, 2019) | | AQR Capital Management, LLC |
Pursuant to an Administration and Shareholder Services Agreement (the “Administration Agreement”), Pacific Life serves as administrator (the “Administrator”) to the Trust. The Trust paid the Administrator an administration fee at an annual rate of 0.15% for each of the PF Underlying Funds. The administration fee is for procuring or providing administrative, transfer agency, and shareholder services. In addition, Pacific Life and PLFA provide support services to the Trust that are outside the scope of the Administrator’s and Investment Adviser’s responsibilities under the Administration Agreement and Investment Advisory Agreement. Under the Support Services Agreement, the Trust compensates Pacific Life and PLFA for their expenses in providing support services to the Trust in connection with various matters, some of
D-17
PACIFIC FUNDS
NOTES TO FINANCIAL STATEMENTS (Continued)
which include the time spent by legal, accounting, and compliance personnel of Pacific Life and PLFA (including individuals who may be officers or Trustees of the Trust) to attend meetings of the Board and to provide assistance with the coordination and supervision in connection with the services procured for the Trust. Support services do not include any services for which PLFA is responsible pursuant to the Investment Advisory Agreement. The Trust reimburses Pacific Life and PLFA for these support services on an approximate cost basis.
Pursuant to a Distribution Agreement, Pacific Select Distributors, LLC (the “Distributor”), a wholly-owned subsidiary of Pacific Life, serves as distributor of the Trust’s shares. Under the Distribution Agreement, the Distributor bears all expenses of providing services, including costs of sales presentations, mailings, advertisements, and other marketing efforts by the Distributor in connection with the distribution or sale of the Trust’s shares and makes distribution and/or service payments to selling groups in connection with the sale of certain of the Trust’s shares and subsequent servicing needs of shareholders provided by selling groups. The Class P shares of the PF Underlying Funds presented in these financial statements are not subject to a distribution and/or service fee.
7. TRANSACTIONS WITH AFFILIATES
A. ADVISORY FEES, ADMINISTRATION FEES AND EXPENSES FOR SUPPORT SERVICES
The Investment Adviser, the Distributor, and Pacific Life are related parties. The advisory fees earned by the Investment Adviser, including any advisory fee waiver, the administration fees earned by Pacific Life, and expenses for support services recovered by PLFA and Pacific Life (see Note 6) from each Fund presented in these financial statements for the fiscal year ended March 31, 2019 are presented in the Statements of Operations. The amounts of each of these fees that remained payable as of March 31, 2019 are presented in the Statements of Assets and Liabilities.
B. EXPENSE LIMITATION AGREEMENTS
To help limit the Trust’s expenses, PLFA has contractually agreed to reimburse each Fund (other than the PF Equity Long/Short Fund) presented in these financial statements for certain operating expenses that exceed an annual rate based on a percentage of a Fund’s average daily net assets. These operating expenses include, but are not limited to: administration fees and expenses; organizational expenses; custody expenses; expenses for audit, tax, and certain legal services; preparation, printing, filing, and distribution to existing shareholders of proxies, prospectuses and shareholder reports, and other regulatory documents, as applicable; independent trustees’ fees and expenses; and establishing, overseeing, and administering the Trust’s compliance program. These operating expenses do not include: investment advisory fees; distribution and/or service fees; dividends on securities sold short; acquired fund fees and expenses; interest (including commitment fees); taxes (including foreign taxes on dividends, interest or gains); brokerage commissions and other transactional expenses; and extraordinary expenses such as litigation expenses, liquidation expenses, reorganization expenses, and other expenses not incurred in the ordinary course of each Fund’s business. The expense cap for the PF Underlying Funds (except the PF Multi-Asset, PF InternationalSmall-Cap, PF Currency Strategies, and PF Equity Long/Short Funds) is 0.15% through July 31, 2019 and 0.30% thereafter through July 31, 2023. The expense cap for the PF Multi-Asset Fund is 0.16% through July 31, 2019. The expense cap for the PF InternationalSmall-Cap and PF Currency Strategies Funds is 0.25% through July 31, 2019. There is no expense cap for the PF Equity Long/Short Fund.
There is no guarantee that PLFA will continue to cap expenses for a Fund upon the expiration of the expense cap. In addition, any expense reimbursements made by PLFA to a Fund are subject to recoupment by PLFA from such Fund in future periods, not to exceed three years from the date on which the reimbursement took place, provided that the recoupment would be limited to the lesser of: (i) the expense cap in effect at the time of the reimbursement or (ii) the expense cap in effect at the time of recoupment. Any amounts repaid to PLFA will have the effect of increasing such expenses of the applicable Fund, but not above the expense cap. The amounts of adviser reimbursement to each applicable Fund presented in these financial statements for the fiscal year ended March 31, 2019 are presented in the Statements of Operations. Any amounts that remained due from the Investment Adviser as of March 31, 2019 are presented in the Statements of Assets and Liabilities.
The cumulative expense reimbursement amounts, if any, as of March 31, 2019 that are subject to recoupment by PLFA from the Funds presented in these financial statements are as follows:
| | | | | | | | | | | | |
| Fund | | 3/31/2020 | | | 3/31/2021 | | | 3/31/2022 | |
| PF Inflation Managed | | | $33,114 | | | | $19,621 | | | | $58,726 | |
| PF Managed Bond | | | 590,876 | | | | 540,942 | | | | 443,715 | |
| PF Short Duration Bond | | | 123,091 | | | | 131,342 | | | | 119,957 | |
| PF Emerging Markets Debt | | | 107,918 | | | | 77,724 | | | | 124,856 | |
| PF Developing Growth | | | 22,807 | | | | 13,829 | | | | 14,826 | |
| PF Growth | | | 82,308 | | | | 89,652 | | | | 112,913 | |
| PF Large-Cap Value | | | 243,001 | | | | 247,008 | | | | 118,375 | |
| PF Mid-Cap Equity | | | 79,956 | | | | 49,499 | | | | 18,220 | |
| PF Multi-Asset | | | | | | | 48,872 | | | | 609,033 | |
| PF Small-Cap Value | | | 104,811 | | | | 75,777 | | | | 53,658 | |
| PF Emerging Markets | | | 433,451 | | | | 516,488 | | | | 310,434 | |
| PF International Large-Cap | | | 336,014 | | | | 256,803 | | | | 124,692 | |
| PF International Small-Cap | | | 46,102 | | | | 28,196 | | | | 60,110 | |
| PF International Value | | | 181,721 | | | | 213,419 | | | | 154,717 | |
| PF Real Estate | | | 46,036 | | | | 30,103 | | | | 30,395 | |
| | | | | | | | | | | | |
| Total | | | $2,431,206 | | | | $2,339,275 | | | | $2,354,627 | |
| | | | | | | | | | | | |
There was no recoupment of expense reimbursement by PLFA from any Funds presented in these financial statements for the fiscal year ended March 31, 2019.
D-18
PACIFIC FUNDS
NOTES TO FINANCIAL STATEMENTS (Continued)
C. INVESTMENTS IN AFFILIATED FUNDS
As of March 31, 2019, Pacific Life owned 100.00% of the total shares outstanding (aggregate of all share classes) of the PFMid-Cap Equity Fund.
D. INDEPENDENT TRUSTEES
The Trust pays each independent trustee of the Board retainer fees and specified amounts for various Board and committee services and for chairing those committees. The fees and expenses of the independent trustees of the Board are presented in the Statements of Operations. Each independent trustee of the Board is eligible to participate in the Trust’s Deferred Compensation Plan (the “Plan”). The Plan allows each independent trustee to voluntarily defer receipt of all or a percentage of fees, which otherwise would be payable for services performed.
Amounts in the deferral account are obligations of each Fund at the time of such deferral and are payable in accordance with the Plan. A Trustee who defers compensation has the ability to select credit rate options that track the performance, at NAV of Class A of certain series of the Trust without a sales load or at NAV of Class I shares of the Pacific Select Fund. Pacific Select Fund is a Delaware statutory trust and is registered under the 1940 Act as anopen-end management investment company. PLFA is the Investment Adviser to Pacific Select Fund. The obligation of each Fund under the Plan (the “DCP Liability”) is recorded as a liability (accrued trustees’ fees and expenses and deferred compensation). Accordingly, the market value appreciation or depreciation on a Fund’s DCP Liability account will cause the expenses of that Fund to increase or decrease due to market fluctuation. The change in net unrealized appreciation or depreciation on a Fund’s DCP Liability account is recorded as an increase or decrease to expenses (trustees’ fees and expenses). For the fiscal year ended March 31, 2019, such expenses increased by $3,282 for all applicable Funds presented in these financial statements as a result of the market value appreciation on such accounts. As of March 31, 2019 the total amount in the DCP Liability accounts was $51,058 for all applicable Funds presented in these financial statements.
E. OFFICERS OF THE TRUST
None of the officers of the Trust received compensation from the Trust.
F. INDEMNIFICATIONS
Under the Trust’s organizational documents, its officers and trustees are indemnified against certain liabilities arising out of performance of their duties to the Trust. In addition, the Trust entered into an agreement with each of the trustees which provides that the Trust will indemnify and hold harmless each trustee against any expenses actually and reasonably incurred by any trustee in any proceeding arising out of or in connection with the trustee’s services to the Trust, to the fullest extent permitted by the Trust’s Declaration of Trust andBy-Laws, the general trust law of the State of Delaware, the Securities Act of 1933, and the 1940 Act, each as now or hereinafter in force. In the normal course of business, the Trust enters into contracts with service providers and others that contain general indemnification clauses. The Trust’s maximum exposure under these arrangements and agreements is dependent on future claims that may be made against the Trust and/or the trustees and, therefore, cannot be estimated; however, based on experience, the risk of loss from such claims is considered remote.
G. INTERFUND TRANSACTIONS
In accordance with Rule17a-7 under the 1940 Act and applicable Trust policies and procedures, purchase and sale transactions may be conducted between a Fund of the Trust and another Fund of the Trust or certain affiliates of the Trust if conducted at the independent “current market price” (the last sales price,intra-day price, or average of highest bid/lowest offer, as applicable) on a commission-free basis with no remuneration paid in connection with the transaction (other than cash payment against prompt delivery). At the quarterly Board meeting subsequent to the purchase and sale transactions taking place, the Board will be asked to determine that the transactions were conducted in compliance with applicable Trust policies and procedures.
For the fiscal year ended March 31, 2019, the purchase and sale transactions with an affiliated Fund conducted in compliance withRule 17a-7 under the 1940 Act are summarized in the following table:
| | | | | | | | | | | | |
| Fund | | Purchases | | | Sales | | | Net Realized Gain (Loss) | |
| PF Multi-Asset | | | $30,193,432 | | | | $— | | | | $— | |
D-19
PACIFIC FUNDS
NOTES TO FINANCIAL STATEMENTS (Continued)
8. PURCHASES AND SALES OF INVESTMENTS
The cost of purchases and proceeds from sales of investments (excluding short-term investments) for the fiscal year ended March 31, 2019, are summarized in the following table:
| | | | | | | | | | | | | | | | |
| | | U.S. Government Securities | | | Other Securities | |
| Fund | | Purchases | | | Sales | | | Purchases | | | Sales | |
| PF Inflation Managed | | | $95,020,461 | | | | $131,340,298 | | | | $10,269,676 | | | | $4,089,132 | |
| PF Managed Bond | | | 3,121,762,236 | | | | 3,059,080,557 | | | | 207,993,359 | | | | 258,546,803 | |
| PF Short Duration Bond | | | 156,846,456 | | | | 140,939,635 | | | | 99,798,450 | | | | 74,350,031 | |
| PF Emerging Markets Debt | | | — | | | | — | | | | 44,182,561 | | | | 46,078,099 | |
| PF Developing Growth | | | — | | | | — | | | | 18,911,013 | | | | 14,719,598 | |
| PF Growth | | | — | | | | — | | | | 49,247,364 | | | | 94,631,007 | |
| PF Large-Cap Value | | | — | | | | — | | | | 85,046,110 | | | | 77,273,694 | |
| PF Mid-Cap Equity | | | — | | | | — | | | | 17,183,247 | | | | 40,364,524 | |
| PF Multi-Asset | | | 262,007,141 | | | | 137,725,449 | | | | 754,099,128 | | | | 513,652,169 | |
| PF Small-Cap Value | | | — | | | | — | | | | 41,520,119 | | | | 50,367,096 | |
| PF Emerging Markets | | | — | | | | — | | | | 65,716,951 | | | | 99,220,383 | |
| PF International Large-Cap | | | — | | | | — | | | | 27,801,209 | | | | 93,773,091 | |
| PF International Small-Cap | | | — | | | | — | | | | 36,003,109 | | | | 79,526,692 | |
| PF International Value | | | — | | | | — | | | | 45,550,698 | | | | 112,627,081 | |
| PF Real Estate | | | — | | | | — | | | | 82,637,023 | | | | 48,690,473 | |
| PF Currency Strategies | | | — | | | | — | | | | 5,428,220 | | | | 2,978,580 | |
9. SECURED BORROWINGS
The contractual maturity of secured borrowings and type of collateral pledged as of March 31, 2019, are summarized in the following table:
| | | | | | | | | | | | | | | | | | | | | | |
| | | | | Remaining Contractual Maturity of the Agreements | |
| Secured Borrowings | | Collateral Type | | Overnight and
Continuous | | | Up to 30 days | | | 31-90 days | | | Greater Than
90 Days | | | Total | |
PF Inflation Managed | | | | | | | | | | | | | | | | | | | | | | |
Sale-buyback financing transactions | | U.S. Treasury Obligations | | | $935,042 | | | | $20,915,808 | | | | $— | | | | $— | | | | $21,850,850 | |
| | | | | | | | | | | | | | | | | | | | | | |
Total borrowings | | | | | $935,042 | | | | $20,915,808 | | | | $— | | | | $— | | | | $21,850,850 | |
| | | | | | | | | | | | | | | | | | | | | | |
PF Managed Bond | | | | | | | | | | | | | | | | | | | | | | |
Sale-buyback financing transactions | | U.S. Treasury Obligations | | | $1,039,889 | | | | $8,183,472 | | | | $1,755,221 | | | | $— | | | | $10,978,582 | |
Reverse repurchase agreement | | U.S. Treasury Obligations | | | — | | | | 2,045,000 | | | | — | | | | — | | | | 2,045,000 | |
| | | | | | | | | | | | | | | | | | | | | | |
Total borrowings | | | | | $1,039,889 | | | | $10,228,472 | | | | $1,755,221 | | | | $— | | | | $13,023,582 | |
| | | | | | | | | | | | | | | | | | | | | | |
10 . FEDERAL INCOME TAX INFORMATION
Each Fund intends to qualify each year as a regulated investment company (“RIC”) under Subchapter M of the Internal Revenue Code (the “Code”). A Fund that qualifies as a RIC does not have to pay income tax as long as it distributes sufficient taxable income and net capital gains. Each Fund declared and paid sufficient dividends on net investment income and capital gains distributions during the fiscal year or period ended March 31, 2019, to qualify as a RIC and is not required to pay Federal income tax under the Code. Accordingly, no provision for Federal income taxes is required in the financial statements. Required distributions are based on net investment income and net realized gains determined in accordance with income tax regulations, which may differ from U.S. GAAP for financial reporting purposes. These differences are primarily due to differing treatments for sale-buyback financing transactions, futures and options, swap income, paydown gain/loss, partnership income, foreign currency transactions, passive foreign investment companies, late year ordinary and post-October capital losses, capital loss carryforwards, and losses deferred due to wash sales. Permanent book and tax differences relating to shareholder distributions will result in reclassifications of capital accounts. In addition, the year in which amounts are distributed may differ from the year in which the net investment income is earned and the net gains are realized by each Fund.
D-20
PACIFIC FUNDS
NOTES TO FINANCIAL STATEMENTS (Continued)
The following table shows the accumulated capital losses and components of distributable earnings on a tax basis, and late year ordinary losses and post-October capital losses deferred, if any, as of March 31, 2019:
| | | | | | | | | | | | | | | | | | | | | | | | | | | | | | | | |
| | | | | | Distributable Earnings | | | | | | Late-Year Ordinary and
Post-October Losses Deferral | |
| Fund | | Accumulated
Capital
Losses | | | Undistributed
Ordinary
Income | | | Undistributed
Long-Term
Capital Gains | | | | | | Late-Year
Ordinary
Losses | | | Short-Term
Capital
Losses | | | Long-Term
Capital
Losses | | | Total | |
|
PF Inflation Managed | | | ($9,181,633 | ) | | | $— | | | | $— | | | | | | | | $251,648 | | | | $— | | | | $— | | | | $251,648 | |
PF Managed Bond | | | (10,615,626 | ) | | | — | | | | — | | | | | | | | 1,294,631 | | | | — | | | | — | | | | 1,294,631 | |
PF Short Duration Bond | | | (2,825,374 | ) | | | 1,372,547 | | | | — | | | | | | | | — | | | | — | | | | — | | | | — | |
PF Emerging Markets Debt | | | (7,496,797 | ) | | | 352,967 | | | | — | | | | | | | | — | | | | — | | | | — | | | | — | |
PF Developing Growth | | | — | | | | — | | | | — | | | | | | | | 25,055 | | | | — | | | | 135,133 | | | | 160,188 | |
PF Growth | | | — | | | | — | | | | 2,496,638 | | | | | | | | — | | | | — | | | | — | | | | — | |
PFLarge-Cap Value | | | — | | | | 376,964 | | | | 3,503,332 | | | | | | | | — | | | | — | | | | — | | | | — | |
PF Multi-Asset | | | — | | | | — | | | | 6,373,980 | | | | | | | | 1,377,429 | | | | — | | | | — | | | | 1,377,429 | |
PFSmall-Cap Value | | | — | | | | — | | | | 993,308 | | | | | | | | — | | | | — | | | | — | | | | — | |
PF Emerging Markets | | | — | | | | 591,402 | | | | 2,382,251 | | | | | | | | — | | | | — | | | | — | | | | — | |
PF InternationalLarge-Cap | | | — | | | | 53,709 | | | | 4,630,687 | | | | | | | | — | | | | — | | | | — | | | | — | |
PF InternationalSmall-Cap | | | (6,996,678 | ) | | | 1,041,350 | | | | — | | | | | | | | — | | | | — | | | | — | | | | — | |
PF International Value | | | — | | | | — | | | | — | | | | | | | | 213,040 | | | | 271,856 | | | | — | | | | 484,896 | |
PF Real Estate | | | — | | | | 301,393 | | | | 191,443 | | | | | | | | — | | | | — | | | | — | | | | — | |
PF Currency Strategies | | | — | | | | — | | | | — | | | | | | | | 159,137 | | | | — | | | | — | | | | 159,137 | |
PF Equity Long/Short | | | — | | | | — | | | | — | | | | | | | | 1,002,623 | | | | 94,148 | | | | — | | | | 1,096,771 | |
Accumulated capital losses represent net capital loss carryovers as of March 31, 2019 that may be available to offset future realized capital gains and thereby reduce future capital gains distributions. The following table shows the expiration dates and the amounts of capital loss carryover, if any, by each of the applicable Funds as of March 31, 2019 and capital loss carryover from prior years utilized during the fiscal year ended March 31, 2019:
| | | | | | | | | | | | | | | | |
| | | Unlimited Period of Net
Capital Loss Carryover | | | Accumulated
Capital Loss
Carryover | | | Capital Loss
Carryover Utilized
During the
Year Ended
March 31, 2019 | |
| Fund | | Short-Term | | | Long-Term | |
PF Inflation Managed | | | ($850,349 | ) | | | ($8,331,284 | ) | | | ($9,181,633 | ) | | | $19,794 | |
PF Managed Bond | | | — | | | | (10,615,626 | ) | | | (10,615,626 | ) | | | — | |
PF Short Duration Bond | | | (807,716 | ) | | | (2,017,658 | ) | | | (2,825,374 | ) | | | 391,755 | |
PF Emerging Markets Debt | | | (2,847,247 | ) | | | (4,649,550 | ) | | | (7,496,797 | ) | | | 111,233 | |
PF Developing Growth | | | — | | | | — | | | | — | | | | 1,011,567 | |
PF Multi-Asset | | | — | | | | — | | | | — | | | | 52,422 | |
PF InternationalSmall-Cap | | | (6,996,678 | ) | | | — | | | | (6,996,678 | ) | | | — | |
PF Currency Strategies | | | — | | | | — | | | | — | | | | 3,212 | |
The aggregate cost of investments and the composition of unrealized appreciation and depreciation on investments and net unrealized appreciation and/or depreciation on derivatives for Federal income tax purposes as of March 31, 2019, were as follows:
| | | | | | | | | | | | | | | | | | | | | | | | |
| Fund | | Total Cost of
Investments
on Tax Basis (1) | | | Gross
Unrealized
Appreciation
on Investments | | | Gross
Unrealized
Depreciation
on Investments | | | Net
Unrealized
Appreciation
(Depreciation)
on Investments | | | Net
Unrealized
Appreciation
(Depreciation)
on Other (2) | | | Net
Unrealized
Appreciation
(Depreciation) | |
PF Inflation Managed | | | $57,790,128 | | | | $516,010 | | | | ($868,863 | ) | | | ($352,853 | ) | | | $36,837 | | | | ($316,016 | ) |
PF Managed Bond | | | 696,930,018 | | | | 13,751,025 | | | | (12,032,258 | ) | | | 1,718,767 | | | | 369,183 | | | | 2,087,950 | |
PF Short Duration Bond | | | 155,233,251 | | | | 906,085 | | | | (280,575 | ) | | | 625,510 | | | | (30 | ) | | | 625,480 | |
PF Emerging Markets Debt | | | 71,963,719 | | | | 1,884,490 | | | | (3,283,223 | ) | | | (1,398,733 | ) | | | (46,715 | ) | | | (1,445,448 | ) |
PF Developing Growth | | | 11,886,071 | | | | 4,187,360 | | | | (418,147 | ) | | | 3,769,213 | | | | — | | | | 3,769,213 | |
PF Growth | | | 105,939,032 | | | | 81,671,639 | | | | (1,019,844 | ) | | | 80,651,795 | | | | (51 | ) | | | 80,651,744 | |
PFLarge-Cap Value | | | 100,124,957 | | | | 72,504,474 | | | | (1,579,050 | ) | | | 70,925,424 | | | | — | | | | 70,925,424 | |
PFMid-Cap Equity | | | 9,412,677 | | | | 1,187,710 | | | | (700,302 | ) | | | 487,408 | | | | — | | | | 487,408 | |
PF Multi-Asset | | | 1,136,665,630 | | | | 5,813,637 | | | | (821,433 | ) | | | 4,992,204 | | | | (4,544,833 | ) | | | 447,371 | |
PFSmall-Cap Value | | | 64,189,977 | | | | 12,391,488 | | | | (6,108,595 | ) | | | 6,282,893 | | | | — | | | | 6,282,893 | |
PF Emerging Markets | | | 91,933,370 | | | | 51,382,943 | | | | (9,206,979 | ) | | | 42,175,964 | | | | (244,215 | ) | | | 41,931,749 | |
PF InternationalLarge-Cap | | | 40,119,591 | | | | 19,753,982 | | | | (2,615,323 | ) | | | 17,138,659 | | | | (143,274 | ) | | | 16,995,385 | |
PF InternationalSmall-Cap | | | 30,468,305 | | | | 4,510,425 | | | | (3,288,274 | ) | | | 1,222,151 | | | | (6,548 | ) | | | 1,215,603 | |
PF International Value | | | 65,923,148 | | | | 4,488,468 | | | | (6,442,842 | ) | | | (1,954,374 | ) | | | (13,275 | ) | | | (1,967,649 | ) |
PF Real Estate | | | 70,715,832 | | | | 11,798,480 | | | | (901,906 | ) | | | 10,896,574 | | | | — | | | | 10,896,574 | |
PF Currency Strategies | | | 45,692,232 | | | | 6,324 | | | | (315,518 | ) | | | (309,194 | ) | | | 3,653 | | | | (305,541 | ) |
PF Equity Long/Short | | | 29,146,740 | | | | 109,897 | | | | (106,877 | ) | | | 3,020 | | | | 22,183 | | | | 25,203 | |
| | (1) | The difference between the total cost of investments on tax basis and investments, at cost, as presented in the Statements of Assets and Liabilities is primarily due to wash sale loss deferrals, investments in passive foreign investment companies, partnerships, and differing treatments for sale-buyback financing transactions and U.S. Treasury Inflation Protected Securities. |
| | (2) | Other includes net appreciation or depreciation on derivatives, short sales, and foreign currencies, if any. |
D-21
PACIFIC FUNDS
NOTES TO FINANCIAL STATEMENTS (Continued)
Each Fund recognizes the financial statement effects of a tax position taken or expected to be taken in a tax return when it is more likely than not, based on the technical merits, that the position will be sustained upon examination by the applicable tax authority. Tax positions not deemed to meet themore-likely-than-not threshold would be recorded as a tax liability for unrecognized tax benefits with a corresponding income tax expense. Management has analyzed all open tax years, as defined by the statute of limitations, for all major jurisdictions and has determined that no provision for income tax is required in the financial statements. Each Fund remains subject to examination by Federal and State tax authorities for the returns filed for tax years ended as of and after March 31, 2015.
11. TAX CHARACTER OF DISTRIBUTIONS
The tax character of income and capital gain distributions to shareholders during the fiscal year or period ended March 31, 2019 and 2018, were as follows:
| | | | | | | | | | | | | | | | | | | | | | | | | | | | |
| | | For the Year Ended March 31, 2019 | | | | | | For the Year or Period Ended March 31, 2018 | |
| Funds | | Ordinary
Income | | | Long-Term
Capital Gains | | | Total
Distributions | | | | | | Ordinary
Income | | | Long-Term
Capital Gains | | | Total
Distributions | |
PF Inflation Managed | | | $2,002,797 | | | | $— | | | | $2,002,797 | | | | | | | | $165,026 | | | | $— | | | | $165,026 | |
PF Managed Bond | | | 15,588,848 | | | | — | | | | 15,588,848 | | | | | | | | 27,252,900 | | | | — | | | | 27,252,900 | |
PF Short Duration Bond | | | 2,654,646 | | | | — | | | | 2,654,646 | | | | | | | | 2,387,342 | | | | — | | | | 2,387,342 | |
PF Emerging Markets Debt | | | 1,235,277 | | | | — | | | | 1,235,277 | | | | | | | | 3,464,056 | | | | — | | | | 3,464,056 | |
PF Developing Growth | | | — | | | | 95,677 | | | | 95,677 | | | | | | | | — | | | | — | | | | — | |
PF Growth | | | 562,295 | | | | 10,205,298 | | | | 10,767,593 | | | | | | | | 1,081,093 | | | | 4,208,497 | | | | 5,289,590 | |
PFLarge-Cap Value | | | 3,580,330 | | | | 61,881,413 | | | | 65,461,743 | | | | | | | | 6,916,773 | | | | 4,416,112 | | | | 11,332,885 | |
PFMid-Cap Equity | | | 446,362 | | | | 5,318,107 | | | | 5,764,469 | | | | | | | | 2,759,880 | | | | 8,496,195 | | | | 11,256,075 | |
PF Multi-Asset | | | 15,433,139 | | | | — | | | | 15,433,139 | | | | | | | | — | | | | — | | | | — | |
PF Small Cap Value | | | 1,150,556 | | | | 15,278,120 | | | | 16,428,676 | | | | | | | | 230,521 | | | | 15,035,437 | | | | 15,265,958 | |
PF Emerging Markets | | | 833,161 | | | | 14,561,366 | | | | 15,394,527 | | | | | | | | 1,205,327 | | | | — | | | | 1,205,327 | |
PF InternationalLarge-Cap | | | 1,238,466 | | | | 22,780,379 | | | | 24,018,845 | | | | | | | | 2,849,998 | | | | — | | | | 2,849,998 | |
PF InternationalSmall-Cap | | | 374,460 | | | | 1,498,859 | | | | 1,873,319 | | | | | | | | 1,494,781 | | | | 3,024,730 | | | | 4,519,511 | |
PF International Value | | | 7,861,965 | | | | 6,034,253 | | | | 13,896,218 | | | | | | | | 7,139,546 | | | | — | | | | 7,139,546 | |
PF Real Estate | | | 900,002 | | | | 5,570,666 | | | | 6,470,668 | | | | | | | | 636,138 | | | | 5,740,391 | | | | 6,376,529 | |
PF Currency Strategies | | | — | | | | — | | | | — | | | | | | | | 2,053,772 | | | | — | | | | 2,053,772 | |
PF Equity Long/Short | | | 1,622,662 | | | | 803,297 | | | | 2,425,959 | | | | | | | | 6,050,516 | | | | 3,896,788 | | | | 9,947,304 | |
12. RECLASSIFICATION OF ACCOUNTS
During the fiscal year ended March 31, 2019, reclassifications as shown in the following table have been made in each Fund’s capital account to report these balances on a tax basis, excluding certain temporary differences, as of March 31, 2019. Additional adjustments may be required in subsequent reporting periods. These reclassifications, which have no impact on the NAV of the Funds, are primarily attributable to reclassifications of sale-buyback financing transactions, paydown gain/loss, partnership income, expiration of capital loss carryforwards, foreign currency transactions,non-deductible expenses, swap income, redesignation of dividends paid, treatment of net operating losses and capital gains under Federal tax rules versus U.S. GAAP. The calculation of net investment income per share in the financial highlights excludes these adjustments.
| | | | | | | | | | | | |
| Fund | | Paid-In Capital | | | Undistributed/
Accumulated
Net Investment
Income (Loss) | | | Undistributed/
Accumulated
Net Realized
Gain (Loss) | |
PF Inflation Managed | | | $— | | | | $183,055 | | | | ($183,055 | ) |
PF Managed Bond | | | — | | | | 897,243 | | | | (897,243 | ) |
PF Short Duration Bond | | | — | | | | 129,940 | | | | (129,940 | ) |
PF Emerging Markets Debt | | | — | | | | (3,048,474 | ) | | | 3,048,474 | |
PF Developing Growth | | | (40,461 | ) | | | 40,461 | | | | — | |
PF Growth | | | (3 | ) | | | 12,623 | | | | (12,620 | ) |
PFLarge-Cap Value | | | — | | | | (445,249 | ) | | | 445,249 | |
PFMid-Cap Equity | | | 14,973,395 | | | | (59,337 | ) | | | (14,914,058 | ) |
PF Multi-Asset | | | 1,550,433 | | | | (11,587,634 | ) | | | 10,037,201 | |
PFSmall-Cap Value | | | — | | | | (23,593 | ) | | | 23,593 | |
PF Emerging Markets | | | — | | | | 247,014 | | | | (247,014 | ) |
PF InternationalLarge-Cap | | | 26,634,840 | | | | (211,566 | ) | | | (26,423,274 | ) |
PF InternationalSmall-Cap | | | — | | | | 185,610 | | | | (185,610 | ) |
PF International Value | | | (4,195,633 | ) | | | (406,024 | ) | | | 4,601,657 | |
PF Currency Strategies | | | — | | | | 961,113 | | | | (961,113 | ) |
PF Equity Long/Short | | | (8,511,664 | ) | | | 5,353,390 | | | | 3,158,274 | |
D-22
PACIFIC FUNDS
NOTES TO FINANCIAL STATEMENTS (Continued)
13. SHARES OF BENEFICIAL INTEREST
Each Fund is authorized to issue an unlimited number of shares of beneficial interest with no par value unless otherwise determined by the trustees of the Board. Changes in shares of beneficial interest of each Fund for the fiscal year ended March 31, 2019 and the fiscal year or period ended March 31, 2018 were as follows:
| | | | | | | | | | | | | | | | | | | | | | | | | | | | | | | | | | | | | | | | | | | | |
| | | Year ended
3/31/2019 | | | Year/
Period ended
3/31/2018 | | | | | | Year ended
3/31/2019 | | | Year ended
3/31/2018 | | | | | | Year ended
3/31/2019 | | | Year ended
3/31/2018 | | | | | | Year ended
3/31/2019 | | | Year ended
3/31/2018 | |
| | | PF Inflation
Managed Fund | | | | | | PF Managed
Bond Fund | | | | | | PF Short Duration
Bond Fund | | | | | | PF Emerging Markets
Debt Fund | |
| | | | | | | | | | | |
Class P | | | | | | | | | | | | | | | | | | | | | | | | | | | | | | | | | | | | | | | | | | | | |
Shares sold | | | 256,207 | | | | 7,313,111 | | | | | | | | 6,352,160 | | | | 531,321 | | | | | | | | 12,928,251 | | | | 501,598 | | | | | | | | 2,106,584 | | | | 4,948,673 | |
Dividends and distributions reinvested | | | 236,457 | | | | 18,480 | | | | | | | | 1,537,362 | | | | 2,548,681 | | | | | | | | 271,714 | | | | 243,358 | | | | | | | | 143,304 | | | | 375,304 | |
Shares repurchased | | | (4,377,223 | ) | | | (271,176 | ) | | | | | | | (17,374,944 | ) | | | (16,107,371 | ) | | | | | | | (9,029,155 | ) | | | (6,235,028 | ) | | | | | | | (3,595,690 | ) | | | (707,964 | ) |
Net increase (decrease) | | | (3,884,559 | ) | | | 7,060,415 | | | | | | | | (9,485,422 | ) | | | (13,027,369 | ) | | | | | | | 4,170,810 | | | | (5,490,072 | ) | | | | | | | (1,345,802 | ) | | | 4,616,013 | |
Beginning shares outstanding | | | 8,533,123 | | | | 1,472,708 | | | | | | | | 56,563,475 | | | | 69,590,844 | | | | | | | | 11,469,397 | | | | 16,959,469 | | | | | | | | 9,152,207 | | | | 4,536,194 | |
Ending shares outstanding | | | 4,648,564 | | | | 8,533,123 | | | | | | | | 47,078,053 | | | | 56,563,475 | | | | | | | | 15,640,207 | | | | 11,469,397 | | | | | | | | 7,806,405 | | | | 9,152,207 | |
| | | | | | | |
| | | PF Developing
Growth Fund | | | | | | PF Growth
Fund | | | | | | PF Large-Cap
Value Fund | | | | | | PF Mid-Cap
Equity Fund | |
| | | | | | | | | | | |
Class P | | | | | | | | | | | | | | | | | | | | | | | | | | | | | | | | | | | | | | | | | | | | |
Shares sold | | | 477,855 | | | | 76,603 | | | | | | | | 1,636,305 | | | | 2,958,294 | | | | | | | | 6,177,036 | | | | 162,487 | | | | | | | | 881,298 | | | | 19,834 | |
Dividends and distributions reinvested | | | 6,044 | | | | — | | | | | | | | 437,817 | | | | 221,110 | | | | | | | | 5,625,143 | | | | 641,021 | | | | | | | | 2,011 | | | | 1,040,934 | |
Shares repurchased | | | (270,382 | ) | | | (204,222 | ) | | | | | | | (3,363,434 | ) | | | (1,488,410 | ) | | | | | | | (6,523,746 | ) | | | (17,877,474 | ) | | | | | | | (2,921,454 | ) | | | (4,145,268 | ) |
Net increase (decrease) | | | 213,517 | | | | (127,619 | ) | | | | | | | (1,289,312 | ) | | | 1,690,994 | | | | | | | | 5,278,433 | | | | (17,073,966 | ) | | | | | | | (2,038,145 | ) | | | (3,084,500 | ) |
Beginning shares outstanding | | | 637,876 | | | | 765,495 | | | | | | | | 8,145,001 | | | | 6,454,007 | | | | | | | | 9,040,089 | | | | 26,114,055 | | | | | | | | 2,918,158 | | | | 6,002,658 | |
Ending shares outstanding | | | 851,393 | | | | 637,876 | | | | | | | | 6,855,689 | | | | 8,145,001 | | | | | | | | 14,318,522 | | | | 9,040,089 | | | | | | | | 880,013 | | | | 2,918,158 | |
| | | | | | | |
| | | PF Multi-Asset
Fund | | | | | | PF Small-Cap
Value Fund | | | | | | PF Emerging
Markets Fund | | | | | | PF International
Large-Cap Fund | |
| | | | | | | | | | | |
Class P | | | | | | | | | | | | | | | | | | | | | | | | | | | | | | | | | | | | | | | | | | | | |
Shares sold | | | 61,114,150 | | | | 77,848,543 | | | | | | | | 1,765,846 | | | | 63,528 | | | | | | | | 2,603,510 | | | | 166,751 | | | | | | | | 1,907,404 | | | | 258,634 | |
Dividends and distributions reinvested | | | 1,819,946 | | | | — | | | | | | | | 2,034,155 | | | | 1,337,718 | | | | | | | | 1,152,531 | | | | 72,654 | | | | | | | | 2,217,372 | | | | 135,456 | |
Shares repurchased | | | (24,969,892 | ) | | | (1 | ) | | | | | | | (2,466,137 | ) | | | (3,945,051 | ) | | | | | | | (4,965,180 | ) | | | (4,456,527 | ) | | | | | | | (5,136,988 | ) | | | (4,094,473 | ) |
Net increase (decrease) | | | 37,964,204 | | | | 77,848,542 | | | | | | | | 1,333,864 | | | | (2,543,805 | ) | | | | | | | (1,209,139 | ) | | | (4,217,122 | ) | | | | | | | (1,012,212 | ) | | | (3,700,383 | ) |
Beginning shares outstanding | | | 77,848,542 | | | | — | | | | | | | | 7,265,519 | | | | 9,809,324 | | | | | | | | 10,311,228 | | | | 14,528,350 | | | | | | | | 6,014,301 | | | | 9,714,684 | |
Ending shares outstanding | | | 115,812,746 | | | | 77,848,542 | | | | | | | | 8,599,383 | | | | 7,265,519 | | | | | | | | 9,102,089 | | | | 10,311,228 | | | | | | | | 5,002,089 | | | | 6,014,301 | |
| | | | | | | |
| | | PF International
Small-Cap Fund | | | | | | PF International
Value Fund | | | | | | PF Real Estate
Fund | | | | | | PF Currency
Strategies Fund | |
| | | | | | | | | | | |
Class P | | | | | | | | | | | | | | | | | | | | | | | | | | | | | | | | | | | | | | | | | | | | |
Shares sold | | | 1,285,828 | | | | 4,317,301 | | | | | | | | 2,962,401 | | | | 509,308 | | | | | | | | 4,140,280 | | | | 778,164 | | | | | | | | 1,004,078 | | | | 868,157 | |
Dividends and distributions reinvested | | | 208,299 | | | | 403,934 | | | | | | | | 1,854,451 | | | | 700,642 | | | | | | | | 562,033 | | | | 495,992 | | | | | | | | — | | | | 235,254 | |
Shares repurchased | | | (6,156,842 | ) | | | (805,699 | ) | | | | | | | (10,296,096 | ) | | | (5,843,205 | ) | | | | | | | (1,536,045 | ) | | | (387,143 | ) | | | | | | | (3,024,855 | ) | | | (3,493,107 | ) |
Net increase (decrease) | | | (4,662,715 | ) | | | 3,915,536 | | | | | | | | (5,479,244 | ) | | | (4,633,255 | ) | | | | | | | 3,166,268 | | | | 887,013 | | | | | | | | (2,020,777 | ) | | | (2,389,696 | ) |
Beginning shares outstanding | | | 7,993,290 | | | | 4,077,754 | | | | | | | | 14,126,782 | | | | 18,760,037 | | | | | | | | 3,500,559 | | | | 2,613,546 | | | | | | | | 6,862,489 | | | | 9,252,185 | |
Ending shares outstanding | | | 3,330,575 | | | | 7,993,290 | | | | | | | | 8,647,538 | | | | 14,126,782 | | | | | | | | 6,666,827 | | | | 3,500,559 | | | | | | | | 4,841,712 | | | | 6,862,489 | |
| | | | | | | |
| | | PF Equity
Long/Short Fund | | | | | | | | | | | | | | | | | | | |
| | | | | | | | | | | |
Class P | | | | | | | | | | | | | | | | | | | | | | | | | | | | | | | | | | | | | | | | | | | | |
Shares sold | | | 2,782,615 | | | | 344,554 | | | | | | | | | | | | | | | | | | | | | | | | | | | | | | | | | | | | | |
Dividends and distributions reinvested | | | 312,462 | | | | 990,313 | | | | | | | | | | | | | | | | | | | | | | | | | | | | | | | | | | | | | |
Shares repurchased | | | (4,145,703 | ) | | | (2,720,419 | ) | | | | | | | | | | | | | | | | | | | | | | | | | | | | | | | | | | | | |
Net increase (decrease) | | | (1,050,626 | ) | | | (1,385,552 | ) | | | | | | | | | | | | | | | | | | | | | | | | | | | | | | | | | | | | |
Beginning shares outstanding | | | 5,880,145 | | | | 7,265,697 | | | | | | | | | | | | | | | | | | | | | | | | | | | | | | | | | | | | | |
Ending shares outstanding | | | 4,829,519 | | | | 5,880,145 | | | | | | | | | | | | | | | | | | | | | | | | | | | | | | | | | | | | | |
D-23
REPORT OF INDEPENDENT REGISTERED PUBLIC ACCOUNTING FIRM
To the shareholders and the Board of Trustees of Pacific Funds Series Trust
Opinion on the Financial Statements and Financial Highlights
We have audited the accompanying statements of assets and liabilities of PF Inflation Managed Fund, PF Managed Bond Fund, PF Short Duration Bond Fund, PF Emerging Markets Debt Fund, PF Developing Growth Fund, PF Growth Fund, PFLarge-Cap Value Fund, PFMid-Cap Equity Fund, PF Multi-Asset Fund,PF Small-Cap Value Fund, PF Emerging Markets Fund, PF InternationalLarge-Cap Fund, PF InternationalSmall-Cap Fund, PF International Value Fund, PF Real Estate Fund, PF Currency Strategies Fund, and PF Equity Long/Short Fund (the “Funds”) (seventeen of the funds comprising Pacific Funds Series Trust), including the schedules of investments, as of March 31, 2019; the related statements of operations and cash flows (for PF Inflation Managed Fund), changes in net assets, and the financial highlights for the periods indicated in the table below; and the related notes. In our opinion, the financial statements and financial highlights present fairly, in all material respects, the financial position of each of the Funds as of March 31, 2019, and the results of their operations and its cash flows (for the PF Inflation Managed Fund), the changes in their net assets, and the financial highlights for the periods listed in the table below, in conformity with accounting principles generally accepted in the United States of America.
| | | | | | |
Individual Fund Comprising
the Pacific Funds Series Trust | | Statements of Operations and
Cash Flows (for PF Inflation
Managed Fund) | | Statements of Changes in
Net Assets | | Financial Highlights |
| PF Inflation Managed Fund, PF Managed Bond Fund, PF Short Duration Bond Fund, PF Emerging Markets Debt Fund , PF Developing Growth Fund, PF Growth Fund, PFLarge-Cap Value Fund, PFMid-Cap Equity Fund,PF Small-Cap Value Fund, PF Emerging Markets Fund, PF InternationalLarge-Cap Fund, PF International Value Fund, PF Real Estate Fund and PF Currency Strategies Fund | | For the year ended March 31, 2019 | | For the years ended March 31, 2019 and 2018 | | For the years ended March 31, 2019, 2018, 2017, 2016, and 2015 |
| PF Multi-Asset Fund | | For the year ended March 31, 2019 | | For the year ended March 31, 2019 and the period from January 31, 2018 (commencement of operations) through March 31, 2018 | | For the year ended March 31, 2019 and the period from January 31, 2018 (commencement of operations) through March 31, 2018 |
| PF InternationalSmall-Cap Fund | | For the year ended March 31, 2019 | | For the years ended March 31, 2019 and 2018 | | For the years ended March 31, 2019, 2018, 2017, 2016, and the period from January 14, 2015 (commencement of operations) through March 31, 2015 |
| PF Equity Long/Short Fund | | For the year ended March 31, 2019 | | For the years ended March 31, 2019 and 2018 | | For the years ended March 31, 2019, 2018, 2017, and the period from April 27, 2015 (commencement of operations) through March 31, 2016 |
Basis for Opinion
These financial statements and financial highlights are the responsibility of the Funds’ management. Our responsibility is to express an opinion on the Funds’ financial statements and financial highlights based on our audits. We are a public accounting firm registered with the Public Company Accounting Oversight Board (United States) (PCAOB) and are required to be independent with respect to the Funds in accordance with the U.S. federal securities laws and the applicable rules and regulations of the Securities and Exchange Commission and the PCAOB.
We conducted our audits in accordance with the standards of the PCAOB. Those standards require that we plan and perform the audit to obtain reasonable assurance about whether the financial statements and financial highlights are free of material misstatement, whether due to error or fraud. The Funds are not required to have, nor were we engaged to perform, an audit of their internal control over financial reporting. As part of our audits we are required to obtain an understanding of internal control over financial reporting but not for the purpose of expressing an opinion on the effectiveness of the Funds’ internal control over financial reporting. Accordingly, we express no such opinion.
Our audits included performing procedures to assess the risks of material misstatement of the financial statements and financial highlights, whether due to error or fraud, and performing procedures that respond to those risks. Such procedures included examining, on a test basis, evidence regarding the amounts and disclosures in the financial statements and financial highlights. Our audits also included evaluating the accounting principles used and significant estimates made by management, as well as evaluating the overall presentation of the financial statements and financial highlights. Our procedures included confirmation of securities owned as of March 31, 2019, by correspondence with the custodian and brokers; when replies were not received from brokers, we performed other auditing procedures. We believe that our audits provide a reasonable basis for our opinion.

Philadelphia, PA
May 24, 2019
We have served as the auditor of one or more affiliated investment companies of Pacific Funds Series Trust since 1988.
E-1
PACIFIC FUNDS
OTHER TAX INFORMATION
(Unaudited)
For corporate shareholders, the percentage of investment income (dividend income and short-term gains, if any) for each of the Funds that qualify for the dividends-received deductions for the fiscal year ended March 31, 2019 is as follows:
| | | | |
| Fund | | Percentage | |
PF Growth | | | 78.63% | |
PFLarge-Cap Value | | | 100.00% | |
PFMid-Cap Equity | | | 22.38% | |
PFSmall-Cap Value | | | 65.06% | |
PF InternationalSmall-Cap | | | 1.00% | |
For the fiscal year ended March 31, 2019 certain dividends paid by the Funds may be subject to a maximum tax rate of 15% as provided by the Jobs and Growth Relief Reconciliation Act of 2003. Of the distributions made by the following Funds, the corresponding percentages represent the amount of each distribution which may qualify for the 15% dividend income tax rate.
| | | | |
| Fund | | Percentage | |
PF Growth | | | 85.45% | |
PFLarge-Cap Value | | | 100.00% | |
PFMid-Cap Equity | | | 24.23% | |
PFSmall-Cap Value | | | 76.24% | |
PF Emerging Markets | | | 100.00% | |
PF InternationalLarge-Cap | | | 100.00% | |
PF InternationalSmall-Cap | | | 97.84% | |
PF International Value | | | 100.00% | |
Shareholders should not use the above tax information to prepare their tax returns. The information will be included in your Form 1099 DIV, which will be sent to you separately in January 2020. The Funds intend to pass through the maximum allowable percentages to shareholders.
The following Funds designated the listed amounts as long-term capital gain dividends during the fiscal year ended March 31, 2019. Distributable long-term gains are based on net realized long-term gains determined on a tax basis and may differ from such amounts for financial reporting purposes.
| | | | |
| Fund | | Amount | |
PF Developing Growth | | | $95,677 | |
PF Growth | | | 10,205,298 | |
PFLarge-Cap Value | | | 61,881,413 | |
PFMid-Cap Equity | | | 13,313,912 | |
PF Multi-Asset | | | 6,373,980 | |
PFSmall-Cap Value | | | 15,278,120 | |
PF Emerging Markets | | | 14,561,366 | |
PF InternationalLarge-Cap | | | 45,443,252 | |
PF InternationalSmall-Cap | | | 1,498,859 | |
PF International Value | | | 6,034,253 | |
PF Real Estate | | | 5,570,666 | |
PF Equity Long/Short | | | 803,297 | |
F-1
PACIFIC FUNDS
DISCLOSURE OF FUND EXPENSES
(Unaudited)
We believe it is important for you to understand the impact of fees and expenses regarding your investment. All mutual funds have operating expenses. As a shareholder of a mutual fund, you incur ongoing costs, which include advisory fees, administration fees and other fund expenses. The following example is intended to help you understand your ongoing costs (in dollars) of investing in each fund and to compare these costs with those of other mutual funds. The example is based on an investment of $1,000.00 made at the beginning of the period and held for the entire six-month period from October 1, 2018 to March 31, 2019.
ACTUAL EXPENSES
The first section of the table for each fund entitled “Actual Fund Return”, provides information about actual account values and actual expenses based on each fund’s actual performance and each fund’s actual expenses, after any applicable advisory fee waivers and adviser expense reimbursements (See Notes 6 and 7B in Notes to Financial Statements). The “Ending Account Value at 03/31/19” column shown is derived from the fund’s actual performance; the “Annualized Expense Ratio” column shows the fund’s actual annualized expense ratio; and the “Expenses Paid During the Period 10/01/18-03/31/19” column shows the dollar amount that would have been paid by you. All the information illustrated in the following table is based on the past six-month period from October 1, 2018 to March 31, 2019.
You may use the information in this section, together with the amount you invested, to estimate the expenses that you paid over the period. To do so, for each fund in your account, simply divide that fund’s value by $1,000.00 (for example, an $8,600.00 fund value divided by $1,000.00 = 8.6), then multiply the result by the number given for your fund(s) in the “Expenses Paid During the Period 10/01/18-03/31/19.”
HYPOTHETICAL EXAMPLE FOR COMPARISON PURPOSES
The second section of the table for each fund, entitled “Hypothetical”, provides information about hypothetical account values and hypothetical expenses based on a 5% per year hypothetical rate of return and actual fund’s expenses, after any applicable advisory fee waivers and adviser expense reimbursements (See Notes 6 and 7B in Notes to Financial Statements). It assumes that the fund had an annual 5% rate of return before expenses, but that the expense ratio is unchanged. The hypothetical account values and expenses may not be used to estimate the actual ending account values or expenses you paid for the period.
You may use the hypothetical example information to compare the ongoing costs of investing in the fund compared to other mutual funds. To do so, compare this 5% hypothetical example with the 5% hypothetical examples that appear in the shareholder reports of other mutual funds.
Please note that the expenses shown in the table are meant to highlight your ongoing costs only and do not reflect any transactional costs. Therefore, the second section of the table is useful in comparing ongoing costs only, and will not help you determine the relative total costs of owning different mutual funds. In addition, if these other costs were included, your costs would have been higher.
| | | | | | | | | | | | | | | | |
| | | Beginning
Account
Value at
10/01/18 | | | Ending
Account
Value at
03/31/19 | | | Annualized
Expense
Ratio | | | Expenses
Paid During
the Period
10/01/18 -
03/31/19 (1) | |
| PF Inflation Managed Fund | |
Actual Fund Return | | | | | | | | | | | | | | | | |
| | | | |
Class P | | | $1,000.00 | | | | $1,025.00 | | | | 1.17% | | | | $5.91 | |
| | | | |
Hypothetical | | | | | | | | | | | | | | | | |
| | | | |
Class P | | | $1,000.00 | | | | $1,019.10 | | | | 1.17% | | | | $5.89 | |
| PF Managed Bond Fund | |
Actual Fund Return | | | | | | | | | | | | | | | | |
| | | | |
Class P | | | $1,000.00 | | | | $1,044.20 | | | | 0.61% | | | | $3.11 | |
| | | | |
Hypothetical | | | | | | | | | | | | | | | | |
| | | | |
Class P | | | $1,000.00 | | | | $1,021.89 | | | | 0.61% | | | | $3.07 | |
| PF Short Duration Bond Fund | |
Actual Fund Return | | | | | | | | | | | | | | | | |
| | | | |
Class P | | | $1,000.00 | | | | $1,022.10 | | | | 0.55% | | | | $2.77 | |
| | | | |
Hypothetical | | | | | | | | | | | | | | | | |
| | | | |
Class P | | | $1,000.00 | | | | $1,022.19 | | | | 0.55% | | | | $2.77 | |
| PF Emerging Markets Debt Fund | |
Actual Fund Return | | | | | | | | | | | | | | | | |
| | | | |
Class P | | | $1,000.00 | | | | $1,060.70 | | | | 0.92% | | | | $4.73 | |
| | | | |
Hypothetical | | | | | | | | | | | | | | | | |
| | | | |
Class P | | | $1,000.00 | | | | $1,020.34 | | | | 0.92% | | | | $4.63 | |
| PF Developing Growth Fund | |
Actual Fund Return | | | | | | | | | | | | | | | | |
| | | | |
Class P | | | $1,000.00 | | | | $967.00 | | | | 0.75% | | | | $3.68 | |
| | | | |
Hypothetical | | | | | | | | | | | | | | | | |
| | | | |
Class P | | | $1,000.00 | | | | $1,021.19 | | | | 0.75% | | | | $3.78 | |
| PF Growth Fund | |
Actual Fund Return | | | | | | | | | | | | | | | | |
| | | | |
Class P | | | $1,000.00 | | | | $996.40 | | | | 0.70% | | | | $3.48 | |
| | | | |
Hypothetical | | | | | | | | | | | | | | | | |
| | | | |
Class P | | | $1,000.00 | | | | $1,021.44 | | | | 0.70% | | | | $3.53 | |
| PF Large-Cap Value Fund | |
Actual Fund Return | | | | | | | | | | | | | | | | |
| | | | |
Class P | | | $1,000.00 | | | | $991.80 | | | | 0.80% | | | | $3.97 | |
| | | | |
Hypothetical | | | | | | | | | | | | | | | | |
| | | | |
Class P | | | $1,000.00 | | | | $1,020.94 | | | | 0.80% | | | | $4.03 | |
| PF Mid-Cap Equity Fund | |
Actual Fund Return | | | | | | | | | | | | | | | | |
| | | | |
Class P | | | $1,000.00 | | | | $972.10 | | | | 0.80% | | | | $3.93 | |
| | | | |
Hypothetical | | | | | | | | | | | | | | | | |
| | | | |
Class P | | | $1,000.00 | | | | $1,020.94 | | | | 0.80% | | | | $4.03 | |
| PF Multi-Asset Fund | |
Actual Fund Return | | | | | | | | | | | | | | | | |
| | | | |
Class P | | | $1,000.00 | | | | $979.20 | | | | 0.51% | | | | $2.52 | |
| | | | |
Hypothetical | | | | | | | | | | | | | | | | |
| | | | |
Class P | | | $1,000.00 | | | | $1,022.39 | | | | 0.51% | | | | $2.57 | |
| PF Small-Cap Value Fund | |
Actual Fund Return | | | | | | | | | | | | | | | | |
| | | | |
Class P | | | $1,000.00 | | | | $893.20 | | | | 0.90% | | | | $4.25 | |
| | | | |
Hypothetical | | | | | | | | | | | | | | | | |
| | | | |
Class P | | | $1,000.00 | | | | $1,020.44 | | | | 0.90% | | | | $4.53 | |
See explanation of references on page F-3
F-2
PACIFIC FUNDS
DISCLOSURE OF FUND EXPENSES (Continued)
(Unaudited)
| | | | | | | | | | | | | | | | |
| | | Beginning
Account
Value at
10/01/18 | | | Ending
Account
Value at
03/31/19 | | | Annualized
Expense
Ratio | | | Expenses
Paid During
the Period
10/01/18 -
03/31/19 (1) | |
| PF Emerging Markets Fund | |
Actual Fund Return | | | | | | | | | | | | | | | | |
| | | | |
Class P | | | $1,000.00 | | | | $1,036.40 | | | | 0.95% | | | | $4.82 | |
| | | | |
Hypothetical | | | | | | | | | | | | | | | | |
| | | | |
Class P | | | $1,000.00 | | | | $1,020.19 | | | | 0.95% | | | | $4.78 | |
| PF International Large-Cap Fund | |
Actual Fund Return | | | | | | | | | | | | | | | | |
| | | | |
Class P | | | $1,000.00 | | | | $990.10 | | | | 1.00% | | | | $4.96 | |
| | | | |
Hypothetical | | | | | | | | | | | | | | | | |
| | | | |
Class P | | | $1,000.00 | | | | $1,019.95 | | | | 1.00% | | | | $5.04 | |
| PF International Small-Cap Fund | |
Actual Fund Return | | | | | | | | | | | | | | | | |
| | | | |
Class P | | | $1,000.00 | | | | $917.00 | | | | 1.10% | | | | $5.26 | |
| | | | |
Hypothetical | | | | | | | | | | | | | | | | |
| | | | |
Class P | | | $1,000.00 | | | | $1,019.45 | | | | 1.10% | | | | $5.54 | |
| PF International Value Fund | |
Actual Fund Return | | | | | | | | | | | | | | | | |
| | | | |
Class P | | | $1,000.00 | | | | $924.90 | | | | 0.80% | | | | $3.84 | |
| | | | |
Hypothetical | | | | | | | | | | | | | | | | |
| | | | |
Class P | | | $1,000.00 | | | | $1,020.94 | | | | 0.80% | | | | $4.03 | |
| PF Real Estate Fund | |
Actual Fund Return | | | | | | | | | | | | | | | | |
| | | | |
Class P | | | $1,000.00 | | | | $1,099.50 | | | | 0.93% | | | | $4.87 | |
| | | | |
Hypothetical | | | | | | | | | | | | | | | | |
| | | | |
Class P | | | $1,000.00 | | | | $1,020.29 | | | | 0.93% | | | | $4.68 | |
| PF Currency Strategies Fund | |
Actual Fund Return | | | | | | | | | | | | | | | | |
| | | | |
Class P | | | $1,000.00 | | | | $1,007.70 | | | | 0.86% | | | | $4.30 | |
| | | | |
Hypothetical | | | | | | | | | | | | | | | | |
| | | | |
Class P | | | $1,000.00 | | | | $1,020.64 | | | | 0.86% | | | | $4.33 | |
| PF Equity Long/Short Fund | |
Actual Fund Return | | | | | | | | | | | | | | | | |
| | | | |
Class P | | | $1,000.00 | | | | $931.70 | | | | 1.57% | | | | $7.56 | |
| | | | |
Hypothetical | | | | | | | | | | | | | | | | |
| | | | |
Class P | | | $1,000.00 | | | | $1,017.10 | | | | 1.57% | | | | $7.90 | |
| (1) | Expenses paid during the period are equal to the fund’s annualized expense ratio (shown in table above), multiplied by the average account value over the period, multiplied by the number of days in the most recent fiscal half-year or applicable period, then divided by 365 days. |
F-3
PACIFIC FUNDS
TRUSTEES AND OFFICERS INFORMATION
(Unaudited)
The business and affairs of the Pacific Funds Series Trust (which may be referred to as “Pacific Funds” or the “Trust”) are managed under the direction of the Board of Trustees under the Declaration of Trust. Information pertaining to the trustees and officers of the Trust is set forth below, effective April 1, 2019. Trustees who are not deemed to be “interested persons” of the Trust, as defined in the 1940 Act, are referred to as “Independent Trustees.” Certain trustees and officers are deemed to be “interested persons” of the Trust and thus are referred to as “Interested Persons”, because of their positions with Pacific Life Insurance Company (“Pacific Life”) and Pacific Life Fund Advisors LLC, a wholly-owned subsidiary of Pacific Life. The Trust’s Statement of Additional Information includes additional information about the trustees. For information on availability of the Trust’s Statement of Additional Information, refer to the WHERE TO GO FOR MORE INFORMATION section of this report.
The address of each trustee and officer is c/o Pacific Funds Series Trust, 700 Newport Center Drive, Newport Beach, CA 92660.
| | | | | | |
Name and Age | | Position(s) with the Fund and Length of Time Served* | | Current Directorship(s) Held and Principal Occupation(s) (and certain additional occupation information) During Past 5 years | | Number of Funds In
Fund Complex
Overseen** |
|
INDEPENDENT TRUSTEES |
| | | |
Gale K. Caruso Year of birth 1957 | | Trustee since 1/01/06 | | Trustee (1/06 to present) of Pacific Select Fund; Independent Trustee (2/15 to present) of Matthews Asia Funds. | | 89 |
| | | |
| | | | Formerly: Member of the Board of Directors of LandAmerica Financial Group, Inc.; President and Chief Executive Officer of Zurich Life; Chairman, President and Chief Executive Officer of Scudder Canada Investor Services, Ltd.; Managing Director of Scudder Kemper Investments; Member of the Advisory Council to the Trust for Public Land in Maine; Member of the Board of Directors of Make-A-Wish of Maine. | | |
| | | |
Paul A. Keller Year of birth 1954 | | Trustee since 6/20/16 | | Trustee (6/16 to present) of Pacific Select Fund; Consultant to the Trust and Pacific Select Fund (11/15 to 6/16); Independent Trustee (8/10 to present) of Fenimore Asset Management Trust (FAM Funds); Business Consultant (7/10 to present) (sole proprietor); Certified Public Accountant in New York (1982 to present); Adjunct Professor of Accounting (2011 to 2015), SUNY College at Old Westbury; Interim Chief Financial Officer (2014 to 2015) of The Leon Levy Foundation. | | 89 |
| | | |
| | | | Formerly: Partner of PricewaterhouseCoopers LLP; Partner of McGladrey & Pullen LLP. | | |
| | | |
Lucie H. Moore Year of birth 1956 | | Trustee since 6/13/01 | | Trustee (10/98 to present) of Pacific Select Funds; Member of the Board of Trustees (2014 to present) of Azusa Pacific University; Member of the Board of Trustees (2016 to present) of Pacifica Christian High School Orange County. | | 89 |
| | | |
| | | | Formerly: Partner of Gibson, Dunn & Crutcher (Law); Member of the Board of Trustees of Sage Hill School; Member of the Board of Trustees of The Pegasus School; and Member of the Advisory Board of Court Appointed Special Advocates (CASA) of Orange County. | | |
| | | |
Nooruddin (Rudy) S. Veerjee Year of birth 1958 | | Trustee since 9/13/05 | | Trustee (1/05 to present) of Pacific Select Fund. Formerly: President of Transamerica Insurance and Investment Group; President of Transamerica Asset Management; Chairman and Chief Executive Officer of Transamerica Premier Funds (Mutual Fund); and Director of various Transamerica Life Companies. | | 89 |
F-4
PACIFIC FUNDS
TRUSTEES AND OFFICERS INFORMATION (Continued)
(Unaudited)
| | | | | | | | |
Name and Age | | Position(s) with the Trust and Length of Time Served* | | Current Directorship(s) Held and Principal Occupation(s) During Past 5 years | | Number of Funds In Fund Complex Overseen** | |
| | |
INTERESTED PERSONS | | | | | | |
| | | |
James T. Morris Year of birth 1960 | | Chairman of the Board and Trustee since 1/11/07 | | Director (4/07 to present), Chairman (5/08 to present), Chief Executive Officer (4/07 to present) and President (1/16 to present) of Pacific Mutual Holding Company and Pacific LifeCorp; Director (4/07 to present), Chairman (5/08 to present), Chief Executive Officer (4/07 to present) and President (1/16 to present) of Pacific Life; Chief Executive Officer (5/07 to 10/15) and President (5/07 to 3/12) of Pacific Life Fund Advisors LLC; Director (4/16 to present) of Edison International (a public utility holding company); and Chairman of the Board and Trustee (1/07 to present) of Pacific Select Fund. | | | 89 | |
| | | |
Adrian S. Griggs Year of birth 1966 | | Chief Executive Officer since 1/01/18 | | Chief Operating Officer (1/17 to present), Executive Vice President (4/12 to present) and Chief Financial Officer (4/12 to 2/17) of Pacific Mutual Holding Company and Pacific LifeCorp; Chief Operating Officer (1/17 to present), Executive Vice President (4/12 to present), Chief Financial Officer (4/12 to 2/17) and Director (1/16 to present) of Pacific Life; Chief Financial Officer (4/12 to 10/15) and Executive Vice President (4/12 to 10/15) of Pacific Life Fund Advisors LLC; Chief Executive Officer (1/15 to present) of Pacific Select Distributors, LLC; and Chief Executive Officer (1/18 to present) of Pacific Select Fund. | | | 89 | |
| | | |
Howard T. Hirakawa Year of birth 1962 | | Senior Vice President since 12/10/14 (Vice President 6/06 to 12/09/14) | | Senior Vice President (4/14 to present), Vice President (5/07 to 3/14) of Pacific Life Fund Advisors LLC; and Senior Vice President (12/14 to present) and Vice President (6/06 to 12/14) of Pacific Select Fund. | | | 89 | |
| | | |
Robin S. Yonis Year of birth 1954 | | Vice President and General Counsel since 6/13/01 and Assistant Secretary since 9/17/15 | | Vice President, Fund Advisor General Counsel and Assistant Secretary (5/07 to present) of Pacific Life Fund Advisors LLC; and Vice President and General Counsel (4/05 to present) and Assistant Secretary (9/15 to present) of Pacific Select Fund. | | | 89 | |
| | | |
Sharon E. Pacheco Year of birth 1957 | | Vice President and Chief Compliance Officer since 6/04/04 | | Vice President and Chief Compliance Officer (11/03 to present) of Pacific Mutual Holding Company and Pacific LifeCorp; Vice President (2/00 to present) and Chief Compliance Officer (1/03 to present) of Pacific Life; Vice President and Chief Compliance Officer (5/07 to present) of Pacific Life Fund Advisors LLC; and Vice President and Chief Compliance Officer (6/04 to present) of Pacific Select Fund. | | | 89 | |
| | | |
Jane M. Guon Year of birth 1964 | | Vice President and Secretary since 1/01/11 | | Vice President and Secretary (1/11 to present) of Pacific Mutual Holding Company, Pacific LifeCorp and Pacific Life; Director (1/11 to 3/17) of Pacific Life; Vice President and Secretary (1/11 to present) of Pacific Life Fund Advisors LLC; Vice President and Secretary (1/11 to present) of Pacific Select Distributors, LLC; and Vice President and Secretary (1/11 to present) of Pacific Select Fund. | | | 89 | |
| | | |
Laurene E. MacElwee Year of birth 1966 | | Vice President since 4/04/05 and Assistant Secretary since 6/13/01 | | Vice President (4/11 to present) and Assistant Secretary (5/07 to present) of Pacific Life Fund Advisors LLC; and Vice President (12/11 to present), Assistant Secretary (4/05 to present) of Pacific Select Fund. | | | 89 | |
| | | |
Carleton J. Muench Year of birth 1973 | | Vice President since 11/30/06 | | Vice President (4/14 to present) and Assistant Vice President (5/07 to 3/14) of Pacific Life Fund Advisors LLC; and Vice President (12/14 to present) and Assistant Vice President (11/06 to 12/14) of Pacific Select Fund. | | | 89 | |
F-5
PACIFIC FUNDS
TRUSTEES AND OFFICERS INFORMATION (Continued)
(Unaudited)
| | | | | | |
Name and Age | | Position(s) with the Trust and Length of Time Served* | | Current Directorship(s) Held and Principal Occupation(s) During Past 5 years | | Number of Funds In Fund Complex
Overseen** |
|
INTERESTED PERSONS (Continued) |
| | | |
Trevor T. Smith Year of birth 1975 | | Vice President since 3/23/16 and Treasurer since 4/01/18 (Assistant Treasurer 3/23/16 to 3/31/18) | | Assistant Vice President (1/17 to present) and Director of Variable Products Accounting (4/09 to 12/16) of Pacific Life; Assistant Vice President (3/16 to present), Treasurer (4/18 to present) and Assistant Treasurer (3/16 to 3/18) of Pacific Select Fund. | | 89 |
| | | |
Kevin W. Steiner Year of birth 1975 | | Vice President since 1/01/13 | | Assistant Vice President (4/12 to present) of Pacific Life Fund Advisors LLC; and Assistant Vice President (1/13 to present) of Pacific Select Fund. | | 89 |
| | | |
Audrey L. Cheng Year of birth 1975 | | Vice President since 12/11/13 | | Assistant Vice President (9/11 to present) of Pacific Life; Assistant Vice President (12/13 to present) of Pacific Select Fund. | | 89 |
| | * | A trustee serves until he or she resigns, retires, or his or her successor is elected and qualified. |
| | ** | As of March 31, 2019, the “Fund Complex” consisted of Pacific Select Fund (55 funds) and Pacific Funds (34 funds). |
F-6
PACIFIC FUNDS
APPROVAL OF INVESTMENT ADVISORY
AND SUB-ADVISORY AGREEMENTS
(Unaudited)
I. Introduction and Background
The Board of Trustees (the “Trustees” or “Board”) of Pacific Funds Series Trust (“Pacific Funds” or the “Trust”) oversees the management of each of the separate funds of the Trust (each a “Fund” and collectively, the “Funds”) and, as required by Section 15(c) of the Investment Company Act of 1940, as amended (the “1940 Act”), initially approves and, after the initial period, determines annually whether to renew the investment advisory agreement (the “Advisory Agreement”) with Pacific Life Fund Advisors LLC (“PLFA”) and eachsub-advisory agreement (the“Sub-Advisory Agreements,” together with the Advisory Agreement, as may be amended from time to time, the “Agreements”) between the Trust, PLFA and the varioussub-advisers (each a“Sub-Adviser” and collectively, the“Sub-Advisers”). PLFA serves as the investment adviser for all of the Funds and directly manages Pacific Funds Short Duration Income, Pacific Funds Core Income, Pacific Funds Strategic Income, Pacific Funds Floating Rate Income and Pacific Funds High Income (the “PAM Managed Funds”) under the name Pacific Asset Management (“PAM”); Pacific Funds Portfolio Optimization Conservative, Pacific Funds Portfolio Optimization Moderate-Conservative, Pacific Funds Portfolio Optimization Moderate, Pacific Funds Portfolio Optimization Growth and Pacific Funds Portfolio Optimization Aggressive-Growth (the “Portfolio Optimization Funds”); and Pacific Funds Diversified Alternatives (together with the Portfolio Optimization Funds, the “Asset Allocation Funds” and together with the Portfolio Optimization Funds and the PAM Managed Funds, the “Directly Managed Funds”). For all other Funds, PLFA has retained other third-party firms to serve asSub-Advisers under PLFA’s oversight. The Board, including all of the Trustees who are not “interested persons” of the Trust, PLFA, theSub-Advisers or the distributor, as that term is defined in the 1940 Act (“Independent Trustees”), last renewed the Agreements at anin-person meeting of the Trustees held on December 12, 2018.1
At this meeting and other meetings, the Board considered information (both written and oral) provided to assist it in its review of the Agreements and made assessments with respect to each Agreement. The Board requested, received and reviewed written materials from PLFA and eachSub-Adviser that were submitted in response to requests from the Independent Trustees and supporting materials relating to those questions and responses. In addition, the Board receivedin-person presentations about the Funds throughout the year, and the Independent Trustees were advised by independent legal counsel with respect to these and other relevant matters. The Board reviewed a variety of factors and considered a significant amount of information, including information received on an ongoing basis at Board and committee meetings, which included reports on Fund performance, expenses, fee comparisons, investment advisory, compliance, and other services provided to the Funds by PLFA and theSub-Advisers. The Board also reviewed financial and profitability information regarding PLFA and theSub-Advisers and information regarding the organization and operations of each entity, such as their compliance monitoring, portfolio trading and brokerage practices, risk management and the personnel providing investment management and administrative services to each Fund. The Board considered the services provided to the Funds under the Agreements and the fees and expenses incurred by and charged to the Funds under the Agreements. The Board took into account that PLFA and its affiliates provide additional services to the Funds under other affiliated service agreements that are essential for the operation of the Funds and that although PLFA and its affiliates are separately compensated under those affiliated service agreements, these additional services are provided in connection with PLFA’s advisory relationship with the Funds. The Board reviewed data provided by PLFA that was gathered from various independent providers of investment company data to provide the Board with information concerning the Funds’ investment performance, advisory fees and expense information (both on an absolute basis and compared to peers). Additionally, the Independent Trustees retained an independent consultant (“Independent Consultant”) with substantial industry experience in providing investment company boards with analysis to assist directors and trustees with their annual 15(c) review process, to assist the Trustees with certain of their analyses and to provide other relevant information. In connection with the analysis, the Independent Consultant utilized and provided the Independent Trustees with information obtained from independent service providers as well as from other sources.
The Trustees’ determinations were made on the basis of each Trustee’s business judgment after consideration of all the information presented. In reviewing the materials presented and in considering the information in the management presentations, the Trustees did not identify any single issue or particular information that, in isolation, would be a controlling factor in making a final decision regarding the proposed Agreements. Individual Trustees may have given different weights to certain factors and assigned various degrees of materiality to information received in connection with the approval process. The following summary describes the most important, but not all, of the factors considered by the Trustees in approving the Agreements. In the case of the Independent Trustees, certain factors were considered in light of the legal advice furnished to them by independent legal counsel and information from the Independent Consultant that they had retained. This discussion is not intended to beall-inclusive.
II. Annual Consideration and Approval of Investment Advisory andSub-Advisory Agreements
In evaluating the Advisory Agreement and eachSub-Advisory Agreement, the Board, including all the Independent Trustees, considered the following factors, among others:
A. Nature, Extent and Quality of Services
PLFA –The Trustees considered the depth and quality of PLFA’s investment management process, including its monitoring and oversight of theSub-Advisers and PAM, and the benefits to shareholders of retaining PLFA and continuing the Advisory Agreement in light of the nature, extent, and quality of the services that have been provided by PLFA, including PAM, since the Advisory Agreement was last renewed. The Trustees considered the overall financial strength and stability of PLFA and its ability to continue to provide a high level and quality of services to the Funds. They also considered PLFA’s responsiveness to questions or concerns raised by the Trustees throughout the year, including PLFA’s willingness to consider and implement investment and operational changes designed to improve investment results and the services provided to the Funds and their shareholders.
| 1 | At the December 12th meeting, the Board did not consider the continuance of theSub-Advisory Agreements relating to the PFMid-Cap Equity Fund and PF Real Estate Fund, as those agreements were not up for renewal at that time. |
F-7
PACIFIC FUNDS
APPROVAL OF INVESTMENT ADVISORY
AND SUB-ADVISORY AGREEMENTS (Continued)
(Unaudited)
The Trustees noted that officers and employees of PLFA regularly consult with, and report to, the Board regarding the investment management services provided to the Funds. The Trustees considered the experience, capability and integrity of PLFA’s senior management and other personnel and the low turnover rates of its key personnel. The Trustees noted that the investment, legal, compliance, risk management and accounting professionals of PLFA and its affiliates have access to and utilize a variety of resources and systems relating to investment management, compliance, trading, performance and risk analysis, security valuation and fund accounting. The Trustees took into account the scope of services provided by PLFA under the Advisory Agreement. The Trustees considered that although PLFA is separately compensated at approximate cost for time spent on Fund matters by certain legal, compliance and accounting professionals of PLFA and its affiliates for services outside of the scope of the Advisory Agreement, these services are being provided as a result of PLFA’s advisory relationship with the Funds. The Trustees further considered PLFA’s continuing need and ability to attract and retain qualified personnel and to maintain and enhance its resources and systems to provide appropriate investment management, compliance, risk management and monitoring services for the Funds. The Trustees also considered the additional resources that PLFA has continued to invest in to enhance its management and oversight of the Funds, including additional tools designed to ensure the Funds’ compliance with new laws and regulations. The Trustees considered that PLFA employs a well-defined method of comparing and evaluating the performance of the asset allocation funds. In addition, the Trustees considered PLFA’ssub-adviser research process and the role of PLFA’s internal conflicts review committee in considering and evaluating potential conflicts of interest with regard toSub-Adviser selection and monitoring.
Directly Managed Funds –The Trustees considered the services provided by PLFA in rendering investment management services for those Funds for which theday-to-day investment management is provided by PLFA, including PAM. The Trustees considered that PLFA, including PAM, is responsible for identifying investments for each Directly Managed Fund and determining when and what securities, cash and/or other investments to purchase, retain, or sell for each Directly Managed Fund. The Trustees also considered that PLFA, including PAM, is responsible for the valuation of portfolio securities, including, but not limited to, the review of custodian pricing files, research and analysis related to fair valued securities and due diligence oversight of pricing vendors. The Trustees additionally noted that PLFA is responsible for evaluating and voting proxies for portfolio holdings of the Directly Managed Funds. With respect to the Asset Allocation Funds, the Trustees also considered, among other things, PLFA’s experience, resources and expertise in analyzing the composition of the various Funds that serve as investment options for the Asset Allocation Funds (collectively, the “Underlying Funds”) and in developing an asset allocation that is appropriate for each Asset Allocation Fund’s investment objectives and risk profile. The Trustees considered, in this regard, the tools and resources used by PLFA in constructing its asset allocation models. The Trustees considered that PLFA had recently engaged a third-party consulting firm to review PLFA’s asset allocation process, and that the firm had reported favorably on PLFA’s asset allocation capabilities. With respect to the PAM Managed Funds, the Trustees also considered the investment oversight and monitoring of PAM discussed below under“Sub-Advised Funds.”
The Trustees also considered that PLFA provides certain additional services to the Funds outside of the scope of the Advisory Agreement at approximate cost and that such services are essential for the administration and operation of the Funds, including administration of the Funds’ compliance program. In this regard, the Trustees considered PLFA’s policies, procedures and systems to ensure compliance with applicable laws and regulations with respect to the Directly Managed Funds, its attention to matters that may involve conflicts of interest between itself and a Fund, and that all material rebalancing of PLFA’s asset allocation models are presented to an internal conflicts review committee that considers and evaluates potential conflicts of interest in the allocation among the Underlying Funds. The Trustees reviewed information provided throughout the year on PLFA’s compliance policies and procedures, its compliance history, and received reports from the Trust’s Chief Compliance Officer (“CCO”) on compliance by PLFA with applicable laws and regulations. The Trustees also reviewed information on any responses by PLFA to regulatory and compliance developments throughout the year. The Trustees further noted the compliance monitoring conducted by PLFA and PAM on an ongoing basis and noted the development of additional procedures and systems necessary to maintain compliance with applicable laws and regulations as well as the resources that PLFA dedicates to these programs. The Trustees considered that the CCO has in place a systematic process for periodically reviewing PLFA’s written compliance policies and procedures, including the assessment of PLFA’s compliance program as required under Rule38a-1 of the 1940 Act and PLFA’s code of ethics. The Trustees also considered that PLFA continues to cooperate with the CCO in reviewing its compliance operations.
Sub-Advised Funds – The Trustees considered PLFA’s responsibilities in rendering services to theSub-Advised Funds and the fact that PLFA monitors and evaluates the performance of theSub-Advisers in comparison to each Fund’s investment objective as well as to appropriate benchmark indices and groups of peer funds. The Trustees also considered that PLFA monitors eachSub-Advised Fund’s adherence to its investment objectives and policies. The Trustees noted that PLFA provides the Board with periodic and special reports related to eachSub-Advised Fund’s performance and PLFA’s investment monitoring and evaluation. The Trustees also considered PLFA’s process in continuously analyzing and, from time to time as necessary and appropriate, recommending for consideration by the Board, the termination of aSub-Advisory Agreement with aSub-Adviser and the replacement of aSub-Adviser.
For both Directly Managed Funds andSub-Advised Funds, the Trustees considered the high quality of the products, information, analysis and services provided by PLFA to the Funds, including return analysis, attribution analysis, risk analysis and stress testing, preparation of periodic performance and other reports, assessment of liquidity, analysis of derivatives, and coordination and oversight of other service providers to the Trust. The Trustees also noted that PLFA regularly informs the Trustees about matters relevant to the Trust and its shareholders, including relationships with financial intermediaries.
The Trustees considered the analyses conducted by PLFA of the Underlying Funds and aSub-Adviser’s management of an Underlying Fund in the broader context of asset allocation strategies intended to target certain return and risk characteristics. The Trustees noted that PLFA has historically recommended new Underlying Funds that PLFA believed would contribute to the Asset Allocation Funds’ targeted return and risk
F-8
PACIFIC FUNDS
APPROVAL OF INVESTMENT ADVISORY
AND SUB-ADVISORY AGREEMENTS (Continued)
(Unaudited)
objectives. The Trustees also took into account PLFA’s continuing analysis of the Underlying Funds and eachSub-Adviser’s investment performance for the impact on broader asset allocation strategies for the Asset Allocation Funds.
The Trustees considered the depth and quality of PLFA’s monitoring and oversight of theSub-Advisers and PAM. The Board noted that PLFA monitors numerous investment, performance, and risk metrics for the Funds. The Trustees considered PLFA’s continued investment in, and development of, its research and analytical capabilities, including investments in personnel and enhanced analytical tools for assessing Fund performance and the performance of theSub-Advisers, including analytical tools relating to return analysis, risk analysis, and Fund performance attribution and reporting on such matters to the Trustees. The Trustees noted that PLFA uses these tools to analyze a Fund’s performance and risk profile and identify Funds that are underperforming as well as those that are performing well, and to analyze the Funds’ performance records against various measures. The Board considered that PLFA also conducts various analyses to assess the sources of and reasons for performance. The Trustees noted that PLFA has developed, and continues to enhance, processes to oversee and monitor the performance ofSub-Advisers, including the use of analytical methods to review Fund performance and execution of investment strategies. The Board noted that PLFA provides the Board with analyses of these data over rolling periods to assist the Board in identifying trends in Fund performance and other areas, and periodically provides the Trustees with information on economic and market trends to provide a context for assessing recent performance. The Trustees also noted that PLFA has developed effective methods for tracking theSub-Advisers’ investment style consistency, for analyzing the use of derivatives bySub-Advisers and for monitoring Fund liquidity. With respect to the PAM Managed Funds, the Board considered that PLFA provides oversight, diligence and reporting with regard to its PAM unit that is similar to the process it employs with regard to theSub-Advisers. In making their assessments, the Trustees considered that PLFA has historically exercised diligence in monitoring the performance of theSub-Advisers and PAM, and has recommended and taken measures to attempt to remedy relative underperformance by a Fund when PLFA and the Trustees believed it to be appropriate. The Trustees also considered the significant work performed by PLFA in conducting searches for newSub-Advisers to replace existingSub-Advisers where appropriate or to manage new Funds in the Trust.
The Board also noted that PLFA conducts regular due diligence onSub-Advisers involving onsite visits,in-person meetings and telephonic meetings to gather information that PLFA uses to gain anin-depth understanding of aSub-Adviser’s investment process and to seek to identify issues that may be relevant to aSub-Adviser’s services to a Fund or a Fund’s performance, including, but not limited to, aSub-Adviser’s investment process, investment capabilities, resources and personnel, the financial strength of aSub-Adviser, significant staffing changes that could affect a Fund, material changes in aSub-Adviser’s assets under management, compliance and regulatory concerns, best execution review and portfolio security valuation support.
The Trustees considered the time and attention paid by PLFA to matters involving the valuation of Fund securities for both the PAM Managed Funds andSub-Advised Funds. The Trustees considered that PLFA has established a Valuation Oversight Committee that is responsible for, among other things, researching and evaluating information concerning securities that are not actively or publicly traded, valuing securities subject to a trading halt or for which a market quotation is not readily available, the valuation of equity securities traded in foreign markets, oversight of and due diligence on pricing vendors and the development of alternate valuation methodologies. The Trustees also considered the information and support provided by PLFA in connection with the Trustees’ fair valuation responsibilities.
The Trustees considered PLFA’s oversight, review and analysis of trade execution reports and trends in trade execution for both the PAM Managed Funds andSub-Advised Funds. The Trustees noted that PLFA works with a third-party transaction cost analysis consultant that provides statistical analysis on portfolio trading, and that PLFA presents information about the Funds’ portfolio trading costs to the Board annually and, where warranted, engages in a dialogue with personnel of aSub-Adviser on trading costs and the quality of execution. The Board also noted that PLFA conducts regular review and analysis of eachSub-Adviser’s use of research obtained with commissions paid to broker-dealers for executing portfolio transactions (“soft dollars”) and presents information about theSub-Advisers’ use of soft dollars to the Board annually and, where deemed necessary, discusses such soft dollar use withSub-Advisers.
The Trustees also considered PLFA’s implementation of transition management programs when handling significant changes in the Funds, such as cash movements between the Funds arising from reallocations byfunds-of-funds and the transition of Fund assets from oneSub-Adviser to another, including steps taken by PLFA to reduce transaction costs associated with a Fund transition. The Trustees considered that PLFA coordinates the onboarding process for newSub-Advisers and oversees the establishment of necessary accounts and documentation for theSub-Advisers to begin managing Fund assets.
In addition to the services described above, the Trustees also considered the compliance monitoring that PLFA and its affiliates conduct on theSub-Advisers and the commitment of PLFA and its affiliates to those programs and PLFA’s efforts to keep the Trustees informed about the compliance programs ofSub-Advisers. In this regard, the Trustees reviewed information and reports from the Trust’s CCO on compliance by theSub-Advisers with applicable laws and regulations. The Trustees considered that the CCO has in place a systematic process for periodically reviewing eachSub-Adviser’s written compliance policies and procedures, including the assessment of eachSub-Adviser’s compliance program as required under Rule38a-1 of the 1940 Act, and eachSub-Adviser’s code of ethics. The Trustees considered that PLFA is compensated at approximate cost for the administration of the Funds’ compliance program. The Trustees also considered that eachSub-Adviser continues to cooperate with the CCO in reviewing its compliance operations.
Sub-Advisers. The Trustees considered the benefits to shareholders of retaining eachSub-Adviser and continuing theSub-Advisory Agreements, particularly in light of the nature, extent, and quality of the services that have been provided by theSub-Advisers. The Trustees considered the services provided by eachSub-Adviser in rendering investment management services to aSub-Advised Fund. The Trustees considered that eachSub-Adviser is responsible for identifying investments for aSub-Advised Fund and determining when and what securities, cash and/or other investments to purchase, retain, or sell for aSub-Advised Fund. The Trustees also considered that eachSub-Adviser is responsible for evaluating and voting proxies for portfolio holdings of aSub-Advised Fund. The Trustees considered the quality of the portfolio
F-9
PACIFIC FUNDS
APPROVAL OF INVESTMENT ADVISORY
AND SUB-ADVISORY AGREEMENTS (Continued)
(Unaudited)
management services which have benefited and should continue to benefit theSub-Advised Funds and their shareholders, the organizational depth and resources of theSub-Advisers, including the background and experience of eachSub-Adviser’s management personnel, and the expertise of eachSub-Adviser’s portfolio management team, as well as the investment methodology used by theSub-Adviser. The Trustees also considered that eachSub-Adviser provides PLFA with information that assists PLFA in performing its oversight role, including information about theSub-Adviser’s compliance program.
The Board concluded that it was satisfied with the nature, extent and quality of the investment management services provided by PLFA and eachSub-Adviser.
B. Investment Results
The Trustees considered the investment results of each Fund in light of its objective, strategies and market conditions. The Trustees compared each Fund’s total returns with the total returns of a group of appropriate peer funds (each a “Selected Performance Peer Group”), which were selected by an Independent Consultant using data from third-party data vendor Morningstar, and the Trustees reviewed a description of the Independent Consultant’s methodology for selecting the peer funds in each Selected Performance Peer Group. In addition, with respect to Funds other than the Portfolio Optimization Funds, the Trustees compared each Fund’s total returns with the total returns of the Fund’s broad-based market index, sector index, composite index or an alternative index selected by the Independent Consultant, as applicable (each, a “primary benchmark”). With respect to the Portfolio Optimization Funds, the Trustees compared each Fund’s total returns with the total returns of a custom benchmark that is comprised of certain broad-based market indices based on the broad asset class target allocations for the Fund. The Trustees took into account the views of the Independent Consultant that these custom benchmarks appeared to be reasonable benchmarks for performance reporting purposes.
The information provided to the Trustees included each Fund’s performance record for theone-, three-, five- andten-year or since inception periods ended September 30, 2018, as available, compared to the applicable benchmark and Selected Performance Peer Group. The Trustees placed greater emphasis on a Fund’s performance against peers as opposed to an unmanaged index.
The Trustees considered the performance of each Fund on acase-by-case basis and noted that some Funds had outperformed their Selected Performance Peer Group over certain periods and/or exceeded the return of their respective benchmark while others underperformed their Selected Performance Peer Group over certain periods and/or trailed the return of their respective benchmark. In considering each Fund’s investment results, the Board placed greater emphasis on each Fund’s longer-term performance track record rather than shorter-term performance. The Board also took into account that each Fund’s track record is measured as of a specific date, and that track records can vary as of different measurement dates. Therefore, in reviewing a Fund that is currently underperforming, the Trustees also considered the broader perspective of the Fund’s performance over varying time periods, the market conditions experienced during the periods under review, as well as the outlook for the Fund going forward in light of expected future market conditions. In the case of the Underlying Funds, the Board also took into account the views of PLFA about the role of a particular Fund within a broader asset allocation strategy for the Asset Allocation Funds. Where there had been a change inSub-Adviser for a Fund, the Board took into account that the currentSub-Adviser was only responsible for certain portions of the Fund’s performance record. The Trustees discussed with PLFA the fact that certain periods of underperformance may be transitory while other periods of underperformance may be reflective of broader issues that may warrant consideration of corrective action. The Trustees discussed these Funds with representatives of PLFA, including an assessment of the approach used by theSub-Advisers, and the approach used by PLFA and PAM with respect to the Directly Managed Funds, as well as the oversight and monitoring by PLFA as the investment adviser, to gain an understanding of underperformance and to assess whether any actions would be appropriate. In addition, the Board considered any specific actions that PLFA, PAM or aSub-Adviser has taken, or agreed to take, to enhance the investment performance of a Fund, and the results of those actions. In reviewing the performance of each Fund, the Board took into account, among other things, each Fund’s performance track record. A summary of each Fund’s track record is provided below.
PF Growth Fund
The Fund: (1) outperformed its Selected Performance Peer Group median for theone-, three-, five- andten-year periods; (2) outperformed its primary benchmark for theone- and three-year periods and underperformed for the five- andten-year periods; and (3) is ranked in the first quintile of its Selected Performance Peer Group for theone-, three- and five-year periods, and the third quintile for theten-year period. In evaluating the performance of the Fund, the Board also considered that the currentSub-Adviser has managed the Fund since 2013.
PFLarge-Cap Value Fund
The Fund: (1) underperformed its Selected Performance Peer Group median for theone-, three-, five- andten-year periods; (2) underperformed its primary benchmark for theone-, three-, five- andten-year periods; and (3) is ranked in the fourth quintile of its Selected Performance Peer Group for theone- and three-year periods and the third quintile for the five- andten-year periods. In evaluating the performance of the Fund, the Board also considered PLFA’s views as to the reasons for the Fund’s relative performance against peers and its benchmark over various time periods and PLFA’s future outlook for the Fund. The Board also considered that PLFA has added the Fund to its performance “watch list” and will be monitoring the Fund closely for improved performance.
Pacific FundsLarge-Cap
The Fund: (1) outperformed its Selected Performance Peer Group median for theone-year period; (2) underperformed its primary benchmark for theone-year period; and (3) is ranked in the third quintile of its Selected Performance Peer Group for theone-year period. In evaluating the performance of the Fund, the Board also considered that the Fund had not been in operation for a sufficient time period to establish a meaningful track record.
F-10
PACIFIC FUNDS
APPROVAL OF INVESTMENT ADVISORY
AND SUB-ADVISORY AGREEMENTS (Continued)
(Unaudited)
Pacific FundsLarge-Cap Value
The Fund: (1) underperformed its Selected Performance Peer Group median for theone-year period; (2) outperformed its primary benchmark for theone-year period; and (3) is ranked in the third quintile of its Selected Performance Peer Group for theone-year period. In evaluating the performance of the Fund, the Board also considered that the Fund had not been in operation for a sufficient time period to establish a meaningful track record.
PF Developing Growth Fund
The Fund: (1) outperformed its Selected Performance Peer Group median for theone- and three-year periods and underperformed for the five- andten-year periods; (2) outperformed its primary benchmark for theone- and three-year periods and underperformed for the five- andten-year periods; and (3) is ranked in the first quintile of its Selected Performance Peer Group for theone-year period, the second quintile for the three-year period, the fourth quintile for the five-year period, and the third quintile for theten-year period. In evaluating the performance of the Fund, the Board also considered that the currentSub-Adviser has managed the Fund since 2014.
PFMid-Cap Equity Fund
The Fund: (1) outperformed its Selected Performance Peer Group median for theone-, three-, five- andten-year periods; (2) outperformed its primary benchmark for theone-, three- and five-year periods and underperformed for theten-year period; and (3) is ranked in the first quintile of its Selected Performance Peer Group for theone-, three- and five-year periods and the second quintile for theten-year period. In evaluating the performance of the Fund, the Board also considered that it had recently approved a newSub-Advisory Agreement for the Fund effective June 2018 and, therefore, theSub-Advisory Agreement was not up for renewal at this time.
Pacific FundsSmall/Mid-Cap
The Fund: (1) outperformed its Selected Performance Peer Group median for theone-year period; (2) underperformed its primary benchmark for theone-year period; and (3) is ranked in the second quintile of its Selected Performance Peer Group for theone-year period. In evaluating the performance of the Fund, the Board also considered that the Fund had not been in operation for a sufficient time period to establish a meaningful track record.
Pacific FundsSmall-Cap
The Fund: (1) outperformed its Selected Performance Peer Group median for theone-year period; (2) underperformed its primary benchmark for theone-year period; and (3) is ranked in the second quintile of its Selected Performance Peer Group for theone-year period. In evaluating the performance of the Fund, the Board also considered that the Fund had not been in operation for a sufficient time period to establish a meaningful track record.
Pacific FundsSmall-Cap Growth
The Fund: (1) underperformed its Selected Performance Peer Group median for theone-year period; (2) outperformed its primary benchmark for theone-year period; and (3) is ranked in the fourth quintile of its Selected Performance Peer Group for theone-year period. In evaluating the performance of the Fund, the Board also considered that the Fund had not been in operation for a sufficient time period to establish a meaningful track record.
PFSmall-Cap Value Fund
The Fund: (1) outperformed its Selected Performance Peer Group median for theone-, three-, five- andten-year periods; (2) underperformed its primary benchmark for theone- and three-year periods and outperformed for the five- andten-year periods; and (3) is ranked in the second quintile of its Selected Performance Peer Group for theone- andten-year periods and the first quintile for the three- and five-year periods. In evaluating the performance of the Fund, the Board also considered that the currentSub-Adviser has managed the Fund since 2014.
Pacific FundsSmall-Cap Value
The Fund: (1) underperformed its Selected Performance Peer Group median for theone-year period; (2) underperformed its primary benchmark for theone-year period; and (3) is ranked in the fourth quintile of its Selected Performance Peer Group for theone-year period. In evaluating the performance of the Fund, the Board also considered that the Fund had not been in operation for a sufficient time period to establish a meaningful track record.
PF Emerging Markets Fund
The Fund: (1) outperformed its Selected Performance Peer Group median for theone-, three-, five- andten-year periods; (2) outperformed its primary benchmark for theone-, three- andten-year periods and underperformed for the five-year period; and (3) is ranked in the first quintile of its Selected Performance Peer Group for theone-, three- andten-year periods and the second quintile for the five-year period.
PF Emerging Markets Debt Fund
The Fund: (1) underperformed its Selected Performance Peer Group median for theone-year period and outperformed for the three- and five-year periods; (2) underperformed its primary benchmark for theone-year period and outperformed for the three- and five-year periods; and (3) is ranked in the fourth quintile of its Selected Performance Peer Group for theone-year period, the first quintile for the three-year period and the third quintile for the five-year period.
F-11
PACIFIC FUNDS
APPROVAL OF INVESTMENT ADVISORY
AND SUB-ADVISORY AGREEMENTS (Continued)
(Unaudited)
PF InternationalLarge-Cap Fund
The Fund: (1) outperformed its Selected Performance Peer Group median for theone- andten-year periods, performed in line for the three-year period, and underperformed for the five-year period; (2) outperformed its primary benchmark for theone-, three-, five- andten-year periods; and (3) is ranked in the third quintile of its Selected Performance Peer Group for theone- and three-year periods, the fourth quintile for the five-year period and the second quintile for theten-year period.
PF InternationalSmall-Cap Fund
The Fund: (1) underperformed the Selected Performance Peer Group median for theone- and three-year periods; (2) underperformed its primary benchmark for theone- and three-year periods; and (3) is ranked in the fourth quintile of its Selected Performance Peer Group for theone-and three-year periods. In evaluating the performance of the Fund, the Board also considered PLFA’s views as to the reasons for the Fund’s relative performance against peers and its benchmark over various time periods. The Board also considered PLFA’s views as to the competitive nature of theSub-Adviser’s longer-term performance and its confidence in theSub-Adviser’s investment process.
PF International Value Fund
The Fund: (1) outperformed its Selected Performance Peer Group median for theone- and three-year periods and underperformed for the five- andten-year periods; (2) underperformed its primary benchmark for theone-, three-, five- andten-year periods; and (3) is ranked in the first quintile of its Selected Performance Peer Group for theone- andthree-year periods, the fourth quintile for the five-year period and the fifth quintile for theten-year period. In evaluating the performance of the Fund, the Board also considered that the currentSub-Adviser has managed the Fund since 2017.
PF Currency Strategies Fund
The Fund: (1) outperformed its Selected Performance Peer Group median for theone-, three- and five-year periods; (2) underperformed its primary benchmark for theone-, three- and five-year periods; and (3) is ranked in the first quintile of its Selected Performance Peer Group for theone-, three- and five-year periods. In evaluating the performance of the Fund, the Board also considered that the Fund had aco-Sub-Adviser from 2014 until 2018.
Pacific Funds Diversified Alternatives
The Fund: (1) underperformed its Selected Performance Peer Group median for theone-year period and outperformed for the three-year period; (2) underperformed its primary benchmark for theone- and three-year periods; and (3) is ranked in the fifth quintile of its Selected Performance Peer Group for theone-year period and the first quintile for the three-year period. In evaluating the performance of the Fund, the Board also considered PLFA’s views as to the reasons for the Fund’s relative performance against peers and its benchmark over various time periods and PLFA’s future outlook for the Fund.
PF Equity Long/Short Fund
The Fund: (1) underperformed its Selected Performance Peer Group median for theone-year period and outperformed its Selected Performance Peer Group median for the three-year period; (2) underperformed its primary benchmark for theone-year period and outperformed for the three-year period; and (3) is ranked in the fifth quintile of its Selected Performance Peer Group for theone-year period and the first quintile for the three-year period. In evaluating the performance of the Fund, the Board also considered PLFA’s views as to the reasons for the Fund’s relative performance against peers and its benchmark over various time periods and PLFA’s future outlook for the Fund. The Board also considered PLFA’s representation that theSub-Adviser’s investment style is currently out of favor.
PF Global Absolute Return Fund
The Fund: (1) underperformed its Selected Performance Peer Group median for theone- and three-year periods and outperformed for the five-year period; (2) underperformed its primary benchmark for theone-, three- and five-year periods; and (3) is ranked in the fourth quintile of its Selected Performance Peer Group for theone- and three-year periods and the third quintile for the five-year period. In evaluating the performance of the Fund, the Board also considered that the Selected Performance Peer Group was of limited usefulness due to the diversity of investment approaches of funds in the peer group. The Board also considered PLFA’s views as to the reasons for the Fund’s relative performance against peers and its benchmark over various time periods and PLFA’s future outlook for the Fund. The Board also considered that PLFA has added the Fund to its performance “watch list” and will be monitoring its performance closely.
PF Real Estate Fund
The Fund: (1) slightly underperformed its Selected Performance Peer Group median for theone-year period and underperformed for the three-, five- andten-year periods; (2) underperformed its primary benchmark for theone-, three-, five- andten-year periods; and (3) is ranked in the third quintile of its Selected Performance Peer Group for theone-year period, the fifth quintile for the three- and five-year periods and the fourth quintile for theten-year period. In evaluating the performance of the Fund, the Board also considered that it had recently approved a newSub-Advisory Agreement for a newSub-Adviser to the Fund effective May 2018 and, therefore, theSub-Advisory Agreement was not up for renewal at this time.
Pacific Funds Core Income
The Fund: (1) outperformed its Selected Performance Peer Group median for theone-, three- and five-year periods; (2) outperformed its primary benchmark for theone-, three- and five-year periods; and (3) is ranked in the first quintile of its Selected Performance Peer Group for theone-, three- and five-year periods.
F-12
PACIFIC FUNDS
APPROVAL OF INVESTMENT ADVISORY
AND SUB-ADVISORY AGREEMENTS (Continued)
(Unaudited)
Pacific Funds Floating Rate Income
The Fund: (1) outperformed its Selected Performance Peer Group median for theone-, three- and five-year periods; (2) underperformed its primary benchmark for theone-, three- and five-year periods; and (3) is ranked in the second quintile of its Selected Performance Peer Group for theone-, three- and five-year periods.
Pacific Funds High Income
The Fund: (1) outperformed its Selected Performance Peer Group median for theone- and three-year periods and performed in line for the five-year period; (2) slightly underperformed its primary benchmark for theone-year period and underperformed for the three- and five-year periods; and (3) is ranked in the second quintile of its Selected Performance Peer Group for theone- and three-year periods and the third quintile for the five-year period.
PF Inflation Managed Fund
The Fund: (1) outperformed its Selected Performance Peer Group median for theone-, three-, five- andten-year periods; (2) slightly outperformed its primary benchmark for theone-year period, underperformed for the three- and five-year periods and outperformed for theten-year period; and (3) is ranked in the second quintile of its Selected Performance Peer Group for theone-, three- and five-year periods and the first quintile for theten-year period. In evaluating the performance of the Fund, the Board also considered that the currentSub-Adviserco-managed the Fund with another firm from January 2015 to October 2016 and since October 2016 has been the soleSub-Adviser.
PF Managed Bond Fund
The Fund: (1) underperformed its Selected Performance Peer Group median for theone-year period and outperformed for the three-, five- andten-year periods; (2) underperformed its primary benchmark for theone-year period and outperformed for the three-, five- andten-year periods; and (3) is ranked in the fifth quintile of its Selected Performance Peer Group for theone-year period and the first quintile for the three-, five- andten-year periods. In evaluating the performance of the Fund, the Board also considered that one of the Fund’sco-Sub-Advisers was the soleSub-Adviser from the Fund’s inception until 2014, and that the otherco-Sub-Adviser hasco-managed the Fund since 2014.
PF Short Duration Bond Fund
The Fund: (1) outperformed its Selected Performance Peer Group median for theone-year period and underperformed for the three-, five- andten-year periods; (2) outperformed its primary benchmark for theone-, three- and five-year periods and slightly underperformed for theten-year period; and (3) is ranked in the third quintile of its Selected Performance Peer Group for theone- and three-year periods, the fourth quintile for the five-year period and the fifth quintile for theten-year period. In evaluating the performance of the Fund, the Board also considered that the currentSub-Adviser has managed the Fund since 2011.
Pacific Funds Short Duration Income
The Fund: (1) outperformed its Selected Performance Peer Group median for theone-, three- and five-year periods; (2) outperformed its primary benchmark for theone-, three- and five-year periods; and (3) is ranked in the first quintile of its Selected Performance Peer Group for theone-, three- and five-year periods.
Pacific Funds Strategic Income
The Fund: (1) outperformed its Selected Performance Peer Group median for theone-, three- and five-year periods; (2) outperformed its primary benchmark for theone-, three- and five-year periods; and (3) is ranked in the first quintile of its Selected Performance Peer Group for theone-, three-, and five-year periods.
Pacific Funds Portfolio Optimization Conservative
The Fund: (1) underperformed its Selected Performance Peer Group median for theone-, three- and five-year periods and performed in line for theten-year period; (2) underperformed its custom benchmark for theone-, five- andten-year periods and outperformed for the three-year period; and (3) is ranked in the fifth quintile of its Selected Performance Peer Group for theone-year period, the fourth quintile for the three- and five-year periods and the third quintile for theten-year period. In evaluating the performance of the Fund, the Board also considered PLFA’s views as to the reasons for the Fund’s relative performance against peers and its benchmark over various time periods and PLFA’s future outlook for the Fund. The Board considered that PLFA would continue to manage exposures to asset classes and underlying managers in an effort to improve performance.
Pacific Funds Portfolio Optimization Moderate-Conservative
The Fund: (1) underperformed its Selected Performance Peer Group median for theone-, three-, five- andten-year periods; (2) underperformed its custom benchmark for theone-, five- andten-year periods and outperformed for the three-year period; and (3) is ranked in the fourth quintile of its Selected Performance Peer Group for theone-, five- andten-year periods and the third quintile for the three-year period. In evaluating the performance of the Fund, the Board also considered PLFA’s views as to the reasons for the Fund’s relative performance against peers and its benchmark over various time periods and PLFA’s future outlook for the Fund. The Board considered that PLFA would continue to manage exposures to asset classes and underlying managers in an effort to improve performance.
Pacific Funds Portfolio Optimization Moderate
The Fund: (1) underperformed its Selected Performance Peer Group median for theone-, three-, five- andten-year periods; (2) underperformed its custom benchmark for theone-, five- andten-year periods and outperformed for the three-year period; and (3) is ranked in the fourth quintile of its Selected Performance Peer Group for theone-, three- and five-year periods and the fifth quintile for theten-year period. In evaluating the
F-13
PACIFIC FUNDS
APPROVAL OF INVESTMENT ADVISORY
AND SUB-ADVISORY AGREEMENTS (Continued)
(Unaudited)
performance of the Fund, the Board also considered PLFA’s views as to the reasons for the Fund’s relative performance against peers and its benchmark over various time periods and PLFA’s future outlook for the Fund. The Board considered that PLFA would continue to manage exposures to asset classes and underlying managers in an effort to improve performance.
Pacific Funds Portfolio Optimization Growth
The Fund: (1) underperformed its Selected Performance Peer Group median for theone-, three-, five- andten-year periods; (2) underperformed its custom benchmark for theone-, five- andten-year periods and outperformed for the three-year period; and (3) is ranked in the fourth quintile of its Selected Performance Peer Group for theone-, five- andten-year periods and the third quintile for the three-year period. In evaluating the performance of the Fund, the Board also considered PLFA’s views as to the reasons for the Fund’s relative performance against peers and its benchmark over various time periods and PLFA’s future outlook for the Fund. The Board considered that PLFA would continue to manage exposures to asset classes and underlying managers in an effort to improve performance.
Pacific Funds Portfolio Optimization Aggressive-Growth
The Fund: (1) outperformed its Selected Performance Peer Group for theone- and three-year periods and underperformed for the five- andten-year periods; (2) underperformed its custom benchmark for theone-, five- andten-year periods and outperformed for the three-year period; and (3) is ranked in the second quintile of its Selected Performance Peer Group for theone- and three-year periods and the fourth quintile for the five- andten-year periods.
The Trustees reviewed the monitoring of eachSub-Advisers’ investment results by PLFA, including PLFA’s historical practice of recommending to the Trustees the use of a newsub-adviser if performance lagged and the prospects for improvement within a reasonable timeframe were not promising, and reviewed the monitoring of the PAM unit’s investment results by PLFA. Generally, the Trustees noted that there continues to be a record of well-managed Funds that are appropriate to serve as Underlying Funds in the Asset Allocation Funds and that the Asset Allocation Funds provide a range of professionally managed asset allocation investment options. The Trustees considered the steps PLFA has taken to seek to improve performance of the Asset Allocation Funds, including ongoing assessment of asset allocation determinations, diversifying asset class investment options by adding additional Underlying Funds, and adding or changingSub-Advisers to the Underlying Funds. The Trustees also noted that the Funds continue to deliver the investment style as disclosed to shareholders. The Trustees also noted the use by investors of the Asset Allocation Funds and the benefits the Asset Allocation Funds provide for shareholders generally.
The Board concluded that PLFA continues to have a long record of effectively managing a multi-manager fund group and asset allocation funds designed to give shareholders a reasonable array of choices through which to implement their investment programs. The Board further concluded that PLFA was appropriately implementing each Fund’s investment objective either directly or through the selection ofSub-Advisers and that PLFA’s record in managing each Fund indicates that PLFA’s continued management, as well as the continuation of the respectiveSub-Advisory Agreements, will benefit each Fund and its shareholders.
C. Advisory Fees and Total Expense Ratios
The Trustees requested, received and reviewed information from PLFA relating to the advisory fees paid by the Funds and thesub-advisory fees paid by PLFA, including the portion of the advisory fees paid to eachSub-Adviser as compared to the portion retained by PLFA. The Trustees considered the nature and quality of the services provided by PLFA and also considered the nature and quality of services provided by eachSub-Adviser. The Independent Trustees also requested and reviewed information from the Independent Consultant along with the Independent Consultant’s analysis of advisory fees,sub-advisory fees and certain Fund expenses, excluding any applicable service or distribution fees, which were selected by the Independent Consultant for purposes of the peer group expense comparisons (“Operating Expenses”). The Trustees reviewed the advisory fees,sub-advisory fees and Operating Expenses of each Fund and compared such amounts with the fees and expense levels of a group of appropriate peer funds identified by the Independent Consultant (each a “Selected Expense Peer Group”). The Trustees reviewed a description of the Independent Consultant’s methodology for constructing the Selected Expense Peer Groups, noting that each Selected Expense Peer Group includes a group ofsimilarly-sized funds with comparable strategies from a universe of funds that (i) included bothsub-advised and directly managed funds; (ii) excluded funds that are managed withnon-standard business models and expense structures; and (iii) excluded index funds. With respect to the Portfolio Optimization Funds, the Trustees also compared the net expense ratio with the average net expense ratio of funds in the Morningstar Category determined to be similar to the relevant Portfolio Optimization Fund (“Comparable Peer Fund Average”).
A summary of certain comparative fee and expense information considered by the Trustees for each Fund is provided below.
PF Growth Fund
The Trustees considered that (a) the advisory fee for the Fund is less than the median advisory fee rate of the funds in its Selected Expense Peer Group and ranked in the first quintile of its Selected Expense Peer Group; and (b) the Operating Expenses for the Fund are less than the median Operating Expenses of the funds in its Selected Expense Peer Group and ranked in the second quintile of its Selected Expense Peer Group.
PFLarge-Cap Value Fund
The Trustees considered that (a) the advisory fee for the Fund is slightly less than the median advisory fee rate of the funds in its Selected Expense Peer Group and ranked in the second quintile of its Selected Expense Peer Group; and (b) the Operating Expenses for the Fund are slightly less than the median Operating Expenses of the funds in its Selected Expense Peer Group and ranked in the second quintile of its Selected Expense Peer Group.
F-14
PACIFIC FUNDS
APPROVAL OF INVESTMENT ADVISORY
AND SUB-ADVISORY AGREEMENTS (Continued)
(Unaudited)
Pacific FundsLarge-Cap
The Trustees considered that (a) the advisory fee for the Fund is less than the median advisory fee rate of the funds in its Selected Expense Peer Group and ranked in the first quintile of its Selected Expense Peer Group; and (b) the Operating Expenses for the Fund are less than the median Operating Expenses of the funds in its Selected Expense Peer Group and ranked in the second quintile of its Selected Expense Peer Group. The Trustees considered that PLFA currently has contractually agreed to waive 0.10% of its advisory fee.
Pacific FundsLarge-Cap Value
The Trustees considered that (a) the advisory fee for the Fund is less than the median advisory fee rate of the funds in its Selected Expense Peer Group and ranked in the second quintile of its Selected Expense Peer Group; and (b) the Operating Expenses for the Fund are less than the median Operating Expenses of the funds in its Selected Expense Peer Group and ranked in the first quintile of its Selected Expense Peer Group.
PF Developing Growth Fund
The Trustees considered that (a) the advisory fee for the Fund is less than the median advisory fee rate of the funds in its Selected Expense Peer Group and ranked in the first quintile of its Selected Expense Peer Group; and (b) the Operating Expenses for the Fund are less than the median Operating Expenses of the funds in its Selected Expense Peer Group and ranked in the first quintile of its Selected Expense Peer Group.
PFMid-Cap Equity Fund
The Trustees considered that (a) the advisory fee for the Fund is less than the median advisory fee rate of the funds in its Selected Expense Peer Group and ranked in the first quintile of its Selected Expense Peer Group; and (b) the Operating Expenses for the Fund are less than the median Operating Expenses of the funds in its Selected Expense Peer Group and ranked in the first quintile of its Selected Expense Peer Group.
Pacific FundsSmall/Mid-Cap
The Trustees considered that (a) the advisory fee for the Fund is slightly greater than the median advisory fee rate of the funds in its Selected Expense Peer Group and ranked in the fourth quintile of its Selected Expense Peer Group; and (b) the Operating Expenses for the Fund are in line with the median Operating Expenses of the funds in its Selected Expense Peer Group and ranked in the third quintile of its Selected Expense Peer Group.
Pacific FundsSmall-Cap
The Trustees considered that (a) the advisory fee for the Fund is slightly less than the median advisory fee rate of the funds in its Selected Expense Peer Group and ranked in the third quintile of its Selected Expense Peer Group; and (b) the Operating Expenses for the Fund are slightly less than the median Operating Expenses of the funds in its Selected Expense Peer Group and ranked in the second quintile of its Selected Expense Peer Group.
Pacific FundsSmall-Cap Growth
The Trustees considered that (a) the advisory fee for the Fund is slightly less than the median advisory fee rate of the funds in its Selected Expense Peer Group and ranked in the third quintile of its Selected Expense Peer Group; and (b) the Operating Expenses for the Fund are less than the median Operating Expenses of the funds in its Selected Expense Peer Group and ranked in the first quintile of its Selected Expense Peer Group.
PFSmall-Cap Value Fund
The Trustees considered that (a) the advisory fee for the Fund is less than the median advisory fee rate of the funds in its Selected Expense Peer Group and ranked in the first quintile of its Selected Expense Peer Group; and (b) the Operating Expenses for the Fund are less than the median Operating Expenses of the funds in its Selected Expense Peer Group and ranked in the first quintile of its Selected Expense Peer Group.
Pacific FundsSmall-Cap Value
The Trustees considered that (a) the advisory fee for the Fund is in line with the median advisory fee rate of the funds in its Selected Expense Peer Group and ranked in the third quintile of its Selected Expense Peer Group; and (b) the Operating Expenses for the Fund are less than the median Operating Expenses of the funds in its Selected Expense Peer Group and ranked in the second quintile of its Selected Expense Peer Group.
PF Emerging Markets Fund
The Trustees considered that (a) the advisory fee for the Fund is less than the median advisory fee rate of the funds in its Selected Expense Peer Group and ranked in the first quintile of its Selected Expense Peer Group; and (b) the Operating Expenses for the Fund are less than the median Operating Expenses of the funds in its Selected Expense Peer Group and ranked in the first quintile of its Selected Expense Peer Group.
PF Emerging Markets Debt Fund
The Trustees considered that (a) the advisory fee for the Fund is slightly less than the median advisory fee rate of the funds in its Selected Expense Peer Group and ranked in the second quintile of its Selected Expense Peer Group; and (b) the Operating Expenses for the Fund are
F-15
PACIFIC FUNDS
APPROVAL OF INVESTMENT ADVISORY
AND SUB-ADVISORY AGREEMENTS (Continued)
(Unaudited)
slightly less than the median Operating Expenses of the funds in its Selected Expense Peer Group and ranked in the second quintile of its Selected Expense Peer Group. The Trustees considered that PLFA currently has contractually agreed to waive 0.02% of its advisory fee.
PF InternationalLarge-Cap Fund
The Trustees considered that (a) the advisory fee for the Fund is slightly greater than the median advisory fee rate of the funds in its Selected Expense Peer Group and ranked in the fourth quintile of its Selected Expense Peer Group; and (b) the Operating Expenses for the Fund are less than the median Operating Expenses of the funds in its Selected Expense Peer Group and ranked in the second quintile of its Selected Expense Peer Group.
PF InternationalSmall-Cap Fund
The Trustees considered that (a) the advisory fee for the Fund is less than the median advisory fee rate of the funds in its Selected Expense Peer Group and ranked in the first quintile of its Selected Expense Peer Group; and (b) the Operating Expenses for the Fund are less than the median Operating Expenses of the funds in its Selected Expense Peer Group and ranked in the first quintile of its Selected Expense Peer Group.
PF International Value Fund
The Trustees considered that (a) the advisory fee for the Fund is less than the median advisory fee rate of the funds in its Selected Expense Peer Group and ranked in the first quintile of its Selected Expense Peer Group; and (b) the Operating Expenses for the Fund are less than the median Operating Expenses of the funds in its Selected Expense Peer Group and ranked in the first quintile of its Selected Expense Peer Group.
PF Currency Strategies Fund
The Trustees considered that (a) the advisory fee for the Fund is in line with the median advisory fee rate of the funds in its Selected Expense Peer Group and ranked in the third quintile of its Selected Expense Peer Group; and (b) the Operating Expenses for the Fund are less than the median Operating Expenses of the funds in its Selected Expense Peer Group and ranked in the first quintile of its Selected Expense Peer Group.
Pacific Funds Diversified Alternatives
The Trustees considered that (a) the advisory fee for the Fund is less than the median advisory fee rate of the funds in its Selected Expense Peer Group and ranked in the first quintile of its Selected Expense Peer Group; and (b) the Operating Expenses for the Fund are less than the median Operating Expenses of the funds in its Selected Expense Peer Group and ranked in the third quintile of its Selected Expense Peer Group. The Trustees noted that pursuant to a fee waiver agreement, PLFA has agreed to a breakpoint schedule that will reduce its advisory fee once the Fund attains varying higher asset levels, but that the Fund has not yet reached the first breakpoint.
PF Equity Long/Short Fund
The Trustees considered that (a) the advisory fee for the Fund is less than the median advisory fee rate of the funds in its Selected Expense Peer Group and ranked in the second quintile of its Selected Expense Peer Group; and (b) the Operating Expenses for the Fund are less than the median Operating Expenses of the funds in its Selected Expense Peer Group and ranked in the second quintile of its Selected Expense Peer Group. The Trustees considered that PLFA currently has contractually agreed to waive 0.15% of its advisory fee. The Trustees also considered that the Operating Expenses for the Fund include investment related expenses.
PF Global Absolute Return Fund
The Trustees considered that (a) the advisory fee for the Fund is less than the median advisory fee rate of the funds in its Selected Expense Peer Group and ranked in the second quintile of its Selected Expense Peer Group; and (b) the Operating Expenses for the Fund are slightly greater than the median Operating Expenses of the funds in its Selected Expense Peer Group and ranked in the third quintile of its Selected Expense Peer Group.
PF Real Estate Fund
The Trustees considered that (a) the advisory fee for the Fund is in line with the median advisory fee rate of the funds in its Selected Expense Peer Group and ranked in the third quintile of its Selected Expense Peer Group; and (b) the Operating Expenses for the Fund are less than the median Operating Expenses of the funds in its Selected Expense Peer Group and ranked in the second quintile of its Selected Expense Peer Group. The Trustees considered that PLFA currently has contractually agreed to waive 0.15% of its advisory fee.
Pacific Funds Core Income
The Trustees considered that (a) the advisory fee for the Fund is slightly greater than the median advisory fee rate of the funds in its Selected Expense Peer Group and ranked in the third quintile of its Selected Expense Peer Group; and (b) the Operating Expenses for the Fund are less than the median Operating Expenses of the funds in its Selected Expense Peer Group and ranked in the second quintile of its Selected Expense Peer Group. The Trustees noted that pursuant to a fee waiver agreement, PLFA has agreed to a breakpoint schedule that will reduce its advisory fee once the Fund attains varying higher asset levels, but that the Fund has not yet reached the first breakpoint.
Pacific Funds Floating Rate Income
The Trustees considered that (a) the advisory fee for the Fund is slightly greater than the median advisory fee rate of the funds in its Selected Expense Peer Group and ranked in the fourth quintile of its Selected Expense Peer Group; and (b) the Operating Expenses for the Fund are slightly less than the median Operating Expenses of the funds in its Selected Expense Peer Group and ranked in the second quintile of its
F-16
PACIFIC FUNDS
APPROVAL OF INVESTMENT ADVISORY
AND SUB-ADVISORY AGREEMENTS (Continued)
(Unaudited)
Selected Expense Peer Group. The Trustees noted that pursuant to a fee waiver agreement, PLFA has agreed to a breakpoint schedule that had the effect of reducing the Fund’s advisory fee based on the Fund having attained varying higher asset levels.
Pacific Funds High Income
The Trustees considered that (a) the advisory fee for the Fund is less than the median advisory fee rate of the funds in its Selected Expense Peer Group and ranked in the second quintile of its Selected Expense Peer Group; and (b) the Operating Expenses for the Fund are less than the median Operating Expenses of the funds in its Selected Expense Peer Group and ranked in the first quintile of its Selected Expense Peer Group. The Trustees noted that pursuant to a fee waiver agreement, PLFA has agreed to a breakpoint schedule that will reduce its advisory fee once the Fund attains varying higher asset levels, but that the Fund has not yet reached the first breakpoint.
PF Inflation Managed Fund
The Trustees considered that (a) the advisory fee for the Fund is slightly less than the median advisory fee rate of the funds in its Selected Expense Peer Group and ranked in the second quintile of its Selected Expense Peer Group; and (b) the Operating Expenses for the Fund are in line with the median Operating Expenses of the funds in its Selected Expense Peer Group and ranked in the third quintile of its Selected Expense Peer Group.
PF Managed Bond Fund
The Trustees considered that (a) the advisory fee for the Fund is slightly less than the median advisory fee rate of the funds in its Selected Expense Peer Group and ranked in the second quintile of its Selected Expense Peer Group; and (b) the Operating Expenses for the Fund are slightly less than the median Operating Expenses of the funds in its Selected Expense Peer Group and ranked in the third quintile of its Selected Expense Peer Group.
PF Short Duration Bond Fund
The Trustees considered that (a) the advisory fee for the Fund is less than the median advisory fee rate of the funds in its Selected Expense Peer Group and ranked in the first quintile of its Selected Expense Peer Group; and (b) the Operating Expenses for the Fund are slightly less than the median Operating Expenses of the funds in its Selected Expense Peer Group and ranked in the second quintile of its Selected Expense Peer Group.
Pacific Funds Short Duration Income
The Trustees considered that (a) the advisory fee for the Fund is slightly less than the median advisory fee rate of the funds in its Selected Expense Peer Group and ranked in the third quintile of its Selected Expense Peer Group; and (b) the Operating Expenses for the Fund are slightly less than the median Operating Expenses of the funds in its Selected Expense Peer Group and ranked in the second quintile of its Selected Expense Peer Group. The Trustees noted that pursuant to a fee waiver agreement, PLFA has agreed to a breakpoint schedule that will reduce its advisory fee once the Fund attains varying higher asset levels, but that the Fund has not yet reached the first breakpoint.
Pacific Funds Strategic Income
The Trustees considered that (a) the advisory fee for the Fund is greater than the median advisory fee rate of the funds in its Selected Expense Peer Group and ranked in the fifth quintile of its Selected Expense Peer Group; and (b) the Operating Expenses for the Fund are in line with the median Operating Expenses of the funds in its Selected Expense Peer Group and ranked in the third quintile of its Selected Expense Peer Group. The Trustees further noted that pursuant to a fee waiver agreement, PLFA has agreed to a breakpoint schedule that will reduce its advisory fee once the Fund attains varying higher asset levels, but that the Fund has not yet reached the first breakpoint. The Trustees considered that the Selected Expense Peer Group also contains intermediate-term bond funds which generally have a lower advisory fee than multisector bond funds, such as the Fund.
Pacific Funds Portfolio Optimization Conservative
The Trustees considered that (a) the advisory fee for the Fund is slightly greater than the median advisory fee rate of the funds in its Selected Expense Peer Group and ranked in the third quintile of its Selected Expense Peer Group; (b) the Operating Expenses for the Fund are greater than the median Operating Expenses of the funds in its Selected Expense Peer Group and ranked in the fourth quintile of its Selected Expense Peer Group; and (c) the net expense ratio was greater than the Comparable Peer Fund Average. The Trustees noted that pursuant to a fee waiver agreement, PLFA has agreed to a breakpoint schedule that will reduce its advisory fee once the Fund attains varying higher asset levels, but that the Fund has not yet reached the first breakpoint.
Pacific Funds Portfolio Optimization Moderate-Conservative
The Trustees considered that (a) the advisory fee for the Fund is slightly greater than the median advisory fee rate of the funds in its Selected Expense Peer Group and ranked in the third quintile of its Selected Expense Peer Group; (b) the Operating Expenses for the Fund are greater than the median Operating Expenses of the funds in its Selected Expense Peer Group and ranked in the fourth quintile of its Selected Expense Peer Group; and (c) the net expense ratio was slightly less than the Comparable Peer Fund Average. The Trustees noted that pursuant to a fee waiver agreement, PLFA has agreed to a breakpoint schedule that will reduce its advisory fee once the Fund attains varying higher asset levels, but that the Fund has not yet reached the first breakpoint.
Pacific Funds Portfolio Optimization Moderate
The Trustees considered that (a) the advisory fee for the Fund is slightly greater than the median advisory fee rate of the funds in its Selected Expense Peer Group and ranked in the third quintile of its Selected Expense Peer Group;(b) the Operating Expenses for the Fund are greater
F-17
PACIFIC FUNDS
APPROVAL OF INVESTMENT ADVISORY
AND SUB-ADVISORY AGREEMENTS (Continued)
(Unaudited)
than the median Operating Expenses of the funds in its Selected Expense Peer Group and ranked in the fourth quintile of its Selected Expense Peer Group; and (c) the net expense ratio was less than the Comparable Peer Fund Average. The Trustees noted that pursuant to a fee waiver agreement, PLFA has agreed to a breakpoint schedule that will reduce its advisory fee once the Fund attains varying higher asset levels, but that the Fund has not yet reached the first breakpoint.
Pacific Funds Portfolio Optimization Growth
The Trustees considered that (a) the advisory fee for the Fund is slightly greater than the median advisory fee rate of the funds in its Selected Expense Peer Group and ranked in the third quintile of its Selected Expense Peer Group; (b) the Operating Expenses for the Fund are greater than the median Operating Expenses of the funds in its Selected Expense Peer Group and ranked in the fourth quintile of its Selected Expense Peer Group; and (c) the net expense ratio was slightly less than the Comparable Peer Fund Average. The Trustees noted that pursuant to a fee waiver agreement, PLFA has agreed to a breakpoint schedule that will reduce its advisory fee once the Fund attains varying higher asset levels, but that the Fund has not yet reached the first breakpoint.
Pacific Funds Portfolio Optimization Aggressive-Growth
The Trustees considered that (a) the advisory fee for the Fund is slightly greater than the median advisory fee rate of the funds in its Selected Expense Peer Group and ranked in the third quintile of its Selected Expense Peer Group; (b) the Operating Expenses for the Fund are greater than the median Operating Expenses of the funds in its Selected Expense Peer Group and ranked in the fourth quintile of its Selected Expense Peer Group; and (c) the net expense ratio was less than the Comparable Peer Fund Average. The Trustees noted that pursuant to a fee waiver agreement, PLFA has agreed to a breakpoint schedule that will reduce its advisory fee once the Fund attains varying higher asset levels, but that the Fund has not yet reached the first breakpoint.
During their review, the Trustees considered that all of the Funds, except for the Equity Long/Short Fund, were subject to contractual expense limitations on certain operating expenses agreed to by PLFA.
The Trustees also considered information from theSub-Advisers regarding the comparativesub-advisory fees charged under other investment advisory contracts for similarly managed accounts, such as contracts of eachSub-Adviser with other similarly managed registered investment companies or other types of clients. The Trustees noted that in many cases there were differences in the level of services provided to the Funds by theSub-Advisers and that the level of services provided by theseSub-Advisers on these other accounts differed due to the nature of the accounts or because there were other reasons to support the difference in fees, such as an affiliation between theSub-Adviser and the account. These differences often explained variations in fee schedules. The Trustees were mindful that, with regard to theSub-Advised Funds, the fee rates were the result of arms’ length negotiations between PLFA and theSub-Advisers, and that anysub-advisory fees are paid by PLFA and are not paid directly by a Fund.
The Board concluded that the advisory fees,sub-advisory fees and total expenses of each Fund were fair and reasonable.
D. Costs, Level of Profits and Economies of Scale
The Trustees reviewed information provided by PLFA regarding PLFA’s costs of sponsoring and operating the Funds and information regarding the profitability of PLFA from each Fund. For purposes of analyzing PLFA’s costs and profitability with respect to the Funds, the Trustees assigned credibility to PLFA’s view that little weight should be given to the fees of Pacific Select Fund, anotheropen-end investment company advised by PLFA that consists of multiple funds, on the basis that there are significant differences between Pacific Funds and Pacific Select Fund, including differences in fund size and platforms on which the funds are offered. For theSub-Advised Funds, the Trustees also reviewed information provided by theSub-Advisers regarding their costs in managing theSub-Advised Funds and their profitability from the Funds.
PLFA and theSub-Advisers’ Costs and Profitability. The Trustees noted that, based on the data available, PLFA appears to be providing and operating products that are competitively priced with other funds, especially other multi-manager and asset allocation funds. The Trustees noted PLFA’s willingness to build its investment capabilities and to sponsor new funds that PLFA believed would benefit the Asset Allocation Funds, despite the potential subsidies required by PLFA during a new Fund’sstart-up phase. The Trustees also noted that the analysis of the Trust’s profitability to PLFA supported a conclusion that PLFA’s costs and profitability are reasonable, whether considered inclusive or exclusive of distribution costs.
The Trustees also reviewed information provided regarding the structure and manner in which PLFA’s investment professionals were compensated and their respective views of the relationship of such compensation to the attraction and retention of quality personnel. The Trustees considered PLFA’s willingness to invest in technology, infrastructure and staff to reinforce and offer new services and to accommodate changing regulatory requirements. The Trustees also considered the organizational strengths of theSub-Advisers and their ability to attract and retain investment personnel over time and to sustain the staffing of investment teams that provide services to theSub-Advised Funds.
With respect to theSub-Advisers, the Trustees noted that it was difficult in many cases to accurately determine or evaluate theSub-Advisers’ costs and the profitability of theSub-Advisory Agreements to theSub-Advisers because of, among other things, the differences in the types and content of information provided by theSub-Advisers, the fact that manySub-Advisers manage substantial assets other than the Funds and, further, that any such assessment would involve assumptions regarding theSub-Advisers’ expense allocation policies, capital structure, cost of capital, business mix and other factors.
Accordingly, in the case of theSub-Advisers, the Trustees considered the data described above in light of the arms’ length nature of the relationship (for theSub-Advised Funds) between PLFA and suchSub-Advisers with respect to the negotiation of fundsub-advisory fees and the fact that such fees are paid by PLFA.
F-18
PACIFIC FUNDS
APPROVAL OF INVESTMENT ADVISORY
AND SUB-ADVISORY AGREEMENTS (Continued)
(Unaudited)
Economies of Scale. The Trustees noted and considered the extent to which economies of scale are realized by PLFA and theSub-Advisers as each Fund grows, and whether advisory fee levels reflect economies of scale if the Funds grow in size. The Trustees noted PLFA’s commitment to competitive total expenses of certain Funds through expense limitation agreements and, for certain Asset Allocation and PAM Managed Funds, through advisory fee waivers. The Trustees also noted PLFA’s and its affiliates’ consistent reinvestment in the business in the form of adding to investment capabilities and resources, improvements in technology, product innovations and customer service. The Trustees considered information relating to economies of scale provided by PLFA, PLFA’s willingness to discuss and evaluate the topic of economies of scale with the Trustees, and PLFA’s agreement to enter into advisory fee waivers for certain PAM Managed Funds and Asset Allocation Funds that create effective breakpoints at asset levels at which PLFA believes it will have attained a level of profit that can be shared with these Funds.
With respect to theSub-Advised Funds, the Trustees considered that the advisory fee for each Fund was originally set at an amount that was intended to be lower than peers to attract assets at the Fund’s inception. The Trustees noted that because fees for the Funds started relatively low from the first dollar under management in relation to peers, economies of scale will be realized at higher asset levels than would otherwise be the case. The Trustees also considered that someSub-Advisers have agreed to breakpoints in theirsub-advisory fee schedules. The Trustees noted that in setting its advisory fees relatively low at inception as compared to peers, and in subsidizing the expenses of the Funds from their inception and for many years, PLFA’s economics from theSub-Advised Funds should be considered separate and apart from the economics of theSub-Advisers. The Trustees noted PLFA’s view that thesub-advisory fee breakpoints were important for PLFA’s economics to overcome its expenses from the Funds. The Trustees also noted that shareholders will benefit from effective breakpoints for the Asset Allocation Funds.
The Trustees also considered PLFA’s willingness to reduce its own fees through certain advisory fee waivers and expense limitation agreements, whereby PLFA will reimburse the Funds for certain expenses that exceed stated expense caps. The Trustees considered that the advisory fee waivers effectively implement breakpoints in PLFA’s advisory fees at higher asset levels of these Funds, which are intended to share economies of scale that PLFA has attained.
The Trustees noted that PLFA and its affiliates had consistently reinvested in the business in the form of improvements in technology, product innovations, personnel and resources. The Trustees additionally noted that economies of scale were difficult to measure with precision, particularly on a Fund by Fund basis. This analysis is complicated by the additional services and content provided by PLFA and its affiliates through reinvestment in the business, as discussed above. The Trustees considered that the Funds are well managed, and provide shareholders with sophisticated asset allocation investment options at reasonable fee levels. The Board noted that PLFA had taken steps to ensure that shareholders benefit by negotiating favorable terms with service providers, and to provide certain support services, including, but not limited to, legal, compliance and accounting services, to the Funds on an approximate cost basis as opposed to an asset-based charge.
The Board determined that PLFA and its affiliates are sharing economies of scale given its agreement to reduce its own fees through fee waivers as assets grow for certain Funds, its commitment to competitive total expenses of the Funds, and the consistent reinvestment in the business in the form of improvements in technology and other resources and investments in personnel. The Board considered that PLFA has not yet attained levels of profitability that warrant sharing of economies of scale for some Funds, including theSub-Advised Funds, but noted that shareholders will benefit in the future from the effective breakpoints for the Asset Allocation Funds. The Board further considered that it will continue to review whether there are additional economies of scale that will be realized as the Funds grow that can be shared with shareholders. The Board concluded that the Funds’ cost structures were reasonable and that overall profitability appeared reasonable at the current time. The Board further concluded that PLFA was sharing economies of scale with each Fund and its shareholders to their benefit.
E. Ancillary Benefits
The Trustees requested and received from PLFA and theSub-Advisers information concerning other benefits received by PLFA, Pacific Life, theSub-Advisers, and their affiliates as a result of their respective relationship with the Funds, including various service arrangements with PLFA affiliates and reimbursement at an approximate cost basis for support services in the case of PLFA, as well as commissions paid to broker-dealers affiliated with certainSub-Advisers and the use of soft-dollars by certain of theSub-Advisers. The Trustees also considered ancillary benefits received by Pacific Life and its affiliates from the Funds. The Trustees considered information concerning other significant economic relations between theSub-Advisers and their affiliates and with PLFA and its affiliates and noted PLFA’s processes and procedures to identify and disclose such relationships and any potential conflicts of interest to the Board. The Trustees also considered PLFA’s and eachSub-Adviser’s strong practices and procedures with regard to managing conflicts of interest and ensuring that such conflicts do not prevent PLFA or theSub-Advisers from acting in the best interests of the Funds and their shareholders.
The Board concluded that such benefits were consistent with those generally derived by investment advisers to mutual funds or were otherwise not unusual.
F. Conclusion
Based on their review, including their consideration of each of the factors referred to above, and assisted by the advice of the Independent Consultant and independent counsel to the Independent Trustees, the Board, including the Independent Trustees, concluded that the Advisory Agreement and each applicableSub-Advisory Agreement are fair and reasonable with respect to each applicable Fund and its shareholders, and that the renewal of the Advisory Agreement and each applicableSub-Advisory Agreement would be in the best interests of each Fund and its shareholders. The Board did not indicate that any single factor was determinative of its decision to approve the Advisory Agreement and each applicableSub-Advisory Agreement, but indicated that the Board based its determination on the total mix of information available to it.
F-19
PACIFIC FUNDS
WHERE TO GO FOR MORE INFORMATION
(Unaudited)
Availability of Quarterly Holdings
The Trust files Part F of Form N-PORT (complete schedules of fund holdings) with the Securities and Exchange Commission (the “SEC”) for the first and third quarters of each fiscal year not later than 60 days after the close of the applicable quarter end. The Trust’s Part F of FormN-PORT, (when required) is filed pursuant to applicable regulations and is available after filing on the SEC’s website at http://www.sec.gov.
Availability of Proxy Voting Record
By August 31 of each year, the Trust files information regarding how the Trust’s managers voted proxies relating to fund securities during the most recent twelve-month period ended June 30. Such information is available after filing on the Trust’s’ website and on the SEC’s website noted below.
Information Relating to Investments Held by the Trust
For complete descriptions of the various securities and other instruments held by the Trust and their risks, please see the Trust’s prospectus and Statement of Additional Information (“SAI”). The prospectus and SAI are available as noted below.
Availability of Proxy Voting Policies
A description of the Proxy Voting Policies and Procedures that the Trust uses to determine how to vote proxies relating to fund securities is described in the Trust’s SAI.
How to obtain Information
The Trust’s prospectus, SAI (including Proxy Voting Policies) and annual and semi-annual reports are available:
| • | | On the Trust’s website at https://www.pacificlife.com/pacificfunds.html |
| • | | On the SEC’s website at http://www.sec.gov |
| • | | Upon request by calling, without charge, 1-800-722-2333, 7 a.m. through 5 p.m. Pacific Time |
F-20
Item 2. Code of Ethics.
As of the end of the period covered by this report, the Registrant has adopted a code of ethics that applies to the Registrant’s principal executive officer, principal financial officer, principal accounting officer or controller, or persons performing similar functions. There were no substantive amendments or waivers to the Code of Ethics during the period covered by this report.
A copy of this Code of Ethics is filed as Exhibit 99 to this FormN-CSR.
Item 3. Audit Committee Financial Expert.
The Registrant’s Board has determined that Paul A. Keller, a member of the Registrant’s Audit Committee, is an “audit committee financial expert” and “independent,” as such terms are defined in this Item. This designation does not increase the designee’s duties, obligations or liability as compared to his duties, obligations and liability as a member of the Audit Committee and of the Board; nor does it reduce the responsibility of the other Audit Committee members. There may be other individuals who, through education or experience, would qualify as “audit committee financial experts” if the Board had designated them as such. Most importantly, the Board believes each member of the Audit Committee contributes significantly to the effective oversight of the Registrant’s financial statements and condition. Mr. Keller is a retired partner of PricewaterhouseCoopers LLP.
Item 4. Principal Accountant Fees and Services.
Audit Fees
| | (a) | The aggregate fees billed for the fiscal years ended March 31, 2019 and 2018 for professional services rendered by the principal accountant for the audit of the registrant’s annual financial statements or services that are normally provided by the accountant in connection with statutory and regulatory filings or engagements for those fiscal years are $800,000 and $915,000, respectively. |
Audit-Related Fees
| | (b) | There were no aggregate fees billed for the fiscal years ended March 31, 2019 and 2018 for assurance and related services by the principal accountant that are reasonably related to the performance of the audit of the registrant’s financial statements and are not reported under paragraph (a) of this Item. |
Tax Fees
| | (c) | The aggregate fees billed for the fiscal years ended March 31, 2019 and 2018 for professional services rendered by the principal accountant for tax compliance, tax advice, and tax planning are $178,143 and $180,010, respectively. The nature of the services comprising the fees was the review of income tax returns and excise tax. |
All Other Fees
| | (d) | There were no aggregate fees billed for the fiscal years ended March 31, 2019 and 2018 for products and services provided by the principal accountant, other than the services reported in paragraphs (a) through (c) of this Item. |
| | (e)(1) | The Audit Committee is required topre-approve audit andnon-audit services performed for the Registrant by the independent auditor as outlined below in order to assure that the provision of such services does not impair the auditor’s independence: |
| | A. | Pre-Approval Requirements for Services to Registrant. Before the Auditor is engaged by the Registrant to render audit related or permissiblenon-audit services, either: |
(i) The Audit Committee shallpre-approve such engagement; or
| | (ii) | Such engagement shall be entered into pursuant topre-approval policies and procedures established by the Audit Committee. Any such policies and procedures must (1) be detailed as to the particular service and (2) not involve any delegation of the Audit Committee’s responsibilities to the Adviser. The Audit Committee hereby delegates authority to its Chairperson, and may delegate to one or more of its other members, the authority to grantpre-approvals. In the event of apre-approval by the Chairperson or other authorized member of the Audit Committee, the person to whom authority is delegated under this Section shall report on suchpre-approval to the full Audit Committee at its next regularly scheduled meeting. |
| | (iii) | De Minimis Exceptions toPre-Approval Requirements.Pre-approval for a service provided to the Registrant other than audit, review or attest services is not required if: (1) the aggregate amount of all suchnon-audit services provided to the Registrant constitutes not more than 5 percent of the total amount of revenues paid by the Registrant to the Auditor during the fiscal year in which the non audit services are provided; (2) such services were not recognized by the Registrant at the time of the engagement to benon-audit services; and (3) such services are promptly brought to the attention of the Audit Committee and are approved by the Audit Committee or by one or more members of the Audit Committee to whom authority to grant such approvals has been delegated by the Audit Committee. |
| | B. | Pre-Approval ofNon-Audit Services Provided to the Adviser and Others. The Audit Committee shallpre-approve anynon-audit services proposed to be provided by the Auditor to (i) the Adviser and (ii) any entity in the investment company complex, if the nature of the services provided relate directly to the operations or financial reporting of the Registrant. Investment company complex means the Pacific Select Fund, the Pacific Funds Series Trust, the Adviser and any entity controlled by or under common control with the Adviser if such entity is an investment adviser or is engaged in the business of providing administrative, custodian, underwriting or transfer agent services to the Trusts or the Adviser. |
| | (i) | De Minimis Exception: The De Minimis exceptions set forth above under Section (e)(1)A.(iii) apply topre-approvals under this Section (e)(1)B. as well, except that the “total amount of revenues” calculation for this Section’s (e)(1)B. services is based on the total amount of revenues paid to the Auditor by the Registrant and any other entity that has its services approved under this Section (i.e., the Adviser or any control person). |
| | C. | Pre-Approval of Program and Subscription Services Provided to the Registrants and their Affiliates. The Audit Committee is deemed to havepre-approved Program and Subscription Services (“Programs”) provided to the Registrant and their affiliates, entities within the Registrant’s investment company complex or their affiliates, including employees of Pacific Life and Pacific Life Fund Advisors LLC (collectively, “Fund Persons”) so long as: (1) such Programs are free to Fund Persons or if there is a charge, Fund Persons pay: (a) the going rate for such Programs, or (b) the Fund Persons receive a discount of $500 or less; or (2) the Program is approved under or covered by and in compliance with the policies and/or procedures of Pacific Life’s Audit Committee with respect to the provision of educational services by the Auditor or other parties. Any Programs that do not meet the above criteria require approval by the Audit Committee, its Chairperson or other delegates as provided in Section (e)(1)A.(iii). Programs are educational programs and seminars provided by the Auditor or its affiliates and include live programs, webcasts, podcasts, websites, database subscriptions, checklists, research reports, local office seminars, Debrief webcast series, Technical library and similar or related items. Any Programs that do not meet the above criteria require approval by the Audit Committee, its Chairperson or other delegates as provided in this Section. |
| (e)(2) | No services included in (b)-(d) above were approved pursuant to paragraph (c)(7)(i)(C) of Rule2-01 of RegulationS-X. |
| | (g) | The aggregate fees billed for the years ended March 31, 2019 and 2018 by the Registrant’s principal accountant fornon-audit services rendered to the Registrant, its investment adviser, and any entity controlling, controlled by, or under common control with the investment adviser that provides ongoing services to the Registrant were $1,636,451 and $1,541,010, respectively. |
| | (h) | The Registrant’s Audit Committee has considered whether the provision ofnon-audit services that were rendered to the Registrant’s investment adviser, and any entity controlling, controlled by, or under common control with the investment adviser that provides ongoing services to the Registrant which were notpre-approved (not requiringpre-approval) is compatible with maintaining the principal accountant’s independence. |
Item 5. Audit Committee of Listed Registrants.
Not applicable.
Item 6. Investments.
| (a) | Schedule of Investments in securities of unaffiliated issuers as of the close of the reporting period is included as part of the report to shareholders filed under Item 1 of this form. |
Item 7. Disclosure of Proxy Voting Policies and Procedures forClosed-End Management Investment Companies.
Not applicable.
Item 8. Portfolio Managers ofClosed-End Management Investment Companies.
Not applicable.
Item 9. Purchases of Equity Securities byClosed-End Management Investment Company and Affiliated Purchasers.
Not applicable.
Item 10. Submission of Matters to a Vote of Security Holders.
There have been no material changes to the procedures by which shareholders may recommend nominees to the Registrant’s Board of Directors.
Item 11. Controls and Procedures.
| | (a) | The Chief Executive Officer and Treasurer have concluded that the Registrant’s disclosure controls and procedures (as defined in Rule30a-3(c) under the Investment Company Act) and internal controls over financial reporting (as defined in Rule30a-3(d) under the Investment Company Act) provide reasonable assurances that material information relating to Registrant is made known to them by the appropriate persons,, based on their evaluation of these controls and procedures as of a date within 90 days of the filing of this report. |
| | (b) | There were no changes in the Registrant’s internal control over financial reporting that occurred during the second fiscal quarterof the period covered by this reportthat have materially affected, or are reasonably likely to materially affect, the Registrant’s internal control over financial reporting. |
Item 12. Disclosure of Securities Lending Activities forClosed-End Management Investment Companies.
Not applicable.
Item 13. Exhibits.
| | (a)(1) | Code of Ethics, subject to the disclosure of Item 2 hereof is attached hereto as Exhibit 99.CODE ETH. |
| | (a)(2) | Separate certifications pursuant toRule 30a-2(a) under the Investment Company Act of 1940 (17 CFR270.30a-2(a)) is attached hereto as Exhibit 99.CERT. |
| | (b) | Certification pursuant to Rule30a-2(b) under the Investment Company Act of 1940 (17 CFR270.30a-2(b)) is attached hereto as Exhibit 99.906 CERT pursuant to Section 906 of the Sarbanes-Oxley Act of 2002. |
Signatures
Pursuant to the requirements of the Securities Exchange Act of 1934 and the Investment Company Act of 1940, the registrant has duly caused this report to be signed on its behalf by the undersigned, thereunto duly authorized.
| | |
Pacific Funds Series Trust |
| |
By: | | /s/ Adrian Griggs |
| | Adrian Griggs |
| | Chief Executive Officer |
| |
Date: | | June 6, 2019 |
Pursuant to the requirements of the Securities Exchange Act of 1934 and the Investment Company Act of 1940, this report has been signed below by the following persons on behalf of the registrant and in the capacities and on the dates indicated.
| | |
By: | | /s/ Adrian Griggs |
| | Adrian Griggs |
| | Chief Executive Officer |
| |
Date: | | June 6, 2019 |
| |
By: | | /s/ Trevor T. Smith |
| | Trevor T. Smith |
| | Treasurer (Principal Financial and Accounting Officer) |
| |
Date: | | June 6, 2019 |