UNITED STATES
SECURITIES AND EXCHANGE COMMISSION
Washington, D.C. 20549
FORM N-CSR
CERTIFIED SHAREHOLDER REPORT OF REGISTERED
MANAGEMENT INVESTMENT COMPANIES
Investment Company Act File Number: 811-10371
LORD ABBETT EQUITY TRUST
(Exact name of Registrant as specified in charter)
90 Hudson Street, Jersey City, NJ 07302
(Address of principal executive offices) (Zip code)
Thomas R. Phillips, Esq., Vice President & Assistant Secretary
90 Hudson Street, Jersey City, NJ 07302
(Name and address of agent for service)
Registrant’s telephone number, including area code: (800) 201-6984
Date of fiscal year end: 7/31
Date of reporting period: 7/31/2013
| Item 1: | Report(s) to Shareholders. |
![]()
2 0 1 3
L O R D A B B E T T
A N N U A L
R E P O R T
Lord Abbett
Calibrated Large Cap Value Fund
Calibrated Mid Cap Value Fund
For the fiscal year ended July 31, 2013
Table of Contents
Lord Abbett Calibrated Large Cap Value Fund and
Lord Abbett Calibrated Mid Cap Value Fund
Annual Report
For the fiscal year ended July 31, 2013
Dear Shareholders: We are pleased to provide you with this overview of the performance of the Funds for the fiscal year ended July 31, 2013. On this page and the following pages, we discuss the major factors that influenced fiscal year performance. For detailed and more timely information about the Funds, please visit our Website at www.lordabbett.com, where you also can access quarterly commentaries that provide updates on each Fund’s performance and other portfolio related updates.
Thank you for investing in Lord Abbett mutual funds. We value the trust that you place in us and look forward to serving your investment needs in the years to come.
Best regards,

Daria L. Foster
Trustee, President and Chief Executive Officer
Calibrated Large Cap Value Fund
For the fiscal year ended July 31, 2013, the Fund returned 29.60%, reflecting performance at the net asset value (NAV) of Class A shares, with all distributions reinvested, compared to its benchmark, the Russell 1000 Value® Index,1 which returned 30.73% over the same period.
The broad market reached record levels near the end of the 12-month period amid strong U.S. employment reports, the improving U.S. housing market, and better than expected corporate earnings. However, the double-digit index return was accompanied by periods of volatility during the latter part of 2012 as investors weighed the impact of the U.S. presidential election and the impending “fiscal cliff.” Equity markets climbed in the beginning of 2013 following the “fiscal cliff” deal on the New Year’s holiday, but volatility returned in late May and early June as equity markets were influenced by fears that the U.S. Federal Reserve may begin reducing bond purchases under its quantitative easing program. Despite these fears, broad equity market indexes rebounded and hit all-time highs in the last month of the period.
The Fund’s performance slightly lagged its index for the period. Stock selection within the information technology and consumer staples sectors detracted from relative performance. Within the information technology sector, shares of Broadcom Corp., a provider of semiconductor chips used in mobility and broadband communication devices and
1
infrastructure, declined after the firm released lower-than-expected revenue guidance in July amid slowing growth in the smartphone market. Shares of Jabil Circuit, Inc., an electronic manufacturing services provider, fell early in the period after reporting softening demand and weaker than expected margins due to challenges rolling out a large program. Within the consumer staples sector, shares of tobacco firms Phillip Morris International Inc. and Altria Group, Inc. underperformed due to concerns about the impact of increased taxes on tobacco products. In addition, shares of Altria Group, Inc. underperformed as price-sensitive customers caused a challenging pricing environment for the Marlboro brand.
Stock selection within the health care and energy sectors contributed to relative performance for the period. Within the health care sector, shares of Actavis, Inc., a generic drug manufacturer, rose after the announced acquisition of a branded pharmaceutical company based in Ireland, an acquisition that will likely expand the firm’s product offering and should result in significant tax savings. Shares of Stryker Corp., a medical technology firm, benefited from the announcement of the acquisition of a Chinese orthopedic manufacturer that has the potential to increase the company’s presence in emerging markets. Within the energy sector, shares of Occidental Petroleum Corp., a global oil and gas exploration and production company, benefited from higher oil and gas prices as well as increased output in the second quarter of 2013. Shares of Atwood Oceanics, Inc., an offshore drilling contractor, rose after announcing a new contract deal as well as a share-repurchase program.
Calibrated Mid Cap Value Fund
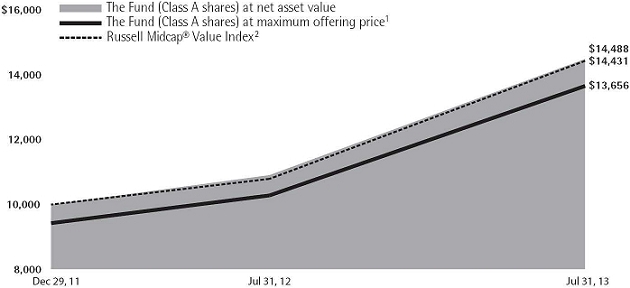
For the fiscal year ended July 31, 2013, the Fund returned 32.83%, reflecting performance at the net asset value (NAV) of Class A shares, with all distributions reinvested, compared to its benchmark, the Russell Mid Cap Value® Index,2 which returned 33.71% over the same period.
The broad market reached record levels near the end of the 12-month period amid strong U.S. employment reports, the improving U.S. housing market, and better than expected corporate earnings. However, the double-digit index return was accompanied by periods of volatility during the latter part of 2012 as investors weighed the impact of the U.S. presidential election and the impending “fiscal cliff.” Equity markets climbed in the beginning of 2013 following the “fiscal cliff” deal on the New Year’s holiday, but volatility returned in late May and early June as equity markets were influenced by fears that the U.S. Federal Reserve may begin reducing bond purchases under its quantitative easing program. Despite these fears, broad equity market indexes rebounded and hit all-time highs in the last month of the period.
The Fund’s performance slightly lagged its index for the period. Stock selection within the information technology and consumer discretionary sectors detracted from relative performance. Within the information technology sector, shares of Marvell Technology Group, a developer of semiconductor technology, fell after the company lowered guidance due to weaker than expected personal computer demand and the negative implications for the company’s storage business. Shares of Maxim Integrated Products, Inc., a manufacturer of integrated power controller chips widely
2
used in cell phones, underperformed due to investors’ concern about a shortfall in sales for a key customer’s smartphone business. Investors also have been concerned about the shift from higher-end smartphones to lower-end smartphones and the negative impact it could put on margins. Shares of department store operator Kohl’s Corp. underperformed within the consumer discretionary sector as management’s attempts to drive customer traffic during the holiday season fell short of expectations.
Stock selection within the materials and health care sectors contributed to relative performance during the period. Within the materials sector, shares of Rock-Tenn Co., a packaging manufacturer, rose as favorable industry trends have led to an increase in containerboard prices. Shares of Rock-Tenn Co. also benefited from the accelerated timing on performance and synergy improvements following the acquisition of Smurfit-Stone Container Corp. Shares of Ashland, Inc., a specialty chemical company that operates the second largest franchised quick-lube chain in the United States, rose after news that an activist investor acquired a stake in the firm. Within the health care sector, shares of HCA Holdings, Inc., owner and operator of hospitals and health care facilities, benefited from investors’ anticipation for the positive impact of the implementation of the Affordable Care Act.
Each Fund’s portfolio is actively managed and, therefore, its holdings and the weightings of a particular issuer or particular sector as a percentage of portfolio assets are subject to change. Sectors may include many industries.
1 The Russell 1000® Value Index measures the performance of those Russell 1000 companies with lower price-to-book ratios and lower forecasted growth values.
2 The Russell Midcap® Value Index measures the performance of those Russell Midcap companies with lower price-to-book ratios and lower forecasted growth values. The stocks are also members of the Russell 1000® Value index.
Unless otherwise specified, indexes reflect total return, with all dividends reinvested. Indexes are unmanaged, do not reflect the deduction of fees or expenses, and are not available for direct investment.
Important Performance and Other Information Performance data quoted in the following pages reflect past performance and are no guarantee of future results. Current performance may be higher or lower than the performance quoted. The investment return and principal value of an investment in the Funds will fluctuate so that shares, on any given day or when redeemed, may be worth more or less than their original cost. You can obtain performance data current to the most recent month end by calling Lord Abbett at 888-522-2388 or referring to www.lordabbett.com.
Except where noted, comparative Fund performance does not account for the deduction of sales charges and would be different if sales charges were included. Each Fund offers several classes of shares with distinct pricing options. For a full description of the differences in pricing alternatives, please see each Fund’s prospectus.
During certain periods shown, expense waivers and reimbursements were in place. Without such expense reimbursements, the Funds’ returns would have been lower.
The annual commentary above discusses the views of the Funds’ management and various portfolio holdings of the Funds as of July 31, 2013. These views and portfolio holdings may have changed after this date. Information provided in the commentary is not a recommendation to buy or sell securities. Because the Funds’ portfolios are actively managed and may change significantly, the Funds may no longer own the securities described above or may have otherwise changed their positions in the securities. For more recent information about the Funds’ portfolio holdings, please visit www.lordabbett.com.
A Note about Risk: See Notes to Financial Statements for a discussion of investment risks. For a more detailed discussion of the risks associated with each Fund, please see each Fund’s prospectus.
Mutual funds are not insured by the FDIC, are not deposits or other obligations of, or guaranteed by, banks, and are subject to investment risks including possible loss of principal amount invested.
3
Calibrated Large Cap Value Fund
Investment Comparison
Below is a comparison of a $10,000 investment in Class A shares with the same investment in the Russell 1000® Value Index, assuming reinvestment of all distributions. The performance of other classes will be greater than or less than the performance shown in the graph below due to different sales loads and expenses applicable to such classes. The graph and performance table below do not reflect the deduction of taxes that a shareholder would pay on Fund distributions or the redemption of Fund shares. During the period, expenses of the Fund have been waived or reimbursed by Lord Abbett; without such waiver or reimbursement of expenses, the Fund’s returns would have been lower. Past performance is no guarantee of future results.
![]()
Average Annual Total Returns at Maximum Applicable
Sales Charge for the Periods Ended July 31, 2013
| 1 Year | Life of Class | |||
| Class A3 | 22.13% | 22.97% | ||
| Class C4 | 27.71% | 26.71% | ||
| Class F5 | 29.82% | 27.81% | ||
| Class I5 | 29.91% | 27.92% | ||
| Class R25 | 29.97% | 27.67% | ||
| Class R35 | 29.51% | 27.43% |
1 Reflects the deduction of the maximum initial sales charge of 5.75%.
2 Performance for the unmanaged index does not reflect any fees or expenses. The performance of each index is not necessarily representative of the Fund’s performance. Performance of the index begins on December 29, 2011.
3 Class A shares commenced operations on December 21, 2011 and performance for the Class began on December 29, 2011. Total return, which is the percentage change in net asset value, after deduction of the maximum initial sales charge of 5.75% applicable to Class A shares, with all dividends and distributions reinvested for the period ended July 31, 2013, is calculated using the SEC-required uniform method to compute such return.
4 Class C shares commenced operations on December 21, 2011 and performance for the Class began on December 29, 2011. Reflects the deduction of the 1% CDSC for Class C shares, which normally applies before the first anniversary of the purchase date.
5 Commenced operations on December 21, 2011 and performance for the Class began on December 29, 2011. Performance is at net asset value.
4
Calibrated Mid Cap Value Fund
Investment Comparison
Below is a comparison of a $10,000 investment in Class A shares with the same investment in the Russell Midcap® Value Index, assuming reinvestment of all distributions. The performance of other classes will be greater than or less than the performance shown in the graph below due to different sales loads and expenses applicable to such classes. The graph and performance table below do not reflect the deduction of taxes that a shareholder would pay on Fund distributions or the redemption of Fund shares. During the period, expenses of the Fund have been waived or reimbursed by Lord Abbett; without such waiver or reimbursement of expenses, the Fund’s returns would have been lower. Past performance is no guarantee of future results.
Average Annual Total Returns at Maximum Applicable
Sales Charge for the Periods Ended July 31, 2013
| 1 Year | Life of Class | |||
| Class A3 | 25.23% | 21.66% | ||
| Class C4 | 30.91% | 25.34% | ||
| Class F5 | 33.01% | 26.44% | ||
| Class I5 | 33.21% | 26.65% | ||
| Class R25 | 33.23% | 26.32% | ||
| Class R35 | 33.21% | 26.36% |
1 Reflects the deduction of the maximum initial sales charge of 5.75%.
2 Performance for the unmanaged index does not reflect any fees or expenses. The performance of each index is not necessarily representative of the Fund’s performance. Performance of the index begins on December 29, 2011.
3 Class A shares commenced operations on December 21, 2011 and performance for the Class began on December 29, 2011. Total return, which is the percentage change in net asset value, after deduction of the maximum initial sales charge of 5.75% applicable to Class A shares, with all dividends and distributions reinvested for the period ended July 31, 2013, is calculated using the SEC-required uniform method to compute such return.
4 Class C shares commenced operations on December 21, 2011 and performance for the Class began on December 29, 2011. Reflects the deduction of the 1% CDSC for Class C shares, which normally applies before the first anniversary of the purchase date.
5 Commenced operations on December 21, 2011 and performance for the Class began on December 29, 2011. Performance is at net asset value.
5
As a shareholder of a Fund, you incur two types of costs: (1) transaction costs, including sales charges (loads) on purchase payments (these charges vary among the share classes); and (2) ongoing costs, including management fees; distribution and service (12b-1) fees (these charges vary among the share classes); and other Fund expenses. This Example is intended to help you understand your ongoing costs (in dollars) of investing in each Fund and to compare these costs with the ongoing costs of investing in other mutual funds.
The Example is based on an investment of $1,000 invested at the beginning of the period and held for the entire period (February 1, 2013 through July 31, 2013).
Actual Expenses
For each class of each Fund, the first line of the table on the following pages provides information about actual account values and actual expenses. You may use the information in this line, together with the amount you invested, to estimate the expenses that you paid over the period. Simply divide your account value by $1,000 (for example, an $8,600 account value divided by $1,000 = 8.6), then multiply the result by the number in the first line under the heading titled “Expenses Paid During Period 2/1/13 - 7/31/13” to estimate the expenses you paid on your account during this period.
Hypothetical Example for Comparison Purposes
For each class of each Fund, the second line of the table on the following pages provides information about hypothetical account values and hypothetical expenses based on the Fund’s actual expense ratio and an assumed rate of return of 5% per year before expenses, which is not the Fund’s actual return. The hypothetical account values and expenses may not be used to estimate the actual ending account balance or expenses you paid for the period. You may use this information to compare the ongoing costs of investing in each Fund and other funds. To do so, compare this 5% hypothetical example with the 5% hypothetical examples that appear in the shareholder reports of the other funds.
6
Calibrated Large Cap Value Fund
Please note that the expenses shown in the table are meant to highlight your ongoing costs only and do not reflect any transactional costs, such as sales charges (loads). Therefore, the second line of the table is useful in comparing ongoing costs only, and will not help you determine the relative total costs of owning different funds. In addition, if these transactional costs were included, your costs would have been higher.
| Beginning Account Value | Ending Account Value | Expenses Paid During Period† | |||||
| 2/1/13 – | |||||||
| 2/1/13 | 7/31/13 | 7/31/13 | |||||
| Class A | |||||||
| Actual | $1,000.00 | $1,149.00 | $4.00 | ||||
| Hypothetical (5% Return Before Expenses) | $1,000.00 | $1,021.09 | $3.76 | ||||
| Class C | |||||||
| Actual | $1,000.00 | $1,145.20 | $7.87 | ||||
| Hypothetical (5% Return Before Expenses) | $1,000.00 | $1,017.46 | $7.40 | ||||
| Class F | |||||||
| Actual | $1,000.00 | $1,150.00 | $3.20 | ||||
| Hypothetical (5% Return Before Expenses) | $1,000.00 | $1,021.84 | $3.01 | ||||
| Class I | |||||||
| Actual | $1,000.00 | $1,150.50 | $2.67 | ||||
| Hypothetical (5% Return Before Expenses) | $1,000.00 | $1,022.33 | $2.51 | ||||
| Class R2 | |||||||
| Actual | $1,000.00 | $1,150.70 | $2.67 | ||||
| Hypothetical (5% Return Before Expenses) | $1,000.00 | $1,022.35 | $2.51 | ||||
| Class R3 | |||||||
| Actual | $1,000.00 | $1,147.60 | $5.32 | ||||
| Hypothetical (5% Return Before Expenses) | $1,000.00 | $1,019.88 | $5.01 |
| † | For each class of the Fund, net expenses are equal to the annualized expense ratio for such class (0.75% for Class A, 1.48% for Class C, 0.60% for Class F, 0.50% for Class I, 0.50% for Class R2 and 1.00% for Class R3) multiplied by the average account value over the period, multiplied by 181/365 (to reflect one-half year period). |
Portfolio Holdings Presented by Sector
July 31, 2013
| Sector* | %** | |||
| Consumer Discretionary | 6.00 | % | ||
| Consumer Staples | 6.46 | % | ||
| Energy | 15.51 | % | ||
| Financials | 29.78 | % | ||
| Health Care | 12.97 | % | ||
| Industrials | 9.73 | % | ||
| Sector* | %** | |||
| Information Technology | 8.29 | % | ||
| Materials | 2.79 | % | ||
| Telecommunication Services | 2.33 | % | ||
| Utilities | 5.92 | % | ||
| Repurchase Agreement | 0.22 | % | ||
| Total | 100.00 | % | ||
| * | A sector may comprise several industries. | |
| ** | Represents percent of total investments. |
7
Calibrated Mid Cap Value Fund
Please note that the expenses shown in the table are meant to highlight your ongoing costs only and do not reflect any transactional costs, such as sales charges (loads). Therefore, the second line of the table is useful in comparing ongoing costs only, and will not help you determine the relative total costs of owning different funds. In addition, if these transactional costs were included, your costs would have been higher.
| Beginning Account Value | Ending Account Value | Expenses Paid During Period† | |||||
| 2/1/13 | 7/31/13 | 2/1/13 – 7/31/13 | |||||
| Class A | |||||||
| Actual | $1,000.00 | $1,148.50 | $4.53 | ||||
| Hypothetical (5% Return Before Expenses) | $1,000.00 | $1,020.62 | $4.26 | ||||
| Class C | |||||||
| Actual | $1,000.00 | $1,144.70 | $8.40 | ||||
| Hypothetical (5% Return Before Expenses) | $1,000.00 | $1,016.95 | $7.90 | ||||
| Class F | |||||||
| Actual | $1,000.00 | $1,149.20 | $3.68 | ||||
| Hypothetical (5% Return Before Expenses) | $1,000.00 | $1,021.38 | $3.46 | ||||
| Class I | |||||||
| Actual | $1,000.00 | $1,150.00 | $3.20 | ||||
| Hypothetical (5% Return Before Expenses) | $1,000.00 | $1,021.83 | $3.01 | ||||
| Class R2 | |||||||
| Actual | $1,000.00 | $1,150.40 | $3.09 | ||||
| Hypothetical (5% Return Before Expenses) | $1,000.00 | $1,021.91 | $2.91 | ||||
| Class R3 | |||||||
| Actual | $1,000.00 | $1,149.80 | $3.14 | ||||
| Hypothetical (5% Return Before Expenses) | $1,000.00 | $1,021.87 | $2.96 |
| † | For each class of the Fund, net expenses are equal to the annualized expense ratio for such class (0.85% for Class A, 1.58% for Class C, 0.69% for Class F, 0.60% for Class I, 0.58% for Class R2, and 0.59% for Class R3) multiplied by the average account value over the period, multiplied by 181/365 (to reflect one-half year period). |
Portfolio Holdings Presented by Sector
July 31, 2013
| Sector* | %** | |||
| Consumer Discretionary | 8.03 | % | ||
| Consumer Staples | 3.53 | % | ||
| Energy | 7.47 | % | ||
| Financials | 32.54 | % | ||
| Financial Services | 0.27 | % | ||
| Health Care | 8.52 | % | ||
| Industrials | 11.12 | % | ||
| Sector* | %** | |||
| Information Technology | 9.84 | % | ||
| Materials | 5.70 | % | ||
| Telecommunication Services | 0.41 | % | ||
| Utilities | 12.32 | % | ||
| Repurchase Agreement | 0.25 | % | ||
| Total | 100.00 | % | ||
| * | A sector may comprise several industries. | |
| ** | Represents percent of total investments. |
8
CALIBRATED LARGE CAP VALUE FUND July 31, 2013
| Fair | ||||||||
| Value | ||||||||
| Investments | Shares | (000) | ||||||
| COMMON STOCKS 99.59% | ||||||||
| Aerospace & Defense 2.27% | ||||||||
| Boeing Co. (The) | 5,600 | $ | 589 | |||||
| Lockheed Martin Corp. | 35,600 | 4,276 | ||||||
| United Technologies Corp. | 38,900 | 4,107 | ||||||
| Total | 8,972 | |||||||
| Airlines 0.46% | ||||||||
| Copa Holdings SA Class A (Panama)(a) | 13,200 | 1,837 | ||||||
| Automobiles 1.98% | ||||||||
| Ford Motor Co. | 462,800 | 7,812 | ||||||
| Capital Markets 1.74% | ||||||||
| Ares Capital Corp. | 386,504 | 6,876 | ||||||
| Chemicals 0.83% | ||||||||
| CF Industries Holdings, Inc. | 16,800 | 3,293 | ||||||
| Commercial Banks 5.79% | ||||||||
| BB&T Corp. | 132,100 | 4,715 | ||||||
| Fifth Third Bancorp | 242,700 | 4,667 | ||||||
| SunTrust Banks, Inc. | 250,700 | 8,722 | ||||||
| U.S. Bancorp | 22,300 | 832 | ||||||
| Wells Fargo & Co. | 89,800 | 3,906 | ||||||
| Total | 22,842 | |||||||
| Communications Equipment 2.00% | ||||||||
| Cisco Systems, Inc. | 308,400 | 7,880 | ||||||
| Computers & Peripherals 4.25% | ||||||||
| Apple, Inc. | 24,275 | 10,984 | ||||||
| EMC Corp. | 104,500 | 2,733 | ||||||
| Hewlett-Packard Co. | 119,700 | 3,074 | ||||||
| Total | 16,791 | |||||||
| Consumer Finance 2.07% | ||||||||
| Capital One Financial Corp. | 118,200 | 8,158 | ||||||
| Containers & Packaging 0.86% | ||||||||
| Rock-Tenn Co. Class A | 29,600 | 3,385 | ||||||
| Fair | ||||||||
| Value | ||||||||
| Investments | Shares | (000) | ||||||
| Diversified Financial Services 7.14% | ||||||||
| Bank of America Corp. | 89,100 | $ | 1,301 | |||||
| Citigroup, Inc. | 182,300 | 9,505 | ||||||
| JPMorgan Chase & Co. | 311,500 | 17,360 | ||||||
| Total | 28,166 | |||||||
| Diversified Telecommunication Services 2.32% | ||||||||
| AT&T, Inc. | 196,000 | 6,913 | ||||||
| Verizon Communications, Inc. | 45,600 | 2,256 | ||||||
| Total | 9,169 | |||||||
| Electric: Utilities 2.64% | ||||||||
| Duke Energy Corp. | 32,100 | 2,279 | ||||||
| Edison International | 14,100 | 703 | ||||||
| Entergy Corp. | 16,600 | 1,120 | ||||||
| PPL Corp. | 198,700 | 6,313 | ||||||
| Total | 10,415 | |||||||
| Electrical Equipment 1.17% | ||||||||
| Emerson Electric Co. | 75,500 | 4,634 | ||||||
| Energy Equipment & Services 1.57% | ||||||||
| Atwood Oceanics, Inc.* | 91,200 | 5,138 | ||||||
| Rowan Cos., plc Class A* | 30,700 | 1,055 | ||||||
| Total | 6,193 | |||||||
| Food & Staples Retailing 2.05% | ||||||||
| Kroger Co. (The) | 53,500 | 2,101 | ||||||
| Wal-Mart Stores, Inc. | 77,100 | 6,009 | ||||||
| Total | 8,110 | |||||||
| Food Products 2.10% | ||||||||
| Bunge Ltd. | 15,700 | 1,193 | ||||||
| Kellogg Co. | 107,200 | 7,101 | ||||||
| Total | 8,294 | |||||||
| Health Care Equipment & Supplies 2.33% | ||||||||
| Baxter International, Inc. | 105,100 | 7,677 | ||||||
| Becton, Dickinson & Co. | 14,600 | 1,514 | ||||||
| Total | 9,191 | |||||||
| See Notes to Financial Statements. | 9 |
Schedule of Investments (continued)
CALIBRATED LARGE CAP VALUE FUND July 31, 2013
| Fair | ||||||||
| Value | ||||||||
| Investments | Shares | (000) | ||||||
| Health Care Providers & Services 3.50% | ||||||||
| Cardinal Health, Inc. | 170,600 | $ | 8,545 | |||||
| Express Scripts Holding Co.* | 80,700 | 5,290 | ||||||
| Total | 13,835 | |||||||
| Household Products 1.39% | ||||||||
| Kimberly-Clark Corp. | 34,100 | 3,369 | ||||||
| Procter & Gamble Co. (The) | 26,400 | 2,120 | ||||||
| Total | 5,489 | |||||||
| Independent Power Producers & Energy Traders 1.58% | ||||||||
| AES Corp. (The) | 500,400 | 6,225 | ||||||
| Industrial Conglomerates 3.01% | ||||||||
| 3M Co. | 53,700 | 6,306 | ||||||
| General Electric Co. | 228,800 | 5,576 | ||||||
| Total | 11,882 | |||||||
| Insurance 8.81% | ||||||||
| ACE Ltd. (Switzerland)(a) | 85,200 | 7,786 | ||||||
| Aflac, Inc. | 86,700 | 5,348 | ||||||
| Allstate Corp. (The) | 85,200 | 4,343 | ||||||
| Berkshire Hathaway, Inc. Class B* | 14,800 | 1,715 | ||||||
| Everest Re Group Ltd. | 26,000 | 3,472 | ||||||
| Hartford Financial Services Group, Inc. | 166,800 | 5,147 | ||||||
| Prudential Financial, Inc. | 11,600 | 916 | ||||||
| Travelers Cos., Inc. (The) | 72,200 | 6,032 | ||||||
| Total | 34,759 | |||||||
| Leisure Equipment & Products 0.19% | ||||||||
| Hasbro, Inc. | 16,700 | 768 | ||||||
| Machinery 1.11% | ||||||||
| Caterpillar, Inc. | 15,900 | 1,318 | ||||||
| Illinois Tool Works, Inc. | 42,600 | 3,069 | ||||||
| Total | 4,387 | |||||||
| Fair | ||||||||
| Value | ||||||||
| Investments | Shares | (000) | ||||||
| Media 1.82% | ||||||||
| Comcast Corp. Class A | 141,600 | $ | 6,383 | |||||
| Time Warner, Inc. | 12,700 | 791 | ||||||
| Total | 7,174 | |||||||
| Metals & Mining 0.51% | ||||||||
| Allegheny Technologies, Inc. | 46,800 | 1,290 | ||||||
| Freeport-McMoRan Copper & Gold, Inc. | 25,800 | 730 | ||||||
| Total | 2,020 | |||||||
| Multi-Line Retail 1.69% | ||||||||
| Kohl’s Corp. | 85,400 | 4,524 | ||||||
| Target Corp. | 30,300 | 2,159 | ||||||
| Total | 6,683 | |||||||
| Multi-Utilities 1.69% | ||||||||
| PG&E Corp. | 145,400 | 6,673 | ||||||
| Oil, Gas & Consumable Fuels 13.91% | ||||||||
| Anadarko Petroleum Corp. | 38,300 | 3,390 | ||||||
| Apache Corp. | 8,400 | 674 | ||||||
| Chevron Corp. | 92,600 | 11,658 | ||||||
| Denbury Resources, Inc.* | 126,400 | 2,212 | ||||||
| Exxon Mobil Corp. | 143,300 | 13,434 | ||||||
| Marathon Petroleum Corp. | 28,100 | 2,061 | ||||||
| Murphy Oil Corp. | 71,800 | 4,862 | ||||||
| Occidental Petroleum Corp. | 78,700 | 7,008 | ||||||
| QEP Resources, Inc. | 120,300 | 3,668 | ||||||
| Valero Energy Corp. | 166,000 | 5,938 | ||||||
| Total | 54,905 | |||||||
| Paper & Forest Products 0.58% | ||||||||
| International Paper Co. | 47,400 | 2,290 | ||||||
| Personal Products 0.42% | ||||||||
| Avon Products, Inc. | 73,100 | 1,671 | ||||||
| 10 | See Notes to Financial Statements. |
Schedule of Investments (continued)
CALIBRATED LARGE CAP VALUE FUND July 31, 2013
| Fair | ||||||||
| Value | ||||||||
| Investments | Shares | (000) | ||||||
| Pharmaceuticals 7.12% | ||||||||
| AbbVie, Inc. | 51,100 | $ | 2,324 | |||||
| Actavis, Inc.* | 14,000 | 1,880 | ||||||
| Bristol-Myers Squibb Co. | 105,400 | 4,558 | ||||||
| Eli Lilly & Co. | 11,900 | 632 | ||||||
| Johnson & Johnson | 24,800 | 2,319 | ||||||
| Mylan, Inc.* | 120,900 | 4,057 | ||||||
| Pfizer, Inc. | 421,600 | 12,323 | ||||||
| Total | 28,093 | |||||||
| Professional Services 0.20% | ||||||||
| Towers Watson & Co. Class A | 9,200 | 775 | ||||||
| Real Estate Investment Trusts 4.19% | ||||||||
| Apartment Investment & | ||||||||
| Management Co. Class A | 39,200 | 1,152 | ||||||
| BioMed Realty Trust, Inc. | 40,700 | 841 | ||||||
| Brandywine Realty Trust | 183,900 | 2,563 | ||||||
| Camden Property Trust | 18,800 | 1,326 | ||||||
| DDR Corp. | 44,600 | 762 | ||||||
| Health Care REIT, Inc. | 25,200 | 1,625 | ||||||
| Liberty Property Trust | 32,600 | 1,246 | ||||||
| Senior Housing Properties Trust | 27,700 | 697 | ||||||
| Simon Property Group, Inc. | 17,350 | 2,777 | ||||||
| Starwood Property Trust, Inc. | 31,500 | 800 | ||||||
| Ventas, Inc. | 17,600 | 1,157 | ||||||
| Vornado Realty Trust | 8,000 | 678 | ||||||
| Weingarten Realty Investors | 29,600 | 927 | ||||||
| Total | 16,551 | |||||||
| Road & Rail 1.48% | ||||||||
| CSX Corp. | 235,800 | 5,850 | ||||||
| Semiconductors & Semiconductor Equipment 1.44% | ||||||||
| Broadcom Corp. Class A | 110,400 | 3,044 | ||||||
| Lam Research Corp.* | 28,900 | 1,422 | ||||||
| Maxim Integrated Products, Inc. | 42,200 | 1,207 | ||||||
| Total | 5,673 | |||||||
| Fair | ||||||||
| Value | ||||||||
| Investments | Shares | (000) | ||||||
| Software 0.59% | ||||||||
| Rovi Corp.* | 102,600 | $ | 2,312 | |||||
| Specialty Retail 0.31% | ||||||||
| Home Depot, Inc. (The) | 15,300 | 1,209 | ||||||
| Tobacco 0.48% | ||||||||
| Altria Group, Inc. | 53,800 | 1,886 | ||||||
| Total Common Stocks (cost $360,056,072) | 393,128 | |||||||
| Principal | ||||||||
| Amount | ||||||||
| (000) | ||||||||
| SHORT-TERM INVESTMENT 0.22% | ||||||||
| Repurchase Agreement | ||||||||
| Repurchase Agreement dated 7/31/2013, 0.01% due 8/1/2013 with Fixed Income Clearing Corp. collateralized by $900,000 of U.S. Treasury Note at 0.875% due 1/31/2018; value: $885,375; proceeds: $865,991 (cost $865,991) | $ | 866 | 866 | |||||
| Total Investments in Securities 99.81% (cost $360,922,063) | 393,994 | |||||||
| Cash and Other Assets in Excess of Liabilities(b) 0.19% | 736 | |||||||
| Net Assets 100.00% | $ | 394,730 | ||||||
| * | Non-income producing security. | |
| (a) | Foreign security traded in U.S. dollars. | |
| (b) | Cash and Other Assets in Excess of Liabilities include net unrealized appreciation on futures contracts as follows: |
| See Notes to Financial Statements. | 11 |
Schedule of Investments (concluded)
CALIBRATED LARGE CAP VALUE FUND July 31, 2013
Open Futures Contracts at July 31, 2013:
| Unrealized | |||||||||||
| Type | Expiration | Contracts | Position | Fair Value | Appreciation | ||||||
| E-Mini S&P 500 Index | September 2013 | 10 | Long | $840,250 | $21,941 |
The following is a summary of the inputs used as of July 31, 2013 in valuing the Fund’s investments carried at fair value(1):
| Level 1 | Level 2 | Level 3 | Total | ||||||||||||
| Investment Type(2)(3) | (000) | (000) | (000) | (000) | |||||||||||
| Common Stocks | $ | 393,128 | $ | — | $ | — | $ | 393,128 | |||||||
| Repurchase Agreement | — | 866 | — | 866 | |||||||||||
| Total | $ | 393,128 | $ | 866 | $ | — | $ | 393,994 | |||||||
| Other Financial Instruments | |||||||||||||||
| Futures Contracts | |||||||||||||||
| Assets | $ | 22 | $ | — | $ | — | $ | 22 | |||||||
| Liabilities | — | — | — | — | |||||||||||
| Total | $ | 22 | $ | — | $ | — | $ | 22 | |||||||
| (1) | Refer to Note 2(h) for a description of fair value measurements and the three-tier hierarchy of inputs. | |
| (2) | See Schedule of Investments for fair values in each industry and identification of foreign issuers and/or geography. | |
| (3) | There were no level transfers during the fiscal year ended July 31, 2013. |
| 12 | See Notes to Financial Statements. |
Schedule of Investments
CALIBRATED MID CAP VALUE FUND July 31, 2013
| Fair | ||||||||
| Value | ||||||||
| Investments | Shares | (000) | ||||||
| COMMON STOCKS 99.70% | ||||||||
| Aerospace & Defense 0.96% | ||||||||
| Rockwell Collins, Inc. | 11,000 | $ | 783 | |||||
| Triumph Group, Inc. | 33,900 | 2,660 | ||||||
| Total | 3,443 | |||||||
| Airlines 0.98% | ||||||||
| Copa Holdings SA Class A (Panama)(a) | 25,300 | 3,521 | ||||||
| Auto Components 0.47% | ||||||||
| TRW Automotive Holdings Corp.* | 23,000 | 1,686 | ||||||
| Capital Markets 4.03% | ||||||||
| Ares Capital Corp. | 375,287 | 6,676 | ||||||
| Artisan Partners Asset Management, Inc.* | 18,200 | 965 | ||||||
| Invesco Ltd. | 213,300 | 6,866 | ||||||
| Total | 14,507 | |||||||
| Chemicals 2.39% | ||||||||
| Ashland, Inc. | 10,157 | 882 | ||||||
| CF Industries Holdings, Inc. | 29,700 | 5,822 | ||||||
| Huntsman Corp. | 39,200 | 706 | ||||||
| Westlake Chemical Corp. | 11,289 | 1,174 | ||||||
| Total | 8,584 | |||||||
| Commercial Banks 6.50% | ||||||||
| Associated Banc-Corp | 46,700 | 791 | ||||||
| CIT Group, Inc.* | 144,900 | 7,261 | ||||||
| Fifth Third Bancorp | 125,800 | 2,419 | ||||||
| First Niagara Financial Group, Inc. | 387,000 | 4,137 | ||||||
| SunTrust Banks, Inc. | 251,400 | 8,746 | ||||||
| Total | 23,354 | |||||||
| Computers & Peripherals 1.72% | ||||||||
| NetApp, Inc. | 150,468 | 6,187 | ||||||
| Fair | ||||||||
| Value | ||||||||
| Investments | Shares | (000) | ||||||
| Construction & Engineering 2.27% | ||||||||
| Fluor Corp. | 81,200 | $ | 5,080 | |||||
| KBR, Inc. | 57,400 | 1,795 | ||||||
| URS Corp. | 27,400 | 1,274 | ||||||
| Total | 8,149 | |||||||
| Containers & Packaging 1.22% | ||||||||
| Rock-Tenn Co. Class A | 38,300 | 4,380 | ||||||
| Diversified Financial Services 0.39% | ||||||||
| McGraw Hill Financial, Inc. | 22,600 | 1,398 | ||||||
| Electric: Utilities 8.34% | ||||||||
| Edison International | 94,400 | 4,706 | ||||||
| Entergy Corp. | 83,300 | 5,623 | ||||||
| Great Plains Energy, Inc. | 311,000 | 7,523 | ||||||
| PPL Corp. | 217,850 | 6,921 | ||||||
| Westar Energy, Inc. | 155,200 | 5,213 | ||||||
| Total | 29,986 | |||||||
| Electrical Equipment 1.24% | ||||||||
| Eaton Corp. plc (Ireland)(a) | 64,694 | 4,461 | ||||||
| Electronic Equipment, Instruments & Components 2.21% | ||||||||
| FLIR Systems, Inc. | 64,600 | 2,098 | ||||||
| Jabil Circuit, Inc. | 255,000 | 5,862 | ||||||
| Total | 7,960 | |||||||
| Energy Equipment & Services 2.05% | ||||||||
| Nabors Industries Ltd. | 98,000 | 1,508 | ||||||
| Rowan Cos., plc Class A* | 170,500 | 5,857 | ||||||
| Total | 7,365 | |||||||
| Food Products 3.53% | ||||||||
| Bunge Ltd. | 70,600 | 5,366 | ||||||
| Campbell Soup Co. | 67,369 | 3,153 | ||||||
| Ingredion, Inc. | 62,100 | 4,173 | ||||||
| Total | 12,692 | |||||||
| Gas Utilities 0.02% | ||||||||
| UGI Corp. | 1,400 | 59 | ||||||
| See Notes to Financial Statements. | 13 |
Schedule of Investments (continued)
CALIBRATED MID CAP VALUE FUND July 31, 2013
| Fair | ||||||||
| Value | ||||||||
| Investments | Shares | (000) | ||||||
| Health Care Providers & Services 6.36% | ||||||||
| Cardinal Health, Inc. | 153,400 | $ | 7,684 | |||||
| CIGNA Corp. | 55,800 | 4,343 | ||||||
| Community Health Systems, Inc. | 87,300 | 4,021 | ||||||
| HCA Holdings, Inc. | 122,600 | 4,781 | ||||||
| Humana, Inc. | 12,700 | 1,159 | ||||||
| Universal Health Services, Inc. Class B | 12,700 | 888 | ||||||
| Total | 22,876 | |||||||
| Hotels, Restaurants & Leisure 1.36% | ||||||||
| Brinker International, Inc. | 60,800 | 2,441 | ||||||
| Darden Restaurants, Inc. | 50,100 | 2,458 | ||||||
| Total | 4,899 | |||||||
| Household Durables 0.78% | ||||||||
| Leggett & Platt, Inc. | 64,100 | 2,013 | ||||||
| Whirlpool Corp. | 6,000 | 804 | ||||||
| Total | 2,817 | |||||||
| Independent Power Producers & Energy Traders 2.19% | ||||||||
| AES Corp. (The) | 631,800 | 7,860 | ||||||
| Information Technology Services 2.24% | ||||||||
| Broadridge Financial Solutions, Inc. | 28,400 | 822 | ||||||
| Fidelity National Information Services, Inc. | 48,100 | 2,076 | ||||||
| Paychex, Inc. | 130,900 | 5,163 | ||||||
| Total | 8,061 | |||||||
| Insurance 8.58% | ||||||||
| Aspen Insurance Holdings Ltd. | 26,560 | 996 | ||||||
| Endurance Specialty Holdings Ltd. | 11,000 | 579 | ||||||
| Everest Re Group Ltd. | 60,200 | 8,039 | ||||||
| Hanover Insurance Group, Inc. (The) | 21,207 | 1,142 | ||||||
| Hartford Financial Services Group, Inc. | 202,308 | 6,243 | ||||||
| Fair | ||||||||
| Value | ||||||||
| Investments | Shares | (000) | ||||||
| Lincoln National Corp. | 124,800 | $ | 5,200 | |||||
| Protective Life Corp. | 93,300 | 4,043 | ||||||
| Reinsurance Group of America, Inc. | 10,798 | 735 | ||||||
| XL Group plc (Ireland)(a) | 123,200 | 3,862 | ||||||
| Total | 30,839 | |||||||
| Leisure Equipment & Products 1.82% | ||||||||
| Hasbro, Inc. | 93,041 | 4,280 | ||||||
| Mattel, Inc. | 53,600 | 2,253 | ||||||
| Total | 6,533 | |||||||
| Machinery 3.70% | ||||||||
| Dover Corp. | 15,800 | 1,353 | ||||||
| Flowserve Corp. | 61,400 | 3,480 | ||||||
| Harsco Corp. | 20,750 | 535 | ||||||
| Joy Global, Inc. | 89,000 | 4,406 | ||||||
| Manitowoc Co., Inc. (The) | 36,896 | 757 | ||||||
| Pentair Ltd. (Switzerland)(a) | 45,500 | 2,779 | ||||||
| Total | 13,310 | |||||||
| Media 0.24% | ||||||||
| Gannett Co., Inc. | 33,400 | 860 | ||||||
| Metals & Mining 1.88% | ||||||||
| Allegheny Technologies, Inc. | 245,600 | 6,771 | ||||||
| Multi-Line Retail 2.56% | ||||||||
| Kohl’s Corp. | 114,300 | 6,056 | ||||||
| Macy’s, Inc. | 64,900 | 3,137 | ||||||
| Total | 9,193 | |||||||
| Multi-Utilities 1.77% | ||||||||
| SCANA Corp. | 122,546 | 6,361 | ||||||
| Oil, Gas & Consumable Fuels 5.42% | ||||||||
| Denbury Resources, Inc.* | 333,600 | 5,838 | ||||||
| Murphy Oil Corp. | 92,800 | 6,284 | ||||||
| Noble Energy, Inc. | 25,500 | 1,594 | ||||||
| Tesoro Corp. | 14,500 | 824 | ||||||
| Valero Energy Corp. | 137,960 | 4,935 | ||||||
| Total | 19,475 | |||||||
| 14 | See Notes to Financial Statements. |
Schedule of Investments (continued)
CALIBRATED MID CAP VALUE FUND July 31, 2013
| Fair | ||||||||
| Value | ||||||||
| Investments | Shares | (000) | ||||||
| Paper & Forest Products 0.20% | ||||||||
| International Paper Co. | 15,100 | $ | 729 | |||||
| Pharmaceuticals 2.15% | ||||||||
| Actavis, Inc.* | 29,976 | 4,025 | ||||||
| Mylan, Inc.* | 110,600 | 3,712 | ||||||
| Total | 7,737 | |||||||
| Professional Services 0.98% | ||||||||
| Towers Watson & Co. Class A | 41,700 | 3,512 | ||||||
| Real Estate Investment Trusts 13.08% | ||||||||
| Alexandria Real Estate Equities, Inc. | 17,200 | 1,178 | ||||||
| American Capital Agency Corp. | 82,700 | 1,863 | ||||||
| Annaly Capital Management, Inc. | 81,700 | 974 | ||||||
| Apartment Investment & Management Co. Class A | 32,500 | 955 | ||||||
| AvalonBay Communities, Inc. | 4,250 | 575 | ||||||
| BioMed Realty Trust, Inc. | 155,900 | 3,221 | ||||||
| Boston Properties, Inc. | 14,200 | 1,519 | ||||||
| Brandywine Realty Trust | 106,533 | 1,485 | ||||||
| Camden Property Trust | 61,200 | 4,317 | ||||||
| CBL & Associates Properties, Inc. | 69,700 | 1,587 | ||||||
| DDR Corp. | 116,300 | 1,986 | ||||||
| Extra Space Storage, Inc. | 22,616 | 951 | ||||||
| Health Care REIT, Inc. | 46,600 | 3,005 | ||||||
| Home Properties, Inc. | 19,700 | 1,257 | ||||||
| Host Hotels & Resorts, Inc. | 29,400 | 525 | ||||||
| Kimco Realty Corp. | 101,000 | 2,278 | ||||||
| Liberty Property Trust | 65,400 | 2,499 | ||||||
| Macerich Co. (The) | 56,500 | 3,506 | ||||||
| Mack-Cali Realty Corp. | 44,300 | 1,066 | ||||||
| Plum Creek Timber Co., Inc. | 17,200 | 839 | ||||||
| ProLogis, Inc. | 48,200 | 1,849 | ||||||
| Retail Properties of America, Inc. Class A | 45,200 | 637 | ||||||
| Starwood Property Trust, Inc. | 74,900 | 1,902 | ||||||
| Fair | ||||||||
| Value | ||||||||
| Investments | Shares | (000) | ||||||
| Ventas, Inc. | 71,500 | $ | 4,700 | |||||
| Vornado Realty Trust | 27,800 | 2,358 | ||||||
| Total | 47,032 | |||||||
| Real Estate Management & Development 0.22% | ||||||||
| Jones Lang LaSalle, Inc. | 8,500 | 774 | ||||||
| Road & Rail 0.25% | ||||||||
| Hertz Global Holdings, Inc.* | 35,300 | 904 | ||||||
| Semiconductors & Semiconductor Equipment 3.11% | ||||||||
| Analog Devices, Inc. | 59,886 | 2,956 | ||||||
| Avago Technologies Ltd. (Singapore)(a) | 44,500 | 1,632 | ||||||
| KLA-Tencor Corp. | 13,000 | 762 | ||||||
| Lam Research Corp.* | 15,800 | 778 | ||||||
| Maxim Integrated Products, Inc. | 177,000 | 5,062 | ||||||
| Total | 11,190 | |||||||
| Software 0.54% | ||||||||
| Rovi Corp.* | 86,400 | 1,947 | ||||||
| Specialty Retail 0.35% | ||||||||
| Aaron’s, Inc. | 8,900 | 255 | ||||||
| DSW, Inc. Class A | 13,400 | 1,016 | ||||||
| Total | 1,271 | |||||||
| Textiles, Apparel & Luxury Goods 0.45% | ||||||||
| Deckers Outdoor Corp.* | 29,400 | 1,612 | ||||||
| Trading Companies & Distributors 0.74% | ||||||||
| Air Lease Corp. | 95,900 | 2,674 | ||||||
| Wireless Telecommunication Services 0.41% | ||||||||
| Telephone & Data Systems, Inc. | 55,600 | 1,474 | ||||||
| Total Common Stocks (cost $325,973,763) | 358,443 | |||||||
| See Notes to Financial Statements. | 15 |
Schedule of Investments (concluded)
CALIBRATED MID CAP VALUE FUND July 31, 2013
| Principal | Fair | |||||||
| Amount | Value | |||||||
| Investments | (000) | (000) | ||||||
| SHORT-TERM INVESTMENT 0.25% | ||||||||
| Repurchase Agreement | ||||||||
| Repurchase Agreement dated 7/31/2013, 0.01% due 8/1/2013 with Fixed Income Clearing Corp. collateralized by $915,000 of U.S. Treasury Note at 0.875% due 1/31/2018 value: $900,131; proceeds: $880,172. (cost $880,172) | $ | 880 | $ | 880 | ||||
| Total Investments in Securities 99.95% (cost $326,853,935) | 359,323 | |||||||
| Cash and Other Assets in Excess of Liabilities(b) 0.05% | 195 | |||||||
| Net Assets 100.00% | $ | 359,518 | ||||||
| * | Non-income producing security. | |
| (a) | Foreign security traded in U.S. dollars. | |
| (b) | Cash and Other Assets in Excess of Liabilities include net unrealized appreciation on futures contracts as follows: |
Open Futures Contracts at July 31, 2013:
| Unrealized | ||||||||||||||
| Type | Expiration | Contracts | Position | Fair Value | Appreciation | |||||||||
| E-Mini S&P 500 Index | September 2013 | 9 | Long | $ | 756,225 | $ | 36,431 | |||||||
The following is a summary of the inputs used as of July 31, 2013 in valuing the Fund’s investments carried at fair value(1):
| Level 1 | Level 2 | Level 3 | Total | ||||||||||||
| Investment Type(2)(3) | (000) | (000) | (000) | (000) | |||||||||||
| Common Stocks | $ | 358,443 | $ | — | $ | — | $ | 358,443 | |||||||
| Repurchase Agreement | — | 880 | — | 880 | |||||||||||
| Total | $ | 358,443 | $ | 880 | $ | — | $ | 359,323 | |||||||
| Other Financial Instruments | |||||||||||||||
| Futures Contracts | |||||||||||||||
| Assets | $ | 36 | $ | — | $ | — | $ | 36 | |||||||
| Liabilities | — | — | — | — | |||||||||||
| Total | $ | 36 | $ | — | $ | — | $ | 36 | |||||||
| (1) | Refer to note 2(h) for a description of fair value measurements and the three-tier hierarchy of inputs. | |
| (2) | See Schedule of Investments for fair values in each industry and identification of foreign issuers and/or geography. | |
| (3) | There were no level transfers during the fiscal year ended July 31, 2013. |
| 16 | See Notes to Financial Statements. |
This page is intentionally left blank.
17
Statements of Assets and Liabilities
July 31, 2013
| Calibrated Large Cap Value Fund | Calibrated Mid Cap Value Fund | |||||||||
| ASSETS: | ||||||||||
| Investments in securities, at cost | $ | 360,922,063 | $ | 326,853,935 | ||||||
| Investments in securities, at fair value | $ | 393,993,515 | $ | 359,322,879 | ||||||
| Cash | 269,113 | 273,520 | ||||||||
| Deposits with brokers for futures collateral | 35,000 | 31,500 | ||||||||
| Receivables: | ||||||||||
| Investment securities sold | 1,433,100 | 1,698,495 | ||||||||
| Capital shares sold | 623,624 | 5,413,246 | ||||||||
| Dividends | 430,478 | 135,239 | ||||||||
| From advisor (See Note 3) | 136,147 | 90,795 | ||||||||
| Prepaid expenses and other assets | 28,897 | 23,170 | ||||||||
| Total assets | 396,949,874 | 366,988,844 | ||||||||
| LIABILITIES: | ||||||||||
| Payables: | ||||||||||
| Investment securities purchased | 1,779,337 | 7,047,288 | ||||||||
| Capital shares reacquired | 79,918 | 107,855 | ||||||||
| 12b-1 distribution fees | 30,510 | 10,004 | ||||||||
| Management fee | 196,811 | 172,953 | ||||||||
| Trustees’ fees | 3,651 | 4,170 | ||||||||
| Fund administration | 13,121 | 11,530 | ||||||||
| To affiliates (See Note 3) | 28,512 | 29,753 | ||||||||
| Variation margin | 2,100 | 1,890 | ||||||||
| Accrued expenses and other liabilities | 85,704 | 85,304 | ||||||||
| Total liabilities | 2,219,664 | 7,470,747 | ||||||||
| NET ASSETS | $ | 394,730,210 | $ | 359,518,097 | ||||||
| COMPOSITION OF NET ASSETS: | ||||||||||
| Paid-in capital | $ | 341,675,878 | $ | 302,260,281 | ||||||
| Undistributed net investment income | 2,686,807 | 1,856,084 | ||||||||
| Accumulated net realized gain on investments and futures contracts | 17,274,132 | 22,896,357 | ||||||||
| Net unrealized appreciation on investments and futures contracts | 33,093,393 | 32,505,375 | ||||||||
| Net Assets | $ | 394,730,210 | $ | 359,518,097 | ||||||
| 18 | See Notes to Financial Statements. |
Statements of Assets and Liabilities (concluded)
July 31, 2013
| Calibrated Large Cap Value Fund | Calibrated Mid Cap Value Fund | |||||||||
| Net assets by class: | ||||||||||
| Class A Shares | $ | 74,465,582 | $ | 27,545,218 | ||||||
| Class C Shares | $ | 7,056,713 | $ | 2,204,153 | ||||||
| Class F Shares | $ | 13,152,900 | $ | 6,061,873 | ||||||
| Class I Shares | $ | 299,672,501 | $ | 323,672,794 | ||||||
| Class R2 Shares | $ | 303,140 | $ | 16,121 | ||||||
| Class R3 Shares | $ | 79,374 | $ | 17,938 | ||||||
| Outstanding shares by class (unlimited number of authorized shares of beneficial interest): | ||||||||||
| Class A Shares | 3,460,544 | 1,305,123 | ||||||||
| Class C Shares | 331,335 | 105,499 | ||||||||
| Class F Shares | 610,729 | 287,098 | ||||||||
| Class I Shares | 13,898,375 | 15,299,407 | ||||||||
| Class R2 Shares | 14,030 | 760.857 | ||||||||
| Class R3 Shares | 3,699 | 847 | ||||||||
| Net asset value, offering and redemption price per share (Net assets divided by outstanding shares): | ||||||||||
| Class A Shares-Net asset value | $21.52 | $21.11 | ||||||||
| Class A Shares-Maximum offering price | ||||||||||
| (Net asset value plus sales charge of 5.75%) | $22.83 | $22.40 | ||||||||
| Class C Shares-Net asset value | $21.30 | $20.89 | ||||||||
| Class F Shares-Net asset value | $21.54 | $21.11 | ||||||||
| Class I Shares-Net asset value | $21.56 | $21.16 | ||||||||
| Class R2 Shares-Net asset value | $21.61 | $21.19 | ||||||||
| Class R3 Shares-Net asset value | $21.46 | $21.18 | ||||||||
| See Notes to Financial Statements. | 19 |
For the Year Ended July 31, 2013
| Calibrated Large Cap Value Fund | Calibrated Mid Cap Value Fund | |||||||||
| Investment income: | ||||||||||
| Dividends (net of foreign withholding taxes of $0 and $1,680, respectively) | $ | 4,845,000 | $ | 5,392,413 | ||||||
| Interest and other | 24,259 | 12,263 | ||||||||
| Total investment income | 4,869,259 | 5,404,676 | ||||||||
| Expenses: | ||||||||||
| Management fee | 1,151,103 | 1,305,289 | ||||||||
| 12b-1 distribution plan-Class A | 129,300 | 38,095 | ||||||||
| 12b-1 distribution plan-Class C | 21,149 | 6,384 | ||||||||
| 12b-1 distribution plan-Class F | 5,905 | 1,860 | ||||||||
| 12b-1 distribution plan-Class R2 | 276 | 2 | ||||||||
| 12b-1 distribution plan-Class R3 | 229 | 24 | ||||||||
| Shareholder servicing | 72,492 | 40,118 | ||||||||
| Professional | 45,285 | 45,797 | ||||||||
| Reports to shareholders | 24,523 | 20,200 | ||||||||
| Fund administration | 76,740 | 87,019 | ||||||||
| Custody | 52,468 | 43,650 | ||||||||
| Trustees’ fees | 5,514 | 6,569 | ||||||||
| Registration | 50,135 | 48,698 | ||||||||
| Offering costs | 10,873 | 9,728 | ||||||||
| Subsidy (See Note 3) | 175,657 | 302,932 | ||||||||
| Other | 10,077 | 10,322 | ||||||||
| Gross expenses | 1,831,726 | 1,966,687 | ||||||||
| Expense reductions (See Note 8) | (75 | ) | (30 | ) | ||||||
| Management fee waived and expense reimbursed (See Note 3) | (715,831 | ) | (615,028 | ) | ||||||
| Net expenses | 1,115,820 | 1,351,629 | ||||||||
| Net investment income | 3,753,439 | 4,053,047 | ||||||||
| Net realized and unrealized gain: | ||||||||||
| Net realized gain on investments and futures contracts | 18,475,127 | 26,240,372 | ||||||||
| Net change in unrealized appreciation/depreciation on investments and futures contracts | 29,661,002 | 31,682,293 | ||||||||
| Net realized and unrealized gain | 48,136,129 | 57,922,665 | ||||||||
| Net Increase in Net Assets Resulting From Operations | $ | 51,889,568 | $ | 61,975,712 | ||||||
| 20 | See Notes to Financial Statements. |
Statements of Changes in Net Assets
| Calibrated Large Cap Value Fund | ||||||||||
| INCREASE IN NET ASSETS | For the Year Ended July 31, 2013 | For the Period Ended July 31, 2012* | ||||||||
| Operations: | ||||||||||
| Net investment income | $ | 3,753,439 | $ | 359,193 | ||||||
| Net realized gain on investments and futures contracts | 18,475,127 | 1,449,397 | ||||||||
| Net change in unrealized appreciation/depreciation on investments and futures contracts | 29,661,002 | 3,432,391 | ||||||||
| Net increase in net assets resulting from operations | 51,889,568 | 5,240,981 | ||||||||
| Distributions to shareholders from: | ||||||||||
| Net investment income | ||||||||||
| Class A | (497,800 | ) | — | |||||||
| Class C | (3,177 | ) | — | |||||||
| Class F | (44,435 | ) | — | |||||||
| Class I | (905,141 | ) | — | |||||||
| Class R2 | (89 | ) | — | |||||||
| Class R3 | (638 | ) | — | |||||||
| Net realized gain | ||||||||||
| Class A | (998,632 | ) | — | |||||||
| Class C | (7,295 | ) | — | |||||||
| Class F | (79,317 | ) | — | |||||||
| Class I | (1,568,912 | ) | — | |||||||
| Class R2 | (264 | ) | — | |||||||
| Class R3 | (1,245 | ) | — | |||||||
| Total distributions to shareholders | (4,106,945 | ) | — | |||||||
| Capital share transactions (See Note 12): | ||||||||||
| Net proceeds from sales of shares | 316,467,788 | 67,412,606 | ||||||||
| Reinvestment of distributions | 3,539,403 | — | ||||||||
| Cost of shares reacquired | (43,264,234 | ) | (2,448,957 | ) | ||||||
| Net increase in net assets resulting from capital share transactions | 276,742,957 | 64,963,649 | ||||||||
| Net increase in net assets | 324,525,580 | 70,204,630 | ||||||||
| NET ASSETS: | ||||||||||
| Beginning of period | $ | 70,204,630 | $ | — | ||||||
| End of period | $ | 394,730,210 | $ | 70,204,630 | ||||||
| Undistributed net investment income | $ | 2,686,807 | $ | 379,048 | ||||||
| * | For the period December 21, 2011 (commencement of operations) to July 31, 2012. |
| See Notes to Financial Statements. | 21 |
Statements of Changes in Net Assets (concluded)
| Calibrated Mid Cap Value Fund | ||||||||||
| INCREASE IN NET ASSETS | For the Year Ended July 31, 2013 | For the Period Ended July 31, 2012* | ||||||||
| Operations: | ||||||||||
| Net investment income | $ | 4,053,047 | $ | 306,642 | ||||||
| Net realized gain on investments and futures contracts | 26,240,372 | 392,102 | ||||||||
| Net change in unrealized appreciation/depreciation on investments and futures contracts | 31,682,293 | 823,082 | ||||||||
| Net increase in net assets resulting from operations | 61,975,712 | 1,521,826 | ||||||||
| Distributions to shareholders from: | ||||||||||
| Net investment income | ||||||||||
| Class A | (177,304 | ) | — | |||||||
| Class C | (1,213 | ) | — | |||||||
| Class F | (5,384 | ) | — | |||||||
| Class I | (2,333,838 | ) | — | |||||||
| Class R2 | (110 | ) | — | |||||||
| Class R3 | (120 | ) | — | |||||||
| Net realized gain | ||||||||||
| Class A | (355,469 | ) | — | |||||||
| Class C | (2,010 | ) | — | |||||||
| Class F | (7,988 | ) | — | |||||||
| Class I | (3,382,734 | ) | — | |||||||
| Class R2 | (253 | ) | — | |||||||
| Class R3 | (253 | ) | — | |||||||
| Total distributions to shareholders | (6,266,676 | ) | — | |||||||
| Capital share transactions (See Note 12): | ||||||||||
| Net proceeds from sales of shares | 194,794,586 | 123,859,997 | ||||||||
| Reinvestment of distributions | 6,135,456 | — | ||||||||
| Cost of shares reacquired | (17,784,737 | ) | (4,718,067 | ) | ||||||
| Net increase in net assets resulting from capital share transactions | 183,145,305 | 119,141,930 | ||||||||
| Net increase in net assets | 238,854,341 | 120,663,756 | ||||||||
| NET ASSETS: | ||||||||||
| Beginning of period | $ | 120,663,756 | $ | — | ||||||
| End of period | $ | 359,518,097 | $ | 120,663,756 | ||||||
| Undistributed net investment income | $ | 1,856,084 | $ | 323,868 | ||||||
| * | For the period December 21, 2011 (commencement of operations) to July 31, 2012. |
| 22 | See Notes to Financial Statements. |
CALIBRATED LARGE CAP VALUE FUND
| Class A Shares | ||||||||
| 12/21/2011(a) | ||||||||
| Year Ended | to | |||||||
| 7/31/2013 | 7/31/2012 | |||||||
| Per Share Operating Performance | ||||||||
| Net asset value, beginning of period | $17.18 | $15.00 | ||||||
| Investment operations: | ||||||||
| Net investment income(b) | .35 | .19 | ||||||
| Net realized and unrealized gain | 4.59 | 1.99 | ||||||
| Total from investment operations | 4.94 | 2.18 | ||||||
| Distributions to shareholders from: | ||||||||
| Net investment income | (.20 | ) | — | |||||
| Net realized gain | (.40 | ) | — | |||||
| Total distributions | (.60 | ) | — | |||||
| Net asset value, end of period | $21.52 | $17.18 | ||||||
| Total Return(c) | 29.60 | % | 14.53 | %(d) | ||||
| Ratios to Average Net Assets: | ||||||||
| Expenses, excluding expense reductions and including management fee waived and expenses reimbursed | .75 | % | .73 | %(e) | ||||
| Expenses, including expense reductions, management fee waived and expenses reimbursed | .75 | % | .73 | %(e) | ||||
| Expenses, excluding expense reductions, management fee waived and expenses reimbursed | 1.12 | % | 1.41 | %(e) | ||||
| Net investment income | 1.83 | % | 1.89 | %(e) | ||||
| Supplemental Data: | ||||||||
| Net assets, end of period (000) | $74,466 | $35,932 | ||||||
| Portfolio turnover rate | 90.00 | % | 62.31 | % | ||||
| (a) | Commencement of operations was 12/21/2011, SEC effective date was 12/15/2011 and date shares first became available to the public was 1/3/2012. |
| (b) | Calculated using average shares outstanding during the period. |
| (c) | Total return does not consider the effects of sales loads and assumes the reinvestment of all distributions. |
| (d) | Not annualized. |
| (e) | Annualized. |
| See Notes to Financial Statements. | 23 |
Financial Highlights (continued)
CALIBRATED LARGE CAP VALUE FUND
| Class C Shares | ||||||||
| 12/21/2011(a) | ||||||||
| Year Ended | to | |||||||
| 7/31/2013 | 7/31/2012 | |||||||
| Per Share Operating Performance | ||||||||
| Net asset value, beginning of period | $17.10 | $15.00 | ||||||
| Investment operations: | ||||||||
| Net investment income(b) | .18 | .15 | ||||||
| Net realized and unrealized gain | 4.59 | 1.95 | ||||||
| Total from investment operations | 4.77 | 2.10 | ||||||
| Distributions to shareholders from: | ||||||||
| Net investment income | (.17 | ) | — | |||||
| Net realized gain | (.40 | ) | — | |||||
| Total distributions | (.57 | ) | — | |||||
| Net asset value, end of period | $21.30 | $17.10 | ||||||
| Total Return(c) | 28.71 | % | 14.00 | %(d) | ||||
| Ratios to Average Net Assets: | ||||||||
| Expenses, excluding expense reductions and including management fee waived and expenses reimbursed | 1.48 | % | 1.47 | %(e) | ||||
| Expenses, including expense reductions, management fee waived and expenses reimbursed | 1.48 | % | 1.47 | %(e) | ||||
| Expenses, excluding expense reductions, management fee waived and expenses reimbursed | 1.85 | % | 2.15 | %(e) | ||||
| Net investment income | .91 | % | 1.44 | %(e) | ||||
| Supplemental Data: | ||||||||
| Net assets, end of period (000) | $7,057 | $61 | ||||||
| Portfolio turnover rate | 90.00 | % | 62.31 | % | ||||
| (a) | Commencement of operations was 12/21/2011, SEC effective date was 12/15/2011 and date shares first became available to the public was 1/3/2012. |
| (b) | Calculated using average shares outstanding during the period. |
| (c) | Total return does not consider the effects of sales loads and assumes the reinvestment of all distributions. |
| (d) | Not annualized. |
| (e) | Annualized. |
| 24 | See Notes to Financial Statements. |
Financial Highlights (continued)
CALIBRATED LARGE CAP VALUE FUND
| Class F Shares | ||||||||
| 12/21/2011(a) | ||||||||
| Year Ended | to | |||||||
| 7/31/2013 | 7/31/2012 | |||||||
| Per Share Operating Performance | ||||||||
| Net asset value, beginning of period | $17.19 | $15.00 | ||||||
| Investment operations: | ||||||||
| Net investment income(b) | .38 | .20 | ||||||
| Net realized and unrealized gain | 4.59 | 1.99 | ||||||
| Total from investment operations | 4.97 | 2.19 | ||||||
| Distributions to shareholders from: | ||||||||
| Net investment income | (.22 | ) | — | |||||
| Net realized gain | (.40 | ) | — | |||||
| Total distributions | (.62 | ) | — | |||||
| Net asset value, end of period | $21.54 | $17.19 | ||||||
| Total Return(c) | 29.82 | % | 14.60 | %(d) | ||||
| Ratios to Average Net Assets: | ||||||||
| Expenses, excluding expense reductions and including management fee waived and expenses reimbursed | .60 | % | .58 | %(e) | ||||
| Expenses, including expense reductions, management fee waived and expenses reimbursed | .60 | % | .58 | %(e) | ||||
| Expenses, excluding expense reductions, management fee waived and expenses reimbursed | .97 | % | 1.33 | %(e) | ||||
| Net investment income | 1.94 | % | 2.03 | %(e) | ||||
| Supplemental Data: | ||||||||
| Net assets, end of period (000) | $13,153 | $35 | ||||||
| Portfolio turnover rate | 90.00 | % | 62.31 | % | ||||
| (a) | Commencement of operations was 12/21/2011, SEC effective date was 12/15/2011 and date shares first became available to the public was 1/3/2012. |
| (b) | Calculated using average shares outstanding during the period. |
| (c) | Total return assumes the reinvestment of all distributions. |
| (d) | Not annualized. |
| (e) | Annualized. |
| See Notes to Financial Statements. | 25 |
Financial Highlights (continued)
CALIBRATED LARGE CAP VALUE FUND
| Class I Shares | ||||||||
| 12/21/2011(a) | ||||||||
| Year Ended | to | |||||||
| 7/31/2013 | 7/31/2012 | |||||||
| Per Share Operating Performance | ||||||||
| Net asset value, beginning of period | $17.20 | $15.00 | ||||||
| Investment operations: | ||||||||
| Net investment income(b) | .39 | .19 | ||||||
| Net realized and unrealized gain | 4.60 | 2.01 | ||||||
| Total from investment operations | 4.99 | 2.20 | ||||||
| Distributions to shareholders from: | ||||||||
| Net investment income | (.23 | ) | — | |||||
| Net realized gain | (.40 | ) | — | |||||
| Total distributions | (.63 | ) | — | |||||
| Net asset value, end of period | $21.56 | $17.20 | ||||||
| Total Return(c) | 29.91 | % | 14.67 | %(d) | ||||
| Ratios to Average Net Assets: | ||||||||
| Expenses, excluding expense reductions and including management fee waived and expenses reimbursed | .50 | % | .49 | %(e) | ||||
| Expenses, including expense reductions, management fee waived and expenses reimbursed | .50 | % | .49 | %(e) | ||||
| Expenses, excluding expense reductions, management fee waived and expenses reimbursed | .87 | % | .94 | %(e) | ||||
| Net investment income | 2.01 | % | 1.89 | %(e) | ||||
| Supplemental Data: | ||||||||
| Net assets, end of period (000) | $299,673 | $34,155 | ||||||
| Portfolio turnover rate | 90.00 | % | 62.31 | % | ||||
| (a) | Commencement of operations was 12/21/2011, SEC effective date was 12/15/2011 and date shares first became available to the public was 1/3/2012. |
| (b) | Calculated using average shares outstanding during the period. |
| (c) | Total return assumes the reinvestment of all distributions. |
| (d) | Not annualized. |
| (e) | Annualized. |
| 26 | See Notes to Financial Statements. |
Financial Highlights (continued)
CALIBRATED LARGE CAP VALUE FUND
| Class R2 Shares | ||||||||
| 12/21/2011(a) | ||||||||
| Year Ended | to | |||||||
| 7/31/2013 | 7/31/2012 | |||||||
| Per Share Operating Performance | ||||||||
| Net asset value, beginning of period | $17.14 | $15.00 | ||||||
| Investment operations: | ||||||||
| Net investment income(b) | .41 | .16 | ||||||
| Net realized and unrealized gain | 4.59 | 1.98 | ||||||
| Total from investment operations | 5.00 | 2.14 | ||||||
| Distributions to shareholders from: | ||||||||
| Net investment income | (.13 | ) | — | |||||
| Net realized gain | (.40 | ) | — | |||||
| Total distributions | (.53 | ) | — | |||||
| Net asset value, end of period | $21.61 | $17.14 | ||||||
| Total Return(c) | 29.97 | % | 14.27 | %(d) | ||||
| Ratios to Average Net Assets: | ||||||||
| Expenses, excluding expense reductions and including management fee waived and expenses reimbursed | .49 | % | 1.06 | %(e) | ||||
| Expenses, including expense reductions, management fee waived and expenses reimbursed | .49 | % | 1.06 | %(e) | ||||
| Expenses, excluding expense reductions, management fee waived and expenses reimbursed | 1.37 | % | 1.81 | %(e) | ||||
| Net investment income | 2.01 | % | 1.55 | %(e) | ||||
| Supplemental Data: | ||||||||
| Net assets, end of period (000) | $303 | $11 | ||||||
| Portfolio turnover rate | 90.00 | % | 62.31 | % | ||||
| (a) | Commencement of operations was 12/21/2011, SEC effective date was 12/15/2011 and date shares first became available to the public was 1/3/2012. |
| (b) | Calculated using average shares outstanding during the period. |
| (c) | Total return assumes the reinvestment of all distributions. |
| (d) | Not annualized. |
| (e) | Annualized. |
| See Notes to Financial Statements. | 27 |
Financial Highlights (concluded)
CALIBRATED LARGE CAP VALUE FUND
| Class R3 Shares | ||||||||
| 12/21/2011(a) | ||||||||
| Year Ended | to | |||||||
| 7/31/2013 | 7/31/2012 | |||||||
| Per Share Operating Performance | ||||||||
| Net asset value, beginning of period | $17.15 | $15.00 | ||||||
| Investment operations: | ||||||||
| Net investment income(b) | .33 | .17 | ||||||
| Net realized and unrealized gain | 4.58 | 1.98 | ||||||
| Total from investment operations | 4.91 | 2.15 | ||||||
| Distributions to shareholders from: | ||||||||
| Net investment income | (.20 | ) | — | |||||
| Net realized gain | (.40 | ) | — | |||||
| Total distributions | (.60 | ) | — | |||||
| Net asset value, end of period | $21.46 | $17.15 | ||||||
| Total Return(c) | 29.51 | % | 14.33 | %(d) | ||||
| Ratios to Average Net Assets: | ||||||||
| Expenses, excluding expense reductions and including management fee waived and expenses reimbursed | .95 | % | .96 | %(e) | ||||
| Expenses, including expense reductions, management fee waived and expenses reimbursed | .95 | % | .96 | %(e) | ||||
| Expenses, excluding expense reductions, management fee waived and expenses reimbursed | 1.35 | % | 1.71 | %(e) | ||||
| Net investment income | 1.70 | % | 1.65 | %(e) | ||||
| Supplemental Data: | ||||||||
| Net assets, end of period (000) | $79 | $11 | ||||||
| Portfolio turnover rate | 90.00 | % | 62.31 | % | ||||
| (a) | Commencement of operations was 12/21/2011, SEC effective date was 12/15/2011 and date shares first became available to the public was 1/3/2012. |
| (b) | Calculated using average shares outstanding during the period. |
| (c) | Total return assumes the reinvestment of all distributions. |
| (d) | Not annualized. |
| (e) | Annualized. |
| 28 | See Notes to Financial Statements. |
Financial Highlights
CALIBRATED MID CAP VALUE FUND
| Class A Shares | ||||||||
| 12/21/2011(a) | ||||||||
| Year Ended | to | |||||||
| 7/31/2013 | 7/31/2012 | |||||||
| Per Share Operating Performance | ||||||||
| Net asset value, beginning of period | $16.47 | $15.00 | ||||||
| Investment operations: | ||||||||
| Net investment income(b) | .31 | .15 | ||||||
| Net realized and unrealized gain | 4.93 | 1.32 | ||||||
| Total from investment operations | 5.24 | 1.47 | ||||||
| Distributions to shareholders from: | ||||||||
| Net investment income | (.22 | ) | — | |||||
| Net realized gain | (.38 | ) | — | |||||
| Total distributions | (.60 | ) | — | |||||
| Net asset value, end of period | $21.11 | $16.47 | ||||||
| Total Return(c) | 32.83 | % | 9.80 | %(d) | ||||
| Ratios to Average Net Assets: | ||||||||
| Expenses, excluding expense reductions and including management fee waived and expenses reimbursed | .85 | % | .83 | %(e) | ||||
| Expenses, including expense reductions, management fee waived and expenses reimbursed | .85 | % | .83 | %(e) | ||||
| Expenses, excluding expense reductions, management fee waived and expenses reimbursed | 1.13 | % | 1.63 | %(e) | ||||
| Net investment income | 1.66 | % | 1.51 | %(e) | ||||
| Supplemental Data: | ||||||||
| Net assets, end of period (000) | $27,545 | $13,726 | ||||||
| Portfolio turnover rate | 90.30 | % | 76.72 | % | ||||
| (a) | Commencement of operations was 12/21/2011, SEC effective date was 12/15/2011 and date shares first became available to the public was 1/3/2012. |
| (b) | Calculated using average shares outstanding during the period. |
| (c) | Total return does not consider the effects of sales loads and assumes the reinvestment of all distributions. |
| (d) | Not annualized. |
| (e) | Annualized. |
| See Notes to Financial Statements. | 29 |
Financial Highlights (continued)
CALIBRATED MID CAP VALUE FUND
| Class C Shares | ||||||||
| 12/21/2011(a) | ||||||||
| Year Ended | to | |||||||
| 7/31/2013 | 7/31/2012 | |||||||
| Per Share Operating Performance | ||||||||
| Net asset value, beginning of period | $16.39 | $15.00 | ||||||
| Investment operations: | ||||||||
| Net investment income(b) | .08 | .08 | ||||||
| Net realized and unrealized gain | 4.99 | 1.31 | ||||||
| Total from investment operations | 5.07 | 1.39 | ||||||
| Distributions to shareholders from: | ||||||||
| Net investment income | (.19 | ) | — | |||||
| Net realized gain | (.38 | ) | — | |||||
| Total distributions | (.57 | ) | — | |||||
| Net asset value, end of period | $20.89 | $16.39 | ||||||
| Total Return(c) | 31.91 | % | 9.27 | %(d) | ||||
| Ratios to Average Net Assets: | ||||||||
| Expenses, excluding expense reductions and including management fee waived and expenses reimbursed | 1.58 | % | 1.54 | %(e) | ||||
| Expenses, including expense reductions, management fee waived and expenses reimbursed | 1.58 | % | 1.54 | %(e) | ||||
| Expenses, excluding expense reductions, management fee waived and expenses reimbursed | 1.86 | % | 2.38 | %(e) | ||||
| Net investment income | .40 | % | .80 | %(e) | ||||
| Supplemental Data: | ||||||||
| Net assets, end of period (000) | $2,204 | $15 | ||||||
| Portfolio turnover rate | 90.30 | % | 76.72 | % | ||||
| (a) | Commencement of operations was 12/21/2011, SEC effective date was 12/15/2011 and date shares first became available to the public was 1/3/2012. |
| (b) | Calculated using average shares outstanding during the period. |
| (c) | Total return does not consider the effects of sales loads and assumes the reinvestment of all distributions. |
| (d) | Not annualized. |
| (e) | Annualized. |
| 30 | See Notes to Financial Statements. |
Financial Highlights (continued)
CALIBRATED MID CAP VALUE FUND
| Class F Shares | ||||||||
| 12/21/2011(a) | ||||||||
| Year Ended | to | |||||||
| 7/31/2013 | 7/31/2012 | |||||||
| Per Share Operating Performance | ||||||||
| Net asset value, beginning of period | $16.48 | $15.00 | ||||||
| Investment operations: | ||||||||
| Net investment income(b) | .27 | .16 | ||||||
| Net realized and unrealized gain | 4.99 | 1.32 | ||||||
| Total from investment operations | 5.26 | 1.48 | ||||||
| Distributions to shareholders from: | ||||||||
| Net investment income | (.25 | ) | — | |||||
| Net realized gain | (.38 | ) | — | |||||
| Total distributions | (.63 | ) | — | |||||
| Net asset value, end of period | $21.11 | $16.48 | ||||||
| Total Return(c) | 33.01 | % | 9.87 | %(d) | ||||
| Ratios to Average Net Assets: | ||||||||
| Expenses, excluding expense reductions and including management fee waived and expenses reimbursed | .69 | % | .68 | %(e) | ||||
| Expenses, including expense reductions, management fee waived and expenses reimbursed | .69 | % | .68 | %(e) | ||||
| Expenses, excluding expense reductions, management fee waived and expenses reimbursed | .98 | % | 1.51 | %(e) | ||||
| Net investment income | 1.35 | % | 1.59 | %(e) | ||||
| Supplemental Data: | ||||||||
| Net assets, end of period (000) | $6,062 | $56 | ||||||
| Portfolio turnover rate | 90.30 | % | 76.72 | % | ||||
| (a) | Commencement of operations was 12/21/2011, SEC effective date was 12/15/2011 and date shares first became available to the public was 1/3/2012. |
| (b) | Calculated using average shares outstanding during the period. |
| (c) | Total return assumes the reinvestment of all distributions. |
| (d) | Not annualized. |
| (e) | Annualized. |
| See Notes to Financial Statements. | 31 |
Financial Highlights (continued)
CALIBRATED MID CAP VALUE FUND
| Class I Shares | ||||||||
| 12/21/2011(a) | ||||||||
| Year Ended | to | |||||||
| 7/31/2013 | 7/31/2012 | |||||||
| Per Share Operating Performance | ||||||||
| Net asset value, beginning of period | $16.50 | $15.00 | ||||||
| Investment operations: | ||||||||
| Net investment income(b) | .35 | .17 | ||||||
| Net realized and unrealized gain | 4.95 | 1.33 | ||||||
| Total from investment operations | 5.30 | 1.50 | ||||||
| Distributions to shareholders from: | ||||||||
| Net investment income | (.26 | ) | — | |||||
| Net realized gain | (.38 | ) | — | |||||
| Total distributions | (.64 | ) | — | |||||
| Net asset value, end of period | $21.16 | $16.50 | ||||||
| Total Return(c) | 33.21 | % | 10.00 | %(d) | ||||
| Ratios to Average Net Assets: | ||||||||
| Expenses, excluding expense reductions and including management fee waived and expenses reimbursed | .60 | % | .58 | %(e) | ||||
| Expenses, including expense reductions, management fee waived and expenses reimbursed | .60 | % | .58 | %(e) | ||||
| Expenses, excluding expense reductions, management fee waived and expenses reimbursed | .88 | % | .95 | %(e) | ||||
| Net investment income | 1.88 | % | 1.73 | %(e) | ||||
| Supplemental Data: | ||||||||
| Net assets, end of period (000) | $323,673 | $106,844 | ||||||
| Portfolio turnover rate | 90.30 | % | 76.72 | % | ||||
| (a) | Commencement of operations was 12/21/2011, SEC effective date was 12/15/2011 and date shares first became available to the public was 1/3/2012. |
| (b) | Calculated using average shares outstanding during the period. |
| (c) | Total return assumes the reinvestment of all distributions. |
| (d) | Not annualized. |
| (e) | Annualized. |
| 32 | See Notes to Financial Statements. |
Financial Highlights (continued)
CALIBRATED MID CAP VALUE FUND
| Class R2 Shares | ||||||||
| 12/21/2011(a) | ||||||||
| Year Ended | to | |||||||
| 7/31/2013 | 7/31/2012 | |||||||
| Per Share Operating Performance | ||||||||
| Net asset value, beginning of period | $16.43 | $15.00 | ||||||
| Investment operations: | ||||||||
| Net investment income(b) | .37 | .11 | ||||||
| Net realized and unrealized gain | 4.93 | 1.32 | ||||||
| Total from investment operations | 5.30 | 1.43 | ||||||
| Distributions to shareholders from: | ||||||||
| Net investment income | (.16 | ) | — | |||||
| Net realized gain | (.38 | ) | — | |||||
| Total distributions | (.54 | ) | — | |||||
| Net asset value, end of period | $21.19 | $16.43 | ||||||
| Total Return(c) | 33.23 | % | 9.53 | %(d) | ||||
| Ratios to Average Net Assets: | ||||||||
| Expenses, excluding expense reductions and including management fee waived and expenses reimbursed | .58 | % | 1.15 | %(e) | ||||
| Expenses, including expense reductions, management fee waived and expenses reimbursed | .58 | % | 1.15 | %(e) | ||||
| Expenses, excluding expense reductions, management fee waived and expenses reimbursed | .87 | % | 2.01 | %(e) | ||||
| Net investment income | 1.98 | % | 1.15 | %(e) | ||||
| Supplemental Data: | ||||||||
| Net assets, end of period (000) | $16 | $11 | ||||||
| Portfolio turnover rate | 90.30 | % | 76.72 | % | ||||
| (a) | Commencement of operations was 12/21/2011, SEC effective date was 12/15/2011 and date shares first became available to the public was 1/3/2012. |
| (b) | Calculated using average shares outstanding during the period. |
| (c) | Total return assumes the reinvestment of all distributions. |
| (d) | Not annualized. |
| (e) | Annualized. |
| See Notes to Financial Statements. | 33 |
Financial Highlights (concluded)
CALIBRATED MID CAP VALUE FUND
| Class R3 Shares | ||||||||
| 12/21/2011(a) | ||||||||
| Year Ended | to | |||||||
| 7/31/2013 | 7/31/2012 | |||||||
| Per Share Operating Performance | ||||||||
| Net asset value, beginning of period | $16.44 | $15.00 | ||||||
| Investment operations: | ||||||||
| Net investment income(b) | .37 | .12 | ||||||
| Net realized and unrealized gain | 4.93 | 1.32 | ||||||
| Total from investment operations | 5.30 | 1.44 | ||||||
| Distributions to shareholders from: | ||||||||
| Net investment income | (.18 | ) | — | |||||
| Net realized gain | (.38 | ) | — | |||||
| Total distributions | (.56 | ) | — | |||||
| Net asset value, end of period | $21.18 | $16.44 | ||||||
| Total Return(c) | 33.21 | % | 9.60 | %(d) | ||||
| Ratios to Average Net Assets: | ||||||||
| Expenses, excluding expense reductions and including management fee waived and expenses reimbursed | .59 | % | 1.05 | %(e) | ||||
| Expenses, including expense reductions, management fee waived and expenses reimbursed | .59 | % | 1.05 | %(e) | ||||
| Expenses, excluding expense reductions, management fee waived and expenses reimbursed | 1.05 | % | 1.91 | %(e) | ||||
| Net investment income | 1.95 | % | 1.24 | %(e) | ||||
| Supplemental Data: | ||||||||
| Net assets, end of period (000) | $18 | $11 | ||||||
| Portfolio turnover rate | 90.30 | % | 76.72 | % | ||||
| (a) | Commencement of operations was 12/21/2011, SEC effective date was 12/15/2011 and date shares first became available to the public was 1/3/2012. |
| (b) | Calculated using average shares outstanding during the period. |
| (c) | Total return assumes the reinvestment of all distributions. |
| (d) | Not annualized. |
| (e) | Annualized. |
| 34 | See Notes to Financial Statements. |
| 1. | ORGANIZATION |
Lord Abbett Equity Trust (the “Trust”) is registered under the Investment Company Act of 1940, as amended (the “Act”), as a diversified, open-end management investment company. The Trust was formed on May 1, 2001 and is organized as a Delaware statutory trust. The Trust consists of the following two funds (each, a “Fund” and collectively, the “Funds”) and their respective classes: Lord Abbett Calibrated Large Cap Value Fund (“Calibrated Large Cap Value Fund”) and Lord Abbett Calibrated Mid Cap Value Fund (“Calibrated Mid Cap Value Fund”).
The investment objective of each Fund is total return. Each Fund has six classes of shares: Class A, C, F, I, R2 and R3, each with different expenses and dividends. A front-end sales charge is normally added to the net asset value (“NAV”) for Class A shares. There is no front-end sales charge in the case of Class C, F, I, R2 and R3 shares, although there may be a contingent deferred sales charge (“CDSC”) in certain cases as follows: Class A shares purchased without a sales charge and redeemed before the first day of the month in which the one-year anniversary of the purchase falls (subject to certain exceptions as set forth in each Fund’s prospectus); and Class C shares redeemed before the first anniversary of purchase.
The preparation of the financial statements in conformity with accounting principles generally accepted in the United States of America requires management to make certain estimates and assumptions that affect the reported amounts of assets and liabilities and disclosure of contingent assets and liabilities at the date of the financial statements and the reported amounts of increases and decreases in net assets from operations during the reporting period. Actual results could differ from those estimates.
| 2. | SIGNIFICANT ACCOUNTING POLICIES |
| (a) | Investment Valuation–Under procedures approved by the Funds’ Board of Trustees (the “Board”), Lord, Abbett & Co. LLC (“Lord Abbett”), the Funds’ investment manager, has formed a Pricing Committee to administer the pricing and valuation of portfolio investments and to ensure that prices utilized reasonably reflect fair value. Among other things, these procedures allow the Funds to utilize independent pricing services, quotations from securities and financial instrument dealers and other market sources to determine fair value. |
| Securities actively traded on any recognized U.S. or non-U.S. exchange or on The NASDAQ Stock Market LLC are valued at the last sale price or official closing price on the exchange or system on which they are principally traded. Events occurring after the close of trading on non-U.S. exchanges may result in adjustments to the valuation of foreign securities to reflect their fair value as of the close of regular trading on the New York Stock Exchange LLC. Each Fund may rely on an independent fair valuation service in adjusting the valuations of foreign securities. Unlisted equity securities are valued at the last quoted sale price or, if no sale price is available, at the mean between the most recently quoted bid and asked prices. Exchange traded options and futures contracts are valued at the last sale price in the market where they are principally traded. If no sale has occurred, the mean between the most recently quoted bid and asked prices is used. | |
| Securities for which prices are not readily available are valued at fair value as determined by the Pricing Committee and approved by the Board. The Pricing Committee considers a number of factors, including observable and unobservable inputs, when arriving at fair value. The Pricing Committee may use related or comparable assets or liabilities, recent transactions, |
35
Notes to Financial Statements (continued)
| market multiples, book values and other relevant information to determine fair value of portfolio investments. The Board or a designated committee thereof regularly reviews fair value determinations made by the Pricing Committee and employs techniques such as reviewing related market activity, reviewing inputs and assumptions, and retrospectively comparing prices of subsequent purchases and sales transactions to fair value determinations made by the Pricing Committee. | |
| Short-term securities with 60 days or less remaining to maturity are valued using the amortized cost method, which approximates fair value. | |
| (b) | Security Transactions–Security transactions are recorded as of the date that the securities are purchased or sold (trade date). Realized gains and losses on sales of portfolio securities are calculated using the identified-cost method. Realized and unrealized gains (losses) are allocated to each class of shares based upon the relative proportion of net assets at the beginning of the day. |
| (c) | Investment Income–Dividend income is recorded on the ex-dividend date. Interest income is recorded on the accrual basis as earned. Discounts are accreted and premiums are amortized using the effective interest method and are included in Interest and other income on the Statements of Operations. Withholding taxes on foreign dividends have been provided for in accordance with the applicable country’s tax rules and rates. Investment income is allocated to each class of shares based upon the relative proportion of net assets at the beginning of the day. |
| (d) | Income Taxes–It is the policy of each Fund to meet the requirements of Subchapter M of the Internal Revenue Code applicable to regulated investment companies and to distribute substantially all taxable income and capital gains to its shareholders. Therefore, no income tax provision is required. |
| Each Fund files U.S. federal and various state and local tax returns. No income tax returns are currently under examination. The statute of limitations on each Fund’s filed U.S. federal tax returns remains open for the fiscal period ended July 31, 2012 through the fiscal year ended July 31, 2013. The statutes of limitations on the Trust’s state and local tax returns may remain open for an additional year depending upon the jurisdiction. | |
| (e) | Expenses–Expenses, excluding class-specific expenses, are allocated to each class of shares based upon the relative proportion of net assets at the beginning of the day. Class A, C, F, R2 and R3 shares bear their class-specific share of all expenses and fees relating to the Funds’ 12b-1 Distribution Plan. |
| (f) | Futures Contracts–Each Fund may purchase and sell index futures contracts to manage cash or as a substitute position for holding the underlying asset on which the instrument is based. |
| At the time of entering into a futures transaction, an investor is required to deposit and maintain a specified amount of cash or eligible securities called “initial margin.” Subsequent payments made or received by a Fund called “variation margin” are made on a daily basis as the market price of the futures contract fluctuates. Each Fund will record an unrealized gain (loss) based on the amount of variation margin. When a contract is closed, a realized gain (loss) is recorded equal to the difference between the opening and closing value of the contract. | |
| (g) | Repurchase Agreements–Each Fund may enter into repurchase agreements with respect to securities. A repurchase agreement is a transaction in which a fund acquires a security and |
36
Notes to Financial Statements (continued)
| simultaneously commits to resell that security to the seller (a bank or securities dealer) at an agreed-upon price on an agreed-upon date. Each Fund requires at all times that the repurchase agreement be collateralized by cash, or by securities of the U.S. Government, its agencies, its instrumentalities, or U.S. Government sponsored enterprises having a value equal to, or in excess of, the value of the repurchase agreement (including accrued interest). If the seller of the agreement defaults on its obligation to repurchase the underlying securities at a time when the fair value of these securities has declined, a Fund may incur a loss upon disposition of the securities. | |
| (h) | Fair Value Measurements–Fair value is defined as the price that each Fund would receive upon selling an investment or transferring a liability in an orderly transaction to an independent buyer in the principal or most advantageous market of the investment. A three-tier hierarchy is used to maximize the use of observable market data and minimize the use of unobservable inputs and to establish classification of fair value measurements for disclosure purposes. Inputs refer broadly to the assumptions that market participants would use in pricing the asset or liability, including assumptions about risk - for example, the risk inherent in a particular valuation technique used to measure fair value (such as a pricing model) and/or the risk inherent in the inputs to the valuation technique. Inputs may be observable or unobservable. Observable inputs reflect the assumptions market participants would use in pricing the asset or liability. Observable inputs are based on market data obtained from sources independent of the reporting entity. Unobservable inputs reflect the reporting entity’s own assumptions about the assumptions market participants would use in pricing the asset or liability. Unobservable inputs are based on the best information available in the circumstances. The three-tier hierarchy of inputs is summarized in the three broad Levels listed below: |
| • | Level 1 – | unadjusted quoted prices in active markets for identical investments; | |
| • | Level 2 – | other significant observable inputs (including quoted prices for similar investments, interest rates, prepayment speeds, credit risk, etc.); and | |
| • | Level 3 – | significant unobservable inputs (including each Fund’s own assumptions in determining the fair value of investments). |
A summary of inputs used in valuing each Fund’s investments as of July 31, 2013, and, if applicable, Level 1/Level 2 transfers and Level 3 rollforwards for the fiscal year then ended is included in each Fund’s Schedule of Investments.
Changes in valuation techniques may result in transfers into or out of an assigned level within the three-tier hierarchy. All transfers between different levels within the three-tier hierarchy are deemed to have occurred as of the beginning of the reporting period. The inputs or methodology used for valuing securities are not necessarily an indication of the risk associated with investing in those securities.
| 3. | MANAGEMENT FEE AND OTHER TRANSACTIONS WITH AFFILIATES |
Management Fee
The Trust has a management agreement with Lord Abbett, pursuant to which Lord Abbett supplies each Fund with investment management services and executive and other personnel, provides office space and pays for ordinary and necessary office and clerical expenses relating to research and statistical work and supervision of each Fund’s investment portfolio.
37
Notes to Financial Statements (continued)
The management fee is based on each Fund’s average daily net assets at the following annual rate:
| First $2 billion | .60% |
| Over $2 billion | .55% |
For the fiscal year ended July 31, 2013, for Calibrated Large Cap Value Fund and Calibrated Mid Cap Value Fund, the effective management fee, net of waivers, was at an annualized rate of .23% and .32%, respectively.
In addition, Lord Abbett provides certain administrative services to each Fund pursuant to an Administrative Services Agreement in return for a fee at an annual rate of .04% of each Fund’s average daily net assets.
For the fiscal year ended July 31, 2013 and continuing through November 30, 2013, Lord Abbett has contractually agreed to waive all or a portion of its management fee and, if necessary, waive all or a portion of its administrative fee and reimburse each Fund’s other expenses to the extent necessary so that the total net annual operating expenses for each class, excluding 12b-1 fees, do not exceed an annual rate of .50% for Calibrated Large Cap Value Fund and .60% for Calibrated Mid Cap Value Fund. This agreement may be terminated only upon the approval of the Board.
Each Fund, along with certain other funds managed by Lord Abbett (collectively, the “Underlying Funds”), has entered into a Servicing Arrangement with Lord Abbett Balanced Strategy Fund, Lord Abbett Diversified Income Strategy Fund and Lord Abbett Growth & Income Strategy Fund of Lord Abbett Investment Trust and Lord Abbett Global Allocation Fund of Lord Abbett Global Fund, Inc., (each, a “Fund of Funds”) pursuant to which each Underlying Fund pays a portion of the expenses (excluding management fees and distribution and service fees) of each Fund of Funds in proportion to the average daily value of total Underlying Fund shares owned by each Fund of Funds. Amounts paid pursuant to the Servicing Arrangement are included in Subsidy expense on each Fund’s Statement of Operations and Payable to affiliates on each Fund’s Statement of Assets and Liabilities.
As of July 31, 2013, the percentages of Calibrated Large Cap Value Fund’s and Calibrated Mid Cap Value Fund’s outstanding shares owned by each Fund of Funds were as follows:
| Underlying Funds | ||||||
| Fund of Funds | Calibrated Large Cap Value Fund | Calibrated Mid Cap Value Fund | ||||
| Lord Abbett Balanced Strategy Fund | 37.68 | % | 46.54 | % | ||
| Lord Abbett Diversified Income Strategy Fund | 1.95 | % | 12.54 | % | ||
| Lord Abbett Global Allocation Fund | 0.28 | % | 5.61 | % | ||
| Lord Abbett Growth & Income Strategy Fund | 28.97 | % | 19.55 | % | ||
12b-1 Distribution Plan
Each Fund has adopted a distribution plan with respect to Class A, C, F, R2 and R3 shares pursuant to Rule 12b-1 under the Act, which provides for the payment of ongoing distribution and service fees to Lord Abbett Distributor LLC (the “Distributor”), an affiliate of Lord Abbett. The following annual rates have been approved by the Board pursuant to the plan:
| Fees* | Class A | Class C | Class F | Class R2 | Class R3 | |||||||||||||||
| Service | .25 | % | .25 | % | — | .25 | % | .25% | ||||||||||||
| Distribution | — | .75 | % | .10 | % | .35 | % | .25% | ||||||||||||
| * | Each Fund may designate a portion of the aggregate fee as attributable to service activities for purposes of calculating Financial Industry Regulatory Authority, Inc. (“FINRA”) sales charge limitations. |
Class I shares do not have a distribution plan.
38
Notes to Financial Statements (continued)
Commissions
Distributor received the following commissions on sales of shares of the Funds, after concessions were paid to authorized dealers, for the fiscal year ended July 31, 2013:
| Distributor Commissions | Dealers’ Concessions | ||||
| Calibrated Large Cap Value Fund | $ | 44,029 | $ | 238,859 | |
| Calibrated Mid Cap Value Fund | 16,665 | 88,645 | |||
Distributor received the following amount of CDSCs for the fiscal year ended July 31, 2013:
| Class A | Class C | ||||
| Calibrated Large Cap Value Fund | $ | 4,694 | $ | 1,646 | |
| Calibrated Mid Cap Value Fund | 86 | 46 | |||
A Trustee and certain of the Trust’s officers have an interest in Lord Abbett.
| 4. | DISTRIBUTIONS AND CAPITAL LOSS CARRYFORWARDS |
Dividends from net investment income, if any, are declared and paid at least annually for each Fund. Taxable net realized gains from investment transactions, reduced by allowable capital loss carryforwards, if any, are declared and distributed to shareholders at least annually. The capital loss carryforward amount, if any, is available to offset future net capital gains. Dividends and distributions to shareholders are recorded on the ex-dividend date. The amounts of dividends and distributions from net investment income and net realized capital gains are determined in accordance with federal income tax regulations, which may differ from accounting principles generally accepted in the United States of America. These book/tax differences are either considered temporary or permanent in nature. To the extent these differences are permanent in nature, such amounts are reclassified within the components of net assets based on their federal tax basis treatment; temporary differences do not require reclassification. Dividends and distributions, which exceed earnings and profits for tax purposes, are reported as a tax return of capital.
The tax character of distributions paid during the fiscal year ended July 31, 2013 and fiscal period ended July 31, 2012 was as follows:
| Calibrated Large Cap Value Fund | Calibrated Mid Cap Value Fund | |||||||||||||||
| Year Ended 7/31/2013 | Period Ended 7/31/2012 | Year Ended 7/31/2013 | Period Ended 7/31/2012 | |||||||||||||
| Distributions paid from: | ||||||||||||||||
| Ordinary income | $4,100,225 | $ | — | $6,234,113 | $ | — | ||||||||||
| Net long-term capital gains | 6,720 | — | 32,563 | — | ||||||||||||
| Total distributions paid | $4,106,945 | $ | — | $6,266,676 | $ | — | ||||||||||
As of July 31, 2013, the components of accumulated gains on a tax-basis were as follows:
| Calibrated Large Cap Value Fund | Calibrated Mid Cap Value Fund | |||||||||||||||
| Undistributed ordinary income - net | $19,466,280 | $22,662,463 | ||||||||||||||
| Undistributed long-term capital gains | 973,701 | 2,392,907 | ||||||||||||||
| Total undistributed earnings | $20,439,981 | $25,055,370 | ||||||||||||||
| Temporary differences | (3,651 | ) | (4,170 | ) | ||||||||||||
| Unrealized gains - net | 32,618,002 | 32,206,616 | ||||||||||||||
| Total accumulated gains - net | $53,054,332 | $57,257,816 | ||||||||||||||
39
Notes to Financial Statements (continued)
As of July 31, 2013, the aggregate unrealized security gains and losses based on cost for U.S. federal income tax purposes were as follows:
| Calibrated Large Cap Value Fund | Calibrated Mid Cap Value Fund | |||||||
| Tax cost | $ | 361,375,513 | $ | 327,116,263 | ||||
| Gross unrealized gain | 33,826,853 | 34,530,962 | ||||||
| Gross unrealized loss | (1,208,851 | ) | (2,324,346 | ) | ||||
| Net unrealized security gain | $ | 32,618,002 | $ | 32,206,616 | ||||
The difference between book-basis and tax-basis unrealized gains (losses) is attributable to the tax treatment of wash sales.
Permanent items identified during the fiscal year ended July 31, 2013 have been reclassified among the components of net assets based on their tax basis treatment as follows:
| Undistributed Net | Accumulated | Paid-in | ||||||||||
| Investment Income | Net Realized Gain | Capital | ||||||||||
| Calibrated Large Cap Value Fund | $ | 5,600 | $ | 5,273 | $ | (10,873 | ) | |||||
| Calibrated Mid Cap Value Fund | (2,862 | ) | 12,590 | (9,728 | ) | |||||||
The permanent differences are attributable to the tax treatment of certain expenses and certain distributions received.
| 5. | PORTFOLIO SECURITIES TRANSACTIONS |
Purchases and sales of investment securities (excluding short-term investments) for the fiscal year ended July 31, 2013 were as follows:
| Purchases | Sales | ||||||
| Calibrated Large Cap Value Fund | $ | 450,109,422 | $ | 175,008,647 | |||
| Calibrated Mid Cap Value Fund | 378,366,078 | 197,924,956 | |||||
There were no purchases or sales of U.S. Government securities for the fiscal year ended July 31, 2013.
| 6. | DISCLOSURES ABOUT DERIVATIVE INSTRUMENTS AND HEDGING ACTIVITIES |
Each Fund entered into E-Mini S&P 500 Index futures contracts for the fiscal year ended July 31, 2013 (as described in note 2(f)) to manage cash. The Funds bear the risk that the underlying index will move unexpectedly, in which case each Fund may realize a loss. There is minimal counterparty credit risk to each Fund since futures are exchange traded and the exchange’s clearinghouse, as counterparty to all exchange traded futures, guarantees futures against default.
As of July 31, 2013, the Funds had the following derivatives, grouped into appropriate risk categories that illustrate how and why the Funds use derivative instruments:
| Calibrated Large Cap Value Fund | Calibrated Mid Cap Value Fund | ||||||||||||||
| Equity Index | Equity Index | ||||||||||||||
| Asset Derivatives | Contracts | Fair Value | Contracts | Fair Value | |||||||||||
| Futures Contracts(1) | $ | 21,941 | $ | 21,941 | $ | 36,431 | $ | 36,431 | |||||||
| Total | $ | 21,941 | $ | 21,941 | $ | 36,431 | $ | 36,431 | |||||||
| (1) | Statements of Assets and Liabilities location: Includes cumulative unrealized appreciation of futures contracts as reported in the Schedule of Investments. Only current day’s variation margin is reported within the Statements of Assets and Liabilities. |
40
Notes to Financial Statements (continued)
Transactions in derivative instruments for the fiscal year ended July 31, 2013, were as follows:
| Calibrated Large Cap Value Fund | Calibrated Mid Cap Value Fund | ||||||||||||||
| Equity Index | Equity Index | ||||||||||||||
| Contracts | Total | Contracts | Total | ||||||||||||
| Net Realized Gain (Loss) (1) | |||||||||||||||
| Futures Contracts | $ | 32,658 | $ | 32,658 | $ | 31,089 | $ | 31,089 | |||||||
| Net Change in Unrealized | |||||||||||||||
| Appreciation/Depreciation(2) | |||||||||||||||
| Futures Contracts | $ | 21,941 | $ | 21,941 | $ | 36,431 | $ | 36,431 | |||||||
| Average Number of Contracts* | |||||||||||||||
| Futures Contracts | 3 | 3 | 3 | 3 | |||||||||||
| * | Calculated based on the number of contracts for the fiscal year ended July 31, 2013. |
| (1) | Statements of Operations location: Net realized gain on investments and futures contracts. |
| (2) | Statements of Operations location: Net change in unrealized appreciation/depreciation on investments and futures contracts. |
| 7. | TRUSTEES’ REMUNERATION |
The Trust’s officers and a Trustee, who are associated with Lord Abbett, do not receive any compensation from the Trust for serving in such capacities. Independent Trustees’ fees are allocated among all Lord Abbett-sponsored funds based on the net assets of each fund. There is an equity-based plan available to all Independent Trustees under which Independent Trustees must defer receipt of a portion of, and may elect to defer receipt of an additional portion of Trustees’ fees. The deferred amounts are treated as though equivalent dollar amounts had been invested in the funds. Such amounts and earnings accrued thereon are included in Trustees’ fees on the Statements of Operations and in Trustees’ fees payable on the Statements of Assets and Liabilities and are not deductible for U.S. federal income tax purposes until such amounts are paid.
| 8. | EXPENSE REDUCTIONS |
The Trust has entered into an arrangement with its transfer agent and custodian, whereby credits realized as a result of uninvested cash balances are used to reduce a portion of each Fund’s expenses.
| 9. | LINE OF CREDIT |
On April 2, 2012, the Funds and certain other funds managed by Lord Abbett (the “participating funds”) entered into an unsecured revolving credit facility (“Facility”) with State Street Bank and Trust Company (“SSB”), to be used for temporary or emergency purposes as an additional source of liquidity to fund redemptions of investor shares. The Board considers annual renewal of the Facility under terms that depend on market conditions at the time of the renewal. The amounts available under the Facility are (i) the lesser of either $250,000,000 or 33.33% of total assets per participating fund and (ii) $350,000,000 in the aggregate for all participating funds. The annual fee to maintain the Facility is .09% of the amount available under the Facility. Each participating fund pays its pro rata share based on the net assets of each participating fund. This amount is included in Other expenses on each Fund’s Statement of Operations. Any borrowings under this Facility will bear interest at current market rates as set forth in the credit agreement.
Effective April 1, 2013, the Funds and the participating funds entered into a short term extension of the Facility through June 30, 2013. Effective July 1, 2013, the Funds and participating funds renewed the Facility through June 30, 2014 under the same terms as described above.
During the fiscal year ended July 31, 2013, a participating fund utilized the Facility and fully repaid its borrowings on June 13, 2013. As of July 31, 2013, there were no loans outstanding pursuant to this Facility.
41
Notes to Financial Statements (continued)
| 10. | CUSTODIAN AND ACCOUNTING AGENT |
SSB is the Trust’s custodian and accounting agent. SSB performs custodial, accounting and recordkeeping functions relating to portfolio transactions and calculating each Fund’s NAV.
| 11. | INVESTMENT RISKS |
Each Fund is subject to the general risks and considerations associated with equity investing. The value of a Fund’s investment in an individual company will fluctuate in response to its changing prospects and movements in the equity securities markets in general. If a Fund’s assessment of a company’s value or prospects for exceeding earnings expectations or market conditions is wrong, the Fund could suffer losses or produce poor performance relative to other funds, even in a rising market.
The market may fail to recognize for a long time the intrinsic value of particular value stocks each Fund may hold. The large companies in which Calibrated Large Cap Value Fund invests may be less able to respond quickly to certain market developments and may have slower rates of growth than smaller companies. The mid-sized companies in which Calibrated Mid Cap Value Fund invests may be less able to weather economic shifts or other adverse developments than larger, more established companies.
Due to each Fund’s exposure to foreign companies and American Depository Receipts, each Fund may experience increased market, liquidity, currency, political, information, and other risks.
These factors can affect each Fund’s performance.
| 12. | SUMMARY OF CAPITAL TRANSACTIONS |
Transactions in shares of beneficial interest were as follows:
| Year Ended | Period Ended | |||||||||||||||
| Calibrated Large Cap Value Fund | July 31, 2013 | July 31, 2012† | ||||||||||||||
| Class A Shares | Shares | Amount | Shares | Amount | ||||||||||||
| Shares sold | 3,331,710 | $ | 63,260,396 | 2,239,545 | $ | 35,285,462 | ||||||||||
| Reinvestment of distributions | 57,492 | 983,676 | — | — | ||||||||||||
| Shares reacquired | (2,020,635 | ) | (37,420,570 | ) | (147,568 | ) | (2,420,649 | ) | ||||||||
| Increase | 1,368,567 | $ | 26,823,502 | 2,091,977 | $ | 32,864,813 | ||||||||||
| Class C Shares | ||||||||||||||||
| Shares sold | 342,988 | $ | 6,745,015 | 5,200 | $ | 83,959 | ||||||||||
| Reinvestment of distributions | 615 | 10,472 | — | — | ||||||||||||
| Shares reacquired | (15,812 | ) | (317,572 | ) | (1,656 | ) | (27,221 | ) | ||||||||
| Increase | 327,791 | $ | 6,437,915 | 3,544 | $ | 56,738 | ||||||||||
| Class F Shares | ||||||||||||||||
| Shares sold | 843,348 | $ | 16,033,964 | 2,016 | $ | 33,260 | ||||||||||
| Reinvestment of distributions | 6,511 | 111,411 | — | — | ||||||||||||
| Shares reacquired | (241,146 | ) | (4,394,773 | ) | — | — | ||||||||||
| Increase | 608,713 | $ | 11,750,602 | 2,016 | $ | 33,260 | ||||||||||
| Class I Shares | ||||||||||||||||
| Shares sold | 11,826,586 | $ | 230,083,137 | 1,986,051 | $ | 31,989,925 | ||||||||||
| Reinvestment of distributions | 142,033 | 2,431,608 | — | — | ||||||||||||
| Shares reacquired | (56,231 | ) | (1,117,836 | ) | (64 | ) | (1,087 | ) | ||||||||
| Increase | 11,912,388 | $ | 231,396,909 | 1,985,987 | $ | 31,988,838 | ||||||||||
42
Notes to Financial Statements (continued)
| Year Ended | Period Ended | |||||||||||||||
| Calibrated Large Cap Value Fund | July 31, 2013 | July 31, 2012† | ||||||||||||||
| Class R2 Shares | Shares | Amount | Shares | Amount | ||||||||||||
| Shares sold | 13,342.780 | $ | 278,134 | 666.667 | $ | 10,000 | ||||||||||
| Reinvestment of distributions | 20.553 | 353 | — | — | ||||||||||||
| Increase | 13,363.333 | $ | 278,487 | 666.667 | $ | 10,000 | ||||||||||
| Class R3 Shares | ||||||||||||||||
| Shares sold | 3,681.083 | $ | 67,142 | 666.667 | $ | 10,000 | ||||||||||
| Reinvestment of distributions | 110.210 | 1,883 | — | — | ||||||||||||
| Shares reacquired | (758.960 | ) | (13,483 | ) | ||||||||||||
| Increase | 3,032.333 | $ | 55,542 | 666.667 | $ | 10,000 | ||||||||||
| † | For the period December 21, 2011 (commencement of operations) to July 31, 2012. |
| Year Ended | Period Ended | |||||||||||||||
| Calibrated Mid Cap Value Fund | July 31, 2013 | July 31, 2012† | ||||||||||||||
| Class A Shares | Shares | Amount | Shares | Amount | ||||||||||||
| Shares sold | 1,421,928 | $ | 27,478,191 | 1,124,432 | $ | 17,407,262 | ||||||||||
| Reinvestment of distributions | 28,488 | 468,011 | — | — | ||||||||||||
| Shares reacquired | (978,957 | ) | (17,127,228 | ) | (290,768 | ) | (4,716,098 | ) | ||||||||
| Increase | 471,459 | $ | 10,818,974 | 833,664 | $ | 12,691,164 | ||||||||||
| Class C Shares | ||||||||||||||||
| Shares sold | 110,029 | $ | 2,124,095 | 944 | $ | 14,330 | ||||||||||
| Reinvestment of distributions | 197 | 3,223 | — | — | ||||||||||||
| Shares reacquired | (5,617 | ) | (108,828 | ) | (54 | ) | (925 | ) | ||||||||
| Increase | 104,609 | $ | 2,018,490 | 890 | $ | 13,405 | ||||||||||
| Class F Shares | ||||||||||||||||
| Shares sold | 304,592 | $ | 6,012,193 | 3,424 | $ | 54,865 | ||||||||||
| Reinvestment of distributions | 813 | 13,369 | — | — | ||||||||||||
| Shares reacquired | (21,731 | ) | (428,948 | ) | — | — | ||||||||||
| Increase | 283,674 | $ | 5,596,614 | 3,424 | $ | 54,865 | ||||||||||
| Class I Shares | ||||||||||||||||
| Shares sold | 8,486,840 | $ | 159,175,451 | 6,475,440 | $ | 106,363,540 | ||||||||||
| Reinvestment of distributions | 343,354 | 5,650,117 | — | — | ||||||||||||
| Shares reacquired | (6,163 | ) | (119,730 | ) | (64 | ) | (1,044 | ) | ||||||||
| Increase | 8,824,031 | $ | 164,705,838 | 6,475,376 | $ | 106,362,496 | ||||||||||
| Class R2 Shares | ||||||||||||||||
| Shares sold | 72.171 | $ | 1,511 | 666.667 | $ | 10,000 | ||||||||||
| Reinvestment of distributions | 22.019 | 363 | — | — | ||||||||||||
| Increase | 94.19 | $ | 1,874 | 666.667 | $ | 10,000 | ||||||||||
| Class R3 Shares | ||||||||||||||||
| Shares sold | 157.834 | $ | 3,145 | 666.667 | $ | 10,000 | ||||||||||
| Reinvestment of distributions | 22.649 | 373 | — | — | ||||||||||||
| Shares reacquired | (.150 | ) | (3 | ) | — | — | ||||||||||
| Increase | 180.333 | $ | 3,515 | 666.667 | $ | 10,000 | ||||||||||
| † | For the period December 21, 2011 (commencement of operations) to July 31, 2012. |
43
Notes to Financial Statements (concluded)
| 13. | RECENT ACCOUNTING STANDARD |
In December 2011, the Financial Accounting Standards Board (“FASB”) issued Accounting Standards Update No. 2011-11 “Disclosures about Offsetting Assets and Liabilities” (“ASU 2011-11”). This disclosure requirement is intended to help investors and other financial statement users better assess the effect or potential effect of offsetting arrangements on a fund’s financial position. ASU 2011-11 requires entities to disclose both gross and net information about both instruments and transactions eligible for offset in the statement of assets and liabilities; and disclose instruments and transactions subject to an agreement similar to a master netting agreement. In addition, in January 2013, FASB issued Accounting Standards Update No. 2013-01 “Clarifying the Scope of Disclosures about Offsetting Assets and Liabilities” (“ASU 2013-01”), specifying exactly which transactions are subject to disclosures about offsetting. ASU 2011-11 and ASU 2013-01 are effective for public entities for interim and annual periods beginning on or after January 1, 2013. Management is currently evaluating the impact the adoption of ASU 2011-11 and ASU 2013-01 will have on the Funds’ financial statement disclosures.
44
Report of Independent Registered Public Accounting Firm
To the Board of Trustees of Lord Abbett Equity Trust and the Shareholders of Lord Abbett Calibrated Large Cap Value Fund and Lord Abbett Calibrated Mid Cap Value Fund:
We have audited the accompanying statements of assets and liabilities, including the schedules of investments, of the Lord Abbett Calibrated Large Cap Value Fund and Lord Abbett Calibrated Mid Cap Value Fund (collectively the “Funds”), the two portfolios constituting the Lord Abbett Equity Trust (the “Trust”) as of July 31, 2013, and the related statements of operations for the year then ended, and the statements of changes in net assets and the financial highlights for the year then ended and for the period December 21, 2011 (commencement of operations) to July 31, 2012. These financial statements and financial highlights are the responsibility of the Trust’s management. Our responsibility is to express an opinion on these financial statements and financial highlights based on our audits.
We conducted our audits in accordance with the standards of the Public Company Accounting Oversight Board (United States). Those standards require that we plan and perform the audits to obtain reasonable assurance about whether the financial statements and financial highlights are free of material misstatement. The Trust is not required to have, nor were we engaged to perform, an audit of its internal control over financial reporting. Our audits included consideration of internal control over financial reporting as a basis for designing audit procedures that are appropriate in the circumstances, but not for the purpose of expressing an opinion on the effectiveness of the Trust’s internal control over financial reporting. Accordingly, we express no such opinion. An audit also includes examining, on a test basis, evidence supporting the amounts and disclosures in the financial statements, assessing the accounting principles used and significant estimates made by management, as well as evaluating the overall financial statement presentation. Our procedures included confirmation of securities owned as of July 31, 2013, by correspondence with the custodian and brokers; where replies were not received from brokers, we performed other auditing procedures. We believe that our audits provide a reasonable basis for our opinion.
In our opinion, such financial statements and financial highlights referred to above present fairly, in all material respects, the financial position of Lord Abbett Calibrated Large Cap Value Fund and Lord Abbett Calibrated Mid Cap Value Fund as of July 31, 2013, the results of their operations for the year then ended, and the changes in their net assets and the financial highlights for the year then ended and for the period December 21, 2011 (commencement of operations) to July 31, 2012, in conformity with accounting principles generally accepted in the United States of America.
DELOITTE & TOUCHE LLP
New York, New York
September 27, 2013
45
Basic Information About Management
The Board is responsible for the management of the business and affairs of the Trust in accordance with the laws of the State of Delaware. The Board elects officers who are responsible for the day-to-day operations of the Funds and who execute policies authorized by the Board. The Board also approves an investment adviser to each Fund and continues to monitor the cost and quality of the services the investment adviser provides, and annually considers whether to renew the contract with the adviser. Generally, each Trustee holds office until his/her successor is elected and qualified or until his/her earlier resignation or removal, as provided in the Trust’s organizational documents.
Lord Abbett, a Delaware limited liability company, is the Trust’s investment adviser. Designated Lord Abbett personnel are responsible for the day-to-day management of the Funds.
Interested Trustee
Ms. Foster is affiliated with Lord Abbett and is an “interested person” of the Trust as defined in the Act. Ms. Foster is a director/trustee and officer of each of the 12 Lord Abbett-sponsored funds, which consist of 55 portfolios or series.
| Name, Address and Year of Birth | Current Position and Length of Service with the Trust | Principal Occupation and Other Directorships During the Past Five Years | ||
| Daria L. Foster Lord, Abbett & Co. LLC 90 Hudson Street Jersey City, NJ 07302 (1954) | Trustee and President since 2006; Chief Executive Officer since 2012 | Principal Occupation: Managing Partner of Lord Abbett (since 2007), and was formerly Director of Marketing and Client Service, joined Lord Abbett in 1990. | ||
Other Directorships: None. |
Independent Trustees
The following Independent Trustees also are directors/trustees of each of the 12 Lord Abbett-sponsored funds, which consist of 55 portfolios or series.
| Name, Address and Year of Birth | Current Position and Length of Service with the Trust | Principal Occupation and Other Directorships During the Past Five Years | ||
| E. Thayer Bigelow Lord, Abbett & Co. LLC c/o Legal Dept. 90 Hudson Street Jersey City, NJ 07302 (1941) | Trustee since 2001; Chairman since 2013 | Principal Occupation: Managing General Partner, Bigelow Media, LLC (since 2000); Senior Adviser, Time Warner Inc. (1998 - 2000). Other Directorships: Currently serves as director of Crane Co. (since 1984) and Huttig Building Products Inc. (since 1998). Previously served as a director of R.H. Donnelley Inc. (2009 - 2010). | ||
| Evelyn E. Guernsey Lord, Abbett & Co. LLC c/o Legal Dept. 90 Hudson Street Jersey City, NJ 07302 (1955) | Trustee since 2011 | Principal Occupation: CEO, Americas of J.P. Morgan Asset Management (2004 - 2010). Other Directorships: None. |
46
Basic Information About Management (continued)
| Name, Address and Year of Birth | Current Position and Length of Service with the Trust | Principal Occupation and Other Directorships During the Past Five Years | ||
| Julie A. Hill Lord, Abbett & Co. LLC c/o Legal Dept. | Trustee since 2004 | Principal Occupation: Owner and CEO of The Hill Company, a business consulting firm (since 1998). | ||
| 90 Hudson Street Jersey City, NJ 07302 (1946) | Other Directorships: Currently serves as director of WellPoint, Inc., a health benefits company (since 1994). Previously served as a director of Lend Lease Corporation Limited, an international retail and residential property group (2006 - 2012). | |||
| Franklin W. Hobbs Lord, Abbett & Co. LLC c/o Legal Dept. | Trustee since 2001 | Principal Occupation: Advisor of One Equity Partners, a private equity firm (since 2004). | ||
| 90 Hudson Street Jersey City, NJ 07302 (1947) | Other Directorships: Currently serves as director and Chairman of the Board of Ally Financial Inc., a financial services firm (since 2009), and as director of Molson Coors Brewing Company (since 2002). | |||
| James M. McTaggart Lord, Abbett & Co. LLC c/o Legal Dept. 90 Hudson Street Jersey City, NJ 07302 (1947) | Trustee since 2012 | Principal Occupation: Independent management advisor and consultant (since 2012); Vice President, CRA International, Inc. (doing business as Charles River Associates), a global management consulting firm (2009 - 2012); Founder and Chairman of Marakon Associates, Inc., a strategy consulting firm (1978 - 2009); and Officer and Director of Trinsum Group, a holding company (2007 - 2009). | ||
| Other Directorships: Currently serves as director of Blyth, Inc., a home products company (since 2004). | ||||
| James L.L. Tullis Lord, Abbett & Co. LLC c/o Legal Dept. | Trustee since 2006 | Principal Occupation: CEO of Tullis-Dickerson and Co. Inc., a venture capital management firm (since 1990). | ||
| 90 Hudson Street Jersey City, NJ 07302 (1947) | Other Directorships: Currently serves as director of Crane Co. (since 1998). Previously served as a director of Synageva BioPharma Corp., a biopharmaceutical company (2009 - 2011). |
47
Basic Information About Management (continued)
Officers
None of the officers listed below have received compensation from the Trust. All of the officers of the Funds also may be officers of the other Lord Abbett-sponsored funds and maintain offices at 90 Hudson Street, Jersey City, NJ 07302. Unless otherwise indicated, the position(s) and title(s) listed under the “Principal Occupation During the Past Five Years” column indicate each officer’s position(s) and title(s) with Lord Abbett.
| Name and Year of Birth | Current Position with the Trust | Length of Service of Current Position | Principal Occupation During the Past Five Years | |||
| Daria L. Foster (1954) | President and Chief Executive Officer | Elected as President in 2006 and Chief Executive Officer in 2012 | Managing Partner of Lord Abbett (since 2007), and was formerly Director of Marketing and Client Service, joined Lord Abbett in 1990. | |||
| Robert P. Fetch (1953) | Executive Vice President | Elected in 2009 | Partner and Director, joined Lord Abbett in 1995. | |||
| Robert I. Gerber (1954) | Executive Vice President | Elected in 2007 | Partner and Chief Investment Officer (since 2007), joined Lord Abbett in 1997 as Director of Taxable Fixed Income Management. | |||
| Walter H. Prahl (1958) | Executive Vice President | Elected in 2011 | Partner and Director, joined Lord Abbett in 1997. | |||
| Frederick J. Ruvkun (1957) | Executive Vice President | Elected in 2011 | Partner and Director, joined Lord Abbett in 2006. | |||
| James W. Bernaiche (1956) | Chief Compliance Officer | Elected in 2004 | Partner and Chief Compliance Officer, joined Lord Abbett in 2001. | |||
| Joan A. Binstock (1954) | Chief Financial Officer and Vice President | Elected in 2001 | Partner and Chief Operations Officer, joined Lord Abbett in 1999. | |||
| John K. Forst (1960) | Vice President and Assistant Secretary | Elected in 2005 | Deputy General Counsel, joined Lord Abbett in 2004. | |||
| Lawrence H. Kaplan (1957) | Vice President and Secretary | Elected in 2001 | Partner and General Counsel, joined Lord Abbett in 1997. | |||
| David J. Linsen (1974) | Vice President | Elected in 2012 | Partner and Director, joined Lord Abbett in 2001. | |||
| A. Edward Oberhaus, III (1959) | Vice President | Elected in 2001 | Partner and Director, joined Lord Abbett in 1983. | |||
| Thomas R. Phillips (1960) | Vice President and Assistant Secretary | Elected in 2008 | Partner and Deputy General Counsel, joined Lord Abbett in 2006. |
48
Basic Information About Management (concluded)
| Name and Year of Birth | Current Position with the Trust | Length of Service of Current Position | Principal Occupation During the Past Five Years | |||
| John P. Piccard (1970) | Vice President | Elected in 2008 | Portfolio Manager, joined Lord Abbett in 2004. | |||
| Lawrence B. Stoller (1963) | Vice President and Assistant Secretary | Elected in 2007 | Partner and Senior Deputy General Counsel, joined Lord Abbett in 2007. | |||
| Scott S. Wallner (1955) | AML Compliance Officer | Elected in 2011 | Assistant General Counsel, joined Lord Abbett in 2004. | |||
| Bernard J. Grzelak (1971) | Treasurer | Elected in 2003 | Partner and Director of Fund Administration, joined Lord Abbett in 2003. |
Please call 888–522–2388 for a copy of the statement of additional information (“SAI”), which contains further information about the Trust’s Trustees. It is available free upon request.
49
Householding
The Trust has adopted a policy that allows it to send only one copy of each Fund’s prospectus, proxy material, annual report and semiannual report to certain shareholders residing at the same “household.” This reduces Fund expenses, which benefits you and other shareholders. If you need additional copies or do not want your mailings to be “householded,” please call Lord Abbett at 888-522-2388 or send a written request with your name, the name of your fund or funds and your account number or numbers to Lord Abbett Family of Funds, P.O. Box 219336, Kansas City, MO 64121.
Proxy Voting Policies, Procedures and Records
A description of the policies and procedures that Lord Abbett uses to vote proxies related to each Fund’s portfolio securities, and information on how Lord Abbett voted each Fund’s proxies during the 12-month period ended June 30 are available without charge, upon request, (i) by calling 888-522-2388; (ii) on Lord Abbett’s Website at www.lordabbett.com; and (iii) on the Securities and Exchange Commission’s (“SEC”) Website at www.sec.gov.
Shareholder Reports and Quarterly Portfolio Disclosure
The Funds are required to file their complete schedule of portfolio holdings with the SEC for their first and third fiscal quarters on Form N-Q. Copies of the filings are available without charge, upon request on the SEC’s Website at www.sec.gov and may be available by calling Lord Abbett at 888-522-2388. You can also obtain copies of Form N-Q by visiting the SEC’s Public Reference Room in Washington, DC (information on the operation of the Public Reference Room may be obtained by calling 800-SEC-0330).
Tax Information
The percentages below reflect the portion of ordinary income distributions that are eligible for the corporate dividend received deduction (DRD) and qualified dividend income (QDI) for individual shareholders:
| Fund Name | DRD | QDI | |||||||
| Calibrated Large Cap Value Fund | 39.26 | % | 39.47 | % | |||||
| Calibrated Mid Cap Value Fund | 35.83 | % | 35.93 | % | |||||
Additionally, of the distributions paid to the shareholders during the fiscal year ended July 31, 2013, the following amounts represent long-term capital gains:
| Fund Name | ||||
| Calibrated Large Cap Value Fund | $ | 6,720 | ||
| Calibrated Mid Cap Value Fund | 32,563 | |||
50


| This report, when not used for the general information of shareholders of the Fund, is to be distributed only if preceded or accompanied by a current fund prospectus. | Lord Abbett Equity Trust | |||
| Lord Abbett mutual fund shares are distributed by LORD ABBETT DISTRIBUTOR LLC. | Lord Abbett Calibrated Large Cap Value Fund Lord Abbett Calibrated Mid Cap Value Fund | CALIBRATED-2-0713 (09/13) |
| Item 2: | Code of Ethics. |
| (a) | In accordance with applicable requirements, the Registrant adopted a Sarbanes-Oxley Code of Ethics on June 19, 2003 that applies to the principal executive officer and senior financial officers of the Registrant (“Code of Ethics”). The Code of Ethics was in effect during the fiscal year ended July 31, 2013 (the “Period”). | |
| (b) | Not applicable. | |
| (c) | The Registrant has not amended the Code of Ethics as described in Form N-CSR during the Period. | |
| (d) | The Registrant has not granted any waiver, including an implicit waiver, from a provision of the Code of Ethics as described in Form N-CSR during the Period. | |
| (e) | Not applicable. | |
| (f) | See Item 12(a)(1) concerning the filing of the Code of Ethics. |
| Item 3: | Audit Committee Financial Expert. |
| The Registrant’s board of trustees has determined that each of the following independent trustees who are members of the audit committee is an audit committee financial expert: E. Thayer Bigelow and Robert B. Calhoun, Jr. Each of these persons is independent within the meaning of the Form N-CSR. |
| Item 4: | Principal Accountant Fees and Services. |
In response to sections (a), (b), (c) and (d) of Item 4, the aggregate fees billed to the Registrant for the fiscal years ended July 31, 2013 and 2012 by the Registrant’s principal accounting firm, Deloitte & Touche LLP, the member firms of Deloitte Touche Tohmatsu and their respective affiliates (collectively, “Deloitte”) were as follows:
| Fiscal year ended: | ||||||||
| 2013 | 2012 | |||||||
| Audit Fees {a} | $ | 73,000 | $ | 112,000 | ||||
| Audit-Related Fees | - 0 - | - 0 - | ||||||
| Total audit and audit-related fees | $ | 73,000 | $ | 112,000 | ||||
| Tax Fees {b} | 21,477 | 21,084 | ||||||
| All Other Fees | - 0 - | - 0 - | ||||||
| Total Fees | $ | 94,477 | $ | 133,084 | ||||
{a} Consists of fees for audits of the Registrant’s annual financial statements.
{b} Fees for the fiscal year ended July 31, 2013 and 2012 consist of fees for preparing the U.S. Income Tax Return for Regulated Investment Companies, New Jersey Corporation Business Tax Return, New Jersey Annual Report Form, U.S. Return of Excise Tax on Undistributed Income of Investment Companies, IRS Forms 1099-MISC and 1096 Annual Summary and Transmittal of U.S. Information Returns.
(e) (1) Pursuant to Rule 2-01(c) (7) of Regulation S-X, the Registrant’s Audit Committee has adopted pre-approval policies and procedures. Such policies and procedures generally provide that the Audit Committee must pre-approve:
| Ÿ | any audit, audit-related, tax, and other services to be provided to the Lord Abbett Funds, including the Registrant, and | |
| Ÿ | any audit-related, tax, and other services to be provided to the Registrant’s investment adviser and any entity controlling, controlled by or under common control with the investment adviser that provides ongoing services to one or more Funds comprising the Registrant if the engagement relates directly to operations and financial reporting of a Fund, by the independent auditor to assure that the provision of such services does not impair the auditor’s independence. |
The Audit Committee has delegated pre-approval authority to its Chairman, subject to a fee limit of $10,000 per event, and not to exceed $25,000 annually. The Chairman will report any pre-approval decisions to the Audit Committee at its next scheduled meeting. Unless a type of service to be provided by the independent auditor has received general pre-approval, it must be pre-approved by the Audit Committee. Any proposed services exceeding pre-approved cost levels will require specific pre-approval by the Audit Committee.
(e) (2) The Registrant’s Audit Committee has approved 100% of the services described in this Item 4 (b) through (d).
(f) Not applicable.
(g) The aggregate non-audit fees billed by Deloitte for services rendered to the Registrant are shown above in the response to Item 4 (a), (b), (c) and (d) as “All Other Fees”.
The aggregate non-audit fees billed by Deloitte for services rendered to the Registrant’s investment adviser, Lord, Abbett & Co. LLC (“Lord Abbett”), for the fiscal years ended July 31, 2013 and 2012 were:
| Fiscal year ended: | ||||||||
| 2013 | 2012 | |||||||
| All Other Fees {a} | $ | 180,602 | $ | 170,618 | ||||
{a} Consist of fees for Independent Services Auditors’ Report on Controls Placed in Operation and Tests of Operating Effectiveness related to Lord Abbett’s Asset Management Services (“SOC-1 Report”).
The aggregate non-audit fees billed by Deloitte for services rendered to entities under the common control of Lord Abbett for the fiscal years ended July 31, 2013 and 2012 were:
| Fiscal year ended: | ||||||||
| 2013 | 2012 | |||||||
| All Other Fees | $ | - 0 - | $ | - 0 - | ||||
(h) The Registrant’s Audit Committee has considered the provision of non-audit services that were rendered to the Registrant’s investment adviser, and any entity controlling, controlled by or under common control with the investment adviser that provides ongoing services to the Registrant, that were not pre-approved pursuant to Rule 2-01 (c)(7)(ii) of Regulation S-X and has determined that the provision of such services is compatible with maintaining Deloitte’s independence.
| Item 5: | Audit Committee of Listed Registrants. |
Not applicable.
| Item 6: | Investments. |
Not applicable.
| Item 7: | Disclosure of Proxy Voting Policies and Procedures for Closed-End Management Investment Companies. |
Not applicable.
| Item 8: | Portfolio Managers of Closed-End Management Investment Companies. |
Not applicable.
| Item 9: | Purchases of Equity Securities by Closed-End Management Investment Company and Affiliated Purchasers. |
Not applicable.
| Item 10: | Submission of Matters to a Vote of Security Holders. |
Not applicable.
| Item 11: | Controls and Procedures. |
| (a) | Based on their evaluation of the Registrant’s disclosure controls and procedures (as defined in Rule 30a-3(c) under the Investment Company Act of 1940) as of a date within 90 days prior to the filing date of this report, the Chief Executive Officer and Chief Financial Officer of the Registrant have concluded that such disclosure controls and procedures are reasonably designed and effective to |
ensure that material information relating to the Registrant, including its consolidated subsidiaries, is made known to them by others within those entities. | ||
| (b) | There were no changes in the Registrant’s internal control over financial reporting (as defined in Rule 30a-3(d) under the Investment Company Act of 1940) that occurred during the second fiscal quarter of the period covered by this report that have materially affected, or are reasonably likely to materially affect, the Registrant’s internal control over financial reporting. |
| Item 12: | Exhibits. |
| (a)(1) | The Lord Abbett Family of Funds Sarbanes Oxley Code of Ethics for the Principal Executive Officer and Senior Financial Officers is attached hereto as part of Ex-99. CODEETH. | |
| (a)(2) | Certification of each Principal Executive Officer and Principal Financial Officer of the Registrant as required by Rule 30a-2 under the Investment Company Act of 1940 is attached hereto as a part of EX-99.CERT. | |
| (b) | Certification of each Principal Executive Officer and Principal Financial Officer of the Registrant as required by Section 906 of the Sarbanes-Oxley Act of 2002 is provided as a part of EX-99.906CERT. |
SIGNATURES
Pursuant to the requirements of the Securities Exchange Act of 1934 and the Investment Company Act of 1940, the Registrant has duly caused this report to be signed on its behalf by the undersigned, thereunto duly authorized.
| LORD ABBETT EQUITY TRUST | |||
| By: | /s/Daria L. Foster | ||
| Daria L. Foster | |||
| President and Chief Executive Officer | |||
| Date: September 30, 2013 | |||
| By: | /s/Joan A. Binstock | ||
| Joan A. Binstock | |||
| Chief Financial Officer and Vice President | |||
| Date: September 30, 2013 | |||
Pursuant to the requirements of the Securities Exchange Act of 1934 and the Investment Company Act of 1940, this report has been signed below by the following persons on behalf of the Registrant and in the capacities and on the dates indicated.
| By: | /s/Daria L. Foster | ||
| Daria L. Foster | |||
| President and Chief Executive Officer | |||
| Date: September 30, 2013 | |||
| By: | /s/Joan A. Binstock | ||
| Joan A. Binstock | |||
| Chief Financial Officer and Vice President | |||
| Date: September 30, 2013 |