UNITED STATES
SECURITIES AND EXCHANGE COMMISSION
Washington, D.C. 20549
FORM N-CSR
CERTIFIED SHAREHOLDER REPORT OF REGISTERED
MANAGEMENT INVESTMENT COMPANIES
Investment Company Act File Number: 811-10371
LORD ABBETT BLEND TRUST
(Exact name of Registrant as specified in charter)
90 Hudson Street, Jersey City, NJ 07302
(Address of principal executive offices) (Zip code)
Thomas R. Phillips, Esq., Vice President & Assistant Secretary
90 Hudson Street, Jersey City, NJ 07302
(Name and address of agent for service)
Registrant’s telephone number, including area code: (800) 201-6984
Date of fiscal year end: 7/31
Date of reporting period: 7/31/2010
| Item 1: | Report to Shareholders. |
2010
LORD ABBETT
ANNUAL
REPORT 
Lord Abbett
Small Cap Blend Fund
For the fiscal year ended July 31, 2010

Lord Abbett Small Cap Blend Fund
Annual Report
For the fiscal year ended July 31, 2010

From left to right: Robert S. Dow, Director and Chairman of the Lord Abbett Funds; E. Thayer Bigelow, Independent Lead Director of the Lord Abbett Funds; and Daria L. Foster, Director and President of the Lord Abbett Funds.
Dear Shareholders: We are pleased to provide you with this overview of Lord Abbett Small Cap Blend Fund’s performance for the fiscal year ended July 31, 2010. On this page and the following pages, we discuss the major factors that influenced performance. For detailed and more timely information about the Fund, please visit our Website at www.lordabbett.com, where you also can access the quarterly commentaries by the Fund’s portfolio managers.
Thank you for investing in Lord Abbett mutual funds. We value the trust that you place in us and look forward to serving your investment needs in the years to come.
Best regards,

Robert S. Dow
Chairman
The Fund returned 6.87%, reflecting performance at the net asset value (NAV) of Class A shares, with all distributions reinvested, compared to its benchmark, the Russell 2000® Index1, which returned 18.43% over the same period.
The Fund underperformed in the fiscal year ended July 31, 2010 due to overall stock selection. For the first nine months of the period, market factors specifically impacted performance. During this time frame, small cap stocks outperformed large cap stocks with the Russell 2000® Index returning 29.73% and the Russell Top 200® Index2 returning 19.76%. This market cap differential held true within the Russell 2000® Index as well with market caps under $500 million up 34.02% versus 29.95% for the overall index. Relative performance in the Fund during this time suffered due to an underweight in securities with market caps under $500 million. Additionally, lower quality stocks performed better within the index as measured by return on equity while the Fund’s strategy focused on higher quality names.
1
Performance was weakest within the information technology, industrials, and health care sectors. Within the information technology sector, FormFactor Inc., a maker of semiconductor probe cards, detracted from performance due to weak earnings and concerns over management’s business model. FTI Consulting, Inc., a business advisory company in the industrials sector, was hindered due to a decline in bankruptcy business. In the health care sector, shares of Amedisys, Inc., a home healthcare provider, suffered as a result of negative press regarding home health reimbursement practices of some major home healthcare providers.
The Fund benefited from stock selection in the consumer staples sector. Shares of Bare Escentuals rose after it was announced that it would be acquired by Shiseido Co., Ltd., a Japanese global cosmetics company. Within the consumer discretionary sector, Deckers Outdoor Corp., a footwear company, performed well due to positive quarterly results and expansion of both its UGG and Teva brands. One of the largest contributors overall was Jones Lang LaSalle Inc., a real estate operations company in the financials sector, which has benefited from revenue growth in the commercial real estate industry.
The Fund’s portfolio is actively managed and, therefore, its holdings and the weightings of a particular issuer or particular sector as a percentage of portfolio assets are subject to change. Sectors may include many industries.
1 The Russell 2000® Index measures the performance of the 2,000 smallest companies in the Russell 3000® Index, which represents approximately 10% of the total market capitalization of the Russell 3000® Index.
2 The Russell Top 200® Index measures the performance of the 200 largest companies in the Russell 1000® Index, which represents approximately 69% of the total market capitalization of the Russell 1000® Index.
Unless otherwise specified, indexes reflect total return, with all dividends reinvested. Indexes are unmanaged, do not reflect the deduction of fees or expenses, and are not available for direct investment.
Important Performance and Other Information Performance data quoted in the following pages reflect past performance and are no guarantee of future results. Current performance may be higher or lower than the performance quoted. The investment return and principal value of an investment in the Fund will fluctuate so that shares, on any given day or when redeemed, may be worth more or less than their original cost. You can obtain performance data current to the most recent month-end by calling Lord Abbett at 888-522-2388 or referring to www.lordabbett.com.
Except where noted, comparative Fund performance does not account for the deduction of sales charges and would be different if sales charges were included. The Fund offers several classes of shares with distinct pricing options. For a full description of the differences in pricing alternatives, please see the Fund’s prospectus.
The views of the Fund’s management and the portfolio holdings described in this report are as of July 31, 2010; these views and portfolio holdings may have changed subsequent to this date, and they do not guarantee the future performance of the markets or the Fund. Information provided in this report should not be considered a recommendation to purchase or sell securities.
A Note about Risk: See Notes to Financial Statements for a discussion of investment risks. For a more detailed discussion of the risks associated with the Fund, please see the Fund’s prospectus.
Mutual funds are not insured by the FDIC, are not deposits or other obligations of, or guaranteed by, banks, and are subject to investment risks, including possible loss of principal amount invested.
2
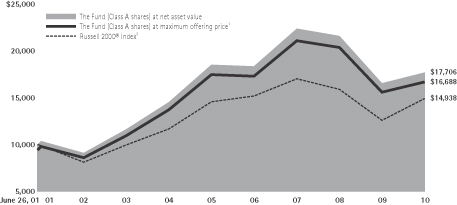
Investment Comparison
Below is a comparison of a $10,000 investment in Class A shares with the same investment in the Russell 2000® Index, assuming reinvestment of all distributions. The performance of other classes will be greater than or less than the performance shown in the graph below due to different sales loads and expenses applicable to such classes. The graph and performance table below do not reflect the deduction of taxes that a shareholder would pay on Fund distributions or the redemption of Fund shares. During certain periods, expenses of the Fund have been waived or reimbursed by Lord Abbett; without such waiver or reimbursement of expenses, the Fund’s returns would have been lower. Past performance is no guarantee of future results.
Average Annual Total Returns at Maximum Applicable
Sales Charge for the Periods Ended July 31, 2010
| 1 Year | 5 Years | Life of Class | ||||
Class A3 | 0.70% | -2.08% | 5.80% | |||
Class B4 | 2.13% | -1.73% | 5.89% | |||
Class C5 | 6.14% | -1.56% | 5.81% | |||
Class F6 | 7.08% | – | -8.49% |
| 1 Year | 5 Years | Life of Class | ||||
Class I7 | 7.25% | -0.57% | 6.82% | |||
Class P8 | 6.71% | -1.02% | 6.44% | |||
Class R29 | 6.56% | – | -6.26% | |||
Class R310 | 6.63% | – | -6.19% |
1 Reflects the deduction of the maximum initial sales charge of 5.75%.
2 Performance of the unmanaged index does not reflect any fees or expenses. The performance of the index is not necessarily representative of the Fund’s performance.
3 Performance is calculated from June 26, 2001. Class A shares were first offered to the public on July 2, 2001. Total return, which is the percent change in net asset value, after deduction of the maximum initial sales charge of 5.75% applicable to Class A Shares, with all distributions reinvested for the periods shown ended July 31, 2010, is calculated using the SEC-required uniform method to compute such return.
4 Performance is calculated from June 26, 2001. Class B shares were first offered to the public on July 2, 2001. Performance reflects the deduction of a CDSC of 4% for 1 year, 1% for 5 years and 0% for life of the Class. Class B shares automatically convert to Class A shares after approximately 8 years. (There is no initial sales charge for automatic conversions.) All returns for periods greater than 8 years reflect this conversion.
5 Performance is calculated from June 26, 2001. Class C shares were first offered to the public on July 2, 2001. The 1% CDSC for Class C shares normally applies before the first anniversary of the purchase date. Performance is at net asset value.
6 Class F shares commenced operations and performance for the Class began on September 28, 2007. Performance is at net asset value.
7 Performance is calculated from June 26, 2001. Class I shares were first offered to the public on July 2, 2001. Performance is at net asset value.
8 Performance is calculated from June 26, 2001. Class P shares were first offered to the public on July 2, 2001. Performance is at net asset value.
9 Class R2 shares commenced operations on March 24, 2008. Performance for the Class began March 31, 2008. Performance is at net asset value.
10 Class R3 shares commenced operations on March 24, 2008. Performance for the Class began March 31, 2008. Performance is at net asset value.
3
Expense Example
As a shareholder of the Fund, you incur two types of costs: (1) transaction costs, including sales charges (loads) on purchase payments (these charges vary among the share classes); and (2) ongoing costs, including management fees; distribution and service (12b-1) fees (these charges vary among the share classes); and other Fund expenses. This Example is intended to help you understand your ongoing costs (in dollars) of investing in the Fund and to compare these costs with the ongoing costs of investing in other mutual funds.
The Example is based on an investment of $1,000 invested at the beginning of the period and held for the entire period (February 1, 2010 through July 31, 2010).
Actual Expenses
For each class of the Fund, the first line of the table on the following page provides information about actual account values and actual expenses. You may use the information in this line, together with the amount you invested, to estimate the expenses that you paid over the period. Simply divide your account value by $1,000 (for example, an $8,600 account value divided by $1,000 = 8.6), then multiply the result by the number in the first line under the heading titled “Expenses Paid During the Period 2/1/10 – 7/31/10” to estimate the expenses you paid on your account during this period.
Hypothetical Example for Comparison Purposes
For each class of the Fund, the second line of the table on the following page provides information about hypothetical account values and hypothetical expenses based on the Fund’s actual expense ratio and an assumed rate of return of 5% per year before expenses, which is not the Fund’s actual return. The hypothetical account values and expenses may not be used to estimate the actual ending account balance or expenses you paid for the period. You may use this information to compare the ongoing costs of investing in the Fund and other funds. To do so, compare this 5% hypothetical example with the 5% hypothetical examples that appear in the shareholder reports of the other funds.
4
Please note that the expenses shown in the table are meant to highlight your ongoing costs only and do not reflect any transactional costs, such as sales charges (loads). Therefore, the second line of the table is useful in comparing ongoing costs only, and will not help you determine the relative total costs of owning different funds. In addition, if these transactional costs were included, your costs would have been higher.
| Beginning Account Value | Ending Account Value | Expenses Paid During Period† | |||||||
| 2/1/10 | 7/31/10 | 2/1/10 - 7/31/10 | |||||||
Class A | |||||||||
Actual | $ | 1,000.00 | $ | 996.90 | $ | 6.63 | |||
Hypothetical (5% Return Before Expenses) | $ | 1,000.00 | $ | 1,018.17 | $ | 6.71 | |||
Class B | |||||||||
Actual | $ | 1,000.00 | $ | 993.40 | $ | 9.84 | |||
Hypothetical (5% Return Before Expenses) | $ | 1,000.00 | $ | 1,014.93 | $ | 9.94 | |||
Class C | |||||||||
Actual | $ | 1,000.00 | $ | 993.40 | $ | 9.84 | |||
Hypothetical (5% Return Before Expenses) | $ | 1,000.00 | $ | 1,014.93 | $ | 9.94 | |||
Class F | |||||||||
Actual | $ | 1,000.00 | $ | 997.70 | $ | 5.40 | |||
Hypothetical (5% Return Before Expenses) | $ | 1,000.00 | $ | 1,019.41 | $ | 5.46 | |||
Class I | |||||||||
Actual | $ | 1,000.00 | $ | 998.50 | $ | 4.91 | |||
Hypothetical (5% Return Before Expenses) | $ | 1,000.00 | $ | 1,019.90 | $ | 4.96 | |||
Class P | |||||||||
Actual | $ | 1,000.00 | $ | 996.10 | $ | 7.13 | |||
Hypothetical (5% Return Before Expenses) | $ | 1,000.00 | $ | 1,017.67 | $ | 7.20 | |||
Class R2 | |||||||||
Actual | $ | 1,000.00 | $ | 995.30 | $ | 7.87 | |||
Hypothetical (5% Return Before Expenses) | $ | 1,000.00 | $ | 1,016.92 | $ | 7.95 | |||
Class R3 | |||||||||
Actual | $ | 1,000.00 | $ | 996.10 | $ | 7.32 | |||
Hypothetical (5% Return Before Expenses) | $ | 1,000.00 | $ | 1,017.44 | $ | 7.40 | |||
| † | For each class of the Fund, net expenses are equal to the annualized expense ratio for such class (1.34% for Class A, 1.99% for Classes B and C, 1.09% for Class F, 0.99% for Class I, 1.44% for Class P, 1.59% for Class R2 and 1.48% for Class R3) multiplied by the average account value over the period, multiplied by 181/365 (to reflect one-half year period). |
Portfolio Holdings Presented by Sector
July 31, 2010
| Sector* | %** | Sector* | %** | |||||
Consumer Discretionary | 15.40% | Industrials | 27.27% | |||||
Consumer Staples | 2.04% | Information Technology | 13.55% | |||||
Energy | 2.94% | Materials | 4.69% | |||||
Financials | 18.55% | Short-Term Investment | 3.00% | |||||
Health Care | 12.56% | Total | 100.00% |
| * | A sector may comprise several industries. |
| ** | Represents percent of total investments. |
5
Schedule of Investments
July 31, 2010
| Investments | Shares | Value (000) | |||
| COMMON STOCKS 97.85% | |||||
| Aerospace & Defense 3.36% | |||||
| Curtiss-Wright Corp. | 422,578 | $ | 12,800 | ||
| HEICO Corp. | 254,303 | 10,053 | |||
| HEICO Corp. Class A | 201,622 | 5,823 | |||
| Moog, Inc. Class A* | 362,347 | 12,976 | |||
| Total | 41,652 | ||||
| Beverages 1.13% | |||||
| Hansen Natural Corp.* | 333,000 | 13,949 | |||
| Capital Markets 1.86% | |||||
| OptionsXpress Holdings, Inc.* | 1,479,402 | 23,079 | |||
| Chemicals 1.82% | |||||
| Kraton Performance Polymers, Inc.* | 836,100 | 19,615 | |||
| Spartech Corp.* | 273,300 | 2,859 | |||
| Total | 22,474 | ||||
| Commercial Banks 9.79% | |||||
| Astoria Financial Corp. | 1,365,800 | 18,083 | |||
| Columbia Banking System, Inc. | 565,154 | 10,331 | |||
| First Financial Bancorp | 412,400 | 6,557 | |||
| Home BancShares, Inc. | 432,430 | 10,391 | |||
| IBERIABANK Corp. | 348,496 | 18,108 | |||
| PacWest Bancorp | 698,979 | 14,630 | |||
| SCBT Financial Corp. | 220,753 | 7,115 | |||
| Washington Banking Co. | 266,400 | 3,839 | |||
| Webster Financial Corp. | 902,400 | 16,821 | |||
| Wintrust Financial Corp. | 494,700 | 15,395 | |||
| Total | 121,270 | ||||
| Commercial Services & Supplies 4.55% | |||||
| Herman Miller, Inc. | 940,900 | 16,183 | |||
| Steelcase, Inc. Class A | 2,398,800 | 16,576 | |||
| Sykes Enterprises, Inc.* | 1,487,974 | 23,584 | |||
| Total | 56,343 | ||||
| Investments | Shares | Value (000) | |||
| Computers & Peripherals 1.26% | |||||
| Stratasys, Inc.* | 687,977 | $ | 15,624 | ||
| Diversified Consumer Services 2.67% | |||||
| American Public Education, Inc.* | 378,615 | 16,909 | |||
| Lincoln Educational Services Corp.* | 768,500 | 16,208 | |||
| Total | 33,117 | ||||
| Electrical Equipment 5.63% | |||||
| A. O. Smith Corp. | 355,813 | 19,456 | |||
| Belden, Inc. | 489,700 | 11,699 | |||
| Regal-Beloit Corp. | 342,593 | 20,840 | |||
| Thomas & Betts Corp.* | 447,581 | 17,742 | |||
| Total | 69,737 | ||||
| Electronic Equipment, Instruments & Components 3.22% | |||||
| FARO Technologies, Inc.* | 779,449 | 16,033 | |||
| Plexus Corp.* | 107,200 | 3,130 | |||
| Rogers Corp.* | 49,000 | 1,517 | |||
| ScanSource, Inc.* | 696,007 | 19,196 | |||
| Total | 39,876 | ||||
| Exchange Traded Fund 0.53% | |||||
| iShares Russell 2000 Index Fund ETF | 100,100 | 6,513 | |||
| Food Products 0.94% | |||||
| J & J Snack Foods Corp. | 278,337 | 11,609 | |||
| Health Care Equipment & Supplies 2.59% | |||||
| Cooper Cos., Inc. (The) | 605,087 | 23,514 | |||
| Gen-Probe, Inc.* | 130,406 | 5,864 | |||
| Masimo Corp. | 117,600 | 2,714 | |||
| Total | 32,092 | ||||
| Health Care Providers & Services 6.03% | |||||
| Catalyst Health Solutions, Inc.* | 245,516 | 8,490 | |||
See Notes to Financial Statements.
6
Schedule of Investments (continued)
July 31, 2010
| Investments | Shares | Value (000) | |||
| Health Care Providers & Services (continued) | |||||
| Centene Corp.* | 708,571 | $ | 15,100 | ||
| LifePoint Hospitals, Inc.* | 477,470 | 14,759 | |||
| MEDNAX, Inc.* | 241,000 | 11,363 | |||
| PSS World Medical, Inc.* | 885,500 | 16,665 | |||
| VCA Antech, Inc.* | 397,191 | 8,277 | |||
| Total | 74,654 | ||||
| Hotels, Restaurants & Leisure 3.15% | |||||
| Buffalo Wild Wings, Inc.* | 497,900 | 21,230 | |||
| Papa John’s International, Inc.* | 702,600 | 17,797 | |||
| Total | 39,027 | ||||
| Information Technology Services 1.23% | |||||
| Acxiom Corp.* | 995,600 | 15,273 | |||
| Insurance 2.29% | |||||
| RLI Corp. | 227,000 | 12,596 | |||
| Tower Group, Inc. | 730,473 | 15,742 | |||
| Total | 28,338 | ||||
| Life Sciences Tools & Services 4.05% | |||||
| ICON plc ADR* | 779,097 | 18,387 | |||
| PerkinElmer, Inc. | 821,300 | 15,982 | |||
| Techne Corp. | 269,450 | 15,736 | |||
| Total | 50,105 | ||||
| Machinery 5.53% | |||||
| Briggs & Stratton Corp. | 1,179,000 | 22,366 | |||
| CLARCOR, Inc. | 684,998 | 25,701 | |||
| Graco, Inc. | 208,500 | 6,582 | |||
| IDEX Corp. | 429,600 | 13,820 | |||
| Total | 68,469 | ||||
| Media 1.36% | |||||
| John Wiley & Sons, Inc. Class A | 427,800 | 16,847 | |||
| Investments | Shares | Value (000) | |||
| Metals & Mining 2.17% | |||||
| Commercial Metals Co. | 420,500 | $ | 6,051 | ||
| Metals USA Holdings Corp.* | 478,000 | 5,922 | |||
| Noranda Aluminum Holding Corp.* | 617,600 | 4,891 | |||
| Reliance Steel & Aluminum Co. | 253,200 | 9,946 | |||
| Total | 26,810 | ||||
| Oil, Gas & Consumable Fuels 2.97% | |||||
| Comstock Resources, Inc.* | 514,146 | 13,013 | |||
| EXCO Resources, Inc. | 1,636,100 | 23,740 | |||
| Total | 36,753 | ||||
| Paper & Forest Products 0.75% | |||||
| Buckeye Technologies, Inc.* | 818,177 | 9,286 | |||
| Professional Services 3.90% | |||||
| Kforce, Inc.*(a) | 2,017,511 | 27,257 | |||
| Robert Half International, Inc. | 836,852 | 21,072 | |||
| Total | 48,329 | ||||
| Real Estate Investment Trusts 1.39% | |||||
| DiamondRock Hospitality Co.* | 860,100 | 7,982 | |||
| LaSalle Hotel Properties | 386,900 | 9,177 | |||
| Total | 17,159 | ||||
| Real Estate Management & Development 1.81% | |||||
| Jones Lang LaSalle, Inc. | 289,386 | 22,416 | |||
| Road & Rail 1.72% | |||||
| Knight Transportation, Inc. | 1,015,700 | 21,248 | |||
| Semiconductors & Semiconductor Equipment 7.13% | |||||
| Atheros Communications, Inc.* | 295,800 | 7,821 | |||
See Notes to Financial Statements.
7
Schedule of Investments (concluded)
July 31, 2010
| Investments | Shares | Value (000) | |||
| Semiconductors & Semiconductor Equipment (continued) | |||||
| NetLogic Microsystems, Inc.* | 416,200 | $ | 12,303 | ||
| Power Integrations, Inc. | 537,715 | 19,008 | |||
| Rudolph Technologies, Inc.* | 823,500 | 7,115 | |||
| Semtech Corp.* | 1,235,063 | 21,465 | |||
| Silicon Laboratories, Inc.* | 220,100 | 8,815 | |||
| Verigy Ltd. (Singapore)*(b) | 1,325,060 | 11,793 | |||
| Total | 88,320 | ||||
| Software 0.82% | |||||
| Solera Holdings, Inc. | 266,779 | 10,132 | |||
| Specialty Retail 6.66% | |||||
| Aaron’s, Inc. | 1,142,547 | 20,749 | |||
| Citi Trends, Inc.* | 509,600 | 15,996 | |||
| Guess?, Inc. | 522,100 | 18,639 | |||
| Kirkland’s, Inc.* | 890,800 | 15,019 | |||
| Select Comfort Corp.* | 1,540,400 | 12,015 | |||
| Total | 82,418 | ||||
| Textiles, Apparel & Luxury Goods 1.69% | |||||
| Deckers Outdoor Corp.* | 410,700 | 20,901 | |||
| Thrifts & Mortgage Finance 1.04% | |||||
| Ocwen Financial Corp.* | 1,220,400 | 12,887 | |||
| Trading Companies & Distributors 2.81% | |||||
| DXP Enterprises, Inc.* | 141,273 | 2,900 | |||
| Rush Enterprises, Inc. Class A* | 400,211 | 5,979 | |||
| Watsco, Inc. | 465,446 | 25,930 | |||
| Total | 34,809 | ||||
| Total Common Stocks (cost $1,160,080,125) | 1,211,516 | ||||
| Investments | Principal Amount (000) | Value (000) | |||||
| SHORT-TERM INVESTMENT 3.03% | |||||||
| Repurchase Agreement | |||||||
| Repurchase Agreement dated 7/30/2010, 0.02% due 8/2/2010 with Fixed Income Clearing Corp. collateralized by $38,375,000 of Federal National Mortgage Assoc. at 0.25% due 5/2/2011; value: $38,279,063; proceeds: $37,527,173 (cost $37,527,110) | $ | 37,527 | $ | 37,527 | |||
| Total Investments in Securities 100.88% (cost $1,197,607,235) | 1,249,043 | ||||||
| Liabilities in Excess of Other Assets (0.88%) | (10,864 | ) | |||||
| Net Assets 100.00% | $ | 1,238,179 | |||||
| ADR | American Depositary Receipt. | |
| ETF | Exchange Traded Fund. | |
| * | Non-income producing security. | |
| (a) | Affiliated issuer (holding represents 5% or more of the underlying issuer’s outstanding voting shares). (See Note 9). | |
| (b) | Foreign security traded in U.S. dollars. |
See Notes to Financial Statements.
8
Statement of Assets and Liabilities
July 31, 2010
ASSETS: | ||||
Investments in unaffiliated issuers, at value (cost $1,171,872,838) | $ | 1,221,786,359 | ||
Investment in affiliated issuer, at value (cost $25,734,397) | 27,256,574 | |||
Receivables: | ||||
Investment securities sold | 8,723,438 | |||
Capital shares sold | 716,034 | |||
Interest and dividends | 217,662 | |||
Prepaid expenses and other assets | 145,993 | |||
Total assets | 1,258,846,060 | |||
LIABILITIES: | ||||
Payables: | ||||
Investment securities purchased | 17,081,718 | |||
Capital shares reacquired | 1,466,969 | |||
Management fee | 772,450 | |||
12b-1 distribution fees | 547,826 | |||
Trustees’ fees | 136,254 | |||
Fund administration | 41,713 | |||
To affiliate (See Note 3) | 11,007 | |||
Accrued expenses and other liabilities | 608,926 | |||
Total liabilities | 20,666,863 | |||
NET ASSETS | $ | 1,238,179,197 | ||
COMPOSITION OF NET ASSETS: | ||||
Paid-in capital | $ | 1,509,259,724 | ||
Accumulated net investment loss | (136,254 | ) | ||
Accumulated net realized loss on investments | (322,379,971 | ) | ||
Net unrealized appreciation on investments | 51,435,698 | |||
Net Assets | $ | 1,238,179,197 |
See Notes to Financial Statements.
9
Statement of Assets and Liabilities (concluded)
July 31, 2010
Net assets by class: | |||
Class A Shares | $ | 494,581,033 | |
Class B Shares | $ | 33,598,558 | |
Class C Shares | $ | 118,244,093 | |
Class F Shares | $ | 14,468,985 | |
Class I Shares | $ | 450,907,737 | |
Class P Shares | $ | 109,109,112 | |
Class R2 Shares | $ | 754,174 | |
Class R3 Shares | $ | 16,515,505 | |
Outstanding shares by class (unlimited number of authorized shares of beneficial interest, no par value): | |||
Class A Shares | 38,312,769 | ||
Class B Shares | 2,774,218 | ||
Class C Shares | 9,773,858 | ||
Class F Shares | 1,113,074 | ||
Class I Shares | 33,848,498 | ||
Class P Shares | 8,461,844 | ||
Class R2 Shares | 58,712 | ||
Class R3 Shares | 1,284,072 | ||
Net asset value, offering and redemption price per share | |||
Class A Shares-Net asset value | $12.91 | ||
Class A Shares-Maximum offering price | $13.70 | ||
Class B Shares-Net asset value | $12.11 | ||
Class C Shares-Net asset value | $12.10 | ||
Class F Shares-Net asset value | $13.00 | ||
Class I Shares-Net asset value | $13.32 | ||
Class P Shares-Net asset value | $12.89 | ||
Class R2 Shares-Net asset value | $12.85 | ||
Class R3 Shares-Net asset value | $12.86 |
See Notes to Financial Statements.
10
Statement of Operations
For the Year Ended July 31, 2010
Investment income: | ||||
Dividends | $ | 8,877,764 | ||
Interest and other | 4,815 | |||
Total investment income | 8,882,579 | |||
Expenses: | ||||
Management fee | 9,733,360 | |||
12b-1 distribution plan-Class A | 1,872,946 | |||
12b-1 distribution plan-Class B | 425,790 | |||
12b-1 distribution plan-Class C | 1,388,043 | |||
12b-1 distribution plan-Class F | 12,762 | |||
12b-1 distribution plan-Class P | 544,414 | |||
12b-1 distribution plan-Class R2 | 4,805 | |||
12b-1 distribution plan-Class R3 | 44,581 | |||
Shareholder servicing | 2,309,920 | |||
Fund administration | 527,621 | |||
Subsidy (See Note 3) | 164,617 | |||
Reports to shareholders | 123,318 | |||
Registration | 121,231 | |||
Professional | 60,683 | |||
Trustees’ fees | 37,751 | |||
Custody | 27,290 | |||
Other | 51,524 | |||
Gross expenses | 17,450,656 | |||
Expense reductions (See Note 7) | (693 | ) | ||
Net expenses | 17,449,963 | |||
Net investment loss | (8,567,384 | ) | ||
Net realized and unrealized gain: | ||||
Net realized gain on investments in unaffiliated issuers | 38,188,331 | |||
Net realized gain on investment in affiliated issuer (See Note 9) | 37,825 | |||
Net change in unrealized appreciation/depreciation on investments | 55,988,629 | |||
Net realized and unrealized gain | 94,214,785 | |||
Net Increase in Net Assets Resulting From Operations | $ | 85,647,401 |
See Notes to Financial Statements.
11
Statements of Changes in Net Assets
| DECREASE IN NET ASSETS | For the Year Ended July 31, 2010 | For the Year Ended July 31, 2009 | ||||||
Operations: | ||||||||
Net investment loss | $ | (8,567,384 | ) | $ | (8,220,455 | ) | ||
Net realized gain (loss) on investments | 38,226,156 | (312,072,921 | ) | |||||
Net change in unrealized appreciation/depreciation on investments | 55,988,629 | (69,108,769 | ) | |||||
Net increase (decrease) in net assets resulting from operations | 85,647,401 | (389,402,145 | ) | |||||
Capital share transactions (Net of share conversions) (See Note 12): |
| |||||||
Net proceeds from sales of shares | 236,703,305 | 337,416,765 | ||||||
Cost of shares reacquired | (327,481,304 | ) | (346,700,841 | ) | ||||
Net decrease in net assets resulting from capital share transactions | (90,777,999 | ) | (9,284,076 | ) | ||||
Net decrease in net assets | (5,130,598 | ) | (398,686,221 | ) | ||||
NET ASSETS: | ||||||||
Beginning of year | $ | 1,243,309,795 | $ | 1,641,996,016 | ||||
End of year | $ | 1,238,179,197 | $ | 1,243,309,795 | ||||
Accumulated net investment loss | $ | (136,254 | ) | $ | (127,489 | ) | ||
See Notes to Financial Statements.
12
Financial Highlights
| Class A Shares | |||||||||||||||
| Year Ended 7/31 | |||||||||||||||
| 2010 | 2009 | 2008 | 2007 | 2006 | |||||||||||
Per Share Operating Performance |
| ||||||||||||||
Net asset value, beginning of year | $12.08 | $15.76 | $18.69 | $16.08 | $16.71 | ||||||||||
Investment operations: | |||||||||||||||
Net investment loss(a) | (.09 | ) | (.08 | ) | (.11 | ) | (.13 | ) | (.12 | ) | |||||
Net realized and unrealized gain (loss) | .92 | (3.60 | ) | (.55 | ) | 3.60 | (.03 | ) | |||||||
Total from investment operations | .83 | (3.68 | ) | (.66 | ) | 3.47 | (.15 | ) | |||||||
Distributions to shareholders from: | |||||||||||||||
Net realized gain | – | – | (2.27 | ) | (.86 | ) | (.48 | ) | |||||||
Net asset value, end of year | $12.91 | $12.08 | $15.76 | $18.69 | $16.08 | ||||||||||
Total Return(b) | 6.87 | % | (23.35 | )% | (3.51 | )% | 22.05 | % | (.99 | )% | |||||
Ratios to Average Net Assets: | |||||||||||||||
Expenses, including expense reductions | 1.35 | % | 1.40 | % | 1.36 | % | 1.36 | % | 1.38 | % | |||||
Expenses, excluding expense reductions | 1.35 | % | 1.40 | % | 1.36 | % | 1.36 | % | 1.38 | % | |||||
Net investment loss | (.67 | )% | (.70 | )% | (.69 | )% | (.74 | )% | (.71 | )% | |||||
| Supplemental Data: | |||||||||||||||
Net assets, end of year (000) | $494,581 | $508,663 | $739,334 | $828,469 | $767,283 | ||||||||||
Portfolio turnover rate | 67.29 | % | 42.78 | % | 53.71 | % | 59.23 | % | 55.39 | % | |||||
| (a) | Calculated using average shares outstanding during the year. |
| (b) | Total return does not consider the effects of sales loads and assumes the reinvestment of all distributions. |
See Notes to Financial Statements.
13
Financial Highlights (continued)
| Class B Shares | |||||||||||||||
| Year Ended 7/31 | |||||||||||||||
| 2010 | 2009 | 2008 | 2007 | 2006 | |||||||||||
Per Share Operating Performance | |||||||||||||||
Net asset value, beginning of year | $11.41 | $14.98 | $17.99 | $15.60 | $16.34 | ||||||||||
Investment operations: | |||||||||||||||
Net investment loss(a) | (.17 | ) | (.15 | ) | (.21 | ) | (.24 | ) | (.23 | ) | |||||
Net realized and unrealized gain (loss) | .87 | (3.42 | ) | (.53 | ) | 3.49 | (.03 | ) | |||||||
Total from investment | .70 | (3.57 | ) | (.74 | ) | 3.25 | (.26 | ) | |||||||
Distributions to shareholders from: | |||||||||||||||
Net realized gain | – | – | (2.27 | ) | (.86 | ) | (.48 | ) | |||||||
Net asset value, end of year | $12.11 | $11.41 | $14.98 | $17.99 | $15.60 | ||||||||||
Total Return(b) | 6.13 | % | (23.83 | )% | (4.15 | )% | 21.29 | % | (1.70 | )% | |||||
Ratios to Average Net Assets: | |||||||||||||||
Expenses, including expense reductions | 2.00 | % | 2.05 | % | 2.01 | % | 2.01 | % | 2.02 | % | |||||
Expenses, excluding expense reductions | 2.00 | % | 2.05 | % | 2.01 | % | 2.01 | % | 2.02 | % | |||||
Net investment loss | (1.33 | )% | (1.36 | )% | (1.34 | )% | (1.39 | )% | (1.36 | )% | |||||
| Supplemental Data: | |||||||||||||||
Net assets, end of year (000) | $33,599 | $44,468 | $71,936 | $89,990 | $89,943 | ||||||||||
Portfolio turnover rate | 67.29 | % | 42.78 | % | 53.71 | % | 59.23 | % | 55.39 | % | |||||
| (a) | Calculated using average shares outstanding during the year. |
| (b) | Total return does not consider the effects of sales loads and assumes the reinvestment of all distributions. |
See Notes to Financial Statements.
14
Financial Highlights (continued)
| Class C Shares | |||||||||||||||
| Year Ended 7/31 | |||||||||||||||
| 2010 | 2009 | 2008 | 2007 | 2006 | |||||||||||
Per Share Operating Performance |
| ||||||||||||||
Net asset value, beginning of year | $11.40 | $14.96 | $17.97 | $15.59 | $16.32 | ||||||||||
Investment operations: | |||||||||||||||
Net investment loss(a) | (.16 | ) | (.15 | ) | (.21 | ) | (.24 | ) | (.23 | ) | |||||
Net realized and unrealized gain (loss) | .86 | (3.41 | ) | (.53 | ) | 3.48 | (.02 | ) | |||||||
Total from investment operations | .70 | (3.56 | ) | (.74 | ) | 3.24 | (.25 | ) | |||||||
Distributions to shareholders from: | |||||||||||||||
Net realized gain | – | – | (2.27 | ) | (.86 | ) | (.48 | ) | |||||||
Net asset value, end of year | $12.10 | $11.40 | $14.96 | $17.97 | $15.59 | ||||||||||
Total Return(b) | 6.14 | % | (23.80 | )% | (4.16 | )% | 21.24 | % | (1.64 | )% | |||||
Ratios to Average Net Assets: | |||||||||||||||
Expenses, including expense reductions | 2.00 | % | 2.05 | % | 2.01 | % | 2.01 | % | 2.02 | % | |||||
Expenses, excluding expense reductions | 2.00 | % | 2.05 | % | 2.01 | % | 2.01 | % | 2.02 | % | |||||
Net investment loss | (1.33 | )% | (1.36 | )% | (1.34 | )% | (1.39 | )% | (1.36 | )% | |||||
| Supplemental Data: | |||||||||||||||
Net assets, end of year (000) | $118,244 | $141,177 | $227,183 | $292,438 | $317,028 | ||||||||||
Portfolio turnover rate | 67.29 | % | 42.78 | % | 53.71 | % | 59.23 | % | 55.39 | % | |||||
| (a) | Calculated using average shares outstanding during the year. |
| (b) | Total return does not consider the effects of sales loads and assumes the reinvestment of all distributions. |
See Notes to Financial Statements.
15
Financial Highlights (continued)
| Class F Shares | |||||||||
| Year Ended 7/31 | 9/28/2007(a) 7/31/2008 | ||||||||
| 2010 | 2009 | ||||||||
Per Share Operating Performance | |||||||||
Net asset value, beginning of period | $12.14 | $15.79 | $19.14 | ||||||
Investment operations: | |||||||||
Net investment loss(b) | (.06 | ) | (.05 | ) | (.02 | ) | |||
Net realized and unrealized gain (loss) | .92 | (3.60 | ) | (1.06 | ) | ||||
Total from investment operations | .86 | (3.65 | ) | (1.08 | ) | ||||
Distributions to shareholders from: | |||||||||
Net realized gain | – | – | (2.27 | ) | |||||
Net asset value, end of period | $13.00 | $12.14 | $15.79 | ||||||
Total Return(c) | 7.08 | % | (23.12 | )% | (5.60 | )%(d) | |||
Ratios to Average Net Assets: | |||||||||
Expenses, including expense reductions | 1.10 | % | 1.14 | % | .90 | %(d) | |||
Expenses, excluding expense reductions | 1.10 | % | 1.14 | % | .90 | %(d) | |||
Net investment loss | (.43 | )% | (.41 | )% | (.14 | )%(d) | |||
| Supplemental Data: | |||||||||
Net assets, end of period (000) | $14,469 | $9,920 | $5,703 | ||||||
Portfolio turnover rate | 67.29 | % | 42.78 | % | 53.71 | % | |||
| (a) | Commencement of investment operations was 9/28/2007, SEC effective date was 9/14/2007 and date shares first became available to the public was 10/1/2007. |
| (b) | Calculated using average shares outstanding during the period. |
| (c) | Total return assumes the reinvestment of all distributions. |
| (d) | Not annualized. |
See Notes to Financial Statements.
16
Financial Highlights (continued)
| Class I Shares | |||||||||||||||
| Year Ended 7/31 | |||||||||||||||
| 2010 | 2009 | 2008 | 2007 | 2006 | |||||||||||
Per Share Operating Performance |
| ||||||||||||||
Net asset value, beginning of year | $12.42 | $16.15 | $19.03 | $16.31 | $16.88 | ||||||||||
Investment operations: | |||||||||||||||
Net investment loss(a) | (.04 | ) | (.04 | ) | (.06 | ) | (.07 | ) | (.06 | ) | |||||
Net realized and unrealized gain (loss) | .94 | (3.69 | ) | (.55 | ) | 3.65 | (.03 | ) | |||||||
Total from investment operations | .90 | (3.73 | ) | (.61 | ) | 3.58 | (.09 | ) | |||||||
Distributions to shareholders from: | |||||||||||||||
Net realized gain | — | — | (2.27 | ) | (.86 | ) | (.48 | ) | |||||||
Net asset value, end of year | $13.32 | $12.42 | $16.15 | $19.03 | $16.31 | ||||||||||
Total Return(b) | 7.25 | % | (23.10 | )% | (3.16 | )% | 22.43 | % | (.61 | )% | |||||
Ratios to Average Net Assets: | |||||||||||||||
Expenses, including expense reductions | 1.00 | % | 1.05 | % | 1.01 | % | 1.01 | % | 1.03 | % | |||||
Expenses, excluding expense reductions | 1.00 | % | 1.05 | % | 1.01 | % | 1.01 | % | 1.03 | % | |||||
Net investment loss | (.32 | )% | (.34 | )% | (.34 | )% | (.39 | )% | (.36 | )% | |||||
| Supplemental Data: | |||||||||||||||
Net assets, end of year (000) | $450,908 | $421,430 | $461,503 | $369,670 | $258,461 | ||||||||||
Portfolio turnover rate | 67.29 | % | 42.78 | % | 53.71 | % | 59.23 | % | 55.39 | % | |||||
| (a) | Calculated using average shares outstanding during the year. |
| (b) | Total return assumes the reinvestment of all distributions. |
See Notes to Financial Statements.
17
Financial Highlights (continued)
| Class P Shares | |||||||||||||||
| Year Ended 7/31 | |||||||||||||||
| 2010 | 2009 | 2008 | 2007 | 2006 | |||||||||||
Per Share Operating Performance |
| ||||||||||||||
Net asset value, beginning of year | $12.08 | $15.77 | $18.72 | $16.12 | $16.77 | ||||||||||
Investment operations: | |||||||||||||||
Net investment loss(a) | (.10 | ) | (.09 | ) | (.13 | ) | (.15 | ) | (.14 | ) | |||||
Net realized and unrealized gain (loss) | .91 | (3.60 | ) | (.55 | ) | 3.61 | (.03 | ) | |||||||
Total from investment operations | .81 | (3.69 | ) | (.68 | ) | 3.46 | (.17 | ) | |||||||
Distributions to shareholders from: | |||||||||||||||
Net realized gain | — | — | (2.27 | ) | (.86 | ) | (.48 | ) | |||||||
Net asset value, end of year | $12.89 | $12.08 | $15.77 | $18.72 | $16.12 | ||||||||||
Total Return(b) | 6.71 | % | (23.40 | )% | (3.62 | )% | 21.93 | % | (1.11 | )% | |||||
Ratios to Average Net Assets: | |||||||||||||||
Expenses, including expense reductions | 1.45 | % | 1.50 | % | 1.46 | % | 1.46 | % | 1.48 | % | |||||
Expenses, excluding expense reductions | 1.45 | % | 1.50 | % | 1.46 | % | 1.46 | % | 1.48 | % | |||||
Net investment loss | (.78 | )% | (.79 | )% | (.79 | )% | (.84 | )% | (.80 | )% | |||||
| Supplemental Data: | |||||||||||||||
Net assets, end of year (000) | $109,109 | $114,373 | $136,221 | $111,015 | $80,298 | ||||||||||
Portfolio turnover rate | 67.29 | % | 42.78 | % | 53.71 | % | 59.23 | % | 55.39 | % | |||||
| (a) | Calculated using average shares outstanding during the year. |
| (b) | Total return assumes the reinvestment of all distributions. |
See Notes to Financial Statements.
18
Financial Highlights (continued)
| Class R2 Shares | |||||||||
| Year Ended 7/31 | 3/24/2008(a) 7/31/2008 | ||||||||
| 2010 | 2009 | ||||||||
Per Share Operating Performance | |||||||||
Net asset value, beginning of period | $12.05 | $15.75 | $14.99 | ||||||
Investment operations: | |||||||||
Net investment loss(b) | (.12 | ) | (.09 | ) | (.03 | ) | |||
Net realized and unrealized gain (loss) | .92 | (3.61 | ) | .79 | (c) | ||||
Total from investment operations | .80 | (3.70 | ) | .76 | |||||
Net asset value, end of period | $12.85 | $12.05 | $15.75 | ||||||
Total Return(d) | 6.56 | % | (23.49 | )% | 5.07 | %(e) | |||
Ratios to Average Net Assets: | |||||||||
Expenses, including expense reductions | 1.60 | % | 1.64 | % | .46 | %(e) | |||
Expenses, excluding expense reductions | 1.60 | % | 1.64 | % | .46 | %(e) | |||
Net investment loss | (.93 | )% | (.84 | )% | (.22 | )%(e) | |||
| Supplemental Data: | |||||||||
Net assets, end of period (000) | $754 | $709 | $11 | ||||||
Portfolio turnover rate | 67.29 | % | 42.78 | % | 53.71 | % | |||
| (a) | Commencement of investment operations was 3/24/2008, SEC effective date was 9/14/2007 and date shares first became available to the public was 4/1/2008. |
| (b) | Calculated using average shares outstanding during the period. |
| (c) | The per share amount does not represent the net realized and unrealized gain (loss) as presented on the Statement of Operations for the period due to the timing of sales of Fund shares and the amount of per share realized and unrealized gains and losses at such time. |
| (d) | Total return assumes the reinvestment of all distributions. |
| (e) | Not annualized. |
See Notes to Financial Statements.
19
Financial Highlights (concluded)
| Class R3 Shares | |||||||||
| Year Ended 7/31 | 3/24/2008(a) 7/31/2008 | ||||||||
| 2010 | 2009 | ||||||||
Per Share Operating Performance | |||||||||
Net asset value, beginning of period | $12.05 | $15.74 | $14.99 | ||||||
Investment operations: | |||||||||
Net investment loss(b) | (.11 | ) | (.08 | ) | (.05 | ) | |||
Net realized and unrealized gain (loss) | .92 | (3.61 | ) | .80 | (c) | ||||
Total from investment operations | .81 | (3.69 | ) | .75 | |||||
Net asset value, end of period | $12.86 | $12.05 | $15.74 | ||||||
Total Return(d) | 6.63 | % | (23.38 | )% | 5.00 | %(e) | |||
Ratios to Average Net Assets: | |||||||||
Expenses, including expense reductions | 1.49 | % | 1.52 | % | .53 | %(e) | |||
Expenses, excluding expense reductions | 1.49 | % | 1.52 | % | .53 | %(e) | |||
Net investment loss | (.81 | )% | (.76 | )% | (.29 | )%(e) | |||
| Supplemental Data: | |||||||||
Net assets, end of period (000) | $16,516 | $2,568 | $105 | ||||||
Portfolio turnover rate | 67.29 | % | 42.78 | % | 53.71 | % | |||
| (a) | Commencement of investment operations was 3/24/2008, SEC effective date was 9/14/2007 and date shares first became available to the public was 4/1/2008. |
| (b) | Calculated using average shares outstanding during the period. |
| (c) | The per share amount does not represent the net realized and unrealized gain (loss) as presented on the Statement of Operations for the period due to the timing of sales of Fund shares and the amount of per share realized and unrealized gains and losses at such time. |
| (d) | Total return assumes the reinvestment of all distributions. |
| (e) | Not annualized. |
See Notes to Financial Statements.
20
Notes to Financial Statements
1. ORGANIZATION
Lord Abbett Blend Trust (the “Trust”) is registered under the Investment Company Act of 1940, as amended (the “Act”), as a diversified, open-end management investment company and was organized as a Delaware statutory trust on May 1, 2001. The Trust has one series, Lord Abbett Small-Cap Blend Fund (the “Fund”). Class A, B, C, F, I, P, R2 and R3 shares of the Fund are not available for purchase by new investors other than through certain retirement and benefit plans, and financial intermediaries that provide recordkeeping or advisory services and have entered into special arrangements with the Fund or the Distributor. In addition, Directors/Trustees of the Lord Abbett Funds, partners and employees of Lord Abbett, and the family members of such persons may purchase shares of the Fund.
The Fund’s investment objective is to seek long-term growth of capital by investing primarily in stocks of small companies. The Fund has eight classes of shares: Class A, B, C, F, I, P, R2 and R3, each with different expenses and dividends. A front-end sales charge is normally added to the net asset value (“NAV”) for Class A shares. There is no front-end sales charge in the case of Class B, C, F, I, P, R2 and R3 shares, although there may be a contingent deferred sales charge (“CDSC”) in certain cases as follows: Class A shares purchased without a sales charge and redeemed before the first day of the month in which the one-year anniversary of the purchase falls (subject to certain exceptions); Class B shares redeemed before the sixth anniversary of purchase; and Class C shares redeemed before the first anniversary of purchase. Class B shares will automatically convert to Class A shares on the 25th day of the month (or, if the 25th is not a business day, the next business day thereafter) following the eighth anniversary of the day on which the purchase order was accepted. The Fund’s Class P shares are closed to substantially all investors, with certain exceptions as set forth in the Fund’s prospectus. On March 31, 2010, the Fund no longer made Class B shares available for purchase.
The preparation of financial statements in conformity with accounting principles generally accepted in the United States of America requires management to make certain estimates and assumptions that affect the reported amounts of assets and liabilities and disclosure of contingent assets and liabilities at the date of the financial statements and the reported amounts of increases and decreases in net assets from operations during the reporting period. Actual results could differ from those estimates.
2. SIGNIFICANT ACCOUNTING POLICIES
| (a) | Investment Valuation–Securities actively traded on any recognized U.S. or non-U.S. exchange or on The NASDAQ Stock Market LLC are valued at the last sale price or official closing price on the exchange or system on which they are principally traded. Events occurring after the close of trading on non-U.S. exchanges may result in adjustments to the valuation of foreign securities to more accurately reflect their fair value as of the close of regular trading on the New York Stock Exchange LLC. The Fund may rely on an independent fair valuation service in adjusting the valuations of foreign securities. Unlisted equity securities are valued at the last quoted sale price or, if no sale price is available, at the mean between the most recently quoted bid and asked prices. Securities for which market quotations are not readily available are valued at fair value as determined by management and approved in good faith by the Board of Trustees. Short-term securities with 60 days or less remaining to maturity are valued using the amortized cost method, which approximates current market value. |
21
Notes to Financial Statements (continued)
| (b) | Security Transactions–Security transactions are recorded as of the date that the securities are purchased or sold (trade date). Realized gains and losses on sales of portfolio securities are calculated using the identified-cost method. Realized and unrealized gains (losses) are allocated to each class of shares based upon the relative proportion of net assets at the beginning of the day. |
| (c) | Investment Income–Dividend income is recorded on the ex-dividend date. Interest income is recorded on the accrual basis as earned. Discounts are accreted and premiums are amortized using the effective interest method. Investment income is allocated to each class of shares based upon the relative proportion of net assets at the beginning of the day. |
| (d) | Income Taxes–It is the policy of the Fund to meet the requirements of Subchapter M of the Internal Revenue Code applicable to regulated investment companies and to distribute substantially all taxable income and capital gains to its shareholders. Therefore, no income tax provision is required. |
The Fund files U.S. federal and various state and local tax returns. No income tax returns are currently under examination. The statute of limitations on the Fund’s U.S. federal tax returns remains open for the fiscal years ended July 31, 2007 through July 31, 2010. The statutes of limitations on the Trust’s state and local tax returns may remain open for an additional year depending upon the jurisdiction.
| (e) | Expenses–Expenses, excluding class-specific expenses, are allocated to each class of shares based upon the relative proportion of net assets at the beginning of the day. Class A, B, C, F, P, R2 and R3 shares bear their class-specific share of all expenses and fees relating to the Fund’s 12b-1 Distribution Plan. |
| (f) | Repurchase Agreements–The Fund may enter into repurchase agreements with respect to securities. A repurchase agreement is a transaction in which a Fund acquires a security and simultaneously commits to resell that security to the seller (a bank or securities dealer) at an agreed-upon price on an agreed-upon date. The Fund requires at all times that the repurchase agreement be collateralized by cash, or by securities of the U.S. Government, its agencies, its instrumentalities, or U.S. Government sponsored enterprises having a value equal to, or in excess of, the value of the repurchase agreement (including accrued interest). If the seller of the agreement defaults on its obligation to repurchase the underlying securities at a time when the value of these securities has declined, a Fund may incur a loss upon disposition of the securities. |
| (g) | Fair Value Measurements–Fair value is defined as the price that the Fund would receive upon selling an investment in an orderly transaction to an independent buyer in the principal or most advantageous market of the investment. A three-tier hierarchy is used to maximize the use of observable market data and minimize the use of unobservable inputs and to establish classification of fair value measurements for disclosure purposes. Inputs refer broadly to the assumptions that market participants would use in pricing the asset or liability, including assumptions about risk – for example, the risk inherent in a particular valuation technique used to measure fair value (such as a pricing model) and/or the risk inherent in the inputs to the valuation technique. Inputs may be observable or unobservable. Observable inputs reflect the assumptions market participants would use in pricing the asset or liability. Observable inputs are based on market data obtained from sources independent of the reporting entity. Unobservable inputs reflect the reporting entity’s own assumptions about the |
22
Notes to Financial Statements (continued)
assumptions market participants would use in pricing the asset or liability. Unobservable inputs are based on the best information available in the circumstances. The three-tier hierarchy of inputs is summarized in the three broad Levels listed below: |
| • | Level 1 – unadjusted quoted prices in active markets for identical investments; |
| • | Level 2 – other significant observable inputs (including quoted prices for similar investments, interest rates, prepayment speeds, credit risk, etc.); and |
| • | Level 3 – significant unobservable inputs (including the Fund’s own assumptions in determining the fair value of investments). |
The inputs or methodology used for valuing securities are not necessarily an indication of the risk associated with investing in those securities.
The following is a summary of the inputs used as of July 31, 2010 in valuing the Fund’s investments carried at value:
| Investment Type* | Level 1 (000) | Level 2 (000) | Level 3 (000) | Total (000) | ||||||||
Common Stocks | $ | 1,211,516 | $ | – | $ | – | $ | 1,211,516 | ||||
Repurchase Agreement | – | 37,527 | – | 37,527 | ||||||||
Total | $ | 1,211,516 | $ | 37,527 | $ | – | $ | 1,249,043 | ||||
| * | See Schedule of Investments for values in each industry. |
3. MANAGEMENT FEE AND OTHER TRANSACTIONS WITH AFFILIATES
Management Fee
The Trust has a management agreement with Lord, Abbett & Co. LLC (“Lord Abbett”), pursuant to which Lord Abbett supplies the Fund with investment management services and executive and other personnel, provides office space and pays for ordinary and necessary office and clerical expenses relating to research and statistical work and supervision of the Fund’s investment portfolio.
The management fee is based on the Fund’s average daily net assets at the following annual rates:
First $1 billion | .75% | |
Over $1 billion | .70% |
For the fiscal year ended July 31, 2010, the effective management fee paid to Lord Abbett was at an annualized rate of .74% of the Fund’s average daily net assets.
In addition, Lord Abbett provides certain administrative services to the Fund pursuant to an Administrative Services Agreement in return for a fee at an annual rate of .04% of the Fund’s average daily net assets.
The Fund, along with certain other funds managed by Lord Abbett (collectively, the “Underlying Funds”), has entered into a Servicing Arrangement with Lord Abbett Alpha Strategy Fund of Lord Abbett Securities Trust (the “Alpha Strategy Fund”), pursuant to which each Underlying Fund pays a portion of the expenses (excluding management fees and distribution and service fees) of the Alpha Strategy Fund in proportion to the average daily value of the Underlying Fund shares owned by the Alpha Strategy Fund. Amounts paid pursuant to the Servicing Arrangement are included in Subsidy expense on the Fund’s Statement of Operations and Payable to affiliate on the Fund’s Statement of Assets and Liabilities.
23
Notes to Financial Statements (continued)
As of July 31, 2010, the percentage of the Fund’s outstanding shares owned by Alpha Strategy Fund was 5.46%.
12b-1 Distribution Plan
The Fund has adopted a distribution plan with respect to Class A, B, C, F, P, R2 and R3 shares pursuant to Rule 12b-1 under the Act, which provides for the payment of ongoing distribution and service fees to Lord Abbett Distributor LLC (the “Distributor”), an affiliate of Lord Abbett. The fees are accrued daily at annual rates based upon the Fund’s average daily net assets as follows:
| Fees* | Class A | Class B | Class C | Class F | Class P | Class R2 | Class R3 | |||||||
Service | .25% | .25% | .25% | — | .25% | .25% | .25% | |||||||
Distribution | .10% | .75% | .75% | .10% | .20% | .35% | .25% |
| * | The Fund may designate a portion of the aggregate fee as attributable to service activities for purposes of calculating Financial Industry Regulatory Authority, Inc. (“FINRA”) sales charge limitations. |
Class I shares do not have a distribution plan.
Commissions
Distributor received the following commissions on sales of shares of the Fund, after concessions were paid to authorized dealers, for the fiscal year ended July 31, 2010:
Distributor Commissions | Dealers’ Concessions | ||
| $38,386 | $ | 209,652 | |
Distributor received CDSCs of $2,395 and $8,660 for Class A and Class C shares, respectively, for the fiscal year ended July 31, 2010.
Two Trustees and certain of the Fund’s officers have an interest in Lord Abbett.
4. DISTRIBUTIONS AND CAPITAL LOSS CARRYFORWARDS
Dividends from net investment income, if any, are declared and paid at least annually. Taxable net realized gains from investment transactions, reduced by allowable capital loss carryforwards, if any, are declared and distributed to shareholders at least annually. The capital loss carryforward amount, if any, is available to offset future net capital gains. Dividends and distributions to shareholders are recorded on the ex-dividend date. The amounts of dividends and distributions from net investment income and net realized capital gains are determined in accordance with federal income tax regulations, which may differ from accounting principles generally accepted in the United States of America. These book/tax differences are either considered temporary or permanent in nature. To the extent these differences are permanent in nature, such amounts are reclassified within the components of net assets based on their federal tax basis treatment; temporary differences do not require reclassification. Dividends and distributions, which exceed earnings and profits for tax purposes, are reported as a tax return of capital.
24
Notes to Financial Statements (continued)
As of July 31, 2010, the components of accumulated losses on a tax-basis were as follows:
Capital loss carryforwards* | $ | (319,348,569 | ) | |
Temporary differences | (136,254 | ) | ||
Unrealized gains – net | 48,404,296 | |||
Total accumulated losses – net | $ | (271,080,527 | ) |
| * | As of July 31, 2010, the capital loss carryforwards, along with the related expiration dates, were as follows: |
| 2017 | 2018 | Total | ||||
| $106,150,213 | $ | 213,198,356 | $ | 319,348,569 | ||
As of July 31, 2010, the aggregate unrealized security gains and losses based on cost for U.S. federal income tax purposes were as follows:
Tax cost | $ | 1,200,638,637 | ||
Gross unrealized gain | 130,089,162 | |||
Gross unrealized loss | (81,684,866 | ) | ||
Net unrealized security gain | $ | 48,404,296 |
The difference between book-basis and tax-basis unrealized gains (losses) is attributable to wash sales.
Permanent items identified during the fiscal year ended July 31, 2010 have been reclassified among the components of net assets based on their tax basis treatment as follows:
Accumulated Net Investment Loss | Accumulated Net Realized Loss | Paid-in Capital | ||||
| $8,558,619 | $(112,832) | $ | (8,445,787 | ) | ||
The permanent differences are primarily attributable to the tax treatment of net investment losses.
5. PORTFOLIO SECURITIES TRANSACTIONS
Purchases and sales of investment securities (excluding short-term investments) for the fiscal year ended July 31, 2010 were as follows:
| Purchases | Sales | ||
| $850,748,017 | $ | 913,260,472 | |
There were no purchases or sales of U.S. Government securities for the fiscal year ended July 31, 2010.
6. TRUSTEES’ REMUNERATION
The Trust’s officers and the two Trustees who are associated with Lord Abbett do not receive any compensation from the Trust for serving in such capacities. Outside Trustees’ fees are allocated among all Lord Abbett-sponsored funds based on the net assets of each fund. There is an equity-based plan available to all outside Trustees under which outside Trustees must defer receipt of a portion of, and may elect to defer receipt of an additional portion of, Trustees’ fees. The deferred amounts are treated as though equivalent dollar amounts had been invested in the funds. Such amounts and earnings accrued thereon are included in Trustees’ fees on the Statement of Operations and in Trustees’ fees payable on the Statement of Assets and Liabilities and are not deductible for U.S. federal income tax purposes until such amounts are paid.
25
Notes to Financial Statements (continued)
7. EXPENSE REDUCTIONS
The Fund has entered into an arrangement with the Fund’s transfer agent and custodian, whereby credits realized as a result of uninvested cash balances are used to reduce a portion of the Fund’s expenses.
8. LINE OF CREDIT
The Fund and certain other funds managed by Lord Abbett have available an unsecured revolving credit facility (“Facility”) from State Street Bank and Trust Company (“SSB”), to be used for temporary or emergency purposes as an additional source of liquidity to fund redemptions of investor shares. The Facility is renewed annually under terms that depend on market conditions at the time of the renewal. Accordingly, effective December 4, 2009, the amount available under the Facility remains $200,000,000 and the annual fee to maintain the Facility (of which each participating fund pays its pro rata share based on the net assets of each participating fund) was changed from .125% of the amount available under the Facility to .15%. This amount is included in Other Expenses on the Fund’s Statement of Operations. In connection with the renewal, the Fund paid an upfront commitment fee of .05% on December 4, 2009, which is included in Prepaid expenses and other assets on the Statement of Assets and Liabilities, and is amortized through Other expenses on the Statement of Operations over the annual period. Any borrowings under this Facility will bear interest at current market rates as set forth in the credit agreement. As of July 31, 2010, there were no loans outstanding pursuant to this Facility nor was the Facility utilized at any time during the fiscal year ended July 31, 2010.
9. TRANSACTIONS WITH AFFILIATED ISSUERS
An affiliated issuer is one in which a Fund has ownership of at least 5% of the outstanding voting securities of the underlying issuer at any point during the fiscal year. The Fund had the following transactions with affiliated issuers during the fiscal year ended July 31, 2010:
| Affiliated Issuer | Balance of Shares Held at 7/31/2009 | Gross Additions | Gross Sales | Balance of Shares Held at 7/31/2010 | Value at 7/31/2010 | Net Realized Gain 8/1/2009 to 7/31/2010(a) | Dividend 8/1/2009 to | |||||||||||
Kforce, Inc.(b) | 1,176,685 | 911,126 | (70,300 | ) | 2,017,511 | $ | 27,256,574 | $ | 37,825 | $ | – | |||||||
| (a) | Represents realized gains (losses) and dividend income earned only when the issuer was an affiliate of the Fund. |
| (b) | Not an affiliated issuer as of July 31, 2009. |
10. CUSTODIAN AND ACCOUNTING AGENT
SSB is the Trust’s custodian and accounting agent. SSB performs custodial, accounting and recordkeeping functions relating to portfolio transactions and calculating the Fund’s NAV.
11. INVESTMENT RISKS
The Fund is subject to the general risks and considerations associated with equity investing, as well as the particular risks associated with growth and value stocks. The value of an investment in the Fund will fluctuate in response to movements in the equity securities markets in general and to the changing prospects of individual companies in which the Fund invests. Different types of stocks tend to shift in and out of favor depending on market and economic conditions. Growth stocks may be more volatile than other stocks. The market may fail to recognize the intrinsic value of
26
Notes to Financial Statements (continued)
particular value stocks for a long time. In addition, if the Fund’s assessment of market conditions or companies is wrong, it could suffer losses or produce poor performance relative to other funds, even in a rising market. The Fund invests primarily in small company stocks, which tend to be more volatile and can be less liquid than large company stocks. Small companies may also have more limited product lines, markets or financial resources, and typically experience a higher risk of failure than large companies.
The Fund’s investments in foreign companies and ADRs may present increased market, liquidity, currency, political, information, and other risks.
These factors can affect the Fund’s performance.
12. SUMMARY OF CAPITAL TRANSACTIONS
Transactions in shares of beneficial interest were as follows:
Year Ended July 31, 2010 | Year Ended July 31, 2009 | |||||||||||||
| Class A Shares | Shares | Amount | Shares | Amount | ||||||||||
Shares sold | 7,939,929 | $ | 105,998,899 | 14,512,563 | $ | 167,287,288 | ||||||||
Converted from Class B* | 383,958 | 5,199,146 | 101,112 | 1,094,489 | ||||||||||
Shares reacquired | (12,114,963 | ) | (159,639,822 | ) | (19,435,695 | ) | (213,959,325 | ) | ||||||
Decrease | (3,791,076 | ) | $ | (48,441,777 | ) | (4,822,020 | ) | $ | (45,577,548 | ) | ||||
| Class B Shares | ||||||||||||||
Shares sold | 161,159 | $ | 1,987,026 | 374,222 | $ | 3,988,930 | ||||||||
Shares reacquired | (876,634 | ) | (10,950,827 | ) | (1,172,667 | ) | (12,356,243 | ) | ||||||
Converted to Class A* | (408,238 | ) | (5,199,146 | ) | (106,842 | ) | (1,094,489 | ) | ||||||
Decrease | (1,123,713 | ) | $ | (14,162,947 | ) | (905,287 | ) | $ | (9,461,802 | ) | ||||
| Class C Shares | ||||||||||||||
Shares sold | 565,938 | $ | 7,049,163 | 1,054,231 | $ | 11,167,647 | ||||||||
Shares reacquired | (3,180,173 | ) | (39,745,528 | ) | (3,852,881 | ) | (40,233,666 | ) | ||||||
Decrease | (2,614,235 | ) | $ | (32,696,365 | ) | (2,798,650 | ) | $ | (29,066,019 | ) | ||||
| Class F Shares | ||||||||||||||
Shares sold | 645,776 | $ | 8,447,468 | 691,159 | $ | 5,788,355 | ||||||||
Shares reacquired | (350,076 | ) | (4,694,586 | ) | (235,045 | ) | (2,486,509 | ) | ||||||
Increase | 295,700 | $ | 3,752,882 | 456,114 | $ | 3,301,846 | ||||||||
| Class I Shares | ||||||||||||||
Shares sold | 5,140,676 | $ | 70,420,497 | 9,134,281 | $ | 103,681,910 | ||||||||
Shares reacquired | (5,214,504 | ) | (70,734,945 | ) | (3,796,716 | ) | (43,660,476 | ) | ||||||
Increase (decrease) | (73,828 | ) | $ | (314,448 | ) | 5,337,565 | $ | 60,021,434 | ||||||
| Class P Shares | ||||||||||||||
Shares sold | 1,677,178 | $ | 22,302,537 | 3,641,481 | $ | 41,985,475 | ||||||||
Shares reacquired | (2,683,687 | ) | (35,452,209 | ) | (2,811,763 | ) | (33,362,250 | ) | ||||||
Increase (decrease) | (1,006,509 | ) | $ | (13,149,672 | ) | 829,718 | $ | 8,623,225 | ||||||
27
Notes to Financial Statements (concluded)
Year Ended July 31, 2010 | Year Ended July 31, 2009 | |||||||||||||
| Class R2 Shares | Shares | Amount | Shares | Amount | ||||||||||
Shares sold | 38,906 | $ | 500,881 | 76,647 | $ | 865,014 | ||||||||
Shares reacquired | (39,053 | ) | (501,565 | ) | (18,484 | ) | (192,202 | ) | ||||||
Increase (decrease) | (147 | ) | $ | (684 | ) | 58,163 | $ | 672,812 | ||||||
| Class R3 Shares | ||||||||||||||
Shares sold | 1,493,918 | $ | 19,996,834 | 251,549 | $ | 2,652,146 | ||||||||
Shares reacquired | (422,858 | ) | (5,761,822 | ) | (45,211 | ) | (450,170 | ) | ||||||
Increase | 1,071,060 | $ | 14,235,012 | 206,338 | $ | 2,201,976 | ||||||||
| * | Automatic conversion of Class B shares occurs on the 25th day of the month (or if the 25th is not a business day, the next business day thereafter) following the eighth anniversary of the day on which the purchase order was accepted. |
13. SUBSEQUENT EVENTS
Management has determined that there were no material subsequent events that would require recognition or additional disclosure in the Fund’s financial statements.
28
Report of Independent Registered Public Accounting Firm
To the Shareholders and Board of Trustees of Lord Abbett Blend Trust:
We have audited the accompanying statement of assets and liabilities, including the schedule of investments, of the Lord Abbett Small-Cap Blend Fund of the Lord Abbett Blend Trust (the “Trust”), as of July 31, 2010, and the related statement of operations for the year then ended, the statements of changes in net assets for each of the two years in the period then ended, and the financial highlights for each of the periods presented. These financial statements and financial highlights are the responsibility of the Trust’s management. Our responsibility is to express an opinion on these financial statements and financial highlights based on our audits.
We conducted our audits in accordance with the standards of the Public Company Accounting Oversight Board (United States). Those standards require that we plan and perform the audit to obtain reasonable assurance about whether the financial statements and financial highlights are free of material misstatement. The Trust is not required to have, nor were we engaged to perform, an audit of its internal control over financial reporting. Our audits included consideration of internal control over financial reporting as a basis for designing audit procedures that are appropriate in the circumstances, but not for the purpose of expressing an opinion on the effectiveness of the Trust’s internal control over financial reporting. Accordingly, we express no such opinion. An audit also includes examining, on a test basis, evidence supporting the amounts and disclosures in the financial statements, assessing the accounting principles used and significant estimates made by management, as well as evaluating the overall financial statement presentation. Our procedures included confirmation of securities owned as of July 31, 2010, by correspondence with the custodian and brokers; where replies were not received from brokers, we performed other auditing procedures. We believe that our audits provide a reasonable basis for our opinion.
In our opinion, the financial statements and financial highlights referred to above present fairly, in all material respects, the financial position of the Lord Abbett Small-Cap Blend Fund of the Lord Abbett Blend Trust as of July 31, 2010, the results of its operations for the year then ended, the changes in its net assets for each of the two years in the period then ended, and the financial highlights for each of the periods presented, in conformity with accounting principles generally accepted in the United States of America.
DELOITTE & TOUCHE LLP
New York, New York
September 29, 2010
29
Basic Information About Management
The Board of Trustees (the “Board”) is responsible for the management of the business and affairs of the Trust in accordance with the laws of the State of Delaware. The Board appoints officers who are responsible for the day-to-day operations of the Trust and who execute policies authorized by the Board. The Board also approves an investment adviser to the Trust and continues to monitor the cost and quality of the services the investment adviser provides, and annually considers whether to renew the contract with the adviser. Generally, each Trustee holds office until his/her successor is elected and qualified or until his/her earlier resignation or removal, as provided in the Trust’s organizational documents.
Lord, Abbett & Co. LLC (“Lord Abbett”), a Delaware limited liability company, is the Trust’s investment adviser.
Interested Trustees
The following Trustees are associated with Lord Abbett and are “interested persons” of the Trust/ as defined in the Act. Mr. Dow and Ms. Foster are officers and directors or trustees of each of the 14 Lord Abbett-sponsored funds, which consist of 57 portfolios or series.
Name, Address and Year of Birth | Current Position and Length of Service with the Trust | Principal Occupation During Past Five Years | Other Directorships | |||
Robert S. Dow Lord, Abbett & Co. LLC 90 Hudson Street Jersey City, NJ 07302 (1945) | Trustee since 2001 and Chairman since 2001 | Senior Partner of Lord Abbett (since 2007), and was formerly Managing Partner (1996 - 2007) and Chief Investment Officer (1995 - 2007), joined Lord Abbett in 1972. | N/A | |||
Daria L. Foster Lord, Abbett & Co. LLC 90 Hudson Street Jersey City, NJ 07302 (1954) | Trustee since 2006 | Managing Partner of Lord Abbett (since 2007) and was formerly Director of Marketing and Client Service, joined Lord Abbett in 1990. | N/A | |||
Independent Trustees
The following independent or outside Trustees (“Independent Trustees”) also are directors or trustees of each of the 14 Lord Abbett-sponsored funds, which consist of 57 portfolios or series.
Name, Address and Year of Birth | Current Position and Length of Service with the Trust | Principal Occupation During Past Five Years | Other Directorships | |||
E. Thayer Bigelow Lord, Abbett & Co. LLC c/o Legal Dept. 90 Hudson Street Jersey City, NJ 07302 (1941) | Trustee since 2001 | Managing General Partner, Bigelow Media, LLC (since 2000); Senior Adviser, Time Warner Inc. (1998 - 2000). | Currently serves as director of Crane Co. (since 1984) and Huttig Building Products Inc. (since 1998). Previously served as director of R.H. Donnelley Inc. and Adelphia Communications Inc. | |||
30
Basic Information About Management (continued)
Name, Address and Year of Birth | Current Position and Length of Service with the Trust | Principal Occupation During Past Five Years | Other Directorships | |||
William H.T. Bush Lord, Abbett & Co. LLC c/o Legal Dept. 90 Hudson Street Jersey City, NJ 07302 (1938) | Trustee since 2001 | Co-founder and Chairman of the Board of the financial advisory firm of Bush- O’Donnell & Company (since 1986). | Currently serves as director of WellPoint, Inc., a health benefits company (since 2002). Previously served as a director of Engineered Support Systems, Inc. | |||
Robert B. Calhoun, Jr. Lord, Abbett & Co. LLC c/o Legal Dept. 90 Hudson Street Jersey City, NJ 07302 (1942) | Trustee since 2001 | Senior Advisor of Monitor Clipper Partners, a private equity investment fund (since 1997); President of Clipper Asset Management Corp. (1991 - 2009). | Previously served as a director of Avondale, Inc. and Interstate Bakeries Corp. | |||
Julie A. Hill Lord, Abbett & Co. LLC c/o Legal Dept. 90 Hudson Street Jersey City, NJ 07302 (1946) | Trustee since 2004 | Owner and CEO of The Hill Company, a business consulting firm (since 1998). | Currently serves as director of WellPoint, Inc., a health benefits company (since 1994). Previously served as a director of Resources Connection, Inc., a consulting firm. | |||
Franklin W. Hobbs Lord, Abbett & Co. LLC c/o Legal Dept. 90 Hudson Street Jersey City, NJ 07302 (1947) | Trustee since 2001 | Advisor of One Equity Partners, a private equity firm (since 2004). | Currently serves as a director and Chairman of the Board of GMAC Inc., a financial services firm (since 2009) and as a director of Molson Coors Brewing Company (since 2002). | |||
Thomas J. Neff Lord, Abbett & Co. LLC c/o Legal Dept. 90 Hudson Street Jersey City, NJ 07302 (1937) | Trustee since 2001 | Chairman of Spencer Stuart (U.S.), an executive search consulting firm (since 1996). | Currently serves as director of Ace, Ltd. (since 1997) and Hewitt Associates, Inc. (since 2004). | |||
James L.L. Tullis Lord, Abbett & Co. LLC c/o Legal Dept. 90 Hudson Street Jersey City, NJ 07302 (1947) | Trustee since 2006 | CEO of Tullis-Dickerson and Co. Inc., a venture capital management firm (since 1990). | Currently serves as director of Crane Co. (since 1998). Previously served as a director of Viacell Inc. | |||
31
Basic Information About Management (continued)
Officers
None of the officers listed below have received compensation from the Trust. All of the officers of the Trust also may be officers of the other Lord Abbett-sponsored funds and maintain offices at 90 Hudson Street, Jersey City, NJ 07302. Unless otherwise indicated, the position(s) and title(s) listed under the “Principal Occupation” column indicate each officer’s position(s) and title(s) with Lord Abbett.
Name and Year of Birth | Current Position with the Trust | Length of Service of Current Position | Principal Occupation During Past Five Years | |||
Robert S. Dow (1945) | Chief Executive Officer and Chairman | Elected in 2001 | Senior Partner of Lord Abbett (since 2007), and was formerly Managing Partner (1996 - 2007) and Chief Investment Officer (1995 - 2007), joined Lord Abbett in 1972. | |||
Daria L. Foster (1954) | President | Elected in 2006 | Managing Partner of Lord Abbett (since 2007), and was formerly Director of Marketing and Client Service, joined Lord Abbett in 1990. | |||
Robert I. Gerber (1954) | Executive Vice President | Elected in 2007 | Partner and Chief Investment Officer (since 2007), joined Lord Abbett in 1997 as Director of Taxable Fixed Income Management. | |||
Michael T. Smith (1963) | Executive Vice President | Elected in 2001 | Partner and Director, joined Lord Abbett in 1997. | |||
James W. Bernaiche (1956) | Chief Compliance Officer | Elected in 2004 | Partner and Chief Compliance Officer, joined Lord Abbett in 2001. | |||
Joan A. Binstock (1954) | Chief Financial Officer and Vice President | Elected in 2001 | Partner and Chief Operations Officer, joined Lord Abbett in 1999. | |||
John K. Forst (1960) | Vice President and Assistant Secretary | Elected in 2005 | Deputy General Counsel, joined Lord Abbett in 2004. | |||
Lawrence H. Kaplan (1957) | Vice President and Secretary | Elected in 2001 | Partner and General Counsel, joined Lord Abbett in 1997. | |||
Craig Leighton (1971) | Vice President | Elected in 2008 | Research Analyst, joined Lord Abbett in 2005. | |||
A. Edward Oberhaus, III (1959) | Vice President | Elected in 2001 | Partner and Director, joined Lord Abbett in 1983. | |||
John P. Piccard (1970) | Vice President | Elected in 2008 | Portfolio Manager, joined Lord Abbett in 2004. | |||
32
Basic Information About Management (concluded)
Name and Year of Birth | Current Position with the Trust | Length of Service of Current Position | Principal Occupation During Past Five Years | |||
Thomas R. Phillips (1960) | Vice President and Assistant Secretary | Elected in 2008 | Deputy General Counsel, joined Lord Abbett in 2006 and was formerly an attorney at Morgan, Lewis & Bockius LLP. | |||
Lawrence B. Stoller (1963) | Vice President and Assistant Secretary | Elected in 2007 | Senior Deputy General Counsel, joined Lord Abbett in 2007 and was formerly an Executive Vice President and the General Counsel at Cohen & Steers Capital Management, Inc. (1999 - 2007). | |||
Bernard J. Grzelak (1971) | Treasurer | Elected in 2003 | Partner and Director of Fund Administration, joined Lord Abbett in 2003. | |||
Please call 888-522-2388 for a copy of the statement of additional information (“SAI”), which contains further information about the Trust’s Trustees. It is available free upon request.
33
Householding
The Trust has adopted a policy that allows it to send only one copy of the Fund’s prospectus, proxy material, annual report and semiannual report to certain shareholders residing at the same “household.” This reduces Fund expenses, which benefits you and other shareholders. If you need additional copies or do not want your mailings to be “householded,” please call Lord Abbett at 888-522-2388 or send a written request with your name, the name of your fund or funds and your account number or numbers to Lord Abbett Family of Funds, P.O. Box 219336, Kansas City, MO 64121.
Proxy Voting Policies, Procedures and Records
A description of the policies and procedures that Lord Abbett uses to vote proxies related to the Fund’s portfolio securities, and information on how Lord Abbett voted the Fund’s proxies during the 12-month period ended June 30 are available without charge, upon request, (i) by calling 888-522-2388; (ii) on Lord Abbett’s Website at www.lordabbett.com; and (iii) on the Securities and Exchange Commission’s (“SEC”) Website at www.sec.gov.
Shareholder Reports and Quarterly Portfolio Disclosure
The Fund is required to file its complete schedule of portfolio holdings with the SEC for its first and third fiscal quarters on Form N-Q. Copies of the filings are available without charge, upon request on the SEC’s Website at www.sec.gov and may be available by calling Lord Abbett at 888-522-2388. You can also obtain copies of Form N-Q by (i) visiting the SEC’s Public Reference Room in Washington, DC (information on the operation of the Public Reference Room may be obtained by calling 800-SEC-0330); (ii) sending your request and duplicating fee to the SEC’s Public Reference Section, Washington, DC 20549-1520; or (iii) sending your request electronically, after paying a duplicating fee, to publicinfo@sec.gov.
34


This report, when not used for the general information of shareholders of the Fund, is to be distributed only if preceded or accompanied by a current fund prospectus.
Lord Abbett mutual fund shares are distributed by LORD ABBETT DISTRIBUTOR LLC
Lord Abbett Blend Trust
Lord Abbett Small-Cap Blend Fund
LASCB-2
(09/10)
| Item 2: | Code of Ethics. |
| (a) | In accordance with applicable requirements, the Registrant adopted a Sarbanes-Oxley Code of Ethics on June 19, 2003 that applies to the principal executive officer and senior financial officers of the Registrant (“Code of Ethics”). The Code of Ethics was in effect during the fiscal year ended July 31, 2010 (the “Period”). |
| (b) | Not applicable. |
| (c) | The Registrant has not amended the Code of Ethics as described in Form N-CSR during the Period. |
| (d) | The Registrant has not granted any waiver, including an implicit waiver, from a provision of the Code of Ethics as described in Form N-CSR during the Period. |
| (e) | Not applicable. |
| (f) | See Item 12(a)(1) concerning the filing of the Code of Ethics. The Registrant will provide a copy of the Code of Ethics to any person without charge, upon request. To obtain a copy, please call Lord Abbett at 888-522-2388. |
| Item 3: | Audit Committee Financial Expert. |
| The Registrant’s board of trustees has determined that each of the following independent trustees who are members of the audit committee is an audit committee financial expert: E. Thayer Bigelow, Robert B. Calhoun Jr., Franklin W. Hobbs, and James L.L. Tullis. Each of these persons is independent within the meaning of the Form N-CSR. |
| Item 4: | Principal Accountant Fees and Services. |
| In response to sections (a), (b), (c) and (d) of Item 4, the aggregate fees billed to the Registrant for the fiscal years ended July 31, 2010 and 2009 by the Registrant’s principal accounting firm, Deloitte & Touche LLP, the member firms of Deloitte Touche Tohmatsu and their respective affiliates (collectively, “Deloitte”) were as follows: |
| Fiscal year ended: | ||||
| 2010 | 2009 | |||
Audit Fees {a} | $40,000 | $40,000 | ||
Audit-Related Fees | - 0 - | - 0 - | ||
Total audit and audit-related fees | $40,000 | 40,000 | ||
Tax Fees {b} | 7,369 | 7,407 | ||
All Other Fees | - 0 - | - 0 - | ||
Total Fees | $47,369 | $47,407 | ||
{a} Consists of fees for audits of the Registrant’s annual financial statements.
{b} Fees for the fiscal year ended July 31, 2010 and 2009 consist of fees for preparing the U.S. Income Tax Return for Regulated Investment Companies, New Jersey Corporation Business Tax Return, New Jersey Annual Report Form, U.S. Return of Excise Tax on Undistributed Income of Investment Companies, IRS Forms 1099-MISC and 1096 Annual Summary and Transmittal of U.S. Information Returns.
(e) (1) Pursuant to Rule 2-01(c) (7) of Regulation S-X, the Registrant’s Audit Committee has adopted pre-approval policies and procedures. Such policies and procedures generally provide that the Audit Committee must pre-approve:
| • | any audit, audit-related, tax, and other services to be provided to the Lord Abbett Funds, including the Registrant, and |
| • | any audit-related, tax, and other services to be provided to the Registrant’s investment adviser and any entity controlling, controlled by or under common control with the investment adviser that provides ongoing services to one or more Funds comprising the Registrant if the engagement relates directly to operations and financial reporting of a Fund, by the independent auditor to assure that the provision of such services does not impair the auditor’s independence. |
The Audit Committee has delegated pre-approval authority to its Chairman, subject to a fee limit of $10,000 per event, and not to exceed $25,000 annually. The Chairman will report any pre-approval decisions to the Audit Committee at its next scheduled meeting. Unless a type of service to be provided by the independent auditor has received general pre-approval, it must be pre-approved by the Audit Committee. Any proposed services exceeding pre-approved cost levels will require specific pre-approval by the Audit Committee.
(e) (2) The Registrant’s Audit Committee has approved 100% of the services described in this Item 4 (b) through (d).
(f) Not applicable.
(g) The aggregate non-audit fees billed by Deloitte for services rendered to the Registrant are shown above in the response to Item 4 (a), (b), (c) and (d) as “All Other Fees”.
The aggregate non-audit fees billed by Deloitte for services rendered to the Registrant’s investment adviser, Lord, Abbett & Co. LLC (“Lord Abbett”), for the fiscal years ended July 31, 2010 and 2009 were:
| Fiscal year ended: | ||||
| 2010 | 2009 | |||
All Other Fees {a} | $140,000 | $237,324 | ||
{a} Consist of fees for Independent Services Auditors’ Report on Controls Placed in Operation and Tests of Operating Effectiveness related to Lord Abbett’s Asset Management Services (“SAS 70 Report”).
The aggregate non-audit fees billed by Deloitte for services rendered to entities under the common control of Lord Abbett for the fiscal years ended July 31, 2010 and 2009 were:
| Fiscal year ended: | ||||
| 2010 | 2009 | |||
All Other Fees | $ - 0 - | $ - 0- | ||
(h) The Registrant’s Audit Committee has considered the provision of non-audit services that were rendered to the Registrant’s investment adviser, and any entity controlling, controlled by or under common control with the investment adviser that provides ongoing services to the Registrant, that were not pre-approved pursuant to Rule 2-01 (c)(7)(ii) of Regulation S-X and has determined that the provision of such services is compatible with maintaining Deloitte’s independence.
| Item 5: | Audit Committee of Listed Registrants. |
| Not applicable. |
| Item 6: | Investments. |
| Not applicable. |
| Item 7: | Disclosure of Proxy Voting Policies and Procedures for Closed-End Management Investment Companies. |
| Not applicable. |
| Item 8: | Portfolio Managers of Closed-End Management Investment Companies. |
| Not applicable. |
| Item 9: | Purchases of Equity Securities by Closed-End Management Investment Company and Affiliated Purchasers. |
| Not applicable. |
| Item 10: | Submission of Matters to a Vote of Security Holders. |
| Not applicable. |
| Item 11: | Controls and Procedures. |
| (a) | Based on their evaluation of the Registrant’s disclosure controls and procedures (as defined in Rule 30a-3(c) under the Investment Company Act of 1940) as of a date within 90 days prior to the filing date of this report, the Chief Executive Officer and Chief Financial Officer of the Registrant have concluded that such disclosure controls and procedures are reasonably designed and effective to ensure that material information relating to the Registrant, including its consolidated subsidiaries, is made known to them by others within those entities. |
| (b) | There were no changes in the Registrant’s internal control over financial reporting (as defined in Rule 30a-3(d) under the Investment Company Act of 1940) that occurred during the second fiscal quarter of the period covered by this report that have materially affected, or are reasonably likely to materially affect, the Registrant’s internal control over financial reporting. |
| Item 12: | Exhibits. |
| (a)(1) | Amendments to Code of Ethics – Not applicable. |
| (a)(2) | Certification of each principal executive officer and principal financial officer of the Registrant as required by Rule 30a-2 under the Investment Company Act of 1940 is attached hereto as a part of EX-99.CERT. |
| (a)(3) | Not applicable. |
| (b) | Certification of each principal executive officer and principal financial officer of the Registrant as required by Section 906 of the Sarbanes-Oxley Act of 2002 is provided as a part of EX-99.906CERT. |
SIGNATURES
Pursuant to the requirements of the Securities Exchange Act of 1934 and the Investment Company Act of 1940, the Registrant has duly caused this report to be signed on its behalf by the undersigned, thereunto duly authorized.
| LORD ABBETT BLEND TRUST | ||||||
| By: | /s/ Robert S. Dow | |||||
| Robert S. Dow | ||||||
| Chief Executive Officer and Chairman | ||||||
| Date: September 27, 2010 | ||||||
| By: | /s/ Joan A. Binstock | |||||
| Joan A. Binstock | ||||||
| Chief Financial Officer and Vice President | ||||||
| Date: September 27, 2010 | ||||||
Pursuant to the requirements of the Securities Exchange Act of 1934 and the Investment Company Act of 1940, this report has been signed below by the following persons on behalf of the Registrant and in the capacities and on the dates indicated.
| By: | /s/ Robert S. Dow | |||||
| Robert S. Dow | ||||||
| Chief Executive Officer and Chairman | ||||||
| Date: September 27, 2010 | ||||||
| By: | /s/ Joan A. Binstock | |||||
| Joan A. Binstock | ||||||
| Chief Financial Officer and Vice President | ||||||
| Date: September 27, 2010 | ||||||