UNITED STATES
SECURITIES AND EXCHANGE COMMISSION
Washington, D.C. 20549
FORM N-CSR
CERTIFIED SHAREHOLDER REPORT OF REGISTERED
MANAGEMENT INVESTMENT COMPANIES
Investment Company Act File Number: 811-10371
LORD ABBETT TRUST I
(Exact name of Registrant as specified in charter)
30 Hudson Street, Jersey City, New Jersey 07302-4804
(Address of principal executive offices) (Zip code)
Randolph A. Stuzin, Esq.
Vice President and Assistant Secretary
30 Hudson Street, Jersey City, New Jersey 07302-4804
(Name and address of agent for service)
Registrant’s telephone number, including area code: (888) 522-2388
Date of fiscal year end: 7/31
Date of reporting period: 7/31/2024
| Item 1: | Report(s) to Shareholders. |
Lord Abbett Climate Focused Bond Fund
Annual Shareholder Report
July 31, 2024
lordabbett.com/FundDocuments
This annual shareholder report contains important information about the Lord Abbett Climate Focused Bond Fund for the period of August 1, 2023 to July 31, 2024, as well as certain changes to the Fund. You can find additional information about the Fund at lordabbett.com/FundDocuments. You can also request this information by contacting us at 888-522-2388.
What were the Fund costs for the last year?
(based on a hypothetical $10,000 investment)
| Class Name | Costs of a $10,000 investment | Costs paid as a percentage of a $10,000 investment |
|---|
| Class A | $67 | 0.65% |
How did the Fund perform last year and what affected its performance?
For the fiscal year ended July 31, 2024, the Fund returned 6.80%, reflecting performance at the net asset value (NAV) of Class A shares with all distributions reinvested, compared to a securities market index with investment characteristics similar to those of the Fund, the ICE BofA Green Bond Index (USD Hedged), which returned 7.81% over the same period. The Fund's broad-based market index, the Bloomberg Aggregate Bond Index, returned 5.10% over the same period.
Positive factors for the markets included momentum around the soft-landing narrative, specifically in the second half of the period, which was supported by signs of a cooling labor market and a slowing economy, leading the market to adjust its expectations of future interest rate cuts by the U.S. Federal Reserve (the Fed). Negative factors, specifically in the beginning of the period, included stronger-than-expected GDP growth, resilient labor market data, and persistently high inflation readings that led to a more prolonged interest rate environment.
Top contributors to performance: The Fund’s allocation to high yield corporate bonds was one of the largest contributors to relative performance.
Top detractors from performance: The Fund’s overweight allocation to commercial mortgage-backed securities detracted from relative performance.
Total Return Based on $10,000 Investment

| Class A with load | ICE BofA Green Bond Index (USD Hedged) | Bloomberg Aggregate Bond Index |
|---|
| 5/28/2020 | $9,775 | $10,000 | $10,000 |
| 5/31/2020 | $9,795 | $10,021 | $10,032 |
| 6/30/2020 | $9,911 | $10,160 | $10,095 |
| 7/31/2020 | $10,115 | $10,313 | $10,246 |
| 8/31/2020 | $10,131 | $10,263 | $10,163 |
| 9/30/2020 | $10,137 | $10,340 | $10,157 |
| 10/31/2020 | $10,153 | $10,403 | $10,112 |
| 11/30/2020 | $10,288 | $10,481 | $10,211 |
| 12/31/2020 | $10,344 | $10,514 | $10,225 |
| 1/31/2021 | $10,340 | $10,466 | $10,152 |
| 2/28/2021 | $10,228 | $10,270 | $10,005 |
| 3/31/2021 | $10,173 | $10,254 | $9,880 |
| 4/30/2021 | $10,216 | $10,235 | $9,959 |
| 5/31/2021 | $10,220 | $10,238 | $9,991 |
| 6/30/2021 | $10,284 | $10,300 | $10,061 |
| 7/31/2021 | $10,378 | $10,478 | $10,174 |
| 8/31/2021 | $10,360 | $10,441 | $10,154 |
| 9/30/2021 | $10,294 | $10,313 | $10,066 |
| 10/31/2021 | $10,267 | $10,264 | $10,064 |
| 11/30/2021 | $10,291 | $10,371 | $10,093 |
| 12/31/2021 | $10,256 | $10,284 | $10,068 |
| 1/31/2022 | $10,086 | $10,100 | $9,851 |
| 2/28/2022 | $9,925 | $9,854 | $9,741 |
| 3/31/2022 | $9,765 | $9,609 | $9,470 |
| 4/30/2022 | $9,490 | $9,263 | $9,111 |
| 5/31/2022 | $9,422 | $9,137 | $9,170 |
| 6/30/2022 | $9,189 | $8,881 | $9,026 |
| 7/31/2022 | $9,472 | $9,279 | $9,246 |
| 8/31/2022 | $9,230 | $8,864 | $8,985 |
| 9/30/2022 | $8,914 | $8,482 | $8,597 |
| 10/31/2022 | $8,901 | $8,474 | $8,485 |
| 11/30/2022 | $9,138 | $8,783 | $8,798 |
| 12/31/2022 | $9,021 | $8,568 | $8,758 |
| 1/31/2023 | $9,230 | $8,801 | $9,027 |
| 2/28/2023 | $9,105 | $8,625 | $8,794 |
| 3/31/2023 | $9,238 | $8,799 | $9,017 |
| 4/30/2023 | $9,282 | $8,852 | $9,072 |
| 5/31/2023 | $9,270 | $8,844 | $8,973 |
| 6/30/2023 | $9,294 | $8,839 | $8,941 |
| 7/31/2023 | $9,340 | $8,881 | $8,935 |
| 8/31/2023 | $9,342 | $8,893 | $8,878 |
| 9/30/2023 | $9,208 | $8,738 | $8,652 |
| 10/31/2023 | $9,188 | $8,731 | $8,516 |
| 11/30/2023 | $9,452 | $9,034 | $8,901 |
| 12/31/2023 | $9,780 | $9,382 | $9,242 |
| 1/31/2024 | $9,749 | $9,353 | $9,217 |
| 2/29/2024 | $9,682 | $9,271 | $9,086 |
| 3/31/2024 | $9,791 | $9,391 | $9,170 |
| 4/30/2024 | $9,666 | $9,257 | $8,939 |
| 5/31/2024 | $9,706 | $9,306 | $9,090 |
| 6/30/2024 | $9,781 | $9,371 | $9,176 |
| 7/31/2024 | $9,975 | $9,575 | $9,391 |
The Fund’s benchmarks are unmanaged indices used as a general measure of market performance. Calculations assume the reinvestment of dividends and capital gains.
Average Annual Total Returns (%)
| 1 Year | Since Inception 5/28/20 |
|---|
| Class A at NAV | 6.80% | 0.49% |
| Class A with sales charge | 4.40% | (0.06%) |
| ICE BofA Green Bond Index (USD Hedged) | 7.81% | (1.04%) |
Bloomberg Aggregate Bond IndexFootnote Reference* | 5.10% | (1.49%) |
| Footnote | Description |
Footnote* | The Fund has adopted the Bloomberg Aggregate Bond Index as its broad-based securities market index. |
The Fund's past performance is no guarantee of future results. The returns do not reflect the deduction of taxes that a shareholder would pay on Fund distributions or redemption of Fund shares.
| Total Net Assets | $21,162,971 |
| # of Portfolio Holdings | 190 |
| Portfolio Turnover Rate | 59% |
| Total Advisory Fees Paid | $0 |
What did the Fund invest in?
| Portfolio Holdings Presented by Portfolio Allocation | %Footnote Reference* |
| Asset-Backed Securities | 0.24% |
| Convertible Bonds | 0.42% |
| Corporate Bonds | 68.64% |
| Floating Rate Loans | 1.93% |
| Foreign Government Obligations | 18.16% |
| Government Sponsored Enterprises Collateralized Mortgage Obligations | 0.43% |
| Municipal Bonds | 1.98% |
| U.S. Treasury Obligations | 6.62% |
| Repurchase Agreements | 1.58% |
| Total | 100.00% |
| Footnote | Description |
Footnote* | Represents percent of total investments, which excludes derivatives |
There were no material fund changes during the period.
Where can I find additional information about the Fund?
For additional information about the Fund, including its Prospectus, Statement of Additional Information, financial statements, holdings and proxy information, please visit lordabbett.com/FundDocuments.
The Fund has adopted a policy that allows it to send only one copy of the Fund's prospectus, proxy material, annual report and semiannual report (or related notice of internet availability of annual report and semiannual report) to certain shareholders residing at the same "household." This reduces Fund expenses, which benefits you and other shareholders.If you need additional copies or do not want your mailings to be "householded," please call Lord Abbett at 888-522-2388.
Lord Abbett Climate Focused Bond Fund
Annual Shareholder Report
July 31, 2024
lordabbett.com/FundDocuments
TSR-A-9060-A
09/24
Lord Abbett Climate Focused Bond Fund
Annual Shareholder Report
July 31, 2024
lordabbett.com/FundDocuments
This annual shareholder report contains important information about the Lord Abbett Climate Focused Bond Fund for the period of August 1, 2023 to July 31, 2024, as well as certain changes to the Fund. You can find additional information about the Fund at lordabbett.com/FundDocuments. You can also request this information by contacting us at 888-522-2388.
What were the Fund costs for the last year?
(based on a hypothetical $10,000 investment)
| Class Name | Costs of a $10,000 investment | Costs paid as a percentage of a $10,000 investment |
|---|
| Class C | $130 | 1.26% |
How did the Fund perform last year and what affected its performance?
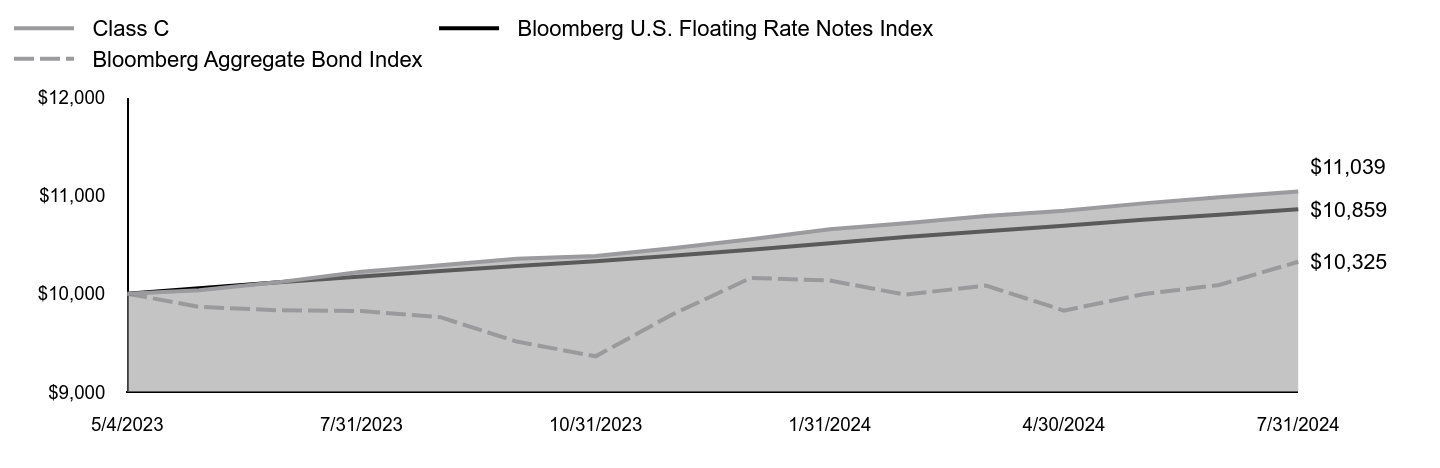
For the fiscal year ended July 31, 2024, the Fund returned 6.15%, reflecting performance at the net asset value (NAV) of Class C shares with all distributions reinvested, compared to a securities market index with investment characteristics similar to those of the Fund, the ICE BofA Green Bond Index (USD Hedged), which returned 7.81% over the same period. The Fund's broad-based market index, the Bloomberg Aggregate Bond Index, returned 5.10% over the same period.
Positive factors for the markets included momentum around the soft-landing narrative, specifically in the second half of the period, which was supported by signs of a cooling labor market and a slowing economy, leading the market to adjust its expectations of future interest rate cuts by the U.S. Federal Reserve (the Fed). Negative factors, specifically in the beginning of the period, included stronger-than-expected GDP growth, resilient labor market data, and persistently high inflation readings that led to a more prolonged interest rate environment.
Top contributors to performance: The Fund’s allocation to high yield corporate bonds was one of the largest contributors to relative performance.
Top detractors from performance: The Fund’s overweight allocation to commercial mortgage-backed securities detracted from relative performance.
Total Return Based on $10,000 Investment
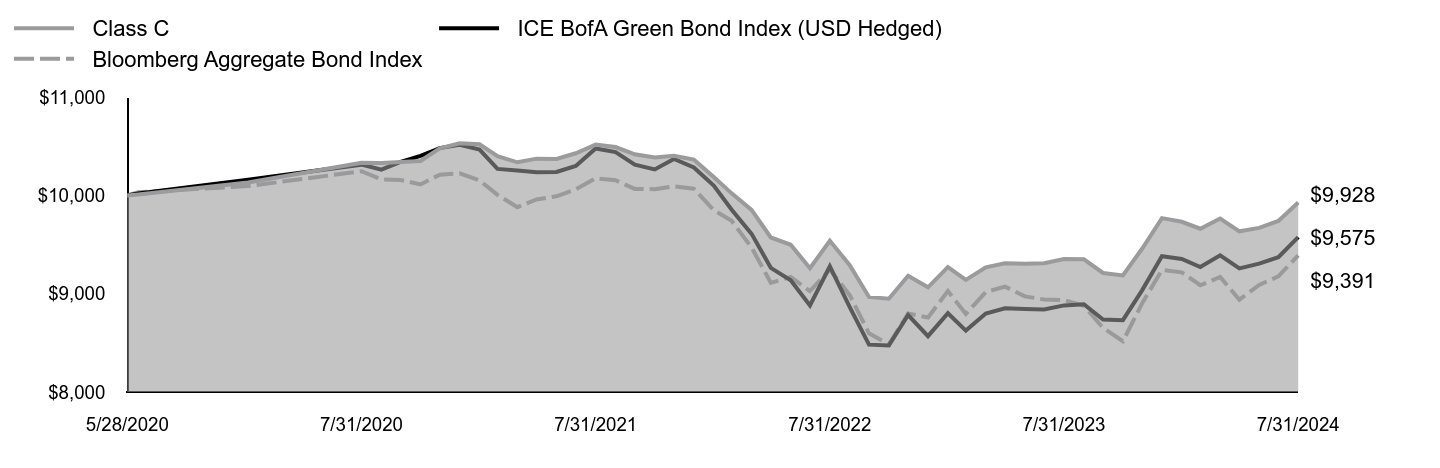
| Class C | ICE BofA Green Bond Index (USD Hedged) | Bloomberg Aggregate Bond Index |
|---|
| 5/28/2020 | $10,000 | $10,000 | $10,000 |
| 5/31/2020 | $10,010 | $10,021 | $10,032 |
| 6/30/2020 | $10,131 | $10,160 | $10,095 |
| 7/31/2020 | $10,332 | $10,313 | $10,246 |
| 8/31/2020 | $10,331 | $10,263 | $10,163 |
| 9/30/2020 | $10,341 | $10,340 | $10,157 |
| 10/31/2020 | $10,350 | $10,403 | $10,112 |
| 11/30/2020 | $10,480 | $10,481 | $10,211 |
| 12/31/2020 | $10,531 | $10,514 | $10,225 |
| 1/31/2021 | $10,520 | $10,466 | $10,152 |
| 2/28/2021 | $10,399 | $10,270 | $10,005 |
| 3/31/2021 | $10,337 | $10,254 | $9,880 |
| 4/30/2021 | $10,374 | $10,235 | $9,959 |
| 5/31/2021 | $10,371 | $10,238 | $9,991 |
| 6/30/2021 | $10,429 | $10,300 | $10,061 |
| 7/31/2021 | $10,517 | $10,478 | $10,174 |
| 8/31/2021 | $10,492 | $10,441 | $10,154 |
| 9/30/2021 | $10,418 | $10,313 | $10,066 |
| 10/31/2021 | $10,385 | $10,264 | $10,064 |
| 11/30/2021 | $10,404 | $10,371 | $10,093 |
| 12/31/2021 | $10,365 | $10,284 | $10,068 |
| 1/31/2022 | $10,188 | $10,100 | $9,851 |
| 2/28/2022 | $10,021 | $9,854 | $9,741 |
| 3/31/2022 | $9,853 | $9,609 | $9,470 |
| 4/30/2022 | $9,572 | $9,263 | $9,111 |
| 5/31/2022 | $9,498 | $9,137 | $9,170 |
| 6/30/2022 | $9,259 | $8,881 | $9,026 |
| 7/31/2022 | $9,539 | $9,279 | $9,246 |
| 8/31/2022 | $9,290 | $8,864 | $8,985 |
| 9/30/2022 | $8,967 | $8,482 | $8,597 |
| 10/31/2022 | $8,949 | $8,474 | $8,485 |
| 11/30/2022 | $9,183 | $8,783 | $8,798 |
| 12/31/2022 | $9,065 | $8,568 | $8,758 |
| 1/31/2023 | $9,271 | $8,801 | $9,027 |
| 2/28/2023 | $9,141 | $8,625 | $8,794 |
| 3/31/2023 | $9,269 | $8,799 | $9,017 |
| 4/30/2023 | $9,309 | $8,852 | $9,072 |
| 5/31/2023 | $9,304 | $8,844 | $8,973 |
| 6/30/2023 | $9,311 | $8,839 | $8,941 |
| 7/31/2023 | $9,353 | $8,881 | $8,935 |
| 8/31/2023 | $9,350 | $8,893 | $8,878 |
| 9/30/2023 | $9,211 | $8,738 | $8,652 |
| 10/31/2023 | $9,186 | $8,731 | $8,516 |
| 11/30/2023 | $9,457 | $9,034 | $8,901 |
| 12/31/2023 | $9,769 | $9,382 | $9,242 |
| 1/31/2024 | $9,732 | $9,353 | $9,217 |
| 2/29/2024 | $9,661 | $9,271 | $9,086 |
| 3/31/2024 | $9,765 | $9,391 | $9,170 |
| 4/30/2024 | $9,635 | $9,257 | $8,939 |
| 5/31/2024 | $9,670 | $9,306 | $9,090 |
| 6/30/2024 | $9,740 | $9,371 | $9,176 |
| 7/31/2024 | $9,928 | $9,575 | $9,391 |
The Fund’s benchmarks are unmanaged indices used as a general measure of market performance. Calculations assume the reinvestment of dividends and capital gains.
Average Annual Total Returns (%)
| 1 Year | Since Inception 5/28/20 |
|---|
| Class C at NAV | 6.15% | (0.17%) |
| Class C with sales charge | 5.15% | (0.17%) |
| ICE BofA Green Bond Index (USD Hedged) | 7.81% | (1.04%) |
Bloomberg Aggregate Bond IndexFootnote Reference* | 5.10% | (1.49%) |
| Footnote | Description |
Footnote* | The Fund has adopted the Bloomberg Aggregate Bond Index as its broad-based securities market index. |
The Fund's past performance is no guarantee of future results. The returns do not reflect the deduction of taxes that a shareholder would pay on Fund distributions or redemption of Fund shares.
| Total Net Assets | $21,162,971 |
| # of Portfolio Holdings | 190 |
| Portfolio Turnover Rate | 59% |
| Total Advisory Fees Paid | $0 |
What did the Fund invest in?
| Portfolio Holdings Presented by Portfolio Allocation | %Footnote Reference* |
| Asset-Backed Securities | 0.24% |
| Convertible Bonds | 0.42% |
| Corporate Bonds | 68.64% |
| Floating Rate Loans | 1.93% |
| Foreign Government Obligations | 18.16% |
| Government Sponsored Enterprises Collateralized Mortgage Obligations | 0.43% |
| Municipal Bonds | 1.98% |
| U.S. Treasury Obligations | 6.62% |
| Repurchase Agreements | 1.58% |
| Total | 100.00% |
| Footnote | Description |
Footnote* | Represents percent of total investments, which excludes derivatives |
There were no material fund changes during the period.
Where can I find additional information about the Fund?
For additional information about the Fund, including its Prospectus, Statement of Additional Information, financial statements, holdings and proxy information, please visit lordabbett.com/FundDocuments.
The Fund has adopted a policy that allows it to send only one copy of the Fund's prospectus, proxy material, annual report and semiannual report (or related notice of internet availability of annual report and semiannual report) to certain shareholders residing at the same "household." This reduces Fund expenses, which benefits you and other shareholders.If you need additional copies or do not want your mailings to be "householded," please call Lord Abbett at 888-522-2388.
Lord Abbett Climate Focused Bond Fund
Annual Shareholder Report
July 31, 2024
lordabbett.com/FundDocuments
TSR-A-9061-C
09/24
Lord Abbett Climate Focused Bond Fund
Annual Shareholder Report
July 31, 2024
lordabbett.com/FundDocuments
This annual shareholder report contains important information about the Lord Abbett Climate Focused Bond Fund for the period of August 1, 2023 to July 31, 2024, as well as certain changes to the Fund. You can find additional information about the Fund at lordabbett.com/FundDocuments. You can also request this information by contacting us at 888-522-2388.
What were the Fund costs for the last year?
(based on a hypothetical $10,000 investment)
| Class Name | Costs of a $10,000 investment | Costs paid as a percentage of a $10,000 investment |
|---|
| Class F | $47 | 0.45% |
How did the Fund perform last year and what affected its performance?
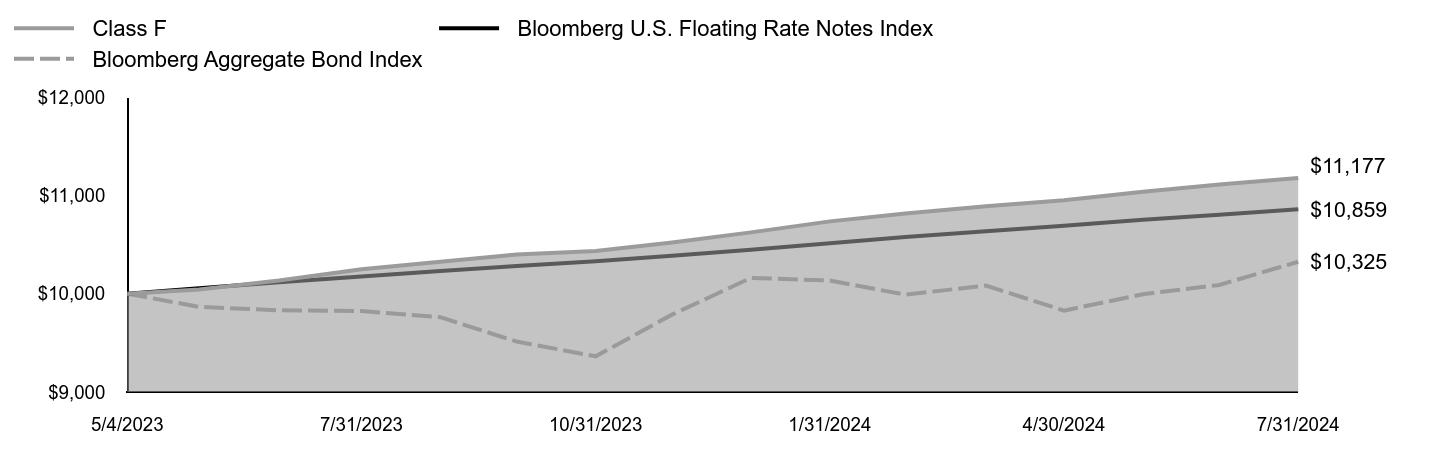
For the fiscal year ended July 31, 2024, the Fund returned 7.01%, reflecting performance at the net asset value (NAV) of Class F shares with all distributions reinvested, compared to a securities market index with investment characteristics similar to those of the Fund, the ICE BofA Green Bond Index (USD Hedged), which returned 7.81% over the same period. The Fund's broad-based market index, the Bloomberg Aggregate Bond Index, returned 5.10% over the same period.
Positive factors for the markets included momentum around the soft-landing narrative, specifically in the second half of the period, which was supported by signs of a cooling labor market and a slowing economy, leading the market to adjust its expectations of future interest rate cuts by the U.S. Federal Reserve (the Fed). Negative factors, specifically in the beginning of the period, included stronger-than-expected GDP growth, resilient labor market data, and persistently high inflation readings that led to a more prolonged interest rate environment.
Top contributors to performance: The Fund’s allocation to high yield corporate bonds was one of the largest contributors to relative performance.
Top detractors from performance: The Fund’s overweight allocation to commercial mortgage-backed securities detracted from relative performance.
Total Return Based on $10,000 Investment

| Class F | ICE BofA Green Bond Index (USD Hedged) | Bloomberg Aggregate Bond Index |
|---|
| 5/28/2020 | $10,000 | $10,000 | $10,000 |
| 5/31/2020 | $10,020 | $10,021 | $10,032 |
| 6/30/2020 | $10,142 | $10,160 | $10,095 |
| 7/31/2020 | $10,352 | $10,313 | $10,246 |
| 8/31/2020 | $10,370 | $10,263 | $10,163 |
| 9/30/2020 | $10,378 | $10,340 | $10,157 |
| 10/31/2020 | $10,396 | $10,403 | $10,112 |
| 11/30/2020 | $10,536 | $10,481 | $10,211 |
| 12/31/2020 | $10,595 | $10,514 | $10,225 |
| 1/31/2021 | $10,593 | $10,466 | $10,152 |
| 2/28/2021 | $10,479 | $10,270 | $10,005 |
| 3/31/2021 | $10,425 | $10,254 | $9,880 |
| 4/30/2021 | $10,471 | $10,235 | $9,959 |
| 5/31/2021 | $10,477 | $10,238 | $9,991 |
| 6/30/2021 | $10,544 | $10,300 | $10,061 |
| 7/31/2021 | $10,642 | $10,478 | $10,174 |
| 8/31/2021 | $10,626 | $10,441 | $10,154 |
| 9/30/2021 | $10,560 | $10,313 | $10,066 |
| 10/31/2021 | $10,534 | $10,264 | $10,064 |
| 11/30/2021 | $10,560 | $10,371 | $10,093 |
| 12/31/2021 | $10,528 | $10,284 | $10,068 |
| 1/31/2022 | $10,355 | $10,100 | $9,851 |
| 2/28/2022 | $10,191 | $9,854 | $9,741 |
| 3/31/2022 | $10,028 | $9,609 | $9,470 |
| 4/30/2022 | $9,748 | $9,263 | $9,111 |
| 5/31/2022 | $9,680 | $9,137 | $9,170 |
| 6/30/2022 | $9,442 | $8,881 | $9,026 |
| 7/31/2022 | $9,735 | $9,279 | $9,246 |
| 8/31/2022 | $9,487 | $8,864 | $8,985 |
| 9/30/2022 | $9,164 | $8,482 | $8,597 |
| 10/31/2022 | $9,152 | $8,474 | $8,485 |
| 11/30/2022 | $9,408 | $8,783 | $8,798 |
| 12/31/2022 | $9,282 | $8,568 | $8,758 |
| 1/31/2023 | $9,499 | $8,801 | $9,027 |
| 2/28/2023 | $9,372 | $8,625 | $8,794 |
| 3/31/2023 | $9,511 | $8,799 | $9,017 |
| 4/30/2023 | $9,557 | $8,852 | $9,072 |
| 5/31/2023 | $9,547 | $8,844 | $8,973 |
| 6/30/2023 | $9,573 | $8,839 | $8,941 |
| 7/31/2023 | $9,622 | $8,881 | $8,935 |
| 8/31/2023 | $9,626 | $8,893 | $8,878 |
| 9/30/2023 | $9,489 | $8,738 | $8,652 |
| 10/31/2023 | $9,470 | $8,731 | $8,516 |
| 11/30/2023 | $9,743 | $9,034 | $8,901 |
| 12/31/2023 | $10,084 | $9,382 | $9,242 |
| 1/31/2024 | $10,053 | $9,353 | $9,217 |
| 2/29/2024 | $9,986 | $9,271 | $9,086 |
| 3/31/2024 | $10,100 | $9,391 | $9,170 |
| 4/30/2024 | $9,973 | $9,257 | $8,939 |
| 5/31/2024 | $10,015 | $9,306 | $9,090 |
| 6/30/2024 | $10,094 | $9,371 | $9,176 |
| 7/31/2024 | $10,297 | $9,575 | $9,391 |
The Fund’s benchmarks are unmanaged indices used as a general measure of market performance. Calculations assume the reinvestment of dividends and capital gains.
Average Annual Total Returns (%)
| 1 Year | Since Inception 5/28/20 |
|---|
| Class F at NAV | 7.01% | 0.70% |
| ICE BofA Green Bond Index (USD Hedged) | 7.81% | (1.04%) |
Bloomberg Aggregate Bond IndexFootnote Reference* | 5.10% | (1.49%) |
| Footnote | Description |
Footnote* | The Fund has adopted the Bloomberg Aggregate Bond Index as its broad-based securities market index. |
The Fund's past performance is no guarantee of future results. The returns do not reflect the deduction of taxes that a shareholder would pay on Fund distributions or redemption of Fund shares.
| Total Net Assets | $21,162,971 |
| # of Portfolio Holdings | 190 |
| Portfolio Turnover Rate | 59% |
| Total Advisory Fees Paid | $0 |
What did the Fund invest in?
| Portfolio Holdings Presented by Portfolio Allocation | %Footnote Reference* |
| Asset-Backed Securities | 0.24% |
| Convertible Bonds | 0.42% |
| Corporate Bonds | 68.64% |
| Floating Rate Loans | 1.93% |
| Foreign Government Obligations | 18.16% |
| Government Sponsored Enterprises Collateralized Mortgage Obligations | 0.43% |
| Municipal Bonds | 1.98% |
| U.S. Treasury Obligations | 6.62% |
| Repurchase Agreements | 1.58% |
| Total | 100.00% |
| Footnote | Description |
Footnote* | Represents percent of total investments, which excludes derivatives |
There were no material fund changes during the period.
Where can I find additional information about the Fund?
For additional information about the Fund, including its Prospectus, Statement of Additional Information, financial statements, holdings and proxy information, please visit lordabbett.com/FundDocuments.
The Fund has adopted a policy that allows it to send only one copy of the Fund's prospectus, proxy material, annual report and semiannual report (or related notice of internet availability of annual report and semiannual report) to certain shareholders residing at the same "household." This reduces Fund expenses, which benefits you and other shareholders.If you need additional copies or do not want your mailings to be "householded," please call Lord Abbett at 888-522-2388.
Lord Abbett Climate Focused Bond Fund
Annual Shareholder Report
July 31, 2024
lordabbett.com/FundDocuments
TSR-A-9062-F
09/24
Lord Abbett Climate Focused Bond Fund
Annual Shareholder Report
July 31, 2024
lordabbett.com/FundDocuments
This annual shareholder report contains important information about the Lord Abbett Climate Focused Bond Fund for the period of August 1, 2023 to July 31, 2024, as well as certain changes to the Fund. You can find additional information about the Fund at lordabbett.com/FundDocuments. You can also request this information by contacting us at 888-522-2388.
What were the Fund costs for the last year?
(based on a hypothetical $10,000 investment)
| Class Name | Costs of a $10,000 investment | Costs paid as a percentage of a $10,000 investment |
|---|
| Class F3 | $45 | 0.43% |
How did the Fund perform last year and what affected its performance?
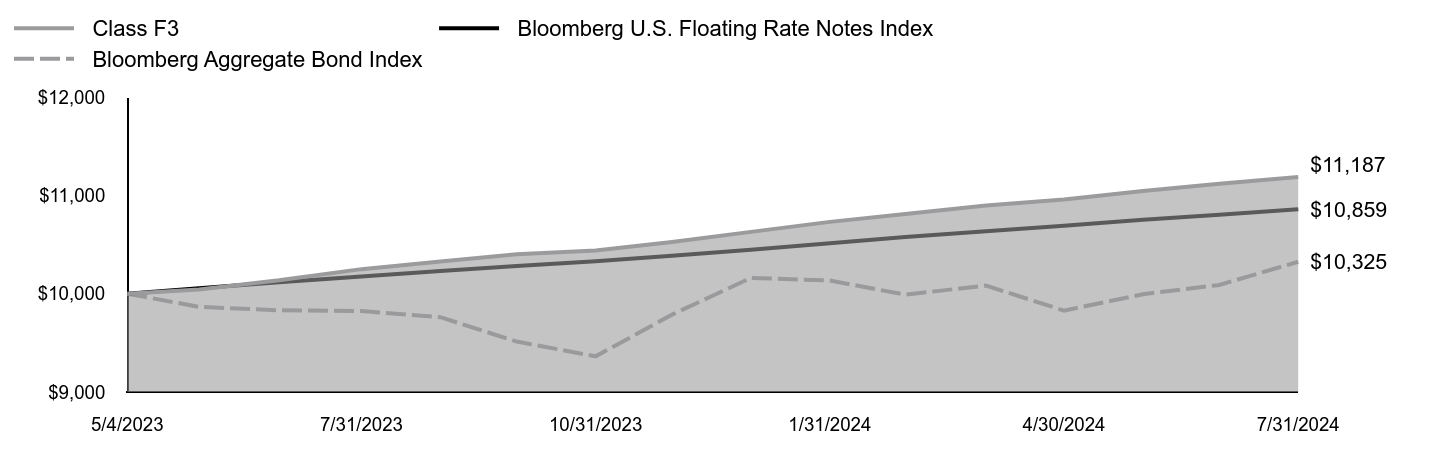
For the fiscal year ended July 31, 2024, the Fund returned 7.02%, reflecting performance at the net asset value (NAV) of Class F3 shares with all distributions reinvested, compared to a securities market index with investment characteristics similar to those of the Fund, the ICE BofA Green Bond Index (USD Hedged), which returned 7.81% over the same period. The Fund's broad-based market index, the Bloomberg Aggregate Bond Index, returned 5.10% over the same period.
Positive factors for the markets included momentum around the soft-landing narrative, specifically in the second half of the period, which was supported by signs of a cooling labor market and a slowing economy, leading the market to adjust its expectations of future interest rate cuts by the U.S. Federal Reserve (the Fed). Negative factors, specifically in the beginning of the period, included stronger-than-expected GDP growth, resilient labor market data, and persistently high inflation readings that led to a more prolonged interest rate environment.
Top contributors to performance: The Fund’s allocation to high yield corporate bonds was one of the largest contributors to relative performance.
Top detractors from performance: The Fund’s overweight allocation to commercial mortgage-backed securities detracted from relative performance.
Total Return Based on $10,000 Investment

| Class F3 | ICE BofA Green Bond Index (USD Hedged) | Bloomberg Aggregate Bond Index |
|---|
| 5/28/2020 | $10,000 | $10,000 | $10,000 |
| 5/31/2020 | $10,020 | $10,021 | $10,032 |
| 6/30/2020 | $10,142 | $10,160 | $10,095 |
| 7/31/2020 | $10,353 | $10,313 | $10,246 |
| 8/31/2020 | $10,362 | $10,263 | $10,163 |
| 9/30/2020 | $10,380 | $10,340 | $10,157 |
| 10/31/2020 | $10,400 | $10,403 | $10,112 |
| 11/30/2020 | $10,540 | $10,481 | $10,211 |
| 12/31/2020 | $10,600 | $10,514 | $10,225 |
| 1/31/2021 | $10,598 | $10,466 | $10,152 |
| 2/28/2021 | $10,485 | $10,270 | $10,005 |
| 3/31/2021 | $10,432 | $10,254 | $9,880 |
| 4/30/2021 | $10,478 | $10,235 | $9,959 |
| 5/31/2021 | $10,485 | $10,238 | $9,991 |
| 6/30/2021 | $10,552 | $10,300 | $10,061 |
| 7/31/2021 | $10,651 | $10,478 | $10,174 |
| 8/31/2021 | $10,635 | $10,441 | $10,154 |
| 9/30/2021 | $10,570 | $10,313 | $10,066 |
| 10/31/2021 | $10,545 | $10,264 | $10,064 |
| 11/30/2021 | $10,571 | $10,371 | $10,093 |
| 12/31/2021 | $10,540 | $10,284 | $10,068 |
| 1/31/2022 | $10,367 | $10,100 | $9,851 |
| 2/28/2022 | $10,204 | $9,854 | $9,741 |
| 3/31/2022 | $10,041 | $9,609 | $9,470 |
| 4/30/2022 | $9,761 | $9,263 | $9,111 |
| 5/31/2022 | $9,693 | $9,137 | $9,170 |
| 6/30/2022 | $9,455 | $8,881 | $9,026 |
| 7/31/2022 | $9,749 | $9,279 | $9,246 |
| 8/31/2022 | $9,501 | $8,864 | $8,985 |
| 9/30/2022 | $9,178 | $8,482 | $8,597 |
| 10/31/2022 | $9,166 | $8,474 | $8,485 |
| 11/30/2022 | $9,412 | $8,783 | $8,798 |
| 12/31/2022 | $9,297 | $8,568 | $8,758 |
| 1/31/2023 | $9,515 | $8,801 | $9,027 |
| 2/28/2023 | $9,388 | $8,625 | $8,794 |
| 3/31/2023 | $9,526 | $8,799 | $9,017 |
| 4/30/2023 | $9,573 | $8,852 | $9,072 |
| 5/31/2023 | $9,563 | $8,844 | $8,973 |
| 6/30/2023 | $9,589 | $8,839 | $8,941 |
| 7/31/2023 | $9,639 | $8,881 | $8,935 |
| 8/31/2023 | $9,642 | $8,893 | $8,878 |
| 9/30/2023 | $9,505 | $8,738 | $8,652 |
| 10/31/2023 | $9,486 | $8,731 | $8,516 |
| 11/30/2023 | $9,760 | $9,034 | $8,901 |
| 12/31/2023 | $10,101 | $9,382 | $9,242 |
| 1/31/2024 | $10,071 | $9,353 | $9,217 |
| 2/29/2024 | $10,004 | $9,271 | $9,086 |
| 3/31/2024 | $10,118 | $9,391 | $9,170 |
| 4/30/2024 | $9,991 | $9,257 | $8,939 |
| 5/31/2024 | $10,033 | $9,306 | $9,090 |
| 6/30/2024 | $10,113 | $9,371 | $9,176 |
| 7/31/2024 | $10,316 | $9,575 | $9,391 |
The Fund’s benchmarks are unmanaged indices used as a general measure of market performance. Calculations assume the reinvestment of dividends and capital gains.
Average Annual Total Returns (%)
| 1 Year | Since Inception 5/28/20 |
|---|
| Class F3 at NAV | 7.02% | 0.75% |
| ICE BofA Green Bond Index (USD Hedged) | 7.81% | (1.04%) |
Bloomberg Aggregate Bond IndexFootnote Reference* | 5.10% | (1.49%) |
| Footnote | Description |
Footnote* | The Fund has adopted the Bloomberg Aggregate Bond Index as its broad-based securities market index. |
The Fund's past performance is no guarantee of future results. The returns do not reflect the deduction of taxes that a shareholder would pay on Fund distributions or redemption of Fund shares.
| Total Net Assets | $21,162,971 |
| # of Portfolio Holdings | 190 |
| Portfolio Turnover Rate | 59% |
| Total Advisory Fees Paid | $0 |
What did the Fund invest in?
| Portfolio Holdings Presented by Portfolio Allocation | %Footnote Reference* |
| Asset-Backed Securities | 0.24% |
| Convertible Bonds | 0.42% |
| Corporate Bonds | 68.64% |
| Floating Rate Loans | 1.93% |
| Foreign Government Obligations | 18.16% |
| Government Sponsored Enterprises Collateralized Mortgage Obligations | 0.43% |
| Municipal Bonds | 1.98% |
| U.S. Treasury Obligations | 6.62% |
| Repurchase Agreements | 1.58% |
| Total | 100.00% |
| Footnote | Description |
Footnote* | Represents percent of total investments, which excludes derivatives |
There were no material fund changes during the period.
Where can I find additional information about the Fund?
For additional information about the Fund, including its Prospectus, Statement of Additional Information, financial statements, holdings and proxy information, please visit lordabbett.com/FundDocuments.
The Fund has adopted a policy that allows it to send only one copy of the Fund's prospectus, proxy material, annual report and semiannual report (or related notice of internet availability of annual report and semiannual report) to certain shareholders residing at the same "household." This reduces Fund expenses, which benefits you and other shareholders.If you need additional copies or do not want your mailings to be "householded," please call Lord Abbett at 888-522-2388.
Lord Abbett Climate Focused Bond Fund
Annual Shareholder Report
July 31, 2024
lordabbett.com/FundDocuments
TSR-A-9064-F3
09/24
Lord Abbett Climate Focused Bond Fund
Annual Shareholder Report
July 31, 2024
lordabbett.com/FundDocuments
This annual shareholder report contains important information about the Lord Abbett Climate Focused Bond Fund for the period of August 1, 2023 to July 31, 2024, as well as certain changes to the Fund. You can find additional information about the Fund at lordabbett.com/FundDocuments. You can also request this information by contacting us at 888-522-2388.
What were the Fund costs for the last year?
(based on a hypothetical $10,000 investment)
| Class Name | Costs of a $10,000 investment | Costs paid as a percentage of a $10,000 investment |
|---|
| Class I | $47 | 0.45% |
How did the Fund perform last year and what affected its performance?
For the fiscal year ended July 31, 2024, the Fund returned 7.01%, reflecting performance at the net asset value (NAV) of Class I shares with all distributions reinvested, compared to a securities market index with investment characteristics similar to those of the Fund, the ICE BofA Green Bond Index (USD Hedged), which returned 7.81% over the same period. The Fund's broad-based market index, the Bloomberg Aggregate Bond Index, returned 5.10% over the same period.
Positive factors for the markets included momentum around the soft-landing narrative, specifically in the second half of the period, which was supported by signs of a cooling labor market and a slowing economy, leading the market to adjust its expectations of future interest rate cuts by the U.S. Federal Reserve (the Fed). Negative factors, specifically in the beginning of the period, included stronger-than-expected GDP growth, resilient labor market data, and persistently high inflation readings that led to a more prolonged interest rate environment.
Top contributors to performance: The Fund’s allocation to high yield corporate bonds was one of the largest contributors to relative performance.
Top detractors from performance: The Fund’s overweight allocation to commercial mortgage-backed securities detracted from relative performance.
Total Return Based on $10,000 Investment

| Class I | ICE BofA Green Bond Index (USD Hedged) | Bloomberg Aggregate Bond Index |
|---|
| 5/28/2020 | $10,000 | $10,000 | $10,000 |
| 5/31/2020 | $10,020 | $10,021 | $10,032 |
| 6/30/2020 | $10,142 | $10,160 | $10,095 |
| 7/31/2020 | $10,352 | $10,313 | $10,246 |
| 8/31/2020 | $10,360 | $10,263 | $10,163 |
| 9/30/2020 | $10,378 | $10,340 | $10,157 |
| 10/31/2020 | $10,396 | $10,403 | $10,112 |
| 11/30/2020 | $10,536 | $10,481 | $10,211 |
| 12/31/2020 | $10,595 | $10,514 | $10,225 |
| 1/31/2021 | $10,593 | $10,466 | $10,152 |
| 2/28/2021 | $10,480 | $10,270 | $10,005 |
| 3/31/2021 | $10,425 | $10,254 | $9,880 |
| 4/30/2021 | $10,471 | $10,235 | $9,959 |
| 5/31/2021 | $10,477 | $10,238 | $9,991 |
| 6/30/2021 | $10,544 | $10,300 | $10,061 |
| 7/31/2021 | $10,642 | $10,478 | $10,174 |
| 8/31/2021 | $10,625 | $10,441 | $10,154 |
| 9/30/2021 | $10,560 | $10,313 | $10,066 |
| 10/31/2021 | $10,534 | $10,264 | $10,064 |
| 11/30/2021 | $10,559 | $10,371 | $10,093 |
| 12/31/2021 | $10,538 | $10,284 | $10,068 |
| 1/31/2022 | $10,354 | $10,100 | $9,851 |
| 2/28/2022 | $10,202 | $9,854 | $9,741 |
| 3/31/2022 | $10,028 | $9,609 | $9,470 |
| 4/30/2022 | $9,748 | $9,263 | $9,111 |
| 5/31/2022 | $9,680 | $9,137 | $9,170 |
| 6/30/2022 | $9,452 | $8,881 | $9,026 |
| 7/31/2022 | $9,734 | $9,279 | $9,246 |
| 8/31/2022 | $9,486 | $8,864 | $8,985 |
| 9/30/2022 | $9,163 | $8,482 | $8,597 |
| 10/31/2022 | $9,151 | $8,474 | $8,485 |
| 11/30/2022 | $9,407 | $8,783 | $8,798 |
| 12/31/2022 | $9,282 | $8,568 | $8,758 |
| 1/31/2023 | $9,499 | $8,801 | $9,027 |
| 2/28/2023 | $9,372 | $8,625 | $8,794 |
| 3/31/2023 | $9,510 | $8,799 | $9,017 |
| 4/30/2023 | $9,568 | $8,852 | $9,072 |
| 5/31/2023 | $9,558 | $8,844 | $8,973 |
| 6/30/2023 | $9,572 | $8,839 | $8,941 |
| 7/31/2023 | $9,622 | $8,881 | $8,935 |
| 8/31/2023 | $9,637 | $8,893 | $8,878 |
| 9/30/2023 | $9,489 | $8,738 | $8,652 |
| 10/31/2023 | $9,470 | $8,731 | $8,516 |
| 11/30/2023 | $9,755 | $9,034 | $8,901 |
| 12/31/2023 | $10,083 | $9,382 | $9,242 |
| 1/31/2024 | $10,065 | $9,353 | $9,217 |
| 2/29/2024 | $9,986 | $9,271 | $9,086 |
| 3/31/2024 | $10,099 | $9,391 | $9,170 |
| 4/30/2024 | $9,972 | $9,257 | $8,939 |
| 5/31/2024 | $10,027 | $9,306 | $9,090 |
| 6/30/2024 | $10,094 | $9,371 | $9,176 |
| 7/31/2024 | $10,296 | $9,575 | $9,391 |
The Fund’s benchmarks are unmanaged indices used as a general measure of market performance. Calculations assume the reinvestment of dividends and capital gains.
Average Annual Total Returns (%)
| 1 Year | Since Inception 5/28/20 |
|---|
| Class I at NAV | 7.01% | 0.70% |
| ICE BofA Green Bond Index (USD Hedged) | 7.81% | (1.04%) |
Bloomberg Aggregate Bond IndexFootnote Reference* | 5.10% | (1.49%) |
| Footnote | Description |
Footnote* | The Fund has adopted the Bloomberg Aggregate Bond Index as its broad-based securities market index. |
The Fund's past performance is no guarantee of future results. The returns do not reflect the deduction of taxes that a shareholder would pay on Fund distributions or redemption of Fund shares.
| Total Net Assets | $21,162,971 |
| # of Portfolio Holdings | 190 |
| Portfolio Turnover Rate | 59% |
| Total Advisory Fees Paid | $0 |
What did the Fund invest in?
| Portfolio Holdings Presented by Portfolio Allocation | %Footnote Reference* |
| Asset-Backed Securities | 0.24% |
| Convertible Bonds | 0.42% |
| Corporate Bonds | 68.64% |
| Floating Rate Loans | 1.93% |
| Foreign Government Obligations | 18.16% |
| Government Sponsored Enterprises Collateralized Mortgage Obligations | 0.43% |
| Municipal Bonds | 1.98% |
| U.S. Treasury Obligations | 6.62% |
| Repurchase Agreements | 1.58% |
| Total | 100.00% |
| Footnote | Description |
Footnote* | Represents percent of total investments, which excludes derivatives |
There were no material fund changes during the period.
Where can I find additional information about the Fund?
For additional information about the Fund, including its Prospectus, Statement of Additional Information, financial statements, holdings and proxy information, please visit lordabbett.com/FundDocuments.
The Fund has adopted a policy that allows it to send only one copy of the Fund's prospectus, proxy material, annual report and semiannual report (or related notice of internet availability of annual report and semiannual report) to certain shareholders residing at the same "household." This reduces Fund expenses, which benefits you and other shareholders.If you need additional copies or do not want your mailings to be "householded," please call Lord Abbett at 888-522-2388.
Lord Abbett Climate Focused Bond Fund
Annual Shareholder Report
July 31, 2024
lordabbett.com/FundDocuments
TSR-A-9063-I
09/24
Lord Abbett Climate Focused Bond Fund
Annual Shareholder Report
July 31, 2024
lordabbett.com/FundDocuments
This annual shareholder report contains important information about the Lord Abbett Climate Focused Bond Fund for the period of August 1, 2023 to July 31, 2024, as well as certain changes to the Fund. You can find additional information about the Fund at lordabbett.com/FundDocuments. You can also request this information by contacting us at 888-522-2388.
What were the Fund costs for the last year?
(based on a hypothetical $10,000 investment)
| Class Name | Costs of a $10,000 investment | Costs paid as a percentage of a $10,000 investment |
|---|
| Class R3 | $98 | 0.95% |
How did the Fund perform last year and what affected its performance?
For the fiscal year ended July 31, 2024, the Fund returned 6.48%, reflecting performance at the net asset value (NAV) of Class R3 shares with all distributions reinvested, compared to a securities market index with investment characteristics similar to those of the Fund, the ICE BofA Green Bond Index (USD Hedged), which returned 7.81% over the same period. The Fund's broad-based market index, the Bloomberg Aggregate Bond Index, returned 5.10% over the same period.
Positive factors for the markets included momentum around the soft-landing narrative, specifically in the second half of the period, which was supported by signs of a cooling labor market and a slowing economy, leading the market to adjust its expectations of future interest rate cuts by the U.S. Federal Reserve (the Fed). Negative factors, specifically in the beginning of the period, included stronger-than-expected GDP growth, resilient labor market data, and persistently high inflation readings that led to a more prolonged interest rate environment.
Top contributors to performance: The Fund’s allocation to high yield corporate bonds was one of the largest contributors to relative performance.
Top detractors from performance: The Fund’s overweight allocation to commercial mortgage-backed securities detracted from relative performance.
Total Return Based on $10,000 Investment

| Class R3 | ICE BofA Green Bond Index (USD Hedged) | Bloomberg Aggregate Bond Index |
|---|
| 5/28/2020 | $10,000 | $10,000 | $10,000 |
| 5/31/2020 | $10,020 | $10,021 | $10,032 |
| 6/30/2020 | $10,136 | $10,160 | $10,095 |
| 7/31/2020 | $10,341 | $10,313 | $10,246 |
| 8/31/2020 | $10,345 | $10,263 | $10,163 |
| 9/30/2020 | $10,359 | $10,340 | $10,157 |
| 10/31/2020 | $10,373 | $10,403 | $10,112 |
| 11/30/2020 | $10,508 | $10,481 | $10,211 |
| 12/31/2020 | $10,563 | $10,514 | $10,225 |
| 1/31/2021 | $10,556 | $10,466 | $10,152 |
| 2/28/2021 | $10,439 | $10,270 | $10,005 |
| 3/31/2021 | $10,380 | $10,254 | $9,880 |
| 4/30/2021 | $10,422 | $10,235 | $9,959 |
| 5/31/2021 | $10,423 | $10,238 | $9,991 |
| 6/30/2021 | $10,486 | $10,300 | $10,061 |
| 7/31/2021 | $10,578 | $10,478 | $10,174 |
| 8/31/2021 | $10,558 | $10,441 | $10,154 |
| 9/30/2021 | $10,488 | $10,313 | $10,066 |
| 10/31/2021 | $10,458 | $10,264 | $10,064 |
| 11/30/2021 | $10,479 | $10,371 | $10,093 |
| 12/31/2021 | $10,443 | $10,284 | $10,068 |
| 1/31/2022 | $10,267 | $10,100 | $9,851 |
| 2/28/2022 | $10,101 | $9,854 | $9,741 |
| 3/31/2022 | $9,935 | $9,609 | $9,470 |
| 4/30/2022 | $9,654 | $9,263 | $9,111 |
| 5/31/2022 | $9,582 | $9,137 | $9,170 |
| 6/30/2022 | $9,353 | $8,881 | $9,026 |
| 7/31/2022 | $9,628 | $9,279 | $9,246 |
| 8/31/2022 | $9,379 | $8,864 | $8,985 |
| 9/30/2022 | $9,056 | $8,482 | $8,597 |
| 10/31/2022 | $9,040 | $8,474 | $8,485 |
| 11/30/2022 | $9,290 | $8,783 | $8,798 |
| 12/31/2022 | $9,162 | $8,568 | $8,758 |
| 1/31/2023 | $9,372 | $8,801 | $9,027 |
| 2/28/2023 | $9,244 | $8,625 | $8,794 |
| 3/31/2023 | $9,376 | $8,799 | $9,017 |
| 4/30/2023 | $9,418 | $8,852 | $9,072 |
| 5/31/2023 | $9,416 | $8,844 | $8,973 |
| 6/30/2023 | $9,426 | $8,839 | $8,941 |
| 7/31/2023 | $9,470 | $8,881 | $8,935 |
| 8/31/2023 | $9,470 | $8,893 | $8,878 |
| 9/30/2023 | $9,331 | $8,738 | $8,652 |
| 10/31/2023 | $9,309 | $8,731 | $8,516 |
| 11/30/2023 | $9,585 | $9,034 | $8,901 |
| 12/31/2023 | $9,904 | $9,382 | $9,242 |
| 1/31/2024 | $9,870 | $9,353 | $9,217 |
| 2/29/2024 | $9,800 | $9,271 | $9,086 |
| 3/31/2024 | $9,908 | $9,391 | $9,170 |
| 4/30/2024 | $9,779 | $9,257 | $8,939 |
| 5/31/2024 | $9,816 | $9,306 | $9,090 |
| 6/30/2024 | $9,890 | $9,371 | $9,176 |
| 7/31/2024 | $10,084 | $9,575 | $9,391 |
The Fund’s benchmarks are unmanaged indices used as a general measure of market performance. Calculations assume the reinvestment of dividends and capital gains.
Average Annual Total Returns (%)
| 1 Year | Since Inception 5/28/20 |
|---|
| Class R3 at NAV | 6.48% | 0.20% |
| ICE BofA Green Bond Index (USD Hedged) | 7.81% | (1.04%) |
Bloomberg Aggregate Bond IndexFootnote Reference* | 5.10% | (1.49%) |
| Footnote | Description |
Footnote* | The Fund has adopted the Bloomberg Aggregate Bond Index as its broad-based securities market index. |
The Fund's past performance is no guarantee of future results. The returns do not reflect the deduction of taxes that a shareholder would pay on Fund distributions or redemption of Fund shares.
| Total Net Assets | $21,162,971 |
| # of Portfolio Holdings | 190 |
| Portfolio Turnover Rate | 59% |
| Total Advisory Fees Paid | $0 |
What did the Fund invest in?
| Portfolio Holdings Presented by Portfolio Allocation | %Footnote Reference* |
| Asset-Backed Securities | 0.24% |
| Convertible Bonds | 0.42% |
| Corporate Bonds | 68.64% |
| Floating Rate Loans | 1.93% |
| Foreign Government Obligations | 18.16% |
| Government Sponsored Enterprises Collateralized Mortgage Obligations | 0.43% |
| Municipal Bonds | 1.98% |
| U.S. Treasury Obligations | 6.62% |
| Repurchase Agreements | 1.58% |
| Total | 100.00% |
| Footnote | Description |
Footnote* | Represents percent of total investments, which excludes derivatives |
There were no material fund changes during the period.
Where can I find additional information about the Fund?
For additional information about the Fund, including its Prospectus, Statement of Additional Information, financial statements, holdings and proxy information, please visit lordabbett.com/FundDocuments.
The Fund has adopted a policy that allows it to send only one copy of the Fund's prospectus, proxy material, annual report and semiannual report (or related notice of internet availability of annual report and semiannual report) to certain shareholders residing at the same "household." This reduces Fund expenses, which benefits you and other shareholders.If you need additional copies or do not want your mailings to be "householded," please call Lord Abbett at 888-522-2388.
Lord Abbett Climate Focused Bond Fund
Annual Shareholder Report
July 31, 2024
lordabbett.com/FundDocuments
TSR-A-9065-R3
09/24
Lord Abbett Climate Focused Bond Fund
Annual Shareholder Report
July 31, 2024
lordabbett.com/FundDocuments
This annual shareholder report contains important information about the Lord Abbett Climate Focused Bond Fund for the period of August 1, 2023 to July 31, 2024, as well as certain changes to the Fund. You can find additional information about the Fund at lordabbett.com/FundDocuments. You can also request this information by contacting us at 888-522-2388.
What were the Fund costs for the last year?
(based on a hypothetical $10,000 investment)
| Class Name | Costs of a $10,000 investment | Costs paid as a percentage of a $10,000 investment |
|---|
| Class R4 | $72 | 0.70% |
How did the Fund perform last year and what affected its performance?
For the fiscal year ended July 31, 2024, the Fund returned 6.74%, reflecting performance at the net asset value (NAV) of Class R4 shares with all distributions reinvested, compared to a securities market index with investment characteristics similar to those of the Fund, the ICE BofA Green Bond Index (USD Hedged), which returned 7.81% over the same period. The Fund's broad-based market index, the Bloomberg Aggregate Bond Index, returned 5.10% over the same period.
Positive factors for the markets included momentum around the soft-landing narrative, specifically in the second half of the period, which was supported by signs of a cooling labor market and a slowing economy, leading the market to adjust its expectations of future interest rate cuts by the U.S. Federal Reserve (the Fed). Negative factors, specifically in the beginning of the period, included stronger-than-expected GDP growth, resilient labor market data, and persistently high inflation readings that led to a more prolonged interest rate environment.
Top contributors to performance: The Fund’s allocation to high yield corporate bonds was one of the largest contributors to relative performance.
Top detractors from performance: The Fund’s overweight allocation to commercial mortgage-backed securities detracted from relative performance.
Total Return Based on $10,000 Investment
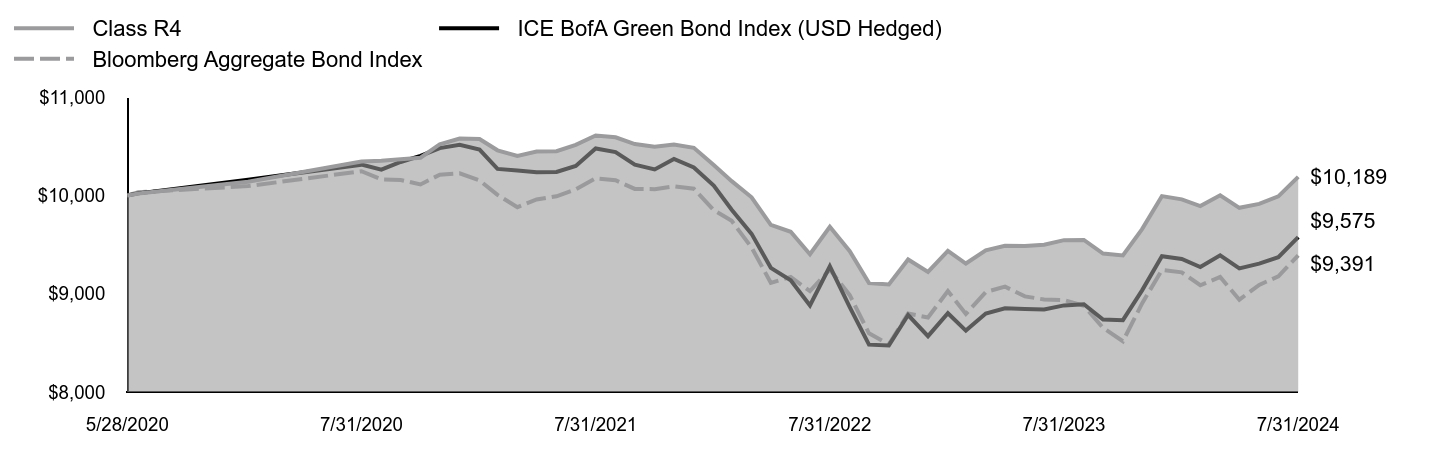
| Class R4 | ICE BofA Green Bond Index (USD Hedged) | Bloomberg Aggregate Bond Index |
|---|
| 5/28/2020 | $10,000 | $10,000 | $10,000 |
| 5/31/2020 | $10,020 | $10,021 | $10,032 |
| 6/30/2020 | $10,139 | $10,160 | $10,095 |
| 7/31/2020 | $10,346 | $10,313 | $10,246 |
| 8/31/2020 | $10,352 | $10,263 | $10,163 |
| 9/30/2020 | $10,368 | $10,340 | $10,157 |
| 10/31/2020 | $10,384 | $10,403 | $10,112 |
| 11/30/2020 | $10,521 | $10,481 | $10,211 |
| 12/31/2020 | $10,579 | $10,514 | $10,225 |
| 1/31/2021 | $10,574 | $10,466 | $10,152 |
| 2/28/2021 | $10,459 | $10,270 | $10,005 |
| 3/31/2021 | $10,402 | $10,254 | $9,880 |
| 4/30/2021 | $10,446 | $10,235 | $9,959 |
| 5/31/2021 | $10,450 | $10,238 | $9,991 |
| 6/30/2021 | $10,514 | $10,300 | $10,061 |
| 7/31/2021 | $10,610 | $10,478 | $10,174 |
| 8/31/2021 | $10,591 | $10,441 | $10,154 |
| 9/30/2021 | $10,523 | $10,313 | $10,066 |
| 10/31/2021 | $10,495 | $10,264 | $10,064 |
| 11/30/2021 | $10,519 | $10,371 | $10,093 |
| 12/31/2021 | $10,484 | $10,284 | $10,068 |
| 1/31/2022 | $10,310 | $10,100 | $9,851 |
| 2/28/2022 | $10,145 | $9,854 | $9,741 |
| 3/31/2022 | $9,981 | $9,609 | $9,470 |
| 4/30/2022 | $9,700 | $9,263 | $9,111 |
| 5/31/2022 | $9,630 | $9,137 | $9,170 |
| 6/30/2022 | $9,402 | $8,881 | $9,026 |
| 7/31/2022 | $9,681 | $9,279 | $9,246 |
| 8/31/2022 | $9,432 | $8,864 | $8,985 |
| 9/30/2022 | $9,109 | $8,482 | $8,597 |
| 10/31/2022 | $9,095 | $8,474 | $8,485 |
| 11/30/2022 | $9,348 | $8,783 | $8,798 |
| 12/31/2022 | $9,222 | $8,568 | $8,758 |
| 1/31/2023 | $9,435 | $8,801 | $9,027 |
| 2/28/2023 | $9,307 | $8,625 | $8,794 |
| 3/31/2023 | $9,442 | $8,799 | $9,017 |
| 4/30/2023 | $9,487 | $8,852 | $9,072 |
| 5/31/2023 | $9,486 | $8,844 | $8,973 |
| 6/30/2023 | $9,498 | $8,839 | $8,941 |
| 7/31/2023 | $9,545 | $8,881 | $8,935 |
| 8/31/2023 | $9,547 | $8,893 | $8,878 |
| 9/30/2023 | $9,409 | $8,738 | $8,652 |
| 10/31/2023 | $9,389 | $8,731 | $8,516 |
| 11/30/2023 | $9,657 | $9,034 | $8,901 |
| 12/31/2023 | $9,993 | $9,382 | $9,242 |
| 1/31/2024 | $9,960 | $9,353 | $9,217 |
| 2/29/2024 | $9,892 | $9,271 | $9,086 |
| 3/31/2024 | $10,002 | $9,391 | $9,170 |
| 4/30/2024 | $9,874 | $9,257 | $8,939 |
| 5/31/2024 | $9,914 | $9,306 | $9,090 |
| 6/30/2024 | $9,991 | $9,371 | $9,176 |
| 7/31/2024 | $10,189 | $9,575 | $9,391 |
The Fund’s benchmarks are unmanaged indices used as a general measure of market performance. Calculations assume the reinvestment of dividends and capital gains.
Average Annual Total Returns (%)
| 1 Year | Since Inception 5/28/20 |
|---|
| Class R4 at NAV | 6.74% | 0.45% |
| ICE BofA Green Bond Index (USD Hedged) | 7.81% | (1.04%) |
Bloomberg Aggregate Bond IndexFootnote Reference* | 5.10% | (1.49%) |
| Footnote | Description |
Footnote* | The Fund has adopted the Bloomberg Aggregate Bond Index as its broad-based securities market index. |
The Fund's past performance is no guarantee of future results. The returns do not reflect the deduction of taxes that a shareholder would pay on Fund distributions or redemption of Fund shares.
| Total Net Assets | $21,162,971 |
| # of Portfolio Holdings | 190 |
| Portfolio Turnover Rate | 59% |
| Total Advisory Fees Paid | $0 |
What did the Fund invest in?
| Portfolio Holdings Presented by Portfolio Allocation | %Footnote Reference* |
| Asset-Backed Securities | 0.24% |
| Convertible Bonds | 0.42% |
| Corporate Bonds | 68.64% |
| Floating Rate Loans | 1.93% |
| Foreign Government Obligations | 18.16% |
| Government Sponsored Enterprises Collateralized Mortgage Obligations | 0.43% |
| Municipal Bonds | 1.98% |
| U.S. Treasury Obligations | 6.62% |
| Repurchase Agreements | 1.58% |
| Total | 100.00% |
| Footnote | Description |
Footnote* | Represents percent of total investments, which excludes derivatives |
There were no material fund changes during the period.
Where can I find additional information about the Fund?
For additional information about the Fund, including its Prospectus, Statement of Additional Information, financial statements, holdings and proxy information, please visit lordabbett.com/FundDocuments.
The Fund has adopted a policy that allows it to send only one copy of the Fund's prospectus, proxy material, annual report and semiannual report (or related notice of internet availability of annual report and semiannual report) to certain shareholders residing at the same "household." This reduces Fund expenses, which benefits you and other shareholders.If you need additional copies or do not want your mailings to be "householded," please call Lord Abbett at 888-522-2388.
Lord Abbett Climate Focused Bond Fund
Annual Shareholder Report
July 31, 2024
lordabbett.com/FundDocuments
TSR-A-9066-R4
09/24
Lord Abbett Climate Focused Bond Fund
Annual Shareholder Report
July 31, 2024
lordabbett.com/FundDocuments
This annual shareholder report contains important information about the Lord Abbett Climate Focused Bond Fund for the period of August 1, 2023 to July 31, 2024, as well as certain changes to the Fund. You can find additional information about the Fund at lordabbett.com/FundDocuments. You can also request this information by contacting us at 888-522-2388.
What were the Fund costs for the last year?
(based on a hypothetical $10,000 investment)
| Class Name | Costs of a $10,000 investment | Costs paid as a percentage of a $10,000 investment |
|---|
| Class R5 | $47 | 0.45% |
How did the Fund perform last year and what affected its performance?
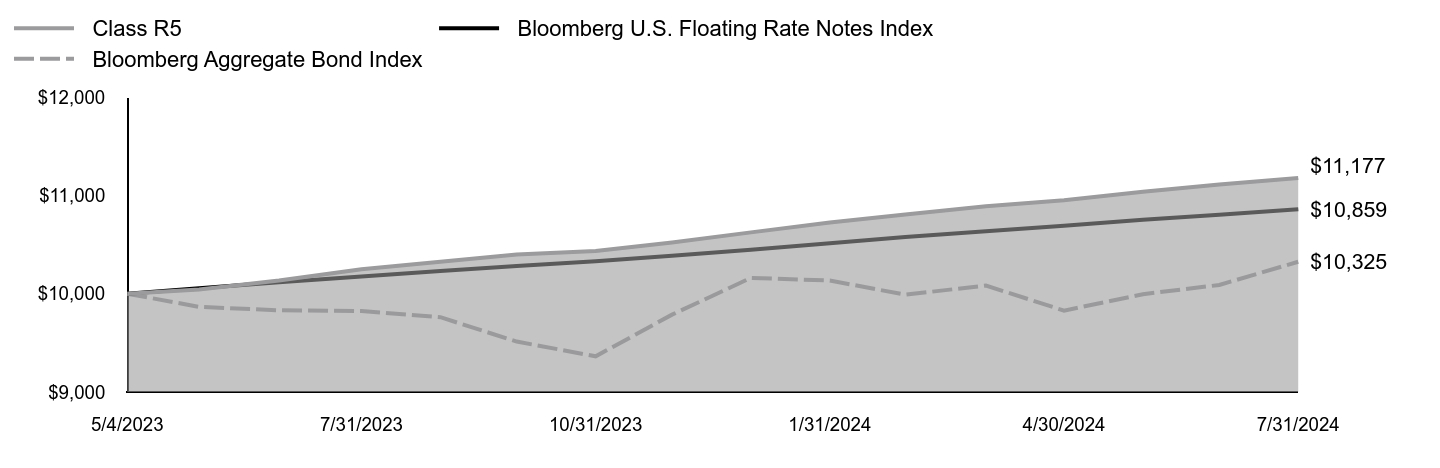
For the fiscal year ended July 31, 2024, the Fund returned 7.01%, reflecting performance at the net asset value (NAV) of Class R5 shares with all distributions reinvested, compared to a securities market index with investment characteristics similar to those of the Fund, the ICE BofA Green Bond Index (USD Hedged), which returned 7.81% over the same period. The Fund's broad-based market index, the Bloomberg Aggregate Bond Index, returned 5.10% over the same period.
Positive factors for the markets included momentum around the soft-landing narrative, specifically in the second half of the period, which was supported by signs of a cooling labor market and a slowing economy, leading the market to adjust its expectations of future interest rate cuts by the U.S. Federal Reserve (the Fed). Negative factors, specifically in the beginning of the period, included stronger-than-expected GDP growth, resilient labor market data, and persistently high inflation readings that led to a more prolonged interest rate environment.
Top contributors to performance: The Fund’s allocation to high yield corporate bonds was one of the largest contributors to relative performance.
Top detractors from performance: The Fund’s overweight allocation to commercial mortgage-backed securities detracted from relative performance.
Total Return Based on $10,000 Investment

| Class R5 | ICE BofA Green Bond Index (USD Hedged) | Bloomberg Aggregate Bond Index |
|---|
| 5/28/2020 | $10,000 | $10,000 | $10,000 |
| 5/31/2020 | $10,020 | $10,021 | $10,032 |
| 6/30/2020 | $10,142 | $10,160 | $10,095 |
| 7/31/2020 | $10,351 | $10,313 | $10,246 |
| 8/31/2020 | $10,359 | $10,263 | $10,163 |
| 9/30/2020 | $10,377 | $10,340 | $10,157 |
| 10/31/2020 | $10,396 | $10,403 | $10,112 |
| 11/30/2020 | $10,535 | $10,481 | $10,211 |
| 12/31/2020 | $10,595 | $10,514 | $10,225 |
| 1/31/2021 | $10,593 | $10,466 | $10,152 |
| 2/28/2021 | $10,479 | $10,270 | $10,005 |
| 3/31/2021 | $10,425 | $10,254 | $9,880 |
| 4/30/2021 | $10,471 | $10,235 | $9,959 |
| 5/31/2021 | $10,477 | $10,238 | $9,991 |
| 6/30/2021 | $10,544 | $10,300 | $10,061 |
| 7/31/2021 | $10,642 | $10,478 | $10,174 |
| 8/31/2021 | $10,625 | $10,441 | $10,154 |
| 9/30/2021 | $10,560 | $10,313 | $10,066 |
| 10/31/2021 | $10,534 | $10,264 | $10,064 |
| 11/30/2021 | $10,559 | $10,371 | $10,093 |
| 12/31/2021 | $10,527 | $10,284 | $10,068 |
| 1/31/2022 | $10,354 | $10,100 | $9,851 |
| 2/28/2022 | $10,191 | $9,854 | $9,741 |
| 3/31/2022 | $10,028 | $9,609 | $9,470 |
| 4/30/2022 | $9,748 | $9,263 | $9,111 |
| 5/31/2022 | $9,680 | $9,137 | $9,170 |
| 6/30/2022 | $9,453 | $8,881 | $9,026 |
| 7/31/2022 | $9,734 | $9,279 | $9,246 |
| 8/31/2022 | $9,487 | $8,864 | $8,985 |
| 9/30/2022 | $9,164 | $8,482 | $8,597 |
| 10/31/2022 | $9,152 | $8,474 | $8,485 |
| 11/30/2022 | $9,408 | $8,783 | $8,798 |
| 12/31/2022 | $9,282 | $8,568 | $8,758 |
| 1/31/2023 | $9,500 | $8,801 | $9,027 |
| 2/28/2023 | $9,372 | $8,625 | $8,794 |
| 3/31/2023 | $9,511 | $8,799 | $9,017 |
| 4/30/2023 | $9,557 | $8,852 | $9,072 |
| 5/31/2023 | $9,559 | $8,844 | $8,973 |
| 6/30/2023 | $9,573 | $8,839 | $8,941 |
| 7/31/2023 | $9,622 | $8,881 | $8,935 |
| 8/31/2023 | $9,626 | $8,893 | $8,878 |
| 9/30/2023 | $9,489 | $8,738 | $8,652 |
| 10/31/2023 | $9,470 | $8,731 | $8,516 |
| 11/30/2023 | $9,755 | $9,034 | $8,901 |
| 12/31/2023 | $10,084 | $9,382 | $9,242 |
| 1/31/2024 | $10,053 | $9,353 | $9,217 |
| 2/29/2024 | $9,986 | $9,271 | $9,086 |
| 3/31/2024 | $10,100 | $9,391 | $9,170 |
| 4/30/2024 | $9,973 | $9,257 | $8,939 |
| 5/31/2024 | $10,015 | $9,306 | $9,090 |
| 6/30/2024 | $10,095 | $9,371 | $9,176 |
| 7/31/2024 | $10,297 | $9,575 | $9,391 |
The Fund’s benchmarks are unmanaged indices used as a general measure of market performance. Calculations assume the reinvestment of dividends and capital gains.
Average Annual Total Returns (%)
| 1 Year | Since Inception 5/28/20 |
|---|
| Class R5 at NAV | 7.01% | 0.70% |
| ICE BofA Green Bond Index (USD Hedged) | 7.81% | (1.04%) |
Bloomberg Aggregate Bond IndexFootnote Reference* | 5.10% | (1.49%) |
| Footnote | Description |
Footnote* | The Fund has adopted the Bloomberg Aggregate Bond Index as its broad-based securities market index. |
The Fund's past performance is no guarantee of future results. The returns do not reflect the deduction of taxes that a shareholder would pay on Fund distributions or redemption of Fund shares.
| Total Net Assets | $21,162,971 |
| # of Portfolio Holdings | 190 |
| Portfolio Turnover Rate | 59% |
| Total Advisory Fees Paid | $0 |
What did the Fund invest in?
| Portfolio Holdings Presented by Portfolio Allocation | %Footnote Reference* |
| Asset-Backed Securities | 0.24% |
| Convertible Bonds | 0.42% |
| Corporate Bonds | 68.64% |
| Floating Rate Loans | 1.93% |
| Foreign Government Obligations | 18.16% |
| Government Sponsored Enterprises Collateralized Mortgage Obligations | 0.43% |
| Municipal Bonds | 1.98% |
| U.S. Treasury Obligations | 6.62% |
| Repurchase Agreements | 1.58% |
| Total | 100.00% |
| Footnote | Description |
Footnote* | Represents percent of total investments, which excludes derivatives |
There were no material fund changes during the period.
Where can I find additional information about the Fund?
For additional information about the Fund, including its Prospectus, Statement of Additional Information, financial statements, holdings and proxy information, please visit lordabbett.com/FundDocuments.
The Fund has adopted a policy that allows it to send only one copy of the Fund's prospectus, proxy material, annual report and semiannual report (or related notice of internet availability of annual report and semiannual report) to certain shareholders residing at the same "household." This reduces Fund expenses, which benefits you and other shareholders.If you need additional copies or do not want your mailings to be "householded," please call Lord Abbett at 888-522-2388.
Lord Abbett Climate Focused Bond Fund
Annual Shareholder Report
July 31, 2024
lordabbett.com/FundDocuments
TSR-A-9067-R5
09/24
Lord Abbett Climate Focused Bond Fund
Annual Shareholder Report
July 31, 2024
lordabbett.com/FundDocuments
This annual shareholder report contains important information about the Lord Abbett Climate Focused Bond Fund for the period of August 1, 2023 to July 31, 2024, as well as certain changes to the Fund. You can find additional information about the Fund at lordabbett.com/FundDocuments. You can also request this information by contacting us at 888-522-2388.
What were the Fund costs for the last year?
(based on a hypothetical $10,000 investment)
| Class Name | Costs of a $10,000 investment | Costs paid as a percentage of a $10,000 investment |
|---|
| Class R6 | $45 | 0.43% |
How did the Fund perform last year and what affected its performance?
For the fiscal year ended July 31, 2024, the Fund returned 7.02%, reflecting performance at the net asset value (NAV) of Class R6 shares with all distributions reinvested, compared to a securities market index with investment characteristics similar to those of the Fund, the ICE BofA Green Bond Index (USD Hedged), which returned 7.81% over the same period. The Fund's broad-based market index, the Bloomberg Aggregate Bond Index, returned 5.10% over the same period.
Positive factors for the markets included momentum around the soft-landing narrative, specifically in the second half of the period, which was supported by signs of a cooling labor market and a slowing economy, leading the market to adjust its expectations of future interest rate cuts by the U.S. Federal Reserve (the Fed). Negative factors, specifically in the beginning of the period, included stronger-than-expected GDP growth, resilient labor market data, and persistently high inflation readings that led to a more prolonged interest rate environment.
Top contributors to performance: The Fund’s allocation to high yield corporate bonds was one of the largest contributors to relative performance.
Top detractors from performance: The Fund’s overweight allocation to commercial mortgage-backed securities detracted from relative performance.
Total Return Based on $10,000 Investment
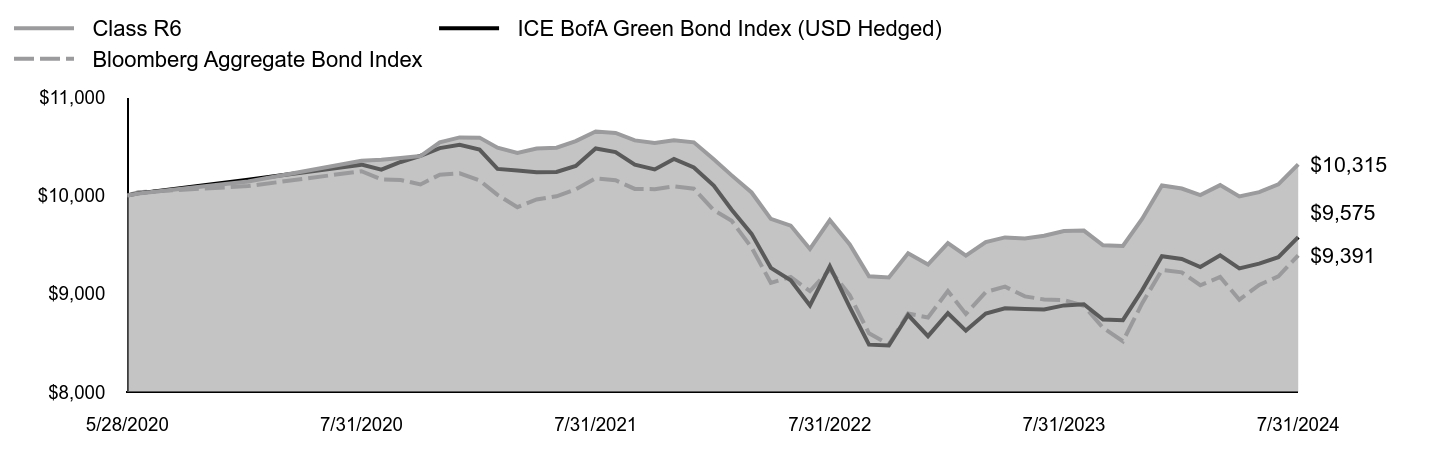
| Class R6 | ICE BofA Green Bond Index (USD Hedged) | Bloomberg Aggregate Bond Index |
|---|
| 5/28/2020 | $10,000 | $10,000 | $10,000 |
| 5/31/2020 | $10,020 | $10,021 | $10,032 |
| 6/30/2020 | $10,142 | $10,160 | $10,095 |
| 7/31/2020 | $10,353 | $10,313 | $10,246 |
| 8/31/2020 | $10,362 | $10,263 | $10,163 |
| 9/30/2020 | $10,380 | $10,340 | $10,157 |
| 10/31/2020 | $10,400 | $10,403 | $10,112 |
| 11/30/2020 | $10,540 | $10,481 | $10,211 |
| 12/31/2020 | $10,590 | $10,514 | $10,225 |
| 1/31/2021 | $10,588 | $10,466 | $10,152 |
| 2/28/2021 | $10,485 | $10,270 | $10,005 |
| 3/31/2021 | $10,432 | $10,254 | $9,880 |
| 4/30/2021 | $10,478 | $10,235 | $9,959 |
| 5/31/2021 | $10,485 | $10,238 | $9,991 |
| 6/30/2021 | $10,552 | $10,300 | $10,061 |
| 7/31/2021 | $10,651 | $10,478 | $10,174 |
| 8/31/2021 | $10,635 | $10,441 | $10,154 |
| 9/30/2021 | $10,560 | $10,313 | $10,066 |
| 10/31/2021 | $10,534 | $10,264 | $10,064 |
| 11/30/2021 | $10,561 | $10,371 | $10,093 |
| 12/31/2021 | $10,540 | $10,284 | $10,068 |
| 1/31/2022 | $10,367 | $10,100 | $9,851 |
| 2/28/2022 | $10,204 | $9,854 | $9,741 |
| 3/31/2022 | $10,030 | $9,609 | $9,470 |
| 4/30/2022 | $9,761 | $9,263 | $9,111 |
| 5/31/2022 | $9,693 | $9,137 | $9,170 |
| 6/30/2022 | $9,455 | $8,881 | $9,026 |
| 7/31/2022 | $9,748 | $9,279 | $9,246 |
| 8/31/2022 | $9,501 | $8,864 | $8,985 |
| 9/30/2022 | $9,178 | $8,482 | $8,597 |
| 10/31/2022 | $9,166 | $8,474 | $8,485 |
| 11/30/2022 | $9,412 | $8,783 | $8,798 |
| 12/31/2022 | $9,297 | $8,568 | $8,758 |
| 1/31/2023 | $9,515 | $8,801 | $9,027 |
| 2/28/2023 | $9,388 | $8,625 | $8,794 |
| 3/31/2023 | $9,526 | $8,799 | $9,017 |
| 4/30/2023 | $9,573 | $8,852 | $9,072 |
| 5/31/2023 | $9,563 | $8,844 | $8,973 |
| 6/30/2023 | $9,589 | $8,839 | $8,941 |
| 7/31/2023 | $9,638 | $8,881 | $8,935 |
| 8/31/2023 | $9,642 | $8,893 | $8,878 |
| 9/30/2023 | $9,493 | $8,738 | $8,652 |
| 10/31/2023 | $9,486 | $8,731 | $8,516 |
| 11/30/2023 | $9,760 | $9,034 | $8,901 |
| 12/31/2023 | $10,101 | $9,382 | $9,242 |
| 1/31/2024 | $10,070 | $9,353 | $9,217 |
| 2/29/2024 | $10,003 | $9,271 | $9,086 |
| 3/31/2024 | $10,105 | $9,391 | $9,170 |
| 4/30/2024 | $9,990 | $9,257 | $8,939 |
| 5/31/2024 | $10,033 | $9,306 | $9,090 |
| 6/30/2024 | $10,112 | $9,371 | $9,176 |
| 7/31/2024 | $10,315 | $9,575 | $9,391 |
The Fund’s benchmarks are unmanaged indices used as a general measure of market performance. Calculations assume the reinvestment of dividends and capital gains.
Average Annual Total Returns (%)
| 1 Year | Since Inception 5/28/20 |
|---|
| Class R6 at NAV | 7.02% | 0.75% |
| ICE BofA Green Bond Index (USD Hedged) | 7.81% | (1.04%) |
Bloomberg Aggregate Bond IndexFootnote Reference* | 5.10% | (1.49%) |
| Footnote | Description |
Footnote* | The Fund has adopted the Bloomberg Aggregate Bond Index as its broad-based securities market index. |
The Fund's past performance is no guarantee of future results. The returns do not reflect the deduction of taxes that a shareholder would pay on Fund distributions or redemption of Fund shares.
| Total Net Assets | $21,162,971 |
| # of Portfolio Holdings | 190 |
| Portfolio Turnover Rate | 59% |
| Total Advisory Fees Paid | $0 |
What did the Fund invest in?
| Portfolio Holdings Presented by Portfolio Allocation | %Footnote Reference* |
| Asset-Backed Securities | 0.24% |
| Convertible Bonds | 0.42% |
| Corporate Bonds | 68.64% |
| Floating Rate Loans | 1.93% |
| Foreign Government Obligations | 18.16% |
| Government Sponsored Enterprises Collateralized Mortgage Obligations | 0.43% |
| Municipal Bonds | 1.98% |
| U.S. Treasury Obligations | 6.62% |
| Repurchase Agreements | 1.58% |
| Total | 100.00% |
| Footnote | Description |
Footnote* | Represents percent of total investments, which excludes derivatives |
There were no material fund changes during the period.
Where can I find additional information about the Fund?
For additional information about the Fund, including its Prospectus, Statement of Additional Information, financial statements, holdings and proxy information, please visit lordabbett.com/FundDocuments.
The Fund has adopted a policy that allows it to send only one copy of the Fund's prospectus, proxy material, annual report and semiannual report (or related notice of internet availability of annual report and semiannual report) to certain shareholders residing at the same "household." This reduces Fund expenses, which benefits you and other shareholders.If you need additional copies or do not want your mailings to be "householded," please call Lord Abbett at 888-522-2388.
Lord Abbett Climate Focused Bond Fund
Annual Shareholder Report
July 31, 2024
lordabbett.com/FundDocuments
TSR-A-9068-R6
09/24
Lord Abbett Emerging Markets Equity Fund
Annual Shareholder Report
July 31, 2024
lordabbett.com/FundDocuments
This annual shareholder report contains important information about the Lord Abbett Emerging Markets Equity Fund for the period of August 1, 2023 to July 31, 2024, as well as certain changes to the Fund. You can find additional information about the Fund at lordabbett.com/FundDocuments. You can also request this information by contacting us at 888-522-2388.
What were the Fund costs for the last year?
(based on a hypothetical $10,000 investment)
| Class Name | Costs of a $10,000 investment | Costs paid as a percentage of a $10,000 investment |
|---|
| Class A | $121 | 1.15% |
How did the Fund perform last year and what affected its performance?
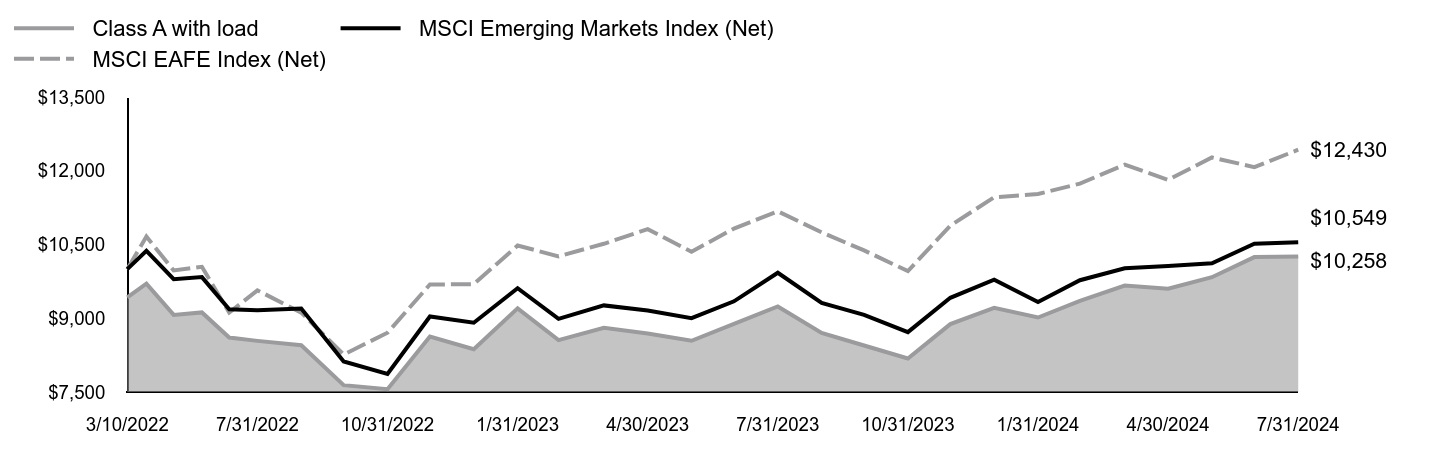
For the fiscal year ended July 31, 2024, the Fund returned 11.01%, reflecting performance at the net asset value (NAV) of Class A shares, compared to the 6.27% of a securities market index with investment characteristics similar to those of the Fund, the MSCI Emerging Markets Index (Net). The Fund's broad-based market index, the MSCI EAFE Index (Net), returned 11.21% over the same period.
Positive factors for the markets included momentum around the soft-landing narrative, specifically in the second half of the period, which was supported by signs of a cooling labor market and a slowing economy, leading the market to adjust its expectations of future interest rate cuts by the U.S. Federal Reserve (the Fed). Negative factors, specifically in the beginning of the period, included stronger-than-expected GDP growth, resilient labor market data, and persistently high inflation readings that led to a more prolonged interest rate environment. Against this backdrop, global equity markets delivered strong returns.
Top contributors to performance: Security selection within the Information Technology sector contributed to relative performance, led by an overweight allocation to Taiwan Semiconductor Manufacturing Co., Ltd. Security selection within the Industrials sector also contributed to relative performance, led by an overweight allocation to LIG Nex1 Co., Ltd.
Top detractors from performance: Security selection within the Financials sector detracted from relative performance, led by an overweight allocation to Ping An Insurance Group Company of China, Ltd. Also, within the Financials sector, an overweight allocation to Prudential PLC detracted from relative performance.
Total Return Based on $10,000 Investment
| Class A with load | MSCI Emerging Markets Index (Net) | MSCI EAFE Index (Net) |
|---|
| 3/10/2022 | $9,427 | $10,000 | $10,000 |
| 3/31/2022 | $9,704 | $10,372 | $10,663 |
| 4/30/2022 | $9,069 | $9,795 | $9,973 |
| 5/31/2022 | $9,119 | $9,838 | $10,047 |
| 6/30/2022 | $8,609 | $9,184 | $9,115 |
| 7/31/2022 | $8,540 | $9,162 | $9,569 |
| 8/31/2022 | $8,452 | $9,200 | $9,115 |
| 9/30/2022 | $7,640 | $8,121 | $8,262 |
| 10/31/2022 | $7,558 | $7,869 | $8,707 |
| 11/30/2022 | $8,628 | $9,036 | $9,687 |
| 12/31/2022 | $8,369 | $8,909 | $9,695 |
| 1/31/2023 | $9,202 | $9,613 | $10,480 |
| 2/28/2023 | $8,555 | $8,989 | $10,261 |
| 3/31/2023 | $8,805 | $9,262 | $10,516 |
| 4/30/2023 | $8,689 | $9,157 | $10,813 |
| 5/31/2023 | $8,542 | $9,003 | $10,355 |
| 6/30/2023 | $8,888 | $9,345 | $10,826 |
| 7/31/2023 | $9,241 | $9,926 | $11,177 |
| 8/31/2023 | $8,702 | $9,315 | $10,748 |
| 9/30/2023 | $8,446 | $9,071 | $10,381 |
| 10/31/2023 | $8,183 | $8,719 | $9,960 |
| 11/30/2023 | $8,882 | $9,417 | $10,885 |
| 12/31/2023 | $9,211 | $9,785 | $11,463 |
| 1/31/2024 | $9,016 | $9,331 | $11,529 |
| 2/29/2024 | $9,354 | $9,775 | $11,740 |
| 3/31/2024 | $9,666 | $10,017 | $12,126 |
| 4/30/2024 | $9,601 | $10,062 | $11,816 |
| 5/31/2024 | $9,836 | $10,118 | $12,273 |
| 6/30/2024 | $10,245 | $10,517 | $12,075 |
| 7/31/2024 | $10,258 | $10,549 | $12,430 |
The Fund’s benchmarks are unmanaged indices used as a general measure of market performance. Calculations assume the reinvestment of dividends and capital gains.
Average Annual Total Returns (%)
| 1 Year | Since Inception 3/10/22 |
|---|
| Class A at NAV | 11.01% | 3.60% |
| Class A with sales charge | 4.62% | 1.07% |
| MSCI Emerging Markets Index (Net) | 6.27% | 2.26% |
MSCI EAFE Index (Net)Footnote Reference* | 11.21% | 9.52% |
| Footnote | Description |
Footnote* | The Fund has adopted the MSCI EAFE Net Index as its broad-based securities market index. |
The Fund's past performance is no guarantee of future results. The returns do not reflect the deduction of taxes that a shareholder would pay on Fund distributions or redemption of Fund shares.
| Total Net Assets | $5,536,385 |
| # of Portfolio Holdings | 85 |
| Portfolio Turnover Rate | 79% |
| Total Advisory Fees Paid | $0 |
What did the Fund invest in?
Portfolio Holdings Presented by SectorFootnote Reference* | % Footnote Reference** |
| Communication Services | 9.53% |
| Consumer Discretionary | 12.30% |
| Consumer Staples | 6.24% |
| Energy | 6.04% |
| Financials | 21.49% |
| Health Care | 4.16% |
| Industrials | 8.15% |
| Information Technology | 25.39% |
| Materials | 2.79% |
| Real Estate | 2.20% |
| Utilities | 1.71% |
| 100.00% |
| Footnote | Description |
Footnote* | A sector may comprise several industries |
Footnote** | Represents percent of total investments, which excludes derivatives. |
There were no material fund changes during the period.
Where can I find additional information about the Fund?
For additional information about the Fund, including its Prospectus, Statement of Additional Information, financial statements, holdings and proxy information, please visit lordabbett.com/FundDocuments.
The Fund has adopted a policy that allows it to send only one copy of the Fund's prospectus, proxy material, annual report and semiannual report (or related notice of internet availability of annual report and semiannual report) to certain shareholders residing at the same "household." This reduces Fund expenses, which benefits you and other shareholders.If you need additional copies or do not want your mailings to be "householded," please call Lord Abbett at 888-522-2388.
Lord Abbett Emerging Markets Equity Fund
Annual Shareholder Report
July 31, 2024
lordabbett.com/FundDocuments
TSR-A-9080-A
09/24
Lord Abbett Emerging Markets Equity Fund
Annual Shareholder Report
July 31, 2024
lordabbett.com/FundDocuments
This annual shareholder report contains important information about the Lord Abbett Emerging Markets Equity Fund for the period of August 1, 2023 to July 31, 2024, as well as certain changes to the Fund. You can find additional information about the Fund at lordabbett.com/FundDocuments. You can also request this information by contacting us at 888-522-2388.
What were the Fund costs for the last year?
(based on a hypothetical $10,000 investment)
| Class Name | Costs of a $10,000 investment | Costs paid as a percentage of a $10,000 investment |
|---|
| Class C | $200 | 1.90% |
How did the Fund perform last year and what affected its performance?
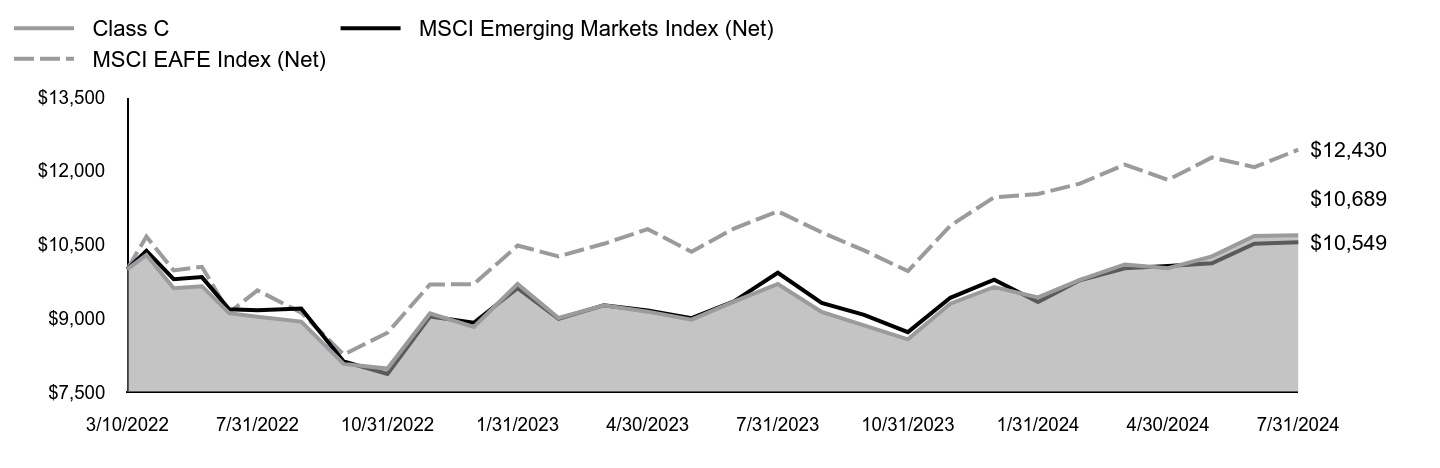
For the fiscal year ended July 31, 2024, the Fund returned 10.22%, reflecting performance at the net asset value (NAV) of Class C shares, compared to the 6.27% of a securities market index with investment characteristics similar to those of the Fund, the MSCI Emerging Markets Index (Net). The Fund's broad-based market index, the MSCI EAFE Index (Net), returned 11.21% over the same period.
Positive factors for the markets included momentum around the soft-landing narrative, specifically in the second half of the period, which was supported by signs of a cooling labor market and a slowing economy, leading the market to adjust its expectations of future interest rate cuts by the U.S. Federal Reserve (the Fed). Negative factors, specifically in the beginning of the period, included stronger-than-expected GDP growth, resilient labor market data, and persistently high inflation readings that led to a more prolonged interest rate environment. Against this backdrop, global equity markets delivered strong returns.
Top contributors to performance: Security selection within the Information Technology sector contributed to relative performance, led by an overweight allocation to Taiwan Semiconductor Manufacturing Co., Ltd. Security selection within the Industrials sector also contributed to relative performance, led by an overweight allocation to LIG Nex1 Co., Ltd.
Top detractors from performance: Security selection within the Financials sector detracted from relative performance, led by an overweight allocation to Ping An Insurance Group Company of China, Ltd. Also, within the Financials sector, an overweight allocation to Prudential PLC detracted from relative performance.
Total Return Based on $10,000 Investment
| Class C | MSCI Emerging Markets Index (Net) | MSCI EAFE Index (Net) |
|---|
| 3/10/2022 | $10,000 | $10,000 | $10,000 |
| 3/31/2022 | $10,287 | $10,372 | $10,663 |
| 4/30/2022 | $9,613 | $9,795 | $9,973 |
| 5/31/2022 | $9,653 | $9,838 | $10,047 |
| 6/30/2022 | $9,105 | $9,184 | $9,115 |
| 7/31/2022 | $9,032 | $9,162 | $9,569 |
| 8/31/2022 | $8,932 | $9,200 | $9,115 |
| 9/30/2022 | $8,071 | $8,121 | $8,262 |
| 10/31/2022 | $7,977 | $7,869 | $8,707 |
| 11/30/2022 | $9,099 | $9,036 | $9,687 |
| 12/31/2022 | $8,823 | $8,909 | $9,695 |
| 1/31/2023 | $9,698 | $9,613 | $10,480 |
| 2/28/2023 | $9,006 | $8,989 | $10,261 |
| 3/31/2023 | $9,264 | $9,262 | $10,516 |
| 4/30/2023 | $9,135 | $9,157 | $10,813 |
| 5/31/2023 | $8,972 | $9,003 | $10,355 |
| 6/30/2023 | $9,339 | $9,345 | $10,826 |
| 7/31/2023 | $9,698 | $9,926 | $11,177 |
| 8/31/2023 | $9,128 | $9,315 | $10,748 |
| 9/30/2023 | $8,857 | $9,071 | $10,381 |
| 10/31/2023 | $8,572 | $8,719 | $9,960 |
| 11/30/2023 | $9,298 | $9,417 | $10,885 |
| 12/31/2023 | $9,637 | $9,785 | $11,463 |
| 1/31/2024 | $9,426 | $9,331 | $11,529 |
| 2/29/2024 | $9,781 | $9,775 | $11,740 |
| 3/31/2024 | $10,095 | $10,017 | $12,126 |
| 4/30/2024 | $10,020 | $10,062 | $11,816 |
| 5/31/2024 | $10,259 | $10,118 | $12,273 |
| 6/30/2024 | $10,676 | $10,517 | $12,075 |
| 7/31/2024 | $10,689 | $10,549 | $12,430 |
The Fund’s benchmarks are unmanaged indices used as a general measure of market performance. Calculations assume the reinvestment of dividends and capital gains.
Average Annual Total Returns (%)
| 1 Year | Since Inception 3/10/22 |
|---|
| Class C at NAV | 10.22% | 2.83% |
| Class C with sales charge | 9.22% | 2.83% |
| MSCI Emerging Markets Index (Net) | 6.27% | 2.26% |
MSCI EAFE Index (Net)Footnote Reference* | 11.21% | 9.52% |
| Footnote | Description |
Footnote* | The Fund has adopted the MSCI EAFE Net Index as its broad-based securities market index. |
The Fund's past performance is no guarantee of future results. The returns do not reflect the deduction of taxes that a shareholder would pay on Fund distributions or redemption of Fund shares.
| Total Net Assets | $5,536,385 |
| # of Portfolio Holdings | 85 |
| Portfolio Turnover Rate | 79% |
| Total Advisory Fees Paid | $0 |
What did the Fund invest in?
Portfolio Holdings Presented by SectorFootnote Reference* | % Footnote Reference** |
| Communication Services | 9.53% |
| Consumer Discretionary | 12.30% |
| Consumer Staples | 6.24% |
| Energy | 6.04% |
| Financials | 21.49% |
| Health Care | 4.16% |
| Industrials | 8.15% |
| Information Technology | 25.39% |
| Materials | 2.79% |
| Real Estate | 2.20% |
| Utilities | 1.71% |
| 100.00% |
| Footnote | Description |
Footnote* | A sector may comprise several industries |
Footnote** | Represents percent of total investments, which excludes derivatives. |
There were no material fund changes during the period.
Where can I find additional information about the Fund?
For additional information about the Fund, including its Prospectus, Statement of Additional Information, financial statements, holdings and proxy information, please visit lordabbett.com/FundDocuments.
The Fund has adopted a policy that allows it to send only one copy of the Fund's prospectus, proxy material, annual report and semiannual report (or related notice of internet availability of annual report and semiannual report) to certain shareholders residing at the same "household." This reduces Fund expenses, which benefits you and other shareholders.If you need additional copies or do not want your mailings to be "householded," please call Lord Abbett at 888-522-2388.
Lord Abbett Emerging Markets Equity Fund
Annual Shareholder Report
July 31, 2024
lordabbett.com/FundDocuments
TSR-A-9081-C
09/24
Lord Abbett Emerging Markets Equity Fund
Annual Shareholder Report
July 31, 2024
lordabbett.com/FundDocuments
This annual shareholder report contains important information about the Lord Abbett Emerging Markets Equity Fund for the period of August 1, 2023 to July 31, 2024, as well as certain changes to the Fund. You can find additional information about the Fund at lordabbett.com/FundDocuments. You can also request this information by contacting us at 888-522-2388.
What were the Fund costs for the last year?
(based on a hypothetical $10,000 investment)
| Class Name | Costs of a $10,000 investment | Costs paid as a percentage of a $10,000 investment |
|---|
| Class F | $95 | 0.90% |
How did the Fund perform last year and what affected its performance?
For the fiscal year ended July 31, 2024, the Fund returned 11.20%, reflecting performance at the net asset value (NAV) of Class F shares, compared to the 6.27% of a securities market index with investment characteristics similar to those of the Fund, the MSCI Emerging Markets Index (Net). The Fund's broad-based market index, the MSCI EAFE Index (Net), returned 11.21% over the same period.
Positive factors for the markets included momentum around the soft-landing narrative, specifically in the second half of the period, which was supported by signs of a cooling labor market and a slowing economy, leading the market to adjust its expectations of future interest rate cuts by the U.S. Federal Reserve (the Fed). Negative factors, specifically in the beginning of the period, included stronger-than-expected GDP growth, resilient labor market data, and persistently high inflation readings that led to a more prolonged interest rate environment. Against this backdrop, global equity markets delivered strong returns.
Top contributors to performance: Security selection within the Information Technology sector contributed to relative performance, led by an overweight allocation to Taiwan Semiconductor Manufacturing Co., Ltd. Security selection within the Industrials sector also contributed to relative performance, led by an overweight allocation to LIG Nex1 Co., Ltd.
Top detractors from performance: Security selection within the Financials sector detracted from relative performance, led by an overweight allocation to Ping An Insurance Group Company of China, Ltd. Also, within the Financials sector, an overweight allocation to Prudential PLC detracted from relative performance.
Total Return Based on $10,000 Investment
| Class F | MSCI Emerging Markets Index (Net) | MSCI EAFE Index (Net) |
|---|
| 3/10/2022 | $10,000 | $10,000 | $10,000 |
| 3/31/2022 | $10,294 | $10,372 | $10,663 |
| 4/30/2022 | $9,626 | $9,795 | $9,973 |
| 5/31/2022 | $9,673 | $9,838 | $10,047 |
| 6/30/2022 | $9,139 | $9,184 | $9,115 |
| 7/31/2022 | $9,065 | $9,162 | $9,569 |
| 8/31/2022 | $8,979 | $9,200 | $9,115 |
| 9/30/2022 | $8,117 | $8,121 | $8,262 |
| 10/31/2022 | $8,031 | $7,869 | $8,707 |
| 11/30/2022 | $9,172 | $9,036 | $9,687 |
| 12/31/2022 | $8,896 | $8,909 | $9,695 |
| 1/31/2023 | $9,788 | $9,613 | $10,480 |
| 2/28/2023 | $9,100 | $8,989 | $10,261 |
| 3/31/2023 | $9,359 | $9,262 | $10,516 |
| 4/30/2023 | $9,243 | $9,157 | $10,813 |
| 5/31/2023 | $9,087 | $9,003 | $10,355 |
| 6/30/2023 | $9,461 | $9,345 | $10,826 |
| 7/31/2023 | $9,842 | $9,926 | $11,177 |
| 8/31/2023 | $9,263 | $9,315 | $10,748 |
| 9/30/2023 | $8,998 | $9,071 | $10,381 |
| 10/31/2023 | $8,719 | $8,719 | $9,960 |
| 11/30/2023 | $9,461 | $9,417 | $10,885 |
| 12/31/2023 | $9,817 | $9,785 | $11,463 |
| 1/31/2024 | $9,610 | $9,331 | $11,529 |
| 2/29/2024 | $9,976 | $9,775 | $11,740 |
| 3/31/2024 | $10,308 | $10,017 | $12,126 |
| 4/30/2024 | $10,239 | $10,062 | $11,816 |
| 5/31/2024 | $10,495 | $10,118 | $12,273 |
| 6/30/2024 | $10,930 | $10,517 | $12,075 |
| 7/31/2024 | $10,944 | $10,549 | $12,430 |
The Fund’s benchmarks are unmanaged indices used as a general measure of market performance. Calculations assume the reinvestment of dividends and capital gains.
Average Annual Total Returns (%)
| 1 Year | Since Inception 3/10/22 |
|---|
| Class F at NAV | 11.20% | 3.84% |
| MSCI Emerging Markets Index (Net) | 6.27% | 2.26% |
MSCI EAFE Index (Net)Footnote Reference* | 11.21% | 9.52% |
| Footnote | Description |
Footnote* | The Fund has adopted the MSCI EAFE Net Index as its broad-based securities market index. |
The Fund's past performance is no guarantee of future results. The returns do not reflect the deduction of taxes that a shareholder would pay on Fund distributions or redemption of Fund shares.
| Total Net Assets | $5,536,385 |
| # of Portfolio Holdings | 85 |
| Portfolio Turnover Rate | 79% |
| Total Advisory Fees Paid | $0 |
What did the Fund invest in?
Portfolio Holdings Presented by SectorFootnote Reference* | % Footnote Reference** |
| Communication Services | 9.53% |
| Consumer Discretionary | 12.30% |
| Consumer Staples | 6.24% |
| Energy | 6.04% |
| Financials | 21.49% |
| Health Care | 4.16% |
| Industrials | 8.15% |
| Information Technology | 25.39% |
| Materials | 2.79% |
| Real Estate | 2.20% |
| Utilities | 1.71% |
| 100.00% |
| Footnote | Description |
Footnote* | A sector may comprise several industries |
Footnote** | Represents percent of total investments, which excludes derivatives. |
There were no material fund changes during the period.
Where can I find additional information about the Fund?
For additional information about the Fund, including its Prospectus, Statement of Additional Information, financial statements, holdings and proxy information, please visit lordabbett.com/FundDocuments.
The Fund has adopted a policy that allows it to send only one copy of the Fund's prospectus, proxy material, annual report and semiannual report (or related notice of internet availability of annual report and semiannual report) to certain shareholders residing at the same "household." This reduces Fund expenses, which benefits you and other shareholders.If you need additional copies or do not want your mailings to be "householded," please call Lord Abbett at 888-522-2388.
Lord Abbett Emerging Markets Equity Fund
Annual Shareholder Report
July 31, 2024
lordabbett.com/FundDocuments
TSR-A-9082-F
09/24
Lord Abbett Emerging Markets Equity Fund
Annual Shareholder Report
July 31, 2024
lordabbett.com/FundDocuments
This annual shareholder report contains important information about the Lord Abbett Emerging Markets Equity Fund for the period of August 1, 2023 to July 31, 2024, as well as certain changes to the Fund. You can find additional information about the Fund at lordabbett.com/FundDocuments. You can also request this information by contacting us at 888-522-2388.
What were the Fund costs for the last year?
(based on a hypothetical $10,000 investment)
| Class Name | Costs of a $10,000 investment | Costs paid as a percentage of a $10,000 investment |
|---|
| Class F3 | $87 | 0.82% |
How did the Fund perform last year and what affected its performance?
For the fiscal year ended July 31, 2024, the Fund returned 11.30%, reflecting performance at the net asset value (NAV) of Class F3 shares, compared to the 6.27% of a securities market index with investment characteristics similar to those of the Fund, the MSCI Emerging Markets Index (Net). The Fund's broad-based market index, the MSCI EAFE Index (Net), returned 11.21% over the same period.
Positive factors for the markets included momentum around the soft-landing narrative, specifically in the second half of the period, which was supported by signs of a cooling labor market and a slowing economy, leading the market to adjust its expectations of future interest rate cuts by the U.S. Federal Reserve (the Fed). Negative factors, specifically in the beginning of the period, included stronger-than-expected GDP growth, resilient labor market data, and persistently high inflation readings that led to a more prolonged interest rate environment. Against this backdrop, global equity markets delivered strong returns.
Top contributors to performance: Security selection within the Information Technology sector contributed to relative performance, led by an overweight allocation to Taiwan Semiconductor Manufacturing Co., Ltd. Security selection within the Industrials sector also contributed to relative performance, led by an overweight allocation to LIG Nex1 Co., Ltd.
Top detractors from performance: Security selection within the Financials sector detracted from relative performance, led by an overweight allocation to Ping An Insurance Group Company of China, Ltd. Also, within the Financials sector, an overweight allocation to Prudential PLC detracted from relative performance.
Total Return Based on $10,000 Investment
| Class F3 | MSCI Emerging Markets Index (Net) | MSCI EAFE Index (Net) |
|---|
| 3/10/2022 | $10,000 | $10,000 | $10,000 |
| 3/31/2022 | $10,294 | $10,372 | $10,663 |
| 4/30/2022 | $9,626 | $9,795 | $9,973 |
| 5/31/2022 | $9,680 | $9,838 | $10,047 |
| 6/30/2022 | $9,139 | $9,184 | $9,115 |
| 7/31/2022 | $9,072 | $9,162 | $9,569 |
| 8/31/2022 | $8,985 | $9,200 | $9,115 |
| 9/30/2022 | $8,117 | $8,121 | $8,262 |
| 10/31/2022 | $8,031 | $7,869 | $8,707 |
| 11/30/2022 | $9,172 | $9,036 | $9,687 |
| 12/31/2022 | $8,900 | $8,909 | $9,695 |
| 1/31/2023 | $9,792 | $9,613 | $10,480 |
| 2/28/2023 | $9,104 | $8,989 | $10,261 |
| 3/31/2023 | $9,370 | $9,262 | $10,516 |
| 4/30/2023 | $9,254 | $9,157 | $10,813 |
| 5/31/2023 | $9,097 | $9,003 | $10,355 |
| 6/30/2023 | $9,472 | $9,345 | $10,826 |
| 7/31/2023 | $9,853 | $9,926 | $11,177 |
| 8/31/2023 | $9,274 | $9,315 | $10,748 |
| 9/30/2023 | $9,009 | $9,071 | $10,381 |
| 10/31/2023 | $8,730 | $8,719 | $9,960 |
| 11/30/2023 | $9,479 | $9,417 | $10,885 |
| 12/31/2023 | $9,831 | $9,785 | $11,463 |
| 1/31/2024 | $9,623 | $9,331 | $11,529 |
| 2/29/2024 | $9,990 | $9,775 | $11,740 |
| 3/31/2024 | $10,322 | $10,017 | $12,126 |
| 4/30/2024 | $10,260 | $10,062 | $11,816 |
| 5/31/2024 | $10,509 | $10,118 | $12,273 |
| 6/30/2024 | $10,952 | $10,517 | $12,075 |
| 7/31/2024 | $10,966 | $10,549 | $12,430 |
The Fund’s benchmarks are unmanaged indices used as a general measure of market performance. Calculations assume the reinvestment of dividends and capital gains.
Average Annual Total Returns (%)
| 1 Year | Since Inception 3/10/22 |
|---|
| Class F3 at NAV | 11.30% | 3.93% |
| MSCI Emerging Markets Index (Net) | 6.27% | 2.26% |
MSCI EAFE Index (Net)Footnote Reference* | 11.21% | 9.52% |
| Footnote | Description |
Footnote* | The Fund has adopted the MSCI EAFE Net Index as its broad-based securities market index. |
The Fund's past performance is no guarantee of future results. The returns do not reflect the deduction of taxes that a shareholder would pay on Fund distributions or redemption of Fund shares.
| Total Net Assets | $5,536,385 |
| # of Portfolio Holdings | 85 |
| Portfolio Turnover Rate | 79% |
| Total Advisory Fees Paid | $0 |
What did the Fund invest in?
Portfolio Holdings Presented by SectorFootnote Reference* | % Footnote Reference** |
| Communication Services | 9.53% |
| Consumer Discretionary | 12.30% |
| Consumer Staples | 6.24% |
| Energy | 6.04% |
| Financials | 21.49% |
| Health Care | 4.16% |
| Industrials | 8.15% |
| Information Technology | 25.39% |
| Materials | 2.79% |
| Real Estate | 2.20% |
| Utilities | 1.71% |
| 100.00% |
| Footnote | Description |
Footnote* | A sector may comprise several industries |
Footnote** | Represents percent of total investments, which excludes derivatives. |
There were no material fund changes during the period.
Where can I find additional information about the Fund?
For additional information about the Fund, including its Prospectus, Statement of Additional Information, financial statements, holdings and proxy information, please visit lordabbett.com/FundDocuments.
The Fund has adopted a policy that allows it to send only one copy of the Fund's prospectus, proxy material, annual report and semiannual report (or related notice of internet availability of annual report and semiannual report) to certain shareholders residing at the same "household." This reduces Fund expenses, which benefits you and other shareholders.If you need additional copies or do not want your mailings to be "householded," please call Lord Abbett at 888-522-2388.
Lord Abbett Emerging Markets Equity Fund
Annual Shareholder Report
July 31, 2024
lordabbett.com/FundDocuments
TSR-A-9083-F3
09/24
Lord Abbett Emerging Markets Equity Fund
Annual Shareholder Report
July 31, 2024
lordabbett.com/FundDocuments
This annual shareholder report contains important information about the Lord Abbett Emerging Markets Equity Fund for the period of August 1, 2023 to July 31, 2024, as well as certain changes to the Fund. You can find additional information about the Fund at lordabbett.com/FundDocuments. You can also request this information by contacting us at 888-522-2388.
What were the Fund costs for the last year?
(based on a hypothetical $10,000 investment)
| Class Name | Costs of a $10,000 investment | Costs paid as a percentage of a $10,000 investment |
|---|
| Class I | $95 | 0.90% |
How did the Fund perform last year and what affected its performance?
For the fiscal year ended July 31, 2024, the Fund returned 11.24%, reflecting performance at the net asset value (NAV) of Class I shares, compared to the 6.27% of a securities market index with investment characteristics similar to those of the Fund, the MSCI Emerging Markets Index (Net). The Fund's broad-based market index, the MSCI EAFE Index (Net), returned 11.21% over the same period.
Positive factors for the markets included momentum around the soft-landing narrative, specifically in the second half of the period, which was supported by signs of a cooling labor market and a slowing economy, leading the market to adjust its expectations of future interest rate cuts by the U.S. Federal Reserve (the Fed). Negative factors, specifically in the beginning of the period, included stronger-than-expected GDP growth, resilient labor market data, and persistently high inflation readings that led to a more prolonged interest rate environment. Against this backdrop, global equity markets delivered strong returns.
Top contributors to performance: Security selection within the Information Technology sector contributed to relative performance, led by an overweight allocation to Taiwan Semiconductor Manufacturing Co., Ltd. Security selection within the Industrials sector also contributed to relative performance, led by an overweight allocation to LIG Nex1 Co., Ltd.
Top detractors from performance: Security selection within the Financials sector detracted from relative performance, led by an overweight allocation to Ping An Insurance Group Company of China, Ltd. Also, within the Financials sector, an overweight allocation to Prudential PLC detracted from relative performance.
Total Return Based on $10,000 Investment
| Class I | MSCI Emerging Markets Index (Net) | MSCI EAFE Index (Net) |
|---|
| 3/10/2022 | $10,000 | $10,000 | $10,000 |
| 3/31/2022 | $10,294 | $10,372 | $10,663 |
| 4/30/2022 | $9,626 | $9,795 | $9,973 |
| 5/31/2022 | $9,673 | $9,838 | $10,047 |
| 6/30/2022 | $9,139 | $9,184 | $9,115 |
| 7/31/2022 | $9,065 | $9,162 | $9,569 |
| 8/31/2022 | $8,979 | $9,200 | $9,115 |
| 9/30/2022 | $8,117 | $8,121 | $8,262 |
| 10/31/2022 | $8,031 | $7,869 | $8,707 |
| 11/30/2022 | $9,172 | $9,036 | $9,687 |
| 12/31/2022 | $8,900 | $8,909 | $9,695 |
| 1/31/2023 | $9,785 | $9,613 | $10,480 |
| 2/28/2023 | $9,097 | $8,989 | $10,261 |
| 3/31/2023 | $9,363 | $9,262 | $10,516 |
| 4/30/2023 | $9,247 | $9,157 | $10,813 |
| 5/31/2023 | $9,090 | $9,003 | $10,355 |
| 6/30/2023 | $9,465 | $9,345 | $10,826 |
| 7/31/2023 | $9,839 | $9,926 | $11,177 |
| 8/31/2023 | $9,260 | $9,315 | $10,748 |
| 9/30/2023 | $8,995 | $9,071 | $10,381 |
| 10/31/2023 | $8,716 | $8,719 | $9,960 |
| 11/30/2023 | $9,465 | $9,417 | $10,885 |
| 12/31/2023 | $9,817 | $9,785 | $11,463 |
| 1/31/2024 | $9,609 | $9,331 | $11,529 |
| 2/29/2024 | $9,976 | $9,775 | $11,740 |
| 3/31/2024 | $10,308 | $10,017 | $12,126 |
| 4/30/2024 | $10,239 | $10,062 | $11,816 |
| 5/31/2024 | $10,495 | $10,118 | $12,273 |
| 6/30/2024 | $10,931 | $10,517 | $12,075 |
| 7/31/2024 | $10,945 | $10,549 | $12,430 |
The Fund’s benchmarks are unmanaged indices used as a general measure of market performance. Calculations assume the reinvestment of dividends and capital gains.
Average Annual Total Returns (%)
| 1 Year | Since Inception 3/10/22 |
|---|
| Class I at NAV | 11.24% | 3.85% |
| MSCI Emerging Markets Index (Net) | 6.27% | 2.26% |
MSCI EAFE Index (Net)Footnote Reference* | 11.21% | 9.52% |
| Footnote | Description |
Footnote* | The Fund has adopted the MSCI EAFE Net Index as its broad-based securities market index. |
The Fund's past performance is no guarantee of future results. The returns do not reflect the deduction of taxes that a shareholder would pay on Fund distributions or redemption of Fund shares.
| Total Net Assets | $5,536,385 |
| # of Portfolio Holdings | 85 |
| Portfolio Turnover Rate | 79% |
| Total Advisory Fees Paid | $0 |
What did the Fund invest in?
Portfolio Holdings Presented by SectorFootnote Reference* | % Footnote Reference** |
| Communication Services | 9.53% |
| Consumer Discretionary | 12.30% |
| Consumer Staples | 6.24% |
| Energy | 6.04% |
| Financials | 21.49% |
| Health Care | 4.16% |
| Industrials | 8.15% |
| Information Technology | 25.39% |
| Materials | 2.79% |
| Real Estate | 2.20% |
| Utilities | 1.71% |
| 100.00% |
| Footnote | Description |
Footnote* | A sector may comprise several industries |
Footnote** | Represents percent of total investments, which excludes derivatives. |
There were no material fund changes during the period.
Where can I find additional information about the Fund?
For additional information about the Fund, including its Prospectus, Statement of Additional Information, financial statements, holdings and proxy information, please visit lordabbett.com/FundDocuments.
The Fund has adopted a policy that allows it to send only one copy of the Fund's prospectus, proxy material, annual report and semiannual report (or related notice of internet availability of annual report and semiannual report) to certain shareholders residing at the same "household." This reduces Fund expenses, which benefits you and other shareholders.If you need additional copies or do not want your mailings to be "householded," please call Lord Abbett at 888-522-2388.
Lord Abbett Emerging Markets Equity Fund
Annual Shareholder Report
July 31, 2024
lordabbett.com/FundDocuments
TSR-A-9084-I
09/24
Lord Abbett Emerging Markets Equity Fund
Annual Shareholder Report
July 31, 2024
lordabbett.com/FundDocuments
This annual shareholder report contains important information about the Lord Abbett Emerging Markets Equity Fund for the period of August 1, 2023 to July 31, 2024, as well as certain changes to the Fund. You can find additional information about the Fund at lordabbett.com/FundDocuments. You can also request this information by contacting us at 888-522-2388.
What were the Fund costs for the last year?
(based on a hypothetical $10,000 investment)
| Class Name | Costs of a $10,000 investment | Costs paid as a percentage of a $10,000 investment |
|---|
| Class R6 | $87 | 0.82% |
How did the Fund perform last year and what affected its performance?
For the fiscal year ended July 31, 2024, the Fund returned 11.30%, reflecting performance at the net asset value (NAV) of Class R6 shares, compared to the 6.27% of a securities market index with investment characteristics similar to those of the Fund, the MSCI Emerging Markets Index (Net). The Fund's broad-based market index, the MSCI EAFE Index (Net), returned 11.21% over the same period.
Positive factors for the markets included momentum around the soft-landing narrative, specifically in the second half of the period, which was supported by signs of a cooling labor market and a slowing economy, leading the market to adjust its expectations of future interest rate cuts by the U.S. Federal Reserve (the Fed). Negative factors, specifically in the beginning of the period, included stronger-than-expected GDP growth, resilient labor market data, and persistently high inflation readings that led to a more prolonged interest rate environment. Against this backdrop, global equity markets delivered strong returns.
Top contributors to performance: Security selection within the Information Technology sector contributed to relative performance, led by an overweight allocation to Taiwan Semiconductor Manufacturing Co., Ltd. Security selection within the Industrials sector also contributed to relative performance, led by an overweight allocation to LIG Nex1 Co., Ltd.
Top detractors from performance: Security selection within the Financials sector detracted from relative performance, led by an overweight allocation to Ping An Insurance Group Company of China, Ltd. Also, within the Financials sector, an overweight allocation to Prudential PLC detracted from relative performance.
Total Return Based on $10,000 Investment
| Class R6 | MSCI Emerging Markets Index (Net) | MSCI EAFE Index (Net) |
|---|
| 3/10/2022 | $10,000 | $10,000 | $10,000 |
| 3/31/2022 | $10,294 | $10,372 | $10,663 |
| 4/30/2022 | $9,626 | $9,795 | $9,973 |
| 5/31/2022 | $9,680 | $9,838 | $10,047 |
| 6/30/2022 | $9,139 | $9,184 | $9,115 |
| 7/31/2022 | $9,072 | $9,162 | $9,569 |
| 8/31/2022 | $8,985 | $9,200 | $9,115 |
| 9/30/2022 | $8,117 | $8,121 | $8,262 |
| 10/31/2022 | $8,031 | $7,869 | $8,707 |
| 11/30/2022 | $9,172 | $9,036 | $9,687 |
| 12/31/2022 | $8,900 | $8,909 | $9,695 |
| 1/31/2023 | $9,792 | $9,613 | $10,480 |
| 2/28/2023 | $9,104 | $8,989 | $10,261 |
| 3/31/2023 | $9,370 | $9,262 | $10,516 |
| 4/30/2023 | $9,254 | $9,157 | $10,813 |
| 5/31/2023 | $9,097 | $9,003 | $10,355 |
| 6/30/2023 | $9,472 | $9,345 | $10,826 |
| 7/31/2023 | $9,853 | $9,926 | $11,177 |
| 8/31/2023 | $9,274 | $9,315 | $10,748 |
| 9/30/2023 | $9,009 | $9,071 | $10,381 |
| 10/31/2023 | $8,730 | $8,719 | $9,960 |
| 11/30/2023 | $9,479 | $9,417 | $10,885 |
| 12/31/2023 | $9,831 | $9,785 | $11,463 |
| 1/31/2024 | $9,623 | $9,331 | $11,529 |
| 2/29/2024 | $9,990 | $9,775 | $11,740 |
| 3/31/2024 | $10,322 | $10,017 | $12,126 |
| 4/30/2024 | $10,260 | $10,062 | $11,816 |
| 5/31/2024 | $10,509 | $10,118 | $12,273 |
| 6/30/2024 | $10,952 | $10,517 | $12,075 |
| 7/31/2024 | $10,966 | $10,549 | $12,430 |
The Fund’s benchmarks are unmanaged indices used as a general measure of market performance. Calculations assume the reinvestment of dividends and capital gains.
Average Annual Total Returns (%)
| 1 Year | Since Inception 3/10/22 |
|---|
| Class R6 at NAV | 11.30% | 3.93% |
| MSCI Emerging Markets Index (Net) | 6.27% | 2.26% |
MSCI EAFE Index (Net)Footnote Reference* | 11.21% | 9.52% |
| Footnote | Description |
Footnote* | The Fund has adopted the MSCI EAFE Net Index as its broad-based securities market index. |
The Fund's past performance is no guarantee of future results. The returns do not reflect the deduction of taxes that a shareholder would pay on Fund distributions or redemption of Fund shares.
| Total Net Assets | $5,536,385 |
| # of Portfolio Holdings | 85 |
| Portfolio Turnover Rate | 79% |
| Total Advisory Fees Paid | $0 |
What did the Fund invest in?
Portfolio Holdings Presented by SectorFootnote Reference* | % Footnote Reference** |
| Communication Services | 9.53% |
| Consumer Discretionary | 12.30% |
| Consumer Staples | 6.24% |
| Energy | 6.04% |
| Financials | 21.49% |
| Health Care | 4.16% |
| Industrials | 8.15% |
| Information Technology | 25.39% |
| Materials | 2.79% |
| Real Estate | 2.20% |
| Utilities | 1.71% |
| 100.00% |
| Footnote | Description |
Footnote* | A sector may comprise several industries |
Footnote** | Represents percent of total investments, which excludes derivatives. |
There were no material fund changes during the period.
Where can I find additional information about the Fund?
For additional information about the Fund, including its Prospectus, Statement of Additional Information, financial statements, holdings and proxy information, please visit lordabbett.com/FundDocuments.
The Fund has adopted a policy that allows it to send only one copy of the Fund's prospectus, proxy material, annual report and semiannual report (or related notice of internet availability of annual report and semiannual report) to certain shareholders residing at the same "household." This reduces Fund expenses, which benefits you and other shareholders.If you need additional copies or do not want your mailings to be "householded," please call Lord Abbett at 888-522-2388.
Lord Abbett Emerging Markets Equity Fund
Annual Shareholder Report
July 31, 2024
lordabbett.com/FundDocuments
TSR-A-9088-R6
09/24
Lord Abbett Enhanced Municipal Yield Completion Fund
Annual Shareholder Report
July 31, 2024
lordabbett.com/SMADocuments
This annual shareholder report contains important information about the Lord Abbett Enhanced Municipal Yield Completion Fund for the period of April 9, 2024 to July 31, 2024, as well as certain changes to the Fund. You can find additional information about the Fund at lordabbett.com/SMADocuments. You can also request this information by contacting us at 888-522-2388.
What were the Fund costs for the last year?
(based on a hypothetical $10,000 investment)
| Fund Name | Costs of a $10,000 investment | Costs paid as a percentage of a $10,000 investment |
|---|
| Enhanced Municipal Yield Completion Fund | $0 | 0.00% |
| Total Net Assets | $4,784,270 |
| # of Portfolio Holdings | 46 |
| Portfolio Turnover Rate | 24% |
| Total Advisory Fees Paid | $0 |
What did the Fund invest in?
Credit Rating S&P or Moody'sFootnote Reference(a) | %Footnote Reference** |
| A- | 6.58% |
| B- | 2.03% |
| BB | 4.31% |
| BB- | 6.69% |
| BB+ | 0.64% |
| BBB | 14.94% |
| BBB- | 24.61% |
| BBB+ | 7.14% |
| CCC+ | 0.25% |
| NR | 32.80% |
| Total | 100.0% |
| Footnote | Description |
Footnote** | Represents percent of total investments, which excludes derivatives. |
Footnote(a) | Certain investments have been rated by Fitch IBC. |
There were no material fund changes during the period.
Where can I find additional information about the Fund?
For additional information about the Fund, including its Prospectus, Statement of Additional Information, financial statements, holdings and proxy information, please visit lordabbett.com/SMADocuments.
The Fund has adopted a policy that allows it to send only one copy of the Fund's prospectus, proxy material, annual report and semiannual report (or related notice of internet availability of annual report and semiannual report) to certain shareholders residing at the same "household." This reduces Fund expenses, which benefits you and other shareholders.If you need additional copies or do not want your mailings to be "householded," please call Lord Abbett at 888-522-2388.
Lord Abbett Investment Grade Floating Rate Fund
Annual Shareholder Report
July 31, 2024
lordabbett.com/FundDocuments
This annual shareholder report contains important information about the Lord Abbett Investment Grade Floating Rate Fund for the period of August 1, 2023 to July 31, 2024, as well as certain changes to the Fund. You can find additional information about the Fund at lordabbett.com/FundDocuments. You can also request this information by contacting us at 888-522-2388.
What were the Fund costs for the last year?
(based on a hypothetical $10,000 investment)
| Class Name | Costs of a $10,000 investment | Costs paid as a percentage of a $10,000 investment |
|---|
| Class A | $57 | 0.55% |
How did the Fund perform last year and what affected its performance?
For the fiscal year ended July 31, 2024, the Fund returned 8.84%, reflecting performance at the net asset value (NAV) of Class A shares with all distributions reinvested, compared to a securities market index with investment characteristics similar to those of the Fund, the Bloomberg U.S. Floating Rate Notes Index, which returned 6.71% over the same period. The Fund's broad-based market index, the Bloomberg Aggregate Bond Index, returned 5.10% over the same period.
Positive factors for the markets included momentum around the soft-landing narrative, specifically in the second half of the period, which was supported by signs of a cooling labor market and a slowing economy, leading the market to adjust its expectations of future interest rate cuts by the U.S. Federal Reserve (the Fed). Negative factors, specifically in the beginning of the period, included stronger-than-expected GDP growth, resilient labor market data, and persistently high inflation readings that led to a more prolonged interest rate environment.
Top contributors to performance: The Fund’s allocation to collateralized loan obligations was one of the largest contributors to relative performance.
Top detractors from performance: The Fund’s lack of exposure to emerging market corporate bonds modestly detracted from relative performance.
Total Return Based on $10,000 Investment
| Class A with load | Bloomberg U.S. Floating Rate Notes Index | Bloomberg Aggregate Bond Index |
|---|
| 5/4/2023 | $9,775 | $10,000 | $10,000 |
| 5/31/2023 | $9,816 | $10,056 | $9,866 |
| 6/30/2023 | $9,903 | $10,116 | $9,831 |
| 7/31/2023 | $10,013 | $10,176 | $9,824 |
| 8/31/2023 | $10,086 | $10,230 | $9,761 |
| 9/30/2023 | $10,156 | $10,282 | $9,513 |
| 10/31/2023 | $10,190 | $10,331 | $9,363 |
| 11/30/2023 | $10,274 | $10,387 | $9,787 |
| 12/31/2023 | $10,371 | $10,447 | $10,161 |
| 1/31/2024 | $10,468 | $10,513 | $10,134 |
| 2/29/2024 | $10,545 | $10,576 | $9,990 |
| 3/31/2024 | $10,626 | $10,636 | $10,083 |
| 4/30/2024 | $10,684 | $10,692 | $9,828 |
| 5/31/2024 | $10,766 | $10,753 | $9,995 |
| 6/30/2024 | $10,835 | $10,803 | $10,089 |
| 7/31/2024 | $10,899 | $10,859 | $10,325 |
The Fund’s benchmarks are unmanaged indices used as a general measure of market performance. Calculations assume the reinvestment of dividends and capital gains.
Average Annual Total Returns (%)
| 1 Year | Since Inception 5/4/23 |
|---|
| Class A at NAV | 8.84% | 9.16% |
| Class A with sales charge | 6.42% | 7.18% |
| Bloomberg U.S. Floating Rate Notes Index | 6.71% | 6.86% |
Bloomberg Aggregate Bond IndexFootnote Reference* | 5.10% | 2.61% |
| Footnote | Description |
Footnote* | The Fund has adopted the Bloomberg Aggregate Bond Index as its broad-based securities market index. |
The Fund's past performance is no guarantee of future results. The returns do not reflect the deduction of taxes that a shareholder would pay on Fund distributions or redemption of Fund shares.
| Total Net Assets | $40,926,751 |
| # of Portfolio Holdings | 160 |
| Portfolio Turnover Rate | 171% |
| Total Advisory Fees Paid | $0 |
What did the Fund invest in?
| Portfolio Holdings Presented by Portfolio Allocation | %Footnote Reference* |
| Asset-Backed Securities | 73.26% |
| Corporate Bonds | 7.84% |
| Floating Rate Loans | 5.31% |
| Government Sponsored Enterprises Securities | 2.30% |
| Non-Agency Commercial Mortgage-Backed Securities | 7.42% |
| U.S. Treasury Obligations | 3.87% |
| Total | 100.00% |
| Footnote | Description |
Footnote* | Represents percent of total investments, which excludes derivatives |
There were no material fund changes during the period.
Where can I find additional information about the Fund?
For additional information about the Fund, including its Prospectus, Statement of Additional Information, financial statements, holdings and proxy information, please visit lordabbett.com/FundDocuments.
The Fund has adopted a policy that allows it to send only one copy of the Fund's prospectus, proxy material, annual report and semiannual report (or related notice of internet availability of annual report and semiannual report) to certain shareholders residing at the same "household." This reduces Fund expenses, which benefits you and other shareholders.If you need additional copies or do not want your mailings to be "householded," please call Lord Abbett at 888-522-2388.
Lord Abbett Investment Grade Floating Rate Fund
Annual Shareholder Report
July 31, 2024
lordabbett.com/FundDocuments
TSR-A-9269-A
09/24
Lord Abbett Investment Grade Floating Rate Fund
Annual Shareholder Report
July 31, 2024
lordabbett.com/FundDocuments
This annual shareholder report contains important information about the Lord Abbett Investment Grade Floating Rate Fund for the period of August 1, 2023 to July 31, 2024, as well as certain changes to the Fund. You can find additional information about the Fund at lordabbett.com/FundDocuments. You can also request this information by contacting us at 888-522-2388.
What were the Fund costs for the last year?
(based on a hypothetical $10,000 investment)
| Class Name | Costs of a $10,000 investment | Costs paid as a percentage of a $10,000 investment |
|---|
| Class C | $140 | 1.35% |
How did the Fund perform last year and what affected its performance?
For the fiscal year ended July 31, 2024, the Fund returned 7.98%, reflecting performance at the net asset value (NAV) of Class C shares with all distributions reinvested, compared to a securities market index with investment characteristics similar to those of the Fund, the Bloomberg U.S. Floating Rate Notes Index, which returned 6.71% over the same period. The Fund's broad-based market index, the Bloomberg Aggregate Bond Index, returned 5.10% over the same period.
Positive factors for the markets included momentum around the soft-landing narrative, specifically in the second half of the period, which was supported by signs of a cooling labor market and a slowing economy, leading the market to adjust its expectations of future interest rate cuts by the U.S. Federal Reserve (the Fed). Negative factors, specifically in the beginning of the period, included stronger-than-expected GDP growth, resilient labor market data, and persistently high inflation readings that led to a more prolonged interest rate environment.
Top contributors to performance: The Fund’s allocation to collateralized loan obligations was one of the largest contributors to relative performance.
Top detractors from performance: The Fund’s lack of exposure to emerging market corporate bonds modestly detracted from relative performance.
Total Return Based on $10,000 Investment
| Class C | Bloomberg U.S. Floating Rate Notes Index | Bloomberg Aggregate Bond Index |
|---|
| 5/4/2023 | $10,000 | $10,000 | $10,000 |
| 5/31/2023 | $10,035 | $10,056 | $9,866 |
| 6/30/2023 | $10,118 | $10,116 | $9,831 |
| 7/31/2023 | $10,223 | $10,176 | $9,824 |
| 8/31/2023 | $10,290 | $10,230 | $9,761 |
| 9/30/2023 | $10,355 | $10,282 | $9,513 |
| 10/31/2023 | $10,383 | $10,331 | $9,363 |
| 11/30/2023 | $10,462 | $10,387 | $9,787 |
| 12/31/2023 | $10,554 | $10,447 | $10,161 |
| 1/31/2024 | $10,655 | $10,513 | $10,134 |
| 2/29/2024 | $10,716 | $10,576 | $9,990 |
| 3/31/2024 | $10,791 | $10,636 | $10,083 |
| 4/30/2024 | $10,843 | $10,692 | $9,828 |
| 5/31/2024 | $10,919 | $10,753 | $9,995 |
| 6/30/2024 | $10,982 | $10,803 | $10,089 |
| 7/31/2024 | $11,039 | $10,859 | $10,325 |
The Fund’s benchmarks are unmanaged indices used as a general measure of market performance. Calculations assume the reinvestment of dividends and capital gains.
Average Annual Total Returns (%)
| 1 Year | Since Inception 5/4/23 |
|---|
| Class C at NAV | 7.98% | 8.29% |
| Class C with sales charge | 6.98% | 8.29% |
| Bloomberg U.S. Floating Rate Notes Index | 6.71% | 6.86% |
Bloomberg Aggregate Bond IndexFootnote Reference* | 5.10% | 2.61% |
| Footnote | Description |
Footnote* | The Fund has adopted the Bloomberg Aggregate Bond Index as its broad-based securities market index. |
The Fund's past performance is no guarantee of future results. The returns do not reflect the deduction of taxes that a shareholder would pay on Fund distributions or redemption of Fund shares.
| Total Net Assets | $40,926,751 |
| # of Portfolio Holdings | 160 |
| Portfolio Turnover Rate | 171% |
| Total Advisory Fees Paid | $0 |
What did the Fund invest in?
| Portfolio Holdings Presented by Portfolio Allocation | %Footnote Reference* |
| Asset-Backed Securities | 73.26% |
| Corporate Bonds | 7.84% |
| Floating Rate Loans | 5.31% |
| Government Sponsored Enterprises Securities | 2.30% |
| Non-Agency Commercial Mortgage-Backed Securities | 7.42% |
| U.S. Treasury Obligations | 3.87% |
| Total | 100.00% |
| Footnote | Description |
Footnote* | Represents percent of total investments, which excludes derivatives |
There were no material fund changes during the period.
Where can I find additional information about the Fund?
For additional information about the Fund, including its Prospectus, Statement of Additional Information, financial statements, holdings and proxy information, please visit lordabbett.com/FundDocuments.
The Fund has adopted a policy that allows it to send only one copy of the Fund's prospectus, proxy material, annual report and semiannual report (or related notice of internet availability of annual report and semiannual report) to certain shareholders residing at the same "household." This reduces Fund expenses, which benefits you and other shareholders.If you need additional copies or do not want your mailings to be "householded," please call Lord Abbett at 888-522-2388.
Lord Abbett Investment Grade Floating Rate Fund
Annual Shareholder Report
July 31, 2024
lordabbett.com/FundDocuments
TSR-A-9270-C
09/24
Lord Abbett Investment Grade Floating Rate Fund
Annual Shareholder Report
July 31, 2024
lordabbett.com/FundDocuments
This annual shareholder report contains important information about the Lord Abbett Investment Grade Floating Rate Fund for the period of August 1, 2023 to July 31, 2024, as well as certain changes to the Fund. You can find additional information about the Fund at lordabbett.com/FundDocuments. You can also request this information by contacting us at 888-522-2388.
What were the Fund costs for the last year?
(based on a hypothetical $10,000 investment)
| Class Name | Costs of a $10,000 investment | Costs paid as a percentage of a $10,000 investment |
|---|
| Class F | $37 | 0.35% |
How did the Fund perform last year and what affected its performance?
For the fiscal year ended July 31, 2024, the Fund returned 9.06%, reflecting performance at the net asset value (NAV) of Class F shares with all distributions reinvested, compared to a securities market index with investment characteristics similar to those of the Fund, the Bloomberg U.S. Floating Rate Notes Index, which returned 6.71% over the same period. The Fund's broad-based market index, the Bloomberg Aggregate Bond Index, returned 5.10% over the same period.
Positive factors for the markets included momentum around the soft-landing narrative, specifically in the second half of the period, which was supported by signs of a cooling labor market and a slowing economy, leading the market to adjust its expectations of future interest rate cuts by the U.S. Federal Reserve (the Fed). Negative factors, specifically in the beginning of the period, included stronger-than-expected GDP growth, resilient labor market data, and persistently high inflation readings that led to a more prolonged interest rate environment.
Top contributors to performance: The Fund’s allocation to collateralized loan obligations was one of the largest contributors to relative performance.
Top detractors from performance: The Fund’s lack of exposure to emerging market corporate bonds modestly detracted from relative performance.
Total Return Based on $10,000 Investment
| Class F | Bloomberg U.S. Floating Rate Notes Index | Bloomberg Aggregate Bond Index |
|---|
| 5/4/2023 | $10,000 | $10,000 | $10,000 |
| 5/31/2023 | $10,043 | $10,056 | $9,866 |
| 6/30/2023 | $10,134 | $10,116 | $9,831 |
| 7/31/2023 | $10,249 | $10,176 | $9,824 |
| 8/31/2023 | $10,324 | $10,230 | $9,761 |
| 9/30/2023 | $10,398 | $10,282 | $9,513 |
| 10/31/2023 | $10,435 | $10,331 | $9,363 |
| 11/30/2023 | $10,522 | $10,387 | $9,787 |
| 12/31/2023 | $10,624 | $10,447 | $10,161 |
| 1/31/2024 | $10,736 | $10,513 | $10,134 |
| 2/29/2024 | $10,816 | $10,576 | $9,990 |
| 3/31/2024 | $10,890 | $10,636 | $10,083 |
| 4/30/2024 | $10,951 | $10,692 | $9,828 |
| 5/31/2024 | $11,037 | $10,753 | $9,995 |
| 6/30/2024 | $11,110 | $10,803 | $10,089 |
| 7/31/2024 | $11,177 | $10,859 | $10,325 |
The Fund’s benchmarks are unmanaged indices used as a general measure of market performance. Calculations assume the reinvestment of dividends and capital gains.
Average Annual Total Returns (%)
| 1 Year | Since Inception 5/4/23 |
|---|
| Class F at NAV | 9.06% | 9.38% |
| Bloomberg U.S. Floating Rate Notes Index | 6.71% | 6.86% |
Bloomberg Aggregate Bond IndexFootnote Reference* | 5.10% | 2.61% |
| Footnote | Description |
Footnote* | The Fund has adopted the Bloomberg Aggregate Bond Index as its broad-based securities market index. |
The Fund's past performance is no guarantee of future results. The returns do not reflect the deduction of taxes that a shareholder would pay on Fund distributions or redemption of Fund shares.
| Total Net Assets | $40,926,751 |
| # of Portfolio Holdings | 160 |
| Portfolio Turnover Rate | 171% |
| Total Advisory Fees Paid | $0 |
What did the Fund invest in?
| Portfolio Holdings Presented by Portfolio Allocation | %Footnote Reference* |
| Asset-Backed Securities | 73.26% |
| Corporate Bonds | 7.84% |
| Floating Rate Loans | 5.31% |
| Government Sponsored Enterprises Securities | 2.30% |
| Non-Agency Commercial Mortgage-Backed Securities | 7.42% |
| U.S. Treasury Obligations | 3.87% |
| Total | 100.00% |
| Footnote | Description |
Footnote* | Represents percent of total investments, which excludes derivatives |
There were no material fund changes during the period.
Where can I find additional information about the Fund?
For additional information about the Fund, including its Prospectus, Statement of Additional Information, financial statements, holdings and proxy information, please visit lordabbett.com/FundDocuments.
The Fund has adopted a policy that allows it to send only one copy of the Fund's prospectus, proxy material, annual report and semiannual report (or related notice of internet availability of annual report and semiannual report) to certain shareholders residing at the same "household." This reduces Fund expenses, which benefits you and other shareholders.If you need additional copies or do not want your mailings to be "householded," please call Lord Abbett at 888-522-2388.
Lord Abbett Investment Grade Floating Rate Fund
Annual Shareholder Report
July 31, 2024
lordabbett.com/FundDocuments
TSR-A-9271-F
09/24
Lord Abbett Investment Grade Floating Rate Fund
Annual Shareholder Report
July 31, 2024
lordabbett.com/FundDocuments
This annual shareholder report contains important information about the Lord Abbett Investment Grade Floating Rate Fund for the period of August 1, 2023 to July 31, 2024, as well as certain changes to the Fund. You can find additional information about the Fund at lordabbett.com/FundDocuments. You can also request this information by contacting us at 888-522-2388.
What were the Fund costs for the last year?
(based on a hypothetical $10,000 investment)
| Class Name | Costs of a $10,000 investment | Costs paid as a percentage of a $10,000 investment |
|---|
| Class F3 | $29 | 0.28% |
How did the Fund perform last year and what affected its performance?
For the fiscal year ended July 31, 2024, the Fund returned 9.13%, reflecting performance at the net asset value (NAV) of Class F3 shares with all distributions reinvested, compared to a securities market index with investment characteristics similar to those of the Fund, the Bloomberg U.S. Floating Rate Notes Index, which returned 6.71% over the same period. The Fund's broad-based market index, the Bloomberg Aggregate Bond Index, returned 5.10% over the same period.
Positive factors for the markets included momentum around the soft-landing narrative, specifically in the second half of the period, which was supported by signs of a cooling labor market and a slowing economy, leading the market to adjust its expectations of future interest rate cuts by the U.S. Federal Reserve (the Fed). Negative factors, specifically in the beginning of the period, included stronger-than-expected GDP growth, resilient labor market data, and persistently high inflation readings that led to a more prolonged interest rate environment.
Top contributors to performance: The Fund’s allocation to collateralized loan obligations was one of the largest contributors to relative performance.
Top detractors from performance: The Fund’s lack of exposure to emerging market corporate bonds modestly detracted from relative performance.
Total Return Based on $10,000 Investment
| Class F3 | Bloomberg U.S. Floating Rate Notes Index | Bloomberg Aggregate Bond Index |
|---|
| 5/4/2023 | $10,000 | $10,000 | $10,000 |
| 5/31/2023 | $10,044 | $10,056 | $9,866 |
| 6/30/2023 | $10,136 | $10,116 | $9,831 |
| 7/31/2023 | $10,250 | $10,176 | $9,824 |
| 8/31/2023 | $10,327 | $10,230 | $9,761 |
| 9/30/2023 | $10,401 | $10,282 | $9,513 |
| 10/31/2023 | $10,439 | $10,331 | $9,363 |
| 11/30/2023 | $10,527 | $10,387 | $9,787 |
| 12/31/2023 | $10,629 | $10,447 | $10,161 |
| 1/31/2024 | $10,731 | $10,513 | $10,134 |
| 2/29/2024 | $10,812 | $10,576 | $9,990 |
| 3/31/2024 | $10,897 | $10,636 | $10,083 |
| 4/30/2024 | $10,959 | $10,692 | $9,828 |
| 5/31/2024 | $11,045 | $10,753 | $9,995 |
| 6/30/2024 | $11,119 | $10,803 | $10,089 |
| 7/31/2024 | $11,187 | $10,859 | $10,325 |
The Fund’s benchmarks are unmanaged indices used as a general measure of market performance. Calculations assume the reinvestment of dividends and capital gains.
Average Annual Total Returns (%)
| 1 Year | Since Inception 5/4/23 |
|---|
| Class F3 at NAV | 9.13% | 9.46% |
| Bloomberg U.S. Floating Rate Notes Index | 6.71% | 6.86% |
Bloomberg Aggregate Bond IndexFootnote Reference* | 5.10% | 2.61% |
| Footnote | Description |
Footnote* | The Fund has adopted the Bloomberg Aggregate Bond Index as its broad-based securities market index. |
The Fund's past performance is no guarantee of future results. The returns do not reflect the deduction of taxes that a shareholder would pay on Fund distributions or redemption of Fund shares.
| Total Net Assets | $40,926,751 |
| # of Portfolio Holdings | 160 |
| Portfolio Turnover Rate | 171% |
| Total Advisory Fees Paid | $0 |
What did the Fund invest in?
| Portfolio Holdings Presented by Portfolio Allocation | %Footnote Reference* |
| Asset-Backed Securities | 73.26% |
| Corporate Bonds | 7.84% |
| Floating Rate Loans | 5.31% |
| Government Sponsored Enterprises Securities | 2.30% |
| Non-Agency Commercial Mortgage-Backed Securities | 7.42% |
| U.S. Treasury Obligations | 3.87% |
| Total | 100.00% |
| Footnote | Description |
Footnote* | Represents percent of total investments, which excludes derivatives |
There were no material fund changes during the period.
Where can I find additional information about the Fund?
For additional information about the Fund, including its Prospectus, Statement of Additional Information, financial statements, holdings and proxy information, please visit lordabbett.com/FundDocuments.
The Fund has adopted a policy that allows it to send only one copy of the Fund's prospectus, proxy material, annual report and semiannual report (or related notice of internet availability of annual report and semiannual report) to certain shareholders residing at the same "household." This reduces Fund expenses, which benefits you and other shareholders.If you need additional copies or do not want your mailings to be "householded," please call Lord Abbett at 888-522-2388.
Lord Abbett Investment Grade Floating Rate Fund
Annual Shareholder Report
July 31, 2024
lordabbett.com/FundDocuments
TSR-A-9272-F3
09/24
Lord Abbett Investment Grade Floating Rate Fund
Annual Shareholder Report
July 31, 2024
lordabbett.com/FundDocuments
This annual shareholder report contains important information about the Lord Abbett Investment Grade Floating Rate Fund for the period of August 1, 2023 to July 31, 2024, as well as certain changes to the Fund. You can find additional information about the Fund at lordabbett.com/FundDocuments. You can also request this information by contacting us at 888-522-2388.
What were the Fund costs for the last year?
(based on a hypothetical $10,000 investment)
| Class Name | Costs of a $10,000 investment | Costs paid as a percentage of a $10,000 investment |
|---|
| Class I | $37 | 0.35% |
How did the Fund perform last year and what affected its performance?
For the fiscal year ended July 31, 2024, the Fund returned 9.06%, reflecting performance at the net asset value (NAV) of Class I shares with all distributions reinvested, compared to a securities market index with investment characteristics similar to those of the Fund, the Bloomberg U.S. Floating Rate Notes Index, which returned 6.71% over the same period. The Fund's broad-based market index, the Bloomberg Aggregate Bond Index, returned 5.10% over the same period.
Positive factors for the markets included momentum around the soft-landing narrative, specifically in the second half of the period, which was supported by signs of a cooling labor market and a slowing economy, leading the market to adjust its expectations of future interest rate cuts by the U.S. Federal Reserve (the Fed). Negative factors, specifically in the beginning of the period, included stronger-than-expected GDP growth, resilient labor market data, and persistently high inflation readings that led to a more prolonged interest rate environment.
Top contributors to performance: The Fund’s allocation to collateralized loan obligations was one of the largest contributors to relative performance.
Top detractors from performance: The Fund’s lack of exposure to emerging market corporate bonds modestly detracted from relative performance.
Total Return Based on $10,000 Investment
| Class I | Bloomberg U.S. Floating Rate Notes Index | Bloomberg Aggregate Bond Index |
|---|
| 5/4/2023 | $10,000 | $10,000 | $10,000 |
| 5/31/2023 | $10,044 | $10,056 | $9,866 |
| 6/30/2023 | $10,134 | $10,116 | $9,831 |
| 7/31/2023 | $10,249 | $10,176 | $9,824 |
| 8/31/2023 | $10,324 | $10,230 | $9,761 |
| 9/30/2023 | $10,398 | $10,282 | $9,513 |
| 10/31/2023 | $10,435 | $10,331 | $9,363 |
| 11/30/2023 | $10,522 | $10,387 | $9,787 |
| 12/31/2023 | $10,624 | $10,447 | $10,161 |
| 1/31/2024 | $10,725 | $10,513 | $10,134 |
| 2/29/2024 | $10,805 | $10,576 | $9,990 |
| 3/31/2024 | $10,890 | $10,636 | $10,083 |
| 4/30/2024 | $10,951 | $10,692 | $9,828 |
| 5/31/2024 | $11,037 | $10,753 | $9,995 |
| 6/30/2024 | $11,110 | $10,803 | $10,089 |
| 7/31/2024 | $11,177 | $10,859 | $10,325 |
The Fund’s benchmarks are unmanaged indices used as a general measure of market performance. Calculations assume the reinvestment of dividends and capital gains.
Average Annual Total Returns (%)
| 1 Year | Since Inception 5/4/23 |
|---|
| Class I at NAV | 9.06% | 9.38% |
| Bloomberg U.S. Floating Rate Notes Index | 6.71% | 6.86% |
Bloomberg Aggregate Bond IndexFootnote Reference* | 5.10% | 2.61% |
| Footnote | Description |
Footnote* | The Fund has adopted the Bloomberg Aggregate Bond Index as its broad-based securities market index. |
The Fund's past performance is no guarantee of future results. The returns do not reflect the deduction of taxes that a shareholder would pay on Fund distributions or redemption of Fund shares.
| Total Net Assets | $40,926,751 |
| # of Portfolio Holdings | 160 |
| Portfolio Turnover Rate | 171% |
| Total Advisory Fees Paid | $0 |
What did the Fund invest in?
| Portfolio Holdings Presented by Portfolio Allocation | %Footnote Reference* |
| Asset-Backed Securities | 73.26% |
| Corporate Bonds | 7.84% |
| Floating Rate Loans | 5.31% |
| Government Sponsored Enterprises Securities | 2.30% |
| Non-Agency Commercial Mortgage-Backed Securities | 7.42% |
| U.S. Treasury Obligations | 3.87% |
| Total | 100.00% |
| Footnote | Description |
Footnote* | Represents percent of total investments, which excludes derivatives |
There were no material fund changes during the period.
Where can I find additional information about the Fund?
For additional information about the Fund, including its Prospectus, Statement of Additional Information, financial statements, holdings and proxy information, please visit lordabbett.com/FundDocuments.
The Fund has adopted a policy that allows it to send only one copy of the Fund's prospectus, proxy material, annual report and semiannual report (or related notice of internet availability of annual report and semiannual report) to certain shareholders residing at the same "household." This reduces Fund expenses, which benefits you and other shareholders.If you need additional copies or do not want your mailings to be "householded," please call Lord Abbett at 888-522-2388.
Lord Abbett Investment Grade Floating Rate Fund
Annual Shareholder Report
July 31, 2024
lordabbett.com/FundDocuments
TSR-A-9273-I
09/24
Lord Abbett Investment Grade Floating Rate Fund
Annual Shareholder Report
July 31, 2024
lordabbett.com/FundDocuments
This annual shareholder report contains important information about the Lord Abbett Investment Grade Floating Rate Fund for the period of August 1, 2023 to July 31, 2024, as well as certain changes to the Fund. You can find additional information about the Fund at lordabbett.com/FundDocuments. You can also request this information by contacting us at 888-522-2388.
What were the Fund costs for the last year?
(based on a hypothetical $10,000 investment)
| Class Name | Costs of a $10,000 investment | Costs paid as a percentage of a $10,000 investment |
|---|
| Class R5 | $37 | 0.35% |
How did the Fund perform last year and what affected its performance?
For the fiscal year ended July 31, 2024, the Fund returned 9.06%, reflecting performance at the net asset value (NAV) of Class R5 shares with all distributions reinvested, compared to a securities market index with investment characteristics similar to those of the Fund, the Bloomberg U.S. Floating Rate Notes Index, which returned 6.71% over the same period. The Fund's broad-based market index, the Bloomberg Aggregate Bond Index, returned 5.10% over the same period.
Positive factors for the markets included momentum around the soft-landing narrative, specifically in the second half of the period, which was supported by signs of a cooling labor market and a slowing economy, leading the market to adjust its expectations of future interest rate cuts by the U.S. Federal Reserve (the Fed). Negative factors, specifically in the beginning of the period, included stronger-than-expected GDP growth, resilient labor market data, and persistently high inflation readings that led to a more prolonged interest rate environment.
Top contributors to performance: The Fund’s allocation to collateralized loan obligations was one of the largest contributors to relative performance.
Top detractors from performance: The Fund’s lack of exposure to emerging market corporate bonds modestly detracted from relative performance.
Total Return Based on $10,000 Investment
| Class R5 | Bloomberg U.S. Floating Rate Notes Index | Bloomberg Aggregate Bond Index |
|---|
| 5/4/2023 | $10,000 | $10,000 | $10,000 |
| 5/31/2023 | $10,043 | $10,056 | $9,866 |
| 6/30/2023 | $10,134 | $10,116 | $9,831 |
| 7/31/2023 | $10,249 | $10,176 | $9,824 |
| 8/31/2023 | $10,324 | $10,230 | $9,761 |
| 9/30/2023 | $10,398 | $10,282 | $9,513 |
| 10/31/2023 | $10,435 | $10,331 | $9,363 |
| 11/30/2023 | $10,522 | $10,387 | $9,787 |
| 12/31/2023 | $10,624 | $10,447 | $10,161 |
| 1/31/2024 | $10,725 | $10,513 | $10,134 |
| 2/29/2024 | $10,805 | $10,576 | $9,990 |
| 3/31/2024 | $10,890 | $10,636 | $10,083 |
| 4/30/2024 | $10,951 | $10,692 | $9,828 |
| 5/31/2024 | $11,037 | $10,753 | $9,995 |
| 6/30/2024 | $11,110 | $10,803 | $10,089 |
| 7/31/2024 | $11,177 | $10,859 | $10,325 |
The Fund’s benchmarks are unmanaged indices used as a general measure of market performance. Calculations assume the reinvestment of dividends and capital gains.
Average Annual Total Returns (%)
| 1 Year | Since Inception 5/4/23 |
|---|
| Class R5 at NAV | 9.06% | 9.38% |
| Bloomberg U.S. Floating Rate Notes Index | 6.71% | 6.86% |
Bloomberg Aggregate Bond IndexFootnote Reference* | 5.10% | 2.61% |
| Footnote | Description |
Footnote* | The Fund has adopted the Bloomberg Aggregate Bond Index as its broad-based securities market index. |
The Fund's past performance is no guarantee of future results. The returns do not reflect the deduction of taxes that a shareholder would pay on Fund distributions or redemption of Fund shares.
| Total Net Assets | $40,926,751 |
| # of Portfolio Holdings | 160 |
| Portfolio Turnover Rate | 171% |
| Total Advisory Fees Paid | $0 |
What did the Fund invest in?
| Portfolio Holdings Presented by Portfolio Allocation | %Footnote Reference* |
| Asset-Backed Securities | 73.26% |
| Corporate Bonds | 7.84% |
| Floating Rate Loans | 5.31% |
| Government Sponsored Enterprises Securities | 2.30% |
| Non-Agency Commercial Mortgage-Backed Securities | 7.42% |
| U.S. Treasury Obligations | 3.87% |
| Total | 100.00% |
| Footnote | Description |
Footnote* | Represents percent of total investments, which excludes derivatives |
There were no material fund changes during the period.
Where can I find additional information about the Fund?
For additional information about the Fund, including its Prospectus, Statement of Additional Information, financial statements, holdings and proxy information, please visit lordabbett.com/FundDocuments.
The Fund has adopted a policy that allows it to send only one copy of the Fund's prospectus, proxy material, annual report and semiannual report (or related notice of internet availability of annual report and semiannual report) to certain shareholders residing at the same "household." This reduces Fund expenses, which benefits you and other shareholders.If you need additional copies or do not want your mailings to be "householded," please call Lord Abbett at 888-522-2388.
Lord Abbett Investment Grade Floating Rate Fund
Annual Shareholder Report
July 31, 2024
lordabbett.com/FundDocuments
TSR-A-9277-R5
09/24
Lord Abbett Investment Grade Floating Rate Fund
Annual Shareholder Report
July 31, 2024
lordabbett.com/FundDocuments
This annual shareholder report contains important information about the Lord Abbett Investment Grade Floating Rate Fund for the period of August 1, 2023 to July 31, 2024, as well as certain changes to the Fund. You can find additional information about the Fund at lordabbett.com/FundDocuments. You can also request this information by contacting us at 888-522-2388.
What were the Fund costs for the last year?
(based on a hypothetical $10,000 investment)
| Class Name | Costs of a $10,000 investment | Costs paid as a percentage of a $10,000 investment |
|---|
| Class R6 | $29 | 0.28% |
How did the Fund perform last year and what affected its performance?
For the fiscal year ended July 31, 2024, the Fund returned 9.13%, reflecting performance at the net asset value (NAV) of Class R6 shares with all distributions reinvested, compared to a securities market index with investment characteristics similar to those of the Fund, the Bloomberg U.S. Floating Rate Notes Index, which returned 6.71% over the same period. The Fund's broad-based market index, the Bloomberg Aggregate Bond Index, returned 5.10% over the same period.
Positive factors for the markets included momentum around the soft-landing narrative, specifically in the second half of the period, which was supported by signs of a cooling labor market and a slowing economy, leading the market to adjust its expectations of future interest rate cuts by the U.S. Federal Reserve (the Fed). Negative factors, specifically in the beginning of the period, included stronger-than-expected GDP growth, resilient labor market data, and persistently high inflation readings that led to a more prolonged interest rate environment.
Top contributors to performance: The Fund’s allocation to collateralized loan obligations was one of the largest contributors to relative performance.
Top detractors from performance: The Fund’s lack of exposure to emerging market corporate bonds modestly detracted from relative performance.
Total Return Based on $10,000 Investment
| Class R6 | Bloomberg U.S. Floating Rate Notes Index | Bloomberg Aggregate Bond Index |
|---|
| 5/4/2023 | $10,000 | $10,000 | $10,000 |
| 5/31/2023 | $10,044 | $10,056 | $9,866 |
| 6/30/2023 | $10,136 | $10,116 | $9,831 |
| 7/31/2023 | $10,250 | $10,176 | $9,824 |
| 8/31/2023 | $10,327 | $10,230 | $9,761 |
| 9/30/2023 | $10,401 | $10,282 | $9,513 |
| 10/31/2023 | $10,439 | $10,331 | $9,363 |
| 11/30/2023 | $10,527 | $10,387 | $9,787 |
| 12/31/2023 | $10,629 | $10,447 | $10,161 |
| 1/31/2024 | $10,731 | $10,513 | $10,134 |
| 2/29/2024 | $10,812 | $10,576 | $9,990 |
| 3/31/2024 | $10,897 | $10,636 | $10,083 |
| 4/30/2024 | $10,959 | $10,692 | $9,828 |
| 5/31/2024 | $11,045 | $10,753 | $9,995 |
| 6/30/2024 | $11,119 | $10,803 | $10,089 |
| 7/31/2024 | $11,187 | $10,859 | $10,325 |
The Fund’s benchmarks are unmanaged indices used as a general measure of market performance. Calculations assume the reinvestment of dividends and capital gains.
Average Annual Total Returns (%)
| 1 Year | Since Inception 5/4/23 |
|---|
| Class R6 at NAV | 9.13% | 9.46% |
| Bloomberg U.S. Floating Rate Notes Index | 6.71% | 6.86% |
Bloomberg Aggregate Bond IndexFootnote Reference* | 5.10% | 2.61% |
| Footnote | Description |
Footnote* | The Fund has adopted the Bloomberg Aggregate Bond Index as its broad-based securities market index. |
The Fund's past performance is no guarantee of future results. The returns do not reflect the deduction of taxes that a shareholder would pay on Fund distributions or redemption of Fund shares.
| Total Net Assets | $40,926,751 |
| # of Portfolio Holdings | 160 |
| Portfolio Turnover Rate | 171% |
| Total Advisory Fees Paid | $0 |
What did the Fund invest in?
| Portfolio Holdings Presented by Portfolio Allocation | %Footnote Reference* |
| Asset-Backed Securities | 73.26% |
| Corporate Bonds | 7.84% |
| Floating Rate Loans | 5.31% |
| Government Sponsored Enterprises Securities | 2.30% |
| Non-Agency Commercial Mortgage-Backed Securities | 7.42% |
| U.S. Treasury Obligations | 3.87% |
| Total | 100.00% |
| Footnote | Description |
Footnote* | Represents percent of total investments, which excludes derivatives |
There were no material fund changes during the period.
Where can I find additional information about the Fund?
For additional information about the Fund, including its Prospectus, Statement of Additional Information, financial statements, holdings and proxy information, please visit lordabbett.com/FundDocuments.
The Fund has adopted a policy that allows it to send only one copy of the Fund's prospectus, proxy material, annual report and semiannual report (or related notice of internet availability of annual report and semiannual report) to certain shareholders residing at the same "household." This reduces Fund expenses, which benefits you and other shareholders.If you need additional copies or do not want your mailings to be "householded," please call Lord Abbett at 888-522-2388.
Lord Abbett Investment Grade Floating Rate Fund
Annual Shareholder Report
July 31, 2024
lordabbett.com/FundDocuments
TSR-A-9278-R6
09/24
Lord Abbett International Growth Fund
Annual Shareholder Report
July 31, 2024
lordabbett.com/FundDocuments
This annual shareholder report contains important information about the Lord Abbett International Growth Fund for the period of August 1, 2023 to July 31, 2024, as well as certain changes to the Fund. You can find additional information about the Fund at lordabbett.com/FundDocuments. You can also request this information by contacting us at 888-522-2388.
What were the Fund costs for the last year?
(based on a hypothetical $10,000 investment)
| Class Name | Costs of a $10,000 investment | Costs paid as a percentage of a $10,000 investment |
|---|
| Class A | $101 | 0.95% |
How did the Fund perform last year and what affected its performance?
For the fiscal year ended July 31, 2024, the Fund returned 12.38%, reflecting performance at the net asset value (NAV) of Class A shares, compared to the 7.69% of a securities market index with investment characteristics similar to those of the Fund, the MSCI All Country World ex USA Growth Index (Net). The Fund's broad-based market index, the MSCI EAFE Index (Net), returned 11.21% over the same period.
Positive factors for the markets included momentum around the soft-landing narrative, specifically in the second half of the period, which was supported by signs of a cooling labor market and a slowing economy, leading the market to adjust its expectations of future interest rate cuts by the U.S. Federal Reserve (the Fed). Negative factors, specifically in the beginning of the period, included stronger-than-expected GDP growth, resilient labor market data, and persistently high inflation readings that led to a more prolonged interest rate environment. Against this backdrop, global equity markets delivered strong returns.
Top contributors to performance: Security selection within the Information Technology sector contributed to relative performance, led by an overweight allocation to NVIDIA Corp. Security selection within the Consumer Discretionary sector also contributed to relative performance, led by an overweight allocation to MercadoLibre, Inc.
Top detractors from performance: Security selection within the Financials sector detracted from relative performance, led by an overweight allocation to Adyen NV. Also, within the Financials sector, an overweight allocation to Grupo Financiero Banorte SAB de CV detracted from relative performance.
Total Return Based on $10,000 Investment
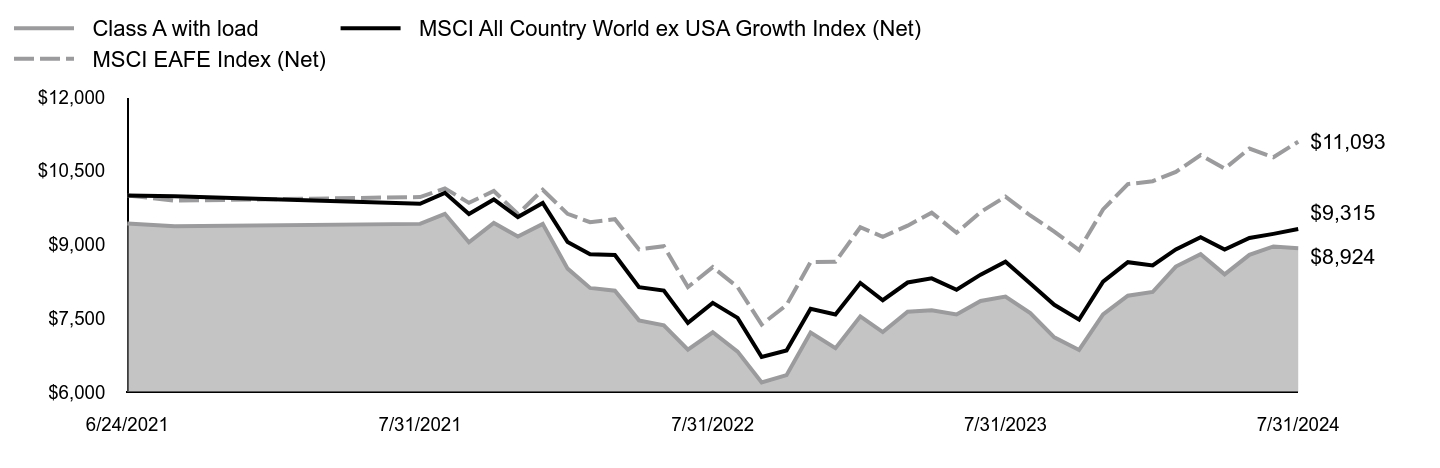
| Class A with load | MSCI All Country World ex USA Growth Index (Net) | MSCI EAFE Index (Net) |
|---|
| 6/24/2021 | $9,427 | $10,000 | $10,000 |
| 6/30/2021 | $9,371 | $9,981 | $9,893 |
| 7/31/2021 | $9,421 | $9,830 | $9,967 |
| 8/31/2021 | $9,626 | $10,052 | $10,143 |
| 9/30/2021 | $9,047 | $9,620 | $9,849 |
| 10/31/2021 | $9,439 | $9,918 | $10,091 |
| 11/30/2021 | $9,165 | $9,560 | $9,621 |
| 12/31/2021 | $9,421 | $9,847 | $10,114 |
| 1/31/2022 | $8,511 | $9,053 | $9,625 |
| 2/28/2022 | $8,118 | $8,801 | $9,455 |
| 3/31/2022 | $8,062 | $8,787 | $9,516 |
| 4/30/2022 | $7,458 | $8,133 | $8,900 |
| 5/31/2022 | $7,358 | $8,063 | $8,967 |
| 6/30/2022 | $6,860 | $7,406 | $8,135 |
| 7/31/2022 | $7,215 | $7,814 | $8,540 |
| 8/31/2022 | $6,822 | $7,509 | $8,135 |
| 9/30/2022 | $6,193 | $6,712 | $7,374 |
| 10/31/2022 | $6,343 | $6,844 | $7,770 |
| 11/30/2022 | $7,209 | $7,695 | $8,645 |
| 12/31/2022 | $6,893 | $7,577 | $8,652 |
| 1/31/2023 | $7,539 | $8,218 | $9,353 |
| 2/28/2023 | $7,219 | $7,867 | $9,158 |
| 3/31/2023 | $7,633 | $8,228 | $9,385 |
| 4/30/2023 | $7,665 | $8,312 | $9,650 |
| 5/31/2023 | $7,577 | $8,081 | $9,241 |
| 6/30/2023 | $7,853 | $8,388 | $9,662 |
| 7/31/2023 | $7,941 | $8,650 | $9,974 |
| 8/31/2023 | $7,608 | $8,209 | $9,592 |
| 9/30/2023 | $7,113 | $7,775 | $9,265 |
| 10/31/2023 | $6,856 | $7,473 | $8,889 |
| 11/30/2023 | $7,577 | $8,246 | $9,714 |
| 12/31/2023 | $7,959 | $8,641 | $10,230 |
| 1/31/2024 | $8,035 | $8,574 | $10,289 |
| 2/29/2024 | $8,552 | $8,902 | $10,477 |
| 3/31/2024 | $8,804 | $9,151 | $10,822 |
| 4/30/2024 | $8,394 | $8,898 | $10,545 |
| 5/31/2024 | $8,791 | $9,133 | $10,953 |
| 6/30/2024 | $8,962 | $9,218 | $10,777 |
| 7/31/2024 | $8,924 | $9,315 | $11,093 |
The Fund’s benchmarks are unmanaged indices used as a general measure of market performance. Calculations assume the reinvestment of dividends and capital gains.
Average Annual Total Returns (%)
| 1 Year | Since Inception 6/24/21 |
|---|
| Class A at NAV | 12.38% | (1.75%) |
| Class A with sales charge | 5.94% | (3.61%) |
| MSCI All Country World ex USA Growth Index (Net) | 7.69% | (2.26%) |
MSCI EAFE Index (Net)Footnote Reference* | 11.21% | 3.40% |
| Footnote | Description |
Footnote* | The Fund has adopted the MSCI EAFE Net Index as its broad-based securities market index. |
The Fund's past performance is no guarantee of future results. The returns do not reflect the deduction of taxes that a shareholder would pay on Fund distributions or redemption of Fund shares.
| Total Net Assets | $2,926,146 |
| # of Portfolio Holdings | 86 |
| Portfolio Turnover Rate | 88% |
| Total Advisory Fees Paid | $0 |
What did the Fund invest in?
Portfolio Holdings Presented by SectorFootnote Reference* | % Footnote Reference** |
| Communication Services | 5.95% |
| Consumer Discretionary | 9.91% |
| Consumer Staples | 6.54% |
| Energy | 0.57% |
| Financials | 8.87% |
| Health Care | 13.69% |
| Industrials | 18.38% |
| Information Technology | 28.35% |
| Materials | 7.04% |
| Real Estate | 0.70% |
| 100.00% |
| Footnote | Description |
Footnote* | A sector may comprise several industries |
Footnote** | Represents percent of total investments, which excludes derivatives. |
There were no material fund changes during the period.
Where can I find additional information about the Fund?
For additional information about the Fund, including its Prospectus, Statement of Additional Information, financial statements, holdings and proxy information, please visit lordabbett.com/FundDocuments.
The Fund has adopted a policy that allows it to send only one copy of the Fund's prospectus, proxy material, annual report and semiannual report (or related notice of internet availability of annual report and semiannual report) to certain shareholders residing at the same "household." This reduces Fund expenses, which benefits you and other shareholders.If you need additional copies or do not want your mailings to be "householded," please call Lord Abbett at 888-522-2388.
Lord Abbett International Growth Fund
Annual Shareholder Report
July 31, 2024
lordabbett.com/FundDocuments
TSR-A-9250-A
09/24
Lord Abbett International Growth Fund
Annual Shareholder Report
July 31, 2024
lordabbett.com/FundDocuments
This annual shareholder report contains important information about the Lord Abbett International Growth Fund for the period of August 1, 2023 to July 31, 2024, as well as certain changes to the Fund. You can find additional information about the Fund at lordabbett.com/FundDocuments. You can also request this information by contacting us at 888-522-2388.
What were the Fund costs for the last year?
(based on a hypothetical $10,000 investment)
| Class Name | Costs of a $10,000 investment | Costs paid as a percentage of a $10,000 investment |
|---|
| Class C | $180 | 1.70% |
How did the Fund perform last year and what affected its performance?
For the fiscal year ended July 31, 2024, the Fund returned 11.56%, reflecting performance at the net asset value (NAV) of Class C shares, compared to the 7.69% of a securities market index with investment characteristics similar to those of the Fund, the MSCI All Country World ex USA Growth Index (Net). The Fund's broad-based market index, the MSCI EAFE Index (Net), returned 11.21% over the same period.
Positive factors for the markets included momentum around the soft-landing narrative, specifically in the second half of the period, which was supported by signs of a cooling labor market and a slowing economy, leading the market to adjust its expectations of future interest rate cuts by the U.S. Federal Reserve (the Fed). Negative factors, specifically in the beginning of the period, included stronger-than-expected GDP growth, resilient labor market data, and persistently high inflation readings that led to a more prolonged interest rate environment. Against this backdrop, global equity markets delivered strong returns.
Top contributors to performance: Security selection within the Information Technology sector contributed to relative performance, led by an overweight allocation to NVIDIA Corp. Security selection within the Consumer Discretionary sector also contributed to relative performance, led by an overweight allocation to MercadoLibre, Inc.
Top detractors from performance: Security selection within the Financials sector detracted from relative performance, led by an overweight allocation to Adyen NV. Also, within the Financials sector, an overweight allocation to Grupo Financiero Banorte SAB de CV detracted from relative performance.
Total Return Based on $10,000 Investment
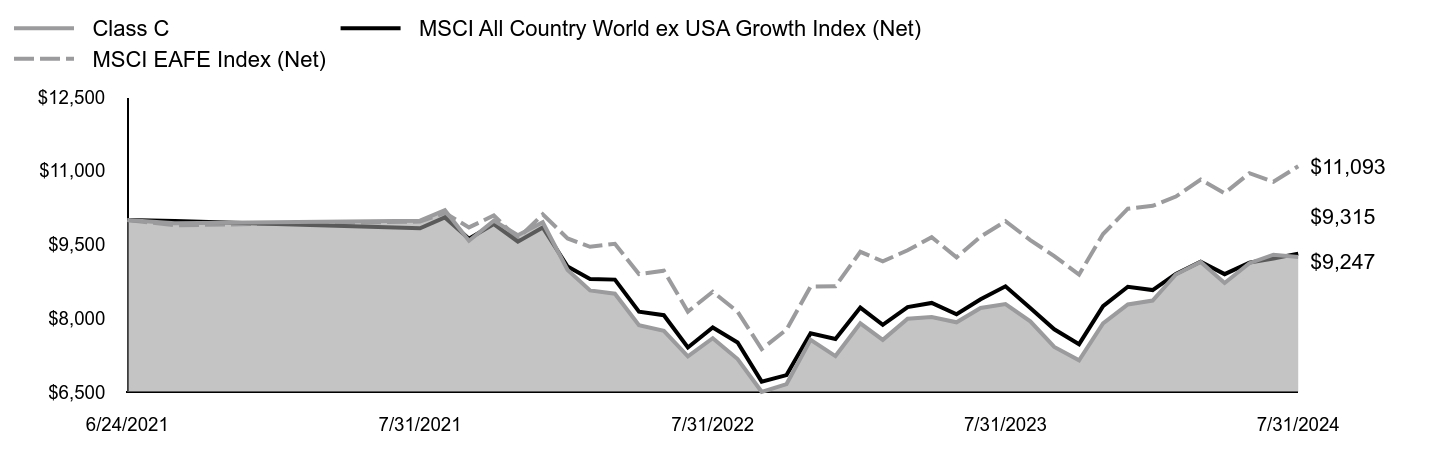
| Class C | MSCI All Country World ex USA Growth Index (Net) | MSCI EAFE Index (Net) |
|---|
| 6/24/2021 | $10,000 | $10,000 | $10,000 |
| 6/30/2021 | $9,934 | $9,981 | $9,893 |
| 7/31/2021 | $9,987 | $9,830 | $9,967 |
| 8/31/2021 | $10,198 | $10,052 | $10,143 |
| 9/30/2021 | $9,577 | $9,620 | $9,849 |
| 10/31/2021 | $9,987 | $9,918 | $10,091 |
| 11/30/2021 | $9,689 | $9,560 | $9,621 |
| 12/31/2021 | $9,954 | $9,847 | $10,114 |
| 1/31/2022 | $8,982 | $9,053 | $9,625 |
| 2/28/2022 | $8,566 | $8,801 | $9,455 |
| 3/31/2022 | $8,500 | $8,787 | $9,516 |
| 4/30/2022 | $7,859 | $8,133 | $8,900 |
| 5/31/2022 | $7,746 | $8,063 | $8,967 |
| 6/30/2022 | $7,224 | $7,406 | $8,135 |
| 7/31/2022 | $7,594 | $7,814 | $8,540 |
| 8/31/2022 | $7,171 | $7,509 | $8,135 |
| 9/30/2022 | $6,504 | $6,712 | $7,374 |
| 10/31/2022 | $6,662 | $6,844 | $7,770 |
| 11/30/2022 | $7,561 | $7,695 | $8,645 |
| 12/31/2022 | $7,231 | $7,577 | $8,652 |
| 1/31/2023 | $7,898 | $8,218 | $9,353 |
| 2/28/2023 | $7,561 | $7,867 | $9,158 |
| 3/31/2023 | $7,991 | $8,228 | $9,385 |
| 4/30/2023 | $8,024 | $8,312 | $9,650 |
| 5/31/2023 | $7,918 | $8,081 | $9,241 |
| 6/30/2023 | $8,209 | $8,388 | $9,662 |
| 7/31/2023 | $8,288 | $8,650 | $9,974 |
| 8/31/2023 | $7,938 | $8,209 | $9,592 |
| 9/30/2023 | $7,416 | $7,775 | $9,265 |
| 10/31/2023 | $7,145 | $7,473 | $8,889 |
| 11/30/2023 | $7,898 | $8,246 | $9,714 |
| 12/31/2023 | $8,282 | $8,641 | $10,230 |
| 1/31/2024 | $8,361 | $8,574 | $10,289 |
| 2/29/2024 | $8,890 | $8,902 | $10,477 |
| 3/31/2024 | $9,147 | $9,151 | $10,822 |
| 4/30/2024 | $8,718 | $8,898 | $10,545 |
| 5/31/2024 | $9,121 | $9,133 | $10,953 |
| 6/30/2024 | $9,293 | $9,218 | $10,777 |
| 7/31/2024 | $9,247 | $9,315 | $11,093 |
The Fund’s benchmarks are unmanaged indices used as a general measure of market performance. Calculations assume the reinvestment of dividends and capital gains.
Average Annual Total Returns (%)
| 1 Year | Since Inception 6/24/21 |
|---|
| Class C at NAV | 11.56% | (2.49%) |
| Class C with sales charge | 10.56% | (2.49%) |
| MSCI All Country World ex USA Growth Index (Net) | 7.69% | (2.26%) |
MSCI EAFE Index (Net)Footnote Reference* | 11.21% | 3.40% |
| Footnote | Description |
Footnote* | The Fund has adopted the MSCI EAFE Net Index as its broad-based securities market index. |
The Fund's past performance is no guarantee of future results. The returns do not reflect the deduction of taxes that a shareholder would pay on Fund distributions or redemption of Fund shares.
| Total Net Assets | $2,926,146 |
| # of Portfolio Holdings | 86 |
| Portfolio Turnover Rate | 88% |
| Total Advisory Fees Paid | $0 |
What did the Fund invest in?
Portfolio Holdings Presented by SectorFootnote Reference* | % Footnote Reference** |
| Communication Services | 5.95% |
| Consumer Discretionary | 9.91% |
| Consumer Staples | 6.54% |
| Energy | 0.57% |
| Financials | 8.87% |
| Health Care | 13.69% |
| Industrials | 18.38% |
| Information Technology | 28.35% |
| Materials | 7.04% |
| Real Estate | 0.70% |
| 100.00% |
| Footnote | Description |
Footnote* | A sector may comprise several industries |
Footnote** | Represents percent of total investments, which excludes derivatives. |
There were no material fund changes during the period.
Where can I find additional information about the Fund?
For additional information about the Fund, including its Prospectus, Statement of Additional Information, financial statements, holdings and proxy information, please visit lordabbett.com/FundDocuments.
The Fund has adopted a policy that allows it to send only one copy of the Fund's prospectus, proxy material, annual report and semiannual report (or related notice of internet availability of annual report and semiannual report) to certain shareholders residing at the same "household." This reduces Fund expenses, which benefits you and other shareholders.If you need additional copies or do not want your mailings to be "householded," please call Lord Abbett at 888-522-2388.
Lord Abbett International Growth Fund
Annual Shareholder Report
July 31, 2024
lordabbett.com/FundDocuments
TSR-A-9251-C
09/24
Lord Abbett International Growth Fund
Annual Shareholder Report
July 31, 2024
lordabbett.com/FundDocuments
This annual shareholder report contains important information about the Lord Abbett International Growth Fund for the period of August 1, 2023 to July 31, 2024, as well as certain changes to the Fund. You can find additional information about the Fund at lordabbett.com/FundDocuments. You can also request this information by contacting us at 888-522-2388.
What were the Fund costs for the last year?
(based on a hypothetical $10,000 investment)
| Class Name | Costs of a $10,000 investment | Costs paid as a percentage of a $10,000 investment |
|---|
| Class F | $74 | 0.70% |
How did the Fund perform last year and what affected its performance?
For the fiscal year ended July 31, 2024, the Fund returned 12.65%, reflecting performance at the net asset value (NAV) of Class F shares, compared to the 7.69% of a securities market index with investment characteristics similar to those of the Fund, the MSCI All Country World ex USA Growth Index (Net). The Fund's broad-based market index, the MSCI EAFE Index (Net), returned 11.21% over the same period.
Positive factors for the markets included momentum around the soft-landing narrative, specifically in the second half of the period, which was supported by signs of a cooling labor market and a slowing economy, leading the market to adjust its expectations of future interest rate cuts by the U.S. Federal Reserve (the Fed). Negative factors, specifically in the beginning of the period, included stronger-than-expected GDP growth, resilient labor market data, and persistently high inflation readings that led to a more prolonged interest rate environment. Against this backdrop, global equity markets delivered strong returns.
Top contributors to performance: Security selection within the Information Technology sector contributed to relative performance, led by an overweight allocation to NVIDIA Corp. Security selection within the Consumer Discretionary sector also contributed to relative performance, led by an overweight allocation to MercadoLibre, Inc.
Top detractors from performance: Security selection within the Financials sector detracted from relative performance, led by an overweight allocation to Adyen NV. Also, within the Financials sector, an overweight allocation to Grupo Financiero Banorte SAB de CV detracted from relative performance.
Total Return Based on $10,000 Investment

| Class F | MSCI All Country World ex USA Growth Index (Net) | MSCI EAFE Index (Net) |
|---|
| 6/24/2021 | $10,000 | $10,000 | $10,000 |
| 6/30/2021 | $9,941 | $9,981 | $9,893 |
| 7/31/2021 | $10,000 | $9,830 | $9,967 |
| 8/31/2021 | $10,218 | $10,052 | $10,143 |
| 9/30/2021 | $9,603 | $9,620 | $9,849 |
| 10/31/2021 | $10,020 | $9,918 | $10,091 |
| 11/30/2021 | $9,736 | $9,560 | $9,621 |
| 12/31/2021 | $10,007 | $9,847 | $10,114 |
| 1/31/2022 | $9,042 | $9,053 | $9,625 |
| 2/28/2022 | $8,625 | $8,801 | $9,455 |
| 3/31/2022 | $8,566 | $8,787 | $9,516 |
| 4/30/2022 | $7,925 | $8,133 | $8,900 |
| 5/31/2022 | $7,819 | $8,063 | $8,967 |
| 6/30/2022 | $7,297 | $7,406 | $8,135 |
| 7/31/2022 | $7,673 | $7,814 | $8,540 |
| 8/31/2022 | $7,257 | $7,509 | $8,135 |
| 9/30/2022 | $6,590 | $6,712 | $7,374 |
| 10/31/2022 | $6,748 | $6,844 | $7,770 |
| 11/30/2022 | $7,673 | $7,695 | $8,645 |
| 12/31/2022 | $7,341 | $7,577 | $8,652 |
| 1/31/2023 | $8,027 | $8,218 | $9,353 |
| 2/28/2023 | $7,687 | $7,867 | $9,158 |
| 3/31/2023 | $8,133 | $8,228 | $9,385 |
| 4/30/2023 | $8,173 | $8,312 | $9,650 |
| 5/31/2023 | $8,073 | $8,081 | $9,241 |
| 6/30/2023 | $8,373 | $8,388 | $9,662 |
| 7/31/2023 | $8,466 | $8,650 | $9,974 |
| 8/31/2023 | $8,113 | $8,209 | $9,592 |
| 9/30/2023 | $7,587 | $7,775 | $9,265 |
| 10/31/2023 | $7,314 | $7,473 | $8,889 |
| 11/30/2023 | $8,087 | $8,246 | $9,714 |
| 12/31/2023 | $8,498 | $8,641 | $10,230 |
| 1/31/2024 | $8,579 | $8,574 | $10,289 |
| 2/29/2024 | $9,128 | $8,902 | $10,477 |
| 3/31/2024 | $9,403 | $9,151 | $10,822 |
| 4/30/2024 | $8,967 | $8,898 | $10,545 |
| 5/31/2024 | $9,396 | $9,133 | $10,953 |
| 6/30/2024 | $9,577 | $9,218 | $10,777 |
| 7/31/2024 | $9,537 | $9,315 | $11,093 |
The Fund’s benchmarks are unmanaged indices used as a general measure of market performance. Calculations assume the reinvestment of dividends and capital gains.
Average Annual Total Returns (%)
| 1 Year | Since Inception 6/24/21 |
|---|
| Class F at NAV | 12.65% | (1.52%) |
| MSCI All Country World ex USA Growth Index (Net) | 7.69% | (2.26%) |
MSCI EAFE Index (Net)Footnote Reference* | 11.21% | 3.40% |
| Footnote | Description |
Footnote* | The Fund has adopted the MSCI EAFE Net Index as its broad-based securities market index. |
The Fund's past performance is no guarantee of future results. The returns do not reflect the deduction of taxes that a shareholder would pay on Fund distributions or redemption of Fund shares.
| Total Net Assets | $2,926,146 |
| # of Portfolio Holdings | 86 |
| Portfolio Turnover Rate | 88% |
| Total Advisory Fees Paid | $0 |
What did the Fund invest in?
Portfolio Holdings Presented by SectorFootnote Reference* | % Footnote Reference** |
| Communication Services | 5.95% |
| Consumer Discretionary | 9.91% |
| Consumer Staples | 6.54% |
| Energy | 0.57% |
| Financials | 8.87% |
| Health Care | 13.69% |
| Industrials | 18.38% |
| Information Technology | 28.35% |
| Materials | 7.04% |
| Real Estate | 0.70% |
| 100.00% |
| Footnote | Description |
Footnote* | A sector may comprise several industries |
Footnote** | Represents percent of total investments, which excludes derivatives. |
There were no material fund changes during the period.
Where can I find additional information about the Fund?
For additional information about the Fund, including its Prospectus, Statement of Additional Information, financial statements, holdings and proxy information, please visit lordabbett.com/FundDocuments.
The Fund has adopted a policy that allows it to send only one copy of the Fund's prospectus, proxy material, annual report and semiannual report (or related notice of internet availability of annual report and semiannual report) to certain shareholders residing at the same "household." This reduces Fund expenses, which benefits you and other shareholders.If you need additional copies or do not want your mailings to be "householded," please call Lord Abbett at 888-522-2388.
Lord Abbett International Growth Fund
Annual Shareholder Report
July 31, 2024
lordabbett.com/FundDocuments
TSR-A-9252-F
09/24
Lord Abbett International Growth Fund
Annual Shareholder Report
July 31, 2024
lordabbett.com/FundDocuments
This annual shareholder report contains important information about the Lord Abbett International Growth Fund for the period of August 1, 2023 to July 31, 2024, as well as certain changes to the Fund. You can find additional information about the Fund at lordabbett.com/FundDocuments. You can also request this information by contacting us at 888-522-2388.This report describes changes to the Fund that occurred during the reporting period.
What were the Fund costs for the last year?
(based on a hypothetical $10,000 investment)
| Class Name | Costs of a $10,000 investment | Costs paid as a percentage of a $10,000 investment |
|---|
| Class F3 | $69 | 0.65% |
How did the Fund perform last year and what affected its performance?
For the fiscal year ended July 31, 2024, the Fund returned 12.77%, reflecting performance at the net asset value (NAV) of Class F3 shares, compared to the 7.69% of a securities market index with investment characteristics similar to those of the Fund, the MSCI All Country World ex USA Growth Index (Net). The Fund's broad-based market index, the MSCI EAFE Index (Net), returned 11.21% over the same period.
Positive factors for the markets included momentum around the soft-landing narrative, specifically in the second half of the period, which was supported by signs of a cooling labor market and a slowing economy, leading the market to adjust its expectations of future interest rate cuts by the U.S. Federal Reserve (the Fed). Negative factors, specifically in the beginning of the period, included stronger-than-expected GDP growth, resilient labor market data, and persistently high inflation readings that led to a more prolonged interest rate environment. Against this backdrop, global equity markets delivered strong returns.
Top contributors to performance: Security selection within the Information Technology sector contributed to relative performance, led by an overweight allocation to NVIDIA Corp. Security selection within the Consumer Discretionary sector also contributed to relative performance, led by an overweight allocation to MercadoLibre, Inc.
Top detractors from performance: Security selection within the Financials sector detracted from relative performance, led by an overweight allocation to Adyen NV. Also, within the Financials sector, an overweight allocation to Grupo Financiero Banorte SAB de CV detracted from relative performance.
Total Return Based on $10,000 Investment

| Class F3 | MSCI All Country World ex USA Growth Index (Net) | MSCI EAFE Index (Net) |
|---|
| 6/24/2021 | $10,000 | $10,000 | $10,000 |
| 6/30/2021 | $9,941 | $9,981 | $9,893 |
| 7/31/2021 | $10,000 | $9,830 | $9,967 |
| 8/31/2021 | $10,218 | $10,052 | $10,143 |
| 9/30/2021 | $9,603 | $9,620 | $9,849 |
| 10/31/2021 | $10,026 | $9,918 | $10,091 |
| 11/30/2021 | $9,736 | $9,560 | $9,621 |
| 12/31/2021 | $10,013 | $9,847 | $10,114 |
| 1/31/2022 | $9,048 | $9,053 | $9,625 |
| 2/28/2022 | $8,632 | $8,801 | $9,455 |
| 3/31/2022 | $8,572 | $8,787 | $9,516 |
| 4/30/2022 | $7,931 | $8,133 | $8,900 |
| 5/31/2022 | $7,826 | $8,063 | $8,967 |
| 6/30/2022 | $7,303 | $7,406 | $8,135 |
| 7/31/2022 | $7,687 | $7,814 | $8,540 |
| 8/31/2022 | $7,264 | $7,509 | $8,135 |
| 9/30/2022 | $6,596 | $6,712 | $7,374 |
| 10/31/2022 | $6,761 | $6,844 | $7,770 |
| 11/30/2022 | $7,680 | $7,695 | $8,645 |
| 12/31/2022 | $7,350 | $7,577 | $8,652 |
| 1/31/2023 | $8,044 | $8,218 | $9,353 |
| 2/28/2023 | $7,697 | $7,867 | $9,158 |
| 3/31/2023 | $8,151 | $8,228 | $9,385 |
| 4/30/2023 | $8,184 | $8,312 | $9,650 |
| 5/31/2023 | $8,091 | $8,081 | $9,241 |
| 6/30/2023 | $8,391 | $8,388 | $9,662 |
| 7/31/2023 | $8,484 | $8,650 | $9,974 |
| 8/31/2023 | $8,131 | $8,209 | $9,592 |
| 9/30/2023 | $7,604 | $7,775 | $9,265 |
| 10/31/2023 | $7,337 | $7,473 | $8,889 |
| 11/30/2023 | $8,111 | $8,246 | $9,714 |
| 12/31/2023 | $8,519 | $8,641 | $10,230 |
| 1/31/2024 | $8,600 | $8,574 | $10,289 |
| 2/29/2024 | $9,158 | $8,902 | $10,477 |
| 3/31/2024 | $9,426 | $9,151 | $10,822 |
| 4/30/2024 | $8,996 | $8,898 | $10,545 |
| 5/31/2024 | $9,420 | $9,133 | $10,953 |
| 6/30/2024 | $9,601 | $9,218 | $10,777 |
| 7/31/2024 | $9,567 | $9,315 | $11,093 |
The Fund’s benchmarks are unmanaged indices used as a general measure of market performance. Calculations assume the reinvestment of dividends and capital gains.
Average Annual Total Returns (%)
| 1 Year | Since Inception 6/24/21 |
|---|
| Class F3 at NAV | 12.77% | (1.42%) |
| MSCI All Country World ex USA Growth Index (Net) | 7.69% | (2.26%) |
MSCI EAFE Index (Net)Footnote Reference* | 11.21% | 3.40% |
| Footnote | Description |
Footnote* | The Fund has adopted the MSCI EAFE Net Index as its broad-based securities market index. |
The Fund's past performance is no guarantee of future results. The returns do not reflect the deduction of taxes that a shareholder would pay on Fund distributions or redemption of Fund shares.
| Total Net Assets | $2,926,146 |
| # of Portfolio Holdings | 86 |
| Portfolio Turnover Rate | 88% |
| Total Advisory Fees Paid | $0 |
What did the Fund invest in?
Portfolio Holdings Presented by SectorFootnote Reference* | % Footnote Reference** |
| Communication Services | 5.95% |
| Consumer Discretionary | 9.91% |
| Consumer Staples | 6.54% |
| Energy | 0.57% |
| Financials | 8.87% |
| Health Care | 13.69% |
| Industrials | 18.38% |
| Information Technology | 28.35% |
| Materials | 7.04% |
| Real Estate | 0.70% |
| 100.00% |
| Footnote | Description |
Footnote* | A sector may comprise several industries |
Footnote** | Represents percent of total investments, which excludes derivatives. |
This is a summary of certain changes of the Fund since July 31, 2024. For more information contact 888-522-2388.
Expenses: As of December 1, 2024, the expense limitation on total net annual operating expenses increased from 0.57% to 0.64% as part of the annual review of transfer agency expenses.
Where can I find additional information about the Fund?
For additional information about the Fund, including its Prospectus, Statement of Additional Information, financial statements, holdings and proxy information, please visit lordabbett.com/FundDocuments.
The Fund has adopted a policy that allows it to send only one copy of the Fund's prospectus, proxy material, annual report and semiannual report (or related notice of internet availability of annual report and semiannual report) to certain shareholders residing at the same "household." This reduces Fund expenses, which benefits you and other shareholders.If you need additional copies or do not want your mailings to be "householded," please call Lord Abbett at 888-522-2388.
Lord Abbett International Growth Fund
Annual Shareholder Report
July 31, 2024
lordabbett.com/FundDocuments
TSR-A-9253-F3
09/24
Lord Abbett International Growth Fund
Annual Shareholder Report
July 31, 2024
lordabbett.com/FundDocuments
This annual shareholder report contains important information about the Lord Abbett International Growth Fund for the period of August 1, 2023 to July 31, 2024, as well as certain changes to the Fund. You can find additional information about the Fund at lordabbett.com/FundDocuments. You can also request this information by contacting us at 888-522-2388.
What were the Fund costs for the last year?
(based on a hypothetical $10,000 investment)
| Class Name | Costs of a $10,000 investment | Costs paid as a percentage of a $10,000 investment |
|---|
| Class I | $74 | 0.70% |
How did the Fund perform last year and what affected its performance?
For the fiscal year ended July 31, 2024, the Fund returned 12.62%, reflecting performance at the net asset value (NAV) of Class I shares, compared to the 7.69% of a securities market index with investment characteristics similar to those of the Fund, the MSCI All Country World ex USA Growth Index (Net). The Fund's broad-based market index, the MSCI EAFE Index (Net), returned 11.21% over the same period.
Positive factors for the markets included momentum around the soft-landing narrative, specifically in the second half of the period, which was supported by signs of a cooling labor market and a slowing economy, leading the market to adjust its expectations of future interest rate cuts by the U.S. Federal Reserve (the Fed). Negative factors, specifically in the beginning of the period, included stronger-than-expected GDP growth, resilient labor market data, and persistently high inflation readings that led to a more prolonged interest rate environment. Against this backdrop, global equity markets delivered strong returns.
Top contributors to performance: Security selection within the Information Technology sector contributed to relative performance, led by an overweight allocation to NVIDIA Corp. Security selection within the Consumer Discretionary sector also contributed to relative performance, led by an overweight allocation to MercadoLibre, Inc.
Top detractors from performance: Security selection within the Financials sector detracted from relative performance, led by an overweight allocation to Adyen NV. Also, within the Financials sector, an overweight allocation to Grupo Financiero Banorte SAB de CV detracted from relative performance.
Total Return Based on $10,000 Investment
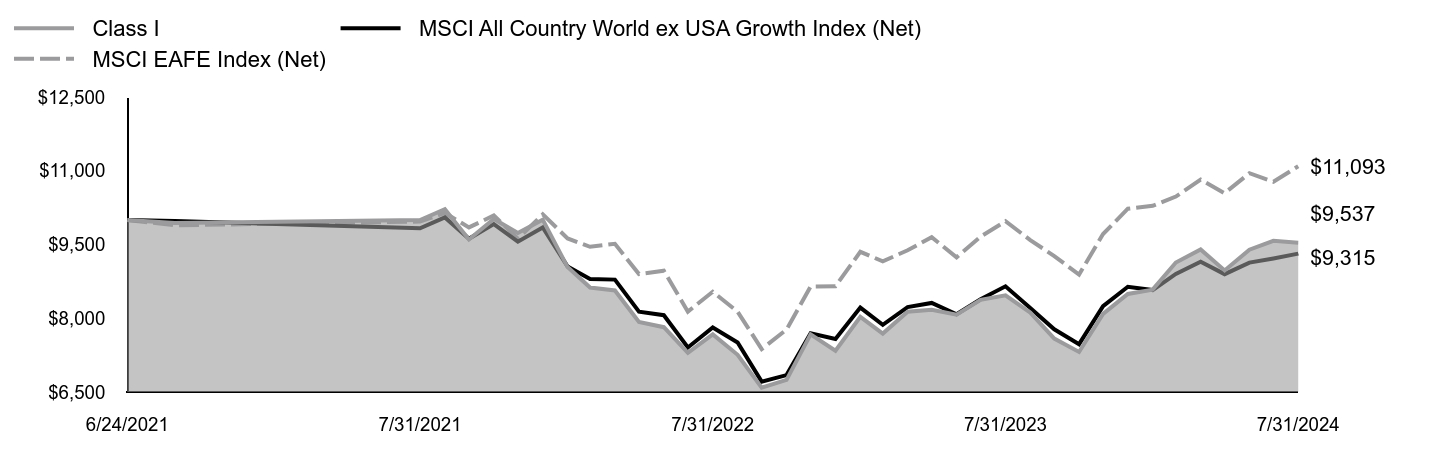
| Class I | MSCI All Country World ex USA Growth Index (Net) | MSCI EAFE Index (Net) |
|---|
| 6/24/2021 | $10,000 | $10,000 | $10,000 |
| 6/30/2021 | $9,941 | $9,981 | $9,893 |
| 7/31/2021 | $10,000 | $9,830 | $9,967 |
| 8/31/2021 | $10,218 | $10,052 | $10,143 |
| 9/30/2021 | $9,603 | $9,620 | $9,849 |
| 10/31/2021 | $10,020 | $9,918 | $10,091 |
| 11/30/2021 | $9,736 | $9,560 | $9,621 |
| 12/31/2021 | $10,007 | $9,847 | $10,114 |
| 1/31/2022 | $9,042 | $9,053 | $9,625 |
| 2/28/2022 | $8,625 | $8,801 | $9,455 |
| 3/31/2022 | $8,566 | $8,787 | $9,516 |
| 4/30/2022 | $7,925 | $8,133 | $8,900 |
| 5/31/2022 | $7,819 | $8,063 | $8,967 |
| 6/30/2022 | $7,297 | $7,406 | $8,135 |
| 7/31/2022 | $7,673 | $7,814 | $8,540 |
| 8/31/2022 | $7,257 | $7,509 | $8,135 |
| 9/30/2022 | $6,590 | $6,712 | $7,374 |
| 10/31/2022 | $6,748 | $6,844 | $7,770 |
| 11/30/2022 | $7,673 | $7,695 | $8,645 |
| 12/31/2022 | $7,341 | $7,577 | $8,652 |
| 1/31/2023 | $8,028 | $8,218 | $9,353 |
| 2/28/2023 | $7,688 | $7,867 | $9,158 |
| 3/31/2023 | $8,135 | $8,228 | $9,385 |
| 4/30/2023 | $8,175 | $8,312 | $9,650 |
| 5/31/2023 | $8,075 | $8,081 | $9,241 |
| 6/30/2023 | $8,375 | $8,388 | $9,662 |
| 7/31/2023 | $8,468 | $8,650 | $9,974 |
| 8/31/2023 | $8,115 | $8,209 | $9,592 |
| 9/30/2023 | $7,588 | $7,775 | $9,265 |
| 10/31/2023 | $7,315 | $7,473 | $8,889 |
| 11/30/2023 | $8,088 | $8,246 | $9,714 |
| 12/31/2023 | $8,496 | $8,641 | $10,230 |
| 1/31/2024 | $8,583 | $8,574 | $10,289 |
| 2/29/2024 | $9,134 | $8,902 | $10,477 |
| 3/31/2024 | $9,402 | $9,151 | $10,822 |
| 4/30/2024 | $8,973 | $8,898 | $10,545 |
| 5/31/2024 | $9,396 | $9,133 | $10,953 |
| 6/30/2024 | $9,577 | $9,218 | $10,777 |
| 7/31/2024 | $9,537 | $9,315 | $11,093 |
The Fund’s benchmarks are unmanaged indices used as a general measure of market performance. Calculations assume the reinvestment of dividends and capital gains.
Average Annual Total Returns (%)
| 1 Year | Since Inception 6/24/21 |
|---|
| Class I at NAV | 12.62% | (1.52%) |
| MSCI All Country World ex USA Growth Index (Net) | 7.69% | (2.26%) |
MSCI EAFE Index (Net)Footnote Reference* | 11.21% | 3.40% |
| Footnote | Description |
Footnote* | The Fund has adopted the MSCI EAFE Net Index as its broad-based securities market index. |
The Fund's past performance is no guarantee of future results. The returns do not reflect the deduction of taxes that a shareholder would pay on Fund distributions or redemption of Fund shares.
| Total Net Assets | $2,926,146 |
| # of Portfolio Holdings | 86 |
| Portfolio Turnover Rate | 88% |
| Total Advisory Fees Paid | $0 |
What did the Fund invest in?
Portfolio Holdings Presented by SectorFootnote Reference* | % Footnote Reference** |
| Communication Services | 5.95% |
| Consumer Discretionary | 9.91% |
| Consumer Staples | 6.54% |
| Energy | 0.57% |
| Financials | 8.87% |
| Health Care | 13.69% |
| Industrials | 18.38% |
| Information Technology | 28.35% |
| Materials | 7.04% |
| Real Estate | 0.70% |
| 100.00% |
| Footnote | Description |
Footnote* | A sector may comprise several industries |
Footnote** | Represents percent of total investments, which excludes derivatives. |
There were no material fund changes during the period.
Where can I find additional information about the Fund?
For additional information about the Fund, including its Prospectus, Statement of Additional Information, financial statements, holdings and proxy information, please visit lordabbett.com/FundDocuments.
The Fund has adopted a policy that allows it to send only one copy of the Fund's prospectus, proxy material, annual report and semiannual report (or related notice of internet availability of annual report and semiannual report) to certain shareholders residing at the same "household." This reduces Fund expenses, which benefits you and other shareholders.If you need additional copies or do not want your mailings to be "householded," please call Lord Abbett at 888-522-2388.
Lord Abbett International Growth Fund
Annual Shareholder Report
July 31, 2024
lordabbett.com/FundDocuments
TSR-A-9254-I
09/24
Lord Abbett International Growth Fund
Annual Shareholder Report
July 31, 2024
lordabbett.com/FundDocuments
This annual shareholder report contains important information about the Lord Abbett International Growth Fund for the period of August 1, 2023 to July 31, 2024, as well as certain changes to the Fund. You can find additional information about the Fund at lordabbett.com/FundDocuments. You can also request this information by contacting us at 888-522-2388.
What were the Fund costs for the last year?
(based on a hypothetical $10,000 investment)
| Class Name | Costs of a $10,000 investment | Costs paid as a percentage of a $10,000 investment |
|---|
| Class R3 | $127 | 1.20% |
How did the Fund perform last year and what affected its performance?
For the fiscal year ended July 31, 2024, the Fund returned 12.09%, reflecting performance at the net asset value (NAV) of Class R3 shares, compared to the 7.69% of a securities market index with investment characteristics similar to those of the Fund, the MSCI All Country World ex USA Growth Index (Net). The Fund's broad-based market index, the MSCI EAFE Index (Net), returned 11.21% over the same period.
Positive factors for the markets included momentum around the soft-landing narrative, specifically in the second half of the period, which was supported by signs of a cooling labor market and a slowing economy, leading the market to adjust its expectations of future interest rate cuts by the U.S. Federal Reserve (the Fed). Negative factors, specifically in the beginning of the period, included stronger-than-expected GDP growth, resilient labor market data, and persistently high inflation readings that led to a more prolonged interest rate environment. Against this backdrop, global equity markets delivered strong returns.
Top contributors to performance: Security selection within the Information Technology sector contributed to relative performance, led by an overweight allocation to NVIDIA Corp. Security selection within the Consumer Discretionary sector also contributed to relative performance, led by an overweight allocation to MercadoLibre, Inc.
Top detractors from performance: Security selection within the Financials sector detracted from relative performance, led by an overweight allocation to Adyen NV. Also, within the Financials sector, an overweight allocation to Grupo Financiero Banorte SAB de CV detracted from relative performance.
Total Return Based on $10,000 Investment

| Class R3 | MSCI All Country World ex USA Growth Index (Net) | MSCI EAFE Index (Net) |
|---|
| 6/24/2021 | $10,000 | $10,000 | $10,000 |
| 6/30/2021 | $9,941 | $9,981 | $9,893 |
| 7/31/2021 | $9,993 | $9,830 | $9,967 |
| 8/31/2021 | $10,212 | $10,052 | $10,143 |
| 9/30/2021 | $9,590 | $9,620 | $9,849 |
| 10/31/2021 | $10,000 | $9,918 | $10,091 |
| 11/30/2021 | $9,709 | $9,560 | $9,621 |
| 12/31/2021 | $9,980 | $9,847 | $10,114 |
| 1/31/2022 | $9,015 | $9,053 | $9,625 |
| 2/28/2022 | $8,599 | $8,801 | $9,455 |
| 3/31/2022 | $8,533 | $8,787 | $9,516 |
| 4/30/2022 | $7,892 | $8,133 | $8,900 |
| 5/31/2022 | $7,786 | $8,063 | $8,967 |
| 6/30/2022 | $7,257 | $7,406 | $8,135 |
| 7/31/2022 | $7,634 | $7,814 | $8,540 |
| 8/31/2022 | $7,211 | $7,509 | $8,135 |
| 9/30/2022 | $6,550 | $6,712 | $7,374 |
| 10/31/2022 | $6,702 | $6,844 | $7,770 |
| 11/30/2022 | $7,614 | $7,695 | $8,645 |
| 12/31/2022 | $7,283 | $7,577 | $8,652 |
| 1/31/2023 | $7,966 | $8,218 | $9,353 |
| 2/28/2023 | $7,621 | $7,867 | $9,158 |
| 3/31/2023 | $8,066 | $8,228 | $9,385 |
| 4/30/2023 | $8,099 | $8,312 | $9,650 |
| 5/31/2023 | $8,000 | $8,081 | $9,241 |
| 6/30/2023 | $8,291 | $8,388 | $9,662 |
| 7/31/2023 | $8,378 | $8,650 | $9,974 |
| 8/31/2023 | $8,026 | $8,209 | $9,592 |
| 9/30/2023 | $7,502 | $7,775 | $9,265 |
| 10/31/2023 | $7,230 | $7,473 | $8,889 |
| 11/30/2023 | $7,993 | $8,246 | $9,714 |
| 12/31/2023 | $8,393 | $8,641 | $10,230 |
| 1/31/2024 | $8,466 | $8,574 | $10,289 |
| 2/29/2024 | $9,011 | $8,902 | $10,477 |
| 3/31/2024 | $9,277 | $9,151 | $10,822 |
| 4/30/2024 | $8,845 | $8,898 | $10,545 |
| 5/31/2024 | $9,257 | $9,133 | $10,953 |
| 6/30/2024 | $9,437 | $9,218 | $10,777 |
| 7/31/2024 | $9,390 | $9,315 | $11,093 |
The Fund’s benchmarks are unmanaged indices used as a general measure of market performance. Calculations assume the reinvestment of dividends and capital gains.
Average Annual Total Returns (%)
| 1 Year | Since Inception 6/24/21 |
|---|
| Class R3 at NAV | 12.09% | (2.01%) |
| MSCI All Country World ex USA Growth Index (Net) | 7.69% | (2.26%) |
MSCI EAFE Index (Net)Footnote Reference* | 11.21% | 3.40% |
| Footnote | Description |
Footnote* | The Fund has adopted the MSCI EAFE Net Index as its broad-based securities market index. |
The Fund's past performance is no guarantee of future results. The returns do not reflect the deduction of taxes that a shareholder would pay on Fund distributions or redemption of Fund shares.
| Total Net Assets | $2,926,146 |
| # of Portfolio Holdings | 86 |
| Portfolio Turnover Rate | 88% |
| Total Advisory Fees Paid | $0 |
What did the Fund invest in?
Portfolio Holdings Presented by SectorFootnote Reference* | % Footnote Reference** |
| Communication Services | 5.95% |
| Consumer Discretionary | 9.91% |
| Consumer Staples | 6.54% |
| Energy | 0.57% |
| Financials | 8.87% |
| Health Care | 13.69% |
| Industrials | 18.38% |
| Information Technology | 28.35% |
| Materials | 7.04% |
| Real Estate | 0.70% |
| 100.00% |
| Footnote | Description |
Footnote* | A sector may comprise several industries |
Footnote** | Represents percent of total investments, which excludes derivatives. |
There were no material fund changes during the period.
Where can I find additional information about the Fund?
For additional information about the Fund, including its Prospectus, Statement of Additional Information, financial statements, holdings and proxy information, please visit lordabbett.com/FundDocuments.
The Fund has adopted a policy that allows it to send only one copy of the Fund's prospectus, proxy material, annual report and semiannual report (or related notice of internet availability of annual report and semiannual report) to certain shareholders residing at the same "household." This reduces Fund expenses, which benefits you and other shareholders.If you need additional copies or do not want your mailings to be "householded," please call Lord Abbett at 888-522-2388.
Lord Abbett International Growth Fund
Annual Shareholder Report
July 31, 2024
lordabbett.com/FundDocuments
TSR-A-9255-R3
09/24
Lord Abbett International Growth Fund
Annual Shareholder Report
July 31, 2024
lordabbett.com/FundDocuments
This annual shareholder report contains important information about the Lord Abbett International Growth Fund for the period of August 1, 2023 to July 31, 2024, as well as certain changes to the Fund. You can find additional information about the Fund at lordabbett.com/FundDocuments. You can also request this information by contacting us at 888-522-2388.
What were the Fund costs for the last year?
(based on a hypothetical $10,000 investment)
| Class Name | Costs of a $10,000 investment | Costs paid as a percentage of a $10,000 investment |
|---|
| Class R4 | $101 | 0.95% |
How did the Fund perform last year and what affected its performance?
For the fiscal year ended July 31, 2024, the Fund returned 12.37%, reflecting performance at the net asset value (NAV) of Class R4 shares, compared to the 7.69% of a securities market index with investment characteristics similar to those of the Fund, the MSCI All Country World ex USA Growth Index (Net). The Fund's broad-based market index, the MSCI EAFE Index (Net), returned 11.21% over the same period.
Positive factors for the markets included momentum around the soft-landing narrative, specifically in the second half of the period, which was supported by signs of a cooling labor market and a slowing economy, leading the market to adjust its expectations of future interest rate cuts by the U.S. Federal Reserve (the Fed). Negative factors, specifically in the beginning of the period, included stronger-than-expected GDP growth, resilient labor market data, and persistently high inflation readings that led to a more prolonged interest rate environment. Against this backdrop, global equity markets delivered strong returns.
Top contributors to performance: Security selection within the Information Technology sector contributed to relative performance, led by an overweight allocation to NVIDIA Corp. Security selection within the Consumer Discretionary sector also contributed to relative performance, led by an overweight allocation to MercadoLibre, Inc.
Top detractors from performance: Security selection within the Financials sector detracted from relative performance, led by an overweight allocation to Adyen NV. Also, within the Financials sector, an overweight allocation to Grupo Financiero Banorte SAB de CV detracted from relative performance.
Total Return Based on $10,000 Investment
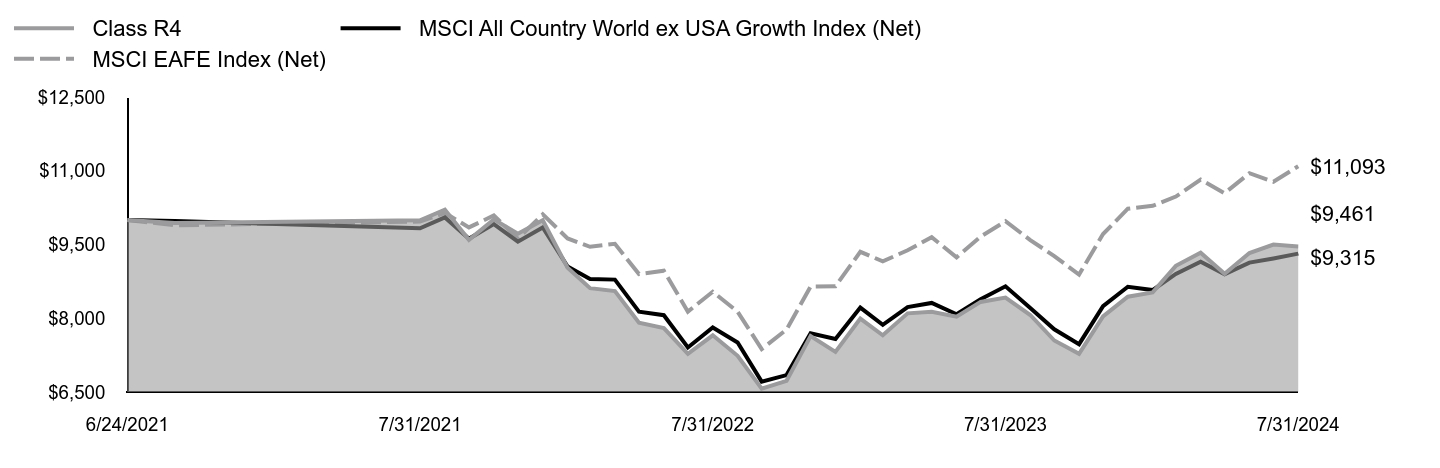
| Class R4 | MSCI All Country World ex USA Growth Index (Net) | MSCI EAFE Index (Net) |
|---|
| 6/24/2021 | $10,000 | $10,000 | $10,000 |
| 6/30/2021 | $9,941 | $9,981 | $9,893 |
| 7/31/2021 | $9,993 | $9,830 | $9,967 |
| 8/31/2021 | $10,212 | $10,052 | $10,143 |
| 9/30/2021 | $9,597 | $9,620 | $9,849 |
| 10/31/2021 | $10,013 | $9,918 | $10,091 |
| 11/30/2021 | $9,722 | $9,560 | $9,621 |
| 12/31/2021 | $9,993 | $9,847 | $10,114 |
| 1/31/2022 | $9,028 | $9,053 | $9,625 |
| 2/28/2022 | $8,612 | $8,801 | $9,455 |
| 3/31/2022 | $8,553 | $8,787 | $9,516 |
| 4/30/2022 | $7,911 | $8,133 | $8,900 |
| 5/31/2022 | $7,799 | $8,063 | $8,967 |
| 6/30/2022 | $7,277 | $7,406 | $8,135 |
| 7/31/2022 | $7,654 | $7,814 | $8,540 |
| 8/31/2022 | $7,237 | $7,509 | $8,135 |
| 9/30/2022 | $6,570 | $6,712 | $7,374 |
| 10/31/2022 | $6,728 | $6,844 | $7,770 |
| 11/30/2022 | $7,640 | $7,695 | $8,645 |
| 12/31/2022 | $7,316 | $7,577 | $8,652 |
| 1/31/2023 | $7,994 | $8,218 | $9,353 |
| 2/28/2023 | $7,655 | $7,867 | $9,158 |
| 3/31/2023 | $8,100 | $8,228 | $9,385 |
| 4/30/2023 | $8,134 | $8,312 | $9,650 |
| 5/31/2023 | $8,034 | $8,081 | $9,241 |
| 6/30/2023 | $8,333 | $8,388 | $9,662 |
| 7/31/2023 | $8,420 | $8,650 | $9,974 |
| 8/31/2023 | $8,067 | $8,209 | $9,592 |
| 9/30/2023 | $7,548 | $7,775 | $9,265 |
| 10/31/2023 | $7,276 | $7,473 | $8,889 |
| 11/30/2023 | $8,040 | $8,246 | $9,714 |
| 12/31/2023 | $8,439 | $8,641 | $10,230 |
| 1/31/2024 | $8,526 | $8,574 | $10,289 |
| 2/29/2024 | $9,067 | $8,902 | $10,477 |
| 3/31/2024 | $9,334 | $9,151 | $10,822 |
| 4/30/2024 | $8,906 | $8,898 | $10,545 |
| 5/31/2024 | $9,327 | $9,133 | $10,953 |
| 6/30/2024 | $9,501 | $9,218 | $10,777 |
| 7/31/2024 | $9,461 | $9,315 | $11,093 |
The Fund’s benchmarks are unmanaged indices used as a general measure of market performance. Calculations assume the reinvestment of dividends and capital gains.
Average Annual Total Returns (%)
| 1 Year | Since Inception 6/24/21 |
|---|
| Class R4 at NAV | 12.37% | (1.77%) |
| MSCI All Country World ex USA Growth Index (Net) | 7.69% | (2.26%) |
MSCI EAFE Index (Net)Footnote Reference* | 11.21% | 3.40% |
| Footnote | Description |
Footnote* | The Fund has adopted the MSCI EAFE Net Index as its broad-based securities market index. |
The Fund's past performance is no guarantee of future results. The returns do not reflect the deduction of taxes that a shareholder would pay on Fund distributions or redemption of Fund shares.
| Total Net Assets | $2,926,146 |
| # of Portfolio Holdings | 86 |
| Portfolio Turnover Rate | 88% |
| Total Advisory Fees Paid | $0 |
What did the Fund invest in?
Portfolio Holdings Presented by SectorFootnote Reference* | % Footnote Reference** |
| Communication Services | 5.95% |
| Consumer Discretionary | 9.91% |
| Consumer Staples | 6.54% |
| Energy | 0.57% |
| Financials | 8.87% |
| Health Care | 13.69% |
| Industrials | 18.38% |
| Information Technology | 28.35% |
| Materials | 7.04% |
| Real Estate | 0.70% |
| 100.00% |
| Footnote | Description |
Footnote* | A sector may comprise several industries |
Footnote** | Represents percent of total investments, which excludes derivatives. |
There were no material fund changes during the period.
Where can I find additional information about the Fund?
For additional information about the Fund, including its Prospectus, Statement of Additional Information, financial statements, holdings and proxy information, please visit lordabbett.com/FundDocuments.
The Fund has adopted a policy that allows it to send only one copy of the Fund's prospectus, proxy material, annual report and semiannual report (or related notice of internet availability of annual report and semiannual report) to certain shareholders residing at the same "household." This reduces Fund expenses, which benefits you and other shareholders.If you need additional copies or do not want your mailings to be "householded," please call Lord Abbett at 888-522-2388.
Lord Abbett International Growth Fund
Annual Shareholder Report
July 31, 2024
lordabbett.com/FundDocuments
TSR-A-9256-R4
09/24
Lord Abbett International Growth Fund
Annual Shareholder Report
July 31, 2024
lordabbett.com/FundDocuments
This annual shareholder report contains important information about the Lord Abbett International Growth Fund for the period of August 1, 2023 to July 31, 2024, as well as certain changes to the Fund. You can find additional information about the Fund at lordabbett.com/FundDocuments. You can also request this information by contacting us at 888-522-2388.
What were the Fund costs for the last year?
(based on a hypothetical $10,000 investment)
| Class Name | Costs of a $10,000 investment | Costs paid as a percentage of a $10,000 investment |
|---|
| Class R5 | $76 | 0.71% |
How did the Fund perform last year and what affected its performance?
For the fiscal year ended July 31, 2024, the Fund returned 12.69%, reflecting performance at the net asset value (NAV) of Class R5 shares, compared to the 7.69% of a securities market index with investment characteristics similar to those of the Fund, the MSCI All Country World ex USA Growth Index (Net). The Fund's broad-based market index, the MSCI EAFE Index (Net), returned 11.21% over the same period.
Positive factors for the markets included momentum around the soft-landing narrative, specifically in the second half of the period, which was supported by signs of a cooling labor market and a slowing economy, leading the market to adjust its expectations of future interest rate cuts by the U.S. Federal Reserve (the Fed). Negative factors, specifically in the beginning of the period, included stronger-than-expected GDP growth, resilient labor market data, and persistently high inflation readings that led to a more prolonged interest rate environment. Against this backdrop, global equity markets delivered strong returns.
Top contributors to performance: Security selection within the Information Technology sector contributed to relative performance, led by an overweight allocation to NVIDIA Corp. Security selection within the Consumer Discretionary sector also contributed to relative performance, led by an overweight allocation to MercadoLibre, Inc.
Top detractors from performance: Security selection within the Financials sector detracted from relative performance, led by an overweight allocation to Adyen NV. Also, within the Financials sector, an overweight allocation to Grupo Financiero Banorte SAB de CV detracted from relative performance.
Total Return Based on $10,000 Investment

| Class R5 | MSCI All Country World ex USA Growth Index (Net) | MSCI EAFE Index (Net) |
|---|
| 6/24/2021 | $10,000 | $10,000 | $10,000 |
| 6/30/2021 | $9,941 | $9,981 | $9,893 |
| 7/31/2021 | $10,000 | $9,830 | $9,967 |
| 8/31/2021 | $10,218 | $10,052 | $10,143 |
| 9/30/2021 | $9,603 | $9,620 | $9,849 |
| 10/31/2021 | $10,020 | $9,918 | $10,091 |
| 11/30/2021 | $9,736 | $9,560 | $9,621 |
| 12/31/2021 | $10,007 | $9,847 | $10,114 |
| 1/31/2022 | $9,042 | $9,053 | $9,625 |
| 2/28/2022 | $8,625 | $8,801 | $9,455 |
| 3/31/2022 | $8,566 | $8,787 | $9,516 |
| 4/30/2022 | $7,925 | $8,133 | $8,900 |
| 5/31/2022 | $7,819 | $8,063 | $8,967 |
| 6/30/2022 | $7,297 | $7,406 | $8,135 |
| 7/31/2022 | $7,673 | $7,814 | $8,540 |
| 8/31/2022 | $7,257 | $7,509 | $8,135 |
| 9/30/2022 | $6,590 | $6,712 | $7,374 |
| 10/31/2022 | $6,748 | $6,844 | $7,770 |
| 11/30/2022 | $7,673 | $7,695 | $8,645 |
| 12/31/2022 | $7,341 | $7,577 | $8,652 |
| 1/31/2023 | $8,028 | $8,218 | $9,353 |
| 2/28/2023 | $7,688 | $7,867 | $9,158 |
| 3/31/2023 | $8,135 | $8,228 | $9,385 |
| 4/30/2023 | $8,175 | $8,312 | $9,650 |
| 5/31/2023 | $8,075 | $8,081 | $9,241 |
| 6/30/2023 | $8,375 | $8,388 | $9,662 |
| 7/31/2023 | $8,462 | $8,650 | $9,974 |
| 8/31/2023 | $8,115 | $8,209 | $9,592 |
| 9/30/2023 | $7,588 | $7,775 | $9,265 |
| 10/31/2023 | $7,315 | $7,473 | $8,889 |
| 11/30/2023 | $8,088 | $8,246 | $9,714 |
| 12/31/2023 | $8,495 | $8,641 | $10,230 |
| 1/31/2024 | $8,582 | $8,574 | $10,289 |
| 2/29/2024 | $9,132 | $8,902 | $10,477 |
| 3/31/2024 | $9,401 | $9,151 | $10,822 |
| 4/30/2024 | $8,971 | $8,898 | $10,545 |
| 5/31/2024 | $9,394 | $9,133 | $10,953 |
| 6/30/2024 | $9,576 | $9,218 | $10,777 |
| 7/31/2024 | $9,535 | $9,315 | $11,093 |
The Fund’s benchmarks are unmanaged indices used as a general measure of market performance. Calculations assume the reinvestment of dividends and capital gains.
Average Annual Total Returns (%)
| 1 Year | Since Inception 6/24/21 |
|---|
| Class R5 at NAV | 12.69% | (1.52%) |
| MSCI All Country World ex USA Growth Index (Net) | 7.69% | (2.26%) |
MSCI EAFE Index (Net)Footnote Reference* | 11.21% | 3.40% |
| Footnote | Description |
Footnote* | The Fund has adopted the MSCI EAFE Net Index as its broad-based securities market index. |
The Fund's past performance is no guarantee of future results. The returns do not reflect the deduction of taxes that a shareholder would pay on Fund distributions or redemption of Fund shares.
| Total Net Assets | $2,926,146 |
| # of Portfolio Holdings | 86 |
| Portfolio Turnover Rate | 88% |
| Total Advisory Fees Paid | $0 |
What did the Fund invest in?
Portfolio Holdings Presented by SectorFootnote Reference* | % Footnote Reference** |
| Communication Services | 5.95% |
| Consumer Discretionary | 9.91% |
| Consumer Staples | 6.54% |
| Energy | 0.57% |
| Financials | 8.87% |
| Health Care | 13.69% |
| Industrials | 18.38% |
| Information Technology | 28.35% |
| Materials | 7.04% |
| Real Estate | 0.70% |
| 100.00% |
| Footnote | Description |
Footnote* | A sector may comprise several industries |
Footnote** | Represents percent of total investments, which excludes derivatives. |
There were no material fund changes during the period.
Where can I find additional information about the Fund?
For additional information about the Fund, including its Prospectus, Statement of Additional Information, financial statements, holdings and proxy information, please visit lordabbett.com/FundDocuments.
The Fund has adopted a policy that allows it to send only one copy of the Fund's prospectus, proxy material, annual report and semiannual report (or related notice of internet availability of annual report and semiannual report) to certain shareholders residing at the same "household." This reduces Fund expenses, which benefits you and other shareholders.If you need additional copies or do not want your mailings to be "householded," please call Lord Abbett at 888-522-2388.
Lord Abbett International Growth Fund
Annual Shareholder Report
July 31, 2024
lordabbett.com/FundDocuments
TSR-A-9257-R5
09/24
Lord Abbett International Growth Fund
Annual Shareholder Report
July 31, 2024
lordabbett.com/FundDocuments
This annual shareholder report contains important information about the Lord Abbett International Growth Fund for the period of August 1, 2023 to July 31, 2024, as well as certain changes to the Fund. You can find additional information about the Fund at lordabbett.com/FundDocuments. You can also request this information by contacting us at 888-522-2388.This report describes changes to the Fund that occurred during the reporting period.
What were the Fund costs for the last year?
(based on a hypothetical $10,000 investment)
| Class Name | Costs of a $10,000 investment | Costs paid as a percentage of a $10,000 investment |
|---|
| Class R6 | $66 | 0.62% |
How did the Fund perform last year and what affected its performance?
For the fiscal year ended July 31, 2024, the Fund returned 12.77%, reflecting performance at the net asset value (NAV) of Class R6 shares, compared to the 7.69% of a securities market index with investment characteristics similar to those of the Fund, the MSCI All Country World ex USA Growth Index (Net). The Fund's broad-based market index, the MSCI EAFE Index (Net), returned 11.21% over the same period.
Positive factors for the markets included momentum around the soft-landing narrative, specifically in the second half of the period, which was supported by signs of a cooling labor market and a slowing economy, leading the market to adjust its expectations of future interest rate cuts by the U.S. Federal Reserve (the Fed). Negative factors, specifically in the beginning of the period, included stronger-than-expected GDP growth, resilient labor market data, and persistently high inflation readings that led to a more prolonged interest rate environment. Against this backdrop, global equity markets delivered strong returns.
Top contributors to performance: Security selection within the Information Technology sector contributed to relative performance, led by an overweight allocation to NVIDIA Corp. Security selection within the Consumer Discretionary sector also contributed to relative performance, led by an overweight allocation to MercadoLibre, Inc.
Top detractors from performance: Security selection within the Financials sector detracted from relative performance, led by an overweight allocation to Adyen NV. Also, within the Financials sector, an overweight allocation to Grupo Financiero Banorte SAB de CV detracted from relative performance.
Total Return Based on $10,000 Investment
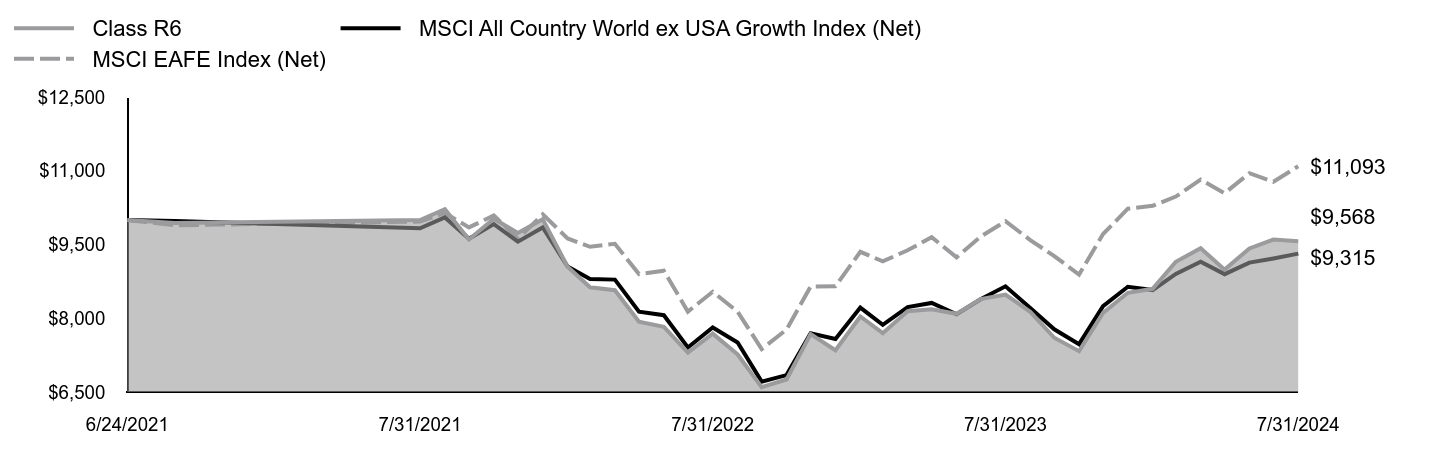
| Class R6 | MSCI All Country World ex USA Growth Index (Net) | MSCI EAFE Index (Net) |
|---|
| 6/24/2021 | $10,000 | $10,000 | $10,000 |
| 6/30/2021 | $9,941 | $9,981 | $9,893 |
| 7/31/2021 | $10,000 | $9,830 | $9,967 |
| 8/31/2021 | $10,218 | $10,052 | $10,143 |
| 9/30/2021 | $9,603 | $9,620 | $9,849 |
| 10/31/2021 | $10,026 | $9,918 | $10,091 |
| 11/30/2021 | $9,736 | $9,560 | $9,621 |
| 12/31/2021 | $10,013 | $9,847 | $10,114 |
| 1/31/2022 | $9,048 | $9,053 | $9,625 |
| 2/28/2022 | $8,632 | $8,801 | $9,455 |
| 3/31/2022 | $8,572 | $8,787 | $9,516 |
| 4/30/2022 | $7,931 | $8,133 | $8,900 |
| 5/31/2022 | $7,826 | $8,063 | $8,967 |
| 6/30/2022 | $7,303 | $7,406 | $8,135 |
| 7/31/2022 | $7,687 | $7,814 | $8,540 |
| 8/31/2022 | $7,264 | $7,509 | $8,135 |
| 9/30/2022 | $6,596 | $6,712 | $7,374 |
| 10/31/2022 | $6,755 | $6,844 | $7,770 |
| 11/30/2022 | $7,680 | $7,695 | $8,645 |
| 12/31/2022 | $7,350 | $7,577 | $8,652 |
| 1/31/2023 | $8,037 | $8,218 | $9,353 |
| 2/28/2023 | $7,697 | $7,867 | $9,158 |
| 3/31/2023 | $8,144 | $8,228 | $9,385 |
| 4/30/2023 | $8,184 | $8,312 | $9,650 |
| 5/31/2023 | $8,091 | $8,081 | $9,241 |
| 6/30/2023 | $8,391 | $8,388 | $9,662 |
| 7/31/2023 | $8,484 | $8,650 | $9,974 |
| 8/31/2023 | $8,131 | $8,209 | $9,592 |
| 9/30/2023 | $7,604 | $7,775 | $9,265 |
| 10/31/2023 | $7,330 | $7,473 | $8,889 |
| 11/30/2023 | $8,111 | $8,246 | $9,714 |
| 12/31/2023 | $8,519 | $8,641 | $10,230 |
| 1/31/2024 | $8,600 | $8,574 | $10,289 |
| 2/29/2024 | $9,151 | $8,902 | $10,477 |
| 3/31/2024 | $9,426 | $9,151 | $10,822 |
| 4/30/2024 | $8,990 | $8,898 | $10,545 |
| 5/31/2024 | $9,420 | $9,133 | $10,953 |
| 6/30/2024 | $9,601 | $9,218 | $10,777 |
| 7/31/2024 | $9,568 | $9,315 | $11,093 |
The Fund’s benchmarks are unmanaged indices used as a general measure of market performance. Calculations assume the reinvestment of dividends and capital gains.
Average Annual Total Returns (%)
| 1 Year | Since Inception 6/24/21 |
|---|
| Class R6 at NAV | 12.77% | (1.42%) |
| MSCI All Country World ex USA Growth Index (Net) | 7.69% | (2.26%) |
MSCI EAFE Index (Net)Footnote Reference* | 11.21% | 3.40% |
| Footnote | Description |
Footnote* | The Fund has adopted the MSCI EAFE Net Index as its broad-based securities market index. |
The Fund's past performance is no guarantee of future results. The returns do not reflect the deduction of taxes that a shareholder would pay on Fund distributions or redemption of Fund shares.
| Total Net Assets | $2,926,146 |
| # of Portfolio Holdings | 86 |
| Portfolio Turnover Rate | 88% |
| Total Advisory Fees Paid | $0 |
What did the Fund invest in?
Portfolio Holdings Presented by SectorFootnote Reference* | % Footnote Reference** |
| Communication Services | 5.95% |
| Consumer Discretionary | 9.91% |
| Consumer Staples | 6.54% |
| Energy | 0.57% |
| Financials | 8.87% |
| Health Care | 13.69% |
| Industrials | 18.38% |
| Information Technology | 28.35% |
| Materials | 7.04% |
| Real Estate | 0.70% |
| 100.00% |
| Footnote | Description |
Footnote* | A sector may comprise several industries |
Footnote** | Represents percent of total investments, which excludes derivatives. |
This is a summary of certain changes of the Fund since July 31, 2024. For more information contact 888-522-2388.
Expenses: As of December 1, 2024, the expense limitation on total net annual operating expenses increased from 0.57% to 0.64% as part of the annual review of transfer agency expenses.
Where can I find additional information about the Fund?
For additional information about the Fund, including its Prospectus, Statement of Additional Information, financial statements, holdings and proxy information, please visit lordabbett.com/FundDocuments.
The Fund has adopted a policy that allows it to send only one copy of the Fund's prospectus, proxy material, annual report and semiannual report (or related notice of internet availability of annual report and semiannual report) to certain shareholders residing at the same "household." This reduces Fund expenses, which benefits you and other shareholders.If you need additional copies or do not want your mailings to be "householded," please call Lord Abbett at 888-522-2388.
Lord Abbett International Growth Fund
Annual Shareholder Report
July 31, 2024
lordabbett.com/FundDocuments
TSR-A-9258-R6
09/24
Lord Abbett Short Duration High Yield Fund
Annual Shareholder Report
July 31, 2024
lordabbett.com/FundDocuments
This annual shareholder report contains important information about the Lord Abbett Short Duration High Yield Fund for the period of August 1, 2023 to July 31, 2024, as well as certain changes to the Fund. You can find additional information about the Fund at lordabbett.com/FundDocuments. You can also request this information by contacting us at 888-522-2388.
What were the Fund costs for the last year?
(based on a hypothetical $10,000 investment)
| Class Name | Costs of a $10,000 investment | Costs paid as a percentage of a $10,000 investment |
|---|
| Class A | $69 | 0.65% |
How did the Fund perform last year and what affected its performance?
For the fiscal year ended July 31, 2024, the Fund returned 11.41%, reflecting performance at the net asset value (NAV) of Class A shares, compared to the 9.95% of a securities market index with investment characteristics similar to those of the Fund, the ICE BofA High Yield U.S. Corporate Cash Pay BB-B (1-5yrs) Index. The Fund's broad-based market index, the Bloomberg Aggregate Bond Index, returned 5.10% over the same period.
Positive factors for the markets included momentum around the soft-landing narrative, specifically in the second half of the period, which was supported by signs of a cooling labor market and a slowing economy, leading the market to adjust its expectations of future interest rate cuts by the U.S. Federal Reserve (the Fed). Negative factors, specifically in the beginning of the period, included stronger-than-expected GDP growth, resilient labor market data, and persistently high inflation readings that led to a more prolonged interest rate environment. Against this backdrop, U.S. high yield credit delivered strong returns.
Top contributors to performance: Security selection within the Energy and Basic Industry sectors contributed to relative performance. An overweight allocation to Single B and CCC-rated bonds contributed to relative performance.
Top detractors from performance: Security selection in the Real Estate and Services sectors detracted from relative performance.
Total Return Based on $10,000 Investment
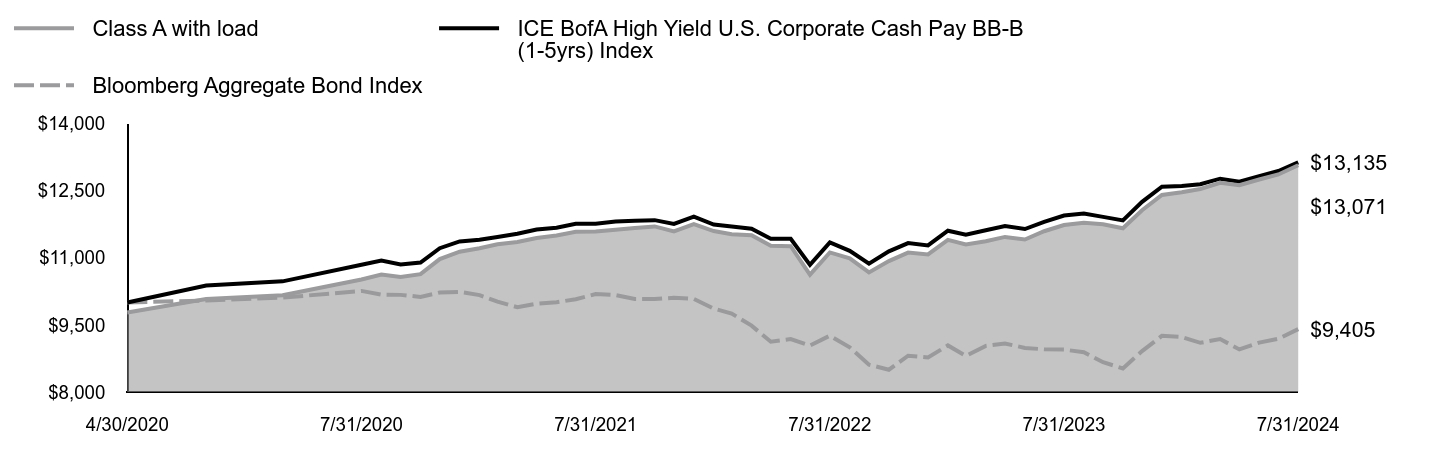
| Class A with load | ICE BofA High Yield U.S. Corporate Cash Pay BB-B (1-5yrs) Index | Bloomberg Aggregate Bond Index |
|---|
| 4/30/2020 | $9,776 | $10,000 | $10,000 |
| 5/31/2020 | $10,080 | $10,381 | $10,047 |
| 6/30/2020 | $10,163 | $10,474 | $10,110 |
| 7/31/2020 | $10,515 | $10,846 | $10,261 |
| 8/31/2020 | $10,627 | $10,941 | $10,178 |
| 9/30/2020 | $10,571 | $10,851 | $10,172 |
| 10/31/2020 | $10,636 | $10,896 | $10,127 |
| 11/30/2020 | $10,972 | $11,216 | $10,226 |
| 12/31/2020 | $11,138 | $11,367 | $10,240 |
| 1/31/2021 | $11,216 | $11,404 | $10,167 |
| 2/28/2021 | $11,305 | $11,467 | $10,020 |
| 3/31/2021 | $11,354 | $11,538 | $9,895 |
| 4/30/2021 | $11,443 | $11,635 | $9,973 |
| 5/31/2021 | $11,501 | $11,675 | $10,006 |
| 6/30/2021 | $11,583 | $11,761 | $10,076 |
| 7/31/2021 | $11,589 | $11,764 | $10,189 |
| 8/31/2021 | $11,626 | $11,815 | $10,169 |
| 9/30/2021 | $11,665 | $11,832 | $10,081 |
| 10/31/2021 | $11,703 | $11,843 | $10,079 |
| 11/30/2021 | $11,592 | $11,760 | $10,108 |
| 12/31/2021 | $11,754 | $11,921 | $10,083 |
| 1/31/2022 | $11,599 | $11,745 | $9,865 |
| 2/28/2022 | $11,529 | $11,700 | $9,755 |
| 3/31/2022 | $11,507 | $11,650 | $9,484 |
| 4/30/2022 | $11,272 | $11,427 | $9,124 |
| 5/31/2022 | $11,261 | $11,428 | $9,183 |
| 6/30/2022 | $10,623 | $10,843 | $9,039 |
| 7/31/2022 | $11,121 | $11,344 | $9,260 |
| 8/31/2022 | $10,989 | $11,158 | $8,998 |
| 9/30/2022 | $10,675 | $10,869 | $8,610 |
| 10/31/2022 | $10,928 | $11,145 | $8,498 |
| 11/30/2022 | $11,117 | $11,330 | $8,811 |
| 12/31/2022 | $11,077 | $11,278 | $8,771 |
| 1/31/2023 | $11,402 | $11,606 | $9,041 |
| 2/28/2023 | $11,298 | $11,518 | $8,807 |
| 3/31/2023 | $11,371 | $11,618 | $9,031 |
| 4/30/2023 | $11,468 | $11,712 | $9,085 |
| 5/31/2023 | $11,411 | $11,645 | $8,986 |
| 6/30/2023 | $11,595 | $11,805 | $8,954 |
| 7/31/2023 | $11,733 | $11,947 | $8,948 |
| 8/31/2023 | $11,786 | $11,991 | $8,891 |
| 9/30/2023 | $11,753 | $11,916 | $8,665 |
| 10/31/2023 | $11,662 | $11,836 | $8,528 |
| 11/30/2023 | $12,065 | $12,253 | $8,914 |
| 12/31/2023 | $12,407 | $12,592 | $9,256 |
| 1/31/2024 | $12,468 | $12,605 | $9,230 |
| 2/29/2024 | $12,540 | $12,645 | $9,100 |
| 3/31/2024 | $12,678 | $12,770 | $9,184 |
| 4/30/2024 | $12,624 | $12,702 | $8,952 |
| 5/31/2024 | $12,751 | $12,826 | $9,104 |
| 6/30/2024 | $12,865 | $12,942 | $9,190 |
| 7/31/2024 | $13,071 | $13,135 | $9,405 |
The Fund’s benchmarks are unmanaged indices used as a general measure of market performance. Calculations assume the reinvestment of dividends and capital gains.
Average Annual Total Returns (%)
| 1 Year | Since Inception 4/30/20 |
|---|
| Class A at NAV | 11.41% | 7.07% |
| Class A with sales charge | 8.92% | 6.50% |
| ICE BofA High Yield U.S. Corporate Cash Pay BB-B (1-5yrs) Index | 9.95% | 6.62% |
Bloomberg Aggregate Bond IndexFootnote Reference* | 5.10% | (1.43%) |
| Footnote | Description |
Footnote* | The Fund has adopted the Bloomberg Aggregate Bond Index as its broad-based securities market index. |
The Fund's past performance is no guarantee of future results. The returns do not reflect the deduction of taxes that a shareholder would pay on Fund distributions or redemption of Fund shares.
| Total Net Assets | $5,199,445,955 |
| # of Portfolio Holdings | 736 |
| Portfolio Turnover Rate | 160% |
| Total Advisory Fees Paid | $7,640,906 |
What did the Fund invest in?
| Portfolio Holdings Presented by Portfolio Allocation | %Footnote Reference* |
| Asset-Backed Securities | 0.97% |
| Convertible Bonds | 1.91% |
| Convertible Preferred Stocks | 0.28% |
| Corporate Bonds | 78.00% |
| Floating Rate Loans | 11.42% |
| Foreign Government Obligations | 0.30% |
| Government Sponsored Enterprises Pass-Throughs | 3.05% |
| Money Market Funds | 3.17% |
| Repurchase Agreements | 0.90% |
| Total | 100.00% |
| Footnote | Description |
Footnote* | Represents percent of total investments, which excludes derivatives |
There were no material fund changes during the period.
Where can I find additional information about the Fund?
For additional information about the Fund, including its Prospectus, Statement of Additional Information, financial statements, holdings and proxy information, please visit lordabbett.com/FundDocuments.
The Fund has adopted a policy that allows it to send only one copy of the Fund's prospectus, proxy material, annual report and semiannual report (or related notice of internet availability of annual report and semiannual report) to certain shareholders residing at the same "household." This reduces Fund expenses, which benefits you and other shareholders.If you need additional copies or do not want your mailings to be "householded," please call Lord Abbett at 888-522-2388.
Lord Abbett Short Duration High Yield Fund
Annual Shareholder Report
July 31, 2024
lordabbett.com/FundDocuments
TSR-A-9050-A
09/24
Lord Abbett Short Duration High Yield Fund
Annual Shareholder Report
July 31, 2024
lordabbett.com/FundDocuments
This annual shareholder report contains important information about the Lord Abbett Short Duration High Yield Fund for the period of August 1, 2023 to July 31, 2024, as well as certain changes to the Fund. You can find additional information about the Fund at lordabbett.com/FundDocuments. You can also request this information by contacting us at 888-522-2388.
What were the Fund costs for the last year?
(based on a hypothetical $10,000 investment)
| Class Name | Costs of a $10,000 investment | Costs paid as a percentage of a $10,000 investment |
|---|
| Class C | $143 | 1.36% |
How did the Fund perform last year and what affected its performance?
For the fiscal year ended July 31, 2024, the Fund returned 10.62%, reflecting performance at the net asset value (NAV) of Class C shares, compared to the 9.95% of a securities market index with investment characteristics similar to those of the Fund, the ICE BofA High Yield U.S. Corporate Cash Pay BB-B (1-5yrs) Index. The Fund's broad-based market index, the Bloomberg Aggregate Bond Index, returned 5.10% over the same period.
Positive factors for the markets included momentum around the soft-landing narrative, specifically in the second half of the period, which was supported by signs of a cooling labor market and a slowing economy, leading the market to adjust its expectations of future interest rate cuts by the U.S. Federal Reserve (the Fed). Negative factors, specifically in the beginning of the period, included stronger-than-expected GDP growth, resilient labor market data, and persistently high inflation readings that led to a more prolonged interest rate environment. Against this backdrop, U.S. high yield credit delivered strong returns.
Top contributors to performance: Security selection within the Energy and Basic Industry sectors contributed to relative performance. An overweight allocation to Single B and CCC-rated bonds contributed to relative performance.
Top detractors from performance: Security selection in the Real Estate and Services sectors detracted from relative performance.
Total Return Based on $10,000 Investment
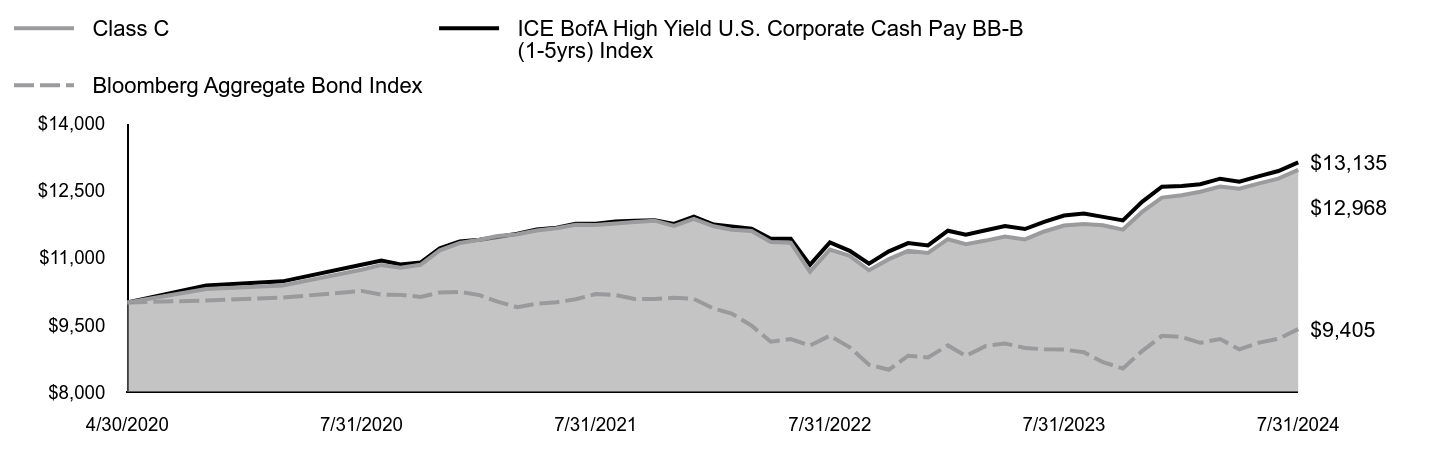
| Class C | ICE BofA High Yield U.S. Corporate Cash Pay BB-B (1-5yrs) Index | Bloomberg Aggregate Bond Index |
|---|
| 4/30/2020 | $10,000 | $10,000 | $10,000 |
| 5/31/2020 | $10,304 | $10,381 | $10,047 |
| 6/30/2020 | $10,382 | $10,474 | $10,110 |
| 7/31/2020 | $10,734 | $10,846 | $10,261 |
| 8/31/2020 | $10,842 | $10,941 | $10,178 |
| 9/30/2020 | $10,777 | $10,851 | $10,172 |
| 10/31/2020 | $10,845 | $10,896 | $10,127 |
| 11/30/2020 | $11,169 | $11,216 | $10,226 |
| 12/31/2020 | $11,331 | $11,367 | $10,240 |
| 1/31/2021 | $11,403 | $11,404 | $10,167 |
| 2/28/2021 | $11,487 | $11,467 | $10,020 |
| 3/31/2021 | $11,529 | $11,538 | $9,895 |
| 4/30/2021 | $11,611 | $11,635 | $9,973 |
| 5/31/2021 | $11,663 | $11,675 | $10,006 |
| 6/30/2021 | $11,739 | $11,761 | $10,076 |
| 7/31/2021 | $11,737 | $11,764 | $10,189 |
| 8/31/2021 | $11,768 | $11,815 | $10,169 |
| 9/30/2021 | $11,800 | $11,832 | $10,081 |
| 10/31/2021 | $11,831 | $11,843 | $10,079 |
| 11/30/2021 | $11,712 | $11,760 | $10,108 |
| 12/31/2021 | $11,869 | $11,921 | $10,083 |
| 1/31/2022 | $11,705 | $11,745 | $9,865 |
| 2/28/2022 | $11,629 | $11,700 | $9,755 |
| 3/31/2022 | $11,599 | $11,650 | $9,484 |
| 4/30/2022 | $11,356 | $11,427 | $9,124 |
| 5/31/2022 | $11,338 | $11,428 | $9,183 |
| 6/30/2022 | $10,690 | $10,843 | $9,039 |
| 7/31/2022 | $11,184 | $11,344 | $9,260 |
| 8/31/2022 | $11,045 | $11,158 | $8,998 |
| 9/30/2022 | $10,723 | $10,869 | $8,610 |
| 10/31/2022 | $10,971 | $11,145 | $8,498 |
| 11/30/2022 | $11,155 | $11,330 | $8,811 |
| 12/31/2022 | $11,109 | $11,278 | $8,771 |
| 1/31/2023 | $11,417 | $11,606 | $9,041 |
| 2/28/2023 | $11,307 | $11,518 | $8,807 |
| 3/31/2023 | $11,386 | $11,618 | $9,031 |
| 4/30/2023 | $11,476 | $11,712 | $9,085 |
| 5/31/2023 | $11,413 | $11,645 | $8,986 |
| 6/30/2023 | $11,590 | $11,805 | $8,954 |
| 7/31/2023 | $11,722 | $11,947 | $8,948 |
| 8/31/2023 | $11,757 | $11,991 | $8,891 |
| 9/30/2023 | $11,730 | $11,916 | $8,665 |
| 10/31/2023 | $11,632 | $11,836 | $8,528 |
| 11/30/2023 | $12,027 | $12,253 | $8,914 |
| 12/31/2023 | $12,348 | $12,592 | $9,256 |
| 1/31/2024 | $12,401 | $12,605 | $9,230 |
| 2/29/2024 | $12,478 | $12,645 | $9,100 |
| 3/31/2024 | $12,595 | $12,770 | $9,184 |
| 4/30/2024 | $12,547 | $12,702 | $8,952 |
| 5/31/2024 | $12,665 | $12,826 | $9,104 |
| 6/30/2024 | $12,771 | $12,942 | $9,190 |
| 7/31/2024 | $12,968 | $13,135 | $9,405 |
The Fund’s benchmarks are unmanaged indices used as a general measure of market performance. Calculations assume the reinvestment of dividends and capital gains.
Average Annual Total Returns (%)
| 1 Year | Since Inception 4/30/20 |
|---|
| Class C at NAV | 10.62% | 6.30% |
| Class C with sales charge | 9.62% | 6.30% |
| ICE BofA High Yield U.S. Corporate Cash Pay BB-B (1-5yrs) Index | 9.95% | 6.62% |
Bloomberg Aggregate Bond IndexFootnote Reference* | 5.10% | (1.43%) |
| Footnote | Description |
Footnote* | The Fund has adopted the Bloomberg Aggregate Bond Index as its broad-based securities market index. |
The Fund's past performance is no guarantee of future results. The returns do not reflect the deduction of taxes that a shareholder would pay on Fund distributions or redemption of Fund shares.
| Total Net Assets | $5,199,445,955 |
| # of Portfolio Holdings | 736 |
| Portfolio Turnover Rate | 160% |
| Total Advisory Fees Paid | $7,640,906 |
What did the Fund invest in?
| Portfolio Holdings Presented by Portfolio Allocation | %Footnote Reference* |
| Asset-Backed Securities | 0.97% |
| Convertible Bonds | 1.91% |
| Convertible Preferred Stocks | 0.28% |
| Corporate Bonds | 78.00% |
| Floating Rate Loans | 11.42% |
| Foreign Government Obligations | 0.30% |
| Government Sponsored Enterprises Pass-Throughs | 3.05% |
| Money Market Funds | 3.17% |
| Repurchase Agreements | 0.90% |
| Total | 100.00% |
| Footnote | Description |
Footnote* | Represents percent of total investments, which excludes derivatives |
There were no material fund changes during the period.
Where can I find additional information about the Fund?
For additional information about the Fund, including its Prospectus, Statement of Additional Information, financial statements, holdings and proxy information, please visit lordabbett.com/FundDocuments.
The Fund has adopted a policy that allows it to send only one copy of the Fund's prospectus, proxy material, annual report and semiannual report (or related notice of internet availability of annual report and semiannual report) to certain shareholders residing at the same "household." This reduces Fund expenses, which benefits you and other shareholders.If you need additional copies or do not want your mailings to be "householded," please call Lord Abbett at 888-522-2388.
Lord Abbett Short Duration High Yield Fund
Annual Shareholder Report
July 31, 2024
lordabbett.com/FundDocuments
TSR-A-9051-C
09/24
Lord Abbett Short Duration High Yield Fund
Annual Shareholder Report
July 31, 2024
lordabbett.com/FundDocuments
This annual shareholder report contains important information about the Lord Abbett Short Duration High Yield Fund for the period of August 1, 2023 to July 31, 2024, as well as certain changes to the Fund. You can find additional information about the Fund at lordabbett.com/FundDocuments. You can also request this information by contacting us at 888-522-2388.
What were the Fund costs for the last year?
(based on a hypothetical $10,000 investment)
| Class Name | Costs of a $10,000 investment | Costs paid as a percentage of a $10,000 investment |
|---|
| Class F | $48 | 0.45% |
How did the Fund perform last year and what affected its performance?
For the fiscal year ended July 31, 2024, the Fund returned 11.63%, reflecting performance at the net asset value (NAV) of Class F shares, compared to the 9.95% of a securities market index with investment characteristics similar to those of the Fund, the ICE BofA High Yield U.S. Corporate Cash Pay BB-B (1-5yrs) Index. The Fund's broad-based market index, the Bloomberg Aggregate Bond Index, returned 5.10% over the same period.
Positive factors for the markets included momentum around the soft-landing narrative, specifically in the second half of the period, which was supported by signs of a cooling labor market and a slowing economy, leading the market to adjust its expectations of future interest rate cuts by the U.S. Federal Reserve (the Fed). Negative factors, specifically in the beginning of the period, included stronger-than-expected GDP growth, resilient labor market data, and persistently high inflation readings that led to a more prolonged interest rate environment. Against this backdrop, U.S. high yield credit delivered strong returns.
Top contributors to performance: Security selection within the Energy and Basic Industry sectors contributed to relative performance. An overweight allocation to Single B and CCC-rated bonds contributed to relative performance.
Top detractors from performance: Security selection in the Real Estate and Services sectors detracted from relative performance.
Total Return Based on $10,000 Investment

| Class F | ICE BofA High Yield U.S. Corporate Cash Pay BB-B (1-5yrs) Index | Bloomberg Aggregate Bond Index |
|---|
| 4/30/2020 | $10,000 | $10,000 | $10,000 |
| 5/31/2020 | $10,313 | $10,381 | $10,047 |
| 6/30/2020 | $10,400 | $10,474 | $10,110 |
| 7/31/2020 | $10,761 | $10,846 | $10,261 |
| 8/31/2020 | $10,878 | $10,941 | $10,178 |
| 9/30/2020 | $10,822 | $10,851 | $10,172 |
| 10/31/2020 | $10,890 | $10,896 | $10,127 |
| 11/30/2020 | $11,235 | $11,216 | $10,226 |
| 12/31/2020 | $11,407 | $11,367 | $10,240 |
| 1/31/2021 | $11,489 | $11,404 | $10,167 |
| 2/28/2021 | $11,582 | $11,467 | $10,020 |
| 3/31/2021 | $11,634 | $11,538 | $9,895 |
| 4/30/2021 | $11,727 | $11,635 | $9,973 |
| 5/31/2021 | $11,789 | $11,675 | $10,006 |
| 6/30/2021 | $11,875 | $11,761 | $10,076 |
| 7/31/2021 | $11,883 | $11,764 | $10,189 |
| 8/31/2021 | $11,924 | $11,815 | $10,169 |
| 9/30/2021 | $11,966 | $11,832 | $10,081 |
| 10/31/2021 | $11,996 | $11,843 | $10,079 |
| 11/30/2021 | $11,895 | $11,760 | $10,108 |
| 12/31/2021 | $12,063 | $11,921 | $10,083 |
| 1/31/2022 | $11,905 | $11,745 | $9,865 |
| 2/28/2022 | $11,836 | $11,700 | $9,755 |
| 3/31/2022 | $11,815 | $11,650 | $9,484 |
| 4/30/2022 | $11,575 | $11,427 | $9,124 |
| 5/31/2022 | $11,555 | $11,428 | $9,183 |
| 6/30/2022 | $10,913 | $10,843 | $9,039 |
| 7/31/2022 | $11,426 | $11,344 | $9,260 |
| 8/31/2022 | $11,281 | $11,158 | $8,998 |
| 9/30/2022 | $10,960 | $10,869 | $8,610 |
| 10/31/2022 | $11,233 | $11,145 | $8,498 |
| 11/30/2022 | $11,418 | $11,330 | $8,811 |
| 12/31/2022 | $11,390 | $11,278 | $8,771 |
| 1/31/2023 | $11,715 | $11,606 | $9,041 |
| 2/28/2023 | $11,610 | $11,518 | $8,807 |
| 3/31/2023 | $11,699 | $11,618 | $9,031 |
| 4/30/2023 | $11,799 | $11,712 | $9,085 |
| 5/31/2023 | $11,731 | $11,645 | $8,986 |
| 6/30/2023 | $11,934 | $11,805 | $8,954 |
| 7/31/2023 | $12,066 | $11,947 | $8,948 |
| 8/31/2023 | $12,123 | $11,991 | $8,891 |
| 9/30/2023 | $12,091 | $11,916 | $8,665 |
| 10/31/2023 | $11,999 | $11,836 | $8,528 |
| 11/30/2023 | $12,428 | $12,253 | $8,914 |
| 12/31/2023 | $12,770 | $12,592 | $9,256 |
| 1/31/2024 | $12,835 | $12,605 | $9,230 |
| 2/29/2024 | $12,911 | $12,645 | $9,100 |
| 3/31/2024 | $13,055 | $12,770 | $9,184 |
| 4/30/2024 | $13,001 | $12,702 | $8,952 |
| 5/31/2024 | $13,134 | $12,826 | $9,104 |
| 6/30/2024 | $13,254 | $12,942 | $9,190 |
| 7/31/2024 | $13,469 | $13,135 | $9,405 |
The Fund’s benchmarks are unmanaged indices used as a general measure of market performance. Calculations assume the reinvestment of dividends and capital gains.
Average Annual Total Returns (%)
| 1 Year | Since Inception 4/30/20 |
|---|
| Class F at NAV | 11.63% | 7.26% |
| ICE BofA High Yield U.S. Corporate Cash Pay BB-B (1-5yrs) Index | 9.95% | 6.62% |
Bloomberg Aggregate Bond IndexFootnote Reference* | 5.10% | (1.43%) |
| Footnote | Description |
Footnote* | The Fund has adopted the Bloomberg Aggregate Bond Index as its broad-based securities market index. |
The Fund's past performance is no guarantee of future results. The returns do not reflect the deduction of taxes that a shareholder would pay on Fund distributions or redemption of Fund shares.
| Total Net Assets | $5,199,445,955 |
| # of Portfolio Holdings | 736 |
| Portfolio Turnover Rate | 160% |
| Total Advisory Fees Paid | $7,640,906 |
What did the Fund invest in?
| Portfolio Holdings Presented by Portfolio Allocation | %Footnote Reference* |
| Asset-Backed Securities | 0.97% |
| Convertible Bonds | 1.91% |
| Convertible Preferred Stocks | 0.28% |
| Corporate Bonds | 78.00% |
| Floating Rate Loans | 11.42% |
| Foreign Government Obligations | 0.30% |
| Government Sponsored Enterprises Pass-Throughs | 3.05% |
| Money Market Funds | 3.17% |
| Repurchase Agreements | 0.90% |
| Total | 100.00% |
| Footnote | Description |
Footnote* | Represents percent of total investments, which excludes derivatives |
There were no material fund changes during the period.
Where can I find additional information about the Fund?
For additional information about the Fund, including its Prospectus, Statement of Additional Information, financial statements, holdings and proxy information, please visit lordabbett.com/FundDocuments.
The Fund has adopted a policy that allows it to send only one copy of the Fund's prospectus, proxy material, annual report and semiannual report (or related notice of internet availability of annual report and semiannual report) to certain shareholders residing at the same "household." This reduces Fund expenses, which benefits you and other shareholders.If you need additional copies or do not want your mailings to be "householded," please call Lord Abbett at 888-522-2388.
Lord Abbett Short Duration High Yield Fund
Annual Shareholder Report
July 31, 2024
lordabbett.com/FundDocuments
TSR-A-9052-F
09/24
Lord Abbett Short Duration High Yield Fund
Annual Shareholder Report
July 31, 2024
lordabbett.com/FundDocuments
This annual shareholder report contains important information about the Lord Abbett Short Duration High Yield Fund for the period of August 1, 2023 to July 31, 2024, as well as certain changes to the Fund. You can find additional information about the Fund at lordabbett.com/FundDocuments. You can also request this information by contacting us at 888-522-2388.This report describes changes to the Fund that occurred during the reporting period.
What were the Fund costs for the last year?
(based on a hypothetical $10,000 investment)
| Class Name | Costs of a $10,000 investment | Costs paid as a percentage of a $10,000 investment |
|---|
| Class F3 | $38 | 0.36% |
How did the Fund perform last year and what affected its performance?
For the fiscal year ended July 31, 2024, the Fund returned 11.70%, reflecting performance at the net asset value (NAV) of Class F3 shares, compared to the 9.95% of a securities market index with investment characteristics similar to those of the Fund, the ICE BofA High Yield U.S. Corporate Cash Pay BB-B (1-5yrs) Index. The Fund's broad-based market index, the Bloomberg Aggregate Bond Index, returned 5.10% over the same period.
Positive factors for the markets included momentum around the soft-landing narrative, specifically in the second half of the period, which was supported by signs of a cooling labor market and a slowing economy, leading the market to adjust its expectations of future interest rate cuts by the U.S. Federal Reserve (the Fed). Negative factors, specifically in the beginning of the period, included stronger-than-expected GDP growth, resilient labor market data, and persistently high inflation readings that led to a more prolonged interest rate environment. Against this backdrop, U.S. high yield credit delivered strong returns.
Top contributors to performance: Security selection within the Energy and Basic Industry sectors contributed to relative performance. An overweight allocation to Single B and CCC-rated bonds contributed to relative performance.
Top detractors from performance: Security selection in the Real Estate and Services sectors detracted from relative performance.
Total Return Based on $10,000 Investment

| Class F3 | ICE BofA High Yield U.S. Corporate Cash Pay BB-B (1-5yrs) Index | Bloomberg Aggregate Bond Index |
|---|
| 4/30/2020 | $10,000 | $10,000 | $10,000 |
| 5/31/2020 | $10,314 | $10,381 | $10,047 |
| 6/30/2020 | $10,401 | $10,474 | $10,110 |
| 7/31/2020 | $10,763 | $10,846 | $10,261 |
| 8/31/2020 | $10,880 | $10,941 | $10,178 |
| 9/30/2020 | $10,825 | $10,851 | $10,172 |
| 10/31/2020 | $10,893 | $10,896 | $10,127 |
| 11/30/2020 | $11,239 | $11,216 | $10,226 |
| 12/31/2020 | $11,411 | $11,367 | $10,240 |
| 1/31/2021 | $11,495 | $11,404 | $10,167 |
| 2/28/2021 | $11,589 | $11,467 | $10,020 |
| 3/31/2021 | $11,641 | $11,538 | $9,895 |
| 4/30/2021 | $11,735 | $11,635 | $9,973 |
| 5/31/2021 | $11,798 | $11,675 | $10,006 |
| 6/30/2021 | $11,884 | $11,761 | $10,076 |
| 7/31/2021 | $11,893 | $11,764 | $10,189 |
| 8/31/2021 | $11,935 | $11,815 | $10,169 |
| 9/30/2021 | $11,977 | $11,832 | $10,081 |
| 10/31/2021 | $12,019 | $11,843 | $10,079 |
| 11/30/2021 | $11,908 | $11,760 | $10,108 |
| 12/31/2021 | $12,077 | $11,921 | $10,083 |
| 1/31/2022 | $11,920 | $11,745 | $9,865 |
| 2/28/2022 | $11,851 | $11,700 | $9,755 |
| 3/31/2022 | $11,830 | $11,650 | $9,484 |
| 4/30/2022 | $11,591 | $11,427 | $9,124 |
| 5/31/2022 | $11,582 | $11,428 | $9,183 |
| 6/30/2022 | $10,929 | $10,843 | $9,039 |
| 7/31/2022 | $11,443 | $11,344 | $9,260 |
| 8/31/2022 | $11,309 | $11,158 | $8,998 |
| 9/30/2022 | $10,988 | $10,869 | $8,610 |
| 10/31/2022 | $11,251 | $11,145 | $8,498 |
| 11/30/2022 | $11,447 | $11,330 | $8,811 |
| 12/31/2022 | $11,408 | $11,278 | $8,771 |
| 1/31/2023 | $11,746 | $11,606 | $9,041 |
| 2/28/2023 | $11,641 | $11,518 | $8,807 |
| 3/31/2023 | $11,718 | $11,618 | $9,031 |
| 4/30/2023 | $11,832 | $11,712 | $9,085 |
| 5/31/2023 | $11,764 | $11,645 | $8,986 |
| 6/30/2023 | $11,968 | $11,805 | $8,954 |
| 7/31/2023 | $12,100 | $11,947 | $8,948 |
| 8/31/2023 | $12,158 | $11,991 | $8,891 |
| 9/30/2023 | $12,126 | $11,916 | $8,665 |
| 10/31/2023 | $12,034 | $11,836 | $8,528 |
| 11/30/2023 | $12,465 | $12,253 | $8,914 |
| 12/31/2023 | $12,808 | $12,592 | $9,256 |
| 1/31/2024 | $12,874 | $12,605 | $9,230 |
| 2/29/2024 | $12,952 | $12,645 | $9,100 |
| 3/31/2024 | $13,097 | $12,770 | $9,184 |
| 4/30/2024 | $13,044 | $12,702 | $8,952 |
| 5/31/2024 | $13,179 | $12,826 | $9,104 |
| 6/30/2024 | $13,300 | $12,942 | $9,190 |
| 7/31/2024 | $13,516 | $13,135 | $9,405 |
The Fund’s benchmarks are unmanaged indices used as a general measure of market performance. Calculations assume the reinvestment of dividends and capital gains.
Average Annual Total Returns (%)
| 1 Year | Since Inception 4/30/20 |
|---|
| Class F3 at NAV | 11.70% | 7.34% |
| ICE BofA High Yield U.S. Corporate Cash Pay BB-B (1-5yrs) Index | 9.95% | 6.62% |
Bloomberg Aggregate Bond IndexFootnote Reference* | 5.10% | (1.43%) |
| Footnote | Description |
Footnote* | The Fund has adopted the Bloomberg Aggregate Bond Index as its broad-based securities market index. |
The Fund's past performance is no guarantee of future results. The returns do not reflect the deduction of taxes that a shareholder would pay on Fund distributions or redemption of Fund shares.
| Total Net Assets | $5,199,445,955 |
| # of Portfolio Holdings | 736 |
| Portfolio Turnover Rate | 160% |
| Total Advisory Fees Paid | $7,640,906 |
What did the Fund invest in?
| Portfolio Holdings Presented by Portfolio Allocation | %Footnote Reference* |
| Asset-Backed Securities | 0.97% |
| Convertible Bonds | 1.91% |
| Convertible Preferred Stocks | 0.28% |
| Corporate Bonds | 78.00% |
| Floating Rate Loans | 11.42% |
| Foreign Government Obligations | 0.30% |
| Government Sponsored Enterprises Pass-Throughs | 3.05% |
| Money Market Funds | 3.17% |
| Repurchase Agreements | 0.90% |
| Total | 100.00% |
| Footnote | Description |
Footnote* | Represents percent of total investments, which excludes derivatives |
This is a summary of certain changes of the Fund since July 31, 2024. For more information contact 888-522-2388.
Expenses: As of December 1, 2024, the expense limitation on total net annual operating expenses decreased from 0.42% to 0.36% as part of the annual review of transfer agency expenses.
Where can I find additional information about the Fund?
For additional information about the Fund, including its Prospectus, Statement of Additional Information, financial statements, holdings and proxy information, please visit lordabbett.com/FundDocuments.
The Fund has adopted a policy that allows it to send only one copy of the Fund's prospectus, proxy material, annual report and semiannual report (or related notice of internet availability of annual report and semiannual report) to certain shareholders residing at the same "household." This reduces Fund expenses, which benefits you and other shareholders.If you need additional copies or do not want your mailings to be "householded," please call Lord Abbett at 888-522-2388.
Lord Abbett Short Duration High Yield Fund
Annual Shareholder Report
July 31, 2024
lordabbett.com/FundDocuments
TSR-A-9054-F3
09/24
Lord Abbett Short Duration High Yield Fund
Annual Shareholder Report
July 31, 2024
lordabbett.com/FundDocuments
This annual shareholder report contains important information about the Lord Abbett Short Duration High Yield Fund for the period of August 1, 2023 to July 31, 2024, as well as certain changes to the Fund. You can find additional information about the Fund at lordabbett.com/FundDocuments. You can also request this information by contacting us at 888-522-2388.
What were the Fund costs for the last year?
(based on a hypothetical $10,000 investment)
| Class Name | Costs of a $10,000 investment | Costs paid as a percentage of a $10,000 investment |
|---|
| Class I | $48 | 0.45% |
How did the Fund perform last year and what affected its performance?
For the fiscal year ended July 31, 2024, the Fund returned 11.63%, reflecting performance at the net asset value (NAV) of Class I shares, compared to the 9.95% of a securities market index with investment characteristics similar to those of the Fund, the ICE BofA High Yield U.S. Corporate Cash Pay BB-B (1-5yrs) Index. The Fund's broad-based market index, the Bloomberg Aggregate Bond Index, returned 5.10% over the same period.
Positive factors for the markets included momentum around the soft-landing narrative, specifically in the second half of the period, which was supported by signs of a cooling labor market and a slowing economy, leading the market to adjust its expectations of future interest rate cuts by the U.S. Federal Reserve (the Fed). Negative factors, specifically in the beginning of the period, included stronger-than-expected GDP growth, resilient labor market data, and persistently high inflation readings that led to a more prolonged interest rate environment. Against this backdrop, U.S. high yield credit delivered strong returns.
Top contributors to performance: Security selection within the Energy and Basic Industry sectors contributed to relative performance. An overweight allocation to Single B and CCC-rated bonds contributed to relative performance.
Top detractors from performance: Security selection in the Real Estate and Services sectors detracted from relative performance.
Total Return Based on $10,000 Investment
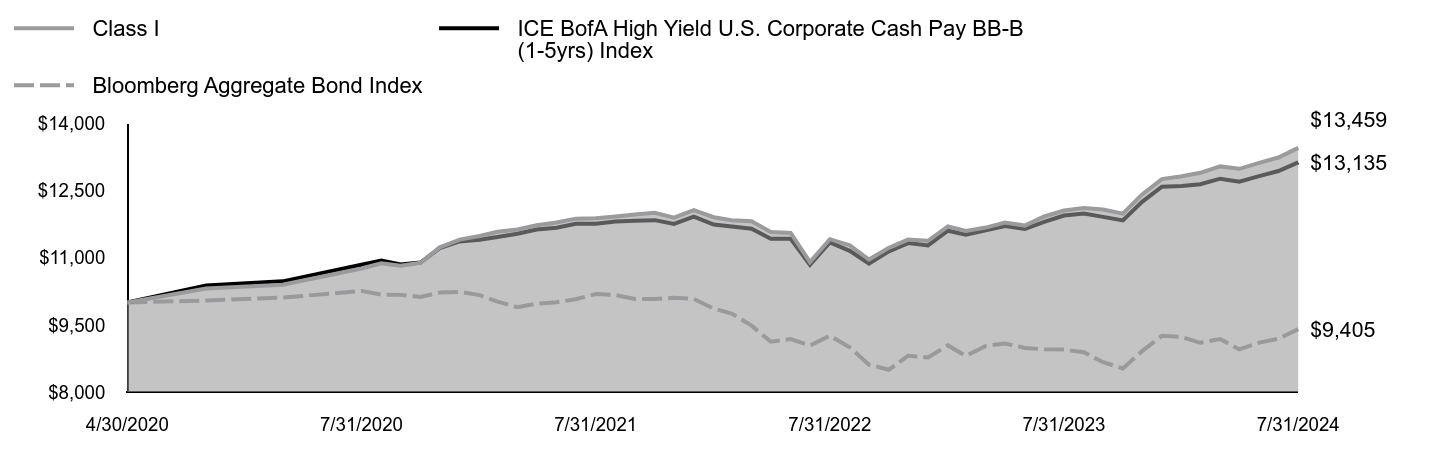
| Class I | ICE BofA High Yield U.S. Corporate Cash Pay BB-B (1-5yrs) Index | Bloomberg Aggregate Bond Index |
|---|
| 4/30/2020 | $10,000 | $10,000 | $10,000 |
| 5/31/2020 | $10,313 | $10,381 | $10,047 |
| 6/30/2020 | $10,400 | $10,474 | $10,110 |
| 7/31/2020 | $10,761 | $10,846 | $10,261 |
| 8/31/2020 | $10,878 | $10,941 | $10,178 |
| 9/30/2020 | $10,822 | $10,851 | $10,172 |
| 10/31/2020 | $10,890 | $10,896 | $10,127 |
| 11/30/2020 | $11,235 | $11,216 | $10,226 |
| 12/31/2020 | $11,408 | $11,367 | $10,240 |
| 1/31/2021 | $11,490 | $11,404 | $10,167 |
| 2/28/2021 | $11,584 | $11,467 | $10,020 |
| 3/31/2021 | $11,636 | $11,538 | $9,895 |
| 4/30/2021 | $11,729 | $11,635 | $9,973 |
| 5/31/2021 | $11,791 | $11,675 | $10,006 |
| 6/30/2021 | $11,877 | $11,761 | $10,076 |
| 7/31/2021 | $11,885 | $11,764 | $10,189 |
| 8/31/2021 | $11,926 | $11,815 | $10,169 |
| 9/30/2021 | $11,968 | $11,832 | $10,081 |
| 10/31/2021 | $12,009 | $11,843 | $10,079 |
| 11/30/2021 | $11,897 | $11,760 | $10,108 |
| 12/31/2021 | $12,066 | $11,921 | $10,083 |
| 1/31/2022 | $11,908 | $11,745 | $9,865 |
| 2/28/2022 | $11,839 | $11,700 | $9,755 |
| 3/31/2022 | $11,817 | $11,650 | $9,484 |
| 4/30/2022 | $11,578 | $11,427 | $9,124 |
| 5/31/2022 | $11,558 | $11,428 | $9,183 |
| 6/30/2022 | $10,904 | $10,843 | $9,039 |
| 7/31/2022 | $11,417 | $11,344 | $9,260 |
| 8/31/2022 | $11,283 | $11,158 | $8,998 |
| 9/30/2022 | $10,962 | $10,869 | $8,610 |
| 10/31/2022 | $11,224 | $11,145 | $8,498 |
| 11/30/2022 | $11,408 | $11,330 | $8,811 |
| 12/31/2022 | $11,381 | $11,278 | $8,771 |
| 1/31/2023 | $11,705 | $11,606 | $9,041 |
| 2/28/2023 | $11,600 | $11,518 | $8,807 |
| 3/31/2023 | $11,677 | $11,618 | $9,031 |
| 4/30/2023 | $11,790 | $11,712 | $9,085 |
| 5/31/2023 | $11,722 | $11,645 | $8,986 |
| 6/30/2023 | $11,925 | $11,805 | $8,954 |
| 7/31/2023 | $12,057 | $11,947 | $8,948 |
| 8/31/2023 | $12,113 | $11,991 | $8,891 |
| 9/30/2023 | $12,081 | $11,916 | $8,665 |
| 10/31/2023 | $11,989 | $11,836 | $8,528 |
| 11/30/2023 | $12,418 | $12,253 | $8,914 |
| 12/31/2023 | $12,760 | $12,592 | $9,256 |
| 1/31/2024 | $12,825 | $12,605 | $9,230 |
| 2/29/2024 | $12,901 | $12,645 | $9,100 |
| 3/31/2024 | $13,045 | $12,770 | $9,184 |
| 4/30/2024 | $12,991 | $12,702 | $8,952 |
| 5/31/2024 | $13,124 | $12,826 | $9,104 |
| 6/30/2024 | $13,244 | $12,942 | $9,190 |
| 7/31/2024 | $13,459 | $13,135 | $9,405 |
The Fund’s benchmarks are unmanaged indices used as a general measure of market performance. Calculations assume the reinvestment of dividends and capital gains.
Average Annual Total Returns (%)
| 1 Year | Since Inception 4/30/20 |
|---|
| Class I at NAV | 11.63% | 7.24% |
| ICE BofA High Yield U.S. Corporate Cash Pay BB-B (1-5yrs) Index | 9.95% | 6.62% |
Bloomberg Aggregate Bond IndexFootnote Reference* | 5.10% | (1.43%) |
| Footnote | Description |
Footnote* | The Fund has adopted the Bloomberg Aggregate Bond Index as its broad-based securities market index. |
The Fund's past performance is no guarantee of future results. The returns do not reflect the deduction of taxes that a shareholder would pay on Fund distributions or redemption of Fund shares.
| Total Net Assets | $5,199,445,955 |
| # of Portfolio Holdings | 736 |
| Portfolio Turnover Rate | 160% |
| Total Advisory Fees Paid | $7,640,906 |
What did the Fund invest in?
| Portfolio Holdings Presented by Portfolio Allocation | %Footnote Reference* |
| Asset-Backed Securities | 0.97% |
| Convertible Bonds | 1.91% |
| Convertible Preferred Stocks | 0.28% |
| Corporate Bonds | 78.00% |
| Floating Rate Loans | 11.42% |
| Foreign Government Obligations | 0.30% |
| Government Sponsored Enterprises Pass-Throughs | 3.05% |
| Money Market Funds | 3.17% |
| Repurchase Agreements | 0.90% |
| Total | 100.00% |
| Footnote | Description |
Footnote* | Represents percent of total investments, which excludes derivatives |
There were no material fund changes during the period.
Where can I find additional information about the Fund?
For additional information about the Fund, including its Prospectus, Statement of Additional Information, financial statements, holdings and proxy information, please visit lordabbett.com/FundDocuments.
The Fund has adopted a policy that allows it to send only one copy of the Fund's prospectus, proxy material, annual report and semiannual report (or related notice of internet availability of annual report and semiannual report) to certain shareholders residing at the same "household." This reduces Fund expenses, which benefits you and other shareholders.If you need additional copies or do not want your mailings to be "householded," please call Lord Abbett at 888-522-2388.
Lord Abbett Short Duration High Yield Fund
Annual Shareholder Report
July 31, 2024
lordabbett.com/FundDocuments
TSR-A-9053-I
09/24
Lord Abbett Short Duration High Yield Fund
Annual Shareholder Report
July 31, 2024
lordabbett.com/FundDocuments
This annual shareholder report contains important information about the Lord Abbett Short Duration High Yield Fund for the period of August 1, 2023 to July 31, 2024, as well as certain changes to the Fund. You can find additional information about the Fund at lordabbett.com/FundDocuments. You can also request this information by contacting us at 888-522-2388.
What were the Fund costs for the last year?
(based on a hypothetical $10,000 investment)
| Class Name | Costs of a $10,000 investment | Costs paid as a percentage of a $10,000 investment |
|---|
| Class R3 | $100 | 0.95% |
How did the Fund perform last year and what affected its performance?
For the fiscal year ended July 31, 2024, the Fund returned 11.08%, reflecting performance at the net asset value (NAV) of Class R3 shares, compared to the 9.95% of a securities market index with investment characteristics similar to those of the Fund, the ICE BofA High Yield U.S. Corporate Cash Pay BB-B (1-5yrs) Index. The Fund's broad-based market index, the Bloomberg Aggregate Bond Index, returned 5.10% over the same period.
Positive factors for the markets included momentum around the soft-landing narrative, specifically in the second half of the period, which was supported by signs of a cooling labor market and a slowing economy, leading the market to adjust its expectations of future interest rate cuts by the U.S. Federal Reserve (the Fed). Negative factors, specifically in the beginning of the period, included stronger-than-expected GDP growth, resilient labor market data, and persistently high inflation readings that led to a more prolonged interest rate environment. Against this backdrop, U.S. high yield credit delivered strong returns.
Top contributors to performance: Security selection within the Energy and Basic Industry sectors contributed to relative performance. An overweight allocation to Single B and CCC-rated bonds contributed to relative performance.
Top detractors from performance: Security selection in the Real Estate and Services sectors detracted from relative performance.
Total Return Based on $10,000 Investment
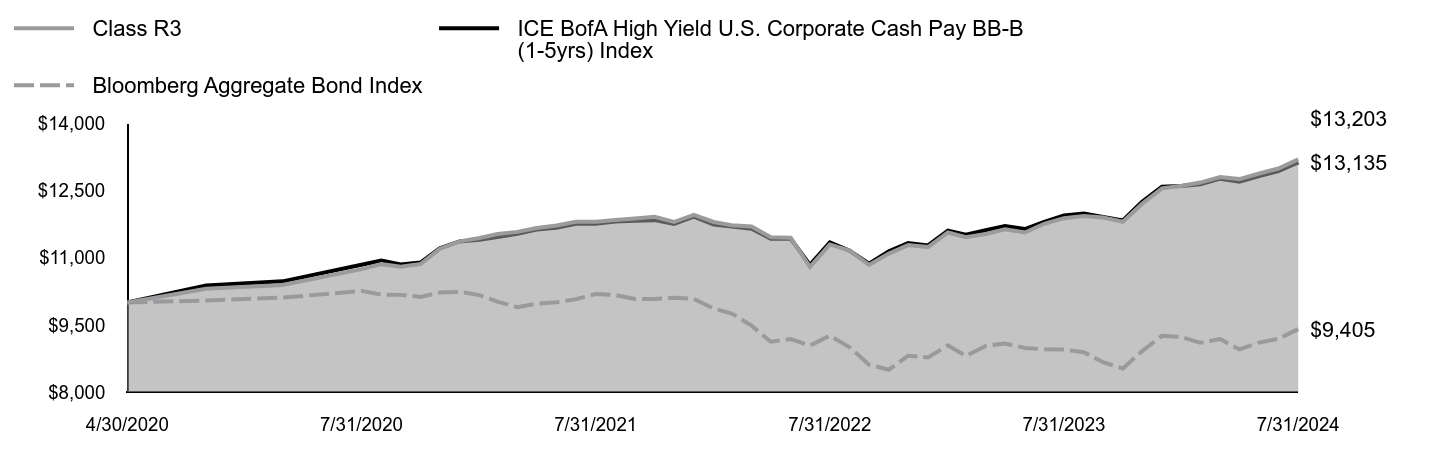
| Class R3 | ICE BofA High Yield U.S. Corporate Cash Pay BB-B (1-5yrs) Index | Bloomberg Aggregate Bond Index |
|---|
| 4/30/2020 | $10,000 | $10,000 | $10,000 |
| 5/31/2020 | $10,309 | $10,381 | $10,047 |
| 6/30/2020 | $10,391 | $10,474 | $10,110 |
| 7/31/2020 | $10,748 | $10,846 | $10,261 |
| 8/31/2020 | $10,859 | $10,941 | $10,178 |
| 9/30/2020 | $10,799 | $10,851 | $10,172 |
| 10/31/2020 | $10,862 | $10,896 | $10,127 |
| 11/30/2020 | $11,201 | $11,216 | $10,226 |
| 12/31/2020 | $11,368 | $11,367 | $10,240 |
| 1/31/2021 | $11,445 | $11,404 | $10,167 |
| 2/28/2021 | $11,534 | $11,467 | $10,020 |
| 3/31/2021 | $11,581 | $11,538 | $9,895 |
| 4/30/2021 | $11,668 | $11,635 | $9,973 |
| 5/31/2021 | $11,725 | $11,675 | $10,006 |
| 6/30/2021 | $11,805 | $11,761 | $10,076 |
| 7/31/2021 | $11,809 | $11,764 | $10,189 |
| 8/31/2021 | $11,844 | $11,815 | $10,169 |
| 9/30/2021 | $11,881 | $11,832 | $10,081 |
| 10/31/2021 | $11,917 | $11,843 | $10,079 |
| 11/30/2021 | $11,801 | $11,760 | $10,108 |
| 12/31/2021 | $11,963 | $11,921 | $10,083 |
| 1/31/2022 | $11,802 | $11,745 | $9,865 |
| 2/28/2022 | $11,729 | $11,700 | $9,755 |
| 3/31/2022 | $11,703 | $11,650 | $9,484 |
| 4/30/2022 | $11,462 | $11,427 | $9,124 |
| 5/31/2022 | $11,448 | $11,428 | $9,183 |
| 6/30/2022 | $10,797 | $10,843 | $9,039 |
| 7/31/2022 | $11,300 | $11,344 | $9,260 |
| 8/31/2022 | $11,163 | $11,158 | $8,998 |
| 9/30/2022 | $10,841 | $10,869 | $8,610 |
| 10/31/2022 | $11,095 | $11,145 | $8,498 |
| 11/30/2022 | $11,285 | $11,330 | $8,811 |
| 12/31/2022 | $11,241 | $11,278 | $8,771 |
| 1/31/2023 | $11,568 | $11,606 | $9,041 |
| 2/28/2023 | $11,460 | $11,518 | $8,807 |
| 3/31/2023 | $11,532 | $11,618 | $9,031 |
| 4/30/2023 | $11,639 | $11,712 | $9,085 |
| 5/31/2023 | $11,566 | $11,645 | $8,986 |
| 6/30/2023 | $11,762 | $11,805 | $8,954 |
| 7/31/2023 | $11,887 | $11,947 | $8,948 |
| 8/31/2023 | $11,938 | $11,991 | $8,891 |
| 9/30/2023 | $11,901 | $11,916 | $8,665 |
| 10/31/2023 | $11,806 | $11,836 | $8,528 |
| 11/30/2023 | $12,210 | $12,253 | $8,914 |
| 12/31/2023 | $12,554 | $12,592 | $9,256 |
| 1/31/2024 | $12,613 | $12,605 | $9,230 |
| 2/29/2024 | $12,683 | $12,645 | $9,100 |
| 3/31/2024 | $12,806 | $12,770 | $9,184 |
| 4/30/2024 | $12,761 | $12,702 | $8,952 |
| 5/31/2024 | $12,886 | $12,826 | $9,104 |
| 6/30/2024 | $12,998 | $12,942 | $9,190 |
| 7/31/2024 | $13,203 | $13,135 | $9,405 |
The Fund’s benchmarks are unmanaged indices used as a general measure of market performance. Calculations assume the reinvestment of dividends and capital gains.
Average Annual Total Returns (%)
| 1 Year | Since Inception 4/30/20 |
|---|
| Class R3 at NAV | 11.08% | 6.75% |
| ICE BofA High Yield U.S. Corporate Cash Pay BB-B (1-5yrs) Index | 9.95% | 6.62% |
Bloomberg Aggregate Bond IndexFootnote Reference* | 5.10% | (1.43%) |
| Footnote | Description |
Footnote* | The Fund has adopted the Bloomberg Aggregate Bond Index as its broad-based securities market index. |
The Fund's past performance is no guarantee of future results. The returns do not reflect the deduction of taxes that a shareholder would pay on Fund distributions or redemption of Fund shares.
| Total Net Assets | $5,199,445,955 |
| # of Portfolio Holdings | 736 |
| Portfolio Turnover Rate | 160% |
| Total Advisory Fees Paid | $7,640,906 |
What did the Fund invest in?
| Portfolio Holdings Presented by Portfolio Allocation | %Footnote Reference* |
| Asset-Backed Securities | 0.97% |
| Convertible Bonds | 1.91% |
| Convertible Preferred Stocks | 0.28% |
| Corporate Bonds | 78.00% |
| Floating Rate Loans | 11.42% |
| Foreign Government Obligations | 0.30% |
| Government Sponsored Enterprises Pass-Throughs | 3.05% |
| Money Market Funds | 3.17% |
| Repurchase Agreements | 0.90% |
| Total | 100.00% |
| Footnote | Description |
Footnote* | Represents percent of total investments, which excludes derivatives |
There were no material fund changes during the period.
Where can I find additional information about the Fund?
For additional information about the Fund, including its Prospectus, Statement of Additional Information, financial statements, holdings and proxy information, please visit lordabbett.com/FundDocuments.
The Fund has adopted a policy that allows it to send only one copy of the Fund's prospectus, proxy material, annual report and semiannual report (or related notice of internet availability of annual report and semiannual report) to certain shareholders residing at the same "household." This reduces Fund expenses, which benefits you and other shareholders.If you need additional copies or do not want your mailings to be "householded," please call Lord Abbett at 888-522-2388.
Lord Abbett Short Duration High Yield Fund
Annual Shareholder Report
July 31, 2024
lordabbett.com/FundDocuments
TSR-A-9055-R3
09/24
Lord Abbett Short Duration High Yield Fund
Annual Shareholder Report
July 31, 2024
lordabbett.com/FundDocuments
This annual shareholder report contains important information about the Lord Abbett Short Duration High Yield Fund for the period of August 1, 2023 to July 31, 2024, as well as certain changes to the Fund. You can find additional information about the Fund at lordabbett.com/FundDocuments. You can also request this information by contacting us at 888-522-2388.
What were the Fund costs for the last year?
(based on a hypothetical $10,000 investment)
| Class Name | Costs of a $10,000 investment | Costs paid as a percentage of a $10,000 investment |
|---|
| Class R4 | $74 | 0.70% |
How did the Fund perform last year and what affected its performance?
For the fiscal year ended July 31, 2024, the Fund returned 11.35%, reflecting performance at the net asset value (NAV) of Class R4 shares, compared to the 9.95% of a securities market index with investment characteristics similar to those of the Fund, the ICE BofA High Yield U.S. Corporate Cash Pay BB-B (1-5yrs) Index. The Fund's broad-based market index, the Bloomberg Aggregate Bond Index, returned 5.10% over the same period.
Positive factors for the markets included momentum around the soft-landing narrative, specifically in the second half of the period, which was supported by signs of a cooling labor market and a slowing economy, leading the market to adjust its expectations of future interest rate cuts by the U.S. Federal Reserve (the Fed). Negative factors, specifically in the beginning of the period, included stronger-than-expected GDP growth, resilient labor market data, and persistently high inflation readings that led to a more prolonged interest rate environment. Against this backdrop, U.S. high yield credit delivered strong returns.
Top contributors to performance: Security selection within the Energy and Basic Industry sectors contributed to relative performance. An overweight allocation to Single B and CCC-rated bonds contributed to relative performance.
Top detractors from performance: Security selection in the Real Estate and Services sectors detracted from relative performance.
Total Return Based on $10,000 Investment

| Class R4 | ICE BofA High Yield U.S. Corporate Cash Pay BB-B (1-5yrs) Index | Bloomberg Aggregate Bond Index |
|---|
| 4/30/2020 | $10,000 | $10,000 | $10,000 |
| 5/31/2020 | $10,311 | $10,381 | $10,047 |
| 6/30/2020 | $10,395 | $10,474 | $10,110 |
| 7/31/2020 | $10,754 | $10,846 | $10,261 |
| 8/31/2020 | $10,869 | $10,941 | $10,178 |
| 9/30/2020 | $10,810 | $10,851 | $10,172 |
| 10/31/2020 | $10,876 | $10,896 | $10,127 |
| 11/30/2020 | $11,218 | $11,216 | $10,226 |
| 12/31/2020 | $11,388 | $11,367 | $10,240 |
| 1/31/2021 | $11,468 | $11,404 | $10,167 |
| 2/28/2021 | $11,559 | $11,467 | $10,020 |
| 3/31/2021 | $11,608 | $11,538 | $9,895 |
| 4/30/2021 | $11,698 | $11,635 | $9,973 |
| 5/31/2021 | $11,757 | $11,675 | $10,006 |
| 6/30/2021 | $11,840 | $11,761 | $10,076 |
| 7/31/2021 | $11,846 | $11,764 | $10,189 |
| 8/31/2021 | $11,884 | $11,815 | $10,169 |
| 9/30/2021 | $11,923 | $11,832 | $10,081 |
| 10/31/2021 | $11,962 | $11,843 | $10,079 |
| 11/30/2021 | $11,847 | $11,760 | $10,108 |
| 12/31/2021 | $12,013 | $11,921 | $10,083 |
| 1/31/2022 | $11,854 | $11,745 | $9,865 |
| 2/28/2022 | $11,782 | $11,700 | $9,755 |
| 3/31/2022 | $11,759 | $11,650 | $9,484 |
| 4/30/2022 | $11,518 | $11,427 | $9,124 |
| 5/31/2022 | $11,507 | $11,428 | $9,183 |
| 6/30/2022 | $10,855 | $10,843 | $9,039 |
| 7/31/2022 | $11,363 | $11,344 | $9,260 |
| 8/31/2022 | $11,228 | $11,158 | $8,998 |
| 9/30/2022 | $10,907 | $10,869 | $8,610 |
| 10/31/2022 | $11,165 | $11,145 | $8,498 |
| 11/30/2022 | $11,357 | $11,330 | $8,811 |
| 12/31/2022 | $11,316 | $11,278 | $8,771 |
| 1/31/2023 | $11,648 | $11,606 | $9,041 |
| 2/28/2023 | $11,541 | $11,518 | $8,807 |
| 3/31/2023 | $11,616 | $11,618 | $9,031 |
| 4/30/2023 | $11,726 | $11,712 | $9,085 |
| 5/31/2023 | $11,655 | $11,645 | $8,986 |
| 6/30/2023 | $11,855 | $11,805 | $8,954 |
| 7/31/2023 | $11,983 | $11,947 | $8,948 |
| 8/31/2023 | $12,038 | $11,991 | $8,891 |
| 9/30/2023 | $12,003 | $11,916 | $8,665 |
| 10/31/2023 | $11,910 | $11,836 | $8,528 |
| 11/30/2023 | $12,333 | $12,253 | $8,914 |
| 12/31/2023 | $12,669 | $12,592 | $9,256 |
| 1/31/2024 | $12,731 | $12,605 | $9,230 |
| 2/29/2024 | $12,805 | $12,645 | $9,100 |
| 3/31/2024 | $12,944 | $12,770 | $9,184 |
| 4/30/2024 | $12,889 | $12,702 | $8,952 |
| 5/31/2024 | $13,018 | $12,826 | $9,104 |
| 6/30/2024 | $13,133 | $12,942 | $9,190 |
| 7/31/2024 | $13,344 | $13,135 | $9,405 |
The Fund’s benchmarks are unmanaged indices used as a general measure of market performance. Calculations assume the reinvestment of dividends and capital gains.
Average Annual Total Returns (%)
| 1 Year | Since Inception 4/30/20 |
|---|
| Class R4 at NAV | 11.35% | 7.02% |
| ICE BofA High Yield U.S. Corporate Cash Pay BB-B (1-5yrs) Index | 9.95% | 6.62% |
Bloomberg Aggregate Bond IndexFootnote Reference* | 5.10% | (1.43%) |
| Footnote | Description |
Footnote* | The Fund has adopted the Bloomberg Aggregate Bond Index as its broad-based securities market index. |
The Fund's past performance is no guarantee of future results. The returns do not reflect the deduction of taxes that a shareholder would pay on Fund distributions or redemption of Fund shares.
| Total Net Assets | $5,199,445,955 |
| # of Portfolio Holdings | 736 |
| Portfolio Turnover Rate | 160% |
| Total Advisory Fees Paid | $7,640,906 |
What did the Fund invest in?
| Portfolio Holdings Presented by Portfolio Allocation | %Footnote Reference* |
| Asset-Backed Securities | 0.97% |
| Convertible Bonds | 1.91% |
| Convertible Preferred Stocks | 0.28% |
| Corporate Bonds | 78.00% |
| Floating Rate Loans | 11.42% |
| Foreign Government Obligations | 0.30% |
| Government Sponsored Enterprises Pass-Throughs | 3.05% |
| Money Market Funds | 3.17% |
| Repurchase Agreements | 0.90% |
| Total | 100.00% |
| Footnote | Description |
Footnote* | Represents percent of total investments, which excludes derivatives |
There were no material fund changes during the period.
Where can I find additional information about the Fund?
For additional information about the Fund, including its Prospectus, Statement of Additional Information, financial statements, holdings and proxy information, please visit lordabbett.com/FundDocuments.
The Fund has adopted a policy that allows it to send only one copy of the Fund's prospectus, proxy material, annual report and semiannual report (or related notice of internet availability of annual report and semiannual report) to certain shareholders residing at the same "household." This reduces Fund expenses, which benefits you and other shareholders.If you need additional copies or do not want your mailings to be "householded," please call Lord Abbett at 888-522-2388.
Lord Abbett Short Duration High Yield Fund
Annual Shareholder Report
July 31, 2024
lordabbett.com/FundDocuments
TSR-A-9056-R4
09/24
Lord Abbett Short Duration High Yield Fund
Annual Shareholder Report
July 31, 2024
lordabbett.com/FundDocuments
This annual shareholder report contains important information about the Lord Abbett Short Duration High Yield Fund for the period of August 1, 2023 to July 31, 2024, as well as certain changes to the Fund. You can find additional information about the Fund at lordabbett.com/FundDocuments. You can also request this information by contacting us at 888-522-2388.
What were the Fund costs for the last year?
(based on a hypothetical $10,000 investment)
| Class Name | Costs of a $10,000 investment | Costs paid as a percentage of a $10,000 investment |
|---|
| Class R5 | $48 | 0.45% |
How did the Fund perform last year and what affected its performance?
For the fiscal year ended July 31, 2024, the Fund returned 11.63%, reflecting performance at the net asset value (NAV) of Class R5 shares, compared to the 9.95% of a securities market index with investment characteristics similar to those of the Fund, the ICE BofA High Yield U.S. Corporate Cash Pay BB-B (1-5yrs) Index. The Fund's broad-based market index, the Bloomberg Aggregate Bond Index, returned 5.10% over the same period.
Positive factors for the markets included momentum around the soft-landing narrative, specifically in the second half of the period, which was supported by signs of a cooling labor market and a slowing economy, leading the market to adjust its expectations of future interest rate cuts by the U.S. Federal Reserve (the Fed). Negative factors, specifically in the beginning of the period, included stronger-than-expected GDP growth, resilient labor market data, and persistently high inflation readings that led to a more prolonged interest rate environment. Against this backdrop, U.S. high yield credit delivered strong returns.
Top contributors to performance: Security selection within the Energy and Basic Industry sectors contributed to relative performance. An overweight allocation to Single B and CCC-rated bonds contributed to relative performance.
Top detractors from performance: Security selection in the Real Estate and Services sectors detracted from relative performance.
Total Return Based on $10,000 Investment

| Class R5 | ICE BofA High Yield U.S. Corporate Cash Pay BB-B (1-5yrs) Index | Bloomberg Aggregate Bond Index |
|---|
| 4/30/2020 | $10,000 | $10,000 | $10,000 |
| 5/31/2020 | $10,313 | $10,381 | $10,047 |
| 6/30/2020 | $10,399 | $10,474 | $10,110 |
| 7/31/2020 | $10,761 | $10,846 | $10,261 |
| 8/31/2020 | $10,878 | $10,941 | $10,178 |
| 9/30/2020 | $10,821 | $10,851 | $10,172 |
| 10/31/2020 | $10,889 | $10,896 | $10,127 |
| 11/30/2020 | $11,234 | $11,216 | $10,226 |
| 12/31/2020 | $11,406 | $11,367 | $10,240 |
| 1/31/2021 | $11,489 | $11,404 | $10,167 |
| 2/28/2021 | $11,582 | $11,467 | $10,020 |
| 3/31/2021 | $11,634 | $11,538 | $9,895 |
| 4/30/2021 | $11,727 | $11,635 | $9,973 |
| 5/31/2021 | $11,789 | $11,675 | $10,006 |
| 6/30/2021 | $11,874 | $11,761 | $10,076 |
| 7/31/2021 | $11,883 | $11,764 | $10,189 |
| 8/31/2021 | $11,923 | $11,815 | $10,169 |
| 9/30/2021 | $11,965 | $11,832 | $10,081 |
| 10/31/2021 | $12,007 | $11,843 | $10,079 |
| 11/30/2021 | $11,895 | $11,760 | $10,108 |
| 12/31/2021 | $12,063 | $11,921 | $10,083 |
| 1/31/2022 | $11,906 | $11,745 | $9,865 |
| 2/28/2022 | $11,837 | $11,700 | $9,755 |
| 3/31/2022 | $11,816 | $11,650 | $9,484 |
| 4/30/2022 | $11,576 | $11,427 | $9,124 |
| 5/31/2022 | $11,568 | $11,428 | $9,183 |
| 6/30/2022 | $10,915 | $10,843 | $9,039 |
| 7/31/2022 | $11,428 | $11,344 | $9,260 |
| 8/31/2022 | $11,294 | $11,158 | $8,998 |
| 9/30/2022 | $10,973 | $10,869 | $8,610 |
| 10/31/2022 | $11,235 | $11,145 | $8,498 |
| 11/30/2022 | $11,431 | $11,330 | $8,811 |
| 12/31/2022 | $11,392 | $11,278 | $8,771 |
| 1/31/2023 | $11,728 | $11,606 | $9,041 |
| 2/28/2023 | $11,623 | $11,518 | $8,807 |
| 3/31/2023 | $11,701 | $11,618 | $9,031 |
| 4/30/2023 | $11,814 | $11,712 | $9,085 |
| 5/31/2023 | $11,745 | $11,645 | $8,986 |
| 6/30/2023 | $11,949 | $11,805 | $8,954 |
| 7/31/2023 | $12,081 | $11,947 | $8,948 |
| 8/31/2023 | $12,138 | $11,991 | $8,891 |
| 9/30/2023 | $12,106 | $11,916 | $8,665 |
| 10/31/2023 | $12,015 | $11,836 | $8,528 |
| 11/30/2023 | $12,431 | $12,253 | $8,914 |
| 12/31/2023 | $12,786 | $12,592 | $9,256 |
| 1/31/2024 | $12,851 | $12,605 | $9,230 |
| 2/29/2024 | $12,927 | $12,645 | $9,100 |
| 3/31/2024 | $13,058 | $12,770 | $9,184 |
| 4/30/2024 | $13,017 | $12,702 | $8,952 |
| 5/31/2024 | $13,151 | $12,826 | $9,104 |
| 6/30/2024 | $13,270 | $12,942 | $9,190 |
| 7/31/2024 | $13,486 | $13,135 | $9,405 |
The Fund’s benchmarks are unmanaged indices used as a general measure of market performance. Calculations assume the reinvestment of dividends and capital gains.
Average Annual Total Returns (%)
| 1 Year | Since Inception 4/30/20 |
|---|
| Class R5 at NAV | 11.63% | 7.29% |
| ICE BofA High Yield U.S. Corporate Cash Pay BB-B (1-5yrs) Index | 9.95% | 6.62% |
Bloomberg Aggregate Bond IndexFootnote Reference* | 5.10% | (1.43%) |
| Footnote | Description |
Footnote* | The Fund has adopted the Bloomberg Aggregate Bond Index as its broad-based securities market index. |
The Fund's past performance is no guarantee of future results. The returns do not reflect the deduction of taxes that a shareholder would pay on Fund distributions or redemption of Fund shares.
| Total Net Assets | $5,199,445,955 |
| # of Portfolio Holdings | 736 |
| Portfolio Turnover Rate | 160% |
| Total Advisory Fees Paid | $7,640,906 |
What did the Fund invest in?
| Portfolio Holdings Presented by Portfolio Allocation | %Footnote Reference* |
| Asset-Backed Securities | 0.97% |
| Convertible Bonds | 1.91% |
| Convertible Preferred Stocks | 0.28% |
| Corporate Bonds | 78.00% |
| Floating Rate Loans | 11.42% |
| Foreign Government Obligations | 0.30% |
| Government Sponsored Enterprises Pass-Throughs | 3.05% |
| Money Market Funds | 3.17% |
| Repurchase Agreements | 0.90% |
| Total | 100.00% |
| Footnote | Description |
Footnote* | Represents percent of total investments, which excludes derivatives |
There were no material fund changes during the period.
Where can I find additional information about the Fund?
For additional information about the Fund, including its Prospectus, Statement of Additional Information, financial statements, holdings and proxy information, please visit lordabbett.com/FundDocuments.
The Fund has adopted a policy that allows it to send only one copy of the Fund's prospectus, proxy material, annual report and semiannual report (or related notice of internet availability of annual report and semiannual report) to certain shareholders residing at the same "household." This reduces Fund expenses, which benefits you and other shareholders.If you need additional copies or do not want your mailings to be "householded," please call Lord Abbett at 888-522-2388.
Lord Abbett Short Duration High Yield Fund
Annual Shareholder Report
July 31, 2024
lordabbett.com/FundDocuments
TSR-A-9057-R5
09/24
Lord Abbett Short Duration High Yield Fund
Annual Shareholder Report
July 31, 2024
lordabbett.com/FundDocuments
This annual shareholder report contains important information about the Lord Abbett Short Duration High Yield Fund for the period of August 1, 2023 to July 31, 2024, as well as certain changes to the Fund. You can find additional information about the Fund at lordabbett.com/FundDocuments. You can also request this information by contacting us at 888-522-2388.This report describes changes to the Fund that occurred during the reporting period.
What were the Fund costs for the last year?
(based on a hypothetical $10,000 investment)
| Class Name | Costs of a $10,000 investment | Costs paid as a percentage of a $10,000 investment |
|---|
| Class R6 | $38 | 0.36% |
How did the Fund perform last year and what affected its performance?
For the fiscal year ended July 31, 2024, the Fund returned 11.71%, reflecting performance at the net asset value (NAV) of Class R6 shares, compared to the 9.95% of a securities market index with investment characteristics similar to those of the Fund, the ICE BofA High Yield U.S. Corporate Cash Pay BB-B (1-5yrs) Index. The Fund's broad-based market index, the Bloomberg Aggregate Bond Index, returned 5.10% over the same period.
Positive factors for the markets included momentum around the soft-landing narrative, specifically in the second half of the period, which was supported by signs of a cooling labor market and a slowing economy, leading the market to adjust its expectations of future interest rate cuts by the U.S. Federal Reserve (the Fed). Negative factors, specifically in the beginning of the period, included stronger-than-expected GDP growth, resilient labor market data, and persistently high inflation readings that led to a more prolonged interest rate environment. Against this backdrop, U.S. high yield credit delivered strong returns.
Top contributors to performance: Security selection within the Energy and Basic Industry sectors contributed to relative performance. An overweight allocation to Single B and CCC-rated bonds contributed to relative performance.
Top detractors from performance: Security selection in the Real Estate and Services sectors detracted from relative performance.
Total Return Based on $10,000 Investment
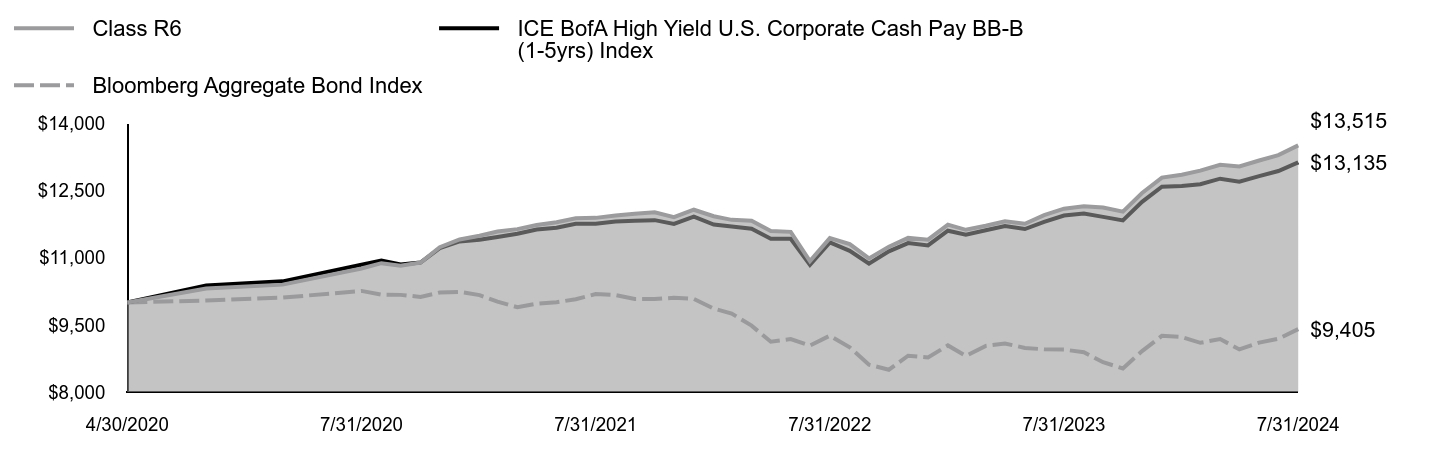
| Class R6 | ICE BofA High Yield U.S. Corporate Cash Pay BB-B (1-5yrs) Index | Bloomberg Aggregate Bond Index |
|---|
| 4/30/2020 | $10,000 | $10,000 | $10,000 |
| 5/31/2020 | $10,314 | $10,381 | $10,047 |
| 6/30/2020 | $10,401 | $10,474 | $10,110 |
| 7/31/2020 | $10,763 | $10,846 | $10,261 |
| 8/31/2020 | $10,881 | $10,941 | $10,178 |
| 9/30/2020 | $10,825 | $10,851 | $10,172 |
| 10/31/2020 | $10,894 | $10,896 | $10,127 |
| 11/30/2020 | $11,239 | $11,216 | $10,226 |
| 12/31/2020 | $11,412 | $11,367 | $10,240 |
| 1/31/2021 | $11,495 | $11,404 | $10,167 |
| 2/28/2021 | $11,589 | $11,467 | $10,020 |
| 3/31/2021 | $11,642 | $11,538 | $9,895 |
| 4/30/2021 | $11,735 | $11,635 | $9,973 |
| 5/31/2021 | $11,798 | $11,675 | $10,006 |
| 6/30/2021 | $11,884 | $11,761 | $10,076 |
| 7/31/2021 | $11,894 | $11,764 | $10,189 |
| 8/31/2021 | $11,946 | $11,815 | $10,169 |
| 9/30/2021 | $11,988 | $11,832 | $10,081 |
| 10/31/2021 | $12,019 | $11,843 | $10,079 |
| 11/30/2021 | $11,908 | $11,760 | $10,108 |
| 12/31/2021 | $12,076 | $11,921 | $10,083 |
| 1/31/2022 | $11,930 | $11,745 | $9,865 |
| 2/28/2022 | $11,850 | $11,700 | $9,755 |
| 3/31/2022 | $11,829 | $11,650 | $9,484 |
| 4/30/2022 | $11,601 | $11,427 | $9,124 |
| 5/31/2022 | $11,581 | $11,428 | $9,183 |
| 6/30/2022 | $10,927 | $10,843 | $9,039 |
| 7/31/2022 | $11,441 | $11,344 | $9,260 |
| 8/31/2022 | $11,307 | $11,158 | $8,998 |
| 9/30/2022 | $10,987 | $10,869 | $8,610 |
| 10/31/2022 | $11,249 | $11,145 | $8,498 |
| 11/30/2022 | $11,446 | $11,330 | $8,811 |
| 12/31/2022 | $11,407 | $11,278 | $8,771 |
| 1/31/2023 | $11,744 | $11,606 | $9,041 |
| 2/28/2023 | $11,627 | $11,518 | $8,807 |
| 3/31/2023 | $11,717 | $11,618 | $9,031 |
| 4/30/2023 | $11,818 | $11,712 | $9,085 |
| 5/31/2023 | $11,762 | $11,645 | $8,986 |
| 6/30/2023 | $11,954 | $11,805 | $8,954 |
| 7/31/2023 | $12,099 | $11,947 | $8,948 |
| 8/31/2023 | $12,156 | $11,991 | $8,891 |
| 9/30/2023 | $12,124 | $11,916 | $8,665 |
| 10/31/2023 | $12,033 | $11,836 | $8,528 |
| 11/30/2023 | $12,450 | $12,253 | $8,914 |
| 12/31/2023 | $12,794 | $12,592 | $9,256 |
| 1/31/2024 | $12,860 | $12,605 | $9,230 |
| 2/29/2024 | $12,950 | $12,645 | $9,100 |
| 3/31/2024 | $13,082 | $12,770 | $9,184 |
| 4/30/2024 | $13,043 | $12,702 | $8,952 |
| 5/31/2024 | $13,177 | $12,826 | $9,104 |
| 6/30/2024 | $13,298 | $12,942 | $9,190 |
| 7/31/2024 | $13,515 | $13,135 | $9,405 |
The Fund’s benchmarks are unmanaged indices used as a general measure of market performance. Calculations assume the reinvestment of dividends and capital gains.
Average Annual Total Returns (%)
| 1 Year | Since Inception 4/30/20 |
|---|
| Class R6 at NAV | 11.71% | 7.34% |
| ICE BofA High Yield U.S. Corporate Cash Pay BB-B (1-5yrs) Index | 9.95% | 6.62% |
Bloomberg Aggregate Bond IndexFootnote Reference* | 5.10% | (1.43%) |
| Footnote | Description |
Footnote* | The Fund has adopted the Bloomberg Aggregate Bond Index as its broad-based securities market index. |
The Fund's past performance is no guarantee of future results. The returns do not reflect the deduction of taxes that a shareholder would pay on Fund distributions or redemption of Fund shares.
| Total Net Assets | $5,199,445,955 |
| # of Portfolio Holdings | 736 |
| Portfolio Turnover Rate | 160% |
| Total Advisory Fees Paid | $7,640,906 |
What did the Fund invest in?
| Portfolio Holdings Presented by Portfolio Allocation | %Footnote Reference* |
| Asset-Backed Securities | 0.97% |
| Convertible Bonds | 1.91% |
| Convertible Preferred Stocks | 0.28% |
| Corporate Bonds | 78.00% |
| Floating Rate Loans | 11.42% |
| Foreign Government Obligations | 0.30% |
| Government Sponsored Enterprises Pass-Throughs | 3.05% |
| Money Market Funds | 3.17% |
| Repurchase Agreements | 0.90% |
| Total | 100.00% |
| Footnote | Description |
Footnote* | Represents percent of total investments, which excludes derivatives |
This is a summary of certain changes of the Fund since July 31, 2024. For more information contact 888-522-2388.
Expenses: As of December 1, 2024, the expense limitation on total net annual operating expenses decreased from 0.42% to 0.36% as part of the annual review of transfer agency expenses.
Where can I find additional information about the Fund?
For additional information about the Fund, including its Prospectus, Statement of Additional Information, financial statements, holdings and proxy information, please visit lordabbett.com/FundDocuments.
The Fund has adopted a policy that allows it to send only one copy of the Fund's prospectus, proxy material, annual report and semiannual report (or related notice of internet availability of annual report and semiannual report) to certain shareholders residing at the same "household." This reduces Fund expenses, which benefits you and other shareholders.If you need additional copies or do not want your mailings to be "householded," please call Lord Abbett at 888-522-2388.
Lord Abbett Short Duration High Yield Fund
Annual Shareholder Report
July 31, 2024
lordabbett.com/FundDocuments
TSR-A-9058-R6
09/24
Item 1(b): Not applicable.
| | (a) | In accordance with applicable requirements, the Registrant adopted a Sarbanes-Oxley Code of Ethics on June 19, 2003 that applies to the principal executive officer and senior financial officers of the Registrant (“Code of Ethics”). The Code of Ethics was in effect during the fiscal year ended July 31, 2024 (the “Period”). |
| | (b) | Not applicable. |
| | | |
| | (c) | The Registrant has not amended the Code of Ethics as described in Form N-CSR during the Period. |
| | | |
| | (d) | The Registrant has not granted any waiver, including an implicit waiver, from a provision of the Code of Ethics as described in Form N-CSR during the Period. |
| | | |
| | (e) | Not applicable. |
| | | |
| | (f) | See Item 19(a)(1) concerning the filing of the Code of Ethics. |
| Item 3: | Audit Committee Financial Expert. |
The Registrant’s board of trustees has determined that each of the following independent trustees who are members of the audit committee is an audit committee financial expert: Evelyn E. Guernsey and Karla M. Rabusch. Each of these persons is independent within the meaning of the Form N-CSR.
| Item 4: | Principal Accountant Fees and Services. |
In response to sections (a), (b), (c) and (d) of Item 4, the aggregate fees billed to the Registrant for the fiscal years ended July 31, 2024 and 2023 by the Registrant’s principal accounting firm, Deloitte & Touche LLP, the member firms of Deloitte Touche Tohmatsu and their respective affiliates (collectively, “Deloitte”) were as follows:
| | | Fiscal year ended: |
| | | 2024 | | 2023 |
| Audit Fees {a} | | $251,250 | | $199,250 |
| Audit-Related Fees | | - 0 - | | - 0 - |
| Total audit and audit-related fees | | $251,250 | | $199250 |
| | | | | |
| Tax Fees | | - 0 - | | - 0 - |
| All Other Fees {b} | | - 0 - | | - 0 - |
| | | | | |
| Total Fees | | $251,250 | | $199,250 |
{a} Consists of fees for audits of the Registrant’s annual financial statements.
{b} Fees for the fiscal year ended July 31, 2024 and 2023 consist of fees for services related to the recovery of excess dividend withholding taxes in certain jurisdictions.
(e) (1) Pursuant to Rule 2-01(c) (7) of Regulation S-X, the Registrant’s Audit Committee has adopted pre-approval policies and procedures. Such policies and procedures generally provide that the Audit Committee must pre-approve:
| | • | any audit, audit-related, tax, and other services to be provided to the Lord Abbett Funds, including the Registrant, and |
| | • | any audit-related, tax, and other services to be provided to the Registrant’s investment adviser and any entity controlling, controlled by or under common control with the investment adviser that provides ongoing services to one or more Funds comprising the Registrant if the engagement relates directly to operations and financial reporting of a Fund, by the independent auditor to assure that the provision of such services does not impair the auditor’s independence. |
The Audit Committee has delegated pre-approval authority to its Chair, subject to a fee limit of $10,000 per event, and not to exceed $25,000 annually. The Chair will report any pre-approval decisions to the Audit Committee at its next scheduled meeting. Unless a type of service to be provided by the independent auditor has received general pre-approval, it must be pre-approved by the Audit Committee. Any proposed services exceeding pre-approved cost levels will require specific pre-approval by the Audit Committee.
(e) (2) The Registrant’s Audit Committee has approved 100% of the services described in paragraphs (b) through (d) of this Item 4, no amount was approved by the Audit Committee pursuant to paragraph (c)(7)(i)(C) of Rule 2-01 of Regulation S-X.
(f) Not applicable.
(g) The aggregate non-audit fees billed by Deloitte for services rendered to the Registrant are shown above in the response to Item 4 (a), (b), (c) and (d) as “All Other Fees”.
The aggregate non-audit fees billed by Deloitte for services rendered to the Registrant’s investment adviser, Lord, Abbett & Co. LLC (“Lord Abbett”), for the fiscal years ended July 31, 2024 and 2023 were:
| | | Fiscal year ended: |
| | | 2024 | | 2023 |
| All Other Fees {a} | | $250,000 | | $230,000 |
{a} Consist of fees for Independent Services Auditors’ Report on Controls Placed in Operation and Tests of Operating Effectiveness related to Lord Abbett’s Asset Management Services (“SOC-1 Report”).
The aggregate non-audit fees billed by Deloitte for services rendered to entities under the common control of Lord Abbett for the fiscal years ended July 31, 2024 and 2023 were:
| | | Fiscal year ended: |
| | | 2024 | | 2023 |
| All Other Fees | | $ - 0 - | | $ - 0 - |
(h) The Registrant’s Audit Committee has considered the provision of non-audit services that were rendered to the Registrant’s investment adviser, and any entity controlling, controlled by or under common control with the investment adviser that provides ongoing services to the Registrant, that were not pre-approved pursuant to Rule 2-01 (c)(7)(ii) of Regulation S-X and has determined that the provision of such services is compatible with maintaining Deloitte’s independence.
(i) Not Applicable.
(j) Not Applicable.
| Item 5: | Audit Committee of Listed Registrants. |
| | Not applicable. |
| | |
| Item 6: | Investments. |
| | The Registrant’s “Schedule I – Investments in securities of unaffiliated issuers” as of the close of the reporting period is included under Item 7 of this Form N-CSR. |
| | |
| Item 7: | Financial Statements and Financial Highlights for Open-End Management Investment Companies. |
| | |
| Item 8: | Changes in and Disagreements with Accountants for Open-End Management Investment Companies. |
| | |
| Item 9: | Proxy Disclosures for Open-End Management Investment Companies. |
| | |
| Item 10: | Remuneration Paid to Directors, Officers, and Others for Open-End Management Investment Companies. |
| | |
| Item 11: | Statement Regarding Basis for Approval of Investment Advisory Contract. |

LORD ABBETT
FINANCIAL STATEMENTS
AND OTHER IMPORTANT
INFORMATION
Lord Abbett
Climate Focused Bond Fund
Emerging Markets Equity Fund
International Growth Fund
Investment Grade Floating Rate Fund
Short Duration High Yield Fund
For the fiscal year ended July 31, 2024
Table of Contents
Schedule of Investments
CLIMATE FOCUSED BOND FUND July 31, 2024
| Investments | | Interest
Rate | | Maturity
Date | | Principal
Amount† | | | Fair
Value | |
| LONG-TERM INVESTMENTS 94.63% | | | | | | | | | | | | |
| | | | | | | | | | | | | |
| ASSET-BACKED SECURITIES 0.24% | | | | | | | | | | | | |
| | | | | | | | | | | | | |
| Automobiles 0.24% | | | | | | | | | | | | |
| Tesla Auto Lease Trust Series 2023-A Class A3† (cost $49,998) | 5.89% | | 6/22/2026 | | $ | 50,000 | | | $ | 50,158 | |
| | | | | | | | | | | | | |
| CONVERTIBLE BONDS 0.42% | | | | | | | | | | | | |
| | | | | | | | | | | | | |
| Energy-Alternate Sources 0.09% | | | | | | | | | | | | |
| Enphase Energy, Inc. | | Zero Coupon | | 3/1/2028 | | | 23,000 | | | | 19,916 | |
| | | | | | | | | | | | | |
| Environmental Control 0.12% | | | | | | | | | | | | |
| Tetra Tech, Inc.† | | 2.25% | | 8/15/2028 | | | 20,000 | | | | 24,273 | |
| | | | | | | | | | | | | |
| REITS 0.21% | | | | | | | | | | | | |
| HAT Holdings I LLC/HAT Holdings II LLC† | | Zero Coupon | | 5/1/2025 | | | 42,000 | | | | 44,363 | |
| Total Convertible Bonds (cost $82,426) | | | | | | | | | | | 88,552 | |
| | | | | | | | | | | | | |
| CORPORATE BONDS 68.42% | | | | | | | | | | | | |
| | | | | | | | | | | | | |
| Auto Manufacturers 1.38% | | | | | | | | | | | | |
| Ford Motor Co. | | 3.25% | | 2/12/2032 | | | 83,000 | | | | 69,703 | |
| Hyundai Capital America† | | 5.80% | | 6/26/2025 | | | 112,000 | | | | 112,516 | |
| Volvo Car AB | | 4.75% | | 5/8/2030 | | EUR | 100,000 | | | | 109,748 | |
| Total | | | | | | | | | | | 291,967 | |
| | | | | | | | | | | | | |
| Auto Parts & Equipment 2.32% | | | | | | | | | | | | |
| Aptiv PLC (Ireland)(a) | | 4.35% | | 3/15/2029 | | $ | 35,000 | | | | 34,304 | |
| BorgWarner, Inc. | | 3.375% | | 3/15/2025 | | | 65,000 | | | | 64,110 | |
| Dana, Inc. | | 4.25% | | 9/1/2030 | | | 92,000 | | | | 81,337 | |
| Forvia SE | | 2.375% | | 6/15/2029 | | EUR | 100,000 | | | | 98,349 | |
| Valeo SE | | 5.375% | | 5/28/2027 | | EUR | 100,000 | | | | 112,139 | |
| ZF Finance GmbH | | 2.25% | | 5/3/2028 | | EUR | 100,000 | | | | 99,908 | |
| Total | | | | | | | | | | | 490,147 | |
| | | | | | | | | | | | | |
| Banks 10.01% | | | | | | | | | | | | |
| AIB Group PLC | | 0.50%
(1 yr. EUR Swap + 0.75% | )# | 11/17/2027 | | EUR | 100,000 | | | | 101,266 | |
| Banco de Sabadell SA | | 2.625%
(1 yr. EUR Swap + 2.20% | )# | 3/24/2026 | | EUR | 100,000 | | | | 107,510 | |
| Bank of America Corp. | | 2.456%
(3 mo. USD
Term SOFR + 1.13% | )# | 10/22/2025 | | $ | 210,000 | | | | 208,492 | |
| BNP Paribas SA | | 1.125% | | 8/28/2024 | | EUR | 200,000 | | | | 216,052 | |
| | | |
| | See Notes to Financial Statements. | 1 |
Schedule of Investments (continued)
CLIMATE FOCUSED BOND FUND July 31, 2024
| Investments | | Interest
Rate | | Maturity
Date | | Principal
Amount† | | | Fair
Value | |
| Banks (continued) | | | | | | | | | | | | |
| BNP Paribas SA (France)†(a) | | 1.675%
(SOFR + 0.91% | )# | 6/30/2027 | | $ | 200,000 | | | $ | 187,266 | |
| Caixa Geral de Depositos SA | | 2.875%
(1 yr. EUR Swap + 1.40% | )# | 6/15/2026 | | EUR | 100,000 | | | | 107,444 | |
| CaixaBank SA | | 1.25%
(5 yr. EUR Swap + 1.63% | )# | 6/18/2031 | | EUR | 100,000 | | | | 103,096 | |
| Danske Bank AS | | 0.75%
(1 yr. EURIBOR ICE Swap + 0.88% | )# | 6/9/2029 | | EUR | 100,000 | | | | 97,857 | |
| ING Groep NV | | 0.875%
(5 yr. EURIBOR ICE Swap + 1.15% | )# | 6/9/2032 | | EUR | 100,000 | | | | 99,731 | |
| Intesa Sanpaolo SpA | | 0.75% | | 3/16/2028 | | EUR | 100,000 | | | | 99,101 | |
| JPMorgan Chase & Co. | | 0.768%
(SOFR + 0.49% | )# | 8/9/2025 | | $ | 221,000 | | | | 220,767 | |
| Kreditanstalt fuer Wiederaufbau | | 0.875% | | 9/15/2026 | | GBP | 100,000 | | | | 119,698 | |
| NatWest Group PLC | | 2.057%
(1 yr. U.K. Government Bond + 1.27% | )# | 11/9/2028 | | GBP | 100,000 | | | | 117,852 | |
| Nordea Bank Abp | | 0.50% | | 3/19/2031 | | EUR | 100,000 | | | | 91,233 | |
| Royal Bank of Canada (Canada)(a) | | 1.15% | | 7/14/2026 | | $ | 150,000 | | | | 140,035 | |
| Toronto-Dominion Bank (Canada)(a) | | 5.264% | | 12/11/2026 | | | 100,000 | | | | 101,191 | |
| Total | | | | | | | | | | | 2,118,591 | |
| | | | | | | | | | | | | |
| Building Materials 1.03% | | | | | | | | | | | | |
| Eco Material Technologies, Inc.† | | 7.875% | | 1/31/2027 | | | 51,000 | | | | 51,937 | |
| EMRLD Borrower LP/Emerald Co-Issuer, Inc.† | | 6.375% | | 12/15/2030 | | EUR | 100,000 | | | | 113,346 | |
| Owens Corning | | 3.95% | | 8/15/2029 | | $ | 55,000 | | | | 52,862 | |
| Total | | | | | | | | | | | 218,145 | |
| | | | | | | | | | | | | |
| Chemicals 1.96% | | | | | | | | | | | | |
| Air Liquide Finance SA | | 0.375% | | 5/27/2031 | | EUR | 100,000 | | | | 90,687 | |
| Air Products & Chemicals, Inc. | | 4.85% | | 2/8/2034 | | $ | 100,000 | | | | 100,334 | |
| Itelyum Regeneration SpA | | 4.625% | | 10/1/2026 | | EUR | 100,000 | | | | 106,791 | |
| Olympus Water U.S. Holding Corp. | | 9.625% | | 11/15/2028 | | EUR | 100,000 | | | | 116,451 | |
| Total | | | | | | | | | | | 414,263 | |
| | | | | | | | | | | | | |
| Commercial Services 2.01% | | | | | | | | | | | | |
| Bureau Veritas SA | | 1.875% | | 1/6/2025 | | EUR | 100,000 | | | | 107,462 | |
| Global Payments, Inc. | | 3.20% | | 8/15/2029 | | $ | 98,000 | | | | 89,839 | |
| Massachusetts Institute of Technology | | 3.959% | | 7/1/2038 | | | 75,000 | | | | 70,486 | |
| Quanta Services, Inc. | | 2.35% | | 1/15/2032 | | | 75,000 | | | | 62,630 | |
| Techem Verwaltungsgesellschaft 674 GmbH | | 6.00% | | 7/30/2026 | | EUR | 87,920 | | | | 95,375 | |
| Total | | | | | | | | | | | 425,792 | |
| | |
| 2 | See Notes to Financial Statements. |
Schedule of Investments (continued)
CLIMATE FOCUSED BOND FUND July 31, 2024
| Investments | | Interest
Rate | | Maturity
Date | | Principal
Amount† | | | Fair
Value | |
| Distribution/Wholesale 0.47% | | | | | | | | | | |
| Rexel SA | | 2.125% | | 12/15/2028 | | EUR | 100,000 | | | $ | 100,069 | |
| | | | | | | | | | | | | |
| Diversified Financial Services 0.49% | | | | | | | | | | | | |
| LeasePlan Corp. NV | | 0.25% | | 2/23/2026 | | EUR | 100,000 | | | | 103,226 | |
| | | | | | | | | | | | | |
| Electric 12.38% | | | | | | | | | | | | |
| AES Corp. | | 2.45% | | 1/15/2031 | | $ | 60,000 | | | | 50,530 | |
| AES Corp. | | 5.45% | | 6/1/2028 | | | 56,000 | | | | 56,558 | |
| CenterPoint Energy Houston Electric LLC | | 5.30% | | 4/1/2053 | | | 96,000 | | | | 94,056 | |
| Clearway Energy Operating LLC† | | 3.75% | | 2/15/2031 | | | 75,000 | | | | 66,486 | |
| Enel Finance International NV (Netherlands)†(a) | | 2.50% | | 7/12/2031 | | | 200,000 | | | | 168,558 | |
| Enel Finance International NV (Netherlands)†(a) | | 5.125% | | 6/26/2029 | | | 200,000 | | | | 201,023 | |
| Engie SA | | 0.375% | | 6/21/2027 | | EUR | 100,000 | | | | 100,145 | |
| Engie SA | | 3.625% | | 1/11/2030 | | EUR | 100,000 | | | | 109,800 | |
| Iberdrola International BV | | 1.45%
(5 yr. EUR Swap + 1.83% | )# | – | (b) | EUR | 100,000 | | | | 101,815 | |
| Iberdrola International BV | | 1.45%
(5 yr. EUR Swap + 1.83% | )# | – | (b) | EUR | 100,000 | | | | 101,815 | |
| Ignitis Grupe AB | | 2.00% | | 5/21/2030 | | EUR | 100,000 | | | | 97,013 | |
| Leeward Renewable Energy Operations LLC† | | 4.25% | | 7/1/2029 | | $ | 82,000 | | | | 74,668 | |
| Liberty Utilities Finance GP 1† | | 2.05% | | 9/15/2030 | | | 70,000 | | | | 58,906 | |
| MidAmerican Energy Co. | | 3.95% | | 8/1/2047 | | | 65,000 | | | | 52,230 | |
| MidAmerican Energy Co. | | 5.85% | | 9/15/2054 | | | 28,000 | | | | 29,521 | |
| NextEra Energy Capital Holdings, Inc. | | 1.90% | | 6/15/2028 | | | 47,000 | | | | 42,368 | |
| NextEra Energy Operating Partners LP† | | 4.50% | | 9/15/2027 | | | 56,000 | | | | 53,658 | |
| Orsted AS | | 2.125% | | 5/17/2027 | | GBP | 100,000 | | | | 119,194 | |
| Pattern Energy Operations LP/Pattern Energy Operations, Inc.† | | 4.50% | | 8/15/2028 | | $ | 49,000 | | | | 46,271 | |
| Ren Finance BV | | 0.50% | | 4/16/2029 | | EUR | 100,000 | | | | 95,859 | |
| ReNew Wind Energy AP2/ReNew Power Pvt Ltd. other 9 Subsidiaries (India)(a) | | 4.50% | | 7/14/2028 | | $ | 200,000 | | | | 184,265 | |
| Solar Star Funding LLC† | | 5.375% | | 6/30/2035 | | | 73,351 | | | | 73,008 | |
| Sorik Marapi Geothermal Power PT (Indonesia)†(a)(c) | | 7.75% | | 8/5/2031 | | | 200,000 | | | | 201,000 | |
| Southwestern Public Service Co. | | 3.75% | | 6/15/2049 | | | 50,000 | | | | 37,248 | |
| SSE PLC | | 4.00% | | 9/5/2031 | | EUR | 100,000 | | | | 112,228 | |
| Terna - Rete Elettrica Nazionale | | 0.75% | | 7/24/2032 | | EUR | 100,000 | | | | 88,967 | |
| TransAlta Corp. (Canada)(a) | | 7.75% | | 11/15/2029 | | $ | 48,000 | | | | 50,393 | |
| Tucson Electric Power Co. | | 1.50% | | 8/1/2030 | | | 60,000 | | | | 50,139 | |
| Vattenfall AB | | 0.50% | | 6/24/2026 | | EUR | 100,000 | | | | 102,874 | |
| Total | | | | | | | | | | | 2,620,596 | |
| | | |
| | See Notes to Financial Statements. | 3 |
Schedule of Investments (continued)
CLIMATE FOCUSED BOND FUND July 31, 2024
| Investments | | Interest
Rate | | Maturity
Date | | Principal
Amount† | | | Fair
Value | |
| Electrical Components & Equipment 1.02% | | | | | | | | | | | | |
| Acuity Brands Lighting, Inc. | | 2.15% | | 12/15/2030 | | $ | 125,000 | | | $ | 106,157 | |
| Nexans SA | | 4.25% | | 3/11/2030 | | EUR | 100,000 | | | | 109,478 | |
| Total | | | | | | | | | | | 215,635 | |
| | | | | | | | | | | | | |
| Electronics 0.25% | | | | | | | | | | | | |
| Hubbell, Inc. | | 3.50% | | 2/15/2028 | | $ | 55,000 | | | | 52,850 | |
| | | | | | | | | | | | | |
| Energy-Alternate Sources 3.33% | | | | | | | | | | | | |
| Continental Wind LLC† | | 6.00% | | 2/28/2033 | | | 49,200 | | | | 49,463 | |
| EEW Energy from Waste GmbH | | 0.361% | | 6/30/2026 | | EUR | 200,000 | | | | 203,066 | |
| Scatec ASA | | 6.33%
(3 mo. EURIBOR + 2.50% | )# | 8/19/2025 | | EUR | 100,000 | | | | 108,225 | |
| Sunnova Energy Corp.† | | 5.875% | | 9/1/2026 | | $ | 97,000 | | | | 80,629 | |
| Sweihan PV Power Co. PJSC (United Arab Emirates)†(a) | | 3.625% | | 1/31/2049 | | | 188,782 | | | | 153,132 | |
| TerraForm Power Operating LLC† | | 4.75% | | 1/15/2030 | | | 55,000 | | | | 51,152 | |
| Topaz Solar Farms LLC† | | 5.75% | | 9/30/2039 | | | 61,417 | | | | 60,048 | |
| Total | | | | | | | | | | | 705,715 | |
| | | | | | | | | | | | | |
| Engineering & Construction 0.49% | | | | | | | | | | | | |
| Jacobs Engineering Group, Inc. | | 5.90% | | 3/1/2033 | | | 101,000 | | | | 103,271 | |
| | | | | | | | | | | | | |
| Environmental Control 2.83% | | | | | | | | | | | | |
| Clean Harbors, Inc.† | | 6.375% | | 2/1/2031 | | | 53,000 | | | | 53,651 | |
| FCC Servicios Medio Ambiente Holding SAU | | 1.661% | | 12/4/2026 | | EUR | 100,000 | | | | 104,467 | |
| GFL Environmental, Inc. (Canada)†(a) | | 6.75% | | 1/15/2031 | | $ | 60,000 | | | | 61,774 | |
| Madison IAQ LLC† | | 5.875% | | 6/30/2029 | | | 54,000 | | | | 50,613 | |
| Paprec Holding SA† | | 3.50% | | 7/1/2028 | | EUR | 100,000 | | | | 104,469 | |
| Veralto Corp.† | | 4.15% | | 9/19/2031 | | EUR | 200,000 | | | | 224,470 | |
| Total | | | | | | | | | | | 599,444 | |
| | | | | | | | | | | | | |
| Food 0.44% | | | | | | | | | | | | |
| Kerry Group Financial Services Unltd. Co. | | 0.875% | | 12/1/2031 | | EUR | 100,000 | | | | 92,586 | |
| | | | | | | | | | | | | |
| Forest Products & Paper 0.49% | | | | | | | | | | | | |
| Ahlstrom Holding 3 OY | | 3.625% | | 2/4/2028 | | EUR | 100,000 | | | | 104,700 | |
| | | | | | | | | | | | | |
| Health Care-Services 0.48% | | | | | | | | | | | | |
| Kaiser Foundation Hospitals | | 3.15% | | 5/1/2027 | | $ | 67,000 | | | | 64,912 | |
| Seattle Children’s Hospital | | 2.719% | | 10/1/2050 | | | 55,000 | | | | 36,136 | |
| Total | | | | | | | | | | | 101,048 | |
| | |
| 4 | See Notes to Financial Statements. |
Schedule of Investments (continued)
CLIMATE FOCUSED BOND FUND July 31, 2024
| Investments | | Interest
Rate | | Maturity
Date | | Principal
Amount† | | | Fair
Value | |
| Insurance 0.92% | | | | | | | | | | |
| AXA SA | | 1.375%
(3 mo. EURIBOR + 2.40% | )# | 10/7/2041 | | EUR | 100,000 | | | $ | 91,635 | |
| PartnerRe Ireland Finance DAC | | 1.25% | | 9/15/2026 | | EUR | 100,000 | | | | 103,519 | |
| Total | | | | | | | | | | | 195,154 | |
| |
| Machinery: Construction & Mining 0.34% | | | | | | | | | | | | |
| Vertiv Group Corp.† | | 4.125% | | 11/15/2028 | | $ | 75,000 | | | | 71,105 | |
| | | | | | | | | | | | | |
| Machinery-Diversified 0.83% | | | | | | | | | | | | |
| Mueller Water Products, Inc.† | | 4.00% | | 6/15/2029 | | | 59,000 | | | | 55,107 | |
| nVent Finance SARL (Luxembourg)(a) | | 2.75% | | 11/15/2031 | | | 144,000 | | | | 121,396 | |
| Total | | | | | | | | | | | 176,503 | |
| |
| Media 0.83% | | | | | | | | | | | | |
| VZ Secured Financing BV (Netherlands)†(a) | | 5.00% | | 1/15/2032 | | | 200,000 | | | | 175,678 | |
| |
| Mining 1.51% | | | | | | | | | | | | |
| Constellium SE†(c) | | 5.375% | | 8/15/2032 | | EUR | 200,000 | | | | 217,235 | |
| Novelis Sheet Ingot GmbH† | | 3.375% | | 4/15/2029 | | EUR | 100,000 | | | | 103,214 | |
| Total | | | | | | | | | | | 320,449 | |
| |
| Miscellaneous Manufacturing 1.50% | | | | | | | | | | | | |
| Eaton Corp. | | 4.15% | | 3/15/2033 | | $ | 62,000 | | | | 59,470 | |
| Pentair Finance SARL (Luxembourg)(a) | | 4.50% | | 7/1/2029 | | | 45,000 | | | | 44,235 | |
| Siemens Financieringsmaatschappij NV | | 3.375% | | 8/24/2031 | | EUR | 100,000 | | | | 111,060 | |
| Wabtec Transportation Netherlands BV | | 1.25% | | 12/3/2027 | | EUR | 100,000 | | | | 101,802 | |
| Total | | | | | | | | | | | 316,567 | |
| |
| Municipal 1.19% | | | | | | | | | | | | |
| Transport for London | | 2.125% | | 4/24/2025 | | GBP | 200,000 | | | | 251,790 | |
| |
| Packaging & Containers 1.62% | | | | | | | | | | | | |
| Canpack SA/Canpack U.S. LLC (Poland)†(a) | | 3.125% | | 11/1/2025 | | $ | 200,000 | | | | 192,935 | |
| Owens-Brockway Glass Container, Inc.† | | 7.25% | | 5/15/2031 | | | 56,000 | | | | 55,479 | |
| Smurfit Kappa Treasury ULC | | 0.50% | | 9/22/2029 | | EUR | 100,000 | | | | 94,399 | |
| Total | | | | | | | | | | | 342,813 | |
| |
| Pharmaceuticals 0.61% | | | | | | | | | | | | |
| Eli Lilly & Co. | | 0.50% | | 9/14/2033 | | EUR | 100,000 | | | | 88,050 | |
| Pfizer, Inc. | | 2.625% | | 4/1/2030 | | $ | 45,000 | | | | 40,830 | |
| Total | | | | | | | | | | | 128,880 | |
| | | |
| | See Notes to Financial Statements. | 5 |
Schedule of Investments (continued)
CLIMATE FOCUSED BOND FUND July 31, 2024
| Investments | | Interest
Rate | | Maturity
Date | | Principal
Amount† | | | Fair
Value | |
| Real Estate 2.77% | | | | | | | | | | | | |
| Blackstone Property Partners Europe Holdings SARL | | 1.625% | | 4/20/2030 | | EUR | 100,000 | | | $ | 95,115 | |
| Kojamo OYJ | | 0.875% | | 5/28/2029 | | EUR | 100,000 | | | | 93,597 | |
| LEG Immobilien SE | | 0.75% | | 6/30/2031 | | EUR | 100,000 | | | | 88,542 | |
| Logicor Financing SARL | | 2.00% | | 1/17/2034 | | EUR | 100,000 | | | | 90,419 | |
| P3 Group SARL | | 4.625% | | 2/13/2030 | | EUR | 100,000 | | | | 110,773 | |
| Prologis International Funding II SA | | 3.625% | | 3/7/2030 | | EUR | 100,000 | | | | 108,831 | |
| Total | | | | | | | | | | | 587,277 | |
| |
| REITS 2.54% | | | | | | | | | | | | |
| CBRE Global Investors Open-Ended Funds SCA SICAV-SIF-Pan European Core Fund | | 4.75% | | 3/27/2034 | | EUR | 100,000 | | | | 113,805 | |
| Digital Dutch Finco BV | | 1.00% | | 1/15/2032 | | EUR | 100,000 | | | | 88,264 | |
| Goodman U.S. Finance Five LLC† | | 4.625% | | 5/4/2032 | | $ | 140,000 | | | | 133,336 | |
| HAT Holdings I LLC/HAT Holdings II LLC† | | 3.75% | | 9/15/2030 | | | 72,000 | | | | 63,260 | |
| Merlin Properties Socimi SA | | 1.375% | | 6/1/2030 | | EUR | 100,000 | | | | 95,066 | |
| Weyerhaeuser Co. | | 6.875% | | 12/15/2033 | | $ | 40,000 | | | | 44,423 | |
| Total | | | | | | | | | | | 538,154 | |
| |
| Sovereign 0.85% | | | | | | | | | | | | |
| European Union | | 1.25% | | 2/4/2043 | | EUR | 226,755 | | | | 178,924 | |
| |
| Telecommunications 1.97% | | | | | | | | | | | | |
| NTT Finance Corp. (Japan)†(a) | | 4.372% | | 7/27/2027 | | $ | 200,000 | | | | 198,612 | |
| Vmed O2 U.K. Financing I PLC† | | 4.50% | | 7/15/2031 | | GBP | 200,000 | | | | 217,570 | |
| Total | | | | | | | | | | | 416,182 | |
| |
| Transportation 5.41% | | | | | | | | | | | | |
| Central Japan Railway Co. (Japan)(a) | | 2.20% | | 10/2/2024 | | $ | 400,000 | | | | 397,639 | |
| Deutsche Bahn Finance GmbH | | 0.95%
(5 yr. EUR Swap + 1.26% | )# | – | (b) | EUR | 100,000 | | | | 106,046 | |
| Ferrovie dello Stato Italiane SpA | | 0.375% | | 3/25/2028 | | EUR | 100,000 | | | | 97,977 | |
| Firstgroup PLC | | 6.875% | | 9/18/2024 | | GBP | 100,000 | | | | 128,670 | |
| Getlink SE | | 3.50% | | 10/30/2025 | | EUR | 100,000 | | | | 107,876 | |
| Hamburger Hochbahn AG | | 0.125% | | 2/24/2031 | | EUR | 100,000 | | | | 90,049 | |
| Ile-de-France Mobilites | | 0.40% | | 5/28/2031 | | EUR | 100,000 | | | | 90,742 | |
| Stagecoach Group Ltd. | | 4.00% | | 9/29/2025 | | GBP | 100,000 | | | | 125,814 | |
| Total | | | | | | | | | | | 1,144,813 | |
| |
| Water 4.15% | | | | | | | | | | | | |
| Aegea Finance SARL (Luxembourg)†(a) | | 9.00% | | 1/20/2031 | | $ | 200,000 | | | | 211,109 | |
| American Water Capital Corp. | | 2.80% | | 5/1/2030 | | | 62,000 | | | | 55,883 | |
| | |
| 6 | See Notes to Financial Statements. |
Schedule of Investments (continued)
CLIMATE FOCUSED BOND FUND July 31, 2024
| Investments | | Interest
Rate | | Maturity
Date | | Principal
Amount† | | | Fair
Value | |
| Water (continued) | | | | | | | | | | | | |
| Severn Trent Utilities Finance PLC | | 4.625% | | 11/30/2034 | | GBP | 100,000 | | | $ | 120,192 | |
| Severn Trent Utilities Finance PLC | | 4.625% | | 11/30/2034 | | GBP | 100,000 | | | | 120,192 | |
| Suez SACA | | 2.875% | | 5/24/2034 | | EUR | 100,000 | | | | 100,976 | |
| United Utilities PLC (United Kingdom)(a) | | 6.875% | | 8/15/2028 | | $ | 50,000 | | | | 53,429 | |
| Veolia Environnement SA | | 2.50%
(5 yr. EUR Swap + 2.84% | )# | – | (b) | EUR | 100,000 | | | | 98,414 | |
| Yorkshire Water Finance PLC | | 1.75% | | 11/26/2026 | | GBP | 100,000 | | | | 117,228 | |
| Total | | | | | | | | | | | 877,423 | |
| Total Corporate Bonds (cost $14,825,867) | | | | | | | | | | | 14,479,757 | |
| | | | | | | | | | | | | |
| FLOATING RATE LOANS(d) 1.92% | | | | | | | | | | | | |
| | | | | | | | | | | | | |
| Building & Construction 0.09% | | | | | | | | | | | | |
| Legence Holdings LLC 2021 Term Loan | | 8.944%
(1 mo. USD Term
SOFR + 3.50% | ) | 12/16/2027 | | $ | 19,153 | | | | 19,246 | |
| | | | | | | | | | | | | |
| Building Materials 0.18% | | | | | | | | | | | | |
| Hobbs & Associates LLC Delayed Draw Term Loan(e) | | – | (f) | 7/16/2031 | | | 3,364 | | | | 3,368 | |
| Hobbs & Associates LLC Term Loan B | | 8.589%
(3 mo. USD Term
SOFR + 3.25% | ) | 7/16/2031 | | | 33,636 | | | | 33,678 | |
| Total | | | | | | | | | | | 37,046 | |
| | | | | | | | | | | | | |
| Commercial Services 0.41% | | | | | | | | | | | | |
| IFCO Management GmbH 2024 EUR Term Loan B | | 7.652%
(6 mo. EURIBOR + 4.00% | ) | 11/29/2029 | | EUR | 33,371 | | | | 36,336 | |
| Techem Verwaltungsgesellschaft 675 GmbH 2024 EUR Term Loan B | | 7.374%
(1 mo. EURIBOR + 3.75% | ) | 7/15/2029 | | EUR | 46,967 | | | | 51,037 | |
| Total | | | | | | | | | | | 87,373 | |
| | | | | | | | | | | | | |
| Containers & Packaging 0.26% | | | | | | | | | | | | |
| Kouti BV 2021 EUR Term Loan | | 7.219%
(3 mo. EURIBOR + 3.43% | ) | 8/31/2028 | | EUR | 50,000 | | | | 54,233 | |
| | | | | | | | | | | | | |
| Electric: Generation 0.25% | | | | | | | | | | | | |
| ExGen Renewables IV LLC 2020 Term Loan | | 8.109%
(3 mo. USD Term
SOFR + 2.50% | ) | 12/15/2027 | | $ | 26,886 | | | | 26,971 | |
| ExGen Renewables IV, LLC 2024 Term Loan B | | – | (f) | 12/15/2027 | | | 26,886 | | | | 26,970 | |
| Total | | | | | | | | | | | 53,941 | |
| | | |
| | See Notes to Financial Statements. | 7 |
Schedule of Investments (continued)
CLIMATE FOCUSED BOND FUND July 31, 2024
| Investments | | Interest
Rate | | Maturity
Date | | Principal
Amount† | | | Fair
Value | |
| Energy: Alternate Sources 0.24% | | | | | | | | | | | | |
| TerraForm Power Operating LLC 2023 Term Loan B | | 7.935%
(3 mo. USD Term SOFR + 2.50% | ) | 5/21/2029 | | $ | 49,984 | | | $ | 50,213 | |
| | | | | | | | | | | | | |
| Integrated Energy 0.08% | | | | | | | | | | | | |
| Esdec Solar Group BV Term Loan B (Netherlands)(a) | | 10.596%
(3 mo. USD Term SOFR + 5.00% | ) | 8/30/2028 | | | 18,223 | | | | 17,084 | |
| | | | | | | | | | | | | |
| Machinery 0.11% | | | | | | | | | | | | |
| Array Technologies, Inc. Term Loan B | | 8.71%
(3 mo. USD Term SOFR + 3.25% | ) | 10/14/2027 | | | 24,191 | | | | 24,233 | |
| | | | | | | | | | | | | |
| Retail 0.06% | | | | | | | | | | | | |
| Thermostat Purchaser III, Inc. 2024 Term Loan B | | 9.594%
(3 mo. USD Term SOFR + 4.25% | ) | 8/31/2028 | | | 13,652 | | | | 13,669 | |
| | | | | | | | | | | | | |
| Service 0.24% | | | | | | | | | | | | |
| Service Logic Acquisition, Inc. Term Loan | | 9.458% - 9.51%
(1 mo. USD Term
SOFR + 4.00%
(3 mo. USD Term
SOFR + 4.00% | )
) | 10/29/2027 | | | 49,743 | | | | 50,085 | |
| Total Floating Rate Loans (cost $405,536) | | | | | | | | | | | 407,123 | |
| | | | | | | | | | | | | |
| FOREIGN GOVERNMENT OBLIGATIONS 18.10% | | | | | | | |
| | | | | | | | | | | | | |
| Chile 0.50% | | | | | | | | | | | | |
| Chile Government International Bonds | | 0.83% | | 7/2/2031 | | EUR | 117,000 | | | | 106,054 | |
| | | | | | | | | | | | | |
| France 4.40% | | | | | | | | | | | | |
| Action Logement Services | | 0.50% | | 10/30/2034 | | EUR | 200,000 | | | | 164,331 | |
| French Republic Government Bonds OAT | | 1.75% | | 6/25/2039 | | EUR | 194,320 | | | | 174,495 | |
| French Republic Government Bonds OAT | | 3.00% | | 6/25/2049 | | EUR | 165,000 | | | | 166,640 | |
| Ile-de-France Mobilites | | 0.40% | | 5/28/2031 | | EUR | 100,000 | | | | 90,742 | |
| SNCF Reseau | | 0.75% | | 5/25/2036 | | EUR | 100,000 | | | | 80,612 | |
| Societe Des Grands Projets EPIC | | 0.30% | | 9/2/2036 | | EUR | 100,000 | | | | 75,772 | |
| Societe Des Grands Projets EPIC | | 1.125% | | 5/25/2034 | | EUR | 200,000 | | | | 178,763 | |
| Total | | | | | | | | | | | 931,355 | |
| | | | | | | | | | | | | |
| Germany 3.40% | | | | | | | | | | | | |
| Bundesrepublik Deutschland Bundesanleihe | | Zero Coupon | | 8/15/2030 | | EUR | 156,315 | | | | 148,796 | |
| Bundesrepublik Deutschland Bundesanleihe | | 3.25% | | 7/4/2042 | | EUR | 478,611 | | | | 571,600 | |
| Total | | | | | | | | | | | 720,396 | |
| | |
| 8 | See Notes to Financial Statements. |
Schedule of Investments (continued)
CLIMATE FOCUSED BOND FUND July 31, 2024
| Investments | | Interest
Rate | | Maturity
Date | | Principal
Amount† | | | Fair
Value | |
| Italy 1.26% | | | | | | | | | | |
| Italy Buoni Poliennali Del Tesoro | | 1.50% | | 4/30/2045 | | EUR | 149,000 | | | $ | 104,625 | |
| Italy Buoni Poliennali Del Tesoro | | 4.00% | | 4/30/2035 | | EUR | 145,000 | | | | 161,897 | |
| Total | | | | | | | | | | | 266,522 | |
| |
| Japan 2.75% | | | | | | | | | | | | |
| Development Bank of Japan, Inc.(a) | | 4.375% | | 9/22/2025 | | $ | 200,000 | | | | 198,718 | |
| Japan Bank for International Cooperation(a) | | 1.625% | | 1/20/2027 | | | 200,000 | | | | 187,380 | |
| Japan Finance Organization for Municipalities | | 0.01% | | 2/2/2028 | | EUR | 200,000 | | | | 195,503 | |
| Total | | | | | | | | | | | 581,601 | |
| |
| Netherlands 1.04% | | | | | | | | | | | | |
| Nederlandse Financierings-Maatschappij voor Ontwikkelingslanden NV | | 3.00% | | 10/25/2027 | | EUR | 200,000 | | | | 219,178 | |
| |
| South Korea 0.95% | | | | | | | | | | | | |
| Korea Electric Power Corp.†(a) | | 4.875% | | 1/31/2027 | | $ | 200,000 | | | | 200,868 | |
| |
| Spain 1.44% | | | | | | | | | | | | |
| Adif Alta Velocidad | | 0.55% | | 4/30/2030 | | EUR | 200,000 | | | | 187,125 | |
| Autonomous Community of Madrid | | 0.419% | | 4/30/2030 | | EUR | 75,000 | | | | 70,374 | |
| Spain Government Bonds | | 1.00% | | 7/30/2042 | | EUR | 66,000 | | | | 47,878 | |
| Total | | | | | | | | | | | 305,377 | |
| |
| United Kingdom 2.36% | | | | | | | | | | | | |
| U.K. Gilts | | 0.875% | | 7/31/2033 | | GBP | 243,000 | | | | 240,377 | |
| U.K. Gilts | | 1.50% | | 7/31/2053 | | GBP | 390,000 | | | | 259,458 | |
| Total | | | | | | | | | | | 499,835 | |
| Total Foreign Government Obligations (cost $3,928,377) | | | | | | 3,831,186 | |
| |
| GOVERNMENT SPONSORED ENTERPRISES COLLATERALIZED MORTGAGE OBLIGATIONS 0.43% |
| Federal Home Loan Mortgage Corp. Multifamily Structured Pass-Through Certificates Series G07 Class A2 (Cost $91,039) | | 3.123% | #(g) | 8/25/2032 | | $ | 100,000 | | | | 91,420 | |
| |
| MUNICIPAL BONDS 1.98% | | | | | | | | | | | | |
| |
| Sales Tax 0.30% | | | | | | | | | | | | |
| Dallas Area Rapid Transit TX | | 2.534% | | 12/1/2036 | | | 80,000 | | | | 62,958 | |
| |
| Taxable Revenue - Water & Sewer 1.68% | | | | | | | | | | | | |
| City of Aurora Water Revenue CO | | 2.348% | | 8/1/2036 | | | 30,000 | | | | 24,100 | |
| City of Dallas Waterworks & Sewer System Revenue TX | | 2.772% | | 10/1/2040 | | | 75,000 | | | | 56,867 | |
| City of Los Angeles Wastewater System Revenue CA | | 5.713% | | 6/1/2039 | | | 50,000 | | | | 52,571 | |
| | | |
| | See Notes to Financial Statements. | 9 |
Schedule of Investments (continued)
CLIMATE FOCUSED BOND FUND July 31, 2024
| Investments | | Interest
Rate | | Maturity
Date | | Principal
Amount† | | | Fair
Value | |
| Taxable Revenue - Water & Sewer (continued) | | | | | | | | | | | | |
| City of San Francisco Public Utilities Commission Water Revenue CA | | 6.00% | | 11/1/2040 | | $ | 100,000 | | | $ | 105,701 | |
| Metropolitan Government of Nashville & Davidson County Water & Sewer Revenue TN | | 2.611% | | 7/1/2036 | | | 20,000 | | | | 16,110 | |
| New York City Municipal Water Finance Authority NY | | 5.75% | | 6/15/2041 | | | 50,000 | | | | 52,277 | |
| San Diego County Water Authority CA | | 1.951% | | 5/1/2034 | | | 60,000 | | | | 47,687 | |
| Total | | | | | | | | | | | 355,313 | |
| Total Municipal Bonds (cost $534,465) | | | | | | | | | | | 418,271 | |
| | | | | | | | | | | | | |
| U.S. TREASURY OBLIGATIONS 3.12% | | | | | | | | | | | | |
| U.S. Treasury Bonds | | 4.25% | | 2/15/2054 | | | 260,000 | | | | 255,755 | |
| U.S. Treasury Notes | | 4.625% | | 2/28/2026 | | | 403,000 | | | | 404,086 | |
| Total U.S. Treasury Obligations (cost $645,719) | | | | | | | | | | | 659,841 | |
| Total Long-Term Investments (cost $20,563,427) | | | | | | | | | | | 20,026,308 | |
| | | | | | | | | | | | | |
| SHORT-TERM INVESTMENTS 5.05% | | | | | | | | | | | | |
| | | | | | | | | | | | | |
| U.S. TREASURY OBLIGATIONS 3.48% | | | | | | | | | | | | |
| U.S. Treasury Bills (Cost $736,202) | | Zero Coupon | | 9/5/2024 | | | 740,000 | | | | 736,207 | |
| | | | | | | | | | | | | |
| REPURCHASE AGREEMENTS 1.57% | | | | | | | | | | | | |
| Repurchase Agreement dated 7/31/2024, 2.800% due 8/1/2024 with Fixed Income Clearing Corp. collateralized by $360,600 of U.S. Treasury Note at 0.375% due 12/31/2025; value: $340,121; proceeds: $333,338 (cost $333,313) | | | | | | | 333,313 | | | | 333,313 | |
| Total Short-Term Investments (cost $1,069,515) | | | | | | | | | | | 1,069,520 | |
| Total Investments in Securities 99.68% (cost $21,632,942) | | | | | | | | 21,095,828 | |
| Less Unfunded Loan Commitments (0.02%) (cost $3,364) | | | | | | | | (3,368 | ) |
| Net Investments in Securities 99.66% (cost $21,629,578) | | | | | | | | 21,092,460 | |
| Other Assets and Liabilities – Net(h) 0.33% | | | | | | | | 70,511 | |
| Net Assets 100.00% | | | | | | | | | | $ | 21,162,971 | |
| | |
| EUR | Euro. |
| GBP | British Pound. |
| EURIBOR | Euro Interbank Offered Rate. |
| ICE | Intercontinental Exchange. |
| REITS | Real Estate Investment Trusts. |
| SOFR | Secured Overnight Financing Rate. |
| | | |
| † | | Principal Amount is denominated in U.S. dollars unless otherwise noted. |
| † | | Security was purchased pursuant to Rule 144A under the Securities Act of 1933 and, unless registered under such Act or exempted from registration, may only be resold to qualified institutional buyers. At July 31, 2024, the total value of Rule 144A securities was $4,312,346, which represents 20.38% of net assets. |
| # | | Variable rate security. The interest rate represents the rate in effect at July 31, 2024. |
| (a) | | Foreign security traded in U.S. dollars. |
| | |
| 10 | See Notes to Financial Statements. |
Schedule of Investments (continued)
CLIMATE FOCUSED BOND FUND July 31, 2024
| (b) | | Security is perpetual in nature and has no stated maturity. |
| (c) | | Securities purchased on a when-issued basis (See Note 2(k)). |
| (d) | | Floating Rate Loans in which the Fund invests generally pay interest at rates which are periodically re-determined at a margin above the SOFR or the prime rate offered by major U.S. banks. The rate(s) shown is the rate(s) in effect at July 31, 2024. |
| (e) | | Security partially/fully unfunded. (See Note 2(l)). |
| (f) | | Interest Rate to be determined. |
| (g) | | Interest rate is based on the weighted average interest rates of the underlying mortgages within the mortgage pool. |
| (h) | | Other Assets and Liabilities – Net include net unrealized appreciation/depreciation on forward foreign currency exchange contracts and futures contracts as follows: |
Forward Foreign Currency Exchange Contracts at July 31, 2024:
Forward
Foreign
Currency
Exchange
Contracts | | Transaction
Type | | Counterparty | | Expiration
Date | | Foreign
Currency | | | U.S. $
Cost on
Origination
Date | | | U.S. $
Current
Value | | | Unrealized
Appreciation | |
| Euro | | Buy | | Bank of America | | 8/20/2024 | | | 47,000 | | | | $ | 50,726 | | | | $ | 50,908 | | | | $ | 182 | |
| Euro | | Buy | | Morgan Stanley | | 8/20/2024 | | | 139,000 | | | | | 149,727 | | | | | 150,558 | | | | | 831 | |
| Euro | | Buy | | State Street
Bank and Trust | | 8/20/2024 | | | 91,000 | | | | | 97,950 | | | | | 98,567 | | | | | 617 | |
| Euro | | Buy | | State Street
Bank and Trust | | 8/20/2024 | | | 95,000 | | | | | 102,827 | | | | | 102,900 | | | | | 73 | |
| Euro | | Sell | | Bank of America | | 8/20/2024 | | | 77,000 | | | | | 83,580 | | | | | 83,403 | | | | | 177 | |
| Euro | | Sell | | Morgan Stanley | | 8/20/2024 | | | 9,435,000 | | | | | 10,300,375 | | | | | 10,219,545 | | | | | 80,830 | |
| Euro | | Sell | | Morgan Stanley | | 8/20/2024 | | | 102,000 | | | | | 111,276 | | | | | 110,482 | | | | | 794 | |
| Euro | | Sell | | Morgan Stanley | | 8/20/2024 | | | 5,000 | | | | | 5,448 | | | | | 5,416 | | | | | 32 | |
| Euro | | Sell | | Morgan Stanley | | 8/20/2024 | | | 62,000 | | | | | 67,691 | | | | | 67,155 | | | | | 536 | |
| Euro | | Sell | | State Street
Bank and Trust | | 8/20/2024 | | | 200,000 | | | | | 217,127 | | | | | 216,631 | | | | | 496 | |
| Euro | | Sell | | Toronto
Dominion Bank | | 8/20/2024 | | | 33,000 | | | | | 36,023 | | | | | 35,744 | | | | | 279 | |
| Total Unrealized Appreciation on Forward Foreign Currency Exchange Contracts | | | | | | | | | $ | 84,847 | |
| | | | | | | | | | | | | | | | | | | | |
Forward
Foreign
Currency
Exchange
Contracts | | Transaction
Type | | Counterparty | | Expiration
Date | | | Foreign
Currency | | | U.S. $
Cost on
Origination
Date | | | U.S. $
Current
Value | | | Unrealized
Depreciation | |
| Euro | | Buy | | State Street
Bank and Trust | | 8/8/2024 | | | 200,000 | | | | $ | 217,006 | | | | $ | 216,509 | | | | $ | (497 | ) |
| Euro | | Buy | | Bank of America | | 8/20/2024 | | | 190,000 | | | | | 206,305 | | | | | 205,799 | | | | | (506 | ) |
| Euro | | Buy | | Bank of America | | 8/20/2024 | | | 93,000 | | | | | 101,231 | | | | | 100,733 | | | | | (498 | ) |
| Euro | | Buy | | State Street
Bank and Trust | | 8/20/2024 | | | 101,000 | | | | | 110,204 | | | | | 109,398 | | | | | (806 | ) |
| Euro | | Buy | | State Street
Bank and Trust | | 8/20/2024 | | | 76,000 | | | | | 82,760 | | | | | 82,320 | | | | | (440 | ) |
| Euro | | Buy | | State Street
Bank and Trust | | 8/20/2024 | | | 24,000 | | | | | 26,221 | | | | | 25,996 | | | | | (225 | ) |
| Euro | | Buy | | Toronto
Dominion Bank | | 8/20/2024 | | | 100,000 | | | | | 108,672 | | | | | 108,315 | | | | | (357 | ) |
| | | |
| | See Notes to Financial Statements. | 11 |
Schedule of Investments (continued)
CLIMATE FOCUSED BOND FUND July 31, 2024
Forward
Foreign
Currency
Exchange
Contracts | | Transaction
Type | | Counterparty | | Expiration
Date | | Foreign
Currency | | | U.S. $
Cost on
Origination
Date | | | U.S. $
Current
Value | | | Unrealized
Depreciation | |
| British pound | | Sell | | State Street
Bank and Trust | | 8/30/2024 | | | 1,303,000 | | | | $ | 1,654,015 | | | | $ | 1,675,529 | | | | $ | (21,514 | ) |
| British pound | | Sell | | State Street
Bank and Trust | | 8/30/2024 | | | 116,000 | | | | | 148,234 | | | | | 149,164 | | | | | (930 | ) |
| British pound | | Sell | | Toronto
Dominion Bank | | 8/30/2024 | | | 85,000 | | | | | 108,667 | | | | | 109,302 | | | | | (635 | ) |
| Euro | | Sell | | Bank of America | | 8/20/2024 | | | 36,000 | | | | | 38,648 | | | | | 38,993 | | | | | (345 | ) |
| Euro | | Sell | | Morgan Stanley | | 8/20/2024 | | | 47,000 | | | | | 50,506 | | | | | 50,908 | | | | | (402 | ) |
| Euro | | Sell | | State Street
Bank and Trust | | 8/20/2024 | | | 55,000 | | | | | 59,264 | | | | | 59,573 | | | | | (309 | ) |
| Total Unrealized Depreciation on Forward Foreign Currency Exchange Contracts | | | | | | | | | | | | | $ | (27,464 | ) |
Futures Contracts at July 31, 2024:
| Type | | Expiration | | Contracts | | Position | | Notional
Amount | | | Notional
Value | | | Unrealized
Appreciation | |
| Euro-Bund | | September 2024 | | 12 | | Long | | EUR | 1,560,191 | | | EUR | 1,604,760 | | | | $ | 48,235 | |
| Euro-Buxl | | September 2024 | | 7 | | Long | | | 893,906 | | | | 943,180 | | | | | 53,327 | |
| Euro-Schatz | | September 2024 | | 20 | | Long | | | 2,104,918 | | | | 2,121,500 | | | | | 17,946 | |
| U.S. 2-Year Treasury Note | | September 2024 | | 12 | | Long | | $ | 2,445,349 | | | $ | 2,464,406 | | | | | 19,057 | |
| Total Unrealized Appreciation on Futures Contracts | | | | | | | | | | | | $ | 138,565 | |
| | | | | | | | | | | | | | | | | |
| Type | | Expiration | | Contracts | | Position | | Notional
Amount | | | Notional
Value | | | Unrealized
Depreciation | |
| U.S. 10-Year Ultra Treasury Note | | September 2024 | | 7 | | Short | | $ | (790,399 | ) | | $ | (809,047 | ) | | | $ | (18,648 | ) |
| U.S. 5-Year Treasury Note | | September 2024 | | 23 | | Short | | | (2,440,044 | ) | | | (2,481,484 | ) | | | | (41,440 | ) |
| U.S. Long Bond | | September 2024 | | 2 | | Short | | | (234,338 | ) | | | (241,563 | ) | | | | (7,225 | ) |
| Total Unrealized Depreciation on Futures Contracts | | | | | | | | | | | | $ | (67,313 | ) |
| | |
| 12 | See Notes to Financial Statements. |
Schedule of Investments (concluded)
CLIMATE FOCUSED BOND FUND July 31, 2024
The following is a summary of the inputs used as of July 31, 2024 in valuing the Fund’s investments carried at fair value(1):
| Investment Type(2) | | Level 1 | | | Level 2 | | | Level 3 | | | Total | |
| Long-Term Investments | | | | | | | | | | | | | | | | |
| Asset-Backed Securities | | $ | – | | | $ | 50,158 | | | $ | – | | | $ | 50,158 | |
| Convertible Bonds | | | – | | | | 88,552 | | | | – | | | | 88,552 | |
| Corporate Bonds | | | – | | | | 14,479,757 | | | | – | | | | 14,479,757 | |
| Floating Rate Loans | | | – | | | | 407,123 | | | | – | | | | 407,123 | |
| Less Unfunded Loan Commitments | | | – | | | | (3,368 | ) | | | – | | | | (3,368 | ) |
| Foreign Government Obligations | | | – | | | | 3,831,186 | | | | – | | | | 3,831,186 | |
| Government Sponsored Enterprises Collateralized Mortgage Obligations | | | – | | | | 91,420 | | | | – | | | | 91,420 | |
| Municipal Bonds | | | – | | | | 418,271 | | | | – | | | | 418,271 | |
| U.S. Treasury Obligations | | | – | | | | 659,841 | | | | – | | | | 659,841 | |
| Short-Term Investments | | | | | | | | | | | | | | | | |
| U.S. Treasury Obligations | | | – | | | | 736,207 | | | | – | | | | 736,207 | |
| Repurchase Agreements | | | – | | | | 333,313 | | | | – | | | | 333,313 | |
| Total | | $ | – | | | $ | 21,092,460 | | | $ | – | | | $ | 21,092,460 | |
| | | | | | | | | | | | | | | | | |
| Other Financial Instruments | | | | | | | | | | | | | | | | |
| Forward Foreign Currency Exchange Contracts | | | | | | | | | | | | | | | | |
| Assets | | $ | – | | | $ | 84,847 | | | $ | – | | | $ | 84,847 | |
| Liabilities | | | – | | | | (27,464 | ) | | | – | | | | (27,464 | ) |
| Futures Contracts | | | | | | | | | | | | | | | | |
| Assets | | | 138,565 | | | | – | | | | – | | | | 138,565 | |
| Liabilities | | | (67,313 | ) | | | – | | | | – | | | | (67,313 | ) |
| Total | | $ | 71,252 | | | $ | 57,383 | | | $ | – | | | $ | 128,635 | |
| | | |
| (1) | | Refer to Note 2(p) for a description of fair value measurements and the three-tier hierarchy of inputs. |
| (2) | | See Schedule of Investments for fair values in each industry and identification of foreign issuers and/or geography. The table above is presented by Investment Type. Industries are presented within an Investment Type should such Investment Type include securities classified as two or more levels within the three-tier fair value hierarchy. When applicable, each Level 3 security is identified on the Schedule of Investments along with the valuation technique utilized. |
A reconciliation of Level 3 investments is presented when the Fund has a material amount of Level 3 investments at the beginning or end of the year in relation to the Fund’s net assets.
| | See Notes to Financial Statements. | 13 |
Schedule of Investments
EMERGING MARKETS EQUITY FUND July 31, 2024
| Investments | | Shares | | | U.S. $
Fair Value | |
| LONG-TERM INVESTMENTS 95.27% | | | | | |
| | | | | | | | | |
| COMMON STOCKS 93.30% | | | | | | | | |
| | | | | | | | | |
| Australia 0.92% | | | | | | | | |
| | | | | | | | | |
| Metals & Mining | | | | | | | | |
| BHP Group Ltd. | | | 1,833 | | | $ | 50,911 | |
| | | | | | | | | |
| Austria 0.98% | | | | | | | | |
| | | | | | | | | |
| Banks | | | | | | | | |
| Erste Group Bank AG | | | 1,046 | | | | 54,409 | |
| | | | | | | | | |
| Brazil 2.72% | | | | | | | | |
| | | | | | | | | |
| Banks 0.80% | | | | | | | | |
| NU Holdings Ltd. Class A* | | | 3,627 | | | | 43,996 | |
| | | | | | | | | |
| Broadline Retail 0.84% | | | | | | | | |
| MercadoLibre, Inc.* | | | 28 | | | | 46,729 | |
| | | | | | | | | |
| Metals & Mining 1.08% | | | | | | | | |
| Vale SA | | | 5,502 | | | | 59,950 | |
| Total Brazil | | | | | | | 150,675 | |
| | | | | | | | | |
| Canada 0.65% | | | | | | | | |
| | | | | | | | | |
| Metals & Mining | | | | | | | | |
| Teck Resources Ltd. Class B | | | 730 | | | | 35,777 | |
| | | | | | | | | |
| China 19.32% | | | | | | | | |
| | | | | | | | | |
| Automobiles 1.57% | | | | | | | | |
| BYD Co. Ltd. Class H | | | 2,929 | | | | 86,712 | |
| | | | | | | | | |
| Banks 3.20% | | | | | | | | |
| China Construction Bank Corp. Class H | | | 144,373 | | | | 100,814 | |
| Industrial & Commercial Bank of China Ltd. Class H | | | 137,564 | | | | 76,208 | |
| | | | | | | | 177,022 | |
| | | | | | | | | |
| Beverages 1.14% | | | | | | | | |
| Kweichow Moutai Co. Ltd. Class A | | | 320 | | | | 62,911 | |
| Investments | | Shares | | | U.S. $
Fair Value | |
| China (continued) | | | | | | | | |
| | | | | | | | | |
| Broadline Retail 1.98% | | | | | | | | |
| Alibaba Group Holding Ltd. | | | 7,339 | | | $ | 72,217 | |
| PDD Holdings, Inc. ADR* | | | 292 | | | | 37,636 | |
| | | | | | | | 109,853 | |
| | | | | | | | | |
| Electrical Equipment 0.76% | | | | | | | | |
| NARI Technology Co. Ltd. Class A | | | 12,720 | | | | 42,262 | |
| | | | | | | | | |
| Entertainment 1.60% | | | | | | | | |
| NetEase, Inc. | | | 2,815 | | | | 51,919 | |
| Tencent Music Entertainment Group ADR | | | 2,579 | | | | 36,570 | |
| | | | | | | | 88,489 | |
| | | | | | | | | |
| Hotels, Restaurants & Leisure 1.40% | | | | | | | | |
| Meituan Class B†* | | | 2,500 | | | | 34,617 | |
| Trip.com Group Ltd.* | | | 999 | | | | 42,649 | |
| | | | | | | | 77,266 | |
| | | | | | | | | |
| Insurance 0.59% | | | | | | | | |
| Ping An Insurance Group Co. of China Ltd. Class H | | | 7,485 | | | | 32,505 | |
| | | | | | | | | |
| Interactive Media & Services 4.77% | | | | | | | | |
| Tencent Holdings Ltd. | | | 5,723 | | | | 264,096 | |
| | | | | | | | | |
| Machinery 0.34% | | | | | | | | |
| Haitian International Holdings Ltd. | | | 6,500 | | | | 18,858 | |
| | | | | | | | | |
| Marine Transportation 0.56% | | | | | | | | |
| SITC International Holdings Co. Ltd. | | | 13,954 | | | | 31,142 | |
| | | | | | | | | |
| Real Estate Management & Development 0.80% | | | | | | | | |
| KE Holdings, Inc. ADR | | | 3,198 | | | | 44,292 | |
| | | | | | | | | |
| Textiles, Apparel & Luxury Goods 0.61% | | | | | | | | |
| ANTA Sports Products Ltd. | | | 3,793 | | | | 33,951 | |
| Total China | | | | | | | 1,069,359 | |
| 14 | See Notes to Financial Statements. | |
Schedule of Investments (continued)
EMERGING MARKETS EQUITY FUND July 31, 2024
| Investments | | Shares | | | U.S. $
Fair Value | |
| France 1.05% | | | | | | | | |
| | | | | | | | | |
| Oil, Gas & Consumable Fuels 0.73% | | | | | | |
| TotalEnergies SE | | | 600 | | | $ | 40,480 | |
| | | | | | | | | |
| Textiles, Apparel & Luxury Goods 0.32% | | | | | | |
| LVMH Moet Hennessy Louis Vuitton SE | | | 25 | | | | 17,634 | |
| Total France | | | | | | | 58,114 | |
| | | | | | | | | |
| Greece 1.09% | | | | | | | | |
| | | | | | | | | |
| Banks | | | | | | | | |
| National Bank of Greece SA | | | 6,873 | | | | 60,325 | |
| | | | | | | | | |
| Hong Kong 0.91% | | | | | | | | |
| | | | | | | | | |
| Machinery 0.72% | | | | | | | | |
| Techtronic Industries Co. Ltd. | | | 3,106 | | | | 39,778 | |
| | | | | | | | | |
| Semiconductors & Semiconductor Equipment 0.19% | |
| ASMPT Ltd. | | | 1,000 | | | | 10,455 | |
| Total Hong Kong | | | | | | | 50,233 | |
| | | | | | | | | |
| Hungary 1.09% | | | | | | | | |
| | | | | | | | | |
| Banks | | | | | | | | |
| OTP Bank Nyrt | | | 1,174 | | | | 60,181 | |
| | | | | | | | | |
| India 24.78% | | | | | | | | |
| | | | | | | | | |
| Automobiles 1.02% | | | | | | | | |
| Maruti Suzuki India Ltd. | | | 359 | | | | 56,328 | |
| | | | | | | | | |
| Banks 3.83% | | | | | | | | |
| Axis Bank Ltd. | | | 2,734 | | | | 38,192 | |
| HDFC Bank Ltd. | | | 3,755 | | | | 72,562 | |
| ICICI Bank Ltd. ADR | | | 3,479 | | | | 101,274 | |
| | | | | | | | 212,028 | |
| | | | | | | | | |
| Beverages 1.10% | | | | | | | | |
| Varun Beverages Ltd. | | | 3,217 | | | | 60,694 | |
| | | | | | | | | |
| Consumer Finance 0.86% | | | | | | | | |
| Shriram Finance Ltd. | | | 1,366 | | | | 47,925 | |
| Investments | | Shares | | | U.S. $
Fair Value | |
| India (continued) | | | | | | | | |
| | | | | | | | | |
| Electric: Utilities 1.63% | | | | | | | | |
| Power Grid Corp. of India Ltd. | | | 21,656 | | | $ | 90,201 | |
| | | | | | | | | |
| Health Care Providers & Services 1.31% | | | | | | |
| Max Healthcare Institute Ltd. | | | 6,599 | | | | 72,873 | |
| | | | | | | | | |
| Hotels, Restaurants & Leisure 2.36% | | | | | | | | |
| MakeMyTrip Ltd.* | | | 761 | | | | 71,222 | |
| Zomato Ltd.* | | | 21,573 | | | | 59,326 | |
| | | | | | | | 130,548 | |
| | | | | | | | | |
| Information Technology Services 1.83% | | | | | | | | |
| Persistent Systems Ltd. | | | 485 | | | | 28,064 | |
| Tata Consultancy Services Ltd. | | | 1,395 | | | | 73,252 | |
| | | | | | | | 101,316 | |
| | | | | | | | | |
| Oil, Gas & Consumable Fuels 2.14% | | | | | | | | |
| Reliance Industries Ltd. | | | 3,293 | | | | 118,721 | |
| | | | | | | | | |
| Personal Care Products 0.99% | | | | | | | | |
| Hindustan Unilever Ltd. | | | 1,692 | | | | 54,740 | |
| | | | | | | | | |
| Pharmaceuticals 1.40% | | | | | | | | |
| Mankind Pharma Ltd.* | | | 1,193 | | | | 28,953 | |
| Torrent Pharmaceuticals Ltd. | | | 1,275 | | | | 48,390 | |
| | | | | | | | 77,343 | |
| | | | | | | | | |
| Real Estate Management & Development 0.35% | | |
| Phoenix Mills Ltd. | | | 446 | | | | 19,194 | |
| | | | | | | | | |
| Tobacco 1.75% | | | | | | | | |
| ITC Ltd. | | | 16,322 | | | | 96,768 | |
| | | | | | | | | |
| Transportation Infrastructure 2.32% | | | | | | | | |
| Adani Ports & Special Economic Zone Ltd. | | | 4,418 | | | | 83,083 | |
| GMR Airports Infrastructure Ltd.* | | | 37,125 | | | | 45,243 | |
| | | | | | | | 128,326 | |
| | | | | | | | | |
| Wireless Telecommunication Services 1.89% | | | | |
| Bharti Airtel Ltd. | | | 5,871 | | | | 104,879 | |
| Total India | | | | | | | 1,371,884 | |
| | See Notes to Financial Statements. | 15 |
Schedule of Investments (continued)
EMERGING MARKETS EQUITY FUND July 31, 2024
| Investments | | Shares | | | U.S. $
Fair Value | |
| Indonesia 0.72% | | | | | | | | |
| | | | | | | | | |
| Banks | | | | | | | | |
| Bank Negara Indonesia Persero Tbk. PT | | | 130,717 | | | $ | 40,035 | |
| | | | | | | | | |
| Japan 0.50% | | | | | | | | |
| | | | | | | | | |
| Electronic Equipment, Instruments & Components | | | | |
| TDK Corp. | | | 400 | | | | 27,905 | |
| | | | | | | | | |
| Mexico 2.24% | | | | | | | | |
| | | | | | | | | |
| Banks 0.65% | | | | | | | | |
| Grupo Financiero Banorte SAB de CV Class O | | | 4,832 | | | | 36,208 | |
| | | | | | | | | |
| Beverages 0.98% | | | | | | | | |
| Fomento Economico Mexicano SAB de CV ADR | | | 491 | | | | 54,133 | |
| | | | | | | | | |
| Consumer Finance 0.29% | | | | | | | | |
| Gentera SAB de CV | | | 13,458 | | | | 15,957 | |
| | | | | | | | | |
| Real Estate Management & Development 0.32% | | | |
| Corp. Inmobiliaria Vesta SAB de CV | | | 6,087 | | | | 17,825 | |
| Total Mexico | | | | | | | 124,123 | |
| | | | | | | | | |
| Netherlands 0.50% | | | | | | | | |
| | | | | | | | | |
| Semiconductors & Semiconductor Equipment | | | | |
| ASM International NV | | | 20 | | | | 13,760 | |
| ASML Holding NV | | | 15 | | | | 13,968 | |
| | | | | | | | 27,728 | |
| | | | | | | | | |
| Peru 0.96% | | | | | | | | |
| | | | | | | | | |
| Banks | | | | | | | | |
| Credicorp Ltd. | | | 312 | | | | 53,240 | |
| | | | | | | | | |
| Philippines 0.83% | | | | | | | | |
| | | | | | | | | |
| Banks | | | | | | | | |
| BDO Unibank, Inc. | | | 19,488 | | | | 45,842 | |
| Investments | | Shares | | | U.S. $
Fair Value | |
| Poland 0.71% | | | | | | | | |
| | | | | | | | | |
| Insurance | | | | | | | | |
| Powszechny Zaklad Ubezpieczen SA | | | 3,199 | | | $ | 39,175 | |
| | | | | | | | | |
| South Korea 12.35% | | | | | | | | |
| | | | | | | | | |
| Aerospace & Defense 1.72% | | | | | | | | |
| Hanwha Aerospace Co. Ltd. | | | 338 | | | | 70,921 | |
| LIG Nex1 Co. Ltd. | | | 167 | | | | 24,280 | |
| | | | | | | | 95,201 | |
| | | | | | | | | |
| Automobiles 1.63% | | | | | | | | |
| Hyundai Motor Co. | | | 231 | | | | 42,100 | |
| Kia Corp. | | | 584 | | | | 47,921 | |
| | | | | | | | 90,021 | |
| | | | | | | | | |
| Banks 1.53% | | | | | | | | |
| KB Financial Group, Inc. | | | 1,315 | | | | 85,009 | |
| | | | | | | | | |
| Life Sciences Tools & Services 0.77% | | | | | | | | |
| Samsung Biologics Co. Ltd.†* | | | 62 | | | | 42,538 | |
| | | | | | | | | |
| Semiconductors & Semiconductor Equipment 1.04% | | | |
| SK Hynix, Inc. | | | 400 | | | | 57,369 | |
| | | | | | | | | |
| Technology Hardware, Storage & Peripherals 5.66% | | |
| Samsung Electronics Co. Ltd. | | | 5,086 | | | | 313,614 | |
| Total South Korea | | | | | | | 683,752 | |
| | | | | | | | | |
| Taiwan 14.51% | | | | | | | | |
| | | | | | | | | |
| Electrical Equipment 0.38% | | | | | | | | |
| Voltronic Power Technology Corp. | | | 374 | | | | 21,286 | |
| | | | | | | | | |
| Electronic Equipment, Instruments & Components 1.57% | |
| Hon Hai Precision Industry Co. Ltd. | | | 9,100 | | | | 55,828 | |
| Unimicron Technology Corp. | | | 5,589 | | | | 31,144 | |
| | | | | | | | 86,972 | |
| 16 | See Notes to Financial Statements. | |
Schedule of Investments (continued)
EMERGING MARKETS EQUITY FUND July 31, 2024
| Investments | | Shares | | | U.S. $
Fair Value | |
| Taiwan (continued) | | | | | | | | |
| | | | | | | | | |
| Semiconductors & Semiconductor Equipment 12.22% | |
| King Yuan Electronics Co. Ltd. | | | 5,800 | | | $ | 18,909 | |
| MediaTek, Inc. | | | 1,407 | | | | 53,586 | |
| Taiwan Semiconductor Manufacturing Co. Ltd. | | | 20,714 | | | | 604,254 | |
| | | | | | | | 676,749 | |
| | | | | | | | | |
| Technology Hardware, Storage & Peripherals 0.34% | |
| Quanta Computer, Inc. | | | 2,183 | | | | 18,599 | |
| Total Taiwan | | | | | | | 803,606 | |
| | | | | | | | | |
| Thailand 1.30% | | | | | | | | |
| | | | | | | | | |
| Health Care Providers & Services 0.48% | | | | | | | | |
| Bangkok Dusit Medical Services PCL Class F | | | 36,300 | | | | 26,759 | |
| | | | | | | | | |
| Wireless Telecommunication Services 0.82% | |
| Advanced Info Service PCL | | | 6,900 | | | | 45,350 | |
| Total Thailand | | | | | | | 72,109 | |
| | | | | | | | | |
| United Arab Emirates 1.58% | | | | | | | | |
| | | | | | | | | |
| Real Estate Management & Development 0.62% | |
| Emaar Development PJSC | | | 14,955 | | | | 34,569 | |
| | | | | | | | | |
| Transportation Infrastructure 0.96% | | | | | | | | |
| Salik Co. PJSC | | | 57,904 | | | | 53,144 | |
| Total United Arab Emirates | | | | | | | 87,713 | |
| | | | | | | | | |
| United Kingdom 1.34% | | | | | | | | |
| | | | | | | | | |
| Banks | | | | | | | | |
| HSBC Holdings PLC | | | 8,272 | | | | 74,107 | |
| Investments | | Shares | | | U.S. $
Fair Value | |
| United States 2.25% | | | | | | | | |
| | | | | | | | | |
| Oil, Gas & Consumable Fuels 1.92% | | | | | | | | |
| Shell PLC | | | 2,909 | | | $ | 106,074 | |
| | | | | | | | | |
| Semiconductors & Semiconductor Equipment 0.33% | |
| NVIDIA Corp. | | | 158 | | | | 18,489 | |
| Total United States | | | | | | | 124,563 | |
| Total Common Stocks (cost $4,279,482) | | | | | | | 5,165,766 | |
| | | | | | | | | |
| PREFERRED STOCKS 1.97% | | | | | | | | |
| | | | | | | | | |
| Brazil 1.97% | | | | | | | | |
| | | | | | | | | |
| Banks 1.00% | | | | | | | | |
| Itau Unibanco Holding SA | | | 9,262 | | | | 55,479 | |
| | | | | | | | | |
| Oil, Gas & Consumable Fuels 0.97% | | | | | |
| Petroleo Brasileiro SA | | | 8,080 | | | | 53,441 | |
| Total Brazil (cost $99,723) | | | | | | | 108,920 | |
Total Investments in Securities 95.27%
(cost $4,379,205) | | | | | | | 5,274,686 | |
| Other Assets and Liabilities – Net 4.73% | | | | | | | 261,699 | |
| Net Assets 100.00% | | | | | | $ | 5,536,385 | |
| ADR | | American Depositary Receipt. |
| * | | Non-income producing security. |
| † | | Security was purchased pursuant to Rule 144A under the Securities Act of 1933 and, unless registered under such Act or exempted from registration, may only be resold to qualified institutional buyers. At July 31, 2024, the total value of Rule 144A securities was $77,155, which represents 1.39% of net assets. |
| | See Notes to Financial Statements. | 17 |
Schedule of Investments (concluded)
EMERGING MARKETS EQUITY FUND July 31, 2024
The following is a summary of the inputs used as of July 31, 2024 in valuing the Fund’s investments carried at fair value(1):
| Investment Type(2) | | Level 1 | | | Level 2 | | | Level 3 | | | Total | |
| Long-Term Investments | | | | | | | | | | | | | | | | |
| Common Stocks | | | | | | | | | | | | | | | | |
| Brazil | | $ | 150,675 | | | $ | – | | | $ | – | | | $ | 150,675 | |
| Canada | | | 35,777 | | | | – | | | | – | | | | 35,777 | |
| China | | | 118,498 | | | | 950,861 | | | | – | | | | 1,069,359 | |
| Greece | | | 60,325 | | | | – | | | | – | | | | 60,325 | |
| India | | | 172,496 | | | | 1,199,388 | | | | – | | | | 1,371,884 | |
| Mexico | | | 124,123 | | | | – | | | | – | | | | 124,123 | |
| Peru | | | 53,240 | | | | – | | | | – | | | | 53,240 | |
| Thailand | | | 72,109 | | | | – | | | | – | | | | 72,109 | |
| United Arab Emirates | | | 34,569 | | | | 53,144 | | | | – | | | | 87,713 | |
| United States | | | 18,489 | | | | 106,074 | | | | – | | | | 124,563 | |
| Remaining Countries | | | – | | | | 2,015,998 | | | | – | | | | 2,015,998 | |
| Preferred Stocks | | | 108,920 | | | | – | | | | – | | | | 108,920 | |
| Total | | $ | 949,221 | | | $ | 4,325,465 | | | $ | – | | | $ | 5,274,686 | |
| | (1) | | Refer to Note 2(p) for a description of fair value measurements and the three-tier hierarchy of inputs. |
| | (2) | | See Schedule of Investments for fair values in each industry and identification of foreign issuers and/or geography. The table above is presented by Investment Type. Countries are presented within an Investment Type should such Investment Type include securities classified as two or more levels within the three-tier fair value hierarchy. When applicable, each Level 3 security is identified on the Schedule of Investments along with the valuation technique utilized. |
A reconciliation of Level 3 investments is presented when the Fund has a material amount of Level 3 investments at the beginning or end of the year in relation to the Fund’s net assets. Management has determined not to provide a reconciliation as the balance of Level 3 investments was not considered to be material to the Fund’s net assets at the beginning or end of the year.
| 18 | See Notes to Financial Statements. | |
Schedule of Investments
INTERNATIONAL GROWTH FUND July 31, 2024
| Investments | | Shares | | | U.S. $
Fair Value | |
| LONG-TERM INVESTMENTS 94.64% | | | | | | | | |
| | | | | | | | | |
| COMMON STOCKS 94.64% | | | | | | | | |
| | | | | | | | | |
| Australia 2.14% | | | | | | | | |
| | | | | | | | | |
| Industrial REITS 0.66% | | | | | | | | |
| Goodman Group | | | 835 | | | $ | 19,277 | |
| | | | | | | | | |
| Metals & Mining 0.70% | | | | | | | | |
| BHP Group Ltd. | | | 734 | | | | 20,387 | |
| | | | | | | | | |
| Software 0.78% | | | | | | | | |
| WiseTech Global Ltd. | | | 367 | | | | 22,996 | |
| Total Australia | | | | | | | 62,660 | |
| | | | | | | | | |
| Austria 1.38% | | | | | | | | |
| | | | | | | | | |
| Banks | | | | | | | | |
| BAWAG Group AG† | | | 250 | | | | 18,249 | |
| Erste Group Bank AG | | | 425 | | | | 22,107 | |
| | | | | | | | 40,356 | |
| | | | | | | | | |
| Brazil 1.37% | | | | | | | | |
| | | | | | | | | |
| Banks 0.52% | | | | | | | | |
| NU Holdings Ltd. Class A* | | | 1,252 | | | | 15,187 | |
| | | | | | | | | |
| Broadline Retail 0.85% | | | | | | | | |
| MercadoLibre, Inc.* | | | 15 | | | | 25,033 | |
| Total Brazil | | | | | | | 40,220 | |
| | | | | | | | | |
| Canada 4.40% | | | | | | | | |
| | | | | | | | | |
| Construction & Engineering 0.93% | | | | | | | | |
| Stantec, Inc. | | | 310 | | | | 27,276 | |
| | | | | | | | | |
| Ground Transportation 1.25% | | | | | | | | |
| Canadian Pacific Kansas City Ltd. | | | 437 | | | | 36,647 | |
| | | | | | | | | |
| Information Technology Services 0.93% | | | | | | | | |
| Shopify, Inc. Class A* | | | 442 | | | | 27,050 | |
| | | | | | | | | |
| Software 1.29% | | | | | | | | |
| Constellation Software, Inc. | | | 12 | | | | 37,863 | |
| Total Canada | | | | | | | 128,836 | |
| Investments | | Shares | | | U.S. $
Fair Value | |
| China 2.80% | | | | | | |
| | | | | | | |
| Automobiles 0.49% | | | | | | | | |
| BYD Co. Ltd. Class H | | | 481 | | | $ | 14,240 | |
| | | | | | | | | |
| Hotels, Restaurants & Leisure 0.43% | | | | | | | | |
| Trip.com Group Ltd. ADR* | | | 300 | | | | 12,759 | |
| | | | | | | | | |
| Interactive Media & Services 1.88% | | | | | | | | |
| Tencent Holdings Ltd. | | | 1,190 | | | | 54,914 | |
| Total China | | | | | | | 81,913 | |
| | | | | | | | | |
| Denmark 6.69% | | | | | | | | |
| | | | | | | | | |
| Air Freight & Logistics 0.63% | | | | | | | | |
| DSV AS | | | 100 | | | | 18,345 | |
| | | | | | | | | |
| Beverages 0.75% | | | | | | | | |
| Royal Unibrew AS* | | | 280 | | | | 21,984 | |
| | | | | | | | | |
| Biotechnology 0.92% | | | | | | | | |
| Zealand Pharma AS* | | | 200 | | | | 26,944 | |
| | | | | | | | | |
| Pharmaceuticals 4.39% | | | | | | | | |
| Novo Nordisk AS Class B | | | 970 | | | | 128,518 | |
| Total Denmark | | | | | | | 195,791 | |
| | | | | | | | | |
| France 6.16% | | | | | | | | |
| | | | | | | | | |
| Chemicals 1.30% | | | | | | | | |
| Air Liquide SA | | | 208 | | | | 37,951 | |
| | | | | | | | | |
| Personal Care Products 1.24% | | | | | | | | |
| L’Oreal SA | | | 84 | | | | 36,325 | |
| | | | | | | | | |
| Professional Services 0.82% | | | | | | | | |
| Bureau Veritas SA | | | 767 | | | | 23,999 | |
| | | | | | | | | |
| Textiles, Apparel & Luxury Goods 2.80% | | | | | | | | |
| Hermes International SCA | | | 12 | | | | 26,224 | |
| LVMH Moet Hennessy Louis Vuitton SE | | | 79 | | | | 55,724 | |
| | | | | | | | 81,948 | |
| Total France | | | | | | | 180,223 | |
| | See Notes to Financial Statements. | 19 |
Schedule of Investments (continued)
INTERNATIONAL GROWTH FUND July 31, 2024
| Investments | | Shares | | | U.S. $
Fair Value | |
| Germany 5.66% | | | | | | |
| | | | | | | |
| Aerospace & Defense 0.89% | | | | | | | | |
| Rheinmetall AG | | | 48 | | | $ | 26,143 | |
| | | | | | | | | |
| Insurance 0.61% | | | | | | | | |
| Muenchener Rueckversicherungs-Gesellschaft AG in Muenchen | | | 36 | | | | 17,731 | |
| | | | | | | | | |
| Interactive Media & Services 0.61% | | | | | | | | |
| Scout24 SE† | | | 225 | | | | 17,788 | |
| | | | | | | | | |
| Personal Care Products 0.66% | | | | | | | | |
| Beiersdorf AG | | | 133 | | | | 19,305 | |
| | | | | | | | | |
| Software 2.89% | | | | | | | | |
| SAP SE | | | 400 | | | | 84,568 | |
| Total Germany | | | | | | | 165,535 | |
| | | | | | | | | |
| Greece 0.68% | | | | | | | | |
| | | | | | | | | |
| Banks | | | | | | | | |
| National Bank of Greece SA | | | 2,250 | | | | 19,748 | |
| | | | | | | | | |
| Hong Kong 0.60% | | | | | | | | |
| | | | | | | | | |
| Machinery | | | | | | | | |
| Techtronic Industries Co. Ltd. | | | 1,370 | | | | 17,545 | |
| | | | | | | | | |
| India 6.79% | | | | | | | | |
| | | | | | | | | |
| Banks 1.35% | | | | | | | | |
| ICICI Bank Ltd. ADR | | | 1,360 | | | | 39,589 | |
| | | | | | | | | |
| Beverages 0.79% | | | | | | | | |
| Varun Beverages Ltd. | | | 1,220 | | | | 23,017 | |
| | | | | | | | | |
| Health Care Providers & Services 0.50% | | | | | | | | |
| Max Healthcare Institute Ltd. | | | 1,340 | | | | 14,798 | |
| | | | | | | | | |
| Hotels, Restaurants & Leisure 0.80% | | | | | | | | |
| MakeMyTrip Ltd.* | | | 250 | | | | 23,397 | |
| | | | | | | | | |
| Information Technology Services 1.33% | | | | | | | | |
| Tata Consultancy Services Ltd. | | | 740 | | | | 38,858 | |
| Investments | | Shares | | | U.S. $
Fair Value | |
| India (continued) | | | | | | | | |
| | | | | | | | | |
| Oil, Gas & Consumable Fuels 0.53% | | | | | | | | |
| Reliance Industries Ltd. | | | 435 | | | $ | 15,683 | |
| | | | | | | | | |
| Pharmaceuticals 0.48% | | | | | | | | |
| Mankind Pharma Ltd.* | | | 575 | | | | 13,955 | |
| | | | | | | | | |
| Wireless Telecommunication Services 1.01% | | | | | |
| Bharti Airtel Ltd. | | | 1,648 | | | | 29,440 | |
| Total India | | | | | | | 198,737 | |
| | | | | | | | | |
| Italy 3.51% | | | | | | | | |
| | | | | | | | | |
| Automobiles 1.13% | | | | | | | | |
| Ferrari NV | | | 80 | | | | 32,926 | |
| | | | | | | | | |
| Banks 0.95% | | | | | | | | |
| UniCredit SpA | | | 675 | | | | 27,725 | |
| | | | | | | | | |
| Electrical Equipment 1.43% | | | | | | | | |
| Prysmian SpA | | | 610 | | | | 41,934 | |
| Total Italy | | | | | | | 102,585 | |
| | | | | | | | | |
| Japan 13.35% | | | | | | | | |
| | | | | | | | | |
| Broadline Retail 0.80% | | | | | | | | |
| Pan Pacific International Holdings Corp. | | | 900 | | | | 23,480 | |
| | | | | | | | | |
| Chemicals 0.68% | | | | | | | | |
| Shin-Etsu Chemical Co. Ltd. | | | 450 | | | | 19,994 | |
| | | | | | | | | |
| Electronic Equipment, Instruments & Components 1.96% | |
| Keyence Corp. | | | 80 | | | | 34,981 | |
| TDK Corp. | | | 320 | | | | 22,324 | |
| | | | | | | | 57,305 | |
| | | | | | | | | |
| Entertainment 0.94% | | | | | | | | |
| Nintendo Co. Ltd. | | | 500 | | | | 27,629 | |
| | | | | | | | | |
| Health Care Equipment & Supplies 1.59% | | | | | | | | |
| Hoya Corp. | | | 200 | | | | 25,060 | |
| Terumo Corp. | | | 1,200 | | | | 21,514 | |
| | | | | | | | 46,574 | |
| 20 | See Notes to Financial Statements. |
Schedule of Investments (continued)
INTERNATIONAL GROWTH FUND July 31, 2024
| Investments | | Shares | | | U.S. $
Fair Value | |
| Japan (continued) | | | | | | | | |
| | | | | | | | | |
| Industrial Conglomerates 2.27% | | | | | | | | |
| Hitachi Ltd. | | | 3,075 | | | $ | 66,441 | |
| | | | | | | | | |
| Information Technology Services 1.06% | | | | | | | | |
| Fujitsu Ltd. | | | 1,700 | | | | 30,872 | |
| | | | | | | | | |
| Insurance 0.81% | | | | | | | | |
| Tokio Marine Holdings, Inc. | | | 600 | | | | 23,540 | |
| | | | | | | | | |
| Machinery 0.50% | | | | | | | | |
| Ebara Corp. | | | 1,012 | | | | 14,493 | |
| | | | | | | | | |
| Semiconductors & Semiconductor Equipment 2.00% | | | | | | | | |
| Disco Corp. | | | 66 | | | | 22,070 | |
| Tokyo Electron Ltd. | | | 174 | | | | 36,409 | |
| | | | | | | | 58,479 | |
| | | | | | | | | |
| Textiles, Apparel & Luxury Goods 0.74% | | | | | | | | |
| Asics Corp. | | | 1,330 | | | | 21,706 | |
| Total Japan | | | | | | | 390,513 | |
| | | | | | | | | |
| Netherlands 6.54% | | | | | | | | |
| | | | | | | | | |
| Financial Services 0.67% | | | | | | | | |
| Adyen NV†* | | | 16 | | | | 19,572 | |
| | | | | | | | | |
| Professional Services 1.54% | | | | | | | | |
| Wolters Kluwer NV | | | 270 | | | | 45,201 | |
| | | | | | | | | |
| Semiconductors & Semiconductor Equipment 4.33% | | | | | | | | |
| ASM International NV | | | 38 | | | | 26,145 | |
| ASML Holding NV | | | 108 | | | | 100,566 | |
| | | | | | | | 126,711 | |
| Total Netherlands | | | | | | | 191,484 | |
| | | | | | | | | |
| South Korea 1.61% | | | | | | | | |
| | | | | | | | | |
| Semiconductors & Semiconductor Equipment 0.49% | | | | | | | | |
| SK Hynix, Inc. | | | 100 | | | | 14,342 | |
| | | | | | | | | |
| Technology Hardware, Storage & Peripherals 1.12% | | | | | | | | |
| Samsung Electronics Co. Ltd. | | | 530 | | | | 32,681 | |
| Total South Korea | | | | | | | 47,023 | |
| Investments | | Shares | | | U.S. $
Fair Value | |
| Spain 1.94% | | | | | | |
| | | | | | | |
| Banks 0.61% | | | | | | | | |
| Banco Bilbao Vizcaya Argentaria SA | | | 1,700 | | | $ | 17,854 | |
| | | | | | | | | |
| Specialty Retail 1.33% | | | | | | | | |
| Industria de Diseno Textil SA | | | 802 | | | | 38,968 | |
| Total Spain | | | | | | | 56,822 | |
| | | | | | | | | |
| Sweden 1.32% | | | | | | | | |
| | | | | | | | | |
| Machinery | | | | | | | | |
| Atlas Copco AB Class A | | | 2,167 | | | | 38,568 | |
| | | | | | | | | |
| Switzerland 4.48% | | | | | | | | |
| | | | | | | | | |
| Chemicals 2.18% | | | | | | | | |
| Givaudan SA | | | 7 | | | | 34,342 | |
| Sika AG Registered Shares | | | 97 | | | | 29,451 | |
| | | | | | | | 63,793 | |
| | | | | | | | | |
| Life Sciences Tools & Services 1.48% | | | | | | | | |
| Lonza Group AG Registered Shares | | | 65 | | | | 43,284 | |
| | | | | | | | | |
| Machinery 0.82% | | | | | | | | |
| VAT Group AG† | | | 48 | | | | 24,055 | |
| Total Switzerland | | | | | | | 131,132 | |
| | | | | | | | | |
| Taiwan 7.86% | | | | | | | | |
| | | | | | | | | |
| Semiconductors & Semiconductor Equipment 7.40% | | |
| MediaTek, Inc. | | | 260 | | | | 9,902 | |
| Realtek Semiconductor Corp. | | | 755 | | | | 11,910 | |
| Taiwan Semiconductor Manufacturing Co. Ltd. ADR | | | 237 | | | | 39,295 | |
| Taiwan Semiconductor Manufacturing Co. Ltd. | | | 5,331 | | | | 155,512 | |
| | | | | | | | 216,619 | |
| | | | | | | | | |
| Technology Hardware, Storage & Peripherals 0.46% | |
| Quanta Computer, Inc. | | | 1,585 | | | | 13,504 | |
| Total Taiwan | | | | | | | 230,123 | |
| | See Notes to Financial Statements. | 21 |
Schedule of Investments (continued)
INTERNATIONAL GROWTH FUND July 31, 2024
| Investments | | Shares | | | U.S. $
Fair Value | |
| United Kingdom 6.85% | | | | | | | | |
| | | | | | | | | |
| Capital Markets 0.83% | | | | | | | | |
| London Stock Exchange Group PLC | | | 200 | | | $ | 24,345 | |
| | | | | | | | | |
| Personal Care Products 1.78% | | | | | | | | |
| Unilever PLC | | | 846 | | | | 51,991 | |
| | | | | | | | | |
| Pharmaceuticals 2.31% | | | | | | | | |
| AstraZeneca PLC | | | 425 | | | | 67,520 | |
| | | | | | | | | |
| Professional Services 1.93% | | | | | | | | |
| RELX PLC | | | 1,200 | | | | 56,637 | |
| Total United Kingdom | | | | | | | 200,493 | |
| | | | | | | | | |
| United States 8.51% | | | | | | | | |
| | | | | | | | | |
| Chemicals 0.85% | | | | | | | | |
| Linde PLC | | | 55 | | | | 24,943 | |
| | | | | | | | | |
| Construction Materials 0.95% | | | | | | | | |
| CRH PLC | | | 327 | | | | 27,814 | |
| | | | | | | | | |
| Electrical Equipment 2.46% | | | | | | | | |
| Schneider Electric SE | | | 298 | | | | 71,829 | |
| | | | | | | | | |
| Food Products 0.97% | | | | | | | | |
| Nestle SA Registered Shares | | | 280 | | | | 28,362 | |
| | | | | | | | | |
| Health Care Equipment & Supplies 0.32% | | | | | | | | |
| Alcon, Inc. | | | 100 | | | | 9,498 | |
| | | | | | | | | |
| Interactive Media & Services 1.20% | | | | | | | | |
| Alphabet, Inc. Class A | | | 83 | | | | 14,238 | |
| Meta Platforms, Inc. Class A | | | 44 | | | | 20,892 | |
| | | | | | | | 35,130 | |
| Investments | | Shares | | | U.S. $
Fair Value | |
| United States (continued) | | | | | | | | |
| | | | | | | | | |
| Pharmaceuticals 0.96% | | | | | | | | |
| Eli Lilly & Co. | | | 35 | | | $ | 28,149 | |
| | | | | | | | | |
| Semiconductors & Semiconductor Equipment 0.80% | | |
| NVIDIA Corp. | | | 200 | | | | 23,404 | |
| Total United States | | | | | | | 249,129 | |
Total Common Stocks
(cost $2,159,779) | | | | | | | 2,769,436 | |
Total Investments in Securities 94.64%
(cost $2,159,779) | | | | | | | 2,769,436 | |
| Other Assets and Liabilities – Net 5.36% | | | | | | | 156,710 | |
| Net Assets 100.00% | | | | | | $ | 2,926,146 | |
| ADR | American Depositary Receipt. |
| REITS | Real Estate Investment Trusts. |
| † | Security was purchased pursuant to Rule 144A under the Securities Act of 1933 and, unless registered under such Act or exempted from registration, may only be resold to qualified institutional buyers. At July 31, 2024, the total value of Rule 144A securities was $79,664, which represents 2.72% of net assets. |
| * | Non-income producing security. |
| 22 | See Notes to Financial Statements. |
Schedule of Investments (concluded)
INTERNATIONAL GROWTH FUND July 31, 2024
The following is a summary of the inputs used as of July 31, 2024 in valuing the Fund’s investments carried at fair value(1):
| Investment Type(2) | | Level 1 | | | Level 2 | | | Level 3 | | | Total | |
| Long-Term Investments | | | | | | | | | | | | | | | | |
| Common Stocks | | | | | | | | | | | | | | | | |
| Brazil | | $ | 40,220 | | | $ | – | | | $ | – | | | $ | 40,220 | |
| Canada | | | 128,836 | | | | – | | | | – | | | | 128,836 | |
| China | | | 12,759 | | | | 69,154 | | | | – | | | | 81,913 | |
| Greece | | | 19,748 | | | | – | | | | – | | | | 19,748 | |
| India | | | 62,986 | | | | 135,751 | | | | – | | | | 198,737 | |
| Taiwan | | | 39,295 | | | | 190,828 | | | | – | | | | 230,123 | |
| United States | | | 121,124 | | | | 128,005 | | | | – | | | | 249,129 | |
| Remaining Countries | | | – | | | | 1,820,730 | | | | – | | | | 1,820,730 | |
| Total | | $ | 424,968 | | | $ | 2,344,468 | | | $ | – | | | $ | 2,769,436 | |
| (1) | | Refer to Note 2(p) for a description of fair value measurements and the three-tier hierarchy of inputs. |
| (2) | | See Schedule of Investments for fair values in each industry and identification of foreign issuers and/or geography. The table above is presented by Investment Type. Countries are presented within an Investment Type should such Investment Type include securities classified as two or more levels within the three-tier fair value hierarchy. When applicable, each Level 3 security is identified on the Schedule of Investments along with the valuation technique utilized. |
A reconciliation of Level 3 investments is presented when the Fund has a material amount of Level 3 investments at the beginning or end of the year in relation to the Fund’s net assets. Management has determined not to provide a reconciliation as the balance of Level 3 investments was not considered to be material to the Fund’s net assets at the beginning or end of the year.
| | See Notes to Financial Statements. | 23 |
Schedule of Investments
INVESTMENT GRADE FLOATING RATE FUND July 31, 2024
| Investments | | Interest
Rate | | Maturity
Date | | Principal
Amount† | | | Fair
Value | |
| LONG-TERM INVESTMENTS 104.08% | | | | | | | | | | | | |
| | | | | | | | | | | | | |
| ASSET-BACKED SECURITIES 78.04% | | | | | | | | | | | | |
| | | | | | | | | | | | | |
| Automobiles 12.43% | | | | | | | | | | | | |
| Ally Bank Auto Credit-Linked Notes Series 2024-A Class B† | | 5.827% | | 5/17/2032 | | $ | 233,942 | | | $ | 235,461 | |
| Bayview Opportunity Master Fund VII LLC Series 2024-CAR1 Class B† | | 6.647%
(30 day USD
SOFR Average + 1.30% | )# | 12/26/2031 | | | 216,873 | | | | 217,606 | |
| Bayview Opportunity Master Fund VII LLC Series 2024-CAR1 Class D† | | 7.397%
(30 day USD
SOFR Average + 2.05% | )# | 12/26/2031 | | | 260,248 | | | | 262,020 | |
| CAL Receivables LLC Series 2022-1 Class B† | | 9.687%
(30 day USD
SOFR Average + 4.35% | )# | 10/15/2026 | | | 303,068 | | | | 302,843 | |
| Carmax Auto Owner Trust Series 2024-3 Class D | | 5.67% | | 1/15/2031 | | | 100,000 | | | | 100,679 | |
| Exeter Automobile Receivables Trust Series 2022-2A Class B | | 3.65% | | 10/15/2026 | | | 1,765 | | | | 1,763 | |
| Exeter Automobile Receivables Trust Series 2023-1A Class D | | 6.69% | | 6/15/2029 | | | 130,000 | | | | 132,277 | |
| Exeter Automobile Receivables Trust Series 2023-2A Class D | | 6.32% | | 8/15/2029 | | | 260,000 | | | | 264,024 | |
| Exeter Automobile Receivables Trust Series 2023-3A Class D | | 6.68% | | 4/16/2029 | | | 230,000 | | | | 235,421 | |
| GLS Auto Select Receivables Trust Series 2023-2A Class D† | | 8.22% | | 2/18/2031 | | | 640,000 | | | | 696,710 | |
| Huntington Bank Auto Credit-Linked Notes Series 2024-1 Class C† | | 8.494%
(30 day USD
SOFR Average + 3.15% | )# | 5/20/2032 | | | 232,501 | | | | 233,140 | |
| Kinetic Advantage Master Owner Trust Series 2024-1A Class A† | | 7.987%
(30 day USD
SOFR Average + 2.65% | )# | 11/15/2027 | | | 325,000 | | | | 326,134 | |
| Merchants Fleet Funding LLC Series 2024-1A Class A† | | 5.82% | | 4/20/2037 | | | 850,000 | | | | 857,943 | |
| Santander Consumer Auto Receivables Trust Series 2021-AA Class F† | | 5.79% | | 8/15/2028 | | | 750,000 | | | | 742,193 | |
| Santander Drive Auto Receivables Trust Series 2024-2 Class D | | 6.28% | | 8/15/2031 | | | 65,000 | | | | 66,901 | |
| | |
| 24 | See Notes to Financial Statements. |
Schedule of Investments (continued)
INVESTMENT GRADE FLOATING RATE FUND July 31, 2024
| Investments | | Interest
Rate | | Maturity
Date | | Principal
Amount† | | | Fair
Value | |
| Automobiles (continued) | | | | | | | | | | | | |
| Westlake Automobile Receivables Trust Series 2024-1 Class D† | | 6.02% | | 10/15/2029 | | $ | 250,000 | | | $ | 252,897 | |
| Westlake Automobile Receivables Trust Series 2024-1A Class B† | | 5.55% | | 11/15/2027 | | | 160,000 | | | | 160,245 | |
| Total | | | | | | | | | | | 5,088,257 | |
| | | | | | | | | | | | | |
| Credit Card 3.00% | | | | | | | | | | | | |
| Capital One Multi-Asset Execution Trust Series 2005-B3 Class B3 | | 6.113%
(3 mo. USD Term
SOFR + 0.81% | )# | 5/15/2028 | | | 200,000 | | | | 199,532 | |
| Mercury Financial Credit Card Master Trust Series 2024-2A Class A† | | 6.56% | | 7/20/2029 | | | 850,000 | | | | 860,191 | |
| World Financial Network Credit Card Master Trust Series 2024-A Class A | | 5.47% | | 2/15/2031 | | | 165,000 | | | | 168,055 | |
| Total | | | | | | | | | | | 1,227,778 | |
| | | | | | | | | | | | | |
| Other 62.03% | | | | | | | | | | | | |
| Affirm Asset Securitization Trust Series 2023-B Class A† | | 6.82% | | 9/15/2028 | | | 100,000 | | | | 101,701 | |
| Affirm Asset Securitization Trust Series 2024-A Class 1A† | | 5.61% | | 2/15/2029 | | | 100,000 | | | | 100,470 | |
| Affirm Asset Securitization Trust Series 2024-X1 Class C† | | 6.57% | | 5/15/2029 | | | 150,000 | | | | 151,274 | |
| AGL CLO 25 Ltd. Series 2023-25A Class D† | | 10.582%
(3 mo. USD Term
SOFR + 5.30% | )# | 7/21/2036 | | | 350,000 | | | | 362,039 | |
| AGL CLO 32 Ltd. Series 2024-32A Class A1†(a) | | 6.80%
(3 mo. USD Term
SOFR + 1.38% | )# | 7/21/2037 | | | 250,000 | | | | 250,000 | |
| AIMCO CLO 22 Ltd. Series 2024-22A Class D† | | 8.727%
(3 mo. USD Term
SOFR + 3.40% | )# | 4/19/2037 | | | 450,000 | | | | 457,395 | |
| Allegro CLO VII Ltd. Series 2018-1A Class AR† | | 6.431%
(3 mo. USD Term
SOFR + 1.13% | )# | 6/13/2031 | | | 433,009 | | | | 432,984 | |
| AMMC CLO 25 Ltd. Series 2022-25A Class BR† | | 7.051%
(3 mo. USD Term
SOFR + 1.75% | )# | 4/15/2035 | | | 500,000 | | | | 499,976 | |
| Annisa CLO Ltd. Series 2016-2A Class CRR† | | 7.132%
(3 mo. USD Term
SOFR + 1.85% | )# | 7/20/2031 | | | 400,000 | | | | 400,193 | |
| | | |
| | See Notes to Financial Statements. | 25 |
Schedule of Investments (continued)
INVESTMENT GRADE FLOATING RATE FUND July 31, 2024
| Investments | | Interest
Rate | | Maturity
Date | | Principal
Amount† | | | Fair
Value | |
| Other (continued) | | | | | | | | | | | | |
| Apidos CLO XLVIII Ltd. Series 2024-48A Class E† | | 11.065%
(3 mo. USD Term
SOFR + 5.75% | )# | 7/25/2037 | | $ | 150,000 | | | $ | 150,608 | |
| Atrium XIII Series 13A Class AR† | | 6.433%
(3 mo. USD Term
SOFR + 1.15% | )# | 11/21/2030 | | | 998,328 | | | | 999,372 | |
| Avant Loans Funding Trust Series 2021-REV1 Class C† | | 2.30% | | 7/15/2030 | | | 97,379 | | | | 96,500 | |
| Avant Loans Funding Trust Series 2024-REV1 Class A† | | 5.92% | | 10/15/2033 | | | 150,000 | | | | 150,842 | |
| Bain Capital CLO Ltd. Series 2024-1A Class E† | | 12.125%
(3 mo. USD Term
SOFR + 6.80% | )# | 4/16/2037 | | | 250,000 | | | | 255,470 | |
| Bain Capital Credit CLO Ltd. Series 2023-3 Class E† | | 13.833%
(3 mo. USD Term
SOFR + 8.55% | )# | 7/24/2036 | | | 250,000 | | | | 263,287 | |
| Ballyrock CLO 20 Ltd. Series 2022-20A Class BR† | | 7.901%
(3 mo. USD Term
SOFR + 2.60% | )# | 7/15/2034 | | | 250,000 | | | | 250,611 | |
| Ballyrock CLO 20 Ltd. Series 2022-20A Class DR† | | 12.551%
(3 mo. USD Term
SOFR + 7.25% | )# | 7/15/2034 | | | 250,000 | | | | 252,824 | |
| Ballyrock CLO 22 Ltd. Series 2024-22A Class A1A† | | 6.863%
(3 mo. USD Term
SOFR + 1.54% | )# | 4/15/2037 | | | 250,000 | | | | 251,082 | |
| Ballyrock CLO 25 Ltd. Series 2023-25A Class A2† | | 7.735%
(3 mo. USD Term
SOFR + 2.45% | )# | 1/25/2036 | | | 250,000 | | | | 250,947 | |
| Ballyrock CLO 25 Ltd. Series 2023-25A Class C† | | 9.985%
(3 mo. USD Term
SOFR + 4.70% | )# | 1/25/2036 | | | 250,000 | | | | 252,490 | |
| Ballyrock CLO 27 Ltd. Series 2024-27A Class A1A†(a) | | 5.283%
(3 mo. USD Term
SOFR + 1.35% | )# | 10/25/2037 | | | 250,000 | | | | 250,000 | |
| Barings CLO Ltd. Series 2024-1A Class A† | | 6.899%
(3 mo. USD Term
SOFR + 1.63% | )# | 1/20/2037 | | | 250,000 | | | | 251,709 | |
| Barings CLO Ltd. Series 2024-1A Class D† | | 9.269%
(3 mo. USD Term
SOFR + 4.00% | )# | 1/20/2037 | | | 250,000 | | | | 255,830 | |
| Barings Loan Partners CLO Ltd. Series LP-3A Class BR† | | 7.382%
(3 mo. USD Term
SOFR + 2.10% | )# | 7/20/2033 | | | 250,000 | | | | 250,630 | |
| | |
| 26 | See Notes to Financial Statements. |
Schedule of Investments (continued)
INVESTMENT GRADE FLOATING RATE FUND July 31, 2024
| Investments | | Interest
Rate | | Maturity
Date | | Principal
Amount† | | | Fair
Value | |
| Other (continued) | | | | | | | | | | | | |
| Bear Mountain Park CLO Ltd. Series 2022-1A Class ER† | | 11.236%
(3 mo. USD Term
SOFR + 5.95% | )# | 7/15/2037 | | $ | 150,000 | | | $ | 149,985 | |
| Benefit Street Partners CLO V-B Ltd. Series 2018-5BA Class A1R† | | 6.862%
(3 mo. USD Term
SOFR + 1.53% | )# | 7/20/2037 | | | 250,000 | | | | 249,930 | |
| Benefit Street Partners CLO XVIII Ltd. Series 2019-18A Class BR† | | 7.263%
(3 mo. USD Term
SOFR + 1.96% | )# | 10/15/2034 | | | 250,000 | | | | 250,576 | |
| Carlyle U.S. CLO Ltd. Series 2022-3A Class CR† | | 7.832%
(3 mo. USD Term
SOFR + 2.55% | )# | 4/20/2037 | | | 250,000 | | | | 253,370 | |
| Carlyle U.S. CLO Ltd. Series 2022-6A Class DR† | | 10.035%
(3 mo. USD Term
SOFR + 4.75% | )# | 10/25/2036 | | | 300,000 | | | | 308,825 | |
| CIFC Funding Ltd. Series 2023-3A Class A† | | 6.882%
(3 mo. USD Term
SOFR + 1.60% | )# | 1/20/2037 | | | 250,000 | | | | 251,585 | |
| CIFC Funding Ltd. Series 2023-3A Class C† | | 7.932%
(3 mo. USD Term
SOFR + 2.65% | )# | 1/20/2037 | | | 375,000 | | | | 380,478 | |
| CIFC Funding Ltd. Series 2024-1A Class A† | | 6.80%
(3 mo. USD Term
SOFR + 1.50% | )# | 4/18/2037 | | | 250,000 | | | | 250,942 | |
| Driven Brands Funding LLC Series 2020-1A Class A2† | | 7.393% | | 10/20/2052 | | | 98,250 | | | | 99,408 | |
| Dryden 102 CLO Ltd. Series 2023-102A Class B† | | 7.751%
(3 mo. USD Term
SOFR + 2.45% | )# | 10/15/2036 | | | 250,000 | | | | 252,285 | |
| Dryden 78 CLO Ltd. Series 2020-78A Class B1R† | | 7.236%
(3 mo. USD Term
SOFR + 1.95% | )# | 4/17/2037 | | | 250,000 | | | | 252,318 | |
| Elmwood CLO 16 Ltd. Series 2022-3A Class AR† | | 6.812%
(3 mo. USD Term
SOFR + 1.53% | )# | 4/20/2037 | | | 250,000 | | | | 250,871 | |
| Elmwood CLO 28 Ltd. Series 2024-4A Class B† | | 7.236%
(3 mo. USD Term
SOFR + 1.90% | )# | 4/17/2037 | | | 250,000 | | | | 252,329 | |
| Elmwood CLO 31 Ltd. Series 2024-7A Class A1†(a) | | 5.53%
(3 mo. USD Term
SOFR + 1.35% | )# | 7/17/2037 | | | 350,000 | | | | 350,000 | |
| | | |
| | See Notes to Financial Statements. | 27 |
Schedule of Investments (continued)
INVESTMENT GRADE FLOATING RATE FUND July 31, 2024
| Investments | | Interest
Rate | | Maturity
Date | | Principal
Amount† | | | Fair
Value | |
| Other (continued) | | | | | | | | | | | | |
| Empower CLO Ltd. Series 2023-1A Class D† | | 10.785%
(3 mo. USD Term
SOFR + 5.50% | )# | 4/25/2036 | | $ | 350,000 | | | $ | 359,446 | |
| Empower CLO Ltd. Series 2024-2A Class E† | | 11.376%
(3 mo. USD Term
SOFR + 6.05% | )# | 7/15/2037 | | | 100,000 | | | | 99,354 | |
| Fairstone Financial Issuance Trust I Series 2020-1A Class A† | | 2.509% | | 10/20/2039 | | CAD | 140,155 | | | | 99,813 | |
| Fairstone Financial Issuance Trust I Series 2020-1A Class D† | | 6.873% | | 10/20/2039 | | CAD | 250,000 | | | | 174,737 | |
| Generate CLO 16 Ltd. Series 2024-16A Class A1† | | 6.861%
(3 mo. USD Term
SOFR + 1.54% | )# | 7/20/2037 | | $ | 500,000 | | | | 500,213 | |
| Generate CLO 16 Ltd. Series 2024-16A Class E† | | 11.471%
(3 mo. USD Term
SOFR + 6.15% | )# | 7/20/2037 | | | 100,000 | | | | 99,056 | |
| Generate CLO 4 Ltd. Series 4A Class ARR† | | 6.712%
(3 mo. USD Term
SOFR + 1.43% | )# | 7/20/2037 | | | 350,000 | | | | 350,000 | |
| GreenSky Home Improvement Trust Series 2024-1 Class A3†(a) | | 5.55% | | 7/25/2059 | | | 425,000 | | | | 426,294 | |
| GREYWOLF CLO VII Ltd. Series 2018-2A Class A2† | | 7.442%
(3 mo. USD Term
SOFR + 2.16% | )# | 10/20/2031 | | | 250,000 | | | | 250,450 | |
| Hartwick Park CLO Ltd. Series 2023-1A Class D† | | 9.782%
(3 mo. USD Term
SOFR + 4.50% | )# | 1/21/2036 | | | 250,000 | | | | 252,373 | |
| HIN Timeshare Trust Series 2020-A Class C† | | 3.42% | | 10/9/2039 | | | 132,945 | | | | 125,819 | |
| KKR CLO 59 Ltd. Series 2024-56A Class E†(a) | | 1.00%
(3 mo. USD Term
SOFR + 6.50% | )# | 10/15/2037 | | | 250,000 | | | | 250,000 | |
| KKR Financial CLO Ltd. Series 2013-1A Class A2R2† | | 6.751%
(3 mo. USD Term
SOFR + 1.45% | )# | 4/15/2029 | | | 1,000,000 | | | | 1,002,522 | |
| Lendmark Funding Trust Series 2021-2A Class A† | | 2.00% | | 4/20/2032 | | | 100,000 | | | | 91,751 | |
| Lodi Park CLO Ltd. Series 2024-1A Class E† | | 10.939%
(3 mo. USD Term
SOFR + 5.65% | )# | 7/21/2037 | | | 100,000 | | | | 100,000 | |
| M&T Equipment Notes Series 2023-1A Class A2† | | 6.09% | | 7/15/2030 | | | 87,849 | | | | 88,026 | |
| Madison Park Funding LVII Ltd. Series 2022-57A Class A1R†(a) | | 1.00%
(3 mo. USD Term
SOFR + 1.28% | )# | 7/27/2034 | | | 500,000 | | | | 500,375 | |
| | |
| 28 | See Notes to Financial Statements. |
Schedule of Investments (continued)
INVESTMENT GRADE FLOATING RATE FUND July 31, 2024
| Investments | | Interest
Rate | | Maturity
Date | | Principal
Amount† | | | Fair
Value | |
| Other (continued) | | | | | | | | | | | | |
| Madison Park Funding LVIII Ltd. Series 2024-58A Class D† | | 8.973%
(3 mo. USD Term
SOFR + 3.65% | )# | 4/25/2037 | | $ | 500,000 | | | $ | 510,212 | |
| Magnetite XXXIX Ltd. Series 2023-39A Class C† | | 7.835%
(3 mo. USD Term
SOFR + 2.55% | )# | 10/25/2033 | | | 250,000 | | | | 250,374 | |
| Magnetite XXXV Ltd. Series 2022-35A Class DR† | | 9.285%
(3 mo. USD Term
SOFR + 4.00% | )# | 10/25/2036 | | | 250,000 | | | | 256,562 | |
| Mariner Finance Issuance Trust Series 2020-AA Class B† | | 3.21% | | 8/21/2034 | | | 400,000 | | | | 394,076 | |
| Mariner Finance Issuance Trust Series 2024-AA Class E†(a) | | 9.02% | | 9/22/2036 | | | 450,000 | | | | 450,902 | |
| MF1 LLC Series 2024-FL14 Class A† | | 7.078%
(1 mo. USD Term
SOFR + 1.74% | )# | 3/19/2039 | | | 100,000 | | | | 99,612 | |
| Neuberger Berman Loan Advisers CLO 51 Ltd. Series 2022-51A Class AR† | | 6.567%
(3 mo. USD Term
SOFR + 1.28% | )# | 10/23/2036 | | | 500,000 | | | | 500,000 | |
| Neuberger Berman Loan Advisers CLO 55 Ltd. Series 2024-55A Class D1† | | 8.823%
(3 mo. USD Term
SOFR + 3.50% | )# | 4/22/2038 | | | 450,000 | | | | 458,530 | |
| OCP CLO Ltd. Series 2023-26A Class E† | | 13.536%
(3 mo. USD Term
SOFR + 8.25% | )# | 4/17/2036 | | | 250,000 | | | | 259,114 | |
| OCP CLO Ltd. Series 2024-31A Class D† | | 9.243%
(3 mo. USD Term
SOFR + 3.95% | )# | 4/20/2037 | | | 250,000 | | | | 254,816 | |
| OHA Credit Funding 14 Ltd. Series 2023-14A Class E† | | 13.032%
(3 mo. USD Term
SOFR + 7.75% | )# | 4/20/2036 | | | 250,000 | | | | 258,560 | |
| OHA Credit Funding 16 Ltd. Series 2023-16A Class C† | | 7.932%
(3 mo. USD Term
SOFR + 2.65% | )# | 10/20/2036 | | | 250,000 | | | | 250,680 | |
| OHA Credit Funding 18 Ltd. Series 2024-18A Class D1† | | 8.742%
(3 mo. USD Term
SOFR + 3.45% | )# | 4/20/2037 | | | 350,000 | | | | 357,109 | |
| | | |
| | See Notes to Financial Statements. | 29 |
Schedule of Investments (continued)
INVESTMENT GRADE FLOATING RATE FUND July 31, 2024
| Investments | | Interest
Rate | | Maturity
Date | | Principal
Amount† | | | Fair
Value | |
| Other (continued) | | | | | | | | | | | | |
| Palmer Square CLO Ltd. Series 2023-1A Class D† | | 10.582%
(3 mo. USD Term
SOFR + 5.30% | )# | 1/20/2036 | | $ | 250,000 | | | $ | 255,645 | |
| Post CLO Ltd. Series 2023-1A Class B1† | | 7.782%
(3 mo. USD Term
SOFR + 2.50% | )# | 4/20/2036 | | | 250,000 | | | | 251,521 | |
| Rad CLO 20 Ltd. Series 2023-20A Class D† | | 10.282%
(3 mo. USD Term
SOFR + 5.00% | )# | 7/20/2036 | | | 250,000 | | | | 256,750 | |
| Rad CLO 7 Ltd. Series 2020-7A Class A1R† | | 6.636%
(3 mo. USD Term
SOFR + 1.35% | )# | 4/17/2036 | | | 1,000,000 | | | | 1,001,724 | |
| Regatta XXV Funding Ltd. Series 2023-1A Class C† | | 8.351%
(3 mo. USD Term
SOFR + 3.05% | )# | 7/15/2036 | | | 250,000 | | | | 251,508 | |
| RR 12 Ltd. Series 2020-12A Class AAR3† | | 6.551%
(3 mo. USD Term
SOFR + 1.25% | )# | 1/15/2036 | | | 350,000 | | | | 349,995 | |
| RR 8 Ltd. Series 2020-8A Class A1R† | | 6.675%
(3 mo. USD Term
SOFR + 1.35% | )# | 7/15/2037 | | | 1,000,000 | | | | 1,003,711 | |
| SCF Equipment Leasing LLC Series 2023-1A Class A2† | | 6.56% | | 1/22/2030 | | | 98,354 | | | | 99,311 | |
| SEB Funding LLC Series 2021-1A Class A2† | | 4.969% | | 1/30/2052 | | | 89,775 | | | | 86,957 | |
| Sixth Street CLO XXII Ltd. Series 2023-22A Class D† | | 10.282%
(3 mo. USD Term
SOFR + 5.00% | )# | 4/22/2036 | | | 300,000 | | | | 306,590 | |
| Sixth Street CLO XXVI Ltd. Series 2024-26A Class E†(a) | | 1.00%
(3 mo. USD Term
SOFR + 5.65% | )# | 10/18/2037 | | | 250,000 | | | | 250,003 | |
| Stratus Static CLO Ltd. Series 2022-3A Class CR† | | 7.682%
(3 mo. USD Term
SOFR + 2.40% | )# | 10/20/2031 | | | 250,000 | | | | 250,979 | |
| Stream Innovations Issuer Trust Series 2024-1A Class A† | | 6.27% | | 7/15/2044 | | | 100,000 | | | | 101,799 | |
| Sycamore Tree CLO Ltd. Series 2024-5A Class D1† | | 9.573%
(3 mo. USD Term
SOFR + 4.25% | )# | 4/20/2036 | | | 250,000 | | | | 253,365 | |
| Valley Stream Park CLO Ltd. Series 2022-1A Class BR† | | 7.532%
(3 mo. USD Term
SOFR + 2.25% | )# | 10/20/2034 | | | 250,000 | | | | 250,305 | |
| Valley Stream Park CLO Ltd. Series 2022-1A Class DR† | | 9.432%
(3 mo. USD Term
SOFR + 4.15% | )# | 10/20/2034 | | | 250,000 | | | | 251,772 | |
| | |
| 30 | See Notes to Financial Statements. |
Schedule of Investments (continued)
INVESTMENT GRADE FLOATING RATE FUND July 31, 2024
| Investments | | Interest
Rate | | Maturity
Date | | Principal
Amount† | | | Fair
Value | |
| Other (continued) | | | | | | | | | | | | |
| Voya CLO Ltd. Series 2023-1A Class C† | | 8.132%
(3 mo. USD Term
SOFR + 2.85% | )# | 1/20/2037 | | $ | 250,000 | | | $ | 252,304 | |
| Wellington Management CLO 3 Ltd. Series 2024-3A Class A1†(a) | | 5.07%
(3 mo. USD Term
SOFR + 1.36% | )# | 7/18/2037 | | | 350,000 | | | | 350,000 | (b) |
| Total | | | | | | | | | | | 25,386,151 | |
| | | | | | | | | | | | | |
| Student Loan 0.58% | | | | | | | | | | | | |
| Bayview Opportunity Master Fund VII LLC Series 2024-EDU1 Class D† | | 8.097%
(30 day USD
SOFR Average + 2.75% | )# | 6/25/2047 | | | 233,461 | | | | 236,296 | |
| Total Asset-Backed Securities (cost $31,839,521) | | | | | | | | | | | 31,938,482 | |
| | | | | | | | | | | | | |
| CORPORATE BONDS 8.36% | | | | | | | | | | | | |
| | | | | | | | | | | | | |
| Auto Manufacturers 1.71% | | | | | | | | | | | | |
| General Motors Financial Co., Inc. | | 6.428%
(SOFR + 1.05% | )# | 7/15/2027 | | | 300,000 | | | | 300,212 | |
| Hyundai Capital America† | | 6.408%
(SOFR + 1.04% | )# | 6/24/2027 | | | 400,000 | | | | 400,609 | |
| Total | | | | | | | | | | | 700,821 | |
| | | | | | | | | | | | | |
| Banks 5.21% | | | | | | | | | | | | |
| ABN AMRO Bank NV (Netherlands)†(c) | | 7.148%
(SOFR + 1.78% | )# | 9/18/2027 | | | 400,000 | | | | 406,608 | |
| Bank of Nova Scotia (Canada)(c) | | 6.471%
(SOFR + 1.08% | )# | 8/1/2029 | | | 200,000 | | | | 200,249 | |
| BPCE SA (France)†(c) | | 7.347%
(SOFR + 1.98% | )# | 10/19/2027 | | | 250,000 | | | | 255,051 | |
| Citigroup, Inc. | | 6.148%
(3 mo. USD
Term SOFR + 0.81% | )# | 8/25/2036 | | | 200,000 | | | | 174,161 | |
| Goldman Sachs Group, Inc. | | 7.217%
(SOFR + 1.85% | )# | 3/15/2028 | | | 383,000 | | | | 391,774 | |
| JPMorgan Chase & Co. | | 6.297%
(SOFR + 0.93% | )# | 7/22/2028 | | | 300,000 | | | | 300,585 | |
| NatWest Markets PLC (United Kingdom)†(c) | | 6.505%
(SOFR + 1.14% | )# | 5/17/2029 | | | 400,000 | | | | 401,742 | |
| Total | | | | | | | | | | | 2,130,170 | |
| | | |
| | See Notes to Financial Statements. | 31 |
Schedule of Investments (continued)
INVESTMENT GRADE FLOATING RATE FUND July 31, 2024
| Investments | | Interest
Rate | | Maturity
Date | | Principal
Amount† | | | Fair
Value | |
| Insurance 0.49% | | | | | | | | | | | | |
| Athene Global Funding† | | 6.579%
(SOFR + 1.21% | )# | 3/25/2027 | | $ | 199,000 | | | $ | 200,103 | |
| | | | | | | | | | | | | |
| Mining 0.95% | | | | | | | | | | | | |
| Glencore Funding LLC† | | 6.428%
(SOFR + 1.06% | )# | 4/4/2027 | | | 387,000 | | | | 387,900 | |
| Total Corporate Bonds (cost $3,419,102) | | | | | | | | | | | 3,418,994 | |
| | | | | | | | | | | | | |
| FLOATING RATE LOANS(d) 5.66% | | | | | | | | | | | | |
| | | | | | | | | | | | | |
| Aerospace 0.24% | | | | | | | | | | | | |
| American Airlines, Inc. 2021 Term Loan | | 10.294%
(3 mo. USD Term
SOFR + 4.75% | ) | 4/20/2028 | | | 96,375 | | | | 99,826 | |
| | | | | | | | | | | | | |
| Building Materials 0.24% | | | | | | | | | | | | |
| Quikrete Holdings, Inc. 2024 Term Loan B | | 7.844%
(1 mo. USD Term
SOFR + 2.50% | ) | 4/14/2031 | | | 97,755 | | | | 98,177 | |
| | | | | | | | | | | | | |
| Computers 0.23% | | | | | | | | | | | | |
| Amentum Government Services Holdings LLC 2024 Term Loan B | | – | (e) | 7/30/2031 | | | 92,000 | | | | 92,345 | |
| | | | | | | | | | | | | |
| Diversified Financial Services 0.86% | | | | | | | | | | | | |
| Avolon TLB Borrower 1 U.S. LLC 2023 Term Loan B6 | | 7.345%
(1 mo. USD Term
SOFR + 2.00% | ) | 6/22/2028 | | | 98,991 | | | | 99,427 | |
| CPI Holdco B LLC Term Loan | | – | (e) | 5/19/2031 | | | 117,000 | | | | 117,159 | |
| Nuvei Technologies Corp. USD Term Loan (Canada)(c) | | 8.444%
(1 mo. USD Term
SOFR + 3.00% | ) | 12/19/2030 | | | 82,585 | | | | 82,964 | |
| Setanta Aircraft Leasing Designated Activity Co. 2024 Term Loan B (Ireland)(c) | | 7.085%
(3 mo. USD Term
SOFR + 1.75% | ) | 11/5/2028 | | | 51,000 | | | | 51,330 | |
| Total | | | | | | | | | | | 350,880 | |
| | | | | | | | | | | | | |
| Diversified Manufacturing Operations 0.69% | | | | | | | | | | | | |
| First Eagle Investment Management LLC 2024 Term Loan B2 | | – | (e) | 3/5/2029 | | | 285,000 | | | | 283,098 | |
| | |
| 32 | See Notes to Financial Statements. |
Schedule of Investments (continued)
INVESTMENT GRADE FLOATING RATE FUND July 31, 2024
| Investments | | Interest
Rate | | Maturity
Date | | Principal
Amount† | | | Fair
Value | |
| Entertainment 0.73% | | | | | | | | | | | | |
| Caesars Entertainment, Inc. 2024 Term Loan B1 | | 8.097%
(3 mo. USD Term
SOFR + 2.75% | ) | 2/6/2031 | | $ | 117,705 | | | $ | 118,115 | |
| Flutter Financing BV Term Loan B (Netherlands)(c) | | 7.585%
(3 mo. USD Term
SOFR + 2.25% | ) | 11/29/2030 | | | 100,460 | | | | 100,732 | |
| GVC Holdings (Gibraltar) Ltd. 2024 EUR Term Loan B | | 6.922%
(6 mo. EURIBOR + 3.25% | ) | 6/30/2028 | | EUR | 73,000 | | | | 79,453 | |
| Total | | | | | | | | | | | 298,300 | |
| | | | | | | | | | | | | |
| Financial 0.67% | | | | | | | | | | | | |
| Hudson River Trading LLC 2021 Term Loan | | – | (e) | 3/20/2028 | | $ | 175,000 | | | | 175,249 | |
| LPL Holdings, Inc. 2019 Term Loan B1 | | 7.193%
(1 mo. USD Term
SOFR + 1.75% | ) | 11/12/2026 | | | 98,708 | | | | 98,858 | |
| Total | | | | | | | | | | | 274,107 | |
| | | | | | | | | | | | | |
| Health Care Services 0.14% | | | | | | | | | | | | |
| Concentra Health Services, Inc. Term Loan B | | – | (e) | 7/28/2031 | | | 56,000 | | | | 56,210 | |
| | | | | | | | | | | | | |
| Lodging 0.24% | | | | | | | | | | | | |
| Hilton Domestic Operating Co., Inc. 2023 Term Loan B3 | | 7.10%
(1 mo. USD Term
SOFR + 1.75% | ) | 6/21/2028 | | | 100,000 | | | | 100,328 | |
| | | | | | | | | | | | | |
| Media 0.24% | | | | | | | | | | | | |
| Charter Communications Operating LLC 2019 Term Loan B2 | | 7.082%
(3 mo. USD Term
SOFR + 1.75% | ) | 2/1/2027 | | | 98,705 | | | | 98,712 | |
| | | | | | | | | | | | | |
| Oil & Gas 0.10% | | | | | | | | | | | | |
| Petroleos Mexicanos 2023 Term Loan (Mexico)(c) | | – | (e) | 11/30/2026 | | | 40,000 | | | | 39,904 | |
| | | | | | | | | | | | | |
| Pharmaceuticals 0.17% | | | | | | | | | | | | |
| Vizient, Inc. 2024 Term Loan B | | – | (e) | 7/18/2031 | | | 68,000 | | | | 68,340 | |
| | | | | | | | | | | | | |
| Real Estate 0.18% | | | | | | | | | | | | |
| Cushman & Wakefield U.S. Borrower LLC 2024 Term Loan | | 9.094%
(1 mo. USD Term
SOFR + 3.75% | ) | 1/31/2030 | | | 73,354 | | | | 73,721 | |
| | | |
| | See Notes to Financial Statements. | 33 |
Schedule of Investments (continued)
INVESTMENT GRADE FLOATING RATE FUND July 31, 2024
| Investments | | Interest
Rate | | Maturity
Date | | Principal
Amount† | | | Fair
Value | |
| Retail 0.34% | | | | | | | | | | | | |
| KFC Holding Co. 2021 Term Loan B | | 7.199%
(1 mo. USD Term
SOFR + 1.75% | ) | 3/15/2028 | | $ | 98,977 | | | $ | 99,153 | |
| Peer Holding III BV 2023 USD Term Loan B4 (Netherlands)(c) | | 8.585%
(3 mo. USD Term
SOFR + 3.25% | ) | 10/28/2030 | | | 41,895 | | | | 42,170 | |
| Total | | | | | | | | | | | 141,323 | |
| | | | | | | | | | | | | |
| Telecommunications 0.49% | | | | | | | | | | | | |
| Lorca Holdco Ltd. 2024 USD Term Loan (United Kingdom)(c) | | – | (e) | 3/25/2031 | | | 199,091 | | | | 200,086 | |
| | | | | | | | | | | | | |
| Utilities 0.10% | | | | | | | | | | | | |
| Compass Power Generation LLC 2022 Term Loan B2 | | 9.708%
(1 mo. USD Term
SOFR + 4.25% | ) | 4/14/2029 | | | 39,418 | | | | 39,797 | |
| Total Floating Rate Loans (cost $2,307,912) | | | | | | | | | | | 2,315,154 | |
| | | | | | | | | | | | | |
| NON-AGENCY COMMERCIAL MORTGAGE-BACKED SECURITIES 7.90% | | |
| BLP Commercial Mortgage Trust Series 2024-IND2 Class A† | | 6.671%
(1 mo. USD Term
SOFR + 1.34% | )# | 3/15/2041 | | | 200,000 | | | | 198,624 | |
| BX Commercial Mortgage Trust Series 2021-XL2 Class A† | | 6.132%
(1 mo. USD Term
SOFR + 0.80% | )# | 10/15/2038 | | | 154,860 | | | | 153,318 | |
| BX Commercial Mortgage Trust Series 2024-XL5 Class A† | | 6.721%
(1 mo. USD Term
SOFR + 1.39% | )# | 3/15/2041 | | | 115,078 | | | | 114,467 | |
| BX Trust Series 2024-VLT4 Class A† | | 6.82%
(1 mo. USD Term
SOFR + 1.49% | )# | 7/15/2029 | | | 200,000 | | | | 199,988 | |
| CONE Trust Series 2024-DFW1 Class A† | | 6.942%
(1 mo. USD Term
SOFR + 1.64% | )# | 8/15/2026 | | | 20,000 | | | | 19,993 | |
| Federal Home Loan Mortgage Corp. STACR REMICS Trust Series 2022-HQA3 Class A1† | | 7.197%
(30 day USD
SOFR Average + 1.85% | )# | 11/25/2043 | | | 290,153 | | | | 294,299 | |
| | |
| 34 | See Notes to Financial Statements. |
Schedule of Investments (continued)
INVESTMENT GRADE FLOATING RATE FUND July 31, 2024
| Investments | | Interest
Rate | | Maturity
Date | | Principal
Amount† | | | Fair
Value | |
| NON-AGENCY COMMERCIAL MORTGAGE-BACKED SECURITIES (continued) |
| Federal Home Loan Mortgage Corp. STACR REMICS Trust Series 2024-DNA1 Class A1† | | 6.697%
(30 day USD
SOFR Average + 1.35% | )# | 2/25/2044 | | $ | 210,721 | | | $ | 211,614 | |
| Federal Home Loan Mortgage Corp. STACR REMICS Trust Series 2024-HQA1 Class A1† | | 6.597%
(30 day USD
SOFR Average + 1.25% | )# | 3/25/2044 | | | 233,743 | | | | 234,477 | |
| Federal National Mortgage Association Connecticut Avenue Securities Series 2024-R05 Class 2A1† | | 6.336%
(30 day USD
SOFR Average + 1.00% | )# | 7/25/2044 | | | 250,000 | | | | 250,218 | |
| Great Wolf Trust Series 2024-WOLF Class A† | | 6.871%
(1 mo. USD Term
SOFR + 1.54% | )# | 3/15/2039 | | | 200,000 | | | | 199,579 | |
| JW Commercial Mortgage Trust Series 2024-MRCO Class A† | | 6.949%
(1 mo. USD Term
SOFR + 1.62% | )# | 6/15/2039 | | | 300,000 | | | | 299,598 | |
| KIND Commercial Mortgage Trust Series 2024-1 Class A†(a) | | 7.24%
(1 mo. USD Term
SOFR + 1.89% | )# | 8/15/2029 | | | 340,000 | | | | 340,066 | |
| MTN Commercial Mortgage Trust Series 2022-LPFL Class A† | | 6.727%
(1 mo. USD Term
SOFR + 1.40% | )# | 3/15/2039 | | | 100,000 | | | | 98,894 | |
| Multifamily Connecticut Avenue Securities Trust Series 2024-01 Class M7† | | 8.097%
(30 day USD
SOFR Average + 2.75% | )# | 7/25/2054 | | | 110,000 | | | | 110,168 | |
| NRTH Mortgage Trust Series 2024-PARK Class A† | | 6.97%
(1 mo. USD Term
SOFR + 1.64% | )# | 3/15/2039 | | | 260,000 | | | | 259,318 | |
| PFP Ltd. Series 2023-10 Class A† | | 7.70%
(1 mo. USD Term
SOFR + 2.36% | )# | 9/16/2038 | | | 100,000 | | | | 100,341 | |
| SDR Commercial Mortgage Trust Series 2024-DSNY Class A† | | 6.721%
(1 mo. USD Term
SOFR + 1.39% | )# | 5/15/2039 | | | 150,000 | | | | 149,394 | |
| Total Non-Agency Commercial Mortgage-Backed Securities (cost $3,226,540) | | | | | | 3,234,356 | |
| | | |
| | See Notes to Financial Statements. | 35 |
Schedule of Investments (continued)
INVESTMENT GRADE FLOATING RATE FUND July 31, 2024
| Investments | | Interest
Rate | | Maturity
Date | | Principal
Amount† | | | Fair
Value | |
| U.S. TREASURY OBLIGATIONS 4.12% | | | | | | | | | | | | |
U.S. Treasury Floating Rate Notes
(cost $1,685,957) | | 5.395%
(3 mo. Treasury
money market
yield + 0.18% | )# | 7/31/2026 | | $ | 1,686,000 | | | $ | 1,687,235 | |
| Total Long-Term Investments (cost $42,479,032) | | | | | | | | | | | 42,594,221 | |
| | | | | | | | | | | | | |
| SHORT-TERM INVESTMENTS 2.44% | | | | | | | | | | | | |
| | | | | | | | | | | | | |
| GOVERNMENT SPONSORED ENTERPRISES SECURITIES 2.44% | | | | | | |
Federal Home Loan Bank Discount Notes
(cost $1,000,000) | | Zero Coupon | | 8/1/2024 | | | 1,000,000 | | | | 999,854 | |
| Total Investments in Securities 106.52% (cost $43,479,032) | | | | | | | | | | | 43,594,075 | |
| Other Assets and Liabilities – Net(f) (6.52)% | | | | | | | | | | | (2,667,324 | ) |
| Net Assets 100.00% | | | | | | | | | | $ | 40,926,751 | |
| | |
| CAD | Canadian Dollar. |
| EUR | Euro. |
| EURIBOR | Euro Interbank Offered Rate. |
| REMICS | Real Estate Mortgage Investment Conduits. |
| SOFR | Secured Overnight Financing Rate. |
| STACR | Structured Agency Credit Risk. |
| | |
| † | | Principal Amount is denominated in U.S. dollars unless otherwise noted. |
| † | | Security was purchased pursuant to Rule 144A under the Securities Act of 1933 and, unless registered under such Act or exempted from registration, may only be resold to qualified institutional buyers. At July 31, 2024, the total value of Rule 144A securities was $36,056,199, which represents 88.10% of net assets. |
| # | | Variable rate security. The interest rate represents the rate in effect at July 31, 2024. |
| (a) | | Securities purchased on a when-issued basis (See Note 2(k)). |
| (b) | | Level 3 Investment as described in Note 2(p) in the Notes to Financial Statements. Security valued utilizing third party pricing information without adjustment. Such valuations are based on unobservable inputs. A significant change in third party information could result in a significantly lower or higher value of such Level 3 investments. |
| (c) | | Foreign security traded in U.S. dollars. |
| (d) | | Floating Rate Loans in which the Fund invests generally pay interest at rates which are periodically re-determined at a margin above the SOFR or the prime rate offered by major U.S. banks. The rate(s) shown is the rate(s) in effect at July 31, 2024. |
| (e) | | Interest Rate to be determined. |
| (f) | | Other Assets and Liabilities – Net include net unrealized appreciation/depreciation on forward foreign currency exchange contracts and futures contracts as follows: |
| | |
| 36 | See Notes to Financial Statements. |
Schedule of Investments (continued)
INVESTMENT GRADE FLOATING RATE FUND July 31, 2024
Forward
Foreign
Currency
Exchange
Contracts | | Transaction
Type | | Counterparty | | Expiration
Date | | Foreign
Currency | | | U.S. $
Cost on
Origination
Date | | | U.S. $
Current
Value | | | Unrealized
Appreciation | |
| Canadian dollar | | Sell | | Morgan Stanley | | 8/9/2024 | | | 446,000 | | | $ | 325,324 | | | $ | 323,108 | | | | $ | 2,216 | |
| | | | | | | | | | | | | | | | | | | | |
Forward
Foreign
Currency
Exchange
Contracts | | Transaction
Type | | Counterparty | | Expiration
Date | | Foreign
Currency | | | U.S. $
Cost on
Origination
Date | | | U.S. $
Current
Value | | | Unrealized
Depreciation | |
| Canadian dollar | | Buy | | Goldman Sachs | | 8/9/2024 | | | 25,000 | | | $ | 18,274 | | | $ | 18,111 | | | | $ | (163 | ) |
| Canadian dollar | | Buy | | Morgan Stanley | | 8/9/2024 | | | 21,000 | | | | 15,425 | | | | 15,214 | | | | | (211 | ) |
| Euro | | Sell | | Morgan Stanley | | 8/20/2024 | | | 150,000 | | | | 161,461 | | | | 162,473 | | | | | (1,012 | ) |
| Total Unrealized Depreciation on Forward Foreign Currency Exchange Contracts | | | | | | | | | $ | (1,386 | ) |
Futures Contracts at July 31, 2024:
| Type | | Expiration | | Contracts | | Position | | Notional
Amount | | | Notional
Value | | | Unrealized
Depreciation | |
| U.S. 2-Year Treasury Note | | September 2024 | | 30 | | Short | | $ | (6,143,648 | ) | | $ | (6,161,016 | ) | | | $ | (17,368 | ) |
| U.S. 5-Year Treasury Note | | September 2024 | | 4 | | Short | | | (430,965 | ) | | | (431,563 | ) | | | | (598 | ) |
| Total Unrealized Depreciation on Futures Contracts | | | | | $ | (17,966 | ) |
The following is a summary of the inputs used as of July 31, 2024 in valuing the Fund’s investments carried at fair value(1):
| Investment Type(2) | | Level 1 | | | Level 2 | | | Level 3 | | | Total | |
| Long-Term Investments | | | | | | | | | | | | | | | | |
| Asset-Backed Securities | | | | | | | | | | | | | | | | |
| Other | | $ | – | | | $ | 25,036,151 | | | $ | 350,000 | | | $ | 25,386,151 | |
| Remaining Industries | | | – | | | | 6,552,331 | | | | – | | | | 6,552,331 | |
| Corporate Bonds | | | – | | | | 3,418,994 | | | | – | | | | 3,418,994 | |
| Floating Rate Loans | | | – | | | | 2,315,154 | | | | – | | | | 2,315,154 | |
| Non-Agency Commercial Mortgage-Backed Securities | | | – | | | | 3,234,356 | | | | – | | | | 3,234,356 | |
| U.S. Treasury Obligations | | | – | | | | 1,687,235 | | | | – | | | | 1,687,235 | |
| Short-Term Investments | | | | | | | | | | | | | | | | |
| Government Sponsored Enterprises Securities | | | – | | | | 999,854 | | | | – | | | | 999,854 | |
| Total | | $ | – | | | $ | 43,244,075 | | | $ | 350,000 | | | $ | 43,594,075 | |
| | | |
| | See Notes to Financial Statements. | 37 |
Schedule of Investments (concluded)
INVESTMENT GRADE FLOATING RATE FUND July 31, 2024
| Investment Type(2) | | Level 1 | | | Level 2 | | | Level 3 | | | Total | |
| Other Financial Instruments | | | | | | | | | | | | | | | | |
| Forward Foreign Currency Exchange Contracts | | | | | | | | | | | | | | | | |
| Assets | | $ | – | | | $ | 2,216 | | | $ | – | | | $ | 2,216 | |
| Liabilities | | | – | | | | (1,386 | ) | | | – | | | | (1,386 | ) |
| Futures Contracts | | | | | | | | | | | | | | | | |
| Assets | | | – | | | | – | | | | – | | | | – | |
| Liabilities | | | (17,966 | ) | | | – | | | | – | | | | (17,966 | ) |
| Total | | $ | (17,966 | ) | | $ | 830 | | | $ | – | | | $ | (17,136 | ) |
| | | |
| (1) | | Refer to Note 2(p) for a description of fair value measurements and the three-tier hierarchy of inputs. |
| (2) | | See Schedule of Investments for fair values in each industry and identification of foreign issuers and/or geography. The table above is presented by Investment Type. Industries are presented within an Investment Type should such Investment Type include securities classified as two or more levels within the three-tier fair value hierarchy. When applicable, each Level 3 security is identified on the Schedule of Investments along with the valuation technique utilized. |
A reconciliation of Level 3 investments is presented when the Fund has a material amount of Level 3 investments at the beginning or end of the year in relation to the Fund’s net assets. Management has determined not to provide a reconciliation as the balance of Level 3 investments was not considered to be material to the Fund’s net assets at the beginning or end of the year.
| | |
| 38 | See Notes to Financial Statements. |
Schedule of Investments
SHORT DURATION HIGH YIELD FUND July 31, 2024
| Investments | | Interest
Rate | | Maturity
Date | | Principal
Amount† | | | Fair
Value | |
| LONG-TERM INVESTMENTS 104.39% | | | | | | | | | | |
| | | | | | | | | | | | | |
| ASSET-BACKED SECURITIES 1.05% | | | | | | | | | | | | |
| | | | | | | | | | | | | |
| Other 1.05% | | | | | | | | | | | | |
| Carlyle U.S. CLO Ltd. Series 2022-3A Class CR† | | 7.832%
(3 mo. USD Term
SOFR + 2.55% | )# | 4/20/2037 | | $ | 7,000,000 | | | $ | 7,094,346 | |
| Carlyle U.S. CLO Ltd. Series 2024-1A Class B† | | 7.294%
(3 mo. USD Term
SOFR + 2.00% | )# | 4/15/2037 | | | 6,270,000 | | | | 6,325,692 | |
| CIFC Funding Ltd. Series 2023-3A Class B† | | 7.582%
(3 mo. USD Term
SOFR + 2.30% | )# | 1/20/2037 | | | 6,040,000 | | | | 6,124,369 | |
| Empower CLO Ltd. Series 2023-1A Class D† | | 10.785%
(3 mo. USD Term
SOFR + 5.50% | )# | 4/25/2036 | | | 7,500,000 | | | | 7,702,411 | |
| Oaktree CLO Ltd. Series 2023-2A Class D† | | 10.732%
(3 mo. USD Term
SOFR + 5.45% | )# | 7/20/2036 | | | 2,000,000 | | | | 2,071,905 | |
| OHA Loan Funding Ltd. Series 2016-1A Class CR2† | | 7.435%
(3 mo. USD Term
SOFR + 2.10% | )# | 7/20/2037 | | | 3,000,000 | | | | 3,030,853 | |
| Palmer Square CLO Ltd. Series 2023-3A Class C† | | 8.182%
(3 mo. USD Term
SOFR + 2.90% | )# | 1/20/2037 | | | 2,750,000 | | | | 2,779,843 | |
| Peebles Park CLO Ltd. Series 2024-1A Class B1† | | 7.304%
(3 mo. USD Term
SOFR + 2.00% | )# | 4/21/2037 | | | 7,970,000 | | | | 8,049,078 | |
| Sixth Street CLO XVI Ltd. Series 2020-16A Class ER† | | 12.702%
(3 mo. USD Term
SOFR + 7.42% | )# | 1/20/2037 | | | 6,500,000 | | | | 6,798,572 | |
| Voya CLO Ltd. Series 2023-1A Class C† | | 8.132%
(3 mo. USD Term
SOFR + 2.85% | )# | 1/20/2037 | | | 4,730,000 | | | | 4,773,590 | |
| Total Asset-Backed Securities (cost $54,648,701) | | | | | | | | | | | 54,750,659 | |
| | See Notes to Financial Statements. | 39 |
Schedule of Investments (continued)
SHORT DURATION HIGH YIELD FUND July 31, 2024
| Investments | | Interest
Rate | | Maturity
Date | | Principal
Amount† | | | Fair
Value | |
| CONVERTIBLE BONDS 2.08% | | | | | | | | | | |
| | | | | | | | | | | |
| Diversified Financial Services 0.10% | | | | | | | | | | |
| Bread Financial Holdings, Inc. | | 4.25% | | 6/15/2028 | | $ | 3,357,000 | | | $ | 5,214,092 | |
| | | | | | | | | | | | | |
| Electric 0.10% | | | | | | | | | | | | |
| Atlantica Sustainable Infrastructure Jersey Ltd. (Jersey)(a) | | 4.00% | | 7/15/2025 | | | 5,000,000 | | | | 4,931,693 | |
| | | | | | | | | | | | | |
| Energy-Alternate Sources 0.17% | | | | | | | | | | | | |
| Enphase Energy, Inc.(b) | | Zero Coupon | | 3/1/2028 | | | 9,903,000 | | | | 8,575,253 | |
| | | | | | | | | | | | | |
| Engineering & Construction 0.09% | | | | | | | | | | | | |
| Granite Construction, Inc. | | 3.75% | | 5/15/2028 | | | 3,100,000 | | | | 4,885,600 | |
| | | | | | | | | | | | | |
| Health Care-Products 0.18% | | | | | | | | | | | | |
| Glaukos Corp. | | 2.75% | | 6/15/2027 | | | 1,962,000 | | | | 4,182,984 | |
| Merit Medical Systems, Inc.† | | 3.00% | | 2/1/2029 | | | 4,362,000 | | | | 5,127,031 | |
| Total | | | | | | | | | | | 9,310,015 | |
| | | | | | | | | | | | | |
| Internet 0.22% | | | | | | | | | | | | |
| MakeMyTrip Ltd. (India)(a) | | Zero Coupon | | 2/15/2028 | | | 2,070,000 | | | | 5,077,710 | |
| Meituan (China)(a) | | Zero Coupon | | 4/27/2027 | | | 6,600,000 | | | | 6,322,800 | |
| Total | | | | | | | | | | | 11,400,510 | |
| | | | | | | | | | | | | |
| Iron-Steel 0.10% | | | | | | | | | | | | |
| ATI, Inc. | | 3.50% | | 6/15/2025 | | | 1,225,000 | | | | 5,358,150 | |
| | | | | | | | | | | | | |
| Leisure Time 0.09% | | | | | | | | | | | | |
| Royal Caribbean Cruises Ltd. | | 6.00% | | 8/15/2025 | | | 1,471,000 | | | | 4,663,622 | |
| | | | | | | | | | | | | |
| Lodging 0.08% | | | | | | | | | | | | |
| Wynn Macau Ltd. (Macau)†(a) | | 4.50% | | 3/7/2029 | | | 4,050,000 | | | | 4,026,713 | |
| | | | | | | | | | | | | |
| Miscellaneous Manufacturing 0.09% | | | | | | | | | | | | |
| Axon Enterprise, Inc. | | 0.50% | | 12/15/2027 | | | 3,372,000 | | | | 4,745,129 | |
| | | | | | | | | | | | | |
| Oil & Gas 0.20% | | | | | | | | | | | | |
| CNX Resources Corp. | | 2.25% | | 5/1/2026 | | | 2,946,000 | | | | 6,160,086 | |
| Permian Resources Operating LLC | | 3.25% | | 4/1/2028 | | | 1,692,000 | | | | 4,430,808 | |
| Total | | | | | | | | | | | 10,590,894 | |
| | | | | | | | | | | | | |
| REITS 0.31% | | | | | | | | | | | | |
| PennyMac Corp. | | 5.50% | | 11/1/2024 | | | 7,856,000 | | | | 7,783,332 | |
| PennyMac Corp. | | 5.50% | | 3/15/2026 | | | 8,728,000 | | | | 8,427,044 | |
| Total | | | | | | | | | | | 16,210,376 | |
| 40 | See Notes to Financial Statements. |
Schedule of Investments (continued)
SHORT DURATION HIGH YIELD FUND July 31, 2024
| Investments | | Interest
Rate | | Maturity
Date | | Principal
Amount† | | | Fair
Value | |
| Semiconductors 0.12% | | | | | | | | | | |
| ams-OSRAM AG | | 2.125% | | 11/3/2027 | | EUR | 7,100,000 | | | $ | 6,108,760 | |
| | | | | | | | | | | | | |
| Software 0.10% | | | | | | | | | | | | |
| Guidewire Software, Inc. | | 1.25% | | 3/15/2025 | | $ | 3,920,000 | | | | 5,286,120 | |
| | | | | | | | | | | | | |
| Telecommunications 0.13% | | | | | | | | | | | | |
| GDS Holdings Ltd. (China)(a) | | 4.50% | | 1/31/2030 | | | 7,350,000 | | | | 6,737,542 | |
| Total Convertible Bonds (cost $103,736,699) | | | | | | | | | | | 108,044,469 | |
| | | | | | | | | | | | | |
| | | Dividend
Rate | | | | | Shares | | | | | |
| CONVERTIBLE PREFERRED STOCKS 0.30% | | | | | | | | | | | | |
| | | | | | | | | | | | | |
| Commercial Banks 0.09% | | | | | | | | | | | | |
| Bank of America Corp. | | 7.25% | | | | | 4,163 | | | | 4,981,029 | |
| | | | | | | | | | | | | |
| Financial Services 0.11% | | | | | | | | | | | | |
| Apollo Global Management, Inc. | | 6.75% | | | | | 82,411 | | | | 5,631,144 | |
| | | | | | | | | | | | | |
| Health Care Providers & Services 0.10% | | | | | | | | | | | | |
| Brookdale Senior Living, Inc. | | 7.00% | | | | | 48,868 | | | | 5,107,195 | |
| Total Convertible Preferred Stocks (cost $14,962,920) | | | | | | | | | | | 15,719,368 | |
| | | | | | | | | | | | | |
| | | Interest
Rate | | Maturity
Date | | | Principal
Amount† | | | | | |
| | | | | | | | | | | | | |
| CORPORATE BONDS 84.86% | | | | | | | | | | | | |
| | | | | | | | | | | | | |
| Advertising 1.24% | | | | | | | | | | | | |
| Advantage Sales & Marketing, Inc.† | | 6.50% | | 11/15/2028 | | $ | 19,305,000 | | | | 17,717,558 | |
| Clear Channel Outdoor Holdings, Inc.† | | 7.50% | | 6/1/2029 | | | 7,155,000 | | | | 6,151,580 | |
| Clear Channel Outdoor Holdings, Inc.† | | 9.00% | | 9/15/2028 | | | 1,332,000 | | | | 1,415,600 | |
| Clear Channel Worldwide Holdings, Inc.† | | 5.125% | | 8/15/2027 | | | 4,500,000 | | | | 4,363,315 | |
| Outfront Media Capital LLC/Outfront Media Capital Corp.† | | 4.25% | | 1/15/2029 | | | 5,130,000 | | | | 4,760,742 | |
| Outfront Media Capital LLC/Outfront Media Capital Corp.† | | 5.00% | | 8/15/2027 | | | 12,517,000 | | | | 12,241,991 | |
| Summer BC Bidco B LLC† | | 5.50% | | 10/31/2026 | | | 2,800,000 | | | | 2,753,757 | |
| Summer BC Holdco A SARL | | 9.25% | | 10/31/2027 | | EUR | 12,048,876 | | | | 12,844,296 | |
| Summer BC Holdco B SARL | | 5.75% | | 10/31/2026 | | EUR | 2,032,000 | | | | 2,189,495 | |
| Total | | | | | | | | | | | 64,438,334 | |
| | See Notes to Financial Statements. | 41 |
Schedule of Investments (continued)
SHORT DURATION HIGH YIELD FUND July 31, 2024
| Investments | | Interest
Rate | | Maturity
Date | | Principal
Amount† | | | Fair
Value | |
| Aerospace/Defense 0.42% | | | | | | | | | | | | |
| Bombardier, Inc. (Canada)†(a) | | 6.00% | | 2/15/2028 | | $ | 4,753,000 | | | $ | 4,744,317 | |
| Bombardier, Inc. (Canada)†(a)(b) | | 7.50% | | 2/1/2029 | | | 6,610,000 | | | | 6,906,504 | |
| TransDigm, Inc. | | 5.50% | | 11/15/2027 | | | 5,877,000 | | | | 5,807,635 | |
| TransDigm, Inc.† | | 6.75% | | 8/15/2028 | | | 1,684,000 | | | | 1,718,475 | |
| Triumph Group, Inc.† | | 9.00% | | 3/15/2028 | | | 2,366,000 | | | | 2,495,044 | |
| Total | | | | | | | | | | | 21,671,975 | |
| | | | | | | | | | | | | |
| Agriculture 0.47% | | | | | | | | | | | | |
| Kernel Holding SA (Ukraine)†(a) | | 6.50% | | 10/17/2024 | | | 7,247,000 | | | | 6,739,710 | |
| Kernel Holding SA (Ukraine)(a) | | 6.75% | | 10/27/2027 | | | 3,000,000 | | | | 2,307,998 | |
| MHP Lux SA (Luxembourg)†(a) | | 6.25% | | 9/19/2029 | | | 7,500,000 | | | | 5,423,550 | |
| Turning Point Brands, Inc.† | | 5.625% | | 2/15/2026 | | | 2,668,000 | | | | 2,636,381 | |
| Vector Group Ltd.† | | 5.75% | | 2/1/2029 | | | 7,400,000 | | | | 7,106,714 | |
| Total | | | | | | | | | | | 24,214,353 | |
| | | | | | | | | | | | | |
| Airlines 1.96% | | | | | | | | | | | | |
| Air Canada (Canada)†(a) | | 3.875% | | 8/15/2026 | | | 6,931,000 | | | | 6,672,112 | |
| American Airlines, Inc.† | | 7.25% | | 2/15/2028 | | | 17,266,000 | | | | 17,264,707 | |
| American Airlines, Inc./AAdvantage Loyalty IP Ltd.† | | 5.50% | | 4/20/2026 | | | 5,250,000 | | | | 5,219,414 | |
| American Airlines, Inc./AAdvantage Loyalty IP Ltd.† | | 5.75% | | 4/20/2029 | | | 9,805,594 | | | | 9,591,478 | |
| Azul Secured Finance LLP | | 11.50% | | 5/28/2029 | | | 2,000,000 | | | | 1,563,469 | |
| Azul Secured Finance LLP† | | 11.93% | | 8/28/2028 | | | 9,000,000 | | | | 8,670,519 | |
| Hawaiian Brand Intellectual Property Ltd./HawaiianMiles Loyalty Ltd.† | | 11.00% | | 4/15/2029 | | | 10,005,449 | | | | 9,550,551 | |
| United Airlines, Inc.† | | 4.625% | | 4/15/2029 | | | 19,900,000 | | | | 18,822,288 | |
| VistaJet Malta Finance PLC/Vista Management Holding, Inc. (Malta)†(a)(b) | | 7.875% | | 5/1/2027 | | | 5,610,000 | | | | 5,083,381 | |
| VistaJet Malta Finance PLC/Vista Management Holding, Inc. (Malta)†(a) | | 9.50% | | 6/1/2028 | | | 21,933,000 | | | | 19,650,130 | |
| Total | | | | | | | | | | | 102,088,049 | |
| | | | | | | | | | | | | |
| Auto Manufacturers 0.78% | | | | | | | | | | | | |
| Aston Martin Capital Holdings Ltd. (United Kingdom)†(a) | | 10.00% | | 3/31/2029 | | | 15,866,000 | | | | 15,942,253 | |
| Ford Motor Credit Co. LLC | | 5.125% | | 6/16/2025 | | | 12,000,000 | | | | 11,944,043 | |
| Jaguar Land Rover Automotive PLC (United Kingdom)†(a) | | 5.875% | | 1/15/2028 | | | 8,000,000 | | | | 7,927,586 | |
| JB Poindexter & Co., Inc.† | | 8.75% | | 12/15/2031 | | | 4,470,000 | | | | 4,704,152 | |
| Total | | | | | | | | | | | 40,518,034 | |
| 42 | See Notes to Financial Statements. |
Schedule of Investments (continued)
SHORT DURATION HIGH YIELD FUND July 31, 2024
| Investments | | Interest
Rate | | Maturity
Date | | Principal
Amount† | | | Fair
Value | |
| Auto Parts & Equipment 1.26% | | | | | | | | | | | | |
| American Axle & Manufacturing, Inc. | | 6.50% | | 4/1/2027 | | $ | 7,375,000 | | | $ | 7,403,349 | |
| American Axle & Manufacturing, Inc. | | 6.875% | | 7/1/2028 | | | 2,500,000 | | | | 2,502,624 | |
| Dana, Inc. | | 5.625% | | 6/15/2028 | | | 3,425,000 | | | | 3,340,507 | |
| Goodyear Tire & Rubber Co. | | 5.00% | | 5/31/2026 | | | 9,764,000 | | | | 9,642,038 | |
| Grupo Antolin-Irausa SA† | | 10.375% | | 1/30/2030 | | EUR | 4,700,000 | | | | 5,096,519 | |
| IHO Verwaltungs GmbH (Germany)†(a) | | 4.75% | | 9/15/2026 | | $ | 6,900,000 | | | | 6,733,702 | |
| IHO Verwaltungs GmbH (Germany)†(a) | | 6.375% | | 5/15/2029 | | | 4,000,000 | | | | 4,007,204 | |
| Standard Profil Automotive GmbH | | 6.25% | | 4/30/2026 | | EUR | 7,281,000 | | | | 6,970,230 | |
| Tenneco, Inc.† | | 8.00% | | 11/17/2028 | | $ | 21,968,000 | | | | 19,952,364 | |
| Total | | | | | | | | | | | 65,648,537 | |
| | | | | | | | | | | | | |
| Banks 2.44% | | | | | | | | | | | | |
| Banco Mercantil del Norte SA (Cayman Islands)(a) | | 5.875%
(5 yr. CMT + 4.64% | )# | – | (c) | | 6,000,000 | | | | 5,751,985 | |
| Bancolombia SA (Colombia)(a) | | 4.625%
(5 yr. CMT + 2.94% | )# | 12/18/2029 | | | 6,800,000 | | | | 6,742,984 | |
| Comerica, Inc. | | 5.982%
(SOFR + 2.16% | )# | 1/30/2030 | | | 3,686,000 | | | | 3,696,197 | |
| Freedom Mortgage Corp.† | | 6.625% | | 1/15/2027 | | | 2,750,000 | | | | 2,697,986 | |
| Freedom Mortgage Corp.† | | 12.00% | | 10/1/2028 | | | 16,990,000 | | | | 18,296,174 | |
| Freedom Mortgage Corp.† | | 12.25% | | 10/1/2030 | | | 4,905,000 | | | | 5,380,437 | |
| ING Groep NV (Netherlands)(a) | | 6.928%
(SOFR + 1.56% | )# | 9/11/2027 | | | 3,500,000 | | | | 3,552,680 | |
| JPMorgan Chase & Co. | | 4.00%
(3 mo. USD Term
SOFR + 2.75% | )# | – | (c) | | 17,508,000 | | | | 17,159,545 | |
| KeyCorp | | 5.00%
(3 mo. USD Term
SOFR + 3.87% | )# | – | (c) | | 6,860,000 | | | | 6,288,456 | |
| M&T Bank Corp. | | 3.50%
(5 yr. CMT + 2.68% | )# | – | (c) | | 10,821,000 | | | | 9,355,456 | |
| Popular, Inc. | | 7.25% | | 3/13/2028 | | | 8,530,000 | | | | 8,905,687 | |
| Societe Generale SA (France)†(a) | | 9.375%
(5 yr. CMT + 5.39% | )# | – | (c) | | 5,308,000 | | | | 5,457,489 | |
| Standard Chartered PLC (United Kingdom)(a) | | 3.516%
(5 yr. CMT + 1.85% | )# | 2/12/2030 | | | 4,800,000 | | | | 4,737,228 | |
| UBS Group AG (Switzerland)(a) | | 5.125%
(5 yr. CMT + 4.86% | )# | – | (c) | | 6,630,000 | | | | 6,385,685 | |
| UBS Group AG (Switzerland)†(a) | 7.75%
(5 yr. USD ICE Swap + 4.16% | )# | – | (c) | | 2,291,000 | | | | 2,360,614 | |
| | See Notes to Financial Statements. | 43 |
Schedule of Investments (continued)
SHORT DURATION HIGH YIELD FUND July 31, 2024
| Investments | | Interest
Rate | | Maturity
Date | | Principal
Amount† | | | Fair
Value | |
| Banks (continued) | | | | | | | | | | | | |
| UBS Group AG (Switzerland)†(a) | | 9.25%
(5 yr. CMT + 4.75% | )# | – | (c) | $ | 2,674,000 | | | $ | 2,917,922 | |
| Wells Fargo & Co. | | 6.437%
(SOFR + 1.07% | )# | 4/22/2028 | | | 9,819,000 | | | | 9,878,970 | |
| Western Alliance Bancorp | | 3.00%
(3 mo. USD Term
SOFR + 2.25% | )# | 6/15/2031 | | | 8,380,000 | | | | 7,521,301 | |
| Total | | | | | | | | | | | 127,086,796 | |
| | | | | | | | | | | | | |
| Building Materials 1.92% | | | | | | | | | | | | |
| ACProducts Holdings, Inc.†(b) | | 6.375% | | 5/15/2029 | | | 5,165,000 | | | | 3,111,839 | |
| AmeriTex HoldCo Intermediate LLC† | | 10.25% | | 10/15/2028 | | | 16,850,000 | | | | 17,935,999 | |
| Camelot Return Merger Sub, Inc.† | | 8.75% | | 8/1/2028 | | | 10,790,000 | | | | 10,738,907 | |
| Eco Material Technologies, Inc.† | | 7.875% | | 1/31/2027 | | | 10,648,000 | | | | 10,843,665 | |
| Griffon Corp. | | 5.75% | | 3/1/2028 | | | 3,690,000 | | | | 3,616,013 | |
| JELD-WEN, Inc.† | | 4.875% | | 12/15/2027 | | | 9,210,000 | | | | 8,778,065 | |
| MIWD Holdco II LLC/MIWD Finance Corp.† | | 5.50% | | 2/1/2030 | | | 5,500,000 | | | | 5,151,284 | |
| New Enterprise Stone & Lime Co., Inc.† | | 5.25% | | 7/15/2028 | | | 7,000,000 | | | | 6,728,441 | |
| Sisecam U.K. PLC (United Kingdom)†(a) | | 8.25% | | 5/2/2029 | | | 6,600,000 | | | | 6,735,531 | |
| Smyrna Ready Mix Concrete LLC† | | 6.00% | | 11/1/2028 | | | 14,604,000 | | | | 14,482,200 | |
| Standard Industries, Inc.† | | 5.00% | | 2/15/2027 | | | 5,360,000 | | | | 5,248,760 | |
| West China Cement Ltd. (China)(a) | | 4.95% | | 7/8/2026 | | | 7,800,000 | | | | 6,424,918 | |
| Total | | | | | | | | | | | 99,795,622 | |
| | | | | | | | | | | | | |
| Chemicals 3.80% | | | | | | | | | | | | |
| ASP Unifrax Holdings, Inc.† | | 5.25% | | 9/30/2028 | | | 15,792,000 | | | | 8,467,434 | |
| Celanese U.S. Holdings LLC | | 6.165% | | 7/15/2027 | | | 4,143,000 | | | | 4,255,661 | |
| Cerdia Finanz GmbH (Germany)†(a) | | 10.50% | | 2/15/2027 | | | 11,562,000 | | | | 11,914,468 | |
| Chemours Co. | | 5.375% | | 5/15/2027 | | | 8,416,000 | | | | 8,093,495 | |
| Chemours Co.† | | 5.75% | | 11/15/2028 | | | 4,901,000 | | | | 4,590,116 | |
| CVR Partners LP/CVR Nitrogen Finance Corp.† | | 6.125% | | 6/15/2028 | | | 13,671,000 | | | | 13,218,452 | |
| Herens Midco SARL | | 5.25% | | 5/15/2029 | | EUR | 16,909,000 | | | | 13,862,071 | |
| INEOS Finance PLC (United Kingdom)†(a)(b) | | 6.75% | | 5/15/2028 | | $ | 10,300,000 | | | | 10,352,878 | |
| INEOS Finance PLC (United Kingdom)†(a) | | 7.50% | | 4/15/2029 | | | 7,750,000 | | | | 7,898,637 | |
| INEOS Quattro Finance 2 PLC | | 8.50% | | 3/15/2029 | | EUR | 4,900,000 | | | | 5,652,096 | |
| INEOS Quattro Finance 2 PLC (United Kingdom)†(a)(b) | | 9.625% | | 3/15/2029 | | $ | 8,250,000 | | | | 8,853,397 | |
| Kobe U.S. Midco 2, Inc.† | | 9.25% | | 11/1/2026 | | | 7,461,825 | | | | 6,128,024 | |
| Minerals Technologies, Inc.† | | 5.00% | | 7/1/2028 | | | 5,500,000 | | | | 5,293,062 | |
| Nobian Finance BV | | 3.625% | | 7/15/2026 | | EUR | 4,362,000 | | | | 4,652,305 | |
| NOVA Chemicals Corp. (Canada)†(a) | | 5.25% | | 6/1/2027 | | $ | 11,766,000 | | | | 11,492,510 | |
| 44 | See Notes to Financial Statements. |
Schedule of Investments (continued)
SHORT DURATION HIGH YIELD FUND July 31, 2024
| Investments | | Interest
Rate | | Maturity
Date | | Principal
Amount† | | | Fair
Value | |
| Chemicals (continued) | | | | | | | | | | | | |
| NOVA Chemicals Corp. (Canada)†(a) | | 9.00% | | 2/15/2030 | | $ | 9,317,000 | | | $ | 9,861,405 | |
| Olympus Water U.S. Holding Corp.† | | 9.75% | | 11/15/2028 | | | 14,207,000 | | | | 15,115,097 | |
| Rain Carbon, Inc.† | | 12.25% | | 9/1/2029 | | | 12,147,000 | | | | 13,144,597 | |
| Rain CII Carbon LLC/CII Carbon Corp.† | | 7.25% | | 4/1/2025 | | | 54,000 | | | | 52,936 | |
| SCIL IV LLC/SCIL USA Holdings LLC† | | 5.375% | | 11/1/2026 | | | 8,550,000 | | | | 8,363,425 | |
| SK Invictus Intermediate II SARL (Luxembourg)†(a) | | 5.00% | | 10/30/2029 | | | 8,832,000 | | | | 8,236,831 | |
| Synthomer PLC | | 7.375% | | 5/2/2029 | | EUR | 5,020,000 | | | | 5,746,644 | |
| Synthomer PLC† | | 7.375% | | 5/2/2029 | | EUR | 2,235,000 | | | | 2,558,516 | |
| Tronox, Inc.† | | 4.625% | | 3/15/2029 | | $ | 9,856,000 | | | | 8,988,142 | |
| WR Grace Holdings LLC† | | 5.625% | | 8/15/2029 | | | 801,000 | | | | 733,819 | |
| Total | | | | | | | | | | | 197,526,018 | |
| | | | | | | | | | | | | |
| Coal 0.79% | | | | | | | | | | | | |
| Alliance Resource Operating Partners LP/Alliance Resource Finance Corp.† | | 8.625% | | 6/15/2029 | | | 19,886,000 | | | | 20,921,086 | |
| Coronado Finance Pty. Ltd. (Australia)†(a) | | 10.75% | | 5/15/2026 | | | 1,063,000 | | | | 1,106,247 | |
| SunCoke Energy, Inc.† | | 4.875% | | 6/30/2029 | | | 18,725,000 | | | | 17,141,757 | |
| Warrior Met Coal, Inc.† | | 7.875% | | 12/1/2028 | | | 1,608,000 | | | | 1,649,970 | |
| Total | | | | | | | | | | | 40,819,060 | |
| | | | | | | | | | | | | |
| Commercial Services 3.61% | | | | | | | | | | | | |
| AA Bond Co. Ltd. | | 6.50% | | 1/31/2026 | | GBP | 2,395,000 | | | | 3,095,211 | |
| AA Bond Co. Ltd. | | 6.50% | | 1/31/2026 | | GBP | 1,200,000 | | | | 1,550,836 | |
| Albion Financing 2 SARL (Luxembourg)†(a) | | 8.75% | | 4/15/2027 | | $ | 6,766,000 | | | | 6,861,746 | |
| Allied Universal Holdco LLC/Allied Universal Finance Corp.† | | 6.625% | | 7/15/2026 | | | 615,000 | | | | 616,416 | |
| Allied Universal Holdco LLC/Allied Universal Finance Corp.† | | 9.75% | | 7/15/2027 | | | 22,783,000 | | | | 22,780,740 | |
| Alta Equipment Group, Inc.† | | 9.00% | | 6/1/2029 | | | 5,248,000 | | | | 4,977,821 | |
| Amber Finco PLC† | | 6.625% | | 7/15/2029 | | EUR | 2,837,000 | | | | 3,188,195 | |
| Avis Budget Car Rental LLC/Avis Budget Finance, Inc.† | | 5.75% | | 7/15/2027 | | $ | 9,143,000 | | | | 8,847,316 | |
| BCP V Modular Services Finance II PLC | | 6.125% | | 11/30/2028 | | GBP | 8,000,000 | | | | 9,551,574 | |
| BCP V Modular Services Finance PLC | | 6.75% | | 11/30/2029 | | EUR | 5,264,000 | | | | 4,870,904 | |
| Champions Financing, Inc.† | | 8.75% | | 2/15/2029 | | $ | 4,787,000 | | | | 4,886,124 | |
| CoreCivic, Inc. | | 8.25% | | 4/15/2029 | | | 12,612,000 | | | | 13,285,077 | |
| CPI CG, Inc.† | | 10.00% | | 7/15/2029 | | | 8,992,000 | | | | 9,382,161 | |
| Garda World Security Corp. (Canada)†(a) | | 7.75% | | 2/15/2028 | | | 3,227,000 | | | | 3,333,036 | |
| GEO Group, Inc. | | 8.625% | | 4/15/2029 | | | 12,035,000 | | | | 12,542,176 | |
| GEO Group, Inc. | | 10.25% | | 4/15/2031 | | | 4,077,000 | | | | 4,373,631 | |
| | See Notes to Financial Statements. | 45 |
Schedule of Investments (continued)
SHORT DURATION HIGH YIELD FUND July 31, 2024
| Investments | | Interest
Rate | | Maturity
Date | | Principal
Amount† | | | Fair
Value | |
| Commercial Services (continued) | | | | | | | | | | | | |
| Herc Holdings, Inc.† | | 5.50% | | 7/15/2027 | | $ | 4,554,000 | | | $ | 4,519,804 | |
| Hertz Corp.(d) | | Zero Coupon | | 10/15/2022 | | | 2,000 | | | | 85 | |
| Hertz Corp.† | | Zero Coupon | | 10/15/2024 | | | 22,000 | | | | 935 | |
| Hertz Corp.†(b) | | 4.625% | | 12/1/2026 | | | 7,846,000 | | | | 5,926,999 | |
| Prime Security Services Borrower LLC/Prime Finance, Inc.† | | 6.25% | | 1/15/2028 | | | 5,849,000 | | | | 5,835,563 | |
| RAC Bond Co. PLC | | 5.25% | | 11/4/2046 | | GBP | 7,125,000 | | | | 8,687,254 | |
| Sabre GLBL, Inc.† | | 8.625% | | 6/1/2027 | | $ | 9,322,000 | | | | 8,720,128 | |
| Sabre GLBL, Inc.† | | 11.25% | | 12/15/2027 | | | 5,148,000 | | | | 5,101,322 | |
| Sotheby’s† | | 7.375% | | 10/15/2027 | | | 11,210,000 | | | | 9,347,339 | |
| WASH Multifamily Acquisition, Inc.† | | 5.75% | | 4/15/2026 | | | 22,527,000 | | | | 22,191,589 | |
| Williams Scotsman, Inc.† | | 6.625% | | 6/15/2029 | | | 2,915,000 | | | | 2,970,733 | |
| Total | | | | | | | | | | | 187,444,715 | |
| | | | | | | | | | | | | |
| Computers 1.10% | | | | | | | | | | | | |
| Ahead DB Holdings LLC† | | 6.625% | | 5/1/2028 | | | 5,884,000 | | | | 5,602,330 | |
| CA Magnum Holdings (Mauritius)(a) | | 5.375% | | 10/31/2026 | | | 10,200,000 | | | | 9,852,129 | |
| NCR Atleos Corp.† | | 9.50% | | 4/1/2029 | | | 6,472,000 | | | | 7,075,172 | |
| NCR Voyix Corp.† | | 5.125% | | 4/15/2029 | | | 9,906,000 | | | | 9,473,302 | |
| Unisys Corp.† | | 6.875% | | 11/1/2027 | | | 14,050,000 | | | | 12,600,148 | |
| Virtusa Corp.† | | 7.125% | | 12/15/2028 | | | 5,180,000 | | | | 4,913,565 | |
| Western Digital Corp. | | 2.85% | | 2/1/2029 | | | 8,696,000 | | | | 7,681,978 | |
| Total | | | | | | | | | | | 57,198,624 | |
| | | | | | | | | | | | | |
| Cosmetics/Personal Care 0.19% | | | | | | | | | | | | |
| Coty, Inc.† | | 5.00% | | 4/15/2026 | | | 10,000,000 | | | | 9,900,502 | |
| | | | | | | | | | | | | |
| Distribution/Wholesale 0.41% | | | | | | | | | | | | |
| Gates Corp.† | | 6.875% | | 7/1/2029 | | | 3,490,000 | | | | 3,558,094 | |
| Manuchar Group SARL | | 7.25% | | 6/30/2027 | | EUR | 3,900,000 | | | | 4,132,666 | |
| SIG PLC | | 5.25% | | 11/30/2026 | | EUR | 8,290,000 | | | | 8,534,474 | |
| Travis Perkins PLC | | 3.75% | | 2/17/2026 | | GBP | 4,300,000 | | | | 5,294,659 | |
| Total | | | | | | | | | | | 21,519,893 | |
| | | | | | | | | | | | | |
| Diversified Financial Services 7.57% | | | | | | | | | | | | |
| AerCap Holdings NV (Ireland)(a) | | 5.875%
(5 yr. CMT + 4.54% | )# | 10/10/2079 | | $ | 3,000,000 | | | | 2,994,963 | |
| AG Issuer LLC† | | 6.25% | | 3/1/2028 | | | 7,009,000 | | | | 6,723,227 | |
| AG TTMT Escrow Issuer LLC† | | 8.625% | | 9/30/2027 | | | 2,500,000 | | | | 2,554,885 | |
| Aretec Group, Inc.† | | 10.00% | | 8/15/2030 | | | 3,162,000 | | | | 3,375,252 | |
| ASG Finance DAC (Ireland)†(a) | | 9.75% | | 5/15/2029 | | | 10,949,000 | | | | 11,003,636 | |
| 46 | See Notes to Financial Statements. |
Schedule of Investments (continued)
SHORT DURATION HIGH YIELD FUND July 31, 2024
| Investments | | Interest
Rate | | Maturity
Date | | Principal
Amount† | | | Fair
Value | |
| Diversified Financial Services (continued) | | | | | | | | | | | | |
| Avolon Holdings Funding Ltd. (Ireland)†(a) | | 5.50% | | 1/15/2026 | | $ | 8,655,000 | | | $ | 8,657,676 | |
| Bread Financial Holdings, Inc.† | | 9.75% | | 3/15/2029 | | | 10,300,000 | | | | 11,051,663 | |
| Castlelake Aviation Finance DAC (Ireland)†(a) | | 5.00% | | 4/15/2027 | | | 18,000,000 | | | | 17,574,070 | |
| Coinbase Global, Inc.† | | 3.375% | | 10/1/2028 | | | 26,709,000 | | | | 23,534,908 | |
| Freedom Mortgage Holdings LLC† | | 9.25% | | 2/1/2029 | | | 13,152,000 | | | | 13,255,112 | |
| GGAM Finance Ltd. (Ireland)†(a) | | 6.875% | | 4/15/2029 | | | 7,074,000 | | | | 7,250,390 | |
| GGAM Finance Ltd. (Ireland)†(a) | | 8.00% | | 2/15/2027 | | | 8,556,000 | | | | 8,852,893 | |
| GGAM Finance Ltd. (Ireland)†(a) | | 8.00% | | 6/15/2028 | | | 15,577,000 | | | | 16,495,622 | |
| Global Aircraft Leasing Co. Ltd. (Cayman Islands)†(a) | | 6.50% | | 9/15/2024 | | | 20,919,685 | | | | 20,060,743 | |
| ILFC E-Capital Trust I† | | 7.159%
(3 mo. USD Term
SOFR + 1.81% | )# | 12/21/2065 | | | 9,299,000 | | | | 7,742,016 | |
| ILFC E-Capital Trust II† | | 7.409%
(3 mo. USD Term
SOFR + 2.06% | )# | 12/21/2065 | | | 11,038,000 | | | | 9,375,427 | |
| Jefferies Finance LLC/JFIN Co-Issuer Corp.† | | 5.00% | | 8/15/2028 | | | 24,700,000 | | | | 22,963,617 | |
| Jefferson Capital Holdings LLC† | | 6.00% | | 8/15/2026 | | | 8,175,000 | | | | 8,124,401 | |
| LFS Topco LLC† | | 5.875% | | 10/15/2026 | | | 9,639,000 | | | | 8,963,359 | |
| Macquarie Airfinance Holdings Ltd. (United Kingdom)†(a) | | 8.125% | | 3/30/2029 | | | 2,325,000 | | | | 2,462,005 | |
| Macquarie Airfinance Holdings Ltd. (United Kingdom)†(a) | | 8.375% | | 5/1/2028 | | | 4,364,000 | | | | 4,624,788 | |
| Midcap Financial Issuer Trust† | | 6.50% | | 5/1/2028 | | | 25,199,000 | | | | 24,362,896 | |
| Nationstar Mortgage Holdings, Inc.† | | 5.50% | | 8/15/2028 | | | 5,000,000 | | | | 4,860,407 | |
| Nationstar Mortgage Holdings, Inc.† | | 6.00% | | 1/15/2027 | | | 8,000,000 | | | | 7,946,206 | |
| Nationstar Mortgage Holdings, Inc.† | | 6.50% | | 8/1/2029 | | | 6,331,000 | | | | 6,329,573 | |
| Navient Corp. | | 4.875% | | 3/15/2028 | | | 509,000 | | | | 475,548 | |
| Navient Corp. | | 6.75% | | 6/25/2025 | | | 2,925,000 | | | | 2,936,121 | |
| Navient Corp. | | 6.75% | | 6/15/2026 | | | 9,325,000 | | | | 9,433,235 | |
| Navient Corp. | | 9.375% | | 7/25/2030 | | | 7,650,000 | | | | 8,156,507 | |
| Navient Corp. | | 11.50% | | 3/15/2031 | | | 3,942,000 | | | | 4,372,439 | |
| OneMain Finance Corp. | | 6.625% | | 1/15/2028 | | | 23,676,000 | | | | 24,012,578 | |
| OneMain Finance Corp. | | 7.125% | | 3/15/2026 | | | 14,859,000 | | | | 15,123,252 | |
| OneMain Finance Corp. | | 7.875% | | 3/15/2030 | | | 7,850,000 | | | | 8,192,221 | |
| Osaic Holdings, Inc.† | | 10.75% | | 8/1/2027 | | | 7,618,000 | | | | 7,780,736 | |
| PennyMac Financial Services, Inc.† | | 5.375% | | 10/15/2025 | | | 8,178,000 | | | | 8,135,701 | |
| PennyMac Financial Services, Inc.† | | 7.875% | | 12/15/2029 | | | 3,806,000 | | | | 3,986,442 | |
| PHH Mortgage Corp.† | | 7.875% | | 3/15/2026 | | | 4,904,000 | | | | 4,816,885 | |
| PRA Group, Inc.† | | 5.00% | | 10/1/2029 | | | 4,617,000 | | | | 4,105,803 | |
| | See Notes to Financial Statements. | 47 |
Schedule of Investments (continued)
SHORT DURATION HIGH YIELD FUND July 31, 2024
| Investments | | Interest
Rate | | Maturity
Date | | Principal
Amount† | | | Fair
Value | |
| Diversified Financial Services (continued) | | | | | | | | | | | | |
| PRA Group, Inc.† | | 8.875% | | 1/31/2030 | | $ | 8,326,000 | | | $ | 8,483,145 | |
| Provident Funding Associates LP/PFG Finance Corp.† | | 6.375% | | 6/15/2025 | | | 696,000 | | | | 679,843 | |
| Rocket Mortgage LLC/Rocket Mortgage Co-Issuer, Inc.† | | 2.875% | | 10/15/2026 | | | 3,945,000 | | | | 3,730,164 | |
| SLM Corp. | | 3.125% | | 11/2/2026 | | | 6,289,000 | | | | 5,956,857 | |
| United Wholesale Mortgage LLC† | | 5.50% | | 4/15/2029 | | | 3,465,000 | | | | 3,344,168 | |
| World Acceptance Corp.† | | 7.00% | | 11/1/2026 | | | 9,190,000 | | | | 8,848,264 | |
| Total | | | | | | | | | | | 393,709,644 | |
| | | | | | | | | | | | | |
| Electric 1.59% | | | | | | | | | | | | |
| Alexander Funding Trust II† | | 7.467% | | 7/31/2028 | | | 3,000,000 | | | | 3,210,893 | |
| Algonquin Power & Utilities Corp. (Canada)(a) | | 4.75%
(5 yr. CMT + 3.25% | )# | 1/18/2082 | | | 12,704,000 | | | | 11,626,167 | |
| Calpine Corp.† | | 5.125% | | 3/15/2028 | | | 8,370,000 | | | | 8,111,731 | |
| Calpine Corp.† | | 5.25% | | 6/1/2026 | | | 4,818,000 | | | | 4,785,757 | |
| Elwood Energy LLC | | 8.159% | | 7/5/2026 | | | 5,654 | | | | 5,258 | |
| Eskom Holdings SOC Ltd. (South Africa)†(a) | | 7.125% | | 2/11/2025 | | | 5,483,000 | | | | 5,486,975 | |
| NRG Energy, Inc.† | | 10.25%
(5 yr. CMT + 5.92% | )# | – | (c) | | 7,265,000 | | | | 8,055,057 | |
| Pattern Energy Operations LP/Pattern Energy Operations, Inc.† | | 4.50% | | 8/15/2028 | | | 3,723,000 | | | | 3,515,637 | |
| Talen Energy Supply LLC† | | 8.625% | | 6/1/2030 | | | 786,000 | | | | 847,508 | |
| Vistra Corp.† | | 7.00%
(5 yr. CMT + 5.74% | )# | – | (c) | | 12,783,000 | | | | 12,866,780 | |
| Vistra Corp.† | | 8.00%
(5 yr. CMT + 6.93% | )# | – | (c) | | 2,467,000 | | | | 2,532,995 | |
| Vistra Corp.† | | 8.875%
(5 yr. CMT + 5.05% | )# | – | (c) | | 10,130,000 | | | | 10,671,773 | |
| Vistra Operations Co. LLC† | | 5.00% | | 7/31/2027 | | | 2,629,000 | | | | 2,576,172 | |
| Vistra Operations Co. LLC† | | 5.50% | | 9/1/2026 | | | 225,000 | | | | 223,131 | |
| Vistra Operations Co. LLC† | | 5.625% | | 2/15/2027 | | | 8,265,000 | | | | 8,206,673 | |
| Total | | | | | | | | | | | 82,722,507 | |
| | | | | | | | | | | | | |
| Electrical Components & Equipment 0.13% | | | | | | | | | | | | |
| Energizer Holdings, Inc.† | | 4.75% | | 6/15/2028 | | | 7,356,000 | | | | 6,983,116 | |
| | | | | | | | | | | | | |
| Energy-Alternate Sources 0.07% | | | | | | | | | | | | |
| TerraForm Power Operating LLC† | | 5.00% | | 1/31/2028 | | | 3,633,000 | | | | 3,503,937 | |
| 48 | See Notes to Financial Statements. |
Schedule of Investments (continued)
SHORT DURATION HIGH YIELD FUND July 31, 2024
| Investments | | Interest
Rate | | Maturity
Date | | Principal
Amount† | | | Fair
Value | |
| Engineering & Construction 0.10% | | | | | | | | | | | | |
| Assemblin Caverion Group AB† | | 6.25% | | 7/1/2030 | | EUR | 2,033,000 | | | $ | 2,249,372 | |
| Weekley Homes LLC/Weekley Finance Corp.† | | 4.875% | | 9/15/2028 | | $ | 3,226,000 | | | | 3,074,078 | |
| Total | | | | | | | | | | | 5,323,450 | |
| | | | | | | | | | | | | |
| Entertainment 0.92% | | | | | | | | | | | | |
| Cinemark USA, Inc.†(b) | | 5.25% | | 7/15/2028 | | | 7,816,000 | | | | 7,563,183 | |
| CPUK Finance Ltd. | | 4.50% | | 8/28/2027 | | GBP | 1,285,000 | | | | 1,551,681 | |
| Empire Resorts, Inc.† | | 7.75% | | 11/1/2026 | | $ | 2,000,000 | | | | 1,930,206 | |
| Flutter Treasury DAC (Ireland)†(a) | | 6.375% | | 4/29/2029 | | | 2,832,000 | | | | 2,885,029 | |
| Inter Media & Communication SpA | | 6.75% | | 2/9/2027 | | EUR | 17,714,153 | | | | 19,041,017 | |
| Jacobs Entertainment, Inc.† | | 6.75% | | 2/15/2029 | | $ | 4,170,000 | | | | 3,901,316 | |
| Penn Entertainment, Inc.†(b) | | 4.125% | | 7/1/2029 | | | 5,613,000 | | | | 4,971,555 | |
| Pinewood Finco PLC | | 3.25% | | 9/30/2025 | | GBP | 4,900,000 | | | | 6,137,921 | |
| Total | | | | | | | | | | | 47,981,908 | |
| | | | | | | | | | | | | |
| Environmental Control 0.25% | | | | | | | | | | | | |
| Enviri Corp.† | | 5.75% | | 7/31/2027 | | $ | 13,335,000 | | | | 12,951,013 | |
| | | | | | | | | | | | | |
| Food 0.59% | | | | | | | | | | | | |
| B&G Foods, Inc.† | | 8.00% | | 9/15/2028 | | | 2,931,000 | | | | 2,992,268 | |
| Bellis Acquisition Co. PLC† | | 8.125% | | 5/14/2030 | | GBP | 4,788,000 | | | | 6,099,895 | |
| Iceland Bondco PLC† | | 10.875% | | 12/15/2027 | | GBP | 654,000 | | | | 896,822 | |
| Iceland Bondco PLC | | 10.875% | | 12/15/2027 | | GBP | 2,898,000 | | | | 3,973,992 | |
| Market Bidco Finco PLC | | 5.50% | | 11/4/2027 | | GBP | 8,850,000 | | | | 10,666,221 | |
| Nathan’s Famous, Inc.† | | 6.625% | | 11/1/2025 | | $ | 10,000 | | | | 10,020 | |
| Sigma Holdco BV (Netherlands)†(a) | | 7.875% | | 5/15/2026 | | | 5,933,000 | | | | 5,879,742 | |
| Total | | | | | | | | | | | 30,518,960 | |
| | | | | | | | | | | | | |
| Forest Products & Paper 0.58% | | | | | | | | | | | | |
| Ahlstrom Holding 3 OYJ (Finland)†(a) | | 4.875% | | 2/4/2028 | | | 13,511,000 | | | | 12,718,688 | |
| Mercer International, Inc. (Canada)(a) | | 5.125% | | 2/1/2029 | | | 10,857,000 | | | | 9,211,056 | |
| Mercer International, Inc. (Canada)(a) | | 5.50% | | 1/15/2026 | | | 3,928,000 | | | | 3,831,999 | |
| Mercer International, Inc. (Canada)†(a) | | 12.875% | | 10/1/2028 | | | 3,960,000 | | | | 4,224,694 | |
| Total | | | | | | | | | | | 29,986,437 | |
| | | | | | | | | | | | | |
| Hand/Machine Tools 0.15% | | | | | | | | | | | | |
| IMA Industria Macchine Automatiche SpA† | | 7.435%
(3 mo. EURIBOR + 3.75% | )# | 4/15/2029 | | EUR | 1,618,000 | | | | 1,772,191 | |
| IMA Industria Macchine Automatiche SpA | | 7.435%
(3 mo. EURIBOR + 3.75% | )# | 4/15/2029 | | EUR | 5,265,000 | | | | 5,766,742 | |
| Total | | | | | | | | | | | 7,538,933 | |
| | See Notes to Financial Statements. | 49 |
Schedule of Investments (continued)
SHORT DURATION HIGH YIELD FUND July 31, 2024
| Investments | | Interest
Rate | | Maturity
Date | | Principal
Amount† | | | Fair
Value | |
| Health Care-Products 0.32% | | | | | | | | | | |
| Bausch & Lomb Corp. (Canada)†(a) | | 8.375% | | 10/1/2028 | | $ | 16,228,000 | | | $ | 16,693,271 | |
| | | | | | | | | | | | | |
| Health Care-Services 2.74% | | | | | | | | | | | | |
| Catalent Pharma Solutions, Inc. | | 2.375% | | 3/1/2028 | | EUR | 950,000 | | | | 996,218 | |
| Catalent Pharma Solutions, Inc.† | | 5.00% | | 7/15/2027 | | $ | 15,075,000 | | | | 14,985,037 | |
| CHS/Community Health Systems, Inc.† | | 5.625% | | 3/15/2027 | | | 26,260,000 | | | | 25,168,225 | |
| CHS/Community Health Systems, Inc.† | | 6.125% | | 4/1/2030 | | | 10,195,000 | | | | 7,746,484 | |
| CHS/Community Health Systems, Inc.†(b) | | 6.875% | | 4/1/2028 | | | 4,244,000 | | | | 3,340,655 | |
| CHS/Community Health Systems, Inc.†(b) | | 6.875% | | 4/15/2029 | | | 5,391,000 | | | | 4,426,359 | |
| CHS/Community Health Systems, Inc.† | | 8.00% | | 12/15/2027 | | | 4,260,000 | | | | 4,267,114 | |
| Global Medical Response, Inc.† | | 6.50% | | 10/1/2025 | | | 6,981,000 | | | | 6,748,224 | |
| HCA, Inc. | | 5.25% | | 4/15/2025 | | | 3,531,000 | | | | 3,524,939 | |
| HCA, Inc. | | 5.375% | | 2/1/2025 | | | 3,969,000 | | | | 3,962,022 | |
| Heartland Dental LLC/Heartland Dental Finance Corp.† | | 10.50% | | 4/30/2028 | | | 18,433,000 | | | | 19,654,178 | |
| Legacy LifePoint Health LLC† | | 4.375% | | 2/15/2027 | | | 9,178,000 | | | | 8,879,158 | |
| LifePoint Health, Inc.†(b) | | 5.375% | | 1/15/2029 | | | 11,343,000 | | | | 10,286,683 | |
| LifePoint Health, Inc.† | | 11.00% | | 10/15/2030 | | | 1,976,000 | | | | 2,220,242 | |
| Select Medical Corp.† | | 6.25% | | 8/15/2026 | | | 5,212,000 | | | | 5,256,319 | |
| Tenet Healthcare Corp. | | 5.125% | | 11/1/2027 | | | 2,100,000 | | | | 2,064,108 | |
| Tenet Healthcare Corp. | | 6.125% | | 10/1/2028 | | | 7,580,000 | | | | 7,604,010 | |
| U.S. Acute Care Solutions LLC† | | 9.75% | | 5/15/2029 | | | 11,496,000 | | | | 11,412,395 | |
| Total | | | | | | | | | | | 142,542,370 | |
| | | | | | | | | | | | | |
| Holding Companies-Diversified 0.21% | | | | | | | | | | | | |
| Benteler International AG† | | 9.375% | | 5/15/2028 | | EUR | 2,150,000 | | | | 2,461,526 | |
| Benteler International AG (Austria)†(a) | | 10.50% | | 5/15/2028 | | $ | 2,814,000 | | | | 2,995,343 | |
| Stena International SA (Luxembourg)†(a) | | 7.25% | | 1/15/2031 | | | 2,756,000 | | | | 2,822,012 | |
| Stena International SA (Luxembourg)†(a) | | 7.625% | | 2/15/2031 | | | 2,616,000 | | | | 2,692,115 | |
| Total | | | | | | | | | | | 10,970,996 | |
| | | | | | | | | | | | | |
| Home Builders 1.20% | | | | | | | | | | | | |
| Ashton Woods USA LLC/Ashton Woods Finance Co.† | | 4.625% | | 8/1/2029 | | | 10,000,000 | | | | 9,278,821 | |
| Brookfield Residential Properties, Inc./Brookfield Residential U.S. LLC (Canada)†(a) | | 5.00% | | 6/15/2029 | | | 7,847,000 | | | | 7,294,419 | |
| Dream Finders Homes, Inc.† | | 8.25% | | 8/15/2028 | | | 2,257,000 | | | | 2,343,409 | |
| Landsea Homes Corp.† | | 8.875% | | 4/1/2029 | | | 11,255,000 | | | | 11,369,004 | |
| LGI Homes, Inc.† | | 8.75% | | 12/15/2028 | | | 9,424,000 | | | | 10,018,428 | |
| M/I Homes, Inc. | | 3.95% | | 2/15/2030 | | | 3,289,000 | | | | 3,005,129 | |
| M/I Homes, Inc. | | 4.95% | | 2/1/2028 | | | 2,111,000 | | | | 2,062,524 | |
| 50 | See Notes to Financial Statements. |
Schedule of Investments (continued)
SHORT DURATION HIGH YIELD FUND July 31, 2024
| Investments | | Interest
Rate | | Maturity
Date | | Principal
Amount† | | | Fair
Value | |
| Home Builders (continued) | | | | | | | | | | | | |
| Miller Homes Group Finco PLC | | 7.00% | | 5/15/2029 | | GBP | 10,265,000 | | | $ | 12,585,851 | |
| STL Holding Co. LLC† | | 8.75% | | 2/15/2029 | | $ | 4,071,000 | | | | 4,241,626 | |
| Total | | | | | | | | | | | 62,199,211 | |
| | | | | | | | | | | | | |
| Housewares 0.59% | | | | | | | | | | | | |
| Newell Brands, Inc. | | 4.875% | | 6/1/2025 | | | 3,993,000 | | | | 3,975,577 | |
| Newell Brands, Inc. | | 5.70% | | 4/1/2026 | | | 1,880,000 | | | | 1,876,965 | |
| Newell Brands, Inc. | | 6.375% | | 9/15/2027 | | | 14,025,000 | | | | 14,052,907 | |
| Newell Brands, Inc.(b) | | 6.625% | | 9/15/2029 | | | 10,500,000 | | | | 10,554,138 | |
| Total | | | | | | | | | | | 30,459,587 | |
| | | | | | | | | | | | | |
| Insurance 0.49% | | | | | | | | | | | | |
| Alliant Holdings Intermediate LLC/Alliant Holdings Co-Issuer† | | 6.75% | | 4/15/2028 | | | 5,036,000 | | | | 5,064,136 | |
| Ardonagh Finco Ltd. (United Kingdom)†(a) | | 7.75% | | 2/15/2031 | | | 6,300,000 | | | | 6,395,325 | |
| Global Atlantic Fin Co.† | | 4.70%
(5 yr. CMT + 3.80% | )# | 10/15/2051 | | | 7,889,000 | | | | 7,402,394 | |
| Jones Deslauriers Insurance Management, Inc. (Canada)†(a) | | 8.50% | | 3/15/2030 | | | 1,343,000 | | | | 1,409,858 | |
| SiriusPoint Ltd. | | 7.00% | | 4/5/2029 | | | 4,907,000 | | | | 5,125,825 | |
| Total | | | | | | | | | | | 25,397,538 | |
| | | | | | | | | | | | | |
| Internet 2.44% | | | | | | | | | | | | |
| Acuris Finance U.S., Inc./Acuris Finance SARL†(e) | | 9.00% | | 8/1/2029 | | | 6,776,000 | | | | 6,826,820 | |
| Cogent Communications Group, Inc./Cogent Communications Finance, Inc.† | | 7.00% | | 6/15/2027 | | | 8,976,000 | | | | 9,071,684 | |
| EquipmentShare.com, Inc.† | | 9.00% | | 5/15/2028 | | | 20,224,000 | | | | 20,842,301 | |
| Gen Digital, Inc.† | | 6.75% | | 9/30/2027 | | | 6,431,000 | | | | 6,545,723 | |
| GrubHub Holdings, Inc.† | | 5.50% | | 7/1/2027 | | | 3,926,000 | | | | 3,621,695 | |
| ION Trading Technologies SARL (Luxembourg)†(a) | | 5.75% | | 5/15/2028 | | | 4,808,000 | | | | 4,466,809 | |
| ION Trading Technologies SARL (Luxembourg)†(a) | | 9.50% | | 5/30/2029 | | | 13,290,000 | | | | 13,820,491 | |
| Newfold Digital Holdings Group, Inc.† | | 6.00% | | 2/15/2029 | | | 4,415,000 | | | | 3,072,368 | |
| Ocado Group PLC | | 3.875% | | 10/8/2026 | | GBP | 6,280,000 | | | | 7,498,036 | |
| Rakuten Group, Inc. (Japan)(a) | | 5.125%
(5 yr. CMT + 4.58% | )# | – | (c) | $ | 10,006,000 | | | | 9,164,535 | |
| Rakuten Group, Inc. (Japan)†(a) | | 9.75% | | 4/15/2029 | | | 30,479,000 | | | | 32,325,448 | |
| Rakuten Group, Inc. (Japan)†(a) | | 11.25% | | 2/15/2027 | | | 9,050,000 | | | | 9,787,394 | |
| Total | | | | | | | | | | | 127,043,304 | |
| | See Notes to Financial Statements. | 51 |
Schedule of Investments (continued)
SHORT DURATION HIGH YIELD FUND July 31, 2024
| Investments | | Interest
Rate | | Maturity
Date | | Principal
Amount† | | | Fair
Value | |
| Investment Companies 0.46% | | | | | | | | | | | | |
| Blue Owl Technology Finance Corp.† | | 4.75% | | 12/15/2025 | | $ | 6,141,000 | | | $ | 5,990,918 | |
| Blue Owl Technology Finance Corp. II† | | 6.75% | | 4/4/2029 | | | 11,367,000 | | | | 11,319,648 | |
| Sixth Street Lending Partners† | | 6.50% | | 3/11/2029 | | | 6,384,000 | | | | 6,475,990 | |
| Total | | | | | | | | | | | 23,786,556 | |
| | | | | | | | | | | | | |
| Iron-Steel 0.91% | | | | | | | | | | | | |
| Algoma Steel, Inc. (Canada)†(a) | | 9.125% | | 4/15/2029 | | | 11,144,000 | | | | 11,133,915 | |
| ATI, Inc. | | 5.875% | | 12/1/2027 | | | 4,425,000 | | | | 4,392,088 | |
| CSN Inova Ventures (Brazil)(a)(b) | | 6.75% | | 1/28/2028 | | | 7,300,000 | | | | 7,061,777 | |
| Eregli Demir ve Celik Fabrikalari TAS (Turkey)†(a) | | 8.375% | | 7/23/2029 | | | 3,900,000 | | | | 3,940,950 | |
| Mineral Resources Ltd. (Australia)†(a) | | 8.00% | | 11/1/2027 | | | 6,411,000 | | | | 6,585,771 | |
| Mineral Resources Ltd. (Australia)†(a) | | 8.50% | | 5/1/2030 | | | 4,492,000 | | | | 4,694,439 | |
| Mineral Resources Ltd. (Australia)†(a) | | 9.25% | | 10/1/2028 | | | 1,508,000 | | | | 1,605,588 | |
| TMS International Corp.† | | 6.25% | | 4/15/2029 | | | 6,864,000 | | | | 6,378,689 | |
| U.S. Steel Corp. | | 6.875% | | 3/1/2029 | | | 1,629,000 | | | | 1,640,548 | |
| Total | | | | | | | | | | | 47,433,765 | |
| | | | | | | | | | | | | |
| Leisure Time 1.92% | | | | | | | | | | | | |
| Carnival Corp.† | | 5.75% | | 3/1/2027 | | | 43,226,000 | | | | 43,037,504 | |
| Carnival Corp.† | | 6.00% | | 5/1/2029 | | | 4,689,000 | | | | 4,680,537 | |
| Deuce Finco PLC | | 5.50% | | 6/15/2027 | | GBP | 5,400,000 | | | | 6,669,673 | |
| NCL Corp. Ltd.† | | 5.875% | | 2/15/2027 | | $ | 3,639,000 | | | | 3,614,909 | |
| NCL Corp. Ltd.† | | 8.125% | | 1/15/2029 | | | 2,534,000 | | | | 2,695,444 | |
| NCL Corp. Ltd.† | | 8.375% | | 2/1/2028 | | | 2,650,000 | | | | 2,793,643 | |
| Pinnacle Bidco PLC | | 10.00% | | 10/11/2028 | | GBP | 6,900,000 | | | | 9,531,551 | |
| Royal Caribbean Cruises Ltd.† | | 5.375% | | 7/15/2027 | | $ | 4,070,000 | | | | 4,048,765 | |
| Royal Caribbean Cruises Ltd.† | | 5.50% | | 8/31/2026 | | | 7,000,000 | | | | 6,972,930 | |
| Royal Caribbean Cruises Ltd.† | | 5.50% | | 4/1/2028 | | | 5,250,000 | | | | 5,233,450 | |
| Royal Caribbean Cruises Ltd.† | | 9.25% | | 1/15/2029 | | | 10,000,000 | | | | 10,695,520 | |
| Total | | | | | | | | | | | 99,973,926 | |
| | | | | | | | | | | | | |
| Lodging 1.47% | | | | | | | | | | | | |
| Full House Resorts, Inc.† | | 8.25% | | 2/15/2028 | | | 4,806,000 | | | | 4,734,823 | |
| Genting New York LLC/GENNY Capital, Inc.† | | 3.30% | | 2/15/2026 | | | 4,013,000 | | | | 3,865,314 | |
| Melco Resorts Finance Ltd. (Hong Kong)†(a) | | 5.75% | | 7/21/2028 | | | 12,750,000 | | | | 11,979,033 | |
| MGM China Holdings Ltd. (Macau)†(a) | | 5.25% | | 6/18/2025 | | | 2,250,000 | | | | 2,226,759 | |
| MGM China Holdings Ltd. (Macau)†(a) | | 5.875% | | 5/15/2026 | | | 3,450,000 | | | | 3,414,195 | |
| MGM Resorts International | | 5.50% | | 4/15/2027 | | | 14,641,000 | | | | 14,545,334 | |
| Sani/Ikos Financial Holdings 1 SARL† | | 7.25% | | 7/31/2030 | | EUR | 2,197,000 | | | | 2,399,251 | |
| Sani/Ikos Financial Holdings 1 SARL | | 7.25% | | 7/31/2030 | | EUR | 2,337,000 | | | | 2,552,139 | |
| | | |
| 52 | See Notes to Financial Statements. | |
Schedule of Investments (continued)
SHORT DURATION HIGH YIELD FUND July 31, 2024
| Investments | | Interest
Rate | | Maturity
Date | | Principal
Amount† | | | Fair
Value | |
| Lodging (continued) | | | | | | | | | | | | |
| Studio City Co. Ltd. (Macau)†(a) | | 7.00% | | 2/15/2027 | | $ | 4,775,000 | | | $ | 4,786,937 | |
| Studio City Finance Ltd. (Hong Kong)(a) | | 6.50% | | 1/15/2028 | | | 10,300,000 | | | | 9,877,323 | |
| Wynn Las Vegas LLC/Wynn Las Vegas Capital Corp.† | | 5.25% | | 5/15/2027 | | | 8,430,000 | | | | 8,266,428 | |
| Wynn Macau Ltd. (Macau)†(a) | | 5.50% | | 10/1/2027 | | | 8,241,000 | | | | 7,871,909 | |
| Total | | | | | | | | | | | 76,519,445 | |
| | | | | | | | | | | | | |
| Machinery-Diversified 0.51% | | | | | | | | | | | | |
| GrafTech Global Enterprises, Inc.† | | 9.875% | | 12/15/2028 | | | 9,342,000 | | | | 7,235,485 | |
| Mangrove Luxco III Sarl† | | 8.674%
(3 mo. EURIBOR + 5.00% | )# | 7/15/2029 | | EUR | 4,046,000 | | | | 4,387,212 | |
| Nova Alexandre III SAS | | 8.914%
(3 mo. EURIBOR + 5.25% | )# | 7/15/2029 | | EUR | 6,398,000 | | | | 6,992,179 | |
| Selecta Group BV | | 8.00% | | 4/1/2026 | | EUR | 7,561,122 | | | | 8,001,974 | |
| Total | | | | | | | | | | | 26,616,850 | |
| | | | | | | | | | | | | |
| Media 4.61% | | | | | | | | | | | | |
| Altice Financing SA (Luxembourg)†(a) | | 5.00% | | 1/15/2028 | | $ | 5,500,000 | | | | 4,397,893 | |
| AMC Networks, Inc.(b) | | 4.25% | | 2/15/2029 | | | 25,666,000 | | | | 17,687,626 | |
| CCO Holdings LLC/CCO Holdings Capital Corp.† | | 5.00% | | 2/1/2028 | | | 4,500,000 | | | | 4,287,991 | |
| CCO Holdings LLC/CCO Holdings Capital Corp.† | | 5.125% | | 5/1/2027 | | | 23,292,000 | | | | 22,642,378 | |
| CCO Holdings LLC/CCO Holdings Capital Corp.† | | 6.375% | | 9/1/2029 | | | 8,245,000 | | | | 8,033,016 | |
| CSC Holdings LLC† | | 11.25% | | 5/15/2028 | | | 4,631,000 | | | | 4,191,391 | |
| CSC Holdings LLC† | | 11.75% | | 1/31/2029 | | | 9,204,000 | | | | 8,326,071 | |
| Directv Financing LLC/Directv Financing Co.-Obligor, Inc.† | | 5.875% | | 8/15/2027 | | | 10,095,000 | | | | 9,729,023 | |
| DISH Network Corp.† | | 11.75% | | 11/15/2027 | | | 6,451,000 | | | | 6,461,444 | |
| Gray Television, Inc.†(b) | | 7.00% | | 5/15/2027 | | | 23,404,000 | | | | 22,678,662 | |
| iHeartCommunications, Inc.(b) | | 6.375% | | 5/1/2026 | | | 4,521,117 | | | | 3,826,687 | |
| LCPR Senior Secured Financing DAC (Ireland)†(a) | | 6.75% | | 10/15/2027 | | | 9,275,000 | | | | 8,654,347 | |
| McGraw-Hill Education, Inc.† | | 5.75% | | 8/1/2028 | | | 10,180,000 | | | | 9,815,506 | |
| Nexstar Media, Inc.† | | 5.625% | | 7/15/2027 | | | 13,170,000 | | | | 12,784,772 | |
| Scripps Escrow, Inc.†(b) | | 5.875% | | 7/15/2027 | | | 6,110,000 | | | | 4,254,454 | |
| Sirius XM Radio, Inc.† | | 3.125% | | 9/1/2026 | | | 16,043,000 | | | | 15,252,743 | |
| Sunrise HoldCo IV BV (Netherlands)†(a) | | 5.50% | | 1/15/2028 | | | 3,500,000 | | | | 3,423,459 | |
| TEGNA, Inc. | | 4.625% | | 3/15/2028 | | | 10,762,000 | | | | 9,913,826 | |
| TEGNA, Inc.† | | 4.75% | | 3/15/2026 | | | 2,200,000 | | | | 2,168,041 | |
| Univision Communications, Inc.† | | 6.625% | | 6/1/2027 | | | 15,563,000 | | | | 15,503,243 | |
| Univision Communications, Inc.† | | 8.00% | | 8/15/2028 | | | 14,941,000 | | | | 15,029,600 | |
| | | |
| | See Notes to Financial Statements. | 53 |
Schedule of Investments (continued)
SHORT DURATION HIGH YIELD FUND July 31, 2024
| Investments | | Interest
Rate | | Maturity
Date | | Principal
Amount† | | | Fair
Value | |
| Media (continued) | | | | | | | | | | | | |
| Virgin Media Vendor Financing Notes IV DAC (Ireland)†(a) | | 5.00% | | 7/15/2028 | | $ | 19,300,000 | | | $ | 18,097,388 | |
| Ziggo Bond Co. BV (Netherlands)†(a) | | 5.125% | | 2/28/2030 | | | 7,000,000 | | | | 6,189,524 | |
| Ziggo Bond Co. BV (Netherlands)†(a) | | 6.00% | | 1/15/2027 | | | 6,475,000 | | | | 6,443,719 | |
| Total | | | | | | | | | | | 239,792,804 | |
| | | | | | | | | | | | | |
| Metal Fabricate-Hardware 0.25% | | | | | | | | | | | | |
| Park-Ohio Industries, Inc.(b) | | 6.625% | | 4/15/2027 | | | 13,605,000 | | | | 13,085,741 | |
| | | | | | | | | | | | | |
| Mining 2.02% | | | | | | | | | | | | |
| China Hongqiao Group Ltd. (China)(a) | | 7.75% | | 3/27/2025 | | | 5,600,000 | | | | 5,636,140 | |
| Compass Minerals International, Inc.†(b) | | 6.75% | | 12/1/2027 | | | 10,183,000 | | | | 10,028,453 | |
| Eldorado Gold Corp. (Canada)†(a) | | 6.25% | | 9/1/2029 | | | 10,510,000 | | | | 10,231,043 | |
| First Quantum Minerals Ltd. (Canada)†(a) | | 6.875% | | 10/15/2027 | | | 4,500,000 | | | | 4,428,351 | |
| First Quantum Minerals Ltd. (Canada)†(a) | | 9.375% | | 3/1/2029 | | | 9,752,000 | | | | 10,268,827 | |
| Hecla Mining Co. | | 7.25% | | 2/15/2028 | | | 20,883,000 | | | | 21,076,481 | |
| Hudbay Minerals, Inc. (Canada)†(a) | | 4.50% | | 4/1/2026 | | | 17,595,000 | | | | 17,220,856 | |
| JW Aluminum Continuous Cast Co.† | | 10.25% | | 6/1/2026 | | | 1,642,000 | | | | 1,647,607 | |
| Novelis Corp.† | | 3.25% | | 11/15/2026 | | | 11,900,000 | | | | 11,334,505 | |
| Taseko Mines Ltd. (Canada)†(a) | | 8.25% | | 5/1/2030 | | | 6,591,000 | | | | 6,766,380 | |
| WE Soda Investments Holding PLC (United Kingdom)†(a) | | 9.50% | | 10/6/2028 | | | 5,934,000 | | | | 6,110,394 | |
| Total | | | | | | | | | | | 104,749,037 | |
| | | | | | | | | | | | | |
| Miscellaneous Manufacturing 0.56% | | | | | | | | | | | | |
| Calderys Financing LLC (France)†(a) | | 11.25% | | 6/1/2028 | | | 3,716,000 | | | | 3,978,859 | |
| FXI Holdings, Inc.† | | 12.25% | | 11/15/2026 | | | 4,843,000 | | | | 4,830,892 | |
| FXI Holdings, Inc.† | | 12.25% | | 11/15/2026 | | | 4,147,000 | | | | 4,134,829 | |
| LSB Industries, Inc.† | | 6.25% | | 10/15/2028 | | | 16,674,000 | | | | 16,234,367 | |
| Total | | | | | | | | | | | 29,178,947 | |
| | | | | | | | | | | | | |
| Office/Business Equipment 0.51% | | | | | | | | | | | | |
| Pitney Bowes, Inc.† | | 6.875% | | 3/15/2027 | | | 4,905,000 | | | | 4,855,753 | |
| Xerox Holdings Corp.† | | 5.00% | | 8/15/2025 | | | 16,401,000 | | | | 16,130,687 | |
| Xerox Holdings Corp.† | | 8.875% | | 11/30/2029 | | | 5,726,000 | | | | 5,323,913 | |
| Total | | | | | | | | | | | 26,310,353 | |
| | | | | | | | | | | | | |
| Oil & Gas 12.25% | | | | | | | | | | | | |
| Aethon United BR LP/Aethon United Finance Corp.† | | 8.25% | | 2/15/2026 | | | 6,413,000 | | | | 6,501,320 | |
| Ascent Resources Utica Holdings LLC/ARU Finance Corp.† | | 5.875% | | 6/30/2029 | | | 9,075,000 | | | | 8,907,400 | |
| | | |
| 54 | See Notes to Financial Statements. | |
Schedule of Investments (continued)
SHORT DURATION HIGH YIELD FUND July 31, 2024
| Investments | | Interest
Rate | | Maturity
Date | | | Principal
Amount† | | | | Fair
Value | |
| Oil & Gas (continued) | | | | | | | | | | | | |
| Ascent Resources Utica Holdings LLC/ARU Finance Corp.† | | 7.00% | | 11/1/2026 | | $ | 7,098,000 | | | $ | 7,110,292 | |
| Berry Petroleum Co. LLC† | | 7.00% | | 2/15/2026 | | | 13,774,000 | | | | 13,646,222 | |
| Borr IHC Ltd./Borr Finance LLC† | | 10.00% | | 11/15/2028 | | | 20,778,710 | | | | 21,788,441 | |
| Borr IHC Ltd./Borr Finance LLC† | | 10.375% | | 11/15/2030 | | | 4,390,777 | | | | 4,634,634 | |
| California Resources Corp.† | | 8.25% | | 6/15/2029 | | | 24,571,000 | | | | 25,177,659 | |
| Canacol Energy Ltd. (Canada)(a)(b) | | 5.75% | | 11/24/2028 | | | 12,000,000 | | | | 5,944,900 | |
| Chord Energy Corp.† | | 6.375% | | 6/1/2026 | | | 4,485,000 | | | | 4,509,102 | |
| CITGO Petroleum Corp.† | | 6.375% | | 6/15/2026 | | | 3,978,000 | | | | 3,983,012 | |
| CITGO Petroleum Corp.† | | 7.00% | | 6/15/2025 | | | 4,238,000 | | | | 4,238,639 | |
| CITGO Petroleum Corp.† | | 8.375% | | 1/15/2029 | | | 21,556,000 | | | | 22,479,610 | |
| Civitas Resources, Inc.† | | 5.00% | | 10/15/2026 | | | 13,269,000 | | | | 12,987,803 | |
| Civitas Resources, Inc.† | | 8.375% | | 7/1/2028 | | | 19,333,000 | | | | 20,322,104 | |
| CNX Resources Corp.† | | 6.00% | | 1/15/2029 | | | 6,500,000 | | | | 6,438,705 | |
| Comstock Resources, Inc.† | | 5.875% | | 1/15/2030 | | | 7,362,000 | | | | 6,854,296 | |
| Comstock Resources, Inc.† | | 6.75% | | 3/1/2029 | | | 17,744,000 | | | | 17,208,299 | |
| Crescent Energy Finance LLC† | | 9.25% | | 2/15/2028 | | | 23,961,000 | | | | 25,313,640 | |
| Diamond Foreign Asset Co./Diamond Finance LLC (Cayman Islands)†(a) | | 8.50% | | 10/1/2030 | | | 5,353,000 | | | | 5,701,855 | |
| Encino Acquisition Partners Holdings LLC† | | 8.50% | | 5/1/2028 | | | 5,815,000 | | | | 5,968,959 | |
| Encino Acquisition Partners Holdings LLC† | | 8.75% | | 5/1/2031 | | | 14,934,000 | | | | 15,687,757 | |
| EnQuest PLC (United Kingdom)†(a)(b) | | 11.625% | | 11/1/2027 | | | 13,670,000 | | | | 13,988,467 | |
| Global Marine, Inc. | | 7.00% | | 6/1/2028 | | | 12,031,000 | | | | 11,331,349 | |
| Gulfport Energy Corp.† | | 8.00% | | 5/17/2026 | | | 4,549,731 | | | | 4,614,078 | |
| HF Sinclair Corp.† | | 6.375% | | 4/15/2027 | | | 3,304,000 | | | | 3,340,203 | |
| Hilcorp Energy I LP/Hilcorp Finance Co.† | | 5.75% | | 2/1/2029 | | | 5,000,000 | | | | 4,919,333 | |
| Hilcorp Energy I LP/Hilcorp Finance Co.† | | 6.25% | | 11/1/2028 | | | 4,914,000 | | | | 4,922,965 | |
| Kosmos Energy Ltd.† | | 7.125% | | 4/4/2026 | | | 6,650,000 | | | | 6,578,203 | |
| Kosmos Energy Ltd.† | | 7.50% | | 3/1/2028 | | | 4,800,000 | | | | 4,636,154 | |
| Kraken Oil & Gas Partners LLC† | | 7.625% | | 8/15/2029 | | | 12,736,000 | | | | 12,866,073 | |
| Leviathan Bond Ltd. (Israel)(a) | | 6.50% | | 6/30/2027 | | | 7,800,000 | | | | 7,382,374 | |
| Magnolia Oil & Gas Operating LLC/Magnolia Oil & Gas Finance Corp.† | | 6.00% | | 8/1/2026 | | | 16,706,000 | | | | 16,667,185 | |
| Matador Resources Co.† | | 6.875% | | 4/15/2028 | | | 1,326,000 | | | | 1,353,145 | |
| MC Brazil Downstream Trading SARL (Luxembourg)†(a) | | 7.25% | | 6/30/2031 | | | 6,180,923 | | | | 5,724,096 | |
| Medco Bell Pte. Ltd. (Singapore)(a) | | 6.375% | | 1/30/2027 | | | 6,034,000 | | | | 5,973,964 | |
| Nabors Industries Ltd.†(b) | | 7.50% | | 1/15/2028 | | | 7,181,000 | | | | 7,061,237 | |
| Nabors Industries, Inc.† | | 7.375% | | 5/15/2027 | | | 6,597,000 | | | | 6,722,106 | |
| | | |
| | See Notes to Financial Statements. | 55 |
Schedule of Investments (continued)
SHORT DURATION HIGH YIELD FUND July 31, 2024
| Investments | | Interest
Rate | | Maturity
Date | | | Principal
Amount† | | | | Fair
Value | |
| Oil & Gas (continued) | | | | | | | | | | | | |
| Nabors Industries, Inc.† | | 8.875% | | 8/15/2031 | | $ | 4,937,000 | | | $ | 5,039,813 | |
| Noble Finance II LLC† | | 8.00% | | 4/15/2030 | | | 6,179,000 | | | | 6,501,550 | |
| PBF Holding Co. LLC/PBF Finance Corp. | | 6.00% | | 2/15/2028 | | | 6,413,000 | | | | 6,296,344 | |
| Permian Resources Operating LLC† | | 7.75% | | 2/15/2026 | | | 3,790,000 | | | | 3,840,149 | |
| Permian Resources Operating LLC† | | 8.00% | | 4/15/2027 | | | 6,858,000 | | | | 7,083,114 | |
| Petroleos Mexicanos (Mexico)(a) | | 6.49% | | 1/23/2027 | | | 11,126,000 | | | | 10,746,144 | |
| Petroleos Mexicanos (Mexico)(a) | | 8.75% | | 6/2/2029 | | | 3,920,000 | | | | 3,893,315 | |
| Precision Drilling Corp. (Canada)†(a) | | 6.875% | | 1/15/2029 | | | 2,592,000 | | | | 2,593,049 | |
| Precision Drilling Corp. (Canada)†(a) | | 7.125% | | 1/15/2026 | | | 2,295,000 | | | | 2,307,561 | |
| Saturn Oil & Gas, Inc. (Canada)†(a) | | 9.625% | | 6/15/2029 | | | 20,205,000 | | | | 20,777,650 | |
| Seadrill Finance Ltd.† | | 8.375% | | 8/1/2030 | | | 5,593,000 | | | | 5,899,168 | |
| Shelf Drilling Holdings Ltd. (United Arab Emirates)†(a)(b) | | 9.625% | | 4/15/2029 | | | 20,596,000 | | | | 19,818,861 | |
| SierraCol Energy Andina LLC† | | 6.00% | | 6/15/2028 | | | 9,200,000 | | | | 8,279,494 | |
| Sitio Royalties Operating Partnership LP/Sitio Finance Corp.† | | 7.875% | | 11/1/2028 | | | 16,748,000 | | | | 17,534,520 | |
| SM Energy Co. | | 6.50% | | 7/15/2028 | | | 5,000,000 | | | | 4,991,352 | |
| SM Energy Co. | | 6.625% | | 1/15/2027 | | | 6,207,000 | | | | 6,218,779 | |
| SM Energy Co.† | | 6.75% | | 8/1/2029 | | | 15,304,000 | | | | 15,415,015 | |
| SM Energy Co.† | | 7.00% | | 8/1/2032 | | | 5,169,000 | | | | 5,228,265 | |
| Strathcona Resources Ltd. (Canada)†(a) | | 6.875% | | 8/1/2026 | | | 17,278,000 | | | | 17,364,217 | |
| Sunoco LP/Sunoco Finance Corp.† | | 7.00% | | 9/15/2028 | | | 4,150,000 | | | | 4,271,985 | |
| Talos Production, Inc.† | | 9.00% | | 2/1/2029 | | | 15,705,000 | | | | 16,557,652 | |
| Talos Production, Inc.† | | 9.375% | | 2/1/2031 | | | 3,643,000 | | | | 3,863,308 | |
| Transocean Aquila Ltd.† | | 8.00% | | 9/30/2028 | | | 6,359,000 | | | | 6,484,241 | |
| Transocean, Inc.† | | 8.25% | | 5/15/2029 | | | 19,234,000 | | | | 19,652,224 | |
| Tullow Oil PLC (United Kingdom)(a) | | 10.25% | | 5/15/2026 | | | 6,800,000 | | | | 6,571,680 | |
| Turkiye Petrol Rafinerileri AS (Turkey)(a) | | 4.50% | | 10/18/2024 | | | 3,788,000 | | | | 3,775,632 | |
| Valaris Ltd.† | | 8.375% | | 4/30/2030 | | | 12,359,000 | | | | 12,948,494 | |
| Vital Energy, Inc.† | | 7.75% | | 7/31/2029 | | | 17,250,000 | | | | 17,457,259 | |
| W&T Offshore, Inc.† | | 11.75% | | 2/1/2026 | | | 11,859,000 | | | | 12,187,245 | |
| Total | | | | | | | | | | | 637,083,661 | |
| | | | | | | | | | | | | |
| Oil & Gas Services 1.28% | | | | | | | | | | | | |
| Helix Energy Solutions Group, Inc.† | | 9.75% | | 3/1/2029 | | | 12,326,000 | | | | 13,180,093 | |
| Kodiak Gas Services LLC† | | 7.25% | | 2/15/2029 | | | 12,273,000 | | | | 12,632,992 | |
| Nine Energy Service, Inc. | | 13.00% | | 2/1/2028 | | | 4,966,000 | | | | 3,964,112 | |
| Oceaneering International, Inc. | | 6.00% | | 2/1/2028 | | | 2,735,000 | | | | 2,725,747 | |
| Oceaneering International, Inc. | | 6.00% | | 2/1/2028 | | | 2,815,000 | | | | 2,805,476 | |
| | | |
| 56 | See Notes to Financial Statements. | |
Schedule of Investments (continued)
SHORT DURATION HIGH YIELD FUND July 31, 2024
| Investments | | Interest
Rate | | Maturity
Date | | | Principal
Amount† | | | | Fair
Value | |
| Oil & Gas Services (continued) | | | | | | | | | | | | |
| Star Holding LLC† | | 8.75% | | 8/1/2031 | | $ | 6,239,000 | | | $ | 6,153,339 | |
| Tidewater, Inc.† | | 10.375% | | 7/3/2028 | | | 1,500,000 | | | | 1,620,000 | |
| USA Compression Partners LP/USA Compression Finance Corp. | | 6.875% | | 9/1/2027 | | | 5,758,000 | | | | 5,794,523 | |
| USA Compression Partners LP/USA Compression Finance Corp.† | | 7.125% | | 3/15/2029 | | | 2,514,000 | | | | 2,560,066 | |
| Welltec International ApS (Denmark)†(a) | | 8.25% | | 10/15/2026 | | | 1,126,000 | | | | 1,154,354 | |
| Welltec International ApS (Denmark)(a) | | 8.25% | | 10/15/2026 | | | 13,614,000 | | | | 13,956,814 | |
| Total | | | | | | | | | | | 66,547,516 | |
| | | | | | | | | | | | | |
| Packaging & Containers 1.27% | | | | | | | | | | | | |
| Ardagh Packaging Finance PLC/Ardagh Holdings USA, Inc. (Ireland)†(a) | | 4.125% | | 8/15/2026 | | | 3,089,000 | | | | 2,616,094 | |
| Canpack SA/Canpack U.S. LLC (Poland)†(a) | | 3.125% | | 11/1/2025 | | | 5,025,000 | | | | 4,847,486 | |
| Iris Holding, Inc.† | | 10.00% | | 12/15/2028 | | | 6,930,000 | | | | 5,882,859 | |
| LABL, Inc.† | | 5.875% | | 11/1/2028 | | | 5,000,000 | | | | 4,626,729 | |
| LABL, Inc.† | | 9.50% | | 11/1/2028 | | | 10,724,000 | | | | 10,847,251 | |
| LABL, Inc.† | | 10.50% | | 7/15/2027 | | | 11,074,000 | | | | 10,798,150 | |
| Mauser Packaging Solutions Holding Co.† | | 7.875% | | 8/15/2026 | | | 9,236,000 | | | | 9,358,935 | |
| Mauser Packaging Solutions Holding Co.† | | 9.25% | | 4/15/2027 | | | 17,019,000 | | | | 17,060,546 | |
| Total | | | | | | | | | | | 66,038,050 | |
| | | | | | | | | | | | | |
| Pharmaceuticals 1.70% | | | | | | | | | | | | |
| 1375209 BC Ltd. (Canada)†(a)(b) | | 9.00% | | 1/30/2028 | | | 5,400,000 | | | | 5,139,147 | |
| AdaptHealth LLC† | | 6.125% | | 8/1/2028 | | | 11,550,000 | | | | 11,270,107 | |
| Bausch Health Cos., Inc. (Canada)†(a)(b) | | 5.50% | | 11/1/2025 | | | 18,877,000 | | | | 17,700,114 | |
| Bausch Health Cos., Inc. (Canada)†(a)(b) | | 9.00% | | 12/15/2025 | | | 4,910,000 | | | | 4,404,908 | |
| Curaleaf Holdings, Inc. | | 8.00% | | 12/15/2026 | | | 17,020,000 | | | | 16,041,350 | |
| Elanco Animal Health, Inc. | | 6.65% | | 8/28/2028 | | | 2,006,000 | | | | 2,045,073 | |
| Herbalife Nutrition Ltd./HLF Financing, Inc.†(b) | | 7.875% | | 9/1/2025 | | | 4,901,000 | | | | 4,873,993 | |
| Owens & Minor, Inc.†(b) | | 4.50% | | 3/31/2029 | | | 4,655,000 | | | | 4,094,984 | |
| Owens & Minor, Inc.†(b) | | 6.625% | | 4/1/2030 | | | 2,708,000 | | | | 2,531,902 | |
| Teva Pharmaceutical Finance Netherlands III BV (Netherlands)(a) | | 6.75% | | 3/1/2028 | | | 4,200,000 | | | | 4,315,193 | |
| Trulieve Cannabis Corp. | | 8.00% | | 10/6/2026 | | | 16,347,000 | | | | 15,685,028 | |
| Total | | | | | | | | | | | 88,101,799 | |
| | | | | | | | | | | | | |
| Pipelines 2.77% | | | | | | | | | | | | |
| AI Candelaria Spain SA (Spain)†(a) | | 7.50% | | 12/15/2028 | | | 2,414,994 | | | | 2,396,102 | |
| Antero Midstream Partners LP/Antero Midstream Finance Corp.† | | 5.75% | | 3/1/2027 | | | 9,661,000 | | | | 9,644,371 | |
| | | |
| | See Notes to Financial Statements. | 57 |
Schedule of Investments (continued)
SHORT DURATION HIGH YIELD FUND July 31, 2024
| Investments | | Interest
Rate | | Maturity
Date | | | Principal
Amount† | | | | Fair
Value | |
| Pipelines (continued) | | | | | | | | | | | | |
| Blue Racer Midstream LLC/Blue Racer Finance Corp.† | | 7.00% | | 7/15/2029 | | $ | 5,291,000 | | | $ | 5,438,719 | |
| Buckeye Partners LP† | | 6.875% | | 7/1/2029 | | | 5,149,000 | | | | 5,234,154 | |
| Delek Logistics Partners LP/Delek Logistics Finance Corp.† | | 7.125% | | 6/1/2028 | | | 11,241,000 | | | | 11,208,658 | |
| Delek Logistics Partners LP/Delek Logistics Finance Corp.† | | 8.625% | | 3/15/2029 | | | 9,674,000 | | | | 10,056,307 | |
| Energy Transfer LP | | 7.125%
(5 yr. CMT + 2.83% | )# | 10/1/2054 | | | 16,700,000 | | | | 16,767,435 | |
| Energy Transfer LP | | 8.00%
(5 yr. CMT + 4.02% | )# | 5/15/2054 | | | 2,164,000 | | | | 2,305,145 | |
| EQM Midstream Partners LP† | | 6.375% | | 4/1/2029 | | | 2,862,000 | | | | 2,923,587 | |
| EQM Midstream Partners LP† | | 7.50% | | 6/1/2027 | | | 4,712,000 | | | | 4,844,330 | |
| Genesis Energy LP/Genesis Energy Finance Corp. | | 8.00% | | 1/15/2027 | | | 3,863,000 | | | | 3,953,094 | |
| Genesis Energy LP/Genesis Energy Finance Corp. | | 8.25% | | 1/15/2029 | | | 4,917,000 | | | | 5,118,671 | |
| NGL Energy Operating LLC/NGL Energy Finance Corp.† | | 8.125% | | 2/15/2029 | | | 9,578,000 | | | | 9,713,008 | |
| Tallgrass Energy Partners LP/Tallgrass Energy Finance Corp.† | | 6.00% | | 3/1/2027 | | | 2,060,000 | | | | 2,046,683 | |
| Venture Global Calcasieu Pass LLC† | | 6.25% | | 1/15/2030 | | | 5,000,000 | | | | 5,138,135 | |
| Venture Global LNG, Inc.† | | 8.125% | | 6/1/2028 | | | 19,647,000 | | | | 20,473,397 | |
| Venture Global LNG, Inc.† | | 9.50% | | 2/1/2029 | | | 24,207,000 | | | | 26,945,157 | |
| Total | | | | | | | | | | | 144,206,953 | |
| | | | | | | | | | | | | |
| Real Estate 0.49% | | | | | | | | | | | | |
| Cushman & Wakefield U.S. Borrower LLC† | | 6.75% | | 5/15/2028 | | | 5,576,000 | | | | 5,591,608 | |
| Howard Hughes Corp.† | | 5.375% | | 8/1/2028 | | | 7,159,000 | | | | 6,949,227 | |
| Hunt Cos., Inc.† | | 5.25% | | 4/15/2029 | | | 13,831,000 | | | | 13,084,243 | |
| Total | | | | | | | | | | | 25,625,078 | |
| | | | | | | | | | | | | |
| REITS 2.01% | | | | | | | | | | | | |
| Brandywine Operating Partnership LP | | 8.875% | | 4/12/2029 | | | 17,649,000 | | | | 18,763,676 | |
| GLP Capital LP/GLP Financing II, Inc. | | 5.25% | | 6/1/2025 | | | 6,723,000 | | | | 6,692,749 | |
| HAT Holdings I LLC/HAT Holdings II LLC† | | 8.00% | | 6/15/2027 | | | 2,469,000 | | | | 2,585,897 | |
| Iron Mountain, Inc.† | | 4.875% | | 9/15/2027 | | | 6,553,000 | | | | 6,403,525 | |
| Ladder Capital Finance Holdings LLLP/Ladder Capital Finance Corp.† | | 4.25% | | 2/1/2027 | | | 6,485,000 | | | | 6,280,049 | |
| Ladder Capital Finance Holdings LLLP/Ladder Capital Finance Corp.† | | 5.25% | | 10/1/2025 | | | 4,816,000 | | | | 4,797,296 | |
| Park Intermediate Holdings LLC/PK Domestic Property LLC/PK Finance Co-Issuer† | | 4.875% | | 5/15/2029 | | | 5,000,000 | | | | 4,729,054 | |
| | | |
| 58 | See Notes to Financial Statements. | |
Schedule of Investments (continued)
SHORT DURATION HIGH YIELD FUND July 31, 2024
| Investments | | Interest
Rate | | Maturity
Date | | | Principal
Amount† | | | | Fair
Value | |
| REITS (continued) | | | | | | | | | | | | |
| Park Intermediate Holdings LLC/PK Domestic Property LLC/PK Finance Co-Issuer† | | 7.00% | | 2/1/2030 | | $ | 5,352,000 | | | $ | 5,451,609 | |
| Piedmont Operating Partnership LP | | 6.875% | | 7/15/2029 | | | 11,908,000 | | | | 12,123,633 | |
| Service Properties Trust | | 4.75% | | 10/1/2026 | | | 6,570,000 | | | | 6,299,641 | |
| Uniti Group LP/Uniti Group Finance, Inc./CSL Capital LLC† | | 10.50% | | 2/15/2028 | | | 9,091,000 | | | | 9,202,532 | |
| VICI Properties LP/VICI Note Co., Inc.† | | 5.75% | | 2/1/2027 | | | 9,824,000 | | | | 9,902,592 | |
| Vornado Realty LP | | 2.15% | | 6/1/2026 | | | 6,711,000 | | | | 6,300,215 | |
| XHR LP† | | 4.875% | | 6/1/2029 | | | 5,500,000 | | | | 5,194,693 | |
| Total | | | | | | | | | | | 104,727,161 | |
| | | | | | | | | | | | | |
| Retail 4.44% | | | | | | | | | | | | |
| Arko Corp.†(b) | | 5.125% | | 11/15/2029 | | | 12,252,000 | | | | 10,698,695 | |
| BCPE Ulysses Intermediate, Inc.† | | 7.75% | | 4/1/2027 | | | 2,041,000 | | | | 1,972,580 | |
| Bloomin’ Brands, Inc./OSI Restaurant Partners LLC† | | 5.125% | | 4/15/2029 | | | 2,924,000 | | | | 2,694,413 | |
| Carvana Co.† | | 13.00% | | 6/1/2030 | | | 5,840,000 | | | | 6,447,018 | |
| CD&R Firefly Bidco PLC | | 8.625% | | 4/30/2029 | | GBP | 4,484,000 | | | | 5,843,757 | |
| CD&R Firefly Bidco PLC† | | 8.625% | | 4/30/2029 | | GBP | 2,196,000 | | | | 2,861,929 | |
| CEC Entertainment LLC† | | 6.75% | | 5/1/2026 | | $ | 7,535,000 | | | | 7,532,240 | |
| Evergreen Acqco 1 LP/TVI, Inc.† | | 9.75% | | 4/26/2028 | | | 7,488,000 | | | | 7,904,947 | |
| FirstCash, Inc.† | | 4.625% | | 9/1/2028 | | | 9,850,000 | | | | 9,418,583 | |
| FirstCash, Inc.† | | 5.625% | | 1/1/2030 | | | 5,000,000 | | | | 4,860,468 | |
| Gap, Inc.† | | 3.625% | | 10/1/2029 | | | 12,169,000 | | | | 10,648,174 | |
| Global Auto Holdings Ltd./AAG FH U.K. Ltd. (United Kingdom)†(a) | | 8.375% | | 1/15/2029 | | | 13,048,000 | | | | 12,745,106 | |
| GPS Hospitality Holding Co. LLC/GPS Finco, Inc.† | | 7.00% | | 8/15/2028 | | | 9,511,000 | | | | 6,951,604 | |
| Group 1 Automotive, Inc.† | | 6.375% | | 1/15/2030 | | | 5,277,000 | | | | 5,335,550 | |
| Ken Garff Automotive LLC† | | 4.875% | | 9/15/2028 | | | 10,935,000 | | | | 10,394,107 | |
| Nordstrom, Inc. | | 4.00% | | 3/15/2027 | | | 9,194,000 | | | | 8,806,732 | |
| Patrick Industries, Inc.† | | 7.50% | | 10/15/2027 | | | 6,834,000 | | | | 6,898,376 | |
| PetSmart, Inc./PetSmart Finance Corp.† | | 7.75% | | 2/15/2029 | | | 30,108,000 | | | | 29,252,819 | |
| Punch Finance PLC | | 6.125% | | 6/30/2026 | | GBP | 8,225,000 | | | | 10,448,618 | |
| QVC, Inc. | | 4.75% | | 2/15/2027 | | $ | 10,049,000 | | | | 8,806,376 | |
| Raising Cane’s Restaurants LLC† | | 9.375% | | 5/1/2029 | | | 5,255,000 | | | | 5,679,674 | |
| Sizzling Platter LLC/Sizzling Platter Finance Corp.† | | 8.50% | | 11/28/2025 | | | 3,384,000 | | | | 3,422,070 | |
| Specialty Building Products Holdings LLC/SBP Finance Corp.† | | 6.375% | | 9/30/2026 | | | 3,948,000 | | | | 3,890,180 | |
| | | |
| | See Notes to Financial Statements. | 59 |
Schedule of Investments (continued)
SHORT DURATION HIGH YIELD FUND July 31, 2024
| Investments | | Interest
Rate | | Maturity
Date | | | Principal
Amount† | | | | Fair
Value | |
| Retail (continued) | | | | | | | | | | | | |
| Staples, Inc.† | | 10.75% | | 9/1/2029 | | $ | 20,045,000 | | | $ | 19,441,923 | |
| Staples, Inc.† | | 12.75% | | 1/15/2030 | | | 6,044,141 | | | | 4,698,848 | |
| Stonegate Pub Co. Financing 2019 PLC | | 8.25% | | 7/31/2025 | | GBP | 5,892,000 | | | | 7,582,984 | |
| Victoria’s Secret & Co.† | | 4.625% | | 7/15/2029 | | $ | 15,613,000 | | | | 12,966,687 | |
| Walgreens Boots Alliance, Inc. | | 3.20% | | 4/15/2030 | | | 3,303,000 | | | | 2,726,666 | |
| Total | | | | | | | | | | | 230,931,124 | |
| | | | | | | | | | | | | |
| Savings & Loans 0.04% | | | | | | | | | | | | |
| New York Community Bancorp, Inc. | | 8.378%
(3 mo. USD Term
SOFR + 3.04% | )# | 11/6/2028 | | | 2,477,000 | | | | 2,229,100 | |
| | | | | | | | | | | | | |
| Semiconductors 0.08% | | | | | | | | | | | | |
| ams-OSRAM AG (Austria)†(a) | | 12.25% | | 3/30/2029 | | | 4,000,000 | | | | 4,228,748 | |
| | | | | | | | | | | | | |
| Software 1.41% | | | | | | | | | | | | |
| Central Parent LLC/CDK Global II LLC/CDK Financing Co., Inc.† | | 8.00% | | 6/15/2029 | | | 2,489,000 | | | | 2,554,881 | |
| Cloud Software Group, Inc.† | | 6.50% | | 3/31/2029 | | | 23,744,000 | | | | 23,160,781 | |
| Cloud Software Group, Inc.† | | 9.00% | | 9/30/2029 | | | 18,607,000 | | | | 18,514,546 | |
| Dye & Durham Ltd. (Canada)†(a) | | 8.625% | | 4/15/2029 | | | 5,000,000 | | | | 5,120,495 | |
| Helios Software Holdings, Inc./ION Corporate Solutions Finance SARL† | | 4.625% | | 5/1/2028 | | | 5,000,000 | | | | 4,563,485 | |
| Helios Software Holdings, Inc./ION Corporate Solutions Finance SARL† | | 8.75% | | 5/1/2029 | | | 9,430,000 | | | | 9,759,811 | |
| IPD 3 BV† | | 7.086%
(3 mo. EURIBOR + 3.38% | )# | 6/15/2031 | | EUR | 2,999,000 | | | | 3,248,406 | |
| IPD 3 BV | | 7.086%
(3 mo. EURIBOR + 3.38% | )# | 6/15/2031 | | EUR | 1,170,000 | | | | 1,267,301 | |
| MicroStrategy, Inc.† | | 6.125% | | 6/15/2028 | | $ | 5,000,000 | | | | 4,949,513 | |
| Total | | | | | | | | | | | 73,139,219 | |
| | | | | | | | | | | | | |
| Telecommunications 2.38% | | | | | | | | | | | | |
| Altice France SA | | 2.125% | | 2/15/2025 | | EUR | 1,786,000 | | | | 1,826,830 | |
| Altice France SA | | 2.50% | | 1/15/2025 | | EUR | 8,039,000 | | | | 8,229,689 | |
| Altice France SA (France)†(a) | | 8.125% | | 2/1/2027 | | $ | 5,108,000 | | | | 4,134,768 | |
| Connect Finco SARL/Connect U.S. Finco LLC (Luxembourg)†(a) | | 6.75% | | 10/1/2026 | | | 14,775,000 | | | | 14,536,294 | |
| Frontier Communications Holdings LLC† | | 5.00% | | 5/1/2028 | | | 17,888,000 | | | | 17,241,017 | |
| Frontier Communications Holdings LLC† | | 5.875% | | 10/15/2027 | | | 9,700,000 | | | | 9,612,353 | |
| Frontier Communications Holdings LLC† | | 6.00% | | 1/15/2030 | | | 170,000 | | | | 153,356 | |
| Frontier Communications Holdings LLC† | | 6.75% | | 5/1/2029 | | | 14,500,000 | | | | 13,716,772 | |
| | | |
| 60 | See Notes to Financial Statements. | |
Schedule of Investments (continued)
SHORT DURATION HIGH YIELD FUND July 31, 2024
| Investments | | Interest
Rate | | Maturity
Date | | | Principal
Amount† | | | | Fair
Value | |
| Telecommunications (continued) | | | | | | | | | | | | |
| Hughes Satellite Systems Corp. | | 5.25% | | 8/1/2026 | | $ | 840,000 | | | $ | 641,209 | |
| Hughes Satellite Systems Corp. | | 6.625% | | 8/1/2026 | | | 9,155,000 | | | | 4,302,850 | |
| Iliad Holding SASU (France)†(a) | | 6.50% | | 10/15/2026 | | | 5,300,000 | | | | 5,316,221 | |
| Iliad Holding SASU (France)†(a) | | 7.00% | | 10/15/2028 | | | 11,800,000 | | | | 11,842,260 | |
| Iliad Holding SASU (France)†(a) | | 8.50% | | 4/15/2031 | | | 6,420,000 | | | | 6,692,863 | |
| Lumen Technologies, Inc.†(b) | | 4.125% | | 4/15/2029 | | | 2,580,504 | | | | 1,903,122 | |
| Lumen Technologies, Inc.† | | 4.125% | | 4/15/2030 | | | 160,052 | | | | 113,637 | |
| VF Ukraine PAT via VFU Funding PLC (Ukraine)†(a) | | 6.20% | | 2/11/2025 | | | 5,300,000 | | | | 4,722,830 | |
| VF Ukraine PAT via VFU Funding PLC (Ukraine)(a) | | 6.20% | | 2/11/2025 | | | 1,000,000 | | | | 891,100 | |
| Viasat, Inc.† | | 5.625% | | 9/15/2025 | | | 13,845,000 | | | | 13,706,884 | |
| Zegona Finance PLC (United Kingdom)†(a) | | 8.625% | | 7/15/2029 | | | 3,967,000 | | | | 4,056,505 | |
| Total | | | | | | | | | | | 123,640,560 | |
| | | | | | | | | | | | | |
| Transportation 0.89% | | | | | | | | | | | | |
| gategroup Finance Luxembourg SA | | 3.00% | | 2/28/2027 | | CHF | 6,700,000 | | | | 6,812,589 | |
| GN Bondco LLC†(b) | | 9.50% | | 10/15/2031 | | $ | 4,539,000 | | | | 4,278,205 | |
| Rand Parent LLC†(b) | | 8.50% | | 2/15/2030 | | | 15,054,000 | | | | 14,898,000 | |
| Seaspan Corp. (Hong Kong)†(a) | | 5.50% | | 8/1/2029 | | | 20,003,000 | | | | 18,022,937 | |
| XPO, Inc.† | | 6.25% | | 6/1/2028 | | | 2,338,000 | | | | 2,367,849 | |
| Total | | | | | | | | | | | 46,379,580 | |
| | | | | | | | | | | | | |
| Trucking & Leasing 0.13% | | | | | | | | | | | | |
| AerCap Global Aviation Trust (Ireland)†(a) | | 6.50%
(3 mo. USD Term
SOFR + 4.56% | )# | 6/15/2045 | | | 1,500,000 | | | | 1,499,593 | |
| Fortress Transportation & Infrastructure Investors LLC† | | 5.50% | | 5/1/2028 | | | 5,347,000 | | | | 5,246,263 | |
| Total | | | | | | | | | | | 6,745,856 | |
| | | | | | | | | | | | | |
| Water 0.17% | | | | | | | | | | | | |
| Solaris Midstream Holdings LLC† | | 7.625% | | 4/1/2026 | | | 8,649,000 | | | | 8,711,904 | |
| Total Corporate Bonds (cost $4,331,894,715) | | | | | | | | | | | 4,412,180,427 | |
| | | | | | | | | | | | | |
| FLOATING RATE LOANS(f) 12.46% | | | | | | | | | | | | |
| | | | | | | | | | | | | |
| Aerospace 0.08% | | | | | | | | | | | | |
| Arcline FM Holdings LLC 2021 1st Lien Term Loan | | 10.346%
(3 mo. USD Term
SOFR + 4.75% | ) | 6/23/2028 | | | 4,353,120 | | | | 4,376,714 | |
| | | |
| | See Notes to Financial Statements. | 61 |
Schedule of Investments (continued)
SHORT DURATION HIGH YIELD FUND July 31, 2024
| Investments | | Interest
Rate | | Maturity
Date | | | Principal
Amount† | | | | Fair
Value | |
| Aerospace/Defense 0.02% | | | | | | | | | | | | |
| Alloy Finco Ltd. USD Holdco PIK Term Loan 13.50% (Jersey)(a) | | 0.50% | | 3/6/2025 | | $ | 1,138,698 | | | $ | 1,110,231 | |
| | | | | | | | | | | | | |
| Air Transportation 0.15% | | | | | | | | | | | | |
| Forward Air Corp. Term Loan B | | 9.752%
(3 mo. USD Term
SOFR + 4.50% | ) | 12/19/2030 | | | 8,682,333 | | | | 8,014,445 | |
| | | | | | | | | | | | | |
| Automobile Manufacturers 0.09% | | | | | | | | | | | | |
| American Trailer World Corp. Term Loan B | | 9.194%
(1 mo. USD Term
SOFR + 3.75% | ) | 3/3/2028 | | | 5,000,000 | | | | 4,897,725 | |
| | | | | | | | | | | | | |
| Automotive 0.17% | | | | | | | | | | | | |
| DexKo Global, Inc. 2021 USD Term Loan B | | 9.346%
(3 mo. USD Term
SOFR + 3.75% | ) | 10/4/2028 | | | 8,874,665 | | | | 8,853,765 | |
| | | | | | | | | | | | | |
| Beverages 0.10% | | | | | | | | | | | | |
| Triton Water Holdings, Inc. 2024 Incremental Term Loan B | | 9.335%
(3 mo. USD Term
SOFR + 4.00% | ) | 3/31/2028 | | | 2,399,194 | | | | 2,415,089 | |
| Triton Water Holdings, Inc. Term Loan | | 8.846%
(3 mo. USD Term
SOFR + 3.25% | ) | 3/31/2028 | | | 2,994,566 | | | | 3,007,083 | |
| Total | | | | | | | | | | | 5,422,172 | |
| | | | | | | | | | | | | |
| Building & Construction 0.09% | | | | | | | | | | | | |
| USIC Holdings, Inc. 2021 2nd Lien Term Loan | | 12.096%
(3 mo. USD Term
SOFR + 6.50% | ) | 5/14/2029 | | | 4,856,454 | | | | 4,678,392 | |
| | | | | | | | | | | | | |
| Building Materials 0.35% | | | | | | | | | | | | |
| ACProducts, Inc. 2021 Term Loan B | | 9.846%
(3 mo. USD Term
SOFR + 4.25% | ) | 5/17/2028 | | | 11,027,181 | | | | 8,828,692 | |
| CP Atlas Buyer, Inc. 2021 Term Loan B | | 9.194%
(1 mo. USD Term
SOFR + 3.75% | ) | 11/23/2027 | | | 3,766,608 | | | | 3,623,496 | |
| | | |
| 62 | See Notes to Financial Statements. | |
Schedule of Investments (continued)
SHORT DURATION HIGH YIELD FUND July 31, 2024
| Investments | | Interest
Rate | | Maturity
Date | | | Principal
Amount† | | | | Fair
Value | |
| Building Materials (continued) | | | | | | | | | | | | |
| Icebox Holdco III, Inc. 2021 1st Lien Term Loan | | 9.346%
(3 mo. USD Term
SOFR + 3.75% | ) | 12/22/2028 | | $ | 6,737 | | | $ | 6,779 | |
| Patagonia Bidco Ltd. 2021 GBP Term Loan B (United Kingdom)(a) | | – | (g) | 11/1/2028 | | GBP | 5,000,000 | | | | 5,688,560 | |
| Total | | | | | | | | | | | 18,147,527 | |
| | | | | | | | | | | | | |
| Chemicals 0.73% | | | | | | | | | | | | |
| Aruba Investments Holdings LLC 2020 2nd Lien Term Loan | | 13.194%
(1 mo. USD Term
SOFR + 7.75% | ) | 11/24/2028 | | $ | 5,000,000 | | | | 4,825,000 | |
| Aruba Investments Holdings LLC 2020 USD Term Loan | | 9.444%
(1 mo. USD Term
SOFR + 4.00% | ) | 11/24/2027 | | | 1,989,770 | | | | 1,992,257 | |
| Iris Holding, Inc. Term Loan | | 10.102%
(3 mo. USD Term
SOFR + 4.75% | ) | 6/28/2028 | | | 11,152,209 | | | | 10,092,749 | |
| Lonza Group AG USD Term Loan B (Luxembourg)(a) | | 9.36%
(3 mo. USD Term
SOFR + 3.93% | ) | 7/3/2028 | | | 7,924,578 | | | | 7,703,323 | |
| Plaskolite LLC 2021 Term Loan | | 9.458%
(1 mo. USD Term
SOFR + 4.00% | ) | 12/15/2025 | | | 4,847,741 | | | | 4,715,301 | |
| PMHC II, Inc. 2022 Term Loan B | | 9.704%
(3 mo. USD Term
SOFR + 4.25% | ) | 4/23/2029 | | | 8,705,696 | | | | 8,530,407 | |
| Total | | | | | | | | | | | 37,859,037 | |
| | | | | | | | | | | | | |
| Commercial Services 0.68% | | | | | | | | | | | | |
| Albion Financing 3 SARL 2024 USD Term Loan B (Luxembourg)(a) | | – | (g) | 8/17/2029 | | | 1,153,000 | | | | 1,163,815 | |
| Allied Universal Holdco LLC 2021 USD Incremental Term Loan B | | 9.194%
(1 mo. USD Term
SOFR + 3.75% | ) | 5/12/2028 | | | 5,391,141 | | | | 5,396,532 | |
| AVSC Holding Corp. 2020 Term Loan B1 PIK 0.25% | | 8.694%
(1 mo. USD Term
SOFR + 3.25% | ) | 3/3/2025 | | | 9,962,377 | | | | 9,936,873 | |
| | | |
| | See Notes to Financial Statements. | 63 |
Schedule of Investments (continued)
SHORT DURATION HIGH YIELD FUND July 31, 2024
| Investments | | Interest
Rate | | Maturity
Date | | | Principal
Amount† | | | | Fair
Value | |
| Commercial Services (continued) | | | | | | | | | | | | |
| Groundworks LLC 2024 Delayed Draw Term Loan(h) | | 8.829%
(1 mo. USD Term
SOFR + 3.50% | ) | 3/14/2031 | | $ | 1,097,265 | | | $ | 1,100,008 | |
| Groundworks LLC 2024 Term Loan | | 8.829%
(1 mo. USD Term
SOFR + 3.50% | ) | 3/14/2031 | | | 5,961,805 | | | | 5,976,710 | |
| Nuvei Technologies Corp. 2024 Term Loan B1 (Canada)(a) | | – | (g) | 7/18/2031 | | | 6,824,000 | | | | 6,811,205 | |
| PG Investment Co. 59 SARL Term Loan B (Luxembourg)(a) | | 8.835%
(3 mo. USD Term
SOFR + 3.50% | ) | 3/26/2031 | | | 4,721,379 | | | | 4,759,740 | |
| Total | | | | | | | | | | | 35,144,883 | |
| | | | | | | | | | | | | |
| Computers 0.16% | | | | | | | | | | | | |
| McAfee LLC 2024 USD Term Loan B | | 8.593%
(1 mo. USD Term
SOFR + 3.25% | ) | 3/1/2029 | | | 8,500,349 | | | | 8,500,987 | |
| | | | | | | | | | | | | |
| Consumer Non-Durables 0.06% | | | | | | | | | | | | |
| Anastasia Parent LLC 2018 Term Loan B | | 9.346%
(3 mo. USD Term
SOFR + 3.75% | ) | 8/11/2025 | | | 4,268,693 | | | | 2,954,106 | |
| | | | | | | | | | | | | |
| Containers & Packaging 0.19% | | | | | | | | | | | | |
| Tosca Services LLC 2021 Term Loan | | 9.014%
(3 mo. USD Term
SOFR + 3.50% | ) | 8/18/2027 | | | 11,179,496 | | | | 9,726,162 | |
| | | | | | | | | | | | | |
| Diversified Capital Goods 0.17% | | | | | | | | | | | | |
| Grinding Media, Inc. 2021 Term Loan B | | 9.569%
(3 mo. USD Term
SOFR + 4.00% | ) | 10/12/2028 | | | 8,951,459 | | | | 8,973,837 | |
| | | | | | | | | | | | | |
| Diversified Financial Services 0.62% | | | | | | | | | | | | |
| Advisor Group, Inc. 2024 Term Loan | | 9.344%
(1 mo. USD Term
SOFR + 4.00% | ) | 8/17/2028 | | | 11,347,000 | | | | 11,194,496 | |
| Aretec Group, Inc. 2024 Term Loan B | | – | (g) | 8/9/2030 | | | 12,604,000 | | | | 12,416,263 | |
| | | |
| 64 | See Notes to Financial Statements. | |
Schedule of Investments (continued)
SHORT DURATION HIGH YIELD FUND July 31, 2024
| Investments | | Interest
Rate | | Maturity
Date | | | Principal
Amount† | | | | Fair
Value | |
| Diversified Financial Services (continued) | | | | | | | | | | | | |
| Assetmark Financial Holdings, Inc. 2024 Term Loan | | – | (g) | 6/3/2031 | | $ | 1,686,000 | | | $ | 1,673,355 | |
| Edelman Financial Engines Center LLC 2024 2nd Lien Term Loan | | 10.594%
(1 mo. USD Term
SOFR + 5.25% | ) | 10/6/2028 | | | 7,012,000 | | | | 7,037,419 | |
| Total | | | | | | | | | | | 32,321,533 | |
| | | | | | | | | | | | | |
| Electric 0.06% | | | | | | | | | | | | |
| Helix Gen Funding LLC 2023 Term Loan | | 10.085%
(3 mo. USD Term
SOFR + 4.75% | ) | 12/31/2027 | | | 2,971,176 | | | | 2,984,784 | |
| | | | | | | | | | | | | |
| Engineering & Construction 0.14% | | | | | | | | | | | | |
| Brand Industrial Services, Inc. 2024 Term Loan B | | 9.827%
(3 mo. USD Term
SOFR + 4.50% | ) | 8/1/2030 | | | 3,682,688 | | | | 3,691,453 | |
| USIC Holdings, Inc. 2021 Term Loan | | – | (g) | 5/12/2028 | | | 3,491,026 | | | | 3,393,277 | |
| Total | | | | | | | | | | | 7,084,730 | |
| | | | | | | | | | | | | |
| Entertainment 0.14% | | | | | | | | | | | | |
| ECL Entertainment LLC 2024 Term Loan B | | 9.344%
(1 mo. USD Term
SOFR + 4.00% | ) | 8/31/2030 | | | 274,338 | | | | 275,847 | |
| Motion Finco SARL 2024 USD Term Loan B (Luxembourg)(a) | | 8.835%
(3 mo. USD Term
SOFR + 3.50% | ) | 11/12/2029 | | | 6,982,500 | | | | 7,012,350 | |
| Total | | | | | | | | | | | 7,288,197 | |
| | | | | | | | | | | | | |
| Environmental Control 0.14% | | | | | | | | | | | | |
| Heritage-Crystal Clean, Inc. Term Loan B | | 9.829%
(3 mo. USD Term
SOFR + 4.50% | ) | 10/17/2030 | | | 7,218,361 | | | | 7,262,573 | |
| | | | | | | | | | | | | |
| Financial 0.42% | | | | | | | | | | | | |
| AqGen Island Holdings, Inc. Term Loan | | 8.958%
(1 mo. USD Term
SOFR + 3.50% | ) | 8/2/2028 | | | 8,964,645 | | | | 8,995,484 | |
| Asurion LLC 2021 Second Lien Term Loan B4 | | 10.708%
(1 mo. USD Term
SOFR + 5.25% | ) | 1/20/2029 | | | 13,898,000 | | | | 12,874,829 | |
| Total | | | | | | | | | | | 21,870,313 | |
| | | |
| | See Notes to Financial Statements. | 65 |
Schedule of Investments (continued)
SHORT DURATION HIGH YIELD FUND July 31, 2024
| Investments | | Interest
Rate | | Maturity
Date | | | Principal
Amount† | | | | Fair
Value | |
| Gaming/Leisure 0.21% | | | | | | | | | | | | |
| 888 Acquisitions Ltd. USD Term Loan B (United Kingdom)(a) | | 10.575%
(3 mo. USD Term
SOFR + 5.25% | ) | 7/1/2028 | | $ | 6,221,835 | | | $ | 6,124,650 | |
| United FP Holdings LLC 2019 1st Lien Term Loan | | 9.514%
(3 mo. USD Term
SOFR + 4.00% | ) | 12/30/2026 | | | 4,961,144 | | | | 4,522,901 | |
| Total | | | | | | | | | | | 10,647,551 | |
| | | | | | | | | | | | | |
| Gas Distribution 0.10% | | | | | | | | | | | | |
| Freeport LNG Investments LLLP Term Loan B | | 9.044%
(3 mo. USD Term
SOFR + 3.50% | ) | 12/21/2028 | | | 4,974,295 | | | | 4,960,317 | |
| | | | | | | | | | | | | |
| Health Care Products 0.03% | | | | | | | | | | | | |
| Resonetics LLC 2024 Term Loan | | 9.084%
(1 mo. USD Term
SOFR + 3.75% | ) | 6/18/2031 | | | 1,763,000 | | | | 1,773,331 | |
| | | | | | | | | | | | | |
| Health Care Services 0.87% | | | | | | | | | | | | |
| ADMI Corp. 2021 Incremental Term Loan B3 | | 9.208%
(1 mo. USD Term
SOFR + 3.75% | ) | 12/23/2027 | | | 13,941,781 | | | | 13,697,800 | |
| Dermatology Intermediate Holdings III, Inc. 2023 Incremental Term Loan B | | – | (g) | 3/30/2029 | | | 7,334,618 | | | | 7,316,281 | |
| eResearchTechnology, Inc. 2024 Term Loan | | 9.349%
(1 mo. USD Term
SOFR + 4.00% | ) | 2/4/2027 | | | 4,488,869 | | | | 4,519,729 | |
| National Mentor Holdings, Inc. 2021 Term Loan | | 9.185% - 9.19%
(1 mo. USD Term
SOFR + 3.75%
(3 mo. USD Term
SOFR + 3.75% | )
) | 3/2/2028 | | | 10,646,201 | | | | 10,057,999 | |
| National Mentor Holdings, Inc. 2021 Term Loan C | | 9.185%
(3 mo. USD Term
SOFR + 3.75% | ) | 3/2/2028 | | | 306,325 | | | | 289,401 | |
| Star Parent, Inc. Term Loan B | | 9.085%
(3 mo. USD Term
SOFR + 3.75% | ) | 9/27/2030 | | | 9,405,693 | | | | 9,432,405 | |
| Total | | | | | | | | | | | 45,313,615 | |
| | | |
| 66 | See Notes to Financial Statements. | |
Schedule of Investments (continued)
SHORT DURATION HIGH YIELD FUND July 31, 2024
| Investments | | Interest
Rate | | | Maturity
Date | | Principal
Amount† | | | Fair
Value | |
| Health Services 0.04% | | | | | | | | | | | | | | |
| Wellpath Holdings, Inc. 2018 1st Lien Term Loan | | | 11.109%
(3 mo. USD Term
SOFR + 5.50% | ) | | 10/1/2025 | | $ | 3,472,441 | | | $ | 2,277,539 | |
| | | | | | | | | | | | | | | |
| Healthcare 0.76% | | | | | | | | | | | | | | |
| Athenahealth Group, Inc. 2022 Term Loan B | | | 8.594%
(1 mo. USD Term
SOFR + 3.25% | ) | | 2/15/2029 | | | 2,992,366 | | | | 2,991,439 | |
| CCRR Parent, Inc. Term Loan B | | | 9.708%
(1 mo. USD Term
SOFR + 4.25% | ) | | 3/6/2028 | | | 11,847,671 | | | | 10,559,237 | |
| Dermatology Intermediate Holdings III, Inc. 2022 Term Loan B | | | – | (g) | | 3/30/2029 | | | 3,978,103 | | | | 3,861,246 | |
| Hunter Holdco 3 Ltd. USD Term Loan B (United Kingdom)(a) | | | 9.685%
(3 mo. USD Term
SOFR + 4.25% | ) | | 8/19/2028 | | | 7,110,000 | | | | 7,083,338 | |
| Medical Solutions Holdings, Inc. 2021 1st Lien Term Loan | | | 8.602%
(3 mo. USD Term
SOFR + 3.25% | ) | | 11/1/2028 | | | 12,724,127 | | | | 10,197,497 | |
| Physician Partners LLC Term Loan | | | – | (g) | | 12/26/2028 | | | 6,443,624 | | | | 4,623,300 | |
| Total | | | | | | | | | | | | | 39,316,057 | |
| | | | | | | | | | | | | | | |
| Home Furnishings 0.06% | | | | | | | | | | | | | | |
| TGP Holdings III LLC 2021 Term Loan | | | 8.694%
(1 mo. USD Term
SOFR + 3.25% | ) | | 6/29/2028 | | | 3,431,495 | | | | 3,211,845 | |
| | | | | | | | | | | | | | | |
| Housing 0.11% | | | | | | | | | | | | | | |
| Solis IV BV USD Term Loan B1 (Netherlands)(a) | | | 8.836%
(3 mo. USD Term
SOFR + 3.50% | ) | | 2/26/2029 | | | 5,959,468 | | | | 5,911,047 | |
| | | | | | | | | | | | | | | |
| Information Technology 0.08% | | | | | | | | | | | | | | |
| Ensono LP 2021 Term Loan | | | 9.458%
(1 mo. USD Term
SOFR + 4.00% | ) | | 5/26/2028 | | | 3,979,540 | | | | 3,947,564 | |
| | See Notes to Financial Statements. | 67 |
Schedule of Investments (continued)
SHORT DURATION HIGH YIELD FUND July 31, 2024
| Investments | | Interest
Rate | | | Maturity
Date | | Principal
Amount† | | | Fair
Value | |
| Insurance 0.30% | | | | | | | | | | | | | | |
| Amynta Agency Borrower, Inc. 2024 Term Loan B | | | 9.099%
(1 mo. USD Term
SOFR + 3.75% | ) | | 2/28/2028 | | $ | 5,352,000 | | | $ | 5,370,170 | |
| Ardonagh Midco 3 PLC 2024 USD Term Loan B (United Kingdom)(a) | | | – | (g) | | 2/17/2031 | | | 8,000,000 | | | | 8,005,000 | |
| OneDigital Borrower LLC 2024 Term Loan | | | 8.594%
(1 mo. USD Term
SOFR + 3.25% | ) | | 7/2/2031 | | | 2,274,000 | | | | 2,270,043 | |
| Total | | | | | | | | | | | | | 15,645,213 | |
| | | | | | | | | | | | | | | |
| Integrated Energy 0.08% | | | | | | | | | | | | | | |
| Esdec Solar Group BV Term Loan B (Netherlands)(a) | | | 10.596%
(3 mo. USD Term
SOFR + 5.00% | ) | | 8/30/2028 | | | 4,604,844 | | | | 4,317,041 | |
| | | | | | | | | | | | | | | |
| Internet 0.19% | | | | | | | | | | | | | | |
| ION Trading Technologies SARL 2021 EUR Term Loan B | | | 7.972%
(3 mo. EURIBOR + 4.25% | ) | | 4/3/2028 | | EUR | 4,082,786 | | | | 4,241,851 | |
| MH Sub I LLC 2021 2nd Lien Term Loan | | | 11.502%
(3 mo. USD Term
SOFR + 6.25% | ) | | 2/23/2029 | | $ | 3,025,738 | | | | 3,014,392 | |
| MH Sub I LLC 2023 Term Loan | | | 9.594%
(1 mo. USD Term
SOFR + 4.25% | ) | | 5/3/2028 | | | 2,763,819 | | | | 2,760,489 | |
| Total | | | | | | | | | | | | | 10,016,732 | |
| | | | | | | | | | | | | | | |
| Investment Management Companies 0.10% | | | | | | | | | | | | | | |
| | | | | | | | | | | | | | | |
| NEXUS Buyer LLC 2024 Term Loan B | | | – | (g) | | 7/18/2031 | | | 5,172,291 | | | | 5,120,568 | |
| | | | | | | | | | | | | | | |
| Leisure Time 0.28% | | | | | | | | | | | | | | |
| City Football Group Ltd. 2024 Term Loan (United Kingdom)(a) | | | 8.283%
(3 mo. USD Term
SOFR + 3.00% | ) | | 7/22/2030 | | | 9,035,165 | | | | 9,052,106 | |
| Fitness International LLC 2024 Term Loan B | | | 10.505% - 10.60%
(1 mo. USD Term
SOFR + 5.25%
(3 mo. USD Term
SOFR + 5.25% | )
) | | 2/5/2029 | | | 4,234,670 | | | | 4,245,257 | |
| Recess Holdings, Inc. 2024 Term Loan B | | | 9.752%
(3 mo. USD Term
SOFR + 4.50% | ) | | 2/20/2030 | | | 1,159,000 | | | | 1,167,982 | |
| Total | | | | | | | | | | | | | 14,465,345 | |
| 68 | See Notes to Financial Statements. |
Schedule of Investments (continued)
SHORT DURATION HIGH YIELD FUND July 31, 2024
| Investments | | Interest
Rate | | | Maturity
Date | | Principal
Amount† | | | Fair
Value | |
| Lodging 0.06% | | | | | | | | | | | | | | |
| Spectacle Gary Holdings LLC 2021 Term Loan B | | | 9.735%
(3 mo. USD Term
SOFR + 4.25% | ) | | 12/11/2028 | | $ | 3,295,288 | | | $ | 3,293,904 | |
| | | | | | | | | | | | | | | |
| Machinery: Diversified 0.51% | | | | | | | | | | | | | | |
| Arcline FM Holdings LLC 2024 Term Loan | | | – | (g) | | 6/23/2028 | | | 2,272,000 | | | | 2,284,314 | |
| CD&R Hydra Buyer, Inc. 2024 Term Loan B | | | 9.279%
(1 mo. USD Term
SOFR + 4.00% | ) | | 3/25/2031 | | | 4,784,010 | | | | 4,807,930 | |
| CPM Holdings, Inc. 2023 Term Loan | | | – | (g) | | 9/28/2028 | | | 10,298,000 | | | | 10,158,565 | |
| Engineered Machinery Holdings, Inc. 2021 USD 2nd Lien Incremental Term Loan | | | 12.096%
(3 mo. USD Term
SOFR + 6.50% | ) | | 5/21/2029 | | | 1,308,359 | | | | 1,318,172 | |
| Engineered Machinery Holdings, Inc. 2021 USD 2nd Lien Term Loan | | | 11.596%
(3 mo. USD Term
SOFR + 6.00% | ) | | 5/21/2029 | | | 5,000,000 | | | | 5,012,500 | |
| SPX Flow, Inc. 2024 Term Loan B | | | 8.844%
(1 mo. USD Term
SOFR + 3.50% | ) | | 4/5/2029 | | | 2,780,351 | | | | 2,803,956 | |
| Total | | | | | | | | | | | | | 26,385,437 | |
| | | | | | | | | | | | | | | |
| Media 0.54% | | | | | | | | | | | | | | |
| Directv Financing LLC 2024 Term Loan | | | 10.708%
(1 mo. USD Term
SOFR + 5.25% | ) | | 8/2/2029 | | | 11,944,967 | | | | 11,946,818 | |
| Sinclair Television Group, Inc. 2021 Term Loan B3 | | | 8.514%
(3 mo. USD Term
SOFR + 3.00% | ) | | 4/1/2028 | | | 7,348,503 | | | | 5,326,893 | |
| Sinclair Television Group, Inc. 2022 Term Loan B4 | | | 9.194%
(1 mo. USD Term
SOFR + 3.75% | ) | | 4/21/2029 | | | 5,353,258 | | | | 3,813,099 | |
| Sinclair Television Group, Inc. Term Loan B2B | | | 8.014%
(3 mo. USD Term
SOFR + 2.50% | ) | | 9/30/2026 | | | 1,677,344 | | | | 1,603,440 | |
| Virgin Media Bristol LLC 2023 USD Term Loan Y | | | 8.656%
(6 mo. USD Term
SOFR + 3.25% | ) | | 3/31/2031 | | | 5,500,000 | | | | 5,264,463 | |
| Total | | | | | | | | | | | | | 27,954,713 | |
| | See Notes to Financial Statements. | 69 |
Schedule of Investments (continued)
SHORT DURATION HIGH YIELD FUND July 31, 2024
| Investments | | Interest
Rate | | | Maturity
Date | | Principal
Amount† | | | Fair
Value | |
| Media: Content 0.02% | | | | | | | | | | | | | | |
| NEP/NCP Holdco, Inc. 2018 2nd Lien Term Loan | | | 12.458%
(1 mo. USD Term
SOFR + 7.00% | ) | | 10/19/2026 | | $ | 1,186,388 | | | $ | 977,584 | |
| | | | | | | | | | | | | | | |
| Metal Fabricate/Hardware 0.14% | | | | | | | | | | | | | | |
| Crosby U.S. Acquisition Corp. 2024 Term Loan B | | | 9.349%
(1 mo. USD Term
SOFR + 4.00% | ) | | 8/16/2029 | | | 2,936,861 | | | | 2,954,981 | |
| Tank Holding Corp. 2022 Term Loan | | | 11.194%
(1 mo. USD Term
SOFR + 5.75% | ) | | 3/31/2028 | | | 3,381,652 | | | | 3,360,517 | |
| Tank Holding Corp. 2023 Incremental Delayed Draw Term Loan(h) | | | 11.44%
(1 mo. USD Term
SOFR + 6.00% | ) | | 3/31/2028 | | | 299,072 | | | | 297,577 | |
| Tank Holding Corp. 2023 Incremental Term Loan | | | 11.444%
(1 mo. USD Term
SOFR + 6.00% | ) | | 3/31/2028 | | | 691,250 | | | | 687,794 | |
| Total | | | | | | | | | | | | | 7,300,869 | |
| | | | | | | | | | | | | | | |
| Oil & Gas 0.23% | | | | | | | | | | | | | | |
| Petroleos Mexicanos 2023 Term Loan (Mexico)(a) | | | – | (g) | | 11/30/2026 | | | 4,850,000 | | | | 4,838,360 | |
| Waterbridge Midstream Operating LLC 2024 1st Lien Term Loan B | | | 10.085%
(3 mo. USD Term
SOFR + 4.75% | ) | | 6/27/2029 | | | 7,028,000 | | | | 7,010,430 | |
| Total | | | | | | | | | | | | | 11,848,790 | |
| | | | | | | | | | | | | | | |
| Oil & Gas Services 0.05% | | | | | | | | | | | | | | |
| BANGL LLC Term Loan B | | | – | (g) | | 2/1/2029 | | | 2,623,405 | | | | 2,648,012 | |
| | | | | | | | | | | | | | | |
| Pipelines 0.28% | | | | | | | | | | | | | | |
| Epic Crude Services LP Term Loan B | | | 10.609%
(3 mo. USD Term
SOFR + 5.00% | ) | | 3/2/2026 | | | 2,960,086 | | | | 2,969,336 | |
| EPIC Y-Grade Services LP 2024 Term Loan B | | | 11.068%
(3 mo. USD Term
SOFR + 5.75% | ) | | 6/29/2029 | | | 7,951,000 | | | | 7,970,242 | |
| 70 | See Notes to Financial Statements. |
Schedule of Investments (continued)
SHORT DURATION HIGH YIELD FUND July 31, 2024
| Investments | | Interest
Rate | | | Maturity
Date | | Principal
Amount† | | | Fair
Value | |
| Pipelines (continued) | | | | | | | | | | | | | | |
| NorthRiver Midstream Finance LP 2023 USD Term Loan B (Canada)(a) | | | – | (g) | | 8/16/2030 | | $ | 12,563 | | | $ | 12,613 | |
| Waterbridge Midstream Operating LLC 2024 Term Loan B | | | 9.826%
(3 mo. USD Term
SOFR + 4.50% | ) | | 5/10/2029 | | | 3,305,000 | | | | 3,319,459 | |
| Total | | | | | | | | | | | | | 14,271,650 | |
| | | | | | | | | | | | | | | |
| Retail 0.59% | | | | | | | | | | | | | | |
| Fogo De Chao, Inc. 2023 Term Loan B | | | 10.002%
(3 mo. USD Term
SOFR + 4.75% | ) | | 9/30/2030 | | | 5,382,950 | | | | 5,170,997 | |
| Johnstone Supply LLC Term Loan | | | 8.332%
(1 mo. USD Term
SOFR + 3.00% | ) | | 6/7/2031 | | | 6,591,000 | | | | 6,615,716 | |
| Park River Holdings, Inc. Term Loan | | | 8.843%
(3 mo. USD Term
SOFR + 3.25% | ) | | 12/28/2027 | | | 4,228,135 | | | | 4,030,998 | |
| RVR Dealership Holdings LLC Term Loan B | | | – | (g) | | 2/8/2028 | | | 11,397,000 | | | | 10,294,340 | |
| Torrid LLC 2021 Term Loan B | | | 10.933% - 10.95%
(1 mo. USD Term
SOFR + 5.50%
(3 mo. USD Term
SOFR + 5.50% | )
) | | 6/14/2028 | | | 4,861,111 | | | | 4,537,847 | |
| Total | | | | | | | | | | | | | 30,649,898 | |
| | | | | | | | | | | | | | | |
| Service 0.16% | | | | | | | | | | | | | | |
| DTI Holdco, Inc. 2022 Term Loan | | | – | (g) | | 4/26/2029 | | | 4,647,000 | | | | 4,670,235 | |
| Red Planet Borrower LLC Term Loan B | | | 8.944%
(1 mo. USD Term
SOFR + 3.50% | ) | | 10/2/2028 | | | 3,601,863 | | | | 3,456,510 | |
| Total | | | | | | | | | | | | | 8,126,745 | |
| | | | | | | | | | | | | | | |
| Software 1.25% | | | | | | | | | | | | | | |
| Applied Systems, Inc. 2024 2nd Lien Term Loan | | | 10.585%
(3 mo. USD Term
SOFR + 5.25% | ) | | 2/23/2032 | | | 1,032,372 | | | | 1,072,382 | |
| Banff Merger Sub, Inc. 2024 2nd Lien Term Loan | | | – | (g) | | 7/2/2032 | | | 7,525,000 | | | | 7,515,594 | |
| Cloudera, Inc. 2021 Term Loan | | | 9.194%
(1 mo. USD Term
SOFR + 3.75% | ) | | 10/8/2028 | | | 3,969,466 | | | | 3,865,267 | |
| | See Notes to Financial Statements. | 71 |
Schedule of Investments (continued)
SHORT DURATION HIGH YIELD FUND July 31, 2024
| Investments | | Interest
Rate | | | Maturity
Date | | Principal
Amount† | | | Fair
Value | |
| Software (continued) | | | | | | | | | | | | | | |
| Constant Contact, Inc. Term Loan | | | 9.566%
(3 mo. USD Term
SOFR + 4.00% | ) | | 2/10/2028 | | $ | 3,982,427 | | | $ | 3,888,402 | |
| Darktrace PLC Term Loan (United Kingdom)(a) | | | – | (g) | | 7/2/2031 | | | 7,850,000 | | | | 7,764,160 | |
| Epicor Software Corp. 2024 Delayed Draw Term Loan(h) | | | – | (g) | | 5/30/2031 | | | 454,580 | | | | 458,187 | |
| Epicor Software Corp. 2024 Term Loan | | | 8.594%
(1 mo. USD Term
SOFR + 3.25% | ) | | 5/23/2031 | | | 3,874,420 | | | | 3,905,164 | |
| Isolved, Inc. 2024 Term Loan | | | 8.844%
(1 mo. USD Term
SOFR + 3.50% | ) | | 10/15/2030 | | | 4,316,705 | | | | 4,343,706 | |
| Ivanti Software, Inc. 2021 Term Loan B | | | 9.833%
(3 mo. USD Term
SOFR + 4.25% | ) | | 12/1/2027 | | | 4,974,555 | | | | 4,178,004 | |
| Mitchell International, Inc. 2024 2nd Lien Term Loan | | | 10.599%
(1 mo. USD Term
SOFR + 5.25% | ) | | 6/17/2032 | | | 4,942,000 | | | | 4,923,467 | |
| Modena Buyer LLC Term Loan | | | 9.832%
(3 mo. USD Term
SOFR + 4.50% | ) | | 7/1/2031 | | | 9,645,000 | | | | 9,308,631 | |
| Polaris Newco LLC EUR Term Loan B | | 7.722%
(3 mo. EURIBOR + 4.00% | ) | | 6/2/2028 | | EUR | 4,826,000 | | | | 5,135,898 | |
| Project Boost Purchaser LLC 2024 2nd Lien Term Loan | | | 10.533%
(3 mo. USD Term
SOFR + 5.25% | ) | | 7/2/2032 | | $ | 1,623,000 | | | | 1,655,460 | |
| Project Boost Purchaser LLC 2024 Term Loan | | | 8.786%
(3 mo. USD Term
SOFR + 3.50% | ) | | 7/16/2031 | | | 1,365,127 | | | | 1,369,679 | |
| Rocket Software, Inc. 2023 USD Term Loan B | | | 10.094%
(1 mo. USD Term
SOFR + 4.75% | ) | | 11/28/2028 | | | 5,704,096 | | | | 5,732,816 | |
| Total | | | | | | | | | | | | | 65,116,817 | |
| | | | | | | | | | | | | | | |
| Technology Hardware & Equipment 0.14% | | | | | | | | | | | | | | |
| Atlas CC Acquisition Corp. Term Loan B | | | – | (g) | | 5/25/2028 | | | 8,150,421 | | | | 6,031,312 | |
| Atlas CC Acquisition Corp. Term Loan C | | | – | (g) | | 5/25/2028 | | | 1,649,579 | | | | 1,220,688 | |
| Total | | | | | | | | | | | | | 7,252,000 | |
| 72 | See Notes to Financial Statements. |
Schedule of Investments (continued)
SHORT DURATION HIGH YIELD FUND July 31, 2024
| Investments | | Interest
Rate | | | Maturity
Date | | Principal
Amount† | | | Fair
Value | |
| Telecommunications 0.37% | | | | | | | | | | | | | | |
| Delta TopCo, Inc. 2024 2nd Lien Term Loan | | | 10.596%
(1 mo. USD Term
SOFR + 5.25% | ) | | 11/30/2029 | | $ | 1,554,000 | | | $ | 1,580,030 | |
| Delta TopCo, Inc. 2024 Term Loan | | | 8.846%
(3 mo. USD Term
SOFR + 3.50% | ) | | 11/30/2029 | | | 2,551,605 | | | | 2,556,925 | |
| Lumen Technologies, Inc. 2024 Extended Term Loan B1 | | | 7.814%
(1 mo. USD Term
SOFR + 2.35% | ) | | 4/15/2029 | | | 14,195,040 | | | | 10,683,755 | |
| Lumen Technologies, Inc. 2024 Extended Term Loan B2 | | | 7.814%
(1 mo. USD Term
SOFR + 2.35% | ) | | 4/15/2030 | | | 5,798,713 | | | | 4,229,842 | |
| Total | | | | | | | | | | | | | 19,050,552 | |
| | | | | | | | | | | | | | | |
| Utilities 0.35% | | | | | | | | | | | | | | |
| Hamilton Projects Acquiror LLC 2024 Term Loan B | | | 9.094%
(3 mo. USD Term
SOFR + 3.75% | ) | | 5/22/2031 | | | 2,499,000 | | | | 2,527,114 | |
| Lightstone Holdco LLC 2022 Extended Term Loan B | | | – | (g) | | 1/29/2027 | | | 10,374,140 | | | | 10,390,375 | |
| Lightstone Holdco LLC 2022 Extended Term Loan C | | | – | (g) | | 1/29/2027 | | | 525,662 | | | | 526,484 | |
| Nautilus Power LLC 2023 Term Loan B | | | – | (g) | | 11/16/2026 | | | 5,000,000 | | | | 4,937,500 | |
| Total | | | | | | | | | | | | | 18,381,473 | |
| Total Floating Rate Loans (cost $651,102,677) | | | | | | | | | | | | | 647,654,322 | |
| | | | | | | | | | | | | | | |
| FOREIGN GOVERNMENT OBLIGATIONS(a) 0.32% | | | | | | | | | | | | | | |
| | | | | | | | | | | | | | | |
| Angola 0.09% | | | | | | | | | | | | | | |
| Angola Government International Bonds | | | 8.25% | | | 5/9/2028 | | | 5,000,000 | | | | 4,746,678 | |
| | | | | | | | | | | | | | | |
| El Salvador 0.10% | | | | | | | | | | | | | | |
| El Salvador Government International Bonds | | | 6.375% | | | 1/18/2027 | | | 5,543,000 | | | | 5,088,918 | |
| | | | | | | | | | | | | | | |
| Gabon 0.13% | | | | | | | | | | | | | | |
| Gabon Government International Bonds | | | 6.95% | | | 6/16/2025 | | | 7,600,000 | | | | 6,889,998 | |
| Total Foreign Government Obligations (cost $16,971,533) | | | | | | | | | | | | | 16,725,594 | |
| | | | | | | | | | | | | | | |
| GOVERNMENT SPONSORED ENTERPRISES PASS-THROUGHS 3.32% | | | | | | | | | | | |
| Government National Mortgage Association(i) | | | 6.00% | | | TBA | | | 21,319,000 | | | | 21,564,714 | |
| Government National Mortgage Association(i) | | | 6.50% | | | TBA | | | 21,117,000 | | | | 21,502,923 | |
| | See Notes to Financial Statements. | 73 |
Schedule of Investments (continued)
SHORT DURATION HIGH YIELD FUND July 31, 2024
| Investments | | Interest
Rate | | | Maturity
Date | | Principal
Amount† | | | Fair
Value | |
| GOVERNMENT SPONSORED ENTERPRISES PASS-THROUGHS (continued) | | | | | | | | | | | |
| Government National Mortgage Association(i) | | | 7.00% | | | TBA | | $ | 15,626,000 | | | $ | 15,954,321 | |
| Uniform Mortgage-Backed Security(i) | | | 5.50% | | | TBA | | | 21,095,000 | | | | 21,317,182 | |
| Uniform Mortgage-Backed Security(i) | | | 6.00% | | | TBA | | | 42,811,000 | | | | 43,515,217 | |
| Uniform Mortgage-Backed Security(i) | | | 6.50% | | | TBA | | | 21,073,000 | | | | 21,606,414 | |
| Uniform Mortgage-Backed Security(i) | | | 7.00% | | | TBA | | | 26,007,000 | | | | 26,874,468 | |
| Total Government Sponsored Enterprises Pass-Throughs (cost $171,734,844) | | | | | | | | 172,335,239 | |
| Total Long-Term Investments (cost $5,345,052,089) | | | | | | | | | | 5,427,410,078 | |
| | | | | | | | | | | | | | | |
| SHORT-TERM INVESTMENTS 4.42% | | | | | | | | | | | | | | |
| | | | | | | | | | | | | | | |
| REPURCHASE AGREEMENTS 0.98% | | | | | | | | | | | | | | |
| Repurchase Agreement dated 7/31/2024, 5.330% due 8/1/2024 with Barclays Bank PLC collateralized by $33,502,600 of U.S. Treasury Note at 4.125% due 07/31/2031; value: $33,673,469; proceeds: $33,004,886 (cost $33,000,000) | | | | | | | | | 33,000,000 | | | | 33,000,000 | |
Repurchase Agreement dated 7/31/2024, 2.800% due 8/1/2024 with Fixed Income Clearing Corp. collateralized by $19,458,000 of U.S. Treasury Note at 0.375% due 12/31/2025; value: $18,349,145; proceeds: $17,990,692
(cost $17,989,293) | | | | | | | | | 17,989,293 | | | | 17,989,293 | |
| Total Repurchase Agreements (cost $50,989,293) | | | | | | | | | | | 50,989,293 | |
| | | | | | | | | | | | | | | |
| | | | | | | | | | Shares | | | | | |
| | | | | | | | | | | | | | | |
| MONEY MARKET FUNDS 3.10% | | | | | | | | | | | | | | |
Fidelity Government Portfolio(j)
(cost $161,255,360) | | | | | | | | | 161,255,360 | | | | 161,255,360 | |
| | | | | | | | | | | | | | | |
| | | | | | | | | | Principal
Amount† | | | | | |
| | | | | | | | | | | | | | | |
| TIME DEPOSITS 0.34% | | | | | | | | | | | | | | |
CitiBank N.A.(j)
(cost $17,917,262) | | | | | | | | $ | 17,917,262 | | | | 17,917,262 | |
| Total Short-Term Investments (cost $230,161,915) | | | | | | | | | | | | 230,161,915 | |
| Total Investments in Securities 108.81% (cost $5,575,214,004) | | | | | | | | | | 5,657,571,993 | |
| Less Unfunded Loan Commitments (0.03%) (cost $1,542,409) | | | | | | | | | | (1,546,369 | ) |
| Net Investments in Securities 108.78% (cost $5,573,671,595) | | | | | | | | | | 5,656,025,624 | |
| Other Assets and Liabilities – Net(k) (8.78)% | | | | | | | | | | | | | (456,579,669 | ) |
| Net Assets 100.00% | | | | | | | | | | | | $ | 5,199,445,955 | |
| 74 | See Notes to Financial Statements. |
Schedule of Investments (continued)
SHORT DURATION HIGH YIELD FUND July 31, 2024
| CHF | Swiss Franc. |
| EUR | Euro. |
| GBP | British Pound. |
| CMT | Constant Maturity Rate. |
| EURIBOR | Euro Interbank Offered Rate. |
| ICE | Intercontinental Exchange. |
| PIK | Payment-in-kind. |
| REITS | Real Estate Investment Trusts. |
| SOFR | Secured Overnight Financing Rate. |
| † | | Principal Amount is denominated in U.S. dollars unless otherwise noted. |
| † | | Security was purchased pursuant to Rule 144A under the Securities Act of 1933 and, unless registered under such Act or exempted from registration, may only be resold to qualified institutional buyers. At July 31, 2024, the total value of Rule 144A securities was $3,500,628,260, which represents 67.33% of net assets. |
| # | | Variable rate security. The interest rate represents the rate in effect at July 31, 2024. |
| (a) | | Foreign security traded in U.S. dollars. |
| (b) | | All or a portion of this security is temporarily on loan to unaffiliated broker/dealers. |
| (c) | | Security is perpetual in nature and has no stated maturity. |
| (d) | | Defaulted (non-income producing security). |
| (e) | | Securities purchased on a when-issued basis (See Note 2(k)). |
| (f) | | Floating Rate Loans in which the Fund invests generally pay interest at rates which are periodically re-determined at a margin above the SOFR or the prime rate offered by major U.S. banks. The rate(s) shown is the rate(s) in effect at July 31, 2024. |
| (g) | | Interest Rate to be determined. |
| (h) | | Security partially/fully unfunded. |
| (i) | | To-be-announced (“TBA”). Security purchased on a forward commitment basis with an approximate principal and maturity date. Actual principal and maturity will be determined upon settlement when the specific mortgage pools are assigned. |
| (j) | | Security was purchased with the cash collateral from loaned securities. |
| (k) | | Other Assets and Liabilities – Net include net unrealized appreciation/depreciation on forward foreign currency exchange contracts, futures contracts and swap contracts as follows: |
Centrally Cleared Credit Default Swap Contracts on Indexes/Issuers - Sell Protection at July 31, 2024(1):
Referenced
Indexes/Issuers | | Central
Clearing
Party | | Fund
Receives
(Quarterly) | | Termination
Date | | Notional
Amount | | | Payments Upfront(2) | | | Unrealized
Appreciation/
(Depreciation) | (3) | | Value | |
| CDX.NA.HY.S42(4) | | Bank of America | | 5.00% | | 6/20/2029 | | | $213,840,000 | | | | $14,192,773 | | | | $349,564 | | | | $14,542,337 | |
| | | | | | | | | | | | | | | | | | | | | | | |
Referenced
Indexes/Issuers | | Central
Clearing
Party | | Fund
Receives
(Quarterly) | | Termination
Date | | | Notional
Amount | | | | Payments
Upfront(2) | | | | Unrealized
Appreciation/
(Depreciation) | (3) | | | Value | |
| CHS/Community Health Systems, Inc.(4) | | Bank of America | | 5.00% | | 12/20/2025 | | | $3,000,000 | | | | $(240,229 | ) | | | $197,619 | | | | $(42,610 | ) |
| (1) | If the Fund is a seller of protection and a credit event occurs, as defined under the terms of that particular swap contracts agreement, the Fund will either (i) pay to the buyer of protection an amount equal to the notional amount of the swap contracts and take delivery of the referenced obligation or underlying securities comprising the referenced index or (ii) pay a net settlement amount in the form of cash or securities equal to the notional amount of the swap contracts less the recovery value of the referenced obligation or underlying securities. |
| (2) | Upfront payments paid (received) by Central Clearing Party are presented net of amortization. |
| (3) | Total unrealized appreciation on Credit Default Swap Contracts on Indexes/Issuers amounted to $547,183. Total unrealized depreciation on Credit Default Swap Contracts on Indexes/Issuers amounted to $0. |
| (4) | Central Clearinghouse: Intercontinental Exchange (ICE). |
| | See Notes to Financial Statements. | 75 |
Schedule of Investments (continued)
SHORT DURATION HIGH YIELD FUND July 31, 2024
Forward Foreign Currency Exchange Contracts at July 31, 2024:
Forward
Foreign
Currency
Exchange
Contracts | | Transaction
Type | | Counterparty | | Expiration
Date | | Foreign
Currency | | U.S. $
Cost on
Origination
Date | | | U.S. $
Current
Value | | | Unrealized
Appreciation | |
| British pound | | Buy | | Morgan Stanley | | 8/30/2024 | | 5,386,000 | | $ | 6,844,626 | | | $ | 6,925,861 | | | | $ | 81,235 | |
| British pound | | Buy | | State Street Bank and Trust | | 8/30/2024 | | 1,438,000 | | | 1,828,610 | | | | 1,849,125 | | | | | 20,515 | |
| British pound | | Buy | | Toronto Dominion Bank | | 8/30/2024 | | 1,638,000 | | | 2,089,219 | | | | 2,106,305 | | | | | 17,086 | |
| British pound | | Buy | | Toronto Dominion Bank | | 8/30/2024 | | 878,000 | | | 1,118,563 | | | | 1,129,021 | | | | | 10,458 | |
| Euro | | Buy | | State Street Bank and Trust | | 8/20/2024 | | 2,291,000 | | | 2,481,085 | | | | 2,481,503 | | | | | 418 | |
| British pound | | Sell | | State Street Bank and Trust | | 8/30/2024 | | 2,377,000 | | | 3,077,675 | | | | 3,056,586 | | | | | 21,089 | |
| British pound | | Sell | | State Street Bank and Trust | | 8/30/2024 | | 9,030,000 | | | 11,679,215 | | | | 11,611,683 | | | | | 67,532 | |
| British pound | | Sell | | State Street Bank and Trust | | 8/30/2024 | | 4,236,000 | | | 5,448,602 | | | | 5,447,075 | | | | | 1,527 | |
| British pound | | Sell | | Toronto Dominion Bank | | 8/30/2024 | | 3,387,000 | | | 4,395,076 | | | | 4,355,346 | | | | | 39,730 | |
| British pound | | Sell | | Toronto Dominion Bank | | 8/30/2024 | | 7,105,000 | | | 9,172,118 | | | | 9,136,325 | | | | | 35,793 | |
| Euro | | Sell | | Bank of America | | 8/20/2024 | | 3,751,000 | | | 4,082,987 | | | | 4,062,905 | | | | | 20,082 | |
| Euro | | Sell | | Morgan Stanley | | 8/20/2024 | | 102,584,000 | | | 111,992,963 | | | | 111,114,125 | | | | | 878,838 | |
| Euro | | Sell | | Morgan Stanley | | 8/20/2024 | | 1,934,000 | | | 2,109,816 | | | | 2,094,817 | | | | | 14,999 | |
| Euro | | Sell | | Morgan Stanley | | 8/20/2024 | | 4,700,000 | | | 5,148,663 | | | | 5,090,817 | | | | | 57,846 | |
| Euro | | Sell | | Morgan Stanley | | 8/20/2024 | | 2,867,000 | | | 3,140,656 | | | | 3,105,398 | | | | | 35,258 | |
| Euro | | Sell | | State Street Bank and Trust | | 8/20/2024 | | 862,000 | | | 942,941 | | | | 933,678 | | | | | 9,263 | |
| Euro | | Sell | | State Street Bank and Trust | | 8/20/2024 | | 458,000 | | | 499,484 | | | | 496,084 | | | | | 3,400 | |
| Euro | | Sell | | State Street Bank and Trust | | 8/20/2024 | | 2,837,000 | | | 3,077,995 | | | | 3,072,904 | | | | | 5,091 | |
| Euro | | Sell | | State Street Bank and Trust | | 8/20/2024 | | 4,005,000 | | | 4,345,812 | | | | 4,338,026 | | | | | 7,786 | |
| Euro | | Sell | | State Street Bank and Trust | | 8/20/2024 | | 2,359,000 | | | 2,570,785 | | | | 2,555,157 | | | | | 15,628 | |
| Euro | | Sell | | State Street Bank and Trust | | 8/20/2024 | | 849,000 | | | 921,703 | | | | 919,597 | | | | | 2,106 | |
| Euro | | Sell | | State Street Bank and Trust | | 8/20/2024 | | 3,922,000 | | | 4,261,881 | | | | 4,248,124 | | | | | 13,757 | |
| Euro | | Sell | | Toronto Dominion Bank | | 8/20/2024 | | 2,151,000 | | | 2,338,076 | | | | 2,329,861 | | | | | 8,215 | |
| Euro | | Sell | | Toronto Dominion Bank | | 8/20/2024 | | 2,197,000 | | | 2,397,081 | | | | 2,379,686 | | | | | 17,395 | |
| Total Unrealized Appreciation on Forward Foreign Currency Exchange Contracts | | | | | | | | | | $ | 1,385,047 | |
| 76 | See Notes to Financial Statements. |
Schedule of Investments (continued)
SHORT DURATION HIGH YIELD FUND July 31, 2024
Forward
Foreign
Currency
Exchange
Contracts | | Transaction
Type | | Counterparty | | Expiration
Date | | Foreign
Currency | | U.S. $
Cost on
Origination
Date | | | U.S. $
Current
Value | | | Unrealized
Depreciation | |
| Euro | | Buy | | Morgan Stanley | | 8/20/2024 | | 3,475,000 | | $ | 3,768,389 | | | $ | 3,763,955 | | | | $ | (4,434 | ) |
| British pound | | Sell | | Barclays Bank plc | | 8/30/2024 | | 2,063,000 | | | 2,630,094 | | | | 2,652,813 | | | | | (22,719 | ) |
| British pound | | Sell | | Morgan Stanley | | 8/30/2024 | | 1,468,000 | | | 1,862,442 | | | | 1,887,702 | | | | | (25,260 | ) |
| British pound | | Sell | | State Street Bank and Trust | | 8/30/2024 | | 69,548,000 | | | 88,283,536 | | | | 89,431,823 | | | | | (1,148,287 | ) |
| British pound | | Sell | | State Street Bank and Trust | | 8/30/2024 | | 2,003,000 | | | 2,547,215 | | | | 2,575,659 | | | | | (28,444 | ) |
| British pound | | Sell | | State Street Bank and Trust | | 8/30/2024 | | 1,561,000 | | | 1,989,709 | | | | 2,007,291 | | | | | (17,582 | ) |
| British pound | | Sell | | State Street Bank and Trust | | 8/30/2024 | | 728,000 | | | 926,586 | | | | 936,136 | | | | | (9,550 | ) |
| British pound | | Sell | | State Street Bank and Trust | | 8/30/2024 | | 824,000 | | | 1,057,798 | | | | 1,059,582 | | | | | (1,784 | ) |
| Euro | | Sell | | Morgan Stanley | | 8/20/2024 | | 3,992,000 | | | 4,300,637 | | | | 4,323,945 | | | | | (23,308 | ) |
| Euro | | Sell | | Morgan Stanley | | 8/20/2024 | | 4,228,000 | | | 4,541,933 | | | | 4,579,569 | | | | | (37,636 | ) |
| Euro | | Sell | | Morgan Stanley | | 8/20/2024 | | 9,097,000 | | | 9,846,736 | | | | 9,853,439 | | | | | (6,703 | ) |
| Euro | | Sell | | State Street Bank and Trust | | 8/20/2024 | | 2,880,000 | | | 3,101,839 | | | | 3,119,479 | | | | | (17,640 | ) |
| Euro | | Sell | | State Street Bank and Trust | | 8/20/2024 | | 472,000 | | | 509,672 | | | | 511,248 | | | | | (1,576 | ) |
| Euro | | Sell | | State Street Bank and Trust | | 8/20/2024 | | 2,033,000 | | | 2,183,270 | | | | 2,202,049 | | | | | (18,779 | ) |
| Euro | | Sell | | State Street Bank and Trust | | 8/20/2024 | | 2,047,000 | | | 2,203,914 | | | | 2,217,213 | | | | | (13,299 | ) |
| Euro | | Sell | | State Street Bank and Trust | | 8/20/2024 | | 2,853,000 | | | 3,070,621 | | | | 3,090,234 | | | | | (19,613 | ) |
| Euro | | Sell | | State Street Bank and Trust | | 8/20/2024 | | 1,525,000 | | | 1,632,516 | | | | 1,651,808 | | | | | (19,292 | ) |
| Euro | | Sell | | State Street Bank and Trust | | 8/20/2024 | | 1,008,000 | | | 1,085,145 | | | | 1,091,818 | | | | | (6,673 | ) |
| Euro | | Sell | | State Street Bank and Trust | | 8/20/2024 | | 4,764,000 | | | 5,155,329 | | | | 5,160,139 | | | | | (4,810 | ) |
| Swiss franc | | Sell | | Morgan Stanley | | 8/15/2024 | | 2,548,000 | | | 2,851,071 | | | | 2,906,322 | | | | | (55,251 | ) |
| Swiss franc | | Sell | | State Street Bank and Trust | | 8/15/2024 | | 3,158,000 | | | 3,514,790 | | | | 3,602,106 | | | | | (87,316 | ) |
| Swiss franc | | Sell | | State Street Bank and Trust | | 8/15/2024 | | 405,000 | | | 453,051 | | | | 461,955 | | | | | (8,904 | ) |
| Total Unrealized Depreciation on Forward Foreign Currency Exchange Contracts | | | | | | | | | | | | $ | (1,578,860 | ) |
Futures Contracts at July 31, 2024:
| Type | | Expiration | | Contracts | | Position | | Notional
Amount | | | Notional
Value | | | Unrealized
Depreciation | |
| U.S. 10-Year Treasury Note | | September 2024 | | 1,594 | | Short | | | $(177,035,000 | ) | | | $(178,229,125 | ) | | | $(1,194,125 | ) |
| | See Notes to Financial Statements. | 77 |
Schedule of Investments (concluded)
SHORT DURATION HIGH YIELD FUND July 31, 2024
The following is a summary of the inputs used as of July 31, 2024 in valuing the Fund’s investments carried at fair value(1):
| Investment Type(2) | | Level 1 | | | Level 2 | | | Level 3 | | | Total | |
| Long–Term Investments | | | | | | | | | | | | | | | | |
| Asset-Backed Securities | | $ | – | | | $ | 54,750,659 | | | $ | – | | | $ | 54,750,659 | |
| Convertible Bonds | | | – | | | | 108,044,469 | | | | – | | | | 108,044,469 | |
| Convertible Preferred Stocks | | | – | | | | 15,719,368 | | | | – | | | | 15,719,368 | |
| Corporate Bonds | | | – | | | | 4,412,180,427 | | | | – | | | | 4,412,180,427 | |
| Floating Rate Loans | | | – | | | | 647,654,322 | | | | – | | | | 647,654,322 | |
| Less Unfunded Loan Commitments | | | – | | | | (1,546,369 | ) | | | – | | | | (1,546,369 | ) |
| Foreign Government Obligations | | | – | | | | 16,725,594 | | | | – | | | | 16,725,594 | |
| Government Sponsored Enterprises Pass-Throughs | | | – | | | | 172,335,239 | | | | – | | | | 172,335,239 | |
| Short–Term Investments | | | | | | | | | | | | | | | | |
| Repurchase Agreements | | | – | | | | 50,989,293 | | | | – | | | | 50,989,293 | |
| Money Market Funds | | | 161,255,360 | | | | – | | | | – | | | | 161,255,360 | |
| Time Deposits | | | – | | | | 17,917,262 | | | | – | | | | 17,917,262 | |
| Total | | $ | 161,255,360 | | | $ | 5,494,770,264 | | | $ | – | | | $ | 5,656,025,624 | |
| Other Financial Instruments | | | | | | | | | | | | | | | | |
| Centrally Cleared Credit Default Swap Contracts | | | | | | | | | | | | | | | | |
| Assets | | $ | – | | | $ | 14,542,337 | | | $ | – | | | $ | 14,542,337 | |
| Liabilities | | | – | | | | (42,610 | ) | | | – | | | | (42,610 | ) |
| Forward Foreign Currency Exchange Contracts | | | | | | | | | | | | | | | | |
| Assets | | | – | | | | 1,385,047 | | | | – | | | | 1,385,047 | |
| Liabilities | | | – | | | | (1,578,860 | ) | | | – | | | | (1,578,860 | ) |
| Futures Contracts | | | | | | | | | | | | | | | | |
| Assets | | | – | | | | – | | | | – | | | | – | |
| Liabilities | | | (1,194,125 | ) | | | – | | | | – | | | | (1,194,125 | ) |
| Total | | $ | (1,194,125 | ) | | $ | 14,305,914 | | | $ | – | | | $ | 13,111,789 | |
| | |
| (1) | Refer to Note 2(p) for a description of fair value measurements and the three-tier hierarchy of inputs. |
| (2) | See Schedule of Investments for fair values in each industry and identification of foreign issuers and/or geography. The table above is presented by Investment Type. Industries are presented within an Investment Type should such Investment Type include securities classified as two or more levels within the three-tier fair value hierarchy. When applicable, each Level 3 security is identified on the Schedule of Investments along with the valuation technique utilized. |
A reconciliation of Level 3 investments is presented when the Fund has a material amount of Level 3 investments at the beginning or end of the year in relation to the Fund’s net assets. Management has determined not to provide a reconciliation as the balance of Level 3 investments was not considered to be material to the Fund’s net assets at the beginning or end of the year.
| 78 | See Notes to Financial Statements. | |
This page is intentionally left blank.
79
Statements of Assets and Liabilities
July 31, 2024
| | | Climate Focused
Bond Fund | | | Emerging
Markets
Equity Fund | |
| ASSETS: | | | | | | | | |
| Investments in securities, at cost | | $ | 21,629,578 | | | $ | 4,379,205 | |
| Investments in securities, at fair value including $0, $0, $0, $0, and $172,320,315, respectively, of securities loaned | | $ | 21,092,460 | | | $ | 5,274,686 | |
| Cash | | | – | | | | 191,166 | |
| Cash at brokers for forwards, swap contracts and TBA collateral | | | – | | | | – | |
| Deposits with brokers for futures collateral | | | 132,192 | | | | – | |
| Deposits with brokers for forwards and swap contracts collateral | | | – | | | | – | |
| Foreign cash, at value (cost $14,937, $24,115, $43,056, $17,248 and $13,556,605, respectively) | | | 14,880 | | | | 14,449 | |
| Receivables: | | | | | | | | |
| Interest and dividends | | | 170,001 | | | | 25,039 | |
| Investment securities sold | | | 102,735 | | | | 11,704 | |
| Capital shares sold | | | 46,231 | | | | – | |
| From advisor (See Note 3) | | | 17,945 | | | | 34,802 | |
| Variation margin for futures contracts | | | 8,289 | | | | – | |
| Unrealized appreciation on forward foreign currency exchange contracts | | | 84,847 | | | | – | |
| Unrealized appreciation on unfunded loan commitments | | | 4 | | | | – | |
| Prepaid expenses | | | 76,067 | | | | 66,934 | |
| Total assets | | | 21,745,651 | | | | 5,618,780 | |
| LIABILITIES: | | | | | | | | |
| Payables: | | | | | | | | |
| Investment securities purchased | | | 416,450 | | | | 22,685 | |
| Capital shares reacquired | | | 24,693 | | | | – | |
| Management fee | | | 6,191 | | | | 3,074 | |
| To bank | | | 2,612 | | | | – | |
| 12b-1 distribution plan | | | 1,315 | | | | 1,195 | |
| Fund administration | | | 708 | | | | 189 | |
| Trustees’ fees | | | 656 | | | | 483 | |
| To brokers for forwards, swap contracts and TBA collateral | | | – | | | | – | |
| Variation margin for futures contracts | | | – | | | | – | |
| Variation margin for centrally cleared swap contracts agreements | | | – | | | | – | |
| Collateral due to broker for securities lending | | | – | | | | – | |
| Foreign capital gains taxes deferred | | | – | | | | 32,483 | |
| Unrealized depreciation on forward foreign currency exchange contracts | | | 27,464 | | | | – | |
| Distributions payable | | | 63,924 | | | | – | |
| Accrued expenses | | | 38,667 | | | | 22,286 | |
| Total liabilities | | | 582,680 | | | | 82,395 | |
| NET ASSETS | | $ | 21,162,971 | | | $ | 5,536,385 | |
| COMPOSITION OF NET ASSETS: | | | | | | | | |
| Paid-in capital | | $ | 25,118,487 | | | $ | 5,239,604 | |
| Total distributable earnings (loss) | | | (3,955,516 | ) | | | 296,781 | |
| Net Assets | | $ | 21,162,971 | | | $ | 5,536,385 | |
| | | |
| 80 | See Notes to Financial Statements. | |
International
Growth Fund | | | Investment
Grade Floating
Rate Fund | | | Short
Duration High
Yield Fund | |
| | | | | | | | | | | |
| $ | 2,159,779 | | | $ | 43,479,032 | | | $ | 5,573,671,595 | |
| | | | | | | | | | | |
| $ | 2,769,436 | | | $ | 43,594,075 | | | $ | 5,656,025,624 | |
| | 61,961 | | | | 765,823 | | | | 6,018 | |
| | – | | | | – | | | | 1,150,000 | |
| | – | | | | 36,700 | | | | 3,188,000 | |
| | – | | | | – | | | | 33,531,464 | |
| | | | | | | | | | | |
| | 39,696 | | | | 17,181 | | | | 13,558,303 | |
| | | | | | | | | | | |
| | 3,445 | | | | 230,650 | | | | 88,613,247 | |
| | 40,245 | | | | 285,831 | | | | 269,444,319 | |
| | – | | | | 1,565,673 | | | | 53,246,285 | |
| | 38,611 | | | | 36,757 | | | | 297,549 | |
| | – | | | | – | | | | 912,824 | |
| | | | | | | | | | | |
| | – | | | | 2,216 | | | | 1,385,047 | |
| | – | | | | – | | | | 3,960 | |
| | 77,181 | | | | 62,343 | | | | 395,197 | |
| | 3,030,575 | | | | 46,597,249 | | | | 6,121,757,837 | |
| | | | | | | | | | | |
| | 55,880 | | | | 5,483,496 | | | | 670,837,765 | |
| | – | | | | 8,546 | | | | 16,722,653 | |
| | 1,125 | | | | 5,379 | | | | 1,316,047 | |
| | – | | | | – | | | | – | |
| | 483 | | | | 1,267 | | | | 171,176 | |
| | 100 | | | | 861 | | | | 165,441 | |
| | 878 | | | | 211 | | | | 31,518 | |
| | – | | | | – | | | | 1,150,000 | |
| | – | | | | 2,691 | | | | – | |
| | – | | | | – | | | | 16,110,604 | |
| | – | | | | – | | | | 179,172,622 | |
| | 1,885 | | | | – | | | | – | |
| | | | | | | | | | | |
| | – | | | | 1,386 | | | | 1,578,860 | |
| | – | | | | 155,478 | | | | 34,306,834 | |
| | 44,078 | | | | 11,183 | | | | 748,362 | |
| | 104,429 | | | | 5,670,498 | | | | 922,311,882 | |
| $ | 2,926,146 | | | $ | 40,926,751 | | | $ | 5,199,445,955 | |
| | | | | | | | | | | |
| $ | 2,894,954 | | | $ | 40,642,529 | | | $ | 5,105,949,557 | |
| | 31,192 | | | | 284,222 | | | | 93,496,398 | |
| $ | 2,926,146 | | | $ | 40,926,751 | | | $ | 5,199,445,955 | |
| | See Notes to Financial Statements. | 81 |
Statements of Assets and Liabilities (concluded)
July 31, 2024
| | | Climate Focused
Bond Fund | | | Emerging Markets
Equity Fund | |
| Net assets by class: | | | | | | | | |
| Class A Shares | | $ | 5,542,734 | | | $ | 3,409,716 | |
| Class C Shares | | $ | 454,311 | | | $ | 543,178 | |
| Class F Shares | | $ | 2,651,948 | | | $ | 26,393 | |
| Class F3 Shares | | $ | 105,386 | | | $ | 264,077 | |
| Class I Shares | | $ | 11,880,581 | | | $ | 500,792 | |
| Class R3 Shares | | $ | 24,894 | | | $ | – | |
| Class R4 Shares | | $ | 30,048 | | | $ | – | |
| Class R5 Shares | | $ | 21,080 | | | $ | – | |
| Class R6 Shares | | $ | 451,989 | | | $ | 792,229 | |
| Outstanding shares by class (unlimited number of authorized shares of beneficial interest): | | | | | | | | |
| Class A Shares | | | 657,439 | | | | 216,202 | |
| Class C Shares | | | 53,874 | | | | 34,715 | |
| Class F Shares | | | 314,537 | | | | 1,667 | |
| Class F3 Shares | | | 12,500 | | | | 16,667 | |
| Class I Shares | | | 1,408,634 | | | | 31,667 | |
| Class R3 Shares | | | 2,952 | | | | – | |
| Class R4 Shares | | | 3,564 | | | | – | |
| Class R5 Shares | | | 2,500 | | | | – | |
| Class R6 Shares | | | 53,620 | | | | 50,000 | |
| Net Asset Value, offering and redemption price per share (Net assets divided by outstanding shares): | | | | | | | | |
| Class A Shares-Net asset value | | | $8.43 | | | | $ | 15.77 | |
| Class A Shares-Maximum offering price (Net asset value plus sales charge of 2.25%, 5.75%, 5.75%, 2.25% and 2.25%, respectively) | | | $8.62 | | | | $ | 16.73 | |
| Class C Shares-Net asset value | | | $8.43 | | | | $ | 15.65 | |
| Class F Shares-Net asset value | | | $8.43 | | | | $ | 15.84 | |
| Class F3 Shares-Net asset value | | | $8.43 | | | | $ | 15.84 | |
| Class I Shares-Net asset value | | | $8.43 | | | | $ | 15.81 | |
| Class R3 Shares-Net asset value* | | | $8.43 | | | | $ | – | |
| Class R4 Shares-Net asset value* | | | $8.43 | | | | $ | – | |
| Class R5 Shares-Net asset value* | | | $8.43 | | | | $ | – | |
| Class R6 Shares-Net asset value | | | $8.43 | | | | $ | 15.84 | |
| * | Net asset value may not recalculate due to rounding of fractional shares. |
| 82 | See Notes to Financial Statements. | |
International
Growth Fund | | | Investment
Grade Floating
Rate Fund | | | Short
Duration High
Yield Fund | |
| | | | | | | | | | | |
| $ | 1,672,286 | | | $ | 4,932,635 | | | $ | 480,251,853 | |
| $ | 129,510 | | | $ | 579,005 | | | $ | 143,009,446 | |
| $ | 94,847 | | | $ | 503,044 | | | $ | 84,123,825 | |
| $ | 9,489 | | | $ | 25,583 | | | $ | 235,130,900 | |
| $ | 200,894 | | | $ | 33,402,661 | | | $ | 4,250,473,726 | |
| $ | 13,407 | | | $ | – | | | $ | 206,584 | |
| $ | 9,440 | | | $ | – | | | $ | 127,728 | |
| $ | 9,466 | | | $ | 25,583 | | | $ | 233,519 | |
| $ | 786,807 | | | $ | 1,458,240 | | | $ | 5,888,374 | |
| | | | | | | | | | | |
| | 118,153 | | | | 482,046 | | | | 48,520,542 | |
| | 9,259 | | | | 56,581 | | | | 14,449,700 | |
| | 6,667 | | | | 49,155 | | | | 8,505,126 | |
| | 667 | | | | 2,500 | | | | 23,745,874 | |
| | 14,148 | | | | 3,264,116 | | | | 430,304,155 | |
| | 949 | | | | – | | | | 20,874 | |
| | 667 | | | | – | | | | 12,904 | |
| | 667 | | | | 2,500 | | | | 23,598 | |
| | 55,289 | | | | 142,500 | | | | 595,032 | |
| | | | | | | | | | | |
| | $14.15 | | | | $ | 10.23 | | | | $ | 9.90 | |
| | | | | | | | | | | |
| | $15.01 | | | | $ | 10.47 | | | | $ | 10.13 | |
| | $13.99 | | | | $ | 10.23 | | | | $ | 9.90 | |
| | $14.23 | | | | $ | 10.23 | | | | $ | 9.89 | |
| | $14.23 | | | | $ | 10.23 | | | | $ | 9.90 | |
| | $14.20 | | | | $ | 10.23 | | | | $ | 9.88 | |
| | $14.12 | | | | $ | – | | | | $ | 9.90 | |
| | $14.16 | | | | $ | – | | | | $ | 9.90 | |
| | $14.20 | | | | $ | 10.23 | | | | $ | 9.90 | |
| | $14.23 | | | | $ | 10.23 | | | | $ | 9.90 | |
| | See Notes to Financial Statements. | 83 |
Statements of Operations
For the Year Ended July 31, 2024
| | | Climate Focused
Bond Fund | | | Emerging
Markets
Equity Fund | |
| Investment income: | | | | | | | | |
| Dividends (net of foreign withholding taxes of $0, $16,087, $5,671, $0 and $0, respectively) | | $ | – | | | $ | 139,408 | |
| Securities lending net income | | | – | | | | – | |
| Interest and other (net of foreign withholding taxes of $0, $0, $0, $0 and $6,668, respectively) | | | 774,472 | | | | 1,247 | |
| Interest earned from Interfund Lending (See Note 10) | | | – | | | | – | |
| Total investment income | | | 774,472 | | | | 140,655 | |
| Expenses: | | | | | | | | |
| Management fee | | | 71,531 | | | | 32,642 | |
| 12b-1 distribution plan–Class A | | | 10,388 | | | | 7,724 | |
| 12b-1 distribution plan–Class C | | | 3,452 | | | | 4,941 | |
| 12b-1 distribution plan–Class F | | | 2,745 | | | | 24 | |
| 12b-1 distribution plan–Class R3 | | | 118 | | | | – | |
| 12b-1 distribution plan–Class R4 | | | 72 | | | | – | |
| Registration | | | 142,112 | | | | 140,092 | |
| Professional | | | 54,075 | | | | 73,302 | |
| Custody | | | 11,497 | | | | 26,944 | |
| Fund administration | | | 8,175 | | | | 2,009 | |
| Shareholder servicing | | | 7,393 | | | | 951 | |
| Reports to shareholders | | | 2,550 | | | | 2,266 | |
| Trustees’ fees | | | 889 | | | | 444 | |
| Other | | | 11,410 | | | | 11,236 | |
| Gross expenses | | | 326,407 | | | | 302,575 | |
| Fees waived and expenses reimbursed (See Note 3) | | | (220,503 | ) | | | (245,480 | ) |
| Net expenses | | | 105,904 | | | | 57,095 | |
| Net investment income | | | 668,568 | | | | 83,560 | |
| Net realized and unrealized gain (loss): | | | | | | | | |
| Net realized gain (loss) on investments | | | (495,353 | ) | | | (31,847 | ) |
| Net realized gain (loss) on futures contracts | | | (10,853 | ) | | | – | |
| Net realized gain (loss) on forward foreign currency exchange contracts | | | 58,950 | | | | – | |
| Net realized gain (loss) on swap contracts | | | – | | | | – | |
| Net realized gain (loss) on foreign currency related transactions | | | (8,264 | ) | | | (15,143 | ) |
| Net change in unrealized appreciation/depreciation on investments | | | 941,208 | | | | 524,739 | |
| Net change in unrealized appreciation/depreciation on futures contracts | | | 38,568 | | | | – | |
| Net change in unrealized appreciation/depreciation on forward foreign currency exchange contracts | | | 223,707 | | | | – | |
| Net change in unrealized appreciation/depreciation on swap contracts | | | – | | | | – | |
| Net change in unrealized appreciation/depreciation on deferred foreign capital gains taxes | | | – | | | | (7,377 | ) |
| Net change in unrealized appreciation/depreciation on translation of assets and liabilities denominated in foreign currencies | | | 5,047 | | | | 5,540 | |
| Net change in unrealized appreciation/depreciation on unfunded loan commitments | | | 4 | | | | – | |
| Net realized and unrealized gain (loss) | | | 753,014 | | | | 475,912 | |
| Net Increase in Net Assets Resulting From Operations | | $ | 1,421,582 | | | $ | 559,472 | |
| 84 | See Notes to Financial Statements. | |
International
Growth Fund | | | Investment
Grade Floating
Rate Fund | | | Short
Duration High
Yield Fund | |
| | | | | | | | | | | |
| | | | | | | | | | | |
| $ | 36,921 | | | $ | – | | | $ | 302,919 | |
| | – | | | | – | | | | 7 | |
| | | | | | | | | | | |
| | 16 | | | | 989,891 | | | | 249,033,758 | |
| | – | | | | – | | | | 2,009 | |
| | 36,937 | | | | 989,891 | | | | 249,338,693 | |
| | | | | | | | | | | |
| | 12,088 | | | | 33,870 | | | | 9,292,634 | |
| | 3,860 | | | | 5,930 | | | | 512,328 | |
| | 1,066 | | | | 5,135 | | | | 663,115 | |
| | 87 | | | | 120 | | | | 52,696 | |
| | 60 | | | | – | | | | 663 | |
| | 21 | | | | – | | | | 218 | |
| | 139,333 | | | | 60,602 | | | | 871,297 | |
| | 71,475 | | | | 57,576 | | | | 145,765 | |
| | 5,081 | | | | 6,930 | | | | 71,910 | |
| | 1,075 | | | | 5,419 | | | | 1,147,437 | |
| | 673 | | | | 2,813 | | | | 2,523,686 | |
| | 812 | | | | 3,774 | | | | 223,792 | |
| | 442 | | | | 634 | | | | 106,207 | |
| | 13,862 | | | | 8,489 | | | | 153,799 | |
| | 249,935 | | | | 191,292 | | | | 15,765,547 | |
| | (226,707 | ) | | | (133,841 | ) | | | (1,776,335 | ) |
| | 23,228 | | | | 57,451 | | | | 13,989,212 | |
| | 13,709 | | | | 932,440 | | | | 235,349,481 | |
| | | | | | | | | | | |
| | (24,747 | ) | | | 178,142 | | | | 10,530,902 | |
| | – | | | | 45,183 | | | | 811,268 | |
| | – | | | | (821 | ) | | | (798,697 | ) |
| | – | | | | – | | | | 10,997,355 | |
| | (1,107 | ) | | | (48 | ) | | | 218,527 | |
| | 318,557 | | | | 53,208 | | | | 73,963,034 | |
| | – | | | | (44,234 | ) | | | (1,194,125 | ) |
| | | | | | | | | | | |
| | – | | | | 830 | | | | 934,133 | |
| | – | | | | – | | | | 181,947 | |
| | | | | | | | | | | |
| | (1,021 | ) | | | – | | | | – | |
| | | | | | | | | | | |
| | (120 | ) | | | 1,092 | | | | 31,515 | |
| | | | | | | | | | | |
| | – | | | | – | | | | 5,524 | |
| | 291,562 | | | | 233,352 | | | | 95,681,383 | |
| $ | 305,271 | | | $ | 1,165,792 | | | $ | 331,030,864 | |
| | See Notes to Financial Statements. | 85 |
Statements of Changes in Net Assets
| | | Climate Focused
Bond Fund | |
| INCREASE (DECREASE) IN NET ASSETS | | For the
Year Ended
July 31, 2024 | | | For the
Year Ended
July 31, 2023 | |
| Operations: | | | | | | | | |
| Net investment income | | $ | 668,568 | | | $ | 459,024 | |
| Net realized gain (loss) on investments, future contracts, forward foreign currency exchange contracts, swap contracts and foreign currency related transactions | | | (455,520 | ) | | | (1,336,249 | ) |
| Net change in unrealized appreciation/depreciation on investments, futures contracts, forward foreign currency exchange contracts, swap contracts, unfunded loan commitments, deferred foreign capital gains taxes and translation of assets and liabilities denominated in foreign currencies | | | 1,208,534 | | | | 551,811 | |
| Net increase (decrease) in net assets resulting from operations | | | 1,421,582 | | | | (325,414 | ) |
| Distributions to shareholders: | | | | | | | | |
| Class A | | | (257,616 | ) | | | (394,474 | ) |
| Class C | | | (18,401 | ) | | | (60,272 | ) |
| Class F | | | (144,177 | ) | | | (332,910 | ) |
| Class F3 | | | (5,343 | ) | | | (9,414 | ) |
| Class I | | | (585,529 | ) | | | (806,393 | ) |
| Class R3 | | | (1,091 | ) | | | (1,798 | ) |
| Class R4 | | | (1,403 | ) | | | (2,326 | ) |
| Class R5 | | | (1,066 | ) | | | (1,878 | ) |
| Class R6 | | | (23,843 | ) | | | (44,264 | ) |
| Total distribution to shareholders | | | (1,038,469 | ) | | | (1,653,729 | ) |
| Capital share transactions (See Note 14): | | | | | | | | |
| Net proceeds from sales of shares | | | 4,969,345 | | | | 5,149,606 | |
| Reinvestment of distributions | | | 740,753 | | | | 884,524 | |
| Cost of shares reacquired | | | (3,924,453 | ) | | | (6,048,380 | ) |
| Net increase (decrease) in net assets resulting from capital share transactions | | | 1,785,645 | | | | (14,250 | ) |
| Net increase (decrease) in net assets | | | 2,168,758 | | | | (1,993,393 | ) |
| NET ASSETS: | | | | | | | | |
| Beginning of year | | $ | 18,994,213 | | | $ | 20,987,606 | |
| End of year | | $ | 21,162,971 | | | $ | 18,994,213 | |
| | |
| (1) | For the period May 1, 2023, commencement of operations, to July 31, 2023. |
| 86 | See Notes to Financial Statements. |
Emerging
Markets
Equity Fund | | | International
Growth Fund | | | Investment
Grade Floating
Rate Fund | |
For the
Year Ended
July 31, 2024 | | | For the
Year Ended
July 31, 2023 | | | For the
Year Ended
July 31, 2024 | | | For the
Year Ended
July 31, 2023 | | | For the
Year Ended
July 31, 2024 | | | For the
Period Ended
July 31, 2023(1) | |
| | | | | | | | | | | | | | | | | | | | | | | |
| $ | 83,560 | | | $ | 72,958 | | | $ | 13,709 | | | $ | 12,542 | | | $ | 932,440 | | | $ | 159,421 | |
| | | | | | | | | | | | | | | | | | | | | | | |
| | (46,990 | ) | | | (285,737 | ) | | | (25,854 | ) | | | (218,143 | ) | | | 222,456 | | | | 19,564 | |
| | | | | | | | | | | | | | | | | | | | | | | |
| | 522,902 | | | | 584,213 | | | | 317,416 | | | | 438,924 | | | | 10,896 | | | | 88,103 | |
| | | | | | | | | | | | | | | | | | | | | | | |
| | 559,472 | | | | 371,434 | | | | 305,271 | | | | 233,323 | | | | 1,165,792 | | | | 267,088 | |
| | | | | | | | | | | | | | | | | | | | | | | |
| | (43,887 | ) | | | (49,847 | ) | | | (7,180 | ) | | | (8,008 | ) | | | (213,308 | ) | | | (24,611 | ) |
| | (3,450 | ) | | | (6,897 | ) | | | – | | | | – | | | | (32,939 | ) | | | (6,121 | ) |
| | (368 | ) | | | (427 | ) | | | (515 | ) | | | (577 | ) | | | (9,124 | ) | | | (368 | ) |
| | (3,901 | ) | | | (4,362 | ) | | | (61 | ) | | | (68 | ) | | | (1,902 | ) | | | (372 | ) |
| | (7,397 | ) | | | (8,274 | ) | | | (1,440 | ) | | | (65 | ) | | | (627,023 | ) | | | (103,038 | ) |
| | – | | | | – | | | | (30 | ) | | | (26 | ) | | | – | | | | – | |
| | – | | | | – | | | | (39 | ) | | | (46 | ) | | | – | | | | – | |
| | – | | | | – | | | | (59 | ) | | | (65 | ) | | | (1,884 | ) | | | (368 | ) |
| | (11,705 | ) | | | (13,085 | ) | | | (4,957 | ) | | | (5,097 | ) | | | (108,450 | ) | | | (21,225 | ) |
| | (70,708 | ) | | | (82,892 | ) | | | (14,281 | ) | | | (13,952 | ) | | | (994,630 | ) | | | (156,103 | ) |
| | | | | | | | | | | | | | | | | | | | | | | |
| | 189,535 | | | | 134,102 | | | | 215,449 | | | | 883,264 | | | | 29,924,769 | | | | 10,947,500 | |
| | 3,843 | | | | 307 | | | | 5,023 | | | | 3,081 | | | | 224,593 | | | | 7,141 | |
| | (93,588 | ) | | | (10,277 | ) | | | (572,125 | ) | | | (152,436 | ) | | | (456,883 | ) | | | (2,516 | ) |
| | | | | | | | | | | | | | | | | | | | | | | |
| | 99,790 | | | | 124,132 | | | | (351,653 | ) | | | 733,909 | | | | 29,692,479 | | | | 10,952,125 | |
| | 588,554 | | | | 412,674 | | | | (60,663 | ) | | | 953,280 | | | | 29,863,641 | | | | 11,063,110 | |
| | | | | | | | | | | | | | | | | | | | | | | |
| $ | 4,947,831 | | | $ | 4,535,157 | | | $ | 2,986,809 | | | $ | 2,033,529 | | | $ | 11,063,110 | | | $ | – | |
| $ | 5,536,385 | | | $ | 4,947,831 | | | $ | 2,926,146 | | | $ | 2,986,809 | | | $ | 40,926,751 | | | $ | 11,063,110 | |
| | See Notes to Financial Statements. | 87 |
Statements of Changes in Net Assets (concluded)
| | | Short Duration High Yield Fund | |
| INCREASE IN NET ASSETS | | For the
Year Ended
July 31, 2024 | | | For the
Year Ended
July 31, 2023 | |
| Operations: | | | | | | | | |
| Net investment income | | $ | 235,349,481 | | | $ | 31,899,201 | |
| Net realized gain (loss) on investments, future contracts, forward foreign currency exchange contracts, swap contracts and foreign currency related transactions | | | 21,759,355 | | | | (1,457,107 | ) |
| Net change in unrealized appreciation/depreciation on investments, futures contracts, forward foreign currency exchange contracts, swap contracts, unfunded loan commitments and translation of assets and liabilities denominated in foreign currencies | | | 73,922,028 | | | | 8,670,579 | |
| Net increase in net assets resulting from operations | | | 331,030,864 | | | | 39,112,673 | |
| Distributions to shareholders: | | | | | | | | |
| Class A | | | (21,136,831 | ) | | | (2,901,640 | ) |
| Class C | | | (5,399,466 | ) | | | (610,196 | ) |
| Class F | | | (4,440,104 | ) | | | (3,005,335 | ) |
| Class F3 | | | (9,533,432 | ) | | | (675 | ) |
| Class I | | | (200,687,533 | ) | | | (26,638,107 | ) |
| Class R3 | | | (10,588 | ) | | | (1,280 | ) |
| Class R4 | | | (7,179 | ) | | | (651 | ) |
| Class R5 | | | (5,208 | ) | | | (673 | ) |
| Class R6 | | | (175,897 | ) | | | (36,303 | ) |
| Total distribution to shareholders | | | (241,396,238 | ) | | | (33,194,860 | ) |
| Capital share transactions (See Note 14): | | | | | | | | |
| Net proceeds from sales of shares | | | 4,642,206,940 | | | | 1,390,013,852 | |
| Reinvestment of distributions | | | 238,040,808 | | | | 32,870,744 | |
| Cost of shares reacquired | | | (972,225,871 | ) | | | (257,966,342 | ) |
| Net increase in net assets resulting from capital share transactions | | | 3,908,021,877 | | | | 1,164,918,254 | |
| Net increase in net assets | | | 3,997,656,503 | | | | 1,170,836,067 | |
| NET ASSETS: | | | | | | | | |
| Beginning of year | | $ | 1,201,789,452 | | | $ | 30,953,385 | |
| End of year | | $ | 5,199,445,955 | | | $ | 1,201,789,452 | |
| 88 | See Notes to Financial Statements. |
This page is intentionally left blank.
Financial Highlights
CLIMATE FOCUSED BOND FUND
| | | | | | Per Share Operating Performance: |
| | | | | | Investment Operations: | | Distributions to
shareholders from: |
| | | | | | | | | | | | | | | | | | | | | | |
| | | Net
asset
value,
beginning
of period | | Net
invest-
ment
income
(loss)(a) | | Net
realized
and
unrealized
gain
(loss) | | Total
from
invest-
ment
opera-
tions | | Net
investment
income | | Net
realized
gain | | Total
distri-
butions |
| Class A | | | | | | | | | | | | | | | | | | | | | | | | | | | | |
| 7/31/2024 | | | $ 8.28 | | | | $0.26 | | | | $ 0.30 | | | | $ 0.56 | | | | $(0.41 | ) | | $ | – | | | | $(0.41 | ) |
| 7/31/2023 | | | 9.16 | | | | 0.19 | | | | (0.85 | ) | | | (0.66 | ) | | | (0.22 | ) | | | – | | | | (0.22 | ) |
| 7/31/2022 | | | 10.38 | | | | 0.12 | | | | (1.00 | ) | | | (0.88 | ) | | | (0.24 | ) | | | (0.10 | ) | | | (0.34 | ) |
| 7/31/2021 | | | 10.30 | | | | 0.13 | | | | 0.14 | | | | 0.27 | | | | (0.19 | ) | | | – | | | | (0.19 | ) |
| 5/20/2020 to 7/31/2020(c) | | | 10.00 | | | | 0.03 | (d) | | | 0.31 | (d) | | | 0.34 | | | | (0.04 | ) | | | – | | | | (0.04 | ) |
| Class C | | | | | | | | | | | | | | | | | | | | | | | | | | | | |
| 7/31/2024 | | | 8.28 | | | | 0.21 | | | | 0.30 | | | | 0.51 | | | | (0.36 | ) | | | – | | | | (0.36 | ) |
| 7/31/2023 | | | 9.16 | | | | 0.14 | | | | (0.85 | ) | | | (0.71 | ) | | | (0.17 | ) | | | – | | | | (0.17 | ) |
| 7/31/2022 | | | 10.38 | | | | 0.05 | | | | (0.99 | ) | | | (0.94 | ) | | | (0.18 | ) | | | (0.10 | ) | | | (0.28 | ) |
| 7/31/2021 | | | 10.30 | | | | 0.05 | | | | 0.13 | | | | 0.18 | | | | (0.10 | ) | | | – | | | | (0.10 | ) |
| 5/20/2020 to 7/31/2020(c) | | | 10.00 | | | | 0.01 | (d) | | | 0.31 | (d) | | | 0.32 | | | | (0.02 | ) | | | – | | | | (0.02 | ) |
| Class F | | | | | | | | | | | | | | | | | | | | | | | | | | | | |
| 7/31/2024 | | | 8.28 | | | | 0.28 | | | | 0.30 | | | | 0.58 | | | | (0.43 | ) | | | – | | | | (0.43 | ) |
| 7/31/2023 | | | 9.16 | | | | 0.21 | | | | (0.85 | ) | | | (0.64 | ) | | | (0.24 | ) | | | – | | | | (0.24 | ) |
| 7/31/2022 | | | 10.38 | | | | 0.14 | | | | (1.00 | ) | | | (0.86 | ) | | | (0.26 | ) | | | (0.10 | ) | | | (0.36 | ) |
| 7/31/2021 | | | 10.30 | | | | 0.15 | | | | 0.14 | | | | 0.29 | | | | (0.21 | ) | | | – | | | | (0.21 | ) |
| 5/20/2020 to 7/31/2020(c) | | | 10.00 | | | | 0.03 | (d) | | | 0.31 | (d) | | | 0.34 | | | | (0.04 | ) | | | – | | | | (0.04 | ) |
| Class F3 | | | | | | | | | | | | | | | | | | | | | | | | | | | | |
| 7/31/2024 | | | 8.28 | | | | 0.28 | | | | 0.30 | | | | 0.58 | | | | (0.43 | ) | | | – | | | | (0.43 | ) |
| 7/31/2023 | | | 9.16 | | | | 0.21 | | | | (0.85 | ) | | | (0.64 | ) | | | (0.24 | ) | | | – | | | | (0.24 | ) |
| 7/31/2022 | | | 10.38 | | | | 0.14 | | | | (1.00 | ) | | | (0.86 | ) | | | (0.26 | ) | | | (0.10 | ) | | | (0.36 | ) |
| 7/31/2021 | | | 10.30 | | | | 0.16 | | | | 0.13 | | | | 0.29 | | | | (0.21 | ) | | | – | | | | (0.21 | ) |
| 5/20/2020 to 7/31/2020(c) | | | 10.00 | | | | 0.03 | (d) | | | 0.31 | (d) | | | 0.34 | | | | (0.04 | ) | | | – | | | | (0.04 | ) |
| Class I | | | | | | | | | | | | | | | | | | | | | | | | | | | | |
| 7/31/2024 | | | 8.28 | | | | 0.28 | | | | 0.30 | | | | 0.58 | | | | (0.43 | ) | | | – | | | | (0.43 | ) |
| 7/31/2023 | | | 9.16 | | | | 0.21 | | | | (0.85 | ) | | | (0.64 | ) | | | (0.24 | ) | | | – | | | | (0.24 | ) |
| 7/31/2022 | | | 10.38 | | | | 0.14 | | | | (1.00 | ) | | | (0.86 | ) | | | (0.26 | ) | | | (0.10 | ) | | | (0.36 | ) |
| 7/31/2021 | | | 10.30 | | | | 0.14 | | | | 0.15 | | | | 0.29 | | | | (0.21 | ) | | | – | | | | (0.21 | ) |
| 5/20/2020 to 7/31/2020(c) | | | 10.00 | | | | 0.03 | (d) | | | 0.31 | (d) | | | 0.34 | | | | (0.04 | ) | | | – | | | | (0.04 | ) |
| Class R3 | | | | | | | | | | | | | | | | | | | | | | | | | | | | |
| 7/31/2024 | | | 8.28 | | | | 0.23 | | | | 0.31 | | | | 0.54 | | | | (0.39 | ) | | | – | | | | (0.39 | ) |
| 7/31/2023 | | | 9.16 | | | | 0.17 | | | | (0.85 | ) | | | (0.68 | ) | | | (0.20 | ) | | | – | | | | (0.20 | ) |
| 7/31/2022 | | | 10.38 | | | | 0.09 | | | | (1.00 | ) | | | (0.91 | ) | | | (0.21 | ) | | | (0.10 | ) | | | (0.31 | ) |
| 7/31/2021 | | | 10.30 | | | | 0.10 | | | | 0.13 | | | | 0.23 | | | | (0.15 | ) | | | – | | | | (0.15 | ) |
| 5/20/2020 to 7/31/2020(c) | | | 10.00 | | | | 0.02 | (d) | | | 0.31 | (d) | | | 0.33 | | | | (0.03 | ) | | | – | | | | (0.03 | ) |
| Class R4 | | | | | | | | | | | | | | | | | | | | | | | | | | | | |
| 7/31/2024 | | | 8.28 | | | | 0.26 | | | | 0.30 | | | | 0.56 | | | | (0.41 | ) | | | – | | | | (0.41 | ) |
| 7/31/2023 | | | 9.16 | | | | 0.19 | | | | (0.85 | ) | | | (0.66 | ) | | | (0.22 | ) | | | – | | | | (0.22 | ) |
| 7/31/2022 | | | 10.38 | | | | 0.11 | | | | (1.00 | ) | | | (0.89 | ) | | | (0.23 | ) | | | (0.10 | ) | | | (0.33 | ) |
| 7/31/2021 | | | 10.30 | | | | 0.12 | | | | 0.14 | | | | 0.26 | | | | (0.18 | ) | | | – | | | | (0.18 | ) |
| 5/20/2020 to 7/31/2020(c) | | | 10.00 | | | | 0.02 | (d) | | | 0.32 | (d) | | | 0.34 | | | | (0.04 | ) | | | – | | | | (0.04 | ) |
| | |
| 90 | See Notes to Financial Statements. |
| | | | | | | Ratios to Average Net Assets: | | Supplemental Data: |
| | | | | | | | | | | | | | | | | | | | |
Net
asset
value,
end of
period | | Total
return(b)
(%) | | Total
expenses
after
waivers
and/or reim-
bursements
(%) | | Total
expenses
(%) | | Net
invest-
ment
income
(loss)
(%) | | Net
assets,
end of
period
(000) | | Portfolio
turnover
rate
(%) |
| | | | | | | | | | | | | | | | | | | | | | | | | | | |
| $ 8.43 | | | | 6.80 | | | | 0.65 | | | | 1.72 | | | | 3.14 | | | | $ 5,543 | | | | 59 | |
| | 8.28 | | | | (1.39 | ) | | | 0.65 | | | | 1.78 | | | | 2.30 | | | | 4,893 | | | | 68 | |
| | 9.16 | | | | (8.72 | ) | | | 0.65 | | | | 1.63 | | | | 1.21 | | | | 5,108 | | | | 74 | |
| | 10.38 | | | | 2.60 | | | | 0.65 | | | | 2.05 | | | | 1.25 | | | | 4,366 | | | | 69 | |
| | 10.30 | | | | 3.37 | (e)(f) | | | 0.65 | (g) | | | 3.04 | (g) | | | 1.28 | (g) | | | 3,521 | | | | 17 | (f) |
| | | | | | | | | | | | | | | | | | | | | | | | | | | |
| | 8.43 | | | | 6.15 | | | | 1.26 | | | | 2.33 | | | | 2.53 | | | | 454 | | | | 59 | |
| | 8.28 | | | | (1.95 | ) | | | 1.26 | | | | 2.39 | | | | 1.62 | | | | 431 | | | | 68 | |
| | 9.16 | | | | (9.29 | ) | | | 1.29 | | | | 2.27 | | | | 0.57 | | | | 852 | | | | 74 | |
| | 10.38 | | | | 1.79 | | | | 1.45 | | | | 2.84 | | | | 0.46 | | | | 901 | | | | 69 | |
| | 10.30 | | | | 3.21 | (e)(f) | | | 1.45 | (g) | | | 3.84 | (g) | | | 0.49 | (g) | | | 622 | | | | 17 | (f) |
| | | | | | | | | | | | | | | | | | | | | | | | | | | |
| | 8.43 | | | | 7.01 | | | | 0.45 | | | | 1.62 | | | | 3.33 | | | | 2,652 | | | | 59 | |
| | 8.28 | | | | (1.15 | ) | | | 0.45 | | | | 1.68 | | | | 2.48 | | | | 2,973 | | | | 68 | |
| | 9.16 | | | | (8.53 | ) | | | 0.45 | | | | 1.53 | | | | 1.41 | | | | 4,134 | | | | 74 | |
| | 10.38 | | | | 2.81 | | | | 0.45 | | | | 1.95 | | | | 1.45 | | | | 3,866 | | | | 69 | |
| | 10.30 | | | | 3.41 | (e)(f) | | | 0.45 | (g) | | | 2.93 | (g) | | | 1.46 | (g) | | | 3,089 | | | | 17 | (f) |
| | | | | | | | | | | | | | | | | | | | | | | | | | | |
| | 8.43 | | | | 7.02 | | | | 0.43 | | | | 1.49 | | | | 3.35 | | | | 105 | | | | 59 | |
| | 8.28 | | | | (1.13 | ) | | | 0.43 | | | | 1.56 | | | | 2.52 | | | | 103 | | | | 68 | |
| | 9.16 | | | | (8.47 | ) | | | 0.39 | | | | 1.42 | | | | 1.46 | | | | 115 | | | | 74 | |
| | 10.38 | | | | 2.88 | | | | 0.38 | | | | 1.81 | | | | 1.53 | | | | 130 | | | | 69 | |
| | 10.30 | | | | 3.43 | (e)(f) | | | 0.38 | (g) | | | 2.63 | (g) | | | 1.53 | (g) | | | 129 | | | | 17 | (f) |
| | | | | | | | | | | | | | | | | | | | | | | | | | | |
| | 8.43 | | | | 7.01 | | | | 0.45 | | | | 1.52 | | | | 3.34 | | | | 11,881 | | | | 59 | |
| | 8.28 | | | | (1.15 | ) | | | 0.45 | | | | 1.58 | | | | 2.50 | | | | 10,139 | | | | 68 | |
| | 9.16 | | | | (8.53 | ) | | | 0.45 | | | | 1.41 | | | | 1.40 | | | | 10,282 | | | | 74 | |
| | 10.38 | | | | 2.80 | | | | 0.45 | | | | 1.72 | | | | 1.40 | | | | 14,042 | | | | 69 | |
| | 10.30 | | | | 3.41 | (e)(f) | | | 0.45 | (g) | | | 2.85 | (g) | | | 1.46 | (g) | | | 3,089 | | | | 17 | (f) |
| | | | | | | | | | | | | | | | | | | | | | | | | | | |
| | 8.43 | | | | 6.48 | | | | 0.95 | | | | 2.01 | | | | 2.84 | | | | 25 | | | | 59 | |
| | 8.28 | | | | (1.64 | ) | | | 0.95 | | | | 2.08 | | | | 2.02 | | | | 23 | | | | 68 | |
| | 9.16 | | | | (8.98 | ) | | | 0.95 | | | | 1.93 | | | | 0.90 | | | | 23 | | | | 74 | |
| | 10.38 | | | | 2.29 | | | | 0.95 | | | | 2.37 | | | | 0.95 | | | | 26 | | | | 69 | |
| | 10.30 | | | | 3.31 | (e)(f) | | | 0.95 | (g) | | | 3.33 | (g) | | | 0.98 | (g) | | | 26 | | | | 17 | (f) |
| | | | | | | | | | | | | | | | | | | | | | | | | | | |
| | 8.43 | | | | 6.74 | | | | 0.70 | | | | 1.77 | | | | 3.09 | | | | 30 | | | | 59 | |
| | 8.28 | | | | (1.40 | ) | | | 0.70 | | | | 1.83 | | | | 2.29 | | | | 28 | | | | 68 | |
| | 9.16 | | | | (8.76 | ) | | | 0.70 | | | | 1.67 | | | | 1.16 | | | | 23 | | | | 74 | |
| | 10.38 | | | | 2.54 | | | | 0.70 | | | | 2.12 | | | | 1.20 | | | | 26 | | | | 69 | |
| | 10.30 | | | | 3.36 | (e)(f) | | | 0.70 | (g) | | | 3.08 | (g) | | | 1.24 | (g) | | | 26 | | | | 17 | (f) |
| | | |
| | See Notes to Financial Statements. | 91 |
Financial Highlights (continued)
CLIMATE FOCUSED BOND FUND
| | | | | | Per Share Operating Performance: |
| | | | | | Investment Operations: | | Distributions to
shareholders from: |
| | | | | | | | | | | | | | | | | | | |
| | | Net
asset
value,
beginning
of period | | Net
invest-
ment
income
(loss)(a) | | Net
realized
and
unrealized
gain
(loss) | | Total
from
invest-
ment
opera-
tions | | Net
investment
income | | Net
realized
gain | | Total
distri-
butions |
| Class R5 | | | | | | | | | | | | | | | | | | | | | | | | | | | | |
| 7/31/2024 | | | $ 8.28 | | | | $0.27 | | | | $ 0.31 | | | | $ 0.58 | | | | $(0.43 | ) | | $ | – | | | | $(0.43 | ) |
| 7/31/2023 | | | 9.16 | | | | 0.21 | | | | (0.85 | ) | | | (0.64 | ) | | | (0.24 | ) | | | – | | | | (0.24 | ) |
| 7/31/2022 | | | 10.38 | | | | 0.14 | | | | (1.00 | ) | | | (0.86 | ) | | | (0.26 | ) | | | (0.10 | ) | | | (0.36 | ) |
| 7/31/2021 | | | 10.30 | | | | 0.15 | | | | 0.14 | | | | 0.29 | | | | (0.21 | ) | | | – | | | | (0.21 | ) |
| 5/20/2020 to 7/31/2020(c) | | | 10.00 | | | | 0.03 | (d) | | | 0.31 | (d) | | | 0.34 | | | | (0.04 | ) | | | – | | | | (0.04 | ) |
| Class R6 | | | | | | | | | | | | | | | | | | | | | | | | | | | | |
| 7/31/2024 | | | 8.28 | | | | 0.28 | | | | 0.30 | | | | 0.58 | | | | (0.43 | ) | | | – | | | | (0.43 | ) |
| 7/31/2023 | | | 9.16 | | | | 0.21 | | | | (0.85 | ) | | | (0.64 | ) | | | (0.24 | ) | | | – | | | | (0.24 | ) |
| 7/31/2022 | | | 10.37 | | | | 0.14 | | | | (0.99 | ) | | | (0.85 | ) | | | (0.26 | ) | | | (0.10 | ) | | | (0.36 | ) |
| 7/31/2021 | | | 10.30 | | | | 0.16 | | | | 0.12 | | | | 0.28 | | | | (0.21 | ) | | | – | | | | (0.21 | ) |
| 5/20/2020 to 7/31/2020(c) | | | 10.00 | | | | 0.03 | (d) | | | 0.31 | (d) | | | 0.34 | | | | (0.04 | ) | | | – | | | | (0.04 | ) |
| | | | | | | | | | | | | | | | | | | | | | | | | | | | | |
| (a) | Calculated using average shares outstanding during the period. |
| (b) | Total return for Classes A and C does not consider the effects of sales loads and assumes the reinvestment of all distributions. Total return for all other classes assumes the reinvestment of all distributions. |
| (c) | Commencement of operations was on 5/20/2020, SEC effective date and date shares first became available to the public was 5/28/2020. |
| (d) | Net investment income and net realized and unrealized gain (loss) amounted to less than $0.01 for the period 5/20/2020 through 5/28/2020. |
| (e) | Total return for the period 5/28/2020 through 7/31/2020 was 3.47% for Class A, 3.32% for Class C, 3.52% for Class F, 3.53% for Class F3, 3.52% for Class I, 3.41% for Class R3, 3.46% for Class R4, 3.51% for Class R5, and 3.53% for Class R6. |
| (f) | Not annualized. |
| (g) | Annualized. |
| | |
| 92 | See Notes to Financial Statements. |
| | | | | | | Ratios to Average Net Assets: | | Supplemental Data: |
| | | | | | | | | | | | | | | | | |
Net
asset
value,
end of
period | | Total
return(b)
(%) | | Total
expenses
after
waivers
and/or reim-
bursements
(%) | | Total
expenses
(%) | | Net
invest-
ment
income
(loss)
(%) | | Net
assets,
end of
period
(000) | | Portfolio
turnover
rate
(%) |
| | | | | | | | | | | | | | | | | | | | | | | | | | | |
| $ 8.43 | | | | 7.01 | | | | 0.45 | | | | 1.51 | | | | 3.32 | | | | $ 21 | | | | 59 | |
| | 8.28 | | | | (1.15 | ) | | | 0.45 | | | | 1.58 | | | | 2.51 | | | | 21 | | | | 68 | |
| | 9.16 | | | | (8.53 | ) | | | 0.45 | | | | 1.42 | | | | 1.41 | | | | 23 | | | | 74 | |
| | 10.38 | | | | 2.80 | | | | 0.45 | | | | 1.86 | | | | 1.45 | | | | 26 | | | | 69 | |
| | 10.30 | | | | 3.41 | (e)(f) | | | 0.45 | (g) | | | 2.83 | (g) | | | 1.49 | (g) | | | 26 | | | | 17 | (f) |
| | | | | | | | | | | | | | | | | | | | | | | | | | | |
| | 8.43 | | | | 7.02 | | | | 0.43 | | | | 1.49 | | | | 3.36 | | | | 452 | | | | 59 | |
| | 8.28 | | | | (1.13 | ) | | | 0.43 | | | | 1.57 | | | | 2.54 | | | | 383 | | | | 68 | |
| | 9.16 | | | | (8.47 | ) | | | 0.39 | | | | 1.43 | | | | 1.46 | | | | 428 | | | | 74 | |
| | 10.37 | | | | 2.88 | | | | 0.38 | | | | 1.79 | | | | 1.52 | | | | 449 | | | | 69 | |
| | 10.30 | | | | 3.43 | (e)(f) | | | 0.38 | (g) | | | 2.63 | (g) | | | 1.53 | (g) | | | 309 | | | | 17 | (f) |
| | | |
| | See Notes to Financial Statements. | 93 |
Financial Highlights (continued)
EMERGING MARKETS EQUITY FUND
| | | | | | Per Share Operating Performance: | | | |
| | | | | | Investment Operations: | | Distributions
to
shareholders
from: | | | |
| | | | | | | | | | | | | | | | | | | |
| | | Net asset
value,
beginning
of period | | Net
invest-
ment
income
(loss)(a) | | Net
realized
and
unrealized
gain (loss) | | Total
from
invest-
ment
opera-
tions | | Net
invest-
ment
income | | Net
asset
value,
end of
period |
| Class A | | | | | | | | | | | | | | | | | | | | | | | | |
| 7/31/2024 | | | $14.41 | | | | $0.24 | | | | $ 1.32 | | | | $ 1.56 | | | | $(0.20 | ) | | | $15.77 | |
| 7/31/2023 | | | 13.56 | | | | 0.21 | | | | 0.89 | | | | 1.10 | | | | (0.25 | ) | | | 14.41 | |
| 3/2/2022 to 7/31/2022(c) | | | 15.00 | | | | 0.17 | (d) | | | (1.61 | )(d) | | | (1.44 | ) | | | – | | | | 13.56 | |
| Class C | | | | | | | | | | | | | | | | | | | | | | | | |
| 7/31/2024 | | | 14.30 | | | | 0.13 | | | | 1.32 | | | | 1.45 | | | | (0.10 | ) | | | 15.65 | |
| 7/31/2023 | | | 13.52 | | | | 0.11 | | | | 0.88 | | | | 0.99 | | | | (0.21 | ) | | | 14.30 | |
| 3/2/2022 to 7/31/2022(c) | | | 15.00 | | | | 0.13 | (d) | | | (1.61 | )(d) | | | (1.48 | ) | | | – | | | | 13.52 | |
| Class F | | | | | | | | | | | | | | | | | | | | | | | | |
| 7/31/2024 | | | 14.46 | | | | 0.27 | | | | 1.33 | | | | 1.60 | | | | (0.22 | ) | | | 15.84 | |
| 7/31/2023 | | | 13.58 | | | | 0.25 | | | | 0.89 | | | | 1.14 | | | | (0.26 | ) | | | 14.46 | |
| 3/2/2022 to 7/31/2022(c) | | | 15.00 | | | | 0.19 | (d) | | | (1.61 | )(d) | | | (1.42 | ) | | | – | | | | 13.58 | |
| Class F3 | | | | | | | | | | | | | | | | | | | | | | | | |
| 7/31/2024 | | | 14.47 | | | | 0.28 | | | | 1.32 | | | | 1.60 | | | | (0.23 | ) | | | 15.84 | |
| 7/31/2023 | | | 13.58 | | | | 0.26 | | | | 0.89 | | | | 1.15 | | | | (0.26 | ) | | | 14.47 | |
| 3/2/2022 to 7/31/2022(c) | | | 15.00 | | | | 0.19 | (d) | | | (1.61 | )(d) | | | (1.42 | ) | | | – | | | | 13.58 | |
| Class I | | | | | | | | | | | | | | | | | | | | | | | | |
| 7/31/2024 | | | 14.45 | | | | 0.27 | | | | 1.32 | | | | 1.59 | | | | (0.23 | ) | | | 15.81 | |
| 7/31/2023 | | | 13.58 | | | | 0.25 | | | | 0.88 | | | | 1.13 | | | | (0.26 | ) | | | 14.45 | |
| 3/2/2022 to 7/31/2022(c) | | | 15.00 | | | | 0.19 | (d) | | | (1.61 | )(d) | | | (1.42 | ) | | | – | | | | 13.58 | |
| Class R6 | | | | | | | | | | | | | | | | | | | | | | | | |
| 7/31/2024 | | | 14.47 | | | | 0.28 | | | | 1.32 | | | | 1.60 | | | | (0.23 | ) | | | 15.84 | |
| 7/31/2023 | | | 13.58 | | | | 0.26 | | | | 0.89 | | | | 1.15 | | | | (0.26 | ) | | | 14.47 | |
| 3/2/2022 to 7/31/2022(c) | | | 15.00 | | | | 0.19 | (d) | | | (1.61 | )(d) | | | (1.42 | ) | | | – | | | | 13.58 | |
| | |
| (a) | Calculated using average shares outstanding during the period. |
| (b) | Total return for Class A and C does not consider the effects of sales loads and assumes the reinvestment of all distributions. Total return for all other classes assumes the reinvestment of all distributions. |
| (c) | Commencement of operations was on 3/2/2022, SEC effective date and date shares first became available to the public was 3/10/2022. |
| (d) | Net investment income and net realized and unrealized gain (loss) amounted to less than $0.01 for the period 3/2/2022 through 3/10/2022. |
| (e) | Total return for the period 3/10/2022 through 7/31/2022 was (9.41%) for Class A, (9.68%) for Class C, (9.35%) for Class F, (9.28%) for Class F3, (9.35%) for Class I, and (9.28%) for Class R6. |
| (f) | Not annualized. |
| (g) | Annualized. |
| | |
| 94 | See Notes to Financial Statements. |
| | | | Ratios to Average Net Assets: | | Supplemental Data: |
| | | | | | | | | | | |
Total
return
(%)(b) | | Total
expenses
after
waivers
and/or reim-
bursements
(%) | | Total
expenses
(%) | | Net
invest-
ment
income
(loss)
(%) | | Net
assets,
end of
period
(000) | | Portfolio
turnover
rate
(%) |
| | 11.01 | | | | 1.15 | | | | 6.03 | | | | 1.65 | | | | $3,410 | | | | 79 | |
| | 8.21 | | | | 1.18 | | | | 5.10 | | | | 1.59 | | | | 3,006 | | | | 145 | |
| | (9.53 | )(e)(f) | | | 1.24 | (g) | | | 3.77 | (g) | | | 2.86 | (g) | | | 2,727 | | | | 56 | (f) |
| | | | | | | | | | | | | | | | | | | | | | | |
| | 10.22 | | | | 1.90 | | | | 6.77 | | | | 0.90 | | | | 543 | | | | 79 | |
| | 7.37 | | | | 1.93 | | | | 5.85 | | | | 0.84 | | | | 496 | | | | 145 | |
| | (9.80 | )(e)(f) | | | 1.99 | (g) | | | 4.52 | (g) | | | 2.11 | (g) | | | 451 | | | | 56 | (f) |
| | | | | | | | | | | | | | | | | | | | | | | |
| | 11.20 | | | | 0.90 | | | | 5.86 | | | | 1.90 | | | | 26 | | | | 79 | |
| | 8.57 | | | | 0.94 | | | | 4.93 | | | | 1.83 | | | | 24 | | | | 145 | |
| | (9.47 | )(e)(f) | | | 0.99 | (g) | | | 3.62 | (g) | | | 3.11 | (g) | | | 23 | | | | 56 | (f) |
| | | | | | | | | | | | | | | | | | | | | | | |
| | 11.30 | | | | 0.82 | | | | 5.76 | | | | 1.98 | | | | 264 | | | | 79 | |
| | 8.61 | | | | 0.85 | | | | 4.74 | | | | 1.91 | | | | 241 | | | | 145 | |
| | (9.40 | )(e)(f) | | | 0.91 | (g) | | | 3.41 | (g) | | | 3.20 | (g) | | | 226 | | | | 56 | (f) |
| | | | | | | | | | | | | | | | | | | | | | | |
| | 11.24 | | | | 0.90 | | | | 5.77 | | | | 1.90 | | | | 501 | | | | 79 | |
| | 8.54 | | | | 0.93 | | | | 4.82 | | | | 1.83 | | | | 458 | | | | 145 | |
| | (9.47 | )(e)(f) | | | 0.99 | (g) | | | 3.52 | (g) | | | 3.11 | (g) | | | 430 | | | | 56 | (f) |
| | | | | | | | | | | | | | | | | | | | | | | |
| | 11.30 | | | | 0.82 | | | | 5.76 | | | | 1.98 | | | | 792 | | | | 79 | |
| | 8.61 | | | | 0.85 | | | | 4.75 | | | | 1.91 | | | | 723 | | | | 145 | |
| | (9.40 | )(e)(f) | | | 0.91 | (g) | | | 3.41 | (g) | | | 3.19 | (g) | | | 679 | | | | 56 | (f) |
| | | |
| | See Notes to Financial Statements. | 95 |
Financial Highlights (continued)
INTERNATIONAL GROWTH FUND
| | | | | | Per Share Operating Performance: | | | |
| | | | | | Investment Operations: | | Distributions
to
shareholders
from: | | | |
| | | | | | | | | | | | | | | | | | | |
| | | Net asset
value,
beginning
of period | | Net
invest-
ment
income
(loss)(a) | | Net
realized
and
unrealized
gain (loss) | | Total
from
invest-
ment
opera-
tions | | Net
invest-
ment
income | | Net
asset
value,
end of
period |
| Class A | | | | | | | | | | | | | | | | | | | | | | | | |
| 7/31/2024 | | | $12.66 | | | | $ 0.06 | | | | $ 1.49 | | | | $ 1.55 | | | | $(0.06 | ) | | | $14.15 | |
| 7/31/2023 | | | 11.58 | | | | 0.05 | | | | 1.10 | | | | 1.15 | | | | (0.07 | ) | | | 12.66 | |
| 7/31/2022 | | | 15.12 | | | | 0.06 | | | | (3.60 | ) | | | (3.54 | ) | | | – | | | | 11.58 | |
| 6/18/2021 to 7/31/2021(c) | | | 15.00 | | | | (0.01 | )(d) | | | 0.13 | (d) | | | 0.12 | | | | – | | | | 15.12 | |
| Class C | | | | | | | | | | | | | | | | | | | | | | | | |
| 7/31/2024 | | | 12.54 | | | | (0.04 | ) | | | 1.49 | | | | 1.45 | | | | – | | | | 13.99 | |
| 7/31/2023 | | | 11.49 | | | | (0.04 | ) | | | 1.09 | | | | 1.05 | | | | – | | | | 12.54 | |
| 7/31/2022 | | | 15.11 | | | | (0.04 | ) | | | (3.58 | ) | | | (3.62 | ) | | | – | | | | 11.49 | |
| 6/18/2021 to 7/31/2021(c) | | | 15.00 | | | | (0.02 | )(d) | | | 0.13 | (d) | | | 0.11 | | | | – | | | | 15.11 | |
| Class F | | | | | | | | | | | | | | | | | | | | | | | | |
| 7/31/2024 | | | 12.71 | | | | 0.09 | | | | 1.51 | | | | 1.60 | | | | (0.08 | ) | | | 14.23 | |
| 7/31/2023 | | | 11.62 | | | | 0.08 | | | | 1.10 | | | | 1.18 | | | | (0.09 | ) | | | 12.71 | |
| 7/31/2022 | | | 15.13 | | | | 0.09 | | | | (3.60 | ) | | | (3.51 | ) | | | – | | | | 11.62 | |
| 6/18/2021 to 7/31/2021(c) | | | 15.00 | | | | – | (d)(h) | | | 0.13 | (d) | | | 0.13 | | | | – | | | | 15.13 | |
| Class F3 | | | | | | | | | | | | | | | | | | | | | | | | |
| 7/31/2024 | | | 12.72 | | | | 0.09 | | | | 1.51 | | | | 1.60 | | | | (0.09 | ) | | | 14.23 | |
| 7/31/2023 | | | 11.63 | | | | 0.09 | | | | 1.10 | | | | 1.19 | | | | (0.10 | ) | | | 12.72 | |
| 7/31/2022 | | | 15.12 | | | | 0.10 | | | | (3.59 | ) | | | (3.49 | ) | | | – | | | | 11.63 | |
| 6/18/2021 to 7/31/2021(c) | | | 15.00 | | | | – | (d)(h) | | | 0.12 | (d) | | | 0.12 | | | | – | | | | 15.12 | |
| Class I | | | | | | | | | | | | | | | | | | | | | | | | |
| 7/31/2024 | | | 12.70 | | | | 0.09 | | | | 1.50 | | | | 1.59 | | | | (0.09 | ) | | | 14.20 | |
| 7/31/2023 | | | 11.62 | | | | 0.02 | | | | 1.16 | | | | 1.18 | | | | (0.10 | ) | | | 12.70 | |
| 7/31/2022 | | | 15.12 | | | | 0.09 | | | | (3.59 | ) | | | (3.50 | ) | | | – | | | | 11.62 | |
| 6/18/2021 to 7/31/2021(c) | | | 15.00 | | | | – | (d)(h) | | | 0.12 | (d) | | | 0.12 | | | | – | | | | 15.12 | |
| Class R3 | | | | | | | | | | | | | | | | | | | | | | | | |
| 7/31/2024 | | | 12.63 | | | | 0.02 | | | | 1.50 | | | | 1.52 | | | | (0.03 | ) | | | 14.12 | |
| 7/31/2023 | | | 11.55 | | | | 0.03 | | | | 1.09 | | | | 1.12 | | | | (0.04 | ) | | | 12.63 | |
| 7/31/2022 | | | 15.11 | | | | 0.02 | | | | (3.58 | ) | | | (3.56 | ) | | | – | | | | 11.55 | |
| 6/18/2021 to 7/31/2021(c) | | | 15.00 | | | | (0.01 | )(d) | | | 0.12 | (d) | | | 0.11 | | | | – | | | | 15.11 | |
| Class R4 | | | | | | | | | | | | | | | | | | | | | | | | |
| 7/31/2024 | | | 12.66 | | | | 0.05 | | | | 1.51 | | | | 1.56 | | | | (0.06 | ) | | | 14.16 | |
| 7/31/2023 | | | 11.58 | | | | 0.05 | | | | 1.10 | | | | 1.15 | | | | (0.07 | ) | | | 12.66 | |
| 7/31/2022 | | | 15.12 | | | | 0.06 | | | | (3.60 | ) | | | (3.54 | ) | | | – | | | | 11.58 | |
| 6/18/2021 to 7/31/2021(c) | | | 15.00 | | | | (0.01 | )(d) | | | 0.13 | (d) | | | 0.12 | | | | – | | | | 15.12 | |
| | |
| 96 | See Notes to Financial Statements. |
| | | | Ratios to Average Net Assets: | | Supplemental Data: |
| | | | | | | | | | | | | | | | | |
Total
return
(%)(b) | | Total
expenses
after
waivers
and/or reim-
bursements
(%) | | Total
expenses
(%) | | Net
invest-
ment
income
(loss)
(%) | | Net
assets,
end of
period
(000) | | Portfolio
turnover
rate
(%) |
| | | | | | | | | | | | | | | | | | | | | | | |
| | 12.38 | | | | 0.95 | | | | 9.37 | | | | 0.43 | | | | $1,672 | | | | 88 | |
| | 10.06 | | | | 0.98 | | | | 12.38 | | | | 0.46 | | | | 1,747 | | | | 86 | |
| | (23.41 | ) | | | 1.06 | | | | 6.90 | | | | 0.45 | | | | 1,242 | | | | 84 | |
| | 0.80 | (e)(f) | | | 1.06 | (g) | | | 16.19 | (g) | | | (0.38 | )(g) | | | 1,058 | | | | 5 | (f) |
| | | | | | | | | | | | | | | | | | | | | | | |
| | 11.56 | | | | 1.70 | | | | 10.20 | | | | (0.30 | ) | | | 130 | | | | 88 | |
| | 9.14 | | | | 1.74 | | | | 13.30 | | | | (0.33 | ) | | | 93 | | | | 86 | |
| | (23.96 | ) | | | 1.81 | | | | 7.51 | | | | (0.29 | ) | | | 92 | | | | 84 | |
| | 0.73 | (e)(f) | | | 1.81 | (g) | | | 16.91 | (g) | | | (1.13 | )(g) | | | 102 | | | | 5 | (f) |
| | | | | | | | | | | | | | | | | | | | | | | |
| | 12.65 | | | | 0.70 | | | | 9.23 | | | | 0.67 | | | | 95 | | | | 88 | |
| | 10.33 | | | | 0.73 | | | | 12.35 | | | | 0.69 | | | | 85 | | | | 86 | |
| | (23.27 | ) | | | 0.81 | | | | 6.51 | | | | 0.68 | | | | 77 | | | | 84 | |
| | 0.87 | (e)(f) | | | 0.81 | (g) | | | 16.02 | (g) | | | (0.14 | )(g) | | | 101 | | | | 5 | (f) |
| | | | | | | | | | | | | | | | | | | | | | | |
| | 12.77 | | | | 0.65 | | | | 9.12 | | | | 0.73 | | | | 9 | | | | 88 | |
| | 10.38 | | | | 0.63 | | | | 12.23 | | | | 0.80 | | | | 8 | | | | 86 | |
| | (23.13 | ) | | | 0.73 | | | | 6.27 | | | | 0.74 | | | | 8 | | | | 84 | |
| | 0.87 | (e)(f) | | | 0.73 | (g) | | | 15.76 | (g) | | | (0.15 | )(g) | | | 10 | | | | 5 | (f) |
| | | | | | | | | | | | | | | | | | | | | | | |
| | 12.62 | | | | 0.70 | | | | 9.09 | | | | 0.66 | | | | 201 | | | | 88 | |
| | 10.36 | | | | 0.69 | | | | 9.81 | | | | 0.15 | | | | 233 | | | | 86 | |
| | (23.27 | ) | | | 0.81 | | | | 6.43 | | | | 0.67 | | | | 8 | | | | 84 | |
| | 0.87 | (e)(f) | | | 0.81 | (g) | | | 15.85 | (g) | | | (0.09 | )(g) | | | 10 | | | | 5 | (f) |
| | | | | | | | | | | | | | | | | | | | | | | |
| | 12.09 | | | | 1.20 | | | | 9.64 | | | | 0.17 | | | | 13 | | | | 88 | |
| | 9.74 | | | | 1.22 | | | | 12.58 | | | | 0.25 | | | | 12 | | | | 86 | |
| | (23.61 | ) | | | 1.31 | | | | 6.93 | | | | 0.18 | | | | 8 | | | | 84 | |
| | 0.80 | (e)(f) | | | 1.31 | (g) | | | 16.38 | (g) | | | (0.62 | )(g) | | | 10 | | | | 5 | (f) |
| | | | | | | | | | | | | | | | | | | | | | | |
| | 12.37 | | | | 0.95 | | | | 9.39 | | | | 0.42 | | | | 9 | | | | 88 | |
| | 10.01 | | | | 1.00 | | | | 12.52 | | | | 0.43 | | | | 8 | | | | 86 | |
| | (23.41 | ) | | | 1.06 | | | | 6.68 | | | | 0.41 | | | | 8 | | | | 84 | |
| | 0.80 | (e)(f) | | | 1.06 | (g) | | | 16.12 | (g) | | | (0.35 | )(g) | | | 10 | | | | 5 | (f) |
| | | |
| | See Notes to Financial Statements. | 97 |
Financial Highlights (continued)
INTERNATIONAL GROWTH FUND
| | | | | | Per Share Operating Performance: | | | |
| | | | | | Investment Operations: | | Distributions
to
shareholders
from: | | | |
| | | | | | | | | | | | | | | | | | | |
| | | Net asset
value,
beginning
of period | | Net
invest-
ment
income
(loss)(a) | | Net
realized
and
unrealized
gain (loss) | | Total
from
invest-
ment
opera-
tions | | Net
invest-
ment
income | | Net
asset
value,
end of
period |
| Class R5 | | | | | | | | | | | | | | | | | | | | | | | | |
| 7/31/2024 | | | $12.70 | | | | $0.09 | | | | $ 1.50 | | | | $ 1.59 | | | | $(0.09 | ) | | | $14.20 | |
| 7/31/2023 | | | 11.62 | | | | 0.08 | | | | 1.10 | | | | 1.18 | | | | (0.10 | ) | | | 12.70 | |
| 7/31/2022 | | | 15.13 | | | | 0.09 | | | | (3.60 | ) | | | (3.51 | ) | | | – | | | | 11.62 | |
| 6/18/2021 to 7/31/2021(c) | | | 15.00 | | | | – | (d)(h) | | | 0.13 | (d) | | | 0.13 | | | | – | | | | 15.13 | |
| Class R6 | | | | | | | | | | | | | | | | | | | | | | | | |
| 7/31/2024 | | | 12.72 | | | | 0.10 | | | | 1.50 | | | | 1.60 | | | | (0.09 | ) | | | 14.23 | |
| 7/31/2023 | | | 11.63 | | | | 0.10 | | | | 1.09 | | | | 1.19 | | | | (0.10 | ) | | | 12.72 | |
| 7/31/2022 | | | 15.13 | | | | 0.10 | | | | (3.60 | ) | | | (3.50 | ) | | | – | | | | 11.63 | |
| 6/18/2021 to 7/31/2021(c) | | | 15.00 | | | | – | (d)(h) | | | 0.13 | (d) | | | 0.13 | | | | – | | | | 15.13 | |
| | |
| (a) | Calculated using average shares outstanding during the period. |
| (b) | Total return for Classes A and C does not consider the effects of sales loads and assumes the reinvestment of all distributions. Total return for all other classes assumes the reinvestment of all distributions. |
| (c) | Commencement of operations was on 6/18/2021, SEC effective date and date shares first became available to the public was 6/28/2021. |
| (d) | Net investment income and net realized and unrealized gain (loss) amounted to less than $0.01 for the period 6/18/2021 through 6/28/2021. |
| (e) | Total return for the period 6/28/2021 through 7/31/2021 was (0.40%) for Class A, (0.46%) for Class C, (0.33%) for Class F, (0.33%) for Class F3, (0.33%) for Class I, (0.40%) for Class R3, (0.40%) for Class R4, (0.33%) for Class R5, and (0.33%) for Class R6. |
| (f) | Not annualized. |
| (g) | Annualized. |
| (h) | Amount less than $0.01. |
| | |
| 98 | See Notes to Financial Statements. |
| | | | Ratios to Average Net Assets: | | Supplemental Data: |
| | | | | | | | | | | | | | | | | |
Total
return
(%)(b) | | Total
expenses
after
waivers
and/or reim-
bursements
(%) | | Total
expenses
(%) | | Net
invest-
ment
income
(loss)
(%) | | Net
assets,
end of
period
(000) | | Portfolio
turnover
rate
(%) |
| | | | | | | | | | | | | | | | | | | | | | | |
| | 12.69 | | | | 0.71 | | | | 9.14 | | | | 0.66 | | | $ | 9 | | | | 88 | |
| | 10.27 | | | | 0.75 | | | | 12.29 | | | | 0.69 | | | | 8 | | | | 86 | |
| | (23.27 | ) | | | 0.81 | | | | 6.43 | | | | 0.67 | | | | 8 | | | | 84 | |
| | 0.87 | (e)(f) | | | 0.81 | (g) | | | 15.85 | (g) | | | (0.09 | )(g) | | | 10 | | | | 5 | (f) |
| | | | | | | | | | | | | | | | | | | | | | | |
| | 12.77 | | | | 0.62 | | | | 9.11 | | | | 0.75 | | | | 787 | | | | 88 | |
| | 10.38 | | | | 0.61 | | | | 12.08 | | | | 0.86 | | | | 792 | | | | 86 | |
| | (23.13 | ) | | | 0.73 | | | | 6.28 | | | | 0.76 | | | | 584 | | | | 84 | |
| | 0.87 | (e)(f) | | | 0.73 | (g) | | | 15.78 | (g) | | | (0.06 | )(g) | | | 756 | | | | 5 | (f) |
| | | |
| | See Notes to Financial Statements. | 99 |
Financial Highlights (continued)
INVESTMENT GRADE FLOATING RATE FUND
| | | | | | Per Share Operating Performance: |
| | | | | | Investment Operations: | | Distributions to
shareholders
from: |
| | | | | | | | | | | | | | | | | | | | | | |
| | | Net asset
value,
beginning
of period | | Net
invest-
ment
income
(loss)(a) | | Net
realized
and
unrealized
gain | | Total
from
invest-
ment
opera-
tions | | Net
investment
income | | Net
realized
gain | | Total
distributions |
| Class A | | | | | | | | | | | | | | | | | | | | | | | | | | | | |
| 7/31/2024 | | | $10.10 | | | | $0.68 | | | | $0.18 | | | | $0.86 | | | | $(0.66 | ) | | | $(0.07 | ) | | | $(0.73 | ) |
| 5/1/2023 to 7/31/2023(c) | | | 10.00 | | | | 0.15 | | | | 0.09 | | | | 0.24 | | | | (0.14 | ) | | | – | | | | (0.14 | ) |
| Class C | | | | | | | | | | | | | | | | | | | | | | | | | | | | |
| 7/31/2024 | | | 10.10 | | | | 0.60 | | | | 0.18 | | | | 0.78 | | | | (0.58 | ) | | | (0.07 | ) | | | (0.65 | ) |
| 5/1/2023 to 7/31/2023(c) | | | 10.00 | | | | 0.13 | | | | 0.09 | | | | 0.22 | | | | (0.12 | ) | | | – | | | | (0.12 | ) |
| Class F | | | | | | | | | | | | | | | | | | | | | | | | | | | | |
| 7/31/2024 | | | 10.10 | | | | 0.70 | | | | 0.18 | | | | 0.88 | | | | (0.68 | ) | | | (0.07 | ) | | | (0.75 | ) |
| 5/1/2023 to 7/31/2023(c) | | | 10.00 | | | | 0.15 | | | | 0.10 | | | | 0.25 | | | | (0.15 | ) | | | – | | | | (0.15 | ) |
| Class F3 | | | | | | | | | | | | | | | | | | | | | | | | | | | | |
| 7/31/2024 | | | 10.10 | | | | 0.71 | | | | 0.18 | | | | 0.89 | | | | (0.69 | ) | | | (0.07 | ) | | | (0.76 | ) |
| 5/1/2023 to 7/31/2023(c) | | | 10.00 | | | | 0.15 | | | | 0.10 | | | | 0.25 | | | | (0.15 | ) | | | – | | | | (0.15 | ) |
| Class I | | | | | | | | | | | | | | | | | | | | | | | | | | | | |
| 7/31/2024 | | | 10.10 | | | | 0.70 | | | | 0.18 | | | | 0.88 | | | | (0.68 | ) | | | (0.07 | ) | | | (0.75 | ) |
| 5/1/2023 to 7/31/2023(c) | | | 10.00 | | | | 0.15 | | | | 0.10 | | | | 0.25 | | | | (0.15 | ) | | | – | | | | (0.15 | ) |
| Class R5 | | | | | | | | | | | | | | | | | | | | | | | | | | | | |
| 7/31/2024 | | | 10.10 | | | | 0.70 | | | | 0.18 | | | | 0.88 | | | | (0.68 | ) | | | (0.07 | ) | | | (0.75 | ) |
| 5/1/2023 to 7/31/2023(c) | | | 10.00 | | | | 0.15 | | | | 0.10 | | | | 0.25 | | | | (0.15 | ) | | | – | | | | (0.15 | ) |
| Class R6 | | | | | | | | | | | | | | | | | | | | | | | | | | | | |
| 7/31/2024 | | | 10.10 | | | | 0.71 | | | | 0.18 | | | | 0.89 | | | | (0.69 | ) | | | (0.07 | ) | | | (0.76 | ) |
| 5/1/2023 to 7/31/2023(c) | | | 10.00 | | | | 0.15 | | | | 0.10 | | | | 0.25 | | | | (0.15 | ) | | | – | | | | (0.15 | ) |
| | |
| (a) | Calculated using average shares outstanding during the period. |
| (b) | Total return for Classes A and C does not consider the effects of sales loads and assumes the reinvestment of all distributions. Total return for all other classes assumes the reinvestment of all distributions. |
| (c) | Commenced on May 1, 2023. |
| (d) | Not annualized. |
| (e) | Annualized. |
| | |
| 100 | See Notes to Financial Statements. |
| | | | | | | Ratios to Average Net Assets: | | Supplemental Data: |
| | | | | | | | | | | |
Net
asset
value,
end of
period | | Total
return
(%)(b) | | Total
expenses
after
waivers
and/or reim-
bursements
(%) | | Total
expenses
(%) | | Net
invest-
ment
income
(loss)
(%) | | Net
assets,
end of
period
(000) | | Portfolio
turnover
rate
(%) |
| | | | | | | | | | | | | | | | | | | | | | | | | | | |
| $10.23 | | | | 8.84 | | | | 0.55 | | | | 1.50 | | | | 6.72 | | | $ | 4,933 | | | | 171 | |
| | 10.10 | | | | 2.44 | (d) | | | 0.55 | (e) | | | 1.95 | (e) | | | 5.88 | (e) | | | 1,970 | | | | 39 | (d) |
| | | | | | | | | | | | | | | | | | | | | | | | | | | |
| | 10.23 | | | | 7.98 | | | | 1.35 | | | | 2.23 | | | | 5.88 | | | | 579 | | | | 171 | |
| | 10.10 | | | | 2.23 | (d) | | | 1.35 | (e) | | | 2.75 | (e) | | | 4.96 | (e) | | | 506 | | | | 39 | (d) |
| | | | | | | | | | | | | | | | | | | | | | | | | | | |
| | 10.23 | | | | 9.06 | | | | 0.35 | | | | 1.54 | | | | 6.92 | | | | 503 | | | | 171 | |
| | 10.10 | | | | 2.49 | (d) | | | 0.35 | (e) | | | 1.85 | (e) | | | 5.95 | (e) | | | 25 | | | | 39 | (d) |
| | | | | | | | | | | | | | | | | | | | | | | | | | | |
| | 10.23 | | | | 9.13 | | | | 0.28 | | | | 1.19 | | | | 6.95 | | | | 26 | | | | 171 | |
| | 10.10 | | | | 2.50 | (d) | | | 0.28 | (e) | | | 1.69 | (e) | | | 6.00 | (e) | | | 25 | | | | 39 | (d) |
| | | | | | | | | | | | | | | | | | | | | | | | | | | |
| | 10.23 | | | | 9.06 | | | | 0.35 | | | | 1.37 | | | | 6.91 | | | | 33,403 | | | | 171 | |
| | 10.10 | | | | 2.49 | (d) | | | 0.35 | (e) | | | 1.76 | (e) | | | 5.94 | (e) | | | 7,071 | | | | 39 | (d) |
| | | | | | | | | | | | | | | | | | | | | | | | | | | |
| | 10.23 | | | | 9.06 | | | | 0.35 | | | | 1.22 | | | | 6.87 | | | | 26 | | | | 171 | |
| | 10.10 | | | | 2.49 | (d) | | | 0.35 | (e) | | | 1.76 | (e) | | | 5.93 | (e) | | | 25 | | | | 39 | (d) |
| | | | | | | | | | | | | | | | | | | | | | | | | | | |
| | 10.23 | | | | 9.13 | | | | 0.28 | | | | 1.20 | | | | 6.94 | | | | 1,458 | | | | 171 | |
| | 10.10 | | | | 2.50 | (d) | | | 0.28 | (e) | | | 1.68 | (e) | | | 6.01 | (e) | | | 1,440 | | | | 39 | (d) |
| | | |
| | See Notes to Financial Statements. | 101 |
Financial Highlights (continued)
SHORT DURATION HIGH YIELD FUND
| | | | | | Per Share Operating Performance: |
| | | | | | Investment Operations: | | Distributions to
shareholders
from: |
| | | Net asset
value,
beginning
of period | | Net
invest-
ment
income
(loss)(a) | | Net
realized
and
unrealized
gain (loss) | | Total
from
invest-
ment
opera-
tions | | Net
investment
income | | Net
realized
gain | | Total
distributions |
| Class A | | | | | | | | | | | | | | | | | | | | | | | | | | | | |
| 7/31/2024 | | | $ 9.64 | | | | $0.78 | | | | $ 0.28 | | | | $ 1.06 | | | | $(0.80 | ) | | $ | – | | | | $(0.80 | ) |
| 7/31/2023 | | | 9.83 | | | | 0.70 | | | | (0.19 | ) | | | 0.51 | | | | (0.70 | ) | | | – | | | | (0.70 | ) |
| 7/31/2022 | | | 11.00 | | | | 0.49 | | | | (0.92 | ) | | | (0.43 | ) | | | (0.59 | ) | | | (0.15 | ) | | | (0.74 | ) |
| 7/31/2021 | | | 10.61 | | | | 0.48 | | | | 0.57 | | | | 1.05 | | | | (0.59 | ) | | | (0.07 | ) | | | (0.66 | ) |
| 4/22/2020 to 7/31/2020(c) | | | 10.00 | | | | 0.15 | (d) | | | 0.63 | (d) | | | 0.78 | | | | (0.17 | ) | | | – | | | | (0.17 | ) |
| Class C | | | | | | | | | | | | | | | | | | | | | | | | | | | | |
| 7/31/2024 | | | 9.64 | | | | 0.71 | | | | 0.28 | | | | 0.99 | | | | (0.73 | ) | | | – | | | | (0.73 | ) |
| 7/31/2023 | | | 9.83 | | | | 0.65 | | | | (0.20 | ) | | | 0.45 | | | | (0.64 | ) | | | – | | | | (0.64 | ) |
| 7/31/2022 | | | 11.00 | | | | 0.42 | | | | (0.92 | ) | | | (0.50 | ) | | | (0.52 | ) | | | (0.15 | ) | | | (0.67 | ) |
| 7/31/2021 | | | 10.61 | | | | 0.42 | | | | 0.55 | | | | 0.97 | | | | (0.51 | ) | | | (0.07 | ) | | | (0.58 | ) |
| 4/22/2020 to 7/31/2020(c) | | | 10.00 | | | | 0.13 | (d) | | | 0.62 | (d) | | | 0.75 | | | | (0.14 | ) | | | – | | | | (0.14 | ) |
| Class F | | | | | | | | | | | | | | | | | | | | | | | | | | | | |
| 7/31/2024 | | | 9.63 | | | | 0.80 | | | | 0.27 | | | | 1.07 | | | | (0.81 | ) | | | – | | | | (0.81 | ) |
| 7/31/2023 | | | 9.83 | | | | 0.70 | | | | (0.18 | ) | | | 0.52 | | | | (0.72 | ) | | | – | | | | (0.72 | ) |
| 7/31/2022 | | | 11.00 | | | | 0.52 | | | | (0.92 | ) | | | (0.40 | ) | | | (0.62 | ) | | | (0.15 | ) | | | (0.77 | ) |
| 7/31/2021 | | | 10.61 | | | | 0.52 | | | | 0.55 | | | | 1.07 | | | | (0.61 | ) | | | (0.07 | ) | | | (0.68 | ) |
| 4/22/2020 to 7/31/2020(c) | | | 10.00 | | | | 0.16 | (d) | | | 0.62 | (d) | | | 0.78 | | | | (0.17 | ) | | | – | | | | (0.17 | ) |
| Class F3 | | | | | | | | | | | | | | | | | | | | | | | | | | | | |
| 7/31/2024 | | | 9.64 | | | | 0.81 | | | | 0.27 | | | | 1.08 | | | | (0.82 | ) | | | – | | | | (0.82 | ) |
| 7/31/2023 | | | 9.83 | | | | 0.68 | | | | (0.15 | ) | | | 0.53 | | | | (0.72 | ) | | | – | | | | (0.72 | ) |
| 7/31/2022 | | | 11.00 | | | | 0.52 | | | | (0.92 | ) | | | (0.40 | ) | | | (0.62 | ) | | | (0.15 | ) | | | (0.77 | ) |
| 7/31/2021 | | | 10.61 | | | | 0.54 | | | | 0.54 | | | | 1.08 | | | | (0.62 | ) | | | (0.07 | ) | | | (0.69 | ) |
| 4/22/2020 to 7/31/2020(c) | | | 10.00 | | | | 0.16 | (d) | | | 0.62 | (d) | | | 0.78 | | | | (0.17 | ) | | | – | | | | (0.17 | ) |
| Class I | | | | | | | | | | | | | | | | | | | | | | | | | | | | |
| 7/31/2024 | | | 9.62 | | | | 0.80 | | | | 0.27 | | | | 1.07 | | | | (0.81 | ) | | | – | | | | (0.81 | ) |
| 7/31/2023 | | | 9.82 | | | | 0.74 | | | | (0.22 | ) | | | 0.52 | | | | (0.72 | ) | | | – | | | | (0.72 | ) |
| 7/31/2022 | | | 11.00 | | | | 0.52 | | | | (0.93 | ) | | | (0.41 | ) | | | (0.62 | ) | | | (0.15 | ) | | | (0.77 | ) |
| 7/31/2021 | | | 10.61 | | | | 0.54 | | | | 0.53 | | | | 1.07 | | | | (0.61 | ) | | | (0.07 | ) | | | (0.68 | ) |
| 4/22/2020 to 7/31/2020(c) | | | 10.00 | | | | 0.16 | (d) | | | 0.62 | (d) | | | 0.78 | | | | (0.17 | ) | | | – | | | | (0.17 | ) |
| Class R3 | | | | | | | | | | | | | | | | | | | | | | | | | | | | |
| 7/31/2024 | | | 9.64 | | | | 0.76 | | | | 0.27 | | | | 1.03 | | | | (0.77 | ) | | | – | | | | (0.77 | ) |
| 7/31/2023 | | | 9.83 | | | | 0.67 | | | | (0.19 | ) | | | 0.48 | | | | (0.67 | ) | | | – | | | | (0.67 | ) |
| 7/31/2022 | | | 11.00 | | | | 0.46 | | | | (0.92 | ) | | | (0.46 | ) | | | (0.56 | ) | | | (0.15 | ) | | | (0.71 | ) |
| 7/31/2021 | | | 10.62 | | | | 0.48 | | | | 0.53 | | | | 1.01 | | | | (0.56 | ) | | | (0.07 | ) | | | (0.63 | ) |
| 4/22/2020 to 7/31/2020(c) | | | 10.00 | | | | 0.15 | (d) | | | 0.63 | (d) | | | 0.78 | | | | (0.16 | ) | | | – | | | | (0.16 | ) |
| Class R4 | | | | | | | | | | | | | | | | | | | | | | | | | | | | |
| 7/31/2024 | | | 9.64 | | | | 0.78 | | | | 0.27 | | | | 1.05 | | | | (0.79 | ) | | | – | | | | (0.79 | ) |
| 7/31/2023 | | | 9.83 | | | | 0.66 | | | | (0.15 | ) | | | 0.51 | | | | (0.70 | ) | | | – | | | | (0.70 | ) |
| 7/31/2022 | | | 11.00 | | | | 0.48 | | | | (0.91 | ) | | | (0.43 | ) | | | (0.59 | ) | | | (0.15 | ) | | | (0.74 | ) |
| 7/31/2021 | | | 10.62 | | | | 0.51 | | | | 0.53 | | | | 1.04 | | | | (0.59 | ) | | | (0.07 | ) | | | (0.66 | ) |
| 4/22/2020 to 7/31/2020(c) | | | 10.00 | | | | 0.15 | (d) | | | 0.63 | (d) | | | 0.78 | | | | (0.16 | ) | | | – | | | | (0.16 | ) |
| 102 | See Notes to Financial Statements. |
| | | | | | | Ratios to Average Net Assets: | | Supplemental Data: |
| | | | | | | | | | | | | | | | | | | | |
Net
asset
value,
end of
period | | Total
return
(%)(b) | | Total
expenses
after
waivers
and/or reim-
bursements
(%) | | Total
expenses
(%) | | Net
invest-
ment
income
(loss)
(%) | | Net
assets,
end of
period
(000) | | Portfolio
turnover
rate
(%) |
| | | | | | | | | | | | | | | | | | | | | | | | | | | |
| $ | 9.90 | | | | 11.41 | | | | 0.65 | | | | 0.71 | | | | 8.00 | | | $ | 480,252 | | | | 160 | |
| | 9.64 | | | | 5.50 | | | | 0.65 | | | | 0.86 | | | | 7.31 | | | | 92,165 | | | | 65 | |
| | 9.83 | | | | (4.04 | ) | | | 0.71 | | | | 1.70 | | | | 4.69 | | | | 11,090 | | | | 123 | |
| | 11.00 | | | | 10.22 | | | | 0.71 | | | | 2.00 | | | | 4.43 | | | | 9,849 | | | | 69 | |
| | 10.61 | | | | 7.81 | (e)(f) | | | 0.71 | (g) | | | 3.95 | (g) | | | 5.45 | (g) | | | 1,727 | | | | 27 | (f) |
| | | | | | | | | | | | | | | | | | | | | | | | | | | |
| | 9.90 | | | | 10.62 | | | | 1.36 | | | | 1.43 | | | | 7.28 | | | | 143,009 | | | | 160 | |
| | 9.64 | | | | 4.81 | | | | 1.30 | | | | 1.48 | | | | 6.74 | | | | 25,681 | | | | 65 | |
| | 9.83 | | | | (4.71 | ) | | | 1.42 | | | | 2.41 | | | | 4.00 | | | | 1,399 | | | | 123 | |
| | 11.00 | | | | 9.34 | | | | 1.51 | | | | 2.91 | | | | 3.81 | | | | 1,324 | | | | 69 | |
| | 10.61 | | | | 7.58 | (e)(f) | | | 1.51 | (g) | | | 4.74 | (g) | | | 4.64 | (g) | | | 584 | | | | 27 | (f) |
| | | | | | | | | | | | | | | | | | | | | | | | | | | |
| | 9.89 | | | | 11.63 | | | | 0.45 | | | | 0.60 | | | | 8.19 | | | | 84,124 | | | | 160 | |
| | 9.63 | | | | 5.60 | | | | 0.46 | | | | 0.73 | | | | 7.28 | | | | 28,477 | | | | 65 | |
| | 9.83 | | | | (3.85 | ) | | | 0.51 | | | | 1.61 | | | | 5.12 | | | | 16,197 | | | | 123 | |
| | 11.00 | | | | 10.43 | | | | 0.51 | | | | 2.03 | | | | 4.80 | | | | 6,071 | | | | 69 | |
| | 10.61 | | | | 7.87 | (e)(f) | | | 0.51 | (g) | | | 3.84 | (g) | | | 5.65 | (g) | | | 2,574 | | | | 27 | (f) |
| | | | | | | | | | | | | | | | | | | | | | | | | | | |
| | 9.90 | | | | 11.70 | | | | 0.36 | | | | 0.42 | | | | 8.29 | | | | 235,131 | | | | 160 | |
| | 9.64 | | | | 5.75 | | | | 0.44 | | | | 0.70 | | | | 7.13 | | | | 9 | | | | 65 | |
| | 9.83 | | | | (3.79 | ) | | | 0.47 | | | | 1.48 | | | | 4.92 | | | | 9 | | | | 123 | |
| | 11.00 | | | | 10.50 | | | | 0.44 | | | | 1.97 | | | | 5.01 | | | | 11 | | | | 69 | |
| | 10.61 | | | | 7.89 | (e)(f) | | | 0.44 | (g) | | | 3.66 | (g) | | | 5.72 | (g) | | | 11 | | | | 27 | (f) |
| | | | | | | | | | | | | | | | | | | | | | | | | | | |
| | 9.88 | | | | 11.63 | | | | 0.45 | | | | 0.51 | | | | 8.19 | | | | 4,250,474 | | | | 160 | |
| | 9.62 | | | | 5.60 | | | | 0.45 | | | | 0.61 | | | | 7.68 | | | | 1,054,582 | | | | 65 | |
| | 9.82 | | | | (3.94 | ) | | | 0.51 | | | | 1.54 | | | | 5.14 | | | | 2,061 | | | | 123 | |
| | 11.00 | | | | 10.44 | | | | 0.51 | | | | 2.02 | | | | 4.94 | | | | 550 | | | | 69 | |
| | 10.61 | | | | 7.87 | (e)(f) | | | 0.51 | (g) | | | 3.77 | (g) | | | 5.65 | (g) | | | 531 | | | | 27 | (f) |
| | | | | | | | | | | | | | | | | | | | | | | | | | | |
| | 9.90 | | | | 11.08 | | | | 0.95 | | | | 1.01 | | | | 7.73 | | | | 207 | | | | 160 | |
| | 9.64 | | | | 5.19 | | | | 0.95 | | | | 1.23 | | | | 6.99 | | | | 63 | | | | 65 | |
| | 9.83 | | | | (4.31 | ) | | | 1.01 | | | | 2.02 | | | | 4.38 | | | | 10 | | | | 123 | |
| | 11.00 | | | | 9.88 | | | | 1.01 | | | | 2.52 | | | | 4.43 | | | | 11 | | | | 69 | |
| | 10.62 | | | | 7.72 | (e)(f) | | | 1.01 | (g) | | | 4.21 | (g) | | | 5.15 | (g) | | | 11 | | | | 27 | (f) |
| | | | | | | | | | | | | | | | | | | | | | | | | | | |
| | 9.90 | | | | 11.35 | | | | 0.70 | | | | 0.76 | | | | 7.98 | | | | 128 | | | | 160 | |
| | 9.64 | | | | 5.46 | | | | 0.73 | | | | 1.01 | | | | 6.89 | | | | 9 | | | | 65 | |
| | 9.83 | | | | (4.08 | ) | | | 0.76 | | | | 1.75 | | | | 4.61 | | | | 9 | | | | 123 | |
| | 11.00 | | | | 10.15 | | | | 0.76 | | | | 2.26 | | | | 4.69 | | | | 11 | | | | 69 | |
| | 10.62 | | | | 7.79 | (e)(f) | | | 0.76 | (g) | | | 3.96 | (g) | | | 5.40 | (g) | | | 11 | | | | 27 | (f) |
| | See Notes to Financial Statements. | 103 |
Financial Highlights (concluded)
SHORT DURATION HIGH YIELD FUND
| | | | | | Per Share Operating Performance: |
| | | | | | Investment Operations: | | Distributions to
shareholders
from: |
| | | Net asset
value,
beginning
of period | | Net
invest-
ment
income
(loss)(a) | | Net
realized
and
unrealized
gain (loss) | | Total
from
invest-
ment
opera-
tions | | Net
investment
income | | Net
realized
gain | | Total
distributions |
| Class R5 | | | | | | | | | | | | | | | | | | | | | | | | | | | | |
| 7/31/2024 | | | $ 9.64 | | | | $0.80 | | | | $ 0.27 | | | | $ 1.07 | | | | $(0.81 | ) | | $ | – | | | | $(0.81 | ) |
| 7/31/2023 | | | 9.83 | | | | 0.69 | | | | (0.16 | ) | | | 0.53 | | | | (0.72 | ) | | | – | | | | (0.72 | ) |
| 7/31/2022 | | | 11.00 | | | | 0.51 | | | | (0.91 | ) | | | (0.40 | ) | | | (0.62 | ) | | | (0.15 | ) | | | (0.77 | ) |
| 7/31/2021 | | | 10.61 | | | | 0.54 | | | | 0.53 | | | | 1.07 | | | | (0.61 | ) | | | (0.07 | ) | | | (0.68 | ) |
| 4/22/2020 to 7/31/2020(c) | | | 10.00 | | | | 0.16 | (d) | | | 0.62 | (d) | | | 0.78 | | | | (0.17 | ) | | | – | | | | (0.17 | ) |
| Class R6 | | | | | | | | | | | | | | | | | | | | | | | | | | | | |
| 7/31/2024 | | | 9.64 | | | | 0.81 | | | | 0.27 | | | | 1.08 | | | | (0.82 | ) | | | – | | | | (0.82 | ) |
| 7/31/2023 | | | 9.83 | | | | 0.72 | | | | (0.19 | ) | | | 0.53 | | | | (0.72 | ) | | | – | | | | (0.72 | ) |
| 7/31/2022 | | | 11.00 | | | | 0.51 | | | | (0.91 | ) | | | (0.40 | ) | | | (0.62 | ) | | | (0.15 | ) | | | (0.77 | ) |
| 7/31/2021 | | | 10.61 | | | | 0.52 | | | | 0.56 | | | | 1.08 | | | | (0.62 | ) | | | (0.07 | ) | | | (0.69 | ) |
| 4/22/2020 to 7/31/2020(c) | | | 10.00 | | | | 0.16 | (d) | | | 0.62 | (d) | | | 0.78 | | | | (0.17 | ) | | | – | | | | (0.17 | ) |
| | |
| (a) | Calculated using average shares outstanding during the period. |
| (b) | Total return for Classes A and C does not consider the effects of sales loads and assumes the reinvestment of all distributions. Total return for all other classes assumes the reinvestment of all distributions. |
| (c) | Commencement of operations was on 4/22/2020, SEC effective date and date shares first became available to the public was 4/30/2020. |
| (d) | Net investment income and net realized and unrealized gain (loss) amounted to less than $0.01 for the period 4/22/2020 through 4/30/2020. |
| (e) | Total return for the period 4/30/2020 through 7/31/2020 was 7.56% for Class A, 7.34% for Class C, 7.61% for Class F, 7.63% for Class F3, 7.61% for Class I, 7.48% for Class R3, 7.54% for Class R4, 7.61% for Class R5, and 7.63% for Class R6. |
| (f) | Not annualized. |
| (g) | Annualized. |
| 104 | See Notes to Financial Statements. |
| | | | | | | Ratios to Average Net Assets: | | Supplemental Data: |
| | | | | | | | | | | | | | | | | | | | |
Net
asset
value,
end of
period | | Total
return
(%)(b) | | Total
expenses
after
waivers
and/or reim-
bursements
(%) | | Total
expenses
(%) | | Net
invest-
ment
income
(loss)
(%) | | Net
assets,
end of
period
(000) | | Portfolio
turnover
rate
(%) |
| | | | | | | | | | | | | | | | | | | | | | | | | | | |
| $ | 9.90 | | | | 11.63 | | | | 0.45 | | | | 0.51 | | | | 8.19 | | | $ | 234 | | | | 160 | |
| | 9.64 | | | | 5.72 | | | | 0.47 | | | | 0.75 | | | | 7.14 | | | | 9 | | | | 65 | |
| | 9.83 | | | | (3.83 | ) | | | 0.51 | | | | 1.49 | | | | 4.86 | | | | 9 | | | | 123 | |
| | 11.00 | | | | 10.43 | | | | 0.51 | | | | 2.01 | | | | 4.94 | | | | 11 | | | | 69 | |
| | 10.61 | | | | 7.86 | (e)(f) | | | 0.51 | (g) | | | 3.71 | (g) | | | 5.65 | (g) | | | 11 | | | | 27 | (f) |
| | | | | | | | | | | | | | | | | | | | | | | | | | | |
| | 9.90 | | | | 11.71 | | | | 0.36 | | | | 0.42 | | | | 8.25 | | | | 5,888 | | | | 160 | |
| | 9.64 | | | | 5.74 | | | | 0.43 | | | | 0.58 | | | | 7.47 | | | | 796 | | | | 65 | |
| | 9.83 | | | | (3.80 | ) | | | 0.47 | | | | 1.48 | | | | 4.90 | | | | 169 | | | | 123 | |
| | 11.00 | | | | 10.50 | | | | 0.44 | | | | 1.85 | | | | 4.81 | | | | 192 | | | | 69 | |
| | 10.61 | | | | 7.89 | (e)(f) | | | 0.44 | (g) | | | 3.69 | (g) | | | 5.73 | (g) | | | 64 | | | | 27 | (f) |
| | See Notes to Financial Statements. | 105 |
Notes to Financial Statements
Lord Abbett Trust I (the “Trust”) is registered under the Investment Company Act of 1940, as amended (the “Act”), as an open-end management investment company and was organized as a Delaware statutory trust on May 1, 2001.
The Trust consists of nine funds as of July 31, 2024. This report covers the following five funds (each, a “Fund” and collectively, the “Funds”) and their respective active share classes:
| Funds | Classes |
| Lord Abbett Climate Focused Bond Fund (“Climate Focused Bond Fund”) | A, C, F, F3, I, R3, R4, R5, and R6 |
| Lord Abbett Emerging Markets Equity Fund (“Emerging Markets Equity Fund”) | A, C, F, F3, I and R6 |
| Lord Abbett International Growth Fund (“International Growth Fund”) | A, C, F, F3, I, R3, R4, R5 and R6 |
| Lord Abbett Investment Grade Floating Rate Fund (“Investment Grade Floating Rate Fund”) | A, C, F, F3, I, R5 and R6 |
| Lord Abbett Short Duration High Yield Fund (“Short Duration High Yield Fund”) | A, C, F, F3, I, R3, R4, R5 and R6 |
Each Fund other than the Emerging Markets Equity Fund is diversified within the meaning of the Act. Investment Grade Floating Rate Fund commenced operations on May 1, 2023.
Climate Focused Bond Fund’s investment objective is total return. Emerging Markets Equity Fund’s and International Growth Fund’s investment objective is to seek long-term capital appreciation. Investment Grade Floating Rate Fund’s investment objective is to seek a high level of current income. Short Duration High Yield Fund’s investment objective is to seek a high current income and the opportunity for capital appreciation to produce a high total return.
Each class of shares has different expenses and dividends. A front-end sales charge is normally added to the net asset value (“NAV”) for Class A shares. There is no front-end sales charge in the case of Class C, F, F3, I, R3, R4, R5 and R6 shares, although there may be a contingent deferred sales charge (“CDSC”) in certain cases as follows: Class A shares purchased without a sales charge and redeemed before the first day of the month in which the one-year anniversary of the purchase falls (subject to certain exceptions as set forth in each Fund’s prospectus); and Class C shares redeemed before the first anniversary of purchase. Class C shares automatically convert to Class A shares on the 25th day of the month (or, if the 25th day is not a business day, the next business day thereafter) following the eighth anniversary of the month on which the purchase order was accepted, provided that the Fund or financial intermediary through which a shareholder purchased Class C shares has records verifying that the Class C shares have been held at least eight years.
The Funds are investment companies and apply the accounting and reporting guidance of the Financial Accounting Standards Board (“FASB”) Accounting Standards Codification Topic 946 Financial Services - Investment Companies. The preparation of the financial statements in conformity with accounting principles generally accepted in the United States of America (“U.S. GAAP”) requires management to make certain estimates and assumptions that affect the reported amounts of assets and liabilities and disclosure of contingent assets and liabilities at the date of the financial statements and the reported amounts of increases and decreases in net assets from operations during the reporting period. Actual results could differ from those estimates.
106
Notes to Financial Statements (continued)
| 2. | SIGNIFICANT ACCOUNTING POLICIES |
| (a) | Investment Valuation–Under procedures approved by the Funds’ Board of Trustees (the “Board”), the Board has designated the determination of fair value of the Funds’ portfolio investments to Lord, Abbett & Co. LLC (“Lord Abbett”) as its valuation designee. Accordingly, Lord Abbett is responsible for, among other things, assessing and managing valuation risks, establishing, applying and testing fair value methodologies, and evaluating pricing services. Lord Abbett has formed a Pricing Committee that performs these responsibilities on behalf of Lord Abbett, administers the pricing and valuation of portfolio investments and ensures that prices utilized reasonably reflect fair value. Among other things, these procedures allow Lord Abbett, subject to Board oversight, to utilize independent pricing services, quotations from securities and financial instrument dealers and other market sources to determine fair value. |
| | |
| | Securities actively traded on any recognized U.S. or non-U.S. exchange or on the NASDAQ Stock Market LLC are valued at the last sale price or official closing price on the exchange or system on which they are principally traded. Events occurring after the close of trading on non-U.S. exchanges may result in adjustments to the valuation of foreign securities to reflect their fair value as of the close of regular trading on the New York Stock Exchange. When valuing foreign equity securities that meet certain criteria, the Pricing Committee uses a third-party fair valuation service that values such securities to reflect market trading that occurs after the close of the applicable foreign markets of comparable securities or other instruments that correlate to the fair-valued securities. Unlisted equity securities are valued at the last quoted sale price or, if no sale price is available, at the mean between the most recently quoted bid and ask prices. Exchange traded options and futures contracts are valued at the last quoted sale price in the market where they are principally traded. If no sale has occurred, the mean between the most recently quoted bid and ask prices is used. Fixed income securities are valued based on evaluated prices supplied by independent pricing services, which reflect broker/dealer supplied valuations and the independent pricing services’ own electronic data processing techniques. Floating rate loans are valued at the average of bid and ask quotations obtained from dealers in loans on the basis of prices supplied by independent pricing services. Forward foreign currency exchange contracts are valued using daily forward exchange rates. Swaps are valued daily using independent pricing services or quotations from broker/dealers to the extent available. |
| | |
| | Securities for which prices are not readily available are valued at fair value as determined by the Pricing Committee. The Pricing Committee considers a number of factors, including observable and unobservable inputs, when arriving at fair value. The Pricing Committee may use observable inputs such as yield curves, broker quotes, observable trading activity, option adjusted spread models and other relevant information to determine the fair value of portfolio investments. The Pricing Committee may also use related or comparable assets or liabilities, recent transactions, market multiples, book values, and other relevant information to determine the fair value of portfolio investments. The Board or a designated committee thereof periodically reviews reports that may include fair value determinations made by the Pricing Committee, related market activity, inputs and assumptions, and retrospective comparison of prices of subsequent purchases and sales transactions to fair value determinations made by the Pricing Committee. |
107
Notes to Financial Statements (continued)
| | Short-term securities with 60 days or less remaining to maturity are valued using the amortized cost method, which approximates fair value Investments in open-end money market mutual funds are valued at their NAV as of the close of each business day. |
| | |
| (b) | Security Transactions–Security transactions are recorded as of the date that the securities are purchased or sold (trade date). Realized gains and losses on sales of portfolio securities are calculated using the identified-cost method. Realized and unrealized gains (losses) are allocated to each class of shares based upon the relative proportion of net assets at the beginning of the day. |
| | |
| (c) | Investment Income–Dividend income is recorded on the ex-dividend date. Interest income is recorded on the accrual basis as earned. Discounts are accreted and premiums are amortized using the effective interest method and are included in Interest and other, if applicable, in the Statements of Operations. Withholding taxes on foreign dividends have been provided for in accordance with the applicable country’s tax rules and rates. Investment income is allocated to each class of shares based upon the relative proportion of net assets at the beginning of the day. |
| | |
| (d) | Income Taxes–It is the policy of each Fund to meet the requirements of Subchapter M of the Internal Revenue Code applicable to regulated investment companies and to distribute substantially all taxable income and capital gains to its shareholders. Therefore, no income tax provision is required. |
| | |
| | Each Fund files U.S. federal and various state and local tax returns. No income tax returns are currently under examination. The statute of limitations on Climate Focused Bond Fund’s, International Growth Fund’s and Short Duration High Yield Fund’s U.S. tax returns remains open for the period ended July 31, 2021 through the fiscal year ended July 31, 2024. The statute of limitations on Emerging Markets Equity Fund’s U.S. federal tax returns remains open for the period ended July 31, 2022 through the fiscal year ended July 31, 2024. The statute of limitations on Investment Grade Floating Rate Fund’s U.S. federal tax returns remains open for the period ended July 31, 2023 through the fiscal year ended July 31, 2024. The statutes of limitations on the Funds’ state and local tax returns may remain open for an additional year depending upon each Fund’s jurisdiction. |
| | |
| (e) | Expenses–Expenses, excluding class-specific expenses, are allocated to each class of shares based upon the relative proportion of net assets at the beginning of the day. In addition, Class F3 and R6 bear their class-specific share of shareholder servicing expenses. Class A, C, F, R3 and R4 shares bear their class-specific share of all expenses and fees relating to the Funds’ 12b-1 Distribution Plan. |
| | |
| (f) | Foreign Transactions–The books and records of each Fund are maintained in U.S. dollars and transactions denominated in foreign currencies are recorded in each Fund’s records at the rate prevailing when earned or recorded. Asset and liability accounts that are denominated in foreign currencies are adjusted daily to reflect current exchange rates and any unrealized gain (loss), if applicable, is included in Net change in unrealized appreciation/depreciation on translation of assets and liabilities denominated in foreign currencies in each Fund’s Statement of Operations. The resultant exchange gains and losses upon settlement of such transactions, if applicable, are included in Net realized gain (loss) on foreign currency related transactions in each Fund’s Statement of Operations. The Funds do not isolate that portion of the results of operations arising as a result of changes in the foreign exchange rates from the changes in market prices of the securities. |
108
Notes to Financial Statements (continued)
| | Each Fund uses foreign currency exchange contracts to facilitate transactions in foreign-denominated securities. Losses from these transactions may arise from changes in the value of the foreign currency or if the counterparties do not perform under the contracts’ terms. |
| | |
| (g) | Forward Foreign Currency Exchange Contracts–Each Fund may enter into forward foreign currency exchange contracts in order to reduce exposure to changes in foreign currency exchange rates on foreign portfolio holdings, or gain or reduce exposure to foreign currency solely for investment purposes. A forward foreign currency exchange contract is a commitment to purchase or sell a foreign currency at a future date at a negotiated rate. The contracts are valued daily at forward exchange rates and any unrealized gain (loss), if applicable, is included in Net change in unrealized appreciation/depreciation on forward foreign currency exchange contracts in each Fund’s Statement of Operations. The gain (loss) arising from the difference between the U.S. dollar cost of the original contract and the value of the forward foreign currency in U.S. dollars upon closing of such contracts is included, if applicable, in Net realized gain (loss) on forward foreign currency exchange contracts in each Fund’s Statement of Operations. |
| | |
| (h) | Futures Contracts–Each Fund may purchase and sell futures contracts to enhance returns, to attempt to economically hedge some of its investment risk, or as a substitute position in lieu of holding the underlying asset on which the instrument is based. At the time of entering into a futures transaction, an investor is required to deposit and maintain a specified amount of cash or eligible securities called “initial margin.” Subsequent payments made or received by the Funds called “variation margin” are made on a daily basis as the market price of the futures contract fluctuates. Each Fund will record an unrealized gain (loss) based on the amount of variation margin. When a contract is closed, a realized gain (loss) is recorded equal to the difference between the opening and closing value of the contract. |
| | |
| (i) | Credit Default Swap Contracts–Each Fund may enter into credit default swap contracts in order to hedge credit risk or for speculation purposes. As a seller of a credit default swap contract (“seller of protection”), a Fund is required to pay the notional amount or other agreed-upon value of a referenced debt obligation to the counterparty in the event of a default by or other credit event involving the referenced issuer, obligation or index. In return, a Fund receives from the counterparty a periodic stream of payments over the term of the contract. |
| | |
| | As a purchaser of a credit default swap contract (“buyer of protection”), a Fund would receive the notional amount or other agreed upon value of a referenced debt obligation from the counterparty in the event of default by or other credit event involving the referenced issuer, obligation or index. In return, a Fund makes periodic payments to the counterparty over the term of the contracts, provided no event of default has occurred. |
| | |
| | These credit default swap contracts may have as a reference obligation corporate or sovereign issuers or credit indexes. These credit indexes are comprised of a basket of securities representing a particular sector of the market. |
| | |
| | Credit default swap contracts are fair valued based upon quotations from counterparties, brokers or market-makers and the change in value, if any, is recorded as unrealized appreciation or depreciation. For a credit default swap contract sold by a Fund, payment of the agreed-upon amount made by a Fund in the event of default of the referenced debt obligation is recorded as the cost of the referenced debt obligation purchased/received. For a credit default swap contract purchased by a Fund, the agreed-upon amount received by a Fund in the |
109
Notes to Financial Statements (continued)
| | event of default of the referenced debt obligation is recorded as proceeds from sale/delivery of the referenced debt obligation and the resulting gain or loss realized on the referenced debt obligation is recorded as such by a Fund. |
| | |
| | Any upfront payments made or received upon entering a credit default swap contract would be amortized or accreted over the life of the swap contract and recorded as realized gains or losses. Collateral, in the form of cash or securities, may be required to be held in segregated accounts with the custodian bank or broker in accordance with the swap contract agreement. The value and credit rating of each credit default swap contract where a Fund is the seller of protection, are both measures of the current payment/performance risk of the swap contract. As the value of the swap contract changes as a positive or negative percentage of the total notional amount, the payment/performance risk may decrease or increase, respectively. The maximum potential amount of future payments (undiscounted) that a Fund as a seller of protection could be required to make under a credit default swap contract agreement would be an amount equal to the notional amount of the agreement. These potential amounts would be partially offset by any recovery values of the respective referenced obligations, upfront payments received upon entering into the agreement, or net amounts received from the settlement of buy protection credit default swap contract agreements entered into by a Fund for the same referenced entity or entities. |
| | |
| | Entering into credit default swap contracts involves credit and market risk. Such risks involve the possibility that there will be no liquid market for these agreements, that the counterparty to the agreements may default on its obligation to perform or disagree as to the meaning of the contractual terms in the agreements, and that there may be unfavorable changes in interest rates, and that Lord Abbett does not correctly predict the creditworthiness of the issuers of the reference obligation on which the credit default swap contract is based. For the centrally cleared credit default swap contracts, there was minimal counterparty risk to the Funds, since such credit default swap contracts entered into were traded through a central clearinghouse, which guarantees against default. |
| | |
| (j) | Repurchase Agreements–Each Fund may enter into repurchase agreements with respect to securities. A repurchase agreement is a transaction in which a fund acquires a security and simultaneously commits to resell that security to the seller (a bank or securities dealer) at an agreed-upon price on an agreed-upon date. Each Fund requires at all times that the repurchase agreement be collateralized by cash, or by securities of the U.S. Government, its agencies, its instrumentalities, or U.S. Government sponsored enterprises having a value equal to, or in excess of, the value of the repurchase agreement (including accrued interest). If the seller of the agreement defaults on its obligation to repurchase the underlying securities at a time when the fair value of these securities has declined, a Fund may incur a loss upon disposition of the securities. |
| | |
| (k) | When-Issued, Forward Transactions or To-Be-Announced (“TBA”) Transactions–Each Fund may purchase portfolio securities on a when-issued or forward basis. When-issued, forward transactions or TBA transactions involve a commitment by a Fund to purchase securities, with payment and delivery (“settlement”) to take place in the future, in order to secure what is considered to be an advantageous price or yield at the time of entering into the transaction. During the period between purchase and settlement, the fair value of the securities will fluctuate and assets consisting of cash and/or marketable securities (normally short-term U.S. Government or U.S. Government sponsored enterprise securities) marked to |
110
Notes to Financial Statements (continued)
| | market daily in an amount sufficient to make payment at settlement will be segregated at each Fund’s custodian in order to pay for the commitment. At the time each Fund makes the commitment to purchase a security on a when-issued basis, it will record the transaction and reflect the liability for the purchase and fair value of the security in determining its NAV. Each Fund, generally, has the ability to close out a purchase obligation on or before the settlement date rather than take delivery of the security. Under no circumstances will settlement for such securities take place more than 120 days after the purchase date. |
| | |
| (l) | Floating Rate Loans–Each Fund may invest in floating rate loans, which usually take the form of loan participations and assignments. Loan participations and assignments are agreements to make money available to U.S. or foreign corporations, partnerships or other business entities (the “Borrower”) in a specified amount, at a specified rate and within a specified time. A loan is typically originated, negotiated and structured by a U.S. or foreign bank, insurance company or other financial institution (the “Agent”) for a group of loan investors (“Loan Investors”). The Agent typically administers and enforces the loan on behalf of the other Loan Investors in the syndicate and may hold any collateral on behalf of the Loan Investors. Such loan participations and assignments are typically senior, secured and collateralized in nature. Each Fund records an investment when the Borrower withdraws money and records interest as earned. These loans pay interest at rates which are periodically reset by reference to a base lending rate plus a spread. These base lending rates are generally the prime rate offered by a designated U.S. bank or Secured Overnight Financing Rate (“SOFR”). |
| | |
| | The loans in which each Fund invests may be subject to some restrictions on resale. For example, each Fund may be contractually obligated to receive approval from the Agent and/or Borrower prior to the sale of these investments. Each Fund generally has no right to enforce compliance with the terms of the loan agreement with the Borrower. As a result, each Fund assumes the credit risk of the Borrower, the selling participant and any other persons interpositioned between each Fund and the Borrower (“Intermediate Participants”). In the event that the Borrower, selling participant or Intermediate Participants become insolvent or enter into bankruptcy, each Fund may incur certain costs and delays in realizing payment or may suffer a loss of principal and/or interest. |
| | |
| | Unfunded loan commitments represent the remaining obligation of each Fund to the Borrower. At any point in time, up to the maturity date of the issue, the Borrower may demand the unfunded portion. Until demanded by the Borrower, unfunded loan commitments are not recognized as an asset on the Statements of Assets and Liabilities. Unrealized appreciation/depreciation on unfunded loan commitments presented, if any, on the Statements of Assets and Liabilities represents mark to market of the unfunded portion of each Fund’s floating rate notes. |
| | |
| | As of July 31, 2024 the Funds had the following unfunded loan commitments: |
| Climate Focused Bond Fund |
| Borrower | | Principal
Amount | | Market
Value | | Cost | | Unrealized
Appreciation/
Depreciation |
| Hobbs & Associate LLC Delayed Draw Term Loan | | $3,364 | | $3,368 | | $3,364 | | $4 |
111
Notes to Financial Statements (continued)
| Short Duration High Yield Fund |
| Borrower | | Principal
Amount | | | Market
Value | | | Cost | | | Unrealized
Appreciation/
Depreciation |
| Epicor Software Corp. 2024 Delayed Draw Term Loan | | $ | 454,580 | | | $ | 458,187 | | | $ | 456,587 | | | $ | 1,600 |
| Groundworks LLC 2024 Delayed Draw Term Loan | | | 921,702 | | | | 924,007 | | | | 922,692 | | | | 1,315 |
| Tank Holding Corp. 2023 Incremental Delayed Draw Term Loan | | | 165,000 | | | | 164,175 | | | | 163,130 | | | | 1,045 |
| Total | | | | | | $ | 1,546,369 | | | $ | 1,542,409 | | | $ | 3,960 |
| | |
| (m) | Inflation-Linked Derivatives–Each Fund may invest in inflation-linked derivatives, such as Consumer Price Index Swap Contract Agreements (“CPI swap contracts”). A CPI swap contract is a contract in which one party agrees to pay a fixed rate in exchange for a variable rate, which is the rate of change in the CPI during the life of the contract. Payments are based on a notional amount of principal. A Fund will normally enter into CPI swap contracts on a zero coupon basis, meaning that the floating rate will be based on the cumulative CPI during the life of the contract, and the fixed rate will compound until the swap contract’s maturity date, at which point the payments are netted. The swap contracts are valued daily and any unrealized gain (loss) is included in the Net change in unrealized appreciation/depreciation on swap contracts in the Fund’s Statement of Operations. A liquidation payment received or made at the termination or maturity of the swap contract is recorded in realized gain (loss) and is included in Net realized gain (loss) on swap contracts in the Fund’s Statement of Operations. Daily changes in valuation of centrally cleared CPI swap contracts, if any, are recorded as a receivable or payable for the change in value as appropriate (“variation margin”) on the Statements of Assets and Liabilities. For the centrally cleared CPI swap contracts, there was minimal counterparty risk to the Funds since such CPI swap contracts entered into were traded through a central clearinghouse, which guarantees against default. |
| | |
| (n) | Interest Rate Swap Contracts–Each Fund may enter into interest rate swap contract agreements. Pursuant to interest rate swap contract agreements, a Fund either makes floating-rate payments to the counterparty (or Central counterparty clearing house (“CCP”) in the case of centrally cleared swap contracts) based on a benchmark interest rate in exchange for fixed-rate payments or a Fund makes fixed-rate payments to the counterparty or CCP in exchange for payments on a floating benchmark interest rate. Payments received or made, including amortization of upfront payments/receipts, are recorded as realized gains or losses. During the term of the outstanding swap agreement, changes in the underlying value of the swap are recorded as unrealized gains or losses. For centrally cleared swap contracts, the daily change in valuation is recorded as a receivable or payable for variation margin and settled in cash with the CCP daily. The value of the swap contract is determined by changes in the relationship between two rates of interest. A Fund is exposed to credit loss in the event of non-performance by the swap contract counterparty. In the case of centrally cleared swap contracts, counterparty risk is minimal due to protections provided by the CCP. Risk may also arise from movements in interest rates. |
| | |
| (o) | Total Return Swap Contracts–Each Fund may enter into total return swap contract agreements to obtain exposure to a security or market without owning such security or investing directly in that market. Each Fund may agree to make payments that are the equivalent of interest in exchange for the right to receive payments equivalent to any appreciation in the value of an |
112
Notes to Financial Statements (continued)
| | underlying security, index or other asset, as well as receive payments equivalent to any distributions made on that asset, over the term of the swap contract. If the value of the asset underlying a total return swap contract declines over the term of the swap contract, each Fund also may be required to pay an amount equal to that decline in value to its counterparty. |
| | |
| (p) | Fair Value Measurements–Fair value is defined as the price that each Fund would receive upon selling an investment or transferring a liability in an orderly transaction to an independent buyer in the principal or most advantageous market of the investment. A three-tier hierarchy is used to maximize the use of observable market data and minimize the use of unobservable inputs and to establish classification of fair value measurements for disclosure purposes. Inputs refer broadly to the assumptions that market participants would use in pricing the asset or liability, including assumptions about risk - for example, the risk inherent in a particular valuation technique used to measure fair value (such as a pricing model) and/or the risk inherent in the inputs to the valuation technique. Inputs may be observable or unobservable. Observable inputs reflect the assumptions market participants would use in pricing the asset or liability. Observable inputs are based on market data obtained from sources independent of the reporting entity. Unobservable inputs reflect the reporting entity’s own assumptions about the assumptions market participants would use in pricing the asset or liability. Unobservable inputs are based on the best information available in the circumstances. The three-tier hierarchy classification is determined based on the lowest level of inputs that is significant to the fair value measurement, and is summarized in the three broad Levels listed below: |
| | |
| | ● | Level 1 – | unadjusted quoted prices in active markets for identical investments; |
| | | |
| | ● | Level 2 – | other significant observable inputs (including quoted prices for similar investments, interest rates, prepayment speeds, credit risk, etc.); and |
| | | |
| | ● | Level 3 – | significant unobservable inputs (including each Fund’s own assumptions in determining the fair value of investments). |
| | | | |
| | A summary of inputs used in valuing each Fund’s investments and other financial instruments as of July 31, 2024 and, if applicable, Level 3 rollforwards for the year then ended is included in each Fund’s Schedule of Investments. |
| | |
| | Changes in valuation techniques may result in transfers into or out of an assigned level within the three-tier hierarchy. The inputs or methodology used for valuing securities are not necessarily an indication of the risk associated with investing in those securities. |
| 3. | MANAGEMENT FEE AND OTHER TRANSACTIONS WITH AFFILIATES |
Management Fee
The Trust has a management agreement with Lord Abbett, pursuant to which Lord Abbett provides each Fund with investment management services and executive and other personnel, provides office space and pays for ordinary and necessary office and clerical expenses relating to research and statistical work and supervision of each Fund’s investment portfolio. The management fee is accrued daily and payable monthly.
113
Notes to Financial Statements (continued)
The management fee is based on each Fund’s average daily net assets at the following annual rates:
| Climate Focused Bond Fund |
| | |
| First $1 billion | .35% |
| Over $1 billion | .30% |
| | |
| Emerging Markets Equity Fund |
| | |
| First $3 billion | .65% |
| Over $3 billion | .60% |
| | |
| International Growth Fund | |
| | |
| First $1 billion | .45% |
| Over $1 billion | .42% |
| | |
| Investment Grade Floating Rate Fund |
| | |
| First $1 billion | .25% |
| Next $1 billion | .22% |
| Over $2 billion | .21% |
| | |
| Short Duration High Yield Fund |
| | |
| First $1 billion | .35% |
| Over $1 billion | .31% |
For the fiscal year ended July 31, 2024, the effective management fee, net of any applicable waivers, was at the following annualized rate of each Fund’s average daily net assets:
| | Net Effective
Management Fee |
| Climate Focused Bond Fund | .00% |
| Emerging Markets Equity Fund | .00% |
| International Growth Fund | .00% |
| Investment Grade Floating Rate Fund | .00% |
| Short Duration High Yield Fund | .26% |
In addition, Lord Abbett provides certain administrative services to each Fund pursuant to an Administrative Services Agreement in return for a fee at an annual rate of .04% of each Fund’s average daily net assets. The fund administration fee is accrued daily and payable monthly. Lord Abbett voluntarily waived the following fund administration fees during the fiscal year ended July 31, 2024.
| Fund | Fund
Administration Fee |
| Climate Focused Bond Fund | $11,497 |
| Emerging Markets Equity Fund | 26,944 |
| International Growth Fund | 5,081 |
| Investment Grade Floating Rate Fund | 6,930 |
| Short Duration High Yield Fund | 71,910 |
114
Notes to Financial Statements (continued)
For the fiscal year ended July 31, 2024 and continuing through November 30, 2024 Lord Abbett has contractually agreed to waive its fees and reimburse expenses to the extent necessary to limit the total net annual operating expenses, excluding certain of the Funds’ expenses, to the following annual rates:
| | | Effective
December 1, 2023 | | Prior to
December 1, 2023 |
| | | | | | | | | |
| | | Classes | | Classes |
| | | | | | | | | |
| Fund | | A, C, F, I, R3,
R4 and R5 | | F3 and
R6 | | A, C, F, I, R3,
R4 and R5 | | F3 and
R6 |
| Climate Focused Bond Fund | | .45% | | .43% | | .45% | | .44% |
| Emerging Markets Equity Fund | | .90% | | .82% | | .90% | | .82% |
| International Growth Fund | | .70% | | .64% | | .70% | | .57% |
| Short Duration High Yield Fund | | .45% | | .36% | | .45% | | .42% |
| | | Effective
May 1, 2023 | |
| | | | | | | |
| | | Classes | |
| | | | | | | |
| Fund | | A, C, F, I and R5 | | F3 and
R6 | | |
| Investment Grade Floating Rate Fund | | .35% | | .28% | | |
All contractual fee waivers and expense reimbursement agreements between the Funds and Lord Abbett may be terminated only upon the approval of the Board.
12b-1 Distribution Plan
Each Fund has adopted a distribution plan with respect to Class A, C, F, R3 and R4 shares pursuant to Rule 12b-1 under the Act, which provides for the payment of ongoing distribution and service fees to Lord Abbett Distributor LLC (the “Distributor”), an affiliate of Lord Abbett. The distribution and service fees are accrued daily and payable monthly.
The following annual rates have been authorized by the Board pursuant to the plan:
| Fees* | | Class A | | Class C(1) | | Class F(2) | | Class R3 | | Class R4 |
| Service | | .15%/.25%(3) | | .25% | | – | | .25% | | .25% |
| Distribution | | .05%(4) | | .75% | | .10% | | .25% | | – |
| * | The Funds may designate a portion of the aggregate fees attributable to service activities for purposes of calculating Financial Industry Regulatory Authority, Inc. sales charge limitations. |
| (1) | The 12b-1 fees that Climate Focused Bond Fund, Investment Grade Floating Rate Fund and Short Duration High Yield Fund pay on Class C shares is a blended rate calculated based on 1.00% of each Fund’s average daily net assets attributable to shares for shares held less than 1 year and 0.80% of each Fund’s average daily net assets attributable to shares held for one year or more. All Class C shareholders of each Fund will bear 12b-1 fees at the same rate. |
| (2) | For the fiscal year ended July 31, 2024 and continuing through November 30, 2024, the Distributor has contractually agreed to waive each Fund’s 0.10% Rule 12b-1 fee for Class F shares. This agreement may be terminated only by the Board. |
| (3) | The 12b-1 service fees on Class A shares that Climate Focused Bond Fund, Investment Grade Floating Rate Fund and Short Duration High Yield Fund pay are 0.15% of each Fund’s average daily net assets and for Emerging Markets Equity Fund and International Growth Fund, 0.25% of each Fund’s average daily net assets. |
| (4) | Not applicable for Emerging Markets Equity Fund or International Growth Fund. |
Class F3, Class I, Class R5 and Class R6 shares do not have a distribution plan.
115
Notes to Financial Statements (continued)
Commissions
The Distributor received the following commissions on sales of shares of the Funds, after concessions were paid to authorized dealers, during the fiscal year ended July 31, 2024:
| | | Distributor
Commissions | | Dealers’
Concessions | |
| Climate Focused Bond Fund | | $ | 227 | | $ | 2,307 | |
| Emerging Markets Equity Fund | | | 14 | | | 93 | |
| International Growth Fund | | | 61 | | | 375 | |
| Investment Grade Floating Rate Fund | | | 4,118 | | | 24,471 | |
| Short Duration High Yield Fund | | | 178,268 | | | 2,429,068 | |
The Distributor received the following amounts of CDSCs for the fiscal year ended July 31, 2024:
| | | Class A | | Class C | |
| Climate Focused Bond Fund | | $ | – | | $ | – | |
| Emerging Markets Equity Fund | | | – | | | – | |
| International Growth Fund | | | – | | | – | |
| Investment Grade Floating Rate Fund | | | – | | | – | |
| Short Duration High Yield Fund | | | – | | | 1,300 | |
One Trustee and certain of the Trust’s officers have an interest in Lord Abbett.
| 4. | DISTRIBUTIONS AND TAX INFORMATION |
Dividends are paid from net investment income, if any. Capital gain distributions are paid from taxable net realized gains from investments transactions, reduced by allowable capital loss carryforwards, if any. The capital loss carryforward amount, if any, is available to offset future net capital gains. Dividends and distributions to shareholders are recorded on the ex-dividend date. The amounts of dividends and distributions from net investment income and net realized capital gains are determined in accordance with federal income tax regulations, which may differ from U.S. GAAP. These book/tax differences are either considered temporary or permanent in nature. To the extent these differences are permanent in nature, such amounts are reclassified within the components of net assets based on their federal tax basis treatment; temporary differences do not require reclassification. Dividends and distributions, which exceed earnings and profits for tax purposes, are reported as a tax return of capital.
The tax character of distributions paid during the fiscal year ended July 31, 2024 was as follows:
| Fund | | Tax-Exempt
Income | | | Ordinary
Income | | | Net
Long-Term
Capital Gains | | | Return of
Capital | | | Total
Distributions
Paid | |
| Climate Focused Bond Fund | | $ | – | | | $ | 1,038,469 | | | $ | – | | | $ | – | | | $ | 1,038,469 | |
| Emerging Markets Equity Fund | | | – | | | | 70,708 | | | | – | | | | – | | | | 70,708 | |
| International Growth Fund | | | – | | | | 14,281 | | | | – | | | | – | | | | 14,281 | |
| Investment Grade Floating Rate Fund | | | – | | | | 964,929 | | | | 29,701 | | | | – | | | | 994,630 | |
| Short Duration High Yield Fund | | | – | | | | 241,396,238 | | | | – | | | | – | | | | 241,396,238 | |
116
Notes to Financial Statements (continued)
The tax character of distributions paid during the fiscal year ended July 31, 2023 was as follows:
Fund | | Tax-Exempt
Income | | | Ordinary
Income | | | Net
Long-Term
Capital Gains | | | Return of
Capital | | | Total
Distributions
Paid | |
| Climate Focused Bond Fund | | $ | – | | | $ | 1,653,729 | | | $ | – | | | $ | – | | | $ | 1,653,729 | |
| Emerging Markets Equity Fund | | | – | | | | 82,892 | | | | – | | | | – | | | | 82,892 | |
| International Growth Fund | | | – | | | | 13,952 | | | | – | | | | – | | | | 13,952 | |
| Investment Grade Floating Rate Fund | | | – | | | | 156,103 | | | | – | | | | – | | | | 156,103 | |
| Short Duration High Yield Fund | | | – | | | | 33,194,860 | | | | – | | | | – | | | | 33,194,860 | |
As of July 31, 2024, the components of distributable earnings (loss) on a tax basis were as follows:
| Fund | | Undistributed
Tax-Exempt
Income | | | Undistributed
Ordinary
Income | | | Undistributed
Net
Long-Term
Capital
Gains | | | Accumulated
Capital and
Other
Losses | | | Unrealized
Appreciation/
(Depreciation) | | | Temporary
Differences | | | Total
Distributable
Earnings
(Loss) - Net | |
| Climate Focused Bond Fund | | $ | – | | | $ | – | | | $ | – | | | $ | (3,059,147 | ) | | $ | (639,588 | ) | | $ | (256,781 | ) | | $ | (3,955,516 | ) |
| Emerging Markets Equity Fund | | | – | | | | 49,809 | | | | – | | | | (494,640 | ) | | | 742,095 | | | | (483 | ) | | | 296,781 | |
| International Growth Fund | | | – | | | | 8,883 | | | | – | | | | (548,939 | ) | | | 572,126 | | | | (878 | ) | | | 31,192 | |
| Investment Grade Floating Rate Fund | | | – | | | | 304,496 | | | | 22,081 | | | | – | | | | 114,026 | | | | (156,381 | ) | | | 284,222 | |
| Short Duration High Yield Fund | | | – | | | | 47,492,642 | | | | 604,376 | | | | – | | | | 79,737,732 | | | | (34,338,352 | ) | | | 93,496,398 | |
Net capital losses recognized by the Funds may be carried forward indefinitely and retain their character as short-term and/or long-term losses. Capital losses incurred that will be carried forward are as follows:
| Fund | | Short-Term
Losses | | | Long-Term
Losses | | | Net Capital
Losses | |
| Climate Focused Bond Fund | | | $(1,106,990 | ) | | | $(1,952,157 | ) | | | $(3,059,147 | ) |
| Emerging Markets Equity Fund | | | (477,562 | ) | | | (17,078 | ) | | | (494,640 | ) |
| International Growth Fund | | | (456,222 | ) | | | (92,717 | ) | | | (548,939 | ) |
| Investment Grade Floating Rate Fund | | | – | | | | – | | | | – | |
| Short Duration High Yield Fund | | | – | | | | – | | | | – | |
At each Fund’s election, certain losses incurred within the taxable year are deemed to arise on the first business day of the Fund’s next taxable year. The Funds incurred and will elect to defer qualified late-year ordinary losses and/or post-October capital losses as follows:
| Fund | | Late-Year Ordinary
Losses | | | Short-Term
Losses | | | Long-Term
Losses | |
| Climate Focused Bond Fund | | | $89,232 | | | $ | – | | | $ | – | |
| Emerging Markets Equity Fund | | | – | | | | – | | | | – | |
| International Growth Fund | | | – | | | | – | | | | – | |
| Investment Grade Floating Rate Fund | | | – | | | | – | | | | – | |
| Short Duration High Yield Fund | | | – | | | | – | | | | – | |
117
Notes to Financial Statements (continued)
As of July 31, 2024, the tax cost of investments and the breakdown of unrealized appreciation/(depreciation) for each Fund are shown below. The difference between book-basis and tax basis unrealized appreciation/(depreciation) is attributable to the tax treatment of certain securities, other financial instruments, amortization of premium, and wash sales.
| Fund | | Tax Cost of
Investments | | | Gross
Unrealized
Appreciation | | | Gross
Unrealized
Depreciation | | | Net
Unrealized
Appreciation/
(Depreciation) | |
| Climate Focused Bond Fund | | $ | 21,860,227 | | | $ | 406,615 | | | $ | (1,045,743 | ) | | $ | (639,128 | ) |
| Emerging Markets Equity Fund | | | 4,486,011 | | | | 1,009,636 | | | | (220,961 | ) | | | 788,675 | |
| International Growth Fund | | | 2,192,062 | | | | 623,185 | | | | (45,811 | ) | | | 577,374 | |
| Investment Grade Floating Rate Fund | | | 43,464,005 | | | | 118,446 | | | | (5,512 | ) | | | 112,934 | |
| Short Duration High Yield Fund | | | 5,575,488,788 | | | | 111,688,855 | | | | (31,988,814 | ) | | | 79,700,041 | |
There were no permanent differences identified as of July 31, 2024.
| 5. | PORTFOLIO SECURITIES TRANSACTIONS |
Purchases and sales of investment securities (excluding short-term investments) during the fiscal year ended July 31, 2024 were as follows:
| | | U.S.
Government
Purchases* | | | Non-U.S.
Government
Purchases | | | U.S.
Government
Sales* | | | Non-U.S.
Government
Sales | |
| Climate Focused Bond Fund | | $ | 3,271,987 | | | $ | 9,650,807 | | | $ | 2,871,924 | | | $ | 8,685,649 | |
| Emerging Markets Equity Fund | | | – | | | | 3,840,112 | | | | – | | | | 3,857,174 | |
| International Growth Fund | | | – | | | | 2,292,375 | | | | – | | | | 2,654,193 | |
| Investment Grade Floating Rate Fund | | | 11,480,740 | | | | 46,108,713 | | | | 9,625,429 | | | | 16,674,479 | |
| Short Duration High Yield Fund | | | 2,399,904,528 | | | | 6,420,083,563 | | | | 2,235,628,592 | | | | 2,555,310,684 | |
| * | Includes U.S. Government sponsored enterprises securities. |
Each Fund is permitted to purchase and sell securities (“cross-trade”) from and to other Lord Abbett funds or client accounts pursuant to procedures approved by the Board in compliance with Rule 17a-7 under the Act (the “Rule”). Each cross-trade is executed at a fair market price in compliance with provisions of the Rule. For the fiscal year ended July 31, 2024, the Funds did not engage in cross-trade purchases or sales.
| 6. | DISCLOSURES ABOUT DERIVATIVE INSTRUMENTS AND HEDGING ACTIVITIES |
Climate Focused Bond Fund, Investment Grade Floating Rate Fund and Short Duration High Yield Fund entered into forward foreign currency exchange contracts during the fiscal year ended July 31, 2024 (as described in Note 2(g)). A forward foreign currency exchange contract reduces each Fund’s exposure to changes in the value of the currency it will deliver (or settle in cash) and increases its exposure to changes in the value of the currency it will receive (or settle in cash) for the duration of the contract. Each Fund’s use of forward foreign currency exchange contracts involves the risk that Lord Abbett will not accurately predict currency movements, and each Fund’s returns could be reduced as a result. Forward foreign currency exchange contracts are subject to the risk that those currencies will decline in value relative to the U.S. dollar, or, in the case of hedged positions, that the U.S. dollar will decline relative to the currency being hedged. Currency rates in foreign countries may fluctuate significantly over short periods of time. Each Fund’s risk of
118
Notes to Financial Statements (continued)
loss from counterparty credit risk is the unrealized appreciation on forward foreign currency exchange contracts
Climate Focused Bond Fund, Investment Grade Floating Rate Fund and Short Duration High Yield Fund entered into futures contracts during the fiscal year ended July 31, 2024 (as described in Note 2(h)) to economically hedge against changes in interest rates. The Funds bear the risk of interest rates moving unexpectedly, in which case the Funds may not achieve the anticipated benefits of the futures contracts and realize a loss. There is minimal counterparty credit risk to the Funds since futures are exchange traded and the exchange’s clearinghouse, as counterparty to all exchange traded futures, guarantees futures against default.
Short Duration High Yield Fund entered into credit default swap contracts during the fiscal year ended July 31, 2024 (as described in Note 2(i)) for investment purposes, to economically hedge credit risk or for speculative purposes. Credit default swap contracts involve the exchange of a fixed rate premium for protection against the loss in value of an underlying security in the event of a defined credit event, such as payment default or bankruptcy. Under a credit default swap contract one party acts as a guarantor by receiving the fixed periodic payment in exchange for the commitment to purchase the underlying security at par if the defined credit event occurs. Upon the occurrence of a defined credit event, the difference between the value of the reference obligation and the swap contract’s notional amount is recorded as net realized gain (loss) on swap contracts in the Statements of Operations. The Fund’s maximum risk of loss from counterparty risk, either as the protection seller or as the protection buyer, is the fair value of the contract. For the centrally cleared credit default swap contracts, there is minimal counterparty credit risk to the Fund since these credit default swap contracts are traded through a central clearinghouse. As a counterparty to all centrally cleared credit default swaps, the clearinghouse guarantees credit default swap contracts against default.
Short Duration High Yield Fund entered into total return swap contracts on indexes during the fiscal year ended July 31, 2024 (as described in Note 2(o)) to hedge credit risk. The Fund may enter into total return swap contract agreements to obtain exposure to a security or market without owning such security or investing directly in that market. The Fund may agree to make payments that are the equivalent of interest in exchange for the right to receive payments equivalent to any appreciation in the value of an underlying security, index or other asset, as well as receive payments equivalent to any distributions made on that asset, over the term of the swap contract. If the value of the asset underlying a total return swap contract declines over the term of the swap contract, the Fund also may be required to pay an amount equal to that decline in value to its counterparty.
As of July 31, 2024, each Fund had the following derivatives at fair value, grouped into appropriate risk categories that illustrate each Funds’ use of derivative instruments:
| | | Climate Focused Bond Fund |
| Asset Derivatives | | Interest
Rate
Contracts | | | Foreign
Currency
Contracts | |
| Forward Foreign Currency Exchange Contracts(1) | | | – | | | $ | 84,847 | |
| Futures Contracts(2) | | $ | 138,565 | | | | – | |
| | | | | | | | | |
| Liability Derivatives | | | | | | | | |
| Forward Foreign Currency Exchange Contracts(3) | | | – | | | $ | 27,464 | |
| Futures Contracts(2) | | $ | 67,313 | | | | – | |
119
Notes to Financial Statements (continued)
| | | Investment Grade Floating Rate Fund |
| Asset Derivatives | | Interest
Rate
Contracts | | | Foreign
Currency
Contracts | |
| Forward Foreign Currency Exchange Contracts(1) | | $ | – | | | $ | 2,216 | |
| | | | | | | | | |
| Liability Derivatives | | | | | | | | |
| Forward Foreign Currency Exchange Contracts(3) | | | – | | | $ | 1,386 | |
| Futures Contracts(2) | | $ | 17,966 | | | | – | |
| | | Short Duration High Yield Fund |
| Asset Derivatives | | Interest
Rate
Contracts | | | Foreign
Currency
Contracts | | | Credit
Contracts | |
| Centrally Cleared Credit Default Swap Contracts(4) | | $ | – | | | | – | | | $ | 14,542,337 | |
| Forward Foreign Currency Exchange Contracts(1) | | | – | | | $ | 1,385,047 | | | | – | |
| | | | | | | | | | | | | |
| Liability Derivatives | | | | | | | | | | | | |
| Centrally Cleared Credit Default Swap Contracts(4) | | | – | | | | – | | | | $42,610 | |
| Forward Foreign Currency Exchange Contracts(3) | | | – | | | $ | 1,578,860 | | | | – | |
| Futures Contracts(2) | | $ | 1,194,125 | | | | – | | | | – | |
| (1) | Statements of Assets and Liabilities location: Unrealized appreciation on forward foreign currency exchange contracts. |
| (2) | Statements of Assets and Liabilities location: Includes cumulative unrealized appreciation/depreciation of futures contracts as reported in the Schedules of Investments. Only current day’s variation margin is reported within the Statements of Assets and Liabilities. |
| (3) | Statements of Assets and Liabilities location: Unrealized depreciation on forward foreign currency exchange contracts. |
| (4) | Statements of Assets and Liabilities location: Includes cumulative unrealized appreciation/depreciation of centrally cleared swap contracts as reported in the Schedules of Investments. Only current day’s variation margin is reported within the Statements of Assets and Liabilities. |
| | | Climate Focused Bond Fund | |
| | | Inflation
Linked/
Interest
Rate
Contracts | | | Foreign
Currency
Contracts | |
| Net Realized Gain (Loss) | | | | | | |
| Forward Foreign Currency Exchange Contracts(1) | | $ | – | | | $ | 58,950 | |
| Futures Contracts(2) | | | (10,853 | ) | | | – | |
| Net Change in Unrealized Appreciation/Depreciation | | | | | | | | |
| Forward Foreign Currency Exchange Contracts(3) | | | – | | | | 223,707 | |
| Futures Contracts(4) | | | 38,568 | | | | – | |
| Average Number of Contracts/Notional Amounts* | | | | | | | | |
| Forward Foreign Currency Exchange Contracts(5) | | | – | | | | 11,827,615 | |
| Futures Contracts(6) | | | 66 | | | | – | |
120
Notes to Financial Statements (continued)
| | | Investment Grade Floating Rate Fund | |
| | | Inflation
Linked/
Interest
Rate
Contracts | | | Foreign
Currency
Contracts | |
| Net Realized Gain (Loss) | | | | | | |
| Forward Foreign Currency Exchange Contracts(1) | | $ | – | | | $ | (821 | ) |
| Futures Contracts(2) | | | 45,183 | | | | – | |
| Net Change in Unrealized Appreciation/Depreciation | | | | | | | | |
| Forward Foreign Currency Exchange Contracts(3) | | | – | | | | 830 | |
| Futures Contracts(4) | | | (44,234 | ) | | | – | |
| Average Number of Contracts/Notional Amounts* | | | | | | | | |
| Forward Foreign Currency Exchange Contracts(5) | | | – | | | | 300,728 | |
| Futures Contracts(6) | | | 8 | | | | – | |
| | | | | | Short Duration High Yield Fund | |
| | | Equity
Contracts | | | Inflation
Linked/
Interest
Rate
Contracts | | | Foreign
Currency
Contracts | | | Credit
Contracts | |
| Net Realized Gain (Loss) | | | | | | | | | | | | |
| Credit Default Swap Contracts(7) | | $ | – | | | $ | – | | | $ | – | | | $ | 11,347,950 | |
| Forward Foreign Currency Exchange Contracts(1) | | | – | | | | – | | | | (798,697 | ) | | | – | |
| Futures Contracts(2) | | | – | | | | 811,268 | | | | – | | | | – | |
| Total Return Swap Contracts(7) | | | (350,595 | ) | | | – | | | | – | | | | – | |
| Net Change in Unrealized Appreciation/Depreciation | | | | | | | | | | | | | | | | |
| Credit Default Swap Contracts(8) | | | – | | | | – | | | | – | | | | 181,947 | |
| Forward Foreign Currency Exchange Contracts(3) | | | – | | | | – | | | | 934,133 | | | | – | |
| Futures Contracts(4) | | | – | | | | (1,194,125 | ) | | | – | | | | – | |
| Average Number of Contracts/Notional Amounts* | | | | | | | | | | | | | | | | |
| Credit Default Swap Contracts(5) | | | – | | | | – | | | | – | | | | 106,194,549 | |
| Forward Foreign Currency Exchange Contracts(5) | | | – | | | | – | | | | 157,538,336 | | | | – | |
| Futures Contracts(6) | | | – | | | | 1,170 | | | | – | | | | – | |
| * | Calculated based on the number of contracts or notional amounts for the fiscal year ended July 31, 2024. |
| (1) | Statements of Operations location: Net realized gain (loss) on forward foreign currency exchange contracts. |
| (2) | Statements of Operations location: Net realized gain (loss) on futures contracts. |
| (3) | Statements of Operations location: Net change in unrealized appreciation/depreciation on forward foreign currency exchange contracts. |
| (4) | Statements of Operations location: Net change in unrealized appreciation/depreciation on futures contracts. |
| (5) | Amount represents notional amounts in U.S. dollars. |
| (6) | Amount represents number of contracts. |
| (7) | Statements of Operations location: Net realized gain (loss) on swap contracts. |
| (8) | Statements of Operations location: Net change in unrealized appreciation/depreciation on swap contracts. |
121
Notes to Financial Statements (continued)
| 7. | DISCLOSURES ABOUT OFFSETTING ASSETS AND LIABILITIES |
The FASB requires disclosures intended to help better assess the effect or potential effect of offsetting arrangements on a fund’s financial position. The following tables illustrate gross and net information about recognized assets and liabilities eligible for offset in the Statements of Assets and Liabilities and disclose such amounts subject to an enforceable master netting agreement or similar agreement, by the counterparty. A master netting agreement is an agreement between a fund and a counterparty which provides for the net settlement of amounts owed under all contracts traded under that agreement, as well as cash collateral, through a single payment by one party to the other in the event of default on or termination of any one contract. The Funds’ accounting policy with respect to balance sheet offsetting is that, absent an event of default by the counterparty or a termination of the agreement, the master netting agreement does not result in an offset of reported amounts of financial assets and liabilities in the Statements of Assets and Liabilities across transactions between the Funds and the applicable counterparty:
| | | Climate Focused Bond Fund |
| Description | | Gross Amounts of
Recognized Assets | | | Gross Amounts
Offset in the
Statement of Assets
and Liabilities | | | Net Amounts of
Assets Presented
in the Statement of
Assets and Liabilities |
| Forward Foreign Currency Exchange Contracts | | $ | 84,847 | | | $ | – | | | $ | 84,847 |
| Repurchase Agreements | | | 333,313 | | | | – | | | | 333,313 |
| Total | | $ | 418,160 | | | $ | – | | | $ | 418,160 |
| | | | | | | | | | | | |
| | | Net Amounts
of Assets
Presented in
the Statement
of Assets and
Liabilities | | |
Amounts Not Offset in the
Statement of Assets and Liabilities | | | |
| Counterparty | | | | Financial
Instruments | | | Cash
Collateral
Received(a) | | | Securities
Collateral
Received(a) | | | Net
Amount(b) |
| Bank of America | | $ | 359 | | | $ | (359 | ) | | $ | – | | | $ | – | | | $ | – |
| Morgan Stanley | | | 83,023 | | | | (402 | ) | | | – | | | | – | | | | 82,621 |
| State Street Bank and Trust | | | 1,186 | | | | (1,186 | ) | | | – | | | | – | | | | – |
| Toronto Dominion Bank | | | 279 | | | | (279 | ) | | | – | | | | – | | | | – |
| Fixed Income Clearing Corp. | | | 333,313 | | | | – | | | | – | | | | (333,313 | ) | | | – |
| Total | | $ | 418,160 | | | $ | (2,226 | ) | | $ | – | | | $ | (333,313 | ) | | $ | 82,621 |
| | | | | | | | | | | | | | | | | | | | |
| Description | | Gross Amounts of
Recognized Liabilities | | | Gross Amounts
Offset in the
Statement of Assets
and Liabilities | | | Net Amounts of
Liabilities Presented
in the Statement of
Assets and Liabilities |
| Forward Foreign Currency Exchange Contracts | | $ | 27,464 | | | $ | – | | | $ | 27,464 |
| Total | | $ | 27,464 | | | $ | – | | | $ | 27,464 |
122
Notes to Financial Statements (continued)
| | | Net Amounts
of Liabilities
Presented in
the Statement
of Assets and
Liabilities | | |
Amounts Not Offset in the
Statement of Assets and Liabilities | | | |
| Counterparty | | | | Financial
Instruments | | | Cash
Collateral
Pledged(a) | | | Securities
Collateral
Pledged(a) | | | Net
Amount(c) |
| Bank of America | | $ | 1,349 | | | $ | (359 | ) | | $ | – | | | $ | – | | | $ | 990 |
| Morgan Stanley | | | 402 | | | | (402 | ) | | | – | | | | – | | | | – |
| State Street Bank and Trust | | | 24,721 | | | | (1,186 | ) | | | – | | | | – | | | | 23,535 |
| Toronto Dominion Bank | | | 992 | | | | (279 | ) | | | – | | | | – | | | | 713 |
| Total | | $ | 27,464 | | | $ | (2,226 | ) | | $ | – | | | $ | – | | | $ | 25,238 |
| | | | | | | | | | | | | | | | | | | | |
| | | | | | Investment Grade Floating Rate Fund |
| Description | | Gross Amounts of
Recognized Assets | | | Gross Amounts
Offset in the
Statement of Assets
and Liabilities | | | Net Amounts of
Assets Presented
in the Statement of
Assets and Liabilities |
| Forward Foreign Currency Exchange Contracts | | $ | 2,216 | | | $ | – | | | $ | 2,216 |
| Total | | $ | 2,216 | | | $ | – | | | $ | 2,216 |
| | | | | | | | | | | | |
| | | Net Amounts
of Assets
Presented in
the Statement
of Assets and
Liabilities | | |
Amounts Not Offset in the
Statement of Assets and Liabilities | | | |
| Counterparty | | | | Financial
Instruments | | | Cash
Collateral
Received(a) | | | Securities
Collateral
Received(a) | | | Net
Amount(b) |
| Morgan Stanley | | $ | 2,216 | | | $ | (1,223 | ) | | $ | – | | | $ | – | | | $ | 993 |
| Total | | $ | 2,216 | | | $ | (1,223 | ) | | $ | – | | | $ | – | | | $ | 993 |
| | | | | | | | | | | | | | | | | | | | |
| Description | | Gross Amounts of
Recognized Liabilities | | | Gross Amounts
Offset in the
Statement of Assets
and Liabilities | | | Net Amounts of
Liabilities Presented
in the Statement of
Assets and Liabilities |
| Forward Foreign Currency Exchange Contracts | | $ | 1,386 | | | $ | – | | | $ | 1,386 |
| Total | | $ | 1,386 | | | $ | – | | | $ | 1,386 |
| | | | | | | | | | | | |
| | | Net Amounts
of Liabilities
Presented in
the Statement
of Assets and
Liabilities | | |
Amounts Not Offset in the
Statement of Assets and Liabilities | | | |
| Counterparty | | | | Financial
Instruments | | | Cash
Collateral
Pledged(a) | | | Securities
Collateral
Pledged(a) | | | Net
Amount(c) |
| Goldman Sachs | | $ | 163 | | | $ | – | | | $ | – | | | $ | – | | | $ | 163 |
| Morgan Stanley | | | 1,223 | | | | (1,223 | ) | | | – | | | | – | | | | – |
| Total | | $ | 1,386 | | | $ | (1,223 | ) | | $ | – | | | $ | – | | | $ | 163 |
123
Notes to Financial Statements (continued)
| | | | | | Short Duration High Yield Fund |
| Description | | Gross Amounts of
Recognized Assets | | | Gross Amounts
Offset in the
Statement of Assets
and Liabilities | | | Net Amounts of
Assets Presented
in the Statement of
Assets and Liabilities |
| Forward Foreign Currency Exchange Contracts | | $ | 1,385,047 | | | $ | – | | | $ | 1,385,047 |
| Repurchase Agreements | | | 50,989,293 | | | | – | | | | 50,989,293 |
| Total | | $ | 52,374,340 | | | $ | – | | | $ | 52,374,340 |
| | | | | | | | | | | | |
| | | Net Amounts
of Assets
Presented in
the Statement
of Assets and
Liabilities | | |
Amounts Not Offset in the
Statement of Assets and Liabilities | | | |
| Counterparty | | | | Financial
Instruments | | | Cash
Collateral
Received(a) | | | Securities
Collateral
Received(a) | | | Net
Amount(b) |
| Bank of America | | $ | 20,082 | | | $ | – | | | $ | – | | | $ | – | | | $ | 20,082 |
| Morgan Stanley | | | 1,068,176 | | | | (152,592 | ) | | | (880,000 | ) | | | – | | | | 35,584 |
| State Street Bank and Trust | | | 168,112 | | | | (168,112 | ) | | | – | | | | – | | | | – |
| Toronto Dominion Bank | | | 128,677 | | | | – | | | | – | | | | – | | | | 128,677 |
| Fixed Income Clearing Corp. | | | 17,989,293 | | | | – | | | | – | | | | (17,989,293 | ) | | | – |
| Barclays Bank PLC | | | 33,000,000 | | | | – | | | | – | | | | (33,000,000 | ) | | | – |
| Total | | $ | 52,374,340 | | | $ | (320,704 | ) | | $ | (880,000 | ) | | $ | (50,989,293 | ) | | $ | 184,343 |
| | | | | | | | | | | | | | | | | | | | |
| Description | | Gross Amounts of
Recognized Liabilities | | | Gross Amounts
Offset in the
Statement of Assets
and Liabilities | | | Net Amounts of
Liabilities Presented
in the Statement of
Assets and Liabilities |
| Forward Foreign Currency Exchange Contracts | | $ | 1,578,860 | | | $ | – | | | $ | 1,578,860 |
| Total | | $ | 1,578,860 | | | $ | – | | | $ | 1,578,860 |
| | | | | | | | | | | | |
| | | Net Amounts
of Liabilities
Presented in
the Statement
of Assets and
Liabilities | | |
Amounts Not Offset in the
Statement of Assets and Liabilities | | | |
| Counterparty | | | | Financial
Instruments | | | Cash
Collateral
Pledged(a) | | | Securities
Collateral
Pledged(a) | | | Net
Amount(c) |
| Barclays Bank PLC | | $ | 22,719 | | | $ | – | | | $ | – | | | $ | – | | | $ | 22,719 |
| Morgan Stanley | | | 152,592 | | | | (152,592 | ) | | | – | | | | – | | | | – |
| State Street Bank and Trust | | | 1,403,549 | | | | (168,112 | ) | | | (1,235,437 | ) | | | – | | | | – |
| Total | | $ | 1,578,860 | | | $ | (320,704 | ) | | $ | (1,235,437 | ) | | $ | – | | | $ | 22,719 |
| | | | | | | | | | | | | | | | | | | | |
| (a) | Collateral disclosed is limited to an amount not to exceed 100% of the net amount of assets (liabilities) presented in the Statements of Assets and Liabilities, for each respective counterparty. |
| (b) | Net amount represents the amount owed to the Fund by the counterparty as of July 31, 2024. |
| (c) | Net amount represents the amount owed by the Fund to the counterparty as of July 31, 2024. |
The Trust’s officers and one Trustee, who are associated with Lord Abbett, do not receive any compensation from the Trust for serving in such capacities. Independent Trustees’ fees are allocated amongst Lord Abbett-sponsored funds subject to the oversight of the Independent Directors. There is an equity-based plan available to Independent Trustees under which Independent Trustees may elect to defer receipt of a portion of Trustees’ fees. The deferred
124
Notes to Financial Statements (continued)
amounts are treated as though equivalent dollar amounts had been invested in the Funds. Such amounts and earnings accrued thereon are included in Trustees’ fees in the Statements of Operations and in Trustees’ fees payable in the Statements of Assets and Liabilities and are not deductible for U.S. federal income tax purposes until such amounts are paid.
For the period ended July 31, 2024, the Funds and certain other funds managed by Lord Abbett (collectively, the “Participating Funds”) were party to a syndicated line of credit facility with various lenders for $1.6 billion (the “Syndicated Facility”) under which State Street Bank and Trust Company (“SSB”) participated as a lender and as agent for the lenders. The Participating Funds were subject to graduated borrowing limits of one-third of fund net assets (if fund net assets are less than $750 million), $250 million, $300 million, $700 million, or $1 billion, based on past borrowings and likelihood of future borrowings, among other factors.
Effective August 1, 2024, the Participating Funds renewed the Syndicated Facility for $1.6 billion. The Participating Funds are subject to graduated borrowing limits of one-third of fund net assets (if fund net assets are less than $750 million), $250 million, $700 million, or $1 billion, based on past borrowings and likelihood of future borrowings, among other factors.
For the period ended July 31, 2024, the Participating Funds were also party to an additional uncommitted line of credit facility with SSB for $330 million (the “Bilateral Facility”). Under the Bilateral Facility, the Participating Funds were subject to graduated borrowing limits of one-third of fund net assets (if fund net assets are less than $750 million), or $250 million based on past borrowings and likelihood of future borrowings, among other factors.
Effective August 1, 2024, the Participating Funds renewed the Bilateral Facility in the same amount. The Participating Funds remain subject to the same borrowing limits as were in place prior to the renewal.
These credit facilities are to be used for short-term working capital purposes as additional sources of liquidity to satisfy redemptions.
For the fiscal year ended July 31, 2024, the Funds did not utilize the Syndicated Facility or Bilateral Facility.
| 10. | INTERFUND LENDING PROGRAM |
Pursuant to an exemptive order issued by the U.S. Securities and Exchange Commission (“SEC exemptive order”) certain registered open-end management investment companies managed by Lord Abbett, including each Fund, participate in a joint lending and borrowing program (the “Interfund Lending Program”). The SEC exemptive order allows the funds that participate in the Interfund Lending Program to borrow money from and lend money to each other for temporary or emergency purposes subject to the limitations and conditions.
For the fiscal year ended July 31, 2024, the following Fund participated as a lender in the Interfund Lending Program. For the period in which the loan was outstanding, the average amount loaned, average interest rate and interest income were as follows:
| Fund | Average
Amount
Loaned | Average
Interest
Rate | Interest
Income* |
| Short Duration High Yield | $16,058,996 | 4.57% | $2,009 |
| | |
| * | Statement of Operations location: Interest earned from interfund lending. |
125
Notes to Financial Statements (continued)
| 11. | CUSTODIAN AND ACCOUNTING AGENT |
SSB is the Funds’ custodian and accounting agent. SSB performs custodial, accounting and recordkeeping functions relating to portfolio transactions and calculating each Fund’s NAV.
| 12. | SECURITIES LENDING AGREEMENT |
The Funds have established a securities lending agreement with Citibank, N.A. for the lending of securities to qualified brokers in exchange for securities or cash collateral equal to at least the market value of securities loaned, plus interest, if applicable. Cash collateral is invested in an approved money market fund. In accordance with the Funds’ securities lending agreement, the market value of securities on loan is determined each day at the close of business and any additional collateral required to cover the value of securities on loan is delivered to the Funds on the next business day. As with other extensions of credit, the Funds may experience a delay in the recovery of their securities or incur a loss should the borrower of the securities breach its agreement with the Funds or the borrower becomes insolvent at a time when the collateral is insufficient to cover the cost of repurchasing securities on loan. Any income earned from securities lending is included in Securities lending net income in each Fund’s Statement of Operations.
The initial collateral received by the Funds is required to have a value equal to at least 100% of the market value of the securities loaned. The collateral must be marked-to-market daily to cover increases in the market value of the securities loaned (or potentially a decline in the value of the collateral). In general, the risk of borrower default will be borne by Citibank, N.A.; the Funds will bear the risk of loss with respect to the investment of the cash collateral. The advantage of such loans is that the Funds continue to receive income on loaned securities while receiving a portion of any securities lending fees and earning returns on the cash amounts which may be reinvested for the purchase of investments in securities.
As of July 31, 2024, the market value of securities loaned and collateral received were as follow:
| Fund | Market Value of
Securities Loaned | Collateral Received(1) |
| Short Duration High Yield Fund | $172,320,315 | $179,172,622 |
| | |
| (1) | Statement of Assets and Liabilities location: Collateral due to broker for securities lending. |
Each of the Climate Focused Bond Fund, Investment Grade Floating Rate Fund and Short Duration High Yield Fund is subject to the general risks and considerations associated with investing in debt securities and to the changing prospects of individual companies and/or sectors in which the Funds invest. The value of an investment will change as interest rates fluctuate and in response to market movements. When interest rates rise, the prices of debt securities are likely to decline; when rates fall, such prices tend to rise. Longer-term debt securities are usually more sensitive to interest rate changes. There is also the risk that an issuer of a debt security will fail to make timely payments of principal or interest to a Fund, a risk that is greater with high-yield securities (sometimes called “lower-rated bonds” or “junk bonds”), in which the Funds may substantially invest. Some issuers, particularly of high-yield securities, may default as to principal and/or interest payments after a fund purchases its securities. A default, or concerns in the market about an increase in the risk of default, may result in losses to the Funds. High-yield securities are subject to greater price fluctuations, as well as additional risks. The market for below investment
126
Notes to Financial Statements (continued)
grade securities may be less liquid, which may make such securities more difficult to sell at an acceptable price, especially during periods of financial distress, increased market volatility, or significant market decline.
Each Fund is subject to the general risks and considerations associated with equity investing. The value of the Funds’ investments will fluctuate in response to movements in the equity securities markets in general and to the changing prospects of individual companies in which the Funds invest. If a Fund’s assessment of a company’s value or prospects for exceeding earnings expectations or market conditions is wrong, the Fund could suffer losses or produce poor performance relative to other funds, even in a favorable market.
Certain instruments in which the Funds may invest have historically relied on LIBOR. As of June 30, 2023, the administrator of LIBOR ceased publication of US dollar LIBOR settings. The LIBOR transition could have adverse impacts on newly issued financial instruments and existing financial instruments which referenced LIBOR and lead to significant short-term and long-term uncertainty and market instability.
The Climate Focused Bond Fund is subject to the risk that its climate-focused investment strategy may select or exclude securities of certain issuers for reasons other than investment performance considerations and that the Fund may underperform funds that do not utilize a climate-focused investment strategy. Certain climate-focused investments may be dependent on government policies and subsidies, which are subject to change or elimination. There can be no assurance that the operations of a given issuer in which the Fund invests will in fact have a positive impact on the climate. Successful application of the Fund’s climate-focused investment strategy will depend on Lord Abbett’s skill in properly identifying and analyzing material climate-related issues and related business practices, and there can be no assurance that the strategy or techniques employed will be successful.
Large company stocks, in which the International Growth Fund may invest, may perform differently than the market as a whole and other types of stocks, such as small company stocks.
Each Fund is subject to the risks of investing in foreign securities. Foreign securities may pose greater risks than domestic securities, including greater price fluctuations, economic, political, and social instability and subject to less government supervision, lack of transparency, inadequate regulatory and accounting standards, foreign taxes, and higher transaction costs. The securities of foreign companies also may be subject to inadequate exchange control regulations, the imposition of economic sanctions, threat thereof or other government restrictions, higher transaction and other costs, and delays in settlement to the extent they are traded on non-U.S. exchanges or markets. Foreign investments also may be affected by changes in currency rates or currency controls. These risks are generally greater for securities issued by companies in emerging market companies.
Each of the Climate Focused Bond Fund, Investment Grade Floating Rate Fund and Short Duration High Yield Fund is subject to the risk of investing in securities issued or guaranteed by the U.S. Government or its agencies and instrumentalities (such as the Government National Mortgage Association (“Ginnie Mae”), the Federal National Mortgage Association (“Fannie Mae”), or the Federal Home Loan Mortgage Corporation (“Freddie Mac”)). Unlike Ginnie Mae securities, securities issued or guaranteed by U.S. Government related organizations such as Fannie Mae and Freddie Mac are not backed by the full faith and credit of the U.S. Government and no assurance can be given that the U.S. Government would provide financial support to its agencies and
127
Notes to Financial Statements (continued)
instrumentalities if not required to do so by law. Consequently, the Funds may be required to look principally to the agency issuing or guaranteeing the obligation.
The mortgage-related and asset-backed securities in which the Climate Focused Bond Fund, Investment Grade Floating Rate Fund and Short Duration High Yield Fund may invest may be particularly sensitive to changes in prevailing interest rates, and economic conditions, including delinquencies and/or defaults. These changes can affect the value, income, and/or liquidity of such positions. When interest rates are declining, the value of these securities with prepayment features may not increase as much as other fixed income securities. Early principal repayment may deprive a Fund of income payments above current market rates. Alternatively, rising interest rates may cause prepayments to occur at a slower-than expected rate, extending the duration of a security and typically reducing its value. The payment rate will thus affect the price and volatility of a mortgage-related security. In addition, a Fund may invest in non-agency asset backed and mortgage related securities, which are issued by private institutions, not by government-sponsored enterprises.
Each of the Emerging Markets Equity Fund and International Growth Fund is subject to the risks of investing in growth stocks. Growth stocks typically trade at higher multiples of current earnings than other stocks. Growth stocks often are more sensitive to market fluctuations than other securities because their market prices are highly sensitive to future earnings expectations. At times when it appears that these expectations may not be met, prices of growth stocks typically fall. Growth stocks may be more volatile than securities of slower-growing issuers.
Each of the Climate Focused Bond Fund and Short Duration High Yield Fund may invest in convertible securities, which have both equity and fixed income risk characteristics, including market, credit, liquidity, and interest rate risks. Generally, convertible securities offer lower interest or dividend yields than non-convertible securities of similar quality and less potential for gains or capital appreciation in a rising equity securities market than equity securities. They tend to be more volatile than other fixed income securities and the market for convertible securities may be less liquid than the markets for stocks or bonds. A significant portion of convertible securities have below investment grade credit ratings and are subject to increased credit and liquidity risks.
Each Fund is subject to the risks associated with derivatives, which may be different from and greater than the risks associated with directly investing in securities. Derivatives may be subject to risks such as liquidity risk, leveraging risk, interest rate risk, market risk, and credit risk. Illiquid securities may lower the Funds’ returns since the Funds may be unable to sell these securities at their desired time or price. Derivatives also may involve the risk of mispricing or improper valuation and the risk that changes in the value of the derivative may not correlate perfectly with the value of the underlying asset, rate or index. Whether a Fund’s use of derivatives is successful may depend on, among other things, the Fund’s ability to correctly forecast market movements and other factors. Losses may also arise from the failure of a derivative counterparty to meet its contractual obligations. If the Fund incorrectly forecasts these and other factors, its performance could suffer. The Fund’s use of derivatives could result in a loss exceeding the amount of the Fund’s investment in these instruments.
Each of the Climate Focused Bond Fund, Investment Grade Floating Rate Fund and Short Duration High Yield Fund may invest in loans, which include, among other things, loans to U.S. or foreign corporations, partnerships, other business entities, or to U.S. and non-U.S. governments. Each Fund may invest in fixed rate and variable rate loans and floating or adjustable rate loans,
128
Notes to Financial Statements (continued)
including bridge loans, novations, assignments, and participations, which are subject to increased credit and liquidity risks. Floating rate or adjustable rate senior loans are subject to increased credit and liquidity risks. The loans in which the Short Duration High Yield Fund invests will usually be rated below investment grade or may also be unrated. Below investment grade loans, as in the case of high-yield debt securities, or junk bonds, are usually more credit sensitive than interest rate sensitive, although the value of these instruments may be impacted by broader interest rate swings in the overall fixed income market. The Short Duration High Yield Fund may also invest in, or obtain exposure to, obligations that may be “covenant-lite,” which means such obligations lack certain financial maintenance covenants. Should a loan held by the Fund begin to deteriorate in quality, the Fund’s ability to negotiate with the borrower may be delayed under a covenant-lite loan compared to a loan with full maintenance covenants. This may in turn delay the Fund’s ability to seek to recover its investment. The Investment Grade Floating Rate Fund may also invest in, or obtain exposure to, collateralized loan obligations (“CLOs”) and may be subject to the economic risks of the underlying loans combined with the risks associated with the CLO structure governing the priority of payments, and include interest rate risk, credit risk, liquidity risk, prepayment risk, and the risk of default of the underlying asset, among others.
Emerging Markets Equity Fund is a non-diversified mutual fund under the Act. The value of the Fund’s investments may be more adversely affected by a single economic, political or regulatory event than the value of the investments of a diversified mutual fund.
Geopolitical and other events (e.g., wars, terrorism, natural disasters, epidemics or pandemics) may disrupt securities markets and adversely affect global economies and markets, thereby decreasing the value of each Fund’s investments. Market disruptions can also prevent each Fund from implementing its investment strategies and achieving its investment objectives.
Other adverse developments that affect financial institutions or the financial services industry generally, or concerns or rumors about any events of these kinds or other similar risks, may reduce liquidity in the market generally or have other adverse effects on the economy, each Fund or issuers in which each Fund invests. In addition, issuers in which each Fund invests and each Fund may not be able to identify all potential solvency or stress concerns with respect to a financial institution or to transfer assets from one bank or financial institution to another in a timely manner in the event such bank or financial institution comes under stress or fails.
The impact of the COVID-19 outbreak, and the effects of other infectious illness outbreaks, epidemics, or pandemics, may be short term or may continue for an extended period of time. For example, a global pandemic or other widespread health crises could negatively affect the global economy, the economies of individual countries, and the financial performance of individual issuers, sectors, industries, asset classes, and markets in significant and unforeseen ways. Health crises caused by outbreaks of disease may also exacerbate other pre-existing political, social, and economic risks in certain countries or globally. The foregoing could disrupt the operations of each Fund and its service providers, adversely affect the value and liquidity of each Fund’s investments, and negatively impact each Fund’s performance and your investment in each Fund.
Advancements in technology may also adversely impact markets and the overall performance of the Funds. For instance, the economy may be significantly impacted by the advanced development and increased regulation of technology. As the use of technology grows, liquidity and market movements may be affected. As technology is used more widely in the asset management industry, the profitability and growth of each Fund’s holdings may be impacted, which could significantly impact the overall performance of each Fund.
129
Notes to Financial Statements (continued)
| 14. | SUMMARY OF CAPITAL TRANSACTIONS |
Transactions in shares of beneficial interest were as follows:
| Climate Focused Bond Fund | | Year Ended
July 31, 2024 | | | Year Ended
July 31, 2023 | |
| Class A Shares | | Shares | | | Amount | | | Shares | | | Amount | |
| Shares sold | | | 77,942 | | | $ | 647,312 | | | | 79,499 | | | $ | 669,267 | |
| Reinvestment of distributions | | | 16,186 | | | | 134,753 | | | | 21,099 | | | | 174,235 | |
| Shares reacquired | | | (27,723 | ) | | | (230,087 | ) | | | (66,962 | ) | | | (582,689 | ) |
| Increase | | | 66,405 | | | $ | 551,978 | | | | 33,636 | | | $ | 260,813 | |
| | | | | | | | | | | | | | | | | |
| Class C Shares | | | | | | | | | | | | | | | | |
| Shares sold | | | 3,007 | | | $ | 24,822 | | | | 1,529 | | | $ | 12,593 | |
| Reinvestment of distributions | | | 53 | | | | 444 | | | | 3,158 | | | | 26,018 | |
| Shares reacquired | | | (1,237 | ) | | | (10,105 | ) | | | (45,595 | ) | | | (378,284 | ) |
| Increase (decrease) | | | 1,823 | | | $ | 15,161 | | | | (40,908 | ) | | $ | (339,673 | ) |
| | | | | | | | | | | | | | | | | |
| Class F Shares | | | | | | | | | | | | | | | | |
| Shares sold | | | 4,988 | | | $ | 41,554 | | | | 40,221 | | | $ | 340,774 | |
| Reinvestment of distributions | | | 1,966 | | | | 16,358 | | | | 12,773 | | | | 105,471 | |
| Shares reacquired | | | (51,595 | ) | | | (432,907 | ) | | | (144,990 | ) | | | (1,211,732 | ) |
| Decrease | | | (44,641 | ) | | $ | (374,995 | ) | | | (91,996 | ) | | $ | (765,487 | ) |
| | | | | | | | | | | | | | | | | |
| Class I Shares | | | | | | | | | | | | | | | | |
| Shares sold | | | 493,037 | | | $ | 4,082,314 | | | | 475,817 | | | $ | 3,965,453 | |
| Reinvestment of distributions | | | 70,071 | | | | 583,261 | | | | 70,039 | | | | 577,189 | |
| Shares reacquired | | | (378,831 | ) | | | (3,134,596 | ) | | | (443,545 | ) | | | (3,726,025 | ) |
| Increase | | | 184,277 | | | $ | 1,530,979 | | | | 102,311 | | | $ | 816,617 | |
| | | | | | | | | | | | | | | | | |
| Class R3 Shares | | | | | | | | | | | | | | | | |
| Shares sold | | | 176 | | | $ | 1,462 | | | | 258 | | | $ | 2,126 | |
| Reinvestment of distributions | | | 16 | | | | 129 | | | | 3 | | | | 25 | |
| Shares reacquired | | | (1 | ) | | | (8 | ) | | | – | | | | – | |
| Increase | | | 191 | | | $ | 1,583 | | | | 261 | | | $ | 2,151 | |
| | | | | | | | | | | | | | | | | |
| Class R4 Shares | | | | | | | | | | | | | | | | |
| Shares sold | | | 161 | | | $ | 1,330 | | | | 799 | | | $ | 6,901 | |
| Reinvestment of distributions | | | 47 | | | | 390 | | | | 61 | | | | 501 | |
| Shares reacquired | | | (3 | ) | | | (24 | ) | | | (1 | ) | | | (10 | ) |
| Increase | | | 205 | | | $ | 1,696 | | | | 859 | | | $ | 7,392 | |
| | | | | | | | | | | | | | | | | |
| Class R6 Shares | | | | | | | | | | | | | | | | |
| Shares sold | | | 20,810 | | | $ | 170,551 | | | | 17,587 | | | $ | 152,492 | |
| Reinvestment of distributions | | | 650 | | | | 5,418 | | | | 131 | | | | 1,085 | |
| Shares reacquired | | | (14,129 | ) | | | (116,726 | ) | | | (18,179 | ) | | | (149,640 | ) |
| Increase (decrease) | | | 7,331 | | | $ | 59,243 | | | | (461 | ) | | $ | 3,937 | |
130
Notes to Financial Statements (continued)
| Emerging Markets Equity Fund | | Year Ended
July 31, 2024 | | | Year Ended
July 31, 2023 | |
| Class A Shares | | Shares | | | Amount | | | Shares | | | Amount | |
| Shares sold | | | 13,644 | | | $ | 188,085 | | | | 8,139 | | | $ | 114,679 | |
| Reinvestment of distributions | | | 265 | | | | 3,707 | | | | 24 | | | | 307 | |
| Shares reacquired | | | (6,243 | ) | | | (92,606 | ) | | | (682 | ) | | | (9,315 | ) |
| Increase | | | 7,666 | | | $ | 99,186 | | | | 7,481 | | | $ | 105,671 | |
| | | | | | | | | | | | | | | | | |
| Class C Shares | | | | | | | | | | | | | | | | |
| Shares sold | | | 97 | | | $ | 1,450 | | | | 1,411 | | | $ | 19,423 | |
| Reinvestment of distributions | | | 10 | | | | 136 | | | | – | | | | – | |
| Shares reacquired | | | (64 | ) | | | (982 | ) | | | (72 | ) | | | (962 | ) |
| Increase | | | 43 | | | $ | 604 | | | | 1,339 | | | $ | 18,461 | |
| | | | | | | | | | | | | | | | | |
| International Growth Fund | | Year Ended
July 31, 2024 | | | Year Ended
July 31, 2023 | |
| Class A Shares | | Shares | | | Amount | | | Shares | | | Amount | |
| Shares sold | | | 11,983 | | | $ | 145,539 | | | | 32,725 | | | $ | 397,519 | |
| Reinvestment of distributions | | | 258 | | | | 3,226 | | | | 280 | | | | 3,081 | |
| Shares reacquired | | | (32,120 | ) | | | (392,441 | ) | | | (2,153 | ) | | | (25,969 | ) |
| Increase (decrease) | | | (19,879 | ) | | $ | (243,676 | ) | | | 30,852 | | | $ | 374,631 | |
| | | | | | | | | | | | | | | | | |
| Class C Shares | | | | | | | | | | | | | | | | |
| Shares sold | | | 2,967 | | | $ | 38,686 | | | | 1,465 | | | $ | 17,711 | |
| Shares reacquired | | | (1,152 | ) | | | (15,136 | ) | | | (2,040 | ) | | | (24,453 | ) |
| Increase (decrease) | | | 1,815 | | | $ | 23,550 | | | | (575 | ) | | $ | (6,742 | ) |
| | | | | | | | | | | | | | | | | |
| Class I Shares | | | | | | | | | | | | | | | | |
| Shares sold | | | 547 | | | $ | 7,705 | | | | 17,673 | | | $ | 221,682 | |
| Reinvestment of distributions | | | 115 | | | | 1,440 | | | | – | | | | – | |
| Shares reacquired | | | (4,854 | ) | | | (60,212 | ) | | | – | | | | – | |
| Increase (decrease) | | | (4,192 | ) | | $ | (51,067 | ) | | | 17,673 | | | $ | 221,682 | |
| | | | | | | | | | | | | | | | | |
| Class R3 Shares | | | | | | | | | | | | | | | | |
| Shares sold | | | 28 | | | $ | 375 | | | | 253 | | | $ | 3,009 | |
| Reinvestment of distributions | | | 1 | | | | 9 | | | | – | | | | – | |
| Increase | | | 29 | | | $ | 384 | | | | 253 | | | $ | 3,009 | |
| | | | | | | | | | | | | | | | | |
| Class R6 Shares | | | | | | | | | | | | | | | | |
| Shares sold | | | 1,729 | | | $ | 23,144 | | | | 20,525 | | | $ | 243,343 | |
| Reinvestment of distributions | | | 27 | | | | 348 | | | | – | | | | – | |
| Shares reacquired | | | (8,745 | ) | | | (104,336 | ) | | | (8,448 | ) | | | (102,014 | ) |
| Increase (decrease) | | | (6,989 | ) | | $ | (80,844 | ) | | | 12,077 | | | $ | 141,329 | |
131
Notes to Financial Statements (continued)
| Investment Grade Floating Rate Fund | | Year Ended
July 31, 2024 | | | For the period ended
July 31, 2023(a) | |
| Class A Shares | | Shares | | | Amount | | | Shares | | | Amount | |
| Shares sold | | | 288,310 | | | $ | 2,938,566 | | | | 194,338 | | | $ | 1,944,000 | |
| Reinvestment of distributions | | | 11,332 | | | | 115,459 | | | | 709 | | | | 7,131 | |
| Shares reacquired | | | (12,643 | ) | | | (129,135 | ) | | | – | | | | – | |
| Increase | | | 286,999 | | | $ | 2,924,890 | | | | 195,047 | | | $ | 1,951,131 | |
| | | | | | | | | | | | | | | | | |
| Class C Shares | | | | | | | | | | | | | | | | |
| Shares sold | | | 7,621 | | | $ | 77,854 | | | | 50,348 | | | $ | 503,500 | |
| Reinvestment of distributions | | | 30 | | | | 307 | | | | 1 | | | | 10 | |
| Shares reacquired | | | (1,169 | ) | | | (11,854 | ) | | | (250 | ) | | | (2,516 | ) |
| Increase | | | 6,482 | | | $ | 66,307 | | | | 50,099 | | | $ | 500,994 | |
| | | | | | | | | | | | | | | | | |
| Class F Shares | | | | | | | | | | | | | | | | |
| Shares sold | | | 49,992 | | | $ | 510,285 | | | | 2,500 | | | $ | 25,000 | |
| Reinvestment of distributions | | | 711 | | | | 7,239 | | | | – | | | | – | |
| Shares reacquired | | | (4,048 | ) | | | (41,239 | ) | | | – | | | | – | |
| Increase | | | 46,655 | | | $ | 476,285 | | | | 2,500 | | | $ | 25,000 | |
| | | | | | | | | | | | | | | | | |
| Class F3 Shares | | | | | | | | | | | | | | | | |
| Shares sold | | | – | | | $ | – | | | | 2,500 | | | $ | 25,000 | |
| Increase | | | – | | | $ | – | | | | 2,500 | | | $ | 25,000 | |
| | | | | | | | | | | | | | | | | |
| Class I Shares | | | | | | | | | | | | | | | | |
| Shares sold | | | 2,581,066 | | | $ | 26,398,064 | | | | 700,000 | | | $ | 7,000,000 | |
| Reinvestment of distributions | | | 9,930 | | | | 101,588 | | | | – | | | | – | |
| Shares reacquired | | | (26,880 | ) | | | (274,655 | ) | | | – | | | | – | |
| Increase | | | 2,564,116 | | | $ | 26,224,997 | | | | 700,000 | | | $ | 7,000,000 | |
| | | | | | | | | | | | | | | | | |
| Class R5 Shares | | | | | | | | | | | | | | | | |
| Shares sold | | | – | | | $ | – | | | | 2,500 | | | $ | 25,000 | |
| Increase | | | – | | | $ | – | | | | 2,500 | | | $ | 25,000 | |
| | | | | | | | | | | | | | | | | |
| Class R6 Shares | | | | | | | | | | | | | | | | |
| Shares sold | | | – | | | $ | – | | | | 142,500 | | | $ | 1,425,000 | |
| Increase | | | – | | | $ | – | | | | 142,500 | | | $ | 1,425,000 | |
| | | | | | | | | | | | | | | | | |
| Short Duration High Yield Fund | | Year Ended
July 31, 2024 | | | Year Ended
July 31, 2023 | |
| Class A Shares | | Shares | | | Amount | | | Shares | | | Amount | |
| Shares sold | | | 42,395,026 | | | $ | 413,714,475 | | | | 9,754,297 | | | $ | 93,457,412 | |
| Reinvestment of distributions | | | 2,127,012 | | | | 20,807,440 | | | | 289,773 | | | | 2,778,711 | |
| Shares reacquired | | | (5,560,295 | ) | | | (54,315,393 | ) | | | (1,613,315 | ) | | | (15,515,526 | ) |
| Increase | | | 38,961,743 | | | $ | 380,206,522 | | | | 8,430,755 | | | $ | 80,720,597 | |
| | | | | | | | | | | | | | | | | |
| Class C Shares | | | | | | | | | | | | | | | | |
| Shares sold | | | 12,244,212 | | | $ | 119,643,772 | | | | 2,732,521 | | | $ | 26,210,610 | |
| Reinvestment of distributions | | | 549,138 | | | | 5,371,788 | | | | 60,574 | | | | 580,948 | |
| Shares reacquired | | | (1,007,780 | ) | | | (9,850,673 | ) | | | (271,313 | ) | | | (2,607,929 | ) |
| Increase | | | 11,785,570 | | | $ | 115,164,887 | | | | 2,521,782 | | | $ | 24,183,629 | |
132
Notes to Financial Statements (concluded)
| Short Duration High Yield Fund | | | | | Year Ended
July 31, 2024 | | | | | | Year Ended
July 31, 2023 | |
| Class F Shares | | Shares | | | Amount | | | Shares | | | Amount | |
| Shares sold | | | 8,950,714 | | | $ | 86,916,794 | | | | 10,086,141 | | | $ | 96,633,583 | |
| Reinvestment of distributions | | | 452,104 | | | | 4,407,784 | | | | 305,656 | | | | 2,929,945 | |
| Shares reacquired | | | (3,853,499 | ) | | | (37,159,617 | ) | | | (9,084,301 | ) | | | (87,269,819 | ) |
| Increase | | | 5,549,319 | | | $ | 54,164,961 | | | | 1,307,496 | | | $ | 12,293,709 | |
| | | | | | | | | | | | | | | | | |
| Class F3 Shares | | | | | | | | | | | | | | | | |
| Shares sold | | | 24,764,409 | | | $ | 240,889,670 | | | | 1 | | | $ | 15 | |
| Reinvestment of distributions | | | 972,336 | | | | 9,530,401 | | | | – | | | | – | |
| Shares reacquired | | | (1,991,804 | ) | | | (19,530,583 | ) | | | – | | | | – | |
| Increase | | | 23,744,941 | | | $ | 230,889,488 | | | | 1 | | | $ | 15 | |
| | | | | | | | | | | | | | | | | |
| Class I Shares | | | | | | | | | | | | | | | | |
| Shares sold | | | 387,990,386 | | | $ | 3,775,170,879 | | | | 122,579,924 | | | $ | 1,173,028,826 | |
| Reinvestment of distributions | | | 20,277,680 | | | | 197,844,593 | | | | 2,774,811 | | | | 26,580,492 | |
| Shares reacquired | | | (87,547,649 | ) | | | (850,916,993 | ) | | | (15,980,804 | ) | | | (152,572,189 | ) |
| Increase | | | 320,720,417 | | | $ | 3,122,098,479 | | | | 109,373,931 | | | $ | 1,047,037,129 | |
| | | | | | | | | | | | | | | | | |
| Class R3 Shares | | | | | | | | | | | | | | | | |
| Shares sold | | | 13,499 | | | $ | 132,478 | | | | 5,518 | | | $ | 52,741 | |
| Reinvestment of distributions | | | 1,009 | | | | 9,875 | | | | 67 | | | | 648 | |
| Shares reacquired | | | (145 | ) | | | (1,423 | ) | | | (92 | ) | | | (869 | ) |
| Increase | | | 14,363 | | | $ | 140,930 | | | | 5,493 | | | $ | 52,520 | |
| | | | | | | | | | | | | | | | | |
| Class R4 Shares | | | | | | | | | | | | | | | | |
| Shares sold | | | 11,487 | | | $ | 112,002 | | | | – | | | $ | – | |
| Reinvestment of distributions | | | 658 | | | | 6,443 | | | | – | | | | – | |
| Shares reacquired | | | (173 | ) | | | (1,696 | ) | | | – | | | | – | |
| Increase | | | 11,972 | | | $ | 116,749 | | | | – | | | $ | – | |
| | | | | | | | | | | | | | | | | |
| Class R5 Shares | | | | | | | | | | | | | | | | |
| Shares sold | | | 22,218 | | | $ | 218,838 | | | | – | | | $ | – | |
| Reinvestment of distributions | | | 452 | | | | 4,448 | | | | – | | | | – | |
| Shares reacquired | | | (4 | ) | | | (39 | ) | | | – | | | | – | |
| Increase | | | 22,666 | | | $ | 223,247 | | | | – | | | $ | – | |
| | | | | | | | | | | | | | | | | |
| Class R6 Shares | | | | | | | | | | | | | | | | |
| Shares sold | | | 552,642 | | | $ | 5,408,032 | | | | 65,416 | | | $ | 630,665 | |
| Reinvestment of distributions | | | 5,889 | | | | 58,036 | | | | – | | | | – | |
| Shares reacquired | | | (46,073 | ) | | | (449,454 | ) | | | (1 | ) | | | (10 | ) |
| Increase | | | 512,458 | | | $ | 5,016,614 | | | | 65,415 | | | $ | 630,655 | |
| (a) | For the period May 1, 2023 (commencement of operations) to July 31, 2023. |
133
Report of Independent Registered Public Accounting Firm
To the shareholders and the Board of Trustees of Lord Abbett Trust I
Opinion on the Financial Statements and Financial Highlights
We have audited the accompanying statements of assets and liabilities of Lord Abbett Trust I comprising the Lord Abbett Climate Focused Bond Fund, Lord Abbett Emerging Markets Equity Fund, Lord Abbett International Growth Fund, Lord Abbett Investment Grade Floating Rate Fund, and Lord Abbett Short Duration High Yield Fund (the “Funds”), including the schedules of investments, as of July 31, 2024, and the related statements of operations, statements of changes in net assets, and the financial highlights for the periods indicated in the table below, and the related notes. In our opinion, the financial statements and financial highlights present fairly, in all material respects, the financial position of each of the funds listed above constituting Lord Abbett Trust I as of July 31, 2024, and the results of their operations, the changes in their net assets and the financial highlights for the periods indicated in the table below, in conformity with accounting principles generally accepted in the United States of America.
Individual Funds Comprising
Lord Abbett Trust I | Statement of
Operations | Statements of
Changes in Net Assets | Financial
Highlights |
| Lord Abbett Climate Focused Bond Fund | For the year ended July 31, 2024 | For the years ended July 31, 2024 and 2023 | For the years ended July 31, 2024, 2023, 2022, 2021, and the period from May 20, 2020 (commencement of operations) through July 31, 2020 |
| Lord Abbett Emerging Markets Equity Fund | For the year ended July 31, 2024 | For the years ended July 31, 2024 and 2023 | For the years ended July 31, 2024, 2023, and the period from March 2, 2022 (commencement of operations) through July 31, 2022 |
| Lord Abbett International Growth Fund | For the year ended July 31, 2024 | For the years ended July 31, 2024 and 2023 | For the years ended July 31, 2024, 2023, 2022, and the period from June 18, 2021 (commencement of operations) through July 31, 2021 |
134
| Lord Abbett Investment Grade Floating Rate Fund | For the year ended July 31, 2024 | For the year ended July 31, 2024, and the period from May 1, 2023 (commencement of operations) through July 31, 2023 |
| Lord Abbett Short Duration High Yield Fund | For the year ended July 31, 2024 | For the years ended July 31, 2024 and 2023 | For the years ended July 31, 2024, 2023, 2022, 2021, and the period from April 22, 2020 (commencement of operations) through July 31, 2020 |
Basis for Opinion
These financial statements and financial highlights are the responsibility of the Funds’ management. Our responsibility is to express an opinion on the Funds’ financial statements and financial highlights based on our audits. We are a public accounting firm registered with the Public Company Accounting Oversight Board (United States) (PCAOB) and are required to be independent with respect to the Funds in accordance with the U.S. federal securities laws and the applicable rules and regulations of the Securities and Exchange Commission and the PCAOB.
We conducted our audits in accordance with the standards of the PCAOB. Those standards require that we plan and perform the audit to obtain reasonable assurance about whether the financial statements and financial highlights are free of material misstatement, whether due to error or fraud. The Funds are not required to have, nor were we engaged to perform, an audit of their internal control over financial reporting. As part of our audits we are required to obtain an understanding of internal control over financial reporting but not for the purpose of expressing an opinion on the effectiveness of the Funds’ internal control over financial reporting. Accordingly, we express no such opinion.
Our audits included performing procedures to assess the risks of material misstatement of the financial statements and financial highlights, whether due to error or fraud, and performing procedures that respond to those risks. Such procedures included examining, on a test basis, evidence regarding the amounts and disclosures in the financial statements and financial highlights. Our audits also included evaluating the accounting principles used and significant estimates made by management, as well as evaluating the overall presentation of the financial statements and financial highlights. Our procedures included confirmation of securities owned as of July 31, 2024, by correspondence with the custodian or counterparties; when replies were not received, we performed other auditing procedures. We believe that our audits provide a reasonable basis for our opinion.
DELOITTE & TOUCHE LLP
New York, New York
September 23, 2024
We have served as the auditor of one or more Lord Abbett Family of Funds’ investment companies since 1932.
135
Changes in and Disagreements with Accountants
There were no changes in or disagreements with accountants during the period.
Proxy Disclosures
There were no matters submitted to a vote of shareholders during the period.
Remuneration Paid to Trustees, Officers, and Others
Remuneration paid to trustees, officers, and others is included in “Trustees’ Remuneration” under Item 7 of this Form N-CSR.
136
Tax Information (unaudited)
The percentages below reflect the portion of ordinary income distributions that are eligible for the corporate dividend received deduction (DRD) and qualified dividend income (QDI) for individual shareholders:
| Fund Name | | DRD | | QDI |
| Climate Focused Bond Fund | | | 0% | | | 0% |
| Emerging Markets Equity Fund | | | 0% | | | 75% |
| International Growth Fund | | | 0% | | | 0% |
| Investment Grade Floating Rate Fund | | | 0% | | | 0% |
| Short Duration High Yield Fund | | | 0% | | | 0% |
For foreign shareholders, the percentages below reflect the portion of net investment income distributions that represent interest-related dividends:
| Fund Name | | Interest-related
dividends |
| Climate Focused Bond Fund | | | 27% |
| Emerging Markets Equity Fund | | | 0% |
| International Growth Fund | | | 0% |
| Investment Grade Floating Rate Fund | | | 48% |
| Short Duration High Yield Fund | | | 59% |
Of the distributions paid to the shareholders during the most recently ended fiscal year, the following amounts represent long-term capital gains:
| Fund Name | | Long-Term
Capital Gains |
| Climate Focused Bond Fund | | $ | – |
| Emerging Markets Equity Fund | | | – |
| International Growth Fund | | | – |
| Investment Grade Floating Rate Fund | | | 29,701 |
| Short Duration High Yield Fund | | | – |
The Funds listed below intend to pass through foreign source income and foreign taxes as follows:
| Fund Name | | Foreign
Source Income | | | Foreign Taxes |
| Climate Focused Bond Fund | | $ | – | | | $ | – |
| Emerging Markets Equity Fund | | | 148,905 | | | | 28,267 |
| International Growth Fund | | | 21,048 | | | | 4,979 |
| Investment Grade Floating Rate Fund | | | – | | | | – |
| Short Duration High Yield Fund | | | – | | | | – |
137


This report, when not used for the general information of shareholders of the Fund, is to be distributed only if preceded or accompanied by a current fund prospectus. Lord Abbett mutual fund shares are distributed by
LORD ABBETT DISTRIBUTOR LLC. | | Lord Abbett Trust I Climate Focused Bond Fund Emerging Markets Equity Fund International Growth Fund Investment Grade Floating Rate Fund Short Duration High Yield Fund | TRUST-I-2
(09/24) |

LORD ABBETT
FINANCIAL STATEMENTS
AND OTHER IMPORTANT
INFORMATION
Lord Abbett
Diversification Shares – Enhanced Municipal Yield Completion Fund
For the period ended July 31, 2024
Table of Contents
Schedule of Investments
July 31, 2024
| Investments | | Interest
Rate | | Maturity
Date | | Credit
Rating:
S&P or
Moody’s(a) | | Principal
Amount | | | Fair
Value | |
| LONG-TERM INVESTMENTS 98.17% | | | | | | | | | | | | | | |
| | | | | | | | | | | | | | | |
| MUNICIPAL BONDS 98.17% | | | | | | | | | | | | | | |
| | | | | | | | | | | | | | | |
| Corporate-Backed 28.67% | | | | | | | | | | | | | | |
| Arkansas Development Finance Authority - Big River Steel LLC AR AMT† | | 4.75% | | 9/1/2049 | | Ba2 | | $ | 100,000 | | | $ | 100,276 | |
| City of Houston Airport System Revenue - United Airlines Inc TX AMT | | 5.00% | | 7/15/2028 | | BB- | | | 100,000 | | | | 102,710 | |
| Hobe-St Lucie Conservancy District Unit of Development No 1A | | 4.75% | | 5/1/2031 | | NR | | | 100,000 | | | | 102,647 | |
| Iowa Finance Authority - Howmet Aerospace Inc | | 4.75% | | 8/1/2042 | | BBB- | | | 200,000 | | | | 199,993 | |
| Iowa Finance Authority - Iowa Fertilizer Co LLC | | 5.00% | | 12/1/2050 | | BBB- | | | 100,000 | | | | 106,221 | |
| Louisiana Local Government Environmental Facilities & Community Development Authority - Westlake Corp | | 3.50% | | 11/1/2032 | | BBB+ | | | 100,000 | | | | 96,991 | |
| Mission Economic Development Corp. - Natgasoline LLC TX AMT† | | 4.625% | | 10/1/2031 | | BB- | | | 100,000 | | | | 99,903 | |
| Mississippi Business Finance Corp. - Huntington Ingalls Industries Inc | | 4.55% | | 12/1/2028 | | BBB- | | | 100,000 | | | | 100,017 | |
| New Jersey Economic Development Authority - United Airlines Inc | | 5.25% | | 9/15/2029 | | BB- | | | 10,000 | | | | 10,006 | |
| New York Transportation Development Corp. - Delta Air Lines Inc AMT | | 5.00% | | 10/1/2035 | | Baa3 | | | 200,000 | | | | 210,500 | |
| Phenix City Industrial Development Board AL | | 3.625% | | 5/15/2030 | | BBB | | | 40,000 | | | | 40,000 | |
| Port of Beaumont Navigation District - Jefferson 2020 Bond Lessee & Borrower LLC Obligated Group TX† | | 5.00% | | 1/1/2039 | | NR | | | 100,000 | | | | 100,893 | |
| Tuscaloosa County Industrial Development Authority - Hunt Refining Co AL† | | 5.25% | | 5/1/2044 | | NR | | | 100,000 | | | | 101,248 | |
| Total | | | | | | | | | | | | | 1,371,405 | |
| | | | | | | | | | | | | | | |
| Energy 2.13% | | | | | | | | | | | | | | |
| PEFA, Inc. IA (cost $101,675) | | 5.00% | #(b) | 9/1/2049 | | A3 | | | 100,000 | | | | 102,097 | |
| | | | | | | | | | | | | | | |
| General Obligation 4.16% | | | | | | | | | | | | | | |
| Academical Village Community Development District FL | | 2.875% | | 5/1/2025 | | NR | | | 100,000 | | | | 98,730 | |
| Chicago Board of Education IL GO | | 5.25% | | 12/1/2039 | | BB+ | | | 30,000 | | | | 30,038 | |
| | | |
| | See Notes to Financial Statements. | 1 |
Schedule of Investments (continued)
July 31, 2024
| Investments | | Interest
Rate | | Maturity
Date | | Credit
Rating:
S&P or
Moody’s(a) | | Principal
Amount | | | Fair
Value | |
| General Obligation (continued) | | | | | | | | | | | | | | |
| Commonwealth of Puerto Rico GO | | Zero Coupon | | 7/1/2033 | | NR | | $ | 83,656 | | | $ | 56,438 | |
| Commonwealth of Puerto Rico GO | | 5.375% | | 7/1/2025 | | NR | | | 13,480 | | | | 13,593 | |
| Total | | | | | | | | | | | | | 198,799 | |
| | | | | | | | | | | | | | | |
| Health Care 21.91% | | | | | | | | | | | | | | |
| California Statewide Communities Development Authority - Loma Linda University Medical Obligated Group† | | 5.00% | | 12/1/2026 | | BB | | | 100,000 | | | | 102,148 | |
| City of Colby KS - Citizens Medical Center Inc | | 5.50% | | 7/1/2026 | | NR | | | 100,000 | | | | 100,325 | |
| City of Minneapolis - Fairview Health Services Obligated Group MN | | 5.00% | | 11/15/2034 | | BBB+ | | | 110,000 | | | | 111,057 | |
| Doylestown Hospital Authority - Doylestown Hospital Obligated Group PA† | | 5.00% | | 7/1/2031 | | NR | | | 30,000 | | | | 31,262 | |
| Dutchess County Local Development Corp. - Nuvance Health Obligated Group NY | | 4.00% | | 7/1/2034 | | BBB | | | 100,000 | | | | 100,048 | |
| Massachusetts Development Finance Agency - Tufts Medicine Obligated Group | | 5.00% | | 7/1/2044 | | BBB- | | | 100,000 | | | | 100,245 | |
| New York State Dormitory Authority - Montefiore Obligated Group | | 4.00% | | 8/1/2036 | | BBB- | | | 125,000 | | | | 123,802 | |
| Public Finance Authority - RBS Evolution LLC WI† | | 10.00% | | 11/1/2038 | | NR | | | 150,000 | | | | 167,691 | |
| Wisconsin Health & Educational Facilities Authority - Marshfield Clinic Health System Obligated Group | | 5.00% | | 2/15/2029 | | BBB | | | 200,000 | | | | 211,566 | |
| Total | | | | | | | | | | | | | 1,048,144 | |
| | | | | | | | | | | | | | | |
| Housing 4.10% | | | | | | | | | | | | | | |
| New Hampshire Business Finance Authority (cost $194,648) | | 4.375% | | 9/20/2036 | | BBB | | | 194,648 | | | | 196,196 | |
| | | | | | | | | | | | | | | |
| Tax Revenue 11.95% | | | | | | | | | | | | | | |
| Matching Fund Special Purpose Securitization Corp. - United States Virgin Islands Federal Excise Tax | | 5.00% | | 10/1/2039 | | NR | | | 200,000 | | | | 208,163 | |
| Public Finance Authority - Southeast Overtown Park West Community Redevelopment Agency WI† | | 5.00% | | 6/1/2041 | | NR | | | 100,000 | | | | 101,458 | |
| Puerto Rico Sales Tax Financing Corp. Sales Tax Revenue | | 4.329% | | 7/1/2040 | | NR | | | 109,000 | | | | 108,414 | |
| | | |
| 2 | See Notes to Financial Statements. | |
Schedule of Investments (continued)
July 31, 2024
| Investments | | Interest
Rate | | Maturity
Date | | Credit
Rating:
S&P or
Moody’s(a) | | Principal
Amount | | | Fair
Value | |
| Tax Revenue (continued) | | | | | | | | | | | | | | |
| Puerto Rico Sales Tax Financing Corp. Sales Tax Revenue | | 4.329% | | 7/1/2040 | | NR | | $ | 54,000 | | | $ | 53,709 | |
| Puerto Rico Sales Tax Financing Corp. Sales Tax Revenue | | 4.50% | | 7/1/2034 | | NR | | | 100,000 | | | | 100,166 | |
| Total | | | | | | | | | | | | | 571,910 | |
| | | | | | | | | | | | | | | |
| Tobacco 6.12% | | | | | | | | | | | | | | |
| Buckeye Tobacco Settlement Financing Authority OH | | 5.00% | | 6/1/2055 | | NR | | | 200,000 | | | | 185,492 | |
| Nassau County Tobacco Settlement Corp. NY | | 5.25% | | 6/1/2026 | | CCC+ | | | 12,068 | | | | 11,892 | |
| Tobacco Settlement Financing Corp. VA | | 5.00% | | 6/1/2047 | | B- | | | 100,000 | | | | 95,537 | |
| Total | | | | | | | | | | | | | 292,921 | |
| | | | | | | | | | | | | | | |
| Transportation 8.90% | | | | | | | | | | | | | | |
| California Municipal Finance Authority - LAX Integrated Express Solutions LLC AMT | | 5.00% | | 12/31/2035 | | BB+ | (c) | | 10,000 | | | | 10,334 | |
| Central Texas Turnpike System | | 5.00% | | 8/15/2042 | | A- | | | 100,000 | | | | 100,461 | |
| New York Transportation Development Corp. - JFK NTO LLC AMT | | 5.25% | | 6/30/2041 | | Baa3 | | | 200,000 | | | | 216,517 | |
| Texas Private Activity Bond Surface Transportation Corp. - NTE Mobility Partners Segments 3 LLC AMT | | 5.375% | | 6/30/2037 | | Baa1 | | | 25,000 | | | | 27,185 | |
| Virginia Small Business Financing Authority - Elizabeth River Crossings OpCo AMT | | 4.00% | | 1/1/2040 | | BBB | | | 75,000 | | | | 71,407 | |
| Total | | | | | | | | | | | | | 425,904 | |
| | | | | | | | | | | | | | | |
| Utilities 10.23% | | | | | | | | | | | | | | |
| Black Belt Energy Gas District AL | | 4.00% | #(b) | 12/1/2052 | | Baa1 | | | 100,000 | | | | 99,967 | |
| Main Street Natural Gas, Inc. GA† | | 4.00% | #(b) | 8/1/2052 | | BBB- | | | 100,000 | | | | 98,480 | |
| Main Street Natural Gas, Inc. GA | | 5.00% | #(b) | 12/1/2054 | | A3 | | | 100,000 | | | | 106,591 | |
| Maricopa County Pollution Control Corp. - El Paso Electric Co AZ | | 3.60% | | 4/1/2040 | | Baa2 | | | 90,000 | | | | 82,656 | |
| Pennsylvania Economic Development Financing Authority - Talen Energy Supply LLC | | 5.25% | #(b) | 12/1/2038 | | BB- | | | 100,000 | | | | 101,642 | |
| Total | | | | | | | | | | | | | 489,336 | |
| Total Investments in Securities 98.17% (cost $4,625,716) | | | | | | | | | | | | | 4,696,712 | |
| Other Assets and Liabilities – Net 1.83% | | | | | | | | | | | | | 87,558 | |
| Net Assets 100.00% | | | | | | | | | | | | $ | 4,784,270 | |
| | | |
| | See Notes to Financial Statements. | 3 |
Schedule of Investments (concluded)
July 31, 2024
| AMT | | Income from the security may be subject to Alternative Minimum Tax. |
| † | | Security was purchased pursuant to Rule 144A under the Securities Act of 1933 and, unless registered under such Act or exempted from registration, may only be resold to qualified institutional buyers. At July 31, 2024, the total value of Rule 144A securities was $903,359, which represents 18.88% of net assets. |
| # | | Variable rate security. The interest rate represents the rate in effect at July 31, 2024. |
| (a) | | Unaudited. |
| (b) | | Variable Rate is Fixed to Float: Rate remains fixed or at Zero Coupon until designated future date. |
| (c) | | This investment has been rated by Fitch IBCA. |
The following is a summary of the inputs used as of July 31, 2024 in valuing the Fund’s investments carried at fair value(1):
| Investment Type(2) | | Level 1 | | | Level 2 | | | Level 3 | | | Total | |
| Long-Term Investments | | | | | | | | | | | | | | | | |
| Municipal Bonds | | $ | – | | | $ | 4,696,712 | | | $ | – | | | $ | 4,696,712 | |
| Total | | $ | – | | | $ | 4,696,712 | | | $ | – | | | $ | 4,696,712 | |
| (1) | | Refer to Note 2(i) for a description of fair value measurements and the three-tier hierarchy of inputs. |
| (2) | | See Schedule of Investments for fair values in each industry. The table above is presented by Investment Type. Industries are presented within an Investment Type should such Investment Type include securities classified as two or more levels within the three-tier fair value hierarchy. When applicable, each Level 3 security is identified on the Schedule of Investments along with the valuation technique utilized. |
A reconciliation of Level 3 investments is presented when the Fund has a material amount of Level 3 investments at the beginning or end of the period in relation to the Fund’s net assets.
| 4 | See Notes to Financial Statements. | |
Statement of Assets and Liabilities
July 31, 2024
| ASSETS: | | | | |
| Investments in securities, at cost | | $ | 4,625,716 | |
| Investments in securities, at fair value | | $ | 4,696,712 | |
| Cash | | | 40,425 | |
| Receivables: | | | | |
| Interest | | | 47,746 | |
| From advisor (See Note 3) | | | 12,698 | |
| Capital shares sold | | | 6,026 | |
| Prepaid expenses | | | 10,404 | |
| Total assets | | | 4,814,011 | |
| LIABILITIES: | | | | |
| Payables: | | | | |
| Capital shares reacquired | | | 4,846 | |
| Trustees’ fees | | | 12 | |
| Distributions payable | | | 17,437 | |
| Accrued expenses | | | 7,446 | |
| Total liabilities | | | 29,741 | |
| NET ASSETS | | $ | 4,784,270 | |
| COMPOSITION OF NET ASSETS: | | | | |
| Paid-in capital | | $ | 4,713,914 | |
| Total distributable earnings (loss) | | | 70,356 | |
| Net Assets | | $ | 4,784,270 | |
| Outstanding shares (unlimited number of authorized shares of beneficial interest): | | | 469,859 | |
| Net asset value, offering and redemption price per share (Net assets divided by outstanding shares) | | | $10.18 | |
| | See Notes to Financial Statements. | 5 |
Statement of Operations
For the Period Ended July 31, 2024*
| Investment income: | | | |
| Interest and other | | $ | 47,355 | |
| Expenses: | | | | |
| Professional | | | 30,413 | |
| Reports to shareholders | | | 2,745 | |
| Registration | | | 1,890 | |
| Shareholder servicing | | | 523 | |
| Custody | | | 400 | |
| Trustees’ fees | | | 29 | |
| Other | | | 1,646 | |
| Gross expenses | | | 37,646 | |
| Fees waived and expenses reimbursed (See Note 3) | | | (37,646 | ) |
| Net expenses | | | – | |
| Net investment income | | | 47,355 | |
| Net realized and unrealized gain (loss): | | | | |
| Net realized gain (loss) on investments | | | (1,893 | ) |
| Net change in unrealized appreciation/depreciation on investments | | | 70,996 | |
| Net realized and unrealized gain (loss) | | | 69,103 | |
| Net Increase in Net Assets Resulting From Operations | | $ | 116,458 | |
| * | For the period April 9, 2024, commencement of operations, to July 31, 2024. |
| 6 | See Notes to Financial Statements. |
Statement of Changes in Net Assets
| INCREASE IN NET ASSETS | | For the Period Ended
July 31, 2024* | |
| Operations: | | | | | |
| Net investment income | | | $ | 47,355 | |
| Net realized gain (loss) on investments | | | | (1,893 | ) |
| Net change in unrealized appreciation/depreciation on investments | | | | 70,996 | |
| Net increase in net assets resulting from operations | | | | 116,458 | |
| Distributions to Shareholders | | | | | |
| Distributions to shareholders: | | | | (46,102 | ) |
| Capital share transactions (See Note 13): | | | | | |
| Net proceeds from sales of shares | | | | 4,712,815 | |
| Reinvestment of distributions | | | | 7,774 | |
| Cost of shares reacquired | | | | (6,675 | ) |
| Net increase in net assets resulting from capital share transactions | | | | 4,713,914 | |
| Net increase in net assets | | | | 4,784,270 | |
| NET ASSETS: | | | | | |
| Beginning of period | | | $ | – | |
| End of period | | | $ | 4,784,270 | |
| * | For the period April 9, 2024, commencement of operations, to July 31, 2024. |
| | See Notes to Financial Statements. | 7 |
Financial Highlights
| | | | | | Per Share Operating Performance: |
| | | | | | Investment Operations: | | Distributions
to
shareholders
from: |
| | | | | | | | | | | | | | | | |
| | | Net asset
value,
beginning
of period | | Net
investment
income(a) | | Net
realized and
unrealized
gain | | Total from
investment
operations | | Net
investment
income |
| | | | | | | | | | | | | | |
| LADS: Enhanced Municipal Yield Completion Fund | | | | | | | | | | | | | |
| 4/9/2024 to 7/31/2024(e) | | | $10.00 | | | | $0.13 | | | | $0.18 | | | | $0.31 | | | | $(0.13 | ) |
| (a) | Calculated using average shares outstanding during the period. |
| (b) | Not annualized. |
| (c) | Total return for the period 4/15/2024 through 7/31/2024 was 2.78%. |
| (d) | Annualized. |
| (e) | Commencement of operations was on 4/9/2024, SEC effective date and date shares first became available to the public was 4/15/2024. |
| 8 | See Notes to Financial Statements. |
| | | | | | | Ratios to Average Net Assets: | | Supplemental Data: |
| | | | | | | | | | | | | | |
Net asset
value,
end of
period | | Total
return(b)(c)
(%) | | Total
expenses
after waivers
and/or
reimburse-
ments(d)
(%) | | Total
expenses(d)
(%) | | Net
investment
income(d)
(%) | | Net assets,
end of
period
(000) | | Portfolio
turnover
rate(b)
(%) |
| | | | | | | | | | | | | | | | | | | | | | | | | | | |
| | $10.18 | | | | 3.09 | | | | 0.00 | | | | 3.40 | | | | 4.27 | | | | $4,784 | | | | 24 | |
| | See Notes to Financial Statements. | 9 |
Notes to Financial Statements
Lord Abbett Trust I (the “Trust”) is registered under the Investment Company Act of 1940, as amended (the “Act”), as an open-end management investment company and was organized as a Delaware statutory trust on May 1, 2001. The Trust consists of nine funds as of July 31, 2024. This report covers Lord Abbett Diversification Shares: Enhanced Municipal Yield Completion Fund (the “Fund”). The Fund is diversified within the meaning of the Act. The Fund commenced operations on April 9, 2024.
Shares of the Fund may be purchased only by or on behalf of separately managed account clients. Lord, Abbett & Co. LLC (“Lord Abbett”) has an agreement with the managed account program sponsor, or directly with the client, to provide advisory and administrative and other similar services for compensation to the managed account.
The Fund’s investment objective is to seek a high level of income exempt from U.S. federal income tax.
The Fund is an investment company and applies the accounting and reporting guidance of the Financial Accounting Standards Board (“FASB”) Accounting Standards Codification Topic 946 Financial Services - Investment Companies. The preparation of the financial statements in conformity with accounting principles generally accepted in the United States of America (“U.S. GAAP”) requires management to make certain estimates and assumptions that affect the reported amounts of assets and liabilities and disclosure of contingent assets and liabilities at the date of the financial statements and the reported amounts of increases and decreases in net assets from operations during the reporting period. Actual results could differ from those estimates.
| 2. | SIGNIFICANT ACCOUNTING POLICIES |
| (a) | Investment Valuation–Under procedures approved by the Fund’s Board of Trustees (the “Board”), the Board has designated the determination of fair value of the Fund’s portfolio investments to Lord Abbett as its valuation designee. Accordingly, Lord Abbett is responsible for, among other things, assessing and managing valuation risks, establishing, applying and testing fair value methodologies, and evaluating pricing services. Lord Abbett has formed a Pricing Committee that performs these responsibilities on behalf of Lord Abbett, administers the pricing and valuation of portfolio investments and ensures that prices utilized reasonably reflect fair value. Among other things, these procedures allow Lord Abbett, subject to Board oversight, to utilize independent pricing services, quotations from securities and financial instrument dealers and other market sources to determine fair value. |
| | |
| | Securities are valued based on evaluated prices supplied by independent pricing services, which reflect broker/dealer supplied valuations and the independent pricing services’ own electronic data processing techniques. Exchange traded options and futures contracts are valued at the last quoted sale price in the market where they are principally traded. If no sale has occurred, the mean between the most recently quoted bid and ask prices is used. |
| | |
| | Securities for which prices are not readily available are valued at fair value as determined by the Pricing Committee. The Pricing Committee considers a number of factors, including observable and unobservable inputs, when arriving at fair value. The Pricing Committee may use related or comparable assets or liabilities, recent transactions, market multiples, book values, and other relevant information to determine the fair value of portfolio investments. The Board or a designated committee thereof periodically reviews reports that may include fair value determinations made by the Pricing Committee, related market activity, inputs and |
10
Notes to Financial Statements (continued)
| | assumptions, and retrospective comparison of prices of subsequent purchases and sales transactions to fair value determinations made by the Pricing Committee. |
| | |
| | Short-term securities with 60 days or less remaining to maturity are valued using the amortized cost method, which approximates fair value. |
| | |
| (b) | Security Transactions–Security transactions are recorded as of the date that the securities are purchased or sold (trade date). Realized gains and losses on sales of portfolio securities are calculated using the identified-cost method. |
| | |
| (c) | Investment Income–Interest income is recorded on the accrual basis as earned. Discounts are accreted and premiums are amortized using the effective interest method and are included in Interest and other, if applicable, in the Statement of Operations. |
| | |
| (d) | Income Taxes–It is the policy of the Fund to meet the requirements of Subchapter M of the Internal Revenue Code applicable to regulated investment companies and to distribute substantially all taxable income and capital gains to its shareholders. Therefore, no income tax provision is required. |
| | |
| | The Fund files U.S. federal and various state and local tax returns. No income tax returns are currently under examination. The statute of limitations on the Fund’s filed U.S. federal tax returns remains open for the period ended July 31, 2024. The statutes of limitations on the Fund’s state and local tax returns may remain open for an additional year depending upon the Fund’s jurisdiction. |
| | |
| (e) | Expenses–Expenses incurred by the Trust that do not specifically relate to an individual fund are generally allocated to the funds within the Trust on a pro rata basis by relative net assets. |
| | |
| (f) | Futures Contracts–The Fund may purchase and sell futures contracts to enhance returns, to attempt to economically hedge some of its investment risk, or as a substitute position in lieu of holding the underlying asset on which the instrument is based. At the time of entering into a futures transaction, an investor is required to deposit and maintain a specified amount of cash or eligible securities called “initial margin.” Subsequent payments made or received by the Fund called “variation margin” are made on a daily basis as the market price of the futures contract fluctuates. The Fund will record an unrealized gain (loss) based on the amount of variation margin. When a contract is closed, a realized gain (loss) is recorded equal to the difference between the opening and closing value of the contract. |
| | |
| (g) | When-Issued Municipal Bonds–The Fund may purchase new issues of municipal bonds, which are generally offered on a when-issued basis. Payment and delivery may take place after a customary settlement period for that security. |
| | |
| (h) | Municipal Bonds Held in Trust–The Fund may invest in leveraged residual certificates (“TOB Residuals”) issued by tender option bond trusts (“TOBs”). A TOB is established by a third party sponsor forming a special purpose entity into which the Fund, or an agent on behalf of the Fund, transfers municipal securities. A TOB typically issues two classes of beneficial interests: short-term floating rate certificates (trust certificates), which are sold to third party investors, and residual certificates, which are generally issued to the Fund which made the transfer or to affiliates of the Fund. The Fund’s transfer of the municipal securities to a TOB is accounted for as a secured borrowing, therefore the municipal securities deposited into a TOB are presented as investments in the Fund’s Schedule of Investments and the proceeds from the transactions are reported as a liability for Trust certificates in the Statement of Assets and Liabilities. Similarly, proceeds from residual certificates issued to affiliates, if any, from the transaction are included |
11
Notes to Financial Statements (continued)
| | in the liability for Trust certificates. Interest income from the underlying security is recorded by the Fund on an accrual basis. Interest expense incurred on the secured borrowing and other expenses related to remarketing, administration and trustee services to a TOB are reported as expenses of a Fund. The floating rate certificates have interest rates that generally reset weekly and their holders have the option to tender certificates to the TOB for redemption at par at each reset date. The residual interests held by the Fund include the right of the Fund (1) to cause the holders of a proportional share of floating rate certificates to tender their certificates at par and (2) to transfer a corresponding share of the municipal securities from the TOB to the Fund. The TOB may also be terminated without the consent of the Fund upon the occurrence of certain events as defined in the TOB agreements. Such termination events may include the bankruptcy or default of the municipal bond, a substantial downgrade in credit quality of the municipal bond, the inability of the TOB to obtain quarterly or annual renewal of the liquidity support agreement, a substantial decline in market value of the municipal bond or the inability to remarket the short-term floating rate certificates to third party investors. For the period ended July 31, 2024, the Fund did not invest in TOBs. |
| | |
| | Financial transactions executed through TOBs generally will underperform the market for fixed rate municipal bonds in a rising interest rate environment, but tend to outperform the market for fixed rate municipal bonds when interest rates decline or remain relatively stable. Should short-term interest rates rise, the Fund’s investment in TOB Residuals likely will adversely affect the Fund’s net investment income and distributions to shareholders. Fluctuations in the market value of municipal securities deposited into the TOB may adversely affect the Fund’s net asset value (“NAV”) per share. The carrying value of the Fund’s liability for Trust certificates approximates its fair value. |
| | |
| | While the Fund’s investment policies and restrictions expressly permit investments in inverse floating rate securities such as TOB Residuals, they generally do not allow the Fund to borrow money for purposes of making investments. The Fund’s management believes that the Fund’s restrictions on borrowings do not apply to TOB transactions accounted for as secured borrowings. |
| | |
| (i) | Fair Value Measurements–Fair value is defined as the price that the Fund would receive upon selling an investment or transferring a liability in an orderly transaction to an independent buyer in the principal or most advantageous market of the investment. A three-tier hierarchy is used to maximize the use of observable market data and minimize the use of unobservable inputs and to establish classification of fair value measurements for disclosure purposes. Inputs refer broadly to the assumptions that market participants would use in pricing the asset or liability, including assumptions about risk - for example, the risk inherent in a particular valuation technique used to measure fair value (such as a pricing model) and/or the risk inherent in the inputs to the valuation technique. Inputs may be observable or unobservable. Observable inputs reflect the assumptions market participants would use in pricing the asset or liability. Observable inputs are based on market data obtained from sources independent of the reporting entity. Unobservable inputs reflect the reporting entity’s own assumptions about the assumptions market participants would use in pricing the asset or liability. Unobservable inputs are based on the best information available in the circumstances. The three-tier hierarchy classification is |
12
Notes to Financial Statements (continued)
| | determined based on the lowest level of inputs that is significant to the fair value measurement, and is summarized in the three broad Levels listed below: |
| | • | Level 1 – | unadjusted quoted prices in active markets for identical investments; |
| | | | |
| | • | Level 2 – | other significant observable inputs (including quoted prices for similar investments, interest rates, prepayment speeds, credit risk, etc.); and |
| | | | |
| | • | Level 3 – | significant unobservable inputs (including Fund’s own assumptions in determining the fair value of investments). |
| | A summary of inputs used in valuing Fund’s investments as of July 31, 2024 and, if applicable, Level 3 rollforwards for the period then ended is included in the Fund’s Schedule of Investments. |
| | |
| | Changes in valuation techniques may result in transfers into or out of an assigned level within the three-tier hierarchy. The inputs or methodology used for valuing securities are not necessarily an indication of the risk associated with investing in those securities. |
| 3. | MANAGEMENT FEE AND OTHER TRANSACTIONS WITH AFFILIATES |
Management Fee
The Fund does not pay a management fee to Lord Abbett under the management agreement between the Trust and Lord Abbett.
Lord Abbett has contractually agreed to waive all fees and to bear and/or reimburse all expenses of the Fund, but excluding acquired fund fees and expenses, brokerage fees and commissions and other portfolio transaction expenses, investment-related expenses including, but not limited to costs of borrowing money and other leveraging methods, interest-related expenses, taxes, governmental fees, expenses related to litigation and potential litigation, and extraordinary expenses. This agreement will continue in effect, unless sooner terminated by the Trust’s Board of Trustees, for so long as Lord Abbett serves as the investment adviser to the Fund pursuant to the management agreement between the Trust and Lord Abbett.
Other Related Parties
One Trustee and certain of the Trust’s officers have an interest in Lord Abbett.
| 4. | DISTRIBUTIONS AND TAX INFORMATION |
Dividends are paid from net investment income, if any. Capital gain distributions are paid from taxable net realized gains from investments transactions, reduced by allowable capital loss carryforwards, if any. The capital loss carryforward amount, if any, is available to offset future net capital gains. Dividends and distributions to shareholders are recorded on the ex-dividend date. The amounts of dividends and distributions from net investment income and net realized capital gains are determined in accordance with federal income tax regulations, which may differ from U.S. GAAP. These book/tax differences are either considered temporary or permanent in nature. To the extent these differences are permanent in nature, such amounts are reclassified within the components of net assets based on their federal tax basis treatment; temporary differences do not require reclassification. Dividends and distributions, which exceed earnings and profits for tax purposes, are reported as a tax return of capital.
13
Notes to Financial Statements (continued)
The tax character of distributions paid during the period ended July 31, 2024 was as follows:
| Fund | | Tax-Exempt
Income | | | Ordinary
Income | | | Net
Long-Term
Capital Gains | | | Return of
Capital | | | Total
Distributions
Paid |
| LADS: Enhanced Municipal Yield Completion Fund | | | $46,102 | | | $ – | | | | $ – | | | | $ – | | | | $46,102 |
As of July 31, 2024, the components of distributable earnings (loss) on a tax basis were as follows:
| Fund | | Undistributed
Tax-Exempt
Income | | | Undistributed
Ordinary
Income | | | Undistributed
Net
Long-Term
Capital
Gains | | | Accumulated
Capital and
Other
Losses | | | Unrealized
Appreciation/
(Depreciation) | | | Temporary
Differences | | | Total
Distributable
Earnings
(Loss) |
| LADS: Enhanced Municipal Yield Completion Fund | | | $17,449 | | | $ | – | | | $ | – | | | | $(1,786 | ) | | | $72,142 | | | | $(17,449 | ) | | | $70,356 |
Net capital losses recognized by the Fund may be carried forward indefinitely and retain their character as short-term and/or long-term losses. Capital losses incurred that will be carried forward are as follows:
| Fund | | Short-Term
Losses | | | Long-Term
Losses | | | Net Capital
Losses |
| LADS: Enhanced Municipal Yield Completion Fund | | $ | (1,786 | ) | | $ | – | | | $ | (1,786) |
As of July 31, 2024, the tax cost of investments and the breakdown of unrealized appreciation/(depreciation) for the Fund are shown below. The difference between book-basis and tax basis unrealized appreciation/(depreciation) is attributable to the tax treatment of premium amortization and wash sales.
| Fund | | Tax Cost
of Investments | | | Gross
Unrealized
Appreciation | | | Gross
Unrealized
Depreciation | | | Net
Unrealized
Appreciation/
(Depreciation) |
| LADS: Enhanced Municipal Yield Completion Fund | | $ | 4,624,570 | | | $ | 72,639 | | | $ | (497 | ) | | $ | 72,142 |
There were no permanent differences identified as of July 31, 2024.
| 5. | PORTFOLIO SECURITIES TRANSACTIONS |
Purchases and sales of investment securities (excluding short-term investments) during the period ended July 31, 2024 were as follows:
| | Purchases | Sales |
| | $5,495,684 | $866,821 |
There were no purchases or sales of U.S. Government securities during the period ended July 31, 2024.
| 6. | DISCLOSURES ABOUT OFFSETTING ASSETS AND LIABILITIES |
The FASB requires disclosures intended to help better assess the effect or potential effect of offsetting arrangements on a fund’s financial position. The following tables illustrate gross and net information about recognized assets and liabilities eligible for offset in the Statement of Assets and Liabilities and disclose such amounts subject to an enforceable master netting agreement or similar agreement, by the counterparty. A master netting agreement is an agreement between a fund and
14
Notes to Financial Statements (continued)
a counterparty which provides for the net settlement of amounts owed under all contracts traded under that agreement, as well as cash collateral, through a single payment by one party to the other in the event of default on or termination of any one contract. The Fund’s accounting policy with respect to balance sheet offsetting is that, absent an event of default by the counterparty or a termination of the agreement, the master netting agreement does not result in an offset of reported amounts of financial assets and liabilities in the Statement of Assets and Liabilities across transactions between the Fund and the applicable counterparty. As of July 31, 2024, the Fund did not have assets or liabilities subject to the FASB disclosure requirements.
The Trust’s officers and one Trustee, who are associated with Lord Abbett, do not receive any compensation from the Trust for serving in such capacities. Independent Trustees’ fees are allocated amongst Lord Abbett-sponsored funds subject to the oversight of the Independent Trustees. There is an equity-based plan available to Independent Trustees under which Independent Trustees may elect to defer receipt of a portion of Trustees’ fees. The deferred amounts are treated as though equivalent dollar amounts had been invested in the Fund. Such amounts and earnings accrued thereon are included in Trustees’ fees in the Statement of Operations and in Trustees’ fees payable in the Statement of Assets and Liabilities and are not deductible for U.S. federal income tax purposes until such amounts are paid.
The Fund and certain other funds managed by Lord Abbett (collectively, the “Participating Funds”) are party to a syndicated line of credit facility with various lenders for $1.6 billion (the “Syndicated Facility”) under which State Street Bank and Trust Company (“SSB”) participates as a lender and as agent for the lenders. The Participating Funds are subject to graduated borrowing limits of one-third of fund net assets (if fund net assets are less than $750 million), $250 million, $700 million, or $1 billion, based on past borrowings and likelihood of future borrowings, among other factors.
The Participating Funds are also party to an additional uncommitted line of credit facility with SSB for $330 million (the “Bilateral Facility”). Under the Bilateral Facility, the Participating Funds are subject to graduated borrowing limits of one-third of fund net assets (if fund net assets are less than $750 million), or $250 million based on past borrowings and likelihood of future borrowings, among other factors.
These credit facilities are to be used for temporary or emergency purposes as additional sources of liquidity to satisfy redemptions.
Effective August 1, 2024, the Fund was added to the Syndicated Facility and Bilateral Facility.
| 9. | INTERFUND LENDING PROGRAM |
Pursuant to an exemptive order issued by the U.S. Securities and Exchange Commission (“SEC exemptive order”) certain registered open-end management investment companies managed by Lord Abbett, including the Fund, participate in a joint lending and borrowing program (the “Interfund Lending Program”). The SEC exemptive order allows the funds that participate in the Interfund Lending Program to borrow money from and lend money to each other for temporary or emergency purposes subject to the limitations and conditions.
For the period ended July 31, 2024, the Fund did not participate as a borrower or lender in the Interfund Lending Program.
15
Notes to Financial Statements (continued)
| 10. | CUSTODIAN AND ACCOUNTING AGENT |
SSB is the Fund’s custodian and accounting agent. SSB performs custodial, accounting and recordkeeping functions relating to portfolio transactions and calculating the Fund’s NAV.
| 11. | SECURITIES LENDING AGREEMENT |
The Fund has established a securities lending agreement with Citibank, N.A. for the lending of securities to qualified brokers in exchange for securities or cash collateral equal to at least the market value of securities loaned, plus interest, if applicable. Cash collateral is invested in an approved money market fund. In accordance with the Fund’s securities lending agreement, the market value of securities on loan is determined each day at the close of business and any additional collateral required to cover the value of securities on loan is delivered to the Fund on the next business day. As with other extensions of credit, the Fund may experience a delay in the recovery of its securities or incur a loss should the borrower of the securities breach its agreement with the Fund or the borrower becomes insolvent at a time when the collateral is insufficient to cover the cost of repurchasing securities on loan. Any income earned from securities lending is included in Securities lending net income in the Fund’s Statement of Operations.
The initial collateral received by the Fund is required to have a value equal to at least 100% of the market value of the securities loaned. The collateral must be marked-to-market daily to cover increases in the market value of the securities loaned (or potentially a decline in the value of the collateral). In general, the risk of borrower default will be borne by Citibank, N.A.; the Fund will bear the risk of loss with respect to the investment of the cash collateral. The advantage of such loans is that the Fund continues to receive income on loaned securities while receiving a portion of any securities lending fees and earning returns on the cash amounts which may be reinvested for the purchase of investments in securities.
As of July 31, 2024, the Fund did not have any securities on loan.
The Fund’s performance and the fair value of its investments will vary in response to changes in interest rates and other market factors. As interest rates rise, the Fund’s investments typically will lose value. This risk is usually greater for long-term bonds and particularly for TOB Residuals. As a result, the Fund, to the extent it invests in long-term bonds and TOB Residuals, is subject to such greater market risk. During periods of falling interest rates, the Fund’s investments may gain value.
There is the risk that an issuer of a municipal bond may fail to make timely payments of principal or interest to the Fund, a risk that is greater with municipal bonds rated below investment grade (sometimes called “lower rated bonds” or “junk bonds”). Some issuers, particularly of junk bonds, may default as to principal and/or interest payments after the Fund purchases their securities. A default, or concerns in the market about an increase in risk of default or the deterioration in the creditworthiness of an issuer, may result in losses to the Fund. Junk bonds are considered predominantly speculative by traditional investment standards. In addition, the market for lower rated municipal bonds generally is less liquid and more volatile than the market for higher rated bonds, subjecting them to greater price fluctuations which could result in losses.
The Fund may invest in private activity bonds (sometimes called “AMT paper”). The credit quality of AMT paper usually is directly related to the credit standing of the private user of the facilities.
The Fund may invest in TOB Residuals. A TOB Residual, sometimes referred to as an inverse floater or a residual interest bond, is a type of derivative debt instrument with a floating or variable interest rate that moves in the opposite direction of the interest rate on another specific fixed-rate security. Changes in
16
Notes to Financial Statements (concluded)
the interest rate on the specific fixed-rate security inversely affect the residual interest paid on the TOB Residual, with the result that when interest rates rise, TOB Residuals’ interest payments are lowered and their value falls faster than securities similar to the specific fixed-rate security. When interest rates fall, not only do TOB Residuals generally provide interest payments that are higher than securities similar to the specific fixed-rate security, but their values generally also rise faster than such similar securities.
The Fund may purchase securities on a forward commitment or when-issued basis. Delivery and payment for such securities can take place a month or more after the transaction date. During this period such securities are subject to market fluctuations.
Geopolitical and other events (e.g., wars, terrorism, natural disasters, epidemics or pandemics) may disrupt securities markets and adversely affect global economies and markets, thereby decreasing the value of the Fund’s investments. Market disruptions can also prevent the Fund from implementing its investment strategies and achieving its investment objective.
Other adverse developments that affect financial institutions or the financial services industry generally, or concerns or rumors about any events of these kinds or other similar risks, may reduce liquidity in the market generally or have other adverse effects on the economy, the Fund or issuers in which the Fund invests. In addition, issuers in which the Fund invests and the Fund may not be able to identify all potential solvency or stress concerns with respect to a financial institution or to transfer assets from one bank or financial institution to another in a timely manner in the event such bank or financial institution comes under stress or fails.
The impact of the COVID-19 outbreak, and the effects of other infectious illness outbreaks, epidemics, or pandemics, may be short term or may continue for an extended period of time. For example, a global pandemic or other widespread health crises could negatively affect the global economy, the economies of individual countries, and the financial performance of individual issuers, sectors, industries, asset classes, and markets in significant and unforeseen ways. Health crises caused by outbreaks of disease may also exacerbate other pre-existing political, social, and economic risks in certain countries or globally. The foregoing could disrupt the operations of the Fund and its service providers, adversely affect the value and liquidity of the Fund’s investments, and negatively impact the Fund’s performance and your investment in the Fund.
Advancements in technology may also adversely impact markets and the overall performance of the Fund. For instance, the economy may be significantly impacted by the advanced development and increased regulation of technology. As the use of technology grows, liquidity and market movements may be affected. As technology is used more widely in the asset management industry, the profitability and growth of the Fund’s holdings may be impacted, which could significantly impact the overall performance of the Fund.
| 13. | SUMMARY OF CAPITAL TRANSACTIONS |
Transactions in shares of beneficial interest were as follows:
| | For the period ended
July 31, 2024(a) | |
| | Shares | | | Amount | |
| Shares sold | | 469,751 | | | $ | 4,712,815 | |
| Reinvestment of distributions | | 765 | | | | 7,774 | |
| Shares reacquired | | (657 | ) | | | (6,675 | ) |
| Increase | | 469,859 | | | $ | 4,713,914 | |
| (a) | For the period April 9, 2024, commencement of operations, to July 31, 2024. |
17
Report of Independent Registered Public Accounting Firm
To the shareholders and the Board of Trustees of Lord Abbett Trust I
Opinion on the Financial Statements and Financial Highlights
We have audited the accompanying statement of assets and liabilities, including the schedule of investments, of Lord Abbett Diversification Shares: Enhanced Municipal Yield Completion Fund (the “Fund”), one of the funds constituting Lord Abbett Trust I, as of July 31, 2024, the related statement of operations, the statement of changes in net assets, and the financial highlights for the period from April 9, 2024 (commencement of operations) through July 31, 2024, and the related notes. In our opinion, the financial statements and financial highlights present fairly, in all material respects, the financial position of the Fund as of July 31, 2024, and the results of its operations, the changes in its net assets, and the financial highlights for the period from April 9, 2024 (commencement of operations) through July 31, 2024, in conformity with accounting principles generally accepted in the United States of America.
Basis for Opinion
These financial statements and financial highlights are the responsibility of the Fund’s management. Our responsibility is to express an opinion on the Fund’s financial statements and financial highlights based on our audit. We are a public accounting firm registered with the Public Company Accounting Oversight Board (United States) (PCAOB) and are required to be independent with respect to the Fund in accordance with the U.S. federal securities laws and the applicable rules and regulations of the Securities and Exchange Commission and the PCAOB.
We conducted our audit in accordance with the standards of the PCAOB. Those standards require that we plan and perform the audit to obtain reasonable assurance about whether the financial statements and financial highlights are free of material misstatement, whether due to error or fraud. The Fund is not required to have, nor were we engaged to perform, an audit of its internal control over financial reporting. As part of our audit we are required to obtain an understanding of internal control over financial reporting but not for the purpose of expressing an opinion on the effectiveness of the Fund’s internal control over financial reporting. Accordingly, we express no such opinion.
Our audit included performing procedures to assess the risks of material misstatement of the financial statements and financial highlights, whether due to error or fraud, and performing procedures that respond to those risks. Such procedures included examining, on a test basis, evidence regarding the amounts and disclosures in the financial statements and financial highlights. Our audit also included evaluating the accounting principles used and significant estimates made by management, as well as evaluating the overall presentation of the financial statements and financial highlights. Our procedures included confirmation of securities owned as of July 31, 2024, by correspondence with the custodian or counterparties; when replies were not received, we performed other auditing procedures. We believe that our audit provides a reasonable basis for our opinion.
DELOITTE & TOUCHE LLP
New York, New York
September 23, 2024
We have served as the auditor of one or more Lord Abbett Family of Funds’ investment companies since 1932.
18
Changes in and Disagreements with Accountants
There were no changes in or disagreements with accountants during the period.
Proxy Disclosures
There were no matters submitted to a vote of shareholders during the period.
Remuneration Paid to Trustees, Officers, and Others
Remuneration paid to trustees, officers, and others is included in “Trustees’ Remuneration” under Item 7 of this Form N-CSR.
Statement Regarding Basis for Approval of Investment Advisory Contract
At the initial organizational meeting for the Lord Abbett Diversification Shares: Enhanced Municipal Yield Completion Fund, the Board, including all of the Trustees who are not “interested persons” of the Trust or of Lord Abbett, as defined in the Investment Company Act of 1940, as amended (the “Independent Trustees”), considered whether to approve the proposed management agreement between the Fund and Lord Abbett (the “Agreement”). The Board reviewed materials relating specifically to the Agreement prior to and during the meeting, and before making its decision as to the Fund, the Board had the opportunity to ask questions and request further information. The Board also took into account its knowledge of Lord Abbett gained through its meetings and discussions.
The materials received by the Board as to the Fund included, but were not limited to: (1) information provided by Broadridge Financial Solutions regarding the expense ratios, contractual and estimated management fee rates, and other expense components for the Fund (estimated where appropriate for the Fund) and certain funds in the same Morningstar category, with generally the same or similar share classes and operational characteristics (the “expense peer group”); (2) information provided by Lord Abbett on the estimated expense ratios, management fee rates, and other expense components for the Fund; (3) information regarding the investment strategies and risks of the Fund; and (4) information regarding the personnel and other resources devoted by Lord Abbett to managing the Fund.
Investment Management and Related Services Generally. The Board considered the services to be provided by Lord Abbett to the Fund, including investment research, portfolio management, and trading, and Lord Abbett’s commitment to compliance with all applicable legal requirements. The Board also observed that Lord Abbett was solely engaged in the investment management business and accordingly did not experience the conflicts of interest that may result from being engaged in other lines of business. The Board considered the investment advisory services provided by Lord Abbett to other clients and the differences in the nature of the services expected to be provided to the Fund and currently provided to other Lord Abbett Funds, on the one hand, and the services provided to other clients, on the other. After reviewing these and related factors, the Board concluded that the Fund was likely to benefit from the nature, extent and quality of the investment services to be provided by Lord Abbett under the Agreement.
Investment Performance. Because the Fund had not yet begun operations, the Fund did not have any investment performance to review. The Board considered Lord Abbett’s performance and reputation generally and the performance of other Lord Abbett-managed funds overseen by the Board.
19
Statement Regarding Basis for Approval of Investment Advisory Contract (concluded)
Lord Abbett’s Personnel and Methods. The Board considered the qualifications of the personnel who are expected to provide investment management services to the Fund, in light of its investment objective and discipline, and other services to be provided to the Fund by Lord Abbett. Among other things, the Board considered the size, experience, and turnover of Lord Abbett’s staff, Lord Abbett’s investment methodology and philosophy, and Lord Abbett’s approach to recruiting, training, and retaining personnel.
Nature and Quality of Other Services. The Board considered the nature, quality, and extent of compliance, administrative, and other services to be performed by Lord Abbett and the nature and extent of Lord Abbett’s supervision of third-party service providers, including the Fund’s transfer agent and custodian.
Expenses. The Board noted that the Fund would only be available to separately managed account clients where Lord Abbett has an agreement with the separately managed account program sponsor, or directly with the client, to provide advisory and administrative and other similar services. The Board considered the estimated expense level of the Fund and noted that the Fund would not pay a management or administrative fee to Lord Abbett. The Board also noted that Lord Abbett had agreed to waive fees and/or reimburse expenses of the Fund to the extent that expenses of the Fund (excluding certain items) would exceed an annual rate of 0.00% of the Fund’s average net assets.
Profitability. Because the Fund had not yet commenced operations, the Board was not able to consider the level of Lord Abbett’s profits in managing the Fund, although the Board understood that, given that the Fund would not pay Lord Abbett an advisory or administrative fee and that Lord Abbett was obligated to pay certain expenses of the Fund, the Fund would not be profitable to Lord Abbett based on revenues received from the Fund.
Economies of Scale. Although the Fund had not yet commenced operations, the Board understood that, given that the Fund would not pay Lord Abbett an advisory or administrative fee and that Lord Abbett was obligated to pay certain expenses of the Fund, the question of sharing of any economies of scale that might exist was not relevant.
Other Benefits to Lord Abbett. The Board considered the intangible benefits expected to be enjoyed by Lord Abbett by virtue of its relationship with the Fund, including direct or indirect compensation by separately managed account program sponsors. The Board also observed that Lord Abbett accrues certain benefits for its business of providing investment advice to clients other than the Lord Abbett Funds, but that business could also benefit the Fund. The Board also took into consideration the investment research that Lord Abbett may receive as a result of client brokerage transactions.
Conclusion. After considering all of the relevant factors, the Board unanimously found that approval of the Agreement was in the best interests of the Fund and voted unanimously to approve the Agreement. In considering whether to approve the Agreement, the Board did not identify any single factor as paramount or controlling. Individual Trustees may have evaluated the information presented differently from one another, giving different weights to various factors. This summary does not discuss in detail all matters considered.
20
| Tax Information (unaudited) | |
| | |
| For foreign shareholders, the percentage below reflects the portion of ordinary income distributions paid during the period ended July 31, 2024 that is tax-exempt dividend income: |
| | |
| LADS: Enhanced Municipal Yield Completion Fund | 100% |
21


| This report, when not used for the general information of shareholders of the Fund, is to be distributed only if preceded or accompanied by a current fund prospectus. | | Lord Abbett Trust I | |
| | | | |
Lord Abbett mutual fund shares are distributed by
LORD ABBETT DISTRIBUTOR LLC. | | Diversification Shares – Enhanced Municipal Yield Completion Fund | EMYC-2
(09/24) |
| Item 12: | Disclosure of Proxy Voting Policies and Procedures for Closed-End Management Investment Companies. |
| | Not applicable. |
| | |
| Item 13: | Portfolio Managers of Closed-End Management Investment Companies. |
| | Not applicable. |
| | |
| Item 14: | Purchases of Equity Securities by Closed-End Management Investment Company and Affiliated Purchasers. |
| | Not applicable. |
| | |
| Item 15: | Submission of Matters to a Vote of Security Holders. |
| | Not applicable. |
| | |
| Item 16: | Controls and Procedures. |
| (a) | The principal executive officer and principal financial & accounting officer have concluded as of a date within 90 days of the filing date of this report, based on their evaluation of the Registrant’s disclosure controls and procedures (as defined in Rule 30a-3(c) under the Investment Company Act of 1940), that the design of such procedures is effective to provide reasonable assurance that material information required to be disclosed by the Registrant on Form N-CSR is recorded, processed, summarized and reported within the time periods specified in the Commission’s rules and forms. |
| | |
| (b) | There were no changes in the Registrant’s internal control over financial reporting (as defined in Rule 30a-3(d) under the Investment Company Act of 1940) that occurred during the period covered by this report that have materially affected, or are reasonably likely to materially affect, the Registrant’s internal control over financial reporting. |
| | |
| Item 17: | Disclosure of Securities Lending Activities for Closed-End Management Investment Companies. |
| | Not applicable. |
| | |
| Item 18: | Recovery of Erroneously Awarded Compensation. |
| | Not applicable. |
| | |
| Item 19: | Exhibits. |
SIGNATURES
Pursuant to the requirements of the Securities Exchange Act of 1934 and the Investment Company Act of 1940, the Registrant has duly caused this report to be signed on its behalf by the undersigned, thereunto duly authorized.
| | | | |
| | LORD ABBETT TRUST I |
| | | | |
| | | By: | /s/ Douglas B. Sieg |
| | | | Douglas B. Sieg |
| | | | President and Chief Executive Officer |
| | | | (Principal Executive Officer) |
Date: September 27, 2024
Pursuant to the requirements of the Securities Exchange Act of 1934 and the Investment Company Act of 1940, this report has been signed below by the following persons on behalf of the Registrant and in the capacities and on the dates indicated.
| | By: | /s/ Douglas B. Sieg |
| | | Douglas B. Sieg |
| | | President and Chief Executive Officer |
| | | (Principal Executive Officer) |
Date: September 27, 2024
| | By: | /s/ Michael J. Hebert |
| | | Michael J. Hebert |
| | | Chief Financial Officer and Treasurer |
| | | (Principal Financial Officer) |
Date: September 27, 2024
0001139819lordabbett:C000218928Memberlordabbett:AssetMunicipalBondsCTIMember2024-07-310001139819lordabbett:LordAbbettIndexMSCIEmergingMarketsIndexNet16714BroadBasedIndexMember2022-09-300001139819lordabbett:LordAbbettIndexMSCIEAFEIndexNet16701AdditionalIndexMember2021-11-300001139819lordabbett:LordAbbettIndexBloombergAggregateBondIndex16749AdditionalIndexMember2023-11-30iso4217:USDxbrli:shares