UNITED STATES
SECURITIES AND EXCHANGE COMMISSION
Washington, D.C. 20549
FORM N-CSR
CERTIFIED SHAREHOLDER REPORT OF REGISTERED
MANAGEMENT INVESTMENT COMPANIES
Investment Company Act File Number: 811-10371
lord abbett Trust I
(Exact name of Registrant as specified in charter)
90 Hudson Street, Jersey City, NJ 07302
(Address of principal executive offices) (Zip code)
John T. Fitzgerald, Esq., Vice President & Assistant Secretary
90 Hudson Street, Jersey City, NJ 07302
(Name and address of agent for service)
Registrant’s telephone number, including area code: (888) 522-2388
Date of fiscal year end: 7/31
Date of reporting period: 7/31/2021
| Item 1: | Report(s) to Shareholders. |

LORD ABBETT
ANNUAL REPORT
Lord Abbett
Climate Focused Bond Fund
International Growth Fund
Mid Cap Innovation Growth Fund
Short Duration High Yield Fund
For the period ended July 31, 2021
Table of Contents
Lord Abbett Trust I
Lord Abbett Climate Focused Bond Fund, Lord Abbett International Growth Fund, Lord Abbett Mid Cap Innovation Growth Fund, Lord Abbett Short Duration High Yield Fund
Annual Report
For the period ended July 31, 2021

From left to right: James L.L. Tullis, Independent Chairman of the Lord Abbett Funds and Douglas B. Sieg, Trustee, President, and Chief Executive Officer of the Lord Abbett Funds. | | Dear Shareholders: We are pleased to provide you with this overview of the performance of the Funds for the period ended July 31, 2021. On this page and the following pages, we discuss the major factors that influenced period performance. For detailed and timely information about the Funds, please visit our website at www.lordabbett.com, where you can also access the quarterly commentaries that provide updates on each Fund’s performance and other portfolio related updates. Thank you for investing in Lord Abbett mutual funds. We value the trust that you place in us and look forward to serving your investment needs in the years to come. Best regards, 
Douglas B. Sieg Trustee, President and Chief Executive Officer |
| | | |
Lord Abbett Climate Focused Bond Fund
For the fiscal year ended July 31, 2021, the Fund returned 2.60%, reflecting performance at the net asset value (NAV) of Class A shares with all distributions reinvested, compared to its benchmark, the ICE BofA Green Bond Index Hedged (USD),1 which returned 1.60% over the same period. The Bloomberg Barclays Global
Aggregate Index Hedged (USD)2 returned 0.23% over the same period.
Over the trailing twelve-month period the S&P 500®3 rallied, returning 36.45% in a period characterized by the dramatic economic and market recovery that occurred within the U.S., despite the persistent presence of the novel Coronavirus. In July 2020, the number of new daily cases of COVID-19 reported in the U.S. reached a record level, as infection
1
rates and deaths, unfortunately, increased. However, risk assets continued their recovery, on the back of progress with respect to COVID-19 treatments and vaccines, commentary from several corporations that indicated stabilization, and massive monetary and fiscal policy globally. In September, market sentiment soured amid political volatility related to the U.S. Supreme Court vacancy, heightened uncertainty leading up to the U.S. Presidential election, and worries about stalled fiscal stimulus talks in Washington.
Despite the volatility in the fall, markets rallied in the month of November with the Dow Jones Industrial Average®4 having its best month since 1987. The rally was largely attributed to the conclusion of the U.S. Presidential election and positive vaccine news. Pfizer and BioNTech announced in November that an initial analysis of a late-stage study showed that their vaccine was over 90% effective. Follow up data concluded that the efficacy rate for the vaccine was 95%. Following Pfizer and BioNTech’s announcement, Moderna announced that its COVID-19 vaccine was 94.5% effective and AstraZeneca said the vaccine the company developed with the University of Oxford was 90% effective. These positive vaccine developments helped bolster optimism about the economy reopening which drove a rotation from growth and momentum stocks to value and cyclical stocks. This rotation continued in 2021, where value outperformed growth during the first quarter by the largest margin in two decades.
U.S. inflation expectations was one of the most important and complicated
macro themes in the second quarter of 2021. There were numerous headlines in the media and a series of comments from corporate leaders detailing the continued upward pressure on prices from supply chain disruptions, higher raw-materials costs, shipping constraints and a tightening labor market. Despite these concerns, the U.S. Federal Reserve (Fed) remained consistent in its messaging regarding expectations that price pressures will be transitory, and the peak inflation theme gained traction as the second quarter progressed, even as economists suggested that ‘transitory’ may be longer than expected. This helped growth and momentum stocks outperform value and cyclicals over the last three months, although growth equities trailed value for the year-to-date period.
The spread of the Delta variant of Covid-19 dominated the headlines towards the end of the period as the U.S. case count progressed to over 100K a day at the end of July for the first time since February. However, economists and strategists were sanguine about the global recovery and market risks given vaccine efficacy, high vaccination rates in the most vulnerable populations, higher natural immunity, reluctance to impose new restrictions, and broader fatigue surrounding social distancing and other behavioral changes.
In terms of earnings, S&P 500®3 reported growth in earnings of 52% during the first quarter of 2021, which was the highest year over year growth since 1Q 2010. Second quarter earnings reported in July were even stronger, with the blended growth rate for the S&P 500®3 at ~85%
2
(with ~60% of the index having reported), on track for the best performance since Q4 2009. Earnings and revenue beat rates were both running at a record level of 88% at the end of July. In aggregate, companies were reporting earnings 17.2% ahead of consensus, the fourth highest on record, and revenues 4.5% ahead of consensus, the highest on record. Companies from a wide range of industries highlighted a strong demand backdrop on their conference calls in July. Top-line strength kept the focus on elevated operating leverage though supply constraints, input price pressures and labor shortages also dominated the narrative.
Lastly, from an ESG perspective, global ESG bond supply from corporate issuers (including financials and non-financials) totaled $235bn during the first half of 2021, a level that far exceeds the $188bn issued during the entirety of 2020. Issuance of all types of securities has risen, but growth is most evident in sustainability and green bonds. Traditionally, the ESG bond market was the domain of highly-rated companies, but recent supply has grown from BBB rated and high yield companies, particularly of sustainability and sustainability-linked bonds. Last year, there was a large rise in ESG bond issuance from US companies; although we are still seeing market growth in that respect, the majority of incremental year-over-year supply has been driven by euro area issuers.
The Fund’s allocation to high yield corporate bonds had a notable positive effect on relative performance, as credit spreads tightened over the period supported by the central bank liquidity
tailwind, fiscal stimulus, vaccine progress and reopening momentum. Additionally, the Fund’s underweight to sovereign debt aided relative performance. More specifically, the Fund’s underweight to French and Belgium sovereign debt aided as European yields rose over the period, resulting in underperformance of those credits. Lastly, the Fund’s off-benchmark allocation to convertible bonds also aided relative returns. Within the asset class, the Fund’s exposure was mainly in renewable energy companies. The sector experienced tailwinds after the election of President Joe Biden, which increased the potential for increased regulation on climate-related issues which we believe would likely bolster renewable energy companies.
Over the period, the Fund did not have a position in the bonds issued by Mexico City Airport Trust, which hindered relative performance. The green bonds were issued to finance the construction of a new airport and rallied over the past six months, as optimism over global travel increased due to the widespread administration of Covid-19 vaccines. The Fund did not hold the issue, as we did not have a favorable outlook on Mexico and the issue did not meet our portfolio criteria for inclusion.
Lord Abbett Mid Cap Innovation Growth Fund
Since the Fund’s inception, for the period of December 28, 2020 through the period ended July 31, 2021, the Fund returned 7.60%, reflecting performance at the net asset value (NAV) of Class A shares with all distributions reinvested, compared to its benchmark, the Russell MidCap®
3
Growth Index,5 which returned 12.02% over the same period.
The trailing seven-month period was characterized by several market-moving events. Various factors impacted markets in January 2021, although the longstanding bullish narrative surrounding stimulus and vaccine optimism remained largely intact. Momentum continued behind the pro-cyclical rotation on the back of the Democrats’ surprise victory in the Georgia U.S. Senate runoff election, and Johnson & Johnson announced that its coronavirus vaccine was only 66% effective in preventing moderate and severe variations of the disease in a widely anticipated late-stage trial. However, one of the bigger stories from a risk sentiment perspective was inflation. There was an unrelenting flurry of headlines and corporate commentary about upward pressure on prices from supply chain disruptions, higher raw-materials costs, shipping constraints and a tightening labor market. In June, headline U.S. consumer prices rose 0.9%, following a gain of 0.6% month-over-month in May and a gain of 0.8% in April. Core consumer prices increased 0.7% month-over-month in May, following a 0.9% gain in April. Headline prices were up 5.0% year-over-year in May, the biggest increase since June 2008, while core prices were up 3.8% year-over-year, the biggest increase since June 1992.
U.S. inflation expectations was one of the most important and complicated macro themes in the second quarter of 2021. There were numerous headlines in the media and a series of comments from corporate leaders detailing the continued
upward pressure on prices from supply chain disruptions, higher raw-materials costs, shipping constraints and a tightening labor market. Despite these concerns, the U.S. Federal Reserve (Fed) remained consistent in its messaging regarding expectations that price pressures would be transitory, and the peak inflation theme gained traction as the second quarter progressed, even as economists suggested that ‘transitory’ may be longer than expected. This helped growth and momentum stocks outperform value and cyclicals over the last three months, although growth equities trailed value for the year-to-date period.
The spread of the Delta variant of Covid-19 dominated the headlines towards the end of the period as the U.S. case count progressed to over 100,000 a day by the end of July for the first time reaching this level since February. However, economists and strategists were fairly sanguine about the global recovery and market risks given vaccine efficacy, high vaccination rates in the most vulnerable populations, higher natural immunity, reluctance to impose new restrictions, and broader fatigue surrounding social distancing and other behavioral changes.
The S&P 500®3 reported growth in earnings of 52% during the first quarter of 2021, which was the highest year over year growth since 1Q 2010. Second quarter earnings reported in July were even stronger with the blended growth rate for the S&P 500® at ~85% (with ~60% of the index having reported), on track for the best performance since Q4 2009. Earnings and revenue beat rates were both running
4
at a record level of 88% at the end of July. In aggregate, companies were reporting earnings 17.2% ahead of consensus, the fourth highest on record, and revenues 4.5% ahead of consensus, the highest on record. Companies from a wide range of industries highlighted a strong demand backdrop on their conference calls in July. Top-line strength kept the focus on elevated operating leverage though supply constraints, input price pressures and labor shortages also dominated the narrative.
Security selection within the health care sector was the primary detractor from relative performance. The Fund’s underweight in Moderna, Inc. a developer of medicines based on messenger ribonucleic acid (mRNA), detracted from relative performance during the period. The company’s COVID-19 vaccine was one of the most effective and helped validate mRNA technology as a platform to treat other potential diseases. Additionally, the expectation of upcoming booster shots to protect against variants drove its share price higher. The Fund’s position in TG Therapeutics, Inc., a developer of treatments for B-cell malignancies and autoimmune diseases, also detracted from performance. Despite the U.S. Food and Drug Administration granting accelerated approval of TG Therapeutic’s drug, Ukoniq, shares of the company, and the biotechnology industry in general, faced substantial valuation headwinds due to rising interest rates and inflation expectations.
The Fund’s underweight to the real estate sector also detracted from relative performance as strong demand and supply dynamics propelled the industry. The real
estate sector was the best performing sector in the index during the period.
Security selection in the information technology sector contributed to relative performance during the period. Shares of Trimble Navigation Ltd., an engineering and construction company, contributed as investors believed the company was poised to benefit from both a post-COVID economic recovery and the pending infrastructure bill. The Fund’s positioning in HubSpot, Inc., a marketing software solutions firm, also contributed to relative performance. Shares of HubSpot rose as the company continued to benefit from the tailwinds of Covid-19, and as investors started to embrace faster growing stocks and reward the sustainability of companies that compounded revenue growth.
Lord Abbett Short Duration High Yield Fund
For the fiscal year ended July 31, 2021, the Fund returned 10.22%, reflecting performance at the net asset value (NAV) of Class A shares with all distributions reinvested, compared to its benchmark, the ICE BofA High Yield U.S. Corporate Cash Pay BB-B (1-5yrs) USD Index6, which returned 8.47% over the same period.
The twelve-month period ending July 31, 2021 brought continued improvement in overall economic activity and market performance following the COVID-19 outbreak. After a plunge of more than 30% in Gross Domestic Product (GDP) for the second quarter, the U.S. economy rebounded extraordinarily well as GDP rose 33% in the third quarter of 2020. This rebound was primarily fueled by continued support from the U.S. government, which
5
provided almost $3 trillion in pandemic relief to households and businesses across the country. U.S. markets also continued their rally from one of the fastest bear markets in U.S. history prompted by the COVID-19 outbreak. Market performance was highlighted initially by both the Dow Jones Industrial Average® and S&P 500® indexes posting their best monthly performances since the 1980’s in August 2020.
U.S. Treasury yields also remained around historic lows during the period, which initially helped fuel a strong market rebound. Specifically, the 10-year US Treasury yield fell to 0.52% in the beginning of August, its lowest level ever. Treasury yields picked up somewhat throughout the remainder of 2020; yet were still suppressed as the U.S. Federal Reserve (Fed) continued its robust monetary support position, which was initially installed in April 2020 in response to the COVID-19 outbreak. These measures kept investor confidence high and boosted risk asset performance. In addition to acting as a financial backstop, the Fed maintained the federal funds rate at the current target range of 0-0.25%, which was consistent throughout the remainder of the period.
The strong third quarter surge occurred despite heightened market volatility, which carried in the fourth quarter, due to the ongoing surge in COVID-19 cases. Infection rates across the globe accelerated and markets plummeted in October 2020, with the Dow Jones Industrial Average®4 and S&P 500®3 sinking 6% and 3.5%, respectively. While increased COVID-19
infections mostly drove losses to start the quarter, the pull-back was also attributed to a lack of government response on increased stimulus for pandemic relief, as well as uncertainty leading into the 2020 presidential elections. However, markets rebounded incredibly well the following month, with the Dow posting a gain of 11.8%, its best mark since 1987. The rally was driven by multiple catalysts, including the conclusion of the U.S. Presidential election, as former U.S. Vice President Biden defeated U.S. President Trump. The fight against COVID-19 also gained positive momentum soon after the completion of the election, as Pfizer/BioNTech, Moderna, and AstraZeneca each announced a COVID-19 vaccine with greater than 90% efficacy rate. These catalysts came despite the ongoing rise in COVID-19 infection across the U.S. as the 7-day moving average daily infection rate surged past 100,000. Economic activity was mainly resilient despite worsening infection rates, as the U.S. economy gained 4% in fourth quarter GDP and finished the year on a positive note around further stimulus packages signed into action and the beginning of vaccine dissemination.
Markets continued their strong performance moving into the new year as the bullish narrative surrounding stimulus and vaccine optimism remained largely intact. The surprise victory for the Democrats in the Georgia U.S. Senate runoff election was the final leg of the Blue Wave that took over Capitol Hill for the first time in over a decade. While investors digested the potential for higher
6
tax rates with the new regime, markets were boosted on the prospect of increased fiscal spending highlighted by a new $1.2T infrastructure plan that would be the Biden Administration’s first blockbuster bill.
As the new year progressed, COVID-19 infection rates decreased to under 20,000 confirmed cases per day in the U.S. as vaccination distribution accelerated. With the pandemic seemingly in better control and economic restrictions being lifted, investors zeroed in on inflation as the immediate market risk, as the economy had been flooded with federal stimulus and demand for goods and services picked up. Specifically, in June 2021, U.S. consumer prices increased 5.4% year-over-year, the highest increase since 2008, amid continued rebound in economic activity coupled with constraints within supply chains. Investor concerns around inflation shifted to whether it was transitory or if it was reflective of a long-term trend. Despite these fears, the Fed remained solid on its position to hold interest rates at historically low levels and cited the labor market having room for improvement before beginning to change its stance.
COVID-19 concerns re-emerged towards the end of the period, however, as the spread of the Delta variant dominated headlines. At the end of July, the U.S. case count progressed back to over 100,000 a day for the first time since February. However, economists and strategists were fairly sanguine about the global recovery and market risks given vaccine efficacy, high vaccination rates in the most vulnerable populations, higher natural immunity, reluctance to impose new
restrictions, and broader fatigue surrounding social distancing and other behavioral changes.
With respect to performance for the period, the Fund benefited from security selection within the automotive sector. Specifically, the Fund held securities from select issuers within the automakers and auto parts and equipment subsectors that outperformed the broader high yield sector over the last twelve months. This was due in part because U.S. auto sales rebounded incredibly well during the period, posting consecutive record months of sales in March through May of 2021. This followed the previous decline in auto sales caused by the COVID-19 outbreak at the beginning of 2020. Security selection within the energy sector also contributed to relative performance. The Fund benefited particularly from select issuers in the exploration and production subsector that outperformed for the period due largely to rising oil prices. Economic activity increased around the globe over the first half of 2021, as COVID-19 restrictions were lifted, which created a bump in consumer activity that drove up global energy demand. However, oil supply remained constrained throughout the period, creating a strong technical relationship that increased oil prices over 60%, reaching over $70 a barrel in July 2021, its highest value since 2018. The Fund also greatly benefited from an overweight allocation to CCC rated credit. Lower credit outperformed higher quality credit throughout the period, and the overweight allocation to CCC rated debt contributed
7
significantly to relative performance over the benchmark.
Although the Fund largely outperformed the benchmark for the period, there were select sector allocations that detracted from relative performance. Security selection within the media sector detracted from relative performance over the period. Within the media sector, the Fund’s exposure to select media content issuers was a detractor due to headwinds of economic reopening following countrywide shelter-in-place mandates that had benefited the sector in early 2020. Security
selection within the financial services sector also detracted from relative performance. While the Fund held select issues in financial services that exhibited positive performance overall, these issuances underperformed the broader sector during the period.
Each Fund’s portfolios is actively managed and, therefore, holdings and the weightings of a particular issuer or particular sector as a percentage of portfolio assets are subject to change. Sectors may include many industries.
1 The ICE BofA Green Bond Index tracks securities issued for qualified green purposes that promote climate change mitigation or adaption. Qualifying bonds must have a clearly designated use of proceeds that is solely applied toward projects or activities that promote climate change mitigation or adaptation or other environmental sustainability purposes as outlined by the ICMA Green Bond Principles.
2 The Bloomberg Barclays Global Aggregate Bond Index provides a broad-based measure of the global investment-grade fixed-income markets. The three major components of this index are the U.S. Aggregate, the Pan-European Aggregate, and the Asian-Pacific Aggregate indexes. The index also includes eurodollar and euro-yen corporate bonds, Canadian government securities, and U.S. dollar investment-grade 144A securities. Indexes are unmanaged, do not reflect the deduction of fees or expenses, and an investor cannot invest directly in an index.
3 The S&P 500® Index is widely regarded as the standard for measuring large cap U.S. stock market performance. Indexes are unmanaged, do not reflect the deduction of fees or expenses, and are not available for direct investment.
4 The Dow Jones Industrial Average® Index is a price-weighted measure of 30 U.S. blue-chip companies. The index covers all industries except transportation and utilities.
5 The Russell MidCap® Growth Index measures the performance of those Russell MidCap® Index companies with higher price-to-book ratios and higher
forecasted growth values. Indexes are unmanaged, do not reflect the deduction of fees or expenses, and an investor cannot invest directly in an index.
6 The ICE BofA High Yield U.S. Corp, Cash Pay, BB-B 1-5 YR USD Index consists of BB-B rated U.S. dollar-denominated corporate bonds publicly issued in the U.S. domestic market with maturities of 1 to 5 years. Indexes are unmanaged, do not reflect the deduction of fees or expenses, and an investor cannot invest directly in an index.”
Unless otherwise specified, indexes reflect total return, with all dividends reinvested. Indexes are unmanaged, do not reflect the deduction of fees or expenses, and are not available for direct investment.
Important Performance and Other Information
Performance data quoted in the following pages reflect past performance and are no guarantee of future results. Current performance may be higher or lower than the performance quoted. The investment return and principal value of an investment in the Funds will fluctuate so that shares, on any given day or when redeemed, may be worth more or less than their original cost. You can obtain performance data current to the most recent month end by calling Lord Abbett at 888-522-2388 or referring to www.lordabbett.com.
Except where noted, comparative Fund performance does not account for the deduction of sales charges and would be different if sales charges were included. Each Fund offers classes of shares with distinct pricing options. For a full description of the differences in pricing alternatives, please see each Fund’s prospectus.
8
During certain periods shown, expense waivers and reimbursements were in place. Without such expense waivers and reimbursements, each Fund’s returns would have been lower.
The annual commentary above discusses the views of the Funds’ management and various portfolio holdings of the Funds as of July 31, 2021. These views and portfolio holdings may have changed after this date. Information provided in the commentary is not a recommendation to buy or sell securities. Because the Funds’ portfolios are actively managed and may change significantly, the Funds may no longer own
the securities described above or may have otherwise changed their positions in the securities. For more recent information about the Funds’ portfolio holdings, please visit www.lordabbett.com.
A Note about Risk: See Notes to Financial Statements for a discussion of investment risks. For a more detailed discussion of the risks associated with each Fund, please see each Fund’s prospectus.
Mutual funds are not insured by the FDIC, are not deposits or other obligations of, or guaranteed by, banks, and are subject to investment risks including possible loss of principal amount invested.
9
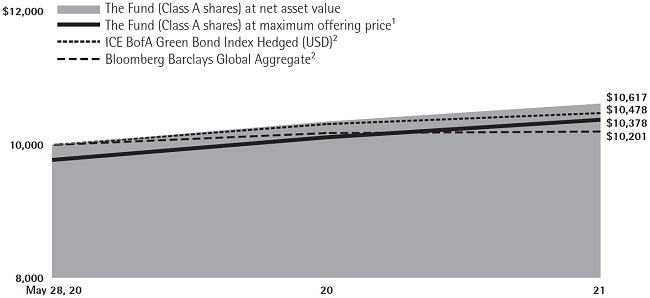
Climate Focused Bond Fund
Investment Comparison
Below is a comparison of a $10,000 investment in Class A shares with the same investment in the ICE BofA Green Bond Index Hedged (USD) and Bloomberg Barclays Global Aggregate, assuming reinvestment of all dividends and distributions. The Fund has adopted the ICE BofA Green Bond Index Hedged (USD), a more broad-based index, as its primary benchmark index. The performance of other classes will be greater than or less than the performance shown in the graph below due to different sales loads and expenses applicable to such classes. The graph and performance table below do not reflect the deduction of taxes that a shareholder would pay on Fund distributions or the redemption of Fund shares. During certain periods, expenses of the Fund have been waived or reimbursed by Lord Abbett; without such waiver or reimbursements of expense, the Fund’s returns would have been lower. Past performance is no guarantee of future results.
Average Annual Total Returns at Maximum Applicable
Sales Charge for the Periods Ended July 31, 2021 | |
| | | | | | |
| | | 1 Year | | Life of Class | |
| Class A3 | | 0.27% | | 3.21% | |
| Class C4 | | 0.79% | | 4.38% | |
| Class F5 | | 2.81% | | 5.44% | |
| Class F35 | | 2.88% | | 5.51% | |
| Class I5 | | 2.80% | | 5.44% | |
| Class R35 | | 2.29% | | 4.90% | |
| Class R45 | | 2.54% | | 5.16% | |
| Class R55 | | 2.80% | | 5.43% | |
| Class R65 | | 2.88% | | 5.51% | |
1 Reflects the deduction of the maximum initial sales charge of 2.25%.
2 Performance for the unmanaged index does not reflect any fees or expenses. The performance of the index is not necessarily representative of the Fund’s performance. Performance of the index began on May 28, 2020.
3 Class A shares commenced operations on May 20, 2020 and performance for the Class began on May 28, 2020. Total return, which is the percent change in net asset value, after deduction of the maximum initial sales charge of 2.25% applicable to Class A shares, with all dividends and distributions reinvested for the period shown ended July 31,
2021, is calculated using the SEC required uniform method to compute such return.
4 Class C shares commenced operations on May 20, 2020 and performance for the Class began on May 28, 2020. The 1% CDSC for Class C shares normally applies before the first anniversary of the purchase date. Performance for other periods is at net asset value.
5 Commenced operations on May 20, 2020 and performance for the Classes began on May 28, 2020. Performance is at net asset value.
10
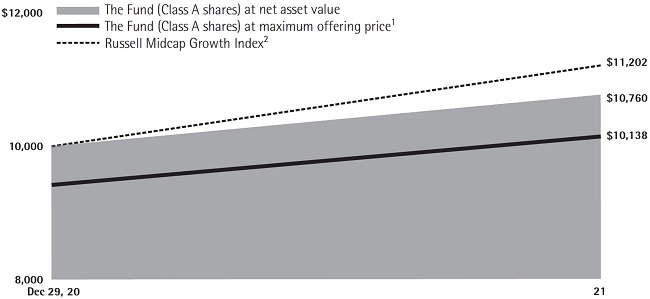
Mid Cap Innovation Growth Fund
Investment Comparison
Below is a comparison of a $10,000 investment in Class A shares with the same investment in the Russell Midcap Growth Index, assuming reinvestment of all dividends and distributions. The performance of other classes will be greater than or less than the performance shown in the graph below due to different sales loads and expenses applicable to such classes. The graph and performance table below do not reflect the deduction of taxes that a shareholder would pay on Fund distributions or the redemption of Fund shares. During certain periods, expenses of the Fund have been waived or reimbursed by Lord Abbett; without such waiver or reimbursements of expense, the Fund’s returns would have been lower. Past performance is no guarantee of future results.
Average Annual Total Returns at Maximum Applicable
Sales Charge for the Period Ended July 31, 2021
| | | Life of Class |
| Class A3 | | 1.38% |
| Class C4 | | 6.13% |
| Class F5 | | 7.80% |
| Class F35 | | 7.80% |
| Class I5 | | 7.80% |
| Class R35 | | 7.47% |
| Class R45 | | 7.60% |
| Class R55 | | 7.80% |
| Class R65 | | 7.80% |
1 Reflects the deduction of the maximum initial sales charge of 5.75%.
2 Performance for the unmanaged index does not reflect any fees or expenses. The performance of the index is not necessarily representative of the Fund’s performance. Performance of the index began on December 29, 2020.
3 Class A shares commenced operations on December 28, 2020 and performance for the Class began on December 29, 2020. Total return, which is the percent change in net asset value, after deduction of the maximum initial sales charge of 5.75% applicable to Class A shares, with all dividends and distributions reinvested for the period shown ended July 31,
2021, is calculated using the SEC required uniform method to compute such return.
4 Class C shares commenced operations on December 28, 2020 and performance for the Class began on December 29, 2020. The 1% CDSC for Class C shares normally applies before the first anniversary of the purchase date.
5 Commenced operations on December 28, 2020 and performance for the Classes began on December 29, 2020. Performance is at net asset value.
11
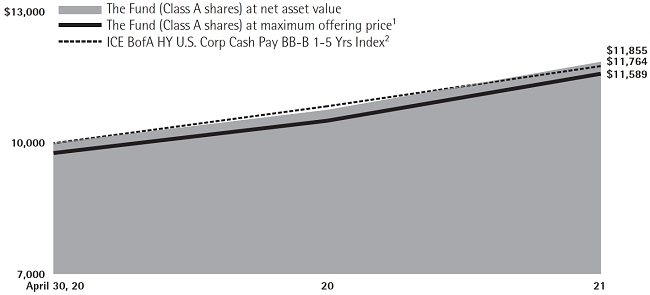
Short Duration High Yield Fund
Investment Comparison
Below is a comparison of a $10,000 investment in Class A shares with the same investment in the ICE BofA HY U.S. Corp Cash Pay BB-B 1-5 Yrs Index, assuming reinvestment of all dividends and distributions. The performance of other classes will be greater than or less than the performance shown in the graph below due to different sales loads and expenses applicable to such classes. The graph and performance table below do not reflect the deduction of taxes that a shareholder would pay on Fund distributions or the redemption of Fund shares. During certain periods, expenses of the Fund have been waived or reimbursed by Lord Abbett; without such waiver or reimbursements of expense, the Fund’s returns would have been lower. Past performance is no guarantee of future results.
Average Annual Total Returns at Maximum Applicable
Sales Charge for the Periods Ended July 31, 2021 |
| | | |
| | | 1 Year | | Life of Class | |
| Class A3 | | 7.78% | | 12.50% | |
| Class C4 | | 8.34% | | 13.65% | |
| Class F5 | | 10.43% | | 14.78% | |
| Class F35 | | 10.50% | | 14.85% | |
| Class I5 | | 10.44% | | 14.79% | |
| Class R35 | | 9.88% | | 14.20% | |
| Class R45 | | 10.15% | | 14.49% | |
| Class R55 | | 10.43% | | 14.77% | |
| Class R65 | | 10.50% | | 14.86% | |
1 Reflects the deduction of the maximum initial sales charge of 2.25%.
2 Performance for the unmanaged index does not reflect any fees or expenses. The performance of the index is not necessarily representative of the Fund’s performance. Performance of the index began on April 30, 2020.
3 Class A shares commenced operations on April 22, 2020 and performance for the Class began on April 30, 2020. Total return, which is the percent change in net asset value, after deduction of the maximum initial sales charge of 2.25% applicable to Class A shares, with all dividends and
distributions reinvested for the period shown ended July 31, 2021, is calculated using the SEC required uniform method to compute such return.
4 Class C shares commenced operations on April 22, 2020 and performance for the Class began on April 30, 2020. The 1% CDSC for Class C shares normally applies before the first anniversary of the purchase date. Performance for other periods is at net asset value.
5 Commenced operations on April 22, 2020 and performance for the Class began on April 30, 2020. Performance is at net asset value.
12
Expense Example
As a shareholder of each Fund, you incur two types of costs: (1) transaction costs, including sales charges (loads) on purchase payments (these charges vary among the share classes); and (2) ongoing costs, including management fees; distribution and service (12b-1) fees (these charges vary among the share classes); and other Fund expenses. This Example is intended to help you understand your ongoing costs (in dollars) of investing in each Fund and to compare these costs with the ongoing costs of investing in other mutual funds.
The Example is based on an investment of $1,000 invested at the beginning of the period and held for the entire period (February 1, 2021 through July 31, 2021 for Climate Focused Bond Fund, Mid Cap Innovation Growth Fund and Short Duration High Yield Fund. June 18, 2021, commencement of operations for International Growth Fund through July 31, 2021).
Actual Expenses
For each class of each Fund, the first line of the applicable table on the following pages provides information about actual account values and actual expenses. You may use the information in this line, together with the amount you invested, to estimate the expenses that you paid over the period. Simply divide your account value by $1,000 (for example, an $8,600 account value divided by $1,000 = 8.6), then multiply the result by the number in the first line under the heading titled “Expenses Paid During Period 2/1/21 – 7/31/21 for Climate Focused Bond Fund, Mid Cap Innovation Growth Fund and Short Duration High Yield Fund. 6/18/21, commencement of operations for International Growth Fund – 7/31/21” to estimate the expenses you paid on your account during this period.
Hypothetical Example for Comparison Purposes
For each class of each Fund, the second line of the applicable table on the following pages provides information about hypothetical account values and hypothetical expenses based on the Fund’s actual expense ratio and an assumed rate of return of 5% per year before expenses, which is not the Fund’s actual return. The hypothetical account values and expenses may not be used to estimate the actual ending account balance or expenses you paid for the period. You may use this information to compare the ongoing costs of investing in each Fund and other funds. To do so, compare this 5% hypothetical example with the 5% hypothetical examples that appear in the shareholder reports of the other funds.
13
Climate Focused Bond Fund
Please note that the expenses shown in the table are meant to highlight your ongoing costs only and do not reflect any transactional costs, such as sales charges (loads). Therefore, the second line of the table is useful in comparing ongoing costs only, and will not help you determine the relative total costs of owning different funds. In addition, if these transactional costs were included, your costs would have been higher.
| | | | Beginning
Account
Value | | Ending
Account
Value | | Expenses
Paid During
Period† | |
| | | | 2/1/21 | | 7/31/21 | | 2/1/21 -
7/31/21 | |
| Class A | | | | | | | | |
| Actual | | | $1,000.00 | | $1,003.70 | | $3.23 | |
| Hypothetical (5% Return Before Expenses) | | | $1,000.00 | | $1,021.57 | | $3.26 | |
| Class C | | | | | | | | |
| Actual | | | $1,000.00 | | $ 999.70 | | $7.19 | |
| Hypothetical (5% Return Before Expenses) | | | $1,000.00 | | $1,017.60 | | $7.25 | |
| Class F | | | | | | | | |
| Actual | | | $1,000.00 | | $1,004.60 | | $2.24 | |
| Hypothetical (5% Return Before Expenses) | | | $1,000.00 | | $1,022.56 | | $2.26 | |
| Class F3 | | | | | | | | |
| Actual | | | $1,000.00 | | $1,005.00 | | $1.89 | |
| Hypothetical (5% Return Before Expenses) | | | $1,000.00 | | $1,022.91 | | $1.91 | |
| Class I | | | | | | | | |
| Actual | | | $1,000.00 | | $1,004.60 | | $2.24 | |
| Hypothetical (5% Return Before Expenses) | | | $1,000.00 | | $1,022.56 | | $2.26 | |
| Class R3 | | | | | | | | |
| Actual | | | $1,000.00 | | $1,002.20 | | $4.72 | |
| Hypothetical (5% Return Before Expenses) | | | $1,000.00 | | $1,020.08 | | $4.76 | |
| Class R4 | | | | | | | | |
| Actual | | | $1,000.00 | | $1,003.40 | | $3.48 | |
| Hypothetical (5% Return Before Expenses) | | | $1,000.00 | | $1,021.32 | | $3.51 | |
| Class R5 | | | | | | | | |
| Actual | | | $1,000.00 | | $1,004.60 | | $2.24 | |
| Hypothetical (5% Return Before Expenses) | | | $1,000.00 | | $1,022.56 | | $2.26 | |
| Class R6 | | | | | | | | |
| Actual | | | $1,000.00 | | $1,006.00 | | $1.89 | |
| Hypothetical (5% Return Before Expenses) | | | $1,000.00 | | $1,022.91 | | $1.91 | |
| † | For each class of the Fund, net expenses are equal to the annualized expense ratio for such class (0.65% for Class A, 1.45% for Class C, 0.45% for Class F, 0.38% for Class F3, 0.45% for Class I, 0.95% for Class R3, 0.70% for Class R4, 0.45% for Class R5 and 0.38% for Class R6) multiplied by the average account value over the period, multiplied by 181/365 (to reflect one-half year period) |
14
Portfolio Holdings Presented by Sector
July 31, 2021
| Sector* | | %** |
| Asset Backed | | | 1.16 | % |
| Basic Materials | | | 0.85 | % |
| Communications | | | 1.46 | % |
| Consumer Cyclical | | | 3.12 | % |
| Consumer Non-Cyclical | | | 5.78 | % |
| Energy | | | 8.97 | % |
| Financial Services | | | 23.36 | % |
| Foreign Government | | | 14.37 | % |
| Industrial | | | 12.65 | % |
| Mortgage Backed | | | 0.60 | % |
| Municipal Bonds | | | 3.84 | % |
| Technology | | | 2.12 | % |
| U.S. Government | | | 4.38 | % |
| Utilities | | | 16.18 | % |
| Repurchase Agreements | | | 1.16 | % |
| Total | | | 100.00 | % |
| * | | A sector may comprise several industries. |
| ** | | Represents percent of total investments. |
15
International Growth Fund
Please note that the expenses shown in the table are meant to highlight your ongoing costs only and do not reflect any transactional costs, such as sales charges (loads). Therefore, the second line of the table is useful in comparing ongoing costs only, and will not help you determine the relative total costs of owning different funds. In addition, if these transactional costs were included, your costs would have been higher.
| | | | Beginning
Account
Value | | Ending
Account
Value | | Expenses
Paid During
Period† | |
| | | | 6/18/21 | | 7/31/21 | | 6/18/21 -
7/31/21 | |
| Class A | | | | | | | | |
| Actual | | | $1,000.00 | | $1,008.00 | | $1.28 | |
| Hypothetical (5% Return Before Expenses) | | | $1,000.00 | | $1,004.75 | | $1.28 | |
| Class C | | | | | | | | |
| Actual | | | $1,000.00 | | $1,007.30 | | $2.19 | |
| Hypothetical (5% Return Before Expenses) | | | $1,000.00 | | $1,003.85 | | $2.19 | |
| Class F | | | | | | | | |
| Actual | | | $1,000.00 | | $1,008.70 | | $0.98 | |
| Hypothetical (5% Return Before Expenses) | | | $1,000.00 | | $1,005.05 | | $0.98 | |
| Class F3 | | | | | | | | |
| Actual | | | $1,000.00 | | $1,008.70 | | $0.88 | |
| Hypothetical (5% Return Before Expenses) | | | $1,000.00 | | $1,005.15 | | $0.88 | |
| Class I | | | | | | | | |
| Actual | | | $1,000.00 | | $1,008.70 | | $0.98 | |
| Hypothetical (5% Return Before Expenses) | | | $1,000.00 | | $1,005.05 | | $0.98 | |
| Class R3 | | | | | | | | |
| Actual | | | $1,000.00 | | $1,008.00 | | $1.59 | |
| Hypothetical (5% Return Before Expenses) | | | $1,000.00 | | $1,004.45 | | $1.58 | |
| Class R4 | | | | | | | | |
| Actual | | | $1,000.00 | | $1,008.00 | | $1.28 | |
| Hypothetical (5% Return Before Expenses) | | | $1,000.00 | | $1,004.75 | | $1.28 | |
| Class R5 | | | | | | | | |
| Actual | | | $1,000.00 | | $1,008.70 | | $0.98 | |
| Hypothetical (5% Return Before Expenses) | | | $1,000.00 | | $1,005.05 | | $0.98 | |
| Class R6 | | | | | | | | |
| Actual | | | $1,000.00 | | $1,008.70 | | $0.88 | |
| Hypothetical (5% Return Before Expenses) | | | $1,000.00 | | $1,005.15 | | $0.88 | |
| † | For each class of the Fund, net expenses are equal to the annualized expense ratio for such class (1.06% for Class A, 1.81% for Class C, 0.81% for Class F, 0.73% for Class F3, 0.81% for Class I, 1.31% for Class R3, 1.06% for Class R4, 0.81% for Class R5 and 0.73% for Class R6) multiplied by the average account value over the period, multiplied by 44/365 (to reflect the period June 18, 2021, commencement of operations, to July 31, 2021). |
16
Portfolio Holdings Presented by Sector
July 31, 2021
| Sector* | | %** |
| Automotive | | | 1.99 | % |
| Capital Goods | | | 13.74 | % |
| Consumer Cyclicals | | | 11.40 | % |
| Consumer Discretionary | | | 4.18 | % |
| Consumer Staples | | | 7.52 | % |
| Energy | | | 2.04 | % |
| Financial Services | | | 9.41 | % |
| Health Care | | | 12.49 | % |
| Materials & Processing | | | 8.96 | % |
| Producer Durables | | | 6.37 | % |
| Technology | | | 19.81 | % |
| Transportation | | | 1.39 | % |
| Utilities | | | 0.70 | % |
| Total | | | 100.00 | % |
| * | | A sector may comprise several industries. |
| ** | | Represents percent of total investments. |
17
Mid Cap Innovation Growth Fund
Please note that the expenses shown in the table are meant to highlight your ongoing costs only and do not reflect any transactional costs, such as sales charges (loads). Therefore, the second line of the table is useful in comparing ongoing costs only, and will not help you determine the relative total costs of owning different funds. In addition, if these transactional costs were included, your costs would have been higher.
| | | | Beginning
Account
Value | | Ending
Account
Value | | Expenses
Paid During
Period† | |
| | | | 2/1/21 | | 7/31/21 | | 2/1/21 -
7/31/21 | |
| Class A | | | | | | | | |
| Actual | | | $1,000.00 | | $1,066.10 | | $5.43 | |
| Hypothetical (5% Return Before Expenses) | | | $1,000.00 | | $1,019.54 | | $5.31 | |
| Class C | | | | | | | | |
| Actual | | | $1,000.00 | | $1,062.10 | | $9.25 | |
| Hypothetical (5% Return Before Expenses) | | | $1,000.00 | | $1,015.82 | | $9.05 | |
| Class F | | | | | | | | |
| Actual | | | $1,000.00 | | $1,068.00 | | $4.15 | |
| Hypothetical (5% Return Before Expenses) | | | $1,000.00 | | $1,020.78 | | $4.06 | |
| Class F3 | | | | | | | | |
| Actual | | | $1,000.00 | | $1,068.00 | | $3.74 | |
| Hypothetical (5% Return Before Expenses) | | | $1,000.00 | | $1,021.17 | | $3.66 | |
| Class I | | | | | | | | |
| Actual | | | $1,000.00 | | $1,068.00 | | $4.15 | |
| Hypothetical (5% Return Before Expenses) | | | $1,000.00 | | $1,020.78 | | $4.06 | |
| Class R3 | | | | | | | | |
| Actual | | | $1,000.00 | | $1,065.40 | | $6.71 | |
| Hypothetical (5% Return Before Expenses) | | | $1,000.00 | | $1,018.30 | | $6.56 | |
| Class R4 | | | | | | | | |
| Actual | | | $1,000.00 | | $1,066.10 | | $5.43 | |
| Hypothetical (5% Return Before Expenses) | | | $1,000.00 | | $1,019.54 | | $5.31 | |
| Class R5 | | | | | | | | |
| Actual | | | $1,000.00 | | $1,068.00 | | $4.15 | |
| Hypothetical (5% Return Before Expenses) | | | $1,000.00 | | $1,020.78 | | $4.06 | |
| Class R6 | | | | | | | | |
| Actual | | | $1,000.00 | | $1,068.00 | | $3.74 | |
| Hypothetical (5% Return Before Expenses) | | | $1,000.00 | | $1,021.17 | | $3.66 | |
| † | For each class of the Fund, net expenses are equal to the annualized expense ratio for such class (1.06% for Class A, 1.81% for Class C, 0.81% for Class F, 0.73% for Class F3, 0.81% for Class I, 1.31% for Class R3, 1.06% for Class R4, 0.81% for Class R5 and 0.73% for Class R6) multiplied by the average account value over the period, multiplied by 181/365 (to reflect one-half year period). |
18
Portfolio Holdings Presented by Sector
July 31, 2021
| Sector* | | %** |
| Capital Goods | | | 8.60 | % |
| Consumer Cyclical | | | 13.37 | % |
| Consumer Discretionary | | | 9.34 | % |
| Financial Services | | | 5.04 | % |
| Health Care | | | 17.51 | % |
| Materials & Processing | | | 2.91 | % |
| Producer Durables | | | 5.09 | % |
| Technology | | | 31.92 | % |
| Telecommunications | | | 0.95 | % |
| Transportation | | | 2.59 | % |
| Repurchase Agreements | | | 2.68 | % |
| Total | | | 100.00 | % |
| * | | A sector may comprise several industries. |
| ** | | Represents percent of total investments. |
19
Short Duration High Yield Fund
Please note that the expenses shown in the table are meant to highlight your ongoing costs only and do not reflect any transactional costs, such as sales charges (loads). Therefore, the second line of the table is useful in comparing ongoing costs only, and will not help you determine the relative total costs of owning different funds. In addition, if these transactional costs were included, your costs would have been higher.
| | | | Beginning
Account
Value | | Ending
Account
Value | | Expenses
Paid During
Period† | |
| | | | 2/1/21 | | 7/31/21 | | 2/1/21 -
7/31/21 | |
| Class A | | | | | | | | |
| Actual | | | $1,000.00 | | $1,033.20 | | $3.58 | |
| Hypothetical (5% Return Before Expenses) | | | $1,000.00 | | $1,021.27 | | $3.56 | |
| Class C | | | | | | | | |
| Actual | | | $1,000.00 | | $1,029.30 | | $7.60 | |
| Hypothetical (5% Return Before Expenses) | | | $1,000.00 | | $1,017.31 | | $7.55 | |
| Class F | | | | | | | | |
| Actual | | | $1,000.00 | | $1,034.30 | | $2.57 | |
| Hypothetical (5% Return Before Expenses) | | | $1,000.00 | | $1,022.27 | | $2.56 | |
| Class F3 | | | | | | | | |
| Actual | | | $1,000.00 | | $1,034.70 | | $2.22 | |
| Hypothetical (5% Return Before Expenses) | | | $1,000.00 | | $1,022.61 | | $2.21 | |
| Class I | | | | | | | | |
| Actual | | | $1,000.00 | | $1,034.40 | | $2.57 | |
| Hypothetical (5% Return Before Expenses) | | | $1,000.00 | | $1,022.27 | | $2.56 | |
| Class R3 | | | | | | | | |
| Actual | | | $1,000.00 | | $1,031.80 | | $5.09 | |
| Hypothetical (5% Return Before Expenses) | | | $1,000.00 | | $1,019.79 | | $5.06 | |
| Class R4 | | | | | | | | |
| Actual | | | $1,000.00 | | $1,033.00 | | $3.83 | |
| Hypothetical (5% Return Before Expenses) | | | $1,000.00 | | $1,021.03 | | $3.81 | |
| Class R5 | | | | | | | | |
| Actual | | | $1,000.00 | | $1,034.30 | | $2.57 | |
| Hypothetical (5% Return Before Expenses) | | | $1,000.00 | | $1,022.27 | | $2.56 | |
| Class R6 | | | | | | | | |
| Actual | | | $1,000.00 | | $1,034.70 | | $2.22 | |
| Hypothetical (5% Return Before Expenses) | | | $1,000.00 | | $1,022.61 | | $2.21 | |
| † | For each class of the Fund, net expenses are equal to the annualized expense ratio for such class (0.71% for Class A, 1.51% for Class C, 0.51% for Class F, 0.44% for Class F3, 0.51% for Class I, 1.01% for Class R3, 0.76% for Class R4, 0.51% for Class R5 and 0.44% for Class R6) multiplied by the average account value over the period, multiplied by 181/365 (to reflect one-half year period). |
20
Portfolio Holdings Presented by Sector
July 31, 2021
| Sector* | | %** |
| Asset Backed | | | 4.22 | % |
| Basic Materials | | | 4.97 | % |
| Communications | | | 7.23 | % |
| Consumer Cyclical | | | 27.47 | % |
| Consumer Non-Cyclical | | | 9.31 | % |
| Energy | | | 19.84 | % |
| Financial Services | | | 11.95 | % |
| Industrial | | | 8.53 | % |
| Mortgage Backed | | | 1.39 | % |
| Technology | | | 1.49 | % |
| Utilities | | | 2.41 | % |
| Repurchase Agreements | | | 1.19 | % |
| Total | | | 100.00 | % |
| * | | A sector may comprise several industries. |
| ** | | Represents percent of total investments. |
21
Schedule of Investments
CLIMATE FOCUSED BOND FUND July 31, 2021
| Investments | | Interest
Rate | | | Maturity
Date | | | Principal
Amount
(000) | | | Fair
Value | |
| LONG-TERM INVESTMENTS 72.33% | | | | | | | | | | | | | | | | |
| | | | | | | | | | | | | | | | | |
| ASSET-BACKED SECURITIES 0.85% | | | | | | | | | | | | | | | | |
| | | | | | | | | | | | | | | | | |
| Automobiles 0.42% | | | | | | | | | | | | | | | | |
| Tesla Auto Lease Trust 2021-A B† | | | 1.02% | | | | 3/20/2025 | | | | $100 | | | $ | 100,684 | |
| | | | | | | | | | | | | | | | | |
| Others 0.43% | | | | | | | | | | | | | | | | |
| TRP - TRIP Rail Master Funding LLC 2021-2 A† | | | 2.15% | | | | 6/19/2051 | | | | 100 | | | | 101,042 | |
| Total Asset-Backed Securities (cost $200,051) | | | | | | | | | | | | | | | 201,726 | |
| | | | | | | | | | | | | | | | | |
| CONVERTIBLE BONDS 0.44% | | | | | | | | | | | | | | | | |
| | | | | | | | | | | | | | | | | |
| Auto Manufacturers 0.08% | | | | | | | | | | | | | | | | |
| NIO, Inc. (China)†(a) | | | 0.50% | | | | 2/1/2027 | | | | 8 | | | | 6,960 | |
| Tesla, Inc. | | | 2.00% | | | | 5/15/2024 | | | | 1 | | | | 11,057 | |
| Total | | | | | | | | | | | | | | | 18,017 | |
| | | | | | | | | | | | | | | | | |
| Electronics 0.09% | | | | | | | | | | | | | | | | |
| Itron, Inc.† | | | Zero Coupon | | | | 3/15/2026 | | | | 21 | | | | 21,628 | |
| | | | | | | | | | | | | | | | | |
| Energy-Alternate Sources 0.27% | | | | | | | | | | | | | | | | |
| Enphase Energy, Inc.† | | | Zero Coupon | | | | 3/1/2026 | | | | 16 | | | | 16,136 | |
| NextEra Energy Partners LP† | | | Zero Coupon | | | | 6/15/2024 | | | | 9 | | | | 9,077 | |
| SolarEdge Technologies, Inc. (Israel)†(a) | | | Zero Coupon | | | | 9/15/2025 | | | | 15 | | | | 17,962 | |
| Sunrun, Inc.† | | | Zero Coupon | | | | 2/1/2026 | | | | 25 | | | | 22,095 | |
| Total | | | | | | | | | | | | | | | 65,270 | |
| Total Convertible Bonds (cost $105,016) | | | | | | | | | | | | | | | 104,915 | |
| | | | | | | | | | | | | | | | | |
| | | | Dividend
Rate | | | | | | | Shares
(000) | | | | | |
| | | | | | | | | | | | | | | | | |
| CONVERTIBLE PREFERRED STOCKS 0.07% | | | | | | | | | | | | | | | | |
| | | | | | | | | | | | | | | | | |
| Electric | | | | | | | | | | | | | | | | |
Algonquin Power & Utilities Corp. (Canada)(a)
(cost $16,000) | | | 7.75% | | | | | | | | – | (b) | | | 16,822 | |
| | | | | | | | | | | | | | | | | |
| | | | Interest
Rate | | | Maturity
Date | | | Principal
Amount
(000) | | | | | |
| | | | | | | | | | | | | | | | | |
| CORPORATE BONDS 51.64% | | | | | | | | | | | | | | | | |
| | | | | | | | | | | | | | | | | |
| Agriculture 0.33% | | | | | | | | | | | | | | | | |
| Darling Ingredients, Inc.† | | | 5.25% | | | | 4/15/2027 | | | | $75 | | | | 78,644 | |
| 22 | See Notes to Financial Statements. |
Schedule of Investments (continued)
CLIMATE FOCUSED BOND FUND July 31, 2021
| Investments | | Interest
Rate | | | | Maturity
Date | | | Principal
Amount
(000) | | | Fair
Value | |
| Apparel 0.51% | | | | | | | | | | | | | | | | |
| Chanel Ceres plc(c) | | | 0.50% | | | | 7/31/2026 | | | EUR | 100 | | | $ | 120,663 | |
| | | | | | | | | | | | | | | | | |
| Auto Manufacturers 0.47% | | | | | | | | | | | | | | | | |
| Tesla, Inc.† | | | 5.30% | | | | 8/15/2025 | | | $ | 108 | | | | 111,085 | |
| | | | | | | | | | | | | | | | | |
| Auto Parts & Equipment 0.54% | | | | | | | | | | | | | | | | |
| Aptiv Corp. | | | 4.15% | | | | 3/15/2024 | | | | 25 | | | | 27,111 | |
| Aptiv plc (Ireland)(a) | | | 4.35% | | | | 3/15/2029 | | | | 35 | | | | 40,881 | |
| BorgWarner, Inc. | | | 3.375% | | | | 3/15/2025 | | | | 35 | | | | 37,925 | |
| Dana, Inc. | | | 4.25% | | | | 9/1/2030 | | | | 23 | | | | 23,935 | |
| Total | | | | | | | | | | | | | | | 129,852 | |
| | | | | | | | | | | | | | | | | |
| Banks 7.76% | | | | | | | | | | | | | | | | |
| AIB Group plc(c) | | | 2.875%
(5 yr. EUSA + 3.30% | )# | | | 5/30/2031 | | | EUR | 100 | | | | 127,753 | |
| Bank of Ireland Group plc(c) | | | 0.375%
(1 yr. EUSA + 0.77% | )# | | | 5/10/2027 | | | EUR | 100 | | | | 119,093 | |
| Bank of Nova Scotia (The) (Canada)(a)(d) | | | 0.65% | | | | 7/31/2024 | | | $ | 25 | | | | 25,036 | |
| Bank of Nova Scotia (The) (Canada)(a) | | | 2.375% | | | | 1/18/2023 | | | | 80 | | | | 82,474 | |
| Barclays plc(c) | | | 1.70%
(5 yr. GUKG + 1.75% | )# | | | 11/3/2026 | | | GBP | 100 | | | | 141,383 | |
| CaixaBank SA(c) | | | 1.25%
(5 yr. EUSA + 1.63% | )# | | | 6/18/2031 | | | EUR | 100 | | | | 120,287 | |
| Citigroup, Inc. | | | 1.678%
(SOFR + 1.67% | )# | | | 5/15/2024 | | | $ | 75 | | | | 76,569 | |
| Industrial & Commercial Bank of China Ltd. (Luxembourg)(a) | | | 2.875% | | | | 10/12/2022 | | | | 200 | | | | 205,190 | |
| ING Groep NV(c) | | | 2.50% | | | | 11/15/2030 | | | EUR | 100 | | | | 143,662 | |
| Intesa Sanpaolo SpA(c) | | | 0.75% | | | | 3/16/2028 | | | EUR | 100 | | | | 121,215 | |
| Kreditanstalt fuer Wiederaufbau(c) | | | 0.875% | | | | 9/15/2026 | | | GBP | 75 | | | | 106,337 | |
| Kreditanstalt fuer Wiederaufbau (Germany)(a) | | | 2.00% | | | | 10/4/2022 | | | $ | 112 | | | | 114,496 | |
| Landesbank Baden-Wuerttemberg(c) | | | 1.50% | | | | 2/3/2025 | | | GBP | 100 | | | | 141,943 | |
| Nordea Bank Abp(c) | | | 0.50% | | | | 3/19/2031 | | | EUR | 100 | | | | 121,628 | |
| Standard Chartered plc (United Kingdom)†(a) | | | 1.214%
(1 Yr Treasury CMT + .88% | )# | | | 3/23/2025 | | | $ | 200 | | | | 201,333 | |
| Total | | | | | | | | | | | | | | | 1,848,399 | |
| | | | | | | | | | | | | | | | | |
| Beverages 0.15% | | | | | | | | | | | | | | | | |
| PepsiCo, Inc. | | | 2.875% | | | | 10/15/2049 | | | | 35 | | | | 36,917 | |
| | | | | | | | | | | | | | | | | |
| Building Materials 0.60% | | | | | | | | | | | | | | | | |
| Johnson Controls International plc / Tyco Fire & Security Finance SCA | | | 1.75% | | | | 9/15/2030 | | | | 86 | | | | 84,952 | |
| Owens Corning, Inc. | | | 3.95% | | | | 8/15/2029 | | | | 50 | | | | 57,070 | |
| Total | | | | | | | | | | | | | | | 142,022 | |
| | See Notes to Financial Statements. | 23 |
Schedule of Investments (continued)
CLIMATE FOCUSED BOND FUND July 31, 2021
| Investments | | Interest
Rate | | | Maturity
Date | | | Principal
Amount
(000) | | | Fair
Value | |
| Commercial Services 1.42% | | | | | | | | | | | | | | | | |
| Global Payments, Inc. | | | 3.75% | | | | 6/1/2023 | | | $ | 30 | | | $ | 31,538 | |
| Massachusetts Institute of Technology | | | 3.959% | | | | 7/1/2038 | | | | 100 | | | | 121,997 | |
| PayPal Holdings, Inc. | | | 1.65% | | | | 6/1/2025 | | | | 60 | | | | 61,730 | |
| Techem Verwaltungsgesellschaft 674 mbH(c) | | | 6.00% | | | | 7/30/2026 | | | EUR | 100 | | | | 122,234 | |
| Total | | | | | | | | | | | | | | | 337,499 | |
| | | | | | | | | | | | | | | | | |
| Computers 0.14% | | | | | | | | | | | | | | | | |
| Apple, Inc. | | | 3.00% | | | | 6/20/2027 | | | $ | 30 | | | | 33,147 | |
| | | | | | | | | | | | | | | | | |
| Distribution/Wholesale 0.51% | | | | | | | | | | | | | | | | |
| Rexel SA(c) | | | 2.125% | | | | 6/15/2028 | | | EUR | 100 | | | | 121,809 | |
| | | | | | | | | | | | | | | | | |
| Diversified Financial Services 0.62% | | | | | | | | | | | | | | | | |
| LeasePlan Corp. NV(c) | | | 0.25% | | | | 2/23/2026 | | | EUR | 100 | | | | 119,244 | |
| Visa, Inc. | | | 0.75% | | | | 8/15/2027 | | | $ | 28 | | | | 27,650 | |
| Total | | | | | | | | | | | | | | | 146,894 | |
| | | | | | | | | | | | | | | | | |
| Electric 8.52% | | | | | | | | | | | | | | | | |
| AB Ignitis Grupe(c) | | | 2.00% | | | | 7/14/2027 | | | EUR | 100 | | | | 132,071 | |
| Clearway Energy Operating LLC† | | | 3.75% | | | | 2/15/2031 | | | $ | 50 | | | | 50,070 | |
| E.ON SE(c) | | | 0.35% | | | | 2/28/2030 | | | EUR | 100 | | | | 120,286 | |
| EDP - Energias de Portugal SA(c) | | 1.70%
(5 yr. EUSA + 1.84% | )# | | | 7/20/2080 | | | EUR | 100 | | | | 120,693 | |
| EnBW Energie Baden-Wuerttemberg AG(c) | | 1.625%
(EUAMDB05 + 1.73% | )# | | | 8/5/2079 | | | EUR | 100 | | | | 120,641 | |
| Energia Group NI FinanceCo PLC/Energia Group ROI Holdings DAC(c) | | | 4.00% | | | | 9/15/2025 | | | EUR | 100 | | | | 119,697 | |
| Engie SA(c) | | | 0.375% | | | | 6/21/2027 | | | EUR | 100 | | | | 121,985 | |
| Iberdrola International BV(c) | | 1.45%
(5 yr. EUSA + 1.83% | )# | | | – | (e) | | EUR | 100 | | | | 120,891 | |
| Interstate Power & Light Co. | | | 3.50% | | | | 9/30/2049 | | | $ | 20 | | | | 22,203 | |
| JSW Hydro Energy Ltd. (India)†(a) | | | 4.125% | | | | 5/18/2031 | | | | 200 | | | | 198,765 | |
| Leeward Renewable Energy Operations LLC† | | | 4.25% | | | | 7/1/2029 | | | | 17 | | | | 17,380 | |
| Liberty Utilities Finance GP 1† | | | 2.05% | | | | 9/15/2030 | | | | 35 | | | | 34,560 | |
| MidAmerican Energy Co. | | | 3.95% | | | | 8/1/2047 | | | | 15 | | | | 18,382 | |
| NextEra Energy Capital Holdings, Inc. | | | 1.90% | | | | 6/15/2028 | | | | 111 | | | | 113,439 | |
| NextEra Energy Operating Partners LP† | | | 4.50% | | | | 9/15/2027 | | | | 55 | | | | 59,450 | |
| Northern States Power Co/MN | | | 2.60% | | | | 6/1/2051 | | | | 50 | | | | 50,043 | |
| Orsted AS(c) | | 2.25%
(5 yr. EUSA + 1.90% | )# | | | – | (e) | | EUR | 100 | | | | 124,659 | |
| Pattern Energy Operations LP/Pattern Energy Operations, Inc.† | | | 4.50% | | | | 8/15/2028 | | | $ | 54 | | | | 55,847 | |
| 24 | See Notes to Financial Statements. |
Schedule of Investments (continued)
CLIMATE FOCUSED BOND FUND July 31, 2021
| Investments | | Interest
Rate | | | | Maturity
Date | | | Principal
Amount
(000) | | | Fair
Value | |
| Electric (continued) | | | | | | | | | | | | | | | | |
| Ren Finance BV(c) | | | 0.50% | | | | 4/16/2029 | | | EUR | 100 | | | $ | 120,846 | |
| Statnett SF(c) | | | 0.518% | | | | 6/30/2023 | | | SEK | 2,000 | | | | 233,824 | |
| Tucson Electric Power Co. | | | 1.50% | | | | 8/1/2030 | | | $ | 60 | | | | 58,259 | |
| Union Electric Co. | | | 2.625% | | | | 3/15/2051 | | | | 17 | | | | 16,761 | |
| Total | | | | | | | | | | | | | | | 2,030,752 | |
| | | | | | | | | | | | | | | | | |
| Electrical Components & Equipment 0.56% | | | | | | | | | | | | | | | | |
| Signify NV(c) | | | 2.375% | | | | 5/11/2027 | | | EUR | 100 | | | | 132,943 | |
| | | | | | | | | | | | | | | | | |
| Energy-Alternate Sources 5.97% | | | | | | | | | | | | | | | | |
| Alerion Cleanpower SpA(c) | | | 3.125% | | | | 12/19/2025 | | | EUR | 50 | | | | 61,225 | |
| Atlantica Sustainable Infrastructure plc (United Kingdom)†(a) | | | 4.125% | | | | 6/15/2028 | | | $ | 200 | | | | 207,910 | |
| EEW Energy from Waste GmbH(c) | | | 0.361% | | | | 6/30/2026 | | | EUR | 100 | | | | 120,725 | |
| Enviva Partners LP/Enviva Partners Finance Corp.† | | | 6.50% | | | | 1/15/2026 | | | $ | 60 | | | | 62,343 | |
| Greenko Dutch BV (Netherlands)†(a) | | | 3.85% | | | | 3/29/2026 | | | | 200 | | | | 201,957 | |
| Investment Energy Resources Ltd.† | | | 6.25% | | | | 4/26/2029 | | | | 200 | | | | 218,590 | |
| Nordex SE(c) | | | 6.50% | | | | 2/1/2023 | | | EUR | 100 | | | | 121,008 | |
| Renewable Energy Group, Inc.† | | | 5.875% | | | | 6/1/2028 | | | $ | 30 | | | | 31,326 | |
| Scatec ASA†(c) | 1.952%
(3 Mo. EURIBOR + 2.50% | )# | | | 8/19/2025 | | | EUR | 200 | | | | 234,284 | |
| TerraForm Power Operating LLC† | | | 4.75% | | | | 1/15/2030 | | | $ | 75 | | | | 79,125 | |
| Topaz Solar Farms LLC† | | | 5.75% | | | | 9/30/2039 | | | | 73 | | | | 85,067 | |
| Total | | | | | | | | | | | | | | | 1,423,560 | |
| | | | | | | | | | | | | | | | | |
| Environmental Control 1.17% | | | | | | | | | | | | | | | | |
| Core & Main LP† | | | 6.125% | | | | 8/15/2025 | | | | 10 | | | | 10,154 | |
| FCC Servicios Medio Ambiente Holding SAU(c) | | | 1.661% | | | | 12/4/2026 | | | EUR | 100 | | | | 126,778 | |
| Madison IAQ LLC† | | | 5.875% | | | | 6/30/2029 | | | $ | 23 | | | | 23,275 | |
| Paprec Holding SA†(c) | | | 3.50% | | | | 7/1/2028 | | | EUR | 100 | | | | 119,774 | |
| Total | | | | | | | | | | | | | | | 279,981 | |
| | | | | | | | | | | | | | | | | |
| Food 0.78% | | | | | | | | | | | | | | | | |
| Co-Operative Group Ltd.(c) | | | 5.125% | | | | 5/17/2024 | | | GBP | 100 | | | | 148,776 | |
| Sysco Corp. | | | 2.40% | | | | 2/15/2030 | | | $ | 35 | | | | 36,385 | |
| Total | | | | | | | | | | | | | | | 185,161 | |
| | | | | | | | | | | | | | | | | |
| Forest Products & Paper 0.10% | | | | | | | | | | | | | | | | |
| Suzano Austria GmbH (Brazil)(a) | | | 3.75% | | | | 1/15/2031 | | | | 24 | | | | 25,033 | |
| | | | | | | | | | | | | | | | | |
| Health Care-Services 0.46% | | | | | | | | | | | | | | | | |
| Kaiser Foundation Hospitals | | | 3.15% | | | | 5/1/2027 | | | | 100 | | | | 110,515 | |
| | See Notes to Financial Statements. | 25 |
Schedule of Investments (continued)
CLIMATE FOCUSED BOND FUND July 31, 2021
| Investments | | Interest
Rate | | | | Maturity
Date | | | Principal
Amount
(000) | | | Fair
Value | |
| Insurance 0.30% | | | | | | | | | | | | | | | | |
| Prudential Financial, Inc. | | | 1.50% | | | | 3/10/2026 | | | $ | 70 | | | $ | 71,591 | |
| | | | | | | | | | | | | | | | | |
| Machinery-Diversified 0.49% | | | | | | | | | | | | | | | | |
| Mueller Water Products, Inc.† | | | 4.00% | | | | 6/15/2029 | | | | 50 | | | | 51,835 | |
| Xylem Inc/NY | | | 2.25% | | | | 1/30/2031 | | | | 30 | | | | 30,800 | |
| Xylem, Inc. | | | 3.25% | | | | 11/1/2026 | | | | 30 | | | | 33,061 | |
| Total | | | | | | | | | | | | | | | 115,696 | |
| | | | | | | | | | | | | | | | | |
| Metal Fabricate/Hardware 0.48% | | | | | | | | | | | | | | | | |
| Advanced Drainage Systems, Inc.† | | | 5.00% | | | | 9/30/2027 | | | | 110 | | | | 115,206 | |
| | | | | | | | | | | | | | | | | |
| Mining 0.52% | | | | | | | | | | | | | | | | |
| Novelis Sheet Ingot GmbH†(c) | | | 3.375% | | | | 4/15/2029 | | | EUR | 100 | | | | 123,142 | |
| | | | | | | | | | | | | | | | | |
| Miscellaneous Manufacturing 1.44% | | | | | | | | | | | | | | | | |
| Alstom SA(c) | | | 0.25% | | | | 10/14/2026 | | | EUR | 100 | | | | 120,171 | |
| Pentair Finance Sarl (Luxembourg)(a) | | | 4.50% | | | | 7/1/2029 | | | $ | 85 | | | | 100,332 | |
| Wabtec Transportation Netherlands BV(c) | | | 1.25% | | | | 12/3/2027 | | | EUR | 100 | | | | 122,601 | |
| Total | | | | | | | | | | | | | | | 343,104 | |
| | | | | | | | | | | | | | | | | |
| Multi-National 4.60% | | | | | | | | | | | | | | | | |
| Asian Development Bank(c) | | | 2.45% | | | | 1/17/2024 | | | AUD | 105 | | | | 81,129 | |
| Asian Development Bank (Philippines)(a) | | | 3.125% | | | | 9/26/2028 | | | $ | 135 | | | | 154,568 | |
| Asian Infrastructure Investment Bank (The)(c) | | | 0.20% | | | | 12/15/2025 | | | GBP | 30 | | | | 41,194 | |
| Asian Infrastructure Investment Bank (The) (China)(a) | | | 0.50% | | | | 5/28/2025 | | | $ | 185 | | | | 184,630 | |
| European Bank for Reconstruction & Development (United Kingdom)(a) | | | 1.625% | | | | 9/27/2024 | | | | 175 | | | | 181,450 | |
| European Investment Bank (Luxembourg)(a) | | | 2.125% | | | | 4/13/2026 | | | | 100 | | | | 106,909 | |
| European Investment Bank (Luxembourg)(a) | | | 2.375% | | | | 5/24/2027 | | | | 75 | | | | 81,409 | |
| International Bank for Reconstruction & Development(c) | | | 0.25% | | | | 1/29/2029 | | | SEK | 180 | | | | 20,668 | |
| International Bank for Reconstruction & Development(c) | | | 1.20% | | | | 7/22/2026 | | | CAD | 25 | | | | 20,112 | |
| International Bank for Reconstruction & Development(c) | | | 2.90% | | | | 11/26/2025 | | | AUD | 155 | | | | 124,407 | |
| International Finance Corp. | | | 2.00% | | | | 10/24/2022 | | | $ | 97 | | | | 99,234 | |
| Total | | | | | | | | | | | | | | | 1,095,710 | |
| | | | | | | | | | | | | | | | | |
| Municipal 0.61% | | | | | | | | | | | | | | | | |
| Transport for London(c) | | | 2.125% | | | | 4/24/2025 | | | GBP | 100 | | | | 145,857 | |
| 26 | See Notes to Financial Statements. |
Schedule of Investments (continued)
CLIMATE FOCUSED BOND FUND July 31, 2021
| Investments | | Interest
Rate | | | Maturity
Date | | | Principal
Amount
(000) | | | Fair
Value | |
| Packaging & Containers 1.52% | | | | | | | | | | | | | | | | |
| Ardagh Metal Packaging Finance USA LLC/Ardagh Metal Packaging Finance plc†(c) | | | 3.00% | | | | 9/1/2029 | | | EUR | 100 | | | $ | 119,133 | |
| CANPACK SA/Eastern PA Land Investment Holding LLC†(c) | | | 2.375% | | | | 11/1/2027 | | | EUR | 100 | | | | 122,177 | |
| OI European Group BV(c) | | | 2.875% | | | | 2/15/2025 | | | EUR | 100 | | | | 120,653 | |
| Total | | | | | | | | | | | | | | | 361,963 | |
| | | | | | | | | | | | | | | | | |
| Pharmaceuticals 0.23% | | | | | | | | | | | | | | | | |
| Pfizer, Inc. | | | 2.625% | | | | 4/1/2030 | | | $ | 50 | | | | 54,255 | |
| | | | | | | | | | | | | | | | | |
| Real Estate 1.67% | | | | | | | | | | | | | | | | |
| Canary Wharf Group Investment Holdings plc†(c) | | | 2.625% | | | | 4/23/2025 | | | GBP | 200 | | | | 282,928 | (f) |
| Signa Development Finance SCS†(c) | | | 5.50% | | | | 7/23/2026 | | | EUR | 100 | | | | 114,621 | |
| Total | | | | | | | | | | | | | | | 397,549 | |
| | | | | | | | | | | | | | | | | |
| REITS 3.33% | | | | | | | | | | | | | | | | |
| Alexandria Real Estate Equities, Inc. | | | 2.00% | | | | 5/18/2032 | | | $ | 22 | | | | 21,939 | |
| Alexandria Real Estate Equities, Inc. | | | 3.80% | | | | 4/15/2026 | | | | 55 | | | | 61,804 | |
| Cyrusone Europe Finance DAC(c) | | | 1.125% | | | | 5/26/2028 | | | EUR | 100 | | | | 119,890 | |
| Digital Dutch Finco BV(c) | | | 1.00% | | | | 1/15/2032 | | | EUR | 100 | | | | 120,678 | |
| Equinix, Inc. | | | 1.55% | | | | 3/15/2028 | | | $ | 110 | | | | 109,697 | |
| HAT Holdings I LLC/HAT Holdings II LLC† | | | 3.75% | | | | 9/15/2030 | | | | 102 | | | | 101,918 | |
| Kilroy Realty LP | | | 4.75% | | | | 12/15/2028 | | | | 45 | | | | 53,022 | |
| Piedmont Operating Partnership LP | | | 3.15% | | | | 8/15/2030 | | | | 60 | | | | 62,322 | |
| UDR, Inc. | | | 3.10% | | | | 11/1/2034 | | | | 80 | | | | 86,185 | |
| Weyerhaeuser Co. | | | 6.875% | | | | 12/15/2033 | | | | 40 | | | | 55,963 | |
| Total | | | | | | | | | | | | | | | 793,418 | |
| | | | | | | | | | | | | | | | | |
| Retail 0.13% | | | | | | | | | | | | | | | | |
| Starbucks Corp. | | | 4.45% | | | | 8/15/2049 | | | | 25 | | | | 31,932 | |
| | | | | | | | | | | | | | | | | |
| Semiconductors 1.28% | | | | | | | | | | | | | | | | |
| Analog Devices, Inc. | | | 2.95% | | | | 4/1/2025 | | | | 83 | | | | 89,145 | |
| Infineon Technologies AG(c) | | | 3.625%
(5 yr. EUSA + 4.00% | )# | | | – | (e) | | EUR | 100 | | | | 132,249 | |
| NXP BV/NXP Funding LLC/NXP USA, Inc. (Netherlands)†(a) | | | 3.40% | | | | 5/1/2030 | | | $ | 75 | | | | 83,087 | |
| Total | | | | | | | | | | | | | | | 304,481 | |
| | | | | | | | | | | | | | | | | |
| Software 0.14% | | | | | | | | | | | | | | | | |
| Fiserv, Inc. | | | 3.20% | | | | 7/1/2026 | | | | 30 | | | | 32,654 | |
| | See Notes to Financial Statements. | 27 |
Schedule of Investments (continued)
CLIMATE FOCUSED BOND FUND July 31, 2021
| Investments | | Interest
Rate | | | | Maturity
Date | | | Principal
Amount
(000) | | | Fair
Value | |
| Telecommunications 1.06% | | | | | | | | | | | | | | | | |
| Swisscom Finance BV(c) | | | 0.375% | | | | 11/14/2028 | | | EUR | 100 | | | $ | 122,262 | |
| Switch Ltd.† | | | 3.75% | | | | 9/15/2028 | | | $ | 78 | | | | 79,953 | |
| Verizon Communications, Inc. | | | 3.875% | | | | 2/8/2029 | | | | 45 | | | | 51,688 | |
| Total | | | | | | | | | | | | | | | 253,903 | |
| | | | | | | | | | | | | | | | | |
| Transportation 1.01% | | | | | | | | | | | | | | | | |
| Ferrovie dello Stato Italiane SpA(c) | | | 0.375% | | | | 3/25/2028 | | | EUR | 100 | | | | 121,009 | |
| Hamburger Hochbahn AG(c) | | | 0.125% | | | | 2/24/2031 | | | EUR | 100 | | | | 119,622 | |
| Total | | | | | | | | | | | | | | | 240,631 | |
| | | | | | | | | | | | | | | | | |
| Water 2.22% | | | | | | | | | | | | | | | | |
| Aegea Finance Sarl (Luxembourg)†(a) | | | 5.75% | | | | 10/10/2024 | | | $ | 200 | | | | 206,651 | |
| American Water Capital Corp. | | | 2.80% | | | | 5/1/2030 | | | | 50 | | | | 54,279 | |
| Canal de Isabel II Gestion SA(c) | | | 1.68% | | | | 2/26/2025 | | | EUR | 100 | | | | 126,120 | |
| Severn Trent Utilities Finance plc(c) | | | 2.00% | | | | 6/2/2040 | | | GBP | 100 | | | | 142,419 | |
| Total | | | | | | | | | | | | | | | 529,469 | |
| Total Corporate Bonds (cost $11,902,868) | | | | | | | | | | | | | | | 12,305,437 | |
| | | | | | | | | | | | | | | | | |
| FLOATING RATE LOANS(g) 1.71% | | | | | | | | | | | | | | | | |
| | | | | | | | | | | | | | | | | |
| Building & Construction 0.17% | | | | | | | | | | | | | | | | |
| Refficiency Holdings LLC 2020 Delayed Draw Term Loan(h) | | | 4.75%
(1 Mo. LIBOR + 4.00% | ) | | | 12/16/2027 | | | $ | 6 | | | | 6,465 | |
| Refficiency Holdings LLC 2020 Term Loan | | | 4.75%
(1 Mo. LIBOR + 4.00% | ) | | | 12/16/2027 | | | | 33 | | | | 33,448 | |
| Total | | | | | | | | | | | | | | | 39,913 | |
| | | | | | | | | | | | | | | | | |
| Electric: Generation 0.13% | | | | | | | | | | | | | | | | |
| ExGen Renewables IV, LLC 2020 Term Loan | | | 3.50%
(3 Mo. LIBOR + 2.50% | ) | | | 12/15/2027 | | | | 31 | | | | 31,273 | |
| | | | | | | | | | | | | | | | | |
| Environmental 0.55% | | | | | | | | | | | | | | | | |
| Bingo Industries Ltd. Term Loan (Australia)(a) | | | – | (i) | | | 7/8/2028 | | | | 20 | | | | 19,925 | (j) |
| Denali Water Solutions Term Loan B | | | 5.00%
(3 Mo. LIBOR + 4.25% | ) | | | 3/25/2028 | | | | 62 | | | | 62,096 | |
| EWT Holdings III Corp. 2021 Term Loan | | | 2.625%
(1 Mo. LIBOR + 2.50% | ) | | | 4/1/2028 | | | | 50 | | | | 49,573 | |
| Total | | | | | | | | | | | | | | | 131,594 | |
| | | | | | | | | | | | | | | | | |
| Integrated Energy 0.31% | | | | | | | | | | | | | | | | |
| Array Technologies, Inc. Term Loan B | | | 3.75%
(1 Mo. LIBOR + 3.25% | ) | | | 10/14/2027 | | | | 76 | | | | 74,194 | |
| 28 | See Notes to Financial Statements. |
Schedule of Investments (continued)
CLIMATE FOCUSED BOND FUND July 31, 2021
| Investments | | Interest
Rate | | Maturity
Date | | Principal
Amount
(000) | | | Fair
Value | |
| Machinery 0.28% | | | | | | | | | | | | |
| Filtration Group Corporation 2018 Term Loan B | | 3.92%
(3 Mo. LIBOR + 3.00% | ) | 3/29/2025 | | $ | 30 | | | $ | 29,411 | |
| Generac Power Systems, Inc. 2019 Term Loan B | | 1.846%
(1 Mo. LIBOR + 1.75% | ) | 12/13/2026 | | | 38 | | | | 37,685 | |
| Total | | | | | | | | | | | 67,096 | |
| | | | | | | | | | | | | |
| Personal & Household Products 0.27% | | | | | | | | | | | | |
| Osmosis Buyer Delayed Draw Term Loan | | – | (i) | 6/16/2028 | | | 7 | | | | 6,952 | |
| Osmosis Buyer Term Loan B | | – | (i) | 7/30/2028 | | | 56 | | | | 55,616 | |
| Total | | | | | | | | | | | 62,568 | |
| Total Floating Rate Loans (cost $405,417) | | | | | | | | | | | 406,638 | |
| | | | | | | | | | | | | |
| FOREIGN GOVERNMENT OBLIGATIONS 11.17% | | | | | | | | | | | | |
| | | | | | | | | | | | | |
| Canada 0.96% | | | | | | | | | | | | |
| Province of Ontario Canada(c) | | 1.85% | | 2/1/2027 | | CAD | 145 | | | | 120,152 | |
| Province of Quebec Canada(c) | | 1.85% | | 2/13/2027 | | CAD | 130 | | | | 108,004 | |
| Total | | | | | | | | | | | 228,156 | |
| | | | | | | | | | | | | |
| France 2.23% | | | | | | | | | | | | |
| Action Logement Services(c) | | 0.50% | | 10/30/2034 | | EUR | 100 | | | | 120,783 | |
| French Republic Government Bond OAT†(c) | | 0.50% | | 6/25/2044 | | EUR | 135 | | | | 160,698 | |
| SNCF Reseau(c) | | 0.75% | | 5/25/2036 | | EUR | 100 | | | | 124,776 | |
| Societe Nationale SNCF SA(c) | | 0.625% | | 4/17/2030 | | EUR | 100 | | | | 124,986 | |
| Total | | | | | | | | | | | 531,243 | |
| | | | | | | | | | | | | |
| Germany 0.26% | | | | | | | | | | | | |
| Bundesrepublik Deutschland Bundesanleihe(c) | | Zero Coupon | | 8/15/2050 | | EUR | 51 | | | | 61,104 | |
| | | | | | | | | | | | | |
| Italy 0.30% | | | | | | | | | | | | |
| Italy Buoni Poliennali Del Tesoro†(c) | | 1.50% | | 4/30/2045 | | EUR | 60 | | | | 72,009 | |
| | | | | | | | | | | | | |
| Japan 0.84% | | | | | | | | | | | | |
| Development Bank of Japan, Inc. (Japan)†(a) | | 0.50% | | 3/4/2024 | | $ | 200 | | | | 200,312 | |
| | | | | | | | | | | | | |
| Netherlands 2.57% | | | | | | | | | | | | |
| BNG Bank NV (Netherlands)†(a) | | 1.50% | | 10/16/2024 | | | 200 | | | | 206,485 | |
| Nederlandse Financierings-Maatschappij voor Ontwikkelingslanden NV (Netherlands)(a) | | 2.75% | | 2/20/2024 | | | 200 | | | | 212,103 | |
| Nederlandse Waterschapsbank NV (Netherlands)(a) | | 1.00% | | 5/28/2030 | | | 200 | | | | 194,790 | |
| Total | | | | | | | | | | | 613,378 | |
| | | | | | | | | | | | | |
| | See Notes to Financial Statements. | 29 |
Schedule of Investments (continued)
CLIMATE FOCUSED BOND FUND July 31, 2021
| Investments | | Interest
Rate | | Maturity
Date | | Principal
Amount
(000) | | | Fair
Value | |
| South Korea 0.89% | | | | | | | | | | | | |
| Korea Water Resources Corp. (South Korea)(a) | | 3.875% | | 5/15/2023 | | $ | 200 | | | $ | 212,235 | |
| | | | | | | | | | | | | |
| Spain 1.28% | | | | | | | | | | | | |
| Adif Alta Velocidad(c) | | 0.55% | | 4/30/2030 | | EUR | 100 | | | | 122,238 | |
| Autonomous Community of Madrid Spain(c) | | 0.419% | | 4/30/2030 | | EUR | 150 | | | | 182,059 | |
| Total | | | | | | | | | | | 304,297 | |
| | | | | | | | | | | | | |
| Sweden 1.84% | | | | | | | | | | | | |
| Kommuninvest I Sverige AB (Sweden)†(a) | | 1.625% | | 4/24/2023 | | $ | 200 | | | | 204,921 | |
| Sweden Government International Bond(c) | | 0.125% | | 9/9/2030 | | SEK | 1,000 | | | | 117,031 | |
| Sweden Government International Bond†(c) | | 0.125% | | 9/9/2030 | | SEK | 1,000 | | | | 117,030 | |
| Total | | | | | | | | | | | 438,982 | |
| Total Foreign Government Obligations (cost $2,611,488) | | | | | | | | | | | 2,661,716 | |
| | | | | | | | | | | | | |
| MUNICIPAL BONDS 2.81% | | | | | | | | | | | | |
| | | | | | | | | | | | | |
| Other Revenue 0.21% | | | | | | | | | | | | |
| City of Corpus Christi TX Utility System Revenue | | 1.966% | | 7/15/2030 | | $ | 50 | | | | 51,228 | |
| | | | | | | | | | | | | |
| Tax Revenue 0.11% | | | | | | | | | | | | |
| Regional Transportation District Sales Tax Revenue | | 2.337% | | 11/1/2036 | | | 25 | | | | 25,416 | |
| | | | | | | | | | | | | |
| Taxable Revenue - Transportation 0.26% | | | | | | | | | | | | |
| Metropolitan Transportation Authority | | 5.175% | | 11/15/2049 | | | 45 | | | | 61,108 | |
| | | | | | | | | | | | | |
| Taxable Revenue - Water & Sewer 2.23% | | | | | | | | | | | | |
| City of Dallas TX Waterworks & Sewer System Revenue | | 2.772% | | 10/1/2040 | | | 75 | | | | 77,216 | |
| City of Los Angeles CA Wastewater System Revenue | | 5.713% | | 6/1/2039 | | | 50 | | | | 72,020 | |
| City of Philadelphia PA Water & Wastewater Revenue | | 1.734% | | 11/1/2028 | | | 40 | | | | 40,657 | |
| City of San Francisco CA Public Utilities Commission Water Revenue | | 6.00% | | 11/1/2040 | | | 100 | | | | 141,510 | |
| Middle Fork Project Finance Authority | | 5.00% | | 4/1/2036 | | | 50 | | | | 63,720 | |
| New York City Water & Sewer System | | 5.75% | | 6/15/2041 | | | 50 | | | | 75,654 | |
| San Diego County Water Authority | | 1.951% | | 5/1/2034 | | | 60 | | | | 60,692 | |
| Total | | | | | | | | | | | 531,469 | |
| Total Municipal Bonds (cost $651,490) | | | | | | | | | | | 669,221 | |
| | | | | | | | | | | | | |
| 30 | See Notes to Financial Statements. |
Schedule of Investments (continued)
CLIMATE FOCUSED BOND FUND July 31, 2021
| Investments | | Interest
Rate | | Maturity
Date | | Principal
Amount
(000) | | | Fair
Value | |
| NON-AGENCY COMMERCIAL MORTGAGE-BACKED SECURITIES 0.44% |
One Bryant Park Trust 2019-OBP A†
(cost $102,171) | | 2.516% | | 9/15/2054 | | $ | 100 | | | $ | 105,377 | |
| | | | | | | | | | | | | |
| U.S. TREASURY OBLIGATIONS 3.20% | | | | | | | | | | | | |
| U.S. Treasury Bond | | 1.125% | | 5/15/2040 | | | 160 | | | | 143,006 | |
| U.S. Treasury Bond | | 1.625% | | 11/15/2050 | | | 15 | | | | 14,026 | |
| U.S. Treasury Bond | | 2.25% | | 8/15/2049 | | | 142 | | | | 152,728 | |
| U.S. Treasury Note | | 0.75% | | 3/31/2026 | | | 235 | | | | 236,093 | |
| U.S. Treasury Note | | 1.625% | | 5/15/2031 | | | 210 | | | | 217,727 | |
| Total U.S. Treasury Obligations (cost $738,773) | | | | | | | | | | | 763,580 | |
| Total Long-Term Investments (cost $16,733,274) | | | | | | | | | | | 17,235,432 | |
| | | | | | | | | | | | | |
| SHORT-TERM INVESTMENTS 0.85% | | | | | | | | | | | | |
| | | | | | | | | | | | | |
| REPURCHASE AGREEMENTS | | | | | | | | | | | | |
Repurchase Agreement dated 7/30/2021, 0.00% due 8/2/2021 with Fixed Income Clearing Corp. collateralized by $207,300 of U.S. Treasury Note at 0.375% due 7/15/2024; value: $207,364; proceeds: $203,247
(cost $203,247) | | | | | | | 203 | | | | 203,247 | |
| Total Investments in Securities 73.17% (cost $16,936,521) | | | | | | | | | 17,438,679 | |
| Less Unfunded Loan Commitments (0.03)% (cost $6,452)(k) | | | | | | | | | (6,465) | |
| Net Investments 73.15% (cost $16,930,069) | | | | | | | | | | | 17,432,214 | |
| Other Assets and Liabilities - Net(l) 26.85% | | | | | | | | | | | 6,399,300 | |
| Net Assets 100.00% | | | | | | | | | | $ | 23,831,514 | |
| | | | | | | | | | | | | |
| AUD | Australian dollar. |
| CAD | Canadian dollar. |
| CMT | Constant maturity rate. |
| EUAMDB05 | Euro constant maturity rate. |
| EUR | Euro. |
| EURIBOR | Euro Interbank Offered Rate. |
| EUSA | Euro Swap Rate. |
| GBP | British pound. |
| GUKG | UK Generic government yield. |
| LIBOR | London Interbank Offered Rate. |
| SEK | Swedish krona. |
| SOFR | Secured Over Night Financing Rate. |
| | |
| † | | Security was purchased pursuant to Rule 144A under the Securities Act of 1933 and, unless registered under such Act or exempted from registration, may only be resold to qualified institutional buyers. At July 31, 2021, the total value of Rule 144A securities was $4,844,006, which represents 20.33% of net assets. |
| # | | Variable rate security. The interest rate represents the rate in effect at July 31, 2021. |
| (a) | | Foreign security traded in U.S. dollars. |
| | | |
| | See Notes to Financial Statements. | 31 |
Schedule of Investments (continued)
CLIMATE FOCUSED BOND FUND July 31, 2021
| (b) | Amount is less than 1,000 shares. |
| (c) | Investment in non-U.S. dollar denominated securities. |
| (d) | Securities purchased on a when-issued basis (See Note 2(i)). |
| (e) | Security is perpetual in nature and has no stated maturity. |
| (f) | Level 3 Investment as described in Note 2(m) in the Notes to Financials. Security valued utilizing third party pricing information without adjustment. Such valuations are based on unobservable inputs. A significant change in third party information could result in a significantly lower or higher value of such Level 3 investments. |
| (g) | Floating Rate Loans in which the Fund invests generally pay interest at rates which are periodically re-determined at a margin above the London Interbank Offered Rate (“LIBOR”) or the prime rate offered by major U.S. banks. The rate(s) shown is the rate(s) in effect at July 31, 2021. |
| (h) | Security is partially/fully unfunded. See Note 2(l). |
| (i) | Interest rate to be determined. |
| (j) | Level 3 Investment as described in Note 2(m) in the Notes to Financials. Floating Rate Loans categorized as Level 3 are valued based on a single quotation obtained from a dealer. Accounting principles generally accepted in the United States of America do not require the Fund to create quantitative unobservable inputs that were not developed by the Fund. Therefore, the Fund does not have access to unobservable inputs and cannot disclose such inputs in the valuation. |
| (k) | See Note 2(l). |
| (l) | Other Assets and Liabilities - Net include net unrealized appreciation/depreciation on forward foreign currency exchange contracts and futures contracts as follows: |
Open Forward Foreign Currency Exchange Contracts at July 31, 2021:
Forward
Foreign
Currency
Exchange
Contracts | | Transaction
Type | | Counterparty | | Expiration
Date | | Foreign
Currency | | U.S. $
Cost on
Origination
Date | | | U.S. $
Current
Value | | | Unrealized
Appreciation | |
| Australian dollar | | Sell | | State Street Bank and Trust | | 9/1/2021 | | | 282,000 | | | $ | 218,363 | | | $ | 206,974 | | | | $ | 11,389 | |
| British pound | | Sell | | Barclays Bank plc | | 9/8/2021 | | | 822,000 | | | | 1,163,957 | | | | 1,142,679 | | | | | 21,278 | |
| Euro | | Sell | | State Street Bank and Trust | | 9/10/2021 | | | 20,000 | | | | 23,785 | | | | 23,743 | | | | | 42 | |
| Euro | | Sell | | State Street Bank and Trust | | 9/10/2021 | | | 4,916,000 | | | | 6,015,417 | | | | 5,835,925 | | | | | 179,492 | |
| Euro | | Sell | | State Street Bank and Trust | | 9/10/2021 | | | 100,000 | | | | 119,572 | | | | 118,713 | | | | | 859 | |
| Euro | | Sell | | State Street Bank and Trust | | 9/10/2021 | | | 100,000 | | | | 119,573 | | | | 118,713 | | | | | 860 | |
| Unrealized Appreciation on Forward Foreign Currency Exchange Contracts | | | | | | | | | | | | | $ | 213,920 | |
| | | | | | | | | | | | | | | | | | |
| 32 | See Notes to Financial Statements. |
Schedule of Investments (continued)
CLIMATE FOCUSED BOND FUND July 31, 2021
Forward
Foreign
Currency
Exchange
Contracts | | Transaction
Type | | Counterparty | | Expiration
Date | | Foreign
Currency | | U.S. $
Cost on
Origination
Date | | | U.S. $
Current
Value | | | Unrealized
Depreciation | |
| Euro | | Buy | | State Street Bank and Trust | | 9/10/2021 | | | 114,000 | | | $ | 135,623 | | | $ | 135,333 | | | | $ | (290 | ) |
| Euro | | Buy | | State Street Bank and Trust | | 9/10/2021 | | | 216,000 | | | | 258,264 | | | | 256,420 | | | | | (1,844 | ) |
| Euro | | Buy | | Toronto Dominion Bank | | 9/10/2021 | | | 106,178 | | | | 126,052 | | | | 126,047 | | | | | (5 | ) |
| British pound | | Sell | | State Street Bank and Trust | | 9/8/2021 | | | 10,000 | | | | 13,893 | | | | 13,901 | | | | | (8 | ) |
| Canadian dollar | | Sell | | State Street Bank and Trust | | 10/20/2021 | | | 311,000 | | | | 243,685 | | | | 249,268 | | | | | (5,583 | ) |
| Euro | | Sell | | Goldman Sachs | | 9/10/2021 | | | 20,000 | | | | 23,569 | | | | 23,742 | | | | | (173 | ) |
| Euro | | Sell | | State Street Bank and Trust | | 9/10/2021 | | | 32,000 | | | | 37,882 | | | | 37,988 | | | | | (106 | ) |
| Euro | | Sell | | State Street Bank and Trust | | 9/10/2021 | | | 99,000 | | | | 116,671 | | | | 117,526 | | | | | (855 | ) |
| Euro | | Sell | | State Street Bank and Trust | | 9/10/2021 | | | 48,000 | | | | 56,738 | | | | 56,982 | | | | | (244 | ) |
| Euro | | Sell | | Toronto Dominion Bank | | 9/10/2021 | | | 112,000 | | | | 132,838 | | | | 132,959 | | | | | (121 | ) |
| Swedish krona | | Sell | | State Street Bank and Trust | | 10/21/2021 | | | 4,200,000 | | | | 484,032 | | | | 488,189 | | | | | (4,157 | ) |
| Unrealized Depreciation on Forward Foreign Currency Exchange Contracts | | | | | | | | | | | | | $ | (13,386 | ) |
Open Futures Contracts at July 31, 2021:
| Type | | Expiration | | Contracts | | Position | | Notional
Amount | | | Notional
Value | | | Unrealized
Appreciation | |
| Euro- Buxl | | September 2021 | | 1 | | Long | | EUR | 200,822 | | | EUR | 215,040 | | | | $ | 16,866 | |
| U.S. Ultra Treasury Bond | | September 2021 | | 2 | | Long | | $ | 371,192 | | | $ | 399,063 | | | | | 27,871 | |
| Total Unrealized Appreciation on Open Futures Contracts | | | | | | | | | | | | | | $ | 44,737 | |
| | | | | | | | | | | | | | | | | | | | |
| Type | | Expiration | | Contracts | | Position | | Notional
Amount | | | Notional
Value | | | Unrealized
Depreciation | |
| Euro-Bobl | | September 2021 | | 7 | | Short | | EUR | (939,388 | ) | | EUR | (947,520 | ) | | | $ | (9,647 | ) |
| Euro-Bund | | September 2021 | | 2 | | Short | | | (343,997 | ) | | | (353,140 | ) | | | | (10,846 | ) |
| U.S. 10-Year Ultra Treasury Note | | September 2021 | | 7 | | Short | | $ | (1,015,323 | ) | | $ | (1,051,750 | ) | | | | (36,427 | ) |
| U.S. 2-Year Treasury Note | | September 2021 | | 3 | | Long | | | 662,107 | | | | 661,969 | | | | | (138 | ) |
| U.S. 5-Year Treasury Note | | September 2021 | | 6 | | Short | | | (743,114 | ) | | | (746,672 | ) | | | | (3,558 | ) |
| Total Unrealized Depreciation on Open Futures Contracts | | | | | | | | | | | | | | $ | (60,616 | ) |
| | See Notes to Financial Statements. | 33 |
Schedule of Investments (continued)
CLIMATE FOCUSED BOND FUND July 31, 2021
The following is a summary of the inputs used as of July 31, 2021 in valuing the Fund’s investments carried at fair value(1):
| Investment Type(2) | | Level 1 | | | Level 2 | | | Level 3 | | | Total | |
| Long-Term Investments | | | | | | | | | | | | | | | | |
| Asset-Backed Securities | | $ | – | | | $ | 201,726 | | | $ | – | | | $ | 201,726 | |
| Convertible Bonds | | | – | | | | 104,915 | | | | – | | | | 104,915 | |
| Convertible Preferred Stocks | | | 16,822 | | | | – | | | | – | | | | 16,822 | |
| Corporate Bonds | | | | | | | | | | | | | | | | |
| Real Estate Development & Management | | | – | | | | 114,621 | | | | 282,928 | | | | 397,549 | |
| Remaining Industries | | | – | | | | 11,907,888 | | | | – | | | | 11,907,888 | |
| Floating Rate Loans | | | | | | | | | | | | | | | | |
| Environmental | | | – | | | | 111,669 | | | | 19,925 | | | | 131,594 | |
| Less Unfunded Commitments | | | – | | | | (6,465 | ) | | | – | | | | (6,465 | ) |
| Remaining Industries | | | – | | | | 275,044 | | | | – | | | | 275,044 | |
| Foreign Government Obligations | | | – | | | | 2,661,716 | | | | – | | | | 2,661,716 | |
| Municipal Bonds | | | – | | | | 669,221 | | | | – | | | | 669,221 | |
| Non-Agency Commercial Mortgage-Backed Securities | | | – | | | | 105,377 | | | | – | | | | 105,377 | |
| U.S. Treasury Obligations | | | – | | | | 763,580 | | | | – | | | | 763,580 | |
| Short-Term Investments | | | | | | | | | | | | | | | | |
| Repurchase Agreements | | | – | | | | 203,247 | | | | – | | | | 203,247 | |
| Total | | $ | 16,822 | | | $ | 17,112,539 | | | $ | 302,853 | | | $ | 17,432,214 | |
| | | | | | | | | | | | | | | | | |
| Other Financial Instruments | | | | | | | | | | | | | | | | |
| Forward Foreign Currency Exchange Contracts | | | | | | | | | | | | | | | | |
| Assets | | $ | – | | | $ | 213,920 | | | $ | – | | | $ | 213,920 | |
| Liabilities | | | – | | | | (13,386 | ) | | | – | | | | (13,386 | ) |
| Futures Contracts | | | | | | | | | | | | | | | | |
| Assets | | | 44,737 | | | | – | | | | – | | | | 44,737 | |
| Liabilities | | | (60,616 | ) | | | – | | | | – | | | | (60,616 | ) |
| Total | | $ | (15,879 | ) | | $ | 200,534 | | | $ | – | | | $ | 184,655 | |
| | | | | | | | | | | | | | | | | |
| (1) | Refer to Note 2(m) for a description of fair value measurements and the three-tier hierarchy of inputs. |
| (2) | See Schedule of Investments for fair values in each industry and identification of foreign issuers and/or geography. The table above is presented by Investment Type. Industries are presented within an Investment Type should such Investment Type include securities classified as two or more levels within the three-tier fair value hierarchy. Each Level 3 security is identified on the Schedule of Investments along with the valuation technique utilized. |
| | |
| 34 | See Notes to Financial Statements. |
Schedule of Investments (concluded)
CLIMATE FOCUSED BOND FUND July 31, 2021
A reconciliation of Level 3 investments is presented when the Fund has a material amount of Level 3 investments at the beginning or end of the year in relation to the Fund’s net assets.
| Investment Type | | Asset-Backed
Securities | | | Corporate
Bonds | | | Floating Rate
Loans | |
| Balance as of August 1, 2020 | | $ | 50,007 | | | $ | – | | | $ | – | |
| Accrued Discounts (Premiums) | | | 1 | | | | (16 | ) | | | 43 | |
| Realized Gain (Loss) | | | 251 | | | | – | | | | 127 | |
| Change in Unrealized Appreciation (Depreciation) | | | (17 | ) | | | 7,198 | | | | 75 | |
| Purchases | | | – | | | | 275,746 | | | | 53,700 | |
| Sales | | | (50,242 | ) | | | – | | | | (34,020 | ) |
| Balance as of July 31, 2021 | | $ | – | | | $ | 282,928 | | | $ | 19,925 | |
| Change in unrealized appreciation/depreciation for the year ended July 31, 2021, related to Level 3 investments held at July 31, 2021 | | $ | – | | | $ | 7,198 | | | $ | 75 | |
| | | | | | | | | | | | | |
| | See Notes to Financial Statements. | 35 |
Schedule of Investments
INTERNATIONAL GROWTH FUND July 31, 2021
| Investments | | Shares | | | U.S. $
Fair Value
(000) | |
| COMMON STOCKS 97.15% | | | | | | | | |
| | | | | | | | | |
| Argentina 1.16% | | | | | | | | |
| | | | | | | | | |
| Internet Software & Services | | | | | | | | |
| MercadoLibre, Inc. * | | | 15 | | | $ | 24 | |
| | | | | | | | | |
| Australia 2.56% | | | | | | | | |
| | | | | | | | | |
| Capital Markets 0.58% | | | | | | | | |
| Macquarie Group Ltd. | | | 108 | | | | 12 | |
| | | | | | | | | |
| Equity Real Estate Investment Trusts 0.72% | | | | | | | | |
| Goodman Group | | | 896 | | | | 15 | |
| | | | | | | | | |
| Metals & Mining 1.26% | | | | | | | | |
| BHP Group Ltd. | | | 652 | | | | 26 | |
| Total Australia | | | | | | | 53 | |
| | | | | | | | | |
| Brazil 0.72% | | | | | | | | |
| | | | | | | | | |
| Metals & Mining | | | | | | | | |
| Vale SA ADR | | | 693 | | | | 15 | |
| | | | | | | | | |
| Canada 3.58% | | | | | | | | |
| | | | | | | | | |
| Aerospace & Defense 0.97% | | | | | | | | |
| CAE, Inc. * | | | 658 | | | | 20 | |
| | | | | | | | | |
| Banks 0.58% | | | | | | | | |
| Royal Bank of Canada | | | 123 | | | | 12 | |
| | | | | | | | | |
| Insurance 0.63% | | | | | | | | |
| Intact Financial Corp. | | | 99 | | | | 13 | |
| | | | | | | | | |
| Internet Software & Services 1.40% | | | | | | | | |
| Shopify, Inc. Class A * | | | 19 | | | | 29 | |
| Total Canada | | | | | | | 74 | |
| | | | | | | | | |
| China 4.26% | | | | | | | | |
| | | | | | | | | |
| Interactive Media & Services 1.69% | | | | | | | | |
| Tencent Holdings Ltd. | | | 571 | | | | 35 | |
| Investments | | Shares | | | U.S. $
Fair Value
(000) | |
| China (continued) | | | | | | | | |
| | | | | | | | | |
| Internet & Direct Marketing Retail 0.73% | | | | | | | | |
| Alibaba Group Holding Ltd. ADR * 76 | | | | | | $ | 15 | |
| | | | | | | | | |
| Life Sciences Tools & Services 0.68% | | | | | | | | |
| Wuxi Biologics Cayman, Inc. * | | | 944 | | | | 14 | |
| | | | | | | | | |
| Textiles, Apparel & Luxury Goods 1.16% | | | | | | | | |
| ANTA Sports Products Ltd. | | | 1,099 | | | | 24 | |
| Total China | | | | | | | 88 | |
| | | | | | | | | |
| Denmark 6.87% | | | | | | | | |
| | | | | | | | | |
| Air Freight & Logistics 1.35% | | | | | | | | |
| DSV PANALPINA A/S | | | 114 | | | | 28 | |
| | | | | | | | | |
| Beverages 0.92% | | | | | | | | |
| Carlsberg A/S Class B | | | 106 | | | | 19 | |
| | | | | | | | | |
| Biotechnology 1.55% | | | | | | | | |
| Genmab A/S * | | | 70 | | | | 32 | |
| | | | | | | | | |
| Health Care Equipment & Supplies 0.82% | | | | | | | | |
| GN Store Nord AS | | | 200 | | | | 17 | |
| | | | | | | | | |
| Pharmaceuticals 2.23% | | | | | | | | |
| Novo Nordisk A/S Class B | | | 495 | | | | 46 | |
| Total Denmark | | | | | | | 142 | |
| | | | | | | | | |
| France 16.44% | | | | | | | | |
| | | | | | | | | |
| Aerospace & Defense 2.27% | | | | | | | | |
| Airbus SE * | | | 181 | | | | 25 | |
| Safran SA | | | 170 | | | | 22 | |
| | | | | | | | 47 | |
| |
| Beverages 1.31% | | | | | | | | |
| Pernod Ricard SA | | | 123 | | | | 27 | |
| |
| Chemicals 1.44% | | | | | | | | |
| Air Liquide SA | | | 171 | | | | 30 | |
| 36 | See Notes to Financial Statements. |
Schedule of Investments (continued)
INTERNATIONAL GROWTH FUND July 31, 2021
| Investments | | Shares | | | U.S. $
Fair Value
(000) | |
| France (continued) | | | | | | | | |
| | | | | | | | | |
| Information Technology Services 1.02% | | | | |
| Capgemini SE | | | 96 | | | $ | 21 | |
| |
| Life Sciences Tools & Services 1.31% | | | | |
| Sartorius Stedim Biotech | | | 48 | | | | 27 | |
| |
| Personal Products 2.18% | | | | | | | | |
| L’Oreal SA | | | 99 | | | | 45 | |
| |
| Professional Services 1.20% | | | | | | | | |
| Teleperformance | | | 59 | | | | 25 | |
| |
| Software 1.02% | | | | | | | | |
| Dassault Systemes SE | | | 370 | | | | 21 | |
| |
| Textiles, Apparel & Luxury Goods 4.69% | | | | |
| Kering SA | | | 38 | | | | 34 | |
| LVMH Moet Hennessy Louis Vuitton SE | | | 79 | | | | 63 | |
| | | | | | | | 97 | |
| Total France | | | | | | | 340 | |
| |
| Germany 4.97% | | | | | | | | |
| |
| Automobiles 0.63% | | | | | | | | |
| Volkswagen AG | | | 39 | | | | 13 | |
| |
| Chemicals 0.77% | | | | | | | | |
| Symrise AG | | | 109 | | | | 16 | |
| |
| Internet & Catalog Retail 1.11% | | | | | | | | |
| Zalando SE * | | | 205 | | | | 23 | |
| |
| Semiconductors & Semiconductor Equipment 1.35% |
| Infineon Technologies AG | | | 739 | | | | 28 | |
| |
| Textiles, Apparel & Luxury Goods 1.11% | | | | |
| adidas AG | | | 63 | | | | 23 | |
| Total Germany | | | | | | | 103 | |
| |
| Hong Kong 4.26% | | | | | | | | |
| |
| Auto Components 0.44% | | | | | | | | |
| Xinyi Glass Holdings Ltd. | | | 2,507 | | | | 9 | |
| Investments | | Shares | | | U.S. $
Fair Value
(000) | |
| Hong Kong (continued) | | | | | | | | |
| |
| Capital Markets 0.92% | | | | | | | | |
| Hong Kong Exchanges & Clearing Ltd. | | | 288 | | | $ | 19 | |
| |
| Insurance 1.79% | | | | | | | | |
| AIA Group Ltd. | | | 3,109 | | | | 37 | |
| |
| Machinery 1.11% | | | | | | | | |
| Techtronic Industries Co. Ltd. | | | 1,267 | | | | 23 | |
| Total Hong Kong | | | | | | | 88 | |
| |
| India 2.37% | | | | | | | | |
| |
| Banks 1.31% | | | | | | | | |
| ICICI Bank Ltd. ADR | | | 1,454 | | | | 27 | |
| |
| Information Technology Services 1.06% | | | | |
| Infosys Ltd. ADR | | | 972 | | | | 22 | |
| Total India | | | | | | | 49 | |
| |
| Indonesia 0.53% | | | | | | | | |
| |
| Banks | | | | | | | | |
| Bank Rakyat Indonesia Persero Tbk PT | | | 42,818 | | | | 11 | |
| |
| Ireland 0.87% | | | | | | | | |
| |
| Construction Materials | | | | | | | | |
| CRH plc | | | 351 | | | | 18 | |
| |
| Japan 11.80% | | | | | | | | |
| |
| Auto Components 1.31% | | | | | | | | |
| Denso Corp. | | | 390 | | | | 27 | |
| |
| Building Products 0.82% | | | | | | | | |
| Daikin Industries Ltd. | | | 83 | | | | 17 | |
| |
| Electrical Equipment 2.03% | | | | | | | | |
| Fuji Electric Co., Ltd. | | | 380 | | | | 17 | |
| Nidec Corp. | | | 226 | | | | 25 | |
| | | | | | | | 42 | |
| | See Notes to Financial Statements. | 37 |
Schedule of Investments (continued)
INTERNATIONAL GROWTH FUND July 31, 2021
| Investments | | Shares | | | U.S. $
Fair Value
(000) | |
| Japan (continued) | | | | | | | | |
| | | | | | | | | |
| Electronic Equipment, Instruments & Components 3.00% | | | | | |
| Keyence Corp. | | | 69 | | | $ | 39 | |
| Murata Manufacturing Co., Ltd. | | | 280 | | | | 23 | |
| | | | | | | | 62 | |
| | | | | | | | | |
| Health Care Equipment & Supplies 1.02% | | | | |
| Hoya Corp. | | | 152 | | | | 21 | |
| | | | | | | | | |
| Household Durables 1.84% | | | | | | | | |
| Sony Group Corp. | | | 360 | | | | 38 | |
| | | | | | | | | |
| Machinery 1.01% | | | | | | | | |
| FANUC Corp. | | | 93 | | | | 21 | |
| | | | | | | | | |
| Semiconductors & Semiconductor Equipment 0.77% | | | | | |
| Tokyo Electron Ltd. | | | 40 | | | | 16 | |
| Total Japan | | | | | | | 244 | |
| | | | | | | | | |
| Netherlands 6.34% | | | | | | | | |
| | | | | | | | | |
| Chemicals 1.06% | | | | | | | | |
| Akzo Nobel NV | | | 179 | | | | 22 | |
| | | | | | | | | |
| Information Technology Services 1.60% | | | | |
| Adyen NV * | | | 12 | | | | 33 | |
| | | | | | | | | |
| Semiconductors & Semiconductor Equipment 3.68% | | | | | |
| ASML Holding NV | | | 100 | | | | 76 | |
| Total Netherlands | | | | | | | 131 | |
| | | | | | | | | |
| Norway 0.92% | | | | | | | | |
| | | | | | | | | |
| Oil, Gas & Consumable Fuels | | | | | | | | |
| Equinor ASA | | | 974 | | | | 19 | |
| | | | | | | | | |
| Saudi Arabia 1.11% | | | | | | | | |
| | | | | | | | | |
| Internet & Direct Marketing Retail | | | | | | | | |
| Delivery Hero SE * | | | 157 | | | | 23 | |
| Investments | | Shares | | | U.S. $
Fair Value
(000) | |
| South Korea 4.16% | | | | | | | | |
| | | | | | | | | |
| Internet Software & Services 1.26% | | | | | | | | |
| NHN Corp. | | | 69 | | | $ | 26 | |
| | | | | | | | | |
| Semiconductors & Semiconductor Equipment 0.87% | | | | | |
| SK Hynix, Inc. | | | 180 | | | | 18 | |
| | | | | | | | | |
| Technology Hardware, Storage & Peripherals 2.03% | | | | | | | | |
| Samsung Electronics Co., Ltd. | | | 622 | | | | 42 | |
| Total South Korea | | | | | | | 86 | |
| | | | | | | | | |
| Spain 1.98% | | | | | | | | |
| | | | | | | | | |
| Diversified Telecommunication Services 1.30% | | | | | |
| Cellnex Telecom SA | | | 414 | | | | 27 | |
| | | | | | | | | |
| Electric: Utilities 0.68% | | | | | | | | |
| Iberdrola SA | | | 1,169 | | | | 14 | |
| Total Spain | | | | | | | 41 | |
| | | | | | | | | |
| Sweden 2.42% | | | | | | | | |
| | | | | | | | | |
| Machinery | | | | | | | | |
| Atlas Copco AB A Shares | | | 415 | | | | 28 | |
| Epiroc AB | | | 943 | | | | 22 | |
| Total Sweden | | | | | | | 50 | |
| | | | | | | | | |
| Switzerland 7.45% | | | | | | | | |
| | | | | | | | | |
| Food Products 3.29% | | | | | | | | |
| Nestle SA Registered Shares | | | 541 | | | | 68 | |
| | | | | | | | | |
| Life Sciences Tools & Services 2.03% | | | | | | | | |
| Lonza Group AG | | | 54 | | | | 42 | |
| | | | | | | | | |
| Pharmaceuticals 2.13% | | | | | | | | |
| Roche Holding AG | | | 113 | | | | 44 | |
| Total Switzerland | | | | | | | 154 | |
| 38 | See Notes to Financial Statements. |
Schedule of Investments (concluded)
INTERNATIONAL GROWTH FUND July 31, 2021
| Investments | | Shares | | | U.S. $
Fair Value
(000) | |
| Taiwan 5.66% | | | | | | | | |
| | | | | | | | | |
| Entertainment 1.02% | | | | | | | | |
| Sea Ltd. ADR * | | | 78 | | | $ | 21 | |
| | | | | | | | | |
| Semiconductors & Semiconductor Equipment 4.64% | | | | | |
| MediaTek, Inc. | | | 402 | | | | 13 | |
| Taiwan Semiconductor Manufacturing Co., Ltd. | | 2,264 | | | | 47 | |
| Taiwan Semiconductor Manufacturing Co., Ltd. ADR | | 303 | | | | 36 | |
| | | | | | | | 96 | |
| Total Taiwan | | | | | | | 117 | |
| | | | | | | | | |
| United Kingdom 5.32% | | | | | | | | |
| | | | | | | | | |
| Beverages 1.80% | | | | | | | | |
| Diageo plc | | | 754 | | | | 37 | |
| | | | | | | | | |
| Insurance 0.48% | | | | | | | | |
| Prudential plc | | | 552 | | | | 10 | |
| Investments | | Shares | | | U.S. $
Fair Value
(000) | |
| United Kingdom (continued) | | | | | | | | |
| | | | | | | | | |
| Multi-Line Retail 0.82% | | | | | | | | |
| Next plc * | | | 151 | | | $ | 17 | |
| | | | | | | | | |
| Pharmaceuticals 2.22% | | | | | | | | |
| AstraZeneca plc | | | 399 | | | | 46 | |
| Total United Kingdom | | | | | | | 110 | |
| | | | | | | | | |
| United States 1.40% | | | | | | | | |
| | | | | | | | | |
| Electrical Equipment | | | | | | | | |
| Schneider Electric SE | | | 174 | | | | 29 | |
Total Common Stocks
(cost $1,978,615) | | | | | | | 2,009 | |
Total Investments in Securities 97.15%
(cost $1,978,615) | | | | | | | 2,009 | |
| Other Assets and Liabilities - Net 2.85% | | | | | | | 59 | |
| Net Assets 100.00% | | | | | | $ | 2,068 | |
| ADR | | American Depositary Receipt. |
| * | | Non-income producing security. |
The following is a summary of the inputs used as of July 31, 2021 in valuing the Fund’s investments carried at fair value(1):
| Investment Type(2) | | Level 1
(000) | �� | | Level 2
(000) | | | Level 3
(000) | | | Total
(000) | |
| Common Stocks | | | | | | | | | | | | | | | | |
| Argentina | | $ | 24 | | | $ | – | | | $ | – | | | $ | 24 | |
| Brazil | | | 15 | | | | – | | | | – | | | | 15 | |
| Canada | | | 74 | | | | – | | | | – | | | | 74 | |
| China | | | 15 | | | | 73 | | | | – | | | | 88 | |
| India | | | 49 | | | | – | | | | – | | | | 49 | |
| Taiwan | | | 57 | | | | 60 | | | | – | | | | 117 | |
| Remaining Countries | | | – | | | | 1,642 | | | | – | | | | 1,642 | |
| Total | | $ | 234 | | | $ | 1,775 | | | $ | – | | | $ | 2,009 | |
| (1) | Refer to Note 2(m) for a description of fair value measurements and the three-tier hierarchy of inputs. |
| (2) | See Schedule of Investments for fair values in each industry and identification of foreign issuers and/or geography. The table above is presented by Investment Type. Industries are presented within an Investment Type should such Investment Type include securities classified as two or more levels within the three-tier fair value hierarchy. |
A reconciliation of Level 3 investments is presented when the Fund has a material amount of Level 3 investments at the beginning or end of the period in relation to the Fund’s net assets.
| | See Notes to Financial Statements. | 39 |
Schedule of Investments
MID CAP INNOVATION GROWTH FUND July 31, 2021
| Investments | | Shares | | | Fair
Value
(000) | |
| COMMON STOCKS 98.25% | | | | | | | | |
| | | | | | | | | |
| Advertising 0.72% | | | | | | | | |
| Trade Desk, Inc. (The) Class A* | | | 521 | | | $ | 43 | |
| | | | | | | | | |
| Aerospace/Defense 1.46% | | | | | | | | |
| HEICO Corp. | | | 361 | | | | 49 | |
| TransDigm Group, Inc.* | | | 59 | | | | 38 | |
| Total | | | | | | | 87 | |
| | | | | | | | | |
| Apparel 3.00% | | | | | | | | |
| Crocs, Inc.* | | | 870 | | | | 118 | |
| Deckers Outdoor Corp.* | | | 149 | | | | 61 | |
| Total | | | | | | | 179 | |
| | | | | | | | | |
| Banks: Regional 1.61% | | | | | | | | |
| First Republic Bank | | | 139 | | | | 27 | |
| SVB Financial Group* | | | 80 | | | | 44 | |
| Western Alliance Bancorp | | | 272 | | | | 25 | |
| Total | | | | | | | 96 | |
| | | | | | | | | |
| Biotechnology Research & Production 3.61% | | | | | | | | |
| Arena Pharmaceuticals, Inc.* | | | 382 | | | | 24 | |
| Argenx SE ADR* | | | 81 | | | | 25 | |
| Horizon Therapeutics plc* | | | 612 | | | | 61 | |
| Intra-Cellular Therapies, Inc.* | | | 1,380 | | | | 47 | |
| Rocket Pharmaceuticals, Inc.* | | | 742 | | | | 26 | |
| TG Therapeutics, Inc.* | | | 916 | | | | 32 | |
| Total | | | | | | | 215 | |
| | | | | | | | | |
| Building Materials 1.75% | | | | | | | | |
| Trex Co., Inc.* | | | 465 | | | | 45 | |
| Vulcan Materials Co. | | | 327 | | | | 59 | |
| Total | | | | | | | 104 | |
| | | | | | | | | |
| Business Services 2.28% | | | | | | | | |
| Avalara, Inc.* | | | 178 | | | | 30 | |
| Chegg, Inc.* | | | 422 | | | | 37 | |
| Shift4 Payments, Inc. Class A* | | | 767 | | | | 69 | |
| Total | | | | | | | 136 | |
| Investments | | Shares | | | Fair
Value
(000) | |
| Computer Hardware 7.02% | | | | | | | | |
| | | | | | | | | |
| Crowdstrike Holdings, Inc. Class A* | | | 462 | | | $ | 117 | |
| Endava plc ADR* | | | 500 | | | | 65 | |
| EPAM Systems, Inc.* | | | 177 | | | | 99 | |
| Logitech International SA (Switzerland)(a) | | | 413 | | | | 45 | |
| Zscaler, Inc.* | | | 391 | | | | 92 | |
| Total | | | | | | | 418 | |
| | | | | | | | | |
| Computer Software 14.60% | | | | | | | | |
| Bill.com Holdings, Inc.* | | | 405 | | | | 84 | |
| Datadog, Inc. Class A* | | | 430 | | | | 48 | |
| DocuSign, Inc.* | | | 427 | | | | 127 | |
| Dynatrace, Inc.* | | | 1,261 | | | | 81 | |
| Elastic NV* | | | 212 | | | | 31 | |
| Five9, Inc.* | | | 311 | | | | 63 | |
| HubSpot, Inc.* | | | 244 | | | | 145 | |
| Lightspeed POS, Inc. (Canada)*(a) | | | 577 | | | | 49 | |
| MSCI, Inc. | | | 161 | | | | 96 | |
| Paycom Software, Inc.* | | | 136 | | | | 54 | |
| RingCentral, Inc. Class A* | | | 115 | | | | 31 | |
| Twilio, Inc. Class A* | | | 162 | | | | 61 | |
| Total | | | | | | | 870 | |
| | | | | | | | | |
| Construction/Homebuilding 1.19% | | | | | | | | |
| LGI Homes, Inc.* | | | 415 | | | | 71 | |
| | | | | | | | | |
| Drugs 3.14% | | | | | | | | |
| DexCom, Inc.* | | | 210 | | | | 108 | |
| Elanco Animal Health, Inc.* | | | 842 | | | | 31 | |
| Intellia Therapeutics, Inc.* | | | 341 | | | | 48 | |
| Total | | | | | | | 187 | |
| | | | | | | | | |
| Electrical Equipment 8.68% | | | | | | | | |
| Brooks Automation, Inc. | | | 528 | | | | 47 | |
| Entegris, Inc. | | | 733 | | | | 89 | |
| KLA Corp. | | | 332 | | | | 116 | |
| MKS Instruments, Inc. | | | 475 | | | | 74 | |
| Monolithic Power Systems, Inc. | | | 196 | | | | 88 | |
| 40 | See Notes to Financial Statements. |
Schedule of Investments (continued)
MID CAP INNOVATION GROWTH FUND July 31, 2021
| Investments | | Shares | | | Fair
Value
(000) | |
| Electrical Equipment (continued) | | | | | | | | |
| Skyworks Solutions, Inc. | | | 316 | | | $ | 58 | |
| Xilinx, Inc. | | | 300 | | | | 45 | |
| Total | | | | | | | 517 | |
| |
| Electrical: Household 2.84% | | | | | | | | |
| AMETEK, Inc. | | | 384 | | | | 53 | |
| Generac Holdings, Inc.* | | | 276 | | | | 116 | |
| Total | | | | | | | 169 | |
| |
| Electronics 3.19% | | | | | | | | |
| Agilent Technologies, Inc. | | | 580 | | | | 89 | |
| Trimble, Inc.* | | | 1,184 | | | | 101 | |
| Total | | | | | | | 190 | |
| |
| Entertainment 3.34% | | | | | | | | |
| Caesars Entertainment, Inc.* | | | 534 | | | | 47 | |
| Live Nation Entertainment, Inc.* 1,058 | | | 84 | | | | | |
| Warner Music Group Corp. Class A | | | 1,810 | | | | 68 | |
| Total | | | | | | | 199 | |
| |
| Equity Real Estate Investment Trusts 1.19% |
| SBA Communications Corp. | | | 209 | | | | 71 | |
| |
| Health Care Products 10.94% | | | | | | | | |
| Align Technology, Inc.* | | | 122 | | | | 85 | |
| Cooper Cos., Inc. (The) | | | 106 | | | | 45 | |
| Edwards Lifesciences Corp.* | | | 822 | | | | 92 | |
| IDEXX Laboratories, Inc.* | | | 225 | | | | 153 | |
| Insulet Corp.* | | | 286 | | | | 80 | |
| Natera, Inc.* | | | 533 | | | | 61 | |
| Penumbra, Inc.* | | | 113 | | | | 30 | |
| Repligen Corp.* | | | 432 | | | | 106 | |
| Total | | | | | | | 652 | |
| |
| Household Equipment/Products 0.47% | | | | | | | | |
| Scotts Miracle-Gro Co. (The) | | | 160 | | | | 28 | |
| |
| Household Furnishings 0.97% | | | | | | | | |
| Sonos, Inc.* | | | 1,746 | | | | 58 | |
| Investments | | Shares | | | Fair
Value
(000) | |
| Machinery: Industrial/Specialty 3.05% | | | | | | | | |
| Cognex Corp. | | | 669 | | | $ | 60 | |
| Dover Corp. | | | 463 | | | | 77 | |
| Stanley Black & Decker, Inc. | | | 226 | | | | 45 | |
| Total | | | | | | | 182 | |
| |
| Manufacturing 2.08% | | | | | | | | |
| Axon Enterprise, Inc.* | | | 667 | | | | 124 | |
| |
| Retail 10.49% | | | | | | | | |
| Burlington Stores, Inc.* | | | 235 | | | | 79 | |
| Carvana Co.* | | | 250 | | | | 84 | |
| Chipotle Mexican Grill, Inc.* | | | 35 | | | | 65 | |
| Five Below, Inc.* | | | 470 | | | | 91 | |
| Lithia Motors, Inc. Class A | | | 163 | | | | 62 | |
| Lululemon Athletica, Inc. (Canada)*(a) | | | 158 | | | | 63 | |
| O’Reilly Automotive, Inc.* | | | 90 | | | | 54 | |
| RH* | | | 105 | | | | 70 | |
| Tractor Supply Co. | | | 313 | | | | 57 | |
| Total | | | | | | | 625 | |
| |
| Technology 5.96% | | | | | | | | |
| Bumble, Inc. Class A* | | | 767 | | | | 39 | |
| Etsy, Inc.* | | | 146 | | | | 27 | |
| Lyft, Inc. Class A* | | | 1,730 | | | | 96 | |
| Match Group, Inc.* | | | 504 | | | | 80 | |
| Roku, Inc.* | | | 264 | | | | 113 | |
| Total | | | | | | | 355 | |
| |
| Telecommunications 0.96% | | | | | | | | |
| Arista Networks, Inc.* | | | 149 | | | | 57 | |
| |
| Transportation: Miscellaneous 1.26% | | | | | | | | |
| Old Dominion Freight Line, Inc. | | | 278 | | | | 75 | |
| |
| Transportation: Miscellaneous 1.36% | | | | | | | | |
| XPO Logistics, Inc.* | | | 585 | | | | 81 | |
| |
| Wholesale 1.09% | | | | | | | | |
| Copart, Inc.* | | | 442 | | | | 65 | |
Total Common Stocks
(cost $5,156,125) | | | | | | | 5,854 | |
| | See Notes to Financial Statements. | 41 |
Schedule of Investments (concluded)
MID CAP INNOVATION GROWTH FUND July 31, 2021
| Investments | | Principal
Amount
(000) | | | Fair
Value
(000) | |
| SHORT-TERM INVESTMENTS 2.71% | | | | | | | | |
| | | | | | | | | |
| Repurchase Agreements | | | | | | | | |
| | | | | | | | | |
Repurchase Agreement dated 7/30/2021, 0.00% due 8/2/2021 with Fixed Income Clearing Corp. collateralized by $164,500 of U.S. Treasury Note at 0.375% due 07/15/2024; value: $164,551; proceeds: $161,254
(cost $161,254) | | $ | 161 | | | $ | 161 | |
Total Investments in Securities 100.96%
(cost $5,317,379) | | | | | | | 6,015 | |
| Other Assets and Liabilities - Net (0.96)% | | | | | | | (57 | ) |
| Net Assets 100.00% | | | | | | $ | 5,958 | |
| | | |
| ADR | | American Depositary Receipt. |
| * | | Non-income producing security. |
| (a) | | Foreign security traded in U.S. dollars. |
The following is a summary of the inputs used as of July 31, 2021 in valuing the Fund’s investments carried at fair value(1):
| Investment Type(2) | | Level 1
(000) | | | Level 2
(000) | | | Level 3
(000) | | | Total
(000) | |
| Common Stocks | | $ | 5,854 | | | $ | – | | | $ | – | | | $ | 5,854 | |
| Short-Term Investments | | | | | | | | | | | | | | | | |
| Repurchase Agreements | | | – | | | | 161 | | | | – | | | | 161 | |
| Total | | $ | 5,854 | | | $ | 161 | | | $ | – | | | $ | 6,015 | |
| (1) | Refer to Note 2(m) for a description of fair value measurements and the three-tier hierarchy of inputs. |
| (2) | See Schedule of Investments for fair values in each industry and identification of foreign issuers and/or geography. |
A reconciliation of Level 3 investments is presented when the Fund has a material amount of Level 3 investments at the beginning or end of the period in relation to the Fund’s net assets.
| 42 | See Notes to Financial Statements. |
Schedule of Investments
SHORT DURATION HIGH YIELD FUND July 31, 2021
| | | | | | | Principal | | | | |
| | | Interest | | Maturity | | Amount | | | Fair | |
| Investments | | Rate | | Date | | (000) | | | Value | |
| LONG-TERM INVESTMENTS 97.31% | | | | | | | | | | | | |
| | | | | | | | | | | | | |
| ASSET-BACKED SECURITIES 4.15% | | | | | | | | | | | | |
| | | | | | | | | | | | | |
| Others | | | | | | | | | | | | |
| AMMC CLO 15 Ltd. 2014-15A DRR† | | 3.526%
(3 Mo. LIBOR + 3.40% | )# | 1/15/2032 | | $ | 100 | | | $ | 99,718 | |
| CIFC Funding III Ltd. 2021-3A D† | | 3.148%
(3 Mo. LIBOR + 3.00% | )# | 7/15/2036 | | | 150 | | | | 149,415 | |
| TCW CLO Ltd. 2017-1A DR† | | 3.28%
(3 Mo. LIBOR + 3.15% | )# | 7/29/2029 | | | 100 | | | | 99,812 | |
| Voya CLO Ltd. 2019-1A BR† | | 1.676%
(3 Mo. LIBOR + 1.55% | )# | 4/15/2031 | | | 150 | | | | 150,384 | |
| Webster Park CLO Ltd. 2015-1A BR† | | 1.934%
(3 Mo. LIBOR + 1.80% | )# | 7/20/2030 | | | 250 | | | | 249,384 | |
| Total Asset-Backed Securities (cost $745,351) | | | | | | | | | | | 748,713 | |
| | | | | | | | | | | | | |
| CONVERTIBLE BONDS 2.64% | | | | | | | | | | | | |
| | | | | | | | | | | | | |
| Auto Manufacturers 0.18% | | | | | | | | | | | | |
| NIO, Inc. (China)†(a) | | 0.50% | | 2/1/2027 | | | 37 | | | | 32,190 | |
| | | | | | | | | | | | | |
| Biotechnology 0.28% | | | | | | | | | | | | |
| Illumina, Inc. | | Zero Coupon | | 8/15/2023 | | | 26 | | | | 32,987 | |
| Novavax, Inc. | | 3.75% | | 2/1/2023 | | | 11 | | | | 17,456 | |
| Total | | | | | | | | | | | 50,443 | |
| | | | | | | | | | | | | |
| Commercial Services 0.09% | | | | | | | | | | | | |
| Square, Inc. | | 0.125% | | 3/1/2025 | | | 8 | | | | 16,750 | |
| | | | | | | | | | | | | |
| Energy-Alternate Sources 0.09% | | | | | | | | | | | | |
| Enphase Energy, Inc.† | | Zero Coupon | | 3/1/2026 | | | 16 | | | | 16,136 | |
| | | | | | | | | | | | | |
| Health Care-Products 0.21% | | | | | | | | | | | | |
| Nevro Corp. | | 2.75% | | 4/1/2025 | | | 10 | | | | 16,506 | |
| Repligen Corp. | | 0.375% | | 7/15/2024 | | | 10 | | | | 21,631 | |
| Total | | | | | | | | | | | 38,137 | |
| | | | | | | | | | | | | |
| Internet 0.65% | | | | | | | | | | | | |
| Q2 Holdings, Inc. | | 0.75% | | 6/1/2026 | | | 12 | | | | 15,732 | |
| Sea Ltd. (Singapore)(a) | | 2.375% | | 12/1/2025 | | | 5 | | | | 15,571 | |
| Shopify, Inc. (Canada)(a) | | 0.125% | | 11/1/2025 | | | 14 | | | | 18,473 | |
| Snap, Inc. | | 0.75% | | 8/1/2026 | | | 11 | | | | 36,142 | |
| | See Notes to Financial Statements. | 43 |
Schedule of Investments (continued)
SHORT DURATION HIGH YIELD FUND July 31, 2021
| | | | | | | Principal | | | | |
| | | Interest | | Maturity | | Amount | | | Fair | |
| Investments | | Rate | | Date | | (000) | | | Value | |
| Internet (continued) | | | | | | | | | | | | |
| Wayfair, Inc.† | | 0.625% | | 10/1/2025 | | $ | 15 | | | $ | 14,625 | |
| Weibo Corp. (China)(a) | | 1.25% | | 11/15/2022 | | | 18 | | | | 17,190 | |
| Total | | | | | | | | | | | 117,733 | |
| | | | | | | | | | | | | |
| Mining 0.10% | | | | | | | | | | | | |
| Livent Corp. | | 4.125% | | 7/15/2025 | | | 7 | | | | 16,922 | |
| | | | | | | | | | | | | |
| REITS 0.24% | | | | | | | | | | | | |
| IH Merger Sub LLC | | 3.50% | | 1/15/2022 | | | 15 | | | | 26,812 | |
| Pebblebrook Hotel Trust | | 1.75% | | 12/15/2026 | | | 15 | | | | 16,793 | |
| Total | | | | | | | | | | | 43,605 | |
| | | | | | | | | | | | | |
| Retail 0.18% | | | | | | | | | | | | |
| Burlington Stores, Inc. | | 2.25% | | 4/15/2025 | | | 10 | | | | 16,388 | |
| Dick’s Sporting Goods, Inc. | | 3.25% | | 4/15/2025 | | | 5 | | | | 15,378 | |
| Total | | | | | | | | | | | 31,766 | |
| | | | | | | | | | | | | |
| Software 0.36% | | | | | | | | | | | | |
| Atlassian, Inc. | | 0.625% | | 5/1/2023 | | | 7 | | | | 27,899 | |
| Five9, Inc. | | 0.50% | | 6/1/2025 | | | 23 | | | | 37,159 | |
| Total | | | | | | | | | | | 65,058 | |
| | | | | | | | | | | | | |
| Transportation 0.26% | | | | | | | | | | | | |
| CryoPort, Inc.† | | 3.00% | | 6/1/2025 | | | 12 | | | | 32,760 | |
| Scorpio Tankers, Inc. (Monaco)†(a) | | 3.00% | | 5/15/2025 | | | 15 | | | | 14,604 | |
| Total | | | | | | | | | | | 47,364 | |
| Total Convertible Bonds (cost $460,691) | | | | | | | | | | | 476,104 | |
| | | | | | | | | | | | | |
| CORPORATE BONDS 79.02% | | | | | | | | | | | | |
| | | | | | | | | | | | | |
| Advertising 0.15% | | | | | | | | | | | | |
| Outfront Media Capital LLC / Outfront Media Capital Corp.† | | 6.25% | | 6/15/2025 | | | 25 | | | | 26,603 | |
| | | | | | | | | | | | | |
| Aerospace/Defense 2.50% | | | | | | | | | | | | |
| Howmet Aerospace, Inc. | | 6.875% | | 5/1/2025 | | | 80 | | | | 93,197 | |
| Kratos Defense & Security Solutions, Inc.† | | 6.50% | | 11/30/2025 | | | 32 | | | | 33,505 | |
| Spirit AeroSystems, Inc.† | | 5.50% | | 1/15/2025 | | | 75 | | | | 78,844 | |
| SSL Robotics LLC† | | 9.75% | | 12/31/2023 | | | 9 | | | | 9,922 | |
| TransDigm, Inc. | | 5.50% | | 11/15/2027 | | | 172 | | | | 177,805 | |
| Triumph Group, Inc. | | 7.75% | | 8/15/2025 | | | 35 | | | | 35,260 | |
| Triumph Group, Inc.† | | 8.875% | | 6/1/2024 | | | 20 | | | | 22,175 | |
| Total | | | | | | | | | | | 450,708 | |
| 44 | See Notes to Financial Statements. |
Schedule of Investments (continued)
SHORT DURATION HIGH YIELD FUND July 31, 2021
| | | | | | | Principal | | | | |
| | | Interest | | Maturity | | Amount | | | Fair | |
| Investments | | Rate | | Date | | (000) | | | Value | |
| Agriculture 0.19% | | | | | | | | | | | | |
| Turning Point Brands, Inc.† | | 5.625% | | 2/15/2026 | | $ | 33 | | | $ | 34,429 | |
| | | | | | | | | | | | | |
| Airlines 2.63% | | | | | | | | | | | | |
| Air Canada (Canada)†(a)(b) | | 3.875% | | 8/15/2026 | | | 36 | | | | 36,132 | |
| American Airlines Group, Inc.† | | 3.75% | | 3/1/2025 | | | 79 | | | | 70,408 | |
| American Airlines Inc/AAdvantage Loyalty IP Ltd.† | | 5.50% | | 4/20/2026 | | | 11 | | | | 11,523 | |
| American Airlines, Inc.† | | 11.75% | | 7/15/2025 | | | 85 | | | | 106,356 | |
| Delta Air Lines, Inc.† | | 7.00% | | 5/1/2025 | | | 20 | | | | 23,538 | |
| Hawaiian Airlines 2013-1 Class A Pass Through Certificates | | 3.90% | | 7/15/2027 | | | 39 | | | | 38,731 | |
| Hawaiian Brand Intellectual Property Ltd./HawaiianMiles Loyalty Ltd.† | | 5.75% | | 1/20/2026 | | | 47 | | | | 49,134 | |
| Spirit Loyalty Cayman Ltd./Spirit IP Cayman Ltd.† | | 8.00% | | 9/20/2025 | | | 26 | | | | 29,339 | |
| United Airlines 2020-1 Class A Pass Through Trust | | 5.875% | | 4/15/2029 | | | 13 | | | | 14,471 | |
| United Airlines, Inc.† | | 4.375% | | 4/15/2026 | | | 92 | | | | 94,772 | |
| Total | | | | | | | | | | | 474,404 | |
| | | | | | | | | | | | | |
| Apparel 0.49% | | | | | | | | | | | | |
| Tapestry, Inc. | | 4.25% | | 4/1/2025 | | | 26 | | | | 28,339 | |
| William Carter Co. (The)† | | 5.50% | | 5/15/2025 | | | 57 | | | | 60,148 | |
| Total | | | | | | | | | | | 88,487 | |
| | | | | | | | | | | | | |
| Auto Manufacturers 4.82% | | | | | | | | | | | | |
| Ford Motor Co. | | 4.346% | | 12/8/2026 | | | 110 | | | | 119,006 | |
| Ford Motor Co. | | 9.00% | | 4/22/2025 | | | 408 | | | | 502,738 | |
| JB Poindexter & Co., Inc.† | | 7.125% | | 4/15/2026 | | | 19 | | | | 20,074 | |
| Mclaren Finance plc(c) | | 5.00% | | 8/1/2022 | | GBP | 100 | | | | 139,000 | |
| Tesla, Inc.† | | 5.30% | | 8/15/2025 | | $ | 66 | | | | 67,885 | |
| Wabash National Corp.† | | 5.50% | | 10/1/2025 | | | 20 | | | | 20,383 | |
| Total | | | | | | | | | | | 869,086 | |
| | | | | | | | | | | | | |
| Auto Parts & Equipment 0.75% | | | | | | | | | | | | |
| American Axle & Manufacturing, Inc. | | 6.25% | | 4/1/2025 | | | 38 | | | | 39,408 | |
| Clarios Global LP† | | 6.75% | | 5/15/2025 | | | 13 | | | | 13,824 | |
| Goodyear Tire & Rubber Co. (The) | | 9.50% | | 5/31/2025 | | | 24 | | | | 26,603 | |
| Meritor, Inc.† | | 6.25% | | 6/1/2025 | | | 22 | | | | 23,499 | |
| Tenneco, Inc. | | 5.00% | | 7/15/2026 | | | 32 | | | | 31,600 | |
| Total | | | | | | | | | | | 134,934 | |
| | See Notes to Financial Statements. | 45 |
Schedule of Investments (continued)
SHORT DURATION HIGH YIELD FUND July 31, 2021
| | | | | | | Principal | | | | |
| | | Interest | | Maturity | | Amount | | | Fair | |
| Investments | | Rate | | Date | | (000) | | | Value | |
| Banks 1.29% | | | | | | | | | | | | |
| Citigroup, Inc. | 3.875%
(5 Yr Treasury CMT + 3.42% | )# | – | (d) | $ | 45 | | | $ | 46,170 | |
| Citigroup, Inc. | | 5.95%
(3 Mo. LIBOR + 4.07% | )# | – | (d) | | 27 | | | | 28,390 | |
| JPMorgan Chase & Co. | | 4.00% (SOFR + 2.75% | )# | – | (d) | | 78 | | | | 78,829 | |
| Popular, Inc. | | 6.125% | | 9/14/2023 | | | 49 | | | | 52,953 | |
| Texas Capital Bancshares, Inc. | 4.00%
(5 Yr Treasury CMT + 3.15% | )# | 5/6/2031 | | | 25 | | | | 26,045 | |
| Total | | | | | | | | | | | 232,387 | |
| | | | | | | | | | | | | |
| Building Materials 0.52% | | | | | | | | | | | | |
| Forterra Finance LLC/FRTA Finance Corp.† | | 6.50% | | 7/15/2025 | | | 41 | | | | 44,033 | |
| Patrick Industries, Inc.† | | 7.50% | | 10/15/2027 | | | 20 | | | | 21,788 | |
| PGT Innovations, Inc.† | | 6.75% | | 8/1/2026 | | | 27 | | | | 28,312 | |
| Total | | | | | | | | | | | 94,133 | |
| | | | | | | | | | | | | |
| Chemicals 0.84% | | | | | | | | | | | | |
| GCP Applied Technologies, Inc.† | | 5.50% | | 4/15/2026 | | | 36 | | | | 36,909 | |
| Ingevity Corp.† | | 4.50% | | 2/1/2026 | | | 53 | | | | 54,033 | |
| Rain CII Carbon LLC/CII Carbon Corp.† | | 7.25% | | 4/1/2025 | | | 21 | | | | 21,709 | |
| Tronox, Inc.† | | 6.50% | | 5/1/2025 | | | 37 | | | | 39,301 | |
| Total | | | | | | | | | | | 151,952 | |
| | | | | | | | | | | | | |
| Coal 0.80% | | | | | | | | | | | | |
| Coronado Finance Pty Ltd. (Australia)†(a) | | 10.75% | | 5/15/2026 | | | 27 | | | | 29,330 | |
| Natural Resource Partners LP / NRP Finance Corp.† | | 9.125% | | 6/30/2025 | | | 26 | | | | 25,900 | |
| Peabody Energy Corp.† | | 6.375% | | 3/31/2025 | | | 7 | | | | 5,534 | |
| Warrior Met Coal, Inc.† | | 8.00% | | 11/1/2024 | | | 82 | | | | 83,697 | |
| Total | | | | | | | | | | | 144,461 | |
| | | | | | | | | | | | | |
| Commercial Services 1.59% | | | | | | | | | | | | |
| Ahern Rentals, Inc.† | | 7.375% | | 5/15/2023 | | | 15 | | | | 13,643 | |
| Allied Universal Holdco LLC/Allied Universal Finance Corp.† | | 9.75% | | 7/15/2027 | | | 15 | | | | 16,473 | |
| Alta Equipment Group, Inc.† | | 5.625% | | 4/15/2026 | | | 35 | | | | 36,353 | |
| APX Group, Inc. | | 7.625% | | 9/1/2023 | | | 9 | | | | 9,241 | |
| CPI CG, Inc.† | | 8.625% | | 3/15/2026 | | | 13 | | | | 13,879 | |
| Legends Hospitality Holding Co. LLC/Legends Hospitality Co-Issuer, Inc.† | | 5.00% | | 2/1/2026 | | | 18 | | | | 18,675 | |
| Prime Security Services Borrower LLC / Prime Finance, Inc.† | | 5.25% | | 4/15/2024 | | | 39 | | | | 41,730 | |
| Prime Security Services Borrower LLC / Prime Finance, Inc.† | | 5.75% | | 4/15/2026 | | | 30 | | | | 32,925 | |
| 46 | See Notes to Financial Statements. |
Schedule of Investments (continued)
SHORT DURATION HIGH YIELD FUND July 31, 2021
| | | | | | | Principal | | | | |
| | | Interest | | Maturity | | Amount | | | Fair | |
| Investments | | Rate | | Date | | (000) | | | Value | |
| Commercial Services (continued) | | | | | | | | | | | | |
| Ritchie Bros Auctioneers, Inc. (Canada)†(a) | | 5.375% | | 1/15/2025 | | $ | 15 | | | $ | 15,383 | |
| Sabre GLBL, Inc.† | | 7.375% | | 9/1/2025 | | | 14 | | | | 14,980 | |
| Sabre GLBL, Inc.† | | 9.25% | | 4/15/2025 | | | 20 | | | | 23,425 | |
| Shift4 Payments LLC/Shift4 Payments Finance Sub, Inc.† | | 4.625% | | 11/1/2026 | | | 28 | | | | 29,248 | |
| Team Health Holdings, Inc.† | | 6.375% | | 2/1/2025 | | | 23 | | | | 21,362 | |
| Total | | | | | | | | | | | 287,317 | |
| | | | | | | | | | | | | |
| Computers 0.25% | | | | | | | | | | | | |
| Western Digital Corp. | | 4.75% | | 2/15/2026 | | | 40 | | | | 44,450 | |
| | | | | | | | | | | | | |
| Cosmetics/Personal Care 0.16% | | | | | | | | | | | | |
| Coty, Inc.† | | 5.00% | | 4/15/2026 | | | 14 | | | | 14,146 | |
| Coty, Inc.† | | 6.50% | | 4/15/2026 | | | 15 | | | | 15,095 | |
| Total | | | | | | | | | | | 29,241 | |
| | | | | | | | | | | | | |
| Distribution/Wholesale 0.07% | | | | | | | | | | | | |
| Avient Corp.† | | 5.75% | | 5/15/2025 | | | 12 | | | | 12,623 | |
| | | | | | | | | | | | | |
| Diversified Financial Services 5.14% | | | | | | | | | | | | |
| Advisor Group Holdings, Inc.† | | 10.75% | | 8/1/2027 | | | 29 | | | | 32,118 | |
| Air Lease Corp. | 4.65%
(5 Yr Treasury CMT + 4.08% | )# | – | (d) | | 53 | | | | 55,518 | |
| Aircastle Ltd.† | | 5.25% | | 8/11/2025 | | | 31 | | | | 34,961 | |
| Aircastle Ltd.† | 5.25%
(5 Yr Treasury CMT + 4.41% | )# | – | (d) | | 32 | | | | 32,400 | |
| Alliance Data Systems Corp.† | | 4.75% | | 12/15/2024 | | | 32 | | | | 32,940 | |
| Ally Financial, Inc. | 4.70%
(5 Yr Treasury CMT + 3.87% | )# | – | (d) | | 49 | | | | 51,377 | |
| Ally Financial, Inc. | | 5.75% | | 11/20/2025 | | | 25 | | | | 28,616 | |
| Avolon Holdings Funding Ltd. (Ireland)†(a) | | 4.25% | | 4/15/2026 | | | 9 | | | | 9,848 | |
| Avolon Holdings Funding Ltd. (Ireland)†(a) | | 5.50% | | 1/15/2026 | | | 15 | | | | 17,137 | |
| Credit Acceptance Corp.† | | 5.125% | | 12/31/2024 | | | 22 | | | | 22,811 | |
| Global Aircraft Leasing Co. Ltd. PIK 7.25%† | | 6.50% | | 9/15/2024 | | | 31 | | | | 30,880 | |
| Jefferson Capital Holdings LLC†(b) | | 6.00% | | 8/15/2026 | | | 23 | | | | 23,316 | |
| LD Holdings Group LLC† | | 6.50% | | 11/1/2025 | | | 26 | | | | 26,646 | |
| Navient Corp. | | 6.75% | | 6/25/2025 | | | 120 | | | | 133,793 | |
| OneMain Finance Corp. | | 7.125% | | 3/15/2026 | | | 63 | | | | 74,261 | |
| OneMain Finance Corp. | | 8.25% | | 10/1/2023 | | | 58 | | | | 65,950 | |
| OneMain Finance Corp. | | 8.875% | | 6/1/2025 | | | 88 | | | | 96,908 | |
| PennyMac Financial Services, Inc.† | | 5.375% | | 10/15/2025 | | | 32 | | | | 33,675 | |
| PHH Mortgage Corp.† | | 7.875% | | 3/15/2026 | | | 47 | | | | 48,458 | |
| PRA Group, Inc.† | | 7.375% | | 9/1/2025 | | | 26 | | | | 28,111 | |
| | See Notes to Financial Statements. | 47 |
Schedule of Investments (continued)
SHORT DURATION HIGH YIELD FUND July 31, 2021
| | | | | | | Principal | | | | |
| | | Interest | | Maturity | | Amount | | | Fair | |
| Investments | | Rate | | Date | | (000) | | | Value | |
| Diversified Financial Services (continued) | | | | | | | | | | | | |
| VistaJet Malta Finance plc/XO Management Holding, Inc. (Malta)†(a) | | 10.50% | | 6/1/2024 | | $ | 43 | | | $ | 46,795 | |
| Total | | | | | | | | | | | 926,519 | |
| | | | | | | | | | | | | |
| Electric 1.86% | | | | | | | | | | | | |
| Calpine Corp.† | | 5.25% | | 6/1/2026 | | | 34 | | | | 35,066 | |
| DPL, Inc. | | 4.125% | | 7/1/2025 | | | 37 | | | | 39,718 | |
| Elwood Energy LLC | | 8.159% | | 7/5/2026 | | | 20 | | | | 21,740 | |
| FirstEnergy Corp. | | 2.05% | | 3/1/2025 | | | 60 | | | | 61,112 | |
| NextEra Energy Operating Partners LP† | | 3.875% | | 10/15/2026 | | | 35 | | | | 36,956 | |
| NextEra Energy Operating Partners LP† | | 4.25% | | 9/15/2024 | | | 22 | | | | 23,182 | |
| Talen Energy Supply LLC | | 6.50% | | 6/1/2025 | | | 41 | | | | 24,281 | |
| Terraform Global Operating LLC† | | 6.125% | | 3/1/2026 | | | 36 | | | | 37,110 | |
| Vistra Operations Co. LLC† | | 5.50% | | 9/1/2026 | | | 55 | | | | 56,719 | |
| Total | | | | | | | | | | | 335,884 | |
| | | | | | | | | | | | | |
| Electrical Components & Equipment 0.15% | | | | | | | | | | | | |
| EnerSys† | | 5.00% | | 4/30/2023 | | | 26 | | | | 27,219 | |
| | | | | | | | | | | | | |
| Electronics 0.24% | | | | | | | | | | | | |
| Sensata Technologies BV† | | 5.00% | | 10/1/2025 | | | 30 | | | | 33,525 | |
| Sensata Technologies BV† | | 5.625% | | 11/1/2024 | | | 8 | | | | 8,924 | |
| Total | | | | | | | | | | | 42,449 | |
| | | | | | | | | | | | | |
| Energy-Alternate Sources 0.40% | | | | | | | | | | | | |
| Enviva Partners LP/Enviva Partners Finance Corp.† | | 6.50% | | 1/15/2026 | | | 33 | | | | 34,289 | |
| TerraForm Power Operating LLC† | | 4.25% | | 1/31/2023 | | | 37 | | | | 38,077 | |
| Total | | | | | | | | | | | 72,366 | |
| | | | | | | | | | | | | |
| Engineering & Construction 0.40% | | | | | | | | | | | | |
| Brundage-Bone Concrete Pumping Holdings, Inc.† | | 6.00% | | 2/1/2026 | | | 27 | | | | 28,249 | |
| Fluor Corp. | | 3.50% | | 12/15/2024 | | | 41 | | | | 42,947 | |
| Total | | | | | | | | | | | 71,196 | |
| | | | | | | | | | | | | |
| Entertainment 2.44% | | | | | | | | | | | | |
| AMC Entertainment Holdings, Inc. PIK 12.00%† | | 12.00% | | 6/15/2026 | | | 26 | | | | 22,789 | |
| Buena Vista Gaming Authority† | | 13.00% | | 4/1/2023 | | | 20 | | | | 21,610 | |
| Caesars Entertainment, Inc.† | | 6.25% | | 7/1/2025 | | | 84 | | | | 88,812 | |
| Caesars Entertainment, Inc.† | | 8.125% | | 7/1/2027 | | | 6 | | | | 6,606 | |
| Caesars Resort Collection LLC/CRC Finco, Inc.† | | 5.25% | | 10/15/2025 | | | 29 | | | | 29,273 | |
| Caesars Resort Collection LLC/CRC Finco, Inc.† | | 5.75% | | 7/1/2025 | | | 13 | | | | 13,682 | |
| CCM Merger, Inc.† | | 6.375% | | 5/1/2026 | | | 29 | | | | 30,471 | |
| 48 | See Notes to Financial Statements. |
Schedule of Investments (continued)
SHORT DURATION HIGH YIELD FUND July 31, 2021
| | | | | | | Principal | | | | |
| | | Interest | | Maturity | | Amount | | | Fair | |
| Investments | | Rate | | Date | | (000) | | | Value | |
| Entertainment (continued) | | | | | | | | | | | | |
| Cinemark USA, Inc.† | | 5.875% | | 3/15/2026 | | $ | 10 | | | $ | 9,838 | |
| Downstream Development Authority of the Quapaw Tribe of Oklahoma† | | 10.50% | | 2/15/2023 | | | 26 | | | | 27,214 | |
| Inter Media & Communication SpA†(c) | | 4.875% | | 12/31/2022 | | EUR | 93 | | | | 110,395 | |
| Mohegan Gaming & Entertainment† | | 7.875% | | 10/15/2024 | | $ | 9 | | | | 9,440 | |
| Mohegan Gaming & Entertainment† | | 8.00% | | 2/1/2026 | | | 26 | | | | 27,103 | |
| Raptor Acquisition Corp. / Raptor Co-Issuer LLC† | | 4.875% | | 11/1/2026 | | | 13 | | | | 13,228 | |
| Scientific Games International, Inc.† | | 8.625% | | 7/1/2025 | | | 16 | | | | 17,300 | |
| Vail Resorts, Inc.† | | 6.25% | | 5/15/2025 | | | 12 | | | | 12,761 | |
| Total | | | | | | | | | | | 440,522 | |
| | | | | | | | | | | | | |
| Food 0.58% | | | | | | | | | | | | |
| Arcor SAIC (Argentina)†(a) | | 6.00% | | 7/6/2023 | | | 23 | | | | 22,761 | |
| Chobani LLC/Chobani Finance Corp., Inc.† | | 7.50% | | 4/15/2025 | | | 38 | | | | 39,699 | |
| Fresh Market, Inc. (The)† | | 9.75% | | 5/1/2023 | | | 15 | | | | 15,508 | |
| Nathan’s Famous, Inc.† | | 6.625% | | 11/1/2025 | | | 25 | | | | 25,681 | |
| Total | | | | | | | | | | | 103,649 | |
| | | | | | | | | | | | | |
| Forest Products & Paper 0.25% | | | | | | | | | | | | |
| Resolute Forest Products, Inc. (Canada)†(a) | | 4.875% | | 3/1/2026 | | | 44 | | | | 45,578 | |
| | | | | | | | | | | | | |
| Health Care-Services 3.90% | | | | | | | | | | | | |
| Air Methods Corp.† | | 8.00% | | 5/15/2025 | | | 44 | | | | 41,573 | |
| Akumin, Inc.† | | 7.00% | | 11/1/2025 | | | 30 | | | | 30,637 | |
| CHS/Community Health Systems, Inc.† | | 5.625% | | 3/15/2027 | | | 50 | | | | 53,002 | |
| Global Medical Response, Inc.† | | 6.50% | | 10/1/2025 | | | 22 | | | �� | 22,853 | |
| Hadrian Merger Sub, Inc.† | | 8.50% | | 5/1/2026 | | | 24 | | | | 25,055 | |
| HCA, Inc. | | 5.375% | | 2/1/2025 | | | 75 | | | | 85,099 | |
| HCA, Inc. | | 7.50% | | 12/15/2023 | | | 108 | | | | 123,663 | |
| Legacy LifePoint Health LLC† | | 4.375% | | 2/15/2027 | | | 30 | | | | 30,175 | |
| ModivCare, Inc.† | | 5.875% | | 11/15/2025 | | | 15 | | | | 15,964 | |
| Radiology Partners, Inc.† | | 9.25% | | 2/1/2028 | | | 15 | | | | 16,217 | |
| RegionalCare Hospital Partners Holdings, Inc./LifePoint Health, Inc.† | | 9.75% | | 12/1/2026 | | | 9 | | | | 9,576 | |
| RP Escrow Issuer LLC† | | 5.25% | | 12/15/2025 | | | 33 | | | | 33,860 | |
| Select Medical Corp.† | | 6.25% | | 8/15/2026 | | | 35 | | | | 37,051 | |
| Tenet Healthcare Corp.† | | 4.625% | | 9/1/2024 | | | 91 | | | | 93,161 | |
| Tenet Healthcare Corp.† | | 4.875% | | 1/1/2026 | | | 70 | | | | 72,362 | |
| US Acute Care Solutions LLC† | | 6.375% | | 3/1/2026 | | | 13 | | | | 13,536 | |
| Total | | | | | | | | | | | 703,784 | |
| | See Notes to Financial Statements. | 49 |
Schedule of Investments (continued)
SHORT DURATION HIGH YIELD FUND July 31, 2021
| | | | | | | Principal | | | | |
| | | Interest | | Maturity | | Amount | | | Fair | |
| Investments | | Rate | | Date | | (000) | | | Value | |
| Home Builders 1.73% | | | | | | | | | | | | |
| Century Communities, Inc. | | 5.875% | | 7/15/2025 | | $ | 36 | | | $ | 37,112 | |
| Forestar Group, Inc.† | | 3.85% | | 5/15/2026 | | | 76 | | | | 77,005 | |
| Meritage Homes Corp. | | 6.00% | | 6/1/2025 | | | 17 | | | | 19,317 | |
| New Home Co., Inc. (The)† | | 7.25% | | 10/15/2025 | | | 51 | | | | 54,396 | |
| Picasso Finance Sub, Inc.† | | 6.125% | | 6/15/2025 | | | 11 | | | | 11,674 | |
| STL Holding Co. LLC† | | 7.50% | | 2/15/2026 | | | 42 | | | | 44,310 | |
| Taylor Morrison Communities, Inc./Monarch Communities, Inc.† | | 5.625% | | 3/1/2024 | | | 12 | | | | 13,006 | |
| TRI Pointe Group, Inc./TRI Pointe Homes, Inc. | | 5.875% | | 6/15/2024 | | | 50 | | | | 55,468 | |
| Total | | | | | | | | | | | 312,288 | |
| | | | | | | | | | | | | |
| Home Furnishings 0.27% | | | | | | | | | | | | |
| WASH Multifamily Acquisition, Inc.† | | 5.75% | | 4/15/2026 | | | 47 | | | | 49,233 | |
| | | | | | | | | | | | | |
| Housewares 0.30% | | | | | | | | | | | | |
| CD&R Smokey Buyer, Inc.† | | 6.75% | | 7/15/2025 | | | 6 | | | | 6,398 | |
| Newell Brands, Inc. | | 4.70% | | 4/1/2026 | | | 30 | | | | 33,450 | |
| Newell Brands, Inc. | | 4.875% | | 6/1/2025 | | | 12 | | | | 13,323 | |
| Total | | | | | | | | | | | 53,171 | |
| | | | | | | | | | | | | |
| Insurance 0.19% | | | | | | | | | | | | |
| Acrisure LLC/Acrisure Finance, Inc.† | | 7.00% | | 11/15/2025 | | | 7 | | | | 7,115 | |
| Global Atlantic Fin Co.† | 4.70%
(5 Yr Treasury CMT + 3.80% | )# | 10/15/2051 | | | 20 | | | | 20,377 | |
| HUB International Ltd.† | | 7.00% | | 5/1/2026 | | | 7 | | | | 7,255 | |
| Total | | | | | | | | | | | 34,747 | |
| | | | | | | | | | | | | |
| Internet 1.97% | | | | | | | | | | | | |
| Cogent Communications Group, Inc.(c) | | 4.375% | | 6/30/2024 | | EUR | 100 | | | | 120,998 | |
| Netflix, Inc.† | | 3.625% | | 6/15/2025 | | $ | 136 | | | | 146,204 | |
| TripAdvisor, Inc.† | | 7.00% | | 7/15/2025 | | | 30 | | | | 32,067 | |
| Uber Technologies, Inc.† | | 7.50% | | 5/15/2025 | | | 12 | | | | 12,881 | |
| Uber Technologies, Inc.† | | 8.00% | | 11/1/2026 | | | 40 | | | | 42,900 | |
| Total | | | | | | | | | | | 355,050 | |
| | | | | | | | | | | | | |
| Iron-Steel 1.00% | | | | | | | | | | | | |
| Allegheny Technologies, Inc. | | 7.875% | | 8/15/2023 | | | 45 | | | | 49,350 | |
| Baffinland Iron Mines Corp./Baffinland Iron Mines LP (Canada)†(a) | | 8.75% | | 7/15/2026 | | | 20 | | | | 21,342 | |
| Cleveland-Cliffs, Inc.† | | 9.875% | | 10/17/2025 | | | 49 | | | | 57,330 | |
| 50 | See Notes to Financial Statements. |
Schedule of Investments (continued)
SHORT DURATION HIGH YIELD FUND July 31, 2021
| | | | | | | Principal | | | | |
| | | Interest | | Maturity | | Amount | | | Fair | |
| Investments | | Rate | | Date | | (000) | | | Value | |
| Iron-Steel (continued) | | | | | | | | | | | | |
| U.S. Steel Corp. | | 6.25% | | 3/15/2026 | | $ | 50 | | | $ | 51,563 | |
| Total | | | | | | | | | | | 179,585 | |
| | | | | | | | | | | | | |
| Leisure Time 3.38% | | | | | | | | | | | | |
| Carnival Corp.† | | 4.00% | | 8/1/2028 | | | 30 | | | | 29,914 | |
| Carnival Corp.† | | 7.625% | | 3/1/2026 | | | 20 | | | | 21,150 | |
| Carnival Corp.† | | 10.50% | | 2/1/2026 | | | 45 | | | | 51,581 | |
| Carnival Corp.† | | 11.50% | | 4/1/2023 | | | 71 | | | | 80,141 | |
| Life Time, Inc.† | | 5.75% | | 1/15/2026 | | | 36 | | | | 36,674 | |
| NCL Corp. Ltd.† | | 3.625% | | 12/15/2024 | | | 33 | | | | 31,436 | |
| NCL Corp. Ltd.† | | 5.875% | | 3/15/2026 | | | 14 | | | | 14,123 | |
| NCL Corp. Ltd.† | | 12.25% | | 5/15/2024 | | | 17 | | | | 20,081 | |
| Pinnacle Bidco PLC(c) | | 5.50% | | 2/15/2025 | | EUR | 100 | | | | 121,789 | |
| Royal Caribbean Cruises Ltd.† | | 9.125% | | 6/15/2023 | | $ | 116 | | | | 126,375 | |
| Royal Caribbean Cruises Ltd.† | | 11.50% | | 6/1/2025 | | | 45 | | | | 51,581 | |
| Viking Cruises Ltd.† | | 6.25% | | 5/15/2025 | | | 25 | | | | 24,911 | |
| Total | | | | | | | | | | | 609,756 | |
| | | | | | | | | | | | | |
| Lodging 1.47% | | | | | | | | | | | | |
| Boyd Gaming Corp.† | | 8.625% | | 6/1/2025 | | | 15 | | | | 16,387 | |
| MGM Resorts International | | 5.50% | | 4/15/2027 | | | 25 | | | | 27,199 | |
| MGM Resorts International | | 5.75% | | 6/15/2025 | | | 15 | | | | 16,341 | |
| MGM Resorts International | | 6.00% | | 3/15/2023 | | | 72 | | | | 76,170 | |
| MGM Resorts International | | 6.75% | | 5/1/2025 | | | 11 | | | | 11,688 | |
| Sugarhouse HSP Gaming Prop Mezz LP/Sugarhouse HSP Gaming Finance Corp.† | | 5.875% | | 5/15/2025 | | | 29 | | | | 28,894 | |
| Travel + Leisure Co. | | 5.65% | | 4/1/2024 | | | 39 | | | | 41,827 | |
| Wynn Las Vegas LLC/Wynn Las Vegas Capital Corp.† | | 4.25% | | 5/30/2023 | | | 14 | | | | 14,367 | |
| Wynn Las Vegas LLC/Wynn Las Vegas Capital Corp.† | | 5.25% | | 5/15/2027 | | | 31 | | | | 32,578 | |
| Total | | | | | | | | | | | 265,451 | |
| | | | | | | | | | | | | |
| Machinery-Diversified 0.16% | | | | | | | | | | | | |
| Clark Equipment Co.† | | 5.875% | | 6/1/2025 | | | 27 | | | | 28,620 | |
| | | | | | | | | | | | | |
| Machinery: Construction & Mining 0.14% | | | | | | | | | | | | |
| Manitowoc Co., Inc. (The)† | | 9.00% | | 4/1/2026 | | | 24 | | | | 25,986 | |
| | See Notes to Financial Statements. | 51 |
Schedule of Investments (continued)
SHORT DURATION HIGH YIELD FUND July 31, 2021
| | | | | | | Principal | | | | |
| | | Interest | | Maturity | | Amount | | | Fair | |
| Investments | | Rate | | Date | | (000) | | | Value | |
| Media 1.87% | | | | | | | | | | | | |
| AMC Networks, Inc. | | 4.75% | | 8/1/2025 | | $ | 48 | | | $ | 49,272 | |
| CCO Holdings LLC/CCO Holdings Capital Corp.† | | 5.75% | | 2/15/2026 | | | 32 | | | | 33,178 | |
| CSC Holdings LLC | | 5.25% | | 6/1/2024 | | | 41 | | | | 44,352 | |
| Diamond Sports Group LLC/Diamond Sports Finance Co.† | | 5.375% | | 8/15/2026 | | | 30 | | | | 17,438 | |
| Diamond Sports Group LLC/Diamond Sports Finance Co.† | | 6.625% | | 8/15/2027 | | | 40 | | | | 15,927 | |
| DISH DBS Corp. | | 5.875% | | 11/15/2024 | | | 50 | | | | 53,934 | |
| Gray Television, Inc.† | | 7.00% | | 5/15/2027 | | | 50 | | | | 53,584 | |
| Radiate Holdco LLC/Radiate Finance, Inc.† | | 4.50% | | 9/15/2026 | | | 35 | | | | 36,269 | |
| Univision Communications, Inc.† | | 5.125% | | 2/15/2025 | | | 32 | | | | 32,558 | |
| Total | | | | | | | | | | | 336,512 | |
| | | | | | | | | | | | | |
| Metal Fabricate/Hardware 0.41% | | | | | | | | | | | | |
| Grinding Media, Inc./Moly-Cop AltaSteel Ltd.† | | 7.375% | | 12/15/2023 | | | 72 | | | | 73,166 | |
| | | | | | | | | | | | | |
| Mining 2.22% | | | | | | | | | | | | |
| Compass Minerals International, Inc.† | | 4.875% | | 7/15/2024 | | | 32 | | | | 33,276 | |
| FMG Resources August 2006 Pty Ltd. (Australia)†(a) | | 4.50% | | 9/15/2027 | | | 83 | | | | 90,839 | |
| FMG Resources August 2006 Pty Ltd. (Australia)†(a) | | 5.125% | | 5/15/2024 | | | 27 | | | | 29,241 | |
| Freeport-McMoRan, Inc. | | 4.55% | | 11/14/2024 | | | 136 | | | | 148,238 | |
| Hudbay Minerals, Inc. (Canada)†(a) | | 4.50% | | 4/1/2026 | | | 55 | | | | 56,031 | |
| New Gold, Inc. (Canada)†(a) | | 6.375% | | 5/15/2025 | | | 21 | | | | 21,656 | |
| Novelis Corp.†(b) | | 3.25% | | 11/15/2026 | | | 6 | | | | 6,098 | |
| Novelis Corp.† | | 5.875% | | 9/30/2026 | | | 14 | | | | 14,546 | |
| Total | | | | | | | | | | | 399,925 | |
| | | | | | | | | | | | | |
| Miscellaneous Manufacturing 1.48% | | | | | | | | | | | | |
| Bombardier, Inc. (Canada)†(a) | | 7.125% | | 6/15/2026 | | | 42 | | | | 43,732 | |
| FXI Holdings, Inc.† | | 7.875% | | 11/1/2024 | | | 42 | | | | 43,182 | |
| General Electric Co. | | 3.449%
(3 Mo. LIBOR + 3.33% | )# | – | (d) | | 97 | | | | 95,267 | |
| Hillenbrand, Inc. | | 5.75% | | 6/15/2025 | | | 18 | | | | 19,250 | |
| Trinity Industries, Inc. | | 4.55% | | 10/1/2024 | | | 62 | | | | 66,087 | |
| Total | | | | | | | | | | | 267,518 | |
| | | | | | | | | | | | | |
| Oil & Gas 12.92% | | | | | | | | | | | | |
| Aethon United BR LP/Aethon United Finance Corp.† | | 8.25% | | 2/15/2026 | | | 53 | | | | 56,763 | |
| Antero Resources Corp.† | | 8.375% | | 7/15/2026 | | | 16 | | | | 18,122 | |
| Apache Corp. | | 4.625% | | 11/15/2025 | | | 81 | | | | 87,176 | |
| 52 | See Notes to Financial Statements. |
Schedule of Investments (continued)
SHORT DURATION HIGH YIELD FUND July 31, 2021
| | | | | | | Principal | | | | |
| | | Interest | | Maturity | | Amount | | | Fair | |
| Investments | | Rate | | Date | | (000) | | | Value | |
| Oil & Gas (continued) | | | | | | | | | | | | |
| Berry Petroleum Co. LLC† | | 7.00% | | 2/15/2026 | | $ | 62 | | | $ | 61,225 | |
| California Resources Corp.† | | 7.125% | | 2/1/2026 | | | 84 | | | | 86,163 | |
| Callon Petroleum Co. | | 6.125% | | 10/1/2024 | | | 46 | | | | 43,180 | |
| Callon Petroleum Co.† | | 9.00% | | 4/1/2025 | | | 30 | | | | 32,435 | |
| Centennial Resource Production LLC† | | 5.375% | | 1/15/2026 | | | 49 | | | | 47,355 | |
| Citgo Holding, Inc.† | | 9.25% | | 8/1/2024 | | | 45 | | | | 44,940 | |
| CITGO Petroleum Corp.† | | 7.00% | | 6/15/2025 | | | 65 | | | | 66,809 | |
| Colgate Energy Partners III LLC† | | 7.75% | | 2/15/2026 | | | 69 | | | | 74,263 | |
| Comstock Resources, Inc.† | | 7.50% | | 5/15/2025 | | | 4 | | | | 4,155 | |
| Continental Resources, Inc. | | 3.80% | | 6/1/2024 | | | 111 | | | | 116,532 | |
| CrownRock LP/CrownRock Finance, Inc.† | | 5.625% | | 10/15/2025 | | | 47 | | | | 48,305 | |
| Endeavor Energy Resources LP/EER Finance, Inc.† | | 5.50% | | 1/30/2026 | | | 29 | | | | 29,980 | |
| EQT Corp.† | | 3.125% | | 5/15/2026 | | | 25 | | | | 25,784 | |
| EQT Corp. | | 6.625% | | 2/1/2025 | | | 70 | | | | 80,987 | |
| Gulfport Energy Operating Corp.† | | 8.00% | | 5/17/2026 | | | 17 | | | | 18,166 | |
| Independence Energy Finance LLC† | | 7.25% | | 5/1/2026 | | | 49 | | | | 51,145 | |
| Laredo Petroleum, Inc. | | 9.50% | | 1/15/2025 | | | 55 | | | | 56,581 | |
| Magnolia Oil & Gas Operating LLC/Magnolia Oil & Gas Finance Corp.† | | 6.00% | | 8/1/2026 | | | 62 | | | | 63,421 | |
| Matador Resources Co. | | 5.875% | | 9/15/2026 | | | 102 | | | | 103,820 | |
| MEG Energy Corp. (Canada)†(a) | | 6.50% | | 1/15/2025 | | | 12 | | | | 12,415 | |
| MEG Energy Corp. (Canada)†(a) | | 7.125% | | 2/1/2027 | | | 20 | | | | 21,043 | |
| Murphy Oil Corp. | | 5.75% | | 8/15/2025 | | | 17 | | | | 17,383 | |
| Murphy Oil Corp. | | 6.875% | | 8/15/2024 | | | 43 | | | | 43,898 | |
| Nabors Industries Ltd.† | | 7.25% | | 1/15/2026 | | | 26 | | | | 24,352 | |
| Nabors Industries, Inc. | | 5.75% | | 2/1/2025 | | | 8 | | | | 6,810 | |
| Nabors Industries, Inc.† | | 9.00% | | 2/1/2025 | | | 40 | | | | 41,367 | |
| Newfield Exploration Co. | | 5.625% | | 7/1/2024 | | | 46 | | | | 50,956 | |
| Oasis Petroleum, Inc.† | | 6.375% | | 6/1/2026 | | | 38 | | | | 39,378 | |
| Occidental Petroleum Corp. | | 5.55% | | 3/15/2026 | | | 290 | | | | 317,914 | |
| Ovintiv Exploration, Inc. | | 5.375% | | 1/1/2026 | | | 25 | | | | 28,232 | |
| PDC Energy, Inc. | | 5.75% | | 5/15/2026 | | | 45 | | | | 46,613 | |
| PDC Energy, Inc. | | 6.125% | | 9/15/2024 | | | 38 | | | | 38,781 | |
| Petroleos Mexicanos (Mexico)(a) | | 3.50% | | 1/30/2023 | | | 27 | | | | 27,522 | |
| Precision Drilling Corp. (Canada)†(a) | | 6.875% | | 1/15/2029 | | | 16 | | | | 16,480 | |
| Precision Drilling Corp. (Canada)†(a) | | 7.125% | | 1/15/2026 | | | 62 | | | | 64,093 | |
| Range Resources Corp. | | 4.875% | | 5/15/2025 | | | 77 | | | | 80,041 | |
| Range Resources Corp. | | 5.00% | | 3/15/2023 | | | 42 | | | | 43,524 | |
| | See Notes to Financial Statements. | 53 |
Schedule of Investments (continued)
SHORT DURATION HIGH YIELD FUND July 31, 2021
| | | | | | | Principal | | | | |
| | | Interest | | Maturity | | Amount | | | Fair | |
| Investments | | Rate | | Date | | (000) | | | Value | |
| Oil & Gas (continued) | | | | | | | | | | | | |
| SM Energy Co. | | 5.625% | | 6/1/2025 | | $ | 87 | | | $ | 85,585 | |
| Southwestern Energy Co. | | 6.45% | | 1/23/2025 | | | 72 | | | | 78,927 | |
| Transocean Guardian Ltd.† | | 5.875% | | 1/15/2024 | | | 17 | | | | 15,891 | |
| Transocean Sentry Ltd.† | | 5.375% | | 5/15/2023 | | | 11 | | | | 10,437 | |
| Total | | | | | | | | | | | 2,328,949 | |
| | | | | | | | | | | | | |
| Oil & Gas Services 1.51% | | | | | | | | | | | | |
| ChampionX Corp | | 6.375% | | 5/1/2026 | | | 31 | | | | 32,319 | |
| Oceaneering International, Inc. | | 4.65% | | 11/15/2024 | | | 97 | | | | 96,636 | |
| TechnipFMC plc (United Kingdom)†(a) | | 6.50% | | 2/1/2026 | | | 66 | | | | 70,752 | |
| Transocean Proteus Ltd.† | | 6.25% | | 12/1/2024 | | | 11 | | | | 10,933 | |
| USA Compression Partners LP / USA Compression Finance Corp. | 6.875% | | 4/1/2026 | | | 59 | | | | 61,872 | |
| Total | | | | | | | | | | | 272,512 | |
| | | | | | | | | | | | | |
| Packaging & Containers 0.47% | | | | | | | | | | | | |
| Ball Corp. | | 5.25% | | 7/1/2025 | | | 36 | | | | 40,648 | |
| Sealed Air Corp.† | | 5.125% | | 12/1/2024 | | | 20 | | | | 21,762 | |
| Silgan Holdings, Inc. | | 4.75% | | 3/15/2025 | | | 15 | | | | 15,252 | |
| Trident TPI Holdings, Inc.† | | 9.25% | | 8/1/2024 | | | 6 | | | | 6,336 | |
| Total | | | | | | | | | | | 83,998 | |
| | | | | | | | | | | | | |
| Pharmaceuticals 0.90% | | | | | | | | | | | | |
| Bausch Health Americas, Inc.† | | 8.50% | | 1/31/2027 | | | 30 | | | | 32,475 | |
| Bausch Health Americas, Inc.† | | 9.25% | | 4/1/2026 | | | 50 | | | | 54,187 | |
| Endo Dac/Endo Finance LLC/Endo Finco, Inc. (Ireland)†(a) | | 6.00% | | 6/30/2028 | | | 31 | | | | 20,965 | |
| Herbalife Nutrition Ltd./HLF Financing, Inc.† | | 7.875% | | 9/1/2025 | | | 29 | | | | 31,538 | |
| Teva Pharmaceutical Finance Netherlands III BV (Netherlands)(a) | 2.80% | | 7/21/2023 | | | 24 | | | | 23,754 | |
| Total | | | | | | | | | | | 162,919 | |
| | | | | | | | | | | | | |
| Pipelines 2.48% | | | | | | | | | | | | |
| Antero Midstream Partners LP/Antero Midstream Finance Corp.† | 7.875% | | 5/15/2026 | | | 52 | | | | 57,712 | |
| Buckeye Partners LP | | 3.95% | | 12/1/2026 | | | 16 | | | | 16,231 | |
| Buckeye Partners LP† | | 4.125% | | 3/1/2025 | | | 12 | | | | 12,477 | |
| Buckeye Partners LP | | 4.15% | | 7/1/2023 | | | 44 | | | | 45,595 | |
| Buckeye Partners LP | | 6.375%
(3 Mo. LIBOR + 4.02% | )# | 1/22/2078 | | | 85 | | | | 78,886 | |
| Energy Transfer LP | 6.50%
(5 Yr Treasury CMT + 5.69% | )# | – | (d) | | 49 | | | | 50,412 | |
| 54 | See Notes to Financial Statements. |
Schedule of Investments (continued)
SHORT DURATION HIGH YIELD FUND July 31, 2021
| | | | | | | Principal | | | | |
| | | Interest | | Maturity | | Amount | | | Fair | |
| Investments | | Rate | | Date | | (000) | | | Value | |
| Pipelines (continued) | | | | | | | | | | | | |
| Northriver Midstream Finance LP (Canada)†(a) | | 5.625% | | 2/15/2026 | | $ | 33 | | | $ | 34,087 | |
| Plains All American Pipeline LP | | 6.125%
(3 Mo. LIBOR + 4.11% | )# | – | (d) | | 30 | | | | 26,888 | |
| Rattler Midstream LP† | | 5.625% | | 7/15/2025 | | | 10 | | | | 10,451 | |
| Western Midstream Operating LP | | 3.95% | | 6/1/2025 | | | 111 | | | | 114,607 | |
| Total | | | | | | | | | | | 447,346 | |
| | | | | | | | | | | | | |
| Real Estate 1.33% | | | | | | | | | | | | |
| Peach Property Finance GmbH†(c) | | 4.375% | | 11/15/2025 | | EUR | 100 | | | | 124,309 | |
| Signa Development Finance SCS†(c) | | 5.50% | | 7/23/2026 | | EUR | 100 | | | | 114,621 | |
| Total | | | | | | | | | | | 238,930 | |
| | | | | | | | | | | | | |
| REITS 2.57% | | | | | | | | | | | | |
| EPR Properties | | 5.25% | | 7/15/2023 | | $ | 37 | | | | 39,096 | |
| HAT Holdings I LLC/HAT Holdings II LLC† | | 3.375% | | 6/15/2026 | | | 68 | | | | 69,003 | |
| HAT Holdings I LLC/HAT Holdings II LLC† | | 6.00% | | 4/15/2025 | | | 74 | | | | 77,984 | |
| Hospitality Properties Trust | | 4.65% | | 3/15/2024 | | | 25 | | | | 25,518 | |
| IIP Operating Partnership LP† | | 5.50% | | 5/25/2026 | | | 20 | | | | 20,929 | |
| Ladder Capital Finance Holdings LLLP/Ladder Capital Finance Corp.† | 4.25% | | 2/1/2027 | | | 15 | | | | 14,994 | |
| Ladder Capital Finance Holdings LLLP/Ladder Capital Finance Corp.† | 5.25% | | 10/1/2025 | | | 38 | | | | 38,682 | |
| MGM Growth Properties Operating Partnership LP/MGP Finance Co-Issuer, Inc.† | 4.625% | | 6/15/2025 | | | 8 | | | | 8,524 | |
| MGM Growth Properties Operating Partnership LP/MGP Finance Co-Issuer, Inc. | 5.625% | | 5/1/2024 | | | 36 | | | | 39,012 | |
| Park Intermediate Holdings LLC/PK Domestic Property LLC/PK Finance Co-Issuer† | 7.50% | | 6/1/2025 | | | 35 | | | | 38,028 | |
| VICI Properties LP / VICI Note Co., Inc.† | | 3.50% | | 2/15/2025 | | | 63 | | | | 64,298 | |
| XHR LP† | | 6.375% | | 8/15/2025 | | | 25 | | | | 26,692 | |
| Total | | | | | | | | | | | 462,760 | |
| | | | | | | | | | | | | |
| Retail 5.01% | | | | | | | | | | | | |
| BCPE Ulysses Intermediate, Inc. PIK 8.50%† | | 7.75% | | 4/1/2027 | | | 40 | | | | 40,261 | |
| Brinker International, Inc.† | | 5.00% | | 10/1/2024 | | | 63 | | | | 66,819 | |
| Caleres, Inc. | | 6.25% | | 8/15/2023 | | | 6 | | | | 6,043 | |
| Carvana Co.† | | 5.625% | | 10/1/2025 | | | 34 | | | | 35,345 | |
| Gap, Inc. (The)† | | 8.625% | | 5/15/2025 | | | 15 | | | | 16,443 | |
| Gap, Inc. (The)† | | 8.875% | | 5/15/2027 | | | 66 | | | | 76,313 | |
| Golden Goose SpA†(c) | 4.875%
(3 Mo. EURIBOR + 4.88% | )# | 5/14/2027 | | EUR | 100 | | | | 117,095 | |
| | See Notes to Financial Statements. | 55 |
Schedule of Investments (continued)
SHORT DURATION HIGH YIELD FUND July 31, 2021
| | | | | | | Principal | | | | |
| | | Interest | | Maturity | | Amount | | | Fair | |
| Investments | | Rate | | Date | | (000) | | | Value | |
| Retail (continued) | | | | | | | | | | | | |
| Guitar Center, Inc.† | | 8.50% | | 1/15/2026 | | $ | 34 | | | $ | 36,338 | |
| IRB Holding Corp.† | | 6.75% | | 2/15/2026 | | | 9 | | | | 9,281 | |
| IRB Holding Corp.† | | 7.00% | | 6/15/2025 | | | 20 | | | | 21,350 | |
| L Brands, Inc.† | | 9.375% | | 7/1/2025 | | | 55 | | | | 71,363 | |
| Lithia Motors, Inc.† | | 4.625% | | 12/15/2027 | | | 50 | | | | 53,252 | |
| Macy’s Retail Holdings LLC | | 3.625% | | 6/1/2024 | | | 70 | | | | 72,011 | |
| NMG Holding Co., Inc./Neiman Marcus Group LLC† | | 7.125% | | 4/1/2026 | | | 16 | | | | 17,100 | |
| Party City Holdings, Inc.† | | 6.625% | | 8/1/2026 | | | 20 | | | | 16,750 | |
| Party City Holdings, Inc.† | | 8.75% | | 2/15/2026 | | | 33 | | | | 34,980 | |
| Penske Automotive Group, Inc. | | 3.50% | | 9/1/2025 | | | 24 | | | | 24,825 | |
| Rite Aid Corp.† | | 8.00% | | 11/15/2026 | | | 22 | | | | 22,113 | |
| Sally Holdings LLC/Sally Capital, Inc.† | | 8.75% | | 4/30/2025 | | | 15 | | | | 16,321 | |
| Specialty Building Products Holdings LLC/SBP Finance Corp.† | 6.375% | | 9/30/2026 | | | 18 | | | | 18,990 | |
| Stonegate Pub Co. Financing plc(c) | 5.75%
(3 Mo. EURIBOR + 5.75% | )# | 7/31/2025 | | EUR | 100 | | | | 118,773 | |
| White Cap Parent LLC PIK 8.25%† | | 8.25% | | 3/15/2026 | | $ | 11 | | | | 11,358 | |
| Total | | | | | | | | | | | 903,124 | |
| | | | | | | | | | | | | |
| Semiconductors 0.25% | | | | | | | | | | | | |
| Microchip Technology, Inc. | | 4.25% | | 9/1/2025 | | | 43 | | | | 45,305 | |
| | | | | | | | | | | | | |
| Software 0.22% | | | | | | | | | | | | |
| Fair Isaac Corp.† | | 5.25% | | 5/15/2026 | | | 20 | | | | 22,809 | |
| Veritas US, Inc./Veritas Bermuda Ltd.† | | 7.50% | | 9/1/2025 | | | 17 | | | | 17,644 | |
| Total | | | | | | | | | | | 40,453 | |
| | | | | | | | | | | | | |
| Telecommunications 1.38% | | | | | | | | | | | | |
| Sprint Corp. | | 7.625% | | 2/15/2025 | | | 175 | | | | 206,518 | |
| Sprint Corp. | | 7.625% | | 3/1/2026 | | | 35 | | | | 42,798 | |
| Total | | | | | | | | | | | 249,316 | |
| | | | | | | | | | | | | |
| Toys/Games/Hobbies 0.34% | | | | | | | | | | | | |
| Mattel, Inc. | | 3.15% | | 3/15/2023 | | | 38 | | | | 38,905 | |
| Mattel, Inc.† | | 3.375% | | 4/1/2026 | | | 21 | | | | 21,903 | |
| Total | | | | | | | | | | | 60,808 | |
| | | | | | | | | | | | | |
| Transportation 0.11% | | | | | | | | | | | | |
| Hertz Corp. (The)†(e) | | 5.50% | | 10/15/2024 | | | 22 | | | | 770 | |
| Hertz Corp. (The)(e) | | 6.25% | | 10/15/2022 | | | 2 | | | | 70 | |
| 56 | See Notes to Financial Statements. |
Schedule of Investments (continued)
SHORT DURATION HIGH YIELD FUND July 31, 2021
| | | | | | | Principal | | | | |
| | | Interest | | Maturity | | Amount | | | Fair | |
| Investments | | Rate | | Date | | (000) | | | Value | |
| Transportation (continued) | | | | | | | | | | | | |
| XPO Logistics, Inc.† | | 6.75% | | 8/15/2024 | | $ | 19 | | | $ | 19,771 | |
| Total | | | | | | | | | | | 20,611 | |
| | | | | | | | | | | | | |
| Trucking & Leasing 0.30% | | | | | | | | | | | | |
| Fortress Transportation and Infrastructure Investors LLC† | | 6.50% | | 10/1/2025 | | | 52 | | | | 53,950 | |
| | | | | | | | | | | | | |
| Water 0.23% | | | | | | | | | | | | |
| Solaris Midstream Holdings LLC† | | 7.625% | | 4/1/2026 | | | 39 | | | | 40,901 | |
| Total Corporate Bonds (cost $13,839,190) | | | | | | | | | | | 14,247,271 | |
| | | | | | | | | | | | | |
| FLOATING RATE LOANS(f) 9.79% | | | | | | | | | | | | |
| | | | | | | | | | | | | |
| Aerospace 0.71% | | | | | | | | | | | | |
| Arcline FM Holdings, LLC 2021 1st Lien Term Loan | | 5.50%
(3 Mo. LIBOR + 4.75% | ) | 6/23/2028 | | | 20 | | | | 19,952 | |
| Atlantic Aviation FBO Inc. 2018 Term Loan B | | 3.85%
(1 Mo. LIBOR + 3.75% | ) | 12/6/2025 | | | 16 | | | | 15,954 | |
| SkyMiles IP Ltd. 2020 Skymiles Term Loan B | | 4.75%
(3 Mo. LIBOR + 3.75% | ) | 10/20/2027 | | | 58 | | | | 61,351 | |
| WP CPP Holdings, LLC 2018 Term Loan | | 4.75%
(1 Mo. LIBOR + 3.75% | ) | 4/30/2025 | | | 32 | | | | 31,375 | |
| Total | | | | | | | | | | | 128,632 | |
| | | | | | | | | | | | | |
| Automotive 0.51% | | | | | | | | | | | | |
| Chassix Inc. 2017 1st Lien Term Loan | | 6.50%
(3 Mo. LIBOR + 5.50% | ) | 11/15/2023 | | | 20 | | | | 19,745 | |
| Drive Chassis HoldCo, LLC 2019 2nd Lien Term Loan | | 7.119%
(3 Mo. LIBOR + 7.00% | ) | 4/10/2026 | | | 33 | | | | 33,727 | |
| Fastlane Parent Company, Inc. 2018 Add On 1st Lien Term Loan | | 4.592%
(1 Mo. LIBOR + 4.50% | ) | 2/4/2026 | | | 38 | | | | 37,731 | |
| Total | | | | | | | | | | | 91,203 | |
| | | | | | | | | | | | | |
| Chemicals 0.49% | | | | | | | | | | | | |
| ASP Unifrax Holdings Inc Term Loan B | | 3.897%
(3 Mo. LIBOR + 3.75% | ) | 12/12/2025 | | | 17 | | | | 16,363 | |
| Messer Industries GmbH 2018 USD Term Loan | | 2.647%
(3 Mo. LIBOR + 2.50% | ) | 3/1/2026 | | | 19 | | | | 18,390 | |
| Starfruit Finco B.V 2018 USD Term Loan B (Netherlands)(a) | | 2.835%
(1 Mo. LIBOR + 2.75% | ) | 10/1/2025 | | | 53 | | | | 52,808 | |
| Total | | | | | | | | | | | 87,561 | |
| | See Notes to Financial Statements. | 57 |
Schedule of Investments (continued)
SHORT DURATION HIGH YIELD FUND July 31, 2021
| | | | | | | Principal | | | | |
| | | Interest | | Maturity | | Amount | | | Fair | |
| Investments | | Rate | | Date | | (000) | | | Value | |
| Consumer Non-Durable 0.11% | | | | | | | | | | | | |
| Anastasia Parent, LLC 2018 Term Loan B | 3.897%
(3 Mo. LIBOR + 3.75%) | | 8/11/2025 | | $ | 25 | | | $ | 19,544 | |
| | | | | | | | | | | | | |
| Energy 0.57% | | | | | | | | | | | | |
| BCP Raptor II, LLC 1st Lien Term Loan | | 4.842%
(1 Mo. LIBOR + 4.75% | ) | 11/3/2025 | | | 39 | | | | 38,149 | |
| Brazos Delaware II, LLC Term Loan B | | 4.085%
(1 Mo. LIBOR + 4.00% | ) | 5/21/2025 | | | 31 | | | | 30,136 | |
| Ulterra Drilling Technologies, LP Term Loan B | | 5.342%
(1 Mo. LIBOR + 5.25% | ) | 11/26/2025 | | | 38 | | | | 34,212 | |
| Total | | | | | | | | | | | 102,497 | |
| | | | | | | | | | | | | |
| Financial Services 0.35% | | | | | | | | | | | | |
| Advisor Group, Inc. 2021 Term Loan | | 4.592%
(1 Mo. LIBOR + 4.50% | ) | 7/31/2026 | | | 39 | | | | 38,703 | |
| SSH Group Holdings, Inc. 2018 1st Lien Term Loan | | 4.397%
(3 Mo. LIBOR + 4.25% | ) | 7/30/2025 | | | 25 | | | | 23,804 | |
| Total | | | | | | | | | | | 62,507 | |
| | | | | | | | | | | | | |
| Food/Tobacco 0.17% | | | | | | | | | | | | |
| Aramark Services, Inc. 2018 Term Loan B3 | | 1.842%
(1 Mo. LIBOR + 1.75% | ) | 3/11/2025 | | | 15 | | | | 14,787 | |
| Sovos Brands Intermediate, Inc. 2021 Term Loan | | 5.00%
(1 Mo. LIBOR + 4.25% | ) | 6/8/2028 | | | 16 | | | | 15,800 | |
| Total | | | | | | | | | | | 30,587 | |
| | | | | | | | | | | | | |
| Healthcare 0.87% | | | | | | | | | | | | |
| Canopy Growth Corporation Term Loan (Canada)(a) | | 9.50%
(6 Mo. LIBOR + 8.50% | ) | 3/18/2026 | | | 12 | | | | 13,456 | |
| EyeCare Partners, LLC 2020 Term Loan | | 3.857%
(1 Mo. LIBOR + 3.75% | ) | 2/18/2027 | | | 15 | | | | 14,780 | |
| Heartland Dental, LLC 2018 1st Lien Term Loan | | 3.592%
(1 Mo. LIBOR + 3.50% | ) | 4/30/2025 | | | 41 | | | | 40,389 | |
| National Mentor Holdings, Inc. 2021 Delayed Draw Term Loan(g) | | – | (h) | 3/2/2028 | | | – | (i) | | | 108 | |
| National Mentor Holdings, Inc. 2021 Term Loan | | – | (h) | 2/18/2028 | | | 1 | | | | 1,258 | |
| National Mentor Holdings, Inc. 2021 Term Loan C | | – | (h) | 3/2/2028 | | | – | (i) | | | 73 | |
| Pearl Intermediate Parent LLC 2018 1st Lien Term Loan | | 2.842%
(1 Mo. LIBOR + 2.75% | ) | 2/14/2025 | | | 18 | | | | 18,146 | |
| 58 | See Notes to Financial Statements. |
Schedule of Investments (continued)
SHORT DURATION HIGH YIELD FUND July 31, 2021
| | | | | | | Principal | | | | |
| | | Interest | | Maturity | | Amount | | | Fair | |
| Investments | | Rate | | Date | | (000) | | | Value | |
| Healthcare (continued) | | | | | | | | | | | | |
| Pearl Intermediate Parent LLC 2018 Incremental Term Loan | | 3.342%
(1 Mo. LIBOR + 3.25% | ) | 2/14/2025 | | $ | 1 | | | $ | 1,364 | |
| PetVet Care Centers, LLC 2021 Term Loan B3 | | 4.25%
(1 Mo. LIBOR + 3.50% | ) | 2/14/2025 | | | 4 | | | | 4,429 | |
| U.S. Renal Care, Inc. 2019 Term Loan B | | 5.125%
(1 Mo. LIBOR + 5.00% | ) | 6/26/2026 | | | 31 | | | | 30,870 | |
| Wellpath Holdings, Inc. 2018 1st Lien Term Loan | | 5.592%
(3 Mo. LIBOR + 5.50% | ) | 10/1/2025 | | | 33 | | | | 32,434 | |
| Total | | | | | | | | | | | 157,307 | |
| | | | | | | | | | | | | |
| Information Technology 0.15% | | | | | | | | | | | | |
| Cvent, Inc. 1st Lien Term Loan B | | 4.75%
(3 Mo. LIBOR + 3.75% | ) | 11/29/2024 | | | 15 | | | | 15,400 | |
| Flexential Intermediate Corporation 2017 1st Lien Term Loan | | 3.647%
(3 Mo. LIBOR + 3.50% | ) | 8/1/2024 | | | 13 | | | | 11,745 | |
| Total | | | | | | | | | | | 27,145 | |
| | | | | | | | | | | | | |
| Insurance 0.09% | | | | | | | | | | | | |
| Asurion LLC 2018 Term Loan B7 | | 3.092%
(1 Mo. LIBOR + 3.00% | ) | 11/3/2024 | | | 16 | | | | 15,617 | |
| | | | | | | | | | | | | |
| Leisure 1.41% | | | | | | | | | | | | |
| Alterra Mountain Company Term Loan B1 | | 2.842%
(1 Mo. LIBOR + 2.75% | ) | 7/31/2024 | | | 18 | | | | 17,701 | |
| Bulldog Purchaser Inc. 2018 Term Loan | | 3.885%
(3 Mo. LIBOR + 3.75% | ) | 9/5/2025 | | | 16 | | | | 15,386 | |
| City Football Group Limited Term Loan (United Kingdom)(a) | | 4.00%
(3 Mo LIBOR + 3.50% | ) | 7/8/2028 | | | 36 | | | | 36,405 | |
| CMBF LLC Delayed Draw Term Loan(g) | | – | (h) | 6/8/2028 | | | 4 | | | | 4,375 | (j) |
| Equinox Holdings, Inc. 2017 1st Lien Term Loan | | 4.00%
(3 Mo. LIBOR + 3.00% | ) | 3/8/2024 | | | 4 | | | | 3,298 | |
| Gibson Brands Inc. 2021 Term Loan | | – | (h) | 6/25/2028 | | | 21 | | | | 20,398 | (j) |
| Golden Nugget, Inc. 2017 Incremental Term Loan B | | 3.25%
(2 Mo. LIBOR + 2.50% | ) | 10/4/2023 | | | 20 | | | | 19,709 | |
| MND Holdings III Corp 2018 1st Lien Term Loan | | 4.50%
(3 Mo. LIBOR + 3.50% | ) | 6/19/2024 | | | 36 | | | | 34,749 | |
| Motion Finco Sarl Delayed Draw Term Loan B2 (Luxembourg)(a) | | 3.397%
(3 Mo. LIBOR + 3.25% | ) | 11/12/2026 | | | 4 | | | | 3,427 | |
| | See Notes to Financial Statements. | 59 |
Schedule of Investments (continued)
SHORT DURATION HIGH YIELD FUND July 31, 2021
| | | | | | | Principal | | | | |
| | | Interest | | Maturity | | Amount | | | Fair | |
| Investments | | Rate | | Date | | (000) | | | Value | |
| Leisure (continued) | | | | | | | | | | | | |
| Motion Finco Sarl USD Term Loan B1 (Luxembourg)(a) | | 3.397%
(3 Mo. LIBOR + 3.25% | ) | 11/12/2026 | | $ | 27 | | | $ | 25,875 | |
| Spectacle Gary Holdings LLC Delayed Draw Term Loan | | 11.00%
(1 Mo. LIBOR + 9.00% | ) | 12/23/2025 | | | 2 | | | | 1,908 | |
| Spectacle Gary Holdings LLC Term Loan B | | 11.00%
(1 Mo. LIBOR + 9.00% | ) | 12/23/2025 | | | 24 | | | | 26,370 | |
| TopGolf International, Inc. Term Loan B | | 7.00%
(3 Mo. LIBOR + 6.25% | ) | 2/8/2026 | | | 25 | | | | 25,306 | |
| United PF Holdings, LLC 2019 1st Lien Term Loan | | 4.147%
(3 Mo. LIBOR + 4.00% | ) | 12/30/2026 | | | 20 | | | | 19,080 | |
| Total | | | | | | | | | | | 253,987 | |
| | | | | | | | | | | | | |
| Manufacturing 0.55% | | | | | | | | | | | | |
| Array Technologies, Inc. Term Loan B | | 3.75%
(1 Mo. LIBOR + 3.25% | ) | 10/14/2027 | | | 44 | | | | 42,606 | |
| Associated Asphalt Partners, LLC 2017 Term Loan B | | 6.25%
(1 Mo. LIBOR + 5.25% | ) | 4/5/2024 | | | 17 | | | | 16,086 | |
| CMBF LLC Term Loan | | – | (h) | 6/8/2028 | | | 15 | | | | 14,699 | (j) |
| Electrical Components International, Inc. 2018 1st Lien Term Loan | | 4.342%
(1 Mo. LIBOR + 4.25% | ) | 6/26/2025 | | | 7 | | | | 6,557 | |
| LTI Holdings, Inc. 2018 Add On 1st Lien Term Loan | | 3.592%
(1 Mo. LIBOR + 3.50% | ) | 9/6/2025 | | | 20 | | | | 19,396 | |
| Total | | | | | | | | | | | 99,344 | |
| | | | | | | | | | | | | |
| Media/Telecommunications 0.77% | | | | | | | | | | | | |
| AMC Entertainment Holdings, Inc. 2019 Term Loan B | | – | (h) | 4/22/2026 | | | 19 | | | | 16,682 | |
| Banijay Entertainment S.A.S USD Term Loan B (France)(a) | | 3.841%
(1 Mo. LIBOR + 3.75% | ) | 3/1/2025 | | | 30 | | | | 29,799 | |
| Cinemark USA, Inc. 2018 Term Loan B | | 1.85%
(1 Mo. LIBOR + 1.75% | ) | 3/31/2025 | | | 20 | | | | 18,449 | |
| CSC Holdings, LLC 2017 Term Loan B1 | | 2.343%
(1 Mo. LIBOR + 2.25% | ) | 7/17/2025 | | | 41 | | | | 40,093 | |
| Cyxtera DC Holdings, Inc. Term Loan B | | 4.00%
(6 Mo. LIBOR + 3.00% | ) | 5/1/2024 | | | 20 | | | | 19,684 | |
| WideOpenWest Finance LLC 2017 Term Loan B | | 4.25%
(1 Mo. LIBOR + 3.25% | ) | 8/18/2023 | | | 14 | | | | 13,901 | |
| Total | | | | | | | | | | | 138,608 | |
| 60 | See Notes to Financial Statements. |
Schedule of Investments (continued)
SHORT DURATION HIGH YIELD FUND July 31, 2021
| | | | | | | Principal | | | | |
| | | Interest | | Maturity | | Amount | | | Fair | |
| Investments | | Rate | | Date | | (000) | | | Value | |
| Metals/Minerals 0.24% | | | | | | | | | | | | |
| Alpha Metallurgical Resources, Inc. 2019 Term Loan | | 10.00%
(3 Mo. LIBOR + 8.00% | ) | 6/14/2024 | | $ | 47 | | | $ | 43,867 | |
| | | | | | | | | | | | | |
| Real Estate 0.22% | | | | | | | | | | | | |
| Claros Mortgage Trust, Inc. Term Loan B | | 6.00%
(1 Mo. LIBOR + 5.00% | ) | 8/9/2026 | | | 39 | | | | 39,089 | (j) |
| | | | | | | | | | | | | |
| Retail 0.79% | | | | | | | | | | | | |
| BDF Acquisition Corp. 1st Lien Term Loan | | 6.25%
(1 Mo. LIBOR + 5.25% | ) | 8/14/2023 | | | 15 | | | | 14,849 | |
| Fogo De Chao, Inc. 2018 Add On Term Loan | | 5.25%
(3 Mo. LIBOR + 4.25% | ) | 4/7/2025 | | | 18 | | | | 17,803 | |
| Miller’s Ale House, Inc. 2018 Term Loan | | 4.839%
(1 Mo. LIBOR + 4.75% | ) | 5/30/2025 | | | 32 | | | | 30,880 | |
| Panera Bread Company Term Loan A | | 2.375%
(1 Mo. LIBOR + 2.25% | ) | 7/18/2022 | | | 42 | | | | 41,728 | |
| Rising Tide Holdings, Inc. Term Loan | | 5.50%
(3 Mo. LIBOR + 4.75% | ) | 6/1/2028 | | | 21 | | | | 21,553 | |
| Torrid LLC 2021 Term Loan B | | 6.25%
(2 Mo. LIBOR + 5.50% | ) | 6/14/2028 | | | 16 | | | | 16,406 | (j) |
| Total | | | | | | | | | | | 143,219 | |
| | | | | | | | | | | | | |
| Service 0.72% | | | | | | | | | | | | |
| Brand Energy & Infrastructure Services, Inc. 2017 Term Loan | | 5.25%
(3 Mo. LIBOR + 4.25% | ) | 6/21/2024 | | | 36 | | | | 35,196 | |
| Deliver Buyer, Inc. Term Loan B | | 5.147%
(3 Mo. LIBOR + 5.00% | ) | 5/1/2024 | | | 17 | | | | 16,877 | |
| KUEHG Corp. 2018 Incremental Term Loan | | 4.75%
(3 Mo. LIBOR + 3.75% | ) | 2/21/2025 | | | 29 | | | | 28,926 | |
| NEP/NCP Holdco, Inc. 2018 1st Lien Term Loan | | 3.342%
(1 Mo. LIBOR + 3.25% | ) | 10/20/2025 | | | 35 | | | | 33,400 | |
| Robertshaw US Holding Corp 2018 1st Lien Term Loan | | 4.50%
(1 Mo. LIBOR + 3.50% | ) | 2/28/2025 | | | 15 | | | | 14,894 | |
| Total | | | | | | | | | | | 129,293 | |
| | | | | | | | | | | | | |
| Technology 0.30% | | | | | | | | | | | | |
| Grab Holdings Inc Term Loan B | | 5.50%
(6 Mo. LIBOR + 4.50% | ) | 1/29/2026 | | | 25 | | | | 25,565 | |
| Imperva, Inc. 1st Lien Term Loan | | 5.00%
(3 Mo. LIBOR + 4.00% | ) | 1/12/2026 | | | 12 | | | | 11,879 | |
| | See Notes to Financial Statements. | 61 |
Schedule of Investments (continued)
SHORT DURATION HIGH YIELD FUND July 31, 2021
| | | | | | | Principal | | | | |
| | | Interest | | Maturity | | Amount | | | Fair | |
| Investments | | Rate | | Date | | (000) | | | Value | |
| Technology (continued) | | | | | | | | | | | | |
| Liftoff Mobile Inc Term Loan | | 4.25%
(3 Mo. LIBOR + 3.50% | ) | 3/17/2028 | | $ | 17 | | | $ | 17,332 | |
| Optiv Security, Inc. 1st Lien Term Loan | | 4.25%
(3 Mo. LIBOR + 3.25% | ) | 2/1/2024 | | | – | (i) | | | 53 | |
| Total | | | | | | | | | | | 54,829 | |
| | | | | | | | | | | | | |
| Transportation 0.19% | | | | | | | | | | | | |
| AIT Worldwide Logistics, Inc 2021 Term Loan | | 5.50%
(1 Mo. LIBOR + 4.75% | ) | 4/6/2028 | | | 18 | | | | 18,259 | |
| Granite Holdings US Acquisition Co. 2021 Term Loan B | | 4.147%
(3 Mo. LIBOR + 4.00% | ) | 9/30/2026 | | | 17 | | | | 16,829 | |
| Total | | | | | | | | | | | 35,088 | |
| | | | | | | | | | | | | |
| Utilities 0.58% | | | | | | | | | | | | |
| Astoria Energy LLC 2020 Term Loan B | | 4.50%
(3 Mo. LIBOR + 3.50% | ) | 12/10/2027 | | | 30 | | | | 29,766 | |
| Helix Gen Funding, LLC Term Loan B | | 4.75%
(3 Mo. LIBOR + 3.75% | ) | 6/3/2024 | | | 21 | | | | 20,684 | |
| Peabody Energy Corporation 2018 Term Loan | | – | (h) | 3/31/2025 | | | 50 | | | | 37,396 | |
| USIC Holdings, Inc. 2021 2nd Lien Term Loan | | 7.25%
(1 Mo LIBOR + 6.50% | ) | 5/14/2029 | | | 16 | | | | 16,691 | |
| Total | | | | | | | | | | | 104,537 | |
| Total Floating Rate Loans (cost $1,726,996) | | | | | | | | | | | 1,764,461 | |
| | | | | | | | | | | | | |
| NON-AGENCY COMMERCIAL MORTGAGE-BACKED SECURITIES 1.37% | | | | | |
| BFLD 2019-DPLO F† | | 2.633%
(1 Mo. LIBOR + 2.54% | )# | 10/15/2034 | | | 33 | | | | 32,518 | |
| Great Wolf Trust 2019-WOLF B† | | 1.427%
(1 Mo. LIBOR + 1.33% | )# | 12/15/2036 | | | 15 | | | | 15,025 | |
| Great Wolf Trust 2019-WOLF D† | | 2.026%
(1 Mo. LIBOR + 1.93% | )# | 12/15/2036 | | | 27 | | | | 26,953 | |
| Great Wolf Trust 2019-WOLF E† | | 2.825%
(1 Mo. LIBOR + 2.73% | )# | 12/15/2036 | | | 17 | | | | 16,772 | |
| JPMorgan Chase Commercial Mortgage Securities Trust 2016-WIKI E† | | 4.009% | #(k) | 10/5/2031 | | | 10 | | | | 9,856 | |
| JPMorgan Chase Commercial Mortgage Securities Trust 2018-LAQ B† | | 1.393%
(1 Mo. LIBOR + 1.30% | )# | 6/15/2032 | | | 16 | | | | 16,039 | |
| JPMorgan Chase Commercial Mortgage Securities Trust 2021 E† | | 3.943%
(1 Mo. LIBOR + 3.85% | )# | 3/15/2036 | | | 100 | | | | 100,465 | |
| 62 | See Notes to Financial Statements. |
Schedule of Investments (continued)
SHORT DURATION HIGH YIELD FUND July 31, 2021
| | | | | | | Principal | | | | |
| | | Interest | | Maturity | | Amount | | | Fair | |
| Investments | | Rate | | Date | | (000) | | | Value | |
| NON-AGENCY COMMERCIAL MORTGAGE-BACKED SECURITIES (continued) | | | |
| KKR Industrial Portfolio Trust 2021-KDIP D† | 1.343%
(1 Mo. LIBOR + 1.25% | )# | 12/15/2037 | | $ | 10 | | | $ | 9,998 | |
| KKR Industrial Portfolio Trust 2021-KDIP E† | 1.643%
(1 Mo. LIBOR + 1.55% | )# | 12/15/2037 | | | 10 | | | | 9,993 | |
| KKR Industrial Portfolio Trust 2021-KDIP F† | 2.143%
(1 Mo. LIBOR + 2.05% | )# | 12/15/2037 | | | 10 | | | | 9,997 | |
| Total Non-Agency Commercial Mortgage-Backed Securities (cost $242,914) | | | | 247,616 | |
| | | | | | | | | | | | | |
| | | Dividend | | | | Shares | | | | |
| | | Rate | | | | (000) | | | | |
| | | | | | | | | | | | | |
| PREFERRED STOCKS 0.34% | | | | | | | | | | | | |
| | | | | | | | | | | | | |
| Banks 0.18% | | | | | | | | | | | | |
| Synovus Financial Corp. | | 6.30% | #(l) | | | | 1 | | | | 32,076 | |
| | | | | | | | | | | | | |
| Media 0.16% | | | | | | | | | | | | |
| ViacomCBS, Inc. | | 5.75% | | | | | – | (m) | | | 29,072 | |
| Total Preferred Stocks (cost $61,440) | | | | | | | | | | | 61,148 | |
| Total Long-Term Investments (cost $17,076,582) | | | | | | | | | | | 17,545,313 | |
| | | | | | | | | | | | | |
| | | | | | | Principal | | | | |
| | | | | | | Amount | | | | |
| | | | | | | (000) | | | | |
| SHORT-TERM INVESTMENTS 1.17% | | | | | | | | | | | | |
| | | | | | | | | | | | | |
| REPURCHASE AGREEMENTS | | | | | | | | | | | | |
Repurchase Agreement dated 7/30/2021, 0.00% due 8/2/2021 with Fixed Income Clearing Corp. collateralized by $215,500 of U.S. Treasury Note at 0.375% due 07/15/2024; value: $215,567; proceeds: $211,292
(cost $211,292) | | | | | | $ | 211 | | | | 211,292 | |
| Total Investments in Securities 98.48% (cost $17,287,874) | | | | | | | | 17,756,605 | |
| Less Unfunded Loan Commitments (0.02%) (cost $4,336)(n) | | | | | | | | (4,423) | |
| Net Investments 98.46% (cost $17,283,538) | | | | | | | | | | | 17,752,182 | |
| Other Assets and Liabilities - Net(o) 1.54% | | | | | | | | | | | 277,720 | |
| Net Assets 100.00% | | | | | | | | | | $ | 18,029,902 | |
| | See Notes to Financial Statements. | 63 |
Schedule of Investments (continued)
SHORT DURATION HIGH YIELD FUND July 31, 2021
| EUR | Euro. |
| GBP | British pound. |
| CMT | Constant Maturity Rate. |
| EURIBOR | Euro Interbank Offered Rate. |
| LIBOR | London Interbank Offered Rate. |
| PIK | Payment-in-kind. |
| SOFR | Secured Over Night Financing Rate. |
| | |
| † | | Security was purchased pursuant to Rule 144A under the Securities Act of 1933 and, unless registered under such Act or exempted from registration, may only be resold to qualified institutional buyers. At July 31, 2021, the total value of Rule 144A securities was $9,148,265, which represents 50.74% of net assets. |
| # | | Variable rate security. The interest rate represents the rate in effect at July 31, 2021. |
| (a) | | Foreign security traded in U.S. dollars. |
| (b) | | Securities purchased on a when-issued basis (See Note 2(i)). |
| (c) | | Investment in non-U.S. dollar denominated securities. |
| (d) | | Security is perpetual in nature and has no stated maturity. |
| (e) | | Defaulted (non-income producing security). |
| (f) | | Floating Rate Loans in which the Fund invests generally pay interest at rates which are periodically re-determined at a margin above the London Interbank Offered Rate (“LIBOR”) or the prime rate offered by major U.S. banks. The rate(s) shown is the rate(s) in effect at July 31, 2021. |
| (g) | | Security partially/fully unfunded. See Note 2(I). |
| (h) | | Interest rate to be determined. |
| (i) | | Amount is less than $1,000. |
| (j) | | Level 3 Investment as described in Note 2(m) in the Notes to Financials. Floating Rate Loans categorized as Level 3 are valued based on a single quotation obtained from a dealer. Accounting principles generally accepted in the United States of America do not require the Fund to create quantitative unobservable inputs that were not developed by the Fund. Therefore, the Fund does not have access to unobservable inputs and cannot disclose such inputs in the valuation. |
| (k) | | Interest rate is based on the weighted average interest rates of the underlying mortgages within the mortgage pool. |
| (l) | | Variable Rate is Fixed to Float: Rate remains fixed or at Zero Coupon until designated future date. |
| (m) | | Amount is less than 1,000 shares. |
| (n) | | See Note 2(I). |
| (o) | | Other Assets and Liabilities - Net include net unrealized appreciation/depreciation on forward foreign currency exchange contracts and futures contracts as follows: |
Open Forward Foreign Currency Exchange Contracts at July 31, 2021:
| Forward | | | | | | | | | | | | | | | |
| Foreign | | | | | | | | | | U.S. $ | | | | | |
| Currency | | | | | | | | | | Cost on | | U.S. $ | | | |
| Exchange | | Transaction | | | | Expiration | | Foreign | | Origination | | Current | Unrealized | |
| Contracts | | Type | | Counterparty | | Date | | Currency | | Date | | Value | Appreciation | |
| British pound | | Sell | | Barclays Bank plc | | 9/8/2021 | | 101,000 | | $143,017 | | $140,402 | | $ | 2,615 | |
| Euro | | Sell | | State Street Bank and Trust | | 9/10/2021 | | 506,000 | | 614,740 | | 600,687 | | | 14,053 | |
| Unrealized Appreciation on Forward Foreign Currency Exchange Contracts | | $ | 16,668 | |
| 64 | See Notes to Financial Statements. |
Schedule of Investments (continued)
SHORT DURATION HIGH YIELD FUND July 31, 2021
| Forward | | | | | | | | | | | | | | | | |
| Foreign | | | | | | | | | | U.S. $ | | | | | | |
| Currency | | | | | | | | | | Cost on | | U.S. $ | | | | |
| Exchange | | Transaction | | | | Expiration | | Foreign | | Origination | | Current | Unrealized | |
| Contracts | | Type | | Counterparty | | Date | | Currency | | Date | | Value | Depreciation | |
| Euro | | Buy | | Goldman Sachs | | 9/10/2021 | | 6,000 | | $ 7,135 | | $ 7,123 | | $ | (12) | |
| Euro | | Sell | | State Street Bank and Trust | | 9/10/2021 | | 103,723 | | 122,674 | | 123,133 | | | (459) | |
| Euro | | Sell | | State Street Bank and Trust | | 9/10/2021 | | 99,000 | | 116,744 | | 117,526 | | | (782) | |
| Unrealized Depreciation on Forward Foreign Currency Exchange Contracts | | | | | | $ | (1,253) | |
Open Futures Contracts at July 31, 2021:
| | | | | | | | | Notional | | Notional | Unrealized | |
| Type | | Expiration | | Contracts | | Position | | Amount | | Value | Appreciation | |
| U.S. 2-Year Treasury Note | | September 2021 | | 9 | | Long | | $1,983,726 | | $1,985,906 | | $ | 2,180 | |
| U.S. 5-Year Treasury Note | | September 2021 | | 14 | | Long | | 1,739,306 | | 1,742,234 | | | 2,928 | |
| Total Unrealized Appreciation on Open Futures Contracts | | | | | | | | $ | 5,108 | |
The following is a summary of the inputs used as of July 31, 2021 in valuing the Fund’s investments carried at fair value(1):
| Investment Type(2) | | Level 1 | | | Level 2 | | | Level 3 | | | Total | |
| Long-Term Investments | | | | | | | | | | | | | | | | |
| Asset-Backed Securities | | $ | – | | | $ | 748,713 | | | $ | – | | | $ | 748,713 | |
| Convertible Bonds | | | – | | | | 476,104 | | | | – | | | | 476,104 | |
| Corporate Bonds | | | – | | | | 14,247,271 | | | | – | | | | 14,247,271 | |
| Floating Rate Loans | | | | | | | | | | | | | | | | |
| Leisure | | | – | | | | 229,214 | | | | 24,773 | | | | 253,987 | |
| Less Unfunded Commitments | | | – | | | | (48 | ) | | | (4,375 | ) | | | (4,423 | ) |
| Manufacturing | | | – | | | | 84,645 | | | | 14,699 | | | | 99,344 | |
| Real Estate Investment Trusts | | | – | | | | – | | | | 39,089 | | | | 39,089 | |
| Retail | | | – | | | | 126,813 | | | | 16,406 | | | | 143,219 | |
| Remaining Industries | | | – | | | | 1,228,822 | | | | – | | | | 1,228,822 | |
| Non-Agency Commercial Mortgage-Backed Securities | | | – | | | | 247,616 | | | | – | | | | 247,616 | |
| Preferred Stocks | | | 61,148 | | | | – | | | | – | | | | 61,148 | |
| Short-Term Investments | | | | | | | | | | | | | | | | |
| Repurchase Agreements | | | – | | | | 211,292 | | | | – | | | | 211,292 | |
| Total | | $ | 61,148 | | | $ | 17,600,442 | | | $ | 90,592 | | | $ | 17,752,182 | |
| | See Notes to Financial Statements. | 65 |
Schedule of Investments (concluded)
SHORT DURATION HIGH YIELD FUND July 31, 2021
| Other Financial Instruments | | | | | | | | | | | | |
| Forward Foreign Currency Exchange Contracts | | | | | | | | | | | | | | | | |
| Assets | | $ | – | | | $ | 16,668 | | | $ | – | | | $ | 16,668 | |
| Liabilities | | | – | | | | (1,253 | ) | | | – | | | | (1,253 | ) |
| Futures Contracts | | | | | | | | | | | | | | | | |
| Assets | | | 5,108 | | | | – | | | | – | | | | 5,108 | |
| Liabilities | | | – | | | | – | | | | – | | | | – | |
| Total | | $ | 5,108 | | | $ | 15,415 | | | $ | – | | | $ | 20,523 | |
| (1) | Refer to Note 2(m) for a description of fair value measurements and the three-tier hierarchy of inputs. |
| (2) | See Schedule of Investments for fair values in each industry and identification of foreign issuers and/or geography. The table above is presented by Investment Type. Industries are presented within an Investment Type should such Investment Type include securities classified as two or more levels within the three-tier fair value hierarchy. Each Level 3 security is identified on the Schedule of Investments along with the valuation technique utilized. |
A reconciliation of Level 3 investments is presented when the Fund has a material amount of Level 3 investments at the beginning or end of the year in relation to the Fund’s net assets. Management has determined not to provide a reconciliation as the balance of Level 3 investments was not considered to be material to the Fund’s net assets at the beginning or end of the year.
| 66 | See Notes to Financial Statements. |
This page is intentionally left blank.
67
Statements of Assets and Liabilities
July 31, 2021
| | Climate Focused
Bond Fund | | International
Growth Fund | |
| ASSETS: | | | | | | | | |
| Investments in securities, at cost | | $ | 16,930,069 | | | $ | 1,978,615 | |
| Investments in securities, at fair value | | $ | 17,432,214 | | | $ | 2,008,960 | |
| Cash | | | – | | | | 55,605 | |
| Deposits with brokers for futures collateral | | | 21,699 | | | | – | |
| Foreign cash, at value (cost $142,937, $2,610, $0 and $0, respectively) | | | 140,441 | | | | 2,613 | |
| Receivables: | | | | | | | | |
| Capital shares sold | | | 6,010,622 | | | | – | |
| Investment securities sold | | | 287,938 | | | | 18,596 | |
| Interest and dividends | | | 110,261 | | | | 415 | |
| From advisor (See Note 3) | | | 9,841 | | | | 24,461 | |
| Variation margin for futures contracts | | | 1,154 | | | | – | |
| Unrealized appreciation on forward foreign currency exchange contracts | | | 213,920 | | | | – | |
| Unrealized appreciation on unfunded commitments | | | 13 | | | | – | |
| Prepaid expenses and other assets | | | 70,109 | | | | 1,711 | |
| Total assets | | | 24,298,212 | | | | 2,112,361 | |
| LIABILITIES: | | | | | | | | |
| Payables: | | | | | | | | |
| Investment securities purchased | | | 246,512 | | | | 22,021 | |
| Capital shares reacquired | | | 32 | | | | – | |
| Offering costs | | | 2,840 | | | | – | |
| Management fee | | | 5,293 | | | | 1,130 | |
| To bank | | | – | | | | – | |
| 12b-1 distribution plan | | | 1,850 | | | | 322 | |
| Fund administration | | | 605 | | | | 70 | |
| Trustees’ fees | | | 394 | | | | – | |
| Unrealized depreciation on forward foreign currency exchange contracts | | | 13,386 | | | | – | |
| Foreign currency overdraft (cost $119,207, $0, $0 and $1,695, respectively) | | | 119,939 | | | | – | |
| Distributions payable | | | 25,213 | | | | – | |
| Accrued expenses | | | 50,634 | | | | 21,094 | |
| Total liabilities | | | 466,698 | | | | 44,637 | |
| Commitments and contingent liabilities | | | | | | | | |
| NET ASSETS | | $ | 23,831,514 | | | $ | 2,067,724 | |
| COMPOSITION OF NET ASSETS: | | | | | | | | |
| Paid-in capital | | $ | 23,341,712 | | | $ | 2,050,090 | |
| Total distributable earnings (loss) | | | 489,802 | | | | 17,634 | |
| Net Assets | | $ | 23,831,514 | | | $ | 2,067,724 | |
| | |
| 68 | See Notes to Financial Statements. |
Mid Cap
Innovation
Growth Fund | | | Short
Duration High
Yield Fund | |
| | | | | | | |
| $ | 5,317,379 | | | $ | 17,283,538 | |
| $ | 6,015,122 | | | $ | 17,752,182 | |
| | – | | | | – | |
| | – | | | | 13,990 | |
| | | | | | | |
| | – | | | | – | |
| | | | | | | |
| | 3,549 | | | | 108,142 | |
| | 54,527 | | | | 301,400 | |
| | 92 | | | | 233,075 | |
| | 6,137 | | | | 14,972 | |
| | – | | | | 2,272 | |
| | | | | | | |
| | – | | | | 16,668 | |
| | – | | | | 87 | |
| | 14,499 | | | | 96,097 | |
| | 6,093,926 | | | | 18,538,885 | |
| | | | | | | |
| | 112,183 | | | | 333,999 | |
| | – | | | | 28,122 | |
| | – | | | | 14,988 | |
| | 3,212 | | | | 6,621 | |
| | – | | | | 9,170 | |
| | 989 | | | | 2,980 | |
| | 198 | | | | 589 | |
| | 49 | | | | 348 | |
| | – | | | | 1,253 | |
| | – | | | | 1,701 | |
| | – | | | | 72,825 | |
| | 19,278 | | | | 36,387 | |
| | 135,909 | | | | 508,983 | |
| | | | | | | |
| $ | 5,958,017 | | | $ | 18,029,902 | |
| | | | | | | |
| $ | 5,572,330 | | | $ | 17,407,428 | |
| | 385,687 | | | | 622,474 | |
| $ | 5,958,017 | | | $ | 18,029,902 | |
| | | |
| | See Notes to Financial Statements. | 69 |
Statements of Assets and Liabilities (concluded)
July 31, 2021
| | Climate Focused
Bond Fund | | International
Growth Fund | |
| Net assets by class: | | | | | | | | |
| Class A Shares | | $ | 4,366,148 | | | $ | 1,058,326 | |
| Class C Shares | | $ | 901,274 | | | $ | 101,726 | |
| Class F Shares | | $ | 3,865,827 | | | $ | 100,846 | |
| Class F3 Shares | | $ | 129,717 | | | $ | 10,086 | |
| Class I Shares | | $ | 14,042,207 | | | $ | 10,085 | |
| Class R3 Shares | | $ | 25,945 | | | $ | 10,079 | |
| Class R4 Shares | | $ | 25,945 | | | $ | 10,082 | |
| Class R5 Shares | | $ | 25,945 | | | $ | 10,084 | |
| Class R6 Shares | | $ | 448,506 | | | $ | 756,410 | |
| Outstanding shares by class (unlimited number of authorized shares of beneficial interest): | | | | | | | | |
| Class A Shares | | | 420,737 | | | | 69,983 | |
| Class C Shares | | | 86,857 | | | | 6,732 | |
| Class F Shares | | | 372,520 | | | | 6,667 | |
| Class F3 Shares | | | 12,500 | | | | 667 | |
| Class I Shares | | | 1,352,890 | | | | 667 | |
| Class R3 Shares | | | 2,500 | | | | 667 | |
| Class R4 Shares | | | 2,500 | | | | 667 | |
| Class R5 Shares | | | 2,500 | | | | 666.50 | |
| Class R6 Shares | | | 43,230 | | | | 50,000 | |
| Net asset value, offering and redemption price per share (Net assets divided by outstanding shares): | | | | | | | | |
| Class A Shares-Net asset value | | | $10.38 | | | | $15.12 | |
| Class A Shares-Maximum offering price (Net asset value plus sales charge of 2.25%, 5.75%, 5.75% and 2.25%, respectively) | | | $10.62 | | | | $16.04 | |
| Class C Shares-Net asset value | | | $10.38 | | | | $15.11 | |
| Class F Shares-Net asset value | | | $10.38 | | | | $15.13 | |
| Class F3 Shares-Net asset value | | | $10.38 | | | | $15.12 | |
| Class I Shares-Net asset value | | | $10.38 | | | | $15.12 | |
| Class R3 Shares-Net asset value | | | $10.38 | | | | $15.11 | |
| Class R4 Shares-Net asset value | | | $10.38 | | | | $15.12 | |
| Class R5 Shares-Net asset value | | | $10.38 | | | | $15.13 | |
| Class R6 Shares-Net asset value | | | $10.37 | | | | $15.13 | |
| | |
| 70 | See Notes to Financial Statements. |
Mid Cap
Innovation
Growth Fund | | | Short
Duration High
Yield Fund | |
| | | | | | | |
| $ | 2,507,727 | | | $ | 9,848,944 | |
| $ | 449,490 | | | $ | 1,323,643 | |
| $ | 1,047,981 | | | $ | 6,071,404 | |
| $ | 10,784 | | | $ | 11,006 | |
| $ | 118,562 | | | $ | 550,278 | |
| $ | 10,747 | | | $ | 11,004 | |
| $ | 57,956 | | | $ | 11,005 | |
| $ | 10,778 | | | $ | 11,005 | |
| $ | 1,743,992 | | | $ | 191,613 | |
| | | | | | | |
| | 155,341 | | | | 895,374 | |
| | 27,966 | | | | 120,334 | |
| | 64,814 | | | | 552,006 | |
| | 666.66 | | | | 1,001 | |
| | 7,333 | | | | 50,027 | |
| | 666.66 | | | | 1,000 | |
| | 3,590 | | | | 1,000.47 | |
| | 666.66 | | | | 1,000.47 | |
| | 107,827 | | | | 17,418 | |
| | | | | | | |
| | $16.14 | | | | $11.00 | |
| | | | | | | |
| | $17.12 | | | | $11.25 | |
| | $16.07 | | | | $11.00 | |
| | $16.17 | | | | $11.00 | |
| | $16.18 | | | | $11.00 | |
| | $16.17 | | | | $11.00 | |
| | $16.12 | | | | $11.00 | |
| | $16.14 | | | | $11.00 | |
| | $16.17 | | | | $11.00 | |
| | $16.17 | | | | $11.00 | |
| | | |
| | See Notes to Financial Statements. | 71 |
Statements of Operations
For the Period Ended July 31, 2021
| | Climate Focused
Bond Fund | | International
Growth Fund* | |
| Investment income: | | | | | | | | |
| Dividends (net of foreign withholding taxes of $0, $238, $0 and $0, respectively) | | $ | – | | | $ | 1,552 | |
| Interest and other (net of foreign withholding taxes of $997, $0, $0 and $0, respectively) | | | 262,888 | | | | – | |
| Total investment income | | | 262,888 | | | | 1,552 | |
| Expenses: | | | | | | | | |
| Management fee | | | 48,728 | | | | 1,489 | |
| 12b-1 distribution plan-Class A | | | 8,380 | | | | 290 | |
| 12b-1 distribution plan-Class C | | | 7,573 | | | | 113 | |
| 12b-1 distribution plan-Class F | | | 3,654 | | | | 11 | |
| 12b-1 distribution plan-Class R3 | | | 129 | | | | 6 | |
| 12b-1 distribution plan-Class R4 | | | 66 | | | | 3 | |
| Professional | | | 33,390 | | | | 27,740 | |
| Registration | | | 40,243 | | | | 218 | |
| Offering costs | | | 66,226 | | | | – | |
| Reports to shareholders | | | 20,951 | | | | 500 | |
| Custody | | | 9,757 | | | | 2,250 | |
| Shareholder servicing | | | 8,424 | | | | 211 | |
| Market data | | | 6,326 | | | | 3,675 | |
| Fund administration | | | 5,569 | | | | 92 | |
| Trustees’ fees | | | 508 | | | | 3 | |
| Other | | | 11,124 | | | | 200 | |
| Gross expenses | | | 271,048 | | | | 36,801 | |
| Expense reductions (See Note 9) | | | (14 | ) | | | – | |
| Fees waived and expenses reimbursed (See Note 3) | | | (192,602 | ) | | | (34,602 | ) |
| Net expenses | | | 78,432 | | | | 2,199 | |
| Net investment income (loss) | | | 184,456 | | | | (647 | ) |
| Net realized and unrealized gain (loss): | | | | | | | | |
| Net realized gain (loss) on investments | | | 388,957 | | | | (12,711 | ) |
| Net realized gain (loss) on futures contracts | | | (36,097 | ) | | | – | |
| Net realized gain (loss) on forward foreign currency exchange contracts | | | (473,231 | ) | | | – | |
| Net realized gain (loss) on swap contracts | | | – | | | | – | |
| Net realized gain (loss) on foreign currency related transactions | | | (60,287 | ) | | | (263 | ) |
| Net change in unrealized appreciation/depreciation on investments | | | (75,876 | ) | | | 30,345 | |
| Net change in unrealized appreciation/depreciation on futures contracts | | | (3,717 | ) | | | – | |
| Net change in unrealized appreciation/depreciation on forward foreign currency exchange contracts | | | 491,809 | | | | – | |
| Net change in unrealized appreciation/depreciation on translation of assets and liabilities denominated in foreign currencies | | | (6,492 | ) | | | – | |
| Net change in unrealized appreciation/depreciation on unfunded commitments | | | 13 | | | | – | |
| Net realized and unrealized gain (loss) | | | 225,079 | | | | 17,371 | |
| Net Increase in Net Assets Resulting From Operations | | $ | 409,535 | | | $ | 16,724 | |
| | |
| * | For the period June 18, 2021, commencement of operations, to July 31, 2021. |
| | |
| ** | For the period December 28, 2020, commencement of operations, to July 31, 2021. |
| | |
| 72 | See Notes to Financial Statements. |
Mid Cap
Innovation
Growth Fund** | | | Short
Duration High
Yield Fund | |
| | | | | | | |
| $ | 3,791 | | | $ | 1,798 | |
| | | | | | | |
| | – | | | | 584,775 | |
| | 3,791 | | | | 586,573 | |
| | | | | | | |
| | 15,939 | | | | 50,216 | |
| | 2,933 | | | | 10,843 | |
| | 1,443 | | | | 8,531 | |
| | 434 | | | | 4,156 | |
| | 30 | | | | 55 | |
| | 64 | | | | 27 | |
| | 25,635 | | | | 33,553 | |
| | 4,401 | | | | 52,164 | |
| | – | | | | 28,212 | |
| | 1,172 | | | | 17,279 | |
| | 2,251 | | | | 6,389 | |
| | 1,824 | | | | 4,861 | |
| | 6,315 | | | | 6,325 | |
| | 981 | | | | 4,464 | |
| | 74 | | | | 452 | |
| | 651 | | | | 6,225 | |
| | 64,147 | | | | 233,752 | |
| | (2 | ) | | | (11 | ) |
| | (40,289 | ) | | | (157,473 | ) |
| | 23,856 | | | | 76,268 | |
| | (20,065 | ) | | | 510,305 | |
| | | | | | | |
| | (310,244 | ) | | | 278,550 | |
| | – | | | | (13,597 | ) |
| | – | | | | (22,030 | ) |
| | – | | | | 87 | |
| | – | | | | (3,930 | ) |
| | 697,743 | | | | 170,170 | |
| | – | | | | 5,108 | |
| | | | | | | |
| | – | | | | 24,023 | |
| | | | | | | |
| | – | | | | (218 | ) |
| | | | | | | |
| | – | | | | 87 | |
| | 387,499 | | | | 438,250 | |
| $ | 367,434 | | | $ | 948,555 | |
| | | |
| | See Notes to Financial Statements. | 73 |
Statements of Changes in Net Assets
| | | Climate Focused Bond Fund |
| INCREASE IN NET ASSETS | | For the
Year Ended
July 31, 2021 | | For the
Period Ended
July 31, 2020(a) | |
| Operations: | | | | | | | | | |
| Net investment income | | | $ | 184,456 | | | $ | 27,866 | |
| Net realized gain (loss) on investments, futures contracts, forward foreign currency exchange contracts and foreign currency related transactions | | | | (180,658 | ) | | | 45,617 | |
| Net change in unrealized appreciation/depreciation on investments, futures contracts, forward foreign currency exchange contracts, unfunded commitments and translation of assets and liabilities denominated in foreign currencies | | �� | | 405,737 | | | | 276,850 | |
| Net increase in net assets resulting from operations | | | | 409,535 | | | | 350,333 | |
| Distributions to shareholders: | | | | | | | | | |
| Class A | | | | (75,154 | ) | | | (12,177 | ) |
| Class C | | | | (7,533 | ) | | | (1,267 | ) |
| Class F | | | | (72,738 | ) | | | (12,233 | ) |
| Class F3 | | | | (2,667 | ) | | | (527 | ) |
| Class I | | | | (90,755 | ) | | | (12,233 | ) |
| Class R3 | | | | (386 | ) | | | (77 | ) |
| Class R4 | | | | (449 | ) | | | (89 | ) |
| Class R5 | | | | (515 | ) | | | (102 | ) |
| Class R6 | | | | (8,066 | ) | | | (1,265 | ) |
| Total distributions to shareholders | | | | (258,263 | ) | | | (39,970 | ) |
| Capital share transactions (See Note 15): | | | | | | | | | |
| Net proceeds from sales of shares | | | | 13,471,303 | | | | 10,524,449 | |
| Reinvestment of distributions | | | | 61,913 | | | | 1,346 | |
| Cost of shares reacquired | | | | (689,132 | ) | | | – | |
| Net increase in net assets resulting from capital share transactions | | | | 12,844,084 | | | | 10,525,795 | |
| Net increase in net assets | | | | 12,995,356 | | | | 10,836,158 | |
| NET ASSETS: | | | | | | | | | |
| Beginning of year | | | $ | 10,836,158 | | | $ | – | |
| End of year | | | $ | 23,831,514 | | | $ | 10,836,158 | |
| | |
| (a) | For the period May 20, 2020, commencement of operations, to July 31, 2020. |
| | |
| 74 | See Notes to Financial Statements. |
Statements of Changes in Net Assets (continued)
| | | International Growth Fund | |
| INCREASE IN NET ASSETS | | For the Period Ended
July 31, 2021(b) | |
| Operations: | | | | |
| Net investment loss | | $ | (647 | ) |
| Net realized gain (loss) on investments and foreign currency related transactions | | | (12,974 | ) |
| Net change in unrealized appreciation/depreciation on investments | | | 30,345 | |
| Net increase in net assets resulting from operations | | | 16,724 | |
| Capital share transactions (See Note 15): | | | | |
| Net proceeds from sales of shares | | | 2,051,000 | |
| Net increase in net assets resulting from capital share transactions | | | 2,051,000 | |
| Net increase in net assets | | | 2,067,724 | |
| NET ASSETS: | | | | |
| Beginning of period | | $ | – | |
| End of period | | $ | 2,067,724 | |
| | |
| (b) | For the period June 18, 2021, commencement of operations, to July 31, 2021. |
| | | |
| | See Notes to Financial Statements. | 75 |
Statements of Changes in Net Assets (continued)
| | | Mid Cap Innovation Growth Fund | |
| INCREASE IN NET ASSETS | | For the Period Ended
July 31, 2021(c) | |
| Operations: | | | | |
| Net investment loss | | $ | (20,065 | ) |
| Net realized gain (loss) on investments | | | (310,244 | ) |
| Net change in unrealized appreciation/depreciation on investments | | | 697,743 | |
| Net increase in net assets resulting from operations | | | 367,434 | |
| Capital share transactions (See Note 15): | | | | |
| Net proceeds from sales of shares | | | 5,838,935 | |
| Cost of shares reacquired | | | (248,352 | ) |
| Net increase in net assets resulting from capital share transactions | | | 5,590,583 | |
| Net increase in net assets | | | 5,958,017 | |
| NET ASSETS: | | | | |
| Beginning of period | | $ | – | |
| End of period | | $ | 5,958,017 | |
| | |
| (c) | For the period December 28, 2020, commencement of operations, to July 31, 2021. |
| | |
| 76 | See Notes to Financial Statements. |
Statements of Changes in Net Assets (concluded)
| | | Short Duration High Yield Fund |
| INCREASE IN NET ASSETS | | For the
Year Ended
July 31, 2021 | | For the
Period Ended
July 31, 2020(d) | |
| Operations: | | | | | | | | | |
| Net investment income | | | $ | 510,305 | | | $ | 77,762 | |
| Net realized gain (loss) on investments, futures contracts, forward foreign currency exchange contracts, swaps and foreign currency related transactions | | | | 239,080 | | | | 26,058 | |
| Net change in unrealized appreciation/depreciation on investments, futures contracts, forward foreign currency exchange contracts, unfunded commitments and translation of assets and liabilities denominated in foreign currencies | | | | 199,170 | | | | 290,046 | |
| Net increase in net assets resulting from operations | | | | 948,555 | | | | 393,866 | |
| Distributions to shareholders: | | | | | | | | | |
| Class A | | | | (305,369 | ) | | | (25,478 | ) |
| Class C | | | | (44,095 | ) | | | (7,256 | ) |
| Class F | | | | (255,287 | ) | | | (41,437 | ) |
| Class F3 | | | | (695 | ) | | | (174 | ) |
| Class I | | | | (34,451 | ) | | | (8,621 | ) |
| Class R3 | | | | (633 | ) | | | (158 | ) |
| Class R4 | | | | (660 | ) | | | (165 | ) |
| Class R5 | | | | (687 | ) | | | (172 | ) |
| Class R6 | | | | (8,408 | ) | | | (1,046 | ) |
| Total distributions to shareholders | | | | (650,285 | ) | | | (84,507 | ) |
| Capital share transactions (See Note 15): | | | | | | | | | |
| Net proceeds from sales of shares | | | | 14,885,110 | | | | 5,215,134 | |
| Reinvestment of distributions | | | | 302,676 | | | | 3,156 | |
| Cost of shares reacquired | | | | (2,978,603 | ) | | | (5,200 | ) |
| Net increase in net assets resulting from capital share transactions | | | | 12,209,183 | | | | 5,213,090 | |
| Net increase in net assets | | | | 12,507,453 | | | | 5,522,449 | |
| NET ASSETS: | | | | | | | | | |
| Beginning of year | | | $ | 5,522,449 | | | $ | – | |
| End of year | | | $ | 18,029,902 | | | $ | 5,522,449 | |
| | |
| (d) | For the period April 22, 2020, commencement of operations, to July 31, 2020. |
| | | |
| | See Notes to Financial Statements. | 77 |
Financial Highlights
CLIMATE FOCUSED BOND FUND
| | | | | | Per Share Operating Performance: | | | |
| | | | | | Investment Operations: | | Distributions
to
shareholders
from: | | | |
| | | | | | | | | | | | | | | | | | | |
| | | Net asset
value,
beginning
of period | | Net
invest-
ment
income(a) | | Net
realized
and
unrealized
gain | | Total
from
invest- ment
opera-
tions | | Net
investment
income | | Net
asset
value,
end of
period |
| Class A | | | | | | | | | | | | | | | | | | | | | | | | |
| 7/31/2021 | | $ | 10.30 | | | $ | 0.13 | | | $ | 0.14 | | | $ | 0.27 | | | $ | (0.19 | ) | | $ | 10.38 | |
| 5/20/2020 to 7/31/2020(c) | | | 10.00 | | | | 0.03 | (d) | | | 0.31 | (d) | | | 0.34 | | | | (0.04 | ) | | | 10.30 | |
| Class C | | | | | | | | | | | | | | | | | | | | | | | | |
| 7/31/2021 | | | 10.30 | | | | 0.05 | | | | 0.13 | | | | 0.18 | | | | (0.10 | ) | | | 10.38 | |
| 5/20/2020 to 7/31/2020(c) | | | 10.00 | | | | 0.01 | (d) | | | 0.31 | (d) | | | 0.32 | | | | (0.02 | ) | | | 10.30 | |
| Class F | | | | | | | | | | | | | | | | | | | | | | | | |
| 7/31/2021 | | | 10.30 | | | | 0.15 | | | | 0.14 | | | | 0.29 | | | | (0.21 | ) | | | 10.38 | |
| 5/20/2020 to 7/31/2020(c) | | | 10.00 | | | | 0.03 | (d) | | | 0.31 | (d) | | | 0.34 | | | | (0.04 | ) | | | 10.30 | |
| Class F3 | | | | | | | | | | | | | | | | | | | | | | | | |
| 7/31/2021 | | | 10.30 | | | | 0.16 | | | | 0.13 | | | | 0.29 | | | | (0.21 | ) | | | 10.38 | |
| 5/20/2020 to 7/31/2020(c) | | | 10.00 | | | | 0.03 | (d) | | | 0.31 | (d) | | | 0.34 | | | | (0.04 | ) | | | 10.30 | |
| Class I | | | | | | | | | | | | | | | | | | | | | | | | |
| 7/31/2021 | | | 10.30 | | | | 0.14 | | | | 0.15 | | | | 0.29 | | | | (0.21 | ) | | | 10.38 | |
| 5/20/2020 to 7/31/2020(c) | | | 10.00 | | | | 0.03 | (d) | | | 0.31 | (d) | | | 0.34 | | | | (0.04 | ) | | | 10.30 | |
| Class R3 | | | | | | | | | | | | | | | | | | | | | | | | |
| 7/31/2021 | | | 10.30 | | | | 0.10 | | | | 0.13 | | | | 0.23 | | | | (0.15 | ) | | | 10.38 | |
| 5/20/2020 to 7/31/2020(c) | | | 10.00 | | | | 0.02 | (d) | | | 0.31 | (d) | | | 0.33 | | | | (0.03 | ) | | | 10.30 | |
| Class R4 | | | | | | | | | | | | | | | | | | | | | | | | |
| 7/31/2021 | | | 10.30 | | | | 0.12 | | | | 0.14 | | | | 0.26 | | | | (0.18 | ) | | | 10.38 | |
| 5/20/2020 to 7/31/2020(c) | | | 10.00 | | | | 0.02 | (d) | | | 0.32 | (d) | | | 0.34 | | | | (0.04 | ) | | | 10.30 | |
| Class R5 | | | | | | | | | | | | | | | | | | | | | | | | |
| 7/31/2021 | | | 10.30 | | | | 0.15 | | | | 0.14 | | | | 0.29 | | | | (0.21 | ) | | | 10.38 | |
| 5/20/2020 to 7/31/2020(c) | | | 10.00 | | | | 0.03 | (d) | | | 0.31 | (d) | | | 0.34 | | | | (0.04 | ) | | | 10.30 | |
| Class R6 | | | | | | | | | | | | | | | | | | | | | | | | |
| 7/31/2021 | | | 10.30 | | | | 0.16 | | | | 0.12 | | | | 0.28 | | | | (0.21 | ) | | | 10.37 | |
| 5/20/2020 to 7/31/2020(c) | | | 10.00 | | | | 0.03 | (d) | | | 0.31 | (d) | | | 0.34 | | | | (0.04 | ) | | | 10.30 | |
| (a) | Calculated using average shares outstanding during the period. |
| (b) | Total return for Classes A and C does not consider the effects of sales loads and assumes the reinvestment of all distributions. Total return for all other classes assumes the reinvestment of all distributions. |
| (c) | Commencement of operations was on 5/20/2020, SEC effective date and date shares first became available to the public was 5/28/2020. |
| (d) | Net investment income and net realized and unrealized gain (loss) amounted to less than $0.01 for the period 5/20/2020 through 5/28/2020. |
| (e) | Total return for the period 5/28/2020 through 7/31/2020 was 3.47% for Class A, 3.32% for Class C, 3.52% for Class F, 3.53% for Class F3, 3.52% for Class I, 3.41% for Class R3, 3.46% for Class R4, 3.51% for Class R5, and 3.53% for Class R6. |
| (f) | Not annualized. |
| (g) | Annualized. |
| 78 | See Notes to Financial Statements. |
| | | | Ratios to Average Net Assets: | | Supplemental Data: |
| | | | | | | | | | | | | | | | | |
Total
return
(%)(b) | | Total
expenses
after
waivers
and/or reim-
bursements
(%) | | Total
expenses
(%) | | Net
invest-
ment
income
(%) | | Net
assets,
end of
period
(000) | | Portfolio
turnover
rate
(%) |
| | | | | | | | | | | | | | | | | |
| | 2.60 | | | | 0.65 | | | | 2.05 | | | | 1.25 | | | $ | 4,366 | | | | 69 | |
| | 3.37 | (e)(f) | | | 0.65 | (g) | | | 3.04 | (g) | | | 1.28 | (g) | | | 3,521 | | | | 17 | (f) |
| | | | | | | | | | | | | | | | | | | | | | | |
| | 1.79 | | | | 1.45 | | | | 2.84 | | | | 0.46 | | | | 901 | | | | 69 | |
| | 3.21 | (e)(f) | | | 1.45 | (g) | | | 3.84 | (g) | | | 0.49 | (g) | | | 622 | | | | 17 | (f) |
| | | | | | | | | | | | | | | | | | | | | | | |
| | 2.81 | | | | 0.45 | | | | 1.95 | | | | 1.45 | | | | 3,866 | | | | 69 | |
| | 3.41 | (e)(f) | | | 0.45 | (g) | | | 2.93 | (g) | | | 1.46 | (g) | | | 3,089 | | | | 17 | (f) |
| | | | | | | | | | | | | | | | | | | | | | | |
| | 2.88 | | | | 0.38 | | | | 1.81 | | | | 1.53 | | | | 130 | | | | 69 | |
| | 3.43 | (e)(f) | | | 0.38 | (g) | | | 2.63 | (g) | | | 1.53 | (g) | | | 129 | | | | 17 | (f) |
| | | | | | | | | | | | | | | | | | | | | | | |
| | 2.80 | | | | 0.45 | | | | 1.72 | | | | 1.40 | | | | 14,042 | | | | 69 | |
| | 3.41 | (e)(f) | | | 0.45 | (g) | | | 2.85 | (g) | | | 1.46 | (g) | | | 3,089 | | | | 17 | (f) |
| | | | | | | | | | | | | | | | | | | | | | | |
| | 2.29 | | | | 0.95 | | | | 2.37 | | | | 0.95 | | | | 26 | | | | 69 | |
| | 3.31 | (e)(f) | | | 0.95 | (g) | | | 3.33 | (g) | | | 0.98 | (g) | | | 26 | | | | 17 | (f) |
| | | | | | | | | | | | | | | | | | | | | | | |
| | 2.54 | | | | 0.70 | | | | 2.12 | | | | 1.20 | | | | 26 | | | | 69 | |
| | 3.36 | (e)(f) | | | 0.70 | (g) | | | 3.08 | (g) | | | 1.24 | (g) | | | 26 | | | | 17 | (f) |
| | | | | | | | | | | | | | | | | | | | | | | |
| | 2.80 | | | | 0.45 | | | | 1.86 | | | | 1.45 | | | | 26 | | | | 69 | |
| | 3.41 | (e)(f) | | | 0.45 | (g) | | | 2.83 | (g) | | | 1.49 | (g) | | | 26 | | | | 17 | (f) |
| | | | | | | | | | | | | | | | | | | | | | | |
| | 2.88 | | | | 0.38 | | | | 1.79 | | | | 1.52 | | | | 449 | | | | 69 | |
| | 3.43 | (e)(f) | | | 0.38 | (g) | | | 2.63 | (g) | | | 1.53 | (g) | | | 309 | | | | 17 | (f) |
| | See Notes to Financial Statements. | 79 |
Financial Highlights (continued)
INTERNATIONAL GROWTH FUND
| | | | | | Per Share Operating Performance: | | | |
| | | | | | Investment Operations: | | | | | | |
| | | | | | | | | | | | | | | | | | | |
| | | Net asset
value,
beginning
of period | | Net
invest-
ment
income
(loss)(a)(b) | | Net
realized
and
unrealized gain
(loss)(b) | | Total
from
invest-
ment
opera-
tions | | Net
asset
value,
end of
period | | Total
return
(%)(c)(d)(e) |
| Class A | | | | | | | | | | | | | | | | | | | | | | | | |
| 6/18/2021 to 7/31/2021(g) | | $ | 15.00 | | | $ | (0.01 | ) | | $ | 0.13 | | | $ | 0.12 | | | $ | 15.12 | | | | 0.80 | |
| Class C | | | | | | | | | | | | | | | | | | | | | | | | |
| 6/18/2021 to 7/31/2021(g) | | | 15.00 | | | | (0.02 | ) | | | 0.13 | | | | 0.11 | | | | 15.11 | | | | 0.73 | |
| Class F | | | | | | | | | | | | | | | | | | | | | | | | |
| 6/18/2021 to 7/31/2021(g) | | | 15.00 | | | | – | (h) | | | 0.13 | | | | 0.13 | | | | 15.13 | | | | 0.87 | |
| Class F3 | | | | | | | | | | | | | | | | | | | | | | | | |
| 6/18/2021 to 7/31/2021(g) | | | 15.00 | | | | – | (h) | | | 0.12 | | | | 0.12 | | | | 15.12 | | | | 0.87 | |
| Class I | | | | | | | | | | | | | | | | | | | | | | | | |
| 6/18/2021 to 7/31/2021(g) | | | 15.00 | | | | – | (h) | | | 0.12 | | | | 0.12 | | | | 15.12 | | | | 0.87 | |
| Class R3 | | | | | | | | | | | | | | | | | | | | | | | | |
| 6/18/2021 to 7/31/2021(g) | | | 15.00 | | | | (0.01 | ) | | | 0.12 | | | | 0.11 | | | | 15.11 | | | | 0.80 | |
| Class R4 | | | | | | | | | | | | | | | | | | | | | | | | |
| 6/18/2021 to 7/31/2021(g) | | | 15.00 | | | | (0.01 | ) | | | 0.13 | | | | 0.12 | | | | 15.12 | | | | 0.80 | |
| Class R5 | | | | | | | | | | | | | | | | | | | | | | | | |
| 6/18/2021 to 7/31/2021(g) | | | 15.00 | | | | – | (h) | | | 0.13 | | | | 0.13 | | | | 15.13 | | | | 0.87 | |
| Class R6 | | | | | | | | | | | | | | | | | | | | | | | | |
| 6/18/2021 to 7/31/2021(g) | | | 15.00 | | | | – | (h) | | | 0.13 | | | | 0.13 | | | | 15.13 | | | | 0.87 | |
| (a) | Calculated using average shares outstanding during the period. |
| (b) | Net investment income and net realized and unrealized gain (loss) amounted to less than $0.01 for the period 6/18/2021 through 6/28/2021. |
| (c) | Total return for Classes A and C does not consider the effects of sales loads and assumes the reinvestment of all distributions. Total return for all other classes assumes the reinvestment of all distributions. |
| (d) | Not annualized. |
| (e) | Total return for the period 6/28/2021 through 7/31/2021 was (0.40%) for Class A, (0.46%) for Class C, (0.33%) for Class F, (0.33%) for Class F3, (0.33%) for Class I, (0.40%) for Class R3, (0.40%) for Class R4, (0.33%) for Class R5, and (0.33%) for Class R6. |
| (f) | Annualized. |
| (g) | Commencement of operations was on 6/18/2021, SEC effective date and date shares first became available to the public was 6/28/2021. |
| (h) | Amount less than $0.01. |
| 80 | See Notes to Financial Statements. |
| Ratios to Average Net Assets: | | Supplemental Data: |
| | | | | | | | | | | | | | |
Total
expenses
after
waivers
and/or reim-
bursements
(%)(f) | | Total
expenses
(%)(f) | | Net
invest-
ment
income
(loss)
(%)(f) | | Net
assets,
end of
period
(000) | | Portfolio
turnover
rate
(%)(d) |
| | | | | | | | | | | | | | |
| | 1.06 | | | | 16.19 | | | | (0.38 | ) | | $ | 1,058 | | | | 5 | |
| | | | | | | | | | | | | | | | | | | |
| | 1.81 | | | | 16.91 | | | | (1.13 | ) | | | 102 | | | | 5 | |
| | | | | | | | | | | | | | | | | | | |
| | 0.81 | | | | 16.02 | | | | (0.14 | ) | | | 101 | | | | 5 | |
| | | | | | | | | | | | | | | | | | | |
| | 0.73 | | | | 15.76 | | | | (0.15 | ) | | | 10 | | | | 5 | |
| | | | | | | | | | | | | | | | | | | |
| | 0.81 | | | | 15.85 | | | | (0.09 | ) | | | 10 | | | | 5 | |
| | | | | | | | | | | | | | | | | | | |
| | 1.31 | | | | 16.38 | | | | (0.62 | ) | | | 10 | | | | 5 | |
| | | | | | | | | | | | | | | | | | | |
| | 1.06 | | | | 16.12 | | | | (0.35 | ) | | | 10 | | | | 5 | |
| | | | | | | | | | | | | | | | | | | |
| | 0.81 | | | | 15.85 | | | | (0.09 | ) | | | 10 | | | | 5 | |
| | | | | | | | | | | | | | | | | | | |
| | 0.73 | | | | 15.78 | | | | (0.06 | ) | | | 756 | | | | 5 | |
| | See Notes to Financial Statements. | 81 |
Financial Highlights (continued)
MID CAP INNOVATION GROWTH FUND
| | | | | | Per Share Operating Performance: | | | |
| | | | | | Investment Operations: | | | | | | |
| | | | | | | | | | | | | | | | | | | |
| | | Net asset
value,
beginning
of period | | Net
invest-
ment
income
(loss)(a) | | Net
realized
and
unrealized
gain | | Total
from
invest-
ment
opera-
tions | | Net
asset
value,
end of
period | | Total
return
(%)(b)(c) |
| Class A | | | | | | | | | | | | | | | | | | | | | | | | |
| 12/28/2020 to 7/31/2021(e) | | $ | 15.00 | | | $ | (0.08 | ) | | $ | 1.22 | | | $ | 1.14 | | | $ | 16.14 | | | | 7.60 | |
| Class C | | | | | | | | | | | | | | | | | | | | | | | | |
| 12/28/2020 to 7/31/2021(e) | | | 15.00 | | | | (0.15 | ) | | | 1.22 | | | | 1.07 | | | | 16.07 | | | | 7.13 | |
| Class F | | | | | | | | | | | | | | | | | | | | | | | | |
| 12/28/2020 to 7/31/2021(e) | | | 15.00 | | | | (0.06 | ) | | | 1.23 | | | | 1.17 | | | | 16.17 | | | | 7.80 | |
| Class F3 | | | | | | | | | | | | | | | | | | | | | | | | |
| 12/28/2020 to 7/31/2021(e) | | | 15.00 | | | | (0.05 | ) | | | 1.23 | | | | 1.18 | | | | 16.18 | | | | 7.80 | |
| Class I | | | | | | | | | | | | | | | | | | | | | | | | |
| 12/28/2020 to 7/31/2021(e) | | | 15.00 | | | | (0.06 | ) | | | 1.23 | | | | 1.17 | | | | 16.17 | | | | 7.80 | |
| Class R3 | | | | | | | | | | | | | | | | | | | | | | | | |
| 12/28/2020 to 7/31/2021(e) | | | 15.00 | | | | (0.10 | ) | | | 1.22 | | | | 1.12 | | | | 16.12 | | | | 7.47 | |
| Class R4 | | | | | | | | | | | | | | | | | | | | | | | | |
| 12/28/2020 to 7/31/2021(e) | | | 15.00 | | | | (0.08 | ) | | | 1.22 | | | | 1.14 | | | | 16.14 | | | | 7.60 | |
| Class R5 | | | | | | | | | | | | | | | | | | | | | | | | |
| 12/28/2020 to 7/31/2021(e) | | | 15.00 | | | | (0.06 | ) | | | 1.23 | | | | 1.17 | | | | 16.17 | | | | 7.80 | |
| Class R6 | | | | | | | | | | | | | | | | | | | | | | | | |
| 12/28/2020 to 7/31/2021(e) | | | 15.00 | | | | (0.05 | ) | | | 1.22 | | | | 1.17 | | | | 16.17 | | | | 7.80 | |
| (a) | Calculated using average shares outstanding during the period. |
| (b) | Total return for Classes A and C does not consider the effects of sales loads and assumes the reinvestment of all distributions. Total return for all other classes assumes the reinvestment of all distributions. |
| (c) | Not annualized. |
| (d) | Annualized. |
| (e) | Commenced operations on December 28, 2020. |
| 82 | See Notes to Financial Statements. |
| Ratios to Average Net Assets: | | Supplemental Data: |
| | | | | | | | | | | | | | |
Total
expenses
after
waivers
and/or reim-
bursements
(%)(d) | | Total
expenses
(%)(d) | | Net
invest-
ment
income
(loss)
(%)(d) | | Net
assets,
end of
period
(000) | | Portfolio
turnover
rate
(%)(c) |
| | | | | | | | | | | | | | |
| | 1.06 | | | | 2.70 | | | | (0.90 | ) | | $ | 2,508 | | | | 58 | |
| | | | | | | | | | | | | | | | | | | |
| | 1.81 | | | | 3.37 | | | | (1.64 | ) | | | 449 | | | | 58 | |
| | | | | | | | | | | | | | | | | | | |
| | 0.81 | | | | 2.53 | | | | (0.65 | ) | | | 1,048 | | | | 58 | |
| | | | | | | | | | | | | | | | | | | |
| | 0.73 | | | | 2.44 | | | | (0.59 | ) | | | 11 | | | | 58 | |
| | | | | | | | | | | | | | | | | | | |
| | 0.81 | | | | 2.53 | | | | (0.67 | ) | | | 119 | | | | 58 | |
| | | | | | | | | | | | | | | | | | | |
| | 1.31 | | | | 3.00 | | | | (1.15 | ) | | | 11 | | | | 58 | |
| | | | | | | | | | | | | | | | | | | |
| | 1.06 | | | | 2.60 | | | | (0.89 | ) | | | 58 | | | | 58 | |
| | | | | | | | | | | | | | | | | | | |
| | 0.81 | | | | 2.50 | | | | (0.64 | ) | | | 11 | | | | 58 | |
| | | | | | | | | | | | | | | | | | | |
| | 0.73 | | | | 2.23 | | | | (0.56 | ) | | | 1,744 | | | | 58 | |
| | See Notes to Financial Statements. | 83 |
Financial Highlights (concluded)
SHORT DURATION HIGH YIELD FUND
| | | | | | Per Share Operating Performance: | | | |
| | | | | | Investment Operations: | | Distributions
to
shareholders
from: |
| | | | | | | | | | | | | | | | | | | |
| | | Net asset
value,
beginning
of period | | Net
invest-
ment
income(a) | | Net
realized
and
unrealized
gain | | Total
from
invest-
ment
opera-
tions | | Net
investment
income | | Net
realized
gain |
| Class A | | | | | | | | | | | | | | | | | | | | | | | | |
| 7/31/2021 | | $ | 10.61 | | | $ | 0.48 | | | $ | 0.57 | | | $ | 1.05 | | | $ | (0.59 | ) | | $ | (0.07 | ) |
| 4/22/2020 to 7/31/2020(c) | | | 10.00 | | | | 0.15 | (d) | | | 0.63 | (d) | | | 0.78 | | | | (0.17 | ) | | | – | |
| Class C | | | | | | | | | | | | | | | | | | | | | | | | |
| 7/31/2021 | | | 10.61 | | | | 0.42 | | | | 0.55 | | | | 0.97 | | | | (0.51 | ) | | | (0.07 | ) |
| 4/22/2020 to 7/31/2020(c) | | | 10.00 | | | | 0.13 | (d) | | | 0.62 | (d) | | | 0.75 | | | | (0.14 | ) | | | – | |
| Class F | | | | | | | | | | | | | | | | | | | | | | | | |
| 7/31/2021 | | | 10.61 | | | | 0.52 | | | | 0.55 | | | | 1.07 | | | | (0.61 | ) | | | (0.07 | ) |
| 4/22/2020 to 7/31/2020(c) | | | 10.00 | | | | 0.16 | (d) | | | 0.62 | (d) | | | 0.78 | | | | (0.17 | ) | | | – | |
| Class F3 | | | | | | | | | | | | | | | | | | | | | | | | |
| 7/31/2021 | | | 10.61 | | | | 0.54 | | | | 0.54 | | | | 1.08 | | | | (0.62 | ) | | | (0.07 | ) |
| 4/22/2020 to 7/31/2020(c) | | | 10.00 | | | | 0.16 | (d) | | | 0.62 | (d) | | | 0.78 | | | | (0.17 | ) | | | – | |
| Class I | | | | | | | | | | | | | | | | | | | | | | | | |
| 7/31/2021 | | | 10.61 | | | | 0.54 | | | | 0.53 | | | | 1.07 | | | | (0.61 | ) | | | (0.07 | ) |
| 4/22/2020 to 7/31/2020(c) | | | 10.00 | | | | 0.16 | (d) | | | 0.62 | (d) | | | 0.78 | | | | (0.17 | ) | | | – | |
| Class R3 | | | | | | | | | | | | | | | | | | | | | | | | |
| 7/31/2021 | | | 10.62 | | | | 0.48 | | | | 0.53 | | | | 1.01 | | | | (0.56 | ) | | | (0.07 | ) |
| 4/22/2020 to 7/31/2020(c) | | | 10.00 | | | | 0.15 | (d) | | | 0.63 | (d) | | | 0.78 | | | | (0.16 | ) | | | – | |
| Class R4 | | | | | | | | | | | | | | | | | | | | | | | | |
| 7/31/2021 | | | 10.62 | | | | 0.51 | | | | 0.53 | | | | 1.04 | | | | (0.59 | ) | | | (0.07 | ) |
| 4/22/2020 to 7/31/2020(c) | | | 10.00 | | | | 0.15 | (d) | | | 0.63 | (d) | | | 0.78 | | | | (0.16 | ) | | | – | |
| Class R5 | | | | | | | | | | | | | | | | | | | | | | | | |
| 7/31/2021 | | | 10.61 | | | | 0.54 | | | | 0.53 | | | | 1.07 | | | | (0.61 | ) | | | (0.07 | ) |
| 4/22/2020 to 7/31/2020(c) | | | 10.00 | | | | 0.16 | (d) | | | 0.62 | (d) | | | 0.78 | | | | (0.17 | ) | | | – | |
| Class R6 | | | | | | | | | | | | | | | | | | | | | | | | |
| 7/31/2021 | | | 10.61 | | | | 0.52 | | | | 0.56 | | | | 1.08 | | | | (0.62 | ) | | | (0.07 | ) |
| 4/22/2020 to 7/31/2020(c) | | | 10.00 | | | | 0.16 | (d) | | | 0.62 | (d) | | | 0.78 | | | | (0.17 | ) | | | – | |
| (a) | Calculated using average shares outstanding during the period. |
| (b) | Total return for Classes A and C does not consider the effects of sales loads and assumes the reinvestment of all distributions. Total return for all other classes assumes the reinvestment of all distributions. |
| (c) | Commencement of operations was on 4/22/2020, SEC effective date and date shares first became available to the public was 4/30/2020. |
| (d) | Net investment income and net realized and unrealized gain (loss) amounted to less than $.01 for the period 4/22/2020 through 4/30/2020. |
| (e) | Total return for the period 4/30/2020 through 7/31/2020 was 7.56% for Class A, 7.34% for Class C, 7.61% for Class F, 7.63% for Class F3, 7.61% for Class I, 7.48% for Class R3, 7.54% for Class R4, 7.61% for Class R5, and 7.63% for Class R6. |
| (f) | Not annualized. |
| (g) | Annualized. |
| 84 | See Notes to Financial Statements. |
| | | | | | | | | | Ratios to Average Net Assets: | | Supplemental Data: |
| | | | | | | | | | | | | | | | | | | | | | | |
Total
Distributions | | Net
asset
value,
end of
period | | Total
return
(%)(b) | | Total
expenses
after
waivers
and/or reim-
bursements
(%) | | Total
expenses
(%) | | Net
invest-
ment
income
(%) | | Net
assets,
end of
period
(000) | | Portfolio
turnover
rate
(%) |
| | | | | | | | | | | | | | | | | | | | | | | |
| $ | (0.66 | ) | | $ | 11.00 | | | | 10.22 | | | | 0.71 | | | | 2.00 | | | | 4.43 | | | $ | 9,849 | | | | 69 | |
| | (0.17 | ) | | | 10.61 | | | | 7.81 | (e)(f) | | | 0.71 | (g) | | | 3.95 | (g) | | | 5.45 | (g) | | | 1,727 | | | | 27 | (f) |
| | | | | | | | | | | | | | | | | | | | | | | | | | | | | | | |
| | (0.58 | ) | | | 11.00 | | | | 9.34 | | | | 1.51 | | | | 2.91 | | | | 3.81 | | | | 1,324 | | | | 69 | |
| | (0.14 | ) | | | 10.61 | | | | 7.58 | (e)(f) | | | 1.51 | (g) | | | 4.74 | (g) | | | 4.64 | (g) | | | 584 | | | | 27 | (f) |
| | | | | | | | | | | | | | | | | | | | | | | | | | | | | | | |
| | (0.68 | ) | | | 11.00 | | | | 10.43 | | | | 0.51 | | | | 2.03 | | | | 4.80 | | | | 6,071 | | | | 69 | |
| | (0.17 | ) | | | 10.61 | | | | 7.87 | (e)(f) | | | 0.51 | (g) | | | 3.84 | (g) | | | 5.65 | (g) | | | 2,574 | | | | 27 | (f) |
| | | | | | | | | | | | | | | | | | | | | | | | | | | | | | | |
| | (0.69 | ) | | | 11.00 | | | | 10.50 | | | | 0.44 | | | | 1.97 | | | | 5.01 | | | | 11 | | | | 69 | |
| | (0.17 | ) | | | 10.61 | | | | 7.89 | (e)(f) | | | 0.44 | (g) | | | 3.66 | (g) | | | 5.72 | (g) | | | 11 | | | | 27 | (f) |
| | | | | | | | | | | | | | | | | | | | | | | | | | | | | | | |
| | (0.68 | ) | | | 11.00 | | | | 10.44 | | | | 0.51 | | | | 2.02 | | | | 4.94 | | | | 550 | | | | 69 | |
| | (0.17 | ) | | | 10.61 | | | | 7.87 | (e)(f) | | | 0.51 | (g) | | | 3.77 | (g) | | | 5.65 | (g) | | | 531 | | | | 27 | (f) |
| | | | | | | | | | | | | | | | | | | | | | | | | | | | | | | |
| | (0.63 | ) | | | 11.00 | | | | 9.88 | | | | 1.01 | | | | 2.52 | | | | 4.43 | | | | 11 | | | | 69 | |
| | (0.16 | ) | | | 10.62 | | | | 7.72 | (e)(f) | | | 1.01 | (g) | | | 4.21 | (g) | | | 5.15 | (g) | | | 11 | | | | 27 | (f) |
| | | | | | | | | | | | | | | | | | | | | | | | | | | | | | | |
| | (0.66 | ) | | | 11.00 | | | | 10.15 | | | | 0.76 | | | | 2.26 | | | | 4.69 | | | | 11 | | | | 69 | |
| | (0.16 | ) | | | 10.62 | | | | 7.79 | (e)(f) | | | 0.76 | (g) | | | 3.96 | (g) | | | 5.40 | (g) | | | 11 | | | | 27 | (f) |
| | | | | | | | | | | | | | | | | | | | | | | | | | | | | | | |
| | (0.68 | ) | | | 11.00 | | | | 10.43 | | | | 0.51 | | | | 2.01 | | | | 4.94 | | | | 11 | | | | 69 | |
| | (0.17 | ) | | | 10.61 | | | | 7.86 | (e)(f) | | | 0.51 | (g) | | | 3.71 | (g) | | | 5.65 | (g) | | | 11 | | | | 27 | (f) |
| | | | | | | | | | | | | | | | | | | | | | | | | | | | | | | |
| | (0.69 | ) | | | 11.00 | | | | 10.50 | | | | 0.44 | | | | 1.85 | | | | 4.81 | | | | 192 | | | | 69 | |
| | (0.17 | ) | | | 10.61 | | | | 7.89 | (e)(f) | | | 0.44 | (g) | | | 3.69 | (g) | | | 5.73 | (g) | | | 64 | | | | 27 | (f) |
| | See Notes to Financial Statements. | 85 |
Notes to Financial Statements
Lord Abbett Trust I (the “Trust”), formerly Lord Abbett Equity Trust, is registered under the Investment Company Act of 1940, as amended (the “Act”), as a diversified, open-end management investment company and was organized as a Delaware statutory Trust on May 1, 2001. The Trust currently consists of the following four funds (separately, a “Fund” and collectively, the “Funds”) and their respective active share classes:
| Funds | Classes |
| Lord Abbett Climate Focused Bond Fund (“Climate Focused Bond Fund”) | A, C, F, F3, I, R3, R4, R5 and R6 |
| Lord Abbett International Growth Fund (“International Growth Fund”) | A, C, F, F3, I, R3, R4, R5 and R6 |
| Lord Abbett Mid Cap Innovation Growth Fund (“Mid Cap Innovation Growth Fund”) | A, C, F, F3, I, R3, R4, R5 and R6 |
| Lord Abbett Short Duration High Yield Fund (“Short Duration High Yield Fund”) | A, C, F, F3, I, R3, R4, R5 and R6 |
The Short Duration High Yield Fund commenced operations on April 22, 2020, the Climate Focused Bond Fund commenced operations on May 20, 2020, the Mid Cap Innovation Growth Fund commenced operations on December 28, 2020, and the International Growth Fund commenced operations on June 18, 2021.
Climate Focused Bond Fund’s investment objective is total return. International Growth Fund’s investment objective is to seek long-term capital appreciation. Mid Cap Innovation Growth Fund’s investment objective is to seek capital appreciation. Short Duration High Yield Fund’s investment objective is to seek a high current income and the opportunity for capital appreciation to produce a high total return.
Each class of shares has different expenses and dividends. A front-end sales charge is normally added to the net asset value (“NAV”) for Class A shares. There is no front-end sales charge in the case of Class C, F, F3, I, R3, R4, R5 and R6 shares, although there may be a contingent deferred sales charge (“CDSC”) in certain cases as follows: Class A shares purchased without a sales charge and redeemed before the first day of the month in which the one-year anniversary of the purchase falls (subject to certain exceptions as set forth in each Fund’s prospectus); and Class C shares redeemed before the first anniversary of purchase. Class C shares automatically convert to Class A shares on the 25th day of the month (or, if the 25th is not a business day, the next business day thereafter) following the eighth anniversary of the month on which the purchase order was accepted, provided that the Fund or financial intermediary through which a shareholder purchased Class C shares has records verifying that the C shares have been held at least eight years.
The preparation of the financial statements in conformity with accounting principles generally accepted in the United States of America (“U.S. GAAP”) requires management to make certain estimates and assumptions that affect the reported amounts of assets and liabilities and disclosure of contingent assets and liabilities at the date of the financial statements and the reported amounts of increases and decreases in net assets from operations during the reporting period. Actual results could differ from those estimates. Each Fund is considered an investment company under U.S. GAAP and follows the accounting and reporting guidance applicable to investment companies.
86
Notes to Financial Statements (continued)
| 2. | SIGNIFICANT ACCOUNTING POLICIES |
| (a) | Investment Valuation–Under procedures approved by the Funds’ Board of Trustees (the “Board”), Lord, Abbett & Co. LLC (“Lord Abbett”), the Funds’ investment manager, has formed a Pricing Committee to administer the pricing and valuation of portfolio investments and to ensure that prices utilized reasonably reflect fair value. Among other things, these procedures allow the Funds to utilize independent pricing services, quotations from securities and financial instrument dealers and other market sources to determine fair value. |
| | |
| | Securities actively traded on any recognized U.S. or non-U.S. exchange or on The NASDAQ Stock Market LLC are valued at the last sale price or official closing price on the exchange or system on which they are principally traded. Events occurring after the close of trading on non-U.S. exchanges may result in adjustments to the valuation of foreign securities to more accurately reflect their fair value as of the close of regular trading on the New York Stock Exchange. When valuing foreign equity securities that meet certain criteria, the Board has approved the use of an independent fair valuation service that values such securities to reflect market trading that occurs after the close of the applicable foreign markets of comparable securities or other instruments that correlate to the fair-valued securities. Unlisted equity securities are valued at the last quoted sale price or, if no sale price is available, at the mean between the most recently quoted bid and asked prices. Exchange traded options and futures contracts are valued at the last sale price in the market where they are principally traded. If no sale has occurred, the mean between the most recently quoted bid and asked prices is used. Fixed income securities are valued based on evaluated prices supplied by independent pricing services, which reflect broker/dealer supplied valuations and the independent pricing services’ own electronic data processing techniques. Floating rate loans are valued at the average of bid and ask quotations obtained from dealers in loans on the basis of prices supplied by independent pricing services. Forward foreign currency exchange contracts are valued using daily forward exchange rates. Swaps are valued daily using independent pricing services or quotations from broker/dealers to the extent available. |
| | |
| | Securities for which prices are not readily available are valued at fair value as determined by the Pricing Committee. The Pricing Committee considers a number of factors, including observable and unobservable inputs, when arriving at fair value. The Pricing Committee may use related or comparable assets or liabilities, recent transactions, market multiples, book values, yield curves, broker quotes, observable trading activity, option adjusted spread models and other relevant information to determine the fair value of portfolio investments. The Board or a designated committee thereof regularly reviews fair value determinations made by the Pricing Committee and may employ techniques such as reviewing related market activity, reviewing inputs and assumptions, and retrospectively comparing prices of subsequent purchases and sales transactions to fair value determinations made by the Pricing Committee. |
| | |
| | Short-term securities with 60 days or less remaining to maturity are valued using the amortized cost method, which approximates fair value. |
| | |
| (b) | Security Transactions–Security transactions are recorded as of the date that the securities are purchased or sold (trade date). Realized gains and losses on sales of portfolio securities are calculated using the identified-cost method. Realized and unrealized gains (losses) are allocated to each class of shares based upon the relative proportion of net assets at the beginning of the day. |
87
Notes to Financial Statements (continued)
| (c) | Investment Income–Dividend income is recorded on the ex-dividend date. Interest income is recorded on the accrual basis as earned. Discounts are accreted and premiums are amortized using the effective interest method and are included in Interest and other on the Statements of Operations. Withholding taxes on foreign dividends have been provided for in accordance with the applicable country’s tax rules and rates. Investment income is allocated to each class of shares based upon the relative proportion of net assets at the beginning of the day. |
| | |
| (d) | Income Taxes–It is the policy of each Fund to meet the requirements of Subchapter M of the Internal Revenue Code applicable to regulated investment companies and to distribute substantially all taxable income and capital gains to its shareholders. Therefore, no income tax provision is required. |
| | |
| | Each Fund files U.S. federal and various state and local tax returns. No tax returns are currently under examination. The statute of limitations on the Climate Focused Bond Fund’s and the Short Duration High Yield Fund’s filed U.S. federal tax returns remains open for the fiscal years ended July 31, 2020 and July 31, 2021. The statute of limitations on the International Growth Fund’s and Mid Cap Innovation Growth Fund’s initial U.S. federal tax returns remains open for the initial period ended July 31, 2021. The statutes of limitations on the state and local tax returns may remain open for an additional year depending upon the Funds’ jurisdiction. |
| | |
| (e) | Expenses–Expenses, excluding class-specific expenses, are allocated to each class of shares based upon the relative proportion of net assets at the beginning of the day. In addition, Class F3 and R6 bear their class-specific share of shareholder servicing expenses. Class A, C, F, R3 and R4 shares bear their class-specific share of all expenses and fees relating to the Funds’ 12b-1 Distribution Plan. |
| | |
| (f) | Foreign Transactions–The books and records of each Fund are maintained in U.S. dollars and transactions denominated in foreign currencies are recorded in each Fund’s records at the rate prevailing when earned or recorded. Asset and liability accounts that are denominated in foreign currencies are adjusted daily to reflect current exchange rates and any unrealized gain (loss) is included in Net change in unrealized appreciation/depreciation on investments, futures contracts, unfunded commitments and translation of assets and liabilities denominated in foreign currencies in each Fund’s Statement of Operations. The resultant exchange gains and losses upon settlement of such transactions are included in Net realized gain (loss) on foreign currency related transactions in each Fund’s Statement of Operations. The Funds do not isolate that portion of the results of operations arising as a result of changes in the foreign exchange rates from the changes in market prices of the securities. |
| | |
| | The Funds use foreign currency exchange contracts to facilitate transactions in foreign denominated securities. Losses from these transactions may arise from changes in the value of the foreign currency or if the counterparties do not perform under the contracts’ terms. |
| | |
| (g) | Forward Foreign Currency Exchange Contracts–Each Fund may enter into forward foreign currency exchange contracts in order to reduce exposure to changes in foreign currency exchange rates on foreign portfolio holdings, or gain or reduce exposure to foreign currency solely for investment purposes. A forward foreign currency exchange contract is a commitment to purchase or sell a foreign currency at a future date at a negotiated rate. The contracts are valued daily at forward exchange rates and any unrealized gain (loss) is included in Net change in unrealized appreciation/depreciation on forward foreign currency exchange contracts in each Fund’s Statement of Operations. The gain (loss) arising from the difference between the |
88
Notes to Financial Statements (continued)
| | U.S. dollar cost of the original contract and the value of the forward foreign currency in U.S. dollars upon closing of such contracts is included in Net realized gain (loss) on forward foreign currency exchange contracts in each Fund’s Statement of Operations. |
| | |
| (h) | Futures Contracts–Each Fund may purchase and sell futures contracts to enhance returns, to attempt to economically hedge some of its investment risk, or as a substitute position in lieu of holding the underlying asset on which the instrument is based. At the time of entering into a futures transaction, an investor is required to deposit and maintain a specified amount of cash or eligible securities called “initial margin.” Subsequent payments made or received by the Funds called “variation margin” are made on a daily basis as the market price of the futures contract fluctuates. Each Fund will record an unrealized gain (loss) based on the amount of variation margin. When a contract is closed, a realized gain (loss) is recorded equal to the difference between the opening and closing value of the contract. |
| | |
| (i) | When-Issued, Forward Transactions or To-Be-Announced (“TBA”) Transactions–Each Fund may purchase portfolio securities on a when-issued or forward basis. When-issued, forward transactions or TBA transactions involve a commitment by a fund to purchase securities, with payment and delivery (“settlement”) to take place in the future, in order to secure what is considered to be an advantageous price or yield at the time of entering into the transaction. During the period between purchase and settlement, the fair value of the securities will fluctuate and assets consisting of cash and/or marketable securities (normally short-term U.S. Government or U.S. Government sponsored enterprise securities) marked to market daily in an amount sufficient to make payment at settlement will be segregated at each Fund’s custodian in order to pay for the commitment. At the time each Fund makes the commitment to purchase a security on a when-issued basis, it will record the transaction and reflect the liability for the purchase and fair value of the security in determining its net asset value (“NAV”). Each Fund, generally, has the ability to close out a purchase obligation on or before the settlement date rather than take delivery of the security. Under no circumstances will settlement for such securities take place more than 120 days after the purchase date. |
| | |
| (j) | Repurchase Agreements–Each Fund may enter into repurchase agreements with respect to securities. A repurchase agreement is a transaction in which a fund acquires a security and simultaneously commits to resell that security to the seller (a bank or securities dealer) at an agreed-upon price on an agreed-upon date. Each Fund requires at all times that the repurchase agreement be collateralized by cash, or by securities of the U.S. Government, its agencies, its instrumentalities, or U.S. Government sponsored enterprises having a value equal to, or in excess of, the value of the repurchase agreement (including accrued interest). If the seller of the agreement defaults on its obligation to repurchase the underlying securities at a time when the fair value of these securities has declined, a Fund may incur a loss upon disposition of the securities. |
| | |
| (k) | Credit Default Swaps–Each Fund may enter into credit default swap contracts in order to hedge credit risk or for speculation purposes. As a seller of a credit default swap contract (“seller of protection”), a Fund is required to pay the notional amount or other agreed-upon value of a referenced debt obligation to the counterparty in the event of a default by or other credit event involving the referenced issuer, obligation or index. In return, a Fund receives from the counterparty a periodic stream of payments over the term of the contract. |
| | |
| | As a purchaser of a credit default swap contract (“buyer of protection”), a Fund would receive the notional amount or other agreed upon value of a referenced debt obligation from the |
89
Notes to Financial Statements (continued)
| | counterparty in the event of default by or other credit event involving the referenced issuer, obligation or index. In return, a Fund would make periodic payments to the counterparty over the term of the contracts, provided no event of default has occurred. |
| | |
| | These credit default swaps may have as a reference obligation corporate or sovereign issuers or credit indexes. These credit indexes are comprised of a basket of securities representing a particular sector of the market. |
| | |
| | Credit default swaps are fair valued based upon quotations from counterparties, brokers or market-makers and the change in value, if any, is recorded as an unrealized appreciation or depreciation. Daily changes in valuation of centrally cleared swaps, if any, are recorded as a receivable or payable for the change in value as appropriate (“variation margin”) on the Statements of Assets and Liabilities. For a credit default swap sold by a Fund, payment of the agreed-upon amount made by a Fund in the event of default of the referenced debt obligation is recorded as the cost of the referenced debt obligation purchased/received. For a credit default swap purchased by a Fund, the agreed-upon amount received by a Fund in the event of default of the referenced debt obligation is recorded as proceeds from sale/delivery of the referenced debt obligation and the resulting gain or loss realized on the referenced debt obligation is recorded as such by a Fund. |
| | |
| | Any upfront payments made or received upon entering a credit default swap contract would be amortized or accreted over the life of the swap and recorded as realized gains or losses. Collateral, in the form of cash or securities, may be required to be held in segregated accounts with the custodian bank or broker in accordance with the swap agreement. The value and credit rating of each credit default swap where a Fund is the seller of protection, are both measures of the current payment/performance risk of the swap. As the value of the swap changes as a positive or negative percentage of the total notional amount, the payment/performance risk may decrease or increase, respectively. The maximum potential amount of future payments (undiscounted) that a Fund as a seller of protection could be required to make under a credit default swap agreement would be an amount equal to the notional amount of the agreement. These potential amounts would be partially offset by any recovery values of the respective referenced obligations, upfront payments received upon entering into the agreement, or net amounts received from the settlement of buy protection credit default swap agreements entered into by a Fund for the same referenced entity or entities. |
| | |
| | Entering into credit default swaps involves credit and market risk. Such risks involve the possibility that there will be no liquid market for these agreements, that there may be unfavorable changes in interest rates, and that Lord Abbett does not correctly predict the creditworthiness of the issuers of the reference obligation on which the credit default swap is based. For centrally cleared swaps there was minimal counterparty credit risk to the Funds, since the credit default swap entered into was traded through a central clearinghouse, which guarantees against default. |
| | |
| (l) | Floating Rate Loans–Each fund may invest in floating rate loans, which usually take the form of loan participations and assignments. Loan participations and assignments are agreements to make money available to U.S. or foreign corporations, partnerships or other business entities (the “Borrower”) in a specified amount, at a specified rate and within a specified time. A loan is typically originated, negotiated and structured by a U.S. or foreign bank, insurance company or other financial institution (the “Agent”) for a group of loan investors (“Loan Investors”). The Agent typically administers and enforces the loan on behalf of the other Loan Investors in the |
90
Notes to Financial Statements (continued)
| | syndicate and may hold any collateral on behalf of the Loan Investors. Such loan participations and assignments are typically senior, secured and collateralized in nature. The Trust records an investment when the Borrower withdraws money and records interest as earned. These loans pay interest at rates which are periodically reset by reference to a base lending rate plus a spread. These base lending rates are generally the prime rate offered by a designated U.S. bank or London InterBank Offered Rate (“LIBOR”). |
| | |
| | The loans in which each Fund invests may be subject to some restrictions on resale. For example, the Funds may be contractually obligated to receive approval from the Agent and/or Borrower prior to the sale of these investments. Each Fund generally has no right to enforce compliance with the terms of the loan agreement with the Borrower. As a result, each Fund assumes the credit risk of the Borrower, the selling participant and any other persons interpositioned between the Funds and the Borrower (“Intermediate Participants”). In the event that the Borrower, selling participant or Intermediate Participants become insolvent or enter into bankruptcy, the Funds may incur certain costs and delays in realizing payment or may suffer a loss of principal and/or interest. |
| | |
| | Unfunded commitments represent the remaining obligation of each Fund to the Borrower. At any point in time, up to the maturity date of the issue, the Borrower may demand the unfunded portion. Until demanded by the Borrower, unfunded commitments are not recognized as an asset on the Statements of Assets and Liabilities. Unrealized appreciation/depreciation on unfunded commitments, if any, on the Statements of Assets and Liabilities represents mark to market of the unfunded portion of each Fund’s floating rate notes. |
| | |
| | As of July 31, 2021, the following funds had unfunded commitments: |
| | |
| | | | | | | | | Climate Focused Bond Fund |
| Borrower | | Principal
Amount | | | Market
Value | | | Cost | | | Unrealized
Appreciation/
Depreciation |
| Refficiency Holdings LLC 2020 Delayed Draw Term Loan | | $ | 6,452 | | | $ | 6,465 | | | $ | 6,452 | | | | $13 |
| | | | | | | | | | | | | | | | |
| | | | | | | | | | | Short Duration High Yield Fund |
| Borrower | | Principal
Amount | | | Market
Value | | | Cost | | | Unrealized
Appreciation/
Depreciation |
| CMBF LLC Delayed Draw Term Loan | | $ | 4,375 | | | $ | 4,375 | | | $ | 4,288 | | | | $87 |
| National Mentor Holdings, Inc. 2021 Delayed Draw Term Loan | | | 48 | | | | 48 | | | | 48 | | | | – |
| Total | | $ | 4,423 | | | $ | 4,423 | | | $ | 4,336 | | | | $87 |
| (m) | Fair Value Measurements–Fair value is defined as the price that each Fund would receive upon selling an investment or transferring a liability in an orderly transaction to an independent buyer in the principal or most advantageous market of the investment. A three-tier hierarchy is used to maximize the use of observable market data and minimize the use of unobservable inputs and to establish classification of fair value measurements for disclosure purposes. Inputs refer broadly to the assumptions that market participants would use in pricing the asset or liability, including assumptions about risk - for example, the risk inherent in a particular valuation technique used to measure fair value (such as a pricing model) and/or the risk inherent in the inputs to the valuation technique. Inputs may be observable or unobservable. Observable inputs reflect the assumptions market participants would use in pricing the asset or liability. |
91
Notes to Financial Statements (continued)
| | Observable inputs are based on market data obtained from sources independent of the reporting entity. Unobservable inputs reflect the reporting entity’s own assumptions about the assumptions market participants would use in pricing the asset or liability. Unobservable inputs are based on the best information available in the circumstances. The three-tier hierarchy classification is determined based on the lowest level of inputs that is significant to the fair value measurement, and is summarized in the three broad Levels listed below: |
| | |
| | • | Level 1 – | unadjusted quoted prices in active markets for identical investments; |
| | | | |
| | • | Level 2 – | other significant observable inputs (including quoted prices for similar investments, interest rates, prepayment speeds, credit risk, etc.); and |
| | | | |
| | • | Level 3 – | significant unobservable inputs (including each Fund’s own assumptions in determining the fair value of investments). |
| | | | |
| | A summary of inputs used in valuing each Fund’s investments and other financial instruments as of July 31, 2021 and, if applicable, Level 3 rollforwards for the period then ended is included in each Fund’s Schedule of Investments. |
| | |
| | Changes in valuation techniques may result in transfers into or out of an assigned level within the three-tier hierarchy. The inputs or methodology used for valuing securities are not necessarily an indication of the risk associated with investing in those securities. |
| 3. | MANAGEMENT FEE AND OTHER TRANSACTIONS WITH AFFILIATES |
Management Fee
The Trust has a management agreement with Lord Abbett, pursuant to which Lord Abbett supplies each Fund with investment management services and executive and other personnel, provides office space and pays for ordinary and necessary office and clerical expenses relating to research and statistical work and supervision of each Fund’s investment portfolio.
The management fee is based on each Fund’s average daily net assets at the following annual rates:
| Climate Focused Bond Fund | |
| | |
| First $1 billion | .35% |
| Over $1 billion | .30% |
| |
| International Growth Fund | |
| | |
| First $2 billion | .65% |
| Next $2 billion | .62% |
| Over $4 billion | .60% |
| |
| Mid Cap Innovation Growth Fund | |
| | |
| First $1 billion | .65% |
| Next $3 billion | .63% |
| Next $1 billion | .60% |
| Over $5 billion | .58% |
| |
| Short Duration High Yield Fund | |
| | |
| First $1 billion | .45% |
| Over $1 billion | .40% |
For the period ended July 31, 2021, the effective management fee, net of waivers, was at an annualized rate of each Fund’s average daily net assets:
92
Notes to Financial Statements (continued)
| | Net Effective
Management Fee |
| Climate Focused Bond Fund | .00% |
| International Growth Fund | .00% |
| Mid Cap Innovation Growth Fund | .00% |
| Short Duration High Yield Fund | .00% |
In addition, Lord Abbett provides certain administrative services to each Fund pursuant to an Administrative Services Agreement in return for a fee at an annual rate of ..04% of each Fund’s average daily net assets. Lord Abbett voluntarily waived the following fund administration fees during the period ended July 31, 2021:
| Fund | Fund
Administration Fee |
| Climate Focused Bond Fund | $9,757 |
| International Growth Fund | 2,250 |
| Mid Cap Innovation Growth Fund | 2,251 |
| Short Duration High Yield Fund | 6,389 |
For the fiscal year ended July 31, 2021 and continuing through November 30, 2021 for Climate Focused Bond Fund and Short Duration High Yield Fund, for the period from December 28, 2020 through November 30, 2022 for Mid Cap Innovation Growth Fund, and for the period from June 18, 2021 through November 30, 2022 for International Growth Fund, Lord Abbett has contractually agreed to waive its fees and reimburse expenses to the extent necessary to limit the total net annual operating expenses, excluding 12b-1 fees, to the following annual rates:
| | | Classes |
| Fund | | A, C, F, I,
R3, R4 and R5 | | F3 and R6 |
| Climate Focused Bond Fund | | | .45 | % | | | .38 | % |
| International Growth Fund | | | .81 | % | | | .73 | % |
| Mid Cap Innovation Growth Fund | | | .81 | % | | | .73 | % |
| Short Duration High Yield Fund | | | .51 | % | | | .44 | % |
All contractual fee waiver and expense reimbursement agreements between the Funds and Lord Abbett may be terminated only upon the approval of the Board.
12b-1 Distribution Plan
Each Fund has adopted a distribution plan with respect to Class A, C, F, R3 and R4 shares pursuant to Rule 12b-1 under the Act, which provides for the payment of ongoing distribution and service fees to Lord Abbett Distributor LLC (the “Distributor”), an affiliate of Lord Abbett. The following annual rates have been authorized by the Board pursuant to the plan:
| Fees* | | Class A | | Class C(1) | | | Class F(2) | | | Class R3 | | | Class R4 | |
| Service | | | .15%/.25 | %(3) | | | .25% | | | | – | | | | .25% | | | | .25% | |
| Distribution | | | .05 | %(4) | | | .75% | | | | .10% | | | | .25% | | | | – | |
| * | The Funds may designate a portion of the aggregate fee as attributable to service activities for purposes of calculating Financial Industry Regulatory Authority, Inc. (“FINRA”) sales charge limitations. |
| (1) | The 12b-1 fees for Climate Focused Bond Fund and Short Duration High Yield Fund pays on Class C shares is a blended rate calculated based on 1.00% of each Fund’s average daily net assets attributable to shares held for less than one year and 0.80% of each Fund’s average daily net assets attributable to shares held for one year or more. All Class C shareholders of each Fund will bear 12b-1 fees at the same rate. |
| (2) | For the period ended July 31, 2021 and continuing through November 30, 2021 (Climate Focused Bond Fund and Short Duration High Yield Fund) and for the period ended July 31, 2021 and continuing through November 30, 2022 (Mid Cap Innovation Growth Fund and International Growth Fund), Lord Abbett Distributor has contractually agreed to waive each Fund’s 0.10% Rule 12b-1 fee for Class F shares. This agreement may be terminated only by the Board. |
| (3) | The 12b-1 service fees on Class A shares for Climate Focused Bond Fund and Short Duration High Yield Fund pays .15% and for International Growth Fund and Mid Cap Innovation Growth Fund pays .25%. |
| (4) | Not applicable for the International Growth Fund and Mid Cap Innovation Growth Fund. |
93
Notes to Financial Statements (continued)
Class F3, I, R5 and R6 shares do not have a distribution plan.
Commissions
Distributor received the following commissions on sales of shares of the Funds, after concessions were paid to authorized dealers, for the period ended July 31, 2021:
| | | Distributor
Commissions | | | Dealers’
Concessions | |
| Climate Focused Bond Fund | | $ | 240 | | | $ | 1,326 | |
| International Growth Fund | | | – | | | | – | |
| Mid Cap Innovation Growth Fund | | | 3,197 | | | | 19,161 | |
| Short Duration High Yield Fund | | | 5,056 | | | | 27,417 | |
Distributor received no CDSCs for the period ended July 31, 2021.
One Trustee and certain of the Trust’s officers have an interest in Lord Abbett.
| 4. | DISTRIBUTIONS AND CAPITAL LOSS CARRYFORWARDS |
Dividends from net investment income, if any, are declared daily and paid monthly by the Climate Focused Bond Fund and Short Duration High Yield Fund. Dividends from net investment income, if any, are declared and distributed at least annually by the International Growth Fund and Mid Cap Innovation Growth Fund. Taxable net realized gains from investment transactions, reduced by allowable capital loss carryforwards, if any, are declared and distributed to shareholders at least annually. The capital loss carryforward amount, if any, is available to offset future net capital gains. Dividends and distributions to shareholders are recorded on the ex-dividend date. The amounts of dividends and distributions from net investment income and net realized capital gains are determined in accordance with federal income tax regulations, which may differ from U.S. GAAP. These book/tax differences are either considered temporary or permanent in nature. To the extent these differences are permanent in nature, such amounts are reclassified within the components of net assets based on their federal tax basis treatment; temporary differences do not require reclassification. Dividends and distributions, which exceed earnings and profits for tax purposes, are reported as a tax return of capital.
The tax character of distributions paid during the period ended July 31, 2021 and the period ended July 31, 2020 was as follows:
| | | | | | Climate Focused
Bond Fund | | | International
Growth Fund | |
| | | Year Ended
7/31/2021 | | | Period Ended
7/31/2020 | | | Period Ended
7/31/2021 | |
| Distributions paid from: | | | | | | | | | |
| Ordinary income | | $ | 258,263 | | | $ | 39,970 | | | $ | – | |
| Total distributions paid | | $ | 258,263 | | | $ | 39,970 | | | $ | – | |
94
Notes to Financial Statements (continued)
| | Mid Cap Innovation
Growth Fund | | | | | | Short Duration
High Yield Fund | |
| | | Period Ended
7/31/2021 | | | Year Ended
7/31/2021 | | | Period Ended
7/31/2020 | |
| Distributions paid from: | | | | | | | | | | | | |
| Ordinary income | | $ | – | | | $ | 647,448 | | | $ | 84,507 | |
| Net long-term capital gains | | | – | | | | 2,837 | | | | – | |
| Total distributions paid | | $ | – | | | $ | 650,285 | | | $ | 84,507 | |
As of July 31, 2021, the components of accumulated gains on a tax-basis were as follows:
| | | Climate
Focused
Bond Fund | | | International
Growth
Fund | | | Mid Cap
Innovation
Growth Fund | | | Short Duration
High Yield
Fund | |
| Undistributed ordinary income – net | | $ | 187,275 | | | $ | – | | | $ | – | | | $ | 199,321 | |
| Undistributed long-term capital gains | | | – | | | | – | | | | – | | | | 30,620 | |
| Total undistributed earnings | | | 187,275 | | | | – | | | | – | | | | 229,941 | |
| Capital loss carryforwards* | | | (97,578 | ) | | | (12,487 | ) | | | (283,544 | ) | | | – | |
| Temporary differences | | | (394 | ) | | | – | | | | (49 | ) | | | (348 | ) |
| Unrealized gains (losses) - net | | | 400,499 | | | | 30,121 | | | | 669,280 | | | | 392,881 | |
| Total accumulated gains – net | | $ | 489,802 | | | $ | 17,634 | | | $ | 385,687 | | | $ | 622,474 | |
| * | The capital losses will carry forward indefinitely. |
As of July 31, 2021, the aggregate unrealized security gains and losses on investments and other financial instruments based on cost for U.S. federal income tax purposes were as follows:
| | | Climate
Focused
Bond Fund | | | International
Growth
Fund | | | Mid Cap
Innovation
Growth Fund | | | Short Duration
High Yield
Fund | |
| Tax cost | | $ | 17,212,157 | | | $ | 1,978,839 | | | $ | 5,345,842 | | | $ | 17,379,873 | |
| Gross unrealized gain | | | 509,892 | | | | 70,661 | | | | 753,945 | | | | 455,327 | |
| Gross unrealized loss | | | (105,167 | ) | | | (40,540 | ) | | | (84,665 | ) | | | (62,408 | ) |
| Net unrealized security gain (loss) | | $ | 404,725 | | | $ | 30,121 | | | $ | 669,280 | | | $ | 392,919 | |
The difference between book-basis and tax-basis unrealized gains (losses) is attributable to the tax treatment of certain distributions received, certain securities, other financial instruments and wash sales.
Permanent items identified during the period year ended July 31, 2021 have been reclassified among the components of net assets based on their tax basis treatment as follows:
| | | Total Distributable
Earnings (Loss) | | | Paid-in Capital | |
| Climate Focused Bond Fund | | | $22,355 | | | $ | (22,355 | ) |
| International Growth Fund | | | 910 | | | | (910 | ) |
| Mid Cap Innovation Growth Fund | | | 18,253 | | | | (18,253 | ) |
| Short Duration High Yield Fund | | | 9,546 | | | | (9,546 | ) |
The permanent differences are attributable to the tax treatment of net investment loss, certain expenses, and certain distributions.
95
Notes to Financial Statements (continued)
| 5. | PORTFOLIO SECURITIES TRANSACTIONS |
Purchases and sales of investment securities (excluding short-term investments) for the period ended July 31, 2021 were as follows:
| | | U.S.
Government
Purchases | | | Non-U.S.
Government
Purchases | | | U.S.
Government
Sales | | | Non-U.S.
Government
Sales | |
| Climate Focused Bond Fund | | $ | 3,135,129 | | | $ | 12,547,113 | | | $ | 2,402,146 | | | $ | 6,905,928 | |
| International Growth Fund | | | – | | | | 2,084,651 | | | | – | | | | 93,907 | |
| Mid Cap Innovation Growth Fund | | | – | | | | 8,010,856 | | | | – | | | | 2,544,487 | |
| Short Duration High Yield | | | – | | | | 19,399,279 | | | | – | | | | 7,675,276 | |
The Funds are permitted to purchase and sell securities (“cross-trade’) from and to other Lord Abbett funds or client accounts pursuant to procedures approved by the Board in compliance with Rule 17a-7 under the Act (the “Rule”). Each cross-trade is executed at a fair market price in compliance with provisions of the Rule. For the period ended July 31, 2021 the Funds did not engage in cross-trades purchases or sales.
| 6. | DISCLOSURES ABOUT DERIVATIVE INSTRUMENTS AND HEDGING ACTIVITIES |
Climate Focused Bond Fund and Short Duration High Yield Fund entered into forward foreign currency exchange contracts during the fiscal year ended July 31, 2021 (as described in note 2(g)). A forward foreign currency exchange contract reduces each Fund’s exposure to changes in the value of the currency it will deliver (or settle in cash) and increases its exposure to changes in the value of the currency it will receive (or settle in cash) for the duration of the contract. Each Fund’s use of forward foreign currency exchange contracts involves the risk that Lord Abbett will not accurately predict currency movements, and each Fund’s returns could be reduced as a result. Forward foreign currency exchange contracts are subject to the risk that those currencies will decline in value relative to the U.S. dollar, or, in the case of hedged positions, that the U.S. dollar will decline relative to the currency being hedged. Currency rates in foreign countries may fluctuate significantly over short periods of time. Each Fund’s risk of loss from counterparty credit risk is the unrealized appreciation on forward foreign currency exchange contracts.
Climate Focused Bond Fund and Short Duration High Yield Fund entered into futures contracts during the fiscal year ended July 31, 2021 (as described in note 2(h)) to manage cash. Each Fund bears the risk that the underlying index will move unexpectedly, in which case the Funds may realize a loss. There is minimal counterparty credit risk to the Funds since futures are exchange traded and the exchange’s clearinghouse, as counterparty to all exchange traded futures, guarantees futures against default.
As of July 31, 2021, each Fund had the following derivatives at fair value, grouped into appropriate risk categories that illustrate the Funds use of derivative instruments:
| | | Climate Focused Bond Fund |
| Asset Derivatives | | Foreign
Currency
Contracts | | | Interest
Rate
Contracts | |
| Forward Foreign Currency Exchange Contracts(1) | | $ | 213,920 | | | | – | |
| Futures Contracts(2) | | | – | | | $ | 44,737 | |
| | | | | | | | | |
| Liability Derivatives | | | | | | | | |
| Forward Foreign Currency Exchange Contracts(3) | | $ | 13,386 | | | | – | |
| Futures Contracts(2) | | | – | | | $ | 60,616 | |
96
Notes to Financial Statements (continued)
| | | Short Duration High Yield Fund |
| Asset Derivatives | | Foreign
Currency
Contracts | | | Interest
Rate
Contracts | |
| Forward Foreign Currency Exchange Contracts(1) | | $ | 16,668 | | | | – | |
| Futures Contracts(2) | | | – | | | $ | 5,108 | |
| | | | | | | | | |
| Liability Derivatives | | | | | | | | |
| Forward Foreign Currency Exchange Contracts(3) | | $ | 1,253 | | | | – | |
| | | | | | | | | |
| (1) | Statements of Assets and Liabilities location: Unrealized appreciation on forward foreign currency exchange contracts. |
| (2) | Statements of Assets and Liabilities location: Includes cumulative unrealized appreciation/depreciation of futures contracts as reported in the Schedule of Investments. Only current day’s variation margin is reported within the Statements of Assets and Liabilities. |
| (3) | Statements of Assets and Liabilities location: Unrealized depreciation on forward foreign currency exchange contracts. |
Transactions in derivative instruments for the period ended July 31, 2021, were as follows:
| | | Climate Focused Bond Fund |
| | | Foreign
Currency
Contracts | | | Interest
Rate
Contracts | |
| Net Realized Gain (Loss) | | | | | | | | |
| Forward Foreign Currency Exchange Contracts(1) | | $ | (473,231 | ) | | | – | |
| Futures Contracts(2) | | | – | | | $ | (36,097 | ) |
| Net Change in Unrealized Appreciation/Depreciation | | | | | | | | |
| Forward Foreign Currency Exchange Contracts(4) | | $ | 491,809 | | | | – | |
| Futures Contracts(5) | | | – | | | $ | (3,717 | ) |
| Average Number of Contracts/Notional Amount* | | | | | | | | |
| Forward Foreign Currency Exchange Contracts(6) | | $ | 6,939,782 | | | | – | |
| Futures Contracts(7) | | | – | | | | 25 | |
| | | | | | | | | |
| | | Short Duration High Yield Fund |
| | | Foreign
Currency
Contracts | | | Interest
Rate
Contracts | | | Credit
Contracts | |
| Net Realized Gain (Loss) | | | | | | | | | | | | |
| Forward Foreign Currency Exchange Contracts(1) | | $ | (22,030 | ) | | | – | | | | – | |
| Futures Contracts(2) | | | – | | | $ | (13,597 | ) | | | – | |
| Credit Default Swap Contracts(3) | | | – | | | | – | | | $ | 87 | |
| Net Change in Unrealized Appreciation/Depreciation | | | | | | | | | | | | |
| Forward Foreign Currency Exchange Contracts(4) | | $ | 24,023 | | | | – | | | | – | |
| Futures Contracts(5) | | | – | | | $ | 5,108 | | | | – | |
| Average Number of Contracts/Notional Amount* | | | | | | | | | | | | |
| Forward Foreign Currency Exchange Contracts(6) | | $ | 493,749 | | | | – | | | | – | |
| Futures Contracts(7) | | | – | | | | 6 | | | | – | |
| * | Calculated based on the number of contracts or notional amounts for the period ended July 31, 2021. |
| (1) | Statements of Operations location: Net realized gain (loss) on forward foreign currency exchange contracts. |
| (2) | Statements of Operations location: Net realized gain (loss) on futures contracts. |
| (3) | Statements of Operations location: Net realized gain (loss) on swap contracts. |
| (4) | Statements of Operations location: Net change in unrealized appreciation/depreciation on forward foreign currency exchange contracts. |
| (5) | Statements of Operations location: Net change in unrealized appreciation/depreciation on futures contracts. |
| (6) | Amount represents notional amounts in U.S. dollars. |
| (7) | Amount represents number of contracts. |
97
Notes to Financial Statements (continued)
| 7. | DISCLOSURES ABOUT OFFSETTING ASSETS AND LIABILITIES |
The Financial Accounting Standards Board (“FASB”) requires disclosures intended to help better assess the effect or potential effect of offsetting arrangements on a fund’s financial position. The following tables illustrate gross and net information about recognized assets and liabilities eligible for offset in the Statements of Assets and Liabilities; and disclose such amounts subject to an enforceable master netting agreement or similar agreement, by counterparty. A master netting agreement is an agreement between a fund and a counterparty which provides for the net settlement of amounts owed under all contracts traded under that agreement, as well as cash collateral, through a single payment by one party to the other in the event of default on or termination of any one contract. The Funds’ accounting policy with respect to balance sheet offsetting is that, absent an event of default by the counterparty or a termination of the agreement, the master netting agreement does not result in an offset of reported amounts of financial assets and liabilities in the Statements of Assets and Liabilities across transactions
| | Climate Focused Bond Fund | |
| Description | | Gross Amounts of
Recognized Assets | | | Gross Amounts
Offset in the
Statement of Assets
and Liabilities | | | Net Amounts of
Assets Presented
in the Statement of
Assets and Liabilities | |
| Repurchase Agreements | | | $203,247 | | | $ | – | | | | $203,247 | |
| Forward Foreign Currency Exchange Contracts | | | 213,920 | | | | – | | | | 213,920 | |
| Total | | | $417,167 | | | $ | – | | | | $417,167 | |
| | | Climate Focused Bond Fund | |
| | | Net Amounts
of Assets
Presented in
the Statement
of Assets and
Liabilities | | |
Amounts Not Offset in the
Statement of Assets and Liabilities | | | | |
| Counterparty | | | | Financial
Instruments | | | Cash
Collateral
Received(a) | | | Securities
Collateral
Received(a) | | | Net
Amount(b) | |
| Fixed Income Clearing Corp. | | $ | 203,247 | | | $ | – | | | $ | – | | | $ | (203,247 | ) | | $ | – | |
| Barclays Bank plc | | | 21,278 | | | | – | | | | – | | | | – | | | | 21,278 | |
| State Street Bank and Trust | | | 192,642 | | | | (13,087 | ) | | | – | | | | – | | | | 179,555 | |
| Total | | $ | 417,167 | | | $ | (13,087 | ) | | $ | – | | | $ | (203,247 | ) | | $ | 200,833 | |
| Description | | Gross Amounts of
Recognized Liabilities | | | Gross Amounts
Offset in the
Statement of Assets
and Liabilities | | | Net Amounts of
Liabilities Presented
in the Statement of
Assets and Liabilities | |
| Forward Foreign Currency Exchange Contracts | | | $13,386 | | | $ | – | | | | $13,386 | |
| Total | | | $13,386 | | | $ | – | | | | $13,386 | |
98
Notes to Financial Statements (continued)
| | Climate Focused Bond Fund | |
| | | Net Amounts
of Liabilities
Presented in
the Statement
of Assets and
Liabilities | | |
Amounts Not Offset in the
Statement of Assets and Liabilities | | | | |
| Counterparty | | | | Financial
Instruments | | | Cash
Collateral
Pledged(a) | | | Securities
Collateral
Pledged(a) | | | Net
Amount(c) | |
| Goldman Sachs | | | $ 173 | | | $ | – | | | $ | – | | | $ | – | | | | $173 | |
| State Street Bank and Trust | | | 13,087 | | | | (13,087 | ) | | | – | | | | – | | | | – | |
| Toronto Dominion Bank | | | 126 | | | | – | | | | – | | | | – | | | | 126 | |
| Total | | | $13,386 | | | $ | (13,087 | ) | | $ | – | | | $ | – | | | | $299 | |
| | Mid Cap Innovation Growth Fund | |
| Description | | Gross Amounts of
Recognized Assets | | | Gross Amounts
Offset in the
Statement of Assets
and Liabilities | | | Net Amounts of
Assets Presented
in the Statement of
Assets and Liabilities | |
| Repurchase Agreements | | | $161,254 | | | $ | – | | | | $161,254 | |
| Total | | | $161,254 | | | $ | – | | | | $161,254 | |
| | | Net Amounts
of Assets
Presented in
the Statement
of Assets and
Liabilities | | |
Amounts Not Offset in the
Statement of Assets and Liabilities | | | | |
| Counterparty | | | | Financial
Instruments | | | Cash
Collateral
Received(a) | | | Securities
Collateral
Received(a) | | | Net
Amount(b) | |
| Fixed Income Clearing Corp. | | | $161,254 | | | $ | – | | | $ | – | | | $ | (161,254 | ) | | $ | – | |
| Total | | | $161,254 | | | $ | – | | | $ | – | | | $ | (161,254 | ) | | $ | – | |
| | Short Duration High Yield Fund | |
| Description | | Gross Amounts of
Recognized Assets | | | Gross Amounts
Offset in the
Statement of Assets
and Liabilities | | | Net Amounts of
Assets Presented
in the Statement of
Assets and Liabilities | |
| Repurchase Agreements | | | $211,292 | | | $ | – | | | | $211,292 | |
| Forward Foreign Currency Exchange Contracts | | | 16,668 | | | | – | | | | 16,668 | |
| Total | | | $227,960 | | | $ | – | | | | $227,960 | |
| | | Net Amounts
of Assets
Presented in
the Statement
of Assets and
Liabilities | | |
Amounts Not Offset in the
Statement of Assets and Liabilities | | | | |
| Counterparty | | | | Financial
Instruments | | | Cash
Collateral
Received(a) | | | Securities
Collateral
Received(a) | | | Net
Amount(b) | |
| Fixed Income Clearing Corp. | | | $211,292 | | | $ | – | | | $ | – | | | $ | (211,292 | ) | | $ | – | |
| Barclays Bank plc | | | 2,615 | | | | – | | | | – | | | | – | | | | 2,615 | |
| State Street Bank and Trust | | | 14,053 | | | | (1,241 | ) | | | – | | | | – | | | | 12,812 | |
| Total | | | $227,960 | | | $ | (1,241 | ) | | $ | – | | | $ | (211,292 | ) | | $ | 15,427 | |
99
Notes to Financial Statements (continued)
| | Short Duration High Yield Fund | |
| Description | | Gross Amounts of
Recognized Liabilities | | | Gross Amounts
Offset in the
Statement of Assets
and Liabilities | | | Net Amounts of
Liabilities Presented
in the Statement of
Assets and Liabilities | |
| Forward Foreign Currency Exchange Contracts | | | $1,253 | | | $ | – | | | | $1,253 | |
| Total | | | $1,253 | | | $ | – | | | | $1,253 | |
| | | Net Amounts
of Liabilities
Presented in
the Statement
of Assets and
Liabilities | | |
Amounts Not Offset in the
Statement of Assets and Liabilities | | | | |
| Counterparty | | | | Financial
Instruments | | | Cash
Collateral
Pledged(a) | | | Securities
Collateral
Pledged(a) | | | Net
Amount(c) | |
| Goldman Sachs | | | $ 12 | | | $ | – | | | $ | – | | | $ | – | | | | $12 | |
| State Street Bank and Trust | | | 1,241 | | | | (1,241 | ) | | | – | | | | – | | | | – | |
| Total | | | $1,253 | | | $ | (1,241 | ) | | $ | – | | | $ | – | | | | $12 | |
| (a) | Collateral disclosed is limited to an amount not to exceed 100% of the net amount of assets (liabilities) presented in the Statements of Assets and Liabilities, for each respective counterparty. |
| (b) | Net amount represents the amount owed to the Fund by the counterparty as of July 31, 2021. |
| (c) | Net amount represents the amount owed by the Fund to the counterparty as of July 31, 2021. |
The Trust’s officers and one Trustee, who are associated with Lord Abbett, do not receive any compensation from the Trust for serving in such capacities. Independent Trustees’ fees are allocated among all Lord Abbett-sponsored funds based on the net assets of each fund. There is an equity-based plan available to all Independent Trustees under which Independent Trustees must defer receipt of a portion of, and may elect to defer receipt of an additional portion of Trustees’ fees. The deferred amounts are treated as though equivalent dollar amounts had been invested in the Funds. Such amounts and earnings accrued thereon are included in Trustees’ fees on the Statements of Operations and in Trustees’ fees payable on the Statements of Assets and Liabilities and are not deductible for U.S. federal income tax purposes until such amounts are paid.
The Trust has entered into an arrangement with its transfer agent and custodian, whereby credits realized as a result of uninvested cash balances are used to reduce a portion of each Fund’s expenses.
For the period ended July 31, 2021, with the exception of International Growth Fund and Mid Cap Innovation Growth Fund, the Funds and certain other funds managed by Lord Abbett (collectively, the “Participating Funds”) entered into a syndicated line of credit facility with various lenders for $1.17 billion (the “Syndicated Facility”) whereas State Street Bank and Trust Company (“SSB”) participated as a lender and as agent for the lenders. The Participating Funds were subject to graduated borrowing limits of one-third of Fund net assets (if Fund net assets are less than $750 million), $250 million, $300 million, $600 million, or $900 million, based on past borrowings and likelihood of future borrowings, among other factors. Effective August 5, 2021, the Participating Funds, including International Growth Fund and Mid Cap Innovation Growth Fund, entered into a Syndicated Facility with various lenders for $1.275 billion whereas SSB participates as a lender and
100
Notes to Financial Statements (continued)
as agent for the lenders. The Participating Funds are subject to graduated borrowing limits of one-third of Fund net assets (if Fund net assets are less than $750 million), $250 million, $300 million, $700 million, or $1 billion, based on past borrowings and likelihood of future borrowings, among other factors.
For the period ended July 31, 2021, the Participating Funds, with the exception of International Growth Fund and Mid Cap Innovation Growth Fund, were party to an additional line of credit facility with SSB for $330 million (the “Bilateral Facility”), $250 million committed and $80 million uncommitted. Under the Bilateral Facility, the Participating Funds are subject to graduated borrowing limits of one-third of Fund net assets (if net assets are less than $750 million), $250 million, $300 million, or $330 million, based on past borrowings and likelihood of future borrowings, among other factors. Effective August 5, 2021, International Growth Fund and Mid Cap Innovation Growth Fund was added to the Facility.
The Syndicated Facility and the Bilateral Facility are to be used for temporary or emergency purposes as additional sources of liquidity to satisfy redemptions.
For the period ended July 31, 2021, the Funds did not utilize the Syndicated Facility or Bilateral Facility.
| 11. | INTERFUND LENDING PROGRAM |
Pursuant to an exemptive order issued by the U.S. Securities and Exchange Commission (“SEC exemptive order”) certain registered open-end management investment companies managed by Lord Abbett, including each Fund, participate in a joint lending and borrowing program (the “Interfund Lending Program”). The SEC exemptive order allows the Funds to borrow money from and lend money to each other for temporary or emergency purposes subject to the limitations and conditions.
For the period ended July 31, 2021, the Funds did not participate as a borrower or lender in the Interfund Lending Program.
| 12. | CUSTODIAN AND ACCOUNTING AGENT |
SSB is the Trust’s custodian and accounting agent. SSB performs custodial, accounting and recordkeeping functions relating to portfolio transactions and calculating each Fund’s NAV.
| 13. | SECURITIES LENDING AGREEMENT |
The Funds have established a securities lending agreement with Citibank, N.A. for the lending of securities to qualified brokers in exchange for securities or cash collateral equal to at least the market value of securities loaned, plus interest, if applicable. Cash collateral is invested in an approved money market fund. In accordance with the Funds’ securities lending agreement, the market value of securities on loan is determined each day at the close of business and any additional collateral required to cover the value of securities on loan is delivered to the Funds on the next business day. As with other extensions of credit, the Funds may experience a delay in the recovery of their securities or incur a loss should the borrower of the securities breach its agreement with the Funds or the borrower becomes insolvent at a time when the collateral is insufficient to cover the cost of repurchasing securities on loan. Any income earned from securities lending is included in Securities lending net income on the Statements of Operations.
The initial collateral received by the Funds are required to have a value equal to at least 100% of the market value of the securities loaned. The collateral must be marked-to-market daily to cover increases in the market value of the securities loaned (or potentially a decline in the value of the collateral). In general, the risk of borrower default will be borne by Citibank, N.A.; the Funds will
101
Notes to Financial Statements (continued)
bear the risk of loss with respect to the investment of the cash collateral. The advantage of such loans is that the Funds continue to receive income on loaned securities while receiving a portion of any securities lending fees and earning returns on the cash amounts which may be reinvested for the purchase of investments in securities.
For the period ended July 31, 2021, the Funds did not loan any securities.
Each of the Climate Focused Bond Fund and Short Duration High Yield Fund is subject to the general risks and considerations associated with investing in debt securities and to the changing prospects of individual companies and/or sectors in which the Fund invests. The value of an investment will change as interest rates fluctuate and in response to market movements. When interest rates rise, the prices of debt securities are likely to decline; when rates fall, such prices tend to rise. Longer-term debt securities are usually more sensitive to interest rate changes. There is also the risk that an issuer of a debt security will fail to make timely payments of principal or interest to a Fund, a risk that is greater with high-yield securities (sometimes called “lower-rated bonds” or “junk bonds”), in which the Funds may substantially invest. Some issuers, particularly of high-yield securities, may default as to principal and/or interest payments after the Fund purchases securities. A default, or concerns in the market about an increase in the risk of default, may result in losses to the Funds.
On July 27, 2017, the head of the United Kingdom’s Financial Conduct Authority announced a desire to phase out the use of LIBOR by the end of 2021. There remains uncertainty regarding the future utilization of LIBOR and the nature of any replacement rate. As such, the potential effect of a transition away from LIBOR on a Fund or the LIBOR-based instruments in which the Fund invests cannot yet be determined. The transition process might lead to increased volatility and illiquidity in markets that currently rely on LIBOR to determine interest rates. It could also lead to a reduction in the value of some LIBOR-based investments and reduce the effectiveness of new hedges placed against existing LIBOR-based instruments. Since the usefulness of LIBOR as a benchmark could deteriorate during the transition period, these effects could occur prior and/or subsequent to the end of 2021.
High-yield securities are subject to greater price fluctuations, as well as additional risks. The market for below investment grade securities may be less liquid, which may make such securities more difficult to sell at an acceptable price, especially during periods of financial distress, increased market volatility, or significant market decline.
The Climate Focused Bond Fund is subject to the risk that its climate-focused investment strategy may select or exclude securities of certain issuers for reasons other than investment performance considerations and that the Fund may underperform funds that do not utilize a climate-focused investment strategy. Certain climate-focused investments may be dependent on government policies and subsidies, which are subject to change or elimination. There can be no assurance that the operations of a given issuer in which the Fund invests will in fact have a positive impact on the climate. Successful application of the Fund’s climate-focused investment strategy will depend on Lord Abbett’s skill in properly identifying and analyzing material climate-related issues and related business practices, and there can be no assurance that the strategy or techniques employed will be successful.
Each Fund may invest in equity securities, the value of which fluctuates in response to movements in the equity securities markets in general, the changing prospects of individual companies in which the Fund invests, or an individual company’s financial condition.
102
Notes to Financial Statements (continued)
The Mid Cap Innovation Growth Fund is subject to the risk of investing in mid-sized companies. The Investments in mid-sized companies may involve greater risks than investments in larger, more established companies. As compared to larger companies, mid-sized companies may have limited management experience or depth, limited ability to generate or borrow capital needed for growth, and limited products or services, or operate in less established markets. Accordingly, securities of mid-sized companies tend to be more sensitive to changing economic, market, and industry conditions and tend to be more volatile and less liquid than equity securities of larger companies, especially over the short term. The securities of mid-sized companies tend to trade less frequently than those of larger, more established companies, which can adversely affect the pricing of these securities and the ability to sell these securities in the future.
Each of the Climate Focused Bond Fund and Short Duration High Yield Fund is subject to the risk of investing in securities issued or guaranteed by the U.S. Government or its agencies and instrumentalities (such as the Government National Mortgage Association (“Ginnie Mae”), the Federal National Mortgage Association (“Fannie Mae”), or the Federal Home Loan Mortgage Corporation (“Freddie Mac”). Unlike Ginnie Mae securities, securities issued or guaranteed by U.S. Government-related organizations such as Fannie Mae and Freddie Mac are not backed by the full faith and credit of the U.S. Government and no assurance can be given that the U.S. Government would provide financial support to its agencies and instrumentalities if not required to do so by law. Consequently, a Fund may be required to look principally to the agency issuing or guaranteeing the obligation.
The mortgage-related and asset-backed securities in which the Climate Focused Bond Fund and Short Duration High Yield Fund may invest may be particularly sensitive to changes in prevailing interest rates, and economic conditions, including delinquencies and/or defaults. These changes can affect the value, income, and/or liquidity of such positions. When interest rates are declining, the value of these securities with prepayment features may not increase as much as other fixed income securities. Early principal repayment may deprive a Fund of income payments above current market rates. Alternatively, rising interest rates may cause prepayments to occur at a slower-than-expected rate, extending the duration of a security and typically reducing its value. The payment rate will thus affect the price and volatility of a mortgage- related security. In addition, a Fund may invest in non-agency asset backed and mortgage related securities, which are issued by private institutions, not by government-sponsored enterprises.
The Mid Cap Innovation Growth Fund is subject to the risks of investing in growth stocks. Growth stocks typically trade at higher multiples of current earnings than other stocks. Growth stocks often are more sensitive to market fluctuations than other securities because their market prices are highly sensitive to future earnings expectations. At times when it appears that these expectations may not be met, prices of growth stocks typically fall. Growth stocks may be more volatile than securities of slower-growing issuers.
Each of the Climate Focused Bond Fund and Short Duration High Yield Fund may invest in convertible securities, which have both equity and fixed income risk characteristics, including market, credit, liquidity, and interest rate risks. Generally, convertible securities offer lower interest or dividend yields than non-convertible securities of similar quality and less potential for gains or capital appreciation in a rising equity securities market than equity securities. They tend to be more volatile than other fixed income securities and the market for convertible securities may be less liquid than the markets for stocks or bonds. A significant portion of convertible securities have below investment grade credit ratings and are subject to increased credit and liquidity risks.
103
Notes to Financial Statements (continued)
Due to each Fund’s investment exposure to foreign companies and American Depositary Receipts, each Fund may experience increased market, industry and sector, liquidity, currency, political, information, and other risks. The securities of foreign companies also may be subject to inadequate exchange control regulations, the imposition of economic sanctions or other government restrictions, higher transaction and other costs, and delays in settlement to the extent they are traded on non-U.S. exchanges or markets.
Each of the Climate Focused Bond Fund and Short Duration High Yield Fund is subject to the risks associated with derivatives, which may be different from and greater than the risks associated with directly investing in securities. Derivatives may be subject to risks such as liquidity risk, leveraging risk, interest rate risk, market risk, and credit risk. Illiquid securities may lower the Fund’s returns since the Fund may be unable to sell these securities at their desired time or price. Derivatives also may involve the risk of mispricing or improper valuation and the risk that changes in the value of the derivative may not correlate perfectly with the value of the underlying asset, rate or index. Whether the Fund’s use of derivatives is successful will depend on, among other things, the Fund’s ability to correctly forecast market movements and other factors. Losses may also arise from the failure of a derivative counterparty to meet its contractual obligations. If the Fund incorrectly forecasts these and other factors, the Fund’s performance could suffer. The Fund’s use of derivatives could result in a loss exceeding the amount of the Fund’s investment in these instruments.
Each of the Climate Focused Bond Fund and Short Duration High Yield Fund may invest in loans, which include, among other things, loans to U.S. or foreign corporations, partnerships, other business entities, or to U.S. and non-U.S. governments. Each Fund may invest in fixed rate and variable rate loans and floating or adjustable rate loans, including bridge loans, novations, assignments, and participations, which are subject to increased credit and liquidity risks. The loans in which the Short Duration High Yield Fund invests will usually be rated below investment grade or may also be unrated. Below investment grade loans, as in the case of high-yield debt securities, or junk bonds, are usually more credit sensitive than interest rate sensitive, although the value of these instruments may be impacted by broader interest rate swings in the overall fixed income market. The Short Duration High Yield Fund may also invest in, or obtain exposure to, obligations that may be “covenant-lite,” which means such obligations lack certain financial maintenance covenants. Should a loan held by the Fund begin to deteriorate in quality, the Fund’s ability to negotiate with the borrower may be delayed under a covenant-lite loan compared to a loan with full maintenance covenants. This may in turn delay the Fund’s ability to seek to recover its investment.
Geopolitical and other events (e.g., wars, terrorism, natural disasters, epidemics or pandemics such as the COVID-19 outbreak which began in late 2019) may disrupt securities markets and adversely affect global economies and markets, thereby decreasing the value of each Fund’s investments. Market disruptions can also prevent each Fund from implementing its investment strategies and achieving its investment objective.
The transmission of COVID-19 and efforts to contain its spread have resulted in, among other things, border closings and other significant travel restrictions and disruptions, significant disruptions to business operations, supply chains and customer activity, lower consumer demand for goods and services, event cancellations and restrictions, service cancellations, reductions and other changes, significant challenges in healthcare service preparation and delivery, and prolonged quarantines, as well as general concern and uncertainty. The impact of the COVID-19 outbreak could negatively affect the global economy, the economies of individual countries, and the financial performance of individual issuers, sectors, industries, asset classes, and markets in significant and unforeseen ways.
104
Notes to Financial Statements (continued)
The COVID-19 pandemic and its effects may last for an extended period of time, and in either case could result in significant market volatility, exchange trading suspensions and closures, declines in global financial markets, higher default rates, and a substantial economic downturn or recession. The foregoing could disrupt the operations of each Fund and its service providers, adversely affect the value and liquidity of each Fund’s investments, and negatively impact each Fund’s performance and your investment in each Fund.
These factors, and others, can affect each Fund’s performance.
| 15. | SUMMARY OF CAPITAL TRANSACTIONS |
Transactions in shares of beneficial interest were as follows:
| Climate Focused Bond Fund | | For the Year Ended
July 31, 2021 | | | For the Period Ended
July 31, 2020(a) | |
| Class A Shares | | Shares | | | Amount | | | Shares | | | Amount | |
| Shares sold | | | 86,613 | | | $ | 892,697 | | | | 341,744 | | | $ | 3,420,449 | |
| Reinvestment of distributions | | | 1,869 | | | | 19,305 | | | | 111 | | | | 1,132 | |
| Shares reacquired | | | (9,600 | ) | | | (99,137 | ) | | | – | | | | – | |
| Increase | | | 78,882 | | | $ | 812,865 | | | | 341,855 | | | $ | 3,421,581 | |
| Class C Shares | | | | | | | | | | | | | | | | |
| Shares sold | | | 28,163 | | | $ | 290,768 | | | | 60,394 | | | $ | 604,000 | |
| Reinvestment of distributions | | | 228 | | | | 2,357 | | | | 21 | | | | 214 | |
| Shares reacquired | | | (1,949 | ) | | | (20,128 | ) | | | – | | | | – | |
| Increase | | | 26,442 | | | $ | 272,997 | | | | 60,415 | | | $ | 604,214 | |
| Class F Shares | | | | | | | | | | | | | | | | |
| Shares sold | | | 71,476 | | | $ | 737,928 | | | | 300,000 | | | $ | 3,000,000 | |
| Reinvestment of distributions | | | 1,061 | | | | 10,952 | | | | – | | | | – | |
| Shares reacquired | | | (17 | ) | | | (176 | ) | | | – | | | | – | |
| Increase | | | 72,520 | | | $ | 748,704 | | | | 300,000 | | | $ | 3,000,000 | |
| Class F3 Shares | | | | | | | | | | | | | | | | |
| Shares sold | | | – | | | $ | – | | | | 12,500 | | | $ | 125,000 | |
| Increase | | | – | | | $ | – | | | | 12,500 | | | $ | 125,000 | |
| Class I Shares | | | | | | | | | | | | | | | | |
| Shares sold | | | 1,103,459 | | | $ | 11,392,372 | | | | 300,000 | | | $ | 3,000,000 | |
| Reinvestment of distributions | | | 2,845 | | | | 29,299 | | | | – | | | | – | |
| Shares reacquired | | | (53,414 | ) | | | (550,017 | ) | | | – | | | | – | |
| Increase | | | 1,052,890 | | | $ | 10,871,654 | | | | 300,000 | | | $ | 3,000,000 | |
| Class R3 Shares | | | | | | | | | | | | | | | | |
| Shares sold | | | – | | | $ | – | | | | 2,500 | | | $ | 25,000 | |
| Increase | | | – | | | $ | – | | | | 2,500 | | | $ | 25,000 | |
| Class R4 Shares | | | | | | | | | | | | | | | | |
| Shares sold | | | – | | | $ | – | | | | 2,500 | | | $ | 25,000 | |
| Increase | | | – | | | $ | – | | | | 2,500 | | | $ | 25,000 | |
| Class R5 Shares | | | | | | | | | | | | | | | | |
| Shares sold | | | – | | | $ | – | | | | 2,500 | | | $ | 25,000 | |
| Increase | | | – | | | $ | – | | | | 2,500 | | | $ | 25,000 | |
105
Notes to Financial Statements (continued)
| Climate Focused Bond Fund | | For the Year Ended
July 31, 2021 | | | For the Period Ended
July 31, 2020(a) | |
| Class R6 Shares | | Shares | | | Amount | | | Shares | | | Amount | |
| Shares sold | | | 15,146 | | | $ | 157,538 | | | | 30,000 | | | $ | 300,000 | |
| Shares reacquired | | | (1,916 | ) | | | (19,674 | ) | | | – | | | | – | |
| Increase | | | 13,230 | | | $ | 137,864 | | | | 30,000 | | | $ | 300,000 | |
| International Growth Fund | | For the
Period Ended
July 31, 2021(b) | |
| Class A Shares | | Shares | | | Amount | |
| Shares sold | | | 69,983 | | | $ | 1,050,000 | |
| Increase | | | 69,983 | | | $ | 1,050,000 | |
| Class C Shares | | | | | | | | |
| Shares sold | | | 6,732 | | | $ | 101,000 | |
| Increase | | | 6,732 | | | $ | 101,000 | |
| Class F Shares | | | | | | | | |
| Shares sold | | | 6,667 | | | $ | 100,000 | |
| Increase | | | 6,667 | | | $ | 100,000 | |
| Class F3 Shares | | | | | | | | |
| Shares sold | | | 667 | | | $ | 10,000 | |
| Increase | | | 667 | | | $ | 10,000 | |
| Class I Shares | | | | | | | | |
| Shares sold | | | 667 | | | $ | 10,000 | |
| Increase | | | 667 | | | $ | 10,000 | |
| Class R3 Shares | | | | | | | | |
| Shares sold | | | 667 | | | $ | 10,000 | |
| Increase | | | 667 | | | $ | 10,000 | |
| Class R4 Shares | | | | | | | | |
| Shares sold | | | 667 | | | $ | 10,000 | |
| Increase | | | 667 | | | $ | 10,000 | |
| Class R5 Shares | | | | | | | | |
| Shares sold | | | 666.5 | | | $ | 10,000 | |
| Increase | | | 666.5 | | | $ | 10,000 | |
| Class R6 Shares | | | | | | | | |
| Shares sold | | | 50,000 | | | $ | 750,000 | |
| Increase | | | 50,000 | | | $ | 750,000 | |
| | | �� | | | | | | |
| Mid Cap Innovation Growth Fund | | | For the
Period Ended
July 31, 2021(c) | |
| Class A Shares | | | Shares | | | | Amount | |
| Shares sold | | | 169,967 | | | $ | 2,576,421 | |
| Shares reacquired | | | (14,626 | ) | | | (224,232 | ) |
| Increase | | | 155,341 | | | $ | 2,352,189 | |
106
Notes to Financial Statements (continued)
| Mid Cap Innovation Growth Fund | | For the
Period Ended
July 31, 2021(c) | |
| Class C Shares | | Shares | | | Amount | |
| Shares sold | | | 28,861 | | | $ | 439,191 | |
| Shares reacquired | | | (895 | ) | | | (13,584 | ) |
| Increase | | | 27,966 | | | $ | 425,607 | |
| Class F Shares | | | | | | | | |
| Shares sold | | | 65,444 | | | $ | 997,492 | |
| Shares reacquired | | | (630 | ) | | | (10,026 | ) |
| Increase | | | 64,814 | | | $ | 987,466 | |
| Class F3 Shares | | | | | | | | |
| Shares sold | | | 666.66 | | | $ | 10,000 | |
| Increase | | | 666.66 | | | $ | 10,000 | |
| Class I Shares | | | | | | | | |
| Shares sold | | | 7,333 | | | $ | 110,000 | |
| Increase | | | 7,333 | | | $ | 110,000 | |
| Class R3 Shares | | | | | | | | |
| Shares sold | | | 666.66 | | | $ | 10,000 | |
| Increase | | | 666.66 | | | $ | 10,000 | |
| Class R4 Shares | | | | | | | | |
| Shares sold | | | 3,591 | | | $ | 59,069 | |
| Shares reacquired | | | (1 | ) | | | (14 | ) |
| Increase | | | 3,590 | | | $ | 59,055 | |
| Class R5 Shares | | | | | | | | |
| Shares sold | | | 666.66 | | | $ | 10,000 | |
| Increase | | | 666.66 | | | $ | 10,000 | |
| Class R6 Shares | | | | | | | | |
| Shares sold | | | 107,860 | | | $ | 1,626,762 | |
| Shares reacquired | | | (33 | ) | | | (496 | ) |
| Increase | | | 107,827 | | | $ | 1,626,266 | |
| Short Duration High Yield Fund | | For the Year Ended
July 31, 2021 | | | For the Period Ended
July 31, 2020(d) | |
| Class A Shares | | Shares | | | Amount | | | Shares | | | Amount | |
| Shares sold | | | 923,517 | | | $ | 10,094,415 | | | | 162,642 | | | $ | 1,632,316 | |
| Reinvestment of distributions | | | 17,981 | | | | 197,186 | | | | 123 | | | | 1,260 | |
| Shares reacquired | | | (208,871 | ) | | | (2,291,971 | ) | | | (18 | ) | | | (187 | ) |
| Increase | | | 732,627 | | | $ | 7,999,630 | | | | 162,747 | | | $ | 1,633,389 | |
| Class C Shares | | | | | | | | | | | | | | | | |
| Shares sold | | | 64,785 | | | $ | 708,804 | | | | 55,469 | | | $ | 557,500 | |
| Reinvestment of distributions | | | 1,315 | | | | 14,394 | | | | 22 | | | | 226 | |
| Shares reacquired | | | (760 | ) | | | (8,331 | ) | | | (497 | ) | | | (5,010 | ) |
| Increase | | | 65,340 | | | $ | 714,867 | | | | 54,994 | | | $ | 552,716 | |
107
Notes to Financial Statements (concluded)
| Short Duration High Yield Fund | | For the Year Ended
July 31, 2021 | | | For the Period Ended
July 31, 2020(d) | |
| Class F Shares | | Shares | | | Amount | | | Shares | | | Amount | |
| Shares sold | | | 363,324 | | | $ | 3,958,363 | | | | 242,417 | | | $ | 2,425,318 | |
| Reinvestment of distributions | | | 8,325 | | | | 91,096 | | | | 134 | | | | 1,349 | |
| Shares reacquired | | | (62,194 | ) | | | (678,301 | ) | | | – | (e) | | | (3 | ) |
| Increase | | | 309,455 | | | $ | 3,371,158 | | | | 242,551 | | | $ | 2,426,664 | |
| Class F3 Shares | | | | | | | | | | | | | | | | |
| Shares sold | | | – | | | $ | – | | | | 1,000 | | | $ | 10,000 | |
| Reinvestment of distributions | | | – | | | | – | | | | 1 | | | | 5 | |
| Increase | | | – | | | $ | – | | | | 1,001 | | | $ | 10,005 | |
| Class I Shares | | | | | | | | | | | | | | | | |
| Shares sold | | | – | | | $ | – | | | | 50,000 | | | $ | 500,000 | |
| Reinvestment of distributions | | | – | | | | – | | | | 27 | | | | 268 | |
| Increase | | | – | | | $ | – | | | | 50,027 | | | $ | 500,268 | |
| Class R3 Shares | | | | | | | | | | | | | | | | |
| Shares sold | | | – | | | $ | – | | | | 1,000 | | | $ | 10,000 | |
| Reinvestment of distributions | | | – | | | | – | | | | – | (e) | | | 5 | |
| Increase | | | – | | | $ | – | | | | 1,000 | | | $ | 10,005 | |
| Class R4 Shares | | | | | | | | | | | | | | | | |
| Shares sold | | | – | | | $ | – | | | | 1,000 | | | $ | 10,000 | |
| Reinvestment of distributions | | | – | (e) | | | – | | | | – | (e) | | | 5 | |
| Increase | | | – | | | $ | – | | | | 1,000 | | | $ | 10,005 | |
| Class R5 Shares | | | | | | | | | | | | | | | | |
| Shares sold | | | – | | | $ | – | | | | 1,000 | | | $ | 10,000 | |
| Reinvestment of distributions | | | – | (e) | | | – | | | | 1 | | | | 5 | |
| Increase | | | – | | | $ | – | | | | 1,001 | | | $ | 10,005 | |
| Class R6 Shares | | | | | | | | | | | | | | | | |
| Shares sold | | | 11,415 | | | $ | 123,528 | | | | 6,000 | | | $ | 60,000 | |
| Reinvestment of distributions | | | – | | | | – | | | | 3 | | | | 33 | |
| Increase | | | 11,415 | | | $ | 123,528 | | | | 6,003 | | | $ | 60,033 | |
| (a) | For the period May 20, 2020 (commencement of operations) to July 31, 2020. |
| (b) | For the period June 18, 2021 (commencement of operations) to July 31, 2021. |
| (c) | For the period December 28, 2020 (commencement of operations) to July 31, 2021. |
| (d) | For the period April 22, 2020 (commencement of operations) to July 31, 2020. |
| (e) | Amount less than 1 share. |
108
Report of Independent Registered Public Accounting Firm
To the shareholders and the Board of Trustees of Lord Abbett Trust I
Opinion on the Financial Statements and Financial Highlights
We have audited the accompanying statements of assets and liabilities of Lord Abbett Trust I (the “Trust”) comprising the Lord Abbett Short Duration High Yield Fund, Lord Abbett Climate Focused Bond Fund, Lord Abbett Mid Cap Innovation Growth Fund, and Lord Abbett International Growth Fund, including the schedules of investments, as of July 31, 2021, and the related statements of operations, statements of changes in net assets, and the financial highlights for the periods indicated in the table below, and the related notes. In our opinion, the financial statements and financial highlights present fairly, in all material respects, the financial position of each of the funds listed above constituting the Lord Abbett Trust I as of July 31, 2021, and the results of their operations, the changes in their net assets and the financial highlights for the periods indicated in the table below in conformity with accounting principles generally accepted in the United States of America.
Individual Funds constituting
Lord Abbett Trust I | Statements of
Operations | Statements of
Changes in Net Assets | Financial
Highlights |
| Lord Abbett Short Duration High Yield Fund | For the year ended July 31, 2021 | For the year ended July 31, 2021 and the period from April 22, 2020 (commencement of operations) through July 31, 2020 |
| Lord Abbett Climate Focused Bond Fund | For the year ended July 31, 2021 | For the year ended July 31, 2021 and the period from May 20, 2020 (commencement of operations) through July 31, 2020 |
| Lord Abbett Mid Cap Innovation Growth Fund | For the period from December 28, 2020 (commencement of operations) through July 31, 2021 |
| Lord Abbett International Growth Fund | For the period from June 18, 2021 (commencement of operations) through July 31, 2021 |
Basis for Opinion
These financial statements and financial highlights are the responsibility of the Trust’s management. Our responsibility is to express an opinion on the Trust’s financial statements and financial highlights based on our audits. We are a public accounting firm registered with the Public Company Accounting Oversight Board (United States) (PCAOB) and are required to be independent with respect to the Trust in accordance with the U.S. federal securities laws and the applicable rules and regulations of the Securities and Exchange Commission and the PCAOB.
We conducted our audits in accordance with the standards of the PCAOB. Those standards require that we plan and perform the audit to obtain reasonable assurance about whether the financial statements and financial highlights are free of material misstatement, whether due to error or fraud. The Trust is not required to have, nor were we engaged to perform, an audit of its internal control over financial reporting. As part of our audits we are required to obtain an understanding of internal control over financial reporting but not for the purpose of expressing an opinion on the effectiveness of the Trust’s internal control over financial reporting. Accordingly, we express no such opinion.
Our audits included performing procedures to assess the risks of material misstatement of the financial statements and financial highlights, whether due to error or fraud, and performing procedures that respond to those risks. Such procedures included examining, on a test basis, evidence regarding the amounts and disclosures in the financial statements and financial highlights. Our audits also included evaluating the accounting principles used and significant estimates made by management, as well as evaluating the overall presentation of the financial statements and financial highlights. Our procedures included confirmation of securities owned as of July 31, 2021, by correspondence with the custodian, brokers, and selling or agent banks; when replies were not received from brokers and selling or agent banks, we performed other auditing procedures. We believe that our audits provide a reasonable basis for our opinion.
DELOITTE & TOUCHE LLP
New York, New York
September 27, 2021
We have served as the auditor of one or more Lord Abbett Family of Funds’ investment companies since 1932.
109
Basic Information About Management
The Board is responsible for the management of the business and affairs of the Fund in accordance with the laws of the state of organization. The Board elects officers who are responsible for the day-to-day operations of the Fund and who execute policies authorized by the Board. The Board also approves an investment adviser to the Fund and continues to monitor the cost and quality of the services the investment adviser provides, and annually considers whether to renew the contract with the investment adviser. Generally, each Board member holds office until his/her successor is elected and qualified or until his/her earlier resignation or removal, as provided in the Fund’s organizational documents.
Lord, Abbett & Co. LLC (“Lord Abbett”), a Delaware limited liability company, is the Fund’s investment adviser. Designated Lord Abbett personnel are responsible for the day-to-day management of the Fund.
Independent Board Members
The following Independent Board Members also are board members of each of the 14 investment companies in the Lord Abbett Family of Funds, which consist of 62 investment portfolios.
Name, Address and
Year of Birth | | Current Position and
Length of Service with
the Fund | | Principal Occupation and Other Directorships
During the Past Five Years |
| | | | | |
Evelyn E. Guernsey
Lord, Abbett & Co. LLC
c/o Legal Dept.
90 Hudson Street
Jersey City, NJ 07302
(1955) | | Board member since 2011 | | Principal Occupation: None. Other Directorships: None. |
| | | | | |
Julie A. Hill
Lord, Abbett & Co. LLC
c/o Legal Dept.
90 Hudson Street
Jersey City, NJ 07302
(1946) | | Board member since 2004 | | Principal Occupation: Owner and CEO of The Hill Company, a business consulting firm (since 1998). Other Directorships: Currently serves as director of Anthem, Inc., a health benefits company (since 1994). |
| | | | | |
Kathleen M. Lutito
Lord, Abbett & Co. LLC
c/o Legal Dept.
90 Hudson Street
Jersey City, NJ 07302
(1963) | | Board member since 2017 | | Principal Occupation: President and Chief Investment Officer of CenturyLink Investment Management Company (since 2006). Other Directorships: None. |
| | | | | |
James M. McTaggart
Lord, Abbett & Co. LLC
c/o Legal Dept.
90 Hudson Street
Jersey City, NJ 07302
(1947) | | Board member since 2012 | | Principal Occupation: Independent management advisor and consultant (since 2012). Other Directorships: Blyth, Inc., a home products company (2004 – 2015). |
| | | | | |
Charles O. Prince
Lord, Abbett & Co. LLC
c/o Legal Dept.
90 Hudson Street
Jersey City, NJ 07302
(1950) | | Board member since 2019 | | Principal Occupation: None. Formerly Chairman and Chief Executive Officer, Citigroup, Inc. (Retired 2007). Other Directorships: Currently serves as director of Johnson & Johnson (2006 – Present). Previously served as director of Xerox Corporation (2008 – 2018). |
110
Basic Information About Management (continued)
Name, Address and
Year of Birth | | Current Position and
Length of Service with
the Fund | | Principal Occupation and Other Directorships
During the Past Five Years |
| | | | | |
Karla M. Rabusch
Lord, Abbett & Co. LLC
c/o Legal Dept.
90 Hudson Street
Jersey City, NJ 07302
(1959) | | Board member since 2017 | | Principal Occupation: President and Director of Wells Fargo Funds Management, LLC (2003 – 2017); President of Wells Fargo Funds (2003 – 2016). Other Directorships: None. |
| | | | | |
Lorin Patrick Taylor Radtke
Lord, Abbett & Co. LLC
c/o Legal Dept.
90 Hudson Street
Jersey City, NJ 07302
(1968) | | Boards member since 2021 | | Principal Occupation: Partner and Co-Founder of M Seven 8 Partners LLC, a venture capital firm (since 2016). Formerly partner, Goldman Sachs. Other Directorships: Currently serves as director of Assured Guaranty (2021 – Present). |
| | | | | |
Leah Song Richardson
Lord, Abbett & Co. LLC
c/o Legal Dept.
90 Hudson Street
Jersey City, NJ 07302
(1966) | | Boards member since 2021 | | Principal Occupation: President of Colorado College (since 2021) and was formerly Dean at University of California, Irvine – School of Law (2017 – 2021) and formerly Professor of Law at University of California, Irvine (2014 – 2017). Other Directorships: None. |
| | | | | |
Mark A. Schmid
Lord, Abbett & Co. LLC
c/o Legal Dept.
90 Hudson Street
Jersey City, NJ 07302
(1959) | | Board member since 2016 | | Principal Occupation: None. Other Directorships: None. |
| | | | | |
James L.L. Tullis
Lord, Abbett & Co. LLC
c/o Legal Dept.
90 Hudson Street
Jersey City, NJ 07302
(1947) | | Board member since 2006;
Chairman since 2017 | | Principal Occupation: Chairman of Tullis Health Investors – FL LLC (since 2018); CEO of Tullis-Dickerson and Co. Inc., a venture capital management firm (1990 – 2016). Other Directorships: Currently serves as director of Crane Co. (since 1998), Alphatec Spine (since 2018), electroCore, Inc. (since 2018), and Exagen Inc. (since 2019). |
111
Basic Information About Management (continued)
Interested Board Members
Mr. Sieg is affiliated with Lord Abbett and is an “interested person” of the Fund as defined in the Act. Mr. Sieg is a board member of each of the 14 investment companies in the Lord Abbett Family of Funds, which consist of 62 investment portfolios. Mr. Sieg is an officer of the Lord Abbett Family of Funds.
Name, Address and
Year of Birth | | Current Position and
Length of Service with
the Fund | | Principal Occupation and Other Directorships
During the Past Five Years |
| | | | | |
Douglas B. Sieg
Lord, Abbett & Co. LLC
90 Hudson Street
Jersey City, NJ 07302
(1969) | | Board member since 2016;
President and Chief Executive Officer since 2018 | | Principal Occupation: Managing Partner (since 2018) and was formerly Head of Client Services, joined Lord Abbett in 1994. Other Directorships: None. |
Officers
None of the officers listed below have received compensation from the Fund. All of the officers of the Fund also may be officers of the other Lord Abbett Funds and maintain offices at 90 Hudson Street, Jersey City, NJ 07302. Unless otherwise indicated, the position(s) and title(s) listed under the “Principal Occupation During the Past Five Years” column indicate each officer’s position(s) and title(s) with Lord Abbett. Each officer serves for an indefinite term (i.e., until his or her death, resignation, retirement, or removal).
Name and
Year of Birth | | Current Position
with the Fund | | Length of Service
of Current
Position | | Principal Occupation
During the Past Five Years |
Douglas B. Sieg
(1969) | | President and Chief Executive Officer | | Elected as President and Chief Executive Officer in 2018 | | Managing Partner of Lord Abbett (since 2018) and was formerly Head of Client Services, joined Lord Abbett in 1994. |
| | | | | | | |
Jackson C. Chan
(1964) | | AML Compliance Officer | | Elected in 2018 | | Deputy Chief Compliance Officer and Director of Regulatory Affairs, joined Lord Abbett in 2014. |
| | | | | | | |
Pamela P. Chen
(1978) | | Vice President, Assistant Secretary and Privacy Officer | | Elected as Vice President and Assistant Secretary in 2018 and Privacy Officer in 2019 | | Associate General Counsel, joined Lord Abbett in 2017 and was formerly Special Counsel at Schulte, Roth & Zabel LLP (2005 – 2017). |
| | | | | | | |
John T. Fitzgerald
(1975) | | Vice President and Assistant Secretary | | Elected in 2018 | | Deputy General Counsel, joined Lord Abbett in 2018 and was formerly Deputy Head of U.S. Funds Legal, Executive Director and Assistant General Counsel at JPMorgan Chase (2005 – 2018). |
112
Basic Information About Management (concluded)
Name and
Year of Birth | | Current Position
with the Fund | | Length of Service
of Current
Position | | Principal Occupation
During the Past Five Years |
| | | | | | | |
Vito A. Fronda
(1969) | | Treasurer | | Elected as Treasurer in 2018 | | Partner and Director of U.S. Fund Treasury & Global Taxation, joined Lord Abbett in 2003. |
| | | | | | | |
Michael J. Hebert
(1976) | | Chief Financial Officer | | Elected as Chief Financial Officer in 2021 | | Head of Global Fund Finance, joined Lord Abbett in 2021 and was formerly Vice President at Eaton Vance Management (EVM) (2014 – 2021) and Calvert Research & Management (CRM) (2016 – 2021), and Assistant Treasurer of registered investment companies managed, advised or administered by EVM and CRM during such years. |
| | | | | | | |
Linda Y. Kim
(1980) | | Vice President and Assistant Secretary | | Elected in 2016 | | Counsel, joined Lord Abbett in 2015. |
| | | | | | | |
Joseph M. McGill
(1962) | | Chief Compliance Officer | | Elected in 2014 | | Partner and Chief Compliance Officer, joined Lord Abbett in 2014. |
| | | | | | | |
Amanda S. Ryan
(1978) | | Vice President and Assistant Secretary | | Elected in 2018 | | Counsel, joined Lord Abbett in 2016 and was formerly a Director and Corporate Counsel at PGIM Investments (2012 – 2016). |
| | | | | | | |
Lawrence B. Stoller
(1963) | | Vice President, Secretary and Chief Legal Officer | | Elected as Vice President and Secretary in 2007 and Chief Legal Officer in 2019 | | Partner and General Counsel, joined Lord Abbett in 2007. |
Please call 888-522-2388 for a copy of the statement of additional information, which contains further information about the Fund’s Board members. It is available free upon request.
113
Approval of Advisory Contract
At the initial organizational meeting for the International Growth Fund, the Board, including all of the Trustees who are not “interested persons” of the Company or of Lord Abbett, as defined in the Investment Company Act of 1940, as amended (the “Independent Trustees”), considered whether to approve the proposed management agreement between the Fund and Lord Abbett (the “Agreement”). The Board reviewed materials relating specifically to the Agreement before and at the meeting and before making its decision, the Board had the opportunity to ask questions and request further information. The Board also took into account its knowledge of Lord Abbett gained through its meetings and discussions.
The materials received by the Board as to the Fund included, but were not limited to: (1) information provided by Broadridge Financial Solutions, Inc. regarding the expense ratios, contractual and actual management fee rates, and other expense components for the Fund (estimated where appropriate for the Fund) and certain funds in the same Morningstar category, with generally the same or similar share classes and operational characteristics (the “expense peer group”); (2) information provided by Lord Abbett on the estimated expense ratios, management fee rates, and other expense components for the Fund; and (3) information regarding the investment strategies and risks of the Fund and the personnel and other resources devoted by Lord Abbett to managing the Fund.
Investment Management and Related Services Generally. The Board considered the services to be provided by Lord Abbett to the Fund, including investment research, portfolio management, and trading, and Lord Abbett’s commitment to compliance with all applicable legal requirements. The Board also observed that Lord Abbett was solely engaged in the investment management business and accordingly did not experience the conflicts of interest that may result from being engaged in other lines of business. The Board considered information previously provided regarding the investment advisory services provided by Lord Abbett to other clients, the fees charged for the services, and the differences in the nature of the services to be provided to the Fund and currently provided to other Lord Abbett Funds, on the one hand, and the services provided to other clients, on the other. In addition, the Board considered its experience with other funds advised by Lord Abbett. After reviewing these and related factors, the Board concluded that the Fund was likely to benefit from the nature, extent and quality of the investment services to be provided by Lord Abbett under the Agreement.
Investment Performance. Because the Fund had not yet begun operations, the Fund did not have any investment performance to review. The Board considered Lord Abbett’s performance and reputation generally and the performance of other Lord Abbett-managed funds overseen by the Board.
Lord Abbett’s Personnel and Methods. The Board considered the qualifications of the personnel who would provide investment management services to the Fund, in light of its investment objective and discipline, and other services to be provided to the Fund by Lord Abbett. Among other things, the Board considered the size, experience, and turnover of Lord Abbett’s staff, Lord Abbett’s investment methodology and philosophy, and Lord Abbett’s approach to recruiting, training, and retaining personnel.
Nature and Quality of Other Services. The Board considered the nature, quality, and extent of compliance, administrative, and other services to be performed by Lord Abbett and the nature and extent of Lord Abbett’s supervision of third party service providers, including the Fund’s transfer agent and custodian.
114
Approval of Advisory Contract (concluded)
Expenses. The Board considered the estimated expense level of the Fund, including the contractual and actual management fee rates, and the expense levels of the Fund’s expense peer group. It also considered how the Fund’s estimated expense level related to those of the expense peer group and the amount and nature of the fees to be paid by shareholders. The Board observed that the estimated net total expense ratio of the Fund was below the median of the expense peer group.
Profitability. Because the Fund had not yet begun operations, the Board was not able to consider the level of Lord Abbett’s profits in managing the Fund. The Board did consider that Lord Abbett would be subsidizing the Fund for the near future. The Board recognized that Lord Abbett’s overall profitability was a factor in enabling it to attract and retain qualified personnel to provide services to the Fund. After reviewing these and related factors, the Board concluded, within the context of its overall approval of the Agreement, that Lord Abbett’s overall profitability was not excessive.
Economies of Scale. The Board considered whether there might be economies of scale in managing the Fund and whether the Fund would benefit appropriately from any such economies of scale. The Board concluded that the existence of two contractual breakpoints in the proposed management fee schedule, in conjunction with the Fund’s proposed expense limitation agreement, adequately addressed any economies of scale in managing the Fund.
Other Benefits to Lord Abbett. The Board considered the amount and nature of the fees to be paid by the Fund and the Fund’s shareholders to Lord Abbett and the Distributor for services other than investment advisory services, such as the fee that Lord Abbett will receive from the Fund for providing administrative services to the Fund. The Board observed that the Distributor receives 12b-1 fees from certain of the Lord Abbett Funds as to shares held in accounts for which there is no other broker of record, may retain a portion of the 12b-1 fees it receives, and receives a portion of the sales charges on sales and redemptions of some classes of shares of the Lord Abbett Funds. In addition, the Board observed that Lord Abbett accrues certain benefits for its business of providing investment advice to clients other than the Lord Abbett Funds, but that business could also benefit the Fund. The Board also noted that Lord Abbett, as will be disclosed in the prospectus of the Fund, has entered into revenue sharing arrangements with certain entities that distribute shares of the Fund. The Board also took into consideration the investment research that Lord Abbett may receive as a result of client brokerage transactions.
Conclusion. After considering all of the relevant factors, the Board unanimously found that approval of the Agreement was in the best interests of the Fund and voted unanimously to approve the Agreement. In considering whether to approve the Agreement, the Board did not identify any single factor as paramount or controlling. Individual Trustees may have evaluated the information presented differently from one another, giving different weights to various factors. This summary does not discuss in detail all matters considered.
115
Liquidity Risk Management Program
Pursuant to Rule 22e-4 under the 1940 Act, each Fund has adopted a Liquidity Risk Management Program and Policy (“Program”). The Program is designed to assess, manage and periodically review each Fund’s liquidity risk. Liquidity risk is defined under Rule 22e-4 as the risk that each Fund could not meet redemption requests without significant dilution of remaining investors’ interests in the Fund. The Board has appointed Lord Abbett as the administrator for the Fund’s Program. At the June 2-3, 2021 meeting, Lord Abbett provided the Board with a report addressing the operation of the Program and assessing its adequacy and effectiveness of implementation for the period March 1, 2020 through March 1, 2021. Lord Abbett reported that the Program operated effectively during the period. In particular, Lord Abbett reported that: each Fund did not breach its 15% limit on illiquid investments at any point during the period and all regulatory reporting related to Rule 22e-4 was completed on time and without issue during the period. There can be no assurance that the Program will achieve its objectives in the future. Please refer to each Fund’s prospectus for more information regarding each Fund’s exposure to liquidity risk and other principal risks to which an investment in each Fund may be subject.
Householding
The Trust has adopted a policy that allows it to send only one copy of each Fund’s prospectus, proxy material, annual report and semiannual report (or related notice of internet availability of annual report and semiannual report) to certain shareholders residing at the same “household.” This reduces Fund expenses, which benefits you and other shareholders. If you need additional copies or do not want your mailings to be “householded,” please call Lord Abbett at 888-522-2388 or send a written request with your name, the name of your fund or funds and your account number or numbers to Lord Abbett Family of Funds, P.O. Box 219336, Kansas City, MO 64121.
Proxy Voting Policies, Procedures and Records
A description of the policies and procedures that Lord Abbett uses to vote proxies related to each Fund’s portfolio securities, and information on how Lord Abbett voted each Fund’s proxies during the 12-month period ended June 30 are available without charge, upon request, (i) by calling 888-522-2388; (ii) on Lord Abbett’s Website at www.lordabbett.com; and (iii) on the Securities and Exchange Commission’s (“SEC”) Website at www.sec.gov.
Shareholder Reports and Quarterly Portfolio Disclosure
The Funds are required to file their complete schedule of portfolio holdings with the SEC for their first and third fiscal quarters as an attachment to Form N-PORT. Copies of the filings are available without charge, upon request on the SEC’s Website at www.sec.gov and may be available by calling Lord Abbett at 888-522-2388.
116
Tax Information (unaudited)
For foreign shareholders, the percentages below reflect the portion of net investment income distributions that represent interest-related dividends:
| Fund Name | | |
| Climate Focused Bond Fund | 45% | |
| Short Duration High Yield Fund | 83% | |
Of the distributions paid to the shareholders during the period ended July 31, 2021, the following amounts represent short-term and long-term capital gains:
| | Short-Term | Long-Term |
| Fund Name | Capital Gains | Capital Gains |
| Short Duration High Yield Fund | $52,252 | $2,837 |
117

 | We Recycle |
| This document is printed on recycled paper. |
| |
| |
| Go Paperless! |
Visit www.lordabbett.com to learn how to receive
all your shareholder communications online. |
| | | Lord Abbett Trust I | | |
This report, when not used for the general information of shareholders of the Fund, is to be distributed only if preceded or accompanied by a current fund prospectus. Lord Abbett mutual fund shares are distributed by
LORD ABBETT DISTRIBUTOR LLC. | | Climate Focused Bond Fund
International Growth Fund
Mid Cap Innovation Growth Fund
Short Duration High Yield Fund | | TRUST-I-2 (09/21) |
| (a) | In accordance with applicable requirements, the Registrant adopted a Sarbanes-Oxley Code of Ethics on June 19, 2003 that applies to the principal executive officer and senior financial officers of the Registrant (“Code of Ethics”). The Code of Ethics was in effect during the fiscal year ended July 31, 2021 (the “Period”). |
| (c) | The Registrant has not amended the Code of Ethics as described in Form N-CSR during the Period. |
| (d) | The Registrant has not granted any waiver, including an implicit waiver, from a provision of the Code of Ethics as described in Form N-CSR during the Period. |
| (f) | See Item 12(a)(1) concerning the filing of the Code of Ethics. |
| Item 3: | Audit Committee Financial Expert. |
The Registrant’s board of trustees has determined that each of the following independent trustees who are members of the audit committee is an audit committee financial expert: Evelyn E. Guernsey, Karla M. Rabusch and Mark A. Schmid. Each of these persons is independent within the meaning of the Form N-CSR.
| Item 4: | Principal Accountant Fees and Services. |
In response to sections (a), (b), (c) and (d) of Item 4, the aggregate fees billed to the Registrant for the fiscal years ended July 31, 2021 and 2020 by the Registrant’s principal accounting firm, Deloitte & Touche LLP, the member firms of Deloitte Touche Tohmatsu and their respective affiliates (collectively, “Deloitte”) were as follows:
| | | Fiscal year ended: |
| | | 2021 | | 2020 |
| Audit Fees {a} | | $90,000 | | $27,000 |
| Audit-Related Fees {b} | | - 0 - | | - 0 - |
| Total audit and audit-related fees | | $90,000 | | $27,000 |
| | | | | |
| Tax Fees {c} | | 27,316 | | 14,480 |
| All Other Fees | | - 0 - | | - 0 - |
| | | | | |
| Total Fees | | $117,316 | | $41,480 |
{a} Consists of fees for audits of the Registrant’s annual financial statements.
{b} Consists of fees for assurance and related services reasonably related to the audit of the Registrant’s financial statements, but which are not included in the amount for “Audit Fees.”
{c} Fees for the fiscal year ended July 31, 2021 and 2020 consist of fees for preparing the U.S. Income Tax Return for Regulated Investment Companies, New Jersey Corporation Business Tax Return, New Jersey Annual Report Form, U.S. Return of Excise Tax on Undistributed Income of Investment Companies, IRS Forms 1099-MISC and 1096 Annual Summary and Transmittal of U.S. Information Returns.
(e) (1) Pursuant to Rule 2-01(c) (7) of Regulation S-X, the Registrant’s Audit Committee has adopted pre-approval policies and procedures. Such policies and procedures generally provide that the Audit Committee must pre-approve:
| | • | any audit, audit-related, tax, and other services to be provided to the Lord Abbett Funds, including the Registrant, and |
| | • | any audit-related, tax, and other services to be provided to the Registrant’s investment adviser and any entity controlling, controlled by or under common control with the investment adviser that provides ongoing services to one or more Funds comprising the Registrant if the engagement relates directly to operations and financial reporting of a Fund, by the independent auditor to assure that the provision of such services does not impair the auditor’s independence. |
The Audit Committee has delegated pre-approval authority to its Chairman, subject to a fee limit of $10,000 per event, and not to exceed $25,000 annually. The Chairman will report any pre-approval decisions to the Audit Committee at its next scheduled meeting. Unless a type of service to be provided by the independent auditor has received general pre-approval, it must be pre-approved by the Audit Committee. Any proposed services exceeding pre-approved cost levels will require specific pre-approval by the Audit Committee.
(e) (2) The Registrant’s Audit Committee has approved 100% of the services described in this Item 4 (b) through (d).
(f) Not applicable.
(g) The aggregate non-audit fees billed by Deloitte for services rendered to the Registrant are shown above in the response to Item 4 (a), (b), (c) and (d) as “All Other Fees”.
The aggregate non-audit fees billed by Deloitte for services rendered to the Registrant’s investment adviser, Lord, Abbett & Co. LLC (“Lord Abbett”), for the fiscal years ended July 31, 2021 and 2020 were:
| | | Fiscal year ended: |
| | | 2021 | | 2020 |
| All Other Fees {a} | | $220,000 | | $259,525 |
{a} Consist of fees for Independent Services Auditors’ Report on Controls Placed in Operation and Tests of Operating Effectiveness related to Lord Abbett’s Asset Management Services (“SOC-1 Report”).
The aggregate non-audit fees billed by Deloitte for services rendered to entities under the common control of Lord Abbett for the fiscal years ended July 31, 2021 and 2020 were:
| | | Fiscal year ended: |
| | | 2021 | | 2020 |
| All Other Fees | | $ - 0 - | | $ - 0 - |
(h) The Registrant’s Audit Committee has considered the provision of non-audit services that were rendered to the Registrant’s investment adviser, and any entity controlling, controlled by or under common control with the investment adviser that provides ongoing services to the Registrant, that were not pre-approved pursuant to Rule 2-01 (c)(7)(ii) of Regulation S-X and has determined that the provision of such services is compatible with maintaining Deloitte’s independence.
| Item 5: | Audit Committee of Listed Registrants. |
Not applicable.
Not applicable.
| Item 7: | Disclosure of Proxy Voting Policies and Procedures for Closed-End Management Investment Companies. |
Not applicable.
| Item 8: | Portfolio Managers of Closed-End Management Investment Companies. |
Not applicable.
| Item 9: | Purchases of Equity Securities by Closed-End Management Investment Company and Affiliated Purchasers. |
Not applicable.
| Item 10: | Submission of Matters to a Vote of Security Holders. |
Not applicable.
| Item 11: | Controls and Procedures. |
| (a) | The principal executive officer and principal financial & accounting officer have concluded as of a date within 90 days of the filing date of this report, based on their evaluation of the Registrant’s disclosure controls and procedures (as defined in Rule 30a-3(c) under the Investment Company Act of 1940), that the design of such procedures is effective to provide reasonable assurance that material information required to be disclosed by the Registrant on Form N-CSR is recorded, processed, summarized and reported within the time periods specified in the Commission’s rules and forms. |
| (b) | There were no changes in the Registrant’s internal control over financial reporting (as defined in Rule 30a-3(d) under the Investment Company Act of 1940) that occurred during the period covered by this report that have materially affected, or are reasonably likely to materially affect, the Registrant’s internal control over financial reporting. |
| Item 12: | Disclosure of Securities Lending Activities for Closed-End Management Investment Companies. |
SIGNATURES
Pursuant to the requirements of the Securities Exchange Act of 1934 and the Investment Company Act of 1940, the Registrant has duly caused this report to be signed on its behalf by the undersigned, thereunto duly authorized.
| | LORD ABBETT TRUST I |
| | | |
| | By: | /s/Douglas B. Sieg |
| | | Douglas B. Sieg |
| | | President and Chief Executive Officer |
Date: September 27, 2021
Pursuant to the requirements of the Securities Exchange Act of 1934 and the Investment Company Act of 1940, this report has been signed below by the following persons on behalf of the Registrant and in the capacities and on the dates indicated.
| | By: | /s/Douglas B. Sieg |
| | | Douglas B. Sieg |
| | | President and Chief Executive Officer |
Date: September 27, 2021
| | By: | /s/Michael J. Hebert |
| | | Michael J. Hebert |
| | | Chief Financial Officer |
Date: September 27, 2021