UNITED STATES
SECURITIES AND EXCHANGE COMMISSION
Washington, D.C. 20549
FORM N-CSR
CERTIFIED SHAREHOLDER REPORT OF REGISTERED
MANAGEMENT INVESTMENT COMPANIES
Investment Company Act File Number: 811-10371
LORD ABBETT EQUITY TRUST
(Exact name of Registrant as specified in charter)
90 Hudson Street, Jersey City, NJ 07302
(Address of principal executive offices) (Zip code)
John T. Fitzgerald, Esq., Vice President & Assistant Secretary
90 Hudson Street, Jersey City, NJ 07302
(Name and address of agent for service)
Registrant’s telephone number, including area code: (800) 201-6984
Date of fiscal year end: 7/31
Date of reporting period: 7/31/2018
| Item 1: | Report(s) to Shareholders. |

LORD ABBETT
ANNUAL REPORT
Lord Abbett
Calibrated Large Cap Value Fund
Calibrated Mid Cap Value Fund
For the fiscal year ended July 31, 2018
Table of Contents
Lord Abbett Equity Trust
Lord Abbett Calibrated Large Cap Value Fund and
Lord Abbett Calibrated Mid Cap Value Fund
Annual Report
For the fiscal year ended July 31, 2018

From left to right: James L.L. Tullis, Independent Chairman of the Lord Abbett Funds and Douglas B. Sieg, Trustee, President, and Chief Executive Officer of the Lord Abbett Funds. | | Dear Shareholders: We are pleased to provide you with this overview of the performance of the Lord Abbett Equity Trust Funds for the fiscal year ended July 31, 2018. On this page and the following pages, we discuss the major factors that influenced fiscal year performance. For additional information about the Funds, please visit our website at www.lordabbett.com, where you also can access quarterly commentaries that provide updates on each Fund’s performance and other portfolio related updates. Thank you for investing in Lord Abbett mutual funds. We value the trust that you place in us and look forward to serving your investment needs in the years to come. Best regards, 
Douglas B. Sieg Trustee, President and Chief Executive Officer |
Lord Abbett Calibrated Large Cap Value Fund
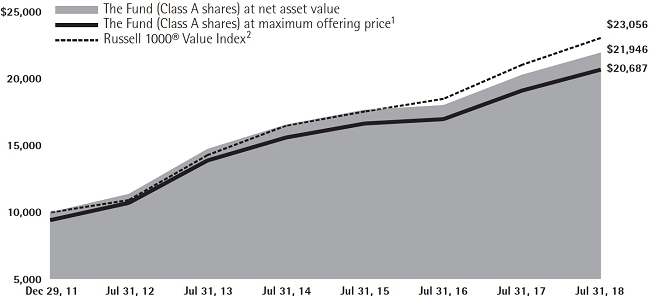
For the fiscal year ended July 31, 2018, the Fund returned 8.18%, reflecting performance at the net asset value (NAV) of Class A shares, with all distributions reinvested, compared to its benchmark, the Russell 1000® Value Index,1 which returned 9.54% over the same period.
Domestic equity returns were positive over the past year, with large cap stocks, as represented by the S&P 500® Index,2 rising
16.24% during the period, while small cap stocks, as represented by the Russell 2000® Index,3 were up 18.73%. During the period, there were several market-moving events. Notably, In December 2017, Congress passed the largest rewrite of the U.S. tax code in decades. The new bill reduced the corporate tax rate from 35% to 21% and allowed for a one-time repatriation tax of 15.5%, rather than the standard 35% rate. In June 2018, the White House announced its intent to impose additional tariffs on $200 billion worth of Chinese goods, on
1
top of the $50 billion previously announced. The global trade war escalated significantly, with China threatening to impose additional tariffs on $50 billion of U.S. goods, and with the European Union, Canada and Mexico all joining the fray with their own retaliatory measures. In December 2017, the Fed raised its target for short-term interest rates by 0.25%, to a range of 1.25% - 1.50%, and indicated that it was targeting three rate hikes in 2018. The Fed followed with two more rate hikes of 0.25% each at its March and June meetings to a 1.75% - 2.00% range. The U.S. economy continued to expand by more than 2% during each quarter of the trailing 12-month period ended July 31, 2018, with domestic GDP growth ranging between 2.8% and 4.1% from the third quarter of 2017 to the second quarter of 2018. The 4.1% growth in the second quarter marked the strongest growth rate since the third quarter of 2014.
Stock selection within the consumer discretionary sector detracted from the Fund’s relative performance over the trailing 12-month period. Within the sector, the share price of Newell Rubbermaid, Inc., a manufacturer of consumer and commercial products, declined after the company became embroiled in a tug of war between activists Carl Icahn and Starboard Value, both of which were trying to unlock value at the beleaguered firm. The Fund’s overweight position in Lennar Corp., a homebuilders company engaging in the provision of real estate related financial services, detracted
from relative performance over the trailing 12-month period, as investors responded negatively to news of the Department of Justice issuing a subpoena to the company’s mortgage subsidiary and to shifts in the company’s executive suite.
Stock selection in the utilities sector detracted from the Fund’s performance relative to its benchmark. An overweight position in PG&E Corp., an electricity and natural gas generation, transmission and distribution company, detracted after the California Department of Forestry and Fire Protection determined that the company’s equipment caused four of the North Bay fires in October 2017 and that the company would be strictly liable for property damages due to their negligence in three of them.
Stock selection within the information technology sector positively contributed to the Fund’s relative performance during the period. Within the sector, shares of computer storage, hardware and data management solutions company NetApp, Inc. rose, as the company posted over five consecutive quarters of 10% year-over-year revenue growth and grew its all-flash array business significantly amid increasing competition. An overweight position in ON Semiconductor Corp., a semiconductor components manufacturer, contributed to relative performance as shares rose. The company benefited from increasing year-over-year revenue in most of its segments and management reiterated the strength of current demand resulting in an upbeat outlook.
2
Stock selection within the energy sector also contributed to the Fund’s performance. Within the sector, an overweight of Valero Energy Corp., a manufacturer of transportation fuels and other petrochemical products, resulted in a positive contribution to relative performance. The company’s stock rose as investors rewarded its position at the bottom of the global refining cost curve, its optionality in its refinery portfolio, and its shareholder capital return program.
Lord Abbett Calibrated Mid Cap Value Fund
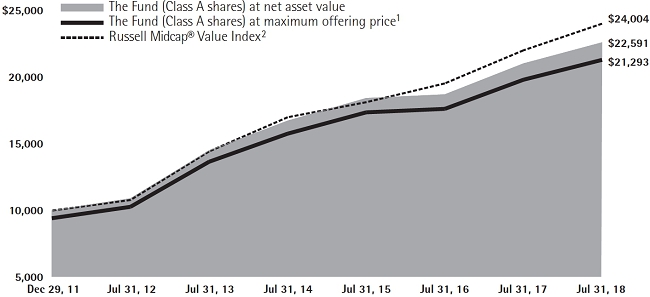
For the fiscal year ended July 31, 2018, the Fund returned 7.52%, reflecting performance at the net asset value (NAV) of Class A shares, with all distributions reinvested, compared to its benchmark, the Russell Midcap® Value Index,4 which returned 9.07% over the same period.
Domestic equity returns were positive over the past year, with large cap stocks, as represented by the S&P 500® Index,2 rising 16.24% during the period, while small cap stocks, as represented by the Russell 2000® Index,3 were up 18.73%. During the period, there were several market-moving events. Notably, In December 2017, Congress passed the largest rewrite of the U.S. tax code in decades. The new bill reduced the corporate tax rate from 35% to 21% and allowed for a one-time repatriation tax of 15.5%, rather than the standard 35% rate. In June 2018, the White House announced its intent to impose additional tariffs on $200 billion worth of Chinese goods, on top of the $50 billion previously
announced. The global trade war escalated significantly, with China threatening to impose additional tariffs on $50 billion of U.S. goods, and with the European Union, Canada and Mexico all joining the fray with their own retaliatory measures. In December 2017, the Fed raised its target for short-term interest rates by 0.25%, to a range of 1.25% - 1.50%, and indicated that it was targeting three rate hikes in 2018. The Fed followed with two more rate hikes of 0.25% each at its March and June meetings to a 1.75% - 2.00% range. The U.S. economy continued to expand by more than 2% during each quarter of the trailing 12-month period ended July 31, 2018, with domestic GDP growth ranging between 2.8% and 4.1% from the third quarter of 2017 to the second quarter of 2018. The 4.1% growth in the second quarter marked the strongest growth rate since the third quarter of 2014.
Stock selection within the real estate sector detracted from the Fund’s relative performance during the period. Within real estate, the Fund’s overweight in Kimco Realty Corp., a real estate investment trust company engaging in the operation of open-air shopping centers, detracted from performance as the stock fell. The company is going through a redevelopment period that is more dilutive than expected, and the lack of earnings growth has not been well-received by investors. An underweight position in Uniti Group Inc., a real estate investment trust company engaged in the acquisition and construction of mission infrastructure in the communications
3
industry, also detracted from relative performance. Uniti Group Inc. was pressured by headline risk related to the ongoing Windstream litigation.
Stock selection in the health care sector also detracted from the Fund’s performance relative to its benchmark. Within health care, an overweight position in Cardinal Health, Inc., a health care services company providing pharmaceutical and medical products, detracted from relative performance as the company has been under pressure with generic drug price deflation, increased wholesaler competition for higher-margin independent customers, and a slowdown in brand drug price increases.
Stock selection within the industrials sector contributed to the Fund’s performance relative to the benchmark. Within the industrials sector, an overweight position in Kar Auction Services, Inc., a whole car auction services and salvage auction company in North America, contributed as the stock rose. The company benefited from strengthening volumes and margins in the Insurance Auto Auctions (salvage) business. An
1 The Russell 1000® Value Index measures the performance of those Russell 1000 companies with lower price-to-book ratios and lower forecasted growth values.
2 The S&P 500® Index is widely regarded as the standard for measuring large cap U.S. stock market performance and includes a representative sample of leading companies in leading industries.
3 The Russell 2000® Index measures the performance of the 2,000 smallest companies in the Russell 3000® Index, which represents approximately 10% of the total market capitalization of the Russell 3000® Index.
underweight position in Nielsen Holdings Plc, a global marketing data collection and analytical services company, contributed to relative performance as shares declined. The company’s continued choppy performance in the Buy segment, which tracks consumer spending behaviors across different industries, as well as long-term concerns about secular changes in media consumption, pressured the stock.
Stock selection within the consumer discretionary sector also contributed to the Fund’s performance relative to its benchmark. Within the sector, an overweight of strong-performing PVH Corp., an apparel design and marketing company, resulted in a positive contribution to relative performance. The company’s stock advanced as it continued to benefit from strong revenue increases in the Calvin Klein and Tommy Hilfiger brands.
Each Fund’s portfolio is actively managed and, therefore, its holdings and the weightings of a particular issuer or particular sector as a percentage of portfolio assets are subject to change. Sectors may include many industries.
4 The Russell Midcap® Value Index measures the performance of those Russell Midcap companies with lower price-to-book ratios and lower forecasted growth values. The stocks are also members of the Russell 1000® Value index.
Unless otherwise specified, indexes reflect total return, with all dividends reinvested. Indexes are unmanaged, do not reflect the deduction of fees or expenses, and are not available for direct investment.
Important Performance and Other Information
Performance data quoted in the following pages reflect past performance and are no guarantee of
4
future results. Current performance may be higher or lower than the performance quoted. The investment return and principal value of an investment in the Funds will fluctuate so that shares, on any given day or when redeemed, may be worth more or less than their original cost. You can obtain performance data current to the most recent month end by calling Lord Abbett at 888-522-2388 or referring to www.lordabbett.com.
Except where noted, comparative Fund performance does not account for the deduction of sales charges and would be different if sales charges were included. Each Fund offers classes of shares with distinct pricing options. For a full description of the differences in pricing alternatives, please see each Fund’s prospectus.
During certain periods shown, expense waivers and reimbursements were in place. Without such waivers and expense reimbursements, the Funds’ returns would have been lower.
The annual commentary above discusses the views of the Funds’ management and various portfolio holdings of the Funds as of July 31, 2018. These views and portfolio holdings may have changed after this date. Information provided in the commentary is not a recommendation to buy or sell securities. Because the Funds’ portfolio is actively managed and may change significantly, the Funds may no longer own the securities described above or may have otherwise changed their positions in the securities. For more recent information about the Funds’ portfolio holdings, please visit www.lordabbett.com.
A Note about Risk: See Notes to Financial Statements for a discussion of investment risks. For a more detailed discussion of the risks associated with each Fund, please see each Fund’s prospectus.
Mutual funds are not insured by the FDIC, are not deposits or other obligations of, or guaranteed by, banks, and are subject to investment risks including possible loss of principal amount invested.
5
Calibrated Large Cap Value Fund
Investment Comparison
Below is a comparison of a $10,000 investment in Class A shares with the same investment in the Russell 1000® Value Index, assuming reinvestment of all distributions. The performance of other classes will be greater than or less than the performance shown in the graph below due to different sales loads and expenses applicable to such classes. The graph and performance table below do not reflect the deduction of taxes that a shareholder would pay on Fund distributions or the redemption of Fund shares. During the period, expenses of the Fund have been waived or reimbursed by Lord Abbett; without such waiver or reimbursement of expenses, the Fund’s returns would have been lower. Past performance is no guarantee of future results.
Average Annual Total Returns at Maximum Applicable
Sales Charge for the Periods Ended July 31, 2018
| | | | 1 Year | | | | 5 Years | | | | Life of Class | |
| Class A3 | | | 1.94% | | | | 7.02% | | | | 11.66% | |
| Class C4 | | | 6.38% | | | | 7.48% | | | | 11.83% | |
| Class F5 | | | 8.43% | | | | 8.49% | | | | 12.86% | |
| Class F36 | | | 8.44% | | | | – | | | | 7.61% | |
| Class I5 | | | 8.44% | | | | 8.56% | | | | 12.95% | |
| Class R25 | | | 7.78% | | | | 7.92% | | | | 12.39% | |
| Class R35 | | | 7.92% | | | | 8.03% | | | | 12.42% | |
| Class R47 | | | 8.15% | | | | – | | | | 7.39% | |
| Class R57 | | | 8.45% | | | | – | | | | 7.67% | |
| Class R67 | | | 8.50% | | | | – | | | | 7.70% | |
1 Reflects the deduction of the maximum initial sales charge of 5.75%.
2 Performance for the unmanaged index does not reflect any fees or expenses. The performance of the index is not necessarily representative of the Fund’s performance. Performance of the index begins on December 29, 2011.
3 Commenced operations on December 21, 2011 and performance for the Class began on December 29, 2011. Total return, which is the percentage change in net asset value, after deduction of the maximum initial sales charge of 5.75% applicable to Class A shares, with all dividends and distributions reinvested for the period ended July 31, 2018, is calculated using the SEC-required uniform method to compute such return.
4 Commenced operations on December 21, 2011 and performance for the Class began on December 29, 2011. The 1% CDSC for Class C shares normally applies before the first anniversary of the purchase date. Performance for other periods is at net asset value.
5 Commenced operations on December 21, 2011 and performance for the Classes began on December 29, 2011. Performance is at net asset value.
6 Commenced operations and performance for the Class began on April 4, 2017. Performance is at net asset value.
7 Commenced operations and performance for the Classes began on June 30, 2015. Performance is at net asset value.
6
Calibrated Mid Cap Value Fund
Investment Comparison
Below is a comparison of a $10,000 investment in Class A shares with the same investment in the Russell Midcap® Value Index, assuming reinvestment of all distributions. The performance of other classes will be greater than or less than the performance shown in the graph below due to different sales loads and expenses applicable to such classes. The graph and performance table below do not reflect the deduction of taxes that a shareholder would pay on Fund distributions or the redemption of Fund shares. During the period, expenses of the Fund have been waived or reimbursed by Lord Abbett; without such waiver or reimbursement of expenses, the Fund’s returns would have been lower. Past performance is no guarantee of future results.
Average Annual Total Returns at Maximum Applicable
Sales Charge for the Periods Ended July 31, 2018
| | | | 1 Year | | | | 5 Years | | | | Life of Class | |
| Class A3 | | | 1.36% | | | | 8.00% | | | | 12.15% | |
| Class C4 | | | 5.70% | | | | 8.48% | | | | 12.32% | |
| Class F5 | | | 7.76% | | | | 9.49% | | | | 13.36% | |
| Class F36 | | | 7.80% | | | | – | | | | 8.14% | |
| Class I5 | | | 7.79% | | | | 9.56% | | | | 13.46% | |
| Class R25 | | | 7.09% | | | | 8.93% | | | | 12.89% | |
| Class R35 | | | 7.26% | | | | 9.04% | | | | 12.99% | |
| Class R47 | | | 7.51% | | | | – | | | | 7.00% | |
| Class R57 | | | 7.75% | | | | – | | | | 7.26% | |
| Class R67 | | | 7.80% | | | | – | | | | 7.28% | |
1 Reflects the deduction of the maximum initial sales charge of 5.75%.
2 Performance for the unmanaged index does not reflect any fees or expenses. The performance of the index is not necessarily representative of the Fund’s performance. Performance of the index begins on December 29, 2011.
3 Commenced operations on December 21, 2011 and performance for the Class began on December 29, 2011. Total return, which is the percentage change in net asset value, after deduction of the maximum initial sales charge of 5.75% applicable to Class A shares, with all dividends and distributions reinvested for the period ended July 31, 2018, is calculated using the SEC-required uniform method to compute such return.
4 Commenced operations on December 21, 2011 and performance for the Class began on December 29, 2011. The 1% CDSC for Class C shares normally applies before the first anniversary of the purchase date. Performance for other periods is at net asset value.
5 Commenced operations on December 21, 2011 and performance for the Classes began on December 29, 2011. Performance is at net asset value.
6 Commenced operations and performance for the Class began on April 4, 2017. Performance is at net asset value.
7 Commenced operations and performance for the Classes began on June 30, 2015. Performance is at net asset value.
7
Expense Example
As a shareholder of each Fund, you incur two types of costs: (1) transaction costs, including sales charges (loads) on purchase payments (these charges vary among the share classes); and (2) ongoing costs, including management fees; distribution and service (12b-1) fees (these charges vary among the share classes); and other Fund expenses. This Example is intended to help you understand your ongoing costs (in dollars) of investing in each Fund and to compare these costs with the ongoing costs of investing in other mutual funds.
The Example is based on an investment of $1,000 invested at the beginning of the period and held for the entire period (February 1, 2018 through July 31, 2018).
Actual Expenses
For each class of each Fund, the first line of the applicable table on the following pages provides information about actual account values and actual expenses. You may use the information in this line, together with the amount you invested, to estimate the expenses that you paid over the period. Simply divide your account value by $1,000 (for example, an $8,600 account value divided by $1,000 = 8.6), then multiply the result by the number in the first line under the heading titled “Expenses Paid During Period 2/1/18 – 7/31/18” to estimate the expenses you paid on your account during this period.
Hypothetical Example for Comparison Purposes
For each class of each Fund, the second line of the applicable table on the following pages provides information about hypothetical account values and hypothetical expenses based on the Fund’s actual expense ratio and an assumed rate of return of 5% per year before expenses, which is not the Fund’s actual return. The hypothetical account values and expenses may not be used to estimate the actual ending account balance or expenses you paid for the period. You may use this information to compare the ongoing costs of investing in each Fund and other funds. To do so, compare this 5% hypothetical example with the 5% hypothetical examples that appear in the shareholder reports of the other funds.
8
Calibrated Large Cap Value Fund
Please note that the expenses shown in the table are meant to highlight your ongoing costs only and do not reflect any transactional costs, such as sales charges (loads). Therefore, the second line of the table is useful in comparing ongoing costs only, and will not help you determine the relative total costs of owning different funds. In addition, if these transactional costs were included, your costs would have been higher.
| | | Beginning
Account
Value | | Ending
Account
Value | | Expenses
Paid During
Period† | |
| | | 2/1/18 | | 7/31/18 | | 2/1/18 –
7/31/18 | |
| Class A | | | | | | | |
| Actual | | $1,000.00 | | $ | 978.60 | | | $4.17 | |
| Hypothetical (5% Return Before Expenses) | | $1,000.00 | | $ | 1,020.58 | | | $4.26 | |
| Class C | | | | | | | | | |
| Actual | | $1,000.00 | | $ | 975.00 | | | $7.84 | |
| Hypothetical (5% Return Before Expenses) | | $1,000.00 | | $ | 1,016.86 | | | $8.00 | |
| Class F | | | | | | | | | |
| Actual | | $1,000.00 | | $ | 979.60 | | | $2.94 | |
| Hypothetical (5% Return Before Expenses) | | $1,000.00 | | $ | 1,021.82 | | | $3.01 | |
| Class F3 | | | | | | | | | |
| Actual | | $1,000.00 | | $ | 980.00 | | | $2.85 | |
| Hypothetical (5% Return Before Expenses) | | $1,000.00 | | $ | 1,021.90 | | | $2.91 | |
| Class I | | | | | | | | | |
| Actual | | $1,000.00 | | $ | 980.00 | | | $2.95 | |
| Hypothetical (5% Return Before Expenses) | | $1,000.00 | | $ | 1,021.82 | | | $3.01 | |
| Class R2 | | | | | | | | | |
| Actual | | $1,000.00 | | $ | 976.90 | | | $5.88 | |
| Hypothetical (5% Return Before Expenses) | | $1,000.00 | | $ | 1,018.84 | | | $6.01 | |
| Class R3 | | | | | | | | | |
| Actual | | $1,000.00 | | $ | 977.50 | | | $5.39 | |
| Hypothetical (5% Return Before Expenses) | | $1,000.00 | | $ | 1,019.34 | | | $5.51 | |
| Class R4 | | | | | | | | | |
| Actual | | $1,000.00 | | $ | 978.60 | | | $4.17 | |
| Hypothetical (5% Return Before Expenses) | | $1,000.00 | | $ | 1,020.58 | | | $4.26 | |
| Class R5 | | | | | | | | | |
| Actual | | $1,000.00 | | $ | 980.00 | | | $2.95 | |
| Hypothetical (5% Return Before Expenses) | | $1,000.00 | | $ | 1,021.82 | | | $3.01 | |
| Class R6 | | | | | | | | | |
| Actual | | $1,000.00 | | $ | 980.00 | | | $2.85 | |
| Hypothetical (5% Return Before Expenses) | | $1,000.00 | | $ | 1,021.92 | | | $2.91 | |
| † | For each class of the Fund, net expenses are equal to the annualized expense ratio for such class (0.85% for Class A, 1.60% for Class C, 0.60% for Class F, 0.58% for Class F3, 0.60% for Class I, 1.20% for Class R2, 1.10% for Class R3, 0.85% for Class R4, 0.60% for Class R5 and 0.58% for Class R6) multiplied by the average account value over the period, multiplied by 181/365 (to reflect one-half year period). |
9
Portfolio Holdings Presented by Sector
July 31, 2018
| Sector* | | %** |
| Consumer Discretionary | | | 7.75% | |
| Consumer Staples | | | 6.69% | |
| Energy | | | 10.85% | |
| Financials | | | 24.20% | |
| Health Care | | | 13.95% | |
| Industrials | | | 8.72% | |
| Information Technology | | | 9.90% | |
| Materials | | | 4.38% | |
| Real Estate | | | 4.29% | |
| Telecommunication Services | | | 3.53% | |
| Utilities | | | 5.46% | |
| Repurchase Agreement | | | 0.28% | |
| Total | | | 100.00% | |
| * | | A sector may comprise several industries. |
| ** | | Represents percent of total investments. |
10
Calibrated Mid Cap Value Fund
Please note that the expenses shown in the table are meant to highlight your ongoing costs only and do not reflect any transactional costs, such as sales charges (loads). Therefore, the second line of the table is useful in comparing ongoing costs only, and will not help you determine the relative total costs of owning different funds. In addition, if these transactional costs were included, your costs would have been higher.
| | | Beginning
Account
Value | | Ending
Account
Value | | Expenses
Paid During
Period† | |
| | | 2/1/18 | | 7/31/18 | | 2/1/18 –
7/31/18 | |
| Class A | | | | | | | |
| Actual | | $1,000.00 | | $ | 998.20 | | | $4.71 | |
| Hypothetical (5% Return Before Expenses) | | $1,000.00 | | $ | 1,020.08 | | | $4.76 | |
| Class C | | | | | | | | | |
| Actual | | $1,000.00 | | $ | 994.00 | | | $8.40 | |
| Hypothetical (5% Return Before Expenses) | | $1,000.00 | | $ | 1,016.36 | | | $8.50 | |
| Class F | | | | | | | | | |
| Actual | | $1,000.00 | | $ | 999.10 | | | $3.47 | |
| Hypothetical (5% Return Before Expenses) | | $1,000.00 | | $ | 1,021.32 | | | $3.51 | |
| Class F3 | | | | | | | | | |
| Actual | | $1,000.00 | | $ | 999.60 | | | $3.22 | |
| Hypothetical (5% Return Before Expenses) | | $1,000.00 | | $ | 1,021.60 | | | $3.26 | |
| Class I | | | | | | | | | |
| Actual | | $1,000.00 | | $ | 999.60 | | | $3.47 | |
| Hypothetical (5% Return Before Expenses) | | $1,000.00 | | $ | 1,021.32 | | | $3.51 | |
| Class R2 | | | | | | | | | |
| Actual | | $1,000.00 | | $ | 996.00 | | | $6.43 | |
| Hypothetical (5% Return Before Expenses) | | $1,000.00 | | $ | 1,018.35 | | | $6.51 | |
| Class R3 | | | | | | | | | |
| Actual | | $1,000.00 | | $ | 996.90 | | | $5.94 | |
| Hypothetical (5% Return Before Expenses) | | $1,000.00 | | $ | 1,018.84 | | | $6.01 | |
| Class R4 | | | | | | | | | |
| Actual | | $1,000.00 | | $ | 998.20 | | | $4.71 | |
| Hypothetical (5% Return Before Expenses) | | $1,000.00 | | $ | 1,020.08 | | | $4.76 | |
| Class R5 | | | | | | | | | |
| Actual | | $1,000.00 | | $ | 999.10 | | | $3.47 | |
| Hypothetical (5% Return Before Expenses) | | $1,000.00 | | $ | 1,021.32 | | | $3.51 | |
| Class R6 | | | | | | | | | |
| Actual | | $1,000.00 | | $ | 999.60 | | | $3.22 | |
| Hypothetical (5% Return Before Expenses) | | $1,000.00 | | $ | 1,021.57 | | | $3.26 | |
| † | For each class of the Fund, net expenses are equal to the annualized expense ratio for such class (0.95% for Class A, 1.70% for Class C, 0.70% for Class F, 0.65% for Class F3, 0.70% for Class I, 1.30% for Class R2, 1.20% for Class R3, 0.95% for Class R4, 0.70% for Class R5 and 0.65% for Class R6) multiplied by the average account value over the period, multiplied by 181/365 (to reflect one-half year period). |
11
Portfolio Holdings Presented by Sector
July 31, 2018
| Sector* | | %** |
| Consumer Discretionary | | | 11.21% | |
| Consumer Staples | | | 4.74% | |
| Energy | | | 7.75% | |
| Financials | | | 18.08% | |
| Health Care | | | 7.09% | |
| Industrials | | | 12.94% | |
| Information Technology | | | 8.85% | |
| Materials | | | 6.19% | |
| Real Estate | | | 13.29% | |
| Utilities | | | 9.40% | |
| Repurchase Agreement | | | 0.46% | |
| Total | | | 100.00% | |
| * | | A sector may comprise several industries. |
| ** | | Represents percent of total investments. |
12
Schedule of Investments
CALIBRATED LARGE CAP VALUE FUND July 31, 2018
| Investments | | Shares | | | Fair
Value
(000) | |
| COMMON STOCKS 99.42% | | | | | | | | |
| | | | | | | | | |
| Aerospace & Defense 1.41% | | | | | | | | |
| Harris Corp. | | | 23,000 | | | $ | 3,794 | |
| Raytheon Co. | | | 14,700 | | | | 2,911 | |
| Total | | | | | | | 6,705 | |
| | | | | | | | | |
| Airlines 0.87% | | | | | | | | |
| Delta Air Lines, Inc. | | | 76,500 | | | | 4,163 | |
| | | | | | | | | |
| Auto Components 0.74% | | | | | | | | |
| Gentex Corp. | | | 151,900 | | | | 3,524 | |
| | | | | | | | | |
| Automobiles 0.75% | | | | | | | | |
| Ford Motor Co. | | | 357,000 | | | | 3,584 | |
| | | | | | | | | |
| Banks 12.63% | | | | | | | | |
| Bank of America Corp. | | | 452,400 | | | | 13,970 | |
| Citigroup, Inc. | | | 23,100 | | | | 1,661 | |
| Citizens Financial Group, Inc. | | | 143,400 | | | | 5,704 | |
| Comerica, Inc. | | | 42,200 | | | | 4,091 | |
| JPMorgan Chase & Co. | | | 166,300 | | | | 19,116 | |
| KeyCorp | | | 106,800 | | | | 2,229 | |
| TCF Financial Corp. | | | 144,000 | | | | 3,616 | |
| U.S. Bancorp | | | 125,600 | | | | 6,658 | |
| Wells Fargo & Co. | | | 54,900 | | | | 3,145 | |
| Total | | | | | | | 60,190 | |
| | | | | | | | | |
| Beverages 0.70% | | | | | | | | |
| Coca-Cola Co. (The) | | | 71,500 | | | | 3,334 | |
| | | | | | | | | |
| Biotechnology 0.36% | | | | | | | | |
| Amgen, Inc. | | | 8,800 | | | | 1,730 | |
| | | | | | | | | |
| Building Products 1.02% | | | | | | | | |
| Johnson Controls International plc | | | 130,000 | | | | 4,876 | |
| | | | | | | | | |
| Capital Markets 3.14% | | | | | | | | |
| Affiliated Managers Group, Inc. | | | 26,700 | | | | 4,272 | |
| Ameriprise Financial, Inc. | | | 17,600 | | | | 2,564 | |
| CME Group, Inc. | | | 13,000 | | | | 2,069 | |
| E*TRADE Financial Corp.* | | | 77,900 | | | | 4,659 | |
| Investments | | Shares | | | Fair
Value
(000) | |
| Invesco Ltd. | | | 51,800 | | | $ | 1,398 | |
| Total | | | | | | | 14,962 | |
| | | | | | | | | |
| Chemicals 2.75% | | | | | | | | |
| Celanese Corp. Series A | | | 35,400 | | | | 4,181 | |
| DowDuPont, Inc. | | | 24,900 | | | | 1,712 | |
| Ecolab, Inc. | | | 12,000 | | | | 1,688 | |
| Huntsman Corp. | | | 45,500 | | | | 1,526 | |
| LyondellBasell Industries NV Class A | | | 36,200 | | | | 4,011 | |
| Total | | | | | | | 13,118 | |
| | |
| Commercial Services & Supplies 0.31% | |
| KAR Auction Services, Inc. | | | 25,100 | | | | 1,492 | |
| | | | | | | | | |
| Communications Equipment 1.89% | |
| Cisco Systems, Inc. | | | 213,000 | | | | 9,008 | |
| | | | | | | | | |
| Construction Materials 0.68% | |
| Eagle Materials, Inc. | | | 32,400 | | | | 3,219 | |
| | | | | | | | | |
| Consumer Finance 1.82% | |
| Ally Financial, Inc. | | | 61,300 | | | | 1,641 | |
| Discover Financial Services | | | 69,700 | | | | 4,977 | |
| Santander Consumer USA Holdings, Inc. | | | 107,400 | | | | 2,066 | |
| Total | | | | | | | 8,684 | |
| | | | | | | | | |
| Containers & Packaging 0.94% | | |
| Graphic Packaging Holding Co. | | | 308,600 | | | | 4,484 | |
| | | | | | | | | |
| Diversified Financial Services 1.57% | |
| Berkshire Hathaway, Inc. Class B* | | | 26,400 | | | | 5,224 | |
| Voya Financial, Inc. | | | 44,300 | | | | 2,238 | |
| Total | | | | | | | 7,462 | |
| | | | | | | | | |
| Diversified Telecommunication Services 3.22% | | |
| AT&T, Inc. | | | 265,100 | | | | 8,475 | |
| Verizon Communications, Inc. | | | 133,600 | | | | 6,899 | |
| Total | | | | | | | 15,374 | |
| | See Notes to Financial Statements. | 13 |
Schedule of Investments (continued)
CALIBRATED LARGE CAP VALUE FUND July 31, 2018
| Investments | | Shares | | | Fair
Value
(000) | |
| Electric: Utilities 3.96% | | | | | | | | |
| American Electric Power Co., Inc. | | | 69,500 | | | $ | 4,944 | |
| Duke Energy Corp. | | | 59,800 | | | | 4,881 | |
| Edison International | | | 31,100 | | | | 2,072 | |
| Evergy, Inc. | | | 27,037 | | | | 1,517 | |
| PPL Corp. | | | 189,300 | | | | 5,446 | |
| Total | | | | | | | 18,860 | |
| | | | | | | | | |
| Electrical Equipment 1.66% | | | | | | | | |
| Eaton Corp. plc | | | 49,500 | | | | 4,117 | |
| Hubbell, Inc. | | | 30,800 | | | | 3,796 | |
| Total | | | | | | | 7,913 | |
| | | | | | | | | |
| Energy Equipment & Services 1.44% | |
| Rowan Cos., plc Class A* | | | 136,300 | | | | 1,974 | |
| Schlumberger Ltd. | | | 72,600 | | | | 4,902 | |
| Total | | | | | | | 6,876 | |
| | | | | | | | | |
| Equity Real Estate Investment Trusts 4.28% | |
| AvalonBay Communities, Inc. | | | 27,900 | | | | 4,934 | |
| Douglas Emmett, Inc. | | | 49,900 | | | | 1,938 | |
| Duke Realty Corp. | | | 142,200 | | | | 4,141 | |
| Federal Realty Investment Trust | | | 31,700 | | | | 3,978 | |
| Liberty Property Trust | | | 34,400 | | | | 1,475 | |
| UDR, Inc. | | | 51,200 | | | | 1,970 | |
| Welltower, Inc. | | | 31,200 | | | | 1,953 | |
| Total | | | | | | | 20,389 | |
| | | | | | | | | |
| Food & Staples Retailing 1.81% | | | | | | | | |
| Walgreens Boots Alliance, Inc. | | | 72,400 | | | | 4,896 | |
| Walmart, Inc. | | | 41,700 | | | | 3,721 | |
| Total | | | | | | | 8,617 | |
| | | | | | | | | |
| Food Products 1.62% | | | | | | | | |
| J.M. Smucker Co. (The) | | | 14,700 | | | | 1,633 | |
| Kraft Heinz Co. (The) | | | 38,000 | | | | 2,290 | |
| Tyson Foods, Inc. Class A | | | 65,500 | | | | 3,776 | |
| Total | | | | | | | 7,699 | |
| Investments | | Shares | | | Fair
Value
(000) | |
| Health Care Equipment & Supplies 2.45% | |
| Abbott Laboratories | | | 87,400 | | | $ | 5,728 | |
| Baxter International, Inc. | | | 21,000 | | | | 1,522 | |
| Medtronic plc (Ireland)(a) | | | 49,300 | | | | 4,448 | |
| Total | | | | | | | 11,698 | |
| | | | | | | | | |
| Health Care Providers & Services 3.69% | |
| Cardinal Health, Inc. | | | 55,700 | | | | 2,782 | |
| Centene Corp.* | | | 10,900 | | | | 1,421 | |
| Envision Healthcare Corp.* | | | 85,900 | | | | 3,802 | |
| Express Scripts Holding Co.* | | | 65,400 | | | | 5,197 | |
| HCA Healthcare, Inc. | | | 16,200 | | | | 2,012 | |
| Humana, Inc. | | | 7,500 | | | | 2,356 | |
| Total | | | | | | | 17,570 | |
| | | | | | | | | |
| Hotels, Restaurants & Leisure 0.85% | |
| Carnival Corp. | | | 39,500 | | | | 2,340 | |
| Las Vegas Sands Corp. | | | 23,900 | | | | 1,718 | |
| Total | | | | | | | 4,058 | |
| | | | | | | | | |
| Household Durables 0.94% | | | | | | | | |
| Lennar Corp. Class A | | | 58,500 | | | | 3,058 | |
| Whirlpool Corp. | | | 11,000 | | | | 1,442 | |
| Total | | | | | | | 4,500 | |
| | | | | | | | | |
| Household Products 1.60% | | | | | | | | |
| Kimberly-Clark Corp. | | | 14,700 | | | | 1,674 | |
| Procter & Gamble Co. (The) | | | 73,500 | | | | 5,944 | |
| Total | | | | | | | 7,618 | |
| | | | | | | | | |
| Information Technology Services 1.43% | |
| Cognizant Technology Solutions Corp. Class A | | | 44,700 | | | | 3,643 | |
| International Business Machines Corp. | | | 22,050 | | | | 3,196 | |
| Total | | | | | | | 6,839 | |
| | | | | | | | | |
| Insurance 4.98% | | | | | | | | |
| Allstate Corp. (The) | | | 15,100 | | | | 1,436 | |
| Arch Capital Group Ltd.* | | | 146,400 | | | | 4,474 | |
| Chubb Ltd. (Switzerland)(a) | | | 31,900 | | | | 4,457 | |
| Hartford Financial Services Group, Inc. (The) | | | 79,400 | | | | 4,184 | |
| 14 | See Notes to Financial Statements. | |
Schedule of Investments (continued)
CALIBRATED LARGE CAP VALUE FUND July 31, 2018
| Investments | | Shares | | | Fair
Value
(000) | |
| Insurance (continued) | | | | | | | | |
| Prudential Financial, Inc. | | | 26,800 | | | $ | 2,705 | |
| RenaissanceRe Holdings Ltd. | | | 35,500 | | | | 4,681 | |
| Unum Group | | | 44,900 | | | | 1,784 | |
| Total | | | | | | | 23,721 | |
| | | | | | | | | |
| Machinery 1.49% | | | | | | | | |
| Caterpillar, Inc. | | | 26,800 | | | | 3,854 | |
| Parker-Hannifin Corp. | | | 19,300 | | | | 3,263 | |
| Total | | | | | | | 7,117 | |
| | | | | | | | | |
| Media 2.57% | | | | | | | | |
| Charter Communications, Inc. Class A* | | | 10,200 | | | | 3,106 | |
| Comcast Corp. Class A | | | 161,400 | | | | 5,775 | |
| Walt Disney Co. (The) | | | 29,700 | | | | 3,373 | |
| Total | | | | | | | 12,254 | |
| | | | | | | | | |
| Multi-Line Retail 1.08% | | | | | | | | |
| Target Corp. | | | 64,000 | | | | 5,164 | |
| | | | | | | | | |
| Multi-Utilities 1.49% | | | | | | | | |
| Dominion Energy, Inc. | | | 55,200 | | | | 3,958 | |
| Sempra Energy | | | 27,000 | | | | 3,121 | |
| Total | | | | | | | 7,079 | |
| | | | | | | | | |
| Oil, Gas & Consumable Fuels 9.37% | |
| Anadarko Petroleum Corp. | | | 55,500 | | | | 4,060 | |
| Chevron Corp. | | | 118,000 | | | | 14,900 | |
| ConocoPhillips | | | 94,300 | | | | 6,806 | |
| Devon Energy Corp. | | | 89,900 | | | | 4,047 | |
| Exxon Mobil Corp. | | | 81,700 | | | | 6,659 | |
| Kinder Morgan, Inc. | | | 112,000 | | | | 1,991 | |
| Valero Energy Corp. | | | 52,500 | | | | 6,213 | |
| Total | | | | | | | 44,676 | |
| | | | | | | | | |
| Pharmaceuticals 7.41% | | | | | | | | |
| Jazz Pharmaceuticals plc (Ireland)*(a) | | | 13,500 | | | | 2,336 | |
| Johnson & Johnson | | | 68,200 | | | | 9,038 | |
| Merck & Co., Inc. | | | 89,200 | | | | 5,876 | |
| Mylan NV* | | | 99,600 | | | | 3,716 | |
| Pfizer, Inc. | | | 359,300 | | | | 14,347 | |
| Total | | | | | | | 35,313 | |
| Investments | | | Shares | | | | Fair
Value
(000) | |
| Road & Rail 1.11% | | | | | | | | |
| Union Pacific Corp. | | | 35,200 | | | $ | 5,276 | |
| | | | | | | | | |
| Semiconductors & Semiconductor Equipment 3.93% |
| Broadcom, Inc. | | | 14,200 | | | | 3,149 | |
| Intel Corp. | | | 196,700 | | | | 9,461 | |
| Qorvo, Inc.* | | | 33,900 | | | | 2,772 | |
| QUALCOMM, Inc. | | | 52,600 | | | | 3,371 | |
| Total | | | | | | | 18,753 | |
| | | | | | | | | |
| Software 1.69% | | | | | | | | |
| FireEye, Inc.* | | | 146,900 | | | | 2,281 | |
| Microsoft Corp. | | | 25,500 | | | | 2,705 | |
| Oracle Corp. | | | 64,800 | | | | 3,090 | |
| Total | | | | | | | 8,076 | |
| | | | | | | | | |
| Specialty Retail 0.79% | | | | | | | | |
| AutoZone, Inc.* | | | 2,800 | | | | 1,975 | |
| Sally Beauty Holdings, Inc.* | | | 108,600 | | | | 1,791 | |
| Total | | | | | | | 3,766 | |
| | | | | | | | | |
| Technology Hardware, Storage & Peripherals 0.92% | |
| NetApp, Inc. | | | 39,400 | | | | 3,054 | |
| Xerox Corp. | | | 51,000 | | | | 1,325 | |
| Total | | | | | | | 4,379 | |
| | | | | | | | | |
| Tobacco 0.95% | | | | | | | | |
| Philip Morris International, Inc. | | | 52,700 | | | | 4,548 | |
| | | | | | | | | |
| Trading Companies & Distributors 0.82% | |
| Air Lease Corp. | | | 89,000 | | | | 3,913 | |
| | | | | | | | | |
| Wireless Telecommunication Services 0.29% | |
| T-Mobile US, Inc.* | | | 23,200 | | | | 1,392 | |
Total Common Stocks
(cost $446,207,110) | | | | | | | 473,973 | |
| | See Notes to Financial Statements. | 15 |
Schedule of Investments (continued)
CALIBRATED LARGE CAP VALUE FUND July 31, 2018
| Investments | | Principal
Amount
(000) | | | Fair
Value
(000) | |
| SHORT-TERM INVESTMENTS 0.28% | |
| | | | | | | | | |
| Repurchase Agreement | | | | | | | | |
Repurchase Agreement dated 7/31/2018, 1.05% due 8/1/2018 with Fixed Income Clearing Corp. collateralized by $1,405,000 of U.S. Treasury Note at 1.875% due 2/28/2022 value: $1,371,669; proceeds: $1,342,973
(cost $1,342,933) | | | $1,343 | | | $ | 1,343 | |
Total Investments in Securities 99.70%
(cost $447,550,043) | | | | | | | 475,316 | |
| Cash and Other Assets in Excess of Liabilities(b) 0.30% | | | | | | | 1,450 | |
| Net Assets 100.00% | | | | | | $ | 476,766 | |
| * | | Non-income producing security. |
| (a) | | Foreign security traded in U.S. dollars. |
| (b) | | Cash and Other Assets in Excess of Liabilities include net unrealized appreciation on futures contracts as follows: |
Open Futures Contracts at July 31, 2018:
| Type | | Expiration | | Contracts | | Position | | Notional
Amount | | Notional
Value | | Unrealized
Appreciation |
| E-Mini S&P 500 Index | | September 2018 | | 16 | | Long | | $2,226,471 | | $2,253,680 | | $27,209 |
| 16 | See Notes to Financial Statements. | |
Schedule of Investments (concluded)
CALIBRATED LARGE CAP VALUE FUND July 31, 2018
The following is a summary of the inputs used as of July 31, 2018 in valuing the Fund’s investments carried at fair value(1):
| Investment Type(2)(3) | | Level 1
(000) | | | Level 2
(000) | | | Level 3
(000) | | | Total
(000) | |
| Common Stocks | | $ | 473,973 | | | $ | – | | | $ | – | | | $ | 473,973 | |
| Short-Term Investment | | | | | | | | | | | | | | | | |
| Repurchase Agreement | | | – | | | | 1,343 | | | | – | | | | 1,343 | |
| Total | | $ | 473,973 | | | $ | 1,343 | | | $ | – | | | $ | 475,316 | |
| | | | | | | | | | | | | | | | | |
| Other Financial Instruments | | | | | | | | | | | | | | | | |
| Futures Contracts | | | | | | | | | | | | | | | | |
| Assets | | $ | 27 | | | $ | – | | | $ | – | | | $ | 27 | |
| Liabilities | | | – | | | | – | | | | – | | | | – | |
| Total | | $ | 27 | | | $ | – | | | $ | – | | | $ | 27 | |
| (1) | | Refer to Note 2(h) for a description of fair value measurements and the three-tier hierarchy of inputs. |
| (2) | | See Schedule of Investments for fair values in each industry and identification of foreign issuers and/or geography. |
| (3) | | There were no Level 1/Level 2 transfers during the fiscal year ended July 31, 2018. |
| | See Notes to Financial Statements. | 17 |
Schedule of Investments
CALIBRATED MID CAP VALUE FUND July 31, 2018
| Investments | | Shares | | | Fair
Value
(000) | |
| COMMON STOCKS 99.56% | | | | | | | | |
| | | | | | | | | |
| Aerospace & Defense 1.85% | | | | | | | | |
| Harris Corp. | | | 52,800 | | | $ | 8,709 | |
| Textron, Inc. | | | 81,200 | | | | 5,544 | |
| Total | | | | | | | 14,253 | |
| | | | | | | | | |
| Airlines 1.35% | | | | | | | | |
| Alaska Air Group, Inc. | | | 27,500 | | | | 1,728 | |
| American Airlines Group, Inc. | | | 113,700 | | | | 4,496 | |
| United Continental Holdings, Inc.* | | | 51,500 | | | | 4,140 | |
| Total | | | | | | | 10,364 | |
| | | | | | | | | |
| Auto Components 0.81% | | | | | | | | |
| Gentex Corp. | | | 268,400 | | | | 6,227 | |
| | | | | | | | | |
| Banks 7.55% | | | | | | | | |
| Citizens Financial Group, Inc. | | | 218,600 | | | | 8,696 | |
| Comerica, Inc. | | | 105,700 | | | | 10,247 | |
| First Horizon National Corp. | | | 274,200 | | | | 4,906 | |
| KeyCorp | | | 543,800 | | | | 11,349 | |
| M&T Bank Corp. | | | 57,700 | | | | 10,002 | |
| TCF Financial Corp. | | | 247,200 | | | | 6,207 | |
| Western Alliance Bancorp* | | | 118,800 | | | | 6,738 | |
| Total | | | | | | | 58,145 | |
| | | | | | | | | |
| Beverages 0.64% | | | | | | | | |
| Molson Coors Brewing Co. Class B | | | 73,600 | | | | 4,931 | |
| | | | | | | | | |
| Building Products 0.66% | | | | | | | | |
| Lennox International, Inc. | | | 23,400 | | | | 5,080 | |
| | | | | | | | | |
| Capital Markets 2.50% | | | | | | | | |
| Affiliated Managers Group, Inc. | | | 17,100 | | | | 2,736 | |
| E*TRADE Financial Corp.* | | | 133,600 | | | | 7,990 | |
| Invesco Ltd. | | | 314,700 | | | | 8,494 | |
| Total | | | | | | | 19,220 | |
| | | | | | | | | |
| Chemicals 1.67% | | | | | | | | |
| Celanese Corp. Series A | | | 73,100 | | | | 8,634 | |
| Huntsman Corp. | | | 126,301 | | | | 4,235 | |
| Total | | | | | | | 12,869 | |
| Investments | | Shares | | | Fair
Value
(000) | |
| Commercial Services & Supplies 1.00% | | | |
| KAR Auction Services, Inc. | | | 88,300 | | | $ | 5,249 | |
| Republic Services, Inc. | | | 34,200 | | | | 2,479 | |
| Total | | | | | | | 7,728 | |
| | | | | | | | | |
| Communications Equipment 0.63% | | | | |
| Juniper Networks, Inc. | | | 183,400 | | | | 4,831 | |
| | | | | | | | | |
| Construction Materials 0.70% | | | | | | | | |
| Eagle Materials, Inc. | | | 53,900 | | | | 5,355 | |
| | | | | | | | | |
| Consumer Finance 1.68% | | | | | | | | |
| Discover Financial Services | | | 48,000 | | | | 3,428 | |
| Santander Consumer USA Holdings, Inc. | | | 122,000 | | | | 2,347 | |
| Synchrony Financial | | | 248,400 | | | | 7,189 | |
| Total | | | | | | | 12,964 | |
| | | | | | | | | |
| Containers & Packaging 2.61% | | | | | | | | |
| Avery Dennison Corp. | | | 24,000 | | | | 2,752 | |
| Bemis Co., Inc. | | | 49,500 | | | | 2,273 | |
| Crown Holdings, Inc.* | | | 102,500 | | | | 4,640 | |
| Graphic Packaging Holding Co. | | | 434,600 | | | | 6,315 | |
| International Paper Co. | | | 76,500 | | | | 4,110 | |
| Total | | | | | | | 20,090 | |
| | | | | | | | | |
| Electric: Utilities 4.79% | | | | | | | | |
| Alliant Energy Corp. | | | 129,800 | | | | 5,578 | |
| Edison International | | | 110,600 | | | | 7,369 | |
| Evergy, Inc. | | | 138,500 | | | | 7,768 | |
| Eversource Energy | | | 55,600 | | | | 3,376 | |
| PPL Corp. | | | 343,200 | | | | 9,874 | |
| Xcel Energy, Inc. | | | 61,600 | | | | 2,887 | |
| Total | | | | | | | 36,852 | |
| | | | | | | | | |
| Electrical Equipment 1.64% | | | | | | | | |
| AMETEK, Inc. | | | 32,400 | | | | 2,521 | |
| Hubbell, Inc. | | | 57,500 | | | | 7,087 | |
| nVent Electric plc (United Kingdom)(a) | | | 109,600 | | | | 3,003 | |
| Total | | | | | | | 12,611 | |
| 18 | See Notes to Financial Statements. | |
Schedule of Investments (continued)
CALIBRATED MID CAP VALUE FUND July 31, 2018
| Investments | | Shares | | | Fair
Value
(000) | |
| Electronic Equipment, Instruments & Components 1.26% | | |
| Corning, Inc. | | | 207,800 | | | $ | 6,895 | |
| Jabil, Inc. | | | 100,300 | | | | 2,825 | |
| Total | | | | | | | 9,720 | |
| | | | | | | | | |
| Energy Equipment & Services 2.02% | | | | | | | | |
| National Oilwell Varco, Inc. | | | 137,300 | | | | 6,675 | |
| Rowan Cos., plc Class A* | | | 424,700 | | | | 6,150 | |
| Superior Energy Services, Inc.* | | | 274,900 | | | | 2,705 | |
| Total | | | | | | | 15,530 | |
| | | | | | | | | |
| Equity Real Estate Investment Trusts 12.79% | | | |
| American Homes 4 Rent Class A | | | 149,200 | | | | 3,303 | |
| AvalonBay Communities, Inc. | | | 35,100 | | | | 6,207 | |
| Boston Properties, Inc. | | | 62,500 | | | | 7,846 | |
| Digital Realty Trust, Inc. | | | 33,000 | | | | 4,007 | |
| Duke Realty Corp. | | | 280,100 | | | | 8,156 | |
| Essex Property Trust, Inc. | | | 23,000 | | | | 5,530 | |
| Extra Space Storage, Inc. | | | 25,900 | | | | 2,434 | |
| Federal Realty Investment Trust | | | 54,700 | | | | 6,865 | |
| GGP, Inc. | | | 268,000 | | | | 5,714 | |
| Mid-America Apartment Communities, Inc. | | | 51,200 | | | | 5,160 | |
| Regency Centers Corp. | | | 68,500 | | | | 4,359 | |
| SL Green Realty Corp. | | | 84,800 | | | | 8,744 | |
| Starwood Property Trust, Inc. | | | 207,600 | | | | 4,741 | |
| UDR, Inc. | | | 252,200 | | | | 9,705 | |
| Ventas, Inc. | | | 150,100 | | | | 8,463 | |
| Vornado Realty Trust | | | 101,300 | | | | 7,285 | |
| Total | | | | | | | 98,519 | |
| | | | | | | | | |
| Food & Staples Retailing 0.71% | | | | | | | | |
| US Foods Holding Corp.* | | | 161,900 | | | | 5,474 | |
| | | | | | | | | |
| Food Products 2.55% | | | | | | | | |
| Bunge Ltd. | | | 80,200 | | | | 5,544 | |
| Hormel Foods Corp. | | | 76,300 | | | | 2,745 | |
| J.M. Smucker Co. (The) | | | 36,700 | | | | 4,078 | |
| Investments | | Shares | | | Fair
Value
(000) | |
| Tyson Foods, Inc. Class A | | | 126,000 | | | $ | 7,264 | |
| Total | | | | | | | 19,631 | |
| | | | | | | | | |
| Health Care Equipment & Supplies 1.76% | | | |
| Hill-Rom Holdings, Inc. | | | 49,200 | | | | 4,635 | |
| Hologic, Inc.* | | | 62,200 | | | | 2,669 | |
| Zimmer Biomet Holdings, Inc. | | | 50,000 | | | | 6,276 | |
| Total | | | | | | | 13,580 | |
| | | | | | | | | |
| Health Care Providers & Services 2.98% | | |
| Cardinal Health, Inc. | | | 57,500 | | | | 2,872 | |
| Centene Corp.* | | | 24,200 | | | | 3,154 | |
| Envision Healthcare Corp.* | | | 124,800 | | | | 5,524 | |
| Laboratory Corp. of America Holdings* | | | 31,100 | | | | 5,453 | |
| Universal Health Services, Inc. Class B | | | 48,800 | | | | 5,958 | |
| Total | | | | | | | 22,961 | |
| | | | | | | | | |
| Hotels, Restaurants & Leisure 1.79% | | | | | | | | |
| Aramark | | | 190,300 | | | | 7,652 | |
| MGM Resorts International | | | 145,700 | | | | 4,570 | |
| Norwegian Cruise Line Holdings Ltd.* | | | 30,500 | | | | 1,526 | |
| Total | | | | | | | 13,748 | |
| | | | | | | | | |
| Household Durables 1.99% | | | | | | | | |
| Leggett & Platt, Inc. | | | 44,000 | | | | 1,917 | |
| Lennar Corp. Class A | | | 157,841 | | | | 8,250 | |
| Newell Brands, Inc. | | | 198,300 | | | | 5,194 | |
| Total | | | | | | | 15,361 | |
| | | | | | | | | |
| Household Products 0.84% | | | | | | | | |
| Church & Dwight Co., Inc. | | | 115,400 | | | | 6,451 | |
| | | | | | | | | |
| Independent Power and Renewable Electricity Producer 1.11% | | |
| AES Corp. | | | 638,300 | | | | 8,528 | |
| | | | | | | | | |
| Information Technology Services 3.57% | | | |
| DXC Technology Co. | | | 55,900 | | | | 4,737 | |
| Fidelity National Information Services, Inc. | | | 65,700 | | | | 6,776 | |
| Leidos Holdings, Inc. | | | 138,400 | | | | 9,469 | |
| | See Notes to Financial Statements. | 19 |
Schedule of Investments (continued)
CALIBRATED MID CAP VALUE FUND July 31, 2018
| Investments | | Shares | | | Fair
Value
(000) | |
| Information Technology Services (continued) | | |
| Worldpay, Inc. Class A* | | | 79,700 | | | $ | 6,550 | |
| Total | | | | | | | 27,532 | |
| | | | | | | | | |
| Insurance 6.35% | | | | | | | | |
| Arch Capital Group Ltd.* | | | 273,800 | | | | 8,367 | |
| Argo Group International Holdings Ltd. | | | 42,000 | | | | 2,627 | |
| Arthur J Gallagher & Co. | | | 84,400 | | | | 6,022 | |
| Fidelity National Financial, Inc. | | | 123,300 | | | | 4,994 | |
| Hanover Insurance Group, Inc. (The) | | | 19,600 | | | | 2,458 | |
| Hartford Financial Services Group, Inc. (The) | | | 171,600 | | | | 9,043 | |
| Lincoln National Corp. | | | 37,600 | | | | 2,561 | |
| RenaissanceRe Holdings Ltd. | | | 55,700 | | | | 7,344 | |
| Unum Group | | | 138,800 | | | | 5,515 | |
| Total | | | | | | | 48,931 | |
| | | | | | | | | |
| Internet Software & Services 0.30% | | | |
| Twitter, Inc.* | | | 71,600 | | | | 2,282 | |
| | | | | | | | | |
| Leisure Products 0.45% | | | | | | | | |
| Hasbro, Inc. | | | 34,500 | | | | 3,436 | |
| | | | | | | | | |
| Life Sciences Tools & Services 0.58% | | | |
| PerkinElmer, Inc. | | | 56,500 | | | | 4,474 | |
| | | | | | | | | |
| Machinery 3.59% | | | | | | | | |
| Cummins, Inc. | | | 21,400 | | | | 3,056 | |
| IDEX Corp. | | | 27,100 | | | | 4,162 | |
| PACCAR, Inc. | | | 68,700 | | | | 4,515 | |
| Parker-Hannifin Corp. | | | 18,600 | | | | 3,144 | |
| Pentair plc (United Kingdom)(a) | | | 108,300 | | | | 4,836 | |
| Stanley Black & Decker, Inc. | | | 53,100 | | | | 7,937 | |
| Total | | | | | | | 27,650 | |
| | | | | | | | | |
| Media 2.48% | | | | | | | | |
| Cinemark Holdings, Inc. | | | 180,100 | | | | 6,469 | |
| Discovery, Inc. Class A* | | | 137,600 | | | | 3,658 | |
| Investments | | Shares | | | Fair
Value
(000) | |
| Interpublic Group of Cos., Inc. (The) | | | 231,500 | | | $ | 5,220 | |
| Viacom, Inc. Class B | | | 128,500 | | | | 3,733 | |
| Total | | | | | | | 19,080 | |
| | | | | | | | | |
| Metals & Mining 0.75% | | | | | | | | |
| Steel Dynamics, Inc. | | | 122,200 | | | | 5,754 | |
| | | | | | | | | |
| Multi-Line Retail 1.87% | | | | | | | | |
| Dollar General Corp. | | | 68,700 | | | | 6,743 | |
| Kohl’s Corp. | | | 60,200 | | | | 4,447 | |
| Macy’s, Inc. | | | 80,700 | | | | 3,206 | |
| Total | | | | | | | 14,396 | |
| | | | | | | | | |
| Multi-Utilities 3.51% | | | | | | | | |
| Ameren Corp. | | | 82,100 | | | | 5,095 | |
| Consolidated Edison, Inc. | | | 58,200 | | | | 4,594 | |
| Public Service Enterprise Group, Inc. | | | 166,900 | | | | 8,605 | |
| Sempra Energy | | | 75,400 | | | | 8,716 | |
| Total | | | | | | | 27,010 | |
| | | | | | | | | |
| Oil, Gas & Consumable Fuels 5.73% | | |
| Cimarex Energy Co. | | | 66,700 | | | | 6,576 | |
| Continental Resources, Inc.* | | | 92,000 | | | | 5,876 | |
| EQT Corp. | | | 65,600 | | | | 3,259 | |
| Marathon Oil Corp. | | | 408,600 | | | | 8,630 | |
| Marathon Petroleum Corp. | | | 77,900 | | | | 6,297 | |
| Noble Energy, Inc. | | | 235,100 | | | | 8,485 | |
| Pioneer Natural Resources Co. | | | 8,600 | | | | 1,628 | |
| Williams Cos., Inc. (The) | | | 114,700 | | | | 3,412 | |
| Total | | | | | | | 44,163 | |
| | | | | | | | | |
| Paper & Forest Products 0.46% | | | | | | | | |
| Domtar Corp. | | | 74,300 | | | | 3,583 | |
| | | | | | | | | |
| Pharmaceuticals 1.76% | | | | | | | | |
| Jazz Pharmaceuticals plc (Ireland)*(a) | | | 26,000 | | | | 4,500 | |
| Mylan NV* | | | 243,200 | | | | 9,074 | |
| Total | | | | | | | 13,574 | |
| 20 | See Notes to Financial Statements. | |
Schedule of Investments (continued)
CALIBRATED MID CAP VALUE FUND July 31, 2018
| Investments | | Shares | | | Fair
Value
(000) | |
| Professional Services 0.78% | | | | | | | | |
| ManpowerGroup, Inc. | | | 64,100 | | | $ | 5,978 | |
| | | | | | | | | |
| Real Estate Management & Development 0.50% | |
| Jones Lang LaSalle, Inc. | | | 22,700 | | | | 3,882 | |
| | | | | | | | | |
| Road & Rail 0.69% | | | | | | | | |
| Ryder System, Inc. | | | 67,900 | | | | 5,316 | |
| | | | | | | | | |
| Semiconductors & Semiconductor Equipment 1.62% | | | |
| Marvell Technology Group Ltd. | | | 233,300 | | | | 4,972 | |
| Qorvo, Inc.* | | | 91,800 | | | | 7,505 | |
| Total | | | | | | | 12,477 | |
| | | | | | | | | |
| Specialty Retail 1.45% | | | | | | | | |
| AutoZone, Inc.* | | | 3,900 | | | | 2,752 | |
| Burlington Stores, Inc.* | | | 25,300 | | | | 3,866 | |
| Penske Automotive Group, Inc. | | | 87,700 | | | | 4,578 | |
| Total | | | | | | | 11,196 | |
| | | | | | | | | |
| Technology Hardware, Storage & Peripherals 1.47% | | |
| NetApp, Inc. | | | 102,600 | | | | 7,954 | |
| Western Digital Corp. | | | 48,300 | | | | 3,388 | |
| Total | | | | | | | 11,342 | |
| | | | | | | | | |
| Textiles, Apparel & Luxury Goods 0.38% | | | |
| PVH Corp. | | | 18,900 | | | | 2,901 | |
| | | | | | | | | |
| Trading Companies & Distributors 1.39% | | | | | | | | |
| Air Lease Corp. | | | 148,700 | | | | 6,537 | |
| HD Supply Holdings, Inc.* | | | 95,100 | | | | 4,182 | |
| Total | | | | | | | 10,719 | |
Total Common Stocks
(cost $747,146,974) | | | | | | | 766,699 | |
| Investments | | Principal
Amount
(000) | | | Fair
Value
(000) | |
| SHORT-TERM INVESTMENTS 0.46% | | | |
| | | | | | | | | |
| Repurchase Agreement | | | | | | | | |
Repurchase Agreement dated 7/31/2018, 1.05% due 8/1/2018 with Fixed Income Clearing Corp. collateralized by $3,690,000 of U.S. Treasury Note at 1.875% due 2/28/2022; value: $3,602,462; proceeds: $3,530,481
(cost $3,530,378) | | | $3,530 | | | $ | 3,530 | |
Total Investments in Securities 100.02%
(cost $750,677,352) | | | | | | | 770,229 | |
| Liabilities in Excess of Other Assets(b) (0.02)% | | | | | | | (160 | ) |
| Net Assets 100.00% | | | | | | $ | 770,069 | |
| * | | Non-income producing security. |
| (a) | | Foreign security traded in U.S. dollars. |
| (b) | | Liabilities in Excess of Other Assets include net unrealized appreciation on futures contracts as follows: |
| | See Notes to Financial Statements. | 21 |
Schedule of Investments (concluded)
CALIBRATED MID CAP VALUE FUND July 31, 2018
Open Futures Contracts at July 31, 2018:
| Type | | Expiration | | Contracts | | Position | | Notional
Amount | | Notional
Value | | Unrealized
Appreciation |
| E-Mini S&P 500 Index | | September 2018 | | 21 | | Long | | $2,908,753 | | $2,957,955 | | $49,202 |
The following is a summary of the inputs used as of July 31, 2018 in valuing the Fund’s investments carried at fair value(1):
| | | Level 1 | | | Level 2 | | | Level 3 | | | Total | |
| Investment Type(2)(3) | | | (000) | | | | (000) | | | | (000) | | | | (000) | |
| Common Stocks | | $ | 766,699 | | | $ | – | | | $ | – | | | $ | 766,699 | |
| Short-Term Investment | | | | | | | | | | | | | | | | |
| Repurchase Agreement | | | – | | | | 3,530 | | | | – | | | | 3,530 | |
| Total | | $ | 766,699 | | | $ | 3,530 | | | $ | – | | | $ | 770,229 | |
| | | | | | | | | | | | | | | | | |
| Other Financial Instruments | | | | | | | | | | | | | | | | |
| Futures Contracts | | | | | | | | | | | | | | | | |
| Assets | | $ | 49 | | | $ | – | | | $ | – | | | $ | 49 | |
| Liabilities | | | – | | | | – | | | | – | | | | – | |
| Total | | $ | 49 | | | $ | – | | | $ | – | | | $ | 49 | |
| (1) | | Refer to Note 2(h) for a description of fair value measurements and the three-tier hierarchy of inputs. |
| (2) | | See Schedule of Investments for fair values in each industry and identification of foreign issuers and/or geography. |
| (3) | | There were no Level 1/Level 2 transfers during the fiscal year ended July 31, 2018. |
| 22 | See Notes to Financial Statements. | |
Statements of Assets and Liabilities
July 31, 2018
| | | Calibrated Large
Cap Value Fund | | | Calibrated Mid
Cap Value Fund | |
| ASSETS: | | | | | | | | |
| Investments in securities, at cost | | $ | 447,550,043 | | | $ | 750,677,352 | |
| Investments in securities, at fair value | | $ | 475,315,759 | | | $ | 770,228,988 | |
| Cash | | | 5,600 | | | | – | |
| Deposits with brokers for futures collateral | | | 72,800 | | | | 117,600 | |
| Receivables: | | | | | | | | |
| Investment securities sold | | | 964,852 | | | | 249,567 | |
| Interest and dividends | | | 548,332 | | | | 250,870 | |
| Capital shares sold | | | 240,707 | | | | 252,247 | |
| From advisor (See Note 3) | | | 40,003 | | | | 27,615 | |
| Variation margin for futures contracts | | | 8,854 | | | | 14,538 | |
| Prepaid expenses and other assets | | | 41,698 | | | | 45,748 | |
| Total assets | | | 477,238,605 | | | | 771,187,173 | |
| LIABILITIES: | | | | | | | | |
| Payables: | | | | | | | | |
| Management fee | | | 238,929 | | | | 390,394 | |
| Capital shares reacquired | | | 63,116 | | | | 367,377 | |
| Trustees’ fees | | | 45,911 | | | | 77,093 | |
| 12b-1 distribution plan | | | 30,662 | | | | 81,226 | |
| Fund administration | | | 15,929 | | | | 26,026 | |
| To bank | | | – | | | | 84 | |
| Accrued expenses | | | 78,265 | | | | 175,706 | |
| Total liabilities | | | 472,812 | | | | 1,117,906 | |
| NET ASSETS | | $ | 476,765,793 | | | $ | 770,069,267 | |
| COMPOSITION OF NET ASSETS: | | | | | | | | |
| Paid-in capital | | $ | 436,031,455 | | | $ | 706,564,482 | |
| Undistributed net investment income | | | 4,269,347 | | | | 3,905,389 | |
| Accumulated net realized gain on investments and futures contracts | | | 8,672,066 | | | | 39,998,558 | |
| Net unrealized appreciation on investments and futures contracts | | | 27,792,925 | | | | 19,600,838 | |
| Net Assets | | $ | 476,765,793 | | | $ | 770,069,267 | |
| | See Notes to Financial Statements. | 23 |
Statements of Assets and Liabilities (concluded)
July 31, 2018
| | | Calibrated Large
Cap Value Fund | | | Calibrated Mid
Cap Value Fund | |
| Net assets by class: | | | | | | | | |
| Class A Shares | | $ | 69,437,872 | | | $ | 93,147,090 | |
| Class C Shares | | $ | 13,546,112 | | | $ | 44,206,416 | |
| Class F Shares | | $ | 8,500,625 | | | $ | 92,221,240 | |
| Class F3 Shares | | $ | 3,475,719 | | | $ | 3,265,502 | |
| Class I Shares | | $ | 378,923,858 | | | $ | 514,972,088 | |
| Class R2 Shares | | $ | 497,033 | | | $ | 1,582,188 | |
| Class R3 Shares | | $ | 112,934 | | | $ | 5,479,688 | |
| Class R4 Shares | | $ | 12,462 | | | $ | 4,306,916 | |
| Class R5 Shares | | $ | 12,559 | | | $ | 4,611,364 | |
| Class R6 Shares | | $ | 2,246,619 | | | $ | 6,276,775 | |
| Outstanding shares by class (unlimited number of authorized shares of beneficial interest): | | | | | | | | |
| Class A Shares | | | 3,299,110 | | | | 4,194,711 | |
| Class C Shares | | | 656,599 | | | | 2,036,868 | |
| Class F Shares | | | 402,474 | | | | 4,141,024 | |
| Class F3 Shares | | | 164,552 | | | | 146,440 | |
| Class I Shares | | | 17,950,074 | | | | 23,097,787 | |
| Class R2 Shares | | | 23,509 | | | | 71,234 | |
| Class R3 Shares | | | 5,404.55 | | | | 246,655 | |
| Class R4 Shares | | | 593.37 | | | | 194,567 | |
| Class R5 Shares | | | 595.21 | | | | 206,855 | |
| Class R6 Shares | | | 106,390 | | | | 281,470 | |
| Net asset value, offering and redemption price per share (Net assets divided by outstanding shares): | | | | | | | | |
| Class A Shares-Net asset value | | | $21.05 | | | | $22.21 | |
| Class A Shares-Maximum offering price (Net asset value plus sales charge of 5.75%) | | | $22.33 | | | | $23.56 | |
| Class C Shares-Net asset value | | | $20.63 | | | | $21.70 | |
| Class F Shares-Net asset value | | | $21.12 | | | | $22.27 | |
| Class F3 Shares-Net asset value | | | $21.12 | | | | $22.30 | |
| Class I Shares-Net asset value | | | $21.11 | | | | $22.30 | |
| Class R2 Shares-Net asset value | | | $21.14 | | | | $22.21 | |
| Class R3 Shares-Net asset value | | | $20.90 | | | | $22.22 | |
| Class R4 Shares-Net asset value | | | $21.00 | | | | $22.14 | |
| Class R5 Shares-Net asset value | | | $21.10 | | | | $22.29 | |
| Class R6 Shares-Net asset value | | | $21.12 | | | | $22.30 | |
| 24 | See Notes to Financial Statements. |
Statements of Operations
For the Year Ended July 31, 2018
| | | Calibrated Large
Cap Value Fund | | | Calibrated Mid
Cap Value Fund | |
| Investment income: | | | | | | | | |
| Dividends | | $ | 11,857,764 | | | $ | 17,358,612 | |
| Interest and other | | | 12,359 | | | | 17,524 | |
| Total investment income | | | 11,870,123 | | | | 17,376,136 | |
| Expenses: | | | | | | | | |
| Management fee | | | 2,874,006 | | | | 5,435,996 | |
| 12b-1 distribution plan-Class A | | | 185,579 | | | | 239,834 | |
| 12b-1 distribution plan-Class C | | | 151,299 | | | | 469,327 | |
| 12b-1 distribution plan-Class F | | | 12,495 | | | | 116,480 | |
| 12b-1 distribution plan-Class R2 | | | 2,836 | | | | 12,203 | |
| 12b-1 distribution plan-Class R3 | | | 880 | | | | 25,494 | |
| 12b-1 distribution plan-Class R4 | | | 30 | | | | 9,999 | |
| Fund administration | | | 191,601 | | | | 362,400 | |
| Shareholder servicing | | | 79,024 | | | | 384,843 | |
| Registration | | | 127,440 | | | | 137,683 | |
| Professional | | | 61,017 | | | | 73,846 | |
| Custody | | | 36,399 | | | | 92,897 | |
| Reports to shareholders | | | 28,398 | | | | 60,334 | |
| Trustees’ fees | | | 12,126 | | | | 23,791 | |
| Other | | | 45,296 | | | | 66,941 | |
| Gross expenses | | | 3,808,426 | | | | 7,512,068 | |
| Expense reductions (See Note 9) | | | (1,678 | ) | | | (4,729 | ) |
| Fees waived and expenses reimbursed (See Note 3) | | | (593,240 | ) | | | (413,341 | ) |
| Net expenses | | | 3,213,508 | | | | 7,093,998 | |
| Net investment income | | | 8,656,615 | | | | 10,282,138 | |
| Net realized and unrealized gain (loss): | | | | | | | | |
| Net realized gain on investments | | | 19,951,311 | | | | 56,313,078 | |
| Net realized gain on futures contracts | | | 77,759 | | | | 494,276 | |
| Net change in unrealized appreciation/depreciation on investments | | | 11,638,269 | | | | 1,682,144 | |
| Net change in unrealized appreciation/depreciation on futures contracts | | | (1,495 | ) | | | (4,374 | ) |
| Net realized and unrealized gain | | | 31,665,844 | | | | 58,485,124 | |
| Net Increase in Net Assets Resulting From Operations | | $ | 40,322,459 | | | $ | 68,767,262 | |
| | See Notes to Financial Statements. | 25 |
Statements of Changes in Net Assets
| | | Calibrated Large Cap Value Fund |
| INCREASE (DECREASE) IN NET ASSETS | | For the Year Ended
July 31, 2018 | | | For the Year Ended
July 31, 2017 | |
| Operations: | | | | | | | | |
| Net investment income | | $ | 8,656,615 | | | $ | 9,770,900 | |
| Net realized gain on investments and futures contracts | | | 20,029,070 | | | | 32,043,840 | |
| Net change in unrealized appreciation/depreciation on investments and futures contracts | | | 11,636,774 | | | | 11,424,377 | |
| Net increase in net assets resulting from operations | | | 40,322,459 | | | | 53,239,117 | |
| Distributions to shareholders from: | | | | | | | | |
| Net investment income | | | | | | | | |
| Class A | | | (1,356,851 | ) | | | (1,461,404 | ) |
| Class C | | | (142,580 | ) | | | (218,174 | ) |
| Class F | | | (217,480 | ) | | | (355,001 | ) |
| Class F3 | | | (81,717 | ) | | | – | |
| Class I | | | (7,354,848 | ) | | | (7,359,121 | ) |
| Class R2 | | | (6,313 | ) | | | (6,624 | ) |
| Class R3 | | | (3,497 | ) | | | (3,419 | ) |
| Class R4 | | | (200 | ) | | | (218 | ) |
| Class R5 | | | (230 | ) | | | (242 | ) |
| Class R6 | | | (47,856 | ) | | | (243 | ) |
| Net realized gain | | | | | | | | |
| Class A | | | (5,429,992 | ) | | | (1,076,582 | ) |
| Class C | | | (1,075,278 | ) | | | (260,387 | ) |
| Class F | | | (818,600 | ) | | | (241,945 | ) |
| Class F3 | | | (284,075 | ) | | | – | |
| Class I | | | (25,598,219 | ) | | | (4,855,519 | ) |
| Class R2 | | | (31,081 | ) | | | (5,751 | ) |
| Class R3 | | | (15,768 | ) | | | (2,818 | ) |
| Class R4 | | | (798 | ) | | | (159 | ) |
| Class R5 | | | (799 | ) | | | (159 | ) |
| Class R6 | | | (166,362 | ) | | | (159 | ) |
| Total distributions to shareholders | | | (42,632,544 | ) | | | (15,847,925 | ) |
| Capital share transactions (Net of share conversions) (See Note 14): |
| Net proceeds from sales of shares | | | 53,462,081 | | | | 106,352,623 | |
| Reinvestment of distributions | | | 39,716,714 | | | | 14,478,514 | |
| Cost of shares reacquired | | | (116,824,775 | ) | | | (87,553,262 | ) |
| Net increase (decrease) in net assets resulting from capital share transactions | | | (23,645,980 | ) | | | 33,277,875 | |
| Net increase (decrease) in net assets | | | (25,956,065 | ) | | | 70,669,067 | |
| NET ASSETS: | | | | | | | | |
| Beginning of year | | $ | 502,721,858 | | | $ | 432,052,791 | |
| End of year | | $ | 476,765,793 | | | $ | 502,721,858 | |
| Undistributed net investment income | | $ | 4,269,347 | | | $ | 5,023,018 | |
| 26 | See Notes to Financial Statements. |
Statements of Changes in Net Assets (concluded)
| | | Calibrated Mid Cap Value Fund |
| INCREASE (DECREASE) IN NET ASSETS | | For the Year Ended
July 31, 2018 | | | For the Year Ended
July 31, 2017 | |
| Operations: | | | | | | | | |
| Net investment income | | $ | 10,282,138 | | | $ | 16,682,878 | |
| Net realized gain on investments and futures contracts | | | 56,807,354 | | | | 88,503,983 | |
| Net change in unrealized appreciation/depreciation on investments and futures contracts | | | 1,677,770 | | | | 8,021,565 | |
| Net increase in net assets resulting from operations | | | 68,767,262 | | | | 113,208,426 | |
| Distributions to shareholders from: | | | | | | | | |
| Net investment income | | | | | | | | |
| Class A | | | (1,123,563 | ) | | | (1,965,228 | ) |
| Class C | | | (201,513 | ) | | | (410,679 | ) |
| Class F | | | (1,462,733 | ) | | | (2,275,963 | ) |
| Class F3 | | | (44,302 | ) | | | – | |
| Class I | | | (10,313,279 | ) | | | (10,927,757 | ) |
| Class R2 | | | (18,624 | ) | | | (33,220 | ) |
| Class R3 | | | (48,748 | ) | | | (41,126 | ) |
| Class R4 | | | (47,731 | ) | | | (24,322 | ) |
| Class R5 | | | (58,817 | ) | | | (5,952 | ) |
| Class R6 | | | (109,896 | ) | | | (11,638 | ) |
| Net realized gain | | | | | | | | |
| Class A | | | (6,405,642 | ) | | | – | |
| Class C | | | (3,212,159 | ) | | | – | |
| Class F | | | (7,405,489 | ) | | | – | |
| Class F3 | | | (203,378 | ) | | | – | |
| Class I | | | (47,418,837 | ) | | | – | |
| Class R2 | | | (149,878 | ) | | | – | |
| Class R3 | | | (327,920 | ) | | | – | |
| Class R4 | | | (257,647 | ) | | | – | |
| Class R5 | | | (270,346 | ) | | | – | |
| Class R6 | | | (504,506 | ) | | | – | |
| Total distributions to shareholders | | | (79,585,008 | ) | | | (15,695,885 | ) |
| Capital share transactions (See Note 14) | | | | | | | | |
| Net proceeds from sales of shares | | | 144,938,156 | | | | 277,109,068 | |
| Reinvestment of distributions | | | 75,532,779 | | | | 14,638,941 | |
| Cost of shares reacquired | | | (471,115,350 | ) | | | (277,566,111 | ) |
| Net increase (decrease) in net assets resulting from capital share transactions | | | (250,644,415 | ) | | | 14,181,898 | |
| Net increase (decrease) in net assets | | | (261,462,161 | ) | | | 111,694,439 | |
| NET ASSETS: | | | | | | | | |
| Beginning of year | | $ | 1,031,531,428 | | | $ | 919,836,989 | |
| End of year | | $ | 770,069,267 | | | $ | 1,031,531,428 | |
| Undistributed net investment income | | $ | 3,905,389 | | | $ | 7,189,172 | |
| | See Notes to Financial Statements. | 27 |
Financial Highlights
CALIBRATED LARGE CAP VALUE FUND
| | | | | Per Share Operating Performance: |
| | | | | Investment Operations: | | Distributions to
shareholders from: |
| | | Net asset
value,
beginning
of period | | Net
invest-
ment
income(a) | | Net
realized
and
unrealized
gain (loss) | | Total
from
invest-
ment
opera-
tions | | Net
investment
income | | Net
realized
gain | | Total
distri-
butions |
| Class A | | | | | | | | | | | | | | | | | | | | | | | | | | | | |
| 7/31/2018 | | $ | 21.25 | | | $ | 0.34 | | | $ | 1.30 | | | $ | 1.64 | | | $ | (0.37 | ) | | $ | (1.47 | ) | | $ | (1.84 | ) |
| 7/31/2017 | | | 19.55 | | | | 0.40 | | | | 2.01 | | | | 2.41 | | | | (0.41 | ) | | | (0.30 | ) | | | (0.71 | ) |
| 7/31/2016 | | | 20.88 | | | | 0.36 | | | | (0.04 | ) | | | 0.32 | | | | (0.36 | ) | | | (1.29 | ) | | | (1.65 | ) |
| 7/31/2015 | | | 22.30 | | | | 0.33 | | | | 1.15 | | | | 1.48 | | | | (0.35 | ) | | | (2.55 | ) | | | (2.90 | ) |
| 7/31/2014 | | | 21.52 | | | | 0.36 | | | | 2.19 | | | | 2.55 | | | | (0.29 | ) | | | (1.48 | ) | | | (1.77 | ) |
| | | | | | | | | | | | | | | | | | | | | | | | | | | | | |
| Class C | | | | | | | | | | | | | | | | | | | | | | | | | | | | |
| 7/31/2018 | | | 20.84 | | | | 0.18 | | | | 1.27 | | | | 1.45 | | | | (0.19 | ) | | | (1.47 | ) | | | (1.66 | ) |
| 7/31/2017 | | | 19.18 | | | | 0.25 | | | | 1.96 | | | | 2.21 | | | | (0.25 | ) | | | (0.30 | ) | | | (0.55 | ) |
| 7/31/2016 | | | 20.53 | | | | 0.22 | | | | (0.05 | ) | | | 0.17 | | | | (0.23 | ) | | | (1.29 | ) | | | (1.52 | ) |
| 7/31/2015 | | | 21.98 | | | | 0.17 | | | | 1.14 | | | | 1.31 | | | | (0.21 | ) | | | (2.55 | ) | | | (2.76 | ) |
| 7/31/2014 | | | 21.30 | | | | 0.19 | | | | 2.17 | | | | 2.36 | | | | (0.20 | ) | | | (1.48 | ) | | | (1.68 | ) |
| | | | | | | | | | | | | | | | | | | | | | | | | | | | | |
| Class F | | | | | | | | | | | | | | | | | | | | | | | | | | | | |
| 7/31/2018 | | | 21.29 | | | | 0.40 | | | | 1.29 | | | | 1.69 | | | | (0.39 | ) | | | (1.47 | ) | | | (1.86 | ) |
| 7/31/2017 | | | 19.57 | | | | 0.44 | | | | 2.03 | | | | 2.47 | | | | (0.45 | ) | | | (0.30 | ) | | | (0.75 | ) |
| 7/31/2016 | | | 20.90 | | | | 0.40 | | | | (0.06 | ) | | | 0.34 | | | | (0.38 | ) | | | (1.29 | ) | | | (1.67 | ) |
| 7/31/2015 | | | 22.32 | | | | 0.36 | | | | 1.16 | | | | 1.52 | | | | (0.39 | ) | | | (2.55 | ) | | | (2.94 | ) |
| 7/31/2014 | | | 21.54 | | | | 0.39 | | | | 2.19 | | | | 2.58 | | | | (0.32 | ) | | | (1.48 | ) | | | (1.80 | ) |
| | | | | | | | | | | | | | | | | | | | | | | | | | | | | |
| Class F3 | | | | | | | | | | | | | | | | | | | | | | | | | | | | |
| 7/31/2018 | | | 21.32 | | | | 0.37 | | | | 1.32 | | | | 1.69 | | | | (0.42 | ) | | | (1.47 | ) | | | (1.89 | ) |
| 4/4/2017 to 7/31/2017(c) | | | 20.98 | | | | 0.11 | | | | 0.23 | | | | 0.34 | | | | – | | | | – | | | | – | |
| | | | | | | | | | | | | | | | | | | | | | | | | | | | | |
| Class I | | | | | | | | | | | | | | | | | | | | | | | | | | | | |
| 7/31/2018 | | | 21.31 | | | | 0.39 | | | | 1.30 | | | | 1.69 | | | | (0.42 | ) | | | (1.47 | ) | | | (1.89 | ) |
| 7/31/2017 | | | 19.60 | | | | 0.45 | | | | 2.02 | | | | 2.47 | | | | (0.46 | ) | | | (0.30 | ) | | | (0.76 | ) |
| 7/31/2016 | | | 20.94 | | | | 0.41 | | | | (0.05 | ) | | | 0.36 | | | | (0.41 | ) | | | (1.29 | ) | | | (1.70 | ) |
| 7/31/2015 | | | 22.36 | | | | 0.39 | | | | 1.15 | | | | 1.54 | | | | (0.41 | ) | | | (2.55 | ) | | | (2.96 | ) |
| 7/31/2014 | | | 21.56 | | | | 0.41 | | | | 2.21 | | | | 2.62 | | | | (0.34 | ) | | | (1.48 | ) | | | (1.82 | ) |
| | | | | | | | | | | | | | | | | | | | | | | | | | | | | |
| Class R2 | | | | | | | | | | | | | | | | | | | | | | | | | | | | |
| 7/31/2018 | | | 21.34 | | | | 0.27 | | | | 1.30 | | | | 1.57 | | | | (0.30 | ) | | | (1.47 | ) | | | (1.77 | ) |
| 7/31/2017 | | | 19.63 | | | | 0.33 | | | | 2.03 | | | | 2.36 | | | | (0.35 | ) | | | (0.30 | ) | | | (0.65 | ) |
| 7/31/2016 | | | 20.97 | | | | 0.30 | | | | (0.05 | ) | | | 0.25 | | | | (0.30 | ) | | | (1.29 | ) | | | (1.59 | ) |
| 7/31/2015 | | | 22.38 | | | | 0.26 | | | | 1.15 | | | | 1.41 | | | | (0.27 | ) | | | (2.55 | ) | | | (2.82 | ) |
| 7/31/2014 | | | 21.61 | | | | 0.31 | | | | 2.19 | | | | 2.50 | | | | (0.25 | ) | | | (1.48 | ) | | | (1.73 | ) |
| | | | | | | | | | | | | | | | | | | | | | | | | | | | | |
| Class R3 | | | | | | | | | | | | | | | | | | | | | | | | | | | | |
| 7/31/2018 | | | 21.12 | | | | 0.29 | | | | 1.29 | | | | 1.58 | | | | (0.33 | ) | | | (1.47 | ) | | | (1.80 | ) |
| 7/31/2017 | | | 19.43 | | | | 0.35 | | | | 2.01 | | | | 2.36 | | | | (0.37 | ) | | | (0.30 | ) | | | (0.67 | ) |
| 7/31/2016 | | | 20.77 | | | | 0.32 | | | | (0.06 | ) | | | 0.26 | | | | (0.31 | ) | | | (1.29 | ) | | | (1.60 | ) |
| 7/31/2015 | | | 22.21 | | | | 0.28 | | | | 1.15 | | | | 1.43 | | | | (0.32 | ) | | | (2.55 | ) | | | (2.87 | ) |
| 7/31/2014 | | | 21.46 | | | | 0.30 | | | | 2.19 | | | | 2.49 | | | | (0.26 | ) | | | (1.48 | ) | | | (1.74 | ) |
| 28 | See Notes to Financial Statements. |
| | | | | Ratios to Average Net Assets: | | Supplemental Data: |
| | | | | | | |
Net
asset
value,
end of
period | | Total
return(b)
(%) | | Total
expenses
after
waivers
and/or reim-
bursements
(%) | | Total
expenses
(%) | | Net
invest-
ment
income
(%) | | Net
assets,
end of
period
(000) | | Portfolio
turnover
rate
(%) |
| | | | | | | | | | | | | |
| $ | 21.05 | | | | 8.18 | | | | 0.85 | | | | 0.97 | | | | 1.63 | | | $ | 69,438 | | | | 64 | |
| | 21.25 | | | | 12.61 | | | | 0.82 | | | | 1.01 | | | | 1.94 | | | | 83,248 | | | | 76 | |
| | 19.55 | | | | 1.94 | | | | 0.75 | | | | 1.12 | | | | 1.93 | | | | 71,423 | | | | 68 | |
| | 20.88 | | | | 6.71 | | | | 0.75 | | | | 1.08 | | | | 1.54 | | | | 75,083 | | | | 80 | |
| | 22.30 | | | | 12.38 | | | | 0.75 | | | | 1.08 | | | | 1.66 | | | | 81,218 | | | | 104 | |
| | | | | | | | | | | | | | | | | | | | | | | | | | | |
| | 20.63 | | | | 7.37 | | | | 1.60 | | | | 1.72 | | | | 0.88 | | | | 13,546 | | | | 64 | |
| | 20.84 | | | | 11.75 | | | | 1.56 | | | | 1.76 | | | | 1.22 | | | | 16,163 | | | | 76 | |
| | 19.18 | | | | 1.18 | | | | 1.50 | | | | 1.87 | | | | 1.19 | | | | 17,878 | | | | 68 | |
| | 20.53 | | | | 5.93 | | | | 1.49 | | | | 1.82 | | | | 0.82 | | | | 18,361 | | | | 80 | |
| | 21.98 | | | | 11.54 | | | | 1.49 | | | | 1.82 | | | | 0.91 | | | | 10,456 | | | | 104 | |
| | | | | | | | | | | | | | | | | | | | | | | | | | | |
| | 21.12 | | | | 8.43 | | | | 0.60 | | | | 0.82 | | | | 1.91 | | | | 8,501 | | | | 64 | |
| | 21.29 | | | | 12.89 | | | | 0.60 | | | | 0.86 | | | | 2.14 | | | | 18,829 | | | | 76 | |
| | 19.57 | | | | 2.06 | | | | 0.60 | | | | 0.98 | | | | 2.13 | | | | 12,029 | | | | 68 | |
| | 20.90 | | | | 6.90 | | | | 0.60 | | | | 0.93 | | | | 1.70 | | | | 26,401 | | | | 80 | |
| | 22.32 | | | | 12.53 | | | | 0.60 | | | | 0.93 | | | | 1.81 | | | | 17,316 | | | | 104 | |
| | | | | | | | | | | | | | | | | | | | | | | | | | | |
| | 21.12 | | | | 8.44 | | | | 0.58 | | | | 0.72 | | | | 1.80 | | | | 3,476 | | | | 64 | |
| | 21.32 | | | | 1.62 | (d) | | | 0.58 | (e) | | | 0.74 | (e) | | | 1.58 | (e) | | | 10 | | | | 76 | |
| | | | | | | | | | | | | | | | | | | | | | | | | | | |
| | 21.11 | | | | 8.44 | | | | 0.60 | | | | 0.72 | | | | 1.88 | | | | 378,924 | | | | 64 | |
| | 21.31 | | | | 12.90 | | | | 0.57 | | | | 0.76 | | | | 2.18 | | | | 381,449 | | | | 76 | |
| | 19.60 | | | | 2.16 | | | | 0.50 | | | | 0.87 | | | | 2.19 | | | | 330,171 | | | | 68 | |
| | 20.94 | | | | 6.99 | | | | 0.50 | | | | 0.83 | | | | 1.80 | | | | 383,101 | | | | 80 | |
| | 22.36 | | | | 12.70 | | | | 0.50 | | | | 0.83 | | | | 1.91 | | | | 343,275 | | | | 104 | |
| | | | | | | | | | | | | | | | | | | | | | | | | | | |
| | 21.14 | | | | 7.78 | | | | 1.20 | | | | 1.32 | | | | 1.27 | | | | 497 | | | | 64 | |
| | 21.34 | | | | 12.26 | | | | 1.17 | | | | 1.36 | | | | 1.59 | | | | 449 | | | | 76 | |
| | 19.63 | | | | 1.55 | | | | 1.10 | | | | 1.47 | | | | 1.58 | | | | 353 | | | | 68 | |
| | 20.97 | | | | 6.35 | | | | 1.10 | | | | 1.43 | | | | 1.21 | | | | 371 | | | | 80 | |
| | 22.38 | | | | 12.04 | | | | 1.01 | | | | 1.44 | | | | 1.43 | | | | 198 | | | | 104 | |
| | | | | | | | | | | | | | | | | | | | | | | | | | | |
| | 20.90 | | | | 7.92 | | | | 1.10 | | | | 1.22 | | | | 1.39 | | | | 113 | | | | 64 | |
| | 21.12 | | | | 12.39 | | | | 1.07 | | | | 1.26 | | | | 1.71 | | | | 198 | | | | 76 | |
| | 19.43 | | | | 1.64 | | | | 1.00 | | | | 1.38 | | | | 1.72 | | | | 167 | | | | 68 | |
| | 20.77 | | | | 6.47 | | | | 1.00 | | | | 1.33 | | | | 1.31 | | | | 336 | | | | 80 | |
| | 22.21 | | | | 12.11 | | | | 1.00 | | | | 1.33 | | | | 1.38 | | | | 141 | | | | 104 | |
| | See Notes to Financial Statements. | 29 |
Financial Highlights (continued)
CALIBRATED LARGE CAP VALUE FUND
| | | | | Per Share Operating Performance: |
| | | | | Investment Operations: | | Distributions to
shareholders from: |
| | | Net asset
value,
beginning
of period | | Net
invest-
ment
income(a) | | Net
realized
and
unrealized
gain (loss) | | Total
from
invest-
ment
opera-
tions | | Net
investment
income | | Net
realized
gain | | Total
distri-
butions |
| Class R4 | | | | | | | | | | | | | | | | | | | | | | | | | | | | |
| 7/31/2018 | | $ | 21.21 | | | $ | 0.33 | | | $ | 1.30 | | | $ | 1.63 | | | $ | (0.37 | ) | | $ | (1.47 | ) | | $ | (1.84 | ) |
| 7/31/2017 | | | 19.51 | | | | 0.40 | | | | 2.02 | | | | 2.42 | | | | (0.42 | ) | | | (0.30 | ) | | | (0.72 | ) |
| 7/31/2016 | | | 20.88 | | | | 0.36 | | | | (0.05 | ) | | | 0.31 | | | | (0.39 | ) | | | (1.29 | ) | | | (1.68 | ) |
| 6/30/2015 to 7/31/2015(f) | | | 20.80 | | | | 0.02 | | | | 0.06 | | | | 0.08 | | | | – | | | | – | | | | – | |
| | | | | | | | | | | | | | | | | | | | | | | | | | | | | |
| Class R5 | | | | | | | | | | | | | | | | | | | | | | | | | | | | |
| 7/31/2018 | | | 21.30 | | | | 0.39 | | | | 1.30 | | | | 1.69 | | | | (0.42 | ) | | | (1.47 | ) | | | (1.89 | ) |
| 7/31/2017 | | | 19.59 | | | | 0.45 | | | | 2.02 | | | | 2.47 | | | | (0.46 | ) | | | (0.30 | ) | | | (0.76 | ) |
| 7/31/2016 | | | 20.93 | | | | 0.41 | | | | (0.05 | ) | | | 0.36 | | | | (0.41 | ) | | | (1.29 | ) | | | (1.70 | ) |
| 6/30/2015 to 7/31/2015(f) | | | 20.85 | | | | 0.03 | | | | 0.05 | | | | 0.08 | | | | – | | | | – | | | | – | |
| | | | | | | | | | | | | | | | | | | | | | | | | | | | | |
| Class R6 | | | | | | | | | | | | | | | | | | | | | | | | | | | | |
| 7/31/2018 | | | 21.31 | | | | 0.40 | | | | 1.30 | | | | 1.70 | | | | (0.42 | ) | | | (1.47 | ) | | | (1.89 | ) |
| 7/31/2017 | | | 19.60 | | | | 0.38 | | | | 2.09 | | | | 2.47 | | | | (0.46 | ) | | | (0.30 | ) | | | (0.76 | ) |
| 7/31/2016 | | | 20.93 | | | | 0.41 | | | | (0.04 | ) | | | 0.37 | | | | (0.41 | ) | | | (1.29 | ) | | | (1.70 | ) |
| 6/30/2015 to 7/31/2015(f) | | | 20.85 | | | | 0.03 | | | | 0.05 | | | | 0.08 | | | | – | | | | – | | | | – | |
| (a) | Calculated using average shares outstanding during the period. |
| (b) | Total return for Classes A and C does not consider the effects of sales loads and assumes the reinvestment of all distributions. Total return for all other classes assumes the reinvestment of all distributions. |
| (c) | Commenced on April 4, 2017. |
| (d) | Not annualized. |
| (e) | Annualized. |
| (f) | Commenced on June 30, 2015. |
| 30 | See Notes to Financial Statements. |
| | | | | Ratios to Average Net Assets: | | Supplemental Data: |
| | | | | | | |
Net
asset
value,
end of
period | | Total
return(b)
(%) | | Total
expenses
after
waivers
and/or reim-
bursements
(%) | | Total
expenses
(%) | | Net
invest-
ment
income
(%) | | Net
assets,
end of
period
(000) | | Portfolio
turnover
rate
(%) |
| | | | | | | | | | | | | | | | | | | | | | | | | | | |
| $ | 21.00 | | | | 8.15 | | | | 0.85 | | | | 0.97 | | | | 1.60 | | | $ | 12 | | | | 64 | |
| | 21.21 | | | | 12.65 | | | | 0.81 | | | | 0.97 | | | | 1.96 | | | | 12 | | | | 76 | |
| | 19.51 | | | | 1.88 | | | | 0.75 | | | | 1.09 | | | | 1.92 | | | | 10 | | | | 68 | |
| | 20.88 | | | | 0.38 | (d) | | | 0.75 | (e) | | | 1.06 | (e) | | | 1.41 | (e) | | | 10 | | | | 80 | |
| |
| | 21.10 | | | | 8.45 | | | | 0.60 | | | | 0.72 | | | | 1.87 | | | | 13 | | | | 64 | |
| | 21.30 | | | | 12.91 | | | | 0.55 | | | | 0.72 | | | | 2.21 | | | | 12 | | | | 76 | |
| | 19.59 | | | | 2.17 | | | | 0.49 | | | | 0.83 | | | | 2.18 | | | | 10 | | | | 68 | |
| | 20.93 | | | | 0.38 | (d) | | | 0.50 | (e) | | | 0.82 | (e) | | | 1.64 | (e) | | | 10 | | | | 80 | |
| |
| | 21.12 | | | | 8.50 | | | | 0.58 | | | | 0.72 | | | | 1.90 | | | | 2,247 | | | | 64 | |
| | 21.31 | | | | 12.91 | | | | 0.58 | | | | 0.72 | | | | 1.81 | | | | 2,353 | | | | 76 | |
| | 19.60 | | | | 2.22 | | | | 0.47 | | | | 0.74 | | | | 2.21 | | | | 10 | | | | 68 | |
| | 20.93 | | | | 0.38 | (d) | | | 0.47 | (e) | | | 0.70 | (e) | | | 1.64 | (e) | | | 10 | | | | 80 | |
| | See Notes to Financial Statements. | 31 |
Financial Highlights (continued)
CALIBRATED MID CAP VALUE FUND
| | | | | Per Share Operating Performance: |
| | | | | Investment Operations: | | Distributions to
shareholders from: |
| | | Net asset
value,
beginning
of period | | Net
invest-
ment
income
(loss)(a) | | Net
realized
and
unrealized
gain (loss) | | Total
from
invest-
ment
opera-
tions | | Net
investment
income | | Net
realized
gain | | Total
distri-
butions |
| Class A | | | | | | | | | | | | | | | | | | | | | | | | | | | | |
| 7/31/2018 | | $ | 22.37 | | | $ | 0.21 | | | $ | 1.38 | | | $ | 1.59 | | | $ | (0.26 | ) | | $ | (1.49 | ) | | $ | (1.75 | ) |
| 7/31/2017 | | | 20.22 | | | | 0.34 | | | | 2.14 | | | | 2.48 | | | | (0.33 | ) | | | – | | | | (0.33 | ) |
| 7/31/2016 | | | 21.70 | | | | 0.27 | | | | (0.06 | ) | | | 0.21 | | | | (0.28 | ) | | | (1.41 | ) | | | (1.69 | ) |
| 7/31/2015 | | | 22.04 | | | | 0.24 | | | | 1.92 | | | | 2.16 | | | | (0.26 | ) | | | (2.24 | ) | | | (2.50 | ) |
| 7/31/2014 | | | 21.11 | | | | 0.29 | | | | 2.78 | | | | 3.07 | | | | (0.23 | ) | | | (1.91 | ) | | | (2.14 | ) |
| | | | | | | | | | | | | | | | | | | | | | | | | | | | | |
| Class C | | | | | | | | | | | | | | | | | | | | | | | | | | | | |
| 7/31/2018 | | | 21.89 | | | | 0.04 | | | | 1.35 | | | | 1.39 | | | | (0.09 | ) | | | (1.49 | ) | | | (1.58 | ) |
| 7/31/2017 | | | 19.80 | | | | 0.17 | | | | 2.10 | | | | 2.27 | | | | (0.18 | ) | | | – | | | | (0.18 | ) |
| 7/31/2016 | | | 21.33 | | | | 0.12 | | | | (0.07 | ) | | | 0.05 | | | | (0.17 | ) | | | (1.41 | ) | | | (1.58 | ) |
| 7/31/2015 | | | 21.71 | | | | 0.07 | | | | 1.90 | | | | 1.97 | | | | (0.11 | ) | | | (2.24 | ) | | | (2.35 | ) |
| 7/31/2014 | | | 20.89 | | | | 0.13 | | | | 2.75 | | | | 2.88 | | | | (0.15 | ) | | | (1.91 | ) | | | (2.06 | ) |
| | | | | | | | | | | | | | | | | | | | | | | | | | | | | |
| Class F | | | | | | | | | | | | | | | | | | | | | | | | | | | | |
| 7/31/2018 | | | 22.41 | | | | 0.27 | | | | 1.37 | | | | 1.64 | | | | (0.29 | ) | | | (1.49 | ) | | | (1.78 | ) |
| 7/31/2017 | | | 20.24 | | | | 0.38 | | | | 2.15 | | | | 2.53 | | | | (0.36 | ) | | | – | | | | (0.36 | ) |
| 7/31/2016 | | | 21.72 | | | | 0.30 | | | | (0.07 | ) | | | 0.23 | | | | (0.30 | ) | | | (1.41 | ) | | | (1.71 | ) |
| 7/31/2015 | | | 22.06 | | | | 0.27 | | | | 1.93 | | | | 2.20 | | | | (0.30 | ) | | | (2.24 | ) | | | (2.54 | ) |
| 7/31/2014 | | | 21.11 | | | | 0.32 | | | | 2.79 | | | | 3.11 | | | | (0.25 | ) | | | (1.91 | ) | | | (2.16 | ) |
| | | | | | | | | | | | | | | | | | | | | | | | | | | | | |
| Class F3 | | | | | | | | | | | | | | | | | | | | | | | | | | | | |
| 7/31/2018 | | | 22.46 | | | | 0.25 | | | | 1.41 | | | | 1.66 | | | | (0.33 | ) | | | (1.49 | ) | | | (1.82 | ) |
| 4/4/2017 to 7/31/2017(c) | | | 21.83 | | | | 0.06 | | | | 0.57 | | | | 0.63 | | | | – | | | | – | | | | – | |
| | | | | | | | | | | | | | | | | | | | | | | | | | | | | |
| Class I | | | | | | | | | | | | | | | | | | | | | | | | | | | | |
| 7/31/2018 | | | 22.46 | | | | 0.27 | | | | 1.38 | | | | 1.65 | | | | (0.32 | ) | | | (1.49 | ) | | | (1.81 | ) |
| 7/31/2017 | | | 20.30 | | | | 0.38 | | | | 2.16 | | | | 2.54 | | | | (0.38 | ) | | | – | | | | (0.38 | ) |
| 7/31/2016 | | | 21.77 | | | | 0.32 | | | | (0.06 | ) | | | 0.26 | | | | (0.32 | ) | | | (1.41 | ) | | | (1.73 | ) |
| 7/31/2015 | | | 22.11 | | | | 0.33 | | | | 1.89 | | | | 2.22 | | | | (0.32 | ) | | | (2.24 | ) | | | (2.56 | ) |
| 7/31/2014 | | | 21.16 | | | | 0.34 | | | | 2.79 | | | | 3.13 | | | | (0.27 | ) | | | (1.91 | ) | | | (2.18 | ) |
| | | | | | | | | | | | | | | | | | | | | | | | | | | | | |
| Class R2 | | | | | | | | | | | | | | | | | | | | | | | | | | | | |
| 7/31/2018 | | | 22.38 | | | | 0.14 | | | | 1.37 | | | | 1.51 | | | | (0.19 | ) | | | (1.49 | ) | | | (1.68 | ) |
| 7/31/2017 | | | 20.25 | | | | 0.26 | | | | 2.15 | | | | 2.41 | | | | (0.28 | ) | | | – | | | | (0.28 | ) |
| 7/31/2016 | | | 21.79 | | | | 0.18 | | | | (0.03 | ) | | | 0.15 | | | | (0.28 | ) | | | (1.41 | ) | | | (1.69 | ) |
| 7/31/2015 | | | 22.16 | | | | 0.16 | | | | 1.93 | | | | 2.09 | | | | (0.22 | ) | | | (2.24 | ) | | | (2.46 | ) |
| 7/31/2014 | | | 21.19 | | | | 0.22 | | | | 2.81 | | | | 3.03 | | | | (0.15 | ) | | | (1.91 | ) | | | (2.06 | ) |
| | | | | | | | | | | | | | | | | | | | | | | | | | | | | |
| Class R3 | | | | | | | | | | | | | | | | | | | | | | | | | | | | |
| 7/31/2018 | | | 22.39 | | | | 0.15 | | | | 1.39 | | | | 1.54 | | | | (0.22 | ) | | | (1.49 | ) | | | (1.71 | ) |
| 7/31/2017 | | | 20.25 | | | | 0.27 | | | | 2.16 | | | | 2.43 | | | | (0.29 | ) | | | – | | | | (0.29 | ) |
| 7/31/2016 | | | 21.78 | | | | 0.22 | | | | (0.06 | ) | | | 0.16 | | | | (0.28 | ) | | | (1.41 | ) | | | (1.69 | ) |
| 7/31/2015 | | | 22.15 | | | | 0.20 | | | | 1.91 | | | | 2.11 | | | | (0.24 | ) | | | (2.24 | ) | | | (2.48 | ) |
| 7/31/2014 | | | 21.18 | | | | 0.23 | | | | 2.82 | | | | 3.05 | | | | (0.17 | ) | | | (1.91 | ) | | | (2.08 | ) |
| 32 | See Notes to Financial Statements. |
| | | | | Ratios to Average Net Assets: | | Supplemental Data: |
| | | | | | | |
Net
asset
value,
end of
period | | Total
return(b)
(%) | | Total
expenses
after
waivers
and/or reim-
bursements
(%) | | Total
expenses
(%) | | Net
invest-
ment
income
(loss)
(%) | | Net
assets,
end of
period
(000) | | Portfolio
turnover
rate
(%) |
| | | | | | | | | | | | | | | | | | | | | | | | | | | |
| $ | 22.21 | | | | 7.52 | | | | 0.95 | | | | 0.98 | | | | 0.96 | | | $ | 93,147 | | | | 73 | |
| | 22.37 | | | | 12.39 | | | | 0.92 | | | | 1.02 | | | | 1.60 | | | | 102,036 | | | | 93 | |
| | 20.22 | | | | 1.50 | | | | 0.85 | | | | 1.12 | | | | 1.41 | | | | 122,604 | | | | 83 | |
| | 21.70 | | | | 10.15 | | | | 0.85 | | | | 1.07 | | | | 1.12 | | | | 132,998 | | | | 78 | |
| | 22.04 | | | | 15.42 | | | | 0.85 | | | | 1.09 | | | | 1.38 | | | | 28,422 | | | | 98 | |
| |
| | 21.70 | | | | 6.70 | | | | 1.70 | | | | 1.73 | | | | 0.20 | | | | 44,206 | | | | 73 | |
| | 21.89 | | | | 11.53 | | | | 1.67 | | | | 1.77 | | | | 0.81 | | | | 49,789 | | | | 93 | |
| | 19.80 | | | | 0.74 | | | | 1.60 | | | | 1.87 | | | | 0.67 | | | | 46,709 | | | | 83 | |
| | 21.33 | | | | 9.33 | | | | 1.60 | | | | 1.81 | | | | 0.31 | | | | 48,851 | | | | 78 | |
| | 21.71 | | | | 14.60 | | | | 1.60 | | | | 1.84 | | | | 0.60 | | | | 4,354 | | | | 98 | |
| |
| | 22.27 | | | | 7.76 | | | | 0.70 | | | | 0.83 | | | | 1.22 | | | | 92,221 | | | | 73 | |
| | 22.41 | | | | 12.64 | | | | 0.70 | | | | 0.87 | | | | 1.77 | | | | 150,913 | | | | 93 | |
| | 20.24 | | | | 1.64 | | | | 0.70 | | | | 0.97 | | | | 1.59 | | | | 133,287 | | | | 83 | |
| | 21.72 | | | | 10.31 | | | | 0.70 | | | | 0.92 | | | | 1.22 | | | | 194,111 | | | | 78 | |
| | 22.06 | | | | 15.66 | | | | 0.70 | | | | 0.94 | | | | 1.50 | | | | 7,853 | | | | 98 | |
| |
| | 22.30 | | | | 7.80 | | | | 0.65 | | | | 0.70 | | | | 1.16 | | | | 3,266 | | | | 73 | |
| | 22.46 | | | | 2.89 | (d) | | | 0.65 | (e) | | | 0.73 | (e) | | | 0.85 | (e) | | | 70 | | | | 93 | |
| |
| | 22.30 | | | | 7.79 | | | | 0.70 | | | | 0.73 | | | | 1.22 | | | | 514,972 | | | | 73 | |
| | 22.46 | | | | 12.66 | | | | 0.67 | | | | 0.77 | | | | 1.80 | | | | 709,215 | | | | 93 | |
| | 20.30 | | | | 1.77 | | | | 0.60 | | | | 0.87 | | | | 1.66 | | | | 610,721 | | | | 83 | |
| | 21.77 | | | | 10.41 | | | | 0.60 | | | | 0.82 | | | | 1.49 | | | | 699,681 | | | | 78 | |
| | 22.11 | | | | 15.70 | | | | 0.60 | | | | 0.84 | | | | 1.59 | | | | 577,851 | | | | 98 | |
| |
| | 22.21 | | | | 7.09 | | | | 1.30 | | | | 1.33 | | | | 0.62 | | | | 1,582 | | | | 73 | |
| | 22.38 | | | | 11.99 | | | | 1.27 | | | | 1.37 | | | | 1.22 | | | | 2,209 | | | | 93 | |
| | 20.25 | | | | 1.20 | | | | 1.19 | | | | 1.47 | | | | 0.98 | | | | 2,390 | | | | 83 | |
| | 21.79 | | | | 9.72 | | | | 1.20 | | | | 1.42 | | | | 0.72 | | | | 234 | | | | 78 | |
| | 22.16 | | | | 15.14 | | | | 1.13 | | | | 1.43 | | | | 1.03 | | | | 31 | | | | 98 | |
| |
| | 22.22 | | | | 7.26 | | | | 1.20 | | | | 1.23 | | | | 0.70 | | | | 5,480 | | | | 73 | |
| | 22.39 | | | | 12.10 | | | | 1.17 | | | | 1.26 | | | | 1.25 | | | | 4,587 | | | | 93 | |
| | 20.25 | | | | 1.27 | | | | 1.10 | | | | 1.37 | | | | 1.16 | | | | 2,777 | | | | 83 | |
| | 21.78 | | | | 9.84 | | | | 1.10 | | | | 1.32 | | | | 0.90 | | | | 385 | | | | 78 | |
| | 22.15 | | | | 15.27 | | | | 1.05 | | | | 1.32 | | | | 1.04 | | | | 72 | | | | 98 | |
| | See Notes to Financial Statements. | 33 |
Financial Highlights (concluded)
CALIBRATED MID CAP VALUE FUND
| | | | | Per Share Operating Performance: |
| | | | | Investment Operations: | | Distributions to
shareholders from: |
| | | Net asset
value,
beginning
of period | | Net
invest-
ment
income
(loss)(a) | | Net
realized
and
unrealized
gain (loss) | | Total
from
invest-
ment
opera-
tions | | Net
investment
income | | Net
realized
gain | | Total
distri-
butions |
| Class R4 | | | | | | | | | | | | | | | | | | | | | | | | | | | | |
| 7/31/2018 | | $ | 22.32 | | | $ | 0.21 | | | $ | 1.38 | | | $ | 1.59 | | | $ | (0.28 | ) | | $ | (1.49 | ) | | $ | (1.77 | ) |
| 7/31/2017 | | | 20.20 | | | | 0.29 | | | | 2.18 | | | | 2.47 | | | | (0.35 | ) | | | – | | | | (0.35 | ) |
| 7/31/2016 | | | 21.70 | | | | 0.22 | | | | (0.01 | ) | | | 0.21 | | | | (0.30 | ) | | | (1.41 | ) | | | (1.71 | ) |
| 6/30/2015 to 7/31/2015(f) | | | 21.60 | | | | (0.01 | ) | | | 0.11 | | | | 0.10 | | | | – | | | | – | | | | – | |
| | | | | | | | | | | | | | | | | | | | | | | | | | | | | |
| Class R5 | | | | | | | | | | | | | | | | | | | | | | | | | | | | |
| 7/31/2018 | | | 22.46 | | | | 0.26 | | | | 1.38 | | | | 1.64 | | | | (0.32 | ) | | | (1.49 | ) | | | (1.81 | ) |
| 7/31/2017 | | | 20.30 | | | | 0.35 | | | | 2.19 | | | | 2.54 | | | | (0.38 | ) | | | – | | | | (0.38 | ) |
| 7/31/2016 | | | 21.77 | | | | 0.28 | | | | (0.02 | ) | | | 0.26 | | | | (0.32 | ) | | | (1.41 | ) | | | (1.73 | ) |
| 6/30/2015 to 7/31/2015(f) | | | 21.67 | | | | – | | | | 0.10 | | | | 0.10 | | | | – | | | | – | | | | – | |
| | | | | | | | | | | | | | | | | | | | | | | | | | | | | |
| Class R6 | | | | | | | | | | | | | | | | | | | | | | | | | | | | |
| 7/31/2018 | | | 22.46 | | | | 0.28 | | | | 1.38 | | | | 1.66 | | | | (0.33 | ) | | | (1.49 | ) | | | (1.82 | ) |
| 7/31/2017 | | | 20.30 | | | | 0.32 | | | | 2.22 | | | | 2.54 | | | | (0.38 | ) | | | – | | | | (0.38 | ) |
| 7/31/2016 | | | 21.77 | | | | 0.30 | | | | (0.04 | ) | | | 0.26 | | | | (0.32 | ) | | | (1.41 | ) | | | (1.73 | ) |
| 6/30/2015 to 7/31/2015(f) | | | 21.67 | | | | – | | | | 0.10 | | | | 0.10 | | | | – | | | | – | | | | – | |
| (a) | Calculated using average shares outstanding during the period. |
| (b) | Total return for Classes A and C does not consider the effects of sales loads and assumes the reinvestment of all distributions. Total return for all other classes assumes the reinvestment of all distributions. |
| (c) | Commenced on April 4, 2017. |
| (d) | Not annualized. |
| (e) | Annualized. |
| (f) | Commenced on June 30, 2015. |
| 34 | See Notes to Financial Statements. |
| | | | | Ratios to Average Net Assets: | | Supplemental Data: |
| | | | | | | |
Net
asset
value,
end of
period | | Total
return(b)
(%) | | Total
expenses
after
waivers
and/or reim-
bursements
(%) | | Total
expenses
(%) | | Net
invest-
ment
income
(loss)
(%) | | Net
assets,
end of
period
(000) | | Portfolio
turnover
rate
(%) |
| |
| $ | 22.14 | | | | 7.51 | | | | 0.95 | | | | 0.98 | | | | 0.95 | | | $ | 4,307 | | | | 73 | |
| | 22.32 | | | | 12.38 | | | | 0.93 | | | | 1.00 | | | | 1.34 | | | | 3,624 | | | | 93 | |
| | 20.20 | | | | 1.51 | | | | 0.84 | | | | 1.12 | | | | 1.20 | | | | 937 | | | | 83 | |
| | 21.70 | | | | 0.46 | (d) | | | 0.85 | (e) | | | 1.06 | (e) | | | (0.35 | )(e) | | | 10 | | | | 78 | |
| |
| | 22.29 | | | | 7.75 | | | | 0.70 | | | | 0.73 | | | | 1.17 | | | | 4,611 | | | | 73 | |
| | 22.46 | | | | 12.66 | | | | 0.68 | | | | 0.75 | | | | 1.62 | | | | 1,821 | | | | 93 | |
| | 20.30 | | | | 1.78 | | | | 0.59 | | | | 0.87 | | | | 1.46 | | | | 310 | | | | 83 | |
| | 21.77 | | | | 0.46 | (d) | | | 0.60 | (e) | | | 0.82 | (e) | | | – | (e) | | | 10 | | | | 78 | |
| |
| | 22.30 | | | | 7.80 | | | | 0.65 | | | | 0.70 | | | | 1.27 | | | | 6,277 | | | | 73 | |
| | 22.46 | | | | 12.68 | | | | 0.64 | | | | 0.70 | | | | 1.45 | | | | 7,267 | | | | 93 | |
| | 20.30 | | | | 1.79 | | | | 0.59 | | | | 0.74 | | | | 1.61 | | | | 102 | | | | 83 | |
| | 21.77 | | | | 0.46 | (d) | | | 0.59 | (e) | | | 0.70 | (e) | | | – | (e) | | | 10 | | | | 78 | |
| See Notes to Financial Statements. | 35 |
Notes to Financial Statements
Lord Abbett Equity Trust (the “Trust”) is registered under the Investment Company Act of 1940, as amended (the “Act”), as a diversified, open-end management investment company. The Trust was formed on May 1, 2001 and is organized as a Delaware statutory trust. The Trust consists of the following two funds (each, a “Fund” and collectively, the “Funds”) and their respective classes: Lord Abbett Calibrated Large Cap Value Fund (“Calibrated Large Cap Value Fund”) and Lord Abbett Calibrated Mid Cap Value Fund (“Calibrated Mid Cap Value Fund”).
The investment objective of each Fund is total return. Each Fund has ten active classes of shares: Class A, C, F, F3, I, R2, R3, R4, R5 and R6, each with different expenses and dividends. A front-end sales charge is normally added to the net asset value (“NAV”) for Class A shares. There is no front-end sales charge in the case of Class C, F, F3, I, R2, R3, R4, R5 and R6 shares, although there may be a contingent deferred sales charge (“CDSC”) in certain cases as follows: Class A shares purchased without a sales charge and redeemed before the first day of the month in which the one-year anniversary of the purchase falls (subject to certain exceptions as set forth in each Fund’s prospectus); and Class C shares redeemed before the first anniversary of purchase. Effective April 30, 2018, Class C shares will convert automatically into Class A shares on the 25th day of the month (or, if the 25th is not a business day, the next business day thereafter) following the tenth anniversary of the month on which the purchase order was accepted.
The preparation of the financial statements in conformity with accounting principles generally accepted in the United States of America (“U.S. GAAP”) requires management to make certain estimates and assumptions that affect the reported amounts of assets and liabilities and disclosure of contingent assets and liabilities at the date of the financial statements and the reported amounts of increases and decreases in net assets from operations during the reporting period. Actual results could differ from those estimates. Each Fund is considered an investment company under U.S. GAAP and follows the accounting and reporting guidance applicable to investment companies.
| 2. | SIGNIFICANT ACCOUNTING POLICIES |
| (a) | Investment Valuation–Under procedures approved by the Funds’ Board of Trustees (the “Board”), Lord, Abbett & Co. LLC (“Lord Abbett”), the Funds’ investment manager, has formed a Pricing Committee to administer the pricing and valuation of portfolio investments and to ensure that prices utilized reasonably reflect fair value. Among other things, these procedures allow the Funds to utilize independent pricing services, quotations from securities and financial instrument dealers and other market sources to determine fair value. |
| | |
| | Securities actively traded on any recognized U.S. or non-U.S. exchange or on The NASDAQ Stock Market LLC are valued at the last sale price or official closing price on the exchange or system on which they are principally traded. Events occurring after the close of trading on non-U.S. exchanges may result in adjustments to the valuation of foreign securities to reflect their fair value as of the close of regular trading on the New York Stock Exchange. Each Fund may utilize an independent fair valuation service in adjusting the valuations of foreign securities. Unlisted equity securities are valued at the last quoted sale price or, if no sale price is available, at the mean between the most recently quoted bid and asked prices. Exchange traded options and futures contracts are valued at the last quoted sale price in the market where they are principally traded. If no sale has occurred, the mean between the most recently quoted bid and asked prices is used. |
36
Notes to Financial Statements (continued)
| | Securities for which prices are not readily available are valued at fair value as determined by the Pricing Committee. The Pricing Committee considers a number of factors, including observable and unobservable inputs, when arriving at fair value. The Pricing Committee may use related or comparable assets or liabilities, recent transactions, market multiples, book values and other relevant information to determine the fair value of portfolio investments. The Board or a designated committee thereof regularly reviews fair value determinations made by the Pricing Committee and may employ techniques such as reviewing related market activity, reviewing inputs and assumptions, and retrospectively comparing prices of subsequent purchases and sales transactions to fair value determinations made by the Pricing Committee. |
| | |
| | Short-term securities with 60 days or less remaining to maturity are valued using the amortized cost method, which approximates fair value. |
| | |
| (b) | Security Transactions–Security transactions are recorded as of the date that the securities are purchased or sold (trade date). Realized gains and losses on sales of portfolio securities are calculated using the identified-cost method. Realized and unrealized gains (losses) are allocated to each class of shares based upon the relative proportion of net assets at the beginning of the day. |
| | |
| (c) | Investment Income–Dividend income is recorded on the ex-dividend date. Interest income is recorded on the accrual basis as earned. Discounts are accreted and premiums are amortized using the effective interest method and are included in Interest and other income on the Statements of Operations. Withholding taxes on foreign dividends have been provided for in accordance with the applicable country’s tax rules and rates. Investment income is allocated to each class of shares based upon the relative proportion of net assets at the beginning of the day. |
| | |
| (d) | Income Taxes–It is the policy of each Fund to meet the requirements of Subchapter M of the Internal Revenue Code applicable to regulated investment companies and to distribute substantially all taxable income and capital gains to its shareholders. Therefore, no income tax provision is required. |
| | |
| | Each Fund files U.S. federal and various state and local tax returns. No income tax returns are currently under examination. The statute of limitations on each Fund’s filed U.S. federal tax returns remains open for the fiscal years ended July 31, 2015 through July 31, 2018. The statutes of limitations on the Trust’s state and local tax returns may remain open for an additional year depending upon the jurisdiction. |
| | |
| (e) | Expenses–Expenses, excluding class-specific expenses, are allocated to each class of shares based upon the relative proportion of net assets at the beginning of the day. Class A, C, F, R2, R3 and R4 shares bear their class-specific share of all expenses and fees relating to the Funds’ 12b-1 Distribution Plan. |
| | |
| (f) | Futures Contracts–Each Fund may purchase and sell index futures contracts to manage cash or as a substitute position in lieu of holding the underlying asset on which the instrument is based. At the time of entering into a futures transaction, an investor is required to deposit and maintain a specified amount of cash or eligible securities called “initial margin.” Subsequent payments made or received by a Fund called “variation margin” are made on a daily basis as the market price of the futures contract fluctuates. Each Fund will record an unrealized gain (loss) based on the amount of variation margin. When a contract is closed, a realized gain (loss) is recorded equal to the difference between the opening and closing value of the contract. |
37
Notes to Financial Statements (continued)
| (g) | Repurchase Agreements–Each Fund may enter into repurchase agreements with respect to securities. A repurchase agreement is a transaction in which a fund acquires a security and simultaneously commits to resell that security to the seller (a bank or securities dealer) at an agreed-upon price on an agreed-upon date. Each Fund requires at all times that the repurchase agreement be collateralized by cash, or by securities of the U.S. Government, its agencies, its instrumentalities, or U.S. Government sponsored enterprises having a value equal to, or in excess of, the value of the repurchase agreement (including accrued interest). If the seller of the agreement defaults on its obligation to repurchase the underlying securities at a time when the fair value of these securities has declined, a Fund may incur a loss upon disposition of the securities. |
| | |
| (h) | Fair Value Measurements–Fair value is defined as the price that each Fund would receive upon selling an investment or transferring a liability in an orderly transaction to an independent buyer in the principal or most advantageous market of the investment. A three-tier hierarchy is used to maximize the use of observable market data and minimize the use of unobservable inputs and to establish classification of fair value measurements for disclosure purposes. Inputs refer broadly to the assumptions that market participants would use in pricing the asset or liability, including assumptions about risk – for example, the risk inherent in a particular valuation technique used to measure fair value (such as a pricing model) and/or the risk inherent in the inputs to the valuation technique. Inputs may be observable or unobservable. Observable inputs reflect the assumptions market participants would use in pricing the asset or liability. Observable inputs are based on market data obtained from sources independent of the reporting entity. Unobservable inputs reflect the reporting entity’s own assumptions about the assumptions market participants would use in pricing the asset or liability. Unobservable inputs are based on the best information available in the circumstances. The three-tier hierarchy classification is determined based on the lowest level of inputs that is significant to the fair value measurement, and is summarized in the three broad Levels listed below: |
| | • | Level 1 – | unadjusted quoted prices in active markets for identical investments; |
| | | | |
| | • | Level 2 – | other significant observable inputs (including quoted prices for similar investments, interest rates, prepayment speeds, credit risk, etc.); and |
| | | | |
| | • | Level 3 – | significant unobservable inputs (including each Fund’s own assumptions in determining the fair value of investments). |
| | A summary of inputs used in valuing each Fund’s investments and other financial instruments as of July 31, 2018 and, if applicable, Level 1/Level 2 transfers and Level 3 rollforwards for the fiscal year then ended is included in each Fund’s Schedule of Investments. |
| | |
| | Changes in valuation techniques may result in transfers into or out of an assigned level within the three-tier hierarchy. All transfers between different levels within the three-tier hierarchy are deemed to have occurred as of the beginning of the reporting period. The inputs or methodology used for valuing securities are not necessarily an indication of the risk associated with investing in those securities. |
| 3. | MANAGEMENT FEE AND OTHER TRANSACTIONS WITH AFFILIATES |
Management Fee
The Trust has a management agreement with Lord Abbett, pursuant to which Lord Abbett supplies each Fund with investment management services and executive and other personnel, provides
38
Notes to Financial Statements (continued)
office space and pays for ordinary and necessary office and clerical expenses relating to research and statistical work and supervision of each Fund’s investment portfolio.
The management fee is based on each Fund’s average daily net assets at the following annual rate:
| First $2 billion | .60% |
| Over $2 billion | .55% |
For the fiscal year ended July 31, 2018, for Calibrated Large Cap Value Fund and Calibrated Mid Cap Value Fund, the effective management fee, net of waivers, was at an annualized rate of .48% and ..57%, respectively.
In addition, Lord Abbett provides certain administrative services to each Fund pursuant to an Administrative Services Agreement in return for a fee at an annual rate of .04% of each Fund’s average daily net assets.
For the fiscal year ended July 31, 2018 and continuing through November 30, 2018, Lord Abbett has contractually agreed to waive its fees and reimburse expenses to the extent necessary to limit the total net annual operating expenses, excluding 12b-1 fees, to the following annual rates:
| | | Classes |
| Fund | | A, C, F, I,
R2, R3, R4 and R5 | | F3 and R6 |
| Calibrated Large Cap Value Fund | | .60% | | .58% |
| Calibrated Mid Cap Value Fund | | .70% | | .65% |
All contractual fee waiver and expense reimbursement agreements between the Funds and Lord Abbett may be terminated only upon the approval of the Funds’ Board.
12b-1 Distribution Plan
Each Fund has adopted a distribution plan with respect to Class A, C, F, R2, R3 and R4 shares pursuant to Rule 12b-1 under the Act, which provides for the payment of ongoing distribution and service fees to Lord Abbett Distributor LLC (the “Distributor”), an affiliate of Lord Abbett. The following annual rates have been authorized by the Board pursuant to the plan:
| Fees* | Class A | Class C | Class F(1)(2) | Class R2 | Class R3 | Class R4 |
| Service | .25% | .25% | – | .25% | .25% | .25% |
| Distribution | – | .75% | .10% | .35% | .25% | – |
| * | Each Fund may designate a portion of the aggregate fee as attributable to service activities for purposes of calculating Financial Industry Regulatory Authority, Inc. (“FINRA”) sales charge limitations. |
| (1) | The Class F shares Rule 12b-1 fee may be designated as a service fee in limited circumstances as described in the Funds’ prospectus. |
| (2) | For the fiscal year ended July 31, 2018 and continuing through November 30, 2018, the Distributor has contractually agreed to waive each Fund’s 0.10% Rule 12b-1 fee for Class F. This agreement may be terminated only by the Funds’ Board of Trustees. |
Class F3, Class I, Class R5 and Class R6 shares do not have a distribution plan.
Commissions
Distributor received the following commissions on sales of shares of the Funds, after concessions were paid to authorized dealers, for the fiscal year ended July 31, 2018:
| | Distributor | Dealers’ |
| | Commissions | Concessions |
| Calibrated Large Cap Value Fund | $12,190 | $65,043 |
| Calibrated Mid Cap Value Fund | 18,269 | 99,080 |
39
Notes to Financial Statements (continued)
Distributor received the following amount of CDSCs for the fiscal year ended July 31, 2018:
| | Class A | Class C |
| Calibrated Large Cap Value Fund | $3,401 | $ 573 |
| Calibrated Mid Cap Value Fund | 1,000 | 4,156 |
Other Related Parties
As of July 31, 2018, the percentages of Calibrated Large Cap Value Fund’s and Calibrated Mid Cap Value Fund’s outstanding shares owned by each Fund of Funds were as follows:
| | | | | Underlying Funds |
| Fund of Funds | | Calibrated Large Cap
Value Fund | | Calibrated Mid Cap
Value Fund |
| Lord Abbett Multi-Asset Balanced Opportunity Fund | | 48.70% | | 21.84% |
| Lord Abbett Multi-Asset Global Opportunity Fund | | 3.41% | | 2.88% |
| Lord Abbett Multi-Asset Growth Fund | | 24.61% | | 17.51% |
| Lord Abbett Multi-Asset Income Fund | | – | | 18.23% |
One Trustee and certain of the Trust’s officers have an interest in Lord Abbett.
| 4. | DISTRIBUTIONS AND CAPITAL LOSS CARRYFORWARDS |
Dividends from net investment income, if any, are declared and paid at least annually. Taxable net realized gains from investment transactions, reduced by allowable capital loss carryforwards, if any, are declared and distributed to shareholders at least annually. The capital loss carryforward amount, if any, is available to offset future net capital gains. Dividends and distributions to shareholders are recorded on the ex-dividend date. The amounts of dividends and distributions from net investment income and net realized capital gains are determined in accordance with federal income tax regulations, which may differ from U.S. GAAP. These book/tax differences are either considered temporary or permanent in nature. To the extent these differences are permanent in nature, such amounts are reclassified within the components of net assets based on their federal tax basis treatment; temporary differences do not require reclassification. Dividends and distributions that exceed earnings and profits for tax purposes are reported as a tax return of capital.
The tax character of distributions paid during the fiscal year ended July 31, 2018 and fiscal year ended July 31, 2017 were as follows:
| | | Calibrated Large Cap Value Fund | | | Calibrated Mid Cap Value Fund | |
| | | Year Ended | | | Year Ended | | | Year Ended | | | Year Ended | |
| | | 7/31/2018 | | | 7/31/2017 | | | 7/31/2018 | | | 7/31/2017 | |
| Distributions paid from: | | | | | | | | | | | | | | | | |
| Ordinary income | | $ | 27,112,983 | | | $ | 15,477,123 | | | $ | 48,959,128 | | | $ | 15,695,885 | |
| Net long-term capital gains | | | 15,519,561 | | | | 370,802 | | | | 30,625,880 | | | | – | |
| Total distributions paid | | $ | 42,632,544 | | | $ | 15,847,925 | | | $ | 79,585,008 | | | $ | 15,695,885 | |
As of July 31, 2018, the components of accumulated gains on a tax-basis were as follows:
| | | Calibrated Large Cap
Value Fund | | | Calibrated Mid Cap
Value Fund | |
| Undistributed ordinary income – net | | $ | 10,524,646 | | | $ | 36,452,560 | |
| Undistributed long-term capital gains | | | 8,035,727 | | | | 19,982,735 | |
| Total undistributed earnings | | | 18,560,373 | | | | 56,435,295 | |
| Temporary differences | | | (45,911 | ) | | | (77,093 | ) |
| Unrealized gains – net | | | 22,219,876 | | | | 7,146,583 | |
| Total accumulated gains – net | | $ | 40,734,338 | | | $ | 63,504,785 | |
40
Notes to Financial Statements (continued)
As of July 31, 2018, the aggregate unrealized security gains and losses on investments and other financial instruments based on cost for U.S. federal income tax purposes were as follows:
| | | Calibrated Large Cap
Value Fund | | | Calibrated Mid Cap
Value Fund | |
| Tax cost | | $ | 453,123,092 | | | $ | 763,131,607 | |
| Gross unrealized gain | | | 40,714,802 | | | | 46,364,957 | |
| Gross unrealized loss | | | (18,494,926 | ) | | | (39,218,374 | ) |
| Net unrealized security gain | | $ | 22,219,876 | | | $ | 7,146,583 | |
The difference between book-basis and tax-basis unrealized gains (losses) is attributable to the tax treatment of certain distributions received, futures and wash sales.
Permanent items identified during the fiscal year ended July 31, 2018 have been reclassified among the components of net assets based on their tax basis treatment as follows:
| | | Undistributed Net
Investment Income | | | Accumulated Net
Realized Gain | |
| Calibrated Large Cap Value Fund | | $ | (198,714 | ) | | $ | 198,714 | |
| Calibrated Mid Cap Value Fund | | | (136,715 | ) | | | 136,715 | |
The permanent differences are attributable to the tax treatment of certain securities and certain distributions received.
| 5. | PORTFOLIO SECURITIES TRANSACTIONS |
Purchases and sales of investment securities (excluding short-term investments) for the fiscal year ended July 31, 2018 were as follows:
| | | Purchases | | | Sales | |
| Calibrated Large Cap Value Fund | | $ | 303,596,440 | | | $ | 360,734,445 | |
| Calibrated Mid Cap Value Fund | | | 658,009,962 | | | | 967,556,974 | |
There were no purchases or sales of U.S. Government securities for the fiscal year ended July 31, 2018.
Each Fund is permitted to purchase and sell securities (“cross-trade”) from and to other Lord Abbett funds or client accounts pursuant to procedures approved by the Board in compliance with Rule 17a-7 under the Act (the “Rule”). Each cross-trade is executed at a fair market price in compliance with provisions of the Rule. For the fiscal year ended July 31, 2018, the following Funds engaged in cross-trades:
| Fund | | Purchases | | | Sales | | | Gain/(Loss) | |
| Calibrated Large Cap Value Fund | | $ | 9,007,454 | | | $ | 165,657 | | | $ | (17,573 | ) |
| Calibrated Mid Cap Value Fund | | | 2,735,362 | | | | 9,156,938 | | | | 682,750 | |
| 6. | DISCLOSURES ABOUT DERIVATIVE INSTRUMENTS AND HEDGING ACTIVITIES |
Each Fund entered into E-Mini S&P 500 Index futures contracts for the fiscal year ended July 31, 2018 (as described in note 2(f)) to manage cash. The Funds bear the risk that the underlying index will move unexpectedly, in which case each Fund may realize a loss. There is minimal counterparty credit risk to each Fund since futures are exchange traded and the exchange’s clearinghouse, as counterparty to all exchange traded futures, guarantees futures against default.
41
Notes to Financial Statements (continued)
As of July 31, 2018, the Funds had the following derivatives at fair value, grouped into appropriate risk categories that illustrate the Funds’ use of derivative instruments:
| | Calibrated Large Cap Value Fund | | Calibrated Mid Cap Value Fund | |
| Asset Derivatives | Equity Index Contracts | | Equity Index Contracts | |
| Futures Contracts(1) | $27,209 | | $49,202 | |
| (1) | Statements of Assets and Liabilities location: Includes cumulative unrealized appreciation/depreciation of futures contracts as reported in the Schedule of Investments. Only the current day’s variation margin is reported within the Statements of Assets and Liabilities. |
Transactions in derivative instruments for the year ended July 31, 2018, were as follows:
| | Calibrated Large Cap Value Fund | | Calibrated Mid Cap Value Fund | |
| | Equity Index Contracts | | Equity Index Contracts | |
| Net Realized Gain(1) | | | | |
| Futures Contracts | $77,759 | | $494,276 | |
| Net Change in Unrealized Appreciation/Depreciation(2) | | | | |
| Futures Contracts | $ (1,495 | ) | $ (4,374 | ) |
| Average Number of Contracts/Notional Amounts* | | | | |
| Futures Contracts(3) | 15 | | 36 | |
| * | Calculated based on the number of contracts or notional amounts for the fiscal year ended July 31, 2018. |
| (1) | Statements of Operations location: Net realized gain on futures contracts. |
| (2) | Statements of Operations location: Net change in unrealized appreciation/depreciation on futures contracts. |
| (3) | Amount represents number of contracts. |
| 7. | DISCLOSURES ABOUT OFFSETTING ASSETS AND LIABILITIES |
The Financial Accounting Standards Board (“FASB”) requires disclosures intended to help better assess the effect or potential effect of offsetting arrangements on a fund’s financial position. The following tables illustrate gross and net information about recognized assets and liabilities eligible for offset in the statement of assets and liabilities; and disclose such amounts subject to an enforceable master netting agreement or similar agreement, by counterparty. A master netting agreement is an agreement between a fund and a counterparty which provides for the net settlement of amounts owed under all contracts traded under that agreement, as well as cash collateral, through a single payment by one party to the other in the event of default on or termination of any one contract. The Fund’s accounting policy with respect to balance sheet offsetting is that, absent an event of default by the counterparty or a termination of the agreement, the master netting agreement does not result in an offset of reported amounts of financial assets and liabilities in the statement of assets and liabilities across transactions between the Fund and the applicable counterparty:
| | | | | | Calibrated Large Cap Value Fund |
| Description | | Gross Amounts of
Recognized Assets | | | Gross Amounts
Offset in the
Statement of Assets
and Liabilities | | | Net Amounts of
Assets Presented
in the Statement of
Assets and Liabilities |
| Repurchase Agreement | | $ | 1,342,933 | | | $ | – | | | $ | 1,342,933 |
| Total | | $ | 1,342,933 | | | $ | – | | | $ | 1,342,933 |
42
Notes to Financial Statements (continued)
| | | Net Amounts | | | | | | | | | | | | | |
| | | of Assets | | | Amounts Not Offset in the | | | | |
| | | Presented in | | | Statement of Assets and Liabilities | | | | |
| | | the Statement | | | | | | Cash | | | Securities | | | | |
| | | of Assets and | | | Financial | | | Collateral | | | Collateral | | | Net | |
| Counterparty | | Liabilities | | | Instruments | | | Received(a) | | | Received(a) | | | Amount(b) | |
| Fixed Income Clearing Corp. | | $ | 1,342,933 | | | $ | – | | | $ | – | | | $ | (1,342,933 | ) | | $ | – | |
| Total | | $ | 1,342,933 | | | $ | – | | | $ | – | | | $ | (1,342,933 | ) | | $ | – | |
| | | | | | Calibrated Mid Cap Value Fund | |
| | | | | | Gross Amounts | | | Net Amounts of | |
| | | | | | Offset in the | | | Assets Presented | |
| | | Gross Amounts of | | | Statement of Assets | | | in the Statement of | |
| Description | | Recognized Assets | | | and Liabilities | | | Assets and Liabilities | |
| Repurchase Agreement | | $ | 3,530,378 | | | $ | – | | | $ | 3,530,378 | |
| Total | | $ | 3,530,378 | | | $ | – | | | $ | 3,530,378 | |
| | | Net Amounts | | | | | | | | | | | | | |
| | | of Assets | | | Amounts Not Offset in the | | | | |
| | | Presented in | | | Statement of Assets and Liabilities | | | | |
| | | the Statement | | | | | | Cash | | | Securities | | | | |
| | | of Assets and | | | Financial | | | Collateral | | | Collateral | | | Net | |
| Counterparty | | Liabilities | | | Instruments | | | Received(a) | | | Received(a) | | | Amount(b) | |
| Fixed Income Clearing Corp. | | $ | 3,530,378 | | | $ | – | | | $ | – | | | $ | (3,530,378 | ) | | $ | – | |
| Total | | $ | 3,530,378 | | | $ | – | | | $ | – | | | $ | (3,530,378 | ) | | $ | – | |
| (a) | Collateral disclosed is limited to an amount not to exceed 100% of the net amount of assets presented in the Statement of Assets and Liabilities, for each respective counterparty. |
| (b) | Net amount represents the amount owed to the Funds by the counterparty as of July 31, 2018. |
The Trust’s officers and one Trustee, who are associated with Lord Abbett, do not receive any compensation from the Trust for serving in such capacities. Independent Trustees’ fees are allocated among all Lord Abbett-sponsored funds based on the net assets of each fund. There is an equity-based plan available to all Independent Trustees under which Independent Trustees must defer receipt of a portion of, and may elect to defer receipt of an additional portion of Trustees’ fees. The deferred amounts are treated as though equivalent dollar amounts had been invested in the funds. Such amounts and earnings accrued thereon are included in Trustees’ fees on the Statements of Operations and in Trustees’ fees payable on the Statements of Assets and Liabilities and are not deductible for U.S. federal income tax purposes until such amounts are paid.
The Trust has entered into an arrangement with its transfer agent and custodian, whereby credits realized as a result of uninvested cash balances are used to reduce a portion of each Fund’s expenses.
During the fiscal year ended July 31, 2018, the Funds and certain other funds managed by Lord Abbett (collectively, the “Participating Funds”) participated in a syndicated line of credit facility with various lenders for $600 million (the “Facility”), whereas State Street Bank and Trust Company (“SSB”) participates as a lender and as agent for the lenders. The Facility is to be used for temporary
43
Notes to Financial Statements (continued)
or emergency purposes as an additional source of liquidity to satisfy redemptions. The Participating Funds are subject to graduated borrowing limits of one-third of Fund assets (if Fund assets are less than $750 million), $250 million, $300 million, or $350 million, based on past borrowings and likelihood of future borrowings. During the fiscal year ended July 31, 2018, the Funds did not utilize the Facility.
Effective August 9, 2018, the Participating Funds entered into an amended syndicated line of credit facility with various lenders for $1.06 billion (the “Syndicated Facility”), whereas SSB participates as a lender and as agent for the lenders. Under the Syndicated Facility, the Participating Funds are subject to graduated borrowing limits of one-third of Fund assets (if Fund assets are less than $750 million), $250 million, $300 million, $350 million, or $1 billion, based on past borrowings and likelihood of future borrowings. Also effective August 9, 2018, the Participating Funds entered into an additional line of credit facility with SSB for $250 million (the “Bilateral Facility,” and together with the Syndicated Facility, the “Facilities”). Under the Bilateral Facility, each Participating Fund may borrow up to the lesser of $250 million or one-third of Fund assets. The Facilities are to be used for temporary or emergency purposes to satisfy redemption requests and manage liquidity.
| 11. | INTERFUND LENDING PROGRAM |
Pursuant to an exemptive order issued by the U.S. Securities and Exchange Commission (“SEC exemptive order”), certain registered open-end management investment companies managed by Lord Abbett, including each Fund, participate in a joint lending and borrowing program (the “Interfund Lending Program”). The SEC exemptive order allows the Funds to borrow money from and lend money to each other for temporary or emergency purposes subject to limitations and conditions.
During the fiscal year ended July 31, 2018, the Funds did not participate as a borrower or lender in the Interfund Lending Program.
| 12. | CUSTODIAN AND ACCOUNTING AGENT |
SSB is the Trust’s custodian and accounting agent. SSB performs custodial, accounting and recordkeeping functions relating to portfolio transactions and calculating each Fund’s NAV.
Each Fund is subject to the general risks and considerations associated with equity investing. The value of a Fund’s investment in an individual company will fluctuate in response to its changing prospects and movements in the equity securities markets in general. If a Fund’s assessment of a company’s value or prospects for exceeding earnings expectations or market conditions is wrong, the Fund could suffer losses or produce poor performance relative to other funds, even in a favorable market.
The market may fail to recognize for a long time the intrinsic value of particular value stocks each Fund may hold. The large companies in which Calibrated Large Cap Value Fund invests may be less able to respond quickly to certain market developments and may have slower rates of growth than smaller companies, especially over the short term. The mid-sized companies in which Calibrated Mid Cap Value Fund invests may be less able to weather economic shifts or other adverse developments than larger, more established companies. Securities of mid-sized companies tend to be more sensitive to changing economic, market, and industry conditions and tend to be less liquid than equity securities of larger companies, especially over the short term. The securities of mid-
44
Notes to Financial Statements (continued)
sized companies may be less well-known and less widely held and trade less frequently and in more limited volume than the securities of large cap company stocks. Mid-sized companies also may fall out of favor relative to larger companies in certain market cycles, causing the Fund to incur losses or underperform.
Because each Fund invests in real estate investment trusts (“REITS”), they may be subject to the risks that impact the value of the underlying properties or mortgages of the REITs in which they invest. Other factors that may adversely affect REITs include poor performance by management of the REIT, changes to the tax laws, or failure by the REIT to qualify for tax-free distribution of income, and changes in local, regional, or general economic conditions.
Due to each Fund’s exposure to foreign companies and American Depository Receipts, each Fund may experience increased market, industry and sector, liquidity, currency, political, information, and other risks. The securities of foreign companies also may be subject to inadequate exchange control regulations, the imposition of economic sanctions or other government restrictions, higher transaction and other costs, and delays in settlement to the extent they are traded on non-U.S. exchanges or markets.
These factors can affect each Fund’s performance.
| 14. | SUMMARY OF CAPITAL TRANSACTIONS |
Transactions in shares of beneficial interest were as follows:
| | | | | | Year Ended | | | | | | Year Ended | |
| Calibrated Large Cap Value Fund | | | | | July 31, 2018 | | | | | | July 31, 2017 | |
| Class A Shares | | Shares | | | Amount | | | Shares | | | Amount | |
| Shares sold | | | 377,658 | | | $ | 7,895,215 | | | | 936,922 | | | $ | 19,301,115 | |
| Converted from Class C** | | | 35,349 | | | | 723,553 | | | | – | | | | – | |
| Reinvestment of distributions | | | 232,927 | | | | 4,644,572 | | | | 85,962 | | | | 1,711,506 | |
| Shares reacquired | | | (1,264,627 | ) | | | (26,557,501 | ) | | | (759,128 | ) | | | (15,445,184 | ) |
| Increase (decrease) | | | (618,693 | ) | | $ | (13,294,161 | ) | | | 263,756 | | | $ | 5,567,437 | |
| | | | | | | | | | | | | | | | | |
| Class C Shares | | | | | | | | | | | | | | | | |
| Shares sold | | | 73,011 | | | $ | 1,491,303 | | | | 148,142 | | | $ | 2,991,589 | |
| Reinvestment of distributions | | | 48,700 | | | | 956,952 | | | | 17,013 | | | | 333,976 | |
| Shares reacquired | | | (204,561 | ) | | | (4,167,677 | ) | | | (322,027 | ) | | | (6,489,558 | ) |
| Converted to Class A** | | | (36,018 | ) | | | (723,553 | ) | | | – | | | | – | |
| Decrease | | | (118,868 | ) | | $ | (2,442,975 | ) | | | (156,872 | ) | | $ | (3,163,993 | ) |
| | | | | | | | | | | | | | | | | |
| Class F Shares | | | | | | | | | | | | | | | | |
| Shares sold | | | 221,232 | | | $ | 4,654,077 | | | | 634,732 | | | $ | 12,927,846 | |
| Reinvestment of distributions | | | 46,500 | | | | 929,063 | | | | 25,151 | | | | 501,006 | |
| Shares reacquired | | | (749,643 | ) | | | (15,821,628 | ) | | | (390,130 | ) | | | (8,034,218 | ) |
| Increase (decrease) | | | (481,911 | ) | | $ | (10,238,488 | ) | | | 269,753 | | | $ | 5,394,634 | |
| | | | | | | | | | | | | | | | | |
| Class F3 Shares(a) | | | | | | | | | | | | | | | | |
| Shares sold | | | 219,148 | | | $ | 4,768,226 | | | | 477 | | | $ | 10,018 | |
| Reinvestment of distributions | | | 18,308 | | | | 365,792 | | | | – | | | | – | |
| Shares reacquired | | | (73,381 | ) | | | (1,525,814 | ) | | | – | (b) | | | (5 | ) |
| Increase | | | 164,075 | | | $ | 3,608,204 | | | | 477 | | | $ | 10,013 | |
45
Notes to Financial Statements (continued)
| | | | | | Year Ended | | | | | | Year Ended | |
| Calibrated Large Cap Value Fund | | | | | July 31, 2018 | | | | | | July 31, 2017 | |
| Class I Shares | | Shares | | | Amount | | | Shares | | | Amount | |
| Shares sold | | | 1,652,786 | | | $ | 34,259,965 | | | | 3,221,562 | | | $ | 68,056,755 | |
| Reinvestment of distributions | | | 1,641,359 | | | | 32,777,942 | | | | 598,295 | | | | 11,924,010 | |
| Shares reacquired | | | (3,244,017 | ) | | | (68,203,469 | ) | | | (2,766,922 | ) | | | (56,917,204 | ) |
| Increase (decrease) | | | 50,128 | | | $ | (1,165,562 | ) | | | 1,052,935 | | | $ | 23,063,561 | |
| | | | | | | | | | | | | | | | | |
| Class R2 Shares | | | | | | | | | | | | | | | | |
| Shares sold | | | 2,390 | | | $ | 48,347 | | | | 3,178 | | | $ | 64,670 | |
| Reinvestment of distributions | | | 83.00 | | | | 1,671 | | | | 30 | | | | 599 | |
| Shares reacquired | | | – | | | | – | | | | (129 | ) | | | (2,554 | ) |
| Increase | | | 2,473 | | | $ | 50,018 | | | | 3,079 | | | $ | 62,715 | |
| | | | | | | | | | | | | | | | | |
| Class R3 Shares | | | | | | | | | | | | | | | | |
| Shares sold | | | 3,338.70 | | | $ | 69,371 | | | | 9,347 | | | $ | 191,253 | |
| Reinvestment of distributions | | | 971.50 | | | | 19,265 | | | | 315 | | | | 6,237 | |
| Shares reacquired | | | (8,283.65 | ) | | | (172,396 | ) | | | (8,892 | ) | | | (183,228 | ) |
| Increase (decrease) | | | (3,973.45 | ) | | $ | (83,760 | ) | | | 770 | | | $ | 14,262 | |
| | | | | | | | | | | | | | | | | |
| Class R4 Shares | | | | | | | | | | | | | | | | |
| Reinvestment of distributions | | | 50.16 | | | $ | 998 | | | | 18.99 | | | $ | 377 | |
| Increase | | | 50.16 | | | $ | 998 | | | | 18.99 | | | $ | 377 | |
| | | | | | | | | | | | | | | | | |
| Class R5 Shares | | | | | | | | | | | | | | | | |
| Reinvestment of distributions | | | 51.53 | | | $ | 1,028 | | | | 20.14 | | | $ | 401 | |
| Increase | | | 51.53 | | | $ | 1,028 | | | | 20.14 | | | $ | 401 | |
| | | | | | | | | | | | | | | | | |
| Class R6 Shares | | | | | | | | | | | | | | | | |
| Shares sold | | | 13,083 | | | $ | 275,577 | | | | 132,928.40 | | | $ | 2,809,378 | |
| Reinvestment of distributions | | | 973 | | | | 19,431 | | | | 20.17 | | | | 402 | |
| Shares reacquired | | | (18,056 | ) | | | (376,290 | ) | | | (23,082 | ) | | | (481,313 | ) |
| Increase (decrease) | | | (4,000 | ) | | $ | (81,282 | ) | | | 109,866.57 | | | $ | 2,328,467 | |
| | | | | | Year Ended | | | | | | Year Ended | |
| Calibrated Mid Cap Value Fund | | | | | July 31, 2018 | | | | | | July 31, 2017 | |
| Class A Shares | | Shares | | | Amount | | | Shares | | | Amount | |
| Shares sold | | | 619,128 | | | $ | 13,468,474 | | | | 1,679,237 | | | $ | 35,497,914 | |
| Converted from Class C** | | | 46,492 | | | | 1,006,079 | | | | – | | | | – | |
| Reinvestment of distributions | | | 314,468 | | | | 6,650,991 | | | | 81,537 | | | | 1,685,378 | |
| Shares reacquired | | | (1,346,511 | ) | | | (29,462,266 | ) | | | (3,261,771 | ) | | | (69,854,926 | ) |
| Decrease | | | (366,423 | ) | | $ | (8,336,722 | ) | | | (1,500,997 | ) | | $ | (32,671,634 | ) |
| | | | | | | | | | | | | | | | | |
| Class C Shares | | | | | | | | | | | | | | | | |
| Shares sold | | | 269,496 | | | $ | 5,750,167 | | | | 581,456 | | | $ | 12,105,415 | |
| Reinvestment of distributions | | | 153,368 | | | | 3,186,981 | | | | 17,530 | | | | 356,383 | |
| Shares reacquired | | | (612,512 | ) | | | (13,088,378 | ) | | | (683,426 | ) | | | (14,184,831 | ) |
| Converted to Class A** | | | (47,502 | ) | | | (1,006,079 | ) | | | – | | | | – | |
| Decrease | | | (237,150 | ) | | $ | (5,157,309 | ) | | | (84,440 | ) | | $ | (1,723,033 | ) |
46
Notes to Financial Statements (concluded)
| | | | | | Year Ended | | | | | | Year Ended | |
| Calibrated Mid Cap Value Fund | | | | | July 31, 2018 | | | | | | July 31, 2017 | |
| Class F Shares | | Shares | | | Amount | | | Shares | | | Amount | |
| Shares sold | | | 1,088,479 | | | $ | 23,892,476 | | | | 3,029,829 | | | $ | 64,743,734 | |
| Reinvestment of distributions | | | 344,105 | | | | 7,288,147 | | | | 92,413 | | | | 1,910,186 | |
| Shares reacquired | | | (4,025,626 | ) | | | (89,171,459 | ) | | | (2,971,997 | ) | | | (63,307,648 | ) |
| Increase (decrease) | | | (2,593,042 | ) | | $ | (57,990,836 | ) | | | 150,245 | | | $ | 3,346,272 | |
| | | | | | | | | | | | | | | | | |
| Class F3 Shares(a) | | | | | | | | | | | | | | | | |
| Shares sold | | | 171,438 | | | $ | 3,807,564 | | | | 3,129 | | | $ | 69,083 | |
| Reinvestment of distributions | | | 11,683 | | | | 247,680 | | | | – | | | | – | |
| Shares reacquired | | | (39,809 | ) | | | (867,387 | ) | | | – | (b) | | | (5 | ) |
| Increase | | | 143,312 | | | $ | 3,187,857 | | | | 3,129 | | | $ | 69,078 | |
| | | | | | | | | | | | | | | | | |
| Class I Shares | | | | | | | | | | | | | | | | |
| Shares sold | | | 3,929,235 | | | $ | 88,945,264 | | | | 6,788,001 | | | $ | 147,306,708 | |
| Reinvestment of distributions | | | 2,701,171 | | | | 57,264,830 | | | | 512,414 | | | | 10,617,214 | |
| Shares reacquired | | | (15,107,361 | ) | | | (331,374,048 | ) | | | (5,806,716 | ) | | | (124,651,835 | ) |
| Increase (decrease) | | | (8,476,955 | ) | | $ | (185,163,954 | ) | | | 1,493,699 | | | $ | 33,272,087 | |
| | | | | | | | | | | | | | | | | |
| Class R2 Shares | | | | | | | | | | | | | | | | |
| Shares sold | | | 24,908 | | | $ | 540,693 | | | | 42,735 | | | $ | 908,969 | |
| Reinvestment of distributions | | | 339 | | | | 7,185 | | | | 46 | | | | 961 | |
| Shares reacquired | | | (52,734 | ) | | | (1,156,162 | ) | | | (62,092 | ) | | | (1,341,805 | ) |
| Decrease | | | (27,487 | ) | | $ | (608,284 | ) | | | (19,311 | ) | | $ | (431,875 | ) |
| | | | | | | | | | | | | | | | | |
| Class R3 Shares | | | | | | | | | | | | | | | | |
| Shares sold | | | 82,092 | | | $ | 1,791,200 | | | | 139,373 | | | $ | 2,996,343 | |
| Reinvestment of distributions | | | 17,767 | | | | 376,668 | | | | 1,985 | | | | 41,126 | |
| Shares reacquired | | | (58,056 | ) | | | (1,264,035 | ) | | | (73,633 | ) | | | (1,584,744 | ) |
| Increase | | | 41,803 | | | $ | 903,833 | | | | 67,725 | | | $ | 1,452,725 | |
| | | | | | | | | | | | | | | | | |
| Class R4 Shares | | | | | | | | | | | | | | | | |
| Shares sold | | | 61,149 | | | $ | 1,326,654 | | | | 165,642 | | | $ | 3,536,496 | |
| Reinvestment of distributions | | | 3,206 | | | | 67,622 | | | | 490 | | | | 10,103 | |
| Shares reacquired | | | (32,178 | ) | | | (701,423 | ) | | | (50,108 | ) | | | (1,078,931 | ) |
| Increase | | | 32,177 | | | $ | 692,853 | | | | 116,024 | | | $ | 2,467,668 | |
| | | | | | | | | | | | | | | | | |
| Class R5 Shares | | | | | | | | | | | | | | | | |
| Shares sold | | | 190,034 | | | $ | 4,165,715 | | | | 67,938 | | | $ | 1,511,290 | |
| Reinvestment of distributions | | | 8,634 | | | | 183,040 | | | | 287 | | | | 5,952 | |
| Shares reacquired | | | (72,883 | ) | | | (1,587,068 | ) | | | (2,427 | ) | | | (52,484 | ) |
| Increase | | | 125,785 | | | $ | 2,761,687 | | | | 65,798 | | | $ | 1,464,758 | |
| | | | | | | | | | | | | | | | | |
| Class R6 Shares | | | | | | | | | | | | | | | | |
| Shares sold | | | 57,335 | | | $ | 1,249,949 | | | | 387,886 | | | $ | 8,433,116 | |
| Reinvestment of distributions | | | 12,247 | | | | 259,635 | | | | 562 | | | | 11,638 | |
| Shares reacquired | | | (111,722 | ) | | | (2,443,124 | ) | | | (69,885 | ) | | | (1,508,902 | ) |
| Increase (decrease) | | | (42,140 | ) | | $ | (933,540 | ) | | | 318,563 | | | $ | 6,935,852 | |
| ** | Automatic conversion of Class C shares occurs on the 25th day of the month (or, if the 25th day was not a business day, the next business day thereafter) following the tenth anniversary of the day on which the purchase order was accepted. |
| (a) | Commenced on April 4, 2017. |
| (b) | Amount is less than 1 share. |
47
Report of Independent Registered Public Accounting Firm
To the shareholders and the Board of Trustees of Lord Abbett Equity Trust:
Opinion on the Financial Statements and Financial Highlights
We have audited the accompanying statements of assets and liabilities of Lord Abbett Equity Trust (the “Trust”) comprising the Lord Abbett Calibrated Large Cap Value Fund, and Lord Abbett Calibrated Mid Cap Value Fund, including the schedules of investments, as of July 31, 2018, the related statements of operations for the year then ended, the statements of changes in net assets for each of the two years in the period then ended, the financial highlights for each of the five years in the period then ended, and the related notes. In our opinion, the financial statements and financial highlights present fairly, in all material respects, the financial position of each of the funds constituting the Lord Abbett Equity Trust as of July 31, 2018, and the results of their operations for the year then ended, the changes in their net assets for each of the two years in the period then ended, and the financial highlights for each of the five years in the period then ended in conformity with accounting principles generally accepted in the United States of America.
Basis for Opinion
These financial statements and financial highlights are the responsibility of the Trust’s management. Our responsibility is to express an opinion on the Trust’s financial statements and financial highlights based on our audits. We are a public accounting firm registered with the Public Company Accounting Oversight Board (United States) (PCAOB) and are required to be independent with respect to the Trust in accordance with the U.S. federal securities laws and the applicable rules and regulations of the Securities and Exchange Commission and the PCAOB.
We conducted our audits in accordance with the standards of the PCAOB. Those standards require that we plan and perform the audit to obtain reasonable assurance about whether the financial statements and financial highlights are free of material misstatement, whether due to error or fraud. The Trust is not required to have, nor were we engaged to perform, an audit of its internal control over financial reporting. As part of our audits, we are required to obtain an understanding of internal control over financial reporting but not for the purpose of expressing an opinion on the effectiveness of the Trust’s internal control over financial reporting. Accordingly, we express no such opinion.
Our audits included performing procedures to assess the risks of material misstatement of the financial statements and financial highlights, whether due to error or fraud, and performing procedures that respond to those risks. Such procedures included examining, on a test basis, evidence regarding the amounts and disclosures in the financial statements and financial highlights. Our audits also included evaluating the accounting principles used and significant estimates made by management, as well as evaluating the overall presentation of the financial statements and financial highlights. Our procedures included confirmation of securities owned as of July 31, 2018, by correspondence with the custodian and brokers. We believe that our audits provide a reasonable basis for our opinion.
DELOITTE & TOUCHE LLP
New York, New York
September 21, 2018
We have served as the auditor of one or more Lord Abbett Family of Funds’ investment companies since 1932.
48
Basic Information About Management
The Board is responsible for the management of the business and affairs of the Trust in accordance with the laws of the State of Delaware. The Board elects officers who are responsible for the day-to-day operations of each Fund and who execute policies authorized by the Board. The Board also approves an investment adviser to each Fund and continues to monitor the cost and quality of the services the investment adviser provides, and annually considers whether to renew the contract with the adviser. Generally, each Trustee holds office until his/her successor is elected and qualified or until his/her earlier resignation or removal, as provided in the Trust’s organizational documents.
Lord Abbett, a Delaware limited liability company, is each Fund’s investment adviser. Designated Lord Abbett personnel are responsible for the day-to-day management of the Funds.
Interested Trustees
Mr. Sieg is affiliated with Lord Abbett and is an “interested person” of the Trust as defined in the Act. Mr. Sieg is director/trustee of each of the 12 investment companies in the Lord Abbett Family of Funds, which consist of 61 portfolios or series. Mr. Sieg is an officer of the Lord Abbett Family of Funds.
Name, Address and
Year of Birth | | Current Position and
Length of Service
with the Trust | | Principal Occupation and Other Directorships
During the Past Five Years |
| | | | | |
Douglas B. Sieg
Lord, Abbett & Co. LLC
90 Hudson Street
Jersey City, NJ 07302
(1969) | | Trustee since 2016;
President and Chief Executive Officer since 2018 | | Principal Occupation: Managing Partner (since 2018) and was formerly Head of Client Services, joined Lord Abbett in 1994. Other Directorships: None. |
Independent Trustees
The following Independent Trustees also are directors/trustees of each of the 12 investment companies in the Lord Abbett Family of Funds, which consist of 61 portfolios or series.
Name, Address and
Year of Birth | | Current Position and
Length of Service
with the Trust | | Principal Occupation and Other Directorships
During the Past Five Years |
| | | | | |
Eric C. Fast
Lord, Abbett & Co. LLC
c/o Legal Dept.
90 Hudson Street
Jersey City, NJ 07302
(1949) | | Trustee since 2014 | | Principal Occupation: Chief Executive Officer of Crane Co., an industrial products company (2001 – 2014). Other Directorships: Currently serves as director of Automatic Data Processing, Inc. (since 2007) and Regions Financial Corporation (since 2010). Previously served as a director of Crane Co. (1999 – 2014). |
| | | | | |
Evelyn E. Guernsey
Lord, Abbett & Co. LLC
c/o Legal Dept. 90 Hudson Street
Jersey City, NJ 07302 (1955) | | Trustee since 2011 | | Principal Occupation: CEO, Americas of J.P. Morgan Asset Management (2004 – 2010). Other Directorships: None. |
49
Basic Information About Management (continued)
Name, Address and
Year of Birth | | Current Position and
Length of Service
with the Trust | | Principal Occupation and Other Directorships
During the Past Five Years |
| | | | | |
Julie A. Hill
Lord, Abbett & Co. LLC
c/o Legal Dept.
90 Hudson Street
Jersey City, NJ 07302
(1946) | | Trustee since 2004 | | Principal Occupation: Owner and CEO of The Hill Company, a business consulting firm (since 1998). Other Directorships: Currently serves as director of Anthem, Inc., a health benefits company (since 1994). |
| | | | | |
Kathleen M. Lutito
Lord, Abbett & Co. LLC
c/o Legal Dept.
90 Hudson Street
Jersey City, NJ 07302
(1963) | | Trustee since 2017 | | Principal Occupation: President and Chief Investment Officer of CenturyLink Investment Management Company (since 2006). Other Directorships: None |
| | | | | |
James M. McTaggart
Lord, Abbett & Co. LLC
c/o Legal Dept.
90 Hudson Street
Jersey City, NJ 07302
(1947) | | Trustee since 2012 | | Principal Occupation: Independent management advisor and consultant (since 2012); Vice President, CRA International, Inc. (doing business as Charles River Associates), a global management consulting firm (2009 – 2012); Founder and Chairman of Marakon Associates, Inc., a strategy consulting firm (1978 – 2009); and Officer and Director of Trinsum Group, a holding company (2007-2009). Other Directorships: Blyth, Inc., a home products company (2004 – 2015). |
| | | | | |
Karla M. Rabusch
Lord, Abbett & Co. LLC
c/o Legal Dept.
90 Hudson Street
Jersey City, NJ 07302
(1959) | | Trustee since 2017 | | Principal Occupation: President and Director of Wells Fargo Funds Management, LLC (2003 – 2017); President of Wells Fargo Funds (2003 – 2016). Other Directorships: None. |
| | | | | |
Mark A. Schmid
Lord, Abbett & Co. LLC
c/o Legal Dept.
90 Hudson Street
Jersey City, NJ 07302
(1959) | | Trustee since 2016 | | Principal Occupation: Vice President and Chief Investment Officer of the University of Chicago (since 2009). Other Directorships: None. |
| | | | | |
James L.L. Tullis
Lord, Abbett & Co. LLC
c/o Legal Dept.
90 Hudson Street
Jersey City, NJ 07302
(1947) | | Trustee since 2006; Chairman since 2017 | | Principal Occupation: CEO of Tullis-Dickerson and Co. Inc., a venture capital management firm (since 1990); CEO of Tullis Health Investors Inc. (since 2012). Other Directorships: Currently serves as director of Crane Co. (since 1998). |
50
Basic Information About Management (continued)
Officers
None of the officers listed below have received compensation from the Trust. All of the officers of the Trust also may be officers of the other Lord Abbett Funds and maintain offices at 90 Hudson Street, Jersey City, NJ 07302. Unless otherwise indicated, the position(s) and title(s) listed under the “Principal Occupation During the Past Five Years” column indicate each officer’s position(s) and title(s) with Lord Abbett. Each officer serves for an indefinite term (i.e., until his or her death, resignation, retirement, or removal).
Name and
Year of Birth | | Current Position
with the Trust | | Length of Service
of Current
Position | | Principal Occupation
During the Past Five Years |
| | | | | | | |
Douglas B. Sieg
(1969) | | President and Chief Executive Officer | | Elected as President in 2018 and Chief Executive Officer in 2018 | | Managing Partner of Lord Abbett, joined Lord Abbett in 1994. |
| | | | | | | |
Robert A. Lee
(1969) | | Executive Vice President | | Elected in 2016 | | Partner and Chief Investment Officer, and was formerly Deputy Chief Investment Officer and Director of Taxable Fixed Income, joined Lord Abbett in 1997. |
| | | | | | | |
David J. Linsen
(1974) | | Executive Vice President | | Elected in 2012 | | Partner and Director, joined Lord Abbett in 2001. |
| | | | | | | |
Marc Pavese
(1972) | | Executive Vice President | | Elected in 2016 | | Partner and Portfolio Manager, joined Lord Abbett in 2008. |
| | | | | | | |
Walter H. Prahl
(1958) | | Executive Vice President | | Elected in 2011 | | Partner and Director, joined Lord Abbett in 1997. |
| | | | | | | |
Pamela P. Chen
(1978) | | Vice President and Assistant Secretary | | Elected in 2018 | | Associate General Counsel, joined Lord Abbett in 2017 and was formerly Special Counsel at Schulte, Roth & Zabel LLP (2005 – 2017). |
| | | | | | | |
John T. Fitzgerald
(1975) | | Vice President and Assistant Secretary | | Elected in 2018 | | Deputy General Counsel, joined Lord Abbett in 2018 and was formerly Deputy Head of U.S. Funds Legal, Executive Director and Assistant General Counsel at JPMorgan Chase (2005 – 2018). |
51
Basic Information About Management (concluded)
Name and
Year of Birth | | Current Position
with the Trust | | Length of Service
of Current
Position | | Principal Occupation
During the Past Five Years |
| | | | | | | |
Bernard J. Grzelak
(1971) | | Chief Financial Officer and Vice President | | Elected in 2017 | | Partner and Chief Operations Officer, and was formerly Director of Fund Administration, joined Lord Abbett in 2003. |
| | | | | | | |
Lawrence H. Kaplan
(1957) | | Vice President and Secretary | | Elected in 2001 | | Partner and General Counsel, joined Lord Abbett in 1997. |
| | | | | | | |
Linda Y. Kim
(1980) | | Vice President and Assistant Secretary | | Elected in 2016 | | Counsel, joined Lord Abbett in 2015 and was formerly an Associate at Stroock & Stroock & Lavan LLP (2007 – 2015). |
| | | | | | | |
Joseph M. McGill
(1962) | | Chief Compliance Officer | | Elected in 2014 | | Partner and Chief Compliance Officer, joined Lord Abbett in 2014 and was formerly Managing Director and the Chief Compliance Officer at UBS Global Asset Management (2003 – 2013). |
| | | | | | | |
A. Edward Oberhaus, III
(1959) | | Vice President | | Elected in 2001 | | Partner and Director, joined Lord Abbett in 1983. |
| | | | | | | |
Amanda S. Ryan
(1978) | | Vice President and Assistant Secretary | | Elected in 2018 | | Counsel, joined Lord Abbett in 2016 and was formerly a Director and Corporate Counsel at PGIM Investments (2012 – 2016). |
| | | | | | | |
Lawrence B. Stoller
(1963) | | Vice President and Assistant Secretary | | Elected in 2007 | | Partner and Senior Deputy General Counsel, joined Lord Abbett in 2007. |
| | | | | | | |
Jackson C. Chan
(1964) | | AML Compliance Officer | | Elected in 2018 | | Deputy Chief Compliance Officer and Director of Regulatory Affairs, joined Lord Abbett in 2014 and was formerly Director at UBS Global Asset Management (2005 – 2014). |
| | | | | | | |
Christian J. Kelly
(1975) | | Treasurer | | Elected in 2017 | | Director of Fund Administration, joined Lord Abbett in 2009. |
Please call 888-522-2388 for a copy of the statement of additional information, which contains further information about the Trust’s Trustees. It is available free upon request.
52
Householding
The Trust has adopted a policy that allows it to send only one copy of each Fund’s prospectus, proxy material, annual report and semiannual report to certain shareholders residing at the same “household.” This reduces Fund expenses, which benefits you and other shareholders. If you need additional copies or do not want your mailings to be “householded,” please call Lord Abbett at 888-522-2388 or send a written request with your name, the name of your fund or funds and your account number or numbers to Lord Abbett Family of Funds, P.O. Box 219336, Kansas City, MO 64121.
Proxy Voting Policies, Procedures and Records
A description of the policies and procedures that Lord Abbett uses to vote proxies related to each Fund’s portfolio securities, and information on how Lord Abbett voted each Fund’s proxies during the 12-month period ended June 30 are available without charge, upon request, (i) by calling 888-522-2388; (ii) on Lord Abbett’s Website at www.lordabbett.com; and (iii) on the Securities and Exchange Commission’s (“SEC”) Website at www.sec.gov.
Shareholder Reports and Quarterly Portfolio Disclosure
The Funds are required to file their complete schedule of portfolio holdings with the SEC for their first and third fiscal quarters on Form N-Q. Copies of the filings are available without charge, upon request on the SEC’s Website at www.sec.gov and may be available by calling Lord Abbett at 888-522-2388. You can also obtain copies of Form N-Q by visiting the SEC’s Public Reference Room in Washington, DC (information on the operation of the Public Reference Room may be obtained by calling 800-SEC-0330).
Tax Information
The percentages below reflect the portion of ordinary income distributions that are eligible for the corporate dividend received deduction (DRD) and qualified dividend income (QDI) for individual shareholders:
| Fund Name | | DRD | | QDI | |
| Calibrated Large Cap Value Fund | | 41% | | 42% | |
| Calibrated Mid Cap Value Fund | | 31% | | 32% | |
Additionally, of the distributions paid to shareholders during the fiscal year ended July 31, 2018, the following amounts represent short-term capital gains and long-term capital gains:
| Fund Name | | Short-term
capital gains | | | Long-term
capital gains | |
| Calibrated Large Cap Value Fund | | $ | 17,901,411 | | | $ | 15,519,561 | |
| Calibrated Mid Cap Value Fund | | $ | 35,529,922 | | | $ | 30,625,880 | |
53


This report, when not used for the general information of shareholders of the Fund, is to be distributed only if preceded or accompanied by a current fund prospectus. Lord Abbett mutual fund shares are distributed by
LORD ABBETT DISTRIBUTOR LLC. | | Lord Abbett Equity Trust Calibrated Large Cap Value Fund Calibrated Mid Cap Value Fund | | CALIBRATED-2 (09/18) |
| (a) | In accordance with applicable requirements, the Registrant adopted a Sarbanes-Oxley Code of Ethics on June 19, 2003 that applies to the principal executive officer and senior financial officers of the Registrant (“Code of Ethics”). The Code of Ethics was in effect during the fiscal year ended July 31, 2018 (the “Period”). |
| (c) | The Registrant has not amended the Code of Ethics as described in Form N-CSR during the Period. |
| (d) | The Registrant has not granted any waiver, including an implicit waiver, from a provision of the Code of Ethics as described in Form N-CSR during the Period. |
| (f) | See Item 12(a)(1) concerning the filing of the Code of Ethics. |
| Item 3: | Audit Committee Financial Expert. |
The Registrant’s board of trustees has determined that each of the following independent trustees who are members of the audit committee is an audit committee financial expert: Evelyn E. Guernsey, Karla M. Rabusch and Mark A. Schmid. Each of these persons is independent within the meaning of the Form N-CSR.
| Item 4: | Principal Accountant Fees and Services. |
In response to sections (a), (b), (c) and (d) of Item 4, the aggregate fees billed to the Registrant for the fiscal years ended July 31, 2018 and 2017 by the Registrant’s principal accounting firm, Deloitte & Touche LLP, the member firms of Deloitte Touche Tohmatsu and their respective affiliates (collectively, “Deloitte”) were as follows:
| | | Fiscal year ended: | |
| | | 2018 | | | 2017 | |
| Audit Fees {a} | | $ | 75,200 | | | $ | 75,200 | |
| Audit-Related Fees | | | - 0 - | | | | - 0 - | |
| Total audit and audit-related fees | | $ | 75,200 | | | $ | 75,200 | |
| | | | | | | | | |
| Tax Fees {b} | | | 14,950 | | | | 15,497 | |
| All Other Fees | | | - 0 - | | | | - 0 - | |
| | | | | | | | | |
| Total Fees | | $ | 90,150 | | | $ | 90,697 | |
{a} Consists of fees for audits of the Registrant’s annual financial statements.
{b} Fees for the fiscal year ended July 31, 2018 and 2017 consist of fees for preparing the U.S. Income Tax Return for Regulated Investment Companies, New Jersey Corporation Business Tax Return, New Jersey Annual Report Form, U.S. Return of Excise Tax on Undistributed Income of Investment Companies, IRS Forms 1099-MISC and 1096 Annual Summary and Transmittal of U.S. Information Returns.
(e) (1) Pursuant to Rule 2-01(c) (7) of Regulation S-X, the Registrant’s Audit Committee has adopted pre-approval policies and procedures. Such policies and procedures generally provide that the Audit Committee must pre-approve:
| · | any audit, audit-related, tax, and other services to be provided to the Lord Abbett Funds, including the Registrant, and |
| · | any audit-related, tax, and other services to be provided to the Registrant’s investment adviser and any entity controlling, controlled by or under common control with the investment adviser that provides ongoing services to one or more Funds comprising the Registrant if the engagement relates directly to operations and financial reporting of a Fund, by the independent auditor to assure that the provision of such services does not impair the auditor’s independence. |
The Audit Committee has delegated pre-approval authority to its Chairman, subject to a fee limit of $10,000 per event, and not to exceed $25,000 annually. The Chairman will report any pre-approval decisions to the Audit Committee at its next scheduled meeting. Unless a type of service to be provided by the independent auditor has received general pre-approval, it must be pre-approved by the Audit Committee. Any proposed services exceeding pre-approved cost levels will require specific pre-approval by the Audit Committee.
(e) (2) The Registrant’s Audit Committee has approved 100% of the services described in this Item 4 (b) through (d).
(f) Not applicable.
(g) The aggregate non-audit fees billed by Deloitte for services rendered to the Registrant are shown above in the response to Item 4 (a), (b), (c) and (d) as “All Other Fees”.
The aggregate non-audit fees billed by Deloitte for services rendered to the Registrant’s investment adviser, Lord, Abbett & Co. LLC (“Lord Abbett”), for the fiscal years ended July 31, 2018 and 2017 were:
| | | Fiscal year ended: | |
| | | 2018 | | | 2017 | |
| All Other Fees {a} | | $ | 200,339 | | | $ | 201,416 | |
{a} Consist of fees for Independent Services Auditors’ Report on Controls Placed in Operation and Tests of Operating Effectiveness related to Lord Abbett’s Asset Management Services (“SOC-1 Report”).
The aggregate non-audit fees billed by Deloitte for services rendered to entities under the common control of Lord Abbett for the fiscal years ended July 31, 2018 and 2017 were:
| | | Fiscal year ended: | |
| | | 2018 | | | 2017 | |
| All Other Fees | | $ | - 0 - | | | $ | - 0 - | |
(h) The Registrant’s Audit Committee has considered the provision of non-audit services that were rendered to the Registrant’s investment adviser, and any entity controlling, controlled by or under common control with the investment adviser that provides ongoing services to the Registrant, that were not pre-approved pursuant to Rule 2-01 (c)(7)(ii) of Regulation S-X and has determined that the provision of such services is compatible with maintaining Deloitte’s independence.
| Item 5: | Audit Committee of Listed Registrants. |
| | |
| | Not applicable. |
| | |
| Item 6: | Investments. |
| | |
| | Not applicable. |
| | |
| Item 7: | Disclosure of Proxy Voting Policies and Procedures for Closed-End Management Investment Companies. |
| | |
| | Not applicable. |
| | |
| Item 8: | Portfolio Managers of Closed-End Management Investment Companies. |
| | |
| | Not applicable. |
| | |
| Item 9: | Purchases of Equity Securities by Closed-End Management Investment Company and Affiliated Purchasers. |
| | |
| | Not applicable. |
| | |
| Item 10: | Submission of Matters to a Vote of Security Holders. |
| | |
| | Not applicable. |
| | |
| Item 11: | Controls and Procedures. |
| (a) | Based on their evaluation of the Registrant’s disclosure controls and procedures (as defined in Rule 30a-3(c) under the Investment Company Act of 1940) as of a date within 90 days prior to the filing date of this report, the Chief Executive Officer and Chief Financial Officer of the Registrant have concluded that such disclosure controls and procedures are reasonably designed and effective to ensure that material information relating to the Registrant, including its consolidated subsidiaries, is made known to them by others within those entities. |
| (b) | There were no changes in the Registrant’s internal control over financial reporting (as defined in Rule 30a-3(d) under the Investment Company Act of 1940) that occurred during the second fiscal quarter of the period covered by this report that have materially affected, or are reasonably likely to materially affect, the Registrant’s internal control over financial reporting. |
| (a)(1) | The Lord Abbett Family of Funds Sarbanes Oxley Code of Ethics for the Principal Executive Officer and Senior Financial Officers is attached hereto as part of Ex-99. CODEETH. |
| | (a)(2) | Certification of each Principal Executive Officer and Principal Financial Officer of the Registrant as required by Rule 30a-2 under the Investment Company Act of 1940 is attached hereto as a part of EX-99.CERT. |
| (b) | Certification of each Principal Executive Officer and Principal Financial Officer of the Registrant as required by Section 906 of the Sarbanes-Oxley Act of 2002 is provided as a part of EX-99.906CERT. |
SIGNATURES
Pursuant to the requirements of the Securities Exchange Act of 1934 and the Investment Company Act of 1940, the Registrant has duly caused this report to be signed on its behalf by the undersigned, thereunto duly authorized.
| | LORD ABBETT EQUITY TRUST |
| | | | |
| | By: | /s/ Douglas B. Sieg | |
| | | Douglas B. Sieg | |
| | | President and Chief Executive Officer | |
Date: September 21, 2018
| | By: | /s/ Bernard J. Grzelak | |
| | | Bernard J. Grzelak | |
| | | Chief Financial Officer and Vice President |
Date: September 21, 2018
Pursuant to the requirements of the Securities Exchange Act of 1934 and the Investment Company Act of 1940, this report has been signed below by the following persons on behalf of the Registrant and in the capacities and on the dates indicated.
| | By: | /s/ Douglas B. Sieg | |
| | | Douglas B. Sieg | |
| | | President and Chief Executive Officer |
Date: September 21, 2018
| | By: | /s/ Bernard J. Grzelak | |
| | | Bernard J. Grzelak | |
| | | Chief Financial Officer and Vice President |
Date: September 21, 2018